Comparison between in vivo and theoretical bite performance: using multi-body modelling to predict...
6
Comparison between in vivo and theoretical bite performance: Using multi-body modelling to predict muscle and bite forces in a reptile skull N. Curtis a,n , M.E.H. Jones b , A.K. Lappin c , P. O’Higgins d , S.E. Evans b , M.J. Fagan a a Department of Engineering, University of Hull, Hull HU6 7RX, United Kingdom b Research Department of Cell and Developmental Biology, Anatomy Building, Gower Street, UCL, University College London, London WCIE 6BT, United Kingdom c Biological Sciences Department, California State Polytechnic University, 3801 West Temple Avenue, Pomona, CA 91768-2553, USA d The Hull York Medical School, University of York, York YO10 5DD, United Kingdom article info Article history: Accepted 29 May 2010 Keywords: Bite force Multi-body analysis Muscle force Skull Sphenodon Muscle Stress abstract In biomechanical investigations, geometrically accurate computer models of anatomical structures can be created readily using computed-tomography scan images. However, representation of soft tissue structures is more challenging, relying on approximations to predict the muscle loading conditions that are essential in detailed functional analyses. Here, using a sophisticated multi-body computer model of a reptile skull (the rhynchocephalian Sphenodon), we assess the accuracy of muscle force predictions by comparing predicted bite forces against in vivo data. The model predicts a bite force almost three times lower than that measured experimentally. Peak muscle force estimates are highly sensitive to fibre length, muscle stress, and pennation where the angle is large, and variation in these parameters can generate substantial differences in predicted bite forces. A review of theoretical bite predictions amongst lizards reveals that bite forces are consistently underestimated, possibly because of high levels of muscle pennation in these animals. To generate realistic bites during theoretical analyses in Sphenodon, lizards, and related groups we suggest that standard muscle force calculations should be multiplied by a factor of up to three. We show that bite forces increase and joint forces decrease as the bite point shifts posteriorly within the jaw, with the most posterior bite location generating a bite force almost double that of the most anterior bite. Unilateral and bilateral bites produced similar total bite forces; however, the pressure exerted by the teeth is double during unilateral biting as the tooth contact area is reduced by half. Crown Copyright & 2010 Published by Elsevier Ltd. All rights reserved. 1. Introduction Sophisticated computer models that simulate function are becoming increasingly important in the assessment of skull mechanics in both extant and extinct animals (e.g. Curtis et al., 2010; Koolstra and Tanaka, 2009; Moazen et al., 2009; Rayfield, 2007; Strait et al., 2007). Such computer models are often based on high resolution computed-tomography (CT) scan data and are thus geometrically accurate. These geometries are then constrained and loaded, normally by representative muscle forces, bite forces, and joint forces. Carefully positioned and well defined constraints allow bite forces and joint forces to be derived in response to applied muscle forces, which themselves can be estimated from anatomical variables such as absolute and relative muscle mass, areas of muscle origins, fibre length, pennation angle, and estimated muscle cross-sectional area (e.g. Anton, 1999; Ross et al., 2005; Weijs and Dantuma, 1975). A standard method of peak muscle force estimation uses a muscle’s physiological cross-sectional area (PCSA) (Anton, 1999) multiplied by muscle stress (Mendez and Keys, 1960; van Ruijven and Weijs, 1990). The accuracy of applied muscle forces is key to determin- ing the accuracy of a model. A validated multi-body model has many potential applications, such as a functional analysis of the feeding apparatus that includes both movements and forces within the muscles and joints. However, without validation such analyses cannot be carried out with confidence, and thus developing such a model and testing it with empirically measured in vivo performance data was the motivation behind this research. A multi-body model of the skull of the reptile Sphenodon has previously shown compar- able jaw movements and muscle activity levels to living animals (Curtis et al., 2010). This suggests the muscle attachment locations and therefore the force vectors used in this model are probably a good representation of reality. Here we assess whether Contents lists available at ScienceDirect journal homepage: www.elsevier.com/locate/jbiomech www.JBiomech.com Journal of Biomechanics 0021-9290/$ - see front matter Crown Copyright & 2010 Published by Elsevier Ltd. All rights reserved. doi:10.1016/j.jbiomech.2010.05.037 n Corresponding author. E-mail addresses: [email protected] (N. Curtis), [email protected] (M.E.H. Jones), [email protected] (A.K. Lappin), [email protected] (P. O’Higgins), [email protected] (S.E. Evans), [email protected] (M.J. Fagan). Journal of Biomechanics 43 (2010) 2804–2809
Transcript of Comparison between in vivo and theoretical bite performance: using multi-body modelling to predict...
Journal of Biomechanics 43 (2010) 2804–2809
Contents lists available at ScienceDirect
journal homepage: www.elsevier.com/locate/jbiomech
Journal of Biomechanics
0021-92
doi:10.1
n Corr
E-m
(M.E.H.
(P. O’Hi
www.JBiomech.com
Comparison between in vivo and theoretical bite performance: Usingmulti-body modelling to predict muscle and bite forces in a reptile skull
N. Curtis a,n, M.E.H. Jones b, A.K. Lappin c, P. O’Higgins d, S.E. Evans b, M.J. Fagan a
a Department of Engineering, University of Hull, Hull HU6 7RX, United Kingdomb Research Department of Cell and Developmental Biology, Anatomy Building, Gower Street, UCL, University College London, London WCIE 6BT, United Kingdomc Biological Sciences Department, California State Polytechnic University, 3801 West Temple Avenue, Pomona, CA 91768-2553, USAd The Hull York Medical School, University of York, York YO10 5DD, United Kingdom
a r t i c l e i n f o
Article history:
Accepted 29 May 2010In biomechanical investigations, geometrically accurate computer models of anatomical structures can
be created readily using computed-tomography scan images. However, representation of soft tissue
Keywords:
Bite force
Multi-body analysis
Muscle force
Skull
Sphenodon
Muscle Stress
90/$ - see front matter Crown Copyright & 2
016/j.jbiomech.2010.05.037
esponding author.
ail addresses: [email protected] (N. Curtis), m
Jones), [email protected] (A.K. Lappin
ggins), [email protected] (S.E. Evans), m.j.fag
a b s t r a c t
structures is more challenging, relying on approximations to predict the muscle loading conditions that
are essential in detailed functional analyses. Here, using a sophisticated multi-body computer model of
a reptile skull (the rhynchocephalian Sphenodon), we assess the accuracy of muscle force predictions by
comparing predicted bite forces against in vivo data. The model predicts a bite force almost three times
lower than that measured experimentally. Peak muscle force estimates are highly sensitive to fibre
length, muscle stress, and pennation where the angle is large, and variation in these parameters can
generate substantial differences in predicted bite forces. A review of theoretical bite predictions
amongst lizards reveals that bite forces are consistently underestimated, possibly because of high levels
of muscle pennation in these animals. To generate realistic bites during theoretical analyses in
Sphenodon, lizards, and related groups we suggest that standard muscle force calculations should be
multiplied by a factor of up to three. We show that bite forces increase and joint forces decrease as the
bite point shifts posteriorly within the jaw, with the most posterior bite location generating a bite force
almost double that of the most anterior bite. Unilateral and bilateral bites produced similar total bite
forces; however, the pressure exerted by the teeth is double during unilateral biting as the tooth contact
area is reduced by half.
Crown Copyright & 2010 Published by Elsevier Ltd. All rights reserved.
1. Introduction
Sophisticated computer models that simulate function arebecoming increasingly important in the assessment of skullmechanics in both extant and extinct animals (e.g. Curtis et al.,2010; Koolstra and Tanaka, 2009; Moazen et al., 2009; Rayfield,2007; Strait et al., 2007). Such computer models are often basedon high resolution computed-tomography (CT) scan data andare thus geometrically accurate. These geometries are thenconstrained and loaded, normally by representative muscle forces,bite forces, and joint forces. Carefully positioned and well definedconstraints allow bite forces and joint forces to be derived inresponse to applied muscle forces, which themselves can beestimated from anatomical variables such as absolute and relative
010 Published by Elsevier Ltd. All
[email protected] (M.J. Fagan).
muscle mass, areas of muscle origins, fibre length, pennationangle, and estimated muscle cross-sectional area (e.g. Anton,1999; Ross et al., 2005; Weijs and Dantuma, 1975). A standardmethod of peak muscle force estimation uses a muscle’sphysiological cross-sectional area (PCSA) (Anton, 1999) multipliedby muscle stress (Mendez and Keys, 1960; van Ruijven and Weijs,1990). The accuracy of applied muscle forces is key to determin-ing the accuracy of a model.
A validated multi-body model has many potential applications,such as a functional analysis of the feeding apparatus thatincludes both movements and forces within the muscles andjoints. However, without validation such analyses cannot becarried out with confidence, and thus developing such a modeland testing it with empirically measured in vivo performance datawas the motivation behind this research. A multi-body model ofthe skull of the reptile Sphenodon has previously shown compar-able jaw movements and muscle activity levels to living animals(Curtis et al., 2010). This suggests the muscle attachmentlocations and therefore the force vectors used in this model areprobably a good representation of reality. Here we assess whether
rights reserved.

N. Curtis et al. / Journal of Biomechanics 43 (2010) 2804–2809 2805
this model can provide realistic predictions of bite force based onmuscle force magnitudes calculated in a standard way fromphysiological cross-sectional area (PSCA) multiplied by musclestress. Predicted bite force is compared to in vivo bite force data(Jones and Lappin, 2009).
Fig. 2. Skull of Sphenodon highlighting bite positions simulated in the multi-body
study. Each bite position represents an individual analysis.
2. Materials and methods
2.1. In vivo bite force measurements
Peak in vivo bite force measurements were recorded from an adult male
Sphenodon (skull length¼62 mm) housed at Dallas Zoo (Jones and Lappin, 2009).
The animal was encouraged to bite a custom designed piezoelectric isometric force
transducer (Type 9203, Kistler Inc., Switzerland), upon which bite point position
and force magnitude were recorded. Strips of leather were glued to the bite force
plates to provide purchase and to avoid damage to the animal’s teeth during the
experiments (see Jones and Lappin, 2009). All bite trials were filmed in order to
record the exact position of each bite along the tooth row, allowing bite forces
obtained from different trials to be standardised and compared (Lappin and Husak,
2005; Jones and Lappin, 2009). Six trials were conducted in total and the peak bite
force value was accepted as a measure of maximum performance.
2.2. Multi-body model construction and simulations
In-depth descriptions of the construction and application of the multi-body
computer model have been given elsewhere (Curtis et al., 2010). The skull of a
large adult male Sphenodon (LDUCZx036; cranial length¼67.7 mm) was subjected
to micro-computed tomography (micro-CT) and the resulting scan images were
used to generate a three-dimensional (3D) geometric model of the skull. This
model was imported into the multi-body dynamics software ADAMS (MSC
Software Corp, USA), in which jaw musculature was represented (Curtis et al.,
2009, 2010; Jones et al., 2009). In order to simulate the in vivo bite force
experiments a virtual bite force transducer was constructed and positioned within
the jaw approximately 90% of the distance between the jaw joint and the most
anterior point on the jaw (see Fig. 1). This is equivalent to the position of the
transducer at which peak bite force was recorded in vivo. During the computer
simulations the jaw was opened, the virtual transducer was placed within the
mouth, and then the jaw was closed. Upon contact with the transducer the muscle
forces increased to their maximum magnitudes, producing the maximum possible
bite force.
Bilateral and unilateral biting simulations were then conducted along the
tooth row (see Fig. 2), and bite forces and joint forces were recorded. In addition,
the significance of how muscles are represented within theoretical simulations
was examined by conducting one-dimensional (1D), two-dimensional (2D), and
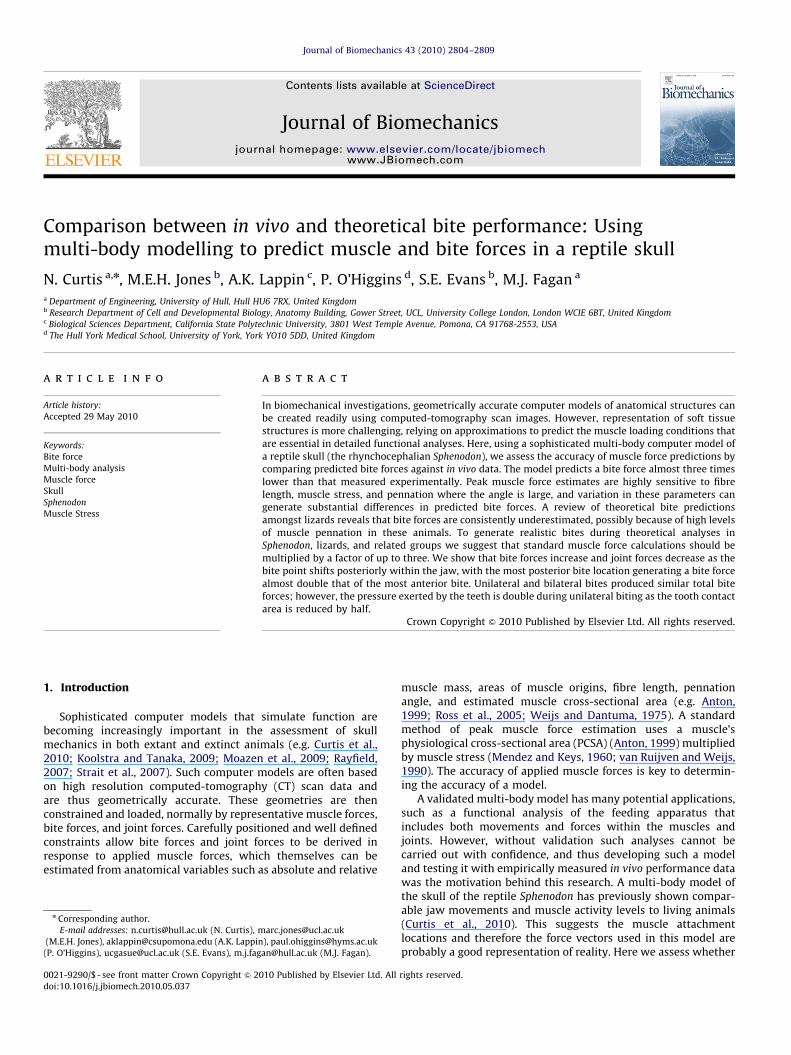
three-dimensional (3D) muscle vector analyses (see Fig. 3).
2.3. Muscle force calculations
Using each muscle’s cross-sectional area multiplied by muscle stress, peak
muscle forces were estimated using the standard equation
F ¼ PCSA� S ð1Þ
Fig. 1. Multi-body computer model used to simulate and estimate in vivo bite
forces. The vertical red cylinder at the front of the skull represents the force
transducer. Other coloured cylinders represent different muscle groups. Visible
muscles are identified in the key (see Curtis et al., 2009 for a full list of muscles
used in this model). (For interpretation of the references to colour in this figure
legend, the reader is referred to the web version of this article.)
where F is the peak muscle force, PCSA the physiological cross-sectional
area¼mcosðyÞ=lr, S the muscle stress, m the muscle mass, r the specific density,
y the pennation angle, and l the fibre length.
The muscle masses and fibre lengths used to calculate jaw muscle cross-
sectional areas in Sphenodon were taken from Gorniak et al. (1982). A range of fibre
lengths was published by Gorniak et al., from which the mean value was used in
this study. Pennation angles (i.e. the angle between the individual muscle fibres
and the tendon upon which they insert) were not reported by Gorniak et al.,
therefore a value of zero (and cos(0)¼1) was used in Eq. 1 as a first approximation.
Generally a muscle stress (also referred to as specific tension and intrinsic muscle
strength) of 25–40 N/cm2 is applied in such calculations (e.g. Curtis et al., 2008;
Christiansen and Wroe, 2007; Herrel et al., 1998; Thomason et al., 1990); we
conservatively used a value of 30 N/cm2. A muscle tissue density of 1000 kg/m3
was used. The muscles measured by Gorniak et al. (1982) were taken from a skull
approximately 20% smaller in length than the one used in this multi-body study,
although the actual skull length was not reported by Gorniak and co-workers, an
estimate derived from the reported snout-vent length (221 mm) was published in
Schaerlaeken et al. (2008). The calculated scaling factor (ratio) between the
estimated skull length presented in Schaerlaeken et al. (2008) (56.8 mm) and that
of the skull used in this multi-body study (67.7 mm) was 1:1.192. Assuming
isometric scaling and a similar increase in skull width and height, this will result in
an increase in both the width and the thickness of the muscle attachment. While
this may well be allometric, we have no data on the possible scaling relationship
and so here we have applied the simplest possible adjustment which is isometric.
As such the PCSA values of all muscles were scaled by a factor of 1.42
(i.e. 1.192�1.192). All PCSA and muscle force data are presented in Table 1.
3. Results
When muscle forces calculated from PCSA (assuming apennation angle of zero) multiplied by muscle stress are used,the bite force predicted by the multi-body analysis wasconsiderably lower than that recorded experimentally. With abite point 90% of the distance from the jaw joint to the snout thepeak in vivo bite force was recorded as 132 N in an adult maleSphenodon (Jones and Lappin, 2009). This value was used as thetarget for this multi-body study. Applying peak muscle forceestimates derived from isometrically scaled muscle mass andfibre length data (Gorniak et al., 1982) multiplied by a standardmuscle stress value of 30 N/cm2 produced a bite force of only 48 Nin the model. To achieve the target bite force of 132 N requires anincrease in muscle force equivalent to that achieved by using amuscle stress value in the muscle force calculations of 82.5 N/cm2.This muscle stress value may exceed that achievable for normaljaw musculature (although a muscle stress value of 87.1 N/cm2
has been reported for other muscles; Hatze, 1981). While thisvalue of muscle stress is needed to obtain a match between theperformance of our model and in vivo experimental measure-ments, it should be noted that increased force may be achieved byother factors that influence muscle force production (see Eq. (1)and Discussion). Table 1 summarises scaled muscle forces thatwere applied to achieve the target bite force.
The model predicted larger bite forces at the back of the jaw.Bite force was seen to increase almost linearly towards the back of

Fig. 3. Representation of a (a) 1D, (b) 2D, and (c) 3D muscle vector analysis. Individual coloured lines represent the applied direction of the muscle forces for the different
muscle groups. Solid circle represents bite point. (For interpretation of the references to colour in this figure legend, the reader is referred to the web version of this article.)
Table 1Fibre length and PCSA data from Gorniak et al. (1982). Scaled PCSA data are for the larger skull used in this study (scaled by a factor of 1.42, see text). Muscle force data are
calculated from the scaled PCSAs. The scaled muscle forces are what would be required to produce an anterior bite force of 132 N.
Muscle group Fibre length (cm) PCSA (cm2) Scaled PCSA (mm2) Muscle force (N) Scaled muscle force (N)
Depressor mandibulae 1.45 0.34 0.48 14.40 39.59
Adductor mandibulae externus superficialis 1.25 0.72 1.02 30.67 84.35
Adductor mandibulae medialis
Ventrolateral 1.10 0.46 0.65 19.36 53.25
Anteromedial 1.45 0.23 0.33 9.99 27.47
Posterior 1.4 0.14 0.20 6.09 16.74
Adductor mandibulae posterior 0.80 0.13 0.18 5.33 14.64
Adductor mandibulae externus profundus 0.80 0.13 0.18 5.33 14.64
Pseudotemporalis superficialis 1.3 0.42 0.59 17.70 48.66
Pseudotemporalis profundus 1.55 0.12 0.17 4.95 13.60
Pterygoideus typicus
Dorsal 0.75 0.11 0.15 4.54 12.50
Middle 1.43 1.16 1.64 49.33 135.65
Ventral 1.90 0.16 0.22 6.73 18.50
Pterygoideus atypicus 1.65 0.07 0.10 2.84 7.81
N. Curtis et al. / Journal of Biomechanics 43 (2010) 2804–28092806
the jaw during bilateral and unilateral biting (Fig. 4a), with thesum of the joint forces (left+right joint force) displaying theopposite trend; an almost linear decrease (Fig. 4b). Duringunilateral biting the ratio between the working and balancingside joint forces also shifted away from unity as the bite pointmoved posteriorly along the jaw (Fig. 4c). At the posterior-mostbite point (bite point 6 in Fig. 2) the balancing side joint force wasalmost double that of the working side (balancing¼279 N;working¼156 N—see Fig. 4c).
Our investigation also considered the impact of modellingmasticatory system function using simplified muscle forces,represented as 1D or 2D muscle vectors. The direction of theforce vector applied in a 3D muscle simulation differs consider-ably from that in a 1D muscle simulation, and this will impact onthe proportion of the total muscle force that is applied in aparticular direction during the simulation. Results from oursimulations using reduced muscle vector dimensions are pre-sented in Table 2 as components of the resultant force vector inthe x, y, and z-axes (see Fig. 3 for the coordinate system used inthis study). Clearly, a muscle force applied in the vertical direction(y-axis) has the greatest influence on bite force during simula-tions, and muscle groups with strong antero-posterior and medio-lateral inclinations are likely to distribute the muscle forcemore across all three vector axes. For example, the middle
portion of the M. pterygoideus typicus is noted to apply only 44%of its total force magnitude in the y-axis during a 3D vectorsimulation, meaning its contribution towards bite force is reducedconsiderably, particularly when compared to a 1D analysis(see Table 2).
4. Discussion
Accurate measurements or reliable estimates of muscle forcemagnitudes are necessary when performing a quantitativeanalysis of bite-force performance using a musculoskeletal model.Muscle physiological cross-sectional area has been used exten-sively to estimate a muscle’s maximum force output (e.g. Curtiset al., 2008; Kleinteich et al., 2008; Ross et al., 2005), andtheoretical models have been constructed to determine biteperformance (e.g. Clausen et al., 2008; Herrel et al., 1998, Moazenet al., 2008). However, direct comparisons between in vivo dataand theoretical models are uncommon, particularly in analysesemploying 3D models. Here we performed such a comparisonusing multi-body computer modelling, in which maximummuscle forces were estimated from muscle physiological cross-sectional areas (PCSAs), and bite force was predicted and thencompared to in vivo measurements. The peak simulated bite force

Fig. 4. (a) Bite force during bilateral and unilateral biting, (b) total joint force
during bilateral and unilateral biting, and (c) working and balancing side joint
force during unilateral biting. Bite point refers to Fig. 2.
N. Curtis et al. / Journal of Biomechanics 43 (2010) 2804–2809 2807
was almost three times lower than that recorded in vivo, implyingerror in the maximum muscle force estimates. Muscle mass andfibre length (as applied in the PCSA calculation), muscle stress,muscle anatomy (including pennation), cranial architecture, andPCSA scaling all contribute to biting performance, and as suchshould be assessed more closely.
The sensitivity of muscle force calculations are highlightedwhen we look at fibre lengths and muscle stress values. A range offibre lengths was published by Gorniak et al. (1982), of which the
mean of the range was used in this multi-body study. Forexample, the fibre length range reported for the anterior portionof the M. adductor mandibulae externus superficialis was 7–18 mm,which corresponds to a calculated muscle force of 51 and 20 Nwhen applying the lower and upper lengths respectively. Pennatemuscles are likely to have greater numbers of shorter fibres,which tends to increase muscle force, whereas increases inpennation angle between the individual muscle fibres and thetendon upon which they insert will tend to decrease overallmuscle force. The major jaw adductor muscles in Sphenodon andlizards are known to be highly pennate (e.g. Haas, 1973; Gomes1974; Rieppel, 1980a, b, 1987; Gorniak et al., 1982; Jones et al.,2009). Pennation angle was not taken into account in the presentstudy, however, due to angle dependence of Eq. (1) only largepennation angles will have a noticeable effect on muscle forcecalculations (e.g. pennation of 151 results in a multiplicationfactor of 0.97; cos(15)¼0.97), and even then increasing pennationangle will reduce force output.
Muscle stress is another source of error, with typical values of25–40 N/cm2 used in studies of bite performance (Christiansenand Wroe, 2007; Curtis et al., 2008; Hannam et al., 2008; Herrelet al., 1998; Thomason et al., 1990), which translates into amuscle force variation of over 60%. It was assumed that allmuscles scale similarly in this study, where PCSAs were multi-plied by factor of 1.42. This assumption may not be accurate,where limited data has shown inconsistent scaling betweendifferent muscles of two specimens (Schaerlaeken et al., 2008).Scaling muscle sizes from a smaller to a larger skull shouldtherefore be viewed as a possible source of error in this study.
Other studies have also tended to underestimate bite perfor-mance using standard muscle force calculations, for example,Moazen et al. (2008) applied multi-body analysis to estimate biteforce in the lizard Uromastyx hardwickii. Bite forces ranging fromapproximately 27–50 N were predicted at various bite positionsalong the jaw line, but for a skull of this size experimental datasuggest a bite force of around 70–100 N (based on relative skulllength and width—Herrel and De Vree, 2009; Lappin and Husak,2005). Further, in the analysis of four different species of lizardand one Sphenodon punctatus, Herrel et al. (1998) predicted biteforces approximately 2–4 times lower than obtained in vivo
during subsequent studies (Herrel and Aerts, 2003; Herrel and DeVree, 2009; Lappin and Husak, 2005; Schaerlaeken et al., 2008).Similarly, Kleinteich et al. (2008) noted bite forces three timeslower in caecilians (limbless amphibians) using calculationsrelative to skull length. We therefore suggest muscle forcesshould be increased by a factor of two to three (assuming astandard muscle stress constant of 30–40 N/cm2) when dealingwith highly pennate muscles. This could be achieved by simplyapplying a higher muscle stress of approximately 80–90 N/cm2 aswe did in this study, or alternatively the effects of pennation maybe build into the model in another way (i.e. shorter fibre lengthsor increased number of fibres). The degree of jaw adductorpennation among species, as well as among muscles in anindividual animal, is certain to vary, which therefore makes thisa difficult aspect to model accurately.
As we have shown, differences exist between theoretical andin vivo analyses. A further potential source of error in suchmodelling studies arises where geometry is simplified from threedimensions to two or less. Here we show that a 3D representationof muscle anatomy distributes force magnitudes among the threecomponent force vectors (see Table 2). A 1D (i.e. as a straight linelever) modelling of muscle force applies the entire forcemagnitude in the vertical direction (i.e. y-axis). A 2D representa-tion distributes muscle forces between the dorso-ventral (y-axis)and antero-posterior directions (x-axis); the medio-lateral actionof a muscle is not taken into account. It has been demonstrated

Table 2Components of adductor muscle forces in 1D, 2D, and 3D muscle analyses. Bracketed numbers represent the % of the total muscle force magnitude applied in the specific
vector direction.
Muscle Group 1D analysis 2D analysis 3D analysis
y-force x-force y-force x-force y-force z-force
Adductor mandibulae externus superficialis 84 N (100%) 6 N (7%) 84 N (�100%) 1 N (1%) 84 N (�100%) 3 N (4%)
Adductor mandibulae medialis
Ventrolateral 53 N (100%) 23 N (43%) 48 N (91%) 17 N (32%) 44 N (83%) 24 N (45%)
Anteromedial 27 N (100%) 6 N (22%) 27 N (�100%) 6 N (22%) 24 N (89%) 13 N (48%)
Posterior 17 N (100%) 7 N (41%) 15 N (88%) 7 N (41%) 15 N (88%) 2 N (12%)
Adductor mandibulae posterior
Adductor mandibulae externus profundus 15 N (100%) 4 N (27%) 14 N (93%) 3 N (20%) 7 N (47%) 2 N (13%)
Pseudotemporalis superficialis 48 N (100%) 1 N (2%) 48 N (�100%) 3 N (6%) 46 N (96%) 18 N (38%)
Pseudotemporalis profundus 14 N (100%) 3 N (21%) 13 N (93%) 2 N (14%) 12 N (86%) 6 N (43%)
Pterygoideus typicus
Dorsal 12 N (100%) 7 N (58%) 10 N (83%) 8 N (67%) 9 N (75%) 4 N (33%)
Middle 135 N (100%) 88 N (65%) 102 N (76%) 95 N (70%) 60 N (44%) 76 N (56%)
Ventral 18 N (100%) 15 N (83%) 11 N (61%) 14 N (78%) 9 N (50%) 8 N (44%)
Pterygoideus atypicus 8 N (100%) 3 N (38%) 7 N (88%) 3 N (38%) 6 N (75%) 4 N (50%)
N. Curtis et al. / Journal of Biomechanics 43 (2010) 2804–28092808
clearly that most muscle groups in Sphenodon show some degreeof medio-lateral inclination (Curtis et al., 2009), with the muscleM. pterygoideus typicus showing a particularly strong medio-lateral component. Indeed, assessing the middle portion of theM. pterygoideus typicus we see that a 1D simulation will apply100% of its force in the y-axis and a 2D simulation will apply 65%in the x-axis and 76% in the y-axis, while a 3D simulation willapply 70% in the x-axis, 44% in the y-axis, and 56% in the z-axis.This muscle is the largest jaw adductor in Sphenodon, andtherefore reducing its efficiency in the jaw closing direction willreduce bite performance. As a result, 3D muscle simulations wereseen to produce bite forces approximately 30% lower than 2Dsimulations. 3D muscle representation also impacts on jointforces when compared with 1D and 2D muscle simulations. For a1D, 2D, and 3D muscle simulation the joint force along the x, y,and z-axis were: 0, 350, 0; 62, 294, 0; and 13, 272, 100 N,respectively. If, for example, the ultimate goal of such aninvestigation is a finite element analysis of the skull, thesevariations in force values will clearly have an effect on themagnitudes, directions, and distribution of the stresses andstrains in a skull.
The simulated bites in the Sphenodon model were conducted atsix different bite positions (Fig. 2). Bite forces increased as the bitepoint shifted posteriorly in the jaw, with the most posterior biteproducing a bite force of 234 N, nearly twice that of an anteriorbite. Considering equal muscle forces, total bite forces duringunilateral bites were similar to those during bilateral biting,although a unilateral bite effectively doubles the pressure (totalpoint loading) exerted on the food because the tooth contact areais half of that used during bilateral biting. Use of a unilateralbiting strategy is observed in live Sphenodon when the tongue isused to position food items in alternate corners of the mouthbetween bites (Gorniak et al., 1982; personal observations). Itallows more resistant food items to be broken down, more rapidreduction of food items, and/or enables food to be reduced withlower muscle forces.
Asymmetric loading across the dentition during unilateralbiting results in asymmetric loading across the jaw joints (seeFig. 4c), a phenomenon that has been addressed in other studies(e.g. Clausen et al., 2008; Greaves, 2000; Hylander et al., 1987).The results of this multi-body modelling analysis are consistentwith observations in the literature, showing that the differencebetween balancing and working side jaw joint forces increases as
the bite point shifts posteriorly. At the most posterior bite point inthis study, balancing side joint forces were almost double those ofthe working side. This situation may be avoided in vivo asbalancing side muscle activity has been shown to be lower thanworking side muscle activity during normal unilateral biting ofpliable food (Gorniak et al., 1982; Hylander et al., 1987; Ross et al.,2005). If muscle force output is equivalent to muscle activity asrecorded via electromyography (EMG), then a reduction inbalancing side muscle activity will lower the peak joint forceswhich may minimise the risk of joint damage. However, balancingside muscle activity has been shown to be close to working sidemuscle activity in primates when greater bite forces are necessary(Hylander et al., 1998; Hylander et al., 2004). This would result ingreater loading of the balancing side joint.
The aim of this study was to test the functioning of acomputational model of a reptile skull in predicting bite forces.We have shown that entry of muscle force estimates into themodel using PCSA multiplied by a standard muscle stress constantdid not generate bite forces equivalent to those measured in vivo.Furthermore, a review of the literature suggests that standardmuscle force calculations may not be reliable in lizards, asunderestimates of bite force are common. This discrepancybetween experimental and theoretical bite force estimates canbe related to several factors, including but not limited to scaling,muscle stress, and the pennation of jaw musculature that affectsfibre length and angle. This study highlights the importance ofempirical data for the validation of theoretical models, althoughcare must be taken since bite force measurement dependssignificantly on the experimental methods used. To facilitatesubsequent modelling the animal’s size, sex, age (if known), bitepoint position, and if possible gape angle should be recorded andpublished in reports of experimental bite force measurement.
Conflict of interest
The authors confirm that there is no conflict of interest.
Acknowledgements
This research is funded by BBSRC grants (BB/E007465/1,BB/E009204/1 and BB/E007813/1). Part of this study was

N. Curtis et al. / Journal of Biomechanics 43 (2010) 2804–2809 2809
supported by a National Science Foundation grant (IOB-0623791/BIO326U-02 to AKL). We thank the Grant Museum of Zoology(UCL) for access to skeletal material, Dallas Zoo (US) and their stafffor help in the collection of in vivo data and Chester Zoo (UK) forallowing access and recording of Sphenodon feeding.
References
Anton, S.C., 1999. Macaque masseter muscle: internal architecture, fiber length,and cross-sectional area. International Journal of Primatology 20, 441–462.
Christiansen, P., Wroe, S., 2007. Bite forces and evolutionary adaptations to feedingecology in carnivores. Ecology 88, 347–358.
Clausen, P.D., McHenry, C.R., Wroe, S., Moreno, K., Bourke, J., 2008. The vector ofjaw muscle force as determined by computer-generated three dimensionalsimulation: a test of Greave’s model. Journal of Biomechanics 41, 3184–3188.
Curtis, N., Kupczik, K., O’Higgins, P., Moazen, M., Fagan, M.J., 2008. Predicting skullloading: applying multibody dynamics analysis to a macaque skull. TheAnatomical Record 291, 491–501.
Curtis, N., Jones, M.E.H., Evans, S.E., O’Higgins, P., Fagan, M.J., 2010. Predictingmuscle activation patterns from motion and anatomy: modelling the skull ofSphenodon (Diapsida: Rhynchocephalia). Journal of the Royal Society Interface7, 153–160.
Curtis, N., Jones, M.E.H., Evans, S.E., O’Higgins, P., Fagan, M.J., 2009. Visualisingmuscle anatomy using three-dimensional computer models—an exampleusing the head and neck muscles of Sphenodon. Palaeontologia Electronica 12(3) 7T: 18p.
Gomes, N., 1974. Anatomie comparee de la musculature trigeminale deslacertilians. Memoirs du Museum National d’Histoire Naturelle, Paris(Zoologie) 90, 1–107.
Gorniak, G.C., Rosenberg, H.I., Gans, C., 1982. Mastication in the tuatara, Sphenodonpunctatus (Reptilia: Rhynchocephalia): structure and activity of the motorsystem. Journal of Morphology 171, 321–353.
Greaves, W.S., 2000. Location of the vector of jaw muscle force in mammals.Journal of Morphology 243, 293–299.
Haas, G., 1973. Muscle of the jaws and associated structures in the Rhynchoce-phalia and Squamata. In: Gans, C., Parsons, T. (Eds.), Biology of the Reptilia, vol.4. Academic Press, London, pp. 285–490.
Hannam, A.G., Stavness, I., Lloyd, J.E., Fels, S., 2008. A dynamic model of jaw andhyoid biomechanics during chewing. Journal of Biomechanics 41, 1069–1076.
Hatze, H., 1981. Estimation of myodynamics parameter values from observationson isometrically contracting muscle groups. European Journal of AppliedPhysiology and Occupational Physiology 46, 325–338.
Herrel, A., Aerts, P., De Vree, F., 1998. Static biting in lizards: functionalmorphology of the temporal ligaments. Journal of Zoology 244, 135–143.
Herrel, A., Aerts, P., 2003. Biomechanical studies of food and diet selection. In:Encyclopaedia of Life Sciences. Nature Publishing Group, London.
Herrel, A., De Vree, F., 2009. Jaw and hyolingual muscle activity patterns and biteforces in the herbivorous lizard Uromastyx acanthinurus. Archives of OralBiology 54, 772–782.
Hylander, W.L., Ravosa, M.J., Ross, C.F., Johnson, K.R., 1998. Mandibular corpusstrain in primates: further evidence for a functional link between symphysealfusion and jaw-adductor muscle force. American Journal Physical Anthropol-ogy 107, 257–271.
Hylander, W.L., Ravosa, M.J., Ross, C.F., 2004. Jaw muscle recruitment patternsduring mastication in anthropoids and prosimians, Evolution. CambridgeUniversity Press, Cambridge 229–257.
Hylander, W.L., Johnson, K.R., Crompton, A.W., 1987. Loading patterns and jawmovements during mastication in Macaca fascicularis: a bone-strain, electro-myographic, and cineradiographic analysis. American Journal of PhysicalAnthropology 72, 287–314.
Jones, M.E.H., Curtis, N., O’Higgins, P., Fagan, M.J., Evans, S.E., 2009. The head andneck muscles associated with feeding in Sphenodon (Reptilia: Lepidosauria:Rhynchocephalia). Palaeontologia Electronica 12.2.7A, www.palaeo-electronica.org/2009_2/179/index.html.
Jones, M.E.H., Lappin, A.K., 2009. Bite-force performance of the last rhynchoce-phalian (Lepidosauria: Sphenodon). Journal of the Royal Society of New Zealand39, 71–83.
Koolstra, J.H., Tanaka, E., 2009. Tensile stress patterns predicted in the articulardisc of the human temporomandibular joint. Journal of Anatomy 215,411–416.
Kleinteich, T., Haas, A., Summers, A.P., 2008. Caecilian jaw-closing mechanics:integrating two muscle systems. Journal of the Royal Society Interface 5,1491–1504.
Lappin, A.K., Husak, J.F., 2005. Weapon performance, not size, determines matingsuccess and potential reproductive output in the collared lizard (Crotaphytuscollaris). The American Naturalist 166, 426–436.
Mendez, J., Keys, A., 1960. Density and composition of mammalian muscle.Metabolism 9, 184–188.
Moazen, M., Curtis, N, O’Higgins, P., Evans, S.E., Fagan, M.J., 2008. Rigid-bodyanalysis of a lizard skull—modelling the skull of Uromastyx hardwickii. Journalof Biomechanics 41, 1274–1280.
Moazen, M., Curtis, N, O’Higgins, P., Evans, S.E., Fagan, M.J., 2009. Biomechanicalassessment of evolutionary changes in the lepidosaurian skull. Proceedings ofthe National Academy of Sciences 106, 8273–8277.
Rayfield, E.J., 2007. Finite element analysis and understanding the biomechanicsand evolution of living and fossil organisms. Annual Review of Earth andPlanetary Sciences 35, 541–576.
Rieppel, O., 1980a. The trigeminal jaw adductor musculature of Tupinambis, withcomments on the phylogenetic relationships of the Teiidae (Reptilia,Lacertilia). Zoological Journal of the Linnean Society 69, 1–29.
Rieppel, O., 1980b. The phylogeny of anguinomorph lizards. Memoires de laSociete Helvetique des Sciences Naturelles 94, 5–86.
Rieppel, O., 1987. The development of the trigeminal jaw adductor musculatureand associated skull elements in the lizard Podarcis simula. Journal of Zoology,London 212, 131–150.
Ross, C.F., Patel, B.A., Slice, D.E., Strait, D.S., Dechow, P.C., Brian, G.R., Spencer, M.A.,2005. Modeling masticatory muscle force in finite element analysis: sensitivityanalysis using principal coordinates analysis. The Anatomical Record Part A283, 288–299.
Schaerlaeken, V., Herrel, A., Aerts, P., Ross, C.F., 2008. The functional significance ofthe lower temporal bar in Sphenodon punctatus. The Journal of ExperimentalBiology 211, 3908–3914.
Strait, D.S., Richmond, B.G., Spencer, M.A., Ross, C.F., Dechow, P.C., Wood, B.A.,2007. Masticatory biomechanics and its relevance to early hominid phylogeny:an examination of palatal thickness using finite-element analysis. Journal ofHuman Evolution 52, 585–599.
Thomason, J.J., Russell, A.P., Morgeli, M., 1990. Forces of biting, body size, andmasticatory muscle tension in the opossum Didelphis virginiana. CanadianJournal of Zoology-Revue Canadienne de Zoologie 68, 318–324.
Weijs, W.A., Dantuma, R., 1975. Electromyography and mechanics of masticationin the albino rat. Journal of Morphology 146, 1–34.
van Ruijven, L.J., Weijs, W.A., 1990. A new model for calculating muscle forcesfrom electromyograms. European Journal of Applied Physiology 61, 479–485.