TRACKING OF REGIONS-OF-INTEREST IN MYOCARDIAL CONTRAST ECHOCARDIOGRAPHY
Comparison between cardiovascular magnetic resonance and transthoracic doppler echocardiography for...
9
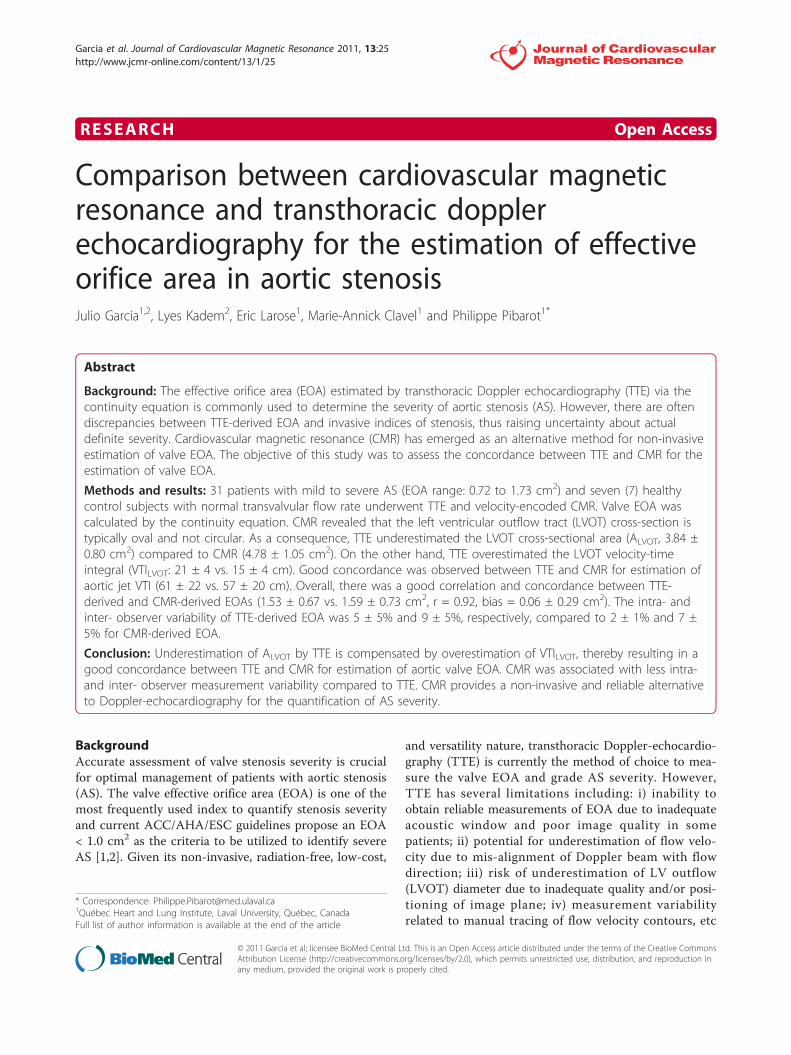
RESEARCH Open Access Comparison between cardiovascular magnetic resonance and transthoracic doppler echocardiography for the estimation of effective orifice area in aortic stenosis Julio Garcia 1,2 , Lyes Kadem 2 , Eric Larose 1 , Marie-Annick Clavel 1 and Philippe Pibarot 1* Abstract Background: The effective orifice area (EOA) estimated by transthoracic Doppler echocardiography (TTE) via the continuity equation is commonly used to determine the severity of aortic stenosis (AS). However, there are often discrepancies between TTE-derived EOA and invasive indices of stenosis, thus raising uncertainty about actual definite severity. Cardiovascular magnetic resonance (CMR) has emerged as an alternative method for non-invasive estimation of valve EOA. The objective of this study was to assess the concordance between TTE and CMR for the estimation of valve EOA. Methods and results: 31 patients with mild to severe AS (EOA range: 0.72 to 1.73 cm 2 ) and seven (7) healthy control subjects with normal transvalvular flow rate underwent TTE and velocity-encoded CMR. Valve EOA was calculated by the continuity equation. CMR revealed that the left ventricular outflow tract (LVOT) cross-section is typically oval and not circular. As a consequence, TTE underestimated the LVOT cross-sectional area (A LVOT , 3.84 ± 0.80 cm 2 ) compared to CMR (4.78 ± 1.05 cm 2 ). On the other hand, TTE overestimated the LVOT velocity-time integral (VTI LVOT : 21 ± 4 vs. 15 ± 4 cm). Good concordance was observed between TTE and CMR for estimation of aortic jet VTI (61 ± 22 vs. 57 ± 20 cm). Overall, there was a good correlation and concordance between TTE- derived and CMR-derived EOAs (1.53 ± 0.67 vs. 1.59 ± 0.73 cm 2 , r = 0.92, bias = 0.06 ± 0.29 cm 2 ). The intra- and inter- observer variability of TTE-derived EOA was 5 ± 5% and 9 ± 5%, respectively, compared to 2 ± 1% and 7 ± 5% for CMR-derived EOA. Conclusion: Underestimation of A LVOT by TTE is compensated by overestimation of VTI LVOT , thereby resulting in a good concordance between TTE and CMR for estimation of aortic valve EOA. CMR was associated with less intra- and inter- observer measurement variability compared to TTE. CMR provides a non-invasive and reliable alternative to Doppler-echocardiography for the quantification of AS severity. Background Accurate assessment of valve stenosis severity is crucial for optimal management of patients with aortic stenosis (AS). The valve effective orifice area (EOA) is one of the most frequently used index to quantify stenosis severity and current ACC/AHA/ESC guidelines propose an EOA < 1.0 cm 2 as the criteria to be utilized to identify severe AS [1,2]. Given its non-invasive, radiation-free, low-cost, and versatility nature, transthoracic Doppler-echocardio- graphy (TTE) is currently the method of choice to mea- sure the valve EOA and grade AS severity. However, TTE has several limitations including: i) inability to obtain reliable measurements of EOA due to inadequate acoustic window and poor image quality in some patients; ii) potential for underestimation of flow velo- city due to mis-alignment of Doppler beam with flow direction; iii) risk of underestimation of LV outflow (LVOT) diameter due to inadequate quality and/or posi- tioning of image plane; iv) measurement variability related to manual tracing of flow velocity contours, etc * Correspondence: [email protected] 1 Québec Heart and Lung Institute, Laval University, Québec, Canada Full list of author information is available at the end of the article Garcia et al. Journal of Cardiovascular Magnetic Resonance 2011, 13:25 http://www.jcmr-online.com/content/13/1/25 © 2011 Garcia et al; licensee BioMed Central Ltd. This is an Open Access article distributed under the terms of the Creative Commons Attribution License (http://creativecommons.org/licenses/by/2.0), which permits unrestricted use, distribution, and reproduction in any medium, provided the original work is properly cited.
Transcript of Comparison between cardiovascular magnetic resonance and transthoracic doppler echocardiography for...
RESEARCH Open Access
Comparison between cardiovascular magneticresonance and transthoracic dopplerechocardiography for the estimation of effectiveorifice area in aortic stenosisJulio Garcia1,2, Lyes Kadem2, Eric Larose1, Marie-Annick Clavel1 and Philippe Pibarot1*
Abstract
Background: The effective orifice area (EOA) estimated by transthoracic Doppler echocardiography (TTE) via thecontinuity equation is commonly used to determine the severity of aortic stenosis (AS). However, there are oftendiscrepancies between TTE-derived EOA and invasive indices of stenosis, thus raising uncertainty about actualdefinite severity. Cardiovascular magnetic resonance (CMR) has emerged as an alternative method for non-invasiveestimation of valve EOA. The objective of this study was to assess the concordance between TTE and CMR for theestimation of valve EOA.
Methods and results: 31 patients with mild to severe AS (EOA range: 0.72 to 1.73 cm2) and seven (7) healthycontrol subjects with normal transvalvular flow rate underwent TTE and velocity-encoded CMR. Valve EOA wascalculated by the continuity equation. CMR revealed that the left ventricular outflow tract (LVOT) cross-section istypically oval and not circular. As a consequence, TTE underestimated the LVOT cross-sectional area (ALVOT, 3.84 ±0.80 cm2) compared to CMR (4.78 ± 1.05 cm2). On the other hand, TTE overestimated the LVOT velocity-timeintegral (VTILVOT: 21 ± 4 vs. 15 ± 4 cm). Good concordance was observed between TTE and CMR for estimation ofaortic jet VTI (61 ± 22 vs. 57 ± 20 cm). Overall, there was a good correlation and concordance between TTE-derived and CMR-derived EOAs (1.53 ± 0.67 vs. 1.59 ± 0.73 cm2, r = 0.92, bias = 0.06 ± 0.29 cm2). The intra- andinter- observer variability of TTE-derived EOA was 5 ± 5% and 9 ± 5%, respectively, compared to 2 ± 1% and 7 ±5% for CMR-derived EOA.
Conclusion: Underestimation of ALVOT by TTE is compensated by overestimation of VTILVOT, thereby resulting in agood concordance between TTE and CMR for estimation of aortic valve EOA. CMR was associated with less intra-and inter- observer measurement variability compared to TTE. CMR provides a non-invasive and reliable alternativeto Doppler-echocardiography for the quantification of AS severity.
BackgroundAccurate assessment of valve stenosis severity is crucialfor optimal management of patients with aortic stenosis(AS). The valve effective orifice area (EOA) is one of themost frequently used index to quantify stenosis severityand current ACC/AHA/ESC guidelines propose an EOA< 1.0 cm2 as the criteria to be utilized to identify severeAS [1,2]. Given its non-invasive, radiation-free, low-cost,
and versatility nature, transthoracic Doppler-echocardio-graphy (TTE) is currently the method of choice to mea-sure the valve EOA and grade AS severity. However,TTE has several limitations including: i) inability toobtain reliable measurements of EOA due to inadequateacoustic window and poor image quality in somepatients; ii) potential for underestimation of flow velo-city due to mis-alignment of Doppler beam with flowdirection; iii) risk of underestimation of LV outflow(LVOT) diameter due to inadequate quality and/or posi-tioning of image plane; iv) measurement variabilityrelated to manual tracing of flow velocity contours, etc
* Correspondence: [email protected]ébec Heart and Lung Institute, Laval University, Québec, CanadaFull list of author information is available at the end of the article
Garcia et al. Journal of Cardiovascular Magnetic Resonance 2011, 13:25http://www.jcmr-online.com/content/13/1/25
© 2011 Garcia et al; licensee BioMed Central Ltd. This is an Open Access article distributed under the terms of the Creative CommonsAttribution License (http://creativecommons.org/licenses/by/2.0), which permits unrestricted use, distribution, and reproduction inany medium, provided the original work is properly cited.

[1]. These limitations may significantly alter the perfor-mance of TTE to accurately quantify AS severity.Furthermore, the cardiologist if often confronted to dis-cordant results among the different stenotic indices (i.e.EOA, transvalvular gradient, peak velocity, dimension-less velocity index) measured by Doppler-echocardiogra-phy or between the Doppler-echocardiographicevaluation of stenosis severity and the patient’s clinicalstatus [3]. These discordances may raise some uncer-tainty about the actual severity of the stenosis and thusabout the indication for aortic valve replacement if thepatient is symptomatic. When Doppler-echocardio-graphic evaluation is inconclusive and/or discordantwith other clinical findings, catheterization may be usedto confirm valve EOA and gradients. However, left heartcatheterization is an invasive method that may causecerebral embolism [4]. Cardiovascular magnetic reso-nance (CMR) has emerged as a non-invasive, radiation-free alternative modality to corroborate AS severity[5-10]. The majority of previous studies have, however,focused on the evaluation of the valvular anatomic (geo-metric) orifice area measured by planimetry on theimages obtained by CMR or computed tomography[11-13]. From a physiologic standpoint, it is importantto emphasize that the transvalvular pressure gradientand thus the LV workload are essentially determined bythe valve EOA, i.e. the cross-sectional area of the venacontracta of the transvalvular flow jet, and not by thevalve anatomic orifice area [14,15]. And in this regard, itshould be noted that the anatomic and effective orificeareas may differ markedly, depending on the magnitudeof the flow contraction downstream of the valve.The objective of this study was to assess the concor-
dance between TTE and CMR for the estimation ofvalve EOA with use of the continuity equation method.
MethodsStudy PopulationSeven (7) healthy control subjects and 31 patients withmild to severe AS (0.72 cm2 ≤ EOA ≤ 1.73 cm2) wereincluded in this study. Exclusion criteria were: age < 21years old, LV ejection fraction < 50%, atrial fibrillation,moderate or severe mitral or aortic regurgitation, poorTTE imaging quality and standard contra-indications tomagnetic resonance imaging. All patients provided writteninformed consent. Initial AS severity classification at studyentry was based on TTE-derived EOA: normal (EOA > 2.0cm2), mild (1.5 cm2 < EOA ≤ 2.0 cm2), moderate (1.0 cm2
< EOA ≤ 1.5 cm2) and severe (EOA ≤ 1.0 cm2).
Transthoracic EchocardiographyTTE studies were performed and analyzed by two experi-enced echocardiographers. The TTE measurements were
performed according to the American Society of Echo-cardiography guidelines [16] and included: LVOT dia-meter, LVOT flow velocity by pulsed-wave Doppler,aortic transvalvular jet velocity by continuous-wave Dop-pler and valve EOA using continuity equation [1]:
EOATTE = SVLVOT/VTIAo = (VTILVOT × ALVOT)/VTIAo (1)
Where SVLVOT is the stroke volume measured in theLVOT, ALVOT is the cross-sectional area of the LVOTcalculated assuming a circular shape: (LVOT diameter)2
× 0.785. and VTILVOT VTIAo are the velocity-time inte-grals of the LVOT and transvalvular flow, respectively.
Cardiovascular Magnetic ResonanceCMR studies were performed 2 to 4 weeks after TTEwith patients in comparable hemodynamic state. Imagingwas performed with a 1.5 Tesla Philips Achieva scanneroperating release 2.6 level 3 and dedicated phased-arraycardiac coil during successive end-expiratory breath-holds (Philips Healthcare, Best, The Netherlands). Cineimaging of cardiac function was performed by steady-state free precession technique at 30 phases per cardiaccycle (by vectorcardiographic gating) in 8-14 parallelshort-axis and 2-chamber, 4-chamber, and 2 orthogonalLVOT planes (8 mm thickness, 0 mm gap). Typical para-meters included TR/TE of 3.4/1.2 ms, flip angle 40°, NEXof 1, yielding in-plane spatial resolution of 1.6 × 2 mm.In addition, through-plane phase-contrast (sQFlowSENSE) imaging was performed in the LVOT at 12 mmupstream from the aortic valve annulus (reference: 0mm) and in the ascending aorta at +6 mm and +10 mmdownstream of the annulus (Figure 1). CMR imagingparameters consisted of: TR/TE of 4.60-4.92/2.76-3.05ms, flip angle 15°, 24 phases, pixel spacing 1.32-2.07 mm,slice thickness 10 mm and acquisition matrix of 256 ×208. Each phase-contrast velocity mapping acquisitionproduced 2 cine images: one magnitude image and onephase image. For each patient, peak aortic jet velocitymeasured by TTE was used to define CMR encodingvelocity (CMR encoding velocity = (1.25 to 1.5) × peakjet velocity) to optimally define resolution.CMR images acquisitions and analyses were per-
formed by investigators blinded to clinical and TTEresults. A custom-made research application was devel-oped using Matlab software (Mathworks, Natick, Ma) toprocess and analyze velocity-encoded images [17]. Spa-tial resolution of CMR images was artificially improvedby a factor of three using bicubic averaged interpolationand the magnitude image stack was processed to filterbackground noise. Regions of interest (ROIs) weredefined on each of the 24 phases of magnitude imagesto include the lumen of the LVOT and of the aorta.The following measurements were performed within
Garcia et al. Journal of Cardiovascular Magnetic Resonance 2011, 13:25http://www.jcmr-online.com/content/13/1/25
Page 2 of 9

each ROI: i) on magnitude images: anterior-posterior(AP) diameter, left-right (LR) diameter, and cross-sec-tional area of LVOT at the -12 mm position; the ratioof AP/LR diameters was calculated to characterize theshape of LVOT (the lower the ratio the more oval theshape of LVOT) (Figure 2) and ii) on matched phaseimages: velocity profiles at -12 mm, +6 and +10 mmpositions.The peak and average flow velocities within the ROI
were used to determine the changes in instantaneouspeak (Vpeak, Figure 3A) and average (Vaverage, Figure 3B)velocity in the LVOT at the -12 mm position during thecardiac cycle. The velocity-time integral of Vaverage dur-ing systole was calculated (Figure 3B) and compared tothe VTI measured by TTE in the LVOT. The instanta-neous LVOT flow rate was calculated by multiplying theinstantaneous Vaverage by the LVOT cross-sectional area,and the stroke volume (SVCMR) was calculated by usingSimpson’s rule to integrate flow during systole (Figure3C).The peak flow velocity within the ROI was used to
determine the instantaneous peak aortic velocity at the6 and 10 mm positions (Figure 3D). The velocity-timeintegral of peak velocity during systole was calculated
(VTIAo) and compared to the VTIAo measured by TTE.Given that slightly higher velocities were obtained at 6mm versus 10 mm, we used the 6 mm position for esti-mation of VTIAo and EOA by CMR in this study.The CMR-derived EOA (EOACMR) was then calcu-
lated with the following formula:
EOACMR = SVCMR/VTIAo (2)
Where SVCMR is the stroke volume using Simpson’srule to integrate systolic flow and VTIAo is the velocity-time integral of the peak aortic flow velocity measuredat 6 mm downstream of the valve during systole.
Measurement variabilityTo evaluate the intra- and inter- observer variabilityrelated to image analysis by CMR and TTE; the mea-surements of EOA were repeated in a subset of 15 stu-dies (11 AS patients and 4 control subjects) by twoblinded observers with the use of the same set of TTEand CMR images. To further evaluate the intra- andinter- observer- variability related to image acquisitionand analysis by TTE and CMR, 5 AS patients wereimaged twice within 4 weeks (including image acquisi-tion and analysis).
Figure 1 Image planes used for CMR measurements. Panel A shows the flow velocity map was acquired at 3 image planes: -12 mmupstream from aortic valve plane (used as the 0 mm reference) and at +6 and +10 mm downstream of the aortic valve plane. The cross-sectional area of the LVOT is measured at the -12 mm position. Panel B shows the measurement of LVOT diameter at annulus location.
Garcia et al. Journal of Cardiovascular Magnetic Resonance 2011, 13:25http://www.jcmr-online.com/content/13/1/25
Page 3 of 9
Statistical analysesResults are expressed as mean ± SD. CMR versus TTEmeasurements were compared by 2-tailed paired Stu-dent t-tests. Correlations and agreements between CMRand TTE measurements were assessed by Pearson’s cor-relations and Bland-Altman comparisons, respectively.Statistical analysis was performed with SPSS 17 (SPSS,Chicago, IL).
ResultsThirty-one patients with mild to severe AS (77% men,age 67 ± 12 years) and seven healthy subjects (71% men,age 34 ± 8 years) were studied by TTE and CMR. Valvemorphology was bicuspid in nine of the 31 AS patientsand indeterminate by TTE in 3 patients. Patient charac-teristics are reported in Table 1.
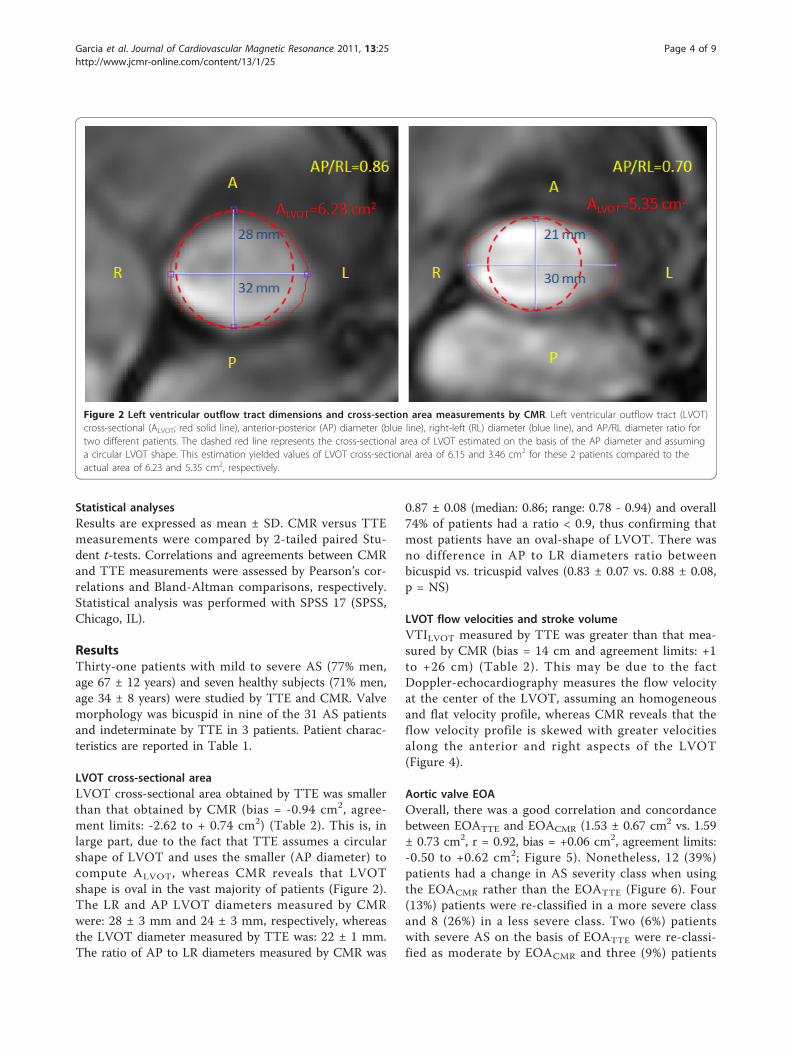
LVOT cross-sectional areaLVOT cross-sectional area obtained by TTE was smallerthan that obtained by CMR (bias = -0.94 cm2, agree-ment limits: -2.62 to + 0.74 cm2) (Table 2). This is, inlarge part, due to the fact that TTE assumes a circularshape of LVOT and uses the smaller (AP diameter) tocompute ALVOT, whereas CMR reveals that LVOTshape is oval in the vast majority of patients (Figure 2).The LR and AP LVOT diameters measured by CMRwere: 28 ± 3 mm and 24 ± 3 mm, respectively, whereasthe LVOT diameter measured by TTE was: 22 ± 1 mm.The ratio of AP to LR diameters measured by CMR was
0.87 ± 0.08 (median: 0.86; range: 0.78 - 0.94) and overall74% of patients had a ratio < 0.9, thus confirming thatmost patients have an oval-shape of LVOT. There wasno difference in AP to LR diameters ratio betweenbicuspid vs. tricuspid valves (0.83 ± 0.07 vs. 0.88 ± 0.08,p = NS)
LVOT flow velocities and stroke volumeVTILVOT measured by TTE was greater than that mea-sured by CMR (bias = 14 cm and agreement limits: +1to +26 cm) (Table 2). This may be due to the factDoppler-echocardiography measures the flow velocityat the center of the LVOT, assuming an homogeneousand flat velocity profile, whereas CMR reveals that theflow velocity profile is skewed with greater velocitiesalong the anterior and right aspects of the LVOT(Figure 4).
Aortic valve EOAOverall, there was a good correlation and concordancebetween EOATTE and EOACMR (1.53 ± 0.67 cm2 vs. 1.59± 0.73 cm2, r = 0.92, bias = +0.06 cm2, agreement limits:-0.50 to +0.62 cm2; Figure 5). Nonetheless, 12 (39%)patients had a change in AS severity class when usingthe EOACMR rather than the EOATTE (Figure 6). Four(13%) patients were re-classified in a more severe classand 8 (26%) in a less severe class. Two (6%) patientswith severe AS on the basis of EOATTE were re-classi-fied as moderate by EOACMR and three (9%) patients
Figure 2 Left ventricular outflow tract dimensions and cross-section area measurements by CMR. Left ventricular outflow tract (LVOT)cross-sectional (ALVOT; red solid line), anterior-posterior (AP) diameter (blue line), right-left (RL) diameter (blue line), and AP/RL diameter ratio fortwo different patients. The dashed red line represents the cross-sectional area of LVOT estimated on the basis of the AP diameter and assuminga circular LVOT shape. This estimation yielded values of LVOT cross-sectional area of 6.15 and 3.46 cm2 for these 2 patients compared to theactual area of 6.23 and 5.35 cm2, respectively.
Garcia et al. Journal of Cardiovascular Magnetic Resonance 2011, 13:25http://www.jcmr-online.com/content/13/1/25
Page 4 of 9

Figure 3 Flow velocity measurements in the left ventricular outflow tract by CMR. Panel A shows the change in peak left ventricularoutflow tract (LVOT) velocity at -12 mm position during the cardiac cycle. Panel B shows the change in the instantaneous average velocityobtained over the region of interest. The velocity-time integral (VTI) is the area under the curve. Panel C shows the change in instantaneous flow(Q) calculated as follows: Q (t) = average velocity (t) × ALVOT, where ALVOT is the cross-sectional area of the LVOT. The stroke volume (SV) is theflow-time integral during systole. Panel D shows the change in peak aortic velocity at +6 mm position during the cardiac cycle, the velocity-timeintegral (VTI) is the area under the curve.
Table 1 Patient Characteristics
Age (years) 62 ± 17
Male gender n (%) 29 (76)
Heart rate (bpm) 65 ± 12
Weight (Kg) 76 ± 13
Height (cm) 169 ± 10
Body surface area (m2) 1.88 ± 0.19
Body mass index (Kg/m2) 26 ± 3
Valve morphology
Tricuspid n (%) 26 (68)
Bicuspid n (%) 9 (24)
Indeterminate n (%) 3 (8)
The table shows the mean ± SD or number of patients and percentage.
Table 2 Comparison of Transthoracic Doppler-echocardiography (TTE) and Cardiovascular MagneticResonance (CMR) data
TTE CMR
Mean ± SD Mean ± SD p-value
Heart rate (bpm) 65 ± 12 66 ± 11 0.40
LVOT area (cm2) 3.84 ± 0.8 4.78 ± 1.05 < 0.001
AP/RL diameter ratio 0.87 ± 0.08 -
LVOT VTI (cm) 21 ± 4 15 ± 4 < 0.001
SV (mL) 80 ± 13 80 ± 18 0.68
Ao VTI (cm) 61 ± 22 57 ± 20 0.02
EOA (cm2) 1.53 ± 0.67 1.59 ± 0.73 0.17
LVOT: Left ventricular outflow tract; AP: Anterior-Posterior diameter; RL: Right-Left diameter; LVOT VTI: flow velocity time-integral in LVOT; SV: Stroke volume;Ao VTI: peak aortic velocity-time integral; EOA: valve effective orifice area.
Garcia et al. Journal of Cardiovascular Magnetic Resonance 2011, 13:25http://www.jcmr-online.com/content/13/1/25
Page 5 of 9

with moderate AS on the basis of EOATTE were classi-fied as severe by EOACMR.
Measurement variabilityIn the subset of 15 subjects (11 AS patients and 4 con-trol subjects) in whom the analyses of EOA wererepeated on the same set of images, the intra- and inter-observer variability of EOATTE was 5 ± 5% and 9 ± 5%,respectively, compared to 2 ± 1% and 7 ± 5% for CMR.
Figure 4 Flow velocity profile obtained by CMR in the LVoutflow tract (LVOT). The figure shows the flow velocity profilewithin the LVOT in a patient with AS. Panels A and B show the 2Dand 3D flow velocity profile.
Figure 5 Comparison of valve effective orifice area (EOA)measured by TTE versus by CMR. Panel A shows the Pearsoncorrelation plot. The solid line is the regression line and the dashedline is the identity line. Panel B shows the Bland-Altman plot. Thesolid line is the mean bias and dashed lines are ± 1.96 standard-deviations lines.
Figure 6 Grading of aortic stenosis severity with the use ofTTE- versus CMR-derived effective orifice areas (EOA).
Garcia et al. Journal of Cardiovascular Magnetic Resonance 2011, 13:25http://www.jcmr-online.com/content/13/1/25
Page 6 of 9

In the subset of 5 patients in whom both the acquisitionand analysis of images were repeated, the intra- andinter- observer variability of EOATTE was 10 ± 8% and12 ± 5%, respectively, compared to 8 ± 8% and 9 ± 8%,for EOACMR.
DiscussionDoppler-echocardiography is the method used to assessAS severity and guide therapeutic management in cur-rent practice. The valve EOA is one of the most fre-quently used Doppler-echocardiographic index toquantify stenosis severity. However, the measurement ofvalve EOA may not be feasible in a significant propor-tion of patients due to poor acoustic window and/orsubvalvular flow acceleration. Moreover, given that thecalculation of EOA requires the inclusion of 3 measures(LVOT diameter, LVOT VTI, and aortic jet VTI) in thecontinuity equation, this method may yield to relativelylarge measurement errors. Finally, there are often dis-cordances between EOA and other Doppler-echocardio-graphic indices of stenosis severity, such as peak aorticjet velocity and transvalvular gradients. These discor-dances are particularly frequent in presence of low flowstate conditions, where the gradients may be low despitethe presence of a severe stenosis [18,19]. Discordant orinconclusive Doppler-echocardiographic findings mayraise some uncertainty about the actual severity of thestenosis and therefore about the therapeutic manage-ment of the patient. There is thus an important needfor additional non-invasive and accurate methods tocorroborate stenosis severity in patients for whom Dop-pler-echocardiography does not provide a definitive con-clusion with regard to AS severity.Multidetector computed tomography is a powerful
imaging modality to measure dimensions, surfaces andvolumes of cardiac chambers. However, this methoddoes not allow measurement of flow velocity andthereby does not permit the determination of valveEOA. CMR is a non-invasive, radiation-free imagingmodality that allows quantification of flow velocity inthe LVOT and aorta. Moreover CMR has superior tem-poral resolution compared to computed tomography.The main finding of this study is that there is a good
agreement between CMR and Doppler-echocardiogra-phy for the estimation of valve EOA. This study alsoconfirms the results of previous studies that reportedthat Doppler-echocardiography underestimates theLVOT cross-sectional area compared to computedtomography imaging [20-26]. This overestimation isessentially related to the fact that Doppler-echocardio-graphy assumes a circular LVOT shape, whereas, in fact,it is oval in most patients. However, as opposed to whatwas previously believed, this underestimation of LVOTarea does not necessarily translate into underestimation
of LV stroke volume and valve EOA. Indeed, TTE over-estimates the LVOT VTI compared to CMR, which thuscompensates the underestimation of LVOT area andyields to concordant estimates of valve EOA. With TTEmethod, it is assumed that: i) the flow velocity profile inthe LVOT is flat, i.e. mean velocity equals peak velocity,and ii) the flow velocity profile is homogenous, i.e. mea-surement of velocity with the pulsed-wave Doppler sam-ple volume positioned in the center of the LVOTaccurately reflects the average velocity throughout thewhole LVOT cross-section. However, as illustrated inFigure 4, CMR reveals that flow velocity profile is notflat and is often skewed with higher velocities along theanterior and right aspects of the LVOT. Hence, tracingof the contour of the peak velocity envelopes obtainedby pulsed-wave Doppler at the center of the LVOToverestimates the actual mean velocity and the VTI inthe LVOT. The overestimation of VTILVOT by TTEsomewhat counterbalances the underestimation ofALVOT. And consequently, the average stroke volumeand EOA determined by TTE are similar to those deter-mined by CMR.
Aortic valve EOASeveral previous CMR studies have focused on the mea-surement of the area of the aortic valve orifice by plani-metry [5,10-13]. However, it is important to underlinethat this “anatomic” orifice area (AOA) is not equivalentto the EOA. The latter indeed reflects the cross-sec-tional area of the vena contracta of the transvalvularflow jet [14,15]. The EOA is generally smaller than theAVA because there is a contraction of the flow down-stream of the valve orifice. From a physiological stand-point, the transvalvular pressure gradient and thus theLV workload are essentially determined by the EOA andthe magnitude of flow rate. The ratio EOA/AOA, i.e.the contraction coefficient, may vary from 0.6 to 1.0depending on the shape of the valve inflow and the geo-metry of the valve orifice [14,15,27]. Hence, the EOA issuperior to the AOA to accurately quantify the LVhemodynamic burden associated with the stenosis. Dop-pler-echocardiography and CMR are the two sole meth-ods capable of measuring the valve EOA.Our results are consistent with those of Caruthers et
al., who reported a very good correlation between EOAdetermined by CMR with the use of continuity equationand that obtained by TTE (r = 0.83, SEE = 0.22 cm2)[6]. In a study where the stroke volume entered in thecontinuity equation was estimated by the Simpsonmethod (i.e. LV end-diastolic volume minus LV end-sys-tolic volume) instead of stroke volume measured in theLVOT, Yap et al. obtained an excellent correlation withTTE (r = 0.91, SEE = 0.17 cm2) [7]. Hagui et al. alsoproposed a hybrid method using the stroke volume
Garcia et al. Journal of Cardiovascular Magnetic Resonance 2011, 13:25http://www.jcmr-online.com/content/13/1/25
Page 7 of 9

measured by CMR and the aortic jet VTI obtained byTTE in the continuity equation [9]. This hybrid CMR-TTE method had a good agreement with the standardTTE method (bias = -0.01 cm2, limits of agreement:-0.36 to 0.34). The correlation between CMR- and TTE-derived EOAs reported in the present study appears tobe better than those reported in previous studies. Thismay be due, at least in part, to differences in the popu-lation samples. Moreover, in the present study, wetested several locations for the measurement of the aor-tic jet VTI and found that highest velocities wereobtained at 6 mm downstream to the valve orifice.These findings suggest that the vena contracta mayactually be closer to the valve orifice compared to whatwas assumed (10 mm) in the previous studies [6-10].In the present study, we also assessed the intra- and
inter- observed variability: first, by repeating the EOAmeasurements with the use of the same sets of CMRand TTE images, and second, by repeating both acquisi-tion and analysis of images. In both situations, CMRwas found to have much less measurement variabilitycompared to TTE, which lends further support to thereliability of this alternative imaging modality to confirmstenosis severity in the AS population.
Clinical implicationsEstimation of EOA by CMR should be contemplatedwhen Doppler-echocardiographic measurement of EOAis not feasible or when the findings are discordant: e.g.valve EOA in the severe range (< 1.0 cm2) but meantransvalvular gradient in the moderate range (< 40mmHg) or vice versa [18,19]. Recent studies haverevealed that these discordances are frequent [3,28]. Thefirst situation (small EOA and low gradient) is oftenfound in presence of low transvalvular flow. The strokevolume and thus the transvalvular flow may indeed besignificantly reduced not only in patients with low LVejection fraction but also in those with preserved LVEF.This latter entity was recently described by our groupand was termed: “paradoxical” low flow AS [3,29]. Thisentity is characterized by pronounced LV concentricremodelling, small LV cavity with impaired LV fillingand reduced stroke volume despite preserved LVEF.These patients with paradoxical low flow AS, who repre-sent approximately 15-20% of AS population, often exhi-bit discordance between EOA and gradient and accuratedetermination of stroke volume and EOA is crucial inthese patients. CMR may be particularly useful in thesepatients to corroborate stenosis severity and guide thera-peutic management.
LimitationsThe main limitations of this study are the relativelysmall number of patients with severe AS and the
absence of a gold standard reference method. Unfortu-nately there is no such method available for in vivomeasurement of valve EOA. The determination of valveEOA by catheterization with the use of the Gorlin for-mula also has important limitations and cannot be con-sidered as a gold standard reference method [30].Furthermore, this method is associated with increasedrisk of cerebral embolism [4].
ConclusionsUnderestimation of ALVOT by TTE is compensated byoverestimation of VTILVOT, thereby resulting in a goodconcordance between TTE and CMR for estimation ofaortic valve EOA. CMR provides a non-invasive andreliable alternative to Doppler-echocardiography for thequantification of AS severity.
AcknowledgementsThis work was supported by a NSERC grant (343165-07) and by a grant fromthe Fondation de l’Institut universitaire de cardiologie et de pneumologie deQuébec. Dr. Pibarot is the director of the Canada Research Chair in ValvularHeart Diseases, Canadian Institutes of Health Research, Ottawa, Ontario,Canada. J. Garcia is supported by CONACYT (Mexico City, Mexico, grant208171) at Laval University. Dr. Larose is a Clinical research scholar of theFonds de la recherché en santé du Québec. We thank Isabel Fortin, HaïfaMahjoub, Jocelyn Beauchemin, Romain Capoulade and Marc Amyot for theirassistance on this study.
Author details1Québec Heart and Lung Institute, Laval University, Québec, Canada.2Laboratory of Cardiovascular Fluid Dynamics, Concordia University,Montréal, Canada.
Authors’ contributionsAll authors contributed to the scope and outline of the manuscript. JGwrote the final draft. All authors read and approved the final manuscript.
Competing interestsThe authors declare that they have no competing interests.
Received: 20 November 2010 Accepted: 28 April 2011Published: 28 April 2011
References1. Bonow RO, Carabello BA, Kanu C, et al: ACC/AHA 2006 guidelines for the
management of patients with valvular heart disease: a report of theAmerican College of Cardiology/American Heart Association Task Forceon Practice Guidelines (writing committee to revise the 1998 Guidelinesfor the Management of Patients With Valvular Heart Disease): developedin collaboration with the Society of Cardiovascular Anesthesiologists:endorsed by the Society for Cardiovascular Angiography andInterventions and the Society of Thoracic Surgeons. Circulation 2006, 114:e84-e231.
2. Vahanian A, Baumgartner H, Bax J, et al: Guidelines on the managementof valvular heart disease: The Task Force on the Management ofValvular Heart Disease of the European Society of Cardiology. Eur Heart J2007, 28(2):230-68.
3. Hachicha Z, Dumesnil JG, Bogaty P, et al: Paradoxical low flow, lowgradient severe aortic stenosis despite preserved ejection fraction isassociated with higher afterload and reduced survival. Circulation 2007,115:2856-2864.
4. Omran H, Schmidt H, Hackenbroch M, et al: Silent and apparent cerebralembolism after retrograde catheterisation of the aortic valve invalvular stenosis: a prospective, randomised study. Lancet 2003,361(9365):1241-6.
Garcia et al. Journal of Cardiovascular Magnetic Resonance 2011, 13:25http://www.jcmr-online.com/content/13/1/25
Page 8 of 9

5. Cawley PJ, Maki JH, Otto CM: Cardiovascular Magnetic ResonanceImaging for Valvular Heart Disease: Technique and Validation. Circulation2009, 119:468-478.
6. Caruthers SD, Lin SJ, Brown P, et al: Practical value of cardiac magneticresonance imaging for clinical quantification of aortic valve stenosis:comparison with echocardiography. Circulation 2003, 108:2236-2243.
7. Yap SC, van Geuns RJ, Meijboom FJ, et al: A simplified continuity equationapproach to the quantification of stenotic bicuspid aortic valves usingvelocity-encoded cardiovascular magnetic resonance. J Cardiovasc MagnReson 2007, 9:899-906.
8. Waters EA, Caruthers SD, Wickline SA: Correlation Analysis of StenoticAortic Valve Flow Patterns Using Phase Contrast MRI. Annals of BiomedEng 2005, 33:878-887.
9. Hagui D, Suselbeck T, Fluechter S, et al: A hybrid approach forquantification of aortic valve stenosis using cardiac magnetic resonanceimaging and echocardiography: comparison to right heartcatheterization and standard echocardiography. Clin Res Cardiol 2006,95:162-167.
10. O’Brien KR, Gabriel RS, Greiser A, et al: Aortic valve stenotic areacalculation from phase contrast cardiovascular magnetic resonance: theimportance of short echo time. J Cardiovasc Magn Reson 2009, 11:49.
11. Malyar NM, Schlosser T, Barkhausen J, et al: Assessment of Aortic ValveArea in Aortic Stenosis Using Cardiac Magnetic Resonance Tomography:Comparison with Echocardiography. Cardiology 2008, 109:126-134.
12. Ropers D, Ropers U, Marwan M, et al: Comparison of dual-sourcecomputed tomography for the quantification of the aortic valve area inpatients with aortic stenosis versus transthoracic echocardiography andinvasive hemodynamic assessment. Am J Cardiol 2009, 104(11):1561-7.
13. Bruder O, Jochims M, Hunold P, et al: Comparison of Aortic Valve AreaMeasured by Magnetic Resonance Imaging and Dual-Source ComputedTomography. Acta Radiol 2009, 50(6):645-51.
14. Garcia D, Kadem L: What do you mean by aortic valve area: geometricorifice area, effective orifice area, or gorlin area? J Heart Valve Dis 2006,15(5):601-8.
15. Pibarot P, Larose E: What our eyes see is not necessarily what our heartfeels. Cardiology 2008, 109(2):122-5.
16. Quinones MA, Otto CM, Stoddard M, et al: Doppler Quantification TaskForce of the Nomenclature and Standards Committee of the AmericanSociety of E: Recommendations for quantification of Dopplerechocardiography: a report from the Doppler Quantification Task Forceof the Nomenclature and Standards Committee of the American Societyof Echocardiography. J Am Soc Echocardiogr 2002, 15:167-184.
17. Garcia J, Kadem L, Larose E, Pibarot P: In vivo Velocity and Flow ErrorsQuantification by Phase-Contrast Magnetic Resonance Imaging. ConfProc IEEE Eng Med Biol Soc 2008, 2008:1377-1380.
18. Pibarot P, Dumesnil JG: Assessment of aortic stenosis severity: when thegradient does not fit with the valve area. Heart 2010, 96:1431-1433.
19. Dumesnil JG, Pibarot P, Akins C: New Approches to Quantifying AorticStenosis Severity. Current Cardiology Reports 2008, 10:91-97.
20. Johnson MA, Moss RR, Munt B: Determining Aortic Stenosis Severity:What to Do When Measuring Left Ventricular Outflow Tract Diameter IsDifficult. J Am Soc Echocardiogr 2009, 22:452-453.
21. Stolzmann P, Knight J, Desbiolles L, et al: Remodelling of the aortic root insevere tricuspid aortic stenosis: implications for trascatheter aoritc valveimplantation. Eur Radiol 2009, 19:1316-1323.
22. Leye M, Brochet E, Lepage L, et al: Size-adjusted left ventricular outflowtract diameter reference values: a safeguard for the evaluation of theseverity of aortic stenosis. J Am Soc Echocardiogr 2009, 22:445-451.
23. Baumgartner H, Kratzer H, Helmreich G, et al: Determination of aortic valvearea by Doppler echocardiography using the continuity equation: acritical evaluation. Cardiology 1990, 77:101-111.
24. Halpern EJ, Mallya R, Sewell M, et al: Differences in aortic valve areameasured with CT planimetry and echocardiography (continuityequation) are related to divergent estimates of left ventricular outflowtract area. AJR Am Roentgenol 2009, 192:1668-1673.
25. Schoenhagen P, Tuzcu EM, Kapadia SR, et al: Three-dimensional imagingof the aortic valve and aortic root with computed tomography: newstandards in an era of transcatheter valve repair/implantation. Eur HeartJ 2009, 30:2079-2086.
26. Doddamani S, Grushko MJ, Makaryus AN: Demonstration of left ventricularoutflow tract eccentricity by 64-slice multi-detector CT. Int J CardiovascImaging 2009, 25:175-181.
27. Gilon D, Cape GC, Handschumacher MD, Song JK, et al: Effect of Three-Dimensional Valve Shape on the Hemodynamics of Aortic Stenosis:Three-Dimensional Echocardiographic Stereolithography and PatientStudies. J Am Coll Cardiol 2002, 40:1479-86.
28. Minners J, Allgeier M, Gohlke-Baerwolf C, et al: Inconsistencies ofechocardiographic criteria for the grading of aortic valve stenosis. EurHeart J 2008, 29(8):1043-8.
29. Dumesnil JG, Pibarot P, Carabello B: Paradoxical low flow and/or lowgradient severe aortic stenosis despite preserved left ventricular ejectionfraction: implications for diagnosis and treatement. Eur Heart J 2010,31:281-289.
30. Chambers J, Bach D, Dumesnil JG, et al: Crossing the Aortic Valve inSevere Aortic Stenosis: No Longer Acceptable? J Heart Valve Dis 2004,12(5):344-6.
doi:10.1186/1532-429X-13-25Cite this article as: Garcia et al.: Comparison between cardiovascularmagnetic resonance and transthoracic doppler echocardiography forthe estimation of effective orifice area in aortic stenosis. Journal ofCardiovascular Magnetic Resonance 2011 13:25.
Submit your next manuscript to BioMed Centraland take full advantage of:
• Convenient online submission
• Thorough peer review
• No space constraints or color figure charges
• Immediate publication on acceptance
• Inclusion in PubMed, CAS, Scopus and Google Scholar
• Research which is freely available for redistribution
Submit your manuscript at www.biomedcentral.com/submit
Garcia et al. Journal of Cardiovascular Magnetic Resonance 2011, 13:25http://www.jcmr-online.com/content/13/1/25
Page 9 of 9