Comparing the results from various performance models of IEEE 802.11g DCF
12
This article appeared in a journal published by Elsevier. The attached copy is furnished to the author for internal non-commercial research and education use, including for instruction at the authors institution and sharing with colleagues. Other uses, including reproduction and distribution, or selling or licensing copies, or posting to personal, institutional or third party websites are prohibited. In most cases authors are permitted to post their version of the article (e.g. in Word or Tex form) to their personal website or institutional repository. Authors requiring further information regarding Elsevier’s archiving and manuscript policies are encouraged to visit: http://www.elsevier.com/copyright
Transcript of Comparing the results from various performance models of IEEE 802.11g DCF

This article appeared in a journal published by Elsevier. The attachedcopy is furnished to the author for internal non-commercial researchand education use, including for instruction at the authors institution
and sharing with colleagues.
Other uses, including reproduction and distribution, or selling orlicensing copies, or posting to personal, institutional or third party
websites are prohibited.
In most cases authors are permitted to post their version of thearticle (e.g. in Word or Tex form) to their personal website orinstitutional repository. Authors requiring further information
regarding Elsevier’s archiving and manuscript policies areencouraged to visit:
http://www.elsevier.com/copyright
Author's personal copy
Comparing the results from various performance models of IEEE 802.11gDCF
P.S. Kritzinger a,*,1, Henry Msiska a, Tino Mundangepfupfu a, Paolo Pileggi a, Andrew Symington b
a Data Network Architectures Group, Computer Science Department, University of Cape Town, South Africab Computing Laboratory, Oxford University, England, UK
a r t i c l e i n f o
Article history:Received 13 April 2009Received in revised form 18 September2009Accepted 3 January 2010Available online 20 January 2010Responsible Editor: T. Tugcu
Keywords:Simulation modellingIEEE 802.11Medium access control (MAC)Distributed coordination function (DCF)WLANWireless test bed
a b s t r a c t
IEEE 802.11 DCF is the most widely-used CSMA/CA access control mechanism. Recent ana-lytic performance models for DCF have received acclaim for both their simplicity andreported accuracy. Most of these models share the assumptions of full single-hop connec-tivity among all stations, that DCF back-off may be modeled as a Markov process and thatthe network is saturated with traffic. In order to verify the accuracy of existing analyticmodels we developed a discrete-event simulator to record the performance of the DCF pro-tocol and ensure that every detail of the standard is represented. Simultaneously we set upa hardware test bed to measure the same performance metrics in an environment thatmakes none of the simplifying assumptions of either the analytic models or the simulation.In the test bed, as in the simulator, we used the same physical parameter settings pre-scribed by the standard. As is the case for the analytic models we used, we subjected thesimulator and the test bed to the same saturated workload for both basic and RTS/CTSaccess modes. Finally, we also implemented a non-saturating Markov Modulated ArrivalProcess (MMAP) workload model for our simulator to test the performance of DCF subjectto more realistic internet traffic conditions. We describe both the simulator and the testbed in some detail in order to testify to the accuracy and detail of our results. The resultsshow that the analytic models are mostly pessimistic for small numbers of nodes and opti-mistic for larger numbers of nodes. The performance measurements from the test bed, inturn, indicate that the simulation results are similarly optimistic when large numbers ofnodes are concerned. Since the test bed uses an error-prone wireless channel, this latterresult is, in principle, not surprising. The rate of deterioration in the actual performanceis however something that is not widely known and is much more rapid than analytic mod-els would suggest.
� 2010 Elsevier B.V. All rights reserved.
1. Introduction
The popularity of wireless networks is gaining momen-tum due to their cost effectiveness and ease of installation.In particular, IEEE 802.11 Wireless Local Area Networks(WLANs) consist of several nodes that connect to the Inter-
net through a central Access Point (AP). In this infrastruc-ture topology all nodes must be situated within thewireless footprint of the AP. Since several nodes sharethe same wireless channel, it is clear that only one nodecan, at any one point in time, transmit successfully on thatchannel. Regulating channel access efficiently is thereforepivotal to maintaining a favorable performance. The IEEE802.11 standard [1] defines several channel access controlmechanisms to achieve this, the most widely-used beingthe Distributed Coordination Function (DCF).
In recent years, a great deal of research has been con-ducted to elucidate the effect of CSMA/CA protocols on
1389-1286/$ - see front matter � 2010 Elsevier B.V. All rights reserved.doi:10.1016/j.comnet.2010.01.003
* Corresponding author. Tel.: +27 833035445; fax: +27 216503551.E-mail address: [email protected] (P.S. Kritzinger).
1 The Data Network Architectures (DNA) research group is funded in partby National Research Foundation (NRF), Telkom Siemens and Technologyand the Human Resources for Industry Programme (THRIP).
Computer Networks 54 (2010) 1672–1682
Contents lists available at ScienceDirect
Computer Networks
journal homepage: www.elsevier .com/locate /comnet

Author's personal copy
aggregate network performance. Analytic models, simula-tion and hardware prototypes have all been used to mea-sure such performance. Analytic models are mostlypreferred because of their efficiency of computation. How-ever, to preserve analytic tractability one is forced to im-pose unrealistic assumptions. Although analytic modelsfor DCF have been shown to produce reasonably accurateresults, they tend to make very restrictive assumptionsabout the characteristics of the workload.
Hardware experiments are rarely carried out, since theyare costly and require more time and effort in terms ofdeployment and maintenance. A hardware experiment iseffectively a small-scale version of the actual system,which is deployed in a controlled environment. Despitetheir limited scalability, such experiments can producemore accurate results since they reflect the nature of a realnetwork most accurately. Examples of wireless networktest beds are the Orbit Laboratory [2], MIT Roofnet [3]and the DNA Test bed [4]. Such networks are costly andtime consuming to set up and researchers therefore oftenturn to simulation.
For a simulation one can either apply existing simulatorplatforms such as the OPNET Modeler�[5], ns2 [6], QualNet[7] or OMNET++ [8] or develop one’s own simulator byimplementing the simulation engine and components ina language such as Java. The OPNET Modeler�WirelessSuite, as one instance, provides high fidelity modeling, sim-ulation, and analysis of a broad range of wireless networks.But these simulators are complex, general-purpose soft-ware suites and it is seldom clear which details of the net-work stack are being modeled and where all the associatedparameters may be found. More controversially, some ofthese systems are commercial products and for proprietaryreasons or otherwise do not make clear [9]
� whether one is assured that the simulation has stabi-lized before sampling,
� what the sample sizes are� or whether sampling is done to ensure identically, inde-
pendently distributed (IID) variables.
In a controversial paper Cavin et al. [10] illustrated thesepoints by showing the deviation in results among severalwidely-adopted simulators, such as OMNeT++ and NS-2for a sample mobile ad-hoc network experiment. State-ments such as ‘‘... users are responsible for verifying forthemselves that their simulations are not invalidatedbecause the model implemented in the simulator is notthe model that they were expecting...” [6] are not veryencouraging when one is conducting a scientific study.Nevertheless, these general simulation platforms andlibraries are obviously useful as witnessed by the manypublished studies that use them.
However, there are others such as the authors and Bian-chi and Tinnirello [11] who prefer the second option. They
� sacrifice the convenience of these software platformsand at the same time
� spend much time delving down into the minute systemdetail of the system being modeled to ensure that theseare represented in the simulation.
Simultaneously it is then possible to measure and recordexactly those performance values relevant to the study.In contrast to the use of general-purpose simulation plat-forms, we call this deep simulation. Deep simulators makeno claim to be general or to replace the existing generalsimulation platforms.
By the very nature of the work reported upon here, theauthors had to develop their own deep simulator. We cal-culated normalised aggregate throughput, channel effi-ciency and packet delay for a modern IEEE 802.11gnetwork using the simulator and list all of the parametersused for the experiments. We compare the simulation re-sults to those from another deep simulator developed byBianchi [11] and his colleagues, to the results from severalanalytic models as well as to measurements taken from theDNA test bed. We show that the results from our test bedexperiments deviate significantly from the analytic mod-els. It turns out that the analytic models are pessimisticfor small numbers of nodes and optimistic for larger num-bers of nodes. Finally, to model a more real-world environ-ment, we used a 6-state Markov Modulated Arrival Process(MMAP), rather than a saturated workload, to model thenetwork traffic.
2. Distributed Coordination Function
The DCF protocol dictates that time at each station is di-vided into fixed length slots of duration r microseconds. Anode wishing to transmit a frame first monitors the chan-nel for a Distributed Inter Frame Space (DIFS) period. If thechannel is idle, the node backs off for a random number ofslots picked uniformly from an integer interval called thecontention window. The length of the contention windowstarts at CWmin and doubles in length after every failedretransmission, up to some maximum length CWmax. Theback-off counter is decremented every r period until itreaches zero when transmission is attempted. This specificaction avoids collisions, since other nodes may have beenmonitoring the channel for the same purpose.
If the channel is sensed busy during back-off, theback-off counter seizes and is only reactivated when thechannel has been sensed idle for a full DIFS period. Whenthe back-off counter reaches zero the node retransmitsthe frame. If two or more stations transmit simulta-neously, a collision occurs at the receiver. To resolve acollision, all nodes involved in the collision restart theirback-off, while all other nodes in the neighborhood coun-ters freeze for a period called the Extended Inter FrameSpace (EIFS). Thus, colliding nodes have a greater proba-bility of medium access for this post-collision period.All frames are acknowledged within a Short Inter FrameSpace (SIFS) period. If the sender does not receive anacknowledgment it either reschedules transmission ordrops the packet, depending on its retry count. Themicrosecond values for r and the Inter Frame Spacesare determined by the modulation scheme employed inthe PHY and are given for pure IEEE 802.11g in Table 1.The standard specifies two channel access schemes forthe DCF: Basic Access (BA), and Request-To-Send/Clear-To-Send (RTS/CTS).
P.S. Kritzinger et al. / Computer Networks 54 (2010) 1672–1682 1673

Author's personal copy
The BA scheme is the general DATA-ACK sequence usedto forward frames. The optional RTS/CTS mechanism re-quires that a short control frame called Request-To-Send(RTS) be sent to reserve time for a data transmission. Onreception of the RTS frame, the intended receiver respondswith a Clear-To-Send (CTS) frame. Once the CTS is receivedby the station wishing to send the packet, transmissioncontinues as in the case of BA. It is important to realize thatthe RTS-CTS access mechanism does not avoid collisions,but only alleviates congestion in networks with many hid-den nodes by reducing the cost of collision.
3. Methodology
In the following sections we discuss and describe thethree modeling paradigms used in our experiments.
3.1. Analytic models
Several analytic models of the IEEE 802.11 DCF are de-scribed in the literature. The most widely-accepted modelsare extensions to Bianchi’s original model [12], which cal-culates aggregate throughput for fully-connected saturatednetworks. Bianchi represents the back-off process at eachnode as a Markov process and uses this model to calculatethe probability of transmitting a packet with success orfailure. Using various IEEE 802.11 parameters, he then cal-culates normalized aggregate throughput as a function ofthe number of nodes in the network. The analytic modelsfound in the literature differ mostly in as far as the follow-ing are concerned:
1. The network is either fully connected or some nodes arehidden. We assume the former in the simulation and sodoes the test bed [4].
2. Some analytic models allow for infinite retries (see Sec-tion 2) as Bianchi’s model [12] does, or have a limit asthe standard specifies and Wu et al. [13], inter alia.The simulation allows only the limited number ofretries given by the standard.
3. The access mode is either basic, as assumed by Bianchi[12] and Szczypiorski [14] or RTS/CTS or both.
4. The standard specifies that the countdown at a nodefreezes during the transmission of a frame by anothernode. The simulation follows the standard accuratelyas does the model by Szczypiorski, which presents aunified model for IEEE 802.11g DCF with corrections
for back-off seizure and finite retransmissions. Theother models we report assume that countdowns arenot interrupted during transmission.
5. Most analytic models assume ideal channel conditions,meaning that the channel does not suffer from nearbyinterfering networks operating at the same frequency,noise, channel fading and path loss. If there is no colli-sion, a packet is transmitted successfully. However,authors such as Ni et al. [15] consider the channels tosuffer randomly distributed errors. Szczypiorski imple-ments both error-free and error-prone transmissions.For error-prone transmissions, errors in the transmis-sion medium are randomly distributed, and all nodeshave the same bit error rate. This is not the way errorswork in practice and Geraniotis [16], for example, hasshown that the standard Gaussian approximation is amuch more adequate approximation of Multiple AccessInterference. That approximation is given by Judge [17].Pham [18] modeled realistic channel conditions byusing a slow Rayleigh fading radio channel linkbetween moving nodes. Our simulation assumes a per-fect channel.
6. Packets, or MAC frames are either of a fixed length orhave a variable packet length distribution. Chen et al.[19] models packets of variable length. All the othermodels assume a fixed length for all data packets. Usingvariable packet length workloads enables the modellingof a hybrid access mechanism, i.e., a combination ofboth the BA and the RTS/CTS schemes. In the standard,a packet length threshold is used to determine theaccess scheme to be used, i.e., either the BA scheme ifthe packet length is smaller than the threshold andotherwise the RTS/CTS scheme. When representingthe workload of measured Internet traffic, we use aMarkov Modulated Arrival Process (MMAP). In thisregard our work is an extension of that by Maloneet al. [20].
A comparison of the results of the various analytic mod-els has to bear all the nuances mentioned above in mind.Our objective was not to compare the analytic modelsagainst each other, but rather how well they compare withan accurate simulation and measured results of an IEEE802.11g network prototype. Discovering why, beyond theobvious, the analytic models fall short is not a trivial task.Much future research is needed in this regard.
3.2. Simulation
Several simulators for DCF exist. Weinmiller et al. [21]developed a process-oriented simulation model usingPTOLEMY, an object-oriented simulation tool. Cocorada[22] used the OMNeT++ simulation environment to modelthe IEEE 802.11g standard using the discrete-event simula-tion paradigm. Chen et al. [19] implemented an activityscanning model that modifies the NS-2 IEEE 802.11 model.As discussed earlier, our deep simulator is written in C++under Linux, rather than using a simulation library suchas OMNeT++ and NS-2. Doing this, and bearing in mindthe objective of our research, meant that we were confi-dent that the simulation accurately followed the IEEE
Table 1Parameter values for the physical layer.
PHY Parameter Value
Data Rate 54 MbpsBasic Rate 24 MbpsSlot Time 9 lsSIFS Time 16 lsPreamble Length 16 lsPLCP Header Length 4 lsCWmin 15CWmax 1023Propagation Delay 1 ls
1674 P.S. Kritzinger et al. / Computer Networks 54 (2010) 1672–1682
Author's personal copy
802.11 standard. Moreover, the reporting facility of thesimulator permitted us to collect data in a flexible manner.
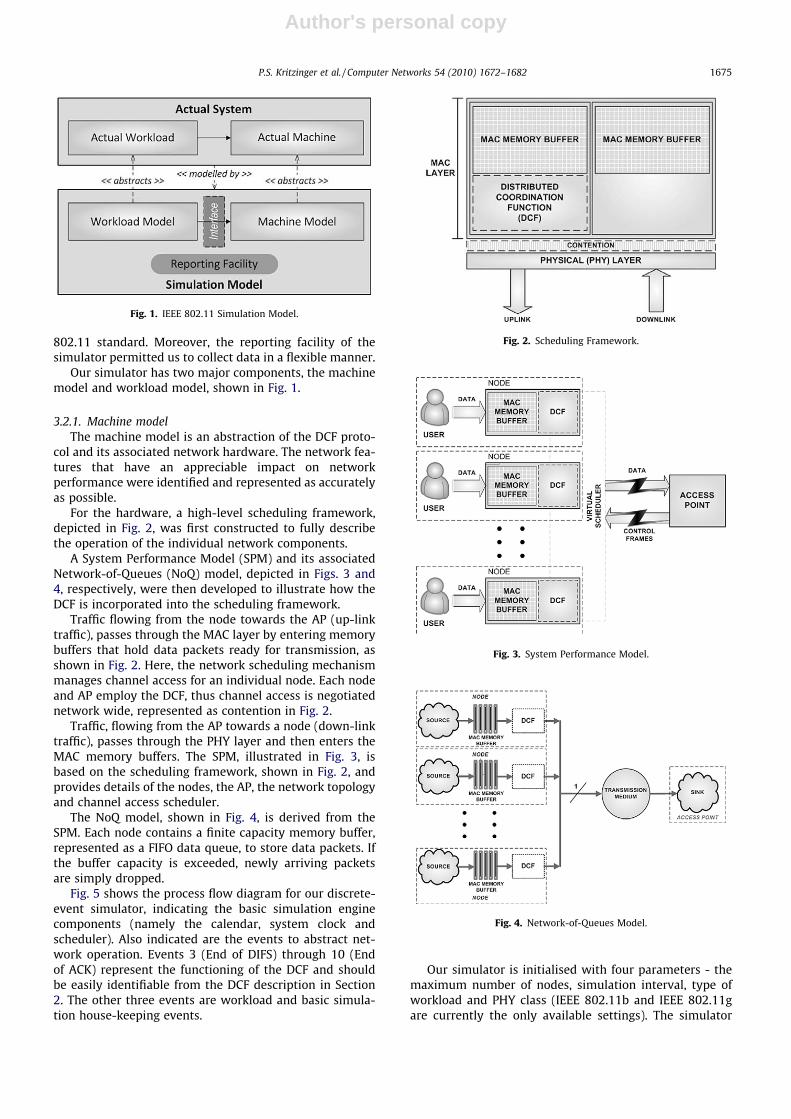
Our simulator has two major components, the machinemodel and workload model, shown in Fig. 1.
3.2.1. Machine modelThe machine model is an abstraction of the DCF proto-
col and its associated network hardware. The network fea-tures that have an appreciable impact on networkperformance were identified and represented as accuratelyas possible.
For the hardware, a high-level scheduling framework,depicted in Fig. 2, was first constructed to fully describethe operation of the individual network components.
A System Performance Model (SPM) and its associatedNetwork-of-Queues (NoQ) model, depicted in Figs. 3 and4, respectively, were then developed to illustrate how theDCF is incorporated into the scheduling framework.
Traffic flowing from the node towards the AP (up-linktraffic), passes through the MAC layer by entering memorybuffers that hold data packets ready for transmission, asshown in Fig. 2. Here, the network scheduling mechanismmanages channel access for an individual node. Each nodeand AP employ the DCF, thus channel access is negotiatednetwork wide, represented as contention in Fig. 2.
Traffic, flowing from the AP towards a node (down-linktraffic), passes through the PHY layer and then enters theMAC memory buffers. The SPM, illustrated in Fig. 3, isbased on the scheduling framework, shown in Fig. 2, andprovides details of the nodes, the AP, the network topologyand channel access scheduler.
The NoQ model, shown in Fig. 4, is derived from theSPM. Each node contains a finite capacity memory buffer,represented as a FIFO data queue, to store data packets. Ifthe buffer capacity is exceeded, newly arriving packetsare simply dropped.
Fig. 5 shows the process flow diagram for our discrete-event simulator, indicating the basic simulation enginecomponents (namely the calendar, system clock andscheduler). Also indicated are the events to abstract net-work operation. Events 3 (End of DIFS) through 10 (Endof ACK) represent the functioning of the DCF and shouldbe easily identifiable from the DCF description in Section2. The other three events are workload and basic simula-tion house-keeping events.
Our simulator is initialised with four parameters - themaximum number of nodes, simulation interval, type ofworkload and PHY class (IEEE 802.11b and IEEE 802.11gare currently the only available settings). The simulator
Fig. 1. IEEE 802.11 Simulation Model.
Fig. 2. Scheduling Framework.
Fig. 3. System Performance Model.
Fig. 4. Network-of-Queues Model.
P.S. Kritzinger et al. / Computer Networks 54 (2010) 1672–1682 1675

Author's personal copy
calculates aggregate throughput, channel efficiency andpacket delay as a function of the number of nodes contend-ing for channel access. Each node is assigned a uniqueidentifier and a set of instance variables containing DCF-re-lated data.
3.2.2. Workload modelAs essential as the accuracy of a machine model, is the
accurate representation of a realistic workload. Duffy andco-workers [20] extend Bianchi’s model for non-saturatedworkload conditions, that is, for bursty network traffic.They derived the frame arrival rates from Voice over IP(VoIP) traffic in an ad-hoc network. Chen et al. [19] presentan extension to Bianchi’s model for variable length frames.
In our simulation experiments we used three differentworkload models: two saturating models and one non-sat-urating model. A saturating workload model with fixedpacket length was used to obtain performance data compa-rable with the analytic model solutions and hardware testbed measurements, while the remaining two were used totest more realistic workload conditions. The non-saturat-ing traffic model is based on work done by Walters [23],who measured Internet traffic over a wire-line networkand fitted various distributions to the measured data. Inparticular, he measured the inter-arrival-time (IAT) andpacket length distributions in both up-link (UL) and down-link (DL) directions.
Using his results we reconstructed the 6-state MMAPfor Internet traffic shown in Fig. 6.
The MMAP models bursty Internet traffic at a uniquerate from each of the three UL-DL state pairs. Each of thestate pairs has the same log-normal packet length distribu-tion. The IAT, however, is assumed to have a Weibull distri-bution with density function f(x) given in Eq. 1. It hasdifferent parameters in each state pair to represent trafficthat places the network under different traffic intensities,namely Low, Medium and High. This is done by adjusting
the scale parameter a of the Weibull distribution withshape parameter c and location parameter l. The mean �xand variance r2 are given in Eqs. (2) and (3), respectively,where C is the gamma function.
f ðxÞ ¼ caðx� lÞ
a
� �ðc�1Þ
e�ðx�lÞ
að Þc ; ð1Þ
�x ¼ aC 1þ 1c
� �; ð2Þ
r2 ¼ a2C 1þ 2c
� �� �x2: ð3Þ
3.3. Hardware test bed
Our test bed comprises nine diskless nodes and onecentral controller, all of which are connected to a wiredEthernet control backbone. The choice of the number ofnodes to use is largely an issue of economy and available,interference-free space. We decided to use eight nodes aswe felt it was sufficiently representative for our purposes.
Each node has one IEEE 802.11g card, which it uses toconduct tests to measure the performance of DCF. On boot-ing, the client nodes request a Linux kernel and root filesystem from the controller node over the wired LAN using
Fig. 5. Process Flow of the Discrete-Event Simulator.
Fig. 6. MMAP Internet Traffic Model.
1676 P.S. Kritzinger et al. / Computer Networks 54 (2010) 1672–1682

Author's personal copy
the Pre-boot Execution Environment (PXE). The root filesystem is a lightweight embedded version of Gentoo Linux[24] compiled against uClibc and uClibc++, which we de-signed specifically for the test bed.
Once the kernel booted into the root file system, a Net-work File System (NFS) store is mounted that provideseach node with a unique set of parameters, such as individ-ual Secure Shell (SSH) keys. At this point - 30 seconds afterbeing switched on - the test bed is prepared for experimen-tation. Fig. 7 shows the test bed architecture, while Fig. 8shows a photograph of it fully constructed.
3.3.1. Client node hardwareEach client node has an additional SMCWPCIT-G wire-
less card with a detachable 2 dBi RPSMA antenna. This carduses the popular Atheros AR5212 IEEE 802.11g chip set,which is known to be well-supported by the MadWifi[25] driver set. The metal chassis of the Mini-ITX PC affectsradio propagation, so we therefore raised the antennaaway from the nodes using plastic PVC tubes of 600 mmin height. Of this, 150 mm was required to take the cablefrom the antenna tubing to the connector on the IEEE802.11 PCI card of the computer. The remaining 150 mmwas slack within the cable itself which allowed the anten-na to be pulled upwards to add or remove the attenuator,referred to below, without disconnecting the cable fromthe IEEE 802.11 card.
In order to artificially create an indoor multi-hop envi-ronment we made provision for an SMA attenuator be-tween the NIC and antenna. We calculated that a 30 dBattenuator provides a theoretical fade margin of 1.5 m forthe case where the RSSI of the radio is �86 dBm and thetransmit power is 0 dBm. Fig. 9 shows the antenna chain.
3.3.2. SoftwareOnce booted into the Linux kernel, only node 5 (hereaf-
ter referred to as the sink) starts a meshnet-listener dae-mon, while the remaining eight nodes (hereafter referredto as sources) start a meshnet-client daemon. The purposeof the meshnet-listener daemon is to accept any incoming
UDP packets that are generated by one or more of themeshnet-client daemons. Note that the sink does notacknowledge frames at either the UDP or IP layer, as thiswould affect the performance tests. Meshnet-client alwaysconnects to meshnet-listener over the wireless network.The meshnet-controller application is run on the controlnode, taking parameters for the experiment, namely thePHY/MAC configuration, size of the test network and thenumber and duration of runs. For each run a random sub-set of sources is selected equal to the size of the testnetwork.
The meshnet-controller application first forwards a set ofconfiguration commands (see Table 2) to all selectedsources and each source configures its wireless cardaccordingly. Once all nodes are correctly configured, themeshnet-controller application instructs all sources to con-nect to the sink for a fixed amount of time and attempts tosaturate the connection with fixed length packets. Usingthe athstats program, each node determines how manypackets were forwarded successfully. Each source reportsthis number back to the meshnet-controller application,which merges it with data from other sources. The final fig-ure is combined with the number of contending nodes todetermine normalized aggregate throughput for theexperiment.
3.3.3. Interference testsMicrowave ovens, Bluetooth and other devices operate
in the same band as IEEE 802.11. Such devices cause inter-ference and can therefore skew experiment results; thesimulator and analytic models make the assumption of aperfect channel. To mitigate the effect of interference theFig. 7. Test Bed Architecture.
Fig. 8. Photograph of the implementation.
Fig. 9. The antenna chain, showing the 20 dB SMA attenuator attachedbetween the NIC and antenna.
P.S. Kritzinger et al. / Computer Networks 54 (2010) 1672–1682 1677

Author's personal copy
test bed was moved to a remote location and two noisetests were conducted in advance of our experiments. Forthe first test we used a spectrum analyzer to measure theenergy in the 2.4 GHz ISM band. We noticed a smallamount of interference from a non-IEEE 802.11 device onchannel 6 (2.437 GHz). We therefore set the test bed touse the non-overlapping channel one (2.412 GHz), whichreported clear for the full thirty minutes of testing. Evenvery low-power IEEE 802.11 frames can negatively affectthe performance of IEEE 802.11; if the PHY performs aClear Channel Assessment (CCA) prior to transmissionand an external very low-power signal is detected, theback-off process is restarted and performance is skewed.In the second test we put the wireless NIC of the sink intoRF monitoring (RFMON) mode and sniffed the channel forany low-power frames using tcpdump [26]. No frameswere observed for the same 30 minute duration as thechannel energy test.
3.3.4. Saturation testsWe conducted all experiments using MadWifi’s demo
interface type, which is effectively an ad-hoc interface
without association and beacon frames - both of whichare not accounted for by our simulator and the analyticmodels.
When an IEEE 802.11 node is brought online in ad-hocmode it first scans to see if there is an existing networkwith the same SSID. If it does not find a network it createsone. It uses its own MAC address as a BSSID network key,which other neighboring stations subsequently adopt.The problem with this scheme is that if two nodes startout of range of one another they create two separate BSSIDnetworks. This leads to a division in the network, referredto as a mesh partition. Using the MadWiFi interface pre-vents the mesh partitioning problem.
The remaining parameters for the wireless card arelisted in Table 2. Note that, although being an ad-hoc net-work, the transmit power was adjusted to enforce full-con-nectivity between nodes. Also note that the MAC headerfor IBSS frames is 24 bytes.
The objective of the experiments was to measure hownormalised aggregate saturation throughput, channel effi-ciency and access delay changes as a function of the num-ber of contending nodes for both basic access and RTSaccess, assuming a fixed MAC Service Data Unit (MSDU)payload length of 1000 bytes. The size of the UDP payloadwas chosen such that, with the UDP, IP and LLC layer head-ers added, the MSDU payload comes to 1000 bytes, thesame size used for the simulator and analytic modelresults.
4. Simulation experiments
With our simulator, we conducted six experiments, la-beled A to F in Table 3, using the IEEE 802.11g ERP-OFDMparameters in Table 4 for a pure mode network. For exper-iments A and B we simulated both the BA and RTS/CTSschemes assuming that there is always a packet of fixedlength to be transmitted at every node. In experiments Cand D we repeated the first two, except that the packetlengths had a log-normal distribution with the parametervalues given in Table 4. For the last two experiments weused the MMAP described in Section 3.2.2.
In our simulations we applied the replication method,as suggested by Banks et al. [9], to estimate point-estima-tor variability. Thirty replication runs were made, resulting
Table 2MadWifi configuration strings and corresponding IEEE 802.11interpretation.
CONFIGURATION STRING DESCRIPTION
iwpriv ath0 mode 11g Set the device to IEEE 802.11g modeiwpriv ath0 pureg Only allow IEEE 802.11g ratesiwpriv ath0 protmode Disable protection for IEEE 802.11b
devicessysctl -w
dev.wifi0.slottime=9Reduce the slot time to 9 ls
sysctl -wdev.wifi0.diversity=0
Turn off antenna diversity
iwpriv ath0 wmm 0 Use DCF and not EDCAiwpriv ath0 abolt 0 Turn off proprietary protocol
extensionsiwconfig ath0 rate 54M
fixedSet the data rate to 54 Mbps
iwpriv ath0 mcast rate24000
Set the basic rate to 24 Mbps
iwconfig ath0 mode ad-hoc
Use an ad-hoc style interface
iwconfig ath0 txpower 5 Adjust the transmit power to 5 dBmiwconfig ath0 channel 1 Use ISM channel one (2.412 GHz)
Table 3Summary of the experiments A to F.
EXPERIMENT A B C D E F
Access mode BA RTS/CTS BA RTS/CTS BA RTS/CTSPacket length fixed length log-normal distribution
Inter-arrival-time saturation condition Weibull distribution
Contention number of nodes = {1, 2, . . ., 16}
Table 4Parameters for the log-normal packet length and Weibull inter-arrival-time workload distributions
Log-normal Up-link (UL) Down-link (DL) Weibull Low Medium High
r 0.33097 1.40509 a 301.09433 60.21887 12.04377
l 5.88372 7.40078 c 0.37091
1678 P.S. Kritzinger et al. / Computer Networks 54 (2010) 1672–1682

Author's personal copy
in approximately normally distributed result variables.Each run was also initialised in the same way but with dif-ferent seeding values. This ensured that the result vari-ables are independent and identically distributed (IID) asdescribed in Law and Kelton [27].
Data samples were recorded from the start of the simu-lation, i.e., no initial transient was determined. The reasonbeing that on inspection of the output, the system stabi-lised so soon after the start of each run that the transientwas considered to have a negligible effect on the IID sam-ple. This is also evident in the results obtained from oursimulator.
For the 30 IID point estimates obtained, the 90, 95, 98and 99 percent confidence intervals were calculated; inthe graphs we show the 95% confidence intervals.
The starting random back-off seed was 10018997 andthe duration of each run was one second. The startingseed for the workload modelling internet traffic, was2548887581 and the steady state vector was estimatedto be p = {0:015,0:035,0:075,0:175,0:21,0:41}.
5. Results
The results of our simulator experiments and thosefrom the test bed are shown in Figs. 10–15. Included inthese graphs are results we obtained using another IEEE802.11 simulator kindly made available to the authors byBianchi [11] and his colleagues. Not all the measurementswe used were available from this simulator. In all cases, ex-cept Fig. 15 the network was considered saturated withtraffic. All the plots of simulation results show the 95% con-fidence interval. Where no confidence interval seemsapparent, it was too narrow to warrant plotting. For theBA and RTS/CTS test bed results, the data have been ex-tended beyond eight nodes using a second order polyno-mial extrapolation.
Fig. 10 illustrates the system performance metric ofnormalised throughput versus number of active nodes forthe BA mode. The normalised throughput is the measuredthroughput normalised with respect to the nominal capac-ity of 54 Mbps of the channel. We plotted the results of
Fig. 10. Simulator, test bed and analytic results for mean normalisedthroughput in BA mode.
Fig. 11. Simulator, test bed and analytic results for mean normalisedthroughput in RTS/CTS mode.
Fig. 12. Simulator, test bed and analytic results for mean channelefficiency for both modes of operation.
Fig. 13. Simulator, test bed and analytic results for mean access delay inBA mode.
P.S. Kritzinger et al. / Computer Networks 54 (2010) 1672–1682 1679

Author's personal copy
experiment A as well as the analytic solutions of Bianchiand Ziouva, the test bed measurements and the simulationresults using the Bianchi simulator. The results from thetwo simulators differ with a virtually constant value of5% and display very similar behaviour, giving us confidencein the correctness of the DNA simulator. The analytic mod-els are much more optimistic in their prediction. The plotsin Fig. 11 reflect much the same results for the case of thenetwork operating in RTS/CTS mode.
Next we computed the network efficiency to be theratio of useful data traffic to total traffic in saturated mode.Fig. 12 illustrates plots of this metric for the various mod-els and model types. There is again an almost constant dif-ference between the results for the two simulators and theanalytic values are, as always more optimistic. The test bedresults show a much lower efficiency, showing that at arelatively small number of say 14 nodes, the network effi-ciency may become unacceptably low for the support ofbandwidth-intensive multimedia applications such asthose typically found on the Internet.
The average access delay in a network is an interestingmetric for a user of the network. This metric is plotted in
Fig. 13 for the BA mode and includes the results for theRTS/CTS mode in Fig. 14. The test bed predicts a cross-overin the mean access from the BA mode to the RTS/CTS modeat 10 nodes. Other methods fail to forecast a cross-overpoint. We think that this is a serious failure of the simula-tion and analytic methods in predicting an operationallyimportant fact.
In the final graph, Fig. 15, we compare all of our simu-lation results using both BA and RTS/CTS schemes, for var-iable packet length and both a saturated condition and aWeibull inter-arrival-time distribution for Internet traffic.For a fixed packet length, the BA scheme is superior toRTS/CTS due to the overhead of the latter in a saturatedtraffic case with a fixed packet length. This is attributedto the fact that, for long frames and small numbers ofnodes, the excess overhead imposed by RTS/CTS is negatedby the advantage of fewer collisions. This result is likely todiffer for multi-hop networks, where channel efficiency isaffected by topology.
For more realistic traffic conditions, it is no longer thecase that BA always outperforms RTS/CTS and the latterperforms better after 10 nodes. From a network manage-ment viewpoint, the cross-over point occurs sooner formore realistic traffic models than predicted by the analyticmodels we have seen.
6. Conclusion
In this study, the authors took great care to accuratelyrepresent the IEEE 802.11 protocol in both a simulationand a test bed model of the same system. We made surethat, where relevant, the parameters had the same valuesand that both were subjected to network traffic with thesame characteristics. We also chose two of the several ana-lytic models available that represent the operation of thesystem the closest.
Unlike the analytic models or simulations, the test bedresults are affected by Linux kernel and hardware features,such as UDP queuing and an imperfect channel. It is thus tobe expected that neither the analytic nor simulation modelresults would match this benchmark precisely.
Nevertheless, in the case of the test bed the negativeperformance trends are much more emphasised than isthe case for the other modelling paradigms. Even thoughthe system setup and conditions are experimental in nat-ure, it is fair to assume that the test bed results reflect realnetworks best. If this is so, the rapid rate of deterioration inthe performance of an IEEE 802.11 network as a function ofthe number of active nodes is something that has not re-ported before. Given the large number of studies of wirelessnetwork performance that rely on analytic and simulationmodels, there is much to be gained from knowing the ex-tent of the divergence in the results. This has importantimplications for any provider of WLAN environments thatmay rely on analytic modelling for its operational decision.
Finally, we are aware that in an effort such as this, thereal challenge is to understand the nature of the real-worldbehaviour through experimentation and not only comparevarious modelling techniques. There is thus further workto be done.
Fig. 14. Simulator, test bed and analytic results for mean access delay inboth modes.
Fig. 15. Mean normalised throughput for both access modes and bothsaturation and Internet traffic.
1680 P.S. Kritzinger et al. / Computer Networks 54 (2010) 1672–1682

Author's personal copy
References
[1] P802.11: Standard for Wireless LAN Medium Access Control (MAC)and Physical Layer (PHY) Specifications, ANSI/IEEE Std. 802.11.Technical report, IEEE, 2007.
[2] M. Ott, I. Seskar, R. Siracusa, M. Singh, Orbit testbed softwarearchitecture: Supporting experiments as a service. In: IEEETridentcom, Trento, Italy, 2005.
[3] D. Aguayo, J. Bicket, S. Biswas, D.D. Couto, MIT Roofnet: Constructionof a Production Quality Ad-Hoc Network, 2003.
[4] A. Symington, A Hardware Testbed for Measuring IEEE 802.11g DCFPerformance, Master’s thesis, Department of Computer Science,University of Cape Town, 2008.
[5] O.T. Incorporated, OPNET Modeler�. (http://www.opnet.com).[6] NS-2: The Network Simulator - NS-2. (http://www.isi.edu/nsnam/
ns).[7] S.N. Technologies, Introducing the VisNetTMNetwork Planning
Software. (http://www.scalable-networks.com).[8] OMNET++: A discrete event simulation system. (http://
www.omnetpp.org).[9] J. Banks, J.S. Carson, B.L. Nelson, D.M. Nicol, Discrete-Event System
Simulation, third ed., Prentice-Hall, 2000.[10] D. Cavin, Y. Sasson, A. Schiper, On the accuracy of MANET simulators.
In: POMC ’02: Proceedings of the second ACM internationalworkshop on Principles of mobile computing, New York, NY, USA,ACM, 2002, pp. 38–43.
[11] G. Bianchi, I. Tinnirello, Remarks on IEEE 802.11DCF performanceanalysis, IEEE Communication Letters 9 (2005) 265–267.
[12] G. Bianchi, Performance analysis of the IEEE 802.11 distributedcoordination function, IEEE Journal on Selected Areas inCommunications 18 (2000) 535–547.
[13] H. Wu, Y. Peng, K. Long, S. Cheng, J. Ma, Performance of ReliableTransport Protocol, In: IEEE 802.11 wireless LAN: analysis andenhancement, in Proc. IEEE INFOCOM. 2002, pp. 599–607.
[14] K. Szczypiorski, J. Lubacz, Performance evaluation of IEEE802.11 DCFnetworks. in: L. Mason, T. Drwiega, J. Yan, (Eds.), Managing TrafficPerformance in Converged Networks, 20th International TeletrafficCongress, ITC20 2007, Ottawa, Canada, June 17-21, 2007,Proceedings. vol. 4516 of Lecture Notes in Computer Science,Springer, 2007, pp. 1084–1095.
[15] Q. Ni, T. Li, T. Turletti, Y. Xiao, Saturation throughput analysis oferror-prone IEEE 802.11 wireless networks, Wiley Journal ofWireless Communications and Mobile Computing JWCMC 5 (2005)945–956.
[16] E. Geraniotis, M. Pursley, Performance of noncoherent direct-sequence spread-spectrum communications over specularmultipath fading channels, IEEE Transactions on Communications(1986) 219–226.
[17] G. Judge, F. Takawira, A simple hidden Markov model for a CDMAchannel with correlated Rayleigh fading, The Transactions of theSAIEE (2002) 17–26.
[18] P.P. Pham, Comprehensive analysis of the IEEE 802.11, Mob. Netw.Appl 10 (2005) 691–703.
[19] Q. Chen, F. Schmidt-Eisenlohr, D. Jiang, M. Torrent-Moreno, L.Delgrossi, H. Hartenstein, Overhaul of IEEE 802.11 modeling andsimulation in NS-2. in: MSWiM ’07: Proceedings of the 10th ACMSymposium on Modeling, analysis, and simulation of wireless andmobile systems, New York, NY, USA, ACM, 2007, pp. 159–168.
[20] D. Malone, K. Duffy, D. Leith, Modeling the IEEE 802.11 distributedcoordination function in nonsaturated heterogeneous conditions,IEEE/ACM Trans. Netw. 15 (2007) 159–172.
[21] J. Weinmiller, M. Schläger, A. Festag, A. Wolisz, Performance study ofaccess control in wireless LANs—IEEE 802.11 DFWMAC and ETSI RES10 Hiperlan, Mob. Netw. Appl. 2 (1997) 55–67.
[22] S. Cocorada, An IEEE 802.11 g simulation model with extendeddebug capabilities. in: Simutools ’08: Proceedings of the 1stinternational conference on Simulation tools and techniques forcommunications, networks and systems & workshops, ICST,Brussels, Belgium, Belgium, ICST (Institute for Computer Sciences,Social-Informatics and Telecommunications Engineering), 2008,pp.1–3.
[23] L. Walters, A Web Browsing Workload for Simulation. Master’sthesis, Department of Computer Science, University of Cape Town,2004.
[24] Gentoo-embedded: Gentoo Linux Projects – Embedded Gentoo,2008.
[25] MadWifi: madwifi.org - trac (2008).
[26] TCPDUMP: TCPDUMP/LIBPCAP public repository, 2008.[27] A. Law, D. Kelton, Simulation Modeling and Analysis, McGraw-Hill,
2000.
Pieter Kritzinger obtained the MSc degree inElectrical Engineering from the University ofthe Witwatersrand and a PhD in ComputerScience from the University of Waterloo,Canada, in 1972. During his academic careerhe worked in the Computer Science Depart-ment at Waterloo, in the Department ofComputing, of Imperial college, London andStellenbosch University, South Africa. In July1985, after spending the previous year as aVisiting Scientist at the IBM Zurich ResearchLaboratory, he was invited to join the
Department of Computer Science at the University of Cape Town as a FullProfessor, a post he still holds. He is a member of IFIP WG 6.1, 6.3 and 7.3and has been on the Technical Programming Committee of severalinternational conferences. In 1996 he was elected a Senior Member of theIEEE and represents South Africa on the IFIP Technical Committee forTelecommunications (IFP TC 6). His research interest has always been inthe modeling and formal specification of concurrent systems.
Henry Msiska received the B.Sc. (Hons)degree with first class Honours in ComputerScience from the University of Cape Town,South Africa, in 2008. During 2008, he was amember of the Data Network Architecturesresearch group and did research focussing oninternet workload modelling. He is currentlyworking as a software developer in industry.
Tinotenda Mundangepfupfu received theB.Sc. (Hons) degree with first class Honours inComputer Science from the University of CapeTown in December 2008. In 2009 he joinedindustry but has also remained a full memberof Data Network Architectures research groupand is pursuing his Master’s degree. His cur-rent research interest involves IEEE 802.11Quality-of-Service and wireless channelmodelling.
Paolo Pileggi received the B.Sc. (Hons) degreewith first class Honours in Computer Sciencefrom the University of Cape Town in Decem-ber 2007. He has worked in the DNA Groupsince 2006. His research interests includeperformance modelling of computer andtelecommunication systems and networksecurity. His Master’s thesis involves simula-tion of wireless Internet technology, showingthe synergistic relationship between admis-sion control and scheduling in IEEE 802.16 (orWiMAX) Resource and Connection
Management.
P.S. Kritzinger et al. / Computer Networks 54 (2010) 1672–1682 1681

Author's personal copy
Andrew Symington received the BBusScidegree with first class Honours in ComputerScience from the University of Cape Town,South Africa, in 2006. He remained and com-pleted an MSc degree in Computer Sciencewith the Data Network Architectures researchgroup in 2008. In January 2009 he joined theSensor Network Group in the ComputingLaboratory at Oxford University in a doctoralprogramme His current research interestinvolves connectivity-constrained UnmannedAerial Vehicle (UAV) networks and multi-
agent exploration.
1682 P.S. Kritzinger et al. / Computer Networks 54 (2010) 1672–1682


![[] IEEE 1120-2004 - IEEE Guide for the Planning, D(Book Fi org)](https://static.fdokumen.com/doc/165x107/63150fb6511772fe45103298/-ieee-1120-2004-ieee-guide-for-the-planning-dbook-fi-org.jpg)