Comparing the performance of different stomatal conductance models using modelled and measured plant...
11
Comparing the performance of different stomatal conductance models using modelled and measured plant carbon isotope ratios (d 13 C): implications for assessing physiological forcing PER E. BODIN*, MARY GAGEN † , DANNY MCCARROLL † , NEIL J. LOADER † , RISTO JALKANEN ‡ , IAIN ROBERTSON † , VINCENT R SWITSUR § , JOHN S. WATERHOUSE § , EWAN J. WOODLEY † , ¶ , GILES H. F. YOUNG † andPAUL B. ALTON † *Department of Physical Geography and Ecosystem Science, Lund University, S€ olvegatan 12, S-223 62 Lund, Sweden, †Department of Geography, Swansea University, Singleton Park, Swansea SA2 8PP, UK, ‡Finnish Forest Research Institute, METLA, PO Box 16 (Etela ¨ranta 55), FI- 96301 Rovaniemi, Finland, §Department of Life Sciences, Anglia Ruskin University, East Road, Cambridge CB1 1PT, UK, ¶Geography, College of Life and Environmental Sciences, University of Exeter, Rennes Drive, Exeter EX4 4RJ, UK Abstract Accurate modelling of long-term changes in plant stomatal functioning is vital to global climate change studies because changes in evapotranspiration influence temperature via physiological forcing of the climate. Various stoma- tal models are included in land surface schemes, but their robustness over longer timescales is difficult to validate. We compare the performance of three stomatal models, varying in their degree of complexity, and coupled to a land surface model. This is carried out by simulating the carbon isotope ratio of tree leaves (d 13 C leaf ) over a period of 53 years, and comparing the results with carbon isotope ratios obtained from tree rings (d 13 C stem ) measured at six sites in northern Europe. All three stomatal models fail to capture the observed interannual variability in the mea- sured d 13 C stem time series. However, the Soil-Plant-Atmosphere (SPA) model performs significantly better than the Ball-Berry (BB) or COX models when tested for goodness-of-fit against measured d 13 C stem . The d 13 C leaf time series simulated using the SPA model are significantly positively correlated (P < 0.05) with measured results over the full time period tested, at all six sites. The SPA model underestimates interannual variability measured in d 13 C stem , but is no worse than the BB model and significantly better than the COX model. The inability of current models to adequately replicate changes in stomatal response to rising levels of CO 2 concentrations, and thus to quantify the associated physiological forcing, warrants further investigation. Keywords: Ball-Berry, dendrochronology, internal conductance, land surface model, SPA model, tree-rings Received 30 January 2013; revised version received 30 January 2013 and accepted 4 February 2013 Introduction The annual rings of trees provide the source for some of the most powerful and widely used of the high- temporal resolution environmental proxies. Trees are long-lived and widespread globally and thus hold great potential for reconstructing climate across the seasonal parts of the planet (McCarroll & Loader, 2004). Various measures of annual tree growth, including ring width, wood density and height increment are commonly used for the reconstruction of climate, most commonly through the last two millennia (e.g., Briffa et al., 2004; Campbell et al., 2007; Trouet et al., 2009; McCarroll et al., 2013). Recently, stable isotope measurements have also begun to feature as a strong dendroclimatic proxy, extending the information that can be obtained using the more traditional methods (e.g., Treydte et al., 2006). Fractionation of carbon in trees is controlled by stomatal conductance and photosynthetic rate, and the dominant environmental signal varies geographically, seemingly providing a proxy for sunshine and cloudi- ness in the Arctic (Young et al., 2010, 2012a; Gagen et al., 2011; Loader et al., 2013), summer temperature in moist mid-latitudes (Loader et al., 2008; Young et al., 2012b) and hydroclimate in dry areas (Gagen et al., 2004; Kress et al., 2010), and, where replication is high, carbon isotopes also have the advantage of retaining climate information at multi-decadal timescales at some sites (Gagen et al., 2007; Young et al., 2011). In addition to climate information, tree-ring stable carbon isotope (d 13 C) time series also contain informa- tion on the response of trees to postindustrial changes in atmospheric carbon dioxide concentration and stable isotope composition, (see McCarroll & Loader (2004) Correspondence: Per E. Bodin, tel. + 46 (0) 46 222 17 35, fax + 46 (0)46 222 03 21, e-mail: [email protected] © 2013 Blackwell Publishing Ltd 1709 Global Change Biology (2013) 19, 1709–1719, doi: 10.1111/gcb.12192
-
Upload
independent -
Category
Documents
-
view
6 -
download
0
Transcript of Comparing the performance of different stomatal conductance models using modelled and measured plant...
Comparing the performance of different stomatalconductance models using modelled and measured plantcarbon isotope ratios (d13C): implications for assessingphysiological forcingPER E . BOD IN * , MARY GAGEN † , DANNY MCCARROLL † , NE I L J . LOADER † ,
R I S TO JALKANEN ‡ , I A IN ROBERTSON † , V INCENT R SW IT SUR § , J OHN S .
WATERHOUSE § , EWAN J . WOODLEY † , ¶ , G I LE S H . F . YOUNG † and PAUL B. ALTON†
*Department of Physical Geography and Ecosystem Science, Lund University, S€olvegatan 12, S-223 62 Lund, Sweden,
†Department of Geography, Swansea University, Singleton Park, Swansea SA2 8PP, UK, ‡Finnish Forest Research Institute,
METLA, PO Box 16 (Etelaranta 55), FI- 96301 Rovaniemi, Finland, §Department of Life Sciences, Anglia Ruskin University, East
Road, Cambridge CB1 1PT, UK, ¶Geography, College of Life and Environmental Sciences, University of Exeter, Rennes Drive,
Exeter EX4 4RJ, UK
Abstract
Accurate modelling of long-term changes in plant stomatal functioning is vital to global climate change studies
because changes in evapotranspiration influence temperature via physiological forcing of the climate. Various stoma-
tal models are included in land surface schemes, but their robustness over longer timescales is difficult to validate.
We compare the performance of three stomatal models, varying in their degree of complexity, and coupled to a land
surface model. This is carried out by simulating the carbon isotope ratio of tree leaves (d13Cleaf) over a period of
53 years, and comparing the results with carbon isotope ratios obtained from tree rings (d13Cstem) measured at six
sites in northern Europe. All three stomatal models fail to capture the observed interannual variability in the mea-
sured d13Cstem time series. However, the Soil-Plant-Atmosphere (SPA) model performs significantly better than the
Ball-Berry (BB) or COX models when tested for goodness-of-fit against measured d13Cstem. The d13Cleaf time series
simulated using the SPA model are significantly positively correlated (P < 0.05) with measured results over the full
time period tested, at all six sites. The SPA model underestimates interannual variability measured in d13Cstem, but is
no worse than the BB model and significantly better than the COX model. The inability of current models to
adequately replicate changes in stomatal response to rising levels of CO2 concentrations, and thus to quantify the
associated physiological forcing, warrants further investigation.
Keywords: Ball-Berry, dendrochronology, internal conductance, land surface model, SPA model, tree-rings
Received 30 January 2013; revised version received 30 January 2013 and accepted 4 February 2013
Introduction
The annual rings of trees provide the source for some
of the most powerful and widely used of the high-
temporal resolution environmental proxies. Trees are
long-lived and widespread globally and thus hold great
potential for reconstructing climate across the seasonal
parts of the planet (McCarroll & Loader, 2004). Various
measures of annual tree growth, including ring width,
wood density and height increment are commonly used
for the reconstruction of climate, most commonly
through the last two millennia (e.g., Briffa et al., 2004;
Campbell et al., 2007; Trouet et al., 2009; McCarroll
et al., 2013). Recently, stable isotope measurements
have also begun to feature as a strong dendroclimatic
proxy, extending the information that can be obtained
using the more traditional methods (e.g., Treydte et al.,
2006). Fractionation of carbon in trees is controlled by
stomatal conductance and photosynthetic rate, and the
dominant environmental signal varies geographically,
seemingly providing a proxy for sunshine and cloudi-
ness in the Arctic (Young et al., 2010, 2012a; Gagen
et al., 2011; Loader et al., 2013), summer temperature in
moist mid-latitudes (Loader et al., 2008; Young et al.,
2012b) and hydroclimate in dry areas (Gagen et al.,
2004; Kress et al., 2010), and, where replication is high,
carbon isotopes also have the advantage of retaining
climate information at multi-decadal timescales at some
sites (Gagen et al., 2007; Young et al., 2011).
In addition to climate information, tree-ring stable
carbon isotope (d13C) time series also contain informa-
tion on the response of trees to postindustrial changes
in atmospheric carbon dioxide concentration and stable
isotope composition, (see McCarroll & Loader (2004)Correspondence: Per E. Bodin, tel. + 46 (0) 46 222 17 35, fax +
46 (0)46 222 03 21, e-mail: [email protected]
© 2013 Blackwell Publishing Ltd 1709
Global Change Biology (2013) 19, 1709–1719, doi: 10.1111/gcb.12192
for a discussion). Whilst the impact of atmospheric CO2
concentration changes on the climate signal retained in
tree-ring d13C can be quantified and removed (Saurer
et al., 1997; Treydte et al., 2009; McCarroll et al., 2009),
this signal component contains valuable information on
tree response to rising CO2 concentrations. Where this
information can be scaled up to forest level, changes in
forest response to CO2 through time might be explored
(Gagen et al., 2010).
The fractionation of stable carbon isotopes by trees
can be linked to physiological processes within the tree
that are relatively well understood and modelled
(Farquhar et al., 1982). The d13C ratio in trunk cellulose
is connected to leaf stomatal conductance (gs) and
assimilation rate (Anet) and, as such, tree-ring d 13C can
be used to explore long-term changes in plant physiol-
ogy (Farquhar et al., 1982; McCarroll & Loader, 2004).
Plants regulate their stomata to maximize carbon
gain whilst minimizing water lost via transpiration (t)
(Williams et al., 1996). In doing so, the relationship
between stomatal conductance and trees’ carbon and
water balance is archived within the d13C of cellulose
revealing that, as CO2 concentration rises, many trees
adapt their water loss to carbon gain accordingly. The
most common way to explore these relationships is by
using tree-ring d13C data as a proxy for intrinsic (poten-
tial) Water Use Efficiency (iWUE or Anet/gs) calculated
using well established physiological relationships
(Gagen et al., 2010). iWUE changes through time, recon-
structed from measurements of tree-ring d13C, show an
increase in iWUE in the postindustrial period, follow-
ing the rising trend in atmospheric CO2 concentrations
(Saurer et al., 2004; Waterhouse et al., 2004; Gagen et al.,
2010; Loader et al., 2011). This widely described rela-
tionship seems logical given that the stomatal apertures
of plants tend to close, decrease in number and alter
their geometry when plants are exposed to elevated
CO2 concentrations (Woodward, 1987; Woodward
& Kelly, 1995; K€urschner et al., 1997; Gray et al., 2000;
Lake et al., 2001).
Tree-ring d13C has been used to explore iWUE
changes in trees from across Europe with indications
that iWUE has risen in recent decades in a variety of
forests (e.g., Waterhouse et al., 2004; Gagen et al., 2011).
If such changes are genuinely widespread they have
the potential to impact strongly upon the temperature
response of the planet to rising CO2 concentrations as
water vapour is a strong greenhouse gas but also due
to the cooling effect of evapotranspiration. The tempera-
ture changes derived from shifts in evapotranspiration
under raised CO2 concentrations are referred to as plant
physiological forcing (e.g., Betts et al., 2007). Physiologi-
cal forcing is an important but poorly quantified process
in the land surface models (LSMs) of General Circula-
tion Models (GCMs) (Doutriaux-Boucher et al., 2009).
The potential climate forcing impact of changes in sto-
matal conductance is substantial when considered at
forest level, given the significance of a reduction in tran-
spired water vapour as CO2 levels rise. One of the most
significant variables in calculating physiological forcing
involves the modelling of stomatal conductance, which
must be characterized properly if derived estimates of
physiological forcing are to be accurate. Here, we assess
the accuracy of stomatal conductance models by com-
paring measured d13Cstem with simulated d13Cleaf.
It is widely assumed that plant response to rising CO2
concentrations will see a continuing stomatally induced
reduction in evapotranspiration (Field et al., 1995;
Gedney et al., 2006; Betts et al., 2007). However, there is
an emerging body of evidence which suggests that trees
can reach a plateau in gs induced rises in iWUE, as an
acclimation point in plant response is reached. Water-
house et al. (2004) find examples of plateaus in rising
iWUE (derived from tree-ring d 13C) across northern
Europe. K€urschner et al. (1997) and Royer (2001) suggest
a response limit in stomatal adjustment to rising CO2
concentrations from studies of stomatal frequency
changes, a response limit which may vary strongly
between species (Haworth et al., 2013). Gagen et al.
(2011) also present evidence for a plateau in tree-ring
d13C derived iWUE in Northern European Scots Pine,
generally noting a levelling off in iWUE detected via a
shift in the observed decrease in tree-ring d13C in recent
decades. The ability of the various stomatal models used
in LSMs to reproduce such features would provide a
useful independent test of their efficacy. It is important
that tree-ring and LSM derived changes in d13C fraction-
ation are reconciled if LSMs are to be used with confi-
dence for simulating future physiological forcing under
elevated CO2 concentrations.
A large number of stomatal models exist (for a review
see Damour et al., 2010) with a varying range of com-
plexity. The most commonly used models (e.g., Ball
et al., 1987; Wang & Leuning, 1998) are based on the
gs-Anet relationship. These models include few model
parameters and their simplicity makes them suitable for
use in LSMs. Several studies use these physically based
models to examine modelled d13C fractionation in trees
or in respired carbon (Baldocchi & Bowling, 2003; Suits
et al., 2005; Aranibar et al., 2006; Chen et al., 2006; Cai
et al., 2008; Hidy et al., 2009; Og�ee et al., 2009). However,
to the best of our knowledge none have tried to validate
long-term changes in simulated d13Cstem against mea-
sured time series from tree-ring cellulose. Here we use
the known link between the d13C in the leaf and stomatal
conductance (Farquhar et al., 1982) to simulate fraction-
ation of carbon isotopes in leaves (d13Cleaf). We then
compare modelled d13C in the leaf with measurements
© 2013 Blackwell Publishing Ltd, Global Change Biology, 19, 1709–1719
1710 P. BODIN et al.
of d13C discrimination in pine or oak tree-ring cellulose
(d13Cstem) at six Northern European sites. Stable carbon
isotope series are part of a developing dendroclimatic
archive produced over the last 15 years.
Our aim was to examine the performance of different
stomatal models in terms of how well they represent
the variability in observed d13Cstem. Three different
models are tested as follows: the COX model (Cox et al.,
1998), the Ball-Berry (BB) model (Ball et al., 1987) and
the stomatal model of the Soil-Plant-Atmosphere (SPA)
model (Williams et al., 1996). The BB and SPA models
have previously been found to give similar results
relating to evapotranspiration (Alton et al., 2009). The
stomatal models were incorporated into the UK Meteo-
rological Office ‘Joint UK Land Environment Simulator’
(JULES) and the model run for 53 years (the extent of
the climate dataset: 1948–2000).
Materials and methods
The JULES model is based on the UK Meteorological Office
Land Surface Exchange Scheme (MOSES; Cox et al., 1999).
JULES uses the standard Penman-Monteith approach for
energy calculation (Monteith, 1965) to ensure a closed energy
budget. Surface albedo is simulated using the two-stream
model of Sellers et al. (1996). Several changes have been made
to the original version of the model relating to leaf orientation,
diffuse sky radiation and sun fleck penetration (Alton et al.,
2007; Alton, 2008; Mercado et al., 2007) and to plant respira-
tion (Ryan, 1991). A more detailed description of the modified
version of the JULES model used in this study (JULES-SF) can
be found in Cox et al. (1999) and Alton & Bodin (2010). The
model separates vegetation into five different plant functional
types (PFTs), including two tree PFTs: broadleaf (BL) and nee-
dle leaf (NL). Required forcing includes local meteorology:
downwelling shortwave (SW) and longwave (LW) radiation,
precipitation (PPT), air temperature (T), windspeed (WIND),
air humidity (SH) and air pressure (PRES). The model also
requires atmospheric CO2 concentration, Leaf Area Index
(LAI) and a set of soil parameters. In this study, we used the
three existing stomatal models in JULES-SF: (i) The COX
model (Cox et al., 1998); and (ii) the extensively used BB
model (BB: Ball et al., 1987) and a more mechanistic approach
stemming from the SPA model (Williams et al., 1996). In the
COX model the internal CO2 concentration (ci) depends on the
CO2 concentration outside the leaf (ca) and the humidity defi-
cit at the leaf level. Stomatal conductance is then dependent
on the resulting photosynthesis (down regulated to take into
account soil moisture deficit) following:
gs ¼ 1:6AnetRT�ca � ci
ð1Þ
where R is the ideal gas constant and T* is leaf surface temper-
ature.
In the BB-model (Eqn. 2), stomatal conductance is depen-
dent on net photosynthesis (Anet), internal CO2 concentration
(ci) and relative humidity (Hr):
gs ¼ bAnetHr
ciþm ð2Þ
where b and m are empirical constants.
Both Eqn. 1 for the COX model and Eqn. 2 for the BB model
are solved iteratively. The SPA model simultaneously maxi-
mizes carbon gain and water loss, which are the main control-
ling factors on stomatal conductance (Williams et al., 1996).
This is performed through a stepwise process where stomata
are opened incrementally until the resulting increase in assim-
ilation is below a certain threshold or if leaf water potential
reaches its specified cavitation limit.
The d13C of leaves (d13Cleaf) was simulated using the stan-
dard formula (Eqn. 3) (Farquhar et al., 1982):
d13Cleaf ¼ d13Catm � a� ðb� aÞðcc=caÞ ð3Þwhere a (4.4&) and b (28&) are constants representing frac-
tionation due to diffusion and carboxylation respectively, cabeing atmospheric CO2 concentration (ppm), cc being the CO2
concentration at the site of carboxylation and d13Catm being
the d13C of atmospheric CO2. Here we assume a constant
d13Catm of �6.4& because the measured d13Cstem values are
expressed relative to this preindustrial d13Catm value. The
JULES-SF model does not include the process of mesophyll
conductance and thus uses the common assumption that cc is
equal to ci (Flexas et al., 2008). Evidence suggests that this
assumption might not always be valid as internal conductance
(the process determining the discrimination between ci and cc)
varies with both ca and leaf temperature (e.g., Flexas et al.,
2008). The understanding about the physical processes behind
these effects is however limited and the inclusion of these
processes to the model would add further uncertainties to our
analysis.
Datasets
The tree-ring data analyzed are derived from published d13Cseries from the annual rings of multiple Scots pine (Pinus syl-
vestris L.) or oak (Quercus robur L.) at six Northern European
sites between 52° and 69°N and 3°W–27°E (see Table 1 for full
references of the data sources used in this study). Some of
these sites are tree line sites whilst others are from less envi-
ronmentally stressed locations. In most cases (Sandringham
and Turku as the exception), samples were analyzed at the
Swansea University stable isotope laboratory. Full methodo-
logical information can be found in the original data sources
(Table 1).
The most northerly Scots pine site is at Forfjorddalen,
beyond the Arctic Circle, in the Vester�alen archipelago of
northwestern Norway. Scots pine was sampled from near to
its northern limit. Core samples were collected using a 12 mm
diameter increment borer, dried at room temperature, sur-
faced and annually dated by dendrochronology against the
local master chronology (Kirchhefer, 2001). The chronology is
the mean of 8–10 samples comprised of annually measured
latewood a-cellulose (see Young et al., 2010 for full site
description and methodology). Laanila is also located north of
the Arctic Circle, south of the Scots pine northern limit, in a
© 2013 Blackwell Publishing Ltd, Global Change Biology, 19, 1709–1719
MEASURED AND MODELLED PLANT Δ 1 3C 1711
research area that has been used to develop tree ring isotope
and associated methodologies for many years (McCarroll
et al., 2011). The Laanila d13C series is comprised of latewood
cellulose extracted from rings of 8 mature P. sylvestris trees
over 200 years in age sampled in 2001. The time series is fully
described elsewhere (Gagen et al., 2007). Trees were sampled
using a 12 mm increment borer and processed to a-celluloseusing standard methodologies. Rovaniemi, also in Finland,
lies south of Laanila close to the Arctic Circle. Sixteen pine
trees were sampled at a single site. Discs from breast height
were cut in the field, dried and the latewood from annual
rings was separated and processed to a-cellulose using stan-
dard methodologies. The series represents the mean of 16
samples of annual latewood. Turku falls within 100 km of the
northern distribution limit of oak in Finland. Five oaks were
cored using a 12 mm diameter increment borer. Annual late-
wood samples were removed and samples were processed to
a-cellulose before measurement. The series represents the
mean of five samples from latewood a-cellulose (see Robert-
son et al., 1997b for full site details and methodology). A fur-
ther oak site Sandringham Park UK is a dry to mesic location
in south east England. The oaks sampled at Sandringham are
found growing in open stands of mixed native and non-native
hardwoods. Five individuals were sampled with 12 mm
diameter increment borers (Loader et al., 1997; Rinne et al.,
2005). Annual latewood samples were removed and samples
processed to a-cellulose using standard methodologies. A fur-
ther Scots pine site is located in the UK, in the Southern Glens
region of central Scotland. The Southern Glens tree-ring d13Cseries is fully discussed in Woodley et al. (2012) and repre-
sents the mean of six samples of annual latewood a-cellulosemean d13C series. In all cases, extracted a-cellulose was mea-
sured for d13C ratios using standard stable isotope ratio mass
spectrometric methods following absolute dating of tree-ring
samples using standard methodologies (Fritts, 1976).
The measured (stem) d13C series were first corrected for
changes in the d13C of atmospheric CO2. The correction was
applied according to McCarroll & Loader (2004) by normaliz-
ing against the preindustrial d13C in the atmosphere of �6.4&.
Corrected d13Cstem can thus be compared directly with simu-
lated d13Cleaf, although it should be noted that these variables
will always be offset slightly (Waterhouse et al., 2004).
A 53 year, 3-hourly reconstructed meteorology dataset at 1
degree resolution (Sheffield et al., 2006) (available at http://
hydrology.princeton.edu, accessed 15 March 2009) was used
to force the model using the 1° gridcell in which each of the
sites were located. Annual average CO2 concentrations were
taken from the Mauna Loa (Keeling et al., 2009) and Law
Dome (Etheridge et al., 1998) datasets. We assessed the bias in
the re-analysis climatology against data from nearby meteorol-
ogy stations. For Laanila and Rovaniemi data were taken from
Sodankyla (67○22′N 26○39′E), for Turku and Sandringham
local climate was used (60○31′N 22○16′E and 52°50′N 0°30′Erespectively), for Forfjorddalen data from Andoya (69○18′N
16○9′E) and for Southern Glens data from Eskdalemuir (55○19′
N 3○12′W). In general, the bias in monthly mean T was very
small (less than 1.0 K on average) and with Root Mean Square
Error (RMSE) smaller than 0.1. For Rovaniemi there is a warm
bias (1.2 K) and Forfjorddalen a cold bias (-1.3 K) compared
with station data. For Rovaniemi this bias is not surprising as
the Sodankyla meteorology station is located 130 km to the
north of the site.
For PPT, the bias in monthly totals was smaller than 25 mm
for all sites except Forfjorddalen which had a wet bias of
45 mm. The greater noise in observed PPT generated a smaller
fit between re-analysis and site data with a RMSE ranging
from 0.29 (Rovaniemi) to 2.3 (Forfjorddalen). Water is, how-
ever, not expected to be limiting to growth for the sites with
highest RMSEs.
Soil parameter values were taken from the GSWP2 1
degree dataset (Dirmeyer et al., 1999). Monthly LAI for each
grid cell was based on calculations made using observed rela-
tionships between the fraction of absorbed photosynthetically
active radiation and T and PPT (Los et al., 2006). Calculated
grid average LAI was normalized to a maximum PFT specific
LAI (4.3 for BL and 4.4 for NL).
Analysis methods for comparing measured d13Cstem andsimulated d13Cleaf
For each site and stomatal model JULES was run for 53 years
(AD 1948–2000). The first 3 years were used as a spin-up of
the soil water pool and were not used in the analysis. Model
parameters, including BB model parameters, were taken from
Alton & Bodin (2010) using optimized values for the five most
influential model parameters and the remaining values taken
from the literature (Alton & Bodin, 2010). The optimization in
their study was carried out by minimizing the error in simu-
lated net carbon exchange, latent heat, sensible heat and net
radiation comparing against data from 30 FLUXNET sites.
PFT specific parameter values for BL trees were used for the
Sandringham and Turku sites and NL specific parameter
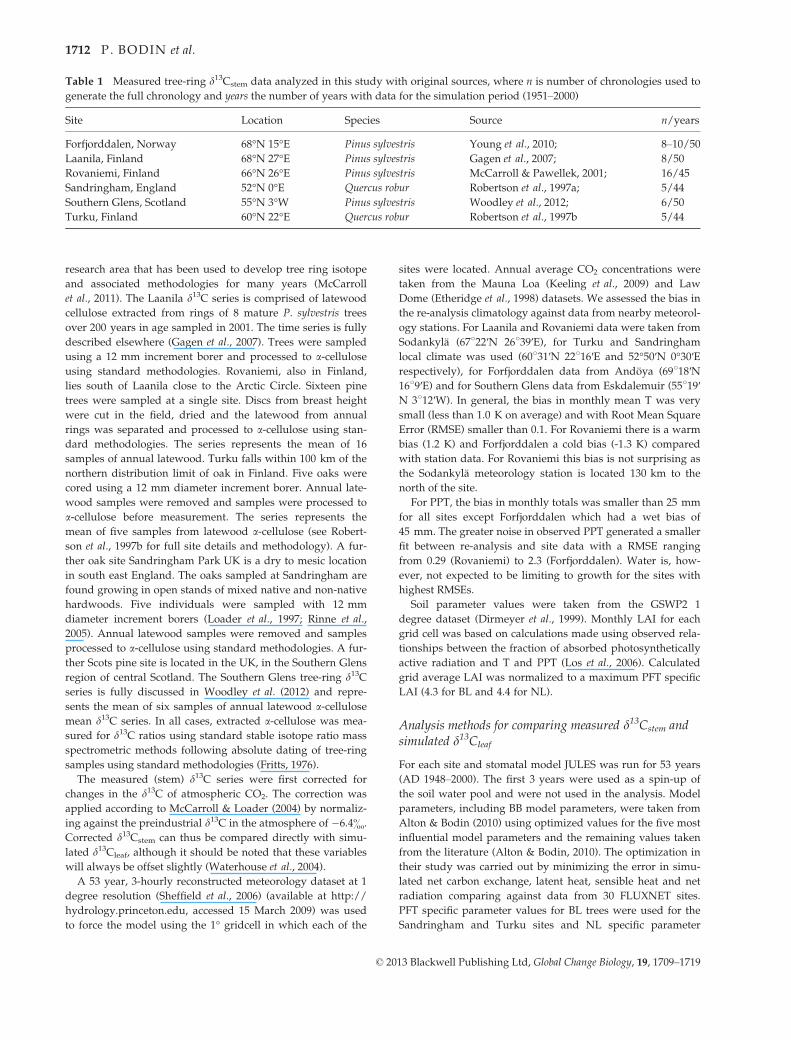
Table 1 Measured tree-ring d13Cstem data analyzed in this study with original sources, where n is number of chronologies used to
generate the full chronology and years the number of years with data for the simulation period (1951–2000)
Site Location Species Source n/years
Forfjorddalen, Norway 68°N 15°E Pinus sylvestris Young et al., 2010; 8–10/50
Laanila, Finland 68°N 27°E Pinus sylvestris Gagen et al., 2007; 8/50
Rovaniemi, Finland 66°N 26°E Pinus sylvestris McCarroll & Pawellek, 2001; 16/45
Sandringham, England 52°N 0°E Quercus robur Robertson et al., 1997a; 5/44
Southern Glens, Scotland 55°N 3°W Pinus sylvestris Woodley et al., 2012; 6/50
Turku, Finland 60°N 22°E Quercus robur Robertson et al., 1997b 5/44
© 2013 Blackwell Publishing Ltd, Global Change Biology, 19, 1709–1719
1712 P. BODIN et al.
values for the remaining sites. The SPA model specific
parameters were taken from the literature (Alton et al., 2009),
and for the COX model the JULES default parameter values
were used. The slope parameter (b) of the Ball-Berry equation
(Eqn. 2) was the only stomatal model specific parameter that
was not taken from the literature. However, no optimization
was made to any of the model parameters in relation to the
data used in this study. To get the annual average simulated
d13Cleaf (d13Cleaf,ann) we calculate a seasonal weighted average
based on daily Anet for the minimum growing period for the
six different sites which was taken as the period June–August:
d13Cleaf;ann ¼
Pn
d¼1
ðd13Cleaf;dAnet; dÞPn
d¼1
Anet;dð4Þ
where d is the number of days since the start of the growing
period and n is the number of days in the growing period.
In comparing the measured d13Cstem and simulated d13Cleaf
results we are interested in the ability of the models to repli-
cate changes in the absolute isotope value over time and to
reproduce the observed magnitude of interannual variability.
However, the procedure is complicated by the fact that stem
and leaf values will always be offset. The mechanisms behind
this offset are not yet clear (Cernusak et al., 2009). However,
the offset has been shown to be systematic across sites and
species (Badeck et al., 2005; Bowling et al., 2008). Our solution
to the problem arising from an offset borrows from split-
period verification techniques developed in palaeoclimatolo-
gy (National Research Council (NRC) (2006). Each data set is
split into two time periods for calibration (1951–1975) and
verification (1976–2000). The measured d13Cstem and simu-
lated d13Cleaf results are then shifted so that they both have a
mean of zero over the early calibration period. The variance
of the series is not adjusted. As the measured and simulated
values now have no offset over the early calibration period,
the absolute values of any offsets in the later verification per-
iod can be regarded as an indication of goodness-of-fit. The
difference between simulated and measured values in the
verification period can be quantified using the Mean Squared
Error (MSE), which can then be used to calculate the Reduc-
tion of Error (RE) and Coefficient of Efficiency (CE) statistics.
The RE statistic is used to verify palaeoclimate reconstruc-
tions by dividing MSE in the verification period (MSEver)
with the MSE that is obtained by simply taking the mean
observed value of the calibration period and applying it to
every year in the verification period (MSEre) so that RE =1–MSEver/MSEre). The CE statistic, which is more difficult to
pass, uses the mean observed value of the verification period.
Both RE and CE scale between one and minus infinity. Nega-
tive values are viewed as failure and the magnitude of posi-
tive values provides a measure of predictive skill that can be
used to compare different predictors. We apply the same
logic here, using isotope ratios rather than climate parameters
and use RE and CE as measures of the relative predictive
skill of the three stomatal models. This simple method is
sensitive to offsets in absolute values, changes in trend
through time, and to differences in variance between the two
data sets.
Results
Average growing season climate is variable across the
network of sites (Table 2). The sites receiving the highest
incoming short wave radiation are located at Sandring-
ham in the UK and Turku in southern Finland. The wet-
test are the Scottish (Southern Glens) and Norwegian
(Forfjorddalen) sites. Growing season mean T varies
across the network of sites by 6 K with Forfjorddalen
being the coldest and Sandringham thewarmest site.
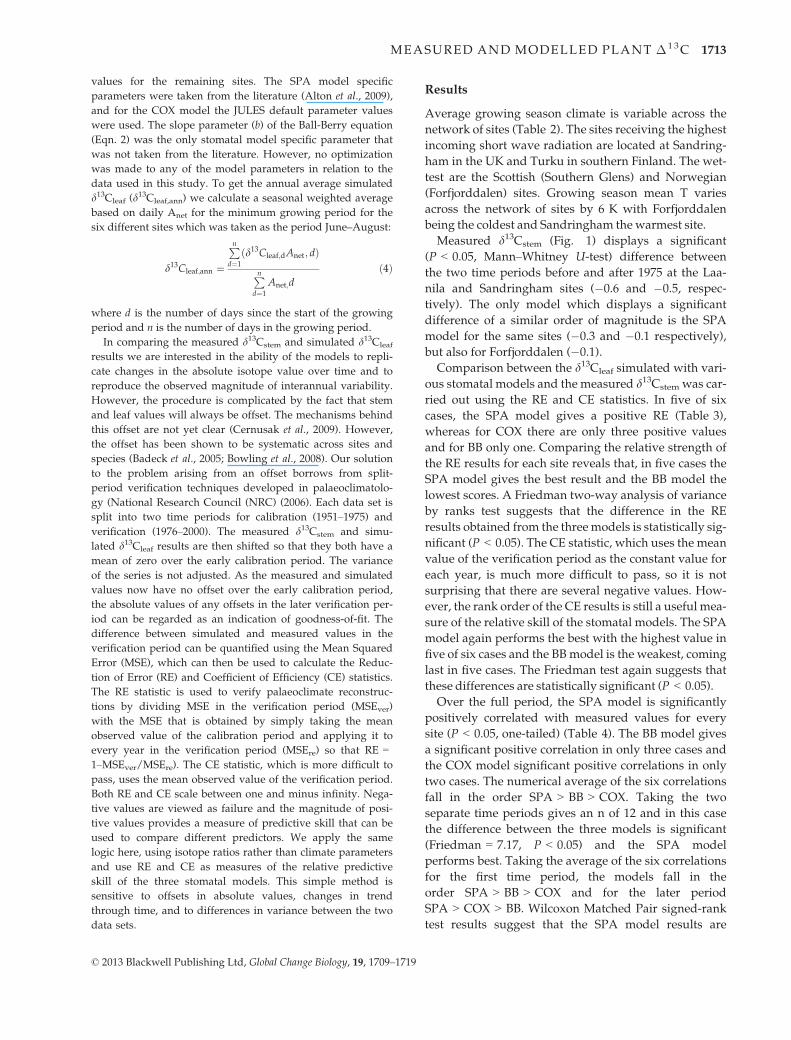
Measured d13Cstem (Fig. 1) displays a significant
(P < 0.05, Mann–Whitney U-test) difference between
the two time periods before and after 1975 at the Laa-
nila and Sandringham sites (�0.6 and �0.5, respec-
tively). The only model which displays a significant
difference of a similar order of magnitude is the SPA
model for the same sites (�0.3 and �0.1 respectively),
but also for Forfjorddalen (�0.1).
Comparison between the d13Cleaf simulated with vari-
ous stomatal models and the measured d13Cstem was car-
ried out using the RE and CE statistics. In five of six
cases, the SPA model gives a positive RE (Table 3),
whereas for COX there are only three positive values
and for BB only one. Comparing the relative strength of
the RE results for each site reveals that, in five cases the
SPA model gives the best result and the BB model the
lowest scores. A Friedman two-way analysis of variance
by ranks test suggests that the difference in the RE
results obtained from the threemodels is statistically sig-
nificant (P < 0.05). The CE statistic, which uses the mean
value of the verification period as the constant value for
each year, is much more difficult to pass, so it is not
surprising that there are several negative values. How-
ever, the rank order of the CE results is still a useful mea-
sure of the relative skill of the stomatal models. The SPA
model again performs the best with the highest value in
five of six cases and the BBmodel is the weakest, coming
last in five cases. The Friedman test again suggests that
these differences are statistically significant (P < 0.05).
Over the full period, the SPA model is significantly
positively correlated with measured values for every
site (P < 0.05, one-tailed) (Table 4). The BB model gives
a significant positive correlation in only three cases and
the COX model significant positive correlations in only
two cases. The numerical average of the six correlations
fall in the order SPA > BB > COX. Taking the two
separate time periods gives an n of 12 and in this case
the difference between the three models is significant
(Friedman = 7.17, P < 0.05) and the SPA model
performs best. Taking the average of the six correlations
for the first time period, the models fall in the
order SPA > BB > COX and for the later period
SPA > COX > BB. Wilcoxon Matched Pair signed-rank
test results suggest that the SPA model results are
© 2013 Blackwell Publishing Ltd, Global Change Biology, 19, 1709–1719
MEASURED AND MODELLED PLANT Δ 1 3C 1713
significantly different from BB, but the other two pairs
(BB/COX and SPA/COX) are not significantly different
(P > 0.05). Using correlation as a measure of goodness-
of-fit also suggests that the SPA model performs best,
but the relative skill of the COX and BB models is not
clear. In general, there is a decrease in fit between the
earlier and the most recent time period.
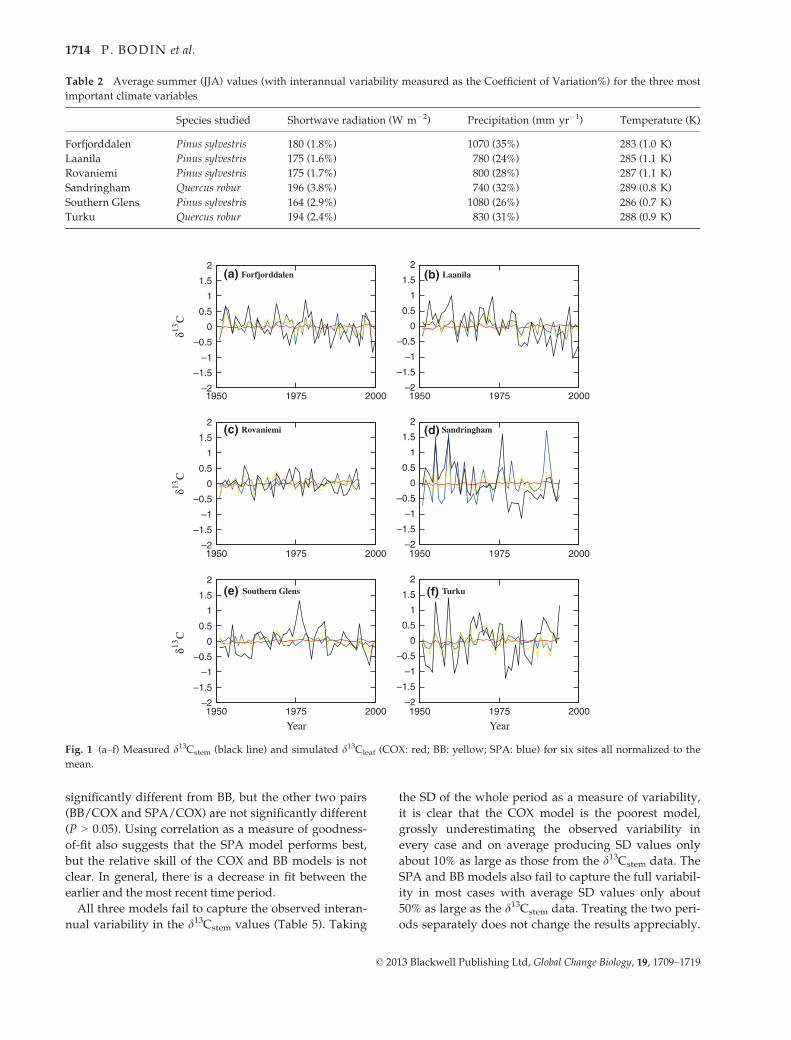
All three models fail to capture the observed interan-
nual variability in the d13Cstem values (Table 5). Taking
the SD of the whole period as a measure of variability,
it is clear that the COX model is the poorest model,
grossly underestimating the observed variability in
every case and on average producing SD values only
about 10% as large as those from the d13Cstem data. The
SPA and BB models also fail to capture the full variabil-
ity in most cases with average SD values only about
50% as large as the d13Cstem data. Treating the two peri-
ods separately does not change the results appreciably.
Table 2 Average summer (JJA) values (with interannual variability measured as the Coefficient of Variation%) for the three most
important climate variables
Species studied Shortwave radiation (W m�2) Precipitation (mm yr�1) Temperature (K)
Forfjorddalen Pinus sylvestris 180 (1.8%) 1070 (35%) 283 (1.0 K)
Laanila Pinus sylvestris 175 (1.6%) 780 (24%) 285 (1.1 K)
Rovaniemi Pinus sylvestris 175 (1.7%) 800 (28%) 287 (1.1 K)
Sandringham Quercus robur 196 (3.8%) 740 (32%) 289 (0.8 K)
Southern Glens Pinus sylvestris 164 (2.9%) 1080 (26%) 286 (0.7 K)
Turku Quercus robur 194 (2.4%) 830 (31%) 288 (0.9 K)
–2
–1.5
–1
–0.5
0
0.5
1
1.5
2
1950 1975 2000
δ13C
Forfjorddalen
–2
–1.5
–1
–0.5
0
0.5
1
1.5
2
1950 1975 2000
Laanila
–2
–1.5
–1
–0.5
0
0.5
1
1.5
2
1950 1975 2000
δ13C
Rovaniemi
–2
–1.5
–1
–0.5
0
0.5
1
1.5
2
1950 1975 2000
Sandringham
–2
–1.5
–1
–0.5
0
0.5
1
1.5
2
1950 1975 2000
Southern Glens
δ13C
Year
–2
–1.5
–1
–0.5
0
0.5
1
1.5
2
1950 1975 2000
Turku
Year
(a) (b)
(c) (d)
(e) (f)
Fig. 1 (a–f) Measured d13Cstem (black line) and simulated d13Cleaf (COX: red; BB: yellow; SPA: blue) for six sites all normalized to the
mean.
© 2013 Blackwell Publishing Ltd, Global Change Biology, 19, 1709–1719
1714 P. BODIN et al.
It is reasonable to conclude that all three models under-
estimate the variability that is seen in the d13Cstem val-
ues. The COX model consistently performs the least
well of the three models and the difference between the
performance of BB and SPA is not statistically signifi-
cant (P > 0.05, Wilcoxon test).
Discussion
There are significant model differences in terms of the
quality of representation of the interannual signal in
measured d13Cstem. The strongest correlation between
simulated d13Cleaf and measured d13Cstem was found
using the SPA model. The correlations for the more
empirical BB and COX models are in general poorer
suggesting that these stomatal models fail to capture
long-term variation in observed d13C discrimination.
Despite displaying a significant correlation for all sites
for the entire simulation period, the SPA model, simi-
larly to the other two models, also fails to reproduce
the magnitude of the interannual variation in measured
d13Cstem.
One factor that might affect the models abilities to
reproduce the interannual variability in d13C is the
parameterization of the models. No tuning of the sto-
matal model parameters was made in this study to
improve the fit of the models to observed d13Cstem. Only
one stomatal model parameter value was not taken
from the literature (the parameter b from the BB model,
Eqn. 2), and in this case the parameterization was made
in an earlier study (Alton & Bodin, 2010) focusing on
the model’s ability to simulate fluxes of net carbon
exchange, latent heat, sensible heat and net radiation
and not d13C fractionation.
Several factors may affect the difference in model fit
between sites. One reason for the difference could be
due to different responses for different tree species.
Table 3 Reduction of Error (RE) and Coefficient of Efficiency
(CE) of simulated d13Cleaf compared with measured d13Cstem
obtained for the three stomatal models at each site
COX BB SPA
Forfjorddalen RE 0.02 �0.02 0.24
CE �0.08 �0.13 0.16
Laanila RE �0.06 0.15 0.37
CE �1.72 �1.19 �0.63
Rovaniemi RE �0.11 �0.56 0.05
CE �0.27 �0.77 �0.08
Sandringham RE �0.05 �0.38 0.08
CE �0.92 �1.50 �0.68
Southern Glens RE 0.10 �0.06 0.26
CE 0.06 �0.10 0.23
Turku RE 0.04 �0.14 �0.08
CE 0.02 �0.16 �0.10
Table 4 Correlation coefficients (Pearson’s r) between d13Cleaf
values obtained using the three models and d13Cstem derived
from tree rings. Statistically significant (P < 0.05) values are
underscored
Forfjorddalen Sandringham
COX BB SPA COX BB SPA
Full period r 0.16 0.25 0.39 �0.19 0.44 0.43
1951–1975 r 0.06 0.27 0.33 0.14 0.72 0.63
1976–2000 r 0.32 0.20 0.40 �0.14 0.36 0.21
Laanila Southern Glens
Full period r �0.07 0.43 0.63 0.58 0.01 0.50
1951–1975 r 0.09 0.56 0.60 0.61 �0.12 0.34
1976–2000 r 0.33 0.25 0.50 0.64 0.16 0.71
Rovaniemi Turku
Full period r 0.14 0.02 0.29 0.56 0.23 0.42
1951–1975 r 0.22 0.14 0.28 0.65 0.48 0.63
1976–2000 r 0.28 �0.05 0.31 0.62 �0.16 0.05
Overall mean
Full period r 0.17 0.20 0.38
1951–1975 r 0.30 0.34 0.47
1976–2000 r 0.29 0.11 0.31
Table 5 Interannual variability of d13Cleaf and d13Cstem
values (measured as the SD of the mean) over the full period
and over the two split periods. Early period (1951–1975) and
late period (1976–2000)
COX BB SPA Stem
Full period
Forfjorddalen 0.03 0.25 0.18 0.39
Laanila 0.04 0.19 0.16 0.53
Rovaniemi 0.07 0.17 0.19 0.28
Sandringham 0.03 0.59 0.24 0.58
Southern Glens 0.04 0.13 0.16 0.42
Turku 0.04 0.18 0.29 0.68
Early period
Forfjorddalen 0.03 0.26 0.18 0.36
Laanila 0.04 0.20 0.20 0.42
Rovaniemi 0.06 0.17 0.21 0.28
Sandringham 0.03 0.64 0.24 0.28
Southern Glens 0.04 0.13 0.15 0.36
Turku 0.05 0.19 0.31 0.70
Late period
Forfjorddalen 0.03 0.24 0.16 0.42
Laanila 0.04 0.18 0.17 0.47
Rovaniemi 0.05 0.15 0.16 0.27
Sandringham 0.02 0.53 0.23 0.58
Southern Glens 0.03 0.12 0.16 0.47
Turku 0.03 0.16 0.25 0.67
© 2013 Blackwell Publishing Ltd, Global Change Biology, 19, 1709–1719
MEASURED AND MODELLED PLANT Δ 1 3C 1715
As data only exist for four sites with stands of pine and
two with oak, no conclusions can be made regarding
species differences in model fit.
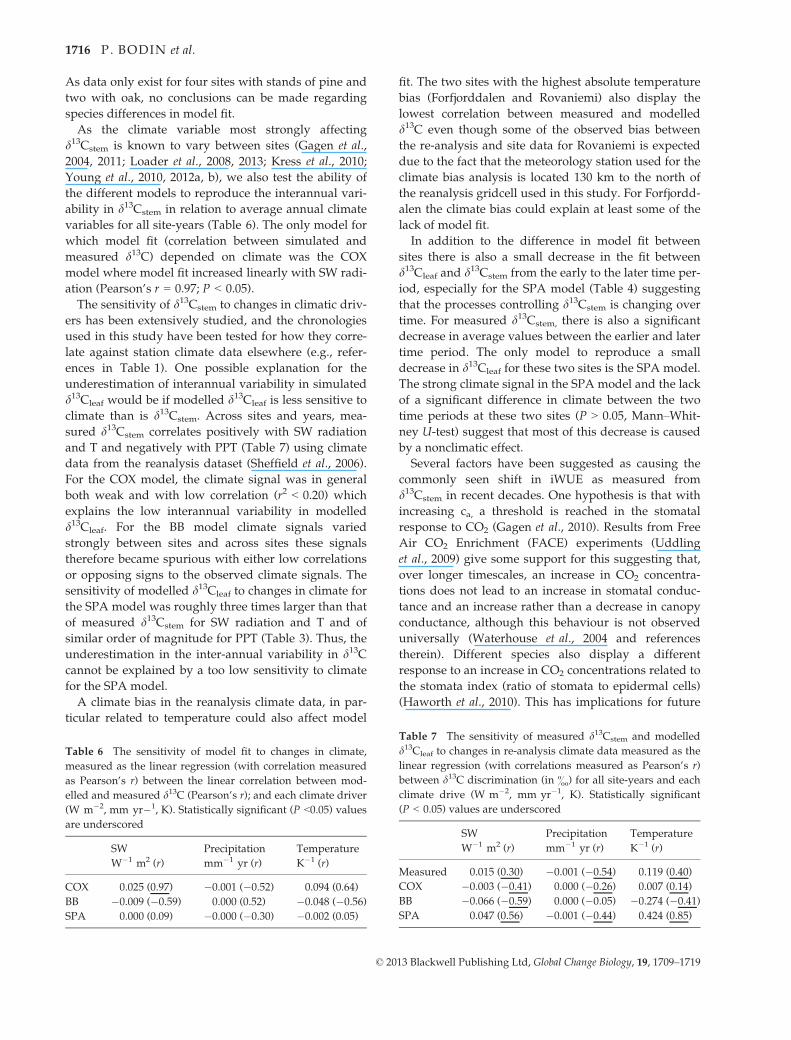
As the climate variable most strongly affecting
d13Cstem is known to vary between sites (Gagen et al.,
2004, 2011; Loader et al., 2008, 2013; Kress et al., 2010;
Young et al., 2010, 2012a, b), we also test the ability of
the different models to reproduce the interannual vari-
ability in d13Cstem in relation to average annual climate
variables for all site-years (Table 6). The only model for
which model fit (correlation between simulated and
measured d13C) depended on climate was the COX
model where model fit increased linearly with SW radi-
ation (Pearson’s r = 0.97; P < 0.05).
The sensitivity of d13Cstem to changes in climatic driv-
ers has been extensively studied, and the chronologies
used in this study have been tested for how they corre-
late against station climate data elsewhere (e.g., refer-
ences in Table 1). One possible explanation for the
underestimation of interannual variability in simulated
d13Cleaf would be if modelled d13Cleaf is less sensitive to
climate than is d13Cstem. Across sites and years, mea-
sured d13Cstem correlates positively with SW radiation
and T and negatively with PPT (Table 7) using climate
data from the reanalysis dataset (Sheffield et al., 2006).
For the COX model, the climate signal was in general
both weak and with low correlation (r2 < 0.20) which
explains the low interannual variability in modelled
d13Cleaf. For the BB model climate signals varied
strongly between sites and across sites these signals
therefore became spurious with either low correlations
or opposing signs to the observed climate signals. The
sensitivity of modelled d13Cleaf to changes in climate for
the SPA model was roughly three times larger than that
of measured d13Cstem for SW radiation and T and of
similar order of magnitude for PPT (Table 3). Thus, the
underestimation in the inter-annual variability in d13Ccannot be explained by a too low sensitivity to climate
for the SPA model.
A climate bias in the reanalysis climate data, in par-
ticular related to temperature could also affect model
fit. The two sites with the highest absolute temperature
bias (Forfjorddalen and Rovaniemi) also display the
lowest correlation between measured and modelled
d13C even though some of the observed bias between
the re-analysis and site data for Rovaniemi is expected
due to the fact that the meteorology station used for the
climate bias analysis is located 130 km to the north of
the reanalysis gridcell used in this study. For Forfjordd-
alen the climate bias could explain at least some of the
lack of model fit.
In addition to the difference in model fit between
sites there is also a small decrease in the fit between
d13Cleaf and d13Cstem from the early to the later time per-
iod, especially for the SPA model (Table 4) suggesting
that the processes controlling d13Cstem is changing over
time. For measured d13Cstem, there is also a significant
decrease in average values between the earlier and later
time period. The only model to reproduce a small
decrease in d13Cleaf for these two sites is the SPA model.
The strong climate signal in the SPA model and the lack
of a significant difference in climate between the two
time periods at these two sites (P > 0.05, Mann–Whit-
ney U-test) suggest that most of this decrease is caused
by a nonclimatic effect.
Several factors have been suggested as causing the
commonly seen shift in iWUE as measured from
d13Cstem in recent decades. One hypothesis is that with
increasing ca, a threshold is reached in the stomatal
response to CO2 (Gagen et al., 2010). Results from Free
Air CO2 Enrichment (FACE) experiments (Uddling
et al., 2009) give some support for this suggesting that,
over longer timescales, an increase in CO2 concentra-
tions does not lead to an increase in stomatal conduc-
tance and an increase rather than a decrease in canopy
conductance, although this behaviour is not observed
universally (Waterhouse et al., 2004 and references
therein). Different species also display a different
response to an increase in CO2 concentrations related to
the stomata index (ratio of stomata to epidermal cells)
(Haworth et al., 2010). This has implications for future
Table 6 The sensitivity of model fit to changes in climate,
measured as the linear regression (with correlation measured
as Pearson’s r) between the linear correlation between mod-
elled and measured d13C (Pearson’s r); and each climate driver
(W m�2, mm yr�1, K). Statistically significant (P <0.05) valuesare underscored
SW
W�1 m2 (r)
Precipitation
mm�1 yr (r)
Temperature
K�1 (r)
COX 0.025 (0.97) �0.001 (�0.52) 0.094 (0.64)
BB �0.009 (�0.59) 0.000 (0.52) �0.048 (�0.56)
SPA 0.000 (0.09) �0.000 (�0.30) �0.002 (0.05)
Table 7 The sensitivity of measured d13Cstem and modelled
d13Cleaf to changes in re-analysis climate data measured as the
linear regression (with correlations measured as Pearson’s r)
between d13C discrimination (in &) for all site-years and each
climate drive (W m�2, mm yr�1, K). Statistically significant
(P < 0.05) values are underscored
SW
W�1 m2 (r)
Precipitation
mm�1 yr (r)
Temperature
K�1 (r)
Measured 0.015 (0.30) �0.001 (�0.54) 0.119 (0.40)
COX �0.003 (�0.41) 0.000 (�0.26) 0.007 (0.14)
BB �0.066 (�0.59) 0.000 (�0.05) �0.274 (�0.41)
SPA 0.047 (0.56) �0.001 (�0.44) 0.424 (0.85)
© 2013 Blackwell Publishing Ltd, Global Change Biology, 19, 1709–1719
1716 P. BODIN et al.
projections of, for example, transpiration. If an
observed levelling off in iWUE (caused by a shift in
measured d13Cstem) translates into actual WUE, then
current LSMs may underestimate future trends in tran-
spiration. LSMs, including JULES-SF, however, simu-
late stomatal conductance up-scaled to the canopy level
without taking into account the number of stomata per
leaves and thus do not take into account any positive or
negative response of an increase in CO2 concentration
on stomatal index.
Another possible explanation would be an increase
in the importance of internal (mesophyll) conductance
with increasing CO2 concentration (e.g., Seibt et al.,
2008). Many other factors are known to affect internal
conductance at varying timescales (e.g., Flexas et al.,
2008) and the mechanisms affecting mesophyll
conductance are still unknown. As we simulate d13Cleaf
and not d13Cstem, we also make the assumption that the
discrimination difference between leaf and stem is con-
stant over time. This assumption is supported by the lit-
erature (Badeck et al., 2005; Bowling et al., 2008), but a
change in this discrimination over time could have an
impact on model fit. Tropospheric ozone and atmo-
spheric pollution (SO2) changes could also affect stoma-
tal functioning over both shorter and longer timescales
(Uddling et al., 2004; Rinne et al., 2010; Haworth et al.,
2012). As the model does not incorporate the effects of
pollutants, an increase in the atmospheric concentra-
tions of these and other pollutants over time this could
also affect the model fit in our study.
This study is a novel initial attempt to use tree-ring
d13C data to evaluate stomatal models incorporated into
a land surface model over multidecadal timescales.
Although the available data are limited to three sites in
Finland, two in the United Kingdom and one in Nor-
way, the results are encouraging with regards to using
tree-ring d13C data for validation and constraining pur-
poses. Of the three stomatal models used, the more com-
plex SPA model performed better than the BB model
which in turn performed better than the simpler COX
model. The SPA model gives positive RE results and the
highest CE results of the three models assessed. The
SPA model is also the only one that is significantly posi-
tively correlated with the measured d13Cstem time series
over the full (50 year) period at every site and which
reproduces some of the shift in measured d13Cstem
between the early and recent time period observed at
two of the sites. The SPA model underestimates the in-
terannual variability measured in the stem, but it is no
worse than the BBmodel and better than the COXmodel
(P < 0.05). The BB model gives the lowest verification
statistics and the correlation results are erratic. The COX
model performs better than BB in terms of verification
statistics, but the loss of interannual variance is extreme.
If the ability of current stomata models to correctly
account for carbon discrimination in plants is indeed
decreasing with rising atmospheric CO2 levels there
may be serious implications for the accuracy of simula-
tions of future physiological forcing. Further physiologi-
cal studies and tests of stomatal models are needed to
explore this further and develop the necessary land sur-
face model improvements. We report a robust and inter-
esting result, namely that one of the stomatal models
simulates the long-term trend in measured tree-ring
d13C (even if underestimated) whilst other stomatal
models, one of which, in various versions is used
extensively (BB) in land-surface simulations, do not.
The inability of current models to adequately predict
changes in stomatal response to rising levels of CO2, and
thus to quantify the associated physiological forcing, is a
cause for concern.
Acknowledgements
This work was funded by the EU-funded Millennium project(017008), the Climate Change Consortium of Wales (C3W) andby the Natural Environment Research Council (NERC) undergrants NE/B/501504 (NJL), NER/S/A/2006/14077 (EJW) andNE/F00205X/1 (PB and PA).
References
Alton P (2008) Reduced carbon sequestration in terrestrial ecosystems under overcast
skies compared to clear skies. Agricultural and Forest Meteorology, 148, 1641–1653.
Alton P, Bodin P (2010) A comparative study of a multilayer and a productivity
(light-use) efficiency land-surface model over different spatial and temporal scales.
Agricultural and Forest Meteorology, 150, 182–195.
Alton PB, North PR, Los SO (2007) The impact of diffuse sunlight on canopy light-use
efficiency, gross photosynthetic product and net ecosystem exchange in three for-
est biomes. Global Change Biology, 13, 776–787.
Alton P, Fisher R, Los S, Williams M (2009) Simulations of global evapotranspiration
using semiempirical and mechanistic schemes of plant hydrology. Global Biogeo-
chemical Cycles, 23, GB4023, doi: 10.1029/2009GB003540
Aranibar JN, Berry JA, Riley WJ, Pataki DE, Law BE, Ehleringer JR (2006) Combining
meteorology, eddy fluxes, isotope measurements, and modeling to understand
environmental controls of carbon isotope discrimination at the canopy scale. Global
Change Biology, 12, 710–730.
Badeck FW, Tcherkez G, Nogue′s S, Piel C, Ghashghaie J (2005) Post-photosynthetic
fractionation of stable carbon isotopes between plant organs-a widespread
phenomenon. Rapid Communications in Mass Spectrometry, 19, 1381–1391.
Baldocchi DD, Bowling DR (2003) Modelling the discrimination of 13CO2 above and
within a temperate broad-leaved forest canopy on hourly to seasonal time scales.
Plant, Cell and Environment, 26, 231–244.
Ball J, Woodrow I, Berry J (1987) A model predicting stomatal conductance and its
contribution to the control of photosynthesis under different environmental condi-
tions. Progress in Photosynthesis Research, 4, 221–224.
Betts RA, Boucher O, Collins M et al. (2007) Projected increase in continental runoff
due to plant responses to increasing carbon dioxide. Nature, 448, 1037–1041.
Bowling DR, Pataki DE, Randerson JT (2008) Carbon isotopes in terrestrial ecosystem
pools and CO2 fluxes. New Phytologist, 178, 24–40.
Briffa K, Osborn T, Schweingruber F (2004) Large-scale temperature inferences from
tree-rings: a review. Global Planetary Change, 40, 11–26.
Cai T, Flanagan LB, Jassal RS, Black TA (2008) Modelling environmental controls on eco-
system photosynthesis and the carbon isotope composition of ecosystem-respired CO2
in a coastalDouglas-fir forest.Plant, Cell and Environment, 31, 435–453.
Campbell R, McCarroll D, Loader NJ, Grudd H, Robertson I, Jalkanen R (2007) Blue
intensity in Pinus sylvestris tree-rings: developing a new palaeoclimate proxy. The
Holocene, 17, 821–828.
© 2013 Blackwell Publishing Ltd, Global Change Biology, 19, 1709–1719
MEASURED AND MODELLED PLANT Δ 1 3C 1717
Cernusak LA, Tcherkez G, Keitel C et al. (2009) Viewpoint: why are non-photosyn-
thetic tissues generally C-13 enriched compared with leaves in C-3 plants?
Review and synthesis of current hypotheses. Functional Plant Biology, 36,
199–213.
Chen B, Chen JM, Huang L, Tans PP (2006) Modeling dynamics of stable carbon iso-
topic exchange between a boreal forest ecosystem and the atmosphere. Global
Change Biology, 12, 1842–1867.
Cox PM, Huntingford C, Harding RJ (1998) A canopy conductance and photosynthe-
sis model for use in a GCM land surface scheme. Journal of Hydrology, 213, 79–94.
Cox P, Betts R, Bunton C, Essery R, Rowntree P, Smith J (1999) The impact of new
land surface physics on the GCM simulation of climate and climate sensitivity.
Climate Dynamics, 15, 183–203.
Damour G, Simonneau T, Cochard H, Urban L (2010) An overview of models of sto-
matal conductance at the leaf level. Plant, Cell and Environment, 33, 149–1438.
Dirmeyer P, Dolman A, Sato N (1999) The global soil wetness project; a pilot project
for global land surface modelling and validation. Bulletin of American Meteorological
Society, 80, 851–878.
Doutriaux-Boucher M, Webb MJ, Gregory JM, Boucher O (2009) Carbon dioxide
induced stomatal closure increases radiative forcing via a rapid reduction in low
cloud. Geophysical Research Letters, 36, L02703, doi: 10.1029/2008GL036273
Etheridge DM, Steele LP, Langenfelds RL, Francey RJ, Barnola J-M, Morgan VI (1998)
Historical CO2 records from the Law Dome DE08, DE08-2, and DSS ice cores. In:
Trends: A Compendium of Data on Global Change. pp. 351–364. Carbon Dioxide Infor-
mation Analysis Center, Oak Ridge, TN.
Farquhar GD, O’Leary MH, Berry JA (1982) On the relationship between carbon
isotope discrimination and the inter-cellular carbon-dioxide concentration in
leaves. Australian Journal of Plant Physiology, 9, 121–137.
Field C, Jackson R, Mooney H (1995) Stomatal responses to increased CO2:
implications from the plant to the global scale. Plant, Cell and Environment, 18,
1214–1255.
Flexas J, Ribas-Carb�o M, Diaz-Espejo A, Galm�es J, Medrano H (2008) Mesophyll con-
ductance to CO2: current knowledge and future prospects. Plant, Cell and Environ-
ment, 31, 602–621.
Fritts HC (1976) Tree Rings and Climate. Academic Press, London.
Gagen M, McCarroll D, Edouard J-L (2004) Latewood width, maximum density and
stable carbon isotope ratios of pine as palaeoclimate indicators in a dry sub-alpine
environment in the southern French Alps. Arctic, Antarctic and Alpine Research, 36,
166–171.
Gagen M, McCarroll D, Loader N, Robertson I, Jalkanen R, Anchukaitis K (2007)
Exorcising the segment length curse: summer temperature reconstruction since
AD 1640 using non-detrended stable carbon isotope ratios from pine trees in
northern Finland. The Holocene, 17, 435–446.
Gagen M, Finsinger M, Wagner-Cremer F et al. (2010) Evidence of changing intrinsic
water-use efficiency under rising atmospheric CO2 concentrations in Boreal Fen-
noscandia from subfossil leaves and tree-ring d13C stem ratios. Global Change Biol-
ogy, 17, 1064–1072.
Gagen M, Zorita E, McCarroll D et al. (2011) Cloud response to summer temperatures
in Fennoscandia over the last thousand years. Geophysical Research Letters, 38,
L05701, doi: 10.1029/2010GL046216
Gedney N, Cox PM, Betts RA, Boucher O, Huntingford C, Stott PA (2006) Detection
of a direct carbon dioxide effect in continental river runoff records. Nature, 439,
835–838.
Gray JE, Holroyd GH, van der Lee FM et al. (2000) The HIC signalling pathway links
CO2 perception to stomatal development. Nature, 408, 713–716.
Haworth M, Heath J, McElwain JC (2010) Differences in the response sensitivity of
stomatal index to atmospheric CO2 among four genera of Cupressaceae conifers.
Annals of Botany, 105, 411–418.
Haworth M, Elliott-Kingston C, Gallagher A, Fitzgerald A, McElwain JC (2012) Sul-
phur dioxide fumigation effects on stomatal density and index of non-resistant
plants: implications for the stomatal palaeo-[CO2] proxy method. Review of Palae-
obotany and Palynology., 182, 44–54.
Haworth M, Elliott-Kingston C, McElwain JC (2013) Co-ordination of physiological
and morphological responses of stomata to elevated [CO 2] in vascular plants.
Oecologia, 171, 71–82.
Hidy D, Haszpra L, Barcza Z, Vermeulen A, Tuba Z, Nagy Z (2009) Modelling of
carbon isotope discrimination by vegetation. Photosynthetica, 47, 457–470.
Keeling R, Piper S, Bollenbacher A, Walker J (2009) Atmospheric CO2 records from
sites in the sio air sampling network. In: Trends: A Compendium of Data on Global
Change. Oak Ridge National Laboratory, Oak Ridge, Tennessee, USA.
Kirchhefer AJ (2001) Reconstruction of summer temperatures from tree-rings of Scots
pine (Pinus sylvestris L.) in coastal northern Norway. The Holocene, 11, 41–52.
Kress A, Saurer M, Siegwolf RTW, Frank D, Esper J, Bugmann H (2010) A 350 year
drought reconstruction from Alpine tree ring stable isotopes. Global Biogeochemical
Cycles, 24, GB2011, doi: 10.1029/2009GB003613
K€urschner WM, Wagner F, Visscher EH, Visscher H (1997) Predicting the response of
leaf stomatal frequency to a future CO2-enriched atmosphere: constraints from his-
torical observations. Geologische Rundschau, 86, 512–517.
Lake JA, Quick WP, Beerling DJ, Woodward FI (2001) Plant development - Signals
from mature to new leaves. Nature, 411, 154–154.
Loader NJ, Robertson I, Barker AC, Switsur VR, Waterhouse JS (1997) An improved
technique for the batch processing of small wholewood samples to a -cellulose.
Chemical Geology, 136, 313–317.
Loader NJ, Santillo PM, Woodman-Ralph JP et al. (2008) Multiple stable isotopes from
oak trees in southwestern Scotland and the potential for stable isotope dendrocli-
matology in maritime climatic regions. Chemical Geology, 252, 62–71.
Loader NJ, Walsh RPD, Robertson I et al. (2011) Recent trends in the Intrinsic Water-
Use Efficiency of S.E. Asian Rainforest Trees. Transactions of the Royal Society
Biological Sciences, 366, 3330–3339.
Loader NJ, Young GHF, Grudd H (2013) Stable carbon isotopes from Tornetrask,
northern Sweden provide a millennial length reconstruction of summer sunshine
and its relationship to Arctic circulation. Quaternary Science Reviews, 62, 97–113.
Los S, Weedon G, North P, Kaduk J, Taylor C, Cox P (2006) An observation-based
estimate of the strength of rainfall-vegetation interactions in the Sahel. Geophysical
Research Letters, 33, L16402, doi: 10.1029/2006GL027065
McCarroll D, Loader NJ (2004) Stable isotopes in tree-rings. Quaternary Science
Reviews, 23, 771–801.
McCarroll D, Pawellek F (2001) Stable carbon isotope ratios of Pinus sylvestris from
northern Finland and the potential for extracting a climate signal from long Fenno-
scandian chronologies. The Holocene, 11, 517–526.
McCarroll D, Gagen MH, Loader N et al. (2009) Correction of tree-ring stable carbon
isotope chronologies for changes in the carbon dioxide content of the atmosphere.
Geochimica et Cosmochimica Acta, 73, 1539–1547.
McCarroll D, TuovinenM, Campbell R et al. (2011) A critical evaluation of multi-proxy
dendroclimatology in northern Finland. Journal of Quaternary Science, 26, 7–14.
McCarroll D, Loader NJ, Jalkanen R (2013) A 1200-year multiproxy record of tree
growth and summer temperature at the northern pine forest limit of Europe. The
Holocene, 23, 471–484.
Mercado LM, Huntingford C, Gash JHC, Cox PM, Jogireddy V (2007) Improving the
representation of radiation interception and photosynthesis for climate model
applications. Tellus B, 59, 553–565.
Monteith JL (1965) Evaporation and environment. Symposia of the Society for Experi-
mental Biology, 19, 205–234.
National Research Council (NRC) (2006) Surface Temperature Reconstructions for the
Last 2,000 Years. The National Academies, Washington, USA.
Og�ee J, Barbour MM, Wingate L et al. (2009) A single-substrate model to interpret
intra-annual stable isotope signals in tree-ring cellulose. Plant, Cell and Environ-
ment, 32, 1071–1090.
Rinne KT, Boettger T, Loader NJ, Robertson I, Switsur VR, Waterhouse JS (2005) On
the purification of a-cellulose from resinous wood for stable isotope (H, C and O)
analysis. Chemical Geology, 222, 75–82.
Rinne KT, Loader NJ, Switsur VR, Treydte K, Waterhouse JS (2010) Investigating the
influence of sulfur dioxide on the stable isotope ratios of tree–rings. Geochimica et
Cosmochimica Acta, 74, 2327–2339.
Robertson I, Switsur VR, Carter AHC, Barker AC, Waterhouse JS, Briffa KR, Jones PD
(1997a) Signal strength and climate relationships in the 13C/12C ratios of tree-ring
cellulose from oak in east England. Journal of Geophysical Research, 102, 19507–19516.
Robertson I, Rolfe J, Switsur VR, Carter AHC, Hall MA, Barker AC, Waterhouse JS
(1997b) Signal strength and climate relationships in the 13C/12C ratios of tree-ring
cellulose from oak in southwest Finland. Geophysical Research Letters, 24, 1487–1490.
Royer DL (2001) Stomatal density and stomatal index as indicators of paleoatmo-
spheric CO2 concentration. Review of Palaeobotany and Palynology, 114, 1–28.
Ryan M (1991) Effects of climate change on plant respiration. Ecological Applications, 1,
157–167.
Saurer M, Borella S, Schweingruber F, Siegwolf R (1997) Stable carbon isotopes in
tree-rings of beech: climatic versus site-related influences. Trees, 11, 291–297.
Saurer M, Siegwolf RTW, Schweingruber FH (2004) Carbon isotope discrimination
indicates improving water-use efficiency of trees in northern Eurasia over the last
100 years. Global Change Biology, 10, 2109–2120.
Seibt U, Rajabi A, Griffiths H, Berry JA (2008) Carbon isotopes and water use effi-
ciency: sense and sensitivity. Oecologia, 155, 441–454.
Sellers P, Randall D, Collatz G (1996) A revised landsurface parameterization (SiB2)
for atmospheric GCMs. Part I. Model formulation. Journal of Climate, 9, 676–705.
© 2013 Blackwell Publishing Ltd, Global Change Biology, 19, 1709–1719
1718 P. BODIN et al.
Sheffield J, Goteti G, Wood E (2006) Development of a 50-year high-resolution global
dataset of meteorological forcings for land surface modelling. Journal of Climate,
19, 3088–3111.
Suits NS, Denning AS, Berry JA, Still CJ, Kaduk J, Miller JB, Baker IT (2005) Simula-
tion of carbon isotope discrimination of the terrestrial biosphere. Global Biogeo-
chemical Cycles, 19, GB1017, doi: 10.1029/2003GB002141
Treydte K, Schleser GH, Helle G, Winiger M, Frank DC, Haug GH, Esper J (2006) The
twentieth century was the wettest period in northern Pakistan over the past
millennium. Nature, 440, 1179–1182.
Treydte KS, Frank DC, Saurer M et al. (2009) Impact of climate and CO2 on a millen-
nium-long tree-ring carbon isotope record. Geochimica et Cosmochimica Acta, 73,
4635–4647.
Trouet V, Esper J, Graham NE, Baker A, Scourse JD, Frank DC (2009) Persistent posi-
tive North Atlantic Oscillation mode dominated the Medieval Climate Anomaly.
Science, 324, 78–80.
Uddling J, G€unthardt-Goerg MS, Matyssek R, Oksanen E, Pleijel H, Selld�en G, Karls-
son PE (2004) Biomass reduction of juvenile birch is more strongly related to sto-
matal uptake of ozone than to indices based on external exposure. Atmospheric
Environment, 38, 4709–4719.
Uddling J, Teclaw RM, Pregitzer KS, Ellsworth DS (2009) Leaf and canopy conduc-
tance in aspen and aspen-birch forests under free air enrichment of carbon dioxide
and ozone. Tree Physiology, 29, 1367–1380.
Wang Y-P, Leuning R (1998) A two-leaf model for canopy conductance, photo-
synthesis and partitioning of available energy I: - Model description and
comparison with a multi-layered model. Agriculture and Forest Meteorology, 91,
89–111.
Waterhouse JS, Switsur VR, Barker AC, Carter AHC, Hemming DL, Loader NJ,
Robertson I (2004) Northern European trees show a progressively diminishing
response to increasing atmospheric carbon dioxide concentrations. Quaternary
Science Review, 23, 803–810.
Williams M, Rastetter EB, Fernandes DN et al. (1996) Modelling the soil-plant-atmo-
sphere continuum in a Quercus-Acer stand at Harvard Forest: the regulation of
stomatal conductance by light, nitrogen and soil/plant hydraulic properties. Plant
Cell and Environment, 19, 911–927.
Woodley EJ, Loader NJ, McCarroll D, Young GHF, Robertson I, Heaton THE, Gagen
MH (2012) Estimating uncertainty in pooled stable isotopes time-series from tree
rings. Chemical Geology, 294–295, 243–248.
Woodward FI (1987) Stomatal numbers are sensitive to increases in CO2 from prein-
dustrial levels. Nature, 327, 617–618.
Woodward FI, Kelly CK (1995) The influence of CO2 concentration on stomatal den-
sity. New Phytologist, 131, 311–327.
Young GHF, McCarroll D, Loader NJ, Kirchhefer AJ (2010) A 500-year record of sum-
mer near-ground solar radiation from tree-ring stable carbon isotopes. The Holo-
cene, 20, 315–324.
Young GHF, Demmler JC, Gunnarson BE, Kirchhefer AJ, Loader NJ, McCarroll D
(2011) Age trends in tree ring growth and isotopic archives: a case study of Pinus
sylvestris L. from northwestern Norway. Global Biogeochemical Cycles, 25, GB2020,
doi: 10.1029/2010GB003913
Young GHF, McCarroll D, Loader NJ, Gagen M, Kirchhefer AJ, Demmler JC (2012a)
Changes in atmospheric circulation and the Arctic Oscillation preserved within a
millennial length reconstruction of summer cloud cover from northern Fennoscan-
dia. Climate Dynamics, 39, 495–507.
Young GHF, Bale RJ, Loader NJ, McCarroll D, Nayling N, Vousdenn N (2012b)
Central England temperature since AD 1850: the potential of stable carbon
isotopes in British oak trees to reconstruct past summer temperatures. Journal of
Quaternary Science, 27, 606–614.
© 2013 Blackwell Publishing Ltd, Global Change Biology, 19, 1709–1719
MEASURED AND MODELLED PLANT Δ 1 3C 1719