Comparing modeled and observed changes in mineral dust transport and deposition to Antarctica...
25
Comparing modeled and observed changes in mineral dust transport and deposition to Antarctica between the Last Glacial Maximum and current climates Samuel Albani • Natalie M. Mahowald • Barbara Delmonte • Valter Maggi • Gisela Winckler Received: 26 November 2010 / Accepted: 28 June 2011 / Published online: 9 July 2011 Ó Springer-Verlag 2011 Abstract Mineral dust aerosols represent an active component of the Earth’s climate system, by interacting with radiation directly, and by modifying clouds and bio- geochemistry. Mineral dust from polar ice cores over the last million years can be used as paleoclimate proxy, and provide unique information about climate variability, as changes in dust deposition at the core sites can be due to changes in sources, transport and/or deposition locally. Here we present results from a study based on climate model simulations using the Community Climate System Model. The focus of this work is to analyze simulated differences in the dust concentration, size distribution and sources in current climate conditions and during the Last Glacial Maximum at specific ice core locations in Ant- arctica, and compare with available paleodata. Model results suggest that South America is the most important source for dust deposited in Antarctica in current climate, but Australia is also a major contributor and there is spatial variability in the relative importance of the major dust sources. During the Last Glacial Maximum the dominant source in the model was South America, because of the increased activity of glaciogenic dust sources in Southern Patagonia-Tierra del Fuego and the Southernmost Pampas regions, as well as an increase in transport efficiency southward. Dust emitted from the Southern Hemisphere dust source areas usually follow zonal patterns, but southward flow towards Antarctica is located in specific areas characterized by southward displacement of air masses. Observations and model results consistently sug- gest a spatially variable shift in dust particle sizes. This is due to a combination of relatively reduced en route wet removal favouring a generalized shift towards smaller particles, and on the other hand to an enhanced relative contribution of dry coarse particle deposition in the Last Glacial Maximum. Keywords Mineral dust Ice cores Antarctica Climate models Last Glacial Maximum 1 Introduction Dust suspended in the atmosphere plays a role in the global radiative balance through scattering and absorption of incoming solar radiation and outgoing planetary radiation (Miller and Tegen 1998; Sokolik et al. 2001; Penner et al. 2001; Tegen 2003). In addition dust aerosols can affect cloud nucleation and optical properties (Levin et al. 1996; Rosenfeld et al. 2001). Additional interactions with atmo- spheric chemistry include heterogeneous reactions and changes in photolysis rate (Dentener et al. 1996; Dickerson et al. 1997). Windblown mineral dust travels long distance S. Albani (&) Graduate School in Polar Sciences, University of Siena, Siena, Italy e-mail: [email protected] S. Albani B. Delmonte V. Maggi Department of Environmental Sciences, University of Milano-Bicocca, Milano, Italy S. Albani N. M. Mahowald Department of Earth and Atmospheric Sciences, Cornell University, Ithaca, NY, USA G. Winckler Lamont-Doherty Earth Observatory, Columbia University, Palisades, NY, USA G. Winckler Department of Earth and Environmental Sciences, Columbia University, New York, NY, USA 123 Clim Dyn (2012) 38:1731–1755 DOI 10.1007/s00382-011-1139-5
-
Upload
independent -
Category
Documents
-
view
0 -
download
0
Transcript of Comparing modeled and observed changes in mineral dust transport and deposition to Antarctica...
Comparing modeled and observed changes in mineral dusttransport and deposition to Antarctica between the Last GlacialMaximum and current climates
Samuel Albani • Natalie M. Mahowald •
Barbara Delmonte • Valter Maggi • Gisela Winckler
Received: 26 November 2010 / Accepted: 28 June 2011 / Published online: 9 July 2011
� Springer-Verlag 2011
Abstract Mineral dust aerosols represent an active
component of the Earth’s climate system, by interacting
with radiation directly, and by modifying clouds and bio-
geochemistry. Mineral dust from polar ice cores over the
last million years can be used as paleoclimate proxy, and
provide unique information about climate variability, as
changes in dust deposition at the core sites can be due to
changes in sources, transport and/or deposition locally.
Here we present results from a study based on climate
model simulations using the Community Climate System
Model. The focus of this work is to analyze simulated
differences in the dust concentration, size distribution and
sources in current climate conditions and during the Last
Glacial Maximum at specific ice core locations in Ant-
arctica, and compare with available paleodata. Model
results suggest that South America is the most important
source for dust deposited in Antarctica in current climate,
but Australia is also a major contributor and there is spatial
variability in the relative importance of the major dust
sources. During the Last Glacial Maximum the dominant
source in the model was South America, because of the
increased activity of glaciogenic dust sources in Southern
Patagonia-Tierra del Fuego and the Southernmost Pampas
regions, as well as an increase in transport efficiency
southward. Dust emitted from the Southern Hemisphere
dust source areas usually follow zonal patterns, but
southward flow towards Antarctica is located in specific
areas characterized by southward displacement of air
masses. Observations and model results consistently sug-
gest a spatially variable shift in dust particle sizes. This is
due to a combination of relatively reduced en route wet
removal favouring a generalized shift towards smaller
particles, and on the other hand to an enhanced relative
contribution of dry coarse particle deposition in the Last
Glacial Maximum.
Keywords Mineral dust � Ice cores � Antarctica �Climate models � Last Glacial Maximum
1 Introduction
Dust suspended in the atmosphere plays a role in the global
radiative balance through scattering and absorption of
incoming solar radiation and outgoing planetary radiation
(Miller and Tegen 1998; Sokolik et al. 2001; Penner et al.
2001; Tegen 2003). In addition dust aerosols can affect
cloud nucleation and optical properties (Levin et al. 1996;
Rosenfeld et al. 2001). Additional interactions with atmo-
spheric chemistry include heterogeneous reactions and
changes in photolysis rate (Dentener et al. 1996; Dickerson
et al. 1997). Windblown mineral dust travels long distance
S. Albani (&)
Graduate School in Polar Sciences, University of Siena, Siena,
Italy
e-mail: [email protected]
S. Albani � B. Delmonte � V. Maggi
Department of Environmental Sciences,
University of Milano-Bicocca, Milano, Italy
S. Albani � N. M. Mahowald
Department of Earth and Atmospheric Sciences,
Cornell University, Ithaca, NY, USA
G. Winckler
Lamont-Doherty Earth Observatory,
Columbia University, Palisades, NY, USA
G. Winckler
Department of Earth and Environmental Sciences,
Columbia University, New York, NY, USA
123
Clim Dyn (2012) 38:1731–1755
DOI 10.1007/s00382-011-1139-5
from the source areas and acts as a carrier for nutrients such
as iron or phosphorus to remote ocean areas, with impli-
cations for biogeochemical cycles and ocean uptake of
carbon dioxide (e.g. Martin et al. 1990; Jickells et al. 2005;
Wolff et al. 2006; Mahowald et al. 2008).
The most important sources of mineral dust for long-
range transport are arid/semiarid regions, with low vege-
tation cover, located within geomorphological settings
prone to accumulation of fine-grained mineral material
(Prospero et al. 2002), and with strong winds. After long-
range transport, mineral dust can be deposited in different
environmental settings; in polar areas, dust is preserved in
snow/firn/ice layers, and under favorable conditions it
maintains the original depositional sequence forming
stratigraphic archives that can be used to study past vari-
ations in the dust cycle (e.g. Kohfeld and Harrison 2001).
Ice cores revealed a pronounced sensitivity of dust to cli-
mate variations both at low latitudes (e.g. Thompson et al.
1995) and in northern and southern polar areas (e.g.
Thompson et al. 1981; Petit et al. 1999; Ruth et al. 2003;
EPICA Community Members 2004, 2006).
More data is available in the current climate, including
in situ concentration data (Prospero and Lamb 2003) or
ground based remote sensing data (e.g. Holben et al. 1998;
Smirnov et al. 2000). Satellite remote sensing observations
provide global insight into worldwide atmospheric dust
distributions (e.g. Prospero et al. 2002; Kaufman et al.
2002). Since the early 1990s, dust has been included in
global transport models (e.g. Joussaume 1990; Tegen and
Fung 1994; Andersen et al. 1998; Mahowald et al. 1999;
Ginoux et al. 2001; Werner et al. 2002).
Combining information from paleodust records and
climate models in coherent studies can be a fruitful
approach from different points of view. For the modeling
and present-day observational communities, paleodust
records represent a large archive of information on the
magnitude and spatial variability of dust deposition for the
pre-observational era, and also they represent a target for
dust models’ validation under different climate scenarios
(e.g. Mahowald et al. 2006). In addition, polar snow and
firn/ice cores—especially from Antarctica—can act on
short (a few years) time scales as collectors for present-day
dust that most available techniques currently fail to record,
due to the very limited amounts of dust reaching such
remote areas (e.g. Bigler et al. 2006; Bory et al. 2010). On
the other hand, the understanding of variability in dust
transport pathways is fundamental to interpreting ice core
dust records. Based on paleoarchives alone it is only pos-
sible to compare the spatial variability of dust flux amounts
and the geochemical features of the two end-members of
the dust life cycle: soil from the potential source areas
and dust deposited in ice cores. For this reason physical
models are useful tools for studying dust transport patterns.
A hierarchy of models has been applied to study aspects
related to dust reaching high latitude ice sheets, ranging from
simple one-dimensional models (Andersen and Ditlevsen
1998; Fischer et al. 2007) to back-trajectories studies (Lunt
and Valdes 2001), to general circulation models (e.g. Genthon
1992; Joussaume 1993; Andersen et al. 1998; Lunt and Valdes
2002a; Werner et al. 2002; Krinner and Genthon 2003; Li et al.
2008; Krinner et al. 2010; Li et al. 2010b).
Here we use an existing, documented model (Mahowald
et al. 2006) to look at changes in sources and transport path-
ways between Southern Hemisphere sources and Antarctica
due to changes in climate, and the resulting changes in dust
particle sizes and deposition patterns. Our goals are (a) to
evaluate the ability of the model to simulate the main physical
parameters typical of ice core studies, by comparing them to
observations, and (b) to combine information from ice cores
and model simulations to make an effort towards explaining
the observed changes in dust deposition fluxes and size dis-
tributions between the LGM and present climate on a glacial-
interglacial timescale. In Sect. 2 we describe the methodology
used in the paper. Section 3 shows model results, with focus
on dust provenance (Sect. 3.2), transport patterns (Sect. 3.3)
and dust size variations (Sect. 3.6), while Sect. 3.4 (dust
deposition) and Sect. 3.5 (seasonality) support our discussion.
Section 4 discusses our conclusions.
2 Methodology
2.1 Model description
This work is based on simulations performed with the dust
model in the Community Atmospheric Model coupled to
the Community Land Model (CAM/CLM), which are parts
of the Community Climate System Model version 3 (Col-
lins et al. 2006). The detailed description of model setup
together with a comparison to observations from the
DIRTMAP database (Kohfeld and Harrison 2001) inte-
grated with more recent data from terrestrial sediment
records have been published in a previous paper (Maho-
wald et al. 2006).
The physical model simulations use slab ocean model
simulations, and initial conditions are average fields from
fully coupled simulations (including atmosphere, land,
ocean and sea ice) run until an equilibrium state for current
climate and the Last Glacial Maximum (LGM) (Otto-
Bliesner et al. 2006; Kiehl et al. 2006). The model has a
spectral resolution of T42, corresponding to a horizontal
resolution of roughly 2.8� 9 2.8� and 26 vertical levels in
the atmosphere in the hybrid sigma-pressure coordinate
system, with 10–20 tropospheric levels depending at first
order on latitude, season and surface elevation. The dust
model uses the source entrainment mechanism from
1732 S. Albani et al.: Comparing modeled and observed changes
123
Zender et al. (2003) for four size bins (bin1 = 0.1–1.0 lm;
bin2 = 1.0–2.5 lm; bin3 = 2.5–5.0 lm; bin4 = 5.0–10.0
lm), and allows for wet and dry deposition (Mahowald
et al. 2006). Dust emission in the transport bins has a fixed
size distribution partitioning (Mahowald et al. 2006), and
dry deposition, more specifically gravitational settling
(Zender et al. 2003), is the other process that is directly
dependent on the size distribution in the model parame-
terizations set used for this study. In the set of simulations
used for this paper, desert areas change in response to
carbon dioxide, temperature, precipitation and insolation
changes, using the BIOME3 equilibrium vegetation model
(Haxeltine and Prentice 1996). The LGM simulations used
here use a tuning procedure to deduce dust source activity
in order to include dust mobilization from known glacio-
genic deposits (Mahowald et al. 2006). Glaciogenic sources
of atmospheric dust correspond to alluvial plains of rivers
draining meltwater and fine-grained debris from glaciers
and are known to have been active dust sources in the past
(e.g. Zarate 2003; Mahowald et al. 2006).
We base this work on 2 sets of simulations, all initial-
ized from equilibrium fields for physical climate: (a) a set
of 2 10-years simulations and (b) a set of 13 1-year
simulations.
The 10-year simulations (a) consist of one simulation for
current climate and one for LGM climate, after a spin up
period for dust of 20 and 30 years respectively. With these we
will be able to evaluate temporal (inter-annual) variability.
The 1-year simulations (b) start after a 3-months spin up
period for dust. The 3-months spin-up period we used for
this set of simulations is enough to reach a background
equilibrium, considering that (1) estimates of transport
times of dust to Antarctica range from a few days to about
2 weeks (Li et al. 2010a; Gasso et al. 2010) and (2) the
estimated age of dust deposited to Antarctica is on average
1 month (Han and Zender 2010; Petit and Delmonte 2009).
We have 6 simulations for current climate and 7 for the
LGM in which one macro-area at time is active as a source
for dust entrainment into the atmosphere (e.g. Mahowald
2007 for current climate; Mahowald et al. 2011 for LGM and
current climates). We will use those simulations to study
dust provenance. Because here we are focusing on the
Southern Ocean and Antarctica, and one of the biggest sig-
nals in this region is the large change in the dust between Last
Glacial Maximum and current, we tune the model slightly
differently than in Mahowald et al. (2006). Dust emission for
each macro-area is tuned a posteriori by applying a factor
yielding the best fit between the simulated and observed
LGM and current deposition rates (as in Mahowald et al.
2006), but we also add the observed LGM/current ratio for
dust deposition. For the tuning procedure, we use LGM/
current ratios for dust deposition fluxes from a set of
observations that includes the observational dataset used in
Mahowald et al. (2006) based primarily on Kohfeld and
Harrison (2001), integrated with additional data listed in
Table 1. The resulting scale factors for each macro-area for
both current and LGM climates are included in Table 2. This
procedure implicitly assumes that the model atmospheric
circulation and geographical location of the source areas are
Table 1 Updated/new data used in combination with Mahowald
et al. (2006) for the tuning procedure
Site name Dome C (EDC) PS2489-2/ODP1090
Longitude 123�210E 8�580E
Latitude 75�060S 42�520S
LGM/current mass
flux ratio
20 (LGM:
18–27 ka BP)
5
Reference Lambert et al.
(2008)
Martınez-Garcıa et al.
(2009)
Table 2 List of model simulations used for the dust provenance study
Macroareas Current climate LGM climate
Tuning factor Column dust
loading South
of 60�S (%)
Dust deposition
South of
60�S (%)
Tuning
factor
Column dust
loading South
of 60�S (%)
Dust deposition
South of
60�S (%)
Asia (ASIA) 1 \1 \1 1 \1 \1
Australia (AUS) 0.3 21 21 2 10 7
North Africa (NAF) 1 10 1 1 \1 \1
North America (NAM) 1 \1 \1 2 \1 \1
South America (SAM) 1 60 71 1 88 93
Miscellanea (MISC—includes
South Africa, East Africa
and the Middle East)
1 (S. hemisphere),
4 (N. hemisphere)
9 6 1 2 \1
Europe (EUR) – – – 1 \1 \1
For each one we indicate the tuning factor, and the dust column loading and deposition flux averaged for grid cells South of 60�S, expressed as a
percentage of the total, calculated as a sum of results of all simulations, for each climate
S. Albani et al.: Comparing modeled and observed changes 1733
123
correct, and forces the magnitude of dust emissions from
macro-areas in order to gain a better fit to the observed LGM/
current ratio of dust deposition.
2.2 Description of observations
Most of the observations used for the tuning procedure are
the same as in Mahowald et al. (2006), and include data
from DIRTMAP2 (Kohfeld and Harrison 2001) and other
terrestrial records. The only two novelties with respect to
Mahowald et al. (2006) are listed in Table 1. Throughout
the rest of the work, observations from available ice core
sites in Antarctica (Tables 3, 4) are used to compare with
model results. In this section we highlight the possible
difficulties arising from the compilation of the observa-
tional dataset, while those related to model-observation
comparison are discussed in the next section. More detailed
descriptions of observations are available in the original
references (Table 4).
Dust concentration data were obtained using different
techniques, depending on the ice core: most are direct
measurements of particle concentrations made with either a
Coulter Particle Counter or a laser sensor (e.g. Lambert
et al. 2008), while other rely on a proxy for mineral dust,
such as Aluminum (e.g. McConnell et al. 2007). Dust
depositional fluxes, when available, are calculated from
concentrations, taking into account the ice/snow accumu-
lation rate of the specific site, which determines the dilu-
tion of dust particles in the ice. Multiplying dust
concentration (mg dust per kg of ice/snow) times the ice/
snow accumulation rate (kg m-2 year-1) gives the dust
depositional flux (mg m-2 year-1). The snow/ice accu-
mulation rate is subject to some degree of uncertainty due
to dating uncertainty and to temporal and spatial variability
of snow accumulation, and because of wind-driven post-
depositional processes (Frezzotti et al. 2007).
The observationally-derived values of concentration or
depositional flux refer to a specific dimensional range of
Table 3 List of Antarctic ice cores with abbreviations used in this
work and geographical location expressed by longitude and latitude
Ice core Abbreviation Longitude Latitude
EPICA dome C EDC 123�210E 75�060S
Vostok Vk 106�E 78�S
EPICA dronning maud land EDML 0�E 75�S
TALDICE Talos 159�060E 72�490S
GV7 GV7 158�520E 70�410S
Dome Argus DA 77�220E 80�S
Dome Fuji DF 39.4�E 77.2�S
Byrd Byrd 119�W 80�S
Siple dome Siple 148�W 81�S
Taylor dome Taylor 158�E 77�S
Law dome LD 113�120E 66�430S
James Ross Island JRI 57.7�W 64.2�S
Dome B DB 94�550E 77�050S
Komsomolskaya KMS 97�290E 74�050S
Berkner Island BI 45�430W 78�360S
Table 4 References for observations from Fig. 2
Ice core Dust concentration/deposition flux Snow accumulation rate Observations
size range (lm)
Model size range
for comparison (lm)
EDC Lambert et al. (2008) EPICA community members
(2004)
0.7–20 0.1–10
Vk LGM: Petit et al. (1999). Holocene: dust
flux data (Petit J.-R.) from
http://www.ncdc.noaa.gov; fluxes have
been recalculated assuming a density of
2.5 g/cm3 for dust. Petit J.-R. (1999):
Dust concentration in the Vostok ice
core, doi:10.1594/PANGAEA.55502.
(Holocene data from the period 0–5.5
kys BP)
Petit et al. (1999) 0.7–20 0.1–10
DA Xu et al. 2007 Hou et al. (2007) 0.7–5 0.1–5
DF Miyake et al., AGU Fall Meeting 2007,
abstract #PP51A-0199
Kameda et al. (2008) – 0.1–10
Byrd Mahowald et al. (1999) and references
therein
Mahowald et al. (1999) and
references therein
– 0.1–10
JRI McConnell et al. (2007) McConnell et al. (2007) Total–based on Al proxy 0.1–10
BI Petit J.-R., personal communication
(2009)
Debret et al. Geophysical Research
Abstracts, Vol. 9, 00807, 2007
0.8–20 0.1–10
Talos Albani et al. (submitted); Delmonte
et al. (2010b)
Frezzotti et al. (2007) 1–5 1–5
1734 S. Albani et al.: Comparing modeled and observed changes
123
dust particles, which may differ depending on the tech-
nique and specific instrumental setup. All the ice core data
we use here span the 1–5 lm range, which contains most of
the dust mass typical of long range transport (e.g. Royer
et al. 1983; Delmonte et al. 2002). When possible, we
compare model results to the observations in the closest
dimensional range (see Table 4).
Measurement uncertainties on each sample are usually
low for particle counters (\10%, e.g. Albani et al., sub-
mitted), and they are lower then the sample-to-sample
(temporal) variability shown by ice core dust records.
When using other proxies, the uncertainty may be higher,
and only a careful calibration against particle counters may
add confidence to the results (e.g. McConnell et al. 2007;
Ruth et al. 2008). In this study we use measurements of
dust carried out with particle counters, with the exception
of the James Ross Island (JRI) data, obtained using Alu-
minum as a proxy for dust (McConnell et al. 2007).
Observations from the ice cores (Table 4) represent
averages of sets of measurements performed on different
ice core samples. They typically differ from each other in
terms of time integration represented by each sample, time
resolution (sampling frequency) and time span of the set of
observations for each ice core.
The main differences in time integration and temporal
resolution depend on the analysis technique and on the ice
accumulation rate at each site (e.g. Masson-Delmotte et al.
2010). These differences can easily be overcome by aver-
aging. The differences in the time span considered is more
difficult to reconcile, especially for comparison with the
current climate simulations. Apart from JRI, for which we
consider the given 19th century average (McConnell et al.
2007), we take dust concentration/flux from averages over
the Holocene or sub-periods of the Holocene, depending on
data availability. In the case of TALDICE (Table 4) we
restricted the time span of reference to the late Holocene
(0.8–5 kys BP), although in most cases ice core dust
records do not show important trends during the Holocene,
compared to the large variability on glacial/interglacial
timesacles. This approximation is reasonable considering
our approach of comparing equilibrium states for current
and LGM climates. When not noted otherwise, observa-
tions used in this study were taken from the DIRTMAP2
database (Kohfeld and Harrison 2001).
3 Model results
3.1 Dust flux and concentration: model results
versus ice core data
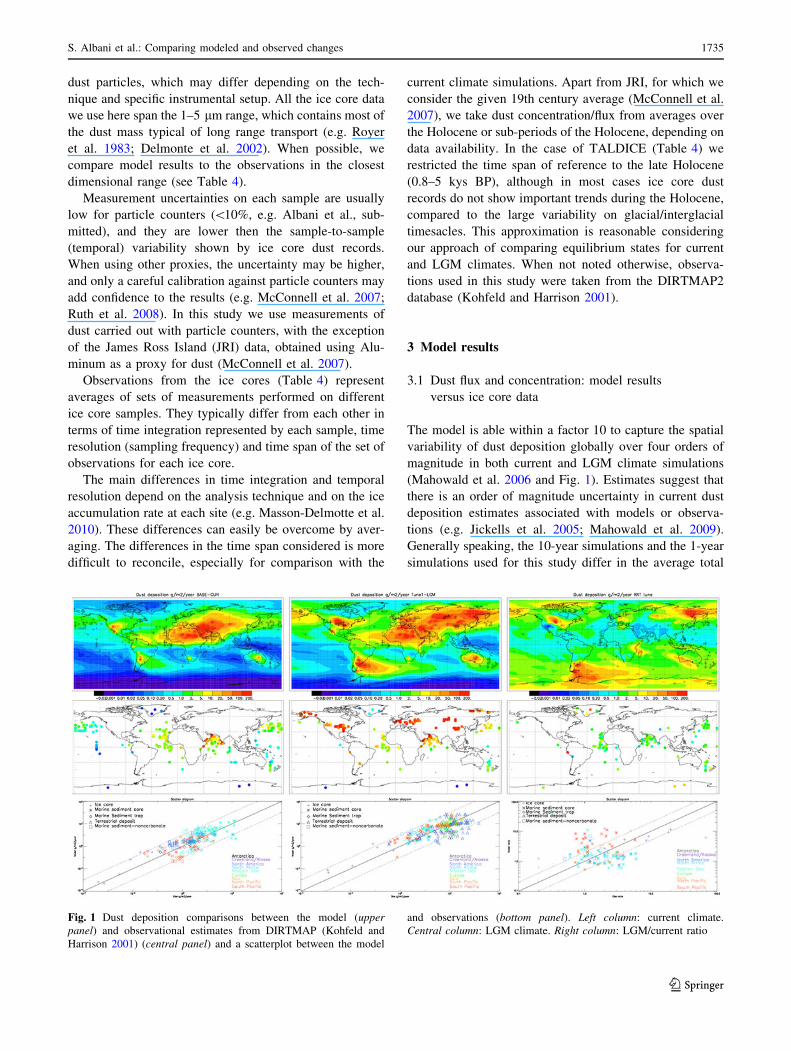
The model is able within a factor 10 to capture the spatial
variability of dust deposition globally over four orders of
magnitude in both current and LGM climate simulations
(Mahowald et al. 2006 and Fig. 1). Estimates suggest that
there is an order of magnitude uncertainty in current dust
deposition estimates associated with models or observa-
tions (e.g. Jickells et al. 2005; Mahowald et al. 2009).
Generally speaking, the 10-year simulations and the 1-year
simulations used for this study differ in the average total
Fig. 1 Dust deposition comparisons between the model (upperpanel) and observational estimates from DIRTMAP (Kohfeld and
Harrison 2001) (central panel) and a scatterplot between the model
and observations (bottom panel). Left column: current climate.
Central column: LGM climate. Right column: LGM/current ratio
S. Albani et al.: Comparing modeled and observed changes 1735
123
dust mobilization rate by *40%, but give similar results in
terms of the main aspects analyzed in this study, including
seasonality and dust size. The main differences are due to
the tuning applied to the source activity in the 1-year
simulations, which includes comparison to the magnitude
of the glacial-interglacial variations in dust deposition at
the observational sites. On the other hand, the number of
observations for the LGM/current ratio in dust deposition,
and their spatial coverage, is more limited than for indi-
vidual climate conditions (Fig. 1), and this is a limitation of
this approach. In addition, the procedure of calculating a
ratio can itself amplify slight mismatches of opposite sign
in the model-observation comparison, resulting in higher
scatter (Fig. 1). Overall, the model is able to capture much
of the observed change in the LGM/current deposition ratio
(Table 5).
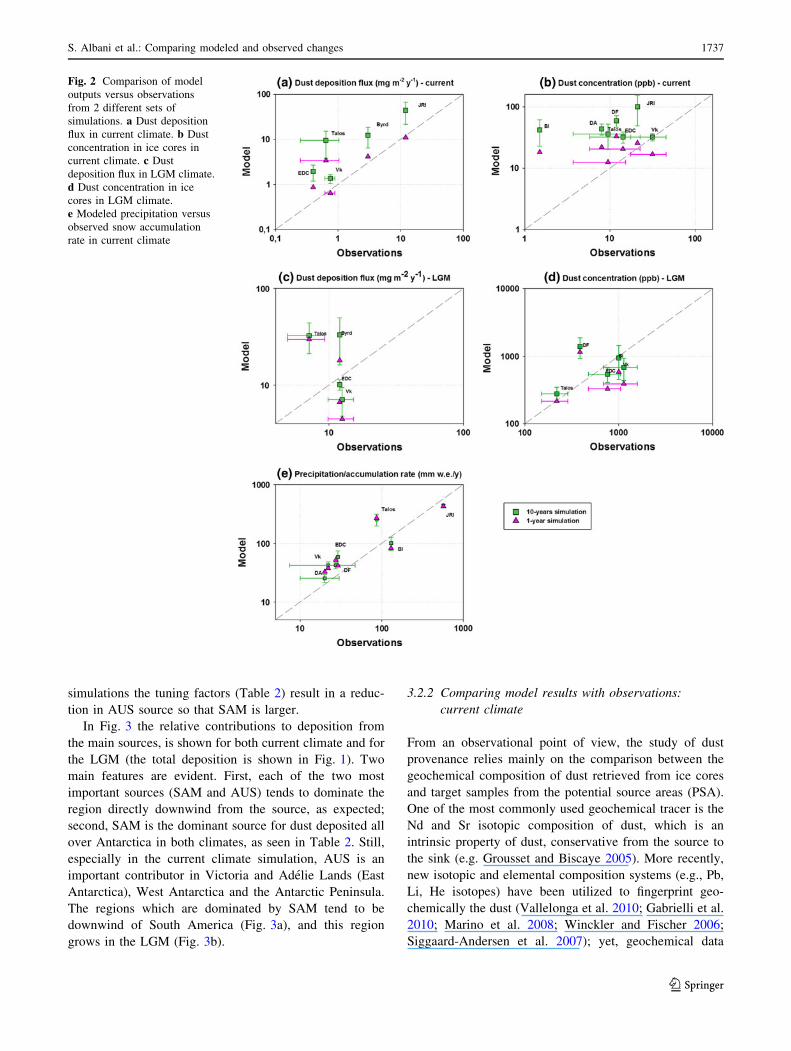
Now we focus on the Antarctic region, using the data
described Table 4. There are two ways to compare obser-
vations and model: deposition flux (Fig. 2a, c) or concen-
tration (Fig. 2b, d) in the ice core, and here we show both
methods. Note that the model calculates deposition based
on precipitation rates and meteorology calculated within
the model, and deposition can be converted to ice core
concentration by dividing by precipitation rate. Errors of
modeled depositional fluxes are comprised of biases in the
modeled precipitation (accumulation) rates, as well as
errors in the spatial distribution of dust.
Modeled depositional fluxes are compared to observa-
tions at different ice cores sites (Fig. 2c). The case-by-case
analysis reveals differences ranging within almost zero and
a factor of 10 in most cases, depending on the site, variable
and simulation. These differences are likely due to uncer-
tainties related to the spatial and temporal variability of
measurements, uncertainties related to the snow/ice accu-
mulation estimates based on observations that are reflected
in the conversion from dust concentration to flux, to the
temporal time window of simulations, as well as to the
spatial resolution and biases in the model, discussed below.
We see from the set of available observations that the
model overpredicts spatial variability in dust fluxes for
sites characterized by similar dust deposition (Fig. 2a, c),
probably due to biases in modeled precipitation and the
associated errors in transport (Fig. 2e). Note that our
model overpredicts the wet versus dry deposition rates in
Antarctica (Mahowald et al. 2011), possibly amplifying
biases in precipitation. Here the relatively coarse spatial
resolution of the model may prevent fully capturing the
changing slopes at the edges of the ice sheets, causing
biases in moisture transport inland and precipitation
rates. Similar findings were discussed in previous mod-
eling studies (Delaygue et al. 2000; Noone and Sim-
monds 2002).
Mahowald et al. (2011) use a correlation technique
using the same model as here to estimate whether at a
given location deposition or concentration is more repre-
sentative of dustiness and deposition. In contrast here we
compare to available data for both deposition and con-
centration. In this case, modeled concentrations compare
better to observations than deposition fluxes, perhaps
because this reduces the biases from errors in precipitation
rates. This highlights the problem with simulating dust
deposition well: in order to get a more realistic represen-
tation of the spatial variability of dust fluxes, the model
needs to capture precipitation correctly as well, which is
not achieved in climate models.
3.2 Dust provenance
3.2.1 Model results
Here we present results from two sets of 1-year simulations
using just one dust source area at a time for current climate
and for the LGM (Table 2). All sources worldwide grouped
in macro-areas roughly corresponding to the continents
(Table 2) are considered, and for present-day climate there
are two major dust sources in the Southern Hemisphere,
namely Australia (AUS) and South America (SAM), and
we consider both the column loading and the deposition.
SAM is the dominant source in the LGM. We highlight
possible interhemispheric dust transport, although the
minor sources from North Africa contribute even less to
dust deposition than loading (Table 2). Similar results for
inter-hemispheric transport were seen in Li et al. (2008).
The comparison among modeled dust mobilization rates
from SAM and AUS from different works (Table 5) shows
that the relative magnitudes vary from case to case. Rela-
tively high values from our simulations depend largely on
the size distribution imposed, with most of the mass in the
coarser bin readily removed close to the source areas
(Mahowald et al. 2006). In the 10-year simulations the
AUS is larger than the SAM source, but in the 1-year
Table 5 Average dust mobilization rate (Tg/year) form SAM and
AUS from model simulations used in this study (1-year and 10-years
simulations, current and LGM climates) and from other relevant
works
Simulation SAM AUS
1-year (current) 162 59
10-years (current) 168 244
Li et al. (2008) (current) 50 120
Johnson et al. (2010) (current) 33 –
Tanaka and Chiba (2006) (current) 44 106
1-year (LGM) 2,073 422
10-years (LGM) 2,360 236
1736 S. Albani et al.: Comparing modeled and observed changes
123
simulations the tuning factors (Table 2) result in a reduc-
tion in AUS source so that SAM is larger.
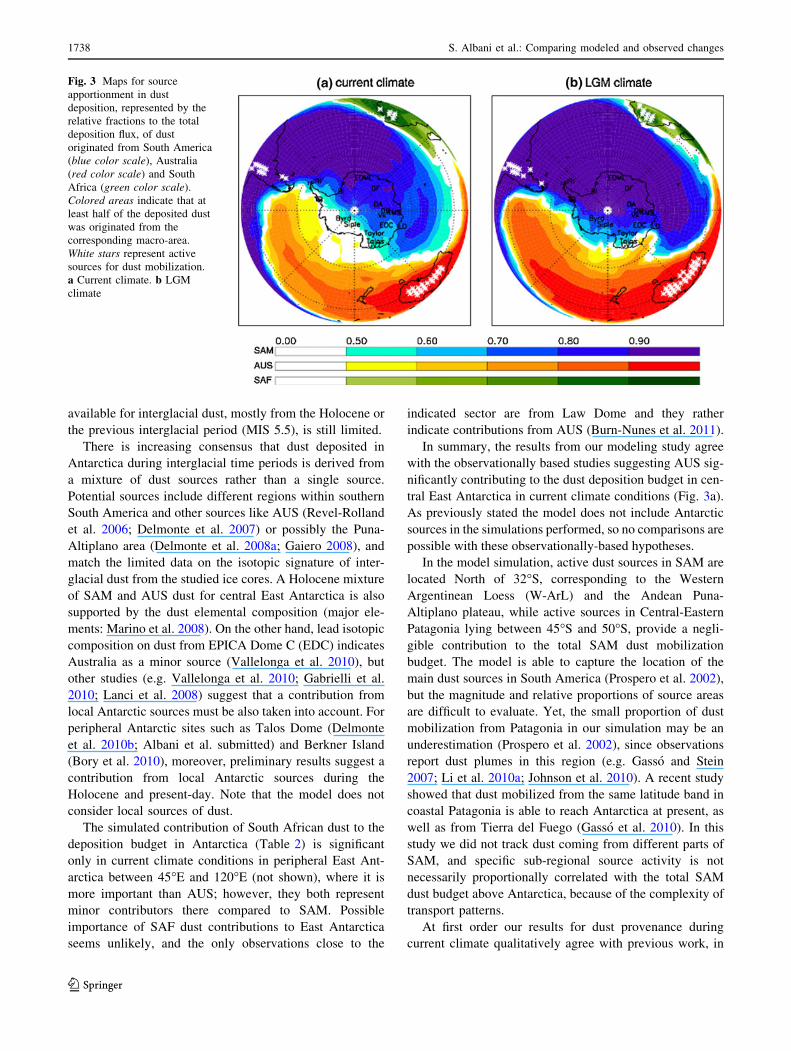
In Fig. 3 the relative contributions to deposition from
the main sources, is shown for both current climate and for
the LGM (the total deposition is shown in Fig. 1). Two
main features are evident. First, each of the two most
important sources (SAM and AUS) tends to dominate the
region directly downwind from the source, as expected;
second, SAM is the dominant source for dust deposited all
over Antarctica in both climates, as seen in Table 2. Still,
especially in the current climate simulation, AUS is an
important contributor in Victoria and Adelie Lands (East
Antarctica), West Antarctica and the Antarctic Peninsula.
The regions which are dominated by SAM tend to be
downwind of South America (Fig. 3a), and this region
grows in the LGM (Fig. 3b).
3.2.2 Comparing model results with observations:
current climate
From an observational point of view, the study of dust
provenance relies mainly on the comparison between the
geochemical composition of dust retrieved from ice cores
and target samples from the potential source areas (PSA).
One of the most commonly used geochemical tracer is the
Nd and Sr isotopic composition of dust, which is an
intrinsic property of dust, conservative from the source to
the sink (e.g. Grousset and Biscaye 2005). More recently,
new isotopic and elemental composition systems (e.g., Pb,
Li, He isotopes) have been utilized to fingerprint geo-
chemically the dust (Vallelonga et al. 2010; Gabrielli et al.
2010; Marino et al. 2008; Winckler and Fischer 2006;
Siggaard-Andersen et al. 2007); yet, geochemical data
Fig. 2 Comparison of model
outputs versus observations
from 2 different sets of
simulations. a Dust deposition
flux in current climate. b Dust
concentration in ice cores in
current climate. c Dust
deposition flux in LGM climate.
d Dust concentration in ice
cores in LGM climate.
e Modeled precipitation versus
observed snow accumulation
rate in current climate
S. Albani et al.: Comparing modeled and observed changes 1737
123
available for interglacial dust, mostly from the Holocene or
the previous interglacial period (MIS 5.5), is still limited.
There is increasing consensus that dust deposited in
Antarctica during interglacial time periods is derived from
a mixture of dust sources rather than a single source.
Potential sources include different regions within southern
South America and other sources like AUS (Revel-Rolland
et al. 2006; Delmonte et al. 2007) or possibly the Puna-
Altiplano area (Delmonte et al. 2008a; Gaiero 2008), and
match the limited data on the isotopic signature of inter-
glacial dust from the studied ice cores. A Holocene mixture
of SAM and AUS dust for central East Antarctica is also
supported by the dust elemental composition (major ele-
ments: Marino et al. 2008). On the other hand, lead isotopic
composition on dust from EPICA Dome C (EDC) indicates
Australia as a minor source (Vallelonga et al. 2010), but
other studies (e.g. Vallelonga et al. 2010; Gabrielli et al.
2010; Lanci et al. 2008) suggest that a contribution from
local Antarctic sources must be also taken into account. For
peripheral Antarctic sites such as Talos Dome (Delmonte
et al. 2010b; Albani et al. submitted) and Berkner Island
(Bory et al. 2010), moreover, preliminary results suggest a
contribution from local Antarctic sources during the
Holocene and present-day. Note that the model does not
consider local sources of dust.
The simulated contribution of South African dust to the
deposition budget in Antarctica (Table 2) is significant
only in current climate conditions in peripheral East Ant-
arctica between 45�E and 120�E (not shown), where it is
more important than AUS; however, they both represent
minor contributors there compared to SAM. Possible
importance of SAF dust contributions to East Antarctica
seems unlikely, and the only observations close to the
indicated sector are from Law Dome and they rather
indicate contributions from AUS (Burn-Nunes et al. 2011).
In summary, the results from our modeling study agree
with the observationally based studies suggesting AUS sig-
nificantly contributing to the dust deposition budget in cen-
tral East Antarctica in current climate conditions (Fig. 3a).
As previously stated the model does not include Antarctic
sources in the simulations performed, so no comparisons are
possible with these observationally-based hypotheses.
In the model simulation, active dust sources in SAM are
located North of 32�S, corresponding to the Western
Argentinean Loess (W-ArL) and the Andean Puna-
Altiplano plateau, while active sources in Central-Eastern
Patagonia lying between 45�S and 50�S, provide a negli-
gible contribution to the total SAM dust mobilization
budget. The model is able to capture the location of the
main dust sources in South America (Prospero et al. 2002),
but the magnitude and relative proportions of source areas
are difficult to evaluate. Yet, the small proportion of dust
mobilization from Patagonia in our simulation may be an
underestimation (Prospero et al. 2002), since observations
report dust plumes in this region (e.g. Gasso and Stein
2007; Li et al. 2010a; Johnson et al. 2010). A recent study
showed that dust mobilized from the same latitude band in
coastal Patagonia is able to reach Antarctica at present, as
well as from Tierra del Fuego (Gasso et al. 2010). In this
study we did not track dust coming from different parts of
SAM, and specific sub-regional source activity is not
necessarily proportionally correlated with the total SAM
dust budget above Antarctica, because of the complexity of
transport patterns.
At first order our results for dust provenance during
current climate qualitatively agree with previous work, in
Fig. 3 Maps for source
apportionment in dust
deposition, represented by the
relative fractions to the total
deposition flux, of dust
originated from South America
(blue color scale), Australia
(red color scale) and South
Africa (green color scale).
Colored areas indicate that at
least half of the deposited dust
was originated from the
corresponding macro-area.
White stars represent active
sources for dust mobilization.
a Current climate. b LGM
climate
1738 S. Albani et al.: Comparing modeled and observed changes
123
terms of identifying SAM in general as the most important
source for Antarctica (Andersen et al. 1998; Lunt and
Valdes 2001, 2002a). If we focus on the relative propor-
tions of dust mobilization within SAM sources, our study is
similar to Andersen et al. (1998), but does not agree with
Lunt and Valdes (2002a). The spatial distribution of areas
dominated by either SAM (as a whole) or AUS dust is
qualitatively similar to Li et al. (2008), although large
differences exist in the relative proportions of the simulated
dust emission from different sub-areas within SAM (e.g.
Patagonia vs Altiplano or Cordoba region), that may render
the comparison difficult because of different efficiencies in
transport.
3.2.3 Comparing model results with observations: LGM
For the LGM the geochemical fingerprint of dust from
central East Antarctic ice cores (Vostok, old Dome C,
Dome B, Komsomolskaya, EPICA-Dome C and Talos
Dome) shows a dominant South American provenance for
dust (e.g. Grousset et al. 1992; Basile et al. 1997, Delmonte
et al. 2004b, 2008b, 2010a), in agreement with the model
outcomes presented in this study (Fig. 3b) and with pre-
vious studies (e.g. Genthon 1992; Andersen et al. 1998;
Lunt and Valdes 2002a; Krinner and Genthon 2003). The
two most active grid cells in the LGM simulation (Fig. 3b)
are located between 37�S and 42�S, roughly corresponding
to the southernmost Pampas, specifically the Rio Colorado
and Rio Negro basins. Samples from those regions have a
typical Patagonian isotopic signature (Gaiero et al. 2007),
which means that the model generally agrees with obser-
vations. The model also shows a weaker source in south-
ernmost Patagonia (S-Pat)—Tierra del Fuego (TdF).
Isotopic data for the TdF are still very scarce (Sugden et al.
2009), preventing any firm conclusion on the importance of
that area. The sources from the Pampas region were
explicitly accounted for as a glaciogenic source for dust in
the LGM, based on Zarate (2003) (Mahowald et al. 2006).
Other active but relatively weak sources in the simula-
tion for the LGM include the Westren Argentinean Loess
(W-ArL) flanking the Andes North of 32�S and the Puna-
Altiplano in the Andean cordillera (Fig. 3b).
3.3 Transport patterns
3.3.1 Current climate
Spatial features of dust loading and transport in the
Southern Hemisphere, together with implications for dust
provenance, are examined in this section. A more detailed
discussion of winds in Community Climate System Model
version 3 (CCSM3) is given in Otto-Bliesner et al. (2006).
We also qualitatively checked winds from both 1-year and
from long-term runs against fully-coupled CCSM3 zonal
winds (Rojas et al. 2009), confirming a good agreement,
especially for the lower levels. Simulated winds capture the
general features of atmospheric circulation above Antarctica
(e.g. King and Turner 1997; Parish and Bromwich 2007).
Dust advection in the atmosphere is controlled by the
general circulation and disturbances on a synoptic scale
(e.g. Li et al. 2010a). Here we analyze climatological
features on a seasonal basis, as simulated by the model.
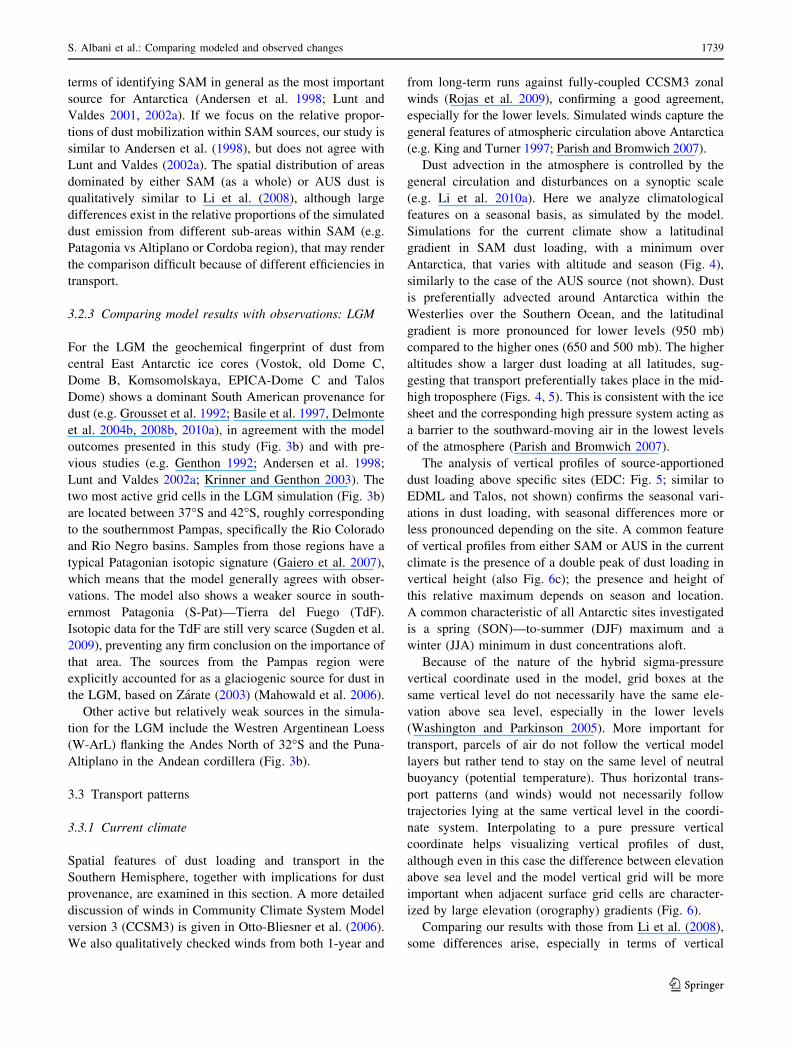
Simulations for the current climate show a latitudinal
gradient in SAM dust loading, with a minimum over
Antarctica, that varies with altitude and season (Fig. 4),
similarly to the case of the AUS source (not shown). Dust
is preferentially advected around Antarctica within the
Westerlies over the Southern Ocean, and the latitudinal
gradient is more pronounced for lower levels (950 mb)
compared to the higher ones (650 and 500 mb). The higher
altitudes show a larger dust loading at all latitudes, sug-
gesting that transport preferentially takes place in the mid-
high troposphere (Figs. 4, 5). This is consistent with the ice
sheet and the corresponding high pressure system acting as
a barrier to the southward-moving air in the lowest levels
of the atmosphere (Parish and Bromwich 2007).
The analysis of vertical profiles of source-apportioned
dust loading above specific sites (EDC: Fig. 5; similar to
EDML and Talos, not shown) confirms the seasonal vari-
ations in dust loading, with seasonal differences more or
less pronounced depending on the site. A common feature
of vertical profiles from either SAM or AUS in the current
climate is the presence of a double peak of dust loading in
vertical height (also Fig. 6c); the presence and height of
this relative maximum depends on season and location.
A common characteristic of all Antarctic sites investigated
is a spring (SON)—to-summer (DJF) maximum and a
winter (JJA) minimum in dust concentrations aloft.
Because of the nature of the hybrid sigma-pressure
vertical coordinate used in the model, grid boxes at the
same vertical level do not necessarily have the same ele-
vation above sea level, especially in the lower levels
(Washington and Parkinson 2005). More important for
transport, parcels of air do not follow the vertical model
layers but rather tend to stay on the same level of neutral
buoyancy (potential temperature). Thus horizontal trans-
port patterns (and winds) would not necessarily follow
trajectories lying at the same vertical level in the coordi-
nate system. Interpolating to a pure pressure vertical
coordinate helps visualizing vertical profiles of dust,
although even in this case the difference between elevation
above sea level and the model vertical grid will be more
important when adjacent surface grid cells are character-
ized by large elevation (orography) gradients (Fig. 6).
Comparing our results with those from Li et al. (2008),
some differences arise, especially in terms of vertical
S. Albani et al.: Comparing modeled and observed changes 1739
123
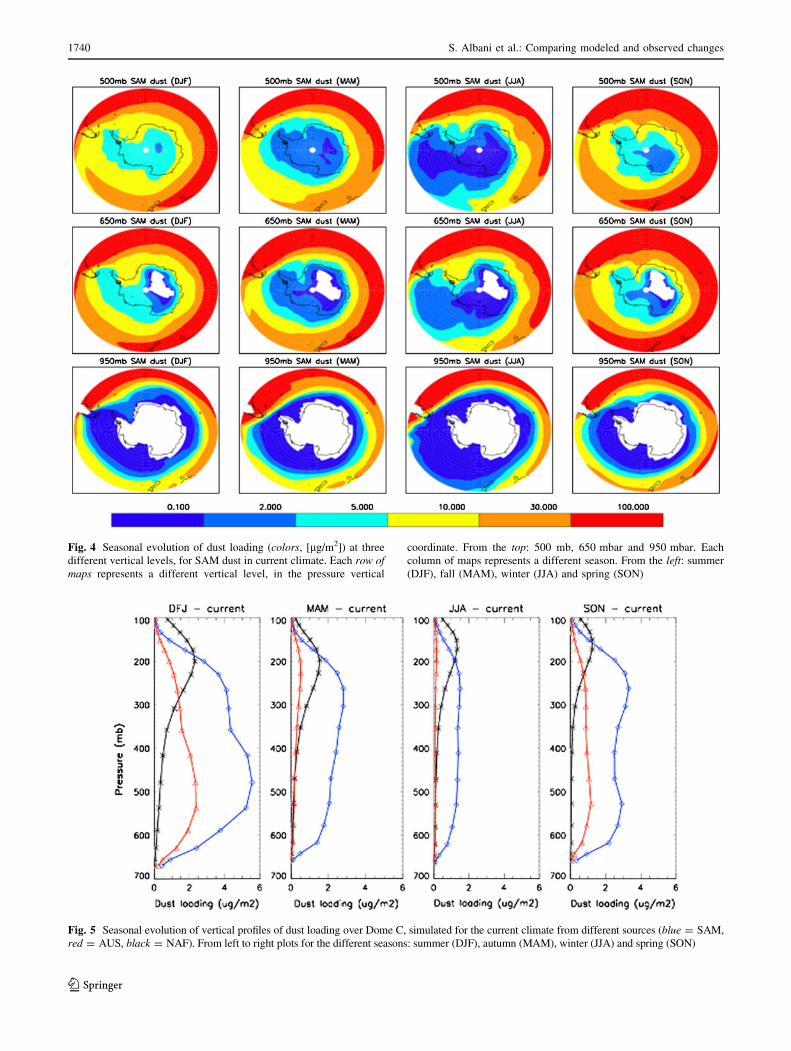
Fig. 4 Seasonal evolution of dust loading (colors, [lg/m2]) at three
different vertical levels, for SAM dust in current climate. Each row ofmaps represents a different vertical level, in the pressure vertical
coordinate. From the top: 500 mb, 650 mbar and 950 mbar. Each
column of maps represents a different season. From the left: summer
(DJF), fall (MAM), winter (JJA) and spring (SON)
Fig. 5 Seasonal evolution of vertical profiles of dust loading over Dome C, simulated for the current climate from different sources (blue = SAM,
red = AUS, black = NAF). From left to right plots for the different seasons: summer (DJF), autumn (MAM), winter (JJA) and spring (SON)
1740 S. Albani et al.: Comparing modeled and observed changes
123
distribution of dust. For the SAM source, part of the dif-
ference may be explained by different location of the active
source areas. These are focused in Patagonia for Li and
coauthors, but more broadly located in the W-ArL, the
Altiplano and Patagonia for this study. In particular, the
Patagonian source is at much higher latitude compared to
the other SAM sources, and has very stable atmospheric
conditions (Li et al. 2008, 2010a). Dust originated from
Patagonia is transported in the boundary layer before being
uplifted by low pressure system moving eastward over the
Southern Ocean (Li et al. 2008, 2010a). On the other hand,
the Altiplano source is at high elevation and dust will be
transported in the free troposphere, and in out model also
dust from W-ArL (the major simulated source) is uplifted
close to the source areas. Patagonia is active in our simu-
lations for current climate, although quantitatively the dust
mobilization is very modest. Despite its low activity in our
simulation, Patagonia could still have the potential be an
important source for dust transported Southward, because
of transport efficiency. This fact has been suggested from
combined satellite observations and models that show dust
plumes from Patagonia are able to travel long distance
reaching the sub-Antarctic Atlantic Ocean (Gasso and
Stein 2007) and even Antarctica (Gasso et al. 2010).
3.3.2 LGM climate
Changes in transport patterns between current climate and
the LGM have been analyzed in order to understand their
role in dust deposition changes and to analyze their
relationship with observed and modeled changes in dust
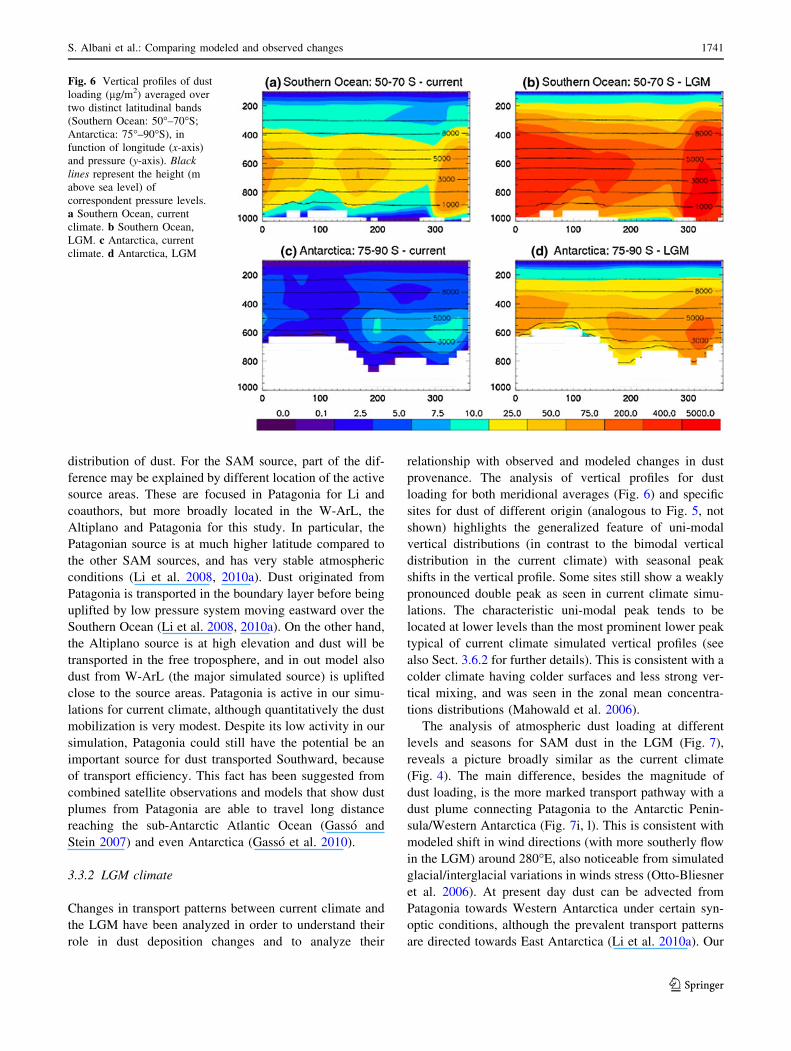
provenance. The analysis of vertical profiles for dust
loading for both meridional averages (Fig. 6) and specific
sites for dust of different origin (analogous to Fig. 5, not
shown) highlights the generalized feature of uni-modal
vertical distributions (in contrast to the bimodal vertical
distribution in the current climate) with seasonal peak
shifts in the vertical profile. Some sites still show a weakly
pronounced double peak as seen in current climate simu-
lations. The characteristic uni-modal peak tends to be
located at lower levels than the most prominent lower peak
typical of current climate simulated vertical profiles (see
also Sect. 3.6.2 for further details). This is consistent with a
colder climate having colder surfaces and less strong ver-
tical mixing, and was seen in the zonal mean concentra-
tions distributions (Mahowald et al. 2006).
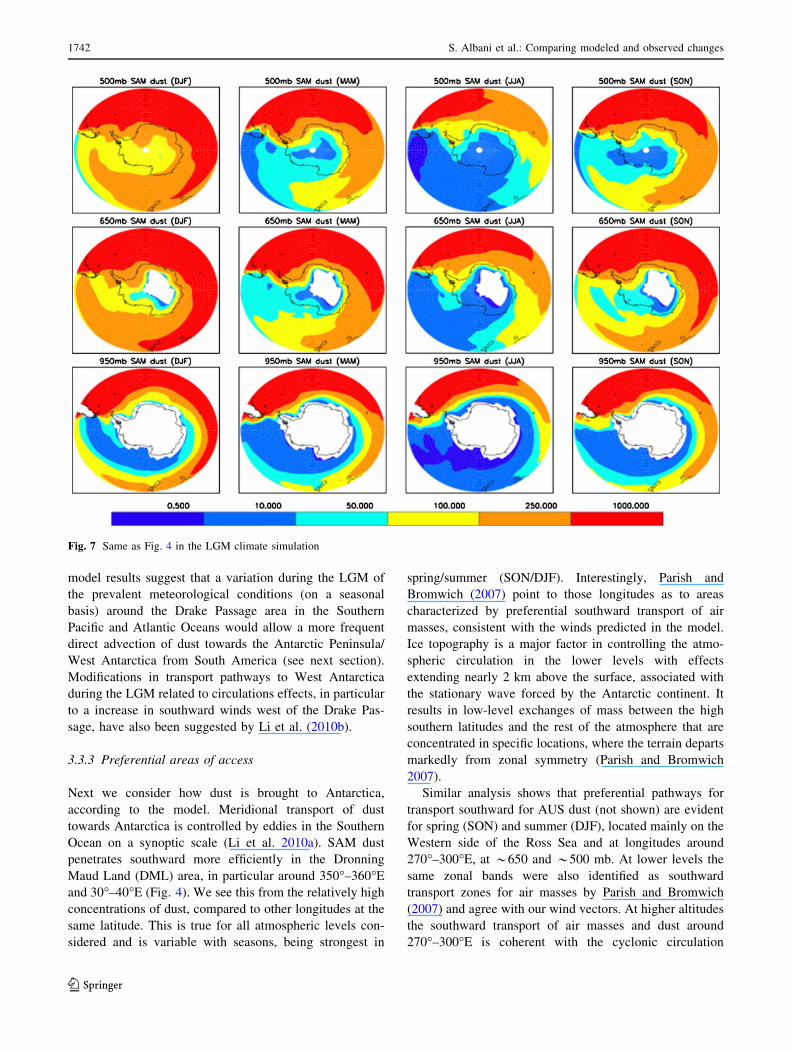
The analysis of atmospheric dust loading at different
levels and seasons for SAM dust in the LGM (Fig. 7),
reveals a picture broadly similar as the current climate
(Fig. 4). The main difference, besides the magnitude of
dust loading, is the more marked transport pathway with a
dust plume connecting Patagonia to the Antarctic Penin-
sula/Western Antarctica (Fig. 7i, l). This is consistent with
modeled shift in wind directions (with more southerly flow
in the LGM) around 280�E, also noticeable from simulated
glacial/interglacial variations in winds stress (Otto-Bliesner
et al. 2006). At present day dust can be advected from
Patagonia towards Western Antarctica under certain syn-
optic conditions, although the prevalent transport patterns
are directed towards East Antarctica (Li et al. 2010a). Our
Fig. 6 Vertical profiles of dust
loading (lg/m2) averaged over
two distinct latitudinal bands
(Southern Ocean: 50�–70�S;
Antarctica: 75�–90�S), in
function of longitude (x-axis)
and pressure (y-axis). Blacklines represent the height (m
above sea level) of
correspondent pressure levels.
a Southern Ocean, current
climate. b Southern Ocean,
LGM. c Antarctica, current
climate. d Antarctica, LGM
S. Albani et al.: Comparing modeled and observed changes 1741
123
model results suggest that a variation during the LGM of
the prevalent meteorological conditions (on a seasonal
basis) around the Drake Passage area in the Southern
Pacific and Atlantic Oceans would allow a more frequent
direct advection of dust towards the Antarctic Peninsula/
West Antarctica from South America (see next section).
Modifications in transport pathways to West Antarctica
during the LGM related to circulations effects, in particular
to a increase in southward winds west of the Drake Pas-
sage, have also been suggested by Li et al. (2010b).
3.3.3 Preferential areas of access
Next we consider how dust is brought to Antarctica,
according to the model. Meridional transport of dust
towards Antarctica is controlled by eddies in the Southern
Ocean on a synoptic scale (Li et al. 2010a). SAM dust
penetrates southward more efficiently in the Dronning
Maud Land (DML) area, in particular around 350�–360�E
and 30�–40�E (Fig. 4). We see this from the relatively high
concentrations of dust, compared to other longitudes at the
same latitude. This is true for all atmospheric levels con-
sidered and is variable with seasons, being strongest in
spring/summer (SON/DJF). Interestingly, Parish and
Bromwich (2007) point to those longitudes as to areas
characterized by preferential southward transport of air
masses, consistent with the winds predicted in the model.
Ice topography is a major factor in controlling the atmo-
spheric circulation in the lower levels with effects
extending nearly 2 km above the surface, associated with
the stationary wave forced by the Antarctic continent. It
results in low-level exchanges of mass between the high
southern latitudes and the rest of the atmosphere that are
concentrated in specific locations, where the terrain departs
markedly from zonal symmetry (Parish and Bromwich
2007).
Similar analysis shows that preferential pathways for
transport southward for AUS dust (not shown) are evident
for spring (SON) and summer (DJF), located mainly on the
Western side of the Ross Sea and at longitudes around
270�–300�E, at *650 and *500 mb. At lower levels the
same zonal bands were also identified as southward
transport zones for air masses by Parish and Bromwich
(2007) and agree with our wind vectors. At higher altitudes
the southward transport of air masses and dust around
270�–300�E is coherent with the cyclonic circulation
Fig. 7 Same as Fig. 4 in the LGM climate simulation
1742 S. Albani et al.: Comparing modeled and observed changes
123
centered above the Ross Sea (e.g. Parish and Bromwich
2007). Additional access points for AUS dust are Western
Antarctica in general, the Weddell Sea and Western DML.
The meridional southward advection of dust through
preferential pathways associated with air masses exchange
between Antarctica and lower latitudes (the climatological
expression of synoptic scale disturbances that control
meridional transport), and subsequent entrainment into the
anticyclonic airflow over the continent, causing mixing and
redistribution of dust all around Antarctica, is consistent
with observational evidence based on ice cores suggesting
rather uniform characteristics of dust deposited over the
Atlantic and Indian sectors of the Eastern Antarctic Ice
Sheet (Ruth et al. 2008), at least for the LGM (Marino et al.
2009).
Other modeling studies pointed out important features
we described such as zonal advection of dust around
Antarctica, with Australia being—at least in some sec-
tors—a major dust source for current climate (Andersen
et al. 1998; Li et al. 2008; Krinner et al. 2010), and pref-
erential access points to the Antarctic interior: the Ross Sea
sector (Andersen et al. 1998), Dronning Maud Land and
West Antarctica (Krinner et al. 2010). Here we suggest a
comprehensive picture of the spatial distribution of
enhanced meridional transport areas and the general fea-
tures of Antarctic atmospheric circulation, and how that
changes between current and LGM climate.
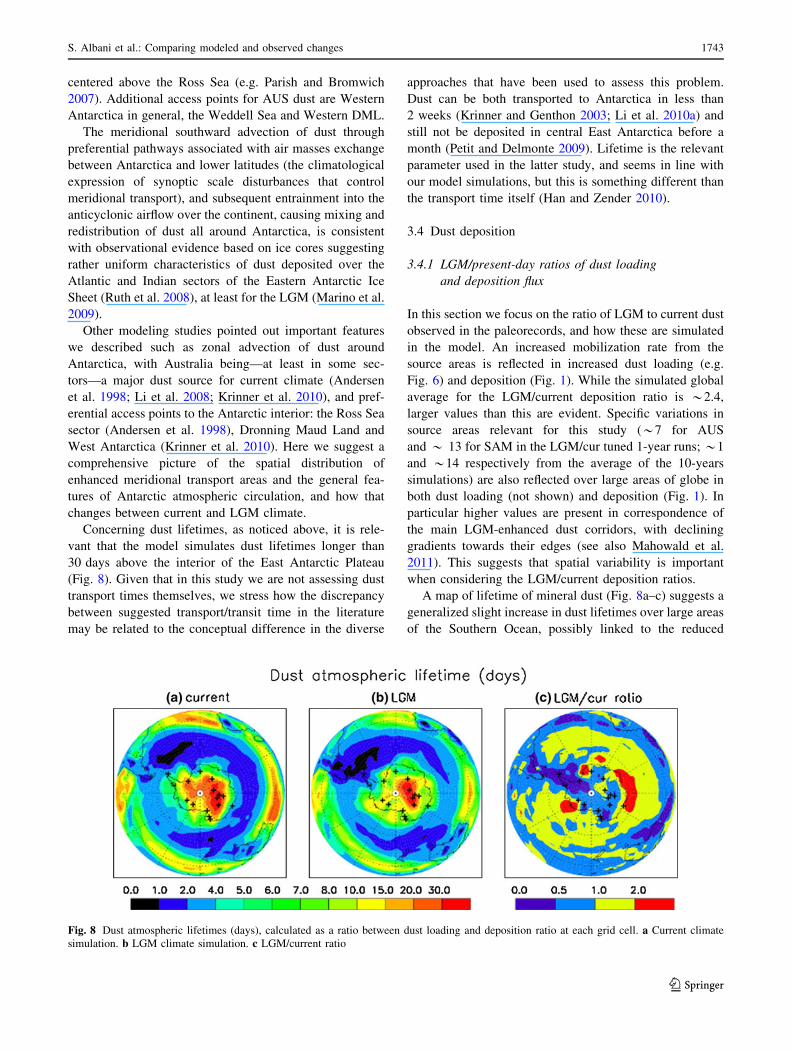
Concerning dust lifetimes, as noticed above, it is rele-
vant that the model simulates dust lifetimes longer than
30 days above the interior of the East Antarctic Plateau
(Fig. 8). Given that in this study we are not assessing dust
transport times themselves, we stress how the discrepancy
between suggested transport/transit time in the literature
may be related to the conceptual difference in the diverse
approaches that have been used to assess this problem.
Dust can be both transported to Antarctica in less than
2 weeks (Krinner and Genthon 2003; Li et al. 2010a) and
still not be deposited in central East Antarctica before a
month (Petit and Delmonte 2009). Lifetime is the relevant
parameter used in the latter study, and seems in line with
our model simulations, but this is something different than
the transport time itself (Han and Zender 2010).
3.4 Dust deposition
3.4.1 LGM/present-day ratios of dust loading
and deposition flux
In this section we focus on the ratio of LGM to current dust
observed in the paleorecords, and how these are simulated
in the model. An increased mobilization rate from the
source areas is reflected in increased dust loading (e.g.
Fig. 6) and deposition (Fig. 1). While the simulated global
average for the LGM/current deposition ratio is *2.4,
larger values than this are evident. Specific variations in
source areas relevant for this study (*7 for AUS
and * 13 for SAM in the LGM/cur tuned 1-year runs; *1
and *14 respectively from the average of the 10-years
simulations) are also reflected over large areas of globe in
both dust loading (not shown) and deposition (Fig. 1). In
particular higher values are present in correspondence of
the main LGM-enhanced dust corridors, with declining
gradients towards their edges (see also Mahowald et al.
2011). This suggests that spatial variability is important
when considering the LGM/current deposition ratios.
A map of lifetime of mineral dust (Fig. 8a–c) suggests a
generalized slight increase in dust lifetimes over large areas
of the Southern Ocean, possibly linked to the reduced
Fig. 8 Dust atmospheric lifetimes (days), calculated as a ratio between dust loading and deposition ratio at each grid cell. a Current climate
simulation. b LGM climate simulation. c LGM/current ratio
S. Albani et al.: Comparing modeled and observed changes 1743
123
precipitation frequency, in accordance with long-term
CCSM3 simulations (Rojas et al. 2009; Mahowald et al.
2011). Precipitation frequency appears more important that
total precipitation for wet deposition lifetime (see discus-
sion in Mahowald et al. 2011). Interestingly, a decrease in
lifetimes is evident in large areas over Antarctica (with the
exception of the interior of central East Antarctic plateau).
This is likely to be related to the lower levels of the dust
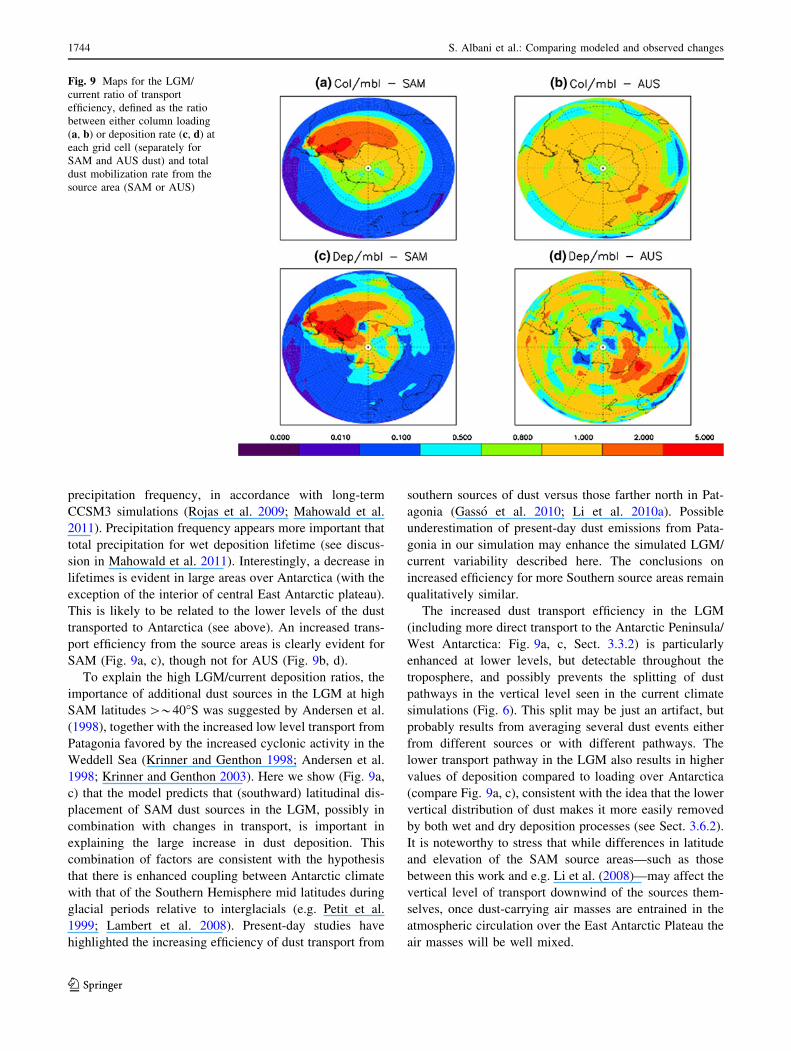
transported to Antarctica (see above). An increased trans-
port efficiency from the source areas is clearly evident for
SAM (Fig. 9a, c), though not for AUS (Fig. 9b, d).
To explain the high LGM/current deposition ratios, the
importance of additional dust sources in the LGM at high
SAM latitudes [*40�S was suggested by Andersen et al.
(1998), together with the increased low level transport from
Patagonia favored by the increased cyclonic activity in the
Weddell Sea (Krinner and Genthon 1998; Andersen et al.
1998; Krinner and Genthon 2003). Here we show (Fig. 9a,
c) that the model predicts that (southward) latitudinal dis-
placement of SAM dust sources in the LGM, possibly in
combination with changes in transport, is important in
explaining the large increase in dust deposition. This
combination of factors are consistent with the hypothesis
that there is enhanced coupling between Antarctic climate
with that of the Southern Hemisphere mid latitudes during
glacial periods relative to interglacials (e.g. Petit et al.
1999; Lambert et al. 2008). Present-day studies have
highlighted the increasing efficiency of dust transport from
southern sources of dust versus those farther north in Pat-
agonia (Gasso et al. 2010; Li et al. 2010a). Possible
underestimation of present-day dust emissions from Pata-
gonia in our simulation may enhance the simulated LGM/
current variability described here. The conclusions on
increased efficiency for more Southern source areas remain
qualitatively similar.
The increased dust transport efficiency in the LGM
(including more direct transport to the Antarctic Peninsula/
West Antarctica: Fig. 9a, c, Sect. 3.3.2) is particularly
enhanced at lower levels, but detectable throughout the
troposphere, and possibly prevents the splitting of dust
pathways in the vertical level seen in the current climate
simulations (Fig. 6). This split may be just an artifact, but
probably results from averaging several dust events either
from different sources or with different pathways. The
lower transport pathway in the LGM also results in higher
values of deposition compared to loading over Antarctica
(compare Fig. 9a, c), consistent with the idea that the lower
vertical distribution of dust makes it more easily removed
by both wet and dry deposition processes (see Sect. 3.6.2).
It is noteworthy to stress that while differences in latitude
and elevation of the SAM source areas—such as those
between this work and e.g. Li et al. (2008)—may affect the
vertical level of transport downwind of the sources them-
selves, once dust-carrying air masses are entrained in the
atmospheric circulation over the East Antarctic Plateau the
air masses will be well mixed.
Fig. 9 Maps for the LGM/
current ratio of transport
efficiency, defined as the ratio
between either column loading
(a, b) or deposition rate (c, d) at
each grid cell (separately for
SAM and AUS dust) and total
dust mobilization rate from the
source area (SAM or AUS)
1744 S. Albani et al.: Comparing modeled and observed changes
123
So several mechanisms likely work together to produce
the higher dust deposition in the LGM: larger dust mobi-
lization, enhanced transport efficiency from Southern
Patagonia, less vertical mixing (see also Mahowald et al.
2006), less wet deposition removal en route and more
efficient scavenging over Antarctica, due to lower transport
levels.
3.5 Seasonality
Here we briefly review the seasonal signals described
throughout the work in comparison with observations, to
check the consistency of our results.
3.5.1 Seasonality: dust mobilization and transport
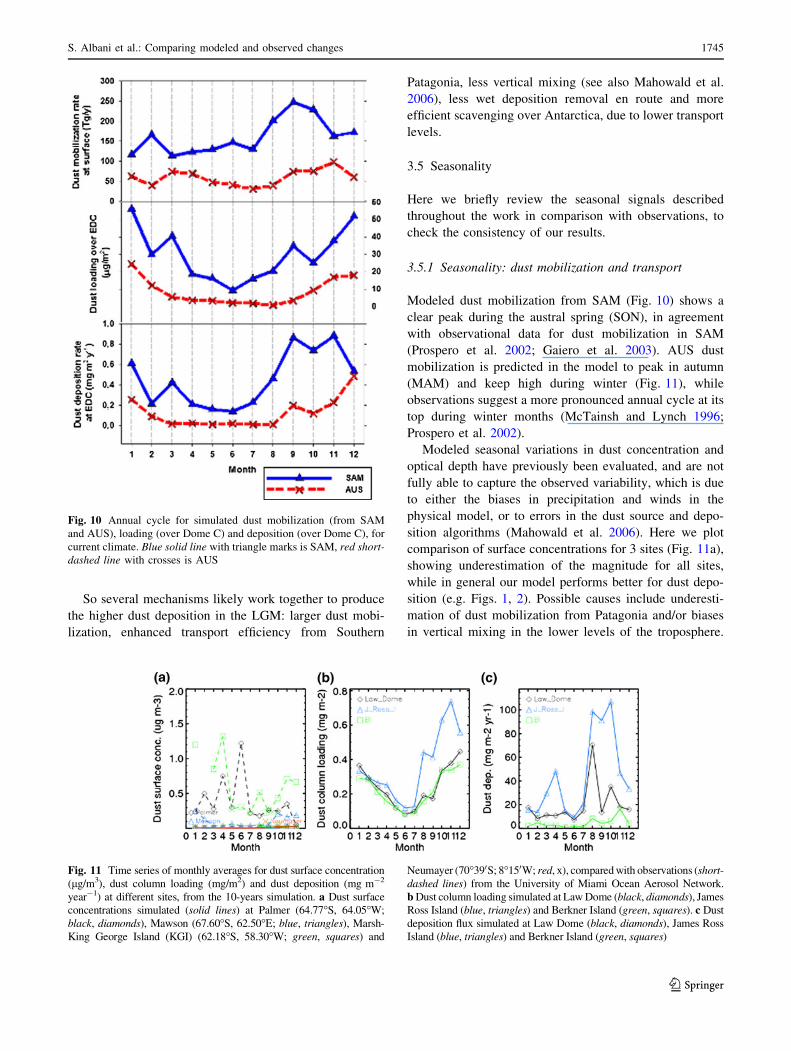
Modeled dust mobilization from SAM (Fig. 10) shows a
clear peak during the austral spring (SON), in agreement
with observational data for dust mobilization in SAM
(Prospero et al. 2002; Gaiero et al. 2003). AUS dust
mobilization is predicted in the model to peak in autumn
(MAM) and keep high during winter (Fig. 11), while
observations suggest a more pronounced annual cycle at its
top during winter months (McTainsh and Lynch 1996;
Prospero et al. 2002).
Modeled seasonal variations in dust concentration and
optical depth have previously been evaluated, and are not
fully able to capture the observed variability, which is due
to either the biases in precipitation and winds in the
physical model, or to errors in the dust source and depo-
sition algorithms (Mahowald et al. 2006). Here we plot
comparison of surface concentrations for 3 sites (Fig. 11a),
showing underestimation of the magnitude for all sites,
while in general our model performs better for dust depo-
sition (e.g. Figs. 1, 2). Possible causes include underesti-
mation of dust mobilization from Patagonia and/or biases
in vertical mixing in the lower levels of the troposphere.
Fig. 10 Annual cycle for simulated dust mobilization (from SAM
and AUS), loading (over Dome C) and deposition (over Dome C), for
current climate. Blue solid line with triangle marks is SAM, red short-dashed line with crosses is AUS
Fig. 11 Time series of monthly averages for dust surface concentration
(lg/m3), dust column loading (mg/m2) and dust deposition (mg m-2
year-1) at different sites, from the 10-years simulation. a Dust surface
concentrations simulated (solid lines) at Palmer (64.77�S, 64.05�W;
black, diamonds), Mawson (67.60�S, 62.50�E; blue, triangles), Marsh-
King George Island (KGI) (62.18�S, 58.30�W; green, squares) and
Neumayer (70�390S; 8�150W; red, x), compared with observations (short-dashed lines) from the University of Miami Ocean Aerosol Network.
b Dust column loading simulated at Law Dome (black, diamonds), James
Ross Island (blue, triangles) and Berkner Island (green, squares). c Dust
deposition flux simulated at Law Dome (black, diamonds), James Ross
Island (blue, triangles) and Berkner Island (green, squares)
S. Albani et al.: Comparing modeled and observed changes 1745
123
Simulations (Fig. 11a) show agreement for the seasonal
cycle at Mawson, but not at Palmer nor (for the limited
observations available) at King George Island. Previous
works also showed simulated summer maxima agreeing
with observations at Mawson (Lunt and Valdes 2002b;
Tanaka and Chiba 2006; Li et al. 2008), but not at Palmer
(Lunt and Valdes 2002b). In addition we show (Fig. 11a)
the simulated average annual cycle of dust surface con-
centration at Neumayer, that shows spring/summer maxima
and winter minima, in agreement with the main seasonal
cycle of Lanthanum-based observations (Weller et al.
2008). Summer maxima were clearly identified from aer-
osol sampling at South Pole, Neumayer Station and the
Antarctic Peninsula (Cunningham and Zoller 1981; Weller
et al. 2008).
For the current climate simulations, the seasonal pattern
of dust loading around and above Antarctica for both SAM
(Figs. 4, 5) and AUS is higher in spring (SON) and in
summer (DJF) with winter (JJA) minima, visible also from
a selection of specific sites on the margins of Antarctica
(Fig. 11b). In autumn (MAM), despite the relatively high
mobilization rate for AUS (Fig. 10), dust transport towards
high latitudes is not maximum (Fig. 4), suggesting that
transport impacts the seasonal cycle of dust over
Antarctica.
Winter and spring storms transport heat, and constitu-
ents towards to the polar regions. On the Antarctic conti-
nent, while surface wind directions in summer differ only
slightly from that observed during the winter, wind speeds
display pronounced seasonal differences, showing winter
maxima. Therefore, as the continent cools, drainage flows
intensify and northward low-level mass fluxes from Ant-
arctica increase. This results in an overall summertime air
mass loading and in a wintertime mass transport away from
the edges of Antarctica, counterbalanced by broad subsi-
dence occurring over the continent (Parish and Bromwich
2007).
3.5.2 Seasonality: dust deposition
A seasonal cycle is evident for dust loading, and less
pronouncedly also for dust deposition flux (Figs. 10, 11b,
c). The picture is qualitatively similar for all ice core sites
analyzed. In the case of LGM simulations we still have a
seasonal cycle, though less well-defined, especially in the
case of dust deposition (not shown).
We compare our results (Figs. 10, 11c) to the limited
observations. Direct observations of dust deposition in
Antarctica are very difficult because of the very low
atmospheric concentrations and deposition rates (Bigler
et al. 2006). Although the first observations of seasonal
cycle in dust concentrations suggested winter peaks
(Thompson 1975) later studies questioned this first
evidence (Thompson 1977; Mumford and Peel 1982 and
references therein). Winter deposition maxima were also
suggested later, based on non-sea salt calcium proxies with
large uncertainties (Sommer et al. 2000). Recently it was
shown, based on trace metals analysis, that the dust
depositional annual cycle at Law Dome shows spring and
autumn maxima and winter minima (Burn-Nunes et al.
2011), while our simulation indicates winter minima in
June followed by late winter/spring maxima (Fig. 11c).
Similarly, our model simulates late winter/spring maxima
at JRI, quite similar to Aluminum-based observations
indicating the peak season in late winter (McConnell et al.
2007). A clear seasonal cycle has been recently observed
from snow-pits at Berkner Island, with summer maxima in
dust deposition, attributed to Southern South American
sources, based on isotopic composition (Bory et al. 2010),
in agreement with our simulation (Fig. 11c).
Previous modeling work showed summertime maxima
in some dust studies (e.g. Genthon 1992; Lunt and Valdes
2002b), but idealized tracers show maxima in wintertime
(Krinner et al. 2010), while transport efficiency was esti-
mated to be maximum in winter (Lunt and Valdes 2001).
Differences appear in coastal versus inland sites.
3.6 Variations in dust size
3.6.1 Model results versus observations
Mineral dust records from ice cores include size distribu-
tion, often described by either a lognormal (Royer et al.
1983) or a Weibull distribution (Delmonte et al. 2004a)
with modal diameter around 1.5–2.0 lm (Royer et al.
1983). The small dimensions of the particles derive from
deposition processes that are responsible for size fraction-
ation during long range transport, increasing the fraction of
small particles with increasing atmospheric residence time
(Junge 1977; Tegen and Lacis 1996).
Variations in dust size with changing climate conditions
have been observed, with shifts towards either finer or
coarser dimensions in colder climates depending on the site
(e.g. Ruth et al. 2003; Delmonte et al. 2004a). These size
variations have been tentatively attributed to changes in the
intensity and/or patterns of the atmospheric circulation in
different climatic conditions (Junge 1977; Delmonte et al.
2004a), but other mechanisms such as deposition processes
(Unnerstad and Hansson 2001) or size altering in-cloud
processing (Wurzler et al. 2000) are likely involved and an
attribution of the relative importance of all these aspects to
determine the features shown by observations is still
uncertain (Ruth et al. 2003; Fischer et al. 2007).
In Antarctica an opposite response to climatic changes
of dust deposited at Vostok and Dome B (coarser in LGM)
compared to EDC and Komsomolskaya (finer in LGM) was
1746 S. Albani et al.: Comparing modeled and observed changes
123
observed (Delmonte et al. 2004a). The association of finer
particles with cold climates and relatively coarse ones with
warmer climates was shown to hold at EDC for eight
glacial-interglacial cycles (Lambert et al. 2008). Pre-
liminary results from EDML seem to indicate rather similar
particle size during the Holocene and the LGM, but with
individual coarse-particle events occurring mainly during
the Holocene (Fischer et al. 2007).
In the present study the model includes dust in 4 size bins:
bin1 = 0.1–1.0 lm; bin2 = 1.0–2.5 lm; bin3 = 2.5–5.0 lm;
bin4 = 5.0–10.0 lm. In order to describe variations in dust size
we use the bin2/bin3 (b2/b3) ratio as a metric, with high values of
b2/b3 indicating abundance of fine particles. The choice is
motivated to focus on the 1–5 lm range, similar to the obser-
vational range.
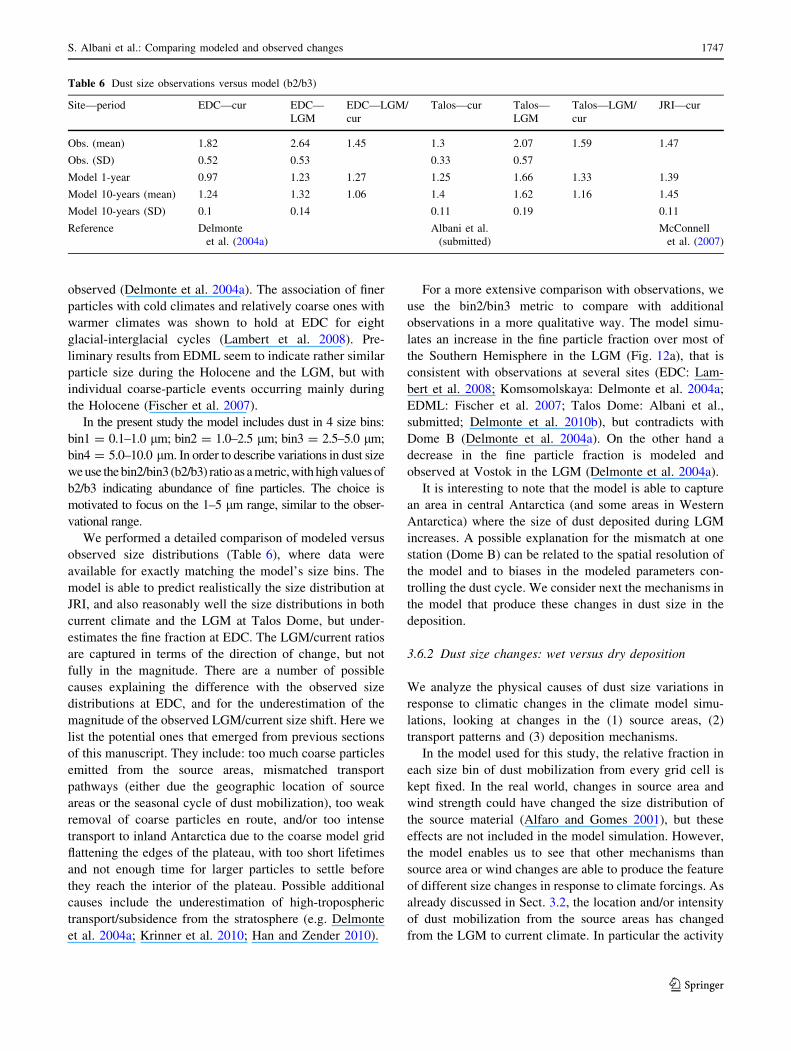
We performed a detailed comparison of modeled versus
observed size distributions (Table 6), where data were
available for exactly matching the model’s size bins. The
model is able to predict realistically the size distribution at
JRI, and also reasonably well the size distributions in both
current climate and the LGM at Talos Dome, but under-
estimates the fine fraction at EDC. The LGM/current ratios
are captured in terms of the direction of change, but not
fully in the magnitude. There are a number of possible
causes explaining the difference with the observed size
distributions at EDC, and for the underestimation of the
magnitude of the observed LGM/current size shift. Here we
list the potential ones that emerged from previous sections
of this manuscript. They include: too much coarse particles
emitted from the source areas, mismatched transport
pathways (either due the geographic location of source
areas or the seasonal cycle of dust mobilization), too weak
removal of coarse particles en route, and/or too intense
transport to inland Antarctica due to the coarse model grid
flattening the edges of the plateau, with too short lifetimes
and not enough time for larger particles to settle before
they reach the interior of the plateau. Possible additional
causes include the underestimation of high-tropospheric
transport/subsidence from the stratosphere (e.g. Delmonte
et al. 2004a; Krinner et al. 2010; Han and Zender 2010).
For a more extensive comparison with observations, we
use the bin2/bin3 metric to compare with additional
observations in a more qualitative way. The model simu-
lates an increase in the fine particle fraction over most of
the Southern Hemisphere in the LGM (Fig. 12a), that is
consistent with observations at several sites (EDC: Lam-
bert et al. 2008; Komsomolskaya: Delmonte et al. 2004a;
EDML: Fischer et al. 2007; Talos Dome: Albani et al.,
submitted; Delmonte et al. 2010b), but contradicts with
Dome B (Delmonte et al. 2004a). On the other hand a
decrease in the fine particle fraction is modeled and
observed at Vostok in the LGM (Delmonte et al. 2004a).
It is interesting to note that the model is able to capture
an area in central Antarctica (and some areas in Western
Antarctica) where the size of dust deposited during LGM
increases. A possible explanation for the mismatch at one
station (Dome B) can be related to the spatial resolution of
the model and to biases in the modeled parameters con-
trolling the dust cycle. We consider next the mechanisms in
the model that produce these changes in dust size in the
deposition.
3.6.2 Dust size changes: wet versus dry deposition
We analyze the physical causes of dust size variations in
response to climatic changes in the climate model simu-
lations, looking at changes in the (1) source areas, (2)
transport patterns and (3) deposition mechanisms.
In the model used for this study, the relative fraction in
each size bin of dust mobilization from every grid cell is
kept fixed. In the real world, changes in source area and
wind strength could have changed the size distribution of
the source material (Alfaro and Gomes 2001), but these
effects are not included in the model simulation. However,
the model enables us to see that other mechanisms than
source area or wind changes are able to produce the feature
of different size changes in response to climate forcings. As
already discussed in Sect. 3.2, the location and/or intensity
of dust mobilization from the source areas has changed
from the LGM to current climate. In particular the activity
Table 6 Dust size observations versus model (b2/b3)
Site—period EDC—cur EDC—
LGM
EDC—LGM/
cur
Talos—cur Talos—
LGM
Talos—LGM/
cur
JRI—cur
Obs. (mean) 1.82 2.64 1.45 1.3 2.07 1.59 1.47
Obs. (SD) 0.52 0.53 0.33 0.57
Model 1-year 0.97 1.23 1.27 1.25 1.66 1.33 1.39
Model 10-years (mean) 1.24 1.32 1.06 1.4 1.62 1.16 1.45
Model 10-years (SD) 0.1 0.14 0.11 0.19 0.11
Reference Delmonte
et al. (2004a)
Albani et al.
(submitted)
McConnell
et al. (2007)
S. Albani et al.: Comparing modeled and observed changes 1747
123
of glaciogenic sources in Southern SAM markedly
decreased since the LGM.
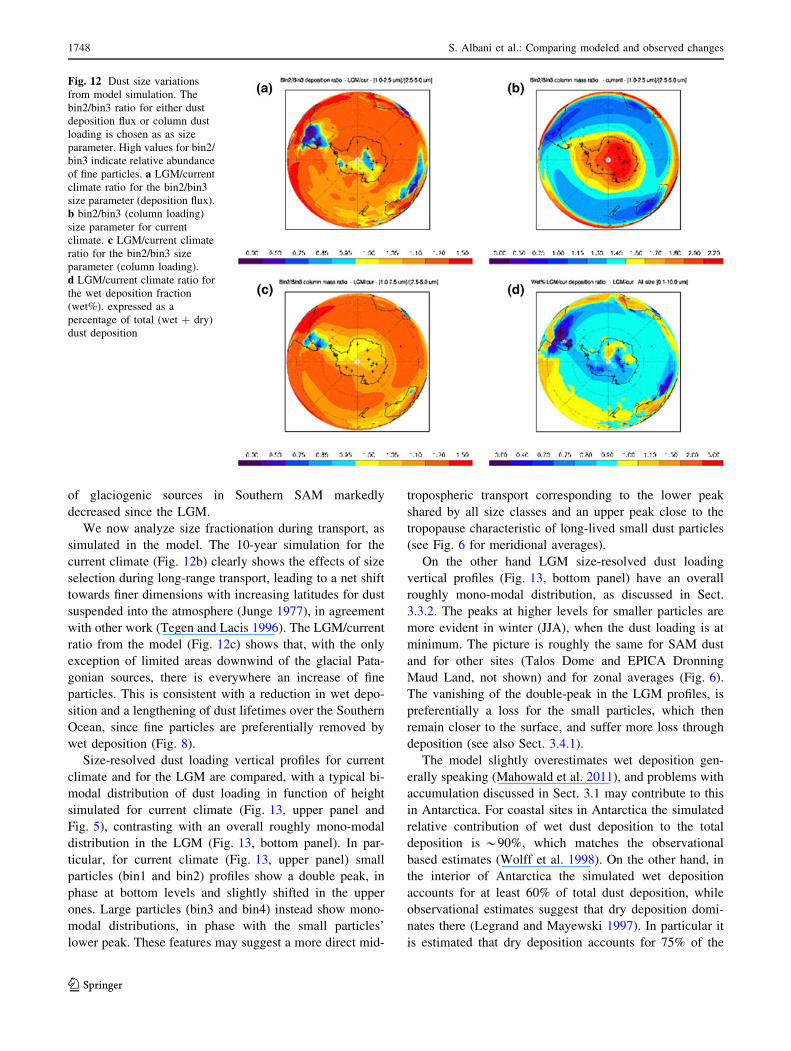
We now analyze size fractionation during transport, as
simulated in the model. The 10-year simulation for the
current climate (Fig. 12b) clearly shows the effects of size
selection during long-range transport, leading to a net shift
towards finer dimensions with increasing latitudes for dust
suspended into the atmosphere (Junge 1977), in agreement
with other work (Tegen and Lacis 1996). The LGM/current
ratio from the model (Fig. 12c) shows that, with the only
exception of limited areas downwind of the glacial Pata-
gonian sources, there is everywhere an increase of fine
particles. This is consistent with a reduction in wet depo-
sition and a lengthening of dust lifetimes over the Southern
Ocean, since fine particles are preferentially removed by
wet deposition (Fig. 8).
Size-resolved dust loading vertical profiles for current
climate and for the LGM are compared, with a typical bi-
modal distribution of dust loading in function of height
simulated for current climate (Fig. 13, upper panel and
Fig. 5), contrasting with an overall roughly mono-modal
distribution in the LGM (Fig. 13, bottom panel). In par-
ticular, for current climate (Fig. 13, upper panel) small
particles (bin1 and bin2) profiles show a double peak, in
phase at bottom levels and slightly shifted in the upper
ones. Large particles (bin3 and bin4) instead show mono-
modal distributions, in phase with the small particles’
lower peak. These features may suggest a more direct mid-
tropospheric transport corresponding to the lower peak
shared by all size classes and an upper peak close to the
tropopause characteristic of long-lived small dust particles
(see Fig. 6 for meridional averages).
On the other hand LGM size-resolved dust loading
vertical profiles (Fig. 13, bottom panel) have an overall
roughly mono-modal distribution, as discussed in Sect.
3.3.2. The peaks at higher levels for smaller particles are
more evident in winter (JJA), when the dust loading is at
minimum. The picture is roughly the same for SAM dust
and for other sites (Talos Dome and EPICA Dronning
Maud Land, not shown) and for zonal averages (Fig. 6).
The vanishing of the double-peak in the LGM profiles, is
preferentially a loss for the small particles, which then
remain closer to the surface, and suffer more loss through
deposition (see also Sect. 3.4.1).
The model slightly overestimates wet deposition gen-
erally speaking (Mahowald et al. 2011), and problems with
accumulation discussed in Sect. 3.1 may contribute to this
in Antarctica. For coastal sites in Antarctica the simulated
relative contribution of wet dust deposition to the total
deposition is *90%, which matches the observational
based estimates (Wolff et al. 1998). On the other hand, in
the interior of Antarctica the simulated wet deposition
accounts for at least 60% of total dust deposition, while
observational estimates suggest that dry deposition domi-
nates there (Legrand and Mayewski 1997). In particular it
is estimated that dry deposition accounts for 75% of the
Fig. 12 Dust size variations
from model simulation. The
bin2/bin3 ratio for either dust
deposition flux or column dust
loading is chosen as as size
parameter. High values for bin2/
bin3 indicate relative abundance
of fine particles. a LGM/current
climate ratio for the bin2/bin3
size parameter (deposition flux).
b bin2/bin3 (column loading)
size parameter for current
climate. c LGM/current climate
ratio for the bin2/bin3 size
parameter (column loading).
d LGM/current climate ratio for
the wet deposition fraction
(wet%), expressed as a
percentage of total (wet ? dry)
dust deposition
1748 S. Albani et al.: Comparing modeled and observed changes
123
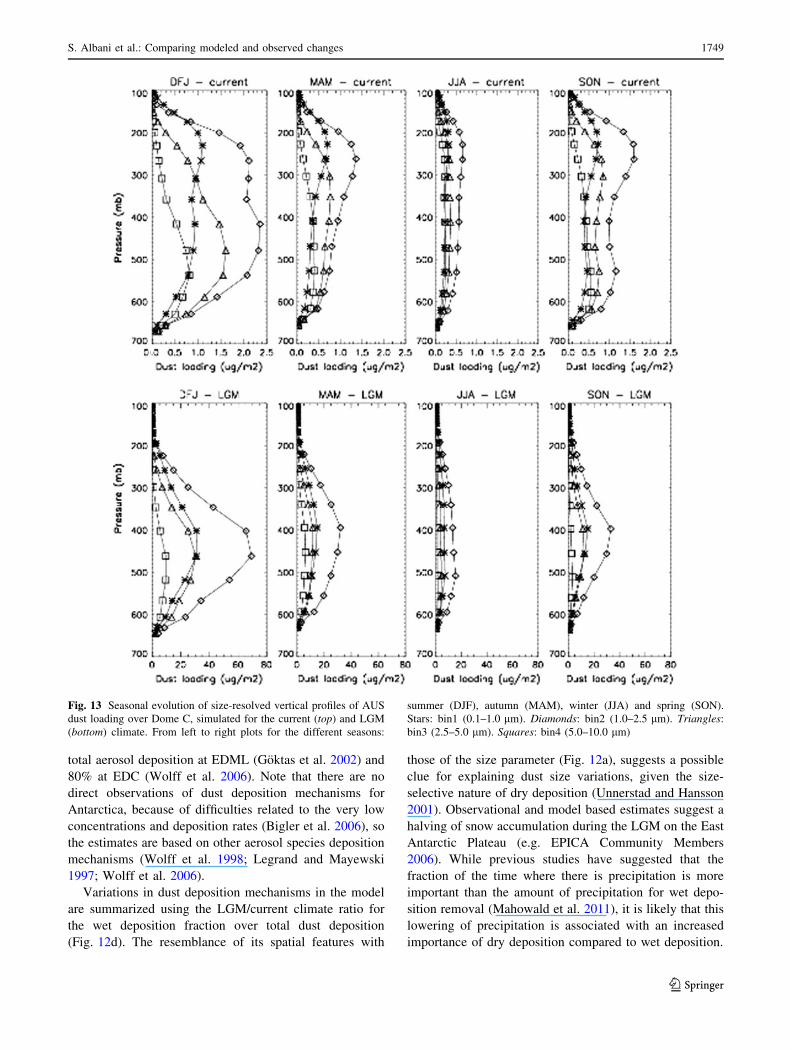
total aerosol deposition at EDML (Goktas et al. 2002) and
80% at EDC (Wolff et al. 2006). Note that there are no
direct observations of dust deposition mechanisms for
Antarctica, because of difficulties related to the very low
concentrations and deposition rates (Bigler et al. 2006), so
the estimates are based on other aerosol species deposition
mechanisms (Wolff et al. 1998; Legrand and Mayewski
1997; Wolff et al. 2006).
Variations in dust deposition mechanisms in the model
are summarized using the LGM/current climate ratio for
the wet deposition fraction over total dust deposition
(Fig. 12d). The resemblance of its spatial features with
those of the size parameter (Fig. 12a), suggests a possible
clue for explaining dust size variations, given the size-
selective nature of dry deposition (Unnerstad and Hansson
2001). Observational and model based estimates suggest a
halving of snow accumulation during the LGM on the East
Antarctic Plateau (e.g. EPICA Community Members
2006). While previous studies have suggested that the
fraction of the time where there is precipitation is more
important than the amount of precipitation for wet depo-
sition removal (Mahowald et al. 2011), it is likely that this
lowering of precipitation is associated with an increased
importance of dry deposition compared to wet deposition.
Fig. 13 Seasonal evolution of size-resolved vertical profiles of AUS
dust loading over Dome C, simulated for the current (top) and LGM
(bottom) climate. From left to right plots for the different seasons:
summer (DJF), autumn (MAM), winter (JJA) and spring (SON).
Stars: bin1 (0.1–1.0 lm). Diamonds: bin2 (1.0–2.5 lm). Triangles:
bin3 (2.5–5.0 lm). Squares: bin4 (5.0–10.0 lm)
S. Albani et al.: Comparing modeled and observed changes 1749
123
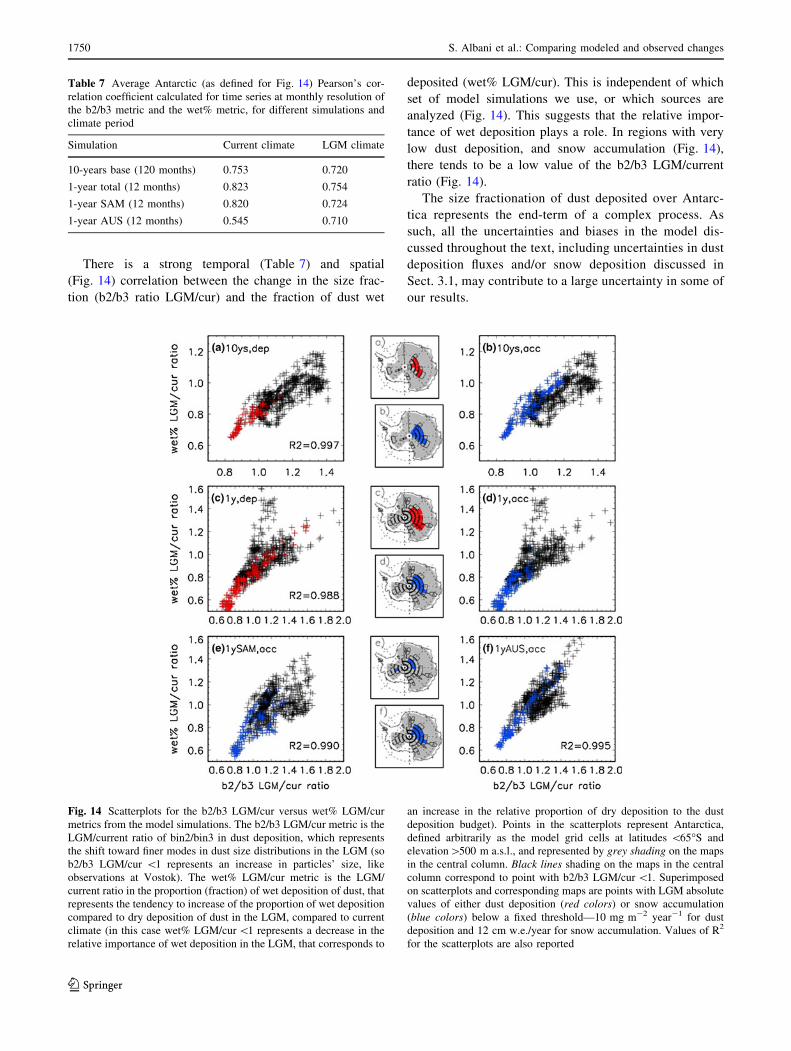
There is a strong temporal (Table 7) and spatial
(Fig. 14) correlation between the change in the size frac-
tion (b2/b3 ratio LGM/cur) and the fraction of dust wet
deposited (wet% LGM/cur). This is independent of which
set of model simulations we use, or which sources are
analyzed (Fig. 14). This suggests that the relative impor-
tance of wet deposition plays a role. In regions with very
low dust deposition, and snow accumulation (Fig. 14),
there tends to be a low value of the b2/b3 LGM/current
ratio (Fig. 14).
The size fractionation of dust deposited over Antarc-
tica represents the end-term of a complex process. As
such, all the uncertainties and biases in the model dis-
cussed throughout the text, including uncertainties in dust
deposition fluxes and/or snow deposition discussed in
Sect. 3.1, may contribute to a large uncertainty in some of
our results.
Table 7 Average Antarctic (as defined for Fig. 14) Pearson’s cor-
relation coefficient calculated for time series at monthly resolution of
the b2/b3 metric and the wet% metric, for different simulations and
climate period
Simulation Current climate LGM climate
10-years base (120 months) 0.753 0.720
1-year total (12 months) 0.823 0.754
1-year SAM (12 months) 0.820 0.724
1-year AUS (12 months) 0.545 0.710
Fig. 14 Scatterplots for the b2/b3 LGM/cur versus wet% LGM/cur
metrics from the model simulations. The b2/b3 LGM/cur metric is the
LGM/current ratio of bin2/bin3 in dust deposition, which represents
the shift toward finer modes in dust size distributions in the LGM (so
b2/b3 LGM/cur \1 represents an increase in particles’ size, like
observations at Vostok). The wet% LGM/cur metric is the LGM/
current ratio in the proportion (fraction) of wet deposition of dust, that
represents the tendency to increase of the proportion of wet deposition
compared to dry deposition of dust in the LGM, compared to current
climate (in this case wet% LGM/cur \1 represents a decrease in the
relative importance of wet deposition in the LGM, that corresponds to
an increase in the relative proportion of dry deposition to the dust
deposition budget). Points in the scatterplots represent Antarctica,
defined arbitrarily as the model grid cells at latitudes \65�S and
elevation[500 m a.s.l., and represented by grey shading on the maps
in the central column. Black lines shading on the maps in the central
column correspond to point with b2/b3 LGM/cur \1. Superimposed
on scatterplots and corresponding maps are points with LGM absolute
values of either dust deposition (red colors) or snow accumulation
(blue colors) below a fixed threshold—10 mg m-2 year-1 for dust
deposition and 12 cm w.e./year for snow accumulation. Values of R2
for the scatterplots are also reported
1750 S. Albani et al.: Comparing modeled and observed changes
123
4 Conclusions
The focus of this work is the variations in dust deposition
fluxes, grain size and provenance in simulations of the
current and the Last Glacial Maximum climates, compared
with available data. The model provides a self-consistent
framework for explaining the changes in deposition and
deposited particles, although the model results may be in
error.
We compare simulated deposition rates and dust con-
centrations in ice cores with observations, including most
recent available data. As previously shown (Mahowald
et al. 2006) the model is able to capture the magnitude
order of those parameters, for both LGM and current cli-
mate, though capturing the spatial distribution of the LGM/
current ratio in dust deposition tends to be difficult, even
after tuning the source activity. The case-to-case differ-
ences are of diverse amplitude and may be attributed to
biases and uncertainties in models and observations, and to
some extent are also inherent in the comparison itself.
Transport patterns from the Southern Hemisphere dust
source areas usually follow zonal patterns, while meridio-
nal transport is controlled by eddies (Li et al. 2010a). We
suggest here that access points to Antarctica are located in
specific areas characterized by southward displacement of
air masses (Parish and Bromwich 2007), with subsequent
mixing and redistribution of dust within the Antarctic
atmospheric circulation. This process appears controlled by
the Antarctic atmospheric circulation, and it is character-
ized by an annual seasonal cycle showing austral summer
maxima for meridional dust transport.
In some locations in the Southern Ocean and Antarctic,
there are large increases in deposition between the LGM
and current climate, and this is quite spatially diverse in
relation to specific source areas. The increase in source
strength is not expected to be the same as the increase in
deposition seen everywhere downwind since the atmo-
sphere is 3-dimensional, and sources and transport path-
ways can vary with climate change. In particular, after
examining the possible mechanisms responsible for the
large ratios in deposition observed in the Antarctic ice
cores (e.g. Petit et al. 1999; Lambert et al. 2008), we
suggest, based on the model’s output, that multiple pro-
cesses likely act together, through an amplification chain
that finally leads to a magnification of glacial/interglacial
concentration ratio: increased activity of the source areas,
more efficient transport, reduced en route removal and
easier deposition over Antarctica because of the lower
levels of transport. This latter mechanism in particular is
related to the preferential concentration of airborne dust in
the lower levels of the troposphere above Antarctica.
Finally, we show for the first time a comparison between
model results and the observed spatial variability of dust
size response to climate variations (Delmonte et al. 2004a).
The model is able to reproduce the increased grain size in
the LGM in some areas over central Eas Antarctica,
opposed to a generalized shift toward finer particle in the
Southern Hemisphere and over most Antarctica in partic-
ular. We analyze the possible mechanisms that could
explain this feature, and suggest that the generalized
increase in the fine fraction in the LGM was probably
related to the reduced en route wet removal. On the other
hand, a key role is also played by the relative proportion of
dry and wet deposition, an enhanced relative contribution
of dry deposition (size-selective) leading to increased
particles size in some areas.
Acknowledgments N. M. Mahowald and S. Albani acknowledge
the support of NSF-0832782, NSF-0745961, NSF-0932946, NSF-
1003509 and NASA-NNG06G127G. The computer simulations used
in this study were performed at the National Center for Atmo-
spheric Research, a National Science Foundation facility. S. Albani
acknowledges funding from ‘‘Dote ricercatori’’: FSE, Regione Lom-
bardia. We gratefully acknowledge Joseph Prospero for providing us
with dust surface concentration data from in situ measurements from
the University of Miami Ocean Aerosol Network. We would also like
to thank two anonymous reviewers for their constructive comments
that helped improving the manuscript.
References
Albani S, Delmonte B, Maggi V, Baroni C, Petit JR, Stenni B,
Mazzola C, Frezzotti M (submitted) Last glacial to Holocene
large-scale and regional atmospheric and dust changes at Talos
Dome, East Antarctica. Geophys Res Lett
Alfaro SC, Gomes L (2001) Modeling mineral aerosol production by
wind erosion: emission intensities and aerosol size distributions
in source areas. J Geophys Res 106(D16):18,075–18,084
Andersen KK, Ditlevsen PD (1998) Glacial/interglacial variations of
meridional transport and washout of dust: a one-dimensional
model. J Geophys Res 103(D8):8955–8962
Andersen KK, Armengaud A, Genthon C (1998) Atmospheric dust
under glacial and interglacial conditions. Geophys Res Lett
25(13):2281–2284
Basile I, Grousset FE, Revel M, Petit J-R, Biscaye PE, Barkov NI
(1997) Patagonian origin of glacial dust deposited in East
Antarctica (Vostok and Dome C) during glacial stages 2, 4 and 6.
Earth Planet Sci Lett 146:573–589
Bigler M, Rothlisberger R, Lambert F, Stocker TF, Wagenbach D
(2006) Aerosol deposited in East Antarctica over the last glacial
cycle: detailed apportionment of continental and sea-salt contribu-
tions. J Geophys Res 111:D08205. doi:10.1029/2005JD006469
Bory AE, Wolff E, Mulvaney R, Jagoutz E, Wegner A, Ruth U,
Elderfield H (2010) Multiple sources supply eolian mineral dust
to the Atlantic sector of coastal Antarctica: evidence from recent
snow layers at the top of Berkner Island ice sheet. Earth Planet
Sci Lett 291:138–148. doi:10.1016/j.epsl.2010.01.006
Burn-Nunes LJ, Vallelonga P, Loss RD, Burton GR, Moy A, Curran
M, Hong S, Smith AM, Edwards R, Morgan VI, Rosman KJR
(2011) Seasonal variability in the input of lead, barium and
indium to Law Dome, Antarctica. Geochimica et Cosmochimica
Acta 75:1–20
Collins WD, Bitz CM, Blackmon ML, Bonan GB, Bretherton CS,
Carton JA, Chang P, Doney SC, Hack JJ, Henderson TB, Kiehl
S. Albani et al.: Comparing modeled and observed changes 1751
123
JT, Large WG, McKenna DS, Santer BD, Smith RD (2006) The
community climate system model version 3 (CCSM3). J Climate
19(11):2122–2143
Cunningham WC, Zoller WH (1981) The chemical composition of
remote area aersols. J Aerosol Sci 12(4):367–384
Delaygue G, Masson V, Jouzel J, Koster RD, Healy RJ (2000) The
origin of Antarctic precipitation: a modelling approach. Tellus B
52:19–36
Delmonte B, Petit JR, Maggi V (2002) Glacial to Holocene
implications of the new 27000-year dust record from the EPICA
Dome C (East Antarctica) ice core. Clim Dyn 18:647–660. doi:
10.1007/s00382-001-0193-9
Delmonte B, Petit J-R, Andersen KK, Basile-Doelsch I, Maggi V,
Lipenkov VY (2004a) Dust size evidence for opposite regional
atmospheric circulation changes over east Antarctica during the
last climatic transition. Clim Dyn 23:427–438. doi:10.1007/
s00382-004-0450-9
Delmonte B, Basile-Doelsch I, Petit J-R, Maggi V, Revel-Rolland M,
Michard A, Jagoutz E, Grousset F (2004b) Comparing the Epica
and Vostok dust records during the last 220,000 years: strati-
graphical correlation and provenance in glacial periods. Earth-
Sci Rev 66:63–87
Delmonte B, Petit J-R, Basile-Doelsch I, Jagoutz E, Maggi V (2007)
Late Quaternary Interglacials in East Antarctica From Ice-Core
Dust Records. In: Sirocko F, Litt T, Clausen M (eds) The climate
of past interglacials. Elsevier, Amsterdam, pp 53–73
Delmonte B, Delmas RJ, Petit J-R (2008a) Comment on ‘‘Dust
provenance in Antarctic ice during glacial periods: from where
in southern South America?’’ by D. M. Gaiero. Geophys Res
Lett 35:L08707. doi:10.1029/2007GL032075
Delmonte B, Andersson PS, Hansson M, Schoberg H, Petit J-R,
Basile-Doelsch I, Maggi V (2008b) Aeolian dust in East
Antarctica (EPICA-Dome C and Vostok): provenance during
glacial ages over the last 800 kyr. Geophys Res Lett 35:L07703.
doi:10.1029/2008GL033382
Delmonte B, Andersson PS, Schoberg H, Hansson M, Petit J-R,
Delmas R, Gaiero DM, Maggi V, Frezzotti M (2010a)
Geographic provenance of aeolian dust in East Antarctica during
Pleistocene glaciations: preliminary results from Talos Dome
and comparison with East Antarctic and new Andean ice core
data. Quat Sci Rev. doi:10.1016/j.quascirev.2009.05.010
Delmonte B, Baroni C, Andersson PS, Schoberg H, Hansson M,
Aciego S, Petit J-R, Albani S, Mazzola C, Maggi V, Frezzotti M
(2010b) Aeolian dust in the Talos Dome ice core (East
Antarctica, Pacific/Ross Sea sector): Victoria Land versus
remote sources over the last two climate cycles. J Quat Sci. doi:
10.1002/jqs.1418
Dentener F, Carmichael G, Zhang Y, Lelieveld J, Crutzen P (1996)
Role of mineral aerosol as a reactive surface in the global
troposphere. J Geophys Res 101(D17):22869–22889
Dickerson RR, Kondragunta S, Stenchikov G, Civerolo KL, Dodd-
ridge BG, Holben BN (1997) The impact of aerosols on solar
ultraviolet radiation and photochemical smog. Science. doi:
10.1126/science.278.5339.827
EPICA community members (2004) Eight glacial cycles from an
Antarctic ice core. Nature, VOL 429, 10 JUNE 2004
EPICA Community Members (2006) One-to-one coupling of glacial
climate variability in Greenland and Antarctica. Nature
444:195–198. doi:10.1038/nature05301
Fischer H, Siggaard-Andersen ML, Ruth U, Rothlisberger R, Wolff E
(2007) Glacial/interglacial changes in mineral dust and sea-salt
records in polar ice cores: sources, transport, and deposition. Rev
Geophys 45:RG1002. doi:10.1029/2005RG000192
Frezzotti M, Urbini S, Proposito M, Scarchilli C, Gandolfi S (2007)
Spatial and temporal variability of surface mass balance near
Talos Dome, East Antarctica. J Geophys Res 112:F02032. doi:
10.1029/2006JF000638
Gabrielli P, Wegner A, Petit J-R, Delmonte B, DeDeckker P, Gaspari
V, Fisher H, Ruth U, Kriews M, Boutron C, Cescon P, Barbante
C (2010) A major glacial-interglacial change in aeolian dust
composition inferred from Rare Earth Elelments in Antarctica
ice. Quat Sci Rev. doi:10.1016/j.quascirev.2009.09.002
Gaiero DM (2008) Reply to comment by B. Delmonte et al. on ‘‘Dust
provenance in Antarctic ice during glacial periods: from where
in southern South America?’’ Geophys Res Lett 35:L08708. doi:
10.1029/2007GL032477
Gaiero DM, Probst J-L, Depetris PJ, Bidart SM, Leleyter L (2003)
Iron and other transition metals in Patagonian riverborne and
windborne materials: geochemical control and transport to the
southern South Atlantic Ocean. Geochimica et Cosmochimica
Acta 67(19):3603–3623. doi:10.1016/S0016-7037(03)00211-4
Gaiero DM, Brunet F, Probst J-L, Depretis PJ (2007) A uniform
isotopic and chemical signature of dust exported from Patagonia:
rock sources and occurrence in southern environments. Chem
Geol 238(1–2):107–120
Gasso S, Stein AF (2007) Does dust from Patagonia reach the sub-
Antarctic Atlantic Ocean? Geophys Res Lett 34:L01801. doi:
10.1029/2006GL027693
Gasso S, Stein A, Marino F, Castellano E, Udisti R, Ceratto J (2010)
A combined observational and modeling approach to study
modern dust transport from the Patagonia desert to East
Antartica. Atmos Chem Phys 10:8287–8303. doi:10.5194/acp-
10-8287-2010
Genthon C (1992) Simulations of desert dust and sea-salt aerosols in
Antarctica with a general circulation model of the atmosphere.
Tellus 44B:371–389
Ginoux P, Chin M, Tegen I, Prospero J, Holben B, Dubovik O, Lin
S-J (2001) Sources and distributions of dust aerosols simulated
with the GOCART model. J Geophys Res 106(D17):20255–
20273
Goktas F, Fischer H, Oerter H, Weller R, Sommer S, Miller H (2002)
A glacio-chemical characterization of the new EPICA deep-
drilling site on Amundsenien, Dronning Maud Land, Antarctica.
Ann Glaciol 35:347–354
Grousset FE, Biscaye PE (2005) Tracing dust sources and transport
patterns using Sr, Nd and Pb isotopes. Chem Geol 222:149–167
Grousset FE, Biscaye PE, Revel M, Petit J-R, Pye K, Joussaume S,
Jouzel J (1992) Antarctic (Dome C) ice-core dust at 18 k.y.B.P.:
Isotopic constraints on origins. Earth Planet Sci Lett 111:
175–182
Han Q, Zender CS (2010) Desert dust aerosol age characterized by
mass-age tracking of tracers. J Geophys Res 115:D22201. doi:
10.1029/2010JD014155
Haxeltine A, Prentice IC (1996) BIOME3: an equilibrium terrestrial
biosphere model based on ecophysiological constraints, resource
availability, and competition among plant functional types.
Global Biogeochem Cycles 10(4):693–709
Holben BN, Eck TF, Slutsker I, Tanre D, Buis JP, Setzer A, Vermote
E, Reagan JA, Kaufman YJ, Nakajima T, Lavenu F, Jankowiak I,
Smirnov A (1998) AERONET: a federated instrument network
and data archive for aerosol characterization. Remote Sens Env
66:1–16
Hou SG, Li YS, Xiao CD, Ren JW (2007) Recent accumulation rate at
Dome Argus, Antarctica. Chinese Sci Bull J 52(3):428–431
Jickells TD, An ZS, Andersen KK, Baker AR, Bergametti G, Brooks
N, Cao JJ, Boyd PW, Duce RA, Hunter KA, Kawahata H,
Kubilay N, LaRoche J, Liss PS, Mahowald NM, Prospero JM,
Ridgwell AJ, Tegen I, Torres R (2005) Global iron connections
between desert dust, ocean biogeochemistry, and climate.
Science 308:67. doi:10.1126/science.1105959
1752 S. Albani et al.: Comparing modeled and observed changes
123
Johnson MS, Meskhidze N, Solmon F, Gasso S, Chuang PY, Gaiero
DM, Yantosca RM, Wu S, Wang Y, Carouge C (2010) Modeling
dust and soluble iron deposition to the South Atlantic Ocean.
J Geophys Res 115:D15202. doi: 10.1029/2009JD013311
Joussaume S (1990) Three-dimensional simulations of the atmo-
spheric cycle of desert dust particles using a general circulation
model. J Geophys Res 95(D2):1909–1941
Joussaume S (1993) Paleoclimatic tracers: an investigation using an
atmospheric general circulation model under ice age condi-
tions 1. Desert Dust J Geophys Res 98(D2):2767–2805
Junge CE (1977) Processes responsible for the trace content in
precipitation. In: Isotopes and impurities in ice and snow, IAHS-
AISH Publ. 118, Int Assoc Hydrol Sci Grenoble
Kameda T, Motoyama H, Fujita S, Takahashi S (2008) Temporal and
spatial variability of surface mass balance at Dome Fuji, East
Antarctica, by the stake method from 1995 to 2006. J Glaciol
54(184):107–116
Kaufman YJ, Tanre D, Boucher O (2002) A satellite view of aerosols
in the climate system. Nature 419:215–223
Kiehl JT, Shields CA, Hack JJ, Collins WD (2006) The climate
sensitivity of the community climate system model version 3
(CCSM3). J Clim 19(11):2584–2596
King JC, Turner J (1997) Antarctic meteorology and climatology. In:
Dessler AJ, Houghton JT, Rycroft MJ (eds) Cambridge atmo-
spheric and space science series. Cambridge University Press,
Cambridge
Kohfeld KE, Harrison SP (2001) DIRTMAP: the geological record of
dust. Earth Sci Rev 54:81–114
Krinner G, Genthon C (1998) GCM simulations of the Last Glacial
Maximum surface climate of Greenland and Antarctica. Clim
Dyn 14(10):741–758
Krinner G, Genthon C (2003) Tropospheric transport of continental
tracers towards Antarctica under varying climatic conditions.
Tellus 55B:54–70
Krinner G, Petit J-R, Delmonte B (2010) Altitude of atmospheric
tracer transport towards Antarctica in present and glacial
climate. Quat Sci Rev. doi:10.1016/j.quascirev.2009.06.020
Lambert F, Delmonte B, Petit J-R, Bigler M, Kaufmann PR, Hutterli
MA, Stocker TF, Ruth U, Steffensen JP, Maggi V (2008). Dust-
climate couplings over the past 800,000 years from the EPICA
Dome C ice core. Nature 452. doi:10.1038/nature06763
Lanci L, Delmonte B, Maggi V, Petit J-R, Kent DV (2008) Ice
magnetization in the EPICA-Dome C ice core: implication for
dust sources during glacial and interglacial periods. J Geophys
Res 113:D14207. doi:10.1029/2007JD009678
Legrand M, Mayewski P (1997) Glaciochemistry of polar ice cores: a
review. Rev Geophys 35(3):219–243
Levin Z, Ganor E, Gladstein V (1996) The effects of desert particles
coated with sulfate on rain formation in the eastern Mediterra-
nean. J Appl Met 35(9):1511–1523
Li F, Ginoux P, Ramaswamy V (2008) Distribution, transport, and
deposition of mineral dust in the Southern Ocean and Antarctica:
Contribution of major sources. J Geophys Res 113:D10207. doi:
10.1029/2007JD009190
Li F, Ginoux P, Ramaswamy V (2010a) Transport of patagonian dust
to Antarctica. J Geophys Res 115:D18217. doi:10.1029/2009JD
012356
Li F, Ramaswamy V, Ginoux P, Broccoli AJ, Delworth T, Zeng F
(2010b) Toward understanding the dust deposition in Antarctica
during the Last Glacial Maximum: sensitivity studies on
plausible causes. J Geophys Res 115:D24120. doi:10.1029/2010
JD014791
Lunt DJ, Valdes PJ (2001) Dust transport to Dome C, Antarctica, at
the Last Glacial Maximum and present day. Geophys Res Lett
28(2):295–298
Lunt DJ, Valdes PJ (2002a) Dust deposition and provenance at the
Last Glacial Maximum and present day. Geophys Res Lett. doi:
10.1029/2002GL015656
Lunt DJ, Valdes PJ (2002b) The modern dust cycle: comparison of
model results with observations and study of sensitivities.
J Geophys Res 107:D23. doi:10.1029/2002JD002316
Mahowald NM (2007) Anthropocene changes in desert area: Sensi-
tivity to climate model predictions. Geophys Res Lett
34:L18817. doi:10.1029/2007GL030472
Mahowald NM, et al (2008) Global distribution of atmospheric
phosphorus sources, concentrations and deposition rates, and
anthropogenic impacts. Global Biogeochem Cycles 22:GB4026.
doi:10.1029/2008GB003240
Mahowald N, Kohfeld K, Hansson M, Balkanski Y, Harrison SP,
Prentice IC, Schulz M, Rodhe H (1999) Dust sources and
deposition during the Last Glacial Maximum and current
climate: a comparison of model results with paleodata from ice
cores and marine sediments. J Geophys Res 104(D13):15895–
15916
Mahowald NM, Muhs DR, Levis S, Rasch PJ, Yoshioka M, Zender
CS, Luo C (2006) Change in atmospheric mineral aerosols in
response to climate: last glacial period, preindustrial, modern,
and doubled carbon dioxide climates. J Geophys Res 111:
D10202
Mahowald NM, Engelstaedter S, Luo C, Sealy A, Artaxo P, Benitez-
Nelson C, Bonnet S, Chen Y, Chuang PY, Cohen DD, Dulac F,
Herut B, Johansen AM, Kubilay N, Losno R, Maenhaut W,
Paytan A, Prospero JM, Shank LM, Siefert RL (2009) Atmo-
spheric iron deposition: global distribution, variability, and
human perturbations. Ann Rev Mar Sci 1:245–278. doi:10.1146/
annurev.marine.010908.163727
Mahowald NM, Albani S, Engelstaedter S, Winckler G, Goman M
(2011) Model insight into paleodust records. Quat Sci Rev
30(7–8):832–854
Marino F, Castellano E, Ceccato D, De Deckker P, Delmonte B,
Ghermanti G, Maggi V, Petit J-R, Revel-Rolland M, Udisti R
(2008) Defining the geochemical composition of the EPICA
Dome C ice core dust during the last glacial-interglacial cycle.
Geochem Geophys Geosyst 9:Q10018. doi:10.1029/2008GC00
2023
Marino F, Castellano E, Nava S, Chiari M, Ruth U, Wegner A,
Lucarelli F, Udisti R, Delmonte B, Maggi V (2009) Coherentcomposition of glacial dust on opposite sides of the East
Antarctic Plateau inferred from the deep EPICA ice cores.
Geophys Res Lett 36:L23703. doi:10.1029/2009GL040732
Martin JH, Gordon RM, Fitzwater SE (1990) Iron in Antarctic waters.
Nature 353(6340):123
Martınez-Garcıa A, Rosell-Mele A, Geibert W, Gersonde R, Masque
P, Gaspari V, Barbante C (2009) Links between iron supply,
marine productivity, sea surface temperature, and CO2 over the
last 1.1 Ma. Paleoceanography 24:PA1207. doi:10.1029/2008PA
001657
Masson-Delmotte V, Stenni B, Pol K, Braconnot P, Cattani O,
Falourd S, Kageyama M, Jouzel J, Landais A, Minster B,
Barnola JM, Chappellaz J, Krinner G, Johnsen S, Rothlisberger
R, Hansen J, Mikolajewicz U, Otto-Bliesner B (2010) EPICA
Dome C record of glacial and interglacial intensities. Quat Sci
Rev 29:113–128. doi:10.1016/j.quascirev.2009.09.030
McConnell JR, Aristarain AJ, Banta JR, Edwards PR, Simoes JC
(2007) 20th-Century doubling in dust archived in an Antarctic
Peninsula ice core parallels climate change and desertification in
South America. PNAS 104(14):5743–5748
McTainsh GH, Lynch AW (1996) Quantitative estimates of the effect
of climate change on dust storm activity in Australia during the
Last Glacial Maximum. Geomorphology 17:263–271
S. Albani et al.: Comparing modeled and observed changes 1753
123
Miller RL, Tegen I (1998) Climate response to soil dust aerosols.
J Clim 11(12):3247–3267
Mumford JW, Peel DA (1982) Microparticles, marine salts and stable
isotopes in a shallow firn core from the Antarctic Peninsula. Br
Antarct Surv Bull 56:37–47
Noone D, Simmonds I (2002) Annular variations in moisture transport
mechanisms and the abundance of d18O in Antarctic snow.
J Geophys Res 107:D24. doi:10.1029/2002JD002262
Otto-Bliesner BE, Brady EC, Clauzet G, Tomas R, Levis S,
Kothavala Z (2006) Last Glacial Maximum and holocene
climate in CCSM3. J Clim 19:2526–2544
Parish TR, Bromwich DH (2007) Reexamination of the near-surface
airflow over the antarctic continent and implications on atmo-
spheric circulations at high southern latitudes. Mon Weather Rev
135(5):1961–1973. doi: 10.1175/MWR3374.1
Penner JE et al (2001) Aerosols, their direct and indirect effect. In:
Houghton JT et al (eds) Climate change 2001: the scientific
basis. Cambridge University Press, New York
Petit J-R, Jouzel J, Raynaud D, Barkov NI, Barnola JM, Basile I,
Bender M, Chappellaz J, Davisk M, Delaygue G, Delmotte M,
Kotlyakov VM, Legrand M, Lipenkov VY, Lorius C, Pepin L,
Ritz C, saltzmank E, Stievenard M (1999) Climate and
atmospheric history of the past 420,000 years from the Vostok
ice core, Antarctica. Nature 399(3):429–436
Petit JR, Delmonte B (2009) A model for large glacial–interglacial
climate-induced changes in dust and sea salt concentrations in
deep ice cores (central Antarctica): palaeoclimatic implications
and prospects for refining ice core chronologies. Tellus B
61:768–790. doi: 10.1111/j.1600-0889.2009.00437.x
Prospero JM, Lamb PJ (2003) African droughts and dust transport to
the caribbean: climate change implications. Science 302(5647):
1024–1027. doi: 10.1126/science.1089915
Prospero JM, Ginoux P, Torres O, Nicholson SE, Gill TE (2002)
Environmental characterization of global sources of atmospheric
soil dust identified with the Nimbus 7 Total Ozone mapping
spectrometer (TOMS) Absorbing Aerosol Product Rev Geophys
40(1):1002. doi:10.1029/2000RG000095
Revel-Rolland M, De Deckker P, Delmonte P, Hesse PP, Magee JW,
Basile-Doelsch I, Grousset F, Bosch D (2006) Eastern Australia:
a possible source of dust in East Antarctica interglacial ice. Earth
Planet Sci Lett 249:1–13
Rojas M, Moreno P, Kageyama M, Crucifix M, Hewitt C, Abe-Ouchi
A, Ohgaito R, Brady EC, Hope P (2009) The Southern
Westerlies during the Last Glacial Maximum in PMIP2 simu-
lations. Clim Dyn 32:525–548. doi:10.1007/s00382-008-0421-7
Rosenfeld D, Rudich Y, Lahav R (2001) Desert dust suppressing
precipitation: a possible desertification feedback loop. PNAS
98(11):5975–5980
Royer A, De Angelis M, Petit J-R (1983) A 30000 year record of
physical and optical properties of microparticles from an east
antarctic ice core and implications for paleoclimate reconstruc-
tion models. Climatic Change 5:381–412
Ruth U, Wagenbach D, Steffensen JP, Bigler M (2003) Continuous
record of microparticle concentration and size distribution in the
central Greenland NGRIP ice core during the last glacial period.
J Geophys Res 108:D3. doi:10.1029/2002JD002376
Ruth U, Barbante C, Bigler M, Delmonte B, Fischer H, Gabrielli P,
Gaspari V, Kaufmann P, Lambert F, Maggi V, Marino F, Petit
J-R, Udisti R, Wagenbach D, Wegner A, Wolff EW (2008)
Proxies and Measurement Techniques for Mineral Dust in
Antarctic Ice Cores. Environ Sci Technol 42 (15): 5675–5681,
doi: 10.1021/es703078z
Siggaard-Andersen M-L, Gabrielli P, Steffensen JP, Strømfeldt T,
Barbante C, Boutron C, Fischer H, Miller H (2007) Soluble and
insoluble lithium dust in the EPICA DomeC ice core–implica-
tions for changes of the East Antarctic dust provenance during
the recent glacial–interglacial transition. Earth Planet Sci Lett
258:32–43
Smirnov A, Holben BN, Savoie D, Prospero JM, Kaufman YJ, Tanre
D, Eck TF, Slutsker I (2000) Relationship between column
aerosol optical thickness and in situ ground based dust concen-
trations over Barbados. Geophys Res Lett 27:1643–1646
Sokolik IN, Winker DM, Bergametti G, Gillette DA, Carmichael G,
Kaufman YJ, Gomes L, Schuetz L, Penner JE (2001) Introduc-
tion to special section: outstanding problems in quantifying the
radiative impacts of mineral dust. J Geophys Res 106:18015–
18027
Sommer S, Wagenbach D, Mulvaney R, Fischer H (2000) Glacio-
chemical study spanning the past 2 kyr on three ice cores from
Dronning Maud Land, Antarctica 2. Seasonally resolved chem-
ical records. J Geophys Res 105(D24):29423–29433
Sugden DE, McCulloch RD, Bory AJM, Hein AS (2009) Influence of
Patagonian glaciers on Antarctic dust deposition during the last
glacial period. Nature Geosci 2. doi:10.1038/NGEO474
Tanaka TY, Chiba M (2006) A numerical study of the contributions
of dust source regions to the global dust budget. Global Planet
Change 52:88–104
Tegen I (2003) Modeling the mineral dust aerosol cycle in the climate
system. Quat Sci Rev 22:1821–1834
Tegen I, Fung I (1994) Modeling of mineral dust in the atmosphere–
sources, transport, and optical-thickness. J Geophys Res 99(D11):
22897–22914
Tegen I, Lacis AA (1996) Modeling of particle size distribution and
its influence on the radiative properties of mineral dust aerosol.
J Geophys Res 101(D14):19237–19244
Thompson LG (1975) Variations in microparticle concentration, size
distribution and elemental composition found in Camp Century,
Greenland, and Byrd station, Antarctica, deep ice cores. In:
Isotopes and Impurities in Snow and Ice (Proceedings of a
symposium held during the XVI Assembly of the International
Union of Geodesy and Geophysics at Grenoble, August–
September 1975). IAHS Publ. no. 118
Thompson LG (1977) Microparticles, ice sheets and climate. Reports
of the Institute of Polar Studies, Ohio State University, No. 64,
148 pp
Thompson LG, Mosley-Thompson E, Petit JR (1981) Glaciological
interpretation of microparticle concentrations from the French
905-m Dome C, Antarctica core. In: Sea Level, Ice, and Climatic
Change (Proceedings of the Canberra Symposium, December
1979). IAHS Publ. no. 131
Thompson LG, Mosley-Thompson E, Davis ME, Lin PN, Henderson
KA, Cole-Dai J, Bolzan JF, Liu KB (1995) Late-glacial stage
and Holocene tropical ice core records from Huascaran, Peru.
Science 269:46–50
Unnerstad L, Hansson M (2001) Simulated airborne particle size
distributions over Greenland during Last Glacial Maximum.
Geophys Res Lett 28(2):287–290
Vallelonga P, Gabrielli P, Balliana E, Wegner A, Delmonte B,
Buretta C, Burton G, Vanhaecke F, Rosman KJR, Hong S,
Boutron CF, Cescon P, Barbante C (2010) Lead isotopic
compositions in the EPICA Dome C ice core and Southern
Hemisphere Potential Source Areas. Quat Sci Rev. doi:10.1016/
j.quascirev.2009.06.019
Washington WM, Parkinson CL (2005) An introduction to three-
dimensional climate modeling, 2nd edn. University Science
Books, Sausalito, California
Weller R, Woltjen J, Piel C, Resenberg R, Wagenbach D, Konig-
Langlo G, Kriews M (2008) Seasonal variability of crustal and
marine trace elements in the aerosol at Neumayer station,
Antarctica. Tellus 60B:742–752
Werner M, Tegen I, Harrison SP, Kohfeld KE, Prentice IC, Balkanski
Y, Rodhe H, Roelandt C (2002) Seasonal and interannual
1754 S. Albani et al.: Comparing modeled and observed changes
123

variability of the mineral dust cycle under present and glacial
climate conditions. J Geophys Res 107(D24):4744. doi:10.1029/
2002JD002365
Winckler G, Fischer H (2006) 30,000 years of cosmic dust in
Antarctic ice. Science 313:491
Wolff EW, et al (2006) Southern Ocean sea-ice extent, productivity
and iron flux over the past eight glacial cycles. Nature 440:23.
doi:10.1038/nature04614
Wolff EW, Hall JS, Mulvaney R, Pasteur EC, Wagenbach D, Legrand
M (1998) Relationship between chemistry of air, fresh snow and
firn cores for aerosol species in coastal Antarctica. J Geophys
Res 103(D9):11057–11070
Wurzler S, Reisin TG, Levin Z (2000) Modification of mineral dust
particles by cloud processing and subsequent effects on drop size
distributions. J Geophys Res 105(D4):4501–4512
Xu J, Hou S, Ren J, Petit J-R (2007) Insoluble dust in a new core from
Dome Argus, central East Antarctica. J Glaciol 53(180):154–156
Zarate MA (2003) Loess of southern South America. Quat Sci Rev
22:1987–2006
Zender CS, Bian H, Newman D (2003) Mineral dust entrainment and
deposition (DEAD) model: description and 1990s dust clima-
tology. J Geophys Res 108(D14):4416. doi:10.1029/2002JD
002775
S. Albani et al.: Comparing modeled and observed changes 1755
123