prime vendors - dla troop support - Executive Business Media

* Corresponding author. E-mail address: [email protected] (A. Soloukdar) © 2015 Growing Science Ltd. All rights reserved. doi: 10.5267/j.dsl.2015.1.002
Decision Science Letters 4 (2015) 137–164
Contents lists available at GrowingScience
Decision Science Letters
homepage: www.GrowingScience.com/dsl
Comparing fuzzy AHP and fuzzy TOPSIS for evaluation of business intelligence vendors
Alireza Soloukdara* and Seyedeh Akram Parpanchib
aDepartment of Industrial Management, Central Tehran Branch, Islamic Azad University, Tehran, Iran bDepartment of Information Technology Management, Electronic Branch, Islamic Azad University, Tehran, Iran C H R O N I C L E A B S T R A C T
Article history: Received July 10, 2014 Accepted December 31, 2014 Available online January 3 2015
The main objective of this study is to identify the most important criteria and indicators in selection of business intelligence vendors, and ranking the vendors of such tools using Fuzzy Analytical hierarchy Process (FAHP) and Fuzzy Technique for Order Preference by Similarity to Ideal Solution (FTOPSIS), to compare results of these two methods and to provide appropriate solutions for the sample company, namely National Iranian Oil Company (NIOC). Spearman's rank correlation test was used for comparing the methods and determining their correlation. A strong positive correlation was observed between the ranks of business intelligence tools at the significance level of 0.05 in both methods. The results of the ranking by means of FAHP method show that IBM Company was the best one, followed by Oracle, SAS, QlikTech, SAP and Microsoft. However, based on the FTOPSIS method, Oracle was the leading company, followed by IBM, SAS and SAP and finally Microsoft.
Growing Science Ltd. All rights reserved. 5© 201
Keywords: Business Intelligence Vendors Fuzzy TOPSIS Fuzzy AHP
1. Introduction
Business intelligence (BI) is an IT approach that assists many organizations in making accurate and timely decisions, improving supervision process to provide better support for their own operational activities, strategic and tactical planning, and forecasting and analyzing market segments. Using business intelligence solutions, organizations are able to have better access to information and use analytical methods for optimizing their business performance. Substantial increase in value of business, better decision-making and high returns on investment are only some of the arguments offered by its vendors. Because of such promises, many organizations have invested in business intelligence. Such an increase of value of business has been achieved in numerous business organizations, and business intelligence has produced satisfactory results (Turban & Turban, 2007).
The term “business intelligence” has become increasingly popular in the recent decade and given various definitions has been offered recently for business intelligence applications, so that it can be said that its definition is an endless and non-conclusive debate and varies from author to author. The current
138
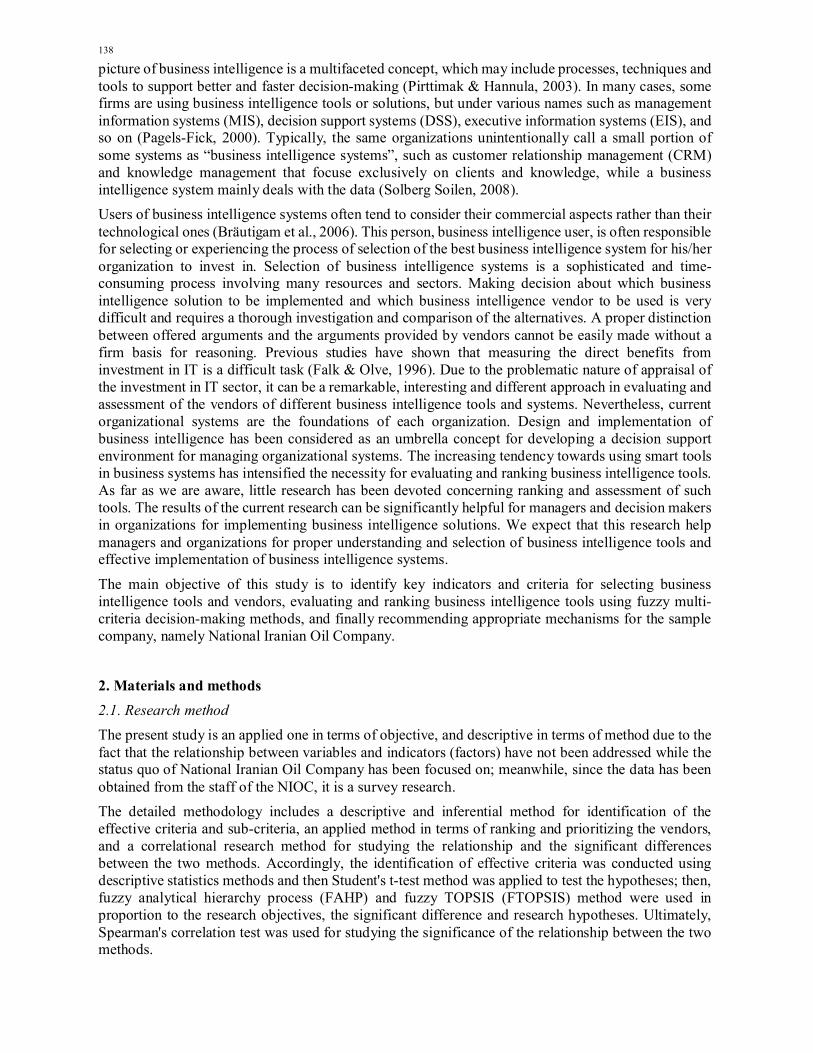
picture of business intelligence is a multifaceted concept, which may include processes, techniques and tools to support better and faster decision-making (Pirttimak & Hannula, 2003). In many cases, some firms are using business intelligence tools or solutions, but under various names such as management information systems (MIS), decision support systems (DSS), executive information systems (EIS), and so on (Pagels-Fick, 2000). Typically, the same organizations unintentionally call a small portion of some systems as “business intelligence systems”, such as customer relationship management (CRM) and knowledge management that focuse exclusively on clients and knowledge, while a business intelligence system mainly deals with the data (Solberg Soilen, 2008). Users of business intelligence systems often tend to consider their commercial aspects rather than their technological ones (Bräutigam et al., 2006). This person, business intelligence user, is often responsible for selecting or experiencing the process of selection of the best business intelligence system for his/her organization to invest in. Selection of business intelligence systems is a sophisticated and time-consuming process involving many resources and sectors. Making decision about which business intelligence solution to be implemented and which business intelligence vendor to be used is very difficult and requires a thorough investigation and comparison of the alternatives. A proper distinction between offered arguments and the arguments provided by vendors cannot be easily made without a firm basis for reasoning. Previous studies have shown that measuring the direct benefits from investment in IT is a difficult task (Falk & Olve, 1996). Due to the problematic nature of appraisal of the investment in IT sector, it can be a remarkable, interesting and different approach in evaluating and assessment of the vendors of different business intelligence tools and systems. Nevertheless, current organizational systems are the foundations of each organization. Design and implementation of business intelligence has been considered as an umbrella concept for developing a decision support environment for managing organizational systems. The increasing tendency towards using smart tools in business systems has intensified the necessity for evaluating and ranking business intelligence tools. As far as we are aware, little research has been devoted concerning ranking and assessment of such tools. The results of the current research can be significantly helpful for managers and decision makers in organizations for implementing business intelligence solutions. We expect that this research help managers and organizations for proper understanding and selection of business intelligence tools and effective implementation of business intelligence systems.
The main objective of this study is to identify key indicators and criteria for selecting business intelligence tools and vendors, evaluating and ranking business intelligence tools using fuzzy multi-criteria decision-making methods, and finally recommending appropriate mechanisms for the sample company, namely National Iranian Oil Company.
2. Materials and methods 2.1. Research method The present study is an applied one in terms of objective, and descriptive in terms of method due to the fact that the relationship between variables and indicators (factors) have not been addressed while the status quo of National Iranian Oil Company has been focused on; meanwhile, since the data has been obtained from the staff of the NIOC, it is a survey research. The detailed methodology includes a descriptive and inferential method for identification of the effective criteria and sub-criteria, an applied method in terms of ranking and prioritizing the vendors, and a correlational research method for studying the relationship and the significant differences between the two methods. Accordingly, the identification of effective criteria was conducted using descriptive statistics methods and then Student's t-test method was applied to test the hypotheses; then, fuzzy analytical hierarchy process (FAHP) and fuzzy TOPSIS (FTOPSIS) method were used in proportion to the research objectives, the significant difference and research hypotheses. Ultimately, Spearman's correlation test was used for studying the significance of the relationship between the two methods.
A. Soloukdar and S. A. Parpanchi / Decision Science Letters 4 (2015)
139
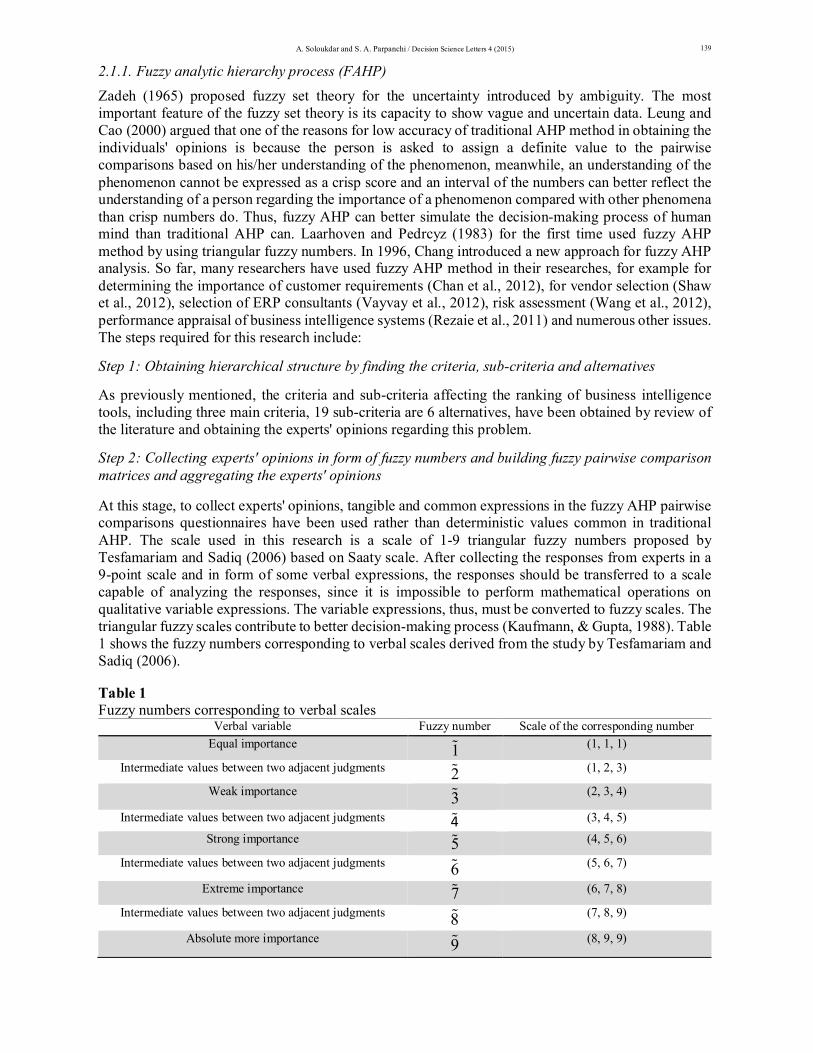
2.1.1. Fuzzy analytic hierarchy process (FAHP) Zadeh (1965) proposed fuzzy set theory for the uncertainty introduced by ambiguity. The most important feature of the fuzzy set theory is its capacity to show vague and uncertain data. Leung and Cao (2000) argued that one of the reasons for low accuracy of traditional AHP method in obtaining the individuals' opinions is because the person is asked to assign a definite value to the pairwise comparisons based on his/her understanding of the phenomenon, meanwhile, an understanding of the phenomenon cannot be expressed as a crisp score and an interval of the numbers can better reflect the understanding of a person regarding the importance of a phenomenon compared with other phenomena than crisp numbers do. Thus, fuzzy AHP can better simulate the decision-making process of human mind than traditional AHP can. Laarhoven and Pedrcyz (1983) for the first time used fuzzy AHP method by using triangular fuzzy numbers. In 1996, Chang introduced a new approach for fuzzy AHP analysis. So far, many researchers have used fuzzy AHP method in their researches, for example for determining the importance of customer requirements (Chan et al., 2012), for vendor selection (Shaw et al., 2012), selection of ERP consultants (Vayvay et al., 2012), risk assessment (Wang et al., 2012), performance appraisal of business intelligence systems (Rezaie et al., 2011) and numerous other issues. The steps required for this research include: Step 1: Obtaining hierarchical structure by finding the criteria, sub-criteria and alternatives
As previously mentioned, the criteria and sub-criteria affecting the ranking of business intelligence tools, including three main criteria, 19 sub-criteria are 6 alternatives, have been obtained by review of the literature and obtaining the experts' opinions regarding this problem. Step 2: Collecting experts' opinions in form of fuzzy numbers and building fuzzy pairwise comparison matrices and aggregating the experts' opinions At this stage, to collect experts' opinions, tangible and common expressions in the fuzzy AHP pairwise comparisons questionnaires have been used rather than deterministic values common in traditional AHP. The scale used in this research is a scale of 1-9 triangular fuzzy numbers proposed by Tesfamariam and Sadiq (2006) based on Saaty scale. After collecting the responses from experts in a 9-point scale and in form of some verbal expressions, the responses should be transferred to a scale capable of analyzing the responses, since it is impossible to perform mathematical operations on qualitative variable expressions. The variable expressions, thus, must be converted to fuzzy scales. The triangular fuzzy scales contribute to better decision-making process (Kaufmann, & Gupta, 1988). Table 1 shows the fuzzy numbers corresponding to verbal scales derived from the study by Tesfamariam and Sadiq (2006).
Table 1 Fuzzy numbers corresponding to verbal scales
Verbal variable Fuzzy number Scale of the corresponding number Equal importance 1 (1, 1, 1)
Intermediate values between two adjacent judgments 2 (1, 2, 3)
Weak importance 3 (2, 3, 4)
Intermediate values between two adjacent judgments 4 (3, 4, 5)
Strong importance 5 (4, 5, 6)
Intermediate values between two adjacent judgments 6 (5, 6, 7)
Extreme importance 7 (6, 7, 8)
Intermediate values between two adjacent judgments 8 (7, 8, 9)
Absolute more importance 9 (8, 9, 9)

140
The triangular fuzzy number is shown in Fig. 1 and Eq. (1). A triangular fuzzy number is shown as (l, m, u). Parameters l, m, and u represent the lowest possible value, the most probable value and the highest possible value, respectively.
( , , ) ; , , , [1 / 9,9] ij ij ij ij
kij ij ij ij ij ija l m u l m u l m u (1)
x
)(~muxuxU f
lmlxxU f
)(~
)(~ xU f
llmlf )()( )()( muuuf Fig. 1. Triangular fuzzy number
Each triangular fuzzy number has a membership function according to what is stated in Eq. (2). Fuzzy pairwise comparison matrix has been shown in Eq. (3).
l x
-x( ) x -
0 Otherwise
x l mm luU x m uu m
(2)
where: kA is the decision matrix of kth decision maker, and kija is the fuzzy assessment of kth decision
maker regarding the pairwise comparison of i and j criteria, and ( , , )k k kij ij ij ija l m u and also
1(1,1,1) : ; :k k
ij ij kij
a i j a i ja
[ ]k kijA a
(3)
Basic algebraic operations for two positive triangular fuzzy numbers A and B can be viewed as summarized in Table 2. Table 2 Basic algebraic operations for two positive triangular fuzzy numbers A and B
Operator Equation Result
Summation A+B (l1+l2 , m1+m2 , u1+u2) Subtraction A-B (l1-u2 , m1-m2, u1-l2)
Multiplication A×B (l1 ×l2 , m1×m2 , u1×u2) Division A/B (l1/u2 , m1/m2, u1/l2)
A=(l1, m1, u1);B= (l2, m2, u2) After building the matrix of pairwise comparisons for each expert, the experts' opinions should be aggregated. In this study, the arithmetic mean calculation method has been used for crisp opinions of the experts (according to Eq. (4)) to obtain the aggregation of opinions of individuals and preparing the final matrices of pairwise comparisons.
A. Soloukdar and S. A. Parpanchi / Decision Science Letters 4 (2015)
141
*1 *2 **...
k
ij ij ijkij a a aa (4)
**[ ]ijij aA (5)
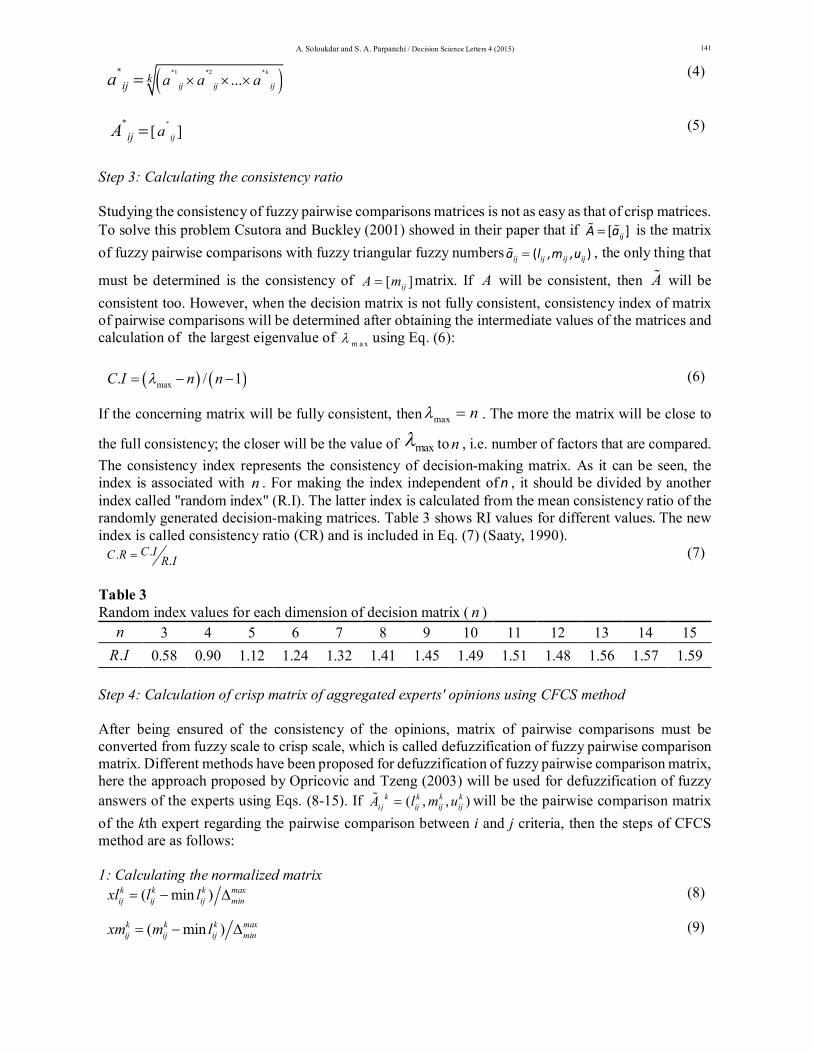
Step 3: Calculating the consistency ratio Studying the consistency of fuzzy pairwise comparisons matrices is not as easy as that of crisp matrices. To solve this problem Csutora and Buckley (2001) showed in their paper that if [ ]ijA a is the matrix of fuzzy pairwise comparisons with fuzzy triangular fuzzy numbers ( , , )ij ij ij ija l m u , the only thing that
must be determined is the consistency of [ ]ijA m matrix. If A will be consistent, then A will be consistent too. However, when the decision matrix is not fully consistent, consistency index of matrix of pairwise comparisons will be determined after obtaining the intermediate values of the matrices and calculation of the largest eigenvalue of m a x using Eq. (6):
max. / 1C I n n (6)
If the concerning matrix will be fully consistent, then max n . The more the matrix will be close to
the full consistency; the closer will be the value of max to n , i.e. number of factors that are compared. The consistency index represents the consistency of decision-making matrix. As it can be seen, the index is associated with n . For making the index independent of n , it should be divided by another index called "random index" (R.I). The latter index is calculated from the mean consistency ratio of the randomly generated decision-making matrices. Table 3 shows RI values for different values. The new index is called consistency ratio (CR) and is included in Eq. (7) (Saaty, 1990).
.. .C IC R R I (7)
Table 3
)nRandom index values for each dimension of decision matrix ( 15 14 13 12 11 10 9 8 7 6 5 4 3 n
1.59 1.57 1.56 1.48 1.51 1.49 1.45 1.41 1.32 1.24 1.12 0.90 0.58 .R I Step 4: Calculation of crisp matrix of aggregated experts' opinions using CFCS method After being ensured of the consistency of the opinions, matrix of pairwise comparisons must be converted from fuzzy scale to crisp scale, which is called defuzzification of fuzzy pairwise comparison matrix. Different methods have been proposed for defuzzification of fuzzy pairwise comparison matrix, here the approach proposed by Opricovic and Tzeng (2003) will be used for defuzzification of fuzzy answers of the experts using Eqs. (8-15). If ( , , )k k k k
i j ij ij ijA l m u will be the pairwise comparison matrix of the kth expert regarding the pairwise comparison between i and j criteria, then the steps of CFCS method are as follows: 1: Calculating the normalized matrix
( min ) k k k maxij ij ij minxl l l (8)
( min ) k k k max
ij ij ij minxm m l (9)
142
( min ) k k k maxij ij ij minxu u l (10)
Where, max min max k k
min ij iju l (11)
2: Calculating the normal left (ls) and right (us) values
(1 ) k k k kij ij ij ijxls xm xm xl (12)
(1 ) k k k kij ij ij ijxus xu xu xm (13)
3: Calculating the crisp normalized value
[ (1 ) ] [1 ] k k k k k kij ij ij ij ij ijx xls xls xus xls xus (14)
4: Calculating the crisp values
* maxminmin k k k
ij ij ija l x (15)
Step 5: Calculating the final weights To obtain the weights, calculating the geometric mean of row vector of crisp decision matrix introduced by Saaty (1980) has been used (shown in Eq. (16)).
* 1 /
1
* 1 /
1 1
( ), 1, 2, ...,
( )
nn
ijj
i nnn
iji j
aw i j n
a
(16)
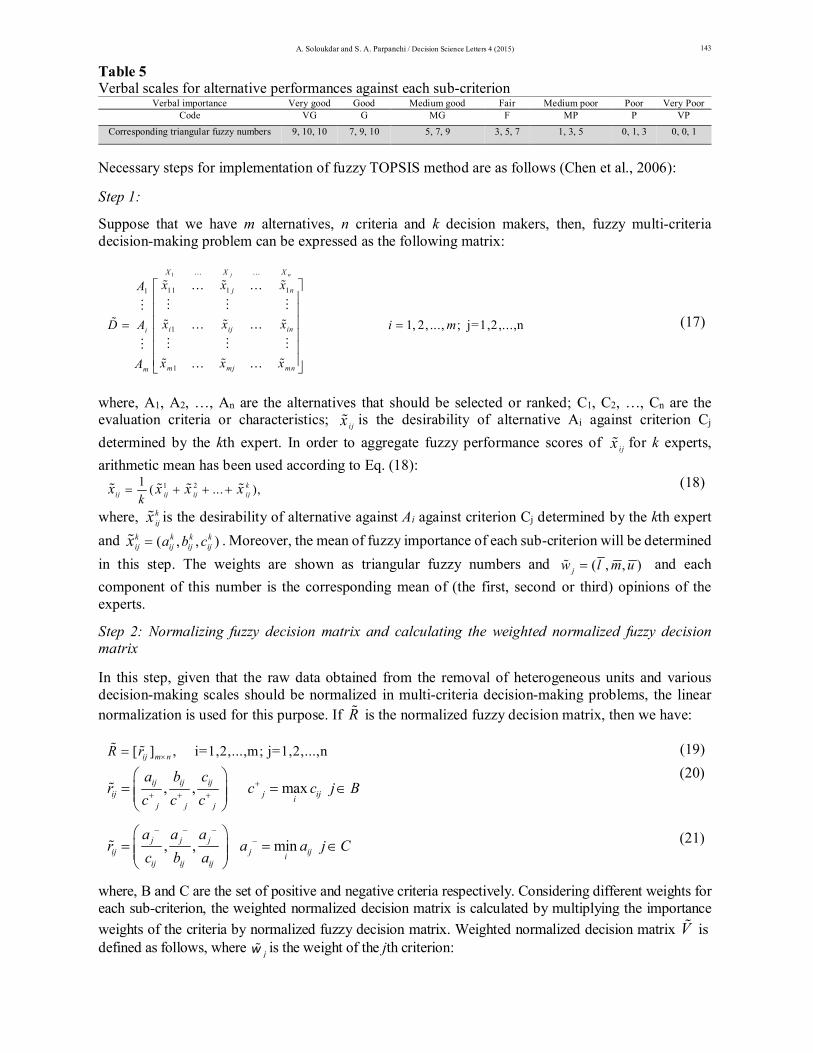
3. Fuzzy TOPSIS Method (FTOPSIS) TOPSIS method was introduced for the first time by Hwang and Yoon (1981). In summary, in this approach the best choice is the closest one to the positive ideal point and yet farthest one from the negative ideal one. The data and inputs of the method are similar to those of the previously explained fuzzy AHP method, i.e. experts' opinions. In this method, experts determine the relative importance of the criteria or sub-criteria and then assess the performance of each alternative against each criterion. However, human's thought and expression of evaluations are accompanied with uncertainty, and this uncertainty has an impact on decision-making. To overcome this issue, fuzzy decision-making methods are used. In this case, the decision matrix elements, or the importance of criteria against alternatives and the importance of criteria (in our problem) are expressed in a fuzzy manner by means of fuzzy number. Fuzzy AHP methodology, like fuzzy TOPSIS method has been used in many cases by various researchers such as Krohling and Campanharo (2011) on the issue of oil spill incidents at sea, Torlak et al. (2011) for competitiveness of businesses in Turkey, and Liao and Kao (2011) for vendor selection problem, and Kelemenis et al. (2011), for selecting support managers. Fuzzy and verbal scales used to measure the importance of the criteria (here sub-criteria) and performance of alternatives, i.e. business intelligence software providers, against each criterion are given in Tables 4 and 5 (Wang & Elhag, 2006). Table 4 Verbal scales for evaluation of importance of criteria
Very Low Very Low Medium Medium Medium High High Very High Verbal importance VL L ML M MH H VH Code
0, 0, 0.1 0, 0.1, 0.3 0.1, 0.3, 0.5 0.3, 0.5, 0.7 0.5, 0.7, 0.9 0.7, 0.9, 1.0 0.9, 1.0, 1.0 Corresponding triangular fuzzy numbers
A. Soloukdar and S. A. Parpanchi / Decision Science Letters 4 (2015)
143
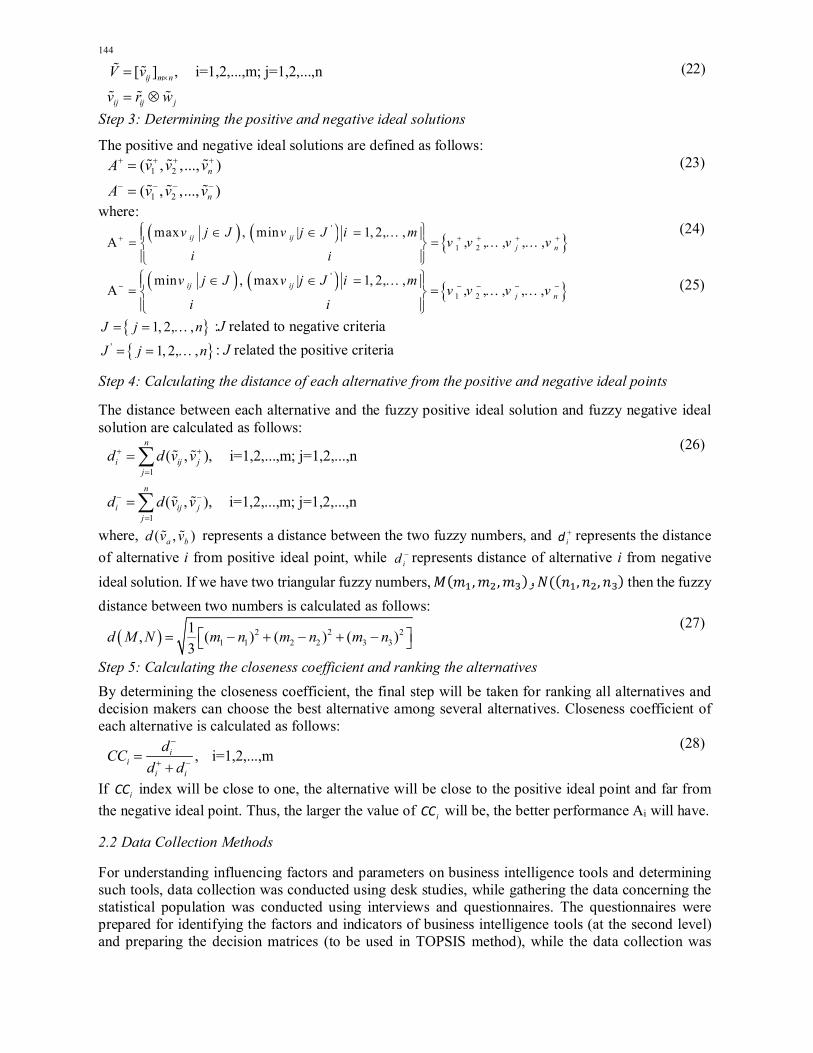
Table 5 Verbal scales for alternative performances against each sub-criterion
Very Poor Poor Medium poor Fair Medium good Good Very good Verbal importance VP P MP F MG G VG Code
0, 0, 1 0, 1, 3 1, 3, 5 3, 5, 7 5, 7, 9 7, 9, 10 9, 10, 10 Corresponding triangular fuzzy numbers
Necessary steps for implementation of fuzzy TOPSIS method are as follows (Chen et al., 2006): Step 1:
Suppose that we have m alternatives, n criteria and k decision makers, then, fuzzy multi-criteria decision-making problem can be expressed as the following matrix:
1
11 1 11
1
1
1, 2, ..., ; j=1,2,...,n
j nX X X
j n
i ij ini
m mj mnm
x x xA
x x xD A i m
x x xA
(17)
where, A1, A2, …, An are the alternatives that should be selected or ranked; C1, C2, …, Cn are the evaluation criteria or characteristics; i jx is the desirability of alternative Ai against criterion Cj determined by the kth expert. In order to aggregate fuzzy performance scores of i jx for k experts, arithmetic mean has been used according to Eq. (18):
1 21 ( ... ),kij ij ij ijk
x x x x (18)
where, kijx is the desirability of alternative against Ai against criterion Cj determined by the kth expert
and ( , , )k k k kij ij ij ija b cx . Moreover, the mean of fuzzy importance of each sub-criterion will be determined
in this step. The weights are shown as triangular fuzzy numbers and ( , , )jw l m u and each component of this number is the corresponding mean of (the first, second or third) opinions of the experts.
Step 2: Normalizing fuzzy decision matrix and calculating the weighted normalized fuzzy decision matrix In this step, given that the raw data obtained from the removal of heterogeneous units and various decision-making scales should be normalized in multi-criteria decision-making problems, the linear normalization is used for this purpose. If R is the normalized fuzzy decision matrix, then we have:
[ ] , i=1,2,...,m; j=1,2,...,nij m nR r (19)
, , maxij ij ijij j iji
j j j
a b cr c c j B
c c c
(20)
, , minj j jij j iji
ij ij ij
a a ar a a j C
c b a
(21)
where, B and C are the set of positive and negative criteria respectively. Considering different weights for each sub-criterion, the weighted normalized decision matrix is calculated by multiplying the importance weights of the criteria by normalized fuzzy decision matrix. Weighted normalized decision matrix V is defined as follows, where jw is the weight of the jth criterion:
144
[ ] , i=1,2,...,m; j=1,2,...,n ij m n
ij ij j
V v
v r w
(22)
Step 3: Determining the positive and negative ideal solutions
The positive and negative ideal solutions are defined as follows: 1 2
1 2
( , ,..., )
( , ,..., )n
n
A v v v
A v v v
(23)
where:
'
1 2
max , min | 1, 2, , A , , , , ,ij ij
j n
v j J v j J i mv v v v
i i
(24)
'
1 2
min , max | 1, 2, , A , , , , ,ij ij
j n
v j J v j J i mv v v v
i i
(25)
1, 2, , J j n :J related to negative criteria
' 1, 2, , J j n : J related the positive criteria
Step 4: Calculating the distance of each alternative from the positive and negative ideal points The distance between each alternative and the fuzzy positive ideal solution and fuzzy negative ideal solution are calculated as follows:
1
1
( , ), i=1,2,...,m; j=1,2,...,n
( , ), i=1,2,...,m; j=1,2,...,n
n
i ij jj
n
i ij jj
d d v v
d d v v
(26)
where, ( , )a bd v v represents a distance between the two fuzzy numbers, and id represents the distance
of alternative i from positive ideal point, while id represents distance of alternative i from negative ideal solution. If we have two triangular fuzzy numbers, 푀(푚 ,푚 ,푚 푁((푛و( ,푛 ,푛 ) then the fuzzy distance between two numbers is calculated as follows:
2 2 21 1 2 2 3 3
1, ( ) ( ) ( )3
d M N m n m n m n (27)
Step 5: Calculating the closeness coefficient and ranking the alternatives
By determining the closeness coefficient, the final step will be taken for ranking all alternatives and decision makers can choose the best alternative among several alternatives. Closeness coefficient of each alternative is calculated as follows:
, i=1,2,...,mii
i i
dCCd d
(28)
If iCC index will be close to one, the alternative will be close to the positive ideal point and far from the negative ideal point. Thus, the larger the value of iCC will be, the better performance Ai will have.
2.2 Data Collection Methods
For understanding influencing factors and parameters on business intelligence tools and determining such tools, data collection was conducted using desk studies, while gathering the data concerning the statistical population was conducted using interviews and questionnaires. The questionnaires were prepared for identifying the factors and indicators of business intelligence tools (at the second level) and preparing the decision matrices (to be used in TOPSIS method), while the data collection was
A. Soloukdar and S. A. Parpanchi / Decision Science Letters 4 (2015)
145
conducted for AHP. 2.3 Statistical Population, Sampling and Sample Size The statistical population includes the experts of the National Iranian Oil Company in the field of information technology. Considering the number of subjects included in the statistical population and in order to achieve more accurate results, census sampling technique was used. The data regarding the factors and parameters influencing business intelligence tools and selection of business intelligence tools was collected by review of literature. Meanwhile gathering the data concerning the statistical population was conducted using interviews and questionnaires. Census sampling method was used for identifying the criteria and indicators using the opinions of 30 IT experts in NIOC, while with the help of AHP and fuzzy TOPSIS questionnaires and the sampling technique, the opinions of seven business intelligence experts were obtained and used for evaluating and ranking the criteria, sub-criteria and the alternatives. 2.4 Data Analysis Methods and Tools In this study, data analysis was conducted using arithmetic mean (descriptive statistics) in order for determining and identifying the influencing parameters and factors; fuzzy AHP and fuzzy TOPSIS methods were used for identifying and ranking business intelligence tools, and Spearman's rank correlation test was used for comparing the methods regarding the test of the hypotheses. The applications used in this analysis include SPSS, Excel, Expert Choice and Matlab. The used data analysis methods can be noted as follows: 1. Student's T-test as an inferential test for determining and identifying the effective factors and
indicators. 2. Fuzzy AHP method for evaluating and prioritizing indicators related to the vendors of intelligence
tools and solutions. 3. Fuzzy TOPSIS method for ranking the vendors of business intelligence tools and solutions based on
the experts' opinions in NIOC. 4. Spearman's rank correlation test for evaluating and comparing the significance of the relationship
between the two methods, i.e. fuzzy AHP and fuzzy TOPSIS methods. 2.5 Scope of Research Thematic scope of this study is evaluating and ranking the criteria, sub-criteria and alternatives related to business intelligence tools and solutions. The spatial scope of this study is the National Iranian Oil Company as the largest producer of oil and petroleum products in Iran. The time scope of this study covers a period of 6 months from March 2012 to September 2012.
2.6 Limitations of Research The main limitation of this study can be regarded as the complexity of obtaining the opinions of the experts. Another point is that theoretically, it is possible to consider even more criteria, sub-criteria or business intelligence tools in addition to what were included in the study. However, since the number of pairwise comparisons in AHP method for n factors is determined by 푛(푛−)/2, and by increasing the number of factors or solutions, the number of pairwise comparisons will increase drastically, these leads to a significant increase in the number of the items of the questionnaire and the experts may refuse to answer them. Insufficient number of business intelligence experts in the organization and lack of their knowledge regarding the methods and concepts used in this paper made us to provide explanations regarding the questionnaires and to conduct interviews, resulting in more time spent on the collection of the data.
146
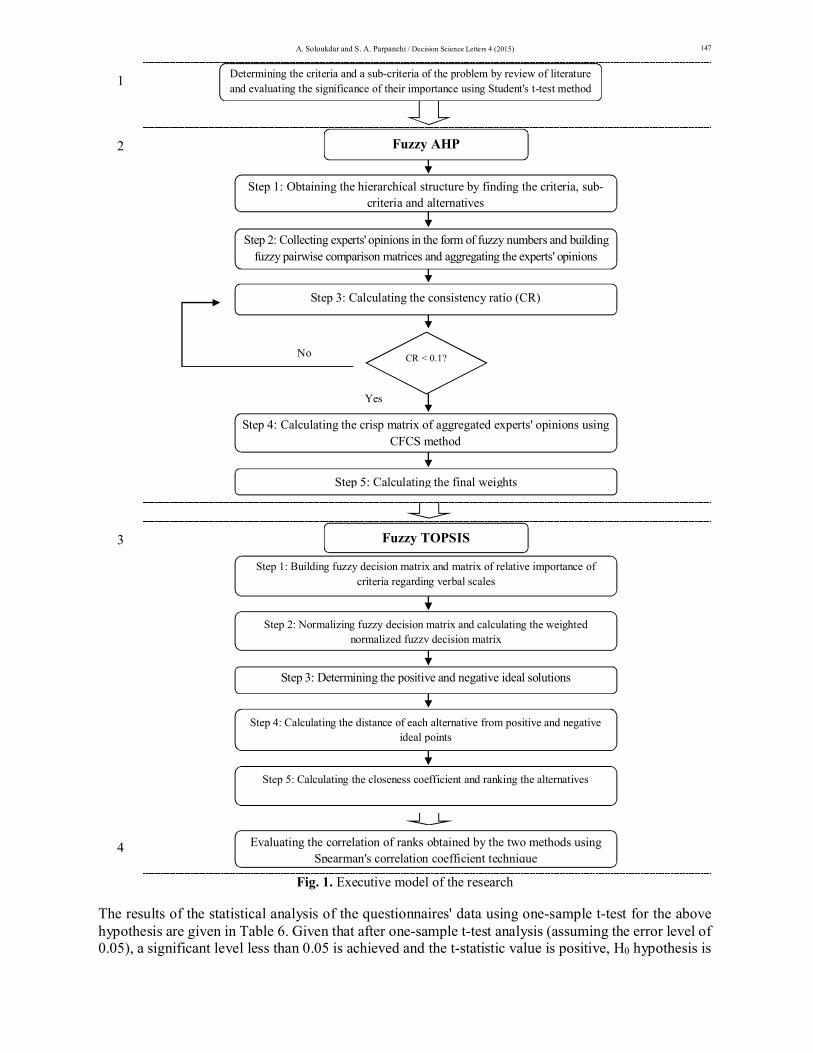
2.7 Implementation Stages of Research
This research was conducted in the following stages and Fig. 1 shows the executive model of the research:
Phase I: Identification of effective criteria and sub-criteria
Identification of important criteria using desk study Collecting the experts' opinions using a Likert scale questionnaire and testing the hypotheses using
Student's t-test method and determining and selecting the effective criteria, sub-criteria and alternatives
Phase II: Implementation of fuzzy AHP method for appraisal and ranking of business intelligence tools and solutions
Prepare the hierarchical levels of criteria, sub-criteria and alternatives and coding them Create hierarchical tree model after identifying the criteria and sub-criteria and effective tools in the
phase II Create a fuzzy AHP questionnaire for verbal scales Collect the experts' opinions in form of fuzzy numbers and preparing fuzzy pairwise comparison
matrices and aggregating the experts' opinions (7 people) Calculate the consistency ratio of pairwise comparisons Calculate crisp matrix of aggregated experts' opinions using CFCS method (defuzzification) Calculate the final weights Phase III: Implement of fuzzy TOPSIS method for evaluating and ranking business intelligence tools
and solutions Prepare fuzzy TOPSIS questionnaire Obtain the opinions of the individuals regarding the importance of the criteria and the performance
of each alternative against each criterion and preparing fuzzy decision matrix and matrix of relative importance of criteria for verbal scales
Convert the judgments of experts into corresponding fuzzy numbers and aggregating their opinions using arithmetic mean
Normalize fuzzy decision matrix and calculating the weighted normalized fuzzy decision matrix Determine positive and negative ideal points Calculate the distance of each alternative from positive and negative ideal points Calculate closeness coefficients and prioritizing the alternatives
Phase IV: Comparison of the two methods, i.e. fuzzy AHP and TOPSIS, and hypothesis testing using Spearman's rank correlation test
Calculate the differences of the ranks and 푑 values.
3. Results
3.1 The Results Regarding the Effective Criteria and Sub-Criteria
In this section, based on the implementation stages of the research and given the research questions and research hypotheses for determining effective criteria and sub-criteria, the hypotheses of such criteria and sub-criteria were tested individually. The following example is only the first hypothesis and the same procedure applies to other criteria and sub-criteria. The initial data was collected using Likert scale, then it was studied, and analyzed using one-sample Student's t-test. Hypothesis 1) “Technology” as a major criterion has a significant positive effect on the choice of business intelligence tools and solutions. The statistical hypotheses include:
0
1
: 3 Effect of "technology" on the choice of business intelligence tools and solutions is not high.: 3 Effect of "technology" on the choice of business intelligence tools and solutions is high.
HH
A. Soloukdar and S. A. Parpanchi / Decision Science Letters 4 (2015)
147
1
2
3
4
Fig. 1. Executive model of the research
The results of the statistical analysis of the questionnaires' data using one-sample t-test for the above hypothesis are given in Table 6. Given that after one-sample t-test analysis (assuming the error level of 0.05), a significant level less than 0.05 is achieved and the t-statistic value is positive, H0 hypothesis is
Step 5: Calculating the final weights
Step 4: Calculating the crisp matrix of aggregated experts' opinions using CFCS method
CR < 0.1?
Step 3: Calculating the consistency ratio (CR)
Step 2: Collecting experts' opinions in the form of fuzzy numbers and building fuzzy pairwise comparison matrices and aggregating the experts' opinions
Step 1: Obtaining the hierarchical structure by finding the criteria, sub-criteria and alternatives
Fuzzy AHP
Step 5: Calculating the closeness coefficient and ranking the alternatives
Step 4: Calculating the distance of each alternative from positive and negative ideal points
Step 3: Determining the positive and negative ideal solutions
Step 2: Normalizing fuzzy decision matrix and calculating the weighted normalized fuzzy decision matrix
Step 1: Building fuzzy decision matrix and matrix of relative importance of criteria regarding verbal scales
Fuzzy TOPSIS
Evaluating the correlation of ranks obtained by the two methods using Spearman's correlation coefficient technique
Yes
No
Determining the criteria and a sub-criteria of the problem by review of literature and evaluating the significance of their importance using Student's t-test method
148
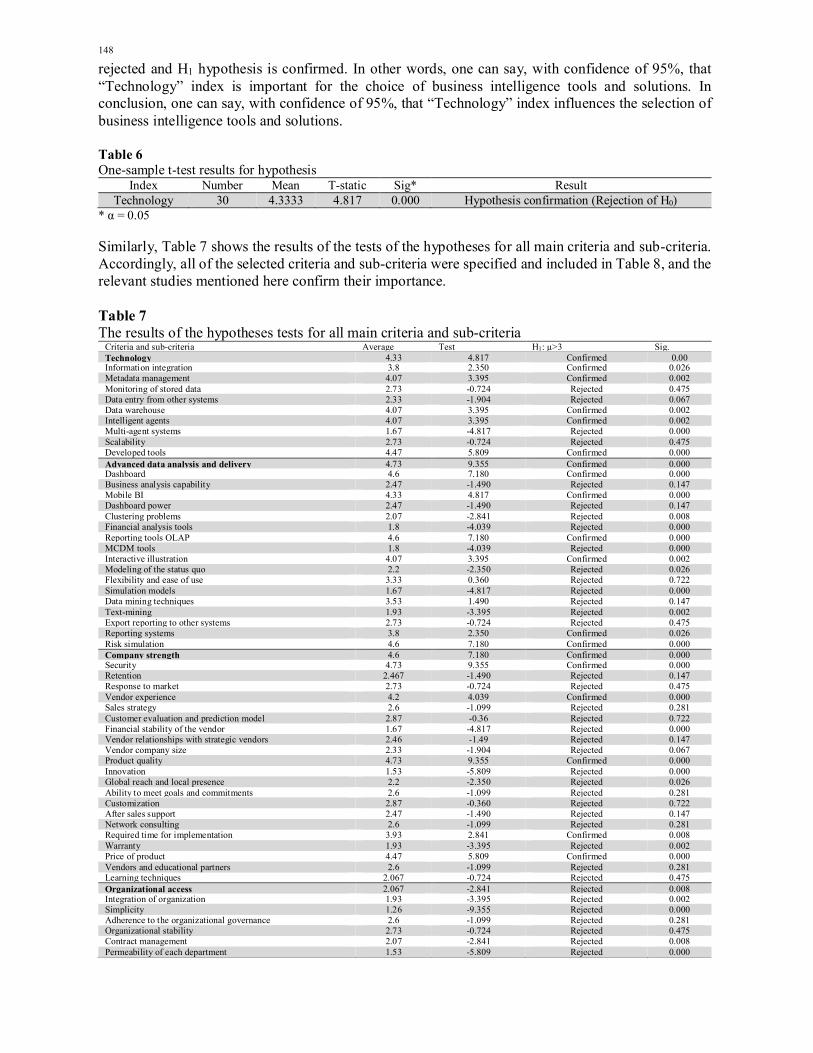
rejected and H1 hypothesis is confirmed. In other words, one can say, with confidence of 95%, that “Technology” index is important for the choice of business intelligence tools and solutions. In conclusion, one can say, with confidence of 95%, that “Technology” index influences the selection of business intelligence tools and solutions. Table 6 One-sample t-test results for hypothesis
Index Number Mean T-static Sig* Result Technology 30 4.3333 4.817 0.000 Hypothesis confirmation (Rejection of H0)
* α = 0.05
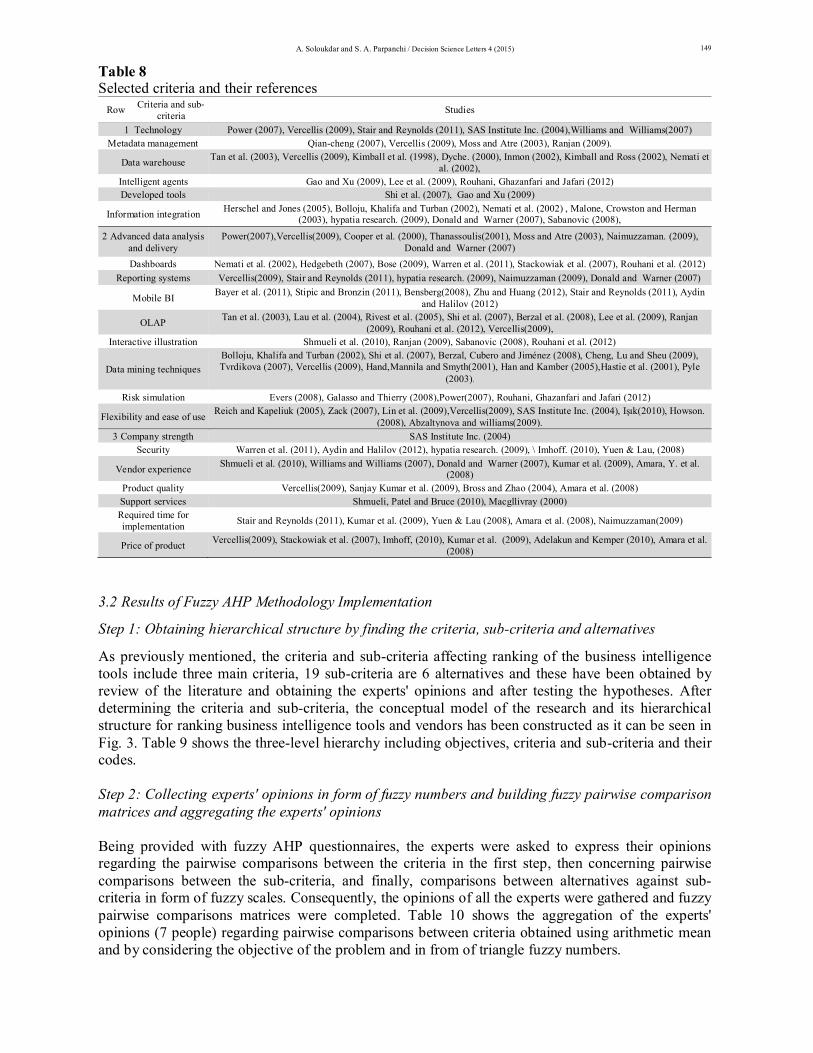
Similarly, Table 7 shows the results of the tests of the hypotheses for all main criteria and sub-criteria. Accordingly, all of the selected criteria and sub-criteria were specified and included in Table 8, and the relevant studies mentioned here confirm their importance. Table 7 The results of the hypotheses tests for all main criteria and sub-criteria
Criteria and sub-criteria Average Test H1: µ>3 Sig. Technology 4.33 4.817 Confirmed 0.00 Information integration 3.8 2.350 Confirmed 0.026 Metadata management 4.07 3.395 Confirmed 0.002 Monitoring of stored data 2.73 -0.724 Rejected 0.475 Data entry from other systems 2.33 -1.904 Rejected 0.067 Data warehouse 4.07 3.395 Confirmed 0.002 Intelligent agents 4.07 3.395 Confirmed 0.002 Multi-agent systems 1.67 -4.817 Rejected 0.000 Scalability 2.73 -0.724 Rejected 0.475 Developed tools 4.47 5.809 Confirmed 0.000 Advanced data analysis and delivery 4.73 9.355 Confirmed 0.000 Dashboard 4.6 7.180 Confirmed 0.000 Business analysis capability 2.47 -1.490 Rejected 0.147 Mobile BI 4.33 4.817 Confirmed 0.000 Dashboard power 2.47 -1.490 Rejected 0.147 Clustering problems 2.07 -2.841 Rejected 0.008 Financial analysis tools 1.8 -4.039 Rejected 0.000 Reporting tools OLAP 4.6 7.180 Confirmed 0.000 MCDM tools 1.8 -4.039 Rejected 0.000 Interactive illustration 4.07 3.395 Confirmed 0.002 Modeling of the status quo 2.2 -2.350 Rejected 0.026 Flexibility and ease of use 3.33 0.360 Rejected 0.722 Simulation models 1.67 -4.817 Rejected 0.000 Data mining techniques 3.53 1.490 Rejected 0.147 Text-mining 1.93 -3.395 Rejected 0.002 Export reporting to other systems 2.73 -0.724 Rejected 0.475 Reporting systems 3.8 2.350 Confirmed 0.026 Risk simulation 4.6 7.180 Confirmed 0.000 Company strength 4.6 7.180 Confirmed 0.000 Security 4.73 9.355 Confirmed 0.000 Retention 2.467 -1.490 Rejected 0.147 Response to market 2.73 -0.724 Rejected 0.475 Vendor experience 4.2 4.039 Confirmed 0.000 Sales strategy 2.6 -1.099 Rejected 0.281 Customer evaluation and prediction model 2.87 -0.36 Rejected 0.722 Financial stability of the vendor 1.67 -4.817 Rejected 0.000 Vendor relationships with strategic vendors 2.46 -1.49 Rejected 0.147 Vendor company size 2.33 -1.904 Rejected 0.067 Product quality 4.73 9.355 Confirmed 0.000 Innovation 1.53 -5.809 Rejected 0.000 Global reach and local presence 2.2 -2.350 Rejected 0.026 Ability to meet goals and commitments 2.6 -1.099 Rejected 0.281 Customization 2.87 -0.360 Rejected 0.722 After sales support 2.47 -1.490 Rejected 0.147 Network consulting 2.6 -1.099 Rejected 0.281 Required time for implementation 3.93 2.841 Confirmed 0.008 Warranty 1.93 -3.395 Rejected 0.002 Price of product 4.47 5.809 Confirmed 0.000 Vendors and educational partners 2.6 -1.099 Rejected 0.281 Learning techniques 2.067 -0.724 Rejected 0.475 Organizational access 2.067 -2.841 Rejected 0.008 Integration of organization 1.93 -3.395 Rejected 0.002 Simplicity 1.26 -9.355 Rejected 0.000 Adherence to the organizational governance 2.6 -1.099 Rejected 0.281 Organizational stability 2.73 -0.724 Rejected 0.475 Contract management 2.07 -2.841 Rejected 0.008 Permeability of each department 1.53 -5.809 Rejected 0.000
A. Soloukdar and S. A. Parpanchi / Decision Science Letters 4 (2015)
149
Table 8 Selected criteria and their references
Row Criteria and sub-criteria Studies
1 Technology Power (2007), Vercellis (2009), Stair and Reynolds (2011), SAS Institute Inc. (2004),Williams and Williams(2007) Metadata management Qian-cheng (2007), Vercellis (2009), Moss and Atre (2003), Ranjan (2009).
Data warehouse Tan et al. (2003), Vercellis (2009), Kimball et al. (1998), Dyche. (2000), Inmon (2002), Kimball and Ross (2002), Nemati et al. (2002),
Intelligent agents Gao and Xu (2009), Lee et al. (2009), Rouhani, Ghazanfari and Jafari (2012) Developed tools Shi et al. (2007), Gao and Xu (2009)
Information integration Herschel and Jones (2005), Bolloju, Khalifa and Turban (2002), Nemati et al. (2002) , Malone, Crowston and Herman (2003), hypatia research. (2009), Donald and Warner (2007), Sabanovic (2008),
2 Advanced data analysis and delivery
Power(2007),Vercellis(2009), Cooper et al. (2000), Thanassoulis(2001), Moss and Atre (2003), Naimuzzaman. (2009), Donald and Warner (2007)
Dashboards Nemati et al. (2002), Hedgebeth (2007), Bose (2009), Warren et al. (2011), Stackowiak et al. (2007), Rouhani et al. (2012) Reporting systems Vercellis(2009), Stair and Reynolds (2011), hypatia research. (2009), Naimuzzaman (2009), Donald and Warner (2007)
Mobile BI Bayer et al. (2011), Stipic and Bronzin (2011), Bensberg(2008), Zhu and Huang (2012), Stair and Reynolds (2011), Aydin and Halilov (2012)
OLAP Tan et al. (2003), Lau et al. (2004), Rivest et al. (2005), Shi et al. (2007), Berzal et al. (2008), Lee et al. (2009), Ranjan (2009), Rouhani et al. (2012), Vercellis(2009),
Interactive illustration Shmueli et al. (2010), Ranjan (2009), Sabanovic (2008), Rouhani et al. (2012)
Data mining techniques Bolloju, Khalifa and Turban (2002), Shi et al. (2007), Berzal, Cubero and Jiménez (2008), Cheng, Lu and Sheu (2009), Tvrdikova (2007), Vercellis (2009), Hand,Mannila and Smyth(2001), Han and Kamber (2005),Hastie et al. (2001), Pyle
(2003). Risk simulation Evers (2008), Galasso and Thierry (2008),Power(2007), Rouhani, Ghazanfari and Jafari (2012)
Flexibility and ease of use Reich and Kapeliuk (2005), Zack (2007), Lin et al. (2009),Vercellis(2009), SAS Institute Inc. (2004), Işık(2010), Howson. (2008), Abzaltynova and williams(2009).
3 Company strength SAS Institute Inc. (2004) Security Warren et al. (2011), Aydin and Halilov (2012), hypatia research. (2009), \ Imhoff. (2010), Yuen & Lau, (2008)
Vendor experience Shmueli et al. (2010), Williams and Williams (2007), Donald and Warner (2007), Kumar et al. (2009), Amara, Y. et al. (2008)
Product quality Vercellis(2009), Sanjay Kumar et al. (2009), Bross and Zhao (2004), Amara et al. (2008) Support services Shmueli, Patel and Bruce (2010), Macgllivray (2000) Required time for implementation Stair and Reynolds (2011), Kumar et al. (2009), Yuen & Lau (2008), Amara et al. (2008), Naimuzzaman(2009)
Price of product Vercellis(2009), Stackowiak et al. (2007), Imhoff, (2010), Kumar et al. (2009), Adelakun and Kemper (2010), Amara et al. (2008)
3.2 Results of Fuzzy AHP Methodology Implementation
Step 1: Obtaining hierarchical structure by finding the criteria, sub-criteria and alternatives
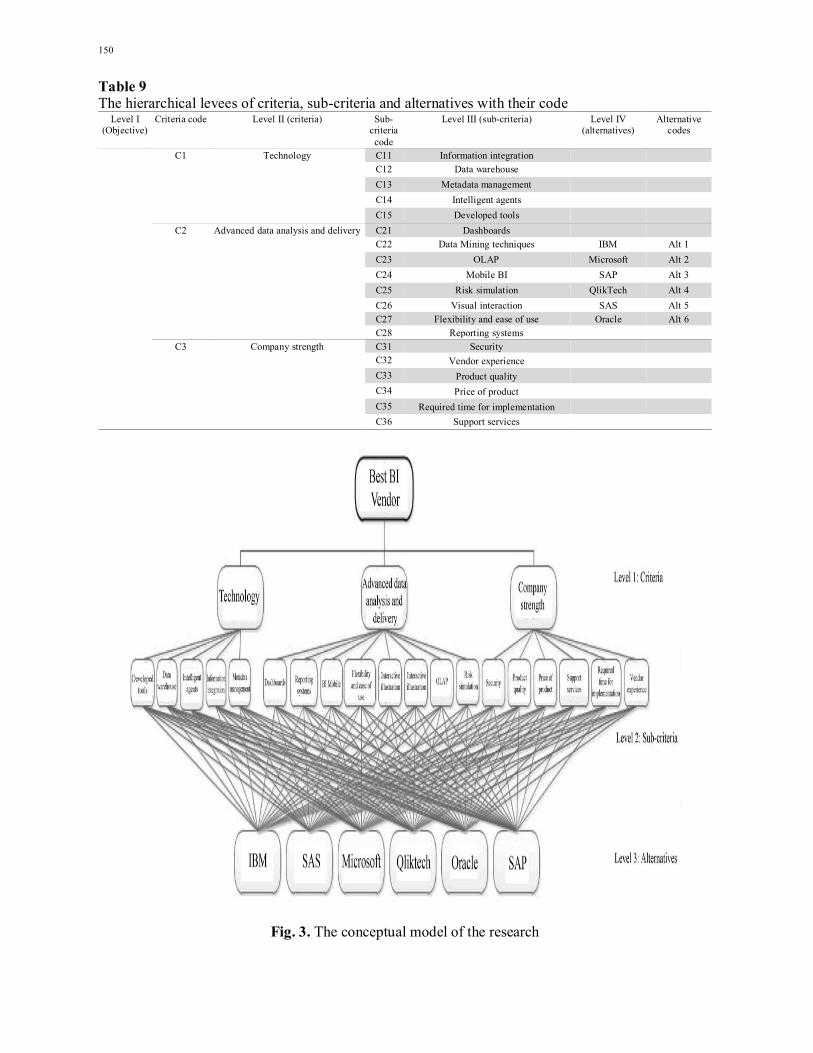
As previously mentioned, the criteria and sub-criteria affecting ranking of the business intelligence tools include three main criteria, 19 sub-criteria are 6 alternatives and these have been obtained by review of the literature and obtaining the experts' opinions and after testing the hypotheses. After determining the criteria and sub-criteria, the conceptual model of the research and its hierarchical structure for ranking business intelligence tools and vendors has been constructed as it can be seen in Fig. 3. Table 9 shows the three-level hierarchy including objectives, criteria and sub-criteria and their codes. Step 2: Collecting experts' opinions in form of fuzzy numbers and building fuzzy pairwise comparison matrices and aggregating the experts' opinions Being provided with fuzzy AHP questionnaires, the experts were asked to express their opinions regarding the pairwise comparisons between the criteria in the first step, then concerning pairwise comparisons between the sub-criteria, and finally, comparisons between alternatives against sub-criteria in form of fuzzy scales. Consequently, the opinions of all the experts were gathered and fuzzy pairwise comparisons matrices were completed. Table 10 shows the aggregation of the experts' opinions (7 people) regarding pairwise comparisons between criteria obtained using arithmetic mean and by considering the objective of the problem and in from of triangle fuzzy numbers.
150
Table 9 The hierarchical levees of criteria, sub-criteria and alternatives with their code
Level I (Objective)
Criteria code Level II (criteria) Sub-criteria code
Level III (sub-criteria) Level IV (alternatives)
Alternative codes
C1 Technology C11 Information integration C12 Data warehouse C13 Metadata management C14 Intelligent agents C15 Developed tools
C2 Advanced data analysis and delivery C21 Dashboards C22 Data Mining techniques IBM Alt 1 C23 OLAP Microsoft Alt 2 C24 Mobile BI SAP Alt 3 C25 Risk simulation QlikTech Alt 4 C26 Visual interaction SAS Alt 5 C27 Flexibility and ease of use Oracle Alt 6 C28 Reporting systems
C3 Company strength C31 Security C32 Vendor experience C33 Product quality C34 Price of product C35 Required time for implementation C36 Support services
Fig. 3. The conceptual model of the research

A. Soloukdar and S. A. Parpanchi / Decision Science Letters 4 (2015)
151
Table 10 Aggregated experts' opinions for pairwise comparisons of level II (criteria)
Criteria C1 C2 C3 C1 (1, 1, 1) (1, 1.346, 1.601) (1.739, 2.284, 2.779) C2 (0.624, 0.743, 1) (1, 1, 1) (1.511, 2.119, 2.643) C3 (0.36, 0.438, 0.575) (0.378, 0.472, 0.662) (1, 1, 1)
Step 3: Calculating the consistency ratio To check the consistency of aggregated expert opinions regarding the first pairwise comparison matrix, which is shown in Table 10, a matrix of intermediate numbers was formed and the Eq. (6), Eq. (7) and Eq. (29) were used to calculate the largest eigenvalue max .
det( ) 0 0
1-1-1.346 2.284
0.743 2.1190.438 0.472 1-
A I
(29)
Using equation 29, the largest eigenvalue of the matrix of intermediate numbers in Table 10 was 0.053; Hence:
max (3.0055 3) 0.00270.0027 . . = 0.0053< 0.11 3 1 0.58
nCI C R
n
Thus, we conclude that the aggregated opinions for the first pairwise comparison matrix are consistent. Step 4: Calculation of crisp matrix of aggregated experts' opinions using CFCS method As mentioned earlier, after being ensured of the consistency of the opinions, matrix of pairwise comparisons must be converted from fuzzy scale to crisp scale, which is called defuzzification of fuzzy pairwise comparison matrix. In this research, equations 8 to 15 were used for defuzzification of fuzzy answers of the experts. Table 11 shows the results of defuzzification of the values in Table 10. Table 11 The results of defuzzification of the values
Criteria C1 C2 C3 C1 1 1.331604 2.237736 C2 0.772016 1 2.071574 C3 0.445693 0.486281 1
Step 5: Calculating the final weights Finally and after calculating the non-fuzzy values of opinions, equation 16 is used to obtain the weights. Table 12 shows these weights.
Table 12 Crisp matrix of aggregated opinions and the final weight of the criteria
Criteria C1 C2 C3 Weight C1 1 1.331604 2.237736 0.4484 C2 0.772016 1 2.071574 0.3644 C3 0.445693 0.486281 1 0.1872
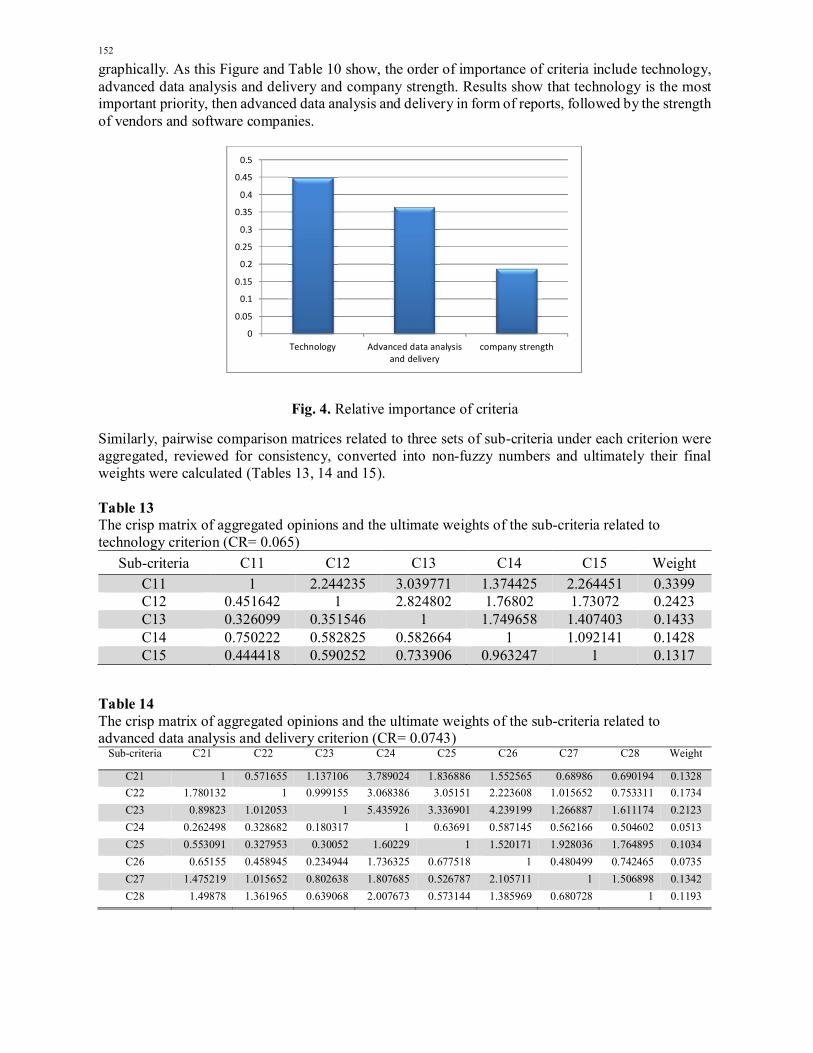
Fig. 4 illustrates the relative importance of the main criteria of the problem compared with each other
152
graphically. As this Figure and Table 10 show, the order of importance of criteria include technology, advanced data analysis and delivery and company strength. Results show that technology is the most important priority, then advanced data analysis and delivery in form of reports, followed by the strength of vendors and software companies.
Fig. 4. Relative importance of criteria
Similarly, pairwise comparison matrices related to three sets of sub-criteria under each criterion were aggregated, reviewed for consistency, converted into non-fuzzy numbers and ultimately their final weights were calculated (Tables 13, 14 and 15). Table 13 The crisp matrix of aggregated opinions and the ultimate weights of the sub-criteria related to technology criterion (CR= 0.065)
Sub-criteria C11 C12 C13 C14 C15 Weight C11 1 2.244235 3.039771 1.374425 2.264451 0.3399 C12 0.451642 1 2.824802 1.76802 1.73072 0.2423 C13 0.326099 0.351546 1 1.749658 1.407403 0.1433 C14 0.750222 0.582825 0.582664 1 1.092141 0.1428 C15 0.444418 0.590252 0.733906 0.963247 1 0.1317
Table 14 The crisp matrix of aggregated opinions and the ultimate weights of the sub-criteria related to advanced data analysis and delivery criterion (CR= 0.0743)
Sub-criteria C21 C22 C23 C24 C25 C26 C27 C28 Weight
C21 1 0.571655 1.137106 3.789024 1.836886 1.552565 0.68986 0.690194 0.1328 C22 1.780132 1 0.999155 3.068386 3.05151 2.223608 1.015652 0.753311 0.1734 C23 0.89823 1.012053 1 5.435926 3.336901 4.239199 1.266887 1.611174 0.2123 C24 0.262498 0.328682 0.180317 1 0.63691 0.587145 0.562166 0.504602 0.0513 C25 0.553091 0.327953 0.30052 1.60229 1 1.520171 1.928036 1.764895 0.1034 C26 0.65155 0.458945 0.234944 1.736325 0.677518 1 0.480499 0.742465 0.0735 C27 1.475219 1.015652 0.802638 1.807685 0.526787 2.105711 1 1.506898 0.1342 C28 1.49878 1.361965 0.639068 2.007673 0.573144 1.385969 0.680728 1 0.1193
0
0.05
0.1
0.15
0.2
0.25
0.3
0.35
0.4
0.45
0.5
Technology Advanced data analysisand delivery
company strength
A. Soloukdar and S. A. Parpanchi / Decision Science Letters 4 (2015)
153
Table 15 The crisp matrix of aggregated opinions and the ultimate weights of the sub-criteria related to company strength criterion (CR= 0.0911)
Sub-criteria C31 C32 C33 C34 C35 C36 Weight C31 1 1.321258 0.807933 1.38186 1.611507 1.904419 0.2045 C32 0.770393 1 1.131916 1.915559 1.056762 1.960722 0.1956 C33 1.268738 0.897061 1 3.642385 3.436424 0.731684 0.2350 C34 0.733586 0.529496 0.269417 1 1.751069 1.579013 0.1293 C35 0.627758 0.9587 0.288345 0.595287 1 1.171978 0.1118 C36 0.541602 0.511301 1.406662 0.65597 0.87244 1 0.1238
To complete the remaining pairwise comparisons required for ranking the alternatives, 19 sub-criteria of the research and 6 alternatives should be compared in a pairwise manner. Table 16 summarizes all results of the weights of alternatives according to each sub-criterion. Table 16 Alternatives weight matrix regarding the sub-criteria of the problem
Alternatives C11
C12
C13
C14
C15
C21
C22
C23
C24
C25
C26
C27
C28
C31
C32
C33
C34
C35
C36
IBM
0.20
52
0.27
78
0.28
9360
016
0.29
4553
044
0.19
13
0.15
72
0.29
19
0.43
54
0.17
16
0.25
24
0.22
16
0.09
83
0.12
79
0.17
67
0.24
18
0.30
78
0.15
92
0.15
83
0.11
13
Mic
roso
ft
0.10
25
0.10
19
0.10
1980
727
0.07
5183
013
0.09
04
0.08
03
0.08
51
0.08
12
0.09
69
0.09
24
0.08
67
0.12
55
0.07
37
0.08
27
0.07
22
0.10
89
0.33
7
0.22
01
0.09
78
SAP
0.20
74
0.13
17
0.13
5184
305
0.13
7521
416
0.10
5
0.18
38
0.10
4
0.13
54
0.15
72
0.13
67
0.11
44
0.14
85
0.10
46
0.14
47
0.09
03
0.09
32
0.11
21
0.07
02
0.17
41
Qlik
Tec
h
0.12
25
0.08
43
0.15
7577
753
0.14
8196
589
0.18
96
0.21
07
0.15
97
0.10
54
0.19
96
0.17
23
0.19
13
0.33
04
0.22
5
0.18
92
0.12
72
0.12
13
0.11
99
0.22
4
0.16
22
SAS
0.12
06
0.15
09
0.12
4165
084
0.18
0860
982
0.21
83
0.17
38
0.20
37
0.13
89
0.22
32
0.19
45
0.23
45
0.20
45
0.26
92
0.15
52
0.25
51
0.17
95
0.13
86
0.18
33
0.19
83
Ora
cle
0.24
17
0.25
34
0.19
1732
114
0.16
3684
956
0.20
54
0.19
41
0.15
57
0.10
37
0.15
16
0.15
17
0.15
15
0.09
29
0.19
96
0.25
14
0.21
34
0.18
94
0.13
32
0.14
4
0.25
63
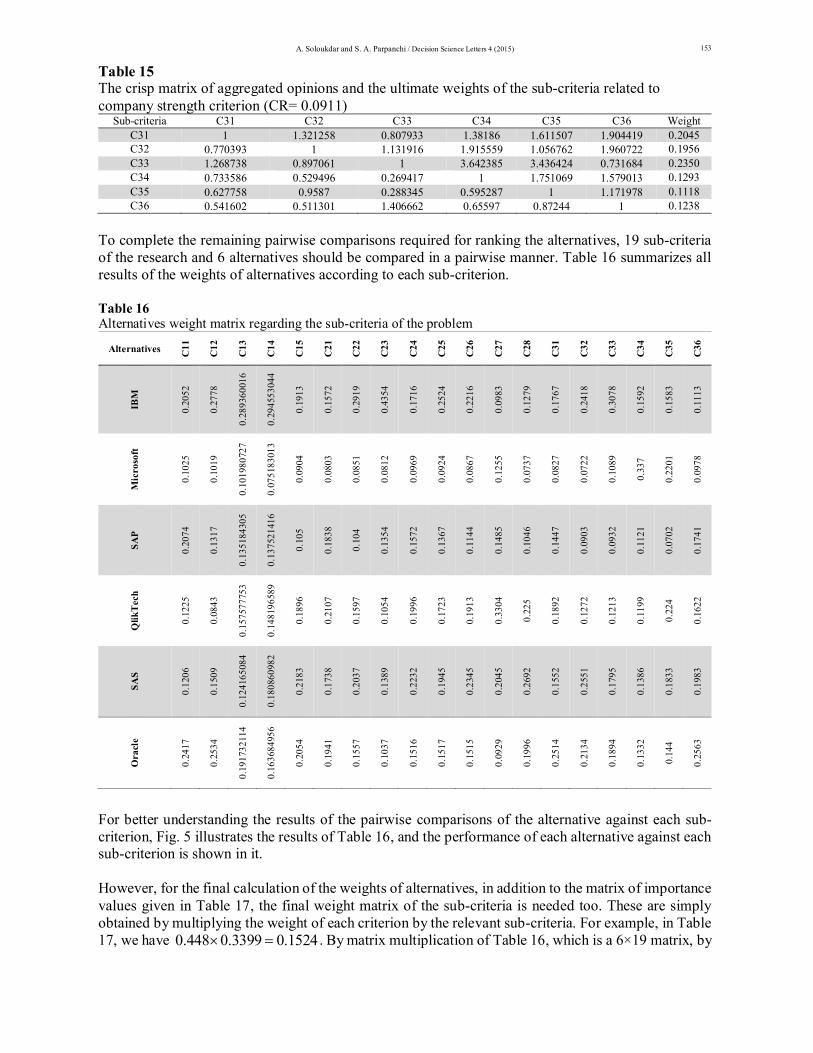
For better understanding the results of the pairwise comparisons of the alternative against each sub-criterion, Fig. 5 illustrates the results of Table 16, and the performance of each alternative against each sub-criterion is shown in it. However, for the final calculation of the weights of alternatives, in addition to the matrix of importance values given in Table 17, the final weight matrix of the sub-criteria is needed too. These are simply obtained by multiplying the weight of each criterion by the relevant sub-criteria. For example, in Table 17, we have 0.448 0.3399 0.1524 . By matrix multiplication of Table 16, which is a 6×19 matrix, by
154
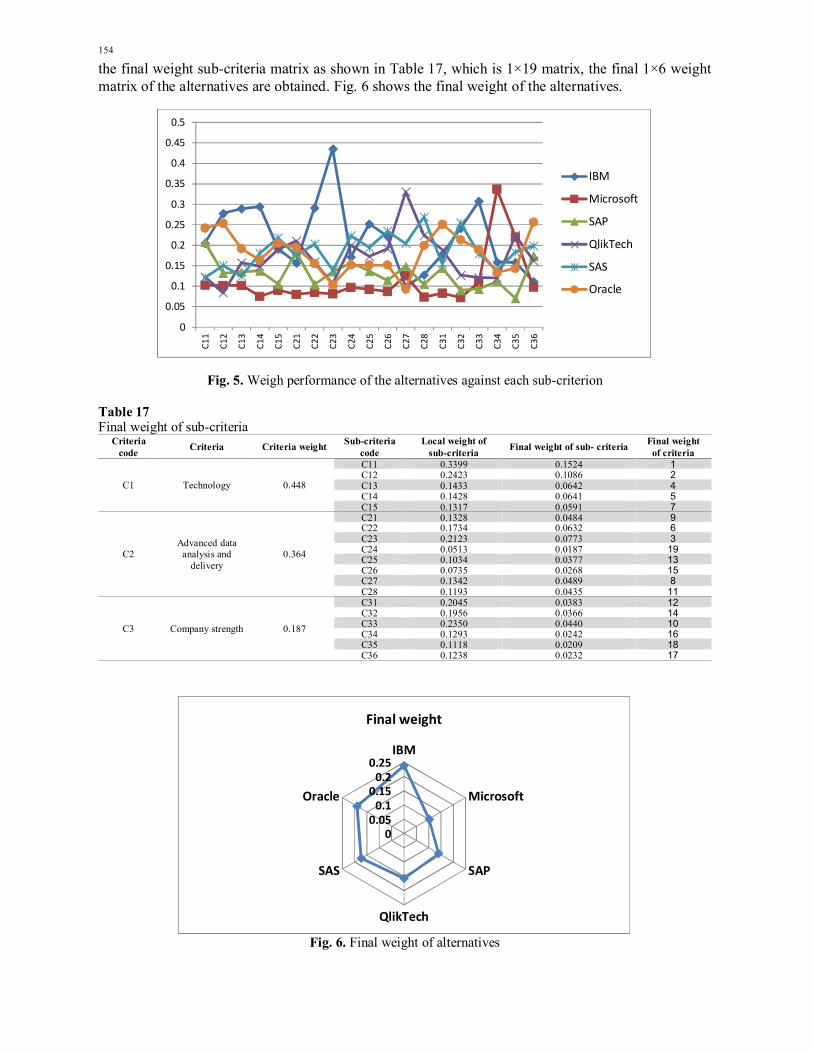
the final weight sub-criteria matrix as shown in Table 17, which is 1×19 matrix, the final 1×6 weight matrix of the alternatives are obtained. Fig. 6 shows the final weight of the alternatives.
Fig. 5. Weigh performance of the alternatives against each sub-criterion
Table 17 Final weight of sub-criteria
Criteria code Criteria Criteria weight Sub-criteria
code Local weight of
sub-criteria Final weight of sub- criteria Final weight of criteria
C1 Technology 0.448
C11 0.3399 0.1524 1 C12 0.2423 0.1086 2 C13 0.1433 0.0642 4 C14 0.1428 0.0641 5 C15 0.1317 0.0591 7
C2 Advanced data
analysis and delivery
0.364
C21 0.1328 0.0484 9 C22 0.1734 0.0632 6 C23 0.2123 0.0773 3 C24 0.0513 0.0187 19 C25 0.1034 0.0377 13 C26 0.0735 0.0268 15 C27 0.1342 0.0489 8 C28 0.1193 0.0435 11
C3 Company strength 0.187
C31 0.2045 0.0383 12 C32 0.1956 0.0366 14 C33 0.2350 0.0440 10 C34 0.1293 0.0242 16 C35 0.1118 0.0209 18 C36 0.1238 0.0232 17
Fig. 6. Final weight of alternatives
0
0.05
0.1
0.15
0.2
0.25
0.3
0.35
0.4
0.45
0.5
C11
C12
C13
C14
C15
C21
C22
C23
C24
C25
C26
C27
C28
C31
C32
C33
C34
C35
C36
IBM
Microsoft
SAP
QlikTech
SAS
Oracle
00.05
0.10.15
0.20.25
IBM
Microsoft
SAP
QlikTech
SAS
Oracle
Final weight
A. Soloukdar and S. A. Parpanchi / Decision Science Letters 4 (2015)
155
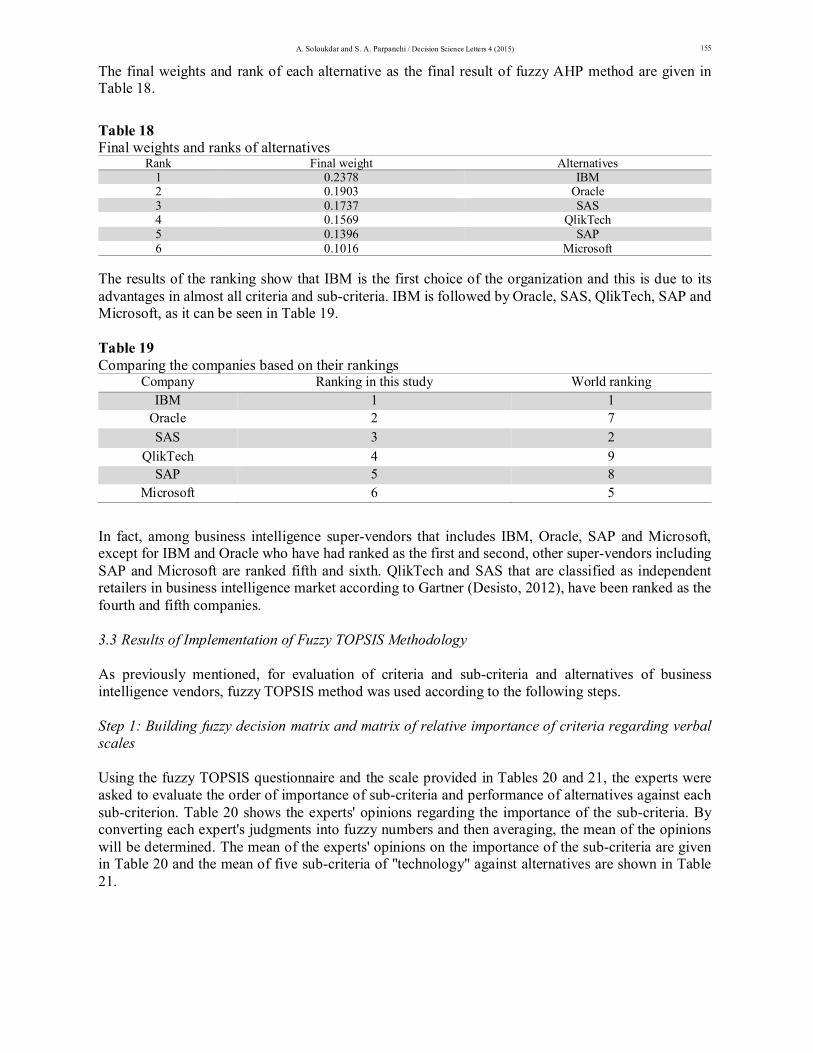
The final weights and rank of each alternative as the final result of fuzzy AHP method are given in Table 18.
Table 18 Final weights and ranks of alternatives
Alternatives Final weight Rank IBM 0.2378 1
Oracle 0.1903 2 SAS 0.1737 3
QlikTech 0.1569 4 SAP 0.1396 5
Microsoft 0.1016 6 The results of the ranking show that IBM is the first choice of the organization and this is due to its advantages in almost all criteria and sub-criteria. IBM is followed by Oracle, SAS, QlikTech, SAP and Microsoft, as it can be seen in Table 19. Table 19 Comparing the companies based on their rankings
Company Ranking in this study World ranking IBM 1 1
Oracle 2 7 SAS 3 2
QlikTech 4 9 SAP 5 8
Microsoft 6 5
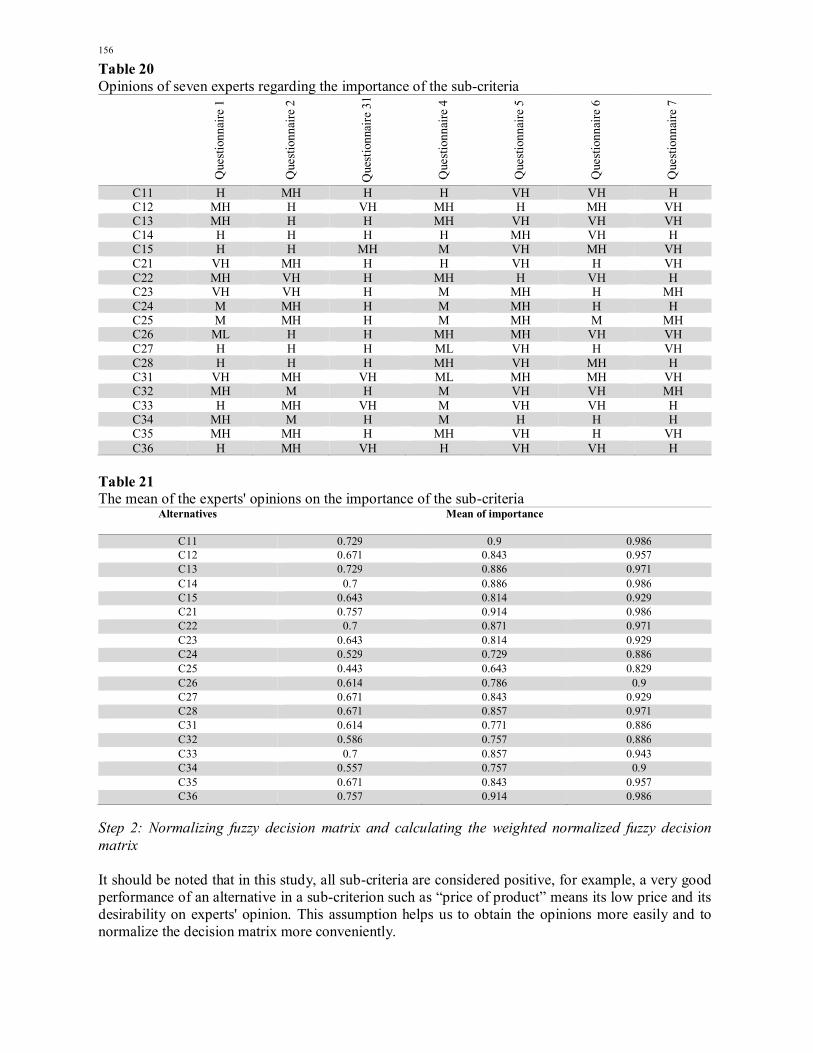
In fact, among business intelligence super-vendors that includes IBM, Oracle, SAP and Microsoft, except for IBM and Oracle who have had ranked as the first and second, other super-vendors including SAP and Microsoft are ranked fifth and sixth. QlikTech and SAS that are classified as independent retailers in business intelligence market according to Gartner (Desisto, 2012), have been ranked as the fourth and fifth companies. 3.3 Results of Implementation of Fuzzy TOPSIS Methodology As previously mentioned, for evaluation of criteria and sub-criteria and alternatives of business intelligence vendors, fuzzy TOPSIS method was used according to the following steps. Step 1: Building fuzzy decision matrix and matrix of relative importance of criteria regarding verbal scales Using the fuzzy TOPSIS questionnaire and the scale provided in Tables 20 and 21, the experts were asked to evaluate the order of importance of sub-criteria and performance of alternatives against each sub-criterion. Table 20 shows the experts' opinions regarding the importance of the sub-criteria. By converting each expert's judgments into fuzzy numbers and then averaging, the mean of the opinions will be determined. The mean of the experts' opinions on the importance of the sub-criteria are given in Table 20 and the mean of five sub-criteria of "technology" against alternatives are shown in Table 21.
156
Table 20 Opinions of seven experts regarding the importance of the sub-criteria
Que
stio
nnai
re 1
Que
stio
nnai
re 2
Que
stio
nnai
re 3
1
Que
stio
nnai
re 4
Que
stio
nnai
re 5
Que
stio
nnai
re 6
Que
stio
nnai
re 7
C11 H MH H H VH VH H C12 MH H VH MH H MH VH C13 MH H H MH VH VH VH C14 H H H H MH VH H C15 H H MH M VH MH VH C21 VH MH H H VH H VH C22 MH VH H MH H VH H C23 VH VH H M MH H MH C24 M MH H M MH H H C25 M MH H M MH M MH C26 ML H H MH MH VH VH C27 H H H ML VH H VH C28 H H H MH VH MH H C31 VH MH VH ML MH MH VH C32 MH M H M VH VH MH C33 H MH VH M VH VH H C34 MH M H M H H H C35 MH MH H MH VH H VH C36 H MH VH H VH VH H
Table 21 The mean of the experts' opinions on the importance of the sub-criteria
Alternatives Mean of importance
C11 0.729 0.9 0.986 C12 0.671 0.843 0.957 C13 0.729 0.886 0.971 C14 0.7 0.886 0.986 C15 0.643 0.814 0.929 C21 0.757 0.914 0.986 C22 0.7 0.871 0.971 C23 0.643 0.814 0.929 C24 0.529 0.729 0.886 C25 0.443 0.643 0.829 C26 0.614 0.786 0.9 C27 0.671 0.843 0.929 C28 0.671 0.857 0.971 C31 0.614 0.771 0.886 C32 0.586 0.757 0.886 C33 0.7 0.857 0.943 C34 0.557 0.757 0.9 C35 0.671 0.843 0.957 C36 0.757 0.914 0.986
Step 2: Normalizing fuzzy decision matrix and calculating the weighted normalized fuzzy decision matrix It should be noted that in this study, all sub-criteria are considered positive, for example, a very good performance of an alternative in a sub-criterion such as “price of product” means its low price and its desirability on experts' opinion. This assumption helps us to obtain the opinions more easily and to normalize the decision matrix more conveniently.
A. Soloukdar and S. A. Parpanchi / Decision Science Letters 4 (2015)
157
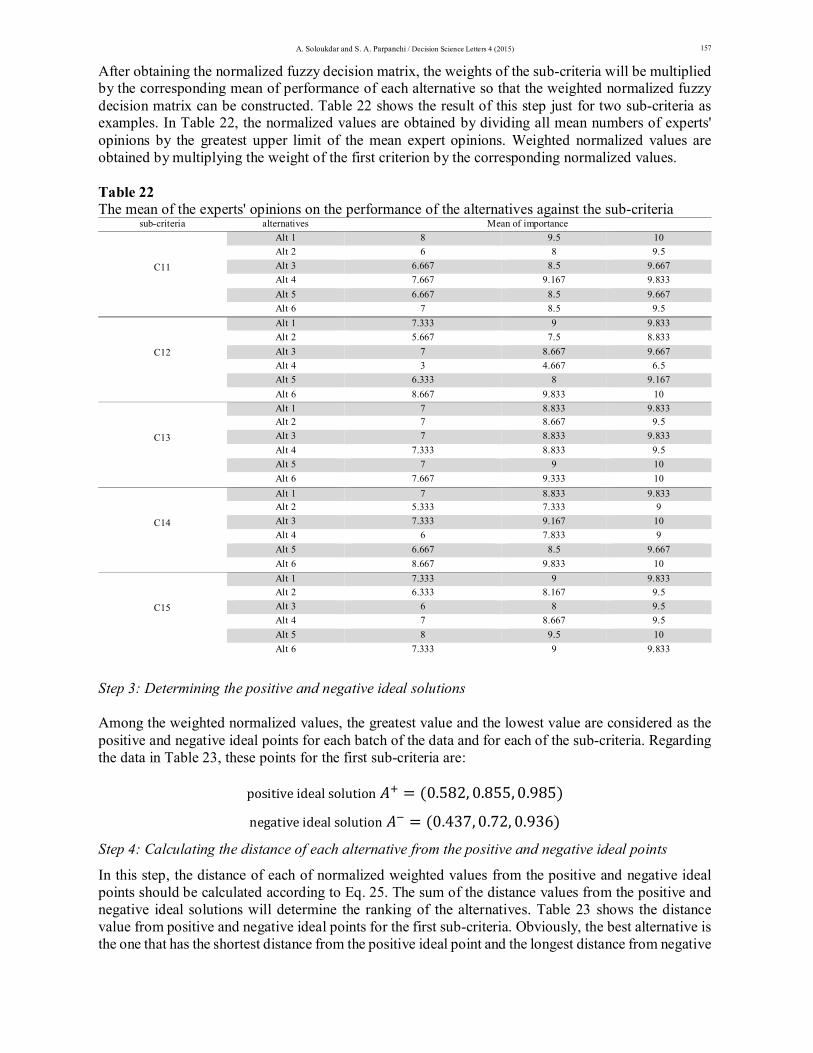
After obtaining the normalized fuzzy decision matrix, the weights of the sub-criteria will be multiplied by the corresponding mean of performance of each alternative so that the weighted normalized fuzzy decision matrix can be constructed. Table 22 shows the result of this step just for two sub-criteria as examples. In Table 22, the normalized values are obtained by dividing all mean numbers of experts' opinions by the greatest upper limit of the mean expert opinions. Weighted normalized values are obtained by multiplying the weight of the first criterion by the corresponding normalized values. Table 22 The mean of the experts' opinions on the performance of the alternatives against the sub-criteria
sub-criteria alternatives Mean of importance
C11
Alt 1 8 9.5 10 Alt 2 6 8 9.5 Alt 3 6.667 8.5 9.667 Alt 4 7.667 9.167 9.833 Alt 5 6.667 8.5 9.667 Alt 6 7 8.5 9.5
C12
Alt 1 7.333 9 9.833 Alt 2 5.667 7.5 8.833 Alt 3 7 8.667 9.667 Alt 4 3 4.667 6.5 Alt 5 6.333 8 9.167 Alt 6 8.667 9.833 10
C13
Alt 1 7 8.833 9.833 Alt 2 7 8.667 9.5 Alt 3 7 8.833 9.833 Alt 4 7.333 8.833 9.5 Alt 5 7 9 10 Alt 6 7.667 9.333 10
C14
Alt 1 7 8.833 9.833 Alt 2 5.333 7.333 9 Alt 3 7.333 9.167 10 Alt 4 6 7.833 9 Alt 5 6.667 8.5 9.667 Alt 6 8.667 9.833 10
C15
Alt 1 7.333 9 9.833 Alt 2 6.333 8.167 9.5 Alt 3 6 8 9.5 Alt 4 7 8.667 9.5 Alt 5 8 9.5 10 Alt 6 7.333 9 9.833
Step 3: Determining the positive and negative ideal solutions Among the weighted normalized values, the greatest value and the lowest value are considered as the positive and negative ideal points for each batch of the data and for each of the sub-criteria. Regarding the data in Table 23, these points for the first sub-criteria are:
positiveidealsolution퐴 = (0.582, 0.855, 0.985)
negativeidealsolution퐴 = (0.437, 0.72, 0.936)
Step 4: Calculating the distance of each alternative from the positive and negative ideal points
In this step, the distance of each of normalized weighted values from the positive and negative ideal points should be calculated according to Eq. 25. The sum of the distance values from the positive and negative ideal solutions will determine the ranking of the alternatives. Table 23 shows the distance value from positive and negative ideal points for the first sub-criteria. Obviously, the best alternative is the one that has the shortest distance from the positive ideal point and the longest distance from negative
158
ideal point in all sub-criteria. Table 23 Weighted normalized values of performance of alternatives for sub-criteria 1 and 2
Sub-criteria Weight Alternatives Mean of experts'
opinions Normalized values Weighted normalized values
1
0.7286 0.9 0.9857 1 8 9.5 10 0.8 0.95 1 0.583 0.855 0.986 0.7286 0.9 0.9857 2 6 8 9.5 0.6 0.8 0.95 0.437 0.720 0.936 0.7286 0.9 0.9857 3 6.667 8.5 9.667 0.6667 0.85 0.96667 0.486 0.765 0.953 0.7286 0.9 0.9857 4 7.667 9.167 9.833 0.7667 0.91667 0.98333 0.559 0.825 0.969 0.7286 0.9 0.9857 5 6.667 8.5 9.667 0.6667 0.85 0.96667 0.486 0.765 0.953 0.7286 0.9 0.9857 6 7 8.5 9.5 0.7 0.85 0.95 0.510 0.765 0.936
2
0.6714 0.8429 0.9571 1 7.333 9 9.833 0.733 0.9 0.98333 0.492381 0.75857 0.94119 0.6714 0.8429 0.9571 2 5.667 7.5 8.833 0.5667 0.75 0.88333 0.3804762 0.63214 0.84548 0.6714 0.8429 0.9571 3 7 8.667 9.667 0.7 0.86667 0.96667 0.47 0.73048 0.92524 0.6714 0.8429 0.9571 4 3 4.667 6.5 0.3 0.46667 0.65 0.2014286 0.39333 0.62215 0.6714 0.8429 0.9571 5 6.333 8 9.167 0.633 0.8 0.91667 0.4252381 0.67429 0.8774 0.6714 0.8429 0.9571 6 8.667 9.833 10 0.8667 0.98333 1 0.5819048 0.82881 0.9571
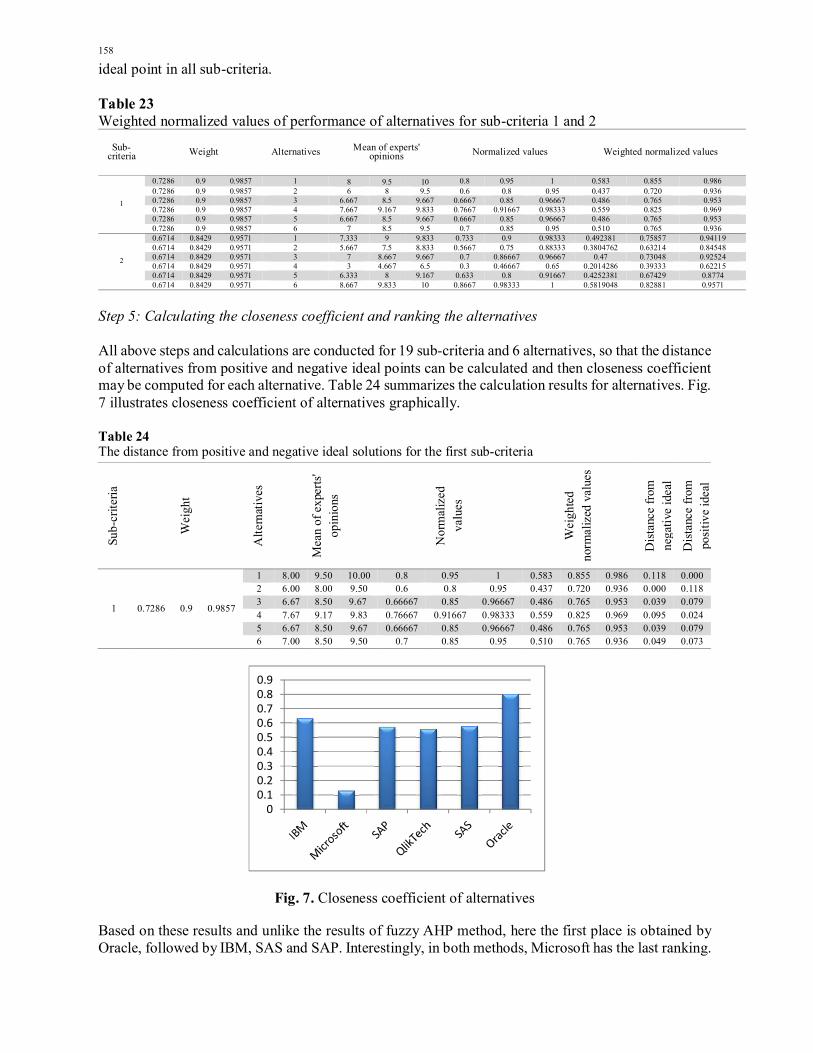
Step 5: Calculating the closeness coefficient and ranking the alternatives All above steps and calculations are conducted for 19 sub-criteria and 6 alternatives, so that the distance of alternatives from positive and negative ideal points can be calculated and then closeness coefficient may be computed for each alternative. Table 24 summarizes the calculation results for alternatives. Fig. 7 illustrates closeness coefficient of alternatives graphically. Table 24 The distance from positive and negative ideal solutions for the first sub-criteria
Fig. 7. Closeness coefficient of alternatives
Based on these results and unlike the results of fuzzy AHP method, here the first place is obtained by Oracle, followed by IBM, SAS and SAP. Interestingly, in both methods, Microsoft has the last ranking.
Sub-
crite
ria
Wei
ght
Alte
rnat
ives
Mea
n of
exp
erts
' op
inio
ns
Nor
mal
ized
va
lues
Wei
ghte
d no
rmal
ized
val
ues
Dis
tanc
e fr
om
nega
tive
idea
l D
ista
nce
from
po
sitiv
e id
eal
1 0.7286 0.9 0.9857
1 8.00 9.50 10.00 0.8 0.95 1 0.583 0.855 0.986 0.118 0.000 2 6.00 8.00 9.50 0.6 0.8 0.95 0.437 0.720 0.936 0.000 0.118 3 6.67 8.50 9.67 0.66667 0.85 0.96667 0.486 0.765 0.953 0.039 0.079 4 7.67 9.17 9.83 0.76667 0.91667 0.98333 0.559 0.825 0.969 0.095 0.024 5 6.67 8.50 9.67 0.66667 0.85 0.96667 0.486 0.765 0.953 0.039 0.079 6 7.00 8.50 9.50 0.7 0.85 0.95 0.510 0.765 0.936 0.049 0.073
00.10.20.30.40.50.60.70.80.9
A. Soloukdar and S. A. Parpanchi / Decision Science Letters 4 (2015)
159
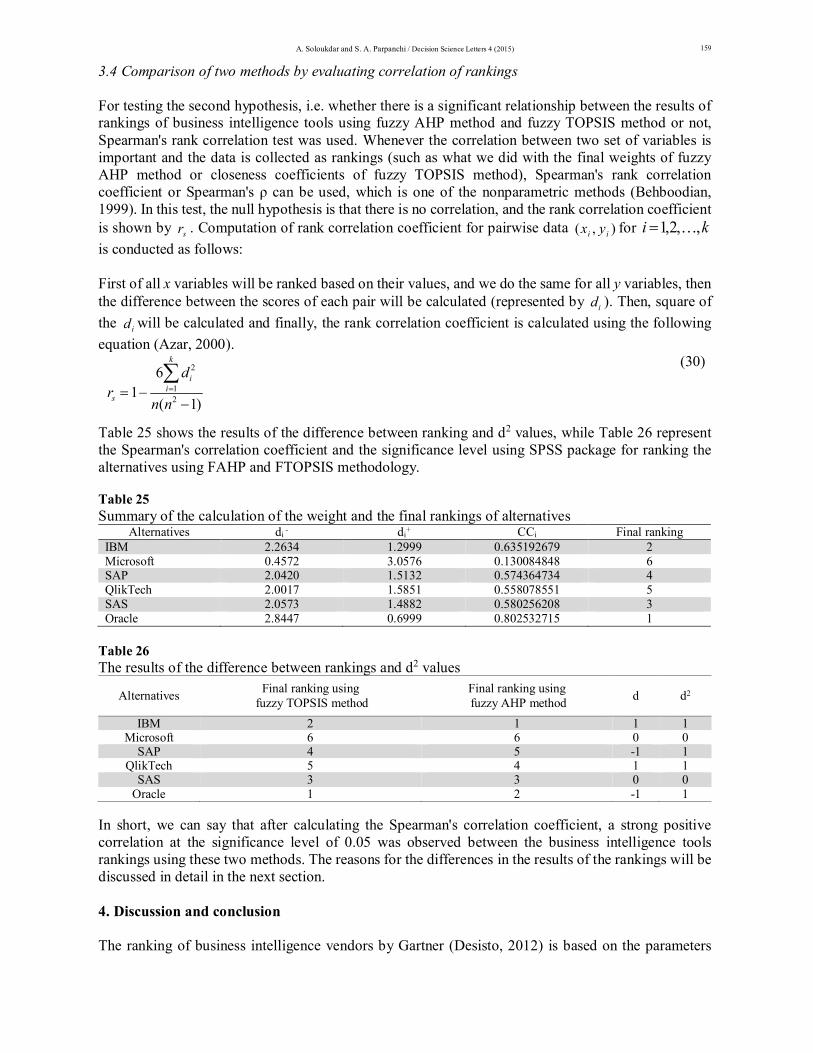
3.4 Comparison of two methods by evaluating correlation of rankings For testing the second hypothesis, i.e. whether there is a significant relationship between the results of rankings of business intelligence tools using fuzzy AHP method and fuzzy TOPSIS method or not, Spearman's rank correlation test was used. Whenever the correlation between two set of variables is important and the data is collected as rankings (such as what we did with the final weights of fuzzy AHP method or closeness coefficients of fuzzy TOPSIS method), Spearman's rank correlation coefficient or Spearman's ρ can be used, which is one of the nonparametric methods (Behboodian, 1999). In this test, the null hypothesis is that there is no correlation, and the rank correlation coefficient is shown by sr . Computation of rank correlation coefficient for pairwise data ),( ii yx for ki ,,2,1 is conducted as follows: First of all x variables will be ranked based on their values, and we do the same for all y variables, then the difference between the scores of each pair will be calculated (represented by id ). Then, square of the id will be calculated and finally, the rank correlation coefficient is calculated using the following equation (Azar, 2000).
2
12
61
( 1)
k
ii
s
dr
n n
(30)
Table 25 shows the results of the difference between ranking and d2 values, while Table 26 represent the Spearman's correlation coefficient and the significance level using SPSS package for ranking the alternatives using FAHP and FTOPSIS methodology. Table 25 Summary of the calculation of the weight and the final rankings of alternatives
Alternatives di - di+ CCi Final ranking IBM 2.2634 1.2999 0.635192679 2 Microsoft 0.4572 3.0576 0.130084848 6 SAP 2.0420 1.5132 0.574364734 4 QlikTech 2.0017 1.5851 0.558078551 5 SAS 2.0573 1.4882 0.580256208 3 Oracle 2.8447 0.6999 0.802532715 1
Table 26 The results of the difference between rankings and d2 values
Alternatives Final ranking using fuzzy TOPSIS method
Final ranking using fuzzy AHP method d d2
IBM 2 1 1 1 Microsoft 6 6 0 0
SAP 4 5 -1 1 QlikTech 5 4 1 1
SAS 3 3 0 0 Oracle 1 2 -1 1
In short, we can say that after calculating the Spearman's correlation coefficient, a strong positive correlation at the significance level of 0.05 was observed between the business intelligence tools rankings using these two methods. The reasons for the differences in the results of the rankings will be discussed in detail in the next section. 4. Discussion and conclusion The ranking of business intelligence vendors by Gartner (Desisto, 2012) is based on the parameters
160
specified by such companies in their annual statistical report, while the key indicators in this study were selected based on a comprehensive review of literature, and evaluation and ranking methods, namely fuzzy multi-criteria decision-making methods, and the measurement procedure is different from those offered by Gartner (Desisto, 2012). Other studies, such as Rouhani, Ghazanfari and Jafari (2012), Mojdeh (2007), Saadi (2012), Rezaie et al (2011) have studied organizational systems based on business intelligence indices, however in this research selecting and ranking of business intelligence vendors have been conducted for the first time, after identifying the integrated key indicators and criteria,. Regarding the obtained results, it can be said that the results of investigating relative importance of the main criteria by conducting pairwise comparisons using FAHP and from the point of view of experts show that the order of importance of criteria include technology, advanced data analysis and delivery and company strength. The weights of these three criteria show that nearly 45 percent of the total relative importance is given to technology on the experts' opinions. As previously mentioned, by technology we mean the capacity of an organizations to collect, store, and organize knowledge. Common business intelligence technological activities include reporting, online analysis process reports, various types of analyses, data mining, process-mining, complex event processing, business performance management, benchmarking, predictive analysis and recommending analysis. The fact that experts see technology as the most important criterion brings about another vital point for FAHP results, i.e. a vendor with better performance in its sub-criteria (information integration, data warehouse, metadata management, intelligent agents and developed tools) will ultimately obtain a higher rank. Vendor performance with respect to each criterion/sub-criterion in FAHP method shows that the most important sub-criterion for technology is "information integration", where Oracle, SAP and IBM respectively had better performance in comparison with other competitors on the experts' opinions. For the sub-criteria of the second criterion, namely "advanced data analysis and delivery", IBM has performed better than other competitors have and SAS and QlickTech have managed to win the second and third places. Another interesting point is the excellent performance of IBM for the most important sub-criteria of the second criterion, namely OLAP. For the sub-criteria of the third criterion, which ranks third in terms of the importance, Oracle has better overall performance than other competitors do. For the most important sub-criterion of the third criterion, namely "product quality", again IBM has earned the highest rank on the experts' opinions. For the first sub-criterion, the worst performance belongs to Microsoft. In fact, for all technology sub-criteria except for the second one, i.e. "data warehouse", Microsoft has performed worse than all competitors. This is also more or less true for Microsoft regarding the second importance criteria, namely "advanced data analysis and delivery" and its sub-criteria except for "flexibility and ease of use". The performance of Microsoft is the worst one for seven sub-criteria of the second criterion. The poor performance of Microsoft on the experts' opinions is again obvious for the third criterion and its first, second and fifth sub-criteria, namely security, vendor experience and support services and eventually Microsoft is ranked the last with a weight difference of 0.04 from SAP. The results of fuzzy TOPSIS method show that Oracle is the first choice by the oil industry experts participating in this research. Appraisal of the importance of each of the 19 sub-criteria of the research using FTOPSIS method on the experts' opinions (that section of the questionnaire which deals with the sub-criteria) shows that the trend of importance for the sub-criteria of the first criterion is descending compared with the second sub-criteria, but it is somewhat ascending for the third criteria. The results of FTOPSIS method also can be explained as follows. Based on the distances from the positive and negative ideal points for each sub-criterion and for each alternative of the study, it can be seen that Microsoft has the worst performance for most sub-criteria (the largest proximity to negative ideal point and the longest distance from the positive ideal point), and Oracle has the best performance for majority of the sub-criteria (the longest distance from the negative ideal solution and the largest proximity to the positive ideal solution). Oracle has the best performance in information integration, developed tools,
A. Soloukdar and S. A. Parpanchi / Decision Science Letters 4 (2015)
161
OLAP, reporting systems, security and price product; while IBM has best performed for intelligent agents, dashboard, mobile BI, flexibility and ease of use, vendor experience, and product quality; the performance of QlikTech has been best for dashboard and risk simulation; SAP has the best visual interaction and support services, SAS has the most efficient data warehouse, required time for implementation, and Microsoft applications has the best performance in terms of developed tools. This study has tried to provide an appropriate model for selection of business intelligence tools. In short, concerning the compare the results of these two methods, it can be said that after calculating Spearman's rank correlation coefficient, there was a strong positive correlation between the ranks of business intelligence tools obtained from FAHP and FTOPSIS methods (ρ = 0.885). However, it seems that the differences between the obtained results by the two methods can be explained by the following points: 1. Calculation mechanisms are largely different in two methods. In FAHP method, sum of the weights
of each criterion and sub-criterion against pairwise comparisons determines the ranking of each alternative, however, in FTOPSIS method the ranks of the alternatives are determined based on their distance from positive and negative ideal solutions.
2. Scales of obtaining opinions do not coincide in these two methods, and it seems that the 9-point scale of pairwise comparisons in FAHP method provides greater scope for experts' opinion compared with 7-point scale used in FTOPSIS method for expressing the importance of the criteria and the performance of the alternatives.
Hence, it seems that FAHP method provides rankings that are more acceptable. In order to check the validity of the obtained results for oil industry, 7 senior managers were asked to express their opinions on the validity of the results. The results of this study showed that the results obtained by FAHP method are much more consistent with their opinions. They also stated that technology is the most effective criteria for selecting business intelligence tools. Another important criterion was advanced data analysis and delivery. Furthermore, using methods other than AHP, such as analytic network process (ANP) assuming the existence of relationships between indicators, or combination of fuzzy TOPSIS, ANP and fuzzy DEMATEL methods significantly reduces the number of pairwise comparisons among effective alternatives. Therefore, it can be suggested that these methods may be used for ranking business intelligence tools and comparing the results with the results of this research.
References Abzaltynova, Z., & Williams, J. (2013). Developments in Business Intelligence Software. Journal of Intelligence
Studies in Business, 3(2). 18-38. Adelakun, O., & Kemper, T. (2010). Software-as-a-Service Business Intelligence: Adoption Criteria and
Business Value. Jonkoping International Business School. 28. Amara, Y., Søilen K. S., Vriens, D., & Jenster, P. (2008). Evaluating Business Intelligence Software - Testing
the SSAV Model, 17th European Conference on Information Systems ECIS Blekinge Institute of Technolog, 12-26.
Aydin, S., & Halilov, A. (2012). State-of-the-art Mobile Business Intelligence A study based on evaluating three BI vendors. (Bachelor of Science Thesis, University of Gothenburg And Chalmers University of Technology, Department of Computer Science and Engineering).
Azar, A. & Momeni M. (2000).Statistics and Application in Management. 3rd ed., Samat Publication, Tehran, Iran.
Bayer, H., Volmer, C., Krauss, A., Stephan, R., & Hein, M. A. (2010, August). Tracking antenna for mobile bi-directional satellite communications in Ka-band. In Wireless Information Technology and Systems (ICWITS), 2010 IEEE International Conference on (pp. 1-4). IEEE.
Behbodian, J. (1999). Non parametric Statistic. Publishing center of Shiraz University, 3rd ed., Shiraz: Iran. Bensberg, F. (2008). Mobile Business Intelligence Besonderheiten, Potenziale und prozessorientierte
Gestaltung. Erfolgsfaktoren des Mobile Marketin. Berlin: Springer, Teil 1, 71-87, Berzal, F., Cubero, J., & Jiménez, A. (2008). The design and use of the TMiner component-based data mining
framework. Expert Systems with Applications, 36(4), 7882-7887.
162
Bolloju, N., Khalifa, M., & Turban E. (2002). Integrating knowledge management into enterprise environments for the next generation decision support. Decision Support Systems, 33, 163–176.
Bose, R. (2009). Advanced analytics: Opportunities and challenges. Industrial Management & Data Systems, 109(2), 155–172.
Bräutigam, D., Gerlach, S., & Miller, G. (2006). Business Intelligence Competency Centers. Hoboken: John Wiley & Sons, Inc.
Bross, M. E. & Zhao, G. (2004). Supplier selection process in emerging markets – The case study of Volvo Bus Corporation in China. School of Economics and Commercial Law, Göteborg University.
Chan, K. Y., Kwong, C. K., & Dillon, T. S. (2012). An Enhanced Fuzzy AHP Method with Extent Analysis for Determining Importance of Customer Requirements. In Computational Intelligence Techniques for New Product Design, Studies in Computational Intelligence , Springer, 403,79–93.
Chen, C. T., Lin, C. T., & Huang, S. F. (2006). A fuzzy approach for supplier evaluation and selection in supply chain management. International Journal of Production Economics, 102, 289–301.
Cheng, H., Lu, Y., & Sheu, C. (2009). An ontology-based business intelligence application in a financial knowledge management system. Expert Systems with Applications, 36, 3614–3622.
Cooper, W., Seiford, L., Tone, K. (2000). Data Envelopment Analysis. A Comprehensive Text with Models, Applications, References and DEA-Solver Software. Springer.
Csutora, R., & Buckley, J. J. (2001). Fuzzy hierarchical analysis: the Lambda-Max method's, Fuzzy Sets and Systems, 120(2), 181–95.
Desisto, R. P. (2012).Magic Quadrant for Sales Force Automation. Gartner Inc. G00234940. Donald, R. & Warner, J. R. ( 2007). Effective and Innovative Use of IT Business Intelligence Tools to Reduce
Manufacturer's Warranty Costs. Lawrence Technological University.92 -109. Dyche, J. (2000). E-Data: Turning Data into Information with Data Warehousing. Addison-Wesley. Evers, M. (2008).An analysis of the requirements for DSS on integrated river basin management. Management
of Environmental Quality: An International Journal, 19(1), 37-53. Falk, T. & Olve, N-G. (1996). IT som en Strategisk Resurs: Företagsekonomiska Perspektiv och Ledningens
Ansvar. Malmö: Liber-Hemonds. Galasso, F., & Thierry, C. (2009). Design of cooperative processes in a customer supplier relationship: An
approach based on simulation and decision theory. Engineering Applications of Artificial Intelligence, 22(6), 865-88.
Gao, S. & Xu, D. (2009). Conceptual modeling and development of an intelligent agent-assisted decision support system for anti-money laundering. Expert Systems with Applications, 36, 1493–1504.
Han, J., Kamber, M. (2005). Data Mining: Concepts and Techniques. Morgan Kaufmann. Hand, D., Mannila, H., & Smyth, P. (2001). Principles of Data Mining. MIT Press. Hastie, T., Tibshirani, R., Friedman, J. (2001). The Elements of Statistical Learning: Data Mining, Inference,
and Prediction. Springer. Hedgebeth, D. (2007). Data-driven decision making for the enterprise: An overview of business intelligence
applications. The Journal of Information and Knowledge Management Systems, 37(4), 414–420. Herschel, R.T. & Jones, N.E., (2005). Knowledge management and business intelligence: the importance of
integration. Journal of Knowledge Management, 9 (4).45-55 Howson, C. (2008) Successful Business Intelligence: Secrets to Making BI a Killer App, McGraw-Hill. Hwang, C. L., & Yoon, K. (1981). Multiple Attribute Decision Making: Methods and Applications. Berlin:
Springer. Hypathia Reasearch & Consulting (2009) Business Intelligence: Connectivity Options & Evaluation Criteria
for SaaS. Hypatia Research, LLC. Imhoff, C.(2010). Business Intelligence as a Service: Key Evaluation Criteria for ISVs to Consider. Intelligent
Solutions, Inc. Inmon, W. (2005). Building the Data Warehouse. 4th ed., John Wiley & Sons. Işık, O. (2010). Business Intelligence Success: An empirical evaluation of the role of BI capabilities and the
decision environment (Doctoral dissertation). University Of North Texas. Kaufmann, A., & Gupta, M. (1988). Fuzzy mathematical models in engineering and Management Science.
North- Holland Amsterdam. Kelemenis, A., Ergazakis, K., & Askounis, D. (2011). Support managers’ selection using an extension of fuzzy
TOPSIS. Expert Systems with Applications, 38(3), 2774–2782. Kimball, R., Thornthwaite W., Reeves L., & Ross, M. (1998). The Data Warehouse Lifecycle Toolkit . Wiley. Kimball, R., & Ross, M. (2002). The Data Warehouse Toolkit: The Complete Guide to Dimensional Modeling.
Wiley.
A. Soloukdar and S. A. Parpanchi / Decision Science Letters 4 (2015)
163
Krohling, R. A., & Campanharo, V. C. (2011). Fuzzy TOPSIS for group decision making: A case study for accidents with oil spill in the sea. Expert Systems with Applications, 38(4), 4190–4197.
Kumar, S., Parashar, N., & Haleem, A. (2009). Analytical hierarchy process applied to vendor selection problem: Small scale, medium scale and large scale industries. Business Intelligence Journal. 2(2), 352-362.
Laarhoven, P. J. M., & Pedrycz, W. (1983). A fuzzy extension of Saaty’s priority theory. Fuzzy Sets and Systems, 11, 229–41.
Lau, H. C. W., Ning, A., Ip, W. H., & Choy, K. L. (2004). A decision support system to facilitate resources allocation: An OLAP-based neural network approach. Journal of Manufacturing Technology Management, 15(8), 771–778.
Lee, C. K. M., Lau, H. C. W., Hob, G. T. S., & Ho, W. (2009). Design and development of agent-based procurement system to enhance business intelligence. Expert Systems with Applications, 36, 877–884.
Leung, L. C., & Cao, D. (2000). On consistency and ranking of alternatives in fuzzy AHP. European Journal of Operational Research, 124(1), 102–113.
Liao, C. N., & Kao, H. P. (2011). An integrated fuzzy TOPSIS and MCGP approach to supplier selection in supply chain management. Expert Systems with Applications, 38(9), 10803–10811.
Lin, M. C., Wang, C. C., Chen, M. S., & Chang, C. A. (2008). Using AHP and TOPSIS approaches in customer-driven product design process. Computers in Industry, 59, 17–31.
Lin, Y., Tsai, K., Shiang, W., Kuo, T., & Tsai, C. (2009). Research on using ANP to establish a performance assessment model for business intelligence systems. Expert Systems with Applications, 36, 4135–4146.
Macgllivray, A. E. (2000). Using Business Intelligence (Information Technology) Tools To Facilitate Front-Line-Priority- Setting In A Public Sector Organization. Royal Roads University. 5-15.
Malone, T., Crowston, K., & Herman A. (2003). Organizing Business Knowledge: The MIT Process Handbook. The MIT Press.
Mojdeh, S. (2007) Business Intelligence Vendor Selection Based on BI Life Cycle: A Fuzzy AHP Approach A Case Study in IranKhodro Automobile Manufacturing Co. The Third National Conference on Performance Management, 15 -16.
Moss, T. M., & S. Atre, S. (2003). Business Intelligence Roadmap: The Complete Project Lifecycle for Decision-Support Applications. Addison-Wesley Professional.
Naimuzzaman, M. D. (2009). Dynamic Report Views Implementation of Business Intelligence and Reporting Tools. Department of Computer Science and Engineering Chambers, University of Gothenburg. 15-34.
Nemati, H., Steiger, D., Iyer, L., & Herschel, R. (2002). Knowledge warehouse: an architectural integration of knowledge management, decision support, artificial intelligence and data warehousing. Decision Support Systems, 33, 143–161.
Opricovic, S. & Tzeng, G. H. (2003). Defuzzification within a multicriteria decision model. International Journal of Uncertainty, Fuzziness and Knowledge-Based Systems, 11(5), 635–652.
Pagels-Fick, G. (2000). Business Intelligence, Om Organization, metorder och tillämpning. Katrineholm: Industrilitteratur AB.
Pirttimäki, V., & Hannula, M. (2003). Process models of business intelligence. Frontiers of E-Business Research, 250-260.
Power, D., & Sharda, R. (2007). Model-driven decision support systems: Concepts and research directions. Decision Support Systems, 43, 1044–1061.
Pyle, D. (2003). Business Modeling and Data Mining. Morgan Kaufmann. Qian-cheng, Y. (2007). Metadata management plan research in business intelligence system. Computer
Knowledge and Technology (Academic Exchange), 22. Ranjan, J. (2009). Business intelligence: Concepts, components, techniques and benefits. Journal of Theoretical
and Applied Information Technology, 9(1). Reich, Y., & Kapeliuk, A. (2005). A framework for organizing the space of decision problems with application
to solving subjective, context-dependent problems Decision Support Systems, 41, 1–19. Rezaie, K. , Ansarinejad, A., Haeri, A., & Nazari-Shirkouhi, A. (2011).Evaluating the Business Intelligence
Systems Performance Criteria Using Group Fuzzy AHP Approach, UKSim 13th International Conference on Modeling and Simulation, 360-364.
Rivest, S., Bédard, Y., Proulx, M.-J., Nadeau, M., Hubert, F. & Pastor, J. (2005). SOLAP technology: Merging business intelligence with geospatial technology for interactive spatio-temporal exploration and analysis of data. Journal of Photogrammetry and Remote Sensing (ISPRS), 60, 17 - 33.
Rouhani, S., Ghazanfari, M., & Jafari, M. (2012). Evaluation model of business intelligence for enterprise systems using fuzzy TOPSIS. Expert Systems with Applications. 39(3), 3764-3771.
164
Saadi, S. (2012). Survey on Business Intelligence Softwares. The Fifth Conference of Electronic Administrative System.
Saaty, T. L. (1990). An exposition of the AHP in reply to the paper: Remarks on the analytic hierarchy process. Management Science, 36(3), 259–268.
Sabanovic, A. (2008). Business Intelligence Software Customer's Understanding, Expectations and Needs. University of Kristianstad. 25.
Sas Institute Inc (2004). How to Select a Business Intelligence Vendor. Shaw, K., Shankar, R., Yadav, S. S., & Thakur, L. S. (2012). Supplier selection using fuzzy AHP and fuzzy
multi-objective linear programming for developing low carbon supply chain. Expert Systems with Applications. 39(9), 8182-8192
Shi, Z., Huang, Y., He, Q., Xu, L., Liu, S., Qin, L., Jia, Z., Li, J., Huang, H., & Zhao, L. (2007). MSMiner—A developing platform for OLAP. Decision Support Systems, 42(4), 2016–2028.
Shmueli, G., Patel, N. R., & Bruce, P. C. (2010). Data Mining for Business Intelligence: Concepts, Techniques, and Applications in Microsof Office Excel with XLMiner. John Wiley and Sons.
Solberg Søilen, K. (2008). Management implementation of Business Intelligence Systems. Hammamet 14 – 16 February: 1st International Conference on Information System and Economic Intelligence SIIEʼ2008.
Stackowiak, R., Rayman, J., & Greenwald, R. (2007). Oracle data warehousing and business intelligence solutions. Hoboken, N.J: Wiley.
Stair, R.M., & Reynolds, G.W. (2011) Fundamentals of Information Systems, 6th ed., USA: Cengage Learning. Stipic, A., & Bronzin, T. (2011). Mobile BI: The past, the present and the future. MIPRO, 2011 Proceedings of
the 34th International Convention, 1560 – 1564. Tan, X., Yen, D.C., & Fang, X. (2003). Web warehousing: Web technology meets data warehousing.
Technology in Society, 25(1), 131–148. Tesfamariam, S., & Sadiq, R. (2006). Risk-based environmental decision-making using fuzzy analytic hierarchy
process (F-AHP). Stochastic Environmental Research and Risk Assessment, 21(1), 35–50. Thanassoulis, E. (2001). Introduction to the theory and application of data envelopment analysis: A foundation
text with integrated software. Norwell, Mass: Kluwer Academic Publishers. Torlak, G., Sevkli, M., Sanal, M., & Zaim, S. (2011). Analyzing business competition by using fuzzy TOPSIS
method: An example of Turkish domestic airline industry. Expert Systems with Applications, 38(4), 3396–3406.
Turban, E., & Turban, E. (2007). Decision support and business intelligence systems. Upper Saddle River, N.J: Pearson Prentice Hall.
Tvrdikova, M. (2007). Support of Decision Making by Business Intelligence Tools., International Conference on Computer Information Systems and Industrial Management Applications, 2007. CISIM '07. 6th , 364 – 368.
Vayvay, O., Ozcan, Y., & Cruz-Cunha, M. M. (2012). ERP consultant selection problem using AHP, fuzzy AHP and ANP: A case study in Turkey. E3 Journal of Business Management and Economics, 3(3), 106–117.
Vercellis, C. (2009). Business Intelligence: Data Mining and Optimization for Decision Making. John Wiley & Sons, Ltd.
Wang, X., Chan, H. K., Yee, R. W. Y., & Diaz-Rainey, I. (2012). A two-stage fuzzy-AHP model for risk assessment of implementing green initiatives in the fashion supply chain. International Journal of Production Economics, 135(2), 595–606.
Wang, Y., & Elhag, T. (2006). Fuzzy TOPSIS method based on alpha level sets with an application to bridge risk assessment. Expert Systems with Applications, 31(2), 309–319.
Warren, N., Neto, M. T., Campbell, J., & Misner, S. (2011). Business Intelligence in Microsoft SharePoint 2010. Microsoft Corporation.
Williams, S., & Williams, N. (2007). The profit impact of business intelligence. Amsterdam: Elsevier/Morgan Kaufmann.
Yuen, K., & Lau, H. (2008). Software vendor selection using fuzzy analytic hierarchy process with ISO/IEC9126. IAENG International journal of computer science, 35(3), 267-274.
Zack, M. (2007). The role of decision support systems in an indeterminate world. Decision Support Systems, 43, 1664–1674.
Zadeh, L. (1965). Fuzzy sets. Information Control, 8, 338–53. Zhu, X., & Huang, Y. (2012). A Framework for Mobile Business Intelligence Based on 3G Communication
Environment. Advances in Future Computer and Control Systems, 160, 75-81.
Copyright © 2022 FDOKUMEN