
Comparative Assessment of the Analytical Risk-averse Premium Model and its Risk and Returns:...
12
Journal for Studies in Management and Planning Available at http://internationaljournalofresearch.org/index.php/JSMaP e-ISSN: 2395-0463 Volume 01 Issue 02 March 2015 Available online: http://internationaljournalofresearch.org/ Page | 293 Comparative Assessment of the Analytical Risk-averse Premium Model and its Risk and Returns: Critical Analysis of Capital Asset Pricing Model (CAMP) S. Husnain Raza Shah 1 , Abbas Jaffar* 2 , Muhammad Anwer 3 , Najabat Ali 4 1 Research Scholar, Department of Business Administration, COMSATS Institute of Information Technology (CIIT), PAKISTAN. * 2 PhD Scholar, Glorious Sun School of Business and Management, Donghua University, West Yan’an Road 1882, Shanghai Post Code 200051 China. 3 Faculty Member & Researcher, Special Education Department, Government of Gilgit-Baltistan, PAKISTAN. 4 Research Scholar, Hamdard Institute of Education and Social Sciences, Hamdard University, Main Campus, Karachi, Post Code 75250 - PAKISTAN. * 2 Corresponding Author: Abbas Jaffar Email: [email protected] Abstract This research study attempts to explain the risk and returns of Capital asset pricing model in stocks and investments scenario. In this present study, the model (CAPM) is validated both theoretically and empirically subsequently. Capital asset pricing model is one of the tools for investors to take a decision regarding their investments in various situations by offering risk adjusted returns. This paper creates a concrete underlying building blocks for an investor keeping in view the Modern Portfolio Theory and also the risk and return considerations. Beta is used to prioritize the understanding of different available funds in the market, fund strategies and also to identify instruments for the investors to diversify portfolios of investments. Finally readers would get the idea of how much exactly the investor would get return in order to put his investment in a riskier asset management company instead of a sovereign entity i.e. bank. This paper provides a general investment opportunities for investors not only in order to quantify the risk but also explaining the best risk adjusted returns into estimates of equities expected return. Keywords: Asset Pricing Models, Capital Asset Pricing Model, Linear Function Relationship, Risk and Return. Introduction Capital Asset Pricing Model (CAMP) defines the appropriate theoretical approach which is obligatory for calculating risk adjusted rate of return for an asset provided that the asset is the asset is added to well- diversified portfolio. The attempt of this paper is to contribute to the literature by explaining the relationship of capital asset
-
Upload
hamdard-pk -
Category
Documents
-
view
1 -
download
0
Transcript of Comparative Assessment of the Analytical Risk-averse Premium Model and its Risk and Returns:...
Journal for Studies in Management and Planning
Available at http://internationaljournalofresearch.org/index.php/JSMaP e-ISSN: 2395-0463
Volume 01 Issue 02
March 2015
Available online: http://internationaljournalofresearch.org/ P a g e | 293
Comparative Assessment of the Analytical Risk-averse
Premium Model and its Risk and Returns: Critical Analysis of
Capital Asset Pricing Model (CAMP)
S. Husnain Raza Shah1, Abbas Jaffar*2, Muhammad Anwer3, Najabat Ali4
1Research Scholar, Department of Business Administration,
COMSATS Institute of Information Technology (CIIT), PAKISTAN.
*2PhD Scholar, Glorious Sun School of Business and Management,
Donghua University, West Yan’an Road 1882, Shanghai Post Code 200051 China. 3Faculty Member & Researcher, Special Education Department, Government of Gilgit-Baltistan, PAKISTAN.
4Research Scholar, Hamdard Institute of Education and Social Sciences,
Hamdard University, Main Campus, Karachi, Post Code 75250 - PAKISTAN.
*2Corresponding Author: Abbas Jaffar Email: [email protected]
Abstract
This research study attempts to explain the risk and returns of Capital asset pricing model in stocks and investments scenario. In this present study, the model (CAPM) is validated both theoretically and empirically subsequently. Capital asset pricing model is one of the tools for investors to take a decision regarding their investments in various situations by offering risk adjusted returns. This paper creates a concrete underlying building blocks for an investor keeping in view the Modern Portfolio Theory and also the risk and return considerations. Beta is used to prioritize the understanding of different available funds in the market, fund strategies and also to identify instruments for the investors to diversify portfolios of investments. Finally readers would get the idea of how much exactly the investor would get return in order to put his
investment in a riskier asset management company instead of a sovereign entity i.e. bank. This paper provides a general investment opportunities for investors not only in order to quantify the risk but also explaining the best risk adjusted returns into estimates of equities expected return.
Keywords: Asset Pricing Models, Capital Asset Pricing Model, Linear Function Relationship, Risk and Return. Introduction Capital Asset Pricing Model (CAMP) defines the appropriate theoretical approach which is obligatory for calculating risk adjusted rate of return for an asset provided that the asset is the asset is added to well-diversified portfolio. The attempt of this paper is to contribute to the literature by explaining the relationship of capital asset
Journal for Studies in Management and Planning
Available at http://internationaljournalofresearch.org/index.php/JSMaP e-ISSN: 2395-0463
Volume 01 Issue 02
March 2015
Available online: http://internationaljournalofresearch.org/ P a g e | 294
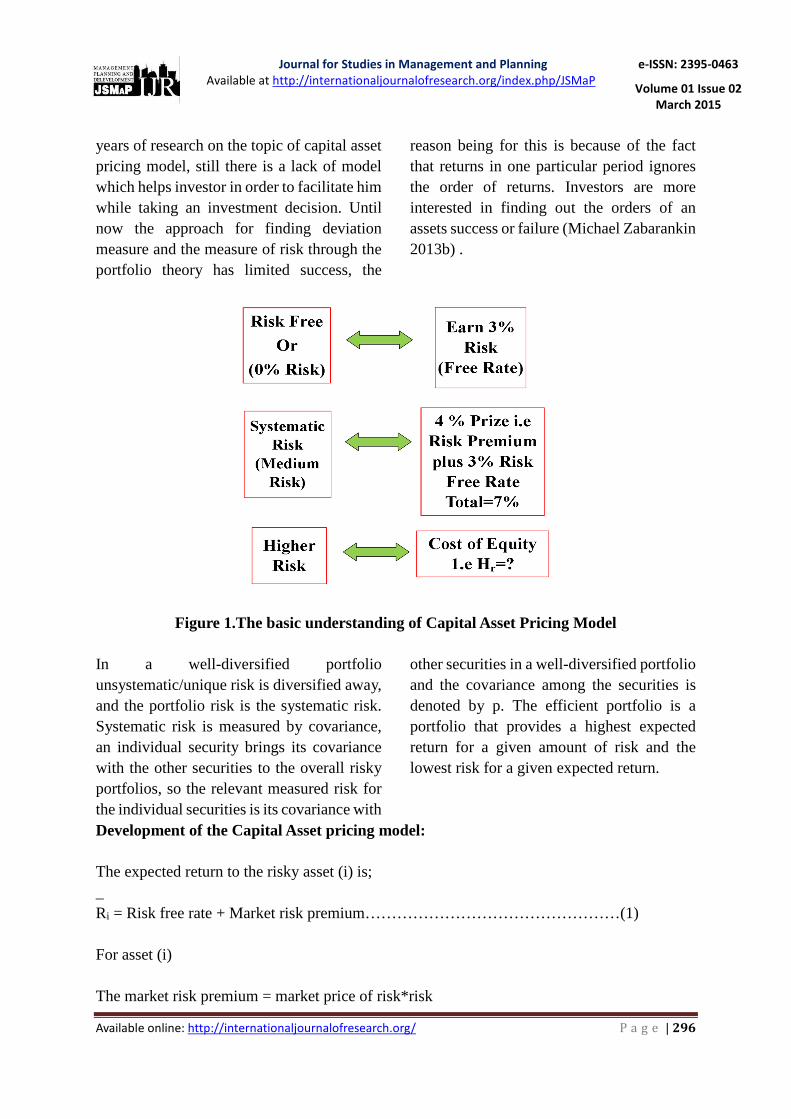
pricing model with the market risk and return. Specifically, this paper constructs a series of relationships between individual and market risk/return behaviors and also tries to compare it empirically. Generally the investors are risk averse. Capital asset pricing model states the relationship between risk and the expected return. Empirically capital asset pricing model is tested by (Black 1972), (Douglas 1969), (Miller 1972). In equilibrium the expected return on an investment is equal to the Risk-free Rate plus a premium for market risk. It characterizes the financial markets in total, in order words the entire demand side and the entire supply side is captured by the capital asset pricing model. An investor would receive return against the placement of capital in some security either risky or a security which has 0% risk. An investor has a choice to put the money in either a bank(term deposit), the bank is guaranteed by the government and the investor has the opportunity to earn 3 percent with 0 risk, also an investor has a choice to put the capital in some asset management company with medium risk which is also called the systematic risk, this investment allows investor to get 3 percent interest, also there is medium risk in this
investment, the investor would go for investing the capital in a bank(term deposit) because there investor would receive exactly the same expected return as the asset management company, so why to take an extra risk, but if an investor put his money in a fund with a medium risk, investor would get 4 percent extra return, so it becomes 7 percent, the investor would get extra 4 percent of bearing the risk, this 4 percent extra is called a risk premium, this is sort of prize, the prize which an investor get in order to bear more risk against his investment, this investment has equal importance because it offers an investment with extra 4% in order to place capital in a security which has medium risk. There is third investment option, this investment has higher risk, the question arises what will be the profit this third company offered to the investor to convince investor to invest his capital in this high risky investment? This has to be answered by the capital asset pricing model the profit for this investment is called the cost of equity denoted by Hr, this is the amount of money which an investor would receive in order to put his capital in more risky security. The model is shown in figure 1.
Journal for Studies in Management and Planning
Available at http://internationaljournalofresearch.org/index.php/JSMaP e-ISSN: 2395-0463
Volume 01 Issue 02
March 2015
Available online: http://internationaljournalofresearch.org/ P a g e | 295
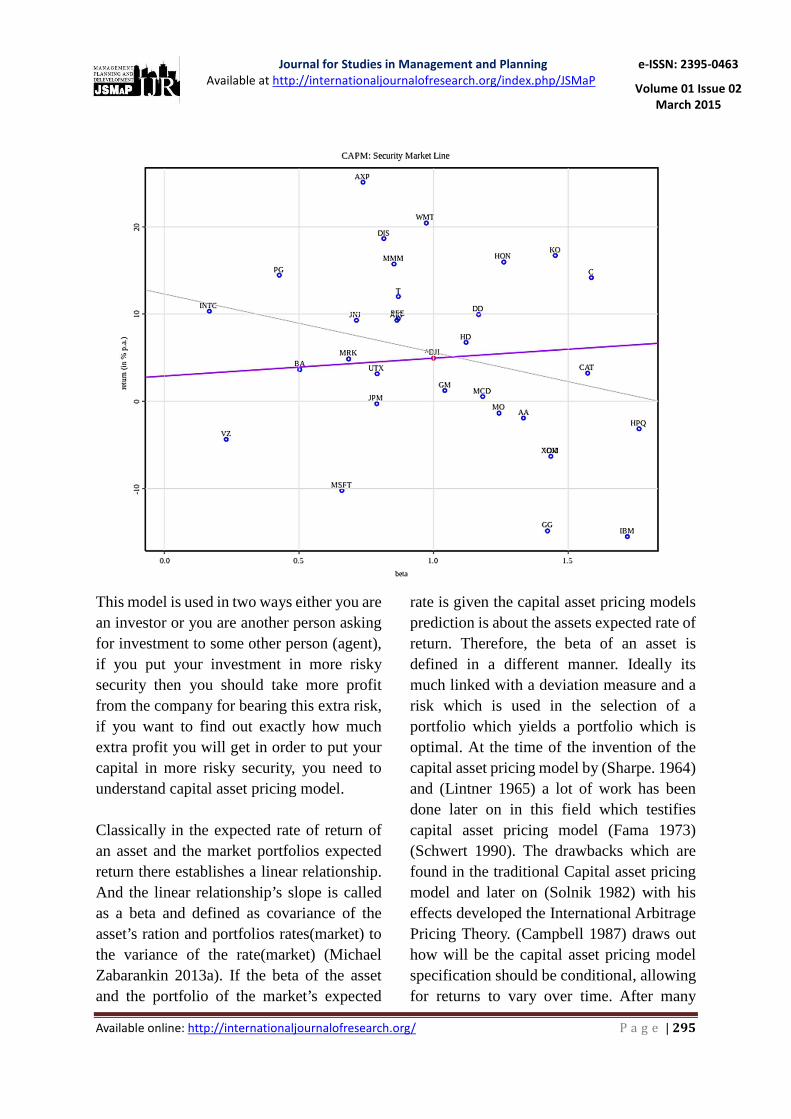
This model is used in two ways either you are an investor or you are another person asking for investment to some other person (agent), if you put your investment in more risky security then you should take more profit from the company for bearing this extra risk, if you want to find out exactly how much extra profit you will get in order to put your capital in more risky security, you need to understand capital asset pricing model. Classically in the expected rate of return of an asset and the market portfolios expected return there establishes a linear relationship. And the linear relationship’s slope is called as a beta and defined as covariance of the asset’s ration and portfolios rates(market) to the variance of the rate(market) (Michael Zabarankin 2013a). If the beta of the asset and the portfolio of the market’s expected
rate is given the capital asset pricing models prediction is about the assets expected rate of return. Therefore, the beta of an asset is defined in a different manner. Ideally its much linked with a deviation measure and a risk which is used in the selection of a portfolio which yields a portfolio which is optimal. At the time of the invention of the capital asset pricing model by (Sharpe. 1964) and (Lintner 1965) a lot of work has been done later on in this field which testifies capital asset pricing model (Fama 1973) (Schwert 1990). The drawbacks which are found in the traditional Capital asset pricing model and later on (Solnik 1982) with his effects developed the International Arbitrage Pricing Theory. (Campbell 1987) draws out how will be the capital asset pricing model specification should be conditional, allowing for returns to vary over time. After many
Journal for Studies in Management and Planning
Available at http://internationaljournalofresearch.org/index.php/JSMaP e-ISSN: 2395-0463
Volume 01 Issue 02
March 2015
Available online: http://internationaljournalofresearch.org/ P a g e | 296
years of research on the topic of capital asset pricing model, still there is a lack of model which helps investor in order to facilitate him while taking an investment decision. Until now the approach for finding deviation measure and the measure of risk through the portfolio theory has limited success, the
reason being for this is because of the fact that returns in one particular period ignores the order of returns. Investors are more interested in finding out the orders of an assets success or failure (Michael Zabarankin 2013b) .
Figure 1.The basic understanding of Capital Asset Pricing Model
In a well-diversified portfolio unsystematic/unique risk is diversified away, and the portfolio risk is the systematic risk. Systematic risk is measured by covariance, an individual security brings its covariance with the other securities to the overall risky portfolios, so the relevant measured risk for the individual securities is its covariance with
other securities in a well-diversified portfolio and the covariance among the securities is denoted by p. The efficient portfolio is a portfolio that provides a highest expected return for a given amount of risk and the lowest risk for a given expected return.
Development of the Capital Asset pricing model: The expected return to the risky asset (i) is; _ Ri = Risk free rate + Market risk premium…………………………………………(1) For asset (i) The market risk premium = market price of risk*risk
Journal for Studies in Management and Planning
Available at http://internationaljournalofresearch.org/index.php/JSMaP e-ISSN: 2395-0463
Volume 01 Issue 02
March 2015
Available online: http://internationaljournalofresearch.org/ P a g e | 297
_ _ Ri = Rf+(Rm-Rf )/ �
�m *
�im…………………………………………………………………………….(2) The risk premium of the market portfolio is expected return of the market minus the risk free rate, investor want the per unit price of risk the measure market risk is the assets covariance of the market, the market
covariance with itself is the variance of the market, so the unit price of market risk is market risk premium divided by the variance of the market as shown under.
_ ( Rm-Rf/�m
2)…………………………………………………………………………(3) The measure risky asset i’s market risk is assets i covariance with the market, asset i’s market risk premium is risk premium per unit of market risk times asset times asset i market risk. _ _ _ Ri=Rf+ (rm-rf) �im/�2
m ……………………………………………………………. (4) _ _ Ri=rf+(rm-rf)�i ……………………………………………………………………….(5) This measure is called the assets i, both covariance im and i can be used in measuring the assets unsystematic risk, beta is a
standardization of the covariance measure and hence a common measure of market risk.
rf= time value of money _ rm – rf = reward for bearing market risk i= amount of market risk Beta is a risk of securities, how volatile stock is, how sensitive it is, beta specifically says that what the stocks do when setting a bench mark against the wider markets of the stocks? Do they move with the market, do they move
less than the market (low volatility) or they move more than the market. The technique we use is the regression analysis (the technique used to get numbers of beta for different stocks).
The market is just a convention which has a beta of 1, if a stock tracks the market just as the same then its beta would also be 1 or very close to 1, on the other hand if a stock exaggerates the market that would have a much higher beta i.e beta>1, the more
volatile stocks, the regression analysis calculates the over the time period the distance between the stock line and the market line. There is another stock which is less volatile then the market has a beta of less than 1.
Journal for Studies in Management and Planning
Available at http://internationaljournalofresearch.org/index.php/JSMaP e-ISSN: 2395-0463
Volume 01 Issue 02
March 2015
Available online: http://internationaljournalofresearch.org/ P a g e | 298
b=0 security has no market risk (zero beta asset) b=0.5 security has half market risk as market portfolio b=1security has some market risk as market portfolio b=2 security has twice market risk than market portfolio The linear empirical version of the model is given as: Equation of capital asset pricing model (Hr = Rf+�(Rm-Rf)) ………………………………………………………………….(6) Explanation of the variables in formula: Hr = cost of equity Rf = Risk free rate/required rate of return/ Rm=Market risk � =beta/standard deviation/ Rm-Rf= Market Risk Premium (Rm-Rf)= Risk Premium m = market portfolio Ri = i + (bi)(Rm)+ ei ………………………………………………………………….(7) Ri = return on asset i= drift
(Bi)(Rm)= systemic risk Ei = diversifiable risk Where; Cov[Ri,Rm]/Var[Rm]………………………………………………………………….(8) Cov=[Ri,Rm] …………………………………………………………………………(9) E[Ri.Rm]-E[Ri]E[Rm]……………………………………………………………...(10) Suppose that Ri and Rm are totally independent it means E[Ri.Rm]= E[Ri]E[Rm]…………………………………………………………...….(11) Cov [Ri,Rm] = 0……………………………………………………………………(12) For the identical assets; E[RmRm]-E[Rm]e……………………………………………………………………(13) E[Rm]-E[Rm]2 (definition of variance)……………………………………………...(14) Var[Rm] =1
Journal for Studies in Management and Planning
Available at http://internationaljournalofresearch.org/index.php/JSMaP e-ISSN: 2395-0463
Volume 01 Issue 02
March 2015
Available online: http://internationaljournalofresearch.org/ P a g e | 299
Expected return of asset; E[Ri]= µi = i+i E[Rm]+E[Ei]………………………………………………………...(15) After cutting E[Rm]+ E[Ei] we get; µi= i +iµm …………………………………………………………………………...(16)
σi = �i 2σm
2 + ei2)1/2 ………………………………………………………………….(17)
ei2= Var[ei]…………………………………………………………………………..(18)
Portfolio return shown by π We want to get return on π n
Δπ/π= wiri = wi�i+ wirirm+wi�i ……………………………….(19)
i=1 0*w i=0 Substituting in the formula of Ri Now, the expected return of our portfolio E[Δπ/π]= µπ = wi�i+µm. wibi+0 ………………………………………...(20) Let �π= � wi�i & bπ = wibi
µπ= �π +µmbπ ……………………………………………………………………...(21) This is our portfolio return. Under capital asset pricing model every return has a drift a systemic risk and diversifiable risk and alphas and betas indicate drifts and the systemic risk and hold the portfolio with the weights of every assets, we figured out that the expected return of the
whole portfolio only depends on the weighted final alpha and beta of our portfolio, so just knowing the alphas and betas of our assets we figure out the returns of our portfolios.
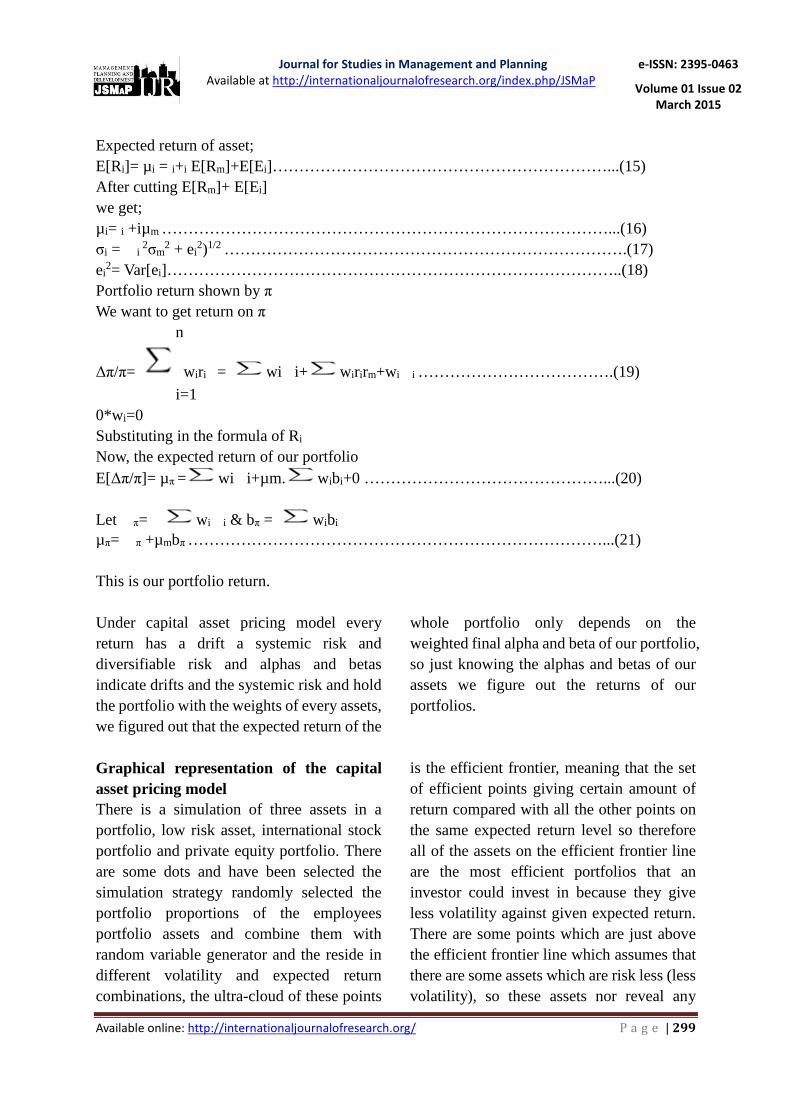
Graphical representation of the capital asset pricing model There is a simulation of three assets in a portfolio, low risk asset, international stock portfolio and private equity portfolio. There are some dots and have been selected the simulation strategy randomly selected the portfolio proportions of the employees portfolio assets and combine them with random variable generator and the reside in different volatility and expected return combinations, the ultra-cloud of these points
is the efficient frontier, meaning that the set of efficient points giving certain amount of return compared with all the other points on the same expected return level so therefore all of the assets on the efficient frontier line are the most efficient portfolios that an investor could invest in because they give less volatility against given expected return. There are some points which are just above the efficient frontier line which assumes that there are some assets which are risk less (less volatility), so these assets nor reveal any
Journal for Studies in Management and Planning
Available at http://internationaljournalofresearch.org/index.php/JSMaP e-ISSN: 2395-0463
Volume 01 Issue 02
March 2015
Available online: http://internationaljournalofresearch.org/ P a g e | 300
volatility nor it reveal any volatility with the remaining assets. In contrast to the efficient frontier points the points which has less volatility doesn’t have concave frontier, it has only linear frontier, so any point on the less volatility and the point below the efficient frontier line has exactly the same
expected return but the volatility is different, so the point above the efficient frontier line dominates because although it has the same return but it has low risk, so the rational investor go for investing in the asset which has low volatility. This phenomenon is shown in figure 2.
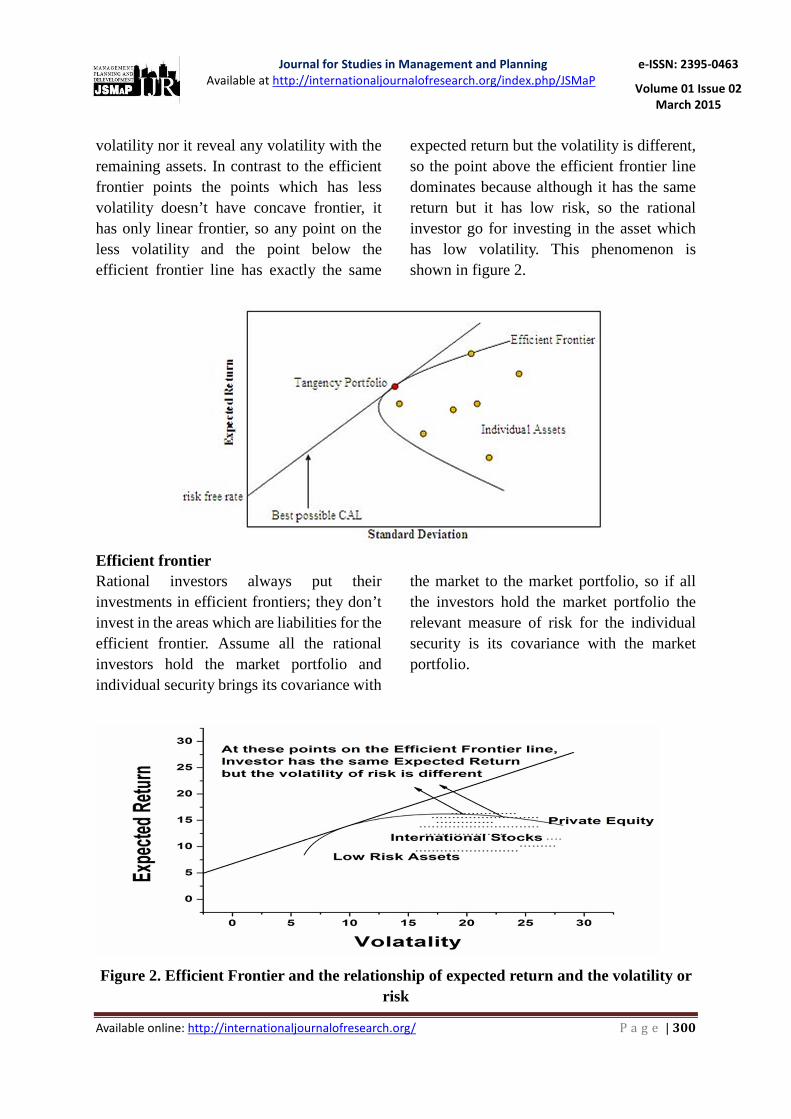
Efficient frontier Rational investors always put their investments in efficient frontiers; they don’t invest in the areas which are liabilities for the efficient frontier. Assume all the rational investors hold the market portfolio and individual security brings its covariance with
the market to the market portfolio, so if all the investors hold the market portfolio the relevant measure of risk for the individual security is its covariance with the market portfolio.
Figure 2. Efficient Frontier and the relationship of expected return and the volatility or risk
Journal for Studies in Management and Planning
Available at http://internationaljournalofresearch.org/index.php/JSMaP e-ISSN: 2395-0463
Volume 01 Issue 02
March 2015
Available online: http://internationaljournalofresearch.org/ P a g e | 301
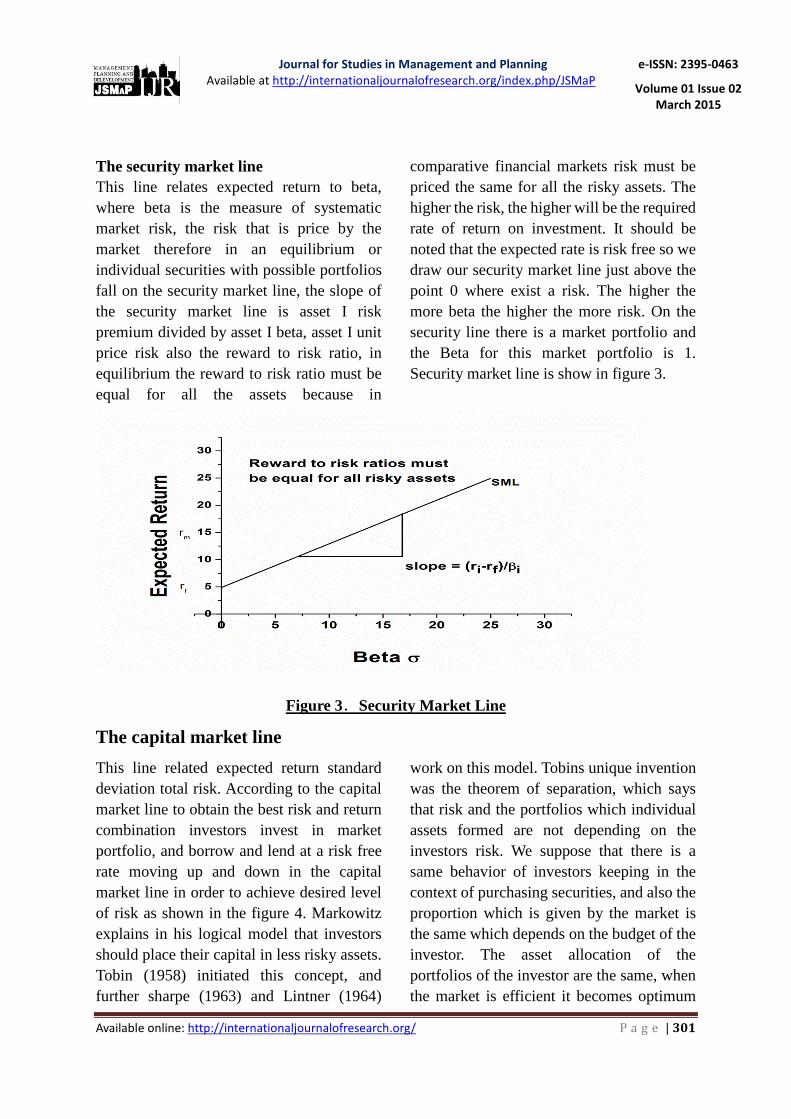
The security market line This line relates expected return to beta, where beta is the measure of systematic market risk, the risk that is price by the market therefore in an equilibrium or individual securities with possible portfolios fall on the security market line, the slope of the security market line is asset I risk premium divided by asset I beta, asset I unit price risk also the reward to risk ratio, in equilibrium the reward to risk ratio must be equal for all the assets because in
comparative financial markets risk must be priced the same for all the risky assets. The higher the risk, the higher will be the required rate of return on investment. It should be noted that the expected rate is risk free so we draw our security market line just above the point 0 where exist a risk. The higher the more beta the higher the more risk. On the security line there is a market portfolio and the Beta for this market portfolio is 1. Security market line is show in figure 3.
Figure 3.Security Market Line
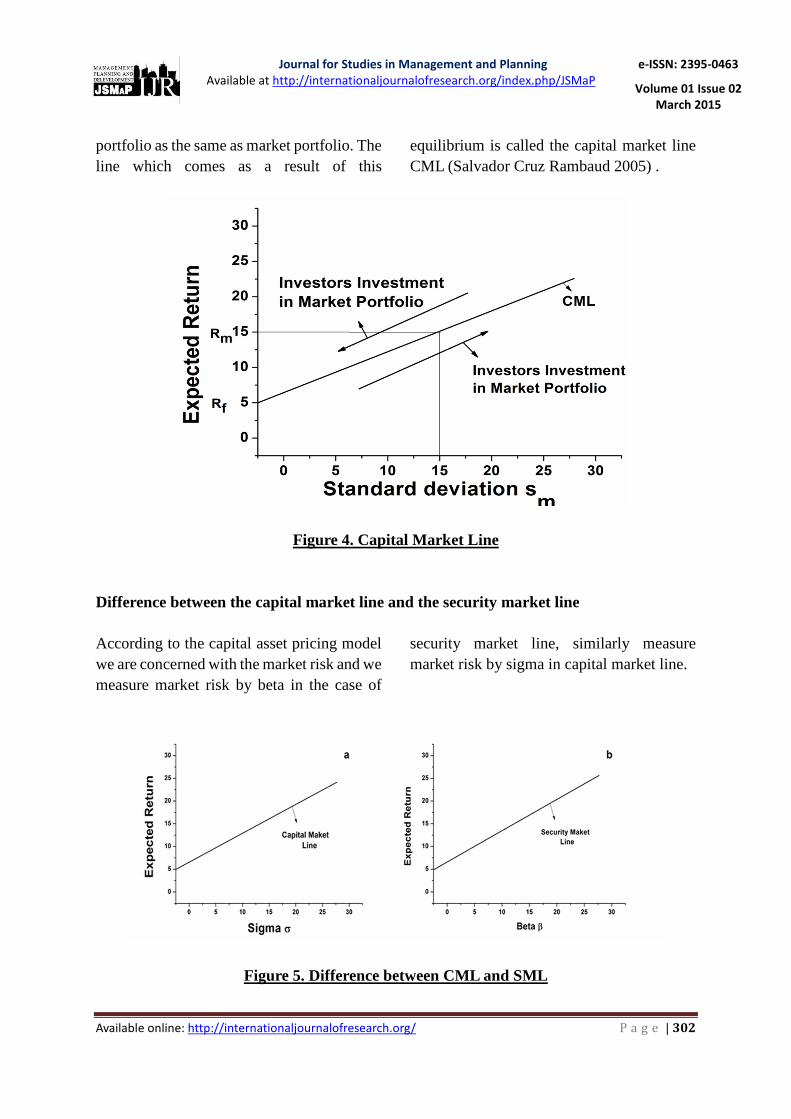
The capital market line
This line related expected return standard deviation total risk. According to the capital market line to obtain the best risk and return combination investors invest in market portfolio, and borrow and lend at a risk free rate moving up and down in the capital market line in order to achieve desired level of risk as shown in the figure 4. Markowitz explains in his logical model that investors should place their capital in less risky assets. Tobin (1958) initiated this concept, and further sharpe (1963) and Lintner (1964)
work on this model. Tobins unique invention was the theorem of separation, which says that risk and the portfolios which individual assets formed are not depending on the investors risk. We suppose that there is a same behavior of investors keeping in the context of purchasing securities, and also the proportion which is given by the market is the same which depends on the budget of the investor. The asset allocation of the portfolios of the investor are the same, when the market is efficient it becomes optimum
Journal for Studies in Management and Planning
Available at http://internationaljournalofresearch.org/index.php/JSMaP e-ISSN: 2395-0463
Volume 01 Issue 02
March 2015
Available online: http://internationaljournalofresearch.org/ P a g e | 302
portfolio as the same as market portfolio. The line which comes as a result of this
equilibrium is called the capital market line CML (Salvador Cruz Rambaud 2005) .
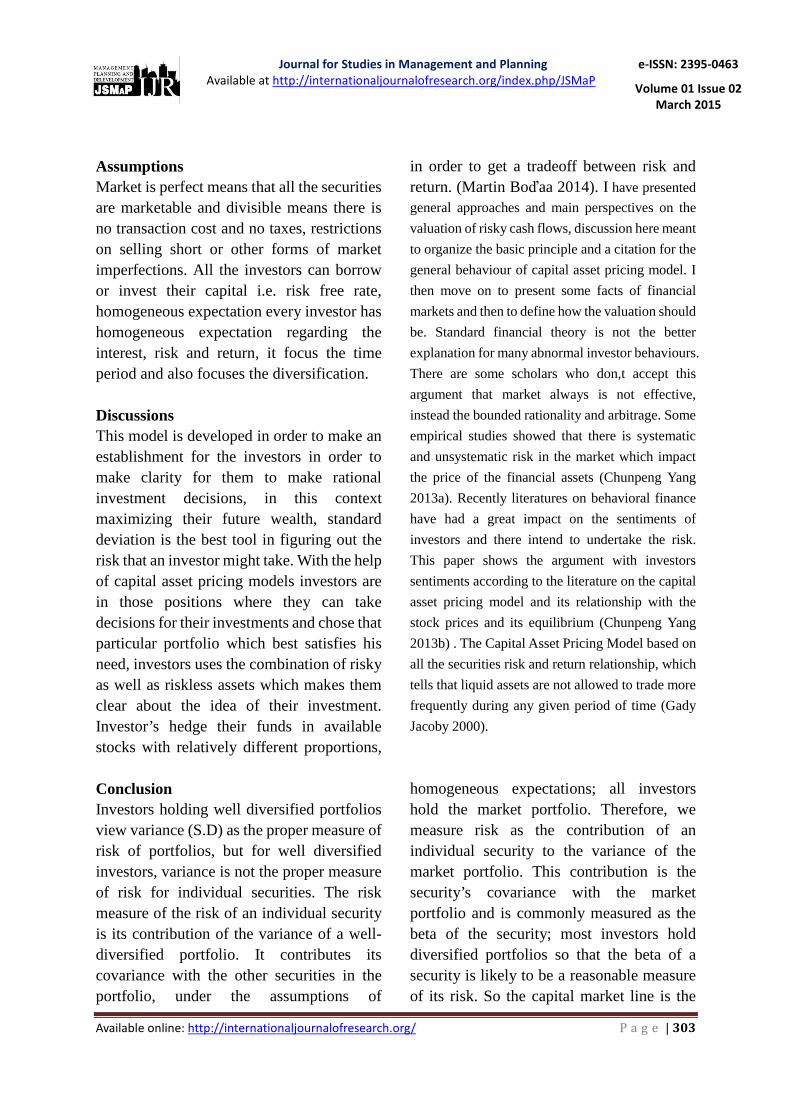
Figure 4. Capital Market Line Difference between the capital market line and the security market line According to the capital asset pricing model we are concerned with the market risk and we measure market risk by beta in the case of
security market line, similarly measure market risk by sigma in capital market line.
Figure 5. Difference between CML and SML
Journal for Studies in Management and Planning
Available at http://internationaljournalofresearch.org/index.php/JSMaP e-ISSN: 2395-0463
Volume 01 Issue 02
March 2015
Available online: http://internationaljournalofresearch.org/ P a g e | 303
Assumptions Market is perfect means that all the securities are marketable and divisible means there is no transaction cost and no taxes, restrictions on selling short or other forms of market imperfections. All the investors can borrow or invest their capital i.e. risk free rate, homogeneous expectation every investor has homogeneous expectation regarding the interest, risk and return, it focus the time period and also focuses the diversification. Discussions This model is developed in order to make an establishment for the investors in order to make clarity for them to make rational investment decisions, in this context maximizing their future wealth, standard deviation is the best tool in figuring out the risk that an investor might take. With the help of capital asset pricing models investors are in those positions where they can take decisions for their investments and chose that particular portfolio which best satisfies his need, investors uses the combination of risky as well as riskless assets which makes them clear about the idea of their investment. Investor’s hedge their funds in available stocks with relatively different proportions,
in order to get a tradeoff between risk and return. (Martin Boďaa 2014). I have presented
general approaches and main perspectives on the
valuation of risky cash flows, discussion here meant
to organize the basic principle and a citation for the
general behaviour of capital asset pricing model. I
then move on to present some facts of financial
markets and then to define how the valuation should
be. Standard financial theory is not the better
explanation for many abnormal investor behaviours.
There are some scholars who don,t accept this
argument that market always is not effective,
instead the bounded rationality and arbitrage. Some
empirical studies showed that there is systematic
and unsystematic risk in the market which impact
the price of the financial assets (Chunpeng Yang
2013a). Recently literatures on behavioral finance
have had a great impact on the sentiments of
investors and there intend to undertake the risk.
This paper shows the argument with investors
sentiments according to the literature on the capital
asset pricing model and its relationship with the
stock prices and its equilibrium (Chunpeng Yang
2013b) . The Capital Asset Pricing Model based on
all the securities risk and return relationship, which
tells that liquid assets are not allowed to trade more
frequently during any given period of time (Gady
Jacoby 2000).
Conclusion Investors holding well diversified portfolios view variance (S.D) as the proper measure of risk of portfolios, but for well diversified investors, variance is not the proper measure of risk for individual securities. The risk measure of the risk of an individual security is its contribution of the variance of a well-diversified portfolio. It contributes its covariance with the other securities in the portfolio, under the assumptions of
homogeneous expectations; all investors hold the market portfolio. Therefore, we measure risk as the contribution of an individual security to the variance of the market portfolio. This contribution is the security’s covariance with the market portfolio and is commonly measured as the beta of the security; most investors hold diversified portfolios so that the beta of a security is likely to be a reasonable measure of its risk. So the capital market line is the
Journal for Studies in Management and Planning
Available at http://internationaljournalofresearch.org/index.php/JSMaP e-ISSN: 2395-0463
Volume 01 Issue 02
March 2015
Available online: http://internationaljournalofresearch.org/ P a g e | 304
best efficient frontier that an investor could invest if there is a risk less investment
opportunity.
References Black, Fisher, Jensen, Michael, and Scholes,Myron.
(1972), "The Capital Asset Pricing Model Some
Emplrlcal Tests, in Studies in the Theory of capital
Markets Michael Jensen, ed , Praeger, New York."
Campbell, J. (1987), "Stock return and the term
structure. ," Journal of Financial Economics 18, 373-
99.
Chunpeng Yang, Jinfang Li (2013a), "Investor
sentiment, information and asset pricing model,"
Economic Modelling, 35, 436–42.
Chunpeng Yang, Rengui Zhang (2013b), "Dynamic
asset pricing model with heterogeneous sentiments,"
Economic Modelling, 33, 248–53.
Douglas, George. (1969), "An Empirical Appraisal of
Market Efficiency.," Risk in the Equity Markets., 9, 3-
45.
Fama, Eugene F., French, Kenneth R. (1973), " Risk,
return, and equilibrium: empirical tests.," Journal of
Political Economy., 81 (3), 607-36.
Gady Jacoby, David J. Fowler, Aron A. Gottesman
(2000), "The capital asset pricing model and the
liquidity effect: A theoretical approach," Journal of
Financial Markets, 3, 69-81.
Lintner, John (1965), "The valuation of risk assets and
selection of risky investments in stock portfolios and
capital budgets. ," Review of Economics and Statistics
47, 13-37.
Martin Boďaa, Mária Kanderová (2014), "Linearity of
the Sharpe-Lintner version of the Capital Asset
Pricing Model," Social and Behavioral Sciences, 110,
1136-47.
Michael Zabarankin , Konstantin Pavlikov , Stan
Uryasev (2013a), "Capital Asset Pricing Model
(CAPM)with drawdown measure," Journal of the
operational research.
Michael Zabarankin, Konstantin Pavlikov, Stan
Uryasev (2013b), "Capital Asset Pricing Model
(CAPM)with drawdown measure," European Journ al
of Operational Research.
Miller, Merton and Scholes, Myron, (1972), "A Re-
exammatlon of Some Recent findings in Studies in the
Theory of Capital Markets," Rates of Return m
Relatron to Risk.
Salvador Cruz Rambaud , Jose Garcia Perez, Miguel
Angel Sanchez Granero, Juan Evangelista Trinidad
Segovia (2005), "Theory of portfolios: New
considerations on classic models and the Capital
Market Line," European Journal of Operational
Research., 163, European Journal of Operational
Research.
Schwert, G. William, Seguin, Paul J. (1990),
"Heteroskedasticity in stock returns.," The Journal of
Finance., 45 (4), 1129-115.
Sharpe., William (1964), "Capital asset prices: a
theory of market equilibrium under conditions of
risk. ," Journal of Finance., 19, 425-42.
Solnik, Bruno (1982), "International arbitrage pricing
theory. ," The Journal of Finance., 38 (2), 449-57.