Error, signal, and the placement of Ctenophora sister to all other animals

This article appeared in a journal published by Elsevier. The attachedcopy is furnished to the author for internal non-commercial researchand education use, including for instruction at the authors institution
and sharing with colleagues.
Other uses, including reproduction and distribution, or selling orlicensing copies, or posting to personal, institutional or third party
websites are prohibited.
In most cases authors are permitted to post their version of thearticle (e.g. in Word or Tex form) to their personal website orinstitutional repository. Authors requiring further information
regarding Elsevier’s archiving and manuscript policies areencouraged to visit:
http://www.elsevier.com/copyright
Author's personal copy
Comparative analysis of secreted enzymes between theanthropophilic–zoophilic sister species Trichophytontonsurans and Trichophyton equinum
Barry L. PREUETTa, Eric SCHUENEMANNa, Jacob T. BROWNa, Michelle E. KOVACa,Sandeep K. KRISHNANa, Susan M. ABDEL-RAHMANa,b,*aDivision of Clinical Pharmacology and Medical Toxicology, The Children’s Mercy Hospitals and Clinics, Kansas City,
MO 64108, United StatesbDepartment of Pediatrics, University of Missouri-Kansas City, School of Medicine, Kansas City, MO 64108, United States
a r t i c l e i n f o
Article history:
Received 20 November 2009
Received in revised form
26 February 2010
Accepted 4 March 2010
Available online 10 March 2010
Corresponding Editor: Michael Lorenz
Keywords:
Dermatophyte
Protease
Secreted
Transcript
Trichophyton
a b s t r a c t
Trichophyton tonsurans (TT) and Trichophyton equinum (TE) are two closely related dermato-
phytes with very different host preferences. This study was designed to examine the ge-
netic and transcript level variations of secreted enzymes between TT and TE. Thirty-one
genes representing 10 gene families were selected for comparison and complete genomic
and cDNA sequences were elucidated. Sequence analyses of the selected genes identified
104 polymorphisms between the two dermatophytes, 37 of which are expected to encode
changes in their polypeptide sequence. Quantitative RT-PCR was used to examine the
differences in levels of transcript between TT and TE grown over 14 d in aqueous keratin
medium. Differences in transcript expression between TT and TE were gene specific and
ranged from 1.1-fold to 33-fold. Intra-specific variability across all genes ranged from
41 % to 250 %. Despite their overall genetic similarity, TT and TE exhibit a moderate degree
of variability in the genomic make-up of their secreted enzymes and the extent to which
they are transcribed when grown in an aqueous keratin medium. Such differences may
contribute to how these genetically similar organisms have adapted to infect divergent
host organisms.
ª 2010 The British Mycological Society. Published by Elsevier Ltd. All rights reserved.
Introduction
The ability to breach the epidermal barrier and cause infection
in otherwise healthy hosts is a characteristic trait shared by
the zoophilic and anthropophilic dermatophytes (Weitzman
& Summerbell 1995). Facilitating the infection process is
a complement of secreted enzymes that function collectively
to provide a pathway for fungal invasion and liberate nutri-
ents from the keratin-rich structures that comprise the outer
integument of the animals that they infect (Apodaca &
McKerrow 1989a, b; Weitzman & Summerbell 1995; Monod
et al. 2002, 2005; Jousson et al. 2004b; Kano et al. 2005; Giddey
et al. 2007a; Vermout et al. 2008; Zaugg et al. 2009). While these
enzymes appear to be conserved among the dermatophytes
examined to date (Apodaca & McKerrow 1989a; Mignon et al.
1998; Brouta et al. 2001, 2002; Descamps et al. 2002; Jousson
et al. 2004a, b; Bhathena et al. 2005; Kano et al. 2005; Monod
et al. 2005; Moallaei et al. 2006; Giddey et al. 2007a, b;
* Corresponding author. Division of Clinical Pharmacology and Medical Toxicology, Children’s Mercy Hospitals and Clinics, 2401 GillhamRd., Kansas City, MO 64108, United States. Tel.: þ1 816 234 3059; fax: þ1 816 855 1958.
E-mail address: [email protected]
journa l homepage : www.e lsev ier . com/ l oca te / funb i o
f u n g a l b i o l o g y 1 1 4 ( 2 0 1 0 ) 4 2 9 – 4 3 7
1878-6146/$ – see front matter ª 2010 The British Mycological Society. Published by Elsevier Ltd. All rights reserved.doi:10.1016/j.funbio.2010.03.004
Author's personal copy
Vermout et al. 2008), the manner in which they are expressed
appears to be relatively species-specific (Giddey et al. 2007a).
Notably, this holds for dermatophytes that are genetically
very closely related (Graser et al. 1999; Summerbell et al.
1999). Such specificity suggests that unique dermatophyte–
host relationships may select, or be selected for, based on
the expression patterns of these putative pathogenicity fac-
tors. A more thorough characterization of these genes and
their expression profiles may offer insight into how dermato-
phytes adapt not only to a unique host niche but to distinct
micro-environments within a single host.
The closely related anthropophilic Trichophyton tonsurans
and zoophilic Trichophyton equinum are among the most
recently diverged dermatophyte sister species. As such, they
offer a unique opportunity to examine differences in the
secreted enzyme expression profiles of two dermatophytes
with a high degree of genetic similarity but clear phenetic
distinctions (e.g. host preference, biochemical profile, physiol-
ogy) (Graser et al. 1999; Abdel-Rahman et al. 2007, 2010; Giddey
et al. 2007a). It is plausible that their predilection for divergent
host environments (i.e. human vs. horse) is facilitated, in part,
by the unique profile of enzymes secreted during infection.
This investigation was initiated to examine the genomic orga-
nization of 31 secreted proteolytic and lipolytic genes from
both species as well as compare their levels of transcription
when grown in a medium containing keratin as the sole
nutrient source.
Materials and methods
Genomic characterization
SpecimensTrichophyton tonsurans isolates (n ¼ 12) were derived from
previously acquired clinical specimens (Abdel-Rahman et al.
2006). Trichophyton equinum isolates (n ¼ 2) were purchased
from the Centraalbureau voor Schimmelcultures (CBS127.97,
Utrecht, Netherlands) and the American Type Culture Collec-
tion (ATCC 22443, Manassas, Virginia). Specimens were main-
tained in the laboratory on desiccated and sterilized 12–28
mesh silica particles (Fisher Scientific, Pittsburgh, PA) stored
at 4 �C. Representative strains for T. tonsurans isolates have
been deposited in the Fungal Genomics Stock Center (FGSC,
University of Missouri, Kansas City).
Nucleic acid isolationSabouraud’s agar plates with chloramphenicol and cyclohex-
imide (Northeast Laboratory Services, Winslow, ME) were
inoculated from silica stocks and cultured for 2–3 weeks at
25 �C. Genomic DNA (gDNA) was isolated using the DNeasy
Plant Mini Kit (Qiagen Inc., Valencia, CA) as previously
described (Gaedigk et al. 2003). Total RNA was isolated from
cultures grown in aqueous keratin media as previously
described (Bhathena et al. 2005). RNA quality was assessed
via micro-fluidic chip analysis on the Experion platform
(BioRad, Hercules, CA) and quantified on a NanoDrop 1000
spectrophotometer. Generation of cDNA was performed using
the OmniScript RT kit (Qiagen).
Gene isolationPrimers for the initial amplification of target genes from
Trichophyton tonsurans and Trichophyton equinum were designed
against the published Trichophyton rubrum sequences depos-
ited in GenBank.
Genes were amplified from approximately 10–15 ng of gDNA
using the Platinum Taq HiFi PCR system (Invitrogen, Carlsbad,
CA). The reaction mixtures were incubated at 94 �C for 3 min,
followed by 35–40 cycles of 94 �C for 30 s, 57–63 �C for 30 s,
68 �C for 2 min 30 s, with a final hold at 4 �C. Purity was verified
bygel electrophoresis. PCR productswere eithercolumnpurified
(Stratagene, La Jolla, CA), or directly treated with Exosap-it (USB,
Swampscott, MA). PCR reactions that had contaminating non-
specific bands were separated by gel electrophoresis on 1.5 %
agarose gels andthe main target bandexcisedand purified using
the MinElute gel purification system (Qiagen).
Rapid Amplification of cDNA Ends (RACE)The 50 untranslated region (UTR) for each gene was captured
using the 50RACE system (Invitrogen). The 30 UTR was captured
with a custom designed oligo-dT nucleotide primer (50 AGA
CAT AGA TGA ATC GAG TCG ACA TCG AGT TTT TTT TTT
TTT TTT T 30) and used to generate a cDNA pool using the
OmniScript Reverse Transcriptase kit (Qiagen). Approximately
5–10 ng of cDNA was added to Platinum Taq HiFi (Stratagene)
in a 25 ml PCR reaction with gene specific forward primers, and
an adapter primer nested to the tail of the oligo-dT primer
(50 ACA TAG ATG AAT CGA GTC GAC AT). The reaction mixture
was incubated at 94 �C for 2 min, followed by 35–40 cycles of
94 �C for 30 s, 60 �C for 30 s, 68 �C for 1 min, with a final hold
at 4 �C. Primary PCR products were diluted 1:100 in sterile wa-
ter and 0.5–1.0 ml of the dilution used as template in a second-
ary PCR reaction containing a nested gene specific 50
oligonucleotide primer and a 30 oligonucleotide primer nested
to the adapter primer (50 TGA ATC GAG TCG ACA TCG AG). The
reaction mixture was incubated at 94 �C for 2 min, followed by
35–40 cycles of 94 �C for 30 s, 60 �C for 30 s, 68 �C for 1 min,
with a final hold at 4 �C. PCR products were analyzed for qual-
ity by gel electrophoresis and purified as described above.
SequencingPurified gDNA and cDNA were cycle sequenced using the DYE-
namic ET dye terminator system (Amersham Biosciences,
Pittsburgh, PA). Sequencing reaction products were cleaned
with the CleanSEQ magnetic bead system (Agencourt, Beverly,
MA) and injected on a MegaBACE 500 capillary sequencer.
Sequence data were automatically base called with the
Sequence Analyzer software platform (Amersham Biosci-
ences) and confirmed by manual inspection with Sequencher
DNA analysis software (Gene Codes Corp., Ann Arbor, MI).
Newly generated gDNA and cDNA sequence for Trichophyton
tonsurans and Trichophyton equinum was used to design addi-
tional sequencing oligonucleotide primers and the initial
genomic PCR products re-sequenced to a minimum of 2� cov-
erage. Gene sequences from both species were aligned on the
CLCBio (Cambridge, MS) and Sequencher software platforms
to examine genomic organization, identify sequence varia-
tions and annotate intron/exon boundaries.
Near the completion of this study, the sequencing of
T. equinum was completed by the Broad Institute and relevant
430 B. L. Preuett et al.
Author's personal copy
gene sequences that could not be amplified in this investiga-
tion were obtained from the Dermatophyte Comparative
Genomics Database (www.broad.harvard.edu/annotation/
genome/microsporum_gypseum/MultiHome.html accessed
September 15, 2009).
Transcript expression
SpecimensFive Trichophyton tonsurans isolates were used to examine pro-
tease transcript expression profiles (obtained under an earlier
investigation; Abdel-Rahman et al. 2010). All specimens dem-
onstrated a distinct genetic profile according to our previously
published typing strategy and, where possible, were selected
from different countries of origin to ensure that the maximum
degree of intra-specific variability in transcript expression
could be observed (i.e. Japan, India, the Netherlands, Mexico
and the United States). Trichophyton equinum isolates (n ¼ 4)
originated from Finland and England and were purchased
from Centraalbureau voor Schimmelcultures (CBS127.97,
CBS933.73, CBS112189, and CBS112196).
Thirty-six milligrams of silica particles were inoculated into
5 ml of aqueous keratin medium and each isolate was grown in
duplicate for 4, 7, 10, 12, and 14 d. Isolates were maintained in
an orbital shaker at 32 �C with constant agitation at 110 rpm.
On the day of isolation, cultures were harvested and the pellets
snap frozen for RNA isolation as described above.
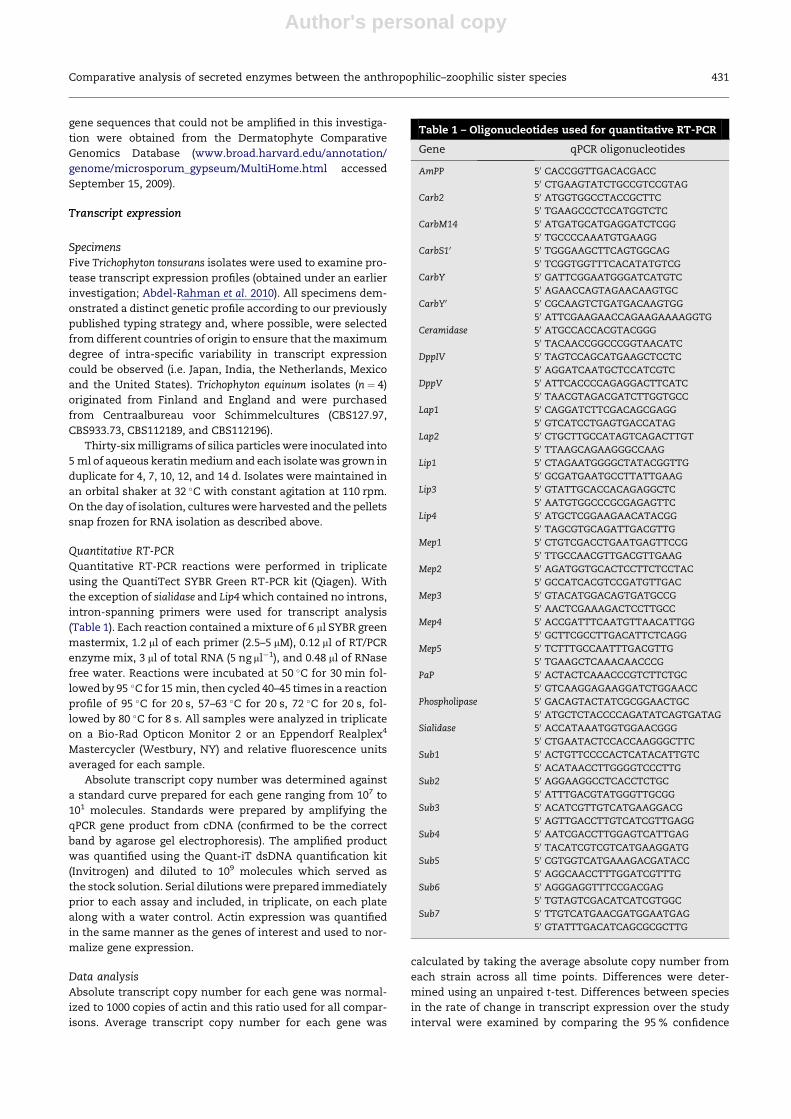
Quantitative RT-PCRQuantitative RT-PCR reactions were performed in triplicate
using the QuantiTect SYBR Green RT-PCR kit (Qiagen). With
the exception of sialidase and Lip4 which contained no introns,
intron-spanning primers were used for transcript analysis
(Table 1). Each reaction contained a mixture of 6 ml SYBR green
mastermix, 1.2 ml of each primer (2.5–5 mM), 0.12 ml of RT/PCR
enzyme mix, 3 ml of total RNA (5 ng ml�1), and 0.48 ml of RNase
free water. Reactions were incubated at 50 �C for 30 min fol-
lowed by 95 �C for 15 min, then cycled 40–45 times in a reaction
profile of 95 �C for 20 s, 57–63 �C for 20 s, 72 �C for 20 s, fol-
lowed by 80 �C for 8 s. All samples were analyzed in triplicate
on a Bio-Rad Opticon Monitor 2 or an Eppendorf Realplex4
Mastercycler (Westbury, NY) and relative fluorescence units
averaged for each sample.
Absolute transcript copy number was determined against
a standard curve prepared for each gene ranging from 107 to
101 molecules. Standards were prepared by amplifying the
qPCR gene product from cDNA (confirmed to be the correct
band by agarose gel electrophoresis). The amplified product
was quantified using the Quant-iT dsDNA quantification kit
(Invitrogen) and diluted to 109 molecules which served as
the stock solution. Serial dilutions were prepared immediately
prior to each assay and included, in triplicate, on each plate
along with a water control. Actin expression was quantified
in the same manner as the genes of interest and used to nor-
malize gene expression.
Data analysisAbsolute transcript copy number for each gene was normal-
ized to 1000 copies of actin and this ratio used for all compar-
isons. Average transcript copy number for each gene was
calculated by taking the average absolute copy number from
each strain across all time points. Differences were deter-
mined using an unpaired t-test. Differences between species
in the rate of change in transcript expression over the study
interval were examined by comparing the 95 % confidence
Table 1 – Oligonucleotides used for quantitative RT-PCR
Gene qPCR oligonucleotides
AmPP 50 CACCGGTTGACACGACC
50 CTGAAGTATCTGCCGTCCGTAG
Carb2 50 ATGGTGGCCTACCGCTTC
50 TGAAGCCCTCCATGGTCTC
CarbM14 50 ATGATGCATGAGGATCTCGG
50 TGCCCCAAATGTGAAGG
CarbS10 50 TGGGAAGCTTCAGTGGCAG
50 TCGGTGGTTTCACATATGTCG
CarbY 50 GATTCGGAATGGGATCATGTC
50 AGAACCAGTAGAACAAGTGC
CarbY0 50 CGCAAGTCTGATGACAAGTGG
50 ATTCGAAGAACCAGAAGAAAAGGTG
Ceramidase 50 ATGCCACCACGTACGGG
50 TACAACCGGCCCGGTAACATC
DppIV 50 TAGTCCAGCATGAAGCTCCTC
50 AGGATCAATGCTCCATCGTC
DppV 50 ATTCACCCCAGAGGACTTCATC
50 TAACGTAGACGATCTTGGTGCC
Lap1 50 CAGGATCTTCGACAGCGAGG
50 GTCATCCTGAGTGACCATAG
Lap2 50 CTGCTTGCCATAGTCAGACTTGT
50 TTAAGCAGAAGGGCCAAG
Lip1 50 CTAGAATGGGGCTATACGGTTG
50 GCGATGAATGCCTTATTGAAG
Lip3 50 GTATTGCACCACAGAGGCTC
50 AATGTGGCCCGCGAGAGTTC
Lip4 50 ATGCTCGGAAGAACATACGG
50 TAGCGTGCAGATTGACGTTG
Mep1 50 CTGTCGACCTGAATGAGTTCCG
50 TTGCCAACGTTGACGTTGAAG
Mep2 50 AGATGGTGCACTCCTTCTCCTAC
50 GCCATCACGTCCGATGTTGAC
Mep3 50 GTACATGGACAGTGATGCCG
50 AACTCGAAAGACTCCTTGCC
Mep4 50 ACCGATTTCAATGTTAACATTGG
50 GCTTCGCCTTGACATTCTCAGG
Mep5 50 TCTTTGCCAATTTGACGTTG
50 TGAAGCTCAAACAACCCG
PaP 50 ACTACTCAAACCCGTCTTCTGC
50 GTCAAGGAGAAGGATCTGGAACC
Phospholipase 50 GACAGTACTATCGCGGAACTGC
50 ATGCTCTACCCCAGATATCAGTGATAG
Sialidase 50 ACCATAAATGGTGGAACGGG
50 CTGAATACTCCACCAAGGGCTTC
Sub1 50 ACTGTTCCCCACTCATACATTGTC
50 ACATAACCTTGGGGTCCCTTG
Sub2 50 AGGAAGGCCTCACCTCTGC
50 ATTTGACGTATGGGTTGCGG
Sub3 50 ACATCGTTGTCATGAAGGACG
50 AGTTGACCTTGTCATCGTTGAGG
Sub4 50 AATCGACCTTGGAGTCATTGAG
50 TACATCGTCGTCATGAAGGATG
Sub5 50 CGTGGTCATGAAAGACGATACC
50 AGGCAACCTTTGGATCGTTTG
Sub6 50 AGGGAGGTTTCCGACGAG
50 TGTAGTCGACATCATCGTGGC
Sub7 50 TTGTCATGAACGATGGAATGAG
50 GTATTTGACATCAGCGCGCTTG
Comparative analysis of secreted enzymes between the anthropophilic–zoophilic sister species 431
Author's personal copy
interval for the slope of the regression estimates. All p-values
were two-sided with those less than 0.05 considered to
indicate statistical significance. All statistical analyses were
performed using SPSS version 12 (SPSS, Chicago, IL).
Nucleotide sequence accession numbers
The nucleic acid sequences for the genes examined in this
study have been deposited in GenBank under the accession
numbers provided in Table 2.
Results
Genomic organization
Of the genes initially selected for this study, Lip2 and CarbS1
failed to amplify from either species despite repeated
attempts with various reaction conditions and primer sets.
Additionally, phospholipase and Lip1 could not be amplified
from Trichophyton equinum. With a few exceptions, the in-
tron–exon structures of the secreted enzymes were consistent
with those previously reported for T. rubrum (Woodfolk et al.
1998; Descamps et al. 2002; Jousson et al. 2004a, b; Kano et al.
2005; Kaufman et al. 2005; Monod et al. 2005; Vermout
et al. 2008). Disparities included a single intron in DppIV that
was not reported in T. rubrum (Monod et al. 2005), along with
additional introns in AmPP, Lip1 and phospholipase that were
previously unreported. We also observed an additional exon
in PaP which disrupts the fifth intron, resulting in the presence
of an additional intron and exon in both Trichophyton tonsurans
and T. equinum as compared with the reported T. rubrum
sequence. The intron/exon junctions for Carb2 and CarbM14
had not been previously delineated for the dermatophyte
and thus, were not available for comparison.
Sequence variations
Alignments of the coding regions from Trichophyton tonsurans
and Trichophyton equinum revealed 99.5 % or greater similarity
for all genes examined with two genes, Mep4 and Sub6, exhib-
iting identical sequences. A total of 104 sequence variations
were identified between T. tonsurans and T. equinum ranging
from 0 to 9 per gene. Thirty-five percent (n ¼ 37) of the
observed variations were predicted to code for non-
synonymous single nucleotide polymorphisms (SNPs) which
were observed in 22 of the 29 genes examined (Table 2). One
of the sequence variations in Lap2 (g.756A > G) results in the
generation of premature stop codon in T. tonsurans that is
not present in T. equinum. An additional putative stop codon
930 bp downstream of the start codon was found in CarbY0 of
both species. Mini- and micro-satellites were also identified
in the UTRs of two subtilisin-like proteases (Sub2 and Sub6). Al-
lele frequencies for the identified sequence and size variations
have been reported previously (Abdel-Rahman et al. 2010).
Transcript copy number
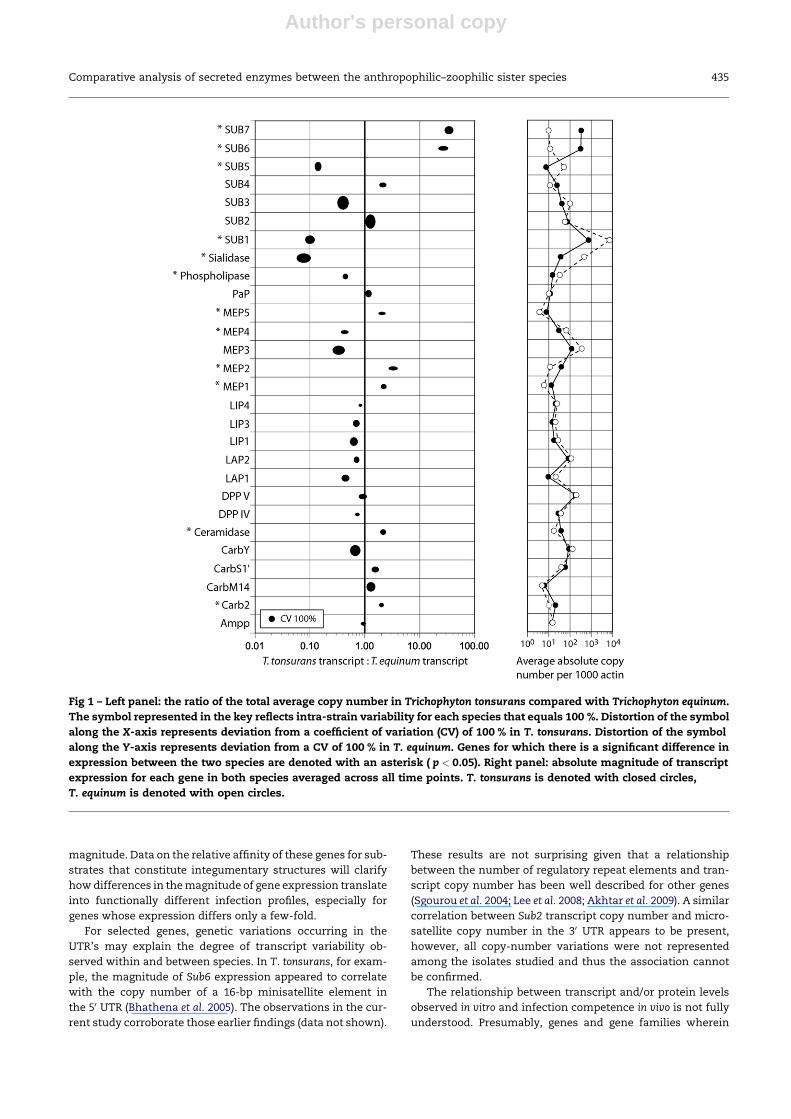
Differences in average transcript copy number over 14 d
between Trichophyton tonsurans and Trichophyton equinum are
detailed in Fig 1. Three metalloproteases (Meps 1, 2 and 5),
two subtilisin-like proteases (Subs 6 and 7), Carb2 and cerami-
dase were all expressed to a significantly greater extent in
T. tonsurans as compared with T. equinum (Fig 1). Conversely,
a singular metalloprotease (Mep4), two subtilisin-like prote-
ases (Subs 1 and 5), phospholipase and sialidase were expressed
to a greater extent in T. equinum (Fig 1).
The magnitude of intra-specific variation in transcript
expression varied widely in both species. However, for the
slight majority of genes (n ¼ 18) a greater degree of inter-
strain variability was observed in T. tonsurans as compared
with T. equinum (Fig 1). Among the Subs, the coefficient of var-
iation (CV) in T. tonsurans exceeded 100 % for each gene and,
with the exception of Subs 4 and 6, the extent of variability
was similar in T. equinum. Among the Meps, there was far
less inter-strain variability in T. equinum (CV 45–153 %) as com-
pared with T. tonsurans (CV 92–211 %). With the exception of
Mep1, the CV for all of the genes in this family exceeded
100 % while only Mep3 demonstrated a comparable magnitude
of variability in T. equinum. Among the Carbs, the extent of
variability observed for CarbY (CV 177–186 %) and CarbM14
(CV 149–160 %) markedly exceeded that of the other members
of this gene family. A lesser degree of variability was observed
among the aminopeptidases of both species (CV 57–68 %).
Similarly, the enzymes involved with lipid or glycolipid cleav-
age (except sialidase) demonstrated only a moderate degree of
inter-strain variability (CV 41–144 %).
For gene families with multiple members, the rank order of
absolute transcript expression demonstrated little by way of
variation between the two species (Fig 1, right panel). Expres-
sion of genes in the metalloprotease, dipeptidylpeptidase and
leucine aminopeptidase gene families demonstrated a compa-
rable rank order in both T. tonsurans and T. equinum. Similarly,
carboxypeptidase rank order was comparable in both species
with CarbY0 below the level of quantification at all time points
in all replicates and strains examined. In contrast, members of
subtilisin-like protease gene family differed more markedly.
Although Sub1 transcript represented the most abundant
gene in both species, Subs 6 and 7 ranked among the most
abundant transcripts in T. tonsurans and lowest in T. equinum
whereas Subs 3 and 5 were among the highest in T. equinum
and the lowest in T. tonsurans.
Discussion
As with many microorganisms, the ability of dermatophytes to
invade live or shed tissues is facilitated by enzymes secreted
into their micro-environment. These proteolytic and lipolytic
enzymes facilitate nutrient acquisition (Apodaca & McKerrow
1989a, b) and, in live hosts, play a significant role in host spec-
ificity, immunogenicity and virulence (Fischer & Kane 1971;
Kane & Fischer 1971; Grappel & Blank 1972; Collins et al. 1973;
Wagner & Sohnle 1995; Mahmoud et al. 1996; Nissen et al.
1998; Mari et al. 2003; Giddey et al. 2007a). Given their impor-
tance in the pathogenesis of infections, an understanding of
the differences in these genes at the structural and functional
levels may help to elucidate how two, otherwise very closely re-
lated, organisms (e.g. Trichophyton tonsurans and Trichophyton
equinum) can demonstrate very different host niches.
432 B. L. Preuett et al.

Author's personal copy
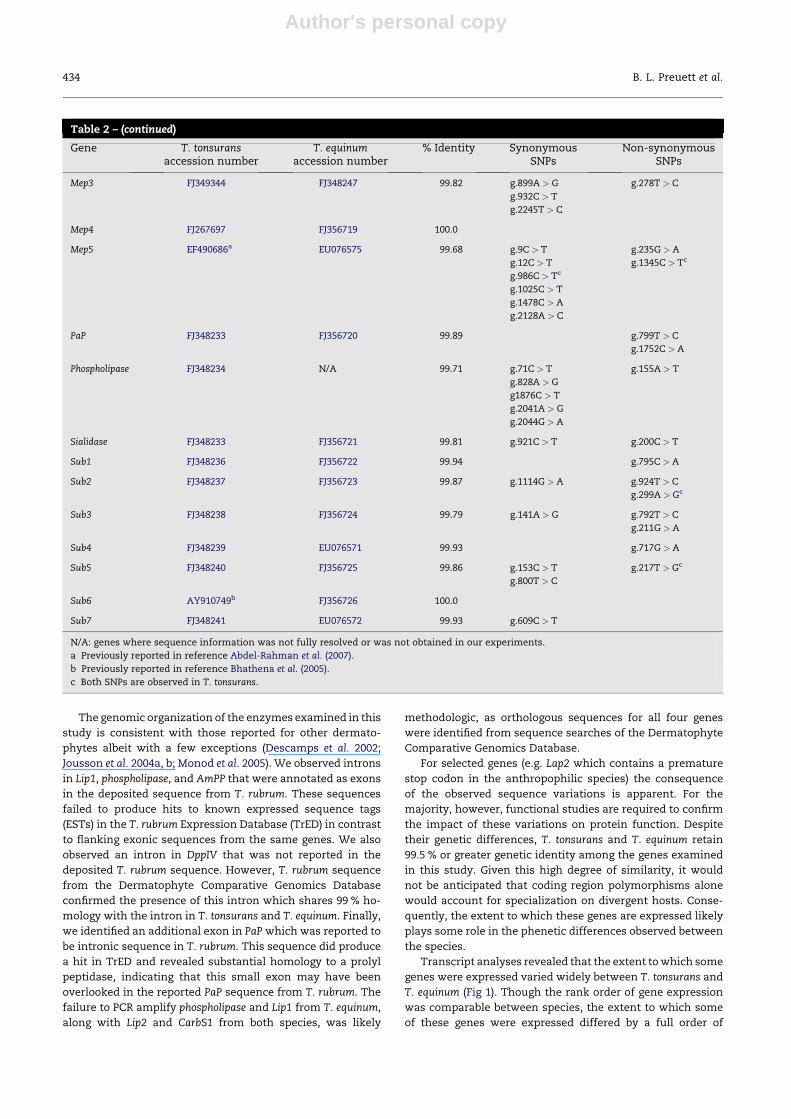
Table 2 – Genes and their representative accession numbers. Genetic similarity is provided as a percentage for each gene.Synonymous and non-synonymous SNPs are denoted by their distance from the ATG start site and reflect the observednucleotide in T. tonsurans > T. equinum. Sequence information represented by the accession numbers reflects theconsensus information generated from the eight strains of T. tonsurans and the two strains of T. equinum respectively.
Gene T. tonsuransaccession number
T. equinumaccession number
% Identity SynonymousSNPs
Non-synonymousSNPs
Ampp EU069830 EU069831 99.96 g.1324C > T
Carb2 FJ267689 FJ348244 99.78 g.350G > A g.915T > C
g.1460C > T
g.1555C > T
CarbM14 FJ267688 FJ348245 99.81 g.994A > G g.1537G > A
g.1168T > Cc
g.1449T > C
CarbS10 FJ267690 EU076570 99.66 g.1252T > C g.2001T > C
g.1504T > C g.2010C > T
g.2023 del > CTT
CarbY EF490685a FJ348246 99.76 g.30T > C g.786A > G
g.111T > C g.1119A > G
CarbY0 N/A N/A g.355 del > GTTA g.178A > G
g.958G > A g.1196T > G
g.1022C > del
g.1610A > G
Ceramidase FJ348243 FJ356718 99.88 g.75C > T
g.617C > Tc
g.707T > C
g.941T > C
DppIV FJ267691 EU076573 99.88 g.32G > A g.1541T > A
g.1572C > Tc g.599T > C
DppV FJ267692 EU076569 99.96 g.1055G > C
Lap1 EU072468 EU072467 99.49 g.48C > T g.275A > G
g.63C > T
g.131T > Gc
g.244C > T
g.320A > C
g.626 del > TT
g.1618C > T
g.1633T > C
Lap2 FJ267693 EU072469 99.82 g.196G > A g.322A > Gc
g.756A > G
Lip1 FJ267694 N/A 99.74 g.33T > C
g.589A > G
g.980A > G
g.1324C > A
Lip3 FJ267695 FJ356717 99.56 g.314 del > CTC
g.345 del > TTT
g.630C > T
g.1075T > C
Lip4 N/A N/A 99.73 g.1287T > C g.680T > C
g.170T > C
g.1378G > A
g.1448C > A
Mep1 FJ348242 EU076574 99.59 g.45C > T g.148A > G
g.886AAAA > del g.519G > A
g.1810C > T g.594A > G
Mep2 FJ267696 EU076576 99.7 g.488C > T g.1564C > T
g.1616C > T g.1597C > A
g.1640C > G
g.1655C > G
(continued on next page)
Comparative analysis of secreted enzymes between the anthropophilic–zoophilic sister species 433
Author's personal copy
The genomic organization of the enzymes examined in this
study is consistent with those reported for other dermato-
phytes albeit with a few exceptions (Descamps et al. 2002;
Jousson et al. 2004a, b; Monod et al. 2005). We observed introns
in Lip1, phospholipase, and AmPP that were annotated as exons
in the deposited sequence from T. rubrum. These sequences
failed to produce hits to known expressed sequence tags
(ESTs) in the T. rubrum Expression Database (TrED) in contrast
to flanking exonic sequences from the same genes. We also
observed an intron in DppIV that was not reported in the
deposited T. rubrum sequence. However, T. rubrum sequence
from the Dermatophyte Comparative Genomics Database
confirmed the presence of this intron which shares 99 % ho-
mology with the intron in T. tonsurans and T. equinum. Finally,
we identified an additional exon in PaP which was reported to
be intronic sequence in T. rubrum. This sequence did produce
a hit in TrED and revealed substantial homology to a prolyl
peptidase, indicating that this small exon may have been
overlooked in the reported PaP sequence from T. rubrum. The
failure to PCR amplify phospholipase and Lip1 from T. equinum,
along with Lip2 and CarbS1 from both species, was likely
methodologic, as orthologous sequences for all four genes
were identified from sequence searches of the Dermatophyte
Comparative Genomics Database.
For selected genes (e.g. Lap2 which contains a premature
stop codon in the anthropophilic species) the consequence
of the observed sequence variations is apparent. For the
majority, however, functional studies are required to confirm
the impact of these variations on protein function. Despite
their genetic differences, T. tonsurans and T. equinum retain
99.5 % or greater genetic identity among the genes examined
in this study. Given this high degree of similarity, it would
not be anticipated that coding region polymorphisms alone
would account for specialization on divergent hosts. Conse-
quently, the extent to which these genes are expressed likely
plays some role in the phenetic differences observed between
the species.
Transcript analyses revealed that the extent to which some
genes were expressed varied widely between T. tonsurans and
T. equinum (Fig 1). Though the rank order of gene expression
was comparable between species, the extent to which some
of these genes were expressed differed by a full order of
Table 2 – (continued)
Gene T. tonsuransaccession number
T. equinumaccession number
% Identity SynonymousSNPs
Non-synonymousSNPs
Mep3 FJ349344 FJ348247 99.82 g.899A > G g.278T > C
g.932C > T
g.2245T > C
Mep4 FJ267697 FJ356719 100.0
Mep5 EF490686a EU076575 99.68 g.9C > T g.235G > A
g.12C > T g.1345C > Tc
g.986C > Tc
g.1025C > T
g.1478C > A
g.2128A > C
PaP FJ348233 FJ356720 99.89 g.799T > C
g.1752C > A
Phospholipase FJ348234 N/A 99.71 g.71C > T g.155A > T
g.828A > G
g1876C > T
g.2041A > G
g.2044G > A
Sialidase FJ348233 FJ356721 99.81 g.921C > T g.200C > T
Sub1 FJ348236 FJ356722 99.94 g.795C > A
Sub2 FJ348237 FJ356723 99.87 g.1114G > A g.924T > C
g.299A > Gc
Sub3 FJ348238 FJ356724 99.79 g.141A > G g.792T > C
g.211G > A
Sub4 FJ348239 EU076571 99.93 g.717G > A
Sub5 FJ348240 FJ356725 99.86 g.153C > T g.217T > Gc
g.800T > C
Sub6 AY910749b FJ356726 100.0
Sub7 FJ348241 EU076572 99.93 g.609C > T
N/A: genes where sequence information was not fully resolved or was not obtained in our experiments.
a Previously reported in reference Abdel-Rahman et al. (2007).
b Previously reported in reference Bhathena et al. (2005).
c Both SNPs are observed in T. tonsurans.
434 B. L. Preuett et al.
Author's personal copy
magnitude. Data on the relative affinity of these genes for sub-
strates that constitute integumentary structures will clarify
how differences in the magnitude of gene expression translate
into functionally different infection profiles, especially for
genes whose expression differs only a few-fold.
For selected genes, genetic variations occurring in the
UTR’s may explain the degree of transcript variability ob-
served within and between species. In T. tonsurans, for exam-
ple, the magnitude of Sub6 expression appeared to correlate
with the copy number of a 16-bp minisatellite element in
the 50 UTR (Bhathena et al. 2005). The observations in the cur-
rent study corroborate those earlier findings (data not shown).
These results are not surprising given that a relationship
between the number of regulatory repeat elements and tran-
script copy number has been well described for other genes
(Sgourou et al. 2004; Lee et al. 2008; Akhtar et al. 2009). A similar
correlation between Sub2 transcript copy number and micro-
satellite copy number in the 30 UTR appears to be present,
however, all copy-number variations were not represented
among the isolates studied and thus the association cannot
be confirmed.
The relationship between transcript and/or protein levels
observed in vitro and infection competence in vivo is not fully
understood. Presumably, genes and gene families wherein
Fig 1 – Left panel: the ratio of the total average copy number in Trichophyton tonsurans compared with Trichophyton equinum.
The symbol represented in the key reflects intra-strain variability for each species that equals 100 %. Distortion of the symbol
along the X-axis represents deviation from a coefficient of variation (CV) of 100 % in T. tonsurans. Distortion of the symbol
along the Y-axis represents deviation from a CV of 100 % in T. equinum. Genes for which there is a significant difference in
expression between the two species are denoted with an asterisk ( p < 0.05). Right panel: absolute magnitude of transcript
expression for each gene in both species averaged across all time points. T. tonsurans is denoted with closed circles,
T. equinum is denoted with open circles.
Comparative analysis of secreted enzymes between the anthropophilic–zoophilic sister species 435
Author's personal copy
the degree of expression was not significant between the two
species reflect gene products with conserved functionality. By
contrast, genes with higher expression levels in one species as
compared to a related sister-species signal those gene prod-
ucts which may offer a selective advantage on unique host or-
ganisms be it enhanced virulence, reduced immunogenicity or
both.
Interestingly, the two gene families (Meps, Subs) wherein
expression of the majority of members differed between T.
tonsurans and T. equinum represent the gene families believed
to have arisen in dermatophytes from gene duplications
(Monod et al. 1991, 1993; Jousson et al. 2004b; Kano et al.
2005). These gene products are demonstrated to cleave integ-
umentary proteins that are relatively resistant to hydrolysis
(Goddard & Michaelis 1934; Lorincz & Stoughton 1958) and
several posses the ability to activate mammalian immune sys-
tems (Slunt et al. 1996; Woodfolk et al. 1998, 2000; Brouta et al.
2003; Descamps et al. 2003; Vermout et al. 2004). Thus, the con-
stitutive expression of the collective protease profile likely
represents a ‘‘proper’’ balance of proteases that will permit
penetration of host structures in a unique micro-environment
with insufficient antigenicity to sensitize the host.
Apart from the putative functional redundancy permitted
by multi-member gene families, selected genes may perform
supplementary roles during the process of infection. In addi-
tion to the keratinolytic properties of Sub3 (Mignon et al.
1998; Descamps et al. 2002), this protein from M. canis has
been demonstrated to facilitate adherence of arthroconidia
to feline corneocytes (Baldo et al. 2008). Interestingly, expres-
sion levels of Sub3 in T. tonsurans and T. equinum are not signif-
icantly different which could support a similar role in
T. tonsurans and T. equinum.
At the outset, this study was designed to characterize the
extremes of expression that might be observed within strains
that are genetically and/or geographically distinct. Conse-
quently, it was not surprising to identify a large degree of
intra-specific variability in transcript expression for a substan-
tial number of genes that were examined. However, all isolates
examined in this investigation derived from clinical infections
suggesting that irrespective of the degree to which the individ-
ual genes are expressed in a single strain, the complementary
expression of all genes in that strain was adequate to permit
infection on their host. Similar comparisons on isolates
acquired from infections where the extent and severity of
disease have been documented are required to understand
whether these differences alter the degree of virulence within
each species (e.g. whether expression is constitutively upregu-
lated to facilitate infection on different host sites or downregu-
lated to limit immunogenicity and host clearance). By
contrast, genes with a lower degree of intra-specific variability
may be more tightly regulated at the transcriptional level. Sim-
ilar levels of transcript expression between strains may indi-
cate the relative importance of these genes during the initial
phases of infection. Alternatively it might suggest that these
genes have a limited role in nutrient scavenging from keratin
(in vitro, in vivo or both) or any significant role relating to the
pathogenic mechanisms utilized during infection.
While the list of genes examined by this study is certainly
not exhaustive, the identification of sequence variations and
the observation of differences in transcript copy number
between T. tonsurans and T. equinum during growth in keratin
provide additional information that expands our understand-
ing of the factors which may have allowed these two dermato-
phytes to select for such divergent hosts. Both species appear
to possess a similar complement of genes coding for secreted
enzymes; however, the extent to which some are expressed is
markedly different. Subsequent studies may confirm whether
the differences in the genetic constitution and/or levels of ex-
pression of these genes facilitate niche selection, or whether
these differences arose to enhance adaptation on a host
with which a relationship had already been established.
Acknowledgements
This study was supported by a grant from the Kenneth L. and
Eva S. Smith foundation.
r e f e r e n c e s
Abdel-Rahman S, Sugita T, Gonzalez G, Ellis D, Arabatzis M, Vella-Zahra L, Viguie-Vallanet C, Hiruma M, Leeder J, Preuett B, 2010.Divergence among an international population of Trichophytontonsurans isolates. Mycopathologia 169: 1–13.
Abdel-Rahman SM, Preuett B, Gaedigk A, 2007. Multilocus geno-typing identifies infections by multiple strains of Trichophytontonsurans. Journal of Clinical Microbiology 45: 1949–1953.
Abdel-Rahman SM, Simon S, Wright KJ, Ndjountche L, Gaedigk A,2006. Tracking Trichophyton tonsurans through a large urbanchild care center: defining infection prevalence and trans-mission patterns by molecular strain typing. Pediatrics 118:2365–2373.
Akhtar P, Singh S, Bifani P, Kaur S, Srivastava BS, Srivastava R, 2009.Variable-number tandem repeat 3690 polymorphism in Indianclinical isolates of Mycobacterium tuberculosis and its influenceon transcription. Journal of Medical Microbiology 58: 798–805.
Apodaca G, McKerrow JH, 1989a. Purification and characterizationof a 27,000-Mr extracellular proteinase from Trichophytonrubrum. Infection and Immunity 57: 3072–3080.
Apodaca G, McKerrow JH, 1989b. Regulation of Trichophyton rubrumproteolytic activity. Infection and Immunity 57: 3081–3090.
Baldo A, Tabart J, Vermout S, Mathy A, Collard A, Losson B,Mignon B, 2008. Secreted subtilisins of Microsporum canis areinvolved in adherence of arthroconidia to feline corneocytes.Journal of Medical Microbiology 57: 1152–1156.
Bhathena A, Gaedigk R, Abdel-Rahman SM, 2005. Characteriza-tion of the ALP1 gene locus of Trichophyton tonsurans.Mycopathologia 160: 265–272.
Brouta F, Descamps F, Fett T, Losson B, Gerday C, Mignon B, 2001.Purification and characterization of a 43.5 kDa keratinolyticmetalloprotease from Microsporum canis. Medical Mycology 39:269–275.
Brouta F, Descamps F, Monod M, Vermout S, Losson B, Mignon B,2002. Secreted metalloprotease gene family of Microsporumcanis. Infection and Immunity 70: 5676–5683.
Brouta F, Descamps F, Vermout S, Monod M, Losson B, Mignon B,2003. Humoral and cellular immune response to a Microsporumcanis recombinant keratinolytic metalloprotease (r-MEP3) inexperimentally infected guinea pigs. Medical Mycology 41:495–501.
Collins JP, Grappel SF, Blank F, 1973. Role of keratinases in der-matophytosis. II. Fluorescent antibody studies with keratinaseII of Trichophyton mentagrophytes. Dermatologica 146: 95–100.
436 B. L. Preuett et al.

Author's personal copy
Descamps F, Brouta F, Monod M, Zaugg C, Baar D, Losson B,Mignon B, 2002. Isolation of a Microsporum canis gene familyencoding three subtilisin-like proteases expressed in vivo. TheJournal of Investigative Dermatology 119: 830–835.
DescampsF,Brouta F,VermoutS,MonodM,LossonB,MignonB,2003.Recombinant expression and antigenic properties of a 31.5-kDakeratinolytic subtilisin-like serine protease from Microsporumcanis. FEMS Immunology and Medical Microbiology 38: 29–34.
Fischer JB, Kane J, 1971. The detection of contamination inTrichophyton rubrum and Trichophyton mentagrophytes. Mycopa-thologia et Mycologia Applicata 43: 169–180.
Gaedigk A, Gaedigk R, Abdel-Rahman SM, 2003. Genetic hetero-geneity in the rRNA gene locus of Trichophyton tonsurans.Journal of Clinical Microbiology 41: 5478–5487.
Giddey K, Favre B, Quadroni M, Monod M, 2007a. Closely relateddermatophyte species produce different patterns of secretedproteins. FEMS Microbiology Letters 267: 95–101.
Giddey K, Monod M, Barblan J, Potts A, Waridel P, Zaugg C,Quadroni M, 2007b. Comprehensive analysis of proteinssecreted by Trichophyton rubrum and Trichophyton violaceumunder in vitro conditions. Journal of Proteome Research 6:3081–3092.
Goddard DR, Michaelis L, 1934. A study on Keratin. Journal ofBiological Chemistry 106: 605–614.
Grappel SF, Blank F, 1972. Role of keratinases in dermatophytosis.I. Immune responses of guinea pigs infected with Trichophytonmentagrophytes and guinea pigs immunized with keratinases.Dermatologica 145: 245–255.
Graser Y, Kuijpers AF, Presber W, De Hoog GS, 1999. Moleculartaxonomy of Trichophyton mentagrophytes and T. tonsurans.Medical Mycology 37: 315–330.
Jousson O, Lechenne B, Bontems O, Capoccia S, Mignon B,Barblan J, Quadroni M, Monod M, 2004a. Multiplication of anancestral gene encoding secreted fungalysin preceded speciesdifferentiation in the dermatophytes Trichophyton andMicrosporum. Microbiology 150: 301–310.
Jousson O, Lechenne B, Bontems O, Mignon B, Reichard U,Barblan J, Quadroni M, Monod M, 2004b. Secreted subtilisingene family in Trichophyton rubrum. Gene 339: 79–88.
Kane J, Fischer JB, 1971. The differentiation of Trichophyton rubrumand T. mentagrophytes by use of Christensen’s urea broth.Canadian Journal of Microbiology 17: 911–913.
Kano R, Yamada T, Makimura K, Yamaguchi H, Watanabe S,Hasegawa A, 2005. Metalloprotease gene of Arthrodermagypseum. Japanese Journal Infectious Diseases 58: 214–217.
Kaufman G, Berdicevsky I, Woodfolk JA, Horwitz BA, 2005.Markers for host-induced gene expression in Trichophytondermatophytosis. Infection and Immunity 73: 6584–6590.
Lee LT, Lam IP, Chow BK, 2008. A functional variable number oftandem repeats is located at the 50 flanking region of the hu-man secretin gene plays a downregulatory role in expression.Journal of Molecular Neuroscience 36: 125–131.
Lorincz AL, Stoughton RB, 1958. Specific metabolic processes ofskin. Physiological Reviews 38: 481–502.
Mahmoud AL, El-Shanawany AA, Omar SA, 1996. Factors affect-ing growth and urease production by Trichophyton spp.Mycopathologia 135: 109–113.
Mari A, Schneider P, Wally V, Breitenbach M, Simon-Nobbe B,2003. Sensitization to fungi: epidemiology, comparative skintests, and IgE reactivity of fungal extracts. Clinical andExperimental Allergy 33: 1429–1438.
Mignon B, Swinnen M, Bouchara JP, Hofinger M, Nikkels A,Pierard G, Gerday C, Losson B, 1998. Purification and
characterization of a 315 kDa keratinolytic subtilisin-like ser-ine protease from Microsporum canis and evidence of its se-cretion in naturally infected cats. Medical Mycology 36: 395–404.
Moallaei H, Zaini F, Larcher G, Beucher B, Bouchara JP, 2006.Partial purification and characterization of a 37 kDa extracel-lular proteinase from Trichophyton vanbreuseghemii. Mycopa-thologia 161: 369–375.
Monod M, Capoccia S, Lechenne B, Zaugg C, Holdom M,Jousson O, 2002. Secreted proteases from pathogenic fungi.International Journal of Medical Microbiology 292: 405–419.
Monod M, Lechenne B, Jousson O, Grand D, Zaugg C, Stocklin R,Grouzmann E, 2005. Aminopeptidases and dipeptidyl-peptidases secreted by the dermatophyte Trichophyton rubrum.Microbiology 151: 145–155.
Monod M, Paris S, Sanglard D, Jaton-Ogay K, Bille J, Latge JP, 1993.Isolation and characterization of a secreted metalloprotease ofAspergillus fumigatus. Infection and Immunity 61: 4099–4104.
Monod M, Togni G, Rahalison L, Frenk E, 1991. Isolation andcharacterisation of an extracellular alkaline protease ofAspergillus fumigatus. Journal of Medical Microbiology 35: 23–28.
Nissen D, Petersen LJ, Esch R, Svejgaard E, Skov PS, Poulsen LK,Nolte H, 1998. IgE-sensitization to cellular and culture filtratesof fungal extracts in patients with atopic dermatitis. Annals ofAllergy, Asthma and Immunology 81: 247–255.
Sgourou A, Routledge S, Antoniou M, Papachatzopoulou A,Psiouri L, Athanassiadou A, 2004. Thalassaemia mutationswithin the 50UTR of the human beta-globin gene disrupttranscription. British Journal of Haematology 124: 828–835.
Slunt JB, Taketomi EA, Woodfolk JA, Hayden ML, Platts-Mills TA,1996. The immune response to Trichophyton tonsurans: distinctT cell cytokine profiles to a single protein among subjects withimmediate and delayed hypersensitivity. Journal of Immunology157: 5192–5197.
Summerbell RC, Haugland RA, Li A, Gupta AK, 1999. rRNA geneinternal transcribed spacer 1 and 2 sequences of asexual,anthropophilic dermatophytes related to Trichophyton rubrum.Journal of Clinical Microbiology 37: 4005–4011.
Vermout S, Baldo A, Tabart J, Losson B, Mignon B, 2008. Secreteddipeptidyl peptidases as potential virulence factors for Micro-sporum canis. FEMS Immunology and Medical Microbiology 54:299–308.
Vermout SM, Brouta FD, Descamps FF, Losson BJ, Mignon BR,2004. Evaluation of immunogenicity and protective efficacy ofa Microsporum canis metalloprotease subunit vaccine in guineapigs. FEMS Immunology and Medical Microbiology 40: 75–80.
Wagner DK, Sohnle PG, 1995. Cutaneous defenses againstdermatophytes and yeasts. Clinical Microbiology Reviews 8:317–335.
Weitzman I, Summerbell RC, 1995. The dermatophytes. ClinicalMicrobiology Reviews 8: 240–259.
Woodfolk JA, Sung SS, Benjamin DC, Lee JK, Platts-Mills TA, 2000.Distinct human T cell repertoires mediate immediate anddelayed-type hypersensitivity to the Trichophyton antigen, Trir 2. Journal of Immunology 165: 4379–4387.
Woodfolk JA, Wheatley LM, Piyasena RV, Benjamin DC, Platts-Mills TA, 1998. Trichophyton antigens associated with IgEantibodies and delayed type hypersensitivity. Sequencehomology to two families of serine proteinases. Journal ofBiological Chemistry 273: 29489–29496.
Zaugg C, Monod M, Weber J, Harshman K, Pradervand S,Thomas J, Bueno M, Giddey K, Staib P, 2009. Gene expressionprofiling in the human pathogenic dermatophyte Trichophytonrubrum during growth on proteins. Eukaryotic Cell 8: 241–250.
Comparative analysis of secreted enzymes between the anthropophilic–zoophilic sister species 437
Copyright © 2022 FDOKUMEN