Comparative analyses of a small molecule/enzyme interaction by multiple users of Biacore technology
16
ANALYTICAL BIOCHEMISTRY Analytical Biochemistry 330 (2004) 98–113 www.elsevier.com/locate/yabio 0003-2697/$ - see front matter 2004 Elsevier Inc. All rights reserved. doi:10.1016/j.ab.2004.02.027 Comparative analyses of a small molecule/enzyme interaction by multiple users of Biacore technology Michelle J. Cannon, a Giuseppe A. Papalia, a Iva Navratilova, a Robert J. Fisher, b Lindsey R. Roberts, b Karen M. Worthy, b Andrew G. Stephen, b Gerardo R. Marchesini, c Edward J. Collins, d Dave Casper, e Huawei Qiu, f Daulet Satpaev, g Stefano F. Liparoto, h Dax A. Rice, i Inna I. Gorshkova, j Ryan J. Darling, k Donald B. Bennett, k Michael Sekar, l Eric Hommema, m Amy M. Liang, n Eric S. Day, o Jean Inman, o Shannon M. Karlicek, p Stephen J. Ullrich, q Dianne Hodges, r Teresa Chu, r Eric Sullivan, r Jack Simpson, s Ashique RaWque, t Béatrice Luginbühl, u Susanne Nyholm Westin, v Magdalena Bynum, w Paul Cachia, x Yue-Jin Li, y Daniel Kao, x Amy Neurauter, z Melanie Wong, aa Michael Swanson, ab and David G. Myszka a,¤ a Center for Biomolecular Interaction Analysis, University of Utah, Salt Lake City, UT 84132, USA b Protein Chemistry Laboratory, SAIC, Frederick, MD 21702, USA c Biomolecular Detection, Rikilt Institute, Wageningen, Netherlands d Department of Microbiology and Immunology, University of North Carolina, Chapel Hill, NC 27510, USA e Locus Pharmaceuticals, Blue Bell, PA 19422, USA f Genzyme Corp., Framingham, MA 01701, USA g Agensys, Inc., Santa Monica, CA 90404, USA h IDEC Pharmaceuticals Corp., San Diego, CA 92191, USA i Myriad Pharmaceuticals, Salt Lake City, UT 84108, USA j LMG NICHD NIH, Bethesda, MD 20892, USA k Eli Lilly and Co., Indianapolis, IN 46285, USA l Applied Biosystems, Bedford, MA 01730, USA m Biacore RCS, Durham, NC 27713, USA n Berlex Biosciences, Richmond, CA 94804, USA o Biogen Inc., Cambridge, MA 02142, USA p Biochemistry Department, PWzer, San Diego, CA 92121, USA q Human Genome Sci., Inc., Rockville, MD 20850, USA r Allergan, Irvine, CA 92612, USA s NCI, Frederick, MD 21702, USA t Regeneron Pharmaceutical, Tarrytown, NY 10591, USA u Department of Biochemistry, Universitaet Zürich, Zürich, Switzerland v Biacore AB, Uppsala, Sweden w Agilent Technologies, Palo Alto, CA 94303, USA x Department of Biochemistry and Molecular Genetics, University of Colorado Health Sciences Center, USA y Monsanto, ChesterWeld, MO 63198, USA z Zyomyx, Inc., Hayward, CA, USA aa EOS Biotechnology, South San Francisco, CA, USA ab Pharmacie, Kalamazoo, MI, USA Received 4 December 2003 Available online 10 May 2004 ¤ Corresponding author. Fax: 1-801-585-3015. E-mail address: [email protected] (D.G. Myszka).
Transcript of Comparative analyses of a small molecule/enzyme interaction by multiple users of Biacore technology
ANALYTICALBIOCHEMISTRY
Analytical Biochemistry 330 (2004) 98–113
www.elsevier.com/locate/yabio
Comparative analyses of a small molecule/enzyme interactionby multiple users of Biacore technology
Michelle J. Cannon,a Giuseppe A. Papalia,a Iva Navratilova,a Robert J. Fisher,b Lindsey R. Roberts,b Karen M. Worthy,b Andrew G. Stephen,b Gerardo R. Marchesini,c Edward J. Collins,d Dave Casper,e Huawei Qiu,f Daulet Satpaev,g Stefano F. Liparoto,h Dax A. Rice,i Inna I. Gorshkova,j Ryan J. Darling,k Donald B. Bennett,k Michael Sekar,l
Eric Hommema,m Amy M. Liang,n Eric S. Day,o Jean Inman,o Shannon M. Karlicek,p Stephen J. Ullrich,q Dianne Hodges,r Teresa Chu,r Eric Sullivan,r Jack Simpson,s
Ashique RaWque,t Béatrice Luginbühl,u Susanne Nyholm Westin,v Magdalena Bynum,w Paul Cachia,x Yue-Jin Li,y Daniel Kao,x Amy Neurauter,z Melanie Wong,aa
Michael Swanson,ab and David G. Myszkaa,¤
a Center for Biomolecular Interaction Analysis, University of Utah, Salt Lake City, UT 84132, USAb Protein Chemistry Laboratory, SAIC, Frederick, MD 21702, USAc Biomolecular Detection, Rikilt Institute, Wageningen, Netherlands
d Department of Microbiology and Immunology, University of North Carolina, Chapel Hill, NC 27510, USAe Locus Pharmaceuticals, Blue Bell, PA 19422, USA
f Genzyme Corp., Framingham, MA 01701, USAg Agensys, Inc., Santa Monica, CA 90404, USA
h IDEC Pharmaceuticals Corp., San Diego, CA 92191, USAi Myriad Pharmaceuticals, Salt Lake City, UT 84108, USA
j LMG NICHD NIH, Bethesda, MD 20892, USAk Eli Lilly and Co., Indianapolis, IN 46285, USAl Applied Biosystems, Bedford, MA 01730, USA
m Biacore RCS, Durham, NC 27713, USAn Berlex Biosciences, Richmond, CA 94804, USA
o Biogen Inc., Cambridge, MA 02142, USAp Biochemistry Department, PWzer, San Diego, CA 92121, USA
q Human Genome Sci., Inc., Rockville, MD 20850, USAr Allergan, Irvine, CA 92612, USAs NCI, Frederick, MD 21702, USA
t Regeneron Pharmaceutical, Tarrytown, NY 10591, USAu Department of Biochemistry, Universitaet Zürich, Zürich, Switzerland
v Biacore AB, Uppsala, Swedenw Agilent Technologies, Palo Alto, CA 94303, USA
x Department of Biochemistry and Molecular Genetics, University of Colorado Health Sciences Center, USAy Monsanto, ChesterWeld, MO 63198, USA
z Zyomyx, Inc., Hayward, CA, USAaa EOS Biotechnology, South San Francisco, CA, USA
ab Pharmacie, Kalamazoo, MI, USA
Received 4 December 2003Available online 10 May 2004
0003-2697/$ - see front matter 2004 Elsevier Inc. All rights reserved.doi:10.1016/j.ab.2004.02.027
¤ Corresponding author. Fax: 1-801-585-3015.E-mail address: [email protected] (D.G. Myszka).
M.J. Cannon et al. / Analytical Biochemistry 330 (2004) 98–113 99
Abstract
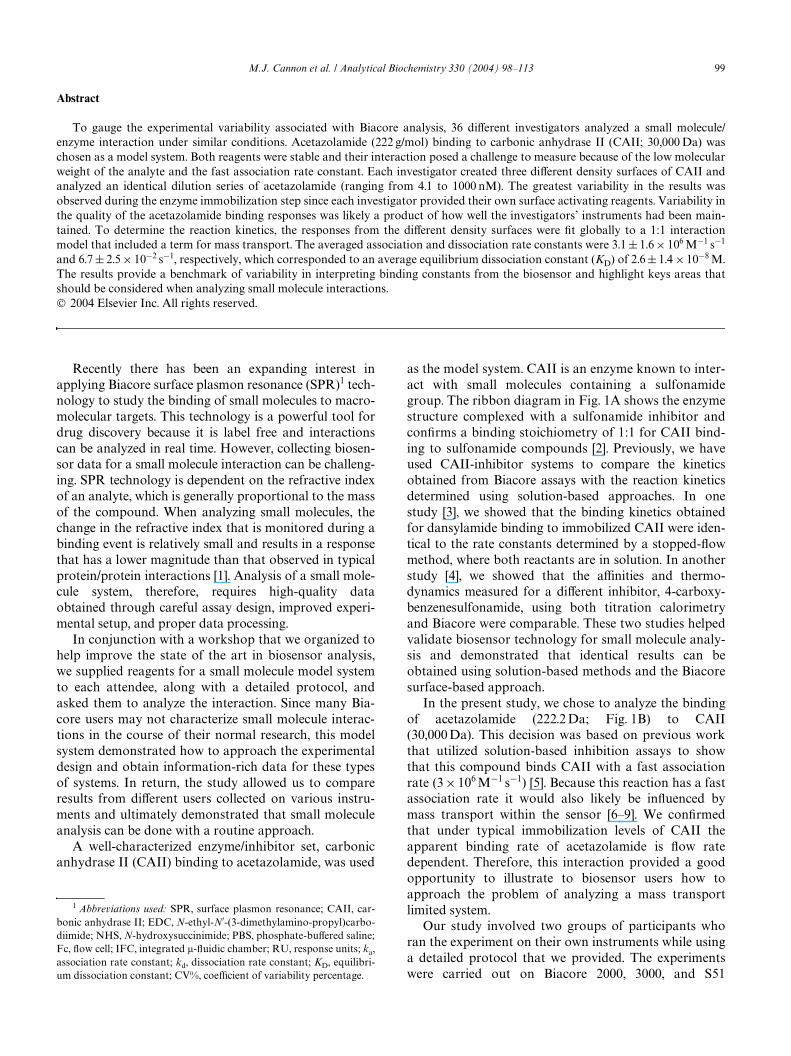
To gauge the experimental variability associated with Biacore analysis, 36 diVerent investigators analyzed a small molecule/enzyme interaction under similar conditions. Acetazolamide (222 g/mol) binding to carbonic anhydrase II (CAII; 30,000 Da) waschosen as a model system. Both reagents were stable and their interaction posed a challenge to measure because of the low molecularweight of the analyte and the fast association rate constant. Each investigator created three diVerent density surfaces of CAII andanalyzed an identical dilution series of acetazolamide (ranging from 4.1 to 1000 nM). The greatest variability in the results wasobserved during the enzyme immobilization step since each investigator provided their own surface activating reagents. Variability inthe quality of the acetazolamide binding responses was likely a product of how well the investigators’ instruments had been main-tained. To determine the reaction kinetics, the responses from the diVerent density surfaces were Wt globally to a 1:1 interactionmodel that included a term for mass transport. The averaged association and dissociation rate constants were 3.1 § 1.6 £ 106 M¡1 s¡1
and 6.7 § 2.5 £ 10¡2 s¡1, respectively, which corresponded to an average equilibrium dissociation constant (KD) of 2.6 § 1.4 £ 10¡8 M.The results provide a benchmark of variability in interpreting binding constants from the biosensor and highlight keys areas thatshould be considered when analyzing small molecule interactions. 2004 Elsevier Inc. All rights reserved.
Recently there has been an expanding interest inapplying Biacore surface plasmon resonance (SPR)1 tech-nology to study the binding of small molecules to macro-molecular targets. This technology is a powerful tool fordrug discovery because it is label free and interactionscan be analyzed in real time. However, collecting biosen-sor data for a small molecule interaction can be challeng-ing. SPR technology is dependent on the refractive indexof an analyte, which is generally proportional to the massof the compound. When analyzing small molecules, thechange in the refractive index that is monitored during abinding event is relatively small and results in a responsethat has a lower magnitude than that observed in typicalprotein/protein interactions [1]. Analysis of a small mole-cule system, therefore, requires high-quality dataobtained through careful assay design, improved experi-mental setup, and proper data processing.
In conjunction with a workshop that we organized tohelp improve the state of the art in biosensor analysis,we supplied reagents for a small molecule model systemto each attendee, along with a detailed protocol, andasked them to analyze the interaction. Since many Bia-core users may not characterize small molecule interac-tions in the course of their normal research, this modelsystem demonstrated how to approach the experimentaldesign and obtain information-rich data for these typesof systems. In return, the study allowed us to compareresults from diVerent users collected on various instru-ments and ultimately demonstrated that small moleculeanalysis can be done with a routine approach.
A well-characterized enzyme/inhibitor set, carbonicanhydrase II (CAII) binding to acetazolamide, was used
1 Abbreviations used: SPR, surface plasmon resonance; CAII, car-bonic anhydrase II; EDC, N-ethyl-N0-(3-dimethylamino-propyl)carbo-diimide; NHS, N-hydroxysuccinimide; PBS, phosphate-buVered saline;Fc, Xow cell; IFC, integrated �-Xuidic chamber; RU, response units; ka,association rate constant; kd, dissociation rate constant; KD, equilibri-um dissociation constant; CV%, coeYcient of variability percentage.
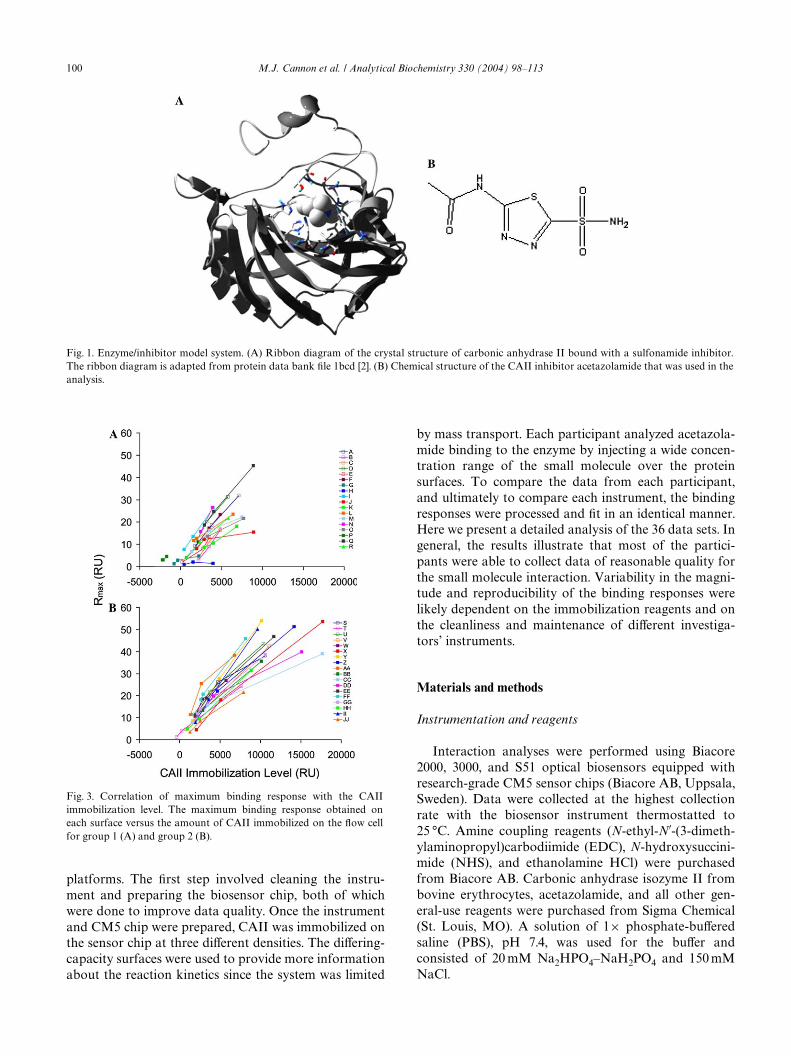
as the model system. CAII is an enzyme known to inter-act with small molecules containing a sulfonamidegroup. The ribbon diagram in Fig. 1A shows the enzymestructure complexed with a sulfonamide inhibitor andconWrms a binding stoichiometry of 1:1 for CAII bind-ing to sulfonamide compounds [2]. Previously, we haveused CAII-inhibitor systems to compare the kineticsobtained from Biacore assays with the reaction kineticsdetermined using solution-based approaches. In onestudy [3], we showed that the binding kinetics obtainedfor dansylamide binding to immobilized CAII were iden-tical to the rate constants determined by a stopped-Xowmethod, where both reactants are in solution. In anotherstudy [4], we showed that the aYnities and thermo-dynamics measured for a diVerent inhibitor, 4-carboxy-benzenesulfonamide, using both titration calorimetryand Biacore were comparable. These two studies helpedvalidate biosensor technology for small molecule analy-sis and demonstrated that identical results can beobtained using solution-based methods and the Biacoresurface-based approach.
In the present study, we chose to analyze the bindingof acetazolamide (222.2 Da; Fig. 1B) to CAII(30,000 Da). This decision was based on previous workthat utilized solution-based inhibition assays to showthat this compound binds CAII with a fast associationrate (3 £ 106 M¡1 s¡1) [5]. Because this reaction has a fastassociation rate it would also likely be inXuenced bymass transport within the sensor [6–9]. We conWrmedthat under typical immobilization levels of CAII theapparent binding rate of acetazolamide is Xow ratedependent. Therefore, this interaction provided a goodopportunity to illustrate to biosensor users how toapproach the problem of analyzing a mass transportlimited system.
Our study involved two groups of participants whoran the experiment on their own instruments while usinga detailed protocol that we provided. The experimentswere carried out on Biacore 2000, 3000, and S51
100 M.J. Cannon et al. / Analytical Biochemistry 330 (2004) 98–113
platforms. The Wrst step involved cleaning the instru-ment and preparing the biosensor chip, both of whichwere done to improve data quality. Once the instrumentand CM5 chip were prepared, CAII was immobilized onthe sensor chip at three diVerent densities. The diVering-capacity surfaces were used to provide more informationabout the reaction kinetics since the system was limited
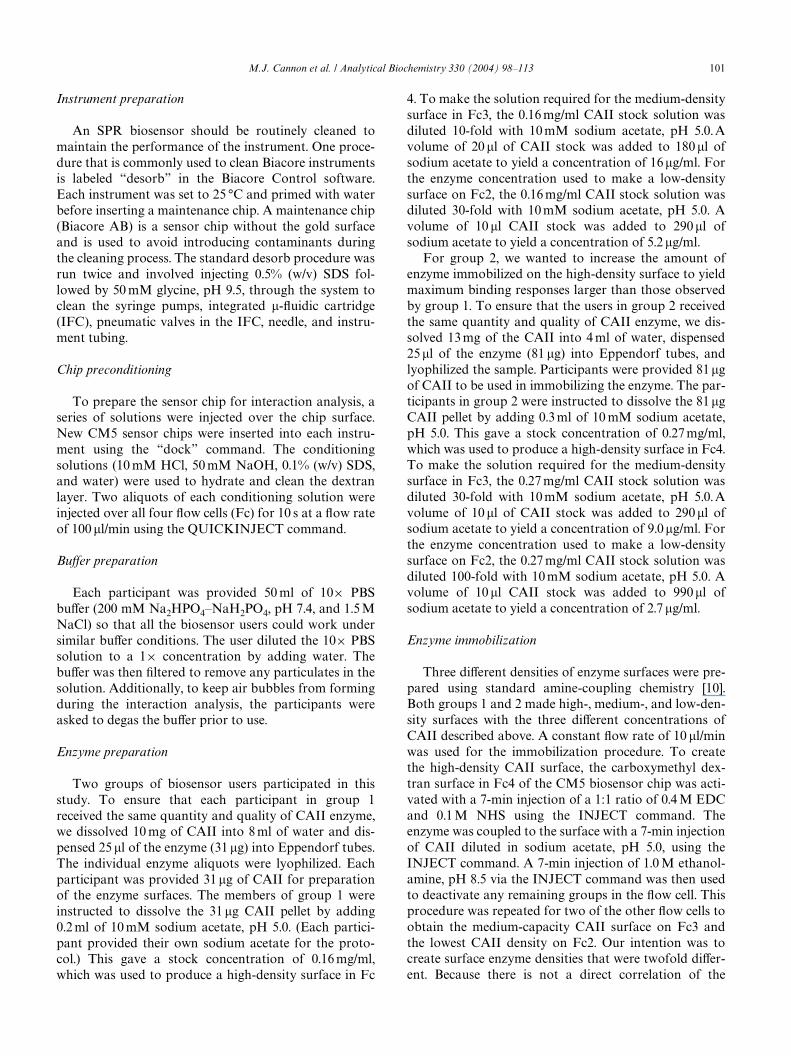
Fig. 3. Correlation of maximum binding response with the CAIIimmobilization level. The maximum binding response obtained oneach surface versus the amount of CAII immobilized on the Xow cellfor group 1 (A) and group 2 (B).
by mass transport. Each participant analyzed acetazola-mide binding to the enzyme by injecting a wide concen-tration range of the small molecule over the proteinsurfaces. To compare the data from each participant,and ultimately to compare each instrument, the bindingresponses were processed and Wt in an identical manner.Here we present a detailed analysis of the 36 data sets. Ingeneral, the results illustrate that most of the partici-pants were able to collect data of reasonable quality forthe small molecule interaction. Variability in the magni-tude and reproducibility of the binding responses werelikely dependent on the immobilization reagents and onthe cleanliness and maintenance of diVerent investiga-tors’ instruments.
Materials and methods
Instrumentation and reagents
Interaction analyses were performed using Biacore2000, 3000, and S51 optical biosensors equipped withresearch-grade CM5 sensor chips (Biacore AB, Uppsala,Sweden). Data were collected at the highest collectionrate with the biosensor instrument thermostatted to25 °C. Amine coupling reagents (N-ethyl-N0-(3-dimeth-ylaminopropyl)carbodiimide (EDC), N-hydroxysuccini-mide (NHS), and ethanolamine HCl) were purchasedfrom Biacore AB. Carbonic anhydrase isozyme II frombovine erythrocytes, acetazolamide, and all other gen-eral-use reagents were purchased from Sigma Chemical(St. Louis, MO). A solution of 1£ phosphate-buVeredsaline (PBS), pH 7.4, was used for the buVer andconsisted of 20 mM Na2HPO4–NaH2PO4 and 150 mMNaCl.
Fig. 1. Enzyme/inhibitor model system. (A) Ribbon diagram of the crystal structure of carbonic anhydrase II bound with a sulfonamide inhibitor.The ribbon diagram is adapted from protein data bank Wle 1bcd [2]. (B) Chemical structure of the CAII inhibitor acetazolamide that was used in theanalysis.
M.J. Cannon et al. / Analytical Biochemistry 330 (2004) 98–113 101
Instrument preparation
An SPR biosensor should be routinely cleaned tomaintain the performance of the instrument. One proce-dure that is commonly used to clean Biacore instrumentsis labeled “desorb” in the Biacore Control software.Each instrument was set to 25 °C and primed with waterbefore inserting a maintenance chip. A maintenance chip(Biacore AB) is a sensor chip without the gold surfaceand is used to avoid introducing contaminants duringthe cleaning process. The standard desorb procedure wasrun twice and involved injecting 0.5% (w/v) SDS fol-lowed by 50 mM glycine, pH 9.5, through the system toclean the syringe pumps, integrated �-Xuidic cartridge(IFC), pneumatic valves in the IFC, needle, and instru-ment tubing.
Chip preconditioning
To prepare the sensor chip for interaction analysis, aseries of solutions were injected over the chip surface.New CM5 sensor chips were inserted into each instru-ment using the “dock” command. The conditioningsolutions (10 mM HCl, 50 mM NaOH, 0.1% (w/v) SDS,and water) were used to hydrate and clean the dextranlayer. Two aliquots of each conditioning solution wereinjected over all four Xow cells (Fc) for 10 s at a Xow rateof 100 �l/min using the QUICKINJECT command.
BuVer preparation
Each participant was provided 50 ml of 10£ PBSbuVer (200 mM Na2HPO4–NaH2PO4, pH 7.4, and 1.5 MNaCl) so that all the biosensor users could work undersimilar buVer conditions. The user diluted the 10£ PBSsolution to a 1£ concentration by adding water. ThebuVer was then Wltered to remove any particulates in thesolution. Additionally, to keep air bubbles from formingduring the interaction analysis, the participants wereasked to degas the buVer prior to use.
Enzyme preparation
Two groups of biosensor users participated in thisstudy. To ensure that each participant in group 1received the same quantity and quality of CAII enzyme,we dissolved 10 mg of CAII into 8 ml of water and dis-pensed 25 �l of the enzyme (31 �g) into Eppendorf tubes.The individual enzyme aliquots were lyophilized. Eachparticipant was provided 31 �g of CAII for preparationof the enzyme surfaces. The members of group 1 wereinstructed to dissolve the 31 �g CAII pellet by adding0.2 ml of 10 mM sodium acetate, pH 5.0. (Each partici-pant provided their own sodium acetate for the proto-col.) This gave a stock concentration of 0.16 mg/ml,which was used to produce a high-density surface in Fc
4. To make the solution required for the medium-densitysurface in Fc3, the 0.16 mg/ml CAII stock solution wasdiluted 10-fold with 10 mM sodium acetate, pH 5.0. Avolume of 20 �l of CAII stock was added to 180�l ofsodium acetate to yield a concentration of 16�g/ml. Forthe enzyme concentration used to make a low-densitysurface on Fc2, the 0.16 mg/ml CAII stock solution wasdiluted 30-fold with 10 mM sodium acetate, pH 5.0. Avolume of 10 �l CAII stock was added to 290�l ofsodium acetate to yield a concentration of 5.2 �g/ml.
For group 2, we wanted to increase the amount ofenzyme immobilized on the high-density surface to yieldmaximum binding responses larger than those observedby group 1. To ensure that the users in group 2 receivedthe same quantity and quality of CAII enzyme, we dis-solved 13 mg of the CAII into 4 ml of water, dispensed25�l of the enzyme (81 �g) into Eppendorf tubes, andlyophilized the sample. Participants were provided 81�gof CAII to be used in immobilizing the enzyme. The par-ticipants in group 2 were instructed to dissolve the 81�gCAII pellet by adding 0.3 ml of 10 mM sodium acetate,pH 5.0. This gave a stock concentration of 0.27 mg/ml,which was used to produce a high-density surface in Fc4.To make the solution required for the medium-densitysurface in Fc3, the 0.27 mg/ml CAII stock solution wasdiluted 30-fold with 10 mM sodium acetate, pH 5.0. Avolume of 10 �l of CAII stock was added to 290�l ofsodium acetate to yield a concentration of 9.0�g/ml. Forthe enzyme concentration used to make a low-densitysurface on Fc2, the 0.27 mg/ml CAII stock solution wasdiluted 100-fold with 10 mM sodium acetate, pH 5.0. Avolume of 10 �l CAII stock was added to 990�l ofsodium acetate to yield a concentration of 2.7 �g/ml.
Enzyme immobilization
Three diVerent densities of enzyme surfaces were pre-pared using standard amine-coupling chemistry [10].Both groups 1 and 2 made high-, medium-, and low-den-sity surfaces with the three diVerent concentrations ofCAII described above. A constant Xow rate of 10 �l/minwas used for the immobilization procedure. To createthe high-density CAII surface, the carboxymethyl dex-tran surface in Fc4 of the CM5 biosensor chip was acti-vated with a 7-min injection of a 1:1 ratio of 0.4 M EDCand 0.1 M NHS using the INJECT command. Theenzyme was coupled to the surface with a 7-min injectionof CAII diluted in sodium acetate, pH 5.0, using theINJECT command. A 7-min injection of 1.0 M ethanol-amine, pH 8.5 via the INJECT command was then usedto deactivate any remaining groups in the Xow cell. Thisprocedure was repeated for two of the other Xow cells toobtain the medium-capacity CAII surface on Fc3 andthe lowest CAII density on Fc2. Our intention was tocreate surface enzyme densities that were twofold diVer-ent. Because there is not a direct correlation of the
102 M.J. Cannon et al. / Analytical Biochemistry 330 (2004) 98–113
enzyme concentration and the capacity immobilized, weempirically determined that the concentrationsdescribed above for each of the groups roughly resultedin twofold diVerences of CAII densities. The immobiliza-tion procedure outlined above was followed by partici-pants using Biacore 2000 and 3000 instruments.However, the S51 platform diVers from the Biacore 2000and 3000 biosensors by having two Xow cells, each con-taining two independent spots for immobilization, ratherthan four separate Xow cells [11]. Because of this, partici-pants using S51 instruments were required to immobilizethe CAII on two spots in one Xow cell and on one spot inanother Xow cell.
Analyte preparation
We provided a 40 �M stock concentration of the acet-azolamide to each participant so that all of the users hadthe same analyte concentration for the interaction analy-sis. To make the stock concentration, 5 mg of acetazola-mide was dissolved in 563 ml of water. The smallmolecule solution was Wltered with a 0.22�m bottle-topWlter to ensure that there was no precipitate in the sam-ple. A volume of 1.0 ml of 40 �M stock solution was dis-pensed into Eppendorf tubes and provided to eachparticipant. To make the samples used in the interactionanalysis, each participant diluted the 40�M acetazol-amide stock to 1 �M by adding 100 �l of the 40 �M solu-tion to 3.9 ml of 1£ PBS, pH 7.4. The 1 �M solution wasserially diluted threefold to yield six additional concen-trations (0.33, 0.11, 0.037, 0.012, 0.0041, and 0.0014 �M).The 0.33 �M acetazolamide solution was prepared byadding 0.5 ml of the 1�M acetazolamide to 1.0 ml of 1£PBS. To continue with the dilution series, the 0.11�Macetazolamide was prepared by adding 0.5 ml of the0.33�M concentration to 1.0 ml of 1£ PBS. This dilutionscheme was continued until a total of seven concentra-tions had been prepared. Aliquots of each concentrationwere transferred into three separate 7-mm Biacore tubesfor triplicate analysis of the concentration series. The 1£PBS buVer was also dispensed into 13 7-mm tubes toserve as blanks. Caps were placed on top of the 7-mmtubes to minimize sample contamination and evapora-tion.
BuVer spike
A tool that we use in our laboratory to help identifyand align the start of each injection is to induce a changein the refractive index between the samples and the run-ning buVer. After preparing all the samples, a small vol-ume of water is mixed with the running buVer. Theaddition of water deliberately causes a mismatchbetween the refractive index of the running buVer andthe refractive index of the buVer used for the samples,thereby inducing a small diVerence in the responses that
typically ranges from 10 to 20 RU. For the acetazola-mide/CAII analysis, 3.6 ml of water was added to 300 mlof the 1£ PBS, pH 7.4. The instrument was primed threetimes with the spiked buVer prior to the interactionanalysis.
Instrument normalization
The participants were instructed to normalize (a func-tion found in Biacore Control software) their instrumentbefore beginning the analyte run. A solution of 40%glycerol in water (v/v) was used for Biacore 2000 instru-ments and 70% glycerol in water (v/v) was used with theBiacore 3000 and S51 platforms.
Acetazolamide injection order
For the interaction analysis, a series of 10 buVer sam-ples were used for the Wrst 10 binding cycles to equili-brate the instrument. The analyte samples were thenarranged in a randomized, yet speciWc order. For arobust experiment, the concentration series was analyzedin triplicate. The acetazolamide samples were injected inthe order of 6, 2, 7, 3, 5, 1, 4, 0, 2, 7, 6, 1, 5, 3, 4, 0, 6, 3, 2,1, 5, 7, 4, and 0, where 1 corresponds to the highest con-centration in the series, 2 corresponds to the second-highest concentration, and so forth. Aliquots of buVerwere labeled as 0 and were used to separate each concen-tration series.
Acetazolamide injection method
Participants were asked to write a customized methodcreated in Biacore Control software. The samples wereanalyzed at a Xow rate of 100 �l/min to minimize masstransport eVects. Samples (100 �l) were injected seriallyover all four Xow cells using the KINJECT commandbecause this injection feature yields the most consistentsample plug. The dissociation of the enzyme/small mole-cule complex was monitored for 7 min to ensure that theacetazolamide fully dissociated from the CAII surfaces.Each binding cycle was followed by an EXTRACLEANcommand to minimize the carryover of sample into thenext injection cycle. This command is also used to cleanthe IFC. The users were requested to set the data collec-tion rate to high and the instrument temperature to25 °C.
Data processing
Data collected on an SPR biosensor require process-ing to remove systematic artifacts related to nonspeciWcbinding, signal drift, and bulk refractive index changes[12]. All of the participants provided their data Wles to us,and we processed each set of binding responses in anidentical fashion using the software tool Scrubber

M.J. Cannon et al. / Analytical Biochemistry 330 (2004) 98–113 103
(BioLogic Software Pty. Australia). To illustrate the datatransformation steps that are used for processing, one setof acetazolamide binding responses on a single immobi-lized CAII surface is shown in Fig. 2. The raw bindingresponse data are given in Fig. 2A. Data within a 10-swindow prior to the injection start (indicated by blackdotted-line box) were averaged and the average valuewas subtracted from each response to zero the data onthe y axis. The y aligned data are shown in Fig. 2B.
To better focus on the association and dissociationphases, data before and after the binding responses thatare not essential for kinetic analysis can be eliminated.The dotted lines in Fig. 2B deWne the boundaries wheredata can be cropped. Fig. 2C shows the cropped data.
As illustrated in the inset of Fig. 2C, many of theinjections start at slightly diVerent times. Mechanicallythe instrument operates by injecting analyte or buVersequentially through each Xow cell, resulting in a staggerbetween the beginnings of the binding response observedon each of the surfaces. To align the sensorgrams, thestart time of each injection was set to zero on the x axisaccording to the bulk refractive index shift observed forthe samples. In Fig. 2D, the injection start times havebeen set to a common time and have been aligned tozero along the x axis. The inset of this panel provides anenlarged view of the injection start for the bindingresponses and clearly shows that the sensorgrams are nolonger staggered. The next transformation is to subtract
Fig. 2. Data transformations used for processing acetazolamide binding responses on one immobilized CAII surface. (A) Raw data. Data within a10-s window before the injection start, as indicated by the black dotted box, were set to zero on the y axis. (B) Data have been aligned along the yaxis. The black dashed lines show where the data will be cropped to focus on the binding reaction. (C) Cropped data. The injection start times arestaggered, as shown by the black dotted box and by the zoomed-in view shown in the inset. (D) Sensorgrams were aligned to zero on the x axis todeWne a common injection start time (the inset provides an enlarged view of the injection start). (E) An average of the triplicate buVer responses(inset) was subtracted from the binding responses to remove the drift in the data. (F) The double-referenced data are shown along with the double-referenced buVer responses included in the inset.
104 M.J. Cannon et al. / Analytical Biochemistry 330 (2004) 98–113
the reference surface data (not shown) from theacetazolamide binding responses. Since CAII was notimmobilized in Fc1, this Xow cell was used to collect ref-erence surface binding signals.
In Fig. 2E, there is a slight trend in the data and a sys-tematic drift occurs in all of the Xow cells. The inset ofFig. 2E shows the responses from three replicate buVerinjections. BuVer injections provide information aboutthis drift and, when their binding signals are averagedand subtracted from the entire data set, the trend isremoved from the sensorgrams. We refer to this as dou-ble referencing [13].
Fig. 2F shows binding responses that have both thereference responses and the buVer responses subtractedfrom them. The inset in Fig. 2F shows the buVerresponses once they have also been double referenced.The sensorgrams from the buVer injections are now Xat,which is to be expected.
Kinetic data analysis
Processed data were globally Wt to a simple 1:1 inter-action model that included a term for mass transport.The reaction A0 t A + B t AB was used as the kineticmodel, where A0 is the analyte in the bulk Xow over thebiosensor chip, A is the analyte near the surface of thebiosensor chip, B is the immobilized enzyme, and AB isthe small molecule/enzyme complex [7]. Data collectedon the three diVerent density surfaces were simulta-neously Wt using the nonlinear regression programClamp [14]. The Biacore 2000 and 3000 instruments usedin this study have the Xow cells position in a serial mode.To account for the position of each Xow cell and for themixing eVects between Xow cells, data from the diVerentXow cells were allowed their own mass transport coeY-cient. Additionally, the separate surfaces were assignedtheir own maximum binding capacity (Rmax) becausethere were diVerent densities of CAII immobilized on thechip. As a Wnal processing step, each sensorgram wasallowed its own bulk refractive index change during theassociation phase.
Results
Immobilization
Four general approaches can be used to create diVer-ent immobilization levels of a ligand on a biosensor chip:(1) vary the contact time of the activation agents, NHSand EDC, injected over the surface, (2) vary the contacttime of the ligand that is coupled to the surface, (3) varythe concentration of the ligand that is coupled to the sur-face, and (4) vary the pH of the coupling buVer. In thisstudy, the users were asked to make three diVerent den-sity surfaces by varying the concentration of the ligand
while maintaining the activation, ligand contact, anddeactivation times as constants at 7 min each. Two diVer-ent concentrations of the enzyme were provided to theseparate groups participating in the study. We supplied ahigher stock concentration of CAII to the biosensorusers in group 2 so that they could immobilize moreenzyme and obtain larger maximum binding responsesthan observed by those in group 1. While the immobili-zation protocol provided to each biosensor user wasdeWned, there was still high variability in the levels ofprotein immobilized. The immobilized CAII densitiesranged from 200 to 2800 RU on the low-density sur-faces, from 1500 to 4000 RU on the medium-density sur-faces, and from 2300 to 8900 RU on the high-densitysurfaces in group 1 (see Fig. 3A). For group 2, the immo-bilized enzyme densities ranged from 750 to 2900 RU onthe low-density surface, from 2400 to 5100 RU on themedium-density surface, and from 5700 to 18,000 RU onthe high-density surface (see Fig. 3B). Because each par-ticipant provided their own NHS and EDC for theexperiments, the variability in the immobilization levelslikely stem from the activity of the activating agents.
Although wide ranges of immobilization levels wererecorded, the variability of the CAII surface density cor-related well with the variability in the maximum aceta-zolamide binding response (Rmax) observed by each user.The graphs in Fig. 3 show the maximum bindingresponse versus the immobilization levels for the twogroups of participants. Fig. 3A shows the Rmax and CAIIimmobilization levels for the Wrst group, who partici-pated in the workshop in December 2002, and Fig. 3Bshows them for a second group of users, who attendedthe workshop in February 2003. Generally, there is agood correlation between the amount of enzyme immo-bilized on the surface and the corresponding Rmax values.The binding capacity of the surfaces increase withgreater amounts of enzyme immobilized, which wasexpected. However, there are a few exceptions to thistrend. For example, in Fig. 3A participants G and Himmobilized suYcient amounts of protein but did notbind a correspondingly equal amount of the small mole-cule. This suggests that the immobilized protein was notactive. In contrast, participant P failed to immobilize asigniWcant amount of CAII and therefore did notobserve any binding responses from the acetazolamide.
Acetazolamide binding responses
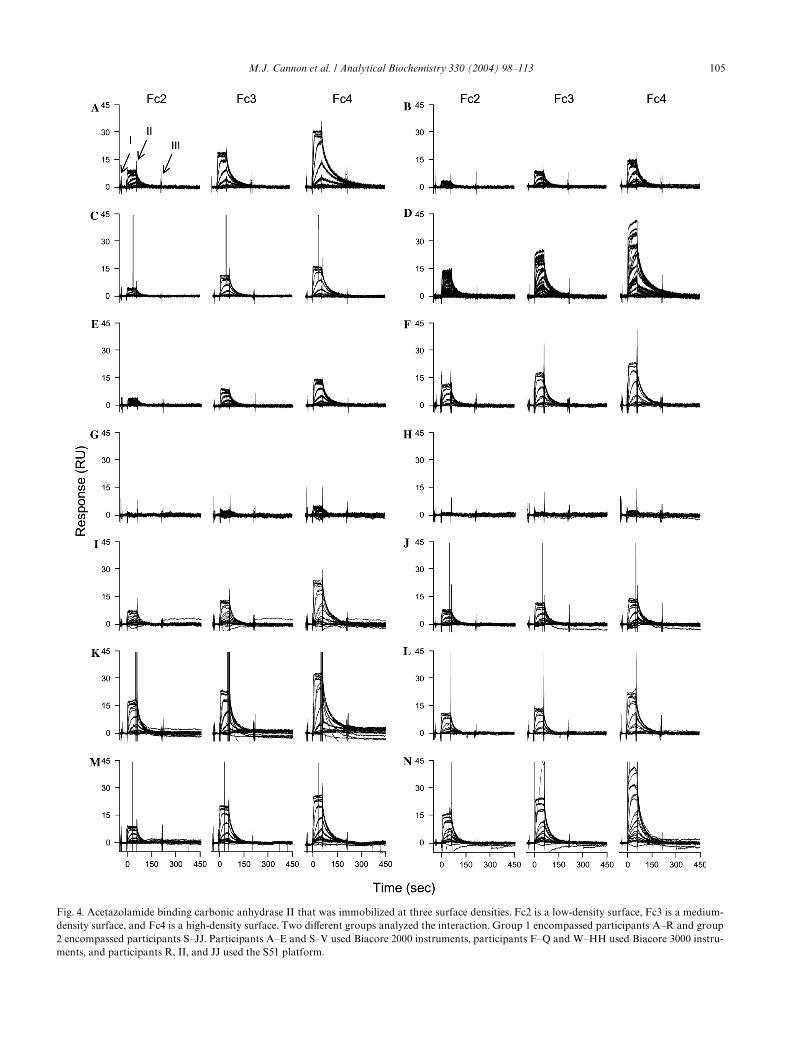
All of the acetazolamide binding data were processedwith the approach described under Materials and meth-ods. The processed data from each participant areillustrated in Fig. 4. Binding responses are shown fromthe three Xow cells: Fc2 (low-density surface), Fc3(medium-density surface), and Fc4 (high-density surface).We plotted every data set on the same time and responsescales to better compare the binding responses between
M.J. Cannon et al. / Analytical Biochemistry 330 (2004) 98–113 105
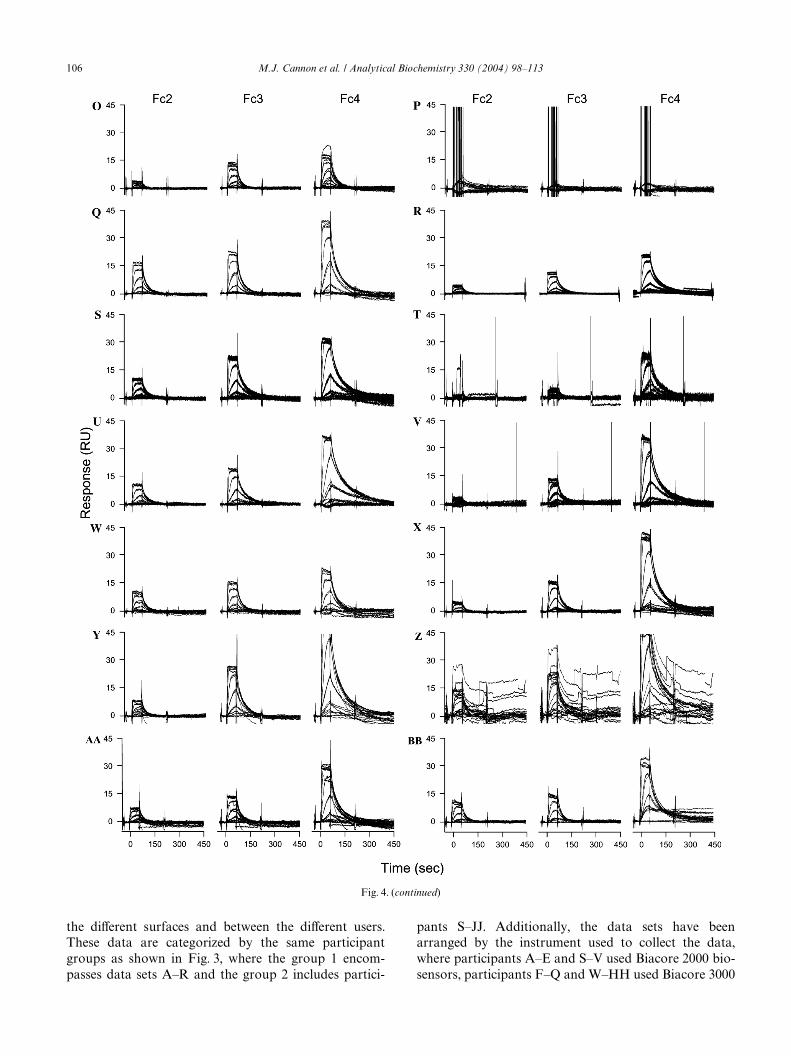
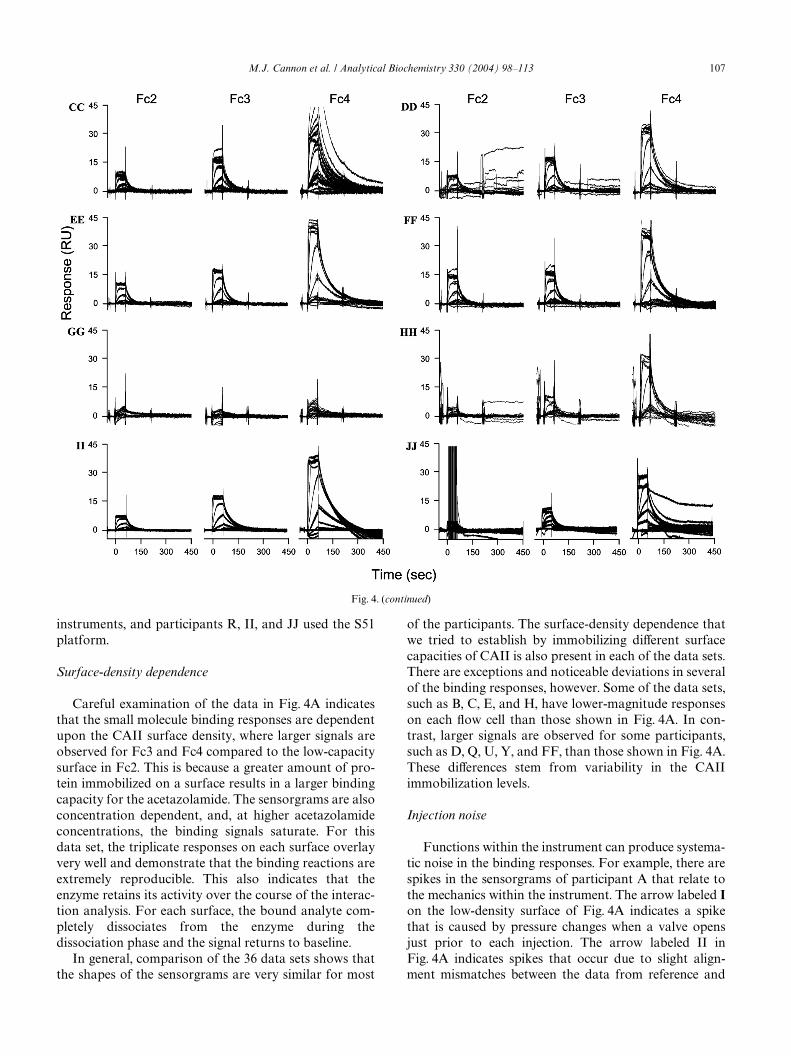
Fig. 4. Acetazolamide binding carbonic anhydrase II that was immobilized at three surface densities. Fc2 is a low-density surface, Fc3 is a medium-density surface, and Fc4 is a high-density surface. Two diVerent groups analyzed the interaction. Group 1 encompassed participants A–R and group2 encompassed participants S–JJ. Participants A–E and S–V used Biacore 2000 instruments, participants F–Q and W–HH used Biacore 3000 instru-ments, and participants R, II, and JJ used the S51 platform.
106 M.J. Cannon et al. / Analytical Biochemistry 330 (2004) 98–113
the diVerent surfaces and between the diVerent users.These data are categorized by the same participantgroups as shown in Fig. 3, where the group 1 encom-passes data sets A–R and the group 2 includes partici-
pants S–JJ. Additionally, the data sets have beenarranged by the instrument used to collect the data,where participants A–E and S–V used Biacore 2000 bio-sensors, participants F–Q and W–HH used Biacore 3000
Fig. 4. (continued)
M.J. Cannon et al. / Analytical Biochemistry 330 (2004) 98–113 107
instruments, and participants R, II, and JJ used the S51platform.
Surface-density dependence
Careful examination of the data in Fig. 4A indicatesthat the small molecule binding responses are dependentupon the CAII surface density, where larger signals areobserved for Fc3 and Fc4 compared to the low-capacitysurface in Fc2. This is because a greater amount of pro-tein immobilized on a surface results in a larger bindingcapacity for the acetazolamide. The sensorgrams are alsoconcentration dependent, and, at higher acetazolamideconcentrations, the binding signals saturate. For thisdata set, the triplicate responses on each surface overlayvery well and demonstrate that the binding reactions areextremely reproducible. This also indicates that theenzyme retains its activity over the course of the interac-tion analysis. For each surface, the bound analyte com-pletely dissociates from the enzyme during thedissociation phase and the signal returns to baseline.
In general, comparison of the 36 data sets shows thatthe shapes of the sensorgrams are very similar for most
of the participants. The surface-density dependence thatwe tried to establish by immobilizing diVerent surfacecapacities of CAII is also present in each of the data sets.There are exceptions and noticeable deviations in severalof the binding responses, however. Some of the data sets,such as B, C, E, and H, have lower-magnitude responseson each Xow cell than those shown in Fig. 4A. In con-trast, larger signals are observed for some participants,such as D, Q, U, Y, and FF, than those shown in Fig. 4A.These diVerences stem from variability in the CAIIimmobilization levels.
Injection noise
Functions within the instrument can produce systema-tic noise in the binding responses. For example, there arespikes in the sensorgrams of participant A that relate tothe mechanics within the instrument. The arrow labeled Ion the low-density surface of Fig. 4A indicates a spikethat is caused by pressure changes when a valve opensjust prior to each injection. The arrow labeled II inFig. 4A indicates spikes that occur due to slight align-ment mismatches between the data from reference and
Fig. 4. (continued)
108 M.J. Cannon et al. / Analytical Biochemistry 330 (2004) 98–113
that from reaction Xow cells. Binding responses fromdiVerent Xow cells are never perfectly aligned because theXow cells are connected in a series, which causes a slightdispersion of the sample plug during an injection. Themisalignment, however, does not impact kinetic analysisof the data. The arrow labeled III in Fig. 4A indicates aspike that is caused by the syringe reWlling. When exam-ining the data sets on the three diVerent density surfacesfor every user, the same kinds of outlier spikes are alsoapparent. Generally, these spikes do not impact the dataanalysis since they are typically only a few data pointsand they can be eliminated before Wtting the data.
Air spikes
Nonsystematic spikes can also occur during the asso-ciation phase. One injection in data set C shows a singlespike. This spike appeared on each of the CAII surfacesand is due to an air bubble that was introduced with thesample into the Xow cells. Multiple sensorgrams can alsoexhibit these air spikes, as shown in data sets J and K.Although it is not unusual to have an air spike present ina single sensorgram (of the 34 total binding cycles shownin the data sets), it is uncommon to have multiplesensorgrams contaminated with these spikes. When thisoccurs, it is likely that the instrument requires cleaningor maintenance. One item in particular that may needreplacement is the sample delivery tubing that deliverssample from the vial into the IFC. It may containadsorbed material that can induce the nucleation of airbubbles.
Nonsystematic deviations
In data set D, the general binding responses on themedium- and high-density surfaces are not as clean asthose observed in other data sets and do not exhibit highreproducibility. These binding responses have bulkrefractive index changes that could not be completelyremoved in the data processing method. However, whenWtting the data, we can account for these changes.
Fig. 4F shows spikes before and after the injectionsthat are larger than those shown in Fig. 4A. These bind-ing responses have a more signiWcant noise structure atthe transition from buVer to sample and could be anindication that the IFC needs to be replaced.
The data shown for participant P suggests a signiW-cant problem because all of the binding responsesappear the same (instead of separate sensorgrams foreach concentration of acetazolamide binding the immo-bilized CAII surfaces). When examining the amount ofenzyme immobilized for these surfaces, we see that thisparticipant was unable to tether CAII adequately to anyof the Xow cell surfaces. The reason for this is notknown, but may be due to the quality of the couplingreagents.
Binding responses for participants I, J, and K indicatea few rogue sensorgrams, which may relate to the instru-ment needing maintenance. One outlier binding responseis not uncommon. When this occurs, the single sensor-gram can be easily removed during the analysis. How-ever, concerns arise when there are data sets that havemultiple outliers. Fig. 4Z is an example of a data set thathas many rogue sensorgrams. The responses containingmany nonsystematic deviations suggest that the instru-ment needs signiWcant cleaning using either the “desorb”function or the “sanitize” procedure in Biacore Controlsoftware. Additionally, the IFC, the sample delivery tub-ing, and/or the injection needle may require replacement.
Data analysis and Wts
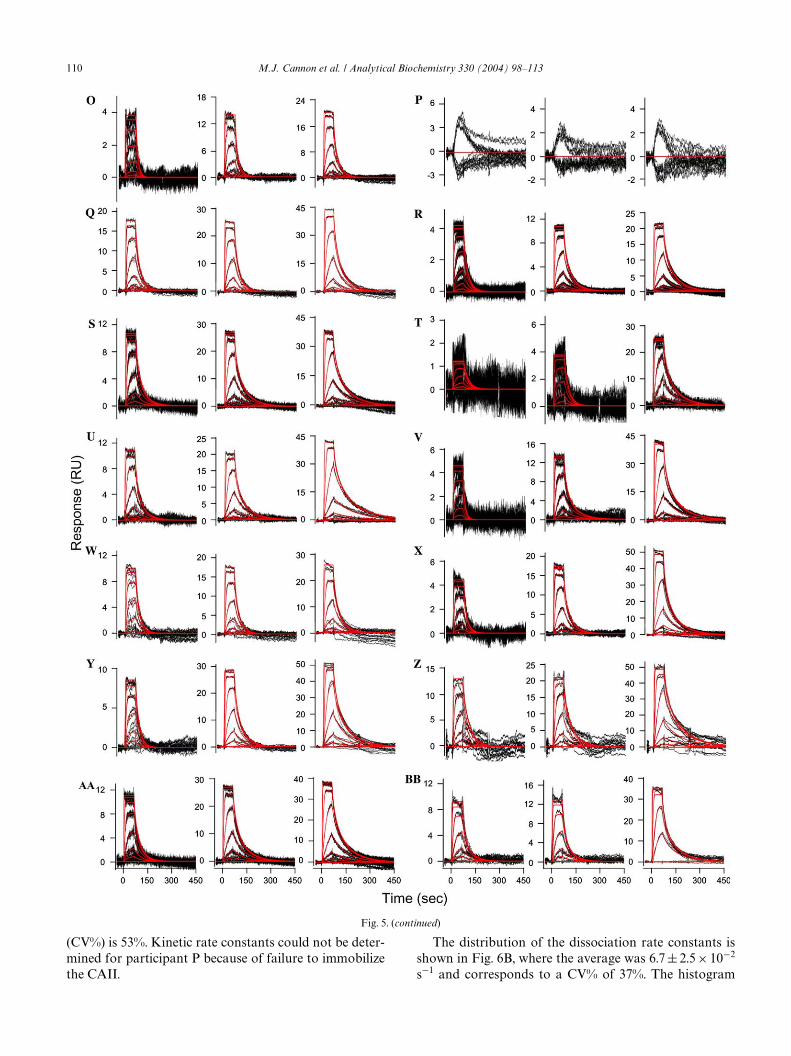
To determine the binding kinetics, all of the data setswere further processed to remove rogue sensorgrams anddelete data points, such as the spikes at the injectioninterface that are clear outliers. The binding kinetics forthe small molecule/protein interaction were interpretedby simultaneously Wtting data from all three surface den-sities to a 1:1 interaction model that includes a term formass transport, as detailed under Materials and methods.This approach provided one set of rate constants todescribe all three reaction surfaces. The data Wts wereconWrmed by setting diVerent starting values at thebeginning of the Wtting process, and these individual Wtsfor each set of data converged to the same minimum.Fig. 5 shows the Wt for each data set, where the red linesare data simulated by the kinetic Wt. Binding responsesfor each participant were scaled so that the responses,even on the low-density surfaces, could be readilyinterpreted.
In general, the data sets Wt well to the simple kineticmodel. Even the extremely low responses obtained byparticipants G and H yielded kinetic data that are con-sistent with the other participants. One set of bindingresponses which were not accurately Wt by the kineticmodel is participant P, who failed to immobilize theCAII enzyme.
Kinetic rate constants
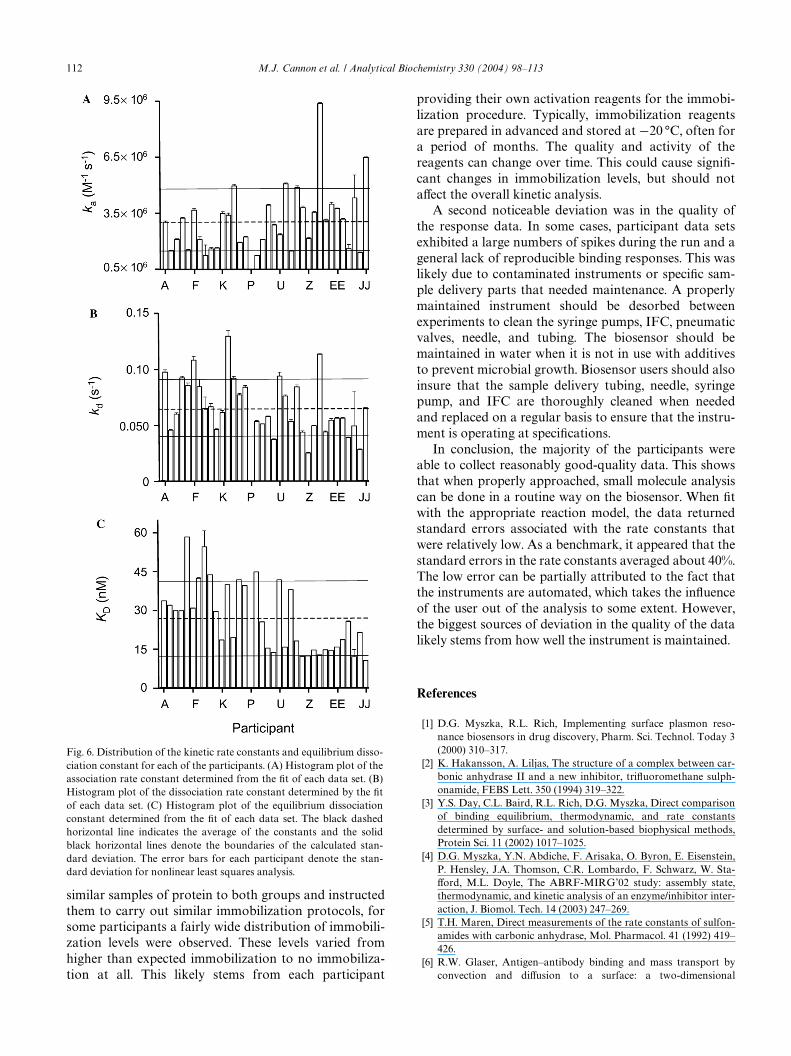
Fig. 6A is a histogram plot of the association rateconstants determined by Wtting the data of each partici-pant. The standard deviation of nonlinear least squaresanalysis is also reported for each participant. The blackdashed horizontal line indicates an overall average ka of3.1 £ 106 M¡1 s¡1. This is in excellent agreement with theka of 3 £ 106 M¡1 s¡1 that was previously determined insolution for this interaction using an enzyme inhibitionassay [5]. The solid black lines show the boundaries ofthe rates which lie within the Wrst standard deviation ofthe returned association rate constants which is § 1.6 £106 M¡1 s¡1; a coeYcient of variability percentage
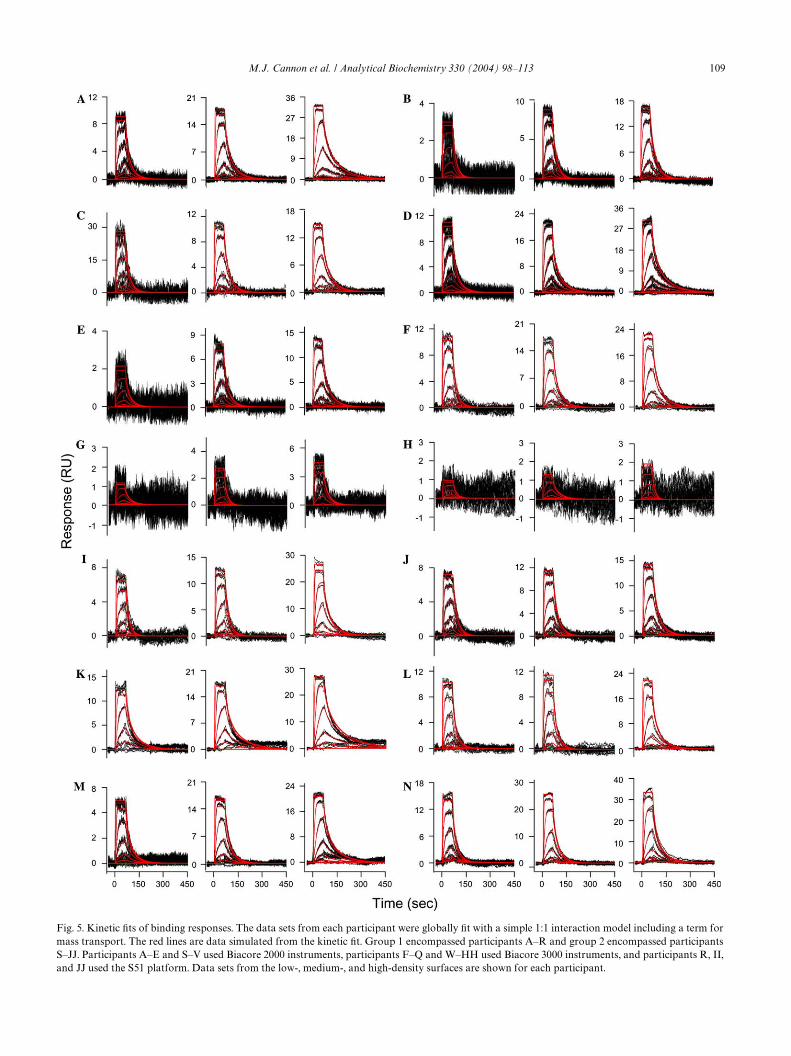
M.J. Cannon et al. / Analytical Biochemistry 330 (2004) 98–113 109
and JJ used the S51 platform. Data sets from the low-, medium-, and high
ensity surfaces are shown for each participant.Fig. 5. Kinetic Wts of binding responses. The data sets from each participant were globally Wt with a simple 1:1 interaction model including a term formass transport. The red lines are data simulated from the kinetic Wt. Group 1 encompassed participants A–R and group 2 encompassed participantsS–JJ. Participants A–E and S–V used Biacore 2000 instruments, participants F–Q and W–HH used Biacore 3000 instruments, and participants R, II,
-d
110 M.J. Cannon et al. / Analytical Biochemistry 330 (2004) 98–113
(CV%) is 53%. Kinetic rate constants could not be deter-mined for participant P because of failure to immobilizethe CAII.
Fig. 5. (c
The distribution of the dissociation rate constants isshown in Fig. 6B, where the average was 6.7 § 2.5 £ 10¡2
s¡1 and corresponds to a CV% of 37%. The histogram
ntinued)
o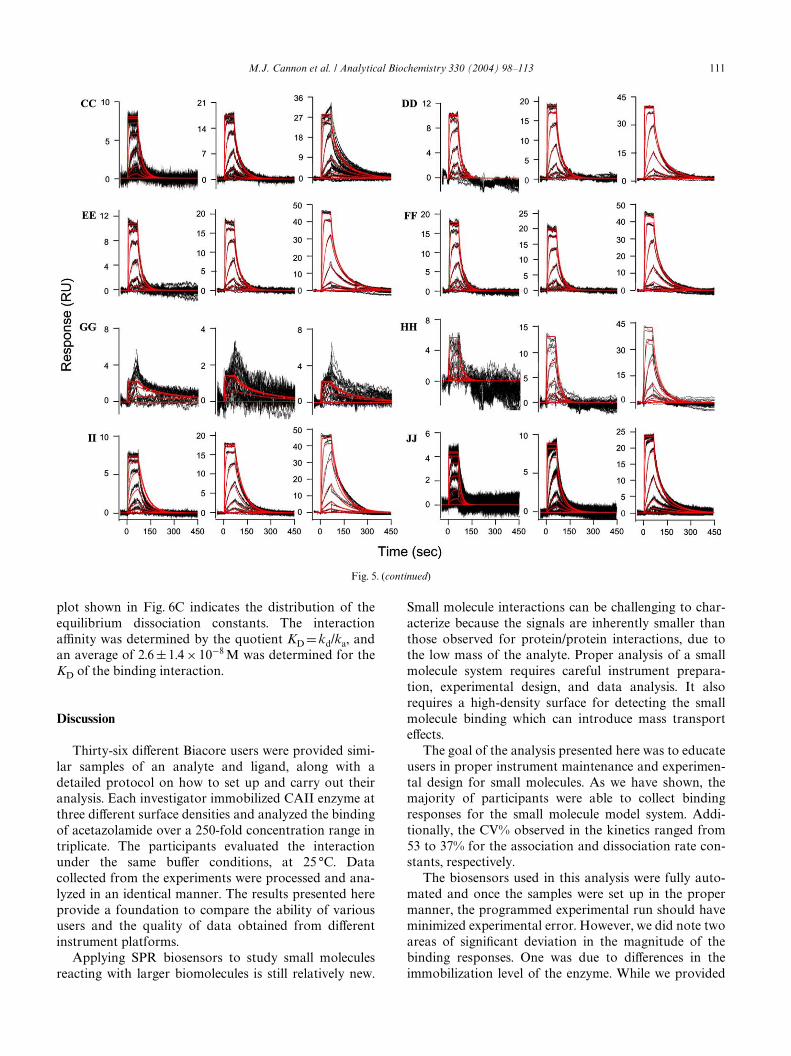
M.J. Cannon et al. / Analytical Biochemistry 330 (2004) 98–113 111
plot shown in Fig. 6C indicates the distribution of theequilibrium dissociation constants. The interactionaYnity was determined by the quotient KD D kd/ka, andan average of 2.6 § 1.4 £ 10¡8 M was determined for theKD of the binding interaction.
Discussion
Thirty-six diVerent Biacore users were provided simi-lar samples of an analyte and ligand, along with adetailed protocol on how to set up and carry out theiranalysis. Each investigator immobilized CAII enzyme atthree diVerent surface densities and analyzed the bindingof acetazolamide over a 250-fold concentration range intriplicate. The participants evaluated the interactionunder the same buVer conditions, at 25 °C. Datacollected from the experiments were processed and ana-lyzed in an identical manner. The results presented hereprovide a foundation to compare the ability of varioususers and the quality of data obtained from diVerentinstrument platforms.
Applying SPR biosensors to study small moleculesreacting with larger biomolecules is still relatively new.
Small molecule interactions can be challenging to char-acterize because the signals are inherently smaller thanthose observed for protein/protein interactions, due tothe low mass of the analyte. Proper analysis of a smallmolecule system requires careful instrument prepara-tion, experimental design, and data analysis. It alsorequires a high-density surface for detecting the smallmolecule binding which can introduce mass transporteVects.
The goal of the analysis presented here was to educateusers in proper instrument maintenance and experimen-tal design for small molecules. As we have shown, themajority of participants were able to collect bindingresponses for the small molecule model system. Addi-tionally, the CV% observed in the kinetics ranged from53 to 37% for the association and dissociation rate con-stants, respectively.
The biosensors used in this analysis were fully auto-mated and once the samples were set up in the propermanner, the programmed experimental run should haveminimized experimental error. However, we did note twoareas of signiWcant deviation in the magnitude of thebinding responses. One was due to diVerences in theimmobilization level of the enzyme. While we provided
Fig. 5. (continued)
112 M.J. Cannon et al. / Analytical Biochemistry 330 (2004) 98–113
similar samples of protein to both groups and instructedthem to carry out similar immobilization protocols, forsome participants a fairly wide distribution of immobili-zation levels were observed. These levels varied fromhigher than expected immobilization to no immobiliza-tion at all. This likely stems from each participant
Fig. 6. Distribution of the kinetic rate constants and equilibrium disso-ciation constant for each of the participants. (A) Histogram plot of theassociation rate constant determined from the Wt of each data set. (B)Histogram plot of the dissociation rate constant determined by the Wtof each data set. (C) Histogram plot of the equilibrium dissociationconstant determined from the Wt of each data set. The black dashedhorizontal line indicates the average of the constants and the solidblack horizontal lines denote the boundaries of the calculated stan-dard deviation. The error bars for each participant denote the stan-dard deviation for nonlinear least squares analysis.
providing their own activation reagents for the immobi-lization procedure. Typically, immobilization reagentsare prepared in advanced and stored at ¡20 °C, often fora period of months. The quality and activity of thereagents can change over time. This could cause signiW-cant changes in immobilization levels, but should notaVect the overall kinetic analysis.
A second noticeable deviation was in the quality ofthe response data. In some cases, participant data setsexhibited a large numbers of spikes during the run and ageneral lack of reproducible binding responses. This waslikely due to contaminated instruments or speciWc sam-ple delivery parts that needed maintenance. A properlymaintained instrument should be desorbed betweenexperiments to clean the syringe pumps, IFC, pneumaticvalves, needle, and tubing. The biosensor should bemaintained in water when it is not in use with additivesto prevent microbial growth. Biosensor users should alsoinsure that the sample delivery tubing, needle, syringepump, and IFC are thoroughly cleaned when neededand replaced on a regular basis to ensure that the instru-ment is operating at speciWcations.
In conclusion, the majority of the participants wereable to collect reasonably good-quality data. This showsthat when properly approached, small molecule analysiscan be done in a routine way on the biosensor. When Wtwith the appropriate reaction model, the data returnedstandard errors associated with the rate constants thatwere relatively low. As a benchmark, it appeared that thestandard errors in the rate constants averaged about 40%.The low error can be partially attributed to the fact thatthe instruments are automated, which takes the inXuenceof the user out of the analysis to some extent. However,the biggest sources of deviation in the quality of the datalikely stems from how well the instrument is maintained.
References
[1] D.G. Myszka, R.L. Rich, Implementing surface plasmon reso-nance biosensors in drug discovery, Pharm. Sci. Technol. Today 3(2000) 310–317.
[2] K. Hakansson, A. Liljas, The structure of a complex between car-bonic anhydrase II and a new inhibitor, triXuoromethane sulph-onamide, FEBS Lett. 350 (1994) 319–322.
[3] Y.S. Day, C.L. Baird, R.L. Rich, D.G. Myszka, Direct comparisonof binding equilibrium, thermodynamic, and rate constantsdetermined by surface- and solution-based biophysical methods,Protein Sci. 11 (2002) 1017–1025.
[4] D.G. Myszka, Y.N. Abdiche, F. Arisaka, O. Byron, E. Eisenstein,P. Hensley, J.A. Thomson, C.R. Lombardo, F. Schwarz, W. Sta-Vord, M.L. Doyle, The ABRF-MIRG’02 study: assembly state,thermodynamic, and kinetic analysis of an enzyme/inhibitor inter-action, J. Biomol. Tech. 14 (2003) 247–269.
[5] T.H. Maren, Direct measurements of the rate constants of sulfon-amides with carbonic anhydrase, Mol. Pharmacol. 41 (1992) 419–426.
[6] R.W. Glaser, Antigen–antibody binding and mass transport byconvection and diVusion to a surface: a two-dimensional
M.J. Cannon et al. / Analytical Biochemistry 330 (2004) 98–113 113
computer model of binding and dissociation kinetics, Anal. Bio-chem. 213 (1993) 152–161.
[7] D.G. Myszka, T.A. Morton, M.L. Doyle, I.M. Chaiken, Kineticanalysis of a protein antigen–antibody interaction limited by masstransport on an optical biosensor, Biophys. Chem. 64 (1997) 127–137.
[8] R. Karlsson, A. Falt, Experimental design for improved kineticanalysis of protein–protein interactions with surface plasmonresonance biosensors, J. Immunol. Methods 200 (1997) 121–133.
[9] D.G. Myszka, X. He, M. Dembo, T.A. Morton, B. Goldstein,Extending the range of rate constants available from BIACORE:interpreting mass transport-inXuenced binding data, Biophys. J.75 (1998) 583–594.
[10] B. Johnsson, S. Löfås, G. Lindquist, Immobilization of proteins toa carboxymethyldextran-modiWed gold surface for biospeciWcinteraction analysis in surface plasmon resonance sensors, Anal.Biochem. 198 (1991) 268–277.
[11] M.J. Cannon, D.G. Myszka, Analyzing the binding of low molecu-lar mass compounds using Biacore S51, Recent Res. Dev. Biophys.Biochem. 3 (2003) 333–344.
[12] T.A. Morton, D.G. Myszka, Kinetic analysis of macromolecularinteractions using surface plasmon resonance biosensors, Meth-ods Enzymol. 295 (1998) 268–294.
[13] D.G. Myszka, Improving biosensor analysis, J. Mol. Recog. 12(1999) 279–284.
[14] D.G. Myszka, T.A. Morton, CLAMP: a biosensor kinetic dataanalysis program, Trends Biochem. Sci. 23 (1998) 149–150.