Attheyella (Canthosella) mervini sp. n.(Canthocamptidae, Harpacticoida) from Jamaican bromeliads
ORIGINAL ARTICLE
Community structure and species diversity of Harpacticoida(Crustacea: Copepoda) at two sites in the deep seaof the Angola Basin (Southeast Atlantic)
Kai Horst George & Gritta Veit-Köhler & Pedro Martínez Arbizu & Sybille Seifried &
Armin Rose & Elke Willen & Karin Bröhldick & Paulo H. Corgosinho & Jan Drewes &Lena Menzel & Gisela Moura & Horst Kurt Schminke
Received: 22 January 2013 /Accepted: 30 August 2013# Gesellschaft für Biologische Systematik 2013
Abstract The aim of this study was to evaluate compositionaldifferences between harpacticoid (Crustacea, Copepoda) as-semblages at two widely separated abyssal locations. Duringthe DIVA 1 cruise of RV METEOR (July/August 2000) to theAngola Basin (Southeast Atlantic), two deep-sea stations, ap-proximately 300 nautical miles apart (Stations 325 and 346),were sampled repeatedly by Multicorer (MUC). For quantita-tive analyses, 5 MUC samples were selected at random fromeach of 15 deployments at both stations, totalling 75 cores.Across the study, 7,081 Harpacticoida specimens were en-countered and of these 31.4 % were adults and could beanalysed to species level: 682 species were identified, with99.3 % new to science. At northern Station 346, a total of 600species were recorded—the highest harpacticoid species num-ber ever recorded for a single deep-sea locality. Most species(56 %) were represented by singletons. Multivariate tests iden-tified significant differences between community compositionsat the two stations. Diversity, species richness and species
density were higher at Station 346, whilst taxonomic distinct-ness, evenness, and rarefaction were similar between stations.Regression and correlation analyses showed that the differencein species diversity was best explained by species densitiesrather than species richness. Under-sampling due to low den-sities was an issue at the southern Station 325. Nevertheless,our study demonstrated significant differences in regional-scale harpacticoid community structures within a single deep-sea basin that would usually be considered a uniform andstable habitat. These observed differences are thought to reflectdifferences in food availability at the two stations.
Keywords Meiofauna . Community analysis . Speciesrichness . Diversity . DIVA . CeDAMar
Introduction
Meiofauna organisms are ubiquitous, and are the numericallydominant metazoans at all water depths (Rex et al. 2006; Weiet al. 2010). Concerning the deep sea, our knowledge of thelarge-scale distributional patterns of metazoan meiofauna spe-cies has grown over the last years. Communities of deep-seameiobenthic taxa (primarily Nematoda and Harpacticoida)have been investigated across complete geographical areas(e.g. Baguley et al. 2006; Lambshead et al. 2000, 2001,2002; Lampadariou et al. 2009) or over certain time periods(Shimanaga et al. 2004). Species turnover of abyssalHarpacticoida has been studied over large scales, showingthat distribution ranges of single harpacticoid species can spanthousands of kilometres (e.g. Gheerardyn and Veit-Köhler2009; Kottmann et al. 2013; Menzel 2011a; Menzel et al.2011; Pointner et al. 2013; Seifried and Martínez Arbizu2008). Nevertheless, diversity of mega- and macro-fauna
Electronic supplementary material The online version of this article(doi:10.1007/s13127-013-0154-2) contains supplementary material,which is available to authorized users.
K. H. George (*) :G. Veit-Köhler : P. M. Arbizu :A. Rose :P. H. Corgosinho : L. Menzel :G. MouraSenckenberg am Meer, Abt. DZMB, Südstrand 44,26382 Wilhelmshaven, Germanye-mail: [email protected]
S. Seifried : E. Willen :K. Bröhldick : J. Drewes :H. K. SchminkeAG Zoosystematik und Morphologie, Fakultät 5, Carl von OssietzkyUniversität, 26111 Oldenburg, Germany
Present Address:P. H. CorgosinhoBiologia aquática & Taxonomia e filogenia de Copepoda,Unesco-HidroEX Foundation/Research Department,Rua Tiradentes 325, Centro Frutal-MG, Brazil 38200-000
Org Divers EvolDOI 10.1007/s13127-013-0154-2
and their role in the ecosystem are far better documented, andspecies-level studies on all Harpacticoida in deep-sea commu-nities are scarce (Coull 1972; Dinet 1973; Soltwedel 1997;Thistle 2001; Baguley et al. 2006).
Besides sediment characteristics, oxygen supply, hydrolog-ic conditions (currents), and catastrophic physical disturbance,food supply plays an important role in structuring meiobenthiccommunities and species diversity in the deep sea (cf. Coull1988; Lambshead et al. 2000, 2001, 2002; Levin et al. 2001;Soltwedel 2000; Tietjen 1984, 1992; Vanhove et al. 1995;Vanreusel et al. 1995a, b). Increased food resources shouldresult in an increased number of corresponding feeders, andthis theory has been supported by a number of recent studies(e.g. Baguley et al. 2006; Danovaro et al. 2000; Gutzmannet al. 2004; Lampadariou et al. 2009; Raes et al. 2010; Roseet al. 2005; Shimanaga et al. 2000). Moreover, it is known thatprimary productivity is higher near the coasts than offshore,even in deep-sea areas (e.g. Brown et al. 1991; Levin et al.2001; Rex et al. 1993; Smith and Hinga 1983; Soltwedel 2000;Thistle 2003; Wasmund et al. 2005). However, environmentalconditions in the deep sea are thought to change only slightlyeven over great distances (cf. Ramírez-Llodra et al. 2010;Thistle 2003; Türkay 2006; Tyler 2003).
The DIVA project (Latitudinal Gradients of Deep-Sea Bio-diversity in the Atlantic Ocean), initiated in 2000, aims todevelop a comprehensive data set to enable a reliable estimateof deep-sea biodiversity. So far, the bottom fauna, from thenano- to the megabenthos, have been studied across fiveAtlantic deep-sea basins during three DIVA expeditions(Balzer et al. 2006; Martínez Arbizu and Schminke 2005).In addition to an extensive taxonomic inventory of the benthosand the description of new species, a primary objective hasbeen the comparison of different deep-sea basins regardingtheir taxonomic composition and species diversity (Türkay2006). The three DIVA expeditions (DIVA 1, 2000; DIVA 2,2005 and DIVA 3, 2009) have sampled extensively the deep-sea basins of the southern Atlantic Ocean, i.e. the Cape,Angola, Guinea, Argentine, and Brazil Basins. The studypresented here relates to the DIVA 1 cruise to the AngolaBasin.
DIVA 1 concentrated on a transect approximately 700 kmlong in the Angola Basin (Türkay 2006). One aim of thiscruise was to evaluate whether the presumed environmentaluniformity and stability within a single deep-sea basin holdstrue (e.g. Levin et al. 2001). Kröncke and Türkay (2003)recorded decreased productivity, biomass, and abundance ofthe mega- and macrobenthos from north to the south along theinvestigated DIVA 1 transect, casting doubt on the assumptionof environmental uniformity for the Angola Basin.
Two Stations of this transect (Fig. 1), one southern (325)and one northern (346), were sampled repeatedly byMulticorer (MUC). This was the first study where a compara-ble, intense sampling effort has been carried out at two stations.
The replicated, quantitative data set was used to compare thesestations regarding their taxonomic composition and speciesdiversity. Rose et al. (2005) demonstrated a significantly higherwithin-core alpha diversity of harpacticoid copepods at thespecies-level, and higher individual densities at the northern-most Station 346 compared to the southern Station 325. Thisearlier study calculated only within-core diversities since spe-cies designations had not been integrated across the stationsbut the data compiled allows a hitherto unmatched investiga-tion of community diversity in the deep sea.
Based on the results of Rose et al. (2005), and taking intoaccount the different productivity regimes of the two investi-gated stations, the following null hypothesis was tested:
The Copepoda Harpacticoida assemblages of the two sta-tions are statistically indistinguishable in their structure (taxacomposition) and diversity.
Materials and methods
Sampling protocol
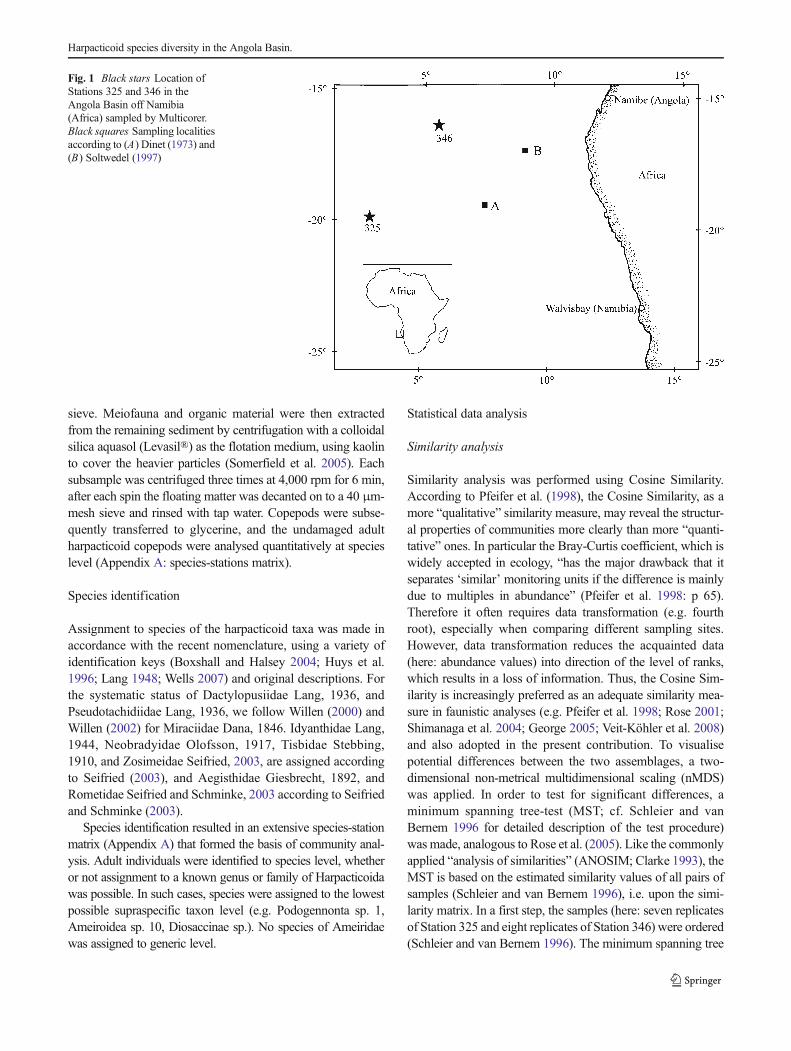
Sampling took place from 6 July to 2 August 2000 during theDIVA 1 campaign of RV METEOR (cruise M48/1) to theAngola Basin (Southeast Atlantic). Two stations, Stations 325and 346 were sampled repeatedly by Multicorer (MUC)—themost quantitative sampling device for soft sediments (Barnettet al. 1984; Bett et al. 1994; Shirayama and Fukushima 1995),each deployment providing ten cores (inner diameter, 9.6 cm,so one core covers 72.4 cm2). Station 325 (19°58.2 S,02°59.8 E; depth, 5,448 m, 550 nautical miles west from theAfrican coast) was located 300 nautical miles south-west ofStation 346 (16°17.0 S, 05°27.0 E; depth, 5,389 m, 350 nauti-cal miles west from the African coast) (Fig. 1). The stationscorrespond to “working areas” 3 and 6 in Kröncke and Türkay(2003) and Fiege et al. (2010), and were characterised bydiffering productivity resulting in divergent biomass and abun-dance of the mega- and macrobenthos. They were sampledeight times each, every deployment being considered as areplicate, with five of the ten cores from each replicate selectedat random to remove operator bias in an attempt to achieverepresentative subsampling of the population (corresponding to362.0 cm2 per replicate). At Station 325, only seven replicateswere successful, providing a total of 35 cores (subsamples)(corresponding to 2,534.0 cm2), whilst at Station 346 all eightreplicates were successful yielding 40 subsamples for furtheranalysis (corresponding to 2,896.0 cm2). Hence, 15 replicatescomprising 75 subsamples (i.e., 5,430.0 cm2=0.54 m2) wereanalysed quantitatively for the present study.
To get the meiofauna, the upper 5 cm layer of sediment wastaken from each subsample. The sediment was preserved in5 % formaldehyde solution on ship. In the laboratory, the fixedsubsamples were washedwith tap water through a 40μm-mesh
K.H. George et al.
sieve. Meiofauna and organic material were then extractedfrom the remaining sediment by centrifugation with a colloidalsilica aquasol (Levasil®) as the flotation medium, using kaolinto cover the heavier particles (Somerfield et al. 2005). Eachsubsample was centrifuged three times at 4,000 rpm for 6 min,after each spin the floating matter was decanted on to a 40 μm-mesh sieve and rinsed with tap water. Copepods were subse-quently transferred to glycerine, and the undamaged adultharpacticoid copepods were analysed quantitatively at specieslevel (Appendix A: species-stations matrix).
Species identification
Assignment to species of the harpacticoid taxa was made inaccordance with the recent nomenclature, using a variety ofidentification keys (Boxshall and Halsey 2004; Huys et al.1996; Lang 1948; Wells 2007) and original descriptions. Forthe systematic status of Dactylopusiidae Lang, 1936, andPseudotachidiidae Lang, 1936, we follow Willen (2000) andWillen (2002) for Miraciidae Dana, 1846. Idyanthidae Lang,1944, Neobradyidae Olofsson, 1917, Tisbidae Stebbing,1910, and Zosimeidae Seifried, 2003, are assigned accordingto Seifried (2003), and Aegisthidae Giesbrecht, 1892, andRometidae Seifried and Schminke, 2003 according to Seifriedand Schminke (2003).
Species identification resulted in an extensive species-stationmatrix (Appendix A) that formed the basis of community anal-ysis. Adult individuals were identified to species level, whetheror not assignment to a known genus or family of Harpacticoidawas possible. In such cases, species were assigned to the lowestpossible supraspecific taxon level (e.g. Podogennonta sp. 1,Ameiroidea sp. 10, Diosaccinae sp.). No species of Ameiridaewas assigned to generic level.
Statistical data analysis
Similarity analysis
Similarity analysis was performed using Cosine Similarity.According to Pfeifer et al. (1998), the Cosine Similarity, as amore “qualitative” similarity measure, may reveal the structur-al properties of communities more clearly than more “quanti-tative” ones. In particular the Bray-Curtis coefficient, which iswidely accepted in ecology, “has the major drawback that itseparates ‘similar’ monitoring units if the difference is mainlydue to multiples in abundance” (Pfeifer et al. 1998: p 65).Therefore it often requires data transformation (e.g. fourthroot), especially when comparing different sampling sites.However, data transformation reduces the acquainted data(here: abundance values) into direction of the level of ranks,which results in a loss of information. Thus, the Cosine Sim-ilarity is increasingly preferred as an adequate similarity mea-sure in faunistic analyses (e.g. Pfeifer et al. 1998; Rose 2001;Shimanaga et al. 2004; George 2005; Veit-Köhler et al. 2008)and also adopted in the present contribution. To visualisepotential differences between the two assemblages, a two-dimensional non-metrical multidimensional scaling (nMDS)was applied. In order to test for significant differences, aminimum spanning tree-test (MST; cf. Schleier and vanBernem 1996 for detailed description of the test procedure)was made, analogous to Rose et al. (2005). Like the commonlyapplied “analysis of similarities” (ANOSIM; Clarke 1993), theMST is based on the estimated similarity values of all pairs ofsamples (Schleier and van Bernem 1996), i.e. upon the simi-larity matrix. In a first step, the samples (here: seven replicatesof Station 325 and eight replicates of Station 346) were ordered(Schleier and van Bernem 1996). The minimum spanning tree
Fig. 1 Black stars Location ofStations 325 and 346 in theAngola Basin off Namibia(Africa) sampled by Multicorer.Black squares Sampling localitiesaccording to (A) Dinet (1973) and(B) Soltwedel (1997)
Harpacticoid species diversity in the Angola Basin.

consists of a series of lines connecting directly those sampleswhich are closest together. After tree building, all lines thatconnect samples of different stations are removed, leaving“subtrees” that link only samples from the same station. Theresulting number of subtrees is the test statistic (Schleier andvan Bernem 1996). If significantly fewer subtrees thanexpected under randomised conditions were left, the two sta-tions would be significantly different. The nMDS ordinationserved as a graphic basis for a drawing of the tree (Rose et al.2005). As the original software SPANTREE 1.0 was notavailable to the authors, the MST-test was performed usingthe software PAST 2.00 (Hammer 2010).
Diversity analyses
As a first qualitative comparison of the absolute species num-ber, S pointed towards much higher species diversity at Sta-tion 346 than at Station 325, estimation of species diversitywas undertaken using several different coefficients, aiming toelucidate if possible differences might be related to speciesrichness or species density. Very first insights into speciesdiversity are provided by the N /S ratio (cf. Rose et al.2005), which is expressed by the relationship between numberof individuals (N) and species number (S ). Also Shannon’sH ’, Pielou’s Evenness J ’, and Simpson’s Evenness 1 -λ con-sider the distribution of species over individuals. As eachcoefficient focusses on particular aspects of diversity (H ’:measures the “average uncertainty” when predicting to whichspecies a specimen selected randomly from given S and Nbelongs; J ’: expresses H ’ in relation to H’max; 1 -λ : gives theprobability that two specimens picked randomly from a givenassemblage belong to the same species; Ludwig and Reynolds1988), they may complement each other, delivering compre-hensive insights into species diversity. In order to account forthe different number of replicates collected at the stations,rarefaction (Hurlbert 1971) was additionally applied to direct-ly compare estimates of expected species numbers [E(Sn)]based on the same number of individuals. In contrast to theabove mentioned diversity and Evenness indices, rarefactiondoes not refer to all species S and individuals N of thedifferent stations, but rather interpolates the species numbersexpected in a sample of n individuals (Hurlbert 1971; Ludwigand Reynolds 1988). This flattens the differences in size andamount of samples and replicates, enabling their directcomparison.
To detect potential influence of phylogenetic structureswithin the harpacticoid assemblages of both stations 325 and346, average taxonomic diversity Δ , and average taxonomicdistinctness Δ* (Clarke and Warwick 1998; Warwick andClarke 1995) were calculated based on the 352 species forwhich genera and family associations could be determined.Following Warwick and Clarke (1995), taxonomic distances(ωij) ranged between 0 and 100; the higher the Δ and Δ*
values, the larger the taxonomic distance within thecommunity.
To estimate the number of species potentially overlookedduring the study, three extrapolative non-parametric methodswere applied to calculate expected number of species: Chao1,Chao2, and Jackknife1 (cf. Baltanás 1992; Chao 1984, 1987;Colwell and Coddington 1994; Heltshe and Forrester 1983;Palmer 1990, 1991). Although such extrapolative estimates ofspecies numbers should be interpreted with caution, due to theirtendency to produce biased values (mainly underestimatingspecies numbers, cf. Rose 2001), they may give an approxima-tion of expected species number provided no under-samplingtook place.
All listed analyses were performed with the software PAST2.00 (Hammer 2010) and PRIMER 6.1.6 (Clarke andWarwick 2001).
Results
Overall data
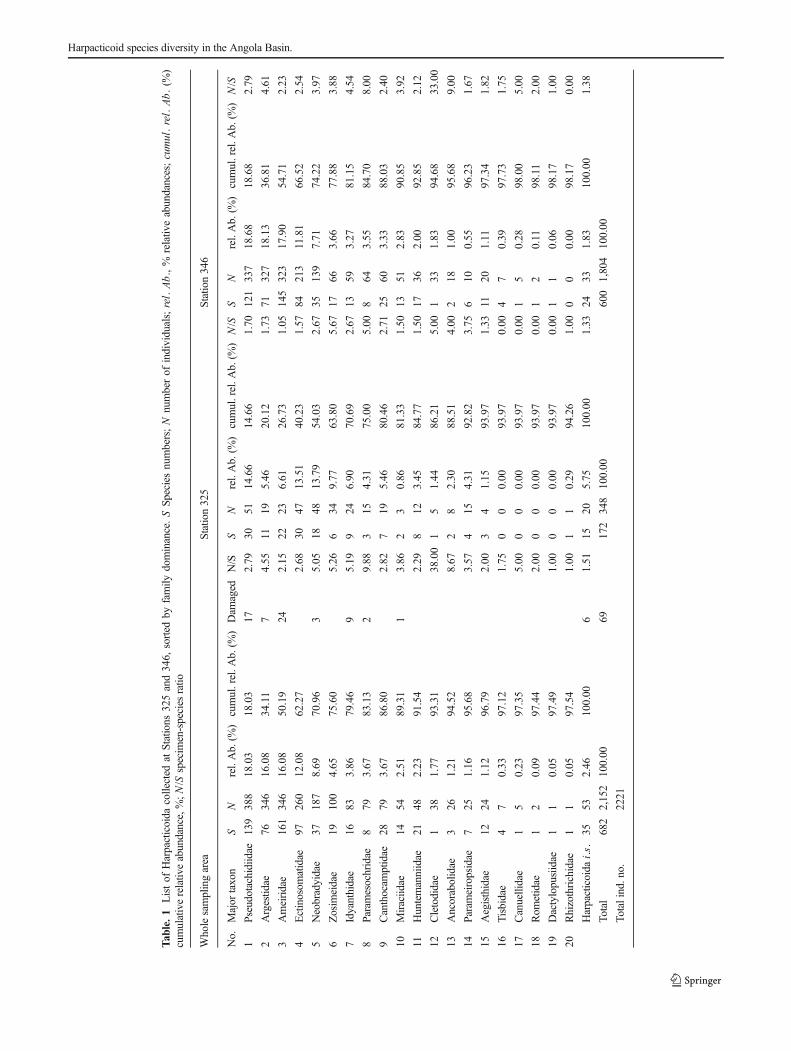
In total, the seven replicates (35 subsamples) from Station 325and the eight replicates (40 subsamples) from Station 346combined yielded 7,081 Harpacticoida specimens, of which4,860 (68.6 %) were copepodids and 2,221 (31.4 %) adults.The adults were 76.2 % female and 23.8 % male. Of the adultspecimens, 69 (3.1 %) were badly damaged and thereforeunidentifiable; quantitative analyses at species-level werebased on the remaining 2,152 adult Harpacticoida (Table 1).
Supraspecific taxa
Altogether, 20 known families were identified (Table 1), withan additional 53 individuals that could not be assigned to any aknown family pooled as “Harpacticoida incertae sedis (i .s .)”.Five families reached dominance values >8 % (N >150), withPseudotachidiidae showing highest abundance values (Table 1).A further five families each represented <0.5 % of relativeabundance (N <10), with Rometidae, Dactylopusiidae, andRhizotrichidae being represented by 2, 1, and 1 specimen,respectively (Table 1).
Generally, Station 346 presented considerably higher abun-dance (N ) values than Station 325 (Table 1, Fig. 2). Also, bothstations exhibited different taxonomic compositions:Canuellidae, Tisbidae, Rometidae, and Dactylopusiidae werefound exclusively at Station 346, with a total of 19 familiesrecorded here, whilst 16 families were found at Station 325,with only Rhizotrichidae being restricted to that station(Table 1). The remaining 15 families were reported from bothstations.
At both stations, Pseudotachidiidae was the most abundanttaxon (Table 1, Fig. 2). At Station 325 it was followed by
K.H. George et al.
Tab
le.1
Listof
Harpacticoida
collected
atStations
325and346,
sorted
byfamily
dominance.SSp
eciesnumbers;N
numberof
individuals;rel.Ab.,%
relativ
eabundances;cumul.rel.Ab.(%
)cumulativerelativ
eabundance,%;N
/Sspecim
en-species
ratio
Wholesamplingarea
Statio
n325
Statio
n346
No.
Major
taxon
SN
rel.Ab.(%
)cumul.rel.A
b.(%
)Dam
aged
N/S
SN
rel.Ab.(%
)cumul.rel.A
b.(%
)N/S
SN
rel.Ab.(%
)cumul.rel.A
b.(%
)N/S
1Pseudotachidiidae
139
388
18.03
18.03
172.79
3051
14.66
14.66
1.70
121
337
18.68
18.68
2.79
2Argestid
ae76
346
16.08
34.11
74.55
1119
5.46
20.12
1.73
71327
18.13
36.81
4.61
3Ameiridae
161
346
16.08
50.19
242.15
2223
6.61
26.73
1.05
145
323
17.90
54.71
2.23
4Ectinosom
atidae
97260
12.08
62.27
2.68
3047
13.51
40.23
1.57
84213
11.81
66.52
2.54
5Neobradyidae
37187
8.69
70.96
35.05
1848
13.79
54.03
2.67
35139
7.71
74.22
3.97
6Zosim
eidae
19100
4.65
75.60
5.26
634
9.77
63.80
5.67
1766
3.66
77.88
3.88
7Idyanthidae
1683
3.86
79.46
95.19
924
6.90
70.69
2.67
1359
3.27
81.15
4.54
8Paramesochridae
879
3.67
83.13
29.88
315
4.31
75.00
5.00
864
3.55
84.70
8.00
9Canthocam
ptidae
2879
3.67
86.80
2.82
719
5.46
80.46
2.71
2560
3.33
88.03
2.40
10Miraciid
ae14
542.51
89.31
13.86
23
0.86
81.33
1.50
1351
2.83
90.85
3.92
11Huntemanniidae
2148
2.23
91.54
2.29
812
3.45
84.77
1.50
1736
2.00
92.85
2.12
12Cletodidae
138
1.77
93.31
38.00
15
1.44
86.21
5.00
133
1.83
94.68
33.00
13Ancorabolidae
326
1.21
94.52
8.67
28
2.30
88.51
4.00
218
1.00
95.68
9.00
14Parameiropsidae
725
1.16
95.68
3.57
415
4.31
92.82
3.75
610
0.55
96.23
1.67
15Aegisthidae
1224
1.12
96.79
2.00
34
1.15
93.97
1.33
1120
1.11
97.34
1.82
16Tisbidae
47
0.33
97.12
1.75
00
0.00
93.97
0.00
47
0.39
97.73
1.75
17Canuellidae
15
0.23
97.35
5.00
00
0.00
93.97
0.00
15
0.28
98.00
5.00
18Rom
etidae
12
0.09
97.44
2.00
00
0.00
93.97
0.00
12
0.11
98.11
2.00
19Dactylopusiidae
11
0.05
97.49
1.00
00
0.00
93.97
0.00
11
0.06
98.17
1.00
20Rhizothrichidae
11
0.05
97.54
1.00
11
0.29
94.26
1.00
00
0.00
98.17
0.00
Harpacticoida
i.s.
3553
2.46
100.00
61.51
1520
5.75
100.00
1.33
2433
1.83
100.00
1.38
Total
682
2,152
100.00
69172
348
100.00
600
1,804
100.00
Totalind.no.
2221
Harpacticoid species diversity in the Angola Basin.
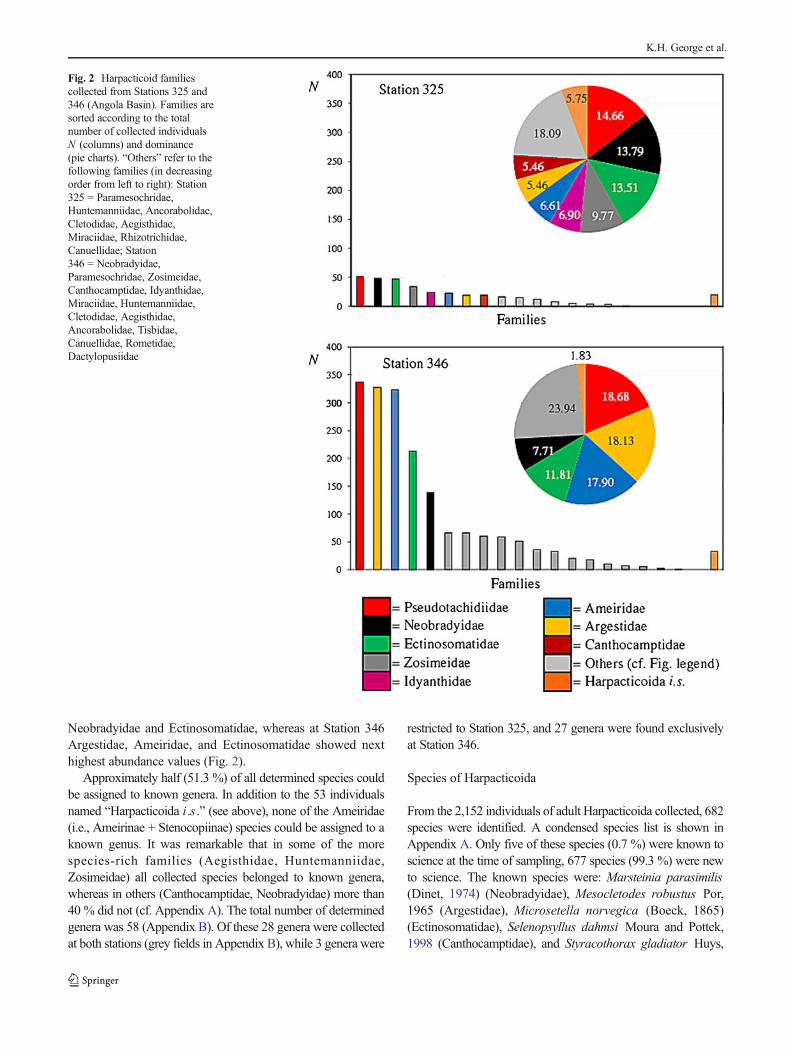
Neobradyidae and Ectinosomatidae, whereas at Station 346Argestidae, Ameiridae, and Ectinosomatidae showed nexthighest abundance values (Fig. 2).
Approximately half (51.3 %) of all determined species couldbe assigned to known genera. In addition to the 53 individualsnamed “Harpacticoida i .s .” (see above), none of the Ameiridae(i.e., Ameirinae + Stenocopiinae) species could be assigned to aknown genus. It was remarkable that in some of the morespecies-rich families (Aegisthidae, Huntemanniidae,Zosimeidae) all collected species belonged to known genera,whereas in others (Canthocamptidae, Neobradyidae) more than40 % did not (cf. Appendix A). The total number of determinedgenera was 58 (Appendix B). Of these 28 genera were collectedat both stations (grey fields in Appendix B), while 3 genera were
restricted to Station 325, and 27 genera were found exclusivelyat Station 346.
Species of Harpacticoida
From the 2,152 individuals of adult Harpacticoida collected, 682species were identified. A condensed species list is shown inAppendix A. Only five of these species (0.7 %) were known toscience at the time of sampling, 677 species (99.3 %) were newto science. The known species were: Marsteinia parasimilis(Dinet, 1974) (Neobradyidae), Mesocletodes robustus Por,1965 (Argestidae), Microsetella norvegica (Boeck, 1865)(Ectinosomatidae), Selenopsyllus dahmsi Moura and Pottek,1998 (Canthocamptidae), and Styracothorax gladiator Huys,
Fig. 2 Harpacticoid familiescollected from Stations 325 and346 (Angola Basin). Families aresorted according to the totalnumber of collected individualsN (columns) and dominance(pie charts). “Others” refer to thefollowing families (in decreasingorder from left to right): Station325 = Paramesochridae,Huntemanniidae, Ancorabolidae,Cletodidae, Aegisthidae,Miraciidae, Rhizotrichidae,Canuellidae; Station346 = Neobradyidae,Paramesochridae, Zosimeidae,Canthocamptidae, Idyanthidae,Miraciidae, Huntemanniidae,Cletodidae, Aegisthidae,Ancorabolidae, Tisbidae,Canuellidae, Rometidae,Dactylopusiidae
K.H. George et al.
1993 (Idyanthidae). As part of the taxonomic goal of theCeDAMar Programme (http://www.cedamar.org), a further 27harpacticoid species have been described recently (Bröhldick2005; Bruch et al. 2011; Corgosinho and Martínez Arbizu2010; George 2006a, b, 2008; George and Müller 2013;Gheerardyn and George 2010; Menzel 2011a, b; Menzel andGeorge 2009; Pointner et al. 2013; Seifried andMartínez Arbizu2008 Seifried and Schminke 2003; Seifried et al. 2007; Veit-Köhler 2004, 2005; Veit-Köhler and Drewes 2009;Willen 2005,2008, 2009).
Harpacticoid densities were comparatively low, with aver-age values of 1.37 individuals (ind.)/10 cm2 (standard devia-tion 0.27) and 6.02 ind./10 cm2 (standard deviation 1.18) atStations 325 and 346, respectively.
Nearly 75 % of all recorded species belonged to just fivefamilies (25 %), namely Ameiridae, Pseudotachidiidae,Ectinosomatidae, Argestidae, and Neobradyidae (Table 1).
Cletodidae showed the highest N /S ratio (38.0), as thisfamily comprised only one species with 38 individuals acrossthe stations. Next highest N /S ratios were calculated forParamesochridae and Ancorabolidae. In contrast, within thespecies-rich families of Ameiridae, Ectinosomatidae, andPseudotachidiidae on average only few individuals wererecorded per species, resulting in low N /S ratios (Table 1).
In total, 384 species (56.3 % of species, 17.9 % of individ-uals) were represented by singletons (Appendix A) and afurther 111 species (16.3 %) were represented by two individ-uals. The most frequently recorded species were: Argestesangolaensis George, 2008 (N =92), Paradanielssenia sp. 1(N =67), Argestes sp. 1 (N =50), Ameiridae sp. 10 (N =47),Cletodidae sp. (N =38), Neobradyidae sp. 1 (N =36), andBradya kurtschminkei Seifried and Martínez Arbizu, 2008(N =26) (Appendix A). Argestes angolaensis , Ameiridae sp.10, and Bradya kurtschminkei were found only at Station 346(Appendix A, cf. George 2008; Seifried and Martínez Arbizu2008). The remaining four species were present at bothstations.
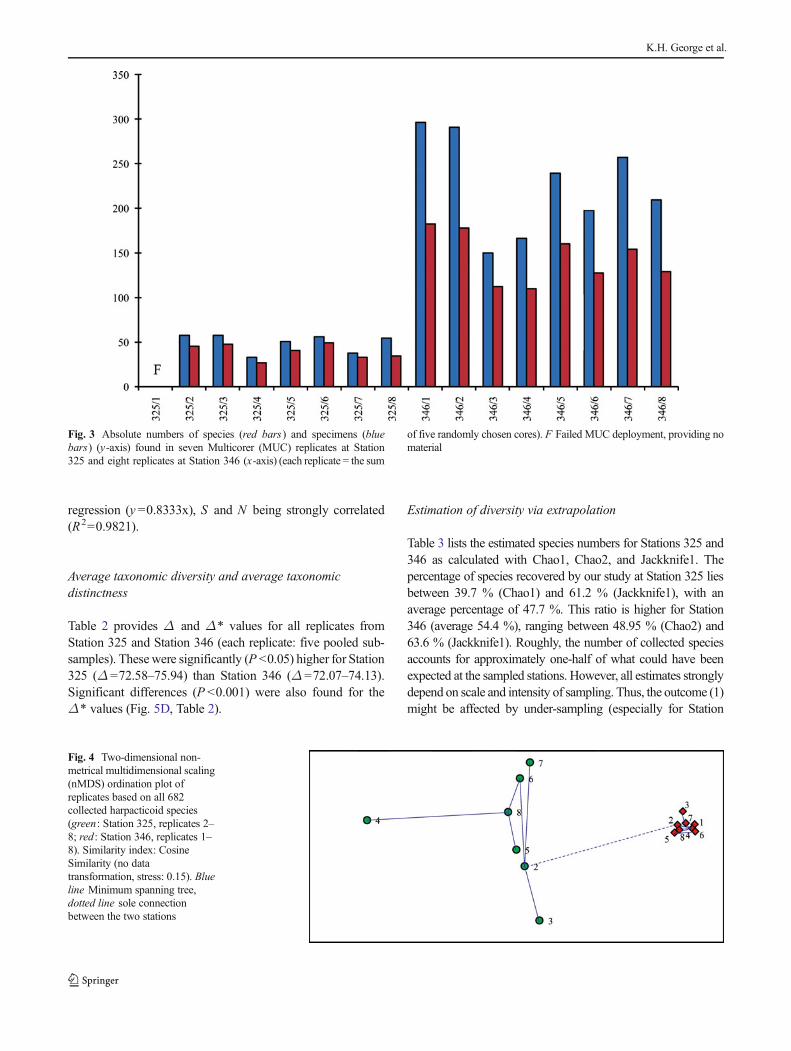
Numbers of individuals and species in single cores werealmost always higher at Station 346 than at Station 325(Fig. 3). At Station 325, a total of 172 species were found(N =348), whilst 600 species were recorded at Station 346(N =1804) (Table 1, Appendix A). The stations shared 90species (Appendix A), whilst 82 and 510 species were exclu-sive to Station 325 and Station 346, respectively. Thus, 592species (86.8 %) were restricted to one station only.
Community analysis
The taxonomic distribution of the species over the familiesalso differed between the stations. At Station 325 the commu-nity was dominated by species of Pseudotachidiidae,Ectinosomatidae, Ameiridae, and Neobradyidae, which to-gether accounted for 100 (58.1 %) of the 172 species sampled
at that station (Table 1, Fig. 2). In contrast, Ameiridae was themost species-rich taxon at Station 346, followed byPseudotachidiidae, Ectinosomatidae, and Argestidae, the fourfamilies representing 421 (70.2%) of the 600 species recorded(Table 1, Fig. 2).
Similarity analyses
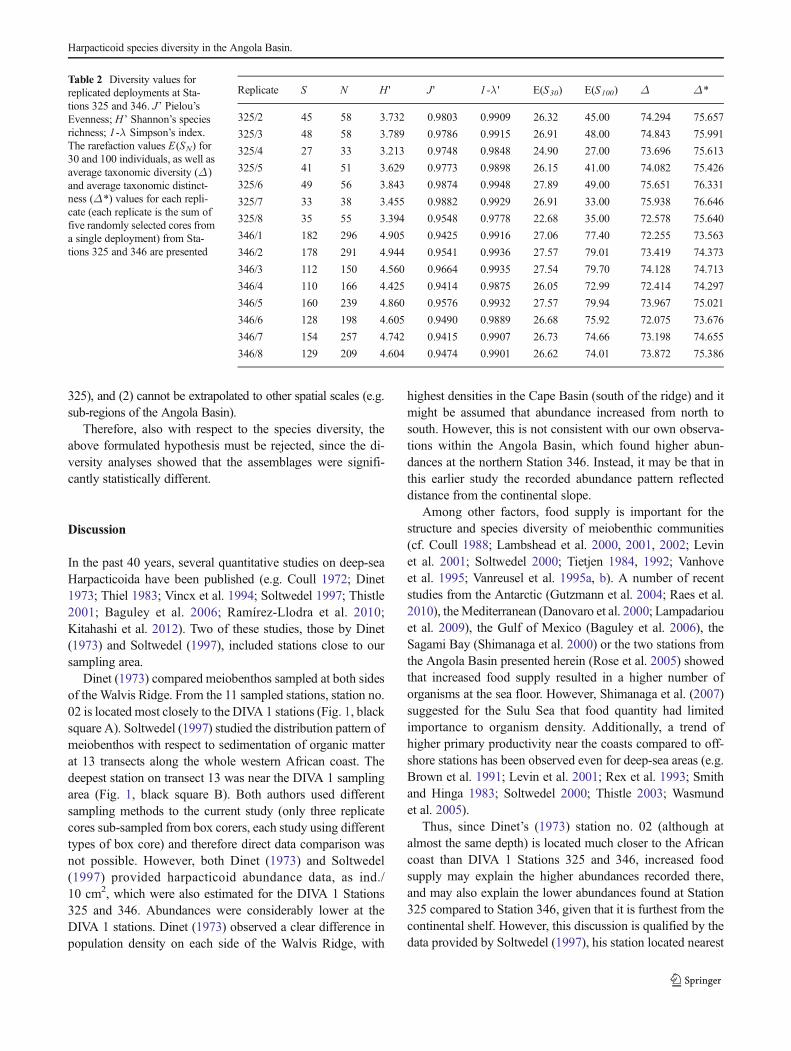
The result of Cosine Similarity analysis is shown in Fig. 4.The non-metric MDS plot (Fig. 4) visualises the separation ofStations 325 and 346 due to species composition and abun-dance values. The stress value (0.15) indicates a relativelyunproblematic down-scaling of the measured similarities(Appendix C: similarity matrix) to the two dimensions of thenMDS plot. The northern Station 346 (red diamonds in Fig. 4representing replicates 1–8) forms a highly distinct group,with all eight replicates located closely to each other anddistant from Station 325 replicates (green circles in Fig. 4).
The MST-test (Fig. 4: blue lines between replicates), re-veals that only two subtrees were left (continuous lines inFig. 4) after removing all connections between replicates ofdifferent stations (just one such connection: dotted line inFig. 4). This was significantly different (P=0.0003) from theexpected number of trees under random conditions (N =8.47).
Hence, with respect to the taxa composition the null hy-pothesis must be rejected, since the similarity analysesshowed that the assemblages were significantly statisticallydifferent.
Diversity analyses
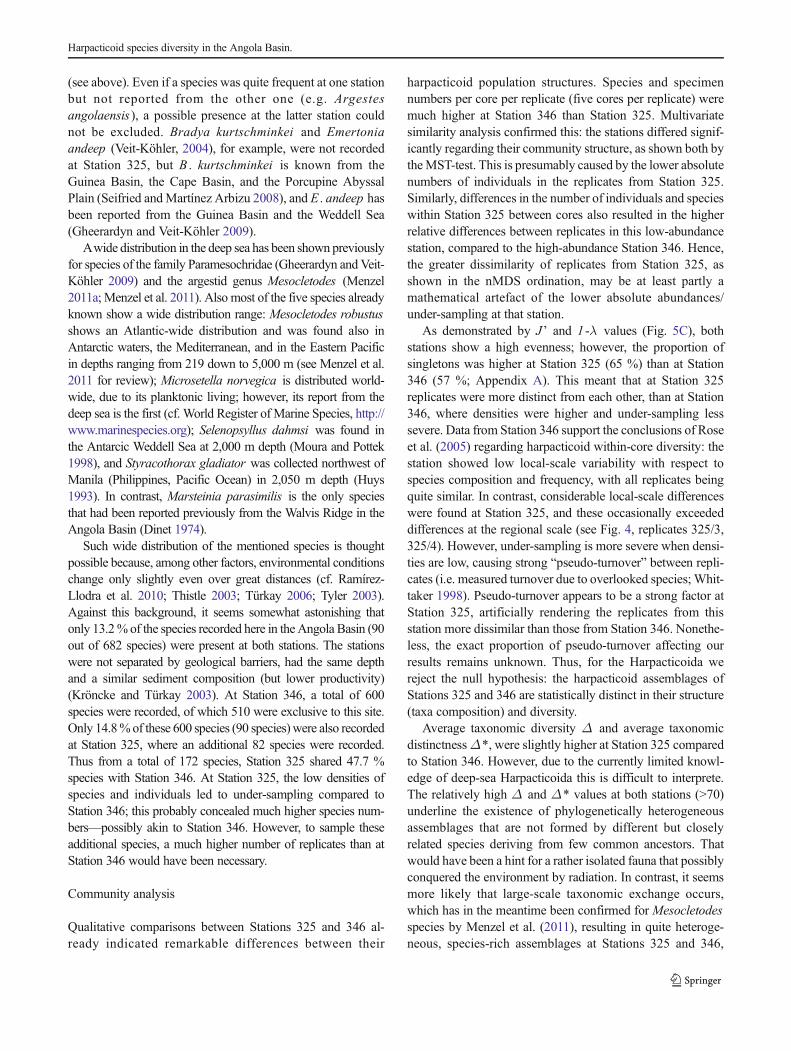
Comparison of different diversity indices (Table 2) revealed acertain complexity of species diversity. When looking at ab-solute species number, S , Station 346 had a clearly higherspecies richness compared to Station 325, a result closelyrelated to the much higher abundance at Station 346 (Table 2,Figs. 3, 5A). Also, Shannon’sH’ (Table 2, Fig. 5B) confirmeda higher species diversity at Station 346, values about threetimes higher than at Station 325. In contrast to the calculatedmuch higher species diversity at Station 346, only a slightlyhigher rarefaction curve was calculated for Station 346(Fig. 6). A detailed analysis of replicate level [sums of fivesubsamples] did not identify differences for E(S30) but didfind differences for E(S100) estimates (Table 2).
Evenness was high at both stations (both J ’ and 1 -λ >0.9);however, J ’ values were significantly higher at Station 325than at Station 346 (P <0.01) (Fig. 5C, Table 2). No signifi-cant difference (P >0.05) was found in Simpson’s Evenness1 -λ between the stations.
Plotting number of individuals against number of speciesfor the single cores, combined for both stations (Fig. 7) com-bined with a regression analysis gave an almost perfect linear
Harpacticoid species diversity in the Angola Basin.
regression (y =0.8333x), S and N being strongly correlated(R2=0.9821).
Average taxonomic diversity and average taxonomicdistinctness
Table 2 provides Δ and Δ* values for all replicates fromStation 325 and Station 346 (each replicate: five pooled sub-samples). Thesewere significantly (P <0.05) higher for Station325 (Δ =72.58–75.94) than Station 346 (Δ =72.07–74.13).Significant differences (P <0.001) were also found for theΔ* values (Fig. 5D, Table 2).
Estimation of diversity via extrapolation
Table 3 lists the estimated species numbers for Stations 325 and346 as calculated with Chao1, Chao2, and Jackknife1. Thepercentage of species recovered by our study at Station 325 liesbetween 39.7 % (Chao1) and 61.2 % (Jackknife1), with anaverage percentage of 47.7 %. This ratio is higher for Station346 (average 54.4 %), ranging between 48.95 % (Chao2) and63.6 % (Jackknife1). Roughly, the number of collected speciesaccounts for approximately one-half of what could have beenexpected at the sampled stations. However, all estimates stronglydepend on scale and intensity of sampling. Thus, the outcome (1)might be affected by under-sampling (especially for Station
Fig. 3 Absolute numbers of species (red bars) and specimens (bluebars) (y-axis) found in seven Multicorer (MUC) replicates at Station325 and eight replicates at Station 346 (x-axis) (each replicate = the sum
of five randomly chosen cores). F Failed MUC deployment, providing nomaterial
Fig. 4 Two-dimensional non-metrical multidimensional scaling(nMDS) ordination plot ofreplicates based on all 682collected harpacticoid species(green: Station 325, replicates 2–8; red: Station 346, replicates 1–8). Similarity index: CosineSimilarity (no datatransformation, stress: 0.15). Blueline Minimum spanning tree,dotted line sole connectionbetween the two stations
K.H. George et al.
325), and (2) cannot be extrapolated to other spatial scales (e.g.sub-regions of the Angola Basin).
Therefore, also with respect to the species diversity, theabove formulated hypothesis must be rejected, since the di-versity analyses showed that the assemblages were signifi-cantly statistically different.
Discussion
In the past 40 years, several quantitative studies on deep-seaHarpacticoida have been published (e.g. Coull 1972; Dinet1973; Thiel 1983; Vincx et al. 1994; Soltwedel 1997; Thistle2001; Baguley et al. 2006; Ramírez-Llodra et al. 2010;Kitahashi et al. 2012). Two of these studies, those by Dinet(1973) and Soltwedel (1997), included stations close to oursampling area.
Dinet (1973) compared meiobenthos sampled at both sidesof the Walvis Ridge. From the 11 sampled stations, station no.02 is located most closely to the DIVA 1 stations (Fig. 1, blacksquare A). Soltwedel (1997) studied the distribution pattern ofmeiobenthos with respect to sedimentation of organic matterat 13 transects along the whole western African coast. Thedeepest station on transect 13 was near the DIVA 1 samplingarea (Fig. 1, black square B). Both authors used differentsampling methods to the current study (only three replicatecores sub-sampled from box corers, each study using differenttypes of box core) and therefore direct data comparison wasnot possible. However, both Dinet (1973) and Soltwedel(1997) provided harpacticoid abundance data, as ind./10 cm2, which were also estimated for the DIVA 1 Stations325 and 346. Abundances were considerably lower at theDIVA 1 stations. Dinet (1973) observed a clear difference inpopulation density on each side of the Walvis Ridge, with
highest densities in the Cape Basin (south of the ridge) and itmight be assumed that abundance increased from north tosouth. However, this is not consistent with our own observa-tions within the Angola Basin, which found higher abun-dances at the northern Station 346. Instead, it may be that inthis earlier study the recorded abundance pattern reflecteddistance from the continental slope.
Among other factors, food supply is important for thestructure and species diversity of meiobenthic communities(cf. Coull 1988; Lambshead et al. 2000, 2001, 2002; Levinet al. 2001; Soltwedel 2000; Tietjen 1984, 1992; Vanhoveet al. 1995; Vanreusel et al. 1995a, b). A number of recentstudies from the Antarctic (Gutzmann et al. 2004; Raes et al.2010), theMediterranean (Danovaro et al. 2000; Lampadariouet al. 2009), the Gulf of Mexico (Baguley et al. 2006), theSagami Bay (Shimanaga et al. 2000) or the two stations fromthe Angola Basin presented herein (Rose et al. 2005) showedthat increased food supply resulted in a higher number oforganisms at the sea floor. However, Shimanaga et al. (2007)suggested for the Sulu Sea that food quantity had limitedimportance to organism density. Additionally, a trend ofhigher primary productivity near the coasts compared to off-shore stations has been observed even for deep-sea areas (e.g.Brown et al. 1991; Levin et al. 2001; Rex et al. 1993; Smithand Hinga 1983; Soltwedel 2000; Thistle 2003; Wasmundet al. 2005).
Thus, since Dinet’s (1973) station no. 02 (although atalmost the same depth) is located much closer to the Africancoast than DIVA 1 Stations 325 and 346, increased foodsupply may explain the higher abundances recorded there,and may also explain the lower abundances found at Station325 compared to Station 346, given that it is furthest from thecontinental shelf. However, this discussion is qualified by thedata provided by Soltwedel (1997), his station located nearest
Table 2 Diversity values forreplicated deployments at Sta-tions 325 and 346. J’ Pielou’sEvenness; H’ Shannon’s speciesrichness; 1-λ Simpson’s index.The rarefaction values E(SN) for30 and 100 individuals, as well asaverage taxonomic diversity (Δ)and average taxonomic distinct-ness (Δ*) values for each repli-cate (each replicate is the sum offive randomly selected cores froma single deployment) from Sta-tions 325 and 346 are presented
Replicate S N H ' J ' 1-λ ' E(S30) E(S100) Δ Δ*
325/2 45 58 3.732 0.9803 0.9909 26.32 45.00 74.294 75.657
325/3 48 58 3.789 0.9786 0.9915 26.91 48.00 74.843 75.991
325/4 27 33 3.213 0.9748 0.9848 24.90 27.00 73.696 75.613
325/5 41 51 3.629 0.9773 0.9898 26.15 41.00 74.082 75.426
325/6 49 56 3.843 0.9874 0.9948 27.89 49.00 75.651 76.331
325/7 33 38 3.455 0.9882 0.9929 26.91 33.00 75.938 76.646
325/8 35 55 3.394 0.9548 0.9778 22.68 35.00 72.578 75.640
346/1 182 296 4.905 0.9425 0.9916 27.06 77.40 72.255 73.563
346/2 178 291 4.944 0.9541 0.9936 27.57 79.01 73.419 74.373
346/3 112 150 4.560 0.9664 0.9935 27.54 79.70 74.128 74.713
346/4 110 166 4.425 0.9414 0.9875 26.05 72.99 72.414 74.297
346/5 160 239 4.860 0.9576 0.9932 27.57 79.94 73.967 75.021
346/6 128 198 4.605 0.9490 0.9889 26.68 75.92 72.075 73.676
346/7 154 257 4.742 0.9415 0.9907 26.73 74.66 73.198 74.655
346/8 129 209 4.604 0.9474 0.9901 26.62 74.01 73.872 75.386
Harpacticoid species diversity in the Angola Basin.
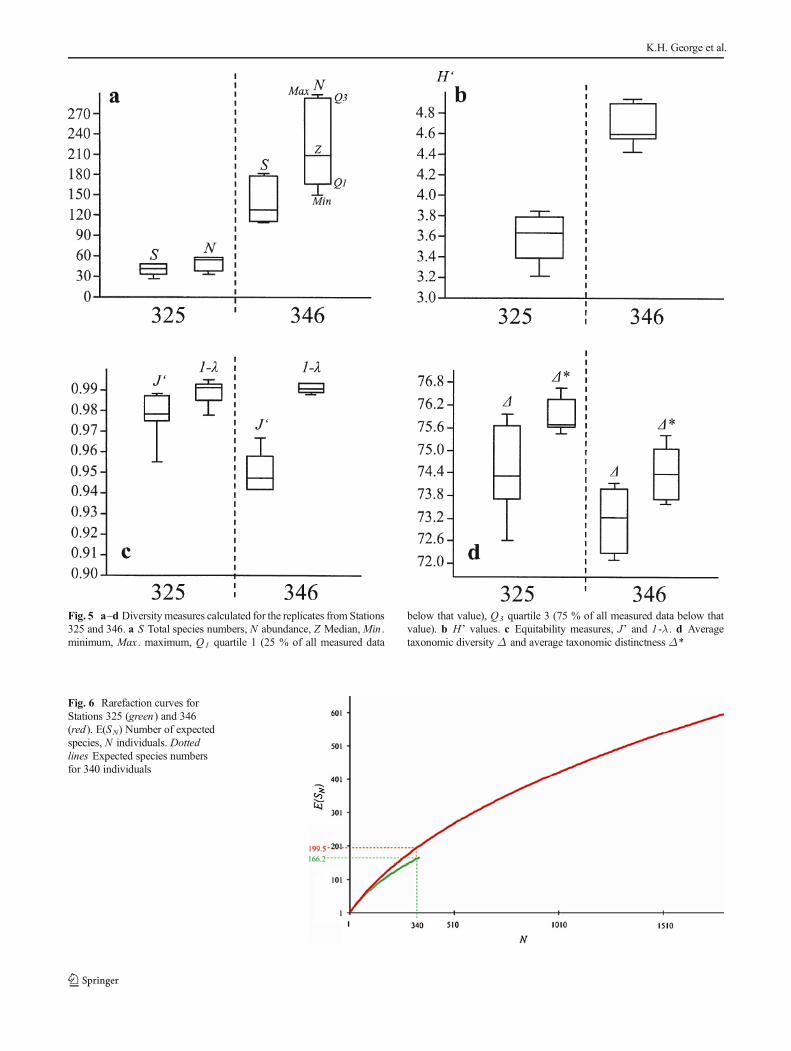
Fig. 6 Rarefaction curves forStations 325 (green) and 346(red). E(SN) Number of expectedspecies, N individuals. Dottedlines Expected species numbersfor 340 individuals
Fig. 5 a–d Diversitymeasures calculated for the replicates from Stations325 and 346. a S Total species numbers, N abundance, Z Median,Min .minimum, Max . maximum, Q1 quartile 1 (25 % of all measured data
below that value), Q3 quartile 3 (75 % of all measured data below thatvalue). b H’ values. c Equitability measures, J’ and 1-λ . d Averagetaxonomic diversity Δ and average taxonomic distinctness Δ*
K.H. George et al.

to the DIVA 1 study area was even closer to the coast thanDinet’s (1973) station 02, yet supported lower abundances(Table 4). Soltwedel (1997) observed discrepancies betweenpotential organic matter input and meiobenthic abundance,and postulated that this resulted from fractionated sedimenta-tion to the sea floor. This may also explain the differentabundance values recorded at DIVA 1 Stations 325 and 346.
Comparing the faunistic results for Harpacticoida to thosefor macrobenthic groups studied during the DIVA 1 expedition,it is notable that no macrobenthic taxon has diversity valuescomparable to the harpacticoids. Of the 58 macrofaunal majortaxa listed by Kröncke and Türkay (2003), only 6 have beeninvestigated to species-level to date. Highest species and abun-dance values were reported for Isopoda (S =100; N =1,326:Brandt et al. 2005). They are followed by Polychaeta (S =83;N =1,047: Fiege et al. 2010), Tanaidacea (S =50; N =194),Cumacea (S =45; N =479), Amphipoda (S =39; N =150), and
Mysidacea (S =7; N =34) (Brandt et al. 2005). The resultsconfirm that, in the deep sea, the meiobenthos generally havea much higher diversity and abundance than the macrobenthos(e.g. Lambshead 1993; Rex 1983; Thiel 1983; Thistle 2001).Moreover, it has to be emphasised that the extraordinarily highnumber of harpacticoid species recorded here (682 species)was collected from only two stations, with 600 species at onlyone station (Station 346), while the macrobenthic studies in thesame area considered five to seven stations along a completetransect (Brandt et al. 2005; Fiege et al. 2010; Kröncke andTürkay 2003). An even higher number of Harpacticoida spe-cies might be expected if all stations were considered.
Supraspecific taxa
Almost all of the 20 families found in the Angola Basin havebeen reported previously from the deep sea; two families werepreviously unreported (Parameiropsidae: Corgosinho andMartínez Arbizu 2010; Rometidae: Seifried and Schminke2003). However, the systematics of many families haschanged in the past decades, and therefore comparison atsuprageneric level with data from other publications may bedifficult (cf. Seifried 2004). Also, 35 species (5.1 %) did notbelong to any known family of Harpacticoida, showing that inthe deep sea new taxa can be discovered even at family level.
Comparing our data with those in the literature, two find-ings were evident:
1. All studies revealed a similar taxonomic composition,confirming the cosmopolitan nature of Harpacticoida atfamily level, as concluded by Wells (1986), and extendingthis hypothesis into the deep sea (Gheerardyn&Veit-Köhler2009; Menzel 2011a; Menzel et al. 2011);
Table 3 Expected species numbers as calculated by three differentextrapolative estimation methods (Chao1, Chao2, Jackknife1), plus theproportion of those collected
Station 325 Station 346
Sobs 172 600
N 349 1,806
Chao1 433.33 1,184.80
% registration 39.69 50.64
Chao2 408.46 1,225.80
% registration 42.11 48.95
Jackknife1 281.00 943.20
% registration 61.21 63.61
Average % reg. 47.67 54.40
Fig. 7 Harpacticoid abundance(N) at core level (Station 325,green dots; Station 346, red dots)plotted against correspondingspecies numbers (S)
Harpacticoid species diversity in the Angola Basin.

2. There are certain differences regarding the composition ofdominant families between marine realms. The northeastAtlantic deep sea seems to be dominated by Cletodidae,Diosaccinae, Ectinosomatidae, Tisbidae, and particularlyCerviniinae (cf. Vincx et al. 1994). In the northern Gulf ofMexico, Tisbidae, Ectinosomatidae, Diosaccinae,Ameiridae, and Argestidae appear to dominate (Hicks &Coull 1983; Baguley et al. 2006). In the Pacific OceanEctinosomatidae, Ameiridae, Tisbidae (here includingZosimeidae for reasons of comparability), Argestidae andMiraciidae (Ahnert and Schriever 2001; Kitahashi et al.2012) are dominant. The new data presented here show thatthe Angola Basin was dominated by Pseudotachidiidae,Argestidae, Ameiridae, Ectinosomatidae, andNeobradyidae,tallying with the North-Atlantic and Pacific data only partly.Only Ectinosomatidae may be regarded as dominant in thewhole Atlantic deep sea.
Some families were dominant in the South-eastern Atlantic(Pseudotachidiidae, Neobradyidae) but only subdominant tosubrecedent in the northern part, and conversely others(Diosaccinae, Cletodidae, Tisbidae, and Cerviniinae) may bedominant in the northern Atlantic but do not play a major rolein the South-eastern Atlantic harpacticoid assemblage. Futuredeep-sea expeditions have to evaluate the validity of suchtrends. However, the partial absence of certain families fromthe Angola Basin (346, no Rhizotrichidae; 325, no Tisbidae,Canuellidae, Rometidae or Dactylopusiidae) must be consid-ered an artefact of under-sampling. They were collected invery low frequencies, which indicate a rarity in this area. Thus,not to find a certain family at one or even both of the stationsdoes not necessarily indicate their absence.
Stations 325 and 346 appeared to show different assemblagestructures, the former station presented a relatively homogenousdistribution of specimens over several families, whilst at thelatter station most individuals belonged to few families thatdominated the assemblage. Communities dominated by few taxaare more commonly found under conditions of higher produc-tivity and often indicate the decrease phase of the unimodalproductivity-diversity relationship (e.g. Rosenzweig 1995).
At genus level the number of unknown taxa was consider-ably higher: of the 647 species that could be assigned to aknown family, 136 (21.0 %) did not belong to a known genus.These results clearly demonstrate the vast number of unknowndeep-sea Harpacticoida, particularly at species level.
Species of Harpacticoida
Recently, Baguley et al. (2006) reported 696 harpacticoid species(distributed over 221 families) from the northern Gulf ofMexico.This impressively high number arises, however, from 43 stationscovering an area of 1,130 x 273 km (see Fig. 1 in Baguley et al.2006). Moreover, station depths range from 212 to 3,150 m,from the continental shelf down to the lower abyssal. Comparedto those data, the 682 species collected from only two deep-seastations in the Angola Basin during the DIVA 1 expedition isremarkable and unexpected. Although being separated by ap-proximately 300 nautical miles, both stations were of approxi-mately the same depth (5,400 m) and were in a generallyuniform environment (Fiege et al. 2010; Kröncke and Türkay2003). Also, 87.8 % of the species were sampled at Station 346alone: 600 Harpacticoida species at one deep-sea station is thehighest ever record from any deep-sea locality so far.
The high percentage (99.3 %) of undescribed species isgreater than any other known record (e.g. George 2005,84.4 %; George and Schminke 2002, 96.4 %; Shimanagaet al. 2004, p. 1099, did not identify to species level). How-ever, in shallower studies, from the sublittoral down to theabyssal (cf. Humes 1994; George 2005, Schminke 2007;Seifried 2004; Veit-Köhler et al. 2010), a high number ofpreviously unknown Harpacticoida species are generallyrecorded. Thus, in a global context, most Harpacticoida spe-cies are doubtlessly unknown to science. Consequently, asignificant increase in taxonomic research is needed to addressthis situation (e.g. Boero 2010; Brökeland and George 2009;Mallet and Willmott 2003; Wheeler 2004; Zhang 2008).
Despite our attempt to optimise the experimental samplingdesign by conducting eight MUC deployments per station andtreating each deployment as a single replicate consisting offive (randomly chosen) cores, some restrictions to quantitativeanalysis still remain. For instance, no statement can be maderegarding the biased occurrence of a species, particularly if itwas recorded in low density. The absence of a taxon from onestation is not necessarily evidence for its absence from thatlocality but may rather reflect an insufficient sampling effort
1 Baguley et al.’s (2006) family list is erroneous, however, including infact 21 instead of 22 taxa: The authors listed both Paranannopidae andDanielsseniidae, which are synonymous (Huys et al. 1996; Boxshall andHalsey 2004).
Table 4 Harpacticoida densities(ind./10 cm2) at different sampledlocalities across the Angola Basin
Station Geographical location Depth (m) Density (Ind./10 cm2) Reference
St. 02 18°54.0 S, 07°22.4 E 5,170 27.00 Dinet 1973
Transect 13 17°10.2 S, 08°54.4 E 4,601 16.00 Soltwedel 1997
Station 325 19°58.2 S, 02°59.8 E 5,448 1.38 Present contribution
Station 346 16°17.0 S, 05°27.0 E 5,389 6.24 Present contribution
K.H. George et al.
(see above). Even if a species was quite frequent at one stationbut not reported from the other one (e.g. Argestesangolaensis ), a possible presence at the latter station couldnot be excluded. Bradya kurtschminkei and Emertoniaandeep (Veit-Köhler, 2004), for example, were not recordedat Station 325, but B . kurtschminkei is known from theGuinea Basin, the Cape Basin, and the Porcupine AbyssalPlain (Seifried andMartínez Arbizu 2008), and E . andeep hasbeen reported from the Guinea Basin and the Weddell Sea(Gheerardyn and Veit-Köhler 2009).
Awide distribution in the deep sea has been shown previouslyfor species of the family Paramesochridae (Gheerardyn andVeit-Köhler 2009) and the argestid genus Mesocletodes (Menzel2011a; Menzel et al. 2011). Also most of the five species alreadyknown show a wide distribution range: Mesocletodes robustusshows an Atlantic-wide distribution and was found also inAntarctic waters, the Mediterranean, and in the Eastern Pacificin depths ranging from 219 down to 5,000 m (see Menzel et al.2011 for review); Microsetella norvegica is distributed world-wide, due to its planktonic living; however, its report from thedeep sea is the first (cf. World Register of Marine Species, http://www.marinespecies.org); Selenopsyllus dahmsi was found inthe Antarcic Weddell Sea at 2,000 m depth (Moura and Pottek1998), and Styracothorax gladiator was collected northwest ofManila (Philippines, Pacific Ocean) in 2,050 m depth (Huys1993). In contrast, Marsteinia parasimilis is the only speciesthat had been reported previously from the Walvis Ridge in theAngola Basin (Dinet 1974).
Such wide distribution of the mentioned species is thoughtpossible because, among other factors, environmental conditionschange only slightly even over great distances (cf. Ramírez-Llodra et al. 2010; Thistle 2003; Türkay 2006; Tyler 2003).Against this background, it seems somewhat astonishing thatonly 13.2% of the species recorded here in theAngola Basin (90out of 682 species) were present at both stations. The stationswere not separated by geological barriers, had the same depthand a similar sediment composition (but lower productivity)(Kröncke and Türkay 2003). At Station 346, a total of 600species were recorded, of which 510 were exclusive to this site.Only 14.8%of these 600 species (90 species) were also recordedat Station 325, where an additional 82 species were recorded.Thus from a total of 172 species, Station 325 shared 47.7 %species with Station 346. At Station 325, the low densities ofspecies and individuals led to under-sampling compared toStation 346; this probably concealed much higher species num-bers—possibly akin to Station 346. However, to sample theseadditional species, a much higher number of replicates than atStation 346 would have been necessary.
Community analysis
Qualitative comparisons between Stations 325 and 346 al-ready indicated remarkable differences between their
harpacticoid population structures. Species and specimennumbers per core per replicate (five cores per replicate) weremuch higher at Station 346 than Station 325. Multivariatesimilarity analysis confirmed this: the stations differed signif-icantly regarding their community structure, as shown both bytheMST-test. This is presumably caused by the lower absolutenumbers of individuals in the replicates from Station 325.Similarly, differences in the number of individuals and specieswithin Station 325 between cores also resulted in the higherrelative differences between replicates in this low-abundancestation, compared to the high-abundance Station 346. Hence,the greater dissimilarity of replicates from Station 325, asshown in the nMDS ordination, may be at least partly amathematical artefact of the lower absolute abundances/under-sampling at that station.
As demonstrated by J ’ and 1 -λ values (Fig. 5C), bothstations show a high evenness; however, the proportion ofsingletons was higher at Station 325 (65 %) than at Station346 (57 %; Appendix A). This meant that at Station 325replicates were more distinct from each other, than at Station346, where densities were higher and under-sampling lesssevere. Data from Station 346 support the conclusions of Roseet al. (2005) regarding harpacticoid within-core diversity: thestation showed low local-scale variability with respect tospecies composition and frequency, with all replicates beingquite similar. In contrast, considerable local-scale differenceswere found at Station 325, and these occasionally exceededdifferences at the regional scale (see Fig. 4, replicates 325/3,325/4). However, under-sampling is more severe when densi-ties are low, causing strong “pseudo-turnover” between repli-cates (i.e. measured turnover due to overlooked species; Whit-taker 1998). Pseudo-turnover appears to be a strong factor atStation 325, artificially rendering the replicates from thisstation more dissimilar than those from Station 346. Nonethe-less, the exact proportion of pseudo-turnover affecting ourresults remains unknown. Thus, for the Harpacticoida wereject the null hypothesis: the harpacticoid assemblages ofStations 325 and 346 are statistically distinct in their structure(taxa composition) and diversity.
Average taxonomic diversity Δ and average taxonomicdistinctnessΔ*, were slightly higher at Station 325 comparedto Station 346. However, due to the currently limited knowl-edge of deep-sea Harpacticoida this is difficult to interprete.The relatively high Δ and Δ* values at both stations (>70)underline the existence of phylogenetically heterogeneousassemblages that are not formed by different but closelyrelated species deriving from few common ancestors. Thatwould have been a hint for a rather isolated fauna that possiblyconquered the environment by radiation. In contrast, it seemsmore likely that large-scale taxonomic exchange occurs,which has in the meantime been confirmed for Mesocletodesspecies by Menzel et al. (2011), resulting in quite heteroge-neous, species-rich assemblages at Stations 325 and 346,
Harpacticoid species diversity in the Angola Basin.
whose diversity becomes manifest even in higher taxonomiclevels.
Regarding classical diversity analyses, harpacticoid density(ind./10 cm2) is about 4.5x higher at Station 346 than atStation 325 and, if comparing absolute S , Station 346 is muchmore diverse than Station 325. If including abundance, N , inan estimation of species diversity, H’, this still holds true: H’ranges from 3.21 to 3.84 at Station 325, and from 4.30 to4.94 at Station 346. However, when comparing species num-bers accounting for abundance by rarefaction, diversity differ-ences are not significant [e.g. for E (S30)]. Even though in thisstudy the Multicorer sampling effort per abyssal deep-seastation was greater than ever before, our results indicate po-tential under-sampling at Station 325; we might have recordedhigher species richness, similar to Station 346, if a greaternumber of individuals had been collected.
Furthermore, a qualitative look at the data reveals that, onaverage, at Station 325 every second specimen resulted in anadditional species (N /S =2.03), whereas at Station 346 threespecimens were needed to add another species (N /S =3.01).This again qualifies the characteristics of higher diversity, asS , at the northern Station 346, and is supported also byevenness J ’, which is higher at Station 325 than at Station346. It was estimated by Simpson’s 1 -λ whether the numberof frequent species at stations 346 and 325 was high or low,the index calculating the probability that two specimens cho-sen randomly belong to the same species. As the index wasalmost identical at the two stations, the probability of findingtwo specimens of the same species is not significantly differ-ent between Stations 325 and 346. The values are high forboth stations, emphasising the low number of commonspecies.
As also shown by Rose et al. (2005) for within-core alpha-diversity of harpacticoid copepods, a higher measured speciesrichness was found at Station 346, since almost all cores fromthat station provided more species and specimens than thoseof Station 325. The almost perfect linearity seen in Fig. 7indicates that the more specimens collected, the more speciesfound, and that, even with the high sampling effort employedhere, we are probably far from the asymptotic part of thecollectors curve. Assuming severe under-sampling at leastfor Station 325, an increase in N might have led to a linearincrease in S at that station for a considerable number offurther individuals, possibly reaching similar species numbersas Station 346 with similar individual numbers. This leads tothe conclusion that the difference in collected species numbersbetween the stations may be explained by species densityrather than by species richness. However, under-samplingwas probably also an issue for Station 346 as indicated bythe linearity of the regression curve for this station also. This isconfirmed by both the Rarefaction analysis as well as byextrapolative species estimation, as both methods suggestpossible hyper-diversity but at the same time under-sampling.
Different productivity levels between the stations mightexplain the different densities recorded. This issue wasdiscussed extensively by Rose et al. (2005) for both stationsand can be summarised as follows: in contrast to Station 325,Station 346 was positioned in an area of upwelling with higherproductivity. Under the assumption that deep-sea habitatsgenerally show lower productivity compared to other marineor terrestrial habitats (Grassle 1989; Thiel 1983; Tietjen 1992;Valiela 1995), productivity can be regarded as a major limitingfactor in deep-sea environments under normal circumstances.A peak or subsequent descending, productivity–diversity re-lationship will probably not be reached within the abyssalproductivity range (following Rosenzweig 1995, p. 351: “Asproductivity rises from very low to moderate levels, diversityalso rises”). However, we have shown that, at family-level, thedescending part of the unimodal productivity–diversity curvemight already have been reached. Thus, large-scale heteroge-neity in food availability could be an important factor instructuring harpacticoid communities in the abyss of the An-gola Basin, and possibly also in other deep-sea regions (Roseet al. 2005). Thus, it can be stated that Stations 325 and 346differ noticeably in some aspects of species diversity, but lessin others. By showing this, our investigation reflects thecomplexity of the term ‘diversity’. The study gives evidencefor pronounced structural difference between the harpacticoidcommunities at Stations 325 and 346, which is expressedmainly by different abundance and species densities, probablycaused by varying food availability in the Angola Basin.
Acknowledgements Sample treatment in the laboratories was carried outby Mrs Iris Zaehle (Carl von Ossietzky Universität Oldenburg, Germany).Mrs Viola Siegler (DZMB, Wilhelmshaven, Germany) helped with thepreparation of illustrations. Special thanks are due to Dr. Natalie Barnes(London, UK) for correcting the English text and thus improving the qualityof the manuscript. The participation of K.H.G. and E.W. on M48/1 DIVA 1was supported financially by the Deutsche Forschungsgemeinschaft (DFG).The support provided to S. Seifried and L.Menzel by theDFG (SCHM352/30, GE 1086/6, GE 1086–11) as well as that to P.H. Corgosinho byCeDAMar is gratefully acknowledged.
References
Ahnert, A., & Schriever, G. (2001). Response of abyssal CopepodaHarpacticoida (Crustacea) and other meiobenthos to an artificialdisturbance and its bearing on future mining for polymetallic nod-ules. Deep-Sea Research II, 48, 3779–3794.
Baguley, J. G., Montagna, P. A., Lee, W., Hyde, L. J., & Rowe, G. T.(2006). Spatial and bathymetric trends in Harpacticoida (Copepoda)community structure in the Northern Gulf of Mexico deep sea.Journal of Experimental Marine Biology and Ecology, 330 , 327–341.
Baltanás, A. (1992). On the use of some methods for the estimation ofspecies richness. OIKOS, 65 , 484–492.
Balzer, W., Alheit, J., Emeis, K.-C., Lass, H.U., & Türkay, M. (2006).South-East Atlantic 2000. Cruise No. 48, 6 July 2000─3 November2000. METEOR-Berichte , Universität Hamburg , 06–05
K.H. George et al.
Barnett, P. R. O., Watson, J., & Connelly, D. (1984). A multiple corer fortaking visually undisturbed samples from shelf, bathyal and abyssalsediments. Oceanologica Acta, 7 , 399–408.
Bett, B. J., Vanreusel, A., Vincx, M., Soltwedel, T., Pfannkuche, O.,Lambshead, P. J. D., Gooday, A. J., Ferrero, T., & Dinet, A.(1994). Sampler bias in the quantitative study of deep-seameiobenthos. Marine Ecology Progress Series, 104 , 197–203.
Boero, F. (2010). The study of species in the era of biodiversity: a tale ofstupidity. Diversity, 2 , 115–126.
Boxshall, G. A., & Halsey, S. H. (2004). An introduction to CopepodDiversity, parts I and II . London: The Ray Society.
Brandt, A., Brenke, N., Andres, H. G., Brix, S., Guerrero-Kommritz, J.,Mühlenhardt-Siegel, U., & Wägele, J. W. (2005). Diversity ofperacarid crustaceans (Malacostraca) from the abyssal plain of theAngola Basin. Organisms, Diversity & Evolution, 5(1), 105–112.
Bröhldick, K. (2005). A new taxon of Idyanthidae (Copepoda,Harpacticoida) from the deep sea of the Angola Basin. Organisms,Diversity & Evolution, 5(1), 43–57.
Brökeland, W., & George, K. H. (2009). Editorial: Deep-sea taxonomy—acontribution to our knowledge of biodiversity. Zootaxa, 2096 , 6–8.
Brown, P. C., Painting, S. J., & Cochrane, K. L. (1991). Estimates ofphytoplankton and bacterial biomass and production in the northernand southern Benguela ecosystems. South African Journal of marineScience, 11 , 537–564.
Bruch, K., Glatzel, T., &Veit-Köhler, G. (2011). Isthmiocaris laurae sp. nov.(Crustacea, Copepoda, Harpacticoida) from the Angola Basin—firstdeep-sea species of the genus with first remarks on its copepodiddevelopment.Meiofauna Marina, 19, 173–193.
Chao, A. (1984). Nonparametric estimation of the number of classes in apopulation. Scandinavian Journal of Statistics, 11 , 265–270.
Chao, A. (1987). Estimating the population size for capture-recapturedata with unequal catchability. Biometrics, 43(4), 783–791.
Clarke, K. R. (1993). Non-parametric multivariate analyses of changes incommunity structure. Australian Journal of Ecology, 18, 117–143.
Clarke, K. R., & Warwick, R. M. (1998). A taxonomic distinctness indexand its statistical properties. Journal of Applied Ecology, 35, 523–531.
Clarke, K.R., & Warwick, R.M. (2001). Change in marine communities :an approach to statistical analysis and interpretation . Plymouth:2nd Edn, PRIMER-E.
Colwell, R. K., & Coddington, J. A. (1994). Estimating terrestrial biodi-versity through extrapolation. Philosphical Transactions of the Roy-al Society of London Series B, Biological Sciences, 345 , 101–118.
Corgosinho, P. H. C., & Martínez Arbizu, P. (2010). Ameiridae Boeckand Argest idae Por revisi ted, with establ ishment ofParameiropsidae, a new family of Harpacticoida (Crustacea,Copepoda) from deep-sea sediments. Helgoland Marine Research,64, 223–255.
Coull, B. C. (1972). Species diversity and faunal affinities of meiobenthicCopepoda in the deep sea. Marine Biology, 1 , 48–51.
Coull, B. C. (1988). Ecology of the marine meiofauna. In R. P. Higgins &H. Thiel (Eds.), Introduction to the Study of Meiofauna (pp. 18–38).Washington: Smithsonian Institution Press.
Danovaro, R., Tselepides, A., Otegui, A., & Della Croce, N. (2000). Dy-namics of meiofaunal assemblages on the continental shelf and deep-sea sediments of the Cretan Sea (NEMediterranean): relationships withseasonal changes in food supply. Progress in Oceanography, 46, 367–400.
Dinet, A. (1973). Distribution quantitative du méiobenthos profond dansla région de la dorsale de Walvis (Sud-Ouest-Africain). MarineBiology, 20, 20–26.
Dinet, A. (1974). Espèces nouvelles des copepodes harpacticoïdes(Crustacea) des sediments profonds de la dorsale de Walvis. Archivesde Zoologie experimentale et génerale, 115 , 549–577.
Fiege, D., Ramsey, P. A., & Ebbe, B. (2010). Diversity and distributionalpatterns of Polychaeta in the deep South Atlantic.Deep-Sea ResearchI. doi:10.1016/j.dsr.2010.06.012.
George, K. H. (2005). Sublittoral and bathyal Harpacticoida (Crustacea:Copepoda) of the Magellan region. Composition, distribution andspecies diversity of selected major taxa. Scientia Marina, 69, 147–158.
George, K. H. (2006a). New Ancorabolinae Sars, 1909 (Copepoda:Harpacticoida: Ancorabolidae) of the Atlantic and the PacificOcean. The taxa Ceratonotus Sars, and Dendropsyllus Conroy-Dalton. Meiofauna Marina, 15, 87–122.
George, K. H. (2006b). Ancorabolinae Sars (Copepoda: Harpacticoida:Ancorabolidae) of the deep Atlantic Ocean. Ancorabolina chimaeragen. et sp. nov. and remarks to the evolution of the first natatorial legin comparison with Laophontoidea T. Scott.MeiofaunaMarina, 15 ,157–176.
George, K. H. (2008). Argestes angolaensis sp. nov. (Copepoda:Harpacticoida: Argestidae) from the Angola Basin (Southeast Atlantic),and the phylogenetic characterization of the taxon Argestes Sars, in-cluding the rediscription of A. mollis Sars, 1910, and A. reductus (Itô,1983). Zootaxa, 1866, 223–262.
George, K. H., & Müller, F. (2013). Characterization of a monophylumEchinocletodes , its exclusion from Ancorabolinae (Copepoda,Harpacticoida), and displacement of E . bodini and E . walvisi toCletodes , including the description of two new species. Zootaxa,3666, 101–136.
George, K. H., & Schminke, H. K. (2002). Harpacticoida (Crustacea,Copepoda) of the Great Meteor Seamount, with first conclusions asto the origin of the plateau fauna. Marine Biology, 141 , 887–895.
Gheerardyn, H., & George, K. H. (2010). New representatives of thegenus Ancorabolina George, 2006 (Copepoda, Harpacticoida,Ancorabolidae) including remarks on ancorabolid phylogeny. Zoo-logical Journal of the Linnean Society, 158 , 16–55.
Gheerardyn, H., & Veit-Köhler, G. (2009). Diversity and large-scalebiogeography of Paramesochridae (Copepoda, Harpacticoida) inSouth Atlantic abyssal plains and the deep Southern Ocean. Deep-Sea Research I, 56(10), 1804–1815. doi:10.1016/j.dsr.2009.05.002.
Grassle, J. F. (1989). Species diversity in deep-sea communities. Trendsin Ecology & Evolution, 4 , 12–15.
Gutzmann, E., Martínez Arbizu, P., Rose, A., & Veit-Köhler, G. (2004).Meiofauna communities along an abyssal depth gradient in theDrake Passage. Deep-Sea Research II, 51 (14–16), 1617–1628.doi:10.1016/j.dsr2.2004.06.
Hammer, Ø. (2010). PAST—PAleontological STatistics , Version 2 .00 .Oslo : Reference Manual. Natural History Museum, University ofOslo 1999–2010.
Heltshe, J. F., & Forrester, N. E. (1983). Estimating species richness usingthe Jackknife Procedure. Biometrics, 39 , 1–11.
Hicks, G. R. F., & Coull, B. C. (1983). The ecology of marinemeiobenthic harpacticoid copepods. Oceanography and MarineBiology Annual Review, 21, 67–175.
Humes, A. G. (1994). How many copepods? Hydrobiologia, 292(293),1–7.
Hurlbert, S. H. (1971). The non-concept of species diversity: a critiqueand alternative parameters. Ecology, 52(4), 577–586.
Huys, R. (1993). Styracothoracidae (Copepoda: Harpacticoida), a newfamily from the Philippine deep sea. Journal of Crustacean Biology,13, 769–783.
Huys, R., Gee, J. M., Moore, C. G., & Hamond, R. (1996). Marine andbrackish water harpacticoid copepods. Part 1. Synopsis of BritishFauna, 51, 1–352.
Kitahashi, T., Kawamura, K., Veit-Köhler, G., Danovaro, R., Tietjen, J.,Kojima, S., & Shimanaga, M. (2012). Assemblages ofHarpacticoida (Crustacea: Copepoda) from the Ryukyu and KurilTrenches, north-west Pacific Ocean. Journal of the Marine Biolog-ical Association of the United Kingdom, 92(2), 275–286. doi:10.1017/S0025315411001536.
Kottmann, J., Kihara, T. C., Glatzel, T., & Veit-Köhler, G. (2013). A newspecies ofWellsopsyllus (Copepoda, Harpacticoida, Paramesochridae)
Harpacticoid species diversity in the Angola Basin.

from the deep Southern Ocean and remarks on its biogeography.Helgoland Marine Research, 67 , 33–48. doi:10.1007/s10152-012-0302-7.
Kröncke, I., & Türkay, M. (2003). Structural and functional aspects of thebenthic communities in the deep Angola Basin. Marine EcologyProgress Series, 260 , 43–53.
Lambshead, P. J. D. (1993). Recent developments in marine benthicbiodiversity research. Océanis, 19(6), 5–24.
Lambshead, P. J. D., Tietjen, J., Ferrero, T., & Jensen, P. (2000). Latitu-dinal diversity gradients in the deep sea with special reference toNorth Atlantic nematodes. Marine Ecology Progress Series, 194 ,159–167.
Lambshead, P. J. D., Tietjen, J., Moncrieff, C. B., & Ferrero, T. J. (2001).North Atlantic latitudinal diversity patterns in deep-sea marine nem-atode data: a reply to Rex et al. Marine Ecology Progress Series,210 , 299–301.
Lambshead, P. J. D., Brown, C. J., Ferrero, T. J., Mitchell, N. J., Smith, C.R., Hawkins, L. E., & Tietjen, J. (2002). Latitudinal diversity pat-terns of deep-sea marine nematodes and organic fluxes: a test fromthe central equatorial Pacific.Marine Ecology Progress Series, 236 ,129–135.
Lampadariou, N., Tselepides, A., & Hatziyanni, E. (2009). Deep-seameiofaunal and foraminiferal communities along a gradient of pri-mary productivity in the eastern Mediterranean Sea. Scientia Mari-na, 73(2), 337–345.
Lang, K. (1948). Monographie der Harpacticiden . Königstein: OttoKoeltz Science Publishers.
Levin, L. A., Etter, R. J., Rex, M. A., Gooday, A. J., Smith, C. R., Pineda,J., Stuart, C. T., Hessler, R. R., & Pawson, D. (2001). Environmentalinfluences on regional deep-sea species diversity. Annual Review ofEcology and Systematics, 32 , 51–93.
Ludwig, J. A., & Reynolds, J. F. (1988). Statistical Ecology. New York:Wiley.
Mallet, J., & Willmott, K. (2003). Taxonomy: renaissance or Tower ofBabel? Trends in Ecology and Evolution, 18(2), 57–59.
Martínez Arb, P., & Schminke, H. K. (2005). Editorial: DIVA-1 expedi-tion to the deep sea of the Angola Basin in 2000 and DIVA-1workshop in 2003. Organisms Diversity & Evolution, 5(1), 1–2.
Menzel, L. (2011a). First descriptions of copepodid stages, sexual dimor-phism and intraspecific variability of Mesocletodes Sars, 1909(Copepoda, Harpacticoida, Argestidae), including the descriptionof a new species with broad abyssal distribution. ZooKeys, 96 ,39–80.
Menzel, L. (2011b). A new species of Eurycletodes Sars, 1909(Copepoda: Harpacticoida: Argestidae) from the southern hemi-sphere including remarks on the phylogeny of and within this genus.Helgoland Marine Research, 65, 479–493.
Menzel, L., & George, K. H. (2009). Description of four new species ofMesocletodes Sars, 1909 (Copepoda, Harpacticoida, Argestidae)and redescription of Mesocletodes robustus Por, 1965 from theSouth Atlantic, including remarks on the Mesocletodes abyssicola-group. Zootaxa, 2096 , 214–256.
Menzel, L., George, K. H., & Martínez Arbizu, P. (2011). Submarineridges do not prevent large-scale dispersal of abyssal fauna: a casestudy of Mesocletodes (Crustacea, Copepoda, Harpacticoida).Deep-Sea Research I, 58, 839–864.
Moura, G., & Pottek, M. (1998). Selenopsyllus , a new genus ofCylindropsyllinae (Copepoda, Harpacticoida) from Atlantic andAntarctic deep waters. Senckenbergiana maritima, 28, 185–209.
Palmer, M. W. (1990). The estimation of species richness by extrapola-tion. Ecology, 71(3), 1195–1198.
Palmer, M. W. (1991). Estimating species richness: the second-orderJackknife reconsidered. Ecology, 72(4), 1512–1513.
Pfeifer, D., Bäumer, H. P., Dekker, R., & Schleier, U. (1998). StatisticalTools for Monitoring Benthic Communities. Senckenbergianamaritima, 29(1/6), 63–76.
Pointner, K., Kihara, T. C., Glatzel, T., & Veit-Köhler, G. (2013). Twonew closely related deep-sea species of Paramesochridae(Copepoda, Harpacticoida) with extremely differing geographicalrange sizes. Marine Biodiversity. doi:10.1007/s12526-013-0158-3.
Raes, M., Rose, A., & Vanreusel, A. (2010). Response of nematodecommunities after large-scale iceshelf collapse events in the Antarc-tic Larsen area. Global Change Biology, 16, 1618–1631.
Ramírez-Llodra, E., Brandt, A., Danovaro, R., De Mol, B., Escobar, E.,German, C. R., Levin, L. A., Martínez Arbizu, P., Menot, L., Buhl-Mortensen, P., Narayanaswamy, B. E., Smith, C. R., Tittensor, D. P.,Tyler, P. A., Vanreusel, A., & Vecchione, M. (2010). Deep, diverseand definitely different: unique attributes of the world’s largestecosystem. Biogeosciences, 7 , 2851–2899.
Rex,M. A. (1983). Georgaphic patterns of species diversity in the deep-seabenthos. In G. T. Rowe (Ed.),Deep-Sea Biology (pp. 453–472). NewYork: Wiley.
Rex,M. A., Etter, R. J., Morris, J. S., Crouse, J., McClain, C. R., Johnson,N. A., Stuart, C. T., Deming, J. W., Thies, R., & Avery, R. (2006).Global bathymetric patterns of standing stock and body size in thedeep-sea benthos. Marine Ecology Progress Series, 317 , 1–8.
Rex, M. A., Stuart, C. T., Hessler, R. R., Allen, J. R., Sanders, H. L., &Wilson, G. D. F. (1993). Global-scale latitudinal patterns of speciesdiversity in the deep-sea benthos. Nature, 365 , 636–639.
Rose, A. (2001). Räumliche und zeitliche Verteilungsmuster derKurzflügelkäfer (Coleoptera, Staphylinidae) auf Nordsee-Düneninselnunterschiedlicher Sukzessionsstadien. Archiv zoologischerPublikationen, 5, 1–220.
Rose, A., Seifried, S.,Willen, E., George, K. H., Veit-Köhler, G., Bröhldick,K., Drewes, J., Moura, G., Martínez Arbizu, P., & Schminke, H. K.(2005). A method for comparing within-core alpha diversity valuesfrom repeated Multicorer samplings, shown for abyssal Harpacticoida(Crustacea: Copepoda) from the Angola Basin. Organisms, Diversity& Evolution, 5(1), 3–17. doi:10.1016/j.ode.2004.10.001.
Rosenzweig, M. L. (1995). Species diversity in space and time . Cam-bridge (UK): Cambridge Universiy Press.
Schleier, U., & van Bernem, K.-H. (1996). A method to compare samples ofsoft bottom communities. Senckenbergianamaritima, 26(3/6), 135–144.
Schminke, H. K. (2007). Entomology for the copepodologist. Journal ofPlankton Research, 29(1), i149–i162.
Seifried, S. (2003). Phylogeny of Harpacticoida (Copepoda): revision of“Maxillipedasphalea” and Exanechentera . Göttingen: Cuvillier.
Seifried, S. (2004). The importance of a phylogenetic system for the studyof deep-sea harpacticoid diversity. Zoological Studies, 43(2), 8–19.
Seifried, S., & Martínez Arbizu, P. (2008). A new and exceptional speciesof Bradya Boeck, 1873 (Copepoda: Harpacticoida: Ectinosomatidae)from the abyssal plain of the Angola Basin and the variability of deep-sea Harpacticoida. Zootaxa, 1866 , 303–322.
Seifried, S., & Schminke, H. K. (2003). Phylogenetic relationships at thebase of Oligoarthra (Copepoda, Harpacticoida) with a new speciesas the cornerstone. Organisms, Diversity & Evolution, 3 , 13–37.
Seifried, S., Plum, C., & Schulz, M. (2007). A new species of ParabradyaLang, 1944 (Copepoda: Harpacticoida: Ectinosomatidae) from theabyssal plain of the Angola Basin. Zootaxa, 1432 , 1–21.
Shimanaga, M., Kitazato, H., & Shirayama, Y. (2000). Seasonal patternsof vertical distribution between meiofaunal groups in relation tophytodetritus deposition in the bathyal Sagami Bay, Central Japan.Journal of Oceanography, 56, 379–387.
Shimanaga,M., Kitazato, H., & Shirayama, Y. (2004). Temporal patterns indiversity and species composition of deep-sea benthic copepods inbathyal Sagami Bay, central Japan.Marine Biology, 144 , 1097–1110.
Shimanaga, M., Nomaki, H., Suetsugu, K., Murayama, M., & Kitazato,H. (2007). Standing stock of deep-sea metazoan meiofauna in theSulu Sea and adjacent areas. Deep-Sea Research II, 54, 131–144.
Shirayama, Y., & Fukushima, T. (1995). Comparisons of deep-sea sedi-ments and overlying water collected using Multiple Corer and BoxCorer. Journal of Oceanography, 51 , 75–82.
K.H. George et al.
Smith, K. L., & Hinga, K. R. (1983). Sediment community respiration inthe deep sea. In G. T. Rowe (Ed.),Deep-Sea Biology (pp. 331–370).New York: Wiley.
Soltwedel, T. (1997). Meiobenthos distribution pattern in the tropical EastAtlantic: indication for fractionated sedimentation of organic matterto the sea floor? Marine Biology, 129 , 747–756.
Soltwedel, T. (2000). Metazoan meiobenthos along continental margins:a review. Progress in Oceanography, 46 , 59–84.
Somerfield, P. J., Warwick, R. M., & Moensm, T. (2005). Meiofaunatechniques. In A. Eleftheriou & A. McIntyre (Eds.),Methods for thestudy of marine benthos (pp. 229–272). Oxford: Blackwell Science.
Thiel, H. (1983). Meiobenthos and nanobenthos of the deep sea. In G. T.Rowe (Ed.), Deep-Sea Biology (pp. 167–230). New York: Wiley.
Thistle, D. (2001). Harpacticoid copepods are successful in the soft-bottom deep sea. Hydrobiologia, 453(454), 255–259.
Thistle, D. (2003). The deep-sea floor: an overview. In P. A. Tyler (Ed.),Ecosystems of the deep oceans (pp. 5–37). Amsterdam: Elsevier.
Tietjen, J. H. (1984). Distribution and species diversity of deep-sea nem-atodes in the Venezuela Basin. Deep-Sea Research, 31(2), 119–132.
Tietjen, J. H. (1992). Abundance and biomass of metazoan meiobenthosin the deep sea. In G. T. Rowe & V. Pariente (Eds.), Deep-sea foodchains and the global carbon cycle (pp. 45–62). Dordrecht: Kluwer.
Türkay, M. (2006). Research program. In: W. Balzer, J. Alheit, K.-C.Emeis, H.U. Lass, & M. Türkay (Eds.), South-East Atlantic 2000.Cruise No. 48, 6 July 2000─3 November 2000. METEOR-Berichte ,Universität Hamburg , 06–05, 1–3
Tyler, P. A. (2003). Introduction. In P. A. Tyler (Ed.), Ecosystems of thedeep oceans (pp. 1–3). Amsterdam: Elsevier.
Valiela, I. (1995). Marine ecological processes. Berlin: Springer.Vanhove, S., Wittoeck, J., Desmet, G., Van den Berghe, B., Herman, R. L.,
Bak, R. P.M., Nieuwland, G., Vosjan, J. H., Boldrin, A., Rabitti, S., &Vincx, M. (1995). Deep-sea meiofauna communities in Antarctica:structural analysis and relation with the environment.Marine EcologyProgress Series, 127 , 65–76.
Vanreusel, A., Vincx, M., Bett, B. J., & Rice, A. L. (1995a). Nematodebiomass spectra at two abyssal sites in the NE Atlantic with a contrast-ing food supply. Internationale Revue der gesamten Hydrobiologie,80(2), 287–296.
Vanreusel, A., Vincx, M., Schram, D., & Van Gansbeke, D. (1995b). Onthe vertical distribution of the metazoan meiofauna in shelf breakand upper slope habitats of the NE Atlantic. Internationale Revueder gesamten Hydrobiologie, 80(2), 313–326.
Veit-Köhler, G. (2004). Kliopsyllus andeep sp. n. (Copepoda:Harpacticoida) from the Antarctic deep sea – a copepod closelyrelated to certain shallow-water species. Deep-Sea Research II,51(14–16), 1629–1641. doi:10.1016/j.dsr2.2004.06.027.
Veit-Köhler, G. (2005). First deep-sea record of the genusKliopsyllus Kunz, 1962 (Copepoda: Harpacticoida) with thedescription of Kliopsyllus diva sp. n.—the most abundant mem-ber of Paramesochridae at two different sites of the AngolaBasin. Organisms, Diversity & Evolution, 5 , 29–42. doi:10.1016/j.ode.2004.10.001.
Veit-Köhler, G., Laudien, J., Knott, J., Velez, J., & Sahade, R. (2008).Meiobenthic colonisation of soft sediments in arctic glacialKongsfjorden (Svalbard). Journal of Experimental Marine Biologyand Ecology, 363 , 58–65. doi:10.1016/j.jembe.2008.06.018.
Veit-Köhler, G., & Drewes, J. (2009). Kliopsyllus schminkei sp. n.(Copepoda, Harpacticoida, Paramesochridae)—a new copepodfrom the southeast Atlantic deep sea (Angola Basin). Zootaxa,
2096, 313–326, http://www.mapress.com/zootaxa/2009/f/zt02096p326.pdf.
Veit-Köhler, G., De Troch, M., Grego, M., Bezerra, T. N., Bonne, W., DeSmet, G., Folkers, C., George, K. H., Guotong, C., Herman, R.,Huys, R., Lampadariou, N., Laudien, J., Martínez Arbizu, P., Rose,A., Schratzberger, M., Seifried, S., Somerfield, P., Vanaverbeke, J.,Vanden Berghe, E., Vincx, M., Vriser, B., & Vandepitte, L. (2010).Large-scale diversity and biogeography of benthic copepods inEuropean waters. Marine Biology, 157 (8), 1819–1835. doi:10.1007/s00227-010-1454-0.
Vincx,M., Bett, B. J., Dinet, A., Ferrero, T., Gooday, A. J., Lambshead, P.J. D., Pfannkuche, O., Soltwedel, T., & Vanreusel, A. (1994).Meiobenthos of the deep northeast Atlantic. Advances in MarineBiology, 30, 1–87.
Warwick, K. R., & Clarke, R. M. (1995). New “biodiversity” measuresreveal a decrease in taxonomic distinctness with increasing stress.Marine Ecology Progress Series, 129 , 301–305.
Wasmund, N., Lass, H.-U., & Nausch, G. (2005). Distribution of nutri-ents, chlorophyll and phytoplankton primary production in relationto hydrographic structures bordering the Benguela-Angolan frontalregion. African Journal of Marine Science, 27(1), 177–190.
Wei, C.-L., Rowe, G. T., Escobar-Briones, E., Boetius, A., Soltwedel, T.,Caley, M. J., Soliman, Y., Huettmann, F., Qu, F., Yu, Z., Pitcher, C.R., Haedrich, R. L., Wicksten, M. K., Rex, M. A., Baguley, J. G.,Sharma, J., Danovaro, R., MacDonald, I. R., Nunnally, C. C.,Deming, J. W., Montagna, P., Lévesque, M., Weslawski, J. M.,Wlodarska-Kowalczuk, M., Ingole, B. S., Bett, B. J., Billett, D. S.M., Yool, A., Bluhm, B. A., Iken, K., & Narayanaswamy, B. E.(2010). Global patterns and predictions of seafloor biomass usingrandom forests. PloS ONE, 5(12), e15323.
Wells, J. B. J. (1986). Biogeography of benthic harpacticoid copepods ofthe marine littoral and continental shelf. Syllogeus, 58 , 126–135.
Wells, J. B. J. (2007). An annotated checklist and keys to the species ofCopepoda Harpacticoida (Crustacea). Zootaxa, 1568, 1–872.
Wheeler, Q. D. (2004). Taxonomic triage and the poverty of phylogeny.Philosophical Transactions of the Royal Society of London . SeriesB: Biological Sciences, 359 , 571–583.
Whittaker, R. J. (1998). Island Biogeography: Ecology, Evolution andConservation . Oxford: Oxford University Press.
Willen, E. (2000). Phylogeny of the Thalestridimorpha Lang, 1944(Crustacea, Copepoda) . Göttingen: Cuvillier.
Willen, E. (2002). Notes on the systematic position of Stenheliinae(Copepoda, Harpacticoida) within the Thalestridimorpha and de-scription of two new species from Motupore Island, Papua NewGuinea. Cahiers de Biologie Marine, 43 , 27–42.
Willen, E. (2005). A new species of Paranannopus Lang, 1936(Copepoda, Harpacticoida, Pseudotachidiidae) with atrophic mouth-parts from the abyssal of the Angola Basin.Organisms, Diversity &Evolution, 5(1), 19–27.
Willen, E. (2008). Pseudotachidiidae (Copepoda: Harpacticoida) from theAngola Basin and the Antarctic deep sea, with the description of anew species of Paradanielssenia Soyer,1970.OrganismsDiversity &Evolution, 8(4), 249–250.
Willen, E. (2009). Nyxis rostrocularis , a new genus and species ofParanannopinae Por, 1986 (Copepoda, Harpacticoida) from theSouthern Atlantic deep sea. Zootaxa, 2096 , 299–312.
Zhang, Z.-Q. (2008). Contributing to the progress of descriptive taxono-my. Zootaxa, 1968 , 65–68.
Harpacticoid species diversity in the Angola Basin.
Copyright © 2022 FDOKUMEN


![Intertwined Paths: Portugal and Rising Angola [SAIIA Occasional Paper, 2011]](https://static.fdokumen.com/doc/165x107/6312a6b25cba183dbf06bf7b/intertwined-paths-portugal-and-rising-angola-saiia-occasional-paper-2011.jpg)