An anthropological perspective on Marianas prehistory, including Guam
Upload
khangminh22Category
view
0download
0
2015
COMMONWEALTH of the
NORTHERN MARIANAS ISLANDS
STATISTICAL YEARBOOK
CENTRAL STATISTICS DIVISION
DEPARTMENT OF COMMERCE


2015
COMMONWEALTH of the
NORTHERN MARIANAS ISLANDS
STATISTICAL YEARBOOK
CENTRAL STATISTICS DIVISION
DEPARTMENT OF COMMERCE


i
Table of Contents List of Tables .......................................................................................................................................................... ii
CHAPTER 1 Population ......................................................................................................................................... 1
CHAPTER 2 Health .............................................................................................................................................. 31
CHAPTER 3 Education ........................................................................................................................................ 43
CHAPTER 4 Labor Force and Employment ........................................................................................................ 56
CHAPTER 5 Income ............................................................................................................................................ 70
CHAPTER 6 Public Safety ................................................................................................................................... 84
CHAPTER 7 Elections ......................................................................................................................................... 90
CHAPTER 8 Visitors ............................................................................................................................................ 95
CHAPTER 9 Housing ......................................................................................................................................... 102
CHAPTER 10 Vehicles ...................................................................................................................................... 118
CHAPTER 11 Trade ........................................................................................................................................... 124
CHAPTER 12 Agriculture and Fishing .............................................................................................................. 168
CHAPTER 13 Government Accounts ................................................................................................................ 175
CHAPTER 14 Consumer Price Index................................................................................................................. 180
CHAPTER 15 Land Use ..................................................................................................................................... 186
CHAPTER 16 Insular Areas Comparisons ......................................................................................................... 190
CHAPTER 17 Freely Associated States (FAS) Citizens In the CNMI .............................................................. 196
CHAPTER 18 Broadband Survey ...................................................................................................................... 209
CHAPTER 19 CNMI Historic ............................................................................................................................ 215
CHAPTER 20 Chamorros in the U.S.A.............................................................................................................. 227
Appendix A: Maps .............................................................................................................................................. 235

ii
List of Tables Table 1.1 Population by Island, CNMI: 1920 to 2010 ..................................................................................................................................................... 3 Table 1.2 Population Density by Island, CNMI: 1920 to 2010 ........................................................................................................................................ 3 Table 1.3 Population by Island and District, CNMI: 1990, 1995, 2000 and 2010 ........................................................................................................... 4 Table 1.4 Population by Age Group, CNMI: 1973 to 2010 .............................................................................................................................................. 4 Table 1.5 Population by Age Group and Sex, CNMI: 1980 to 2010 ................................................................................................................................ 5 Table 1.6 Age Distribution by Island, CNMI: 1990 to 2010 ............................................................................................................................................ 5 Table 1.7 Population Change by Age and Island: 2010 .................................................................................................................................................... 6 Table 1.8 Population by Age, Island and District: 2010 ................................................................................................................................................... 6 Table 1.9 Population by Age, Island and District: 2010 ................................................................................................................................................... 7 Table 1.10 Population by Age, Island and District: 2010 ................................................................................................................................................. 8 Table 1.11 Males per 100 Females by Age, Island and District: 2010.............................................................................................................................. 8 Table 1.12 Males per 100 Females by Age, CNMI: 1980 to 2010 .................................................................................................................................. 9 Table 1.13 Males per 100 Females by Island, CNMI: 1990 to 2010 ............................................................................................................................... 9 Table 1.14 Relationship by District and Island, CNMI: 2010 ......................................................................................................................................... 10 Table 1.15 Relationship by District and Island, CNMI: 2010 ......................................................................................................................................... 10 Table 1.16 Households by Type and Island, CNMI: 2010 .............................................................................................................................................. 11 Table 1.17 Grandparents as Caregivers by District and Island, CNMI: 2010 ................................................................................................................. 11 Table 1.18 Grandparents as Caregivers by Island, CNMI: 2000 and 2010 ..................................................................................................................... 11 Table 1.19 Marital Status by District and Island, CNMI: 2010 ...................................................................................................................................... 12 Table 1.20 Marital Status by Island, CNMI: 2000 and 2010 .......................................................................................................................................... 12 Table 1.21a. Children Ever Born by District and Island, CNMI: 2010 ........................................................................................................................... 13 Table 1.21b. Children Ever Born by District and Island, CNMI: 2010 .......................................................................................................................... 13 Table 1.21c. Children Ever Born by District and Island, CNMI: 2010 ........................................................................................................................... 13 Table 1.21d. Children Ever Born by District and Island, CNMI: 2010 .......................................................................................................................... 13 Table 1.21e. Children Ever Born by District and Island, CNMI: 2010 ........................................................................................................................... 13 Table 1.22 Fertility by Islands, CNMI: 2000 and 2010 ................................................................................................................................................. 14 Table 1.23 Place of birth for the Foreign-born population by District and Island, CNMI: 2010 .................................................................................... 14 Table 1.24 Place of birth for the Foreign-born population by Island, CNMI: 2000 and 2010 ........................................................................................ 15 Table 1.25 Place of birth of Parents by District and Island, CNMI: 2010 ...................................................................................................................... 15 Table 1.26 Place of birth of Parents by Island, CNMI: 2000 and 2010 .......................................................................................................................... 16 Table 1.27 Nativity, Citizenship Status, and Year of Entry by District and Island, CNMI: 2010 ................................................................................... 16 Table 1.28 Nativity, Citizenship Status, and Year of Entry by Island, CNMI: 2000 and 2010 ....................................................................................... 17 Table 1.29 Reason for moving to the CNMI by District and Island, CNMI: 2010 ......................................................................................................... 17 Table 1.30 Residence in 2009 by District and Island, CNMI: 2010 ............................................................................................................................... 18 Table 1.31 Ethnicity by District and Island, CNMI: 2010 .............................................................................................................................................. 18 Table 1.33 Veteran Status by District and Island, CNMI: 2010 ..................................................................................................................................... 19 Table 1.34 Veteran Status by Island, CNMI: 2000 and 2010 ......................................................................................................................................... 19 Table 1.35 Disability Status for Civilian Noninstitutional Population by District and Island, CNMI: 2010 .................................................................. 19 Table 1.36 Language Spoken at Home by District and Island, CNMI: 2010 .................................................................................................................. 20 Table 1.37 Language Spoken at Home by Island, CNMI: 2000 and 2010 ...................................................................................................................... 20 Table 1.38 Language Spoken at Home and Frequency of Language Usage by District and Island, CNMI: 2010 .......................................................... 21 Table 1.39 Language Spoken at Home and Frequency of Language Usage by Island, CNMI: 2000 and 2010 .............................................................. 21 Table 1.40 Demographics and Education for Saipan Villages, CNMI Age by Village, Saipan: 2010 ............................................................................ 22 Table 1.41 Nativity, Residence in 2009, Fertility and Disabled by Village, CNMI: 2010 .............................................................................................. 23 Table 1.42 Language and Ethnicity by Village, CNMI: 2010 ........................................................................................................................................ 24 Table 1.42 Language and Ethnicity by Village, CNMI: 2010 – Continued – ................................................................................................................. 25 Table 1.43 Economic Characteristics by Village, CNMI: 2010 ...................................................................................................................................... 26 Table 1.43 Economic Characteristics by Village, CNMI: 2010 – Continued – .............................................................................................................. 27 Table 1.44 Housing Characteristics by Village, CNMI: 2010 ........................................................................................................................................ 28 Table 1.45 Housing Facilities, Value, and Rent for Villages, CNMI: 2010.................................................................................................................... 29 Table 1.45 Housing Facilities, Value, and Rent for Villages, CNMI: 2010 – Continued – ............................................................................................ 30 Table 2.1 Births by Year and Resident Status, CNMI: 2009 to 2014 ............................................................................................................................. 34

iii
Table 2.2 Number of births per year by detailed residency/visa classification of mother, CNMI: 2009-2014 ............................................................... 34 Table 2.3 Number of live births to ‘Tourist’ mothers by ethnicity, CNMI: 2009-2014 .................................................................................................. 34 Table 2.4 Crude birth rate, by residency/visa classification of mother, CNMI: 2009-2014 ............................................................................................ 35 Table 2.5 Births by Birth Weight and Residency/Visa of mother, CNMI: 2009-2014 ................................................................................................... 35 Table 2.6 Births by Gestational Period and Residency/Visa Classification of Mother, CNMI: 2009-2014 ................................................................... 35 Table 2.7 Age-Specific Births by Residency/Visa Classification of Mother, CNMI: 2009-2014 ................................................................................... 36 Table 2.8 Age-specific Fertility Rates by Residency/Visa Classification of Mother, CNMI: 2009-2011 ...................................................................... 36 Table 2.9 Deaths by Sex and Year, CNMI: 2011-2014 .................................................................................................................................................. 36 Table 2.10 Leading Causes of Death, CNMI: 2011 to 2014 ........................................................................................................................................... 37 Table 2.11 Deaths by Age and Sex, CNMI: 2011 to 2014 .............................................................................................................................................. 37 Table 2.12 Deaths to neonates, infants and children by year, CNMI: 2011-2014........................................................................................................... 38 Table 2.13 During the Past 30 days, Days using Substances, CNMI: 2013 .................................................................................................................... 38 Table 2.14 Age When First Used Substance, CNMI: 2013 ............................................................................................................................................ 38 Table 2.15 Risks of Substance Use, CNMI: 2013 .......................................................................................................................................................... 39 Table 2.16 Disapproval of Substance Use, CNMI: 2013 ................................................................................................................................................ 39 Table 2.17 Driving with Substances, CNMI: 2013 ......................................................................................................................................................... 39 Table 2.18 Days in last 30 Days with Mental Conditions, CNMI: 2013 ........................................................................................................................ 40 Table 2.19 Nutritional Assistance Program Actual Participation by Month, CNMI: FY 2001 thru FY 2004 ............................................................... 40 Table 2.19 Nutritional Assistance Program Actual Participation by Month, CNMI: FY 2001 thru FY 2004 – Continued – ........................................ 40 Table 2.20 Nutritional Assistance Program Actual Participation by Island, CNMI: FY 2004 ........................................................................................ 41 Table 2.21 Nutritional Assistance Program Actual Participation by Month, CNMI: FY 2001 thru FY 2004 ................................................................ 41 Table 2.21 Nutritional Assistance Program Actual Participation by Month, CNMI: FY 2001 thru FY 2004 – Continued – ......................................... 41 Table 2.22 Nutritional Assistance Program Actual Participation by Ethnicity, CNMI: FY 2002-FY 2004................................................................... 42 Table 2.22 Nutritional Assistance Program Actual Participation by Ethnicity, CNMI: FY 2002-FY 2004 – Continued – ........................................... 42 Table 2.23 Nutritional Assistance Program Actual Participants by Ethnicity, CNMI: FY 2000 thru FY 2004 ............................................................. 42 Table 3.1 School Enrollment by District and Island, CNMI: 2010 ................................................................................................................................. 45 Table 3.2 School Enrollment by District and Island, CNMI: 2010 ................................................................................................................................. 45 Table 3.3 Educational Attainment by District and Island, CNMI: 1980 to 2010 ............................................................................................................ 45 Table 3.4 Educational Attainment by District and Island, CNMI: 2010 ......................................................................................................................... 46 Table 3.5 Educational Attainment by District and Island, CNMI: 2010 ......................................................................................................................... 46 Table 3.6 Student Enrollment by Type of School, CNMI: SY 1997-1998 to SY 2004-2005 ........................................................................................ 47 Table 3.7 Student Enrollment for Public Schools, CNMI: SY 1997-1998 to SY 2004-2005 ........................................................................................ 47 Table 3.8 Student Enrollment for Private Schools, CNMI: SY 1997-1998 to SY 2004-2005 ....................................................................................... 48 Table 3.9 Total Student Enrollment by Grade: SY 1999 to SY 2004 ............................................................................................................................ 48 Table 3.9 Total Student Enrollment by Grade: SY 1999 to SY 2004 - Continued - ...................................................................................................... 49 Table 3.10 Students by Ethnicity, CNMI: SY 1996-1997 to SY 2004-2005 ................................................................................................................. 49 Table 3.11 Headstart Pupils and Staff by Center, CNMI: SY 1998-1999 to SY 2004-2005 ......................................................................................... 50 Table 3.11 Headstart Pupils and Staff by Center, CNMI: SY 1998-1999 to SY 2004-2005 - Continued - ................................................................... 50 Table 3.12 Teachers and Teacher Aides by Island and Type of School, CNMI: SY 1999-00 to SY 2004-2005 ........................................................... 51 Table 3.13 Public School Teachers and Teacher Aides by School, CNMI: SY 1999-00 to SY 2004-2005 .................................................................. 51 Table 3.14 Private School Teachers and Teacher Aides by School, CNMI: SY 1999-00 through SY 2004-2005 ........................................................ 52 Table 3.15 Educational Background of Teachers, CNMI: SY 1996-1997 to SY 2004-2005 ......................................................................................... 52 Table 3.16 Student-Teacher Ratio by School Level, CNMI: SY 1996-1997 to SY 2003-2004 ..................................................................................... 52 Table 3.17 Graduates from Secondary School by Type of School, CNMI: SY 1992-1993 to SY 2003-2004 ............................................................... 53 Table 3.18 Graduates from Private Schools, CNMI: SY 1994-1995 to SY 2003-2004 ................................................................................................. 53 Table 3.19 Northern Marianas College Enrollment, CNMI: SY 1996-1997 to SY 2003-2004 ..................................................................................... 54 Table 3.20 Northern Marianas College Enrollment by Sex, CNMI: SY 1994-1995 to SY 2003-2004 ......................................................................... 54 Table 3.21 Northern Marianas College Enrollment by Ethnicity: SY 1994-1995 to SY 2003-2004 ............................................................................. 54 Table 3.22 Degrees Awarded from Northern Marianas College, CNMI: SY 1996-1997 to SY 2003-2004 .................................................................. 55 Table 3.23 Graduates from Northern Marianas College, CNMI: 1997 to 2004 ............................................................................................................. 55 Table 4.1 CNMI Employment Status by Sex, CNMI: 1973 to 2010 ............................................................................................................................. 59 Table 4.2 Employment Status and Subsistence Activity by District and Island, CNMI: 2010 ....................................................................................... 59 Table 4.3 Employment Status and Subsistence Activity for Males by District and Island, CNMI: 2010 ....................................................................... 60 Table 4.4 Employment Status and Subsistence Activity for Females by District and Island, CNMI: 2010 ................................................................... 60

iv
Table 4.5 Employment Status and Subsistence Activity by District and Island, CNMI: 2010 ....................................................................................... 60 Table 4.6 Employment Status and Subsistence Activity for Males by District and Island, CNMI: 2010 ....................................................................... 61 Table 4.7 Employment Status and Subsistence Activity for Females by District and Island, CNMI: 2010 ................................................................... 61 Table 4.8 Labor Force Participation by Ethnicity, CNMI: 1980, 1990, 1995 and 2000 ................................................................................................ 61 Table 4.9 Labor Force Participation by Citizenship Status, CNMI: 1973, 1980, 1990, 1995 and 2000 ........................................................................ 62 Table 4.10 Occupation by District and Island, CNMI: 2010 .......................................................................................................................................... 62 Table 4.11 Occupation by District and Island, CNMI: 2010 .......................................................................................................................................... 62 Table 4.13 Occupation by Sex, CNMI: 1980, 1990, 1995 and 2002 ............................................................................................................................. 63 Table 4.13 Occupation by Sex, CNMI: 1980, 1990, 1995 and 2002 – Continued – ...................................................................................................... 63 Table 4.14 Occupation by Sex, CNMI: 2000 ................................................................................................................................................................. 64 Table 4.15 Employed Persons by Industry, CNMI: 1980 to 2010 ................................................................................................................................. 64 Table 4.16 Industry by District and Island, CNMI: 2010 ............................................................................................................................................... 65 Table 4.17 Industry by District and Island, CNMI: 2010 ............................................................................................................................................... 65 Table 4.18 Class of Worker by District and Island, CNMI: 2010 ................................................................................................................................... 65 Table 4.19 Class of Worker by District and Island, CNMI: 2010 ................................................................................................................................... 65 Table 4.20 Class of Worker by District and Island, CNMI: 2010 ................................................................................................................................... 66 Table 4.21 Commuting to Work for Workers 16 years and over by District and Island, CNMI: 2010........................................................................... 66 Table 4.22 Commuting to Work for Workers 16 years and over by District and Island, CNMI: 2010........................................................................... 66 Table 4.23 Health Insurance Coverage Status by District and Island, CNMI: 2010 ....................................................................................................... 67 Table 4.24 Non-Resident Work Permits Issued by Industry, CNMI: FY 1996 to FY 2004 ........................................................................................... 67 Table 4.25 Number of Non-U.S. Resident Work Permits Issued by Nationality, CNMI: 1999 to 2004 ........................................................................ 67 Table 4.26 Number of Permits Issued to Non-Resident Workers by Industry and Month, CNMI: FY 2004 ................................................................ 68 Table 4.27 Number of Permits Issued to Non-Resident Workers by Industry, CNMI: 2003 and 2004 ......................................................................... 68 Table 4.28 Number of Permits Issued to Non-Resident Workers by Industry, CNMI: 2000 and 2002 ......................................................................... 68 Table 4.29 Number of Permits Issued to Non-Resident Workers by Industry, CNMI: 1999 and 2001 ......................................................................... 69 Table 4.30 Number of Permits Issued to Non-Resident Workers by Nationality: FY 2004 ........................................................................................... 69 Table 4.31 Number of Permits Issued to Non-Residents Workers by Nationality: FY 2003 .......................................................................................... 69 Table 5.1 Household and Family Income in Year before Census, CNMI: 1980 to 2000 ............................................................................................... 72 Table 5.2 Household Income in 2009 by District and Island, CNMI: 2010 .................................................................................................................... 72 Table 5.3 Household Income in 1999 and 2009 by Island, CNMI: 2000 and 2010 ........................................................................................................ 73 Table 5.4 Household Income in 2009 by type and District and Island, CNMI: 2010 ..................................................................................................... 73 Table 5.5 Household Income in 1999 and 2009 by Type and Island, CNMI: 2000 and 2010 ........................................................................................ 73 Table 5.7 Family Income in 2009 by District and Island, CNMI: 2010.......................................................................................................................... 74 Table 5.8 Family Income in 2009 by District and Island, CNMI: 2010.......................................................................................................................... 74 Table 5.9 Other Income Characteristics in 2009 by District and Island, CNMI: 2010 ................................................................................................... 74 Table 5.10 Nonfamily Income, Per Capital Income and Median Earnings in 1999 and 2009 by Island, CNMI: 2000 and 2010 .................................. 75 Table 5.11 Remittance Sent Abroad in 2009 by District and Island, CNMI: 2010 ......................................................................................................... 75 Table 5.12 Families with Income in 2009 below Poverty Level by District and Island, CNMI: 2010 ........................................................................... 75 Table 5.13 Persons with Income in 2009 below Poverty Level by District and Island, CNMI: 2010 ............................................................................. 76 Table 5.14. Persons with Income in 2009 below Poverty Level by District and Island, CNMI: 2010 ............................................................................ 76 Table 5.15. Families with Income in 1999 and 2009 below Poverty Level by Island, CNMI: 2000 and 2010 ............................................................... 76 Table 5.16 Wage and Salary Income, Number of Wage and Salary Earners and Average Earnings, CNMI: 1980 to 2003 .......................................... 77 Table 5.17 Average Hourly Wages by Occupation and Sex, CNMI: 2014 ..................................................................................................................... 77 Table 5.18 Average Hourly Wages by Ethnicity and Sex, CNMI: 2014 ........................................................................................................................ 78 Table 5.19 Average Hourly Wages by Visa Type by Age and Sex, CNMI: 2014 .......................................................................................................... 78 Table 5.20 Average Hourly Wages by Occupation and Island, CNMI: 2014 ................................................................................................................. 78 Table 5.21 Average Hourly Wages by Occupation and Employment Status, CNMI: 2014............................................................................................ 79 Table 5.22 Average Hourly Wages by Occupation, Sex, and Employment Status, CNMI: 2014 ................................................................................... 79 Table 5.23 Average Hourly Wages by Occupation and Age, CNMI: 2014 .................................................................................................................... 80 Table 5.24 Average Hourly Wages by Occupation and Detailed Age Group, CNMI: 2014........................................................................................... 80 Table 5.25 Average Hourly Wages by Occupation and Ethnicity, CNMI: 2014 ............................................................................................................ 81 Table 5.26 Average Hourly Wages by Occupation and Educational Attainment, CNMI: 2014 ..................................................................................... 81 Table 5.27 Average Hourly Wages by Occupation and Citizenship, CNMI: 2014 ......................................................................................................... 82 Table 5.28 SOC by US-Non Citizen and Sex, US-Non Citizen and Sex ........................................................................................................................ 82

v
Table 5.29 Average Hourly Wages by Occupation and Sector, CNMI: 2014 ................................................................................................................ 83 Table 5.30 Average Hourly Wages by Occupation, Sex, and Sector, CNMI: 2014 ........................................................................................................ 83 Table 6.1 Type and Number of Juvenile Arrests, CNMI: 1998 to 2004 ........................................................................................................................ 86 Table 6.2 Type and Number of Juvenile Arrests, CNMI: CY 1995 to CY 2002 ........................................................................................................... 86 Table 6.2 Number of Violent and Property Crimes of Juvenile Offenses, CNMI: 1986 to 2004 .................................................................................. 87 Table 6.3 Number of Traffic Accidents by Month, CNMI: CY 1995 to CY 2004 ........................................................................................................ 87 Table 6.4 Driving Under the Influence (DUI) Arrests by Ethnicity and Sex, Saipan: 2000 to 2004 ............................................................................. 88 Table 6.5 DUI Arrests by Ethnicity and Month, Saipan: CY 2004 ................................................................................................................................ 88 Table 6.5 DUI Arrests by Ethnicity and Month, Saipan: CY 2002 ................................................................................................................................ 89 Table 6.6 Selected Type of Offenses, Saipan: 1991 to 2004 ......................................................................................................................................... 89 Table 7.1 Number of Registered Voters by Sex and Election District, CNMI: 1997, 1999, 2001 and 2002 ................................................................. 92 Table 7.2 Voters by Sex and by Election Districts, CNMI: 1997, 1999, 2001 and 2003 ............................................................................................... 92 Table 7.3 Percent of Registered Voters Who Voted by Election District, CNMI: 1997, 1999 and 2001 ...................................................................... 93 Table 7.4 Voters by Election District, Age Group and Sex, CNMI: 2004 ..................................................................................................................... 93 Table 7.5 Registered Voters by Election District and Ethnicity, CNMI: 1999 .............................................................................................................. 94 Table 8.1 Visitor Entries by Country of Origin, CNMI: FY 1997 to FY 2013 .............................................................................................................. 97 Table 8.1 Visitor Entries by Country of Origin, CNMI: FY 1997 to FY 2013 – Continued – ....................................................................................... 97 Table 8.2. Visitor Arrival Statistics by Year, CNMI: FY 2004 to FY 2013 ................................................................................................................... 98 Table 8.2a Visitor Arrival Statistics by Year, CNMI: FY 2004 to FY 2013 ................................................................................................................... 98 Table 8.3 Visitor Arrivals by Quarter, CNMI: 1997 to 2013 .......................................................................................................................................... 99 Table 8.4 Japanese Visitor Arrival Statistics by Year, CNMI: FY 2004 to FY 2013 ..................................................................................................... 99 Table 8.5 Visitor Arrivals from Japan by Quarter, CNMI: CY 1998 to CY 2004 ....................................................................................................... 100 Table 8.6. Korean Visitor Arrival Statistics by Year, CNMI: FY 2004 to FY 2013 ..................................................................................................... 100 Table 8.7 Visitor Arrivals from Korea by Quarter, CNMI: 1998 to 2013.................................................................................................................... 101 Table 8.7a Visitor Arrivals from Korea by Month, CNMI: 1999 to 2004 ................................................................................................................... 101 Table 8.8 Chinese Visitor Arrival Statistics by Month, CNMI: FY 2004 to FY 2013 .................................................................................................. 101 Table 9.1 Housing Occupancy by District and Island, CNMI: 2010 ............................................................................................................................ 105 Table 9.2 Housing Occupancy by District and Island, CNMI: 2010 ............................................................................................................................ 105 Table 9.3 Housing Units in Structure, CNMI: 1980 to 2010 ....................................................................................................................................... 106 Table 9.4 Units in Structure by District and Island, CNMI: 2010 ................................................................................................................................ 106 Table 9.5 Units in Structure by Island, CNMI: 2000 to 2010 ....................................................................................................................................... 106 Table 9.6 Year Structure Built by District and Island, CNMI: 2010 ............................................................................................................................ 107 Table 9.7 Year Householder Moved into Unit by District and Island, CNMI: 2010 .................................................................................................... 107 Table 9.8 Material for Outside Walls, CNMI: 1990 to 2010 ....................................................................................................................................... 107 Table 9.9. Material used for Outside Walls by District and Island, CNMI: 2010 ......................................................................................................... 108 Table 9.10 Material for Outside Walls by Island, CNMI: 1990, 1995 and 2000 ......................................................................................................... 108 Table 9.11 Material for Roof, CNMI: 1990 to 2010 .................................................................................................................................................... 108 Table 9.12 Material used for Roof by District and Island, CNMI: 2010 ...................................................................................................................... 109 Table 9.13 Material for Roof, CNMI: 1990 to 2010 .................................................................................................................................................... 109 Table 9.14 Material used for Foundation by District and Island, CNMI: 2010 ............................................................................................................ 109 Table 9.15 Material used for Foundation by Island, CNMI: 2000 and 2010 ................................................................................................................ 110 Table 9.16 Rooms by District and Island, CNMI: 2010 ............................................................................................................................................... 110 Table 9.17 Rooms by Island, CNMI: 2000 and 2010 ................................................................................................................................................... 110 Table 9.18 Rooms by District and Island, CNMI: 2010 ............................................................................................................................................... 111 Table 9.19 Occupants per Room by District and Island, CNMI: 2010 ......................................................................................................................... 111 Table 9.20 Occupants per Room by Island, CNMI: 2000 and 2010 ............................................................................................................................. 111 Table 9.22 Bedrooms by District and Island, CNMI: 2010 .......................................................................................................................................... 112 Table 9.23 Bedrooms by Island, CNMI: 2000 and 2010 .............................................................................................................................................. 112 Table 9.24 Selected Housing Conditions by District and Island, CNMI: 2010 ............................................................................................................ 112 Table 9.25 Selected Housing Conditions by District and Island, CNMI: 2010 ............................................................................................................ 113 Table 9.26 Source of Water by District and Island, CNMI: 2010 ................................................................................................................................. 113 Table 9.27 Source of Water, CNMI: 1990 to 2010 ...................................................................................................................................................... 113 Table 9.28 Source of Water by Island: 1990 to 2010................................................................................................................................................... 114 Table 9.29 Sewage Disposal by District and Island, CNMI: 2010 ............................................................................................................................... 114

vi
Table 9.30 Sewage Disposal by Island, CNMI: 2000 and 2010 ................................................................................................................................... 114 Table 9.31 Selected Housing Conditions by District and Island, CNMI: 2010 ............................................................................................................ 115 Table 9.32 Selected Housing Conditions by District and Island, CNMI: 2010 ............................................................................................................ 115 Table 9.33 Value of structure by District and Island, CNMI: 2010 .............................................................................................................................. 115 Table 9.34 Mortgage Status by Selected Monthly Owner Costs and District and Island, CNMI: 2010 ....................................................................... 116 Table 9.35 Median Selected Monthly Owner Costs by District and Island, CNMI: 2010 ............................................................................................ 116 Table 9.38 Gross Rent by District and Island, CNMI: 2010 ......................................................................................................................................... 116 Table 9.39 Gross Rent as percentage of Household Income in 2009 by District and Island, CNMI: 2010 .................................................................. 117 Table 9.40 Gross Rent as percentage of Household Income in 2009 by District and Island, CNMI: 2010 .................................................................. 117 Table 10.1 Vehicles Available by District and Island, CNMI: 2010 ............................................................................................................................ 120 Table 10.2 Vehicles Available by Island, CNMI: 2000 and 2010 ................................................................................................................................ 120 Table: 10.3 Registered Motor Vehicles by Type, CNMI: 1989 to 2004 ...................................................................................................................... 120 Table 10.4 Registered Vehicles, Saipan 1990 to 2004 .................................................................................................................................................. 121 Table 10.5 Motor Vehicle Registration Renewals, Saipan: 1986 to 2004.................................................................................................................... 121 Table 10.6 Type of Registered Vehicles, Tinian: 1997 to 2004 ................................................................................................................................... 122 Table 10.7 Type of Vehicles, Rota: 1997 to 2004 ....................................................................................................................................................... 122 Table 10.8 Registered and Inspected Government Vehicles by Type, Saipan: 1984 to 2004 ...................................................................................... 122 Table 10.9 Taxicabs by Type of Registration, CNMI: CY 1992 to CY 2004 .............................................................................................................. 123 Table 10.10 Number of Installed Telephones by Type of Subscribers, CNMI: 1982 to 2004 ..................................................................................... 123 Table 11.1 General Statistics for Selected Industries, CNMI: 1987 to 2012 ............................................................................................................... 126 Table 11.2a Comparative Statistics by Type of Business, CNMI: 2012 ....................................................................................................................... 127 Table 11.2b Comparative Statistics by Type of Business, CNMI: 2007 ....................................................................................................................... 128 Table 11.2c Comparative Statistics by Type of Business, CNMI: 2002 ....................................................................................................................... 129 Table 11.3a General Characteristics by Sector and Subsector, CNMI: 2012 ................................................................................................................ 130 Table 11.3b General Characteristics by Sector and Subsector, CNMI: 2012 ............................................................................................................... 131 Table 11.3c General Characteristics by Sector and Subsector, CNMI: 2012 ................................................................................................................ 132 Table 11.3d General Characteristics by Sector and Subsector, CNMI: 2012 ............................................................................................................... 133 Table 11.3e General Characteristics by Sector and Subsector, CNMI: 2012 ................................................................................................................ 134 Table 11.3f General Characteristics by Sector and Subsector, CNMI: 2012 ................................................................................................................ 135 Table 11.3g General Characteristics by Sector and Subsector, CNMI: 2012 ............................................................................................................... 136 Table 11.3h General Characteristics by Sector and Subsector, CNMI: 2012 ............................................................................................................... 137 Table 11.3i General Characteristics by Sector and Subsector, CNMI: 2012 ................................................................................................................ 138 Table 11.3j General Characteristics by Sector and Subsector, CNMI: 2012 ................................................................................................................ 139 Table 11.3k General Characteristics by Sector and Subsector, CNMI: 2012 ............................................................................................................... 140 Table 11.3l General Characteristics by Sector and Subsector, CNMI: 2012 ................................................................................................................ 141 Table 11.4a General Characteristics of Kind of Business and Legal Organization, CNMI: 2012 ................................................................................ 142 Table 11.4b General Characteristics of Kind of Business and Legal Organization, CNMI: 2012 ................................................................................ 143 Table 11.5a Size of Sales and Receipts by Sector, CNMI: 2012 .................................................................................................................................. 144 Table 11.5b Size of Sales and Receipts by Sector, CNMI: 2012 .................................................................................................................................. 145 Table 11.5c Size of Sales and Receipts by Sector, CNMI: 2012 .................................................................................................................................. 146 Table 11.5d Size of Sales and Receipts by Sector, CNMI: 2012 .................................................................................................................................. 147 Table 11.5e Size of Sales and Receipts by Sector, CNMI: 2012 .................................................................................................................................. 148 Table 11.5f Size of Sales and Receipts by Sector, CNMI: 2012 ................................................................................................................................... 149 Table 11.5h Size of Sales and Receipts by Sector, CNMI: 2012 .................................................................................................................................. 150 Table 11.6a Employment Size by Sector, CNMI: 2012 ................................................................................................................................................ 151 Table 11.6b Employment Size by Sector, CNMI: 2012 ............................................................................................................................................... 152 Table 11.6c Employment Size by Sector, CNMI: 2012 ................................................................................................................................................ 153 Table 11.7a Gender Status of Ownership, CNMI: 2012 ............................................................................................................................................... 154 Table 11.7b Gender Status of Ownership, CNMI: 2012 ............................................................................................................................................... 155 Table 11.7c Gender Status of Ownership, CNMI: 2012 ............................................................................................................................................... 156 Table 11.8a Citizenship Status by Sector, CNMI: 2012 ............................................................................................................................................... 157 Table 11.8b Citizenship Status by Sector, CNMI: 2012 ............................................................................................................................................... 158 Table 11.8c Citizenship Status by Sector, CNMI: 2012 ............................................................................................................................................... 159 Table 11.8d Citizenship Status by Sector, CNMI: 2012 ............................................................................................................................................... 160

vii
Table 11.8e Citizenship Status by Sector, CNMI: 2012 ............................................................................................................................................... 161 Table 11.8f Citizenship Status by Sector, CNMI: 2012 ................................................................................................................................................ 162 Table 11.9 Percent Distribution of sales, receipts, or revenue by Sector, CNMI: 2012 ................................................................................................ 163 Table 11.9 Percent Distribution of sales, receipts, or revenue by Sector, CNMI: 2012 – Continued – ........................................................................ 163 Table 11.10 Capital Expenditures and Depreciation Charges by Sector, CNMI: 2012 ................................................................................................ 164 Table 11.11 E-Commerce Characteristics, CNMI: 2012 .............................................................................................................................................. 164 Table 11.12 Number of Business Licenses Issued by Activities, CNMI: 1996 to 2001 .............................................................................................. 165 Table 11.13 Aggregated Banking Activities, CNMI: 1996 to 2004 [Values in Thousands of Dollars] ....................................................................... 165 Table 11.14 Inbound and Outbound Ocean Cargo, Port of Saipan, CNMI: FY 1985 to FY 2004 ............................................................................... 166 Table 11.15 Gross Revenue Tons and Container Trends, Port of Saipan: 1985 to 2004 ............................................................................................. 166 Table 11.16 Value of Major Imported Commodities, CNMI: 1997 to 2003 [in revenue tons] .................................................................................... 167 Table 11.17 Origin Revenue Tons of Import Commodities, CNMI: 1997 to 2004 ..................................................................................................... 167 Table 12.1 Farms, Land in Farms and Land Use, CNMI: 1980 to 2007 ...................................................................................................................... 170 Table 12.2 Number of Livestock Farms, CNMI: 1990 to 2007 ................................................................................................................................... 170 Table 12.3 Number of Livestock Sold, CNMI: 1990 to 2007 ...................................................................................................................................... 170 Table 12.4 Market Value of Agricultural Products Sold, CNMI: 1990 to 2007 .......................................................................................................... 171 Table 12.5a Amount and Value of Commercial Fish Landing for Common Species, CNMI: 2003 to 2004 ............................................................... 172 Table 12.5 Amount and Value of Commercial Fish Landing for Common Species, CNMI: 2000 to 2002 ................................................................. 173 Table 12.6 Pounds of Fish Products Imported by Month, CNMI: 1997 to 2003 ......................................................................................................... 174 Table 12.7 Commercial Fish Landings by Pound, Value in Dollars and Average Price, CNMI: 1997 to 2004 .......................................................... 174 Table 13.1 All Government Funds Revenue and Other Financing Sources: FY 1995 to FY 2003 (in thousands of US$) .......................................... 177 Table 13.2 All Government Fund Expenditures by Function, CNMI: 1995 to 2002 (in millions of US$) .................................................................. 177 Table 13.3 CNMI General Fund Revenue and Other Financing Sources: FY 1995 to FY 2003 (in thousands of US$).............................................. 178 Table 13.4 General Fund Operating Expenditures by Function, CNMI: 1995 to 2002 (in millions of US$) ............................................................... 178 Table 13.5 General Fund Operating Expenditures and Transfers by Object Class, CNMI: 1993 to 2003 [in millions of US$] .................................. 179 Table 13.6 Reported Business Gross Revenue by Business Activity, CNMI: 1995 to 2002 [in millions of US$] ...................................................... 179 Table 14.1 Saipan CPI: Q4 2008 to Q1 2015 ............................................................................................................................................................... 182 Table 14.2 Saipan Quarterly Change in CPI, Q1 2009 to Q1 2015 .............................................................................................................................. 182 Table 14.3 Consumer Price Index, by Group, Tinian: Qtr. 1 2010 to Qtr. 1 2015 ........................................................................................................ 183 Table 14.4 Consumer Price Index, by group, Rota: Qtr. 1 2010 - Qtr. 1 2015 ............................................................................................................. 183 Table 14.5 Consumer Price Index Change, by Group, Tinian: Qtr. 2 2010 to Qtr. 1 2015 ........................................................................................... 184 Table 14.6 Consumer Price Index Change, by group, Rota: Qtr. 2 2010 - Qtr. 1 2015 ................................................................................................ 184 Table 14.7 CPI Weights for Each island, CNMI: 2015 ................................................................................................................................................ 185 Table 15.1 Geographic Characteristics, CNMI: 2015 .................................................................................................................................................. 188 Table 15.2 Public Land by Land Use Category, Saipan: 2003 .................................................................................................................................... 188 Table 15.3 Village Homestead Permits Issued by Island, CNMI: 1997 to 2003 .......................................................................................................... 188 Table 15.4 Land Exchange Cases by Island, CNMI: 1997 to 2003 ............................................................................................................................. 189 Table 15.5 Type of Permits and Commercial Leases Issued, CNMI: 1997 to 2003 .................................................................................................... 189 Table 16.1 Insular Areas by Age: 2010 ........................................................................................................................................................................ 192 Table 16.2 Population in Insular Areas by Age and Sex: 2010..................................................................................................................................... 192 Table 16.3 School Enrollment, Insular Areas: 2010 ..................................................................................................................................................... 193 Table 16.4 Insular Areas by Educational Attainment: 2010 ......................................................................................................................................... 193 Table 16.5 Insular Areas Marital Status: 2010 ............................................................................................................................................................. 194 Table 16.6 Employment Status and Subsistence Activity, Insular Areas: 2010 ........................................................................................................... 194 Table 16.7 Household Income in 2009, Insular Areas: 2010 ........................................................................................................................................ 195 Table 16.8 Housing Occupancy, Insular Areas: 2010 ................................................................................................................................................... 195 Table 16.9 Housing Tenure, Insular Areas: 2010 ......................................................................................................................................................... 195 Table 17.1 Population distribution by Age, FSM-born, CNMI: 1992 to 2012 ............................................................................................................. 198 Table 17.2 Age by Sex, CNMI: 1992 to 2012 .............................................................................................................................................................. 198 Table 17.3 Males per Females by Age Group, CNMI: 1993 to 2012 ........................................................................................................................... 199 Table 17.4 Marital Status for Persons 15 years and over, FSM-born, CNMI: 1998 to 2010 ........................................................................................ 199 Table 17.5 Compact Impact Allocation by Expense Classification .............................................................................................................................. 200 Table 17.6. Proposed Allocation by Agency and Quarter for FAS Expenditures, CNMI: 2014 ................................................................................... 200 Table 17.7. CHCC Public Health (Hospital) FAS Expenses, CNMI: 2001 to 2013 ..................................................................................................... 201

viii
Table17.8. Department of Public Health Community Guidance Center (GCG) FAS Expenditures, CNMI: 2001 to 2013 .......................................... 201 Table 17.9a Division of Youth Services FAS Expenditures, CNMI: 2001 to 2013 ...................................................................................................... 202 Table 17.9b Division of Youth Services FAS Expenditures, CNMI: 2009 to 2013...................................................................................................... 202 Table 17.10a Department of Public Safety FAS Arrests, CNMI: 2001 to 2013 ........................................................................................................... 203 Table 17.10b Department of Public Safety FAS Arrests, CNMI: 2009 to 2013 ........................................................................................................... 203 Table 17.11a Department of Corrections FAS Incarcerations, CNMI: 2001 to 2013 ................................................................................................... 204 Table 17.11b Department of Corrections FAS Incarcerations, CNMI: 2001 to 2013 ................................................................................................... 204 Table 17.12a Office of Public Defender FAS Expenditures, CNMI: 2001 to 2013 ...................................................................................................... 205 Table 17.12b Office of Public Defender FAS Expenditures, CNMI: 2009 to 2013...................................................................................................... 205 Table 17.13a Northern Marianas College FAS Expenditures: 2001 to 2013 ................................................................................................................ 206 Table 17.13b Northern Marianas College FAS Expenditures: 2009 to 2013 ................................................................................................................ 206 Table 17.14a Public School System FAS Expenditures, CNMI: 2001 to 2013 ............................................................................................................ 207 Table 17.14b Public School System FAS Expenditures, CNMI: 2008 to 2013 ............................................................................................................ 207 Table 17.15a Karidat (NGO) FAS Expenses, CNMI: 2008 to 2013 [Fiscal Year] ....................................................................................................... 208 Table 17.15b Karidat (NGO) FAS Expenses, CNMI: 2009 to 2013 [Fiscal Year] ....................................................................................................... 208 Table 18.1. Sex and Age by Island and Internet at home, CNMI: 2014 ....................................................................................................................... 211 Table 18.2. Sex and Education by Island and Internet at home, CNMI: 2014 .............................................................................................................. 212 Table 18.3. Sex and Labor force by Island and Internet at home, CNMI: 2014 ........................................................................................................... 213 Table 18.4. Sex and Ethnicity by Island and Internet at home, CNMI: 2014 ............................................................................................................... 214 Table 18.5. Sex and Language by Island and Internet at home, CNMI: 2014 .............................................................................................................. 214 Table 19.1 Population of Rota: 1897 ........................................................................................................................................................................... 217 Table 19.2 Population by Island: 1902 ........................................................................................................................................................................ 217 Table 19.3 Change in the Native Population: 1920 to 1935 ......................................................................................................................................... 217 Table 19.4 Population by Ethnicity: 1925 to 1935 ....................................................................................................................................................... 218 Table 19.5 Population by Age, Sex, and Ethnicity: 1930 ............................................................................................................................................. 218 Table 19.6 Birthplace of de Facto Population: 1930 ..................................................................................................................................................... 219 Table 19.7 Birthplace of Chamorros: 1930 ................................................................................................................................................................... 219 Table 19.8 Birthplace of Carolinians: 1930 .................................................................................................................................................................. 220 Table 19.9 Population by Ethnicity: 1935 .................................................................................................................................................................... 220 Table 19.10 Age by Island: 1935 .................................................................................................................................................................................. 221 Table 19.11 Age by Island for Males: 1935.................................................................................................................................................................. 221 Table 19.12 Age by Island for Females: 1935 .............................................................................................................................................................. 221 Table 19.13 Birth and Death Rates: 1924 to 1935 ........................................................................................................................................................ 222 Table 19.14 Change in the Native Population, Saipan: 1944 to 1947 ........................................................................................................................... 222 Table 19.15 Population by Island: 1949 to 1973 .......................................................................................................................................................... 222 Table 19.16 Population of the Northern Islands: 1949 to 1973 .................................................................................................................................... 223 Table 19.17 Vital Rates: 1955 to 1979 ......................................................................................................................................................................... 223 Table 19.18 Age Specific and Total Fertility Rates: 1967 to 1979 ............................................................................................................................... 223 Table 19.19 Population by Age and Sex: 1958 ............................................................................................................................................................. 224 Table 19.20 Population by Age and Sex, Rota: 1958 ................................................................................................................................................... 224 Table 19.21 Population by Age and Sex, Saipan, Tinian and N Islands: 1958 ............................................................................................................. 224 Table 19.22 Population by Island: 1920 to 1980 .......................................................................................................................................................... 225 Table 19.23 Population Density by Island: 1920 to 1980 ............................................................................................................................................. 225 Table 19.24 Population Density by Island: 1920 to 1980 ............................................................................................................................................. 225 Table 19.25 Population by Island and Place: 1973 and 1980 ....................................................................................................................................... 226 Table 19.25 Population by Island and Place: 1973 and 1980 ....................................................................................................................................... 226 Table 20.1a Chamorro Population, United States and Insular Areas: 2010 .................................................................................................................. 229 Table 20.1b Chamorro Population, United States and Insular Areas: 2000 .................................................................................................................. 230 Table 20.1c Chamorro Population, United States and Insular Areas: 1980 to 1990 ..................................................................................................... 231 Table 20.2a Chamorro Population, United States and Insular Areas: 2010 .................................................................................................................. 232 Table 20.2b Chamorro Population, United States and Insular Areas: 2000 .................................................................................................................. 233 Table 20.2c Chamorro Population, United States and Insular Areas: 1980 to 1990 ..................................................................................................... 234

ix
English and Metric Conversion Table
English Conversion
Parameter
Metric Metric Conversion
Parameter
English
Length Length
Inches x 25.4 = Milimeters Milimeters x 0.039 = Inches
Feet x 0.305 = Meter Meter x 3.281 = Feet
Statute miles x 1.609 = Kilometers Kilometers x 0.621 = Statute miles
Area Area
Sq. feet x 0.093 = Sq. meter Sq. meter x 10.764 = Sq. feet
Acres x 0.405 = Hectares Hectares x 2.471 = Acres
Sq. miles x 2.589 = Sq. kilometers Sq. kilometers x 0.386 = Sq. miles
Volume & Capacity Volume & Capacity
Cubic feet x 0.028 = Cubic meters Cubic meters x 35.315 = Cubic feet
Cubic yard x 0.765 = Cubic meters Cubic meters x 1.308 = Cubic yard
Fluid ounces x 29.573 = Mililiters Mililiters x 0.034 = Fluid ounces
Quarts (liq.) x 0.946 = Liter Liter x 0.057 = Quarts (liq.)
Gallons (liq.) x 3.785 = Liters Liters x 0.264 = Gallons (liq.)
Mass Mass
Ounces x 28.35 = Grams Grams x 0.065 = Ounces
Pounds x 0.454 = Kilograms Kilograms x 2.205 = Pounds
Hwt x 45.359 = Kilograms Kilograms x 0.022 = Hwt
Short tons x 0.907 = Metric tons Metric tons x 1.102 = Short tons
Symbols and Abbreviations
The following symbols and abbreviations are used in the tables throughout this report:
"-" A dash means no data was available.
". . ." Three periods mean not applicable.
(D) A Capital Letter "D" means data withheld to avoid disclosing individual(s) or enti-
ties.
N. Is. Or North Is. N. Is. Or North Is. Means Northern Islands

11th Statistical Yearbook, Central Statistics Division, Department of Commerce
CHAPTER 1
Population

2015 CNMI Statistical Yearbook Chapter 1 Page 1
11th Statistical Yearbook, Central Statistics Division, Department of Commerce
Chapter 1 – Population
The population of the CNMI in 2010 was 53,883 according to the U.S. Census Bureau. Until the 2000,
CNMI’s population increased in every census, but it decreased between 2000 and 2010 primarily because of
the closing of the garment factories. Saipan continued to have about 90 percent of the population in 2010, at
about 48,000, while Rota had about 2,500 and Tinian had about 3,100. The Northern Islands were uninhab-
ited.
The Commonwealth had about 300 people per square mile in 2010, but not even divided. Saipan’s density
was more than 1,000 per square mile compared to 77 for Rota and 80 for Tinian.
The population of the CNMI was about 3,000 during Japanese times, but began increasing rapidly under the
American governance with better health and education. The population was 8,300 in 1958, at the time of the
first full U.S. Census, in connection with the 1960 US Census, and it increased to more than 14,000 in 1973,
17,000 in 1980, 43,000 in 1990, and 69,000 in 2000, before the recent decrease.
While the populations of Rota and Tinian were small enough that the Census Bureau did not disaggregate
them further, Saipan’s 5 Districts were enumerated, with District 3 being largest with 15,600 people, followed
by District 1 (15,200), District 5 (7,200), District 2 (6,400), and District 4 being smallest at 3,800.
The median age – the age that equally divides the population into an older and younger half – was 33.4 years
in 2010. The median age in 1973 was 17.2, so that age almost doubled during the period. The median age
increased to 19.7 by 1980 and remained around 28 from 1990 to 2000 before increasing by about 5 years in
the decade before the 2010 census. The median age for males in 2010 was 34.4 years compared to 32.5 for
females, so the average male was about 2 years older. Saipan’s median age was 33.3, compared to 35.0 for
Rota and 33.8 for Tinian.
The CNMI had about 106 males for every 100 females in 2010. This sex ratio was about 111 in 1980 during
the last years of the Trust Territory, and stayed at the level in 1990, but decreased in 1995 to 95 males per
100 females and 85 in 2000 at the height of the garment factory period when many single Chinese and other
foreign females were on island. In 2000, CNMI had only 37 males for every 100 females in the 20 to 24 age
group. The disparity continued in the middle age groups in 2010 to a lesser extent. In 2010, Saipan saw a
sex ratio of 105 compared to 112 in Rota and 114 in Tinian, with the neighbor islands being even more female
than Saipan.
The average household size in 2010 was 3.26 people compared to 3.65 in 2000, so the average size decreased
by about half a person during the decade. The average family size decreased from 4.16 to 3.80 people.
Family sizes are generally larger than household sizes because households include people living alone, who
are not included in the family averages. Saipan had the largest families and households in 2010, but Tinian
and Rota had larger families than Saipan in 2000.
The U.S. Census collects information on grandparents in the house watching grandchildren. Of course, tra-
ditional Chamorro and Carolinian cultures expect everyone to participate in child rearing, especially grand-
parents. The total number of grandparents in households did not change very much between 2000 and 2010,
at more than 2,000. More than half of the grandparents in each census were responsible for their grandchil-
dren, with about half of them being responsible for the grandchildren for 5 years or more.
About 2.2 children were ever born to females 35 to 44 years (the end of the reproductive period), with only
Rota being higher, at about 2.7 children. These rates are near replacement, so any increase in CNMI’s pop-
ulation would be due to immigration (and decreases would be to emigration). The rate increased from about
2.1 in 2000 as many of the remaining garment factories left the islands.

Page 2 Chapter 1 2015 CNMI Statistical Yearbook
11th Statistical Yearbook, Central Statistics Division, Department of Commerce
About 24,000 CNMI residents in 2010 were born in foreign places. Asia born were by far the largest, of
course, with about 90 percent, and Oceania (particularly those from FSM) were most of the rest of the foreign
born. Saipan had about 22,000 of the foreign born, with Tinian having about 1,400 and Rota about 800. The
numbers of foreign born decreased considerably between 2000 and 2010. In 2000, about 40,000 resident
were foreign born, with about 15,700 born in the Philippines and about 15,600 born in China; the Philippines
born decreased to 14,500 in 2000 but the China born decreased by more than 10,000 to 3,400 in 2010. The
Oceania populations also decreased as the Freely Associated States migrants pursued better economic oppor-
tunities on Guam and Hawaii. About 34,000 (about 2 out of every 3) residents had mothers and fathers
foreign born, a considerable decrease from 2000.
About 35,000 CNMI residents native-born U.S. Citizens, including about 27,000 born in the CNMI itself.
Of the 24,000 Foreign born, only about 1,000 were naturalized U.S. citizens. Of those not citizens, about
equal numbers had arrived in the last decade compared to previous decades – more than 10,000 in each group.
The percentage of native born increased considerably between 2000 and 2010, while the number of foreign
citizens decreased from about 39,000 to 23,000 during the decade, accounting for almost all of the decline in
the total population. As would be expected, most of the foreigners came to work.
The U.S. Census uses residence 5 years before the census to measure short term migration. About 44,000
people (or about 83 percent) of the population 5 years and older lived in the same house in 2005 as 2010. Of
the others, about 13 percent lived in a different house in the CNMI, and about 2,000 lived outside the CNMI.
The largest ethnic group in the CNMI in 2010 were Filipinos, at 19,000 being about 35 percent of the total
resident population. Chamorros were the largest other single ethnicity, at 12,900, but 4,600 people reported
as Chamorro with some other ethnic group, so the total was about 17,500 or about 32 percent of the popula-
tion. About 2,500 were reported as Carolinian, 3,700 as Chinese, and 2,600 as Koreans. Of the Freely
Associated States, about 1,200 reported as Chuukese and a slightly smaller number reported as Palauan.
About 2 percent of the CNMI adult population were military veterans, but the rate would be higher if only
U.S. citizens were included. About 5.5 percent of the population reported having a disability, but about 38
percent of those 65 years and over.
Of the population 5 years and over, about 33,000 (or 2 out of every 3 non-English speakers) spoke a Pacific
Islander language at home. About 8,400 spoke only English at home. About 12,000 spoke Chamorro (about
1 in every 4 of the resident speakers) and about 16,000 spoke a Filipino language (about 1 in 3). (For some
reason, Philippines languages are included in the Pacific Islander category here.) About 3,300 spoke Chinese
languages and 2,300 spoke Korean at home. As expected, the numbers speaking Chinese languages de-
creased by about 10,000 during the decade before the 2010 census, while Philippines languages increased
slightly and Chamorro decreased from about 14,000 to about 12,000. About half the non-English speakers
spoke English as about as often as their other language at home, while about 7,000 spoke English more than
the other language, and 19,000 spoke the other language more than English. The percentage speaking English
only increased considerably during the decade before the census.
Because of the closing of the garment factories within decade or so before the 2010 census, estimates and
projections are very difficult to make.
The last part of the chapter shows results for the villages in Saipan. Both population and housing variables
from the 2010 are included.

2015 CNMI Statistical Yearbook Chapter 1 Page 3
11th Statistical Yearbook, Central Statistics Division, Department of Commerce
Table 1.1 Population by Island, CNMI: 1920 to 2010
Year
Number of Persons Percent
Total Saipan Rota Tinian N. Island Total Saipan Rota Tinian N. Islands
2010 53,883 48,220 2,527 3,136 0 100.0 89.5 4.7 5.8 0.0
2000 69,221 62,392 3,283 3,540 6 100.0 90.1 4.7 5.1 0.0
1995 58,846 52,698 3,509 2,631 8 100.0 89.6 6.0 4.5 0.0
1990 43,345 38,896 2,295 2,118 36 100.0 89.7 5.3 4.9 0.1
1980 16,780 14,549 1,261 866 104 100.0 86.7 7.5 5.2 0.6
1973 14,333 12,382 1,104 714 133 100.0 86.4 7.7 5.0 0.9
1967 10,986 9,035 1,078 610 263 100.0 82.2 9.8 5.6 2.4
1958 8,290 6,654 969 405 262 100.0 80.3 11.7 4.9 3.2
1935 4,297 3,194 788 24 291 100.0 74.3 18.3 0.6 6.8
1930 3,829 2,915 644 43 227 100.0 76.1 16.8 1.1 5.9
1925 3,493 2,639 487 180 187 100.0 75.6 13.9 5.2 5.4
1920 3,398 2,449 651 112 186 100.0 72.1 19.2 3.3 5.5
Source: Census reports for respective years
Note: 1920 to 1935 for Natives only
Note: "0.0" means less than 1 percent.
Table 1.2 Population Density by Island, CNMI: 1920 to 2010
Census
Year
Population Persons Per Square Mile
Total Saipan Rota Tinian
N. Is-
land Total Saipan Rota Tinian
N. Is-
lands
2010 53,883 48,220 2,527 3,136 0 305 1,037 77 80 0
2000 69,221 62,392 3,283 3,540 6 392 1,342 100 90 0
1995 58,846 52,698 3,509 2,631 8 333 1,133 107 67 0
1990 43,345 38,896 2,295 2,118 36 246 836 70 54 1
1980 16,780 14,549 1,261 866 104 95 313 38 22 2
1973 14,333 12,382 1,104 714 133 81 266 34 18 2
1967 10,986 9,035 1,078 610 263 62 194 33 16 5
1958 8,290 6,654 969 405 262 47 143 30 10 5
1935 4,297 3,194 788 24 291 24 69 24 1 5
1930 3,829 2,915 644 43 227 22 63 20 1 4
1925 3,493 2,639 487 180 187 20 57 15 5 3
1920 3,398 2,449 651 112 186 19 53 20 3 3
Source: Census reports for respective years
Note; 1920 to 1935 for Natives only
Note: Total 176.5 sq. mi; Saipan 46.5, Rota 32.8, Tinian 39.2, Northern Islands 55.3
017,5
00
35,0
00
52,5
00
70,0
00
Popuplation, CNMI: 1920 to 2010
19 20 22 24
4762
8195
246
333
392
305
0100
200
300
400
Persons per Square Mile
Saipan
89.5%
Rota
4.7%
Tinian
5.8%
Popuplation, CNMI: 2010
Saipan
86.7%
Rota
7.5%
Tinian
5.2%
N Islands
0.6%
Popuplation, CNMI: 1980
Saipan
72.1%
Rota
19.2%Tinian
3.3%
N Islands
5.5%
Popuplation, CNMI: 1920

Page 4 Chapter 1 2015 CNMI Statistical Yearbook
11th Statistical Yearbook, Central Statistics Division, Department of Commerce
Table 1.3 Population by Island and District, CNMI: 1990, 1995, 2000 and 2010
Island and
District
Numbers Percent
change 2000
to 2010
Percent
2010 2000 1995 1990 2010 2000 1995 1990
Total 53,883 69,221 58,846 43,345 -22.2 100.0 100.0 100.0 100.0
Saipan 48,220 62,392 52,698 38,896 -22.7 89.5 90.1 89.6 89.7
District 1 15,160 12,887 9,739 7,685 17.6 28.1 18.6 16.5 17.7
District 2 6,382 6,348 6,508 5,256 0.5 11.8 9.2 11.1 12.1
District 3 15,624 18,744 17,674 14,954 -16.6 29.0 27.1 30.0 34.5
District 4 3,847 8,568 6,271 4,425 -55.1 7.1 12.4 10.7 10.2
District 5 7,207 15,845 12,506 6,576 -54.5 13.4 22.9 21.3 15.2
Rota 2,527 3,283 3,509 2,295 -23.0 4.7 4.7 6.0 5.3
Tinian 3,136 3,540 2,631 2,118 -11.4 5.8 5.1 4.5 4.9
Northern Is. 0 6 8 36 -100.0 0.0 0.0 0.0 0.1
Source: 1990 CPH-6-CNMI Table 3, 1995 Census Table 1 and 2000 and 2010 Censuses
Note: 2010 Districts determined by the courts; previous districts 2 to 5 now District 2, District 6 now District 1,
District 9 now District 4, District 11 now District 3; Parts of Previous District 1 now in 1 and 2, District 8 now in
Districts 4 and 5 and District 10 now in Districts 1 and 5. So, numbers are estimates.
Table 1.4 Population by Age Group, CNMI: 1973 to 2010
Age Group
Total
2010 2000 1995 1990 1980 1973
Total 53,883 69,221 58,846 43,345 16,780 14,496
Less than 5 4,827 5,792 6,084 4,139 2,464 2,416
5 to 9 4,613 5,420 4,619 3,275 2,148 2,195
10 to 14 4,921 4,377 3,600 2,901 2,193 1,920
15 to 19 4,250 3,943 3,335 2,773 1,703 1,644
20 to 24 2,670 7,566 6,406 5,624 1,512 1,291
25 to 29 3,027 10,540 8,914 6,140 1,463 1,023
30 to 34 3,898 9,641 7,720 5,878 1,303 778
35 to 39 5,057 7,060 6,465 4,330 864 722
40 to 44 5,766 5,591 4,420 3,112 824 614
45 to 49 5,009 3,771 3,040 1,921 660 459
50 to 54 4,123 2,437 1,603 1,247 496 424
55 to 59 2,612 1,199 1,053 771 388 332
60 to 64 1,544 837 649 458 267 271
65 to 74 1,139 748 401 349 228 280
75 to 84 370 233 259 190 139 86
85 yrs. & over 57 66 278 237 128 41
Median 33.4 28.6 28.0 27.4 19.7 17.2
Source: U.S. Census Bureau reports
15,16012,887 9,739 7,685
6,382
6,348 6,508 5,256
15,624
18,744 17,67414,954
3,847
8,5686,271
4,425
7,20715,845 12,506
6,576
0%
10%
20%
30%
40%
50%
60%
70%
80%
90%
100%
2010 2000 1995 1990
Saipan Districts, CNMI: 1990 to 2010
Disrict 1 Disrict 2 Disrict 3
Disrict 4 Disrict 5
17.2
19.7
27.4 28.0 28.6
33.4
0.0
5.0
10.0
15.0
20.0
25.0
30.0
35.0
40.0
1973 1980 1990 1995 2000 2010
Median Age

2015 CNMI Statistical Yearbook Chapter 1 Page 5
11th Statistical Yearbook, Central Statistics Division, Department of Commerce
Table 1.5 Population by Age Group and Sex, CNMI: 1980 to 2010
Age Group
Males Females
2010 2000 1995 1990 1980 2010 2000 1995 1990 1980
Males 27,746 31,984 29,276 22,802 8,817 26,137 37,237 29,570 20,543 7,963
Less than 5 2,476 3,043 3,114 2,130 1,274 2,351 2,749 2,970 2,009 1,190
5 to 9 2,339 2,788 2,355 1,686 1,040 2,274 2,632 2,264 1,589 1,108
10 to 14 2,589 2,245 1,808 1,494 1,119 2,332 2,132 1,792 1,407 1,074
15 to 19 2,199 1,738 1,616 1,215 842 2,051 2,205 1,719 1,558 861
20 to 24 1,321 2,065 2,198 1,832 709 1,349 5,501 4,208 3,792 803
25 to 29 1,321 3,527 3,631 3,134 753 1,706 7,013 5,283 3,006 710
30 to 34 1,846 4,200 3,903 3,330 743 2,052 5,441 3,817 2,548 560
35 to 39 2,481 3,775 3,625 2,635 520 2,576 3,285 2,840 1,695 344
40 to 44 2,978 3,200 2,634 2,042 520 2,788 2,391 1,786 1,070 304
45 to 49 2,756 2,187 1,872 1,352 404 2,253 1,584 1,168 569 256
50 to 54 2,288 1,488 1,035 861 315 1,835 949 568 386 181
55 to 59 1,435 729 656 466 225 1,177 470 397 305 163
60 to 64 882 493 378 262 125 662 344 271 196 142
65 to 74 638 380 221 195 119 501 368 180 154 109
75 to 84 174 104 127 85 65 196 129 132 105 74
85 yrs. &
over 23 22 103 83 44 34 44 175 154 84
Median 34.4 30.7 29.9 29.9 20.9 32.5 27.4 26.7 24.9 18.5
Source: U.S. Census Bureau reports
Table 1.6 Age Distribution by Island, CNMI: 1990 to 2010
Age
Group
Saipan Rota Tinian
2010 2000 1995 1990 2010 2000 1995 1990 2010 2000 1995 1990
Total 48,220 62,392 52,698 38,896 2,562 3,283 3,509 2,295 3,170 3,540 2,631 2,118
0 to 4 4,349 5,103 5,311 3,591 203 368 393 277 275 321 379 263
5 to 9 4,139 4,703 4,004 2,817 227 367 312 235 247 350 303 219
10 to 14 4,407 3,801 3,128 2,498 257 287 262 210 257 288 210 190
15 to 19 3,835 3,512 2,955 2,494 192 220 205 149 223 209 175 127
20 to 24 2,436 7,190 5,886 5,179 84 166 325 221 150 210 194 220
25 to 29 2,711 9,766 8,126 5,608 115 299 476 222 201 475 311 307
30 to 34 3,429 8,763 7,005 5,326 186 387 411 287 283 490 302 258
35 to 39 4,458 6,340 5,826 3,944 247 323 368 206 352 396 270 179
40 to 44 5,105 4,989 3,964 2,803 277 296 266 175 384 306 190 134
45 to 49 4,482 3,335 2,705 1,744 220 220 201 93 307 215 134 82
50 to 54 3,725 2,157 1,457 1,144 203 149 92 49 195 131 53 53
55 to 59 2,339 1,088 959 706 147 70 56 46 126 41 38 19
60 to 64 1,389 748 578 390 80 43 45 44 75 46 25 24
65 to 69 634 429 343 302 41 34 37 25 24 23 21 22
70 to 74 403 216 227 162 17 24 17 24 20 22 15 4
75 and
over 379 252 224 188 31 30 43 32 17 17 11 17
Median 33.3 28.7 28.1 27.6 35.0 29.1 27.7 26.2 33.8 29.2 25.9 25.6
Source: 1995 CNMI Mid-Decade Census Table 6, 1990, 2000 and 2010 CNMI Censuses
20.9
29.9 29.9 30.7
34.4
18.5
24.926.7 27.4
32.5
0.0
5.0
10.0
15.0
20.0
25.0
30.0
35.0
40.0
1980 1990 1995 2000 2010
Median Age by Sex
Males Females
0.0
5.0
10.0
15.0
20.0
25.0
30.0
35.0
40.0
2010 2000 1995 1990
Median Age by Island: 1990 to 2010
Saipan Rota Tinian

Page 6 Chapter 1 2015 CNMI Statistical Yearbook
11th Statistical Yearbook, Central Statistics Division, Department of Commerce
Table 1.7 Population Change by Age and Island: 2010
Age
CNMI Total Saipan Rota Tinian
2010 2000 Change 2010 2000 Change 2010 2000 Change 2010 2000 Change
Total 53,883 69,221 -22.2 48,220 62,390 -22.7 2,527 3,284 -23.1 3,136 3,541 -11.4
Under 5 4,827 5,792 -16.7 4,349 5,103 -14.8 203 368 -44.8 275 321 -14.3
5 to 9 4,613 5,420 -14.9 4,139 4,703 -12.0 227 367 -38.1 247 350 -29.4
10 to 14 4,921 4,377 12.4 4,407 3,801 15.9 257 287 -10.5 257 288 -10.8
15 to 19 4,250 3,943 7.8 3,835 3,512 9.2 192 220 -12.7 223 209 6.7
20 to 24 2,670 7,566 -64.7 2,436 7,190 -66.1 84 166 -49.4 150 210 -28.6
25 to 29 3,027 10,540 -71.3 2,711 9,765 -72.2 115 300 -61.7 201 475 -57.7
30 to 34 3,898 9,641 -59.6 3,429 8,762 -60.9 186 387 -51.9 283 491 -42.4
35 to 39 5,057 7,060 -28.4 4,458 6,340 -29.7 247 323 -23.5 352 396 -11.1
40 to 44 5,766 5,591 3.1 5,105 4,989 2.3 277 296 -6.4 384 306 25.5
45 to 49 5,009 3,771 32.8 4,482 3,335 34.4 220 220 0.0 307 215 42.8
50 to 54 4,123 2,437 69.2 3,725 2,157 72.7 203 149 36.2 195 131 48.9
55 to 59 2,612 1,199 117.8 2,339 1,088 115.0 147 70 110.0 126 41 207.3
60 to 64 1,544 837 84.5 1,389 748 85.7 80 43 86.0 75 46 63.0
65 to 69 699 486 43.8 634 429 47.8 41 34 20.6 24 23 4.3
70 to 74 440 262 67.9 403 216 86.6 17 24 -29.2 20 22 -9.1
75 and over 427 299 42.8 379 252 50.4 31 30 3.3 17 17 0.0
Source: U.S. Census Bureau
Table 1.8 Population by Age, Island and District: 2010
Age CNMI
Saipan
Rota Tinian Total District 1 District 2 District 3 District 4 District 5
Total 53,883 48,220 15,160 6,382 15,624 3,847 7,207 2,527 3,136
Under 5 4,827 4,349 1,441 578 1,378 334 618 203 275
5 to 9 4,613 4,139 1,404 519 1,240 323 653 227 247
10 to 14 4,921 4,407 1,428 533 1,210 379 857 257 257
15 to 19 4,250 3,835 1,207 450 1,044 311 823 192 223
20 to 24 2,670 2,436 814 305 727 195 395 84 150
25 to 29 3,027 2,711 832 353 947 234 345 115 201
30 to 34 3,898 3,429 1,076 462 1,250 245 396 186 283
35 to 39 5,057 4,458 1,317 630 1,642 277 592 247 352
40 to 44 5,766 5,105 1,472 755 1,745 410 723 277 384
45 to 49 5,009 4,482 1,397 614 1,486 365 620 220 307
50 to 54 4,123 3,725 1,164 529 1,231 297 504 203 195
55 to 59 2,612 2,339 729 324 790 214 282 147 126
60 to 64 1,544 1,389 455 158 449 116 211 80 75
65 to 69 699 634 191 76 216 60 91 41 24
70 to 74 440 403 112 45 152 44 50 17 20
75 to 79 250 225 71 27 71 28 28 17 8
80 to 84 120 107 32 14 35 13 13 9 4
85 and over 57 47 18 10 11 2 6 5 5
Median 33.4 33.3 32.1 34.9 35.1 32.9 28.8 35.0 33.8
Source: U.S. Census Bureau
33.4 33.332.1
34.9 35.132.9
28.8
35.033.8
0.0
5.0
10.0
15.0
20.0
25.0
30.0
35.0
40.0
Median Age for Districts and Islands: 2010
11000 9000 7000 5000 3000 1000 1000 3000 5000 7000 9000 11000
Under 5
5 to 9
10 to 14
15 to 19
20 to 24
25 to 29
30 to 34
35 to 39
40 to 44
45 to 49
50 to 54
55 to 59
60 to 64
65 to 69
70 to 74
75 and over
CNMI: 2000 and 2010 - 1. Population by Age and Year
2010 2000

2015 CNMI Statistical Yearbook Chapter 1 Page 7
11th Statistical Yearbook, Central Statistics Division, Department of Commerce
Table 1.9 Population by Age, Island and District: 2010
Age CNMI
Saipan
Rota Tinian Total District 1 District 2 District 3 District 4 District 5
Males 27,746 24,735 7,770 3,398 7,963 1,996 3,608 1,337 1,674
Under 5 2,476 2,216 717 290 729 163 317 105 155
5 to 9 2,339 2,090 697 259 658 161 315 118 131
10 to 14 2,589 2,350 790 296 600 211 453 114 125
15 to 19 2,199 1,983 621 236 531 162 433 103 113
20 to 24 1,321 1,204 414 163 332 100 195 45 72
25 to 29 1,321 1,172 362 164 389 106 151 46 103
30 to 34 1,846 1,627 506 230 575 129 187 95 124
35 to 39 2,481 2,149 629 348 785 131 256 127 205
40 to 44 2,978 2,594 747 414 861 221 351 167 217
45 to 49 2,756 2,458 785 329 826 193 325 130 168
50 to 54 2,288 2,060 623 312 713 156 256 113 115
55 to 59 1,435 1,282 397 175 443 119 148 80 73
60 to 64 882 785 249 92 263 59 122 49 48
65 to 69 387 354 112 45 115 40 42 23 10
70 to 74 251 237 65 25 90 23 34 9 5
75 to 79 114 101 28 12 33 15 13 8 5
80 to 84 60 54 18 6 16 6 8 4 2
85 and over 23 19 10 2 4 1 2 1 3
Median 34.4 34.2 32.9 36.1 36.4 33.5 28.3 37.2 35.4
Source: U.S. Census Bureau
3000 2000 1000 0 1000 2000 3000
Under 5
5 to 9
10 to 14
15 to 19
20 to 24
25 to 29
30 to 34
35 to 39
40 to 44
45 to 49
50 to 54
55 to 59
60 to 64
65 to 69
70 to 74
75 to 79
80 to 84
85 and over
CNMI: 2010 - 1. Population by Age and Sex
Male Female
175 125 75 25 25 75 125 175
Under 5
5-9
10-14
15-19
20-24
25-29
30-34
35-39
40-44
45-49
50-54
55-59
60-64
65-69
70-74
75-79
80-84
85+
Rota: 2010 - Population by Age and Sex
Male Female
2700 1800 900 0 900 1800 2700
Under 5
5-9
10-14
15-19
20-24
25-29
30-34
35-39
40-44
45-49
50-54
55-59
60-64
65-69
70-74
75-79
80-84
85+
Saipan: 2010 - Population by Age and Sex
Male Female
225 150 75 0 75 150 225
Under 5
5-9
10-14
15-19
20-24
25-29
30-34
35-39
40-44
45-49
50-54
55-59
60-64
65-69
70-74
75-79
80-84
85+
Tinian: 2010 - Population by Age and Sex
Male Female

Page 8 Chapter 1 2015 CNMI Statistical Yearbook
11th Statistical Yearbook, Central Statistics Division, Department of Commerce
Table 1.10 Population by Age, Island and District: 2010
Age CNMI
Saipan
Rota Tinian Total District 1 District 2 District 3 District 4 District 5
Females 26,137 23,485 7,390 2,984 7,661 1,851 3,599 1,190 1,462
Under 5 2,351 2,133 724 288 649 171 301 98 120
5 to 9 2,274 2,049 707 260 582 162 338 109 116
10 to 14 2,332 2,057 638 237 610 168 404 143 132
15 to 19 2,051 1,852 586 214 513 149 390 89 110
20 to 24 1,349 1,232 400 142 395 95 200 39 78
25 to 29 1,706 1,539 470 189 558 128 194 69 98
30 to 34 2,052 1,802 570 232 675 116 209 91 159
35 to 39 2,576 2,309 688 282 857 146 336 120 147
40 to 44 2,788 2,511 725 341 884 189 372 110 167
45 to 49 2,253 2,024 612 285 660 172 295 90 139
50 to 54 1,835 1,665 541 217 518 141 248 90 80
55 to 59 1,177 1,057 332 149 347 95 134 67 53
60 to 64 662 604 206 66 186 57 89 31 27
65 to 69 312 280 79 31 101 20 49 18 14
70 to 74 189 166 47 20 62 21 16 8 15
75 to 79 136 124 43 15 38 13 15 9 3
80 to 84 60 53 14 8 19 7 5 5 2
85 and over 34 28 8 8 7 1 4 4 2
Median 32.5 32.5 31.5 33.5 33.9 32.0 29.3 32.6 32.3
Source: U.S. Census Bureau
Table 1.11 Males per 100 Females by Age, Island and District: 2010
Age CNMI
Saipan
Rota Tinian Total District 1 District 2 District 3 District 4 District 5
Total 106.2 105.3 105.1 113.9 103.9 107.8 100.3 112.4 114.5
Under 5 105.3 103.9 99.0 100.7 112.3 95.3 105.3 107.1 129.2
5 to 9 102.9 102.0 98.6 99.6 113.1 99.4 93.2 108.3 112.9
10 to 14 111.0 114.2 123.8 124.9 98.4 125.6 112.1 79.7 94.7
15 to 19 107.2 107.1 106.0 110.3 103.5 108.7 111.0 115.7 102.7
20 to 24 97.9 97.7 103.5 114.8 84.1 105.3 97.5 115.4 92.3
25 to 29 77.4 76.2 77.0 86.8 69.7 82.8 77.8 66.7 105.1
30 to 34 90.0 90.3 88.8 99.1 85.2 111.2 89.5 104.4 78.0
35 to 39 96.3 93.1 91.4 123.4 91.6 89.7 76.2 105.8 139.5
40 to 44 106.8 103.3 103.0 121.4 97.4 116.9 94.4 151.8 129.9
45 to 49 122.3 121.4 128.3 115.4 125.2 112.2 110.2 144.4 120.9
50 to 54 124.7 123.7 115.2 143.8 137.6 110.6 103.2 125.6 143.8
55 to 59 121.9 121.3 119.6 117.4 127.7 125.3 110.4 119.4 137.7
60 to 64 133.2 130.0 120.9 139.4 141.4 103.5 137.1 158.1 177.8
65 to 69 124.0 126.4 141.8 145.2 113.9 200.0 85.7 127.8 71.4
70 to 74 132.8 142.8 138.3 125.0 145.2 109.5 212.5 112.5 33.3
75 to 79 83.8 81.5 65.1 80.0 86.8 115.4 86.7 88.9 166.7
80 to 84 100.0 101.9 128.6 75.0 84.2 85.7 160.0 80.0 100.0
85 and over 67.6 67.9 125.0 25.0 57.1 100.0 50.0 25.0 150.0
Source: U.S. Census Bureau
106.2105.3 105.1
113.9
103.9
107.8
100.3
112.4
114.5
90.0
95.0
100.0
105.0
110.0
115.0
120.0
Males per 100 Females for Districts and Islands:
2010

2015 CNMI Statistical Yearbook Chapter 1 Page 9
11th Statistical Yearbook, Central Statistics Division, Department of Commerce
Table 1.12 Males per 100 Females by Age, CNMI: 1980 to 2010
Age Group 2010 2000 1995 1990 1980
Total 106.2 85.9 99.0 111.0 110.7
Less than 5 105.3 110.7 104.8 106.0 107.1
5 to 9 102.9 105.9 104.0 106.1 93.9
10 to 14 111.0 105.3 100.9 106.2 104.2
15 to 19 107.2 78.8 94.0 78.0 97.8
20 to 24 97.9 37.5 52.2 48.3 88.3
25 to 29 77.4 50.3 68.7 104.3 106.1
30 to 34 90.0 77.2 102.3 130.7 132.7
35 to 39 96.3 114.9 127.6 155.5 151.2
40 to 44 106.8 133.8 147.5 190.8 171.1
45 to 49 122.3 138.1 160.3 237.6 157.8
50 to 54 124.7 156.8 182.2 223.1 174.0
55 to 59 121.9 155.1 165.2 152.8 138.0
60 to 64 133.2 143.3 139.5 133.7 88.0
65 to 74 127.3 103.3 122.8 126.6 109.2
75 to 84 88.8 80.6 96.2 81.0 87.8
85 yrs. & over 67.6 50.0 58.9 53.9 52.4
Source: PC80-l-B57A Table 4a, CPH-6-CNMI Table 6 and 1995 CNMI Mid-Decade Census Table 6
Table 1.13 Males per 100 Females by Island, CNMI: 1990 to 2010
Age group
Saipan Rota Tinian
2010 2000 1995 1990 2010 2000 1995 1990 2010 2000 1995 1990
Total 105.3 82.6 96.5 109.2 112.4 123.2 136.0 126.6 114.5 121.2 108.3 130.7
Less than 5 103.9 112.4 104.7 105.9 107.1 89.7 114.8 113.1 129.2 109.8 97.4 99.2
5 to 9 102.0 105.8 105.6 106.1 108.3 119.8 109.4 99.2 112.9 94.4 80.4 114.7
10 to 14 114.2 106.4 99.6 108.9 79.7 109.5 109.6 105.9 94.7 89.5 110.0 77.6
15 to 19 107.1 74.6 92.3 75.5 115.7 124.5 107.1 101.4 102.7 122.3 110.8 108.2
20 to 24 97.7 35.4 49.3 45.3 115.4 102.4 99.4 102.8 92.3 94.4 92.1 88.0
25 to 29 76.2 46.7 64.3 100.7 66.7 115.8 168.9 155.2 105.1 119.9 94.4 147.6
30 to 34 90.3 73.3 98.6 128.4 104.4 144.9 193.6 154.0 78.0 118.2 102.7 163.3
35 to 39 93.1 110.6 125.3 154.6 105.8 176.1 161.0 131.5 139.5 152.2 138.9 219.6
40 to 44 103.3 132.0 147.4 188.7 151.8 129.5 146.3 191.7 129.9 173.2 150.0 243.6
45 to 49 121.4 140.1 158.1 239.3 144.4 115.7 168.0 190.6 120.9 133.7 197.8 272.7
50 to 54 123.7 152.9 186.8 229.7 125.6 166.1 170.6 188.2 143.8 227.5 112.0 140.9
55 to 59 121.3 156.6 170.1 153.0 119.4 159.3 143.5 119.0 137.7 115.8 100.0 280.0
60 to 64 130.0 149.3 142.9 130.8 158.1 115.0 87.5 144.4 177.8 91.7 177.8 166.7
65 to 69 126.4 106.3 127.2 132.3 127.8 70.0 117.6 177.8 71.4 130.0 75.0 46.7
70 to 74 142.8 98.2 90.8 80.0 112.5 118.2 183.3 71.4 33.3 120.0 114.3 300.0
75 and over 84.9 68.0 51.4 49.2 72.2 114.3 87.0 60.0 142.9 88.9 175.0 112.5
Source: 1995 CNMI Mid-Decade Census Table 6, 1990, 2000 and 2010 CNMI Censuses
106.2
85.9
99.0
111.0 110.7
0.0
20.0
40.0
60.0
80.0
100.0
120.0
2010 2000 1995 1990 1980
Males per 100 Females: 1980 to 2010
105.3
112.4
114.5
82.6
123.2
121.2
96.5
136.0
108.3
109.2
126.6
130.7
0.0
20.0
40.0
60.0
80.0
100.0
120.0
140.0
160.0
Saipan Rota Tinian
Males per 100 Females by Island: 1990 to 2010
2010 2000 1995 1990

Page 10 Chapter 1 2015 CNMI Statistical Yearbook
11th Statistical Yearbook, Central Statistics Division, Department of Commerce
Table 1.14 Relationship by District and Island, CNMI: 2010
Relationship
2010 2000
Total Saipan Rota Tinian Total Saipan Rota Tinian
Total 53,883 48,220 2,527 3,136 69,215 62,392 3,283 3,540
In households 52,312 47,066 2,444 2,802 51,424 45,562 3,003 2,859
Householder 16,035 14,406 755 874 14,054 12,507 757 790
Spouse 6,551 5,914 318 319 6,445 5,746 362 337
Child 17,463 15,714 825 924 17,557 15,348 1,117 1,092
Under 18 years 13,873 12,437 687 749 14,352 12,510 920 922
Other relatives 5,988 5,444 238 306 5,682 5,085 344 253
Under 18 years 2,942 2,641 129 172 2,930 2,568 210 152
Nonrelatives 6,275 5,588 308 379 7,688 6,878 423 387
Unmarried partner 2,706 2,366 153 187 1,559 1,370 109 80
In group quarters 1,571 1,154 83 334 17,791 16,830 280 681
Institutional population 133 133 0 0 92 92 0 0
Noninstitutional population 1,438 1,021 83 334 17,699 16,738 280 681
Source: U.S. Census Bureau
Table 1.15 Relationship by District and Island, CNMI: 2010
Relationship Total
Saipan
Rota Tinian Total Dist. 1 Dist. 2 Dist. 3 Dist. 4 Dist. 5
Total 53,883 48,220 15,160 6,382 15,624 3,847 7,207 2,527 3,136
In households 52,312 47,066 14,966 6,132 15,103 3,756 7,109 2,444 2,802
Householder 16,035 14,406 4,287 2,010 5,183 1,066 1,860 755 874
Spouse 6,551 5,914 1,851 690 1,906 506 961 318 319
Child 17,463 15,714 5,181 1,940 4,545 1,275 2,773 825 924
Under 18 years 13,873 12,437 4,069 1,554 3,716 932 2,166 687 749
18 to 26 years 2,442 2,227 750 252 525 222 478 95 120
Other relatives 5,988 5,444 1,845 649 1,531 550 869 238 306
Under 18 years 2,942 2,641 906 300 682 292 461 129 172
65 years and over 294 269 102 29 76 21 41 19 6
Nonrelatives 6,275 5,588 1,802 843 1,938 359 646 308 379
Under 18 years 274 249 91 42 83 10 23 10 15
65 years and over 45 42 16 5 14 4 3 3 0
Unmarried partner 2,706 2,366 773 374 732 164 323 153 187
In group quarters 1,571 1,154 194 250 521 91 98 83 334
Institutional population 133 133 0 125 1 0 7 0 0
Males 124 124 0 116 1 0 7 0 0
Female 9 9 0 9 0 0 0 0 0
Noninstitutional population 1,438 1,021 194 125 520 91 91 83 334
Males 932 644 155 99 250 75 65 75 213
Female 506 377 39 26 270 16 26 8 121
Source: U.S. Census Bureau
Household
er
31%
Spouse
13%Child
33%
Other
relatives
11%
Nonrelatives
12%
Relationship to Householder: 2010
16,035 14,406 755 874
6,551 5,914 318 319
17,463 15,714 825 924
5,988 5,444 238 306
6,275 5,588 308 379
0%
10%
20%
30%
40%
50%
60%
70%
80%
90%
100%
Total Saipan Rota Tinian
Relationship by Island: 2010
Householder Spouse Child Other relatives Nonrelatives
Househol
der
30%
Spouse
12%
Child
32%
Other
relatives
11%
Nonrelatives
12%
In group
quarters
3%
Relationship, CNMI: 2010

2015 CNMI Statistical Yearbook Chapter 1 Page 11
11th Statistical Yearbook, Central Statistics Division, Department of Commerce
Table 1.16 Households by Type and Island, CNMI: 2010
Household Type
2010 2000
Total Saipan Rota Tinian Total Saipan Rota Tinian
Total 16,035 14,406 755 874 14,054 12,507 757 790
Family households 10,714 9,633 508 573 9,406 8,364 538 504
With own children under 18 years 6,931 6,243 322 366 6,569 5,824 376 369
Married husband-wife families 6,551 5,914 318 319 6,445 5,746 362 337
With own children under 18 years 4,051 3,672 180 199 4,526 4,031 252 243
Female householder, no wife present 2,428 2,211 92 125 1,662 1,481 95 86
With own children under 18 years 1,622 1,483 64 75 1,106 984 60 62
Nonfamily households 5,321 4,773 247 301 4,648 4,143 219 286
Householder living alone 3,531 3,166 162 203 2,699 2,408 114 177
65 years and over 183 161 13 9 78 63 9 6
With individuals under 18 years 8,030 7,224 377 429 7,382 6,538 431 413
With individuals 65 years and over 1,332 1,200 78 54 876 753 72 51
Average household size 3.26 3.27 3.24 3.21 xx 3.64 3.97 3.62
Average family size 3.80 3.81 3.72 3.70 xx 4.13 4.39 4.34
Source: U.S. Census Bureau
Table 1.17 Grandparents as Caregivers by District and Island, CNMI: 2010
Grandparents Total
Saipan
Rota Tinian Total Dist. 1 Dist. 2 Dist. 3 Dist. 4 Dist. 5
Total 2,143 1,908 700 187 466 206 349 115 120
Grandparent responsible for grandchildren 1,261 1,118 416 119 266 116 201 70 73
Less than 6 months 124 114 38 13 25 10 28 7 3
6 to 11 months 102 90 26 18 22 6 18 5 7
1 or 2 years 293 252 86 24 60 35 47 16 25
3 or 4 years 189 171 77 16 34 14 30 14 4
5 years or more 553 491 189 48 125 51 78 28 34
Source: U.S. Census Bureau
Table 1.18 Grandparents as Caregivers by Island, CNMI: 2000 and 2010
Grandparents
2010 2000
Total Saipan Rota Tinian Total Saipan Rota Tinian
Total 2,143 1,908 115 120 2,182 1,924 145 113
Grandparent responsible for grandchildren 1,261 1,118 70 73 1,266 1109 84 73
Less than 6 months 124 114 7 3 99 80 12 7
6 to 11 months 102 90 5 7 99 83 7 9
1 or 2 years 293 252 16 25 288 258 21 9
3 or 4 years 189 171 14 4 213 182 16 15
5 years or more 553 491 28 34 568 507 28 33
Source: U.S. Census Bureau
3.26 3.27 3.24 3.21
3.66 3.64
3.97
3.623.80 3.81 3.72 3.70
4.16 4.134.39 4.34
0.00
0.50
1.00
1.50
2.00
2.50
3.00
3.50
4.00
4.50
5.00
Total Saipan Rota Tinian Total Saipan Rota Tinian
2010 2000
Household and Family Size by Island: 2000 and 2010
Average household size Average family size
58.8 58.6
60.9 60.8
58.0 57.6 57.9
64.6
54.0
56.0
58.0
60.0
62.0
64.0
66.0
To
tal
Sai
pan
Ro
ta
Tin
ian
To
tal
Sai
pan
Ro
ta
Tin
ian
2010 2000
Percent Grandparent Responsible for
Grandchildren by Island: 2000 and 2010

Page 12 Chapter 1 2015 CNMI Statistical Yearbook
11th Statistical Yearbook, Central Statistics Division, Department of Commerce
Table 1.19 Marital Status by District and Island, CNMI: 2010
Marital Status Total
Saipan
Rota Tinian Total Dist. 1 Dist. 2 Dist. 3 Dist. 4 Dist. 5
Males 20,342 18,079 5,566 2,553 5,976 1,461 2,523 1,000 1,263
Never married 7,622 6,783 2,089 973 2,112 560 1,049 355 484
Now married 10,766 9,562 2,952 1,288 3,268 786 1,268 542 662
Separated 865 759 235 118 271 50 85 50 56
Widowed 395 360 112 63 120 22 43 21 14
Divorced 694 615 178 111 205 43 78 32 47
Females 19,180 17,246 5,321 2,199 5,820 1,350 2,556 840 1,094
Never married 7,616 6,834 2,134 868 2,263 535 1,034 314 468
Now married 8,819 7,960 2,441 966 2,725 631 1,197 395 464
Separated 720 633 191 116 214 38 74 36 51
Widowed 1,158 1,029 311 162 318 102 136 63 66
Divorced 867 790 244 87 300 44 115 32 45
Source: U.S. Census Bureau
Table 1.20 Marital Status by Island, CNMI: 2000 and 2010
Marital Status
2010 2000
Total Saipan Rota Tinian Total Saipan Rota Tinian
Males 20,342 18,079 1,000 1,263 23,906 21,152 1,289 1,465
Never married 7,622 6,783 355 484 9,037 8,007 470 560
Now married 10,766 9,562 542 662 13,814 12,255 729 830
Separated 865 759 50 56 452 379 45 28
Widowed 395 360 21 14 239 197 24 18
Divorced 694 615 32 47 364 314 21 29
Females 19,180 17,246 840 1,094 29,721 27,633 972 1,116
Never married 7,616 6,834 314 468 13,425 12,575 353 497
Now married 8,819 7,960 395 464 14,406 13,419 495 492
Separated 720 633 36 51 464 383 39 42
Widowed 1,158 1,029 63 66 881 762 65 54
Divorced 867 790 32 45 545 494 20 31
Source: U.S. Census Bureau
37.5 37.535.5
38.3 37.8 37.9 36.5 38.239.7 39.6
37.4
42.8
45.2 45.5
36.3
44.5
20.0
25.0
30.0
35.0
40.0
45.0
50.0
Total Saipan Rota Tinian Total Saipan Rota Tinian
2010 2000
Percent Never Married by Island and Sex: 2000 and
2010
Males Females

2015 CNMI Statistical Yearbook Chapter 1 Page 13
11th Statistical Yearbook, Central Statistics Division, Department of Commerce
Table 1.21a. Children Ever Born by District and Island, CNMI: 2010
CHILDREN EVER
BORN (FERTILITY)
FOR WOMEN 15 TO 44
YEARS [7] CNMI
Saipan
Rota Tinian Total
District
1
District
2
District
3
District
4
District
5
Total: 12,522 11,245 3,439 1,400 3,882 823 1,701 518 759
15 to 24 years: 3,400 3,084 986 356 908 244 590 128 188
Children ever born
(aggregate) 1,013 913 353 100 188 76 196 30 70
25 to 34 years: 3,758 3,341 1,040 421 1,233 244 403 160 257
Children ever born
(aggregate) 5,659 4,967 1,734 663 1,500 376 694 289 403
35 to 44 years: 5,364 4,820 1,413 623 1,741 335 708 230 314
Children ever born
(aggregate) 11,661 10,353 3,126 1,298 3,220 759 1,950 619 689
Source: US Census Bureau, 2010
Table 1.21b. Children Ever Born by District and Island, CNMI: 2010
CHILDREN EVER
BORN (FERTILITY)
FOR EVER MARRIED
WOMEN 15 TO 44
YEARS [7] CNMI
Saipan
Rota Tinian Total
District
1
District
2
District
3
District
4
District
5
Total: 6,103 5,504 1,648 700 1,986 384 786 254 345
15 to 24 years: 342 312 128 44 84 17 39 14 16
Children ever born
(aggregate) 358 332 144 45 75 22 46 12 14
25 to 34 years: 1,867 1,670 524 214 619 118 195 78 119
Children ever born
(aggregate) 3,327 2,969 1,065 372 924 218 390 149 209
35 to 44 years: 3,894 3,522 996 442 1,283 249 552 162 210
Children ever born
(aggregate) 9,104 8,136 2,380 985 2,598 623 1,550 458 510
Source: US Census Bureau, 2010
Table 1.21c. Children Ever Born by District and Island, CNMI: 2010
CHILDREN EVER
BORN (FERTILITY)
PER 1,000 WOMEN 15
TO 44 YEARS [3] CNMI
Saipan
Rota Tinian Total
District
1
District
2
District
3
District
4
District
5
Children ever born per
1,000 women — Women 15 to 24
years (rate) 298 296 358 281 207 311 332 234 372
Women 25 to 34
years (rate) 1,506 1,487 1,667 1,575 1,217 1,541 1,722 1,806 1,568
Women 35 to 44
years (rate) 2,174 2,148 2,212 2,083 1,850 2,266 2,754 2,691 2,194
Source: US Census Bureau, 2010
Table 1.21d. Children Ever Born by District and Island, CNMI: 2010
CHILDREN EVER
BORN (FERTILITY)
PER 1,000 EVER MAR-
RIED WOMEN 15 TO
44 YEARS [3] CNMI
Saipan
Rota Tinian Total
District
1
District
2
District
3
District
4
District
5
Children ever born per
1,000 women — Ever married women
15 to 24 years (rate) 1,047 1,064 1,125 1,023 893 1,294 1,179 857 875
Ever married women
25 to 34 years (rate) 1,782 1,778 2,032 1,738 1,493 1,847 2,000 1,910 1,756
Ever married women
35 to 44 years (rate) 2,338 2,310 2,390 2,229 2,025 2,502 2,808 2,827 2,429
Source: US Census Bureau, 2010
Table 1.21e. Children Ever Born by District and Island, CNMI: 2010
CHILDREN EVER
BORN (FERTILITY)
FOR WOMEN 35 TO 44
YEARS [7] CNMI
Saipan
Rota Tinian Total
District
1
District
2
District
3
District
4
District
5
Total: 5,364 4,820 1,413 623 1,741 335 708 230 314
No children 822 727 204 69 316 53 85 36 59
1 child 1,232 1,132 318 185 471 61 97 23 77
2 children 1,376 1,272 380 168 475 91 158 46 58
3 children 946 841 245 110 272 66 148 57 48
4 children 513 438 137 49 118 27 107 34 41
5 or more children 475 410 129 42 89 37 113 34 31
Source: US Census Bureau, 2010
2.17 2.15 2.212.08
1.85
2.27
2.75 2.69
2.19
0.00
0.50
1.00
1.50
2.00
2.50
3.00
Children Born to Females 35 to 44 years by District
and Island: 2010

Page 14 Chapter 1 2015 CNMI Statistical Yearbook
11th Statistical Yearbook, Central Statistics Division, Department of Commerce
Table 1.22 Fertility by Islands, CNMI: 2000 and 2010
Fertility
2010 2000
Total Saipan Rota Tinian Total Saipan Rota Tinian
Women 15 to 24 years 3,400 3,084 128 188 7,705 7,323 180 202
Children ever born 1,013 913 30 70 1,763 1,524 124 115
Per 1,000 women 298 296 234 372 229 208 689 569
Women ever married 342 312 14 16 859 805 25 29
Children ever born 358 332 12 14 778 702 39 37
Per 1,000 women 1,047 1,064 857 875 906 872 1,560 1,276
Women 25 to 34 years 3,758 3,341 160 257 12,453 11,716 296 441
Children ever born 5,659 4,967 289 403 12,693 11,515 585 593
Per 1,000 women 1,506 1,487 1,806 1,568 1,019 983 1,976 1,345
Women ever married 1,867 1,670 78 119 7,718 7,348 172 198
Children ever born 3,327 2,969 149 209 10,192 9,382 399 411
Per 1,000 women 1,782 1,778 1,910 1,756 1,321 1,277 2,320 2,076
Women 35 to 44 years 5,364 4,820 230 314 5,676 5,161 246 269
Children ever born 11,661 10,353 619 689 11,892 10,494 675 723
Per 1,000 women 2,174 2,148 2,691 2,194 2,095 2,033 2,744 2,688
No children 822 727 36 59 1,129 1,042 38 49
1 child 1,232 1,132 23 77 1,325 1,249 36 40
2 children 1,376 1,272 46 58 1,272 1,176 50 46
3 children 946 841 57 48 833 737 49 47
4 children 513 438 34 41 547 485 25 37
5 or more children 475 410 34 31 570 472 48 50
Women ever married 3,894 3,522 162 210 4,308 3,907 198 203
Children ever born 9,104 8,136 458 510 10,347 9,129 601 617
Per 1,000 women 2,338 2,310 2,827 2,429 2,402 2,337 3,035 3,039
Source: US Census Bureau, 2000 and 2010
Table 1.23 Place of birth for the Foreign-born population by District and Island, CNMI: 2010
Birthplace Total
Saipan
Rota Tinian Total Dist. 1 Dist. 2 Dist. 3 Dist. 4 Dist. 5
Total 24,168 21,993 6,519 3,452 8,639 1,334 2,049 821 1,354
Asia 21,570 19,491 5,547 3,175 8,014 1,095 1,660 774 1,305
Bangladesh 487 365 101 82 155 17 10 64 58
China 3,405 3,179 918 548 1,448 73 192 5 221
Japan 705 646 85 41 380 89 51 22 37
Korea 1,887 1,833 562 296 718 72 185 8 46
Philippines 14,506 13,009 3,798 2,123 5,133 791 1,164 672 825
Other Asia 680 559 183 85 180 53 58 3 118
Oceania 2,325 2,239 847 269 566 208 349 42 44
FSM 1,465 1,411 536 173 380 123 199 25 29
Marshall Islands 62 60 21 7 17 6 9 2 0
Palau 741 716 267 86 154 73 136 15 10
Other Oceania 57 52 23 3 15 6 5 0 5
Elsewhere 173 163 25 8 59 31 40 5 5
Source: U.S. Census Bureau
2.17 2.15
2.69
2.192.10 2.03
2.74 2.69
0.00
0.50
1.00
1.50
2.00
2.50
3.00
Total Saipan Rota Tinian Total Saipan Rota Tinian
2010 2000
Children ever born to Females 35 to 44 by Island:
2000 and 2010
0%
10%
20%
30%
40%
50%
60%
70%
80%
90%
100%
Foreign Born by District and Island: 2010
Philippines China Korea FSM Others

2015 CNMI Statistical Yearbook Chapter 1 Page 15
11th Statistical Yearbook, Central Statistics Division, Department of Commerce
Table 1.24 Place of birth for the Foreign-born population by Island, CNMI: 2000 and 2010
Birthplace
2010 2000
Total Saipan Rota Tinian Total Saipan Rota Tinian
Total 24,168 21,993 821 1,354 40,122 37,424 1,054 1,643
Asia 21,570 19,491 774 1,305 36,323 33,762 985 1,575
Bangladesh 487 365 64 58 897 713 91 93
China 3,405 3,179 5 221 15,583 15,320 19 244
Japan 705 646 22 37 892 845 30 17
Korea 1,887 1,833 8 46 1,797 1,725 7 65
Philippines 14,506 13,009 672 825 15,701 13,928 831 941
Other Asia 680 559 3 118 5,252 4,893 76 283
Oceania 2,325 2,239 42 44 3,572 3,456 63 53
FSM 1,465 1,411 25 29 2,094 2,020 40 34
Marshall Islands 62 60 2 0 120 117 3 0
Palau 741 716 15 10 1,244 1,217 20 7
Other Oceania 57 52 0 5 114 102 0 12
Elsewhere 173 163 5 5 227 206 6 15
Source: U.S. Census Bureau
Table 1.25 Place of birth of Parents by District and Island, CNMI: 2010
Birthplace Total
Saipan
Rota Tinian Total Dist. 1 Dist. 2 Dist. 3 Dist. 4 Dist. 5
MOTHER'S BIRTHPLACE Total 53,883 48,220 15,160 6,382 15,624 3,847 7,207 2,527 3,136
Born in CNMI 16,567 14,306 4,850 1,377 3,138 1,528 3,413 1,175 1,086
Born in US 1,379 1,264 309 87 467 185 216 46 69
Born in other US Area 1,099 852 295 72 168 54 263 143 104
Born elsewhere 34,838 31,798 9,706 4,846 11,851 2,080 3,315 1,163 1,877
FATHER'S BIRTHPLACE Total 53,883 48,220 15,160 6,382 15,624 3,847 7,207 2,527 3,136
Born in CNMI 17,224 14,829 5,001 1,428 3,251 1,574 3,575 1,263 1,132
Born in US 1,873 1,730 436 112 625 250 307 60 83
Born in other US Area 1,245 983 313 109 212 75 274 155 107
Born elsewhere 33,541 30,678 9,410 4,733 11,536 1,948 3,051 1,049 1,814
Source: U.S. Census Bureau
0%
10%
20%
30%
40%
50%
60%
70%
80%
90%
100%
Total Saipan Rota Tinian Total Saipan Rota Tinian
2010 2000
Foreign Born by Island: 2000 and 2010
Philippines China Korea FSM Others
30.7 29.732.0
21.6 20.1
39.7
47.4 46.5
34.6
0.0
5.0
10.0
15.0
20.0
25.0
30.0
35.0
40.0
45.0
50.0
Percent Mothers Born in CNMI by District and
Island: 2010
32.0 30.833.0
22.4 20.8
40.9
49.6 50.0
36.1
0.0
10.0
20.0
30.0
40.0
50.0
60.0
Percent Fathers Born in CNMI by District and Island:
2010

Page 16 Chapter 1 2015 CNMI Statistical Yearbook
11th Statistical Yearbook, Central Statistics Division, Department of Commerce
Table 1.26 Place of birth of Parents by Island, CNMI: 2000 and 2010
Birthplace
2010 2000
Total Saipan Rota Tinian Total Saipan Rota Tinian
MOTHER'S BIRTHPLACE Total 53,883 48,220 2,527 3,136 69,215 62,392 3,283 3,540
Born in CNMI 16,567 14,306 1,175 1,086 18,088 15,199 1,676 1,213
Born in US 1,379 1,264 46 69 1,716 1,561 80 75
Born in other US Area 1,099 852 143 104 1,245 933 186 126
Born elsewhere 34,838 31,798 1,163 1,877 48,166 44,699 1,341 2,126
FATHER'S BIRTHPLACE Total 53,883 48,220 2,527 3,136 69,215 62,392 3,283 3,540
Born in CNMI 17,224 14,829 1,263 1,132 18,769 15,788 1,722 1,259
Born in US 1,873 1,730 60 83 2,228 2,001 105 122
Born in other US Area 1,245 983 155 107 1,314 997 190 127
Born elsewhere 33,541 30,678 1,049 1,814 46,904 43,606 1,266 2,032
Source: U.S. Census Bureau
Table 1.27 Nativity, Citizenship Status, and Year of Entry by District and Island, CNMI: 2010
Nativity, Citizen, Year enter Total
Saipan
Rota Tinian Total Dist. 1 Dist. 2 Dist. 3 Dist. 4 Dist. 5
Total 53,883 48,220 15,160 6,382 15,624 3,847 7,207 2,527 3,136
Native 35,115 26,227 8,641 2,930 6,985 2,513 5,158 1,706 7,182
Born in CNMI 26,599 23,565 7,865 2,714 6,174 2,206 4,606 1,437 1,597
Born in US 1,641 1,493 401 99 546 200 247 61 87
Born in other US Area 1,198 914 297 102 190 72 253 199 85
Born else of US parents 277 255 78 15 75 35 52 9 13
Foreign born 24,168 21,993 6,519 3,452 8,639 1,334 2,049 821 1,354
Entered 2000 to March 2010 12,461 11,257 3,112 1,821 4,898 508 918 382 822
Entered before 2000 11,707 10,736 3,407 1,631 3,741 826 1,131 439 532
Naturalized US citizen 984 875 246 95 287 94 153 56 53
Entered 2000 to March 2010 187 164 47 16 67 14 20 13 10
Entered before 2000 797 711 199 79 220 80 133 43 43
Not a US citizen 23,184 21,118 6,273 3,357 8,352 1,240 1,896 765 1,301
Entered 2000 to March 2010 12,274 11,093 3,065 1,805 4,831 494 898 369 812
Entered before 2000 10,910 10,025 3,208 1,552 3,521 746 998 396 489
Source: U.S. Census Bureau
30.7 29.7
46.5
34.6
26.1 24.4
51.1
34.3
0.0
10.0
20.0
30.0
40.0
50.0
60.0
Total Saipan Rota Tinian Total Saipan Rota Tinian
2010 2000
Percent Mothers Born in CNMI by Island: 2000 and
2010
32.0 30.8
50.0
36.1
27.1 25.3
52.5
35.6
0.0
10.0
20.0
30.0
40.0
50.0
60.0
Total Saipan Rota Tinian Total Saipan Rota Tinian
2010 2000
Percent Fathers Born in the CNMI by Island: 2000
and 2010
49.4 48.9
51.9
42.5
39.5
57.3
63.9
56.9
50.9
30.0
35.0
40.0
45.0
50.0
55.0
60.0
65.0
Percent born in the CNMI by District and Island
47.1 47.5
51.1
46.2
42.2
60.2
52.6 51.8
37.6
30.0
35.0
40.0
45.0
50.0
55.0
60.0
65.0
Percent non-citizens arriving before 2000

2015 CNMI Statistical Yearbook Chapter 1 Page 17
11th Statistical Yearbook, Central Statistics Division, Department of Commerce
Table 1.28 Nativity, Citizenship Status, and Year of Entry by Island, CNMI: 2000 and 2010
Nativity, Citizen, Year enter
2010 2000
Total Saipan Rota Tinian Total Saipan Rota Tinian
Total 53,883 48,220 2,527 3,136 69,215 62,392 3,283 3,540
Native 35,115 26,227 1,706 1,782 29,094 24,968 2,229 1,897
Born in CNMI 26,599 23,565 1,437 1,597 24,816 21,512 1,720 1,584
Born in US 1,641 1,493 61 87 2,243 1,957 152 134
Born in other US Area 1,198 914 199 85 1,626 1,158 331 137
Born else of US parents 277 255 9 13 409 341 26 42
Foreign born 24,168 21993 821 1,354 40,121 37,424 1,054 1,643
Entered within 10 years of census 12,461 11257 382 822 34,601 32,261 866 1,474
Entered more than 10 years before 11,707 10736 439 532 5,520 5,163 188 169
Naturalized US citizen 984 875 56 53 1,033 940 37 56
Entered within 10 years of census 187 164 13 10 448 409 17 22
Entered more than 10 years before 797 711 43 43 585 531 20 34
Not a US citizen 23,184 21118 765 1,301 39,088 36,484 1,017 1,587
Entered within 10 years of census 12,274 11093 369 812 34,153 31,852 849 1,452
Entered more than 10 years before 10,910 10025 396 489 4,935 4,632 168 135
Source: U.S. Census Bureau
Table 1.29 Reason for moving to the CNMI by District and Island, CNMI: 2010
Reason for Moving Total
Saipan
Rota Tinian Total Dist. 1 Dist. 2 Dist. 3 Dist. 4 Dist. 5
Total 27,284 24,655 7,295 3,668 9,450 1,641 2,601 1,090 1,539
Employment 18,867 16,900 4,887 2,668 6,825 1,085 1,435 732 1,235
Military 8 8 3 0 2 0 3 0 0
Subsistence activities 61 60 18 7 21 7 7 1 0
Missionary activities 200 178 66 27 51 11 23 17 5
Moved with spouse or parent 4,360 3,902 1,185 453 1,275 319 670 234 224
To attend school 1,521 1,481 427 224 600 70 160 22 18
Medical 17 17 3 2 7 2 3 0 0
Housing 281 274 104 45 77 9 39 4 3
Other 1,969 1,835 602 242 592 138 261 80 54
Source: U.S. Census Bureau
12,461
11257 382822
34,601
32,261 8661,474
11,707
10736
439532
5,5205,163 188
169
0%
10%
20%
30%
40%
50%
60%
70%
80%
90%
100%
Tota
l
Sai
pan
Rota
Tin
ian
Tota
l
Sai
pan
Rota
Tin
ian
2010 2000
Percent Foreign Born by Time of Entry and Island:
2000 and 2010
Entered more than 10 years before
Entered within 10 years of census
69.2 68.567.0
72.7 72.2
66.1
55.2
67.2
80.2
50.0
55.0
60.0
65.0
70.0
75.0
80.0
85.0
Percent Foreigners Coming for Employment

Page 18 Chapter 1 2015 CNMI Statistical Yearbook
11th Statistical Yearbook, Central Statistics Division, Department of Commerce
Table 1.30 Residence in 2009 by District and Island, CNMI: 2010
Residence in 2009 Total
Saipan
Rota Tinian Total Dist. 1 Dist. 2 Dist. 3 Dist. 4 Dist. 5
Total 52,859 47,292 14,849 6,249 15,353 3,775 7,066 2,492 3,075
Same house 44,075 39,425 12,517 4,986 12,496 3,292 6,134 2,154 2,496
Different house in CNMI 6,878 6,145 1,830 1,060 2,172 389 694 269 464
Same municipality 6,607 6,007 1,779 1,031 2,143 373 681 218 382
Different municipality 271 138 51 29 29 16 13 51 82
Outside the CNMI 1,906 1,722 502 203 685 94 238 69 115
Oceania 319 276 108 23 85 15 45 22 21
Asia 937 889 198 137 444 18 92 17 31
China 347 342 59 40 221 2 20 0 5
Philippines 367 344 88 66 150 11 29 16 7
Other Asia 223 203 51 31 73 5 43 1 19
United States 634 544 189 43 154 59 99 29 61
Elsewhere 16 13 7 0 2 2 2 1 2
Source: U.S. Census Bureau
Table 1.31 Ethnicity by District and Island, CNMI: 2010
Ethnic origin Total
Saipan
Rota Tinian Total Dist. 1 Dist. 2 Dist. 3 Dist. 4 Dist. 5
Total 53,883 48,220 15,160 6,382 15,624 3,847 7,207 2,527 3,136
One ethnic origin or race 47,051 41,993 13,244 5,727 14,094 3,058 5,870 2,296 2,762
Native Hawaiian and
other Pacific Is-
lander 18,800 16,210 5,716 1,626 3,718 1,473 3,677 1,368 1,222
Carolinian 2,461 2,446 674 201 846 224 501 5 10
Chamorro 12,902 10,411 3,737 1,011 1,996 973 2,694 1,308 1,183
Chuukese 1,242 1,225 467 149 432 64 113 10 7
Kosraean 37 36 14 7 13 2 0 0 1
Marshallese 68 67 28 6 20 5 8 1 0
Palauan 1,169 1,128 444 136 250 101 197 29 12
Pohnpeian 425 411 143 58 68 52 90 12 2
Yapese 228 219 112 37 36 20 14 3 6
Other Native Hawai-
ian and Pacific Is-
lander 268 267 97 21 57 32 60 0 1
Asian 26,908 24,562 7,266 4,004 9,908 1,392 1,992 883 1,463
Bangladeshi 501 382 105 86 161 19 11 64 55
Chinese 3,659 3,419 1,039 584 1,520 78 198 3 237
Filipino 19,017 17,285 5,151 2,863 6,758 1,047 1,466 782 950
Japanese 795 738 105 39 437 105 52 20 37
Korean 2,636 2,202 688 362 848 86 218 9 425
Nepalese 227 129 42 14 54 15 4 1 97
Thai 266 256 105 32 69 18 32 1 9
Other Asian 190 151 31 24 61 24 11 3 36
Black or African
American 55 45 4 6 19 6 10 4 6
Hispanic or African
American 54 46 17 3 14 7 5 2 6
White 1,117 1,021 212 50 411 177 171 39 57
Other ethnic origin or
race 117 109 29 38 24 3 15 0 8
Two or more ethnic ori-
gins 6,832 6,227 1,916 655 1,530 789 1,337 231 374
Native Hawaiian and
other Pacific Is-
lander 6,064 5,502 1,765 536 1,207 734 1,260 221 341
Chamorro and other
groups 4,608 4,076 1,355 395 830 568 928 208 324
Asian and other groups 3,235 2,806 874 315 776 242 599 160 269
Source: U.S. Census Bureau
83.4 83.4 84.3
79.881.4
87.2 86.8 86.4
81.2
13.0 13.0 12.3
17.0 14.1
10.3 9.8 10.8
15.1
3.6 3.6 3.4 3.2 4.52.5 3.4 2.8 3.7
75.0
80.0
85.0
90.0
95.0
100.0
Percent in Same House, Different House, or Outside
CNMI in 2009
Same house different house CNMI Outside CNMI
0%
10%
20%
30%
40%
50%
60%
70%
80%
90%
100%
Ethnicity by District and Island
Chamorro Filipino Other Asian Others

2015 CNMI Statistical Yearbook Chapter 1 Page 19
11th Statistical Yearbook, Central Statistics Division, Department of Commerce
Table 1.33 Veteran Status by District and Island, CNMI: 2010
Veteran Status CNMI
Saipan
Rota Tinian Total
District
1
District
2
District
3
District
4
District
5
Civilians 18 years and over 36,715 32,818 10,085 4,481 11,089 2,613 4,550 1,698 2,199
Veterans 685 593 174 53 198 47 121 46 46
Percent 1.9 1.8 1.7 1.2 1.8 1.8 2.7 2.7 2.1
Has no service-connected
disability rating 561 488 148 47 156 36 101 38 35
Has a service-connected
disability rating 124 105 26 6 42 11 20 8 11
Source: U.S. Census Bureau
Table 1.34 Veteran Status by Island, CNMI: 2000 and 2010
Veteran Status
2010 2000
CNMI Saipan Rota Tinian CNMI Saipan Rota Tinian
Civilians 18 years and over 36,715 32,818 1,698 2,199 51,477 46,915 2,115 2,447
Veterans 685 593 46 46 868 709 92 67
Percent 1.9 1.8 2.7 2.1 1.7 1.5 4.3 2.7
Has no service-connected disability
rating 561 488 38 35 . . . . . . . . . . . .
Has a service-connected disability rat-
ing 124 105 8 11 . . . . . . . . . . . .
Source: U.S. Census Bureau
Table 1.35 Disability Status for Civilian Noninstitutional Population by District and Island, CNMI: 2010
Disability CNMI
Saipan
Rota Tinian Total District 1 District 2 District 3 District 4 District 5
Total 53,731 48,070 15,153 6,256 15,617 3,847 7,197 2,525 3,136
With a disability 2,949 2,693 873 316 715 236 553 141 115
Percent 5.5 5.6 5.8 5.1 4.6 6.1 7.7 5.6 3.7
Under 18 years: 17,146 15,382 5,068 1,900 4,529 1,234 2,651 827 937
With a disability 449 407 134 47 95 28 103 24 18
Percent 2.6 2.6 2.6 2.5 2.1 2.3 3.9 2.9 1.9
18 to 64 years: 35,021 31,274 9,661 4,186 10,603 2,466 4,358 1,609 2,138
With a disability 1,905 1,753 570 206 452 156 369 84 68
Percent 5.4 5.6 5.9 4.9 4.3 6.3 8.5 5.2 3.2
No disability 33,116 29,521 9,091 3,980 10,151 2,310 3,989 1,525 2,070
65 years and over: 1,564 1,414 424 170 485 147 188 89 61
With a disability 595 533 169 63 168 52 81 33 29
Percent 38.0 37.7 39.9 37.1 34.6 35.4 43.1 37.1 47.5
Source: U.S. Census Bureau
12,90210,411
1,308
1,183
14,74411,644
1,780
1,320
19,017
17,285
782
950
18,14016,280
891
969
7,8917,277
101
513
20,469
19,705
157
607
14,073
13,247
336 490 15,86214,763
455 644
0%
10%
20%
30%
40%
50%
60%
70%
80%
90%
100%
Total Saipan Rota Tinian Total Saipan Rota Tinian
2010 2000
Ethnicity by Island in 2000 and 2010
Chamorro Filipino Other Asian Others
5.5 5.6 5.8
5.14.6
6.1
7.7
5.6
3.7
0.0
1.0
2.0
3.0
4.0
5.0
6.0
7.0
8.0
9.0
Percent with a Disability by District and Island

Page 20 Chapter 1 2015 CNMI Statistical Yearbook
11th Statistical Yearbook, Central Statistics Division, Department of Commerce
Table 1.36 Language Spoken at Home by District and Island, CNMI: 2010
Language Total
Saipan
Rota Tinian Total Dist. 1 Dist. 2 Dist. 3 Dist. 4 Dist. 5
Total 49,056 43,871 13,719 5,804 14,246 3,513 6,589 2,324 2,861
Pacific Island languages 32,875 29,116 9,352 3,870 9,062 2,399 4,433 1,872 1,887
Chamorro 11,819 9,668 3,426 906 1,783 1,195 2,358 1,111 1,040
Carolinian 2,466 2,453 693 187 896 138 539 4 9
Philippine languages 16,100 14,558 4,295 2,450 5,723 879 1,211 719 823
Other Pacific Islands Languages 2,490 2,437 938 327 660 187 325 38 15
Asian languages 6,897 6,539 1,844 1,018 2,842 309 526 36 322
Chinese 3,316 3,098 914 515 1,409 69 191 3 215
Korean 2,295 2,235 677 402 859 83 214 8 52
Other Asian languages 1,286 1,206 253 101 574 157 121 25 55
Source: U.S. Census Bureau
Table 1.37 Language Spoken at Home by Island, CNMI: 2000 and 2010
Language
2010 2000
Total Saipan Rota Tinian Total Saipan Rota Tinian
Total 49,056 43,871 2,324 2,861 56,604 51,316 2,528 2,760
Pacific Island languages 32,875 29,116 1,872 1,887 35,679 31,205 2,365 2,109
Chamorro 11,819 9,668 1,111 1,040 14,174 11,464 1,506 1,204
Carolinian 2,466 2,453 4 9 2,419 2,418 1 0
Philippine languages 16,100 14,558 719 823 15,486 13,827 791 868
Other Pacific Islands Languages 2,490 2,437 38 15 3,600 3,496 67 37
Asian languages 6,897 6,539 36 322 19,014 18,581 64 369
Chinese 3,316 3,098 3 215 14,862 14,600 19 243
Korean 2,295 2,235 8 52 2,226 2,152 4 70
Other Asian languages 1,286 1,206 25 55 1,926 1,829 41 56
Source: U.S. Census Bureau
0%
20%
40%
60%
80%
100%
Non-English Language Spoken at Home
Asian languagesOther Pacific Islands LanguagesPhilippine languagesCarolinianChamorro
0%
20%
40%
60%
80%
100%
Total Saipan Rota Tinian Total Saipan Rota Tinian
2010 2000
Non-English Language Spoken at Home: 2000 and
2010
Asian languagesOther Pacific Islands languagesPhilippines languagesCarolinianChamorro

2015 CNMI Statistical Yearbook Chapter 1 Page 21
11th Statistical Yearbook, Central Statistics Division, Department of Commerce
Table 1.38 Language Spoken at Home and Frequency of Language Usage by District and Island, CNMI: 2010
Language Use Total
Saipan
Rota Tinian Total Dist. 1 Dist. 2 Dist. 3 Dist. 4 Dist. 5
Total 49,056 43,871 13,719 5,804 14,246 3,513 6,589 2,324 2,861
English only 8,354 7,522 2,340 802 2,069 740 1,571 339 493
Language other than English 40,702 36,349 11,379 5,002 12,177 2,773 5,018 1,985 2,368
Speak other language less fre-
quently than English 7,181 6,386 2,104 749 1,793 464 1,276 471 324
Speak other language equally of-
ten as English 13,476 12,107 3,897 1,672 3,699 1,113 1,726 691 678
Speak other language more fre-
quently than English 19,054 17,079 5,007 2,435 6,480 1,183 1,974 814 1,161
Does not speak English 791 777 371 146 205 13 42 9 5
Source: U.S. Census Bureau
Table 1.39 Language Spoken at Home and Frequency of Language Usage by Island, CNMI: 2000 and 2010
Language Use
2010 2000
Total Saipan Rota Tinian Total Saipan Rota Tinian
Total 49,056 43,871 2,324 2,861 63,423 57,289 2,915 3,219
English only 8,354 7,522 339 493 6,819 5,973 387 459
Language other than English 40,702 36,349 1,985 2,368 56,604 51,316 2,528 2,760
Speak other language less frequently than
English 7,181 6,386 471 324 5,306 4,470 460 376
Speak other language equally often as English 13,476 12,107 691 678 12,296 10,660 767 869
Speak other language more frequently than
English 19,054 17,079 814 1,161 29,714 26,952 1,259 1,503
Does not speak English 791 777 9 5 9,288 9,234 42 12
Source: U.S. Census Bureau
17.0 17.1
14.6
17.2
10.8 10.4
13.314.3
0.0
2.0
4.0
6.0
8.0
10.0
12.0
14.0
16.0
18.0
20.0
Total Saipan Rota Tinian Total Saipan Rota Tinian
2010 2000
Percent Speaking Only English at Home
17.0 17.1 17.1
13.814.5
21.1
23.8
14.6
17.2
10.0
12.0
14.0
16.0
18.0
20.0
22.0
24.0
Percent Speaking Only English at Home

Page 22 Chapter 1 2015 CNMI Statistical Yearbook
11th Statistical Yearbook, Central Statistics Division, Department of Commerce
Table 1.40 Demographics and Education for Saipan Villages, CNMI Age by Village, Saipan: 2010
Village
Sex Median age
HHs
HH
size
Fam
size
En-
rolle
d
Percent
Total Males
Fe-
males Total Males
Fe-
males
HS
grad
BA/
BS
Achugao 209 111 98 29.3 28.5 29.5 51 4.10 4.26 71 75.9 13.8
Afetnas 1,486 809 677 35.9 36.9 35.0 457 3.16 3.59 378 81.4 12.6
Agingan 308 167 141 34.8 37.5 33.6 82 3.60 3.76 70 75.1 18.4
As Akina 99 49 50 37.5 42.5 31.5 25 3.96 4.05 32 89.8 37.3
As Falipe 6 3 3 48.0 49.5 41.5 2 3.00 3 1 100.0 40.0
As Gonna 157 79 78 32.6 37.5 28.0 42 3.55 3.9 38 73.1 12.9
As Lito 920 459 461 31.1 32.2 29.8 237 3.88 4.02 295 87.6 16.5
As Mahetog 304 163 141 32.0 30.8 32.8 75 4.05 4.12 80 77.1 14.5
As Matuis 596 285 311 27.2 25.4 27.8 147 4.05 4.2 195 81.6 20.3
As Palacios 718 383 335 35.2 35.6 34.6 252 2.77 3.41 167 88.8 28.2
As Perdido 238 129 109 36.3 36.8 35.8 68 3.50 3.78 59 80.1 24.7
As Rabagau 677 354 323 33.2 33.7 32.5 207 3.26 3.9 189 87.8 26.6
As Teo 317 170 147 30.6 31 29.9 87 3.64 4.05 92 82.0 14.6
As Terlaje 282 139 143 33.4 34.2 33.1 90 3.13 3.73 94 89.3 16.0
Capitol Hill 1,028 504 524 36.1 35.8 36.3 339 3.03 3.56 294 89.6 28.5
Chacha 65 37 28 41.5 42.5 41.0 19 3.42 3.47 16 78.0 9.8
Chalan Galaide 178 86 92 32.6 33.3 30.0 55 3.24 3.88 54 90.2 36.3
Chalan Kanoa I 1,304 691 613 36.7 37.8 34.7 440 2.93 3.6 331 82.3 17.6
Chalan Kanoa II 921 463 458 35.7 36.8 34.2 333 2.76 3.45 214 81.2 22.2
Chalan Kanoa III 794 438 356 35.8 36.7 34.6 259 3.07 3.43 195 80.0 10.3
Chalan Kanoa IV 631 335 296 34.0 33.6 34.3 174 3.41 4.23 185 73.1 16.2
Chalan Kiya 1,062 525 537 34.2 34.9 33.7 312 3.40 3.78 334 87.2 25.3
Chalan Laulau 1,096 551 545 33.9 33.8 34.0 346 3.17 3.79 297 81.6 20.4
Chalan Piao 1,282 637 645 36.0 38.4 33.8 410 3.13 3.47 309 82.7 20.9
Chalan Rueda 257 140 117 33.3 33.8 32.5 80 3.00 3.62 60 79.9 20.1
China Town 1,274 666 608 35.4 37.2 34.1 394 3.16 3.73 315 86.0 20.3
Dagu 780 415 365 36.3 36.9 35.3 246 3.13 3.52 203 90.9 27.6
Dandan 3,280 1,649 1,631 27.1 26.5 27.7 810 4.02 4.33
1,04
5 76.9 15.7
Fananganan 1,201 584 617 28.0 26.8 28.8 324 3.70 4.21 427 80.1 22.3
Finasisu 2,451 1,259 1,192 33.3 33.7 32.8 793 3.09 3.69 709 84.5 22.8
Garapan 3,983 1,953 2,030 36.6 38.5 34.4
1,55
3 2.41 3.22 713 83.9 21.6
Gualo Rai 1,660 915 745 34.8 35.3 34.5 553 2.85 3.53 481 90.0 31.4
Hilaihai 35 21 14 38.5 31.5 42.0 10 3.50 3.71 11 81.8 18.2
I Akgak 327 162 165 32.8 32.3 33.3 89 3.67 3.91 108 89.8 28.3
I Denni 27 14 13 43.5 42.5 45.5 7 3.86 3.14 6 78.9 0.0
I Liyang 917 470 447 33.2 34.2 31.6 269 3.07 3.57 275 86.3 29.1
I Naftan 36 24 12 31.0 29 31.0 11 3.27 4.67 11 84.2 5.3
I Pitot 54 25 29 32.5 32.5 32.5 18 3.00 3.36 13 78.8 27.3
Kagman 92 47 45 40.0 42.5 37.3 35 2.63 3.2 17 66.7 5.8
Kagman I 358 173 185 25.3 27.2 23.3 79 4.53 4.58 114 77.3 13.3
Kagman II 918 459 459 23.6 22 26.7 213 4.31 4.26 305 74.2 10.2
Kagman III 2,402 1,204 1,198 21.0 20.3 22.3 543 4.36 4.46 954 71.9 10.4
Kagman IV 456 223 233 18.9 19.5 18.8 101 4.51 4.55 189 66.2 3.5
Kannat Tabla 874 438 436 35.9 34.8 36.6 257 3.31 3.68 229 84.3 23.6
Koblerville 2,493 1,266 1,227 28.6 28.5 28.6 625 3.94 4.16 764 77.4 18.0
Laulau Bay 226 128 98 39.6 42 38.3 69 2.72 3.38 46 93.6 32.5
Lower Base 50 38 12 44.0 46.3 39.5 27 1.59 3 4 72.7 11.4
Marpi 85 55 30 42.6 43.1 40.0 20 2.40 3.17 12 88.4 18.8
Matansa 65 37 28 35.3 37.5 34.0 19 3.42 4.17 19 85.0 22.5
Maturana Hill 161 76 85 40.5 38.5 42.3 46 2.78 3.35 38 78.4 25.2
Nanasu 40 22 18 36.5 39 33.5 11 3.64 3.9 15 75.0 20.8
Navy Hill 260 131 129 35.5 34.8 36.2 85 3.00 3.28 66 87.8 38.9
Opyan 20 13 7 48.0 46.5 51.5 8 2.50 3.2 2 58.8 5.9
Papago 380 191 189 33.4 31.2 35.6 107 3.51 3.8 131 82.7 25.5
Sadog Tasi 115 55 60 36.5 39.3 35.0 44 2.61 3.33 30 96.2 53.8
San Antonio 1,149 596 553 34.2 34.9 33.7 352 3.11 3.67 275 74.0 13.9
San Jose (Oleai) 954 496 458 37.4 38.5 35.7 324 2.94 3.59 228 83.7 19.2
San Roque 741 400 341 35.2 37.1 32.7 211 3.35 3.87 182 88.1 17.1
San Vicente 2,091 1,045 1,046 34.0 35.3 33.3 620 3.35 3.65 622 83.4 23.9
Susupe 2,078 1,133 945 33.7 35.1 31.8 605 3.11 3.72 487 83.1 24.9
Talafofo 41 28 13 42.2 43 36.5 11 2.36 3.6 5 78.8 12.1
Tanapag 829 429 400 29.8 30.9 29.1 225 3.67 4.29 219 75.9 11.9
Tapochao 124 61 63 36.0 39.5 33.1 46 2.70 3.41 34 90.7 45.3
Tottotville 258 127 131 23.0 16.9 27.5 57 4.53 4.66 113 88.3 25.0
Source: 2010 CNMI Census

2015 CNMI Statistical Yearbook Chapter 1 Page 23
11th Statistical Yearbook, Central Statistics Division, Department of Commerce
Table 1.41 Nativity, Residence in 2009, Fertility and Disabled by Village, CNMI: 2010
Village Total:
%
CNMI
born
Foreign born (and percent)
% same
house
2009
Chil-
dren per
Women
35 to 44
years
(rate)
% disa-
bled
Foreign
born
% Phil-
ippines
Other
Asia FAS
Achugao 209 64.1 68 77.9 2.9 17.6 93.2 3,250 3.3
Afetnas 1,486 46.3 762 69.7 23.2 6.8 85.8 2,099 5.7
Agingan 308 50.3 146 66.4 19.9 13.7 89.8 1,870 6.5
As Akina 99 50.5 35 40.0 11.4 25.7 90.8 1,750 7.1
As Falipe 6 33.3 2 100.0 0.0 0.0 100.0 0 0.0
As Gonna 157 50.3 59 57.6 37.3 5.1 87.7 2,824 7.1
As Lito 920 58.8 321 55.5 20.9 23.1 86.6 2,700 5.4
As Mahetog 304 62.2 88 76.1 11.4 10.2 79.8 2,417 7.6
As Matuis 596 66.8 123 39.0 39.0 17.9 92.7 2,828 8.4
As Palacios 718 36.8 394 67.3 26.1 6.1 80.3 1,859 4.9
As Perdido 238 48.3 115 48.7 41.7 8.7 79.9 1,957 5.0
As Rabagau 677 50.1 279 45.9 41.6 10.8 82.2 2,375 4.3
As Teo 317 65.9 85 68.2 15.3 14.1 86.4 2,500 6.0
As Terlaje 282 44.7 149 50.3 49.7 0.0 79.8 2,269 5.7
Capitol Hill 1,028 50.7 346 47.7 37.9 10.1 85.1 1,840 5.8
Chacha 65 56.9 17 70.6 11.8 17.6 87.3 5,000 12.3
Chalan Galaide 178 55.6 54 44.4 51.9 3.7 86.8 1,958 7.9
Chalan Kanoa I 1,304 43.3 700 75.0 18.1 6.7 78.9 2,417 5.4
Chalan Kanoa II 921 40.8 514 61.3 30.5 7.2 79.2 1,679 5.8
Chalan Kanoa III 794 42.4 442 54.1 36.9 9.0 82.3 2,075 3.1
Chalan Kanoa IV 631 46.3 324 45.7 47.5 6.8 86.7 1,971 5.1
Chalan Kiya 1,062 47.2 521 64.3 32.1 3.3 83.0 2,034 4.4
Chalan Laulau 1,096 48.0 535 63.6 29.5 6.0 87.2 1,899 7.2
Chalan Piao 1,282 39.4 736 49.9 47.3 2.2 78.3 1,814 4.4
Chalan Rueda 257 45.1 138 50.0 38.4 11.6 91.2 1,615 6.2
China Town 1,274 39.9 736 73.5 23.1 3.3 84.2 2,090 4.7
Dagu 780 40.8 405 76.0 16.5 6.2 83.8 2,103 3.2
Dandan 3,280 66.3 933 59.3 17.7 22.3 88.6 2,635 6.5
Fananganan 1,201 55.7 483 56.9 17.6 25.1 88.3 2,700 5.9
Finasisu 2,451 44.8 1222 55.9 33.9 9.7 82.5 2,117 4.7
Garapan 3,983 25.9 2844 55.6 40.6 3.4 75.0 1,494 3.4
Gualo Rai 1,660 37.7 949 56.4 36.9 5.6 82.9 1,780 2.8
Hilaihai 35 54.3 11 63.6 18.2 18.2 82.4 2,000 8.8
I Akgak 327 54.7 77 55.8 16.9 18.2 87.0 2,455 9.2
I Denni 27 66.7 9 55.6 22.2 11.1 84.6 1,000 7.4
I Liyang 917 34.2 549 57.4 36.4 5.6 76.1 1,560 3.2
I Naftan 36 52.8 15 60.0 13.3 26.7 77.8 3,500 11.1
I Pitot 54 50.0 15 53.3 20.0 26.7 83.0 2,000 7.4
Kagman 92 44.6 47 40.4 34.0 25.5 85.7 2,833 14.1
Kagman I 358 76.5 72 62.5 9.7 27.8 89.5 2,471 9.8
Kagman II 918 76.3 150 48.7 14.7 33.3 88.8 2,941 9.2
Kagman III 2,402 75.1 449 46.3 17.1 35.9 85.8 3,113 8.5
Kagman IV 456 76.1 72 51.4 8.3 38.9 90.5 3,333 11.2
Kannat Tabla 874 43.8 458 74.5 17.7 7.2 85.8 2,306 5.0
Koblerville 2,493 55.9 1003 56.4 20.0 23.1 85.2 2,443 7.9
Laulau Bay 226 31.4 118 63.6 18.6 7.6 87.4 1,889 6.4
Lower Base 50 14.0 43 55.8 44.2 0.0 86.0 3,000 4.0
Marpi 85 24.7 60 63.3 28.3 5.0 96.5 1,667 2.4
Matansa 65 55.4 22 72.7 27.3 0.0 87.3 2,333 7.7
Maturana Hill 161 37.9 94 58.5 18.1 14.9 70.9 1,857 16.8
Nanasu 40 57.5 12 16.7 25.0 58.3 87.5 1,667 0.0
Navy Hill 260 39.2 105 45.7 45.7 2.9 74.9 1,786 7.7
Opyan 20 55.0 7 14.3 57.1 28.6 85.0 0 0.0
Papago 380 58.7 94 57.4 22.3 8.5 89.3 2,447 6.6
Sadog Tasi 115 33.9 56 50.0 46.4 1.8 82.3 2,000 3.5
San Antonio 1,149 39.8 627 39.1 48.2 11.3 74.6 1,556 5.9
San Jose (Oleai) 954 39.6 565 70.1 23.9 5.7 83.7 1,835 4.1
San Roque 741 52.4 327 80.7 13.5 4.3 85.5 2,070 4.9
San Vicente 2,091 49.1 887 62.1 28.3 8.0 83.9 2,293 4.9
Susupe 2,078 40.4 1153 62.2 30.6 6.6 78.2 2,033 4.9
Talafofo 41 41.5 23 91.3 4.3 4.3 92.7 333 4.9
Tanapag 829 64.3 263 46.0 20.5 32.7 85.3 2,346 6.0
Tapochao 124 44.4 23 73.9 8.7 0.0 89.4 1,500 4.9
Tottotville 258 65.1 62 61.3 27.4 11.3 92.6 2,500 3.1
Source: 2010 CNMI Census

Page 24 Chapter 1 2015 CNMI Statistical Yearbook
11th Statistical Yearbook, Central Statistics Division, Department of Commerce
Table 1.42 Language and Ethnicity by Village, CNMI: 2010
Village
Language spoken at home
Total 5+ yrs. English only Chamorro Carolinian
Philippine lan-
guages Others
Achugao 191 48 63 11 60 9
Afetnas 1,344 169 283 17 617 258
Agingan 279 34 65 28 98 54
As Akina 91 38 16 9 12 16
As Falipe 5 2 1 0 2 0
As Gonna 140 23 51 1 34 31
As Lito 839 155 243 53 203 185
As Mahetog 276 46 109 20 79 22
As Matuis 548 144 230 35 49 90
As Palacios 644 107 76 16 297 148
As Perdido 221 39 58 4 58 62
As Rabagau 618 147 157 9 129 176
As Teo 281 46 134 2 68 31
As Terlaje 266 38 62 0 86 80
Capitol Hill 937 250 244 59 175 209
Chacha 60 15 29 2 12 2
Chalan Galaide 157 43 52 0 28 34
Chalan Kanoa I 1,183 147 192 21 631 192
Chalan Kanoa II 840 117 143 22 346 212
Chalan Kanoa III 706 96 93 13 284 220
Chalan Kanoa IV 580 74 60 79 172 195
Chalan Kiya 971 157 161 77 388 188
Chalan Laulau 991 124 63 220 388 196
Chalan Piao 1,161 154 152 15 447 393
Chalan Rueda 227 23 19 50 75 60
China Town 1,140 132 99 71 637 201
Dagu 708 132 118 11 330 117
Dandan 2,943 551 1,100 286 599 407
Fananganan 1,069 192 190 72 315 300
Finasisu 2,240 370 422 60 790 598
Garapan 3,693 336 231 79 1,744 1,303
Gualo Rai 1,526 186 223 68 614 435
Hilaihai 34 10 3 11 6 4
I Akgak 298 97 108 9 41 43
I Denni 25 5 14 0 4 2
I Liyang 839 128 96 30 322 263
I Naftan 34 10 10 0 8 6
I Pitot 50 28 13 0 5 4
Kagman 90 7 27 11 16 29
Kagman I 310 64 141 26 44 35
Kagman II 827 205 386 100 65 71
Kagman III 2,189 567 929 274 186 233
Kagman IV 410 121 128 90 29 42
Kannat Tabla 795 119 166 13 373 124
Koblerville 2,229 379 516 201 642 491
Laulau Bay 213 73 24 3 74 39
Lower Base 49 1 3 1 25 19
Marpi 81 9 9 0 37 26
Matansa 60 7 29 0 17 7
Maturana Hill 147 21 23 4 59 40
Nanasu 38 12 10 0 4 12
Navy Hill 234 68 60 5 45 56
Opyan 19 2 10 1 1 5
Papago 361 119 130 2 62 48
Sadog Tasi 104 37 15 0 28 24
San Antonio 1,037 171 181 14 276 395
San Jose (Oleai) 873 106 61 67 458 181
San Roque 671 114 177 1 307 72
San Vicente 1,943 404 533 18 635 353
Susupe 1,892 249 262 117 802 462
Talafofo 40 7 12 1 19 1
Tanapag 752 131 332 25 140 124
Tapochao 118 53 39 1 13 12
Tottotville 234 63 82 18 48 23
Source: 2010 CNMI Census

2015 CNMI Statistical Yearbook Chapter 1 Page 25
11th Statistical Yearbook, Central Statistics Division, Department of Commerce
Table 1.42 Language and Ethnicity by Village, CNMI: 2010 – Continued –
Village
Ethnicity or Race
Total:
Chamorro
Carolinian
alone FAS alone Filipino alone Total Alone And Others
Achugao 209 76 35 41 10 14 74
Afetnas 1,486 401 317 84 19 96 721
Agingan 308 82 75 7 25 30 122
As Akina 99 26 13 13 8 4 18
As Falipe 6 1 0 1 0 0 2
As Gonna 157 72 63 9 1 2 42
As Lito 920 372 273 99 43 129 229
As Mahetog 304 137 85 52 22 10 92
As Matuis 596 310 200 110 49 29 55
As Palacios 718 118 88 30 12 30 365
As Perdido 238 72 61 11 2 11 78
As Rabagau 677 239 140 99 20 62 159
As Teo 317 194 147 47 1 11 77
As Terlaje 282 88 78 10 0 0 103
Capitol Hill 1,028 386 284 102 55 52 210
Chacha 65 42 40 2 0 5 12
Chalan Galaide 178 80 62 18 0 3 41
Chalan Kanoa I 1,304 281 199 82 16 69 734
Chalan Kanoa II 921 214 149 65 21 47 408
Chalan Kanoa III 794 153 110 43 7 65 340
Chalan Kanoa IV 631 94 60 34 91 36 194
Chalan Kiya 1,062 238 203 35 93 24 465
Chalan Laulau 1,096 125 57 68 193 30 451
Chalan Piao 1,282 251 179 72 7 25 539
Chalan Rueda 257 31 13 18 47 18 90
China Town 1,274 131 108 23 67 28 789
Dagu 780 204 169 35 16 40 397
Dandan 3,280 1,559 1,136 423 273 300 734
Fananganan 1,201 326 189 137 61 247 374
Finasisu 2,451 709 528 181 70 159 918
Garapan 3,983 361 243 118 77 128 1,982
Gualo Rai 1,660 328 279 49 54 69 712
Hilaihai 35 7 4 3 12 4 7
I Akgak 327 168 134 34 7 14 51
I Denni 27 17 13 4 0 1 6
I Liyang 917 178 129 49 30 39 389
I Naftan 36 16 13 3 4 5 9
I Pitot 54 29 15 14 0 2 7
Kagman 92 30 28 2 7 17 19
Kagman I 358 223 186 37 29 23 52
Kagman II 918 549 412 137 97 71 89
Kagman III 2,402 1,420 1,004 416 243 199 243
Kagman IV 456 232 158 74 95 34 36
Kannat Tabla 874 278 205 73 4 32 429
Koblerville 2,493 786 498 288 194 333 794
Laulau Bay 226 47 32 15 5 10 84
Lower Base 50 4 4 0 1 0 25
Marpi 85 11 4 7 0 1 40
Matansa 65 32 18 14 0 0 22
Maturana Hill 161 33 23 10 2 16 74
Nanasu 40 17 9 8 0 9 4
Navy Hill 260 84 73 11 5 1 53
Opyan 20 12 12 0 2 1 1
Papago 380 200 154 46 2 9 86
Sadog Tasi 115 26 20 6 1 1 32
San Antonio 1,149 281 189 92 11 99 323
San Jose (Oleai) 954 109 51 58 74 49 549
San Roque 741 265 201 64 6 21 369
San Vicente 2,091 782 627 155 27 100 762
Susupe 2,078 390 286 104 120 116 946
Talafofo 41 17 14 3 1 1 21
Tanapag 829 341 170 171 91 99 163
Tapochao 124 60 41 19 1 0 19
Tottotville 258 142 101 41 15 6 54
Source: 2010 CNMI Census

Page 26 Chapter 1 2015 CNMI Statistical Yearbook
11th Statistical Yearbook, Central Statistics Division, Department of Commerce
Table 1.43 Economic Characteristics by Village, CNMI: 2010
Village
Total, 16+
years
Percent in La-
bor Force
Percent Unem-
ployed F LFP F Unemp % driving alone
Achugao 138 69.6 27.1 66.1 26.8 60.0
Afetnas 1,074 76.6 15.6 72.3 21.7 31.7
Agingan 227 68.7 14.2 60.4 16.4 47.0
As Akina 71 66.2 2.1 59.0 0 52.2
As Falipe 5 100.0 0 100.0 0 40.0
As Gonna 114 64.9 8.2 58.8 6.7 44.8
As Lito 637 70.2 13.9 62.3 9.8 50.4
As Mahetog 207 70.0 18.6 66.3 30.8 47.5
As Matuis 418 67.2 15.7 62.6 17.3 46.8
As Palacios 516 75.2 4.1 65.8 5.8 48.2
As Perdido 180 70.0 9.5 64.7 10.9 34.5
As Rabagau 504 69.4 9.1 66.5 13.5 47.4
As Teo 215 67.0 13.2 58.6 17.2 54.0
As Terlaje 218 64.2 3.6 62.2 2.9 46.3
Capitol Hill 760 71.3 7.2 65.4 10.2 55.3
Chacha 50 72.0 8.3 66.7 14.3 54.5
Chalan Galaide 118 77.1 6.6 69.8 9.1 61.2
Chalan Kanoa I 944 81.9 15.4 75.7 20.8 40.8
Chalan Kanoa II 693 73.0 11.7 67.1 13.6 35.3
Chalan Kanoa III 569 68.0 12.9 60.9 13.8 41.3
Chalan Kanoa IV 444 67.8 13.6 60.1 20.8 32.2
Chalan Kiya 739 72.5 13.9 67.5 15.7 50.4
Chalan Laulau 798 73.1 13.2 65.1 16.1 40.9
Chalan Piao 941 72.2 18.3 64.1 20.3 34.9
Chalan Rueda 191 70.7 9.6 60.5 9.6 35.3
China Town 910 77.4 8.7 71.6 12.7 42.4
Dagu 561 83.2 4.3 76.2 7.1 37.3
Dandan 2,185 65.1 13.1 56.5 14.3 47.5
Fananganan 737 66.5 13.1 58.1 13.3 49.4
Finasisu 1,797 72.5 13.4 66.3 12.7 43.2
Garapan 3,218 82.5 5.9 79.5 7.4 26.9
Gualo Rai 1,243 72.2 6.6 66.1 7.5 45.7
Hilaihai 29 58.6 12.5 46.2 0 46.7
I Akgak 221 66.5 7.5 66.1 9.5 54.1
I Denni 20 65.0 15.4 66.7 0 27.3
I Liyang 713 66.2 6.4 63.5 8.2 36.5
I Naftan 25 72.0 0 66.7 0 16.7
I Pitot 42 61.9 3.8 71.4 6.7 48.0
Kagman 81 58.0 6.4 56.8 9.5 27.9
Kagman I 247 60.3 19.5 52.9 17.2 52.9
Kagman II 628 64.6 20.2 60.4 25 54.8
Kagman III 1,545 60.6 17.3 55.0 21.1 41.2
Kagman IV 270 61.5 24.7 57.4 23.1 41.5
Kannat Tabla 648 74.4 7.9 70.6 8.3 41.8
Koblerville 1,669 67.0 17.8 60.7 20.6 42.3
Laulau Bay 184 70.7 7.7 70.4 10.5 44.2
Lower Base 48 85.4 12.2 70.0 14.3 8.3
Marpi 73 84.9 1.6 80.8 4.8 31.1
Matansa 43 74.4 3.1 65.0 7.7 48.4
Maturana Hill 124 62.1 11.7 52.1 10.8 35.3
Nanasu 27 55.6 13.3 54.5 16.7 33.3
Navy Hill 197 74.1 5.5 66.7 5.7 50.4
Opyan 18 38.9 42.9 33.3 0 75.0
Papago 261 70.1 14.8 67.2 13.6 51.9
Sadog Tasi 84 79.8 4.5 75.6 8.8 61.9
San Antonio 846 67.1 21.8 61.6 25.9 36.8
San Jose (Oleai) 705 78.9 11.3 72.5 12 29.9
San Roque 524 78.1 9.5 71.6 11 52.9
San Vicente 1,479 71.2 9.7 65.4 12 43.5
Susupe 1,534 69.8 9.3 70.0 10 35.2
Talafofo 36 77.8 7.1 63.6 28.6 32.0
Tanapag 593 63.6 14.6 52.5 16.2 44.5
Tapochao 95 75.8 8.5 63.8 6.7 60.6
Tottotville 150 68.7 6.8 65.9 9.3 50.0
Source: 2010 CNMI Census

2015 CNMI Statistical Yearbook Chapter 1 Page 27
11th Statistical Yearbook, Central Statistics Division, Department of Commerce
Table 1.43 Economic Characteristics by Village, CNMI: 2010 – Continued –
Village
Total,
16+
years
Occupation
Private
sector
Median
household
income in
2009
% in
pov-
erty
Management,
business, sci-
ence, and arts
occupations
Service
occu-
pations
Sales
and
office
occu-
pa-
tions
Natural re-
sources, con-
struction, and
maintenance
occupations
Production,
transporta-
tion, and
material
moving oc-
cupations
Achugao 138 25.7 48.6 15.7 5.7 4.3 70.0 $20,938 50.0
Afetnas 1,074 16.7 35.1 12.7 21.7 13.8 87.1 $14,549 63.9
Agingan 227 20.3 33.8 23.3 16.5 6.0 82.0 $18,500 43.3
As Akina 71 43.5 21.7 21.7 8.7 4.3 63.0 $63,750 28.6
As Falipe 5 60.0 20.0 0.0 20.0 0.0 60.0 $138,750 0.0
As Gonna 114 31.3 22.4 22.4 16.4 7.5 67.2 $16,250 45.2
As Lito 637 32.4 22.7 27.2 11.0 6.8 70.0 $28,250 38.8
As Mahetog 207 22.9 28.0 22.9 17.8 8.5 65.3 $23,750 47.4
As Matuis 418 35.9 26.6 26.2 6.3 5.1 58.2 $32,361 31.5
As Palacios 516 29.8 26.1 22.0 13.2 8.9 79.3 $21,500 43.4
As Perdido 180 25.4 18.4 28.9 16.7 10.5 78.1 $25,000 36.7
As Rabagau 504 32.4 23.0 23.0 10.7 11.0 76.7 $27,250 31.2
As Teo 215 33.6 21.6 20.8 17.6 6.4 59.2 $31,875 34.4
As Terlaje 218 20.0 27.4 25.9 20.7 5.9 84.4 $17,500 37.5
Capitol Hill 760 43.9 17.7 24.1 8.3 6.0 64.6 $37,411 23.9
Chacha 50 12.1 24.2 24.2 30.3 9.1 75.8 $38,750 20.0
Chalan Galaide 118 50.6 14.1 24.7 8.2 2.4 62.4 $47,083 19.5
Chalan Kanoa I 944 19.0 29.2 17.6 23.1 11.0 86.1 $15,156 51.6
Chalan Kanoa II 693 23.5 29.8 18.6 18.1 10.1 85.7 $14,293 54.2
Chalan Kanoa III 569 16.3 32.6 23.1 17.2 10.7 89.0 $14,141 58.1
Chalan Kanoa IV 444 16.2 28.1 23.1 21.9 10.8 88.8 $14,250 57.9
Chalan Kiya 739 32.8 25.7 19.1 15.0 7.4 75.9 $24,063 38.7
Chalan Laulau 798 26.3 27.9 21.1 15.8 8.9 84.0 $18,333 47.3
Chalan Piao 941 23.8 28.6 21.6 16.6 9.4 84.5 $14,286 57.7
Chalan Rueda 191 24.6 25.4 17.2 19.7 13.1 90.2 $16,136 54.7
China Town 910 24.0 31.5 17.5 14.5 12.5 89.1 $18,000 53.4
Dagu 561 29.5 25.5 16.3 18.1 10.5 79.4 $24,318 37.9
Dandan 2,185 29.1 24.1 24.8 13.9 8.0 65.0 $24,231 43.1
Fananganan 737 33.6 26.1 22.5 10.8 7.0 73.2 $20,000 46.0
Finasisu 1,797 27.6 24.0 23.3 16.9 8.2 78.9 $19,594 44.0
Garapan 3,218 23.3 42.3 17.0 10.7 6.8 91.9 $14,940 51.5
Gualo Rai 1,243 37.1 25.7 17.9 12.3 7.0 82.9 $22,546 34.9
Hilaihai 29 21.4 14.3 28.6 28.6 7.1 64.3 $60,000 14.3
I Akgak 221 44.1 23.5 21.3 5.9 5.1 48.5 $45,938 23.7
I Denni 20 18.2 0.0 54.5 18.2 9.1 63.6 $26,250 42.9
I Liyang 713 29.9 26.7 18.3 16.7 8.4 84.4 $17,083 44.0
I Naftan 25 11.1 33.3 16.7 27.8 11.1 66.7 $28,750 16.7
I Pitot 42 40.0 44.0 12.0 4.0 0.0 64.0 $35,000 21.4
Kagman 81 25.0 20.5 13.6 25.0 15.9 75.0 $16,250 30.0
Kagman I 247 34.2 27.5 25.0 5.0 8.3 50.0 $35,417 35.2
Kagman II 628 31.5 24.4 29.0 7.1 8.0 55.6 $29,125 37.1
Kagman III 1,545 28.0 25.9 27.7 9.8 8.5 52.9 $27,552 44.4
Kagman IV 270 25.6 31.2 23.2 7.2 12.8 51.2 $22,679 52.2
Kannat Tabla 648 27.4 25.6 21.0 18.1 7.9 80.8 $21,761 41.2
Koblerville 1,669 25.1 24.3 20.8 16.7 13.2 77.5 $19,103 55.0
Laulau Bay 184 39.2 25.8 18.3 12.5 4.2 77.5 $26,250 28.6
Lower Base 48 13.9 0.0 16.7 33.3 36.1 97.2 $10,938 0.0
Marpi 73 23.0 55.7 6.6 13.1 1.6 91.8 $25,000 25.0
Matansa 43 32.3 19.4 22.6 12.9 12.9 64.5 $41,250 33.3
Maturana Hill 124 25.0 33.8 19.1 11.8 10.3 86.8 $16,667 41.9
Nanasu 27 38.5 7.7 38.5 7.7 7.7 46.2 $26,250 50.0
Navy Hill 197 53.6 20.3 18.8 5.8 1.4 60.9 $64,375 13.3
Opyan 18 0.0 25.0 75.0 0.0 0.0 75.0 $21,250 20.0
Papago 261 40.4 22.4 25.6 7.7 3.8 52.6 $39,583 25.0
Sadog Tasi 84 60.9 17.2 14.1 4.7 3.1 67.2 $51,667 18.5
San Antonio 846 21.4 32.4 20.5 16.9 8.8 84.7 $12,414 63.9
San Jose (Oleai) 705 20.9 32.5 18.9 18.5 9.3 91.9 $14,783 64.8
San Roque 524 20.3 37.3 19.2 12.4 10.8 83.2 $21,016 49.7
San Vicente 1,479 32.1 26.4 19.5 16.2 5.9 75.4 $25,750 36.5
Susupe 1,534 26.2 35.6 18.2 10.6 9.4 88.9 $16,709 55.0
Talafofo 36 15.4 50.0 11.5 23.1 0.0 84.6 $9,375 40.0
Tanapag 593 18.6 27.6 25.5 11.5 16.8 73.9 $19,609 51.6
Tapochao 95 46.2 23.1 20.0 9.2 1.5 56.9 $70,000 3.7
Tottotville 150 39.6 22.9 24.0 8.3 5.2 61.5 $41,250 28.0
Source: 2010 CNMI Census

Page 28 Chapter 1 2015 CNMI Statistical Yearbook
11th Statistical Yearbook, Central Statistics Division, Department of Commerce
Table 1.44 Housing Characteristics by Village, CNMI: 2010
Village Total
Occupied
housing
units
% 1 unit
detached
Median
rooms
Water
Public Sys
only
% public
sewer
% con-
crete roof
Vehicles
per house-
hold (rate)
Achugao 63 51 85.7 3.6 73.0 17.5 31.7 1.3
Afetnas 538 457 29.0 3.1 80.5 54.5 19.0 1
Agingan 101 82 52.5 3.4 87.1 77.2 45.5 1.1
As Akina 31 25 80.6 4.8 45.2 0.0 61.3 1.8
As Falipe 3 2 66.7 4.0 66.7 0.0 0.0 2.5
As Gonna 51 42 68.6 3.9 86.3 7.8 41.2 1.3
As Lito 277 237 55.6 4.1 78.0 31.4 57.8 1.4
As Mahetog 101 75 59.4 3.4 69.3 69.3 57.4 1.4
As Matuis 173 147 84.4 4.5 65.9 13.9 76.9 1.5
As Palacios 401 252 13.7 3.8 70.1 91.8 67.3 1.1
As Perdido 108 68 38.9 3.0 80.6 46.3 60.2 1.3
As Rabagau 329 207 40.4 3.4 72.9 51.4 67.2 1.4
As Teo 106 87 69.8 4.4 82.1 16.0 42.5 1.5
As Terlaje 111 90 44.1 3.2 86.5 65.8 67.6 1.3
Capitol Hill 453 339 51.4 4.0 71.7 49.0 81.0 1.6
Chacha 36 19 88.9 5.3 80.6 22.2 66.7 1.6
Chalan Galaide 73 55 27.4 3.3 54.8 65.8 89.0 1.5
Chalan Kanoa I 578 440 21.6 2.9 82.5 84.4 39.4 0.9
Chalan Kanoa II 424 333 23.8 3.0 81.8 90.6 53.8 0.9
Chalan Kanoa III 297 259 27.3 3.1 87.2 93.3 39.7 0.9
Chalan Kanoa IV 227 174 30.4 3.3 86.8 89.9 55.5 0.8
Chalan Kiya 384 312 47.9 3.4 64.6 35.2 42.4 1.3
Chalan Laulau 478 346 28.0 2.9 59.2 59.6 53.8 1.1
Chalan Piao 598 410 21.4 2.6 78.6 66.9 42.1 0.9
Chalan Rueda 101 80 35.6 2.2 52.5 64.4 64.4 1
China Town 496 394 22.2 2.6 80.4 75.4 58.3 1.1
Dagu 320 246 38.8 2.8 71.6 40.9 40.0 1.3
Dandan 1,003 810 68.1 3.9 77.3 12.5 52.8 1.5
Fananganan 407 324 44.7 3.7 79.4 72.0 70.0 1.2
Finasisu 1,058 793 36.4 3.2 81.0 58.2 55.1 1.2
Garapan 1,974 1,553 10.5 2.4 83.0 91.7 65.2 0.7
Gualo Rai 759 553 34.0 3.0 76.2 68.9 56.4 1.2
Hilaihai 10 10 90.0 4.5 70.0 0.0 60.0 1.3
I Akgak 118 89 89.8 4.5 71.2 16.1 71.2 1.7
I Denni 7 7 100.0 3.8 85.7 0.0 42.9 1.3
I Liyang 315 269 26.0 3.2 61.6 71.4 54.9 1.2
I Naftan 12 11 83.3 4.2 58.3 0.0 16.7 1.4
I Pitot 19 18 63.2 4.1 84.2 5.3 63.2 1.2
Kagman 48 35 77.1 3.8 81.3 27.1 31.3 1
Kagman I 107 79 90.7 4.4 76.6 0.0 57.0 1.6
Kagman II 290 213 92.4 4.4 82.1 3.8 64.1 1.4
Kagman III 760 543 95.7 3.7 78.2 5.7 50.1 1.3
Kagman IV 164 101 97.6 3.6 80.5 2.4 42.1 1.2
Kannat Tabla 301 257 45.8 3.5 65.4 23.3 48.5 1.3
Koblerville 755 625 48.3 3.8 81.2 68.3 55.4 1.2
Laulau Bay 91 69 67.0 4.3 57.1 33.0 60.4 1.3
Lower Base 27 27 11.1 2.1 88.9 81.5 29.6 0.7
Marpi 43 20 27.9 1.4 90.7 65.1 90.7 1.1
Matansa 49 19 32.7 3.3 95.9 67.3 81.6 1.4
Maturana Hill 51 46 60.8 3.8 82.4 21.6 17.6 1.2
Nanasu 12 11 100.0 4.3 8.3 0.0 41.7 1.4
Navy Hill 117 85 33.3 3.6 49.6 76.1 87.2 1.6
Opyan 11 8 100.0 3.6 63.6 0.0 9.1 1
Papago 144 107 74.3 4.0 61.1 18.8 63.2 1.6
Sadog Tasi 72 44 44.4 4.1 56.9 63.9 81.9 1.3
San Antonio 482 352 18.5 2.5 81.3 92.1 43.6 0.9
San Jose (Oleai) 392 324 24.0 2.6 80.4 79.8 43.9 0.9
San Roque 245 211 42.9 3.8 61.6 65.3 42.4 1.2
San Vicente 807 620 45.6 3.7 68.5 37.1 67.5 1.3
Susupe 760 605 22.2 2.8 79.3 83.7 47.2 0.9
Talafofo 17 11 88.2 3.3 64.7 0.0 29.4 1
Tanapag 270 225 62.6 3.8 82.2 63.7 57.8 1.2
Tapochao 61 46 55.7 4.5 55.7 36.1 80.3 1.7
Tottotville 65 57 93.8 5.0 70.8 78.5 75.4 1.7
Source: 2010 CNMI Census

2015 CNMI Statistical Yearbook Chapter 1 Page 29
11th Statistical Yearbook, Central Statistics Division, Department of Commerce
Table 1.45 Housing Facilities, Value, and Rent for Villages, CNMI: 2010
Village Total Units
Percent
Lacking complete plumbing facilities Lacking complete kitchen facilities
Without air condition-
ing
Achugao 63 30.2 34.9 44.4
Afetnas 538 17.3 29.9 33.1
Agingan 101 8.9 21.8 34.7
As Akina 31 12.9 12.9 29.0
As Falipe 3 0.0 66.7 66.7
As Gonna 51 19.6 25.5 49.0
As Lito 277 14.8 28.2 22.7
As Mahetog 101 10.9 29.7 23.8
As Matuis 173 5.2 26.0 26.0
As Palacios 401 3.5 12.2 9.5
As Perdido 108 8.3 36.1 13.0
As Rabagau 329 5.8 20.4 21.6
As Teo 106 5.7 27.4 31.1
As Terlaje 111 11.7 34.2 35.1
Capitol Hill 453 3.3 14.8 18.5
Chacha 36 8.3 52.8 38.9
Chalan Galaide 73 5.5 6.8 2.7
Chalan Kanoa I 578 13.5 29.8 36.3
Chalan Kanoa II 424 13.7 30.7 23.3
Chalan Kanoa III 297 11.1 17.5 26.6
Chalan Kanoa IV 227 15.0 30.0 33.9
Chalan Kiya 384 14.3 22.1 19.5
Chalan Laulau 478 22.0 39.5 23.4
Chalan Piao 598 14.4 38.3 32.8
Chalan Rueda 101 33.7 40.6 26.7
China Town 496 17.3 26.4 25.0
Dagu 320 23.8 30.9 26.3
Dandan 1,003 14.4 25.4 31.8
Fananganan 407 20.6 21.4 23.8
Finasisu 1,058 12.0 31.7 25.7
Garapan 1,974 8.0 27.3 14.4
Gualo Rai 759 19.5 27.3 22.9
Hilaihai 10 10.0 30.0 10.0
I Akgak 118 6.8 7.6 16.1
I Denni 7 28.6 14.3 42.9
I Liyang 315 16.5 30.2 20.3
I Naftan 12 25.0 16.7 25.0
I Pitot 19 10.5 36.8 42.1
Kagman 48 37.5 45.8 47.9
Kagman I 107 15.9 26.2 33.6
Kagman II 290 10.7 26.6 36.9
Kagman III 760 23.8 28.9 37.4
Kagman IV 164 29.3 37.8 44.5
Kannat Tabla 301 7.3 19.9 29.2
Koblerville 755 10.7 19.9 27.2
Laulau Bay 91 14.3 19.8 27.5
Lower Base 27 33.3 37.0 44.4
Marpi 43 4.7 55.8 4.7
Matansa 49 0.0 12.2 18.4
Maturana Hill 51 13.7 19.6 35.3
Nanasu 12 50.0 50.0 50.0
Navy Hill 117 0.9 6.8 6.8
Opyan 11 72.7 45.5 63.6
Papago 144 10.4 22.9 25.7
Sadog Tasi 72 1.4 2.8 4.2
San Antonio 482 18.0 30.3 33.6
San Jose (Oleai) 392 24.5 21.9 19.9
San Roque 245 10.6 16.3 13.5
San Vicente 807 9.3 17.6 22.4
Susupe 760 14.5 27.4 27.0
Talafofo 17 47.1 58.8 64.7
Tanapag 270 16.3 30.0 28.9
Tapochao 61 0.0 4.9 13.1
Tottotville 65 4.6 6.2 10.8
Source: 2010 CNMI Census

Page 30 Chapter 1 2015 CNMI Statistical Yearbook
11th Statistical Yearbook, Central Statistics Division, Department of Commerce
Table 1.45 Housing Facilities, Value, and Rent for Villages, CNMI: 2010 – Continued –
Village
Total
Units
Occupied Units
Occupied
units
No Tele-
phone No Radio
No Com-
puter
No inter-
net
Median
home
value
Median
gross rent
Achugao 63 51 11.8 39.2 52.9 5.9 $65,000 $283
Afetnas 538 457 11.2 31.1 42.5 13.8 $112,500 $204
Agingan 101 82 11.0 62.2 43.9 8.5 $120,313 $225
As Akina 31 25 4.0 28.0 72.0 8.0 $350,000 $2,000
As Falipe 3 2 0.0 0.0 100.0 0.0 $450,000 $0
As Gonna 51 42 26.2 35.7 54.8 11.9 $108,333 $333
As Lito 277 237 6.3 32.9 58.6 17.7 $178,125 $464
As Mahetog 101 75 12.0 34.7 57.3 12.0 $117,857 $317
As Matuis 173 147 6.8 29.3 64.6 15.0 $123,148 $613
As Palacios 401 252 5.6 33.7 69.4 7.1 $117,708 $297
As Perdido 108 68 8.8 58.8 55.9 13.2 $212,500 $467
As Rabagau 329 207 7.7 25.1 68.6 11.6 $162,500 $432
As Teo 106 87 4.6 28.7 62.1 16.1 $167,188 $242
As Terlaje 111 90 7.8 42.2 64.4 15.6 $225,000 $244
Capitol Hill 453 339 6.8 19.5 73.2 11.8 $207,143 $673
Chacha 36 19 21.1 15.8 42.1 10.5 $106,250 $450
Chalan Galaide 73 55 1.8 21.8 90.9 5.5 $187,500 $608
Chalan Kanoa I 578 440 9.3 42.7 43.9 11.8 $137,500 $249
Chalan Kanoa II 424 333 12.9 43.2 51.4 9.9 $125,000 $291
Chalan Kanoa III 297 259 11.2 37.1 41.7 11.6 $81,667 $238
Chalan Kanoa IV 227 174 16.1 56.9 51.1 12.6 $150,000 $292
Chalan Kiya 384 312 9.6 25.0 65.1 10.9 $206,250 $400
Chalan Laulau 478 346 13.0 27.5 60.1 12.1 $234,375 $376
Chalan Piao 598 410 13.7 52.4 57.6 14.4 $300,000 $293
Chalan Rueda 101 80 7.5 63.8 53.8 11.3 $122,500 $239
China Town 496 394 10.4 44.4 59.6 12.4 $137,500 $321
Dagu 320 246 10.6 37.0 57.3 13.8 $164,583 $316
Dandan 1,003 810 10.1 34.7 53.2 14.7 $150,735 $419
Fananganan 407 324 12.0 44.8 53.4 8.3 $116,071 $446
Finasisu 1,058 793 12.1 44.6 60.3 11.5 $125,000 $355
Garapan 1,974 1,553 7.6 50.4 59.8 10.2 $275,000 $308
Gualo Rai 759 553 7.2 45.2 70.2 9.8 $246,154 $349
Hilaihai 10 10 10.0 40.0 60.0 10.0 $156,250 $1,750
I Akgak 118 89 5.6 24.7 70.8 10.1 $184,375 $725
I Denni 7 7 0.0 14.3 28.6 0.0 $350,000 $0
I Liyang 315 269 9.7 39.8 63.6 13.4 $225,000 $353
I Naftan 12 11 0.0 18.2 72.7 54.5 $225,000 $0
I Pitot 19 18 11.1 33.3 38.9 11.1 $450,000 $875
Kagman 48 35 17.1 40.0 40.0 20.0 $112,500 $400
Kagman I 107 79 16.5 12.7 55.7 13.9 $106,250 $425
Kagman II 290 213 12.2 21.1 53.1 14.1 $89,722 $460
Kagman III 760 543 15.7 27.1 47.0 15.5 $87,558 $483
Kagman IV 164 101 11.9 25.7 37.6 9.9 $85,000 $375
Kannat Tabla 301 257 7.0 24.9 59.1 13.6 $154,167 $331
Koblerville 755 625 10.6 30.1 53.3 15.7 $116,250 $343
Laulau Bay 91 69 4.3 24.6 69.6 4.3 $237,500 $620
Lower Base 27 27 11.1 37.0 40.7 11.1 $22,500 $125
Marpi 43 20 10.0 20.0 80.0 15.0 $118,750 $115
Matansa 49 19 10.5 10.5 73.7 21.1 $625,000 $592
Maturana Hill 51 46 4.3 30.4 47.8 15.2 $275,000 $300
Nanasu 12 11 27.3 36.4 36.4 0.0 $108,333 $0
Navy Hill 117 85 5.9 34.1 90.6 11.8 $375,000 $738
Opyan 11 8 37.5 50.0 25.0 12.5 $55,000 $0
Papago 144 107 8.4 14.0 57.9 10.3 $170,833 $544
Sadog Tasi 72 44 9.1 25.0 93.2 15.9 $212,500 $963
San Antonio 482 352 15.1 51.7 47.7 9.9 $206,250 $182
San Jose (Oleai) 392 324 11.1 52.5 48.8 9.3 $119,643 $258
San Roque 245 211 8.1 31.3 53.6 12.3 $170,313 $267
San Vicente 807 620 6.5 34.8 61.1 13.1 $167,000 $453
Susupe 760 605 10.6 39.3 60.0 12.4 $158,333 $314
Talafofo 17 11 18.2 9.1 27.3 18.2 $85,000 $275
Tanapag 270 225 16.4 26.7 40.4 14.7 $105,469 $263
Tapochao 61 46 4.3 23.9 93.5 4.3 $487,500 $1,167
Tottotville 65 57 5.3 28.1 77.2 5.3 $98,571 $475
Source: 2010 CNMI Census

11th Statistical Yearbook, Central Statistics Division, Department of Commerce
CHAPTER 2
Health

Page 32 Chapter 2 2015 CNMI Statistical Yearbook
11th Statistical Yearbook, Central Statistics Division, Department of Commerce
Chapter 2 – Health
Health data are collected and maintained by the CNMI Commonwealth Healthcare Corporation (CHC). The
data included here go through calendar 2014, but the CHC collects statistics on a monthly basis, and so has
more recent data.
The CNMI has about 1,000 births a year, and that number has remained fairly constant in recent years. About
half the births are to residents, while the remainder are to temporary residents and tourists, with tourist births
staying about 300 in recent years. More male than female births were reported in each year (569 to 488 or a
sex ratio of 117 in 2014).
Of the 6,500 births between 2009 and 2014, about 3,500 (about 54 percent) were to residents, with about
3,000 being U.S. citizen births, about 360 to Freely Associated citizens, and about 200 on Immediate Resident
Permits. Of the temporary residents, almost all were guest workers, although about 100 were to guest worker
dependents. About, as noted, about 1,300 were to tourists. Of the tourists, about 1,100 of the 1,300 were
Chinese.
The crude birth rate (births per 1,000 population) increased from about 19.9 in 2009 to 2011 to about 21.1
during 2012 to 2014. Resident births were about half the total as noted. The CNMI had very few low-weight
births and almost all babies were born to term. The total fertility rate decreased from about 2.9 births over
the reproductive period during 2009 to 2011 based on the age-specific births to about 2.2 during the 2012 to
2014 period. The age-specific rates decreased for females younger than 35 but increased for those 35 years
and over.

2015 CNMI Statistical Yearbook Chapter 2 Page 33
11th Statistical Yearbook, Central Statistics Division, Department of Commerce
About 800 deaths were reported for the CNMI during the period 2011 to 2014. About 62 percent of the
deaths were to males. During the 4 year period, the largest number of deaths were of the circulatory system
(heart attacks and strokes), at 251 (about 1 in 3), followed by Neoplasms – cancers (133 or 1 in 6). Males
died on average at 60.3 years while females died on average at 63.6 years, so life expectancy is lower than
in the States. The CNMI had very few neonatal and post-neonatal deaths during the period.
In 2013, the CNMI conducted a Behavioral Risk Survey. The estimated population of adults at that time was
34,670. About 20,000 adults had never smoked cigarettes (59 percent) while 6,800 (20 percent) smoked
every day. More people did not chew betel nut with tobacco daily, but still 5,100 or 15 percent of the adults
did chew betel nut with tobacco daily. While 12,600 (37 percent) had never used alcohol, about 900 (3
percent) drank alcohol on a daily basis. And 244 adults reported smoking marijuana on a daily basis. The
numbers for heroin use, hallucinogens, inhalants, and prescription drugs use were very small and not reliable.
The average user of cigarettes, betel nut with tobacco, alcohol, and marijuana was between 16 and 20 years
old when he or she started using.
Most adults found considerable risk in all of the substances presented, and the large majority also disapproved
of their use. Most adults had not driven vehicles when impaired and most had not been riding with someone
else impaired. And, most adults had not suffered from a nervous condition in the month before the survey.
The Nutrition Assistance Program (NAP), Department of Community and Cultural Affairs, used to provide
statistics on participants. Data are included in this chapter based on data up to FY 2004. More recent data
are probably available, but were not provided.

Page 34 Chapter 2 2015 CNMI Statistical Yearbook
11th Statistical Yearbook, Central Statistics Division, Department of Commerce
Table 2.1 Births by Year and Resident Status, CNMI: 2009 to 2014
Year
Total Males Females
Total
Resi-
dent
Temp.
Res.
Tour-
ist Total
Resi-
dent
Temp.
Res.
Tour-
ist Total
Resi-
dent
Temp.
Res.
Tour-
ist
2014 1,057 527 216 314 569 272 113 184 488 255 103 130
2013 1,057 586 184 287 570 310 89 171 487 276 95 116
2012 1,129 588 222 319 604 317 113 174 525 271 109 145
2011 1,033 527 268 238 502 264 124 114 531 263 144 124
2010 1,077 671 336 70 566 360 165 41 511 311 171 29
2009 1,111 626 434 51 566 304 234 28 545 322 200 23
Source: CNMI CHC Vital Statistics
Note: Resident: permanently reside in the CNMI and are citizens of the US or a Freely Associated State (FAS), or are an immediate
relative (e.g. husband, wife) of a US or FAS citizen; Temporary Resident: non-permanent residents who are not US or FAS citizens but
have been in the CNMI for several months/years on short or long term visas, predominantly working visas; Tourist: from other countries
(predominantly Asian), and only in the CNMI for a short period of time to deliver their baby.
Table 2.2 Number of births per year by detailed residency/visa classification of mother, CNMI: 2009-2014
Residency/visa classification Total 2014 2013 2012 2011 2010 2009
Total 6,464 1,057 1,057 1,129 1,033 1,077 1,111
Resident 3,525 527 586 588 527 671 626
US citizen 2,968 458 508 494 447 538 523
FAS citizen* 360 55 53 58 77 76 41
Immediate Relative Permit 197 14 25 36 3 57 62
Temporary resident 1,660 216 184 222 268 336 434
Guest Worker 1,507 160 158 206 268 304 411
Guest Worker Dependent 98 56 22 9 - 11 -
Other temporary VISA** 55 - 4 7 - 21 23
Tourist 1,279 314 287 319 238 70 51
Source: CNMI CHC Vital Statistics
*FAS citizen: Citizens from the Freely Associated States (FSM, Palau, and Marshall Islands)
**Other temporary VISA: includes student VISA’s, business permit VISA’s, missionary and diplomatic VISA’s.
Table 2.3 Number of live births to ‘Tourist’ mothers by ethnicity, CNMI: 2009-2014
Ethnicity Total 2014 2013 2012 2011 2010 2009
Total 1,279 314 287 319 238 70 51
Chinese 1,068 295 270 287 178 26 12
Korean 154 14 13 24 34 37 32
Filipino 23 1 1 5 5 6 5
Japanese 21 0 1 1 18 0 1
Russian 7 3 2 1 0 0 1
Nepalese 3 0 0 1 1 1 0
Thai 2 0 0 0 2 0 0
Kazakhstan 1 1 0 0 0 0 0
Source: CNMI CHC Vital Statistics
527 586 588 527671 626
216184 222 268
336 434314 287
319238
7051
0
200
400
600
800
1000
1200
2014 2013 2012 2011 2010 2009
Births by Residency
Resident Temp. Res. Tourist
US
citizen
46%
FAS
citizen*
6%
Immedia
te
Relative
Permit
3%Guest
Worker
23%
Guest
Worker
Dependent
1%
Other
temporary
VISA**
1%
Tourist
20%
Births by Residency: 2009 to 2014
83.5
93.9 94.190.0
74.8
37.1
23.5
0.0
10.0
20.0
30.0
40.0
50.0
60.0
70.0
80.0
90.0
100.0
Total 2014 2013 2012 2011 2010 2009
Chinese Tourist Births

2015 CNMI Statistical Yearbook Chapter 2 Page 35
11th Statistical Yearbook, Central Statistics Division, Department of Commerce
Table 2.4 Crude birth rate, by residency/visa classification of mother, CNMI: 2009-2014
Period All births Resident births Temporary resident births Tourist births
2009-2011 19.9 (18.8-21.1) 11.3 (10.4-12.2) 6.4 (5.7-7.1) 2.2 (1.8-2.6)
2012-2014 21.1 (19.9-22.4) 11.1 (10.2-12.0) 4.0 (3.5-4.6) 6.0 (5.3-6.7)
Source: CNMI CHC Vital Statistics
N° (number); 95%CI (95% confidence interval)
See footnotes of Table 2.1 for definitions of mother’s residency/visa classification.
Table 2.5 Births by Birth Weight and Residency/Visa of mother, CNMI: 2009-2014
Period of Birth Total
Birth weight category
<2500g ≥2500g Unknown
2009-2011 3,221 67 3,148 6
Resident 1,824 44 1,775 5
Temporary resident 1,038 18 1,019 1
Tourist 359 5 354 0
2012-2014 3,243 9 3,233 1
Resident 1,701 6 1,695 0
Temporary resident 622 1 621 0
Tourist 920 2 917 1
Source: CNMI CHC Vital Statistics
Please see footnotes of Table 2.1 for definitions of mother’s residency/visa classification.
Table 2.6 Births by Gestational Period and Residency/Visa Classification of Mother, CNMI: 2009-2014
Period of Birth Total
Gestational age category (proportion %)
<37 weeks ≥37 weeks Unknown
2009-2011 3,221 199 2,964 58
Resident 1,824 118 1,671 35
Temporary resident 1,038 71 949 18
Tourist 359 10 344 5
2012-2014 3,243 263 2,884 96
Resident 1,701 166 1,473 62
Temporary resident 622 57 552 13
Tourist 920 40 859 21
Source: CNMI CHC Vital Statistics
Please see footnotes of Table 2.1 for classifications of mother’s residency/visa status categories.
11.3 11.1
6.44.0
2.2 6.0
0
4
8
12
16
20
24
2009-2011 2012-2014
Crude Birth Rates, CNMI: 2009-2014
Resident births Temporary resident Tourist births
2.1
2.4
1.7
1.4
0.3
0.4
0.2
0.2
0.0 0.5 1.0 1.5 2.0 2.5
2009-2011
Resident
Temporary resident
Tourist
2012-2014
Resident
Temporary resident
Tourist
Percent Underweight Babies, CNMI: 2009 to 2014
6.2
6.5
6.8
2.8
8.1
9.8
9.2
4.3
0.0 2.0 4.0 6.0 8.0 10.0
2009-2011
Resident
Temporary resident
Tourist
2012-2014
Resident
Temporary resident
Tourist
Percent Premature

Page 36 Chapter 2 2015 CNMI Statistical Yearbook
11th Statistical Yearbook, Central Statistics Division, Department of Commerce
Table 2.7 Age-Specific Births by Residency/Visa Classification of Mother, CNMI: 2009-2014
Age
group
All Residents Temporary residents Tourists
2009-11 2012-14 2009-11 2012-14 2009-11 2012-14 2009-11 2012-14
10-14 2 2 2 2 0 0 0 0
15-19 101 73 98 70 2 0 1 3
20-24 203 236 166 193 24 10 13 33
25-29 273 264 157 124 82 39 34 101
30-34 253 279 108 106 102 70 43 103
35-39 176 164 61 57 92 55 23 52
40-44 62 59 16 15 41 30 5 15
45-49 3 3 0 0 3 2 0 0
Source: CNMI CHC Vital Statistics
Please see footnotes of Table 2.1 above for definitions of mother’s residency/visa classification.
Table 2.8 Age-specific Fertility Rates by Residency/Visa Classification of Mother, CNMI: 2009-2011
Age
group
2009-2011 2012-2014
Total Residents Temp Res. Tourists Total Residents Temp Res. Tourists
TFR 2,874.0 1,724.5 841.5 308.5 2,371.5 1,323.0 426.0 622.5
15-19 49.2 47.8 1.0 0.5 45.5 43.6 0.0 1.9
20-24 150.5 123.1 17.8 9.6 126.4 103.4 5.4 17.7
25-29 160.0 92.0 48.1 19.9 109.0 51.2 16.1 41.7
30-34 123.3 52.6 49.7 21.0 83.4 31.7 20.9 30.8
35-39 68.3 23.7 35.7 8.9 77.2 26.8 25.9 24.5
40-44 22.2 5.7 14.7 1.8 31.1 7.9 15.8 7.9
45-49 1.3 0.0 1.3 0.0 1.7 0.0 1.1 0.0
Source: CNMI CHC Vital Statistics
Please see footnotes of Table 2.1 for definitions of mother’s residency/visa classification.
Table 2.9 Deaths by Sex and Year, CNMI: 2011-2014
Year Total Male Female
Total 756 466 290
Average 189 117 73
2014 220 142 78
2013 200 123 77
2012 175 104 71
2011 161 97 64
Source: CNMI CHC Vital Statistics
0
50
100
150
200
250
300
15-19 20-24 25-29 30-34 35-39 40-44 45-49
Births by Age of Mother
2009-11 2012-14
0.0
20.0
40.0
60.0
80.0
100.0
120.0
140.0
160.0
180.0
15-19 20-24 25-29 30-34 35-39 40-44 45-49
Age-Specific Birth Rates: 2009 to 2014
2009-2011 2012-2014
142123
104 97
7877
7164
0
50
100
150
200
250
2014 2013 2012 2011
Deaths by Sex and Year, CNMI 2011 - 2014
Males Females

2015 CNMI Statistical Yearbook Chapter 2 Page 37
11th Statistical Yearbook, Central Statistics Division, Department of Commerce
Table 2.10 Leading Causes of Death, CNMI: 2011 to 2014
Cause of Death ICD-10 Code Total 2011 2012 2013 2014
Total 756 161 175 200 220
Disease of the circulatory system I00-I99 251 51 63 61 76
Neoplasms C00-D48 133 31 25 34 43
External causes of mortality V01-Y89 68 9 16 16 27
Endocrine, nutritional and metabolic diseases E0-E90 54 17 10 11 16
Diseases of the genitourinary system N00-N99 53 12 18 13 10
Disease of the respiratory system J00-J98 52 10 10 15 17
Disease of the digestive system K00-K93 37 10 9 14 4
Symptoms, signs and abnormal clinical and laboratory findings,
not elsewhere classified R00-R99 35 8 10 16 1
Certain infectious and parasitic diseases A00-B99 24 3 3 8 10
Disease of the nervous system G00-G98 13 2 3 8
Certain conditions originating in the perinatal period P00-P96 11 3 6 2
Congenital malformations, deformations and chromosomal ab-
normalities Q00-Q99 9 2 4 3
Diseases of the skin and subcutaneous tissue L00-L99 7 2 3 2
Mental and behavioral disorders F00-F99 5 1 1 1 2
Diseases of the musculoskeletal system and connective tissue M00-M99 3 2 1
Pregnancy, childbirth and the puerperium O00-O99 1 1
Source: CNMI CHC Vital Statistics
Table 2.11 Deaths by Age and Sex, CNMI: 2011 to 2014
Number of deaths Average number of deaths
Age group Male Female Total Male Female Total
Total 466 290 756 117 73 189
Less than 1 17 10 27 4 3 7
1-4 4 4 8 1 1 2
5-9 1 0 1 0 0 0
10-14 3 0 3 1 0 1
15-19 5 0 5 1 0 1
20-24 5 2 7 1 1 2
25-29 4 6 10 1 2 3
30-34 10 6 16 3 2 4
35-39 11 9 20 3 2 5
40-44 20 12 32 5 3 8
45-49 29 21 50 7 5 13
50-54 49 19 68 12 5 17
55-59 71 29 100 18 7 25
60-64 61 38 99 15 10 25
65-69 46 31 77 12 8 19
70-74 46 24 70 12 6 18
75-79 27 28 55 7 7 14
80-84 37 24 61 9 6 15
85 + 20 27 47 5 7 12
Source: CNMI CHC Vital Statistics
Disease of
the
circulatory
system
33%
Neoplasms
18%External
causes of
mortality
9%
Endocrine,
nutritional
and
metabolic
diseases
7%
Diseases of
the
genitourina
ry system
7%
Disease of
the
respiratory
system
7%All others
19%
Cause of Death
0
10
20
30
40
50
60
70
80L
ess
than
1
1-4
5-9
10-1
4
15-1
9
20-2
4
25-2
9
30-3
4
35-3
9
40-4
4
45-4
9
50-5
4
55-5
9
60-6
4
65-6
9
70-7
4
75-7
9
80-8
4
85 +
Age at Death by Sex
Males Females

Page 38 Chapter 2 2015 CNMI Statistical Yearbook
11th Statistical Yearbook, Central Statistics Division, Department of Commerce
Table 2.12 Deaths to neonates, infants and children by year, CNMI: 2011-2014
Year
Total children
under age 5 years Infants under age 1 Children aged
under 5 Total <1 year Under 28 days 28 days to <1 year 1-4 years
Total 35 27 17 10 8
Average 9 7 4 3 2
2014 7 6 2 4 1
2013 13 11 9 2 2
2012 11 8 5 3 3
2011 4 2 1 1 2
Source: CNMI CHC Vital Statistics
Table 2.13 During the Past 30 days, Days using Substances, CNMI: 2013
Days Cigarettes
Other to-
bacco
Betel nut
with to-
bacco Alcohol
Mariju-
ana Heroin
Hallucin-
ogens Inhalants
Prescrip-
tion drugs
Total 34,669 34,670 34,670 34,670 34,671 34,671 34,670 34,670 34,670
None 5,830 1,949 2,172 8,552 3,798 969 887 807 845
1 to 4 days 622 118 722 9,391 386
5 to 9 days 410 100 318 1,731 147 21 6
10 to 14 days 296 76 164 593 60
15 to 19 days 189 19 105 499 95 4
20 to 24 days 123 20 75 235 38
25 to 29 days 6 24 30 94 18
30 days 6,796 709 5,100 926 244 6 6 6 6
Never used 20,376 31,623 25,963 12,621 29,820 33,642 33,744 33,832 33,796
Refused 21 32 21 28 65 33 33 19 19
Source: 2013 CNMI Behavioral Health Survey
Table 2.14 Age When First Used Substance, CNMI: 2013
Age Cigarettes
Betel nut
with to-
bacco Alcohol Marijuana Heroin
Hallucino-
gens Inhalants
Prescrip-
tion drugs
Total 34,670 34,670 34,670 34,669 34,673 34,671 34,648 34,671
1-5 59 92 19
6-10 260 558 181 84 6 13 4 17
11-15 2,716 2,413 2,231 914 31 33
16-20 6,872 2,680 10,935 2,251 110 80 27
21-25 2,163 592 4,588 342 26 12
26-30 734 395 1,495 131 6 5
31-35 266 135 366 89 12 6
36-40 61 296 511 68
41-45 88 98 238 9
46-50 46 100 103 8
51-55 8 27 33 4
56-60 34 35 15
61-65
66-70 14 11
Unknown 124 349 322 82 17 17 21
Never used 21,146 26,777 13,224 30,530 34,372 34,477 34,547 34,530
Refused 186 143 316 123 82 78 64 59
Source: 2013 CNMI Behavioral Health Survey
24.4
3.1
18.8
38.8
2.8
0.0 10.0 20.0 30.0 40.0
Cigarettes
Other tobacco
Betel nut with tobacco
Alcohol
Maijuana
Percent Using at least Once in Last 30 Days,
CNMI: 2013

2015 CNMI Statistical Yearbook Chapter 2 Page 39
11th Statistical Yearbook, Central Statistics Division, Department of Commerce
Table 2.15 Risks of Substance Use, CNMI: 2013
Substance Use Total No risk Slight risk
Moderate
Risk Great Risk
Don't
know Refused
Smoking one or more packs of
cigarettes per day 34,671 479 880 2,416 29,299 1,582 15
Drinking 5 or more beverages
once or twice a week 34,671 871 2,374 8,706 21,322 1,389 9
Smoke Marijuana once or twice
a week 34,670 1,590 1,647 4,008 23,878 3,521 26
Use other Tobacco products 34,669 547 818 2,957 27,916 2,422 9
Betel nut with tobacco 34,670 679 1,475 4,802 24,962 2,726 26
Betel not with tobacco at least
12 times a day 34,671 488 840 1,744 28,805 2,779 15
Heroin, cocaine, methampheta-
mine 34,670 262 117 268 31,201 2,813 9
Hallucinogens 34,670 228 135 402 30,965 2,931 9
Source: 2013 CNMI Behavioral Health Survey
Table 2.16 Disapproval of Substance Use, CNMI: 2013
Substance Total
Neither Approve
/ Disapprove
Somewhat Dis-
approve
Strongly Disap-
prove Refused
Smoking one or more packs of
cigarettes a day 34,670 3,606 2,912 28,032 120
Family and friends think about
smoking 34,669 3,541 3,890 27,051 187
Trying Marijuana or hashish 34,670 4,052 2,896 27,633 89
Trying Marijuana or hashish
once a month or more 34,670 4,054 3,052 27,487 77
One of two alcoholic beverages
per day 34,670 5,330 4,425 24,816 99
Source: 2013 CNMI Behavioral Health Survey
Table 2.17 Driving with Substances, CNMI: 2013
Driving with Substance Total
Driven with Passengers: Been Passenger with Driver:
No
< 18
only
18+
only
Mixe
d Other No
Under
18 18+ Other
Driven under alcohol 34,669 28,938 102 1,583 470 3,576 29,847 66 4,688 69
Driven under drugs 34,670 30,756 33 255 52 3,574 33,792 29 822 27
Driven under alcohol & drugs 34,670 30,933 - 99 52 3,586 34,025 40 556 49
Source: 2013 CNMI Behavioral Health Survey

Page 40 Chapter 2 2015 CNMI Statistical Yearbook
11th Statistical Yearbook, Central Statistics Division, Department of Commerce
Table 2.18 Days in last 30 Days with Mental Conditions, CNMI: 2013
Days in last 30 with Condition
Mental condition Total None 1 to 4 5 to 9
10 to
14
15 to
19
20 to
24
25 to
29 30
Re-
fused
Feeling nervous 34,670 29,999 3,259 455 228 53 40 24 500 112
Feeling hopeless 34,671 31,995 1,585 401 159 167 32 33 183 116
Restless or fidgety 34,670 29,565 2,647 809 412 171 120 20 816 110
Feeling depressed 34,670 30,793 2,278 440 295 167 23 24 518 132
Everything an effort 34,669 30,616 1,574 472 255 169 36 82 1,318 147
Keep from working 34,669 33,292 745 161 147 17 38 26 173 70
Source: 2013 CNMI Behavioral Health Survey
Table 2.19 Nutritional Assistance Program Actual Participation by Month, CNMI: FY 2001 thru FY 2004
Island
2004 2003
HH Individuals Benefits ($) HH Individuals Benefits ($)
Total 2,140 6,860 551,004 2,097 6,773 540,985
Saipan 1,988 6,367 511,278 1,949 6,246 498,710
Tinian 67 210 17,243 68 237 18,115
Rota 85 283 22,483 80 290 24,160
Source: Department of Community and Cultural Affairs, Nutrition Assistance Program (NAP)
Note: Values are monthly averages for the year
Note: Table will be updated with current information
Table 2.19 Nutritional Assistance Program Actual Participation by Month, CNMI: FY 2001 thru FY 2004 – Continued –
Island
2002 2001
HH Individuals Benefits ($) HH Individuals Benefits ($)
Total 0 0 506,648 0 0 0
Saipan 0 0 467,496 0 0 0
Tinian 0 0 0 0 0 0
Rota 0 0 0 0 0 0
Source: Department of Community and Cultural Affairs, Nutrition Assistance Program (NAP)
Note: Values are monthly averages for the year
Note: Table will be updated with current information

2015 CNMI Statistical Yearbook Chapter 2 Page 41
11th Statistical Yearbook, Central Statistics Division, Department of Commerce
Table 2.20 Nutritional Assistance Program Actual Participation by Island, CNMI: FY 2004
Month
Saipan Rota Tinian
HH
Individu-
als
Benefits
($) HH
Individu-
als
Benefits
($) HH
Individu-
als
Benefits
($)
October 1,975 6,315 501,420 87 828 21,713 66 209 17,097
November 2,024 6,413 513,592 79 849 20,359 62 200 16,444
December 2,052 6,488 523,940 82 253 20,770 57 181 14,335
January 1,945 6,230 500,792 91 306 24,297 70 218 17,808
February 1,972 6,313 511,335 90 300 23,796 69 222 18,073
March 1,968 6,304 512,172 88 305 23,976 68 215 18,171
April 1,950 6,281 505,725 87 304 23,880 69 215 17,870
May 1,978 6,395 509,453 80 280 22,125 68 222 18,720
June 2,010 6,467 515,786 76 260 21,069 69 217 17,660
July 1,983 6,406 513,099 82 271 22,027 69 214 17,063
August 2,017 6,458 519,099 87 291 22,816 67 204 16,452
September 1,980 6,335 508,955 86 288 22,967 67 205 17,221
Source: Department of Community and Cultural Affairs, Nutrition Assistance Program (NAP)
Note: Table will be updated with current information
Table 2.21 Nutritional Assistance Program Actual Participation by Month, CNMI: FY 2001 thru FY 2004
Month
2004 2003
HH Individuals Benefits ($) HH Individuals Benefits ($)
October 2,133 6,818 541,612 2,053 6,625 524,250
November 2,170 6,874 551,777 2,085 6,701 527,402
December 2,196 6,934 560,427 2,102 6,782 534,039
January 2,108 6,760 543,555 2,083 6,736 530,986
February 2,134 6,845 554,146 2,088 6,785 539,566
March 2,127 6,834 555,435 2,087 6,798 537,446
April 2,109 6,811 548,591 2,079 6,757 537,596
May 2,130 6,908 551,481 2,073 6,729 536,361
June 2,159 6,955 555,764 2,106 6,813 542,072
July 2,138 6,902 553,438 2,135 6,894 549,078
August 2,176 6,965 559,711 2,130 6,824 543,636
September 2,138 6,840 550,525 2,144 6,842 545,123
Source: Department of Community and Cultural Affairs, Nutrition Assistance Program (NAP)
Note: Table will be updated with current information
Table 2.21 Nutritional Assistance Program Actual Participation by Month, CNMI: FY 2001 thru FY 2004 – Continued –
Month
2002 2001 2000
HH
Individu-
als
Benefits
($) HH
Individu-
als
Benefits
($) HH
Individu-
als
Benefits
($)
October 1,807 5,818 455,488 1,633 5,250 400,056 1,544 5,141 391,549
November 1,880 6,039 474,399 1,660 5,312 403,828 1,555 5,153 388,982
December 1,953 6,227 489,091 1,661 5,321 407,497 1,552 5,153 391,350
January 1,910 6,149 492,838 1,631 5,248 403,336 1,494 5,019 383,633
February 1,995 6,367 512,928 1,654 5,280 407,314 1,540 5,088 391,681
March 2,018 6,452 520,632 1,691 5,366 412,283 1,573 5,180 399,952
April 2,046 6,487 521,597 1,716 5,395 416,725 1,624 5,295 403,404
May 2,041 6,472 514,934 1,740 5,466 421,788 1,648 5,318 405,435
June 2,061 6,554 521,042 1,761 5,539 426,648 1,668 5,387 409,871
July 2,071 6,618 525,379 1,749 5,521 429,867 1,656 5,379 411,925
August 2,082 6,651 528,729 1,741 5,551 433,892 1,636 5,295 406,834
September 2,073 6,622 523,508 1,769 5,695 439,359 1,618 5,244 401,840
Source: Department of Community and Cultural Affairs, Nutrition Assistance Program (NAP)
Note: Table will be updated with current information

Page 42 Chapter 2 2015 CNMI Statistical Yearbook
11th Statistical Yearbook, Central Statistics Division, Department of Commerce
Table 2.22 Nutritional Assistance Program Actual Participation by Ethnicity, CNMI: FY 2002-FY 2004
Ethnicity
2004 2003
Households Persons Benefits ($) Households Persons Benefits ($)
Chamorro 943 3,613 3,636,956 11,000 42,769 3,516,810
Carolinian 373 1,350 1,377,845 4,250 16,226 1,373,919
Chuukese 144 410 410,767 1,678 4,741 379,986
Palauan 96 310 311,553 1,233 3,908 320,006
Ponapean 44 112 108,833 597 1,445 120,480
Yapese 13 34 30,192 122 317 22,984
Filipino 493 959 676,462 5,902 11,100 653,791
Others 39 83 73,854 383 780 59,579
Source: Department of Community and Cultural Affairs, Nutrition Assistance Program (NAP)
Note: Table will be updated with current information
Table 2.22 Nutritional Assistance Program Actual Participation by Ethnicity, CNMI: FY 2002-FY 2004 – Continued –
Ethnicity
2002 2001
Households Persons Benefits ($) Households Persons Benefits ($)
Chamorro 875 3,361 3,326,945 736 2,799 2,685,316
Carolinian 333 1,274 1,296,081 288 1,109 1,080,625
Chuukese 131 355 344,997 120 329 304,207
Palauan 103 328 317,680 87 291 273,996
Ponapean 42 102 98,292 33 79 76,604
Yapese 9 27 25,365 10 29 32,035
Filipino 471 856 606,367 405 727 503,345
Others 31 68 64,838 22 48 46,465
Source: Department of Community and Cultural Affairs, Nutrition Assistance Program (NAP)
Note: Table will be updated with current information
Table 2.23 Nutritional Assistance Program Actual Participants by Ethnicity, CNMI: FY 2000 thru FY 2004
Ethnicity
Households Participants
2004 2003 2002 2001 2000 2004 2003 2002 2001 2000
Chamorro 11,310 11,000 875 736 704 43,356 42,769 3,361 736 2,751
Carolinian 4,470 4,250 333 288 271 16,206 16,226 1,274 288 1,102
Chuukese 1,724 1,678 131 120 112 4,922 4,741 355 120 301
Palauan 1,151 1,233 103 87 91 3,717 3,908 328 87 290
Ponapean 525 597 42 33 26 1,344 1,445 102 33 68
Yapese 159 122 9 10 8 159 317 27 352 24
Filipino 5,914 5,902 474 405 352 5,914 11,100 856 727 632
Others 465 383 31 22 27 465 780 68 580 53
Source: Department of Community and Cultural Affairs, Nutrition Assistance Program (NAP)
Note: Table will be updated with current information

11th Statistical Yearbook, Central Statistics Division, Department of Commerce
CHAPTER 3
Education

2015 CNMI Statistical Yearbook Chapter 3 Page 44
11th Statistical Yearbook, Central Statistics Division, Department of Commerce
Chapter 3 – Education
The U.S. Census and the CNMI Public School System report statistics on school enrollment and educational
attainment.
In 2010, the Census reported about 15,000 students enrolled in schools in the CNMI. About half of these
were enrolled in elementary schools, about 1 in 4in high schools, and smaller numbers in college, and pre-
schools. The numbers enrolled increased between 2000 and 2010 even though the total population decreased
during the period. Most of the increase was in those attending high school an increase of about 50 percent
to almost 3,700. The numbers attending tertiary schools increased from about 1,100 to 1,800.
The percentage of high schools graduates increased from about 47 percent in 1980 to 82 percent in 2010,
although with a dip during the garment factory years. Similarly, the percentage with a bachelor’s degree or
more, increased from about 12 percent in 1980 to about 20 percent in 2010. Because it is most of the popu-
lation, the high school and college graduation rates for Saipan were very similar to those for the whole Com-
monwealth. Tinian had about the same high school graduation rate, but a lower percentage of college grad-
uates, while Rota had a higher high school graduation rate but a lower college graduation rate. Of Saipan’s
Districts, District 3 had the highest high school and college graduation rates, with about 1 in 4 of the adults
being college graduates.
The percentages being high school graduates (from 69 to 82 percent) and college graduates (15 to 20 percent)
increased considerably during the decade. The percentage of college graduates increased for both Saipan
and Rota, but decreased for Tinian, while the high school graduation rates increased for all three islands.
This chapter also includes data from the CNMI Public School System, but they have not provided data since
2005, so only available data are shown here.

2015 CNMI Statistical Yearbook Chapter 3 Page 45
11th Statistical Yearbook, Central Statistics Division, Department of Commerce
Table 3.1 School Enrollment by District and Island, CNMI: 2010
School Enrollment Total
Saipan
Rota Tinian Total Dist. 1 Dist. 2 Dist. 3 Dist. 4 Dist. 5
Total 14,929 13,467 4,364 1,583 3,993 1,067 2,460 705 757
Pre-kindergarten 701 610 183 84 216 50 77 50 41
Kindergarten 937 829 286 97 258 61 127 52 56
Elementary school (grades 1-8) 7,819 7,006 2,323 840 1,999 579 1,265 401 412
High school (grades 9-12) 3,669 3,273 1,043 384 878 275 693 179 217
College, graduate or professional
school 1,803 1,749 529 178 642 102 298 23 31
Source: U.S. Census Bureau
Table 3.2 School Enrollment by District and Island, CNMI: 2010
School Enrollment
2010 2000
Total Saipan Rota Tinian Total Saipan Rota Tinian
Total 14,929 13,467 705 757 13,388 11,563 938 887
Pre-kindergarten 701 610 50 41 679 552 78 49
Kindergarten 937 829 52 56 946 803 73 70
Elementary school (grades 1-8) 7,819 7,006 401 412 7,883 6,845 520 518
High school (grades 9-12) 3,669 3,273 179 217 2,750 2,376 197 177
College, graduate or professional
school 1,803 1,749 23 31 1,130 987 70 73
Source: U.S. Census Bureau
Table 3.3 Educational Attainment by District and Island, CNMI: 1980 to 2010
Educational Attainment 2010 2000 1995 1990 1980
Total 32,602 42,123 34,524 24,342 7,000
Less than 9th grade 2,550 5,794 4,099 3,994 2,832
9th to 12th grade. No diploma 3,187 7,181 4,056 4,016 898
High school graduate (inc equiv) 12,063 14,986 13,106 8,659 1,501
Some college, no degree 5,987 5,293 4,396 2,627 937
Associate’s degree 2,230 2,341 2,708 1,191
Bachelor's degree 5,383 5,342 5,202 3,234 637
Graduate or professional degree 1,202 1,186 957 621 195
Percent high school graduates 82.4 69.2 76.4 67.1 46.7
Percent bachelor's degree 20.2 15.5 17.8 15.8 11.9
Source: U.S. Census Bureau
82.4
69.276.4
67.1
46.7
20.215.5 17.8 15.8
11.9
0.0
20.0
40.0
60.0
80.0
100.0
2010 2000 1995 1990 1980
Percent High School and College Graduates,
CNMI: 1980 to 2010
Percent high school graduates Percent bachelor's degree
0%
10%
20%
30%
40%
50%
60%
70%
80%
90%
100%
Total Saipan Rota Tinian
School Enrollment by Island, CNMI: 2010
College, graduate or
professional school
High school (grades
9-12)
Elementary school
(grades 1-8)
Kindergarten
Pre-kindergarten
0%
10%
20%
30%
40%
50%
60%
70%
80%
90%
100%
Tota
l
Sai
pan
Rota
Tin
ian
Tota
l
Sai
pan
Rota
Tin
ian
2010 2000
School Enrollment by island: 2000 and 2010
College, graduate or
professional school
High school (grades
9-12)
Elementary school
(grades 1-8)
Kindergarten
Pre-kindergarten

Page 46 Chapter 3 2015 CNMI Statistical Yearbook
11th Statistical Yearbook, Central Statistics Division, Department of Commerce
Table 3.4 Educational Attainment by District and Island, CNMI: 2010
Educational Attainment Total
Saipan
Rota Tinian Total Dist. 1 Dist. 2 Dist. 3 Dist. 4 Dist. 5
Total 32,602 29,054 8,866 3,997 10,025 2,305 3,861 1,564 1,984
Less than 9th grade 2,550 2,311 752 370 680 155 354 124 115
9th to 12th grade. No diploma 3,187 2,847 946 377 818 243 463 109 231
High school graduate (inc equiv) 12,063 10,696 3,361 1,596 3,476 853 1,410 633 734
Some college, no degree 5,987 5,299 1,618 599 1,885 469 728 308 380
Associate’s degree 2,230 1,924 535 271 714 155 249 134 172
Bachelor's degree 5,383 4,860 1,357 676 2,034 308 485 217 306
Graduate or professional degree 1,202 1,117 297 108 418 122 172 39 46
Percent high school graduates 82.4 82.2 80.8 81.3 85.1 82.7 78.8 85.1 82.6
Percent bachelor's degree 20.2 20.6 18.7 19.6 24.5 18.7 17.0 16.4 17.7
Source: U.S. Census Bureau
Table 3.5 Educational Attainment by District and Island, CNMI: 2010
2010 2000
Educational Attainment Total Saipan Rota Tinian Total Saipan Rota Tinian
Total 32,602 29,054 1,564 1,984 42,120 38,083 1,875 2,162
Less than 9th grade 2,550 2,311 124 115 5,793 5,358 242 193
9th to 12th grade. No diploma 3,187 2,847 109 231 7,181 6,649 202 330
High school graduate (inc equiv) 12,063 10,696 633 734 14,984 13,652 664 668
Some college, no degree 5,987 5,299 308 380 5,293 4,565 337 391
Associate’s degree 2,230 1,924 134 172 2,341 2,076 135 130
Bachelor's degree 5,383 4,860 217 306 5,342 4,698 252 392
Graduate or professional degree 1,202 1,117 39 46 1,186 1,085 43 58
Percent high school graduates 82.4 82.2 85.1 82.6 69.2 68.5 76.3 75.8
Percent bachelor's degree 20.2 20.6 16.4 17.7 15.5 15.2 15.7 20.8
Source: U.S. Census Bureau
82.4 82.2 80.8 81.385.1 82.7
78.885.1 82.6
20.2 20.6 18.7 19.624.5
18.7 17.0 16.4 17.7
0.0
10.0
20.0
30.0
40.0
50.0
60.0
70.0
80.0
90.0
Percent High School and College Graduates by
Island and District, CNMI: 2010
Percent high school graduates Percent bachelor's degree
82.4 82.2 85.1 82.6
69.2 68.576.3 75.8
20.2 20.616.4 17.7 15.5 15.2 15.7
20.8
0.0
10.0
20.0
30.0
40.0
50.0
60.0
70.0
80.0
90.0
Total Saipan Rota Tinian Total Saipan Rota Tinian
2010 2000
Percent High School and College Graduates by
Island: 2000 and 2010
Percent high school graduates Percent bachelor's degree

2015 CNMI Statistical Yearbook Chapter 3 Page 47
11th Statistical Yearbook, Central Statistics Division, Department of Commerce
Table 3.6 Student Enrollment by Type of School, CNMI: SY 1997-1998 to SY 2004-2005
School
School Year
2004-2005 2003-2004 2002-2003 2001-2002 2000-2001 1999-2000 1998-1999 1997-1998
Total Enroll-
ment 14,434 13,985 13,521 13,323 12,819 12,534 12,485 12,208
Public Schools 11,603 11,244 11,195 10,522 10,004 9,692 9,498 9,246
Percent 78.0 78.0 78.0 78.0 78.0 77.3 76.1 75.7
Private Schools 2,831 2,741 2,326 2,801 2,815 2,842 2,987 2,962
Source: Public School System
Data collected from PSS for SY 2001-02 and 2002-03 combined Tinian Jr. and Tinian High
Note: Tables will be updated when current data are received
Table 3.7 Student Enrollment for Public Schools, CNMI: SY 1997-1998 to SY 2004-2005
School
School Year
2004-
2005
2003-
2004
2002-
2003
2001-
2002
2000-
2001
1999-
2000
1998-
1999
1997-
1998
All Public
Schools 11,603 11,244 11,195 10,522 10,004 9,692 9,498 9,246
Early Child-
hood/SPEd (4) 46 78 35 97 47 0 0 0
Headstart (Rota &
Tinian) 579 585 606 523 579 549 526 588
Elementary Schools 5,829 5,767 5,849 5,828 5,710 5,651 5,591 5,355
G.T. Camacho 224 227 236 235 213 329 378 357
Tanapag 261 265 283 270 302 462 405 381
Garapan 861 848 898 969 865 899 918 876
San Vicente 757 765 715 653 649 827 1,113 1,058
Oleai 481 457 443 422 419 480 499 504
W.S. Reyes 625 596 667 608 642 725 819 773
San Antonio 372 363 345 366 359 355 347 341
Kagman (3) 743 722 715 757 674 0 0 0
Koblerville 452 458 479 448 470 449 413 400
DanDan (2) 468 445 425 424 388 407 0 0
Tinian 310 353 380 393 388 372 347 340
Rota 275 268 263 283 341 346 352 325
Secondary Schools 5,117 4,814 4,705 4,074 3,668 3,492 3,381 3,303
Hopwood Jr.
High 995 928 962 1,332 1,253 1,197 1,129 1,050
Cha Cha
Oceanview Jr.
High 670 582 599 Tinian Jr. &
High 348 323 309 297 123 90 72 91
Rota Jr. High 140 142 155 158 97 107 102 100
Marianas High 1216 1,154 1020 2,103 1,852 1,738 1,718 1,701
Kagman High 809 706 697 Saipan Southern
High 745 778 783
Tinian High * * * * 149 170 179 168
Rota High 194 201 180 184 194 190 181 193
Source: Public School System
* Data collected from PSS for SY 2001-02 and 2002-03 combined Tinian Jr. and Tinian High
Note: (1) Opened in SY1998-99 (2) Opened in SY1999-00 (3) Opened in SY 2000-01
(4) Data collection began in SY 2000-01 (5) Opened in SY 2001-02
Note: Tables will be updated when current data are received
0
2,000
4,000
6,000
8,000
10,000
12,000
14,000
16,000
Public and Private School Enrolled,
CNMI: 1997-2005
Public Schools Private Schools
0
1,000
2,000
3,000
4,000
5,000
6,000
7,000
8,000
9,000
10,000
11,000
Elementary and Secondary School Students, CNMI:
1997 to 2005
Elementary Schools Secondary Schools

Page 48 Chapter 3 2015 CNMI Statistical Yearbook
11th Statistical Yearbook, Central Statistics Division, Department of Commerce
Table 3.8 Student Enrollment for Private Schools, CNMI: SY 1997-1998 to SY 2004-2005
School
School Year
2004-
2005
2003-
2004
2002-
2003
2001-
2002
2000-
2001
1999-
2000
1998-
1999
1997-
1998
All Private Schools 2,726 2,741 2,326 2,801 2,815 2,842 2,987 2,962
Mt. Carmel Grade, Junior & High 603 608 585 663 717 769 758 720
Saipan Community 177 184 189 200 216 208 218 223
Grace Christian Academy 491 544 557 638 750 833 888 918
Golden Harvest International (2) 68 50 34 51 24 15 0 0
Eucon International (1) 131 158 150 168 164 104 199 0
NMC Lab School (5) 38 68 92 90 0 0 0 0
Marianas Baptist Academy 75 93 82 78 58 83 85 79
Calvary Christian Academy 167 162 170 177 161 148 170 175
Sister Remedios Pre 167 177 154 172 193 203 206 313
Brilliant Star Montessori (3) 62 49 23 38 32 0 0 0
Joshua Generation Academy 57 56 60 43 67 42 65 59
K-5 Childhd Dev. Center 43 52 38 30 0 0 0 0
Seventh Day Adventist 90 99 14 91 88 93 99 108
San Francisco De Borja, Rota 76 93 7 59 62 63 83 133
Saint Joseph Tinian (2) 41 26 25 26 18 27 0 0
Whispering Palms 56 51 47 51 51 54 52 54
Northern Marianas Academy 58 54 56 69 59 54 40 46
Saipan International 200 217 43 157 155 146 124 134
Source: Public School System
Data collected from PSS for SY 2001-02 and 2002-03 combined Tinian Jr. and Tinian High
Note: (1) Opened in SY1998-99 (2) Opened in SY1999-00 (3) Opened in SY 2000-01
(4) Data collection began in SY 2000-01 (5) Opened in SY 2001-02
Note: Tables will be updated when current data are received
Table 3.9 Total Student Enrollment by Grade: SY 1999 to SY 2004
Grade
Total
2004-2005 2003-2004 2002-2003 2001-2002 2000-2001 1999-2000
Total Enrollment 14,434 13,985 13,833 13,226 12,772 12,534
Headstart/pre-school 1,033 1,005 902 853 894 817
Grade K 1,028 996 1,013 989 924 900
Grade 1 1,186 1,177 1,180 1,145 1,087 1,282
Grade 2 1,138 1,206 1,094 1,053 1,199 1,084
Grade 3 1,083 1,099 1,058 1,187 1,028 1,090
Grade 4 1,055 1,006 1,168 1,029 1,081 1,045
Grade 5 1,027 1,056 1,015 1,058 1,014 982
Grade 6 1,129 977 1,037 985 943 950
Grade 7 1,056 1,009 1,017 997 988 906
Grade 8 1,018 946 1,007 974 922 891
Grade 9 1,098 1,057 1,043 1,005 998 897
Grade 10 967 925 973 870 672 713
Grade 11 787 820 770 544 587 544
Grade 12 753 706 556 537 435 433
Source: Public School System
Note: Tables will be updated when current data are received
1,033
1,028
1,186
1,138
1,083
1,055
1,027
1,129
1,056
1,018
1,098
967
787
753
- 250 500 750 1,000 1,250
Headstart/pre-school
Grade K
Grade 1
Grade 2
Grade 3
Grade 4
Grade 5
Grade 6
Grade 7
Grade 8
Grade 9
Grade 10
Grade 11
Grade 12
Students by Grade, CNMI: 2004-2005

2015 CNMI Statistical Yearbook Chapter 3 Page 49
11th Statistical Yearbook, Central Statistics Division, Department of Commerce
Table 3.9 Total Student Enrollment by Grade: SY 1999 to SY 2004 - Continued -
Grade
2004-2005 2003-2004 2002-2003 2001-2002 2000-2001 1999-2000
Public Schools
Total Public 11,244 11,160 10,425 9,957 9,692
Headstart/pre-school 663 606 523 579 549
Grade K 672 662 665 589 574
Grade 1 897 924 872 860 974
Grade 2 970 868 855 939 837
Grade 3 883 887 962 825 878
Grade 4 841 978 832 890 838
Grade 5 875 845 879 834 787
Grade 6 807 871 813 773 763
Grade 7 808 831 781 759 700
Grade 8 776 816 779 714 694
Grade 9 929 906 861 848 746
Grade 10 802 854 737 541 567
Grade 11 725 651 434 464 441
Grade 12 596 461 432 342 344
Private Schools
Total Private 2,741 2,673 2,801 2,815 2,842
Headstart/pre-school 342 296 330 315 268
Grade K 324 351 324 335 326
Grade 1 280 256 273 227 308
Grade 2 236 226 198 260 247
Grade 3 216 171 225 203 212
Grade 4 165 190 197 191 207
Grade 5 181 170 179 180 195
Grade 6 170 166 172 170 187
Grade 7 201 186 216 229 206
Grade 8 170 191 195 208 197
Grade 9 128 137 144 150 151
Grade 10 123 119 133 131 146
Grade 11 95 119 110 123 103
Grade 12 110 95 105 93 89
Source: Public School System
Note: Early childhood/Special education numbers in public schools by year: 91 (2002-03); 97 (2001-02): 47 (2000-01)
Note: Tables will be updated when current data are received
Table 3.10 Students by Ethnicity, CNMI: SY 1996-1997 to SY 2004-2005
Ethnicity
School Year
2004-
2005
2002-
2003
2001-
2002
2000-
2001
1999-
2000
1998-
1999
1997-
1998
1996-
1997
All Ethnicities 10,942 10,581 10,554 12,193 9,143 8,972 8,658 8,465
Chamorro 5,224 5,413 5,708 4,628 5,170 4,928 4,675 4,862
Carolinian 1,122 1,074 1,153 803 1,203 1,218 1,239 974
Chamolinian 297 389 361 387 441 431 390 293
African/American 2 3 4 168 67 76 86 73
Palauan 503 482 449 445 348 441 447 417
Pohnpeian 212 209 136 168 150 197 159 160
Yapese 75 68 55 53 57 58 53 74
Chuukese 493 430 414 372 326 349 353 336
Marshallese 47 47 50 55 47 42 35 37
Filipino 2,296 1,887 1,630 1,717 980 931 911 852
Korean 205 160 128 458 134 157 171 136
Japanese 36 22 12 86 9 10 3 2
Other 430 397 454 2,853 211 134 136 249
Source: Public School System
Note: Total in this table differ from totals in other tables. Headstart and Special Education ethnic breakdown were not included and the tabu-
lations of total by ethnicity were performed at different times during the school year.
Note: Tables will be updated when current data are received
0%
10%
20%
30%
40%
50%
60%
70%
80%
90%
100%
Students by Ethnicity CNMI: 1997-2005
Other
Chuukese
Palauan
Carolinian
Filipino
Chamorro

Page 50 Chapter 3 2015 CNMI Statistical Yearbook
11th Statistical Yearbook, Central Statistics Division, Department of Commerce
Table 3.11 Headstart Pupils and Staff by Center, CNMI: SY 1998-1999 to SY 2004-2005
Headstart Center
Number of Pupils
2003-2004 2002-2003 2001-2002 2000-2001 1999-2000 1998-1999
Total 580 606 523 579 549 526
Saipan 480 496 422 460 449 427
San Roque 20 31 20 20 19 20
Tanapag 40 28 40 40 40 40
Garapan 80 104 43 40 40 40
Oleai 40 43 42 40 40 40
San Vicente 40 53 41 40 41 40
Dan Dan … … 62 60 60 59
Susupe … … - 20 19 20
Chalan Kanoa 140 136 84 100 99 80
San Antonio 40 42 49 60 51 48
Kagman II & III 80 59 41 40 40 40
Tinian 40 50 41 59 40 40
Rota (Sinapalo & Songsong) 60 60 60 60 60 59
Source: Public School System
Note: (1) Dan Dan Center opened in SY 1994-95; therefore, no data for prior school years since SY1995-96 Peer program mainstream with
regular headstart program. Kagman and Paupau centers opened in SY 1996-1997
Note: "…" means data not available
Note: Tables will be updated when current data are received
Table 3.11 Headstart Pupils and Staff by Center, CNMI: SY 1998-1999 to SY 2004-2005 - Continued -
Headstart Center
Number of Staff
2003-2004 2002-2003 2001-2002 2000-2001 1999-2000 1998-1999
Total 56 98 42 50 49 52
Saipan 46 90 33 40 39 42
San Roque 2 2 1 2 2 2
Tanapag 4 2 3 4 4 4
Garapan 8 12 4 3 4 4
Oleai 4 4 3 3 2 4
San Vicente 4 6 3 4 3 4
Dan Dan … … 4 5 6 6
Susupe … … - 2 2 2
Chalan Kanoa 13 14 8 8 8 8
San Antonio 3 42 3 5 4 4
Kagman II & III 8 8 4 4 4 4
Tinian 4 3 4 4 4 4
Rota (Sinapalo & Songsong) 6 5 5 6 6 6
Source: Public School System
Note: (1) Dan Dan Center opened in SY 1994-95; therefore, no data for prior school years since SY1995-96 Peer program mainstream with
regular headstart program. Kagman and Paupau centers opened in SY 1996-1997
Note: "…" means data not available
Note: Tables will be updated when current data are received

2015 CNMI Statistical Yearbook Chapter 3 Page 51
11th Statistical Yearbook, Central Statistics Division, Department of Commerce
Table 3.12 Teachers and Teacher Aides by Island and Type of School, CNMI: SY 1999-00 to SY 2004-2005
Type of school
Teachers Teacher Aids
2004-
2005
2002-
2003
2001-
2002
2000-
2001
1999-
2000
2003-
2004
2002-
2003
2001-
2002
2000-
2001
1999-
2000
All Teachers 752 717 728 722 677 196 188 180 179 132
Public School Teachers 539 531 512 521 481 177 165 153 153 113
Saipan 462 408 428 429 395 151 143 134 127 98
Rota 37 53 46 48 42 13 10 6 11 9
Tinian 40 70 38 44 44 13 12 13 15 6
Private School Teachers 213 186 216 201 196 19 23 27 26 19
Saipan 183 167 194 180 170 19 22 26 24 18
Rota 21 15 14 10 14 0 1 1 1 0
Tinian 9 4 8 11 12 0 0 0 1 1
Source: Public School System
Note: Tables will be updated when current data are received
Table 3.13 Public School Teachers and Teacher Aides by School, CNMI: SY 1999-00 to SY 2004-2005
School
Teachers Teacher Aids
2004-
2005
2002-
2003
2001-
2002
2000-
2001
1999-
2000
2004-
2005
2002-
2003
2001-
2002
2000-
2001
1999-
2000
Public School Teachers 539 531 512 521 481 177 165 153 153 113
Elementary School
Teachers 297 283 304 306 288 130 134 127 130 96
G.T. Camacho 17 13 14 15 17 4 7 8 8 6
Tanapag 15 15 17 18 22 7 9 9 9 8
Garapan 41 43 44 45 42 14 15 15 18 21
San Vicente 30 29 33 33 36 19 21 22 6 14
Oleai 28 25 24 25 28 11 12 9 13 8
W.S. Reyes 30 30 35 37 39 9 9 9 9 4
San Antonio 19 18 18 19 20 9 9 11 7 6
Dan Dan 22 23 24 19 18 16 14 13 15 8
Kagman 33 30 32 26 … 11 16 16 16 …
Koblerville 24 20 26 26 22 17 11 5 9 9
Tinian Elementary 21 19 18 22 24 9 8 8 9 5
Rota Elementary 17 18 19 21 20 4 3 2 11 7
High School Teachers 242 248 208 215 193 47 31 26 23 17
Hopwood Junior
High 54 49 67 70 56 5 7 7 9 8
Kagman High (2) 34 6 Cha Cha Oceanview
Jr. High (1) 33 31 0 0 0 12 0 0 0 0
Tinian Jr. & High 19 21 20 6 6 4 4 5 4 0
Rota Jr. High 11 22 11 7 6 6 5 4 0 0
Marianas High 54 53 94 96 95 10 13 10 8 6
Tinian High * 30 * 16 14 * * * 2 1
Saipan Southern
High (1) 28 29 1
Rota High 9 13 16 20 16 3 2 0 0 2
Source: Public School System
*Data combined for Tinian Jr. and High Schools
(1) These schools were opened in SY 2002-2003
(2) This school opened in SY 2003-2004
Note: Tables will be updated when current data are received

Page 52 Chapter 3 2015 CNMI Statistical Yearbook
11th Statistical Yearbook, Central Statistics Division, Department of Commerce
Table 3.14 Private School Teachers and Teacher Aides by School, CNMI: SY 1999-00 through SY 2004-2005
School
Teachers Teacher Aids
2003-
2004
2002-
2003
2001-
2002
2000-
2001
1999-
2000
2004-
2005
2002-
2003
2001-
2002
2000-
2001
1999-
2000
Private School Teachers 213 186 216 201 196 19 23 27 26 19
Saipan 181 167 194 180 170 19 22 26 24 18
Sister Remedios Pre Sch 10 12 12 12 12 3 6 6 5 6
Brilliant Star Montessori 2 2 2 2 … 2 … 3 0 …
Joshua Generation Acad-
emy 8 9 8 6 8 0 0 2 11 0
K-5 Child Dev. Center (1) 3 2 4 … … 5 1 0 … …
Mt. Carmel Grade, Junior
& High 37 45 47 49 45 0 0 0 1 0
Grace Christian, Saipan 27 19 30 30 36 0 1 1 1 0
Eucon International 12 7 12 13 9 0 2 2 2 2
NMC Lab School (1) 5 4 6 … … 1 9 5 … …
Marianas Baptist Academy 5 5 4 4 5 0 0 0 0 0
Seventh Day Adventist 7 7 7 7 7 0 0 1 0 4
Northern Marianas Acad-
emy 12 11 10 9 9 0 … 0 0 0
Saipan Community 12 12 12 12 12 2 2 2 2 4
Saipan International 17 11 18 14 9 5 1 2 2 2
Calvary Christian 14 13 14 13 11 0 0 0 0 0
Whispering Palms 6 4 3 5 5 0 0 0 0 0
Golden Harvest Interna-
tional 4 4 5 4 2 1 0 2 0 0
Rota 22 15 14 10 14 0 1 1 1 0
San Francisco De Borja 10 9 7 5 6 0 0 1 0 0
Grace Christian, Rota 12 6 7 5 8 0 1 0 1 0
Tinian 10 4 8 11 12 0 0 0 1 1
St. Joseph 5 … 3 3 3 0 … 0 0 0
Grace Christian Academy 5 4 5 8 9 0 0 0 1 1
Source: Public School System
(1) This school opened in SY 2001-2002
Note: Tables will be updated when current data are received
Table 3.15 Educational Background of Teachers, CNMI: SY 1996-1997 to SY 2004-2005
Year
Educational Attainment 2004-2005 2000-2001 1999-2000 1998-1999 1997-1998 1996-1997
Total 501 504 460 485 469 441
Associate of Arts 2 2 2 14 18 26
Associate of Science 0 0 0 0 0 0
Bachelor of Arts 274 279 227 221 209 173
Bachelor of Science 157 162 126 126 126 131
Master of Arts 67 60 104 122 115 109
Doctorate Degree, PhD 1 1 1 2 1 2
Source: Northern Marianas College
Note: 2002 data not available
Note: Tables will be updated when current data are received
Table 3.16 Student-Teacher Ratio by School Level, CNMI: SY 1996-1997 to SY 2003-2004
Level
School Year
2003-04 2002-03 2001-02 2000-01 1999-00 1998-99 1997-98 1996-97
Total 18 20 17 17 18 17 18 20
Public School 24 20 18 18 19 18 19 19
Elementary (1-6 grade) 19 21 19 19 20 19 19 20
Junior High (7-8 grade) 18 18 18 18 21 20 19 20
High School (9-12 grade) 22 21 19 17 17 18 17 17
Private School 13 14 15 15 16 17
Elementary 13 … … 14 15 15 17 19
Secondary 13 … … 13 10 13 13 14
Source : Public School System
Note: "…" means data not available
Note: Tables will be updated when current data are received

2015 CNMI Statistical Yearbook Chapter 3 Page 53
11th Statistical Yearbook, Central Statistics Division, Department of Commerce
Table 3.17 Graduates from Secondary School by Type of School, CNMI: SY 1992-1993 to SY 2003-2004
School Year
Total Public Schools Private Schools
8th grade 12th grade 8th grade 12th grade 8th grade 12th grade
2003-04 927 680 770 575 157 105
2002-03 946 706 776 596 170 110
2001-02 900 495 719 415 181 80
2000-01 847 461 672 360 175 101
1999-00 911 504 734 432 177 72
1998-99 728 425 539 341 189 84
1997-98 715 441 559 374 156 67
1996-97 623 375 497 309 126 66
1995-96 599 374 476 322 123 52
1994-95 545 386 407 319 138 67
1993-94 624 384 510 328 114 56
1992-93 393 303 335 245 58 58
Source: Public School System
Note: Tables will be updated when current data are received
Table 3.18 Graduates from Private Schools, CNMI: SY 1994-1995 to SY 2003-2004
School
School Year
2003-
2004
2002-
2003
2001-
2002
2000-
2001
1999-
2000
1998-
1999
1997-
1998
1996-
1997
1995-
1996
1994-
1995
Total 262 280 257 266 263 279 209 192 175 205
Junior High (8th) 157 177 180 165 177 189 142 126 123 138
Mt. Carmel Jr. High 60 59 60 68 69 70 75 64 57 75
Calvary Christian Academy 1 10 12 14 7 5 ... ... ... ...
Eucon Int'l School 7 19 5 9 7 8 ... ... ... ...
NMC Lab School (*) 6 6 Saipan Community School 11 10 21 21 18 21 14 20 23 19
Grace Christian Academy 30 30 34 22 52 50 39 28 29 27
San Francisco De Borja 3 4 4 6 5 7 ... ... ... ...
Saipan Int'l School 15 15 10 7 3 1 ... ... ... ...
Seventh Day Adventist 5 4 16 6 10 11 12 9 8 12
Marianas Baptist Academy 16 17 10 10 5 15 ... ... ... ...
Whispering Palms 3 3 8 2 1 1 2 5 6 5
High School (12 th) 105 103 77 101 86 90 67 66 52 67
Mt. Carmel High 45 46 43 48 37 50 27 32 15 31
Northern Marianas Academy 17 17 … … 14 6 5 10 5 5
Grace Christian Academy 26 27 20 47 23 27 23 24 25 27
Marianas Baptist Academy 11 12 8 6 12 7 12 … 6 3
Calvary Christian Academy 1 1 6 … … … … … 1 1
Eucon Int'l High 5
Source: Public School System
Note: "…" means data not available
*NMC graduation began SY 2002-2003
Note: Tables will be updated when current data are received
0
100
200
300
400
500
600
700
800
900
1000
Secondary School Graduates, CNMI: 1992 to 2004
8th grade 12th grade

Page 54 Chapter 3 2015 CNMI Statistical Yearbook
11th Statistical Yearbook, Central Statistics Division, Department of Commerce
Table 3.19 Northern Marianas College Enrollment, CNMI: SY 1996-1997 to SY 2003-2004
School Year Semester Average Fall Spring Summer
2003-2004 1725 1233 1212 437
2002-2003 1,017 1,291 1,291 470
2001-2002 913 1,128 1,140 472
2000-2001 794 967 1,013 403
1999-2000 673 813 842 363
1998-1999 708 884 883 357
1997-1998 813 900 972 568
1996-1997 835 924 786 794
Source: Northern Marianas College
Note: Tables will be updated when current data are received
Table 3.20 Northern Marianas College Enrollment by Sex, CNMI: SY 1994-1995 to SY 2003-2004
School Years Total
Gender
Females Males
2003-2004 1,725 1,079 646
2002-2003 1,854 1,183 671
2001-2002 1,641 1,037 604
2000-2001 2,383 1536 847
1999-2000 1,502 889 603
1998-1999 1,607 943 664
1997-1998 1,884 1,099 785
1996-1997 1,721 991 730
1995-1996 1,647 932 715
1994-1995 1,590 614 976
Source: Northern Marianas College
Note: Includes part-time and full-time enrollment
Note: Tables will be updated when current data are received
Table 3.21 Northern Marianas College Enrollment by Ethnicity: SY 1994-1995 to SY 2003-2004
School Years Total
Ethnicity
Chamorro Carolinian Pacific Islanders Asian Other
2003-2004 1,725 831 107 180 465 142
2002-2003 1,854 863 157 198 502 134
2001-2002 1,641 784 131 187 433 106
2000-2001 2,383 1,347 … 272 585 179
1999-2000 1,502 753 89 199 348 113
1998-1999 1,607 784 120 199 355 149
1997-1998 1,884 1,011 129 219 353 172
1996-1997 1,721 919 121 185 306 190
1995-1996 1,647 880 123 194 312 138
1994-1995 1,590 843 124 196 257 170
Source: Northern Marianas College
Note: "…" means total enrollment were combined with Chamorros
Note: Tables will be updated when current data are received

2015 CNMI Statistical Yearbook Chapter 3 Page 55
11th Statistical Yearbook, Central Statistics Division, Department of Commerce
Table 3.22 Degrees Awarded from Northern Marianas College, CNMI: SY 1996-1997 to SY 2003-2004
Degree
Year
2003-
2004
2002-
2003
2001-
2002
2000-
2001
1999-
2000
1998-
1999
1997-
1998
1996-
1997
Total 186 146 113 122 101 109 238 251
Associate of Arts 42 46 48 31 50 45 82 118
Associate of Applied Science 41 26 30 34 33 30 5 6
Associate of Science 14 8 4 7 2 11 43 26
Certificates 56 42 0 21 9 6 64 91
Bachelor of Arts ( University of
Guam) 33 24 27 14 7 17 19 10
Masters of Arts ( San Diego
State University) 0 0 4 15 0 0 25 0
Source: Northern Marianas College
Note: Tables will be updated when current data are received
Table 3.23 Graduates from Northern Marianas College, CNMI: 1997 to 2004
Degree
School Year
2004 2003 2002 2001 2000 1999 1998 1997
Total 186 146 113 122 101 109 238 251
Associate of Arts 65 70 75 31 50 45 82 118
Business and Public Admin-
istration 0 … … 0 0 0 0 0
Business and Public Admin-
istration 0 … … 0 0 3 13 3
Education 24 25 27 0 0 3 15 20
Education Summary 0 … 1 0 3 0 3 3
Liberal Arts 41 45 47 31 47 39 61 73
Associate of Applied Science 6 5 6 34 33 30 5 6
Construction Trades 0 … … 1 1 0 1 1
Criminal Justice 5 5 4 5 8 12 8 3
Electrical Inst. Management 0 … … 0 0 0 1 1
Hospitality Management 1 … 2 1 0 2 3 4
Tourism Industry Management 0 … … 0 0 0 0 0
Associate of A.S. in Business
Administration 44 26 24 21 0 16 20 17
Accounting 13 9 8 8 5 5 0 6
Data Processing 0 1 1 0 0 3 4 3
Computer Applications 8 6 6 7 10 … … …
Business Management 22 8 9 4 8 7 10 5
Sales & Marketing 1 … … 2 0 0 0 3
Office Technology 0 2 … 0 1 1 6 0
Associate of Science 71 3 4 7 2 11 43 26
Nursing 14 3 4 7 2 11 5 5
Others 57 42 4 29 16 7 88 84
Source: Northern Marianas College
Note: "…" means no data available

11th Statistical Yearbook, Central Statistics Division, Department of Commerce
CHAPTER 4
Labor Force and
Employment

2015 CNMI Statistical Yearbook Chapter 4 Page 57
11th Statistical Yearbook, Central Statistics Division, Department of Commerce
Chapter 4 – Labor Force and Employment
Data on labor force participation and employment come from the U.S. Census and the CNMI Department of
Labor and Immigration.
Of the 39,000 adults in the CNMI in 2010, about 28,000 (72 percent) were in the labor force, as the U.S.
government defines it. The United Nations agencies include subsistence activities as “in the labor force” and
so come up with higher participation rates and lower unemployment rates. The U.S. defined unemployment
rate in 2010 was 11.2 percent. The female participation rate was 67 percent (2 out of 3 of the male adults)
compared to 78 percent for the males. And, male unemployment in 2010 was 10 percent compared to 13
percent for the females.
Because censuses take snapshots of a population at different points in time, the participation and unemploy-
ment rates represent only those particular points. Economic activities vary from season to season and from
year to year. Nonetheless, the male participation rate was highest in the 1995 census at 90 percent and the
female rate was highest in that year and in 2000. And the unemployment rates also varied considerably over
time.
The participation rate for Saipan in 2010 was 72 percent as well, compared to 76 percent for Rota and 81
percent for Tinian. The unemployment rate for Saipan at that time was 12 percent, compared to 8 percent
for Rota and 7 percent for Tinian. About 1,100 people were doing subsistence in addition to work for pay.
These adults were fishing or growing agriculture products for home use in addition to working at paid jobs.
Males on Saipan participated at 77 percent compared to 81 percent on Rota and 86 percent on Tinian, while
females participated at 66 percent on Saipan, 71 percent on Rota, and 75 percent on Tinian. The labor force
participation rate for the islands decreased between 2000 and 2010, partly because of the closing of the gar-
ment factories and the private sector jobs supporting them. The rate for Saipan decreased from 84 percent to
72 percent, for Rota from 79 to 76 percent, and for Tinian from 83 to 81 percent. Both males and females on
each island showed similar decreases.
Unfortunately, the U.S. Census Bureau does not release Public Use Microdata Samples (PUMS) to CNMI
and American Samoa as they do for Guam and the U.S. Virgin Islands, and so some trends could not be
maintained. So, we can only show labor force participation rates for ethnic groups up to 2000. For the
historical record, the rate for Chamorros in 2000 was 59 percent compared to 54 percent for Carolinians, 92
percent for Filipinos, and 99 percent for Chinese.

Page 58 Chapter 4 2015 CNMI Statistical Yearbook
11th Statistical Yearbook, Central Statistics Division, Department of Commerce
The Census collects information on occupation in 5 major categories: management, service, sales, resources,
and production. The largest category in 2010 was service jobs with 7,400 (or 30 percent), followed by man-
agement, business and science with 6,700 (or 27percent). About 43,000 adults had specified occupations in
2000 compared to 25,000 in 2010. All of the categories remained about the same except for production,
transportation and material moving, which decreased from 18,000 in 2000 to 2,000 in 2010, almost totally
because of the closing of the garment factories. In fact, the number of machine operators increased from 118
in 1980 to 4,800 in 1990, and then 6,900 in 1995 before decreasing to 2,200 in 2000. Almost all of the
workers were female.
The census data on industry show similar results. The numbers in manufacturing (so including the garment
factories) increased from 110 in 1980 to 5,700 in 1990, 7,800 in 1995, and then jumped to 17,000 in 2000
before decreasing to just 700 in 2010. However, the tourism industry took off at about the same time as the
garments were leaving. Service jobs increased from 1,800 in 1980 to 6,800 in 1990, 11,200 in 1995 before
decreasing to 2,400 in 2000 and then increase to 1,600 in 2010. (It looks like 2000 industries may have been
coded differently from the other years.)
The Census Bureau defines 3 main classes of workers: private sector, public sector, and self-employed (and
family). In 2010, about 19,000 adults were in the private sector (about 3 in every 4 workers) and about 5,300
(about 1 in 5) were government workers. As expected, Saipan had the largest numbers of workers. About
700 (50 percent) of Rota’s workers were in the private sector compared to about 1,200 (69 percent) of
Tinian’s workers. In 2000, 37,000 (87 percent of the workers in the private sector – 7 of 8 compared to 6 of
8 in 2010), and about 5,000 (about 1 in 8) were in the public sector. The percentage in the private sector
increased from about 56 percent in 1980 to 85 percent in 1990, 83 percent in 1995, 87 percent in 2000 and
77 percent in 2010.
CNMI basically has no public transportation. In 2010, of the 24,500 workers, about 9,800 (40 percent – 2 in
every 5) workers drove alone to work in a private vehicle. Another 8,000 (about 1 in 3) drove to work in a
private vehicle, but with others, that is, carpooling. The next category of workers was those who walked to
work. About 3,800 (15 percent) were in this category. And about 1,500 (about 6 percent) worked at home.
The number who walked in the 2000 census was 16,895 (about 37 percent) occurred because of the continu-
ing presence of the garment factories. The percentage of those who drove alone increased between 2000 and
2010, but only about half as many carpooled in 2010 as did in 2000.
About 36,000 (2 out of every 3) people had health insurance in 2010, so about 1/3rd did not have health
insurance. Of those under 18, though, only about 17 percent did not have health insurance coverage.
The Department of Labor and Immigration collects data on current labor force participation. Unfortunately,
the trends stopped in 2004. When new data become available, they will be included in the yearbook.

2015 CNMI Statistical Yearbook Chapter 4 Page 59
11th Statistical Yearbook, Central Statistics Division, Department of Commerce
Table 4.1 CNMI Employment Status by Sex, CNMI: 1973 to 2010
Employment Status
Year
2010 2000 1995 1990 1980 1973
Persons 16 years and over 38,679 52,898 43,846 32,522 9,599 7,601
In labor force 27,968 44,471 37,540 26,581 6,089 4,787
Percent of 16 + yrs. 72.3 84.1 85.6 81.7 63.4 63.0
Employed 24,826 42,753 34,812 25,965 5,941 4,186
At work 35 or more hours ... … 32,545 24,573 5,448 3,945
Unemployed 3,123 1,712 2,728 616 148 601
Percent of civilian labor 11.2 3.9 7.3 2.3 2.4 12.6
Not in labor force 10,711 8,427 6,306 5,933 3,497 2,814
Female 16 years and over 18,770 29,356 22,211 15,256 4,402 3,533
In labor force 12,498 24,093 18,033 11,491 2,094 1,373
Percent of 16 + yrs. 66.6 82.1 81.2 75.3 47.6 38.9
Employed 10,864 23,268 16,475 11,183 2,039 1,075
At work 35 or more hours ... … 15,359 10,526 1,777 995
Unemployed 1,630 825 1,558 308 55 298
Percent of civilian labor 13.0 3.4 8.6 2.7 2.6 21.7
Not in labor force 6,272 5,263 4,178 3,763 2,308 2,160
Male 16 years and over 19,909 23,542 21,635 17,266 5,197 4,068
In labor force 15,470 20,378 19,507 15,090 3,995 3,414
Percent of 16 + yrs. 77.7 86.6 90.2 87.4 76.9 83.9
Employed 13,962 19,485 18,337 14,782 3,902 3,111
At work 35 or more hours ... … 17,186 14,047 3,671 2,950
Unemployed 1,493 893 1,170 308 93 303
Percent of civilian labor 9.7 4.4 6.0 2.0 2.3 8.9
Not in labor force 4,439 3,164 2,128 2,170 1,189 654
Source: Recent Trends in Population, Current Labor Force Survey and Census 2000 Population and Housing Profiles
Note: "…" means data not available
Table 4.2 Employment Status and Subsistence Activity by District and Island, CNMI: 2010
Employment
Total
Saipan
Rota Tinian Status Total Dist. 1 Dist. 2 Dist. 3 Dist. 4 Dist. 5
Total 38,679 34,581 10,634 4,670 11,597 2,752 4,928 1,787 2,311
In labor force 27,968 24,726 7,449 3,420 8,701 1,932 3,224 1,364 1,878
Percent 72.3 71.5 70.0 73.2 75.0 70.2 65.4 76.3 81.3
Civilian 27,949 24,709 7,442 3,419 8,695 1,932 3,221 1,362 1,878
Employed 24,826 21,816 6,384 2,983 7,973 1,693 2,783 1,258 1,752
Also did subsistence activity 1,136 981 274 103 357 92 155 64 91
Unemployed 3,123 2,893 1,058 436 722 239 438 104 126
Percent 11.2 11.7 14.2 12.8 8.3 12.4 13.6 7.6 6.7
Armed Forces 19 17 7 1 6 0 3 2 0
Not in labor force 10,711 9,855 3,185 1,250 2,896 820 1,704 423 433
Subsistence activity only 234 204 59 19 50 26 50 22 8
Source: U.S. Census Bureau
0.0
10.0
20.0
30.0
40.0
50.0
60.0
70.0
80.0
90.0
100.0
2010 2000 1995 1990 1980 1973
Labor Force Participation: 1973 to 2010
Total Males Females
0.0
5.0
10.0
15.0
20.0
25.0
2010 2000 1995 1990 1980 1973
Percent unemployed: 1973 to 2010
Total Males Females
50.0
55.0
60.0
65.0
70.0
75.0
80.0
85.0
90.0
Labor Force Participation by Sex and District and
Island
Total Males Females
0.0
2.0
4.0
6.0
8.0
10.0
12.0
14.0
16.0
18.0
Unemployment Rate by District and Island
Total Males Females

Page 60 Chapter 4 2015 CNMI Statistical Yearbook
11th Statistical Yearbook, Central Statistics Division, Department of Commerce
Table 4.3 Employment Status and Subsistence Activity for Males by District and Island, CNMI: 2010
Employment
Total
Saipan
Rota Tinian Status Total Dist. 1 Dist. 2 Dist. 3 Dist. 4 Dist. 5
Total 19,909 17,697 5,437 2,513 5,867 1,436 2,444 969 1,243
In labor force 15,470 13,615 4,166 1,929 4,711 1,099 1,710 781 1,074
Percent 77.7 76.9 76.6 76.8 80.3 76.5 70.0 80.6 86.4
Civilian 15,455 13,602 4,160 1,928 4,708 1,099 1,707 779 1,074
Employed 13,962 12,223 3,636 1,718 4,383 988 1,498 723 1,016
Also did subsistence activity 787 672 180 77 235 64 116 52 63
Unemployed 1,493 1,379 524 210 325 111 209 56 58
Percent 9.7 10.1 12.6 10.9 6.9 10.1 12.2 7.2 5.4
Armed Forces 15 13 6 1 3 0 3 2 0
Not in labor force 4,439 4,082 1,271 584 1,156 337 734 188 169
Subsistence activity only 147 125 36 10 33 10 36 17 5
Source: U.S. Census Bureau
Table 4.4 Employment Status and Subsistence Activity for Females by District and Island, CNMI: 2010
Employment
Total
Saipan
Rota Tinian Status Total Dist. 1 Dist. 2 Dist. 3 Dist. 4 Dist. 5
Total 18,770 16,884 5,197 2,157 5,730 1,316 2,484 818 1,068
In labor force 12,498 11,111 3,283 1,491 3,990 833 1,514 583 804
Percent 66.6 65.8 63.2 69.1 69.6 63.3 61.0 71.3 75.3
Civilian 12,494 11,107 3,282 1,491 3,987 833 1,514 583 804
Employed 10,864 9,593 2,748 1,265 3,590 705 1,285 535 736
Also did subsistence activity 349 309 94 26 122 28 39 12 28
Unemployed 1,630 1,514 534 226 397 128 229 48 68
Percent 13.0 13.6 16.3 15.2 10.0 15.4 15.1 8.2 8.5
Armed Forces 4 4 1 0 3 0 0 0 0
Not in labor force 6,272 5,773 1,914 666 1,740 483 970 235 264
Subsistence activity only 87 79 23 9 17 16 14 5 3
Source: U.S. Census Bureau
Table 4.5 Employment Status and Subsistence Activity by District and Island, CNMI: 2010
Employment 2010 2000
Status Total Saipan Rota Tinian Total Saipan Rota Tinian
Total 38,679 34,581 1,787 2,311 52,898 48,142 2,209 2,542
In labor force 27,968 24,726 1,364 1,878 44,471 40,634 1,736 2,100
Percent 72.3 71.5 76.3 81.3 84.1 84.4 78.6 82.6
Civilian 27,949 24,709 1,362 1,878 44,465 40,629 1,736 2,099
Employed 24,826 21,816 1,258 1,752 42,753 39,223 1,591 1,938
Also did subsistence activity 1,136 981 64 91 1,079 802 173 104
Unemployed 3,123 2,893 104 126 1,712 1,406 145 161
Percent 11.2 11.7 7.6 6.7 3.9 3.5 8.4 7.7
Armed Forces 19 17 2 0 6 5 0 1
Not in labor force 10,711 9,855 423 433 8,427 7,508 473 442
Subsistence activity only 234 204 22 8 499 400 58 41
Source: U.S. Census Bureau
0.0
2.0
4.0
6.0
8.0
10.0
12.0
14.0
16.0
Total Saipan Rota Tinian Total Saipan Rota Tinian
2010 2000
Unemployment Rate by Sex and Island
Total Males Females
50.0
55.0
60.0
65.0
70.0
75.0
80.0
85.0
90.0
Total Saipan Rota Tinian Total Saipan Rota Tinian
2010 2000
Labor Force Particpation by Sex and Island: 2000 and
2010
Total Males Females

2015 CNMI Statistical Yearbook Chapter 4 Page 61
11th Statistical Yearbook, Central Statistics Division, Department of Commerce
Table 4.6 Employment Status and Subsistence Activity for Males by District and Island, CNMI: 2010
Employment 2010 2000
Status Total Saipan Rota Tinian Total Saipan Rota Tinian
Total 19,909 17,697 969 1,243 23,545 20,829 1,262 1,449
In labor force 15,470 13,615 781 1,074 20,378 18,059 1,060 1,258
Percent 66.6 65.8 80.6 86.4 86.5 86.7 84.0 86.8
Civilian 15,455 13,602 779 1,074 20,373 18,054 1,060 1,258
Employed 13,962 12,223 723 1,016 19,485 17,328 990 1,166
Also did subsistence activity 787 672 52 63 744 555 127 62
Unemployed 1,493 1,379 56 58 888 726 70 92
Percent 13.0 13.6 7.2 5.4 4.4 4.0 6.6 7.3
Armed Forces 15 13 2 0 5 5 0 0
Not in labor force 4,439 4,082 188 169 3,167 2,770 202 191
Subsistence activity only 147 125 17 5 297 234 38 25
Source: U.S. Census Bureau
Table 4.7 Employment Status and Subsistence Activity for Females by District and Island, CNMI: 2010
Employment 2010 2000
Status Total Saipan Rota Tinian Total Saipan Rota Tinian
Total 18,770 16,884 818 1,068 29,353 27,313 947 1,093
In labor force 12,498 11,111 583 804 24,093 22,575 676 842
Percent 66.6 65.8 71.3 75.3 82.1 82.7 71.4 77.0
Civilian 12,494 11,107 583 804 24,092 22,575 676 841
Employed 10,864 9,593 535 736 23,268 21,895 601 772
Also did subsistence activity 349 309 12 28 335 247 46 42
Unemployed 1,630 1,514 48 68 824 680 75 69
Percent 13.0 13.6 8.2 8.5 3.4 3.0 11.1 8.2
Armed Forces 4 4 0 0 1 0 0 1
Not in labor force 6,272 5,773 235 264 5,260 4,738 271 251
Subsistence activity only 87 79 5 3 202 166 20 16
Source: U.S. Census Bureau
Table 4.8 Labor Force Participation by Ethnicity, CNMI: 1980, 1990, 1995 and 2000
Ethnicity
Census or Survey Year
2000 1995 1990 1980
All persons 16 + years 81.3 85.6 81.7 63.4
Total single ethnic 81.9 86.3 82.2 63.5
Chamorro 58.7 69.4 61.9 58.1
Carolinian 54.4 59.6 54.7 49.8
Palauan 62.4 76.0 72.4 63.9
Other Micronesia 62.6 68.2 64.1 51.4
Filipino 92.4 95.4 94.1 89.9
Chinese 99.3 97.3 97.4 78.3
Other Asian 79.1 81.9 85.4 69.9
Other single 90.3 91.1 84.5 76.0
Multiple ethnic 65.9 69.9 64.1 58.6
All females 16 + years 78.4 81.2 75.3 47.6
Total single ethnic 79.0 81.9 75.7 47.6
Chamorro 50.8 62.0 52.4 45.8
Carolinian 42.1 46.0 44.4 36.7
Palauan 62.4 66.7 65.9 56.7
Other Micronesia 49.8 57.2 52.4 32.4
Filipino 88.6 92.3 89.8 72.5
Chinese 99.1 97.5 97.8 54.5
Other Asian 70.4 70.0 82.3 38.0
Other single 80.9 83.2 75.1 58.1
Multiple ethnic 58.8 63.2 57.2 48.1
Source: Recent Trends in Population, Labor Force Survey Table A12.0 and 2002 CNMI American Community Survey
Note: Values are percent in the labor force.
0
20
40
60
80
100
120
2000 1995 1990 1980
Labor Force Participation by Ethnicity, CNMI: 1980
to 2000
Chamorro Carolinian Palauan Filipino

Page 62 Chapter 4 2015 CNMI Statistical Yearbook
11th Statistical Yearbook, Central Statistics Division, Department of Commerce
Table 4.9 Labor Force Participation by Citizenship Status, CNMI: 1973, 1980, 1990, 1995 and 2000
Citizenship
Year
2000 1995 1990 1980 1973
Persons 16+ years 49,106 37,540 26,581 6,089 4,787
U.S. Citizen 16,249 10,020 6,685 3,787 3,472
CNMI born 12,560 7,050 5,085 3,388 3,092
Other U.S. citizen 1,960 2,970 1,600 399 380
Not a Citizen 32,857 27,520 19,896 2,302 1,315
Permanent residence 3,900 1,706 1,522 620 538
Temporary residence 28,957 25,814 18,374 1,682 777
Females 16+ years 28,675 18,033 11,491 2,094 1,373
U.S. Citizen 7,782 4,189 2,688 1,443 1,107
CNMI born 6,092 3,003 2,100 1,309 1,004
Other U.S. citizen 732 1,186 588 134 103
Not a Citizen 20,894 13,844 8,803 651 266
Permanent residence 2,374 774 713 260 155
Temporary residence 18,520 13,070 8,090 391 111
Males 16+ years 20,431 19,507 15,090 3,995 3,414
U.S. Citizen 8,467 5,831 3,997 2,344 2,365
CNMI born 6,468 4,047 2,985 2,079 2,088
Other U.S. citizen 1,228 1,784 1,012 265 277
Not a Citizen 11,963 13,676 11,093 1,651 1,049
Permanent residence 1,526 932 809 360 383
Temporary residence 10,437 12,744 10,284 1,291 666
Source: Recent Trends in Population, Labor Force Survey Table A10.0 and Population and Housing Profiles, US Census Bureau, 2000
Table 4.10 Occupation by District and Island, CNMI: 2010
Occupation Total
Saipan
Rota Tinian Total Dist. 1 Dist. 2 Dist. 3 Dist. 4 Dist. 5
Total 24,826 21,816 6,384 2,983 7,973 1,693 2,783 1,258 1,752
Management, business, science 6,734 5,987 1,689 639 2,319 480 860 343 404
Service 7,417 6,333 1,688 938 2,500 491 716 364 720
Sales and office 5,024 4,501 1,365 576 1,506 377 677 225 298
Natural resources, construction and
maintenance 3,579 3,096 1,046 526 1,009 195 320 254 229
Production, transportation, and mate-
rial moving 2,072 1,899 596 304 639 150 210 72 101
Source: U.S. Census Bureau
Table 4.11 Occupation by District and Island, CNMI: 2010
Occupation
2010 2000
Total Saipan Rota Tinian Total Saipan Rota Tinian
Total 24,826 21,816 1,258 1,752 42,752 39,223 1,591 1,938
Management, business, science 6,734 5,987 343 404 6,736 5,885 409 442
Service 7,417 6,333 364 720 7,741 6,604 451 686
Sales and office 5,024 4,501 225 298 5,702 5,091 283 328
Natural resources, construction and maintenance 3,579 3,096 254 229 4,643 3,969 366 308
Production, transportation, and material moving 2,072 1,899 72 101 17,930 17,674 82 174
Source: U.S. Census Bureau
2,072
3,579
5,024
7,417
6,734
17,930
4,643
5,702
7,741
6,736
0 5,000 10,000 15,000 20,000
Production, transportation,
and material moving
Natural resources,
construction and…
Sales and office
Service
Management, business,
science. And arts
Occupation: 2000 and 2010
2000 2010
Manageme
nt,
business,
science
27%
Service
30%
Sales and
office
20%
Natural
resources,
constructio
n and
maintenanc
e
15%
Production,
transportation,
and material
moving
8%
Occupation
-
10.0
20.0
30.0
40.0
50.0
60.0
70.0
80.0
90.0
100.0
Labor Force Participation by Citizenship, CNMI:
1980 to 2000
1980 1990 1995 1999

2015 CNMI Statistical Yearbook Chapter 4 Page 63
11th Statistical Yearbook, Central Statistics Division, Department of Commerce
Table 4.13 Occupation by Sex, CNMI: 1980, 1990, 1995 and 2002
Occupation
Total
2002 1995 1990 1980
Employed persons 16 yrs. & over 25,556 34,812 25,965 5,941
Managerial and professional specialty 7,042 6,933 4,636 1,381
Executive, administrative, and manager 6,765 4,405 2,914 776
Professional specialty 3,857 2,528 1,722 605
Technical, sales, and admin support 6,013 5,726 3,631 1,523
Technologists and technicians 376 413 339 193
Sales 2,888 2,579 1,535 388
Administrative support, incl clerical 2,750 2,734 1,757 942
Service 5,321 6,795 4,550 1,150
Private household 1,444 1,763 1,225 105
Protective service 1,167 1,176 496 182
Service, except protective & household 5,321 3,856 2,829 863
Farming, forestry, and fishing 514 1,078 727 122
Precision production, craft and repair 2,413 4,855 6,067 1,175
Mechanics and repairers 1,543 1,794 753 301
Construction trades 613 2,813 4,588 699
Precision production 257 235 715 172
Operators, fabricators, and laborers 4,213 9,425 6,354 584
Machine operators, assemblers, inspect 2,196 6,922 4,799 118
Transportation and material moving 771 995 772 232
Handlers, equip cleaners, helpers, 1,246 1,508 783 234
Source: Recent Trends in Population and Labor Force Survey Table A17.0
Table 4.13 Occupation by Sex, CNMI: 1980, 1990, 1995 and 2002 – Continued –
Occupation
Males Females
2002 1995 1990 1980 2002 1995 1990 1980
Employed persons 16 yrs. & over 13,708 16,475 11,183 2,039 11,848 18,337 14,782 3,902
Managerial and professional specialty 3,699 3,126 1,823 401 3,343 3,807 2,813 980
Executive, administrative, and manager 2,987 1,998 1,042 158 3,778 2,407 1,872 618
Professional specialty 2,116 1,128 781 243 1,741 1,400 941 362
Technical, sales, and admin support 2,551 3,273 2,119 909 3,462 2,453 1,512 614
Technologists and technicians 277 132 66 52 99 281 273 141
Sales 1,068 1,607 911 271 1,820 972 624 117
Administrative support, incl clerical 1,207 1,534 1,142 586 1,543 1,200 615 356
Service 2,255 3,907 2,783 631 3,066 2,888 1,767 519
Private household 20 1,694 1,206 105 1,424 69 19 0
Protective service 1,108 74 21 7 59 1,102 475 175
Service, except protective & household 2,236 2,139 1,556 519 3,085 1,717 1,273 344
Farming, forestry, and fishing 494 35 16 6 20 1,043 711 116
Precision production, craft and repair 2,275 188 330 51 138 4,667 5,737 1,124
Mechanics and repairers 1,523 51 17 6 20 1,743 736 295
Construction trades 613 16 24 4 - 2,797 4,564 695
Precision production 138 112 288 41 119 123 427 131
Operators, fabricators, and laborers 2,433 5,946 4,112 40 1,780 3,479 2,242 544
Machine operators, assemblers, inspect 792 5,502 3,948 23 1,404 1,420 851 95
Transportation and material moving 731 56 32 2 40 939 740 230
Handlers, equip cleaners, helpers, 910 388 132 15 336 1,120 651 219
Source: Recent Trends in Population and Labor Force Survey Table A17.0

Page 64 Chapter 4 2015 CNMI Statistical Yearbook
11th Statistical Yearbook, Central Statistics Division, Department of Commerce
Table 4.14 Occupation by Sex, CNMI: 2000
Occupation Total Males Females
Employed persons 16 yrs. & over 25,556 13,708 11,848
Managerial and professional specialty 7,042 3,699 3,343
Executive, administrative, and manager 6,765 2,987 3,778
Professional specialty 3,857 2,116 1,741
Technical, sales, and admin support 6,013 2,551 3,462
Technologists and technicians 376 277 99
Sales 2,888 1,068 1,820
Administrative support, incl clerical 2,750 1,207 1,543
Service 5,321 2,255 3,066
Private household 1,444 20 1,424
Protective service 1,167 1,108 59
Service, except protective & household 5,321 2,236 3,085
Farming, forestry, and fishing 514 494 20
Precision production, craft and repair 2,413 2,275 138
Mechanics and repairers 1,543 1,523 20
Construction trades 613 613 -
Precision production 257 138 119
Operators, fabricators, and laborers 4,213 2,433 1,780
Machine operators, assemblers, inspect 2,196 792 1,404
Transportation and material moving 771 731 40
Handlers, equip cleaners, helpers, 1,246 910 336
Source: Population and Housing Profiles, US Census Bureau 2000
Table 4.15 Employed Persons by Industry, CNMI: 1980 to 2010
Employed Persons
Year
2010 2000 1995 1990 1980
Employed persons 16 years and over 24,826 42,753 34,812 25,965 5,941
Agriculture, fishing, and mining 472 623 557 700 126
Construction 1,786 2,785 3,489 5,767 1,000
Manufacturing 689 17,398 7,770 5,688 110
Transportation, communication & other utilities 1,429 1,449 2,540 1,635 517
Wholesale trade 700 680 518 365 101
Retail trade 2,645 3,056 5,462 3,090 818
Finance, insurance, and real estate 1,064 1,013 723 518 163
Services 16,041 2,373 11,201 6,793 1,836
Personal services 3,085 0 5,103 3,353 706
Entertainment and recreation services 5,519 0 860 544 54
Professional and related services 1,974 2,117 3,360 2,059 895
Business and repair services or Other 3,049 0 1,560 837 181
Public administration 2,414 2,583 2,552 1,409 1,264
Source: Recent Trends in Population, Labor Force Survey Table A13.0 and Census 2000 Population and Housing Profiles and 2010 Census
Agriculture
, fishing,
and mining
2%
Constructi
on
6%
Manufactu
ring
2%
Transportat
ion,
communic
ation &
other
utilities
5%
Wholesale
trade
3%
Retail
trade
10%
Finance,
insurance,
and real
estate
4%
Services
59%
Public
administrat
ion
9%
Industry: 2010
Personal
services
23%
Entertainm
ent and
recreation
services
41%
Profession
al and
related
services
14%
Business
and repair
services or
Other
22%
Types of Service Industries: 2010
0%
10%
20%
30%
40%
50%
60%
70%
80%
90%
100%
2010 2000 1995 1990 1980
Industry, CNMI: 1980 to 2010
Others
Public
administration
Services
Retail trade
Manufacturing
Construction

2015 CNMI Statistical Yearbook Chapter 4 Page 65
11th Statistical Yearbook, Central Statistics Division, Department of Commerce
Table 4.16 Industry by District and Island, CNMI: 2010
Industry Total
Saipan
Rota Tinian Total Dist. 1 Dist. 2 Dist. 3 Dist. 4 Dist. 5
Total 24,826 21,816 6,384 2,983 7,973 1,693 2,783 1,258 1,752
Agriculture, fishing, and mining 472 369 124 38 94 46 67 62 41
Construction 1,786 1,554 637 263 435 69 150 153 79
Manufacturing 689 663 236 96 240 34 57 21 5
Wholesale trade 700 683 207 108 246 56 66 7 10
Retail trade 2,645 2,488 679 442 934 152 281 81 76
Transportation and warehous-
ing, and utilities 1,429 1,241 381 125 431 112 192 61 127
Information 496 462 155 69 154 24 60 5 29
Finance and insurance, real es-
tate and leasing 1,064 1,003 305 126 416 52 104 30 31
Professional, scientific, and
management 1,974 1,884 511 263 792 140 178 37 53
Education and health 3,085 2,689 839 258 867 251 474 218 178
Arts, entertainment, recreation,
accommodation and food 5,519 4,623 1,095 683 1,974 423 448 224 672
Other services, except public
administration 2,553 2,315 647 372 905 127 264 107 131
Public administration 2,414 1,842 568 140 485 207 442 252 320
Source: U.S. Census Bureau
Table 4.17 Industry by District and Island, CNMI: 2010
Industry
2010 2000
Total Saipan Rota Tinian Total Saipan Rota Tinian
Total 24,826 21,816 1,258 1,752 42,752 39,223 1,591 1,938
Agriculture, fishing, and mining 472 369 62 41 623 445 114 64
Construction 1,786 1,554 153 79 2,785 2,410 205 170
Manufacturing 689 663 21 5 17,398 17,329 18 51
Wholesale trade 700 683 7 10 680 665 6 9
Retail trade 2,645 2,488 81 76 3,056 2,858 109 89
Transportation and warehousing, and utilities 1,429 1,241 61 127 1,449 1,282 67 100
Information 496 462 5 29 603 560 5 38
Finance and insurance, real estate and leasing 1,064 1,003 30 31 1,013 940 34 39
Professional, scientific, and management 1,974 1,884 37 53 2,116 2,062 18 36
Education and health 3,085 2,689 218 178 2,239 1,882 197 160
Arts, entertainment, recreation, accommoda-
tion and food 5,519 4,623 224 672 5,834 4,714 324 796
Other services, except public administration 2,553 2,315 107 131 2,373 2,116 160 97
Public administration 2,414 1,842 252 320 2,583 1,960 334 289
Source: U.S. Census Bureau
Table 4.18 Class of Worker by District and Island, CNMI: 2010
Class of Worker Total
Saipan
Rota Tinian Total Dist. 1 Dist. 2 Dist. 3 Dist. 4 Dist. 5
Total 24,826 21,816 6,384 2,983 7,973 1,693 2,783 1,258 1,752
Private wage and salary workers 19,092 17,144 4,895 2,587 6,689 1,202 1,771 741 1,207
Government workers 5,313 4,277 1,370 342 1,154 448 963 504 532
Self-employed and family 421 395 119 54 130 43 49 13 13
Source: U.S. Census Bureau
Table 4.19 Class of Worker by District and Island, CNMI: 2010
Class of Worker
2010 2000
Total Saipan Rota Tinian Total Saipan Rota Tinian
Total 24,826 21,816 1,258 1,752 42,752 39,223 1,591 1,938
Private wage and salary workers 19,092 17,144 741 1,207 37,267 34,847 1,001 1,419
Government workers 5,313 4,277 504 532 4,996 3,924 568 504
Self-employed and family 421 395 13 13 489 452 22 15
Source: U.S. Census Bureau
4,895 2,587 6,6891,202 1,771 741 1,207
1,370 342 1,154448 963 504 532
0%
50%
100%
Dist 1 Dist 2 Dist 3 Dist 4 Dist 5 Rota Tinian
Public and Private Workers by District and Island:
2010
Private wage and salary workers Government workers
19,09217,144741
1,20737,26734,847
1,0011,419
5,313 4,277504
5324,996 3,924
568504
0%
20%
40%
60%
80%
100%
Total Saipan Rota Tinian Total Saipan Rota Tinian
2010 2000
Private and Public Sector Workers by Island: 2000
and 2010
Private wage and salary workers Government workers

Page 66 Chapter 4 2015 CNMI Statistical Yearbook
11th Statistical Yearbook, Central Statistics Division, Department of Commerce
Table 4.20 Class of Worker by District and Island, CNMI: 2010
Class of Worker 2010 2000 1995 1990 1980
Total 24,826 42,753 34,812 25,965 5,941
Private wage and salary workers 19,092 37,268 28,841 22,027 3,308
Government workers 5,313 4,996 5,018 3,510 2,500
Self-employed and family 421 489 953 428 133
Source: U.S. Census Bureau
Table 4.21 Commuting to Work for Workers 16 years and over by District and Island, CNMI: 2010
Commuting Total
Saipan
Rota Tinian Total Dist. 1 Dist. 2 Dist. 3 Dist. 4 Dist. 5
Total 24,541 21,559 6,314 2,942 7,878 1,676 2,749 1,250 1,732
Private vehicle - drive alone 9,833 8,857 2,595 1,129 3,032 832 1,269 482 494
Private vehicle - carpooled 7,985 7,122 2,349 874 2,268 547 1,084 417 446
Public transport 44 44 15 8 12 4 5 0 0
Public van/bus 21 21 4 2 10 2 3 0 0
Boat 33 33 11 6 12 2 2 0 0
Taxicab 403 402 107 84 176 11 24 1 0
Motorcycle 155 93 31 24 24 5 9 4 58
Bicycle 399 302 64 69 151 16 2 39 58
Walked 3,781 3,058 601 502 1,612 163 180 199 524
Other means 452 347 140 53 108 8 38 30 75
Worked at home 1,479 1,324 412 199 485 90 138 78 77
Mean Minutes to work 12.0 13.0 14.0 13.0 11.0 13.0 16.0 11.0 7.0
Source: U.S. Census Bureau
Table 4.22 Commuting to Work for Workers 16 years and over by District and Island, CNMI: 2010
Commuting
2010 2000
Total Saipan Rota Tinian Total Saipan Rota Tinian
Total 24,541 21,559 1,250 1,732 45,924 42,441 1,564 1,919
Private vehicle - drive alone 9,833 8,857 482 494 10,521 9,596 547 378
Private vehicle - carpooled 7,985 7,122 417 446 15,033 13,897 558 578
Public transport 44 44 0 0 225 215 6 4
Public van/bus 21 21 0 0 199 192 5 2
Boat 33 33 0 0 26 23 1 2
Taxicab 403 402 1 0 43 41 0 2
Motorcycle 155 93 4 58 38 28 3 7
Bicycle 399 302 39 58 274 222 32 20
Walked 3,781 3,058 199 524 16,895 15,780 300 815
Other means 452 347 30 75 824 789 18 17
Worked at home 1,479 1,324 78 77 2,071 1,873 100 98
Mean Minutes to work 12.0 13.0 11.0 7.0 xx 9.8 11.0 7.0
Source: U.S. Census Bureau
40.1 41.1 41.138.4 38.5
49.646.2
38.6
28.5
0.0
10.0
20.0
30.0
40.0
50.0
60.0
Percent Driving to Work Alone
0
5,000
10,000
15,000
20,000
25,000
30,000
35,000
40,000
2010 2000 1995 1990 1980
Private and Public Sector, CNMI: 1980 to 2010
Private wage and
salary workers
Government
workers
Self-employed and
family
40.1 41.138.6
28.5
22.9 22.6
35.0
19.7
0.0
5.0
10.0
15.0
20.0
25.0
30.0
35.0
40.0
45.0
Total Saipan Rota Tinian Total Saipan Rota Tinian
2010 2000
Percent Driving to Work Alone by Island: 2000 and
2010

2015 CNMI Statistical Yearbook Chapter 4 Page 67
11th Statistical Yearbook, Central Statistics Division, Department of Commerce
Table 4.23 Health Insurance Coverage Status by District and Island, CNMI: 2010
Health Insurance Total
Saipan
Rota Tinian Total Dist. 1 Dist. 2 Dist. 3 Dist. 4 Dist. 5
Total 53,731 48,070 15,153 6,256 15,617 3,847 7,197 2,525 3,136
With health insurance coverage 35,617 31,783 10,143 3,702 9,547 2,895 5,496 1,729 2,105
With private health insurance
coverage only 16,697 14,737 4,345 1,586 5,075 1,359 2,372 894 1,066
With public health insurance
coverage only 17,224 15,535 5,323 1,947 4,040 1,386 2,839 757 932
With both private and public
health insurance 1,696 1,511 475 169 432 150 285 78 107
No health insurance coverage 18,114 16,287 5,010 2,554 6,070 952 1,701 796 1,031
Total under 18 years 17,146 15,382 5,068 1,900 4,529 1,234 2,651 827 937
With health insurance 14,199 12,766 4,260 1,541 3,604 1,075 2,286 671 762
No health insurance 2,947 2,616 808 359 925 159 365 156 175
Source: U.S. Census Bureau
Table 4.24 Non-Resident Work Permits Issued by Industry, CNMI: FY 1996 to FY 2004
Employment Sector
Year
2004 2003 2002 2001 2000 1999 1998 1997 1996
Total 36,408 29,380 31,434 31,043 39,411 22,717 26,411 36,566 26,039
Banking 11 15 5 16 12 10 31 52 53
Construction 2,076 1,500 2,143 1,777 2,922 2,070 2,794 4,780 3,878
Garment 14,513 13,742 13,320 15,536 19,470 10,342 11,177 12,889 8,498
Hotels 2,687 2,298 2,557 2,430 3,008 1,540 2,328 2,231 1,946
Government 193 93 53 65 93 45 32 23 30
Private households 2,012 1,615 1,775 1,461 1,800 1,237 1,690 2,548 1,869
Services 11,000 7,411 8,454 7,007 8,688 5,357 6,773 13,883 9,763
Others 3,916 2,706 3,127 2,751 3,418 2,116 1,586 160 2
Source: Department of Labor & Immigration, LIIDS
NOTE: Tables will be updated when current data are available
Table 4.25 Number of Non-U.S. Resident Work Permits Issued by Nationality, CNMI: 1999 to 2004
Nationality
Year
2004 2003 2002 2001 2000 1999 1997
Total 36,408 29,380 29,455 30,958 38,522 31,907 36,566
Chinese 16,701 14,448 14,000 16,057 18,987 15,818 16,024
Filipino 16,015 11,827 12,058 11,667 15,654 12,905 16,730
Japanese 743 539 615 620 749 588 770
Korean 870 644 622 648 792 659 884
Thai 898 873 902 677 764 671 615
Bangladesh 470 432 501 557 672 544 …
Other 711 617 757 732 904 722 1,543
Source: Recent Trends 1973 to 1999 and Department of Labor & Immigration, LIIDS
NOTE: Tables will be updated when current data are available
66.3 66.1 66.9
59.2 61.1
75.3 76.4
68.5 67.1
0.0
10.0
20.0
30.0
40.0
50.0
60.0
70.0
80.0
90.0
Percent with Health Insurance by District and Island
0% 6%
40%
7%1%
5%
30%
11%
NON-RESIDENT WORK PERMITS
ISSUED BY INDUSTRY, CNMI: FY 2004
Banking
Construction
Garment
Hotels
Government
Private households
Services
Others
0
10,000
20,000
30,000
40,000
1996 1997 1998 1999 2000 2001 2002 2003 2004
Non-Resident Work Permits Issued by Industry, CNMI FY 1996-2004
Banking Construction Garment Hotels Government Private households Services Others
46%
44%
2%
2%3% 1%
2%
PERCENTAGE OF NON-U.S. RESIDENT WORK
PERMITS ISSUED BY NATIONALITY, CNMI:
2004
Chinese
Filipino
Japanese
Korean
Thai
Bangladesh
Other
16,70116,015
743 870 898 470 711
0
2,000
4,000
6,000
8,000
10,000
12,000
14,000
16,000
18,000
Chinese Filipino Japanese Korean Thai Bangladesh Other
Number of Non-U.S. Resident Work Permits Issued by Nationality, CNMI: 2004

Page 68 Chapter 4 2015 CNMI Statistical Yearbook
11th Statistical Yearbook, Central Statistics Division, Department of Commerce
Table 4.26 Number of Permits Issued to Non-Resident Workers by Industry and Month, CNMI: FY 2004
Employment
Sector Total Banking
Con-
struction Garment Hotels
Govern-
ment
Private
House-
holds Services Others
Total 360,407 11 2,076 14,513 2,687 193 2,012 10,999 3,916
October 2,668 0 167 1,051 304 21 159 719 267
November 2,309 0 118 1,135 127 13 146 559 211
December 2,232 0 96 1,051 134 1 128 588 234
January 2,634 1 168 1,012 283 8 108 743 311
February 4,189 2 245 2,226 150 2 138 1,078 348
March 4,550 0 310 1,097 360 20 369 1,775 619
April 3,574 3 223 1,148 324 10 220 1,241 405
May 2,943 4 150 1,155 178 16 159 908 373
June 2,785 1 157 1,028 231 9 142 917 300
July 3,118 0 179 1,098 238 44 169 1,063 327
August 3,054 0 141 1,661 155 9 137 692 259
September 2,331 0 122 851 203 40 137 716 262
Source: Department of Labor & Immigration, LIIDS
NOTE: Tables will be updated when current data are available
Table 4.27 Number of Permits Issued to Non-Resident Workers by Industry, CNMI: 2003 and 2004
Employment Sector
Total Chinese Filipino
2004 2003 2004 2003 2004 2003
Total 36,408 29,380 16,701 14,448 16,015 11,827
Banking 11 15 1 1 10 13
Construction 2,076 1,500 117 65 1,835 1,333
Garment 14,513 13,742 13,072 12,227 351 426
Hotels 2,687 2,298 316 263 1,898 1,595
Government 193 93 1 0 145 60
Private Households 2,012 1,615 74 42 1,891 1,535
Services 11,000 7,411 2,284 1,393 7,568 5,191
Other 3,916 2,706 2,317 457 2,317 1674
Source: Department of Labor & Immigration (LIIDS)
NOTE: Tables will be updated when current data are available
Table 4.28 Number of Permits Issued to Non-Resident Workers by Industry, CNMI: 2000 and 2002
Employment sector
Total Chinese Filipino
2002 2000 2002 2000 2002 2000
Total 29,455 38,520 13,998 18,986 12,059 15,654
Banking 10 15 1 4 9 11
Construction 1,793 2,689 98 165 1,510 2,305
Garment 13,289 18,339 11,766 16,600 415 596
Hotels 2,445 2,959 261 350 1,650 1,984
Government 71 90 0 0 30 58
Private Households 1,552 1,854 51 59 1,453 1,753
Services 7,496 8,999 1,389 1,255 5,216 6,676
Other 2,799 3,575 276 553 1,776 2,271
Source: Department of Labor & Immigration (LIIDS)

2015 CNMI Statistical Yearbook Chapter 4 Page 69
11th Statistical Yearbook, Central Statistics Division, Department of Commerce
Table 4.29 Number of Permits Issued to Non-Resident Workers by Industry, CNMI: 1999 and 2001
Employment Sector
Total Chinese Filipino
2001 1999 2001 1999 2001 1999
Total 44,256 33,027 16,494 16,814 11,417 13049
Banking 11 13 1 1 9 12
Construction 2,899 2,888 221 220 2,458 2447
Garment 30,497 16,533 15,044 14,857 596 640
Hotels 1,847 2,106 200 196 1,451 1437
Government 47 73 2 2 43 43
Private Households 1,737 2,163 55 132 1,550 1870
Services 7,218 7,022 971 937 5,310 5218
Other 0 2,229 0 469 0 1382
Source: Department of Labor & Immigration (LIIDS)
Table 4.30 Number of Permits Issued to Non-Resident Workers by Nationality: FY 2004
Employment Sector Total Chinese Filipino Japanese Korean Thailand
Bangla-
desh
Total 35,711 16,705 16,024 744 870 898 470
Banking 13 4 9 - - - -
Construction 2,012 117 1,835 1 8 1 50
Garment 14,459 13,072 351 0 164 827 45
Hotels 2,444 316 1,898 136 45 7 42
Government 150 1 145 3 0 0 1
Private Households 1,997 74 1,891 0 3 19 10
Services 10,789 2,284 7,568 258 456 33 190
Others 3,847 837 2,327 346 194 11 132
Source: Department of Labor & Immigration, LIIDS
NOTE: Tables will be updated when current data are available
Table 4.31 Number of Permits Issued to Non-Residents Workers by Nationality: FY 2003
Employment Sector Total Chinese Filipino Japanese Korean Thailand
Bangla-
desh
Total 29,370 11,825 14,448 539 642 867 432
Construction 1,498 1,331 65 2 5 1 51
Garment 13,742 426 12,227 0 154 804 69
Hotels 2,298 1,595 263 110 35 11 38
Government 93 60 0 3 0 0 1
Private Households 1,615 1,535 42 0 3 15 8
Services 7,411 5,191 1,393 203 308 26 130
Others 2,713 1,687 458 221 137 10 135
Source: Department of Labor & Immigration, LIIDS

11th Statistical Yearbook, Central Statistics Division, Department of Commerce
CHAPTER 5
Income

2015 CNMI Statistical Yearbook Chapter 5 Page 71
11th Statistical Yearbook, Central Statistics Division, Department of Commerce
Chapter 5 – Income
The Census Bureau collects income of individuals in households using a series of categories, like wages,
business, interest, rentals, and so forth. The individual incomes are compiled, but the Census also combines
the individual incomes into household and family incomes, and usually provides mean (average) income as
well as median income (that income where half the category is richer and have poorer than that amount.
The median household income in 2009 (last full year before the 2010 census) was $19,958 and the mean
income was $31,463. The mean was higher because some households made much more money than aver-
age, and so brought the average amount up. The median household income for Saipan was about $400 less,
at about $19,600, while the median household incomes for Rota and Tinian were $23,125 and $24,470
respectively. The median household income for Saipan’s District 5 was much higher than the others, at
$27,200. The median household income for District 4 was 24,700, followed by District 1 ($19,400), District
3 ($18,800), and District 2 ($15,700).
The median household income, adjusted for inflation, decreased from $29,500 in 1999 to $20,000 in 2009.
The inflation adjustment is from the U.S. and so might not be completely appropriate for the CNMI. All
three islands saw very significant dips in their household incomes under this measure. But, the CNMI house-
hold income decreased from 1999 to 2009 even without considering inflation, from $22,900 to the afore-
mentioned $20,000.
Although the Census collects income in a series of categories, our tables show the largest four: earnings,
social security, supplemental social security, and retirement. The median household earnings in 2009 was
$29,000.

Page 72 Chapter 5 2015 CNMI Statistical Yearbook
11th Statistical Yearbook, Central Statistics Division, Department of Commerce
Table 5.1 Household and Family Income in Year before Census, CNMI: 1980 to 2000
Income Level
Households Families
2010 2000 1995 1990 1980 2010 2000 1995 1990 1980
All households 16,035 14,055 12,057 6,873 3,028 10,714 9,407 8,252 5,312 2,652
Less than $2,500 903 611 1,501 362 343 594 428 871 201 188
$2,500 to $4,999 558 307 569 374 515 310 190 276 235 467
$5,000 to $9,999 2,529 1,961 1,609 954 870 1,350 935 1,020 738 797
$10,000 to $14,999 2,097 1,892 1,441 860 515 1,280 1,162 995 695 479
$15,000 to $24,999 3,349 2,735 2,164 1,449 465 2,232 1,864 1,533 1,146 422
$25,000 to $49,999 3,635 3,595 2,850 1,780 266 2,598 2,581 2,028 1,409 250
$50,000 to $74,999 1,557 1,556 1,055 581 32 1,227 1,191 834 482 30
$75,000 or more 1,407 1,398 868 513 22 1,123 1,056 695 406 19
Median (dollars) 19,958 22,898 19,198 21,118 8,770 22,455 25,853 21,288 21,867 9,210
Mean (dollars) 31,463 37,015 29,946 37,713 12,859 34,580 37,986 32,921 35,994 13,294
Source: U.S. Census Bureau and 1995 CNMI Census
Note: All values in current dollars.
Table 5.2 Household Income in 2009 by District and Island, CNMI: 2010
Household Income Total
Saipan
Rota Tinian Total Dist. 1 Dist. 2 Dist. 3 Dist. 4 Dist. 5
Total 16,035 14,406 4,287 2,010 5,183 1,066 1,860 755 874
Less than $2,500 903 852 322 145 235 45 105 26 25
$2,500 to $4,999 558 511 164 90 185 30 42 23 24
$5,000 to $9,999 2,529 2,314 654 391 964 109 196 94 121
$10,000 to $14,999 2,097 1,895 558 334 705 125 173 112 90
$15,000 to $24,999 3,349 3,023 861 454 1,130 228 350 142 184
$25,000 to $29,999 982 875 268 121 285 67 134 54 53
$30,000 to $39,999 1,554 1,340 381 188 459 105 207 102 112
$40,000 to $49,999 1,099 957 289 79 337 91 161 54 88
$50,000 to $74,999 1,557 1,373 423 116 449 122 263 84 100
$75,000 to $99,999 673 588 172 42 195 65 114 39 46
$100,000 or more 734 678 195 50 239 79 115 25 31
Median 19,958 19,607 19,415 15,670 18,785 24,730 27,162 23,125 24,470
Mean 31,463 31,328 30,333 23,409 30,966 38,167 39,273 32,139 33,092
Source: U.S. Census Bureau
0
5,000
10,000
15,000
20,000
25,000
30,000
35,000
40,000
2010 2000 1995 1990 1980
Mean and Median Household Income in Current
Dollars: 1980 to 2010
Median (dollars) Mean (dollars)
0
5,000
10,000
15,000
20,000
25,000
30,000
35,000
40,000
2010 2000 1995 1990 1980
Mean and Median Family Income in Current Dollars:
1980 to 2010
Median (dollars) Mean (dollars)
19,958
19,607
19,415
15,670
18,785
24,73027,162
23,12524,470
0
5,000
10,000
15,000
20,000
25,000
30,000
Median Household Income in 2009 by District and
Island
31,46331,328
30,333
23,409
30,966
38,16739,273
32,13933,092
0
5,000
10,000
15,000
20,000
25,000
30,000
35,000
40,000
45,000
Mean Household Income in 2009 by District and
Island

2015 CNMI Statistical Yearbook Chapter 5 Page 73
11th Statistical Yearbook, Central Statistics Division, Department of Commerce
Table 5.3 Household Income in 1999 and 2009 by Island, CNMI: 2000 and 2010
Household Income
2010 2000
Total Saipan Rota Tinian Total Saipan Rota Tinian
Total 16,035 14,406 755 874 14,055 12,507 757 790
Less than $2,500 903 852 26 25 611 535 20 56
$2,500 to $4,999 558 511 23 24 307 263 22 22
$5,000 to $9,999 2,529 2,314 94 121 1,961 1,773 71 117
$10,000 to $14,999 2,097 1,895 112 90 1,892 1,718 84 90
$15,000 to $24,999 3,349 3,023 142 184 2,735 2,475 136 124
$25,000 to $49,999 3,635 3,172 210 253 3,595 3,180 232 182
$50,000 to $74,999 1,557 1,373 84 100 1,556 1,334 114 108
$75,000 or more 1,407 1,266 64 77 1,398 1,229 78 91
Median (2009 dollars) 19,958 19,607 23,125 24,470 29,486 29,044 36,967 30,315
Mean (2009 dollars) 31,463 31,328 32,139 33,092 47,664 47,282 54,758 46,942
Median (1999 dollars) ... ... ... ... 22,898 22,555 28,708 23,542
Mean (1999 dollars) ... ... ... ... 37,015 36,718 42,524 36,454
Source: U.S. Census Bureau
Table 5.4 Household Income in 2009 by type and District and Island, CNMI: 2010
Household Income Total
Saipan
Rota Tinian Total Dist. 1 Dist. 2 Dist. 3 Dist. 4 Dist. 5
With earnings 14,364 12,853 3,701 1,797 4,758 956 1,641 682 829
Mean earnings $28,894 $28,881 $28,461 $21,963 $28,429 $33,843 $35,824 $27,866 $29,951
With Social Security 1,241 1,132 365 122 337 120 188 59 50
Mean Social Security $8,425 $8,489 $8,349 $8,510 $8,530 $9,208 $8,218 $8,158 $7,275
With Supplemental Social Security 1,881 1,740 602 221 446 153 318 63 78
Mean Supplemental Social Security $4,324 $4,356 $4,220 $4,161 $3,922 $5,023 $5,036 $4,085 $3,809
With Retirement Income 1,755 1,482 504 117 380 183 298 156 117
Mean Retirement Income $23,402 $23,276 $21,589 $21,977 $25,165 $23,905 $23,843 $24,991 $22,882
Source: U.S. Census Bureau
Table 5.5 Household Income in 1999 and 2009 by Type and Island, CNMI: 2000 and 2010
Household Income
2010 2000
Total Saipan Rota Tinian Total Saipan Rota Tinian
With earnings 14,364 12,853 682 829 13,071 11,650 706 715
Mean earnings (dollars) $28,894 $28,881 $27,866 $29,951 $35,077 $34,841 $38,971 $35,085
With Social Security 1,241 1,132 59 50 747 664 43 40
Mean Social Security (dollars) $8,425 $8,489 $8,158 $7,275 $7,047 $7,174 $5,459 $6,653
With Supplemental Social Security 1,881 1,740 63 78 335 293 30 12
Mean Supplemental Social Security (dollars) $4,324 $4,356 $4,085 $3,809 $5,468 $5,563 $4,687 $5,111
With Retirement Income 1,755 1,482 156 117 1,279 1,041 141 97
Mean Retirement Income (dollars) $23,402 $23,276 $24,991 $22,882 $19,318 $19,322 $19,332 $19,253
Source: U.S. Census Bureau
$19,958
$19,607$23,125
$24,470$29,486
$29,044
$36,967
$30,315
$0
$5,000
$10,000
$15,000
$20,000
$25,000
$30,000
$35,000
$40,000
Tota
l
Sai
pan
Rota
Tin
ian
Tota
l
Sai
pan
Rota
Tin
ian
2010 2000
Median Household Income in 2009 dollars by Island:
2000 and 2010
$28,894$28,881
$28,461
$21,963
$28,429
$33,843
$35,824
$27,866
$29,951
$10,000
$15,000
$20,000
$25,000
$30,000
$35,000
$40,000
Mean Earnings in 2009 by District and Island
$28,894
$28,881
$27,866
$29,951
$35,077
$34,841
$38,971
$35,085
$20,000
$22,000
$24,000
$26,000
$28,000
$30,000
$32,000
$34,000
$36,000
$38,000
$40,000
Tota
l
Sai
pan
Rota
Tin
ian
Tota
l
Sai
pan
Rota
Tin
ian
2010 2000
Mean earnings in year before census by
Island: 2000 and 2010
$0
$10,000
$20,000
$30,000
$40,000
$50,000
$60,000
Tota
l
Sai
pan
Rota
Tin
ian
Tota
l
Sai
pan
Rota
Tin
ian
2010 2000
Mean Household Income in 2009 dollars by Island:
2000 and 2010

Page 74 Chapter 5 2015 CNMI Statistical Yearbook
11th Statistical Yearbook, Central Statistics Division, Department of Commerce
Table 5.7 Family Income in 2009 by District and Island, CNMI: 2010
Family Income Total
Saipan
Rota Tinian Total Dist. 1 Dist. 2 Dist. 3 Dist. 4 Dist. 5
Total 10,714 9,633 3,064 1,239 3,056 777 1,497 508 573
Less than $2,500 594 564 234 88 125 34 83 19 11
$2,500 to $4,999 310 295 106 40 98 20 31 9 6
$5,000 to $9,999 1,350 1,243 421 214 394 73 141 46 61
$10,000 to $14,999 1,280 1,146 365 181 379 87 134 77 57
$15,000 to $24,999 2,232 2,020 622 291 680 149 278 89 123
$25,000 to $29,999 726 637 181 87 207 54 108 41 48
$30,000 to $39,999 1,089 948 285 124 288 73 178 62 79
$40,000 to $49,999 783 685 207 52 231 63 132 43 55
$50,000 to $74,999 1,227 1,077 337 91 322 102 225 70 80
$75,000 to $99,999 537 473 147 31 152 56 87 32 32
$100,000 or more 586 545 159 40 180 66 100 20 21
Median 22,455 22,086 20,891 17,298 22,266 27,056 28,620 26,522 27,563
Mean 34,580 34,496 32,468 26,131 35,743 40,585 39,864 35,443 35,225
Source: U.S. Census Bureau
Table 5.8 Family Income in 2009 by District and Island, CNMI: 2010
Family Income
2010 2000
Total Saipan Rota Tinian Total Saipan Rota Tinian
Total 10,714 9,633 508 573 9,406 8,364 538 504
Less than $2,500 594 564 19 11 428 366 18 44
$2,500 to $4,999 310 295 9 6 190 164 16 10
$5,000 to $9,999 1,350 1,243 46 61 935 864 39 32
$10,000 to $14,999 1,280 1,146 77 57 1,161 1,072 43 46
$15,000 to $24,999 2,232 2,020 89 123 1,864 1,680 99 85
$25,000 to $49,999 2,598 2,270 146 182 2,581 2,268 181 132
$50,000 to $74,999 1,227 1,077 70 80 1,191 1,006 88 97
$75,000 or more 1,123 1,018 52 53 1,056 944 54 58
Median (2009 dollars) 22,455 22,086 26,522 27,563 33,291 32,556 38,491 39,168
Mean (2009 dollars) 34,580 34,496 35,443 35,225 48,915 48,683 51,822 49,717
Median (1999 dollars) ... ... ... ... 25,853 25,282 29,891 30,417
Mean (1999 dollars) ... ... ... ... 37,986 37,806 40,244 38,609
Source: U.S. Census Bureau
Table 5.9 Other Income Characteristics in 2009 by District and Island, CNMI: 2010
Income Characteristics Total
Saipan
Rota Tinian Total Dist. 1 Dist. 2 Dist. 3 Dist. 4 Dist. 5
Per capita Income $9,656 $9,586 $8,711 $7,630 $10,477 $10,820 $10,568 $9,964 $10,489
Population 16 years and over with earn-
ings in 2009
Male, year-round full-time workers $11,807 $11,717 $11,644 $10,000 $11,360 $13,464 $16,706 $12,893 $12,122
Female, year-round full-time workers $11,666 $11,595 $12,102 $9,699 $10,770 $15,303 $15,799 $12,885 $11,845
Non-family Households 5,321 4,773 1,223 771 2,127 289 363 247 301
Median income $11,537 $11,394 $11,062 $10,204 $11,436 $15,491 $13,631 $13,424 $12,986
Mean income $19,390 $19,324 $18,171 $14,974 $19,896 $24,055 $25,327 $19,118 $20,658
Source: U.S. Census Bureau
$22,455
$22,086
$20,891
$17,298
$22,266
$27,056
$28,620
$26,522$27,563
$0
$5,000
$10,000
$15,000
$20,000
$25,000
$30,000
$35,000
Median Family Income in 2009 by District and Island
$34,580
$34,496
$32,468
$26,131
$35,743
$40,585$39,864
$35,443
$35,225
$0
$5,000
$10,000
$15,000
$20,000
$25,000
$30,000
$35,000
$40,000
$45,000
Mean Family Income in 2009 by District and Island
$22,455
$22,086$26,522
$27,563$33,291
$32,556
$38,491
$39,168
$0$5,000
$10,000$15,000$20,000$25,000$30,000$35,000$40,000$45,000
Tota
l
Sai
pan
Rota
Tin
ian
Tota
l
Sai
pan
Rota
Tin
ian
2010 2000
Median Family Income in 2009 dollars by Island:
2000 and 2010
$34,580
$34,496
$35,443
$35,225
$48,915
$48,683
$51,822
$49,717
$0
$10,000
$20,000
$30,000
$40,000
$50,000
$60,000
Tota
l
Sai
pan
Rota
Tin
ian
Tota
l
Sai
pan
Rota
Tin
ian
2010 2000
Mean Family Income in 2009 dollars by Island: 2000
and 2010
$9,656
$9,586
$8,711
$7,630
$10,477
$10,820
$10,568
$9,964$10,489
$6,000
$7,000
$8,000
$9,000
$10,000
$11,000
$12,000
Per Capita Income in 2009 by District and Island

2015 CNMI Statistical Yearbook Chapter 5 Page 75
11th Statistical Yearbook, Central Statistics Division, Department of Commerce
Table 5.10 Nonfamily Income, Per Capital Income and Median Earnings in 1999 and 2009 by Island, CNMI: 2000 and 2010
Nonfamily Income in 1999, Per capita income, and
Median earnings
2010 2000
Total Saipan Rota Tinian Total Saipan Rota Tinian
Non-family Households 5,321 4,773 247 301 4,648 4,143 219 286
Median income $11,537 $11,394 $13,424 $12,986 $13,363 $13,270 $15,268 $12,738
Mean income $19,390 $19,324 $19,118 $20,658 $23,368 $23,084 $28,337 $23,665
Per capita Income $9,656 $9,586 $9,964 $10,489 $9,151 $9,021 $10,326 $10,344
Population 16 years and over with earnings in 2009
Male, year-round full-time workers $11,807 $11,717 $12,893 $12,122 $9,927 $9,828 $11,833 $11,607
Female, year-round full-time workers $11,666 $11,595 $12,885 $11,845 $10,113 $10,074 $13,516 $10,556
Sources: U.S. Census Bureau
Table 5.11 Remittance Sent Abroad in 2009 by District and Island, CNMI: 2010
Family Income Total
Saipan
Rota Tinian Total Dist. 1 Dist. 2 Dist. 3 Dist. 4 Dist. 5
Households 16,035 14,406 4,287 2,010 5,183 1,066 1,860 755 874
With remittances sent abroad in 2009 8,332 7,411 2,039 1,122 3,015 492 743 413 508
Percent 52.0 51.4 47.6 55.8 58.2 46.2 39.9 54.7 58.1
Median $3,021 $3,007 $2,582 $2,473 $3,185 $3,052 $2,339 $2,975 $3,500
Mean $4,925 $4,926 $4,479 $4,077 $5,574 $5,066 $4,719 $4,819 $4,992
Source: U.S. Census Bureau
Table 5.12 Families with Income in 2009 below Poverty Level by District and Island, CNMI: 2010
Family Poverty Total
Saipan
Rota Tinian Total Dist. 1 Dist. 2 Dist. 3 Dist. 4 Dist. 5
ALL FAMILIES 10,714 9,633 3,064 1,239 3,056 777 1,497 508 573
Families below poverty 4,760 4,379 1,492 663 1,341 316 567 189 192
Percent 44.4 45.5 48.7 53.5 43.9 40.7 37.9 37.2 33.5
Families with related children under 18
years 4,061 3,735 1,270 557 1,137 271 500 157 169
Families with related children under 5
years 2,037 1,866 641 291 586 127 221 70 101
Husband-wife families below poverty 2,253 2,104 720 300 649 160 275 81 68
Percent 21.0 21.8 23.5 24.2 21.2 20.6 18.4 15.9 11.9
Families with related children under 18
years 1,799 1,689 572 237 518 132 230 56 54
Families with related children under 5
years 902 848 293 124 278 60 93 22 32
Male householder, no wife present fam-
ilies 1,082 963 345 153 279 70 116 52 67
Percent 10.1 10.0 11.3 12.3 9.1 9.0 7.7 10.2 11.7
Families with related children under 18
years 976 863 310 138 245 61 109 49 64
Families with related children under 5
years 524 460 164 79 131 33 53 25 39
Female householder, no husband pre-
sent 1,425 1,312 427 210 413 86 176 56 57
Percent 13.3 13.6 13.9 16.9 13.5 11.1 11.8 11.0 9.9
Families with related children under 18
years 1,286 1,183 388 182 374 78 161 52 51
Families with related children under 5
years 611 558 184 88 177 34 75 23 30
Source: U.S. Census Bureau
$9,656
$9,586
$9,964
$10,489
$9,151$9,021
$10,326
$10,344
$8,000
$8,500
$9,000
$9,500
$10,000
$10,500
$11,000
Tota
l
Sai
pan
Rota
Tin
ian
Tota
l
Sai
pan
Rota
Tin
ian
2010 2000
Per Capita Income in Year Before Census by Island:
2000 and 2010
52.0 51.4 47.655.8 58.2
46.239.9
54.7 58.1
0.0
10.0
20.0
30.0
40.0
50.0
60.0
70.0
Percent Households with Remittances Sent Abroad in
2009
44.4 45.548.7
53.5
43.940.7
37.9 37.233.5
0.0
10.0
20.0
30.0
40.0
50.0
60.0
Percent Families In Poverty by District and Island
0.0
10.0
20.0
30.0
40.0
50.0
60.0
CN
MI
Sai
pan
Dis
t 1
Dis
t 2
Dis
t 3
Dis
t 4
Dis
t 5
Rota
Tin
ian
Percent Families in Poverty by Type and District and
Island
Female
Householder, no
husband
Male householder,
no wife
Married Couple
Families

Page 76 Chapter 5 2015 CNMI Statistical Yearbook
11th Statistical Yearbook, Central Statistics Division, Department of Commerce
Table 5.13 Persons with Income in 2009 below Poverty Level by District and Island, CNMI: 2010
Persons Poverty Total
Saipan
Rota Tinian Total Dist. 1 Dist. 2 Dist. 3 Dist. 4 Dist. 5
Total 53,883 48,220 15,160 6,382 15,624 3,847 7,207 2,527 3,136
Persons below poverty 27,921 25,439 8,319 3,897 8,185 1,807 3,231 1,118 1,364
Percent 51.8 52.8 54.9 61.1 52.4 47.0 44.8 44.2 43.5
Persons 18 years and over in poverty 18,604 16,890 5,385 2,668 5,714 1,187 1,936 752 962
Persons 65 years and over in poverty 502 462 159 63 156 33 51 26 14
Related children under 18 in families in pov-
erty 9,249 8,491 2,913 1,221 2,446 619 1,292 362 396
Related children 5 to 17 years in families in
poverty 6,464 5,933 2,025 826 1,645 455 982 269 262
Unrelated individuals 15 years and over in
poverty 9,316 8,242 2,424 1,378 3,181 503 756 430 644
Source: U.S. Census Bureau
Table 5.14. Persons with Income in 2009 below Poverty Level by District and Island, CNMI: 2010
Persons in Poverty
2010 2000
Total Saipan Rota Tinian Total Saipan Rota Tinian
Total 53,883 48,220 2,527 3,136
Persons below poverty 27,921 25,439 1,118 1,364 31,659 29,096 1,111 1,452
Percent 51.8 52.8 44.2 43.5 30.6 46.9 34.2 41.2
Persons 18 years and over in poverty 18,604 16,890 752 962 25,083 23,148 806 1,129
Persons 65 years and over in poverty 502 462 26 14 272 242 18 12
Related children under 18 in families in
poverty 9,249 8,491 362 396 6,500 5,882 300 318
Related children 5 to 17 years in families in
poverty 6,464 5,933 269 262 4,173 3,780 187 206
Unrelated individuals 15 years and over in
poverty 9,316 8,242 430 644 16,711 15,522 475 714
Source: U.S. Census Bureau
Table 5.15. Families with Income in 1999 and 2009 below Poverty Level by Island, CNMI: 2000 and 2010
2010 2000
Families in Poverty Total Saipan Rota Tinian Total Saipan Rota Tinian
ALL FAMILIES 10,714 9,633 508 573
Families below poverty 4,760 4,379 189 192 2,875 2,610 124 141
Percent 44.4 45.5 37.2 33.5 20.6 31.2 23.0 28.0
Families with related children under 18 years 4,061 3,735 157 169 2,560 2,324 117 119
Families with related children under 5 years 2,037 1,866 70 101 1,579 1,429 75 75
Female householder, no husband present 1,425 1,312 56 57 818 725 51 42
Percent 13.3 13.6 11.0 9.9 37.9 49.0 53.7 48.8
Families with related children under 18 years 1,286 1,183 52 51 765 677 51 37
Families with related children under 5 years 611 558 23 30 449 397 30 22
Source: U.S. Census Bureau
51.8 52.854.9
61.1
52.4
47.044.8 44.2 43.5
0.0
10.0
20.0
30.0
40.0
50.0
60.0
70.0
Percent Persons in Poverty by District and Island
51.8 52.8
44.2 43.5
30.6
46.9
34.2
41.2
0.0
10.0
20.0
30.0
40.0
50.0
60.0
Total Saipan Rota Tinian Total Saipan Rota Tinian
2010 2000
Percent Persons In Poverty by Island: 2000 and
2010
0.0
10.0
20.0
30.0
40.0
50.0
60.0
Total Saipan Rota Tinian Total Saipan Rota Tinian
2010 2000
Percent Families Below Poverty,
CNMI: 2000 and 2010
Families below poverty Female Hher, no husband present

2015 CNMI Statistical Yearbook Chapter 5 Page 77
11th Statistical Yearbook, Central Statistics Division, Department of Commerce
Table 5.16 Wage and Salary Income, Number of Wage and Salary Earners and Average Earnings, CNMI: 1980 to 2003
Year
Total Wages and Salary Income
(in thousands of dollars) Number of W2's Filed Average Earnings ($)
2003 107,975 ... ...
2002 108,859 ... ...
2001 113,739 ... ...
2000 558,814 56,457 9,898
1999 n/a n/a n/a
1998 n/a n/a n/a
1997 581,321 57,917 10,037
1996 515,766 53,157 9,703
1995 464,774 51,268 9,066
1994 415,444 48,368 8,589
1993 384,775 48,546 7,926
1992 366,972 30,613 11,987
1991 322,301 47,867 6,733
1990 262,251 41,531 6,315
1989 209,746 35,882 5,845
1988 105,211 19,435 5,413
1987 101,058 19,350 5,223
1986 80,006 14,640 5,465
1985 77,504 10,367 7,476
1984 69,500 9,980 6,964
1983 63,725 9,753 6,534
1982 54,868 8,681 6,320
1981 48,180 8,180 5,890
1980 41,863 7,627 5,489
Source: Department of Finance, Division of Revenue and Taxation
Note: The number of W-2 forms filed and the average earnings from the year 2001 thru 2003 not submitted
Note: Table will be updated with more current data
Table 5.17 Average Hourly Wages by Occupation and Sex, CNMI: 2014
Occupation
Numbers Average Hourly Wage
Total Male Female Total Male Female
Total 25,658 13,996 11,662 $8.71 $8.79 $8.61
Management 3,848 2,350 1,498 $11.97 $12.22 $11.58
Business and Financial Operations 1,203 374 829 $10.36 $10.87 $10.13
Computer and Mathematical 114 88 26 $11.83 $12.65 $9.08
Architecture and Engineering 141 135 6 $11.00 $10.87 $13.67
Life Physical and Social Science 117 85 32 $11.72 $10.60 $14.69
Community and Social Service 191 79 112 $10.83 $9.44 $11.80
Legal 158 110 48 $23.42 $24.88 $20.08
Education Training and Library 998 313 685 $13.04 $14.35 $12.45
Arts Design Entertainment Sports and Media 377 208 169 $9.39 $8.38 $10.64
Healthcare Practitioners and Technical 673 237 436 $22.68 $30.23 $18.58
Healthcare Support 461 71 390 $7.34 $8.69 $7.09
Protective Service 1,182 1,077 105 $7.53 $7.44 $8.36
Food Preparation and Serving Related 2,092 978 1,114 $6.23 $6.35 $6.12
Building and Grounds Cleaning and Maintenance 1,511 776 735 $6.14 $6.20 $6.09
Personal Care and Service 1,055 425 630 $6.50 $6.49 $6.50
Sales and Related 2,810 690 2,120 $6.43 $6.52 $6.40
Office and Administrative Support 3,189 1,226 1,963 $7.80 $7.60 $7.92
Farming Fishing and Forestry 425 399 26 $6.39 $6.30 $7.69
Construction and Extraction 1,259 1,166 93 $6.73 $6.74 $6.53
Installation Maintenance and Repair 1,512 1,392 120 $7.31 $7.29 $7.58
Production 1,132 704 428 $6.36 $6.48 $6.15
Transportation and Material Moving 1,210 1,113 97 $7.64 $7.69 $7.04
Source: 2014 CNMI Prevailing Wage and Workforce Assessment Study
$7.64
$6.36
$7.31
$6.73
$6.39
$7.80
$6.43
$6.50
$6.14
$6.23
$7.53
$7.34
$22.68
$9.39
$13.04
$23.42
$10.83
$11.72
$11.00
$11.83
$10.36
$11.97
$8.71
$0.00 $7.00 $14.00 $21.00 $28.00
Transportation and Material
Moving
Production
Installation Maintenance and
Repair
Construction and Extraction
Farming Fishing and Forestry
Office and Administrative
Support
Sales and Related
Personal Care and Service
Building and Grounds Cleaning
and Maintenance
Food Preparation and Serving
Related
Protective Service
Healthcare Support
Healthcare Practitioners and
Technical
Arts Design Entertainment
Sports and Media
Education Training and Library
Legal
Community and Social Service
Life Physical and Social Science
Architecture and Engineering
Computer and Mathematical
Business and Financial
Operations
Management
Total
Average Hourly Wage by Occupation, CNMI: 2014

Page 78 Chapter 5 2015 CNMI Statistical Yearbook
11th Statistical Yearbook, Central Statistics Division, Department of Commerce
Table 5.18 Average Hourly Wages by Ethnicity and Sex, CNMI: 2014
Ethnicity
Numbers Average Hourly Wage
Total Male Female Total Male Female
Total 25,658 13,996 11,662 $8.71 $8.79 $8.61
Chamorro 3,942 2,211 1,731 $9.72 $8.79 $10.90
Carolinian 269 169 100 $6.91 $6.60 $7.43
FAS 641 424 217 $7.66 $7.24 $8.48
Filipino 12,101 6,272 5,829 $7.25 $7.20 $7.29
Other Asian 7,442 4,064 3,378 $9.11 $9.42 $8.73
Others 1,263 856 407 $18.12 $18.60 $17.12
Source: 2014 CNMI Prevailing Wage and Workforce Assessment Study
Table 5.19 Average Hourly Wages by Visa Type by Age and Sex, CNMI: 2014
Sex Numbers Average Hourly Wage
Age Total CWI Other visa No visa Total CWI Other visa No visa
Total 25,658 14,988 1,865 8,805 $8.71 $7.37 $8.92 $10.94
Less than 30 yrs. 3,344 730 108 2,506 $7.42 $7.00 $7.16 $7.56
30 to 49 yrs. 14,457 9,373 1,034 4,050 $8.54 $7.28 $9.08 $11.31
50 yrs. and over 7,857 4,885 723 2,249 $9.57 $7.61 $8.96 $14.03
Males 13,996 8,178 861 4,957 $8.79 $7.32 $9.91 $11.01
Less than 30 yrs. 1,771 306 33 1,432 $7.17 $6.60 $6.64 $7.31
30 to 49 yrs. 7,413 4,763 421 2,229 $8.57 $7.21 $10.47 $11.11
50 yrs. and over 4,812 3,109 407 1,296 $9.73 $7.57 $9.60 $14.95
Females 11,662 6,810 1,004 3,848 $8.61 $7.43 $8.07 $10.84
Less than 30 yrs. 1,573 424 75 1,074 $7.70 $7.29 $7.39 $7.89
30 to 49 yrs. 7,044 4,610 613 1,821 $8.51 $7.35 $8.12 $11.57
50 yrs. and over 3,045 1,776 316 953 $9.32 $7.68 $8.15 $12.77
Source: 2014 CNMI Prevailing Wage and Workforce Assessment Study
Table 5.20 Average Hourly Wages by Occupation and Island, CNMI: 2014
Occupation
Numbers Average Hourly Wage
Total Saipan Tinian Rota Total Saipan Tinian Rota
Total 25,658 24,166 994 498 $8.71 $8.74 $8.26 $8.09
Management 3,848 3,670 135 43 $11.97 $11.99 $11.93 $10.81
Business and Financial Operations 1,203 1,158 21 24 $10.36 $10.37 $9.48 $10.25
Computer and Mathematical 114 109 3 2 $11.83 $12.05 $7.00 $7.50
Architecture and Engineering 141 136 3 2 $11.00 $11.13 $6.67 $8.50
Life Physical and Social Science 117 107 4 6 $11.72 $11.84 $8.25 $11.83
Community and Social Service 191 140 9 42 $10.83 $11.94 $9.89 $7.31
Legal 158 158 0 0 $23.42 $23.42 ... ...
Education Training and Library 998 992 4 2 $13.04 $13.08 $6.50 $6.50
Arts Design Entertainment Sports and Media 377 371 3 3 $9.39 $9.39 $11.33 $7.00
Healthcare Practitioners and Technical 673 639 18 16 $22.68 $22.82 $23.33 $16.38
Healthcare Support 461 439 9 13 $7.34 $7.28 $9.00 $8.00
Protective Service 1,182 1,059 83 40 $7.53 $7.45 $7.88 $8.83
Food Preparation and Serving Related 2,092 1,850 190 52 $6.23 $6.20 $6.55 $5.94
Building and Grounds Cleaning and Maintenance 1,511 1,467 10 34 $6.14 $6.14 $5.70 $6.38
Personal Care and Service 1,055 1,008 32 15 $6.50 $6.34 $9.16 $11.60
Sales and Related 2,810 2,727 50 33 $6.43 $6.43 $6.58 $6.09
Office and Administrative Support 3,189 2,886 241 62 $7.80 $7.81 $7.63 $7.94
Farming Fishing and Forestry 425 388 12 25 $6.39 $6.31 $7.83 $6.92
Construction and Extraction 1,259 1,115 112 32 $6.73 $6.67 $7.04 $7.66
Installation Maintenance and Repair 1,512 1,465 27 20 $7.31 $7.32 $7.37 $6.90
Production 1,132 1,103 7 22 $6.36 $6.35 $6.71 $6.36
Transportation and Material Moving 1,210 1,179 21 10 $7.64 $7.68 $6.33 $6.50
Source: 2014 CNMI Prevailing Wage and Workforce Assessment Study
$0.00
$5.00
$10.00
$15.00
$20.00
Average Hourly Wages by Ethnicity and Sex,
CNMI: 2014
Total
Male
Female
$0.00
$2.00
$4.00
$6.00
$8.00
$10.00
$12.00Average Hourly Wage by Sex and Age, CNMI: 2014
Total
Male
Female
$8.71$8.74
$8.26
$8.09
$7.60
$7.80
$8.00
$8.20
$8.40
$8.60
$8.80
Total Saipan Tinian Rota
Average Hourly Wage by Island: 2014
$8.7
1
$7.3
7
$8.9
2 $10.9
4
$7.4
2
$7.0
0
$7.1
6
$7.5
6
$8.5
4
$7.2
8 $9.0
8 $11.3
1
$9.5
7
$7.6
1
$8.9
6
$14.0
3
$0.00
$2.00
$4.00
$6.00
$8.00
$10.00
$12.00
$14.00
$16.00
Total CWI Other visa No visa
Average Hourly Wages by Age and Visa, CNMI: 2014
Total Less than 30 yrs 30 to 49 yrs 50 yrs and over

2015 CNMI Statistical Yearbook Chapter 5 Page 79
11th Statistical Yearbook, Central Statistics Division, Department of Commerce
Table 5.21 Average Hourly Wages by Occupation and Employment Status, CNMI: 2014
Occupation
Numbers Average Hourly Wage
Total Full time Part time Total Full time Part time
Total 25,658 22,099 3,559 $8.71 $8.97 $7.08
Management 3,848 3,621 227 $11.97 $11.95 $12.29
Business and Financial Operations 1,203 1,064 139 $10.36 $10.62 $8.32
Computer and Mathematical 114 107 7 $11.83 $11.80 $12.29
Architecture and Engineering 141 137 4 $11.00 $11.10 $7.50
Life Physical and Social Science 117 117 0 $11.72 $11.72 ...
Community and Social Service 191 180 11 $10.83 $11.02 $7.73
Legal 158 147 11 $23.42 $22.56 $35.00
Education Training and Library 998 832 166 $13.04 $14.29 $6.79
Arts Design Entertainment Sports and Media 377 284 93 $9.39 $9.88 $7.89
Healthcare Practitioners and Technical 673 612 61 $22.68 $23.41 $15.36
Healthcare Support 461 397 64 $7.34 $7.46 $6.59
Protective Service 1,182 1,134 48 $7.53 $7.66 $4.31
Food Preparation and Serving Related 2,092 1,652 440 $6.23 $6.27 $6.05
Building and Grounds Cleaning and Maintenance 1,511 1,129 382 $6.14 $6.17 $6.06
Personal Care and Service 1,055 802 253 $6.50 $6.54 $6.39
Sales and Related 2,810 2,079 731 $6.43 $6.41 $6.49
Office and Administrative Support 3,189 2,784 405 $7.80 $7.98 $6.56
Farming Fishing and Forestry 425 416 9 $6.39 $6.39 $6.00
Construction and Extraction 1,259 1,150 109 $6.73 $6.77 $6.24
Installation Maintenance and Repair 1,512 1,325 187 $7.31 $7.49 $6.10
Production 1,132 1,058 74 $6.36 $6.38 $6.07
Transportation and Material Moving 1,210 1,072 138 $7.64 $7.77 $6.66
Source: 2014 CNMI Prevailing Wage and Workforce Assessment Study
Table 5.22 Average Hourly Wages by Occupation, Sex, and Employment Status, CNMI: 2014
Occupation
Total Full time Part time
Total Male Female Total Male Female Total Male Female
Total $8.71 $8.79 $8.61 $8.97 $8.99 $8.95 $7.08 $7.10 $7.07
Management $11.97 $12.22 $11.58 $11.95 $12.19 $11.56 $12.29 $12.61 $11.88
Business and Financial Operations $10.36 $10.87 $10.13 $10.62 $11.35 $10.31 $8.32 $8.00 $8.52
Computer and Mathematical $11.83 $12.65 $9.08 $11.80 $12.60 $9.20 $12.29 $13.33 $6.00
Architecture and Engineering $11.00 $10.87 $13.67 $11.10 $10.98 $13.67 $7.50 $7.50 ...
Life Physical and Social Science $11.72 $10.60 $14.69 $11.72 $10.60 $14.69 ... ... ...
Community and Social Service $10.83 $9.44 $11.80 $11.02 $9.44 $12.26 $7.73 ... $7.73
Legal $23.42 $24.88 $20.08 $22.56 $23.62 $20.30 $35.00 $37.50 $10.00
Education Training and Library $13.04 $14.35 $12.45 $14.29 $14.69 $14.06 $6.79 $7.07 $6.76
Arts Design Entertainment Sports and Media $9.39 $8.38 $10.64 $9.88 $9.78 $9.99 $7.89 $5.06 $13.55
Healthcare Practitioners and Technical $22.68 $30.23 $18.58 $23.41 $30.89 $19.04 $15.36 $16.55 $15.10
Healthcare Support $7.34 $8.69 $7.09 $7.46 $9.11 $7.15 $6.59 $6.10 $6.70
Protective Service $7.53 $7.44 $8.36 $7.66 $7.59 $8.36 $4.31 $4.31 ...
Food Preparation and Serving Related $6.23 $6.35 $6.12 $6.27 $6.43 $6.13 $6.05 $6.02 $6.08
Building and Grounds Cleaning and Maintenance $6.14 $6.20 $6.09 $6.17 $6.22 $6.10 $6.06 $6.06 $6.06
Personal Care and Service $6.50 $6.49 $6.50 $6.54 $6.57 $6.51 $6.39 $6.19 $6.50
Sales and Related $6.43 $6.52 $6.40 $6.41 $6.56 $6.35 $6.49 $6.36 $6.52
Office and Administrative Support $7.80 $7.60 $7.92 $7.98 $7.79 $8.09 $6.56 $6.46 $6.64
Farming Fishing and Forestry $6.39 $6.30 $7.69 $6.39 $6.31 $7.83 $6.00 $6.00 $6.00
Construction and Extraction $6.73 $6.74 $6.53 $6.77 $6.79 $6.60 $6.24 $6.26 $6.13
Installation Maintenance and Repair $7.31 $7.29 $7.58 $7.49 $7.39 $9.37 $6.10 $6.36 $5.45
Production $6.36 $6.48 $6.15 $6.38 $6.50 $6.16 $6.07 $6.08 $6.06
Transportation and Material Moving $7.64 $7.69 $7.04 $7.77 $7.82 $7.03 $6.66 $6.55 $7.07
Source: 2014 CNMI Prevailing Wage and Workforce Assessment Study
$8.71 $8.79$8.61
$8.97 $8.99 $8.95
$7.08 $7.10 $7.07
$6.00
$6.50
$7.00
$7.50
$8.00
$8.50
$9.00
$9.50
Total Males Females
Average Hourly Wages by Sex and Full- or Part-time
Employment: 2014
Total Full-time Part-time
$11.97
$7.80
$6.43
$6.23
$7.31
$6.14
$- $6.00 $12.00
Management
Office and Administrative
Support
Sales and Related
Food Preparation and Serving
Related
Installation Maintenance and
Repair
Building and Grounds Cleaning
and Maintenance
Average Hourly Wage for Largest Occupations,
CNMI: 2014

Page 80 Chapter 5 2015 CNMI Statistical Yearbook
11th Statistical Yearbook, Central Statistics Division, Department of Commerce
Table 5.23 Average Hourly Wages by Occupation and Age, CNMI: 2014
Occupation
Numbers Average Hourly Wage
Total < 30 yrs. 30-49 yrs. 50+ yrs. Total < 30 yrs. 30-49 yrs. 50+ yrs.
Total 25,658 3,344 14,457 7,857 $8.71 $7.42 $8.54 $9.57
Management 3,848 168 1,961 1,719 $11.97 $8.98 $12.06 $12.17
Business and Financial Operations 1,203 135 632 436 $10.36 $9.19 $10.20 $10.95
Computer and Mathematical 114 24 58 32 $11.83 $9.13 $13.24 $11.31
Architecture and Engineering 141 23 70 48 $11.00 $10.57 $9.99 $12.69
Life Physical and Social Science 117 18 65 34 $11.72 $12.06 $12.51 $10.03
Community and Social Service 191 31 114 46 $10.83 $9.29 $10.87 $11.76
Legal 158 11 66 81 $23.42 $20.09 $27.74 $20.36
Education Training and Library 998 232 574 192 $13.04 $10.99 $12.68 $16.60
Arts Design Entertainment Sports and Media 377 60 233 84 $9.39 $5.52 $9.37 $12.21
Healthcare Practitioners and Technical 673 84 396 193 $22.68 $10.89 $20.27 $32.78
Healthcare Support 461 75 311 75 $7.34 $6.85 $7.13 $8.69
Protective Service 1,182 293 641 248 $7.53 $6.62 $8.00 $7.35
Food Preparation and Serving Related 2,092 319 1,135 638 $6.23 $6.05 $6.23 $6.30
Building and Grounds Cleaning and Maintenance 1,511 86 781 644 $6.14 $6.07 $6.08 $6.23
Personal Care and Service 1,055 65 747 243 $6.50 $6.32 $6.57 $6.33
Sales and Related 2,810 524 1,876 410 $6.43 $6.55 $6.36 $6.59
Office and Administrative Support 3,189 805 1,629 755 $7.80 $6.93 $7.79 $8.75
Farming Fishing and Forestry 425 23 264 138 $6.39 $6.13 $6.47 $6.28
Construction and Extraction 1,259 32 671 556 $6.73 $7.19 $6.63 $6.82
Installation Maintenance and Repair 1,512 103 889 520 $7.31 $8.17 $7.21 $7.32
Production 1,132 94 626 412 $6.36 $6.40 $6.23 $6.54
Transportation and Material Moving 1,210 139 718 353 $7.64 $6.78 $7.45 $8.38
Source: 2014 CNMI Prevailing Wage and Workforce Assessment Study
Table 5.24 Average Hourly Wages by Occupation and Detailed Age Group, CNMI: 2014
Occupation Total 15-24 25-34 35-44 45-54 55-64 65+
Total $8.71 $6.63 $8.39 $8.64 $8.52 $10.02 $14.20
Management $11.97 $7.27 $11.08 $11.97 $11.71 $12.29 $15.81
Business and Financial Operations $10.36 $7.70 $9.94 $10.66 $10.58 $11.29 $8.15
Computer and Mathematical $11.83 $9.50 $9.97 $13.61 $12.62 $10.75 …
Architecture and Engineering $11.00 $7.08 $13.50 $8.94 $12.38 $12.88 $25.50
Life Physical and Social Science $11.72 $9.50 $11.17 $13.34 $14.05 $8.95 $10.60
Community and Social Service $10.83 $7.40 $9.62 $11.56 $11.52 $12.22 $7.00
Legal $23.42 $15.50 $26.59 $25.97 $15.64 $24.69 $48.40
Education Training and Library $13.04 $9.01 $12.44 $12.60 $14.18 $15.84 $22.75
Arts Design Entertainment Sports and Media $9.39 $4.85 $6.41 $9.05 $15.27 $10.40 $17.00
Healthcare Practitioners and Technical $22.68 $8.79 $15.10 $21.35 $22.96 $33.08 $44.42
Healthcare Support $7.34 $6.71 $6.72 $7.44 $7.88 $11.13 $6.10
Protective Service $7.53 $6.01 $7.32 $8.03 $7.96 $7.56 $6.92
Food Preparation and Serving Related $6.23 $6.02 $6.16 $6.23 $6.28 $6.40 $5.65
Building and Grounds Cleaning and Maintenance $6.14 $6.05 $5.94 $6.18 $6.10 $6.24 $7.55
Personal Care and Service $6.50 $6.89 $6.52 $6.69 $6.35 $6.10 $7.77
Sales and Related $6.43 $6.46 $6.50 $6.32 $6.46 $6.64 $6.57
Office and Administrative Support $7.80 $6.57 $7.51 $7.62 $8.33 $8.81 $10.76
Farming Fishing and Forestry $6.39 $6.08 $6.46 $6.37 $6.40 $6.29 $14.00
Construction and Extraction $6.73 $6.21 $6.82 $6.48 $6.76 $6.94 $7.73
Installation Maintenance and Repair $7.31 $7.10 $8.42 $7.40 $6.91 $7.76 $8.31
Production $6.36 $6.18 $6.42 $6.16 $6.34 $6.82 $6.44
Transportation and Material Moving $7.64 $6.39 $6.91 $7.75 $7.49 $8.12 $20.81
Source: 2014 CNMI Prevailing Wage and Workforce Assessment Study
$8.71
$7.42
$8.54
$9.57
$0.00
$2.00
$4.00
$6.00
$8.00
$10.00
$12.00
Total < 30 yrs 30-49 yrs 50+ yrs
Average Hourly Wage by Age: 2014
$6.63
$8.39 $8.64 $8.52
$10.02
$14.20
$0.00
$2.00
$4.00
$6.00
$8.00
$10.00
$12.00
$14.00
$16.00
15-24 25-34 35-44 45-54 55-64 65+
Average Hourly Wage by Age Group, CNMI: 2014

2015 CNMI Statistical Yearbook Chapter 5 Page 81
11th Statistical Yearbook, Central Statistics Division, Department of Commerce
Table 5.25 Average Hourly Wages by Occupation and Ethnicity, CNMI: 2014
Occupation
Numbers Average Hourly Wages
Total
Chamorro/
Carolinian Filipino Others Total
Chamorro/
Carolinian Filipino Others
Total 25,658 4,211 12,101 9,346 $8.71 $9.54 $7.25 $10.23
Management 3,848 600 889 2,359 $11.97 $13.47 $10.80 $12.03
Business and Financial Operations 1,203 161 688 354 $10.36 $11.40 $9.40 $11.75
Computer and Mathematical 114 19 55 40 $11.83 $17.42 $8.80 $13.35
Architecture and Engineering 141 15 92 34 $11.00 $14.27 $8.85 $15.38
Life Physical and Social Science 117 11 14 92 $11.72 $11.64 $7.79 $12.33
Community and Social Service 191 34 7 150 $10.83 $13.97 $10.29 $10.13
Legal 158 20 31 107 $23.42 $14.80 $13.97 $27.78
Education Training and Library 998 432 257 309 $13.04 $14.37 $10.39 $13.39
Arts Design Entertainment Sports and Media 377 74 179 124 $9.39 $5.27 $6.73 $15.69
Healthcare Practitioners and Technical 673 111 298 264 $22.68 $18.45 $14.26 $33.97
Healthcare Support 461 53 134 274 $7.34 $9.30 $7.26 $6.99
Protective Service 1,182 275 236 671 $7.53 $7.43 $5.88 $8.14
Food Preparation and Serving Related 2,092 205 1,227 660 $6.23 $6.30 $6.15 $6.34
Building and Grounds Cleaning and Maintenance 1,511 117 1,207 187 $6.14 $6.85 $6.02 $6.49
Personal Care and Service 1,055 64 647 344 $6.50 $6.61 $6.26 $6.93
Sales and Related 2,810 516 1,296 998 $6.43 $6.32 $6.36 $6.58
Office and Administrative Support 3,189 800 1,240 1,149 $7.80 $7.76 $7.07 $8.62
Farming Fishing and Forestry 425 52 278 95 $6.39 $6.10 $5.97 $7.76
Construction and Extraction 1,259 50 965 244 $6.73 $7.34 $6.51 $7.47
Installation Maintenance and Repair 1,512 140 988 384 $7.31 $9.00 $6.47 $8.88
Production 1,132 54 848 230 $6.36 $6.30 $6.34 $6.44
Transportation and Material Moving 1,210 408 525 277 $7.64 $8.25 $6.98 $7.99
Source: 2014 CNMI Prevailing Wage and Workforce Assessment Study
Table 5.26 Average Hourly Wages by Occupation and Educational Attainment, CNMI: 2014
Occupation
Numbers Average Hourly Wage
Total
High school
or less
College thru
Associates
BA/BS or
more Total
High school
or less
College thru
Associates
BA/BS or
more
Total 25,658 14,050 6,415 5,193 $8.71 $7.96 $8.80 $10.61
Management 3,848 1,310 1,009 1,529 $11.97 $11.31 $12.17 $12.40
Business and Financial Operations 1,203 337 321 545 $10.36 $11.55 $9.06 $10.38
Computer and Mathematical 114 37 44 33 $11.83 $14.30 $9.55 $12.09
Architecture and Engineering 141 39 27 75 $11.00 $11.64 $12.15 $10.25
Life Physical and Social Science 117 17 57 43 $11.72 $12.06 $12.96 $9.95
Community and Social Service 191 89 69 33 $10.83 $11.49 $10.07 $10.64
Legal 158 49 28 81 $23.42 $29.10 $22.50 $20.31
Education Training and Library 998 615 167 216 $13.04 $15.34 $6.67 $11.44
Arts Design Entertainment Sports
and Media 377 175 97 105 $9.39 $9.01 $9.39 $10.03
Healthcare Practitioners and Tech-
nical 673 148 351 174 $22.68 $25.97 $19.96 $25.40
Healthcare Support 461 236 113 112 $7.34 $6.75 $8.19 $7.72
Protective Service 1,182 840 115 227 $7.53 $7.09 $6.82 $9.50
Food Preparation and Serving Re-
lated 2,092 1,435 535 122 $6.23 $6.12 $6.42 $6.61
Building and Grounds Cleaning and
Maintenance 1,511 1,224 206 81 $6.14 $6.12 $6.10 $6.64
Personal Care and Service 1,055 607 311 137 $6.50 $6.42 $6.23 $7.50
Sales and Related 2,810 1,737 785 288 $6.43 $6.42 $6.37 $6.61
Office and Administrative Support 3,189 1,424 925 840 $7.80 $7.79 $7.46 $8.18
Farming Fishing and Forestry 425 375 25 25 $6.39 $6.14 $7.80 $8.68
Construction and Extraction 1,259 822 310 127 $6.73 $6.38 $6.95 $8.47
Installation Maintenance and Repair 1,512 946 352 214 $7.31 $7.08 $6.92 $9.00
Production 1,132 775 264 93 $6.36 $6.11 $6.48 $8.09
Transportation and Material Moving 1,210 813 304 93 $7.64 $7.08 $8.78 $8.88
Source: 2014 CNMI Prevailing Wage and Workforce Assessment Study
$8.71
$7.96
$8.80
$10.61
$0.00 $3.00 $6.00 $9.00 $12.00
Total
High school or less
College thru Asso
BA/BS or more
Average Hourly Wage by Educational Attainment:
2014
$8.71
$9.54
$7.25
$10.23
$0.00
$2.00
$4.00
$6.00
$8.00
$10.00
$12.00
Total Chamorro /
Carolinian
Filipino Others
Average Hourly wage by Ethnicity: 2014

Page 82 Chapter 5 2015 CNMI Statistical Yearbook
11th Statistical Yearbook, Central Statistics Division, Department of Commerce
Table 5.27 Average Hourly Wages by Occupation and Citizenship, CNMI: 2014
Occupation
Numbers Average Hourly Wage
Total U.S. citizen
Non-U.S.
Citizen Total U.S. citizen
Non-U.S.
Citizen
Total 25,658 8,808 16,850 $8.71 $10.94 $7.54
Management 3,848 1,330 2,518 $11.97 $15.40 $10.16
Business and Financial Operations 1,203 521 682 $10.36 $11.50 $9.48
Computer and Mathematical 114 58 56 $11.83 $14.66 $8.91
Architecture and Engineering 141 53 88 $11.00 $13.36 $9.57
Life Physical and Social Science 117 91 26 $11.72 $12.13 $10.27
Community and Social Service 191 158 33 $10.83 $11.18 $9.09
Legal 158 118 40 $23.42 $25.38 $17.65
Education Training and Library 998 657 341 $13.04 $15.07 $9.13
Arts Design Entertainment Sports and Media 377 107 270 $9.39 $7.45 $10.16
Healthcare Practitioners and Technical 673 296 377 $22.68 $29.40 $17.41
Healthcare Support 461 105 356 $7.34 $9.44 $6.72
Protective Service 1,182 724 458 $7.53 $8.49 $6.00
Food Preparation and Serving Related 2,092 410 1,682 $6.23 $6.34 $6.20
Building and Grounds Cleaning and Maintenance 1,511 193 1,318 $6.14 $6.93 $6.03
Personal Care and Service 1,055 121 934 $6.50 $7.95 $6.31
Sales and Related 2,810 941 1,869 $6.43 $6.40 $6.44
Office and Administrative Support 3,189 1,625 1,564 $7.80 $8.33 $7.25
Farming Fishing and Forestry 425 102 323 $6.39 $7.52 $6.03
Construction and Extraction 1,259 168 1,091 $6.73 $8.30 $6.49
Installation Maintenance and Repair 1,512 384 1,128 $7.31 $9.66 $6.51
Production 1,132 109 1,023 $6.36 $6.67 $6.32
Transportation and Material Moving 1,210 537 673 $7.64 $8.98 $6.58
Source: 2014 CNMI Prevailing Wage and Workforce Assessment Study
Table 5.28 SOC by US-Non Citizen and Sex, US-Non Citizen and Sex
Occupation
Total US citizen Non US citizen
Total Male Female Total Male Female Total Male Female
Total 25,658 13,996 11,662 8,808 4,959 3,849 16,850 9,037 7,813
Management 3,848 2,350 1,498 1,330 833 497 2,518 1,517 1,001
Business and Financial Opera-
tions 1,203 374 829 521 173 348 682 201 481
Computer and Mathematical 114 88 26 58 51 7 56 37 19
Architecture and Engineering 141 135 6 53 49 4 88 86 2
Life Physical and Social Science 117 85 32 91 65 26 26 20 6
Community and Social Service 191 79 112 158 73 85 33 6 27
Legal 158 110 48 118 84 34 40 26 14
Education Training and Library 998 313 685 657 226 431 341 87 254
Arts Design Entertainment
Sports and Media 377 208 169 107 66 41 270 142 128
Healthcare Practitioners and
Technical 673 237 436 296 117 179 377 120 257
Healthcare Support 461 71 390 105 24 81 356 47 309
Protective Service 1,182 1,077 105 724 643 81 458 434 24
Food Preparation and Serving
Related 2,092 978 1,114 410 219 191 1,682 759 923
Building and Grounds Cleaning
and Maintenance 1,511 776 735 193 157 36 1,318 619 699
Personal Care and Service 1,055 425 630 121 99 22 934 326 608
Sales and Related 2,810 690 2,120 941 240 701 1,869 450 1,419
Office and Administrative Sup-
port 3,189 1,226 1,963 1,625 671 954 1,564 555 1,009
Farming Fishing and Forestry 425 399 26 102 91 11 323 308 15
Construction and Extraction 1,259 1,166 93 168 150 18 1,091 1,016 75
Installation Maintenance and
Repair 1,512 1,392 120 384 348 36 1,128 1,044 84
Production 1,132 704 428 109 83 26 1,023 621 402
Transportation and Material
Moving 1,210 1,113 97 537 497 40 673 616 57
Source: 2014 CNMI Prevailing Wage and Workforce Assessment Study
$8.71
$10.94
$7.54
$0.00
$2.00
$4.00
$6.00
$8.00
$10.00
$12.00
Total U.S. citizen Non-U.S. Citizen
Average Hourly Wage by Citizenship: 2014
$8.71 $8.79 $8.61
$10.94 $11.01 $10.84
$7.54 $7.57 $7.51
$0.00
$2.00
$4.00
$6.00
$8.00
$10.00
$12.00
Total Males Females
Average Hourly Wage by Citizenship and Sex: 2014
Total U.S. Citizen Non-U.S. Citizen

2015 CNMI Statistical Yearbook Chapter 5 Page 83
11th Statistical Yearbook, Central Statistics Division, Department of Commerce
Table 5.29 Average Hourly Wages by Occupation and Sector, CNMI: 2014
Occupation
Numbers Average Hourly Wage
Total Private Public Total Private Public
Total 25,658 21,643 4,015 $8.71 $7.57 $14.82
Management 3,848 3,420 428 $11.97 $10.92 $20.32
Business and Financial Operations 1,203 967 236 $10.36 $9.57 $13.59
Computer and Mathematical 114 76 38 $11.83 $10.04 $15.42
Architecture and Engineering 141 102 39 $11.00 $8.77 $16.82
Life Physical and Social Science 117 12 105 $11.72 $7.75 $12.17
Community and Social Service 191 14 177 $10.83 $9.36 $10.94
Legal 158 83 75 $23.42 $18.83 $28.51
Education Training and Library 998 375 623 $13.04 $7.08 $16.63
Arts Design Entertainment Sports and Media 377 336 41 $9.39 $8.98 $12.78
Healthcare Practitioners and Technical 673 240 433 $22.68 $16.67 $26.02
Healthcare Support 461 373 88 $7.34 $6.86 $9.39
Protective Service 1,182 683 499 $7.53 $5.80 $9.89
Food Preparation and Serving Related 2,092 2,069 23 $6.23 $6.21 $7.22
Building and Grounds Cleaning and Maintenance 1,511 1,449 62 $6.14 $6.00 $9.37
Personal Care and Service 1,055 1,029 26 $6.50 $6.31 $13.92
Sales and Related 2,810 2,809 1 $6.43 $6.43 $14.00
Office and Administrative Support 3,189 2,559 630 $7.80 $7.05 $10.86
Farming Fishing and Forestry 425 382 43 $6.39 $6.02 $9.63
Construction and Extraction 1,259 1,143 116 $6.73 $6.41 $9.90
Installation Maintenance and Repair 1,512 1,262 250 $7.31 $6.62 $10.84
Production 1,132 1,120 12 $6.36 $6.30 $11.42
Transportation and Material Moving 1,210 1,140 70 $7.64 $7.48 $10.31
Source: 2014 CNMI Prevailing Wage and Workforce Assessment Study
Table 5.30 Average Hourly Wages by Occupation, Sex, and Sector, CNMI: 2014
Occupation
Total Private Public
Total Male Female Total Male Female Total Male Female
Total $8.71 $8.79 $8.61 $7.57 $7.72 $7.40 $14.82 $14.66 $15.01
Management $11.97 $12.22 $11.58 $10.92 $11.32 $10.27 $20.32 $20.82 $19.79
Business and Financial Op-
erations $10.36 $10.87 $10.13 $9.57 $9.86 $9.44 $13.59 $14.29 $13.19
Computer and Mathematical $11.83 $12.65 $9.08 $10.04 $11.07 $7.00 $15.42 $15.55 $14.71
Architecture and Engineer-
ing $11.00 $10.87 $13.67 $8.77 $8.80 $8.00 $16.82 $16.61 $19.33
Life Physical and Social Sci-
ence $11.72 $10.60 $14.69 $7.75 $7.64 $10.00 $12.17 $11.04 $14.84
Community and Social Ser-
vice $10.83 $9.44 $11.80 $9.36 ... $9.36 $10.94 $9.44 $12.15
Legal $23.42 $24.88 $20.08 $18.83 $19.09 $17.75 $28.51 $33.91 $21.25
Education Training and Li-
brary $13.04 $14.35 $12.45 $7.08 $8.41 $6.71 $16.63 $16.45 $16.73
Arts Design Entertainment
Sports and Media $9.39 $8.38 $10.64 $8.98 $7.66 $10.66 $12.78 $15.47 $10.50
Healthcare Practitioners and
Technical $22.68 $30.23 $18.58 $16.67 $20.43 $14.38 $26.02 $36.34 $20.77
Healthcare Support $7.34 $8.69 $7.09 $6.86 $8.07 $6.69 $9.39 $9.84 $9.21
Protective Service $7.53 $7.44 $8.36 $5.80 $5.78 $6.17 $9.89 $10.01 $9.20
Food Preparation and Serv-
ing Related $6.23 $6.35 $6.12 $6.21 $6.35 $6.10 $7.22 $6.70 $7.69
Building and Grounds
Cleaning and Mainte-
nance $6.14 $6.20 $6.09 $6.00 $6.00 $6.01 $9.37 $9.28 $9.63
Personal Care and Service $6.50 $6.49 $6.50 $6.31 $6.18 $6.40 $13.92 $13.16 $16.00
Sales and Related $6.43 $6.52 $6.40 $6.43 $6.52 $6.40 $14.00 ... $14.00
Office and Administrative
Support $7.80 $7.60 $7.92 $7.05 $6.90 $7.14 $10.86 $10.83 $10.87
Farming Fishing and For-
estry $6.39 $6.30 $7.69 $6.02 $6.02 $6.06 $9.63 $9.42 $10.30
Construction and Extraction $6.73 $6.74 $6.53 $6.41 $6.41 $6.35 $9.90 $9.81 $14.50
Installation Maintenance and
Repair $7.31 $7.29 $7.58 $6.62 $6.57 $7.18 $10.84 $10.86 $10.33
Production $6.36 $6.48 $6.15 $6.30 $6.45 $6.06 $11.42 $12.25 $11.00
Transportation and Material
Moving $7.64 $7.69 $7.04 $7.48 $7.54 $6.73 $10.31 $10.34 $10.11
Source: 2014 CNMI Prevailing Wage and Workforce Assessment Study
$8.71
$7.57
$14.82
$0.00
$2.00
$4.00
$6.00
$8.00
$10.00
$12.00
$14.00
$16.00
Total Private Public
Average Hourly Wages by Sector: 2014
$8.71 $8.79 $8.61
$7.57 $7.72 $7.40
$14.82 $14.66 $15.01
$0.00
$2.00
$4.00
$6.00
$8.00
$10.00
$12.00
$14.00
$16.00
Total Males Females
Average Hourly Wage by Sector and Sex: 2014
Total Private Public

11th Statistical Yearbook, Central Statistics Division, Department of Commerce
CHAPTER 6
Public Safety

2015 CNMI Statistical Yearbook Chapter 6 Page 85
11th Statistical Yearbook, Central Statistics Division, Department of Commerce
Chapter 6 – Public Safety
The Department of Public Safety and Division of Youth Services provide data for the yearbook on public
safety. Some of the agencies are Criminal Justice Information System, Criminal Justice Planning Agency,
and Division of Highway Safety. They have not provided any recent statistics, so only previous statistics are
included here.

Page 86 Chapter 6 2015 CNMI Statistical Yearbook
11th Statistical Yearbook, Central Statistics Division, Department of Commerce
Table 6.1 Type and Number of Juvenile Arrests, CNMI: 1998 to 2004
Type of Arrest 2004 2003 2002 2001 2000 1999 1998 1997 1996 1995
Total 151 318 622 567 258 312 298 517 363 279
Homicide 2 0 0 0 0 3 0 2 0
Robbery 5 1 8 4 2 11 2 5 5 4
Assault & battery/with dangerous weapon 9 35 36 55 39 24 16 73 47 65
Burglary 3 11 14 49 7 20 18 38 32 21
Theft 21 24 66 76 33 50 61 50 31 32
Auto theft 6 5 11 6 1 3 7 23 21 4
Arson 0 … 0 4 1 4 1 0 0 0
Disturbing the peace 24 31 27 43 25 18 37 40 16 23
Criminal mischief 19 14 34 17 12 18 17 21 29 22
Commercial Offense, Possession, Manufacture 11 1 62 58 40 64 24 25 21 23
& Trafficking of Controlled Substance 0
Possession of firearms 0 … 0 1 0 2 0 0 1 0
Criminal trespass 0 2 13 0 4 2 8 3 0 9
Other 88 115 17 13 27 70 28 26
Traffic 3 8 5 14 9 5 4 7 7
Truancy 15 2 36 73 4 14 8 5 3 3
Liquor consumption 52 61 110 32 41 28 71 84 28
Curfew violations 36 40 117 50 19 17 34 75 24 11
Tobacco 9 10 7 8 2 1 14 6 1
Runaway 0 … 4 9 0 0 1 0 6 0
Source: Department of Youth Services (DCCA)
Note: Table will be updated when data become available
Table 6.2 Type and Number of Juvenile Arrests, CNMI: CY 1995 to CY 2002
Type of Arrest
Year
2004 2003 2002 2001 2002 2001 2000 1999 1998 1997 1996 1995
Total 53 41 257 312 298 517 363 279
Homicide … … 0 0 3 0 2 0
Robbery … … 2 11 2 5 5 4
Assault & battery/with dangerous weapon 7 3 38 24 16 73 47 65
Burglary 3 4 7 20 18 38 32 21
Theft 6 1 33 50 61 50 31 32
Auto theft 1 … 1 3 7 23 21 4
Arson … … 1 4 1 0 0 0
Disturbing the peace 4 9 25 18 37 40 16 23
Criminal mischief 2 … 12 18 17 21 29 22
Commercial Offense, Possession, Manufacture &
Trafficking of Controlled Substance 3 1 40 64 24 25 21 23
Possession of firearms … … 0 2 0 0 1 0
Criminal trespass … … 4 2 8 3 0 9
Other 13 5 17 13 27 70 28 26
Traffic 2 4 14 9 5 4 7 7
Truancy … … 4 14 8 5 3 3
Liquor consumption 12 9 32 41 28 71 84 28
Curfew violations … 4 19 17 34 75 24 11
Tobacco … 1 8 2 1 14 6 1
Runaway … … 0 0 1 0 6 0
Source: Department of Public Safety, Criminal Justice Information Systems
Note: "…" means data not available

2015 CNMI Statistical Yearbook Chapter 6 Page 87
11th Statistical Yearbook, Central Statistics Division, Department of Commerce
Table 6.2 Number of Violent and Property Crimes of Juvenile Offenses, CNMI: 1986 to 2004
Year Total
Type of Offense
Homicide Rape Robbery
Assault and
Battery Burglary Larceny Auto Theft Arson
2004 48 0 0 5 34 3 0 6 0
2003 46 … … 1 29 11 … 5 …
2000 82 0 0 2 38 7 33 1 1
1999 112 0 0 11 24 20 50 3 4
1998 109 3 1 2 16 18 61 7 1
1997 197 0 0 5 71 38 60 23 0
1996 138 2 0 5 47 32 31 21 0
1995 126 0 0 4 65 21 32 4 0
1994 139 0 0 6 69 23 34 6 1
1993 109 0 0 3 45 29 24 8 0
1992 130 2 0 1 49 39 28 11 0
1991 164 0 0 14 49 55 31 15 0
1990 67 0 0 0 34 11 19 3 0
1989 165 0 1 2 46 52 44 18 2
1988 201 0 1 1 16 132 39 11 1
1987 151 1 0 0 29 75 35 11 0
1986 163 1 0 0 43 44 48 26 1
Source: Department of Public Safety, Criminal Justice Information System
Note: No compiled figures for 2001 and 2002
Note: Table will be updated when data become available
Table 6.3 Number of Traffic Accidents by Month, CNMI: CY 1995 to CY 2004
Month
Year
2004 2002 2001 1999 1998 1997 1996 1995
Total 2,203 2,507 2,561 2,491 2,544 1,235 2,249 2,150
January 160 222 234 204 234 97 200 191
February 173 227 190 260 240 116 167 159
March 214 168 227 268 223 133 141 165
April 171 158 189 244 204 109 115 207
May 162 181 200 176 319 151 216 189
June 189 196 218 194 248 93 166 145
July 199 192 209 168 271 109 173 236
August 165 184 215 194 145 73 135 125
September 178 217 222 201 141 123 203 135
October 200 253 235 239 93 129 219 211
November 198 223 209 181 153 14 251 224
December 194 286 213 162 273 88 263 163
Source: Department of Public Safety, Criminal Justice Planning Agency
Note: No compiled figures for 2000 and 2003
Note: Table will be updated when data become available

Page 88 Chapter 6 2015 CNMI Statistical Yearbook
11th Statistical Yearbook, Central Statistics Division, Department of Commerce
Table 6.4 Driving Under the Influence (DUI) Arrests by Ethnicity and Sex, Saipan: 2000 to 2004
Ethnicity
2004 2003 2002 2001 2000
Total Male Female Total Male Female Total Male Female Total Male Female Total Male Female
Total 311 298 13 296 283 13 474 408 18 463 454 9 375 363 12
American/Caucasian 6 5 1 13 13 0 12 12 0 8 8 0 9 9 0
Bangladeshi 4 4 0 8 8 0 5 5 0 7 7 0 8 8 0
Carolinian 23 21 2 19 14 5 31 28 3 24 24 0 21 17 4
Chamorro 63 60 3 63 61 2 102 94 8 96 94 2 64 61 3
Chinese 32 32 0 24 23 1 21 21 0 32 31 1 26 26 0
Chuukese 20 18 2 21 21 0 26 25 1 25 25 0 30 30 0
Filipino 90 90 0 77 74 3 117 114 3 144 144 0 118 117 1
Japanese 8 7 1 4 4 0 2 2 0 16 13 3 12 10 2
Korean 19 17 2 30 29 1 30 29 1 51 50 1 22 22 0
Marshallese 0 0 0 0 0 0 1 1 0 1 1 0 0 0 0
Nepalese 2 2 0 0 0 0 2 2 0 2 2 0 1 1 0
Palauan 26 24 2 20 20 0 23 23 0 38 36 2 52 50 2
Pohnpeian 6 6 0 8 8 0 11 11 0 8 8 0 6 6 0
Polynesian 3 3 0 0 … … 0 … … … … … 1 1 0
Thai 5 5 0 4 3 1 4 2 2 2 2 0 3 3 0
Yapese 3 3 0 4 4 0 3 3 0 5 5 0 2 2 0
All Others 1 1 0 1 1 0 84 36 0 4 4 0 … … …
Source: Department of Public Safety, Division of Highway Safety
Note: "…" means data not available
Note: Table will be updated when data become available
Table 6.5 DUI Arrests by Ethnicity and Month, Saipan: CY 2004
Ethnicity Total
Month
Jan Feb Mar Apr May Jun Jul Aug Sep Oct Nov Dec
Total 311 35 36 26 22 18 26 30 25 25 27 18 30
American/Caucasian 6 1 0 0 0 0 0 1 0 2 2 0 0
Bangladeshi 4 0 1 1 0 1 0 1 0 0 0 0 0
Carolinian 23 3 5 1 0 0 1 0 1 1 2 5 4
Chamorro 63 9 6 3 4 4 7 3 3 7 8 4 5
Chinese 32 2 4 3 5 2 2 1 3 3 3 0 4
Chuukese 20 1 3 0 1 3 2 2 3 0 1 2 2
Filipino 90 11 8 13 4 5 8 7 5 6 5 4 14
Japanese 8 0 1 1 1 1 1 1 0 1 0 0 1
Korean 19 4 3 1 1 1 0 1 5 1 1 1 0
Marshallese 0 0 0 0 0 0 0 0 0 0 0 0 0
Nepal 2 1 1 0 0 0 0 0 0 0 0 0 0
Palauan 26 3 4 1 4 0 4 1 6 1 2 0 0
Pohnpeian 6 0 0 0 1 0 0 0 2 0 2 1 0
Polynesian 3 0 0 0 0 1 0 0 0 1 0 1 0
Thailand 5 0 0 1 1 0 1 0 1 1 0 0 0
Yapese 3 0 0 1 0 0 0 0 1 0 1 0 0
All Others 1 0 0 0 0 0 0 0 0 1 0 0 0
Source: Department of Public Safety, Division of Highway Safety
Note: "…" means data not available
Note: Table will be updated when data become available

2015 CNMI Statistical Yearbook Chapter 6 Page 89
11th Statistical Yearbook, Central Statistics Division, Department of Commerce
Table 6.5 DUI Arrests by Ethnicity and Month, Saipan: CY 2002
Ethnicity Total
Month
Jan Feb Mar Apr May Jun Jul Aug Sep Oct Nov Dec
Total 474 27 25 32 13 28 47 24 40 37 36 43 43
American/Caucasian 12 2 0 2 1 1 1 2 0 1 1 1 0
Bangladeshi 5 0 0 1 0 0 0 1 0 1 1 1 0
Carolinian 31 2 2 2 0 3 4 2 2 4 4 3 3
Chamorro 102 1 5 8 2 5 14 12 13 13 13 8 8
Chinese 21 3 2 1 0 0 2 1 0 3 2 2 5
Chuukese 26 5 2 0 1 3 3 2 0 2 2 3 3
Filipino 117 10 5 10 4 10 17 1 15 8 8 17 12
Japanese 2 0 0 1 0 0 0 1 0 0 0 0 0
Korean 30 3 5 3 5 1 2 1 3 1 1 2 3
Marshallese 1 0 0 0 0 1 0 0 0 0 0 0 0
Nepal 2 0 0 0 0 0 0 0 0 1 1 0 0
Palauan 23 0 1 3 0 1 3 1 2 2 2 4 4
Pohnpeian 11 1 1 1 0 1 1 0 2 1 1 1 1
Polynesian … … … … … … … … … … … … …
Thailand 4 0 0 0 0 1 0 0 1 0 0 1 1
Yapese 3 0 0 0 0 1 0 0 1 0 0 0 1
All Others 84 0 2 0 0 0 0 0 1 0 0 0 2
Source: Department of Public Safety, Division of Highway Safety
Note: "…" means data not available
Table 6.6 Selected Type of Offenses, Saipan: 1991 to 2004
Year Total
Type of Offense
Homicide Rape Robbery
Assault and
Battery Burglary Larceny Auto Theft Arson Others
2004 2,203 2 8 42 765 694 … 72 … 620
2003 2,719 … … 5 318 23 … 10 … 2363
2000 4,249 3 14 57 1,350 883 1,815 59 17 51
1999 4,469 2 4 58 1,291 1,011 2,037 56 10 …
1998 4,067 2 9 53 1,343 817 1,767 68 8 …
1997 4,282 3 8 25 1,485 868 1,772 108 13 …
1996 4,397 5 5 17 1,463 945 1,935 11 16 …
1995 4,337 10 11 17 1,585 1,250 1,411 42 11 …
1994 3,861 4 3 17 620 1,009 2,097 111 0 …
1993 2,368 5 4 23 661 735 859 76 0 5
1992 2,740 3 2 14 947 104 1,525 96 0 49
1991 2,058 0 5 31 743 460 713 99 0 7
Source: Department of Public Safety, Criminal Justice Information System
Note: No compiled figures 2001 and 2002
"…" means data not indicated
Note: Table will be updated when data become available

11th Statistical Yearbook, Central Statistics Division, Department of Commerce
CHAPTER 7
Elections

2015 CNMI Statistical Yearbook Chapter 7 Page 91
11th Statistical Yearbook, Central Statistics Division, Department of Commerce
Chapter 7 – Elections
The election commission supplies the yearbook with current information and trends in numbers of registered
voters and election results. They have supplied no current data, and so only previous data are shown here.

Page 92 Chapter 7 2015 CNMI Statistical Yearbook
11th Statistical Yearbook, Central Statistics Division, Department of Commerce
Table 7.1 Number of Registered Voters by Sex and Election District, CNMI: 1997, 1999, 2001 and 2002
Election District
Total Males Females
2003 2002 2001 1999 1997 2003 2002 1999 1997 2003 2002 1999 1997
All Registered Voters 11,987 16,637 15,792 14,329 13,384 6,016 8,528 7,412 6,918 6,908 8,109 6,917 6,466
District 1 4,666 6,464 5,986 5,358 4,946 2,330 3,277 2,754 2,537 2,336 3,187 2,604 2,409
San Antonio 923 914 858 831 481 460 434 442 398 397
San Vicente 3,409 3,191 2,904 2,753 1,718 1,479 1,400 1,691 1,425 1,353
Koblerville 1,063 960 891 1,362 522 444 703 541 447 659
Kagman 1,069 921 705 … 556 371 - 513 334 -
District 2 794 1,158 1,149 1,075 1,032 393 606 575 552 401 552 500 480
Chalan Kanoa … 1,149 1,075 771 … 575 403 … 500 368
Susupe … … ... 261 … … 149 … … 112
District 3 2,361 3,534 3,488 3,219 2,980 1,175 1,826 1,645 1,498 1,186 1,708 1,574 1,482
San Jose 1,018 980 955 895 497 494 441 521 461 454
Garapan 2,433 2,337 2,239 2,045 1,267 1,138 1,035 1,166 1,101 1,010
Northern Islands 83 171 25 40 62 13 22 21 12 18
District 4 1,887 2,689 2,561 2,336 2,235 937 1,369 1,199 1,166 950 1,320 1,137 1,069
Tanapag 694 665 617 589 340 321 318 354 296 271
San Roque 577 548 504 466 296 257 245 281 247 221
Capitol Hill 1,418 1,348 1,215 1,180 733 621 603 685 594 577
District 5 980 1,274 1,193 1,047 929 507 658 556 489 473 616 491 440
Tinian 1,274 1,193 1,047 929 658 556 489 616 491 440
District 6 1,299 1,518 1,415 1,294 1,262 674 792 683 676 625 726 611 586
Rota 1,518 1,415 1,294 1,262 792 683 676 726 611 586
Source: Election Commission
Note: Table will be updated when data become available
Table 7.2 Voters by Sex and by Election Districts, CNMI: 1997, 1999, 2001 and 2003
Election District
Total Males Females
2003 2002 2001 1999 1997 2003 2001 1999 1997 2003 2001 1999 1997
Total Voted 11,987 11,259 12,966 11,191 12,289 8,528 6,556 5,728 6,312 8,109 6,410 5,463 5,977
District 1 4,666 4,329 4,937 4,100 4,489 3,277 2,464 2,096 2,292 3,187 2,473 2,004 2,197
San Antonio … 737 674 769 481 384 363 401 442 353 311 368
San Vicente … 2,590 2,182 2,499 1,148 1,272 1,102 1,263 1,186 1,318 1,080 1,236
Koblerville … 836 695 1,221 522 402 345 628 541 434 350 593
Kagman … 774 549 - 513 406 286 - 556 368 263 -
District 2 794 763 939 868 966 488 461 512 451 407 454
Chalan Kanoa … 939 868 719 488 461 375 451 407 344
Susupe … … … 247 … … 137 … … 110
District 3 2,361 2,174 2,699 2,416 2,731 1,267 1,339 1,202 1,353 1,166 1,360 1,214 1,378
San Jose … 829 785 836 497 392 402 412 521 437 383 424
Garapan … 1,782 1,618 1,855 1,267 881 795 919 1,166 901 823 936
Northern Islands … 88 13 40 62 66 5 22 21 22 8 18
District 4 1,887 1,787 2,067 1,777 2,016 733 1,061 907 1,047 685 1,006 870 969
Tanapag … 596 517 545 340 302 263 294 354 294 254 251
San Roque … 461 420 434 296 239 217 228 281 222 203 206
Capitol Hill … 1,010 840 1,037 733 520 427 525 685 490 413 512
District 5 980 926 1,040 918 876 658 534 479 460 616 506 439 416
Tinian 1,040 918 876 658 534 479 460 616 506 439 416
District 6 1,299 1,280 1,284 1,112 1,211 792 670 583 648 726 614 529 563
Rota 1,284 1,112 1,211 792 670 583 648 726 614 529 563
Source: Election Commission
Note: Polling places indicate villages. Since 1999 some villages are combined to reflect only election district
Note: Total figures for 2002 were submitted by election district only, not by villages and not by gender in this category
Note: Table will be updated when data become available

2015 CNMI Statistical Yearbook Chapter 7 Page 93
11th Statistical Yearbook, Central Statistics Division, Department of Commerce
Table 7.3 Percent of Registered Voters Who Voted by Election District, CNMI: 1997, 1999 and 2001
Election District
All Voters Male Female
2001 1999 1997 1999 1997 1999 1997
All Districts 82.5 78.1 91.8 77.3 91.2 79.0 92.4
District 1 82.5 76.5 90.8 76.1 90.3 77.0 91.2
San Antonio 80.6 78.6 92.5 78.9 92.4 78.1 92.7
San Vicente 81.2 75.1 90.8 74.5 90.2 75.8 91.4
Koblerville 87.1 78.0 89.6 77.7 89.3 78.3 90.0
Kagman 84.0 77.9 … 77.1 … 78.7 …
District 2 81.7 80.7 93.6 80.2 92.8 81.4 94.6
Chalan Kanoa … 80.7 93.3 80.2 93.1 81.4 93.5
Susupe … … 94.6 … 91.9 … 98.2
District 3 79.2 75.1 91.6 73.1 90.3 77.1 93.0
San Jose 84.6 82.2 93.4 81.4 93.4 83.1 93.4
Garapan 76.3 72.3 79.1 69.9 88.8 74.8 92.7
Northern Is. 98.9 52.0 100.0 38.5 100.0 66.7 100.0
District 4 80.7 76.1 90.2 75.6 89.8 76.5 90.6
Tanapag 89.6 83.8 92.5 81.9 92.5 85.8 92.6
San Roque 84.1 83.3 93.1 84.4 93.1 82.2 93.2
Capitol Hill 74.9 69.1 87.9 68.8 87.1 69.5 88.7
District 5 87.2 87.7 94.3 86.2 94.1 89.4 94.5
Tinian 87.2 87.7 94.3 86.2 94.1 89.4 94.5
District 6 90.7 85.9 96.0 85.4 95.9 86.6 96.1
Rota 90.7 85.9 96.0 85.4 95.9 86.6 96.1
Source: Election Commission
Note: 2002 data not available in this category
Note: Polling places indicate villages. Since 1999 some villages are combined to reflect only
Note: "…" means data not available
Note: Table will be updated when data become available
Table 7.4 Voters by Election District, Age Group and Sex, CNMI: 2004
Election Dis-
trict All Ages
Age Group
18-22 23-27 28-32 33-37 38-42 43-47 48-52 53-57 58-62 63-67 68+
All Voters 11,987 930 1,476 1,464 1,496 1,346 1,307 1,232 996 634 436 666
District 1 4,666 367 513 573 597 581 526 500 393 261 146 209
District 2 794 40 100 110 120 70 72 65 60 39 34 80
District 3 2,361 155 296 293 304 245 226 230 225 137 110 140
District 4 1,887 167 213 196 173 201 247 223 173 97 83 114
District 5 980 99 159 123 129 119 98 97 55 35 21 45
District 6 1,299 102 195 169 173 130 138 117 90 65 42 78
All Males 6,016 418 683 693 753 705 673 619 514 348 263 348
District 1 2,330 164 232 265 275 304 275 255 202 148 95 115
District 2 393 20 41 48 71 37 41 36 28 19 18 35
District 3 1,175 78 138 133 160 127 108 108 112 70 65 76
District 4 937 61 97 101 86 97 127 114 89 47 54 64
District 5 507 47 73 66 69 64 49 52 33 22 9 23
District 6 674 48 102 80 92 76 73 54 50 42 22 35
All Females 5,971 512 793 771 743 641 534 613 482 285 178 309
District 1 2,336 203 281 308 322 277 151 245 191 113 51 94
District 2 401 20 59 62 49 33 31 29 32 19 21 46
District 3 1,186 77 158 160 144 118 118 122 113 67 45 64
District 4 950 106 116 95 87 104 120 109 84 50 29 40
District 5 473 52 86 57 60 55 49 45 22 13 12 22
District 6 625 54 93 89 81 54 65 63 40 23 20 43
Source: Election Commission
Note: 2002 data not available in this category
Note: Table will be updated when data become available

Page 94 Chapter 7 2015 CNMI Statistical Yearbook
11th Statistical Yearbook, Central Statistics Division, Department of Commerce
Table 7.5 Registered Voters by Election District and Ethnicity, CNMI: 1999
Election District All Voters
Ethnicity
Chamorro Carolinian American Palauan Filipino Other
All voters 14,329 9,547 2,054 1,316 371 658 383
District 1 5,358 3,848 463 445 145 276 181
San Antonio 858 625 19 67 52 74 21
San Vicente 2,904 2,137 150 298 50 139 130
Koblerville 891 568 198 33 31 47 14
Kagman 705 518 96 47 12 16 16
District 2 1,075 741 126 53 47 87 21
Chalan Kanoa 1,075 741 126 53 47 87 21
District 3 3,219 1,454 1,100 298 109 176 82
San Jose 955 258 585 31 20 36 25
Garapan 2,239 1,195 491 267 89 140 57
North. Is. 25 1 24 0 0 0 0
District 4 2,336 1,409 353 388 60 53 73
Tanapag 617 287 246 24 23 9 28
San Roque 504 393 28 42 14 14 13
Capitol Hill 1,215 729 79 322 23 30 32
District 5 1,046 912 6 70 4 36 19
Tinian 1,046 912 6 70 4 36 18
District 6 1,294 1,183 6 62 6 30 7
Rota 1,294 1,183 6 62 6 30 7
Source: Election Commission
Note: This is the most recent data available by election district and by ethnicity
Note: Table will be updated when data become available
11th Statistical Yearbook, Central Statistics Division, Department of Commerce
CHAPTER 8
Visitors

Page 96 Chapter 8 2015 CNMI Statistical Yearbook
11th Statistical Yearbook, Central Statistics Division, Department of Commerce
Chapter 8 – Visitors
The Marianas Visitor Authority supplies the information on numbers of types of visitors, countries of origin,
and other characteristics. The information here is through Fiscal Year 2013. More recent information will
appear in the next yearbook or can be obtained directly from the Visitors Bureau.
About 434,000 visitors came to the CNMI in 2013. Of these, Japan provided the most visitors (148,000)
followed by Korea (135,000), U.S. and Guam (21,000), and others (129,000). The number of visitors from
China has been increasing rapidly in recent years, and that trend continues. As of 2013, Japan and Korea
visitors had been declining, as have those from the United States and Guam. Visitors from Russia were also
increasing, although their numbers remained small compared to other major Asian country senders.
The number of visitors in general decreased from 2004 until about 2011, when they started to increase again.
In recent years, numbers arriving in the second and 4th quarters have been increasing or remaining constant,
while those coming in the first and 3rd quarters have been declining. On average, between 2004 and 2013,
January saw the largest number of visitors, followed by August, while the months of April through June, and
September and October saw the lowest number of visitors.
Tables show changes in numbers of visitors for Japan, Korea, and China separately.
More recent figures are available from the Marianas Visitors Authority and will appear in the next yearbook.

2015 CNMI Statistical Yearbook Chapter 8 Page 97
11th Statistical Yearbook, Central Statistics Division, Department of Commerce
Table 8.1 Visitor Entries by Country of Origin, CNMI: FY 1997 to FY 2013
Fiscal Year
Numbers
Total Japan U.S. & Guam Korea China & others
2013 433,925 148,423 21,120 135,458 128,924
2012 389,475 150,292 23,264 127,197 88,722
2011 338,106 148,634 24,557 106,483 58,432
2010 368,186 182,820 27,196 108,079 50,091
2009 375,808 210,567 28,967 92,995 43,279
2008 396,497 202,041 32,225 116,710 45,521
2007 395,360 215,196 27,956 98,403 53,805
2006 443,812 280,292 33,010 80,764 49,746
2005 529,557 376,263 40,119 65,049 48,126
2004 531,584 384,845 33,875 69,480 43,384
2003 458,443 318,225 34,877 79,831 25,510
2002 424,932 293,921 34,307 77,665 19,039
2001 497,685 373,525 38,992 63,046 22,122
2000 526,111 381,518 51,880 67,979 24,734
1999 491,602 372,101 50,590 45,691 23,220
1998 526,298 381,228 64,100 54,281 26,689
1997 726,690 450,190 88,971 147,929 39,600
Source: Marianas Visitors Authority
Table 8.1 Visitor Entries by Country of Origin, CNMI: FY 1997 to FY 2013 – Continued –
Fiscal Year
Change from Previous Year
Total Japan U.S. & Guam Korea China & others
2013 44,450 -1,869 -2,144 8,261 40,202
2012 51,369 1,658 -1,293 20,714 30,290
2011 -30,080 -34,186 -2,639 -1,596 8,341
2010 -7,622 -27,747 -1,771 15,084 6,812
2009 -20,689 8,526 -3,258 -23,715 -2,242
2008 1,137 -13,155 4,269 18,307 -8,284
2007 -48,452 -65,096 -5,054 17,639 4,059
2006 -85,745 -95,971 -7,109 15,715 1,620
2005 -2,027 -8,582 6,244 -4,431 4,742
2004 73,141 66,620 -1,002 -10,351 17,874
2003 33,511 24,304 570 2,166 6,471
2002 -72,753 -79,604 -4,685 14,619 -3,083
2001 -28,426 -7,993 -12,888 -4,933 -2,612
2000 34,509 9,417 1,290 22,288 1,514
1999 -34,696 -9,127 -13,510 -8,590 -3,469
1998 -200,392 -68,962 -24,871 -93,648 -12,911
1997 ... ... ... ... ...
Source: Marianas Visitors Authority
0
100,000
200,000
300,000
400,000
500,000
600,000
700,000
800,000
2013
2012
2011
2010
2009
2008
2007
2006
2005
2004
2003
2002
2001
2000
1999
1998
1997
Visitors by Country, CNMI: 1997 to 2013
Japan U.S. & Guam Korea China & others

Page 98 Chapter 8 2015 CNMI Statistical Yearbook
11th Statistical Yearbook, Central Statistics Division, Department of Commerce
Table 8.2. Visitor Arrival Statistics by Year, CNMI: FY 2004 to FY 2013
Month 2004 2005 2006 2007 2008 2009 2010 2011 2012 2013
Total 531,584 529,557 443,812 395,360 396,497 375,808 368,186 338,106 389,475 433,925
Oct 38,512 40,042 35,418 34,203 27,238 29,611 20,467 25,784 24,693 26,767
Nov 43,361 43,890 35,267 30,961 31,618 31,690 23,008 27,179 29,275 32,894
Dec 45,587 47,817 38,353 35,556 35,849 34,181 30,155 31,572 33,418 39,272
Jan 49,160 50,270 39,500 38,047 38,119 38,932 35,716 34,738 38,263 39,391
Feb 47,362 46,356 37,228 37,990 40,222 35,594 37,850 33,659 36,332 38,350
Mar 43,125 42,719 35,768 33,606 32,352 32,908 36,220 30,376 36,033 40,666
Apr 39,595 39,748 32,981 26,286 31,800 27,833 26,255 21,629 30,691 32,521
May 39,216 39,125 37,247 29,093 31,203 24,128 27,015 23,451 28,193 32,913
Jun 45,714 43,155 38,510 29,989 30,936 21,803 28,372 23,604 29,402 33,539
Jul 47,442 46,107 39,552 33,804 35,259 30,301 35,164 27,203 32,478 39,287
Aug 46,154 44,469 40,201 39,573 34,251 37,072 38,047 33,503 40,225 44,996
Sep 46,356 45,859 33,787 26,252 27,650 31,755 29,917 25,408 30,472 33,329
Source: Marianas Visitors Authority
Table 8.2a Visitor Arrival Statistics by Year, CNMI: FY 2004 to FY 2013
Country 2004 2005 2006 2007 2008 2009 2010 2011 2012 2013
Total 531,584 529,557 443,812 395,360 396,497 375,808 368,186 338,106 389,475 433,925
Japan 384,845 376,263 280,292 215,196 202,041 210,567 182,820 148,634 150,292 148,423
Korea 69,480 65,049 80,764 98,403 116,710 92,995 108,079 106,483 127,197 135,458
China 29,238 32,441 38,385 41,024 31,095 27,859 40,398 46,451 78,928 112,570
Guam/US 33,875 40,119 33,010 27,956 32,225 28,967 27,196 24,557 23,264 21,120
United
States 14,491 17,013 11,497 8,546 12,432 10,949 9,713 8,928 8,398 7,438
Guam 19,384 23,106 21,513 19,410 19,793 18,018 17,483 15,629 14,866 13,682
Hong
Kong 1,997 3,172 0 0 0 0 314 1,881 672 626
Taiwan 497 2,771 756 453 278 417 220 153 0 0
Russia 0 266 1,571 3,043 6,178 6,801 4,329 5,092 5,611 11,002
Others 11,652 9,476 9,034 9,285 7,970 8,202 4,830 4,855 3,511 4,726
Source: Marianas Visitors Authority
Note: Hong Kong arrivals for FY2006 to FY2009 included in China
0
100,000
200,000
300,000
400,000
500,000
600,000
Visitors, CNMI: FY2004-FY2013
0
100,000
200,000
300,000
400,000
500,000
600,000Visitors by Country, FY2004 to FY2013
Total
Japan
Korea
China
Guam/US
Hong Kong
Taiwan
Russia
Others

2015 CNMI Statistical Yearbook Chapter 8 Page 99
11th Statistical Yearbook, Central Statistics Division, Department of Commerce
Table 8.3 Visitor Arrivals by Quarter, CNMI: 1997 to 2013
Year Total 1st quarter 2nd quarter 3rd quarter 4th quarter
2013 433,925 98,933 118,407 98,973 117,612
2012 389,475 87,386 110,628 88,286 103,175
2011 338,106 84,535 98,773 68,684 86,114
2010 368,186 73,630 109,786 81,642 103,128
2009 375,808 95,482 107,434 73,764 99,128
2008 396,497 94,705 110,693 93,939 97,160
2007 395,360 100,720 109,643 85,368 99,629
2006 443,812 109,038 112,496 108,738 113,540
2005 529,557 131,749 139,345 122,028 136,435
2004 531,584 127,460 139,647 124,525 139,952
2003 459,457 135,360 82,801 113,836 127,460
2002 475,547 117,850 111,821 119,430 126,446
2001 444,281 134,260 117,755 116,435 75,831
2000 528,597 134,243 127,234 137,888 129,232
1999 501,788 129,479 117,707 127,856 126,746
1998 490,165 134,207 118,029 121,369 116,560
1997 694,797 187,921 178,036 176,238 152,602
Source: Marianas Visitors Authority
Table 8.4 Japanese Visitor Arrival Statistics by Year, CNMI: FY 2004 to FY 2013
Month 2004 2005 2006 2007 2008 2009 2010 2011 2012 2013
Total 384,845 376,263 280,292 215,196 202,041 210,567 182,820 148,634 150,292 148,423
Oct 27,125 28,586 22,591 21,330 12,513 16,193 8,602 11,279 8,696 9,534
Nov 33,294 30,454 21,893 16,900 13,282 17,539 10,553 11,447 9,527 10,082
Dec 34,689 34,015 24,047 19,789 17,196 20,517 15,638 14,279 13,094 14,668
Jan 34,388 35,795 25,555 21,302 20,078 22,302 18,018 15,646 15,467 15,217
Feb 35,416 30,040 23,624 19,675 18,886 22,275 19,271 17,450 15,335 14,883
Mar 33,191 32,845 24,309 21,685 18,135 18,852 21,685 17,214 16,742 18,210
Apr 28,472 27,930 20,184 14,445 15,743 14,214 10,463 7,696 11,452 9,438
May 28,172 27,697 22,969 15,610 16,433 12,833 11,434 7,567 9,727 9,057
Jun 32,822 30,469 22,403 15,446 15,904 11,152 13,451 8,645 9,051 8,713
Jul 32,037 31,306 24,708 15,529 19,012 14,277 16,596 10,151 10,988 10,783
Aug 29,024 30,484 25,459 20,691 17,623 19,404 20,117 15,388 17,969 17,755
Sep 36,215 36,642 22,550 12,794 17,236 21,009 16,992 11,872 12,244 10,083
Source: Marianas Visitors Authority
0
100,000
200,000
300,000
400,000
500,000
600,000
700,000
2013
2012
2011
2010
2009
2008
2007
2006
2005
2004
2003
2002
2001
2000
1999
1998
1997
Visitor Arrivals by Quarter, CNMI: 1997 to 2013
1st quarter 2nd quarter 3rd quarter 4th quarter
0
100,000
200,000
300,000
400,000
500,000
600,000
Visitors by Quarter, CNMI: 2004 to 2013
1st Quarter 2nd Quarter 3rd Quarter 4th Quarter30,274
32,914
37,176
40,214
39,094
36,377
30,934
31,158
32,502
36,66039,849
33,079
0
5,000
10,000
15,000
20,000
25,000
30,000
35,000
40,000
45,000
Average Number of Visitors by Month,
CNMI: 2004 to 2013531,584
529,557
443,812395,360
396,497
375,808
368,186
338,106
389,475
433,925
0
100,000
200,000
300,000
400,000
500,000
600,000
Visitors, CNMI: FY2004-FY2013
0
50,000
100,000
150,000
200,000
250,000
300,000
350,000
400,000
2004
2005
2006
2007
2008
2009
2010
2011
2012
2013
Japanese Visitors by Quarter, CNMI: 2004 to 2013
4th Quarter
3rd Quarter
2nd Quarter
1st Quarter

Page 100 Chapter 8 2015 CNMI Statistical Yearbook
11th Statistical Yearbook, Central Statistics Division, Department of Commerce
Table 8.5 Visitor Arrivals from Japan by Quarter, CNMI: CY 1998 to CY 2004
Month
Japan
2004 2003 2002 2001 2000 1999 1998
Total 377,537 328,075 326,724 333,910 378,758 380,473 376,539
January 33,604 40,813 27,633 34,707 32,628 34,240 37,877
February 34,752 32,652 27,966 34,980 35,135 31,372 33,683
March 32,569 25,920 27,897 35,184 34,188 34,081 34,759
April 28,114 19,010 22,469 28,585 27,848 28,252 28,883
May 27,343 16,393 25,247 29,486 29,267 30,013 31,985
June 32,421 18,504 28,036 30,716 31,550 29,005 30,413
July 31,374 22,569 25,429 32,122 30,677 32,645 30,652
August 28,705 25,517 26,212 33,779 32,878 33,412 33,658
September 35,633 31,589 30,577 21,896 32,524 32,630 28,178
October 26,834 27,125 23,407 15,129 27,229 31,045 24,753
November 32,781 33,294 26,772 15,595 32,520 31,698 29,499
December 33,407 34,689 35,079 21,731 32,314 32,080 32,199
Source: Marianas Visitors Authority
Table 8.6. Korean Visitor Arrival Statistics by Year, CNMI: FY 2004 to FY 2013
Month 2004 2005 2006 2007 2008 2009 2010 2011 2012 2013
Total 69,480 65,049 80,764 98,403 116,710 92,995 108,079 106,483 127,197 135,458
Oct 5,453 3,156 5,369 5,818 8,076 8,715 4,813 8,681 7,880 8,105
Nov 4,829 4,723 6,503 7,481 11,626 8,912 6,892 10,428 11,389 11,833
Dec 5,267 6,492 7,402 8,102 11,617 8,098 10,157 10,485 11,345 12,873
Jan 7,825 7,554 6,902 9,953 11,227 8,676 11,710 12,685 12,758 13,241
Feb 6,434 7,328 6,778 7,721 11,116 8,305 9,603 10,133 12,537 10,098
Mar 4,228 4,641 4,745 6,271 7,169 5,532 8,185 7,072 9,431 9,395
Apr 4,827 4,657 5,854 6,196 8,743 6,576 8,619 6,349 9,399 9,645
May 4,294 4,337 7,165 7,565 9,925 6,557 9,643 7,303 9,052 11,525
Jun 5,967 5,015 7,440 9,139 9,616 6,735 8,931 7,064 10,369 11,435
Jul 7,298 6,661 8,146 10,901 10,208 9,987 10,782 8,997 11,391 13,071
Aug 8,550 7,032 8,053 10,651 10,690 10,600 10,786 10,540 12,810 13,389
Sep 4,508 3,453 6,407 8,605 6,697 4,302 7,958 6,746 8,836 10,848
Source: Marianas Visitors Authority
0
20,000
40,000
60,000
80,000
100,000
120,000
140,000
160,000
2004
2005
2006
2007
2008
2009
2010
2011
2012
2013
Korean Visitors by Quarter, CNMI: 2004 to 2013
4th quarter
3rd quarter
2nd quarter
1st quarter

2015 CNMI Statistical Yearbook Chapter 8 Page 101
11th Statistical Yearbook, Central Statistics Division, Department of Commerce
Table 8.7 Visitor Arrivals from Korea by Quarter, CNMI: 1998 to 2013
Year Total 1st quarter 2nd quarter 3rd quarter 4th quarter
2013 135,458 32,811 32,734 32,605 37,308
2012 127,197 30,614 34,726 28,820 33,037
2011 106,483 29,594 29,890 20,716 26,283
2010 108,079 21,862 29,498 27,193 29,526
2009 92,995 25,725 22,513 19,868 24,889
2008 116,710 31,319 29,512 28,284 27,595
2007 98,403 21,401 23,945 22,900 30,157
2006 80,764 19,274 18,425 20,459 22,606
2005 65,049 14,371 19,523 14,009 17,146
2004 69,480 15,549 18,487 15,088 20,356
2003 69,642 19,474 14,900 19,719 15,549
2002 90,324 21,640 19,407 23,539 25,738
2001 56,625 13,710 13,540 16,296 13,079
2000 71,614 14,518 17,875 19,822 19,399
1999 51,150 11,121 10,952 13,313 15,764
1998 27,813 4,771 6,087 6,650 10,305
Source: Marianas Visitors Authority
Table 8.7a Visitor Arrivals from Korea by Month, CNMI: 1999 to 2004
Month
Korea
2004 2003 2002 2001 2000 1999 1998
Total 68,609 69,642 90,324 56,625 71,614 51,150 27,813
January 7,023 8,666 7,282 6,006 4,936 3,906 1,757
February 6,424 6,635 8,175 4,213 4,772 3,676 1,359
March 4,220 4,173 6,183 3,491 4,810 3,539 1,655
April 4,825 4,008 6,242 4,849 5,918 3,409 1,777
May 4,292 5,692 6,007 4,554 6,584 4,178 2,224
June 5,965 5,200 7,158 4,137 5,373 3,365 2,086
July 7,291 7,140 7,773 6,022 7,807 4,683 2,250
August 8,528 7,997 10,190 6,691 7,504 5,418 2,550
September 4,500 4,582 5,576 3,583 4,511 3,212 1,850
October 5,453 5,453 7,297 2,674 6,376 4,495 2,498
November 4,825 4,829 10,021 4,868 6,354 5,153 3,529
December 5,263 5,267 8,420 5,537 6,669 6,116 4,278
Source: Marianas Visitors Authority
Table 8.8 Chinese Visitor Arrival Statistics by Month, CNMI: FY 2004 to FY 2013
Month 2004 2005 2006 2007 2008 2009 2010 2011 2012 2013
Total 29,238 32,441 38,385 41,024 31,095 27,859 40,398 46,451 78,928 112,570
Oct 2,157 3,541 3,637 3,630 3,861 1,891 3,820 3,143 5,134 6,886
Nov 1,830 2,687 3,245 3,239 2,821 2,040 2,715 2,316 5,936 8,214
Dec 1,819 2,803 3,095 3,976 3,470 2,004 1,283 3,584 5,708 8,716
Jan 3,727 2,938 3,886 3,869 3,494 4,447 3,038 3,918 7,660 7,791
Feb 1,435 3,862 3,952 7,298 5,913 2,345 6,267 3,923 6,208 10,776
Mar 1,594 1,119 2,182 1,583 2,260 1,955 3,176 2,635 6,779 9,021
Apr 1,996 2,084 3,378 2,062 1,641 1,883 3,446 2,754 7,176 10,305
May 2,263 1,863 3,401 2,450 1,608 1,587 3,143 5,017 6,685 9,161
Jun 1,746 2,419 2,715 1,629 1,142 322 2,261 4,535 6,814 9,959
Jul 3,742 2,882 3,197 4,107 1,749 2,470 4,583 4,989 7,480 11,177
Aug 4,405 3,591 3,683 5,081 2,162 3,892 4,320 5,118 6,762 10,804
Sep 2,524 2,652 2,014 2,100 974 3,023 2,346 4,519 6,586 9,760
Source: Marianas Visitors Authority
0
20,000
40,000
60,000
80,000
100,000
120,000
140,000
2013
2012
2011
2010
2009
2008
2007
2006
2005
2004
2003
2002
2001
2000
1999
1998
Korean Visitors by Quarter, CNMI: 1998 to 2013
1st quarter 2nd quarter 3rd quarter 4th quarter

11th Statistical Yearbook, Central Statistics Division, Department of Commerce
CHAPTER 9
Housing

2015 CNMI Statistical Yearbook Chapter 9 Page 103
11th Statistical Yearbook, Central Statistics Division, Department of Commerce
Chapter 9 – Housing
Data on housing come from the U.S. Census Bureau’s Decennial Censuses and from the Marianas Housing
Authority. Trends in housing also include the 1995 CNMI Census which was conducted completely inter-
nally. Housing data are also collected in labor force and other surveys.
The CNMI had about 21,000 housing units in the 2010 census, about 16,000 (about 3 out of every 4) being
occupied. About 4,500 (about 1 in 4 of the occupied units) were owner-occupied, and about 12,000 were
rented. The average unit had 3.3 people, about 4.2 for owner-occupied units, and about 2.9 for renter units.
All three islands had similar distributions.
While the number of units increased between 2000 and 2010, the percentage being vacant increased more
rapidly. In 2000, about 20 percent of the units were vacant, but that increased to about 23 percent in 2010.
The percent vacant increased on Saipan and Rota, but decreased on Tinian. The average size of population
in units decreased from 3.7 to 3.3, with owner-occupied units decreasing from 4.9 to 4.2 and rental units from
3.0 to 2.9, so little change for rentals.
The percentage of single family, unattached unites decreased over the decades, from 85 percent in 1980 to
about half in 2000, and then to 43 percent in 2010. The percentage of housing units that were in building of
20 or more apartments increased from less than 1 percent in 1980 to 9 percent in 2010. In 2010, about 42
percent of Saipan’s units were unattached single-family units, compared to 67 percent on Rota and 57 percent
on Tinian. The numbers of multi-family units increased for all three islands between 1990 and 2010.
The largest number of units were built during the 1990s, with about equal numbers built in the 1980s and
2000s, about half as many as during the 1990s. About 3 in every 4 householders moved into their units
during the 2000s.
The percentage of units with concrete walls increased from about 66 percent in 1980 to 83 percent in 2010,
and units rebuilt after typhoons under FEMA and other funding were more likely to be stronger. The per-
centage with wood walls decreased from 14 percent to 8 percent and the percentage with metal walls de-
creased from 20 percent to 8 percent. The percentage of units with concrete roofs increased from 48 percent
to 56 percent between 1980 and 2010, while the percent with metal roofs decreased from about 50 percent to
36 percent. Almost all of the units had concrete foundations.
The median number of rooms in 2010 was 3.3, with a slightly higher number – 3.7 – on Rota. The number
of rooms increased from 2000, from 2.9 to 3.3, and on Saipan and Tinian, from 2.7 to 3.3. However, in 1990
and 1995 the average unit had more than 4 rooms, so increased population saw decreasing numbers of rooms.
The percentage of one-room units was 22 percent in 2000 before decreasing to 10 percent in 2010. About
14 percent of the units in 2010, down from about 29 percent in 2010, had more than 1.5 people per room, a

Page 104 Chapter 9 2015 CNMI Statistical Yearbook
11th Statistical Yearbook, Central Statistics Division, Department of Commerce
sign of crowding. In 2010, about 1 in 4 units had exactly one bedroom, slightly less than those with two
bedrooms, but more than those with 3 or more bedrooms.
In 2010, 14 percent of the units did not have complete plumbing facilities (hot and cold running water, toilet,
and tub or shower), with Rota at 7 percent but Tinian at 17 percent. These numbers are high because many
people don’t feel hot water is needed, and heating water is very expensive. The percentage without complete
plumbing decreased from 17 percent in 2000.
About 27 percent of the units did not have complete kitchen facilities (sink, stove, and refrigerator), 26 per-
cent on Saipan, 33 percent on Rota and 32 percent on Tinian. The percent without complete kitchen facilities
actually increased from 25 percent in 2000, with all of the increase on Saipan – both Rota and Tinian saw
decreases from about 36 percent in 2000.
And 27 percent of the units did not have air conditioning, 25 percent on Saipan, 44 percent on Rota and 38
percent on Tinian. The cost of electricity makes air conditioning prohibitively expensive for many house-
holds. The percent without air conditioning decreased from the 32 percent in 2000, with all islands seeing
decreases.
The percentage of units using a public system only for source of water increased from 63 percent in 1990 to
79 percent in 2010, while the percent using the public system as well as catchments decreased from 26 percent
in 1990 to 19 percent in 2010. Because of frequent droughts and water shortages, many housing units con-
tinue to have water catchments to supplement the public system. The percentage having catchments only
decreased from about 3 percent in 1990 to less than 1 percent in 2010. Almost all units on Rota and Tinian
were attached to the public system only.
About 53 percent of the units in 2010 were attached to a public sewer, compared to about 40 percent reported
to use a septic tank. However, the large majority of the units on Rota and Tinian continued to use septic
tanks for disposal.
For communications, about 8 percent of the units in 2010 were without telephone service, about 30 percent
without a radio, and 43 percent without a computer, and about 10 percent without some access to the internet
(although that access may not have been in the home.) The percentage without phone service decreased from
39 percent in 2000, but the percentage without a battery-powered radio increased from 14 percent.
The average value of owner-occupied structures in Saipan was $124,000 in 2010 dollars. The value was
slightly higher on Saipan, and slightly lower on Rota and Tinian. About 28 percent of the owner-occupied
units had a mortgage. The monthly owner costs for those with a mortgage was about $1,000 compared to
about $250 for those without a mortgage.
The average rent paid was $324 in 2010 dollars. The rent was about $328 on Saipan, compared to $297 on
Rota and $261 on Tinian.

2015 CNMI Statistical Yearbook Chapter 9 Page 105
11th Statistical Yearbook, Central Statistics Division, Department of Commerce
Table 9.1 Housing Occupancy by District and Island, CNMI: 2010
Housing Occupancy Total
Saipan
Rota Tinian Total Dist. 1 Dist. 2 Dist. 3 Dist. 4 Dist. 5
Total 20,850 18,683 5,479 2,527 6,775 1,379 2,523 1,049 1,118
Occupied housing units 16,035 14,406 4,287 2,010 5,183 1,066 1,860 755 874
Owner-occupied 4,537 3,906 1,196 317 960 454 979 327 304
Renter-occupied 11,498 10,500 3,091 1,693 4,223 612 881 428 570
Vacant units 4,815 4,277 1,192 517 1,592 313 663 294 244
For seasonal, recreational, or occasional
use 387 332 49 25 184 31 43 46 9
Population in occupied units 52,312 47,066 14,966 6,132 15,103 3,756 7,109 2,444 2,802
Owner-occupied 18,844 16,276 5,110 1,288 3,786 1,903 4,189 1,258 1,310
Renter-occupied 33,468 30,790 9,856 4,844 11,317 1,853 2,920 1,186 1,492
Total 3.26 3.27 3.49 3.05 2.91 3.52 3.82 3.24 3.21
Owner-occupied 4.15 4.17 4.27 4.06 3.94 4.19 4.28 3.85 4.31
Renter-occupied 2.91 2.93 3.19 2.86 2.68 3.03 3.31 2.77 2.62
Source: U.S. Census Bureau
Table 9.2 Housing Occupancy by District and Island, CNMI: 2010
Housing Occupancy
2010 2000
Total Saipan Rota Tinian Total Saipan Rota Tinian
Total 20,850 18,683 1,049 1,118 17,563 15,527 981 1,055
Occupied housing units 16,035 14,406 755 874 14,054 12,507 757 790
Owner-occupied 4,537 3,906 327 304 4,549 3,878 392 279
Renter-occupied 11,498 10,500 428 570 9,506 8,629 365 511
Vacant units 4,815 4,277 294 244 3,509 3,020 224 265
Percent 23.1 22.9 28.0 21.8 20.0 19.4 22.8 25.1
Population in occupied units 52,312 47,066 2,444 2,802 51,438 45,525 3,005 2,860
Owner-occupied 18,844 16,276 1,258 1,310 22,472 19,235 1,811 1,406
Renter-occupied 33,468 30,790 1,186 1,492 28,993 26,318 1,194 1,456
Total 3.26 3.27 3.24 3.21 3.66 3.64 3.97 3.62
Owner-occupied 4.15 4.17 3.85 4.31 4.94 4.96 4.62 5.04
Renter-occupied 2.91 2.93 2.77 2.62 3.05 3.05 3.27 2.85
Source: U.S. Census Bureau
23.1 22.921.8
20.5
23.522.7
26.328.0
21.8
0.0
5.0
10.0
15.0
20.0
25.0
30.0
Percent Vacant Units By District and Island
23.1 22.9
28.0
21.8
20.0 19.4
22.8
25.1
0.0
5.0
10.0
15.0
20.0
25.0
30.0
Total Saipan Rota Tinian Total Saipan Rota Tinian
2010 2000
Percent Vacant Units by Island: 2000 and 2010

Page 106 Chapter 9 2015 CNMI Statistical Yearbook
11th Statistical Yearbook, Central Statistics Division, Department of Commerce
Table 9.3 Housing Units in Structure, CNMI: 1980 to 2010
Units in Structure
Number Percent
2010 2000 1995 1990 1980 2010 2000 1995 1990 1980
Total 20,850 17,566 12,057 8,210 3,531 100.0 100.0 100.0 100.0 100.0
1, detached 8,925 8,582 6,702 5,864 3,004 42.8 48.9 55.6 71.4 85.1
1, attached 3,185 2,366 1,520 850 62 15.3 13.5 12.6 10.4 1.8
2 587 522 286 126 82 2.8 3.0 2.4 1.5 2.3
3 or 4 1,333 1,324 717 445 67 6.4 7.5 5.9 5.4 1.9
5 to 9 2,266 2,022 1083 431 148 10.9 11.5 9.0 5.2 4.2
10 to 19 2,578 1,512 671 276 148 12.4 8.6 5.6 3.4 4.2
20 or more 1,830 1,106 466 71 2 8.8 6.3 3.9 0.9 0.1
Other 146 132 612 147 18 0.7 0.8 5.1 1.8 0.5
Source: 1980 Census Table 9, 1990 CPH-6 CNMI Table 101, 1990 CPH-6-CNMI Table 105, 1995 CNMI Mid-Decade Census Table 147 and
Census 2000 Population and Housing Profiles
Table 9.4 Units in Structure by District and Island, CNMI: 2010
Units in Structure Total
Saipan
Rota Tinian Total Dist. 1 Dist. 2 Dist. 3 Dist. 4 Dist. 5
Total 20,834 18,670 5,475 2,525 6,769 1,379 2,522 1,049 1,115
1 unit, detached 8,925 7,578 2,326 671 1,846 818 1,917 710 637
1 unit, attached 3,185 2,875 1,119 525 858 146 227 120 190
2 units 587 515 155 76 189 53 42 31 41
3 or 4 units 1,333 1,195 289 239 531 64 72 54 84
5 to 9 units 2,266 2,105 433 490 952 157 73 80 81
10 to 19 units 2,578 2,469 668 425 1,166 94 116 51 58
20 or more units 1,830 1,820 451 89 1,180 44 56 0 10
Mobile home 63 63 17 9 24 1 12 0 0
Container 67 50 17 1 23 2 7 3 14
Source: U.S. Census Bureau
Table 9.5 Units in Structure by Island, CNMI: 2000 to 2010
Units in Structure
2010 2000 1990
Total Saipan Rota Tinian Total Saipan Rota Tinian Total Saipan Rota Tinian
Total 20,850 18,670 1,049 1,115 17,563 15,527 1,055 981 8,199 7,251 519 429
1 unit, de-
tached 8,925 7,578 710 637 8,579 7,229 595 755 5,853 4,993 475 385 1 unit, at-
tached 3,185 2,875 120 190 2,366 2,136 124 106 850 801 22 27
2 units 587 515 31 41 522 463 41 18 126 121 3 2
3 or 4 units 1,333 1,195 54 84 1,324 1,242 47 35 445 433 7 5
5 to 9 units 2,266 2,105 80 81 2,022 1,835 143 44 431 417 7 7
10 to 19
units 2,578 2,469 51 58 1,512 1,421 75 16 276 276 0 0 20 or more
units 1,830 1,820 0 10 1,106 1,101 5 0 82 81 1 0
Other 146 113 3 14 132 100 25 7 136 129 4 3
Source: 1990 CPH-6-CNMI Table 105, 2000 and 2010 Population and Housing Censuses
8,925 8,5826,702 5,864
3,004
11,9258,984
5,355
2,346
527
0
5,000
10,000
15,000
20,000
25,000
2010 2000 1995 1990 1980
Housing Units by Structure, CNMI: 1980 to 2010
1 unit, detached Others
18,67015,527
7,251
1,049
1,055
519
1,115
981
429
0
5,000
10,000
15,000
20,000
25,000
2010 2000 1990
Housing Units by Island, CNMI: 1990 to 2010
Saipan Rota Tinian
0
3000
6000
9000
12000
15000
18000
21000
Units in Structure by Island and District, CNMI:
2010
1 unit, detached Other

2015 CNMI Statistical Yearbook Chapter 9 Page 107
11th Statistical Yearbook, Central Statistics Division, Department of Commerce
Table 9.6 Year Structure Built by District and Island, CNMI: 2010
Year Built Total
Saipan
Rota Tinian Total Dist. 1 Dist. 2 Dist. 3 Dist. 4 Dist. 5
Total 20,850 18,683 5,479 2,527 6,775 1,379 2,523 1,049 1,118
Built 2009 to March 2010 1,345 1,282 253 373 456 69 131 16 47
Built 2000 to 2008 4,118 3,577 1,252 376 1,017 186 746 226 315
Built 1990 to 1999 8,170 7,307 2,166 975 2,415 592 1,159 399 464
Built 1980 to 1989 5,818 5,275 1,518 551 2,378 435 393 286 257
Built 1970 to 1979 1,065 954 213 165 424 73 79 83 28
Built before 1970 334
Built 1960 to 1969 261 220 61 62 68 21 8 36 5
Built 1950 to 1959 35 31 9 10 4 1 7 3 1
Built 1940 to 1949 20 19 3 7 8 1 0 0 1
Built 1939 or earlier 18 18 4 8 5 1 0 0 0
Source: U.S. Census Bureau
Table 9.7 Year Householder Moved into Unit by District and Island, CNMI: 2010
Year Moved Total
Saipan
Rota Tinian Total Dist. 1 Dist. 2 Dist. 3 Dist. 4 Dist. 5
Total 16,035 14,406 4,287 2,010 5,183 1,066 1,860 755 874
Moved in:
2009 to March 2010 4,508 4,107 1,164 724 1,647 225 347 145 256
2000 to 2008 7,575 6,839 1,963 935 2,543 453 945 347 389
1990 to 1999 2,621 2,296 774 197 621 254 450 168 157
1980 to 1989 1,034 905 319 91 286 107 102 67 62
1970 to 1979 225 196 48 40 74 19 15 21 8
1969 or earlier 72 63 19 23 12 8 1 7 2
Source: U.S. Census Bureau
Table 9.8 Material for Outside Walls, CNMI: 1990 to 2010
Type of Material
Number Percent Change Percent
2010 2000 1995 1990
2000 to
2010
1995 to
2000
1990 to
1995 2010 2000 1995 1990
Total 20,850 17,566 12,057 8,210 18.7 45.7 46.9 100.0 100.0 100.0 100.0
Concrete 17,213 13,209 8,619 5,460 30.3 53.3 57.9 82.6 75.2 71.5 66.5
Poured 3,093 2,302 1,733 941 34.4 32.8 84.2 14.8 13.1 14.4 11.5
Blocks 14,120 10,907 6,886 4,519 29.5 58.4 52.4 67.7 62.1 57.1 55.0
Metal 1,610 2,156 1,695 1,625 -25.3 27.2 4.3 7.7 12.3 14.1 19.8
Wood 1,706 1,936 1,649 1,106 -11.9 17.4 49.1 8.2 11.0 13.7 13.5
Other 321 265 94 19 21.1 181.9 394.7 1.5 1.5 0.8 0.2
Source: 1990 CPH-6-CNMI Table 105, 1995 CNMI Mid-Decade Census Table 148 and Census 2000 Population and Housing Profiles
Built 2009 to
March 2010
6%
Built
2000 to
2008
20%
Built 1990
to 1999
39%
Built 1980
to 1989
28%
Built 1970 to 1979
5%
Built
before
1970
2%
Year Structure Built
2009 to
March
2010
28%
2000 to
2008
47%
1990 to
1999
16%
1980 to
1989
7%
1970 to
1979
1%
1969 or
earlier
1%
Year Householder Moved In
3,093 2,302 1,733 941
14,12010,907 6,886
4,519
1,6102,156 1,695 1,625
1,706 1,936 1,649 1,106
0%
20%
40%
60%
80%
100%
2010 2000 1995 1990
Material for Outside Walls, CNMI: 1990 to
2010
Poured Concrete Concrete Blocks Metal Wood

Page 108 Chapter 9 2015 CNMI Statistical Yearbook
11th Statistical Yearbook, Central Statistics Division, Department of Commerce
Table 9.9. Material used for Outside Walls by District and Island, CNMI: 2010
Outside Total
Saipan
Rota Tinian Total Dist. 1 Dist. 2 Dist. 3 Dist. 4 Dist. 5
Total 20,850 18,683 5,479 2,527 6,775 1,379 2,523 1,049 1,118
Poured concrete 3,093 2,974 820 462 1,178 236 278 44 75
Concrete blocks 14,120 12,455 3,598 1,568 4,535 949 1,805 885 780
Metal 1,610 1,373 424 157 414 94 284 48 189
Wood 1,706 1,585 525 300 561 80 119 66 55
Other 321 296 112 40 87 20 37 6 19
Source: U.S. Census Bureau
Table 9.10 Material for Outside Walls by Island, CNMI: 1990, 1995 and 2000
Type of Material
Saipan Tinian Rota
2010 2000 1995 1990 2010 2000 1995 1990 2010 2000 1995 1990
Total 20,850 15,527 10,844 7,251 1,118 1,055 522 429 1,049 981 690 519
Concrete 17,213 11,838 7,810 4,928 855 683 347 205 929 641 462 326
Poured 3,093 2,158 1,634 890 75 97 35 9 44 45 64 42
Blocks 14,120 9,680 6,176 4,038 780 586 312 196 885 641 398 284
Metal 1,610 1,762 1,420 1,263 189 232 107 195 48 162 167 161
Wood 1,706 1,751 1,529 1,045 55 110 66 29 66 74 54 28
Other 321 176 85 15 19 30 2 0 6 59 7 4
Source: 1990 CPH-6-CNMI Table 105, 1995 CNMI Mid-Decade Census Table 148 and Census 2000 Population and Housing Profiles
Table 9.11 Material for Roof, CNMI: 1990 to 2010
Roof
Number Percent Change Percent
2010 2000 1995 1990 2000-2010 1995-2000 1990-1995 2010 2000 1995 1990
Total 20,850 17,566 12,057 8,210 18.7 45.7 46.9 100.0 100.0 100.0 100.0
Concrete 11,677 9,483 6,081 3,952 23.1 55.9 53.9 56.0 54.0 50.4 48.1
Metal 7,587 7,039 5,557 4,064 7.8 26.7 36.7 36.4 40.1 46.1 49.5
Wood 477 384 317 124 24.2 21.1 155.6 2.3 2.2 2.6 1.5
Other 1,109 660 102 70 68.0 547.1 45.7 5.3 3.8 0.8 0.9
Source: 1990 Census Table 105, 1995 CNMI Mid-Decade Census Table 148 and Census 2000 and 2010 Population and Housing Profiles
3,093 2,974 820 462 1,178 236 278 44 75
14,120 12,455 3,598 1,568 4,535 9491,805 885
780
1,610 1,373 424 157414 94 284 48
189
1,706 1,585 525 300561 80 119 66 55
0%
20%
40%
60%
80%
100%
Material of Outside Walls by District and Island,
CNMI: 2010
Poured concrete Concrete blocks Metal Wood
82.6
76.2
72.0
68.07
6.5
64.7
66.5
47.8
88.6
65.3
67.0
62.8
0.0
20.0
40.0
60.0
80.0
100.0
2010 2000 1995 1990
Percent of Walls Made of Concrete by Island, CNMI:
1990 to 2010
Saipan Tinian Rota
2,685
1,191
4,112
8501,434
802 603
2,304
1,180
2,068
439918
189 489
0
1,000
2,000
3,000
4,000
5,000
6,000
7,000
Dist 1 Dist 2 Dist 3 Dist 4 Dist 5 Rota Tinian
Poured Concrete and Metal Roof
by District and Island
Poured concrete Metal

2015 CNMI Statistical Yearbook Chapter 9 Page 109
11th Statistical Yearbook, Central Statistics Division, Department of Commerce
Table 9.12 Material used for Roof by District and Island, CNMI: 2010
Roof Total
Saipan
Rota Tinian Total Dist. 1 Dist. 2 Dist. 3 Dist. 4 Dist. 5
Total 20,850 18,683 5,479 2,527 6,775 1,379 2,523 1,049 1,118
Poured concrete 11,677 10,272 2,685 1,191 4,112 850 1,434 802 603
Metal 7,587 6,909 2,304 1,180 2,068 439 918 189 489
Wood 477 448 114 45 189 58 42 19 10
Other 1,109 1,054 376 111 406 32 129 39 16
Source: U.S. Census Bureau
Table 9.13 Material for Roof, CNMI: 1990 to 2010
Type of Material
Saipan Tinian Rota
2010 2000 1995 1990 2010 2000 1995 1990 2010 2000 1995 1990
Total 18,683 15,527 10,844 7,251 1,118 1,055 522 429 1,049 981 690 519
Concrete 10,272 8,433 5,454 3,543 603 470 244 130 802 578 383 279
Metal 6,909 6,202 5,035 3,518 489 533 221 299 189 303 300 236
Wood 448 350 258 122 10 20 56 0 19 14 3 2
Other 1,054 542 97 68 16 32 1 0 39 86 4 2
Source: 1990 Census Table 105, 1995 CNMI Mid-Decade Census Table 148 and Census 2000 Population and Housing Profiles
Table 9.14 Material used for Foundation by District and Island, CNMI: 2010
Foundation Total
Saipan
Rota Tinian Total Dist. 1 Dist. 2 Dist. 3 Dist. 4 Dist. 5
Total 20,850 18,683 5,479 2,527 6,775 1,379 2,523 1,049 1,118
Concrete 20,153 18,014 5,264 2,443 6,522 1,336 2,449 1,037 1,102
Wood pier or pilings 597 577 192 75 208 39 63 10 10
Other 100 92 23 9 45 4 11 2 6
Source: U.S. Census Bureau
11,6779,483
6,0813,952
7,587
7,039
5,557
4,064
0
2,000
4,000
6,000
8,000
10,000
12,000
14,000
16,000
18,000
20,000
2010 2000 1995 1990
Type of Roof, CNMI: 1990 to 2010
Poured concrete Metal
55.0 54.350.3 48.9
53.9
44.5 46.7
30.3
76.5
58.955.5 53.8
0.0
10.0
20.0
30.0
40.0
50.0
60.0
70.0
80.0
90.0
2010
2000
1995
1990
2010
2000
1995
1990
2010
2000
1995
1990
Saipan Tinian Rota
Percent Concrete Roofs by Island: 1990 to 2010
10,272 8,4335,454
3,543
603 470244
130
802 578383 279
1
10
100
1,000
10,000
100,000
2010 2000 1995 1990
Concrete Roofs by Island: 1990 to 2010
Saipan Tinian Rota
11,67710,272
802
603 9,483 8,433578
470
7,587 6,909
189
489 7,039 6,202303
533
0%
10%
20%
30%
40%
50%
60%
70%
80%
90%
100%
Total Saipan Rota Tinian Total Saipan Rota Tinian
2010 2000
Type of Roof by Island: 2000 and 2010
Poured concrete Metal
2,685
1,191
4,112
8501,434
802 603
2,304
1,180
2,068
439
918
189 489
0
1,000
2,000
3,000
4,000
5,000
6,000
7,000
Dist 1 Dist 2 Dist 3 Dist 4 Dist 5 Rota Tinian
Poured Concrete and Metal Roof by District and
Island
Poured concrete Metal

Page 110 Chapter 9 2015 CNMI Statistical Yearbook
11th Statistical Yearbook, Central Statistics Division, Department of Commerce
Table 9.15 Material used for Foundation by Island, CNMI: 2000 and 2010
Foundation
2010 2000
Total Saipan Rota Tinian Total Saipan Rota Tinian
Total 20,850 18,683 1,049 1,118 17,566 15,530 981 1,055
Concrete 20,153 18,014 1,037 1,102 16,735 14,770 933 1,032
Wood pier or pilings 597 577 10 10 731 683 34 14
Other 100 92 2 6 100 77 14 9
Source: U.S. Census Bureau
Table 9.16 Rooms by District and Island, CNMI: 2010
Rooms Total
Saipan
Rota Tinian Total Dist. 1 Dist. 2 Dist. 3 Dist. 4 Dist. 5
Total 20,850 18,683 5,479 2,527 6,775 1,379 2,523 1,049 1,118
1 room 2,076 1,892 415 254 1,033 87 103 79 105
2 rooms 4,431 4,032 1,285 685 1,541 188 333 148 251
3 rooms 4,911 4,402 1,201 671 1,605 297 628 265 244
4 rooms 4,155 3,719 1,117 430 1,207 318 647 214 222
5 rooms 2,490 2,164 696 239 587 234 408 182 144
6 rooms 1,236 1,078 338 117 327 116 180 83 75
7 rooms 622 561 188 36 166 64 107 29 32
8 rooms 312 260 81 26 62 36 55 23 29
9 or more rooms 617 575 158 69 247 39 62 26 16
Median 3.3 3.3 3.4 3.0 3.0 3.9 3.8 3.7 3.3
Source: U.S. Census Bureau
Table 9.17 Rooms by Island, CNMI: 2000 and 2010
Rooms
2010 2000
Total Saipan Rota Tinian Total Saipan Rota Tinian
Total 20,850 18,683 1,053 1,121 17,566 15,527 981 1,055
1 room 2,076 1,892 79 105 3,898 3,461 128 309
2 rooms 4,431 4,032 148 251 3,476 3,131 156 189
3 rooms 4,911 4,402 265 244 3,825 3,425 205 195
4 rooms 4,155 3,719 214 222 2,878 2,518 196 161
5 rooms 2,490 2,164 182 144 1,731 1,463 157 111
6 rooms 1,236 1,078 83 75 918 796 74 48
7 rooms 622 561 29 32 361 319 23 19
8 rooms 312 260 23 29 233 199 19 15
9 or more rooms 617 575 26 16 246 215 23 8
Median 3.3 3.3 3.7 3.3 2.9 2.7 3.5 2.7
Source: U.S. Census Bureau
31.2 31.7 31.0
37.2 38.0
19.917.3
21.6
31.8
0.0
5.0
10.0
15.0
20.0
25.0
30.0
35.0
40.0
Percent Two Rooms or less by District and Island
31.2 31.7
21.6
31.7
42.0 42.5
29.0
47.2
0.0
5.0
10.0
15.0
20.0
25.0
30.0
35.0
40.0
45.0
50.0
Total Saipan Rota Tinian Total Saipan Rota Tinian
2010 2000
Percent Two Rooms or Less by Island: 2000 and
2010

2015 CNMI Statistical Yearbook Chapter 9 Page 111
11th Statistical Yearbook, Central Statistics Division, Department of Commerce
Table 9.18 Rooms by District and Island, CNMI: 2010
Rooms
Number Percent
2010 2000 1995 1990 2010 2000 1995 1990
Total 20,850 17,566 12,057 8,210 100.0 100.0 100.0 100.0
1 room 2,076 3,898 1,351 677 10.0 22.2 11.2 8.2
2 rooms 4,431 3,476 1,623 1,007 21.3 19.8 13.5 12.3
3 rooms 4,911 3,825 1,991 1,524 23.6 21.8 16.5 18.6
4 rooms 4,155 2,878 2,733 1,975 19.9 16.4 22.7 24.1
5 rooms 2,490 1,731 2,122 1,714 11.9 9.9 17.6 20.9
6 rooms 1,236 918 1,097 790 5.9 5.2 9.1 9.6
7 rooms 622 361 552 265 3.0 2.1 4.6 3.2
8 or more rooms 929 479 588 258 4.5 2.7 4.9 3.1
Median 3.3 2.9 4.4 4.0 . . . . . . . . . . . .
Source: U.S. Census Bureau
Table 9.19 Occupants per Room by District and Island, CNMI: 2010
Occupants per Room Total
Saipan
Rota Tinian Total Dist. 1 Dist. 2 Dist. 3 Dist. 4 Dist. 5
Total 16,035 14,406 4,287 2,010 5,183 1,066 1,860 755 874
1.00 or less 11,385 10,173 2,939 1,443 3,769 783 1,239 559 653
1.01 to 1.50 2,468 2,218 721 291 699 154 353 118 132
1.51 or more 2,182 2,015 627 276 715 129 268 78 89
Source: U.S. Census Bureau
Table 9.20 Occupants per Room by Island, CNMI: 2000 and 2010
Occupants per Room
2010 2000
Total Saipan Rota Tinian Total Saipan Rota Tinian
Total 16,035 14,406 755 874 14,054 12,507 757 790
1.00 or less 11,385 10,173 559 653 7,767 6,866 463 438
1.01 to 1.50 2,468 2,218 118 132 2,245 1,978 136 131
1.51 or more 2,182 2,015 78 89 4,042 3,663 158 221
Source: U.S. Census Bureau
0
5,000
10,000
15,000
20,000
25,000
2010 2000 1995 1990
Housing Units by Number of Rooms,
CNMI: 1990 to 2010
5+ rooms
4 rooms
3 rooms
2 rooms
1 room
0
1,000
2,000
3,000
4,000
5,000
6,000
Occupants per Room by District and Island
1.51 or more
1.01 to 1.50
1.00 or less
11,385
7,7675,037
3,725
2,468
2,2464,183
1,489
2,182
4,0422,837 1,659
0%
10%
20%
30%
40%
50%
60%
70%
80%
90%
100%
2010 2000 1995 1990
Occupants per Room, 1990 to 2010
1.51 or more
1.01 to 1.50
1.00 or less

Page 112 Chapter 9 2015 CNMI Statistical Yearbook
11th Statistical Yearbook, Central Statistics Division, Department of Commerce
Table 9.22 Bedrooms by District and Island, CNMI: 2010
Bedrooms Total
Saipan
Rota Tinian Total Dist. 1 Dist. 2 Dist. 3 Dist. 4 Dist. 5
Total 20,850 18,683 5,479 2,527 6,775 1,379 2,523 1,049 1,118
No bedrooms 2,198 2,008 442 275 1,084 95 112 83 107
1 bedroom 6,021 5,416 1,644 934 2,018 313 507 240 365
2 bedrooms 6,644 5,957 1,682 761 2,056 450 1,008 356 331
3 bedrooms 3,669 3,242 1,055 311 934 315 627 231 196
4 bedrooms 1,374 1,213 429 129 334 138 183 88 73
5 or more bedrooms 944 847 227 117 349 68 86 51 46
Source: U.S. Census Bureau
Table 9.23 Bedrooms by Island, CNMI: 2000 and 2010
Bedrooms
2010 2000
Total Saipan Rota Tinian Total Saipan Rota Tinian
Total 20,850 18,683 1,049 1,118 17,563 15,527 981 1,055
No bedrooms 2,198 2,008 83 107 4,235 3,769 139 327
1 bedroom 6,021 5,416 240 365 4,021 3,547 231 243
2 bedrooms 6,644 5,957 356 331 4,967 4,427 286 254
3 bedrooms 3,669 3,242 231 196 2,657 2,322 200 135
4 bedrooms 1,374 1,213 88 73 989 866 64 59
5 or more bedrooms 944 847 51 46 694 596 61 37
Source: U.S. Census Bureau
Table 9.24 Selected Housing Conditions by District and Island, CNMI: 2010
Conditions Total
Saipan
Rota Tinian Total Dist. 1 Dist. 2 Dist. 3 Dist. 4 Dist. 5
Total 20,850 18,683 5,479 2,527 6,775 1,379 2,523 1,049 1,118
Lacking complete plumbing facilities 2,832 2,562 770 346 906 147 393 78 192
Percent 13.6 13.7 14.1 13.7 13.4 10.7 15.6 7.4 17.2
Lacking complete kitchen facilities 5,585 4,887 1,486 722 1,702 326 651 346 352
Percent 26.8 26.2 27.1 28.6 25.1 23.6 25.8 33.0 31.5
Without air conditioning 5,631 4,739 1,558 742 1,307 324 808 463 429
Percent 27.0 25.4 28.4 29.4 19.3 23.5 32.0 44.1 38.4
Source: U.S. Census Bureau
10.5 10.7
8.1
10.9
16.0
6.9
4.4
7.9
9.6
0.0
2.0
4.0
6.0
8.0
10.0
12.0
14.0
16.0
18.0
Percent No Bedroom by District and Island
10.5 10.77.9
9.6
24.1 24.3
14.2
31.0
0.0
5.0
10.0
15.0
20.0
25.0
30.0
35.0
Total Saipan Rota Tinian Total Saipan Rota Tinian
2010 2000
Percent No Bedroom by Island: 2000 and
2010
0.0
5.0
10.0
15.0
20.0
25.0
30.0
35.0
40.0
45.0
50.0
Selected Housing Conditions by District and
Island
Lacking
complete
plumbing
facilities
Lacking
complete
kitchen
facilities
Without air
conditioning

2015 CNMI Statistical Yearbook Chapter 9 Page 113
11th Statistical Yearbook, Central Statistics Division, Department of Commerce
Table 9.25 Selected Housing Conditions by District and Island, CNMI: 2010
Conditions
2010 2000
Total Saipan Rota Tinian Total Saipan Rota Tinian
Total 20,850 18,683 1,049 1,118 17,566 15,530 981 1,055
Lacking complete plumbing facilities 2,832 2,562 78 192 2,951 2,490 181 280
Percent 13.6 13.7 7.4 17.2 16.8 16.0 18.5 26.5
Lacking complete kitchen facilities 5,585 4,887 346 352 4,377 3,634 359 384
Percent 26.8 26.2 33.0 31.5 24.9 23.4 36.6 36.4
Without air conditioning 5,631 4,739 463 429 5,580 4,655 460 465
Percent 27.0 25.4 44.1 38.4 31.8 30.0 46.9 44.1
Source: U.S. Census Bureau
Table 9.26 Source of Water by District and Island, CNMI: 2010
Source of Water Total
Saipan
Rota Tinian Total Dist. 1 Dist. 2 Dist. 3 Dist. 4 Dist. 5
Total 20,850 18,683 5,479 2,527 6,775 1,379 2,523 1,049 1,118
Public system only 16,405 14,283 4,296 2,081 5,031 985 1,890 1,035 1,087
Public system and catchment 4,006 3,977 1,097 424 1,561 339 556 7 22
Individual well 220 220 49 12 104 36 19 0 0
Catchment, tanks, or drums only 162 150 22 6 67 16 39 4 8
Some other source 57 53 15 4 12 3 19 3 1
Source: U.S. Census Bureau
Table 9.27 Source of Water, CNMI: 1990 to 2010
Plumbing Facilities
Number Percent Change Percent
2010 2000 1995 1990
2000 to
2010
1990 to
2000
1990 to
1995 2010 2000 1995 1990
Total 20,850 18,243 12,804 8,722 14.3 42.5 46.8 100.0 96.3 94.2 94.1
Public system only 16,405 13,403 9,389 5,462 22.4 42.8 71.9 78.7 73.5 73.3 62.6
Public system and catchment 4,006 3,486 1,921 2,236 14.9 81.5 -14.1 19.2 19.1 15.0 25.6
Other source 439 677 747 512
Individual well 220 113 0 123 94.7 0.0 -100.0 1.1 0.6 0.0 1.4
Catchment, tanks, or drums only 162 369 456 267 -56.1 -19.1 70.8 0.8 2.0 3.6 3.1
Other source 57 195 291 122 -70.8 -33.0 138.5 0.3 1.1 2.3 1.4
Source: 1990 CPH-6-CNMI Table 105, 1995 CNMI Mid-Decade Census Table 151 and Census 2000 Population and Housing Profiles
0.0
5.0
10.0
15.0
20.0
25.0
30.0
35.0
40.0
45.0
50.0
Tota
l
Sai
pan
Rota
Tin
ian
Tota
l
Sai
pan
Rota
Tin
ian
2010 2000
Selected Housing Conditions by Island,
CNMI: 2000 and 2010
Lacking
complete
plumbing
facilities
Lacking
complete
kitchen
facilities
Without air
conditioning
Public
system
only
79%
Public
system and
catchment
19%
Individual
well
1%
Catchment,
tanks, or
drums only
1%
Some
other
source
0%
Source of Water
16,40513,403
9,389
5,462
4,006
3,486
1,921
2,236
439
677
747
512
0
5,000
10,000
15,000
20,000
25,000
2010 2000 1995 1990
Source of Water: 1990 to 2010
Other source
Public
system and
catchment
Public
system only

Page 114 Chapter 9 2015 CNMI Statistical Yearbook
11th Statistical Yearbook, Central Statistics Division, Department of Commerce
Table 9.28 Source of Water by Island: 1990 to 2010
Source of Water
Saipan Tinian Rota
2010 2000 1995 1990 2010 2000 1995 1990 2010 2000 1995 1990
Total 18,683 15,527 10,844 7,251 1,118 1,055 544 429 1,049 981 690 509
Public system only 14,283 11,523 8,232 4,646 1,087 975 511 373 1,035 904 642 433
Public system and catchment 3,977 3,417 1,909 2,212 22 49 4 14 7 18 6 10
Individual well 220 109 0 121 0 2 0 1 0 2 0 1
Catchment, tanks, or drums only 150 332 437 151 8 16 10 41 4 21 19 65
Other source 53 146 266 121 1 13 19 0 3 36 23 0
Source: 1990 CPH-6-CNMI Table 105, 1995 CNMI Mid-Decade Census Table 151, Census 2000 Population & Housing Profiles
Table 9.29 Sewage Disposal by District and Island, CNMI: 2010
Sewage Disposal Total
Saipan
Rota Tinian Total Dist. 1 Dist. 2 Dist. 3 Dist. 4 Dist. 5
Total 20,850 18,683 5,479 2,527 6,775 1,379 2,523 1,049 1,118
Public sewer 11,250 10,918 2,825 2,072 4,933 653 435 171 161
Septic tank or cesspool 8,367 6,649 2,351 352 1,490 638 1,818 856 862
Other means 1,233 1,116 303 103 352 88 270 22 95
Source: U.S. Census Bureau
Table 9.30 Sewage Disposal by Island, CNMI: 2000 and 2010
Sewage
Disposal
2010 2000 1995
Total Saipan Rota Tinian Total Saipan Rota Tinian Total Saipan Rota Tinian
Total 20,850 18,683 1,049 1,118 17,566 15,530 981 1,055 14,589 13,048 920 621
Public sewer 11,250 10,918 171 161 8,513 8,168 93 252 4,226 4,174 17 35
Septic tank
or cesspool 8,367 6,649 856 862 7,340 5,926 765 649 6,921 5,852 608 461
Other means 1,233 1,116 22 95 1,713 1,436 123 154 909 818 65 26
Source: U.S. Census Bureau
76.474.2 75.9
64.1
97.2
92.4 93.9
86.9
98.7
92.2 93.0
85.1
50.0
60.0
70.0
80.0
90.0
100.0
2010 2000 1995 1990
Percent on Public Water Syetem Only by Island: 1990
to 2010
Saipan Tinian Rota
2,8252,072
4,933
653 435 171 161
2,351
352
1,490
6381,818
856 862
303
103
352
88
270
22 95
0
1,000
2,000
3,000
4,000
5,000
6,000
7,000
8,000
Sewage Disposal by District and Island
Other
means
Septic
tank or
cesspool
Public
sewer
11,2508,513
4,226
8,367
7,340
6,922
1,233
1,713
909
0
5,000
10,000
15,000
20,000
25,000
2010 2000 1995
Type of Sewage Disposal, CNMI: 1995 to 2010
Other
means
Septic
tank or
cesspool
Public
sewer

2015 CNMI Statistical Yearbook Chapter 9 Page 115
11th Statistical Yearbook, Central Statistics Division, Department of Commerce
Table 9.31 Selected Housing Conditions by District and Island, CNMI: 2010
Conditions Total
Saipan
Rota Tinian Total Dist. 1 Dist. 2 Dist. 3 Dist. 4 Dist. 5
Total 20,850 18,683 5,479 2,527 6,775 1,379 2,523 1,049 1,118
Without telephone service 1,637 1,457 464 226 457 107 203 80 100
Percent 7.9 7.8 8.5 8.9 6.7 7.8 8.0 7.6 8.9
Without battery-operated radio 6,188 5,481 1,681 896 2,143 298 463 339 368
Percent 29.7 29.3 30.7 35.5 31.6 21.6 18.4 32.3 32.9
Without home computer or laptop 9,034 8,241 2,335 1,025 3,235 609 1,037 350 443
Percent 43.3 44.1 42.6 40.6 47.7 44.2 41.1 33.4 39.6
Without internet service 1,979 1,756 593 231 538 143 251 110 113
Percent 9.5 9.4 10.8 9.1 7.9 10.4 9.9 10.5 10.1
Source: U.S. Census Bureau
Table 9.32 Selected Housing Conditions by District and Island, CNMI: 2010
Conditions
2010 2000
Total Saipan Rota Tinian Total Saipan Rota Tinian
Total 20,850 18,683 1,049 1,118 12,057 10,845 690 522
Without telephone service 1,637 1,457 80 100 4,696 4,124 322 250
Percent 7.9 7.8 7.6 8.9 38.9 38.0 46.7 47.9
Without battery-operated radio 6,188 5,481 339 368 1,753 1,593 77 83
Percent 29.7 29.3 32.3 32.9 14.5 14.7 11.2 15.9
Without home computer or laptop 9,034 8,241 350 443 (NA) (NA) (NA) (NA)
Percent 43.3 44.1 33.4 39.6 (NA) (NA) (NA) (NA)
Without internet service 1,979 1,756 110 113 (NA) (NA) (NA) (NA)
Percent 9.5 9.4 10.5 10.1 (NA) (NA) (NA) (NA)
Source: U.S. Census Bureau
Table 9.33 Value of structure by District and Island, CNMI: 2010
Value Total
Saipan
Rota Tinian Total Dist. 1 Dist. 2 Dist. 3 Dist. 4 Dist. 5
Total 4,537 3,906 1,196 317 960 454 979 327 304
Less than $40,000 327 291 81 36 52 33 89 21 15
$40,000 to $49,999 91 78 21 7 13 10 27 8 5
$50,000 to $59,999 311 257 71 28 48 24 86 28 26
$60,000 to $69,999 158 126 32 7 30 9 48 21 11
$70,000 to $79,999 259 214 70 18 38 23 65 26 19
$80,000 to $89,999 309 271 72 19 50 17 113 24 14
$90,000 to $99,999 104 85 27 2 16 13 27 13 6
$100,000 to
$149,999 836 699 220 60 155 91 173 62 75 $150,000 to
$199,999 562 482 179 40 89 59 115 39 41
$200,000 to
$299,999 582 503 166 38 151 47 101 40 39 $300,000 to
$399,999 279 257 97 14 66 37 43 9 13
$400,000 to $499,999 100 90 18 4 39 11 18 7 3
$500,000 or more 619 553 142 44 213 80 74 29 37
Median $123,777 $127,632 $150,690 $120,750 $188,542 $153,646 $105,459 $109,868 $121,212
Source: U.S. Census Bureau
8.58.9
6.77.8 8.0 7.6
8.9
10.8
9.1
7.9
10.4 9.910.5 10.1
0.0
2.0
4.0
6.0
8.0
10.0
12.0
Dist 1 Dist 2 Dist 3 Dist 4 Dist 5 Rota Tinian
Units Without Telephone or Internet Service
by District and Island
Without telephone service Without internet service
7.9 7.8 7.6 8.9
38.9 38.0
46.7 47.9
0.0
10.0
20.0
30.0
40.0
50.0
60.0
Total Saipan Rota Tinian
Percent Units Without Telephone, CNMI:
2000 and 2010
2010 2000
$123,777
$127,632
$150,690
$120,750
$188,542
$153,646
$105,459
$109,868
$121,212
$0
$20,000
$40,000
$60,000
$80,000
$100,000
$120,000
$140,000
$160,000
$180,000
$200,000
Median Value of Structure by District and
Island

Page 116 Chapter 9 2015 CNMI Statistical Yearbook
11th Statistical Yearbook, Central Statistics Division, Department of Commerce
Table 9.34 Mortgage Status by Selected Monthly Owner Costs and District and Island, CNMI: 2010
Value Total
Saipan
Rota Tinian Total Dist. 1 Dist. 2 Dist. 3 Dist. 4 Dist. 5
Total 4,537 3,906 1,196 317 960 454 979 327 304
With a mortgage 1,272 1,092 352 49 228 119 344 98 82
Less than $500 139 111 33 2 11 11 54 18 10
$500 to $599 85 64 18 2 4 9 31 9 12
$600 to $699 89 69 20 3 8 8 30 6 14
$700 to $799 113 92 28 6 14 9 35 12 9
$800 to $899 103 82 30 5 11 2 34 11 10
$900 to $999 84 74 26 2 17 6 23 4 6
$1,000 to $1,249 215 193 64 8 35 27 59 12 10
$1,250 to $1,499 149 132 52 9 33 15 23 10 7
$1,500 to $1,749 103 95 33 2 29 10 21 5 3
$1,750 to $1,999 58 55 20 3 17 6 9 2 1
$2,000 to $2,499 71 67 18 3 23 10 13 4 0
$2,500 to $2,999 19 18 1 2 10 2 3 1 0
$3,000 or more 44 40 9 2 16 4 9 4 0
Without a mortgage 3,265 2,814 844 268 732 335 635 229 222
Source: U.S. Census Bureau
Table 9.35 Median Selected Monthly Owner Costs by District and Island, CNMI: 2010
Value Total
Saipan
Rota Tinian Total Dist. 1 Dist. 2 Dist. 3 Dist. 4 Dist. 5
Total 4,537 3,906 1,196 317 960 454 979 327 304
With a mortgage $1,027 $1,070 $1,082 $1,141 $1,356 $1,134 $865 $836 $756
Without a mortgage $250 $246 $251 $256 $265 $244 $215 $267 $286
Source: U.S. Census Bureau
Table 9.38 Gross Rent by District and Island, CNMI: 2010
Value Total
Saipan
Rota Tinian Total Dist. 1 Dist. 2 Dist. 3 Dist. 4 Dist. 5
Total 11,498 10,500 3,091 1,693 4,223 612 881 428 570
Less than $200 2,499 2,297 749 464 866 127 91 61 141
$200 to $299 1,565 1,445 430 280 602 53 80 54 66
$300 to $399 1,239 1,158 339 192 503 63 61 27 54
$400 to $499 968 907 257 144 388 41 77 26 35
$500 to $599 710 674 197 106 284 34 53 17 19
$600 to $699 501 470 122 47 229 30 42 11 20
$700 to $799 367 349 91 45 151 21 41 9 9
$800 to $899 266 256 60 34 111 16 35 4 6
$900 to $999 193 182 39 29 80 16 18 7 4
$1,000 to $1,249 257 247 68 33 104 23 19 7 3
$1,250 to $1,499 117 114 31 10 49 8 16 3 0
$1,500 or more 123 122 28 16 56 10 12 1 0
No rent paid 2,693 2,279 680 293 800 170 336 201 213
Median $324 $328 $307 $283 $344 $359 $459 $297 $261
Source: U.S. Census Bureau
$1,027
$1,070$1,082
$1,141$1,356
$1,134
$865 $836$756
$0
$200
$400
$600
$800
$1,000
$1,200
$1,400
$1,600
Median Selected Monthly Owner Costs With a
Mortgage by District and Island
$324 $328$307
$283
$344 $359
$459
$297$261
$0
$50
$100
$150
$200
$250
$300
$350
$400
$450
$500
Median Gross Rent by District and Island
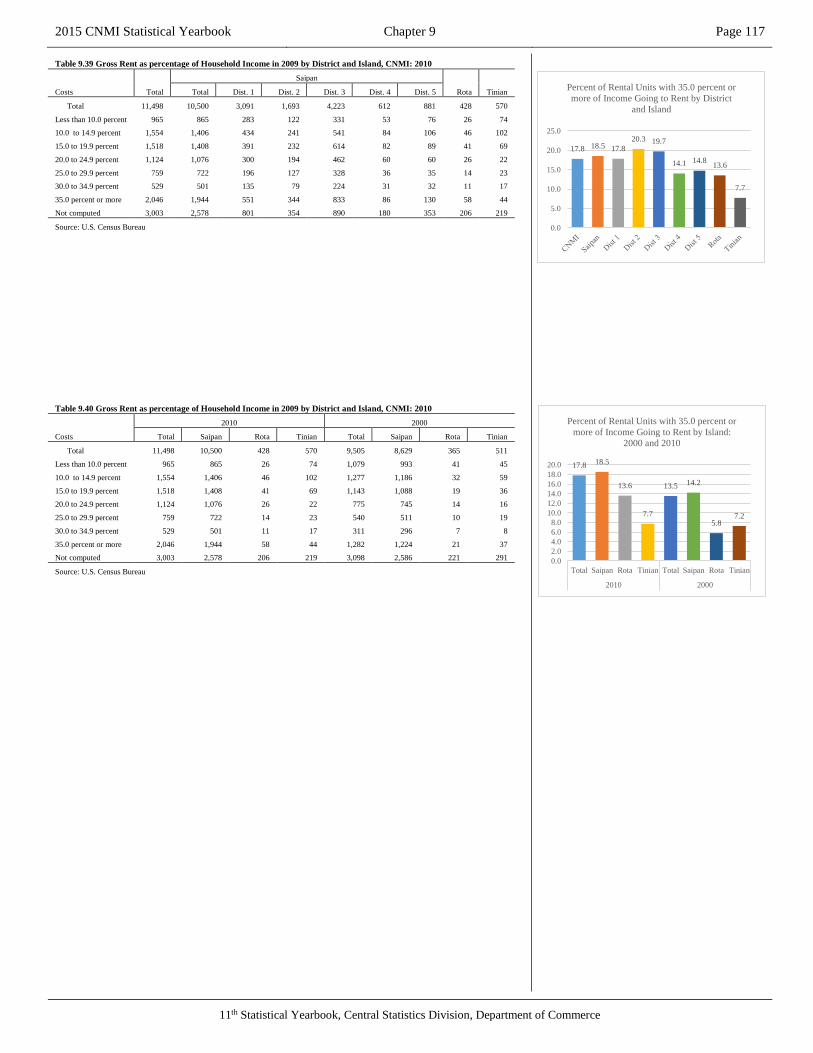
2015 CNMI Statistical Yearbook Chapter 9 Page 117
11th Statistical Yearbook, Central Statistics Division, Department of Commerce
Table 9.39 Gross Rent as percentage of Household Income in 2009 by District and Island, CNMI: 2010
Costs Total
Saipan
Rota Tinian Total Dist. 1 Dist. 2 Dist. 3 Dist. 4 Dist. 5
Total 11,498 10,500 3,091 1,693 4,223 612 881 428 570
Less than 10.0 percent 965 865 283 122 331 53 76 26 74
10.0 to 14.9 percent 1,554 1,406 434 241 541 84 106 46 102
15.0 to 19.9 percent 1,518 1,408 391 232 614 82 89 41 69
20.0 to 24.9 percent 1,124 1,076 300 194 462 60 60 26 22
25.0 to 29.9 percent 759 722 196 127 328 36 35 14 23
30.0 to 34.9 percent 529 501 135 79 224 31 32 11 17
35.0 percent or more 2,046 1,944 551 344 833 86 130 58 44
Not computed 3,003 2,578 801 354 890 180 353 206 219
Source: U.S. Census Bureau
Table 9.40 Gross Rent as percentage of Household Income in 2009 by District and Island, CNMI: 2010
Costs
2010 2000
Total Saipan Rota Tinian Total Saipan Rota Tinian
Total 11,498 10,500 428 570 9,505 8,629 365 511
Less than 10.0 percent 965 865 26 74 1,079 993 41 45
10.0 to 14.9 percent 1,554 1,406 46 102 1,277 1,186 32 59
15.0 to 19.9 percent 1,518 1,408 41 69 1,143 1,088 19 36
20.0 to 24.9 percent 1,124 1,076 26 22 775 745 14 16
25.0 to 29.9 percent 759 722 14 23 540 511 10 19
30.0 to 34.9 percent 529 501 11 17 311 296 7 8
35.0 percent or more 2,046 1,944 58 44 1,282 1,224 21 37
Not computed 3,003 2,578 206 219 3,098 2,586 221 291
Source: U.S. Census Bureau
17.8 18.5 17.8
20.3 19.7
14.1 14.813.6
7.7
0.0
5.0
10.0
15.0
20.0
25.0
Percent of Rental Units with 35.0 percent or
more of Income Going to Rent by District
and Island
17.8 18.5
13.6
7.7
13.5 14.2
5.87.2
0.0
2.0
4.0
6.0
8.0
10.0
12.0
14.0
16.0
18.0
20.0
Total Saipan Rota Tinian Total Saipan Rota Tinian
2010 2000
Percent of Rental Units with 35.0 percent or
more of Income Going to Rent by Island:
2000 and 2010

11th Statistical Yearbook, Central Statistics Division, Department of Commerce
CHAPTER 10
Vehicles

2015 CNMI Statistical Yearbook Chapter 10 Page 119
11th Statistical Yearbook, Central Statistics Division, Department of Commerce
Chapter 10 – Vehicles
The information on vehicles comes from the U.S. Census Decennial census and from the Department of
Public Safety’s Bureau of Motor Vehicles.
Of the 16,000 housing units in the CNMI in 2010, about 3,700 (about 1 in 4) had no vehicle. About 1,200
(about 1 in 12) had 3 or more vehicles. In 1995, about 1 in 10 of the housing units had no vehicle, but in
2000, this ratio changed to about the same 1 in 4 as in 2010. The number of units with 3 or more vehicles
remained about the same in 1995 and 2000 and then increased by about 200 in 2010.
The numbers of vehicles and their characteristics in the CNMI are collected annually, but have not been
passed to yearbook since 2004. The CNMI also collects numbers of taxicabs and landline phone lines but
those also have been reported recently.

Page 120 Chapter 10 2015 CNMI Statistical Yearbook
11th Statistical Yearbook, Central Statistics Division, Department of Commerce
Table 10.1 Vehicles Available by District and Island, CNMI: 2010
Vehicles Available Total
Saipan
Rota Tinian Total Dist. 1 Dist. 2 Dist. 3 Dist. 4 Dist. 5
Total 16,035 14,406 4,287 2,010 5,183 1,066 1,860 755 874
No vehicle available 3,728 3,352 946 621 1,395 143 247 145 231
1 vehicle 7,941 7,152 2,095 1,015 2,552 575 915 380 409
2 vehicles 3,160 2,813 892 277 887 247 510 172 175
3 or more vehicles 1,206 1,089 354 97 349 101 188 58 59
Source: U.S. Census Bureau
Table 10.2 Vehicles Available by Island, CNMI: 2000 and 2010
Vehicles Available
2010 2000 1995
Total Saipan Rota Tinian Total Saipan Rota Tinian Total Saipan Rota Tinian
Total 16,035 14,406 755 874 14,054 12,507 757 790 12,056 10,844 690 522
No vehicle available 3,728 3,352 145 231 3,235 2,873 148 214 1,263 1,136 92 35
1 vehicle 7,941 7,152 380 409 7,035 6,237 374 424 6,985 6,296 360 329
2 vehicles 3,160 2,813 172 175 2,766 2,475 187 104 2,776 2,486 170 120
3 or more vehicles 1,206 1,089 58 59 1,018 922 48 48 1,032 926 68 38
Source: U.S. Census Bureau
Table: 10.3 Registered Motor Vehicles by Type, CNMI: 1989 to 2004
Year Total New Island Dealer Import Renewal Transfer
2004 20,454 1,567 396 15,849 2,448
2003 19,242 1,557 … 407 16,150 1,982
2002 17,349 830 … 279 15,579 5,123
2001 17,900 905 913 289 16,141 5,072
2000 17,616 839 851 279 16,777 4,920
1999 17,717 1,090 876 214 16,627 5,234
1998 19,626 1,806 8 1,798 17,820 5,554
1997 16,096 2,632 1,757 875 13,464 3,678
1996 17,485 2,061 1,415 646 15,424 3,178
1995 15,398 1,879 1,314 565 13,519 0
1994 17,327 1,772 1,288 484 15,555 3,792
1993 16,043 1,662 1,290 372 14,381 3,354
1992 16,566 2,180 1,707 473 14,386 1,744
1991 15,014 3,300 2,798 502 11,714 1,823
1990 13,239 3,572 2,918 654 9,667 1,549
1989 11,357 2,899 2,344 555 8,458 829
Source: Department of Public Safety, Bureau of Motor Vehicles
Note: "..." means data not available
NOTE: Tables will be updated when current data received
3,728 3,2351,263
7,9417,035
6,985
3,160
2,766
2,776
1,206
1,018
1,032
0
2,000
4,000
6,000
8,000
10,000
12,000
14,000
16,000
18,000
2010 2000 1995
Vehicles Available, CNMI: 1995 to 2010
3 or more
vehicles
2 vehicles
1 vehicle
No vehicle
available
23.2 23.322.1
30.9
26.9
13.4 13.3
19.2
26.4
0.0
5.0
10.0
15.0
20.0
25.0
30.0
35.0
Percent No Vehicle Present by Island and District,
CNMI: 2010
-
3,000
6,000
9,000
12,000
15,000
18,000
21,000
2004
2003
2002
2001
2000
1999
1998
1997
1996
1995
1994
1993
1992
1991
1990
1989
Registered Motor Vehicles, CNMI: 1989 to 2004

2015 CNMI Statistical Yearbook Chapter 10 Page 121
11th Statistical Yearbook, Central Statistics Division, Department of Commerce
Table 10.4 Registered Vehicles, Saipan 1990 to 2004
Year Total New Registration Renewal Heavy Equipment
2004 19,242 1,557 14,927 1,212
2003 18,442 1,286 16,150 1,006
2002 17,349 830 15,579 940
2001 17,802 913 16,141 748
2000 17,616 839 16,777 1,118
1999 18,674 1,090 16,627 957
1998 20,729 1,798 17,820 1,111
1997 15,221 1,736 13,266 219
1996 18,644 2,061 15,424 1,159
1995 13,214 1,348 11,489 377
1994 16,167 1,659 14,132 376
1993 17,249 1,676 14,526 1,047
1992 17,372 2,180 14,386 806
1991 15,708 3,300 11,714 694
1990 13,746 3,572 9,657 517
Source: Department of Public Safety, Bureau of Motor Vehicles
NOTE: Tables will be updated when current data received
Table 10.5 Motor Vehicle Registration Renewals, Saipan: 1986 to 2004
Year Total
Sedans, Jeeps,
and Station
wagons
Vans and
Mini-buses
Commercial
buses
Trucks Mopeds and Motorcycles
Total
Light
pickups
and trucks
Heavy
equipment
Combina-
tion Total
Up to
100 cc
Over
100 cc
2004 14,927 8082 2641 1 4127 4127 76 … …
2002 15,579 10,285 693 … 4,536 3,593 940 3 65 … …
2001 16,416 11,019 170 255 4,928 4,313 615 0 44 0 0
2000 15,778 10,052 314 355 5,002 4,512 490 0 55 0 0
1999 16,629 10,987 775 242 4,567 4,061 506 0 58 0 0
1998 17,820 11,381 674 270 5,402 4,876 526 0 93 0 0
1997 13,464 8,848 385 99 4,103 4,004 66 33 29 18 11
1996 15,424 9,538 567 334 4,920 4,125 795 0 65 23 42
1995 11,489 7,246 397 123 3,700 3,126 574 0 23 5 18
1994 14,132 8623 584 165 4,706 3995 711 0 54 25 29
1993 13,831 8,703 538 121 4,408 3,739 653 16 61 15 46
1992 14,402 8,887 517 115 4,818 4,108 696 14 65 12 53
1991 11,712 7,005 438 115 4,082 3,499 568 15 72 11 61
1990 9,665 5,978 349 79 3,175 2,762 400 13 84 52 32
1989 8,355 5,114 315 48 2,799 2,420 378 1 79 41 38
1988 5,392 3,332 167 46 1,785 1,605 180 0 62 53 9
1987 6,810 4,730 145 65 1,748 1,671 71 6 122 77 45
1986 6,239 4,062 106 56 1,944 1,784 149 11 71 30 41
Source: Department of Public Safety, Bureau of Motor Vehicles
Note: 2003 data in this category not available
NOTE: Tables will be updated when current data received

Page 122 Chapter 10 2015 CNMI Statistical Yearbook
11th Statistical Yearbook, Central Statistics Division, Department of Commerce
Table 10.6 Type of Registered Vehicles, Tinian: 1997 to 2004
Type of Vehicle
Year
2004 2003 2002 2001 2000 1999 1998 1997
All vehicles 831 838 776 636 731 735 435 747
Sedan, Jeep, Wagon,
Flatbed and Pickup Truck 725 747 699 632 717 663 398 682
Heavy Equipment 28 6 … 0 5 57 21 28
Scooter, Moped and Motorcycle 25 36 16 4 3 6 15 31
Bus (van or minivan) 53 11 … 0 6 9 1 6
MCSAP 0 … 46 … … … … …
PSSW & PSSV 0 38 15 … … … … …
Source: Department of Public Safety, Office of the Resident Director
Note: "…" means data not available
NOTE: Tables will be updated when current data received
Table 10.7 Type of Vehicles, Rota: 1997 to 2004
Type of Vehicle
Year
2004 2003 2002 2001 2000 1999 1998 1997
All vehicles 556 425 577 848 890 914 519 442
Sedan and wagon 232 155 256 317 415 396 349 219
Pickup including 4x4 206 117 235 362 374 418 97 195
Moped/Scooter 0 4 … 0 0 7 0 1
Buses 6 … 3 0 13 9 0 1
Heavy equipment/MCSAP 16 37 18 34 17 7 17 2
Passenger Van 68 40 38 19 15 28 16 7
Flatbed truck 4 0 5 0 0 4 4 …
Jeep 12 10 12 29 11 42 36 15
Motorcycle 12 * 10 1 0 3 0 2
Others 0 62 … 86 45 0 0 0
Source: Department of Public Safety, Motor Vehicle Section
Note: "…" means data not available
Note: "*" means 2003 data combined for Moped and Scooter
NOTE: Tables will be updated when current data received
Table 10.8 Registered and Inspected Government Vehicles by Type, Saipan: 1984 to 2004
Year Total Motorcycle Sedan Jeep Pickup
Trucks &
H.E.
Station
Wagon Van Bus
2004 225 … 86 68 2 4 63 1
2003 234 … … … … … … … …
2002 502 3 156 7 171 8 0 153 4
2001 421 0 126 8 180 4 74 0 29
1999 539 0 158 44 180 41 74 33 9
1998 188 0 53 8 66 9 46 0 6
1997 287 0 141 39 37 0 37 19 14
1996 169 0 75 21 31 12 25 2 3
1995 322 0 116 42 88 21 43 6 6
1994 523 2 156 19 199 25 59 30 33
1993 573 6 184 17 181 45 64 38 38
1992 590 3 212 22 202 46 41 41 23
1991 597 8 184 41 208 59 43 30 24
1990 187 0 69 8 61 36 6 7 0
1989* 104 4 27 24 25 11 8 5 0
1988 348 3 106 19 142 16 27 18 17
1987 31 0 8 2 15 3 1 2 0
1986 30 3 15 0 6 0 4 1 1
1985 17 0 7 1 6 0 1 2 0
1984 28 0 6 1 7 0 1 0 13
Source: Department of Public Safety, Bureau of Motor Vehicles
Note: 2000 data not available
Note: "…" mean data not submitted by type, only total figure was given
NOTE: Tables will be updated when current data received

2015 CNMI Statistical Yearbook Chapter 10 Page 123
11th Statistical Yearbook, Central Statistics Division, Department of Commerce
Table 10.9 Taxicabs by Type of Registration, CNMI: CY 1992 to CY 2004
Year Total New Renewal Non-Renewal
2004 203 43 103 57
2003 186 33 120 33
2002 224 7 179 38
2001 256 18 189 49
2000 232 43 169 20
1999 308 0 84 224
1998 300 0 300 0
1997 530 0 332 198
1996 520 0 520 0
1995 239 0 239 0
1994 49 0 32 17
1993 95 0 68 27
1992 124 0 104 20
Source: Department of Commerce, Enforcement and Compliance Division-Taxicabs
Note: New registered taxicabs were not recorded from Years 1992 to 1999
Note: Data for Non-Renewal is classified as Deregistered for the year 2003 only
NOTE: Tables will be updated when current data received
Table 10.10 Number of Installed Telephones by Type of Subscribers, CNMI: 1982 to 2004
Year Total Residential Subscribers Business Subscribers
2004 23,662 11,803 11,859
2003 29,747 11,645 18,102
2001 25,306 11,322 13,984
2000 24,890 11,113 13,777
1999 25,025 11,132 13,893
1998 22,579 10,733 11,846
1997 16,306 10,242 6,064
1996 14,567 9,052 5,515
1995 15,460 8,038 7,422
1994 14,358 7,356 7,002
1993 13,618 6,919 6,699
1992 12,971 6,999 5,972
1991 12,240 6,761 5,479
1990 9,773 5,264 4,509
1989 7,232 3,826 3,406
1988 5,634 3,334 2,300
1987 5,022 2,819 2,203
1986 4,576 2,870 1,706
1985 2,389 1,264 1,125
1984 2,245 1,214 1,031
1983 1,829 1,012 817
1982 1,603 879 724
Source: Verizon, Saipan
Note: 2002 data incomplete so they are not shown
NOTE: Tables will be updated when current data received

11th Statistical Yearbook, Central Statistics Division, Department of Commerce
CHAPTER 11
Trade

2015 CNMI Statistical Yearbook Chapter 11 Page 125
11th Statistical Yearbook, Central Statistics Division, Department of Commerce
Chapter 11 – Trade
Information on trade statistics comes from the U.S. Census Bureau’s Economic Census taken every 5 years.
The number of establishments in the CNMI increased from 800 in 1987 to more than 1,300 in 2012. The
biggest increase was between 1987 and 1992 because of the rise of the garment factories and other businesses
associated with those factories. Sales increased from about $400 million in 1987 to about $2 billion in 1997
before decreasing to about $1.3 billion in 2007 and continuing at that level in 2012. The annual payroll
increased from about $57 million in 1987 to $381 million in 2002 before decreasing to about $200 million in
2012. And the number of paid employees was less than 10,000 in 1987, but doubled in 5 years, and went up
about the same amount again in 1997. The number of paid employees peaked in 2002 at about 33,000 before
decreasing to about 14,000 in 2012.
In the 2012 Economic census, service industries had by far the largest number of employees at about 9,600,
followed by retail trade (2,500), construction (820), wholesale trade (720), and finally manufacturing (590).
This last was somewhat astounding. The number in manufacturing in 1987 was 2,300, but increased to 6,300
in 1992, and then 13,700 in 1997. The number peaked at 17,000 in 2002, and then decreased rapidly to 7,100
in 2007 and the aforementioned 600 in 2012. So, manufacturing increased rapidly with the garment factories,
and then decreased to even lower levels after their departure.
In 2012, the largest number of establishments were in retail trade (284), followed by real estate (177), and
accommodations and food services (142). Retail trade highest the value of sales at $314 million, followed
by wholesale trade ($247 million), and Accommodations ($180 million). Series on distributions for selected
industries go back to 2002. More detailed industries are also presented.
The 1,068 corporations were 80 percent of all the businesses and legal organizations in the 2012 census. Of
the 1,339 establishments, 203 (15 percent) had sales and receipts of $1 million or more. Of these establish-
ments, 14 had no paid employees, 674 (about half) had 1 to 4 employees, 302 had 5 to 9 employees, 206 had
10 to 19 employees, and 143 (11 percent) had 20 employees or more. About 550 of the establishments were
reported as male-owned, 260 s female-owned, 140 as 50/50 male-female, 62 with gender unknown, and 327
with gender unreported.
The census reported 221 CNMI-born owned establishments and 135 other U.S. citizen-owned businesses, so
about 2 out of every 5 establishments. The census all showed 114 Chinese citizen businesses as well as 104
Japanese, 61 Filipino, 122 Korean, 42 dual or other citizen-owned establishments, as well as 339 citizenship
either not reported or unknown. The census also reported on the classes of consumers crossed by type of
establishment, as well as capital expenditures and depreciation charges.
The CNMI Division of Revenue and Taxation in the Department of Finance reports Business Licenses issued,
but the data here are not complete, and will be updated when newer data are available. Banking activities
are also lacking for recent years. Inbound and outbound cargo information is collected by the Commonwealth
Ports Authority, but those data are also not current.

Page 126 Chapter 11 2015 CNMI Statistical Yearbook
11th Statistical Yearbook, Central Statistics Division, Department of Commerce
Table 11.1 General Statistics for Selected Industries, CNMI: 1987 to 2012
Number of Establishments Sales and receipts ($1,000) Annual Payroll ($1,000)
Number of paid Employ-
ees
2012 1,339 2012 1,323,742 2012 208,434 2012 14,215
2007 1,191 2007 1,284,188 2007 246,113 2007 22,622
2002 1,276 2002 1,832,130 2002 381,575 2002 32,790
1997 1,232 1997 2,082,740 1997 323,069 1997 28,906
1992 1,266 1992 1,132,039 1992 161,184 1992 20,105
1987 768 1987 373,946 1987 57,311 1987 9,090
Construction
2012 62 2,012 37,230 2,012 7,707 2,012 821
2007 50 2,007 31,398 2,007 6,844 2,007 528
2002 63 2,002 50,008 2,002 11,276 2,002 1,013
1997 85 1997 87,942 1997 21,471 1997 2,302
1992 103 1992 87,602 1992 17,712 1992 3,036
1987 72 1987 43,488 1987 11,572 1987 2,061
Manufacturing
2012 39 2,012 20,887 2,012 6,700 2,012 592
2007 59 2,007 189,715 2,007 56,565 2,007 7,094
2002 78 2,002 665,774 2,002 184,706 2,002 16,941
1997 84 1997 762,080 1997 146,583 1997 13,715
1992 73 1992 264,467 1992 48,652 1992 6,267
1987 39 1987 58,138 1987 14,495 1987 2,257
Wholesale Trade
2012 74 2,012 246,827 2,012 10,746 2,012 716
2007 72 2,007 142,929 2,007 10,044 2,007 872
2002 78 2,002 122,634 2,002 8,820 2,002 849
1997 57 1997 222,655 1997 9,417 1997 745
1992 60 1992 132,095 1992 5,877 1992 534
1987 28 1987 49,746 1987 1,598 1987 187
Retail Trade
2012 284 2,012 314,066 2,012 30,662 2,012 2,463
2007 255 2,007 271,763 2,007 28,578 2,007 2,770
2002 297 2,002 312,384 2,002 29,309 2,002 2,916
1997 519 1997 570,266 1997 54,186 1997 4,811
1992 616 1992 384,354 1992 37,969 1992 4,715
1987 383 1987 155,378 1987 14,138 1987 2,304
Service Industries and others
2012 880 2,012 704,732 2,012 152,619 2,012 9,623
2007 755 2,007 648,383 2,007 144,082 2,007 11,358
2002 760 2,002 681,330 2,002 147,464 2,002 11,071
1997 457 1997 439,797 1997 91,412 1997 7,333
1992 414 1992 263,521 1992 50,974 1992 5,553
1987 246 1987 67,196 1987 15,508 1987 2,281
Source: CNMI Economic Censuses
1,339
1,1911,276
1,232 1,266
768
0
200
400
600
800
1,000
1,200
1,400
1,600
2012 2007 2002 1997 1992 1987
Number of Establishments: 1987 to 2012
0
500,000
1,000,000
1,500,000
2,000,000
2,500,000
2012 2007 2002 1997 1992 1987
Sales and receipts ($1,000): 1987 to 2012
0
50,000
100,000
150,000
200,000
250,000
300,000
350,000
400,000
450,000
2012 2007 2002 1997 1992 1987
Annual Payroll ($1,000): 1987 to 2012
14,215
22,622
32,790
28,906
20,105
9,090
0
5,000
10,000
15,000
20,000
25,000
30,000
35,000
2012 2007 2002 1997 1992 1987
Number of Paid Employees: 1987 to 2012

2015 CNMI Statistical Yearbook Chapter 11 Page 127
11th Statistical Yearbook, Central Statistics Division, Department of Commerce
Table 11.2a Comparative Statistics by Type of Business, CNMI: 2012
Industry
2012
Establishments
Value of sales, re-
ceipts, revenue,
shipments, or
business done
($1,000)
Annual payroll
($1,000)
Paid employees
pay period incl
March 12
Total for all sectors 1,339 1,323,742 208,434 14,215
Mining, quarrying, and oil and
gas extraction 1 D D b
Utilities 6 D D e
Construction 62 37,230 7,707 821
Manufacturing 39 20,887 6,700 592
Wholesale trade 74 246,827 10,746 716
Retail trade 284 314,066 30,662 2,463
Transportation and warehous-
ing 26 46,438 11,387 641
Information 20 25,138 8,384 323
Finance and insurance 47 57,560 8,559 327
Real estate and rental and leas-
ing 177 30,675 8,305 694
Professional, scientific, and
technical services 105 28,703 9,710 602
Management of companies and
enterprises 4 D D b
Administrative and support
and waste management and
remediation services 115 50,913 17,689 1,396
Educational services 43 4,979 1,582 133
Health care and social assis-
tance 36 41,349 19,656 725
Arts, entertainment, and recre-
ation 43 37,467 7,160 497
Accommodation and food ser-
vices 142 179,975 37,761 3,195
Other services (except public
administration) 115 20,636 6,517 576
Source: U.S. Census Bureau, 2002, 2007 and 2012 Economic Census of Island Areas
D Withheld to avoid disclosing data for individual companies; data are included in higher level totals
f 500 to 999 employees
e 250 to 499 employees
c 100 to 249 employees
b 20 to 99 employees
a 0 to 19 employees

Page 128 Chapter 11 2015 CNMI Statistical Yearbook
11th Statistical Yearbook, Central Statistics Division, Department of Commerce
Table 11.2b Comparative Statistics by Type of Business, CNMI: 2007
Industry
2007
Establishments
Value of sales, re-
ceipts, revenue, ship-
ments, or business
done ($1,000)
Annual payroll
($1,000)
Paid employees pay
period incl March 12
Total for all sectors 1,191 1,284,188 246,113 22,622
Mining, quarrying, and oil and gas
extraction 1 D D a
Utilities 4 D D e
Construction 50 31,398 6,844 528
Manufacturing 59 189,715 56,565 7,094
Wholesale trade 72 142,929 10,044 872
Retail trade 255 271,763 28,578 2,770
Transportation and warehousing 59 50,178 15,636 1,105
Information 24 66,968 12,884 604
Finance and insurance 60 97,436 12,769 536
Real estate and rental and leasing 109 30,649 7,854 637
Professional, scientific, and tech-
nical services 87 24,961 8,685 404
Management of companies and
enterprises 5 D D b
Administrative and support and
waste management and remedi-
ation services 75 41,185 15,611 1,358
Educational services 44 3,567 1,215 136
Health care and social assistance 32 13,842 4,427 267
Arts, entertainment, and recreation 48 22,602 5,854 580
Accommodation and food services 140 172,682 44,806 4,772
Other services (except public ad-
ministration) 67 17,388 5,190 547
Source: U.S. Census Bureau, 2002, 2007 and 2012 Economic Census of Island Areas
D Withheld to avoid disclosing data for individual companies; data are included in higher level totals
f 500 to 999 employees
e 250 to 499 employees
c 100 to 249 employees
b 20 to 99 employees
a 0 to 19 employees

2015 CNMI Statistical Yearbook Chapter 11 Page 129
11th Statistical Yearbook, Central Statistics Division, Department of Commerce
Table 11.2c Comparative Statistics by Type of Business, CNMI: 2002
Industry
2002
Establishments
Value of sales, re-
ceipts, revenue,
shipments, or busi-
ness done ($1,000)
Annual payroll
($1,000)
Paid employees pay
period incl March
12
Total for all sectors 1,276 1,832,130 381,575 32,790
Mining, quarrying, and oil and gas ex-
traction 3 D D b
Utilities 2 D D e
Construction 63 50,008 11,276 1,013
Manufacturing 78 665,774 184,706 16,941
Wholesale trade 78 122,634 8,820 849
Retail trade 297 312,384 29,309 2,916
Transportation and warehousing 48 58,361 13,816 919
Information 21 48,486 6,650 306
Finance and insurance 54 53,748 8,409 419
Real estate and rental and leasing 108 27,499 6,266 573
Professional, scientific, and technical
services 93 30,819 7,658 373
Management of companies and enter-
prises 4 31,844 514 21
Administrative and support and waste
management and remediation services 83 72,024 25,908 2,001
Educational services 31 D D c
Health care and social assistance 26 15,568 3,666 194
Arts, entertainment, and recreation 45 29,316 6,418 662
Accommodation and food services 151 197,187 47,275 4,304
Other services (except public administra-
tion) 91 35,738 7,563 773
Source: U.S. Census Bureau, 2002, 2007 and 2012 Economic Census of Island Areas
D Withheld to avoid disclosing data for individual companies; data are included in higher level totals
f 500 to 999 employees
e 250 to 499 employees
c 100 to 249 employees
b 20 to 99 employees
a 0 to 19 employees

Page 130 Chapter 11 2015 CNMI Statistical Yearbook
11th Statistical Yearbook, Central Statistics Division, Department of Commerce
Table 11.3a General Characteristics by Sector and Subsector, CNMI: 2012
Sector and Subsector
Number of
establish-
ments
Value of
sales, re-
ceipts, reve-
nue, ship-
ments, or
business
done
($1,000)
Annual pay-
roll ($1,000)
First-quarter
payroll
($1,000)
Payroll taxes
& other em-
ployee bene-
fits ($1,000)
Voluntarily
provided
benefits
($1,000)
Total for all sectors 1,339 1,323,742 208,434 51,887 17,327 17,032
Mining, quarrying, and oil and gas
extraction 1 D D D D D
Utilities 6 D D D D D
Utilities 6 D D D D D
Electric power generation, trans-
mission and distribution 5 D D D D D
Water, sewage and other systems 1 D D D D D
Construction 62 37,230 7,707 2,009 786 148
Construction of buildings 43 14,576 3,383 908 528 58
Heavy and civil engineering con-
struction 4 2,659 392 101 31 S
Specialty trade contractors 15 19,995 3,932 1,001 226 67
Manufacturing 39 20,887 6,700 1,738 470 338
Food manufacturing 9 3,702 1,198 288 54 S
Beverage and tobacco product man-
ufacturing 6 3,507 751 159 48 32
Textile mills 1 D D D D D
Apparel manufacturing 3 D D D D D
Printing and related support activi-
ties 10 3,329 1,295 341 99 26
Nonmetallic mineral product manu-
facturing 6 3,859 1,364 357 102 79
Fabricated metal product manufac-
turing 1 D D D D D
Electrical equipment, appliance,
and component manufacturing 1 D D D D D
Transportation equipment manufac-
turing 2 D D D D D
Wholesale trade 74 246,827 10,746 2,685 1,105 1,302
Merchant wholesalers, durable
goods 24 18,851 2,355 601 506 328
Merchant wholesalers, nondurable
goods 48 226,008 8,275 2,052 588 959
Paper and paper product merchant
wholesalers 2 D D D D D
Drugs and druggists' sundries
merchant wholesalers 2 D D D D D
Apparel, piece goods, and notions
merchant wholesalers 1 D D D D D
Grocery and related product mer-
chant wholesalers 27 85,940 5,193 1,257 394 536
Petroleum and petroleum prod-
ucts merchant wholesalers 5 D D D D D
Beer, wine, and distilled alcoholic
beverage merchant wholesalers 3 D D D D D
Miscellaneous nondurable goods
merchant wholesalers 8 14,595 645 150 36 61
Wholesale electronic markets and
agents and brokers 2 D D D D D
Source: U.S. Census Bureau, 2012 Economic Census of Island Areas
X Not applicable (for the Commodity Flow Survey, not applicable or comparison data unavailable)
D Withheld to avoid disclosing data for individual companies; data are included in higher level totals
f 500 to 999 employees
e 250 to 499 employees
c 100 to 249 employees
b 20 to 99 employees
a 0 to 19 employees

2015 CNMI Statistical Yearbook Chapter 11 Page 131
11th Statistical Yearbook, Central Statistics Division, Department of Commerce
Table 11.3b General Characteristics by Sector and Subsector, CNMI: 2012
Sector and Subsector
Number of es-
tablishments
Paid employees
for pay period
including March
12 (number)
Operating ex-
penses ($1,000)
Total invento-
ries, beginning-
of-year ($1,000)
Total invento-
ries, end-of-year
($1,000)
Total for all sectors 1,339 14,215 653,399 X X
Mining, quarrying, and oil and gas
extraction 1 b D X X
Utilities 6 e D X X
Utilities 6 e D X X
Electric power generation, trans-
mission and distribution 5 e D X X
Water, sewage and other systems 1 a D X X
Construction 62 821 13,840 10,631 7,558
Construction of buildings 43 480 6,780 3,273 2,833
Heavy and civil engineering con-
struction 4 39 1,044 674 601
Specialty trade contractors 15 302 6,016 6,684 4,125
Manufacturing 39 592 15,547 3,086 4,128
Food manufacturing 9 125 2,397 669 501
Beverage and tobacco product
manufacturing 6 125 1,994 431 451
Textile mills 1 a D D D
Apparel manufacturing 3 a D D D
Printing and related support activi-
ties 10 151 1,820 455 452
Nonmetallic mineral product manu-
facturing 6 88 4,091 1,142 2,287
Fabricated metal product manufac-
turing 1 a D D D
Electrical equipment, appliance,
and component manufacturing 1 b D D D
Transportation equipment manufac-
turing 2 b D D D
Wholesale trade 74 716 42,987 37,572 43,684
Merchant wholesalers, durable
goods 24 174 5,958 7,760 6,895
Merchant wholesalers, nondurable
goods 48 530 36,913 29,733 36,455
Paper and paper product mer-
chant wholesalers 2 a D D D
Drugs and druggists' sundries
merchant wholesalers 2 a D D D
Apparel, piece goods, and notions
merchant wholesalers 1 a D D D
Grocery and related product mer-
chant wholesalers 27 392 16,988 14,784 15,208
Petroleum and petroleum prod-
ucts merchant wholesalers 5 b D D D
Beer, wine, and distilled alcoholic
beverage merchant wholesalers 3 b D D D
Miscellaneous nondurable goods
merchant wholesalers 8 44 1,864 846 1,470
Wholesale electronic markets and
agents and brokers 2 a D D D
Source: U.S. Census Bureau, 2012 Economic Census of Island Areas
X Not applicable (for the Commodity Flow Survey, not applicable or comparison data unavailable)
D Withheld to avoid disclosing data for individual companies; data are included in higher level totals
f 500 to 999 employees
e 250 to 499 employees
c 100 to 249 employees
b 20 to 99 employees
a 0 to 19 employees

Page 132 Chapter 11 2015 CNMI Statistical Yearbook
11th Statistical Yearbook, Central Statistics Division, Department of Commerce
Table 11.3c General Characteristics by Sector and Subsector, CNMI: 2012
Sector and Subsector
Number of
establish-
ments
Value of
sales, re-
ceipts, reve-
nue, ship-
ments, or
business
done
($1,000)
Annual pay-
roll ($1,000)
First-quarter
payroll
($1,000)
Payroll taxes
& other em-
ployee bene-
fits ($1,000)
Voluntarily
provided
benefits
($1,000)
Total for all sectors 1,339 1,323,742 208,434 51,887 17,327 17,032
Retail trade 284 314,066 30,662 8,002 2,471 2,075
Motor vehicle and parts dealers 16 18,747 2,434 625 159 196
Automobile dealers 3 14,295 1,852 484 113 160
Other motor vehicle dealers 1 D D D D D
Automotive parts, accessories,
and tire stores 12 4,012 533 130 43 33
Electronics and appliance stores 11 7,083 1,772 432 182 66
Building material and garden
equipment and supplies dealers 11 11,838 1,612 446 143 94
Food and beverage stores 79 68,108 6,541 1,535 406 139
Grocery stores 72 61,578 5,879 1,386 380 130
Specialty food stores 6 6,313 632 142 24 S
Beer, wine, and liquor stores 1 D D D D D
Health and personal care stores 6 11,492 1,707 381 137 83
Gasoline stations 22 23,279 2,413 599 203 114
Clothing and clothing accessories
stores 47 38,810 2,694 732 328 288
Clothing stores 33 18,020 1,509 436 223 184
Women's clothing stores 7 7,157 451 136 109 97
Children's and infants' clothing
stores 1 D D D D D
Family clothing stores 17 2,852 469 128 43 28
Clothing accessories stores 4 D D D D D
Other clothing stores 4 569 57 15 S S
Shoe stores 4 3,135 345 86 31 20
Jewelry, luggage, and leather
goods stores 10 17,655 840 210 74 85
Jewelry stores 7 2,893 287 75 24 25
Luggage and leather goods
stores 3 14,762 552 135 51 59
Sporting goods, hobby, musical in-
strument, and book stores 11 4,100 808 213 54 69
Sporting goods, hobby, and musi-
cal instrument stores 8 2,495 649 166 42 56
Book stores and news dealers 3 1,605 159 46 S 14
General merchandise stores 43 109,117 8,054 2,467 617 807
Source: U.S. Census Bureau, 2012 Economic Census of Island Areas
X Not applicable (for the Commodity Flow Survey, not applicable or comparison data unavailable)
D Withheld to avoid disclosing data for individual companies; data are included in higher level totals
f 500 to 999 employees
e 250 to 499 employees
c 100 to 249 employees
b 20 to 99 employees
a 0 to 19 employees

2015 CNMI Statistical Yearbook Chapter 11 Page 133
11th Statistical Yearbook, Central Statistics Division, Department of Commerce
Table 11.3d General Characteristics by Sector and Subsector, CNMI: 2012
Sector and Subsector
Number of es-
tablishments
Paid employees
for pay period
including March
12 (number)
Operating ex-
penses ($1,000)
Total invento-
ries, beginning-
of-year ($1,000)
Total invento-
ries, end-of-year
($1,000)
Total for all sectors 1,339 14,215 653,399 X X
Retail trade 284 2,463 85,294 78,984 91,713
Motor vehicle and parts dealers 16 152 5,035 10,838 12,133
Automobile dealers 3 104 3,944 5,637 5,442
Other motor vehicle dealers 1 a D D D
Automotive parts, accessories,
and tire stores 12 44 1,038 5,201 6,540
Electronics and appliance stores 11 77 3,112 2,055 2,138
Building material and garden
equipment and supplies dealers 11 140 2,692 6,164 6,224
Food and beverage stores 79 613 18,090 19,885 17,695
Grocery stores 72 551 17,003 19,559 16,764
Specialty food stores 6 59 1,011 114 600
Beer, wine, and liquor stores 1 a D D D
Health and personal care stores 6 87 5,662 2,501 2,865
Gasoline stations 22 327 7,059 200 7,519
Clothing and clothing accessories
stores 47 227 10,209 8,901 11,142
Clothing stores 33 147 5,328 3,447 5,087
Women's clothing stores 7 43 2,620 950 956
Children's and infants' clothing
stores 1 a D D D
Family clothing stores 17 68 1,278 1,423 1,835
Clothing accessories stores 4 b D D D
Other clothing stores 4 a 163 0 164
Shoe stores 4 35 945 715 588
Jewelry, luggage, and leather
goods stores 10 46 3,936 4,739 5,468
Jewelry stores 7 23 497 1,753 1,854
Luggage and leather goods
stores 3 22 3,440 2,985 3,614
Sporting goods, hobby, musical in-
strument, and book stores 11 61 1,729 836 1,176
Sporting goods, hobby, and musi-
cal instrument stores 8 54 1,199 767 831
Book stores and news dealers 3 a 530 70 345
General merchandise stores 43 546 23,975 21,581 23,644
Source: U.S. Census Bureau, 2012 Economic Census of Island Areas
X Not applicable (for the Commodity Flow Survey, not applicable or comparison data unavailable)
D Withheld to avoid disclosing data for individual companies; data are included in higher level totals
f 500 to 999 employees
e 250 to 499 employees
c 100 to 249 employees
b 20 to 99 employees
a 0 to 19 employees

Page 134 Chapter 11 2015 CNMI Statistical Yearbook
11th Statistical Yearbook, Central Statistics Division, Department of Commerce
Table 11.3e General Characteristics by Sector and Subsector, CNMI: 2012
Sector and Subsector
Number
of estab-
lishments
Value of
sales, re-
ceipts,
revenue,
ship-
ments, or
business
done
($1,000)
Annual
payroll
($1,000)
First-
quarter
payroll
($1,000)
Payroll
taxes &
other em-
ployee
benefits
($1,000)
Voluntar-
ily pro-
vided
benefits
($1,000)
Total for all sectors 1,339 1,323,742 208,434 51,887 17,327 17,032
Miscellaneous store retailers 27 15,595 2,046 426 187 185
Florists 4 558 161 33 16 S
Office supplies, stationery,
and gift stores 21 14,941 1,856 385 170 173
Other miscellaneous store re-
tailers 2 D D D D D
Nonstore retailers 11 5,898 580 147 55 34
Transportation and warehousing 26 46,438 11,387 2,847 924 1,540
Truck transportation 1 D D D D D
Transit and ground passenger
transportation 2 D D D D D
Scenic and sightseeing transpor-
tation 3 D D D D D
Support activities for transporta-
tion 19 44,749 10,906 2,721 880 1,453
Support activities for air trans-
portation 6 25,538 7,825 1,964 659 1,192
Support activities for water
transportation 4 6,957 1,586 417 133 56
Freight transportation arrange-
ment 9 12,254 1,494 340 87 S
Couriers and messengers 1 D D D D D
Information 20 25,138 8,384 2,064 650 506
Publishing industries (except in-
ternet) 2 D D D D D
Motion picture and sound re-
cording industries 2 D D D D D
Broadcasting (except internet) 7 2,492 887 204 98 48
Telecommunications 4 D D D D D
Data processing, hosting, and
related services 3 155 53 19 S S
Other information services 2 D D D D D
Finance and insurance 47 57,560 8,559 2,238 730 823
Credit intermediation and re-
lated activities 24 18,937 4,628 1,235 371 429
Depository credit intermediation 14 16,625 3,855 1,039 310 364
Nondepository credit intermedi-
ation 10 2,312 772 196 60 64
Securities, commodity contracts,
and other financial investments
and related activities 3 D D D D D
Insurance carriers and related
activities 20 16,397 3,139 807 294 318
Insurance carriers 3 D D D D D
Agencies, brokerages, and
other insurance related activi-
ties 17 11,286 2,285 588 230 240
Source: U.S. Census Bureau, 2012 Economic Census of Island Areas
X Not applicable (for the Commodity Flow Survey, not applicable or comparison data unavailable)
D Withheld to avoid disclosing data for individual companies; data are included in higher level totals
f 500 to 999 employees
e 250 to 499 employees
c 100 to 249 employees
b 20 to 99 employees
a 0 to 19 employees

2015 CNMI Statistical Yearbook Chapter 11 Page 135
11th Statistical Yearbook, Central Statistics Division, Department of Commerce
Table 11.3f General Characteristics by Sector and Subsector, CNMI: 2012
Sector and Subsector
Number of
establish-
ments
Paid employ-
ees for pay
period in-
cluding
March 12
(number)
Operating
expenses
($1,000)
Total inven-
tories, begin-
ning-of-year
($1,000)
Total inven-
tories, end-
of-year
($1,000)
Total for all sectors 1,339 14,215 653,399 X X
Miscellaneous store retailers 27 186 6,451 5,793 6,469
Florists 4 15 290 203 201
Office supplies, stationery,
and gift stores 21 166 6,114 5,559 6,226
Other miscellaneous store re-
tailers 2 a D D D
Nonstore retailers 11 50 1,281 231 710
Transportation and warehousing 26 641 25,232 101 111
Truck transportation 1 a D D D
Transit and ground passenger
transportation 2 a D D D
Scenic and sightseeing transpor-
tation 3 b D D D
Support activities for transporta-
tion 19 563 23,921 84 92
Support activities for air trans-
portation 6 350 14,990 61 75
Support activities for water
transportation 4 125 5,445 0 0
Freight transportation arrange-
ment 9 86 3,485 S S
Couriers and messengers 1 a D D D
Information 20 323 17,734 1,108 1,064
Publishing industries (except in-
ternet) 2 a D D D
Motion picture and sound re-
cording industries 2 a D D D
Broadcasting (except internet) 7 49 1,531 43 32
Telecommunications 4 c D D D
Data processing, hosting, and
related services 3 a 77 0 S
Other information services 2 b D D D
Finance and insurance 47 327 22,803 X X
Credit intermediation and re-
lated activities 24 175 12,152 X X
Depository credit intermediation 14 131 10,588 X X
Nondepository credit intermedi-
ation 10 44 1,564 X X
Securities, commodity contracts,
and other financial investments
and related activities 3 a D X X
Insurance carriers and related
activities 20 134 8,304 X X
Insurance carriers 3 b D X X
Agencies, brokerages, and
other insurance related activi-
ties 17 103 5,912 X X
Source: U.S. Census Bureau, 2012 Economic Census of Island Areas
X Not applicable (for the Commodity Flow Survey, not applicable or comparison data unavailable)
D Withheld to avoid disclosing data for individual companies; data are included in higher level totals
f 500 to 999 employees
e 250 to 499 employees
c 100 to 249 employees
b 20 to 99 employees
a 0 to 19 employees

Page 136 Chapter 11 2015 CNMI Statistical Yearbook
11th Statistical Yearbook, Central Statistics Division, Department of Commerce
Table 11.3g General Characteristics by Sector and Subsector, CNMI: 2012
Sector and Subsector
Number
of estab-
lishments
Value of
sales, re-
ceipts,
revenue,
ship-
ments, or
business
done
($1,000)
Annual
payroll
($1,000)
First-
quarter
payroll
($1,000)
Payroll
taxes &
other em-
ployee
benefits
($1,000)
Voluntar-
ily pro-
vided
benefits
($1,000)
Total for all sectors 1,339 1,323,742 208,434 51,887 17,327 17,032
Real estate and rental and leasing 177 30,675 8,305 1,932 897 549
Real estate 148 21,217 5,944 1,370 587 405
Lessors of real estate 142 20,674 5,682 1,290 568 397
Offices of real estate agents
and brokers 3 364 182 53 S S
Activities related to real estate 3 180 79 27 S S
Rental and leasing services 29 9,457 2,360 561 309 144
Automotive equipment rental
and leasing 13 3,877 899 212 126 S
Consumer goods rental 8 3,938 877 216 140 78
Commercial and industrial
machinery and equipment
rental and leasing 8 1,642 586 134 44 S
Professional, scientific, and tech-
nical services 105 28,703 9,710 2,394 934 495
Professional, scientific, and
technical services 105 28,703 9,710 2,394 934 495
Legal services 30 11,261 2,254 553 242 118
Accounting, tax preparation,
bookkeeping, and payroll ser-
vices 11 2,957 2,170 432 202 112
Architectural, engineering,
and related services 17 6,151 2,128 553 177 169
Specialized design services 1 D D D D D
Computer systems design and
related services 7 672 190 41 16 S
Management, scientific, and
technical consulting services 23 5,582 2,236 629 227 66
Advertising, public relations,
and related services 2 D D D D D
Other professional, scientific,
and technical services 14 1,495 541 140 47 17
Management of companies and
enterprises 4 D D D D D
Administrative and support and
waste management and remedi-
ation services 115 50,913 17,689 4,393 1,381 992
Administrative and support ser-
vices 108 49,107 17,179 4,265 1,344 970
Office administrative services 2 D D D D D
Facilities support services 1 D D D D D
Employment services 6 596 265 77 S S
Business support services 5 735 293 82 20 18
Travel arrangement and reser-
vation services 51 34,638 10,243 2,435 779 702
Investigation and security ser-
vices 14 7,850 3,338 838 302 96
Services to buildings and
dwellings 26 4,722 2,710 749 194 138
Other support services 3 251 72 18 S S
Waste management and reme-
diation services 7 1,807 511 129 37 S
Source: U.S. Census Bureau, 2012 Economic Census of Island Areas
X Not applicable (for the Commodity Flow Survey, not applicable or comparison data unavailable)
D Withheld to avoid disclosing data for individual companies; data are included in higher level totals
f 500 to 999 employees
e 250 to 499 employees
c 100 to 249 employees
b 20 to 99 employees
a 0 to 19 employees

2015 CNMI Statistical Yearbook Chapter 11 Page 137
11th Statistical Yearbook, Central Statistics Division, Department of Commerce
Table 11.3h General Characteristics by Sector and Subsector, CNMI: 2012
Sector and Subsector
Number of
establish-
ments
Paid employ-
ees for pay
period in-
cluding
March 12
(number)
Operating
expenses
($1,000)
Total inven-
tories, begin-
ning-of-year
($1,000)
Total inven-
tories, end-
of-year
($1,000)
Total for all sectors 1,339 14,215 653,399 X X
Real estate and rental and leasing 177 694 26,399 X X
Real estate 148 497 20,004 X X
Lessors of real estate 142 475 19,490 X X
Offices of real estate agents
and brokers 3 17 390 X X
Activities related to real estate 3 a 123 X X
Rental and leasing services 29 197 6,395 X X
Automotive equipment rental
and leasing 13 92 3,278 X X
Consumer goods rental 8 67 1,832 X X
Commercial and industrial
machinery and equipment
rental and leasing 8 39 1,286 X X
Professional, scientific, and tech-
nical services 105 602 19,479 X X
Professional, scientific, and
technical services 105 602 19,479 X X
Legal services 30 109 5,388 X X
Accounting, tax preparation,
bookkeeping, and payroll ser-
vices 11 73 3,809 X X
Architectural, engineering,
and related services 17 93 4,755 X X
Specialized design services 1 a D X X
Computer systems design and
related services 7 a 275 X X
Management, scientific, and
technical consulting services 23 257 3,937 X X
Advertising, public relations,
and related services 2 a D X X
Other professional, scientific,
and technical services 14 48 1,081 X X
Management of companies and
enterprises 4 b D D D
Administrative and support and
waste management and remedi-
ation services 115 1,396 34,467 X X
Administrative and support ser-
vices 108 1,351 32,774 X X
Office administrative services 2 a D X X
Facilities support services 1 a D X X
Employment services 6 38 658 X X
Business support services 5 33 516 X X
Travel arrangement and reser-
vation services 51 554 21,009 X X
Investigation and security ser-
vices 14 374 6,248 X X
Services to buildings and
dwellings 26 328 3,890 X X
Other support services 3 a 142 X X
Waste management and reme-
diation services 7 46 1,693 X X
Source: U.S. Census Bureau, 2012 Economic Census of Island Areas
X Not applicable (for the Commodity Flow Survey, not applicable or comparison data unavailable)
D Withheld to avoid disclosing data for individual companies; data are included in higher level totals
f 500 to 999 employees
e 250 to 499 employees
c 100 to 249 employees
b 20 to 99 employees
a 0 to 19 employees

Page 138 Chapter 11 2015 CNMI Statistical Yearbook
11th Statistical Yearbook, Central Statistics Division, Department of Commerce
Table 11.3i General Characteristics by Sector and Subsector, CNMI: 2012
Sector and Subsector
Number
of estab-
lishments
Value of
sales, re-
ceipts,
revenue,
ship-
ments, or
business
done
($1,000)
Annual
payroll
($1,000)
First-
quarter
payroll
($1,000)
Payroll
taxes &
other em-
ployee
benefits
($1,000)
Voluntar-
ily pro-
vided
benefits
($1,000)
Total for all sectors 1,339 1,323,742 208,434 51,887 17,327 17,032
Educational services 43 4,979 1,582 402 370 S
Health care and social assistance 36 41,349 19,656 4,132 1,756 362
Ambulatory health care ser-
vices 19 11,117 4,948 1,047 368 109
Offices of physicians 6 4,385 1,843 332 110 46
Offices of dentists 2 D D D D D
Offices of other health practi-
tioners 3 2,107 609 163 56 17
Outpatient care centers 1 D D D D D
Home health care services 4 D D D D D
Other ambulatory health care
services 3 1,825 1,036 243 104 S
Hospitals 2 D D D D D
General medical and surgical
hospitals 2 D D D D D
Social assistance 15 1,710 1,007 248 86 16
Individual and family services 4 223 150 34 S S
Community food and housing,
and emergency and other relief
services 2 D D D D D
Child day care services 9 1,160 606 149 49 S
Arts, entertainment, and recrea-
tion 43 37,467 7,160 1,799 642 696
Performing arts, spectator
sports, and related industries 1 D D D D D
Museums, historical sites, and
similar institutions 1 D D D D D
Amusement, gambling, and rec-
reation industries 41 37,248 7,061 1,766 635 693
Amusement parks and arcades 6 7,452 1,090 290 82 33
Gambling industries 12 7,825 1,022 256 170 49
Other amusement and recrea-
tion industries 23 21,973 4,949 1,221 383 613
Accommodation and food ser-
vices 142 179,975 37,761 9,802 2,859 4,674
Accommodation 24 127,408 26,235 6,964 2,078 4,184
Traveler accommodation 24 127,408 26,235 6,964 2,078 4,184
Hotels (except casino hotels)
and motels 22 107,440 21,734 5,992 1,685 3,319
Casino hotels 1 D D D D D
Other traveler accommoda-
tion 1 D D D D D
Source: U.S. Census Bureau, 2012 Economic Census of Island Areas
X Not applicable (for the Commodity Flow Survey, not applicable or comparison data unavailable)
D Withheld to avoid disclosing data for individual companies; data are included in higher level totals
f 500 to 999 employees
e 250 to 499 employees
c 100 to 249 employees
b 20 to 99 employees
a 0 to 19 employees

2015 CNMI Statistical Yearbook Chapter 11 Page 139
11th Statistical Yearbook, Central Statistics Division, Department of Commerce
Table 11.3j General Characteristics by Sector and Subsector, CNMI: 2012
Sector and Subsector
Number of
establish-
ments
Paid employ-
ees for pay
period in-
cluding
March 12
(number)
Operating
expenses
($1,000)
Total inven-
tories, begin-
ning-of-year
($1,000)
Total inven-
tories, end-
of-year
($1,000)
Total for all sectors 1,339 14,215 653,399 X X
Educational services 43 133 4,066 X X
Health care and social assistance 36 725 38,051 X X
Ambulatory health care ser-
vices 19 261 9,741 X X
Offices of physicians 6 91 4,334 X X
Offices of dentists 2 a D X X
Offices of other health practi-
tioners 3 41 1,068 X X
Outpatient care centers 1 a D X X
Home health care services 4 b D X X
Other ambulatory health care
services 3 39 1,805 X X
Hospitals 2 e D X X
General medical and surgical
hospitals 2 e D X X
Social assistance 15 117 1,743 X X
Individual and family services 4 a 261 X X
Community food and housing,
and emergency and other relief
services 2 a D X X
Child day care services 9 98 1,031 X X
Arts, entertainment, and recrea-
tion 43 497 28,661 X X
Performing arts, spectator
sports, and related industries 1 b D X X
Museums, historical sites, and
similar institutions 1 a D X X
Amusement, gambling, and rec-
reation industries 41 470 28,524 X X
Amusement parks and arcades 6 68 3,611 X X
Gambling industries 12 93 5,873 X X
Other amusement and recrea-
tion industries 23 309 19,040 X X
Accommodation and food ser-
vices 142 3,195 122,906 X X
Accommodation 24 1,953 94,991 X X
Traveler accommodation 24 1,953 94,991 X X
Hotels (except casino hotels)
and motels 22 1,606 75,849 X X
Casino hotels 1 e D X X
Other traveler accommoda-
tion 1 a D X X
Source: U.S. Census Bureau, 2012 Economic Census of Island Areas
X Not applicable (for the Commodity Flow Survey, not applicable or comparison data unavailable)
D Withheld to avoid disclosing data for individual companies; data are included in higher level totals
f 500 to 999 employees
e 250 to 499 employees
c 100 to 249 employees
b 20 to 99 employees
a 0 to 19 employees

Page 140 Chapter 11 2015 CNMI Statistical Yearbook
11th Statistical Yearbook, Central Statistics Division, Department of Commerce
Table 11.3k General Characteristics by Sector and Subsector, CNMI: 2012
Sector and Subsector
Number
of estab-
lishments
Value of
sales, re-
ceipts,
revenue,
ship-
ments, or
business
done
($1,000)
Annual
payroll
($1,000)
First-
quarter
payroll
($1,000)
Payroll
taxes &
other em-
ployee
benefits
($1,000)
Voluntar-
ily pro-
vided
benefits
($1,000)
Total for all sectors 1,339 1,323,742 208,434 51,887 17,327 17,032
Food services and drinking
places 118 52,566 11,526 2,838 781 491
Special food services 10 12,695 2,203 582 154 S
Drinking places (alcoholic
beverages) 22 5,534 1,417 381 112 S
Restaurants and other eating
places 86 34,337 7,906 1,874 516 451
Other services (except public ad-
ministration) 115 20,636 6,517 1,524 649 255
Repair and maintenance 55 11,668 3,147 753 364 175
Automotive repair and mainte-
nance 31 5,117 1,485 361 160 64
Electronic and precision
equipment repair and mainte-
nance 4 D D D D D
Commercial and indus-
trial machinery and equipment
(except automotive and elec-
tronic) repair and maintenance 12 4,657 1,031 252 138 55
Personal and household goods
repair and maintenance 8 1,108 406 91 31 14
Personal and laundry services 52 8,420 2,920 664 249 56
Personal care services 40 4,269 1,636 372 177 24
Death care services 1 D D D D D
Dry cleaning and laundry ser-
vices 9 3,515 1,164 261 65 21
Other personal services 2 D D D D D
Religious, grant making, civic,
professional, and similar or-
ganizations 8 550 449 107 35 23
Source: U.S. Census Bureau, 2012 Economic Census of Island Areas
X Not applicable (for the Commodity Flow Survey, not applicable or comparison data unavailable)
D Withheld to avoid disclosing data for individual companies; data are included in higher level totals
f 500 to 999 employees
e 250 to 499 employees
c 100 to 249 employees
b 20 to 99 employees
a 0 to 19 employees

2015 CNMI Statistical Yearbook Chapter 11 Page 141
11th Statistical Yearbook, Central Statistics Division, Department of Commerce
Table 11.3l General Characteristics by Sector and Subsector, CNMI: 2012
Sector and Subsector
Number of es-
tablishments
Paid employees
for pay period
including March
12 (number)
Operating ex-
penses ($1,000)
Total invento-
ries, beginning-
of-year ($1,000)
Total invento-
ries, end-of-year
($1,000)
Total for all sectors 1,339 14,215 653,399 X X
Food services and drinking places 118 1,242 27,915 X X
Special food services 10 254 6,100 X X
Drinking places (alcoholic bever-
ages) 22 157 2,833 X X
Restaurants and other eating
places 86 830 18,982 X X
Other services (except public admin-
istration) 115 576 16,269 X X
Repair and maintenance 55 271 8,369 X X
Automotive repair and mainte-
nance 31 147 3,720 X X
Electronic and precision equip-
ment repair and maintenance 4 a D X X
Commercial and indus-
trial machinery and equipment
(except automotive and elec-
tronic) repair and maintenance 12 67 3,312 X X
Personal and household goods re-
pair and maintenance 8 44 969 X X
Personal and laundry services 52 284 7,161 X X
Personal care services 40 202 3,180 X X
Death care services 1 a D X X
Dry cleaning and laundry services 9 73 3,677 X X
Other personal services 2 a D X X
Religious, grant making, civic, pro-
fessional, and similar organiza-
tions 8 20 740 X X
Source: U.S. Census Bureau, 2012 Economic Census of Island Areas
X Not applicable (for the Commodity Flow Survey, not applicable or comparison data unavailable)
D Withheld to avoid disclosing data for individual companies; data are included in higher level totals
f 500 to 999 employees
e 250 to 499 employees
c 100 to 249 employees
b 20 to 99 employees
a 0 to 19 employees

Page 142 Chapter 11 2015 CNMI Statistical Yearbook
11th Statistical Yearbook, Central Statistics Division, Department of Commerce
Table 11.4a General Characteristics of Kind of Business and Legal Organization, CNMI: 2012
Meaning of 2012 NAICS code
Number
of estab-
lishments
Value of
sales, re-
ceipts,
revenue,
ship-
ments, or
business
done
($1,000)
Annual
payroll
($1,000)
First-
quarter
payroll
($1,000)
Paid em-
ployees
for pay
period in-
cluding
March 12
(number)
Operating
expenses
($1,000)
Total in-
ventories,
begin-
ning-of-
year
($1,000)
Total in-
ventories,
end-of-
year
($1,000)
Total for all sectors 1,339 1,323,742 208,434 51,887 14,215 653,399 X X
Corporations 1,068 1,090,720 175,936 44,390 12,206 470,434 X X
Other legal forms of organization 271 233,022 32,497 7,498 2,009 182,965 X X
Mining, quarrying, oil, gas extraction 1 D D D b D X X
Corporations 1 D D D b D X X
Other legal forms of organization 0 0 0 0 0 0 X X
Utilities 6 D D D e D X X
Corporations 3 D D D b D X X
Other legal forms of organization 3 D D D e D X X
Construction 62 37,230 7,707 2,009 821 13,840 10,631 7,558
Corporations 46 35,196 6,950 1,813 707 12,508 10,078 7,107
Other legal forms of organization 16 2,035 758 196 114 1,332 554 450
Manufacturing 39 20,887 6,700 1,738 592 15,547 3,086 4,128
Corporations 32 20,512 6,511 1,707 579 15,296 2,990 4,056
Other legal forms of organization 7 374 189 30 12 250 96 72
Wholesale trade 74 246,827 10,746 2,685 716 42,987 37,572 43,684
Corporations 68 241,225 10,302 2,565 657 41,933 37,135 42,769
Other legal forms of organization 6 5,602 445 120 59 1,054 437 915
Retail trade 284 314,066 30,662 8,002 2,463 85,294 78,984 91,713
Corporations 245 289,523 28,076 7,432 2,210 77,474 75,268 87,311
Other legal forms of organization 39 24,543 2,586 570 254 7,820 3,716 4,402
Transportation and warehousing 26 46,438 11,387 2,847 641 25,232 101 111
Corporations 20 26,928 6,279 1,660 442 14,231 101 111
Other legal forms of organization 6 D D D c D D D
Information 20 25,138 8,384 2,064 323 17,734 1,108 1,064
Corporations 15 20,364 7,515 1,829 267 14,823 985 953
Other legal forms of organization 5 D D D b D D D
Source: U.S. Census Bureau, 2012 Economic Census of Island Areas
X Not applicable (for the Commodity Flow Survey, not applicable or comparison data unavailable)
D Withheld to avoid disclosing data for individual companies; data are included in higher level totals
f 500 to 999 employees
e 250 to 499 employees
c 100 to 249 employees
b 20 to 99 employees
a 0 to 19 employees

2015 CNMI Statistical Yearbook Chapter 11 Page 143
11th Statistical Yearbook, Central Statistics Division, Department of Commerce
Table 11.4b General Characteristics of Kind of Business and Legal Organization, CNMI: 2012
Meaning of 2012 NAICS code
Number
of estab-
lishments
Value of
sales, re-
ceipts,
revenue,
ship-
ments, or
business
done
($1,000)
Annual
payroll
($1,000)
First-
quarter
payroll
($1,000)
Paid em-
ployees
for pay
period in-
cluding
March 12
(number)
Operating
expenses
($1,000)
Total in-
ventories,
begin-
ning-of-
year
($1,000)
Total in-
ventories,
end-of-
year
($1,000)
Total for all sectors 1,339 1,323,742 208,434 51,887 14,215 653,399 X X
Finance and insurance 47 57,560 8,559 2,238 327 22,803 X X
Corporations 44 35,278 7,753 2,035 309 19,816 X X
Other legal forms of organization 3 D D D a D X X
Real estate and rental and leasing 177 30,675 8,305 1,932 694 26,399 X X
Corporations 133 28,545 7,580 1,767 591 24,806 X X
Other legal forms of organization 44 2,129 725 165 103 1,593 X X
Professional, scientific, and technical
services
105 28,703 9,710 2,394 602 19,479 X X
Corporations 61 18,057 6,911 1,727 431 13,380 X X
Other legal forms of organization 44 10,645 2,800 668 170 6,099 X X
Management of companies and enter-
prises
4 D D D b D D D
Corporations 4 D D D b D D D
Other legal forms of organization 0 0 0 0 0 0 0 0
Administrative and support and waste
management and remediation ser-
vices
115 50,913 17,689 4,393 1,396 34,467 X X
Corporations 83 43,144 14,945 3,700 1,129 27,457 X X
Other legal forms of organization 32 7,769 2,744 693 268 7,009 X X
Educational services 43 4,979 1,582 402 133 4,066 X X
Corporations 37 4,716 1,468 378 121 3,787 X X
Other legal forms of organization 6 264 114 23 a 279 X X
Health care and social assistance 36 41,349 19,656 4,132 725 38,051 X X
Corporations 24 36,504 17,148 3,657 603 32,819 X X
Other legal forms of organization 12 4,844 2,507 474 122 5,233 X X
Arts, entertainment, and recreation 43 37,467 7,160 1,799 497 28,661 X X
Corporations 40 36,923 6,970 1,754 466 28,151 X X
Other legal forms of organization 3 544 191 46 31 511 X X
Accommodation and food services 142 179,975 37,761 9,802 3,195 122,906 X X
Corporations 125 176,249 37,009 9,625 3,079 120,795 X X
Other legal forms of organization 17 3,726 753 177 117 2,112 X X
Other services (except public admin-
istration)
115 20,636 6,517 1,524 576 16,269 X X
Corporations 87 17,890 5,404 1,301 480 14,235 X X
Other legal forms of organization 28 2,746 1,112 222 95 2,033 X X
Source: U.S. Census Bureau, 2012 Economic Census of Island Areas
X Not applicable (for the Commodity Flow Survey, not applicable or comparison data unavailable)
D Withheld to avoid disclosing data for individual companies; data are included in higher level totals
f 500 to 999 employees
e 250 to 499 employees
c 100 to 249 employees
b 20 to 99 employees
a 0 to 19 employees

Page 144 Chapter 11 2015 CNMI Statistical Yearbook
11th Statistical Yearbook, Central Statistics Division, Department of Commerce
Table 11.5a Size of Sales and Receipts by Sector, CNMI: 2012
Size of Sales and Receipts by Sector
Number
of estab-
lishments
Value of
sales, re-
ceipts,
revenue,
ship-
ments, or
business
done
($1,000)
Annual
payroll
($1,000)
First-
quarter
payroll
($1,000)
Paid em-
ployees
for pay
period in-
cluding
March 12
(number)
Operating
expenses
($1,000)
Total in-
ventories,
begin-
ning-of-
year
($1,000)
Total in-
ventories,
end-of-
year
($1,000)
Total for all sectors 1,339 1,323,742 208,434 51,887 14,215 653,399 X X
Less than $5,000 22 28 1,321 258 44 2,627 X X
$5,000 to $9,999 13 93 169 44 24 208 X X
$10,000 to $24,999 74 1,263 897 236 143 1,489 X X
$25,000 to $49,999 158 5,797 2,739 706 389 5,863 X X
$50,000 to $99,999 206 14,524 5,473 1,356 653 11,453 X X
$100,000 to $249,999 345 55,906 17,541 4,414 1,852 41,103 X X
$250,000 to $499,999 194 69,094 18,302 4,486 1,567 40,872 X X
$500,000 to $999,999 124 87,422 21,116 5,098 1,462 49,818 X X
$1,000,000 or more 203 1,089,613 140,873 35,288 8,076 499,961 X X
Mining, quarrying, and oil and gas
extraction
1 D D D b D X X
Less than $5,000 0 0 0 0 0 0 X X
$5,000 to $9,999 0 0 0 0 0 0 X X
$10,000 to $24,999 0 0 0 0 0 0 X X
$25,000 to $49,999 0 0 0 0 0 0 X X
$50,000 to $99,999 0 0 0 0 0 0 X X
$100,000 to $249,999 0 0 0 0 0 0 X X
$250,000 to $499,999 0 0 0 0 0 0 X X
$500,000 to $999,999 1 D D D b D X X
$1,000,000 or more 0 0 0 0 0 0 X X
Utilities 6 D D D e D X X
Less than $5,000 0 0 0 0 0 0 X X
$5,000 to $9,999 0 0 0 0 0 0 X X
$10,000 to $24,999 0 0 0 0 0 0 X X
$25,000 to $49,999 1 D D D a D X X
$50,000 to $99,999 0 0 0 0 0 0 X X
$100,000 to $249,999 1 D D D a D X X
$250,000 to $499,999 0 0 0 0 0 0 X X
$500,000 to $999,999 0 0 0 0 0 0 X X
$1,000,000 or more 4 D D D e D X X
Source: U.S. Census Bureau, 2012 Economic Census of Island Areas
N Not available or not comparable
X Not applicable (for the Commodity Flow Survey, not applicable or comparison data unavailable)
S Withheld because estimate did not meet publication standards.
D Withheld to avoid disclosing data for individual companies; data are included in higher level totals
f 500 to 999 employees
e 250 to 499 employees
c 100 to 249 employees
b 20 to 99 employees
a 0 to 19 employees
0 50 100 150 200 250 300 350
Less than $5,000
$5,000 to $9,999
$10,000 to $24,999
$25,000 to $49,999
$50,000 to $99,999
$100,000 to $249,999
$250,000 to $499,999
$500,000 to $999,999
$1,000,000 or more
Size of Sales and Receipts: 2012

2015 CNMI Statistical Yearbook Chapter 11 Page 145
11th Statistical Yearbook, Central Statistics Division, Department of Commerce
Table 11.5b Size of Sales and Receipts by Sector, CNMI: 2012
Size of Sales and Receipts by Sector
Number
of estab-
lishments
Value of
sales, re-
ceipts,
revenue,
ship-
ments, or
business
done
($1,000)
Annual
payroll
($1,000)
First-
quarter
payroll
($1,000)
Paid em-
ployees
for pay
period in-
cluding
March 12
(number)
Operating
expenses
($1,000)
Total in-
ventories,
begin-
ning-of-
year
($1,000)
Total in-
ventories,
end-of-
year
($1,000)
Total for all sectors 1,339 1,323,742 208,434 51,887 14,215 653,399 X X
Construction 62 37,230 7,707 2,009 821 13,840 10,631 7,558
Less than $5,000 2 D D D a D D D
$5,000 to $9,999 0 0 0 0 0 0 0 0
$10,000 to $24,999 7 134 128 30 19 195 36 25
$25,000 to $49,999 8 284 109 33 15 290 83 61
$50,000 to $99,999 11 817 321 79 46 566 207 205
$100,000 to $249,999 9 1,791 550 134 113 1,317 505 338
$250,000 to $499,999 10 3,494 817 213 187 2,340 774 703
$500,000 to $999,999 9 6,043 1,453 375 99 2,858 2,135 1,066
$1,000,000 or more 6 24,666 4,269 1,129 334 6,109 6,891 5,160
Manufacturing 39 20,887 6,700 1,738 592 15,547 3,086 4,128
Less than $5,000 0 0 0 0 0 0 0 0
$5,000 to $9,999 1 D D D a D D D
$10,000 to $24,999 5 77 95 18 a 126 61 62
$25,000 to $49,999 2 D D D a D D D
$50,000 to $99,999 5 355 120 37 a 213 53 61
$100,000 to $249,999 11 1,992 691 179 69 2,028 309 264
$250,000 to $499,999 6 2,057 688 182 59 1,359 322 400
$500,000 to $999,999 1 D D D a D D D
$1,000,000 or more 8 15,580 4,810 1,240 423 11,285 1,877 2,822
Wholesale trade 74 246,827 10,746 2,685 716 42,987 37,572 43,684
Less than $5,000 1 D D D a D D D
$5,000 to $9,999 1 D D D a D D D
$10,000 to $24,999 0 0 0 0 0 0 0 0
$25,000 to $49,999 2 D D D a D D D
$50,000 to $99,999 2 D D D a D D D
$100,000 to $249,999 13 2,109 307 98 39 1,017 511 574
$250,000 to $499,999 12 4,436 705 210 57 1,472 1,260 1,307
$500,000 to $999,999 11 8,321 1,616 386 126 4,222 2,506 3,052
$1,000,000 or more 32 231,716 7,970 1,947 473 36,047 33,037 38,549
Source: U.S. Census Bureau, 2012 Economic Census of Island Areas
N Not available or not comparable
X Not applicable (for the Commodity Flow Survey, not applicable or comparison data unavailable)
S Withheld because estimate did not meet publication standards.
D Withheld to avoid disclosing data for individual companies; data are included in higher level totals
f 500 to 999 employees
e 250 to 499 employees
c 100 to 249 employees
b 20 to 99 employees
a 0 to 19 employees

Page 146 Chapter 11 2015 CNMI Statistical Yearbook
11th Statistical Yearbook, Central Statistics Division, Department of Commerce
Table 11.5c Size of Sales and Receipts by Sector, CNMI: 2012
Size of Sales and Receipts by Sector
Number
of estab-
lishments
Value of
sales, re-
ceipts,
revenue,
ship-
ments, or
business
done
($1,000)
Annual
payroll
($1,000)
First-
quarter
payroll
($1,000)
Paid em-
ployees
for pay
period in-
cluding
March 12
(number)
Operating
expenses
($1,000)
Total in-
ventories,
begin-
ning-of-
year
($1,000)
Total in-
ventories,
end-of-
year
($1,000)
Total for all sectors 1,339 1,323,742 208,434 51,887 14,215 653,399 X X
Retail trade 284 314,066 30,662 8,002 2,463 85,294 78,984 91,713
Less than $5,000 1 D D D a D D D
$5,000 to $9,999 3 22 16 S a 25 S S
$10,000 to $24,999 7 101 82 21 a 134 21 90
$25,000 to $49,999 17 652 240 72 37 484 436 333
$50,000 to $99,999 34 2,492 801 182 96 1,761 1,595 1,955
$100,000 to $249,999 70 11,587 2,215 509 273 4,950 5,861 5,814
$250,000 to $499,999 54 19,420 3,073 745 299 6,388 7,106 8,426
$500,000 to $999,999 37 26,582 3,842 974 353 8,774 10,258 10,495
$1,000,000 or more 61 253,210 20,362 5,489 1,390 62,689 53,686 64,571
Transportation and warehousing 26 46,438 11,387 2,847 641 25,232 101 111
Less than $5,000 1 D D D a D D D
$5,000 to $9,999 0 0 0 0 0 0 0 0
$10,000 to $24,999 0 0 0 0 0 0 0 0
$25,000 to $49,999 2 D D D a D D D
$50,000 to $99,999 4 277 81 21 a 145 0 0
$100,000 to $249,999 5 754 285 71 34 724 0 0
$250,000 to $499,999 4 1,479 1,251 308 64 2,201 0 0
$500,000 to $999,999 2 D D D b D D D
$1,000,000 or more 8 42,608 8,942 2,244 485 20,176 78 94
Information 20 25,138 8,384 2,064 323 17,734 1,108 1,064
Less than $5,000 0 0 0 0 0 0 0 0
$5,000 to $9,999 1 D D D a D D D
$10,000 to $24,999 1 D D D a D D D
$25,000 to $49,999 4 149 47 S a 83 0 S
$50,000 to $99,999 4 282 142 40 14 201 122 111
$100,000 to $249,999 3 574 224 47 a 470 0 0
$250,000 to $499,999 1 D D D a D D D
$500,000 to $999,999 2 D D D b D D D
$1,000,000 or more 4 22,640 7,074 1,761 248 15,413 953 888
Source: U.S. Census Bureau, 2012 Economic Census of Island Areas
N Not available or not comparable
X Not applicable (for the Commodity Flow Survey, not applicable or comparison data unavailable)
S Withheld because estimate did not meet publication standards.
D Withheld to avoid disclosing data for individual companies; data are included in higher level totals
f 500 to 999 employees
e 250 to 499 employees
c 100 to 249 employees
b 20 to 99 employees
a 0 to 19 employees

2015 CNMI Statistical Yearbook Chapter 11 Page 147
11th Statistical Yearbook, Central Statistics Division, Department of Commerce
Table 11.5d Size of Sales and Receipts by Sector, CNMI: 2012
Size of Sales and Receipts by Sector
Number
of estab-
lishments
Value of
sales, re-
ceipts,
revenue,
ship-
ments, or
business
done
($1,000)
Annual
payroll
($1,000)
First-
quarter
payroll
($1,000)
Paid em-
ployees
for pay
period in-
cluding
March 12
(number)
Operating
expenses
($1,000)
Total in-
ventories,
begin-
ning-of-
year
($1,000)
Total in-
ventories,
end-of-
year
($1,000)
Total for all sectors 1,339 1,323,742 208,434 51,887 14,215 653,399 X X
Finance and insurance 47 57,560 8,559 2,238 327 22,803 X X
Less than $5,000 1 D D D a D X X
$5,000 to $9,999 0 0 0 0 0 0 X X
$10,000 to $24,999 3 51 66 18 a 152 X X
$25,000 to $49,999 2 D D D a D X X
$50,000 to $99,999 4 268 300 S a 593 X X
$100,000 to $249,999 13 1,915 798 198 52 2,371 X X
$250,000 to $499,999 9 3,661 1,087 263 48 2,854 X X
$500,000 to $999,999 6 4,054 1,352 351 55 2,988 X X
$1,000,000 or more 9 47,543 4,899 1,312 145 13,451 X X
Real estate and rental and leasing 177 30,675 8,305 1,932 694 26,399 X X
Less than $5,000 1 D D D a D X X
$5,000 to $9,999 5 37 109 S 13 122 X X
$10,000 to $24,999 18 327 184 48 36 356 X X
$25,000 to $49,999 35 1,320 543 122 61 1,736 X X
$50,000 to $99,999 44 3,105 1,008 232 100 2,612 X X
$100,000 to $249,999 49 7,508 1,994 521 206 6,014 X X
$250,000 to $499,999 11 3,858 1,141 285 75 3,730 X X
$500,000 to $999,999 9 6,468 1,724 386 122 5,159 X X
$1,000,000 or more 5 8,046 1,600 314 80 6,665 X X
Professional, scientific, and technical
services
105 28,703 9,710 2,394 602 19,479 X X
Less than $5,000 1 D D D a D X X
$5,000 to $9,999 0 0 0 0 0 0 X X
$10,000 to $24,999 5 83 49 S a 74 X X
$25,000 to $49,999 12 414 165 55 19 263 X X
$50,000 to $99,999 16 1,131 490 125 68 925 X X
$100,000 to $249,999 39 5,949 1,833 499 131 3,587 X X
$250,000 to $499,999 18 6,720 1,872 396 73 4,217 X X
$500,000 to $999,999 8 5,454 1,903 487 89 3,758 X X
$1,000,000 or more 6 8,951 2,572 678 206 5,109 X X
Source: U.S. Census Bureau, 2012 Economic Census of Island Areas
N Not available or not comparable
X Not applicable (for the Commodity Flow Survey, not applicable or comparison data unavailable)
S Withheld because estimate did not meet publication standards.
D Withheld to avoid disclosing data for individual companies; data are included in higher level totals
f 500 to 999 employees
e 250 to 499 employees
c 100 to 249 employees
b 20 to 99 employees
a 0 to 19 employees

Page 148 Chapter 11 2015 CNMI Statistical Yearbook
11th Statistical Yearbook, Central Statistics Division, Department of Commerce
Table 11.5e Size of Sales and Receipts by Sector, CNMI: 2012
Size of Sales and Receipts by Sector
Number
of estab-
lishments
Value of
sales, re-
ceipts,
revenue,
ship-
ments, or
business
done
($1,000)
Annual
payroll
($1,000)
First-
quarter
payroll
($1,000)
Paid em-
ployees
for pay
period in-
cluding
March 12
(number)
Operating
expenses
($1,000)
Total in-
ventories,
begin-
ning-of-
year
($1,000)
Total in-
ventories,
end-of-
year
($1,000)
Total for all sectors 1,339 1,323,742 208,434 51,887 14,215 653,399 X X
Management of companies and enter-
prises
4 D D D b D D D
Less than $5,000 1 D D D a D D D
$5,000 to $9,999 0 0 0 0 0 0 0 0
$10,000 to $24,999 0 0 0 0 0 0 0 0
$25,000 to $49,999 0 0 0 0 0 0 0 0
$50,000 to $99,999 1 D D D a D D D
$100,000 to $249,999 0 0 0 0 0 0 0 0
$250,000 to $499,999 0 0 0 0 0 0 0 0
$500,000 to $999,999 0 0 0 0 0 0 0 0
$1,000,000 or more 2 D D D b D D D
Administrative and support and waste
management and remediation ser-
vices
115 50,913 17,689 4,393 1,396 34,467 X X
Less than $5,000 2 D D D a D X X
$5,000 to $9,999 0 0 0 0 0 0 X X
$10,000 to $24,999 6 87 61 S a 90 X X
$25,000 to $49,999 14 502 355 80 67 552 X X
$50,000 to $99,999 22 1,467 642 177 88 1,301 X X
$100,000 to $249,999 35 5,567 2,411 624 247 5,080 X X
$250,000 to $499,999 16 5,241 1,772 467 174 3,957 X X
$500,000 to $999,999 8 5,809 1,803 461 99 4,327 X X
$1,000,000 or more 12 32,237 10,625 2,561 710 19,137 X X
Educational services 43 4,979 1,582 402 133 4,066 X X
Less than $5,000 1 D D D a D X X
$5,000 to $9,999 1 D D D a D X X
$10,000 to $24,999 6 113 82 22 a 137 X X
$25,000 to $49,999 9 316 179 40 16 328 X X
$50,000 to $99,999 9 592 242 61 26 413 X X
$100,000 to $249,999 13 2,000 621 154 53 1,503 X X
$250,000 to $499,999 3 959 429 116 22 682 X X
$500,000 to $999,999 0 0 0 0 0 0 X X
$1,000,000 or more 1 D D D a D X X
Source: U.S. Census Bureau, 2012 Economic Census of Island Areas
N Not available or not comparable
X Not applicable (for the Commodity Flow Survey, not applicable or comparison data unavailable)
S Withheld because estimate did not meet publication standards.
D Withheld to avoid disclosing data for individual companies; data are included in higher level totals
f 500 to 999 employees
e 250 to 499 employees
c 100 to 249 employees
b 20 to 99 employees
a 0 to 19 employees

2015 CNMI Statistical Yearbook Chapter 11 Page 149
11th Statistical Yearbook, Central Statistics Division, Department of Commerce
Table 11.5f Size of Sales and Receipts by Sector, CNMI: 2012
Size of Sales and Receipts by Sector
Number
of estab-
lishments
Value of
sales, re-
ceipts,
revenue,
ship-
ments, or
business
done
($1,000)
Annual
payroll
($1,000)
First-
quarter
payroll
($1,000)
Paid em-
ployees
for pay
period in-
cluding
March 12
(number)
Operating
expenses
($1,000)
Total in-
ventories,
begin-
ning-of-
year
($1,000)
Total in-
ventories,
end-of-
year
($1,000)
Total for all sectors 1,339 1,323,742 208,434 51,887 14,215 653,399 X X
Health care and social assistance 36 41,349 19,656 4,132 725 38,051 X X
Less than $5,000 2 D D D a D X X
$5,000 to $9,999 0 0 0 0 0 0 X X
$10,000 to $24,999 0 0 0 0 0 0 X X
$25,000 to $49,999 5 192 170 S b 231 X X
$50,000 to $99,999 5 393 168 38 29 303 X X
$100,000 to $249,999 9 1,511 763 176 78 1,540 X X
$250,000 to $499,999 3 929 442 102 32 552 X X
$500,000 to $999,999 5 3,430 1,551 305 79 2,738 X X
$1,000,000 or more 7 34,893 16,536 3,462 479 32,640 X X
Arts, entertainment, and recreation 43 37,467 7,160 1,799 497 28,661 X X
Less than $5,000 0 0 0 0 0 0 X X
$5,000 to $9,999 0 0 0 0 0 0 X X
$10,000 to $24,999 3 D D D a D X X
$25,000 to $49,999 4 150 42 15 a 97 X X
$50,000 to $99,999 1 D D D a D X X
$100,000 to $249,999 10 1,706 610 131 72 1,686 X X
$250,000 to $499,999 7 2,536 723 152 53 2,225 X X
$500,000 to $999,999 7 4,497 1,115 300 85 3,385 X X
$1,000,000 or more 11 28,465 4,630 1,184 273 21,219 X X
Accommodation and food services 142 179,975 37,761 9,802 3,195 122,906 X X
Less than $5,000 2 D D D a D X X
$5,000 to $9,999 0 0 0 0 0 0 X X
$10,000 to $24,999 6 103 54 20 b 77 X X
$25,000 to $49,999 16 633 296 85 59 626 X X
$50,000 to $99,999 21 1,541 578 139 74 1,203 X X
$100,000 to $249,999 37 5,931 1,839 489 263 4,261 X X
$250,000 to $499,999 24 8,448 2,469 616 271 4,921 X X
$500,000 to $999,999 12 8,812 1,969 409 186 4,999 X X
$1,000,000 or more 24 154,499 30,537 8,037 2,316 106,792 X X
Source: U.S. Census Bureau, 2012 Economic Census of Island Areas
N Not available or not comparable
X Not applicable (for the Commodity Flow Survey, not applicable or comparison data unavailable)
S Withheld because estimate did not meet publication standards.
D Withheld to avoid disclosing data for individual companies; data are included in higher level totals
f 500 to 999 employees
e 250 to 499 employees
c 100 to 249 employees
b 20 to 99 employees
a 0 to 19 employees

Page 150 Chapter 11 2015 CNMI Statistical Yearbook
11th Statistical Yearbook, Central Statistics Division, Department of Commerce
Table 11.5h Size of Sales and Receipts by Sector, CNMI: 2012
Size of Sales and Receipts by Sector
Number
of estab-
lishments
Value of
sales, re-
ceipts,
revenue,
ship-
ments, or
business
done
($1,000)
Annual
payroll
($1,000)
First-
quarter
payroll
($1,000)
Paid em-
ployees
for pay
period in-
cluding
March 12
(number)
Operating
expenses
($1,000)
Total in-
ventories,
begin-
ning-of-
year
($1,000)
Total in-
ventories,
end-of-
year
($1,000)
Total for all sectors 1,339 1,323,742 208,434 51,887 14,215 653,399 X X
Other services (except public admin-
istration)
115 20,636 6,517 1,524 576 16,269 X X
Less than $5,000 6 D D D a D X X
$5,000 to $9,999 1 D D D a D X X
$10,000 to $24,999 7 121 60 13 a 89 X X
$25,000 to $49,999 25 883 440 102 56 884 X X
$50,000 to $99,999 23 1,476 501 117 66 1,101 X X
$100,000 to $249,999 28 4,759 2,219 508 188 4,297 X X
$250,000 to $499,999 16 5,592 1,687 394 134 3,706 X X
$500,000 to $999,999 6 3,796 752 187 64 2,488 X X
$1,000,000 or more 3 3,987 628 153 42 3,381 X X
Source: U.S. Census Bureau, 2012 Economic Census of Island Areas
N Not available or not comparable
X Not applicable (for the Commodity Flow Survey, not applicable or comparison data unavailable)
S Withheld because estimate did not meet publication standards.
D Withheld to avoid disclosing data for individual companies; data are included in higher level totals
f 500 to 999 employees
e 250 to 499 employees
c 100 to 249 employees
b 20 to 99 employees
a 0 to 19 employees

2015 CNMI Statistical Yearbook Chapter 11 Page 151
11th Statistical Yearbook, Central Statistics Division, Department of Commerce
Table 11.6a Employment Size by Sector, CNMI: 2012
Number of Employees
by Sector
Number of
establish-
ments
Value of
sales, re-
ceipts, rev-
enue, ship-
ments, or
business
done
($1,000)
Annual
payroll
($1,000)
First-quar-
ter payroll
($1,000)
Paid em-
ployees for
pay period
including
March 12
(number)
Operating
expenses
($1,000)
Total in-
ventories,
beginning-
of-year
($1,000)
Total in-
ventories,
end-of-year
($1,000)
Total for all sectors 1,339 1,323,742 208,434 51,887 14,215 653,399 X X
No paid 14 1,276 326 29 0 1,098 X X
1 to 4 674 93,275 18,556 4,550 1,489 52,000 X X
5 to 9 302 155,803 26,572 6,483 2,003 67,917 X X
10 to 19 206 269,194 37,473 9,333 2,743 107,451 X X
20 or more 143 804,193 125,506 31,492 7,977 424,934 X X
Construction 62 37,230 7,707 2,009 821 13,840 10,631 7,558
No paid 0 0 0 0 0 0 0 0
1 to 4 30 3,269 841 178 66 1,971 1,146 737
5 to 9 9 2,168 527 132 61 1,259 428 369
10 to 19 13 8,365 1,656 453 173 3,469 2,406 1,843
20 or more 10 23,428 4,684 1,245 521 7,140 6,651 4,608
Manufacturing 39 20,887 6,700 1,738 592 15,547 3,086 4,128
No paid 0 0 0 0 0 0 0 0
1 to 4 17 1,430 487 133 37 1,433 321 323
5 to 9 8 1,507 496 121 50 1,188 146 140
10 to 19 6 2,370 907 244 82 1,641 744 844
20 or more 8 15,580 4,810 1,240 423 11,285 1,877 2,822
Wholesale trade 74 246,827 10,746 2,685 716 42,987 37,572 43,684
No paid 0 0 0 0 0 0 0 0
1 to 4 29 11,986 893 246 61 2,564 1,610 2,183
5 to 9 17 32,468 1,832 452 124 7,884 8,427 8,115
10 to 19 20 67,621 3,998 1,016 281 12,206 10,786 10,024
20 or more 8 134,752 4,024 972 251 20,333 16,749 23,362
Retail trade 284 314,066 30,662 8,002 2,463 85,294 78,984 91,713
No paid 3 188 29 0 0 48 S 217
1 to 4 135 27,218 3,611 833 325 9,331 10,115 10,981
5 to 9 77 57,537 6,365 1,648 520 16,911 19,703 22,506
10 to 19 38 52,311 6,458 1,540 527 15,788 13,111 14,318
20 or more 31 176,812 14,199 3,980 1,091 43,217 36,008 43,692
Transportation and
warehousing
26 46,438 11,387 2,847 641 25,232 101 111
No paid 0 0 0 0 0 0 0 0
1 to 4 10 793 248 63 22 653 S S
5 to 9 1 D D D a D D D
10 to 19 5 10,740 1,124 267 72 2,175 0 0
20 or more 10 34,466 9,876 2,486 542 22,023 78 94
Source: U.S. Census Bureau, 2012 Economic Census of Island Areas
N Not available or not comparable
X Not applicable (for the Commodity Flow Survey, not applicable or comparison data unavailable)
S Withheld because estimate did not meet publication standards.
D Withheld to avoid disclosing data for individual companies; data are included in higher level totals
f 500 to 999 employees
e 250 to 499 employees
c 100 to 249 employees
b 20 to 99 employees
a 0 to 19 employees
No paid
1%
1 to 4
50%
5 to 9
23%
10 to 19
15%
20 or
more
11%
Number of Employees: 2012

Page 152 Chapter 11 2015 CNMI Statistical Yearbook
11th Statistical Yearbook, Central Statistics Division, Department of Commerce
Table 11.6b Employment Size by Sector, CNMI: 2012
Number of Employees
by Sector
Number of
establish-
ments
Value of
sales, re-
ceipts, rev-
enue, ship-
ments, or
business
done
($1,000)
Annual
payroll
($1,000)
First-quar-
ter payroll
($1,000)
Paid em-
ployees for
pay period
including
March 12
(number)
Operating
expenses
($1,000)
Total in-
ventories,
beginning-
of-year
($1,000)
Total in-
ventories,
end-of-year
($1,000)
Total for all sectors 1,339 1,323,742 208,434 51,887 14,215 653,399 X X
Information 20 25,138 8,384 2,064 323 17,734 1,108 1,064
No paid 0 0 0 0 0 0 0 0
1 to 4 9 464 199 58 13 329 0 S
5 to 9 6 2,308 756 173 42 1,299 165 143
10 to 19 2 D D D b D D D
20 or more 3 21,522 6,879 1,716 239 15,104 911 856
Finance and insurance 47 57,560 8,559 2,238 327 22,803 X X
No paid 0 0 0 0 0 0 X X
1 to 4 22 3,769 1,071 274 53 3,880 X X
5 to 9 15 7,672 2,043 511 101 5,428 X X
10 to 19 9 43,737 3,927 1,069 129 10,286 X X
20 or more 1 D D D b D X X
Real estate and rental
and leasing
177 30,675 8,305 1,932 694 26,399 X X
No paid 0 0 0 0 0 0 X X
1 to 4 133 12,138 2,671 627 251 10,147 X X
5 to 9 27 6,216 1,907 483 174 5,288 X X
10 to 19 13 8,277 2,353 587 169 7,034 X X
20 or more 4 4,045 1,374 235 101 3,931 X X
Professional, scientific,
and technical services
105 28,703 9,710 2,394 602 19,479 X X
No paid 1 D D D a D X X
1 to 4 66 10,424 2,564 651 136 5,527 X X
5 to 9 25 6,741 3,294 707 152 6,387 X X
10 to 19 11 9,394 2,819 696 136 5,720 X X
20 or more 2 D D D c D X X
Administrative and sup-
port and waste man-
agement and remedi-
ation services
115 50,913 17,689 4,393 1,396 34,467 X X
No paid 2 D D D a D X X
1 to 4 47 4,343 1,300 309 113 3,208 X X
5 to 9 33 11,665 2,454 656 213 5,477 X X
10 to 19 15 7,639 2,788 681 179 5,727 X X
20 or more 18 27,050 11,101 2,746 891 19,811 X X
Source: U.S. Census Bureau, 2012 Economic Census of Island Areas
N Not available or not comparable
X Not applicable (for the Commodity Flow Survey, not applicable or comparison data unavailable)
S Withheld because estimate did not meet publication standards.
D Withheld to avoid disclosing data for individual companies; data are included in higher level totals
f 500 to 999 employees
e 250 to 499 employees
c 100 to 249 employees
b 20 to 99 employees
a 0 to 19 employees

2015 CNMI Statistical Yearbook Chapter 11 Page 153
11th Statistical Yearbook, Central Statistics Division, Department of Commerce
Table 11.6c Employment Size by Sector, CNMI: 2012
Number of Employees
by Sector
Number of
establish-
ments
Value of
sales, re-
ceipts, rev-
enue, ship-
ments, or
business
done
($1,000)
Annual
payroll
($1,000)
First-quar-
ter payroll
($1,000)
Paid em-
ployees for
pay period
including
March 12
(number)
Operating
expenses
($1,000)
Total in-
ventories,
beginning-
of-year
($1,000)
Total in-
ventories,
end-of-year
($1,000)
Total for all sectors 1,339 1,323,742 208,434 51,887 14,215 653,399 X X
Educational services 43 4,979 1,582 402 133 4,066 X X
No paid 0 0 0 0 0 0 X X
1 to 4 39 4,011 996 254 95 3,231 X X
5 to 9 2 D D D a D X X
10 to 19 2 D D D b D X X
20 or more 0 0 0 0 0 0 X X
Health care and social
assistance
36 41,349 19,656 4,132 725 38,051 X X
No paid 0 0 0 0 0 0 X X
1 to 4 11 877 494 124 26 928 X X
5 to 9 6 1,251 688 149 38 1,092 X X
10 to 19 9 2,552 1,302 283 112 2,259 X X
20 or more 10 36,668 17,172 3,576 549 33,772 X X
Arts, entertainment, and
recreation
43 37,467 7,160 1,799 497 28,661 X X
No paid 1 D D D a D X X
1 to 4 9 466 127 42 17 326 X X
5 to 9 15 7,200 1,308 257 95 4,433 X X
10 to 19 14 18,972 3,055 737 178 12,751 X X
20 or more 4 10,619 2,624 762 204 11,028 X X
Accommodation and
food services
142 179,975 37,761 9,802 3,195 122,906 X X
No paid 3 145 41 0 0 154 X X
1 to 4 44 4,066 1,011 273 118 2,170 X X
5 to 9 37 6,259 1,815 467 248 4,802 X X
10 to 19 31 16,034 3,795 923 422 8,613 X X
20 or more 27 153,471 31,099 8,137 2,406 107,167 X X
Other services (except
public administration)
115 20,636 6,517 1,524 576 16,269 X X
No paid 4 D D D a D X X
1 to 4 70 7,919 1,975 463 151 6,188 X X
5 to 9 23 5,709 2,225 480 158 4,558 X X
10 to 19 15 4,654 1,582 409 188 3,287 X X
20 or more 3 2,178 693 171 78 1,943 X X
Source: U.S. Census Bureau, 2012 Economic Census of Island Areas
N Not available or not comparable
X Not applicable (for the Commodity Flow Survey, not applicable or comparison data unavailable)
S Withheld because estimate did not meet publication standards.
D Withheld to avoid disclosing data for individual companies; data are included in higher level totals
f 500 to 999 employees
e 250 to 499 employees
c 100 to 249 employees
b 20 to 99 employees
a 0 to 19 employees

Page 154 Chapter 11 2015 CNMI Statistical Yearbook
11th Statistical Yearbook, Central Statistics Division, Department of Commerce
Table 11.7a Gender Status of Ownership, CNMI: 2012
Meaning of 2012 NA-
ICS code
Number of estab-
lishments
Value of sales, re-
ceipts, revenue,
shipments, or busi-
ness done ($1,000)
Annual payroll
($1,000)
First-quarter pay-
roll ($1,000)
Paid employees for
pay period includ-
ing March 12
(number)
Total for all sectors 1,339 1,323,742 208,434 51,887 14,215
Female-owned 262 143,099 20,386 4,745 1,967
Male-owned 549 361,676 66,186 16,259 5,349
50/50 Male/Female 139 81,640 17,514 4,442 1,318
Gender unknown 62 457,545 47,321 12,293 2,455
Gender unreported 327 279,783 57,028 14,148 3,127
Construction 62 37,230 7,707 2,009 821
Female-owned 10 1,567 370 101 152
Male-owned 34 30,483 6,339 1,663 575
50/50 Male/Female 5 2,570 425 100 b
Gender unknown 2 D D D a
Gender unreported 11 2,567 501 127 51
Manufacturing 39 20,887 6,700 1,738 592
Female-owned 5 1,986 869 215 106
Male-owned 18 10,107 2,993 724 281
50/50 Male/Female 6 5,135 1,811 447 146
Gender unknown 0 0 0 0 0
Gender unreported 10 3,658 1,026 351 58
Wholesale trade 74 246,827 10,746 2,685 716
Female-owned 14 40,374 1,853 436 154
Male-owned 30 61,801 4,555 1,068 298
50/50 Male/Female 5 3,671 677 185 52
Gender unknown 5 111,525 1,724 492 62
Gender unreported 20 29,457 1,938 506 149
Retail trade 284 314,066 30,662 8,002 2,463
Female-owned 64 49,952 4,488 1,081 486
Male-owned 109 75,678 10,378 2,451 820
50/50 Male/Female 31 41,822 4,820 1,196 406
Gender unknown 5 95,701 5,435 1,853 236
Gender unreported 75 50,914 5,542 1,422 516
Transportation and
warehousing
26 46,438 11,387 2,847 641
Female-owned 3 D D D a
Male-owned 13 9,849 3,334 985 292
50/50 Male/Female 0 0 0 0 0
Gender unknown 5 D D D e
Gender unreported 5 3,044 696 199 33
Source: U.S. Census Bureau, 2012 Economic Census of Island Areas
N Not available or not comparable
X Not applicable (for the Commodity Flow Survey, not applicable or comparison data unavailable)
S Withheld because estimate did not meet publication standards.
D Withheld to avoid disclosing data for individual companies; data are included in higher level totals
Female-
owned
20%
Male-
owned
41%
50/50
Male/Female
10%
Gender
unknown
5%
Gender
unreported
24%
Gender Status of Ownership: 2012

2015 CNMI Statistical Yearbook Chapter 11 Page 155
11th Statistical Yearbook, Central Statistics Division, Department of Commerce
Table 11.7b Gender Status of Ownership, CNMI: 2012
Meaning of 2012 NA-
ICS code
Number of estab-
lishments
Value of sales, re-
ceipts, revenue,
shipments, or busi-
ness done ($1,000)
Annual payroll
($1,000)
First-quarter pay-
roll ($1,000)
Paid employees for
pay period includ-
ing March 12
(number)
Total for all sectors 1,339 1,323,742 208,434 51,887 14,215
Information 20 25,138 8,384 2,064 323
Female-owned 2 D D D a
Male-owned 11 3,144 1,343 309 65
50/50 Male/Female 0 0 0 0 0
Gender unknown 1 D D D b
Gender unreported 6 D D D c
Finance and insurance 47 57,560 8,559 2,238 327
Female-owned 5 1,470 444 111 24
Male-owned 19 31,216 3,056 784 130
50/50 Male/Female 9 6,210 2,783 705 94
Gender unknown 7 9,781 1,260 335 49
Gender unreported 7 8,884 1,016 302 31
Real estate and rental
and leasing
177 30,675 8,305 1,932 694
Female-owned 55 9,360 2,712 558 213
Male-owned 64 9,879 2,605 622 243
50/50 Male/Female 22 3,687 1,065 263 79
Gender unknown 11 3,507 828 209 51
Gender unreported 25 4,243 1,096 280 108
Professional, scientific,
and technical services
105 28,703 9,710 2,394 602
Female-owned 8 1,472 527 136 38
Male-owned 55 16,020 5,182 1,354 374
50/50 Male/Female 10 1,427 591 132 33
Gender unknown 3 427 119 27 14
Gender unreported 29 9,355 3,290 745 143
Management of compa-
nies and enterprises
4 D D D b
Female-owned 0 0 0 0 0
Male-owned 0 0 0 0 0
50/50 Male/Female 0 0 0 0 0
Gender unknown 1 D D D a
Gender unreported 3 D D D b
Administrative and sup-
port and waste manage-
ment and remediation
services
115 50,913 17,689 4,393 1,396
Female-owned 24 4,803 2,568 692 250
Male-owned 45 12,141 4,469 1,137 387
50/50 Male/Female 14 2,573 1,062 259 97
Gender unknown 4 7,874 3,884 924 336
Gender unreported 28 23,522 5,706 1,381 326
Source: U.S. Census Bureau, 2012 Economic Census of Island Areas
N Not available or not comparable
X Not applicable (for the Commodity Flow Survey, not applicable or comparison data unavailable)
S Withheld because estimate did not meet publication standards.
D Withheld to avoid disclosing data for individual companies; data are included in higher level totals

Page 156 Chapter 11 2015 CNMI Statistical Yearbook
11th Statistical Yearbook, Central Statistics Division, Department of Commerce
Table 11.7c Gender Status of Ownership, CNMI: 2012
Meaning of 2012 NA-
ICS code
Number of estab-
lishments
Value of sales, re-
ceipts, revenue,
shipments, or busi-
ness done ($1,000)
Annual payroll
($1,000)
First-quarter pay-
roll ($1,000)
Paid employees for
pay period includ-
ing March 12
(number)
Total for all sectors 1,339 1,323,742 208,434 51,887 14,215
Educational services 43 4,979 1,582 402 133
Female-owned 6 1,482 359 90 b
Male-owned 15 1,688 579 138 47
50/50 Male/Female 6 494 127 35 a
Gender unknown 1 D D D a
Gender unreported 15 1,191 442 121 49
Health care and social
assistance
36 41,349 19,656 4,132 725
Female-owned 7 2,125 1,023 205 60
Male-owned 11 6,841 2,627 486 160
50/50 Male/Female 8 3,764 1,682 452 131
Gender unknown 1 D D D a
Gender unreported 9 D D D e
Arts, entertainment, and
recreation
43 37,467 7,160 1,799 497
Female-owned 6 6,394 1,248 247 72
Male-owned 17 14,336 2,308 577 171
50/50 Male/Female 7 5,973 1,001 259 b
Gender unknown 1 D D D c
Gender unreported 12 4,535 807 198 85
Accommodation and
food services
142 179,975 37,761 9,802 3,195
Female-owned 26 7,168 1,952 437 222
Male-owned 61 67,885 13,237 3,223 1,225
50/50 Male/Female 7 3,066 1,032 268 113
Gender unknown 7 65,284 13,084 3,470 865
Gender unreported 41 36,573 8,456 2,403 770
Other services (except
public administration)
115 20,636 6,517 1,524 576
Female-owned 26 4,176 1,103 259 113
Male-owned 46 10,575 3,167 736 281
50/50 Male/Female 8 996 256 68 31
Gender unknown 4 D D D a
Gender unreported 31 4,638 1,807 420 143
Source: U.S. Census Bureau, 2012 Economic Census of Island Areas
N Not available or not comparable
X Not applicable (for the Commodity Flow Survey, not applicable or comparison data unavailable)
S Withheld because estimate did not meet publication standards.
D Withheld to avoid disclosing data for individual companies; data are included in higher level totals

2015 CNMI Statistical Yearbook Chapter 11 Page 157
11th Statistical Yearbook, Central Statistics Division, Department of Commerce
Table 11.8a Citizenship Status by Sector, CNMI: 2012
Meaning of 2012 NAICS code
Number of es-
tablishments
Value of sales,
receipts, reve-
nue, shipments,
or business done
($1,000)
Annual payroll
($1,000)
First-quarter
payroll ($1,000)
Paid employees
for pay period
including March
12 (number)
Total for all sectors 1,339 1,323,742 208,434 51,887 14,215
U.S. citizen - CNMI born
(Chamorro or Carolinian)
201 127,179 23,921 5,881 2,195
U.S. citizen - CNMI born (NOT
Chamorro or Carolinian)
21 15,262 2,304 608 178
U.S. citizen - not CNMI born 335 324,769 46,458 11,851 3,146
Chinese citizen 114 63,465 10,465 2,388 971
Japanese citizen 104 95,809 21,913 5,682 1,530
Filipino citizen 61 41,135 4,276 1,122 488
Korean citizen 122 66,173 12,430 3,102 970
Dual citizenship/other citizenship 42 30,011 6,553 1,593 608
Citizenship not known/not determi-
nable
36 299,186 26,107 6,206 1,167
Citizenship not reported 303 260,751 54,008 13,456 2,961
Construction 62 37,230 7,707 2,009 821
U.S. citizen - CNMI born
(Chamorro or Carolinian)
7 1,240 464 133 70
U.S. citizen - CNMI born (NOT
Chamorro or Carolinian)
2 D D D b
U.S. citizen - not CNMI born 19 23,258 4,680 1,146 401
Chinese citizen 5 4,293 371 90 40
Japanese citizen 2 D D D a
Filipino citizen 11 3,354 798 292 156
Korean citizen 6 2,235 712 191 60
Dual citizenship/other citizenship 1 D D D a
Citizenship not known/not determi-
nable
0 0 0 0 0
Citizenship not reported 9 1,592 371 92 40
Manufacturing 39 20,887 6,700 1,738 592
U.S. citizen - CNMI born
(Chamorro or Carolinian)
7 5,043 1,896 477 219
U.S. citizen - CNMI born (NOT
Chamorro or Carolinian)
2 D D D b
U.S. citizen - not CNMI born 8 4,852 1,256 304 133
Chinese citizen 4 484 140 37 a
Japanese citizen 4 D D D c
Filipino citizen 2 D D D a
Korean citizen 3 D D D a
Dual citizenship/other citizenship 0 0 0 0 0
Citizenship not known/not determi-
nable
0 0 0 0 0
Citizenship not reported 9 3,471 984 345 55
Source: U.S. Census Bureau, 2012 Economic Census of Island Areas
N Not available or not comparable
X Not applicable (for the Commodity Flow Survey, not applicable or comparison data unavailable)
S Withheld because estimate did not meet publication standards.
D Withheld to avoid disclosing data for individual companies; data are included in higher level totals
f 500 to 999 employees
e 250 to 499 employees
c 100 to 249 employees
b 20 to 99 employees
a 0 to 19 employees
0 125 250 375
U.S. citizen - CNMI born
(Chamorro or Carolinian)
U.S. citizen - CNMI born
(NOT Chamorro or
Carolinian)
U.S. citizen - not CNMI
born
Chinese citizen
Japanese citizen
Filipino citizen
Korean citizen
Dual citizenship/other
citizenship
Citizenship not known/not
determinable
Citizenship not reported
Citizenship Status, CNMI: 2012

Page 158 Chapter 11 2015 CNMI Statistical Yearbook
11th Statistical Yearbook, Central Statistics Division, Department of Commerce
Table 11.8b Citizenship Status by Sector, CNMI: 2012
Meaning of 2012 NAICS code
Number of es-
tablishments
Value of sales,
receipts, reve-
nue, shipments,
or business done
($1,000)
Annual payroll
($1,000)
First-quarter
payroll ($1,000)
Paid employees
for pay period
including March
12 (number)
Total for all sectors 1,339 1,323,742 208,434 51,887 14,215
Wholesale trade 74 246,827 10,746 2,685 716
U.S. citizen - CNMI born
(Chamorro or Carolinian)
5 4,916 472 152 54
U.S. citizen - CNMI born (NOT
Chamorro or Carolinian)
2 D D D b
U.S. citizen - not CNMI born 24 63,267 4,447 1,038 283
Chinese citizen 7 13,003 1,141 269 86
Japanese citizen 2 D D D a
Filipino citizen 7 23,169 787 176 68
Korean citizen 5 5,826 574 141 38
Dual citizenship/other citizenship 2 D D D a
Citizenship not known/not determi-
nable
2 D D D b
Citizenship not reported 18 28,471 1,751 454 128
Retail trade 284 314,066 30,662 8,002 2,463
U.S. citizen - CNMI born
(Chamorro or Carolinian)
36 62,892 5,763 1,419 523
U.S. citizen - CNMI born (NOT
Chamorro or Carolinian)
2 D D D a
U.S. citizen - not CNMI born 70 126,322 10,115 3,013 668
Chinese citizen 44 16,616 2,228 470 200
Japanese citizen 9 3,027 1,411 346 71
Filipino citizen 6 6,150 644 157 57
Korean citizen 36 31,218 3,797 882 353
Dual citizenship/other citizenship 9 8,457 1,174 303 83
Citizenship not known/not determi-
nable
2 D D D b
Citizenship not reported 70 46,606 5,008 1,294 485
Transportation and warehousing 26 46,438 11,387 2,847 641
U.S. citizen - CNMI born
(Chamorro or Carolinian)
6 D D D c
U.S. citizen - CNMI born (NOT
Chamorro or Carolinian)
1 D D D a
U.S. citizen - not CNMI born 9 5,352 2,241 713 175
Chinese citizen 0 0 0 0 0
Japanese citizen 2 D D D a
Filipino citizen 0 0 0 0 0
Korean citizen 0 0 0 0 0
Dual citizenship/other citizenship 0 0 0 0 0
Citizenship not known/not determi-
nable
5 D D D e
Citizenship not reported 3 D D D b
Source: U.S. Census Bureau, 2012 Economic Census of Island Areas
N Not available or not comparable
X Not applicable (for the Commodity Flow Survey, not applicable or comparison data unavailable)
S Withheld because estimate did not meet publication standards.
D Withheld to avoid disclosing data for individual companies; data are included in higher level totals
f 500 to 999 employees
e 250 to 499 employees
c 100 to 249 employees
b 20 to 99 employees
a 0 to 19 employees

2015 CNMI Statistical Yearbook Chapter 11 Page 159
11th Statistical Yearbook, Central Statistics Division, Department of Commerce
Table 11.8c Citizenship Status by Sector, CNMI: 2012
Meaning of 2012 NAICS code
Number of es-
tablishments
Value of sales,
receipts, reve-
nue, shipments,
or business done
($1,000)
Annual payroll
($1,000)
First-quarter
payroll ($1,000)
Paid employees
for pay period
including March
12 (number)
Total for all sectors 1,339 1,323,742 208,434 51,887 14,215
Information 20 25,138 8,384 2,064 323
U.S. citizen - CNMI born
(Chamorro or Carolinian)
2 D D D a
U.S. citizen - CNMI born (NOT
Chamorro or Carolinian)
0 0 0 0 0
U.S. citizen - not CNMI born 6 6,603 1,466 369 80
Chinese citizen 2 D D D a
Japanese citizen 2 D D D a
Filipino citizen 0 0 0 0 0
Korean citizen 1 D D D a
Dual citizenship/other citizen-
ship
0 0 0 0 0
Citizenship not known/not de-
terminable
1 D D D b
Citizenship not reported 6 D D D c
Finance and insurance 47 57,560 8,559 2,238 327
U.S. citizen - CNMI born
(Chamorro or Carolinian)
7 3,095 1,025 260 47
U.S. citizen - CNMI born (NOT
Chamorro or Carolinian)
2 D D D a
U.S. citizen - not CNMI born 16 31,900 4,559 1,178 147
Chinese citizen 1 D D D a
Japanese citizen 1 D D D a
Filipino citizen 6 2,464 615 148 41
Korean citizen 1 D D D a
Dual citizenship/other citizen-
ship
3 D D D a
Citizenship not known/not de-
terminable
4 8,874 956 264 36
Citizenship not reported 6 8,743 985 288 30
Real estate and rental and leasing 177 30,675 8,305 1,932 694
U.S. citizen - CNMI born
(Chamorro or Carolinian)
55 8,811 2,921 648 246
U.S. citizen - CNMI born (NOT
Chamorro or Carolinian)
2 D D D a
U.S. citizen - not CNMI born 33 8,478 1,612 369 130
Chinese citizen 9 459 106 25 a
Japanese citizen 11 1,687 646 177 67
Filipino citizen 5 D D D b
Korean citizen 26 3,657 1,236 286 86
Dual citizenship/other citizen-
ship
7 957 194 41 14
Citizenship not known/not de-
terminable
6 D D D a
Citizenship not reported 23 4,011 972 247 91
Source: U.S. Census Bureau, 2012 Economic Census of Island Areas
N Not available or not comparable
X Not applicable (for the Commodity Flow Survey, not applicable or comparison data unavailable)
S Withheld because estimate did not meet publication standards.
D Withheld to avoid disclosing data for individual companies; data are included in higher level totals
f 500 to 999 employees
e 250 to 499 employees
c 100 to 249 employees
b 20 to 99 employees
a 0 to 19 employees

Page 160 Chapter 11 2015 CNMI Statistical Yearbook
11th Statistical Yearbook, Central Statistics Division, Department of Commerce
Table 11.8d Citizenship Status by Sector, CNMI: 2012
Meaning of 2012 NAICS code
Number of es-
tablishments
Value of sales,
receipts, reve-
nue, shipments,
or business done
($1,000)
Annual payroll
($1,000)
First-quarter
payroll ($1,000)
Paid employees
for pay period
including March
12 (number)
Total for all sectors 1,339 1,323,742 208,434 51,887 14,215
Professional, scientific, and technical
services
105 28,703 9,710 2,394 602
U.S. citizen - CNMI born
(Chamorro or Carolinian)
16 4,335 1,547 474 212
U.S. citizen - CNMI born (NOT
Chamorro or Carolinian)
2 D D D a
U.S. citizen - not CNMI born 43 11,178 4,360 994 172
Chinese citizen 2 D D D a
Japanese citizen 4 659 281 61 25
Filipino citizen 4 1,060 315 89 25
Korean citizen 4 319 132 37 a
Dual citizenship/other citizenship 2 D D D a
Citizenship not known/not determi-
nable
2 D D D a
Citizenship not reported 26 9,028 2,375 584 126
Management of companies and enter-
prises
4 D D D b
U.S. citizen - CNMI born
(Chamorro or Carolinian)
0 0 0 0 0
U.S. citizen - CNMI born (NOT
Chamorro or Carolinian)
0 0 0 0 0
U.S. citizen - not CNMI born 0 0 0 0 0
Chinese citizen 0 0 0 0 0
Japanese citizen 0 0 0 0 0
Filipino citizen 0 0 0 0 0
Korean citizen 0 0 0 0 0
Dual citizenship/other citizenship 0 0 0 0 0
Citizenship not known/not determi-
nable
1 D D D a
Citizenship not reported 3 D D D b
Administrative and support and waste
management and remediation ser-
vices
115 50,913 17,689 4,393 1,396
U.S. citizen - CNMI born
(Chamorro or Carolinian)
18 4,921 2,730 742 261
U.S. citizen - CNMI born (NOT
Chamorro or Carolinian)
4 1,567 281 77 29
U.S. citizen - not CNMI born 26 7,846 2,660 638 228
Chinese citizen 8 418 176 40 b
Japanese citizen 12 10,724 2,303 564 104
Filipino citizen 7 917 276 68 42
Korean citizen 7 2,377 956 250 68
Dual citizenship/other citizenship 8 4,205 2,728 674 304
Citizenship not known/not determi-
nable
1 D D D b
Citizenship not reported 24 16,167 5,022 1,211 292
Source: U.S. Census Bureau, 2012 Economic Census of Island Areas
N Not available or not comparable
X Not applicable (for the Commodity Flow Survey, not applicable or comparison data unavailable)
S Withheld because estimate did not meet publication standards.
D Withheld to avoid disclosing data for individual companies; data are included in higher level totals
f 500 to 999 employees
e 250 to 499 employees
c 100 to 249 employees
b 20 to 99 employees
a 0 to 19 employees

2015 CNMI Statistical Yearbook Chapter 11 Page 161
11th Statistical Yearbook, Central Statistics Division, Department of Commerce
Table 11.8e Citizenship Status by Sector, CNMI: 2012
Meaning of 2012 NAICS code
Number of es-
tablishments
Value of sales,
receipts, reve-
nue, shipments,
or business done
($1,000)
Annual payroll
($1,000)
First-quarter
payroll ($1,000)
Paid employees
for pay period
including March
12 (number)
Total for all sectors 1,339 1,323,742 208,434 51,887 14,215
Educational services 43 4,979 1,582 402 133
U.S. citizen - CNMI born
(Chamorro or Carolinian)
3 406 290 72 14
U.S. citizen - CNMI born (NOT
Chamorro or Carolinian)
0 0 0 0 0
U.S. citizen - not CNMI born 5 503 231 54 19
Chinese citizen 0 0 0 0 0
Japanese citizen 16 1,570 490 127 38
Filipino citizen 0 0 0 0 0
Korean citizen 2 D D D a
Dual citizenship/other citizen-
ship
3 256 68 14 a
Citizenship not known/not de-
terminable
0 0 0 0 0
Citizenship not reported 14 1,128 410 112 48
Health care and social assistance 36 41,349 19,656 4,132 725
U.S. citizen - CNMI born
(Chamorro or Carolinian)
8 3,633 1,925 331 100
U.S. citizen - CNMI born (NOT
Chamorro or Carolinian)
0 0 0 0 0
U.S. citizen - not CNMI born 16 9,024 3,340 791 230
Chinese citizen 0 0 0 0 0
Japanese citizen 0 0 0 0 0
Filipino citizen 1 D D D a
Korean citizen 0 0 0 0 0
Dual citizenship/other citizen-
ship
0 0 0 0 0
Citizenship not known/not de-
terminable
0 0 0 0 0
Citizenship not reported 11 D D D e
Arts, entertainment, and recreation 43 37,467 7,160 1,799 497
U.S. citizen - CNMI born
(Chamorro or Carolinian)
2 D D D b
U.S. citizen - CNMI born (NOT
Chamorro or Carolinian)
0 0 0 0 0
U.S. citizen - not CNMI born 10 12,404 1,994 440 96
Chinese citizen 0 0 0 0 0
Japanese citizen 8 4,062 1,109 291 104
Filipino citizen 0 0 0 0 0
Korean citizen 8 13,300 2,699 765 160
Dual citizenship/other citizen-
ship
1 D D D a
Citizenship not known/not de-
terminable
1 D D D a
Citizenship not reported 13 4,898 933 230 96
Source: U.S. Census Bureau, 2012 Economic Census of Island Areas
N Not available or not comparable
X Not applicable (for the Commodity Flow Survey, not applicable or comparison data unavailable)
S Withheld because estimate did not meet publication standards.
D Withheld to avoid disclosing data for individual companies; data are included in higher level totals
f 500 to 999 employees
e 250 to 499 employees
c 100 to 249 employees
b 20 to 99 employees
a 0 to 19 employees

Page 162 Chapter 11 2015 CNMI Statistical Yearbook
11th Statistical Yearbook, Central Statistics Division, Department of Commerce
Table 11.8f Citizenship Status by Sector, CNMI: 2012
Meaning of 2012 NAICS code
Number of es-
tablishments
Value of sales,
receipts, reve-
nue, shipments,
or business done
($1,000)
Annual payroll
($1,000)
First-quarter
payroll ($1,000)
Paid employees
for pay period
including March
12 (number)
Total for all sectors 1,339 1,323,742 208,434 51,887 14,215
Accommodation and food services 142 179,975 37,761 9,802 3,195
U.S. citizen - CNMI born
(Chamorro or Carolinian)
17 8,180 1,880 459 189
U.S. citizen - CNMI born (NOT
Chamorro or Carolinian)
1 D D D a
U.S. citizen - not CNMI born 22 9,633 2,141 500 253
Chinese citizen 18 25,573 5,637 1,292 505
Japanese citizen 23 65,289 13,317 3,556 945
Filipino citizen 3 124 50 S a
Korean citizen 12 2,581 911 222 95
Dual citizenship/other citizenship 3 D D D c
Citizenship not known/not determi-
nable
4 D D D e
Citizenship not reported 39 35,633 8,231 2,377 745
Other services (except public admin-
istration)
115 20,636 6,517 1,524 576
U.S. citizen - CNMI born
(Chamorro or Carolinian)
10 1,835 631 166 52
U.S. citizen - CNMI born (NOT
Chamorro or Carolinian)
1 D D D a
U.S. citizen - not CNMI born 28 4,151 1,355 304 130
Chinese citizen 13 2,291 566 143 83
Japanese citizen 8 1,808 510 123 20
Filipino citizen 9 2,232 285 69 41
Korean citizen 11 2,842 1,048 237 73
Dual citizenship/other citizenship 2 D D D b
Citizenship not known/not determi-
nable
4 229 217 49 a
Citizenship not reported 29 4,606 1,813 418 145
Source: U.S. Census Bureau, 2012 Economic Census of Island Areas
N Not available or not comparable
X Not applicable (for the Commodity Flow Survey, not applicable or comparison data unavailable)
S Withheld because estimate did not meet publication standards.
D Withheld to avoid disclosing data for individual companies; data are included in higher level totals
f 500 to 999 employees
e 250 to 499 employees
c 100 to 249 employees
b 20 to 99 employees
a 0 to 19 employees

2015 CNMI Statistical Yearbook Chapter 11 Page 163
11th Statistical Yearbook, Central Statistics Division, Department of Commerce
Table 11.9 Percent Distribution of sales, receipts, or revenue by Sector, CNMI: 2012
Class of Customer and Sector Total
Con-
struction
Manufac-
turing
Whole-
sale trade
Retail
trade
Transport
and
ware-
housing
Infor-
mation Finance
Real es-
tate and
leasing
Total for all sectors 100.0 100.0 100.0 100.0 100.0 100.0 100.0 100.0 100.0
Household consumers (Ex-
cluding visiting tourists.)
21.5 4.3 19.4 15.9 36.8 4.9 46.2 25.2 20.0
Retailers 16.4 4.0 13.4 31.7 8.4 10.2 7.0 14.6 6.9
Wholesalers 2.9 D 7.2 6.8 2.1 13.9 5.6 2.6 1.8
Visiting tourists 17.9 0.0 2.2 0.6 37.2 2.6 0.0 0.1 11.2
Hotels or other traveler ac-
commodations
5.6 2.5 4.8 7.8 2.9 1.7 11.4 2.7 1.0
Construction contractors 2.0 24.8 6.6 2.1 0.9 1.4 3.2 1.7 1.9
Farmers for farm use 0.2 0.0 D 0.0 0.8 0.0 D 0.0 0.1
Restaurants, food services,
and nightclubs
0.7 0.1 2.7 0.3 0.7 D D 0.6 0.4
Travel agencies and other
passenger transportation
services
2.7 0.0 0.5 0.5 0.3 26.7 3.8 1.0 0.8
Other service establishments
including truck and passen-
ger car rental and leasing
0.7 0.5 2.9 0.3 0.6 4.1 D 0.4 2.7
Apparel manufacturers 0.1 0.0 0.7 0.0 0.1 0.0 D 0.1 0.1
Other manufacturer estab-
lishments and quarries
3.4 5.9 2.4 1.5 2.8 9.5 2.1 3.8 17.8
Banks, insurance, and real
estate companies
0.7 0.1 0.9 0.1 0.8 D 4.2 2.5 4.7
Governmental bodies 11.2 53.8 34.0 22.0 4.4 10.7 7.3 1.3 6.8
All other classes of custom-
ers
14.0 3.9 2.4 D 1.2 13.1 1.3 43.5 23.9
Source: 2012 CNMI Economic Census
Table 11.9 Percent Distribution of sales, receipts, or revenue by Sector, CNMI: 2012 – Continued –
Class of Customer and Sector
Professional
and scien-
tific
Administra-
tive support
Educational
services Health care
Arts and en-
tertainment
Accommo-
dation and
food Others
Total for all sectors 100.0 100.0 100.0 100.0 100.0 100.0 100.0
Household consumers (Ex-
cluding visiting tourists.)
28.2 5.6 3.0 50.1 23.9 14.1 29.9
Retailers 4.6 3.9 1.0 1.8 D 2.9 8.6
Wholesalers 2.0 0.5 0.0 0.1 0.0 1.5 1.9
Visiting tourists 2.1 32.5 86.6 0.9 30.9 42.6 15.2
Hotels or other traveler ac-
commodations
3.8 7.2 0.0 0.0 3.0 17.3 4.8
Construction contractors 6.4 0.5 0.0 0.0 0.3 0.2 10.4
Farmers for farm use 0.0 0.0 0.0 0.0 0.0 0.0 0.0
Restaurants, food services,
and nightclubs
0.5 1.3 0.0 0.0 0.0 1.6 0.4
Travel agencies and other
passenger transportation
services
2.0 27.3 1.4 0.1 1.3 1.9 3.1
Other service establishments
including truck and passen-
ger car rental and leasing
2.4 1.3 0.0 0.2 0.0 0.0 1.5
Apparel manufacturers 0.1 0.0 0.0 0.0 0.0 0.0 0.0
Other manufacturer estab-
lishments and quarries
3.0 2.4 0.0 D 0.0 8.4 0.0
Banks, insurance, and real
estate companies
5.3 0.6 0.0 0.6 0.0 0.2 1.2
Governmental bodies 19.1 4.5 0.0 7.5 14.1 2.1 7.4
All other classes of custom-
ers
20.6 12.5 8.0 38.4 25.0 7.4 15.6
Source: 2012 CNMI Economic Census

Page 164 Chapter 11 2015 CNMI Statistical Yearbook
11th Statistical Yearbook, Central Statistics Division, Department of Commerce
Table 11.10 Capital Expenditures and Depreciation Charges by Sector, CNMI: 2012
Sector
Number of
establish-
ments
Value of
sales, re-
ceipts, reve-
nue, ship-
ments, or
business
done
($1,000)
Total capital
expenditures
($1,000)
Capital ex-
penditures on
buildings and
other struc-
tures (new
and
used)($1,000
)
Capital ex-
penditures on
machinery
and equip-
ment (new
and used)
($1,000)
Depreciation
charges
($1,000)
Total for all sectors 1,339 1,323,742 482,234 405,743 76,490 170,498
Mining, quarrying, and oil and gas
extraction 1 D D D D D
Utilities 6 D D D D D
Construction 62 37,230 4,707 2,254 2,452 1,761
Manufacturing 39 20,887 3,333 1,054 2,280 2,308
Wholesale trade 74 246,827 9,763 6,495 3,269 53,515
Retail trade 284 314,066 189,566 180,431 9,135 19,992
Transportation and warehousing 26 46,438 83,601 67,213 16,387 12,038
Information 20 25,138 8,643 6,744 1,899 1,061
Finance and insurance 47 57,560 18,051 10,805 7,246 6,432
Real estate and rental and leasing 177 30,675 89,263 84,729 4,534 11,952
Professional, scientific, and technical
services 105 28,703 3,454 1,272 2,182 1,216
Management of companies and enter-
prises 4 D D D D D
Administrative and support and waste
management and remediation ser-
vices 115 50,913 4,071 1,669 2,401 3,105
Educational services 43 4,979 5,111 2,911 2,199 1,580
Health care and social assistance 36 41,349 15,719 10,118 5,601 2,440
Arts, entertainment, and recreation 43 37,467 7,377 3,450 3,928 10,404
Accommodation and food services 142 179,975 13,164 6,681 6,483 19,926
Other services (except public admin-
istration) 115 20,636 10,466 4,714 5,751 5,408
Source: U.S. Census Bureau, 2012 Economic Census of Island Areas
D Withheld to avoid disclosing data for individual companies; data are included in higher level totals
Table 11.11 E-Commerce Characteristics, CNMI: 2012
Number of establishments 1,339
Value of sales, receipts, revenue, shipments, or business done ($1,000) 1,323,742
Number of e-commerce establishments 101
Value of e-commerce sales, receipts, revenue, shipments or business done ($1,000) 40,758
Value of sales, receipts, revenue, shipments, or business done as a percent of total sales 3.1
Source: U.S. Census Bureau, 2012 Economic Census of Island Areas
1
6
62
39
74
284
26
20
47
177
105
4
115
43
36
43
142
115
0 100 200 300
Mining, quarrying, and oil and gas
extraction
Utilities
Construction
Manufacturing
Wholesale trade
Retail trade
Transportation and warehousing
Information
Finance and insurance
Real estate and rental and leasing
Professional, scientific, and
technical services
Management of companies and
enterprises
Administrative and support and
waste management and…
Educational services
Health care and social assistance
Arts, entertainment, and recreation
Accommodation and food services
Other services (except public
administration)
Type of Sectors: 2012

2015 CNMI Statistical Yearbook Chapter 11 Page 165
11th Statistical Yearbook, Central Statistics Division, Department of Commerce
Table 11.12 Number of Business Licenses Issued by Activities, CNMI: 1996 to 2001
Activity
Year
2001 2000 1999 1998 1997 1996
Total 9,790 7,873 7,116 7,449 9,751 8,507
Agriculture, forestry and fishing 102 82 134 128 122 117
Mining 14 15 4 7 9 0
Construction 603 530 357 405 607 440
Manufacturing 342 323 173 201 325 198
Transportation, communication, electric and sanitary services 331 326 534 504 688 551
Wholesale trade 471 421 331 312 628 307
Retail trade 2,557 2,151 2,381 2,447 2,598 2,287
Finance, insurance and real estate 1,742 1654 852 1,064 1,316 1,182
Services 3,628 2,371 2,350 2,378 3,455 2,653
Public Administration 0 0 0 3 3 3
Nonclassifiable establishments 0 0 0 0 0 769
Source: Business License, Division of Revenue & Taxation, Department of Finance
Note: 2002 and 2003 data was not submitted by the source indicated above
Note: Table will be updated when current data are available
Table 11.13 Aggregated Banking Activities, CNMI: 1996 to 2004 [Values in Thousands of Dollars]
Banking Activity
Year
2004 2003 2002 2001 2000 1999 1998 1997 1996
Deposits 663.9 553.7 549.3 599.8 595.7 570.4 522.8 481.1 463.0
Demand 177.6 157.8 133.2 146.6 144.0 153.0 133.6 140.8 136.7
Savings 224.1 217.1 223.8 195.6 176.2 184.5 192.5 163.2 163.2
TCDs 177.8 178.8 192.4 257.7 275.5 232.9 196.7 177.0 163.1
Loans 157.2 212.0 253.1 276.2 325.1 288.3 304.7 239.4 280.2
Consumer 82.7 67.2 60.9 75.8 70.8 74.7 83.6 71.9 71.3
Commercial 75.3 99.0 126.4 151.0 209.6 159.9 165.3 134.5 173.5
Real Estate Home Improvement 45.8 45.7 65.8 46.6 41.9 53.4 54.7 31.7 34.0
Non-local 0.0 0.0 0.0 0.0 0.0 0.0 0.0 0.0 0.0
Government 0.0 * * 2.9 2.8 0.4 1.1 1.3 1.4
Interest paid 763.5 23.4 35.1 44.2 38.0 37.6 39.6 35.1
All deposit accounts 559.7 553.7 16.8 13.9 18.6 14.4 14.3 14.9 12.7
By borrowers 203.8 21.2 6.6 21.2 25.7 23.7 23.4 24.8 22.3
Commonwealth Development Authority * 35.3 * * 3.9 6.5 8.3 7.0 4.3
Direct loans * 18.5 * * 1.8 0.9 2.2 0.5 1.0
Guarantee loans * 16.8 * * 2.1 5.6 6.0 6.5 3.3
Source: Department of Commerce and Commonwealth Development Authority
Note: Board of the Directors made moratorium to cease the Direct and Guarantee loans.
Note: "*" means data not available
Note: Table will be updated when current data are available
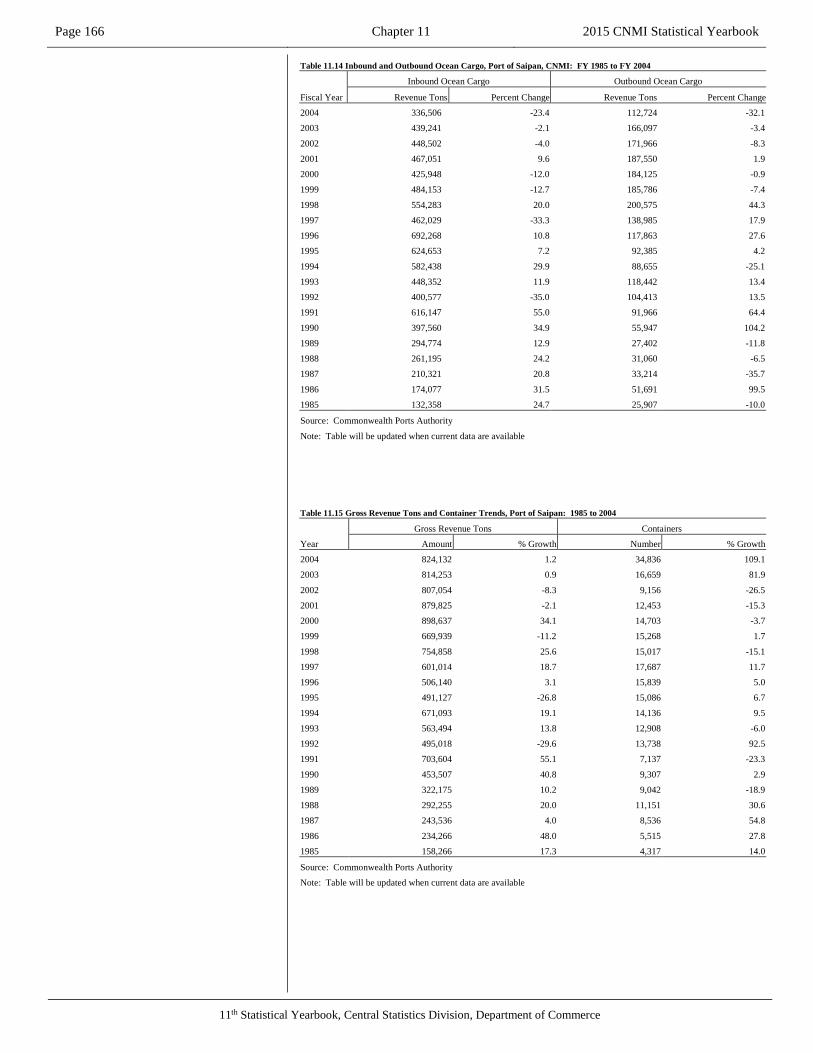
Page 166 Chapter 11 2015 CNMI Statistical Yearbook
11th Statistical Yearbook, Central Statistics Division, Department of Commerce
Table 11.14 Inbound and Outbound Ocean Cargo, Port of Saipan, CNMI: FY 1985 to FY 2004
Fiscal Year
Inbound Ocean Cargo Outbound Ocean Cargo
Revenue Tons Percent Change Revenue Tons Percent Change
2004 336,506 -23.4 112,724 -32.1
2003 439,241 -2.1 166,097 -3.4
2002 448,502 -4.0 171,966 -8.3
2001 467,051 9.6 187,550 1.9
2000 425,948 -12.0 184,125 -0.9
1999 484,153 -12.7 185,786 -7.4
1998 554,283 20.0 200,575 44.3
1997 462,029 -33.3 138,985 17.9
1996 692,268 10.8 117,863 27.6
1995 624,653 7.2 92,385 4.2
1994 582,438 29.9 88,655 -25.1
1993 448,352 11.9 118,442 13.4
1992 400,577 -35.0 104,413 13.5
1991 616,147 55.0 91,966 64.4
1990 397,560 34.9 55,947 104.2
1989 294,774 12.9 27,402 -11.8
1988 261,195 24.2 31,060 -6.5
1987 210,321 20.8 33,214 -35.7
1986 174,077 31.5 51,691 99.5
1985 132,358 24.7 25,907 -10.0
Source: Commonwealth Ports Authority
Note: Table will be updated when current data are available
Table 11.15 Gross Revenue Tons and Container Trends, Port of Saipan: 1985 to 2004
Year
Gross Revenue Tons Containers
Amount % Growth Number % Growth
2004 824,132 1.2 34,836 109.1
2003 814,253 0.9 16,659 81.9
2002 807,054 -8.3 9,156 -26.5
2001 879,825 -2.1 12,453 -15.3
2000 898,637 34.1 14,703 -3.7
1999 669,939 -11.2 15,268 1.7
1998 754,858 25.6 15,017 -15.1
1997 601,014 18.7 17,687 11.7
1996 506,140 3.1 15,839 5.0
1995 491,127 -26.8 15,086 6.7
1994 671,093 19.1 14,136 9.5
1993 563,494 13.8 12,908 -6.0
1992 495,018 -29.6 13,738 92.5
1991 703,604 55.1 7,137 -23.3
1990 453,507 40.8 9,307 2.9
1989 322,175 10.2 9,042 -18.9
1988 292,255 20.0 11,151 30.6
1987 243,536 4.0 8,536 54.8
1986 234,266 48.0 5,515 27.8
1985 158,266 17.3 4,317 14.0
Source: Commonwealth Ports Authority
Note: Table will be updated when current data are available

2015 CNMI Statistical Yearbook Chapter 11 Page 167
11th Statistical Yearbook, Central Statistics Division, Department of Commerce
Table 11.16 Value of Major Imported Commodities, CNMI: 1997 to 2003 [in revenue tons]
Commodity 2003 2000 1999 1998 1997 1996 1995
Total 413.2 267.2 488.0 797.8 836.2 551.2 528.0
Petroleum products … … … … 68.5 65.3 70.4
Construction Materials (including fixtures) 21.0 7.4 13.2 39.5 35.1 16.8 17.2
Food stuff 67.2 0.3 53.7 88.8 80.1 39.5 44.7
Vehicles (including parts) 19.6 5.9 8.6 35.4 42.1 34.2 35.6
Beverages other than dairy & juice 25.1 7.6 19.4 37.6 12.8 15.1 20.4
Tobacco Products 0.0 0 0.1 0.2 5.4 4.9 5.5
Clothing 127.6 73.7 29.5 1.0 59.0 27.1 18.5
All Other 152.6 172.3 363.5 595.3 533.2 348.1 315.8
Source: Department of Finance, Division of Custom Services
Note: "…" means data for this category not available, included in all others
Note: 2001 and 2002 data incomplete, so not shown
Note: Table will be updated when current data are available
Table 11.17 Origin Revenue Tons of Import Commodities, CNMI: 1997 to 2004
Commodity
Year
2004 2003 2001 2000 1999 1998 1997
Total 323.5 369.6 320.5 331.2 390.9 638.7 836.2
United States 154.9 102.6 45.7 54.7 108.1 286.7 361.3
US mainland 2.0 5.8 9.3 9.9 9.2 12.9 63.3
Guam 49.2 96.8 36.4 44.8 98.9 273.8 298.0
Asia 250.6 249.3 262.6 269.3 260.8 291.5 402.2
Japan 33.3 31.2 28.0 33.1 35.5 50.9 118.3
Philippines 11 8.6 8.0 8.5 7.3 8.6 2.8
Hong Kong 109.3 114.2 133.8 127.6 134.0 143.9 200.5
Korea 97.2 95.3 92.8 100.1 84.0 88.1 80.6
Other Areas 21.6 17.7 12.2 7.2 22.0 60.5 72.7
Source: Commonwealth Port Authority, Seaport
Note: 2002 data not available
Note: Table will be updated when current data are available

11th Statistical Yearbook, Central Statistics Division, Department of Commerce
CHAPTER 12
Agriculture and
Fishing

2015 CNMI Statistical Yearbook Chapter 12 Page 169
11th Statistical Yearbook, Central Statistics Division, Department of Commerce
Chapter 12 – Agriculture and Fishing
Agriculture data used to come from the U.S. Census of Agriculture done with the Decennial census in 1980
and 1990, and then every 5 years, ending in 2007. The Agriculture Census was not collected in 2012, and it
does not look like there will be one in 2017 either. While the CNMI has farms, it does not publish annual
statistics on its products. The Division of Fish and Wildlife is responsible for collecting and publishing data
on fish and fisheries, but has not supplied data for the yearbook since 2004.
The number of farms in the CNMI increased from 299 to 346 between 1980 and 1990, but 1997 showed only
103 farms, while 2002 recorded 214 farms, and 2007 saw 256 farms. The average size of farms decreased
from about 41 acres in 1980 to 16 in 2007.
The number of livestock farms with cattle was 36 in 1990, 29 in 1997, 55 in 2002 and 63 in 2007. The
number of animals decreased from 4,500 to 1,400, partly as a result of decreases on Tinian. In 1990, CNMI
had 66 hog farms, which was about the same as in 2002 and 2007. In 2010, about 1,500 hogs were counted.
Small numbers of goats and horses were also enumerated.
The average sales from farms was about $1 million in 1990 (in 1990 dollars) and about $2.4 in 2010 (in 2010
dollars. In 2007, 106 farms sold root crops, 110 sold vegetables and melons, 115 sold fruits and nuts, 98 sold
livestock, and smaller numbers sold poultry and eggs, and fish and aquaculture products.

Page 170 Chapter 12 2015 CNMI Statistical Yearbook
11th Statistical Yearbook, Central Statistics Division, Department of Commerce
Table 12.1 Farms, Land in Farms and Land Use, CNMI: 1980 to 2007
Land Use
2007 2002 1997 1990 1980
Number
of Farms
Farm
size
(acres)
Number
of Farms
Farm
size
(acres)
Number
of Farms
Farm
size
(acres)
Number
of Farms
Farm
size
(acres)
Number
of Farms
Farm
size
(acres)
Farms 256 214 103 ... 346 ... 299 ...
Land in farms' ... 4,013 ... 2,353 ... 3,413 ... 16,442 ... 12,187
Average size of farm ... 15.7 ... 11.0 ... 33.1 ... 48.0 ... 40.8
Approximate land area ... 117,760 ... 117,760 ... 117,760 ... 117,760 ... 117,760
Proportion in farms (per-
cent) ... 3.4 ... 2.0 ... 33.1 ... 14.0 ... 10.3
Cropland 213 773 194 882 88 490 281 5,235 289 2,643
Used for crops 208 538 189 529 84 413 270 769 280 950
Used for other purposes 91 235 117 353 20 40 80 4,466 146 1,693
Pastureland, except cropland
pastured 75 2,955 60 1,222 22 2,681 124 5,534 129 8,706
Other land 157 283 190 248 43 156 218 3,673 132 839
Source: 1998 Census of Agriculture AC97 -A- 56, Table 1, 2007 Agriculture Report, and earlier Agriculture Census Reports
Note: Figures may not add to total due to rounding
Table 12.2 Number of Livestock Farms, CNMI: 1990 to 2007
Livestock
2007 2002 1997 1990
Farms Animals Farms Animals Farms Animals Farms Animals
Cattle and calves of all ages 63 1,395 55 1,319 29 1,789 36 4,513
Milk cows 7 83 3 14 6 80
Other cattle and calves 62 1,312 55 1,319 28 1,775 33 4,433
Hog and pigs of all ages 62 1,483 61 2,242 24 831 66 1,260
Goats and kids of all ages 19 276 15 198 10 249 21 482
Horses, mules and colts of all ages 1 2 1 D 2 D
Other livestock 4 32 4 32
Source: 1997 Census of Agriculture, AC97-A-56, Table 11 and 2007 Agriculture Census Report
Note: "D" means data withheld to avoid disclosing figures for individual establishments; data are included in higher level
totals
Table 12.3 Number of Livestock Sold, CNMI: 1990 to 2007
Livestock
2007 2002 1997 1990
Farms Animals Farms Animals Farms Animals Farms Animals
Cattle and calves of all ages 59 275 39 296 17 456 14 702
Milk cows 4 13 ... D ... 22
Other cattle and calves 57 262 39 296 17 447 ... 680
Hog and pigs of all ages 50 675 42 3,039 22 635 28 360
Goats and kids of all ages 8 43 3 92 3 27 3 8
Horses, mules and colts of all ages 1 1 1 D 1 D
Other livestock 1 D 1 D
Source: 1997 Census of Agriculture, AC97-A-56, Table 11 and 2007 Agriculture Census Report
Note: "D" means data withheld to avoid disclosing figures for individual establishments; data are included in higher level
totals
256214
103
346
299
0
100
200
300
400
2007 2002 1997 1990 1980
Farms: 1980 to 2007
256214
103
346
299
0
100
200
300
400
2007 2002 1997 1990 1980
Farms: 1980 to 2007
0
10
20
30
40
50
60
70
2007 2002 1997 1990
Animal Farms: 1990 to 2007
Cattle and calves of
all ages
Hog and pigs of all
ages
Goats and kids of
all ages
0
1,000
2,000
3,000
4,000
5,000
2007 2002 1997 1990
Animals on Farms: 1990 to 2007
Cattle and calves of
all ages
Hog and pigs of all
ages
Goats and kids of
all ages

2015 CNMI Statistical Yearbook Chapter 12 Page 171
11th Statistical Yearbook, Central Statistics Division, Department of Commerce
Table 12.4 Market Value of Agricultural Products Sold, CNMI: 1990 to 2007
Items
Farms Value (dollars)
2007 2002 1997 1990 2007 2002 1997 1990
Total Sales 256 214 103 119 2,409,513 2,287,407 2,814,321 1,063,950
Average Sales (x) (x) 9,412 10,689 27,324 8,941
Farms by Value of Sales:
Less than $1,200 20 19 7 43 24,385 19,640 7,387 19,405
$1,200 to $2,499 68 55 14 22 114,952 95,818 23,099 40,518
$2,500 to $4,999 49 44 18 23 174,365 151,614 58,804 73,930
$5,000 to $7,499 42 23 17 5 249,645 134,878 97,854 32,386
$7,500 to $9,999 18 17 4 3 153,950 140,537 35,882 24,840
$10,000 or more 59 56 43 23 1,692,216 1,744,920 2,591,295 872,771
Sales by commodity group or product
Root crops 106 85 43 N/A 638,498 404,734 129,201 N/A
Sales of $500 or more 84 74 29 N/A 633,728 633,728 126,199 N/A
Vegetables and melons 110 102 79 N/A 631,470 821,293 1,217,972 N/A
Sales of $500 or more 94 84 72 N/A 627,295 816,883 1,216,115 N/A
Fruits and nuts 115 103 36 47 401,664 343,021 251,550 155,341
Sales of $500 or more 95 82 23 28 397,359 338,085 248,679 152,307
Nursery crops (inc. ornamentals) 17 10 7 8 178,311 93,997 (D) 58,885
Sales of $500 or more 15 9 6 7 177,781 92,997 (D) (D)
Livestock 98 71 37 37 279,485 475,187 390,905 367,383
Sales of $500 or more 93 62 35 26 277,910 472,517 (D) 364,628
Poultry and eggs 18 32 9 8 214,360 143,795 712,423 12,115
Sales of $500 or more 7 23 5 4 34,075 141,725 712,153 11,550
Fish and aquaculture products 5 5 1 0 65,725 64,150 (D) 0
Sales of $500 or more 4 3 1 0 65,600 5,550 (D) 0
Source: 1997 Census of Agriculture, AC97-A-56, Table 6 and 2007 Agriculture Census Report
$2,409,513 $2,287,407
$2,814,321
$1,063,950
$-
$500,000
$1,000,000
$1,500,000
$2,000,000
$2,500,000
$3,000,000
2007 2002 1997 1990
Total sales: 1990 to 2007

Page 172 Chapter 12 2015 CNMI Statistical Yearbook
11th Statistical Yearbook, Central Statistics Division, Department of Commerce
Table 12.5a Amount and Value of Commercial Fish Landing for Common Species, CNMI: 2003 to 2004
Common Species
2004 2003
Price per
pound Weight (lbs.) Value ($)
Price per
pound Weight (lbs.) Value ($)
Total 1.98 133,761 460,455 2.23 290,121 648,156
Pelagic (troll) fish 1.73 64 111 1.95 180,525 352,371
Bigeye scad (Atulai) 2.31 4,408 10,266 2.39 12,010 28,645
Barracuda 1.87 3,817.87 9,079.11 * * *
Dogtooth tuna 1.76 4,106 7,218 1.58 6,274 9,895
Other tuna * * *
Saba (kawakawa) 1.76 3,097 5,455 1.78 982 1,747
Yellowfin tuna 2.00 15,434 30,844 2.11 20,400 42,971
Jacks * * * * * *
Dolphin (Mahi Mahi) 2.15 19,912.33 42,803.49 * * *
Marlin 1.33 1,101 1,468 1.71 904 1,543
Rainbow runner 2.00 2,349 4,704 1.91 3,483 6,669
Skipjack 1.95 83,237 162,148 1.93 135,892 262,648
Wahoo 2.38 3,818 9,079 2.03 6,243 12,678
Miscellaneous 2.00 30 60
Reef fish 2.62 74,460 194,719
Emperor(Mafute) * * *
Goat fish 2.34 29 68 2.96 207 613
Rabbitfish 3.25 2,043 6,639 3.32 5,711 18,963
Parrotfish 3.44 1,182 4,069 2.80 1,057 2,962
Reef Fish 2.57 30,588 78,528 Rudderfish (guilli) 2.50 30,588 78,528 2.62 107 280
Squirrelfish 2.50 12.57 31.43 * * *
Unicornfish 2.42 328 793
Wrasse 3.50 75.00 262.50 * * *
Surgeon/Hagnon 2.11 62 131 2.00 9 17
Miscellaneous * * *
Bottom fish 2.84 33,349 94,764
Gindai (flower snap) 2.98 573 1,708 3.02 2,040 6,165
Grouper 2.93 721 2,108 2.58 3,855 9,959
Silvermouth (lehi) 2.55 405 1,035 2.83 1,299 3,677
Onaga (red snapper) 3.84 1,726 6,625 3.46 5,319 18,382
Amberjack 1.96 269 527 * * *
Blackjack 1.91 512 979 * * *
Blueline Snapper 3.25 56 182 * * *
Bottom Fish 2.38 11,484 27,609 * * *
Brassy Trevally 2.00 15 30 * * *
Ehu (Red Snapper) 3.00 625 1,873 * * *
Emperor (Mafute/misc) 2.70 11,215 30,292 * * *
Giant Trevally 2.75 50 138 * * *
Jacks (misc.) 2.57 267 684 Jobfish (uku) 1.89 657 1,238 Kalikali (yellowtail) 2.55 1,788 4,560 Red Snapper 2.00 112 224 Opakapaka (pink snp) 3.05 467 1,422 3.28 1,810 5,939
Miscellaneous * * *
Invertebrates 3.53 1,786 6,303
Lobster 6.58 1,611 10,601 6.28 591 3,706
Shrimp (salt&fresh water) * * * * * *
Squid 2.40 19.90 47.80 Octopus 2.27 1,158 2,633 2.17 1,193 2,590
Miscellaneous * * * * * *
Source: DLNR, Division of Fish & Wildlife
Note: "*" classified elsewhere
Note: Current data will be shown in the Yearbook when received.

2015 CNMI Statistical Yearbook Chapter 12 Page 173
11th Statistical Yearbook, Central Statistics Division, Department of Commerce
Table 12.5 Amount and Value of Commercial Fish Landing for Common Species, CNMI: 2000 to 2002
Common Species
2002 2001 2000
Price per
pound
Weight
(lbs.) Value ($)
Price per
pound
Weight
(lbs.) Value ($)
Price per
pound
Weight
(lbs.) Value ($)
Total 2.31 384,489 888,776 2.06 346,251 713,484 2.01 336,092 676,386
Pelagic (troll) fish 1.97 221,532 446,425 2.11 169,094 357,268 2.01 168,391 332,988
Bigeye scad (Atulai) 2.54 15,695 39,903 2.69 22,972 61,774 2.78 19,074 53,014
Barracuda 2.75 47 129 1.50 3 5 1.91 196 373
Dogtooth tuna 1.71 9,710 16,587 2.09 2,778 5,806 1.89 1,854 3,511
Other tuna * * * 1.25 178 223 1.80 1,100 1,977
Saba (kawakawa) 1.71 2,836 4,836 2.05 2,888 5,911 1.58 2,539 4,007
Yellowfin tuna 2.08 23,799 49,574 2.11 11,634 24,588 2.63 13,924 27,966
Jacks 2.21 3,393 7,505 2.99 3,009 9,007 2.18 1,578 4,148
Dolphin (Mahi mahi) 1.90 14,263 27,147 2.15 11,384 24,487 1.61 5,665 12,370
Marlin 1.78 1,009 1,799 1.40 1,539 2,161 2.24 2,886 4,670
Rainbow runner 1.73 1,674 2,895 2.69 1,707 4,588 1.84 1,111 2,492
Skipjack 1.98 142,114 282,068 1.96 107,107 209,539 2.34 111,281 205,222
Wahoo 1.98 6,570 13,004 2.37 3,640 8,620 2.01 3,223 7,542
Miscellaneous 2.26 423 978 2.19 256 560 1.53 3,960 6,069
Reef fish 2.59 130,564 337,715 1.41 119,393 168,033 2.32 131,572 228,570
Emperor(Mafute) 2.90 4,291 12,462 3.00 13,590 40,754 2.81 8,226 23,141
Goat fish 2.85 857 2,447 3.10 2,356 7,307 2.75 1,232 3,382
Rabbitfish 3.29 7,281 23,930 3.41 6,727 22,953 3.30 9,869 32,602
Parrotfish 3.05 3,990 12,166 3.19 22,635 72,242 2.99 7,071 21,136
Reef Fish
Rudderfish (guilli) 2.97 327 972 3.22 1,328 4,275 2.99 682 2,040
Squirrelfish 1.70 1,298 2,205 3.21 1,708 5,487 2.79 273 762
Unicornfish 2.93 2,001 5,841 3.05 9,725 29,640 2.31 5,172 14,012
Wrasse 2.95 236 697 3.02 738 2,230 2.79 586 1,758
Surgeon/Hagnon 2.90 1,092 3,169 3.07 4,158 12,745 2.95 5,602 16,531
Miscellaneous 2.51 109,191 273,827 0.16 70,019 11,155 2.71 101,085 232,577
Bottom fish 2.98 27,843 83,011 3.08 53,973 166,288 2.62 33,037 99,623
Gindai (flower snap) 3.05 2,526 7,704 3.00 1,533 4,592 2.66 172 457
Grouper 2.15 4,031 8,655 2.58 6,175 15,943 2.31 2,895 6,690
Silvermouth (lehi) 2.90 2,783 8,082 3.33 2,068 6,889 3.01 2,091 6,305
Onaga (red snapper) 3.42 9,277 31,690 3.65 13,087 47,729 3.01 8,390 28,538
Opakapaka (pink snp) 3.31 3,098 10,253 3.45 3,161 10,907 3.40 8,390 28,538
Miscellaneous 2.72 6,128 16,627 1.35 27,950 37,806 2.81 11,099 29,095
Invertebrates 4.75 4,551 21,626 5.78 3,791 21,896 2.87 3,092 15,205
Lobster 5.69 3,284 18,691 5.76 3,786 21,821 5.52 2,494 13,760
Shrimp (salt&fresh wa-
ter) 4.50 21 87 15.00 5 75
Squid
Octopus 2.20 1,208 2,658 2.50 563 1,405 2.42 598 1,445
Miscellaneous 5.00 38 190
Source: DLNR, Division of Fish & Wildlife
Note: "*" classified elsewhere
Note: Current data will be shown in the Yearbook when received.

Page 174 Chapter 12 2015 CNMI Statistical Yearbook
11th Statistical Yearbook, Central Statistics Division, Department of Commerce
Table 12.6 Pounds of Fish Products Imported by Month, CNMI: 1997 to 2003
Month
Year
2004 2003 2002 2001 2000 1999 1998 1997
Total 302,074 210,322 383,352 301,379 337,434 320,094 301,410 184,363
January 24,461 18,162 39,947 28,228 28,533 33,947 17,680 48,691
February 34,596 20,815 38,114 26,376 14,681 36,849 22,413 19,174
March 32,003 26,505 41,772 35,201 32,706 31,664 17,938 17,914
April 24,695 10,991 39,240 21,271 31,151 24,193 20,109 9,386
May 23,862 14,904 36,111 23,976 18,299 32,858 15,035 12,988
June 18,753 12,455 30,803 26,579 16,121 29,817 16,842 4,472
July 24,795 15,910 24,825 27,187 25,895 35,097 32,614 5,477
August 17,133 18,414 27,667 19,677 30,803 22,414 28,351 12,439
September 34,590 13,988 29,222 58,394 70,530 22,774 28,305 12,090
October 25,757 18,521 25,035 11,400 21,877 12,344 21,599 10,179
November 15,044 15,983 25,319 11,904 19,286 14,773 38,380 16,313
December 26,385 23,674 25,297 11,186 27,552 23,364 42,143 15,239
Source: DLNR, Division of Fish & Wildlife
Note: Current data will be shown in the Yearbook when received.
Table 12.7 Commercial Fish Landings by Pound, Value in Dollars and Average Price, CNMI: 1997 to 2004
Type of fish
Year
2004 2003 2002 2001 2000 1999 1998 1997
Total pounds 206,273 290,121 365,249 355,297 310,744 381,336 389,168 380,135
Troll fish 133,761 180,525 202,289 169,021 145,004 194,884 192,568 183,921
Reef fish 34,245 74,460 130,564 130,492 137,411 142,277 163,604 147,127
Bottom fish 31,041 33,349 27,846 51,430 25,927 41,678 32,850 48,093
Invertebrates 2,789 1,786 4,551 4,354 2,402 2,497 146 993
Total value (dollars) 460,455 648,156 840,999 866,211 704,370 991,482 986,625 893,940
Troll fish 265,252 352,371 398,647 357,122 271,819 420,856 405,772 407,182
Reef fish 90,421 194,719 337,715 319,529 344,285 379,737 428,732 323,265
Bottom fish 81,234 94,764 83,011 166,259 74,757 173,669 147,506 160,031
Invertebrates 13,282 6,303 21,626 23,301 13,509 17,220 4,615 3,462
Average price/pound 2.23 2.74 3.07 3.29 3.02 2.64 3.13 2.81
Troll fish ($) 2.38 2 1.97 2.11 1.53 1.88 2.06 2.21
Reef fish ($) 2.64 3 2.59 2.45 2.32 2.43 2.44 2.20
Bottom fish ($) 2.62 3 2.98 3.23 2.62 2.73 2.76 3.33
Invertebrates ($) 4.76 4 4.75 5.35 5.62 3.5 5.26 3.49
Source: DLNR, Division of Fish & Wildlife
Note: Current data will be shown in the Yearbook when received.

11th Statistical Yearbook, Central Statistics Division, Department of Commerce
CHAPTER 13
Government
Accounts

Page 176 Chapter 13 2015 CNMI Statistical Yearbook
11th Statistical Yearbook, Central Statistics Division, Department of Commerce
Chapter 13 – Government Accounts
Government Accounts are collected and compiled, and published by the CNMI’s Department of Finance.
Finance has not provided recent to the yearbook, and so the available data are shown here.

2015 CNMI Statistical Yearbook Chapter 13 Page 177
11th Statistical Yearbook, Central Statistics Division, Department of Commerce
Table 13.1 All Government Funds Revenue and Other Financing Sources: FY 1995 to FY 2003 (in thousands of US$)
Revenues
Fiscal Year
2003 2002 2001 2000 1999 1998 1997 1996 1995
Total Revenue and Other Financing
Sources 197,697 271,604 346,809 291,720 291,652 285,576 284,474 261,528 280,670
Total Taxes 166,523 166,809 178,806 185,098 188,159 201,019 201,873 191,531 169,592
General Fund Tax Revenue 166,523 166,750 178,527 184,996 187,884 199,984 200,879 190,941 168,891
Developer's Tax 59 279 102 275 1,035 994 590 701
Total Fees, Services and Other
Revenues 31,174 45,946 51,197 41,143 42,441 46,029 51,938 38,982 83,692
General Fund Fees, Services
& Other Rev 31,174 28,696 35,098 30,829 33,251 36,959 41,682 31,414 30,888
Non Resident Worker/Depor-
tation Fees … 6,256 6,707 6,545 6,149 7,188 8,126 6,138 51,115
Court Fines & Fees … 1,307 1,424 1,426 1,287 1,149 1,180 785 789
Mayoral Local Poker, Gam-
ing & Other Fees … 4,652 2,390 2,095 1,137 0 0 0 0
Other Fees, Services & Other
Revenues … 535 819 248 617 733 950 645 900
MPLC/OPL/MPLA Revenues … 4,500 4,759 0 0 0 0 0 0
Total Other Local Financing … 5,442 66,879 13,600 17,704 2,500 2,964 1,937 1,220
Operating Transfers In-CDA
CIP Matching … 1,835 2,843 4,103 1,322 915 1,301 0 0
Bank of Guam Loan Proceeds … 0 0 8,175 14,980 0 0 0 0
PSS Bond Proceeds (CIP) … 0 0 0 0 0 0 0 0
CDA $60 Million Bond Pro-
ceeds (CIP) … 0 60,000 0 0 0 0 0 0
Operating Transfers In-MPLT
(G/F & AMP) … 1,507 1,398 1,322 1,402 1,585 1,663 1,937 1,220
Interest on Unspent Bond
Proceeds … 2,100 2,638 0 0 0 0 0 0
Total Federal Contribution … 53,407 49,927 51,879 43,348 36,028 27,699 29,078 26,166
Federal Contributions - CIP … 27,457 22,836 21,852 20,327 15,268 10,682 11,852 9,216
Federal Contributions -
NMHC … 0 0 224 1,531 699 873 1,328 579
Federal Contributions - Cate-
gorical Grants … 25,076 26,937 28,461 20,895 18,418 15,042 15,298 15,539
Other Contributions - CIP … 580 7 889 222 1,269 701 316 675
Other Contributions - Other
Projects … 294 147 453 373 374 401 284 157
Source: Department of Finance
Note: FY 2002 and FY 2003 Unaudited Finance Data
Note: "…" means data not submitted
NOTE: Tables will be updated when current data received
Table 13.2 All Government Fund Expenditures by Function, CNMI: 1995 to 2002 (in millions of US$)
Function
Fiscal Year
2002 2001 2000 1999 1998 1997 1996 1995
Total Expenditures 318.8 319.3 287.3 288.2 296.3 296.1 254.5 220.4
Health 52.4 55.4 49.9 46.0 46.8 50.2 46.2 42.5
Education 47.4 48.2 47.1 49.4 54.8 55.6 46.0 40.0
Public Safety 24.3 24.0 22.8 21.0 30.3 25.9 21.9 15.6
Public Works 8.7 9.1 10.0 8.9 11.3 13.4 10.4 10.8
Community & Social Services 27.7 31.3 29.5 25.0 26.1 27.9 19.0 15.6
Lands & Natural Resources 15.8 13.1 10.9 14.3 16.6 12.6 13.4 12.9
Economic Development 7.5 8.9 10.6 8.5 11.7 17.9 10.3 7.7
Judiciary 4.8 4.8 4.6 4.6 5.5 4.8 4.2 3.5
Legislature 7.2 7.8 7.5 7.1 6.7 4.8 4.9 4.8
Other Elected Officials 12.4 12.9 13.1 17.1 17.4 26.4 19.9 15.0
General Government 30.9 41.8 36.9 36.0 44.5 43.0 41.9 36.1
Debt Service 5.9 3.9 2.3 2.0 0.0 0.0 0.0 0.0
Capital Projects 63.3 45.7 31.5 27.4 20.3 10.1 13.3 11.6
Other Federal Programs 10.5 12.4 10.6 5.9 4.3 3.5 3.1 4.3
Transfer PSS Bond Proceeds 0.0 0.0 0.0 15.0 0.0 0.0 0.0 0.0
Source: Department of Finance
Note: FY 2002 Unaudited Finance Data
Note: FY 2003 data was not submitted
Public School System and Northern Marianas College federal grants expenditures are not included above
NOTE: Tables will be updated when current data received

Page 178 Chapter 13 2015 CNMI Statistical Yearbook
11th Statistical Yearbook, Central Statistics Division, Department of Commerce
Table 13.3 CNMI General Fund Revenue and Other Financing Sources: FY 1995 to FY 2003 (in thousands of US$)
Revenue Type
Fiscal Year
2003 2002 2001 2000 1999 1998 1997 1996 1995
Total Revenues 213,411 199,713 219,638 228,827 240,994 242,282 248,036 226,701 203,650
Total Taxes 166,523 166,750 178,527 184,996 187,884 199,984 200,879 190,941 168,891
Gross Business Revenue 51,584 48,565 52,122 57,180 54,157 61,443 74,568 67,187 59,104
Personal/Corporate Income 49,527 56,971 54,392 52,220 60,036 62,589 46,564 56,288 47,386
Excise 22,637 18,726 21,611 21,391 19,883 24,308 29,175 25,007 26,818
Customs Certification User 29,491 30,929 35,816 38,644 39,311 36,846 27,653 17,981 13,897
Fuel 2,704 3,833 4,374 4,182 4,183 2,486 4,925 7,524 6,459
Beverage Container 1,290 1,354 1,439 1,461 1,527 1,568 3,998 4,130 3,461
Hotel 5,432 4,865 5,923 6,116 5,958 7,744 10,800 9,932 8,656
Other (Bar, P&I) 3,858 1,507 2,850 3,802 2,829 3,000 3,196 2,892 3,110
Total Fees, Servs, & Other Reve-
nue 31,174 28,696 35,098 30,829 33,251 36,959 41,682 31,414 30,888
Amusement Machine License
Fees 6,422 7,063 8,083 6,510 5,719 4,329 3,949 2,971 2,347
Other Licenses and Fees 5,446 5,368 5,005 5,268 5,411 5,699 5,232 4,674 4,396
Hospital Charges 13,824 12,109 16,061 6,090 8,364 8,371 11,806 7,601 6,385
Other Charges for Services 3,258 2,514 2,984 6,957 3,847 11,337 9,058 5,011 2,637
Division of Public Lands 0 0 0 3,416 6,413 5,658 6,293 6,541 4,448
Lottery Commission 193 271 427 394 275 603 337 313 348
Other Revenue 2,031 1,522 2,538 2,194 3,222 962 5,007 4,303 10,327
Total Other Financing Sources 15,714 4,267 6,013 13,002 19,859 5,339 5,475 4,346 3,871
Operating Transfer In 15,714 4,267 6,013 13,002 4,879 5,339 5,475 4,346 3,871
Bond Proceeds (Transfer to
CIP) 0 0 0 0 14,980 0 0 0 0
Source: Department of Finance
Note: FY 2002 and FY 2003 Unaudited Finance Data
NOTE: Tables will be updated when current data received
Table 13.4 General Fund Operating Expenditures by Function, CNMI: 1995 to 2002 (in millions of US$)
Function
Fiscal Year
2002 2001 2000 1999 1998 1997 1996 1995
Total Expenditures 213.4 237.7 222.0 236.3 255.6 268.1 221.7 191.5
Health 45.7 49.9 43.7 41.9 45.7 46.5 40.6 39.5
Education 47.4 48.2 47.1 49.4 55.1 55.8 44.9 39.6
Public Safety 21.2 22.4 21.6 20.1 24.5 24.7 20.8 14.8
Public Works 8.7 9.1 10.0 8.9 11.3 13.4 10.4 10.8
Community & Social Services 15.3 21.0 18.1 15.1 17.9 19.7 12.1 7.9
Lands & Natural Resources 6.4 7.3 9.0 10.7 15.3 11.1 12.2 11.8
Economic Development 7.5 8.6 8.1 8.4 11.7 17.9 9.8 7.7
Judiciary 4.8 4.8 4.6 4.6 5.5 4.8 4.2 3.5
Legislature 7.2 7.8 7.5 7.1 6.7 4.8 4.9 4.8
Other Elected Officials 12.4 12.9 13.1 17.1 17.4 26.4 19.9 15.0
General Government 30.9 41.8 36.9 36.0 44.5 43.0 41.9 36.1
Debt Service 5.9 3.9 2.3 2.0 0.0 0.0 0.0 0.0
Transfer PSS Bond Proceeds 0.0 0.0 0.0 15.0 0.0 0.0 0.0 0.0
Source: Department of Finance
Note: FY 2002 Unaudited Finance Data
NOTE: Tables will be updated when current data received

2015 CNMI Statistical Yearbook Chapter 13 Page 179
11th Statistical Yearbook, Central Statistics Division, Department of Commerce
Table 13.5 General Fund Operating Expenditures and Transfers by Object Class, CNMI: 1993 to 2003 [in millions of US$]
Expenditures
Fiscal Year
2003 2002 2001 2000 1999 1998 1997 1996 1995
Total Expenditures & Transfers 213,347 213,357 237,282 222,040 234,547 255,648 268,122 221,715 191,446
Total Expenditures 154,823 156,789 176,939 163,956 161,905 190,097 196,210 166,108 142,757
Wages & Salaries 107,975 108,859 113,739 110,662 107,920 115,795 114,180 102,944 91,442
Professional Services 11,875 11,317 15,641 10,126 10,920 13,173 24,898 15,150 11,372
Utilities 10,624 8,948 11,678 9,965 10,609 10,840 10,103 10,645 9,802
Travel 3,199 3,172 4,067 3,969 3,727 4,629 4,729 3,340 2,306
Rental/Leases 2,945 3,709 4,022 4,627 5,509 7,061 7,230 5,288 4,438
Communication 1,541 1,512 1,698 1,895 1,443 1,979 2,063 1,284 1,159
Official Representation 460 565 688 970 946 1,433 2,304 1,023 773
Repairs & Maintenance 1,369 1,525 2,104 1,891 1,500 1,892 2,184 1,668 1,341
Supplies 5,866 5,512 9,162 6,046 7,115 5,334 5,224 5,761 6,664
Capital Expenditures 942 1,414 3,839 2,000 3,564 8,842 8,055 7,156 7,035
Other Services & Charges 3,837 6,194 6,766 8,665 4,858 13,731 10,269 7,536 3,297
Judgements Against the Government 500 366 48 143 201 104 418 268 478
Scholarships & Grants 3,690 3,696 3,487 2,997 3,593 5,284 4,553 4,045 2,650
Total Transfers & Debt Service 58,524 56,568 60,343 58,084 72,642 65,551 71,912 55,607 48,689
Transfer Out to Other Agencies &
Funds 52,651 50,695 56,460 55,789 57,462 65,551 71,912 55,607 48,689
Debt Service on Bonds 5,873 5,873 3,883 2,295 200 0 0 0 0
Transfer Bond Proceeds to CIP 0 0 0 0 14,980 0 0 0 0
Source: Department of Finance
Note: Data for 2002 and 2003 Unaudited Finance Data
NOTE: Tables will be updated when current data received
Table 13.6 Reported Business Gross Revenue by Business Activity, CNMI: 1995 to 2002 [in millions of US$]
Business Activity 2002 2001 2000 1999 1998 1997 1996 1995
Total 2,008.9 2,111.2 2,255.6 2,180.9 2,229.7 2,591.5 2,216.9 1,817.8
Agriculture/fishing 1.7 1.5 1.2 2.6 2.1 4.4 4.4 2.3
Banking 83.2 46.6 51.6 52.7 49.9 51.7 49.6 27.7
Construction 61.7 53.9 53.0 53.7 71.9 76.9 84.6 103.3
Manufacturing 474.4 740.3 783.3 802.8 792.8 687.8 553.6 411.0
Garment 473.0 400.0 406.0 434.3 656.4 524.4 484.3 209.3
Other Manufacturing 1.3 340.3 377.3 368.5 136.4 163.4 69.4 201.7
Hotels/motels 91.2 66.9 85.0 109.4 93.8 167.6 170.8 136.2
Restaurants/bars 58.9 44.9 48.7 50.3 47.6 65.4 60.2 51.4
Retail trade 392.4 406.7 400.2 401.5 430.8 635.4 458.5 393.3
Shipping … 10.5 8.4 7.5 5.0 5.1 4.2 7.9
Wholesale trade 380.1 241.2 155.6 128.7 129.6 154.6 153.8 133.3
Professional service 41.0 294.6 131.7 118.2 63.0 136.5 153.9 103.2
Petroleum 0.0 0.0 13.5 13.6 0.0 54.4 114.9 48.5
Land lease 14.2 8.0 8.3 6.7 7.7 12.2 10.3 13.0
Transportation services 62.6 16.0 26.3 24.0 27.4 18.3 14.7 13.0
Gas service stations … 0.0 3.2 0.0 2.2 4.8 5.5 6.9
Others 347.4 180.1 485.6 409.2 505.9 516.4 377.9 367.0
Source: Department of Finance
Note: Industry category is dependent on what taxpayer reports on tax return
Note: CY 2002 Unaudited Finance Data
"…" means included in Others category
NOTE: Tables will be updated when current data received

11th Statistical Yearbook, Central Statistics Division, Department of Commerce
CHAPTER 14
Consumer Price
Index
2015 CNMI Statistical Yearbook Chapter 14 Page 181
11th Statistical Yearbook, Central Statistics Division, Department of Commerce
Chapter 14 – Consumer Price Index
The consumer Price Index (CPI) measures inflation. The Central Statistics Division in the Department of
Commerce measures inflation for the CNMI. The CPI is reset to 100 after a major survey called a Household
Income and Expenditures Survey (HIES), which provides a new “market basket” as the base for changes in
the components of the CPI.
The current CPI was rebased as of 4th quarter 2008, when the total value was reset to 100. The HIES provided
weighted amounts for the various items in the total index. For Saipan, Housing and Utilities was the biggest
component, at 30 percent, followed by Transportation at 22 percent, and Food at 17 percent. Those three
made up almost 70 percent of the items.
For Saipan, the CPI increased by about 11 percent between 2008 and the 1st quarter of 2015. However, it
had increased to as much as 114 in 2012, before experiencing a kind of deflation to 2015. Food and Trans-
portation had increased 20 percent during the period, Medical Care by 30 percent, but Housing Costs re-
mained about the same, actually slightly decreasing.
The CPI for Tinian increased about 14 percent during the period, with Medical and Housing costs increasing
the fastest. And, the CPI for Rota increased by about 12 percent, with Medical and Transportation costs
increasing the most.
The weights used for each island for the CPI are included at the end of the chapter.

Page 182 Chapter 14 2015 CNMI Statistical Yearbook
11th Statistical Yearbook, Central Statistics Division, Department of Commerce
Table 14.1 Saipan CPI: Q4 2008 to Q1 2015
Year.Qtr All Items Food
Alcoholic
Beverages
Housing
& Utilities Apparel
Transpor-
tation
Medical
Care Recreation
Education
& Com-
munica-
tion
Other
Goods &
Services
Weights 100.00 17.1 1.4 30.4 6.1 22.2 10.7 3.4 5.6 3.1
2008.04 100.0 100.0 100.0 100.0 100.0 100.0 100.0 100.0 100.0 100.0
2009.01 100.0 100.9 97.8 98.9 100.0 100.5 101.6 100.0 97.2 101.5
2009.02 101.6 102.3 106.0 100.4 100.0 103.9 101.6 103.2 97.0 101.5
2009.03 101.9 104.9 106.5 97.6 103.4 105.3 98.4 103.6 105.5 102.5
2009.04 105.4 104.5 106.5 106.6 104.3 108.4 98.4 103.8 105.8 103.0
2010.01 106.0 102.9 107.5 105.7 102.7 113.7 100.5 101.6 105.1 102.6
2010.02 106.6 103.4 107.5 106.8 100.2 114.5 100.5 102.4 105.1 104.4
2010.03 106.9 103.0 107.5 106.9 100.1 116.9 99.5 101.4 104.9 104.3
2010.04 111.2 104.4 110.3 108.0 100.3 123.9 119.3 101.2 104.5 106.2
2011.01 109.7 106.5 111.0 100.7 99.7 124.5 119.2 102.7 104.2 112.2
2011.02 110.5 109.3 111.0 101.1 99.3 125.8 119.2 102.6 104.2 112.4
2011.03 113.7 110.8 111.5 102.3 100.1 129.1 135.1 102.6 104.6 112.7
2011.04 113.8 110.3 106.6 102.9 101.4 129.3 135.1 101.6 105.2 112.9
2012.01 114.4 110.2 110.3 103.0 100.2 131.4 135.0 104.3 105.0 113.1
2012.02 113.5 110.4 111.9 102.4 99.6 126.9 137.8 104.3 103.9 113.3
2012.03 113.8 110.5 112.4 101.6 97.4 129.3 139.2 104.1 104.4 113.4
2012.04 115.0 110.3 112.4 103.3 95.9 131.9 141.5 104.0 104.9 113.4
2013.01 113.7 110.5 114.4 103.6 95.6 127.6 143.1 103.5 94.3 113.4
2013.02 113.6 110.7 114.4 103.7 94.8 126.6 143.1 103.5 94.3 113.4
2013.03 112.4 112.2 116.6 103.7 94.3 127.3 128.3 103.1 94.5 113.7
2013.04 112.1 112.2 116.6 103.5 94.3 126.5 128.3 103.0 94.5 113.5
2014.01 112.7 114.3 117.7 102.9 95.2 127.9 128.6 103.3 93.1 113.6
2014.02 113.6 115.1 119.3 104.4 95.3 128.8 128.7 105.6 93.1 113.6
2014.03 113.3 115.3 119.3 103.9 93.4 128.8 128.8 103.1 93.2 113.6
2014.04 113.8 119.3 119.9 100.5 93.7 130.8 129.0 103.1 93.2 126.3
2015.01 111.4 120.1 119.9 99.1 94.9 120.4 129.0 102.9 93.2 131.7
Source: Central Statistics Division, CNMI Department of Commerce
Table 14.2 Saipan Quarterly Change in CPI, Q1 2009 to Q1 2015
Year.Qtr All Items Food
Alcoholic
Beverages
Housing
& Utilities Apparel
Transpor-
tation
Medical
Care Recreation
Education
& Com-
munica-
tion
Other
Goods &
Services
Weights 100.0 17.1 1.4 30.4 6.1 22.2 10.7 3.4 5.6 3.1
2009.01 0.0 0.9 ‐2.2 ‐1.1 0.0 0.5 1.6 0.0 ‐2.8 1.5
2009.02 1.7 1.4 8.4 1.5 0.0 3.4 0.0 3.2 ‐0.1 0.0
2009.03 0.3 2.5 0.4 ‐2.8 3.4 1.3 ‐3.2 0.4 8.7 1.0
2009.04 3.4 ‐0.4 0.0 9.3 0.9 2.9 0.1 0.2 0.3 0.4
2010.01 0.6 ‐1.5 0.9 ‐0.9 ‐1.5 4.8 2.0 ‐2.1 ‐0.7 ‐0.4
2010.02 0.5 0.4 0.0 1.1 ‐2.5 0.7 0.1 0.8 0.0 1.7
2010.03 0.3 ‐0.4 0.0 0.1 ‐0.1 2.1 ‐1.0 ‐0.9 ‐0.2 ‐0.1
2010.04 4.0 1.3 2.6 1.0 0.2 6.0 19.9 ‐0.3 ‐0.4 1.9
2011.01 ‐1.4 2.0 0.7 ‐6.7 ‐0.6 0.4 ‐0.1 1.5 ‐0.3 5.6
2011.02 0.8 2.6 0.0 0.3 ‐0.4 1.1 0.0 ‐0.2 0.0 0.2
2011.03 2.8 1.4 0.4 1.2 0.8 2.6 13.3 0.0 0.4 0.2
2011.04 0.1 ‐0.4 ‐4.4 0.5 1.3 0.1 0.0 ‐0.9 0.6 0.2
2012.01 0.5 ‐0.1 3.4 0.1 ‐1.2 1.6 ‐0.1 2.7 ‐0.2 0.2
2012.02 ‐0.8 0.2 1.5 ‐0.6 ‐0.6 ‐3.4 2.1 0.0 ‐1.1 0.2
2012.03 0.3 0.0 0.5 ‐0.8 ‐2.2 1.8 1.0 ‐0.2 0.5 0.1
2012.04 1.1 ‐0.2 0.0 1.7 ‐1.5 2.0 1.7 ‐0.1 0.4 0.0
2013.01 ‐1.1 0.2 1.7 0.3 ‐0.3 ‐3.3 1.1 ‐0.5 ‐10.1 0.0
2013.02 ‐0.2 0.2 0.0 0.1 ‐0.9 ‐0.7 0.0 0.0 0.0 0.0
2013.03 ‐1.0 1.3 2.0 0.0 ‐0.5 0.6 ‐10.3 ‐0.4 0.3 0.3
2013.04 ‐0.2 0.0 0.0 ‐0.2 0.0 ‐0.7 0.0 ‐0.1 0.0 ‐0.2
2014.01 0.5 1.8 0.9 ‐0.5 1.0 1.1 0.2 0.4 ‐1.5 0.1
2014.02 0.8 0.7 1.4 1.4 0.1 0.7 0.1 2.2 0.0 0.0
2014.03 ‐0.3 0.1 0.0 ‐0.5 ‐2.0 0.0 0.1 ‐2.4 0.1 0.0
2014.04 0.5 3.5 0.5 ‐3.3 0.3 1.6 0.1 0.0 0.0 11.2
2015.01 ‐2.1 0.7 0.0 ‐1.4 1.2 ‐8.0 0.0 ‐0.2 0.0 4.3
Source: Central Statistics Division, CNMI Department of Commerce
Food
17%
Alcoholic
Beverages
2%
Housing &
Utilities
30%
Apparel
6%
Transport-
ation
22%
Medical
Care
11%
Recreation
3%
Education
&
Commun-
ication
6%
Other
Goods &
Services
3%
CPI distribution by Type: 2015
111.4
120.1
119.9
99.1
94.9
120.4
129.0
102.9
93.2
131.7
0.0 70.0 140.0
All Items
Food
Alcoholic Beverages
Housing & Utilities
Apparel
Transport-ation
Medical Care
Recreation
Education & Commun-
ication
Other Goods & Services
CPI by Type for Saipan, First Quarter 2015

2015 CNMI Statistical Yearbook Chapter 14 Page 183
11th Statistical Yearbook, Central Statistics Division, Department of Commerce
Table 14.3 Consumer Price Index, by Group, Tinian: Qtr. 1 2010 to Qtr. 1 2015
Year.Qtr All Items Food
Alcoholic
Beverages
Housing
& Utilities Apparel
Transpor-
tation
Medical
Care Recreation
Education
& Com-
munica-
tion
Other
Goods &
Services
2010.01 100.0 100.0 100.0 100.0 100.0 100.0 100.0 100.0 100.0 100.0
2010.02 101.3 98.9 102.1 105.2 96.0 101.1 100.0 99.7 100.5 101.6
2010.03 101.1 98.7 102.1 104.3 96.3 101.8 100.0 99.6 100.2 101.6
2010.04 104.4 97.5 100.1 109.4 96.0 101.5 119.5 99.2 99.6 102.7
2011.01 105.4 96.3 102.0 111.8 95.1 104.9 119.5 98.5 99.8 105.1
2011.02 106.0 96.3 102.0 111.8 94.4 113.5 119.5 98.3 99.6 105.1
2011.03 109.7 97.5 102.1 116.0 94.6 115.3 135.0 105.5 99.7 105.5
2011.04 110.0 99.6 102.2 114.9 94.4 114.6 137.0 105.5 99.7 106.2
2012.01 112.5 100.3 102.3 123.0 94.4 114.0 134.2 109.6 100.3 105.8
2012.02 112.8 101.2 105.2 122.1 93.6 117.5 134.2 108.9 100.3 108.1
2012.03 112.5 101.0 104.2 121.6 91.8 119.3 134.2 107.7 100.0 107.6
2012.04 115.9 101.4 106.5 124.8 90.2 119.0 154.6 107.2 103.3 108.2
2013.01 116.3 101.6 106.2 126.3 89.4 118.4 155.1 107.8 100.1 110.0
2013.02 116.5 103.5 106.2 125.7 87.8 118.4 155.1 110.2 100.3 109.2
2013.03 114.8 103.7 106.5 125.4 87.2 119.0 140.9 109.2 100.6 108.7
2013.04 114.9 103.8 106.5 125.7 87.2 119.0 140.9 109.2 101.0 108.7
2014.01 114.6 104.0 108.5 123.9 89.2 119.0 140.8 107.8 100.2 109.0
2014.02 115.7 105.3 110.9 126.4 89.2 119.0 140.8 108.3 100.2 109.4
2014.03 117.2 109.6 110.9 127.1 91.0 121.7 140.8 107.4 100.0 108.9
2014.04 115.6 109.9 110.9 120.9 91.0 115.3 140.8 107.4 100.0 119.8
2015.01 114.5 111.7 110.9 117.9 93.2 109.2 139.8 107.9 98.0 120.2
Source: Central Statistics Division, CNMI Department of Commerce
Table 14.4 Consumer Price Index, by group, Rota: Qtr. 1 2010 - Qtr. 1 2015
Year.Qtr All Items Food
Alcoholic
Beverages
Housing
& Utilities Apparel
Transpor-
tation
Medical
Care Recreation
Education
& Com-
munica-
tion
Other
Goods &
Services
2010.01 100.0 100.0 100.0 100.0 100.0 100.0 100.0 100.0 100.0 100.0
2010.02 99.9 100.0 100.0 100.1 100.5 101.6 100.0 100.2 82.8 102.0
2010.03 101.0 99.1 101.6 102.6 97.7 102.5 100.0 100.2 82.6 105.0
2010.04 102.0 98.4 101.6 100.9 98.0 103.5 117.3 99.8 82.5 106.2
2011.01 104.2 98.8 101.8 103.9 98.0 107.5 117.3 100.5 82.5 111.0
2011.02 105.1 98.7 101.8 103.8 97.5 116.4 117.3 100.3 82.5 111.0
2011.03 106.6 100.4 101.8 103.9 98.4 116.9 131.1 99.9 81.8 109.7
2011.04 106.6 100.5 101.8 104.0 98.3 116.5 131.1 99.4 81.8 109.7
2012.01 107.1 101.8 102.8 104.5 97.4 117.5 131.0 100.9 81.8 109.7
2012.02 107.3 102.2 102.8 104.5 97.2 119.5 131.0 100.4 81.8 109.7
2012.03 108.5 102.8 102.8 107.1 95.3 120.9 131.0 99.5 78.2 110.3
2012.04 109.7 102.6 102.8 109.1 92.3 121.3 136.7 99.8 78.3 111.1
2013.01 109.9 102.6 102.8 109.5 91.2 120.8 137.6 100.1 78.0 111.1
2013.02 110.5 104.9 102.8 110.2 92.2 118.0 138.9 100.1 78.5 112.3
2013.03 109.9 105.5 112.7 110.3 92.6 120.0 126.5 98.8 78.7 113.6
2013.04 110.3 110.5 127.7 109.7 92.7 117.4 126.5 98.7 78.7 114.1
2014.01 111.8 109.7 130.7 109.5 92.5 119.2 141.4 100.3 79.1 113.6
2014.02 112.1 106.5 113.9 111.6 92.5 119.1 141.6 103.0 78.7 114.0
2014.03 112.5 107.5 104.0 112.0 93.8 122.5 140.2 101.7 78.7 113.6
2014.04 111.5 109.3 109.0 108.9 93.9 116.3 140.1 101.7 79.6 122.2
2015.01 111.5 110.5 109.1 108.1 93.8 116.3 140.1 101.7 79.6 125.0
Source: Central Statistics Division, CNMI Department of Commerce
114.5
111.7
110.9
117.9
93.2
109.2
139.8
107.9
98.0
120.2
0.0 50.0 100.0 150.0
All Items
Food
Alcoholic Beverages
Housing & Utilities
Apparel
Transport-ation
Medical Care
Recreation
Education & Commun-
ication
Other Goods & Services
CPI by Group, Tinian, First Quarter 2015
111.5
110.5
109.1
108.1
93.8
116.3
140.1
101.7
79.6
125.0
0.0 50.0 100.0 150.0
All Items
Food
Alcoholic Beverages
Housing & Utilities
Apparel
Transport-ation
Medical Care
Recreation
Education & Commun-
ication
Other Goods & Services
CPI by Group, Rota, First Quarter, 2015

Page 184 Chapter 14 2015 CNMI Statistical Yearbook
11th Statistical Yearbook, Central Statistics Division, Department of Commerce
Table 14.5 Consumer Price Index Change, by Group, Tinian: Qtr. 2 2010 to Qtr. 1 2015
Year.Qtr All Items Food
Alcoholic
Beverages
Housing
& Utilities Apparel
Transpor-
tation
Medical
Care Recreation
Education
& Com-
munica-
tion
Other
Goods &
Services
2010.02 1.3 ‐1.1 2.1 5.2 ‐4.0 1.1 0.0 ‐0.3 0.5 1.6
2010.03 ‐0.3 ‐0.2 0.0 ‐0.9 0.3 0.7 0.0 0.0 ‐0.3 0.0
2010.04 3.3 ‐1.3 ‐2.0 4.9 ‐0.3 ‐0.4 19.5 ‐0.4 ‐0.6 1.1
2011.01 0.9 ‐1.2 1.9 2.1 ‐0.9 3.4 0.0 ‐0.7 0.2 2.4
2011.02 0.6 0.0 0.0 0.0 ‐0.8 8.2 0.0 ‐0.2 ‐0.2 0.0
2011.03 3.5 1.2 0.1 3.8 0.3 1.6 13.0 7.3 0.0 0.3
2011.04 0.3 2.2 0.1 ‐1.0 ‐0.2 ‐0.6 1.4 0.0 0.0 0.7
2012.01 2.3 0.7 0.1 7.1 ‐0.1 ‐0.6 ‐2.0 3.9 0.7 ‐0.3
2012.02 0.3 0.9 2.9 ‐0.7 ‐0.9 3.1 0.0 ‐0.6 0.0 2.1
2012.03 ‐0.3 ‐0.2 ‐0.9 ‐0.4 ‐1.8 1.6 0.0 ‐1.1 ‐0.3 ‐0.5
2012.04 3.0 0.4 2.1 2.6 ‐1.8 ‐0.3 15.2 ‐0.5 3.3 0.6
2013.01 0.4 0.2 ‐0.2 1.2 ‐0.9 ‐0.4 0.3 0.5 ‐3.2 1.7
2013.02 0.1 1.9 0.0 ‐0.4 ‐1.8 0.0 0.0 2.2 0.3 ‐0.8
2013.03 ‐1.4 0.2 0.3 ‐0.3 ‐0.6 0.5 ‐9.2 ‐0.8 0.3 ‐0.4
2013.04 0.1 0.1 0.0 0.2 0.0 0.0 0.0 0.0 0.4 0.0
2014.01 ‐0.3 0.3 1.8 ‐1.5 2.2 0.0 ‐0.1 ‐1.3 ‐0.7 0.3
2014.02 1.0 1.3 2.2 2.0 0.0 0.0 0.0 0.5 0.0 0.3
2014.03 1.2 4.0 0.0 0.6 2.0 2.3 0.0 ‐0.8 ‐0.3 ‐0.4
2014.04 ‐1.4 0.3 0.0 ‐4.9 0.0 ‐5.3 0.0 0.0 0.0 10.0
2015.01 ‐0.9 1.6 0.0 ‐2.4 2.4 ‐5.3 ‐0.7 0.4 ‐2.0 0.4
Source: Central Statistics Division, CNMI Department of Commerce
Table 14.6 Consumer Price Index Change, by group, Rota: Qtr. 2 2010 - Qtr. 1 2015
Year.Qtr All Items Food
Alcoholic
Beverages
Housing
& Utilities Apparel
Transpor-
tation
Medical
Care Recreation
Education
& Com-
munica-
tion
Other
Goods &
Services
2010.02 ‐0.1 0.0 0.0 0.1 0.5 1.6 0.0 0.2 ‐17.2 2.0
2010.03 1.1 ‐0.9 1.6 2.5 ‐2.9 0.9 0.0 0.0 ‐0.2 2.9
2010.04 1.0 ‐0.8 0.0 ‐1.7 0.3 0.9 17.3 ‐0.3 ‐0.1 1.2
2011.01 2.2 0.5 0.2 3.0 0.0 3.9 0.0 0.6 0.0 4.6
2011.02 0.8 ‐0.1 0.0 0.0 ‐0.6 8.3 0.0 ‐0.1 0.0 0.0
2011.03 1.5 1.7 0.0 0.1 1.0 0.4 11.8 ‐0.4 ‐0.8 ‐1.2
2011.04 0.0 0.2 0.0 0.1 ‐0.2 ‐0.4 0.0 ‐0.5 0.0 0.0
2012.01 0.4 1.3 1.0 0.5 ‐0.9 0.9 ‐0.1 1.5 0.0 0.0
2012.02 0.2 0.4 0.0 0.0 ‐0.2 1.7 0.0 ‐0.5 0.0 0.0
2012.03 1.1 0.5 0.0 2.5 ‐1.9 1.2 0.0 ‐0.9 ‐4.5 0.5
2012.04 1.2 ‐0.1 0.1 1.8 ‐3.2 0.3 4.3 0.4 0.2 0.7
2013.01 0.1 0.0 ‐0.1 0.4 ‐1.2 ‐0.4 0.6 0.2 ‐0.4 0.0
2013.02 0.6 2.2 0.0 0.7 1.1 ‐2.3 1.0 0.0 0.6 1.1
2013.03 ‐0.5 0.6 9.7 0.0 0.4 1.7 ‐8.9 ‐1.2 0.2 1.1
2013.04 0.4 4.8 13.3 ‐0.5 0.1 ‐2.2 0.0 ‐0.1 0.0 0.5
2014.01 1.3 ‐0.7 2.3 ‐0.1 ‐0.2 1.5 11.8 1.6 0.5 ‐0.5
2014.02 0.3 ‐2.9 ‐12.8 1.9 0.0 ‐0.1 0.1 2.7 ‐0.5 0.4
2014.03 0.4 0.9 ‐8.7 0.4 1.3 2.9 ‐1.0 ‐1.3 0.0 ‐0.4
2014.04 ‐0.9 1.7 4.8 ‐2.8 0.1 ‐5.1 ‐0.1 0.0 1.2 7.6
2015.01 0.0 1.1 0.1 ‐0.7 0.0 0.0 0.0 0.0 0.0 2.3
Source: Central Statistics Division, CNMI Department of Commerce

2015 CNMI Statistical Yearbook Chapter 14 Page 185
11th Statistical Yearbook, Central Statistics Division, Department of Commerce
Table 14.7 CPI Weights for Each island, CNMI: 2015
ALL GROUPS Saipan Tinian Rota
Food 17.108 21.048 12.906
Cereal Products 2.705 4.623 2.635
Meat Products 4.040 6.027 3.149
Seafood Produce 1.499 0.899 N/A
Dairy Produce 1.534 2.035 1.483
Fruit 0.320 0.585 0.076
Vegetables 1.049 1.190 0.991
Non‐alcoholic Beverages 1.649 2.807 1.578
Confectionery 0.307 0.200 0.227
Miscellaneous Food 0.569 1.297 0.552
Take‐away Food 3.436 1.385 2.215
Alcoholic Beverages 1.377 3.193 1.589
Alcoholic Beverages 1.377 3.193 1.589
Housing & Utilities 30.386 31.151 44.625
Housing 15.128 7.889 13.789
Utilities 10.059 12.041 14.599
Household Goods/Furniture 1.089 5.346 2.081
Household Maintenance 4.110 5.876 14.156
Apparel 6.144 8.702 7.803
Mens Clothing 1.702 2.928 1.585
Womens Clothing 2.020 3.004 2.474
Infant Clothing 0.688 0.507 0.757
Footwear 1.256 1.868 2.529
Accessories 0.478 0.394 0.458
Transportation 22.228 7.975 10.314
Vehicle Purchase 13.890 0.459 2.139
Vehicle Maintenance 7.239 5.327 7.692
Public Transport 1.100 2.190 0.483
Medical Care 10.662 10.892 9.376
Medical Supplies 1.229 1.391 2.392
Medical Services 9.433 9.501 6.984
Recreation 3.399 4.003 2.268
Recreation 3.399 4.003 2.268
Education & Communication 5.629 5.711 2.926
Education 0.640 0.619 0.482
Communication 4.990 5.092 2.444
Other Goods & Services 3.066 7.324 8.194
Cigarettes & Betelnut 1.738 2.656 4.175
Other Goods 0.535 0.446 0.348
Other Services 0.792 4.222 3.672
Source: Central Statistics Division, CNMI Department of Commerce

11th Statistical Yearbook, Central Statistics Division, Department of Commerce
CHAPTER 15
Land Use

2015 CNMI Statistical Yearbook Chapter 15 Page 187
11th Statistical Yearbook, Central Statistics Division, Department of Commerce
Chapter 15 – Land Use
The Marianas Public Land Authority provides information on land use in the CNMI. The data include land
areas, elevations, and distances from Saipan. The data also include land use.
Saipan is the largest island, at 46.5 square miles, followed by Tinian at 39.2 square miles, and Rota at 32.8
square miles. The highest point in the CNMI is on Agrihan, at 3,200 feet. About 5,700 of the 12,300 hectares
(about 46 percent) of the land is private lands.
Data on annual homesteads, land exchanges, permits and commercial leases is not current, and will updated
when new information becomes available.

Page 188 Chapter 15 2015 CNMI Statistical Yearbook
11th Statistical Yearbook, Central Statistics Division, Department of Commerce
Table 15.1 Geographic Characteristics, CNMI: 2015
Islands Area (sq. mi.) Highest Elevation (feet) Distance from Saipan (naut. mi.)
Total 176.5 22,179 …
Rota 32.8 1,625 69 South
Aguijan (Goat Island) 2.7 584 12 S.
Tinian 39.2 583 6 S.
Saipan 46.5 1,554 …
Farallon de Medinilla 0.4 266 45 North
Anatahan 12.5 2,585 75 N.
Sarigan 1.9 1,801 95 N.
Guguan 1.5 988 130 N.
Alamagan 4.4 2,441 146 N.
Pagan 18.6 1,870 173 N.
Agrihan 11.4 3,166 206 N.
Asuncion 2.8 2,923 260 N.
Maug (3 islands) 0.8 746 280 N.
Farallon de Pajaros 1.0 1,047 315 N.
Source: Marianas Public Land Authority
"…" means data not indicated
Table 15.2 Public Land by Land Use Category, Saipan: 2003
Land Use Category Area (Hectares) Percent
Total 12,296.0 100.0
Private Lands 5,711.0 46.4
Public Lands (Encumbered) Commercial 1,403.0 11.4
Homestead (developed) 554.0 4.5
(proposed) 186.0 1.5
CNMI Government Usage 656.0 5.3
U. S. Military Usage 72.0 0.6
Wildlife/Forestry 845.0 6.9
Utilities/Transportation 480.0 3.9
Reserved for Land Exchanged 79.0 0.6
Public Lands (Unencumbered) 2,310.0 18.8
Source: Marianas Public Land Authority
Table 15.3 Village Homestead Permits Issued by Island, CNMI: 1997 to 2003
Island
Year
2003 2002 2001 2000 1999 1998 1997
Total 120 120 273 40 210 71 173
Saipan 110 110 153 6 190 69 16
Dandan … … 4 0 1 0 0
Lower Dandan … … 5 0 0 0 0
Lower Navy Hill … … 0 0 0 0 0
Kagman III … … 134 7 189 69 16
Kagman II … … 4 0 0 0 0
Kagman I … … 1 0 0 0 0
As Matuis … … 5 1 0 0 0
Rota 0 10 0 33 19 2 157
Sinapalo III … … 0 0 1 0 82
Sinapalo II … … 0 0 1 0 61
Sinapalo I … … 0 0 17 2 14
Tinian 10 0 120 1 1 0 0
Source: Marianas Public Land Authority
Note: "…" means figures from MPLA were submitted by Islands only and not by villages

2015 CNMI Statistical Yearbook Chapter 15 Page 189
11th Statistical Yearbook, Central Statistics Division, Department of Commerce
Table 15.4 Land Exchange Cases by Island, CNMI: 1997 to 2003
Case Status
Year
2003 2002 2001 2000 1999 1998 1997
Total 245 278 746 247 226 13 44
Saipan 245 253 553 223 197 13 44
Completed 16 8 309 1 9 9 34
Pending 229 245 244 222 188 4 10
Rota 25 145 24 29 0 0
Completed 1 1 120 0 11 0 0
Pending 23 24 25 24 18 0 0
Tinian 0 48 0 0 0 0
Completed 0 0 48 0 0 0 0
Pending 0 0 0 0 0 0 0
Source: Marianas of Public Land Authority
Table 15.5 Type of Permits and Commercial Leases Issued, CNMI: 1997 to 2003
Type of Permit
Year
2003 2002 2001 2000 1999 1998 1997
Total 12 30 20 13 17 19 16
Commercial Permits, 1-5 year 8 3 0 0 9 8 4
Quarry Permits 0 0 0 0 2 1 1
Maintenance Permits 2 0 2 2 1 1 1
Agriculture/Grazing Permits 1 23 5 5 1 4 1
Saipan 0 2 5 5 1 4 1
Rota 0 0 0 0 0 0 0
Tinian 1 21 0 0 0 0 0
Commercial Lease 1 4 8 1 3 1 8
Source: Marianas of Public Land Authority

11th Statistical Yearbook, Central Statistics Division, Department of Commerce
CHAPTER 16
Insular Areas
Comparisons

2015 CNMI Statistical Yearbook Chapter 16 Page 191
11th Statistical Yearbook, Central Statistics Division, Department of Commerce
Chapter 16 – Insular Areas comparisons
The United States, in addition to the District of Columbia, has 5 populated areas that are not states. Puerto
Rico and the D.C. are treated as States for statistical purposes, but the other four areas are called Insular
Areas. These are the Commonwealth of the Northern Mariana Islands (CNMI), the incorporated territories
of Guam and the U.S. Virgin Islands, and the unincorporated territory of American Samoa.
In 2010, The CNMI had an enumerated population of 53,883, making it the smallest of the four Insular Areas.
American Samoa’s population was 55,519 compared to the U.S. Virgin Islands 106,405 and Guam’s 159,338.
The U.S. Virgin Islands people were oldest, with a median age of 39.1 years (Half were older and half
younger), CNMI at 30.7, Guam at 29.5 and American Samoa youngest at 22.6 years. At that time the U.S.
Median Age in 2010 37.2.
Only the Virgin Islands had more females than males (the normal situation in closed populations since fe-
males tend to live longer than males). More males were present than females in CNMI, Guam, and American
Samoa because of migration trends, mostly for employment. But the median age for males in the CNMI
(34.4 years) was older than for females (32.5); the median age for females was older than males in Guam
(30.0 vs 29.0), American Samoa (23.3 vs 22.0) and the Virgin Islands (39.7 vs 38.4).
Guam had by far the largest population enrolled at various levels of education because of its largest popula-
tion, but also because of its various tertiary colleges and the University of Guam. While CNMI’s population
was only slightly less than American Samoa, it had about 50 percent fewer students. But, among adults,
CNMI had the highest percentage of high school graduates, at 82.4 percent of adults, compared to 82.1 per-
cent for American Samoa, 79.4 percent for Guam, and 68.9 percent for the Virgin Islands. The percentage
of college graduates, though, was about the same for Guam, CNMI, and the Virgin Islands, at about 1 in
every 5 adults, compared to about 1 in 10 for American Samoa.
About 72 percent of adults in the CNMI were in the labor force in 2010, the highest among the four Areas.
About equal numbers of those in Guam and the Virgin Islands were in the labor force (about 2 of every 3),
while only somewhat more than half of American Samoans were. But CNMI had the highest unemployment
rate (as defined by the U.S. Census Bureau), at 11 percent. American Samoa was next, at 9 percent, followed
by the Virgin Islands (also 9 percent), and Guam (8 percent). The rates are all based on the U.S. definitions
of labor force participation – the U.N. definitions would differ somewhat. Median household incomes could
not be compared because different categories were used for the various Areas.
Because of the end of the garment factories, CNMI had the highest vacancy rate at 23 percent of all housing
units, but the Virgin Islands was at almost the same level. About 17 percent of Guam’s units were unoccupied
as were about 12 percent of American Samoa’s. But American Samoa had the highest level of “owner”
occupied units at almost 3 of 4, compared to about half of those in Guam and the Virgin Islands, but only a
little more than 1 in 4 of CNMI’s units. Conversely, the SNMI had the highest percentage of rental units.
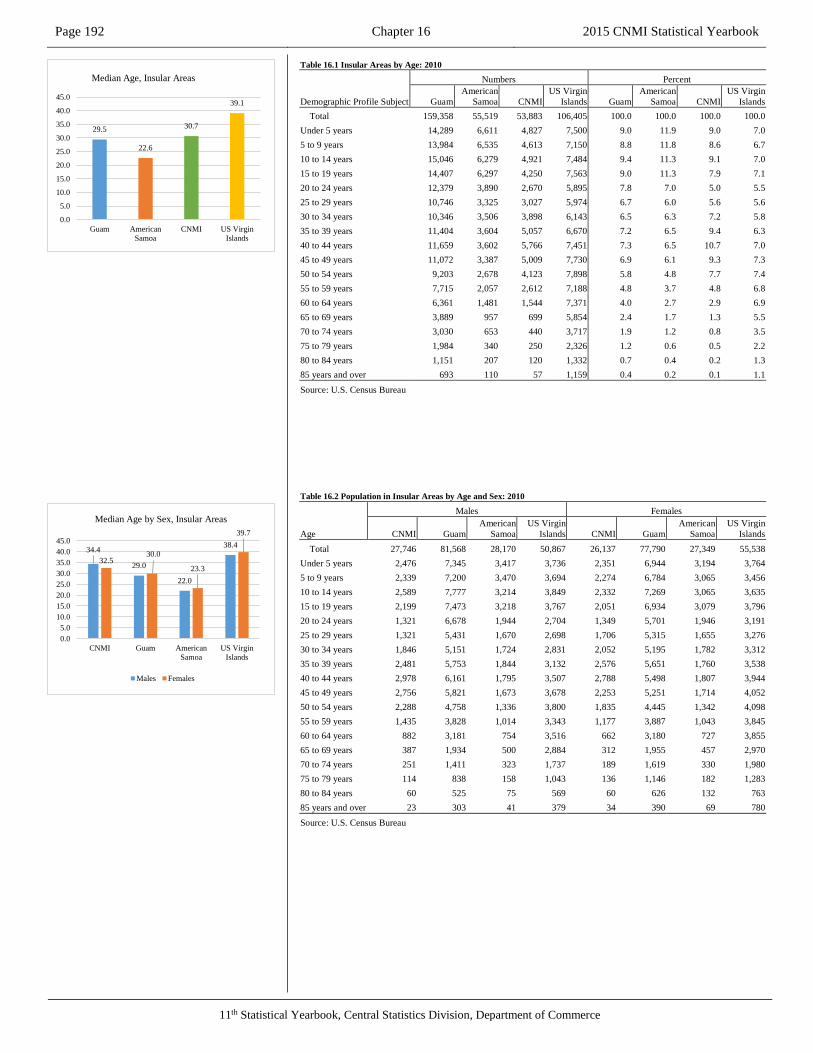
Page 192 Chapter 16 2015 CNMI Statistical Yearbook
11th Statistical Yearbook, Central Statistics Division, Department of Commerce
Table 16.1 Insular Areas by Age: 2010
Demographic Profile Subject
Numbers Percent
Guam
American
Samoa CNMI
US Virgin
Islands Guam
American
Samoa CNMI
US Virgin
Islands
Total 159,358 55,519 53,883 106,405 100.0 100.0 100.0 100.0
Under 5 years 14,289 6,611 4,827 7,500 9.0 11.9 9.0 7.0
5 to 9 years 13,984 6,535 4,613 7,150 8.8 11.8 8.6 6.7
10 to 14 years 15,046 6,279 4,921 7,484 9.4 11.3 9.1 7.0
15 to 19 years 14,407 6,297 4,250 7,563 9.0 11.3 7.9 7.1
20 to 24 years 12,379 3,890 2,670 5,895 7.8 7.0 5.0 5.5
25 to 29 years 10,746 3,325 3,027 5,974 6.7 6.0 5.6 5.6
30 to 34 years 10,346 3,506 3,898 6,143 6.5 6.3 7.2 5.8
35 to 39 years 11,404 3,604 5,057 6,670 7.2 6.5 9.4 6.3
40 to 44 years 11,659 3,602 5,766 7,451 7.3 6.5 10.7 7.0
45 to 49 years 11,072 3,387 5,009 7,730 6.9 6.1 9.3 7.3
50 to 54 years 9,203 2,678 4,123 7,898 5.8 4.8 7.7 7.4
55 to 59 years 7,715 2,057 2,612 7,188 4.8 3.7 4.8 6.8
60 to 64 years 6,361 1,481 1,544 7,371 4.0 2.7 2.9 6.9
65 to 69 years 3,889 957 699 5,854 2.4 1.7 1.3 5.5
70 to 74 years 3,030 653 440 3,717 1.9 1.2 0.8 3.5
75 to 79 years 1,984 340 250 2,326 1.2 0.6 0.5 2.2
80 to 84 years 1,151 207 120 1,332 0.7 0.4 0.2 1.3
85 years and over 693 110 57 1,159 0.4 0.2 0.1 1.1
Source: U.S. Census Bureau
Table 16.2 Population in Insular Areas by Age and Sex: 2010
Age
Males Females
CNMI Guam
American
Samoa
US Virgin
Islands CNMI Guam
American
Samoa
US Virgin
Islands
Total 27,746 81,568 28,170 50,867 26,137 77,790 27,349 55,538
Under 5 years 2,476 7,345 3,417 3,736 2,351 6,944 3,194 3,764
5 to 9 years 2,339 7,200 3,470 3,694 2,274 6,784 3,065 3,456
10 to 14 years 2,589 7,777 3,214 3,849 2,332 7,269 3,065 3,635
15 to 19 years 2,199 7,473 3,218 3,767 2,051 6,934 3,079 3,796
20 to 24 years 1,321 6,678 1,944 2,704 1,349 5,701 1,946 3,191
25 to 29 years 1,321 5,431 1,670 2,698 1,706 5,315 1,655 3,276
30 to 34 years 1,846 5,151 1,724 2,831 2,052 5,195 1,782 3,312
35 to 39 years 2,481 5,753 1,844 3,132 2,576 5,651 1,760 3,538
40 to 44 years 2,978 6,161 1,795 3,507 2,788 5,498 1,807 3,944
45 to 49 years 2,756 5,821 1,673 3,678 2,253 5,251 1,714 4,052
50 to 54 years 2,288 4,758 1,336 3,800 1,835 4,445 1,342 4,098
55 to 59 years 1,435 3,828 1,014 3,343 1,177 3,887 1,043 3,845
60 to 64 years 882 3,181 754 3,516 662 3,180 727 3,855
65 to 69 years 387 1,934 500 2,884 312 1,955 457 2,970
70 to 74 years 251 1,411 323 1,737 189 1,619 330 1,980
75 to 79 years 114 838 158 1,043 136 1,146 182 1,283
80 to 84 years 60 525 75 569 60 626 132 763
85 years and over 23 303 41 379 34 390 69 780
Source: U.S. Census Bureau
29.5
22.6
30.7
39.1
0.0
5.0
10.0
15.0
20.0
25.0
30.0
35.0
40.0
45.0
Guam American
Samoa
CNMI US Virgin
Islands
Median Age, Insular Areas
34.4
29.0
22.0
38.4
32.530.0
23.3
39.7
0.0
5.0
10.0
15.0
20.0
25.0
30.0
35.0
40.0
45.0
CNMI Guam American
Samoa
US Virgin
Islands
Median Age by Sex, Insular Areas
Males Females

2015 CNMI Statistical Yearbook Chapter 16 Page 193
11th Statistical Yearbook, Central Statistics Division, Department of Commerce
Table 16.3 School Enrollment, Insular Areas: 2010
Characteristic Guam American Samoa CNMI US Virgin Islands
Total 48,137 21,196 14,929 27,015
Pre-kindergarten 1,651 1,465 701 2,149
Kindergarten 2,737 1,829 937 1,677
Elementary school (grades 1-8) 22,994 10,151 7,819 12,181
High school (grades 9-12) 12,154 5,384 3,669 6,494
College, graduate or professional school 8,601 2,367 1,803 4,514
Source: U.S. Census Bureau
Table 16.4 Insular Areas by Educational Attainment: 2010
Educational Attainment
Numbers Percents
Guam
American
Samoa CNMI
US Vir-
gin Is-
lands Guam
American
Samoa CNMI
US Vir-
gin Is-
lands
Total 89,253 25,907 32,602 70,813 Less than 9th grade 6,919 1,775 2,550 11,543 100.0 100.0 100.0 100.0
9th to 12th grade, no diploma 11,429 2,867 3,187 10,479 92.2 93.1 92.2 83.7
High school graduate (includes equiva-
lency) 30,176 12,512 12,063 21,598 79.4 82.1 82.4 68.9
Some college, no degree 17,587 3,952 5,987 10,505 45.6 33.8 45.4 38.4
Associate's degree 4,963 2,227 2,230 3,109 25.9 18.5 27.0 23.6
Bachelor's degree 13,513 1,668 5,383 8,350 20.4 9.9 20.2 19.2
Graduate or professional degree 4,666 906 1,202 5,229 5.2 3.5 3.7 7.4
Source: U.S. Census Bureau
79.4
82.1 82.4
68.9
60.0
65.0
70.0
75.0
80.0
85.0
Guam American
Samoa
CNMI US Virgin
Islands
High School Graduates, Insular Areas
20.4
9.9
20.219.2
0.0
5.0
10.0
15.0
20.0
25.0
Guam American
Samoa
CNMI US Virgin
Islands
BA/BS or more, Insular Areas
0
5,000
10,000
15,000
20,000
25,000
30,000
35,000
40,000
45,000
50,000
Guam American
Samoa
CNMI US Virgin
Islands
School Enrollment, Insular Areas: 2010
College,
graduate or
professional
school
High school
(grades 9-
12)
Elementary
school
(grades 1-8)
Pre-
Elementary

Page 194 Chapter 16 2015 CNMI Statistical Yearbook
11th Statistical Yearbook, Central Statistics Division, Department of Commerce
Table 16.5 Insular Areas Marital Status: 2010
Marital Status
Numbers Percent
Guam
American
Samoa CNMI
US Vir-
gin Is-
lands Guam
American
Samoa CNMI
US Vir-
gin Is-
lands
TOTAL 116,039 36,094 39,522 84,271 Males 59,246 18,069 20,342 39,588 100.0 100.0 100.0 100.0
Never married 23,958 7,327 7,622 16,751 40.4 40.6 37.5 42.3
Now married (except separated) 30,025 9,854 10,766 16,156 50.7 54.5 52.9 40.8
Separated 831 211 865 1,037 1.4 1.2 4.3 2.6
Widowed 1,030 369 395 1,064 1.7 2.0 1.9 2.7
Divorced 3,402 308 694 4,580 5.7 1.7 3.4 11.6
Marital
Females 56,793 18,025 19,180 44,683 100.0 100.0 100.0 100.0
Never married 19,837 6,207 7,616 18,208 34.9 34.4 39.7 40.7
Now married (except separated) 27,831 9,631 8,819 15,602 49.0 53.4 46.0 34.9
Separated 945 267 720 1,328 1.7 1.5 3.8 3.0
Widowed 4,273 1,479 1,158 3,476 7.5 8.2 6.0 7.8
Divorced 3,907 441 867 6,069 6.9 2.4 4.5 13.6
Source: U.S. Census Bureau
Table 16.6 Employment Status and Subsistence Activity, Insular Areas: 2010
Characteristic Guam
American
Samoa CNMI
US Virgin
Islands
Total 113,067 34,767 38,679 82,634
In labor force 74,400 18,387 27,968 54,541
Percent 65.8 52.9 72.3 66.0
Civilian 69,394 18,300 27,949 54,288
Employed 63,678 16,616 24,826 49,588
Also did subsistence activity 2,606 1,614 1,136 *
Unemployed 5,716 1,684 3,123 4,700
Percent 8.2 9.2 11.2 8.7
Armed Forces 5,006 87 19 253
Not in labor force 38,667 16,380 10,711 28,093
Subsistence activity only 710 633 234 *
Source: U.S. Census Bureau
* Data not collected or data not comparable due to question or response choice differences
40.4 40.637.5
42.3
49.053.4
46.0
34.9
0.0
10.0
20.0
30.0
40.0
50.0
60.0
Guam American
Samoa
CNMI US Virgin
Islands
Percent of Adults Never Married, Insular
Areas
Males Females
65.8
52.9
72.3
66.0
0.0
10.0
20.0
30.0
40.0
50.0
60.0
70.0
80.0
Guam American
Samoa
CNMI US Virgin
Islands
Percent in the Labor Force, Insular Areas
8.2
9.2
11.2
8.7
0.0
2.0
4.0
6.0
8.0
10.0
12.0
Guam American
Samoa
CNMI US Virgin
Islands
Percent Unemployed, Insular Areas

2015 CNMI Statistical Yearbook Chapter 16 Page 195
11th Statistical Yearbook, Central Statistics Division, Department of Commerce
Table 16.7 Household Income in 2009, Insular Areas: 2010
Demographic Profile Subject Guam
American
Samoa CNMI
US Virgin
Islands
Total: 42,026 9,688 16,035 43,214
Less than $2,500 1,726 504 903 *
$2,500 to $4,999 552 182 558 *
$5,000 to $9,999 1,278 1,087 2,529 2,649
$10,000 to $14,999 2,007 1,203 2,097 2,977
$15,000 to $19,999 2,217 * * *
$20,000 to $24,999 2,418 * * *
$25,000 to $29,999 2,387 739 982 *
$30,000 to $39,999 4,811 1,169 1,554 *
$40,000 to $49,999 4,237 740 1,099 *
$50,000 to $59,999 3,782 * * *
$60,000 to $69,999 3,249 * * *
$70,000 to $79,999 2,598 * * *
$80,000 to $99,999 3,939 * * *
$100,000 or more 6,825 449 734 5,267
Source: U.S. Census Bureau
NOTE: CNMI = Commonwealth of the Northern Mariana Islands
* Data not collected or data not comparable due to question or response choice differences
Table 16.8 Housing Occupancy, Insular Areas: 2010
Characteristic Guam
American Sa-
moa CNMI
US Virgin Is-
lands
Total 50,567 10,963 20,850 55,901
Occupied housing units 42,026 9,688 16,035 43,214
Percent 83.1 88.4 76.9 77.3
Vacant units 8,541 1,275 4,815 12,687
For seasonal, recreational, or occasional use 411 210 387 3,748
Source: U.S. Census Bureau
Table 16.9 Housing Tenure, Insular Areas: 2010
Characteristic Guam American Samoa CNMI US Virgin Islands
Total 42,026 9,688 16,035 43,214
Owner-occupied housing units 21,140 7,106 4,537 20,700
Percent 50.3 73.3 28.3 47.9
Renter-occupied housing units 20,886 2,582 11,498 22,514
Source: U.S. Census Bureau
16.9
11.6
23.1 22.7
0.0
5.0
10.0
15.0
20.0
25.0
Guam American
Samoa
CNMI US Virgin
Islands
Percent Vacant Units, Insular Areas
50.3
73.3
28.3
47.9
0.0
10.0
20.0
30.0
40.0
50.0
60.0
70.0
80.0
Guam American
Samoa
CNMI US Virgin
Islands
Percent Owner-Occupied Housing Units,
Insular Areas

11th Statistical Yearbook, Central Statistics Division, Department of Commerce
CHAPTER 17
Freely Associated
States (FAS) Citizens
In the CNMI

2015 CNMI Statistical Yearbook Chapter 17 Page 197
11th Statistical Yearbook, Central Statistics Division, Department of Commerce
Chapter 17 – Freely Associated States (FAS)
CNMI and Guam make up what the Western world calls the Mariana Islands. The Marshall Islands are at
the other end of Micronesia. The Caroline Islands, comprised of Palau and the Federated States of Micronesia
(FSM) are in the middle. Palau, FSM, and the Marshall Islands together are called the Freely Associated
States (FAS), and are linked to the United States by the Compact of Free Association (COFA).
These parts of Micronesia, except for Guam, were “independent” until the 1500s and the age of exploration.
They were claimed by Spain from the 16th through the 19th century, and then became German possessions
after the Spanish American War, and then a League of Nations Mandate under Japanese Rule from the end
of World War I through World War II. Pearl Harbor was bombed from a based in the Marshall Islands, so
the United States insisted on taking Micronesia as a strategic Trust Territory (of the Pacific Islands – TTPI)
after World War II.
The CNMI split from the rest of the TTPI in 1978, becoming a Commonwealth in 1986. About the same
time the former Districts of Yap, Chuuk, Pohnpei, and Kosrae became the FSM, and the Marshall Islands
both signed Compacts of Free Association with the United States, making them independent, at least in name.
Palau followed in 1994.
The Office of Insular Affairs (OIA), U.S. Department of the Interior, is required to report on the impact of
the Compacts of Free Association on the U.S. Insular Areas and the State of Hawaii within 5 year periods.
The first census of Micronesian migrants to the CNMI was conducted in 1993, followed by surveys in 1998
and 2003. The U.S. Census Bureau conducted snowball-method surveys in those years; in 2008 and 2013,
OIA contracted with the Census Bureau again, but the Bureau did not produce characteristics of CNMI mi-
grants in those surveys. Partly because of this, the FSM government funded its own survey of migrants to
CNMI, Guam, Hawaii, and the U.S. Mainland. The migrants were included in the Decennial Censuses, so
characteristics can be shown for FSM for 6 enumerations. Palau and RMI migrant analysis will be displayed
in future publications.
For FSM-born migrants, the numbers increased from 2,300 in 1993 to about 4,300 in 2012, so almost dou-
bling during the period. Measuring migrants in CNMI is difficult because many FSM born were in the CNMI
during TTPI times and many married and had children, and so many, while reporting as Micronesian by
ethnicity, were not included among the migrants. Also, many changed their ethnicity to “Carolinian” over
time, as shown in the previous chapter on ethnicity.
The median age of the FSM-born migrants actually decreased from 23.9 in 1993 to 16.9 in 2012, although
the median of 22.0 years in the 2010 could also be close to the real number. As migrants become established,
they bring their relatives under the visa-free entry program instituted as part of the Compacts. The 2010
census was complete throughout CNMI, the 2012 was a sample, although in the case of CNMI, it was a
random sample based on all units reporting an FSM-born householder. The median age for males in 2010
was 21.6 compared to 22.5 for females (and was 17.2 compared to 16.7 if the 2012 data are considered.
In 1993, considerably more migrant females than males were enumerated – about 88 males for every 100
females – probably because of the incipient garment factory period. The population remained predominantly
female throughout the period, ending back at 86 per 100 in 2012 (but 96 if the 2010 census is the measure).
OIA requires annual reporting from the Insular Areas on the impact of the Compact on those Areas. The
CNMI produces annual reports, and some of the tables from recent reports are included here.

Page 198 Chapter 17 2015 CNMI Statistical Yearbook
11th Statistical Yearbook, Central Statistics Division, Department of Commerce
Table 17.1 Population distribution by Age, FSM-born, CNMI: 1992 to 2012
Age Group
CNMI
1993 1998 2000 2003 2010 2012
Total 2,261 1,792 2,545 3,097 3,437 4,286
0 to 4 239 229 275 414 281 492
5 to 9 225 256 285 338 321 535
10 to 14 216 195 245 349 350 622
15 to 19 216 187 250 297 344 566
20 to 24 302 195 235 324 211 263
25 to 29 257 203 275 261 228 191
30 to 34 264 160 280 283 228 252
35 to 39 149 133 250 248 298 272
40 to 44 107 78 170 217 334 305
45 to 49 51 73 105 141 285 272
50 to 54 31 28 75 93 210 230
55 to 59 29 18 40 64 148 126
60 to 64 22 13 25 27 89 97
65 to 69 7 14 15 19 58 30
70 to 74 13 3 10 16 29 12
75+ yrs. 133 7 10 6 23 21
Median 23.9 20.7 20.9 22.3 22.0 16.9
Source: Micronesian Migrants Surveys
Table 17.2 Age by Sex, CNMI: 1992 to 2012
Age Group
Males Females
1993 1998 2000 2003 2010 2012 1993 1998 2000 2003 2010 2012
Total 1,055 885 1,231 1,528 1,680 1,988 1,206 907 1,314 1,569 1,756 2,299
0 to 4 116 122 150 225 134 225 123 107 125 189 147 267
5 to 9 112 135 145 184 157 218 113 121 140 154 164 317
10 to 14 104 105 125 175 190 316 112 90 120 174 160 306
15 to 19 101 89 120 134 175 264 115 98 130 163 169 302
20 to 24 125 90 105 145 117 108 177 105 130 179 94 155
25 to 29 102 90 130 122 99 98 155 113 145 139 129 93
30 to 34 129 80 135 149 112 90 135 80 145 134 116 162
35 to 39 73 59 115 112 147 136 76 74 135 136 151 136
40 to 44 56 40 75 100 165 128 51 38 95 117 169 177
45 to 49 26 38 50 65 146 133 25 35 55 76 139 139
50 to 54 14 12 40 50 88 111 17 16 35 43 122 119
55 to 59 12 11 20 36 66 69 17 7 20 28 82 57
60 to 64 8 5 15 10 38 51 14 8 10 17 51 46
65 to 69 1 5 0 10 29 21 6 9 15 9 29 9
70 to 74 9 0 0 9 13 5 4 3 10 7 16 8
75+ yrs. 67 4 6 2 4 15 66 3 4 4 18 6
Median 23.8 22.3 20.7 21.6 21.6 17.2 23.9 21.8 21.1 22.9 22.5 16.7
Source: Micronesian Migrants Surveys
23.9
20.7 20.922.3 22.0
16.9
0.0
5.0
10.0
15.0
20.0
25.0
30.0
1993 1998 2000 2003 2010 2012
Median Age FSM born in CNMI: 1993 to
2012
23.8
22.3
20.7 21.6 21.6 17.2
23.9
21.8
21.1 22.9 22.5
16.7
0
5
10
15
20
25
30
1993 1998 2000 2003 2010 2012
Median Age by Sex, FSM born in CNMI:
1993 to 2012
Males Females

2015 CNMI Statistical Yearbook Chapter 17 Page 199
11th Statistical Yearbook, Central Statistics Division, Department of Commerce
Table 17.3 Males per Females by Age Group, CNMI: 1993 to 2012
Age Group 1993 1998 2000 2003 2010 2012
Total 87.5 97.6 93.7 97.4 95.7 86.5
0 to 4 94.3 114.0 120.0 119.0 91.2 84.3
5 to 9 99.1 111.6 103.6 119.5 95.7 68.8
10 to 14 92.9 116.7 104.2 100.6 118.8 103.3
15 to 19 87.8 90.8 92.3 82.2 103.6 87.4
20 to 24 70.6 85.7 80.8 81.0 124.5 69.7
25 to 29 65.8 79.6 89.7 87.8 76.7 105.4
30 to 34 95.6 100.0 93.1 111.2 96.6 55.6
35 to 39 96.1 79.7 85.2 82.4 97.4 100.0
40 to 44 109.8 105.3 78.9 85.5 97.6 72.3
45 to 49 104.0 108.6 90.9 85.5 105.0 95.7
50 to 54 82.4 75.0 114.3 116.3 72.1 93.3
55 to 59 70.6 157.1 100.0 128.6 80.5 121.1
60 to 64 57.1 62.5 150.0 58.8 74.5 110.9
65 to 69 16.7 55.6 0.0 111.1 100.0 233.3
70 to 74 225.0 0.0 0.0 128.6 81.3 62.5
75+ yrs. 101.5 133.3 150.0 50.0 22.2 250.0
Source: Micronesian Migrants Surveys
Table 17.4 Marital Status for Persons 15 years and over, FSM-born, CNMI: 1998 to 2010
Marital Status 1998 2000 2003 2010
Males, 15+ 622 885 748 1200
Never married 238 410 280 583
Percent 38.3 46.3 37.4 48.6
Now married 369 385 432 529
Separated 8 15 9 32
Widowed 3 4 4 28
Divorced 4 4 23 28
Females, 15+ 693 925 848 1285
Never married 272 435 343 576
Percent 39.2 47.0 40.4 44.8
Now married 379 425 433 531
Separated 20 10 33 44
Widowed 18 40 7 92
Divorced 4 15 32 42
Source: 1994 and 2000 FSM Censuses, 1998 FSM HIES, and Micronesian Migrant Surveys
87.5
97.6
93.7
97.4
95.7
86.5
80.0
82.0
84.0
86.0
88.0
90.0
92.0
94.0
96.0
98.0
100.0
1993 1998 2000 2003 2010 2012
Males per 100 Females (Sex Ratio), FSM
Born: 1993 to 2012

Page 200 Chapter 17 2015 CNMI Statistical Yearbook
11th Statistical Yearbook, Central Statistics Division, Department of Commerce
Table 17.5 Compact Impact Allocation by Expense Classification
Department/Agencies
Person-
nel All Others Total
Cost to FAS
Based on His-
torical Aver-
age
2013 Cost To
FAS
Unfunded
Variance Ab-
sorbed By G/F
CHCC - Public Health - 618,111 618,111 1,992,591 2,548,442 -1,930,331
CGC - Public Health 34,964 0 34,964 83,236 144,156 -109,192
Division of Youth Services 62,773 0 62,773 215,043 258,811 -196,038
Department of Public Safety 642,148 0 642,148 1,795,658 2,647,546 -2,005,398
Department of Corrections 158,670 0 158,670 727,914 654,189 -495,519
Office of Public Defender 27,049 0 27,049 140,768 111,520 -84,471
Northern Marianas College 86,762 86,762 621,300 357,716 -270,954
Public School System 220,004 220,004 3,249,396 907,066 -687,062
Karidat 79,961 0 79,961 72,742 329,674 -249,713
TOTAL 1,005,565 924,877 1,930,443 8,898,648 7,959,120 -6,028,678
Source: 2014 CNMI Compact Impact Grant Request
Table 17.6. Proposed Allocation by Agency and Quarter for FAS Expenditures, CNMI: 2014
Proposed Allocation by Quarter Governor's En-
acted Submis-
sion: 2014
Budget
Percent of
2014 CI*
Budget Sup-
plement Department/Agencies Total Percent 1st 2nd 3rd 4th
TOTAL $1,930,44
3 100.0 $482,614 $482,611 $482,609 $482,608 $49,086,072 3.93%
CHCC - Public Health $618,111 32.0 $154,528 $154,528 $154,528 $154,527 $1,047,493 59.01%
CGC - Public Health* $34,964 1.8 $8,741 $8,741 $8,741 $8,741 $173,269 20.18%
Division of Youth Services $62,773 3.3 $15,694 $15,693 $15,693 $15,693 $327,144 19.19%
Department of Public Safety $642,148 33.3 $160,537 $160,537 $160,537 $160,537 $7,215,836 8.90%
Department of Corrections $158,670 8.2 $39,668 $39,668 $39,667 $39,667 $3,471,302 4.57%
Office of Public Defender $27,049 1.4 $6,763 $6,762 $6,762 $6,762 $470,827 5.74%
Northern Marianas College $86,762 4.5 $21,691 $21,691 $21,690 $21,690 $4,162,667 2.08%
Public School System $220,004 11.4 $55,001 $55,001 $55,001 $55,001 $32,190,464 0.68%
Karidat $79,961 4.1 $19,991 $19,990 $19,990 $19,990 $27,070 295.39%
Source: 2014 CNMI Compact Impact Grant Request

2015 CNMI Statistical Yearbook Chapter 17 Page 201
11th Statistical Yearbook, Central Statistics Division, Department of Commerce
Table 17.7. CHCC Public Health (Hospital) FAS Expenses, CNMI: 2001 to 2013
[Fiscal year. Costs in $ 000S]
Expenditures Total 2001-2008 2009-2013 2009 2010 2011 2012 2013 Average
Total $277,437.3 $166,090.1 $111,347.2 $19,912.0 $19,813.2 $2,655.5 $25,524.9 $43,441.7 $23,119.8
Local $166,090.1 $19,912.0 $19,813.2 $2,655.5 $25,524.9 $35,645.4
Federal $7,796.2
Total 1,215,644 884,554 331,090 110,569 17,260 48,717 54,544 84,942 101,304
Total FAS 104,771 76,683 28,088 9,585 8,093 5,665 4,745 4,983 8,731
Percent 8.6% 8.7% 8.5% 8.7% 6.9% 11.6% 8.7% 5.9% 8.6%
FSM 65,171 45,280 19,891 5,660 4,776 3,447 2,461 3,547 5,431
Palau 42,141 29,588 12,553 3,699 3,110 2,137 2,205 1,402 3,512
RMI 2,443 1,815 628 227 207 81 79 34 204
CNMI 424,117 248,571 175,546 31,071 46,464 27,400 22,422 48,189 35,343
Other 766,715 559,300 207,415 69,913 62,703 15,652 27,377 31,770 63,893
Costs to FAS $23,911.1 $14,398.5 $9,446.1 $1,726.1 $1,367.5 $308.8 $2,220.5 $2,548.4 $1,992.6
Source: 2014 CNMI Compact Impact Grant Request
Table17.8. Department of Public Health Community Guidance Center (GCG) FAS Expenditures, CNMI: 2001 to 2013
Expenditures Total 2001-2008 2009-2013 2009 2010 2011 2012 2013 Average
Total $8,573,944 $6,272,082 $2,301,862 $425,784 $324,420 $209,432 $292,726 $1,049,500 $714,495
Local $6,272,082 $425,784 $324,420 $209,432 $292,726 $173,269
Federal $876,231
Total Caseload 61,667 49,641 12,026 1,109 3,691 4,440 1,825 961 5,139
Total FAS 7,184 5,313 1,871 110 542 722 365 132 599
Percent 11.7% 10.7% 15.6% 9.9% 14.7% 16.3% 20.0% 13.7% 11.7%
FSM 4,140 2,906 1,234 43 332 520 255 84 345
Palau 2,969 2,343 626 64 202 202 110 48 247
RMI 75 64 11 3 8 0 0 0 6
CNMI 29,398 21,901 7,497 770 2,341 2,524 1,184 678 2,450
Other 25,085 22,427 2,658 229 808 1,194 276 151 2,090
Cost to FAS $998,836 $671,291 $358,123 $42,233 $47,639 $34,056 $58,545 $144,156 $83,236
Source: 2014 CNMI Compact Impact Grant Request

Page 202 Chapter 17 2015 CNMI Statistical Yearbook
11th Statistical Yearbook, Central Statistics Division, Department of Commerce
Table 17.9a Division of Youth Services FAS Expenditures, CNMI: 2001 to 2013
Expenditures Total 2001-2008 2009-2013
Total Expendi-
tures $12,726,499 $7,500,920 $5,225,579
Local $7,500,920
Federal
Total cli-
ents 22,933 13,417 9,505
Total FAS 4,650 2,960 1,690
Percent 20.3% 22.1% 17.8%
FSM 3,267 2,124 1,143
Palau 1,090 733 357
RMI 144 103 41
CNMI 13,496 8,608 4,888
Other 4,787 1,849 2,938
Cost to FAS $2,580,521 $1,654,820 $929,147
Source: 2014 CNMI Compact Impact Grant Request
Table 17.9b Division of Youth Services FAS Expenditures, CNMI: 2009 to 2013
Expenditures 2009 2010 2011 2012 2013 Average
Total Expenditures $1,036,742 $955,078 $510,317 $795,340 $1,928,102 $1,060,542
Local $1,036,742 $955,078 $510,317 $795,340 $246,870
Federal $1,681,232
Total clients 1,956 1,163 2,116 1,968 2,302 1,911
Total FAS 480 300 217 384 309 388
Percent 24.5% 25.8% 10.3% 19.5% 13.4% 20.3%
FSM 356 244 59 255 229 272
Palau 99 56 8 117 77 91
RMI 26 0 0 12 3 12
CNMI 1,160 603 1,190 629 1,306 1,125
Other 316 260 720 955 687 399
Cost to FAS $254,459 $246,366 $52,334 $155,188 $258,811 $215,043
Source: 2014 CNMI Compact Impact Grant Request

2015 CNMI Statistical Yearbook Chapter 17 Page 203
11th Statistical Yearbook, Central Statistics Division, Department of Commerce
Table 17.10a Department of Public Safety FAS Arrests, CNMI: 2001 to 2013
Expenditures Total 2001-2008 2009-2013
Total $82,032,542 $51,080,736 $30,951,806
Local $51,080,736
Federal
Total ar-
rests 21,786 15,439 6,347
Total FAS 5,723 4,013 1,710
Percent 26.3% 26.0% 26.9%
FSM 2,080 952 1,128
Palau 992 432 560
RMI 33 24 9
CNMI 4,625 1,806 2,819
Other 11,438 9,620 1,818
Costs to FAS $21,547,898 $13,277,220 $8,337,221
Source: 2014 CNMI Compact Impact Grant Request
Table 17.10b Department of Public Safety FAS Arrests, CNMI: 2009 to 2013
Expenditures 2009 2010 2011 2012 2013 Average
Total $4,027,503 $4,027,503 $2,871,420 $7,568,891 $12,456,489 $6,836,045
Local $4,027,503 $4,027,503 $2,871,420 $7,568,891 $8,581,425
Federal $3,875,064
Total ar-
rests 953 1,186 1,657 1,403 1,148 1,816
Total FAS 264 564 358 280 244 477
Percent 27.7% 47.6% 21.6% 20.0% 21.3% 26.3%
FSM 185 363 228 190 162 173
Palau 76 201 114 89 80 83
RMI 3 0 3 1 2 3
CNMI 343 318 830 724 605 385
Other 347 305 469 399 299 953
Costs to FAS $1,114,290 $1,915,092 $620,379 $1,510,541 $2,647,546 $1,795,658
Source: 2014 CNMI Compact Impact Grant Request

Page 204 Chapter 17 2015 CNMI Statistical Yearbook
11th Statistical Yearbook, Central Statistics Division, Department of Commerce
Table 17.11a Department of Corrections FAS Incarcerations, CNMI: 2001 to 2013
Expenditures Total 2001-2008 2009-2013
Total $38,415,904 $24,311,142 $14,104,762
Total incarcerations 23,507 16,486 7,021
Total FAS 5,345 3,782 1,563
Percent 22.7% 22.9% 22.3%
FSM 3,301 2,263 1,038
Palau 1,956 1,445 511
RMI 88 74 14
CNMI 1,386 0 1,386
Other 16,776 12,704 4,072
Local Costs to FAS $8,734,973 $5,577,141 $3,139,972
Source: 2014 CNMI Compact Impact Grant Request
Table 17.11b Department of Corrections FAS Incarcerations, CNMI: 2001 to 2013
Expenditures 2009 2010 2011 2012 2013 Average
Total $3,587,592 $3,418,283 $1,926,458 $2,735,395 $2,437,034 $3,201,325
Total incarcerations 1,580 1,506 1,515 1,403 1,017 1,959
Total FAS 332 343 335 280 273 445
Percent 21.0% 22.8% 22.1% 20.0% 26.8% 22.7%
FSM 219 219 230 190 180 275
Palau 107 123 102 89 90 163
RMI 6 1 3 1 3 7
CNMI 0 724 662 116
Other 1,248 1,163 1,180 399 82 1,398
Local Costs to FAS $753,848 $778,533 $425,982 $545,909 $654,189 $727,914
Source: 2014 CNMI Compact Impact Grant Request

2015 CNMI Statistical Yearbook Chapter 17 Page 205
11th Statistical Yearbook, Central Statistics Division, Department of Commerce
Table 17.12a Office of Public Defender FAS Expenditures, CNMI: 2001 to 2013
Expenditures Total 2001-2008 2009-2013
Total $6,866,206 $4,871,373 $1,994,833
Local $4,871,373
Federal
Total caseload 10,053 5,604 $4,449
Total FAS 2,473 1,334 $1,139
Percent 24.6% 23.8% 25.6%
FSM 1,700 868 $832
Palau 735 440 $295
RMI 38 26 $12
CNMI 1,697 821 $876
Other 5,882 3,449 $2,433
Cost to FAS $1,689,212 $1,159,602 $510,802
Source: 2014 CNMI Compact Impact Grant Request
Table 17.12b Office of Public Defender FAS Expenditures, CNMI: 2009 to 2013
Expenditures 2009 2010 2011 2012 2013 Average
Total $425,925 $429,622 $389,209 $345,682 $404,395 $572,184
Local $425,925 $429,622 $389,209 $345,682 $392,371
Federal $12,024
Total caseload 612 604 731 1,008 1,494 838
Total FAS 158 160 178 232 412 206
Percent 25.8% 26.4% 24.4% 23.0% 27.6% 24.6%
FSM 120 120 126 149 317 142
Palau 35 37 50 80 93 61
RMI 3 2 2 3 2 3
CNMI 75 25 0 0 776 141
Other 379 419 553 776 306 490
Cost to FAS $109,729 $113,491 $94,773 $79,562 $111,520 $140,768
Source: 2014 CNMI Compact Impact Grant Request

Page 206 Chapter 17 2015 CNMI Statistical Yearbook
11th Statistical Yearbook, Central Statistics Division, Department of Commerce
Table 17.13a Northern Marianas College FAS Expenditures: 2001 to 2013
Expenditures Total 2001-2007 2009-2013
Total $87,215,081 $54,099,430 $33,115,651
Local
Federal
Total students 196,257 140,270 55,987
Total FAS 15,379 12,750 2,629
Percent 7.84% 9.09% 4.70%
FSM 13,056 11,283 1,773
Palau 2,112 1,302 810
RMI 211 165 46
CNMI 155,607 113,938 41,669
Other 25,185 13,582 11,603
Costs to FAS $6,834,296 $4,917,429 $1,555,013
Source: 2014 CNMI Compact Impact Grant Request
Note: No data available for 2010
Table 17.13b Northern Marianas College FAS Expenditures: 2009 to 2013
Expenditures 2008 2009 2011 2012 2013 Average
Total $5,315,954 $5,168,232 $4,269,328 $5,170,272 $13,191,865 $7,928,644
Local $4,514,964
Federal $8,676,901
Total students 22,613 28,289 1,332 2,241 1,512 17,842
Total FAS 803 1,420 153 212 41 1,398
Percent 3.55% 5.02% 11.49% 9.46% 2.71% 7.84%
FSM 519 987 104 135 28 1,187
Palau 275 409 45 69 12 192
RMI 9 24 4 8 1 19
CNMI 17,104 20,484 976 1,823 1,282 14,146
Other 4,706 6,386 116 206 189 2,290
Costs to FAS $188,772 $259,422 $490,396 $489,111 $357,716 $621,300
Source: 2014 CNMI Compact Impact Grant Request
Note: No data available for 2010

2015 CNMI Statistical Yearbook Chapter 17 Page 207
11th Statistical Yearbook, Central Statistics Division, Department of Commerce
Table 17.14a Public School System FAS Expenditures, CNMI: 2001 to 2013
Expenditures Total 2001-2007 2008-2013
Total $439,917,160 $258,483,266 $181,433,894
Local $258,483,266
Federal
Total students 126,412 73,636 52,776
Total FAS 10,271 7,126 3,145
Percent 8.13% 9.68% 5.96%
FSM 6,408 4,392 2,016
Palau 3,538 2,483 1,055
RMI 325 251 74
CNMI 93,522 53,072 40,450
Other 22,619 13,438 9,181
Costs to FAS $35,743,356 $25,014,283 $10,811,914
Source: 2014 CNMI Compact Impact Grant Request
Note: No report for 2010
Table 17.14b Public School System FAS Expenditures, CNMI: 2008 to 2013
Expenditures 2008 2009 2011 2012 2013 Average
Total $33,515,058 $31,447,744 $26,355,872 $29,820,998 $60,294,222 $39,992,469
Local $33,515,058 $31,447,744 $26,355,872 $29,820,998 $31,051,037
Federal $29,243,185
Total students 10,742 10,369 10,505 10,591 10,569 11,492
Total FAS 1,311 1,295 196 184 159 934
Percent 12.20% 12.49% 1.87% 1.74% 1.50% 8.13%
FSM 801 796 155 143 121 583
Palau 482 479 30 33 31 322
RMI 28 20 11 8 7 30
CNMI 5,721 5,181 9,805 9,866 9,877 8,502
Other 3,710 3,893 504 541 533 2,056
Costs to FAS $4,090,322 $3,927,556 $491,742 $518,087 $907,066 $3,249,396
Source: 2014 CNMI Compact Impact Grant Request
Note: No report for 2010

Page 208 Chapter 17 2015 CNMI Statistical Yearbook
11th Statistical Yearbook, Central Statistics Division, Department of Commerce
Table 17.15a Karidat (NGO) FAS Expenses, CNMI: 2008 to 2013 [Fiscal Year]
Expenditures TOTAL 2008 2009-2013
Total $865,165 $40,004 $825,161
Local $40,004
Federal
Number of Cli-
ents:
Total clients 6,061 1,196 4,865
Total FAS 2,548 482 2,066
Percent 42.0% 40.3% 42.5%
FSM 1,847 374 1,473
Palau 663 93 570
RMI 38 15 23
CNMI 2,845 567 2,278
Other 668 147 521
Cost to FAS $363,709 $16,122 $350,418
Source: 2014 CNMI Compact Impact Grant Request
Table 17.15b Karidat (NGO) FAS Expenses, CNMI: 2009 to 2013 [Fiscal Year]
Expenditures 2009 2010 2011 2012 2013 Average
Total $40,004 $40,004 $40,004 $40,004 $665,145 $173,033
Local $40,004 $40,004 $40,004 $40,004 $28,452
Federal $636,693
Number of Cli-
ents:
Total clients 1,481 1,520 199 747 918 1,212
Total FAS 684 486 58 383 455 510
Percent 46.2% 32.0% 29.2% 51.3% 49.6% 42.0%
FSM 454 334 33 303 349 369
Palau 208 151 25 80 106 133
RMI 22 1 0 0 0 8
CNMI 600 908 111 292 367 569
Other 197 126 30 72 96 134
Cost to FAS $18,476 $12,791 $11,659 $20,511 $329,674 $72,742
Source: 2014 CNMI Compact Impact Grant Request

11th Statistical Yearbook, Central Statistics Division, Department of Commerce
CHAPTER 18
Broadband Survey

Page 210 Chapter 18 2015 CNMI Statistical Yearbook
11th Statistical Yearbook, Central Statistics Division, Department of Commerce
Chapter 18 – Internet Use
Under Federal funding, the CNMI’s Central Statistics Division has collected random samples of broadband
internet use in recent years. In the 2014 Broadband survey, when the sample was weighted to the 2010 census
count, about 88 percent of CNMI population had access to the internet. The percentages were similar for the
islands – 88 percent on Saipan and Rota and 85 percent on Tinian.
Young people were the most likely to use the internet – about 90 percent of those younger than 30, the same
for those 30 to 44, but decreasing to 83 percent for those 45 to 59, 70 percent for those 60 to 74 and 60 percent
for those 75 years and over.
Koreans were the most likely to use the internet, at 96 percent, followed by Filipinos and Chinese at 89
percent, Chamorros and FAS migrants at 87 percent, and Carolinians at 80 percent. All of these show high
usage of the internet and the importance of its use for communication and education in the Commonwealth.
Those speaking English at home were the most likely of language speakers to use the internet, at 92 percent,
followed by Other Asians at 88 percent, Tagalog (Filipino) speakers at 87 percent, Chamorros at 82 percent,
and Carolinian speakers at 76 percent.
In general, more educated adults were also more likely to use the internet. While less than 88 percent of
those with high school diplomas or less used the internet, about 97 percent of those with Bachelor’s degrees,
99 percent of those with some graduate work, and 94 percent of those with graduate degrees were using the
internet.
For labor force participation, about 90 percent of full-time and 84 percent of part-time workers were using the
internet. About 90 percent of more of students used the internet, while the unemployed were about 80 percent
and retired people were about 75 percent.

2015 CNMI Statistical Yearbook Chapter 18 Page 211
11th Statistical Yearbook, Central Statistics Division, Department of Commerce
Table 18.1. Sex and Age by Island and Internet at home, CNMI: 2014
Age and Sex
Total Saipan Tinian Rota
Total Yes No Total Yes No Total Yes No Total Yes No
Total 53,883 47,126 6,757 48,220 42,217 6,003 3,136 2,760 376 2,527 2,149 378
0 – 14 14,181 12,746 1,435 12,534 11,265 1,269 980 885 95 667 596 71
15 – 29 10,097 9,322 774 9,135 8,440 695 552 497 54 411 385 25
30 – 44 14,607 13,093 1,514 12,987 11,677 1,310 906 797 109 714 619 95
45 – 59 11,862 9,801 2,062 10,723 8,869 1,856 574 480 94 564 452 112
60 – 74 2,715 1,914 803 2,469 1,745 725 101 81 20 146 89 57
75+ 419 251 169 371 224 148 23 19 4 25 8 17
Median 32.7 31.6 41.4 32.8 31.8 41.9 30.6 29.9 35.4 33.9 32.3 44.6
Male Total 27,759 24,069 3,689 24,856 21,619 3,237 1,592 1,372 220 1,310 1,078 231
0 – 14 7,336 6,596 740 6,498 5,869 629 504 437 67 333 290 43
15 – 29 4,926 4,594 331 4,456 4,160 296 289 266 24 181 169 11
30 – 44 7,208 6,327 881 6,379 5,626 752 462 394 67 367 306 61
45 – 59 6,577 5,422 1,155 5,979 4,945 1,035 275 225 50 323 252 71
60 – 74 1,529 1,023 506 1,386 927 459 51 40 12 91 56 35
75+ 185 109 77 159 94 67 11 11 0 15 5 11
Median 33.3 32 42.7 33.5 32.1 43.8 30.1 29.1 34.3 35.8 33.9 45.1
Female Total 26,124 23,057 3,067 23,364 20,598 2,765 1,544 1,388 156 1,217 1,071 146
0 – 14 6,846 6,150 696 6,035 5,396 640 476 449 28 334 306 28
15 – 29 5,171 4,728 443 4,679 4,280 398 263 232 30 230 216 14
30 – 44 7,401 6,767 634 6,610 6,051 559 445 403 42 347 314 33
45 – 59 5,285 4,378 906 4,744 3,923 820 299 255 44 242 200 41
60 – 74 1,188 891 297 1,084 818 266 49 41 8 54 32 23
75+ 234 141 93 212 130 82 12 8 4 10 3 7
Median 32 31.3 39.6 32.2 31.5 39.2 31.1 30.5 37.2 31.9 30.7 43.8
Source: 2014 CNMI Broadband Survey
87.5 87.6
88.0
85.0
83.5
84.0
84.5
85.0
85.5
86.0
86.5
87.0
87.5
88.0
88.5
CNMI Saipan Tinian Rota
Percent Internet Access by Island
89.9 92.3 89.6
82.6
70.5
59.8
0.0
10.0
20.0
30.0
40.0
50.0
60.0
70.0
80.0
90.0
100.0
0 – 14 15 – 29 30 – 44 45 – 59 60 – 74 75+
Percent Internet Access by Age

Page 212 Chapter 18 2015 CNMI Statistical Yearbook
11th Statistical Yearbook, Central Statistics Division, Department of Commerce
Table 18.2. Sex and Education by Island and Internet at home, CNMI: 2014
Education
Total Saipan Tinian Rota
Total Yes No Total Yes No Total Yes No Total Yes No
Total 53,883 47,126 6,757 48,220 42,217 6,003 3,136 2,760 376 2,527 2,149 378
Less than 9th grade 15,936 13,696 2,240 14,313 12,236 2,077 922 833 89 700 626 74
Some HS 6,824 5,944 880 6,313 5,502 811 318 280 39 192 162 30
HS diploma 15,916 13,370 2,544 13,762 11,571 2,190 1,176 986 190 977 813 164
GED 892 727 165 777 646 131 77 51 26 38 30 7
Some College 9,465 8,704 761 8,573 7,918 655 450 424 26 442 362 80
BA/BS 3,240 3,153 88 2,920 2,857 63 150 144 7 170 153 18
Grad work 290 286 4 267 267 0 19 19 0 4 0 4
Grad degree 1,321 1,247 75 1,295 1,221 75 23 23 0 3 3 0
Males 27,759 24,069 3,689 24,856 21,619 3,237 1,592 1,372 220 1,310 1,078 231
Less than 9th grade 8,179 7,051 1,128 7,352 6,330 1,023 471 413 58 355 309 47
Some HS 3,570 3,048 523 3,295 2,813 482 183 157 26 93 77 16
HS diploma 8,360 6,926 1,434 7,163 5,941 1,222 638 539 100 559 447 112
GED 397 296 99 349 269 79 34 17 17 13 10 4
Some College 4,922 4,460 462 4,545 4,142 403 172 152 20 205 166 39
BA/BS 1,603 1,565 40 1,456 1,428 29 69 69 0 78 67 11
Grad work 169 166 4 152 152 0 14 14 0 4 0 4
Grad degree 558 558 0 544 544 0 12 12 0 3 3 0
Females 26,124 23,057 3,067 23,364 20,598 2,765 1,544 1,388 156 1,217 1,071 146
Less than 9th grade 7,757 6,646 1,111 6,961 5,908 1,053 451 420 30 345 318 28
Some HS 3,254 2,896 357 3,018 2,689 329 136 123 13 100 84 15
HS diploma 7,555 6,445 1,111 6,599 5,630 969 538 448 91 419 367 52
GED 496 430 66 428 376 53 43 34 9 25 21 4
Some College 4,543 4,245 298 4,028 3,776 252 278 272 6 237 196 40
BA/BS 1,638 1,588 48 1,463 1,428 34 81 74 7 93 85 7
Grad work 120 120 0 115 115 0 5 5 0 0 0 0
Grad degree 763 688 75 751 676 75 12 12 0 0 0 0
Percent HS Graduates 57.8 58.3 53.8 57.2 58.0 51.9 60.5 59.7 66.3 64.7 63.3 72.3
Percent BA/BS or more 9.0 9.9 2.5 9.3 10.3 2.3 6.1 6.7 1.9 7.0 7.2 5.7
Source: 2014 CNMI Broadband Survey
85.9
87.1
84.0
81.5
92.0
97.3
98.8
94.4
0.0 20.0 40.0 60.0 80.0 100.0
Less than 9th grade
Some HS
HS diploma
GED
Some College
BA/BS
Grad work
Grad degree
Internet by Educational Attainment

2015 CNMI Statistical Yearbook Chapter 18 Page 213
11th Statistical Yearbook, Central Statistics Division, Department of Commerce
Table 18.3. Sex and Labor force by Island and Internet at home, CNMI: 2014
Employment
Total Saipan Tinian Rota
Total Yes No Total Yes No Total Yes No Total Yes No
Total 38,806 33,556 5,250 34,853 30,191 4,662 2,126 1,845 281 1,827 1,520 306
Employed full-time 21,841 19,579 2,263 19,641 17,646 1,997 1,280 1,116 164 920 817 103
Employed part-time 1,335 1,122 212 1,132 950 180 83 74 9 119 97 23
Student and not employed 3,396 3,222 174 3,174 3,017 157 124 119 5 98 86 12
Student and employed 89 80 9 89 80 9 0 0 0 0 0 0
Retired 1,761 1,328 434 1,386 1,060 327 160 142 19 214 126 88
Not employed not looking for work 4,760 3,849 911 4,471 3,609 862 161 130 32 127 110 17
Not employed ooking for work 4,637 3,567 1,069 4,150 3,175 974 205 165 41 282 227 55
Caregiver unpaid 165 118 47 89 60 29 45 33 12 31 25 5
Other 822 691 132 721 594 128 66 66 0 36 32 4
Male Total 19,985 17,069 2,915 17,945 15,370 2,574 1,064 911 153 976 788 188
Employed full-time 12,616 11,014 1,601 11,344 9,928 1,417 705 601 104 566 486 81
Employed part-time 686 546 139 591 476 115 35 26 9 60 44 16
Student and not employed 1,614 1,555 59 1,493 1,447 46 79 74 5 42 34 8
Student and employed 56 48 9 56 48 9 0 0 0 0 0 0
Retired 1,127 847 281 875 663 212 113 103 11 139 81 58
Not employed not looking for work 1,330 1,020 310 1,257 955 302 31 27 4 42 38 4
Not employed ooking for work 2,107 1,668 439 1,919 1,523 396 79 59 20 109 86 23
Caregiver unpaid 27 9 18 27 9 18 0 0 0 0 0 0
Other 421 363 59 381 322 59 22 22 0 19 19 0
Female Total 18,821 16,485 2,334 16,909 14,820 2,088 1,062 934 128 850 732 118
Employed full-time 9,225 8,563 662 8,297 7,717 580 575 515 60 354 331 23
Employed part-time 650 576 74 541 475 67 48 48 0 60 53 7
Student and not employed 1,782 1,667 116 1,681 1,570 111 45 45 0 56 52 4
Student and employed 32 32 0 32 32 0 0 0 0 0 0 0
Retired 634 482 153 511 397 115 48 40 8 75 45 30
Not employed not looking for work 3,429 2,830 599 3,214 2,655 559 130 103 28 85 72 13
Not employed ooking for work 2,529 1,899 630 2,230 1,652 578 126 106 20 173 141 32
Caregiver unpaid 138 109 29 62 50 12 45 33 12 31 25 5
Other 403 330 73 341 272 69 45 45 0 17 13 4
Source: 2014 CNMI Broadband Survey
89.6
84.0
94.9
89.5
75.4
80.9
76.9
71.6
84.1
0.0 20.0 40.0 60.0 80.0 100.0
Employed full-time
Employed part-time
Student and not employed
Student and employed
Retired
Not employed not looking
for work
Not employed ooking for
work
Caregiver unpaid
Other
Internet by Labor Force Participation

Page 214 Chapter 18 2015 CNMI Statistical Yearbook
11th Statistical Yearbook, Central Statistics Division, Department of Commerce
Table 18.4. Sex and Ethnicity by Island and Internet at home, CNMI: 2014
Ethnicity
Total Saipan Tinian Rota
Total Yes No Total Yes No Total Yes No Total Yes No
Total 53,883 47,126 6,757 48,220 42,217 6,003 3,136 2,760 376 2,527 2,149 378
Chamorro 21,727 18,791 2,935 18,010 15,564 2,447 2,170 1,931 238 1,547 1,296 250
Carolinian 3,653 2,933 719 3,632 2,912 719 0 0 0 21 21 0
Freely Associated States 3,996 3,463 534 3,875 3,367 509 12 12 0 109 84 25
Filipino 16,233 14,474 1,759 15,063 13,414 1,650 449 405 44 720 656 65
Chinese 2,877 2,548 328 2,786 2,482 305 91 66 24 0 0 0
Korean 1,457 1,405 52 1,400 1,349 52 56 56 0 0 0 0
Other Asian 2,214 1,850 364 1,868 1,601 267 276 206 69 71 43 28
Others 1,727 1,662 65 1,585 1,530 55 82 82 0 59 49 10
Male Total 27,759 24,069 3,689 24,856 21,619 3,237 1,592 1,372 220 1,310 1,078 231
Chamorro 10,952 9,506 1,447 9,061 7,891 1,169 1,091 955 136 800 659 141
Carolinian 1,801 1,503 298 1,789 1,492 298 0 0 0 12 12 0
Freely Associated States 2,042 1,737 306 1,980 1,688 292 6 6 0 56 43 14
Filipino 8,554 7,457 1,097 7,968 6,946 1,022 216 190 27 370 322 49
Chinese 1,577 1,368 210 1,528 1,330 198 49 38 12 0 0 0
Korean 816 775 41 786 745 41 30 30 0 0 0 0
Other Asian 1,180 926 255 973 785 187 164 119 46 43 22 22
Others 837 799 38 773 742 32 36 36 0 28 21 6
Female Total 26,124 23,057 3,067 23,364 20,598 2,765 1,544 1,388 156 1,217 1,071 146
Chamorro 10,775 9,285 1,489 8,949 7,671 1,277 1,078 976 102 747 637 109
Carolinian 1,852 1,431 422 1,843 1,421 422 0 0 0 9 9 0
Freely Associated States 1,955 1,727 228 1,896 1,679 217 7 7 0 53 41 12
Filipino 7,679 7,017 662 7,096 6,468 628 233 216 18 350 334 16
Chinese 1,300 1,180 119 1,258 1,152 107 41 29 13 0 0 0
Korean 640 630 11 614 603 11 26 26 0 0 0 0
Other Asian 1,034 924 109 895 816 80 111 88 24 27 21 6
Others 890 863 27 812 789 23 46 46 0 32 28 4
Source: 2014 CNMI Broadband Survey
Table 18.5. Sex and Language by Island and Internet at home, CNMI: 2014
Language
Total Saipan Tinian Rota
Total Yes No Total Yes No Total Yes No Total Yes No
Total 53,883 47,126 6,757 48,220 42,217 6,003 3,136 2,760 376 2,527 2,149 378
English 19,545 17,996 1,551 16,133 15,005 1,130 2,066 1,849 218 1,346 1,142 204
Chamorro 12,192 9,966 2,227 11,104 9,048 2,056 365 302 63 723 616 107
Carolinian 2,075 1,583 492 2,054 1,562 492 0 0 0 21 21 0
Tagalog 11,940 10,422 1,519 11,149 9,698 1,452 406 377 29 385 346 39
Other Asian 5,572 4,899 672 5,247 4,668 578 273 207 66 52 24 28
Others 2,558 2,262 296 2,533 2,237 296 25 25 0 0 0 0
Male Total 27,759 24,069 3,689 24,856 21,619 3,237 1,592 1,372 220 1,310 1,078 231
English 9,819 9,061 760 8,115 7,603 513 1,028 908 120 677 550 127
Chamorro 6,216 5,122 1,093 5,648 4,643 1,004 189 152 36 379 326 53
Carolinian 972 771 200 961 759 200 0 0 0 12 12 0
Tagalog 6,405 5,429 976 5,993 5,064 929 204 187 17 208 178 30
Other Asian 3,016 2,554 461 2,830 2,436 393 152 106 47 34 12 22
Others 1,330 1,133 198 1,310 1,113 198 20 20 0 0 0 0
Female Total 26,124 23,057 3,067 23,364 20,598 2,765 1,544 1,388 156 1,217 1,071 146
English 9,726 8,934 791 8,018 7,402 616 1,039 941 98 670 592 77
Chamorro 5,977 4,843 1,133 5,457 4,404 1,052 177 150 27 344 289 54
Carolinian 1,103 812 292 1,093 803 292 0 0 0 9 9 0
Tagalog 5,536 4,993 543 5,157 4,634 523 202 191 12 177 168 9
Other Asian 2,555 2,344 211 2,417 2,232 185 121 101 20 17 11 6
Others 1,227 1,129 98 1,222 1,124 98 5 5 0 0 0 0
Source: 2014 CNMI Broadband Survey
86.5
80.3
86.7
89.2
88.6
96.5
83.6
96.2
0.0 20.0 40.0 60.0 80.0 100.0
Chamorro
Carolinian
Freely Associated States
Filipino
Chinese
Korean
Other Asian
Others
Internet by Ethnicity

11th Statistical Yearbook, Central Statistics Division, Department of Commerce
CHAPTER 19
CNMI Historic

Page 216 Chapter 19 2015 CNMI Statistical Yearbook
11th Statistical Yearbook, Central Statistics Division, Department of Commerce
Chapter 19 – Historical Tables
Previous editions of the yearbook have not included many historical tables, and so this version includes
available tables from the late 19th century through most of the 20th century, up to the period being considered
in the earlier chapters showing trends in demography, social characteristics, education, employment, and
housing. The tables are made available to students and other researchers in their work.

2015 CNMI Statistical Yearbook Chapter 19 Page 217
11th Statistical Yearbook, Central Statistics Division, Department of Commerce
Table 19.1 Population of Rota: 1897
Age Group
Numbers Percent
Total Males Females Total Males Females
Total 495 217 278 100.0 100.0 100.0
0 to 4 yrs. 78 38 40 15.8 17.5 14.4
5 to 9 yrs. 65 32 33 13.1 14.7 11.9
10 to 14 yrs. 70 31 39 14.1 14.3 14.0
15 to 19 yrs. 46 21 25 9.3 9.7 9.0
20 to 24 yrs. 38 16 22 7.7 7.4 7.9
25 to 29 yrs. 47 24 23 9.5 11.1 8.3
30 to 34 yrs. 35 13 22 7.1 6.0 7.9
35 to 39 yrs. 28 14 14 5.7 6.5 5.0
40 to 44 yrs. 23 6 17 4.6 2.8 6.1
45 to 49 yrs. 12 4 8 2.4 1.8 2.9
50 to 54 yrs. 12 7 5 2.4 3.2 1.8
55 to 59 yrs. 16 4 12 3.2 1.8 4.3
60 to 64 yrs. 13 3 10 2.6 1.4 3.6
65 to 69 yrs. 7 2 5 1.4 0.9 1.8
70 to 74 yrs. 2 1 1 0.4 0.5 0.4
75 to 79 yrs. 3 1 2 0.6 0.5 0.7
Source: Underwood, 1973:31.
Table 19.2 Population by Island: 1902
Island
Numbers Percent
Total Chamorros Carolinians Other Total Chamorros Carolinians Other
Total 2,401 1,505 852 44 100.0 62.7 35.5 1.8
Saipan 1,631 967 621 43 100.0 59.3 38.1 2.6
Rota 490 440 49 1 100.0 89.8 10.0 0.2
Tinian 95 36 59 0 100.0 37.9 62.1 0.0
Northern Is 185 62 123 0 100.0 33.5 66.5 0.0
Source: Hermann 1910; Fritz 1904.
Table 19.3 Change in the Native Population: 1920 to 1935
Year Total Chamorros Carolinians Percent Total Chamorros Carolinians
Taeuber and Han: 1920 3,398 2,824 574 83.1 1925 3,493 2,952 541 84.5 2.8 4.5 -5.7
1930 3,829 3,301 528 86.2 9.6 11.8 -2.4
1935 4,297 3,720 577 86.6 12.2 12.7 9.3
Borja and Levin: 1920 3,398 2,512 886 73.9 1925 3,493 2,578 915 73.8 2.8 2.6 3.3
1930 3,829 2,846 983 74.3 9.6 10.4 7.4
1935 4,297 3,274 1,023 76.2 12.2 15.0 4.1
Source: Japanese Censuses of 1930 and 1935
1,505 967 440 36 62
852 621
49
59 123
44 43 1 0 0
0%
10%
20%
30%
40%
50%
60%
70%
80%
90%
100%
CNMI by Ethnicity: 1902
Others
Carolinians
Chamorros

Page 218 Chapter 19 2015 CNMI Statistical Yearbook
11th Statistical Yearbook, Central Statistics Division, Department of Commerce
Table 19.4 Population by Ethnicity: 1925 to 1935
Island and Place
1935 1930 1925
Total Chamorros Carolinians Total Chamorros Carolinians Total Chamorros Carolinians
Total 4,297 3,274 1,023 3,813 2,841 972 3,469 2,579 890
Saipan 3,194 2,331 863 1,050 201 849 2,639 1,863 776
South Garapan 1,300 635 665 1,074 387 687 977 346 631
North Garapan 1,594 1,562 32 1,592 1,576 16 1,450 1,437 13
Puntan Muchut 54 54 0 6 6 0 0 0 0
Gaulo Rai 13 9 4 6 4 2 0 0 0
Tanapag 221 59 162 227 83 144 201 69 132
Chalan Kanoa 12 12 0 5 5 0 11 11 0
Rota 788 782 6 644 639 5 487 484 3
Tinian 24 23 1 43 41 2 180 169 11
Northern Islands 291 138 153 216 100 116 162 62 100
Anatahan 82 3 79 66 1 65 48 1 47
Pagan 131 103 28 122 94 28 86 61 25
Alamagan 20 20 0 5 5 0 0 0 0
Sarigan 21 11 10 23 0 23 23 0 23
Agrigan 37 1 36 0 0 0 5 0 5
Source: Japanese Census 1935
Table 19.5 Population by Age, Sex, and Ethnicity: 1930
Island
Total Males Females
Total Chamorros Carolinians Total Chamorros Carolinians Total Chamorros Carolinians
Total 3,829 2,846 983 1,945 1,455 490 1,884 1,391 493
Percent 100.0 99.9 100.0 100.0 100.1 100.0 99.9 100.1 99.8
0-4 years 16.9 17.5 15.3 16.5 17.4 13.7 17.4 17.6 16.8
5-9 years 12.2 12.3 12.0 13.0 12.6 14.1 11.5 12.1 9.9
10-14 years 12.0 12.5 10.6 11.5 12.4 9.0 12.5 12.7 12.2
15-19 years 11.7 12.0 10.8 12.5 12.6 12.4 10.8 11.4 9.1
20-24 years 10.0 9.9 10.5 10.4 10.4 10.6 9.6 9.3 10.3
25-39 years 20.0 18.3 24.6 19.4 17.3 25.5 20.5 19.4 23.7
40-59 years 13.5 13.2 14.1 13.2 13.3 12.9 13.7 13.2 15.4
60+ years 3.7 4.2 2.1 3.5 4.1 1.8 3.9 4.4 2.4
Median 18.8 18.2 20.6 18.6 18.1 20.1 18.9 18.3 21.0
Source: Japanese Census, 1930

2015 CNMI Statistical Yearbook Chapter 19 Page 219
11th Statistical Yearbook, Central Statistics Division, Department of Commerce
Table 19.6 Birthplace of de Facto Population: 1930
Island and Place
Number Percent
Total
Same Lo-
cality
Same
District
Other
District Guam Total
Same Lo-
cality
Same
District
Other
District Guam
CNMI 3,829 2,839 405 114 471 100.0 74.1 10.6 3.0 12.3
Saipan 2,915 2,253 168 104 390 100.0 77.3 5.8 3.6 13.4
S Garapan 1,074 838 76 53 107 100.0 78.0 7.1 4.9 10.0
N Garapan 1,592 1,245 55 25 267 100.0 78.2 3.5 1.6 16.8
Tanapag 227 154 36 26 11 100.0 67.8 15.9 11.5 4.8
Other 22 16 1 0 5 100.0 72.7 4.5 0.0 22.7
Rota 644 520 79 2 43 100.0 80.7 12.3 0.3 6.7
Tinian 43 4 30 0 9 100.0 9.3 69.8 0.0 20.9
Sariguan 22 2 19 1 0 100.0 9.1 86.4 4.5 0.0
Alamagan 16 1 12 1 2 100.0 6.3 75.0 6.3 12.5
Pagan 122 39 56 3 24 100.0 32.0 45.9 2.5 19.7
Anatahan 64 20 41 3 0 100.0 31.3 64.1 4.7 0.0
Source: 1930 Japanese Census Report, Natives Only
Table 19.7 Birthplace of Chamorros: 1930
Island and Place
Number Percent
Total
Same Lo-
cality
Same
District
Other
District Guam Total
Same Lo-
cality
Same
District
Other
District Guam
CNMI 2,846 2,135 248 24 439 100.0 75.0 8.7 0.8 15.4
Saipan 2,066 1,583 101 22 360 100.0 76.6 4.9 1.1 17.4
S Garapan 387 272 35 2 78 100.0 70.3 9.0 0.5 20.2
N Garapan 1,576 1,234 55 20 267 100.0 78.3 3.5 1.3 16.9
Tanapag 83 63 10 0 10 100.0 75.9 12.0 0.0 12.0
Other 20 14 1 0 0 100.0 70.0 5.0 0.0 0.0
Rota 639 519 77 0 43 100.0 81.2 12.1 0.0 6.7
Tinian 41 4 28 0 9 100.0 9.8 68.3 0.0 22.0
Alamagan 5 0 3 0 2 100.0 0.0 60.0 0.0 40.0
Pagan 94 29 39 2 24 100.0 30.9 41.5 2.1 25.5
Anatahan 1 0 0 0 0 100.0 0.0 0.0 0.0 0.0
Source: 1930 Japanese Census Report, Natives Only

Page 220 Chapter 19 2015 CNMI Statistical Yearbook
11th Statistical Yearbook, Central Statistics Division, Department of Commerce
Table 19.8 Birthplace of Carolinians: 1930
Island and Place
Number Percent
Total
Same Lo-
cality
Same Dis-
trict
Other Dis-
trict Guam Total
Same Lo-
cality
Same Dis-
trict
Other Dis-
trict Guam
CNMI 983 704 157 90 32 100.0 71.6 16.0 9.2 3.3
Saipan 849 670 67 82 30 100.0 78.9 7.9 9.7 3.5
S Garapan 687 566 41 51 29 100.0 82.4 6.0 7.4 4.2
N Garapan 16 11 0 5 0 100.0 68.8 0.0 31.3 0.0
Tanapag 144 91 26 26 1 100.0 63.2 18.1 18.1 0.7
Other 2 2 0 0 0 100.0 100.0 0.0 0.0 0.0
Rota 5 1 2 2 0 100.0 20.0 40.0 40.0 0.0
Tinian 2 0 2 0 0 100.0 0.0 100.0 0.0 0.0
Sariguan 22 2 19 1 0 100.0 9.1 86.4 4.5 0.0
Alamagan 11 1 9 1 0 100.0 9.1 81.8 9.1 0.0
Pagan 28 10 17 1 0 100.0 35.7 60.7 3.6 0.0
Anatahan 64 20 41 3 0 100.0 31.3 64.1 4.7 0.0
Source: 1930 Japanese Census Report, Natives Only
Table 19.9 Population by Ethnicity: 1935
Island and Place
Number Percent
Total Chamorros Carolinians Total Chamorros Carolinians
Total 4,297 3,274 1,023 100.0 76.2 23.8
Saipan 3,194 2,331 863 100.0 73.0 27.0
South Garapan 1,300 635 665 100.0 48.8 51.2
North Garapan 1,594 1,562 32 100.0 98.0 2.0
Puntan Muchut 54 54 0 100.0 100.0 0.0
Gaulo Rai 13 9 4 100.0 69.2 30.8
Tanapag 221 59 162 100.0 26.7 73.3
Chalan Kanoa 12 12 0 100.0 100.0 0.0
Rota 788 782 6 100.0 99.2 0.8
Tinian 24 23 1 100.0 95.8 4.2
Northern Islands 291 138 153 100.0 47.4 52.6
Anatahan 82 3 79 100.0 3.7 96.3
Pagan 131 103 28 100.0 78.6 21.4
Alamagan 20 20 0 100.0 100.0 0.0
Sarigan 21 11 10 100.0 52.4 47.6
Agrigan 37 1 36 100.0 2.7 97.3
Source: Japanese Census 1935

2015 CNMI Statistical Yearbook Chapter 19 Page 221
11th Statistical Yearbook, Central Statistics Division, Department of Commerce
Table 19.10 Age by Island: 1935
Age
Number Percent
Total Saipan Rota Tinian N Is. Total Saipan Rota Tinian N Is.
Total 4,297 3,194 788 24 291 100.0 100.0 100.0 100.0 100.0
Less than 1 yr. 204 148 43 1 12 4.7 4.6 5.5 4.2 4.1
1-5 yrs. 691 519 125 5 42 16.1 16.2 15.9 20.8 14.4
6-14 yrs. 875 667 150 2 56 20.4 20.9 19.0 8.3 19.2
15-19 yrs. 464 330 96 2 36 10.8 10.3 12.2 8.3 12.4
20-24 yrs. 471 352 80 3 36 11.0 11.0 10.2 12.5 12.4
25-59 yrs. 1,422 1,041 265 10 106 33.1 32.6 33.6 41.7 36.4
60-64 yrs. 78 64 13 1 0 1.8 2.0 1.6 4.2 0.0
65-69 yrs. 45 36 7 0 2 1.0 1.1 0.9 0.0 0.7
70+ yrs. 47 37 9 0 1 1.1 1.2 1.1 0.0 0.3
Median 19.1 19.0 18.9 20.0 15.0 . . . . .
Source: 1935 Japanese Census Report, Natives Only
Table 19.11 Age by Island for Males: 1935
Age
Number Percent
Total Saipan Rota Tinian N Is. Total Saipan Rota Tinian N Is.
Total 2,217 1,611 413 14 179 100.0 100.0 100.0 100.0 100.0
Less than 1 yr. 104 78 23 1 2 4.7 4.8 5.6 7.1 1.1
1-5 yrs. 353 261 65 3 24 15.9 16.2 15.7 21.4 13.4
6-14 yrs. 474 355 80 2 37 21.4 22.0 19.4 14.3 20.7
15-19 yrs. 226 153 49 1 23 10.2 9.5 11.9 7.1 12.8
20-24 yrs. 259 190 44 0 25 11.7 11.8 10.7 0.0 14.0
25-39 yrs. 451 314 87 3 47 20.3 19.5 21.1 21.4 26.3
40-59 yrs. 264 192 50 3 19 11.9 11.9 12.1 21.4 10.6
60-64 yrs. 40 31 8 1 0 1.8 1.9 1.9 7.1 0.0
65-69 yrs. 25 21 3 0 1 1.1 1.3 0.7 0.0 0.6
70+ yrs. 21 16 4 0 1 0.9 1.0 1.0 0.0 0.6
Source: 1935 Japanese Census Report, Natives Only
Table 19.12 Age by Island for Females: 1935
Age
Number Percent
Total Saipan Rota Tinian N Is. Total Saipan Rota Tinian N Is.
Total 2,080 1,583 375 10 112 100.0 100.0 100.0 100.0 100.0
Less than 1 yr. 100 70 20 0 10 4.8 4.4 5.3 0.0 8.9
1-5 yrs. 338 258 60 2 18 16.3 16.3 16.0 20.0 16.1
6-14 yrs. 401 312 70 0 19 19.3 19.7 18.7 0.0 17.0
15-19 yrs. 238 177 47 1 13 11.4 11.2 12.5 10.0 11.6
20-24 yrs. 212 162 36 3 11 10.2 10.2 9.6 30.0 9.8
25-44 yrs. 522 397 89 3 33 25.1 25.1 23.7 30.0 29.5
45-59 yrs. 185 138 39 1 7 8.9 8.7 10.4 10.0 6.3
60-64 yrs. 38 33 5 0 0 1.8 2.1 1.3 0.0 0.0
65-69 yrs. 20 15 4 0 1 1.0 0.9 1.1 0.0 0.9
70+ yrs. 26 21 5 0 0 1.3 1.3 1.3 0.0 0.0
Source: 1935 Japanese Census Report, Natives Only

Page 222 Chapter 19 2015 CNMI Statistical Yearbook
11th Statistical Yearbook, Central Statistics Division, Department of Commerce
Table 19.13 Birth and Death Rates: 1924 to 1935
Period Births per 1,000 Persons Deaths per 1,000 Persons
1924 40.6 18.2
1924-1930 41.7 25.7
1925 33.2 28.6
1925-1929 41.3 29.2
1931-1937 38.9 23.8
1935 38.0 18.9
Source: Preliminary Report: Marianas District
Table 19.14 Change in the Native Population, Saipan: 1944 to 1947
Date
Number Percent Percent
Total Chamorros Carolinians Chamorros Total Chamorros Carolinians
7/5/1944 3,040 2,258 782 74.3 . . . . . . . . .
4/11/1945 3,236 2,426 810 75.0 6.4 7.4 3.6
7/1/1947 4,796 3,754 1,042 78.3 48.2 54.7 28.6
Source: Underwood 1973: 39.
Table 19.15 Population by Island: 1949 to 1973
Year Total Saipan Rota Tinian Northern Islands
1949 6,225 4,898 681 364 282
1950 6,286 4,943 686 368 289
1951 6,506 5,059 753 405 289
1952 6,701 5,209 753 390 349
1954 7,372 5,800 847 437 288
1955 8,494 6,781 893 470 350
1956 8,494 6,781 893 470 350
1957 8,042 6,270 962 463 347
1958 8,220 6,611 970 367 272
1959 8,319 6,666 990 455 208
1960 9,134 7,317 996 468 353
1961 9,300 7,464 1,014 467 355
1962 9,586 7,830 1,054 416 286
1963 10,062 8,151 1,080 486 345
1964 10,275 8,404 1,108 495 268
1965 10,486 8,422 1,182 544 338
1966 10,743 8,664 1,142 596 341
1967 10,986 9,035 1,078 610 263
1971 13,074 10,458 1,727 781 108
1972 13,381 10,745 1,727 779 130
1973 14,333 12,382 1,104 714 133
Source: TTPI Annual Reports

2015 CNMI Statistical Yearbook Chapter 19 Page 223
11th Statistical Yearbook, Central Statistics Division, Department of Commerce
Table 19.16 Population of the Northern Islands: 1949 to 1973
Year Northern Islands Alamagan Pagan Agrihan Anatahan Sariguan
1949 282 136 0 146 0 0
1950 289 135 0 154 0 0
1951 289 145 0 144 0 0
1952 349 88 88 173 0 0
1954 288 80 107 90 11 0
1955 350 82 76 128 64 0
1956 350 82 76 128 64 0
1957 347 93 81 120 53 0
1958 272 57 75 94 35 11
1959 208 54 0 102 43 9
1960 353 81 93 113 32 34
1961 355 89 93 116 25 32
1962 286 40 65 126 37 18
1963 345 41 70 157 46 31
1964 268 48 49 148 14 9
1965 338 50 91 161 21 15
1966 341 63 96 131 32 19
1967 263 15 87 94 64 3
1971 108 2 54 52 0 0
1972 130 24 56 50 0 0
1973 130 25 57 48 0 0
Source: TTPI Annual Reports
Table 19.17 Vital Rates: 1955 to 1979
Year
Estim. Pop-
ulation Births Birth Rate
Infant
Deaths
Infant
Death Rate Deaths Death Rate
Natural In-
crease
Rate of Nat-
ural In-
crease
1955-59 7,951 2,065 51.9 (NA) (NA) 253 6.4 1,812 45.6
1960-64 9,671 2,128 44.0 76 35.7 315 6.5 1,813 37.5
1965-69 11,099 2,322 41.8 109 46.9 379 6.8 1,943 35.0
1970-74 12,134 2,508 41.3 108 43.1 409 6.7 2,099 34.6
1975-79 14,362 2,783 38.8 73 26.2 452 6.3 2,331 32.5
Source: Population from Annual Reports; births and deaths from registration
Table 19.18 Age Specific and Total Fertility Rates: 1967 to 1979
Age Group
Women Births ASFR
1976-1979 1971-1975 1967-1970 1976-1979 1971-1975 1967-1970 1976-1979 1971-1975 1967-1970
15 to 19 3,443 4,222 2,969 391 472 351 114 112 118
20 to 24 3,018 3,243 1,765 803 953 611 266 294 346
25 to 29 2,464 2,247 1,182 591 552 396 240 246 335
30 to 34 1,874 1,591 985 293 310 314 156 195 319
35 to 39 1,310 1,465 925 115 177 221 88 121 239
40 to 44 1,126 1,188 703 40 77 60 36 65 85
45 to 49 905 891 635 2 1 7 2 1 11
TFR . . . . . . . . . . . . . . . . . . 4,507 5,165 7,267
Source: Numerators from registered births, Denominators interpolated from 1967 and 1973 census

Page 224 Chapter 19 2015 CNMI Statistical Yearbook
11th Statistical Yearbook, Central Statistics Division, Department of Commerce
Table 19.19 Population by Age and Sex: 1958
Age Group
Numbers Percent
Total Males Females Total Males Females
Total 8,290 4,169 4,121 100.0 100.0 100.0
Under 5 years 1,750 858 892 21.1 20.6 21.6
5 to 14 years 2,499 1,250 1,249 30.1 30.0 30.3
15 to 24 years 1,310 677 633 15.8 16.2 15.4
25 to 34 years 910 469 441 11.0 11.2 10.7
35 to 44 years 713 356 357 8.6 8.5 8.7
45 to 54 years 549 284 265 6.6 6.8 6.4
55 to 64 years 334 155 179 4.0 3.7 4.3
65 years and over 225 120 105 2.7 2.9 2.5
Source: High Commissioner’s Census, Table 14
Table 19.20 Population by Age and Sex, Rota: 1958
Age Group
Numbers Percent
Total Males Females Total Males Females
Total 969 469 500 100.0 100.0 100.0
Under 5 years 244 108 136 25.2 23.0 27.2
5 to 14 years 301 157 144 31.1 33.5 28.8
15 to 24 years 130 63 67 13.4 13.4 13.4
25 to 34 years 86 42 44 8.9 9.0 8.8
35 to 44 years 82 39 43 8.5 8.3 8.6
45 to 54 years 68 36 32 7.0 7.7 6.4
55 to 64 years 42 18 24 4.3 3.8 4.8
65 years and over 16 6 10 1.7 1.3 2.0
Source: High Commissioner’s Census, Table 14
Table 19.21 Population by Age and Sex, Saipan, Tinian and N Islands: 1958
Age Group
Numbers Percent
Total Males Females Total Males Females
Total 7,321 3,700 3,621 100.0 100.0 100.0
Under 5 years 1,506 750 756 20.6 20.3 20.9
5 to 14 years 2,198 1,093 1,105 30.0 29.5 30.5
15 to 24 years 1,180 614 566 16.1 16.6 15.6
25 to 34 years 824 427 397 11.3 11.5 11.0
35 to 44 years 631 317 314 8.6 8.6 8.7
45 to 54 years 481 248 233 6.6 6.7 6.4
55 to 64 years 292 137 155 4.0 3.7 4.3
65 years and over 209 114 95 2.9 3.1 2.6
Source: High Commissioner’s Census, Table 14

2015 CNMI Statistical Yearbook Chapter 19 Page 225
11th Statistical Yearbook, Central Statistics Division, Department of Commerce
Table 19.22 Population by Island: 1920 to 1980
Year
Numbers Percent
Total Saipan Rota Tinian N Is Total Saipan Rota Tinian N Is
1980 16,780 14,549 1,261 866 104 100.0 86.7 7.5 5.2 0.6
1973 14,333 12,382 1,104 714 133 100.0 86.4 7.7 5.0 0.9
1967 10,986 9,035 1,078 610 263 100.0 82.2 9.8 5.6 2.4
1958 8,290 6,654 969 405 262 100.0 80.3 11.7 4.9 3.2
1935 4,297 3,194 788 24 291 100.0 74.3 18.3 0.6 6.8
1930 3,829 2,915 644 43 227 100.0 76.1 16.8 1.1 5.9
1925 3,493 2,639 487 180 187 100.0 75.6 13.9 5.2 5.4
1920 3,398 2,449 651 112 186 100.0 72.1 19.2 3.3 5.5
Source: Census Reports for respective years: 1920 to 1935 for Natives only
Table 19.23 Population Density by Island: 1920 to 1980
Year
Numbers Per Square Mile
Total Saipan Rota Tinian N Is Total Saipan Rota Tinian N Is
1980 16,780 14,549 1,261 866 104 91.2 323.3 39.4 22.2 1.5
1973 14,333 12,382 1,104 714 133 77.9 275.2 34.5 18.3 2.0
1967 10,986 9,035 1,078 610 263 59.7 200.8 33.7 15.6 3.9
1958 8,290 6,654 969 405 262 45.1 147.9 30.3 10.4 3.9
1935 4,297 3,194 788 24 291 23.4 71.0 24.6 0.6 4.3
1930 3,829 2,915 644 43 227 20.8 64.8 20.1 1.1 3.3
1925 3,493 2,639 487 180 187 19.0 58.6 15.2 4.6 2.8
1920 3,398 2,449 651 112 186 18.5 54.4 20.3 2.9 2.7
Source: Census Reports for respective years: 1920 to 1935 for Natives only
Table 19.24 Population Density by Island: 1920 to 1980
Year
Change from previous census Annual Change (Linear)
Total Saipan Rota Tinian N Is Total Saipan Rota Tinian N Is
1980 17.1 17.5 14.2 21.3 -21.8 2.4 2.5 2.0 3.0 -3.1
1973 30.5 37.0 2.4 17.0 -49.4 5.1 6.2 0.4 2.8 -8.2
1967 32.5 35.8 11.2 50.6 0.4 3.6 4.0 1.2 5.6 0.0
1958 92.9 108.3 23.0 1,587.5 -10.0 4.0 4.7 1.0 69.0 -0.4
1935 12.2 9.6 22.4 -44.2 28.2 2.4 1.9 4.5 -8.8 5.6
1930 9.6 10.5 32.2 -76.1 21.4 1.9 2.1 6.4 -15.2 4.3
1925 2.8 7.8 -25.2 60.7 0.5 0.6 1.6 -5.0 12.1 0.1
Source: Census Reports for respective years: 1920 to 1935 for Natives only
0
2,500
5,000
7,500
10,000
12,500
15,000
17,500
Population by Island, CNMI: 1920 to 1980
N Is
Tinian
Rota
Saipan

Page 226 Chapter 19 2015 CNMI Statistical Yearbook
11th Statistical Yearbook, Central Statistics Division, Department of Commerce
Table 19.25 Population by Island and Place: 1973 and 1980
Island and Place
Numbers
Percent Change
Percent
1980 1973 1980 1973 1980 1973
Total 16,780 14,333 17.1 100.0 100.0 . .
Saipan 14,549 12,382 17.5 86.7 86.4 100.0 100.0
San Roque 629 627 0.3 3.7 4.4 4.3 5.1
Tanapag 1,476 1,146 28.8 8.8 8.0 10.1 9.3
Garapan 4,006 2,717 47.4 23.9 19.0 27.5 21.9
Oleai 1,720 1,456 18.1 10.3 10.2 11.8 11.8
Susupe 722 812 -11.1 4.3 5.7 5.0 6.6
Chalan Kanoa 2,678 3,479 -23.0 16.0 24.3 18.4 28.1
District 1 836 1,035 -19.2 5.0 7.2 5.7 8.4
District 2 677 969 -30.1 4.0 6.8 4.7 7.8
District 3 734 838 -12.4 4.4 5.8 5.0 6.8
District 4 431 637 -32.3 2.6 4.4 3.0 5.1
San Antonio 1,644 1,360 20.9 9.8 9.5 11.3 11.0
San Vicente 1,674 785 113.2 10.0 5.5 11.5 6.3
Rota 1,261 1,104 14.2 7.5 7.7 . .
Tinian 866 714 21.3 5.2 5.0 . .
Northern Is 104 133 -21.8 0.6 0.9 . .
Source: PC80-1-A57A, Tables 4a and 5, TTPI Census Report
Table 19.25 Population by Island and Place: 1973 and 1980
Island and Place
Numbers Percent
1980 1973 1970 1980 1973 1970
Total 16,780 14,333 9,640 . . .
Saipan 14,549 12,382 7,967 100.0 100.0 100.0
San Roque 629 627 550 4.3 5.1 6.9
Tanapag 1,476 1,146 654 10.1 9.3 8.2
Garapan 4,006 2,717 1,098 27.5 21.9 13.8
Oleai 1,720 1,456 1,220 11.8 11.8 15.3
Susupe 722 812 274 5.0 6.6 3.4
Chalan Kanoa 2,678 3,479 3,481 18.4 28.1 43.7
San Antonio 1,644 1,360 483 11.3 11.0 6.1
San Vicente 1,674 785 207 11.5 6.3 2.6
Rota 1,261 1,104 895 . . .
Tinian 866 714 710 . . .
Northern Is 104 133 68 . . .
Source: PC80-1-A57A, Tables 4a and 5, TTPI Census Report, PC(1)-A58, Table 3

11th Statistical Yearbook, Central Statistics Division, Department of Commerce
CHAPTER 20
Chamorros in
the U.S.A.

Page 228 Chapter 20 2015 CNMI Statistical Yearbook
11th Statistical Yearbook, Central Statistics Division, Department of Commerce
Chapter 20 – Chamorros in the U.S.A.
Western powers divided the population of Chamorros artificially after the Spanish American War, with Guam
going to the United States, and the rest of the Marianas going to Germany, and then after World War I, to
Japan, where it remained until after World War II, when the United States took our islands as well. We
remained part of the TTPI until 1978, and became a Commonwealth in 1986. However, our kinship with
Guam as Chamorros has continued.
Chamorros have migrated to the United States since the early 1900s, first from Guam, and then only recently
from the CNMI. Many Chamorros have joined the U.S. military branches. Guam has several military bases,
and CNMI has military reserves and National Guard. And, as Chamorros have been stationed throughout the
United States, many have settled in areas near bases after leaving the Armed Forces, or in other areas. And,
the Census Bureau also counts Chamorros in the military on their military bases during the Decennial Census.
The 2010 United States census counted 88,300 people who claimed Chamorro “race” only, and another
59,500 who claimed Chamorro and at least one other race, for a total of about 148,000. Part-Chamorros are
reported through marriage, when offspring have more than one ethnicity or race from each parent. If two full
Chamorros marry, their children would normally be reported as Chamorro only.
California reported the most Chamorros, at 44,400 or about 30 percent of the total. While California is the
largest state, it is only about 10 percent of the U.S. population, so Chamorros are choosing to live in California
in more than predicted numbers, partly because of previous military assignments and continuing generations
once settled. Washington had the second largest number of Chamorros, at 14,800, and Texas was 3rd at
10,200. These 3 states constituted just less than half of all the reported full and part-Chamorros in the 2010
census. California also by far the highest number of full Chamorros, at about 24,300, again followed by
Washington and Texas.
The 2000 census showed a similar distribution, but with smaller numbers. The same three states had the
largest numbers of Chamorros reported. The count was 92,600 total Chamorros – 58,200 full Chamorros
and 34,400 part-Chamorros. While the three states were in the same order for full Chamorros, Hawaii was
3rd in part-Chamorros, at 2,600, surpassing Texas. The 1980 and 1990 census did not show Chamorros, but
instead used the term “Guamanian”, and so it is not clear how CNMI Chamorros would have reported. But
the figures for Guamanian in 1980 were 30,700 and in 1990 were 47,800. The order was the same for the
three largest states in 1990, but in 1980 Hawaii followed California and Washington.
The final tables in this series show the data in alphabetical order for the States, and also include numbers
reported as Chamorro in the CNMI and Guam.

2015 CNMI Statistical Yearbook Chapter 20 Page 229
11th Statistical Yearbook, Central Statistics Division, Department of Commerce
Table 20.1a Chamorro Population, United States and Insular Areas: 2010
Geography Level:
State (Rank Order)
2010 Census
Total Population Total Chamorro Chamorro Part-Chamorro
United States 281,421,906 147,798 88,310 59,488
California 33,871,648 44,425 24,299 20,126
Washington 5,894,121 14,829 9,746 5,083
Texas 20,851,820 10,167 6,591 3,576
Florida 15,982,378 5,904 3,747 2,157
Nevada 1,998,257 5,512 3,513 1,999
Georgia 8,186,453 3,856 2,746 1,110
Hawaii 1,211,537 6,647 2,700 3,947
Arizona 5,130,632 4,276 2,646 1,630
North Carolina 8,049,313 3,682 2,505 1,177
New York 18,976,457 3,407 2,235 1,172
Virginia 7,078,515 3,592 2,222 1,370
Colorado 4,301,261 3,056 1,784 1,272
Alabama 4,447,100 2,325 1,774 551
Oregon 3,421,399 3,014 1,755 1,259
Tennessee 5,689,283 2,124 1,507 617
Maryland 5,296,486 2,100 1,319 781
Ohio 11,353,140 1,977 1,145 832
Illinois 12,419,293 1,928 1,100 828
South Carolina 4,012,012 1,568 1,046 522
Missouri 5,595,211 1,551 969 582
Pennsylvania 12,281,054 1,605 968 637
Oklahoma 3,450,654 1,470 924 546
New Jersey 8,414,350 1,447 915 532
Kentucky 4,041,769 1,287 866 421
Louisiana 4,468,976 1,189 738 451
Massachusetts 6,349,097 1,179 671 508
Indiana 6,080,485 1,113 636 477
Kansas 2,688,418 1,002 571 431
Mississippi 2,844,658 817 560 257
Idaho 1,293,953 860 543 317
Michigan 9,938,444 1,072 521 551
Nebraska 1,711,263 729 501 228
Utah 2,233,169 880 493 387
Connecticut 3,405,565 770 455 315
Arkansas 2,673,400 719 442 277
New Mexico 1,819,046 805 420 385
Wisconsin 5,363,675 716 387 329
Alaska 626,932 667 380 287
Minnesota 4,919,479 727 378 349
Iowa 2,926,324 572 313 259
Rhode Island 1,048,319 360 232 128
Delaware 783,600 319 215 104
South Dakota 754,844 216 148 68
District of Columbia 572,059 187 111 76
New Hampshire 1,235,786 195 110 85
Montana 902,195 228 107 121
Wyoming 493,782 174 101 73
West Virginia 1,808,344 194 80 114
Maine 1,274,923 152 67 85
North Dakota 642,200 126 65 61
Vermont 608,827 81 43 38
Puerto Rico 3,808,610 94 30 64
Source: 1980, 1990, 2000 and 2010 Censuses of Population and Housing
NOTE: Chamorro - "Guamanian or Chamorro" selected or written entries "Guam" or "Chamorro" (2000 and 2010 Census definition)
NOTE: Part-Chamorro - Chamorro and one or more additional race (2000 and 2010 Census definition)
NOTE: Reported as "Guamanian" in 1980 and 1990 stateside Census results
* Commonwealth of the Northern Mariana Islands
** Including part-Chamorros

Page 230 Chapter 20 2015 CNMI Statistical Yearbook
11th Statistical Yearbook, Central Statistics Division, Department of Commerce
Table 20.1b Chamorro Population, United States and Insular Areas: 2000
Geography Level: State
(Rank Order)
2000 Census
Total Population Total Chamorro Chamorro Part-Chamorro
United States 281,421,906 92,611 58,240 34,371
California 33,871,648 33,849 20,918 12,931
Washington 5,894,121 8,597 5,823 2,774
Texas 20,851,820 5,410 3,641 1,769
Florida 15,982,378 3,549 2,319 1,230
Nevada 1,998,257 2,090 1,346 744
Georgia 8,186,453 2,173 1,566 607
Hawaii 1,211,537 4,221 1,663 2,558
Arizona 5,130,632 2,101 1,354 747
North Carolina 8,049,313 1,828 1,313 515
New York 18,976,457 2,746 1,931 815
Virginia 7,078,515 2,045 1,310 735
Colorado 4,301,261 1,867 1,124 743
Alabama 4,447,100 804 577 227
Oregon 3,421,399 1,668 1,015 653
Tennessee 5,689,283 962 696 266
Maryland 5,296,486 1,108 708 400
Ohio 11,353,140 1,117 618 499
Illinois 12,419,293 1,496 988 508
South Carolina 4,012,012 745 489 256
Missouri 5,595,211 761 435 326
Pennsylvania 12,281,054 1,037 646 391
Oklahoma 3,450,654 966 585 381
New Jersey 8,414,350 1,135 779 356
Kentucky 4,041,769 616 403 213
Louisiana 4,468,976 584 342 242
Massachusetts 6,349,097 812 529 283
Indiana 6,080,485 732 470 262
Kansas 2,688,418 565 325 240
Mississippi 2,844,658 381 213 168
Idaho 1,293,953 386 254 132
Michigan 9,938,444 1,007 622 385
Nebraska 1,711,263 439 273 166
Utah 2,233,169 348 202 146
Connecticut 3,405,565 412 281 131
Arkansas 2,673,400 370 231 139
New Mexico 1,819,046 534 363 171
Wisconsin 5,363,675 573 332 241
Alaska 626,932 387 227 160
Minnesota 4,919,479 483 266 217
Iowa 2,926,324 293 170 123
Rhode Island 1,048,319 314 248 66
Delaware 783,600 132 89 43
South Dakota 754,844 104 58 46
District of Columbia 572,059 104 62 42
New Hampshire 1,235,786 118 83 35
Montana 902,195 141 73 68
Wyoming 493,782 100 65 35
West Virginia 1,808,344 156 87 69
Maine 1,274,923 123 70 53
North Dakota 642,200 69 30 39
Vermont 608,827 53 28 25
Puerto Rico 3,808,610 234 149 85
Source: 1980, 1990, 2000 and 2010 Censuses of Population and Housing
NOTE: Chamorro - "Guamanian or Chamorro" selected or written entries "Guam" or "Chamorro" (2000 and 2010 Census definition)
NOTE: Part-Chamorro - Chamorro and one or more additional race (2000 and 2010 Census definition)
NOTE: Reported as "Guamanian" in 1980 and 1990 stateside Census results
* Commonwealth of the Northern Mariana Islands
** Including part-Chamorros

2015 CNMI Statistical Yearbook Chapter 20 Page 231
11th Statistical Yearbook, Central Statistics Division, Department of Commerce
Table 20.1c Chamorro Population, United States and Insular Areas: 1980 to 1990
Geography Level: State
(Rank Order)
1990 Census 1980 Census
Total Population Guamanian Total Population Guamanian
United States 248,709,873 47,754 226,545,805 30,695
California 29,760,021 23,783 23,667,902 17,009
Washington 4,866,692 3,816 4,132,156 1,739
Texas 16,986,510 2,592 14,229,191 1,229
Florida 12,937,926 1,188 9,746,324 442
Nevada 1,201,833 411 800,493 275
Georgia 6,478,216 571 5,463,105 503
Hawaii 1,108,229 2,357 964,691 1,630
Arizona 3,665,228 570 2,718,215 346
North Carolina 6,628,637 583 5,881,766 388
New York 17,990,455 1,332 17,558,072 1,017
Virginia 6,187,358 971 5,346,818 548
Colorado 3,294,394 668 2,889,964 506
Alabama 4,040,587 196 3,893,888 62
Oregon 2,842,321 887 2,633,105 366
Tennessee 4,877,185 306 4,591,120 66
Maryland 4,781,468 625 4,216,975 323
Ohio 10,847,115 279 10,797,630 137
Illinois 11,430,602 1083 11,426,518 367
South Carolina 3,486,703 213 3,121,820 182
Missouri 5,117,073 235 4,916,686 203
Pennsylvania 11,881,643 345 11,863,895 164
Oklahoma 3,145,585 450 3,025,290 261
New Jersey 7,730,188 447 7,364,823 199
Kentucky 3,685,296 249 3,660,777 208
Louisiana 4,219,973 306 4,205,900 230
Massachusetts 6,016,425 527 5,737,037 251
Indiana 5,544,159 218 5,490,224 119
Kansas 2,477,574 260 2,363,679 259
Mississippi 2,573,216 44 2,520,638 87
Idaho 1,006,749 148 943,935 42
Michigan 9,295,297 279 9,262,078 199
Nebraska 1,578,385 148 1,569,825 109
Utah 1,722,850 110 1,461,037 64
Connecticut 3,287,116 123 3,107,576 100
Arkansas 2,350,725 163 2,286,435 65
New Mexico 1,515,069 270 1,302,894 43
Wisconsin 4,891,769 180 4,705,767 162
Alaska 550,043 245 401,851 129
Minnesota 4,375,099 150 4,075,970 102
Iowa 2,776,755 48 2,913,808 95
Rhode Island 1,003,464 104 947,154 116
Delaware 666,168 21 594,338 45
South Dakota 696,004 30 690,768 46
District of Columbia 606,900 25 638,333 89
New Hampshire 1,109,252 27 920,610 5
Montana 799,065 32 786,690 11
Wyoming 453,588 12 469,557 10
West Virginia 1,793,477 24 1,949,644 29
Maine 1,227,928 79 1,124,660 79
North Dakota 638,800 8 652,717 18
Vermont 562,758 16 511,456 21
Puerto Rico ------ ------ ------ ------
Source: 1980, 1990, 2000 and 2010 Censuses of Population and Housing
NOTE: Chamorro - "Guamanian or Chamorro" selected or written entries "Guam" or "Chamorro" (2000 and 2010 Census definition)
NOTE: Part-Chamorro - Chamorro and one or more additional race (2000 and 2010 Census definition)
NOTE: Reported as "Guamanian" in 1980 and 1990 stateside Census results
* Commonwealth of the Northern Mariana Islands
** Including part-Chamorros

Page 232 Chapter 20 2015 CNMI Statistical Yearbook
11th Statistical Yearbook, Central Statistics Division, Department of Commerce
Table 20.2a Chamorro Population, United States and Insular Areas: 2010
Geography Level: State
(Rank Order)
2010 Census
Total Population Chamorro Part-Chamorro Total Chamorro
United States 281,421,906 88,310 59,488 147,798
Alabama 4,447,100 1,774 551 2,325
Alaska 626,932 380 287 667
Arizona 5,130,632 2,646 1,630 4,276
Arkansas 2,673,400 442 277 719
California 33,871,648 24,299 20,126 44,425
Colorado 4,301,261 1,784 1,272 3,056
Connecticut 3,405,565 455 315 770
Delaware 783,600 215 104 319
District of Columbia 572,059 111 76 187
Florida 15,982,378 3,747 2,157 5,904
Georgia 8,186,453 2,746 1,110 3,856
Hawaii 1,211,537 2,700 3,947 6,647
Idaho 1,293,953 543 317 860
Illinois 12,419,293 1,100 828 1,928
Indiana 6,080,485 636 477 1,113
Iowa 2,926,324 313 259 572
Kansas 2,688,418 571 431 1,002
Kentucky 4,041,769 866 421 1,287
Louisiana 4,468,976 738 451 1,189
Maine 1,274,923 67 85 152
Maryland 5,296,486 1,319 781 2,100
Massachusetts 6,349,097 671 508 1,179
Michigan 9,938,444 521 551 1,072
Minnesota 4,919,479 378 349 727
Mississippi 2,844,658 560 257 817
Missouri 5,595,211 969 582 1,551
Montana 902,195 107 121 228
Nebraska 1,711,263 501 228 729
Nevada 1,998,257 3,513 1,999 5,512
New Hampshire 1,235,786 110 85 195
New Jersey 8,414,350 915 532 1,447
New Mexico 1,819,046 420 385 805
New York 18,976,457 2,235 1,172 3,407
North Carolina 8,049,313 2,505 1,177 3,682
North Dakota 642,200 65 61 126
Ohio 11,353,140 1,145 832 1,977
Oklahoma 3,450,654 924 546 1,470
Oregon 3,421,399 1,755 1,259 3,014
Pennsylvania 12,281,054 968 637 1,605
Rhode Island 1,048,319 232 128 360
South Carolina 4,012,012 1,046 522 1,568
South Dakota 754,844 148 68 216
Tennessee 5,689,283 1,507 617 2,124
Texas 20,851,820 6,591 3,576 10,167
Utah 2,233,169 493 387 880
Vermont 608,827 43 38 81
Virginia 7,078,515 2,222 1,370 3,592
Washington 5,894,121 9,746 5,083 14,829
West Virginia 1,808,344 80 114 194
Wisconsin 5,363,675 387 329 716
Wyoming 493,782 101 73 174
Puerto Rico 3,808,610 30 64 94
Island Areas
2010 Census
Total Population Chamorro Part-Chamorro Total Chamorro
CNMI * 69,221 12,902 4,608 17,510
Guam 154,805 59,381 9,717 69,098
Source: 1980, 1990, 2000 and 2010 Censuses of Population and Housing
NOTE: Chamorro - "Guamanian or Chamorro" selected or written entries "Guam" or "Chamorro" (2000 and 2010 Census definition)
NOTE: Part-Chamorro - Chamorro and one or more additional race (2000 and 2010 Census definition)
NOTE: Reported as "Guamanian" in 1980 and 1990 stateside Census results
* Commonwealth of the Northern Mariana Islands
** Including part-Chamorros

2015 CNMI Statistical Yearbook Chapter 20 Page 233
11th Statistical Yearbook, Central Statistics Division, Department of Commerce
Table 20.2b Chamorro Population, United States and Insular Areas: 2000
Geography Level: State
(Rank Order)
2000 Census
Total Population Chamorro Part-Chamorro Total Chamorro
United States 281,421,906 58,240 34,371 92,611
Alabama 4,447,100 577 227 804
Alaska 626,932 227 160 387
Arizona 5,130,632 1,354 747 2,101
Arkansas 2,673,400 231 139 370
California 33,871,648 20,918 12,931 33,849
Colorado 4,301,261 1,124 743 1,867
Connecticut 3,405,565 281 131 412
Delaware 783,600 89 43 132
District of Columbia 572,059 62 42 104
Florida 15,982,378 2,319 1,230 3,549
Georgia 8,186,453 1,566 607 2,173
Hawaii 1,211,537 1,663 2,558 4,221
Idaho 1,293,953 254 132 386
Illinois 12,419,293 988 508 1,496
Indiana 6,080,485 470 262 732
Iowa 2,926,324 170 123 293
Kansas 2,688,418 325 240 565
Kentucky 4,041,769 403 213 616
Louisiana 4,468,976 342 242 584
Maine 1,274,923 70 53 123
Maryland 5,296,486 708 400 1,108
Massachusetts 6,349,097 529 283 812
Michigan 9,938,444 622 385 1,007
Minnesota 4,919,479 266 217 483
Mississippi 2,844,658 213 168 381
Missouri 5,595,211 435 326 761
Montana 902,195 73 68 141
Nebraska 1,711,263 273 166 439
Nevada 1,998,257 1,346 744 2,090
New Hampshire 1,235,786 83 35 118
New Jersey 8,414,350 779 356 1,135
New Mexico 1,819,046 363 171 534
New York 18,976,457 1,931 815 2,746
North Carolina 8,049,313 1,313 515 1,828
North Dakota 642,200 30 39 69
Ohio 11,353,140 618 499 1,117
Oklahoma 3,450,654 585 381 966
Oregon 3,421,399 1,015 653 1,668
Pennsylvania 12,281,054 646 391 1,037
Rhode Island 1,048,319 248 66 314
South Carolina 4,012,012 489 256 745
South Dakota 754,844 58 46 104
Tennessee 5,689,283 696 266 962
Texas 20,851,820 3,641 1,769 5,410
Utah 2,233,169 202 146 348
Vermont 608,827 28 25 53
Virginia 7,078,515 1,310 735 2,045
Washington 5,894,121 5,823 2,774 8,597
West Virginia 1,808,344 87 69 156
Wisconsin 5,363,675 332 241 573
Wyoming 493,782 65 35 100
Puerto Rico 3,808,610 149 85 234
Island Areas
2000 Census
Total Population Chamorro Part-Chamorro Total Chamorro
CNMI * 69,221 14,749 4,383 19,132
Guam 154,805 57,297 7,946 65,243
Source: 1980, 1990, 2000 and 2010 Censuses of Population and Housing
NOTE: Chamorro - "Guamanian or Chamorro" selected or written entries "Guam" or "Chamorro" (2000 and 2010 Census definition)
NOTE: Part-Chamorro - Chamorro and one or more additional race (2000 and 2010 Census definition)
NOTE: Reported as "Guamanian" in 1980 and 1990 stateside Census results
* Commonwealth of the Northern Mariana Islands
** Including part-Chamorros

Page 234 Chapter 20 2015 CNMI Statistical Yearbook
11th Statistical Yearbook, Central Statistics Division, Department of Commerce
Table 20.2c Chamorro Population, United States and Insular Areas: 1980 to 1990
Geography Level: State
(Rank Order)
1990 Census 1980 Census
Total Population Guamanian Total Population Guamanian
United States 248,709,873 47,754 226,545,805 30,695
Alabama 4,040,587 196 3,893,888 62
Alaska 550,043 245 401,851 129
Arizona 3,665,228 570 2,718,215 346
Arkansas 2,350,725 163 2,286,435 65
California 29,760,021 23,783 23,667,902 17,009
Colorado 3,294,394 668 2,889,964 506
Connecticut 3,287,116 123 3,107,576 100
Delaware 666,168 21 594,338 45
District of Columbia 606,900 25 638,333 89
Florida 12,937,926 1,188 9,746,324 442
Georgia 6,478,216 571 5,463,105 503
Hawaii 1,108,229 2,357 964,691 1,630
Idaho 1,006,749 148 943,935 42
Illinois 11,430,602 1083 11,426,518 367
Indiana 5,544,159 218 5,490,224 119
Iowa 2,776,755 48 2,913,808 95
Kansas 2,477,574 260 2,363,679 259
Kentucky 3,685,296 249 3,660,777 208
Louisiana 4,219,973 306 4,205,900 230
Maine 1,227,928 79 1,124,660 79
Maryland 4,781,468 625 4,216,975 323
Massachusetts 6,016,425 527 5,737,037 251
Michigan 9,295,297 279 9,262,078 199
Minnesota 4,375,099 150 4,075,970 102
Mississippi 2,573,216 44 2,520,638 87
Missouri 5,117,073 235 4,916,686 203
Montana 799,065 32 786,690 11
Nebraska 1,578,385 148 1,569,825 109
Nevada 1,201,833 411 800,493 275
New Hampshire 1,109,252 27 920,610 5
New Jersey 7,730,188 447 7,364,823 199
New Mexico 1,515,069 270 1,302,894 43
New York 17,990,455 1,332 17,558,072 1,017
North Carolina 6,628,637 583 5,881,766 388
North Dakota 638,800 8 652,717 18
Ohio 10,847,115 279 10,797,630 137
Oklahoma 3,145,585 450 3,025,290 261
Oregon 2,842,321 887 2,633,105 366
Pennsylvania 11,881,643 345 11,863,895 164
Rhode Island 1,003,464 104 947,154 116
South Carolina 3,486,703 213 3,121,820 182
South Dakota 696,004 30 690,768 46
Tennessee 4,877,185 306 4,591,120 66
Texas 16,986,510 2,592 14,229,191 1,229
Utah 1,722,850 110 1,461,037 64
Vermont 562,758 16 511,456 21
Virginia 6,187,358 971 5,346,818 548
Washington 4,866,692 3,816 4,132,156 1,739
West Virginia 1,793,477 24 1,949,644 29
Wisconsin 4,891,769 180 4,705,767 162
Wyoming 453,588 12 469,557 10
Puerto Rico ------ ------ ------ ------
Island Areas
1990 Census 1980 Census
Total Population Chamorro ** Total Population Chamorro **
CNMI * 43,345 14,194 16,780 10,048
Guam 133,152 57,648 105,979 48,675
Source: 1980, 1990, 2000 and 2010 Censuses of Population and Housing
NOTE: Chamorro - "Guamanian or Chamorro" selected or written entries "Guam" or "Chamorro" (2000 and 2010 Census definition)
NOTE: Part-Chamorro - Chamorro and one or more additional race (2000 and 2010 Census definition)
NOTE: Reported as "Guamanian" in 1980 and 1990 stateside Census results
* Commonwealth of the Northern Mariana Islands
** Including part-Chamorros

11th Statistical Yearbook, Central Statistics Division, Department of Commerce
Appendix A:
Maps

Page 236 Appendix A 2015 CNMI Statistical Yearbook
11th Statistical Yearbook, Central Statistics Division, Department of Commerce

2015 CNMI Statistical Yearbook Appendix A Page 237
11th Statistical Yearbook, Central Statistics Division, Department of Commerce

Page 238 Appendix A 2015 CNMI Statistical Yearbook
11th Statistical Yearbook, Central Statistics Division, Department of Commerce
Copyright © 2022 FDOKUMEN