Common dolphin (Delphinus delphis) habitat preferences using data from two platforms of opportunity
10
This article appeared in a journal published by Elsevier. The attached copy is furnished to the author for internal non-commercial research and education use, including for instruction at the authors institution and sharing with colleagues. Other uses, including reproduction and distribution, or selling or licensing copies, or posting to personal, institutional or third party websites are prohibited. In most cases authors are permitted to post their version of the article (e.g. in Word or Tex form) to their personal website or institutional repository. Authors requiring further information regarding Elsevier’s archiving and manuscript policies are encouraged to visit: http://www.elsevier.com/copyright
Transcript of Common dolphin (Delphinus delphis) habitat preferences using data from two platforms of opportunity
This article appeared in a journal published by Elsevier. The attachedcopy is furnished to the author for internal non-commercial researchand education use, including for instruction at the authors institution
and sharing with colleagues.
Other uses, including reproduction and distribution, or selling orlicensing copies, or posting to personal, institutional or third party
websites are prohibited.
In most cases authors are permitted to post their version of thearticle (e.g. in Word or Tex form) to their personal website orinstitutional repository. Authors requiring further information
regarding Elsevier’s archiving and manuscript policies areencouraged to visit:
http://www.elsevier.com/copyright

Author's personal copy
Original article
Common dolphin (Delphinus delphis) habitat preferences usingdata from two platforms of opportunity
André E. Mouraa,*, Neftalí Sillerob, Ana Rodriguesc
a School of Biological and Biomedical Sciences, Durham University, South Road, Durham, DH1 3LE, UKbCentro de Investigação em Ciências Geo-Espaciais (CICGE), Universidade do Porto, Faculdade de Ciências, 4169-007 Porto, PortugalcCentro de Investigação em Biodiversidade e Recursos Genéticos (CIBIO), Campus Agrário de Vairão, 4485-661, Portugal
a r t i c l e i n f o
Article history:Received 31 March 2011Accepted 25 August 2011Available online 13 September 2011
Keywords:Ecological niche modellingCetaceaCommon dolphinMaxentPortugal
a b s t r a c t
Cetaceans are difficult to observe in the wild, and demand complex logistics for dedicated collection ofbiological data. As such, the distribution of most cetacean species is still poorly understood. Ecologicalniche models are useful in studying species distributions and their ecological determinants, and plat-forms of opportunity (e.g. commercial nautical operators) can provide an alternative source for that datain cetaceans. In this study, we modelled common dolphin (Delphinus delphis) habitat preferences usingecological niche modelling and presence data obtained from distinct platforms of opportunity in twodifferent areas in the Portuguese coast (west and south mainland Portugal) for the period 2005e2007.Models from southern Portugal were projected to western Portugal and vice-versa, to check forrobustness in predicting the species ecological niche. Our results show that data from platforms ofopportunity can result in robust ecological models and provide extremely useful information on cetaceanecology. We found that common dolphins exhibit a patchy distribution pattern over the Portuguesecoastline, and identified key habitats for their occurrence. The most important variable associated withthis species’ distribution was chlorophyll concentration which, given the results from previous research,we hypothesise reflects an ecological specialisation on pelagic schooling fish. Given that the mostabundant schooling fish species in Portugal is increasingly overexploited and in constant decline, moreattention should be given to the conservation of common dolphin in Portuguese waters.
� 2011 Elsevier Masson SAS. All rights reserved.
1. Introduction1
The study of species’ distributions can provide importantinformation regarding their ecology (Guisan and Zimmermann,2000). Ecological niche models (ENM) can be useful in predictingspecies movement ranges, identifying habitat preferences andpotential population breaks, as well as ecological barriers to speciesdispersal (Austin et al., 1996; Gottfried et al., 1999; Osborne et al.,2001; Bentivegna et al., 2007; Isari et al., 2007; Ravago-Gotancoet al., 2007; Skov et al., 2008; for a review see Sillero et al., 2010).ENM can be particularly helpful in studying species with largedistribution ranges and low sighting rates, where detailed distri-bution information can be very difficult to obtain (Guisan et al.,
2006). In the case of highly mobile oceanic species, geographicalbarriers are extremely uncommon, leading to what has been calledthemarine-speciation paradox (Bierne et al., 2003). One hypothesisstates that adaptation to different environments (and not physicalbarriers) would effectively stop gene flow between groups(Palumbi, 1994; Jackson and Cheetham, 1999; Schluter, 2001;Via, 2001), thus ecological niche modelling studies might also bean important tool in identifying ecological barriers in mobilemarine organisms.
Despite its name, the common dolphin (Delphinusspp.) has beensurprisingly ill studied, especially when compared to its closelyrelated species, the bottlenose dolphin (Tursiops spp.). Commondolphins are considered opportunistic feeders, targeting pelagicschooling fish, usually the most abundant local species (e.g.: Silva,1999; de Pierrepont et al., 2005; Meynier et al., 2008). Althoughocean wide genetic differentiation tends to be low (Natoli et al.,2006; Mirimin et al., 2009), controversy over its alpha taxonomyis ongoing (Rosel et al., 1994; Kingston and Rosel, 2004; Natoli et al.,2006). Natoli et al. (2006) suggested that the described differencesin common dolphin morphology (Heyning and Perrin, 1994) might
* Corresponding author. Tel.: þ44 07521042848.E-mail address: [email protected] (A. E. Moura).
1 AUC e Area Under the Curve; EGV e Ecogeographical Variables; ENM e
Ecological Niche Models; WWC e Whale Watching Companies; ROC e ReceiverOperated Characteristics; SD e Standard Deviation; SPEA e Society for the Study ofBirds; SST e Sea Surface Temperature.
Contents lists available at SciVerse ScienceDirect
Acta Oecologica
journal homepage: www.elsevier .com/locate/actoec
1146-609X/$ e see front matter � 2011 Elsevier Masson SAS. All rights reserved.doi:10.1016/j.actao.2011.08.006
Acta Oecologica 38 (2012) 24e32
Author's personal copy
be the result of local adaptation rather than incipient speciation(Kingston and Rosel, 2004). The study of its distribution however,has been faced with a large degree of uncertainty and dramaticchanges in the established knowledge. With a large dispersalpotential and spending most of their time underwater, observa-tions in the wild can be notoriously difficult. It was once widelyaccepted that common dolphins had an ubiquitous worldwidepantropical distribution (e.g.: Carwardine, 1995). However, morerecently the common dolphin has been represented as having anessentially coastal distribution and being effectively absent frommany of the pantropical coastlines of the world (Folkens et al.,2002). Further to this, a recent analysis of common dolphinrecords in the eastern coasts of the North and South Americancontinents concluded that confirmed sightings of the species wereonly restricted to three discrete areas within that coastline(Jefferson et al., 2009). Although these studies tend to be conser-vative, they show that this species might actually occupy onlycertain “restricted” habitats. These habitats appear to overlap withregions having oceanographic characteristics usually related tohigh productivity (Reilly, 1990; Reilly and Fiedler, 1994; Fiedler andReilly, 1994; Cañadas et al., 2005; Jefferson et al., 2009). However,very few studies have tested which environmental variables bestcorrelate with common dolphin distribution. Previous studies havefound that it tends to occupy areas with good upwelling conditions(Reilly, 1990; Reilly and Fiedler, 1994; Fiedler and Reilly, 1994;Jefferson et al., 2009). Cañadas and Hammond (2008) showedchlorophyll concentration to be correlated with common dolphinabundance but did not determine the species spatial ecologicalniche (Sillero, 2011).
Dedicated cetacean surveys are rare owing to their complex andexpensive logistics, and few institutions are capable of promotingthem. Researchers have alternatively relied on two types ofplatforms of opportunity to collect such data: (1) surveys withconstant linear route efforts, such as commercial transportationservices (e.g.: Wall et al., 2006; Williams et al., 2006); and (2) tar-geted observational efforts, such as whale-watching companies(Hauser et al., 2006) or nature watching enthusiasts (Evans andHammond, 2004). Both types are suboptimal and have inherentprocedural limitations, but can provide information that wouldotherwise be unavailable. Although both opportunistic data sourceshave been used in previous studies, no study to date compared therelative performance of each type in analysing dolphin distribution.
The Iberian Peninsula stands as a very interesting region to carryout ecological niche studies. Standing in the transition between twovery different environments (the Mediterranean Sea and the NorthAtlantic), it exhibits a high level of habitat complexity (Alcaraz et al.,2006). The common dolphin is the most commonly strandedcetacean species on this coast (Sequeira et al., 1996), and it exhibitsa considerable level of morphological variation (Murphy et al.,2006). However, high occurrence of strandings may not reflecta homogeneous distribution along the coast; moreover, patterns ofdistribution of common dolphins in Portugal remain unknown. Infact, after performing three years of fieldwork on this species foranother study (A. Moura, unpublished data), we hypothesised thatthe species is not distributed uniformly along the coast, but itexhibits patches of higher probability of occurrence.
In our study, we first aimed at modelling common dolphinhabitat preferences using ecological niche modelling and distri-bution data obtained from two platforms of opportunity (constantlinear route and targeted observational data sources), over a periodof several years and for two geographical areas. Second, we testwhether or not there might be spatial patches of preferred habitatfor common dolphins along the Portuguese coast, and whetherthese are constant through time. Finally, we compare the modelsobtained by the two opportunity data sources and discuss their
inherent strengths and limitations. With this study, we hope tohighlight the potential for both data sources to be used in model-ling cetacean distribution, and thus encourage the use of such data,in many regions the only available from these animals.
2. Materials and methods
2.1. Species datasets and study areas
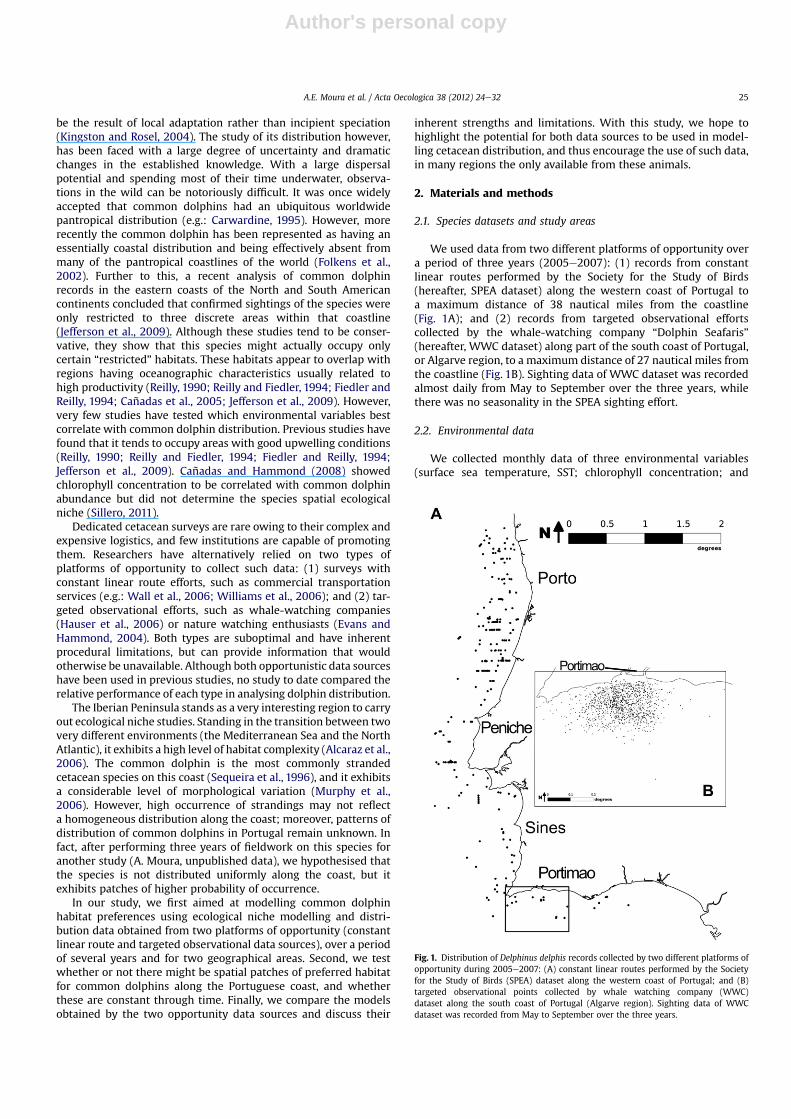
We used data from two different platforms of opportunity overa period of three years (2005e2007): (1) records from constantlinear routes performed by the Society for the Study of Birds(hereafter, SPEA dataset) along the western coast of Portugal toa maximum distance of 38 nautical miles from the coastline(Fig. 1A); and (2) records from targeted observational effortscollected by the whale-watching company “Dolphin Seafaris”(hereafter, WWC dataset) along part of the south coast of Portugal,or Algarve region, to a maximum distance of 27 nautical miles fromthe coastline (Fig. 1B). Sighting data of WWC dataset was recordedalmost daily from May to September over the three years, whilethere was no seasonality in the SPEA sighting effort.
2.2. Environmental data
We collected monthly data of three environmental variables(surface sea temperature, SST; chlorophyll concentration; and
Fig. 1. Distribution of Delphinus delphis records collected by two different platforms ofopportunity during 2005e2007: (A) constant linear routes performed by the Societyfor the Study of Birds (SPEA) dataset along the western coast of Portugal; and (B)targeted observational points collected by whale watching company (WWC)dataset along the south coast of Portugal (Algarve region). Sighting data of WWCdataset was recorded from May to September over the three years.
A.E. Moura et al. / Acta Oecologica 38 (2012) 24e32 25

Author's personal copy
depth) from May to September during 2005e2007. Environmentalvariables were retrieved from the NASA’s online PO.DAAC OceanESIP Tool (POET) (http://podaac.jpl.nasa.gov/poet), the OceanColorwebsite (http://oceancolor.gsfc.nasa.gov/) and the GEBCO website(http://www.gebco.net/), respectively. We further derived thestandard deviation (SD) of the monthly data series SST across allyears to examine average intra-annual (seasonal) variability. Wederived the SD of depth using a filter where the SD of one pixel iscomputed using the nine surrounding pixels. Therefore, the modelswere calculated including five variables in total. The original spatialresolution was 0.042� (4.7 km approximately). This spatial resolu-tion was kept during the calculation of the ENMs.
2.3. Ecological niche models
We modelled the realized niche (sensu Hutchinson, 1957; seeSillero, 2011) of Delphinus delphis in the two study areas (westerncoast of Portugal with the Society for the Study of Birds e SPEA e
dataset, and south coast of Portugal or Algarve region with thewhale watching companies e WWC e dataset; Fig. 1).
In the Algarve coastal area, we built a model using each of thefollowing: mean values of variables for all the three years sampled(2005e2007); mean values for each year individually; and meanvalues for each month from May to September (by averagingindividual months across years). The model including data from allthree years was projected to the Portuguese western coast (SPEAstudy area). Models were calculated for each year and month inorder to evaluate temporal patterns in the spatial distribution ofcommon dolphins.
In the Portuguese western coast, we built a model using datapooled from the three survey years (2005, 2006 and 2007), as eachannual SPEA survey covered different regions within the Portu-guese coastline. This model was then projected to the Algarvecoastal area (WWC study area). The WWC projected model was
compared with the SPEA model and vice-versa, using a spatialcorrelation analysis, to evaluate the predictive capabilities of eachmodel. In both cases, the study areas did not go beyond the areascovered by the surveys.
2.4. Maximum entropy models
We built Maximum Entropy models, as implemented in Max-ent 3.3.1 software (www.cs.princeton.edu/wschapire/maxent), toidentify which environmental variables correlated better with thespecies distribution, as well as areas of potential occurrence. Thisis a general-purpose machine learning method that uses presence-only occurrence data (Phillips et al., 2004, 2006; Phillips andDudik, 2008), and thus calculates the realized ecological niche(sensu Hutchinson, 1957; see Sillero, 2011). The Maxent output forthe realized niche model is a map representing the suitability ofhabitats through an index (Sillero, 2011). This index is continuousfrom very suitable habitats (value 1) to very unsuitable habitats(value 0) for the species. Maxent is particularly well suited to noisyor sparse information and it is capable of dealing with continuousand categorical ecogeographical variables (EGV) at the same time(Phillips et al., 2006). Maxent models consistently outperformmore established methods, either presence-only methods (Bio-clim, Domain) or presenceeabsence methods (GAM, GLM), espe-cially when samples sizes are low (Elith et al., 2006; Hernandezet al., 2006).
Maximum Entropy looks for the statistical model that producesthe most uniform distribution but still infers as accurately aspossible the observed data. It compares the presence-only recordswith data extracted randomly from all the background (includingthe species records; see Phillips et al., 2009). These backgrounddata were extracted by Maxent automatically. Hence, Maxentcalculated a set of ten models for each datasets through an iterativeprocess and performed an average ensemble model (Araújo and
Fig. 2. Ensemble Maxent models for whale watching company (WWC) dataset for years 2005e2007 together, and separately for years 2005, 2006 and 2007.
A.E. Moura et al. / Acta Oecologica 38 (2012) 24e3226
Author's personal copy
New, 2007; Sillero, 2009, 2010). Maxent estimates the range ofa species with the constraint that the expected value of eachenvironmental variable (or its transform and/or interactions)should match its empirical average, i.e. the average value for a set ofsample points taken from the species distribution (Phillips et al.,2004, 2006). Maxent weights each EGV by a constant and theestimated probability distribution is exponential in the sum of theweighed features, divided by a scaling constant to ensure that theprobability values range from 0.0 to 1.0 and sum to 1.0. The programstarts with an uniform probability distribution (gain ¼ 0) anditeratively alters one weight at a time to maximize the likelihood ofthe occurrence dataset. The algorithm converges to the optimumprobable distribution, and thus, the gain can be interpreted asrepresenting how much better the distribution fits the samplepoints than the uniform distribution (Phillips et al., 2004, 2006;Phillips and Dudik, 2008).
Maxent was run with autofeatures randomly selecting 70% ofthe presence records as training data and 30% as test data. Defaultparameters were used in order to allow different models tobe comparable. Models were evaluated with receiver operated
characteristics (ROC) plots. The area under the curve (AUC) of theROC plot was taken as a measure of the overall fit of the Maxentmodel (Liu et al., 2005). AUCwas selected because it is independentof prevalence (the proportion of presence in relation to the totaldataset size; see Van der Wal et al., 2009). The importance of eachEGV for explaining the species distribution was determined by: (1)jackknife analysis of the average AUC with training and test data;and (2) average percentage contribution of each environmentalfactor to the models. This was done by creating a model excludingone environmental variable, followed by the creation of a modelusing only the excluded individual variable. This procedure wasrepeated for each individual variable.
3. Results
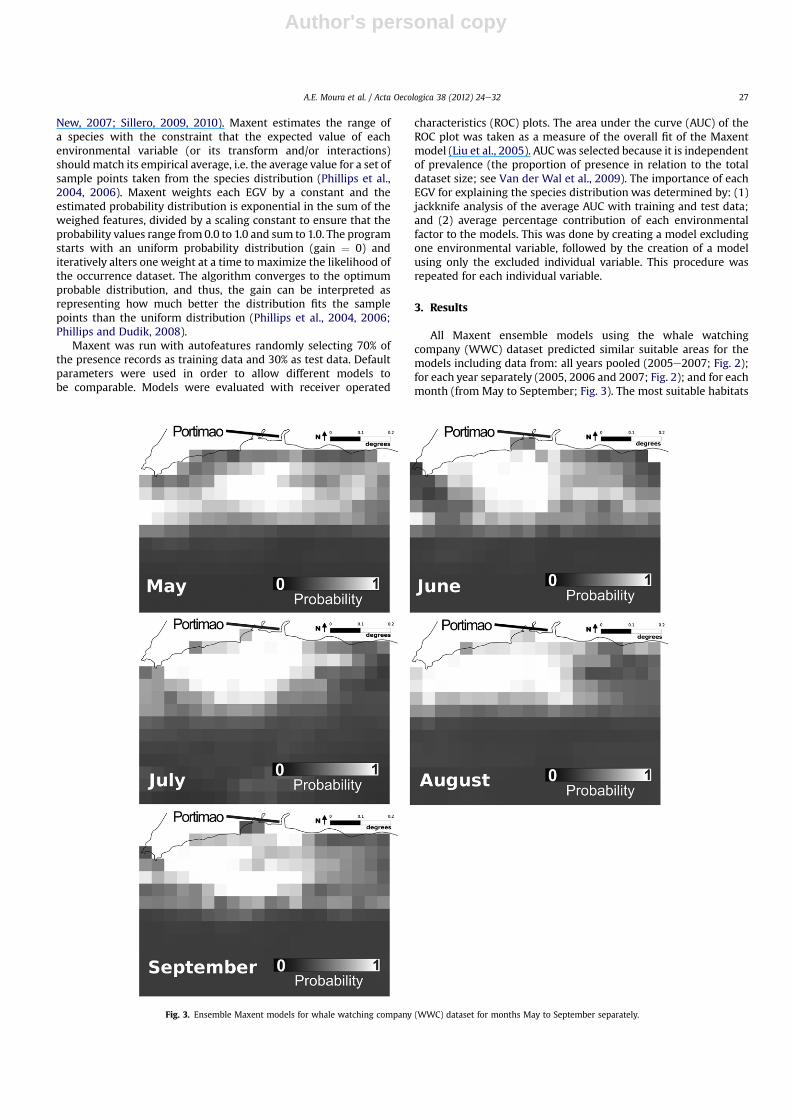
All Maxent ensemble models using the whale watchingcompany (WWC) dataset predicted similar suitable areas for themodels including data from: all years pooled (2005e2007; Fig. 2);for each year separately (2005, 2006 and 2007; Fig. 2); and for eachmonth (from May to September; Fig. 3). The most suitable habitats
Fig. 3. Ensemble Maxent models for whale watching company (WWC) dataset for months May to September separately.
A.E. Moura et al. / Acta Oecologica 38 (2012) 24e32 27

Author's personal copy
were located close to the coast, around the main group of commondolphin records (Figs. 2 and 3). This pattern was similar in theMaxent ensemble model using the Society for the Study of Birds(SPEA) dataset (Fig. 4) as in the most suitable habitats were locatedclose to the coast.
The projected models of the WWC dataset to the Portuguesewestern coast (Fig. 5), and of the SPEA dataset to the Algarve coast(Fig. 4) were similar to the respective ensemble models of SPEA(Fig. 4; spatial correlation: R ¼ 0.877) and WWC dataset (Fig. 2;spatial correlation R ¼ 0.769). In the projected models of the WWCdataset to the Portuguese western coast, suitable habitats had, ingeneral, a lower suitability index (WWC projection: range ¼0.02e0.65, mean ¼ 0.31 � 0.14; SPEA model: range ¼ 0.01e0.72,mean ¼ 0.19 � 0.21; Fig. 5). In the projected model of the SPEAdataset to the Algarve coast, the most suitable habitats were dis-placed to the west (Fig. 4).
All Maxent ensemble models of WWC dataset obtained meanAUC values higher than 0.8 when using the training data; in somecases, AUC was higher than 0.9 (Table 1). The respective AUC valuesfor the test data were always higher than 0.75 (Table 1). Theensemble models of SPEA dataset obtained an AUC ¼ 0.9 with thetraining data, and an AUC ¼ 0.83 with test data.
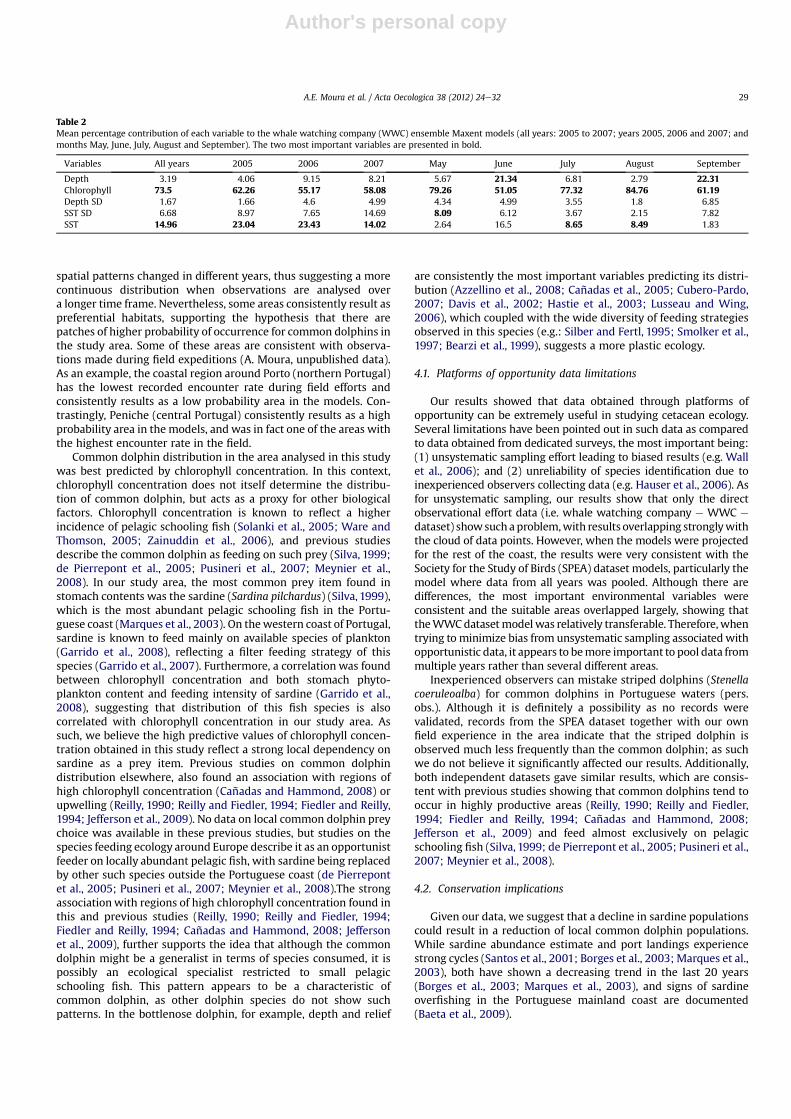
In the WWC ensemble models, the variables chlorophyllconcentration and sea surface temperature (SST) contributed moreto the explained variation in the model, in almost all group models(all sampling years; years 2005, 2006, 2007; and months July andAugust; Table 2). There were three exceptions: in May, the variableSD of SST substituted SST; in June and September, the depthsubstituted SST. Therefore, chlorophyll concentration was the mostimportant variable in all groups (Table 2). These patterns can beobserved in the jackknife analysis of AUC and gain values of trainingand test data, for models calculated with only one variable and
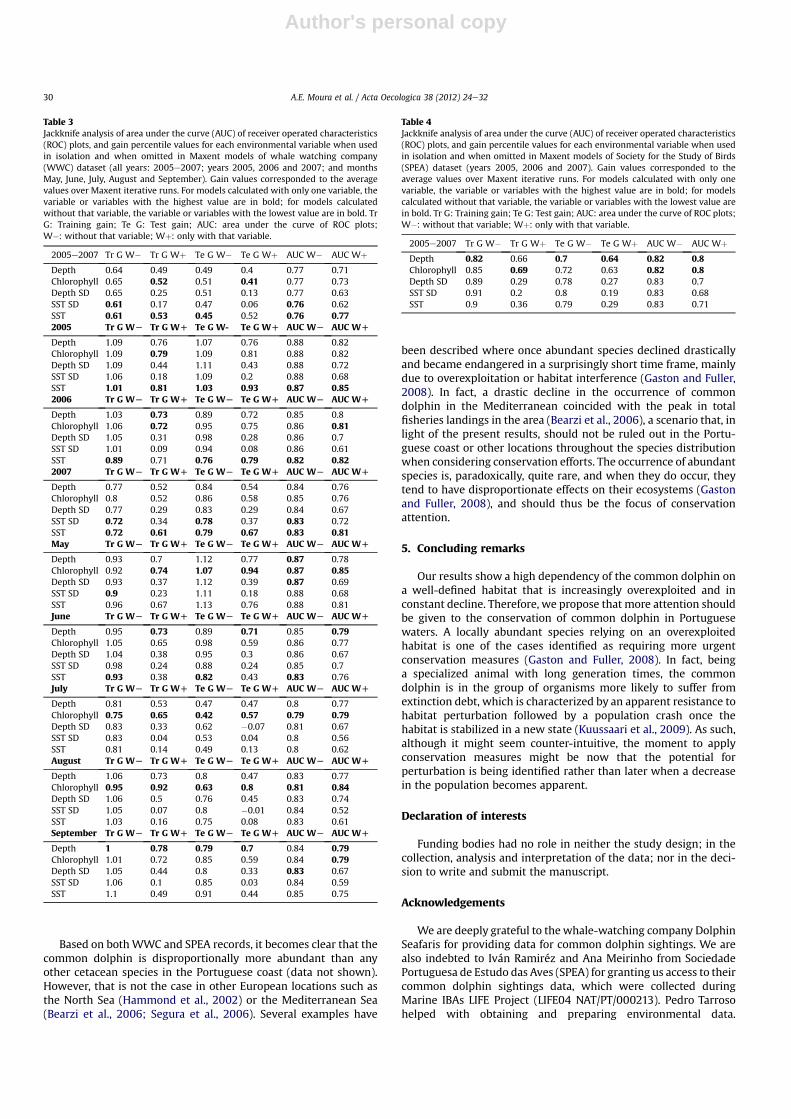
models calculated without that variable (Table 3). Although thepattern is not always observed, in most cases, chlorophyllconcentration and SST were the most important variables (Table 3).
In the SPEA ensemble model, the variables chlorophyllconcentration and depth contributed more to the explained varia-tion in the model: 49.54% and 35.67%, respectively. The othervariables had very low contribution values: SST ¼ 7.43%; SD ofdepth ¼ 3.75%; and SD of SST ¼ 3.61%. Like in the WWC ensemblemodels, these two variables were the most important in the jack-knife analysis of AUC and gain values of training and test data, formodels calculated with only one variable and models calculatedwithout that variable (Table 4).
4. Discussion
Our results showed that common dolphins exhibit a patchydistribution over the Portuguese coastline. However, the exact
Fig. 4. Ensemble (western Portuguese coast) and projected (Algarve coast) Maxentmodels for Society for the Study of Birds (SPEA) dataset.
Fig. 5. Projected Maxent models for whale watching company (WWC) dataset foryears 2005e2007 together.
Table 1Mean results of the area under the curve (AUC) of the receiver operated character-istics (ROC) plots for Delphinus delphis Maxent ensemble models of the whalewatching company (WWC) dataset (all years: 2005e2007; years 2005, 2006 and2007; and months May, June, July, August and September).
Year Training Testing
All years 0.83 0.772005 0.91 0.882006 0.91 0.862007 0.88 0.84May 0.92 0.89June 0.91 0.86July 0.88 0.8August 0.9 0.83September 0.92 0.85
A.E. Moura et al. / Acta Oecologica 38 (2012) 24e3228
Author's personal copy
spatial patterns changed in different years, thus suggesting a morecontinuous distribution when observations are analysed overa longer time frame. Nevertheless, some areas consistently result aspreferential habitats, supporting the hypothesis that there arepatches of higher probability of occurrence for common dolphins inthe study area. Some of these areas are consistent with observa-tions made during field expeditions (A. Moura, unpublished data).As an example, the coastal region around Porto (northern Portugal)has the lowest recorded encounter rate during field efforts andconsistently results as a low probability area in the models. Con-trastingly, Peniche (central Portugal) consistently results as a highprobability area in the models, and was in fact one of the areas withthe highest encounter rate in the field.
Common dolphin distribution in the area analysed in this studywas best predicted by chlorophyll concentration. In this context,chlorophyll concentration does not itself determine the distribu-tion of common dolphin, but acts as a proxy for other biologicalfactors. Chlorophyll concentration is known to reflect a higherincidence of pelagic schooling fish (Solanki et al., 2005; Ware andThomson, 2005; Zainuddin et al., 2006), and previous studiesdescribe the common dolphin as feeding on such prey (Silva, 1999;de Pierrepont et al., 2005; Pusineri et al., 2007; Meynier et al.,2008). In our study area, the most common prey item found instomach contents was the sardine (Sardina pilchardus) (Silva, 1999),which is the most abundant pelagic schooling fish in the Portu-guese coast (Marques et al., 2003). On thewestern coast of Portugal,sardine is known to feed mainly on available species of plankton(Garrido et al., 2008), reflecting a filter feeding strategy of thisspecies (Garrido et al., 2007). Furthermore, a correlation was foundbetween chlorophyll concentration and both stomach phyto-plankton content and feeding intensity of sardine (Garrido et al.,2008), suggesting that distribution of this fish species is alsocorrelated with chlorophyll concentration in our study area. Assuch, we believe the high predictive values of chlorophyll concen-tration obtained in this study reflect a strong local dependency onsardine as a prey item. Previous studies on common dolphindistribution elsewhere, also found an association with regions ofhigh chlorophyll concentration (Cañadas and Hammond, 2008) orupwelling (Reilly, 1990; Reilly and Fiedler, 1994; Fiedler and Reilly,1994; Jefferson et al., 2009). No data on local common dolphin preychoice was available in these previous studies, but studies on thespecies feeding ecology around Europe describe it as an opportunistfeeder on locally abundant pelagic fish, with sardine being replacedby other such species outside the Portuguese coast (de Pierrepontet al., 2005; Pusineri et al., 2007; Meynier et al., 2008).The strongassociationwith regions of high chlorophyll concentration found inthis and previous studies (Reilly, 1990; Reilly and Fiedler, 1994;Fiedler and Reilly, 1994; Cañadas and Hammond, 2008; Jeffersonet al., 2009), further supports the idea that although the commondolphin might be a generalist in terms of species consumed, it ispossibly an ecological specialist restricted to small pelagicschooling fish. This pattern appears to be a characteristic ofcommon dolphin, as other dolphin species do not show suchpatterns. In the bottlenose dolphin, for example, depth and relief
are consistently the most important variables predicting its distri-bution (Azzellino et al., 2008; Cañadas et al., 2005; Cubero-Pardo,2007; Davis et al., 2002; Hastie et al., 2003; Lusseau and Wing,2006), which coupled with the wide diversity of feeding strategiesobserved in this species (e.g.: Silber and Fertl, 1995; Smolker et al.,1997; Bearzi et al., 1999), suggests a more plastic ecology.
4.1. Platforms of opportunity data limitations
Our results showed that data obtained through platforms ofopportunity can be extremely useful in studying cetacean ecology.Several limitations have been pointed out in such data as comparedto data obtained from dedicated surveys, the most important being:(1) unsystematic sampling effort leading to biased results (e.g. Wallet al., 2006); and (2) unreliability of species identification due toinexperienced observers collecting data (e.g. Hauser et al., 2006). Asfor unsystematic sampling, our results show that only the directobservational effort data (i.e. whale watching company e WWC e
dataset) showsuchaproblem,with results overlapping stronglywiththe cloud of data points. However, when the models were projectedfor the rest of the coast, the results were very consistent with theSociety for the Study of Birds (SPEA) dataset models, particularly themodel where data from all years was pooled. Although there aredifferences, the most important environmental variables wereconsistent and the suitable areas overlapped largely, showing thattheWWCdatasetmodelwas relatively transferable. Therefore,whentrying to minimize bias from unsystematic sampling associatedwithopportunistic data, it appears to bemore important to pool data frommultiple years rather than several different areas.
Inexperienced observers can mistake striped dolphins (Stenellacoeruleoalba) for common dolphins in Portuguese waters (pers.obs.). Although it is definitely a possibility as no records werevalidated, records from the SPEA dataset together with our ownfield experience in the area indicate that the striped dolphin isobserved much less frequently than the common dolphin; as suchwe do not believe it significantly affected our results. Additionally,both independent datasets gave similar results, which are consis-tent with previous studies showing that common dolphins tend tooccur in highly productive areas (Reilly, 1990; Reilly and Fiedler,1994; Fiedler and Reilly, 1994; Cañadas and Hammond, 2008;Jefferson et al., 2009) and feed almost exclusively on pelagicschooling fish (Silva, 1999; de Pierrepont et al., 2005; Pusineri et al.,2007; Meynier et al., 2008).
4.2. Conservation implications
Given our data, we suggest that a decline in sardine populationscould result in a reduction of local common dolphin populations.While sardine abundance estimate and port landings experiencestrong cycles (Santos et al., 2001; Borges et al., 2003; Marques et al.,2003), both have shown a decreasing trend in the last 20 years(Borges et al., 2003; Marques et al., 2003), and signs of sardineoverfishing in the Portuguese mainland coast are documented(Baeta et al., 2009).
Table 2Mean percentage contribution of each variable to the whale watching company (WWC) ensemble Maxent models (all years: 2005 to 2007; years 2005, 2006 and 2007; andmonths May, June, July, August and September). The two most important variables are presented in bold.
Variables All years 2005 2006 2007 May June July August September
Depth 3.19 4.06 9.15 8.21 5.67 21.34 6.81 2.79 22.31Chlorophyll 73.5 62.26 55.17 58.08 79.26 51.05 77.32 84.76 61.19Depth SD 1.67 1.66 4.6 4.99 4.34 4.99 3.55 1.8 6.85SST SD 6.68 8.97 7.65 14.69 8.09 6.12 3.67 2.15 7.82SST 14.96 23.04 23.43 14.02 2.64 16.5 8.65 8.49 1.83
A.E. Moura et al. / Acta Oecologica 38 (2012) 24e32 29
Author's personal copy
Based on bothWWC and SPEA records, it becomes clear that thecommon dolphin is disproportionally more abundant than anyother cetacean species in the Portuguese coast (data not shown).However, that is not the case in other European locations such asthe North Sea (Hammond et al., 2002) or the Mediterranean Sea(Bearzi et al., 2006; Segura et al., 2006). Several examples have
been described where once abundant species declined drasticallyand became endangered in a surprisingly short time frame, mainlydue to overexploitation or habitat interference (Gaston and Fuller,2008). In fact, a drastic decline in the occurrence of commondolphin in the Mediterranean coincided with the peak in totalfisheries landings in the area (Bearzi et al., 2006), a scenario that, inlight of the present results, should not be ruled out in the Portu-guese coast or other locations throughout the species distributionwhen considering conservation efforts. The occurrence of abundantspecies is, paradoxically, quite rare, and when they do occur, theytend to have disproportionate effects on their ecosystems (Gastonand Fuller, 2008), and should thus be the focus of conservationattention.
5. Concluding remarks
Our results show a high dependency of the common dolphin ona well-defined habitat that is increasingly overexploited and inconstant decline. Therefore, we propose that more attention shouldbe given to the conservation of common dolphin in Portuguesewaters. A locally abundant species relying on an overexploitedhabitat is one of the cases identified as requiring more urgentconservation measures (Gaston and Fuller, 2008). In fact, beinga specialized animal with long generation times, the commondolphin is in the group of organisms more likely to suffer fromextinction debt, which is characterized by an apparent resistance tohabitat perturbation followed by a population crash once thehabitat is stabilized in a new state (Kuussaari et al., 2009). As such,although it might seem counter-intuitive, the moment to applyconservation measures might be now that the potential forperturbation is being identified rather than later when a decreasein the population becomes apparent.
Declaration of interests
Funding bodies had no role in neither the study design; in thecollection, analysis and interpretation of the data; nor in the deci-sion to write and submit the manuscript.
Acknowledgements
We are deeply grateful to the whale-watching company DolphinSeafaris for providing data for common dolphin sightings. We arealso indebted to Iván Ramiréz and Ana Meirinho from SociedadePortuguesa de Estudo das Aves (SPEA) for granting us access to theircommon dolphin sightings data, which were collected duringMarine IBAs LIFE Project (LIFE04 NAT/PT/000213). Pedro Tarrosohelped with obtaining and preparing environmental data.
Table 4Jackknife analysis of area under the curve (AUC) of receiver operated characteristics(ROC) plots, and gain percentile values for each environmental variable when usedin isolation and when omitted in Maxent models of Society for the Study of Birds(SPEA) dataset (years 2005, 2006 and 2007). Gain values corresponded to theaverage values over Maxent iterative runs. For models calculated with only onevariable, the variable or variables with the highest value are in bold; for modelscalculated without that variable, the variable or variables with the lowest value arein bold. Tr G: Training gain; Te G: Test gain; AUC: area under the curve of ROC plots;W�: without that variable; Wþ: only with that variable.
2005e2007 Tr G W� Tr G Wþ Te G W� Te G Wþ AUC W� AUC WþDepth 0.82 0.66 0.7 0.64 0.82 0.8Chlorophyll 0.85 0.69 0.72 0.63 0.82 0.8Depth SD 0.89 0.29 0.78 0.27 0.83 0.7SST SD 0.91 0.2 0.8 0.19 0.83 0.68SST 0.9 0.36 0.79 0.29 0.83 0.71
Table 3Jackknife analysis of area under the curve (AUC) of receiver operated characteristics(ROC) plots, and gain percentile values for each environmental variable when usedin isolation and when omitted in Maxent models of whale watching company(WWC) dataset (all years: 2005e2007; years 2005, 2006 and 2007; and monthsMay, June, July, August and September). Gain values corresponded to the averagevalues over Maxent iterative runs. For models calculated with only one variable, thevariable or variables with the highest value are in bold; for models calculatedwithout that variable, the variable or variables with the lowest value are in bold. TrG: Training gain; Te G: Test gain; AUC: area under the curve of ROC plots;W�: without that variable; Wþ: only with that variable.
2005e2007 Tr G W� Tr G Wþ Te G W� Te G Wþ AUC W� AUC WþDepth 0.64 0.49 0.49 0.4 0.77 0.71Chlorophyll 0.65 0.52 0.51 0.41 0.77 0.73Depth SD 0.65 0.25 0.51 0.13 0.77 0.63SST SD 0.61 0.17 0.47 0.06 0.76 0.62SST 0.61 0.53 0.45 0.52 0.76 0.772005 Tr G WL Tr G WD Te G W- Te G WD AUC WL AUC WD
Depth 1.09 0.76 1.07 0.76 0.88 0.82Chlorophyll 1.09 0.79 1.09 0.81 0.88 0.82Depth SD 1.09 0.44 1.11 0.43 0.88 0.72SST SD 1.06 0.18 1.09 0.2 0.88 0.68SST 1.01 0.81 1.03 0.93 0.87 0.852006 Tr G WL Tr G WD Te G WL Te G WD AUC WL AUC WD
Depth 1.03 0.73 0.89 0.72 0.85 0.8Chlorophyll 1.06 0.72 0.95 0.75 0.86 0.81Depth SD 1.05 0.31 0.98 0.28 0.86 0.7SST SD 1.01 0.09 0.94 0.08 0.86 0.61SST 0.89 0.71 0.76 0.79 0.82 0.822007 Tr G WL Tr G WD Te G WL Te G WD AUC WL AUC WD
Depth 0.77 0.52 0.84 0.54 0.84 0.76Chlorophyll 0.8 0.52 0.86 0.58 0.85 0.76Depth SD 0.77 0.29 0.83 0.29 0.84 0.67SST SD 0.72 0.34 0.78 0.37 0.83 0.72SST 0.72 0.61 0.79 0.67 0.83 0.81May Tr G WL Tr G WD Te G WL Te G WD AUC WL AUC WD
Depth 0.93 0.7 1.12 0.77 0.87 0.78Chlorophyll 0.92 0.74 1.07 0.94 0.87 0.85Depth SD 0.93 0.37 1.12 0.39 0.87 0.69SST SD 0.9 0.23 1.11 0.18 0.88 0.68SST 0.96 0.67 1.13 0.76 0.88 0.81June Tr G WL Tr G WD Te G WL Te G WD AUC WL AUC WD
Depth 0.95 0.73 0.89 0.71 0.85 0.79Chlorophyll 1.05 0.65 0.98 0.59 0.86 0.77Depth SD 1.04 0.38 0.95 0.3 0.86 0.67SST SD 0.98 0.24 0.88 0.24 0.85 0.7SST 0.93 0.38 0.82 0.43 0.83 0.76July Tr G WL Tr G WD Te G WL Te G WD AUC WL AUC WD
Depth 0.81 0.53 0.47 0.47 0.8 0.77Chlorophyll 0.75 0.65 0.42 0.57 0.79 0.79Depth SD 0.83 0.33 0.62 �0.07 0.81 0.67SST SD 0.83 0.04 0.53 0.04 0.8 0.56SST 0.81 0.14 0.49 0.13 0.8 0.62August Tr G WL Tr G WD Te G WL Te G WD AUC WL AUC WD
Depth 1.06 0.73 0.8 0.47 0.83 0.77Chlorophyll 0.95 0.92 0.63 0.8 0.81 0.84Depth SD 1.06 0.5 0.76 0.45 0.83 0.74SST SD 1.05 0.07 0.8 �0.01 0.84 0.52SST 1.03 0.16 0.75 0.08 0.83 0.61September Tr G WL Tr G WD Te G WL Te G WD AUC WL AUC WD
Depth 1 0.78 0.79 0.7 0.84 0.79Chlorophyll 1.01 0.72 0.85 0.59 0.84 0.79Depth SD 1.05 0.44 0.8 0.33 0.83 0.67SST SD 1.06 0.1 0.85 0.03 0.84 0.59SST 1.1 0.49 0.91 0.44 0.85 0.75
A.E. Moura et al. / Acta Oecologica 38 (2012) 24e3230

Author's personal copy
Malgorzata Pilot provided useful comments to the manuscript. AMand NS are supported respectively by a doctoral grant (SFRH/BD/28012/2006) and a post-doctoral position (SFRH/BPD/26666/2006)from FCT (Portugal). We also acknowledge the comments from twoanonymous reviewers that greatly improved initial versions of themanuscript.
References
Alcaraz, D., Paruelo, J., Cabello, J., 2006. Identification of current ecosystem func-tional types in the Iberian Peninsula. Global Ecol. Biogeogr. 15, 200e212.
Araújo, M.B., New, M., 2007. Ensemble forecasting of species distributions. TrendsEcol. Evol. 22, 42e47.
Austin, G.E., Thomas, C.J., Houston, D.C., Thompson, D.B., 1996. Predicting the spatialdistribution of buzzard Buteo buteo nesting areas using a geographical infor-mation system and remote sensing. J. Appl. Ecol. 33, 1541e1550.
Azzellino, A., Gaspari, S., Airoldi, S., Nani, B., 2008. Habitat use and preferences ofcetaceans along the continental slope and the adjacent pelagic waters in thewestern Ligurian Sea. Deep-Sea Res. Part I 55, 296e323.
Baeta, F., Costa, M.J., Cabral, H., 2009. Changes in the trophic level of Portugueselandings and fish market price variation in the last decades. Fish. Res. 97,216e222.
Bearzi, G., Politi, E., Agazzi, S., Azzellino, A., 2006. Prey depletion caused by overf-ishing and the decline of marine megafauna in eastern Ionian Sea coastalwaters (central Mediterranean). Biol. Conserv. 127, 373e382.
Bearzi, G., Politi, E., Notarbartolo-di-Sciara, G., 1999. Diurnal behavior of free-ranging bottlenose dolphins in the Kvarneric (northern Adriatic Sea). Mar.Mamm. Sci. 15, 1065e1097.
Bentivegna, F., Valentino, F., Falco, P., Zambianchi, E., Hochscheid, S., 2007. Therelationship between loggerhead turtle (Caretta caretta) movement patternsand Mediterranean currents. Mar. Biol. 151, 1605e1614.
Bierne, N., Bonhomme, F., David, P., 2003. Habitat preference and the marine-speciation paradox. Proc. R. Soc. Lond. B. 270, 1399e1406.
Borges, M.F., Santos, A.M.P., Crato, N., Mendes, H., Mota, B., 2003. Sardine regimeshifts off Portugal: a time series analysis of catches and wind conditions. Sci.Mar. 67, 235e244.
Cañadas, A., Hammond, P.S., 2008. Abundance and habitat preferences of the short-beaked common dolphin Delphinus delphis in the southwestern Mediterranean:implications for conservation. Endang. Species Res. 4, 309e331.
Cañadas, A., Sagarminaga, R., de Stephanis, R., Urquiola, E., Hammond, P.S., 2005.Habitat preference modelling as a conservation tool: proposals for marineprotected areas for cetaceans in southern Spanish waters. Aquat. Conserv. 15,495e521.
Carwardine, M., 1995. Whales, Dolphins, and Porpoises. Dorling Kindersley, London.Cubero-Pardo, P., 2007. Environmental factors governing the distribution of the
bottlenose (Tursiops truncatus) and the spotted dolphin (Stenella attenuata) ingolfo dulce, South Pacific, off Costa Rica. Investigaciones Marinas 35, 15e23.
Davis, R.W., Ortega-Ortiz, J.G., Ribic, C.A., Evans, W.E., Biggs, D.C., Ressler, P.H.,Cady, R.B., Leben, R.R., Mullin, K.D., Würsig, B., 2002. Cetacean habitat in thenorthern oceanic Gulf of Mexico. Deep-Sea Res. Part I 49, 121e142.
de Pierrepont, J.F., Dubois, B., Desormonts, S., Santos, M.B., Robin, J.P., 2005. Stomachcontents of english channel cetaceans stranded on the coast of Normandy.J. Mar. Biol. Ass. UK 85, 1539e1546.
Elith, J., Graham, C., Anderson, R., Dudik, M., Ferrier, S., Guisan, A., Hijmans, R.,Huettmann, F., Leathwick, J., Lehmann, A., Li, J., Lohmann, L., Loiselle, B.,Manion, G., Moritz, C., Nakamura, M., Nakazawa, Y., Overton, J., Peterson, A.T.,Phillips, S.J., Richardson, K., Scachetti-Pereira, R., Schapire, R., Soberón, J.,Williams, S., Wisz, M., Zimmermann, N.E., 2006. Novel methods improveprediction of species’ distributions from occurrence data. Ecography 29,129e151.
Evans, P.G.H., Hammond, P.S., 2004. Monitoring cetaceans in European waters.Mamm. Rev. 34, 131e156.
Fiedler, P.C., Reilly, S.B., 1994. Interannual variability of dolphin habitats in theeastern tropical Pacific. II: effects on abundances estimated from tuna vesselsightings, 1975e1990. Fish. Bull. 92, 451e463.
Folkens, P.A., Reeves, R.R., Stewart, B.S., Clapham, P.J., Powell, J.A., 2002. Guide toMarine Mammals of the World. Alfred A. Knopf.
Garrido, S., Ben-Hamadou, R., Oliveira, P.B., Cunha, M.E., Chícharo, M.A., van derLingen, C.D., 2008. Diet and feeding intensity of sardine Sardina pilchardus:correlation with satellite-derived chlorophyll data. Mar. Ecol. Prog. Ser. 354,245e256.
Garrido, S., Marçalo, A., Zwolinski, J., van der Lingen, C.D., 2007. Laboratory inves-tigations on the effect of prey size and concentration on the feeding behaviourof Sardina pilchardus. Mar. Ecol. Prog. Ser. 330, 189e199.
Gaston, K.J., Fuller, R.A., 2008. Commonness, population depletion and conservationbiology. Trends Ecol. Evol. 23, 14e19.
Gottfried, M., Pauli, H., Reiter, K., Grabherr, G., 1999. A fine-scaled predictive modelfor changes in species distribution patterns of high mountain plants induced byclimate warming. Divers. Distrib 5, 241e251.
Guisan, A., Broennimann, O., Engler, R., Vust, M., Yoccoz, N.G., Lehmann, A.,Zimmermann, N.E., 2006. Using niche-based models to improve the sampling ofrare species. Conserv. Biol. 20, 501e511.
Guisan, A., Zimmermann, N.E., 2000. Predictive habitat distribution models inecology. Ecol. Model. 135, 147e186.
Hammond, P.S., Berggren, P., Benke, H., Borchers, D.L., Collet, A., Heide-Jørgensen, M.P., Heimlich, S., Hiby, A.R., Leopold, M.F., Øien, N., 2002. Abun-dance of harbour porpoise and other cetaceans in the North Sea and adjacentwaters. J. App. Ecol. 39, 361e376.
Hastie, G.D., Wilson, B., Thompson, P.M., 2003. Fine-scale habitat selection bycoastal bottlenose dolphins: application of a new land-based video-montagetechnique. Can. J. Zool. 81, 469e478.
Hauser, D.D.W., Vanblaricom, G.R., Holmes, E.E., Osborne, R.W., 2006. Evaluating theuse of whalewatch data in determining killer whale (Orcinus orca) distributionpatterns. J. Cetacean Res. Manage. 8, 273e281.
Hernandez, P.A., Graham, C.H., Master, L.L., Albert, D.L., 2006. The effect of samplesize and species characteristics on performance of different species distributionmodeling methods. Ecography 29, 773e785.
Heyning, J.E., Perrin, W.F., 1994. Evidence for two species of common dolphin(genus Delphinus) form the eastern north pacific. Nat. Hist. Mus. Los Ang.County Contrib. Sci. 442, 1e35.
Hutchinson, G.E., 1957. Concluding remarks. Cold Spring Harb. Symp. Quant Biol. 22,415e427.
Isari, S., Psarra, S., Pitta, P., Mara, P., Tomprou, M., Ramfos, A., Somarakis, S.,Tselepides, A., Koutsikopoulos, C., Fragopoulu, N., 2007. Differential patterns ofmesozooplankters distribution in relation to physical and biological variables ofthe northeastern Aegean Sea (easternMediterranean). Mar. Biol.151,1035e1050.
Jackson, J.B.C., Cheetham, A.H., 1999. Tempo and mode of speciation in the sea.Trends Ecol. Evol. 14, 72e77.
Jefferson, T.A., Fertl, D., Bolaños-Jiménez, J., Zerbini, A.N., 2009. Distribution ofcommon dolphins (Delphinus spp.) in the western Atlantic ocean: a critical re-examination. Mar. Biol. 156, 1109e1124.
Kingston, S.E., Rosel, P.E., 2004. Genetic differentiation among recently divergeddelphinid taxa determined using AFLP markers. J. Hered. 95, 1e10.
Kuussaari, M., Bommarco, R., Heikkinen, R.K., Helm, A., Krauss, J., Lindborg, R.,Öckinger, E., Pärtel, M., Pino, J., Rodà, F., Stefanescu, C., Teder, T., Zobel, M.,Steffan-Dewenter, I., 2009. Extinction debt: a challenge for biodiversityconservation. Trends Ecol. Evol. 24, 564e571.
Liu, C., Berry, P.M., Dawson, T.P., Pearson, R.G., 2005. Selecting thresholds ofoccurrence in the prediction of species distributions. Ecography 28, 385e393.
Lusseau, S.M., Wing, S.R., 2006. Importance of local production versus pelagicsubsidies in the diet of an isolated population of bottlenose dolphins Tursiopssp. Mar. Ecol. Prog. Ser. 321, 283e293.
Marques, V., Morais, A., Pestana, G., 2003. Distribuição, Abundância e Evolução doManancial de Sardinha Presente na Plataforma Continental Portuguesa Entre1995 e 2002. Relat. Cient. Téc. IPIMAR, Série digital. http://ipimar-iniap.ipimar.pt 10, 29.
Meynier, L., Pusineri, C., Spitz, J., Santos, M.B., Pierce, G.J., Ridoux, V., 2008. Intra-specific dietary variation in the short-beaked common dolphin Delphinus del-phis in the Bay of Biscay: importance of fat fish. Mar. Ecol. Prog. Ser. 354,277e287.
Mirimin, L., Westgate, A., Rogan, E., Rosel, P., Read, A., Coughlan, J., Cross, T., 2009.Population structure of short-beaked common dolphins (Delphinus delphis) inthe North Atlantic Ocean as revealed by mitochondrial and nuclear geneticmarkers. Mar. Biol. 156, 821e834.
Murphy, S., Herman, J.S., Pierce, G.J., Rogan, E., Kitchener, A.C., 2006. Taxonomicstatus and geographical cranial variation of common dolphins (Delphinus) inthe Eastern North Atlantic. Mar. Mamm. Sci. 22, 573e599.
Natoli, A., Cañadas, A., Peddemors, V.M., Aguilar, A., Vaquero, C., Fernández-Piqueras, P., Hoelzel, A.R., 2006. Phylogeography and alpha taxonomy of thecommon dolphin (Delphinus sp.). J. Evol. Biol. 19, 943e954.
Osborne, P.E., Alonso, J.C., Bryant, R.G., 2001. Modelling landscape-scale habitat useusing GIS and remote sensing: a case study with great bustards. J. App. Ecol. 38,458e471.
Palumbi, S.R., 1994. Genetic divergence, reproductive isolation, and marine speci-ation. Annu. Rev. Ecol. Syst. 25, 547e572.
Phillips, S.J., Anderson, R.P., Schapire, R.E., 2006. Maximum entropy modeling ofspecies geographic distributions. Ecol. Model. 190, 231e259.
Phillips, S.J., Dudik, M., 2008. Modeling of species distributions with Maxent: newextensions and a comprehensive evaluation. Ecography 31, 161e175.
Phillips, S.J., Dudík, M., Elith, J., Graham, C.H., Lehmann, A., Leathwick, J., Ferrier, S.,2009. Sample selection bias and presence-only distribution models: implica-tions for background and pseudo-absence data. Ecol. Appl. 19, 181e197.
Phillips, S.J., Dudík, M., Schapire, R.E., 2004. A maximum entropy approach tospecies distribution modeling. In: Proceedings of the Twenty-First InternationalConference on Machine Learning, pp. 655e662.
Pusineri, C., Magnin, V., Meynier, L., Spitz, J., Hassani, S., Ridoux, V., 2007. Food andfeeding ecology of the common dolphin (Delphinus delphis) in the oceanicnortheast Atlantic and comparison with its diet in neritic areas. Mar. Mamm.Sci. 23, 30e47.
Ravago-Gotanco, R.G., Magsino, R.M., Juinio-Meñez, M.A., 2007. Influence of thenorth equatorial current on the population genetic structure of Tridacna crocea(mollusca: tridacnidae) along the eastern Philippine seaboard. Mar. Ecol. Prog.Ser. 336, 161e168.
Reilly, S.B., 1990. Seasonal changes in distribution and habitat differences amongdolphins in the eastern tropical Pacific. Mar. Ecol. Prog. Ser. 66, 1e11.
Reilly, S.B., Fiedler, P.C.,1994. Interannual variability of dolphin habitats in the easterntropical Pacific. I: research vessel surveys, 1986e1990. Fish. Bull. 92, 434e450.
A.E. Moura et al. / Acta Oecologica 38 (2012) 24e32 31
Author's personal copy
Rosel, P.E., Dizon, A.E., Heyning, J.E., 1994. Genetic analysis of sympatric morpho-types of common dolphins (genus Delphinus). Mar. Biol. 119, 159e167.
Santos, A.M.P., Borges, M.F., Groom, S., 2001. Sardine and horse mackerel recruit-ment and upwelling off Portugal. ICES. J. Mar. Sci. 58, 589e596.
Schluter, D., 2001. Ecology and the origin of species. Trends Ecol. Evol. 16, 372e380.Segura, A.G., Crespo, E.A., Pedraza, S.N., Hammond, P.S., Raga, J.A., 2006. Abundance
of small cetaceans in waters of the central Spanish Mediterranean. Mar. Biol.150, 149e160.
Sequeira, M., Inácio, A., Silva, M.A., Reiner, F., 1996. Arrojamentos de mamíferosmarinhos na costa continental Portuguesa entre 1989 e 1994. ICN, Lisboa.
Silber, G.K., Fertl, D., 1995. Intentional beaching by bottlenose dolphins (Tursiopstruncatus) in the Colorado River delta, Mexico. Aquatic Mammals 21,183e186.
Sillero, N., 2009. Potential distribution of the new populations of Hyla meridionalisin Salamanca (Spain). Acta Herpetologica 4, 83e98.
Sillero, N., 2010. Modelling new suitable areas for Hyla meridionalis in a current andfuture expansion scenario. Amphibia-Reptilia 31, 37e50.
Sillero, N., 2011. What does ecological modelling model? A proposed classificationof ecological niche models based on their underlying methods. Ecol. Model.222, 1343e1346.
Sillero, N., Barbosa, M., Martínez-Freiría, F., Raimundo, R., 2010. Los modelos denicho ecológico en la herpetología ibérica: pasado, presente y futuro. Boletín dela Asociación Herpetológica Española 21, 2e24.
Silva, M.A., 1999. Diet of common dolphins, Delphinus delphis, off the Portuguesecontinental coast. J. Mar. Biol. Ass. UK 79, 531e540.
Skov, H., Gunnlaugsson, T., Budgell, W.P., Horne, J., Nottestad, L., Olsen, E.,Soiland, H., Vikingsson, G., Waring, G., 2008. Small-scale spatial variability ofsperm and sei whales in relation to oceanographic and topographic featuresalong the mid-Atlantic ridge. Deep-Sea Res. Part II 55, 254e268.
Smolker, R., Richards, A., Connor, R., Mann, J., Berggren, P., 1997. Sponge carrying bydolphins (delphinidae, Tursiops sp.): a foraging specialization involving tooluse? Ethol. 103, 454e465.
Solanki, H.U., Mankodi, P.C., Nayak, S.R., Somvanshi, V.S., 2005. Evaluation ofremote-sensing-based potential fishing zones (PFZs) forecast methodology.Cont. Shelf Res. 25, 2163e2173.
Van der Wal, J., Shoo, L.P., Graham, C., Williams, S.E., 2009. Selecting pseudo-absence data for presence-only distribution modelling: how far should youstray from what you know? Ecol. Model. 220, 589e594.
Via, S., 2001. Sympatric speciation in animals: the ugly duckling grows up. TrendsEcol. Evol. 16, 381e390.
Wall, D., O’Brien, J., Meade, J., Allen, B.M., 2006. Summer distribution and relativeabundance of cetaceans off the west coast of Ireland. Biol. Environ. Proc. R. Ir.Acad. B. 106, 135e142.
Ware, D.M., Thomson, R.E., 2005. Bottom-up ecosystem trophic dynamics deter-mine fish production in the northeast pacific. Science 308, 1280e1284.
Williams, R., Hedley, S.L., Hammond, P.S., 2006. Modelling distribution and abun-dance of Antarctic baleen whales using ships of opportunity. Ecol. Soc. 11, 1.
Zainuddin, M., Kiyofuji, H., Saitoh, K., Saitoh, S.I., 2006. Using multi-sensor satelliteremote sensing and catch data to detect ocean hot spots for albacore (Thunnusalalunga) in the northwestern north pacific. Deep-Sea Res. Part II 53, 419e431.
A.E. Moura et al. / Acta Oecologica 38 (2012) 24e3232