Fine-scale genetic structure in short-beaked common dolphins ( Delphinus delphis ) along the East...
14
Mar Biol (2011) 158:113–126 DOI 10.1007/s00227-010-1546-x 123 ORIGINAL PAPER Fine-scale genetic structure in short-beaked common dolphins (Delphinus delphis) along the East Australian Current Luciana Möller · Fernanda Pedone Valdez · Simon Allen · Kerstin Bilgmann · Shannon Corrigan · Luciano B. Beheregaray Received: 17 January 2010 / Accepted: 13 September 2010 / Published online: 29 September 2010 © Springer-Verlag 2010 Abstract Oceanographic processes play a signiWcant role in shaping the genetic structure of marine populations, but it is less clear whether they aVect genetic diVerentiation of highly mobile vertebrates. We used microsatellite markers and mtDNA control region sequences to investigate the spatial genetic structure of short-beaked common dolphins (Delphinus delphis) in southeastern Australia, a region characterised by complex oceanographic conditions associ- ated with the East Australian Current (EAC). A total of 115 biopsy samples of dolphins were collected from six locali- ties spanning approximately 1,000 km of the New South Wales (NSW) coastline. We found evidence for contrasting genetic diversity and Wne-scale genetic structure, character- ised by three genetically diVerentiated populations with varying levels of admixture. Spatial genetic structure was not explained by a model of isolation by distance, instead it coincides with main patterns of oceanographic variation along the EAC. We propose that common dolphins along the EAC may be adapted to three water masses recently characterised in this region. Introduction Understanding spatial genetic connectivity of marine popu- lations is essential for conservation management and for identifying factors that promote genetic diVerentiation in the marine environment. Life-history traits, such as dis- persal capability and local recruitment, as well as eVective population size, ocean conditions and historical factors are recognised as playing an important role in shaping genetic structure of marine organisms (e.g. Galarza et al. 2009; Gonzalez and Zardoya 2007; Palumbi 2004). In cetacean populations, habitat association, foraging specialisations and kin interactions, in combination with past bottlenecks and periods of expansion and contraction, can lead to discontinuous relationships between genetic and geographic distance (reviewed in Hoelzel 2009). Accord- ingly, habitat discontinuities and changes in oceanographic features, prey distribution and philopatric behaviour have been identiWed as inXuencing the spatial genetic structure of several delphinid species (e.g. Bilgmann et al. 2007a; Fullard et al. 2000; Hoelzel et al. 1998a; Mendez et al. 2010; Möller et al. 2007; Natoli et al. 2005; Rosel et al. 2009). Common dolphins are globally distributed in temperate regions (Perrin 2009) and some tropical zones with unusu- ally cold, productive waters (JeVerson et al. 2009). Two species (Delphinus delphis and D. capensis) and two Communicated by C. Riginos. L. Möller (&) · L. B. Beheregaray Molecular Ecology Laboratory, School of Biological Sciences, Flinders University, Bedford Park, SA 5042, Australia e-mail: [email protected] L. Möller · K. Bilgmann Marine Mammal Research Group, Graduate School of the Environment, Macquarie University, Sydney, NSW 2109, Australia F. P. Valdez · S. Corrigan · L. B. Beheregaray Molecular Ecology Laboratory, Department of Biological Sciences, Macquarie University, Sydney, NSW 2109, Australia S. Allen Murdoch University Cetacean Research Unit, Centre for Fish and Fisheries Research, School of Biological Sciences and Biotechnology, Murdoch University, Perth, WA 6150, Australia
-
Upload
independent -
Category
Documents
-
view
0 -
download
0
Transcript of Fine-scale genetic structure in short-beaked common dolphins ( Delphinus delphis ) along the East...
Mar Biol (2011) 158:113–126
DOI 10.1007/s00227-010-1546-xORIGINAL PAPER
Fine-scale genetic structure in short-beaked common dolphins (Delphinus delphis) along the East Australian Current
Luciana Möller · Fernanda Pedone Valdez · Simon Allen · Kerstin Bilgmann · Shannon Corrigan · Luciano B. Beheregaray
Received: 17 January 2010 / Accepted: 13 September 2010 / Published online: 29 September 2010© Springer-Verlag 2010
Abstract Oceanographic processes play a signiWcant rolein shaping the genetic structure of marine populations, butit is less clear whether they aVect genetic diVerentiation ofhighly mobile vertebrates. We used microsatellite markersand mtDNA control region sequences to investigate thespatial genetic structure of short-beaked common dolphins(Delphinus delphis) in southeastern Australia, a regioncharacterised by complex oceanographic conditions associ-ated with the East Australian Current (EAC). A total of 115biopsy samples of dolphins were collected from six locali-ties spanning approximately 1,000 km of the New SouthWales (NSW) coastline. We found evidence for contrastinggenetic diversity and Wne-scale genetic structure, character-ised by three genetically diVerentiated populations with
varying levels of admixture. Spatial genetic structure wasnot explained by a model of isolation by distance, instead itcoincides with main patterns of oceanographic variationalong the EAC. We propose that common dolphins alongthe EAC may be adapted to three water masses recentlycharacterised in this region.
Introduction
Understanding spatial genetic connectivity of marine popu-lations is essential for conservation management and foridentifying factors that promote genetic diVerentiation inthe marine environment. Life-history traits, such as dis-persal capability and local recruitment, as well as eVectivepopulation size, ocean conditions and historical factors arerecognised as playing an important role in shaping geneticstructure of marine organisms (e.g. Galarza et al. 2009;Gonzalez and Zardoya 2007; Palumbi 2004).
In cetacean populations, habitat association, foragingspecialisations and kin interactions, in combination withpast bottlenecks and periods of expansion and contraction,can lead to discontinuous relationships between genetic andgeographic distance (reviewed in Hoelzel 2009). Accord-ingly, habitat discontinuities and changes in oceanographicfeatures, prey distribution and philopatric behaviour havebeen identiWed as inXuencing the spatial genetic structureof several delphinid species (e.g. Bilgmann et al. 2007a;Fullard et al. 2000; Hoelzel et al. 1998a; Mendez et al.2010; Möller et al. 2007; Natoli et al. 2005; Rosel et al.2009).
Common dolphins are globally distributed in temperateregions (Perrin 2009) and some tropical zones with unusu-ally cold, productive waters (JeVerson et al. 2009). Twospecies (Delphinus delphis and D. capensis) and two
Communicated by C. Riginos.
L. Möller (&) · L. B. BeheregarayMolecular Ecology Laboratory, School of Biological Sciences, Flinders University, Bedford Park, SA 5042, Australiae-mail: [email protected]
L. Möller · K. BilgmannMarine Mammal Research Group, Graduate School of the Environment, Macquarie University, Sydney, NSW 2109, Australia
F. P. Valdez · S. Corrigan · L. B. BeheregarayMolecular Ecology Laboratory, Department of Biological Sciences, Macquarie University, Sydney, NSW 2109, Australia
S. AllenMurdoch University Cetacean Research Unit, Centre for Fish and Fisheries Research, School of Biological Sciences and Biotechnology, Murdoch University, Perth, WA 6150, Australia
123
114 Mar Biol (2011) 158:113–126
subspecies (D. capensis tropicalis and D. delphis ponticus)are currently recognised (Perrin 2009), but the taxonomy iscontroversial and a revision of the genus is required (Ama-ral et al. 2009). Common dolphins are highly gregariousanimals with groups generally composed of dozens to hun-dreds of individuals (Bearzi et al. 2003; JeVerson et al.2007). They have a Xuid social structure, with some evi-dence for segregation in age and sex classes (Neumannet al. 2002; Perrin 2009), but kinship relationships areunlikely to be of importance (Viricel et al. 2008). Althoughtheir movements or migratory patterns are not well under-stood, they are highly mobile and capable of long-rangedispersal (hundreds of kilometres), which can be associatedwith the movement of their prey (e.g. in association withthe sardine migration in southern Africa, Cockcroft andPeddemors 1990). Common dolphins are believed to begeneralist predators feeding mainly on small schooling Wshand squid (JeVerson et al. 2007), and their diet is thought tovary both seasonally and regionally according to the distri-bution and abundance of prey items (e.g. Meyner et al.2008; Young and Cockcroft 1994). However, in manyareas, sardines and anchovies predominate in their diet (e.g.Kemper and Gibbs 2002; Meyner et al. 2008; Young andCockcroft 1994) and, in fact, most of their global distribu-tion (JeVerson et al. 2007, 2009) appears to coincide withthe distribution of these Wshes (Grant and Bowen 1998). InAustralia, common dolphins appear to be restricted to sub-tropical and temperate waters from southern Queenslandaround the south of the continent to Western Australia(JeVerson and van Waerebeek 2002). In southeastern andsouthern Australia, they appear to occur mainly in mediumwater depths over the continental shelf (Möller, pers. obs.).In this region, only the short-beaked form (currently recog-nised as D. delphis) has been reported (Bell et al. 2002;Bilgmann et al. 2008). In general, common dolphins havenot been well surveyed in Australia, and speciWc ranges,movements and population sizes are currently unknown(DEWHA 2010).
The few studies of the population genetic structure ofcommon dolphins around the world have been predomi-nantly reliant upon samples from stranded animals (e.g.Amaral et al. 2007; Mirimin et al. 2009; Natoli et al. 2006;Rosel et al. 1994; but see Bilgmann et al. 2008). Highgenetic diVerentiation has been reported between short-beaked and long-beaked forms (Natoli et al. 2006; Roselet al. 1994). In California, for example, genetic diVerentia-tion combined with morphological divergence led to theproposal of the two species (Heyning and Perrin 1994;Rosel et al. 1994). In short-beaked common dolphins, lowto moderate genetic diVerentiation has been reported onlyat geographical scales ¸1,500 km (e.g. Bilgmann et al.2008; Mirimin et al. 2009). Low genetic diVerentiation wasuncovered between western and eastern basins of the North
Atlantic, but populations within basins were homoge-nous—although samples originated only from high lati-tudes (Mirimin et al. 2009). In Australia, signiWcant geneticdiVerentiation has been reported between short-beakedcommon dolphins from South Australia and southeasternTasmania (»1,500 km apart), but not within approximately600 km of the central South Australian coastline (Bilgmannet al. 2008).
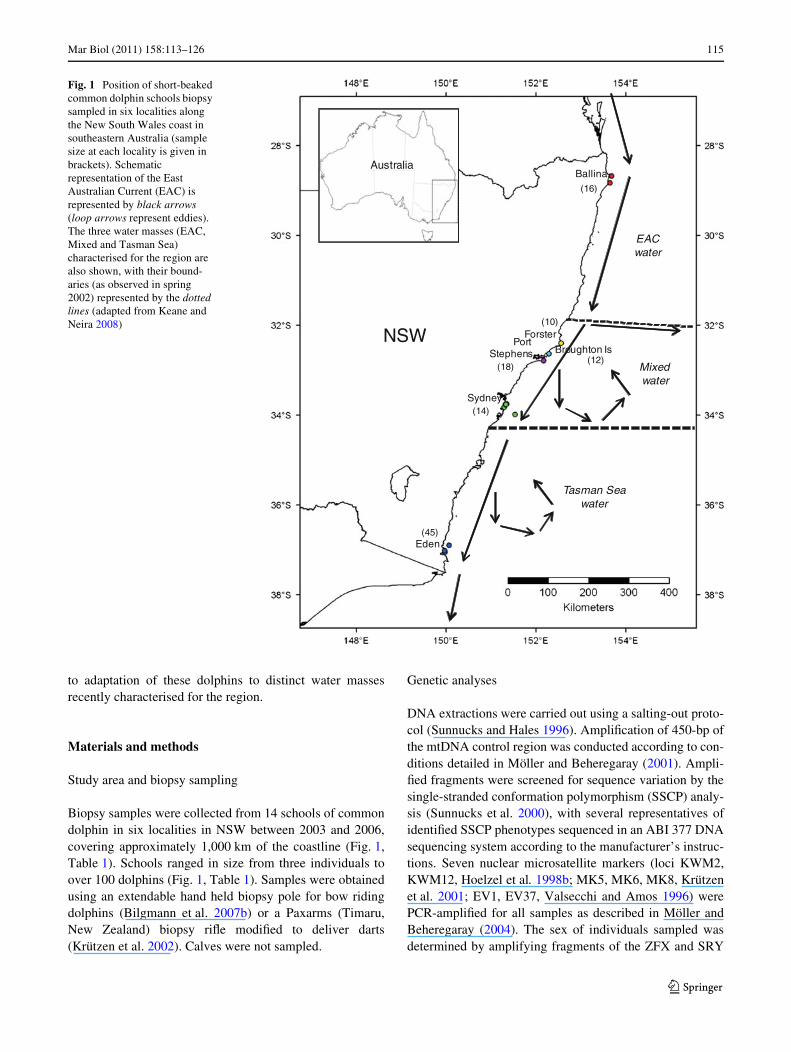
This study investigates the spatial genetic structure ofcommon dolphins in southeastern Australia along the NewSouth Wales (NSW) coast, a region where the East Austra-lian Current (EAC) dominates oceanographic conditions(Fig. 1). The EAC is a warm western boundary current thatXows southward and is characterised by four broad stages:the formation, which occurs along the mid-Queensland(QLD) coast from about 15°S to 24°S; the intensiWcation,mainly between 22°S (QLD) to 35°S (NSW); the separa-tion, where the current decelerates and detaches from thecoast at around 31°S (NSW), then turns sharply eastwardbetween 32°S and 35°S to Xow as the Tasman Front; andthe decline, where the southward Xow gradually weakensand becomes highly variable in strength and direction(Ridgway and Dunn 2003; Mata et al. 2006). South of theEAC separation, the region is characterised by periodiceddy formation (Godfrey et al. 1980; Ridgway and Dunn2003; Mata et al. 2006). However, the processes controllingthe timing and the spatial scales of current separation andeddy shedding remain unclear; the separation point variesseasonally and there are times when the current separatesfrom the continental slope north of 30°S (Mata et al. 2006).
The EAC zone of separation, which extends for approxi-mately 150 km (Ridgway and Dunn 2003), has been pro-posed to disrupt intra-speciWc genetic homogeneity in adirect developer snail (Hoskin 2000). A diVerent perspec-tive about biotic connectivity in this region has recentlyemerged in studies of planktonic dispersers. These studiesprovided evidence for Wne-scale genetic structure south ofthe EAC separation point in species with high dispersalpotential (e.g. for the sea urchin, Centrostephanusrodgersii, Banks et al. 2007; for the abalone, Haliotiscoccoradiata, Piggott et al. 2008).
Here, we use data from highly resolving microsatelliteDNA markers and mtDNA control region sequences to testthe hypothesis that the oceanographic variation found alongthe EAC has impacted on the contemporary genetic struc-ture of a highly mobile marine vertebrate—the short-beaked common dolphin (D. delphis). Our prediction wasthat genetic subdivision would be expected across the sepa-ration point of the EAC from the coast, which would act asan environmental barrier separating a northern from asouthern group of regional subpopulations. Our results sup-port this prediction but also revealed the presence of addi-tional genetic structure, a surprising Wnding that may relate
123
Mar Biol (2011) 158:113–126 115
to adaptation of these dolphins to distinct water massesrecently characterised for the region.
Materials and methods
Study area and biopsy sampling
Biopsy samples were collected from 14 schools of commondolphin in six localities in NSW between 2003 and 2006,covering approximately 1,000 km of the coastline (Fig. 1,Table 1). Schools ranged in size from three individuals toover 100 dolphins (Fig. 1, Table 1). Samples were obtainedusing an extendable hand held biopsy pole for bow ridingdolphins (Bilgmann et al. 2007b) or a Paxarms (Timaru,New Zealand) biopsy riXe modiWed to deliver darts(Krützen et al. 2002). Calves were not sampled.
Genetic analyses
DNA extractions were carried out using a salting-out proto-col (Sunnucks and Hales 1996). AmpliWcation of 450-bp ofthe mtDNA control region was conducted according to con-ditions detailed in Möller and Beheregaray (2001). Ampli-Wed fragments were screened for sequence variation by thesingle-stranded conformation polymorphism (SSCP) analy-sis (Sunnucks et al. 2000), with several representatives ofidentiWed SSCP phenotypes sequenced in an ABI 377 DNAsequencing system according to the manufacturer’s instruc-tions. Seven nuclear microsatellite markers (loci KWM2,KWM12, Hoelzel et al. 1998b; MK5, MK6, MK8, Krützenet al. 2001; EV1, EV37, Valsecchi and Amos 1996) werePCR-ampliWed for all samples as described in Möller andBeheregaray (2004). The sex of individuals sampled wasdetermined by amplifying fragments of the ZFX and SRY
Fig. 1 Position of short-beaked common dolphin schools biopsy sampled in six localities along the New South Wales coast in southeastern Australia (sample size at each locality is given in brackets). Schematic representation of the East Australian Current (EAC) is represented by black arrows (loop arrows represent eddies). The three water masses (EAC, Mixed and Tasman Sea) characterised for the region are also shown, with their bound-aries (as observed in spring 2002) represented by the dotted lines (adapted from Keane and Neira 2008)
Ballina
Forster
Broughton IsPort
Stephens
Sydney
Eden
NSW
Australia
(16)
(10)
(12)(18)
(14)
(45)
EACwater
Mixed water
Tasman Seawater
123
116 Mar Biol (2011) 158:113–126
genes by the polymerase chain reaction (PCR) (Gilson et al.1998). PCR conditions are reported in Möller et al. (2001).
Data analyses
Mitochondrial DNA control region sequences were editedand aligned in SEQUENCHER V.4.1.2 (Gene Codes Cor-poration, MI). Genetic diversity at the haplotype (h) andnucleotide (�) levels was estimated for samples at eachlocality using ARLEQUIN v.3.1 (ExcoYer et al. 2005).Values of haplotype diversity that take into account diVer-ences in sample size between localities were obtainedthrough a rarefaction analysis using CONTRIB (Petit et al.1998). Genetic diVerentiation using FST, which takes intoaccount haplotype frequencies, and �ST, which takes intoaccount genetic distance, were estimated using ARLEQUIN.�ST values were estimated using the Tamura-Nei model(gamma correction, � = 0.5) as suggested by MODELTESTv.3.06 (Posada and Crandall 1998), using the Akaike’sinformation criterion, as the most appropriate model ofsequence evolution for the dataset. Genealogical relation-ships of the haplotypes were investigated by constructing amedian-joining network in NETWORK v.4.510 (Bandeltet al. 1999) with default settings.
For microsatellites, the dataset of each putative popula-tion was initially checked for genotyping or scoring errors,caused by null alleles, stuttering and short allele domi-nance, using MICRO-CHECKER 2.2.3 (van Oosterhoutet al. 2004). Genetic variability was then estimated by cal-culating number of alleles and expected (HE) and observed(HO) heterozygosities using GENEPOP v.3.4 (Raymondand Rousset 1995). Allelic richness (AR), which takes sam-ple size into account, was estimated using FSTAT v.2.9.3(Goudet 2001). Tests for deviations from Hardy–Weinbergequilibrium (HWE), applying an exact test and 10,000
iterations, and tests for linkage disequilibrium were alsoconducted in GENEPOP. SigniWcance levels for the multi-ple tests were B–Y corrected to balance the risks of Type 1and Type 2 errors (Narum 2006), including for the FST
analysis (below).To evaluate the power of the dataset to diVerentiate
individuals, so that potential duplicate samples could beremoved, we calculated the probability of identity for fullsiblings (PIDsib) in GenAlEx v.6 (Peakall and Smouse2006). Initially, we estimated PIDsib including all samplesas a single population but the analysis was later repeatedfor each population when genetic subdivision was dis-closed.
Genetic diVerentiation between pairs of putative popu-lations was investigated by computing FST (signiWcanceassessed by 10,000 permutations) using ARLEQUINv.3.1 (ExcoYer et al. 2005). Analysis of FST was pre-ferred over RST (Slatkin 1995) as FST is more conservativefor estimation when sample sizes and number of loci arerelatively small (Gaggiotti et al. 1999). In addition, aBayesian clustering approach based on a spatial model(coloured Poisson-Voronoi tessellation) in GENELANDv.3.1.4 was used to infer the number of populations andtheir spatial boundaries. This model makes use of geno-types and spatial coordinates of sampled individuals tocluster them into populations that are approximately atHardy–Weinberg equilibrium, considering linkage equi-librium between loci (Guillot et al. 2009). For this analy-sis, an allele frequency correlated model was used, with100,000 MCMC iterations and thinning of 100, with 10independent runs, and minimum number of populationsset to one and maximum set to seven (number of samplesplus one to test for the possibility of further subdivision inthe dataset). For comparison, we also used the Bayesianclustering method implemented in STRUCTURE 2.3.1(Hubisz et al. 2009), which does not take into accountspatial information, to test the assignment of individualsamples to genetic clusters. The number of clusters(K) was inferred from the posterior probability distribu-tion Pr (K/X) calculated from the posterior probability ofthe data Log Pr (X/K). For this analysis, we used a burn inperiod of 100,000 iterations, runs of 106, values ofK between one and seven (number of samples plus one),series of Wve independent runs for each value of K, withthe admixture model using sampling locations as prior,and the correlated allele frequency model.
Isolation by distance (IBD) was tested using a Manteltest in IBDWS v.3.16 (Jensen et al. 2005), with statisticalsigniWcance assessed using 10,000 randomisations. Geo-graphical distances between the central positions of the sixsampling locations were calculated using the shortest dis-tance via the coastal environment approximately at the50 m isobath.
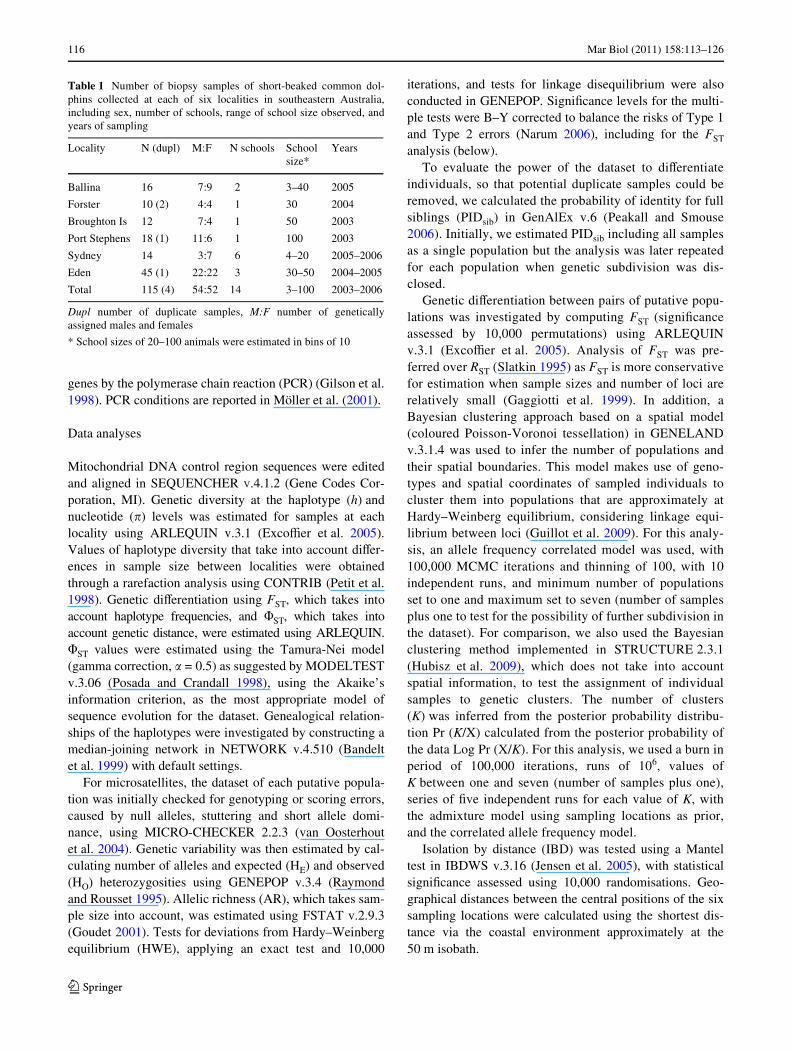
Table 1 Number of biopsy samples of short-beaked common dol-phins collected at each of six localities in southeastern Australia,including sex, number of schools, range of school size observed, andyears of sampling
Dupl number of duplicate samples, M:F number of geneticallyassigned males and females
* School sizes of 20–100 animals were estimated in bins of 10
Locality N (dupl) M:F N schools School size*
Years
Ballina 16 7:9 2 3–40 2005
Forster 10 (2) 4:4 1 30 2004
Broughton Is 12 7:4 1 50 2003
Port Stephens 18 (1) 11:6 1 100 2003
Sydney 14 3:7 6 4–20 2005–2006
Eden 45 (1) 22:22 3 30–50 2004–2005
Total 115 (4) 54:52 14 3–100 2003–2006
123
Mar Biol (2011) 158:113–126 117
Sex bias in dispersal was tested by comparing two statis-tical descriptors between males and females (FST and meancorrected assignment indices, mAIc) using FSTAT v.2.9.3,with signiWcance assessed by 10,000 randomisations(Goudet 2001). FST and mAIc are expected to be higher forthe more philopatric sex than for the more dispersing sex(Goudet et al. 2002).
A coalescence-based analysis with a Maximum Like-lihood strategy was employed to assess the possibility ofasymmetric migration and estimate migration rates inMIGRATE v.2.1.2 (Beerli 2008) using the microsatellitedataset. The dataset was partitioned into three popula-tions for analysis; northern NSW (Ballina), central NSW(Forster, Broughton Island, Port Stephens and Sydney)and southern NSW (Eden). This partitioning was basedon the results obtained with the spatial model in GENE-LAND, which identiWed these three as the most likelynumber and boundaries of genetic clusters in the dataset,in corroboration with the results from STRUCTURE andthe FST based on the mtDNA control region data. Forthe MIGRATE analysis, the Brownian motion modelwas used, and the migration rate (M = m*�) and theta(� = 4Ne�) (Beerli 2008) were initially estimated withFST (Markov chain settings were 10 short chains,100,000 trees sampled; 3 long chains, 1,000,000 treessampled, 10,000 trees discarded). A second simulationwas carried out with M values from the initial run andsame Markov chain settings. A third simulation was thenconducted to ensure convergence of results (30 shortchains, 100,000 trees sampled; 5 long chains, 1,000,000trees sampled, 10,000 trees discarded).
Results
Samples, Hardy–Weinberg equilibrium and linkage disequilibrium
In total, 115 samples were obtained, ranging from 12 to46 at each locality (Table 1). From these samples, fourwere considered duplicate samples based on a very lowprobability of identity for full siblings (range ofPIDsib = 0.001¡0.003), identical mtDNA control regionhaplotypes, microsatellite genotypes and same sex, withone of each pair subsequently removed from the dataanalyses. Of the remaining 111 samples, 54 were sexedas males and 52 as females, with Wve samples not suc-cessfully sexed (Table 1). There was no evidence fornull alleles, stutter bands or short allele dominance inthe microsatellite dataset. There was also no evidencefor Hardy–Weinberg disequilibrium at any locus orputative population, nor was there linkage disequilibrium
between any locus pair comparison after B–Y correc-tion.
Diversity and diVerentiation at mtDNA and genealogical relationships of haplotypes
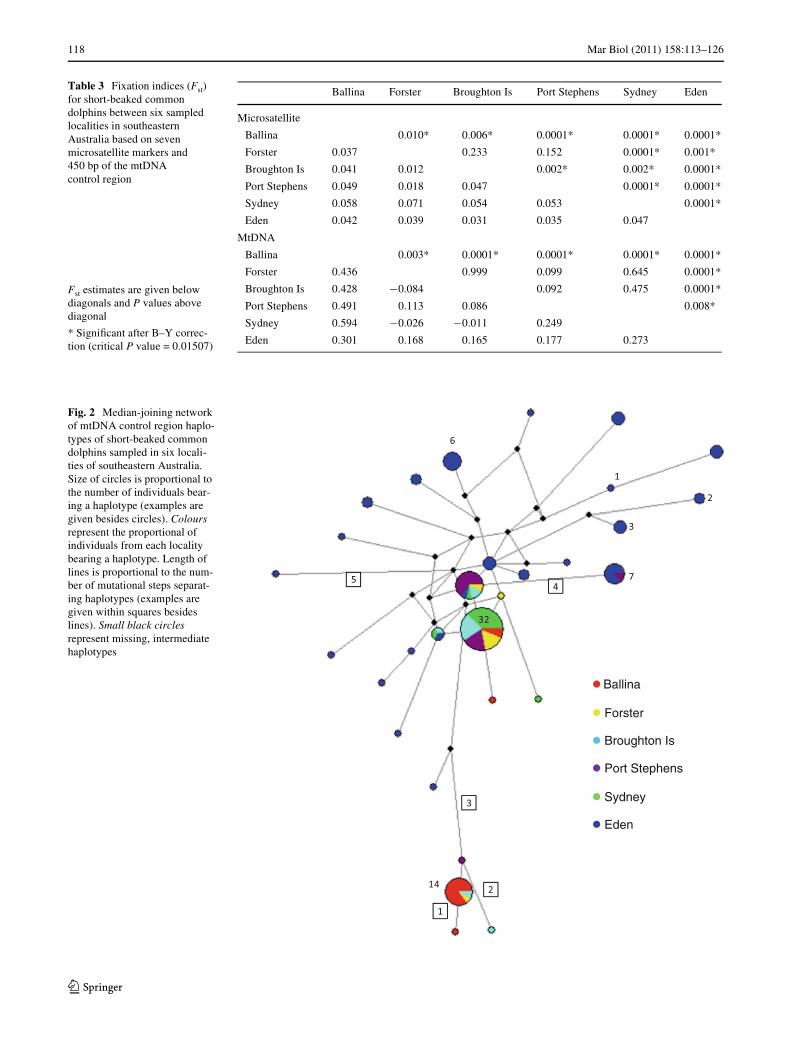
SSCP analysis and sequencing of 450 bp of the mtDNAcontrol region revealed 29 haplotypes, with between threeand 22 haplotypes identiWed per locality (Appendix 1,Table 2). Haplotypic diversity varied considerably betweenlocalities, with lower diversity found in Ballina, northernNSW, and higher diversity in Eden, southern NSW(Table 2). Nucleotide diversity was moderate to high, andagain, higher at Eden compared to the other localities(Table 2). There was low to high genetic diVerentiationbetween pairs of localities with FST values ranging from¡0.08 to 0.59 (Table 3), and an overall FST of 0.26(P < 0.0001). The same trend, albeit with generally largervalues, was found for the �ST pairwise comparisons (datanot shown). Localities in central NSW (Forster, BroughtonIsland, Port Stephens, Sydney, Fig. 1) were, with oneexception, not signiWcantly diVerent from each other,whereas Ballina in northern NSW and Eden in southernNSW (Fig. 1) were signiWcantly diVerent from all otherlocalities (Table 3). The median-joining network depicted acomplex branching pattern. A group of closely related,highly divergent lineages, including one high frequencyhaplotype, was mostly represented by individuals fromnorthern NSW. Another two closely related and high fre-quency haplotypes were generally represented by samplesfrom central NSW. By contrast, several highly divergentand low frequency haplotypes were represented by individ-uals from southern NSW (Fig. 2).
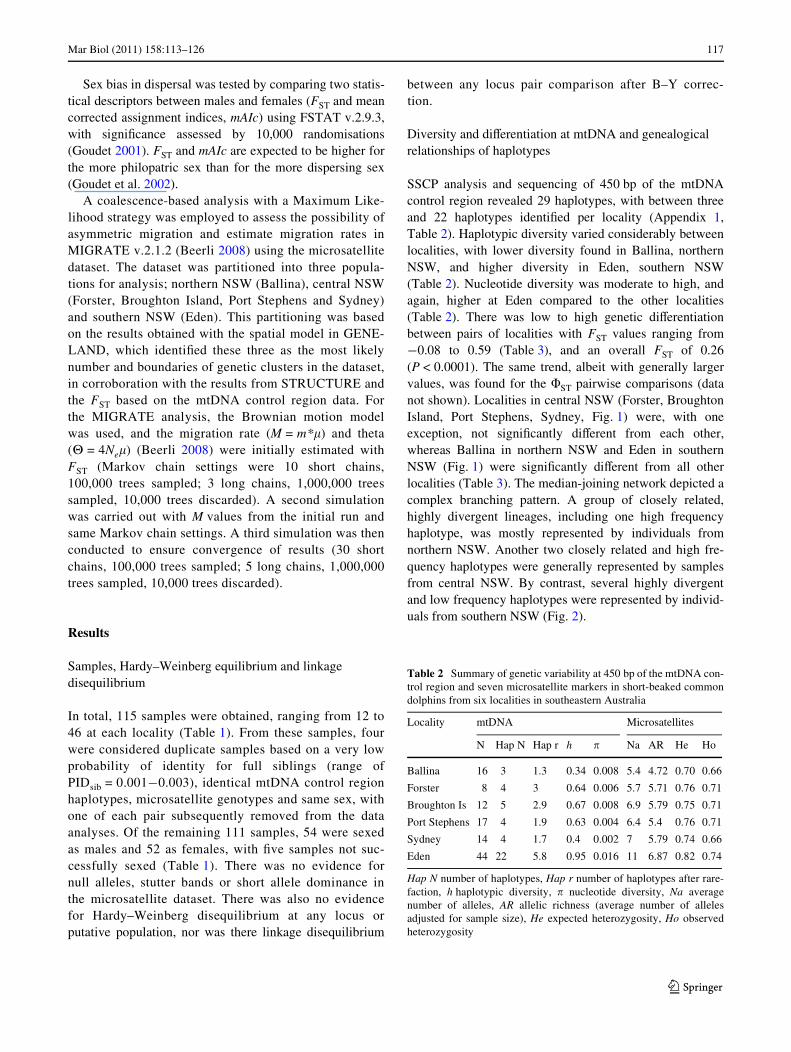
Table 2 Summary of genetic variability at 450 bp of the mtDNA con-trol region and seven microsatellite markers in short-beaked commondolphins from six localities in southeastern Australia
Hap N number of haplotypes, Hap r number of haplotypes after rare-faction, h haplotypic diversity, � nucleotide diversity, Na averagenumber of alleles, AR allelic richness (average number of allelesadjusted for sample size), He expected heterozygosity, Ho observedheterozygosity
Locality mtDNA Microsatellites
N Hap N Hap r h � Na AR He Ho
Ballina 16 3 1.3 0.34 0.008 5.4 4.72 0.70 0.66
Forster 8 4 3 0.64 0.006 5.7 5.71 0.76 0.71
Broughton Is 12 5 2.9 0.67 0.008 6.9 5.79 0.75 0.71
Port Stephens 17 4 1.9 0.63 0.004 6.4 5.4 0.76 0.71
Sydney 14 4 1.7 0.4 0.002 7 5.79 0.74 0.66
Eden 44 22 5.8 0.95 0.016 11 6.87 0.82 0.74
123
118 Mar Biol (2011) 158:113–126
Table 3 Fixation indices (Fst) for short-beaked common dolphins between six sampled localities in southeastern Australia based on seven microsatellite markers and 450 bp of the mtDNA control region
Ballina Forster Broughton Is Port Stephens Sydney Eden
Microsatellite
Ballina 0.010* 0.006* 0.0001* 0.0001* 0.0001*
Forster 0.037 0.233 0.152 0.0001* 0.001*
Broughton Is 0.041 0.012 0.002* 0.002* 0.0001*
Port Stephens 0.049 0.018 0.047 0.0001* 0.0001*
Sydney 0.058 0.071 0.054 0.053 0.0001*
Eden 0.042 0.039 0.031 0.035 0.047
MtDNA
Ballina 0.003* 0.0001* 0.0001* 0.0001* 0.0001*
Forster 0.436 0.999 0.099 0.645 0.0001*
Broughton Is 0.428 ¡0.084 0.092 0.475 0.0001*
Port Stephens 0.491 0.113 0.086 0.008*
Sydney 0.594 ¡0.026 ¡0.011 0.249
Eden 0.301 0.168 0.165 0.177 0.273
Fst estimates are given below diagonals and P values above diagonal
* SigniWcant after B–Y correc-tion (critical P value = 0.01507)
Fig. 2 Median-joining network of mtDNA control region haplo-types of short-beaked common dolphins sampled in six locali-ties of southeastern Australia. Size of circles is proportional to the number of individuals bear-ing a haplotype (examples are given besides circles). Colours represent the proportional of individuals from each locality bearing a haplotype. Length of lines is proportional to the num-ber of mutational steps separat-ing haplotypes (examples are given within squares besides lines). Small black circles represent missing, intermediate haplotypes
Ballina
Forster
Broughton Is
Port Stephens
Sydney
Eden
123
Mar Biol (2011) 158:113–126 119
Variability, diVerentiation and spatial structure at microsatellites
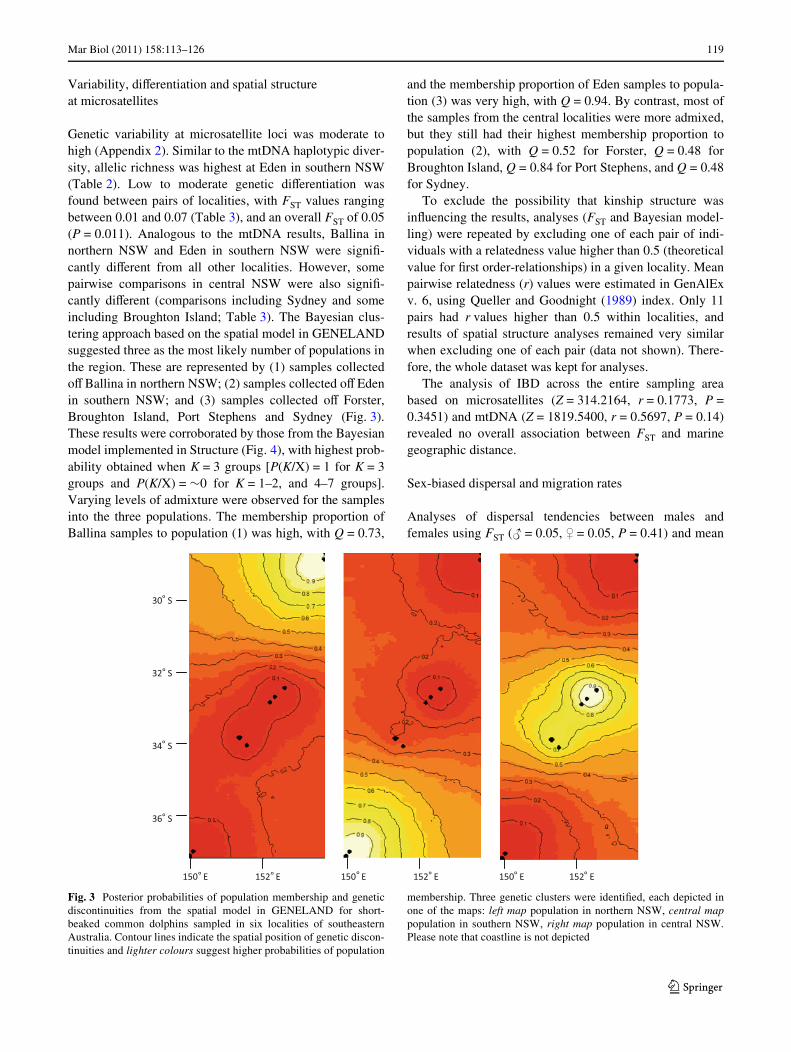
Genetic variability at microsatellite loci was moderate tohigh (Appendix 2). Similar to the mtDNA haplotypic diver-sity, allelic richness was highest at Eden in southern NSW(Table 2). Low to moderate genetic diVerentiation wasfound between pairs of localities, with FST values rangingbetween 0.01 and 0.07 (Table 3), and an overall FST of 0.05(P = 0.011). Analogous to the mtDNA results, Ballina innorthern NSW and Eden in southern NSW were signiW-cantly diVerent from all other localities. However, somepairwise comparisons in central NSW were also signiW-cantly diVerent (comparisons including Sydney and someincluding Broughton Island; Table 3). The Bayesian clus-tering approach based on the spatial model in GENELANDsuggested three as the most likely number of populations inthe region. These are represented by (1) samples collectedoV Ballina in northern NSW; (2) samples collected oV Edenin southern NSW; and (3) samples collected oV Forster,Broughton Island, Port Stephens and Sydney (Fig. 3).These results were corroborated by those from the Bayesianmodel implemented in Structure (Fig. 4), with highest prob-ability obtained when K = 3 groups [P(K/X) = 1 for K = 3groups and P(K/X) = »0 for K = 1–2, and 4–7 groups].Varying levels of admixture were observed for the samplesinto the three populations. The membership proportion ofBallina samples to population (1) was high, with Q = 0.73,
and the membership proportion of Eden samples to popula-tion (3) was very high, with Q = 0.94. By contrast, most ofthe samples from the central localities were more admixed,but they still had their highest membership proportion topopulation (2), with Q = 0.52 for Forster, Q = 0.48 forBroughton Island, Q = 0.84 for Port Stephens, and Q = 0.48for Sydney.
To exclude the possibility that kinship structure wasinXuencing the results, analyses (FST and Bayesian model-ling) were repeated by excluding one of each pair of indi-viduals with a relatedness value higher than 0.5 (theoreticalvalue for Wrst order-relationships) in a given locality. Meanpairwise relatedness (r) values were estimated in GenAlExv. 6, using Queller and Goodnight (1989) index. Only 11pairs had r values higher than 0.5 within localities, andresults of spatial structure analyses remained very similarwhen excluding one of each pair (data not shown). There-fore, the whole dataset was kept for analyses.
The analysis of IBD across the entire sampling areabased on microsatellites (Z = 314.2164, r = 0.1773, P =0.3451) and mtDNA (Z = 1819.5400, r = 0.5697, P = 0.14)revealed no overall association between FST and marinegeographic distance.
Sex-biased dispersal and migration rates
Analyses of dispersal tendencies between males andfemales using FST (# = 0.05, $ = 0.05, P = 0.41) and mean
Fig. 3 Posterior probabilities of population membership and geneticdiscontinuities from the spatial model in GENELAND for short-beaked common dolphins sampled in six localities of southeasternAustralia. Contour lines indicate the spatial position of genetic discon-tinuities and lighter colours suggest higher probabilities of population
membership. Three genetic clusters were identiWed, each depicted inone of the maps: left map population in northern NSW, central mappopulation in southern NSW, right map population in central NSW.Please note that coastline is not depicted
123

120 Mar Biol (2011) 158:113–126
assignment indices (# = 0.05, $ = ¡ 0.06, P = 0.58) sug-gested that there is no signiWcant sex bias in dispersal. Esti-mation of migration rates using the maximum likelihoodapproach suggests asymmetric migration between the threegenetic populations identiWed by the Bayesian models.Comparatively, very low migration was found from centraland southern NSW to northern NSW; low migration wasdetected from central NSW to southern NSW; and moder-ate migration was estimated from northern and southernNSW to central NSW (Table 4).
Discussion
Fine-scale genetic structure in short-beaked common dolphins along the EAC
Common dolphins in NSW coastal waters show Wne-scale genetic structure, at the scale of few hundred kilo-
metres, with at least three genetically diVerentiated pop-ulations with varying levels of admixture located insouthern, central and northern NSW. These results weresupported by analyses conducted with the microsatelliteand mitochondrial DNA control region data sets(Table 3, Figs. 3, 4). The spatial scale of genetic struc-ture presented here was unexpected, given the capacityfor long-range dispersal by these animals. For example,low to moderate genetic diVerentiation in this specieshas been previously reported only at geographical scales¸1,500 km (e.g. Bilgmann et al. 2008; Mirimin et al.2009). The pattern of Wne-scale genetic structureobserved in our study is not explained by a simple modelof isolation by distance, instead it appears to coincidewith variation in oceanographic conditions along theEAC (e.g. Godfrey et al. 1980; Ridgway and Dunn2003). The northern dolphin population is located in thearea of EAC intensiWcation, the central population islocated in the EAC zone of separation, an area characterised
Fig. 4 Bayesian clustering from STRUCTURE for short-beaked com-mon dolphins sampled in six localities of southeastern Australia. Themost likely number of genetic clusters in the data set was identiWed asthree. Each individual is represented by a vertical column partitioned
into three coloured segments, with the length proportional to the indi-vidual’s estimated membership coeYcient into the three groups:Northern NSW, Central NSW and Southern NSW
Table 4 Maximum likelihood estimation of asymmetric migration rates (M) in MIGRATE based on seven microsatellite markers between threepopulations of short-beaked common dolphins in southeastern Australia
The three populations were previously identiWed by genetic models in GENELAND and STRUCTURE. 95% conWdence intervals of estimates areprovided in brackets
(M = m*�), � = 4Ne�
To
� Northern NSW Central NSW Southern NSW
From
Northern 5.741 4.225 2.597
NSW (5.318–6.176) (3.761–4.723) (2.362–2.844)
Central 6.33 0.013 0.298
NSW (5.658–7.104) (0.004–0.03) (0.223–0.388)
Southern 23.577 0.013 3.96
NSW (20.540–26.964) (0.004–0.03) (3.501–4.467)
123
Mar Biol (2011) 158:113–126 121
by periodic eddy formation, and the southern populationis located in the EAC’s area of decline, where the inXu-ence of the EAC weakens. These areas were recentlycharacterised by three diVerent water masses with diVer-ent temperature proWles (but negligible variability insalinity), including the warmer EAC waters, the mixed(EAC and Tasman Sea) waters, and the colder TasmanSea waters (Keane and Neira 2008). Furthermore, thesewater masses were shown to present diVerent Wsh larvalassemblages (Keane and Neira 2008). Other studies havealso found evidence for genetic discontinuity associatedwith the EAC zone of separation (e.g. for the sea urchin,Centrostephanus rodgersii, Banks et al. 2007; for thegastropod, Bedeva hanleyi, Hoskin 2000; for the snap-per, Pagrus auratus, Sumpton et al. 2008). Variation inocean current circulation, through its inXuence on larvaltransport and recruitment appear to be responsible forthe patterns observed in such studies (e.g. Banks et al.2007). However, for the active disperser common dol-phin, a more plausible explanation is that the geneticdiVerentiation observed reXects the adaptation of theseanimals to the three diVerent water masses of the EAC.DiVerences in water temperature and dissimilar distribu-tion and abundance of schooling Wsh species have alsobeen suggested to explain the genetic diVerentiationfound between common dolphins occurring in SouthAustralia and Tasmania (Bilgmann et al. 2008). In SouthAustralia, sardines (Sardinops sagax) and anchovies(Engraulis australis) are known to comprise the major-ity of common dolphin diet (Kemper and Gibbs 2002),while in Tasmania their diet is more likely to includejack mackerel (Trachurus declivis) and redbait (Emme-lichthys nitidius) (Furlani et al. 2007). In anotherdelphinid, the common bottlenose dolphin (Tursiopstruncatus), population genetic structure along a contigu-ous distributional range from the Black Sea to theeastern North Atlantic was found to coincide with transi-tions between habitat regions characterised by oceano-graphic features such as surface salinity, productivityand temperature (Natoli et al. 2005). On smallergeographic scales, salinity gradients, habitat type andforaging specialisations have also been proposed to con-tribute to genetic diVerentiation between other bottle-nose dolphin populations (e.g. Bilgmann et al. 2007a;Möller et al. 2007; Sellas et al. 2005; Wiszniewski et al.2009).
Asymmetric migration between the common dolphin populations
The NSW common dolphins appear to show a strikingasymmetric migration pattern. A coalescence-basedanalysis of nuclear microsatellite DNA suggested that
migration has occurred mostly from southern and north-ern NSW to central NSW (Table 4). This is also appar-ent in the results of the Bayesian analysis ofSTRUCTURE, which shows higher levels of admixturefor the individuals belonging to the central population(Fig. 4). Analyses of sex-biased dispersal refuted thehypothesis of male-biased dispersal, as is generallyobserved in terrestrial mammals, and suggests that bothmales and females migrate. Interestingly, a similar pat-tern of asymmetric migration and no sex bias in dis-persal has been recently reported for coastal Indo-PaciWcbottlenose dolphins inhabiting the same region (Wisz-niewski et al. 2009). While migration from northern tocentral NSW for these animals may be due to the south-ward Xow of the EAC, migration from southern to cen-tral NSW is more diYcult to explain. This could berelated to the process of eddy formation after the EAC’sseparation point from the coast, which causes retroXec-tion of the EAC northward (Godfrey et al. 1980;Ridgway and Dunn 2003). For instance, just south ofSugarloaf Point (which is located at 32.5°S and gener-ally considered the point of separation), the northwardcurrents are common and eddies are considered circular(Tilburg et al. 2001). Concomitantly, migration could bemediated by northward movement of dolphins followingmigration of their prey. Sardines, which are known to beimportant in the diet of common dolphins in South Aus-tralia (Kemper and Gibbs 2002), migrate north along theNSW coast to secondary spawning areas in southernQLD (Ward et al. 2003), a pattern also observed forother marine Wsh species on the east coast of Australia(e.g. for the snapper Pagrus auratus; Sumpton et al.2008). Along the east coast of South Africa, for exam-ple, common dolphins are known to move northwardduring the annual sardine migration to take advantage ofthis plentiful food resource (Cockcroft and Peddemors1990; Young and Cockcroft 1994). Our estimates ofmigration rates, however, have to be taken with caution,given the assumptions of equilibrium and populationsize parity inherent to these analyses (Beerli 2008), aswell as the small sample sizes and number of microsatel-lite markers used.
DiVerences in genetic variability between common dolphin populations
The three identiWed populations along the NSW coastshow considerable diVerences in genetic variation, particu-larly at the mtDNA level. Haplotypic diversity (adjustedfor sample size) was much higher in southern NSW com-pared to northern NSW and intermediate in central NSW.The median-joining network shows that many of the lowfrequency haplotypes found in southern NSW are also
123

122 Mar Biol (2011) 158:113–126
highly divergent from each other. The high diversity foundin southern NSW is comparable to that reported for otherpopulations of short-beaked common dolphins (Amaralet al. 2009; Mirimin et al. 2009; Natoli et al. 2006),including those in other parts of Australia. In a study ofcommon dolphins in South Australia and Tasmania, Bilg-mann et al. (2008) reported similar levels of genetic diver-sity at the same segment of the mtDNA control region.The generally high genetic diversity characteristic ofshort-beaked common dolphins on a global scale has beensuggest to represent a signature of large, long-term eVec-tive population size (Amaral et al. 2009). Lower diversityin central and northern NSW, generally represented byclosely related and few abundant haplotypes in each of thetwo regions, may be due to range expansion by a smallnumber of maternal lineages from southern to northernNSW, and could be characteristic for these animals at theirdistributional range margin at lower latitudes, wherewaters are less productive. However, information at smallgeographical scales from other regions around the worldwould be required to test this hypothesis.
Implications for conservation and management and for the design of Marine Protected Areas (MPAs) in NSW
Common dolphin populations, particularly those inhab-iting near-shore coastal environments, are subject to arange of anthropogenic impacts throughout their globaldistribution. Australia’s east coast is no exception and,in a global study of cumulative human impacts onmarine ecosystems, the NSW coast was classiWed as aregion with medium to high impacts (Halpern et al.2008). In this area, common dolphins are exposed tointeractions with nature-based tourism (Gill and Burke1999) and numerous commercial Wsheries (Scandol et al.2008) and are subject to entanglement in anti-shark net-ting programs (Krogh and Reid 1996). Results from thisstudy, particularly the delineation of three common dol-phin populations which show low to moderate levels ofgenetic connectivity, should be taken into account by therelevant wildlife management agencies (NSW Depart-ment of Environment and Climate Change, Departmentof Primary Industries and Marine Parks AuthorityNSW). These results should also be considered whenidentifying additional areas for marine protection in
NSW (NSW Marine Parks Authority 2006). At present,six multiple use marine parks and 12 small aquaticreserves have been declared in NSW. These MPAs cur-rently lie within four coastal bioregions (Tweed-Mor-eton, Manning Shelf, Hawkesbury Shelf and BatemansShelf) and one marine province (Lord Howe). Two ofthe common dolphin populations identiWed in this studywere sampled within two of these marine parks: thenorthern population within Cape Byron Marine Park inthe Tweed-Moreton bioregion; and the central popula-tion within the Port Stephens-Great Lakes Marine Parkin the Manning Shelf bioregion. Nonetheless, protectedstatus has yet to be aVorded any site in one of NSW’scoastal bioregions, the Twofold Shelf. This bioregioncoincides with the area where the southern common dol-phin population was identiWed. This population showsthe highest genetic diversity compared to the other twopopulations, and appears to be the main source ofmigrants to the central population. While attaining pro-tection for animals with large home ranges such as dol-phins within marine parks may be a challenge, it seemsimportant that a MPA in the Twofold Shelf bioregion beestablished. A large-scale assessment of genetic diver-sity and connectivity of other marine organisms inNSW, including additional marine vertebrates with long-dispersal capabilities, would contribute towards a betterunderstanding on the role of the EAC in shaping geneticstructure in this region and the implications of this forthe design of MPAs in NSW and adjacent states.
Acknowledgments The authors would like to thank the people thathave provided logistical support for Weld eVorts (Owen and LindaGriYths, Alan and Libby Hepburn, Elizabeth Allen and Don Sinclair),contributed to the collection of samples (Robert Harcourt, JoannaWiszniewski, Peter Tung and Heidi Ahonen), and assisted withlaboratory and statistical analyses (Peter Teske, Sam Banks, CatherineAttard and Ana Amaral). Funding for this project was provided byMacquarie University. The research was carried out under scientiWcpermit from the New South Wales Government Department of Envi-ronment, Climate Change and Water, and approval from the MacquarieUniversity Animal Ethics Committee. This contribution representsmanuscript #36 of the Molecular Ecology Group for Marine Research(MEGMAR), a multi-institutional team initially supported by a Mac-quarie University Research Innovation Fund (grant MQ A006162).
Appendix 1
See Table 5.
123
Mar Biol (2011) 158:113–126 123
Appendix 2
See Table 6.
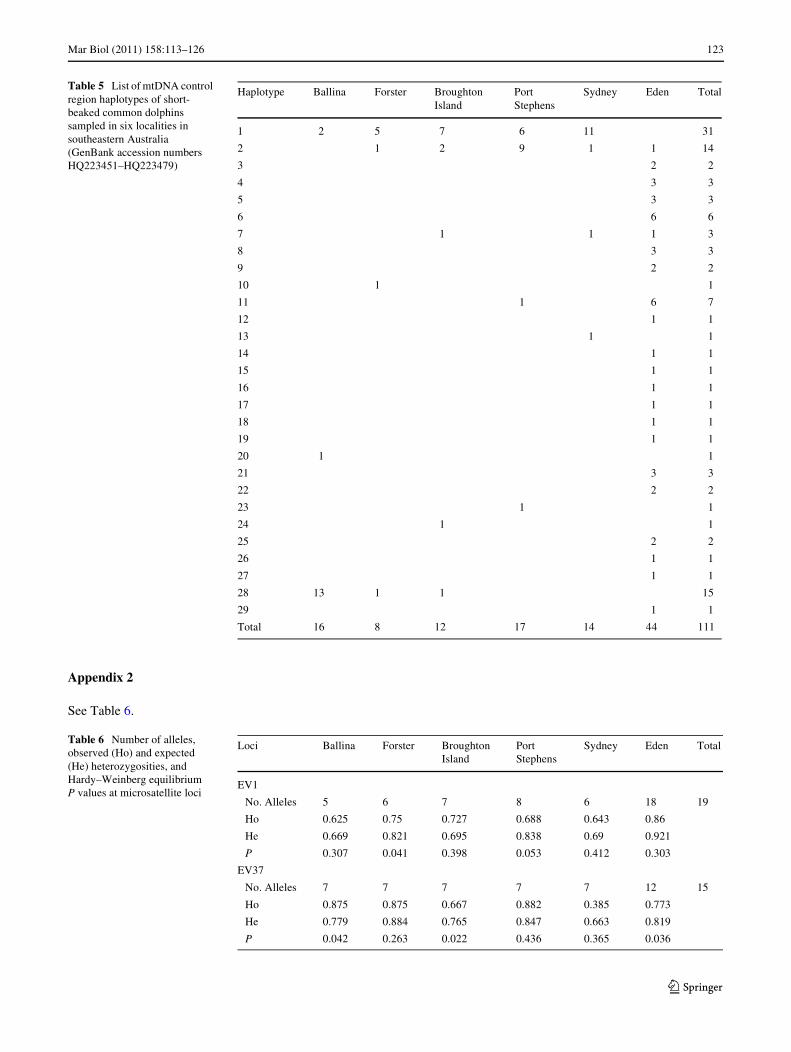
Table 5 List of mtDNA control region haplotypes of short-beaked common dolphins sampled in six localities in southeastern Australia (GenBank accession numbers HQ223451–HQ223479)
Haplotype Ballina Forster Broughton Island
Port Stephens
Sydney Eden Total
1 2 5 7 6 11 31
2 1 2 9 1 1 14
3 2 2
4 3 3
5 3 3
6 6 6
7 1 1 1 3
8 3 3
9 2 2
10 1 1
11 1 6 7
12 1 1
13 1 1
14 1 1
15 1 1
16 1 1
17 1 1
18 1 1
19 1 1
20 1 1
21 3 3
22 2 2
23 1 1
24 1 1
25 2 2
26 1 1
27 1 1
28 13 1 1 15
29 1 1
Total 16 8 12 17 14 44 111
Table 6 Number of alleles, observed (Ho) and expected (He) heterozygosities, and Hardy–Weinberg equilibrium P values at microsatellite loci
Loci Ballina Forster BroughtonIsland
Port Stephens
Sydney Eden Total
EV1
No. Alleles 5 6 7 8 6 18 19
Ho 0.625 0.75 0.727 0.688 0.643 0.86
He 0.669 0.821 0.695 0.838 0.69 0.921
P 0.307 0.041 0.398 0.053 0.412 0.303
EV37
No. Alleles 7 7 7 7 7 12 15
Ho 0.875 0.875 0.667 0.882 0.385 0.773
He 0.779 0.884 0.765 0.847 0.663 0.819
P 0.042 0.263 0.022 0.436 0.365 0.036
123
124 Mar Biol (2011) 158:113–126
References
Amaral AR, Sequeira M, Martínez-Cedeira J, Coelho MM (2007) Newinsights on population genetic structure of Delphinus delphisfrom the northeast Atlantic and phylogenetic relationships withinthe genus inferred from two mitochondrial markers. Mar Biol151:1967–1976
Amaral AR, Beheregaray LB, Coelho MM, Sequeira M, RobertsonKM, Möller LM (2009) Worldwide phylogeography of the genusDelphinus revisited. Report of the International Whaling Com-mission (SC/61/SM11)
Bandelt HJ, Forster P, Rohl A (1999) Median-joining networksfor inferring intraspeciWc phylogenies. Mol Biol Evol 16:37–48
Banks SC, Piggott MP, Williamson JE, Bove U, Holbrook NJ, Behe-regaray LB (2007) Oceanic variability and coastal topographyshape genetic structure in a long-dispersing sea urchin. Ecology88:3055–3064
Bearzi G, Reeves RR, Notarbartolo di Sciara G, Politi E, Cañadas A,Frantzis A, Mussi B (2003) Ecology, status and conservation ofshort-beaked common dolphins Delphinus delphis in the Mediter-ranean Sea. Mammal Rev 33:224–252
Beerli P (2008) Migrate version 3.0—a maximum likelihood andBayesian estimator of gene Xow using the coalescent. Availableat http://popgen.scs.edu/migrate.html
Bell CH, Kemper CM, Conran JG (2002) Common dolphins Delphi-nus delphis in southern Australia: a morphometric study. AustMammal 24:1–10
Bilgmann K, Möller LM, Harcourt RG, Gibbs SE, Beheregaray LB(2007a) Genetic diVerentiation in bottlenose dolphins from SouthAustralia: Association with local oceanography and coastal geog-raphy. Mar Ecol Prog Ser 341:265–276
Bilgmann K, GriYths OJ, Allen SJ, Möller LM (2007b) A biopsy polesystem for bow-riding dolphins: sampling success, behavioralresponses and test for sampling bias. Mar Mamm Sci 23:218–225
Bilgmann K, Möller LM, Gales R, Harcourt RG, Beheregaray LB(2008) Common dolphins subject to Wsheries impacts in SouthernAustralia are genetically diVerentiated: implications for conserva-tion. Anim Cons 11:518–528
Cockcroft VG, Peddemors VM (1990) Seasonal distribution and den-sity of common dolphins Delphinus delphis oV the south-eastcoast of Southern Africa. S Afr J Mar Sci 9:371–377
Department of the Environment, Water, Heritage and the Arts (2010)Delphinus delphis in species proWle and threats database, depart-ment of the environment, water, heritage and the arts, Canberra.Available at http://www.environment.gov.au/sprat
ExcoYer L, Laval G, Schneider S (2005) Arlequin ver. 3.0: An inte-grated software package for population genetics data analysis.Evol Bioinform Online 1:47–50
Fullard KJ, Early G, Heide-Jorgensen MP, Bloch D, Rosing-Asvid A,Amos W (2000) Population structure of long-Wnned pilot whalesin the North Atlantic: a correlation with sea surface temperature?Mol Ecol 9:949–958
Furlani D, Gales R, Pemberton D (2007) Otoliths of common Austra-lian temperate Wsh: a photographic guide. CSIRO Publishing,Collingwood, VIC
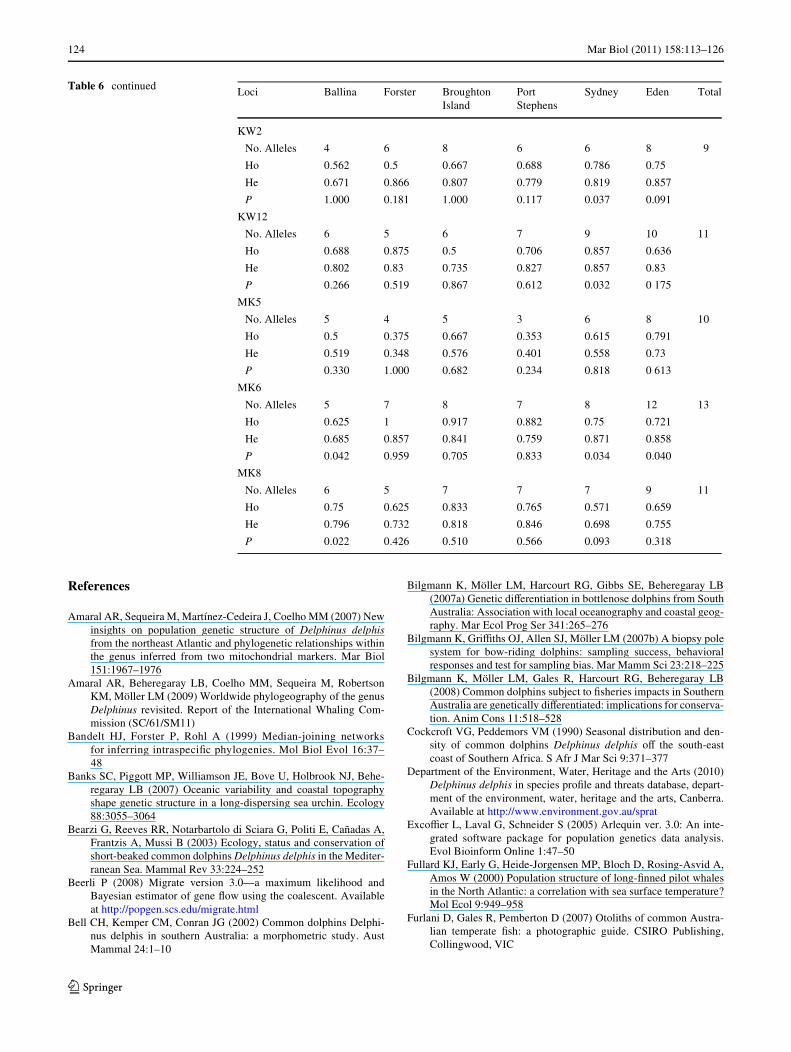
Table 6 continued Loci Ballina Forster BroughtonIsland
Port Stephens
Sydney Eden Total
KW2
No. Alleles 4 6 8 6 6 8 9
Ho 0.562 0.5 0.667 0.688 0.786 0.75
He 0.671 0.866 0.807 0.779 0.819 0.857
P 1.000 0.181 1.000 0.117 0.037 0.091
KW12
No. Alleles 6 5 6 7 9 10 11
Ho 0.688 0.875 0.5 0.706 0.857 0.636
He 0.802 0.83 0.735 0.827 0.857 0.83
P 0.266 0.519 0.867 0.612 0.032 0 175
MK5
No. Alleles 5 4 5 3 6 8 10
Ho 0.5 0.375 0.667 0.353 0.615 0.791
He 0.519 0.348 0.576 0.401 0.558 0.73
P 0.330 1.000 0.682 0.234 0.818 0 613
MK6
No. Alleles 5 7 8 7 8 12 13
Ho 0.625 1 0.917 0.882 0.75 0.721
He 0.685 0.857 0.841 0.759 0.871 0.858
P 0.042 0.959 0.705 0.833 0.034 0.040
MK8
No. Alleles 6 5 7 7 7 9 11
Ho 0.75 0.625 0.833 0.765 0.571 0.659
He 0.796 0.732 0.818 0.846 0.698 0.755
P 0.022 0.426 0.510 0.566 0.093 0.318
123
Mar Biol (2011) 158:113–126 125
Gaggiotti OE, Lange O, Rassmann K, Gliddon C (1999) A comparisonof two indirect methods for estimating average levels of gene Xowusing microsatellite data. Mol Ecol 8:1513–1520
Galarza JA, Carreras-Carbonell J, Macpherson E, Pascual M, RoquesS, Turner GF (2009) The inXuence of oceanographic fronts andearly-life-history traits on connectivity among littoral Wsh species.Proc Natl Acad Sci USA 106:1473–1478
Gill P, Burke C (1999) Whale watching in Australian and New Zealandwaters. New Holland, Sydney, p 148
Gilson A, Syvanen M, Levine K, Banks J (1998) Deer gender determi-nation by polymerase chain reaction: validation study and appli-cation to tissues, bloodstains, and hair forensic samples fromCalifornia. Calif Fish Game 84:159–169
Godfrey J, Cresswell G, Golding T, Pearce A, Boyd R (1980) Theseparation of the East Australian Current. J Phys Oceanogr10:430–440
Gonzalez EG, Zardoya R (2007) Relative role of life-history traits andhistorical factors in shaping genetic population structure of sar-dines (Sardina pilchardus). BMC Evol Biol 7:197
Goudet J (2001) FSTAT, a program to estimate and test gene diversi-ties and Wxation indices (version 2.9.3). Available at http://www.unil.ch/izea/softwares/fstat.html
Goudet J, Perrin N, Waser P (2002) Tests for sex-biased dispersalusing bi-parentally inherited genetic markers. Mol Ecol 11:1103–1114
Grant WS, Bowen BW (1998) Shallow population histories in deepevolutionary lineages of marine Wshes: insights from sardines andanchovies and lessons for conservation. J Hered 89:415–426
Guillot G, Santos F, Estoup A (2009) Population genetics analysisusing R and Geneland. Available at http://www2.imm.dtu.dk/»gigu/Geneland/
Halpern BS et al (2008) A global map of human impact on marine eco-systems. Science 319:948–952
Heyning JE, Perrin WF (1994) Evidence for two species of commondolphins (Genus Delphinus) from the eastern north PaciWc. Con-trib Sci 442:1–35
Hoelzel AR (2009) Evolution of population genetic structure in marinemammal species. In: Bertorelle G, Bruford MW, HauVe HC,Rizzoli A, Vernesi C (eds) Population genetics for animal conser-vation. Cambridge University Press, Cambridge, pp 294–318
Hoelzel AR, Potter CW, Best PB (1998a) Genetic diVerentiationbetween parapatric ‘nearshore’ and ‘oVshore’ populations of thebottlenose dolphin. Proc Royal Soc London B 265:1177–1183
Hoelzel AR, Dahlheim M, Stern SJ (1998b) Low genetic variationamong killer whales (Orcinus orca) in the eastern North PaciWcand genetic diVerentiation between foraging specialists. J Hered89:121–128
Hoskin MG (2000) EVects of the East Australian Current on the genet-ic structure of a direct developing muricid snail (Bedeva hanleyi,Angas): variability within and among local populations. Biol JLinn Soc 69:245–262
Hubisz MJ, Falush D, Stephens M, Pritchard JK (2009) Inferring weakpopulation structure with the assistance of sample group informa-tion. Mol Ecol Resour 9:1322–1332
JeVerson TA, Van Waerebeek K (2002) The taxonomic status of thenominal dolphin species Delphinus tropicalis van Bree, 1971.Mar Mamm Sci 18:787–818
JeVerson TA, Webber MA, Pitman RL (2007) Marine mammals of theworld: a comprehensive guide to their identiWcation. AcademicPress, San Diego
JeVerson TA, Fertl D, Bolanos-Jimenez J, Zerbini AN (2009) Distribu-tion of common dolphins (Delphinus spp.) in the western AtlanticOcean: a critical re-examination. Mar Biol 156:1109–1124
Jensen JL, Bohonak AJ, Kelley ST (2005) Isolation by distance, webservice. BMC Genetics 6: 13. v.3.16. Available at http://ibdws.sdsu.edu/
Keane JP, Neira FJ (2008) Larval Wsh assemblages along the south-eastern Australian shelf: linking mesoscale non-depth-discrimi-nate structure and water masses. Fish Oceanogr 17:263–280
Kemper CM, Gibbs SE (2002) Dolphin interactions with tuna feedlotsat Port Lincoln, South Australia and recommendations for mini-mising entanglements. J Cetacean Res Manag 3:283–292
Krogh M, Reid D (1996) Bycatch in the protective shark meshingprogramme oV south-eastern New South Wales, Australia. BiolConserv 77:219–226
Krützen M, Valsecchi E, Connor RC, Sherwin WB (2001) Character-ization of microsatellite loci in Tursiops aduncus. Mol Ecol Notes1:170–172
Krützen M, Barre LM, Möller LM, Heithaus MR, Simms C, SherwinWB (2002) A biopsy system for small cetaceans: darting successand wound healing in Tursiops spp. Mar Mamm Sci 18:863–878
Mata MM, WijVels SE, Church JA, Tomczak M (2006) Eddy sheddingand energy conversions in the East Australian Current. J GeophysRes 111:C09034
Mendez M, Rosenbaum HC, Subramaniam A, Yackulic C, Bordino P(2010) Isolation by environmental distance in mobile marine spe-cies: molecular ecology of franciscana dolphins at their southernrange. Mol Ecol 19:2212–2228
Meyner L, Pusineri C, Spitz J, Santos MB, Pierce GJ, Ridoux V (2008)IntraspeciWc dietary variation in the short-beaked common dol-phin Delphinus delphis in the Bay of Biscay: importance of fatWsh. Mar Ecol Prog Ser 354:277–287
Mirimin L, Westgate A, Rogna E, Rosel P, Read A, Coughlan J, Cross T(2009) Population structure of short-beaked common dolphins(Delphinus delphis) in the North Atlantic Ocean as revealed bymitochondrial and nuclear genetic markers. Mar Biol 156:821–834
Möller LM, Beheregaray LB (2001) Coastal bottlenose dolphins fromsoutheastern Australia are Tursiops aduncus according tosequences of the mitochondrial DNA control region. Mar MammSci 17:249–263
Möller LM, Beheregaray LB (2004) Genetic evidence for sex-biaseddispersal in resident bottlenose dolphins (Tursiops aduncus). MolEcol 13:1607–1612
Möller LM, Beheregaray LB, Harcourt RG, Krützen M (2001) Alli-ance membership and kinship in wild male bottlenose dolphins(Tursiops aduncus) of southeastern Australia. Proc Royal SocLondon B 268:1941–1947
Möller LM, Wiszniewski J, Allen SJ, Beheregaray LB (2007) Habitattype promotes rapid and localized genetic diVerentiation in dol-phins. Mar Freshw Res 58:640–648
Narum SR (2006) Beyond Bonferroni: less conservative analyses forconservation genetics. Conserv Genet 7:783–787
Natoli A, Birkun A, Aguilar A, Lopez A, Hoelzel AR (2005) Habitatstructure and the dispersal of male and female bottlenose dolphins(Tursiops truncatus). Proc Royal Soc London B 272:1217–1226
Natoli A, Cañadas A, Peddemors VM, Aguilar A, Vaquero C, Fernán-dez-Piqueras P, Hoelzel AR (2006) Phylogeography and alphataxonomy of the common dolphin (Delphinus sp.). J Evol Biol19:943–954
Neumann DR, Leitenberger A, Orams MB (2002) Photo-identiWcationof short-beaked common dolphins (Delphinus delphis) in north-east New Zealand: a photo-catalogue of recognisable individuals.N Z J Mar Freshw Res 36:593–604
NSW Marine Parks Authority (2006) NSW Marine Parks AuthorityStatus Report 2004–2005. 44pp. Available at http://www.mpa.nsw.gov.au
Palumbi SR (2004) Marine reserves and ocean neighborhoods: Thespatial scale of marine populations and their management. AnnuRev Environ Resour 29:31–68
Peakall R, Smouse PE (2006) GENALEX 6: genetic analyses in excel.Population genetic software for teaching and research. Mol EcolNotes 6:288–295
123

126 Mar Biol (2011) 158:113–126
Perrin WF (2009) Common dolphins. In: Perrin WF, Wursig B,Thewissen JGM (eds) Encyclopedia of marine mammals.Academic Press, San Diego, pp 255–259
Petit RJ, El Mousadik A, Pons O (1998) Identifying populations forconservation on the basis of genetic markers. Conserv Biol12:844–855
Piggott MP, Banks SC, Tung P, Beheregaray LB (2008) Geneticevidence for diVerent scales of connectivity in a marine mollusc.Mar Ecol Prog Ser 365:127–136
Posada D, Crandall KA (1998) MODELTEST: testing the model ofDNA substitution. Bioinformatics 14:817–818
Queller DC, Goodnight KF (1989) Estimating relatedness using genet-ic markers. Evolution 43:258–275
Raymond M, Rousset F (1995) Population genetics software for exacttests of ecumenicism. J Hered 86:248–249
Ridgway KR, Dunn JR (2003) Mesoscale structure of the mean EastAustralian Current System and its relationship with topography.Prog Oceanogr 56:189–222
Rosel PE, Dizon AE, Heyning JE (1994) Genetic analysis of sympatricmorphotypes of common dolphins (genus Delphinus). Mar Biol119:159–168
Rosel PE, Hansen L, Hohn AA (2009) Restricted dispersal in a contin-uously distributed marine species: common bottlenose dolphinsTursiops truncatus in coastal waters of the western North Atlan-tic. Mol Ecol 18:5030–5045
Scandol J, Rowling K, Graham K (eds) (2008) Status of Wsheriesresources in NSW 2006/07. NSW Department of Primary Indus-tries, Cronulla, p 334
Sellas AB, Wells RS, Rosel PE (2005) Mitochondrial and nuclearDNA analyses reveal Wne scale geographic structure in bottlenosedolphins (Tursiops truncatus) in the Gulf of Mexico. ConservGenet 6:715–728
Slatkin M (1995) A measure of population subdivision based on micro-satellite allele frequencies. Genetics 139:457–462
Sumpton WD, Ovenden JR, Keenan CP, Street R (2008) Evidence fora stock discontinuity of snapper (Pagrus auratus) on the eastcoast of Australia. Fish Res 94:92–98
Sunnucks P, Hales DF (1996) Numerous transposed sequences ofmitochondrial cytochrome oxidase I-II in aphids of the genusSitobion (Hemiptera: Aphididae). Mol Biol Evol 13:510–524
Sunnucks P, Wilson ACC, Beheregaray LB, Zenger K, French J,Taylor AC (2000) SSCP is not so diYcult: the application andutility of single-stranded conformation polymorphism in evolu-tionary biology and molecular ecology. Mol Ecol 9:1699–1710
Tilburg CE, Hurlburt HE, O’Brien JJ, Shriver JF (2001) The dynamicsof the East Australian Current system: the Tasman Front, the EastAuckland Current, and the East Cape Current. J Phys Oceanogr31:2917–2943
Valsecchi E, Amos W (1996) Microsatellite markers for the study ofcetacean populations. Mol Ecol 5:151–156
van Oosterhout C, Hutchinson WF, Wills DPM, Shipley P (2004)Micro-checker: software for identifying and correcting genotyp-ing errors in microsatellite data. Mol Ecol Note 4:535–538
Viricel A, Strand AE, Rosel PE, Ridoux V, Garcia P (2008) Insights oncommon dolphin (Delphinus delphis) social organization fromgenetic analysis of a mass-stranded pod. Behav Ecol Sociobiol63:173–185
Ward TM, Staunton-Smith J, Hoyle S, Halliday IA (2003) Spawningpatterns of four species of predominantly temperate pelagic Wshesin the sub-tropical waters of southern Queensland. Estuar CoastShelf Sci 56:1125–1140
Wiszniewski J, Beheregaray LB, Allen SJ, Moller LM (2009) Environ-mental and social inXuences on the genetic structure of bottlenosedolphins (Tursiops aduncus) in Southeastern Australia. Con Gen(Online early) doi:10.1007/s10592-009-9968-z
Young DD, Cockcroft VG (1994) Diet of common dolphins (Delphi-nus delphis) oV the south-east coast of southern Africa–opportun-ism or specialization? J Zool 234:41–53
123