COMMISSION OF THE EUROPEAN COMMUNITIES - EUR-Lex
187
COMMISSION OF THE EUROPEAN COMMUNITIES C0M(94) 464 final Brussels, 31.10.1994 TWENTY-THIRD FINANCIAL REPORT on THE EUROPEAN AGRICULTURAL GUIDANCE AND GUARANTEE FUND EAGGF GUARANTEE SECTION - 1993 -
-
Upload
khangminh22 -
Category
Documents
-
view
4 -
download
0
Transcript of COMMISSION OF THE EUROPEAN COMMUNITIES - EUR-Lex
COMMISSION OF THE EUROPEAN COMMUNITIES
C0M(94) 464 final Brussels, 31.10.1994
TWENTY-THIRD FINANCIAL REPORT
on
THE EUROPEAN AGRICULTURAL GUIDANCE AND GUARANTEE FUND
EAGGF
GUARANTEE SECTION
- 1993 -
3—_
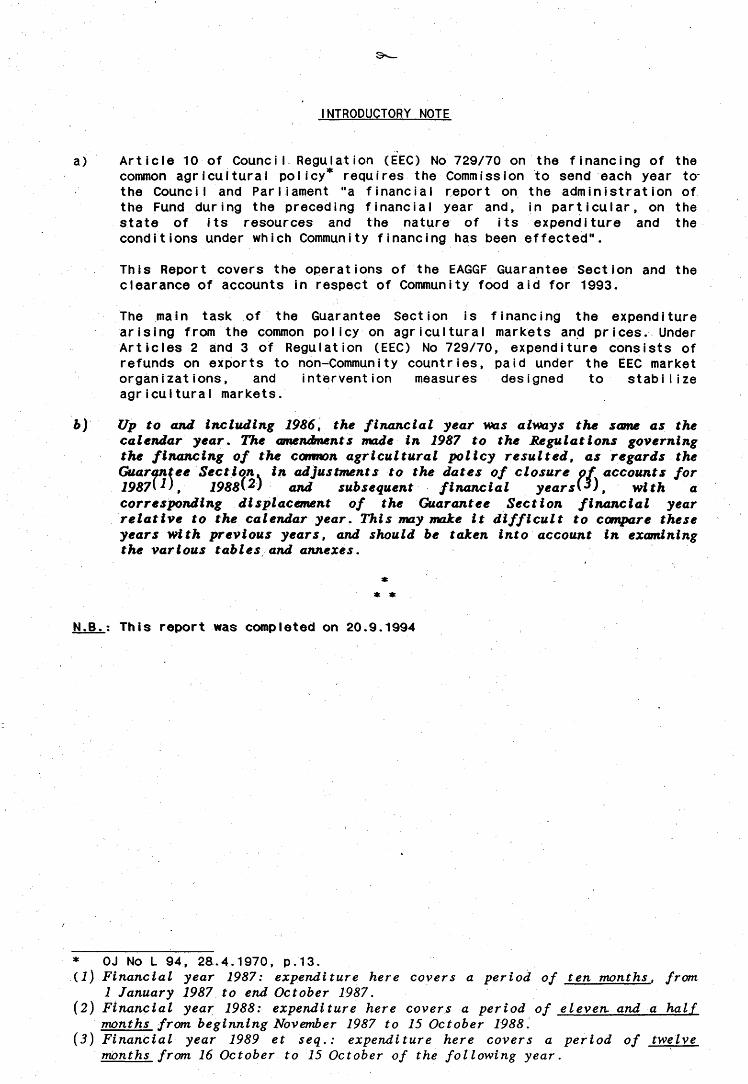
NTRODUCTORY NOTE
a) Article 10 of CounciI Régulât ion (EEC) No 729/70 on the financing of the common agricultural policy* requires the Commission to send each year to-the Council and Parliament "a financial report on the administration of the Fund during the preceding financial year and, in particular, on the state of its resources and the nature of its expenditure and the conditions under which Community financing has been effected".
This Report covers the operations of the EAGGF Guarantee Section and the clearance of accounts in respect of Community food aid for 1993.
The main task of the Guarantee Section is financing the expenditure arising from the common policy-on agricultural markets and prices. Under Articles 2 and 3 of Regulation (EEC) No 729/70, expenditure consists of refunds on exports to non-Community countries, paid under the EEC market organizations, and intervention measures designed to stabilize agricultural markets.
b) tip to and including 1986, the financial year was always the same as the calendar year. The amendments made in 1987 to the Regulations governing the financing of the common agricultural policy resulted, as regards the Guarantee Section, in adjustments to the dates of closure of accounts for 1987\1), 1988\2) and subsequent financial years'*), with a corresponding displacement of the Guarantee Section financial year relative to the calendar year. This may make it difficult to compare these years with previous years, and should be taken into account in examining the various tables and annexes.
* * *
N.B.: This report was completed on 20.9.1994
* 0J No L 94, 28.4.1970, p.13. (i) Financial year 1987: expenditure here covers a period of ten months, from
1 January 1987 to end October 1987. (2) Financial year 1988: expenditure here covers a period of eleven, and a half
months from beginning November 1987 to 15 October 1988.' (3) Financial year 1989 et seq.: expenditure here covers a period of twelve
months from 16 October to 15 October of the fotlowing year.
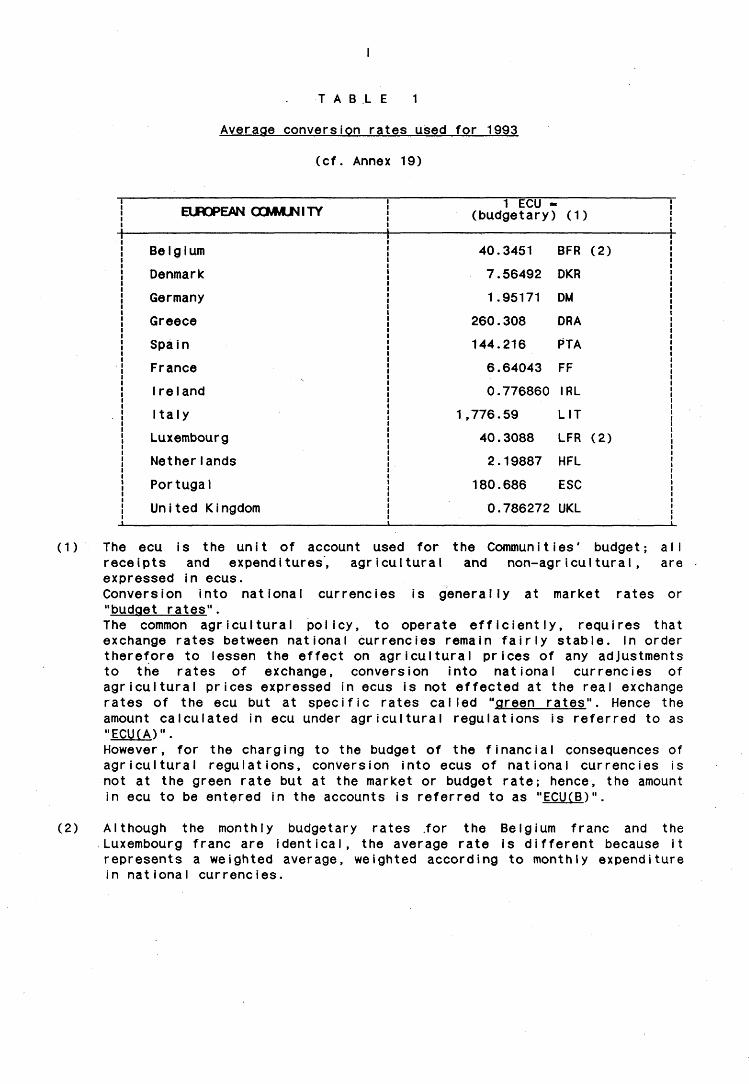
T A B L E 1
Average conversion rates used for 1993
(cf. Annex 19)
| EUROPEAN GOAfJNITY j (budgetary) (1) |
! Belgium Î 40.3451 BFR (2) i
! Denmark ! 7.56492 DKR i
i Germany ! 1.95171 DM i
! Greece ! 260.308 DRA !
! Spain \ 144.216 PTA j
î France \ 6.64043 FF j
! Ireland ! 0.776860 IRL i
! Italy j 1,776.59 LIT i
| Luxembourg ! 40.3088 LFR (2) |
! Netherlands ! 2.19887 HFL !
! Portugal j 180.686 ESC j
j United Kingdom j 0.786272 UKL \
(1) The ecu is the unit of account used for the Communities' budget; all receipts and expenditures, agricultural and non-agricultural, are expressed in ecus. Conversion into national currencies is generally at market rates or "budget rates". The common agricultural policy, to operate efficiently, requires that exchange rates between national currencies remain fairly stable. In order therefore to lessen the effect on agricultural prices of any adjustments to the rates of exchange, conversion into national currencies of agricultural prices expressed in ecus is not effected at the real exchange rates of the ecu but at specific rates called "green rates". Hence the amount calculated in ecu under agricultural regulations is referred to as "ECU(A)". However, for the charging to the budget of the financial consequences of agricultural regulations, conversion into ecus of national currencies is not at the green rate but at the market or budget rate; hence, the amount in ecu to be entered in the accounts is referred to as "ECU(B)".
(2) Although the monthly budgetary rates for the Belgium franc and the Luxembourg franc are identical, the average rate is different because it represents a weighted average, weighted according to monthly expenditure in national currencies.
INDEX
> . ' ' Pages
SUMMARY VII
TITLE I : COMMUNITY EXPENDITURE ON MARKETS . . . .... 1
1. General 1
1.1. 1993 budget .. .,.. 1 1.2. Transfers of appropriations and appropriations available ....... 4 1.3. Agricultural expenditure . .......;. 4 1.4. Fixing of farm prices and related measures for 1993/94 ... ... 6 1.5. The agri-monetary situât ion ... ....... — 6 1.6." Reform of the CAP ... 8 1.7. Set-aside 12 1.8. Emergency operations in support of Central and Eastern Europe
and the Soviet Union 14
2. Financing of the markets 25
2.1. Comparison of original appropriations and expenditure in 1993... 25 2.2. Breakdown of expenditure by economic type . 37 2.3. Trend of pub I ic stocks 40 2.4. Corrections to be made to the breakdown of expenditure by Member
State in connection with monetary compensatory amounts (MCAS) .. 45 2.5. Overall cost of Guarantee Section 47
3. Amendments to legislation governing the EAGGF Guarantee Section. 51
TITLE II : CASH POSITION AND MANAGEMENT OF APPROPRIATIONS ....... . 5 5
4. Management of appropriations 55
4.1 1993 budget . 55 4.2. Non-automatic carryovers of appropriations from 1992 58 4.3 Automatic carryovers of appropriations from 1992 59 4.4 Summary of execution of 1993 budget 59
5. Advances and direct payments 61
5.1 Advance payments to the Member States , 61 5.2 Direct payments 63
IV
TITLE HI : PREVENTION AND PROSECUTION OF FRAUD.
6.1 General remarks 67 6.2 Application of control measures 68 6.3 Improvement of legislation and control methods 73 6.4 Sem i nars 75 6.5 Special checks and investigations 75 6.6 Cases of fraud and irregularities reported 79 6.7 Recovery of amounts wrongly paid out 81 6.8 Meetings of the EAGGF irregular ities and Mutual Assitance Group 81 6.9 Specific control arrangements . 83 6.10 Remote sensing 87
TITLE IV : ACCOUNTS CLEARANCE . 91
7.1 Verification of EAGGF Guarantee Section expenditure and clearance procedure - 1990 91
7.2 1991 93 7.3 1992 95 7.4 Application of Council Regulation (EEC) No 4045/89 regarding
Member States' controls of beneficiaries records 97 7.5 Appeals to the Court of Justice against clearance decisions .... 98
TITLE V : CLEARANCE OF ACCOUNTS IN RESPECT OF COMMUNITY FOOD AID FOR PRODUCTS SUBJECT TO EEC MARKET ORGANIZATION 103
Annexes 105
INDEX OF TABLES Pages
1. Average conversion rates used for 1993 I 2. Summary of the main totals in the 23nd EAGGF Guarantee Section
Financial Report XI 3. Total appropriations relating to the EAGGF Guarantee Section ... 1 4. EAGGF Guarantee Section expenditure in relation to EC expenditure 5 5. Results of set-aside (Five-year scheme) 13 6. Evolution of 1993 appropriations and expenditure . ........ 24 7. Breakdown by sectors of the differences between expenditure
and appropriations (initial and final) .. 27 8. Breakdown of agr i cuIturaI expend i ture by economi c type 36 9. Breakdown of expenditure by Member State, a I lowing for the
impact of the arrangement whereby exporting Member states may pay intra-Community MCAs for importing Member States (article 10 of Regulation No 1677/85) 45
10. Overall trend of EAGGF (Guarantee Section) expenditure 47 11. Revenue under the Common Agricultural Policy accruing as own
resources of the Community ,. 49 12. The system of advance payments and expend i ture 60 13. D i rect payments 62 14. Advances to the Member States and expenditure charged to the
1993 budget .. 64 15. Expenditure recorded in the Member States against the 1992
budget by type of f i nanc Ing 65 16. EAGGF Guarantee expenditure claimed for 1991 93 17. Operations subject to a system audit in 1993 ....... 94 18.- Transmission of the first declarations of expenditure - 1992 ... 95 19. Appeals filed against the clearance of accounts decisions - 1989 100 20. Appeals filed against the clearance of accounts decisions - 1990 101-102
LIST OF GRAPHS
1. Breakdown of EAGGF Guarantee expenditure by product group VI 2. EAGGF Guarantee expenditure by economic type 34 3. EAGGF Guarantee expenditure by economic type (percentage) ...... 35 4. Quantities of public stocks with intervention agencies ......... 42 5. Book value of public stocks with intervention agencies ......... 43 6. Expenditure by Member State 44 7. Trend of the EAGGF (Guarantee Section) expenditure 46 8. Trend of own resources resulting from the CAP -..'. 48
VI
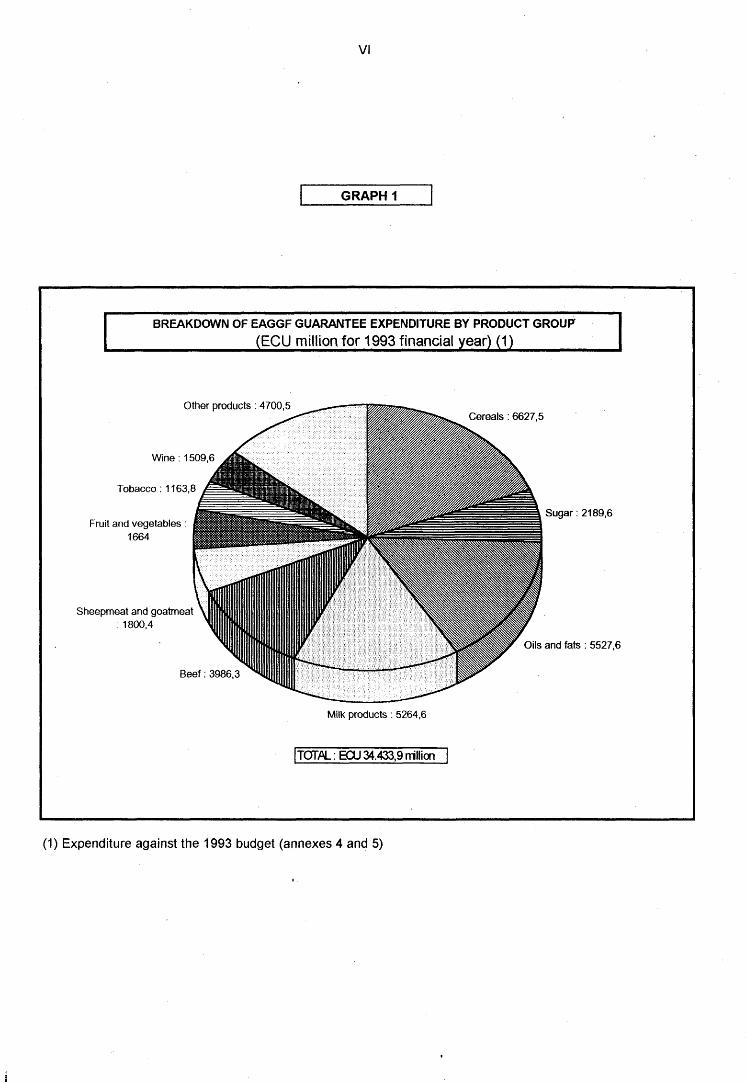
GRAPH 1
BREAKDOWN OF EAGGF GUARANTEE EXPENDITURE BY PRODUCT GROUP (ECU million for 1993 financial year) (1)
Other products : 4700,5
Wine: 1509,6
Tobacco: 1163,8
Fruit and vegetables 1664
Sheepmeat and goatmeat : 1800,4
Beef : 3986,3
Cereals : 6627,5
Sugar : 2189,6
Oils and fats : 5527,6
Milk products : 5264,6
TOTAL : ECU 34.433,9 million
(1) Expenditure against the 1993 budget (annexes 4 and 5)
SUMMARY OF THE TWENTY-TH1RD FINANCIAL REPORT EAGGF GUARANTEE SECTION
Community expenditure on markets
1. After transfers were made and taking account of the supplementary and amending budget, appropriations available for the EAGGF Guarantee Section for 1993 amounted to ECU 35 343 million, including the Fisheries Guarantee Fund (ECU 33 million), set-aside of land from agricultural production (ECU 427 million), income aid (ECU 36 million) and accompanying measures (ECU 298 million) (see Table 6 ) .
2. Allowing for the clearance of accounts for previous years (- ECU 385 million) and the financial contribution of cereal producers and of milk producers (ECU 89.6 million and - ECU 24 million respectively), total agricultural expenditure chargeable to the Guarantee Section for 1993 stood at ECU 34 590 million (see Table 6 ) .
3. Total expenditure taken into account for the 1993 budget, excluding the clearance of accounts (- ECU 385 million) and misee IUneous payments like fraud prevention and food aid (ECU 541 mi I I ion), i.e. ECU 34 434 mi I I ion, can be divided into expenditure on export refunds and intervention measures. These items amounted to ECU 10 159 million and ECU 24 275 million respectively.
A breakdown of such expenditure by product group shows that cereals and rice and milk products accounted on their own for up for 51% of expenditure on refunds, followed by beef and veal (17%) and sugar (15%).
The product groups mainly responsible for expenditure on intervention were cereals (13%), oiIseeds (13%), milk products (12%), olive oil (10%) and beef (9%).
4. Given the increase in quantities of certain products in public storage during 1993, the book value of stocks rose slightly (+ 3%) from ECU 2 580.5 million in 1992 to ECU 2 659.7 million in 1993.
As regards the actual quantities in stock, there was:
- a very great rise in stocks of olive oil, and a considerable rise in cereals and alcohol;
- a fall in other product groups, in particular tobacco.
Cash position and management of appropriations
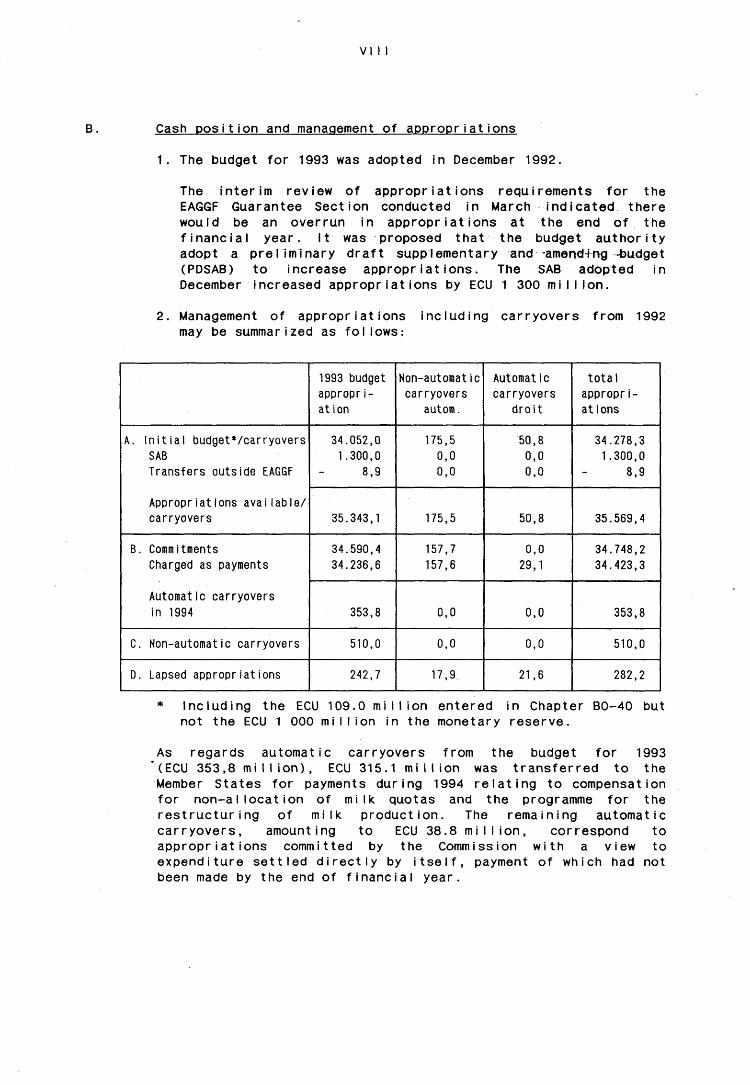
1. The budget for 1993 was adopted in December 1992.
The interim review of appropriations requirements for the EAGGF Guarantee Section conducted in March indicated there would be an overrun in appropriations at the end of the financial year. It was proposed that the budget authority adopt a preliminary draft supplementary and -amending -budget (PDSAB) to increase appropriations. The SAB adopted in December increased appropriations by ECU 1 300 million.
2. Management of appropriations may be summarized as follows:
including carryovers from 1992
A. Initial budget*/carryovers SAB Transfers outside EAGGF
Appropriations available/ carryovers
B. Commitments Charged as payments
Automatic carryovers
in 1994
C. Non-automatic carryovers
D. Lapsed appropriations
1993 budget appropriation
34.052,0 1.300,0
8,9
35.343,1
34.590,4
34.236,6
353,8
510,0
242,7
Non-automatic carryovers
autom.
175,5 0,0 0,0
175,5
157,7
157,6
0,0
0,0
17,9
Automatic carryovers
droit
50,8 0,0 0,0
50,8
0,0
29,1
0,0
0,0
21,6
total appropriations
34.278,3
1.300,0 8,9
35.569,4
34.748,2
34.423,3
353,8
510,0
282,2
Including the ECU 109.0 million entered in Chapter BO-40 but not the ECU 1 000 million in the monetary reserve.
As regards automatic carryovers from the budget for 1993 (ECU 353,8 million), ECU 315.1 million was transferred to the Member States for payments during 1994 relating to compensation for non-allocation of milk quotas and the programme for the restructuring of milk production. The remaining automatic carryovers, amounting to ECU 38.8 million, correspond to appropriations committed by the Commission with a view to expenditure settled directly by itself, payment of which had not been made by the end of financial year.
IX
Appropriations to be carried over non-automatically (ECU 510 million) represent expenditure which was provided for in the 1993 budget but could not be incurred by the Member States before the financial year closed, and for which no appropriations were available in the 1994 budget.
3. With regard to the 1993 financial year, the Commission adopted 14 decisions, 12 of which were routine. After the SAB was adopted, an additional advance payment was necessary, as was an extraordinary advance decided in December 1993.
C. Invest ligations and irregular it ies:
During 1993 the Commission stepped up its efforts to combat fraud and irregularities to the detriment of the EAGGF. It concentrated on two main areas: strengthening provisions on controls in the agricultural regulations, in particular in those arising from the reform of the CAP, and investigations in the field.
Thus, pursuant to Regulation (EEC) No 3508/92, Commission staff made several inspection visits to all Member States to monitor very closely the introduction of effective arrangements for management and monitoring required by the new system of price and income support stemming from the reform of the CAP. The introduction of the register of agricultural parcels and of a system for identifying cattle and suçkler cows was given full consideration by the EAGGF.
The integrated system has made it compulsory to apply the risk analysis method, which permits better targeting of checks.
Lastly, monitoring by remote-sensing techniques, with the impetus coming from the EAGGF and assistance from the research centre in Ispra, is being used systematically in the Member States at present and provides an effective technique in particular for prevention.
The Commission also continued its work on the ground, opening investigations in various areas such as cereals, cotton, tobacco, olive oil, beef, meat exports and food aid.
With a view to greater effectiveness, the Commission continued work to improve the provisions connected with Regulations (EEC) Nos 386/90 (concerning checks of exports of agricultural products on which refunds are paid) and 4045/89 (concerning ex-post administrative checks of commercial documents of recipients of EAGGF Guarantee Section assistance).
Cases of irregularities notified by the Member States pursuant to Regulation (EEC) No 595/91 numbered 1 298, at a total value of ECU 248.3 million. These figures are substantially above those for 1992, in particular as regards cereals, milk products, beef and wine.
Furthermore, the supervisory agencies for olive-oil which were set up in the main producer Member States conducted a higher number of checks at producers' premises, mills and bottling plants, thus uncovering many cases of irregularities. At the same time, two series of checks relating to fruit and vegetables and wine revealed irregularities and resulted in a stepping-up of checks, in particular of quality.
Clearance of accounts
In 1993, the Commission amended the decision on the clearance of accounts for 1989 (milk quotas) and adopted a formal decision on the clearance of accounts for 1990.
Tasks involving checking expenditure for 1991, for an amount of ECU 31 900 million, commenced in March 1992 and were completed in May 1993. They involved a systems audit and on-the-spot checks to verify the conformity of expenditure declared with Community legislation. They showed that the Member States are encountering growing difficulties in applying the legislative provisions of the common agricultural policy on account of their complexity.
Since 1991 the payment systems of the Member States' paying agencies have been subject to verification by external audit companies. This measure aims initially to conduct a financial audit in the 44 main paying agencies in the Member States. With a view to the clearance of accounts for 1992, the EAGGF conducted checks on 20 of those paying agencies accounting for more than two thirds of EAGGF expenditure.
On 5 March 1993, the Commission approved the guidelines put forward by the Belle Group with a view to a reform of the procedure for the clearance of EAGGF Guarantee Section accounts: the reform is to be introduced for the clearance of accounts for the 1992 budget year. Extensive consultations with the Member States have been commenced with a view to drawing up the legislation for presentation to the Council during the first half of 1994.
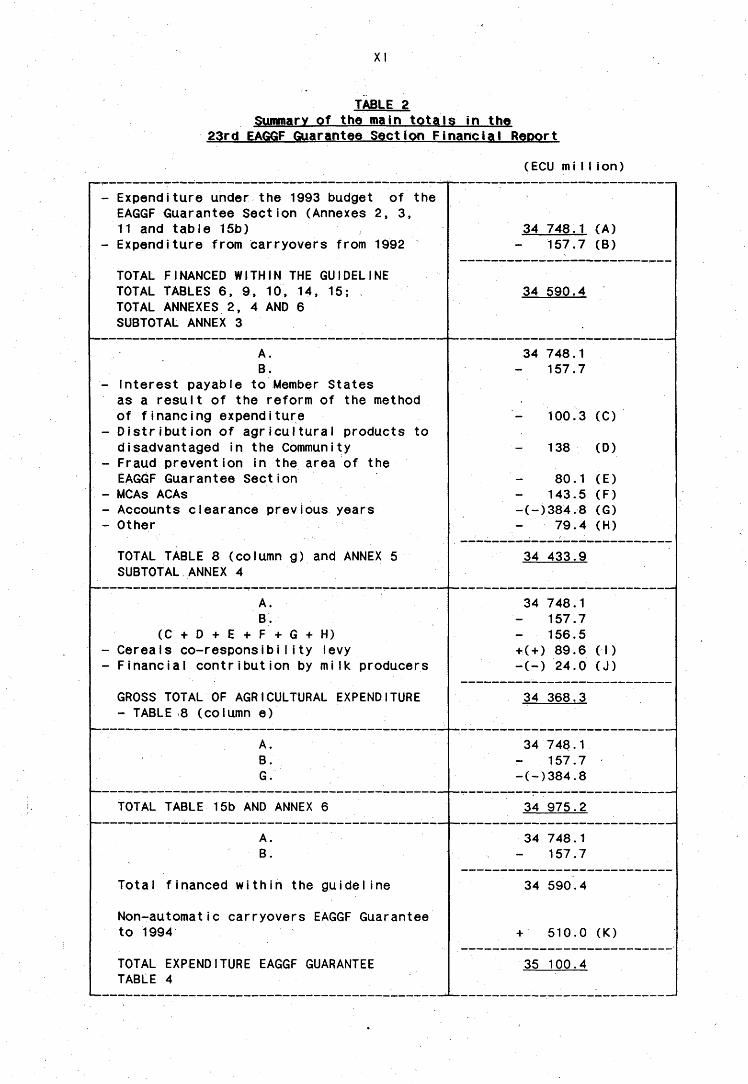
TABLE 2 Summary of the main totals in the
23rd EAGGF Guarantee Sect Ion F i nanc i a I Repor t
(ECU mi I I ion)
Expenditure under the 1993 budget of the EAGGF Guarantee Section (Annexes 2, 3, 11 and table 15b) Expenditure from carryovers from 1992
TOTAL FINANCED WITHIN THE GUIDELINE TOTAL TABLES 6, 9, 10, 14, 15; TOTAL ANNEXES 2, 4 AND 6 SUBTOTAL ANNEX 3
A. B.
Interest payable to Member States as a result of the reform of the method of financing expenditure Distribution of agricultural products to disadvantaged in the Community Fraud prevention in the area of the EAGGF Guarantee Section MCAs ACAs Accounts clearance previous years Other
TOTAL TABLE 8 (column g) and ANNEX 5 SUBTOTAL ANNEX 4
A. B.
(C + D + E + F + G + H) Cereals co-responsibiIity levy Financial contribution by milk producers
GROSS TOTAL OF AGRICULTURAL EXPENDITURE - TABLE 8 (column e)
A. B. G.
TOTAL TABLE 15b AND ANNEX 6
Total financed within the guideline
Non-automatic carryovers EAGGF Guarantee to 1994
TOTAL EXPENDITURE EAGGF GUARANTEE TABLE 4
34 748.1 (A) 157.7 (B)
34 590.4
34 748.1 157.7
100.3 (C)
138 (D)
80.1 (E)
143.5 (F) (-)384.8 (G)
79.4 (H)
34 433.9
34 748.1 157.7 156.5
+(+) 89.6 (I) -(-) 24.0 (J)
34 368.3
34 748.1 157.7
-(-)384.8
34 975.2
34 748.1 157.7
34 590.4
+ 510.0 (K)
35 100.4
1
1.
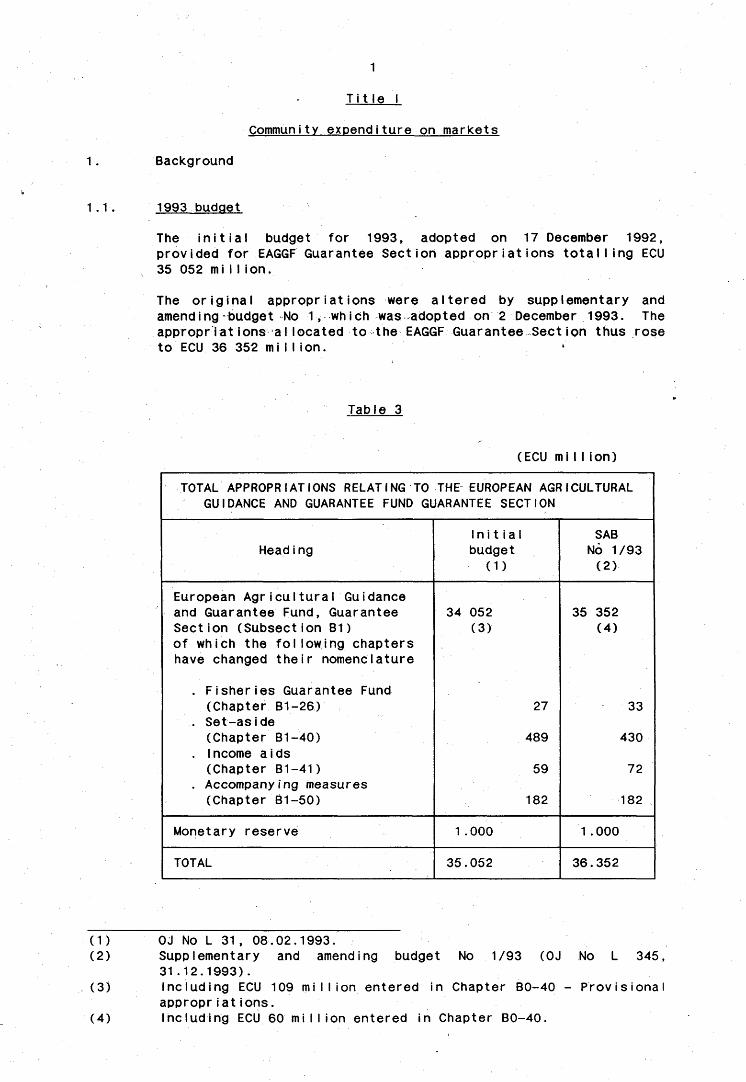
Title I
Community expenditure on markets
Background
1.1. 1993 budget
The initial budget for 1993, adopted on 17 December 1992, provided for EAGGF Guarantee Section appropriations totalling ECU 35 052 mi I I ion.
The original appropriations were altered by supplementary and amending-budget No 1, which was-adopted on 2 December 1993. The appropriât ions a I located to the EAGGF Guarantee Sect ion thus rose to ECU 36 352 mi I I ion.
Table 3
(ECU mi I I ion)
TOTAL APPROPRIATIONS RELATING TO THE EUROPEAN AGRICULTURAL GUIDANCE AND GUARANTEE FUND GUARANTEE SECTION
Initial SAB Heading budget No 1/93
(1) (2)
European Agricultural Guidance and Guarantee Fund, Guarantee 34 052 35 352 Section (Subsection B1) (3) (4) of which the following chapters have changed their nomenclature
. Fisheries Guarantee Fund (Chapter B1-26) 27 33
. Set-aside (Chapter B1-40) 489 430
. Income aids (Chapter B1-41) 59 72
. Accompanying measures (Chapter B1-50) 182 182
Monetary reserve 1.000 1.000
TOTAL 35.052 36.352
(1) 0J No L 31, 08.02.1993. (2) Supplementary and amending budget No 1/93 (OJ No L 345,
31.12.1993). (3) Including ECU 109 mi I I ion entered in Chapter BO-40 - Provisional
appropriations. (4) including ECU 60 mi I I ion entered in Chapter BO-40.
The ECU 35 052 million provided for in the initial budget and the ECU 36 352 million resulting from supplementary and amending budget No 1/93 included:
the appropriations entered in the monetary reserve (ECU 1 biI I ion).
- the appropriations entered in Chapter BO-40 "Provisions".
The monetary reserve
The ECU 1 billion entered as a provision in the monetary reserve was intended to cover significant and unexpected movements in the US dol lar/ECU exchange rate in relation to the parity used to establish the budget. This reserve is not included in the guideline mentioned below.
Where savings are made in the Guarantee Section as a result of a favourable trend in the parity between the ECU and the dollar, they are transferred to the monetary reserve. Where the reverse happens, transfers are made to the budget headings for the Guarantee Section affected by this trend. A "franchise" of ECU 400 million is allowed, below which transfers to or from the monetary reserve are not made.
The application of these provisions to the 1988, 1989, 1990 and 1991 financial years was presented in the 21st Financial Report concerning 1991 (see pages 2 and 3). For 1992 see the 22nd Report (p. 3).
Since the franchise of ECU 400 million was not reached in 1993, no transfers were made to or from the monetary reserve.
As regards the impact of movements in the dollar parity on Guarantee Section expenditure in 1993,1 the trend during the period 1 August 1992 to 31 July 1993 was dollar appreciation (2.5% higher than the budget parity).
The savings stemming from a 2.5% fall in world prices in dollars converted into ecus using the average switchover coefficient of 1.187295 for the year amounted to ECU 182 million.
However, the depreciation of the ecu in dollar terms which generated these savings was only one of the monetary changes which disturbed the currency markets during 1993. The depreciation of certain Community currencies led, through operation of the switchover mechanism, to extra expenditure by the EAGGF Guarantee Section estimated at ECU 265 million, (effect of the switchover on refunds)
Report on the impact on EAGGF Guarantee Section expenditure of movements of the dollar/ecu exchange rate in 1993 - C0M(93) 538 final of 5 November 1993.
This means that the savings arising from the higher dollar rate were more than offset by the impact of the monetary realignments of September and November 1992 and January and May 1993 so that the net impact of currency changes was extra expenditure amounting to some ECU 83 mi 11 ion (ECU 265 million ECU 182 mi 11 ion).
It should be noted that the extra costs arising from the change in the switchover had already been included in the total cost of the currency realignments for 1993 entered in SAB No 1/93.
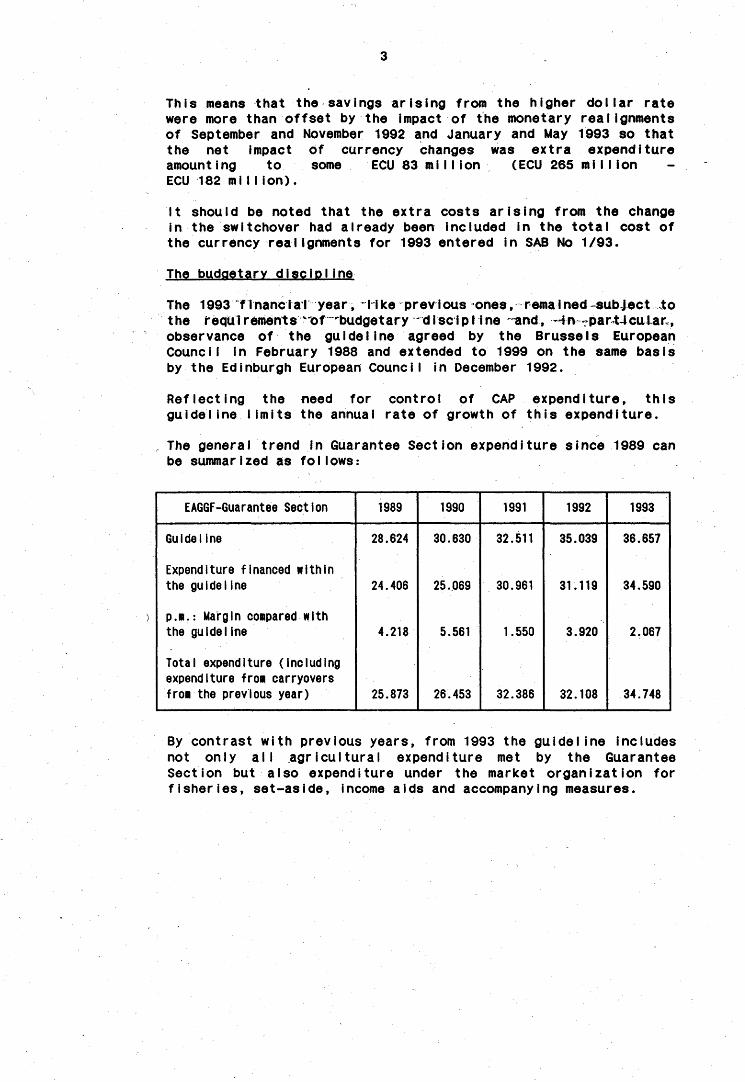
The budgetary discipline
The 1993 financial year, I ike previous ones, remained subject to the requirements "Of budgetary discipline and, -4n -part-lcular,, observance of the guideline agreed by the Brussels European Council in February 1988 and extended to 1999 on the same basis by the Edinburgh European Council in December 1992.
Reflecting the need for control of CAP expenditure, this guideline Iimits the annual rate of growth of this expenditure.
The general trend in Guarantee Section expenditure since 1989 can be summarized as follows:
EAGGF-Guarantee Section
Guideline
Expenditure financed within the guideline
p.m.: Margin compared with the guideline
Total expenditure (including expenditure froa carryovers froai the previous year)
1989
28.624
24.406
4.218
25.873
1990
30.630
25.069
5.561
26.453
1991
32.511
30.961
1.550
32.386
1992
35.039
31.119
3.920
32.108
1993
36.657
34.590
2.067
34.748
By contrast with previous years, from 1993 the guideline includes not only all agricultural expenditure met by the Guarantee Section but also expenditure under the market organization for fisheries, set-aside, income aids and accompanying measures.
1.2. Transfers of appropriât ions and appropriations available
On account of numerous unforeseeable factors, both internal and external, including the ECU/US dollar exchange rate, agricultural expenditure may frequently diverge in the course of the financial year from the initial forecasts, which are outlined some twelve months before the beginning of the financial year in question, i.e. more than twenty months before some expenditure.
However, since the introduction of the early warning system (cf. 18th Financial Report on the Guarantee Fund, page 4), the Commission has been able to monitor more closely the trend of agricultural expenditure, chapter by chapter, act accordingly and thus ensUre^compl1ance*with^the budget. In view^of-the-rate of ut iIizat ion of the appropr iat ions, however, some -transfers proved necessary (see Table 6 below).
As in 1992, internal transfers were small, thanks partly to the adoption of supplementary and amending budget No 1/93, which enabled appropriations to be reallocated to headings in Subsection B1. The total value of these internal movements was ECU 1 024.5 million, compared with over ECU 2 300 million in 1990 and 1991.
The budgetary authority also adopted a transfer out of the EAGGF Guarantee Sect ion of ECU 8.9 mi I I ion from Chapter B1-17 "Tobacco" to Chapter B7-01 "Common foreign and security policy".
As a result, the total amount of appropriations available for the EAGGF Guarantee Section (Subsection B1) for 1993, including supplementary and amending budget No 1/93, came to ECU 35 343,1 mi I I ion.1
1.3. Agricultural expenditure
Taking into account, firstly, the expenditure of ECU 384.8 million on clearance of accounts for previous years and, secondly, the financial contribution of cereal producers (ECU 89.6 million) and milk producers (- ECU 24.0 million), the total agricultural expenditure chargeable to the EAGGF Guarantee Section for the 1993 financial year and to the budget for that year amounted to ECU 34 590.4 million, not counting expenditure against carryovers of appropriations from 1992. A detailed analysis of the financing of the different sectors is given below (points 2.1. et seq.).
Including an amount of ECU 60 million entered in BO-40 ("Reserves and provisions") but not counting the appropriations entered in the monetary reserve (ECU 1 billion).
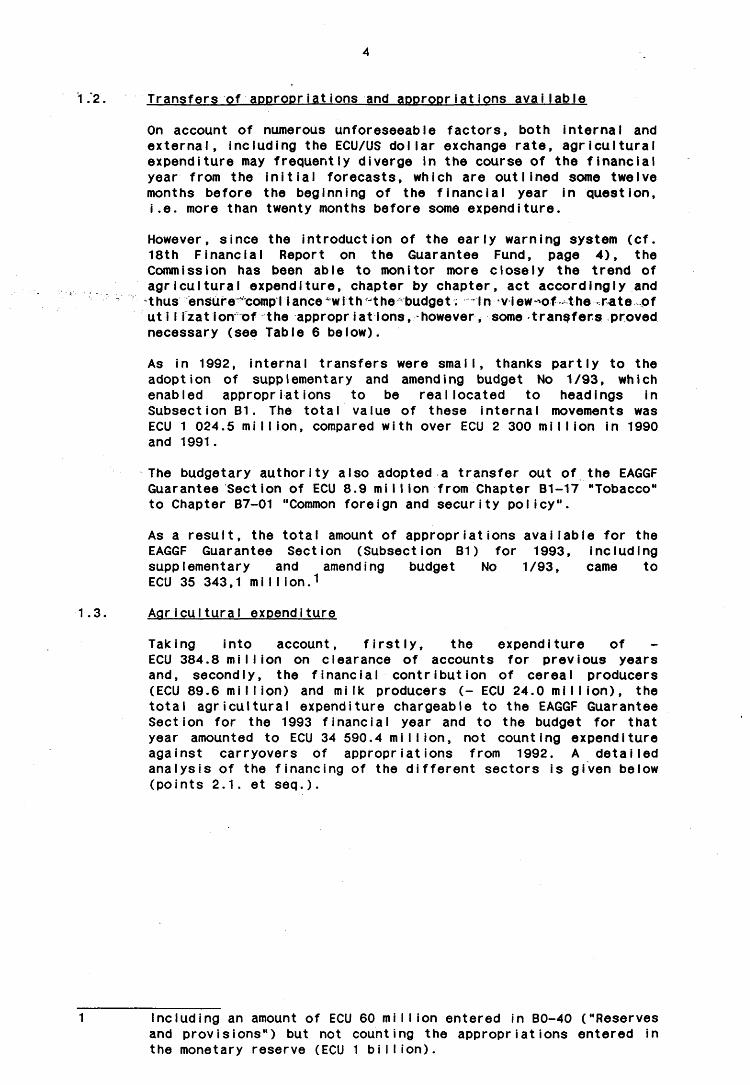
TABLE 4
EAGGF Guarantee Section expenditure^P in relation to total EC expenditure^2)
Year
1988
1989
1990
1991
1992
1993
Total EC expenditure (ECU mill ion)
41 120.9
40 850.0
44 378.9 <4>
53 823.1 (5)
58 857.0 (6)
65 268.5 <7)
EAGGF Guarantee Section expenditure
(ECU mi I I ion)
26 400.4 (3>
24 406.0
25 754.7 <4)
31 126.8 <5)
31 294.0 <6>
35 100.4 (7)
%
64.2 %
59.7 %
58.0 %
57.8 %
53.2 %
53.8 %
(1) Expenditure in payment appropriations under Titles B1.1, B1.2, B1.3 and B1.4 (from 1991) and B1.5 (from 1993) - (Titles 1 and 2 and Chapter 390, Guarantee part, before 1991) of the budget, including carryovers to the following year.
(2) Total expenditure in payment appropriations, including carryovers to the following year.
(3) Expenditure covering a period of 11J4 months. (4) Of which ECU 685.5 million non-automatic EAGGF Guarantee
Section carryovers. (5) Of which ECU 166.0 mi 11 ion non-automatic EAGGF Guarantee
Section carryovers. (6) Of which ECU 175.5 million non-automatic EAGGF Guarantee
Section carryovers. (7) Of which ECU 510.0 million non-automatic EAGGF Guarantee
Section carryovers.
TOTAL EC EXPENDITURE EAGGF GUARANTEE SECTION EXPENDITURE
5| 40000 +
O 30000 + UJ
1988 1989 1990 1991 1992 1993
1.4. Fixing of farm prices and related measures for 1993/94
The Council reached agreement on the 1993/94 prices on 27 May 19932, keeping, with a few changes (see below), the institutional prices applied in 1992/93. However, since 1993/94 is the first year of transition to the full application of the reform, some new mechanisms were introduced and some measures extended. These included:
- cereals: the introduction of a single target price (ECU 130/t) and intervention price (ECU 117/t) irrespective of species.
The premium for producers of potato starch was continued at the same level "but production may not exceed 1.5 million tonnes;
- milk products: the intervention price for butter was reduced by 3% (from 1 July 1993) and the milk target price and the threshold prices adjusted accordingly. As far as quotas are concerned, the reallocation of "direct sales" to "deliveries" in Portugal and Germany and the 0.6% increase in the total guaranteed quantities for deliveries to meet indemnities to SLOM III producers (which does not apply to Spain, Greece and Italy) should be noted;
1.5. The agri-monetary situation
The agri-monetary system for the single market came into force on 1 January 1993. Its legal basis is Regulations (EEC) Nos 3813/92 and 1068/93. MCAs have been abolished. The system is based on the following principles:
- the ecu is the unit of account for fixing prices and amounts while payments are made in national currencies;
- the conversion rates used in agriculture are calculated on the basis of the market rates for the ecu.
The conversion between the ecu and national currency is carried out using:
(a) for fixed currencies (the Belgian and Luxembourg franc, the krone, the mark, the French franc, the Irish pound and the guilder), the central rate applicable since 01.01.93 to 02.08.93;
The details of this agreement are contained in the issue of "CAP Working Notes" on the 1993/94 agricultural prices - Council decisions.
(b) for floating currencies (the drachma, the peseta, the lira, the escudo and sterling), a rate close to the average market rate. Except in exceptional circumstances, the agricultural conversion rates for fixed currencies are adjusted when currencies are realigned. In the case of the floating currencies, they may also be adjusted at the beginning of each month or, more rarely, on the 11th or 21st day of each month;
- the agricultural conversion rate applicable to a particular price or amount is that prevailing at the time when the operative event (the achievement of the economic goal of the operation in question) took place;
- prices and some amounts fixed in green ecus are reduced when the green ecu is revalued. The impact on incomes of this reduction, or of that of the agricultural conversion rates, may be offset by an increase in certain amounts fixed in (green) ecus or through aid on a tapering scale.
There were two monetary realignments in 1993, one on t February and another on 14 May. As a result, the agri-monetary correction factor (switchover) rose from 1.195066 to 1.207509 and the coefficient for the reduction of prices in ecus had risen to 1.013088 by the beginning of the 1993/94 marketing year.
The agricultural conversion rates for fixed currencies remained unchanged (except for the Irish pound) while those for floating currencies were adjusted to reflect the new monetary situation.
On 2 August 1993 the Council of finance ministers decided to increase to 15% the bilateral margin within which the currencies participating in the ERM could fluctuate. Since no rates were changed, there was no currency realignment and the correction factor remained unaltered at 1.207509.
Since then the currencies of all the Member States have been regarded as floating and the agricultural conversion rates for floating currencies are regularly adjusted in line with the actual exchange rate situation (in accordance with (b) above).
Following the events of 2 August 1993, in order to avoid frequent changes which could destabilize the agricultural markets and in some circumstances reduce producers' incomes, the Commission decided temporarily to suspend all the rates for the automatic adjustment of agricultural conversion rtties. On 21 December the Council amended Regulation (EEC) No 3813/92 to take account of the problems caused by revalued currencies. Thus, the monetary gaps permitted before green rates are changed, and which had previously been fixed at 4 points (-2/+2) have been increased to 5 points. This gap should not be exceded in order to avoid speculative trade movement. In addition, if the situation deteriorates, this gap may be flexible, i.e. the franchise may move from -2/+3 to 0/+5; when the situation improves, it is brought back to its normal level (-2/+3).
1.6. CAP reform
On 21 May 1992 the agriculture Council reached a political agreement on the reform of the CAP1 affecting most of the agricultural market organizations. The changes will be implemented over three marketing years, starting with 1993/94. The new provisions therefore partially concern the 1993 budget year, which covers the period from 16 October 1992 to 15 October 1993. However, payments under the new measures adopted for field crops and the premium for male cattle were not made until 16 October 1993 and will therefore be covered by the 1994 budget.
The Council adopted the threemain guidelines proposed by the Commission, i.e.:
- a substantial cut in prices for agricultural products, to make them more competitive on internal and external markets;
- compensatory payments or premiums which are not directly linked to the quantities produced but which depend on the inputs involved;
- measures limiting the use of inputs, such as set-aside of arable land, restrictions on stocking rates and quotas.
Conscious of the need to encourage the restructuring of agricultural holdings, improve protection of the environment and the countryside and wishing to promote environment-friendly farming methods, the Council also adopted accompanying measures focusing on three schemes:
- the environmental aspects of farming; - the afforestation of farmland; - early retirement.
a) Arable crops
For cereals, a significant cut, spaced over three marketing years starting in 1993/94, will bring the target price down to ECU 110/tonne in 1995/96, i.e. a 29% reduction on current I eve I s.
The difference between the target price and the threshold pr ice wiI I by ECU 45.
For more details, see the issue of "CAP Working Notes 1992" published on 7 July 1992 on the reform of the common agricultural policy.
The cut in cereals prices wi11 be offset by an aid per hectare calculated by multiplying a basic amount (ECU 25, ECU 35 and ECU 45 per tonne for the marketing years 1993/94, 1994/95 and 1995/96 respectively) by a regional yield which is the average of the yields recorded during the period 1986/86 to 1990/91. This amount will be granted on the basis of the crop areas recorded for the three previous marketing years.
The aid will be paid to producers of cereals, oilseeds and protein crops whose average production exceeds the equivalent of 92 tonnes of cereals provided that they subscribe to a programme to set aside 15% of their land normally used for
'"' those crops" (this^percentageappl ies^o4*the*ri993/94~mar-ket-ing year).
The co-responsibility levy and the two aid systems for small farmers linked to the levy is abolished as of the 1992/93 market ing year.
From 1993/94 oiI seeds wi11 no longer benefit from guaranteed price, only an aid per hectare subject to regional variations on the basis of average cereal yields or average oilseed yields for individual regions. Aid of ECU 359/ha, paid in two instalments (one at the beginning and one at the end of the marketing year), adjustable in the light of world price trends, has been introduced. From 1993/94, the arrangements applicable to protein crops (peas, field beans and sweet lupins) are to be replaced by an aid per hectare cultivated, equal to the regional yield of cereals expressed in tonnes per hectare multiplied by ECU 65.
b) As regards tobacco, from 1993 a single premium is fixed for each group of varieties. It is increased by 10% in the case of contracts signed with producers' associations. The quotas are set at 370 000 tonnes for 1993/94 and 350 000 tonnes for subsequent marketing years.
Other measures were also adopted, including:
- the abolition of intervention and export refunds;
- the creation of a Community research and information fund, financed from a levy equal to not more than 1% of the premiums granted;
- the establishment of agencies in each Member State to monitor the implementation of the Community control scheme;
- the implementation of a programme for the conversion of certain var iet ies.
10
c) Milk products
The reform involves the following changes:
The Council decided to extend the additional levy system for seven years from 1993/94.
With regard to reference quantities, in view of market trends, the Council decided not to apply the 1% reduction initially planned for the 1992/93 marketing year, while maintaining the 1% reductions for 1993/94 and 1994/95 subject to market developments, in the light of which the Council again did not apply "the reduct ion 'for -'1993/94 ̂ but -postponed <i t Hint U -the following marketing year (resulting in a total reduction of 2% in 1994/95). Again, this decision may be changed on the basis of market trends during the current marketing year.
The Council also decided to cut the price of butter by 3% in 1993/94 and 2% in 1994/95.
d) Beef/veal
The intervention price for beef is to be cut by 15% over three years. To offset the resulting loss of income, however, the premiums for the production of beef have been increased, but, to prevent excessive intensification, the Council decided to limit the support provided in the form of premiums by setting a maximum stocking rate per hectare of forage area, which will be reduced gradually to 2 LSU1 per hectare in 1996. However, a derogation has been granted to farmers with less than 15 LSU, who may be eligible for premiums without having to comply with the maximum stocking rate (this derogation also applies to stockfarmers using intensive rearing under cover since there is no point in calculating stocking per hectare in their case).
Beef producers may be eligible for:
- a premium for male bovines payable a maximum of twice in the life of the animal. The premium is set at ECU 60 from 1 January 1993, ECU 75 from 1 January 1994 and ECU 90 for subsequent years, and
- a suck 1er cow premium payable per animal and limited for each producer to the number of premiums paid for 1990, 1991 or 1992, to be decided by the Member State concerned. The premium is also set to increase gradually: ECU 70 from 1 January 1993, ECU 95 from 1 January 1994 and ECU 120 for subsequent years.
LSU - Iivestock unit.
11
The two premiums may be increased by ECU 30 in the case of producers with less than 1.4 LSU per hectare (extensification premium).
The Member States, depending on their production structures, may also introduce either a calf processing premium of ECU 100 per young male dairy calf withdrawn from production before the age of 10 days, or an intervention system for lightweight animals, i.e. those with a carcase weight of 150 to 200 kg.
The intervention system for beef is also undergoing changes. These relate to the fol lowing:
-• the •'• f ix Ing of ce111ngs on Intervent ion buy ing-1n -reduc ing the total in stages from 750 000 tonnes in 1993 to 350 000 tonnes in 1997;
- the creation of a safety net in Member States where the market price is less than 60% of the intervention price during a reference period;
- the restriction of intervention to quality meat, thus excluding young male cattle of a lower quality (0 in the carcase classification scale) as from 1993.
e) In the sheeomeat sector, the existing premium arrangements are maintained and the individual ceilings per producer are set at 1 000 head in the less-favoured regions and at 500 head in other regions. Beyond those limits the premiums will be reduced by 50%. The premiums for lightweight sheep and for goats are increased to 80% of the normal premium. Premiums are granted on the basis of a reference year (1989, 1990 or 1991, to be decided by the Member State).
An additional reserve equal to 1% of the individual rights of producers in the less-favoured regions of each Member State is also being established. This is to be allocated exclusively to these regions in accordance with criteria to be laid down by the Member States.
There are rules on the transfer of rights between producers and between regions, but the Member States must take appropriate measures to prevent these rights from being transferred outside the sensitive areas or regions where sheep production is particularly
12
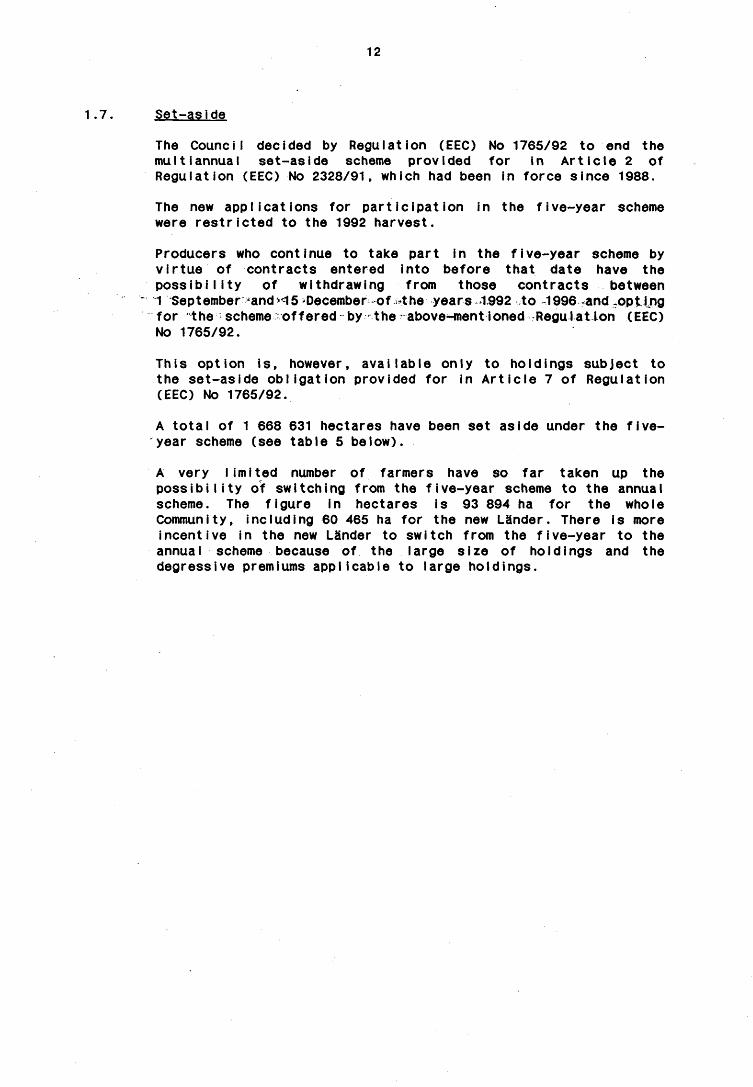
1.7. Set-aside
The Council decided by Regulation (EEC) No 1765/92 to end the multiannual set-aside scheme provided for in Article 2 of Regulation (EEC) No 2328/91, which had been in force since 1988.
The new applications for participation in the five-year scheme were restricted to the 1992 harvest.
Producers who continue to take part in the five-year scheme by virtue of contracts entered into before that date have the possibility of withdrawing from those contracts between 1 September -and v<i 5 December-of *the years -1992 to -1996 .and .opting for the scheme -offered by the above-mentioned Régulât ion (EEC) No 1765/92.
This option is, however, available only to holdings subject to the set-aside obligation provided for in Article 7 of Regulation (EEC) No 1765/92.
A total of 1 668 631 hectares have been set aside under the five-year scheme (see table 5 below).
A very limited number of farmers have so far taken up the possibility of switching from the five-year scheme to the annual scheme. The figure in hectares is 93 894 ha for the whole Community, including 60 465 ha for the new Lander. There is more incentive in the new Lander to switch from the five-year to the annual scheme because of the large size of holdings and the degressive premiums applicable to large holdings.
TABLE N° 5 Results of set-aside (five-year scheme)
MEMBER STATE
B • .
DK DE(D EL ES F IR IT L NL PO UK
Areas set-as i de (ha)
New applications -In. marketing years
1988-1989
380
167.364
25.080 14.220 1.141
85.650 6
2.446
52.091
1989-1990
• 118
51 .924 250
13.864 40.598
486 239.995
31 5.885
48.820
1990-1991
222 4.596
7 9.77 7 0
28.720 110.044
52 239.952
47 6.696
27.654
1991-1992 (2)
160 3.545 . '- '
183.710 37(3)
22.279 60.152
32 200.675
6 268
3.477
1992-1993 (4)
3 15
- 67.362 0
2.231 0 68
1.382 4
84
- 22.803
< Total
1988-1993
877 8.156
415.413 213
87,712 225.015
1 .643 764.890
94 15.379
109.239
Switching to annual scheme
Ha
3 0
67.362 0*
2.231 0
68 1.382
1 ' . 0" 4 5
22.803
Total EUR 12 348.378 401.971 497.760 474.267 93.746 1.628.631 93.894
( 1 ) (2) (3) (4)
Including new Lander from the 1991/1992 marketing year. Including the changes under Article 12 of Regulation (EEC) No 1272/88 This area has been withdrawn from the five year scheme. Negative areas means areas switched to annual scheme.
Scheme not app lied.
14
1.8 Free supply of agricultural products to the countries of central and eastern Europe and the former USSR
1.8.1
Since 1989 the Community, acting under various regulations, has provided free supplies of agricultural products for the populations of a number of central and eastern European countries and the former USSR (see Financial Reports for 1990, 1991 and 1992).
The following tables show the cumulative expenditure, specifying, where appropriate, the expenditure for 1993.
Free supply of agricultural products to Poland and Romania decided on in 1989 and 1990
The final figures for expenditure on these supplies for Poland and Romania are given in the following tables:
1st tranche appropriations for POLAND and ROMANIA (EAGGF) CU 149 mi I I ion
2nd tranche appropriations for POLAND and ROMANIA (PHARE) ECU 51 mill ion
Total appropriations allocated ECU 200 mill ion
Product Quantity Tonnes
Accounts entries(ECU all I Ion)
during 1993 fin. year
Aggregate up to end 1993
POLAND (in 1992)
1st tranche (R.2247/89)
(in 1990)
Bread wheat Barley Maize Olive oil Beef Citrus fruit
TOTAL
- 2nd tranche (R. 457/90) Charged to PHARE (DG 1)
800 000 200 000 100 000 5 400 10 000 20 000
TOTAL FOR OPERATION
0.0
0.0
75.1 15.1 6.4 8.6 10.1 8.1
123.4
Bread wheat | 300 000 - 27.1
150.5

15
ROMANIA (in 1990)
- 1st tranche (R.282/90)
(in 1990)
- 2nd tranche (R.456/90) Charged to PHARE (DG I)
Rye Maize Olive oil Butter Beef
Total
Rye Maize Olive oil - Costs of delay
in taking over Butter Beef
Total
TOTAL FOR OPERAT 10
62 500 62 500 2 500 2 500 10 000
62 500 62 500 2 500
2 500 10 000
^
-
0.0
3.6 3.6 4.1 2.8 9.6
23.7
-
0.4
3.7 3.6 4.0
0.7 2.7 9.5
24.2
0.4 47.9
The costs incurred by the delay in taking over products by the authorities to which they were consigned at the dates planned are to be repaid by the Commission (Decision C(91) 1672). So far ECU 727 322.2 has been repaid in this way.
However, it should be noted that the total cost to the budget, including the costs of delays, is ECU 198.4 million (ECU 7.3 million to the 1989 budget, ECU 183.3 million to the 1990 budget, ECU 7.4 million to the 1991 budget and ECU 400 000 to the 1992 budget).
Not all of this amount has been charged to the Guarantee Section. ECU 51.3 million, the cost of the second tranches for Poland and Romania, was prefinanced by the EAGGF and finally taken over following its charging to the budget line for cooperation with developing and non-member countries.
These products have been placed on sale in local markets and the proceeds of those sales used to set up local currency counterpart funds. These funds will be used, in conjunction with the Phare programme, for projects related to the modernization of agricultural structures in the countries concerned.

16
1.8.2. Free supply of agricultural products to Bulgaria. Romania and the CIS decided on in 1991
The general climate of political change in the East, which began in 1989/90 in central and eastern Europe, spread in 1991 to the former Soviet Union.
Following the Rome European Council in December 1990, the Council of Ministers adopted measures to assist Bulgaria (ECU 27 million), Romania (ECU 53 million) and the former Soviet Union (ECU 250 million) by supplying food and by providing ECU 500 million in loan guarantees for exports of agricultural and food products.
The detailed rules for the application of these programmes were adopted between May and July 1991.
var ious
All these operations, costing a total of ECU 330 million, were financed by the EAGGF from appropriations carried over from 1990.
Under the regulations adopted, the total quantities supplied from 1991 were as follows:
Product Quantity Tonnes
Accounts entries (ECU ail I Ion)
during 1993 fin. year
Aggregate up to end 1993
ROMANIA (in 1991)
(R. 597/91) TOT APPROP ECU 80 mill ion
BULGARIA (in 199
Bread wheat SMP Butter Sunflower oil Sugar Baby food Whole-mi Ik powder Cost of checks
TOTAL FOR OPERATIC»
)
SMP Butter Beef
TOTAL FOR OPERATIOF
50 000 2 000 5 000 20 000 20 000 1 500 2 000
i
7 500 4 000 11 000
i
0.009
0.009
3.9 2.8 6.8 10.6 15.8 4.1 4.9 0.2
49.1
-
0.0
8.2 5.6
» 12.8
26.6
17
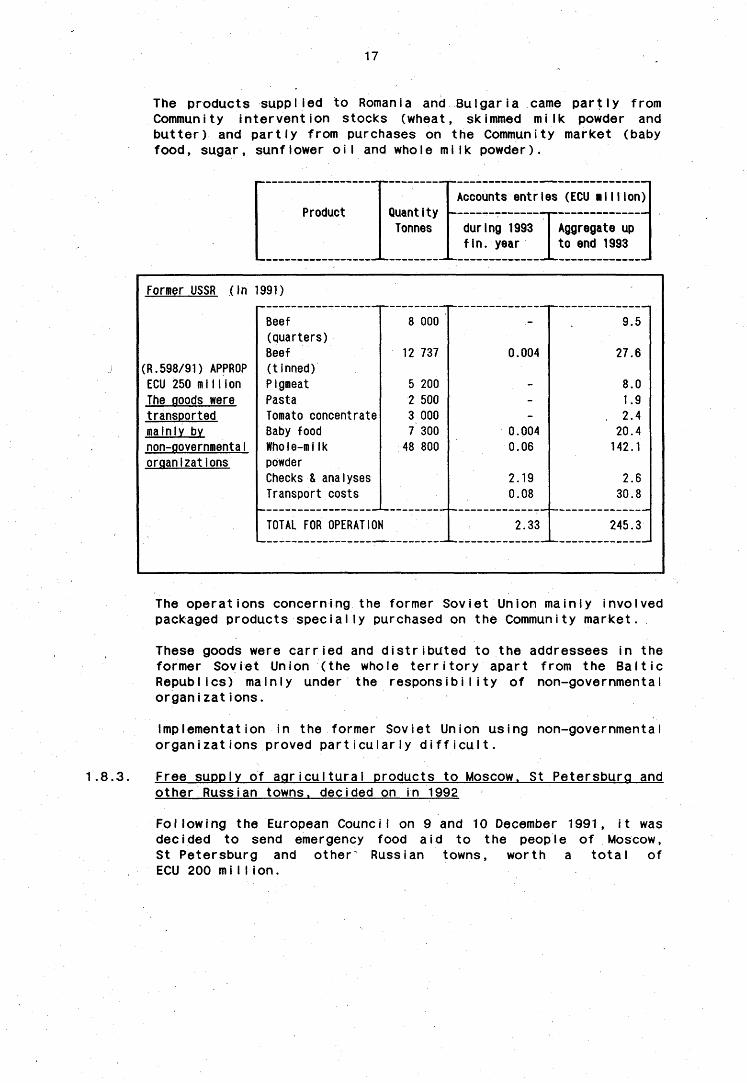
The products supplied to Romania and Bulgaria came partly from Community intervention stocks (wheat, skimmed milk powder and butter) and partly from purchases on the Community market (baby food, sugar, sunflower oil and whole milk powder).
Product Quantity Tonnes
Accounts entr ies (ECU ai 11 ion)
during 1993 Aggregate up f i n . year I to end 1993
Former USSR ( i n 1991)
(R.598/91) APPROP ECU 250 mi l l ion The goods were transported mainly by non-governmentaI organizations
Beef (quarters) Beef (tinned) Pigmeat Pasta Tomato concentrate Baby food Whole-milk powder Checks & analyses Transport costs
TOTAL FOR OPERATION
8 000
12 737
200 500 000 300
48 800
0.004
0.004 0.06
2.19 0.08
2.33
9.5
27.6
8.0
1.9 2.4
20.4 142.1
2.6 30.8
245.3
The opera t ions concerning the former Soviet Union mainly involved packaged products s p e c i a l l y purchased on the Community market .
These goods were c a r r i e d and d i s t r i b u t e d to the addressees in the former Soviet Union ( the whole t e r r i t o r y apart from the B a l t i c Republ ics) mainly under the r e s p o n s i b i l i t y of non-governmental o r g a n i z a t i o n s .
Implementation in the former Soviet Union us ing non-governmental o rgan iza t i ons proved p a r t i c u l a r l y d i f f i c u l t .
1 .8 .3 . Free supply of a g r i c u l t u r a l products to Moscow, other Russian towns, decided on in 1992
St Petersburg and
Fo l lowing the European Council on 9 and 10 December 1991, i t was decided to send emergency food a id to the people of Moscow, St Petersburg and other Russian towns, worth a t o t a l of ECU 200 mi I I ion .
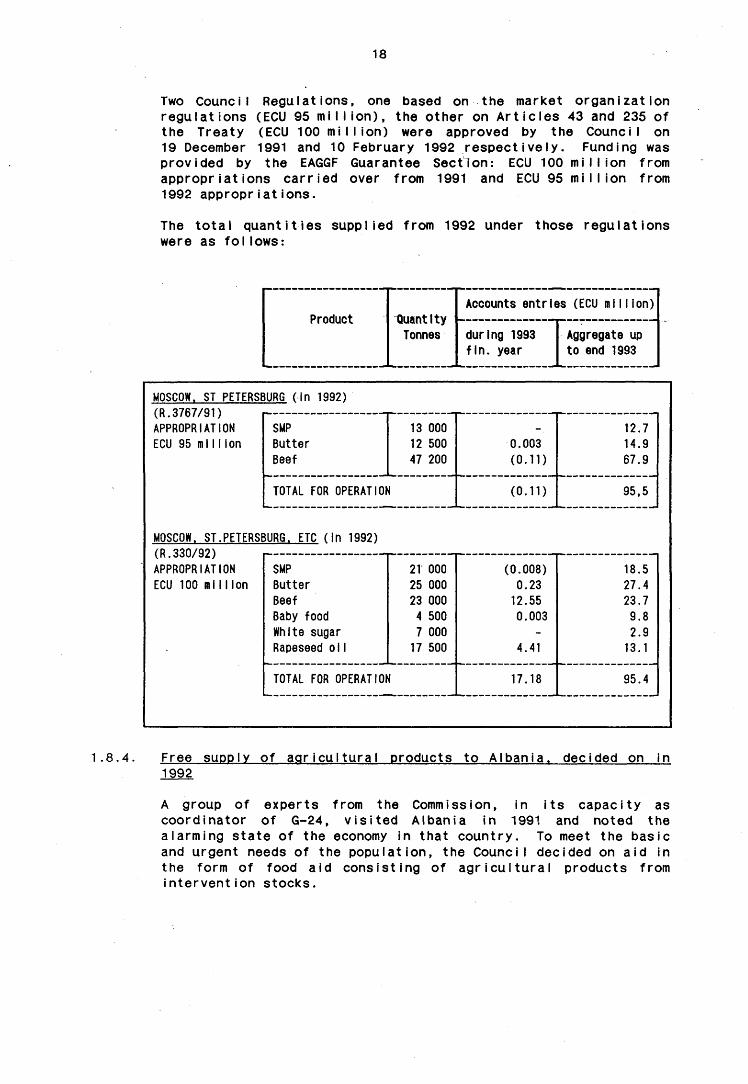
18
Two Council Regulations, one based on the market organization regulations (ECU 95 million), the other on Articles 43 and 235 of the Treaty (ECU 100 million) were approved by the Council on 19 December 1991 and 10 February 1992 respectively. Funding was provided by the EAGGF Guarantee Section: ECU 100 million from appropriations carried over from 1991 and ECU 95 million from 1992 appropriations.
The total quantities supplied from 1992 under those regulations were as fol lows:
Product Quantity Tonnes
Accounts entries (ECU mil
IAggregate up to end 1993
on)
during 1993 fin. year
MOSCOW. ST PETERSBURG (in 1992) (R.3767/91) APPROPRIATION ECU 95 million
SMP Butter Beef
13 000 12 500 47 200
TOTAL FOR OPERATION
MOSCOW. ST.PETERSBURG. ETC (In 1992) (R.330/92) APPROPRIATION ECU 100 million
SMP Butter Beef Baby food White sugar Rapeseed oiI
TOTAL FOR OPERATION
21 000 25 000 23 000 4 500 7 000 17 500
0.003 (0.11)
(0.11)
(0.008) 0.23 12.55 0.003
4.41
17.18
12.7 14.9 67.9
95,5
18.5 27.4 23.7 9.8 2.9 13.1
95.4
1-8.4. Free supply of agricultura 1992
products to Albania, decided on in
A group of experts from the Commission, in its capacity as coordinator of G-24, visited Albania in 1991 and noted the alarming state of the economy in that country. To meet the basic and urgent needs of the population, the Council decided on aid in the form of food aid consisting of agricultural products from intervention stocks.
19
Italy had established a military supply system to channel food aid from that country to various regions within Albania. This system was kept in place by Italy and used to transport Community food aid by land (Pellicano).
The Commission bore the costs of land transport which had been met by Italy between 1 January and 31 December 1.992.
The total quantities supplied under the various Regulations from 1992 are as follows:
Product Quantity Tonnes
Accounts entries (ECU million
during 1993 Aggregate up fin. year to end 1993
ALBANIA (in 1992) (R. 2938/91)
Charged to PHARE (DG I)
Bread wheat 100 000
TOTAL FOR OPERATION
8.7
8.7
8.7
8.7
N.B. : This amount was prefinanced by the EAGGF Guarantee Section and charged in fine against the appropriations for cooperation with non-Community countries.
ALBANIA (in 1992) (R. 3860/91) APPROPRIATION ECU 35 million
Bread wheat Flour Meal
SMP Butter Beef
130 000 38 000 2 000 5 000 1 000 11 000
TOTAL FOR OPERATION
2.6 2.0 0.28 (0,03) 0.08
4.92
10.8 * 3.9
0.3 4.5 1.4 13.9
34.8
* About ECU 250 000 still to be booked (to be entered In the accounts in 1994)|
20
Product Quantity Tonnes
Accounts entries(ECU all I ion)
during 1993 Aggregate up fin. year to end 1993
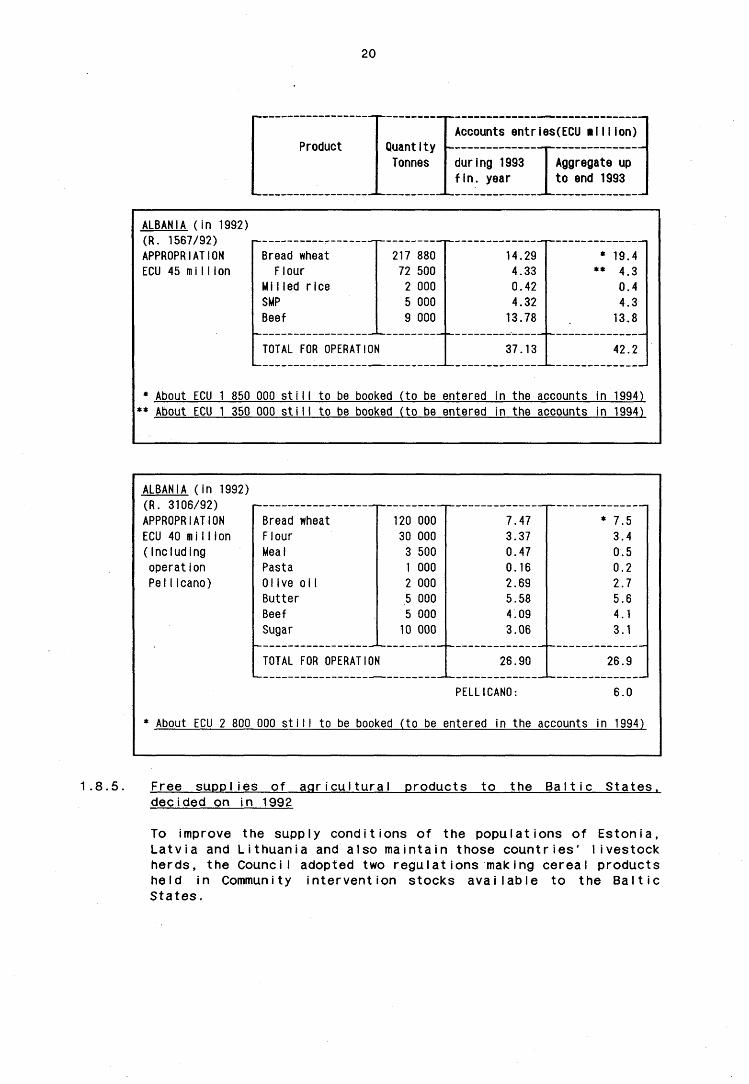
ALBANIA (in 1992) (R. 1567/92) APPROPRIATION ECU 45 million
Bread wheat Flour
Milled rice SMP Beef
TOTAL FOR OPERATION
217 880 72 500 2 000 5 000 9 000
14.29 4.33 0.42 4.32 13.78
37.13
19.4 4.3 0.4 4.3 13.8
42.2
* About ECU 1 850 000 still to be booked (to be entered in the accounts in 1994) ** About ECU 1 350 000 still to be booked (to be entered in the accounts in 1994)
ALBANIA (in 1992) (R. 3106/92) APPROPRIATION ECU 40 million (Including operation Pel Iicano)
Bread wheat Flour Meal Pasta Olive oil Butter Beef Sugar
120 000 30 000
TOTAL FOR OPERATION
500 000 000 000 000
10 000
7.47 3.37 0.47 0.16 2.69 5.58 4.09 3.06
26.90
7.5 3.4 0.5 0.2 2.7 5.6 4.1 3.1
26.9
PELLICANO: 6.0
* About ECU 2 800 000 still to be booked (to be entered in the accounts in 1994)
1.8.5. Free supplies of agricultural products to the Baltic States. decided on in 1992
To improve the supply conditions of the populations of Estonia, Latvia and Lithuania and also maintain those countries' livestock herds, the Council adopted two régulât ions making cereal products held in Community intervention stocks available to the Baltic States.

21
The total quantities supplied under those Regulations in 1992 were as fol lows:
Product Quantity Tonnes
Accounts entries(ECU ai 11 Ion)
during 1993 I Aggregate up fin. year I to end 1993
BALTIC STATES (R. APPROPRIATION ECU
Estonia
Latvia
Lithuania
3861/91) (in 1992) 45 mi 11 ion
Bread wheat - Flour Feed wheat Barley Rye
TOTAL
Bread wheat Barley Rye
TOTAL
Bread wheat Barley Rye
TOTAL
TOTAL FOR OPERAT 101
60 000 2 000 10 000 50 000 20.000
80 000 60 000 50 000
150 000 85 000 20 000
*
0.56 0.001
0.56
4.4 0.2 0.7 3,7 1.4
10.4
(0.021) 0.60 0.002
0.58
5.9 3.9 3.5
13.9
0.08 1.08 0.001
1.16
10,8 6.1 1.4
18.3
2.30 42.5
22
Product Quantity Tonnes
Accounts entries(ECU ill I ion)
during 1993 Aggregate up fin. year to end 1993
BALTIC STATES (R. 2335/92) (in 1992) APPROPRIATION ECU 45 million
Estonia
Latvia
Lithuania
Bread wheat Feed wheat Barley
TOTAL
Bread wheat Barley Rye
TOTAL
Bread wheat Rye
TOTAL
TOTAL FOR OPERATION
60 000 10 000 75 000
80 000 25 000 50 000
200 000 74 000
4.65 0.51 5.00
10.16
5.15 1.16 3.25
9.56
16.10 6.16
22.26
41.97
4.7 0.8 5.7
11.2
6.5 1.9 3.9
12.4
16.1 6.2
22.3
45.8
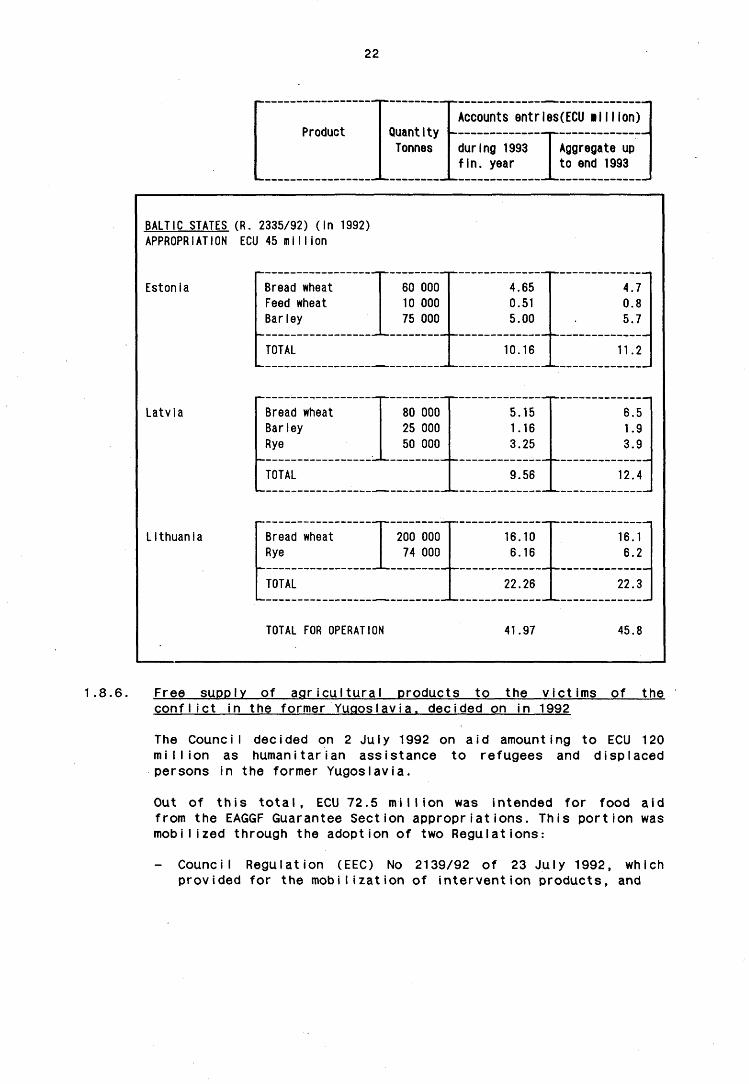
1.8.6. Free supply of agricultural products to the victims of the conflict in the former Yugoslavia, decided on in 1992
The Council decided on 2 July 1992 on aid amounting to ECU 120 million as humanitarian assistance to refugees and displaced persons in the former Yugoslavia.
Out of this total, ECU 72.5 million was intended for food aid from the EAGGF Guarantee Sect ion appropriations. This portion was mobilized through the adoption of two Regulations:
- Council Regulation (EEC) No 2139/92 of 23 July 1992, which provided for the mobiIization of intervention products, and
23
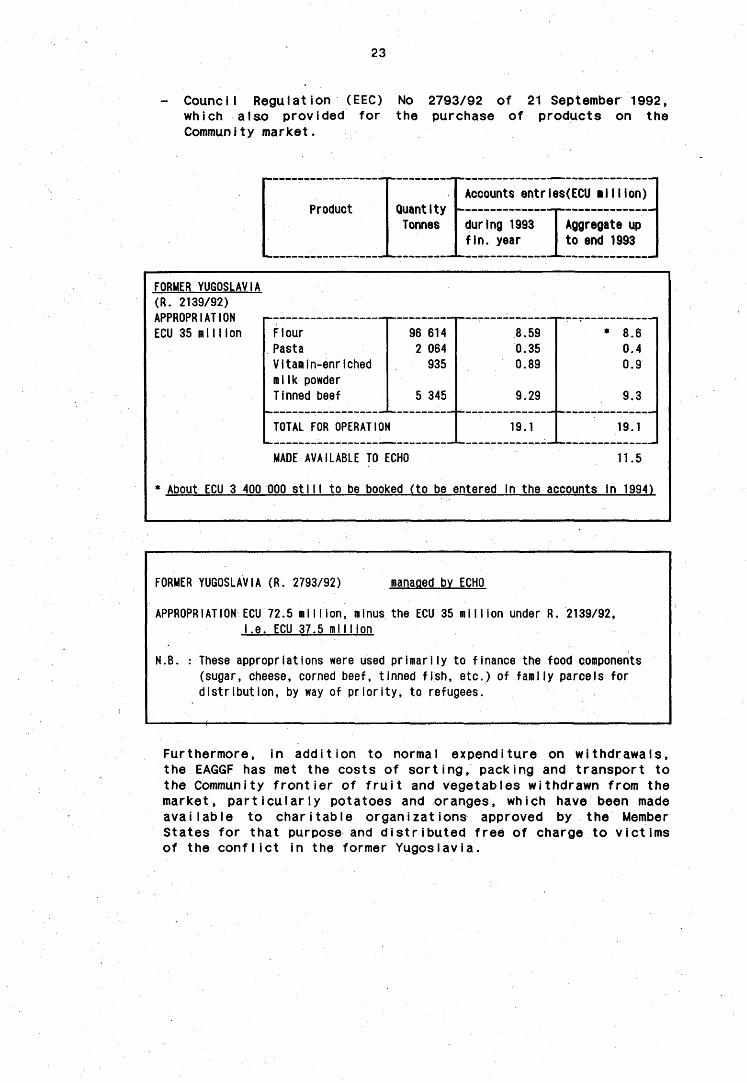
Council Regulation (EEC) No 2793/92 of 21 September 1992, which also provided for the purchase of products on the Community market.
Product Quantity Tonnes
Accounts entries(ECU il 11 ion)
during 1993 I Aggregate up fin. year to end 1993
FORMER YUGOSLAVIA (R. 2139/92) APPROPRIATION ECU 35 million Flour
Pasta
Vitamin-enriched mi Ik powder Tinned beef
96 614 2 064 935
5 345 9.29 9.3
TOTAL FOR OPERATION 19.1 19.1
MADE AVAILABLE TO ECHO 11.5
* About ECU 3 400 000 still to be booked (to be entered In the accounts in 1994)
8.59 0.35 0.89
8.6 0.4 0.9
FORMER YUGOSLAVIA (R. 2793/92) managed bv ECHO
APPROPRIATION ECU 72.5 million, minus the ECU 35 million under R. 2139/92, i.e. ECU 37.5 million
N.B. : These appropriations were used primarily to finance the food components (sugar, cheese, corned beef, tinned fish, etc.) of family parcels for distribution, by way of priority, to refugees.
Fur thermore, in a d d i t i o n to normal expend i ture on w i t h d r a w a l s , the EAGGF has met the costs of s o r t i n g , packing and t r a n s p o r t to the Community f r o n t i e r of f r u i t and vegetab les withdrawn from the market , p a r t i c u l a r l y potatoes and oranges, which have been made a v a i l a b l e to c h a r i t a b l e o r g a n i z a t i o n s approved by the Member S t a t e s for tha t purpose and d i s t r i b u t e d f r e e of charge to v i c t i m s of the c o n f l i c t in the former Yugos lav ia .
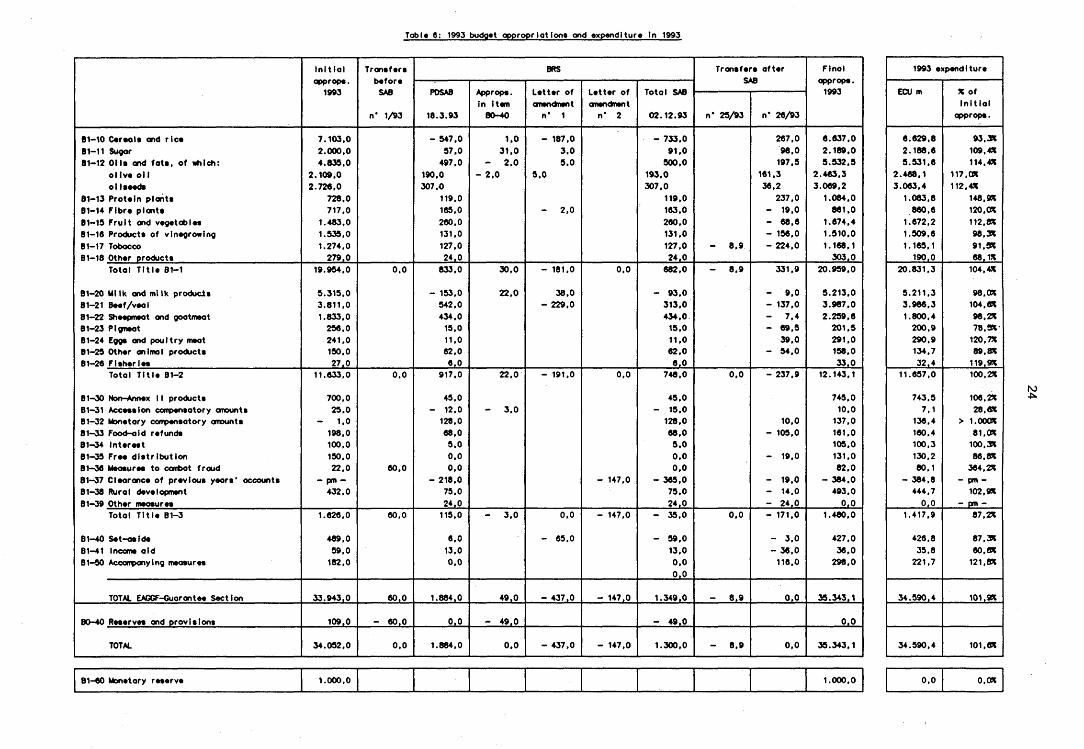
Toble 6: 1993 budget opproprlot Ion» ond expenditure In 1993
81-10 Cereols and rice
81-11 Sugar
81-12 Oils and fats, of which:
olive oil
Oilseeds
81-13 Protein plants
81-14 Fibre plant*
81-15 Fruit and vegetables
B1-16 Product* of vinegrowing
B1-17 Tobacco
B1-18 Other product*
Total Tit 1* B1-1
81-20 Mi Ik and mi Ik product*
81-21 Beef/veal
81—22 Sheepmeat and goatmeat
81-23 Plgmeat
B1—24 Eggs and poultry meat
B1-2S Other animal products
B1-26 Fisheries
Total Till* B1-2
B1-30 Non-Ann«x 11 products
B1-31 Accession compensatory amounts
B1-32 Monetary compensatory amounts
81-33 Food-aid refunds
81-34 Intsrsst
B1-35 Free distribution
B1-36 Msosurss to combat fraud
81-37 Clearance of previous year*' oceounts
81-38 Rural dsvslopmsnt
B1-39 Other msosurss
Totol Title B1-3
81-40 Set-aside
B1-41 Income aid
81-50 Accompanying measure*
TOTAL EAGGF-Guorontee Section
TOTAL
81-60 Monetory reserve
Initial
opprops.
1993
7.103,0
2.000.0
4.835.0
2.109.0
2.726.0
728.0
717.0
1.483.0
1.535.0
1.274.0
279,0
19.954.0
9.319,0
3.811,0
1.833.0
296.0
241.0
150.0
27.0
11.633.0
700.0
29.0
- 1.0
198.0
100.0
190.0
22.0
- p m -
432.0
1.626.0
489,0
99,0
182.0
33.943,0
109.0
34.092.0
1.000.0
Transfers
before
SAB
n* 1/93
0.0
0.0
60,0
60.0
60,0
- 60.0
0.0
BRS
POSAS
18.3.93
- 547.0
57.0
497.0
190,0
307.0
119.0
165.0
260.0
131,0
127,0
24,0
833.0
- 153,0
542,0
434.0
15,0
11.0
62.0
6.0
917.0
45.0
- 12.0
128.0
68.0
5,0
0.0
0.0
- 218.0
75.0
24,0
115,0
6.0
13.0
0.0
1.884,0
0.0
1.884.0
Approps.
in item
BO-40
1.0
31,0
- 2.0
- 2,0
30,0
22,0
22.0
- 3.0
- 3.0
49.0
- 49.0
0.0
Letter of
dnsoctavnt
n* 1
- 187.0
3.0
5.0
5.0
- 2.0
- 181.0
38.0
- 229,0
- 191.0
0.0
- 65.0
- 437,0
- 437,0
Letter of
onfwncnwnt
n* 2
0,0
0,0
- 147,0
- 147,0
- 147,0
- 147,0
Total SAB
02.12.93
- 733.0
91,0
900,0
193.0
307.0
119.0
163.0
260.0
131.0
127,0
24.0
682,0
- 93.0
313.0
434,0
19,0
11,0
62,0
6,0
748.0
49.0
- 19.0
128.0
68.0
9.0
0,0
0.0
- 369.0
79.0
24.0
- 39,0
- 99,0
13,0
0,0
0.0
1.349.0
- 49.0
1.300.0
Transfers after
SAB
n* 29/93
- 8.9
- 8.9
0.0
0.0
- 8.9
- 8.9
n' 26/93
267.0
98.0
197.9
161.3
36.2
237,0
- 19,0
- 68.6
- 196.0
- 224.0
331,9
- 9,0
- 137,0
- 7,4
- 69.9
39.Q
- 94.0
- 237,9
10,0
- 109,0
- 19,0
- 19.0
- 14.0 - 24.0 - 171.0
- 3.0
- 36.0
116.0
0.0
0.0
Final
approps.
1993
6.637.0
2.189.0
9.932.9
2.463.3
3.069.2
1.084.0
861,0
1.674.4
1.510.0
1.168.1
303.0
20.959,0
5.213,0
3.987,0
2.299,6
201.9
291,0
198.0
33.0
12.143.1
749,0
10,0
137,0
161.0
109.0
131.0
82.0
- 384.0
493.0
0.0
1.480,0
427.0
36.0
298.0
39.343.1
0.0
39.343.1
1.000.0
1993 expenditure
ECU m
6.629,8
2.188.6
9.931.6
2.468.1
3.063.4
1.083.8
860.6
1.672.2
1.909.6
1.169.1
190,0
20.831,3
3.211.3
3.986.3
1.800.4
200.9
290.9
134.7
32,4
11.697.0
743.5
7.1
136.4
160.4
100.3
130,2
80.1
- 384,8
444.7
0.0
1.417.9
426.8
35,8
221,7
34.590,4
34.590,4
0,0
X of initial
approps.
93.3*
109.451
114.431
117,OX
112,4*
148.9*
120.0X
112,8*
98.3%
91.3*
68.1*
104.4*
98,0*
104,6*
98,2*
78.5V
120,7*
89.8*
119,9*
100,2*
106.2*
28.6*
> 1.000*
81.0*
100,3*
86,8*
364,2*
- p m -
102,9*
- pm -
87,2*
87,3*
60,6*
121,8*
101.9*
101.6*
0.0*
25
2. FINANCING OF THE MARKETS
2.1. Comparison between original appropriations and expenditure in 1993
The original EAGGF guarantee appropriations amounted to ECU 34 052 mi I I ion.CD
Expenditure for the financial year totalled ECU 34 590.4 million. On top of this is expenditure incurred using carryovers from 1992 amounting to ECU 157.7 million.
The difference between the original appropriations and actual expenditure is explained' by the fact that agricultural expenditure, which is significantly affected by external factors (e.g. the weather, the international trade situation, fluctuations in the US dollar/ecu parity) often departs from the original forecasts made 20 months before some items of expenditure are actually incurred.
A supplementary and amending budget was accordingly adopted to take account of the new data available, thus reducing the gap between final appropriations and expenditure (see Table 7).
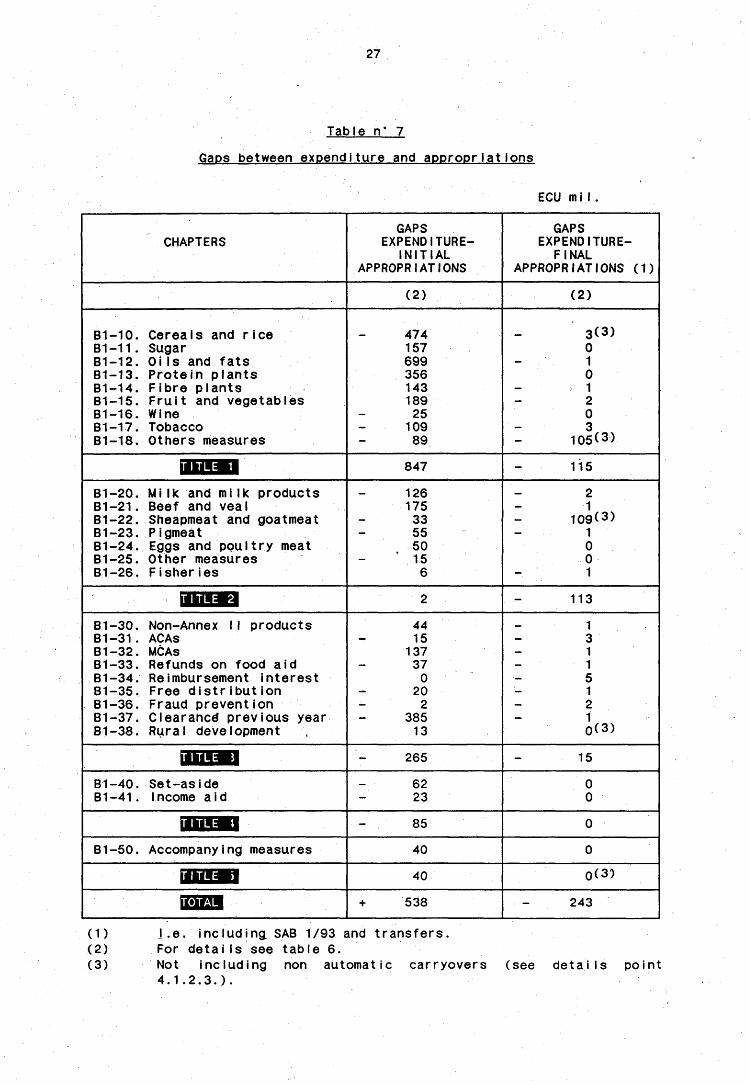
Thus, taking into account supplementary and amending budget 1/93 adopted by the budget authority and transfers which increased the total EAGGF guarantee appropriations subject to the guideline to ECU 35 343 million*2), unused appropriations for 1993 totalled ECU 243-miI Iion(3)( i.e. 0,7% of the EAGGF guarantee budget.
Differences between original appropriations and actual expenditure are the result of two types of factors, namely:
- non-market factors, accounting for a total of ECU 912 million, such as the impact of monetary realignments within the EMS, the variation in the US dollar/ecu parity, the outcome of the clearance of accounts for previous years, compensation paid for non-allocation of milk quotas (SLOM) and the programme for the restructuring of milk-production;
- factors specific to the markets.
A. NON-MARKET FACTORS
These can be summed up as follows:
(1) Not including the monetary reserve of ECU 1 billion (2) As a consequence, since the initial budget for subsection B1
provided for appropriations of ECU 34 052 million, the appropriat ions allocated to that subsection were increased by ECU 1 291 million during the financial year.
(3) Not including ECU 510 million, which were carried over non-automat icaI I y to 1994.
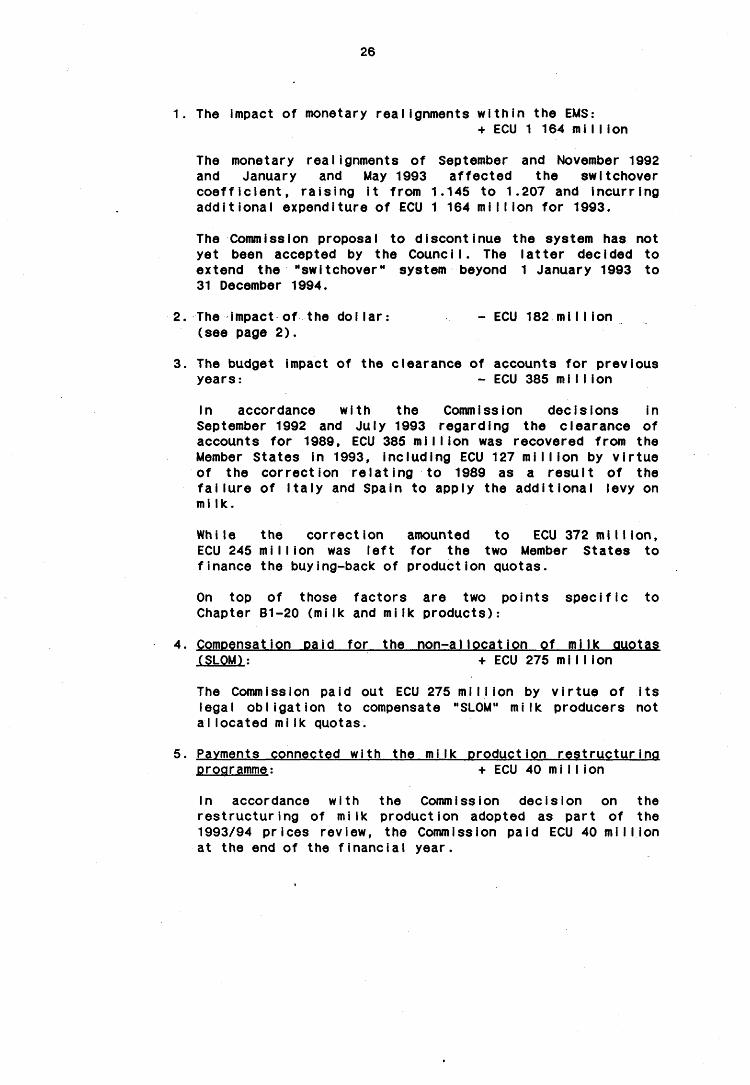
26
1. The impact of monetary realignments within the EMS: -i- ECU 1 164 mi I I ion
The monetary realignments of September and November 1992 and January and May 1993 affected the switchover coefficient, raising it from 1.145 to 1.207 and incurring additional expenditure of ECU 1 164 million for 1993.
The Commission proposal to discontinue the system has not yet been accepted by the Council. The latter decided to extend the "switchover" system beyond 1 January 1993 to 31 December 1994.
2. The impact of the do 11ar: - ECU 182 mi 11 ion (see page 2).
3. The budget impact of the clearance of accounts for previous years: - ECU 385 million
In accordance with the Commission decisions in September 1992 and July 1993 regarding the clearance of accounts for 1989, ECU 385 mi 11 ion was recovered from the Member States in 1993, including ECU 127 million by virtue of the correction relating to 1989 as a result of the failure of Italy and Spain to apply the additional levy on milk.
While the correction amounted to ECU 372 million, ECU 245 million was left for the two Member States to finance the buying-back of production quotas.
On top of those factors are two points specific to Chapter B1-20 (milk and milk products):
4. Compensation paid for the non-allocation of milk quotas (SLOM): + ECU 275 mil I ion
The Commission paid out ECU 275 million by virtue of its legal obligation to compensate "SLOM" milk producers not allocated milk quotas.
5. Payments connected with the milk production restructuring programme: + ECU 40 mi I I ion
In accordance with the Commission decision on the restructuring of milk production adopted as part of the 1993/94 prices review, the Commission paid ECU 40 million at the end of the financial year.
27
Table n' 7
Gaps between expenditure and appropriations
ECU mi I
GAPS GAPS CHAPTERS EXPENDITURE- EXPENDITURE-
INITIAL FINAL APPROPRIATIONS APPROPRIATIONS (1)
(2) (2)
B1-10. Cereals and rice - 474 - 3(3) B1-11. Sugar 157 0 B1-12. Oils and fats 699 - 1 B1-13. Protein plants 356 0 B1-14. Fibre plants 143 - 1 B1-15. Fruit and vegetables 189 - 2 B1-16. Wine - 25 0 B1-17. Tobacco - 109 - 3 B1-18. Others measures - 89 - 105(3)
SDUO 847 115
B1-20. Milk and milk products - 126 - 2 B1-21. Beef and veal 175 - 1 Bl-22. Sheapmeat and goatmeat - 33 - 109(3) B1-23. Pigmeat - 55 - 1 B1-24. Eggs and poultry meat 50 0 B1-25. Other measures - 15 0 B1-26. Fisheries 6 - 1
HLHHM 2 113
B1-30. Non-Annex II products 44 - 1 B1-31. ACAs - 15 - 3 B1-32. MCAs 137 - 1 B1-33. Refunds on food aid - 37 - 1 B1-34. Reimbursement interest 0 - 5 B1-35. Free distribution - 20 - 1 B1-36. Fraud prevention - 2 - 2 B1-37. Clearance previous year - 385 - 1 B1-38. Rural development 13 0(3)
litdl^l - 2 6 5 15
B1-40. Set-as ide - 62 0
B1-41 . Income a id - 23 0
H i d l d B l - 85 0
B1-50. Accompanying measures 40 0
H H 1 « 40 0(3)
IMfJl + 538 - 243
(1) j.e. including SAB 1/93 and transfers. (2) For details see table 6. (3) Not including non automatic carryovers
4.1.2.3.). (see detaiIs point

28
B. BUDGETARY ANALYSIS OF THE MAIN CHAPTERS AND/OR ARTICLES
The main events explaining the difference between the initial appropriations and actual expenditure^) are summed up below.
PLANT PRODUCTS
Chapter B1-10: Cereals and rice - ECU 474 million of which: cereals - ECU 443 million
r ice - ECU 31 mi I I ion
The main reasons explaining this difference are the following:
Firstly, a ser ious-drought in many producer regions affected both cereals and rice harvests; in addition, the rise in world prices during the 1992/93 marketing year resulted in less being spent on export refunds.
However, the significant under-utiIization which could have resulted was partly offset by substantial buying-in as operators wished to face the period of falling prices, in line with the reform of the CAP, with minimum stocks. Furthermore, the fall in world prices during 1993/94 brought about significant expenditure on stock depreciation.
Chapter B1-11: Sugar + ECU 157 million
Art icle 110: Refunds + ECU 190 million The rise in requirements is the result of an increase in exports of sugar subject to quotas at an average rate of refund which was higher than that used to draw up the budget since the average world price was lower than anticipated.
Art icle 111 : Intervention - ECU 32 million Expenditure on the various items was close to the original estimates.
Chapter B1-12: Oils and fats + ECU 699 million
1. 01ive oil + ECU 361 million The overrun mainly involved the following articles:
Art icle 121 : Production aid + ECU 187 million This overrun is mainly due to payments by Italy of outstanding balances from five marketing years prior to 1992/93.
(1) Monthly carryovers under the warning system give a detailed view of actual expenditure compared with the appropriations allocated.

29
Art icle 123: Intervention in the form of storage of olive oil
+ ECU 172 mi I I ion Contrary to the budget assumptions, there were purchases into public intervention, indeed, in substantial quantities (132 000 t), and aid was paid on 180 000 t in private storage.
2. OiI seeds + ECU 338 mi I I ion The main factor was an overrun on appropriations for production support (+ ECU 287 million). This was due to a greater area el igible for the aid than anticipated, in particular in Spain, where many producers chose to grow sunflower seed, wh i ch i s more res i stent to a shortage of water.
Chapter B1-13: Protein plants + ECU 356 million
Article 130: Peas and field beans + ECU 140 million The reasons for under-utiIizat ion are the switch from 1992 to 1993 in payments owing to the late start to the 1992 harvest and a smà 11er - reduction in the guide price than expected on account of a poor harvest.
As from 1993/94, the system of aid per hectare for such products has been incorporated into that for arable crops.
Art icle 131 : Dried fodder + ECU 219 mi I I ion A substantial rise in production was one of the causes in the overrun observed, but it also stems from the very early processing carried out by operators, who thus received the higher aid (former scheme for cereals) applying prior to 1 July 1993, given that the fall in the price for barley resulted in a reduction in the aid.
Chapter B1-14: Fibre plants + ECU 143 million
Article 141 : Cotton + ECU 143 million The high expenditure can be explained by a fall in the world price and a bigger harvest than expected; the overrun in the MGQ should have resulted in a 20% price reduction, limited to 15% by the CounciI.
Chapter B1-15: Fruit and vegetables + ECU 189 million
Art icle 150: Fresh fruit and vegetables + ECU 341 million The overrun was due to a sharp increase in quant ities exported and thus in refunds and to major withdrawals of apples, peaches and nectarines.
30
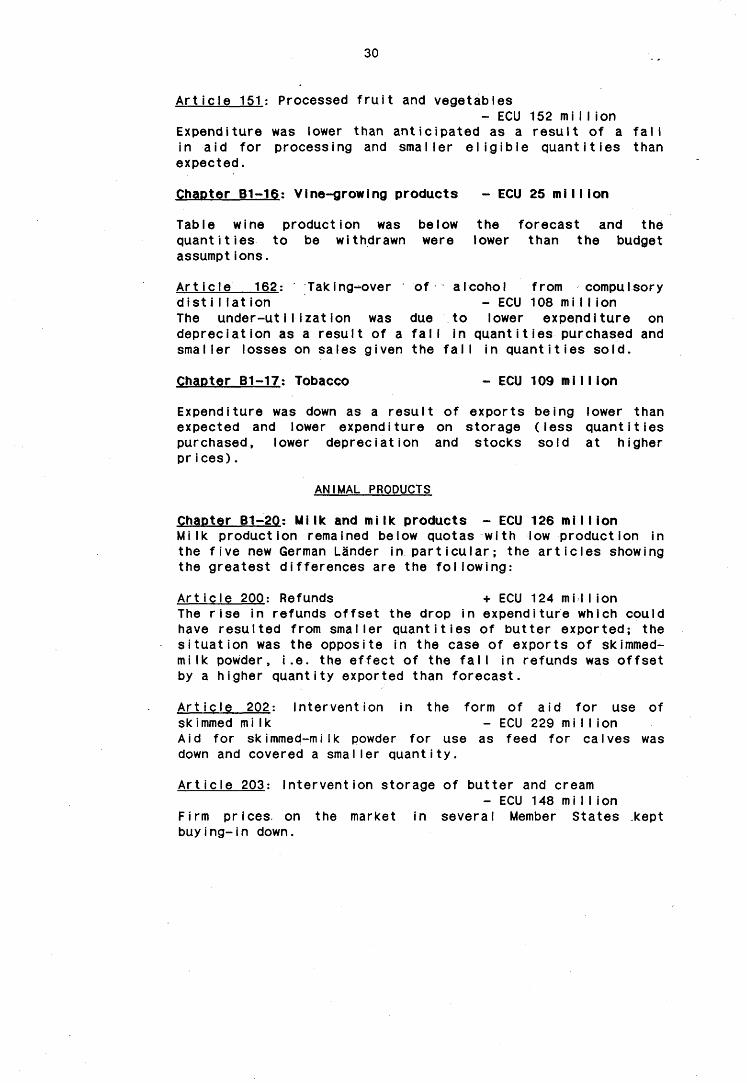
Art icle 151 : Processed fruit and vegetables - ECU 152 mi I I ion
Expenditure was lower than anticipated as a result of a fall in aid for processing and smaller eligible quantities than expected.
Chapter B1-16: Vine-growing products - ECU 25 million
Table wine production was below the forecast and the quantities to be withdrawn were lower than the budget assumpt ions.
Article 162: Taking-over of alcohol from compulsory distillation - ECU 108 million The under-utiIization was due to lower expenditure on depreciation as a result of a fall in quantities purchased and smaller losses on sales given the fall in quantities sold.
Chapter B1-17: Tobacco - ECU 109 million
Expenditure was down as a result of exports being lower than expected and lower expenditure on storage (less quantities purchased, lower depreciation and stocks sold at higher prices).
ANIMAL PRODUCTS
Chapter B1-20; Milk and milk products - ECU 126 million Milk production remained below quotas with low production in the five new German Lander in particular; the articles showing the greatest differences are the following:
Art icle 200: Refunds + ECU 124 mil I ion The rise in refunds offset the drop in expenditure which could have resulted from smaller quantities of butter exported; the situation was the opposite in the case of exports of skimmed-milk powder, i.e. the effect of the fall in refunds was offset by a higher quantity exported than forecast.
Article 202: Intervention in the form of aid for use of skimmed milk - ECU 229 million Aid for skimmed-milk powder for use as feed for calves was down and covered a smaller quantity.
Art icle 203: Intervention storage of butter and cream - ECU 148 mi I I ion
Firm prices on the market in several Member States kept buying-in down.
31
Art icle 206: Other measures - ECU 206 mi I I ion The cost of measures for the cessation of, or reduction in, milk production in 1991/92 was lower than expected. This under-ut11ization was limited by higher expenditure on promotion campaigns and measures to improve quality for 1993/94, undertaken on account of the discontinuation of the co-responsibiIity levy (as from 1 April 1993).
Article 209; Other intervention + ECU 315 million This covered compensation for "SLOM" milk producers not allocated milk quotas and the payment of measures for the restructuring of milk production adopted as part of the 1993/94 prices review.
Chapter B1-21: Beef/veal + ECU 175 mi 11 ion
Article 210: Refunds + ECU 176 million This overrun was due to a shift from exports from intervention to exports from the market.
For the rest, the overrun in expenditure on the special premium for adult bovine animals in 1992 as a result of the increase in the number eligible (Article 212) was offset by under-utiIization on intervention storage (Article 211).
Chapter B1-22: Sheepmeat and goatmeat - ECU 33 mi 11 ion
It is not apparent from this slight-, Under-ut i I izat ion that in the face of adverse market condit ions, the Commission decided to bring forward the second advance on the ewe premium and to make the payment in respect of the 1993 financial year. The SAB took this into account. However, certain Member States were not able to make these payments earlier than planned and a request for a carryover to 1994 was proposed in respect of this Chapter.
Chapter B1-23: Pigmeat - ECU 55 mi 11 ion
Art icle 231 : Intervention - ECU 32 million Contracts concluded and paid in 1993 cover very small quant ities.
Art icle 239: Other intervention - ECU 20 million Expenditure on combating epizootics was low.
Chapter B1-24: Eggs and poultrymeat + ECU 50 million
Art icle 241 : Refunds on poultrymeat + ECU 51 million This overrun was due to higher exports than forecast not offset .by .the-falI in refunds decided in July.
32
Chapter B1-26: Fishery products + ECU 6 million
Although small, this overrun represents a major proportion of the total budget for the Chapter (ECU 27 million). It was due to a difficult market situation, involving a collapse in prices as a result of the fall in consumption and cheap imports, leading to higher quantities withdrawn than ant icipated.
OTHER SECTORS
Chapter B1-30; Refunds on non-Annex 11 products + ECU 44 mi 11 ion
Exports of goods obtained by processing agricultural products were higher than expected.
Chapter B1-32: MCAs + ECU 137 mi 11 ion
The introduction of the single market on 1 January 1993 implied, by the same token, the abolition of MCAs, the dismantlement of which had almost been completed before the monetary realignments in September and October 1992.
However, the devaluation of certain Community currencies resulted in negative MCAs in Italy, the United Kingdom, Spain and Greece up to 1 January 1993, the date the system was abolished.
Chapter B1-33: Refunds on food aid - ECU 37 million
The main reason for the under-ut i I izat ion was lower expenditure on cereals following a fall in refunds and in the number of invitations to tender.
Chapter B1-35: Distribution of agricultural products to deprived persons in the Community - ECU 20 million
Not all appropriations could be used as certain Member States were not able to dispose of the goods allocated to them by the time limits laid down.
Chapter B1-38: Rural development schemes linked to market operations + ECU 13 million
A significant overrun due to the increase in the ewe premium in less-favoured, mountain and hill areas (+ ECU 85 million) was offset by under-utiIizat ion in respect of the suckler cow premium in mixed herds (smaller number of eligible animals than expected, giving - ECU 22 million) and aid to small producers of arable crops (- ECU 40 million), discontinued after the 1991/92 marketing year.
33
Chapter B1-40: Set-aside - ECU 62 million
The under-utiIization relates to the special scheme for temporary set-aside for 1991/92, where expenditure was lower than forecast.
Chapter B1-41; Income aid - ECU 23 million
The under-utiIization stems from problems in implementing and in the launching the new programmes, in particular in Spain.
Chapter B1-50; Accompany ing measures + ECU 40 million
The rate of implementation of the programmes under new measures approved by the ̂ Counci I on 30 July 1992 i« -the reason for the overrun. Part of the latter is covered by a request for a carryover to 1994 following late declarations by the Member States.
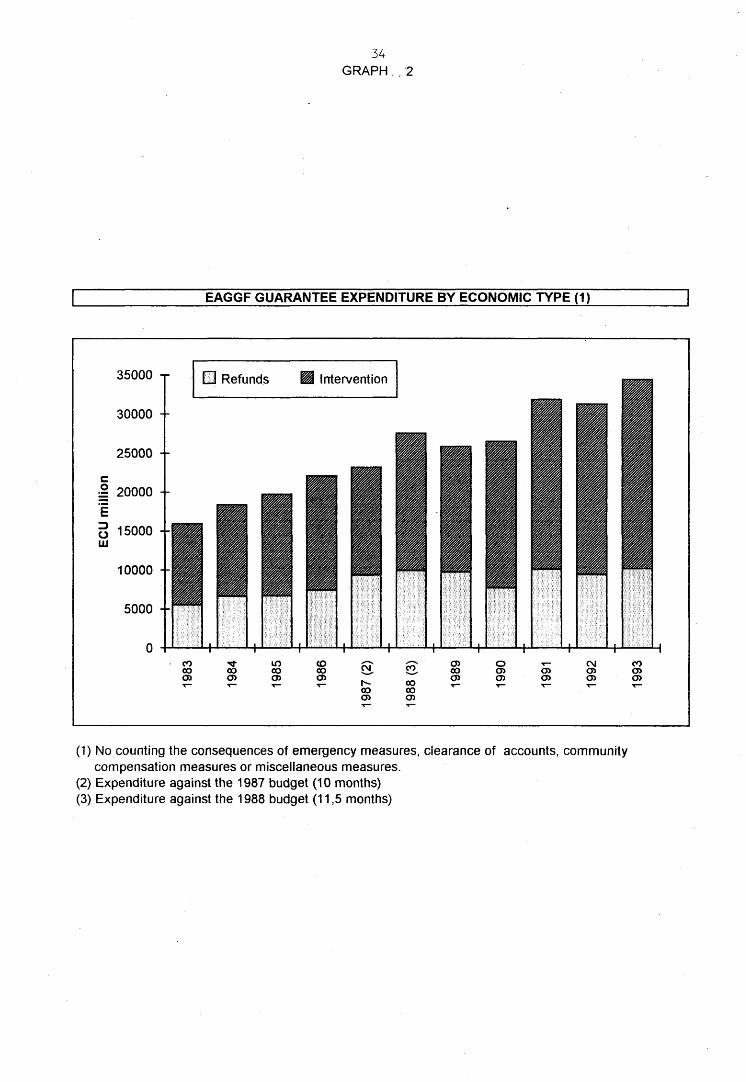
34 GRAPH
EAGGF GUARANTEE EXPENDITURE BY ECONOMIC TYPE (1)
35000
30000
25000
c £ 20000
g 15000 1X1
10000
5000
El Refunds Intervention
CO 00 oo
o> m oo o>
CD 00 04,
00
CO
CO 00 Oî
OO o CM CO Oî
(1) No counting the consequences of emergency measures, clearance of accounts, community compensation measures or miscellaneous measures.
(2) Expenditure against the 1987 budget (10 months) (3) Expenditure against the 1988 budget (11,5 months)
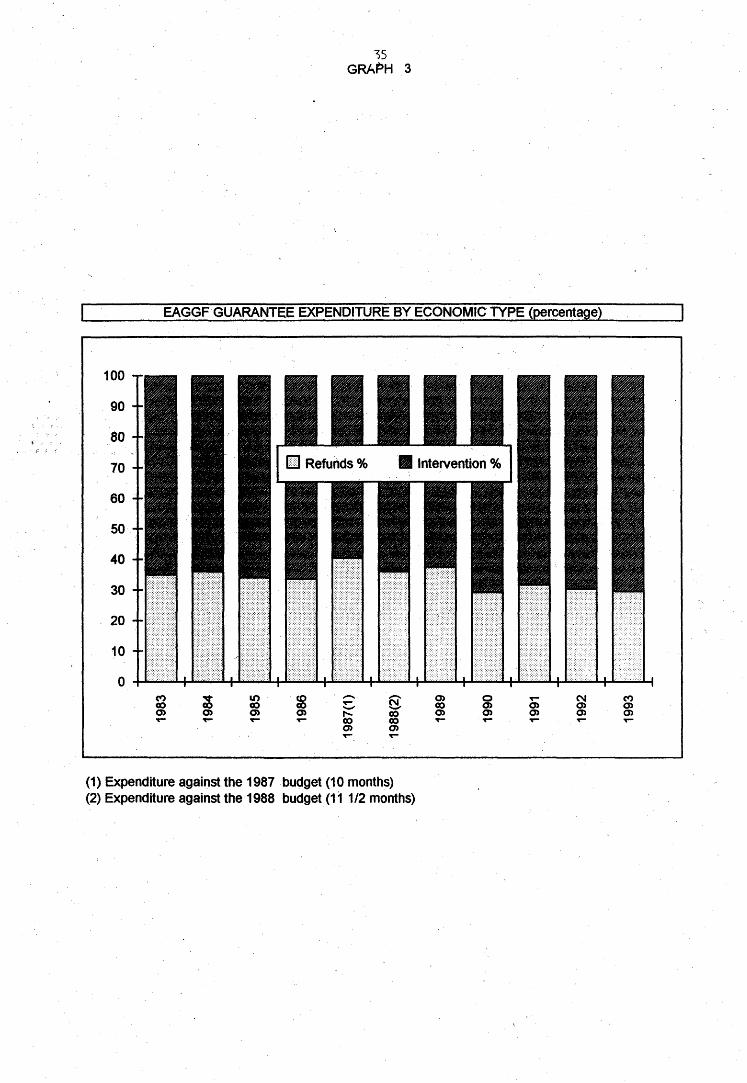
15 GRAPH 3
EAGGF GUARANTEE EXPENDITURE BY ECONOMIC TYPE (percentage)
(1) Expenditure against the 1987 budget (10 months) (2) Expenditure against the 1988 budget (11 1/2 months)
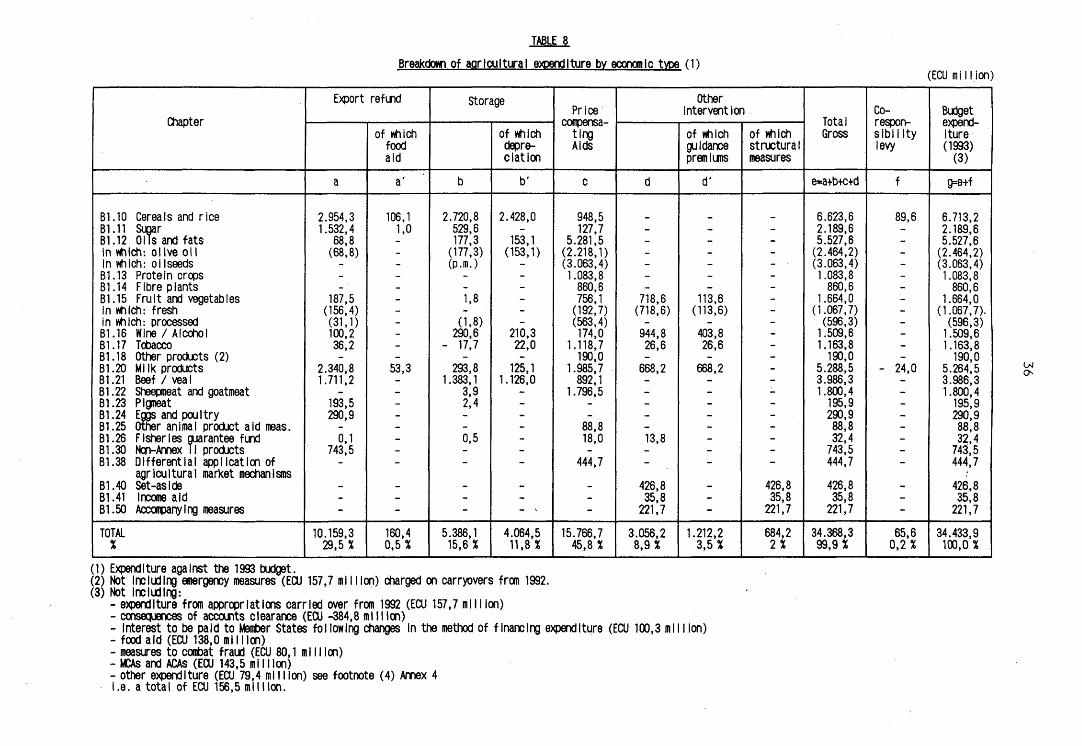
TABLE 8
Breakdown of agricultural expenditure bv economic type (1) (ECU mi 11 ion)
Chapter
B1.10 Cereals and rice B1.11 Sugar B1.12 OMS and fats in which: olive oil in which: oilseeds B1.13 Protein crops B1.14 Fibre plants Bl .15 Fruit and vegetables in which: fresh in which: processed Bl-16 Wine / Alcohol Bl .17 Tobacco Bl .18 Other products (2) B1.20 Milk products B1.21 Beef / veal B1.22 Sheepmeat and goatmeat B1.23 Pigmeat B1.24 Eggs and poultry B1.25 Other animal product aid meas. B1.26 Fisheries guarantee fund B1.30 Non-Armex II products B1.38 Differential application of
agricultural market mechanisms B1.40 Set-aside B1.41 Income aid Bl .50 Accompanying measures
TOTAL %
Export refind
a
2.954,3 1.532,4
68,8 (68,8)
187,5 (156,4) (31,1) 100,2 36,2
2.340,8 1.711,2
193,5 290,9
0,1 743,5
10.159,3 29,5%
of which food aid
a'
106,1 1,0
53,3
160,4 0,5%
Storage
b
2.720,8 529,6 177,3 (177,3) (p.m.)
1,8
(1,8) 290,6
- 17,7
293,8 1.383,1
3,9 2,4
0,5
5.386,1 15,6%
of which depreciation
b'
2.428,0
153,1 (153,1)
210,3 22,0
125,1 1.126,0
4.064,5 11,8%
Price compensating Aids
c
948,5 127,7
5.281,5 (2.218,1) (3.063,4) 1.083,8 860,6 756,1 (192,7) (563,4) 174,0
1.118,7 190,0
1.985,7 892,1
1.796,5
88,8 18,0
444,7
15.766,7 45,8%
Other intervention
d
718,6 (718,6)
944,8 26,6
668,2
13,8
426,8 35,8 221,7
3.056,2 8,9%
of which guidance premiums
d'
113,6 (113,6)
403,8 26,6
668,2
1.212,2 3,5%
of which structural measures
426,8 35,8 221,7
684,2 2%
Total Gross
e=a+b+c+d
6.623,6 2.189,6 5.527,6 (2.464,2) (3.063,4) 1.083,8 860,6
1.664,0 (1.067,7) (596,3) 1.509,6 1.163,8 190,0
5.288,5 3.986,3 1.800,4 195,9 290,9 88,8 32,4 743,5 444,7
426,8 35,8
221,7
34.368,3 99,9%
Co-responsibility levy
f
89,6
- 24,0
65,6 0,2%
Budget expenditure (1993) (3)
g=e+f
6.713,2 2.189,6 5.527,6 (2.464,2) (3.063,4) 1.083,8 860,6
1.664,0 (1.067,7). (596,3) 1.509,6 1.163,8 190,0
5.264,5 3.986,3 1.800,4 195,9 290,9 88,8 32,4 743,5 444,7
426,8 35,8 221,7
34.433,9 100,0%
(1) Expenditure against the 1993 budget. (2) Not Including emergency measures (ECU 157,7 million) charged on carryovers from 1992. (3) Not Including:
- expenditure from appropriations carried over from 1992 (ECU 157,7 mill ion) - consequences of accounts clearance (ECU -384,8 mi 11 Ion) - Interest to be paid to Member States fol lowing changes in the method of financing expenditure (ECU 100,3 mi 11 Ion) - food aid (ECU 138,0 million) - measures to combat fraud (ECU 80,1 mi 11 Ion) - MCAs and ACAs (ECU 143,5 mi 11 ion) - other expenditure (ECU 79,4 ml 11 ion) see footnote (4) Annex 4 i.e. a total of ECU 156,5 million.
o
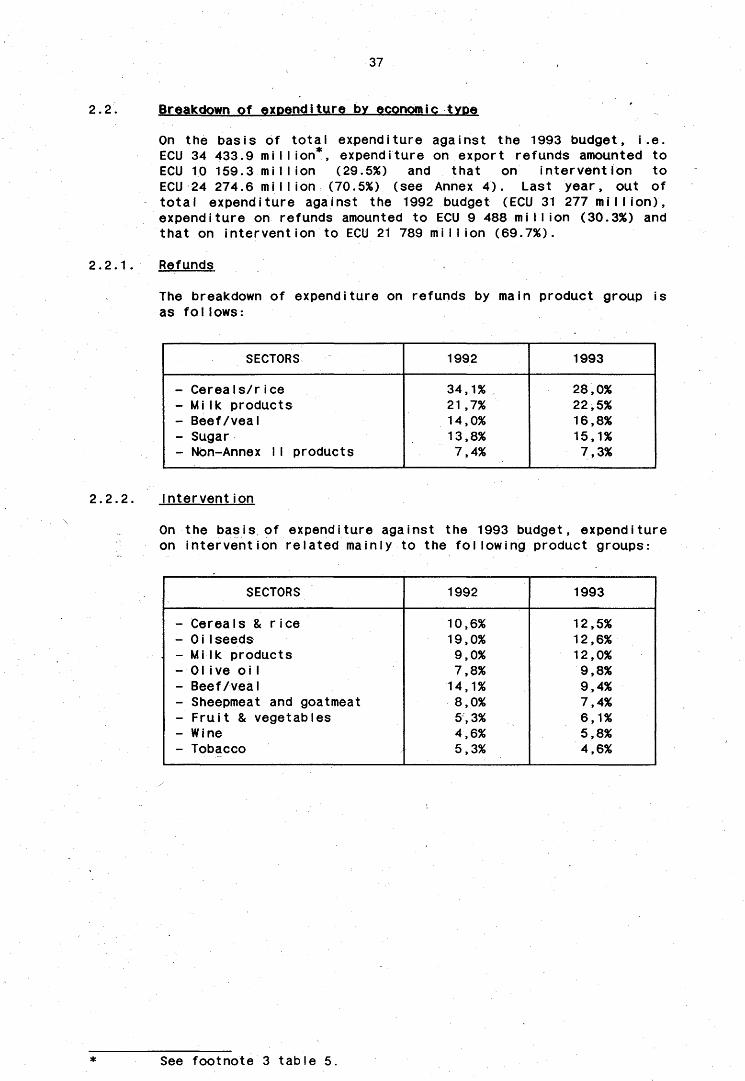
37
2.2 Breakdown of expenditure by economic type
On the basis of total expenditure against the 1993 budget, i.e. ECU 34 433.9 million*, expenditure on export refunds amounted to ECU 10 159.3 million (29.5%) and that on intervention to ECU 24 274.6 million (70.5%) (see Annex 4). Last year, out of total expenditure against the 1992 budget (ECU 31 277 million), expenditure on refunds amounted to ECU 9 488 mi I I ion (30.3%) and that on intervention to ECU 21 789 million (69.7%).
2.2.1 Refunds
The breakdown of expenditure on refunds by main product group is as fol lows:
SECTORS 1992 1993
- Cereals/rice 34,1% 28,0% -Milk products 21,7% 22,5% - Beef/veal 14,0% 16,8% - Sugar 13,8% 15,1% - Non-Annex I I products 7,4% 7,3%
2.2.2 Intervent ion
On the basis of expenditure against the 1993 budget, expenditure on intervention related mainly to the following product groups:
SECTORS 1992 1993
- Cereals & rice 10,6% 12,5% - OiIseeds 19,0% 12,6% - Milk products 9,0% 12,0% - OIive oiI 7,8% 9,8% - Beef/veal 14,1% 9,4% - Sheepmeat and goatmeat 8,0% 7,4% - Fruit & vegetables 5,3% 6,1% - Wine 4,6% 5,8% - Tobacco 5,3% 4,6%
See footnote 3 table 5.

38
Intervention, broken down by the economic nature of the measures concerned, consists of public or private storage aid, withdrawals and similar operations, price compensating aids, guidance premiums and a new category: structural measures (see Annex 7).
Compared with the total for intervention (ECU 24 209 million)1, price compensating aids came to ECU 15 766.7 million (65.1%), storage aids to ECU 5 386.1 million (22.3%), guidance premiums to ECU 1 212.2 million (5.0%), withdrawals and similar operations to ECU 1 159.8 mi 11 ion (4.8%) and structural measures to ECU 684.2 mi I I ion (2.8%).
2.2.2.1 Price compensating aids remain the most important type of intervention. This heading groups aids granted ;on the internal Community market so that the consumer price is lower than the producer price and is competitive with products imported from non-member countries
This type of aid accounts for 65.1% of total intervention (1992: 67.3%) and 45.8% of total expenditure against the 1993 budget2
(1992: 50.0%).
SECTORS 1 9 9 2 1 9 9 3
ECU mi I I ion ECU mi I I ion
Oilseeds 4.132 3.063 01ive oiI 1.663 2.218 Milk products 1.897 1.986 Sheepmeat and goatmeat 1.747 1.797 Tobacco 1.161 1.119 Cereals/rice 937 949 Beef/veal 891 892 Protein plants 862 1.084
Annex 8, which gives the breakdown of those aids, shows that production aids are mainly granted for oilseeds (rape and sunflower), sheepmeat and goatmeat and tobacco. However, aids for processing and promotion are concentrated on milk products, olive oil and fruit and vegetables.
Not taking into account co-responsibility levies for cereals (ECU 89.6 million) and the financial contribution of milk producers (- ECU 24.0 million). Not counting the clearance of accounts for previous years and m i see I Ianeous expend i ture.

39
2.2.2.2. Storage intervention totalled ECU 5 386 million, accounting for 22.3% of all intervention (1992: 26.1%) and 15.6% of ail expenditure against the 1993 budget1 (1992 financial year: 19.4%). This kind .of'intervention covers the costs of storage, whether public or private (the details of expenditure are given in Annex 9). On the basis of a total of ECU 5 386 million, expenditure on private storage totalled ECU 826 million and that on public storage ECU 4 560 million.
Private storage aids relate mainly to sugar (ECU 530 million), but costs in this sector are covered by the col lection of storage levies from sugar manufacturers (see Annex 13); then come storage costs for mi Ik products (ECU 212 mi 11 ion) and for wine/alcohol (ECU 57 mil I ion).
A detailed analysis of pub Iic storage is contained in paragraph 2.3. and Annex 10.
2.2.2.3. Withdrawals and similar operations affect only a Iimi ted number of sectors. They account for 4.8% of total intervention and 3.4% of total expenditure booked to the 1993 budget1, compared with 2.6% and 1.9% respectively for 1992.
2.2.2.4. Guidance premiums are granted only in the fruit and vegetables, wine and milk products sectors. They account for 5.0% of total intervention and 3.5% of total expenditure booked to the 1993 budget1, compared with 4.1% and 3.0% respectively for 1992.
In the fruit and vegetables sector, premiums make up the Community's contribution to the financing of schemes for developing and improving the consumption and use of nuts and/or locust-beans and to the financing of expenditure on schemes for grubbing fruit trees, in the wine sector premiums are granted for permanent abandonment of land under vines, in the milk sector they are granted for permanent abandonment of milk production, as compensation for temporary suspension of milk quotas and the surrender of milk quotas, this latter measure arising from the implementation of the Community programme for the redistribution of milk quotas to producers in regions of the Community where production conditions are difficult. In the tobacco sector premiums are granted for varietal conversion in Greece.
Excluding the clearance of accounts for previous years and misee 11aneous expenditure.
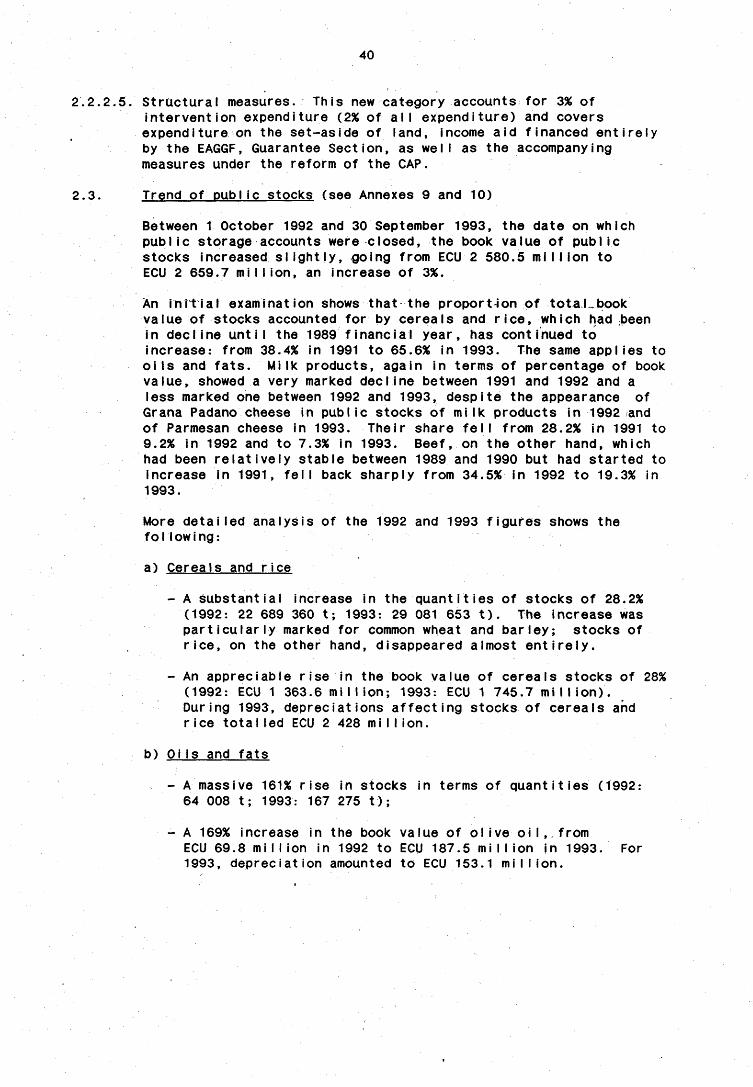
40
2.2.2.5. Structural measures. This new category accounts for 3% of intervention expenditure (2% of all expenditure) and covers expenditure on the set-aside of land, income aid financed entirely by the EAGGF, Guarantee Section, as well as the accompanying measures under the reform of the CAP.
2.3. Trend of pub Iic stocks (see Annexes 9 and 10)
Between 1 October 1992 and 30 September 1993, the date on which public storage accounts were closed, the book value of public stocks increased siightly, going from ECU 2 580.5 million to ECU 2 659.7 million, an increase of 3%.
An initial examination shows that the proportion of tolal„book value of stocks accounted for by cereals and rice, which had been in decline until the 1989 financial year, has continued to increase: from 38.4% in 1991 to 65.6% in 1993. The same applies to oils and fats. Milk products, again in terms of percentage of book value, showed a very marked decline between 1991 and 1992 and a less marked one between 1992 and 1993, despite the appearance of Grana Padano cheese in public stocks of milk products in 1992 and of Parmesan cheese in 1993. Their share fell from 28.2% in 1991 to 9.2% in 1992 and to 7.3% in 1993. Beef, on the other hand, which had been relatively stable between 1989 and 1990 but had started to increase in 1991, fell back sharply from 34.5% in 1992 to 19.3% in 1993.
More detailed analysis of the 1992 and 1993 figures shows the fol lowing:
a) Cereals and r ice
- A substantial increase in the quant ities of stocks of 28.2% (1992: 22 689 360 t; 1993: 29 081 653 t). The increase was particularly marked for common wheat and barley; stocks of rice, on the other hand, disappeared almost entirely.
- An appreciable rise in the book value of cereals stocks of 28% (1992: ECU 1 363.6 mi I I ion; 1993: ECU 1 745.7 mi I I ion). During 1993, depreciations affecting stocks of cereals and rice totalled ECU 2 428 million.
b) OiIs and fats
- A massive 161% rise in stocks in terms of quantities (1992: 64 008 t; 1993: 167 275 t);
- A 169% increase in the book value of ol ive oi I,, from ECU 69.8 million in 1992 to ECU 187.5 million in 1993. For 1993, depreciation amounted to ECU 153.1 million.

41
c) Tobacco
- The sharp decline in the quantities in stock continued. Of the 30 036 t in storage in 1992, only 13 540 t remained in 1993 (- 55%). The decrease applied mainly to processed tobacco, stocks of which having virtually disappeared.
- Parallel to this, a drop in the total book value of tobacco stocks of 54%. The book value for 1993 amounted to ECU 4.2 million. The financial depreciation of tobacco stocks totalled ECU 22 million in 1993.
d) Mi Ik products
- Stocks of skimmed-miIk powder and butter fell slightly from 231 581 t in 1992 to 210 381 t in 1993 (- 9%). The intensity of this decrease was particularly significant in the case of skimmed-miIk powder, which declined by half; stocks of Parmesan cheese appeared (2 971 t).
- An appreciable decline (44%) in the book value of stocks of skimmed-miIk powder (1992: ECU 53.3 million; 1993: ECU 29.9 mi I I ion). During 1993 the financial depreciation for butter and skimmed-miIk powder totalled ECU 125.1 million.
e) Beef
- Quantities in stock (carcase equivalent) amounted to 899 945 tonnes on 31 September 1993;
- A sharp fall of 42% in the book value of stocks (1992: 890 million; 1993: ECU 514.8 mi I I ion). Financial depreciation for the year totalled ECU 1 126 million.
f) Alcohol
- Stocks of public alcohol were 32% up on 1992: from 2 151 799 hectolitres in 1992 to 2 839 796 in 1993.
- The book value rose by 43% (1992: ECU 10.3 million; 1993: ECU 14.7 mi I I ion); the financial depreciation during 1993 total led ECU 210.3 mi I I ion.
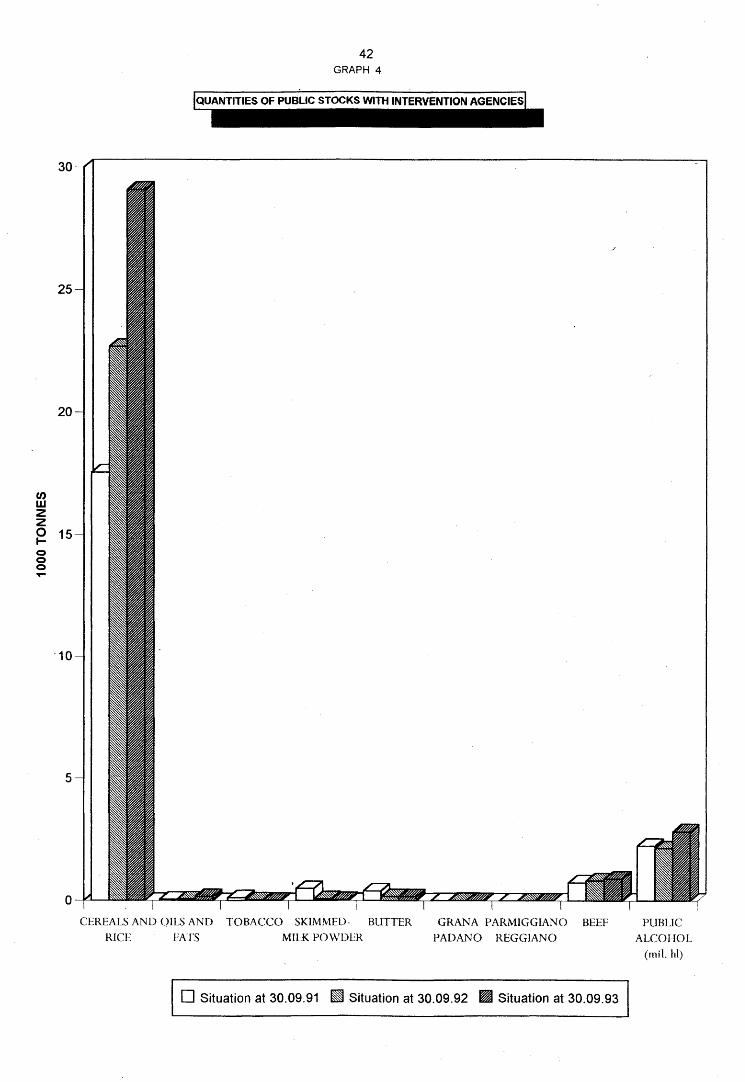
42 GRAPH 4
to
z z o h-o o o
CEREALS AND OILS AND RICE EATS
TOBACCO SKIMMED- BUTTER MILK POWDER
GRANA PARMIGGIANO BEEF PAD AN O REGGIANO
PUBLIC ALCOHOL
(mil. hi)
• Situation at 30.09.91 H Situation at 30.09.92 H Situation at 30.09.93
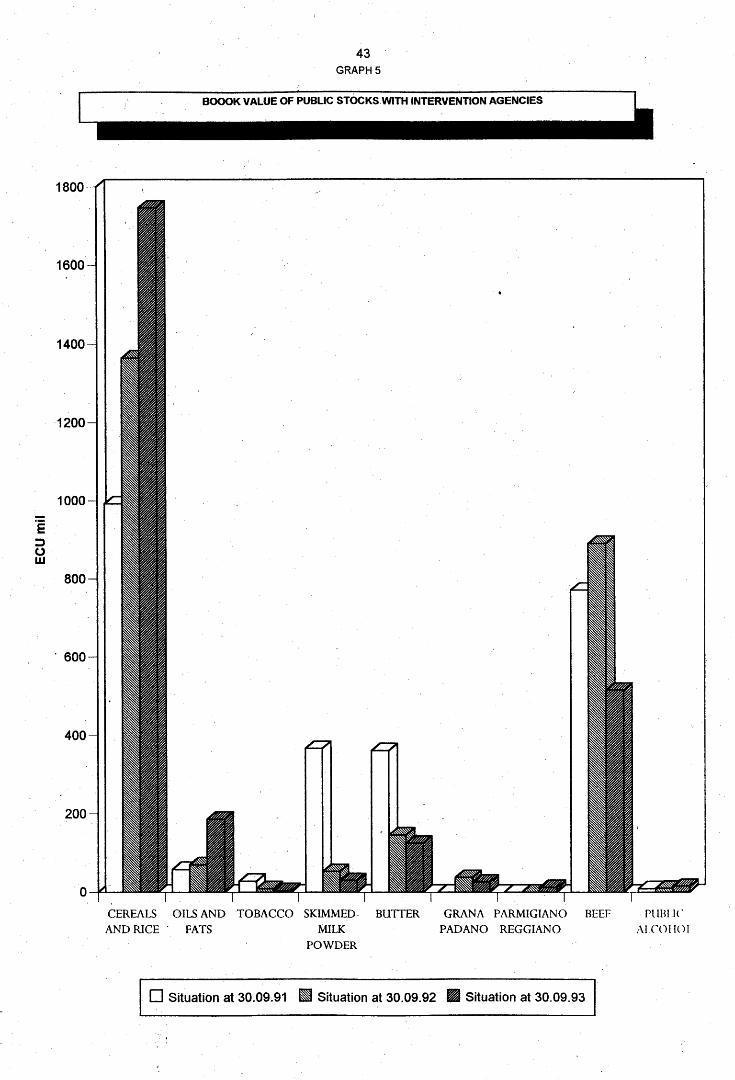
1800
1600
1400 H
1200 H
1000 H
O LU
800
600
400
200 H
43 GRAPH 5
CEREALS OILS AND TOBACCO SKIMMED- BUTTER GRANA PARMIGIANO BEEE PUBLIC AND RICE FATS MILK PADANO REGGIANO AI.COHOl
POWDER
D Situation at 30.09.91 H Situation at 30.09.92 H Situation at 30.09.93
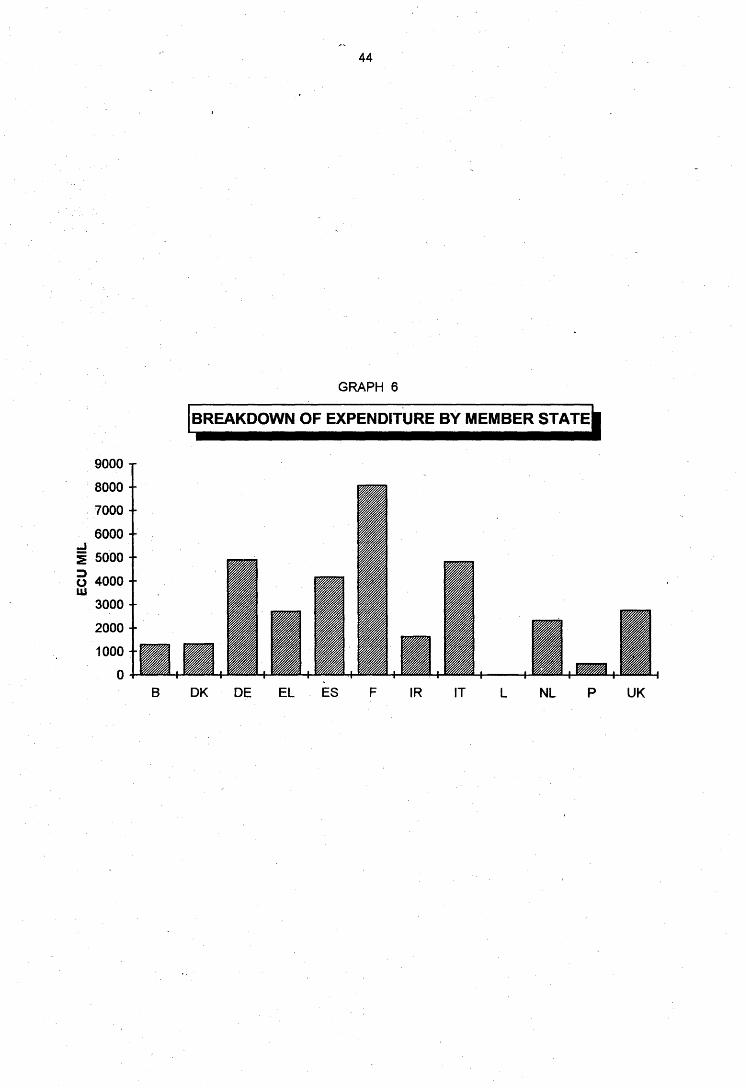
44
GRAPH 6
BREAKDOWN OF EXPENDITURE BY MEMBER STATE I 9000-r
8000-
7000 -
6 0 0 0 -- j
1 5000--
O 4000 -LU
3000-
2000 - -1000 -|-§§§
0
in
m ! -i v i » M g 8 i 8 8 M |
B DK DE EL ES IR IT NL UK
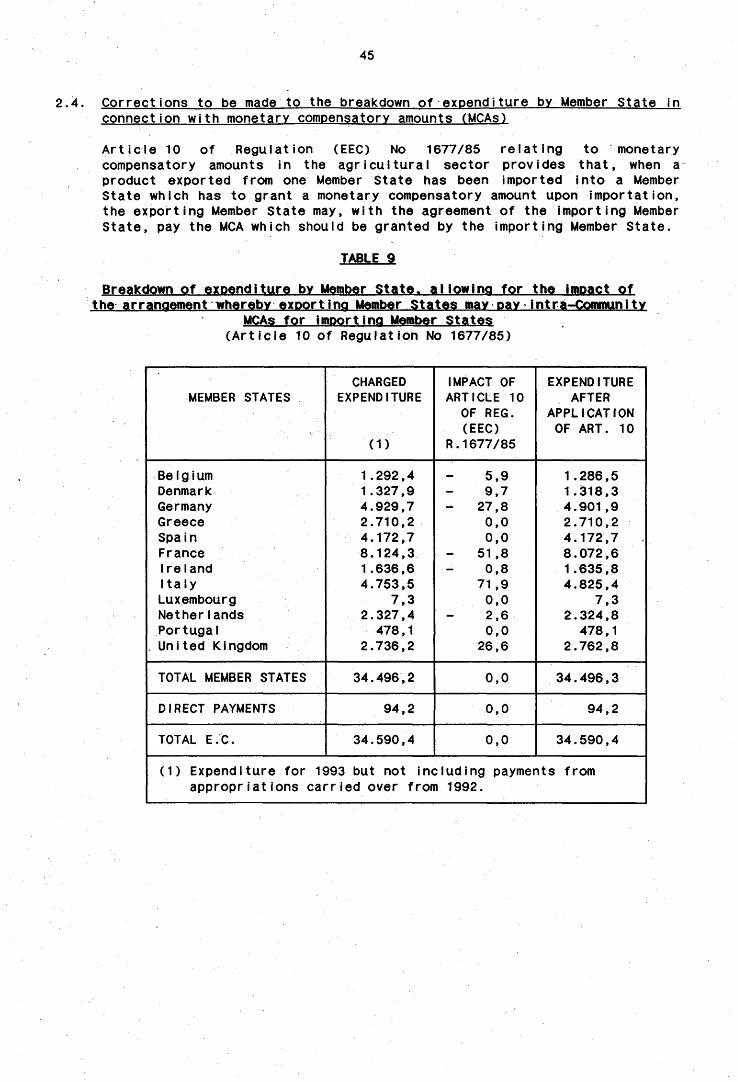
45
2.4. Corrections to be made to the breakdown of expenditure by Member State in connection with monetary compensatory amounts (MCAs)
Article 10 of Regulation (EEC) No 1677/85 relating to monetary compensatory amounts in the agricultural sector provides that, when a product exported from one Member State has been imported into a Member State which has to grant a monetary compensatory amount upon importation, the exporting Member State may, with the agreement of the importing Member State, pay the MCA which should be granted by the importing Member State.
TABLE 9
Breakdown of expenditure by Member State, allowing for the impact of the arrangement whereby exporting Member States may pay intra^Communitv
MCAs for importing Member States (Article 10 of Regulation No 1677/85)
MEMBER STATES
Belgium Denmark Germany Greece Spain France Ireland Italy Luxembourg Netherlands Portugal
. United Kingdom
TOTAL MEMBER STATES
DIRECT PAYMENTS
TOTAL E.C.
CHARGED EXPENDITURE
(1)
1.292,4 1.327,9 4.929,7 2.710,2 4.172,7 8.124,3 1.636,6 4.753,5
7,3 2.327,4 478,1
2.736,2
34.496,2
94,2
34.590,4
IMPACT OF ARTICLE 10 OF REG. (EEC)
R. 1677/85
5,9 9,7 27,8 0,0 0,0
51,8 0,8
71,9 0,0 2,6 0,0 26,6
0,0
0,0
0,0
EXPENDITURE AFTER
APPLICATION OF ART. 10
1.286,5 1.318,3 4.901,9 2.710,2 4.172,7 8.072,6 1.635,8 4.825,4
7,3 2.324,8 478,1
2.762,8
34.496,3
94,2
34.590,4
(1) Expenditure for 1993 but not including payments from appropriations carried over from 1992.

46
40000 T
35000-
30000 -
J 25000?
| 20000 • •
îu 15000 ••
10000--
5000 -
GRAPH 7
TREND OF EAGGF GUARANTEE SECTION EXPENDITURE
• -
1
GUIDELINE
EXPENDITURE WITHIN GUIDELINE
TOTAL EXPENDITURE
1988 1989 1990 1991 1992 1993
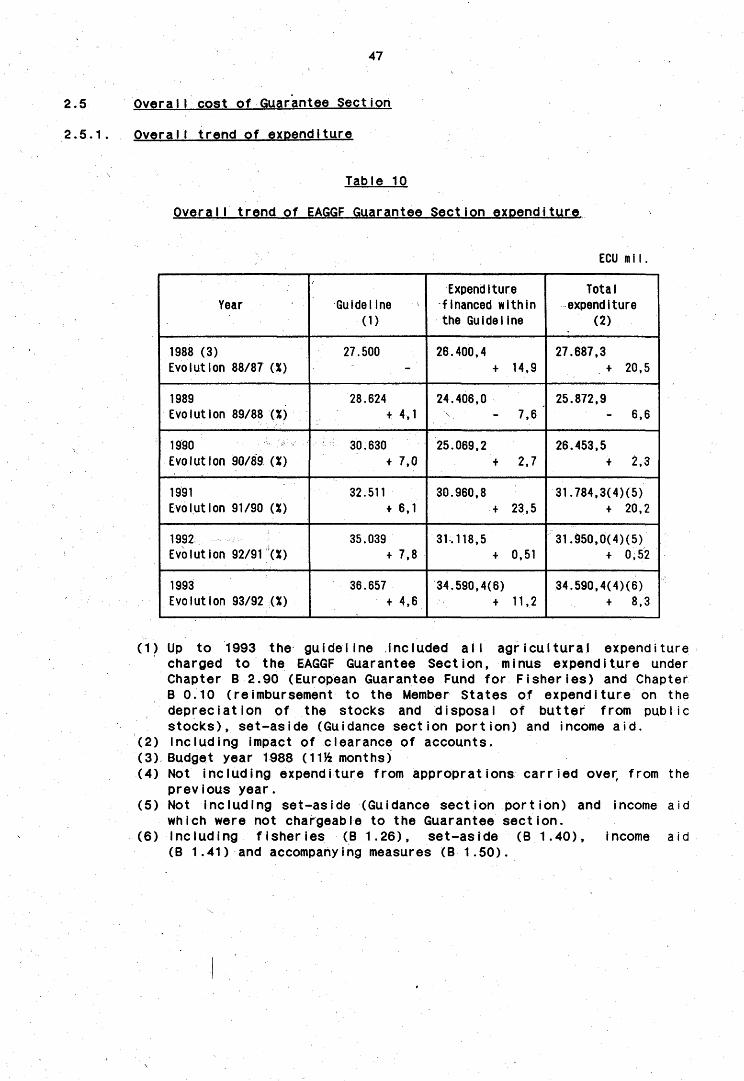
47
2.5 Overall cost of Guarantee Section
2.5.1. Overali trend of expenditure
Table 10
Overall trend of EAGGF Guarantee Section expenditure
ECU mil
Year
1988 (3) Evolution 88/87 (X)
1989 Evolution 89/88 (X)
1990 Evolution 90/89 (X)
1991 Evolution 91/90 (X)
1992; Evolution 92/91 (X)
1993 Evolution 93/92 (X)
Guideline {-(1)
27.500
28.624 + 4,1
30.630 + 7,0
32.511 + 6,1
35.039 + 7,8
36.657 + 4,6
Expenditure financed within the Guideline
26.400,4 + 14,9
24.406,0 - 7,6'
25.069,2 + 2,7
30.960,8 + 23,5
31.118,5 + 0,51
34.590,4(6) + 11,2
Total expenditure
(2)
27.687,3 + 20,5
25.872,9 - 6,6
26.453,5 + 2,3
31.784,3(4)(5) + 20,2
31.950,0(4)(5) + 0,52
34.590,4(4)(6) + 8,3
(1) Up to 1993 the guideline included all agricultural expenditure charged to the EAGGF Guarantee Section, minus expenditure under Chapter B 2.90 (European Guarantee Fund for Fisheries) and Chapter B 0.10 (reimbursement to the Member States of expenditure on the depreciation of the stocks and disposal of butter from public stocks), set-aside (Guidance section portion) and income aid.
(2) Including impact of clearance of accounts. (3) Budget year 1588 (1-1J4 months) (4) Not including expenditure from approprations carried over, from the
previous year. (5) Not including set-aside (Guidance section portion) and income aid
which were not chargeable to the Guarantee section. (6) Including fisheries (B1.26), set-aside (B 1.40), income aid
(B 1.41) and accompanying measures (B 1.50).
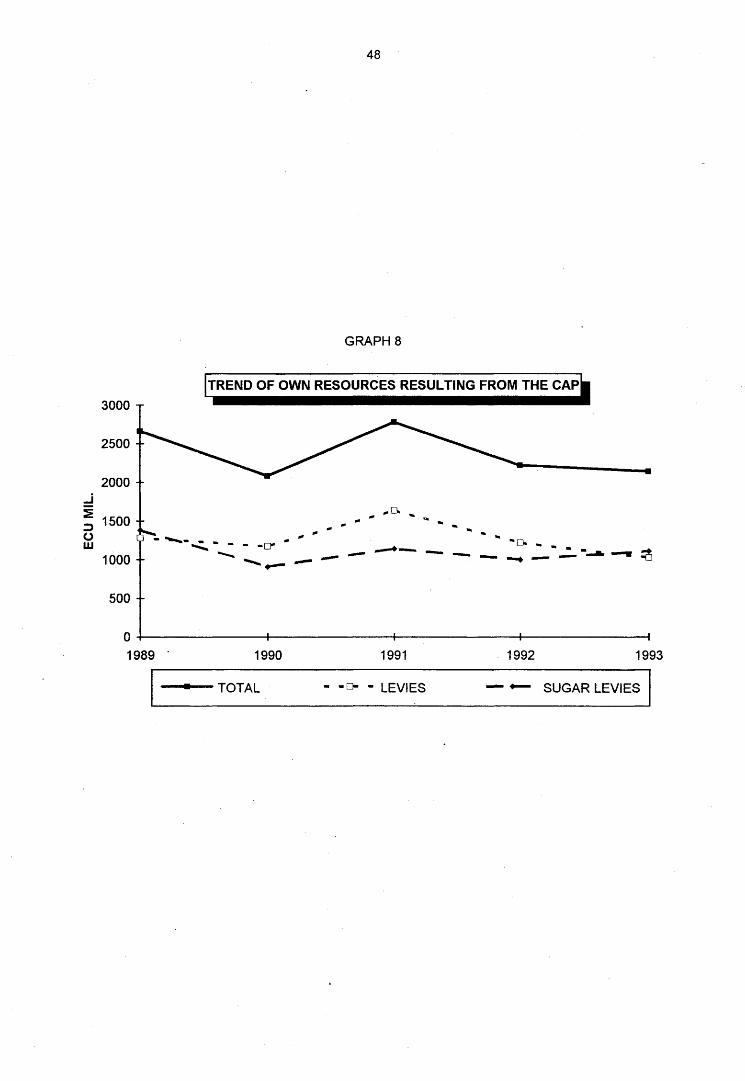
48
GRAPH 8
3000 T
2500 +
O LU
iJTRENP OF OWN RESOURCES RESULTING FROM THE CAP^
1989 1990 1991 1992 1993
TOTAL LEVIES — •— SUGAR LEVIES
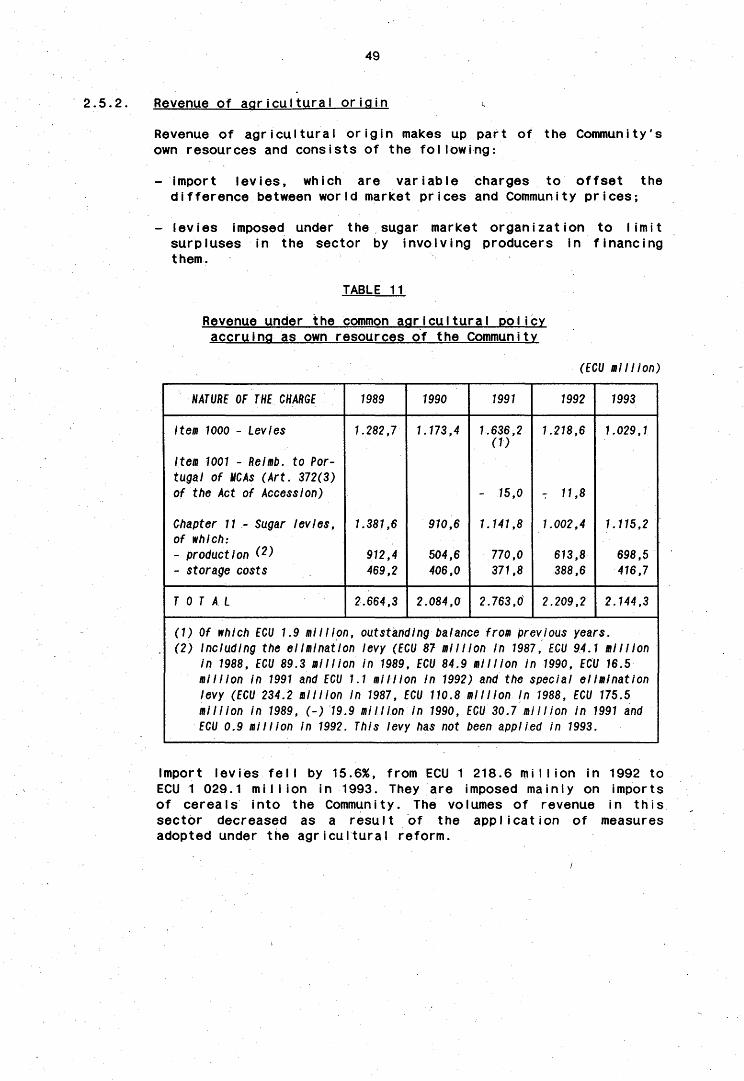
49
2.5.2. Revenue of agricultural origin (,
Revenue of agricultural origin makes up part of the Community's own resources and consists of the following:
- import levies, which are variable charges to offset the difference between world market prices and Community prices;
- levies imposed under the sugar market organization to limit surpluses in the sector by involving producers in financing them.
TABLE 11
Revenue under the common agricultural policy accruing as own resources of the Community
(ECU million)
HATURE OF THE CHARGE
Item 1000 - levies
Item 1001 - Relmb. to Portugal of UCAs (Art. 372(3) of the Act of Accession)
Chapter 11 - Sugar levies, of which: - production ^ - storage costs
TOTAL
1989
1.282,7
1.381,6
912,4 469,2
2.664,3
1990
1.173,4
910,6
504,6 406,0
2.084,0
1991
1.636,2 (V
- 15,0
1.141,8
770,0 371,8
2.763,6
1992
1.218,6
7 11,8
1.002,4
613,8 388,6
2.209,2
1993
1.029,1
1.115,2
698,5 416,7
2.144,3
(1) Of which ECU 1.9 million, outstanding balance from previous years. (2) Including the elimination levy (ECU 87million in 1987, ECU 94.1 million
in 1988, ECU 89.3 million in 1989, ECU 84.9 million in 1990, ECU 76.5 million in 1991 and ECU 1.1 million in 1992) and the special elimination levy (ECU 234.2 mil lion in 1987, ECU 110.8 mi 11 ion in 1988, ECU 775.5 Million in 1989, (-) 19.9 million in 1990, ECU 30.7 mi 1 lion in 1991 and ECU 0.9 million In 1992. This levy has not been applied in 1993.
Import levies fell by 15.6%, from ECU 1 218.6 million in 1992 to ECU 1 029.1 million in 1993. They are imposed mainly on imports of cereals into the Community. The volumes of revenue in this sector decreased as a result of the application of measures adopted under the agricultural reform.

50
The sugar levies, for their part, were up by 11.3% on the previous year in 1993, with a total of ECU 1 115.2 million. This market trend was in the opposite direction to that of 1992. The increase in the amount raised from sugar levies was the result of the increase in production levies caused by the lower level of world prices as against 1992. In addition, the slight fall in internal consumption of sugar, combined with the fact that production was reestablishesd in certain regions, led to a rise in the cost to Community producers of exporting sugar and, conseguently, in the cost of production levies.
The co-responsibility levies and additional levies paid by cereal producers and milk producers also constitute revenue of agricultural origin, but not being own resources, they are classed as intervention to regulate the agricultural markets and are therefore deducted from agricultural expenditure for the year in the sectors concerned.
It should be noted that the co-responsibility levies on cereals were abolished with effect from the 1992/93 marketing year, and those on milk with effect from the 1993/94 marketing year. Only the levies for exceeding milk production quotas are still being paid by producers.
It should be pointed out that the abolition of these levies explains why the amounts collected are so low. Thus in 1993 producers' financial contributions amounted to ECU 24 million in the milk products sector (ECU 368 million in 1992) and ECU 89.6 million in the cereals sector (ECU 1 116 million in 1992).
2.5.3. Guarantee costs compared with GDP
Comparison of total expenditure by the EAGGF Guarantee Section in 1993 with the most significant economic indicator i.e. the Community's gross domestic product at market prices (GDP), shows an upward movement in contrast to the slight fail seen in 1992.
The cost of the Guarantee Section represented 0.65% of estimated GDP in 1993, compared with 0.61% in 1992 (see Annex 11).
- 51 -
3. AMENDMENTS TO LEGISLATION GOVERNING THE EAGGF GUARANTEE SECTION
During 1993, a certain number of amendments and routine management measures were adopted in connection with legislation directly concerning the EAGGF Guarantee Section. They are out Iined below. >
3.1. EAGGF Guarantee Section regulations proper
(a) COUNCIL REGULATION (EEC) No 1571/93 of 14 June 1993
amending Regulation (EEC) No 1883/78 laying down general rules for the financing of interventions
by the European Agricultural Guidance and Guarantee Fund, Guarantee Section(1)
This Regulation provides that where the interest rate borne by a Member State to finance measures under the EAGGF Guarantee Section is more than twice the uniform interest rate laid down by Regulation (EEC) No 1883/78, the Commission may, for the financial years 1993 to 1995 apply to that Member State the uniform rate of interest plus the difference between double that rate and the actual rate borne by that Member State.
For the 1993 EAGGF financial year this provision has been applied to Greece which was in the situation specified above. The interest rate applied was thus raised to 16.95% whilst the uniform rate was 10.3%.
(b) COUNCIL REGULATION (EEC) No 1992/93 of 19 July 1993
transferring the financing of certain aids provided for in Regulations (EEC) No 1096/88 and (EEC) No 2328/91 from
the EAGGF Guidance Section to the EAGGF Guarantee Section^2)
This Regulation provides for the transfer to the EAGGF Guarantee Section of the financing of aid provided for in Council Regulation (EEC) No 1096/88 (Community scheme to encourage the cessation of farming) originally financed by the EAGGF Guidance Section.
Furthermore; it amends Council Regulation (EEC) No 2328/91 by discontinuing the EAGGF Guidance Section's contribution to the financing of the scheme to encourage set-aside.
These changes were made on account of the fact that the EAGGF Guarantee Section is already responsible for financing aid for early retirement and set-aside under the reform of the CAP.
(1) OJ No L 154, 25.6.1993. (2) OJ No L 182, 24.7.1993.
52
(C) COMMISSION REGULATION (EEC) No 2428/93 of 1 September 1993
fixing depreciation percentages to be applied when agricultural products are bought in, for the 1994 financial year^3)
This Regulation fixes the depreciation percentages for the products concerned for 1994. The coefficients are intended to permit depreciation as from buying-in of the value of the products by the difference between the relevant buying-in and the foreseeable selling prices.
(d) COMMISSION REGULATION (EEC) No ,2777/93 of 8 October 1993
on the rate of interest to be used for calculâting the costs of * financing intervention measures comprising buying-in, storage
and disposal^4^
The aim of this Regulation is to fix the interest rate for financing public storage at 7.5%, except in the case of Greece (18.8%), the Netherlands (6.5%) and the United Kingdom (5.5%), before the beginning of the financial year.
3.2 Regulations adopted in connection with the common organization of the markets introducing new types of measures financed by the EAGGF Guarantee Section
(a) COUNCIL REGULATION (EEC) No 404/93 of 13 February 1993
on the common organization of the market in bananas^)
This Regulation provides for compensation for any loss of income to be granted to producers, supplementary aid to be granted to producer regions and a single premium to be granted to Community producers who cease to grow bananas.
Cb) COUNCIL REGULATION (EEC) No 2019/93 of 19 July 1993
introducing specific measures for the smaller Aegean islands concerning certain agricultural products^6)
Given their geographical situation and the handicaps this entails, this Regulation provides for aid for the supply in those islands of a certain number of agricultural products essential for everyday consumption or agricultural production and for various measures to support local products.
(3) OJ NO L 223, 2.9.1993. (4) OJ No L 252, 9.10.1993 (5) OJ No L 47, 25.2.1993. (6) OJ No L 184, 27.7.1993
53
The set of measures concerned is comparable to those adopted under the POSE I DOM, POSEICAN and POSEIMA programmes.
(c) COUNCIL REGULATION (EEC) No 2187/93 Of 22 July 1993
providing for an offer of compensation to certain producers of milk and milk products temporarily prevented from
carrying on their trade^7^
This Regulation relates to producers (known as "SLOM" producers) who were not allocated individual reference quantities when the milk quota system was introduced in 1984 although they were taking part in a scheme involving the non-marketingof mi Ik and mi Ik products and the conversion of dairy herds during the reference year used by the Member State.
(7) OJ No L 196, 5.8.1993.
-5V- 55 -
Title I I CASH POSITION AND MANAGEMENT OF APPROPRIATIONS
4. MANAGEMENT OF APPROPRIATIONS
The appropriations for the 1993 financial year break down into three types: 1. 1993 budget appropriations, 2. Appropriations carried over non-automaticaI I y from 1992, 3. Appropriations carried over automatically from 1992.
4.1. Budget for 1993 financial year
4.1.1. Appropr iat ions
4.1.1.1. Initial budget
The initial budget for 1993 was adopted in December 1992. Initial appropriations totalled ECU 34 052.0 million.
This includes ECU 109.0 million entered in Chapter BO-40 (provisions for measures the legal basis for which has not yet been adopted). It does not comprise the ECU 1 000 million allocated to the monetary reserve, which may be used only in the event of variations in the ecu/dollar ratio (cf. point 4.1.1.5).
4.1.1.2 Supplementary and amending budget (SAB)
The short-term review of appropriation requirements for the EAGGF Guarantee Section conducted in March indicated there would be an overrun of appropriations at the end of the financial year. A PDSAB was proposed to the budget authority to increase appropriations by ECU 1 884 million. By letters of amendment Nos 1 and 2 to the PDSAB, appropriation requirements were reduced by ECU 584 million. The SAB finally adopted in December shows an increase of ECU 1 300 million.
4.1.1.3 Transfers of appropriations within the EAGGF Guarantee Section
Transfers within the EAGGF Guarantee Section were carried out on two occasions: - at the beginning of the financial year, ECU 60 million was
transferred from the BO-40 reserve; - a second transfer was made at the end of the financial year to
chapters where appropriations were seen to be short. In accordance with the conclusions of the European Council of 11 and 13 February 1988, the Commission is anxious to make adjustments to appropriations as far as possible before any chapter is seen to have been used up. To that end, it may propose transfers; however, given the lengthiness of the SAB adoption procedure, it was not possible to propose transfers during the greater part of the financial year.

56
Total transfers between chapters to cover expenditure incurred in 1993 amounted to only ECU 1 024.5 million.
4.1.1.4 Transfers outside the EAGGF Guarantee Section
ECU 8.9 million was transferred from the EAGGF Guarantee Sect ion for emergency aid operations in the former Yugoslavia.
4.1.1.5 Transfers to or from the monetary reserve
The average dollar exchange rate during thé financial year was higher than that on which the 1993 budget was based, leading to a saving of ECU 182 million.
Since this amount did *• not exceed the "franchise" of ECU 400 million, no transfer to the monetary reserve was necessary.
4.1.1.6 Appropriations available
The appropriations available at the end of the financial year totalled ECU 35 343.1 mi 11 ion, not including ECU 1 000 million for the monetary reserve. Table 6 shows expenditure against appropriations during the financial year.
4.1.2. Ut iIizat ion of appropr iations
4.1.2.1 Budget operations
The following table shows in detail the budget operations covering 1993 budget appropriations:
1. Appropriations available
. 2. Itemized commitments - for expenditure incurred by MS - for direct payments Total commitements
3. Sums charged as payments - for expenditure incurred by MS - for direct payments Total charged
4. Appropriations to be carried over automatically - for expenditure incurred by MS - for direct payments Total to be carried over automatically
5. Appropriations to be carried over non-automatically
6. Lapsed appropriations ( = 1 - 3 - 4 - 5 )
35.343.100.000,00
34.496.278.007.75 94.154.189.57
34.590.432.197,32
34.181.197.720.45 55.385.343.67
34.236.583.064,12
315.080.287,30 38.768.845.90 353.849.133,20
510,000.000.00
242.667.802,68
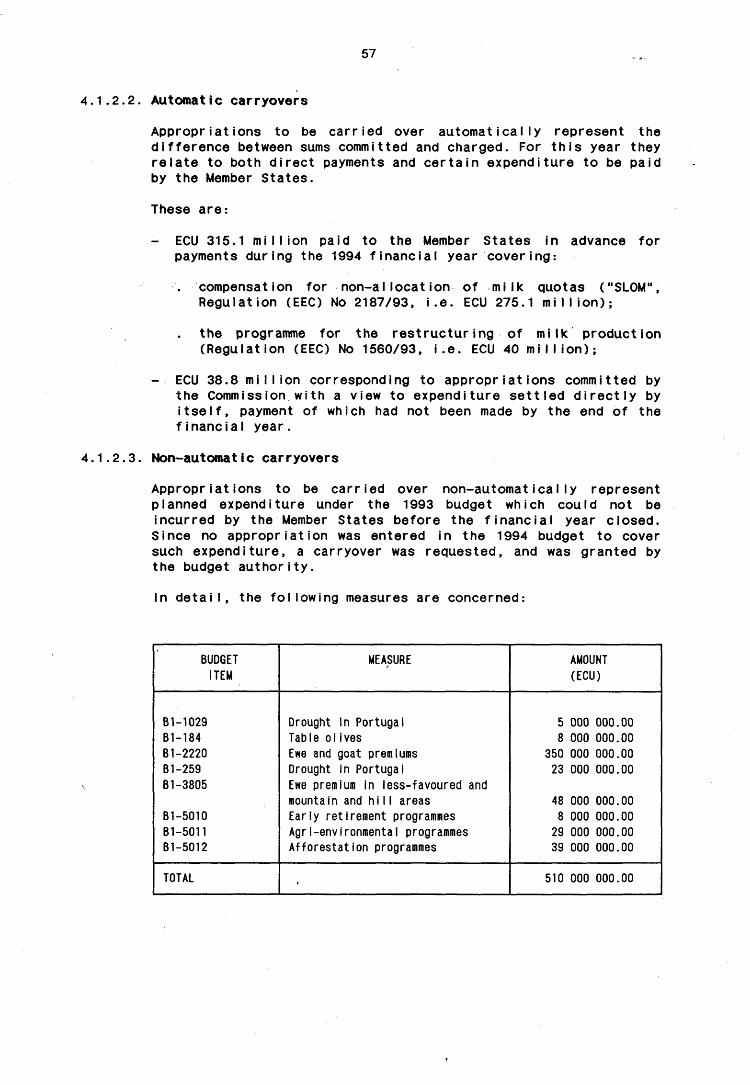
57
4.1.2.2. Automatic carryovers
Appropriations to be carried over automatically represent the difference between sums committed and charged. For this year they relate to both direct payments and certain expenditure to be paid by the Member States.
These are:
ECU 315.1 million paid to the Member States in payments during the 1994 financial year covering:
advance fo r
. compensation for non -a l l o ca t i on o f m i l k quotas ("SLOM", Regulat ion (EEC) No 2187/93, i . e . ECU 275.1 m i l l i o n ) ;
. the programme for the r e s t r u c t u r i n g o f m i l k p roduc t ion (Regulat ion (EEC) No 1560/93, i . e . ECU 40 m i l l i o n ) ;
- ECU 38.8 m i l l i o n corresponding to app rop r i a t i ons committed by the Commission w i th a view to expendi ture s e t t l e d d i r e c t l y by i t s e l f , payment of which had not been made by the end of the f i n a n c i a l year .
4 . 1 . 2 . 3 . Non-automatic carryovers
Appropr ia t i ons to be c a r r i e d over non-au tomat i ca I l y represent planned expendi ture under the 1993 budget which cou ld not be incur red by the Member States before the f i n a n c i a l year c l osed . Since no approp r ia t i on was entered in the 1994 budget to cover such expend i tu re , a carryover was requested, and was granted by the budget a u t h o r i t y .
In d e t a i l , the f o l l ow ing measures are concerned:
BUDGET MEASURE AMOUNT ITEM ' (ECU)
B1-1029 Drought in Portugal 5 000 000.00 B1-184 Table ol ives 8 000 000.00 B1-2220 Ewe and goat premiums 350 000 000.00 B1-259 Drought in Portugal 23 000 000.00 B1-3805 Ewe premium in less-favoured and
mountain and h i l l areas 48 000 000.00 B1-5010 Early retirement programmes 8 000 000.00 B1-5011 Agri-environmental programmes 29 000 000.00 B1-5012 Afforestat ion programmes 39 000 000.00
TOTAL , 510 000 000.00
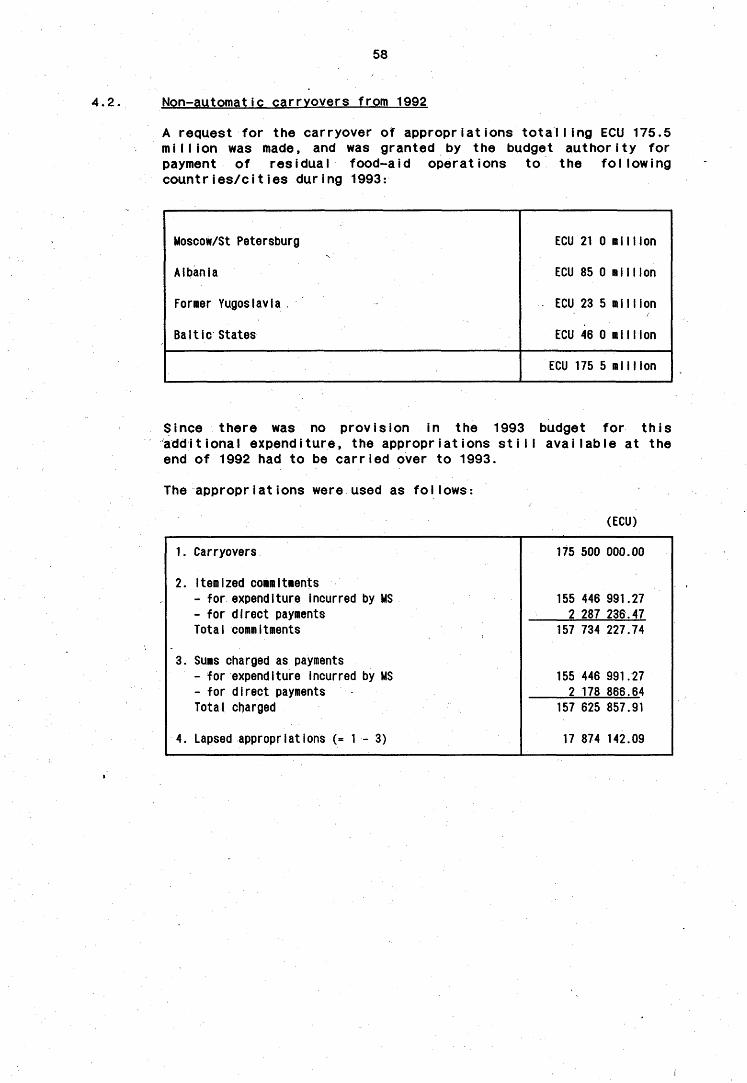
4.2
58
Non-automatic carryovers from 1992
A request for the carryover of appropriations total Iing ECU 175.5 million was made, and was granted by the budget authority for payment of residual food-aid operations to the following countries/cities during 1993:
Moscow/St Petersburg
Albania
Former Yugoslavia
Baltic States
ECU 210 million
ECU 85 0 million
ECU 23 5 million
ECU 46 0 million
ECU 175 5 million
Since there was no provision in the 1993 budget for th is addit ional expenditure, the appropriations s t i l l avai lable at the end of 1992 had to be carried over to 1993.
The appropriations were used as follows
(ECU)
1. Carryovers 175 500 000.00
2. Itemized commitments - for expenditure incurred by MS 155 446 991.27 - for direct payments 2 287 236.47 Total commitments 157 734 227.74
3. Sums charged as payments - for expenditure incurred by MS 155 446 991.27 - for dIrect payments 2 178 866.64 Total charged 157 625 857.91
4. Lapsed appropriations (- 1 - 3) 17 874 142.09

59
4.3 Automatic carryovers from 1992
The 1992 appropriations carried over automatically to 1993 cover direct payments amounting to ECU 50 759 385.13.
The following table shows utilization of carryovers during 1993.
1. Commitments carried over
2. Sums charged as payments - for expenditure incurred by MS - for direct payments Total charged
3. Lapsed appropriations (= 1 - 2 )
50 759 385.13
0.00 29 110 747.53 29 110 747.53
21 648 637.60
For details of direct payments, see point 5.2. and in particular Table 13.
4.4 Summary of appropriation management
A. I n i t i a l budgets/carryovers SAB Transfers outside EAGGF
Appropr iat ions ava i l ab le / carryovers
B. Commitments charged as payments
Automatic carryovers in 1994
C. Non-automatic carryovers
D. Lapsed appropr iat ions
Approp. 1993 budget
34 052.0 1 300.0
8.9
35 343.1
34 590.4 34 236.6
353.8
510.0
242.7
Non-automat ic carryovers
175.5 0.0 0.0
175.5
157.7 157.6
0 . 0
0 . 0
17.9
Automatic carryovers
50.8 0.0 0.0
50.8
0.0 29.1
0 . 0
0 . 0
21.6
Total approp.
34 278.3 1 300.0
8.9
35 569.4
34 748.2 34 423.3
353.8
510.0
282.2
* Including the ECU 109.0 million entered in Chapter 80-40 but not the ECU 1 000 million in the monetary reserve.
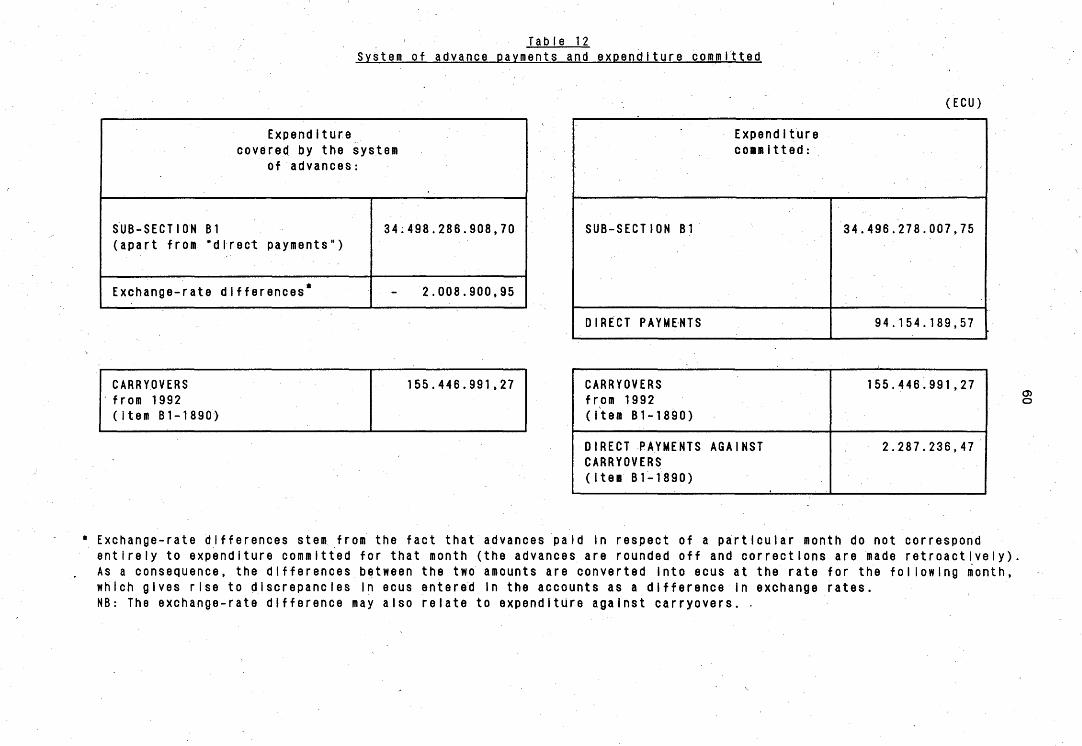
Table 12 System of advance payments and expenditure committed
(ECU)
Expenditure covered by the system
of advances:
SUB-SECTION B1 34:498.286.908,70 (apart from "direct payments")
Exchange-rate differences* - 2.008.900,95
Expenditure committed:
SUB-SECTION B1 34.496.278.007,75
DIRECT PAYMENTS 94.154.189,57
CARRYOVERS from 1992 (item B1-1890')
155.446.991,27 CARRYOVERS 155.446.991,27 from 1992 (item B1-1890)
DIRECT PAYMENTS AGAINST 2.287.236,47 CARRYOVERS (item B1-1890)
o
* Exchange-rate differences stem from the fact that advances paid in respect of a particular month do not correspond entirely to expenditure committed for that month (the advances are rounded off and corrections are made retroactively) As a consequence, the differences between the two amounts are converted Into ecus at the rate for the following month, which gives rise to discrepancies in ecus entered in the accounts as a difference In exchange rates. NB: The exchange-rate difference may also relate to expenditure against carryovers. .

61
5. SYSTEM OF ADVANCES AND DIRECT PAYMENTS
5.1. Advances to the Member States
5.1.1. System of monthly advances on entry in the accounts
Council Regulation (EEC) No 2048/88 of 24 June 1988<1) amending Regulation (EEC) No 729/70<2) makes the system of monthly advances on entry of expenditure in the accounts a permanent feature. Advances are paid to the Member States at the beginning of the second month following that in which expenditure is effected by the paying agencies.
Strictly speaking, these are not advances but rather reimbursements of expenditure which the Member States have already effected. The term "advance" stresses the provisional nature of such payments. Advances are worked out on the basis of monthly declarations of expenditure forwarded by the Member States; such expenditure is entered definitively in the accounts after verification on the spot in the following financial years (cf. TITLE IV on accounts clearance).
The system of advances covers payments made by the Member States from 16 October 1992 to 15 October 1993. They involve more than 99% of expenditure borne by the EAGGF Guarantee Section. For the remainder, the Commission itself makes direct payments for a limited number of measures (cf. Table 14).
5.1.2. Decisions on advance payments in respect of 1993
With regard to the 1993 financial year, the Commission adopted 14 decisions, 12 of which were routine.
As the supplementary and amending budget (SAB) requested by the Commission had not been adopted at the beginning of December, the advance payment covering expenditure for October 1993 had to be paid in two instalments since the appropriations available in the initial budget were no longer sufficient (only one part, equal to approximately 75%, was covered). After the SAB had been adopted, the additional advance was paid several days late.
An extraordinary advance to adjust the advances granted to total expenditure chargeable to the year was passed in December 1993.
(1) OJ No L 185, 15.7.1988, p. 1. (2) OJ No L 94, 28.4.1970, p. 13.
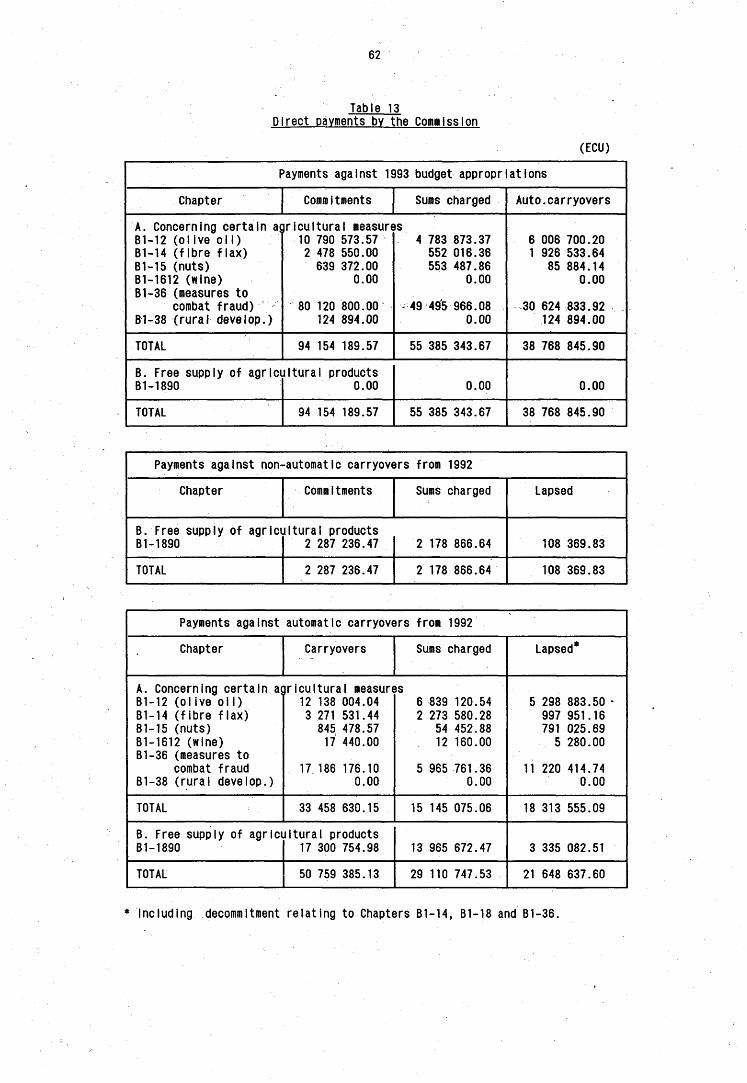
62
Table 13 Direct payments by the Commission
(ECU)
Payments against 1993 budget appropriations
Chapter Commitments Sums charged Auto.carryovers
A. Concerning certain agricultural measures 81-12 (olive oil) B1-14 (fibre flax) B1-15 (nuts) B1-1612 (wine) B1-36 (measures to
combat fraud) ~ B1-38 (rural develop.)
10 790 573.57 2 478 550.00 639 372.00
0.00
80 120 800.00 124 894.00
4 783 873.37 552 016.36 553 487.86
0.00
49 495 966.08 0.00
6 006 700.20 1 926 533.64
85 884.14 0.00
30 624 833.92 124 894.00
TOTAL 94 154 189.57 55 385 343.67 38 768 845.90
B. Free supply of agricultural products B1-1890 0.00 0.00 0.00
TOTAL 94 154 189.57 55 385 343.67 38 768 845.90
Payments against non-automatic carryovers from 1992
Chapter
B. Free supply of agrici B1-1890
TOTAL
Commitments
iltural products 2 287 236.47
2 287 236.47
Sums charged
2 178 866.64
2 178 866.64
Lapsed
108 369.83
108 369.83
Payments against automatic carryovers from 1992
Chapter Carryovers Sums charged Lapsed*
A. Concerning certain agr B1-12 (olive oil) B1-14 (fibre flax) B1-15 (nuts) B1-1612 (wine) B1-36 (measures to
combat fraud B1-38 (rural develop.)
I cultural measures 12 138 004.04 3 271 531.44
845 478.57 17 440.00
17 186 176.10 0.00
6 839 120.54 2 273 580.28
54 452.88 12 160.00
5 965 761.36 0.00
5 298 883.50 997 951.16 791 025.69
5 280.00
11 220 414.74 0.00
TOTAL 33 458 630.15 15 145 075.06 18 313 555.09
B. Free supply of agricultural products B1-1890 17 300 754.98 13 965 672.47 3 335 082.51
TOTAL 50 759 385.13 29 110 747.53 21 648 637.60
•Including decommitment relating to Chapters B1-14, B1-18 and B1-36.
63
5.2. Direct payments
5.2.1. Direct payments for certain agricultural measures
In certain cases the Commission makes direct payments to operators in connection with certain schemes that are not conventional market measures but are intended to increase the scope for disposal of products, in particular olive oil, fibre flax and nuts and to finance rural development and measures to combat fraud.
Table 13 gives details of direct payments.
Some of these measures are financed by withholding a proportion of the aid to be paid to producers. Annex 20 gives an overall picture of sums withheld in relation to expenditure.
Although expenditure relating to the olive cultivation register is paid out by the paying agencies and does not therefore take the form of direct payments by the Commission, it was thought useful to include it in the Annex to make the position as regards amounts withheld and used clear.
5.2.2. Direct payments for the free supply of agricultural products
Payments relating to transport and distribution of food aid for the former USSR carried out by non-governmental organizations (NGOs) during the 1992 financial year were made in the course of 1993 using appropriations carried over to that end (cf. Table 13).

Table 14
Advances to the Member States for 1993
Member State
Belgium Denmark Germany Greece Spain France Ireland Italy Luxembourg Nether lands PortugaI United Kingdom
SubtotaI
EAGGF (Direct payments)
^TOTAL E.C.
Advances for 1993
(a)
1.298.728.742,91 1.334.709.844,66 4.976.156.107,78 2.715.045.065,16 4.175.633.669,34 8.184.829.998,04 1.649.916.544,48 4.765.103.447,86
7.304.102,35 2.328.082.061,48 478.106.657,81
2.740.117.658,10
34.653.733.899,97
34.653.733.899,97
Exchange rate differences*
(b)
5.383,94 15,73
1.421,74 28.477,34 21.399,42 64.375,32 1.077,82
332.908,24 15.855,03
863,29 47.539,55
-2.242.863,89
-2.008.900,95
-2.008.900,95
Expenditure charged In 1993
(c) - a + b
1.298.734.126,85 1.334.709.860,39 4.976.154.686,04 2.715.016.587,82 4.175.655.068,76 8,184.765.622,72 1.649.917.622,30 4.765.436.356,10
7.319.957,38 2.328.081.198,19 478.059.118,26
2.737.874.794,21
34.851.724.999,02
96.441.426,04
34.748.166.425,06
Payments from carryovers from
1992 (d)
6.359.597,45 6.762.377,64
46.490.019,85 4.783.058,44 2.996.946,35 60.440.349,07 13.351.876,38 11.919.794,39
0,00 696.971,14
0,00 1.646.000,56
155.446.991,27
2.287.236,47
157.734.227,74
Expenditure charged to 1992
budget (e) - c - d
1.292.374.529,40 1.327.947.482,75 4.929.664.666,19 2.710.233.529,38 4.172.658.122,41 8.124.325.273,65 1.636.565.745,92 4.753.516.561,71
7.319.957,38 2.327.384.227,05 478.059.118,26
2.736.228.793,65
34.496.278.007,75
94.154.189,57
34.590.432.197,32
Exchange-rate differences stem from the fact that advances paid In respect of a particular month do not correspond entirely to expenditure committed for that month (the advances are rounded off and corrections are made rectroact ively). As a consequence, the differences between the two amounts are converted into ecus at the rate for the fol lowing month, which gives rise to discrepancies in ecus entered in the accounts as a difference In exchange rates. NB: The exchange-rate difference may also relate to expenditure against carryovers.
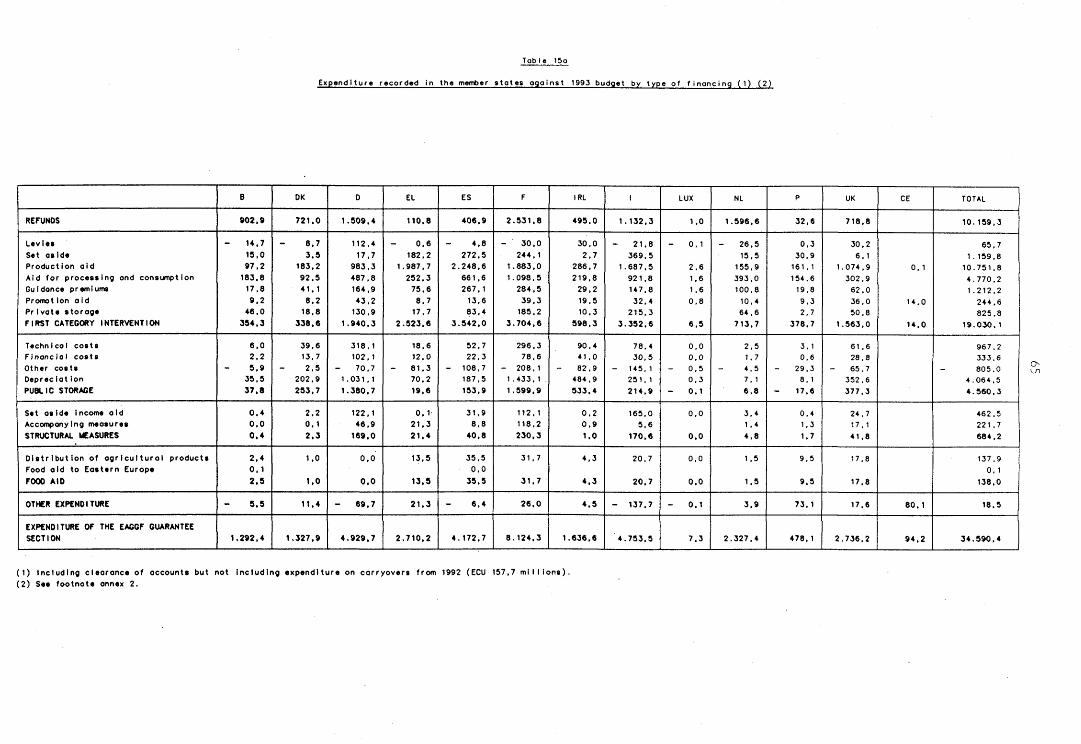
Expenditure recorded in the member stotes ogoinst 1993 budget by type of finoncing (1) (2)
REFUNDS
Levies Set aside Production aid Aid for processing and consumption Guidance premiums PromotIon old Private storage FIRST CATEGORY INTERVENTION
Technical costs Financial costs Other costs Depreclot ion PUBLIC STORAGE
Set aside Income aid Accompanying measures STRUCTURAL MEASURES
OlstrIbution of agricultural products Food aid to Eastern Europe FOOD AID
OTHER EXPENDITURE
EXPENDITURE OF THE EAGGF GUARANTEE SECTION
8
902.9
14.7 15,0 97,2 183,8 17,8 9.2 46,0 354.3
6.0 2,2 5.9 35,5 37.8
0.4 0,0 0.4
2.4 0,1 2.5
9.5
1.292.4
DK
721.0
8.7 3.5
183.2 92.5 41.1 8.2 18,8
338.6
39,6 13.7 2,5
202,9 253.7
2.2 0.1 2.3
1.0
1.0
11.4
1.327.9
D
1.509.4
112,4 17,7
983,3 487,8 164,9 43.2 130,9
1.940.3
318,1 102,1 70,7
1.031,1 1.380.7
122.1 46,9 169.0
0,0
0.0
- 69.7
4.929,7
EL
110,8
0.6 182.2
1.987.7 252.3 75.6 8.7 17.7
2.523.6
18,6 12,0 81.3 70.2 19.6
0.1 21,3 21.4
13,5
13,5
21.3
2.710.2
ES
406.9
4,8 272.5
2.248.6 661,6 267,1 13,6 83,4
3.542.0
52,7 22,3
- 108,7 187,5 153,9
31,9 8.8 40.8
35,5 0,0 35.5
6,4
4.172.7
F
2.531.8
- 30.0 244,1
1.883.0 1.098,5 284,5 39.3 185.2
3.704.6
296.3 78.6
- 208,1 1.433,1 1.599.9
112,1 118.2 230,3
31,7
31.7
26.0
8.124.3
IRL
495.0
30,0 2,7
286,7 219,8 29,2 19,5 10,3
598,3
90,4 41.0 82.9 484,9 533.4
0,2 0,9 1.0
4,3
4.3
4.5
1.636.6
1
1.132.3
21,8 369,5
1.687,5 921.8 147.8 32,4 215,3
3.352.6
78,4 30,5
- 145.1 251. 1 214.9
165,0 5.6
170.6
20.7
20.7
- 137.7
4.753.5
LUX
1.0
0,1
2.6 1.6 1,6 0,8
6,5
0,0 0,0 0.5 0.3 0.1
0.0
0.0
0.0
0,0
0.1
7.3
NL
1.596.6
26,5 15,5 155,9 393,0 100,8 10.4 64,6 713,7
2,5 1.7 4,5 7. 1 6,8
3,4 1 .4 4,8
1 ,5
1.5
3.9
2.327.4
P
32.6
0,3 30,9 161. 1 154,6 19.8 9.3 2,7
378.7
3, 1 0,6 29.3 8. 1 17,6
0.4 1.3 1.7
9.5
9.5
73.1
478,1
UK
718.8
30,2 6,1
1.074,9 302,9 62.0 36,0 50,8
1.563.0
61 .6 28,8 65,7 352,6 377,3
24,7 17,1 41,8
17.8
17,8
17,6
2.736,2
CE
0.1
14.0
14.0
80.1
94.2
TOTAL
10.159.3
65,7 1.159,8 10.751.8 4.770,2 1.212.2 244.6 825,8
19.030,1
967.2 333.6 805.0
4.064,5 4.560.3
462,5 221.7 684,2
137.9 0, 1
138.0
18.5
34.590.4
(1) Including clearance of accounts but not including expenditure on carryovers from 1992 (ECU 157,7 millions). (2) See footnote annex 2.
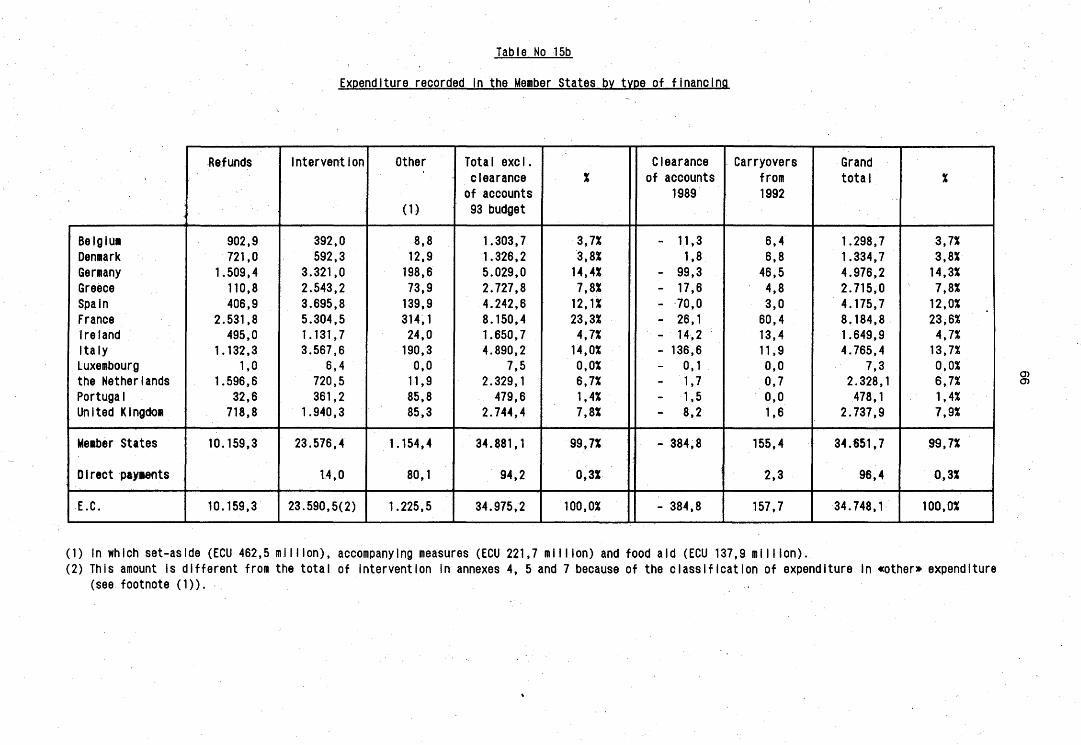
Table No 15b
Expenditure recorded In the Member States bv type of financing
i
Belgium Denmark Germany Greece Spain France Ireland Italy Luxembourg the Netherlands Portugal United Kingdom
Member States
DIrect payments
E.C.
Refunds
902,9 721,0
1.509,4 110,8 406,9
2.531,8 495,0
1.132,3 1,0
1.596,6 32,6 718,8
10.159,3
10.159,3
Intervention
392,0 592,3
3.321,0 2.543,2 3.695,8 5.304,5 1.131,7 3.567,6
6,4 720,5 361,2
1.940,3
23.576,4
14,0
23.590,5(2)
Other
(1)
8,8 12,9 198,6 73,9 139,9 314,1 24,0 190,3 0,0 11,9 85,8 85,3
1.154,4
80,1
1.225,5
Total excl. clearance of accounts 93 budget
1.303,7 1.326,2 5.029,0 2.727,8 4.242,6 8.150,4 1.650,7 4.890,2
7,5 2.329,1 479,6
2.744,4
34.881,1
94,2
34.975,2
X
3,7% 3,8% 14,4% 7,8% 12,1% 23,3% 4,7% 14,0% 0,0% 6,7% 1,4% 7,8%
99,7%
0,3%
100,0%
Clearance of accounts
1989
- 11,3 1,8
- 99,3 - 17,6 - 70,0 - 26,1 - 14,2 - 136,6 - 0,1 - 1,7 - 1,5 - 8,2
- 384,8
- 384,8
Carryovers from 1992
6,4 6,8 46,5 4,8 3,0 60,4 13,4 11,9 0,0 0,7 0,0 1,6
155,4
2,3
157,7
Grand tota I
1.298,7 1.334,7 4.976,2 2.715,0 4.175,7 8.184,8 1.649,9 4.765,4
7,3 2.328,1 478,1
2.737,9
34.651,7
96,4
34.748,1
%
3,7% 3,8% 14,3% 7,8% 12,0% 23,6% 4,7% 13,7% 0,0% 6,7% 1,4% 7,9%
99,7%
0,3%
100,0%
(1) In which set-aside (ECU 462,5 million), accompanying measures (ECU 221,7 million) and food aid (ECU 137,9 million). (2) This amount is different from the total of intervention in annexes 4, 5 and 7 because of the classification of expenditure In «other» expenditure
(see footnote (1)).
67
TITLE III
FRAUD PREVENT I P N C )
6.1 General
The main task of the Member States being to apply the Community regulations, they must take all measures necessary to ensure that operations financed by the EAGGF Guarantee Section are implemented in accordance with the rules^2). The responsibility for combating fraud affecting the EAGGF falls firstly on the Member States, which have suitable national departments for conducting verifications and investigations.
In this area the Commission's role essentially is to encourage, coordinate and monitor the control work of the Member States and to urge the latter to conduct the relevant investigations.
Using the legal instruments at its disposal, independently of checks carried out for the purposes of the clearance of accounts, the Commission can request the Member States to carry out investigations,-• in which it may participate, carry out checks itself, or organize selective checks where several Member States are concerned or where problems arise in a particular sector.
There are also arrangements for the exchange of information between the Member States and with the Commission to step up the effectiveness of the fight against fraud.
In 1993 the Commission continued its activities with regard to the prevention of fraud and irregularities involving EAGGF funds. This work concentrated on three main objectives:
prevention, including the application of legislative provisions on controls and improvements to the regulations and methodology;
. conducting of investigations and special checks;
setting up and operation of specific control mechanisms and application of suitable, effective verification techniques and methods.
(1) Certain items under this Title also appear in the 1993 annual report on the fight against fraud ("Protecting the financial interests of the Community: The fight against fraud"). The points enlarged upon in that report are only outlined in brief in this title.
(2) Article 8 of Council Regulation (EEC) No 729/70, OJ No L 94, 28.4.1970.
68
6.2 Application of control measures
6.2.1 A posteriori audit (R. (EEC) No 4045/89)
1. The object of Council Regulation (EEC) No 4045/89 is the ex-post audit by each Member State of the commercial documents of beneficiaries of EAGGF guarantee funds. This scrutiny is complementary to pre-payment checks. In only the third year since the introduction of the regulation, the initiatives already undertaken by the Commission are considerable.
They include:
- a first round of visits to ail Member States to assess national arrangements as described in their reply to the Commission's questionnaire;
in the light of this experience, proposals to modify the regulation, in particular to provide for the application of risk analysis techniques;
- the demonstration of computer techniques in all Member States (except Luxembourg) to aid the planning and performance of scrutinies; and
- a demonstration project to «further mutual assistance between member States.
A second round of visits is being undertaken to verify in detail the quality of the scrutiny work undertaken regarding implementing instructions, organisational structures and operational arrangements for planning, executing, monitoring and reviewing the strategic and practical application of the regulation.
2. The Commission has focused on a number of general criteria. These criteria are general standards against which to assess existing conditions. They equate with good management practices, indicate the scope of the assessment and provide an objective basis against which to measure the degree of compliance with the regulation, and the effectiveness of the work done.
- The relevant criteria adopted are:
i) The objectives of a posteriori audit under Council Regulation (EEC) No 4045/89 should be clearly stated in national legislation and administrative notices.
69
ii) The scrutiny programme should be consistent with the requirements of Council Regulations (EEC) No 4045/89.
iii) Special units and their control partners should have available all the information necessary to plan and perform the a posteriori controls.
- Procedures should be established for ensuring that the planned a posteriori audits are the most likely to target high risk undertakings and transactions. In particular undertakings and transactions should be assessed against documented risk criteria.
- The human resource commitment to the performance of a posteriori controls should be consistent with the workload.
- A posteriori control reports should be tailored to the objectives of the control.
- The performance of planned a posteriori controls should be monitored by the responsible control body and, centrally, by the special uni t.
- The arrangements for the exchange of information between the special unit and the control bodies should provide reliable, relevant, and timely information on progress and f indings.
- Thbe quality and effectiveness of the work performed should be evaluated systematically.
- All material irregularities identified by inspectors should be made known to the special unit, the decisions on the recovery of sums unduly paid should be documented, and the end result notified to the inspectors responsible, the special unit and to the the Commission services.
3. Risk analysis is an essential tool in the selection of beneficiaries and transactions for scrutiny. This is why the Commission gave a presentation on the application of risk analysis to the 5th meeting of the «Experts Group» on Council Regulation (EEC) No 4045/89, held on 2 March 1993. Similar presentations have been made to operational staff in Member States.
The 6th meeting of the «Experts Group», on 26 October, included a presentation by the Dutch delegation on their experiences of risk analysis. The German delegation gave a similar presentation to a meeting of the "frauds and irregularities" group in June.
70
In addition, the Commission has chaired a special working group of national Customs experts on risk analysis and on 13 and 14 December, a first seminar was held in Brussels for inspectors working under the Regulation.
4. Mutual assistance between Member States under Article 7 of Council Regulation (EEC) No 4045/89 has proved disappointing. This is why proposed amendments to. the regulation will seek changes and why a demonstration project to encourage mutual assistance is being undertaken. The objectives of the demonstration project are to:
- develop cooperation between Member States and between the Commission and Member States;
- reinforce the audit of undertakings operating within and across national boundaries and in third countries;
- develop the use of risk analysis techniques, particularly in the selection of undertakings and transactions to be scrutinised;
- encourage cross-checking with third party sources upstream and downstream of undertakings, particularly where this involves activities in a place other than in the Member State in which subsidy is received.
6.2.2. integrated administration and control system as part of the reform of the CAP *
With the reform of the CAP, it has been necessary to tackle the problems of management and control in a different way. Council Regulation (EEC) No 3508/92 of 27 November 1992 establishing an integrated administration and control system^1) essentially provides for : - a computerized database, - an alphanumeric identification system for agricultural
parcels, • - a system for the identification and registration of
animals^2), - aid applicat ions, - an integrated control system (administrative checks, on-the-
spot checks and, where appropriate, verification by aerial or satellite remote sensing).
By collating all the information relating to areas, animals and producers available to it, the control authority is in a position to carry out a very detailed administrative check. This procedure should make it possible to detect far more irregularities or anomalies at the aid application stage and to reduce the number of elements that have to be checked on-the-spot. Computerizing these administrative checks makes for greater efficiency and cost-effectiveness.
(1) 0J No L 355, 5.12.1992. (2) In accordance with Articles 4, 5, 6 and 8 of Council Direc
tive 92/102/EEC of 27 November 1992 (OJ No L 355, 5.12.1992).
71
Regulation (EEC) No 3508/92 provides for the integrated system to apply as from 1 February 1993 with the exception of the alphanumeric identification system for agricultural parcels and the computerized database, which will be applicable as from 1 January 1996.
In 1993 Commission staff carried out several «education» visits to all the Member States. The first series of visits studied the organization of the Introduction of the system, the administrative and on-the-spot checks and the introduction of systems for the identification of agricultural parcels.
A second series of visits related in particular to an in-depth examination of the introduction of the register of agricultural parcels by the Member States. In September and November seminars were organized in Brussels on this subject, measurement methods and the applicable tolerances.
In the autumn another series of visits have been made with a view to the inclusion of livestock production aid schemes in the integrated system.
A fairly positive first impression has emerged of the introduction of the integrated system in the Member States. In most cases officials met during visits showed great motivation given the difficulties with which they are faced.
Nevertheless, major problems remain to be solved, in particular as regards the introduction of the register of agricultural parcels and the application of Council Directive 92/102/EEC of 27 November 1992 on the identification and registration of animals.
6.2.3. Identification and registration of animals
Directive 92/102/EEC of 27 January 1992 provides that the Council is to undertake a review of the Directive before the end of 1996 with a view to defining a harmonized Community system of identification and to taking a decision on its introduction in the light of progress achieved in this area by the International Organization for Standardization (ISO).
72
Accordingly, the Commission decided to contribute towards the financing of a project developed by three research institutes for a large-scale trial involving the electronic identification of Iivestock (cattle, sheep and goats), to see if the generalized application of such an identification system could be achieved for all livestock qualifying for Community premiums paid in respect of individual animals.
6.2.4. Reinforcing monitoring (Regulation (EEC) No 307/91)
Regulation (EEC) No 307/91 provides for the reinforcing of monitoring of certain expenditure chargeable to the EAGGF Guarantee Section in the field of exports of agricultural products and products exported in the form of goods not covered by Annex il to the treaty (Article 1) as well as in connection with certain intervention measures (Article 2) the total annual ce iIi ng i s ECU 20 m i11i on.
In 1992, all Member States (with the exception of Luxembourg) showed interest in applying for Community funds. The eligible expenditure declared by the Member States amounted to ECU 9.2 million, giving a rate of utilization of 46% of the ECU 20 mi 11 ion made avaiI able to them under the Regulation.
This is naturally an average rate, which masks highly divergent national figures ranging from full utilization of the amount allocated (NL) or fairly high rates of utilization (DK, E and F) to modest (B, D, IRL and UK) or low rates (GR, I and P ) . As regards the latter three countries, the results achieved in 1992 show an improvement over the situation recorded in the previous year. Part-financing covering expenditure on monitoring of exports was higher than that relating to expenditure on the stepping-up of monitoring of intervention measures, the rate of utilization of Community appropriations being 61% and 39% respect ively.
Generally speaking, the Member States continued to give priority to utiIizing appropriât ions for the rémunérât ion of personnel as against those for training, despite the Commission's efforts to improve the situation in an area which is extremely important for efficient monitoring.
Forecasts of expenditure for 1993 provided by the Member States point to ECU 11 million of Community appropriations being used, i.e. 55% of the total (ECU 20 million) made available.
73
On the basis of these forecasts, the Member States received advance payments totalling ECU 8.2 million. The balance of the Community contribution will be paid after the presentation of declarations of expenditure incurred, scheduled for 15 May 1994, and only then will it be possible to establish the final figures for utilization in 1993.
6.2.5. Physical checks on exports of agricultural products
Pursuant to Regulation (EEC) No 386/90(1), a supplementary report to the Council was drawn up^2^ on the basis of an enquiry conducted in the Member States. At the same time, a proposal was made to the Council to amend that Regulation in order to:
- apply the rule for an inspection rate of 5% to cover all sectors on the basis of a risk analysis with a minimum rate of 2% in each product group-,
- provide for the possibility of laying down a minimum rate of inspection by the customs office of departure.
At its meetings of 16 and 17 December 1993, the Council adopted the abovementioned proposals (Regulation (EEC) No 163/94, OJ No L 24, 29.1.1994).
6.3. Improvement of legislation and control methods
6.3.1. Simplification and revision of agricultural legislation
In spring 1993, the Commission decided to maintain the Lachaux Group for a further three-year period and also defined its task and method of operation. The objective of simplification is not only to combat fraud but also to work towards better understanding and application of measures adopted under the reform of the CAP.
In 1993 the Group worked on the simplification of provisions implementing the reform of the CAP, in particular with regard to set-aside, compensatory area payments, oilseeds, the harmonization of terms of payment and the rotation of permanent crops.
Although the Commission adopted the Group's main proposals, it noted that the work which should have been entrusted to the group was not completely satisfactory and that further reflection on its tasks was required.
(1) Council Regulation (EEC) No 386/90 of 12 February 1990 on the monitoring carried out at the time of export of agricultural products receiving funds or other amounts (OJ No L 42, 16.2.1990).
(2) Supplementary report on the application of Regulation (EEC) No 386/90 on the monitoring carried out at the time of export of agricultural products receiving funds or other amounts (C0M(93) 339 final, 19.7.1993).

74
6.3.2. Risk analysis
Risk analysis is a working method used by both the Member States and the Commission. It allows better targeting of controls and greater effectiveness in the fight against fraud by inspection authorities.
Article 2 of Regulation (EEC) No 4045/89 makes provision for risk analysis. Proposals to amend Regulation (EEC) No 4045/89 were drawn up in 1993 with the aim in particular of using risk analysis for controls based on accounts. The method was enlarged upon and made mandatory in Regulation (EEC) No 3887/92, Article 6 of which provides that on-the-spot checks relating to aid applications are to be carried out in particular on the basis of risk analysis.
Further Commission initiatives were taken in 1993. The proposals concerning the amendment of Regulation (EEC) No 386/90, with the(
aim in particular of applying the rule of a 5% inspection rate for all product groups on the basis of a risk analysis, were adopted by the Council (Regulation (EEC) No 163/94, OJ L 24, 29.1.1994).
Risk analysis has also been introduced for milk and milk products and in particular for checks on the application of the additional levy under the arrangements on milk quotas (Article 7 of Regulation (EEC) No 536/93, OJ No L 57, 10.5.1993).
6.3.3. Reduction in number of lines in Nomenclature for export refunds
As part of the simplification measures, over 100 headings were deleted from the Nomenclature for export refunds. The headings deleted are those where no refund is fixed; they relate in particular to processed cereal products, pigmeat, processed fruit and vegetables, poultrymeat, wine and tobacco.
6.3.4. Measures to protect Community interests: operators who present a r isk
As part of the measures to protect Community financial interests, the Commission is considering the possibility of excluding operators who do not provide the necessary guarantees, in particular on account of fraud committed, from benefiting from Community aid granted by the EAGGF Guarantee Section. Suitable proposals for regulations have been presented.

75
6.4. Seminars
Under its training policy, the Commission organizes seminars to increase the awareness of national departments to the Community dimension of fraud and to improve their knowledge of measures taken to prevent and combat fraud.
In this connection the following seminars were organized in 1993:
two seminars in Brussels on the introduction of the integrated administration and control system in the framework of the common agricultural policy (introduction of register of agricultural parcels and parcel measurement);
. one seminar in Brussels on ex-post accounting checks (Regulation (EEC) No 4045/89) relating to the EAGGF Guarantee Sect ion.
6.5. Investigations and special checks
The Commission can conduct the controls it considers useful, including on-the-spot checks^1), or have such checks carried out by the national authorities, possibly with the participation of Commission officials^2). It may also ask for information from the Member States concerned and carry out inspection visits in this connect ion.
This Chapter covers a series of investigations in which the Commission participated actively.
This Chapter also reports on several investigations conducted by national departments (tomato processing, export of alcohol, canned meat).
The investigations conducted by officials from the EAGGF Guarantee Section in 1993 were particularly fruitful. These missions could have been more numerous and the results more beneficial if the number of officials allocated to the EAGGF for this task had been greater. In fact, currently they number only about a dozen. Thanks to the efforts of a small number of officials, a significant number of investigations were carried out and many cases of fraud covering a substantial amount detected. The fraud uncovered relates to around ECU 250 million. That figure may be compared with the total of ECU 1 000 million for fraud detected in the last 20 years by the Member States and the Commission.
6.5.1. New cases
By way of an example, the following two investigations may be mentioned:
(1) Council Regulation (EEC) No 729/70, OJ No L 94, 28.4.1970 (2) Council Regulation (EEC) No 595/91, OJ No L 67, 14.3.1992
76
Cereals
(a) Intervention stocks
The Commission services felt (risk analysis) that the considerable reduction in the intervention prices for cereals as a result of the reform of the CAP could lead to a high risk of fraud, involving in particular selling cereals before the new marketing year and replacing them with products harvested at the beginning of 1993/94.
It was agreed firstly with all the Member States that suitable checks should be conducted by the national authorities on the basis of a programme drawn up in conjunction with the Commission.
Following an examination of data forwarded, the Commission organized inspection visits tp three Member States in May and June 1993 to verify the actual existence of intervention stocks.
It was noted in Italy that 25% of the stock checked was non-inex)stent.. In France, despite the shortcomings of the present system of administration and control, no major irregularities were observed. In Greece, on-the-spot checks conducted by Commission officials and the national authorities showed that certain warehouses were not suitable for the storage of cereals and some quantities were missing and/or had deteriorated. The amounts concerned are:
Italy: ECU 76 mi I I ion Greece: ECU 15 million France: ECU 0.5 million.
(b) Pref inaneing
In the course of the on-the-spot checks in Italy, it was ascertained that major quantities of durum wheat, which had benefited from prefinancing of the refund, were non-inexistent. In all likelihood, cereals from intervention stocks were used to justify such prefinancing. The sums unduly paid amount to around ECU 99 million.
Olive oil in intervention storage
As a result of sales difficulties on a market unable to produce all of its own requirements an investigation was carried out to check the quantity and quality of the oil in intervention storage in Italy in late 1993.
77
Generally speaking the quantities declared were found on inspection to be in storage. Samples representing 90% of the oil in intervention, mainly from the 1992/93 marketing year, were taken and sent for analysis to a Community laboratory. Initial indications are that 93% of the oil in storage is of a lower quality than that accepted on entry, and of that 31.5% was not even eligible for intervention. The amount involved is put at ECU 33.6 mi I I ion.
Other investigations
In 1993, other major investigations were also carried out by the EAGGF agents in complete col laborat ion with UCLAF. References to them below are very brief but they are described in detail in the Commission's 1993 report on the fight against fraud.
As a general remark it must be pointed out that a number of frauds detected reveals a weakness in customs controls.
. Swine fever
Community measures have been taken to support the pigmeat •market in Germany and Belgium as a result of the outbreak of swine fever. The Commission initiated an inquiry to determine whether the control arrangements introduced by the national authorities are capable of ensuring that the operations are carried out in a proper manner. Checks carried out on the spot in Germany have shown that there are shortcomings in the control arrangements.
. Beef exported from and re imported into the Community
An investigation of beef and pigmeat imports from Romania brought to light a fraudulent operation whereby beef was being exported to certain third countries, the T1 documents never having been cleared, and the goods were released for consumption on the Community market.
As a result of a Community fact-finding mission in Romania the Commission was able to determine the quantity of such exports. The amount of the refunds involved is put at ECU 0.7 million.
Community sugar re imported
Sugar exported from France and Belgium to the former USSR was re imported into Spain under cover of false T2L documents.
78
. Olive oil exports: false declaration of type and destination
An investigation in Greece into olive oil exports with refunds revealed that the product had not reached its declared destinations.
It was also established that most of the goods exported did not consist of olive oil but of other products. The fraud involves the undue payment of refunds totalling ECU 3 million.
• Beef exports: false documents
It was found during a fact-finding mission to Turkey that beef exported from Germany intended for Lebanon was diverted to Turkey. False Lebanese import documents had been presented. The amount of the fraud is approximately ECU 4 million.
. Beef exported as food aid
During an investigation it was found that preserved meat from Italy intended as food aid for the former USSR had not been adequately sterilized. Part of the meat was brought back for analysis. The results confirmed insufficient sterilization. The Commission requested that beef already delivered but not yet eaten be destroyed. The amount involved is put at around ECU 11.5 mi II ion.
. Dried fig stocks
Intervention stocks of dried figs were found, as a result of on-the-spot checks in Greece, to be unsuitable for processing for human consumption. Community financing will not therefore be avaiI able (estimated amount : ECU 0.4 million).
Investigations carried out bv the Member States
Several major investigations were carried out. Below, as an example, a brief description is given of three:
. Processing of tomatoes
The Italian authorities detected a major case of fraud involving the fictitious supply of tomatoes to the processing industry. The amount concerned is ECU 2 million. Arrests have been made and recovery of the amount unduly paid is in hand.
79
Alcohol exported from and re imported into the Community
Significant quantities of alcohol for industrial use (86 354 hi) were exported in June and September 1993 to former Yugoslavia. After successive sales the goods reached France with false Hungarian certificates of origin.
Recovery proceedings against the exporters and importers in question are now in hand. The amount concerned is ECU 4.7 mi I I ion.
Preserved meat - fraud regarding its composition
The Dutch authorities discovered major cases of fraud involving the compositiion of preserved meat. During the investigation it was found that the company had established a dual accounting system in order to obtain extra export refunds. It was shown too that offal was being used in place of meat.
The fraud involved HFL 4 million. The recovery procedure is now in hand.
6.5.2. Old cases
In 1993 there were significant developments as regards the files opened in earlier years and presented in the 1992 Financial Report on the EAGGF Guarantee Section.
These files can be classified as follows:
(a) Cases which will result in a financial adjustment under the 1990 accounts clearance operation
- Fruit and vegetables withdrawals in Italy: correction: LIT 1 840.3 million.
- Quality of cereals (durum wheat, common wheat) in Italian intervention stores. Correction: LIT 943.3 million.
- Pigmeat withdrawals following the outbreak of swine fever in Belgium: correction: FB 110.7 million.
- Placing of butter in intervention in the Netherlands (NIZO case): correction: HFL 82.6 million.
- Beef exports to Zimbabwe: Netherlands: correction: HFL 0.5 million. United Kingdom: correction: UKL 0.7 million. Germany: partial clearance in 1991.
(b) Cases where the financial implications will be drawn as part of the 1991 clearance operation or a specific one
- Premium for the abandonment of winegrowing areas (1991 clearance operation)
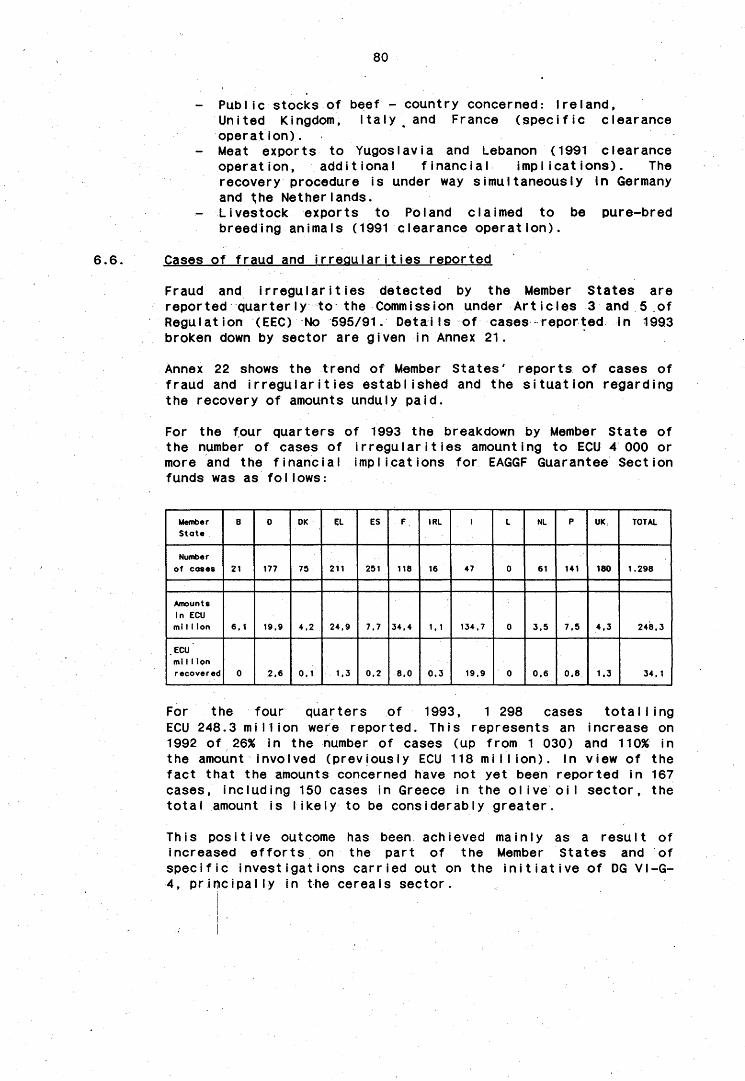
80
- PubIic stocks of beef - country concerned: Ireland, United Kingdom, Italy .and France (specific clearance operation).
- Meat exports to Yugoslavia and Lebanon (1991 clearance operation, additional financial implications). The recovery procedure is under way simultaneously in Germany and the Netherlands.
- Livestock exports to Poland claimed to be pure-bred breeding animals (1991 clearance operation).
6.6. Cases of fraud and irregularities reported
Fraud and irregularities detected by the Member States are reported quarterly to the Commission under Articles 3 and 5 of Regulation (EEC) No 595/91. DetaiIs of cases reported in 1993 broken down by sector are given in Annex 21.
Annex 22 shows the trend of Member States' reports of cases of fraud and irregularities established and the situation regarding the recovery of amounts unduly paid.
For the four quarters of 1993 the breakdown by Member State of the number of cases of irregularities amounting to ECU 4 000 or more and the financial implications for EAGGF Guarantee Section funds was as follows:
Member State
Number of cases
Amounts in ECU mi 11 ion
ECU mi 11 ion recovered
B
21
6.1
0
0
177
19.9
2.6
OK
75
4.2
0.1
EL
211
24,9
1,3
ES
251
7.7
0.2
F
118
34.4
8,0
IRL
16
1.1
0.3
1
47
134.7
19.9
L
0
0
0
NL
61
3.5
0.6
P
141
7.5
0.8
UK
180
4.3
1.3
TOTAL
1.298
248.3
34,1
For the four quarters of 1993, 1 298 cases totalling ECU 248.3 mi II ion were reported. This represents an increase on 1992 of 26% in the number of cases (up from 1 030) and 110% in the amount involved (previously ECU 118 million). In view of the fact that the amounts concerned have not yet been reported in 167 cases, including 150 cases in Greece in the olive oil sector, the total amount is likely to be considerably greater.
This positive outcome has been achieved mainly as a result of increased efforts on the part of the Member States and of specific investigations- carried out on the initiative of DG Vl-G-4, principally in the cereals sector.
81
Not counting cereals, where the rise is obvious (161 cases totalling ECU 146 mi I I ion, up ECU 33.7 mi I I ion on 1992), appreciable increases have taken place also in the number of cases and the amounts reported in the following sectors:
- Milk and milk products, with 314 cases and ECU 40.3 million (153 cases and ECU 6 million in 1992). France reported the major cases (22 related to the additional milk levy scheme totalling around ECU 15.6 million), together with Italy (three cases in all, one of which - concerning the scheme for the use of skimmed milk in feed - amounted to ECU 11.7 million).
- Beef - a risk sector with 134 cases totalling ECU 18 million (in 1992 95 cases totalling ECU 7.6 million), the major ones having occurred in Germany (33 cases totalling ECU 12 million including 30 cases involving the beef refund scheme amounting to ECU 11 mi I I ion).
- Wine with 39 cases totalling ECU 8 million (up from three cases representing ECU 0.06 million in 1992) including the largest, a case in France totalling ECU 6 million relating to sales by tendering procedure of alcohol of vinous origin.
Reports in the field of olive oil, however, show a sharp drop on 1992 in the number of cases, down from 369 to 335, and in the amounts, down from ECU 75 million to ECU 8 million, even allowing for the lack of financial figures concerning 150 cases in Greece.
6.7. Recovery of amounts unduly paid
The situation regarding amounts to be recovered in respect of irregularities reported was better in late 1993 than in 1992 as a result of the combined efforts of DG VI-G-4 and the Member States to update the data available in the IRENE data base.
The recovery rate for all Member States rose slightly by 15%.
Persistence is still needed in the efforts by Member States to recover EAGGF Guarantee Section payments unduly made and to raise the rate of recovery which is still too low. This, together with the constant updating of the information on irregularities available in the IRENE data base, is essential for securing in an acceptable way the Community's financial interests as provided for in Regulation (EEC) No 729/70.
82
Some progress has been achieved already in this area, notably on 8 244 cases entered in IRENE. In 5 210 of these cases the recovery procedure has been successful, sometimes partially. The amount recovered totals ECU 158.1 million, of which ECU 123.7 million is accounted for by 5 139 cases that have been completed. It should be pointed out that 1 011 of the cases completed have no financial implications.
Cases completed produced recoveries amounting to ECU 117 million, i.e. 94.6% of the total, with the Community having to bear ECU 6.7 million (5.4%). Almost all of these cases were for small amounts, recovery of the large ones requiring an enormous amount of time by virtue of the complex and, in most cases, lengthy administrative and legal procedures.
6.8. EAGGF Irregularities and Mutual Assistance Group meetings
These meetings, which are held pursuant to Article 8 of Regulation (EEC) No 595/91, bring together, under the chairmanship of an EAGGF representative, Commission officials and Member States' representatives responsible for control and investigations. Three plenary meetings were held in 1993 at which the introduction of the new regulations and procedures for the notification of irregularities were discussed together with many alleged or established irregularity cases, and the action to be taken in each case was considered.
At meetings of the Group:
- major cases of fraud can be discussed with the Member States;
- an exchange of views can take place on the application of the Community rules;
- Member States' authorities can be alerted to new methods and techniques (risk analysis, remote sensing, etc.);
- discussions can be held on experience gained in various sectors;
- all fraud cases reported can be discussed and assessed with a view to the risk analysis to be completed by the individual Member States.
In 1993 some 80 bilateral and multilateral meetings were held with Member States at which specific points were examined.
83
6.9. Specific control arrangements
6.9.1. Control agencies for olive oil
Pursuant to Council Regulation (EEC) No 2262/84C) and Commission Regulation (EEC) No 27/85<2), control agencies for olive oil were set up in the main producer Member States: Italy, Greece, Spain and Portugal (see 18th Financial Report on the EAGGF, pp. 53, 54).
The main changes to the operation of the agencies in 1993 arise from the amendment of Commission Regulation (EEC) No 2677/85 laying down implementing rules in respect of the system of consumption aid for olive oil by Regulation (EEC) No 643/93(3) which provides for:
- the active involvement of the agencies in the procedure for the grant of new approval to packaging undertakings;
- the periods within which the agencies are to forward the results of their checks to the Member States;
- the penalties which are to be imposed by the competent authority where an infringement is detected;
- the liability of suppliers in cases where they are unable to show that quant ities of oiI are delivered is eligible for aid.
These changes have made it possible to strengthen the preventive role of thé agencies, to improve the notification and follow-up of infringements and to optimize their operation by making the cross-checking of suppliers easier.
The four agencies carried out their control tasks during the 1992/93 marketing year in accordance with the forecasts in the activity programmes and the forward estimates^ approved by the Member States' authorities and the Commission.
In Italy, since commencing operation, the agency has carried out checks on 4 309 mills out of 6 090 and on 34 643 producers out of the average of 654 000 who over the past eight marketing years have submitted aid applications. Twenty checks concerned the six unions of associations and 341 concerned the 186 producers' associations. The agency also took part in determining yields in 1 549 communes.
In relation to consumption aid, the agency has been operating for four marketing years and has carried out 3 294 checks on 659 recognized undertakings.
(1) OJ No L 208, 3.8.1984 (2) OJ No L 4, 5.1.1984 (3) 0J No L 69, 20.3.1993

84
As a result of these checks the agency has made a total of 460 proposals for withdrawal of approval, of which 431 are for mills and 29 for producers' associations. Not counting the effect on producers of the withdrawal of approval from associations, the aid received by more than 5 000 producers will be limited as a result of the agency's checks. In addition, 837 reports have been sent to the Guardia di Finanza for the purpose of completing checks.
As regards consumption aid, 2 458 irregularities have been detected, of which 177 have led to a proposal for the withdrawal of approval of the undertaking. A total of 151 cases have been referred to the Guardia di Finanza.
The agency continued its control activities in the 1992/93 marketing year during which it carried out checks on 2 239 producers, 632 mills and 10 producers' associations. It carried out 943 checks on packaging plants and 2 235 cross-checks.
Since beginning its operations, the Greek control agency (0EEE) has carried out 2 945 checks on the 3 000 or so mills in operation and has proposed penalties in 449 cases: 253 proposals for the withdrawal of approval and 205 fines.
The 331 checks on the 77 producers' organizations have led to six proposals for the withdrawal of approval and 37 fines. Proposals for penalties on producers are made via the associations.
As regards consumption aid, the agency carried out 1 459 checks on the 231 packaging undertakings, proposing one withdrawal of approval and 379 fines.
For the 1992/93 marketing year, the agency carried out 683 checks on the 2 949 mills in operation and proposed 44 withdrawals of approval and 96 fines. The checks on associations did not give rise to any proposals for penalties. The 1 054 checks on packaging undertakings resulted in the quantities declared being challenged in 186 cases.
In Portugal, since commencing its operations, the agency has carried out checks on 3 289 producers and proposed 1 323 corrections to the quantities declared. According to tire agency, Portugal dealt with 348 cases and recovered nearly ESC 40 million. The number of producers submitting aid applications varies considerably from one marketing year to another on account of the rotation of crops: 32 000 in 1989/90, 22 000 in 1990/91, 40 882 in 1991/92 and 34 485 in 1992/93.
85
The number of approved mills varied between 60 and 70 up to 1991 whereas in the last two years it has been more than 1 600. The 755 checks carried out led to 43 proposals for the withdrawal of approval.
With regard to consumption aid, the 174 checks carried out during the last three marketing years have resulted in Portugal reporting irregularities in 12 cases. The 90 samples taken to check the quality of the oil have led to seven irregularities being reported to the national authorities.
For the 1992/93 marketing year, the agency carried out checks on 796 producers, 337 of whom were found wanting. The number of approved mills rose to 1 635 and the agency inspected 278. Proposals were made for the withdrawal of approval in 16 cases and acted upon by the Member State.
The 60 inspections at the 48 packaging plants revealed shortcomings in the keeping of accounts in the case of two plants and corrections in quantities in the case of nine plants. On the question of quality, four infringements were reported to the national authorities.
In Spain since it was set up the agency has carried out 2 452 checks on the 1 932 approved mills and has proposed the withdrawal of approval in eight cases. The 72 producers' organizations have been checked on 245 occasions and 13 withdrawals of approval have been proposed. Of the 500 000 producers, 9 916 have been checked and 467 found to be in an irregular position. The 511 packaging plants have been the subject of 1 195 checks. Proposals have been made regarding 31 withdrawals of approval and 944 corrections of quantities declared.
For 1992/93 the agency checked 711 mills, two unions of associations, 40 producers' organizations, 1 639 producers and 516 packaging plants. One hundred and seventy-three producers were found to be in an irregular position, seven producers' organizations had their approval withdrawn, quantities declared by packaging plants were cut in 530 cases and penalties were proposed in the case of 28 plants.
6.9.2. Community control body in the wine sector
The activities of Commission officials, seriously undermined by the gradual cut-back in staff numbers, were concentrated in 1993 on checks on the annual harvest and production declarations, the permanent abandonment of vine-growing, annual stock declarations and long-term storage contracts.

86 (PBUD/EN/0329-20)
It emerged that ih several Member States the reliability of the data concerning areas and per hectare yields based on the declaration system was doubtful. This has major implications for the application of intervention measures.
Some irregularities were uncovered also regarding grubbing operations for which premiums were granted. Fictional cases of grubbing were found (no vines on the land) and more frequently the areas grubbed up were overestimated and grubbing was not carried out correctly.
The forthcoming reform of the market organization will take account of the above.
6.9.3. Community control body in the fruit and vegetables sector
The control body continued this year to carry out the checks provided for in Regulation (EEC) No 1319/89 (on the reinforcement of the application of Community rules on fruit and vegetables).
During the first half of the year the checks were targeted at citrus fruit withdrawals and deliveries to the processing industry. In the second half inspections covered peaches (withdrawals and processing) as well as the application of Commission Regulation (EEC) No 2251/92 on quality inspection of fresh fruit and vegetables.
.The insufficient number of Commission officials assigned to this control body did not permit the number of examinations desired and necessary to be carried out.
Withdrawals of oranges were shown to be structural in nature in some Member states. In many cases the quality of the oranges and peaches withdrawn and of the fruit delivered to the processing industry was below the minimum required under the rules.
In the case of both oranges and peaches the minimum price that the processor is required to pay the grower is not always observed, the farmer very often receiving a lower price than that provided for. To conclude, the main problem encountered in the application of the new quality inspection Regulation is the avoidance by a very large number of consignors of the inspection requirement provided for under the rules.
87
6.10. Remote sensing
The mechanism for checks by remote sensing developed gradually since 1991 is common to all participating Member States. The main stages can be summarized as- fol lows:
- selection of control areas centred on a satellite image;
- selection and computerization by the national authorities of files lodged in those areas;
- digitization of the boundaries of the declared parcels;
- acquisition and processing of satellite images ;
- automatic classification and/or photo-interpretation of parcels on images;
- classification of files (agreed, refused, doubtful);
- on-the-spot checks by the national authorities of part of the files and validation of the conclusions of photo-interpretat ions.
The photo-interpretation of files must check both the area and the type of land use. On-the-spot checks on files (classified as approved, refused or doubtful on the basis of photo-interpretation), are performed by the national authorities and are used to validate photo-interpretations or to resolve doubtful cases and are combined with a decision on the eligibility of the file. The authorities can therefore target their on-the-spot checks at the parcels where problems have been pointed out.
For the 1993 checks the Commission issued an invitation to tender and published common general conditions in agreement with the Member States in December 1992. All Member States took part with some variations, except Luxembourg. These checks were part-financed, with a maximum of ECU 10 mi I I ion (including images) chargeable to the EAGGF, on the basis of a share-out formula between Member States. Unlike last year the contracts were signed by the Member States following consultations with the Commission. In the main the procedure followed in 1992 was retained.

88
In order to ensure the adequate distribution of the checks throughout the area concerned, 44 sites in all were identified in 1993 (as against 27 in 1992). The number of declarations, the area declared and the figures for the checks carried out by remote sensing are shown in the table below:
Remote sensing
Member State
Be1 g i urn
Denmark
Germany
Greece
Spa i n
France
Ireland
Italy
Luxembourg
Netherlands
Portugal
United Kingdom
TOTAL
Files
lodged
45 629
68 116
403 012
283 586
363 437
538 995
17 150
535 907
2 206
46 970
60 000
61 977
2 426 985
Area
declared.
ha
461 000
1 912 000
10 127 000
1 288 000
8 602 000
13 440 000
296 000
4 471 000
39 000
373 000
1 012 000
4 246 000
46 267 000
Files
checked
2 055
3 054
451
3 509
7 425
343
1 714
1Q 172
0
2 751
994
2 206
34 674
Parcels
17 S56
26 160
10 020
14 059
111 136
7 903
8 258
56 398
0
9 831
4 632
65 614
331 567
Hectares
27 156
93 915
79 554
14 681
262 191
18 479
37 179
73 459
0
30 184
50 612
249 645
937 055
Checks must be carried out on not less than 5% of the files lodged (i.e. 121 349 files and 2 313 350 ha). It has been noticed that remote sensing has already permitted the checking of 34 674 files (i.e. 29%) and 937 055 ha (i.e. 41%); the rest has been checked by classic controls.
A sum of approximately ECU 1 million ( out of the ECU 10 million planned) has been earmarked by the Commission for the purchase of satellite images. A contract has been signed directly with LANDSAT and SPOT (suppliers of images). The images are lent to the contractors and recovered on completion of the contract.
The rules also call for «historical» checks over reference periods, carried out too by remote sensing in some Member States. A large number of selected files were checked in this way in the United Kingdom against archive images from 1988 to 1992. More restricted tests were carried out in Denmark, Ireland and the Nether lands.
In 1993 special care was taken to filter the files in advance, making it possible to detect errors and omissions and to prevent incomplete files from undergoing photo-interpretation.
89
The 1993 results were presented at a meeting attended by representatives of all the Member States on 9 November 1993. The average percentage of files approved by photo-interprétât ion is around 66% with 23% refused and 11% doubtful. By parcel these frgures represent 84%, 7% and 9% respectively. This means that only 16% of parcels did not succeed in being photo-interpreted and had to be checked on the spot.
The average cost of checks in the Community was ECU 307 per declaration in 1992. In 1993 it fell to ECU 249 per file, i.e. ECU 26.1 per parcel or ECU 9.2/ha, including images. The cost of buying the images is around ECU 27 per file. The average cost of equivalent checks on the ground has been put at ECU 302 per file.
.So- 91
TITLE IV
ACCOUNTS CLEARANCE
7.1. Verification of EAGGF Guarantee Sect Ion expenditure and clearance procedure - 1990
7.1.1. Pursuant to Article 5(2)(b) of Regulation (EEC) No 729/70, the Commission, after consulting the EAGGF Committee, cleared the accounts for 1990 (Decision 93/659/EC of 25 November 1993). For that financial year the expenditure disa I lowed total led ECU 582.6 mil I ion.
The clearance of accounts for 1990 covered claimed expenditure of ECU 25 660 mi I I ion.
7.1.2. The 1990 financial year was the fifth one to which the systems audit method applied in accordance with the rules set out in the EAGGF Guarantee Section audit manual.
The progressive application of the systems audit method nonetheless requires additional checks on selected individual operations to ascertain whether Community law has been complied with. A considerable workload results, especially because of the timetable for the clearance of accounts.
The results of the checks carried out are shown in the Summary Report for 1990, which also contains the main elements to come out of the dialogue with the Member States and the financial consequences for the Member States.
7.1.3. As in previous clearance operations, the EAGGF worked in close cooperation, during the various stages of the procedure, with the Legal Service and the Directorate-General for Financial Control. The latter took part in several inspection visits.
The financial corrections were based on the Commission Decision of 20 December 1985 on the criteria to be applied and concern cases of failure to observe Community law, the granting of illegal aids by Member States and infringements with regard to the clearance of accounts. The financial consequences for 1990 are set out in detail in Annex 23 to this report.
Two sectors require additional explanations.
92
Application of the additional levy on milk
In its Decision 93/524/EEC of 27 September 1993 on the clearance of the 1989 accounts, the Commission amended its earlier Decision 92/491/EEC of 23 September 1992. The financial corrections for Italy and Spain were reduced by LIT 499 016 million and PTA 43 million respectively. At the same time the two Member States qualified for a Community contribution for a repurchase programme. This decision was taken subject to the actual introduction of the system of milk quotas in those countries.
In its Decision 93/659/EC of 25 November 1993 on the clearance of the 1990 accounts, the Commission again made substantial corrections for Italy and Spain (of LIT 526 309 million and PTA 29 492 million respectively) for failure to collect the additional levy for 1989/90. As in the case of the 1989 decision, these corrections were made subject to the actual introduction of the system of milk quotas.
In May 1993 the Council allocated provisional additional quantities to Italy, Spain and Greece. These concern the 1993/94 milk year only and had to be reaffirmed in March 1994. In March 1994 the Commission presented report COM(94)64 to the Council on the application of the system of milk quotas in these three Member States. The Council decided on the basis of that report and a complementary report on Italy (C0M(94)150, 18.04.94) to confirm the additional allocation for Spain and to refwew the allocation of Italy for 1994/1995.
Additional export refund inquiry
Under the 1989 accounts clearance, a financial correction was applied to the expenditure presented by four Member States in relation to export refunds, on account of the inadequacy of customs controls.
The additional inquiries were carried out in the four Member States concerned during 1993. On the whole these inquiries involving exporters did not bring to light irregularities in relation to claims. In a few individual cases limited corrections were applied during the 1990 clearance.
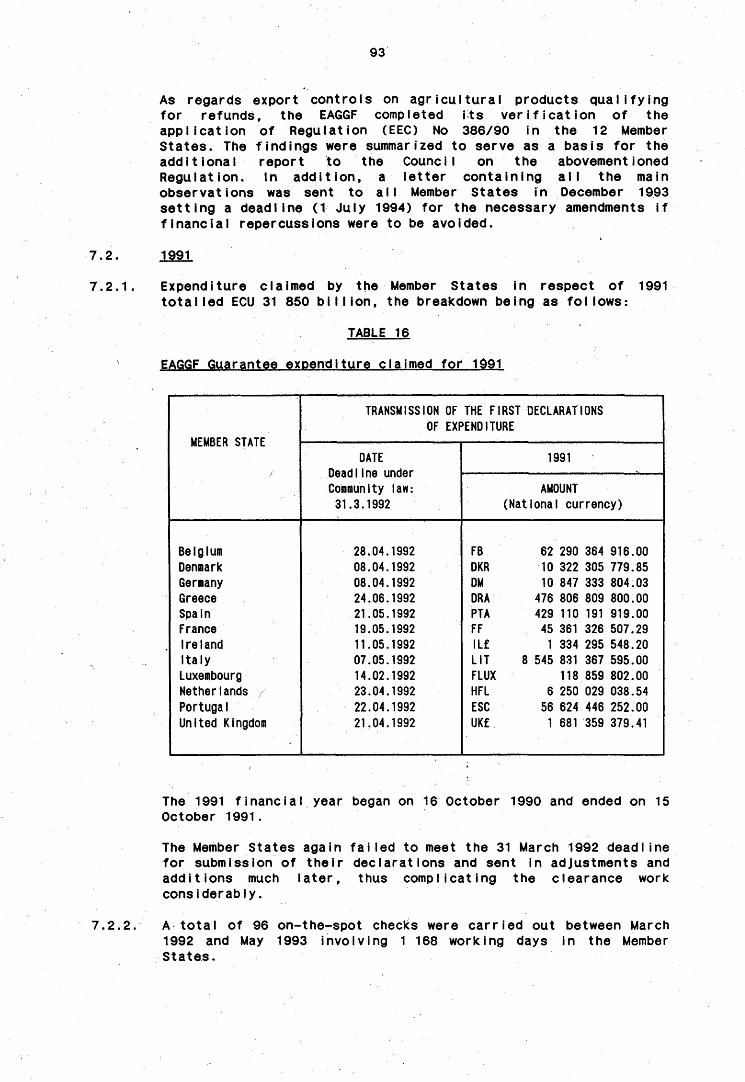
93
As regards export controls on agricultural products qualifying for refunds, the EAGGF completed its verification of the application of Regulation (EEC) No 386/90 in the 12 Member States. The findings were summarized to serve as a basis for the additional report to the Council on the abovementioned Regulation. In addition, a letter containing all the main observations was sent to all Member States in December 1993 setting a deadline (1 July 1994) for the necessary amendments if financial repercussions were to be avoided.
7.2. 1991
7.2.1. Expenditure claimed by the Member States in respect of 1991 totalled ECU 31 850 billion, the breakdown being as fol lows:
TABLE 16
EAGGF Guarantee e x p e n d i t u r e c l a i m e d for* 1991
TRANSMISSION OF THE FIRST DECLARATIONS OF EXPENDITURE
MEMBER STATE • 1 DATE 1991
Deadl ine under » Community law: AMOUNT
31.3.1992 (National currency)
Belgium 28.04.1992 FB 62 290 364 916.00 Denmark 08.04.1992 DKR 10 322 305 779.85 Germany 08.04.1992 DM 10 847 333 804.03 Greece 24.06.1992 DRA 476 806 809 800.00 Spain 21.05.1992 PTA 429 110 191919 .00 France 19.05.1992 FF 45 3 6 1 3 2 6 507.29 Ireland 11.05.1992 IL£ 1 334 295 548.20 Italy 07.05.1992 LIT 8 545 831 367 595.00 Luxembourg 14.02.1992 FLUX 118 859 802.00 Nether lands / 23.04.1992 HFL 6 250 029 038.54 Por tuga l 22.04.1992 ESC 56 624 446 252.00 Un i t ed Kingdom 21.04.1992 UK£ 1 681 359 379.41
The 1991 f i n a n c i a l year began on 16 October 1990 and ended on 15 October 1991.
The Member States again f a i l e d to meet the 31 March 1992 deadl ine fo r submission of t h e i r dec la ra t ions and sent in adjustments and add i t i ons much l a t e r , thus compl ica t ing the c learance work cons iderab ly .
7 . 2 . 2 . A t o t a l o f 96 1992 and May S ta tes .
on- the-spot checks were c a r r i e d out between March 1993 invo lv ing 1 168 working days in the Member
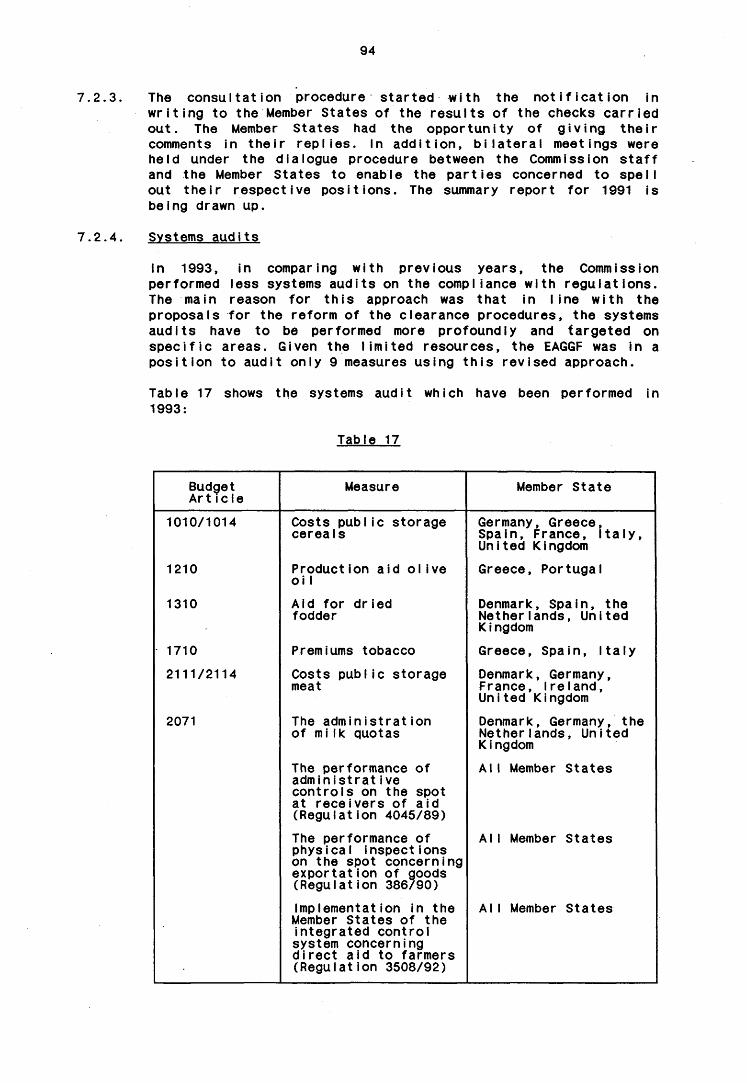
94
7.2.3. The consultation procedure started with the notification in writing to the Member States of the results of the checks carried out. The Member States had the opportunity of giving their comments in their replies. In addition, bilateral meetings were held under the dialogue procedure between the Commission staff and the Member States to enable the parties concerned to spell out their respective positions. The summary report for 1991 is being drawn up.
7.2.4 Systems audits
In 1993, in comparing with previous years, the Commission performed less systems audits on the compliance with regulations. The main reason for this approach was that in line with the proposals for the reform of the clearance procedures, the systems audits have to be performed more profoundly and targeted on specific areas. Given the limited resources, the EAGGF was in a position to audit only 9 measures using this revised approach.
Table 17 1993:
shows the systems audit which have been performed in
Table 17
Budget Article
Measure Member State
1010/1014
1210
1310
1710
2111/2114
2071
Costs public storage cereals
Production aid olive oil
Aid for dried fodder
Premiums tobacco
Costs public storage meat
The administrât ion of milk quotas
The performance of administrât ive controls on the spot at receivers of aid (Regulation 4045/89)
The performance of physical inspections on the spot concerning exportation of goods (Régulât ion 386/90)
Implementation in the Member States of the integrated control system concerning direct aid to farmers (Regulation 3508/92)
Germany, Greece, Spain, France, Italy, United Kingdom
Greece, Portugal
Denmark, Spain, the Netherlands, United K i ngdom
Greece, Spain, Italy
Denmark, Germany, France, Ireland, United Kingdom
Denmark, Germany, the Netherlands, United K i ngdom
AI I Member States
AI I Member States
AI I Member States
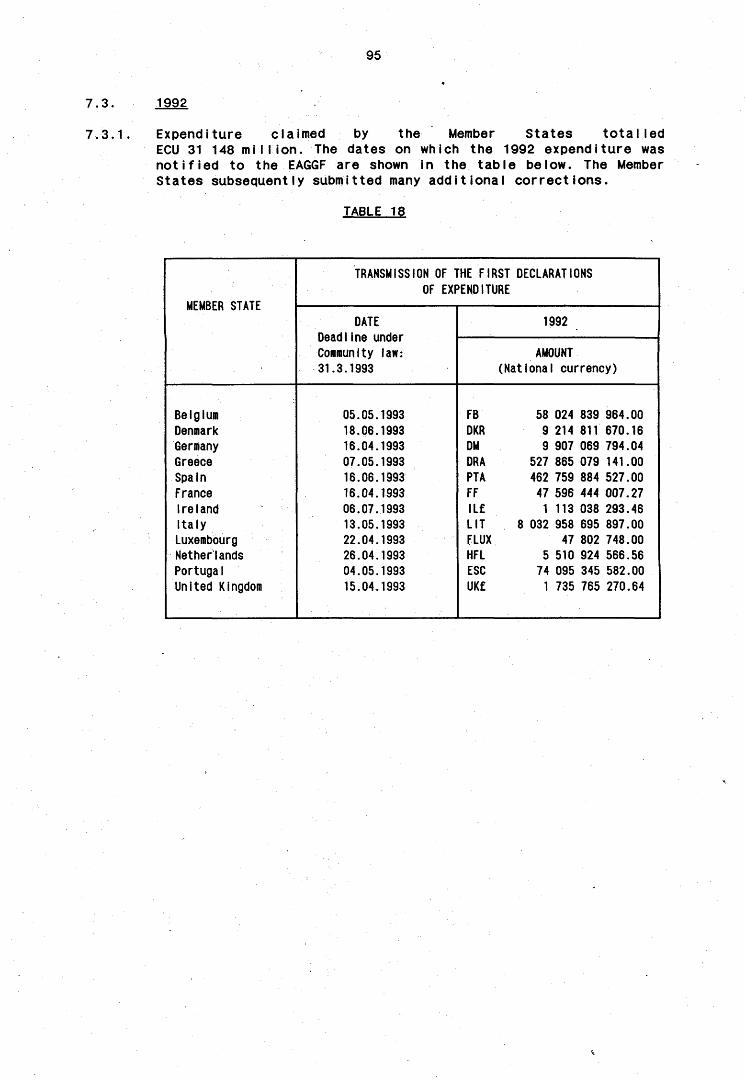
95
7.3. 1992
7.3.1. Expenditure claimed by the Member States totalled ECU 31 148 million. The dates on which the 1992 expenditure was notified to the EAGGF are shown in the table below. The Member States subsequently submitted many additional corrections.
TABLE 18
TRANSMISSION OF THE FIRST DECLARATIONS OF EXPENDITURE
MEMBER STATE r DATE 1992
Deadline under Community law: AMOUNT 31.3.1993 (National currency)
Belgium 05.05.1993 FB 58 024 839 964.00 Denmark 18.06.1993 DKR 9 214 811 670.16 Germany 16.04.1993 DM 9 907 069 794.04 Greece 07.05.1993 DRA 527 865 079 141.00 Spain 16.06.1993 PTA 462 759 884 527.00 France 16.04.1993 FF 47 596 444 007.27 Ireland 06.07.1993 IL£ 1 113 038 293.46 Italy 13.05.1993 LIT 8 032 958 695 897.00 Luxembourg 22.04.1993 FLUX 47 802 748.00 Netherlands 26.04.1993 HFL 5 510 924 566.56 Portugal 04.05.1993 ESC 74 095 345 582.00 United Kingdom 15.04.1993 UK£ 1 735 765 270.64
96
7.3.2. Reform of the procedure for the clearance accounts
Following the approval by the Commission on the 5 March 1993, of the guidelines proposed by the Belle Group for a reform of the clearance of the accounts of EAGGF-Guarantee Section, it is decided to have this reform implemented for expenditure in the budget year 1992.
According to this the clearance operation should be split into two separate procedures:
- a financial audit - a compIi ance aud i t.
This proposal aims to ensure that the accounting clearance can be effected in a reasonable time scale (more quickly than in the past). Once the Council has adopted the modification of the clearance procedure, a Commission regulation will define the detailed rules regarding nature and scope of both types of audit.
The reform of the clearance procedures also involves the fol lowing aims:
- the requirement for the Member States to improve their own controls over guarantee expenditure, and to make them more transparent, so as to make a meaningful financial clearance possible within a short period after the year,
- the obligation for the Commission to evaluate the significance of a Member States failure to comply with the rules before establishing the financial consequences, and to limit the period which those consequences can cover.
7.3.3. Financial audits in 1993
The object of the financial audits executed in 1993 was the Annual Declaration for the 1992 financial year as drawn up by the paying agencies and the Member States. The purpose of the audits was to gain an opinion about procedures and measures of internal control in the financial departments of the paying agencies. The auditors had to control whether amounts stated in the annual declaration are based on complete receipts and correct payments and whether receipts and payments had been properly authorised and correctly classified, booked and reported as to date and measure. For that reason the auditors had to establish the existence of adequate systems and procedures to ensure the conformity of the transactions with the conditions of Community legislation and their reliability. However, in general the examination did not address compliance with EC rules and regulations governing specific «market» aspects.
97
For the 1992 financial year the EAGGF carried out audits at 20 of the 44 paying agencies and together these agencies account for over two-thirds of the total expense of the EAGGF. The total audit costs of thezse audits was ECU 485 000.
During the audits the auditors described and appraised controls over payment systems, and computer systems in particular, as adequate descriptions were, in most of the cases, not available. As well verifying the accuracy of the declaration, the auditors paid attention to the improvement of the paying agencies' systems, and recommendations were made concerning:
- The improvement of internal control procedures and the EDP-organisation at the paying agencies.
- The providing of accurate and timely monthly and annual declarations.
- The improvement of the accounting procedures and of the division of duties between the market and the financial department.
- The implementation of new book-keeping routines and commercial procedures for the private and public intervantion to ensure correct recording of the intervention activities.
- The improvement of controls carried out by the paying agencies to ensure that the claims authorised by external bodies are bona fide and comply with Community rules.
7.4. Application of Council Regulation nO 4045/89
(a) 1993 saw the Commission move towards a more active role as part of its increasing effort to combat fraud in the EAGGF. During the year missions were carried out to all Member States to gain a better understanding of how the Regulation is implemented. Repeat visits were carried out either to follow up on points observed in the earlier visit, or to carry the observation to a deeper level.
(b) Differences in approach and organisation were found in all cases Member States regarding implementation of the Regulation. In two Member States the obligation to establish a special supervisory body to oversee implementation of the Regulation had not yet been comp I ied with, but both Member States are taking steps to rectify this situation.
98
(c) All Member States complied with theobligation in Article 10 of the Regulation to provide a detailed report on the implementation of the Regulation, with wide variations in content and style.
(d) The programme of scrutinies required by Article 10 of the Regulation was also provided by each Member State, and in all cases complied broadly with the requirements of the Regulation. The scrutinies planned in those programmes began to be carrried out on 1 July 1993, and the results of them will be the subject of the Member States' annual reports to be sent to the Commission by 1 January 1995.
(e) The Commission undertook, during 1993, to propose a modification of the Regulation. The most important change proposed concerns the use of risk analysis techniques in the selection of undertakings for scrutiny.
(f) Another ana to which the Commission attaches great importance is that of mutual assistance between Member States. In order to improve existing arrangements the Commission began a special exercise in 1993, in which multinational or transnational firms in receipt of payments from the EAGGF were selected for coordinated control by all Member States concerned.
99
7.5 Appeals to the Court of Justice against clearance decisions
7.5.1 Judgments handed down bv the Court
Since the Summary Report for 1990 was drawn up, the Court of Justice has handed down two new judgments in respect of appeals lodged by Member States against clearance decisions for the 1988 financial year:
- Judgment of 10 November 1993 (Case C-48/91) concerning the co-responsibility levy in the cereals sector; the Court annul led the 1988 clearance decision for failing to charge a sum of HFL 708 540 to the EAGGF.
- Judgment of 6 October 1993 (Case C-55/91) concerning the additional levy on milk, public storage in the tobacco sector, olive oil, aid for processing soya beans and aid for durum wheat production in Italy; the Court rejected the Member State's appeal.
In Case C-417/92 (Ireland v Commission) concerning export refunds in the beef sector, the Irish Government withdrew its appeal once the correction in dispute was reversed and the appeal became unnecessary. The Court removed the case from its register.
7.5.2 Appeals pending at 31 December 1992
The situation at 1 June concerning appeals pending and the amounts involved is given in Tables below.
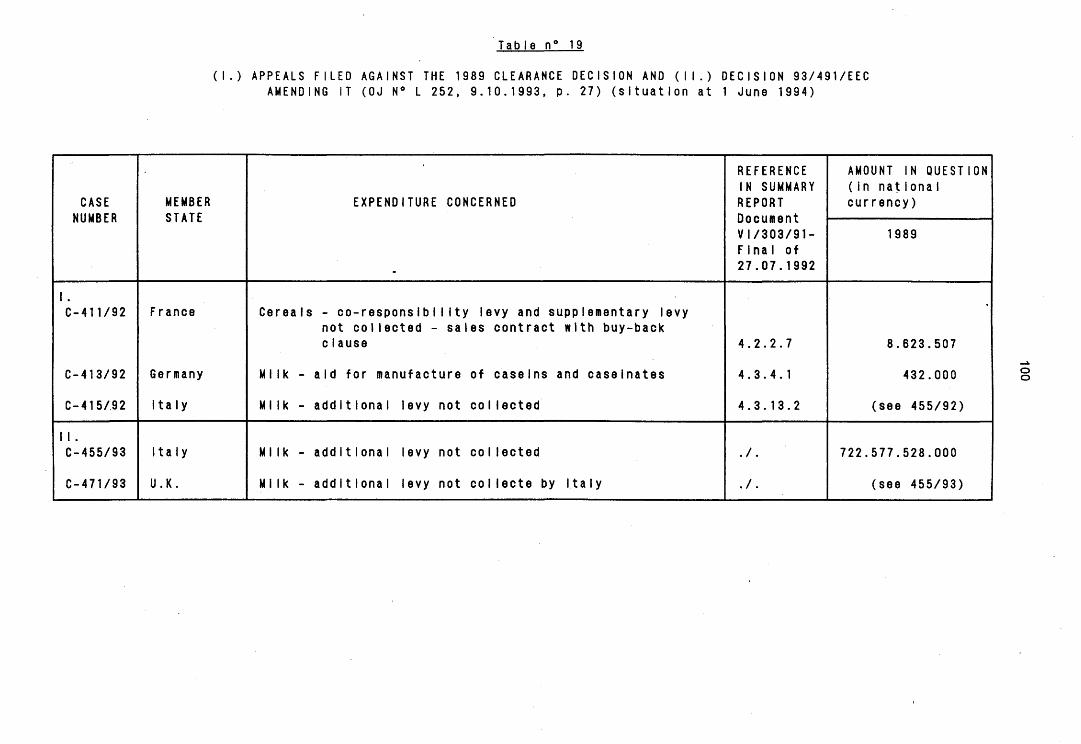
Table n° 19
(I.) APPEALS FILED AGAINST THE 1989 CLEARANCE DECISION AND (II.) DECISION 93/491/EEC AMENDING IT (OJ N° L 252, 9.10.1993, p. 27) (situation at 1 June 1994)
CASE NUMBER
I . C-411/92
C-413/92
C-415/.92
I I. C-455/93
C-471/93
MEMBER STATE
France
Germany
Italy
Italy
U.K.
EXPENDITURE CONCERNED
Cereals - co-responsibility levy and supplementary levy not collected - sales contract with buy-back clause
Milk - aid for manufacture of caseins and caseinates
Milk - additional levy not collected
Milk - additional levy not collected
Milk - additional levy not collecte by Italy
REFERENCE IN SUMMARY REPORT Document VI/303/91-Final of 27.07.1992
4.2.2.7
4.3.4.1
4.3.13.2
./.
./.
AMOUNT IN QUESTION (in nat iona I currency)
1989
8.623.507
432.000
(see 455/92)
722.577.528.000
(see 455/93)
o o

Table n° 20a
APPEALS fILED AGAINST THE 1990 CLEARANCE DECISION (situation at 1 June 1994)
CASE NUMBER
C-27/94
C-28/94
C-37/94
C-41/94
C-47/94
MEMBER STATE
Netherlands
Nether lands
France
Germany
U.K.
EXPENDITURE CONCERNED
Export refunds - inadequate controls
Milk - intervention buying-ln of butter (NIZO)
CereaIs - Co-responsab11ity and supplementary levy not collected - sales contract with buy-back clause
Beef - Inadequate management and controls under beef special premium scheme
Milk - additional levy scheme - non application of quotas Italy and Spain
REFERENCE IN SUMMARY REPORT Document V1/119/93-Final of 01.10.1993
4.2.8.1.1.
6.1.3.1.
4.4.5.2.
4.10.4.2.
4.3.6.6.
AMOUNT IN QUESTION ( In nat iona I currency)
1990
3.317.334,26
82.656.019
9.171.526,98
7.518.141
(see 52/94 and 53/94)
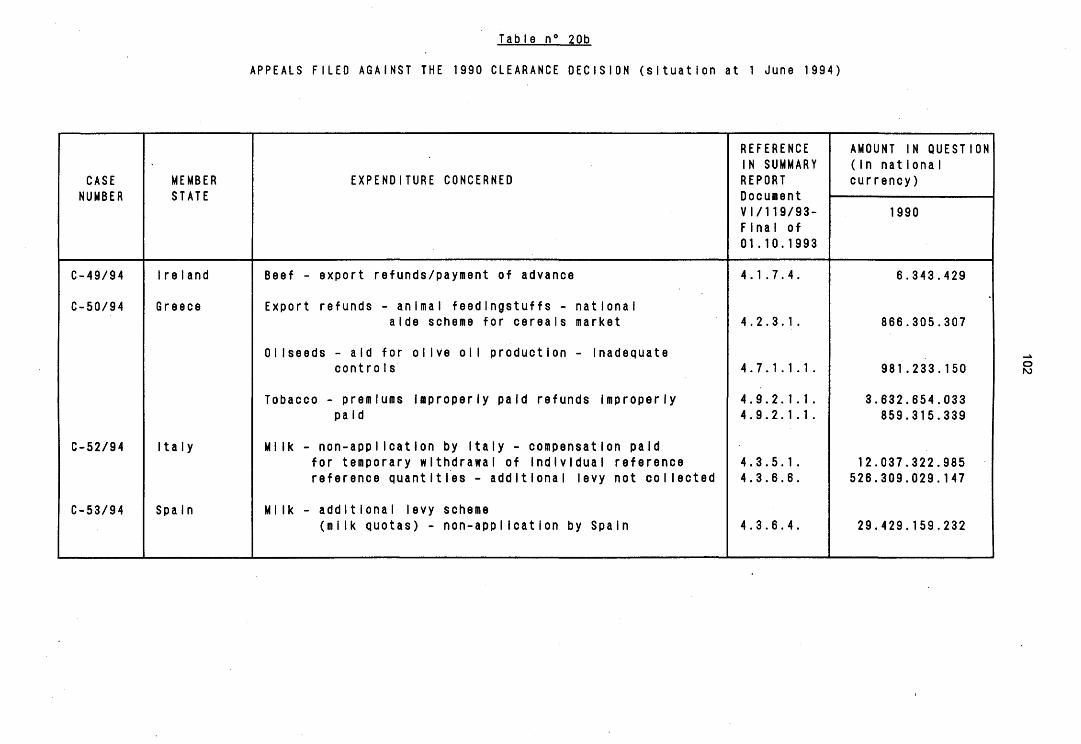
Table n° 20b
APPEALS FILED AGAINST THE 1990 CLEARANCE DECISION (situation at 1 June 1994)
CASE NUMBER
C-49/94
C-50/94
C-52/94
C-53/94
MEMBER STATE
I reland
Greece
Italy
Spa In
EXPENDITURE CONCERNED
Beef - export refunds/payment of advance
Export refunds - animal feed Ingstuffs - national aide scheme for cereals market
Oilseeds - aid for olive oil production - inadequate controls
Tobacco - premiums Improperly paid refunds improperly pa id
Milk - non-application by Italy - compensation paid for temporary withdrawal of Individual reference reference quantities - additional levy not collected
Milk - additional levy scheme (milk quotas) - non-application by Spain
REFERENCE IN SUMMARY REPORT Document V I /119/93-Final of 01.10.1993
4.1 .7.4.
4.2.3.1.
4.7,1.1.1.
4.9.2.1.1 . 4.9.2.1.1.
4.3.5.1. 4.3.6.6.
4.3.6.4.
AMOUNT IN QUESTION (In natlona I currency)
1990
6.343.429
866.305.307
981.233.150
3.632.654.033 859.315.339
12.037.322.985 526.309.029.147
29.429.159.232
o rO
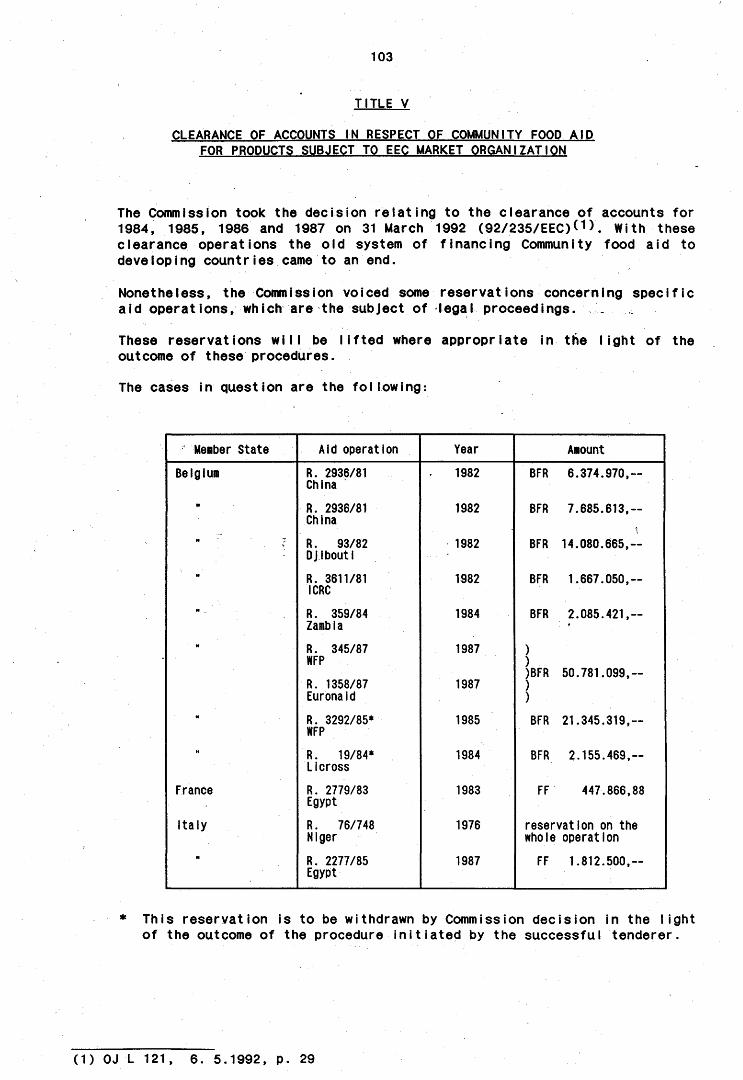
103
TITLE V
CLEARANCE OF ACCOUNTS IN RESPECT OF COMMUNITY FOOD AID FOR PRODUCTS SUBJECT TO EEC MARKET ORGANIZATION
The Commission took the decision relating to the clearance of accounts for 1984, 1985, 1986 and 1987 on 31 March 1992 (92/235/EEC)<1>. With these clearance operations the old system of financing Community food aid to developing countries came to an end.
Nonetheless, the Commission voiced some reservations concerning specific aid operations, which are the subject of legal proceedings. .
These reservations will be lifted where appropriate in the light of the outcome of these procedures.
The cases in question are the following:
Member State
Belgium
France
Italy
Aid operation
R. 2936/81 China
R. 2936/81 China
R. 93/82 Djibouti
R. 3611/81 ICRC
R. 359/84 Zambia
R. 345/87 WFP
R. 1358/87 Euronaid
R. 3292/85* WFP
R. 19/84* Licross
R. 2779/83 Egypt
R. 76/748 Niger
R. 2277/85 Egypt
Year
1982
1982
1982
1982
1984
1987
1987
1985
1984
1983
1976
1987
Amount
BFR 6.374.970,—
BFR 7.685.613,--
BFR 14.080.665,—
BFR 1.667.050,—
BFR 2.085.421,—
) ) )BFR 50.781.099,— ) )
BFR 21.345.319,—
BFR 2.155.469,—
FF 447.866,88
reservation on the whole operation
FF 1.812.500,--
* This reservation is to be withdrawn by Commission decision in the light of the outcome of the procedure initiated by the successful tenderer.
(1) OJ L 121, 6. 5.1992, p. 29
A N N E X E S
104
INDEX OF ANNEXES Pages
1. Summary of implementation for 1993 105 2. Expenditure charged against the 1993 budget 106 3. EAGGF Guarantee expend i ture by sector 146 4. Breakdown of expenditure by sector and economic category - 1993 149 5. Breakdown of expenditure by sector and economic category
(1989-1993) 150 6. EAGGF Guarantee expenditure: breakdown by sector and percentage
(1989)1993) 151 7. Breakdown of expenditure by economic category 152 8. Breakdown of intervention expenditure in the form of price
compensât i ng a i ds 153 9. Breakdown of intervention expenditure in the form of storage
costs 154 9.1 - 9.6 Trend in quantities in intervention stocks 155 10. Quantity and value of products in public storage 161 11. Overall cost of the Guarantee Section as a percentage of gross
domest i c product (GDP) 162 12. Revenue from the co-responsibility levy on milk and allocation
of proceeds among var ious schemes 163 13. Equalization of storage costs for sugar - Community sugar 164 14. Revenue from levies in the sugar sector - 1993 165 15. Self-financing arrangements in the sugar sector 1986/87 to
1990/91 market i ng year 166 16. Self-financing arrangements in the sugar sector 1991/92 to
1992/93 marketing year 167 17a and b. Advance payments to Member States for 1993 168-169 18. MCAs appl ied to trade - 1993 170 19. Exchange rates 1993 171 20. Amounts withheld from production and consumption aid in the
olive oil, fibre flax and grape juice sectors and their uti I izat ion 172
21. Irregularities reported and recovery situation (1993) 174 22. Irregularities reported and recovery situation (until 1993) .... 176 23. Financial results of clearance of the 1990 accounts 177
105
ANNEX 1
SUMMARY OF IMPLEMENTATION FOR 1993
1993 appropriations: ECU
APPROPRIATIONS IMPLEMENTATION
1. Original appropriation*. Title Bl 33.943.000.000,00 1. Commitments (not counting 1 000 000 In - for expenditure incurred by M.S. 34.496.278.007,75 monetary reserve) - for direct payments 94.154.189.87
2. Orlg. appropriations. Chapter BO-40 109.000.000.00 Total commitments 34.590.432.197.32 3. Amending budgets 1.300.000.000.00 2. Payments (attributed) 4. Transfers of appropriations ••- 8.900.000.00 — for expenditure incurred by M.S. 34.181.197.720,45 Total EAGGF Guarantee appropriations 35.343.100.000,00 - for direct payments 55.385.343.87
Total attributed 34.238.583.084,12 3. Approps to be carried over automatically 50.759
- for expenditure incurred by M.S. 315.080.287.30 - for direct payments 38.788.845.90 Total automatic carryovers 353.849.133.20
4. Appropriations to be carried over non-automatical I y 510.000.000,00
5. Lapsed appropriations 242.667.802,68
Non-automatic carryovers from 1992:
APPROPRIATIONS IMPLEMENTATION
1. Appropriations (ltemB-1890) 175.500.000.00 1. Commitment - for expenditure incurred by M.S. 155.446.991,27 - for direct payments 2.287.236,47 Total commitments 157.734.227,74
2. Payments (attributed) - for expenditure incurred by M.S. 155.446.991.27 - for direct payments 2.178.866.64 Total attributed 157.625.857.91
3. Lapsed appropriations 17.874.142,09
Appropriations carr ied over automatically from 1992:
APPROPRIATIONS IMPLEMENTATION
1. Appropriations 50.759.385.13 1. Payments (attributed) (Appropriations commited in 1992 but not allocated) - for expenditure incurred by M.S. 0,00
- for direct payments 29.110.747.53 Total attributed 29.110.747,53
2. Approps to be carried over"automatically - for expenditure incurred by M.S. 0,00 - for direct payments 21.648.637,60 Total automatic carryovers 21.648.637,60
ANNEX 2
EAGGF GUARANTEE EXPENDITURE CHARGED AGAINST THE 1993 BUDGET (ECU MILLION)
BELGIQUE DANMARK DEUTSCHLAND ELLAS ESPANA FRANCE IRELAND ITALIA LUXEMBOURG NEDERLAND PORTUGAL UNIT.KINGD COMMUNITY TOTALS !
BOl-lOOO REFUNDS ON COMMON WHEAT GRAIN AND FLOUR 92,044 60,465 110,607 2,754 12,955 738,181 69,871 93,569 0,330 167,768 1.348,545
B01-1001 REFUNDS ON BARLEY GRAIN AND MALT 92,026 17,929 82,755 . 24,117 265,832 6,442 0,175 18,349 0,018 84,949 592,591
B01-1002 REFUNDS ON DURUM WHEAT AND ON DURUM 0,018 0,006. 4,344 109,913 41,576 248,217 0,000 0,009 0,000 404,083
WHEAT FLOUR, GROATS AND MEAL
B01-1003 REFUNDS ON OTHER CEREALS 17,427 27,492 109,874 9,045 1,709 94,016 0,554 101,127 0,001 72,369 0,417 9,575 443,607
B01-100 REFUNDS ON CEREALS 201,497 105,905 303,242 16,144 148,694 1.139,605 6,996 419,389 0,001 184,287 0,774 262,293 2.788,826
B01-1010 CARRYOVER PAYMENTS ' -0,210 — ~ — — -0,210
B01-1011 TECHNICAL COSTS OF PUBLIC STORAGE 4,946 25,183 258,229 15,758 30,435 237,789 3,502 47,982 0,039 2,787 19,710 646,361
B01-1012 FINANCIAL COSTS OF PUBLIC STORAGE 1,643 8,662 ?9,484 10,375 8,941 58,210 1,074 18,480 0,016 0,349 7,240 194,474 O
B01-1013 OTHER PUBLIC INTERVENTION STORAGE COSTS -2,189 -0,355 -115,921 -35,342 -78,125 -176,745 -1,487 -110,700 -0,426 0,000 -20,788 -4,168 -546,245
B01-1014 DEPRECIATION OF STOCKS 32,371 129,812 786,359 43,813 21,715 1.151,403 25,936 66,238 0,294 0,037 170,008 2.427,987
B01-1019 OTHER INTERVENTION STORAGE 1,396 1,396
B01-101 INTERVENTION STORAGE OF CEREALS 36,771 163,301 1.008,152 36,001 -17,034 1.270,657 29,026 21,790 -0,076 0,000 -17,616 192,790 2.723,763
B01-1020 PRODUCTION AID FOR DURUM WHEAT* — — 82,295 96,750 0,050 246,580 0,237 425,913
B01-1021 PRODUCTION REFUNDS FOR POTATO STARCH 0,890 15,692 11,276 0,000 1,392 6,973 1,378 51,561 6,986 96,149
B01-1022 OTHER PRODUCTION REFUNDS 12,708 7,970 81,498 1,180 20,858 99,948 1,412 31,687 30,030 1,936 30,250 319,479
BOl-1023 PREMIUM FOR INCOPORATION OF CEREALS — —
IN FEED
BOl-1029 OTHER INTERVENTION - ^ — 56,540 56,540
EAGGF GUARANTEE EXPENDITURE CHARGED AGAINST THE 1993 BUDGET (ECU MILLION)
BELGIQUE DANMARK DEUTSCHLAND ELLAS ESPANA FRANCE IRELAND ITALIA LUXEMBOURG NEDERLAND PORTUGAL UNIT.KINGD COMMUNITY
BOl-102 INTERVENTION, OTHER THAN STORAGE, OF CEREALS
13,598 23,663 92,775 83,475 119,000 106,972 1,4*2 279,645 81,591 58,713 37,236
TOTALS !
898,080
B01-1030 (^RESPONSIBILITY LEVY
B01-1031 AID TO SMALL PRODUCERS
B01-1032 ADDITIONAL CORESPONSIBILITY LEVY
B01-1033 REIMBURSEMENT OF THE ADDITIONAL CORESPONSIBILITY LEVY
B01-1034 REIMBURSEMENT OF THE CORESPONSIBILITY LEVY: SET-ASIDE
-0,182 -0,061 -1,542 -0,605 -2,395 0,124 0,006 0,219 0,000 0,125 0,320 -1,690
2,541 3,900 21,465
-0,007 -0,006 -0,202
-0,001
0,317 0,077 49,917
0,004
26,681 1,446
-0,122 0,001 -0,024
0,165 1,486
-0,004
0,035
1,519 39,227 0,684 0,002
2,402
-0,674
0,023
4,534
-5,680
60,086
-1,039
0,061
96,276
B01-103 CORESPONSIBILITY LEVY AND AID TO SMALL PRODUCERS
2,669 3,910 69,637 -0,605 -0,872 65,910 2,138 0,230 0,167 1,607 0,320 4,595 149,705
JO B01-1040 REFUNDS ON RICE
B01-104 REFUNDS ON RICE
B01-1050 TECHNICAL COSTS OF PUBLIC STORAGE
B01-1051 FINANCIAL COSTS OF PUBLIC STORAGE
B01-1052 OTHER PUBLIC INTERVENTION STORAGE COSTS
BOl-1053 DEPRECIATION OF STOCKS
1501-1059 OTHER STORAGE MEASURES
B01-105 INTERVENTION FOR STORAGE OF RICE
1)01-1060 REFUNDS ON RICE USED FOR THE PRODUCTION 0,031 OF SI ARCH AND IN THE BREWING INDUSTRY
0,019 0,470 0,051 1,450 0,712
0,019 0,470 0,051 1,450 0,712
0,051 0,036
0,015 0,011
-0,707 -0,512
-0,641 -0,465
54,042
54,042
0,227
0,081
-2,178
0,002
-1,867
0,321 2,190 0,054
0,321 2,190 0,054
0,000
59,308
59,308
0,314
0,107
-3,397
0,002
-2,973
0,031
EAGGF GUARANTEE EXPENDITURE CHARGED AGAINST THE 1993 BUDGET (ECU MILLION)
BELGIQUE DANMARK DEUTSCHLAND ELLAS ESPANA FRANCE IRELAND ITALIA LUXEMBOURG NEDERLAND PORTUGAL UNIT.KINGD COMMUNITY TOTALS
BOl-1061 SUBSIDIES FOR SUPPLY OF RICE TO THE FRENCH OVERSEAS DEPARTMENT OF REUNION*
001-1062 PRODUCTION AID FOR' INDICA RICE*
B01-1069 OTHER INTERVENTION
0,790 6,926 0,516 4,004 0,824
0,035
13,061
0,035
B01-106 INTERVENTION FOR RICE OTHER THAN STORAGE
0,031 0,790 6,926 0,516 4,004 0,000 0,859 13,127
B01-10 CEREALS AND RICE 254,566 296,797 1.474,275 135,856 257,524 2.583,907 39,572 777,234 0,091 267,806 45,241 496,968 6.629,837
O OO
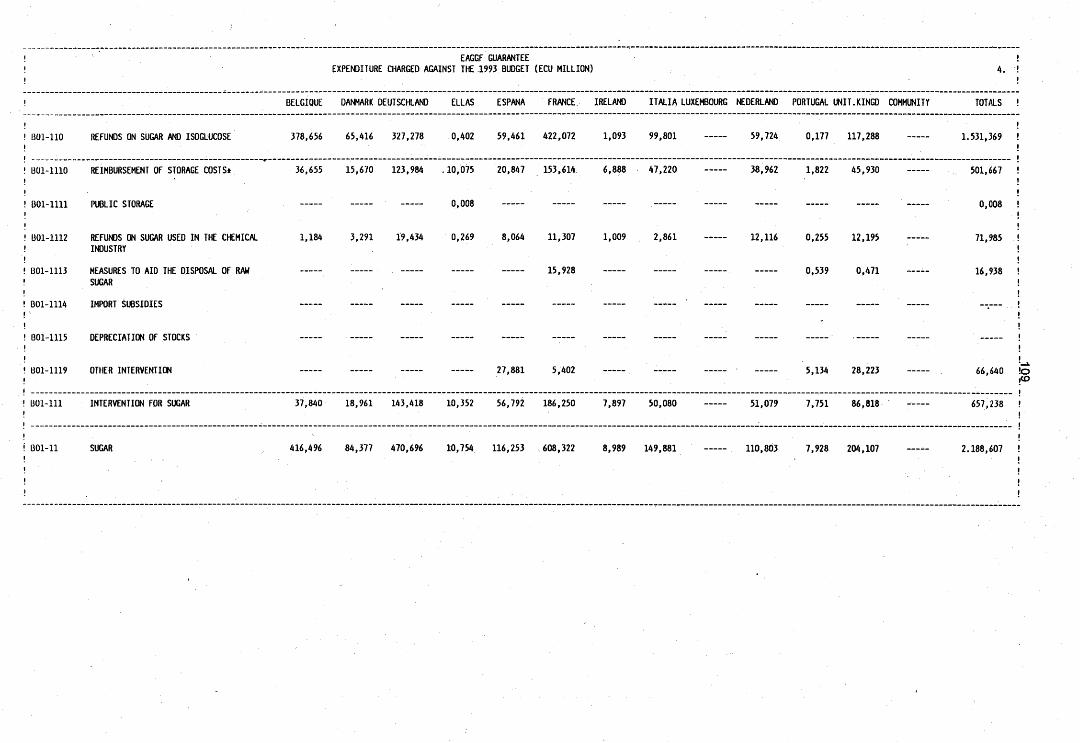
EAGGF GUARANTEE EXPENDITURE CHARGED AGAINST THE 1993 BUDGET (ECU MILLION)
BELGIQUE DANMARK DEUTSCHLAND ELLAS ESPANA FRANCE IRELAND ITALIA LUXEMBOURG NEDERLAND PORTUGAL UNIT.KINGD COMMUNITY TOTALS !
BOl-110 REFUNDS ON SUGAR AND ISOGLUCOSE
BOl-lllO REIMBURSEMENT OF STORAGE COSTS*
BOl-1111 PUBLIC STORAGE
BOl-1112 REFUNDS ON SUGAR USED IN THE CHEMICAL INDUSTRY
1301-1113 MEASURES TO AID THE DISPOSAL OF RAW SUGAR
B01-1114 IMPORT SUBSIDIES
B01-1115 DEPRECIATION OF STOCKS
B01-1119 OTHER INTERVENTION
378,656 65,416 327,278 0,402 59,461 422,072 1,093 99,801
36,655 15,670 123,984 .10,075 20,847 153,614, 6,888 47,220
59,724 0,177 117,288
38,962 1,822 45,930
1.531,369
501,667
0,008
71,985
16,938
0,008
1,184 3,291 19,434 0,269 8,064 11,307 1,009 2,861
15,928
27,881 5,402
12,116 0,255 12,195
0,539 0,471
5,134 28,223 66,640 !o i<0
B01-111 INTERVENTION FOR SUGAR 37,840 18,961 143,418 10,352 56,792 186,250 7,897 50,080 51,079 7,751 86,818 657,238
B01-11 SUGAR 416,496 84,377 470,696 10,754 116,253 608,322 8,989 149,881 110,803 7,928 204,107 2.188,607
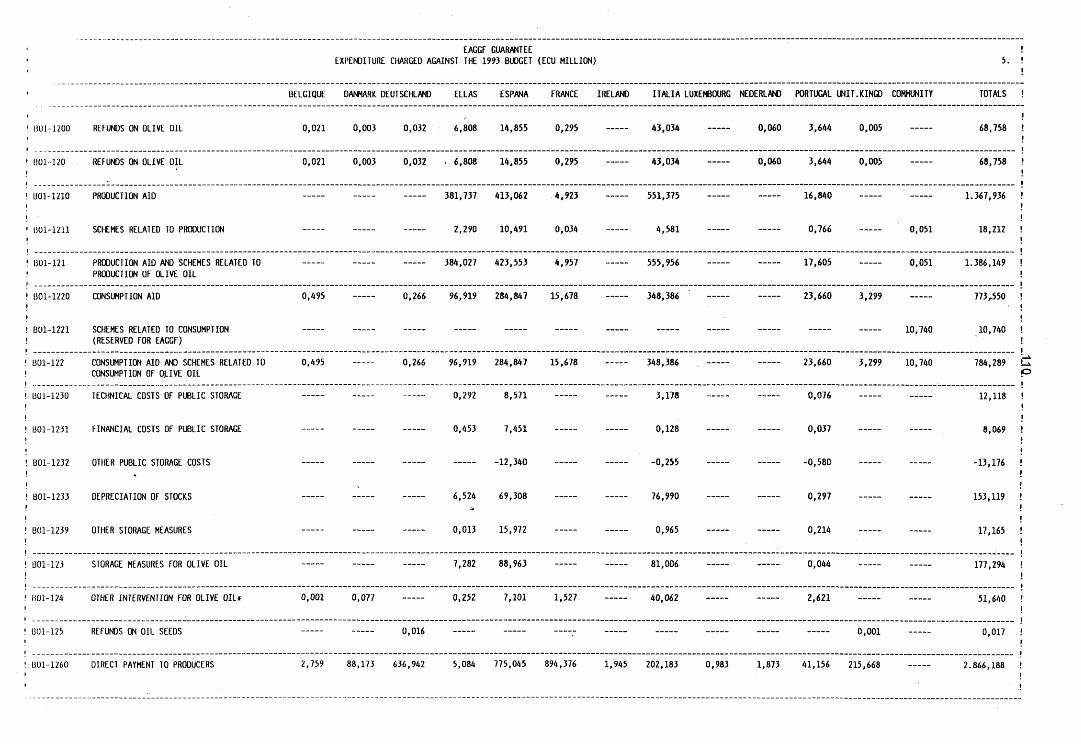
EAGGF GUARANTEE EXPENDITURE CHARGED AGAINST THE 1993 BUDGET (ECU MILLION)
BELGIQUE DANMARK DEUTSCHLAND ELLAS ESPANA FRANCE IRELAND ITALIA LUXEMBOURG NEDERLAND PORTUGAL UNIT.KINGD COMMUNITY TOTALS
U01-1200 REFUNDS ON OLIVE OIL 0,021 0,003 0,032 6,808 14,855 0,295 43,034 0,060 3,644 0,005 68,758
1)01-120 REFUNDS ON OLIVE OIL 0,021 0,003 0,032 . 6,808 14,855 0,295 43,034 0,060 3,644 0,005 68,758
B01-1210 PRODUCTION AID
«01-1211 SCHEMES RELATED TO PRODUCTION
381,737 413,062 4,923
2,290 10,491 0,034
551,375
4,581
16,840
0,766 0,051
1.367,936
18,212
1301-121 PRODUCTION AID AND SCHEMES RELATED TO PRODUCTION OF OLIVE OIL
384,027 423,553 4,957 555,956 17,605 0,051 1.386,149
BOl-1220 CONSUMPTION AID 0,495
[301-1221 SCHEMES RELATED TO CONSUMPTION (RESERVED FOR EAGGF)
0,266 96,919 284,847 15,678 348,386 23,660 3,299
10,740
773,550
10,740
BOl-122 CONSUMPTION AID AND SCHEMES RELATED TO 0,495 CONSUMPTION OF OJ.IVE OIL
0,266 96,919 284,847 15,678
0,292 8,571
0,453 7,451
-12,340
348,386
3,178
0,128
-0,255
76,990
0,965
23,660 3,299 10,740
0,076
0,037
-0,580
784,289
12,118
8,069
-13,176
153,119
17,165
B01-1230 TECHNICAL COSTS OF PUBLIC STORAGE
1301-1231 FINANCIAL COSTS OF PUBLIC STORAGE
BOl-1232 OTHER PUBLIC STORAGE COSTS
B01-1233 DEPRECIATION OF STOCKS
BOl-1239 OTHER STORAGE MEASURES
6,524 69,308
0,013 15,972
0,297
0,214
BOl-123 STORAGE MEASURES FOR OLIVE OIL 7,282 88,963 81,006 0,044 177,294
1301-124 OTHER INTERVENTION FOR OLIVE OIL* 0,001 0,077 0,252 7,101 1,527 40,062 2,621 51,640
1301-125 REFUNDS ON OIL SEEDS 0,016 0,001 0,017
2.866,188 1)01-1260 DIRECT PAYMENT TO PRODUCERS 2,759 88,173 636,942 5,084 775,045 894,376 1,945 202,183 0,983 1,873 41,156 215,668
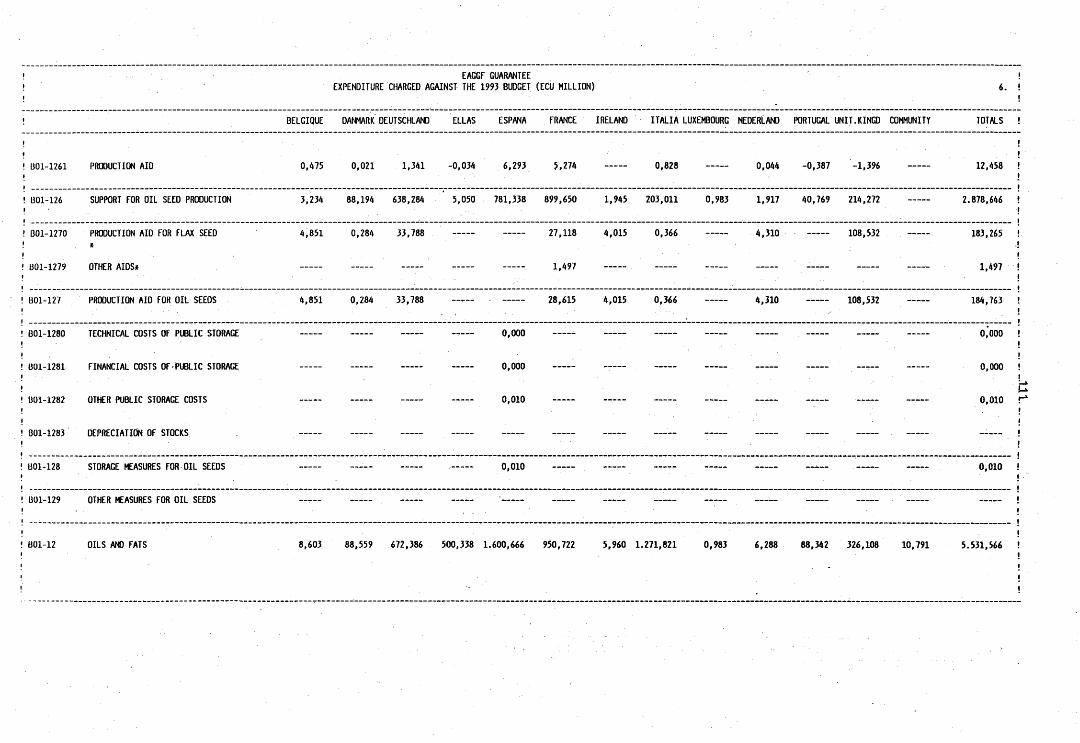
EAGGF GUARANTEE EXPENDITURE CHARGED AGAINST THE 1993 BUDGET (ECU MILLION)
BELGIQUE DANMARK DEUTSCHLAND ELLAS ESPANA FRANCE IRELAND ITALIA LUXEMBOURG NEDERLAND PORTUGAL UNIT.KINGD COMMUNITY TOTALS !
BOl-1261 PRODUCTION AID 0,475 0,021 1,341 -0,034 6,293 5,274 0,828 0,044 -0,387 -1,396 12,458
BOl-126 SUPPORT FOR OIL SEED PRODUCTION 3,234 88,194 638,284 5,050 781,338 899,650 1,945 203,011 0,983 1,917 40,769 214,272 2.878,646
B01-1270 PRODUCTION AID FOR FLAX SEED
B01-1279 OTHER AIDS*
4,851 0,284 33,788 27,118 4,015 0,366 4,310
1,497
108,532 183,265
1,497
BOl-127 PRODUCTION AID FOR OIL SEEDS 4,851 0,284 33,788 28,615 4,015 0,366 4,310 108,532 184,763
B01-1280 TECHNICAL COSTS OF PUBLIC STORAGE
B01-1281 FINANCIAL COSTS OF-PUBLIC STORAGE
B01-1282 OTHER PUBLIC STORAGE COSTS
B01-1283 DEPRECIATION OF STOCKS
B01-128 STORAGE MEASURES FOR OIL SEEDS
B01-129 OTHER MEASURES FOR OIL SEEDS
B01-12 OILS AND FATS
0,000
0,000
0,010
0,010
0,000
0,000
o.oio r
0,010
8,603 88,559 672,386 500,338 1.600,666 950,722 5,960 1.271,821 0,983 6,288 88,342 326,108 10,791 5.531,566
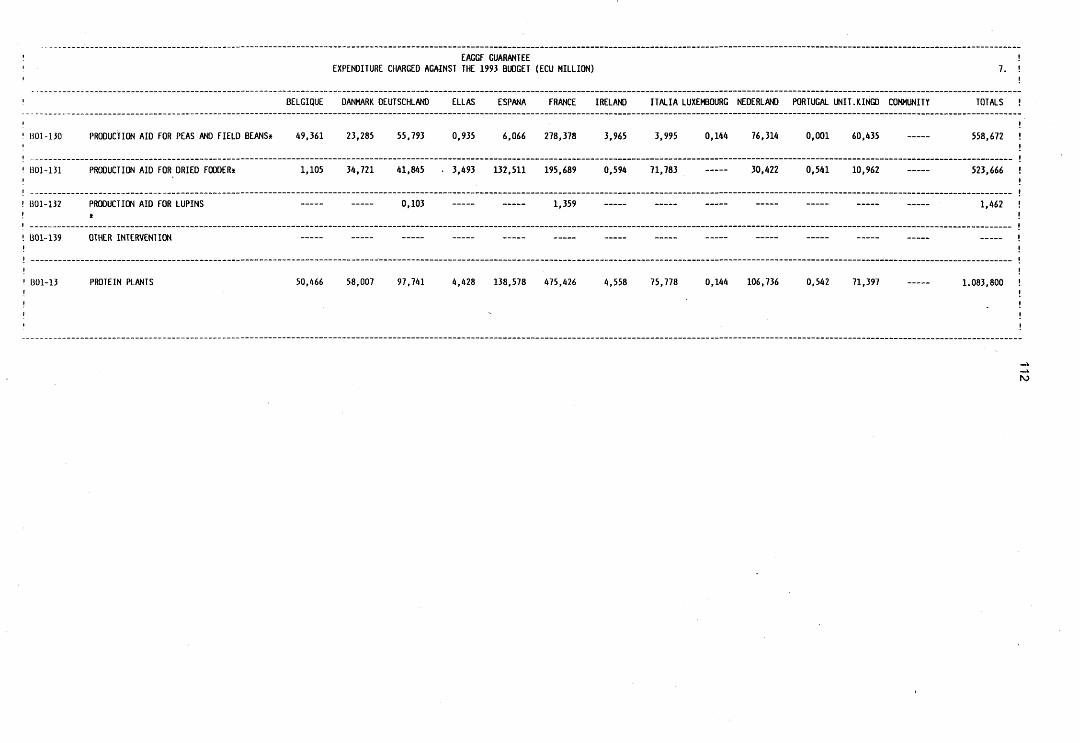
EAGGF GUARANTEE EXPENDITURE CHARGED AGAINST THE 1993 BUDGET (ECU MILLION)
BELGIQUE DANMARK DEUTSCHLAND ELLAS ESPANA FRANCE IRELAND ITALIA LUXEMBOURG NEDERLAND PORTUGAL UNIT.KINGD COMMUNITY TOTALS !
BOl-130 PRODUCTION AID FOR PEAS AND FIELD BEANS* 49,361 23,285 55,793 0,935 6,066 278,378 3,965 3,995 0,144 76,314 0,001 60,435 558,672
1301-131 PRODUCTION AID FOR DRIED FODDER* 1,105 34,721 41,845 . 3,493 132,511 195,689 0,594 71,783 30,422 0,541 10,962 523,666
B01-132 PRODUCTION AID FOR LUPINS 0,103 1,359 1,462
B01-139 OTHER INTERVENTION
B01-13 PROTEIN PLANTS 50,466 58,007 97,741 4,428 138,578 475,426 4,558 75,778 0,144 106,736 0,542 71,397 1.083,800
ro
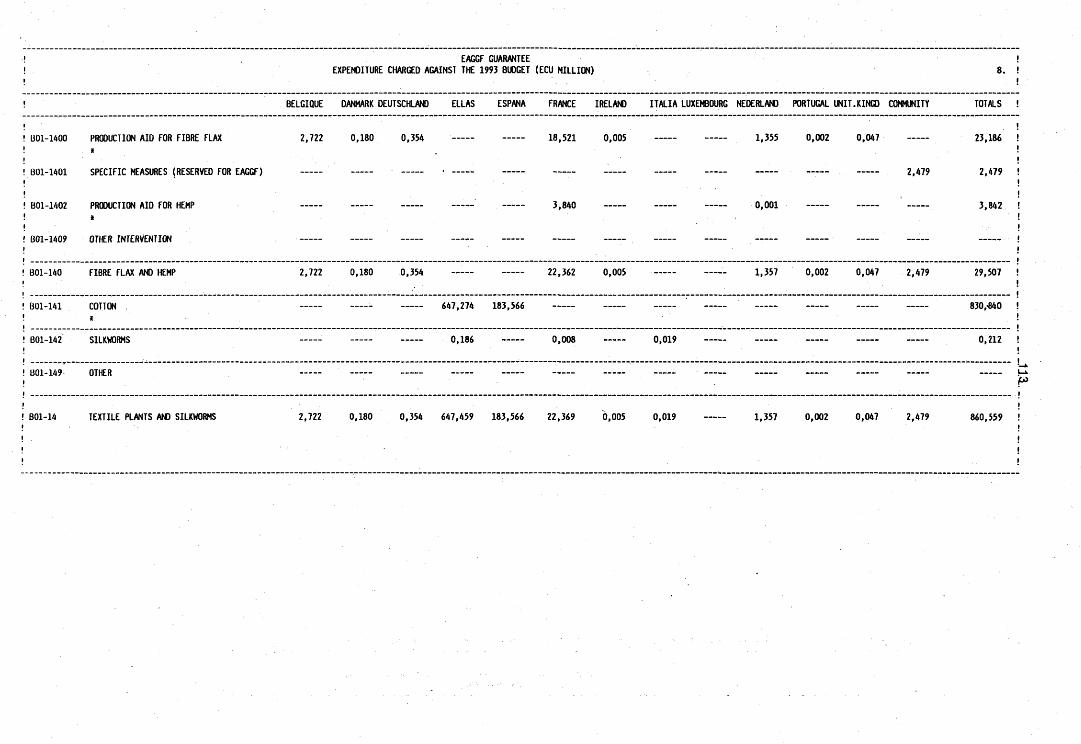
EAGGF GUARANTEE EXPENDITURE CHARGED AGAINST THE 1993 BUDGET (ECU MILLION)
BELGIQUE DANMARK DEUTSCHLAND ELLAS ESPANA FRANCE IRELAND ITALIA LUXEMBOURG NEDERLAND PORTUGAL UNIT.KINGD COMMUNITY TOTALS
B01-1400 PRODUCTION AID FOR FIBRE FLAX
BOl-1401 SPECIFIC MEASURES (RESERVED FOR EAGGF)
BOl-1402 PRODUCTION AID FOR HEMP
B01-14O9 OTHER INTERVENTION
2,722 0,180 0,354 18,521 0,005
3,840
1,355 0,002 0,047
0,001
2,479
23,186
2,479
3,842
B01-140 FIBRE FLAX AND HEMP 2,722 0,180 0,354 22,362 0,005 1,357 0,002 0,047 2,479 29,507
B01-141 COTTON 647,274 183,566 830,-840
B01-142 SILKWORMS 0,186 0,008 0,019 0,212
B01-149 OTHER ^
B01-14 TEXTILE PLANTS AND SILKWORMS 2,722 0,180 0,354 647,459 183,566 22,369 0,005 0,019 1,357 0,002 0,047 2,479 860,559
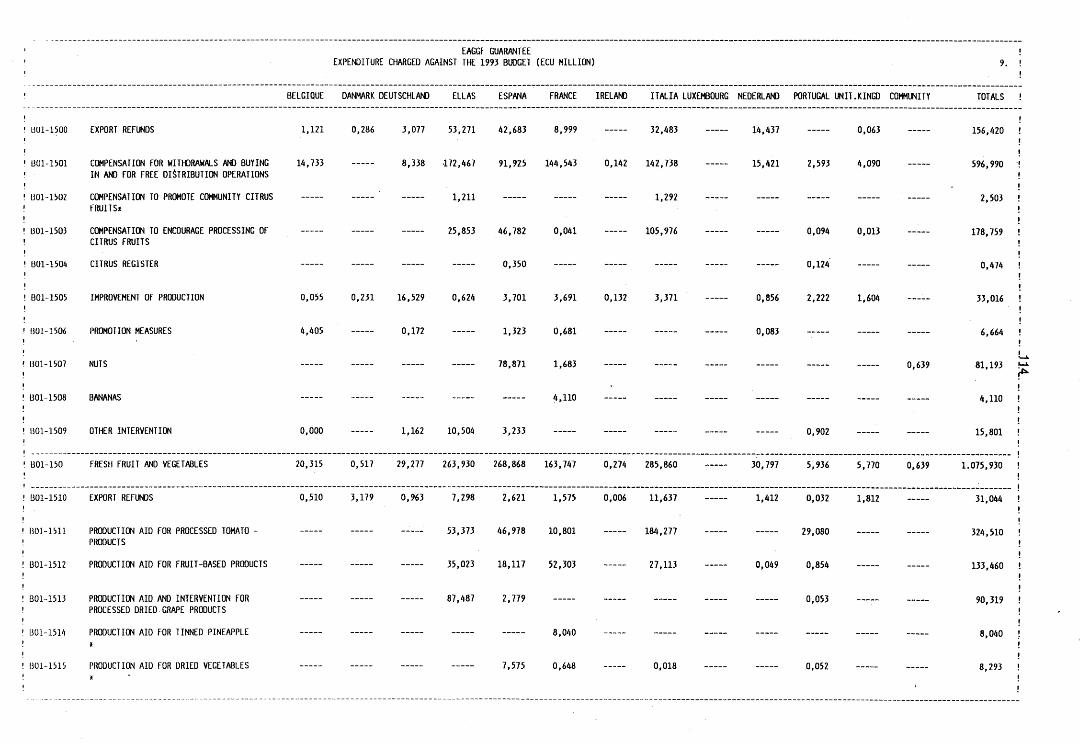
EAGGF GUARANTEE EXPENDITURE CHARGED AGAINST THE 1993 BUDGET (ECU MILLION)
BELGIQUE DANMARK DEUTSCHLAND ELLAS ESPANA FRANCE IRELAND ITALIA LUXEMBOURG NEDERLAND PORTUGAL UNIT.KINGD COMMUNITY TOTALS !
UO1-15O0 EXPORT REFUNDS
1301-1501 COMPENSATION FOR WITHDRAWALS AND BUYING IN AND FOR FREE DISTRIBUTION OPERATIONS
(301-1502 COMPENSATION TO PROMOTE COMMUNITY CITRUS FRUITS*
B01-1503 COMPENSATION TO ENCOURAGE PROCESSING OF CITRUS FRUITS
BOl-1504 CITRUS REGISTER
B01-1505 IMPROVEMENT OF PRODUCTION
1)01-1506 PROMOTION MEASURES
B01-15O7 NUTS
B01-1508 BANANAS
BOl-1509 OTHER INTERVENTION
B01-150 FRESH FRUIT AND VEGETABLES
B01-1510 EXPORT REFUNDS
1301-1511 PRODUCTION AID FOR PROCESSED TOMATO -PRODUCTS
1301-1512 PRODUCTION AID FOR FRUIT-BASED PRODUCTS
B01-1513 PRODUCTION AID AND INTERVENTION FOR PROCESSED DRIED-GRAPE PRODUCTS
1301-1514 PRODUCTION AID FOR TINNED PINEAPPLE
1301-1515 PRODUCTION AID FOR DRIED VEGETABLES
1,121 0,286 3,077 53,271 42,683 8,999
14,733
4,405
0,000
1,211
25,853 46,782 0,041
0,350
0,172 1,323 0,681
78,871 1,683
4,110
1,162 10,504 3,233
53,373 46,978 10,801
35,023 18,117 52,303
87,487 2,779
8,040
7,575 0,648
32,483 14,437
8,338 172,467 91,925 144,543 0,142 142,738
1,292
105,976
0,055 0,231 16,529 0,624 3,701 3,691 0,132 3,371
20,315 0,517 29,277 263,930 268,868 163,747 0,274 285,860
0,510 3,179 0,963 7,298 2,621 1,575 0,006 11,637
184,277
27,113
0,018
0,083
0,124
0,902
0,053
0,052
0,063
15,421 2,593 4,090
0,094 0,013
0,856 2,222 1,604
0,639
1,412 0,032 1,812
29,080
0,049 0,854
156,420
596,990
2,503
178,759
0,474
33,016
6,664
81,193 H>
4,110
15,801
30,797 5,936 5,770 0,639 1.075,930
31,044
324,510
133,460
90,319
8,040
8,293

EAGGF GUARANTEE EXPENDITURE CHARGED AGAINST THE 1993 BUDGET (ECU MILLION) 10.
BELGIQUE DANMARK DEUTSCHLAND ELLAS ESPANA FRANCE IRELAND ITALIA LUXEMBOURG NEDERLAND PORTUGAL UNIT.KINGD COMMUNITY TOTALS
B01-1516 AIDS FOR PROCESSED RASPBERRIES
B01-1519 OTHER INTERVENTION"
0,634 0,634
B01-151 PROCESSED FRUIT AND VEGETABLES 0,510 3,179 0,963 183,181 78,070 73,367 0,006 223,045 1,461 30,071 2,447 596,300
B01-152 OTHER INTERVENTION
B01-15 FRUIT AND VEGETABLES 20,825 3,695 30,239 447,111 346,938 237,115 0,281 508,905 32,258 36,006 8,216 0,639 1.672,229
cn

EAGGF GUARANTEE EXPENDITURE CHARGED AGAINST THE 1993 BUDGET (ECU MILLION) 11.
BELGIQUE DANMARK DEUTSCHLAND ELLAS ESPANA FRANCE IRELAND ITALIA LUXEMBOURG NEDERLAND PORTUGAL UNIT.KINGD COMMUNITY TOTALS !
B01-160 REFUNDS ON PRODUCTS OF THE VINE-GROWING 0,011 SECTOR
B01-1610 INTERVENTION STORAGE OF WINE AND GRAPE MUST(R. 822/87)
B01-1611 DISTILLATION OF WINE (REG. 822/87)
B01-1612 COMPULSORY DISTILLATION OF THE BYPRODUCTS OF WINE-MAKING (ART.35 822 /87 )
B01-161 INTERVENTION FOR PRODUCTS OF THE VINE-GROWING SECTOR
0,205 0,147 68,518 7,196
0,270 . 3,676 18,141 16,005
8,018 4,820 160,367 67,001
0,010 17,733 30,521
8,287 8,506 196,240 113,527
0,047 6,479 0,793
7,916
18,720
204,871
21,906
245,496
4,426
1,143
1,517
64,915
1,419 14,801 0,000
0,656
19,250
6,524
26,431
100,213
57,468
464,327
76,693
598,488
11J46
2,514
8,612
210,273
B01-1620 TECHNICAL COSTS
1301-1621 FINANCIAL COSTS
B01-1622 OTHER COSTS
B01-1623 DEPRECIATION OF STOCKS
0,015
0,000
2,196
1,254 0,103
3,462 3,632
71,841 66,015 5,306
tOî
B01-162 TAKING OVER OF ALCOHOL FROM COMPULSORY DISTILLATION(ARTS.37 AND 40 OF R.822/87)
2,259 83,036 70,544 72,000 5,306 233,145
B01-163 AID FOR THE USE OF MUST 0,991 3,099 5,746 51,895 104,742 0.560 0,673 167,707
B01-164 PERMANENT ABANDONMENT PREMIUMS IN RESPECT OF AREAS UNDER VINES
0,855 48,186 148,984 81,187
2,583 1,054 1,735
114,266
0,671
10,287 403,766
6,263 B01-165 OTHER INTERVENTION 0,008 0,213
B01-16 PRODUCTS OF THE VINE-GROWING SECTOR 0,019 15,180 59,938 503,579 326,085 545,092 1,632 57,385 0,673 1.509,583

EAGGF GUARANTEE EXPENDITURE CHARGED AGAINST THE 1993 BUDGET (ECU MILLION) 12.
BELGIQUE DANMARK DEUTSCHLAND ELLAS ESPANA FRANCE IRELAND ITALIA LUXEMBOURG NEDERLAND PORTUGAL UNIT.KINGD COMMUNITY TOTALS
BOl-170 REFUNDS ON TOBACCO 0,464
9,532
1,110 13,780 1,543 0,479 18,582 0,282
14,113
36,241
B01-171 PREMIUMS FOR TOBACCO 42,822 .521,023 108,092 68,468 354,716 1.118,766
1301-1720 TECHNICAL COSTS OF PUBLIC STORAGE
B01-1721 FINANCIAL COSTS OF PUBLIC STORAGE
B01-1722 OTHER PUBLIC STORAGE COSTS
B01-1723 DEPRECIATION OF STOCKS
2,500
0,000 1,201
-0,026 -38,195
19,909
0,578
0,050
-5,794
2,099
3,079
1,251
-44,015
22,007
BOl-172 INTERVENTION STORAGE OF TOBACCO -0,026 -14,585 -3,067 -17,678
B01-173 OTHER INTERVENTION FOR TOBACCO 27,807 27,807 U H
B01-17 TOBACCO 9,995 43,907 548,024 109,635 68,947 370,232 14,395 1.165,136
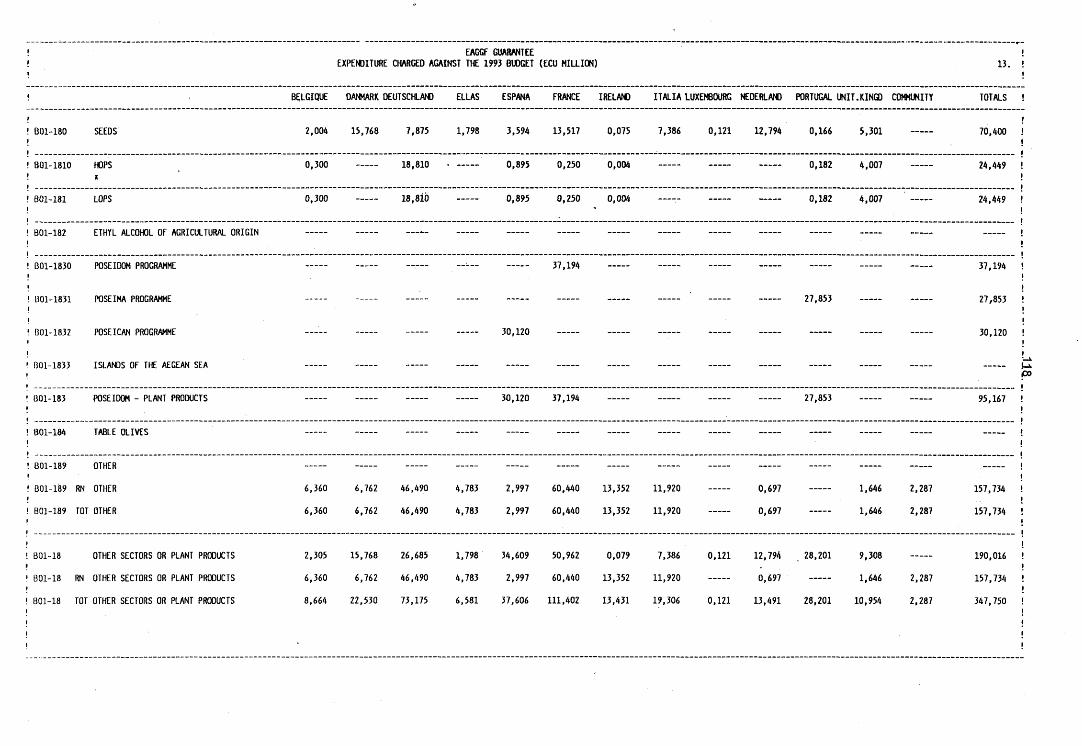
EAGGF GUARANTEE EXPENDITURE CHARGED AGAINST THE 1993 BUDGET (ECU MILLION) 13.
BELGIQUE DANMARK DEUTSCHLAND ELLAS ESPANA FRANCE IRELAND ITALIA LUXEMBOURG NEDERLAND PORTUGAL UNIT.KINGD COMMUNITY TOTALS !
801-180 SEEDS 2,004 15,768 7,875 1,798 3,594 13,517 0,075 7,386 0,121 12,794 0,166 5,301 70,400
24,449
24,449
B01-1810 HOPS 0,300 18,810 0,895 0,250 0,004 0,182 4,007
B01-181 LOPS 0,300 18,810 0,895 0,250 0,004 0,182 4,007
B01-182 ETHYL ALCOHOL OF AGRICULTURAL ORIGIN
B01-1830 POSEIDOM PROGRAMME
B01-1831 POSEIMA PROGRAMME
B01-1832 POSEICAN PROGRAMME
B01-1833 ISLANDS OF THE AEGEAN SEA
30,120
37,194
27,853
37,194
27,853
30,120
B01-183 POSEIDOM - PLANT PRODUCTS 30,120 37,194 27,853 95,167
B01-184 TABLE OLIVES
801-189 OTHER
B01-189 RN OTHER
B01-189 TOT OTHER
6,360 6,762 46,490 4,783 2,997 60,440 13,352 11,920
6,360 6,762 46,490 4,783 2,997 60,440 13,352 11,920
0,697
0,697
1,646 2,287
1,646 2,287
157,734
157,734
B01-18 OTHER SECTORS OR PLANT PRODUCTS
B01-18 RN OTHER SECTORS OR PLANT PRODUCTS
B01-18 TOT OTHER SECTORS OR PLANT PRODUCTS
2,305 15,768 26,685
6,360 6,762 46,490
8,664 22,530 73,175
1,798 34,609 50,962 0,079 7,386
4,783 2,997 60,440 13,352 11,920
6,581 37,606 111,402 13,431 19,306
0,121 12,794 28,201 9,308
0,697 1,646
0,121 13,491 28,201 10,954
2,287
2,287
190,016
157,734
347,750
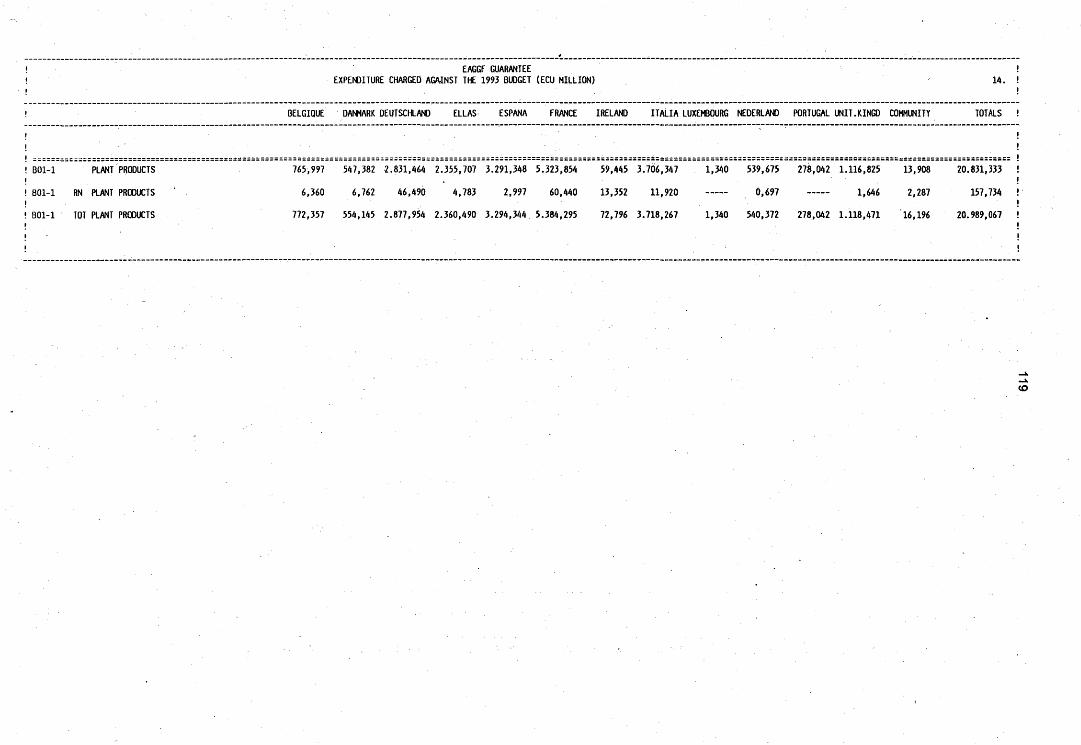
EAGGF GUARANTEE EXPENDITURE CHARGED AGAINST THE 1993 BUDGET (ECU MILLION) 14.
BELGIQUE DANMARK DEUTSCHLAND ELLAS ESPANA FRANCE IRELAND ITALIA LUXEMBOURG NEDERLAND PORTUGAL UNIT.KINGO COMMUNITY TOTALS
BOl-1 PLANT PRODUCTS
BOl-1 RN PLANT PRODUCTS
BOl-1 TOT PLANT PRODUCTS
765,997 547,382 2.831,464 2.355,707 3.291,348 5.323,854 59,445 3.706,347 1,340 539,675 278,042 1.116,825 13,908 20.831,333
6,360 6,762 46,490 4,783 2,997 60,440 13,352 11,920 0,697 1,646 2,287 157,734
772,357 554,145 2.877,954 2.360,490 3.294,344 5.384,295 72,796 3.718,267 1,340 540,372 278,042 1.118,471 16,196 20.989,067
CO
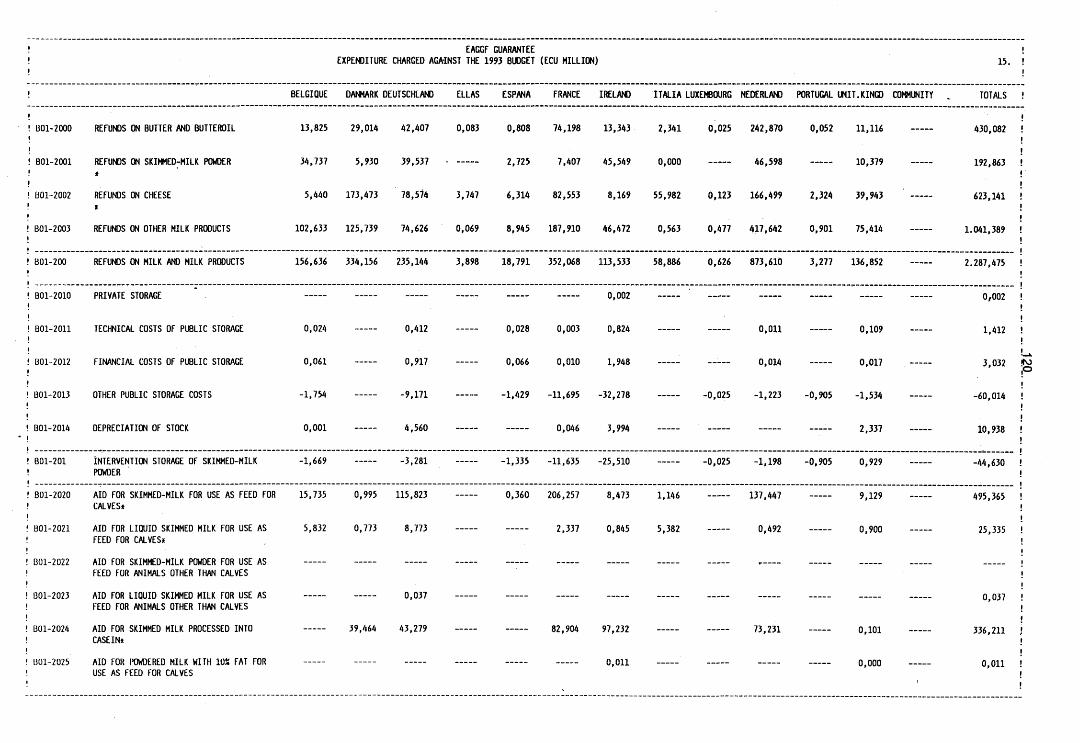
EAGGF GUARANTEE EXPENDITURE CHARGED AGA-INST THE 1993 BUDGET (ECU MILLION) 15.
BELGIQUE DANMARK DEUTSCHLAND ELLAS ESPANA FRANCE IRELAND ITALIA LUXEMBOURG NEDERLAND PORTUGAL UNIT.KINGD COMMUNITY TOTALS !
BOl-2000 REFUNDS ON BUTTER AND BUTTEROIL
BO1-2001 REFUNDS ON SKIMMED-MILK POWDER
BOl-2002 REFUNDS ON CHEESE
BOl-2003 REFUNDS ON OTHER MILK PRODUCTS
13,825 29,014 42,407 0,083 0,808 74,198 13,343 2,341 0,025 242,870 0,052 11,116
34,737 5,930 39,537 • 2,725 7,407 45,549 0,000 46,598 10,379
5,440 173,473 78,574 3,747 6,314 82,553 8,169 55,982 0,123 166,499 2,324 39,943
102,633 125,739 74,626 0,069 8,945 187,910 46,472 0,563 0,477 417,642 0,901 75,414
430,082
192,863
623,141
1.041,389
B01-200 REFUNDS ON MILK AND MILK PRODUCTS 156,636 334,156 235,144 3,898 18,791 352,068 113,533 58,886 0,626 873,610 3,277 136,852 2.287,475
B01-2010 PRIVATE STORAGE
B01-2011 TECHNICAL COSTS OF PUBLIC STORAGE
BOl-2012 FINANCIAL COSTS OF PUBLIC STORAGE
B01-2013 OTHER PUBLIC STORAGE COSTS
B01-2014 DEPRECIATION OF STOCK
B01-201 INTERVENTION STORAGE OF SKIMMED-MILK POWDER
0,024
0,061
-1,754
0,001
-1,669
0,412
0,917
-9,171
4,560
-3,281
0,002
B01-2020 AID FOR SKIMMED-MILK FOR USE AS FEED FOR CALVES*
BOl-2021 AID FOR LIQUID SKIMMED MILK FOR USE AS FEED FOR CALVES*
BOl-2022 AID FOR SKIMMED-MILK POWDER FOR USE AS FEED FOR ANIMALS OTHER THAN CALVES
B01-2023 AID FOR LIQUID SKIMMED MILK FOR USE AS FEED FOR ANIMALS OTHER THAN CALVES
B01-2024 AID FOR SKIMMED MILK PROCESSED INTO CASEIN*
1301-2025 AID FOR POWDERED MILK WITH 10* FAT FOR USE AS FEED FOR CALVES
15,735 0,995 115,823
5,832 0,773 8,773
0,037
39,464 43,279
0,028 0,003 0,824
0,066 0,010 1,948
-1,429 -11,695 -32,278
0,046 3,994
-1,335 -11,635 -25,510
0,360 206,257 8,473 1,146
2,337 0,845 5,382
-0,025
0,011
0,014
-1,223 -0,905
0,109
0,017
-1,534
2,337
-0,025 -1,198 -0,905 0,929
137,447
0,492
9,129
0,900
82,904 97,232
0,011
73,231 0,101
0,000
0,002
1,412
3,032 CO
-60,014
10,938
-44,630
495,365
25,335
0,037
336,211
0,011
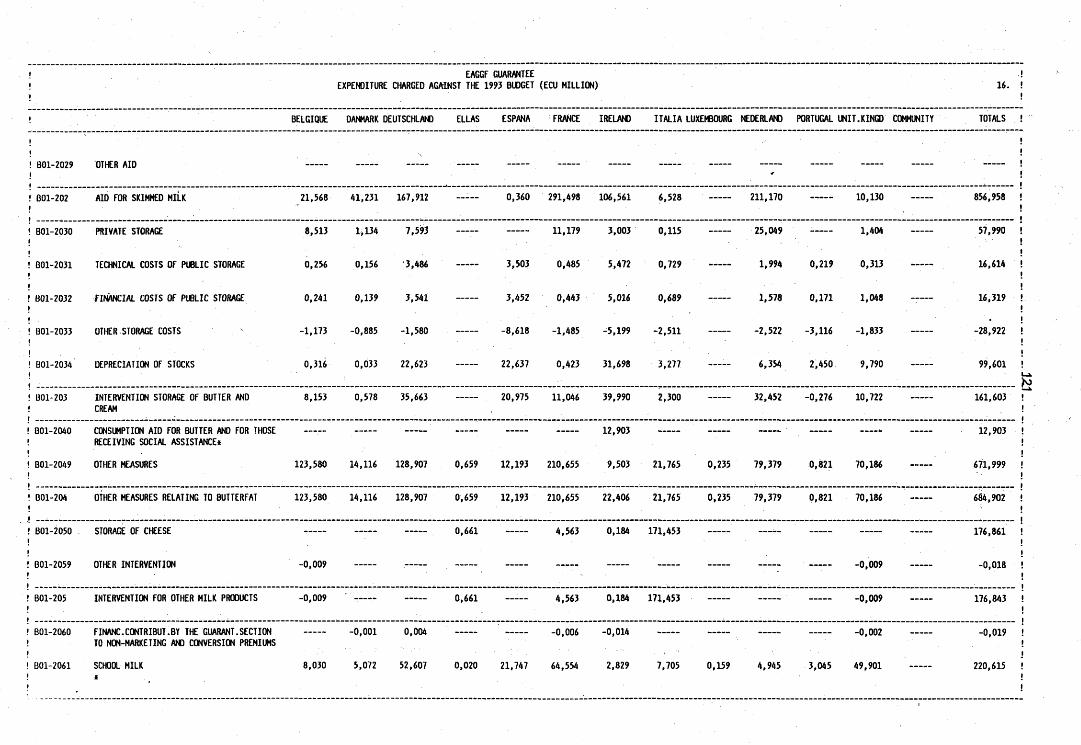
EAGGF GUARANTEE EXPENDITURE CHARGED AGAINST THE 1993 BUDGET (ECU MILLION) 16.
BELGIQUE DANMARK DEUTSCHLAND ELLAS ESPANA FRANCE IRELAND ITALIA LUXEMBOURG NEDERLAND PORTUGAL UNIT.KINGD COMMUNITY TOTALS
BOl-2029 OTHER AID
BOl-202 AID FOR SKIMMED MILK 21,568 41,231 167,912 0,360 291,498 106,561 6,528 211,170 10,130 856,958
BOl-2030 PRIVATE STORAGE
B01-2031 TECHNICAL COSTS OF PUBLIC STORAGE
B01-2032 FINANCIAL COSTS OF PUBLIC STORAGE
B01-2033 OTHER STORAGE COSTS
BOl-2034 DEPRECIATION OF STOCKS
8,513 1,134 7,593
0,256 0,156 3,486
0,241 0,139 3,541
-1,173 -0,885 -1,580
0,316 0,033 22,623
11,179 3,003 0,115
3,503 0,485 5,472 0,729
3,452 0,443 5,016 0,689
-8,618 -1,485 -5,199 -2,511
22,637 0,423 31,698 3,277
25,049 1,404
1,994 0,219 0,313
1,578 0,171 1,048
-2,522 -3,116 -1,833
6,354 2,450 9,790
57,990
16,614
16,319
-28,922
99,601
& B01-203 INTERVENTION STORAGE OF BUTTER AND
CREAM 8,153 0,578 35,663 20,975 11,046 39,990 2,300 32,452 -0,276 10,722 161,603
B01-2040 CONSUMPTION AID FOR BUTTER AND FOR THOSE RECEIVING SOCIAL ASSISTANCE*
B01-2049 OTHER MEASURES
12,903
123,580 14,116 128,907
123,580 14,116 128,907
0,659 12,193 210,655 9,503 21,765 0,235 79,379
0,659 12,193 210,655 22,406 21,765 0,235 79,379
0,821 70,186
0,821 70,186
12,903
671,999
684,902 B01-204 OTHER MEASURES RELATING TO BUTTERFAT
B01-2050 STORAGE OF CHEESE
B01-2059 OTHER INTERVENTION -0,009
0,661 4,563 0,184 171,453
-0,009
176,861
-0,018
BO1-205 INTERVENTION FOR OTHER MILK PRODUCTS -0,009 0,661 4,563 0,184 171,453 -0,009 176,843
B01-2060 FINANC.CONTRIBUT.BY THE GUARANT.SECTION TO NON-MARKETING AND CONVERSION PREMIUMS
B01-2061 SCHOOL MILK
0,001 0,004 -0,006 -0,014 -0,002
8,030 5,072 52,607 0,020 21,747 64,554 2,829 7,705 0,159 4,945 3,045 49,901
-0,019
220,615
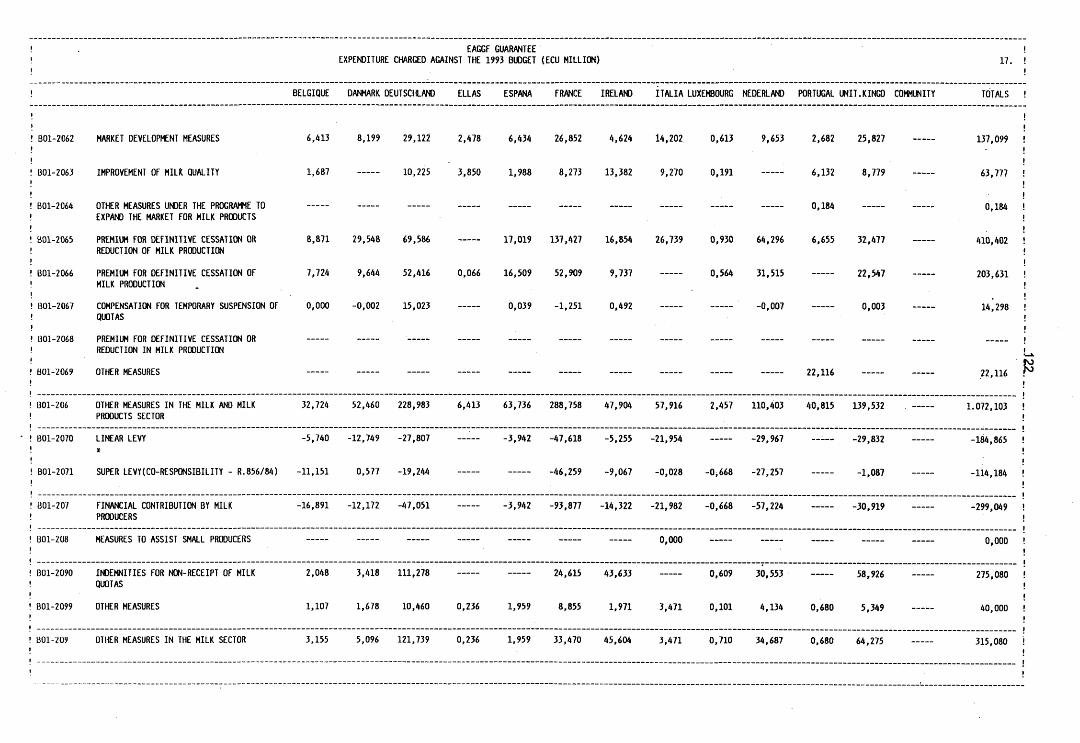
EAGGF GUARANTEE EXPENDITURE CHARGED AGAINST THE 1993 BUDGET (ECU MILLION) 17.
BELGIQUE DANMARK DEUTSCHLAND ELLAS ESPANA FRANCE IRELAND ITALIA LUXEMBOURG NEDERLAND PORTUGAL UNIT.KINGD COMMUNITY TOTALS
BOl-2062 MARKET DEVELOPMENT MEASURES
BOl-2063 IMPROVEMENT OF MILK QUALITY
BO1-2064 OTHER MEASURES UNDER THE PROGRAMME TO EXPAND THE MARKET FOR MILK PRODUCTS
B01-2065 PREMIUM FOR DEFINITIVE CESSATION OR REDUCTION OF MILK PRODUCTION
6,413 8,199 29,122 2,478 6,434 26,852 4,624 14,202 0,613 9,653 2,682 25,827
1,687 10,225 3,850 1,988 8,273 13,382 9,270 0,191
8,871 29,548 69,586
6,132 8,779
0,184
17,019 137,427 16,854 26,739 0,930 64,296 6,655 32,477
B01-2066 PREMIUM FOR DEFINITIVE CESSATION OF MILK PRODUCTION
BOl-2067 COMPENSATION FOR TEMPORARY SUSPENSION OF QUOTAS
B01-2068 PREMIUM FOR DEFINITIVE CESSATION OR REDUCTION IN MILK PRODUCTION
B01-2069 OTHER MEASURES
7,724 9,644 52,416 0,066 16,509 52,909 9,737
0,000 -0,002 15,023 0,039 -1,251 0,492
0,564 31,515
-0,007
22,547
0,003
22,116
137,099
63,777
0,184
410,402
203,631
14,298
22,116 13
B01-206 OTHER MEASURES IN THE MILK AND MILK PRODUCTS SECTOR
32,724 52,460 228,983 6,413 63,736 288,758 47,904 57,916 2,457 110,403 40,815 139,532 1.072,103
B01-2070 LINEAR LEVY -5,740 -12,749 -27,807
*
BOl-2071 SUPER LEVY(CO-RESPONSIBILITY - R.856/84) -11,151 0,577 -19,244
-3,942 -47,618 -5,255 -21,954 -29,967
-46,259 -9,067 -0,028 -0,668 -27,257
-29,832
-1,087
-184,865
-114,184
B01-207 FINANCIAL CONTRIBUTION BY MILK PRODUCERS
-16,891 -12,172 -47,051 -3,942 -93,877 -14,322 -21,982 -0,668 -57,224 -30,919 -299,049
BOl-208 MEASURES TO ASSIST SMALL PRODUCERS 0,000 0,000
B01-2090 INDEMNITIES FOR NON-RECEIPT OF MILK QUOTAS
B01-2099 OTHER MEASURES
2,048 3,418 111,278 24,615 43,633 0,609 30,553 58,926
1,107 1,678 10,460 0,236 1,959 8,855 1,971 3,471 0,101 4,134 0,680 5,349
3,155 5,096 121,739 0,236 1,959 33,470 45,604 3,471 0,710 34,687 0,680 64,275
275,080
40,000
315,080 B01-209 OTHER MEASURES IN THE MILK SECTOR
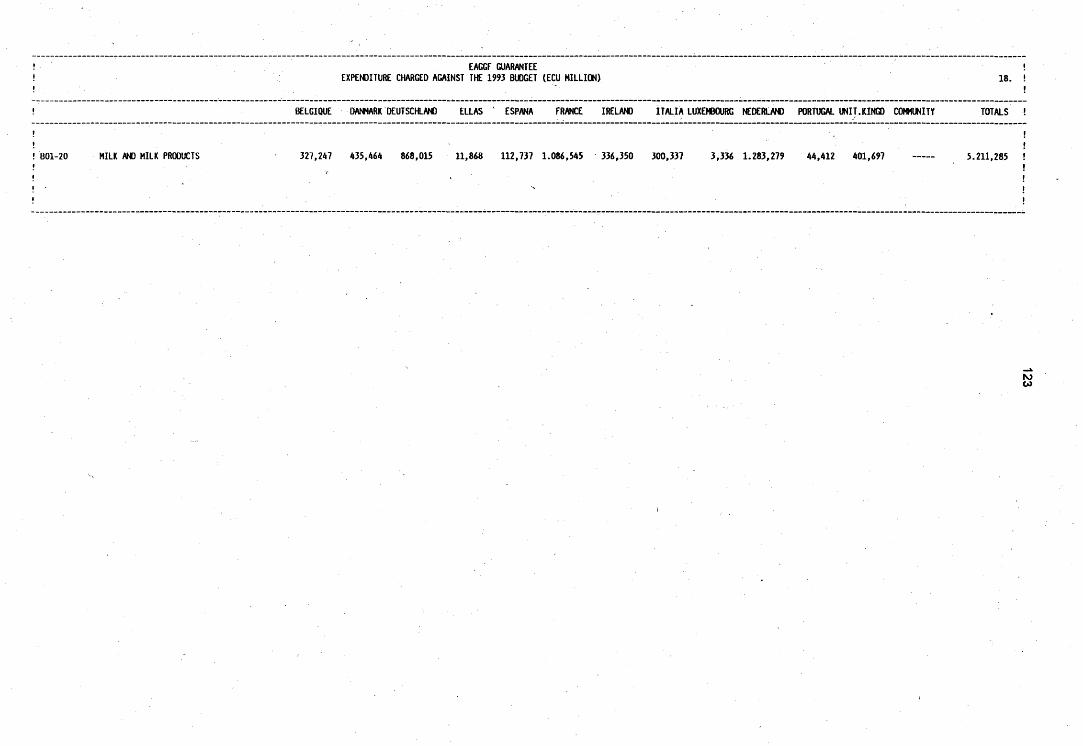
EAGGF GUARANTEE EXPENDITURE CHARGED AGAINST THE 1993 BUDGET (ECU MILLION) 18.
BELGIQUE DANMARK DEUTSCHLAND ELLAS ESPANA FRANCE IRELAND ITALIA LUXEMBOURG NEDERLAND PORTUGAL UNIT.KINGD COMMUNITY TOTALS !
BOl-20 MILK AND MILK PRODUCTS 327,247 435,464 868,015 11,868 112,737 1.086,545 336,350 300,337 3,336 1.283,279 44,412 401,697 5.211,285
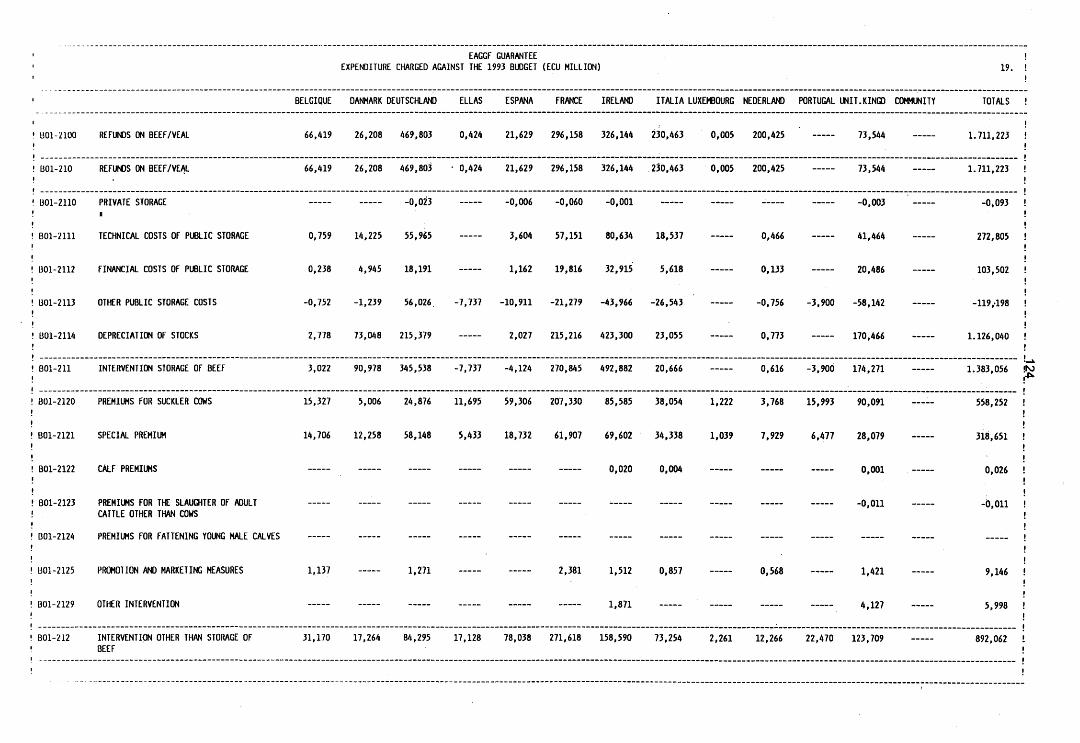
EAGGF GUARANTEE EXPENDITURE CHARGED AGAINST THE 1993 BUDGET (ECU MILLION) 19.
BELGIQUE DANMARK DEUTSCHLAND ELLAS ESPANA FRANCE IRELAND ITALIA LUXEMBOURG NEDERLAND PORTUGAL UNIT.KINGD COMMUNITY TOTALS !
801-2100 REFUNDS ON BEEF/VEAL 66,419 26,208 469,803 0,424 21,629 296,158 326,144 230,463 0,005 200,425 73,544 1.711,223
B01-210 REFUNDS ON BEEF/VEAL 66,419 26,208 469,803 • 0,424 21,629 296,158 326,144 230,463 0,005 200,425 73,544 1.711,223
B01-2110 PRIVATE STORAGE *
B01-2111 TECHNICAL COSTS OF PUBLIC STORAGE
B01-2112 FINANCIAL COSTS OF PUBLIC STORAGE
B01-2113 OTHER PUBLIC STORAGE COSTS
BOl-2114 DEPRECIATION OF STOCKS
-0,023
0,759 14,225 55,965
0,238 4,945 18,191
-0,006 -0,060 -0,001
3,604 57,151 80,634 18,537
1,162 19,816 32,915 5,618
-0,752 -1,239 56,026 -7,737 -10,911 -21,279 -43,966 -26,543
2,778 73,048 215,379 2,027 215,216 423,300 23,055
0,466
0,133
-0,003
41,464
20,486
-0,756 -3,900 -58,142
0,773 170,466
-0,093
272,805
103,502
-119/198
1.126,040
B01-211 INTERVENTION STORAGE OF BEEF 3,022 90,978 345,538 -7,737 -4,124 270,845 492,882 20,666 0,616 -3,900 174,271 1.383,056
B01-2120 PREMIUMS FOR SUCKLER COWS
B01-2121 SPECIAL PREMIUM
BOl-2122 CALF PREMIUMS
B01-2123 PREMIUMS FOR THE SLAUGHTER OF ADULT CATTLE OTHER THAN COWS
BOl-2124 PREMIUMS FOR FATTENING YOUNG MALE CALVES
B01-2125 PROMOTION AND MARKETING MEASURES
BOl-2129 OTHER INTERVENTION
15,327 5,006 24,876 11,695 59,306 207,330 85,585 38,054 1,222 3,768 15,993 90,091
14,706 12,258 58,148 5,433 18,732 61,907 69,602 34,338 1,039 7,929 6,477 28,079
1,137 1,271
0,020 0,004
2,381 1,512 0,857
1,871
0,568
0,001
-0,011
1,421
4,127
558,252
318,651
0,026
-0,011
9,146
5,998
B01-212 INTERVENTION OTHER THAN STORAGE OF BEEF
31,170 17,264 84,295 17,128 78,038 271,618 158,590 73,254 2,261 12,266 22,470 123,709 892,062
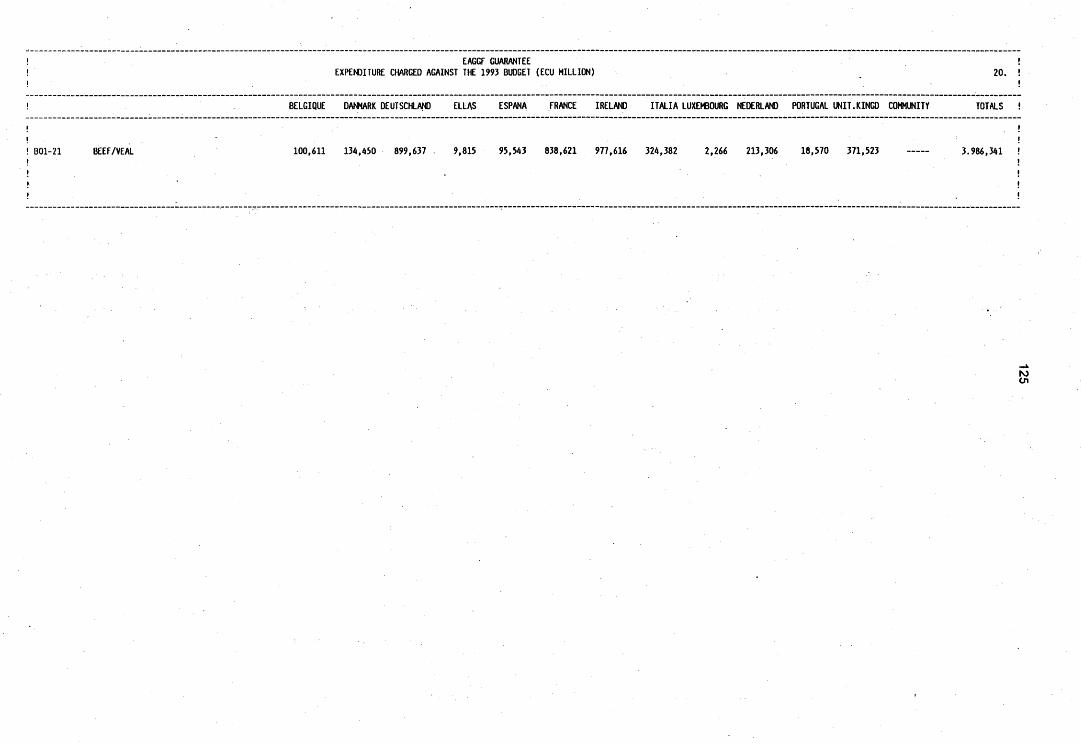
EAGGF GUARANTEE EXPENDITURE CHARGED AGAINST THE 1993 BUDGET (ECU MILLION) 20.
! BELGIQUE DANMARK DEUTSCHLAND ELLAS ESPANA FRANCE IRELAND ITALIA LUXEMBOURG NEDERLAND PORTUGAL UNIT.KINGD COMMUNITY TOTALS !
i
! " ! B01-21 BEEF/VEAL 100,611 134,450 899,637 9,815 95,543 838,621 977,616 324,382 2,266 213,306 18,570 371,523 3.986,341
en
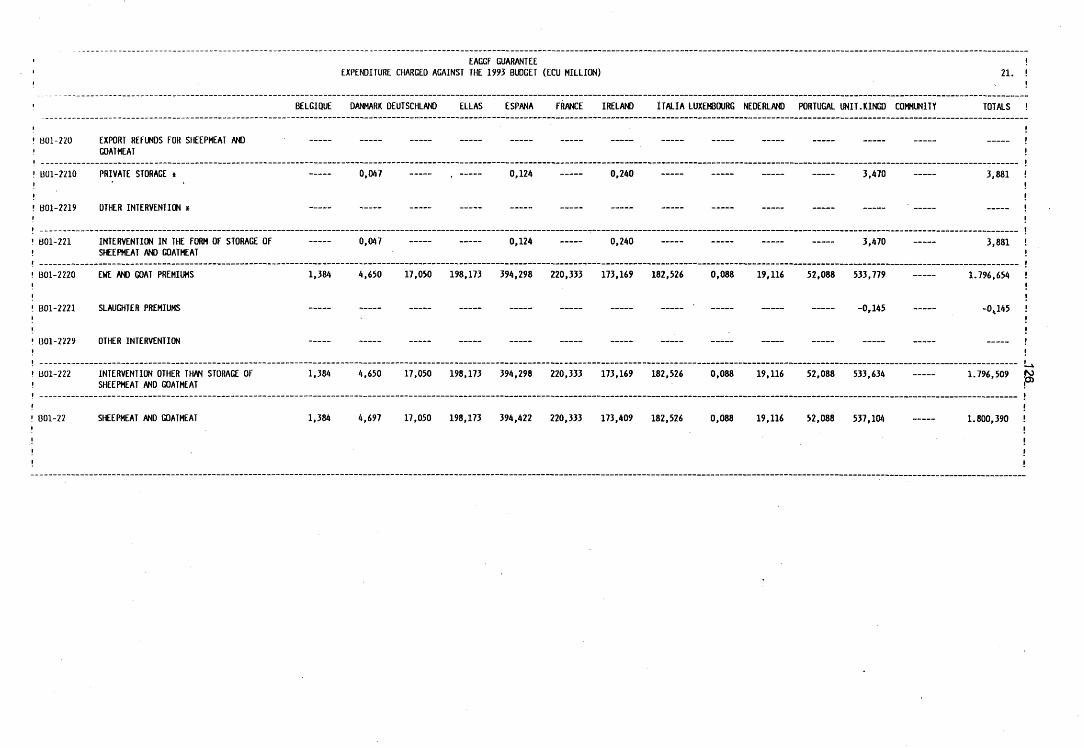
EAGGF GUARANTEE EXPENDITURE CHARGED AGAINST THE 1993 BUDGET (ECU MILLION) 21.
BELGIQUE DANMARK DEUTSCHLAND ELLAS ESPANA FRANCE IRELAND ITALIA LUXEMBOURG NEDERLAND PORTUGAL UNIT.KINGD COMMUNITY TOTALS !
1301-220 EXPORT REFUNDS FOR SHEEPMEAT AND GOATMEAT
B01-2210 PRIVATE STORAGE *
B01-2219 OTHER INTERVENTION *
0,047 0,124 0,240 3,470 3,881
B01-221 INTERVENTION IN THE FORM OF STORAGE OF SHEEPMEAT AND GOATMEAT
0,047 0,124 0,240 3,470 3,881
B01-2220 EWE AND GOAT PREMIUMS
B01-2221 SLAUGHTER PREMIUMS
B01-2229 OTHER INTERVENTION
1,384 4,650 17,050 198,173 394,298 220,333 173,169 182,526 0,088 19,116 52,088 533,779
-0,145
1.796,654
-0J45
BOl-222 INTERVENTION OTHER THAN STORAGE OF SHEEPMEAT AND GOATMEAT
BOl-22 SHEEPMEAT AND GOATMEAT
1,384 4,650 17,050 198,173 394,298 220,333 173,169 182,526 0,088 19,116 52,088 533,634
1,384 4,697 17,050 198,173 394,422 220,333 173,409 182,526 0,088 19,116 52,088 537,104
1.796,509
1.800,390

EAGGF GUARANTEE EXPENDITURE CHARGED AGAINST THE 1993 BUDGET (ECU MILLION) 22.
BELGIQUE DANMARK DEUTSCHLAND ELLAS ESPANA FRANCE IRELAND ITALIA LUXEMBOURG NEDERLAND PORTUGAL UNIT.KINGD COMMUNITY TOTALS !
BOl-230 REFUNDS ON PIGMEAT
*
BOl-231 INTERVENTION FOR PIGMEAT *
BOl-239 OTHER INTERVENTION
10,236 102,719 32,485 1,113 5,338 6,236 2,525 5,615
0,841 1,969 -0,885
-0,071 2,063
0,074 -0,134 0,006
23,481 1,050 2,673
0,556
3,034
193,471
2,427
5,025
BOl-23 PIGMEAT 11,005 104,688 33,663 1,113 5,412 6,102 2,531 5,615 27,070 1,050 2,673 200,923
rO
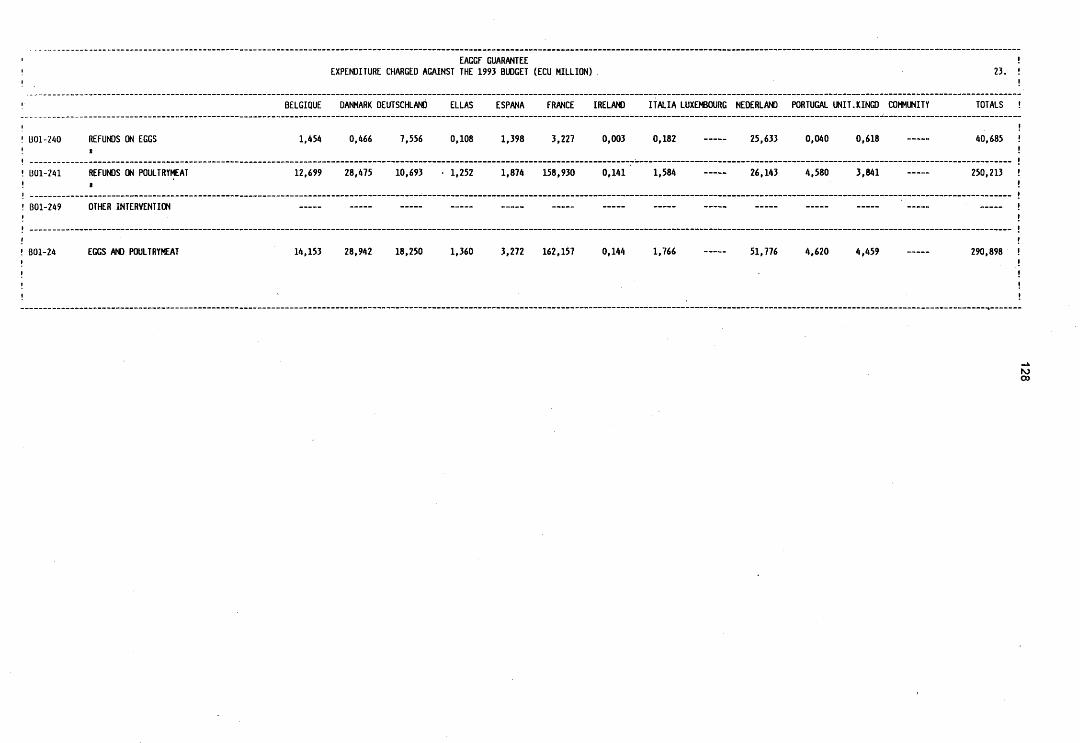
EAGGF GUARANTEE EXPENDITURE CHARGED AGAINST THE 1993 BUDGET (ECU MILLION) 23.
BELGIQUE DANMARK DEUTSCHLAND ELLAS ESPANA FRANCE IRELANO ITALIA LUXEMBOURG NEDERLAND PORTUGAL UNIT.KINGD COMMUNITY TOTALS !
B01-240 REFUNDS ON EGGS 1,454 0,466 7,556 0,108 1,398 3,227 0,003 0,182 25,633 0,040 0,618 40,685
250,213 1301-241 REFUNDS ON POULTRYMEAT
*
B01-249 OTHER INTERVENTION
12,699 28,475 10,693 • 1,252 1,874 158,930 0,141 1,584 26,143 4,580 3,841
B01-24 EGGS AND POULTRYMEAT 14,153 28,942 18,250 1,360 3,272 162,157 0,144 1,766 51,776 4,620 4,459 290,898
ro oo
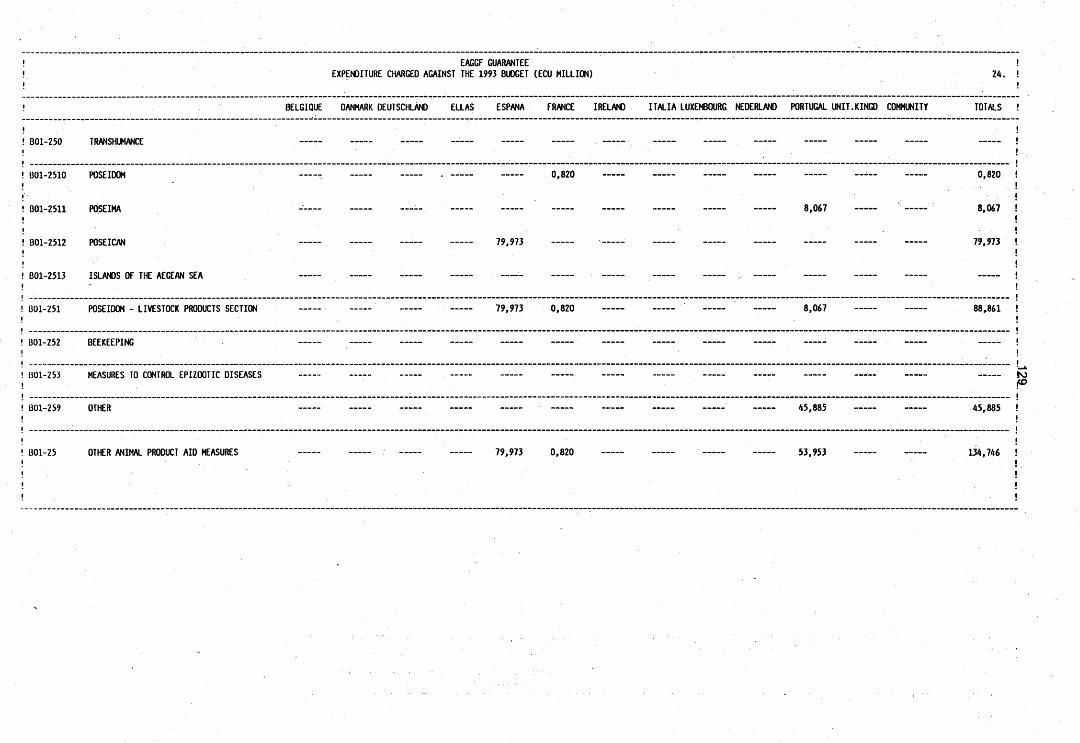
EAGGF GUARANTEE EXPENDITURE CHARGED AGAINST THE 1993 BUDGET (ECU MILLION) 24.
BELGIQUE DANMARK DEUTSCHLAND ELLAS ESPANA FRANCE IRELAND ITALIA LUXEMBOURG NEDERLAND PORTUGAL UNIT.KINGD COMMUNITY TOTALS
BOl-250 TRANSHUMANCE
BOl-2510 POSEIDOM
BOl-2511 PCfSEIMA
BOl-2512 POSEICAN
BOl-2513 ISLANDS OF THE AEGEAN SEA
0,820
79,973
8,067
0,820
8,067
79,973
BOl-251 POSEIDOM - LIVESTOCK PRODUCTS SECTION 79,973 0,820 8,067 88,861
BOl-252 BEEKEEPING
BOl-253 MEASURES TO CONTROL EPIZOOTIC DISEASES
B01-259 OTHER 45,885 45,885
1301-25 OTHER ANIMAL PRODUCT AID MEASURES 79,973 0,820 53,953 134,746
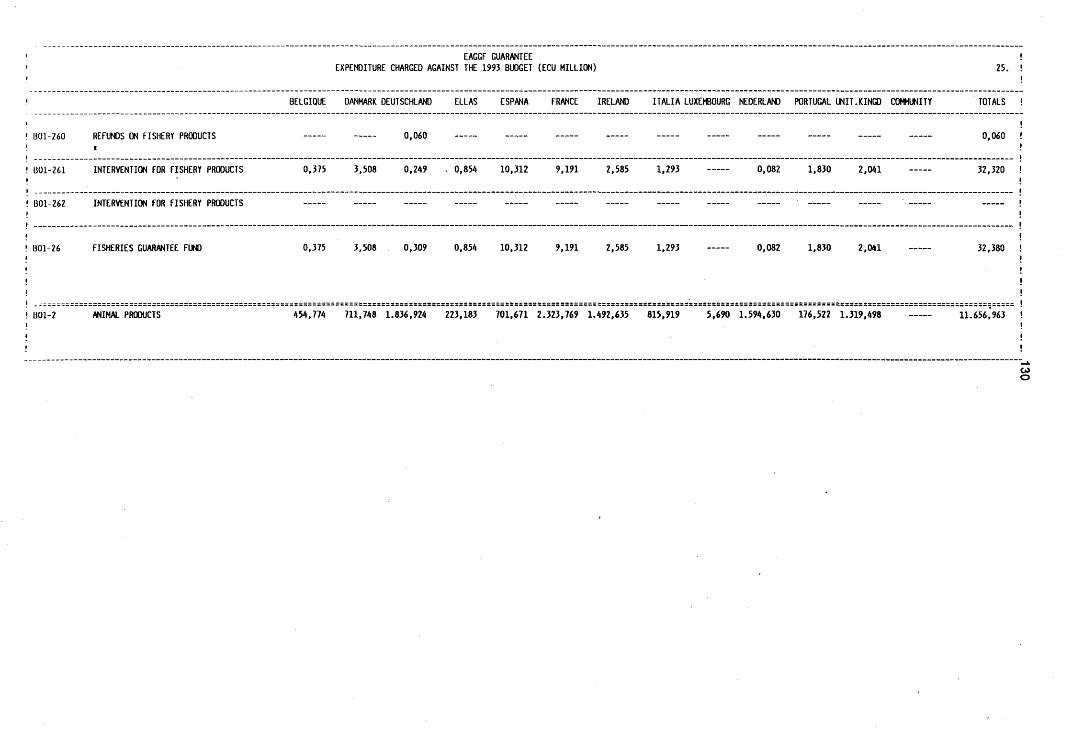
EAGGF GUARANTEE EXPENDITURE CHARGED AGAINST THE 1993 BUDGET (ECU MILLION) 25.
BELGIQUE DANMARK DEUTSCHLAND ELLAS ESPANA FRANCE IRELAND ITALIA LUXEMBOURG NEDERLAND PORTUGAL UNIT.KINGD COMMUNITY TOTALS
B01-260 REFUNDS ON FISHERY PRODUCTS 0,060 0,060
32,320 B01-261 INTERVENTION FOR FISHERY PRODUCTS 0,375 3,508 0,249 . 0,854 10,312 9,191 2,585 1,293 0,082 1,830 2,041
B01-262 INTERVENTION FOR FISHERY PRODUCTS
BOl-26 FISHERIES GUARANTEE FUND 0,375 3,508 0,309 0,854 10,312 9,191 2,585 1,293 0,082 1,830 2,041
B01-2 ANIMAL PRODUCTS 454,774 711,748 1.836,924 223,183 701,671 2.323,769 1.492,635 815,919 5,690 1.594,630 176,522 1.319,498
32,380
11.656,963
O
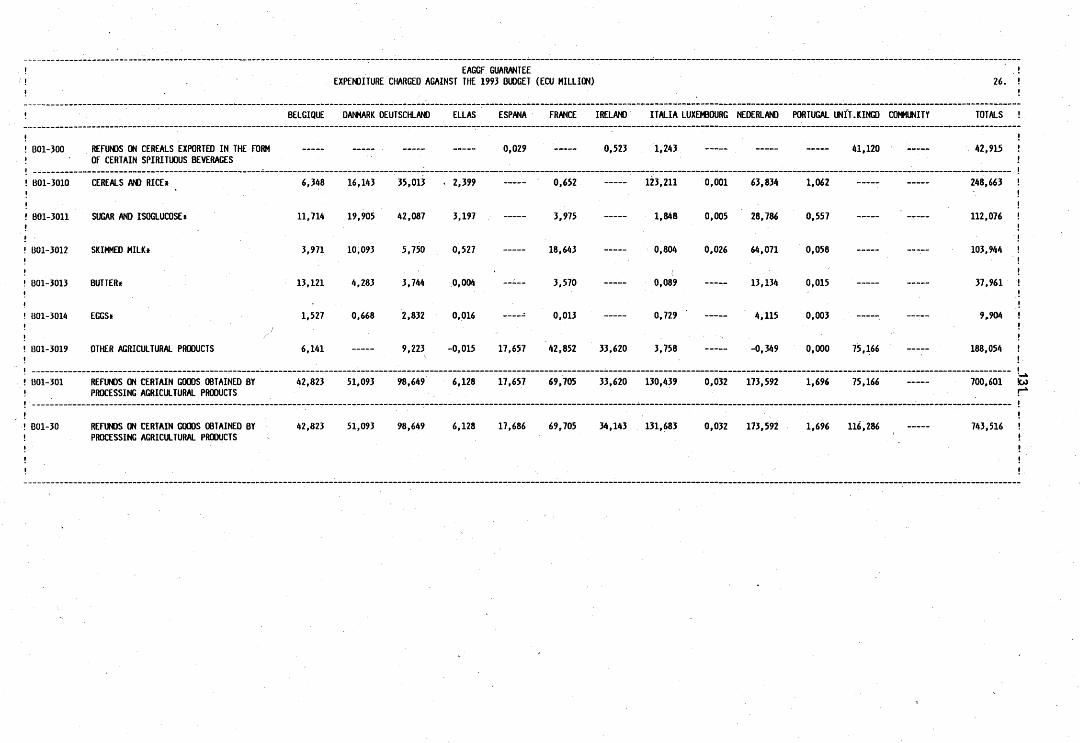
EAGGF GUARANTEE !
EXPENDITURE CHARGED AGAINST THE 1993 BUDGET (ECU MILLION) 26. !
BELGIQUE DANMARK DEUTSCHLAND ELLAS ESPANA FRANCE IRELAND ITALIA LUXEMBOURG NEDERLAND PORTUGAL UNIT.KINGD COMMUNITY TOTALS !
BOl-300 REFUNDS ON CEREALS EXPORTED IN THE FORM — - 0,029 0,523 1,243 41,120 42,915
OF CERTAIN SPIRITUOUS BEVERAGES
B01-3010 CEREALS AND RICE* 6,348 16,143 35,013 . 2,399 0,652 123,211 0,001 63,834 1,062 ----- 248,663
B01-30U SUGAR AND ISOGLUCOSE* 11,714 19,905 42,087 3,197 3,975 1,848 0,005 28,786 0,557 — — 112,076
B01-3012 SKIMMED MILK* 3,971 10,093 5,750 0,527 18,643 0,804 0,026 64,071 0,058 —.-- 103,944
BOl-3013 BUTTER* 13,121 4,283 3,744 0,004 ----- 3,570 — — 0,089 13,134 0,015 - 37,961
BOl-3014 EGGS* 1,527 0,668 2,832 0,016 0,013 0,729 4,115 0,003 --.— ----- 9,904
B01-3019 OTHER AGRICULTURAL PRODUCTS 6,141 9,223 -0,015 17,657 42,852 33,620 3,758 -0,349 0,000 75,166 — - 188,054
B01-301 REFUNDS ON CERTAIN GOODS OBTAINED BY 42,823 51,093 98,649 6,128 17,657 69,705 33,620 130,439 0,032 173,592 1,696 75,166 700,601 !w
PROCESSING AGRICULTURAL PRODUCTS f4,
B01-30 REFUNDS ON CERTAIN GOODS OBTAINED BY 42,823 51,093 98,649 6,128 17,686 69,705 34,143 131,683 0,032 173,592 1,696 116,286 743,516 PROCESSING AGRICULTURAL PRODUCTS
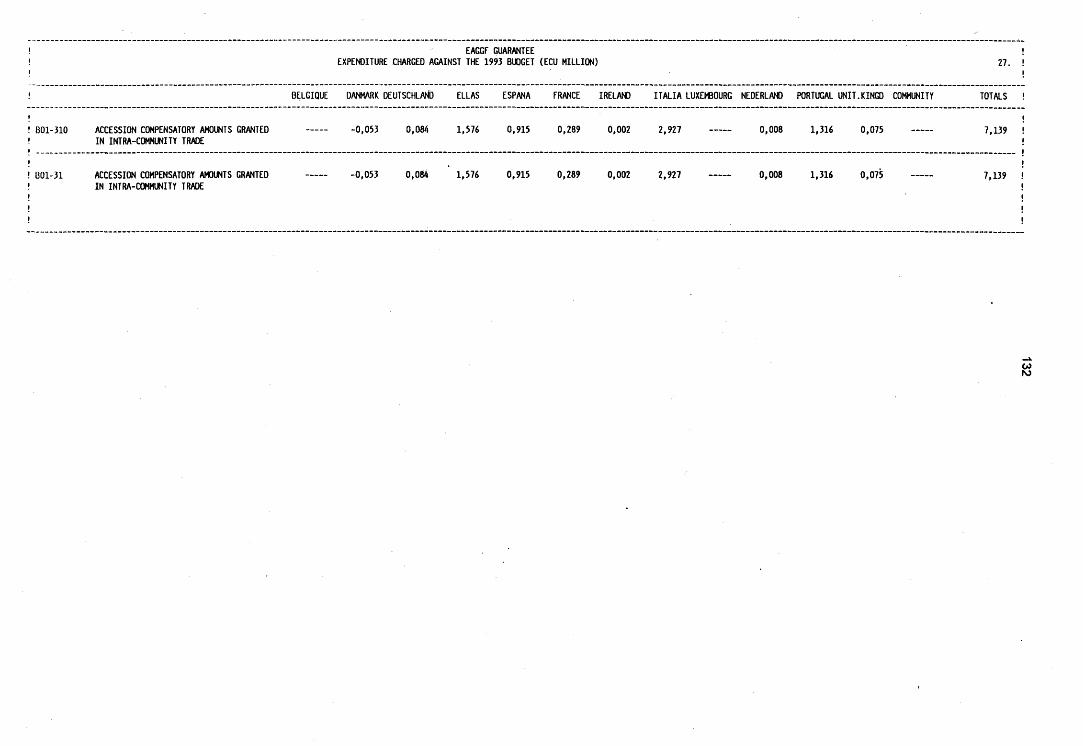
EAGGF GUARANTEE !
EXPENDITURE CHARGED AGAINST THE 1993 BUDGET (ECU MILLION) 27. !
BELGIQUE DANMARK DEUTSCHLAND ELLAS ESPANA FRANCE IRELAND ITALIA LUXEMBOURG NEDERLAND PORTUGAL UNIT.KINGD COMMUNITY TOTALS !
B01-310 ACCESSION COMPENSATORY AMOUNTS GRANTED -0,053 0,084 1,576 0,915 0,289 0,002 2,927 0,008 1,316 0,075 7,139
IN INTRA-COMMUNITY TRADE 1301-31 ACCESSION COMPENSATORY AMOUNTS GRANTED -0,053 0,084 1,576 0,915 0,289 0,002 2,927 0,008 1,316 0,075 7,139
IN INTRA-COMMUNITY TRADE
CO rO
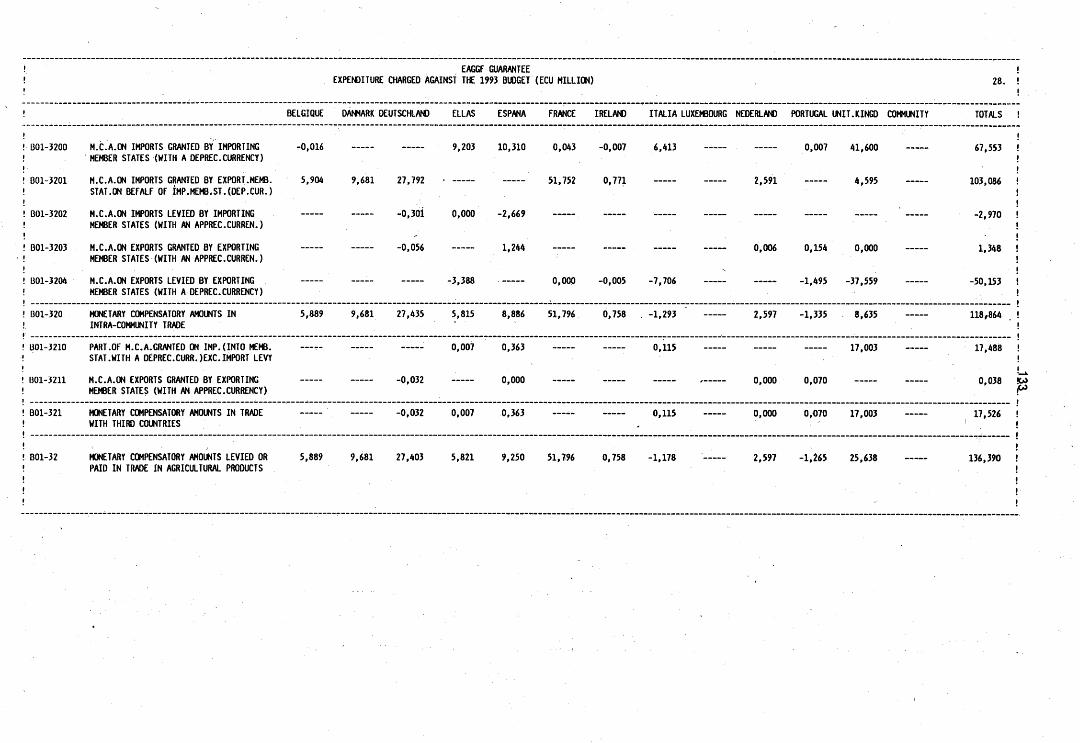
EAGGF GUARANTEE EXPENDITURE CHARGED AGAINST THE 1993 BUDGET (ECU MILLION) 28.
BELGIQUE DANMARK DEUTSCHLAND ELLAS ESPANA FRANCE IRELAND ITALIA LUXEMBOURG NEDERLAND PORTUGAL UNIT.KINGD COMMUNITY TOTALS
B01-320O M.C.A.ON IMPORTS GRANTED BY IMPORTING MEMBER STATES (WITH A DEPREC.CURRENCY)
BOl-3201 M.C.A.ON IMPORTS GRANTED BY EXPORT.MEMB. STAT.ON BEFALF OF IMP.MEMB.ST.(DEP.CUR.)
B01-3202 M.C.A.ON IMPORTS LEVIED BY IMPORTING MEMBER STATES (WITH AN APPREC.CURREN.)
BOl-3203 M.C.A.ON EXPORTS GRANTED BY EXPORTING MEMBER STATES (WITH AN APPREC.CURREN.)
B01-3204 M.C.A.ON EXPORTS LEVIED BY EXPORTING MEMBER STATES (WITH A DEPREC.CURRENCY)
-0,016
5,904 9,681 27,792 • -—•-
0,30i 0,000 -2,669
_0,056
9,203 10,310 0,043 -0,007 6,413
51,752 0,771
1,244
-3,388 0,000 -0,005 -7,706
2,591
0,007 41,600
4,595
0,006 0,154 0,000
-1,495 -37,559
67,553
103,086
-2,970
1,348
-50,153
B01-320 MONETARY COMPENSATORY AMOUNTS IN INTRA-COMMUNITY TRADE
5,889 9,681 27,435 5,815 8,886 51,796 0,758 -1,293 2,597 -1,335 8,635 118,864
B01-3210 PART.OF M.C.A.GRANTED ON IMP.(INTO MEMB. STAT.WITH A DEPREC.CURRJEXC.IMPORT LEVY
1301-3211 M.C.A.ON EXPORTS GRANTED BY EXPORTING MEMBER STATES (WITH AN APPREC.CURRENCY)
0,007 0,363
-0,032 0,000
0,115 17,003
0,000 0,070
17,488
0,038 .<*> fW
B01-321 MONETARY COMPENSATORY AMOUNTS IN TRADE WITH THIRD COUNTRIES
-0,032 0,007 0,363 0,115 0,000 0,070 17,003 17,526
B01-32 MONETARY COMPENSATORY AMOUNTS LEVIED OR 5,889 9,681 27,403 5,821 9,250 51,796 0,758 -1,178 PAID IN TRADE IN AGRICULTURAL PRODUCTS
2,597 -1,265 25,638 136,390

EAGGF GUARANTEE EXPENDITURE CHARGED AGAINST THE 1993 BUDGET (ECU MILLION) 29.
BELGIQUE DANMARK DEUTSCHLAND ELLAS ESPANA FRANCE IRELAND ITALIA LUXEMBOURG NEDERLAND PORTUGAL UNIT.KINGD COMMUNITY TOTALS !
BO1-330 REFUNDS IN CONNECTION WITH COMMUNITY FOOD AID (CEREALS)*
14,363 3,051 2,729 0,128 64,563 1,204 0,327 0,129 3,510 90,005
16,125
0,976
B01-331 REFUNDS IN CONNECTION WITH COMMUNITY FOOD AID (RICE)*
0,036 0,243 15,846
BOl-332 REFUNDS IN CONNECTION WITH COMMUNITY FOOD AID (SUGAR)*
0,976
BOl-333 REFUNDS IN CONNECTION WITH COMMUNITY FOOD AID (VEGETABLE OIL/OLIVE OIL)*
B01-334 REFUNDS IN CONNECTION WITH COMMUNITY FOOD AID (SKIMMED-MILK POWDER)*
14,991 15,898 9,366
1,086
9,670
2,303
49,925
3,388 B01-335 REFUNDS IN CONNECTION WITH COMMUNITY FOOD AID (BUTTEROIL)*
B01-33 REFUNDS IN CONNECTION WITH COMMUNITY FOOD AID
30,367 3,051 18,628 0,371 64,563 10,452 17,050 0,327 12,102 3,510 160,419
*
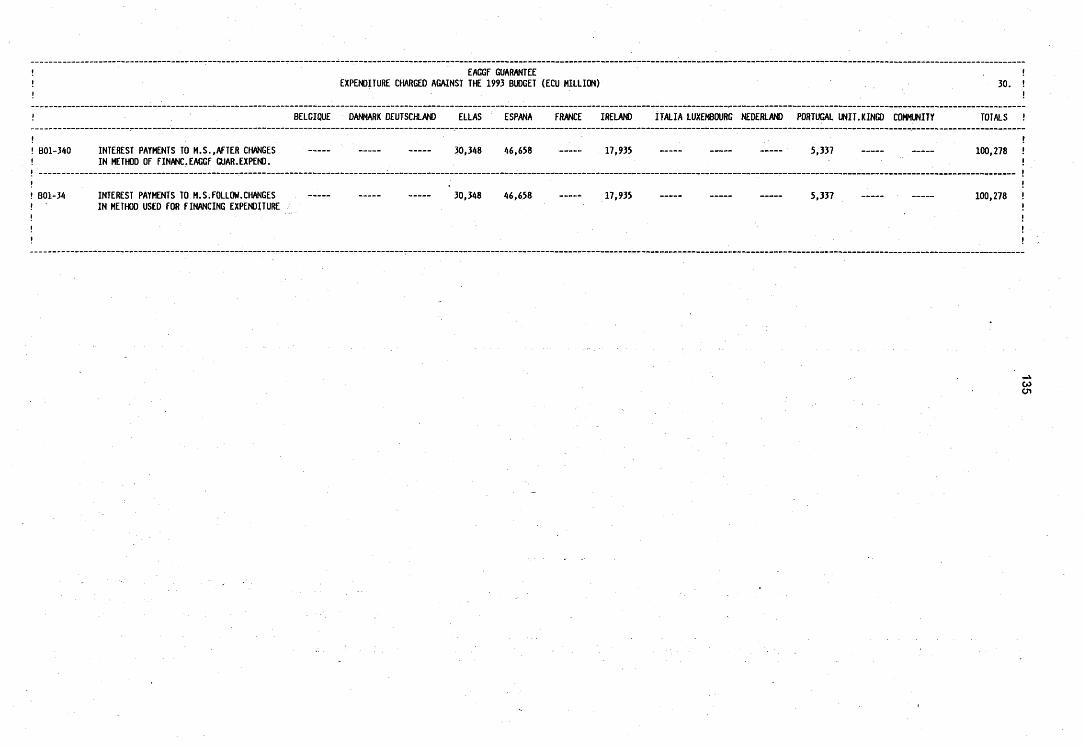
EAGGF GUARANTEE EXPENDITURE CHARGED AGAINST THE 1993 BUDGET (ECU MILLION) 30.
BELGIQUE DANMARK DEUTSCHLAND ELLAS ESPANA FRANCE IRELAND ITALIA LUXEMBOURG NEDERLAND PORTUGAL UNIT.KINGD COMMUNITY TOTALS
B01-340 INTEREST PAYMENTS TO M.S.,AFTER CHANGES 30,348 46,658 17,935 — — 5,337 — - 100,278 IN METHOD OF FINANC.EAGGF GUAR.EXPEND.
B01-34 INTEREST PAYMENTS TO M.S.FOLLOW.CHANGES ----- — ~ 30,348 46,658 17,935 5,337 ~ — 100,278 IN METHOD USED FOR FINANCING EXPENDITURE
en
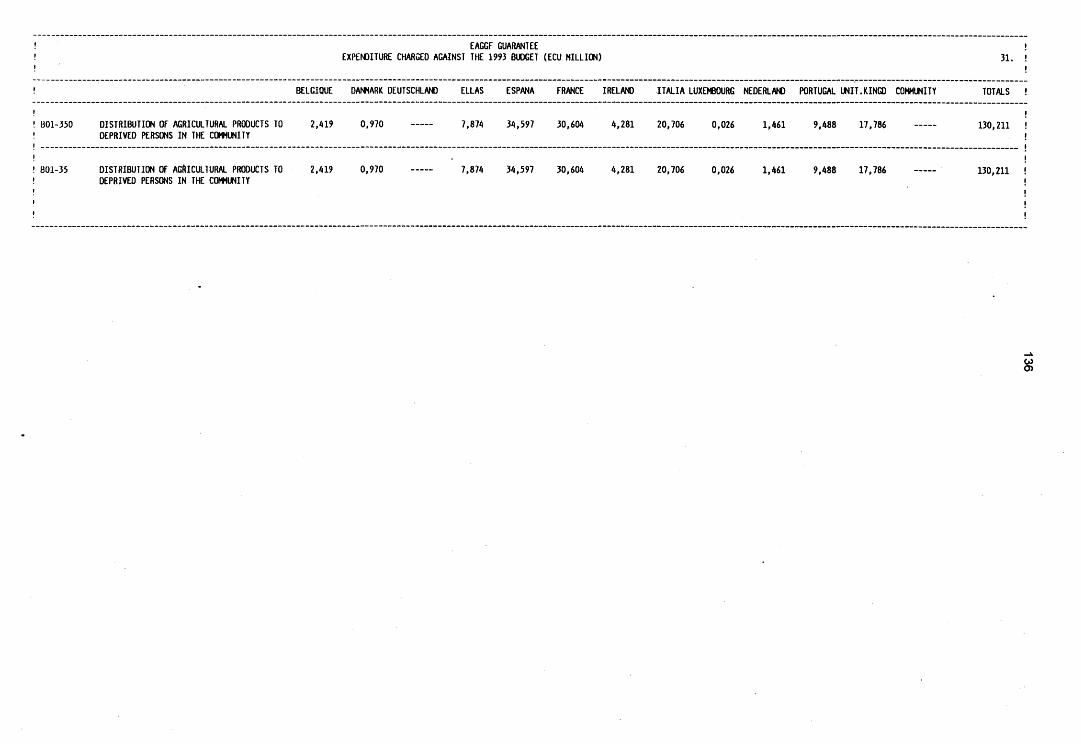
EAGGF GUARANTEE EXPENDITURE CHARGED AGAINST THE 1993 BUDGET (ECU MILLION) 31.
BELGIQUE DANMARK DEUTSCHLAND ELLAS ESPANA FRANCE IRELAND ITALIA LUXEMBOURG NEDERLAND PORTUGAL UNIT.KINGD COMMUNITY TOTALS
B01-350 DISTRIBUTION OF AGRICULTURAL PRODUCTS TO 2,419 0,970 7,874 34,597 30,604 4,281 20,706 0,026 1,461 9,488 17,786 130,211 DEPRIVED PERSONS IN THE COMMUNITY
B01-35 DISTRIBUTION OF AGRICULTURAL PRODUCTS TO 2,419 0,970 7,874 34,597 30,604 4,281 20,706 0,026 1,461 9,488 17,786 130,211 DEPRIVED PERSONS IN THE COMMUNITY
CO CD
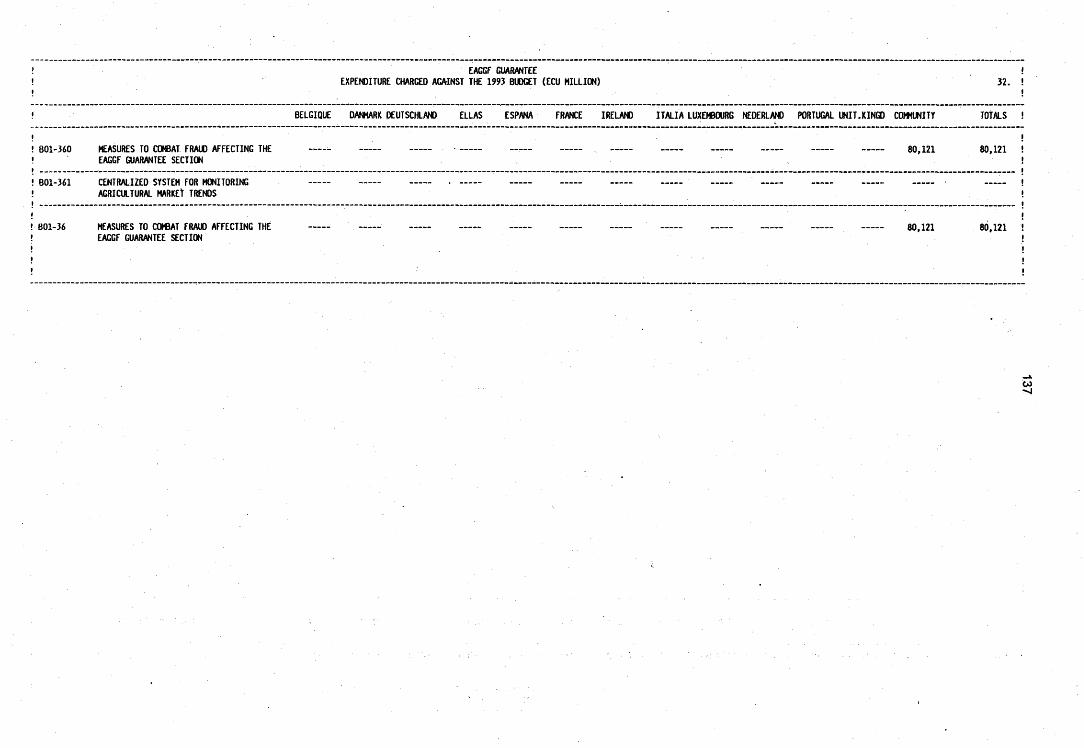
EAGGF GUARANTEE EXPENDITURE CHARGED AGAINST THE 1993 BUDGET (ECU MILLION) 32.
BELGIQUE DANMARK DEUTSCHLAND ELLAS ESPANA FRANCE IRELAND ITALIA LUXEMBOURG NEDERLAND PORTUGAL UNIT.KINGD COMMUNITY TOTALS !
BOl-360 MEASURES TO COMBAT FRAUD AFFECTING THE EAGGF GUARANTEE SECTION
80,121 ),121
B01-361 CENTRALIZED SYSTEM FOR MONITORING AGRICULTURAL MARKET TRENDS
B01-36 MEASURES TO COMBAT FRAUD AFFECTING THE EAGGF GUARANTEE SECTION
80,121 80,121
CO
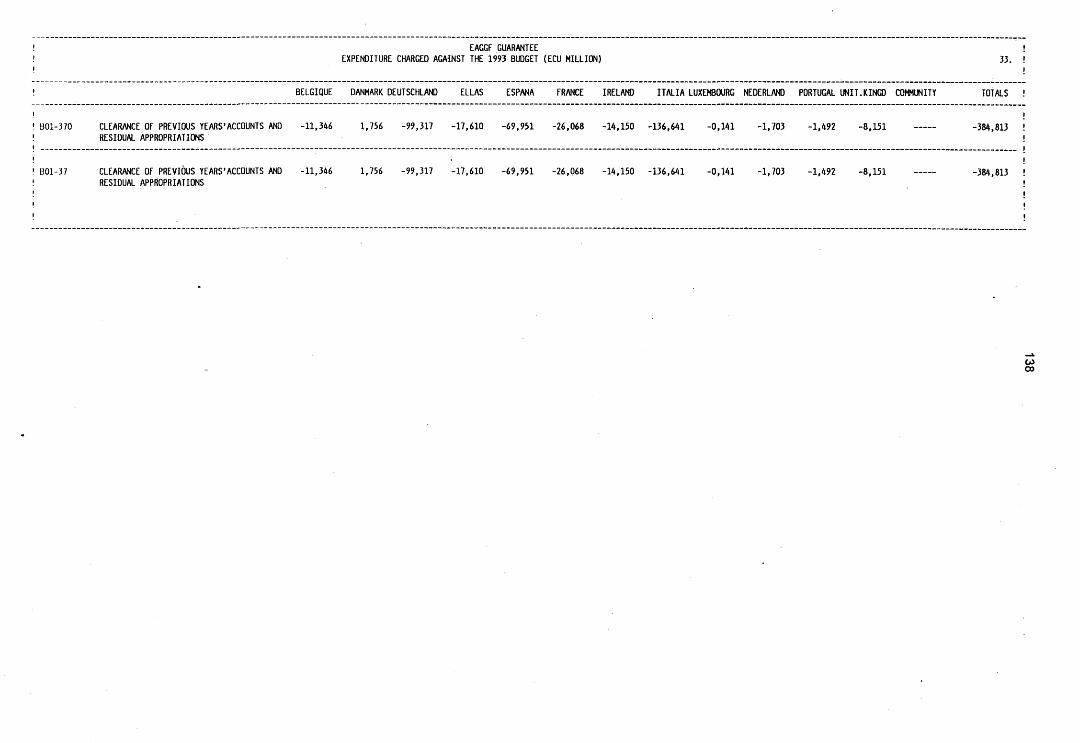
EAGGF GUARANTEE !
EXPENDITURE CHARGED AGAINST THE 1993 BUDGET (ECU MILLION) 33. !
BELGIQUE DANMARK DEUTSCHLAND ELLAS ESPANA FRANCE IRELAND ITALIA LUXEMBOURG NEDERLAND PORTUGAL UNIT.KINGD COMMUNITY TOTALS !
B01-370 CLEARANCE OF PREVIOUS YEARS'ACCOUNTS AND -11,346 1,756 -99,317 -17,610 -69,951 -26,068 -14,150 -136,641 -0,141 -1,703 -1,492 -8,151 -384,813
RESIDUAL APPROPRIATIONS 1301-37 CLEARANCE OF PREVIOUS YEARS'ACCOUNTS AND -11,346 1,756 -99,317 -17,610 -69,951 -26,068 -14,150 -136,641 -0,141 -1,703 -1,492 -8,151 -384,813
RESIDUAL APPROPRIATIONS
CO
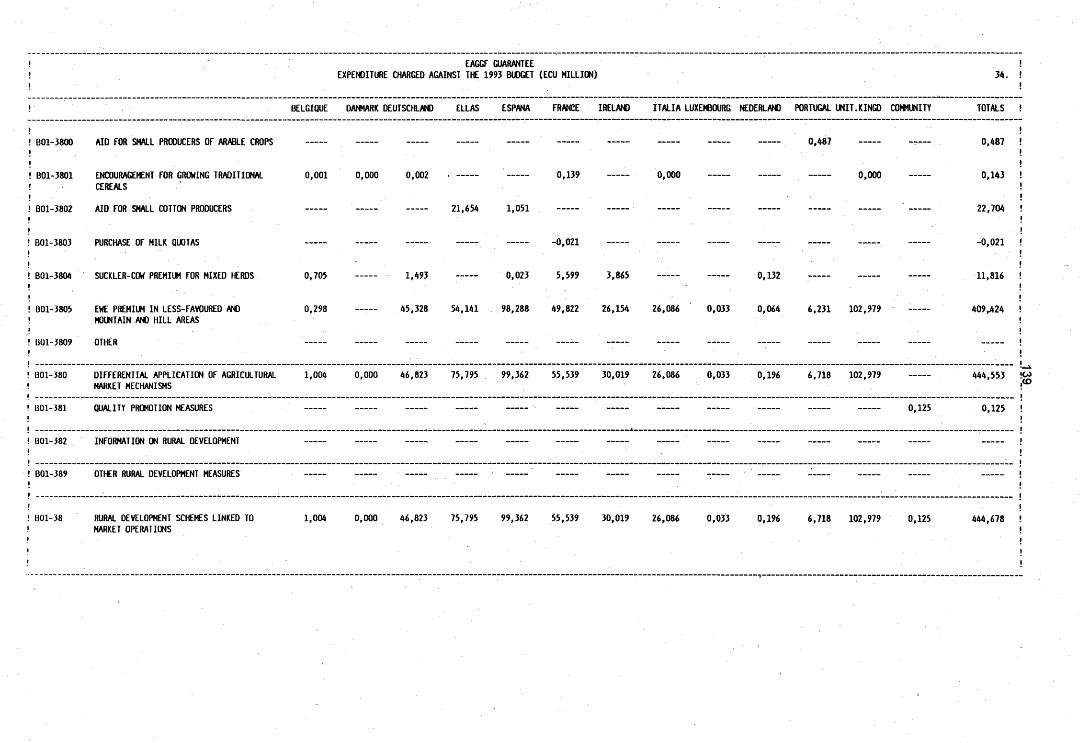
EAGGF GUARANTEE !
EXPENDITURE CHARGED AGAINST THE 1993 BUDGET (ECU MILLION) 34. !
BELGIQUE DANMARK DEUTSCHLAND ELLAS ESPANA FRANCE IRELAND ITALIA LUXEMBOURG NEDERLAND PORTUGAL UNIT.KINGD COMMUNITY TOTALS !
B01-3800 AID FOR SMALL PRODUCERS OF ARABLE CROPS -—— 0,487 - r — 0,487
B01-3801 ENCOURAGEMENT FOR GROWING TRADITIONAL 0,001 0,000 0,002 • 0,139 0,000 0,000 0,143
CEREALS B01-3802 AID FOR SMALL COTTON PRODUCERS 21,654 1,051 .—_ __— _ 22,704
BO1-3803 PURCHASE OF MILK QUOTAS -0,021 — — --— -0,021
B01-3804 SUCKLER-COW PREMIUM FOR MIXED HERDS 0,705 1,493 0,023 5,599 3,865 0,132 11,816
B01-3805 EWE PREMIUM IN LESS-FAVOURED AND 0,298 45,328 54,141 98,288 49,822 26,154 26,086 0,033 0,064 6,231 102,979 — — 409,424
MOUNTAIN AND HILL AREAS B01-3809 OTHER
B01-380 DIFFERENTIAL APPLICATION OF AGRICULTURAL 1,004 0,000 46,823 75,795 99,362 55,539 30,019 26,086 0,033 0,196 6,718 102,979 444,553 !W MARKET MECHANISMS ,<0
B01-381 QUALITY PROMOTION MEASURES --— 0,125 0,125
B01-382 INFORMATION ON RURAL DEVELOPMENT
B01-389 OTHER RURAL DEVELOPMENT MEASURES
B01-38 RURAL DEVELOPMENT SCHEMES LINKED TO 1,004 0,000 46,823 75,795 99,362 55,539 30,019 26,086 0,033 0,196 6,718 102,979 0,125 444,678 MARKET OPERATIONS
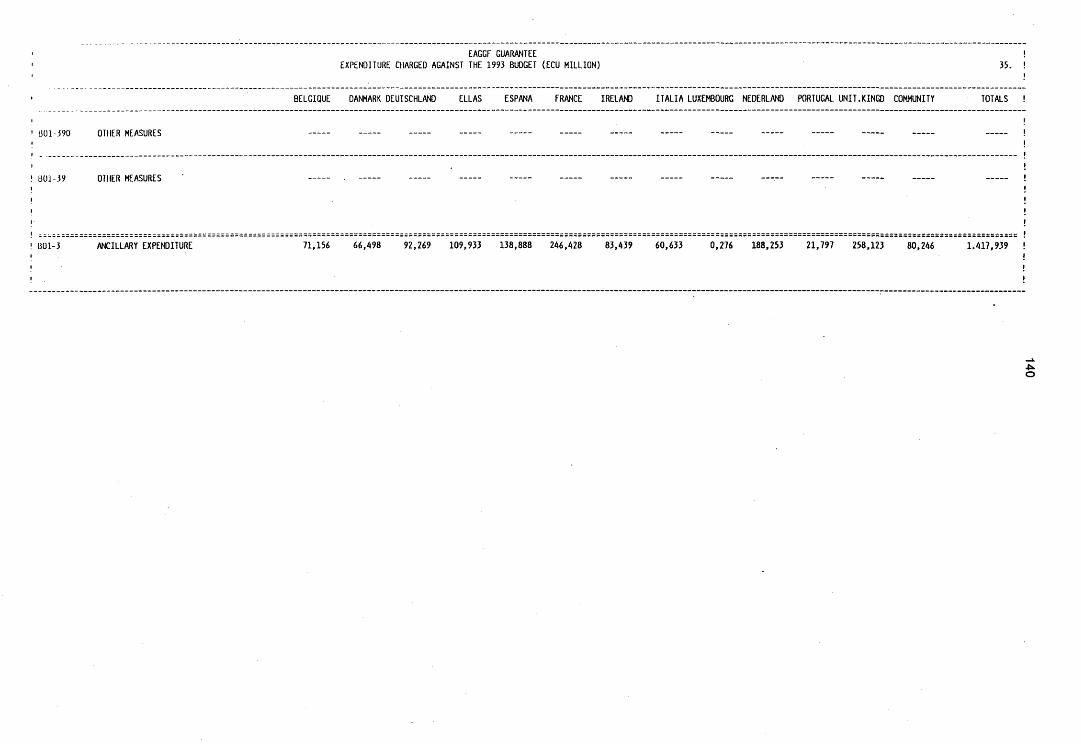
EAGGF GUARANTEE ! EXPENDITURE CHARGED AGAINST THE 1993 BUDGET (ECU MILLION) 35. !
BELGIQUE DANMARK DEUTSCHLAND ELLAS ESPANA FRANCE IRELAND ITALIA LUXEMBOURG NEDERLAND PORTUGAL UNIT.KINGD COMMUNITY TOTALS !
1301-390 OTHER MEASURES
UOl-39 OTHER MEASURES
B01-3 ANCILLARY EXPENDITURE 71,156 66,498 92,269 109,933 138,888 246,428 83,439 60,633 0,276 188,253 21,797 258,123 80,246 1.417,939
4*. o
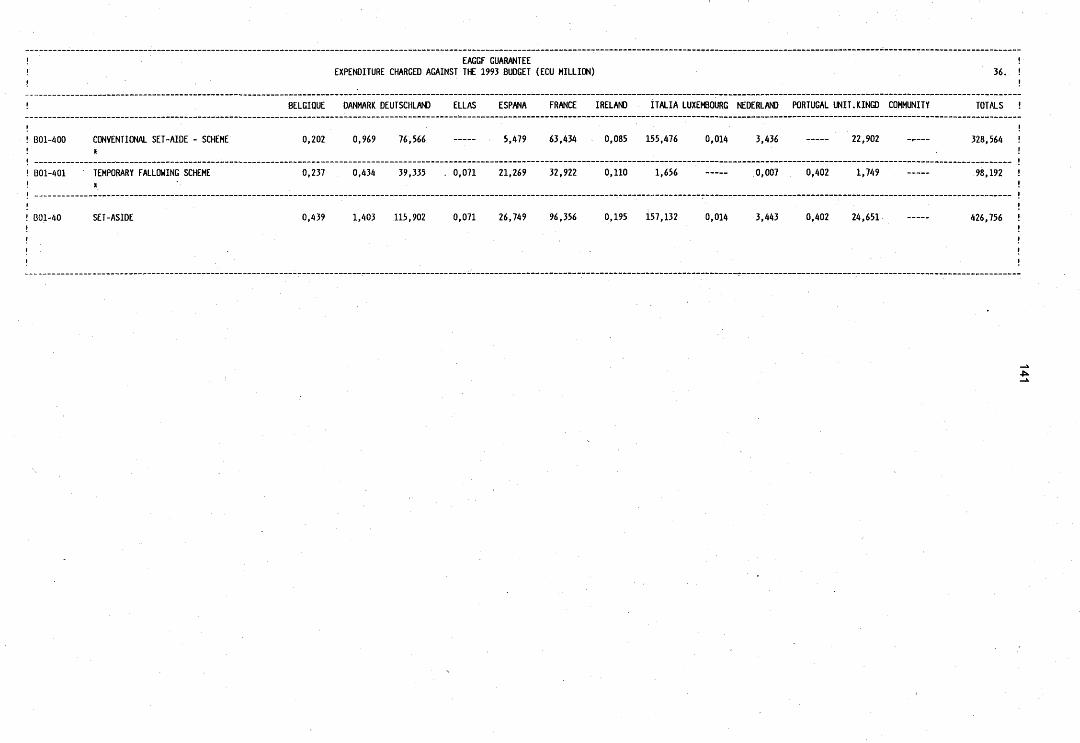
EAGGF GUARANTEE EXPENDITURE CHARGED AGAINST THE 1993 BUDGET (ECU MILLION) 36.
BELGIQUE DANMARK DEUTSCHLAND ELLAS ESPANA FRANCE IRELAND ITALIA LUXEMBOURG NEDERLAND PORTUGAL UNIT.KINGD COMMUNITY TOTALS !
BOl-400 CONVENTIONAL SET-AIDE - SCHEME
B01-401 TEMPORARY FALLOWING SCHEME
0,202 0,969 76,566 5,479 63,434 0,085 155,476 0,014 3,436
0,237 0,434 39,335 . 0,071 21,269 32,922 0,110 1,656
22,902
0,007 0,402 1,749
328,564
98,192
B01-40 SET-ASIDE 0,439 1,403 115,902 0,071 26,749 96,356 0,195 157,132 0,014 3,443 0,402 24,651 426,756
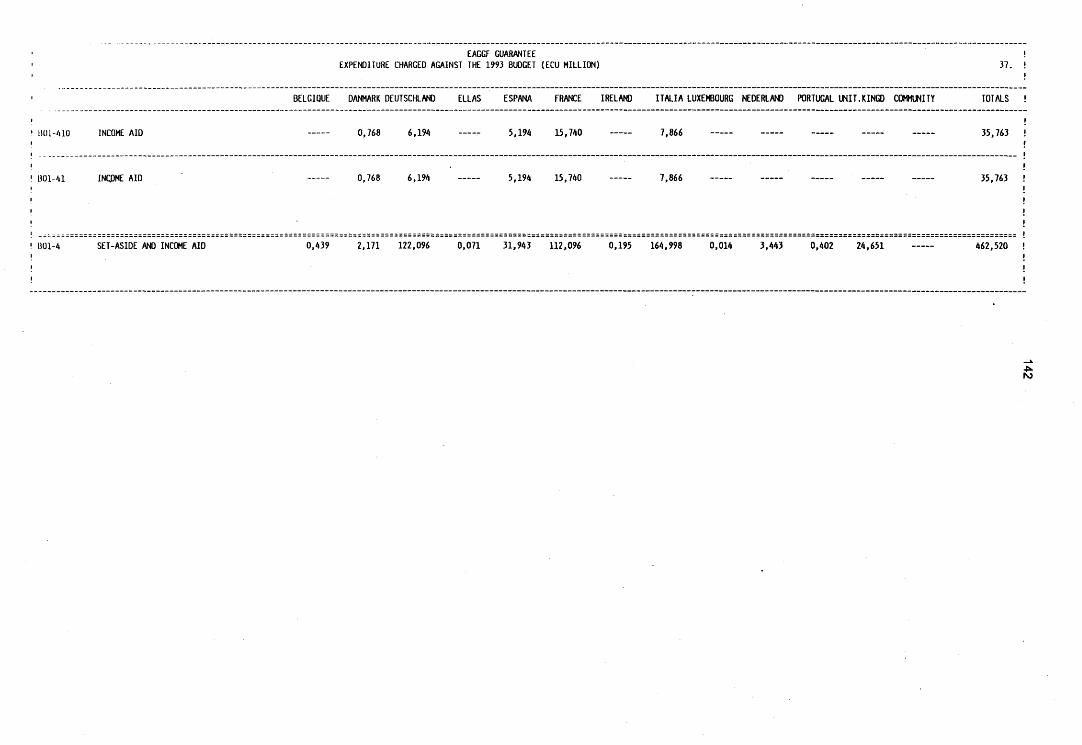
EAGGF GUARANTEE
EXPENDITURE CHARGED AGAINST THE 1993 BUDGET (ECU MILLION) 37.
BELGIQUE DANMARK DEUTSCHLAND ELLAS ESPANA FRANCE IRELAND ITALIA LUXEMBOURG NEDERLAND PORTUGAL UNIT.KINGD COMMUNITY TOTALS !
1)01-410 INCOME AID 0,768 6,194 5,194 15,740 7,866 35,763
B01-41 INCOME AID 0,768 6,194 5,194 15,740 7,866 35,763
801-4 SET-ASIDE AND INCOME AID 0,439 2,171 122,096 0,071 31,943 112,096 0,195 164,998 0,014 3,443 0,402 24,651 462,520
ro
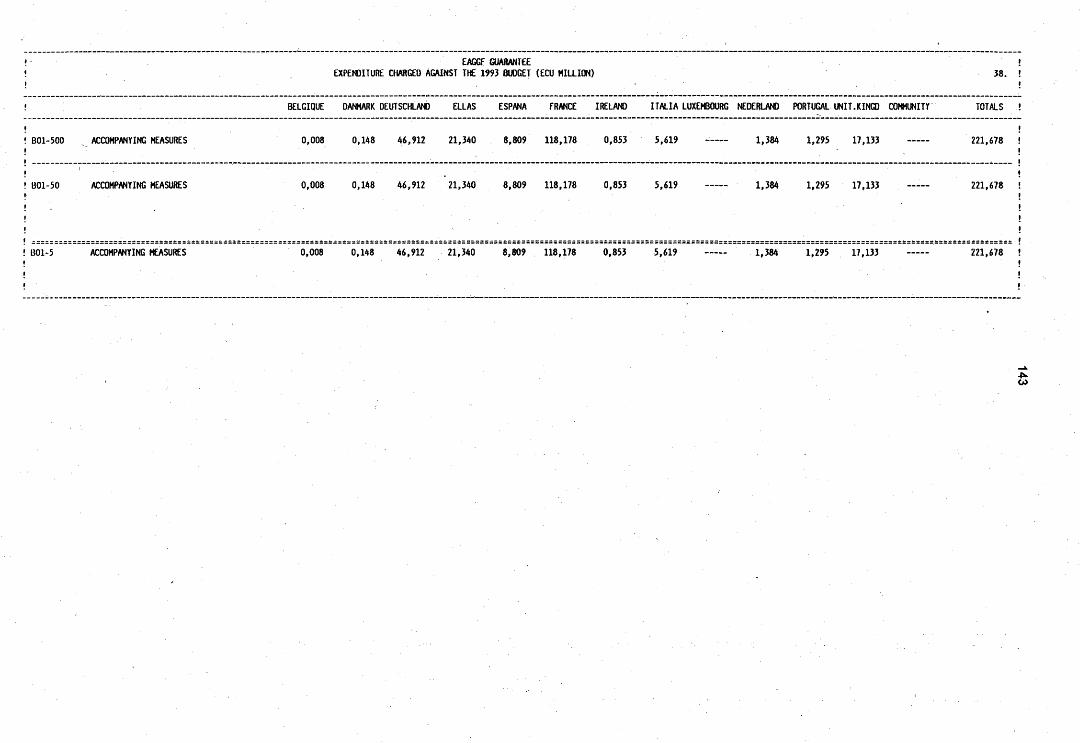
EAGGF GUARANTEE EXPENDITURE CHARGED AGAINST THE 1993 BUDGET (ECU MILLION) 38.
BELGIQUE DANMARK DEUTSCHLAND ELLAS ESPANA FRANCE IRELAND ITALIA LUXEMBOURG NEDERLAND PORTUGAL UNIT.KINGD COMMUNITY TOTALS !
BOl-500 ACCOMPANYING MEASURES 0,008 0,148 46,912 21,340 8,809 118,178 0,853 5,619 1,384 1,295 17,133 221,678
B01-50 ACCOMPANYING MEASURES 0,008 0,148 46,912 21,340 8,809 118,178 0,853 5,619 1,384 1,295 17,133 221,678
B01-5 ACCOMPANYING MEASURES 0,008 0,148 46,912 21,340 8,809 118,178 0,853 5,619 1,384 1,295 17,133 221,678
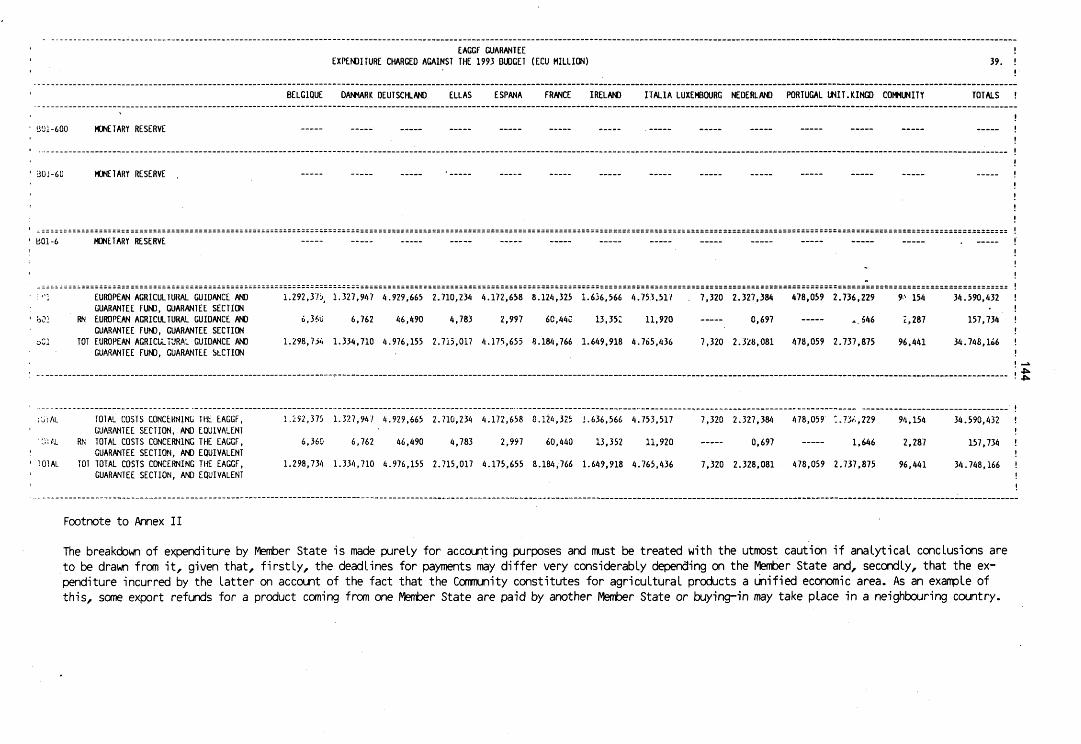
EAGGF GUARANTEE EXPENDITURE CHARGED AGAINST THE 1993 BUDGET (ECU MILLION) 39.
BELGIQUE DANMARK DEUTSCHLAND ELLAS ESPANA FRANCE IRELAND ITALIA LUXEMBOURG NEDERLAND PORTUGAL UNIT.KINGD COMMUNITY TOTALS
B'Ji-600 MONETARY RESERVE
1301-6U MONETARY RESERVE
B01-6 MONETARY RESERVE
EUROPEAN AGRICULTURAL GUIDANCE AND GUARANTEE FUND, GUARANTEE SECTION
RN EUROPEAN AGRICULTURAL GUIDANCE AND GUARANTEE FUND, GUARANTEE SECTION
TOT EUROPEAN AGRICULTURAL GUIDANCE AND GUARANIEE FUND, GUARANTEE StCTION
1.292,375, 1.327,947 4.929,665 2.710,234 4.172,658 8.124,325 1.636,566 4.753.517 . 7,320 2.327,384 478,059 2.736,229 9'' 154 34.590,432
6,360 6,762 46,490 4,783 2,997 6C.44C 13,35: 11,920 0,697 .646 2,287 157,734
1.298,734 1.334,710 4.976,155 2.715,01? 4.175,655 8.184,766 1.649,918 4.765,436 7,320 2.328,081 478,059 2.737,875 96.441 34.748,166
l'u'iAL T01AL COSTS CONCERNING THE EAGGF, GUARANTEE SECTION, AND EQUIVALENT
:v:AL RN TOTAL COSTS CONCERNING THE EAGGF, GUARANTEE SECTION, AND EQUIVALENT
TOTAL TOI TOTAL COSTS CONCERNING THE EAGGF, GUARANTEE SECTION, AND EQUIVALENT
1.252,375 1.327,947 4.929,665 2.710,234 4.172,658 8.126,325 i.636,566 4.753,517
6,360 6,762 46,490 4,783 2,997 60,440 13,352 11,920
1.298,734 1.334,710 4.976,155 2.715,017 4.175,655 8.184,766 1.649,918 4.765,436
7,320 2.327,384 478,059 '..Tit,,229 94,154 34.590,432
0,697 1,646 2,287 157,734
7,320 2.328,081 478,059 2.737,875 96,441 34.748,166
Footnote to Annex II
The breakdown of expenditure by Member State is made purely for accounting purposes and must be treated with the utmost caution if analytical conclusions are to be drawn from it, given that, firstly, the deadlines for payments may differ very considerably depending on the Member State and, secondly, that the expenditure incurred by the latter on account of the fact that the Community constitutes for agricultural products a unified economic area. As an example of this, some export refunds for a product coming from one Member State are paid by another Member State or buying-in may take place in a neighbouring country.

ANNEX 3 : EAGGF GUARANTEE EXPENDITURE BY SECTOR (1) (2)
(ECU mi I I ion)
CHAPTERS SECTOR OR TYPE OF MEASURE 1 9 8 9 1 9 9 0 1 9 9 1 1 9 9 2 1 9 9 3
81 - 10
Bl - 11
Bl - 12
B1 - 13
B1 - 1*
81 - 15
81 - 16
Bl - 17
CEREALS AND RICE Of which CEREALS
Refunds Intervention, of which: - Product ion refund* - Aid for durum wheat - Storoge - Co-responsibility levy
of which RICE Refunds Intervention
SUGAR Refunds Intervention, of which: - Reimbursement of storage costs
OIL AND FATS of which OLIVE OIL
Refunds Intervention
of which OILSEEDS Refunds Intervention, of which: - Rape and sunflower seed - Soya - Flax seed
PROTEIN PLANTS Refunds Intervention, of which: - Peas and field beans - Dried fodder
FIBER PLANTS AND SILK WORMS, of which: - Flax and hemp - Cotton
FRUIT AND VEGETABLES Refunds - Fresh - Processed
Intervention - Fresh - Processed
WINE PRODUCTS Refunds Intervention, of which: - Private storage old - Compulsory distillation of the
by—products of wine-moking - Distillation
TOBACCO Refunds Intervention
(3 .261 .5 ) 3 .150 ,0
2.597.1 552,9
111.5 45.3 66,2
1.979,8 1.451,3
528.5
( 4 . 1 3 8 , 1 ) 1 .464,5
301.2 365.0 576.4
-720.5
421.6
9 3 , 1 1.371.4
2.673 .6 5.8
2 .667,8
642,9
600 ,7
1 .018.6
642,9
78,7
939.9
1 .1 *7 ,7 45,3
1.102,4
.176,6 460,4
30.0
423.5 218 ,9
2 9 , 1 570.9
63 .4 15.3
433.1 506.8
67.4
78.5 422.5
1.138.8 61 .9
1.076.9
(3 .884 .6) 3 .799 ,5
2. 1.
8 5 . 1
1 .388,3
443,4 356 .1
275,9 419.5
1.251,4 -656 ,2
29.1 56.0
925.9 462,4
(4 .645 .2) 1.168,2
383,3
134.9 . 033 .3
3 . 4 7 7 . 0
834 ,8
580 .3
1 .253.0
1.0 ,476 .0
2.856,2 581.3
37.6
834,8
80.6
745,2
1.232.1
1.172,4
54.7 690,5
61 .9 170,2
536,4 298.0
40.3 539.8
67,0 13,6
603,4 569,0
39.9
68.3 267.4
(5 .189 .3 ) 5 .077.4
3 .601 ,5 1.475.9
111.9
1 .814,9
77 ,8 3 4 , 1
1.251.2 563,7
( 5 . 4 2 3 , 7 ) 1 .874,2
111.8 1 .762,4
3 . 5 4 9 . 5 0.5
3 .549,0
419,1 516,1
.419 .4 924 .3
460,9
959,0
521 ,8
1.106.5
959.0
9 4 . 8
1 .047,8
1 .011,7
55 .5 992.3
.876.7 594.6
76.4
550.8 403.9
33.6 487.9
76.9 17.9
412.0 599.7
72.3 367,2
1.329,6 65,3
1.264.3
(5 .544 ,2 ) 5 .456 ,9
3 . 1 3 9 . 7 2 . 3 1 7 . 2
8 7 . 3 9 1 , 8
4 ,5 1 .937.4
1 .305 .6 631 ,8
( 5 . 8 8 6 . 3 ) 1 .754 .3
360.7 456.4
.497.4
.098,8
496.1
48 .4 1 .705 .9
4 . 1 3 2 , 0 0 .1
4 . 1 3 1 , 9
862.0
771 ,3
1 .261.7
862.0
1. 145,0
77 .3 1 .009,9
. 1 1 8 . 2 478,4 125.7
480,3 380 .2
2 9 . 0 742.1
91 .6 25, 1
516.0 629.0
40.4
8 9 . 2 320.7
1.233,0 71 ,9
1 .161.1
(6 .629 .8) 6 .560.3
2.788, 3 . 7 7 1 ,
415.7 425.9
2 .723,8 89.6
69.5
2 . 1 8 8 . 6 1.531,
657,
(5 .531 ,6 ) 2 .468 ,2
68, ' 2.399,
3 .063.4 0,
3.063,
501.7
.)2. 878,6
183,3 1 .083.8
860.6
1.672.2
1.509,6
1.165,1
1.083.8
187,5
100 1.409
36, 1.128,
55É 523,7
29.6 830.8
156.4 31 .1
919,5 565.2
57,5
76.7 464,3
J.
I
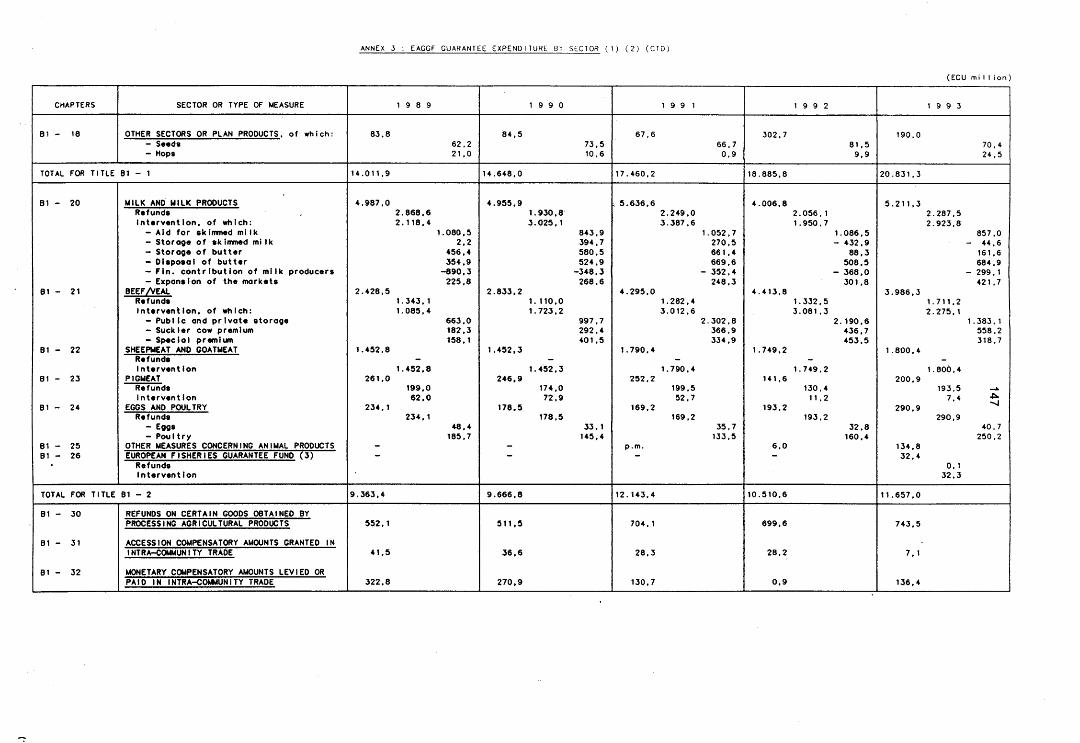
ANNEX 3 : EAGGF GUARANTEE EXPENDITURE BY SECTOR (1) (2) (CTD)
(ECU mi I I ion)
CHAPTERS SECTOR OR TYPE OF MEASURE 19 9 0
Bl - 18 OTHER SECTORS OR PLAN PRODUCTS, of which: - Seeds - Hops
84.5 67.6 302.7 62.2 21,0
73,5 10.6
66.7 0.9
81,5 9.9
70.4 24,5
TOTAL FOR TITLE B1 - 1 14.011,9 14.648.0 17.460,2 18.885.8 20.831.3
Bl - 20
81 - 21
B1 - 22
81 - 23
81 - 24
81 - 25 Bl - 26
MILK AND MILK PRODUCTS Refunds Intervention, of which:
- Aid for skimmed milk - Storage of skimmed milk - Storoge of butter - Disposal of butter - Fin. contribution of milk producers - Expansion of the markets
BEEFAEAL Refunds Intervention, of which: - PublIc and prIvate storage - Suck 1er cow premium - Special premium
SHEEPMEAT AND GOATMEAT Refunds Intervention
PIGMEAT Refunds Intervent ion
EGGS AND POULTRY
4.987.0 4.955.9 5.636.6 4.006.8 2.868.6 2.118.4
1.930.8 3.025.1
5.211,3 2.249, 3.387,
2.056, 1.950,
2.287.5 2.923,8
1.080,5 2.2
456.4 354.9
-890.3 225,8
2.428.5 1.343,1 1.085,4
663.0 182.3 158.1
1.452,8
2 . 8 3 3 . 2
1 .452,3
110.0 723.2
843 ,9 394,7 580,5 524.9
- 3 4 8 . 3 268.6
9 9 7 , 7 2 9 2 . 4 4 0 1 . 5
4 . 2 9 5 . 0 1.282, 3 .012,
1 . 0 5 2 , 7 2 7 0 , 5 6 6 1 . 4 6 6 9 . 6
- 352 ,4 248.3
. 3 0 2 , 8 3 6 6 . 9 3 3 4 . 9
1.086.5 - 432 .9
8 8 . 3 508.5
- 368 .0 301.8
8 5 7 . 0 - 44.6
161.6 684.9
- 299.1 421,7
4 .413 .8 1 .332.5 3 .081 .3
. 1 9 0 . 6 4 3 6 . 7 4 5 3 . 5
1.790.4 1.749.2
234.1 Refunds
- Eggs - Poultry
OTHER MEASURES CONCERNING ANIMAL PRODUCTS EUROPEAN FISHERIES GUARANTEE FUND (3)
Refunds Intervention
1.452.8
199.0 6 2 . 0
234 .1
1 .452.3 1.790.4 1 .749.2 2 4 6 . 9
178.5
174.0 72 .9
178.5
2 5 2 . 2
169,2
1 9 9 . 5 5 2 . 7
169.2 48 .4
185.7 3 3 . 1
145,4 3 5 , 7
1 3 3 , 5
141,6
193,2
6 . 0
130.4 11.2
193,2 3 2 . 8
160.4
3 . 9 8 6 , 3
1.800.4
200 .9
290 .9
134.8 32 ,4
1.711.2 2 . 2 7 5 . 1
1.800.4
193.5 7,4
290.9
1 .383.1 558,2 318.7
-si
4 0 . 7 2 5 0 . 2
0 ,1 32 .3
TOTAL FOR TITLE B1 - 2 9.363.4 9.666.8 12.143.4 10.510.6 11.657.0
81 - 30
Bl - 31
Bl - 32
REFUNDS ON CERTAIN GOODS OBTAINED BY PROCESSING AGRICULTURAL PRODUCTS
ACCESSION COMPENSATORY AMOUNTS GRANTED IN INTRA-COMMUNITY TRAOE
MONETARY COMPENSATORY AMOUNTS LEVIED OR PAID IN INTRA-COMMUNITY TRADE
552,1
41,5
322.8
511.5
36.6
270.9
704.1
28,3
130.7
699,6
28,2
0.9
743.5
136,4

ANNEX 3 : EAGGF GUARANTEE EXPENDITURE BY SECTOR (1) (2) (CTD)
CHAPTERS
Bl - 33
B1 - 34
Bl - 35
Bl - 36
Bl - 37
81 - 38
1
SECTORS OR TYPE OF MEASURE
REFUNDS IN CONNECTION WITH COMMUNITY FOOD AID
INTEREST PAYMENTS TO MEMBER STATES AFTER CHANGES IN METHOO OF FINANCING EXPENDITURE
DISTRIBUTION OF AGRICULTURAL PRODUCTS TO THE MOST DEPRIVED PERSONS IN THE COMMUNITY
MEASURES TO COMBAT FRAUD IN CONNECTION WITH THE EAGGF GUARANTEE SECTION
CLEARANCE OF ACCOUNTS OF PREVIOUS YEARS AND REMAINING APPROPRIATIONS
RURAL DEVELOPMENT MEASURES LINKED TO THE MARKETS
TOTAL FOR TITLE Bl - 3
TOTAL FOR TITLES 81 - 1. 81 - 2, BT - 3
Bl - 40
81 - 41
SET-ASIDE(4)
INCOME AID(4)
TOTAL FOR TITLE Bl - 4
81 - 50 ACCOMPANYING MEASURES(4)
TOTAL FINANCEO WITHIN THE GUIDELINE
[GUIDELINE]
[Bl - 60] [MONETARY RESERVE1
EXPENDITURE FINANCED OUTSIDE THE GUIDELINE
82-90
80-10
FISHERIES GUARANTEE FUN0{3) Refunds Intervention
REPAYMENT TO MEMBER STATES OF COST OF DEPRECIATION OF STOCKS OF AGRICULTURAL PROOUCTS ANO SPECIFIC DISPOSAL OF BUTTER FROM PUBLIC STOCKS
EXPENDITURE USING APPROPRIATIONS CARRIED OVER FROM PREVIOUS YEAR
TOTAL EAGGF GUARANTEE EXPENDITURE
19 8 9
132,6
48.5
132.9
-202,7
1.027.7
24.403,0
3.0
-
3.0
-
24.406.0
[28.624,0]
[1.000,0]
24.0 0.1 23.9
1.442.9
25.872.9(5)
19 9 0
85.6
66.6
136,9
3.0
-377.9
733.2
25.048,0
21,2
-
21.2
-
25.069,2
[30.630,0]
[1.000,0]
23,6
23.6
1.360,7
26.453.5(5)
19 9 1
217,0
84.7
145.0
20,1
-437.8
388.2
1.280.3
30.883.9
76.9
-
76.9
-
30.960.8
[32.511.0]
[1.000.0]
26.2
26.2
797,3
601.6
32.385.9(5)
19 9 2
221.6
86.0
130.2
24.6
79.0
304.4
1.574,5
30.970.9
147,6
-
147.6
-
31.118.5
[35.039,0]
[1.000,0]
32,1 1.9
30.2
799.5
157.4
32.107,5(5)
(ECU mi 1 1 ion)
19 9 3
160.4
100.3
130.2
80.1
- 384.8
444,7
1.417.9
33.906.1
426.8
35.8
462.6
221.7 &
34.590.4
[36.657,0]
[1.000.0]
157,7
34.748.1
(1) The expenditure Is based on the claims by the Member States under the advance payments arrangements and charged to each year in accordance with Article 100 of the Financial Regulation. (2) Expenditure charged from 18 October to 15 October of the following year. (3) The European Fisheries Guarontee Fund expenditure have been financed within the guideline since 1993. (4) Set—aside payments by the Guidance Section, income aid ond accompanying measures have been financed within the guideline since 1993. (5) Not including set-aside payments by the Guidance Section and income aid, which were not in charge of the Guarantee Section.

ANNEX 4 BREAKDOWN OF EXPENDITURE BY SbC'IOR AND ECONOMIC CATEGORY
1993 (1) - (not including expenditure using appropriations carried over from 1992)
(2) I SECTORS
TOTAL EXPENDITURE
ECU million
EXPORT REFUNDS
ECU million
INTERVENTION (3)
ECU million
1.10 CEREALS AND RICE (4) - of which rice
1.11 SUGAR 1.12 OILS AND FATS (4)
- of which olIve oil - of which oilseeds
1.13 PROTEIN PLANTS - of which peas and field beans - of which dried fodder
1.14 FIBRE PLANTS - of which flax and hemp - of which cotton
1.15a FRESH FRUIT AND VEGETABLES (4) (5) 1.15b PROCESSED FRUIT AND VEGETABLES (4) 1.16 WINE PRODUCTS 1.17 TOBACCO (4) 1.18 OTHER CROP OR SECTOR PRODUCTS
- of which seeds 1.20 MILK PRODUCTS
- of which skimmed ml Ik - of which butter
1.21 BEEF/VEAL 1.22 SHEEPMEAT AND GOATMEAT 1.23 PIGMEAT (4) 1.24 EGGS AND POULTRY 1.25 OTHER ANIMAL PRODUCT AID MEASURES 1.26 FISHERIES GUARANTEE FUND 1.30 NON-ANNEX II PRODUCTS 1..33 REFUNDS "FOOD AID" MEASURES 1.38 DIFFERENTI AT I ON OF AGRICULTURAL
MARKET MECHANISMS 1.40 SET-ASIDE 1.41 INCOME AID 1.50 ACCOMPANYING MEASURES S U B T O T A L 1.31 B1.32 ACAs MCAs 1.34 INTEREST REFORM FOR FINANCING 1.36 MEASURES TO COMBAT FRAUD 1.37 CLEARANCE OF PREVIOUS YEARS
FOOD AID (5) OTHER (4)
T O T A L
6.607
2.188,6 5.527,6
1.083,8
860,6
1.067,7 596,3
1.509,6 1.163,8 190,0
5.211,3
.986,3
.800,4 195,9 290,9 88,8 32,4 743,5 160,4
444,7 426,8 35,8 221.7
34.433,9 143,5 100,3 80,1
- 384,8 138,0 79.4
34.5ÔÔ 4
(69,5)
(2.464,2) (3.063,4)
(558,7) (523,7)
(29,6) (830,8)
(70,4)
(1.005,2) (1.276,6)
19,2
6,3 16,0
3,1
2,5
3,1 1,7 4,4 3,4 0,5
15,1
11,5 5,2 0,6 0,8 0,2 0,1 2,1 0,5
1,3 1,2 0,1
2.848,1
1.531,4 68,8
156,4 31,1 100,2 36,2
2.287,5
1.711,2
193,5 290,9
0,1 743,5 160,4
(59,3)
(68,8) (P.m.)
(-) (-)
(-) (-)
28,0
15,1 0,7
(192,9) (430,1)
1,5 0,3 1,0 0,4
22,5
16,8
1,9 2,9
p.m. 7,3 1,6
0,4 0,3 0,2
- 1,1 0,4 0.2
ToT^
10.159,3
3.758,9*
657,2 5.458,8
1.083,8
860,6
911,3 565,2
1.409,4 1.127,6 190,0
2.923,8*
2.275,1 1.800,4
2,4
88,8 32,3
444,7 426,8 35,8 221.7
(10,2)
(2.395,4) (3.063,4)
(558,7) (523,7)
(29,6) (830,8)
(70,4)
(812,3) (846,5)
100 24.274,6
15,5
2,7 22,4
4,5
3,5
3,8 2,3 5,8 4,6 0,8
12,0
9,4 7 4-k
p.m. To
0,4 0,1
1,8 1,8 0,2 0.9
100
SOlt : 29,5 % -1- -Lsolt : 70,5 %
of. a g r i c u l t u r a l e x p e n d i t u r e (34.433,9)
(1) Expenditure charged against the 1993 budget. (2) Budget chapters or articles. (3) The breakdown of Intervention by economic category Is shown In Annex 7. (4) In «OTHERS» are Included expenditure on: drought in Portugal (ECU 22,8 million - B01.10). register of olive cultivation (ECU 4,0 million - B01.12), register
of citrus cultivation (ECU 0,5 million - B01.15), control agencies for tobacco (ECU 1,2 million - B01.17), an expenditure of ECU 5,0 million for pigmeat (B01.23) and ECU 45,9 million for measures to control epizootic diseases (B01.25). These amounts are not taken into account In the concerned chapters.
(5) Food aid: ECU 7,8 million chapter Bl.15 - fruit and vegetables given to Eastern countries and ECU 130,2 million chapter B1.35 - distribution of agricultural products to deprived persons in the Community.
(*) Including co-responsibility levies for cereals and the financial contribution of milk producers.
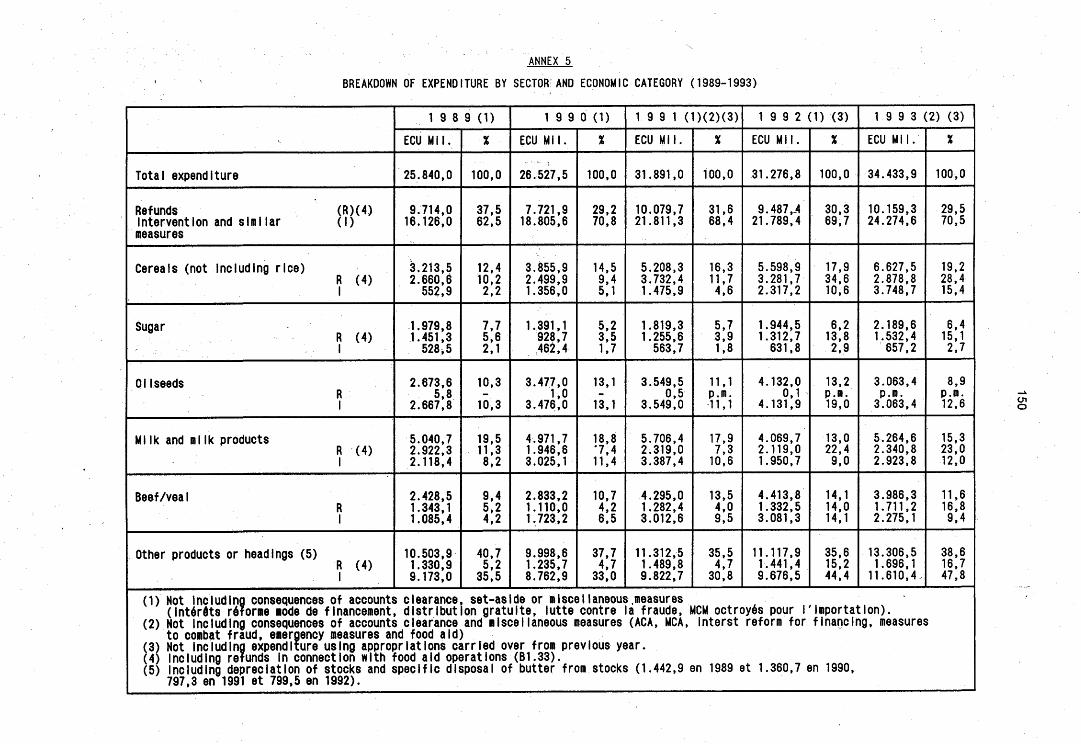
ANNEX 5
BREAKDOWN OF EXPENDITURE BY SECTOR AND ECONOMIC CATEGORY (1989-1993)
Total expenditure
Refunds (R)(4) Intervention and similar (I) measures
Cereals (not Including rice) R (4) I
Sugar R (4) 1
011seeds R 1
HI Ik and milk products R (4) 1
Beef/veal R 1
Other products or headings (5) R (4) 1
1 9 8 9 (1)
ECU Mil.
25.840,0
9.714,0 16.126,0
3.213,5 2.660,6 552,9
1.979,8 1.451,3 528*5
2.673,6 5,8
2.667,8
5.040,7 2.922,3 2.118,4
2.428,5 1.343,1 1.085,4
10.503,9 1.330,9 9.173,0
%
100,0
37,5 62,5
12,4 10,2 2,2
7,7 5,6 2,1
10,3
10,3
19,5 11,3 8,2
9,4 5,2 4,2
40,7 5,2 35,5
1 9 9 0 (1)
ECU Mil.
26.527,5
7.721,9 18.805,6
3.855,9 2.499,9 1.356,0
1.391,1 928,7 ,462,4
3.477,0 1,0
3.476,0
4.971,7 1.946,6 3.025,1
2.833,2 1.110,0 1.723,2
9.998,6 1.235,7 8.762,9
%
100,0
29,2 70,8
14,5 9,4 5,1
5,2 3,5 1,7
13,1
13,1
18,8 •7,4 11,4
10,7 4,2 6,5
37,7 4,7 33,0
1 9 9 1 (1)(2)(3)
ECU Mil.
31.891,0
10.079,7 21.811,3
5.208,3 3.732,4 1.475,9
1.819,3 1.255,6 563,7
3.549,5 0,5
3.549,0
5.706,4 2.319,0 3.387,4
4.295,0 1.282,4 3.012,6
11.312,5 1.489,8 9.822,7
%
100,0
31,6 68,4
16,3 11,7 4,6
5,7 3,9 1,8
11,1 p.m. •11.1
17,9 7,3 10.6
13,5 4,0 9,5
35,5 4,7 30,8
1 9 9 2 (1) (3)
ECU Mil.
31.276,8
9.487,-4 21.789,4
5.598,9 3.281,7 2.317,2
1.944,5 1.312,7 631,8
4.132,0 0,1
4.131,9
4.069,7 2.119,0 1.950,7
4.413,8 1.332,5 3.081,3
11.117,9 1.441,4 9.676,5
%
100,0
30,3 69,7
17.9 34,6 10,6
6,2 13,8 2,9
13.2 p.m. 19,0
13,0 22,4 9,0
14,1 14,0 14,1
35,6 15,2 44,4
1 9 9 3 (2) (3)
ECU Mil.
34.433,9
10.159,3 24.274,6
6.627,5 2.878,8 3.748.7
2.189,6 1.532,4 657,2
3.063,4 p.m. 3.063,4
5.264,6 2.340,8 2.923,8
3.986,3 1.711,2 2.275,1
13.306,5 1.696,1 11.610,4.
%
100,0
29,5 70,5
19,2 28,4 15,4
6,4 15,1 2,7
8,9 p.m. 12,6
15,3 23,0 12,0
11,6 16,8 9,4
38,6 16,7 47,8
(1) Not including consequences of accounts clearance, set-aside or miscellaneous.measures (Intérêts réforme mode de financement, distribution gratuite, lutte contre la fraude, MCM octroyés pour l'Importation).
(2) Not Including consequences of accounts clearance and miscellaneous measures (ACA, MCA, interst reform for financing, measures to combat fraud, emergency measures and food aid)
(3) Not Including expenditure using appropriations carried over from previous year. (4) Including refunds in connection with food aid operations (B1.33). (5) Including depreciation of stocks and specific disposal of butter from stocks (1.442,9 en 1989 et 1.360,7 en 1990,
797,3 en 1991 et 799,5 en 1992).
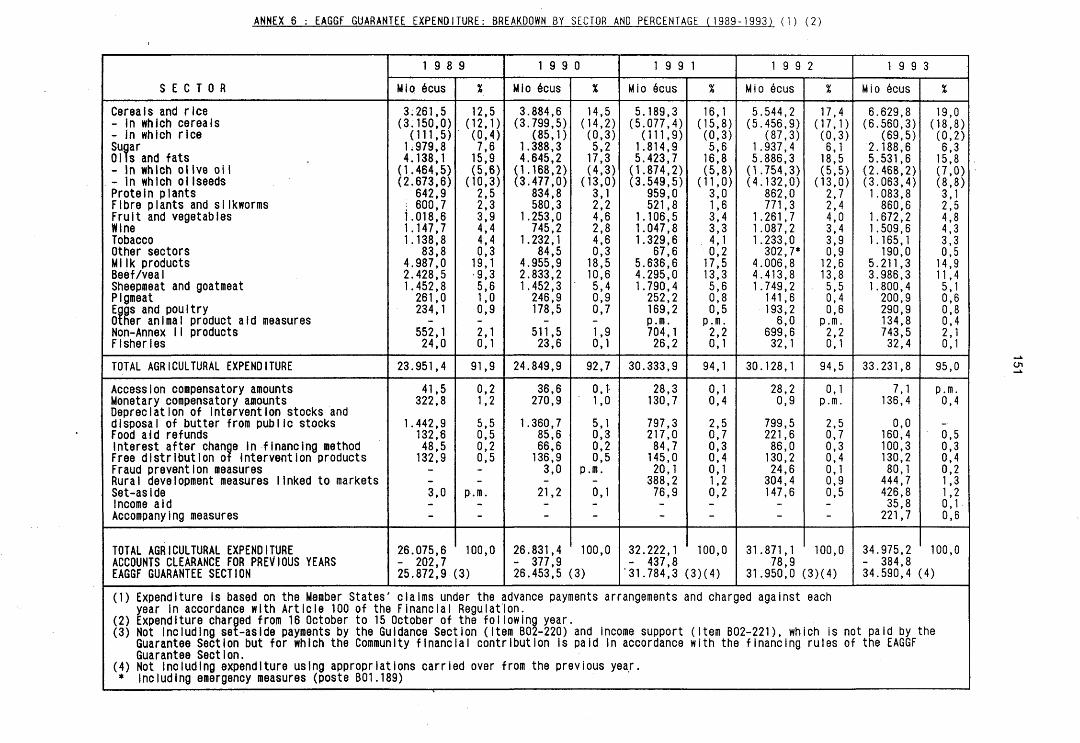
ANNEX 6 : EAGGF GUARANTEE EXPENDITURE: BREAKDOWN 8Y SECTOR AND PERCENTAGE (1989-1993) (1) (2)
S E C T O R
Cereals and rice - in which cereals - In which rice Sugar Oils and fats - in which olive oi1 - In which oilseeds Protein plants Fibre plants and silkworms Fruit and vegetables Wine Tobacco Other sectors Ml Ik products Beef/veal Sheepmeat and goatmeat Pigmeat Eggs and poultry Other animal product aid measures Non-Annex 11 products Fisheries
TOTAL AGRICULTURAL EXPENDITURE
Accession compensatory amounts Monetary compensatory amounts Depreciation of intervention stocks and disposal of butter from public stocks Food aid refunds Interest after change in financing method Free distribution of intervention products Fraud prevention measures Rural development measures linked to markets Set-aside Income aid Accompanying measures
TOTAL AGRICULTURAL EXPENDITURE ACCOUNTS CLEARANCE FOR PREVIOUS YEARS EAGGF GUARANTEE SECTION
1 9 8 9
Mio ecus
3.261,5 (3.150,0) (111.5) 1.979,8 4.138,1 (1.464,5) (2.673,6)
642,9 : 600,7 1.018,6 1.147,7 1.138,8
83,8 4.987,0 2.428,5 1.452,8 261,0 234,1
552,1 24,0
23.951,4
41,5 322,8
1.442,9 132,6 48,5 132.9
3,0
26.075,6 - 202,7 25.872,9
*.
12,5 (12,1) (0,4) 7,6 15,9 (5,6) (10,3) 2,5 2,3 3,9 4,4 4,4 0,3 19,1 •9,3 5,6 1,0 0,9
2,1 0,1
91,9
0,2 1,2
5,5 0,5 0,2 0,5
p.m.
100,0
13)
1 9 9 0
Mio ecus
3.884,6 (3.799,5)
(85,1) 1.388,3 4.645,2 (1.168,2) (3.477.0)
834,8 580,3
1.253,0 745,2
1.232,1 84,5
4.955,9 2.833,2 1.452,3 246,9 178,5
511,5 23,6
24.849,9
36,6 270,9
1.360,7 85,6 66,6 136,9 3,0
21,2
26.831,4 - 377,9 26.453,5
%
•14,5 (14,2) (0,3) 5,2 17,3 (4,3) (13,0) 3,1 2,2 4,6 2,8 4,6 0,3 18,5 10,6 5,4 0,9 0,7
1,9 0,1
92,7
0,1-1,0
5,1 0,3 0,2 0,5
p.m.
0,1
100,0
[3)
1 9 9 1
Mio ecus
5.189,3 (5.077,4) (111,9) 1.814,9 5.423,7 (1.874,2) (3.549,5)
959,0 521,8
1.106,5 1.047,8 1.329,6
67,6 5.636,6 4.295,0 1.790,4 252,2 169,2 p.m. 704,1 26,2
30.333,9
28,3 130,7
797,3 217,0 84,7 145,0 20,1 388,2 76,9
32.222,1 - 437,8 '31.784,3
%
16,1 (15,8) (0,3) 5,6 16,8 (5,8) (11,0) 3,0 1,6 3,4 3,3 4,1 0,2 17,5 13,3 5,6 0,8 0,5
p.m. 2,2 0,1
94,1
0,1 0,4
2,5 0,7 0,3 0,4 0,1 1,2 0,2
100,0
I3)(4)
1 9 9 2
Mio ecus
5.544,2 (5.456,9)
(87,3) 1.937,4 5.886,3 (1.754,3) (4.132,0)
862,0 771,3
1.261,7 1.087,2 1.233,0 302,7*
4.006,8 4.413,8 1.749,2 141,6 193,2 6,0
699,6 32,1
30.128,1
28,2 0,9
799,5 221,6 86,0 130,2 24,6 304,4 147,6
31.871,1 78,9
31.950,0
%
17,4 (17,1) (0,3) 6,1 18,5 (5,5) (13,0) 2,7 2,4 4,0 3,4 3,9 0,9 12,6 13,8 5,5 0,4 0,6
p.m. 2,2 0,1
94,5
0,1 p.m.
2,5 0,7 0,3 0,4 0,1 0,9 0,5
100,0
i3)(4)
1 9 9 3
Mio ecus
6.629,8 (6.560,3)
(69,5) 2.188,6 5.531,6 (2.468,2) (3.063,4) 1.083,8 860,6
1.672,2 1.509,6 1.165,1 190,0
5.211,3 3.986,3 1.800,4 200,9 290,9 134,8 743,5 32,4
33.231,8
7,1 136,4
0,0 160,4 100,3 130,2 80,1 444,7 426,8 35,8 221,7
34.975,2 - 384,8 34.590,4
%
19,0 (18,8) (0,2) 6,3 15,8 (7,0) (8,8) 3,1 2,5 4,8 4,3 3,3 0,5 14,9 11,4 5,1 0,6 0.8 0,4 2,1 0,1
95,0
p.m. 0,4
0,5 0,3 0,4 0,2 1,3 1,2 0,1 0,6
100,0
[4)
(1) Expenditure is based on the Member States' claims under the advance payments arrangements and charged against each year in accordance with Article 100 of the Financial Regulation.
(2) Expenditure charged from 16 October to 15 October of the following year. (3) Not including set-aside payments by the Guidance Section (Item B02-220) and income support (Item B02-221), which is not paid by the
Guarantee Section but for which the Community financial contribution is paid in accordance with the financing rules of the EAGGF Guarantee Section.
(4) Not Including expenditure using appropriations carried over from the previous year. * Including emergency measures (poste B01.189)

ANNEX 7 : BREAKDOWN OF EXPENDITURE BY ECONOMIC CATEGORY
(ECU mil I ion)
BUDGET CHAPTER/ ARTICLE
81.10
81.11 B1.12
81.13
B1.14
B1.19o B1.19b B1.16 81.17 81.18
81.20
81.21 B1.22 81.23 B1.24 81.29
B1.26 81.30 81.38
81.40 B1.41 B1.90
SECTOR
CEREALS - of which rice SUGAR OIL AND FATS - of which olive oi1 - of which oiIseeds PROTEIN PLANTS - of which peas and field beans - of which dried fodder FIBRE PLANTS - of which flax ond hemp - of which cotton FRESH FRUIT AND VEGETABLES PROCESSED FRUIT AND VEGETABLES WINE PRODUCTS TOBACCO OTHER CROP OR SECTOR PRODUCTS - of which seeds MILK PRODUCTS - of which skimmed milk - of which butter BEEF/VEAL SHEEPMEAT AND GOATMEAT PIGMEAT EGGS AND POULTRY OTHER ANIMAL PRODUCT AID MEASURES FISHERIES GUARANTEE FUND NON-ANNEX 11 PRODUCTS DIFFERENTIATION OF AGRICULTURAL DES MARCHES AGRICOLES SET-ASIDE INCOME AI0 ACCOMPANYING MEASURES
SUBTOTAL X Co-responsibility levy cereals Fin. contrib. milk producer* TOTAL
TOTAL INTERVENTION
(D 3.669,3
(10.2) 697,2
9.498,8 (2.399,4) (3.063,4)
1.083.8 (998,7) (923,7)
860.6 (29.6) (830,8)
911.3 969,2
1.409,4 1.127,6 190,0
(70,4) 2.947.8
(812,3) (846,9)
2.279,1 1.800.4
2.4
88.8 32.3
444.7 426,8 39,8 221.7
24.209.0 (100 X)
+ 89.6 - 24,0 24.274 «
STORAGE (2)
2.720.8 (-3.0)
929.6 177,3
(177,3) p.m.
1.8 290,6
- 17,7
293.8 (-44.6) (161,6)
1.383.1 3,9 2,4
0,9
9.386,1 (22,3 X)
WITHDRAWALS AND SIMILAR OPERATIONS
609.0
941.0
13,8
1.199,8 (4,8 X)
PRICE COMPENSATING AIDS (3) y
948,9(4) (13,1)
127.7 9.281.9
(2.218,1) (3.063.4)
1.083,8 (998,7) (923,7)
860,6 (29.6} (830,8)
192,7 963,4 174,0
1.118,7 190,0
(70.4) 1.989.7(9)
(896.9) (684,9)
892,1 1.796,9
88,8 18,0
444.7
19.766.7 (69,1 X)
GUIDANCE PREMIUMS
113,6
403,8 26,6
668,2
1.212.2 (9.0 X)
STRUCTURAL MEASURES
Z M
426.8 35,8 221,7
684,2 (2,8 X)
MJ Expenditure charged against 1993 budget. i2l Details of expenditure on storage are shown in Annex 9. (3) The breakdown of expenditure on intervention in the form of price compensating aid is shown in Annex 8. 141 This amount does not take into account the co-responsibility levy (ECU 89,6 million). (9) This amount does not take into account the financial contribution of milk producers (ECU -24,0 million).

153
ANNEX 8 Breakdown of intervention expenditure in the form
of price compensating aid
(ECU mi I I ion)
SECTOR TOTAL Product ion a id
Aid for processing, consumpt ion and promot ion
CEREALS AND RICE
- of wh ich r ice
SUGAR
OIL AND OILSEEDS - of wh ich olive oil - of wh ich oiIseeds PROTEIN PLANTS - of which peas and field beans - of which dried fodder
FIBRE PLANTS - of which flax and hemp
- of wh ich cotton
FRESH FRUIT AND VEGETABLES
PROCESSED FRUIT AND VEGETABLES
WINE PRODUCTS
TOBACCO
OTHER CROP SECTORS OR PRODUCTS - of which seeds - of which hops MILK PRODUCTS - of which skimmed milk - of which butter
BEEF/VEAL
SHEEPMEAT AND GOATMEAT
PIGMEAT
OTHER ANIMAL PRODUCT AID MEASURES
FISHERIES GUARANTEE FUND
DIFFERENTIATION OF AGRICULTURAL MARKET MECHANISMS
948,5
127,7
(13,1)
5.281,5 (2.218,1) (3.063,4)
1.083,8
860,6
192,7
563,4
174,0
1.118,7
190,0
1.985,7
892,1
1.796,5
88,8
18,0
444,7
(558,7) (523,7)
(29,5) (830,8)
(70,4) (24,4)
(857,0) (684,9)
499,1 (1) (13,1)
4.431,4 (1.368,0) (3.063,4)
1.083,8
858,1
13,3
64,5
1.118,7
94,8
22,1
324,7
1.796,7
(558,7) (523,7)
(29,5) (830,8)
(70,4) (24,4)
(-) (-)
444,6
449,4
127,7
850,1
2,5
179,4
498,9
174,0
95,2
1.963,6
567,4
- 0,2
88,8
18,0
0,1
(-)
(850,1 (-
(-) (-)
(857,0) (684,9)
TOTAL 15.766,7 10.751,8 5.014,9
(1) Aid to the production of durum wheat = ECU 425,9 million
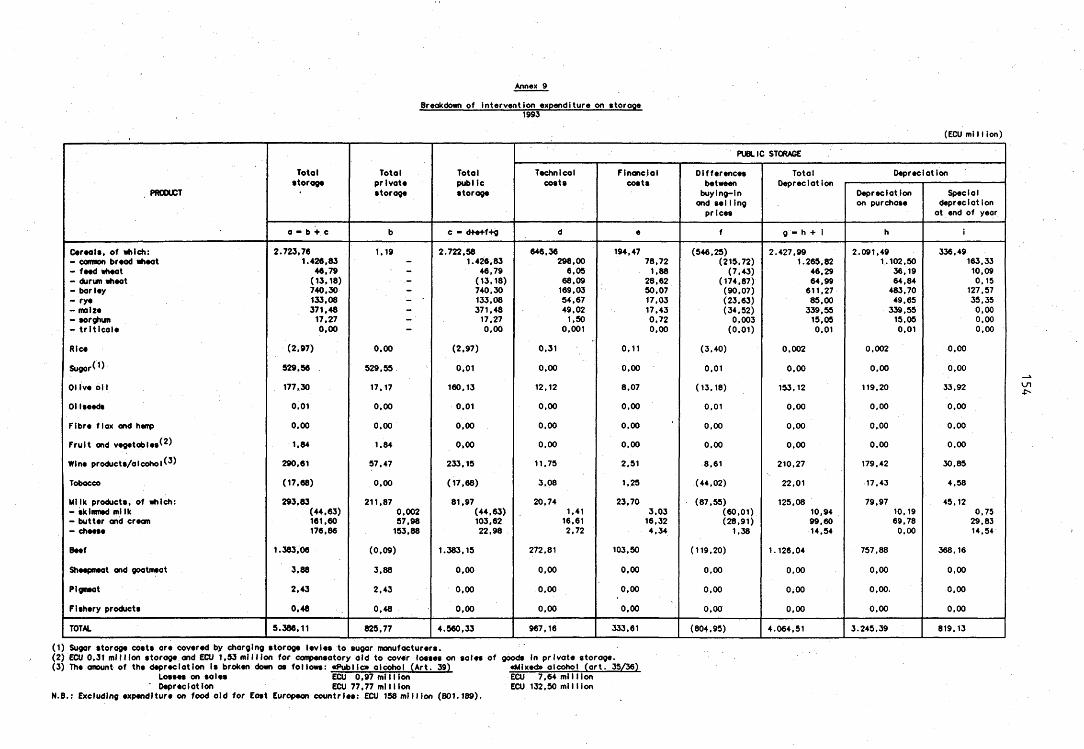
Breokdown of Intervention expenditure on storoge 1993
(ECU ml 11 ion)
PRODUCT
Total storoge
a * b + c
Total private storoge
Total public storoge
c » dte+f+g
PUBLIC STORAGE
Technical costs
Financial costs
Differences between buylng-ln and eel Iing prices
Total Depreciation
Depreciation
g - h + i
Depreciation on purchase
Special depreciation
at end of yeor
Cereals, of which: - cannon bread wheat - feed wheat - durum wheat - barley -rye - maize - sorghum - triticale
Rice
SugorO)
Olive oil
Oilseeds
Fibre flax and hemp
Fruit and vegetables*2^
Wine products/olcohol*3)
Tobacco
Milk products, of which:
- skimmed milk - butter and cream - cheese
Beef
Sheepmeat and goatmeat
Pigmeat
Fishery products
2.723,76 1.426.83
46.79 (13,18) 740.30 133.08 371,48 17,27
0.00
(2.97)
929.96
177,30
0.01
0,00
1,84
290,61
(17,68)
293.83
(44.63) 161.60 176.86
1.383.06
3,88
2,43
0,48
1.19
0,00
529.99
17,17
0,00
0.00
1.84
57.47
0.00
211,87 0.002 57,98 193.88
(0,09)
3,88
2,43
0,48
2.722.58 1.426.83
46,79 (13,18) 740,30 133.08 371,48 17,27 0,00
(2.97)
0.01
160.13
0.01
0,00
0*00
233.15
(17,68)
81.97 (44,63) 103,62 22,98
1.383,15
0,00
0,00
0,00
646,36 194,47 298,00
6,05 68,09 169.03 54,67 49.02 1,50
0,001
78,72 1,88
28.62 50.07 17.03 17.43 0.72 0.00
0.31
0,00
12,12
0.00
0.00
0.00
11,75
3.08
20,74
272.81
0.00
0.00
0,00
1.41 16,61 2.72
0,11
0,00
8,07
0,00
0,00
0,00
2,51
1.25
23,70
103,50
0,00
0,00
0,00
3,03 16,32 4,34
(546,25) (219.72) (7.43)
(174,87) (90.07) (23.63) (34,52) 0.003
(0.01)
(3.40)
0.01
(13.18)
0.01
0.00
0.00
8.61
(44.02)
(87.55)
(60,01) (28.91)
1.38
(119.20)
0,00
0,00
0.00
2.427.99 1.265.82
46,29 64,99 611.27 85.00 339,55 15,05 0.01
0.002
0,00
153,12
0.00
0.00
0.00
210,27
22.01
125.08 10,94 99.60 14.54
1.126,04
0.00
0,00
0,00
2.091.49 1.102,50
36,19 64.84 483.70 49.65 339.55 15.05 0,01
0.002
0.00
119.20
0.00
0.00
0,00
179.42
17.43
79,97
10,19 69,78 0.00
757.88
0.00
0,00.
0.00
336.49 163.33 10,09 0.15
127.57 35.35 0.00 0.00 0,00
0.00
0.00
33.92
0.00
0.00
0.00
30,85
4.58
45.12
368.16
0.00
0,00
0.00
0.75 29,83 14.54
TOTAL 5.386,11 829.77 4.960,33 967,16 333,61 (804.95) 4.064,51 3.245,39 819.13
(1) Sugar storage costs are covered by charging storoge levies to sugar manufacturers. (2) ECU 0,31 million storage and ECU 1,93 million for compensatory aid to cover losses on sales of goods in private storage. (3) The amount of the depreciation is broken down as follows: «Public» alcohol (Art. 39) «Mixed» alcohol (art. 35/36)
Losses on sales ECU 0,97 mi 11 ion ECU 7,64 ml 11 ion ' Depreciation ECU 77.77 mi I lion ECU 132,50 ml I lion
N.B.: Excluding expenditure on food aid for East European countries: ECU 158 million (801.189).

155
ANNEX 9.1 TRENDS IN QUANTITIES IN INTERVENTIONSTOCKS
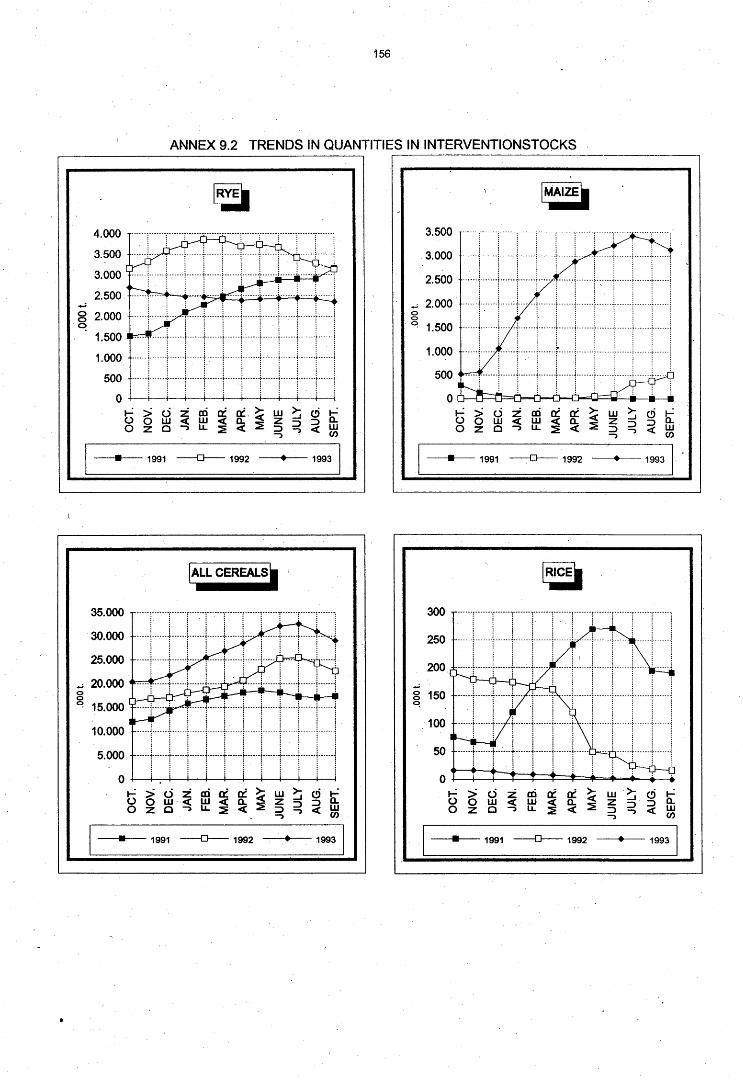
156
ANNEX 9.2 TRENDS IN QUANTITIES IN INTERVENTIONSTOCKS
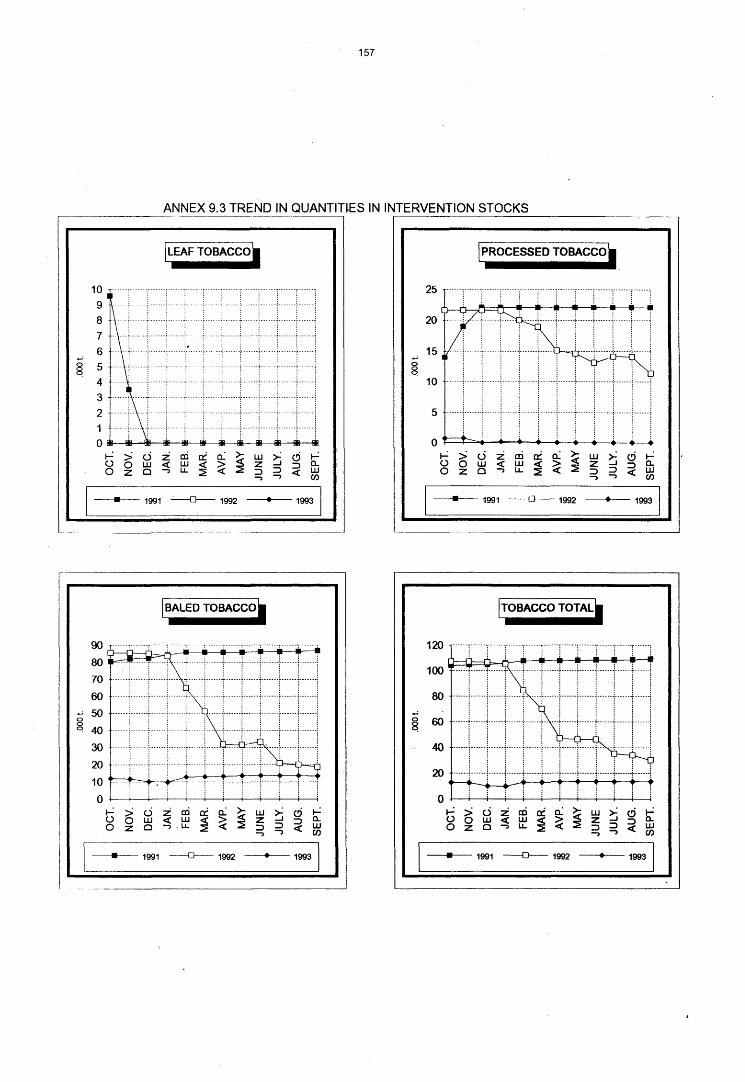
157
ANNEX 9.3 TREND IN QUANTITIES IN INTERVENTION STOCKS
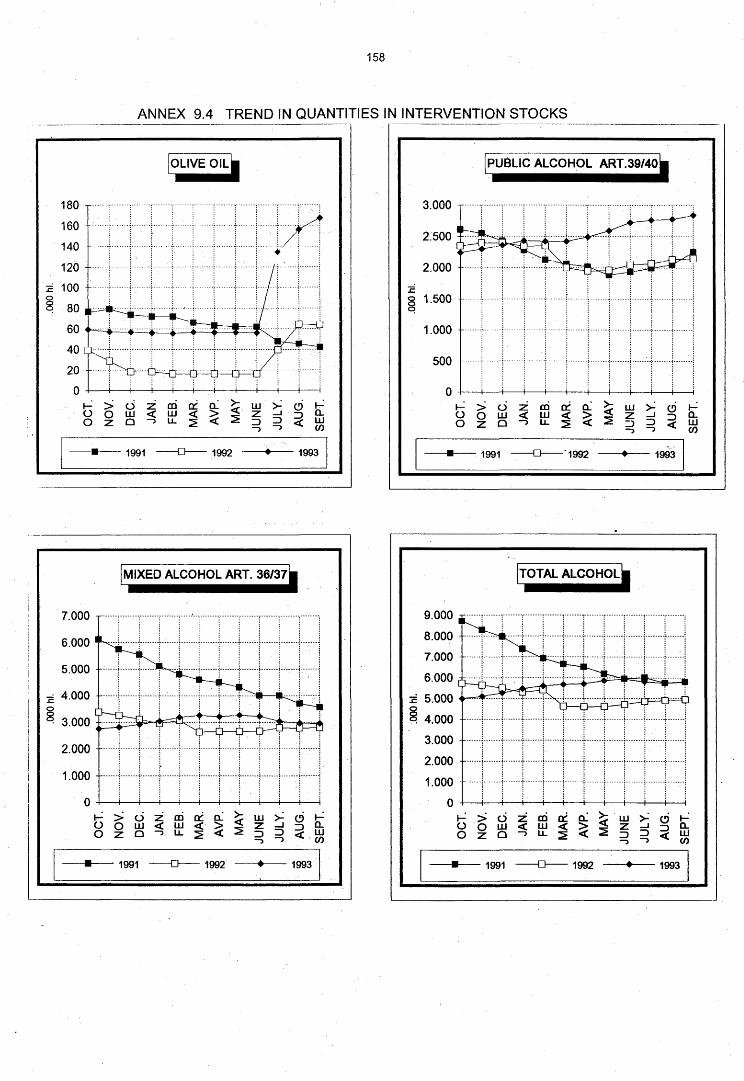
158
ANNEX 9.4 TREND IN QUANTITIES IN INTERVENTION STOCKS
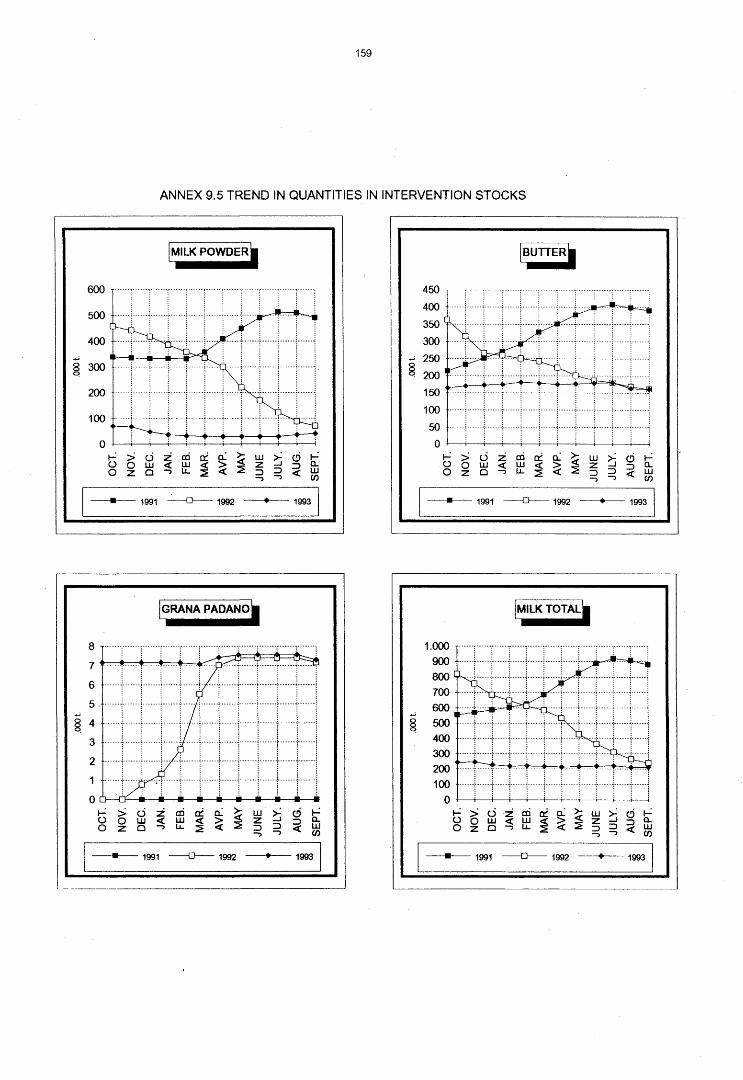
159
ANNEX 9.5 TREND IN QUANTITIES IN INTERVENTION STOCKS
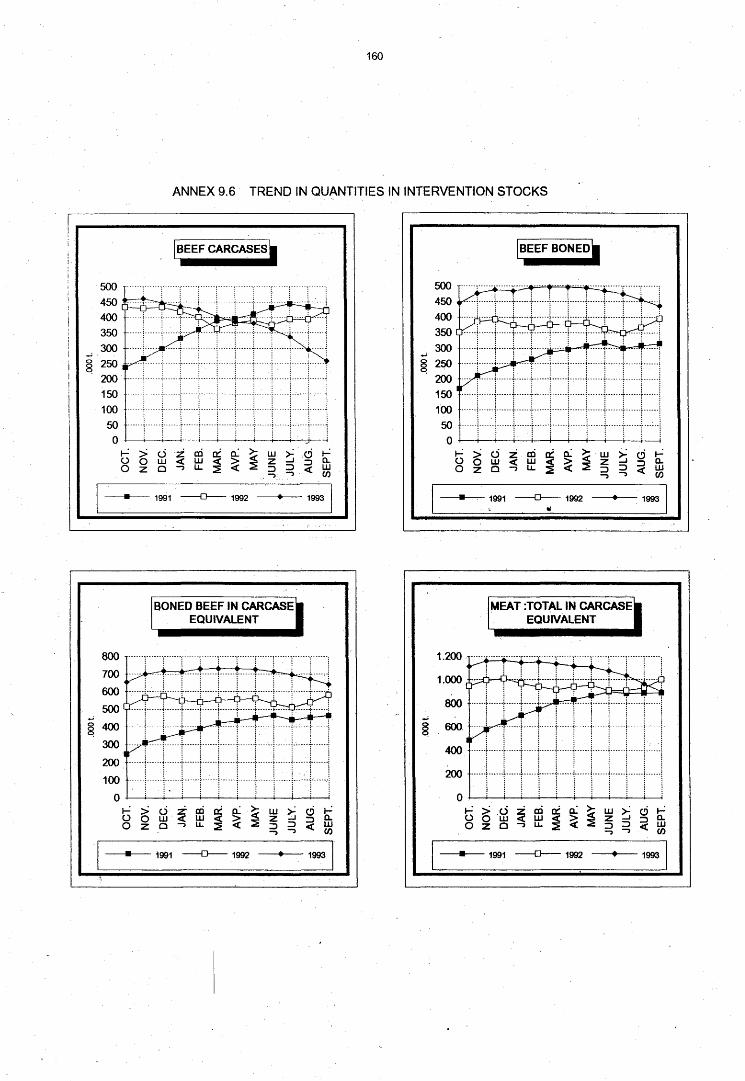
160
ANNEX 9.6 TREND IN QUANTITIES IN INTERVENTION STOCKS

QUANTITY AND VALUE OF PRODUCTS IN' PUBLIC STORAGE
(Including additional depreciation at the end of the year)
PRODUCTS
Common wheat Coimon wheat not suitable for bread-making
Bar ley Rye
Durum wheat Ma i ze Sorghum Rice
Total cereals/rice
01 i ve oil Rape Sunflower
Total oils and fats
Tobacco - leaf Tobacco - processed Tobacco - baled
Total tobacco
Skimmed milk powder Butter Grana Padano Parmesan reg
Total mi Ik products
Beef (quarters) Boned beef (5)
Total beef (5)
Public alcohol (hi)
GRAND TOTAL
Situation at 30.09.1991 (1)
Ouant i ty (tonnes)
5.820.874 173.201
5.381.602 3.158.524 2.824.359
876 0
190.750
17.550.186
42.260 13.438
416
56.114
29 22.130 86.877
109.036
490.501 390.173
880.674
425.549 315.121
740.670
2.248.797
-
Book value (ECU mi 11 ion)
(2)
341.2 10,6
307.6 184,0 123,4 0,1
25,5
992,4
55, 1 2,4 0. 1
57,6
0 3.0
25.4
28,4
366,5 360,5
727,0
368,4 401,5
769,9
8,7
2.584,0
% of book value
13,2 0,4
11.9 7.1 4,8
p.m.
1.0
38,4
2,1 0, 1
p.m.
2,2
0,1 1.0
1,1
14,3 13.9
28,2
14,3 15,5
29.8
0.3
100 %
Foreseeable sales value
(ECU mi 11 ion)
346.6 10,1
314,2 184.4 216.7
0,1
25.8
1.097,9
53.2 2.3 0.1
55.6
6.6 25,9
32,5
367,9 350,7
718,6
382,5 414,9
797,4
10,3
2.712,3
Situation at 30.09.1992 (1)
Ouant i ty (tonnes)
8.340.864 184.563
5.962.893 3. 132.956 4.550.513
500.847 0
16.723
22.689.359
64.008 0 0
64.008
6 11.323 18.707
30.036
71.267 161.156 7.158
239.581
427.736 395.551
823.287
2.151.799
-
Book value (ECU mi I 1 ion)
(3)
491, 1 11,3
358,4 188,4 283.7 28.7
2.2
1.363,8
69.8
69,8
p.m. 1,4 7.9
• 9,3
53,3 145,6 38,4
237,3
382. 1 507.9
890.0
10,3
2.580,5
% of book va lue
19.0 0.4
13,9 7.3 11.0 1 . 1
0.1
52,8
2.7
2,7
p.m. 0,1 0.3
0.4
2,1 5.6 1.5
9.2
14.8 19,7
34.5
0,4
100 X
ForeseeabIe sales value
(ECU mi I I ion)
495,3 11 .0
354.1 186.0 337,8 29.7
2.3
1.416.2
81 .8
81 ,8
p.m. 3,2 5,3
8,5
53,6 145.5 38.6
237,7
383. 1 519.0
902, 1
9,9
2.656,2
Situât ion at 30.09.1993 (1)
Ouant i ty (tonnes)
11.295.254 482.606
8.191.724 2.348.223 3.480.731 3.131.086
152.003 25
29.081.653
167.275 0 0
167.275
0 35
13.505
13.540
39.751 160.365 7.295 2.97 1
210.381
258.9*9 640.996
899.945
2.839.796
-
Book value (ECU mi 1 1 ion)
(4)
687.8 28,7
445,6 119,7 197,3 254,4 12,2 p .m.
1.745.7
187,5
187,5
p.m. 4.2
4,2
29,9 124,5 26, 1 12.3
192,8
149,6 365.2
514,8
14,7
2.659,7
% of book va lue
25.9 1 . 1
16.8 4,5 7.4 9.5 0.4
65.6
7.0
7.0
p.m. 0.2
0,2
1 . 1 4.7 1.0 0.5
7,3
5.6 13.7
19.3
0.6
100.0
ForeseeabIe sa I es value
(ECU mi I 1 ion)
699,5 28,2
439, 1 117,5 261 ,2 261 , 1 12.7 p.m.
1.819,1
214.6
214,6
p.m. 4, 1
4, K3Î
31 .2
123,4 25,8 12.2
192.5
149, 1 362,2
511.3
13,2
2.754,7
(1) Regulation (EEC) No 2776/88 provides that 2nd category expenditure to be claimed for a given year is to be calculated on the basis of the opérât ions xorried out during the period from October of one year to September of the next year.
(2) The value expressed in ECU has been obtained by applying to the carryover value in national currency the budgetary rates valid for the conversion of expenditure in September 1991. (3) The value expressed In ECU hoe been obtained by applying to the carryover value in national currency the budgetary rotes valid for the conversion of expenditure in September 1992. (4) The value expressed In ECU has been obtained by applying to the carryover value in national currency the budgetary rates valid for the conversion of expenditure in September 1993. (5) Quantity In «carcass equivalent» since 1993.
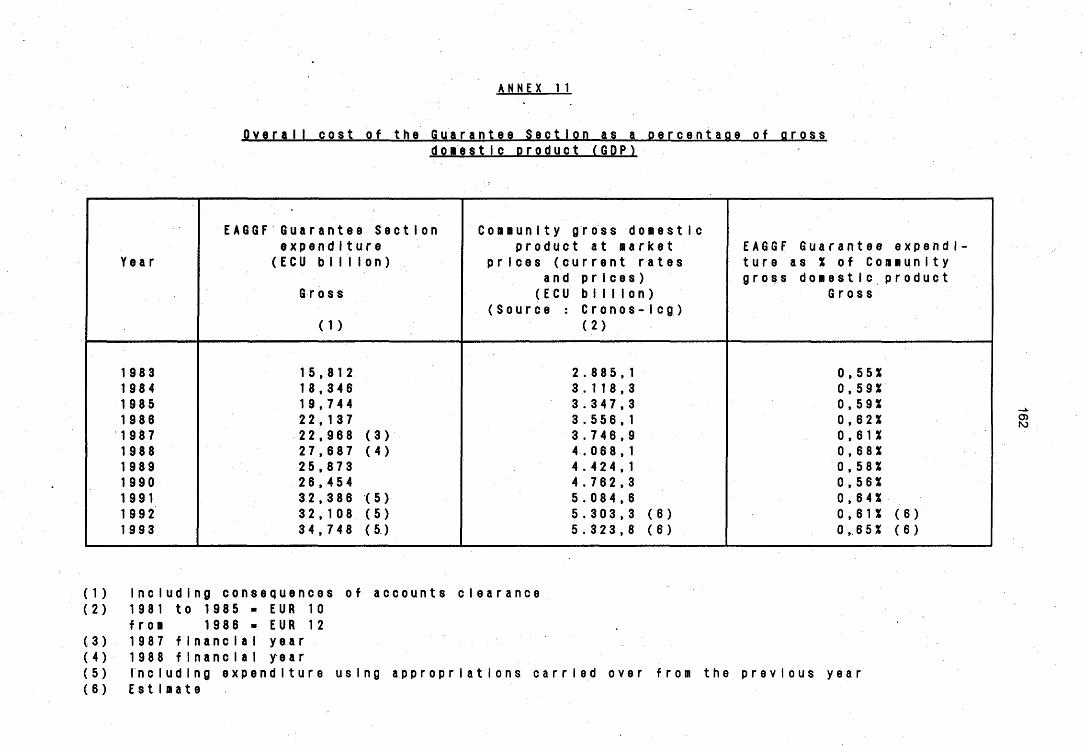
A N N E X 1 1
O v e r a l l c o s t of the G u a r a n t e e S e c t i o n as a p e r c e n t a g e of g r o s s do m e s t l c p r o d u c t ( G D P )
Year
1983 198 4 1985 1986 1987 1988 1989 1990 1991 1992 1993
EAGGF Guarantee Section expenditure
(ECU b i 1 I Ion)
Gross
15,812 18,346 19,744 2 2 , 1 3 7 2 2 , 9 6 8 (3) 2 7 , 6 8 7 ( 4 ) 25,87 3 2 6,454 3 2,3 86 (5) 3 2,108 (5 ) 34,748 (5)
Community gross domestic product at market
prices (current rates and prices)
(ECU billion) (Source : Cronos- leg)
( 2 )
2 . 8 8 5 , 1 3.118,3 3.347,3 3.556,1 3.746,9 4 . 0 6 8 , 1 4.42 4 , 1 4.762,3 5.084,6 5.303,3 (6) 5.323,8 (6)
EAGGF G u a r a n t e e e x p e n d i ture as % of C o m m u n 11y gross d o m e s t i c p r o d u c t
G r o s s
0,55% 0,595! 0,5 9% 0, 6 2 % 0,61% 0 , 6 8 % 0 , 5 8 % 0,56% 0 , 6 4 % 0 , 6 1 % ( 6 ) 0,65% (6)
rO
(D (2)
(3) (4) (5) (6)
Including consequences of accounts clearance 1981 from 1987 1988
to 1985 -1986 -
f I n a n c I a I f i n a n c i a l
EUR 10 EUR 12 y e a r y e a r
Ine lu d I ng Est I m a t e
e x p e n d i t u r e u s i n g a p p r o p r i a t i o n s c a r r i e d o v e r f r o m t h e p r e v i o u s y e a r
163
A N N E X 1 2
REVENUE FROM THE CO-RESPONSIBILITY LEVY ON MILK AND ALLOCATION TO VARIOUS MEASURES
(ECU m i l l i o n )
M E A S U R E
FROM 16.09.1977
TO 31.12.1986
1987 1988
(D 1989
(2)
1990 1991 1992 1993
FROM 16.09.1977
TO 15.10.1993
A. REVENUE FROM LEVY
(3)
3.931,2 447,6 487,3 423,7 313,7 292,0 291,5 184,9 (4)
6.371,9
B. TOTAL EXPENDITURE
a) School mi Ik (R.1080/77)
b) Butter for the manufacture of Ice-cream (R.232/75, R.262/79, R.1932/81, R.570/88)
c) Butter for pastry manufacture (R.262/79, R.1932/81, R.442/84, R.570/88)
d) Concentrated butter for direct consumption (R.349/73, R.649/78,
R.3143/85) e) Promotion, advertising
and marketing research in the Community (R.723/78)
f) Market research outside the Community
(R.1993/78, R.1024/78) g) Improvement of the
quality of milk (R.1271/78, R.382/89)
h) Disposal for pig and poultry feed (R.368/77, R.443/77, R.1844/77)
i) Other butter destocking schemes
j) Financing of priority measures
3.931,2
540,6
254,0
356,4
80,6
447,6
99,3
40,6
122,3
pm (5)
487,3
112,7
49,6
117,2
pm (5)
423,7
136,2
32,0
120,1
57,7
313,7
140,6
29,3
19,7
43,1
292,0
139,9
53,5
35,6
1,3
291,5
174,5
26,0
18,2'
3,7
184,9 (6)
83,5
351,2
79,4
791,9
152,7
1.324,2
40,7
5,2
35,1
1,5
39,0
5,3
58,4
22,6
54,5
7,2
58,6
10,5
69,1
32,3
102,1
37,4
2,3
168,9
33,4
6.371,9
1.427,3
485,0
789,7
186,4
706,6
164,0
791,9
290,5
1.530,5
(1) Revenue from co-responsibility levy and expenditure against the 1987 budget (approximately 10 months). (2) Revenue from co-responsiblllty levy and expenditure against the 1988 budget (approximately 1114months). (3) Excluding appropriations carried over from one year to the next. (4) This levy was suppressed since 31.03.1993. (5) Expenditure in the Member States on the disposal of concentrated butter was ECU 67.4 million in 1987 and
ECU 162.8 million in 1988. That expenditure is being reimbursed to the Member States in four installments from 1989 pursuant to Regulation (EEC) No 801/87.
(6) The available funds have been allocated between the three priority measures in proportion to expenditure.
ANNEX 13
EQUALIZATION OF STORAGE COSTS FOR SUGAR
COMMUNITY SUGAR Situation at 31.01.1994
(a) % of annua I levies. (b) X of cumulative annual levies.
Sugar year
1968/69 1969/70 1 970/71
1971/72 1972/73 1973/74 1974/75 1975/76 1976/77 1977/78 1978/79 1979/80
.1980/81 1981/82 1982/83 1983/84 1984/85 1985/86 1986/87 1987/88 1988/89 1989/90 1990/91 1991/92 1992/93
Tota1 levies
(ECU A)
64.844.437,00 65.226.052,11 69.029.052,44 97.151.231,54 91.067.000,23 101.755.638,48 104.267.684,38 109.434.959,31 201.167.705,37 233.088.196,54 248.919.064.38 239.233.167,49 326.426.745.59 407.407.510,45 478.721.551,25 448.951.270,25 482.847.708,67 476.418.365,75 499.294.690.40 515.128.981,40 446.395.404,00 369.741.408,00 326.977.355,00 327.909.129,70 363.572.753,18
Total Re imbursements
(ECU A)
63.916.054.19 69.848.500,70
65. 11 K. 106.99 92.680.188,23 90.747.372,33 92.645.695,20 97.929.484,41
160. 690 .227.31 184.974.731,36 230.545.532,13 239.524.266,97 251.107.813,79 316.364.823,82 432.958.350,12 540.741 .184,20 465.584.257,59 407.810.922,59 435.699.775,44 486.190.963,77 414.782.844,00 387.616.123,86 349.230.940,32 401.561 .961 ,84 428.510.772,04 439.290.158,21
Annual balance
absolute (ECU A)
+ 928.382,81 4. 622.'448,59
+ 3.917.945,45 + 4.471.043,31 + 319.627,90 + 9.109.943,28 + 6.338.199,97
- 51.255.268,00 + 16.192.974,01 + 2.542.664,41 + 9.394.797,41 - 11.874.646,30 + 10.061.921,77 - 25.550.839,67 - 62.019.632,95 - 16-.632.987,34 + 75.036.786,08 + 40.718.590,31 + 13.103.726,63 + 100.346 .137,40 + 58.779.280,14 + 20.510.467,68
- 74.584.606,84 - 100.601.642,34 - 75.717.405,03
% (a)
+ 1,43 - 7,09 + 5,68 + 4,60 + 0,35 + 8,95 + 6,08
- 46,84 + 8,05 f 1,09 + 3,77 - 4,96 + 3,08 - 6,27 - 12,96 - 3,70 + 15,54 + 8,55 + 2,62 + 19,48 + 13,17 + 5,55
- 22,81 - 30,68 - 20,83
Cumulat ive ba lance
absolute (ECU A)
+ 928.382,81 3 .69 4.065,78
+ 223.879,67 + 4.694.922,98 + 5.014.550,88 + 14.124.494,16 + 20.462.694,13
- 30.792.573,87 - 14.599.599,86 - 12.056.935,45
2.662.138,04 - 14.536.784,34
4.474.862,57 - 30.025.702,24 - 92.045.335,19 - 108.678.322,53 - 33.641.536,45 + 7.077.053,86 + 20 .180.780 , 49 + 120.526.917,89 + 179.306.198,03 + 199.816.665,71 + 125.232.058,87 + 24.630.416,53
- 51.086.988,50
% (b)
+ 1 ,43 - 2,84 + 0,11 + 1 ,58 + 1,29 + 2,89 + 3,45
- 4,38 - 1 ,62 - 1 .06 - 0,19 - 0,89 - 0,23 - 1 .27 - 3,24 - 3,31 - 0,89 + 0,17 + 0,43 + 2,29 + 3,14 + 3,29 + 1 ,96 + 0,37
- 0,72
Durat ion of storage (months)
5,63 6,13 5,38 5,9 4 5,81 4,80 4,64 6,24 5,99 5,8 4 6,35 6,17 6,09 6,50 7,62 7,73 6,77 7,33 7,35 6,57 6,20
' 5,90 5,90 6,28 5,81
165
ANNEX 14
REVENUE FROM LEVIES IN THE SUGAR SECTOR
1993
(Situation at 31.01.1994)
BUDG. AMOUNT HEAD. TITLE IN ECU (B)
110 Sugar production levies (1) 692.980.573
112 Isoglucose production levies (1) 5.435.530
116 Additional levy (-2)
115 Elimination levy (2)
111 Sugar storage levies 416.676.836
113 Amounts charged on production of C sugar 89.880 and isoglucose which is not exported
114 Amounts charged on substituted C sugar 79.544 and C isoglucose
TOTAL REVENUE BUDGET CHAPTER 11 1.115.262.361
(1) Basic production levies and B levies pursuant to Article 28 of Council Regulation (CEE) No 1785/81.
(2) Designed to eliminate, during the period covering marketing years 1986/86 to 1990/91, the deficit of ECU (A) 400 mi I I ion recorded following application of the quota arrangements for marketing years 1981/82 to 1985/86, pursuant to Article 32a of Council Regulation (EEC) No 1785/81.
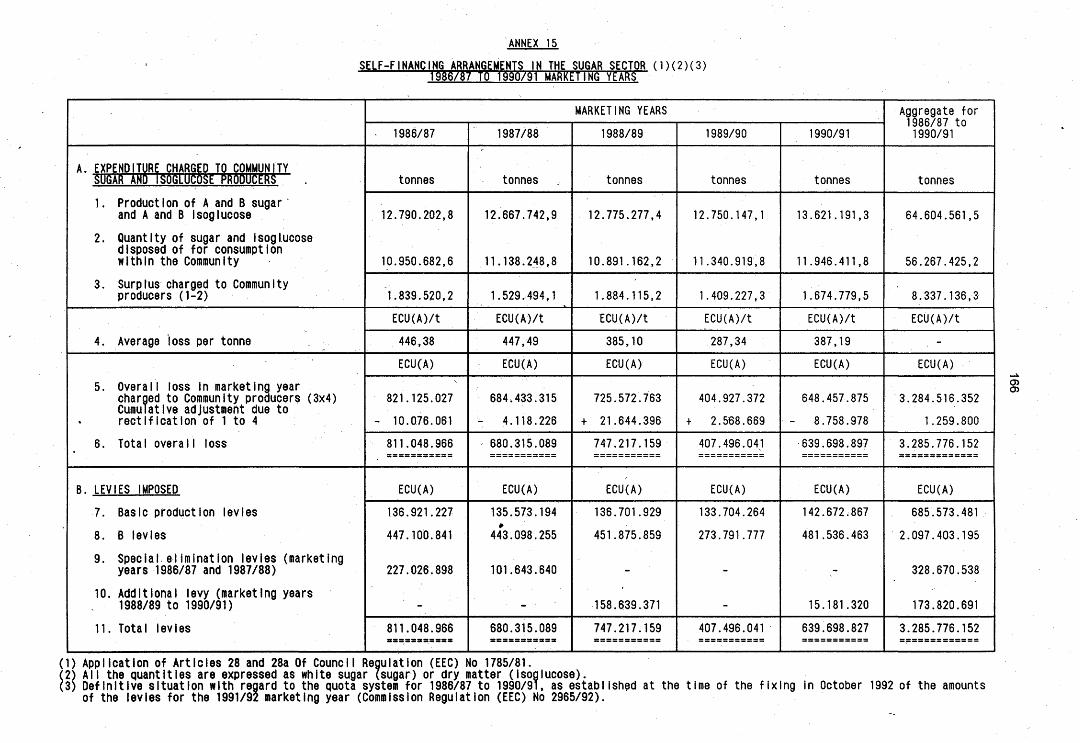
ANNEX 15
SELF-FINANCING ARRANGEMENTS IN THE SUGAR SECTOR (1)(2)(3) 1986/87 TO 1990/91 MARKETING YEARS"
A. EXPENDITURE CHARGED TO COMMUNITY SUGAR AND ISOGLUCC-SE PRODUCERS
) . Production of A and B sugar and A and B isoglucose
2. Quantity of sugar and isoglucose disposed of for consumption within the Community
3. Surplus charged to Community producers (1-2)
4. Average loss per tonne
5. Overall loss in marketing year charged to Community producers (3x4) Cumulative adjustment due to rectification of 1 to 4
6. Total overalI loss
B. LEVIES IMPOSED
7. Basic production levies
8. B levies
9. Special elimination levies (marketing years 1986/87 and 1987/88)
10. Additional levy (marketing years 1988/89 to 1990/91)
11. Total levies
MARKETING YEARS
- 1986/87
tonnes
12.790.202,8
10.950.682,6
1.839.520,2
ECU(A)/t
446,38
ECU(A)
821.125.027
- 10.076.061
811.048.966
ECU(A)
136.921.227
447.100.841
227.026.898
CO
H
CO
II
CO
||
• II
OO
II
T
H
O
II •
II y—
II
y—
N
OO
H
1987/88
tonnes
12.667.742,9
.11.138.248,8
1.529.494,1
ECU(A)/t
447,49
ECU(A)
684.433.315
- 4.118.226
680.315.089
ECU(A)
135.573.194
44*3.098.255
101.643.640
680.315.089 S S 3 S 3 S S S 3 S 3
1988/89
tonnes
12.775.277,4
10.891.162,2
1.884.115,2
ECU(A)/t
385,10
ECU(A)
725.572.763
+• 21.644.396
747.217.159
ECU(A)
136.701.929
451.875.859
158.639.371
747.217.159
1989/90
tonnes
12.750.147,1
11.340.919,8
1.409.227,3
ECU(A)/t
287,34
ECU(A)
404.927.372
+ 2.568.669
407.496.041
ECU(A)
133.704.264
273.791.777
407.496.041
1990/91
tonnes
13.621.191,3
11.946.411,8
1.674.779,5
ECU(A)/t
387,19
ECU(A)
648.457.875
- 8.758.978
639.698.897
ECU(A)
142.672.867
481.536.463
15.181.320
639.698.827
Aggregate for 1986/87 to 1990/91
tonnes
64.604.561,5
56.267.425,2
8.337.136,3
ECU(A)/t
. -
ECU(A)
3.284.516.352
1.259.800
3.285.776.152
ECU(A)
685.573.481
2,097.403.195
328.670.538
173.820.691
3.285.776.152
(1) Application of Articles 28 and 28a Of Council Regulation (EEC) No 1785/81. (2) All the quantities are expressed as white sugar (sugar) or dry matter (isoglucose). (3) Definitive situation with regard to the quota system for 1986/87 to 1990/91, as established at the time of the fixing in October 1992 of the amounts
of the levies for the 1991/92 marketing year (Commission Regulation (EEC) No 2965/92).
Oi
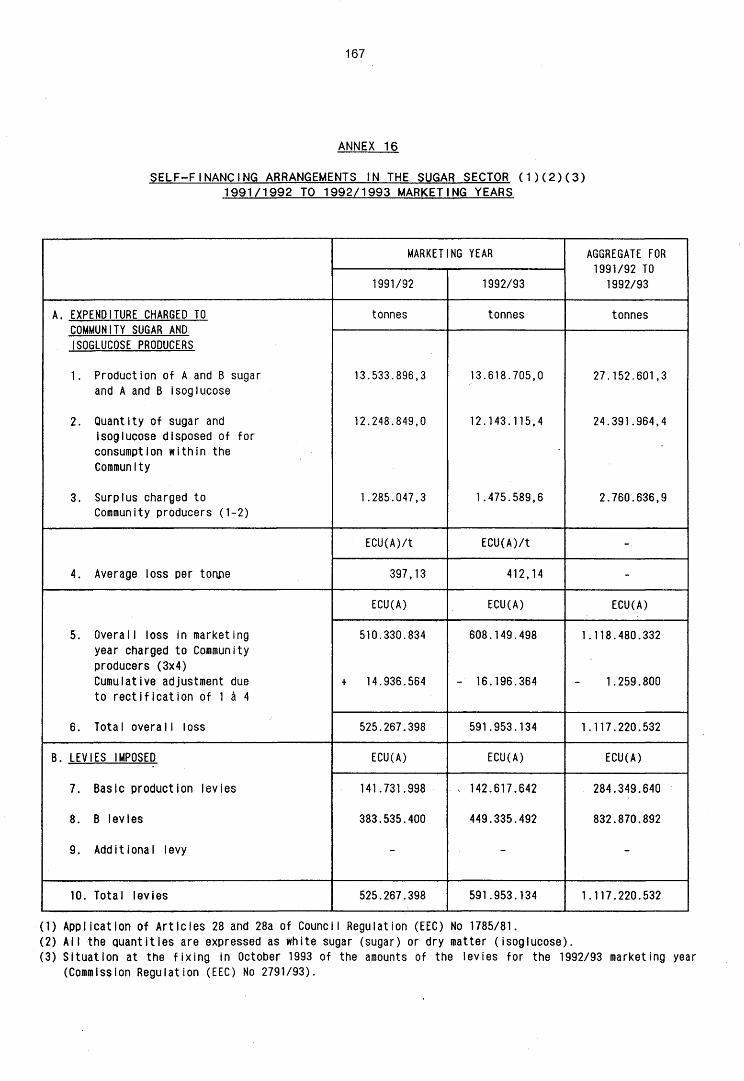
167
ANNEX 16
SELF-FINANCING ARRANGEMENTS IN THE SUGAR SECTOR ( 1 ) ( 2 ) ( 3 ) 1991/1992 TO 1992/1993 MARKETING YEARS
A. EXPENDITURE CHARGED TO COMMUNITY SUGAR AND ISOGLUCOSE PRODUCERS
1. Production of A and B sugar and A and B isoglucose
2. Quantity of sugar and isoglucose disposed of for consumption within the Community
3. Surplus charged to Community producers (1-2)
4. Average loss per tonxie
5. Overall loss in marketing year charged to Community producers (3x4) Cumulative adjustment due to rectification of 1 à 4
6. Total overal I loss
B. LEVIES IMPOSED
7. Basic production levies
8. B levies
9. Additional levy
10. Total levies
MARKETING YEAR
1991/92
tonnes
13.533.896,3
12.248.849,0
1.285.047,3
ECU(A)/t
397,13
ECU(A)
510.330.834
+ 14.936.564
525.267.398
ECU(A)
141.731.998
383.535.400
525.267.398
1992/93
tonnes
13.618.705,0
12.143.115,4
1.475.589,6
ECU(A)/t
412,14
ECU(A)
608.149.498
- 16.196.364
591.953.134
ECU(A)
, 142.617.642
449.335.492
591.953.134
AGGREGATE FOR 1991/92 TO
1992/93
tonnes
27.152.601,3
24.391.964,4
2.760.636,9
-.
-
ECU(A)
1.118.480.332
1.259.800
1.117.220.532
ECU(A)
284.349.640
832.870.892
1.117.220.532
(1) Application of Ar t ic les 28 and 28a of Council Regulation (EEC) No 1785/81. (2) Al l the quantit ies are expressed as white sugar (sugar) or dry matter (isoglucose). (3) Situation at the f i x ing in October 1993 of the amounts of the levies for the 1992/93 marketing year
(Commission Regulation (EEC) No 2791/93).
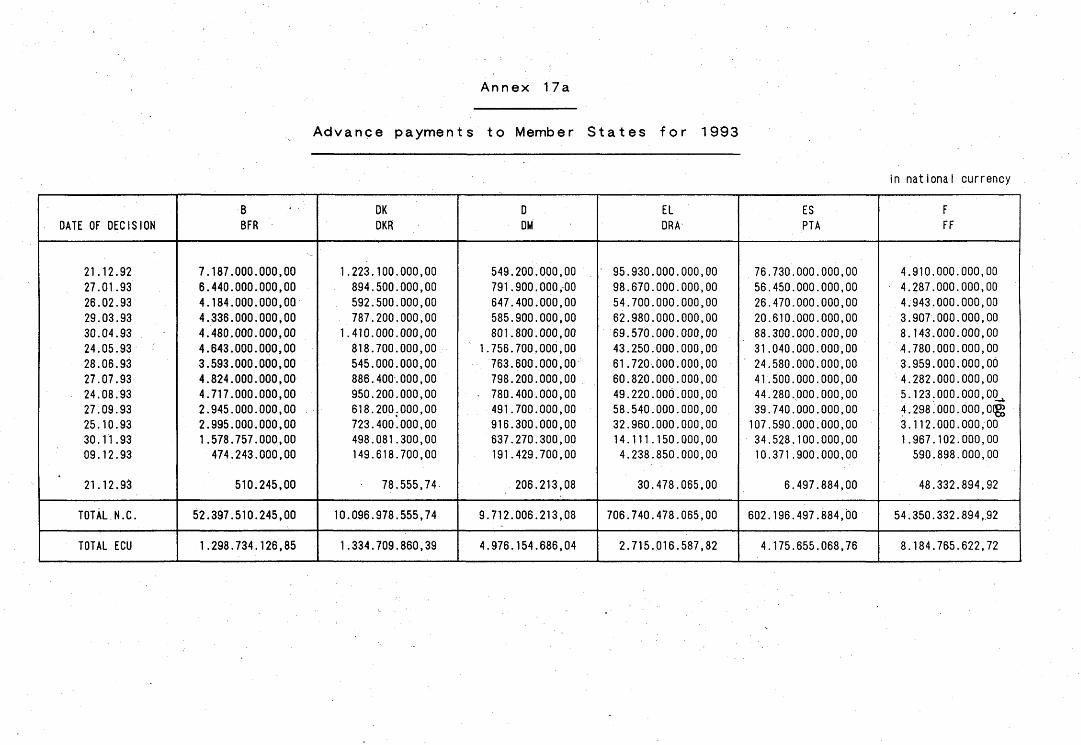
Annex 17a
A d v a n c e p a y m e n t s t o Member S t a t e s f o r 1993
in national currency
DATE OF DECISION
21.12.92 27.01.93 26.02.93 29,03.93 30.04.93 24.05.93 28.06.93 27.07.93 24.08.93 27.09.93 25.10.93 30.11.93 09.12.93
21.12,93
TOTAL N.C.
TOTAL ECU
B BFR
7.187.000.000,00 6.440.000.000,00 4.184.000.000,00 4.336.000.000,00 4.480.000.000,00 4.643.000.000,00 3.593.000.000,00 4.824.000.000,00 4.717.000.000,00 2.945.000.000,00 -2.995.000.000,00 1.578.757.000,00 474.243.000,00
510.245,00
52.397.510.245,00
1.298.734.126,85
DK DKR
1.223.100.000,00 894.500.000,00 592.500.000,00 787.200.000,00
1.410.000.000,00 818.700.000,00 545.000.000,00 886.400.000,00 950.200.000,00 618.200.000,00 723.400'. 000,00 498.081.300,00 149.618.700,00
78.555,74-
10.096.978.555,74
1.334.709.860,39
D DM
549.200.000,00 791.900.000,00 647.400.000,00 585.900.000,00 801.800.000,00
1.756.700.000,00 763.600.000,00 798.200.000,00
• 780.400.000,00 491.700.000,00 916.300.000,00 637.270.300,00 191.429.700,00
206.213,08
9.712.006.213,08
4.976.154.686,04
EL DRA
• 95.930.000.000,00 98.670.000.000,00 54.700.000.000,00 62.980.000.000,00 69.570.000.000,00 43.250.000.000,00 61.720.000.000,00 60.820.000.000,00 49.220.000.000,00 58.540.000.000,00 32.960.000.000,00 14.111.150.000,00 4.238.850.000,00
30.478.065,00
706.740.478.065,00
2.715.016.587,82
ES PTA
76.730.000.000,00 56.450.000.000,00 26.470.000.000,00 20.610.000.000,00 88.300.000.000,00 31.040.000.000,00 24.580.000.000,00 41-.500.000.000,00 44.280.000.000,00 39.740.000.000,00 107.590.000.000,00 34.528.100.000,00 10.371.900.000,00
6.497.884,00
602.196.497.884,00
4.175.655.068,76
F FF
4.910.000.000,00 4.287.000.000,00 4.943.000.000,00 3.907.000.000,00 8.143.000.000,00 4.780.000.000,00 3.959.000.000,00 4.282.000.000,00 5.123.000.000,00^ 4.298!000.000,0(g 3.112.000.000,00 1.967.102.000,00 590.898.000,00
48.332.894,92
54.350.332.894,92
8.184.765.622,72
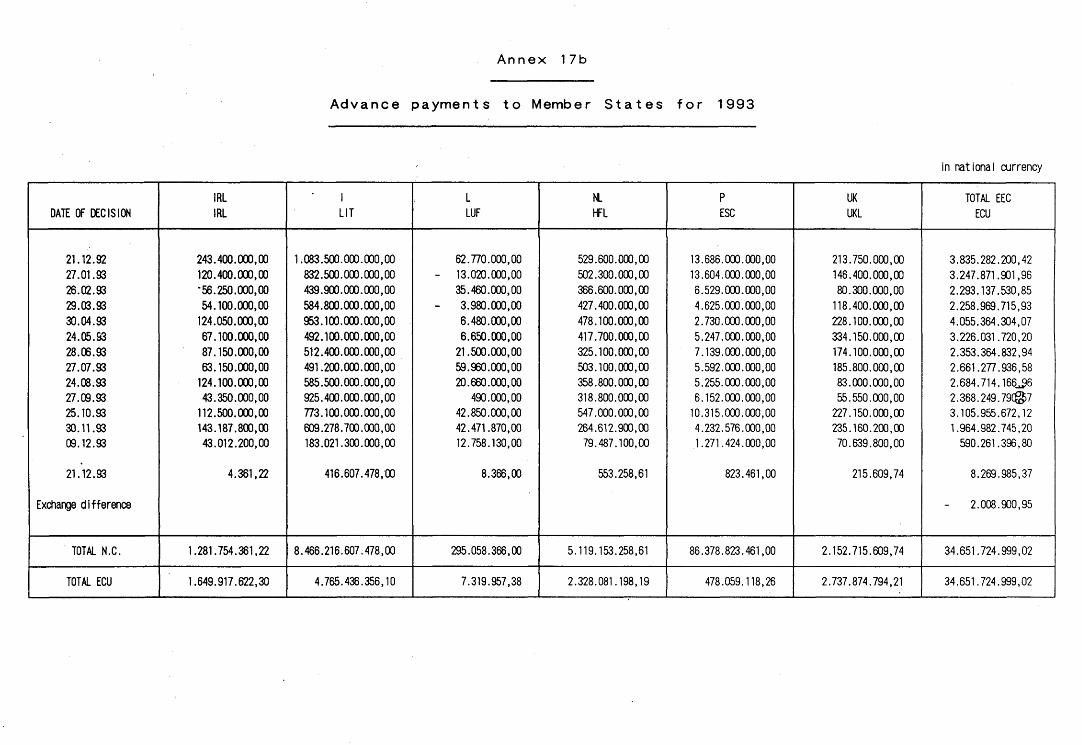
Annex 17b
Advance payments to Member S t a t e s f o r 1993
in national currency
DATE OF DECISION
21.12.92 27.01.93 26.02.93 29.03.93 30.04.93 24.05.93 28.06.93 27.07.93 24.08.93 27.09.93 25.10.93 30.11.93 09.12.93
21.12.93
Exchange difference
TOTAL N.C.
TOTAL ECU
IRL
IRL
243.400.000,00
120.400.000,00 -56.250.000,00
54.100.000,00
124.050.000,00 67.100.000,00
87.150.000,00 63.150.000,00
124.100.000,00 43.350.000,00
112.500.000,00 143.187.800,00 43.012.200,00
4.361,22
1.281.754.361,22
1.649.917.622,30
I LIT
1.083.500.000.000,00 832.500.000.000,00 439.900.000.000,00 584.800.000.000,00 953.100.000.000,00 492.100.000.000,00 512.400.000.000,00 491.200.000.000,00 585.500.000.000,00 925.400.000.000,00 773.100.000.000,00 609.278.700.000,00 183.021.300.000,00
416.607.478,00
8.466.216.607.478,00
4.765.436.356,10
L LUF
62.770.000,00 - 13.020.000,00
35.460.000,00
- 3.980.000,00 6.480.000,00 6.650.000,00
21.500.000,00 59.960.000,00 20.660.000,00
490.000,00 42.850.000,00 42.471.870,00 12.758.130,00
8.366,00
295.058.366,00
7.319.957,38
NL
HFL
529.600.000,00 502.300.000,00 366.600.000,00 427.400.000,00 478.100.000,00 417.700.000,00 325.100.000,00 503.100.000,00 358.800.000,00 318.800.000,00 547.000.000,00 264.612.900,00
79.487.100,00
553.258,61
5.119.153.258,61
2.328.081.198,19
P ESC
13.686.000.000,00 13.604.000.000,00 6.529.000.000,00 4.625.000.000,00 2.730.000.000,00 5.247.000.000,00 7.139.000.000,00 5.592.000.000,00 5.255.000.000,00 6.152.000.000,00
10.315.000.000,00 4.232.576.000,00 1.271.424.000,00
823.461,00
86.378.823.461,00
478.059.118,26
UK
UKL
213.750.000,00 146.400.000,00
80.300.000,00 118.400.000,00 228.100.000,00 334.150.000,00 174.100.000,00 185.800.000,00
83.000.000,00 55.550.000,00
227.150.000,00 235.160.200,00
70.639.800,00
215.609,74
2.152.715.609,74
2.737.874.794,21
TOTAL EEC
ECU
3.835.282.200,42 3.247.871.901,96 2.293.137.530,85 2.258.969.715,93 4.055.364.304,07 3.226.031.720,20 2.353.364.832,94 2.661.277.936,58 2.684.714.166^96 2.368.249.79©7 3.105.955.672,12 1.964.982.745,20
590.261.396,80
8.269.985,37
2.008.900,95
34.651.724.999,02
34.651.724.999,02
170
ANNEX 18 meas applied to trade
CURRENCY
DM
BFR/LFR
HFL
FF
LIT
IRL
DKR
UKL
DRA
PTA '
ESC
PRODUCTS
AI I products
AI I products
AI I products
AI I products
Beef and milk products Crops and sugar Pigmeat Eggs and poultry Wine OIive oiI
AI I products
AI I products
Milk and beef Crops and sugar Pigmeat Eggs and poultry OIive oiI Wine
Pigmeat Eggs and poultry Other livestock products Wine 01i ve o iI Cereals and sugar
Beef and milk products Pigmeat Eggs and poultry Wine Cereals, sugar OIive oiI
Eggs and poultry Pigmeat Beef and milk products Wine 01i ve o iI Cereals, sugar
RATE USED FOR THE 1993
BUDGET (JULY '92)
FROM 15.08.92 TO 31.12.92
0
0
0
0
0 0 0 0 0 0
0
0
0
o 0 0 0 0
0 0 0 0 0 0
+ 1 ,8 0 0 0
+ 1 ,6 0
0 0
+ 3,7 0 0
.+ ' 3,7
RATES RECORDED RELATING TO 1993
(AVERAGE MONTHLY RATE)
MINIMUM
0
o
0
0
- 9 - 9 - 2,2 - 5,5 - 5,5 - 1,5
0
0
- 10,1 • - 10,1 - 3,3 - 6,6 - 1,6
0 - 0,3 - 3,8 - 0,6 "- 2,3 - 3,8
- 5,6 - 0,2 - 2,3 - 3,3 - 5,8
0
0 0 0 0 0 0
MAXIMUM
0
0
0
0
- 2,2 - 2,2
0 0
- 0,3 0
0
0
- 3,3 - 3,3
0 0 0
0 0 0 0 0 0
- 0,9 0 0
- 0,1 - 0,9
0
0 0
+ 0,2 0 0
+ 0,2
Annex 19
Exchange rates 1993
1) Conversion of monthly expenditure Into ECU - Budget rates
Expenditure
11.92 12.92 01.93 02.93 03.93 04.93 05.93 06.93 07.93 08.93 09.93 10.93
Rate on: OJ:
18.09.92 - C 240/92 20.10.92 - C 272/92 20.11.92-- C 304/92
18.12.92 - C 336/92 20.01.93 - C 015/93 19.02.93 - C 050/93 19.03.93 - C 079/93 20.04.93 - C 111/93 19.05.93 - C 142/93 18.06.93 - C 168/93 20.07.93 - C 197/93 20.08.93 - C 226/93
B
40,9612 40,4480 40,4302 40,2569 40,3754 39,9677 39,9912 40,1113 40,2072 40,2678 40,2530 40,4526
DK
7,72663 7,56692 7,64658 7,55860 7,53343 7,44024 7,47021 7,47236 7,50449 7,49571 7,52550 7,84533
D
1,98221 1,96551 1,96370 1,95722 1,96115 1,94039 1,94127 1,94886 1,95576 1,95955 1,94915 1,92767
EL
251,701 254,860 255,728 260,308 262,065 260,849 263,911 265,864 264,516 266,946 266,409 270,591
ES
139,627 139,339 140,603
" 139,254 138,784 139,206 139,128 140,901 149,234 149,726 152,873 155,729
F
6,77810 6,66474 6,64511 6,68999 6,63172 6,56858 6,62654 6,58529 6,59513 6,58360 6,65338 6,70505
IRL
0,751564 0,745396 0,748299 0,740804 0,739439 0,795488 0,801266 0,799168 0,801790 0,802198 0,808102 0,815243
1
1673,30 1723,08 1700,56 1762,47 1796,29 1855,75 1880,23 1867,86 1777,78 1776,87 1810,56 1820,07
LUX
40,9612 40,4480 40,4302 40,2569 40,3754 39,9677 39,9912 40,1113 40,2072 40,2678 40,2530 40,4526
NL
2,23271 2,21221 2,21017 2,20086 2,20507 2,18455 2,18179 2,18966 2,19319 2,19728 2,19390 2,16830
P
176,470 174,757 177,492 174,948 176,418 177,541 180,113 180,161 186,115 186,292 189,744 195,476
UK
0,758678 0,800981 0,810417 0,797640 0,792033 0,819901 0,795838^ 0,79066£! 0,785180 0,780182 0,759397 0,759810
Average rate » in ECU
Total expend, in NC
Total expend. In ECU 40,3451 7,56492 1,95171 260,308 144,216 6,64043 0,776860 1776,59 40,3088 2,19887 180,686 0,786272
A N N E X 20
AMOUNTS WITHHELD FROM PRODUCTION AND CONSUMPTION AID IN THE OLIVE OIL. FIBRE FLAX
AND CRAPE JUICE SECTORS AND THEIR UTILIZATION
(ECU)
SCHEMES RELATED TO OLIVE
OIL CONSUMPTION
(Art.11(6) - R.136/66/EEC)
INFORMATION AND PROMOTION
SCHEMES
SCHEMES RELATED TO aIVE
OIL PRODUCTION
(Art.5(2) and(4)- R.136/66/EEC)
ESTABLISHMENT OF
a IVE OIL REGISTER
SCHEMES RELATED TO a IVE
OIL PRODUCTION
(Art .5(4) - R. 136/66/EEC)
IMPROVEMENT OF
QUALITY OF aIVE OIL
SCHEMES RELATED TO OLIVE
OIL PRODUCTION
(Art.20d(1) -
R.136/66/EEC)
CONTRIBUTIONS TO COSTS OF
RECOGNIZED ORGANIZATIONS
AND ASSOCIATIONS
SPECIFIC SCHEMES
CONCERNING FIBRE FLAX
(Art.2 - R.(EEC) 1308/70)
INFORMATION AND PROMOTION
SCHEMES
SCHEMES RELATED TO THE CONSUMPTION OF
GRAPE JUICE
Art.4(2) -
R.2275/85/EEC
Art.4(2) -
R.2275/85/EEC
PROMOTION
SCHEMES
A.20
(1) and
A.3(4)
R.3461/
85/EEC
FINANC. OF
RESEARCH
Art. 4
(•)
R.3461/
85/EEC
OVER
HEADS
YEAR WITHHELD UTILIZATION WITHHELD UTILIZATION WITHHELD UTILIZATION WITHHELD UTILIZATION WITHHELD UTILIZATION WITHHELD UTILIZATION UTILIZ. UTILIZ.
Until
197»
1960
1981
1982
1983
1984
1985
1966
1987
1988
1989
1990
1991
1992
1993
314.322
3.002.587
2.450.465
6.186.243
164.079
(61.380)
7.385.034
16.814.429
1.904.138
27.568.043
24.431.817
19.037.203
29.760.024
13.151.205
5.725.087
186.053
228.892
2.637.599
178.196
3.908.825
4.469.156
1.415.569
1.529.035
8.756.550
9.781.272
4.175.724
16.912.766
22.383.755
10.739.627
(1)
11.596.900
1.913.256
2.478.668
2.790.595
7.269.763
15.922.259
9.841.270
5.703.249
14.574.601
10.865.415
20.847.757
15.020.682
28.302.535
27.876.365
32.885.611
154.567
10.217.222
2.533.411
10.560.376
16.652.197
13.510.537
22.024.203
16.887.665
22.880.775
23.026.556
20.587.986
8.178.986
17.292.122
4.052.643
3.508.293
8.468.414
978.326
12.804.438
10.669.627
20.400.643
21.840.665
23.693.984
4.135.329
4.606.092
10.611.885
7.504.480
14.129.759
5.840.301
4.240.523
11.758.762
5.746.143
14.527.146
8.944.125
14.847.811
15.903.625
17.644.148
477.096
10.022.034
9.709.384
6.591.949
5.033.263
7.239.877
7.186.494
6.635.186
7.431.095
300.381
637.351
949.916
1.218.506
1.146.909
1.698.562
1.787.949
2.015.517
2.395.084
2.433.702
3.941.124
2.556.035
2.239.724
2.594.027
537.151
996.897
244.931
1.154.500
1.073.342
3.274.836
500.500
1.303.210
2.829.373
1.649.911
1.654.180
4.995.386
2.478.550
(D
2.720.876
3.156.545
7.441.746
5.137.237
6.523.170
6.493.761
6.493.724
8.890.122
3.901.559
2.314.470
5.293.257
4.174.999
6.296.229
4.741.154
4.841.138
82.041
8.093
TOTAL 154.777.843 87.303.019
(1) Commitment»
208.080.866 188.559.246 102.476.945 40.987.546 99.541.665 60.326.378 25.914.785 22.665.768 46.857.181 31.562.807 90.134
Annex 21
EAGGF Guorontoo Section - 1993 - IrroqulorIt lee reported - Regulation (EEC) No 595/91
ECU 1.000
AMOUNT DK AMOUNT DE AMOUNT EL AMOUNT ES AMOUNT FR AMOUNT
SECTOR Coses Costs Cases Cases Casss Casss B
10. Csrsals and ries
11. Sugar ond Isoglucose
12. Oils ond fats
13. Protein crops
14. Fibre plants ond si Ik worms
15. Fruits ond vegetables
16. Wine
18. Other crop products
20. Milk ond milk products
21. BeefA«ol
22. Sheepmeat and goatmeat
23. Pigmeat
24. Eggs and poultry
25. Non-Annex 11 products
27. Accession compensatory amounts
28. Monetory compensatory amounts
29. Other Guorantee measures
40. Fishery products
99. Sector not specified
1.079
3.573
1.117
305
60
15
1.070
3.573
1.117
298
42
16
15
12
15
2
13
650
10
239
2.272
108
90
860
20
68
2.222
108
14
818
42
12
1
2
72
33
1
1
5
751
424
98
33
5.505
12.086
190
147
539
133
283 21
1
156*
9
14
4
16.590
1.926*
5.628
689
4.813
11.412
190
410
15.773
1.457
5.628
662
44
91
47
12
8
8
7
149
4
13
2.177
403
585
587
158
3.327
98
280
2.143
348
585
587
134
3.241
98
280
63
5
63
5
27
15
2
7
4
14
22
10
6.716
380
87
2.991
43
6.371
15.643
947
1.116
19
40
2.602
114
87
496
43
5.180
15.629
939 (XM
S 1.104
12
40
TOTAL 21 6.149 6.100 75 4.235 3.256 177 19.912 17.328 211 24.877 23.564 251 7.688 7.489 118 34.353 26.246
A - Totol amount indicated. B - Balance to be recovered. • Included ISO cases without financial Indication. N.B.: for sector «17 Tobacco» no irregularity reported in 1993.

Annex 21 (ctd)
SECTOR
10. Cereals and rice
11. Sugar and Isoglucose
12. Oils ond fats
13. Protein crops
14. Fibre plants and s 11 kworme
15. Fruits and vegetables
16. Wine *;
18. Other crop products
20. Milk and milk products
21. BeefA«ol
22. Sheepmeat and goatmeat
23. Plgmeot
24. Eggs ond poultry
25. Non-Annex 11 products
27. Accession compensatory amounts
28. Monetory compensatory amounts
29. Other Guarantee measures
40. Fishery products
99. Sector not specified
TOTAL
IR
Cases
15
16
AMOUNT
824
254
1.078
572
254
826
Coses
6
1
13
1
12
AMOUNT
118.618
13
1.232
161
1.309
11.715
1.119
550
25
47 134.742 114.832
B
99.272
13
674
161
1.303
11.715
1.119
550
25
NL
Coses
17
4
10
1
4
61
AMOUNT
255
121
85
342
12
2.512
11
165
3.503
20
62
26
104
12
2.500
165
2.889
P0
Coses
17
106
1
141
AMOUNT
1.030
2.379
76
548
480
3.024
7.549
1.030
1.707
76
531
480
2.941
6.765
UK
Cases
12
4
9
5
24
43
28
1
3
33
180
A - Total amount Indicated. B - Balance to be recovered. •• Included 163 cases without financial Indication. N.B.: for sector «17. TABAC» no Irregularity reported In
AMOUNT
289
38
73
47
1.919
430
329
132
760
70
103
80
4.274
221
14
56
38
1.777
200
211
19
291
45
67
2.939
CEE
Cases
161
41
335
34
9
37
39
7
314
134
41
30
19
61
10
18
2
1
1.298**
Amount Indi
cated
Balance to be recov'd
145.978
4.549
7.982
3.635
5.628
2.030
8.273
158
40.331
18.093
609
2.870
1.511
2.900
3.099
403
238
68
5
120.291
3.776
6.222
1.009
5.628
1.982
7.076
134
38.988
16.872
491
-M2.840
en
1.137
2.246
2.946
345
183
63
5
248.360 212.234
1993.
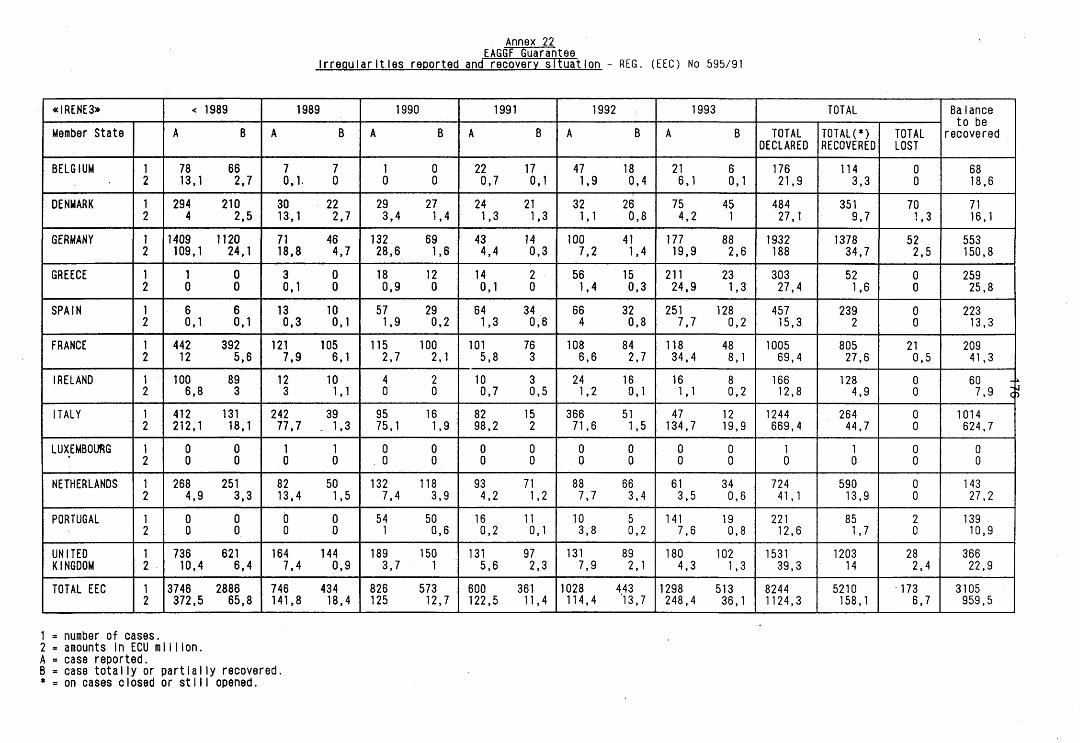
Annex 22 EAGGF Guarantee
Irregularities reported and recovery situation - REG. (EEC) No 595/91
«IRENE3»
Member State
BELGIUM
DENMARK
GERMANY
GREECE
SPAIN
FRANCE
IRELAND
ITALY
LUXEMBOURG
NETHERLANDS
PORTUGAL
UNITED KINGDOM
TOTAL EEC
1 2
1 2
1 2
1 2
1 2
1 2
1 2
1 2
1 2
1 2
1 2
1 2
1 2
< 1989
A B
78 66 13,1 2,7
294 210 4 2,5
1409 1120 109,1 24,1
1 0 0 0
6 6 0,1 0,1
442 392 12 5,6
100 89 6,8 3
412 131 212,1 18,1
0 0 0 0
268 251 4,9 3,3
0 0 0 o
736 621 10,4 6,4
3746 2886 372,5 65,8
1989
A B
7 7 0,1. 0
30 22 13,1 2,7
71 46 18,8 4,7
3 0 0,1 0
13 10 0,3 0,1
121 105 7,9 6,1
12 10 3 1,1
242 39 77,7 1,3
1 1 0 0
82 50 13,4 1,5
0 0 0 0
164 144 7,4 0,9
746 434 141,8 18,4
1990
A B
1 0 0 0
29 27 3,4 1,4
132 69 28,6 1,6
18 12 0,9 0
57 29 1,9 0,2
115 100 2,7 2,1
4 2 0 0
95 16 75,1 1,9
0 0 . 0 0
132 118 7,4 3,9
54 50 1 0,6
189 150 3,7 1
826 573 125 12,7
1991
A B
22 17 0,7 0,1
24 21 1,3 1,3
43 14 4,4 0,3
14 2 0,1 0
64 34 1,3 0,6
101 76 5,8 3
10 3 0,7 0,5
82 15 98,2 2
0 0 0 0
93 71 4,2 1,2
16 11 0,2 0,1
131 97 5,6 2,3
600 361 122,5 11,4
1992
A B
47 18 1,9 0,4
32 26 1,1 0,8
100 41 7,2 1,4
56 15 1,4 0,3
66 32 4 0,8
108 84 6,6 2,7
24 16 1,2 0,1
366 51 71,6 1,5
0 0 0 0
88 66 7,7 3,4
10 5 3,8 0,2
131 89 7,9 2,1
1028 443 114,4 '13,7
1993
A B
21 6 6,1 0,1
75 45 4,2 1
177 88 19,9 2,6
211 23 24,9 1,3
251 128 7,7 0,2
118 48 34,4 8,1
16 8 U 0,2
47 12 134,7 19,9
0 0 0 0
61 34 3,5 0,6
141 19 7,6 0,8
180 102 4,3 1,3
1298 513 248,4 36,1
TOTAL
TOTAL DECLARED
176 21,9
484 27,1
1932 188
303 27,4
457 15,3
1005 69,4
166 12,8
1244 669,4
1 0
724 41,1
221 12,6
1531 39,3
8244 1124,3
TOTAL(*) RECOVERED
114 3,3
351 9,7
1378 34,7
52 1,6
239 2
805 27,6
128 4,9
264 44,7
1 0
590 13,9
85 1,7
1203 14
5210 158,1
TOTAL LOST
0 0
70 1,3
52 2,5
0 0
0 0
21 0,5
0 0
0 0
0 0
0 0
2 0
28 2,4
•173 6,7
Balance to be
recovered
68 18,6
71 16,1
553 150,8
259 25,8
223 13,3
209 41,3
60 7,9 H
1014 624,7
0 0
143 27,2
139 10,9
366 22,9
3105 959,5
1 = number of cases. 2 = amounts in ECU mi 11 ion. A = case reported. B = case totally or partially recovered, * = on cases closed or still opened.
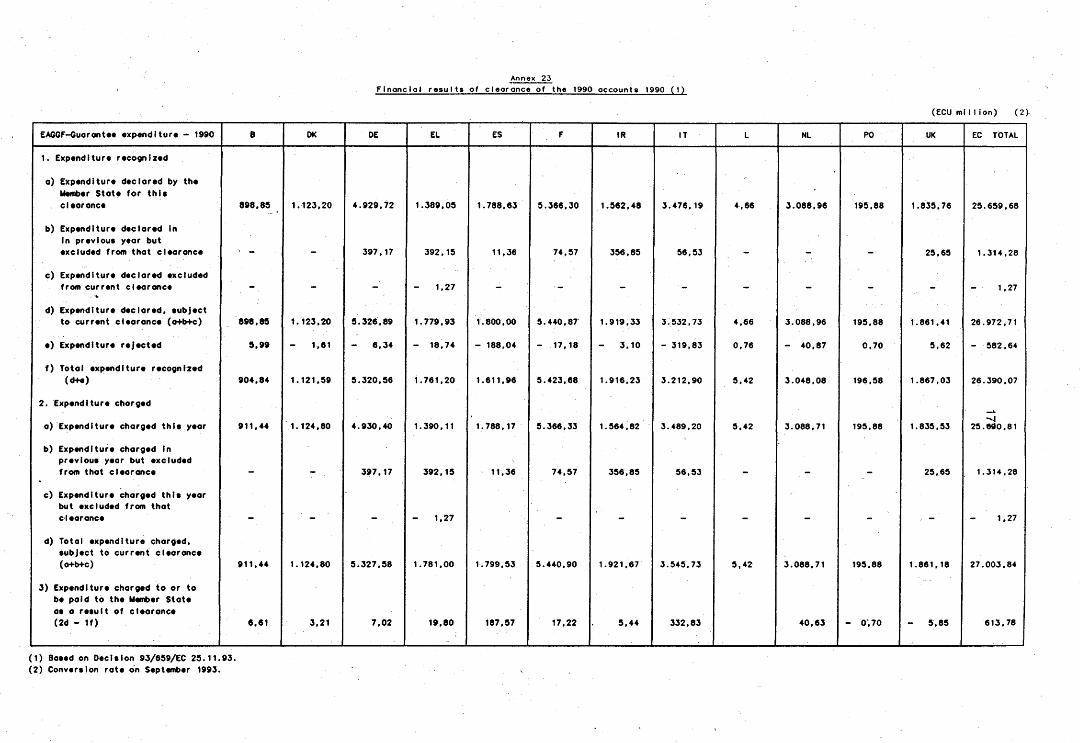
Flnonclol results of cleoronce of the 1990 occounts 1990 (1)
(ECU ml I I ion) (2>
EAGGF-Guorontee expenditure — 1990 DK DE EL ES IR IT NL PO UK EC TOTAL
1. Expenditure recognized
a) Expenditure declared by the Member State for this
. cleoronce
b) Expenditure declared in in previous year but excluded from that clearance
c) Expenditure declared excluded from current clearance
d) Expenditure declared, subject to current clearance (o+b+c)
e) Expenditure rejected
f) Total expenditure recognized
(d+e)
2. Expenditure charged
a) Expenditure charged this year
b) Expenditure charged in previous year but excluded from that clearance
c) Expenditure charged this year but excluded from that cIearonce
d) Total expenditure charged, subject to current clearance (o+b+c)
3) Expenditure charged to or to be paid to the Member State as a result of cleoronce (2d - 1f)
898.85
898.85
5,99
904.84
911,44
911,44
6,61
1.123,20
1.123,20
1,61
1.121.59
1.124,80
1.124.80
3,21
4.929.72
5.326,89
- 6.34
5.320.56
4.930.40
397,17
5.327,58
7,02
1.389.05
397,17 392,15
1.27
1.779.93
- 18,74
1.761.20
1.390.11
392.15
1.27
1.781,00
19.80
1.788,63
11,36
1.800.00
- 188.04
1.611.96
1.788.17
11.36
1.799,53
187,57
5.366.30
74,57
5.440,87
- 17,18
5.423.68
5.366,33
74,57
5.440.90
17.22
1.562,48
356,85
1.919.33
3.10
1.916.23
1.564,82
356.85
1.921,67
5.44
3.476.19
56,53
3.532.73
- 319,83
3.212.90
3.489,20
56,53
3.545.73
332,83
4,66
4.66
0.76
5.42
5.42
5,42
3.088.96
3.088,96
- 40.87
3.048,08
3.088,71
3.088.71
40.63
195.88
195.88
0.70
196.58
195.88
195.88
- 0.70
1.835,76
1.861.41
5.62
1.867,03
1.835.53
25.65
1.861,18
25.659,68
25,65 1.314.28
1.27
26.972.71
- 582,64
26.390.07
--4 25.600.81
1.314.28
1.27
27.003.84
- 5,85 613.78
(1) Based on Decision 93/659/EC 25.11. (2) Conversion rate on September 1993.
93.
ISSN 0254-1475
COM(94) 464 final
DOCUMENTS
E N 0103
Catalogue number : CB-CO-94-489-EN-C
ISBN 92-77-81443-8
Office for Official Publications of the European Communities
L-2985 Luxembourg