
Combustion and Sootblowing Optimization Help Reduce Emissions and Improve Performance and...
46
Combustion and Sootblowing Optimization Help Reduce Emissions and Improve Performance and Availability of Boilers Firing Western Fuels Nenad Sarunac, Carlos E. Romero, Harun Bilirgen and Edward K. Levy Energy Research Center Lehigh University 610-758-4090
Transcript of Combustion and Sootblowing Optimization Help Reduce Emissions and Improve Performance and...
Combustion and Sootblowing
Optimization Help Reduce
Emissions and Improve
Performance and Availability of
Boilers Firing Western Fuels
Nenad Sarunac, Carlos E. Romero,
Harun Bilirgen and Edward K. Levy Energy Research Center
Lehigh University
610-758-4090
EPGA's 2005 Power Generation Conference, Hershey, PA September 7-8, 2005 2
Presentation Outline
Introduction
Fuel Properties
Combustion Optimization
Case Studies
Sootblowing Optimization
Case Study
Predicting Catastrophic Slagging/Fouling
Events
Early Warning Advisor
EPGA's 2005 Power Generation Conference, Hershey, PA September 7-8, 2005 3
Introduction
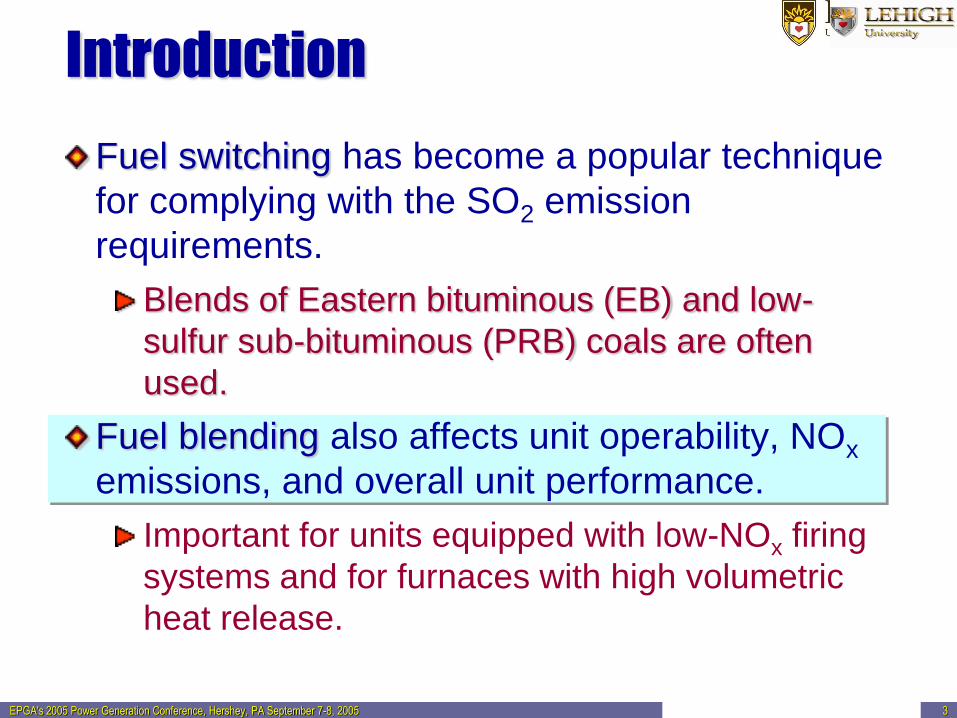
Fuel switching has become a popular technique
for complying with the SO2 emission
requirements.
Blends of Eastern bituminous (EB) and low-
sulfur sub-bituminous (PRB) coals are often
used.
Fuel blending also affects unit operability, NOx
emissions, and overall unit performance.
Important for units equipped with low-NOx firing
systems and for furnaces with high volumetric
heat release.
EPGA's 2005 Power Generation Conference, Hershey, PA September 7-8, 2005 6
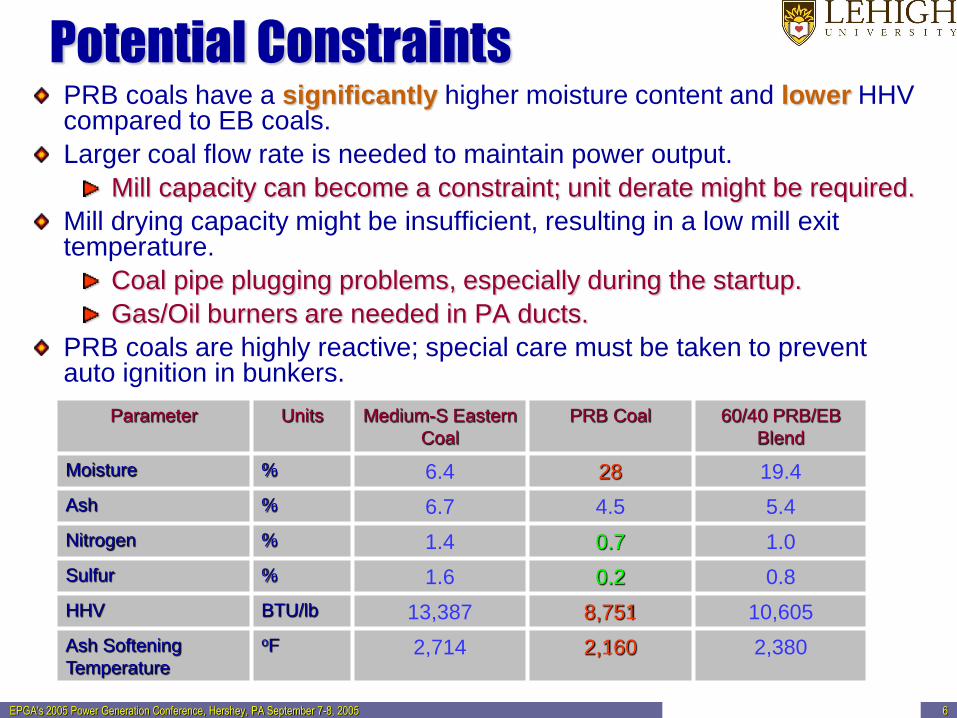
Potential Constraints PRB coals have a significantly higher moisture content and lower HHV compared to EB coals.
Larger coal flow rate is needed to maintain power output.
Mill capacity can become a constraint; unit derate might be required.
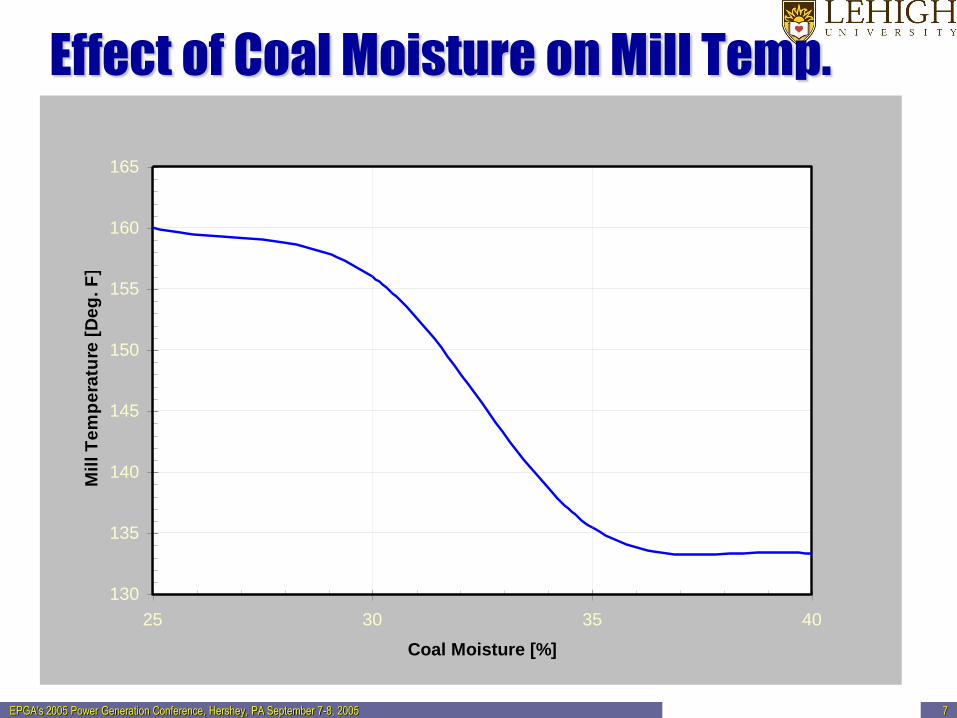
Mill drying capacity might be insufficient, resulting in a low mill exit temperature.
Coal pipe plugging problems, especially during the startup.
Gas/Oil burners are needed in PA ducts.
PRB coals are highly reactive; special care must be taken to prevent auto ignition in bunkers.
Parameter Units Medium-S Eastern
Coal
PRB Coal 60/40 PRB/EB
Blend
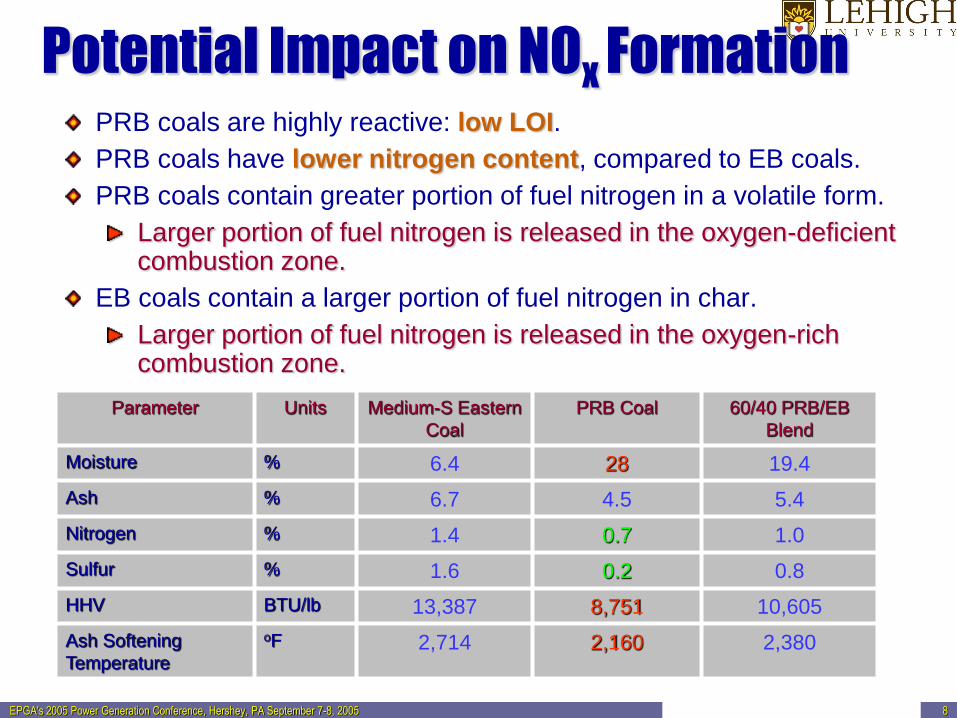
Moisture % 6.4 28 19.4
Ash % 6.7 4.5 5.4
Nitrogen % 1.4 0.7 1.0
Sulfur % 1.6 0.2 0.8
HHV BTU/lb 13,387 8,751 10,605
Ash Softening
Temperature
oF 2,714 2,160 2,380
EPGA's 2005 Power Generation Conference, Hershey, PA September 7-8, 2005 7
Effect of Coal Moisture on Mill Temp.
130
135
140
145
150
155
160
165
25 30 35 40
Coal Moisture [%]
Mil
l T
em
pe
ratu
re [
De
g.
F]
EPGA's 2005 Power Generation Conference, Hershey, PA September 7-8, 2005 8
Potential Impact on NOx Formation PRB coals are highly reactive: low LOI.
PRB coals have lower nitrogen content, compared to EB coals.
PRB coals contain greater portion of fuel nitrogen in a volatile form.
Larger portion of fuel nitrogen is released in the oxygen-deficient combustion zone.
EB coals contain a larger portion of fuel nitrogen in char.
Larger portion of fuel nitrogen is released in the oxygen-rich combustion zone.
Parameter Units Medium-S Eastern
Coal
PRB Coal 60/40 PRB/EB
Blend
Moisture % 6.4 28 19.4
Ash % 6.7 4.5 5.4
Nitrogen % 1.4 0.7 1.0
Sulfur % 1.6 0.2 0.8
HHV BTU/lb 13,387 8,751 10,605
Ash Softening
Temperature
oF 2,714 2,160 2,380
EPGA's 2005 Power Generation Conference, Hershey, PA September 7-8, 2005 11
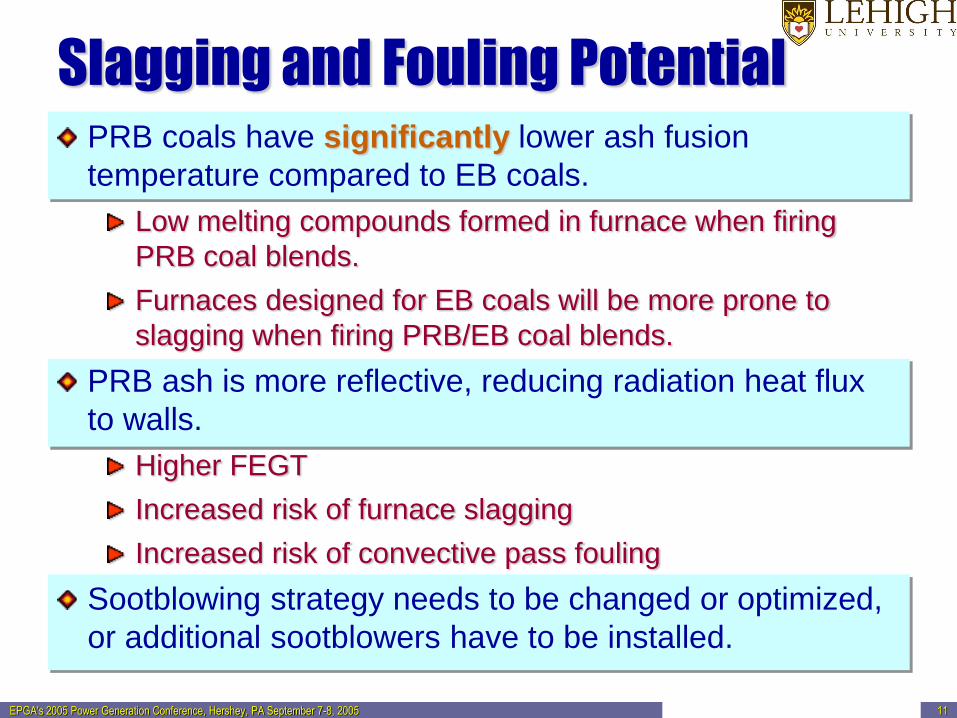
Slagging and Fouling Potential PRB coals have significantly lower ash fusion
temperature compared to EB coals.
Low melting compounds formed in furnace when firing
PRB coal blends.
Furnaces designed for EB coals will be more prone to
slagging when firing PRB/EB coal blends.
PRB ash is more reflective, reducing radiation heat flux
to walls.
Higher FEGT
Increased risk of furnace slagging
Increased risk of convective pass fouling
Sootblowing strategy needs to be changed or optimized,
or additional sootblowers have to be installed.
Combustion Optimization
EPGA's 2005 Power Generation Conference, Hershey, PA September 7-8, 2005 13
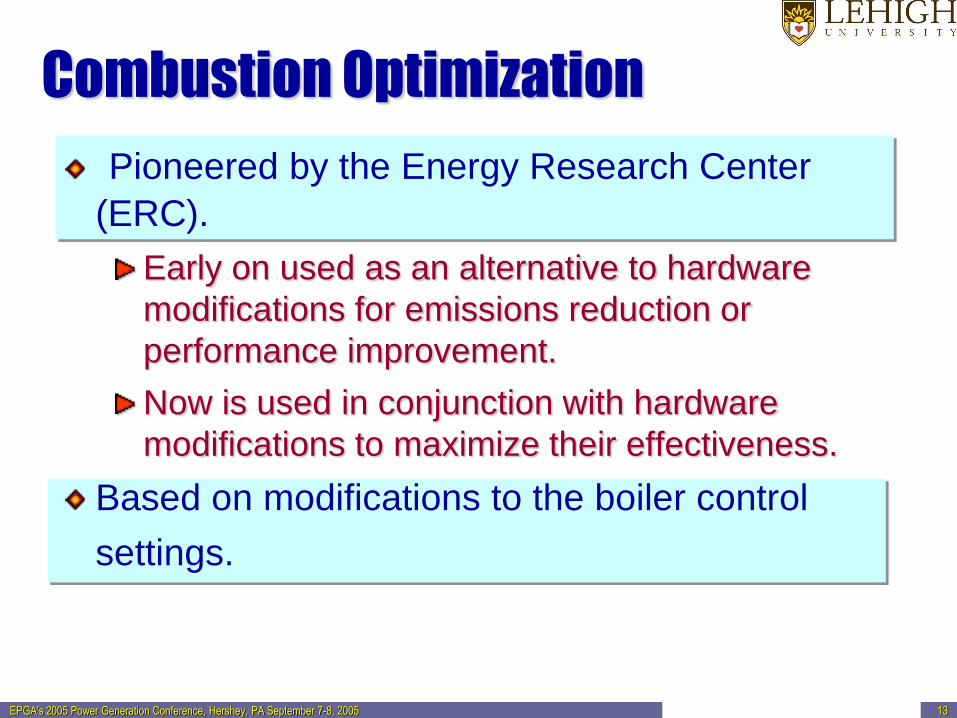
Combustion Optimization
Pioneered by the Energy Research Center
(ERC).
Early on used as an alternative to hardware
modifications for emissions reduction or
performance improvement.
Now is used in conjunction with hardware
modifications to maximize their effectiveness.
Based on modifications to the boiler control
settings.
EPGA's 2005 Power Generation Conference, Hershey, PA September 7-8, 2005 17
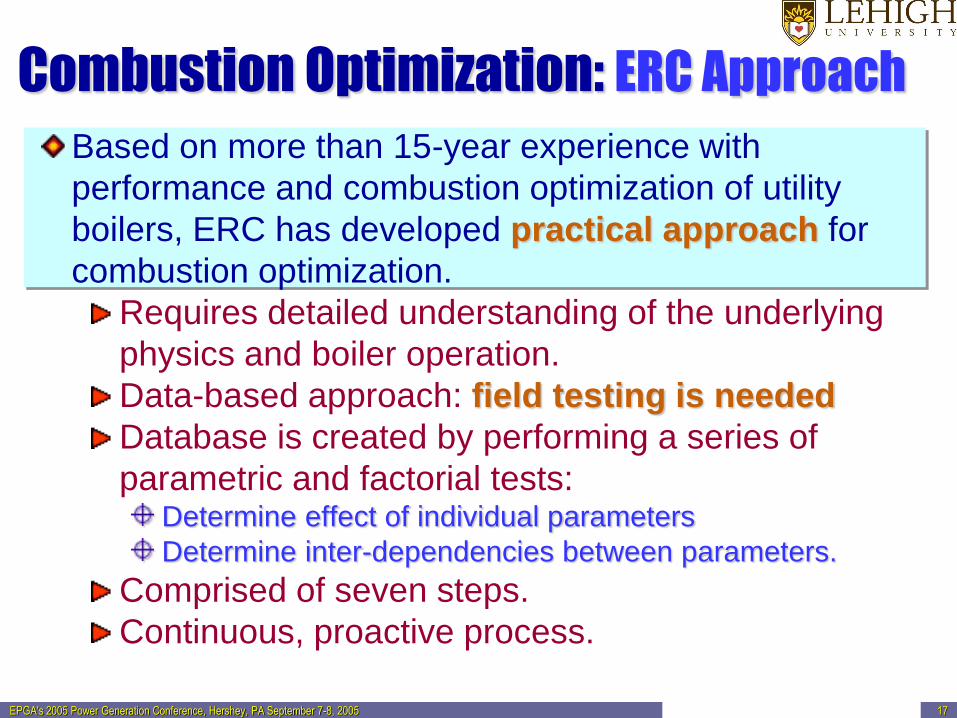
Combustion Optimization: ERC Approach
Based on more than 15-year experience with
performance and combustion optimization of utility
boilers, ERC has developed practical approach for
combustion optimization.
Requires detailed understanding of the underlying
physics and boiler operation.
Data-based approach: field testing is needed
Database is created by performing a series of
parametric and factorial tests: Determine effect of individual parameters
Determine inter-dependencies between parameters.
Comprised of seven steps.
Continuous, proactive process.
EPGA's 2005 Power Generation Conference, Hershey, PA September 7-8, 2005 19
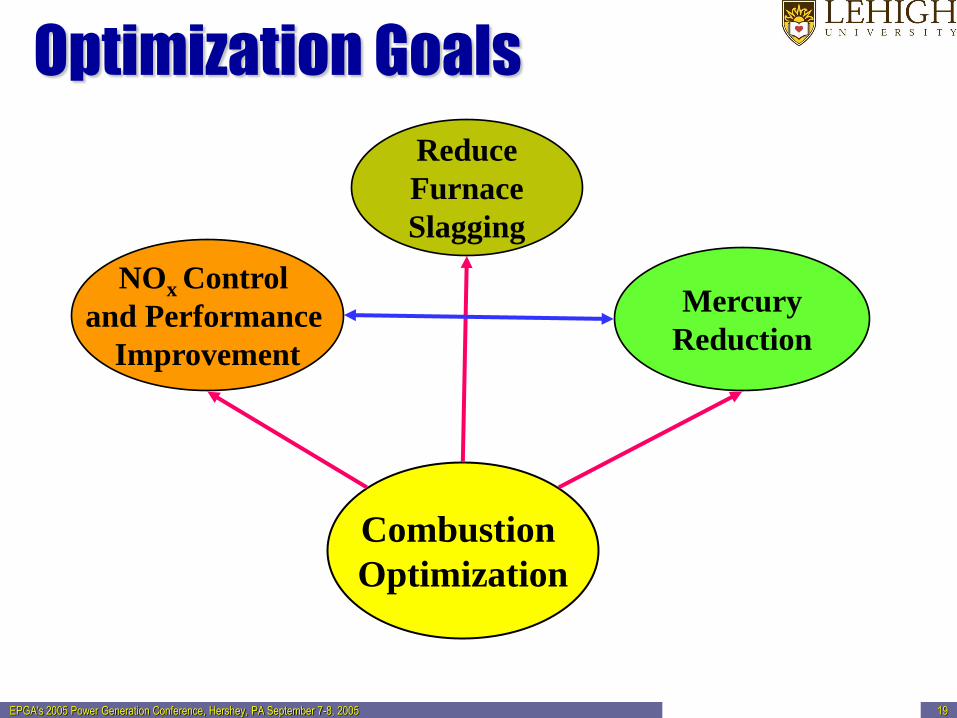
Optimization Goals
Combustion
Optimization
NOx Control
and Performance
Improvement
Reduce
Furnace
Slagging
Mercury
Reduction
EPGA's 2005 Power Generation Conference, Hershey, PA September 7-8, 2005 20
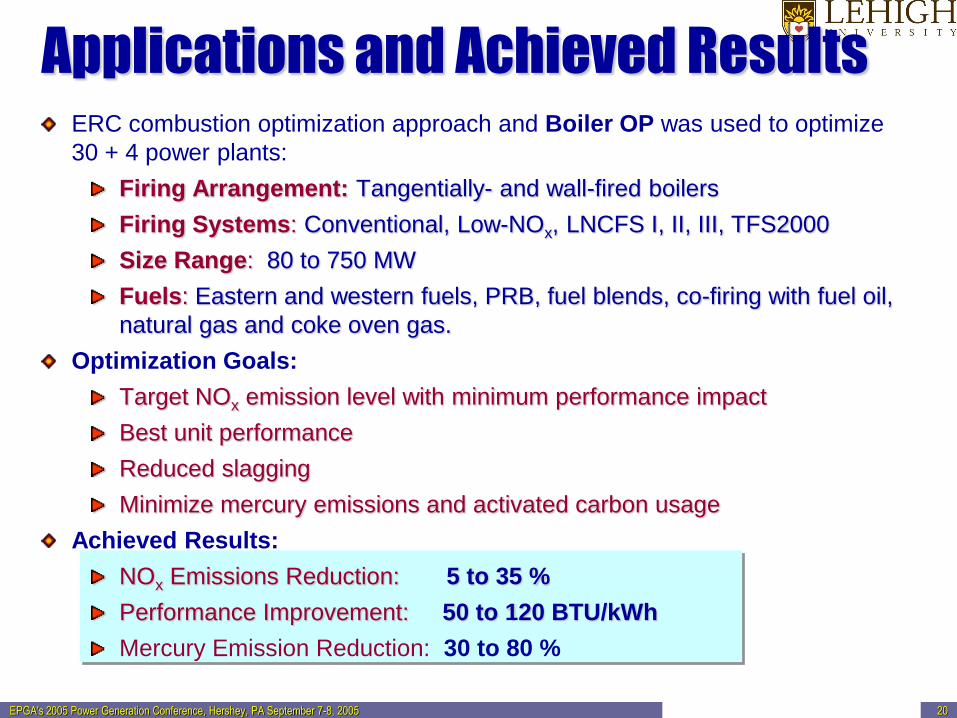
Applications and Achieved Results ERC combustion optimization approach and Boiler OP was used to optimize
30 + 4 power plants:
Firing Arrangement: Tangentially- and wall-fired boilers
Firing Systems: Conventional, Low-NOx, LNCFS I, II, III, TFS2000
Size Range: 80 to 750 MW
Fuels: Eastern and western fuels, PRB, fuel blends, co-firing with fuel oil,
natural gas and coke oven gas.
Optimization Goals:
Target NOx emission level with minimum performance impact
Best unit performance
Reduced slagging
Minimize mercury emissions and activated carbon usage
Achieved Results:
NOx Emissions Reduction: 5 to 35 %
Performance Improvement: 50 to 120 BTU/kWh
Mercury Emission Reduction: 30 to 80 %
Combustion Optimization
Case Studies:
Unit A - 100% PRB Coal
Unit B - PRB/EB Blend
Unit C - PRB/EB Blend
EPGA's 2005 Power Generation Conference, Hershey, PA September 7-8, 2005 22
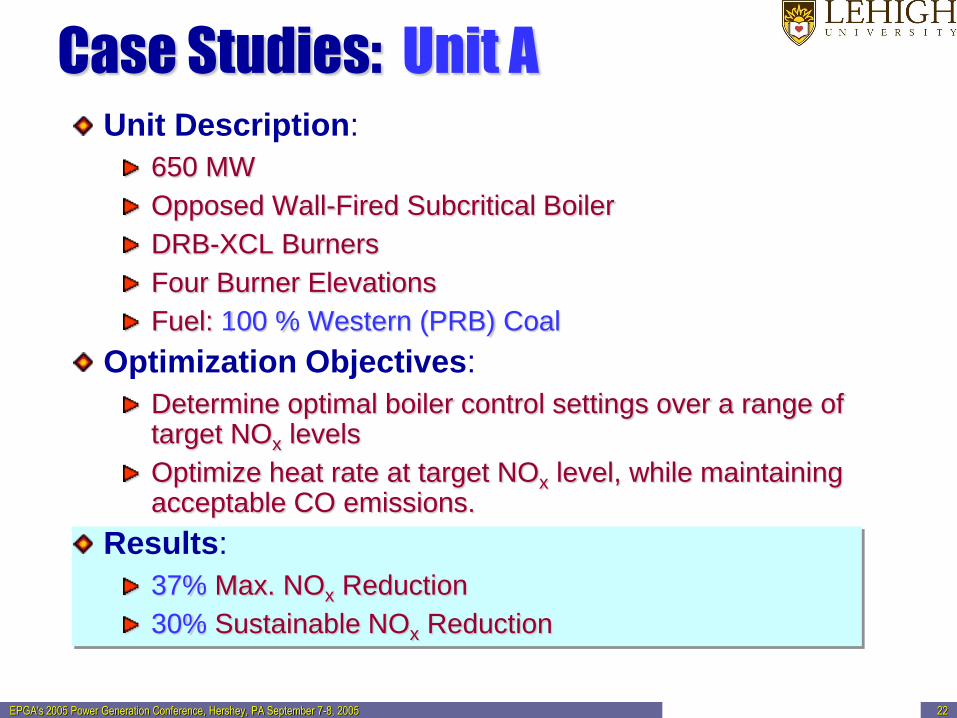
Case Studies: Unit A Unit Description:
650 MW
Opposed Wall-Fired Subcritical Boiler
DRB-XCL Burners
Four Burner Elevations
Fuel: 100 % Western (PRB) Coal
Optimization Objectives:
Determine optimal boiler control settings over a range of target NOx levels
Optimize heat rate at target NOx level, while maintaining acceptable CO emissions.
Results:
37% Max. NOx Reduction
30% Sustainable NOx Reduction
EPGA's 2005 Power Generation Conference, Hershey, PA September 7-8, 2005 23
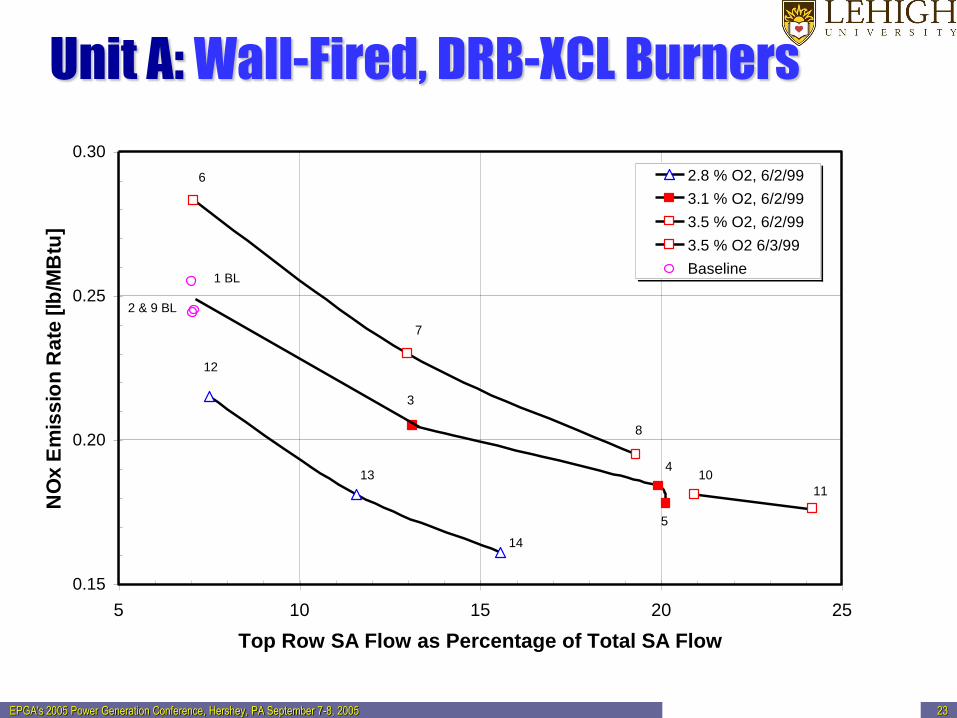
0.15
0.20
0.25
0.30
5 10 15 20 25
Top Row SA Flow as Percentage of Total SA Flow
NO
x E
mis
sio
n R
ate
[lb
/MB
tu]
2.8 % O2, 6/2/99
3.1 % O2, 6/2/99
3.5 % O2, 6/2/99
3.5 % O2 6/3/99
Baseline
3
4
5
6
7
8
10
11
12
13
14
1 BL
2 & 9 BL
Unit A: Wall-Fired, DRB-XCL Burners
EPGA's 2005 Power Generation Conference, Hershey, PA September 7-8, 2005 25
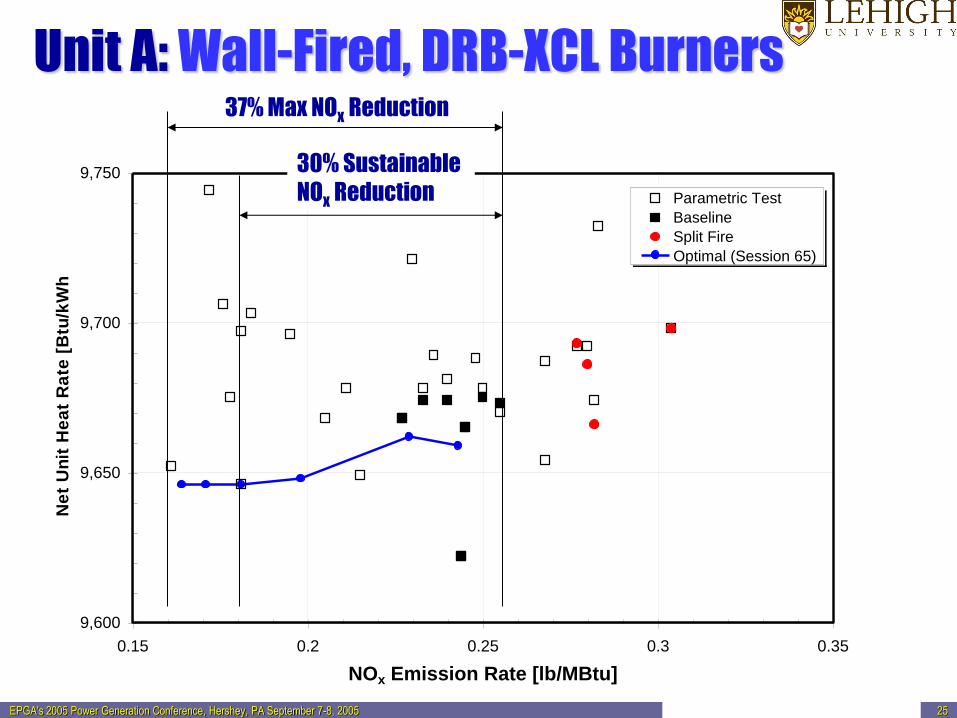
Unit A: Wall-Fired, DRB-XCL Burners
9,600
9,650
9,700
9,750
0.15 0.2 0.25 0.3 0.35
NOx Emission Rate [lb/MBtu]
Ne
t U
nit
He
at
Ra
te [
Btu
/kW
h]
Parametric Test
Baseline
Split Fire
Optimal (Session 65)
37% Max NOx Reduction
30% Sustainable
NOx Reduction
EPGA's 2005 Power Generation Conference, Hershey, PA September 7-8, 2005 26
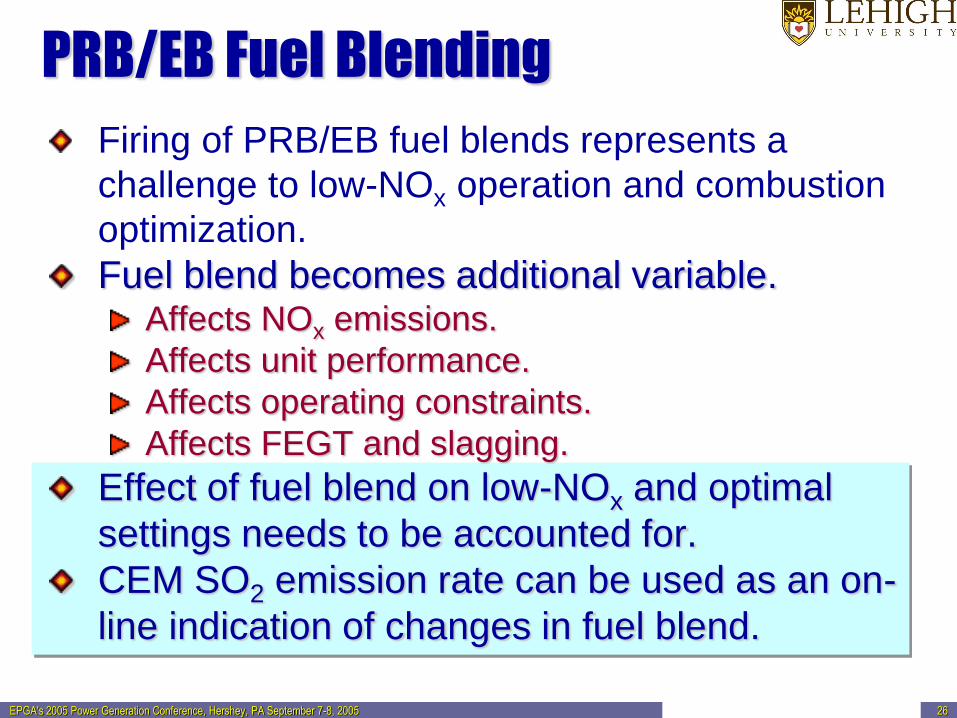
PRB/EB Fuel Blending
Firing of PRB/EB fuel blends represents a
challenge to low-NOx operation and combustion
optimization.
Fuel blend becomes additional variable. Affects NOx emissions.
Affects unit performance.
Affects operating constraints.
Affects FEGT and slagging.
Effect of fuel blend on low-NOx and optimal
settings needs to be accounted for.
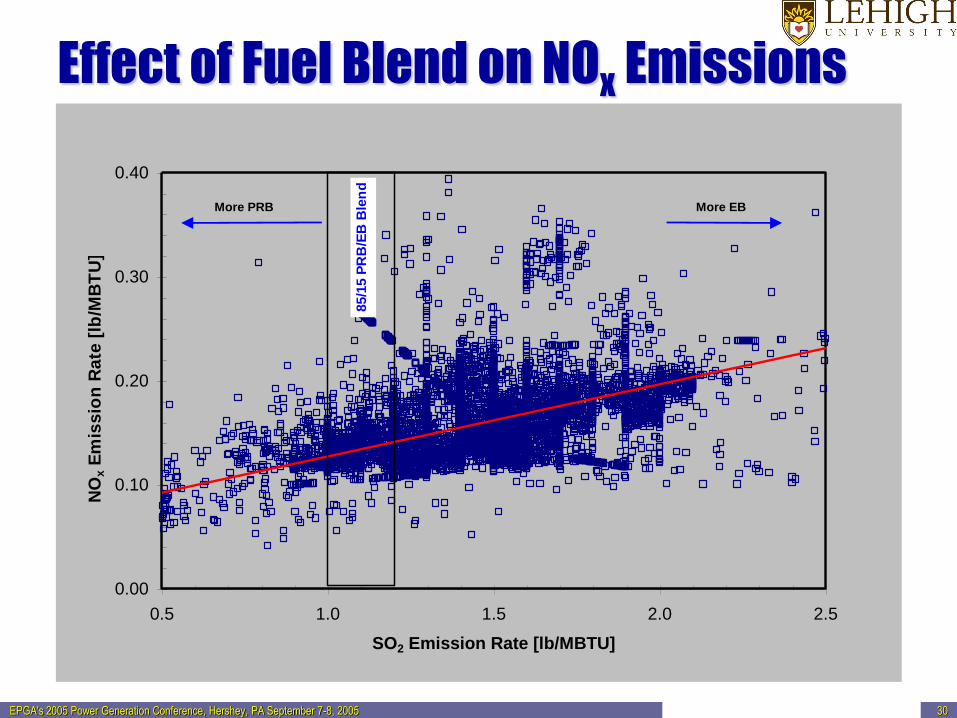
CEM SO2 emission rate can be used as an on-
line indication of changes in fuel blend.
EPGA's 2005 Power Generation Conference, Hershey, PA September 7-8, 2005 27
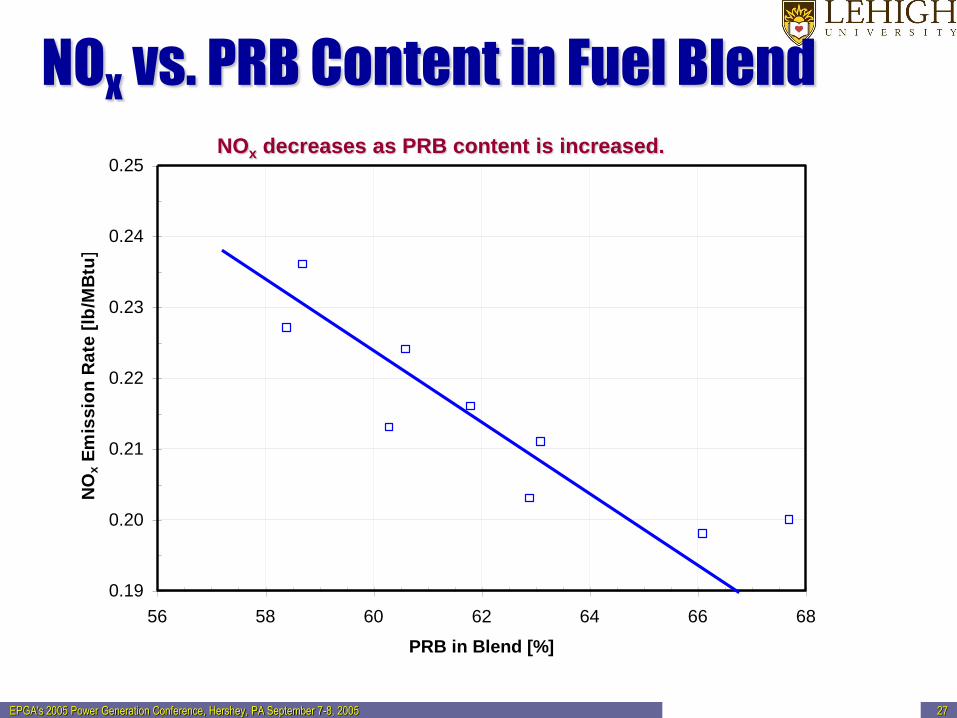
NOx vs. PRB Content in Fuel Blend
0.19
0.20
0.21
0.22
0.23
0.24
0.25
56 58 60 62 64 66 68
PRB in Blend [%]
NO
x E
mis
sio
n R
ate
[lb
/MB
tu]
NOx decreases as PRB content is increased.
EPGA's 2005 Power Generation Conference, Hershey, PA September 7-8, 2005 28
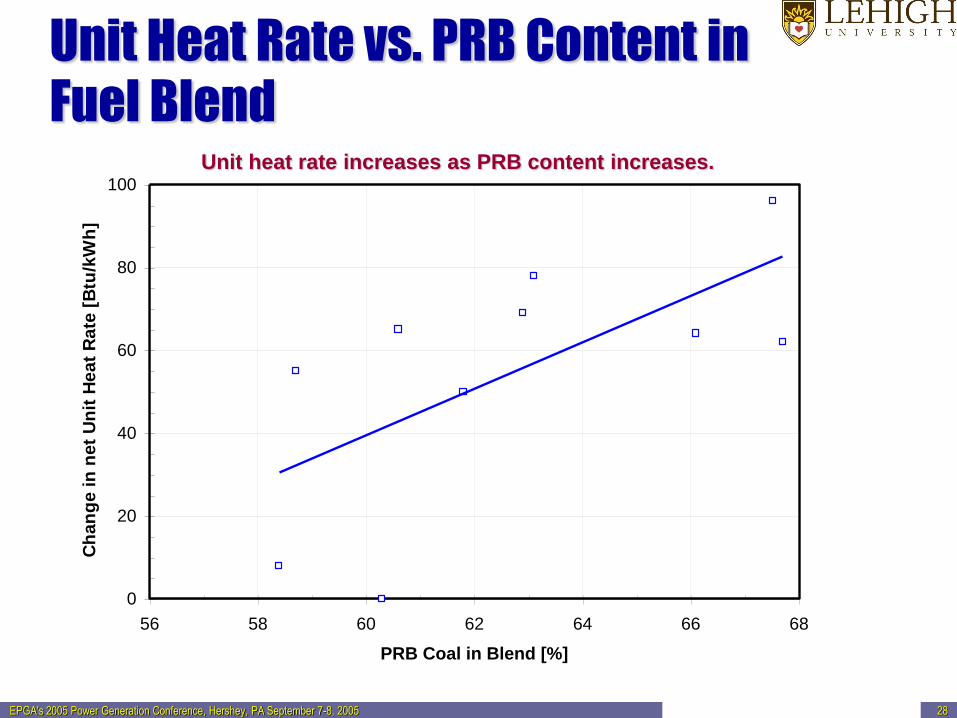
Unit Heat Rate vs. PRB Content in
Fuel Blend
0
20
40
60
80
100
56 58 60 62 64 66 68
PRB Coal in Blend [%]
Ch
an
ge
in
ne
t U
nit
He
at
Ra
te [
Btu
/kW
h]
Unit heat rate increases as PRB content increases.
EPGA's 2005 Power Generation Conference, Hershey, PA September 7-8, 2005 29
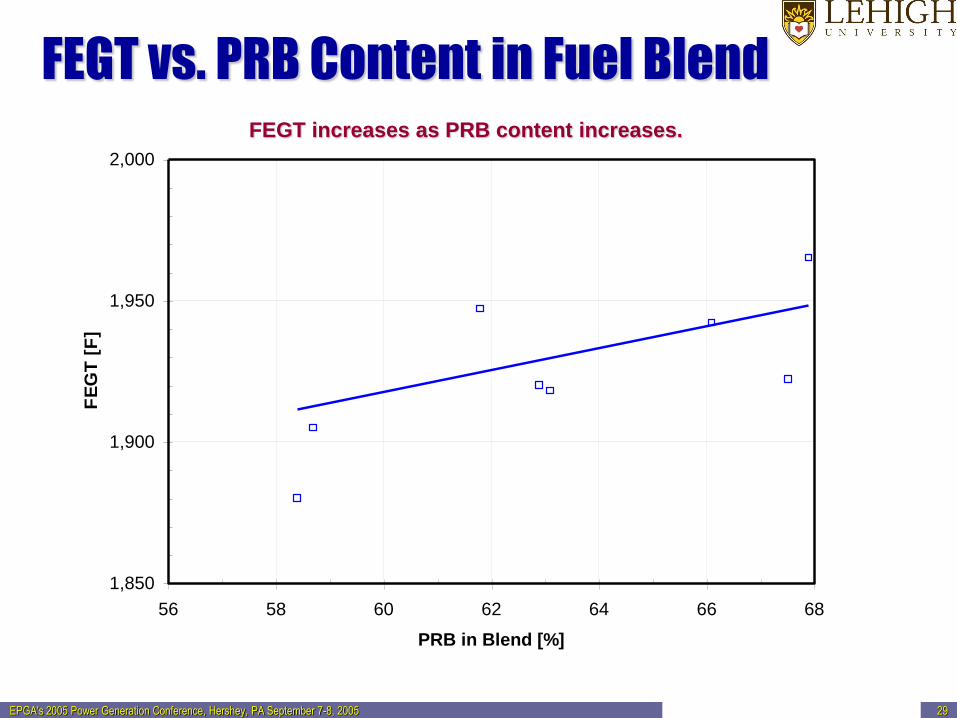
FEGT vs. PRB Content in Fuel Blend
1,850
1,900
1,950
2,000
56 58 60 62 64 66 68
PRB in Blend [%]
FE
GT
[F
]
FEGT increases as PRB content increases.
EPGA's 2005 Power Generation Conference, Hershey, PA September 7-8, 2005 30
Effect of Fuel Blend on NOx Emissions
0.00
0.10
0.20
0.30
0.40
0.5 1.0 1.5 2.0 2.5
SO2 Emission Rate [lb/MBTU]
NO
x E
mis
sio
n R
ate
[lb
/MB
TU
]
More PRB More EB
85/1
5 P
RB
/EB
Ble
nd
EPGA's 2005 Power Generation Conference, Hershey, PA September 7-8, 2005 31
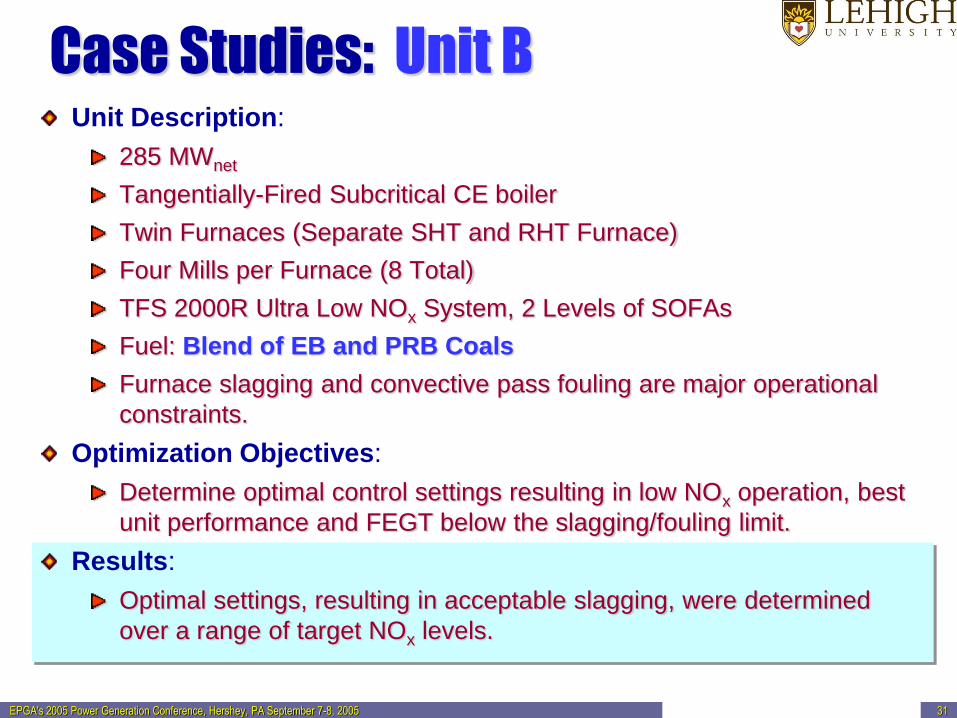
Case Studies: Unit B Unit Description:
285 MWnet
Tangentially-Fired Subcritical CE boiler
Twin Furnaces (Separate SHT and RHT Furnace)
Four Mills per Furnace (8 Total)
TFS 2000R Ultra Low NOx System, 2 Levels of SOFAs
Fuel: Blend of EB and PRB Coals
Furnace slagging and convective pass fouling are major operational
constraints.
Optimization Objectives:
Determine optimal control settings resulting in low NOx operation, best
unit performance and FEGT below the slagging/fouling limit.
Results:
Optimal settings, resulting in acceptable slagging, were determined
over a range of target NOx levels.
EPGA's 2005 Power Generation Conference, Hershey, PA September 7-8, 2005 33
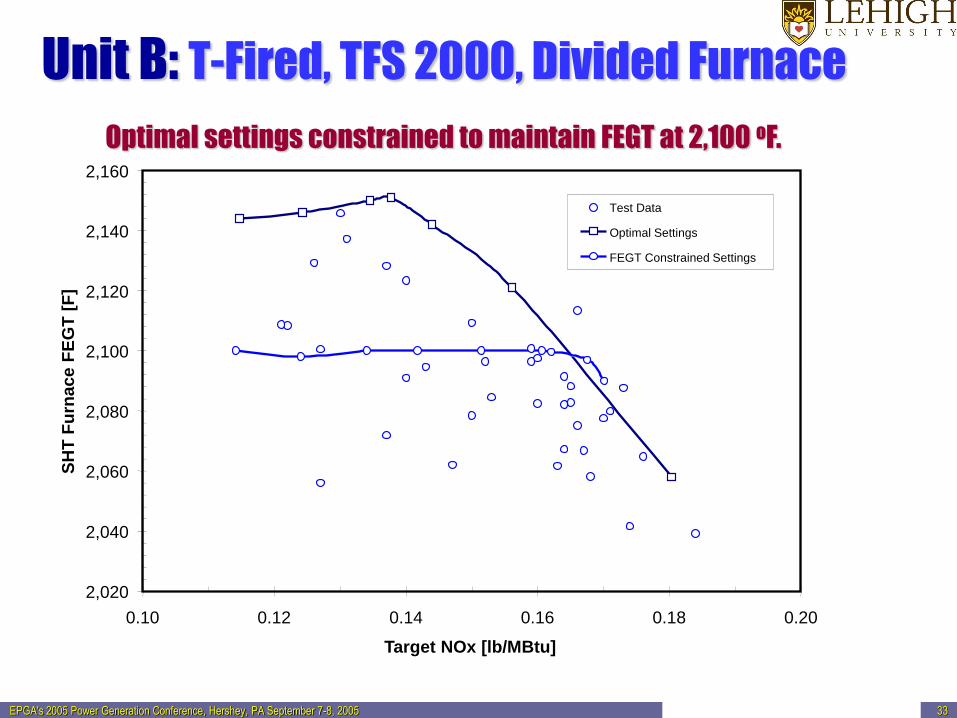
Unit B: T-Fired, TFS 2000, Divided Furnace
2,020
2,040
2,060
2,080
2,100
2,120
2,140
2,160
0.10 0.12 0.14 0.16 0.18 0.20
Target NOx [lb/MBtu]
SH
T F
urn
ace F
EG
T [
F]
Test Data
Optimal Settings
FEGT Constrained Settings
Optimal settings constrained to maintain FEGT at 2,100 oF.
EPGA's 2005 Power Generation Conference, Hershey, PA September 7-8, 2005 34
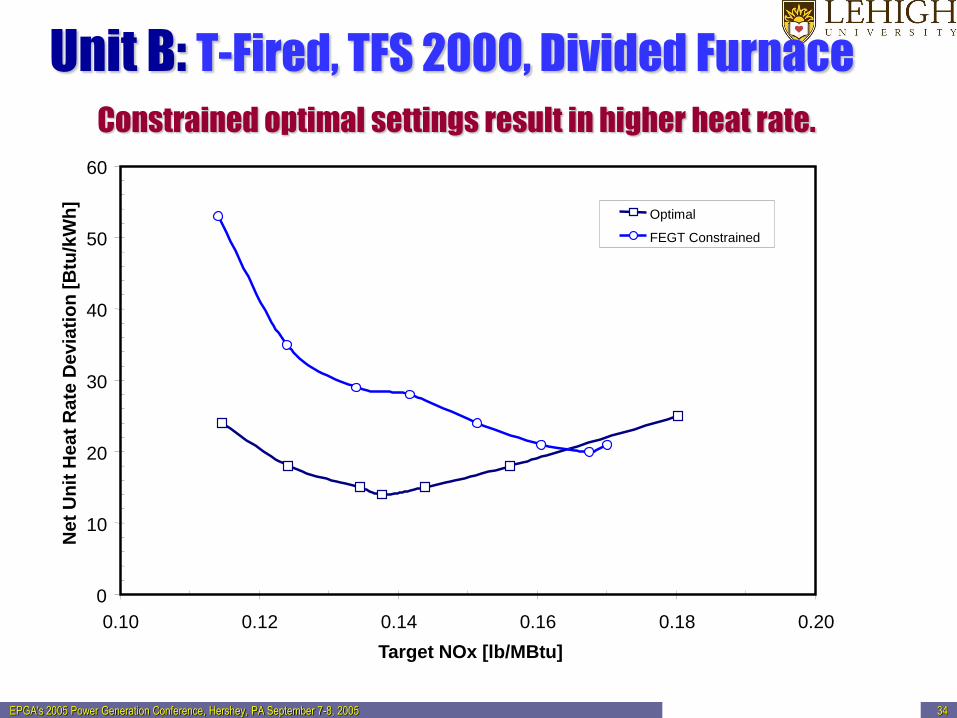
Unit B: T-Fired, TFS 2000, Divided Furnace
0
10
20
30
40
50
60
0.10 0.12 0.14 0.16 0.18 0.20
Target NOx [lb/MBtu]
Ne
t U
nit
He
at
Ra
te D
evia
tio
n [
Btu
/kW
h]
Optimal
FEGT Constrained
Constrained optimal settings result in higher heat rate.
EPGA's 2005 Power Generation Conference, Hershey, PA September 7-8, 2005 49
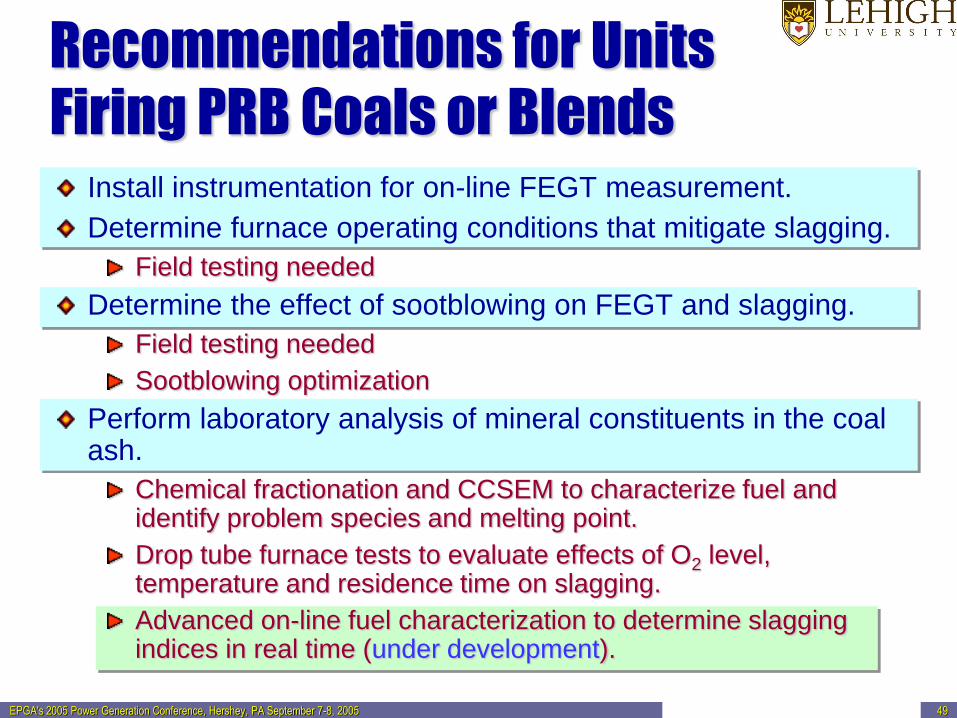
Recommendations for Units
Firing PRB Coals or Blends Install instrumentation for on-line FEGT measurement.
Determine furnace operating conditions that mitigate slagging.
Field testing needed
Determine the effect of sootblowing on FEGT and slagging.
Field testing needed
Sootblowing optimization
Perform laboratory analysis of mineral constituents in the coal ash.
Chemical fractionation and CCSEM to characterize fuel and identify problem species and melting point.
Drop tube furnace tests to evaluate effects of O2 level, temperature and residence time on slagging.
Advanced on-line fuel characterization to determine slagging indices in real time (under development).
EPGA's 2005 Power Generation Conference, Hershey, PA September 7-8, 2005 50
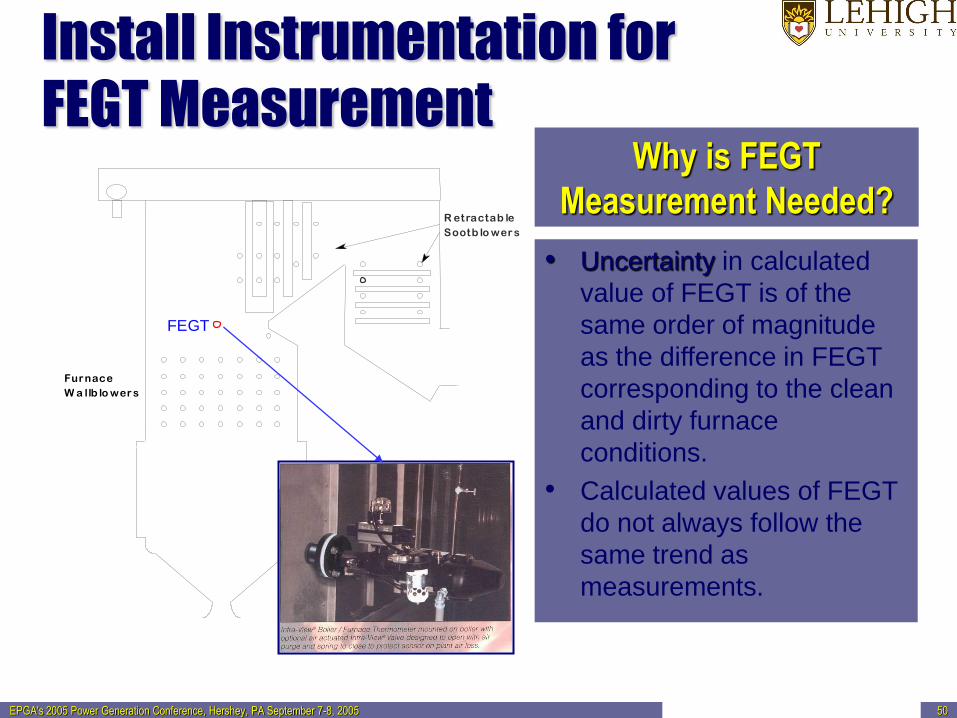
Furnace
Wa llb lowers
R etractab le
Sootb lowers
FEGT
Install Instrumentation for
FEGT Measurement
• Uncertainty in calculated
value of FEGT is of the
same order of magnitude
as the difference in FEGT
corresponding to the clean
and dirty furnace
conditions.
• Calculated values of FEGT
do not always follow the
same trend as
measurements.
Why is FEGT
Measurement Needed?
EPGA's 2005 Power Generation Conference, Hershey, PA September 7-8, 2005 51
CONCLUSIONS: PRB Blend, Combustion
Optimization
PRB content in fuel:
Has a direct impact on emissions, performance,
and unit operability.
Affects FEGT.
Can be directly related to furnace slagging and
convection pass fouling.
Needs to be incorporated into a combustion
optimization program as an additional independent
parameter.
Sootblowing Optimization
EPGA's 2005 Power Generation Conference, Hershey, PA September 7-8, 2005 53
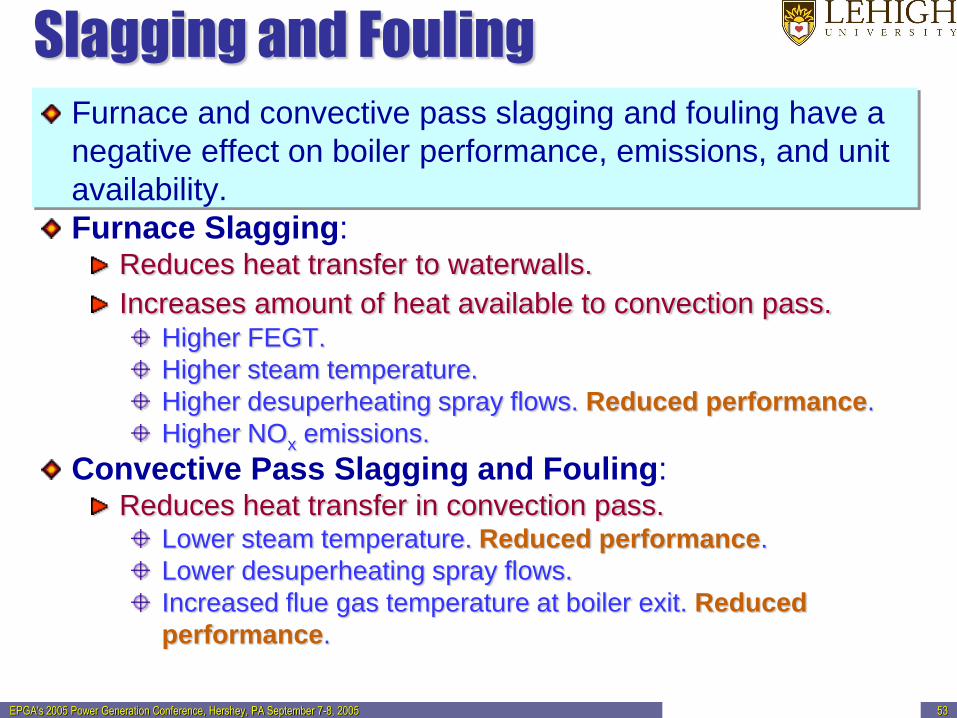
Slagging and Fouling
Furnace and convective pass slagging and fouling have a
negative effect on boiler performance, emissions, and unit
availability.
Furnace Slagging: Reduces heat transfer to waterwalls.
Increases amount of heat available to convection pass. Higher FEGT.
Higher steam temperature.
Higher desuperheating spray flows. Reduced performance.
Higher NOx emissions.
Convective Pass Slagging and Fouling: Reduces heat transfer in convection pass.
Lower steam temperature. Reduced performance.
Lower desuperheating spray flows.
Increased flue gas temperature at boiler exit. Reduced
performance.
EPGA's 2005 Power Generation Conference, Hershey, PA September 7-8, 2005 54
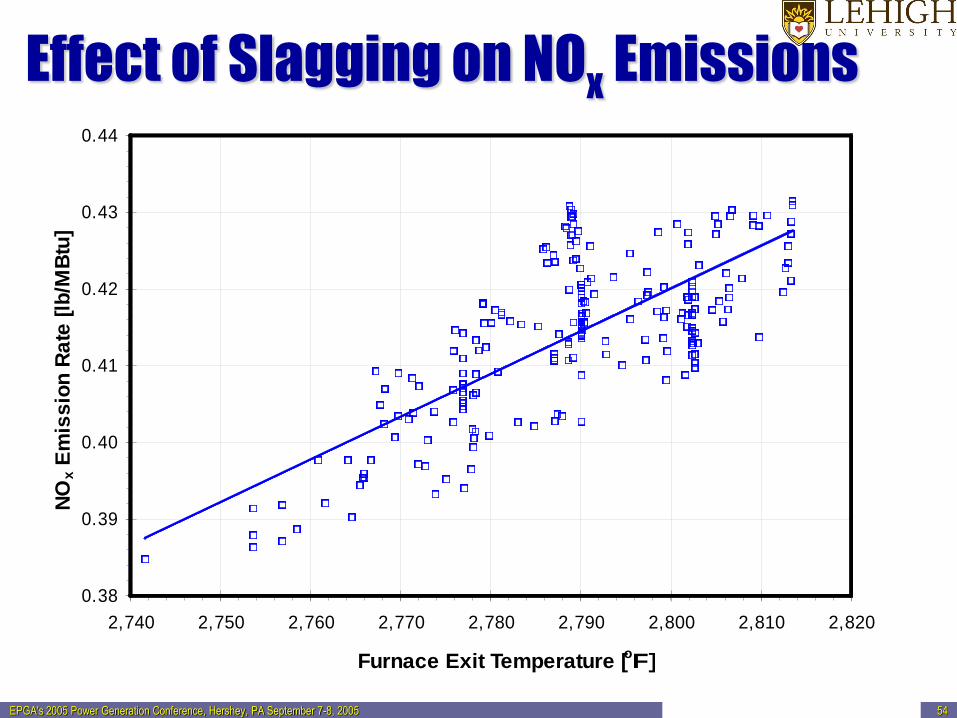
0.38
0.39
0.40
0.41
0.42
0.43
0.44
2,740 2,750 2,760 2,770 2,780 2,790 2,800 2,810 2,820
Furnace Exit Temperature [oF]
NO
x E
mis
sio
n R
ate
[lb
/MB
tu]
Effect of Slagging on NOx Emissions
EPGA's 2005 Power Generation Conference, Hershey, PA September 7-8, 2005 55
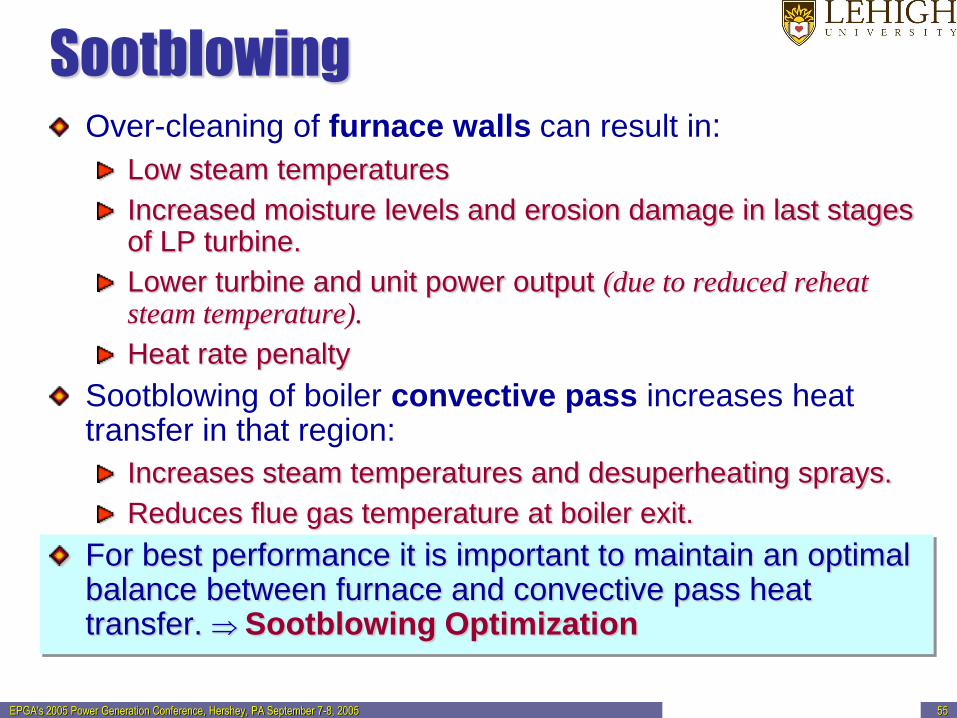
Sootblowing Over-cleaning of furnace walls can result in:
Low steam temperatures
Increased moisture levels and erosion damage in last stages of LP turbine.
Lower turbine and unit power output (due to reduced reheat steam temperature).
Heat rate penalty
Sootblowing of boiler convective pass increases heat transfer in that region:
Increases steam temperatures and desuperheating sprays.
Reduces flue gas temperature at boiler exit.
For best performance it is important to maintain an optimal balance between furnace and convective pass heat transfer. Sootblowing Optimization
EPGA's 2005 Power Generation Conference, Hershey, PA September 7-8, 2005 57
Optimization Challenge
Determine which portions of boiler to clean and on
what schedule.
Consider trade-offs: NOx
Opacity
Steam Temperatures
Heat Rate
Other Factors: Tube life, Sootblower steam or air
consumption, and Maintenance cost.
For utilities affected by the Ozone Transport Season
(OTS) regulations, the trade-offs will be different during
the OTS than for the rest of the year.
EPGA's 2005 Power Generation Conference, Hershey, PA September 7-8, 2005 62
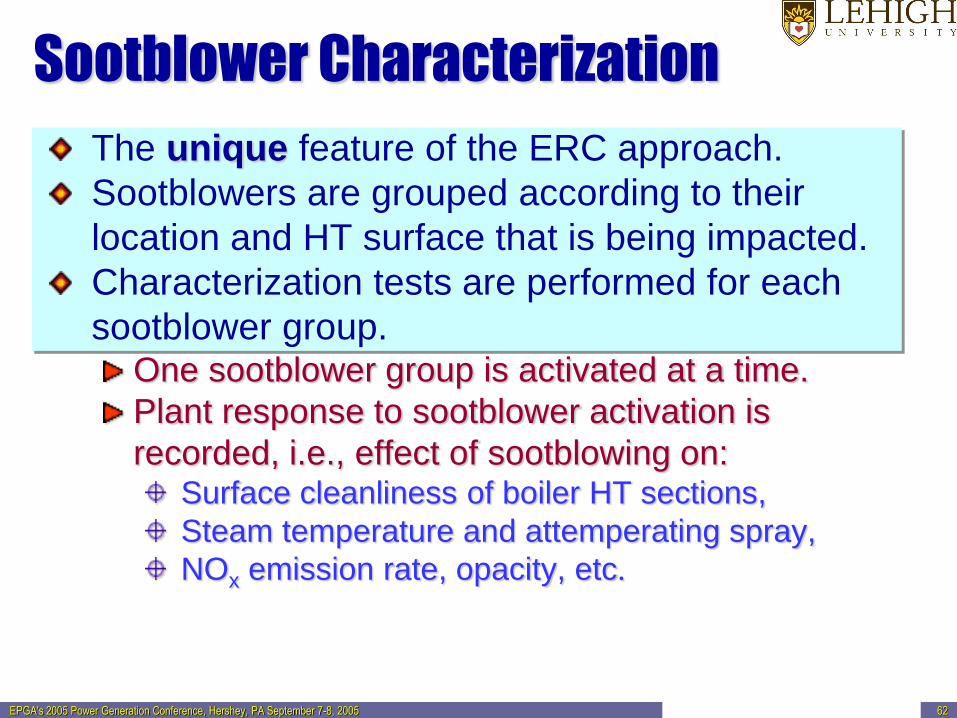
Sootblower Characterization
The unique feature of the ERC approach.
Sootblowers are grouped according to their
location and HT surface that is being impacted.
Characterization tests are performed for each
sootblower group. One sootblower group is activated at a time.
Plant response to sootblower activation is
recorded, i.e., effect of sootblowing on: Surface cleanliness of boiler HT sections,
Steam temperature and attemperating spray,
NOx emission rate, opacity, etc.
EPGA's 2005 Power Generation Conference, Hershey, PA September 7-8, 2005 66
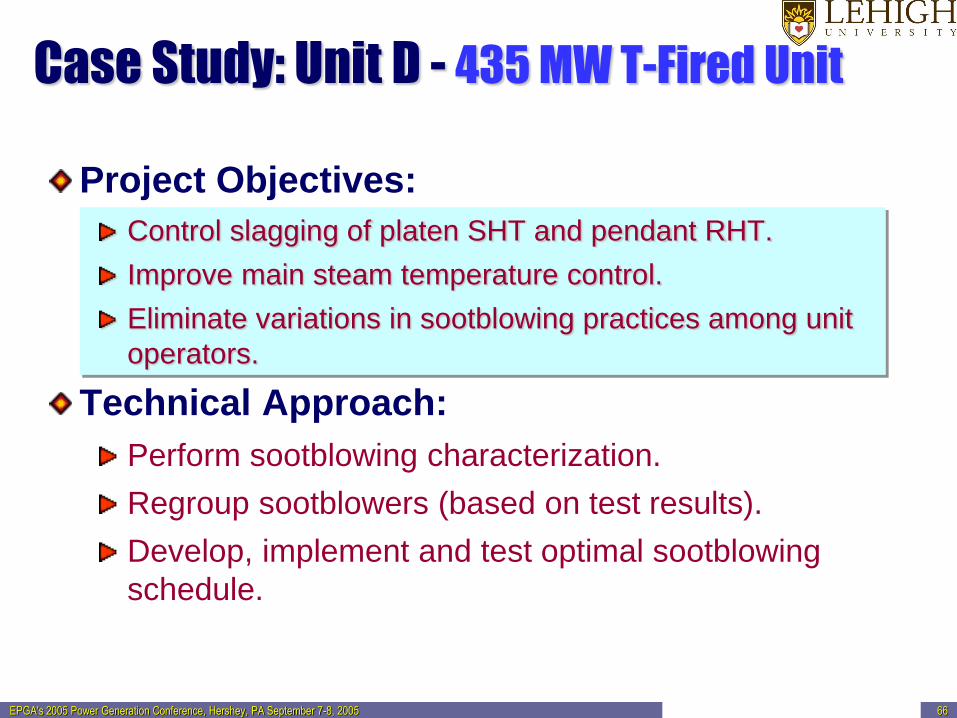
Case Study: Unit D - 435 MW T-Fired Unit
Project Objectives:
Control slagging of platen SHT and pendant RHT.
Improve main steam temperature control.
Eliminate variations in sootblowing practices among unit
operators.
Technical Approach:
Perform sootblowing characterization.
Regroup sootblowers (based on test results).
Develop, implement and test optimal sootblowing
schedule.
EPGA's 2005 Power Generation Conference, Hershey, PA September 7-8, 2005 67
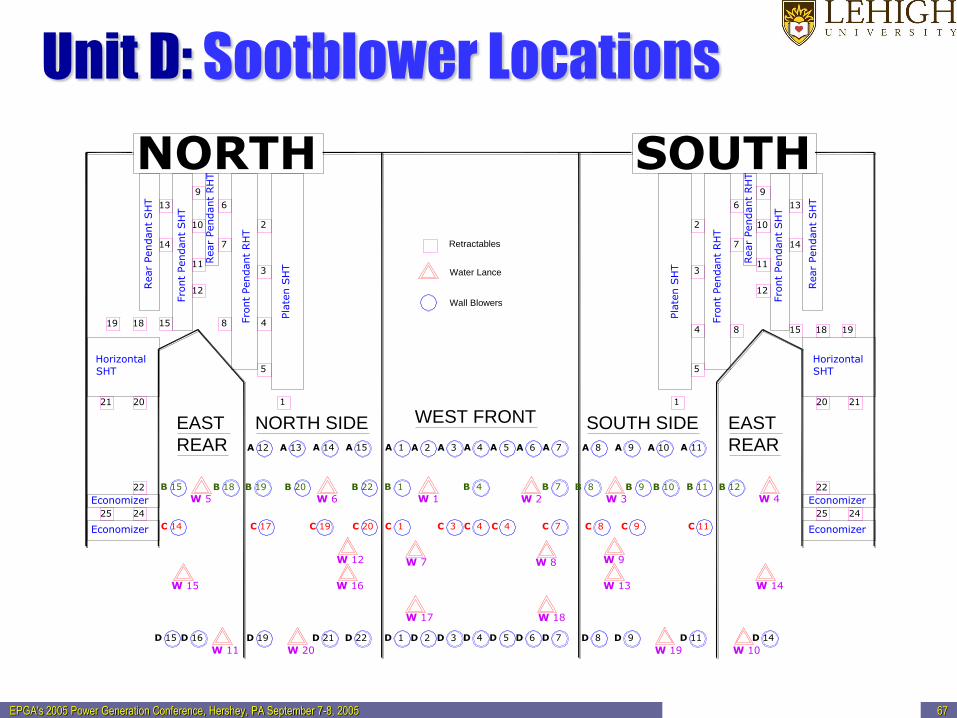
Unit D: Sootblower Locations
NORTH SOUTH9
13 6
2
7
8 4
3
1
5
14
11
12
151819
2021
22
2425
10
9
136
2 10
7 14
113
4 8 15 18 19
5
1
12
2120
22
25 24
A 12 A 13 A 14 A 15 A 1 A 2 A 3 A 4 A 5 A 6 A 7 A 8 A 9 A 10 A 11
B 15 B 18 B 19 B 20 B 22 B 1 B 4 B 7 B 8 B 9 B 10 B 11 B 12
W 5 W 6 W 1 W 2 W 3 W 4
C 14 C 17 C 19 C 20 C 1 C 3 C 4 C 4 C 7 C 8 C 9 C 11
W 15
W 12
W 20
W 16 W 13 W 14
W 7 W 8 W 9
W 19 W 10
W 17 W 18
D 15 D 16 D 19 D 21 D 22 D 1 D 2 D 3 D 4 D 5 D 6 D 7 D 8 D 9 D 11 D 14
Pla
ten S
HT
Fro
nt
Pendant
SH
T
Rear
Pendant
SH
T
Fro
nt
Pendant
RH
T
Rear
Pendant
RH
T
Horizontal
SHT
Economizer
Economizer
Pla
ten S
HT
Fro
nt
Pendant
RH
T
Rear
Pendant
RH
T
Fro
nt
Pendant
SH
T
Rear
Pendant
SH
T
Horizontal
SHT
Economizer
Economizer
Retractables
Water Lance
Wall Blowers
W 11
WEST FRONTNORTH SIDE SOUTH SIDE EAST
REAR
EAST
REAR
EPGA's 2005 Power Generation Conference, Hershey, PA September 7-8, 2005 69
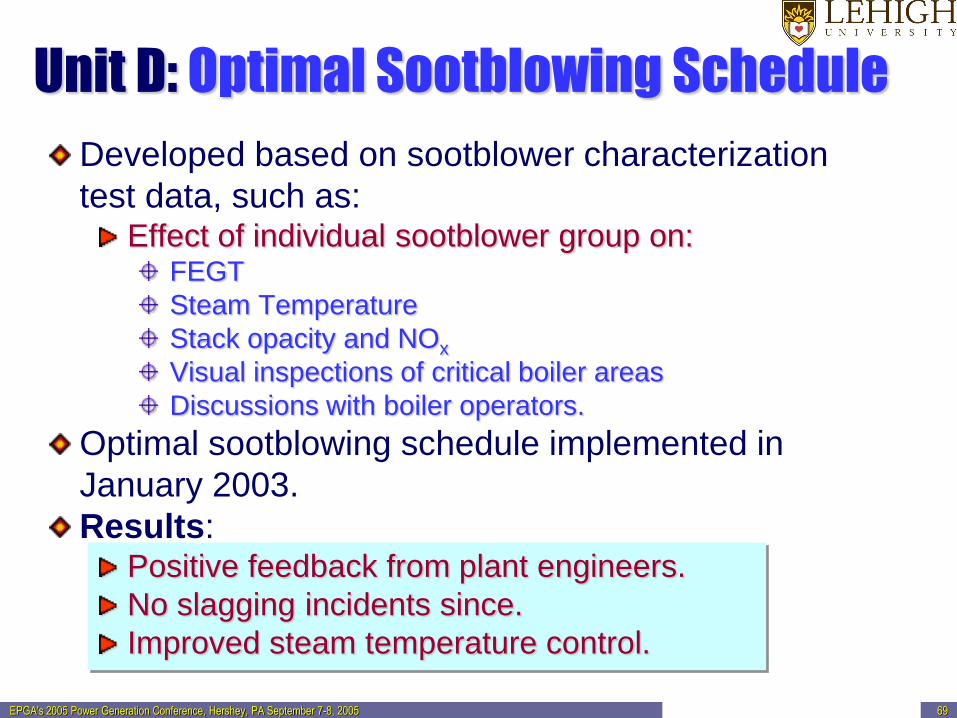
Unit D: Optimal Sootblowing Schedule
Developed based on sootblower characterization
test data, such as: Effect of individual sootblower group on:
FEGT
Steam Temperature
Stack opacity and NOx
Visual inspections of critical boiler areas
Discussions with boiler operators.
Optimal sootblowing schedule implemented in
January 2003.
Results: Positive feedback from plant engineers.
No slagging incidents since.
Improved steam temperature control.
EPGA's 2005 Power Generation Conference, Hershey, PA September 7-8, 2005 71
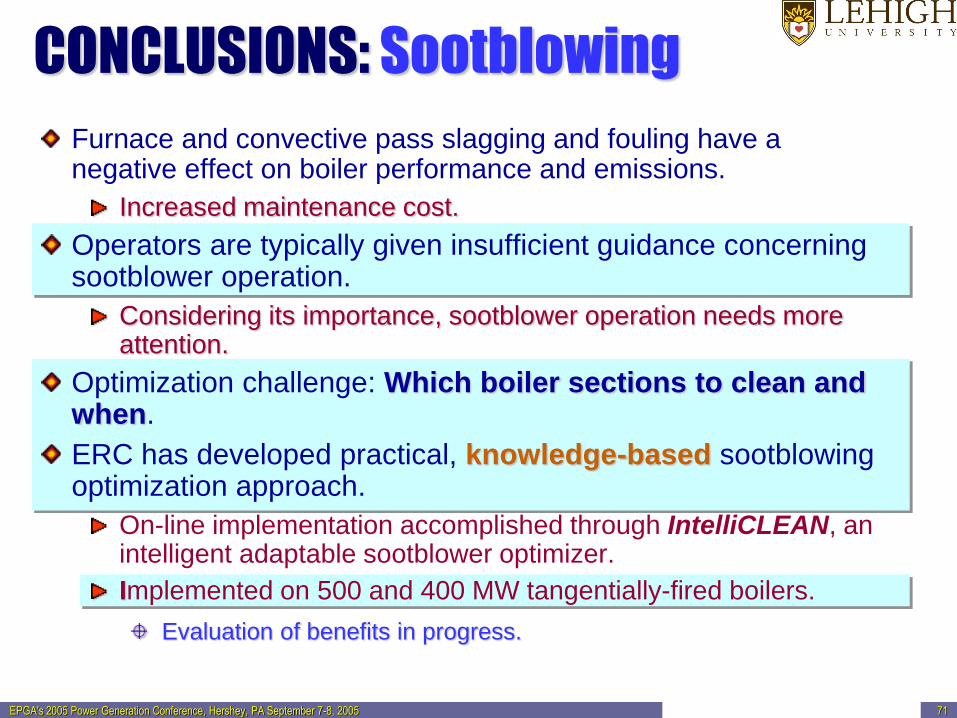
CONCLUSIONS: Sootblowing
Furnace and convective pass slagging and fouling have a negative effect on boiler performance and emissions.
Increased maintenance cost.
Operators are typically given insufficient guidance concerning sootblower operation.
Considering its importance, sootblower operation needs more attention.
Optimization challenge: Which boiler sections to clean and when.
ERC has developed practical, knowledge-based sootblowing optimization approach.
On-line implementation accomplished through IntelliCLEAN, an intelligent adaptable sootblower optimizer.
Implemented on 500 and 400 MW tangentially-fired boilers.
Evaluation of benefits in progress.
Predicting Catastrophic
Slagging/Fouling Events:
Early Warning Advisor
EPGA's 2005 Power Generation Conference, Hershey, PA September 7-8, 2005 73
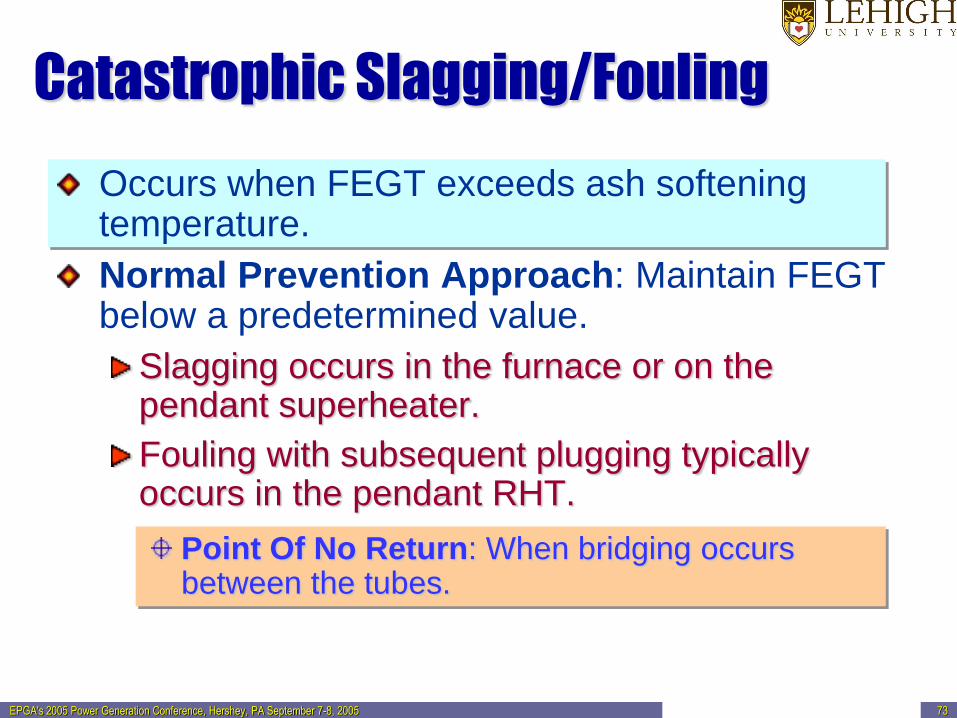
Catastrophic Slagging/Fouling
Occurs when FEGT exceeds ash softening temperature.
Normal Prevention Approach: Maintain FEGT below a predetermined value.
Slagging occurs in the furnace or on the pendant superheater.
Fouling with subsequent plugging typically occurs in the pendant RHT.
Point Of No Return: When bridging occurs between the tubes.
EPGA's 2005 Power Generation Conference, Hershey, PA September 7-8, 2005 74
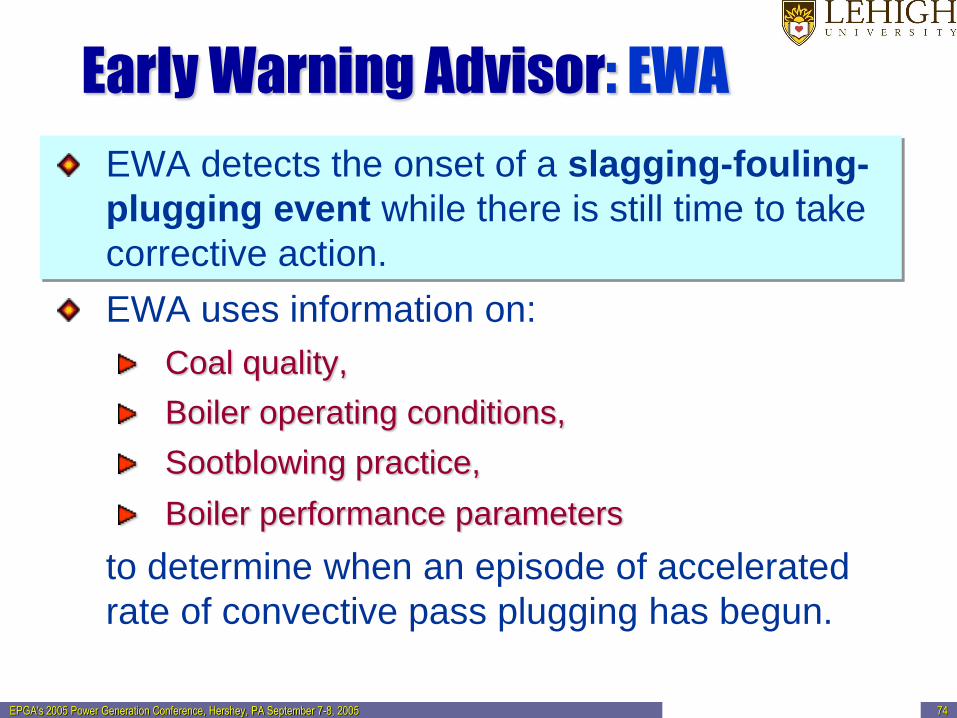
Early Warning Advisor: EWA
EWA detects the onset of a slagging-fouling-
plugging event while there is still time to take
corrective action.
EWA uses information on:
Coal quality,
Boiler operating conditions,
Sootblowing practice,
Boiler performance parameters
to determine when an episode of accelerated
rate of convective pass plugging has begun.
EPGA's 2005 Power Generation Conference, Hershey, PA September 7-8, 2005 75
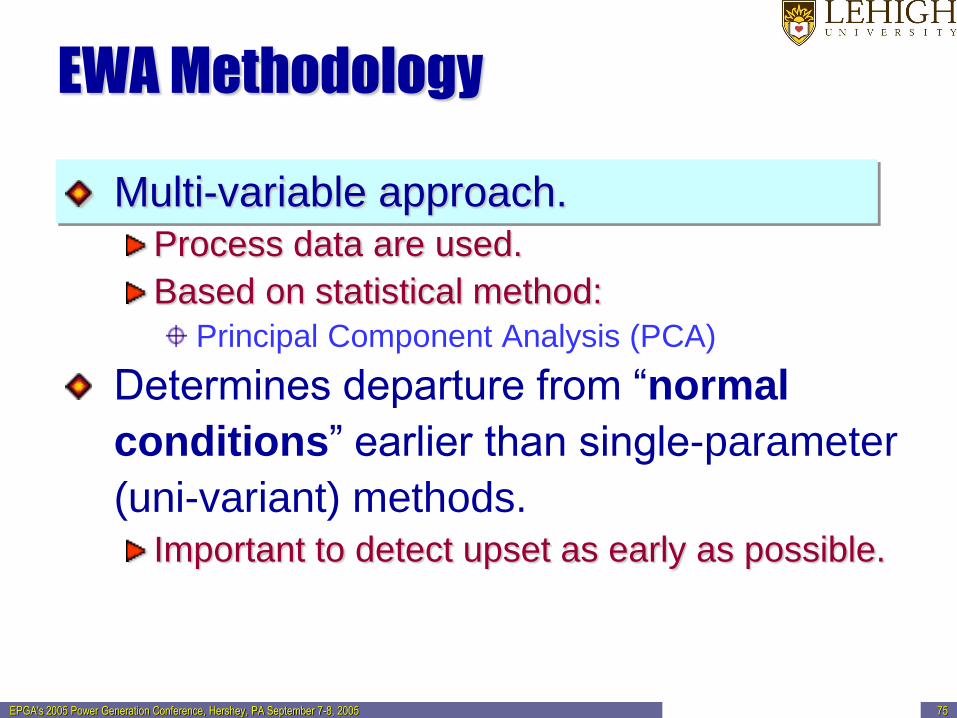
EWA Methodology
Multi-variable approach. Process data are used.
Based on statistical method:
Principal Component Analysis (PCA)
Determines departure from “normal
conditions” earlier than single-parameter
(uni-variant) methods. Important to detect upset as early as possible.
EPGA's 2005 Power Generation Conference, Hershey, PA September 7-8, 2005 76
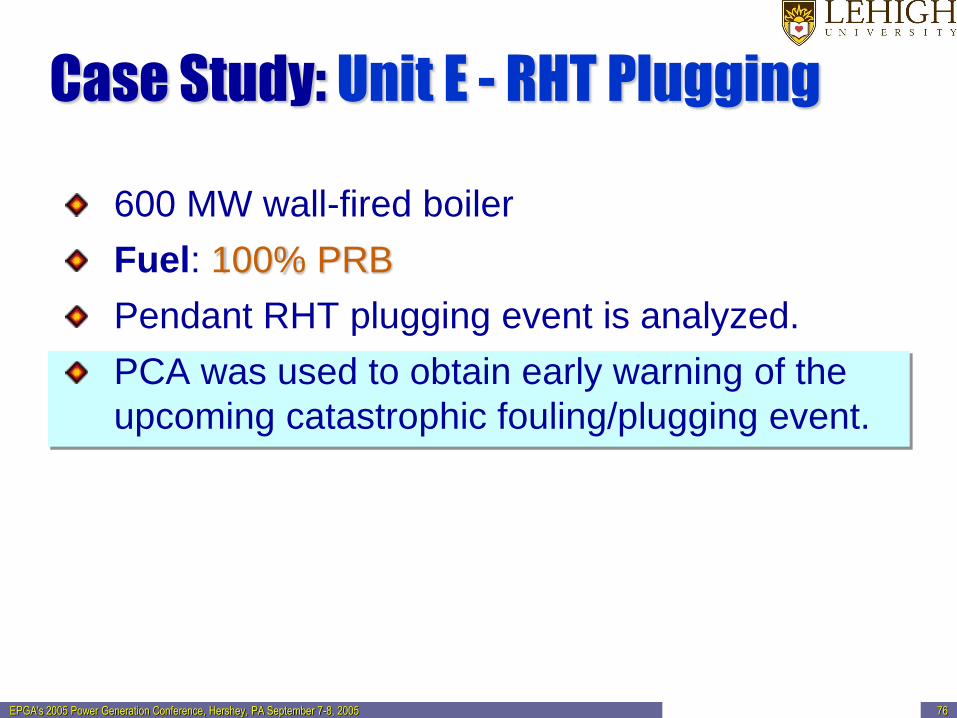
Case Study: Unit E - RHT Plugging
600 MW wall-fired boiler
Fuel: 100% PRB
Pendant RHT plugging event is analyzed.
PCA was used to obtain early warning of the
upcoming catastrophic fouling/plugging event.
EPGA's 2005 Power Generation Conference, Hershey, PA September 7-8, 2005 78
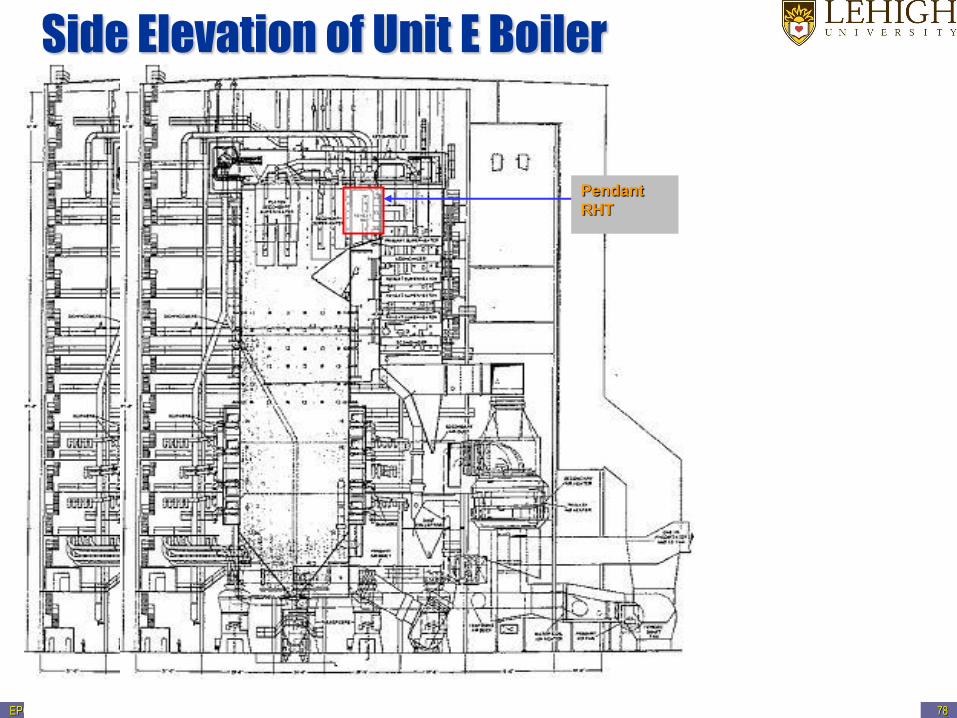
Pendant
RHT
Side Elevation of Unit E Boiler
Pendant
RHT
EPGA's 2005 Power Generation Conference, Hershey, PA September 7-8, 2005 84
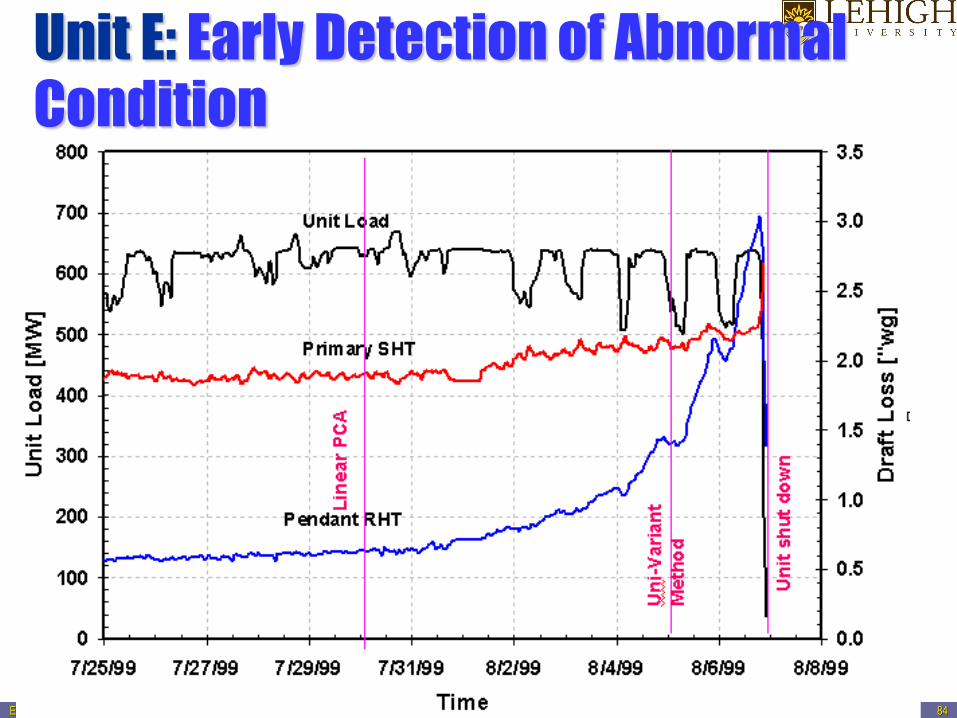
Unit E: Early Detection of Abnormal
Condition
EPGA's 2005 Power Generation Conference, Hershey, PA September 7-8, 2005 86
CONCLUSIONS: Early Warning Advisor
Convection pass of PRB-fired boilers is susceptible to flyash fouling/plugging.
Pendant RHT
Principal Component Analysis (PCA) was successfully applied for early detection of catastrophic fouling/plugging event.
Provided 5-day advanced warning of catastrophic plugging event.
EWA can be used to provide early warning of other abnormal events.

Questions …