Combining Temporal Abstraction and Data Mining Methods in Medical Data Analysis
12
Combining temporal abstraction and data mining to study hepatitis T.B. Ho 1 , S. Kawasaki 1 , S.Q. Le 1 , T.N. Tran 1 , K. Takabayashi 2 , H. Yokoi 2 1 JAIST, School of Knowledge Science, Ishikawa, Japan {bao, skawasa, quang, tt-nam}@jaist.ac.jp 2 Chiba University Hospital, Chiba, Japan {takaba, yokoi}@ho.chiba-u.ac.jp Abstract. This paper introduces a framework and results of analyzing the hepa- titis data with combination of temporal abstraction and data mining methods. In particular, we developed a novel temporal abstraction technique for temporal data irregularly collected in a long period suitable for hepatitis data, and we ap- plied mining methods to data abstracted by the temporal abstraction method. Carefully evaluated results were judged interesting by medical experts. 1 Introduction The hepatitis dataset contains the results of laboratory examinations taken on patients of hepatitis B and C, who were admitted to Chiba University Hospital in Japan. The dataset contains temporal data on laboratory examinations of 771 patients of hepatitis B and C taken between 1982 and 2001. Among four posed challenges for Discovery Challenge 2004, we focus on three following problems: P1. Discover the differences in temporal patterns between hepatitis B and C. P2. Evaluate whether laboratory examinations can be used to estimate the stage of liver fibrosis (If possible, we may be able to use laboratory examinations as the substitutes for biopsy because biopsy is invasive to patients). P3. Evaluate whether the interferon therapy is effective or not. Our solution to these problems is based on a combination of temporal and data min- ing methods. Temporal abstraction (TA) aims to transform time-stamped data into an interval-based representation of data by extracting their most relevant features. The TA process concerns with abstracting time-stamped data within episodes and it typi- cally extracts states (e.g., low, normal, high) and/or trends (e.g., increase, stable, decrease), as well as finding temporal relationships between findings. Typical TA works include the knowledge-based TA framework [12], methods for context- sensitive and expectation-guided TA [7, 8, 11], methods for combining statistical and probability techniques with TA [1], among others. However, these TA methods are for regular temporal data and thus cannot be applied to irregular hepatitis data gath- ered from many laboratory tests in different periods, varying from several weeks to more than twenty years, and most of them are taken at irregular time-stamped points. Within the proposed framework, shown in Figure 1, for combining temporal abstrac-
Transcript of Combining Temporal Abstraction and Data Mining Methods in Medical Data Analysis
Combining temporal abstraction and data mining to study hepatitis
T.B. Ho1, S. Kawasaki1, S.Q. Le1, T.N. Tran1, K. Takabayashi2, H. Yokoi2
1 JAIST, School of Knowledge Science, Ishikawa, Japan {bao, skawasa, quang, tt-nam}@jaist.ac.jp
2 Chiba University Hospital, Chiba, Japan {takaba, yokoi}@ho.chiba-u.ac.jp
Abstract. This paper introduces a framework and results of analyzing the hepa-titis data with combination of temporal abstraction and data mining methods. In particular, we developed a novel temporal abstraction technique for temporal data irregularly collected in a long period suitable for hepatitis data, and we ap-plied mining methods to data abstracted by the temporal abstraction method. Carefully evaluated results were judged interesting by medical experts.
1 Introduction The hepatitis dataset contains the results of laboratory examinations taken on patients of hepatitis B and C, who were admitted to Chiba University Hospital in Japan. The dataset contains temporal data on laboratory examinations of 771 patients of hepatitis B and C taken between 1982 and 2001. Among four posed challenges for Discovery Challenge 2004, we focus on three following problems:
P1. Discover the differences in temporal patterns between hepatitis B and C. P2. Evaluate whether laboratory examinations can be used to estimate the stage
of liver fibrosis (If possible, we may be able to use laboratory examinations as the substitutes for biopsy because biopsy is invasive to patients).
P3. Evaluate whether the interferon therapy is effective or not.
Our solution to these problems is based on a combination of temporal and data min-ing methods. Temporal abstraction (TA) aims to transform time-stamped data into an interval-based representation of data by extracting their most relevant features. The TA process concerns with abstracting time-stamped data within episodes and it typi-cally extracts states (e.g., low, normal, high) and/or trends (e.g., increase, stable, decrease), as well as finding temporal relationships between findings. Typical TA works include the knowledge-based TA framework [12], methods for context-sensitive and expectation-guided TA [7, 8, 11], methods for combining statistical and probability techniques with TA [1], among others. However, these TA methods are for regular temporal data and thus cannot be applied to irregular hepatitis data gath-ered from many laboratory tests in different periods, varying from several weeks to more than twenty years, and most of them are taken at irregular time-stamped points. Within the proposed framework, shown in Figure 1, for combining temporal abstrac-
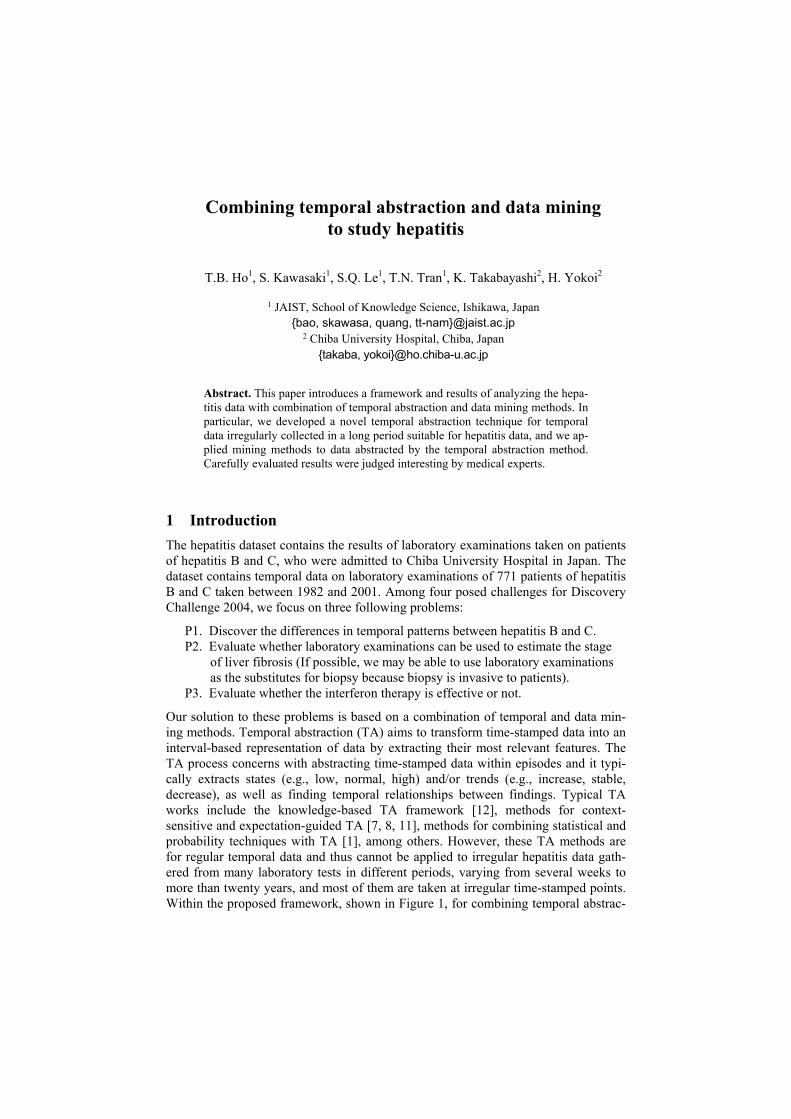
tion and mining methods, we developed novel basic TA algorithms to transform ir-regular temporal data into abstracted values, and carried out complex TA by different data mining methods for symbolic data. This paper first briefly presents the frame-work, summarizes two TA algorithms for short-term and long-term changed tests for irregular temporal data [5], and focuses on the results of applying data mining methods to abstracted data. The paper is completed with the discussion of physicians on the methods and obtained results.
Figure 1. Framework for combing temporal abstraction and data mining
2 Combining temporal abstraction and data mining methods Before applying our methods to the hepatitis data, all related data is joined by the combined key of the patient id and the test date from the original tables, and most typical test items are selected according to the frequency and suggestion from doctors. Each patient is described with value sequences of selected test items and labels for the hepatitis type, fibrosis stage, and interferon effectiveness.
2.1 Basic temporal abstraction algorithms in the hepatitis domain
The task of basic TA is to find abstractions of value sequences of test items of each patient. Our basic idea to abstract a sequence is to map it into a set of abstraction patterns viewed as combinations of TA primitives in subsequences. To this end, our method consists of two parts: (1) to determine typical abstraction patterns; and (2) to assign each test sequence into one of abstraction patterns. We specify the episodes as sequences of five years from the beginning of the sequence for P1, before interferon therapy for P3 and before biopsy for P2.
2.1.1 Determination of typical abstraction patterns
This problem can be stated as follows: Is it possible to determine a small number of typical abstraction patterns to be used to characterize most real sequences observed? In our opinion, the solution to such a problem can be well obtained by a combination of TA primitive computation with human inspection using visual tools [6].
The TA primitives and relations Based on visual analysis of various sequences, we determined the following temporal abstraction primitives and relations:
1. State primitives: N (normal), L (low), VL (very low), XL (extreme low), H (high), VH (very high), XH (extreme high).
2. Trend primitives: S (stable), I (increasing), FI (fast increasing), D (decreasing), and FD (fast decreasing).
3. Peak primitives: P (peaks occurred). 4. Relations: > (“change state to”), & (“and”), – (“and then”), / (“majority/minority”,
X/Y” means that the majority of points are in state X and the minority of points are in state Y). The relation “and then” means some new state or trend occurs after some change of state appeared, says, “H>N–S”.
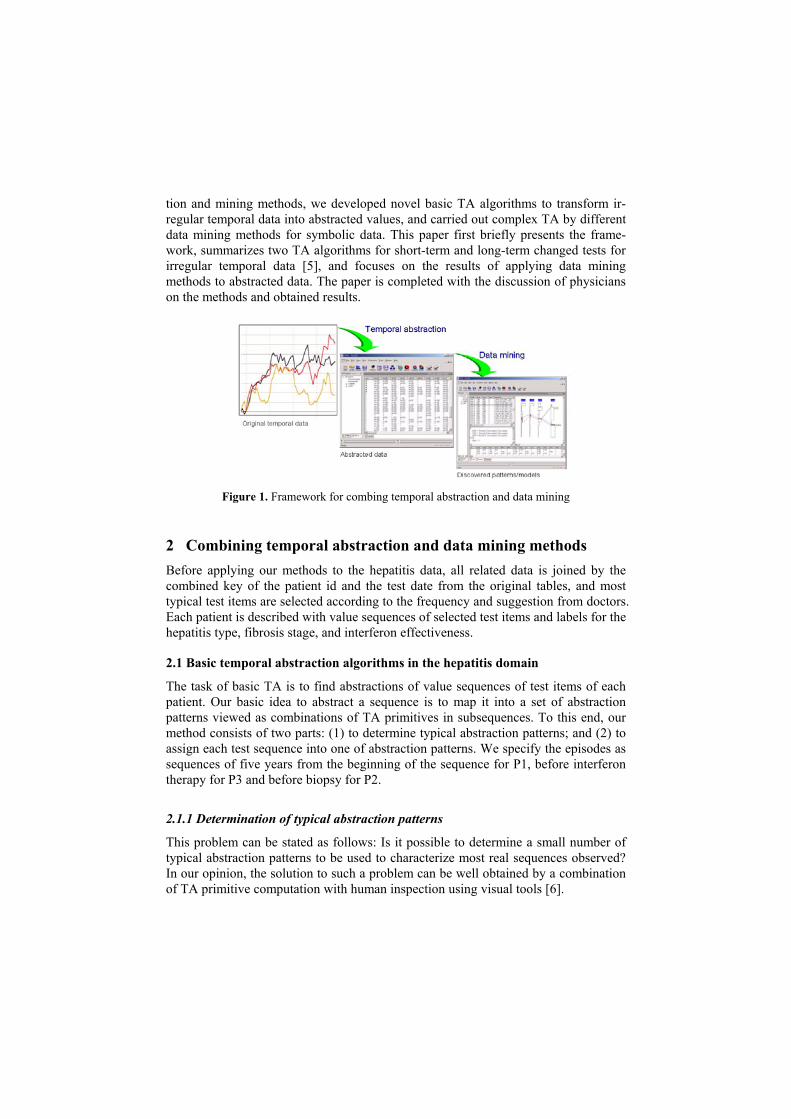
Observation and determination of abstraction patterns By analyzing various real sequences with visual tools and expert opinions, we formu-lated four possible structures of abstraction patterns that can be used to represent most hepatitis sequences (see [5] for the details).
Figure 2. Visual analysis of temporal sequences and structure of abstraction patterns
After applying the procedure and consulting physicians, we tentatively determined 8 typical abstraction patterns for short-term changed tests as shown in Figure 3, and 22 typical patterns for long-term changed tests shown in Figure 4. Our key idea is to use the “change of state” to characterize sequences of the long-term changed tests. We firstly distinguish two kinds of sequences: those fluctuate around the boundary of the normal region and those do not. The latter can then be observed if at their beginning, the first data points take which of the three states “N”, “H”, or “L”. It will happen that either the sequence changes from one state to another state, smoothly or variably (at boundaries), or the sequence remains in its initial state without changing. We deter-mined four groups of abstraction patterns for long-term changed tests:
- “Varying states”: Consisting of patterns that fluctuate around the boundary of the normal region (N/H, H/N, N/L, L/N);
- “Change from high state”: Consisting of abstraction patterns H−S, H−I, H−D, H>N, H>N>H;
- Change from low state”: Consisting of abstraction patterns L−S, L−D, L−I, L>N, L>N>L;

- “Change from normal state”: Consisting of abstraction patterns N, N>H, N>H−D, N>H>N, N>L, N>L>N, N>L−I.
Figure 3. Typical abstraction patterns for short-term changed tests
Figure 4. Typical abstraction patterns for long-term changed tests
2.1.2 Basic TA algorithms
Abstraction of short-term changed tests Our observation and analysis showed that the short term changed tests, especially GPT and GOT, can go up in some very short period of time and then go back to some “stable” state. We found that the two most representative characteristics of these tests are that of the “stable” state, called base state (BS), and the position and value of peaks, where the tests suddenly go up [5].
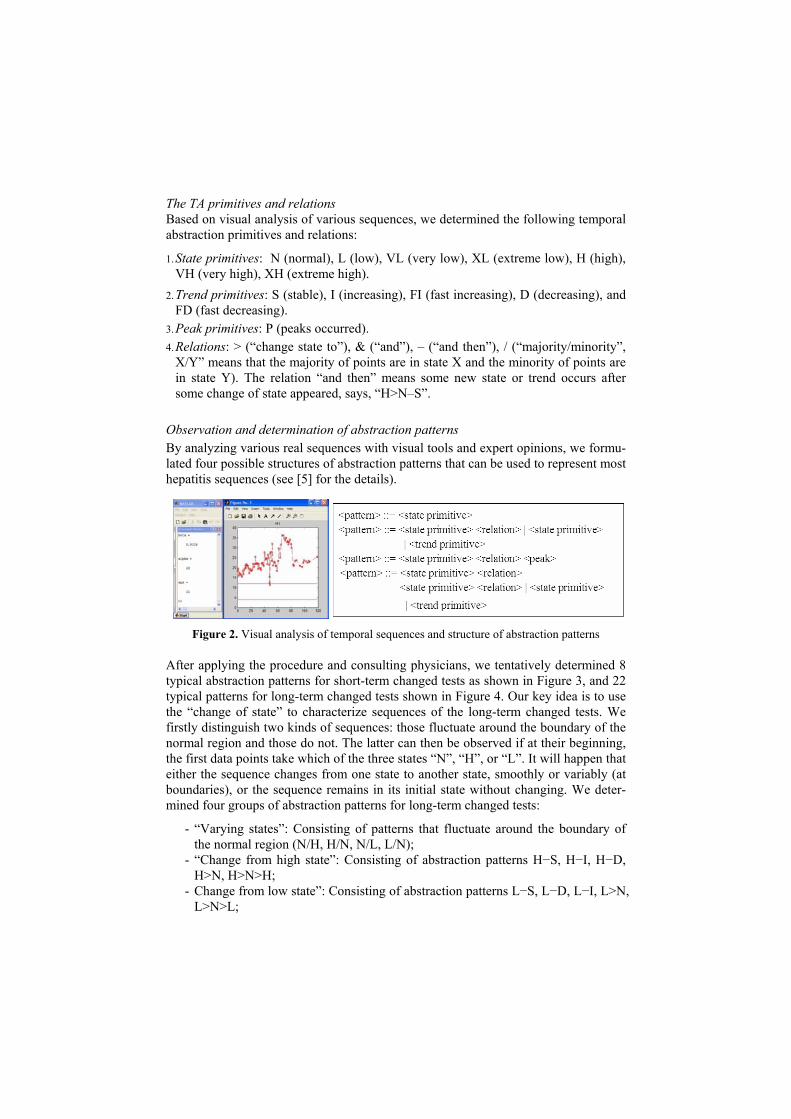
Algorithm 1 (for short-term changed tests) Input: A sequence of patient’s values of a test S = {s1, s2, …, sN} in a given episode. Output: Base state and peaks, and an abstraction of the sequence derived from them. Parameters: NU, HU, VHU, XHU: upper thresholds of normal, high, very high,
extremely high regions of a test, and threshold α (real). Basic idea: 1. Searching for base state: Viewed as the state with maximal number points in com-
paring with other states. 2. Searching for peaks: Peaks are viewed as local suddenly increasing maximum
points in the sequence. 3. Abstracting the sequence: By matching the base state and peaks with possible
abstraction patterns.
Abstraction of long-term changed tests The key idea is to use the “change of state” as the main feature to characterize se-quences of the long-term changed tests. The “change of state” contains information of both state and trend, and can compactly characterize the sequence. From the begin-ning of a sequence, the first data points can be at one of the three states “N”, “H”, or “L”. It will happen that: either the sequence changes from one state to another state, smoothly or variably (at boundaries) or the sequence remains in its state without changing. Detailed description of these algorithms can be found in [5].
For the simplicity, in this first consideration we just use 9 above values for abstrac-tion. They would be extended in future work for representing more complex situa-tions. Algorithm 2 (for long-term changed tests) Input: A sequence of patient’s values of a test S = {s1, s2, …, sN} in a given episode. Output: An abstraction of the sequence in form of abstracted patterns Parameters: α, δ, ε, σ (integer), β (real) Basic idea: 1. Separate two kinds of sequences with and without many crosses in the boundaries
of the normal region. 2. For sequences with many crosses, comparing different indexes to determine the
region of the majority points. 3. For sequences without many crosses, determine their changes of states depending
on their starting and ending states.
2.2 Mining abstracted data by data mining methods
After obtaining abstracted data from temporal data as shown in Figure 5, we have applied various mining methods for symbolic data to extract knowledge as solutions to problems under investigation. These data mining methods include C5.0 and asso-ciation rules in system Clementine (SPSS), and our rule induction method LUPC and decision tree induction CABRO implemented in system D2MS [6].
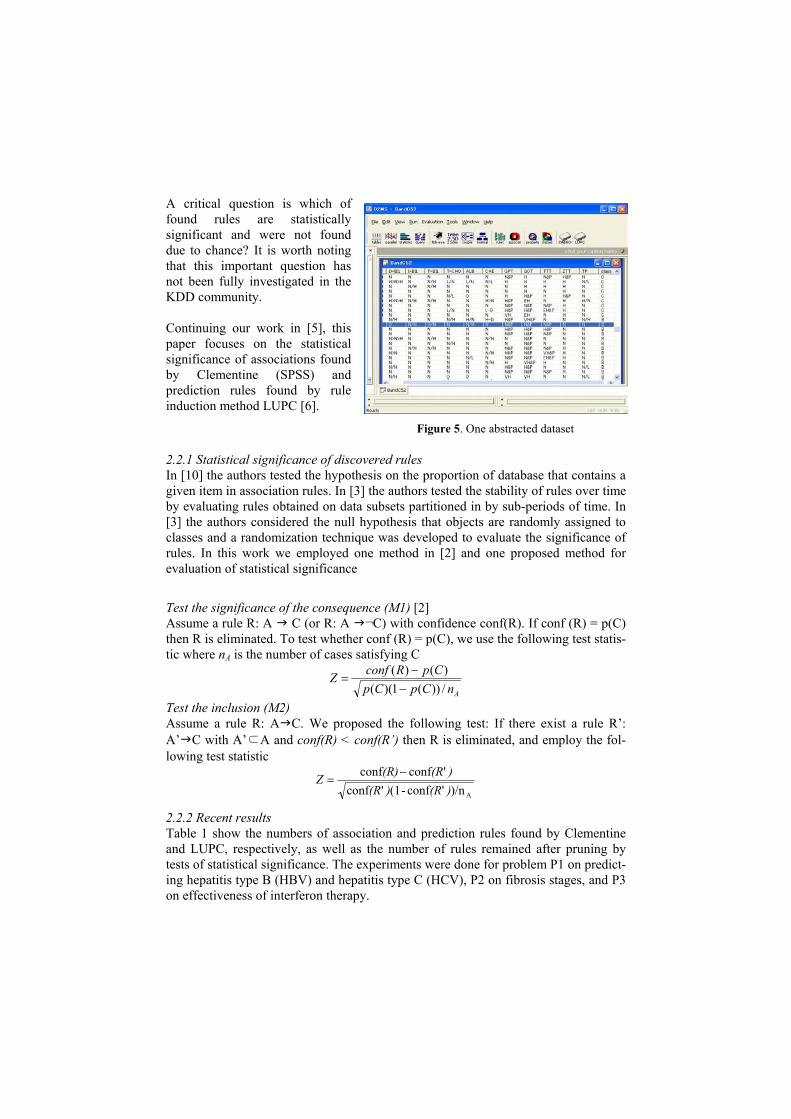
A critical question is which of found rules are statistically significant and were not found due to chance? It is worth noting that this important question has not been fully investigated in the KDD community.
Continuing our work in [5], this paper focuses on the statistical significance of associations found by Clementine (SPSS) and prediction rules found by rule induction method LUPC [6].
Figure 5. One abstracted dataset
2.2.1 Statistical significance of discovered rules In [10] the authors tested the hypothesis on the proportion of database that contains a given item in association rules. In [3] the authors tested the stability of rules over time by evaluating rules obtained on data subsets partitioned in by sub-periods of time. In [3] the authors considered the null hypothesis that objects are randomly assigned to classes and a randomization technique was developed to evaluate the significance of rules. In this work we employed one method in [2] and one proposed method for evaluation of statistical significance
Test the significance of the consequence (M1) [2] Assume a rule R: A C (or R: A ¬C) with confidence conf(R). If conf (R) = p(C) then R is eliminated. To test whether conf (R) = p(C), we use the following test statis-tic where nA is the number of cases satisfying C
AnCpCpCpRconfZ
/))(1)(()()(
−−
=
Test the inclusion (M2) Assume a rule R: A C. We proposed the following test: If there exist a rule R’: A’ C with A’⊂A and conf(R) < conf(R’) then R is eliminated, and employ the fol-lowing test statistic
A)/n'conf-(1'conf'confconf)(R)(R)(R(R)Z −
=
2.2.2 Recent results Table 1 show the numbers of association and prediction rules found by Clementine and LUPC, respectively, as well as the number of rules remained after pruning by tests of statistical significance. The experiments were done for problem P1 on predict-ing hepatitis type B (HBV) and hepatitis type C (HCV), P2 on fibrosis stages, and P3 on effectiveness of interferon therapy.
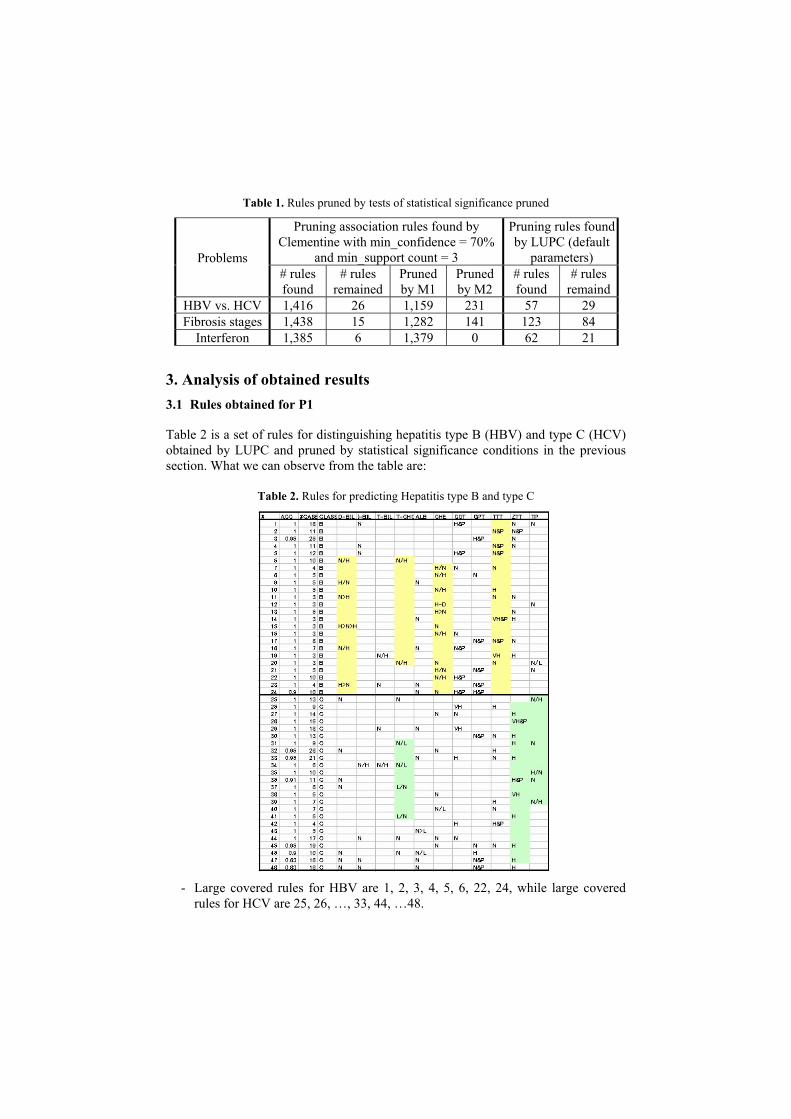
Table 1. Rules pruned by tests of statistical significance pruned
Pruning association rules found by Clementine with min_confidence = 70%
and min_support count = 3
Pruning rules found by LUPC (default
parameters)
Problems # rules found
# rules remained
Pruned by M1
Pruned by M2
# rules found
# rules remaind
HBV vs. HCV 1,416 26 1,159 231 57 29 Fibrosis stages 1,438 15 1,282 141 123 84
Interferon 1,385 6 1,379 0 62 21
3. Analysis of obtained results 3.1 Rules obtained for P1
Table 2 is a set of rules for distinguishing hepatitis type B (HBV) and type C (HCV) obtained by LUPC and pruned by statistical significance conditions in the previous section. What we can observe from the table are:
Table 2. Rules for predicting Hepatitis type B and type C
- Large covered rules for HBV are 1, 2, 3, 4, 5, 6, 22, 24, while large covered
rules for HCV are 25, 26, …, 33, 44, …48.
- “Direct Bilirubin” (D-BIL) with N/H, H>N and “Cholinesterase” (CHE) with N/H, H/N, H>N occurred only in HBV rules.
- “Zinc Sulfate Turbidity Test” with H, H&P, VH, VH&P and “Total Protein” with N/H, H/N only occurred in HCV rules.
- “Total Cholesterol” in HBV rules occurred with N/H while in HCV with N/L or L/N.
3.2 Rules obtained for P2
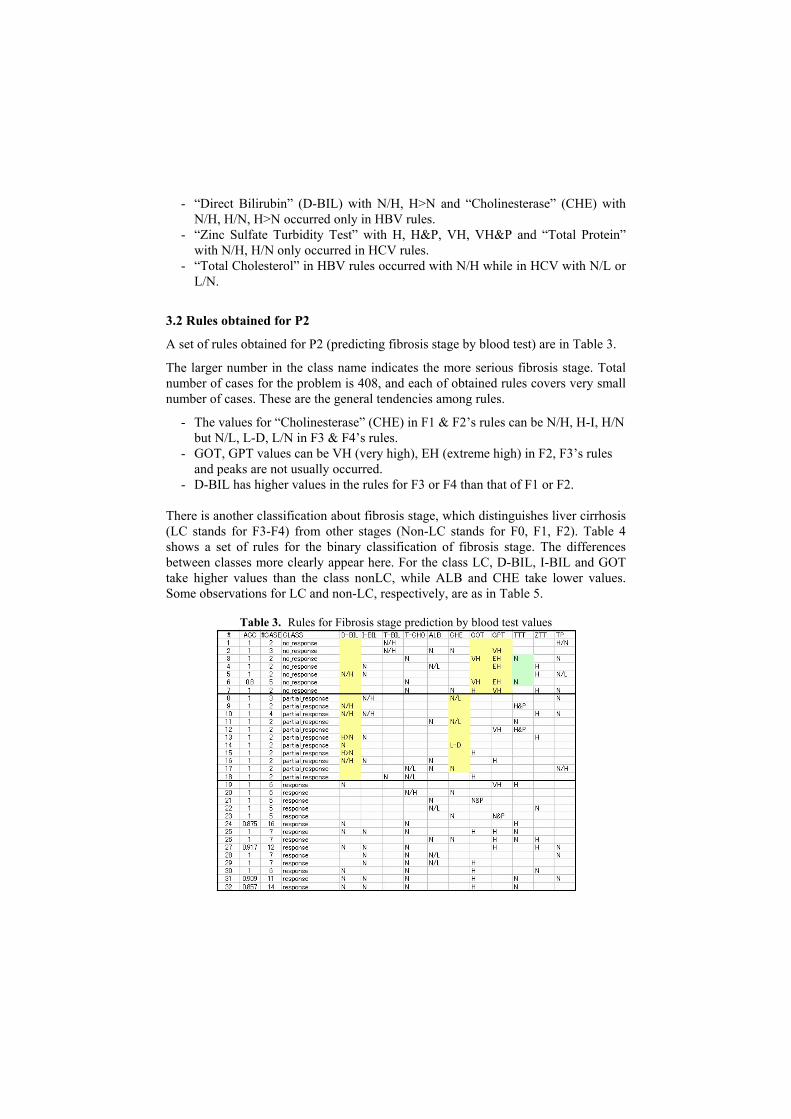
A set of rules obtained for P2 (predicting fibrosis stage by blood test) are in Table 3.
The larger number in the class name indicates the more serious fibrosis stage. Total number of cases for the problem is 408, and each of obtained rules covers very small number of cases. These are the general tendencies among rules.
- The values for “Cholinesterase” (CHE) in F1 & F2’s rules can be N/H, H-I, H/N but N/L, L-D, L/N in F3 & F4’s rules.
- GOT, GPT values can be VH (very high), EH (extreme high) in F2, F3’s rules and peaks are not usually occurred.
- D-BIL has higher values in the rules for F3 or F4 than that of F1 or F2. There is another classification about fibrosis stage, which distinguishes liver cirrhosis (LC stands for F3-F4) from other stages (Non-LC stands for F0, F1, F2). Table 4 shows a set of rules for the binary classification of fibrosis stage. The differences between classes more clearly appear here. For the class LC, D-BIL, I-BIL and GOT take higher values than the class nonLC, while ALB and CHE take lower values. Some observations for LC and non-LC, respectively, are as in Table 5.
Table 3. Rules for Fibrosis stage prediction by blood test values

Table 4. Rules on LC and non-LC
Table 5. Typical values of tests in LC and non-LC rules
D-BIL I-BIL ALB CHE GOT ZTT TP Typical values in
rules for LC H-C, H/N N/H L-S L/N,
L-D VH, H H N/H
Typical values in rules for non-LC N N N N N,
N&P N N
3.3 Rules obtained for P3
The effect of interferon therapy is evaluated in three levels of “no-response”, “partial response” and “response” according to some criteria including virus check, change of GPT value. Table 6 shows a set of rules for effectiveness of interferon therapy. Each rule for “no response” and “partial response” covers a few cases.
- In all rules for the class “response”, D-BIL takes the value “N”, while the other classes mainly take the values of combinations of “N” and “H”.
- In rules for the class “no response”, the values for GOT or GPT take values higher than “H” and TTT takes “N”.
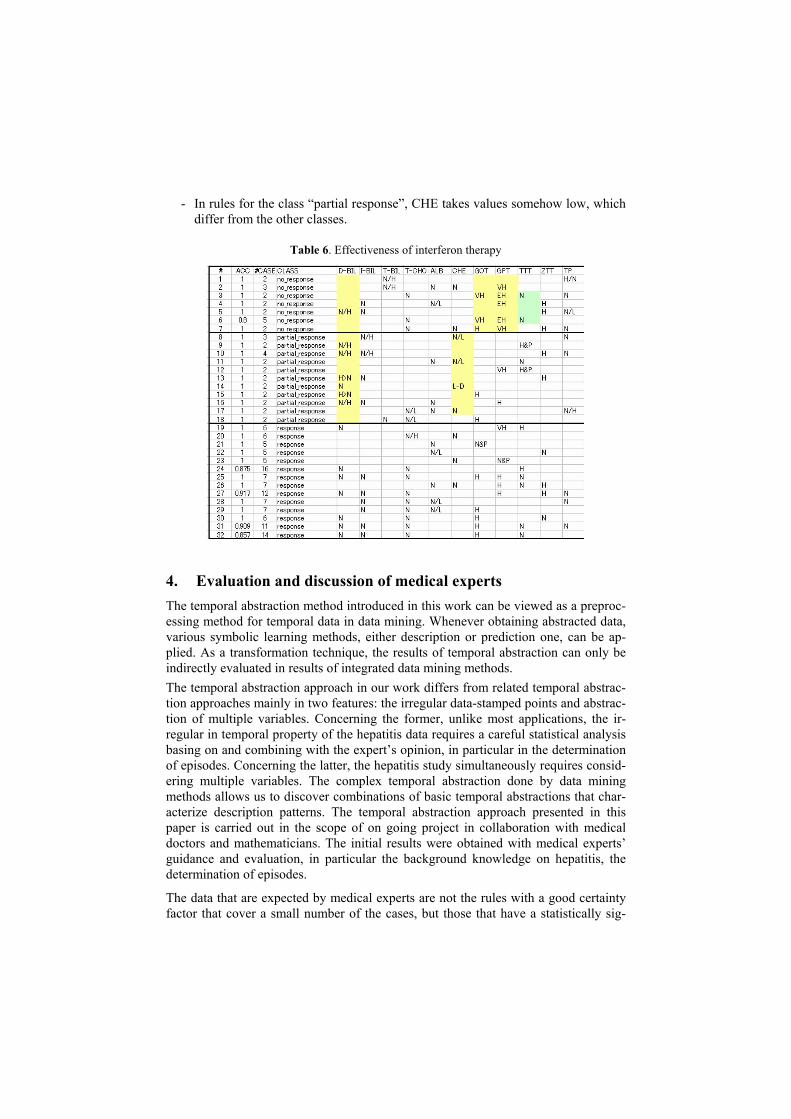
- In rules for the class “partial response”, CHE takes values somehow low, which differ from the other classes.
Table 6. Effectiveness of interferon therapy
4. Evaluation and discussion of medical experts The temporal abstraction method introduced in this work can be viewed as a preproc-essing method for temporal data in data mining. Whenever obtaining abstracted data, various symbolic learning methods, either description or prediction one, can be ap-plied. As a transformation technique, the results of temporal abstraction can only be indirectly evaluated in results of integrated data mining methods. The temporal abstraction approach in our work differs from related temporal abstrac-tion approaches mainly in two features: the irregular data-stamped points and abstrac-tion of multiple variables. Concerning the former, unlike most applications, the ir-regular in temporal property of the hepatitis data requires a careful statistical analysis basing on and combining with the expert’s opinion, in particular in the determination of episodes. Concerning the latter, the hepatitis study simultaneously requires consid-ering multiple variables. The complex temporal abstraction done by data mining methods allows us to discover combinations of basic temporal abstractions that char-acterize description patterns. The temporal abstraction approach presented in this paper is carried out in the scope of on going project in collaboration with medical doctors and mathematicians. The initial results were obtained with medical experts’ guidance and evaluation, in particular the background knowledge on hepatitis, the determination of episodes.
The data that are expected by medical experts are not the rules with a good certainty factor that cover a small number of the cases, but those that have a statistically sig-
nificant difference. Therefore we performed statistical analysis before providing them to the domain experts, which also efficient to avoid checking too many rules by prun-ing many rules. The experts however do not recognize all the rules useful from medi-cal point of view even though the rules satisfy statistical significance as well as high accuracy and broad coverage. They can judge the results only on the basis of whether they could be explained by current medical knowledge that is limited. From a medical perspective, results are classified as common sense results that can be used as a posi-tive control, probable results, possible results, unclear results that are difficult to evaluate, and nonsense results that serve as a negative control. An important medical discovery may be lurking somewhere between common sense and nonsense results, but to find it is problematic. For instance, if most of the results from a data mining technique are nonsense results, domain researchers are apt to consider the rest of the unclear results as nonsense as well. To avoid this, medical experts should introduce enough medical knowledge before using such a data mining technique and minimize the insignificant rules.
The medical experts are generally reluctant to accept the rules composed from too complicated factors or through black box beyond their understanding. It is difficult for humans to interpret a complicated discrimination function even if it may have very high confidence. On the other hand, such as a rule that consists of the data in a long duration and the pattern of which doctors are overlooking or difficult to check may be a good field for data mining approach. From the rules, further reconstruction or combination of several rules have some potential to discover new facts by medical experts. Then they can apply them to conventional medical experiments such as prospective studies to demonstrate the justice of the hypothesis.
Close communication is very important among domain researchers, computer scien-tists, and developers of interactive tools in active mining until the universal tools will be produced. Medical studies are currently required a prospective way or Cohort study as a good study design, which means a carefully planed experiment. If we think of a long-term experiment lasting more than 10 years, however, it is impractica-ble to use a prospective study from now. Retrospective studies are expected for these works and data mining techniques will play a major role in this filed to discover many mined facts.
5. Conclusion We have presented a TA approach to mining short-term and long-term changed tests in temporal hepatitis data. Our TA approach differs from related temporal abstraction approaches in dealing with irregular time stamped data of multiple variables, as well a rule pruning method by criteria of statistical significance, which ensures to users the high confidence of obtained rules.
The findings by our temporal abstraction methods are positively evaluated by medical doctors in terms of novelty, acceptability and utility. They have evaluated many found patterns (rules) as new and interesting, and the sets of rules partially answered the problems under consideration (P1, P2, and P3). The TA approach is one of ap-proaches to study the hepatitis database in the Active Mining Project in Japan: clus-
tering by Hirano and Tsumoto group, temporal decision trees by Suzuki group, graph-based mining by Motoda group, among others [12]. A comparative study will be done at the end phase of the project.
The temporal abstraction approach presented in this paper is carried out in the scope of an on going project in collaboration with medical doctors. The issues to be investi-gated in the next step include refinement of abstracted patterns (for example, posi-tions of peaks or parameters for abstraction), the post-processing and interpretation of obtained complex temporal abstractions.
Acknowledgments This research is supported by the project “Realization of Active Mining in the Era of Information Flood”, Grant-in-aid for scientific research on priority areas (B). References 1. Bellazzi, R., Larizza, C., Magni, P., Monntani, S., and Stefanelli,M., “Intelligent Analysis
of Clinic Time Series: An Application in the Diabetes Mellitus Domain”, Artificial Intelli-gence in Medicine, 20, 37-57, 2000.
2. Bruzzese, D. and Davino, C., “Statistical Pruning of Discovered Association Rules”, Computational Statistics, 16 (3), pp. 387 -398, 2001.
3. Gediga, G. and Duntsch, I., “A fast randomisation test for rule significance”, Technical Report, Brock University, 2002.
4. Hirano, S. and Tsumoto, S., “Mining Similar Temporal Patterns in Long Time-Series Data and Its Application to Medicine”, IEEE International Conference on Data Mining ICDM 2002, Maebashi, December 2002, 219-226.
5. Ho, T.B., Nguyen, T.D., Kawasaki, S., Le, S.Q., Nguyen, D.D., Yokoi, H., Takabayashi, K., “Mining Hepatitis Data with Temporal Abstraction”, ACM Inter. Conf. on Knowledge Discovery and Data Mining KDD-03, 2003, 369-377.
6. Ho T.B., Nguyen T.D., Nguyen D.D., Kawasaki S., “Visualization Support for User-Centered Model Selection in Knowledge Discovery and Data Mining”, Int. Journal Artifi-cial Intelligence Tools, 2001;10(4): 691-713.
7. Horn, W., “AI in medicine on its way from knowledge intensive to data-intensive systems”, Artificial Intelligence in Medicine, 23, 5-12, 2001.
8. Larizza, C., Bellazzi, R., and Riva, A., “Temporal abstractions for diabetic patients man-agement”, Artificial Intelligence in Medicine, Keravnou, E. et al. (eds.), Proc.AIME-97, 319-330, 1997.
9. Liu, B., Ma, Y., Lee, R., “Analyzing the interestingness of association rules from the tem-poral dimension”, IEEE International Conference on Data Mining ICDM 2001, 377-382, 2001.
10. Megiddo, N. and Srikant, R., “Discovering Predictive Association Rules”, ACM Interna-tional Conference on Knowledge Discovery and Data Mining KDD 98, 274-278, 1998.
11. Miksch S., Horn W., Popow C., and Paky F., “Utilizing temporal data abstraction for data validation and therapy planning for artificially ventilated newborn infants”, Artificial Intel-ligence in Medicine, 8, 543-576, 1996.
12. Motoda, H., Active Mining: New Directions of Data Mining, IOS Press, 2002. 13. Shahar, Y., “A Framework for Knowledge-based Temporal Abstraction”, Artificial Intelli-
gence, 90, 79-133, 1997.