
Combining physical and participatory sensing in urban mobility networks
18
Combining Physical and Participatory Sensing in Urban Mobility Networks Xiao-Feng Xie a,c , Zun-Jing Wang b,c a The Robotics Institute, Carnegie Mellon University, Pittsburgh, PA b Department of Physics, Carnegie Mellon University, Pittsburgh, PA c WIOMAX LLC, Pittsburgh, PA [email protected], [email protected] Abstract It is very important to understand human mobility and activity patterns in urban environments. In smart traffic control systems, abundant traffic flow data could be collected over time by physical sensing. However, each controlled region only covers a small area, and there is no user information in the data. The rapid rise of location-based services provides another opportunity to achieve the information of human mobility, in the form of participatory sensing, where users can share their digital footprints (i.e., checkins) at different geo-locations (i.e., venues) with timestamps. These checkins pro- vide a broad citywide coverage, but the instant number of checkins in urban areas is still limited. In this study, we focus on exploring the potentials of combining physical and participatory sensing data in urban mobility networks, based on 3.4 million checkins collected in the Pittsburgh metropolitan area, and 125 million vehicle records collected in a sub-area controlled by the SURTRAC adaptive traffic control system. First we display the spacial and temporal characteristics of the sensing data. Next, we perform user checkin statistics to reveal the distribution of user behaviors, and study entropy and regularity by cluster analysis to show a strong time-dependent predictability in human mobility patterns. Finally, we illustrate some potential usages of the sensing data in urban mobility applications, e.g., finding reasons in anomaly traffic detection, disclosing nontrivial traffic-related information in topic-specific checkins, and providing traffic origin and destination patterns based on transitions between user checkins. This work provides some essential supports for improving urban mobility. Index terms— Participatory Sensing, Human Mobility, Urban Mobility, Traffic 1
-
Upload
independent -
Category
Documents
-
view
0 -
download
0
Transcript of Combining physical and participatory sensing in urban mobility networks
Combining Physical and Participatory
Sensing in Urban Mobility Networks
Xiao-Feng Xie a,c, Zun-Jing Wang b,c
a The Robotics Institute, Carnegie Mellon University, Pittsburgh, PA
b Department of Physics, Carnegie Mellon University, Pittsburgh, PA
c WIOMAX LLC, Pittsburgh, PA
[email protected], [email protected]
Abstract
It is very important to understand human mobility and activity patterns in urban
environments. In smart traffic control systems, abundant traffic flow data could be
collected over time by physical sensing. However, each controlled region only covers a
small area, and there is no user information in the data. The rapid rise of location-based
services provides another opportunity to achieve the information of human mobility,
in the form of participatory sensing, where users can share their digital footprints (i.e.,
checkins) at different geo-locations (i.e., venues) with timestamps. These checkins pro-
vide a broad citywide coverage, but the instant number of checkins in urban areas is still
limited. In this study, we focus on exploring the potentials of combining physical and
participatory sensing data in urban mobility networks, based on 3.4 million checkins
collected in the Pittsburgh metropolitan area, and 125 million vehicle records collected
in a sub-area controlled by the SURTRAC adaptive traffic control system. First we
display the spacial and temporal characteristics of the sensing data. Next, we perform
user checkin statistics to reveal the distribution of user behaviors, and study entropy
and regularity by cluster analysis to show a strong time-dependent predictability in
human mobility patterns. Finally, we illustrate some potential usages of the sensing
data in urban mobility applications, e.g., finding reasons in anomaly traffic detection,
disclosing nontrivial traffic-related information in topic-specific checkins, and providing
traffic origin and destination patterns based on transitions between user checkins. This
work provides some essential supports for improving urban mobility.
Index terms— Participatory Sensing, Human Mobility, Urban Mobility, Traffic1
1 Introduction
Understanding human mobility and activity patterns in urban environments is a significant
and fundamental issue from various perspectives (Brockmann, Hufnagel, & Geisel, 2006; Si-
mini, Gonzalez, Maritan, & Barabasi, 2012; Song, Koren, Wang, & Barabasi, 2010; Gonzalez,
Hidalgo, & Barabasi, 2008; Han, Hao, Wang, & Zhou, 2011), e.g., understanding regional
socio-economics, improving traffic planning, providing local-based services, and promoting
sustainable urban mobility. Traditionally, relevant information is however rarely obtained
due to difficulties and costs in tracking the time-resolved locations of individuals over time.
In recent years, an increasing attention has been placed on introducing smart traffic
control systems into urban road networks (Papageorgiou, Diakaki, Dinopoulou, Kotsialos,
& Wang, 2003; Xie, Smith, Lu, & Barlow, 2012). The primary objectives of such systems
are to reduce travel time, resolve traffic congestion, and reduce vehicle emissions. Recent
work in real-time, decentralized, schedule-driven control of traffic signals has demonstrated
the strong potential of real-time adaptive signal control in urban environments (Xie, Smith,
Lu, & Barlow, 2012; Xie, Smith, & Barlow, 2012). The system, called SURTRAC (Scalable
URban TRAffic Control), achieved improvements of over 26% reductions in travel times,
over 40% reductions in idle time, and a projected reduction in emissions of over 21%, in
an initial urban deployment (Xie, Smith, & Barlow, 2014). To facilitate effective real-time
control, vehicle flows are monitored by different physical sensors, e.g., induction loops and
video detectors, and pedestrian flows might be detected and inferred using push-buttons or
other devices. Traffic flow data in fine granularity can be logged in real time, but usage of
these physical sensing data is often limited to the region that is being controlled. For the
broad uncontrolled regions instead, no information is available.
The rise of location-based services provides another way to achieve the information of
human mobility, in the form of participatory sensing (Burke et al., 2006; Silva, Vaz de Melo,
Almeida, & Loureiro, 2013; Doran, Gokhale, & Konduri, 2014). With mobile devices, users
can share their digital footprints at various geo-locations (i.e., venues) with timestamps
through checkins, e.g., geo-enabled tweets and geo-tagged photos and videos. Using of these
services grows fast worldwide, although the instant sampling rate of trajectories is still very
limited, and some web-based services, e.g., Waze and Facebook, do not open their location-
based data to public. Different work has been conducted to understand temporal, spatial,
social patterns, and some combined patterns of human mobility (Ferrari, Rosi, Mamei, &
Zambonelli, 2011; Chiang, Lin, Peng, & Yu, 2013; Wang, Pedreschi, Song, Giannotti, &
Barabasi, 2011; Z. Cheng, Caverlee, Lee, & Sui, 2011; Gao, Tang, Hu, & Liu, 2013; Arase,
Xie, Hara, & Nishio, 2010; Cranshaw, Schwartz, Hong, & Sadeh, 2012; Noulas, Scellato,
2
Mascolo, & Pontil, 2011; Schneider, Belik, Couronne, Smoreda, & Gonzalez, 2013).
In this study, we focus on exploring the potentials of combining physical and participatory
sensing data in urban mobility networks. The participatory sensing data are collected in
the Pittsburgh metropolitan area with the APIs provided by the location-based services
including Twitter, Foursquare, Flickr, Picasa, and Panoramio. The physical traffic flow data
are collected in an area controlled by the SURTRAC adaptive traffic control system.
We first display the basic spatial and temporal characteristics of the physical and par-
ticipatory sensing data. Afterward, we study human mobility patterns. User checkins are
examined to disclose the distribution of user behaviors, which is a fundamental statistical
properties of mobility pattern. geo-location based cluster analysis is performed to identify
personal favorite places of users in the studied regions. User entropy is measured to reveal
the degree of predictability of user activities. Time-dependent mobility patterns are analyzed
to show the regularity of user behaviors, based on most visited places of users.
Finally we presented results of combining physical and participatory sensing data in
urban mobility applications. We evaluate the attraction and limit in using sensing data on
anomaly detection and reasoning for the time series of traffic flow. We examine if nontrivial
information could be extracted from participatory sensing data to effectively recognize traffic
congestion in temporal and spacial dimensions. We then choose two zones in the controlled
region to check closely on the correlation between physical and participatory sensing patterns.
For the two zones, we also investigate the origin and destination (O-D) patterns from the
transitions between user checkins, which are valuable for urban mobility.
2 Data Description
We implement our study in the Pittsburgh metropolitan area. The participatory sensing data
contain a list of checkins. Each checkin can be represented as a tuple <userID, venueID,
time, [comment ]>, where userID is associated with a unique user, venueID is associated with
a venue at the geo-location of (latitude, longitude) with the precision of six decimal places.
Our checkin data were collected (between March and July of 2014) from the geo-APIs of some
location-sharing services, including geo-enabled tweets from Twitter and geo-tagged photos
from Flickr, Picasa and Panorami. We also included existing checkin data directly crawled
from Foursquare (Long, Jin, & Joshi, 2012). For studying urban mobility patterns, we only
consider checkins at venues in the spacial latitude/longitude bounding box of (40.309640, -
80.135014, 40.608740, -79.676678), as shown in Figure 1a. For studying up-to-date patterns,
we only consider the recent data within the range of dates [1/1/2012, 7/1/2014]. The
collected data contains 3,399,376 checkins of 74,658 users at 2,198,572 venues.3

(a) Participatory Sensing Region (b) Region Controlled by SURTRAC
Figure 1: Participatory and Physical Sensing Regions in Pittsburgh, PA.
The physical traffic flow data are collected in a road network which is currently controlled
by an adaptive traffic control system called SURTRAC (Xie, Smith, Lu, & Barlow, 2012;
Xie, Smith, & Barlow, 2012, 2014) (see Figure 1a, and for more details see Figure 1b). The
system was first installed on nine intersections (A to I) in the East Liberty neighborhood
since June, 2012, and then expanded to nine more intersections (J to R) in the Bakery
Square neighborhood since October, 2013. The total area include five major streets, Penn
Ave, Centre Ave, Highland Ave, East Liberty Blvd, and Fifth Ave, with dynamic traffic
flows throughout the day. For collecting real-time flow data, detectors were deployed on
each entry/exit lane at the near end of each intersection and on entry lanes at the far end
of boundary intersections. For each detector, a vehicle record is generated at the time when
a vehicle is detected to pass the detector. Compared to that in a checkin, there is no userID
and comment information available in a vehicle record. In total, the traffic flow data contains
125,369,318 vehicle records generated at 126 stop-bar detectors by the end of 7/1/2014.
3 Basic Spacial and Temporal Characteristics
3.1 Spatial Distribution of Checkins
We first investigate the spatial distribution of all checkins in the whole region. Figure 2a is
the geo-distribution of checkins. It shows a highly non-uniform dynamics of human mobility
in the urban area. A few high-density regions (red colored) are shown in the heat map (see
Figure 2b), one of which overlaps with the controlled region in Figure 1b.
4

(a) Checkin Locations (b) Heat Map of Checkins
Figure 2: Distribution of Checkins in the Participatory Sensing Region.
3.2 Temporal Patterns
We are interested in the recurrent nature of human mobility over time. To investigate
temporal mobility patterns, each week is segmented into 24× 7 = 168 hourly bins (starting
from Monday). For obtaining seasonal average results, each year is divided into four seasons
(A to D), and the binned results are averaged over 13 weeks in each season. We considered
all four seasons in 2013 and the first two seasons in 2014.
Figure 3a gives the seasonal average checkin patterns in the participatory sensing region.
It shows that the number of checkins has increased significantly over the seasons. Figure 3b
shows the average checkin frequency normalized by the total checkin size in each season. It
shows that the checkin frequency has similar patterns for different seasons. The “social day”
(Silva et al., 2013; Noulas et al., 2011) of Pittsburgh starts at around 4AM, and the checkin
frequency peaks at around 8-9PM. It also shows high checkin activity during Sunday.
For vehicle flow in the controlled region (Figure 1b), we considered two pivotal inter-
sections, i.e., intersection D of Centre Ave and Penn Ave in East Liberty and intersection
P of Fifth Ave and Penn Ave in Bakery Square, which service for most vehicles in this
road network. The seasonal average vehicle flow patterns are shown in Figures 4a and 4b,
respectively. For intersection P, the vehicle flow data is only available for the two seasons
in 2014. During weekdays, the traffic flow has three peaks in the morning (8AM), middle
day(12PM), and afternoon (5PM). During weekends, the traffic pattern presents a smoother
change that peaks at around 1PM. The flow in weekdays is heavier than that in weekends.
5

2014-B2014-A
2013-D2013-C
2013-B2013-A
Time (hour)
AverageCheckin
Count
168144120967248240
1000
800
600
400
200
0
(a) Checkin Counts
2014-B2014-A
2013-D2013-C
2013-B2013-A
Time (hour)
Checkin
Frequency
168144120967248240
0.016
0.012
0.008
0.004
0
(b) Checkin Frequency
Figure 3: Seasonal Average Checkin Patterns in the Participatory Sensing Region.
4 Human Mobility Patterns
In this section, we evaluate human mobility characteristics based on user activities.
4.1 User Checkin Statistics
Figure 5 presents some basic user checkin statistics in the participatory sensing region.
Let Ni be the number of checkins for user i, it turns out that the probability distribution
follows a scaling law (see Figure 5a). We then consider the distribution of the radius of
gyration (rg) for each user. For user i, let V ji be the venue of the jth checkin, then rig =
√
1
Ni
∑Ni
j=1(dist(V j
i , Vic ))
2, where the dist function gives the distance between a checkin V ji
and the center of mass V ic for the checkins of user i. As shown in Figure 5b, most user
activities are confined to a limited neighborhood within 10 km, which is similar to the
findings in the ref. (Gonzalez et al., 2008). Figures 5c and 5d show the distributions in the
time and distance intervals between consecutive checkins made by users, respectively. The
probability of inter-checkin times decreases with the increase in time, and interestingly, it
has apparent daily and weekly patterns. The distribution of inter-checkin distances is quite
similar to the distribution of rg in Figure 5b.
6

2014-B2014-A
2013-D2013-C
2013-B2013-A
Time (hour)
AverageVehicle
Count
168144120967248240
2500
2000
1500
1000
500
0
(a) Intersection D
2014-B2014-A
Time (hour)
AverageVehicle
Count
168144120967248240
3000
2500
2000
1500
1000
500
0
(b) Intersection P
Figure 4: Seasonal Average Vehicle Flow Patterns for The Two Intersections in Figure 1b.
4.2 Finding Checkin Places
Each user tend to stay in a limited number of places, where each of places is defined to
accommodate similar checkins/activities of the user in its vicinity (C. Cheng, Yang, King,
& Lyu, 2012; Gao et al., 2013; Song, Qu, Blumm, & Barabasi, 2010). This definition of
places is able to tolerate some geo-location tracking errors. Notice that the existing tracking
techniques (e.g., GPS, WiFi, and mobile tower) might have the location inaccuracy as high
as several hundred meters (Jiang, Ferreira Jr, & Gonzalez, 2012; Song, Qu, et al., 2010).
For our collected data, we identify the checkin places by clustering, where each cluster C
defines the place of a set of checkins. We use an unsupervised clustering method, DBSCAN
(Ester, Kriegel, Sander, & Xu, 1996), which is a density-based clustering algorithm that
requires only two parameters, i.e., eps to define a neighborhood threshold and minPts to
define a density threshold. By default, eps =250 meters and minPts =2 points were used.
4.3 User Entropy
User entropy is a fundamental quantity to capture the degree of predictability for a user (Song,
Qu, et al., 2010). For user i, let Cki be the kth cluster, and K be the number of clus-
ters. After the clustering, the temporal-uncorrelated user entropy Si is defined as Si =
7

User Checkin Count
Probability
1E+031E+021E+011E+00
1E-02
1E-03
1E-04
1E-05
1E-06
1E-07
(a) Distribution of User Checkin Counts
Radius of Gyration (kilometer)
Probability
1E+011E+001E-01
1E-02
1E-03
1E-04
1E-05
1E-06
1E-07
(b) Distribution of Radius of Gyration
Inter-Checkin Time (day)
Probability
28211470
1E+00
1E-01
1E-02
1E-03
1E-04
1E-05
1E-06
1E-07
(c) Distribution of Inter-Checkin Times
Inter-Checkin Distance (kilometer)
Probability
1E+011E+001E-01
1E-01
1E-02
1E-03
1E-04
1E-05
1E-06
(d) Distribution of Inter-Checkin Distances
Figure 5: Basic User Checkin Statistics in the Participatory Sensing Region.
−∑K
k=1pi(k) log2 pi(k), where pi(k) = |Ck
i |/∑K
k=1|Ck
i | is the probability that cluster k was
visited by user i. A lower user entropy means a higher degree of predictability for visitation
Patterns. Figures 6a and 6b respectively show the user entropy versus the checkin numbers
(N) and the cluster numbers (K). The users in a single cluster is not shown in the log-scale
figures since their user entropy are zero. As shown in Figures 6a and 6b, a larger number of
checkins might lead to a lower user entropy, while a larger cluster number often leads to a
higher user entropy.
4.4 Regularity
We study the mobility regularity of users by computing the probability of finding users in
their primary and secondary most-visited places (ranked using pi(k)) at hourly interval in a
week, using DBSCAN clustering with eps ={250, 1000} meters (see Figure 7).
We first check the case for the primary most-visited places. The regularity is high during
the night, and it peaks at around 4AM, the start of a “social day”. In weekdays, there are
minima during morning (around 8AM), middle day (1PM), and afternoon (6PM) correspond-
ing to the transitions to other places for commuting or having lunch. In weekends, there
is no local minimum during morning. This pattern indicates that the primary most-visited8

User Checkin Count
UserEntropy
1E+041E+031E+021E+01
1E+01
1E+00
1E-01
1E-02
(a) Checkin Counts of Users
Cluster Number
UserEntropy
1E+021E+011E+00
1E+01
1E+00
1E-01
1E-02
(b) Checkin Cluster Numbers of Users
Figure 6: User Entropy for Checkins in the Participatory Sensing Region.
places should contain a large portion of home places.
For the secondary most-visited places, the regularity curve peaks at around 8AM, and
reaches minima during night in weekdays, but appears being quite flat in weekends. There-
fore, the secondary most-visited places are likely associated with work places.
Notice that when we change eps from 250m to 1000m (i.e. clustering becomes more
coarsed), the increase in probability for the primary most-visited places is much more than
the decrease in probability for the secondary most-visited places. This means that many
users perform their other activities (i.e. except for the primary and secondary activities)
near their home places (primary places). During night, the probability is nearly 90% for the
primary place and 10% for the secondary place.
5 Urban Mobility Applications
In this section, we explore the usage and limit of combining physical and participatory
sensing data in applications of urban mobility networks by presenting a few examples.
Secondary(eps=1000m)Primary(eps=1000m)Secondary(eps=250m)Primary(eps=250m)
Time (hour)
Probability
168144120967248240
1
0.9
0.8
0.7
0.6
0.5
0.4
0.3
0.2
0.1
0
Figure 7: Mobility Regularity of Users at Primary and Secondary Most Visited Clusters.
9

(Oct 23, 2013)
Bridge Reopen
(Mar 4, 2013)
Bridge Closure
Time (day)
Vehicle
Count
365292219146730
7000
6000
5000
4000
3000
2000
1000
Figure 8: Vehicle Flow Pattern in Year 2013 for the Turning Movement CDE (in Fig. 1b) atIntersection D. (The Data in 09/01, 09/02, and 10/02 are Excluded due to Disk Full Issue.)
5.1 Anomaly Detection and Reasoning
In 2013, the bridge on South Highland Ave (location shown in 1b) was closed for replacement.
This cut off the connection between Shadyside and East Liberty. Therefore a large portion of
traffic (including all bus lines) on Highland Avenue was forced to pass through intersection
D, which is a pivotal node that services for most vehicles in this road network.
Figure 8 shows the vehicle flow pattern in year 2013 for the right-turn movement at
intersection D (see Figure 1bb, from C to D to E) . The flow significantly increased between
early March and late October. This is a typical change point problem for anomaly detection
in time series of traffic. Using analysis techniques of statistics (Hajji, 2005) on traffic data,
we can approximately detect change points, but we are not able to find the exact time and
the reason leading to the events.
Analyzing participatory sensing data is helpful at this point. A search of our geo-tagged
data gives five checkins with the time of the bridge reopening ceremony. For example, at
5:47PM, October 23, a user mentioned joyfully, Wow the bridge on South Highland is open.
Life was rough for a while. We did not find a checkin associated with the bridge closure
for our collected data, which might due to the closure event happened too long time ago
and the earlier data was not kept by our location-sharing services. A search of the non-
geo-tagged Tweets pinpoints the time both for closure and reopening events (for which nine
and fourteen tweets have been found respectively, posted by some of the users or their first-
degree friends). In further studies, fusing non-geo-tagged and geo-tagged information will be
very useful for anomaly detection and reasoning, especially in case the available geo-tagged
checkin information is not sufficient. In fact, many users generate both non-geo-tagged and
geo-tagged information in practice. In presence of a high user regularity as shown in Section
4.4 (which is a very common case), the locations of non-geo-tagged information of the users
can be inferred from their geo-tagged checkins. In addition, locations can also be estimated
10

(a) Global View (b) Local View
Figure 9: Spatial Checkin Patterns for the “Traffic” Topic.
using content-derived information (Z. Cheng, Caverlee, & Lee, 2010).
5.2 Topic Related to Traffic
Many users generate checkins with the information of their current traffic conditions in
travel. Tweet semantics has been used to build indicators for long-term traffic prediction
(He, Shen, Divakaruni, Wynter, & Lawrence, 2013). By taking the search topic “traffic”
as an example, we examine more potential usages of the participatory sensing checkins for
obtaining important traffic information. Figures 9a and 9b show the spatial patterns of
the checkins. A global view (see Figure 9a) indicates most checkins are located on major
highways and congested neighborhoods. While a local view (see Figure 9a) shows most
checkins are located on intersections in the urban road network. These participatory sensing
information is nontrivial for marking popular route choices and for identifying congested
intersections and road segments where traffic conditions should be improved significantly.
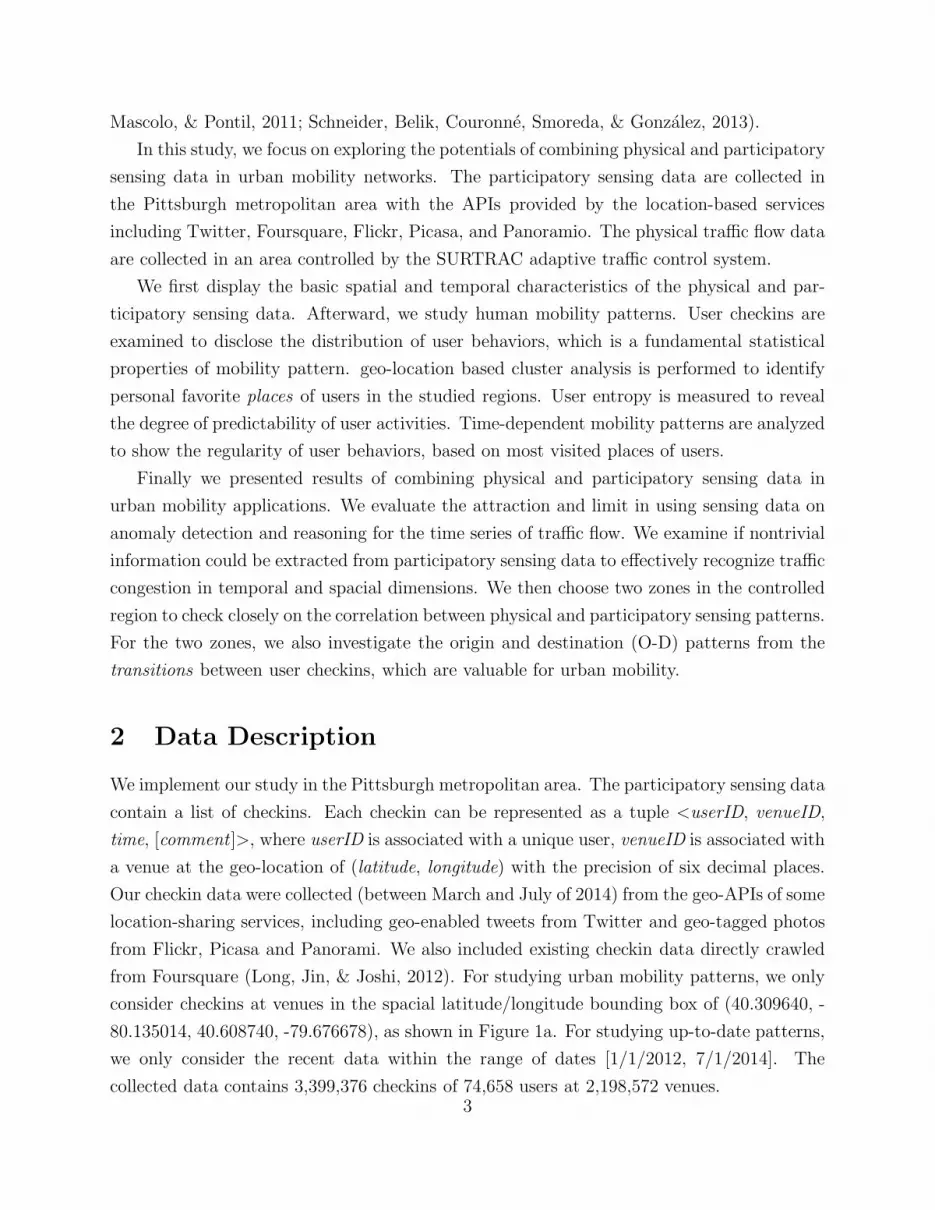
Figure 10 shows the temporal patterns of the checkins. We can clearly see that check-
ins mainly happened during weekdays, especially during the morning (around 8AM) and
afternoon (around 5PM), reflecting the heavy traffic time during the commuting periods.
5.3 A Tale of Two Zones
Our controlled region spans some adjacent livehoods (Cranshaw et al., 2012) with different
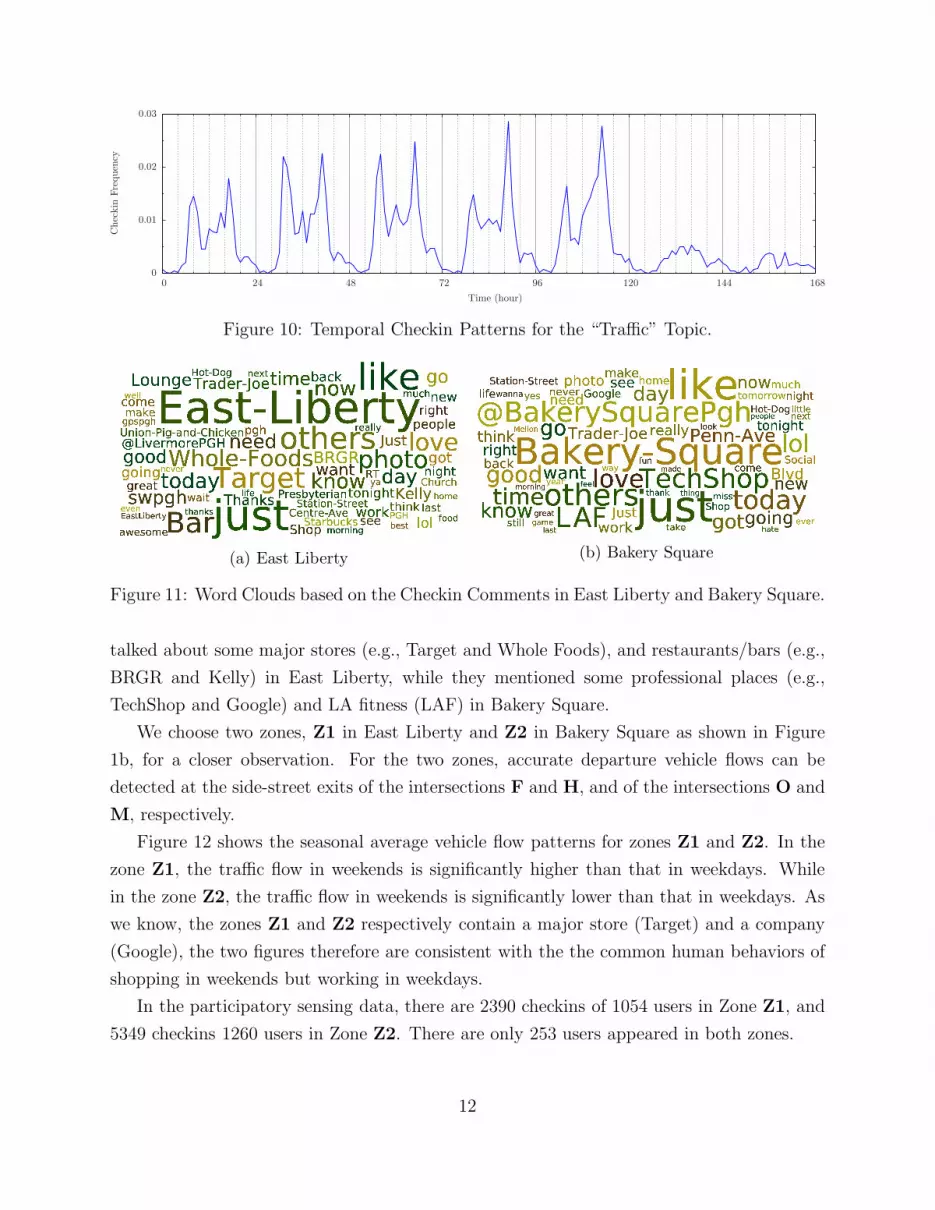
life activity patterns, including East Liberty and Bakery Square. Figure 11 gives two word
clouds generated using the checkin comments in East Liberty and Bakery Square. Users11
Time (hour)
Checkin
Frequency
168144120967248240
0.03
0.02
0.01
0
Figure 10: Temporal Checkin Patterns for the “Traffic” Topic.
(a) East Liberty (b) Bakery Square
Figure 11: Word Clouds based on the Checkin Comments in East Liberty and Bakery Square.
talked about some major stores (e.g., Target and Whole Foods), and restaurants/bars (e.g.,
BRGR and Kelly) in East Liberty, while they mentioned some professional places (e.g.,
TechShop and Google) and LA fitness (LAF) in Bakery Square.
We choose two zones, Z1 in East Liberty and Z2 in Bakery Square as shown in Figure
1b, for a closer observation. For the two zones, accurate departure vehicle flows can be
detected at the side-street exits of the intersections F and H, and of the intersections O and
M, respectively.
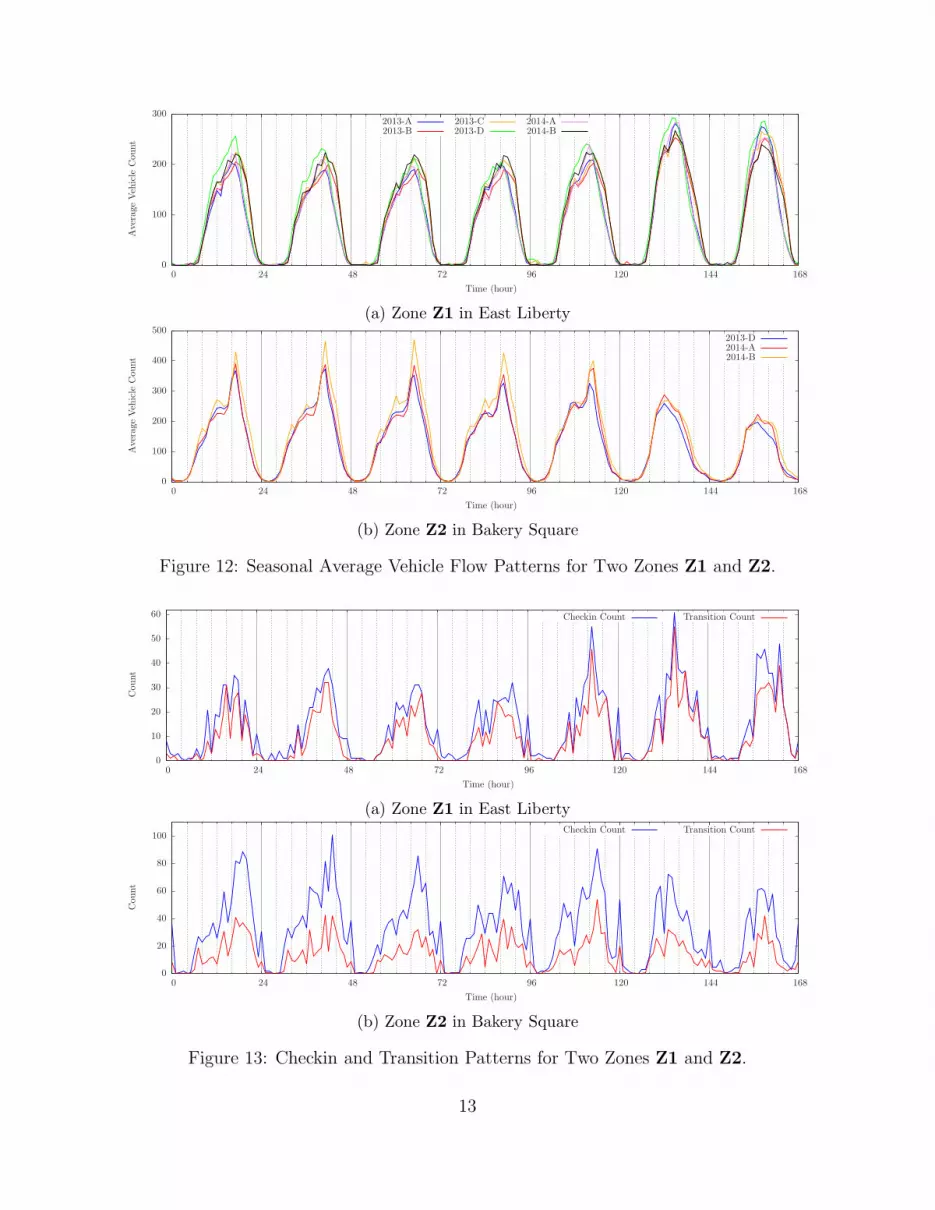
Figure 12 shows the seasonal average vehicle flow patterns for zones Z1 and Z2. In the
zone Z1, the traffic flow in weekends is significantly higher than that in weekdays. While
in the zone Z2, the traffic flow in weekends is significantly lower than that in weekdays. As
we know, the zones Z1 and Z2 respectively contain a major store (Target) and a company
(Google), the two figures therefore are consistent with the the common human behaviors of
shopping in weekends but working in weekdays.
In the participatory sensing data, there are 2390 checkins of 1054 users in Zone Z1, and
5349 checkins 1260 users in Zone Z2. There are only 253 users appeared in both zones.
12
2014-B2014-A
2013-D2013-C
2013-B2013-A
Time (hour)
AverageVehicle
Count
168144120967248240
300
200
100
0
(a) Zone Z1 in East Liberty
2014-B2014-A2013-D
Time (hour)
AverageVehicle
Count
168144120967248240
500
400
300
200
100
0
(b) Zone Z2 in Bakery Square
Figure 12: Seasonal Average Vehicle Flow Patterns for Two Zones Z1 and Z2.
Transition CountCheckin Count
Time (hour)
Count
168144120967248240
60
50
40
30
20
10
0
(a) Zone Z1 in East LibertyTransition CountCheckin Count
Time (hour)
Count
168144120967248240
100
80
60
40
20
0
(b) Zone Z2 in Bakery Square
Figure 13: Checkin and Transition Patterns for Two Zones Z1 and Z2.
13

(a) Transitions for Zone Z1 (b) Transitions for Zone Z2
(c) Origin/Destination Checkins for Zone Z1 (d) Origin/Destination Checkins for Zone Z2
Figure 14: Users Transitions for Zones Z1 and Z2.
We further find the transitions of users for the zones. For each zone, each user transition
is defined as two consecutive checkins, one is within the zone and another is outside of the
zone, made by a user in a time threshold (four hours in this paper). If the later checkin is in
the zone, the transition is an in-zone transition, otherwise it is an out-zone transition. For
each zone, the in-zone and out-zone transitions are more related to arrival and departure
traffic. The transitions also provide origin and destination (O-D) information for each zone.
Figure 13 gives the checkin and transition patterns for the two zones. In Z1, most checkins
have turned to be transitions, which might due to that users do not stay too long after the
shopping. In Z1, the number of transitions is significantly lower than that of checkins, as
users might stay long and send checkins in their work places. For weekdays and weekends, the14
temporal checkin patterns are roughly similar to that of traffic flow patterns. The numbers
of both checkins and transitions are still not large enough to support a correlation analysis in
statistics with the traffic flow data shown in Figure 12. But the situation should be improved
in the near future based on the rapid increasing trend as shown in Figure 3a.
Figure 14 gives the user transition information for zones Z1 and Z2. The origin/destination
(O-D) checkins of transitions are distributed broadly in the participatory sensing region. As
shown in 14c and 14d, the O-D locations are highly clustered, and the majority of them are
covered by a few clusters of sources. For the two zones, they share most of the O-D sources
(clusters in blue), although they have an apparent difference in both the checkin and flow
patterns. It implies that urban traffic might be mostly generated among a few clustered
sources.
The O-D information might be used to further understand the traffic demands, based
on some modeling frameworks, e.g., the gravity model (Yang, Jin, Wan, Li, & Ran, 2014)
or the radiant model (Simini et al., 2012). Together with popular route information (Wei,
Zheng, & Peng, 2012), the information beyond the traffic control region might be useful for
recommending time-sensitive alternative routes (Hsieh, Li, & Lin, 2012) to help reducing
traffic congestion within urban traffic control systems (Xie, Feng, Smith, & Head, 2014),
especially if traffic anomaly (Pan, Demiryurek, Shahabi, & Gupta, 2013) has been quickly
identified or predicted. It is also possible to provide carpooling recommendation for users
based on the similarity in their O-D transition patterns.
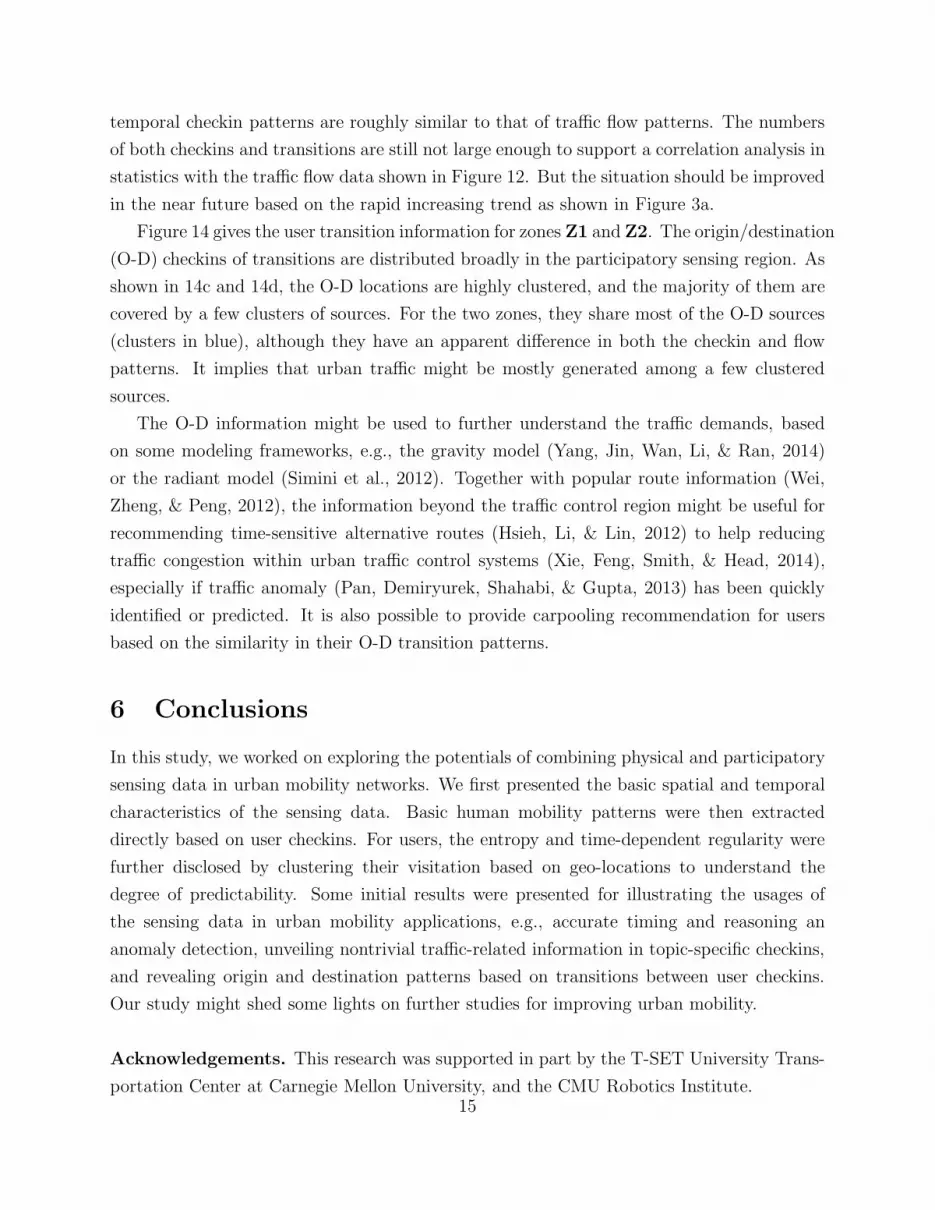
6 Conclusions
In this study, we worked on exploring the potentials of combining physical and participatory
sensing data in urban mobility networks. We first presented the basic spatial and temporal
characteristics of the sensing data. Basic human mobility patterns were then extracted
directly based on user checkins. For users, the entropy and time-dependent regularity were
further disclosed by clustering their visitation based on geo-locations to understand the
degree of predictability. Some initial results were presented for illustrating the usages of
the sensing data in urban mobility applications, e.g., accurate timing and reasoning an
anomaly detection, unveiling nontrivial traffic-related information in topic-specific checkins,
and revealing origin and destination patterns based on transitions between user checkins.
Our study might shed some lights on further studies for improving urban mobility.
Acknowledgements. This research was supported in part by the T-SET University Trans-
portation Center at Carnegie Mellon University, and the CMU Robotics Institute.15

References
Arase, Y., Xie, X., Hara, T., & Nishio, S. (2010). Mining people’s trips from large scalegeo-tagged photos. In International Conference on Multimedia (pp. 133–142).
Brockmann, D., Hufnagel, L., & Geisel, T. (2006). The scaling laws of human travel. Nature,439 (7075), 462–465.
Burke, J. A., Estrin, D., Hansen, M., Parker, A., Ramanathan, N., Reddy, S., & Srivastava,M. B. (2006). Participatory sensing. In International Workshop on World-Sensor-
Web.
Cheng, C., Yang, H., King, I., & Lyu, M. R. (2012). Fused matrix factorization with geo-graphical and social influence in location-based social networks. In AAAI Conference
on Artificial Intelligence (pp. 17–23).Cheng, Z., Caverlee, J., & Lee, K. (2010). You are where you tweet: a content-based approach
to geo-locating twitter users. In ACM International Conference on Information and
Knowledge Management (pp. 759–768).Cheng, Z., Caverlee, J., Lee, K., & Sui, D. Z. (2011). Exploring millions of footprints in
lcation sharing services. In International AAAI Conference on Weblogs and Social
Media (pp. 81–88).Chiang, M.-F., Lin, Y.-H., Peng, W.-C., & Yu, P. S. (2013). Inferring distant-time loca-
tion in low-sampling-rate trajectories. In ACM SIGKDD international Conference on
Knowledge Discovery and Data Mining (pp. 1454–1457).Cranshaw, J., Schwartz, R., Hong, J. I., & Sadeh, N. M. (2012). The livehoods project:
Utilizing social media to understand the dynamics of a city. In International AAAI
Conference on Weblogs and Social Media (pp. 58–65).Doran, D., Gokhale, S. S., & Konduri, K. C. (2014). Participatory paradigms: Promises and
challenges for urban transportation. In Transportation research board annual meeting.
Washington, DC.Ester, M., Kriegel, H.-P., Sander, J., & Xu, X. (1996). A density-based algorithm for
discovering clusters in large spatial databases with noise. In International Conference
on Knowledge Discovery and Data Mining (pp. 226–231).Ferrari, L., Rosi, A., Mamei, M., & Zambonelli, F. (2011). Extracting urban patterns
from location-based social networks. In ACM SIGSPATIAL International Workshop
on Location-Based Social Networks (pp. 9–16).Gao, H., Tang, J., Hu, X., & Liu, H. (2013). Modeling temporal effects of human mo-
bile behavior on location-based social networks. In ACM International Conference on
Information and Knowledge Management (pp. 1673–1678).Gonzalez, M. C., Hidalgo, C. A., & Barabasi, A.-L. (2008). Understanding individual human
mobility patterns. Nature, 453 (7196), 779–782.Hajji, H. (2005). Statistical analysis of network traffic for adaptive faults detection. IEEE
Transactions on Neural Networks , 16 (5), 1053–1063.Han, X.-P., Hao, Q., Wang, B.-H., & Zhou, T. (2011). Origin of the scaling law in human
mobility: Hierarchy of traffic systems. Physical Review E , 83 (3), 036117.He, J., Shen, W., Divakaruni, P., Wynter, L., & Lawrence, R. (2013). Improving traf-
fic prediction with tweet semantics. In International Joint Conference on Artificial
Intelligence (pp. 1387–1393).16

Hsieh, H.-P., Li, C.-T., & Lin, S.-D. (2012). Exploiting large-scale check-in data to rec-ommend time-sensitive routes. In ACM SIGKDD International Workshop on Urban
Computing (pp. 55–62).Jiang, S., Ferreira Jr, J., & Gonzalez, M. C. (2012). Discovering urban spatial-temporal
structure from human activity patterns. In ACM SIGKDD International Workshop
on Urban Computing (pp. 95–102).Long, X., Jin, L., & Joshi, J. (2012). Exploring trajectory-driven local geographic topics in
foursquare. In Workshop on Location-Based Social Networks (pp. 927–934).Noulas, A., Scellato, S., Mascolo, C., & Pontil, M. (2011). An empirical study of geographic
user activity patterns in foursquare. In International AAAI Conference on Weblogs
and Social Media (pp. 570–573).Pan, B., Demiryurek, U., Shahabi, C., & Gupta, C. (2013). Forecasting spatiotemporal
impact of traffic incidents on road networks. In IEEE International Conference on
Data Mining (pp. 587–596).Papageorgiou, M., Diakaki, C., Dinopoulou, V., Kotsialos, A., & Wang, Y. (2003). Review
of road traffic control strategies. Proceedings of the IEEE , 91 , 2043–2067.Schneider, C. M., Belik, V., Couronne, T., Smoreda, Z., & Gonzalez, M. C. (2013). Unrav-
elling daily human mobility motifs. Journal of the Royal Society: Interface, 10 (84),20130246.
Silva, T. H., Vaz de Melo, P., Almeida, J. M., & Loureiro, A. A. (2013). Challenges andopportunities on the large scale study of city dynamics using participatory sensing. InIEEE Symposium on Computers and Communications (pp. 528–534).
Simini, F., Gonzalez, M. C., Maritan, A., & Barabasi, A.-L. (2012). A universal model formobility and migration patterns. Nature, 484 (7392), 96–100.
Song, C., Koren, T., Wang, P., & Barabasi, A.-L. (2010). Modelling the scaling propertiesof human mobility. Nature Physics , 6 (10), 818–823.
Song, C., Qu, Z., Blumm, N., & Barabasi, A.-L. (2010). Limits of predictability in humanmobility. Science, 327 (5968), 1018–1021.
Wang, D., Pedreschi, D., Song, C., Giannotti, F., & Barabasi, A.-L. (2011). Human mo-bility, social ties, and link prediction. In ACM SIGKDD International Conference on
Knowledge Discovery and Data Mining (pp. 1100–1108).Wei, L.-Y., Zheng, Y., & Peng, W.-C. (2012). Constructing popular routes from uncertain
trajectories. In ACM SIGKDD International Conference on Knowledge Discovery and
Data Mining (pp. 195–203).Xie, X.-F., Feng, Y., Smith, S., & Head, K. L. (2014). Unified route choice framework
and empirical study in urban traffic control environment. In Transportation Research
Board Annual Meeting. Washington, DC.Xie, X.-F., Smith, S., & Barlow, G. (2012). Schedule-driven coordination for real-time traffic
network control. In International Conference on Automated Planning and Scheduling
(pp. 323–331). Sao Paulo.Xie, X.-F., Smith, S., & Barlow, G. (2014). Smart and Scalable Urban Signal Networks:
Methods and Systems for Adaptive Traffic Signal Control (U.S. Patent Pending, Ap-plication No. 14/308,238).
Xie, X.-F., Smith, S., Lu, L., & Barlow, G. (2012). Schedule-driven intersection control.Transportation Research Part C , 24 , 168-189. doi: 10.1016/j.trc.2012.03.004
17

Yang, F., Jin, P. J., Wan, X., Li, R., & Ran, B. (2014). Dynamic origin-destination traveldemand estimation using location based social networking data. In Transportation
Research Board Annual Meeting. Washington, DC.
18