Combined MYC and P53 Defects Emerge at Medulloblastoma Relapse and Define Rapidly Progressive,...
26
Cancer Cell Article Combined MYC and P53 Defects Emerge at Medulloblastoma Relapse and Define Rapidly Progressive, Therapeutically Targetable Disease Rebecca M. Hill, 1,15 Sanne Kuijper, 2,15 Janet C. Lindsey, 1,15 Kevin Petrie, 2,15 Ed C. Schwalbe, 1 Karen Barker, 2 Jessica K.R. Boult, 3 Daniel Williamson, 1 Zai Ahmad, 2 Albert Hallsworth, 2 Sarra L. Ryan, 1 Evon Poon, 2 Simon P. Robinson, 3 Ruth Ruddle, 2 Florence I. Raynaud, 2 Louise Howell, 2 Colin Kwok, 2 Abhijit Joshi, 4 Sarah Leigh Nicholson, 1 Stephen Crosier, 1 David W. Ellison, 5 Stephen B. Wharton, 6 Keith Robson, 7 Antony Michalski, 8 Darren Hargrave, 8 Thomas S. Jacques, 8,9 Barry Pizer, 10 Simon Bailey, 1 Fredrik J. Swartling, 11 William A. Weiss, 12,13,14 Louis Chesler, 2,16, * and Steven C. Clifford 1,16, * 1 Northern Institute for Cancer Research, Newcastle University, Newcastle upon Tyne NE1 4LP, UK 2 Division of Clinical Studies 3 Division of Radiotherapy and Imaging The Institute of Cancer Research, Sutton SM2 5NG, UK 4 Department of Cellular Pathology, Royal Victoria Infirmary, Newcastle upon Tyne NE1 4LP, UK 5 St. Jude Children’s Research Hospital, Memphis, TN 38105, USA 6 Sheffield Institute for Translational Neuroscience, University of Sheffield, Sheffield S10 2HQ, UK 7 Children’s Brain Tumour Research Centre, Queen’s Medical Centre, University of Nottingham, Nottingham NG7 2RD, UK 8 Great Ormond Street Hospital for Children NHS Foundation Trust, London WC1N 3JH, UK 9 Neural Development Unit, UCL Institute of Child Health, London WC1N 1EH, UK 10 Oncology Unit, Alder Hey Children’s Hospital, Liverpool L12 2AP, UK 11 Department of Immunology, Genetics and Pathology, Science for Life Laboratory, Rudbeck Laboratory, Uppsala University, Uppsala 751 85, Sweden 12 Department of Pediatrics, UCSF Benioff Children’s Hospital 13 Departments of Neurology and Neurological Surgery 14 Helen Diller Family Comprehensive Cancer Center University of California, San Francisco, San Francisco, CA 94158, USA 15 Co-first author 16 Co-senior author *Correspondence: [email protected] (L.C.), [email protected] (S.C.C.) http://dx.doi.org/10.1016/j.ccell.2014.11.002 This is an open access article under the CC BY license (http://creativecommons.org/licenses/by/3.0/). SUMMARY We undertook a comprehensive clinical and biological investigation of serial medulloblastoma biopsies obtained at diagnosis and relapse. Combined MYC family amplifications and P53 pathway defects commonly emerged at relapse, and all patients in this group died of rapidly progressive disease postrelapse. To study this interaction, we investigated a transgenic model of MYCN-driven medulloblastoma and found sponta- neous development of Trp53 inactivating mutations. Abrogation of p53 function in this model produced aggressive tumors that mimicked characteristics of relapsed human tumors with combined P53-MYC dysfunction. Restoration of p53 activity and genetic and therapeutic suppression of MYCN all reduced tumor growth and prolonged survival. Our findings identify P53-MYC interactions at medulloblastoma relapse as biomarkers of clinically aggressive disease that may be targeted therapeutically. Significance There are currently no effective therapies for children with relapsed medulloblastoma. Although clinical and biological features of the disease at diagnosis are increasingly well understood, biopsy is rarely performed at relapse, and few biolog- ical data are available to guide more effective treatments. Here, we show that medulloblastomas develop altered biology at relapse, which is predictive of disease course and cannot be detected at diagnosis. We have discovered the emergence of P53-MYC interactions at relapse, as biomarkers of clinically aggressive relapsed disease, which can be modeled and targeted therapeutically in genetically engineered mice. These data support the incorporation of biopsy at relapse into routine clinical practice, to direct palliative care and the development of improved treatment strategies. 72 Cancer Cell 27, 72–84, January 12, 2015 ª2015 The Authors
Transcript of Combined MYC and P53 Defects Emerge at Medulloblastoma Relapse and Define Rapidly Progressive,...

Cancer Cell
Article
Combined MYC and P53 Defects Emergeat Medulloblastoma Relapse and Define RapidlyProgressive, Therapeutically Targetable DiseaseRebecca M. Hill,1,15 Sanne Kuijper,2,15 Janet C. Lindsey,1,15 Kevin Petrie,2,15 Ed C. Schwalbe,1 Karen Barker,2
Jessica K.R. Boult,3 DanielWilliamson,1 Zai Ahmad,2 Albert Hallsworth,2 Sarra L. Ryan,1 Evon Poon,2 Simon P. Robinson,3
Ruth Ruddle,2 Florence I. Raynaud,2 Louise Howell,2 Colin Kwok,2 Abhijit Joshi,4 Sarah Leigh Nicholson,1
Stephen Crosier,1 David W. Ellison,5 Stephen B. Wharton,6 Keith Robson,7 Antony Michalski,8 Darren Hargrave,8
Thomas S. Jacques,8,9 Barry Pizer,10 Simon Bailey,1 Fredrik J. Swartling,11 William A. Weiss,12,13,14 Louis Chesler,2,16,*and Steven C. Clifford1,16,*1Northern Institute for Cancer Research, Newcastle University, Newcastle upon Tyne NE1 4LP, UK2Division of Clinical Studies3Division of Radiotherapy and Imaging
The Institute of Cancer Research, Sutton SM2 5NG, UK4Department of Cellular Pathology, Royal Victoria Infirmary, Newcastle upon Tyne NE1 4LP, UK5St. Jude Children’s Research Hospital, Memphis, TN 38105, USA6Sheffield Institute for Translational Neuroscience, University of Sheffield, Sheffield S10 2HQ, UK7Children’s Brain Tumour Research Centre, Queen’s Medical Centre, University of Nottingham, Nottingham NG7 2RD, UK8Great Ormond Street Hospital for Children NHS Foundation Trust, London WC1N 3JH, UK9Neural Development Unit, UCL Institute of Child Health, London WC1N 1EH, UK10Oncology Unit, Alder Hey Children’s Hospital, Liverpool L12 2AP, UK11Department of Immunology, Genetics and Pathology, Science for Life Laboratory, Rudbeck Laboratory, Uppsala University, Uppsala 751
85, Sweden12Department of Pediatrics, UCSF Benioff Children’s Hospital13Departments of Neurology and Neurological Surgery14Helen Diller Family Comprehensive Cancer Center
University of California, San Francisco, San Francisco, CA 94158, USA15Co-first author16Co-senior author
*Correspondence: [email protected] (L.C.), [email protected] (S.C.C.)
http://dx.doi.org/10.1016/j.ccell.2014.11.002This is an open access article under the CC BY license (http://creativecommons.org/licenses/by/3.0/).
SUMMARY
We undertook a comprehensive clinical and biological investigation of serial medulloblastoma biopsiesobtained at diagnosis and relapse. CombinedMYC family amplifications and P53 pathway defects commonlyemerged at relapse, and all patients in this group died of rapidly progressive disease postrelapse. To studythis interaction, we investigated a transgenic model of MYCN-driven medulloblastoma and found sponta-neous development of Trp53 inactivating mutations. Abrogation of p53 function in this model producedaggressive tumors that mimicked characteristics of relapsed human tumors with combined P53-MYCdysfunction. Restoration of p53 activity and genetic and therapeutic suppression of MYCN all reduced tumorgrowth and prolonged survival. Our findings identify P53-MYC interactions at medulloblastoma relapse asbiomarkers of clinically aggressive disease that may be targeted therapeutically.
Significance
There are currently no effective therapies for children with rfeatures of the disease at diagnosis are increasingly well underical data are available to guide more effective treatments. Hererelapse, which is predictive of disease course and cannot be dP53-MYC interactions at relapse, as biomarkers of clinicallytargeted therapeutically in genetically engineered mice. Thesroutine clinical practice, to direct palliative care and the devel
72 Cancer Cell 27, 72–84, January 12, 2015 ª2015 The Authors
elapsed medulloblastoma. Although clinical and biologicalstood, biopsy is rarely performed at relapse, and few biolog-, we show that medulloblastomas develop altered biology atetected at diagnosis. We have discovered the emergence ofaggressive relapsed disease, which can be modeled ande data support the incorporation of biopsy at relapse intoopment of improved treatment strategies.
Cancer Cell
MYC-P53 Interactions at Medulloblastoma Relapse
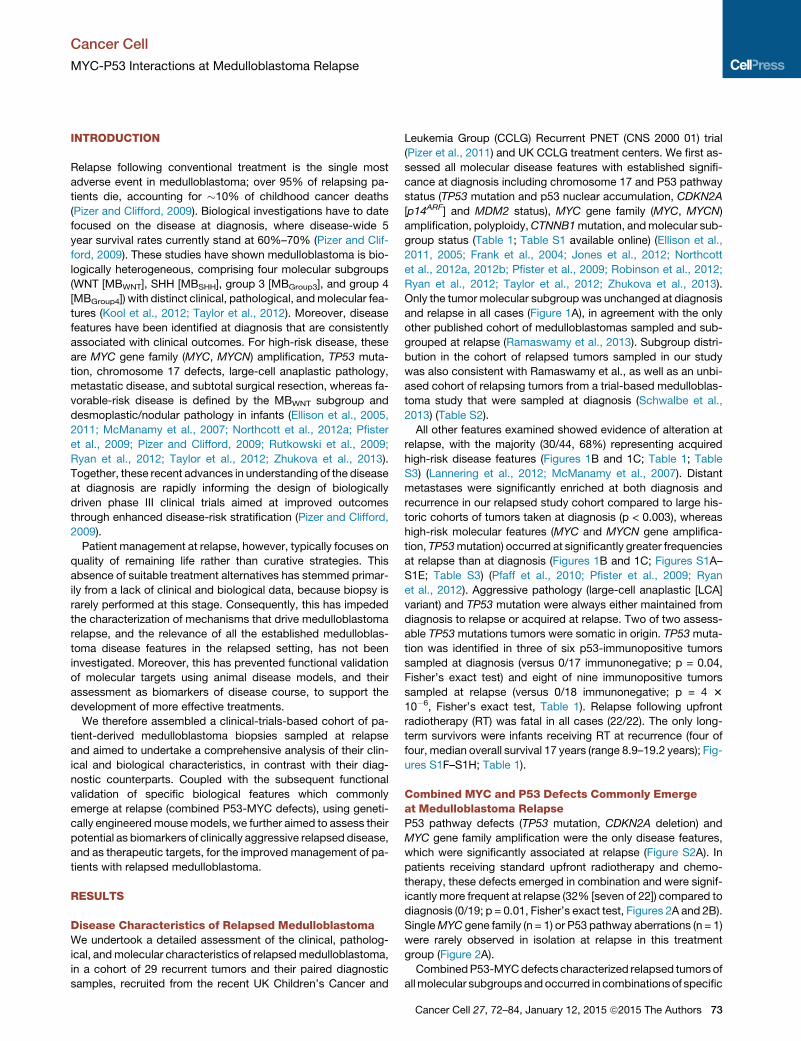
INTRODUCTION
Relapse following conventional treatment is the single most
adverse event in medulloblastoma; over 95% of relapsing pa-
tients die, accounting for �10% of childhood cancer deaths
(Pizer and Clifford, 2009). Biological investigations have to date
focused on the disease at diagnosis, where disease-wide 5
year survival rates currently stand at 60%–70% (Pizer and Clif-
ford, 2009). These studies have shown medulloblastoma is bio-
logically heterogeneous, comprising four molecular subgroups
(WNT [MBWNT], SHH [MBSHH], group 3 [MBGroup3], and group 4
[MBGroup4]) with distinct clinical, pathological, andmolecular fea-
tures (Kool et al., 2012; Taylor et al., 2012). Moreover, disease
features have been identified at diagnosis that are consistently
associated with clinical outcomes. For high-risk disease, these
are MYC gene family (MYC, MYCN) amplification, TP53 muta-
tion, chromosome 17 defects, large-cell anaplastic pathology,
metastatic disease, and subtotal surgical resection, whereas fa-
vorable-risk disease is defined by the MBWNT subgroup and
desmoplastic/nodular pathology in infants (Ellison et al., 2005,
2011; McManamy et al., 2007; Northcott et al., 2012a; Pfister
et al., 2009; Pizer and Clifford, 2009; Rutkowski et al., 2009;
Ryan et al., 2012; Taylor et al., 2012; Zhukova et al., 2013).
Together, these recent advances in understanding of the disease
at diagnosis are rapidly informing the design of biologically
driven phase III clinical trials aimed at improved outcomes
through enhanced disease-risk stratification (Pizer and Clifford,
2009).
Patient management at relapse, however, typically focuses on
quality of remaining life rather than curative strategies. This
absence of suitable treatment alternatives has stemmed primar-
ily from a lack of clinical and biological data, because biopsy is
rarely performed at this stage. Consequently, this has impeded
the characterization of mechanisms that drive medulloblastoma
relapse, and the relevance of all the established medulloblas-
toma disease features in the relapsed setting, has not been
investigated. Moreover, this has prevented functional validation
of molecular targets using animal disease models, and their
assessment as biomarkers of disease course, to support the
development of more effective treatments.
We therefore assembled a clinical-trials-based cohort of pa-
tient-derived medulloblastoma biopsies sampled at relapse
and aimed to undertake a comprehensive analysis of their clin-
ical and biological characteristics, in contrast with their diag-
nostic counterparts. Coupled with the subsequent functional
validation of specific biological features which commonly
emerge at relapse (combined P53-MYC defects), using geneti-
cally engineeredmousemodels, we further aimed to assess their
potential as biomarkers of clinically aggressive relapsed disease,
and as therapeutic targets, for the improved management of pa-
tients with relapsed medulloblastoma.
RESULTS
Disease Characteristics of Relapsed MedulloblastomaWe undertook a detailed assessment of the clinical, patholog-
ical, andmolecular characteristics of relapsedmedulloblastoma,
in a cohort of 29 recurrent tumors and their paired diagnostic
samples, recruited from the recent UK Children’s Cancer and
Leukemia Group (CCLG) Recurrent PNET (CNS 2000 01) trial
(Pizer et al., 2011) and UK CCLG treatment centers. We first as-
sessed all molecular disease features with established signifi-
cance at diagnosis including chromosome 17 and P53 pathway
status (TP53 mutation and p53 nuclear accumulation, CDKN2A
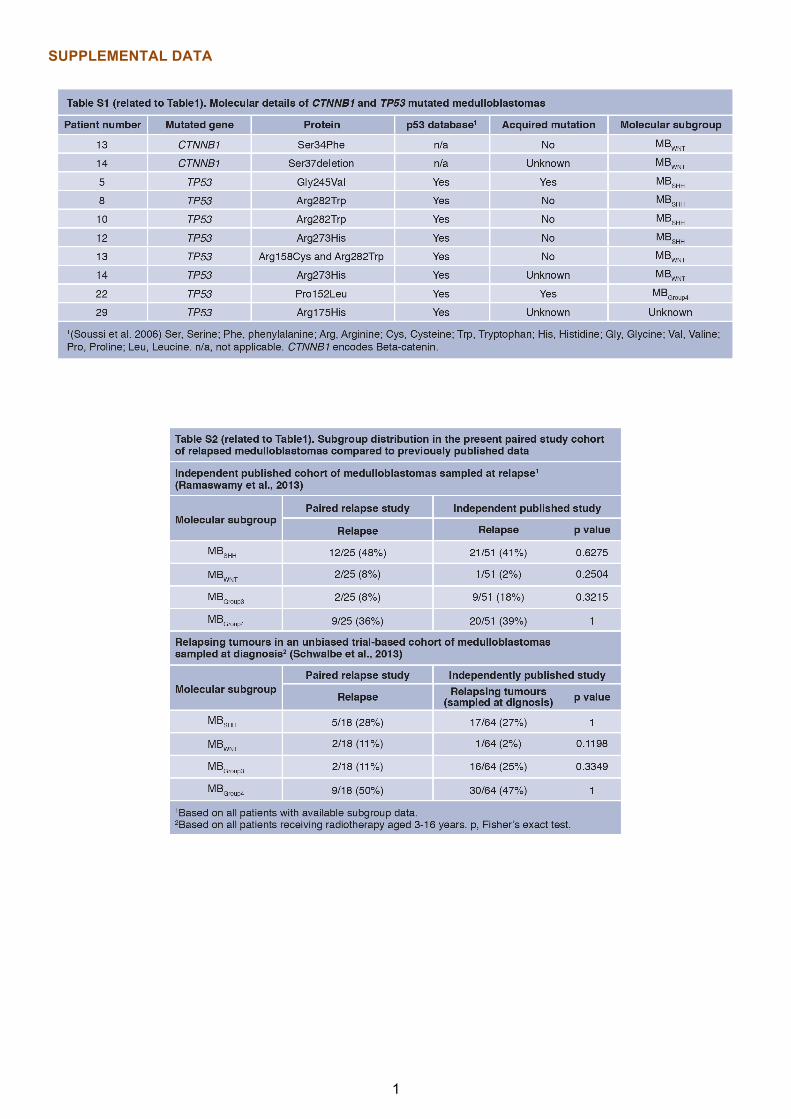
[p14ARF] and MDM2 status), MYC gene family (MYC, MYCN)
amplification, polyploidy,CTNNB1mutation, andmolecular sub-
group status (Table 1; Table S1 available online) (Ellison et al.,
2011, 2005; Frank et al., 2004; Jones et al., 2012; Northcott
et al., 2012a, 2012b; Pfister et al., 2009; Robinson et al., 2012;
Ryan et al., 2012; Taylor et al., 2012; Zhukova et al., 2013).
Only the tumor molecular subgroupwas unchanged at diagnosis
and relapse in all cases (Figure 1A), in agreement with the only
other published cohort of medulloblastomas sampled and sub-
grouped at relapse (Ramaswamy et al., 2013). Subgroup distri-
bution in the cohort of relapsed tumors sampled in our study
was also consistent with Ramaswamy et al., as well as an unbi-
ased cohort of relapsing tumors from a trial-based medulloblas-
toma study that were sampled at diagnosis (Schwalbe et al.,
2013) (Table S2).
All other features examined showed evidence of alteration at
relapse, with the majority (30/44, 68%) representing acquired
high-risk disease features (Figures 1B and 1C; Table 1; Table
S3) (Lannering et al., 2012; McManamy et al., 2007). Distant
metastases were significantly enriched at both diagnosis and
recurrence in our relapsed study cohort compared to large his-
toric cohorts of tumors taken at diagnosis (p < 0.003), whereas
high-risk molecular features (MYC and MYCN gene amplifica-
tion, TP53mutation) occurred at significantly greater frequencies
at relapse than at diagnosis (Figures 1B and 1C; Figures S1A–
S1E; Table S3) (Pfaff et al., 2010; Pfister et al., 2009; Ryan
et al., 2012). Aggressive pathology (large-cell anaplastic [LCA]
variant) and TP53 mutation were always either maintained from
diagnosis to relapse or acquired at relapse. Two of two assess-
able TP53mutations tumors were somatic in origin. TP53muta-
tion was identified in three of six p53-immunopositive tumors
sampled at diagnosis (versus 0/17 immunonegative; p = 0.04,
Fisher’s exact test) and eight of nine immunopositive tumors
sampled at relapse (versus 0/18 immunonegative; p = 4 3
10�6, Fisher’s exact test, Table 1). Relapse following upfront
radiotherapy (RT) was fatal in all cases (22/22). The only long-
term survivors were infants receiving RT at recurrence (four of
four, median overall survival 17 years (range 8.9–19.2 years); Fig-
ures S1F–S1H; Table 1).
Combined MYC and P53 Defects Commonly Emergeat Medulloblastoma RelapseP53 pathway defects (TP53 mutation, CDKN2A deletion) and
MYC gene family amplification were the only disease features,
which were significantly associated at relapse (Figure S2A). In
patients receiving standard upfront radiotherapy and chemo-
therapy, these defects emerged in combination and were signif-
icantly more frequent at relapse (32% [seven of 22]) compared to
diagnosis (0/19; p = 0.01, Fisher’s exact test, Figures 2A and 2B).
SingleMYC gene family (n = 1) or P53 pathway aberrations (n = 1)
were rarely observed in isolation at relapse in this treatment
group (Figure 2A).
CombinedP53-MYCdefects characterized relapsed tumorsof
allmolecular subgroups andoccurred in combinations of specific
Cancer Cell 27, 72–84, January 12, 2015 ª2015 The Authors 73
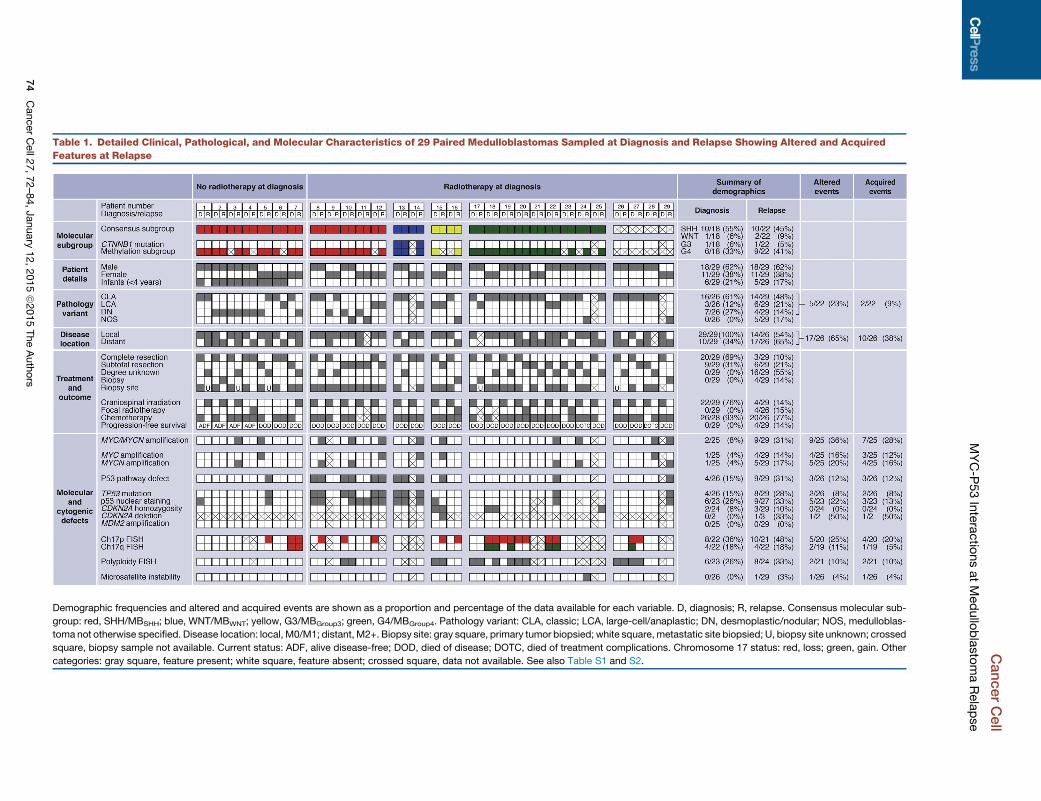
Table 1. Detailed Clinical, Pathological, and Molecular Characteristics of 29 Paired Medulloblastomas Sampled at Diagnosis and Relapse Showing Altered and Acquired
Features at Relapse
Demographic frequencies and altered and acquired events are shown as a proportion and percentage of the data available for each variable. D, diagnosis; R, relapse. Consensus molecular sub-
group: red, SHH/MBSHH; blue, WNT/MBWNT; yellow, G3/MBGroup3; green, G4/MBGroup4. Pathology variant: CLA, classic; LCA, large-cell/anaplastic; DN, desmoplastic/nodular; NOS, medulloblas-
toma not otherwise specified. Disease location: local, M0/M1; distant, M2+. Biopsy site: gray square, primary tumor biopsied; white square, metastatic site biopsied; U, biopsy site unknown; crossed
square, biopsy sample not available. Current status: ADF, alive disease-free; DOD, died of disease; DOTC, died of treatment complications. Chromosome 17 status: red, loss; green, gain. Other
categories: gray square, feature present; white square, feature absent; crossed square, data not available. See also Table S1 and S2.
CancerCell
MYC-P
53Interactio
nsatMedullo
blastomaRelapse
74
CancerCell27,72–84,January
12,2015ª2015TheAuthors
Cancer Cell
MYC-P53 Interactions at Medulloblastoma Relapse
defects that are not observed at diagnosis. Only combined TP53
mutation/MYCN amplification in MBSHH have previously been
observed at diagnosis (�6% of MBSHH) (Zhukova et al., 2013).
Direct comparison with the incidence of P53-MYC defects in
our own large cohort (n = 344) of uniformly characterized primary
medulloblastomas, sampled and subgrouped at diagnosis,
showed significant enrichment of these combined defects in
relapsedMBSHH subgroup tumors following treatment with stan-
dard chemotherapy and radiotherapy (60% [three of five] versus
12% [eight of 65] at diagnosis [p = 0.0250, Figure 2B]). Equivalent
trends were observed for the instances of combined P53-MYC
alterations detected in relapsed MBWNT and MBGroup3 tumors
(one of two tumors in both groups); these defects were not
observed in any tumor sampled at diagnosis (0/48 [p = 0.0400]
and 0/124 [p = 0.0159], respectively, Figure 2B). Combined de-
fects observed at relapse in MBGroup4 following conventional
therapy were apparently less frequent than in MBSHH (one of
nine versus three of five; p=0.095, Fisher’s exact test).Moreover,
combinations of specific P53-MYC defects were uniquely
observed at relapse and were not observed at diagnosis in our
large control cohorts, or in previously reported studies (Pfaff
et al., 2010) (e.g., CDKN2A deletion and MYC amplification in a
relapsed MBGroup3 tumor; TP53mutation andMYC amplification
in a relapsedMBSHH tumor; TP53mutation andMYCN amplifica-
tion in a relapsed MBGroup4 tumor; TP53 mutation and MYC
amplification in a relapsed MBWNT tumor).
P53 pathway and MYC gene family defects combined at
relapse, both through maintenance of defects from diagnosis
(P53 pathway) and/or the emergence at relapse (P53 pathway,
MYC gene family) of one or both events (Figure 2C). Assess-
ments of intratumoral molecular heterogeneity by single-cell
iFISH and deep sequencing supported both de novo acquisition
and clonal enrichment as mechanisms of defect emergence at
relapse and demonstrated the occurrence of both defects in
the same cell (Figure S2B).
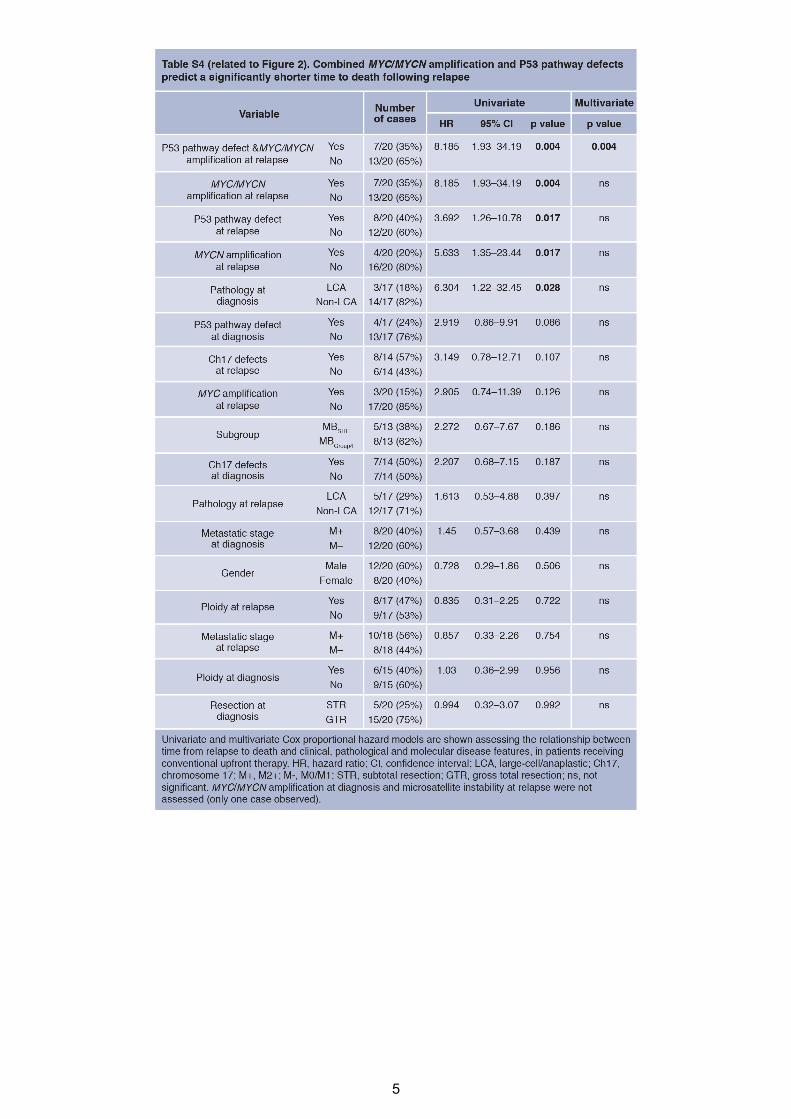
P53-MYC Interactions Characterize Locally AggressiveRelapsed DiseaseImportantly, the co-occurrence of P53 pathway andMYC gene
family defects at relapse defined a population of patients with
clinically aggressive tumors in which time to relapse was equiv-
alent to that of other patients, but time to death (TTD) was signif-
icantly more rapid postrecurrence (Figure 2D; Table S4). These
combined P53-MYCdefects were themost significant indepen-
dent predictor of TTD in multivariate survival analysis, which
included tumor molecular subgroup. This group of patients all
died quickly within 9 months following relapse (0.57 years
[0.33–0.72 years range] median time to death post-relapse,
versus 1.22 years for other tumors [0.02–2.9 years]; p =
0.0165).Moreover,MYC-P53 andMYCN-P53 defects remained
significantly associated with TTD when considered in isolation
against patients without combined defects (p = 0.0183 and
0.0039, respectively, log rank test).
Relapsed tumors with P53-MYC defects were significantly
associated with adverse LCA pathology (Ellison et al., 2011;
McManamy et al., 2007) (four of five assessable tumors, 80%,
p = 0.0099, Fisher’s exact test), but most did not have distant
metastases (five of seven, 71%), suggesting locally aggressive
disease (Figure 2E). Moreover, these tumors could not be distin-
guished by their clinical and pathological features and require bi-
opsy and staging at themolecular level. In summary, our findings
demonstrate that the emergence of combined MYC gene family
amplification and P53 pathway defects is a common event at
relapse following standard upfront therapy, associated with an
aggressive clinical course, and can occur in tumors from all mo-
lecular disease subgroups and in specific combinations of ge-
netic events that are not observed at diagnosis. Such patients
could potentially be targeted using biomarker-driven, individual-
ized therapeutic approaches.
Trp53 and MYCN Interact Directly in MedulloblastomaDevelopmentThese clinical observations and previous modeling of medullo-
blastoma in mice suggested that aberrant activation of the
MYC gene family synergizes with inactivation of p53 or Rb in
the genesis of biologically aggressive medulloblastoma (Kawau-
chi et al., 2012; Pei et al., 2012; Shakhova et al., 2006). The hy-
pothesis that MYC or MYCN specifically interacts with p53 loss
of functionwasestablished in recent studies inwhichTrp53-inac-
tivated murine cerebellar stem or progenitor cells were trans-
formed by forced overexpression of exogenous Myc or Mycn,
driving formationof aggressive tumors resemblinghumanmedul-
loblastoma following transplantation into the cerebellum (Kawau-
chi et al., 2012; Pei et al., 2012). To investigate whether the P53-
MYC interaction could be directly responsible for the genesis of
spontaneous tumorswithin anative anatomic anddevelopmental
context, we examined Trp53 status using a transgenic MYCN-
driven mouse model (GTML; Glt1-tTA/TRE-MYCN-Luc) (Swar-
tling et al., 2010). Selection of this experimental system was of
particular interest given that GTML is a native transgenic model
of medulloblastoma driven by fully reversible expression of
MYCN, allowing direct assessment of its role in spontaneous
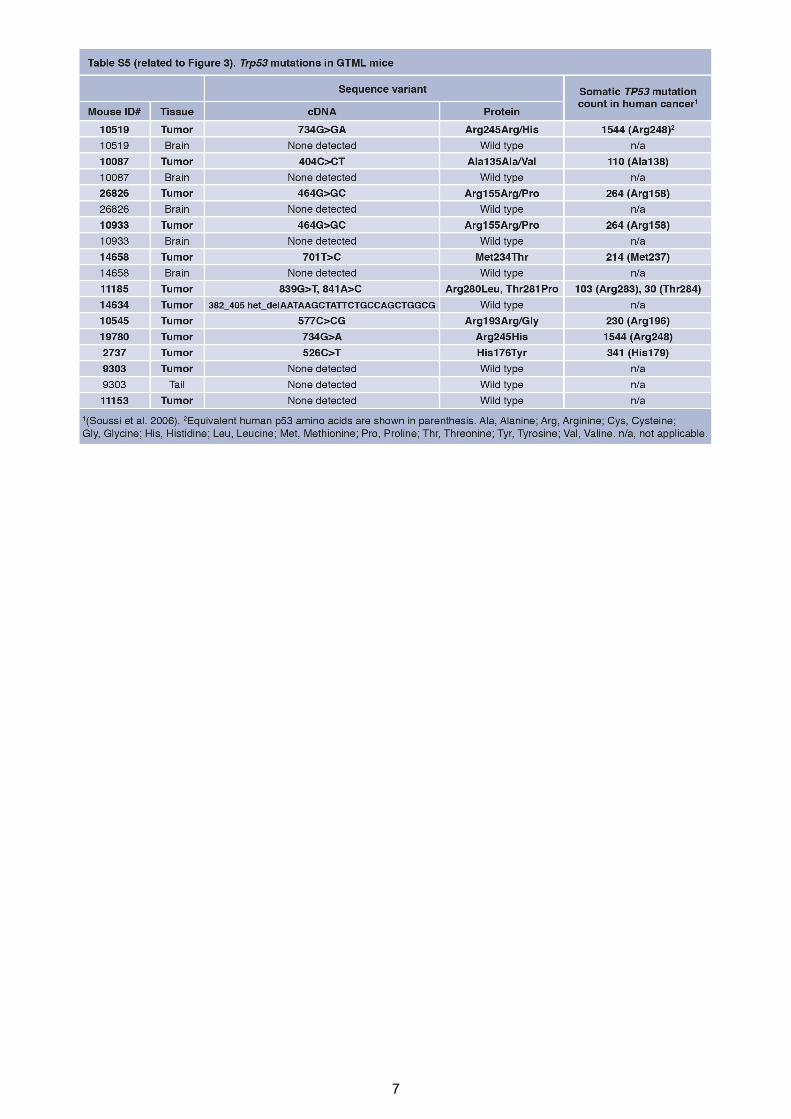
tumor development. Somatic Trp53 DNA-binding domain muta-
tions were found in 83% of tumors examined (ten of 12) (Fig-
ureS3A; Table S5).We next tested directlywhether tumor growth
was dependent on both p53 and MYCN by generating GTML
mice deficient in functional p53, using a mouse model in which
the endogenous Trp53 gene is replaced with a knockin allele
(Trp53KI) encoding a 4-hydroxytamoxifen (4-OHT)-regulatable
p53ERTAM fusion protein (Christophorou et al., 2005). Mice
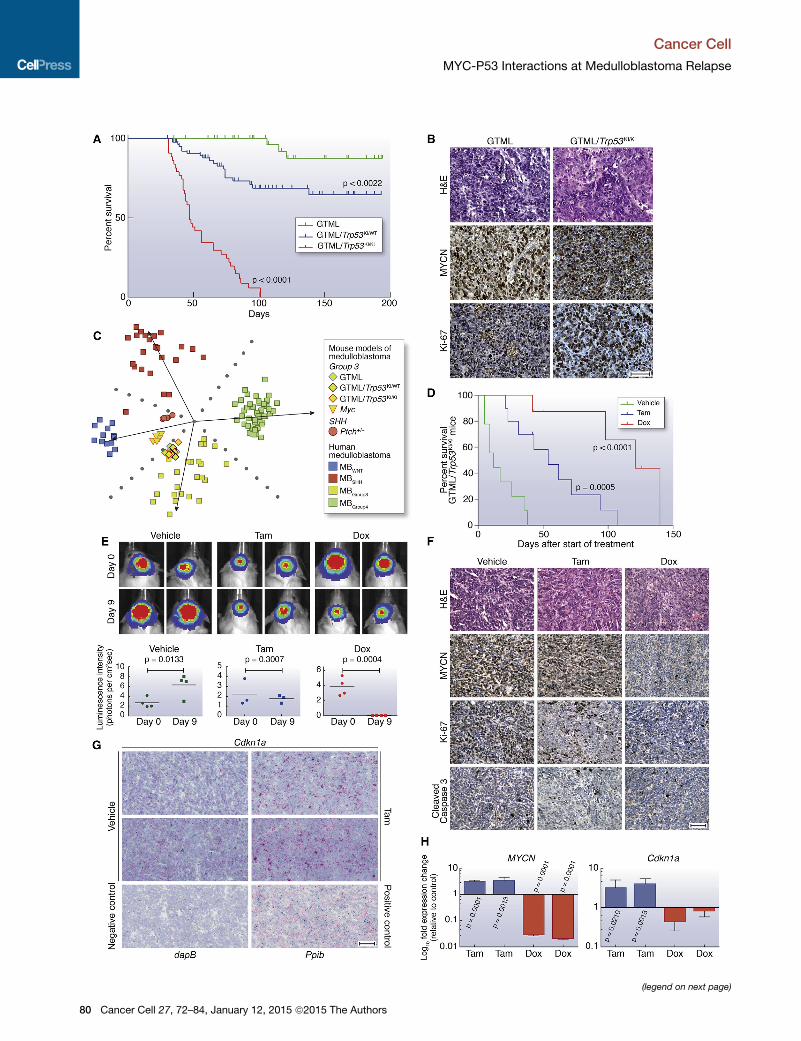
completely deficient for p53 (GTML/Trp53KI/KI) developed tu-
mors with dramatically increased penetrance and significantly
decreased overall survival (100%, 43/43 versus 6%, three of
50 in GTML, p < 0.0001, Figure 3A). Medulloblastomas from
GTML/Trp53KI/WT andGTML/Trp53KI/KI mice uniformly displayed
aggressive clinical and pathological features (high mitotic index,
LCA pathology) equivalent to that of tumors in GTML mice with
spontaneous Trp53 mutations (Figure 3B). Moreover, tumors of
all three genotypes were representative of the locally aggressive
disease features (i.e., nonmetastatic, LCA) of themajority of P53-
MYC-associated relapsed human tumors (Figures 2E, 3B, and
S3B) anddisplayed gene expression profiles characteristic of hu-
man MBGroup3 (Figures 3C and S3C).
MYCN-Driven Murine Tumor Maintenance Is Dependenton p53 and MYCN StatusBoth p53 loss of function and expression of MYCN were
required for maintenance of GTML/Trp53KI/KI tumors. Addition
Cancer Cell 27, 72–84, January 12, 2015 ª2015 The Authors 75
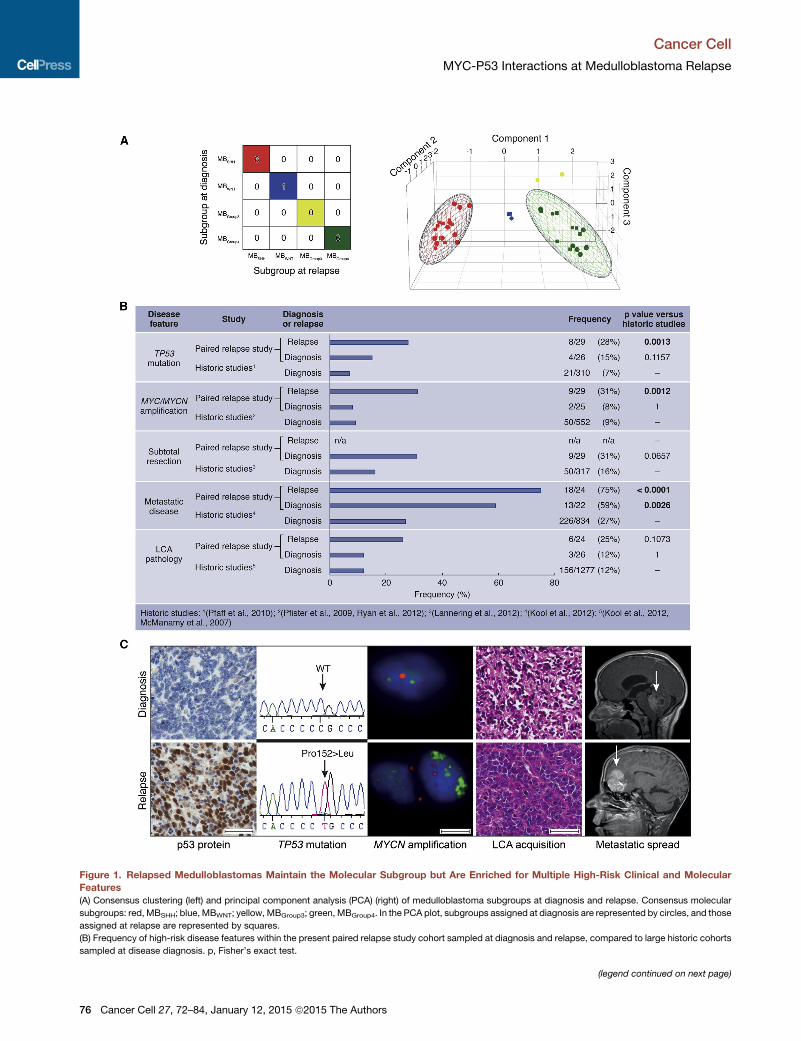
Figure 1. Relapsed Medulloblastomas Maintain the Molecular Subgroup but Are Enriched for Multiple High-Risk Clinical and Molecular
Features
(A) Consensus clustering (left) and principal component analysis (PCA) (right) of medulloblastoma subgroups at diagnosis and relapse. Consensus molecular
subgroups: red, MBSHH; blue, MBWNT; yellow, MBGroup3; green, MBGroup4. In the PCA plot, subgroups assigned at diagnosis are represented by circles, and those
assigned at relapse are represented by squares.
(B) Frequency of high-risk disease features within the present paired relapse study cohort sampled at diagnosis and relapse, compared to large historic cohorts
sampled at disease diagnosis. p, Fisher’s exact test.
(legend continued on next page)
Cancer Cell
MYC-P53 Interactions at Medulloblastoma Relapse
76 Cancer Cell 27, 72–84, January 12, 2015 ª2015 The Authors
Cancer Cell
MYC-P53 Interactions at Medulloblastoma Relapse
of either tamoxifen (Tam), which is metabolized to 4-OHT in
the liver leading to reactivation of p53, or Dox (suppression of
MYCN expression) resulted in loss of clonogenic capacity and
reduced growth in GTML/Trp53KI/KI medulloblastoma-derived
neurospheres, associated with loss ofMYCN expression and in-
duction of p53 target genes, respectively (Figures S3D–S3F).
In vivo, administration of either drug led to increased survival
in GTML/Trp53KI/KI mice, relating to inhibition of tumor growth
(Tam) or induction of tumor regression (Dox) (Figures 3D and
3E). Treatment with either Dox or Tam led to dramatic tumor-
specific reductions in the Ki-67 cellular proliferation marker,
Dox-specific loss of MYCN expression, or Tam-specific induc-
tion of the p53 target Cdkn1a (Figures 3F–3H; Figure S3G).
Together, these findings validate the critical dependency
of MYCN-driven murine tumor growth on TP53 defects. The
continued dependency on this interaction for tumor mainte-
nance offers the potential for therapeutic intervention in
relapsed human medulloblastomas.
Therapeutic Targeting with Aurora-A Kinase InhibitorsWe recently showed that small molecules that target the kinase
domain of Aurora-A, a MYCN-binding protein and gatekeeper of
MYCN oncoprotein stability, can induce regression and differen-
tiation of MYCN-driven neuroblastoma (Brockmann et al., 2013),
highlighting the clinical feasibility of targeting MYCN using this
class of inhibitor. In vitro treatment of GTML/Trp53KI/KI medullo-
blastoma-derived neurospheres with the Aurora-A kinase inhib-
itor MLN8237 (Alisertib) destabilized MYCN via disruption of the
Aurora-A/MYCN complex and caused growth inhibition compa-
rable to doxycycline-mediated genetic suppression of MYCN
expression (Figure 4A; Figures S4A–S4C). Consistent with their
relationship to human MBGroup3, GTML/Trp53KI/KI tumors lack
sonic hedgehog (SHH) signaling as evidenced by absence of
Gli1 expression (Figure S4D). Thus, treatment with the SHH
antagonist GDC-0449 (Vismodegib), which specifically targets
medulloblastoma of granule cell origin driven by SHH expres-
sion, had no effect on MYCN and failed to reduce clonogenic
capacity or growth of GTML/Trp53KI/KI-derived medulloblas-
toma neurospheres (Figures S4A, S4B, and S4E). Moreover,
MLN8237 but not GDC-0449 significantly prolonged survival in
medulloblastoma-bearing GTML/Trp53KI/KI mice (Figure 4B).
Treatment with MLN8237 completely inhibited tumor growth as
measured by MRI (Figure 4C). In vivo compound measurement
revealed both MLN8237 and GDC-0449 achieved blood-brain
barrier penetration (Figure S4F). MLN8237 treatment led to an
increase in phosphorylated histone H3 (indicative of an accumu-
lation inG2 andmitosis due to Aurora-A inhibition) aswell as spe-
cific reductions in both MYCN and Ki-67, but not an increase in
cleaved caspase-3 (Figures 4D and 4E). Together, these results
demonstrate the target-dependent activity of MLN8237 against
GTML/Trp53KI/KI medulloblastomas and suggest clinical benefit
in treating relapsed P53-MYCmedulloblastoma with agents that
target aberrant expression of MYCN.
(C) Acquisition of molecular and clinical disease features between diagnosis (top) a
accumulation; TP53 homozygous missense mutation (Pro152Leu); interphase fl
versus centromeric control (red); H&E showing LCA acquisition and magnetic res
Scale bars, 50 mM (immunohistochemistry, H&E) or 5 mM (iFISH).
See also Figure S1 and Table S3.
DISCUSSION
Patients with medulloblastoma who relapse following upfront
radiotherapy rarely survive, irrespective of therapy received
postrecurrence (Pizer et al., 2011). Importantly, here we show
that, whereas tumor subgroup did not change, clinical, patho-
logical, and other molecular disease features were commonly
altered at relapse. The emergence of combined P53-MYC
gene family defects at relapse following standard upfront
therapy is a common feature that occurs across disease sub-
groups, involves specific combinations of events not observed
at diagnosis, and is associated with rapid progression to
death. The validation of these combined mutations as thera-
peutically targetable molecular drivers of tumorigenesis in
genetically engineered mice demonstrates the development
of effective therapies for relapsed medulloblastoma will require
strategies tailored to the unique molecular features of these
tumors.
This study shows GTML/Trp53KI/KI mice to be an important
model for understanding and targeting P53-MYC family interac-
tions inmedulloblastoma. Our preclinical investigations targeting
Aurora-A kinase inhibition with MLN8237 in GTML/Trp53KI/KI
mice, together with recent research describing CD532 (an
Aurora-A inhibitor structurally distinct from MLN8237) (Gustaf-
son et al., 2014), demonstrate proof-of-principle for indirect
therapeutic targeting of MYCN in medulloblastoma and its
advancement to the clinic. Establishment of their wider rele-
vance to medulloblastoma at diagnosis, alongside other MYC/
MYCN amplified and overexpressing malignancies, is para-
mount. Furthermore, the essential role of loss of functional p53
in GTML/Trp53KI/KI tumor growth suggests additional opportu-
nities for intervention with emerging therapeutics that reactivate
wild-type P53 by inhibiting the P53-MDM2 interaction (Carol
et al., 2013; Chene, 2003; Van Maerken et al., 2014).
Our continuously collected and centrally reviewed trials-based
cohort of 29 relapsed medulloblastomas is both representative
of other reported relapse cohorts and reflective of the expected
subgroup distribution of tumors at relapse (Table S2). Its investi-
gation has enabled a comprehensive characterization of the
clinical, pathological, and biological features of relapsed medul-
loblastoma and important discoveries with immediate implica-
tions for future clinical and research strategies. Although
subgroup stability at relapse supports the use of diagnostic bi-
opsy to define subgroup-directed therapies at relapse (e.g.,
SHH pathway inhibitors) (Rudin et al., 2009), we now understand
that medulloblastomas display unique and emergent biology at
relapse, which cannot be predicted at diagnosis. The identifica-
tion of critical biomarkers such as P53-MYC defects in relapsed
tumors will allow us, in the short term, to adapt palliative strate-
gies tailoring therapy to predicted disease course and quality of
remaining life. Looking to the future, the discovery of additional
clinically relevant biomarkers will inform the further development
and stratified use of targeted therapies. We particularly note
nd relapse (bottom). Left to right: immunohistochemical analysis of p53 protein
uorescence in situ hybridization (iFISH) showing MYCN amplification (green
onance imaging (MRI) showing metastatic spread (arrows indicate tumor site).
Cancer Cell 27, 72–84, January 12, 2015 ª2015 The Authors 77
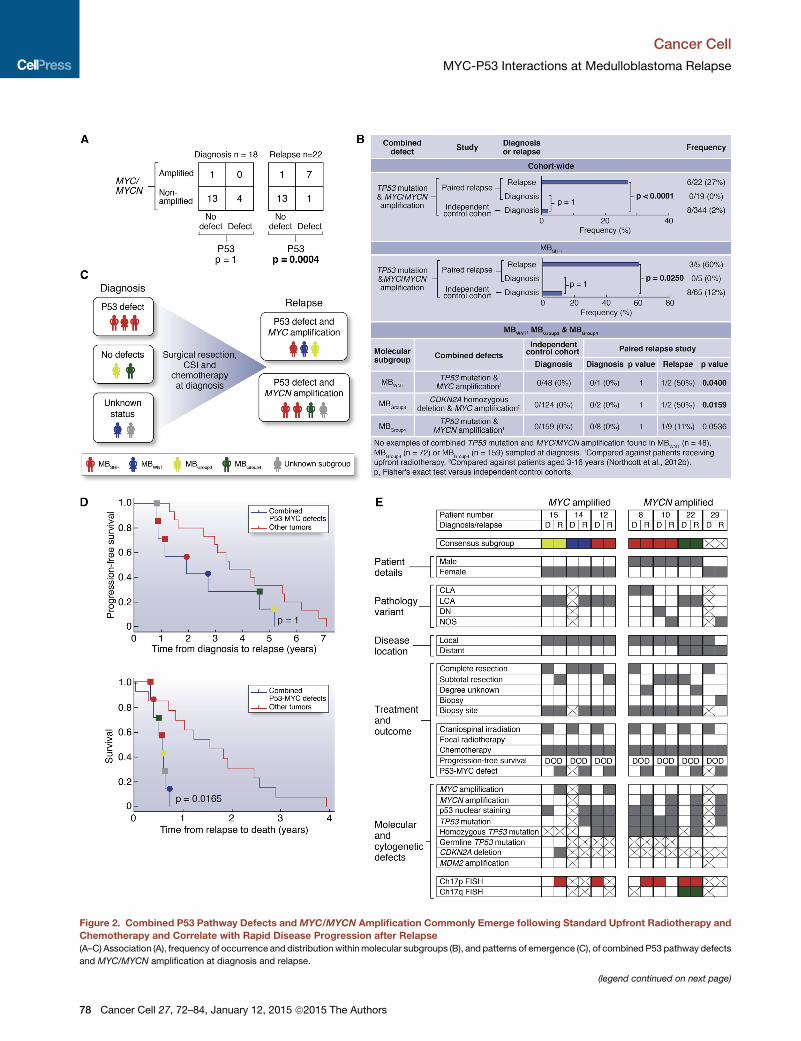
Figure 2. Combined P53 Pathway Defects and MYC/MYCN Amplification Commonly Emerge following Standard Upfront Radiotherapy and
Chemotherapy and Correlate with Rapid Disease Progression after Relapse
(A–C) Association (A), frequency of occurrence and distribution withinmolecular subgroups (B), and patterns of emergence (C), of combined P53 pathway defects
and MYC/MYCN amplification at diagnosis and relapse.
(legend continued on next page)
Cancer Cell
MYC-P53 Interactions at Medulloblastoma Relapse
78 Cancer Cell 27, 72–84, January 12, 2015 ª2015 The Authors

Cancer Cell
MYC-P53 Interactions at Medulloblastoma Relapse
MBGroup3 tumors are less commonly sampled at medulloblas-
toma relapse (this study; Ramaswamy et al., 2013), likely re-
flecting their associated early, disseminated pattern of relapse
(Ramaswamy et al., 2013) and a clinical decision not to biopsy.
The routine sampling of relapsed medulloblastoma is therefore
now essential to expand our findings, inform comprehensive bio-
logical investigations across all clinical and molecular disease
demographics, and direct clinical management and future ther-
apeutic advances aimed at improved outcomes for children
with relapsed medulloblastoma.
EXPERIMENTAL PROCEDURES
Tumor Material and Clinical Data
Clinical data and tumor tissue were obtained for 29 patients from UK CCLG
institutions and collaborating centers (Table 1), encompassing patients
enrolled on the Recurrent PNET (CNS 2000 01) trial (Pizer et al., 2011). The
median age at diagnosis was 8.6 years (range 0.1–33.7 years), and median
age of recurrence was 10.7 years (range 2.4–36.3 years) with a median time
to relapse of 2.6 years (range 0.5–7.1 years). Within the cohort, six of 29
(21%) children at diagnosis were infants (<4 years old). Metastatic stage
was determined according to Chang’s criteria and pathology was centrally re-
viewed by a panel of neuropathologists from UK Children’s Cancer and Leu-
kemia Group (CCLG) according to current WHO criteria (Chang et al., 1969;
Louis et al., 2007). Clinical data were collated and centrally reviewed.
Genomic DNA was extracted using standard methods, and validation of
paired sample identity was performed using a panel of microsatellite markers
(see below). Human tumor samples were provided by the UK CCLG as part
of CCLG-approved biological study BS-2007-04; informed consent was ob-
tained from all subjects. Human tumor investigations were conducted with
approval from Newcastle/North Tyneside Research Ethics Committee (study
reference 07/Q0905/71).
Selection and Assessment of Critical Medulloblastoma Molecular
Features
Established medulloblastoma molecular features, with validated relationships
to disease molecular pathology and prognosis, were assessed. These
comprised (1) the four consensus medulloblastoma molecular subgroups
associated with distinct molecular events, clinicopathological features, and
prognosis (Taylor et al., 2012); (2)MYC andMYCN amplification (predominant
in MBGroup3 and MBSHH/Group4, respectively), and associated with poor
outcome (Ellison et al., 2011; Northcott et al., 2012a; Pfister et al., 2009; Pizer
and Clifford, 2009; Ryan et al., 2012); (3) TP53, one of the most frequently
mutated genes in medulloblastoma, associated with MBWNT/SHH, and reduced
survival rates in the MBSHH subgroup (Northcott et al., 2012a; Zhukova et al.,
2013); (4) additional defects of the P53 pathway (CDKN2A deletion/methyl-
ation, MDM2 amplification, and p53 nuclear accumulation) linked to poor
outcome in other pediatric embryonal tumors including relapsed neuroblas-
toma (Carr-Wilkinson et al., 2010; Frank et al., 2004); (5) CTNNB1 mutation,
associated with MBWNT (Taylor et al., 2012); (6) polyploidy, associated with
genomic instability, MBGroup3/MBGroup4 and poor prognosis (Jones et al.,
2012; Northcott et al., 2012a); and (7) defects of chromosome 17, including
the most common medulloblastoma cytogenetic abnormalities (i.e., gains of
17q, isochromosome 17q [i{17q}], and loss of 17p; Ellison et al., 2011; Pfister
et al., 2009; Taylor et al., 2012), associated with MBGroup3/MBGroup4 and poor
survival (Pfister et al., 2009; Shih et al., 2014).
(D) Survival of patients with tumors harboring combined P53-MYC gene family d
relapse to death (bottom). Circle, P53-MYC; square, P53-MYCN. p, log rank tes
(E) Detailed clinical, pathological, and molecular demographics of patients with
Consensus molecular subgroup (red, MBSHH; blue, MBWNT; yellow, MBGroup3; gre
nodular/desmoplastic; NOS, medulloblastoma not otherwise specified. Disease
biopsied; white square,metastatic site biopsied; crossed square, biopsy sample n
loss; green, gain. Other categories: gray square, feature present; white square, f
See also Figure S2 and Table S4.
Molecular Subgroup Status
All samples, where DNA was of sufficient quantity and quality as assessed by
PicoGreen dsDNA quantitation assay (Life Technologies), were processed on
the 450K methylation array (Illumina). Subgrouping according to methylation
status was achieved using established methods (Hovestadt et al., 2013;
Schwalbe et al., 2013). Consensus nonnegative matrix factorization (NMF)
clustering of a 225 member primary medulloblastoma training cohort was
used to define four methylation-dependent disease subgroups by identifying
subgroup-specific metagenes. A support vector machine (SVM) classifier to
assign subgroup for additional diagnostic and relapsed medulloblastoma
samples, based on their projected metagene profiles (Tamayo et al., 2007),
was developed using previously published methods (Schwalbe et al., 2013).
Confidence of the classifier call made for these samples was assessed by
repeated sampling of 80% of the training cohort to rederive the classifier.
Mutational analysis of CTNNB1 (Table S1) (Taylor et al., 2012) was performed
as previously described (Ellison et al., 2005, 2011) (see Supplemental Experi-
mental Procedures).
Copy-Number Analysis in Clinical Samples
Copy-number estimates were carried out using iFISH, microsatellite typing, or
multiplex ligation-dependent probe amplification (MLPA) using SALSA re-
agents (MRC-Holland). Copy-number assessment by iFISH of MYC (8q24.21
probes), MYCN (2p24.3 probes), and chromosome 17 imbalances (17p13.3
and 17q12 probes) versus respective centromeric reference loci was per-
formed on available material as previously described (Lamont et al., 2004;
Langdon et al., 2006; Nicholson et al., 2000). One hundred nonoverlapping
nuclei were scored by two independent assessors, and amplification was
defined as previously reported (Ryan et al., 2012).
Copy-number assessment by MLPA of MYC, MYCN, and MDM2 were
measured relative to four independent reference loci (B2M, TBP, 7q31, and
14q22). Normal diploid control samples were used to define cutoffs for the
detection of elevated copy numbers (>95% confidence interval of the normal
distribution). Tumor samples showing reproducibly elevated copy numbers (in
multiple replicates and versus three or more reference loci) were deemed to
have copy-number elevation. Samples with evidence of raised copy number
by MLPA were validated by iFISH on available material against a panel of
normal copy-number tumor controls.
Copy-number analysis of CDKN2A (p14ARF) was performed using
polymorphic microsatellite markers for chromosome 9p21 (d9s942 and
d9s1748) as previously reported (Randerson-Moor et al., 2001). Copy-
number status of three cases homozygous for both polymorphic microsatel-
lite markers, suggestive of chromosomal deletion at the CDKN2A locus
(Berggren et al., 2003), was further assessed by 450K methylation array
(Sturm et al., 2012) (n = 2) or the Illumina Human Omniexpress array (Illumina
(n = 1). Methylation of CDKN2A was also assessed by 450K methylation
array.
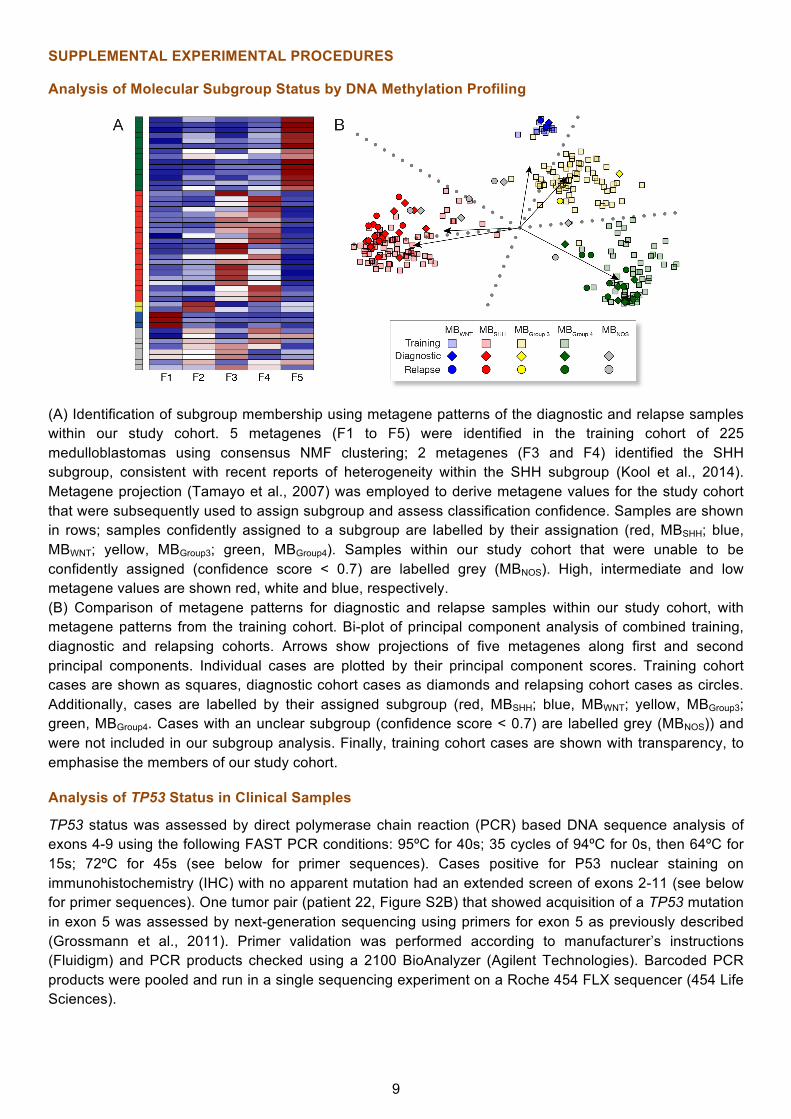
Analysis of TP53 Status in Clinical Samples
Immunohistochemistry (IHC) in human samples for p53 immunopositivity, pre-
viously associated with TP53 mutation (Pfaff et al., 2010; Tabori et al., 2010),
was performed on formalin-fixed, paraffin-embedded (FFPE) samples
(M7001, Dako) using the Menapath Polymer HRP Detection system (A. Menar-
ini Diagnostics). All samples were analyzed by a neuropathologist, blind to
mutation status, and by a nuclear stain algorithm (Spectrum, Aperio Technol-
ogies). TP53 mutation status was assessed by direct PCR-based DNA
sequence analysis, and one tumor pair was assessed by next-generation
sequencing (see Supplemental Experimental Procedures).
efects versus other tumors, showing time from diagnosis to relapse (top) and
t, Bonferroni corrected.
combined P53-MYC gene family defects at relapse. D, diagnosis; R, relapse.
en, MBGroup4). Pathology variant: CLA, classic; LCA, large-cell/anaplastic; DN,
location: local, M0/M1; distant, M2+. Biopsy site: gray square, primary tumor
ot available. Current status: DOD, died of disease. Chromosome 17 status: red,
eature absent; crossed square, data not available.
Cancer Cell 27, 72–84, January 12, 2015 ª2015 The Authors 79
(legend on next page)
Cancer Cell
MYC-P53 Interactions at Medulloblastoma Relapse
80 Cancer Cell 27, 72–84, January 12, 2015 ª2015 The Authors
Cancer Cell
MYC-P53 Interactions at Medulloblastoma Relapse
Statistical Analysis of Clinical Samples
Chi-square and Fisher’s exact tests were used to assess associations be-
tween clinicopathological andmolecular features, and p valueswere corrected
for multiple testing using the Bonferroni procedure (Abdi, 2007). The log rank
test was used to assess all univariate survival markers. Cox proportional haz-
ards models were used to investigate the significance of variables for event-
free survival (EFS), overall survival (OS), and time to death (TTD) analyses in
(1) univariate and (2) multivariate models using forward likelihood-ratio testing.
In Vivo Studies
All experimental protocols were monitored and approved by The Institute of
Cancer Research Animal Welfare and Ethical Review Body, in compliance
with guidelines specified by the UK Home Office Animals (Scientific Proce-
dures) Act 1986 and the United Kingdom National Cancer Research Institute
guidelines for the welfare of animals in cancer research (Workman et al.,
2010). GTML mice have been described previously (Swartling et al., 2010).
The Trp53KI/KI mice were kindly provided by G.I. Evan (Christophorou et al.,
2005) and crossed with GTML animals into a background of the FVB/NJ inbred
strain (Taketo et al., 1991). To image for bioluminescence expression, animals
were injected with 75 mg/kg D-luciferin in saline (PerkinElmer) prior to imaging
in the IVIS Lumina (PerkinElmer) using Living Image Software. Transgenic
GTML/Trp53KI/KI animals with bioluminescence signals higher than 1.5 3
10�9 photons/seconds (20–30 days of life) were randomized to treatment
groups and treated with 30 mg/kg MLN8237 (Alisertib, Millennium) or
50 mg/kg GDC-0449 (Vismodegib, LC Laboratories). MLN8237, GDC-0449,
and the respective vehicles were dosed orally on a daily basis. Doxycycline
was given via chow at 1,250 mg/kg diet to provide a daily dose of approxi-
mately 160 mg/kg. Restoration of wild-type p53 was achieved by administra-
tion of either 1 mg of tamoxifen dissolved in 100 ml peanut oil carrier daily by
intraperitoneal injection or via chow at 400 mg/kg diet to provide a daily
dose of approximately 64 mg/kg. Animals were monitored twice a week for
bioluminescence signal and were sacrificed upon detection of a signal higher
than 9 3 10�9 photons/second or overt signs of intracranial expansion asso-
ciated with tumor growth. Mice were allowed access to food and water ad
libitum.
In Vivo Imaging
Multislice 1HMRI was performed on a 7T horizontal bore microimaging system
(Bruker Instruments) using a 3 cm birdcage coil and a 2.5 3 2.5 cm field of
view. Anesthesia was induced with a 10 ml/kg intraperitoneal injection of fen-
tanyl citrate (0.315mg/ml) plus fluanisone (10mg/ml, Hypnorm, Janssen Phar-
maceutical), midazolam (5 mg/ml, Hypnovel, Roche), and sterile water (1:1:2).
Core body temperaturewasmaintained bywarm air blown through themagnet
bore. Magnetic-field homogeneity was optimized by shimming over the entire
brain using an automated shimming routine (FASTmap). T2-weighted images
acquired using a rapid acquisition with refocused echoes (RARE) sequence
(12 contiguous 1 mm sagittal slices or 20 contiguous 1 mm axial slices,
256 3 256 matrix, four averages, echo times [TE] = 36 and 132 ms, repetition
Figure 3. Aberrant Expression of MYCN in Combination with p53 Loss o
(A) Kaplan-Meier survival curves for GTML/Trp53KI/KI (n = 43), GTML/Trp53KI/WT
(B) H&E and immunohistochemical staining indicating levels of MYCN protein an
(C) Subgroup classification ofmouse expression profiles using a support vector m
matrix factorization for cross-species projection.
(D) Kaplan-Meier survival for GTML/Trp53KI/KI mice treated with doxycycline (Dox,
rank test.
(E) GTML/Trp53KI/KI mice coexpressing firefly luciferase (FLuc) were treated with
mice after 9 days treatment with Dox or Tam as indicated (top). Luminescence inte
p, unpaired t test.
(F) H&E and immunohistochemical staining indicating levels of MYCN, Ki-67, or a
or Tam.
(G) RNAscope 2-plex chromogenic assay. Cdkn1a expression (red) was analyzed
control as indicated. Samples were costained for expression of theUbc (ubiquitin
Cyclophilin B) (red) and Polr2a (DNA-directed RNA polymerase II subunit RPB1) (g
reductase gene from B. subtilis was used as a negative control. Sections were c
(H) Fold difference of human MYCN or mouse Cdkn1a mRNA levels in tumor tiss
Scale bars, 50 mm. Error bars represent mean ± SD. See also Figure S3 and Tab
time [TR] = 4.5 s, RARE factor = 8) were used for localization of the tumor and
measurement of tumor volume.
Neurosphere Isolation and Culture
Tissue isolated from GTML/Trp53KI/KI tumors was transferred into cold HBSS,
cut into 2–3mm2 pieces and dissociated before trituration in medium and filtra-
tion through 70 mmmesh. To generate neurospheres, cells were cultured under
self-renewal conditions in DMEM/F12 medium (Life Technologies) supple-
mented with 2% B27 supplement (Life Technologies), 20 ng/ml epidermal
growth factor (Sigma-Aldrich), and 20 ng/ml fibroblast growth factor (Life Tech-
nologies). For in vitro analyses, cells were treated with the following drug
concentrations: 100 nM 4-OHT (Sigma-Aldrich), 1 mg/ml doxycycline (Sigma-
Aldrich), 100 nM MLN8237, and 500 nM GDC-0449. Neurosphere formation
was assessed by performing limiting dilutions from 1,000 to 60 cells and imag-
ing using a Celigo S Imaging Cell Cytometer (Brooks Life Science Systems).
Western Blot Analysis and IHC
Westernblot analysisofmouse tissuesandneurosphereswasperformedaspre-
viously described (Brockmann et al., 2013; Chesler et al., 2006). For IHC of
mouse tissues, samples were fixed in 4%paraformaldehyde in phosphate buff-
ered saline for at least 24 hr, decalcified with 0.3 M EDTA, and processed using
a Leica ASP300S tissue processor. Sections were cut at 4 mM for hematoxylin
and eosin staining (H&E) staining and immunohistochemistry as previously
described (Chesler et al., 2006). Antibodies used were MYCN (OP-13, Merck-
Millipore), Ki-67 (556003, BD Biosciences), GFAP (Z0334, DAKO), Cleaved
Caspase3 (9664,CellSignalingTechnology),Synaptophysin (180130,LifeTech-
nologies), Phospo-S10-Histone H3 (9706, Cell Signaling), phospho-AurkABC
(2914, Cell Signaling), AurkA (4718, Cell Signaling), Sonic Hedgehog (ab73958,
Abcam), Gli-1 (2534, Cell Signaling), and GAPDH (2118, Cell Signaling).
ACCESSION NUMBERS
The Gene Expression Omnibus (GEO) accession number for 450K DNA
methylation array profiles used for the determination of human medulloblas-
toma molecular subgroup status is GSE62618. The GEO accession number
for microarray expression profiles of mouse medulloblastomas is GSE62625.
The GEO SuperSeries accession number for this study is GSE62626.
SUPPLEMENTAL INFORMATION
Supplemental Information includes Supplemental Experimental Procedures,
four figures, and five tables and can be found with this article online at
http://dx.doi.org/10.1016/j.ccell.2014.11.002.
AUTHOR CONTRIBUTIONS
L.C. and S.C.C. conceived the study. S.L.N. and S.C. collected and processed
human tissue cohorts. D.H., B.P., D.W.E., and A.M. provided human tumor
f Function Drives Highly Penetrant and Aggressive Medulloblastoma
(n = 83), or GTML transgenic mice (n = 50) mice as indicated. p, log rank test.
d cell proliferation (Ki-67) in GTML/Trp53KI/KI and GTML transgenic mice.
achine trained on humanmedulloblastoma expression profiles and nonnegative
n = 8) or tamoxifen (Tam, n = 10) compared to vehicle (n = 9) as indicated. p, log
Tam, Dox, or vehicle for 9 days. Bioluminescent imaging of GTML/Trp53KI/KI
nsity at days 0 and 9 are shown (bottom). Data points represent individual mice.
poptosis (cleaved caspase 3) in GTML/Trp53KI/KI mice after treatment with Dox
on brain sections fromGTML/Trp53KI/KI mice treated with either Tam or vehicle
C) housekeeping gene (green). Expression of Ppib (Peptidylprolyl Isomerase B,
reen) were used as positive controls. Expression of dapB (dihydrodipicolinate)
ounterstained with Gill’s hematoxylin.
ues treated with either Dox or Tam. (p, unpaired t test.)
le S5.
Cancer Cell 27, 72–84, January 12, 2015 ª2015 The Authors 81
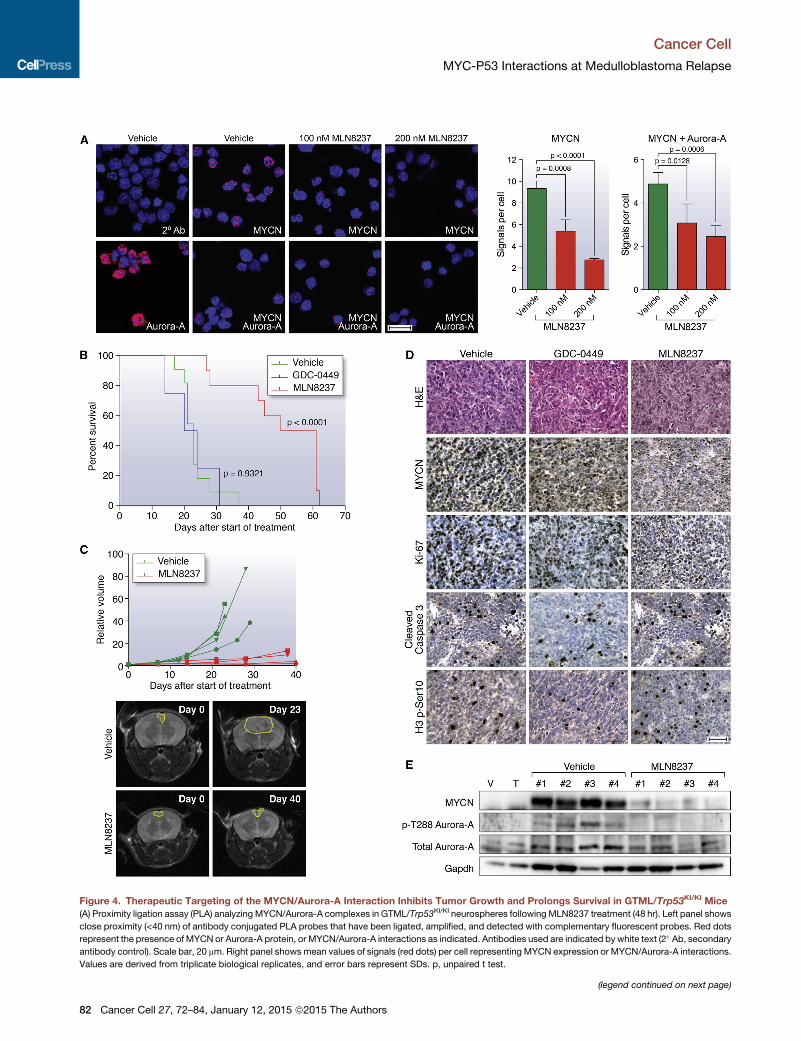
Figure 4. Therapeutic Targeting of the MYCN/Aurora-A Interaction Inhibits Tumor Growth and Prolongs Survival in GTML/Trp53KI/KI Mice
(A) Proximity ligation assay (PLA) analyzing MYCN/Aurora-A complexes in GTML/Trp53KI/KI neurospheres following MLN8237 treatment (48 hr). Left panel shows
close proximity (<40 nm) of antibody conjugated PLA probes that have been ligated, amplified, and detected with complementary fluorescent probes. Red dots
represent the presence ofMYCN or Aurora-A protein, or MYCN/Aurora-A interactions as indicated. Antibodies used are indicated by white text (2� Ab, secondaryantibody control). Scale bar, 20 mm. Right panel showsmean values of signals (red dots) per cell representing MYCN expression or MYCN/Aurora-A interactions.
Values are derived from triplicate biological replicates, and error bars represent SDs. p, unpaired t test.
(legend continued on next page)
Cancer Cell
MYC-P53 Interactions at Medulloblastoma Relapse
82 Cancer Cell 27, 72–84, January 12, 2015 ª2015 The Authors
Cancer Cell
MYC-P53 Interactions at Medulloblastoma Relapse
samples. S.B., S.C.C., and R.M.H. collected and centrally reviewed clinical
data. R.M.H., J.C.L., and S.C.C. designed experiments on human tumor co-
horts, which were carried out by R.M.H., J.C.L., and S.L.R. E.C.S. planned
and executed human 450K methylation array analysis. R.M.H., J.C.L.,
E.C.S., and S.C.C. planned and carried out all other analyses of human tumor
data. T.S.J., K.R., and S.B.W. performed central pathology review of human
tumors. A.J. performed p53 immunohistochemistry analysis. S.K., K.P.,
F.J.S., W.A.W., and L.C. planned mouse experiments, which were carried
out by S.K. and A.H. MRI of tumors was planned by J.K.R.B. and S.P.R. and
carried out by J.K.R.B. In vivo compound measurement was planned by
R.R. and F.I.R. and carried out by R.R. S.K., K.P., and L.C. planned experi-
ments to characterize tumor biology and response to therapeutics, which
were executed by S.K., K.B., Z.A., E.P., L.H., and C.K.; S.K., K.P., and L.C.
analyzed these data. D.W. planned and executed gene expression analysis
of mouse tumors. Histopathological analysis of mouse tumors was performed
by T.S.J. K.P., R.M.H., L.C., and S.C.C. wrote the manuscript.
ACKNOWLEDGMENTS
This study was supported by grants from Cancer Research UK (grants
C34648/A12054, C8464/A13457, and C1060/A10334), Action Medical
Research (RTF1414), Sparks (09NCL02), The Brain Tumour Charity (grants
SDR004X and 16/164), the JGW Patterson Foundation, and Christopher’s
Smile (CXC002H) and was undertaken as part of the INSTINCT network, co-
funded by The Brain Tumour Charity, Great Ormond Street Children’s Charity,
and Children with Cancer UK (grant 16/193). T.S.J. is supported by the Na-
tional Institute for Health Research and a Great Ormond Street Hospital UCL
Biomedical Research Centre award. F.I.R. and R.R. are employees of the Insti-
tute of Cancer Research and are involved in the development of aurora kinase
inhibitors.
Received: April 25, 2014
Revised: September 2, 2014
Accepted: November 5, 2014
Published: December 18, 2014
REFERENCES
Abdi, H. (2007). Bonferroni and Sidak corrections for multiple comparisons. In
Encyclopedia of Measurement and Statistics, N.J. Salkind, ed. (Thousand
Oaks, CA: Sage).
Berggren, P., Kumar, R., Sakano, S., Hemminki, L., Wada, T., Steineck, G.,
Adolfsson, J., Larsson, P., Norming, U., Wijkstrom, H., and Hemminki, K.
(2003). Detecting homozygous deletions in the CDKN2A(p16(INK4a))/
ARF(p14(ARF)) gene in urinary bladder cancer using real-time quantitative
PCR. Clin. Cancer Res. 9, 235–242.
Brockmann, M., Poon, E., Berry, T., Carstensen, A., Deubzer, H.E., Rycak, L.,
Jamin, Y., Thway, K., Robinson, S.P., Roels, F., et al. (2013). Small molecule
inhibitors of aurora-a induce proteasomal degradation of N-myc in childhood
neuroblastoma. Cancer Cell 24, 75–89.
Carol, H., Reynolds, C.P., Kang, M.H., Keir, S.T., Maris, J.M., Gorlick, R., Kolb,
E.A., Billups, C.A., Geier, B., Kurmasheva, R.T., et al. (2013). Initial testing of
the MDM2 inhibitor RG7112 by the Pediatric Preclinical Testing Program.
Pediatr. Blood Cancer 60, 633–641.
Carr-Wilkinson, J., O’Toole, K., Wood, K.M., Challen, C.C., Baker, A.G., Board,
J.R., Evans, L., Cole, M., Cheung, N.K., Boos, J., et al. (2010). High Frequency
(B) Kaplan-Meier survival for GTML/Trp53KI/KI mice treated with MLN8237 (n = 10
test.)
(C) Longitudinal MRI analysis of tumor volume (n = 4) on the axial plane (top). Rep
vehicle as indicated at day 0 and last day of treatment (bottom).
(D) H&E and immunohistochemical staining indicating levels of MYCN protein,
measured by phosphorylated Ser10 on histone H3 (H3 p-S10) after treatment wi
(E) Immunoblotting of MYCN protein levels, and total and phosphorylated Thr288
(E), animals were treated with vehicle, GDC-0449, or MLN8237 for 48 hr, and sa
Error bars represent mean ± SD. See also Figure S4.
of p53/MDM2/p14ARF Pathway Abnormalities in Relapsed Neuroblastoma.
Clin. Cancer Res. 16, 1108–1118.
Chang, C.H., Housepian, E.M., and Herbert, C., Jr. (1969). An operative stag-
ing system and a megavoltage radiotherapeutic technic for cerebellar medul-
loblastomas. Radiology 93, 1351–1359.
Chene, P. (2003). Inhibiting the p53-MDM2 interaction: an important target for
cancer therapy. Nat. Rev. Cancer 3, 102–109.
Chesler, L., Schlieve, C., Goldenberg, D.D., Kenney, A., Kim, G., McMillan, A.,
Matthay, K.K., Rowitch, D., and Weiss, W.A. (2006). Inhibition of phosphatidy-
linositol 3-kinase destabilizes Mycn protein and blocks malignant progression
in neuroblastoma. Cancer Res. 66, 8139–8146.
Christophorou, M.A., Martin-Zanca, D., Soucek, L., Lawlor, E.R., Brown-
Swigart, L., Verschuren, E.W., and Evan, G.I. (2005). Temporal dissection of
p53 function in vitro and in vivo. Nat. Genet. 37, 718–726.
Ellison, D.W., Onilude, O.E., Lindsey, J.C., Lusher, M.E., Weston, C.L., Taylor,
R.E., Pearson, A.D., and Clifford, S.C. (2005). beta-Catenin status predicts a
favorable outcome in childhood medulloblastoma: the United Kingdom
Children’s Cancer Study Group Brain Tumour Committee. J. Clin. Oncol. 23,
7951–7957.
Ellison, D.W., Kocak, M., Dalton, J., Megahed, H., Lusher, M.E., Ryan, S.L.,
Zhao, W., Nicholson, S.L., Taylor, R.E., Bailey, S., and Clifford, S.C. (2011).
Definition of disease-risk stratification groups in childhood medulloblastoma
using combined clinical, pathologic, and molecular variables. J. Clin. Oncol.
29, 1400–1407.
Frank, A.J., Hernan, R., Hollander, A., Lindsey, J.C., Lusher, M.E., Fuller, C.E.,
Clifford, S.C., and Gilbertson, R.J. (2004). The TP53-ARF tumor suppressor
pathway is frequently disrupted in large/cell anaplastic medulloblastoma.
Brain Res. Mol. Brain Res. 121, 137–140.
Gustafson,W.C., Meyerowitz, J.G., Nekritz, E.A., Chen, J., Benes, C., Charron,
E., Simonds, E.F., Seeger, R., Matthay, K.K., Hertz, N.T., et al. (2014). Drugging
MYCN through an allosteric transition in Aurora kinase A. Cancer Cell 26,
414–427.
Hovestadt, V., Remke, M., Kool, M., Pietsch, T., Northcott, P.A., Fischer, R.,
Cavalli, F.M., Ramaswamy, V., Zapatka, M., Reifenberger, G., et al. (2013).
Robust molecular subgrouping and copy-number profiling of medulloblas-
toma from small amounts of archival tumour material using high-density
DNA methylation arrays. Acta Neuropathol. 125, 913–916.
Jones, D.T., Jager, N., Kool, M., Zichner, T., Hutter, B., Sultan, M., Cho, Y.J.,
Pugh, T.J., Hovestadt, V., Stutz, A.M., et al. (2012). Dissecting the genomic
complexity underlying medulloblastoma. Nature 488, 100–105.
Kawauchi, D., Robinson, G., Uziel, T., Gibson, P., Rehg, J., Gao, C.,
Finkelstein, D., Qu, C., Pounds, S., Ellison, D.W., et al. (2012). A mouse model
of the most aggressive subgroup of human medulloblastoma. Cancer Cell 21,
168–180.
Kool, M., Korshunov, A., Remke, M., Jones, D.T., Schlanstein, M., Northcott,
P.A., Cho, Y.J., Koster, J., Schouten-van Meeteren, A., van Vuurden, D.,
et al. (2012). Molecular subgroups of medulloblastoma: an international
meta-analysis of transcriptome, genetic aberrations, and clinical data of
WNT, SHH, Group 3, and Group 4 medulloblastomas. Acta Neuropathol.
123, 473–484.
Lamont, J.M., McManamy, C.S., Pearson, A.D., Clifford, S.C., and Ellison,
D.W. (2004). Combined histopathological andmolecular cytogenetic stratifica-
tion of medulloblastoma patients. Clin. Cancer Res. 10, 5482–5493.
), GDC-0449 SHH antagonist (n = 4), or vehicle (n = 11) as indicated. (p, log rank
resentative MRIs of the axial plane of MLN8237-treated animals compared to
cell proliferation (Ki-67), apoptosis (cleaved caspase 3), or mitotic activity as
th GDC-0449 or MLN8237. Scale bar, 50 mm.
on Aurora-A (p-T288 Aurora-A) in MLN8237-treated tumor tissues. For (D) and
mples were taken 2 hr after final administration of agent.
Cancer Cell 27, 72–84, January 12, 2015 ª2015 The Authors 83
Cancer Cell
MYC-P53 Interactions at Medulloblastoma Relapse
Langdon, J.A., Lamont, J.M., Scott, D.K., Dyer, S., Prebble, E., Bown, N.,
Grundy, R.G., Ellison, D.W., and Clifford, S.C. (2006). Combined genome-
wide allelotyping and copy number analysis identify frequent genetic losses
without copy number reduction in medulloblastoma. Genes Chromosomes
Cancer 45, 47–60.
Lannering, B., Rutkowski, S., Doz, F., Pizer, B., Gustafsson, G., Navajas, A.,
Massimino, M., Reddingius, R., Benesch, M., Carrie, C., et al. (2012).
Hyperfractionated versus conventional radiotherapy followed by chemo-
therapy in standard-risk medulloblastoma: results from the randomized multi-
center HIT-SIOP PNET 4 trial. J. Clin. Oncol. 30, 3187–3193.
Louis, D.N., Ohgaki, H., Wiestler, O.D., Cavenee, W.K., Burger, P.C., Jouvet,
A., Scheithauer, B.W., and Kleihues, P. (2007). The 2007 WHO classification
of tumours of the central nervous system. Acta Neuropathol. 114, 97–109.
McManamy, C.S., Pears, J., Weston, C.L., Hanzely, Z., Ironside, J.W., Taylor,
R.E., Grundy, R.G., Clifford, S.C., and Ellison, D.W. (2007). Nodule formation
and desmoplasia in medulloblastomas-defining the nodular/desmoplastic
variant and its biological behavior. Brain Pathol. 17, 151–164.
Nicholson, J., Wickramasinghe, C., Ross, F., Crolla, J., and Ellison, D. (2000).
Imbalances of chromosome 17 in medulloblastomas determined by compar-
ative genomic hybridisation and fluorescence in situ hybridisation. Mol.
Pathol. 53, 313–319.
Northcott, P.A., Jones, D.T., Kool, M., Robinson, G.W., Gilbertson, R.J., Cho,
Y.J., Pomeroy, S.L., Korshunov, A., Lichter, P., Taylor, M.D., and Pfister, S.M.
(2012a). Medulloblastomics: the end of the beginning. Nat. Rev. Cancer 12,
818–834.
Northcott, P.A., Shih, D.J., Peacock, J., Garzia, L., Morrissy, A.S., Zichner, T.,
Stutz, A.M., Korshunov, A., Reimand, J., Schumacher, S.E., et al. (2012b).
Subgroup-specific structural variation across 1,000 medulloblastoma ge-
nomes. Nature 488, 49–56.
Pei, Y., Moore, C.E., Wang, J., Tewari, A.K., Eroshkin, A., Cho, Y.J., Witt, H.,
Korshunov, A., Read, T.A., Sun, J.L., et al. (2012). An animal model of MYC-
driven medulloblastoma. Cancer Cell 21, 155–167.
Pfaff, E., Remke, M., Sturm, D., Benner, A., Witt, H., Milde, T., von Bueren,
A.O., Wittmann, A., Schottler, A., Jorch, N., et al. (2010). TP53 mutation is
frequently associated with CTNNB1 mutation or MYCN amplification and is
compatible with long-term survival in medulloblastoma. J. Clin. Oncol. 28,
5188–5196.
Pfister, S., Remke, M., Benner, A., Mendrzyk, F., Toedt, G., Felsberg, J.,
Wittmann, A., Devens, F., Gerber, N.U., Joos, S., et al. (2009). Outcome pre-
diction in pediatric medulloblastoma based on DNA copy-number aberrations
of chromosomes 6q and 17q and the MYC and MYCN loci. J. Clin. Oncol. 27,
1627–1636.
Pizer, B.L., and Clifford, S.C. (2009). The potential impact of tumour biology on
improved clinical practice for medulloblastoma: progress towards biologically
driven clinical trials. Br. J. Neurosurg. 23, 364–375.
Pizer, B., Donachie, P.H., Robinson, K., Taylor, R.E., Michalski, A., Punt, J.,
Ellison, D.W., and Picton, S. (2011). Treatment of recurrent central nervous
system primitive neuroectodermal tumours in children and adolescents: re-
sults of a Children’s Cancer and Leukaemia Group study. Eur. J. Cancer 47,
1389–1397.
Ramaswamy, V., Remke, M., Bouffet, E., Faria, C.C., Perreault, S., Cho, Y.J.,
Shih, D.J., Luu, B., Dubuc, A.M., Northcott, P.A., et al. (2013). Recurrence pat-
terns acrossmedulloblastoma subgroups: an integrated clinical andmolecular
analysis. Lancet Oncol. 14, 1200–1207.
Randerson-Moor, J.A., Harland, M., Williams, S., Cuthbert-Heavens, D.,
Sheridan, E., Aveyard, J., Sibley, K., Whitaker, L., Knowles, M., Bishop, J.N.,
and Bishop, D.T. (2001). A germline deletion of p14(ARF) but not CDKN2A in
a melanoma-neural system tumour syndrome family. Hum. Mol. Genet. 10,
55–62.
Robinson, G., Parker, M., Kranenburg, T.A., Lu, C., Chen, X., Ding, L., Phoenix,
T.N., Hedlund, E., Wei, L., Zhu, X., et al. (2012). Novel mutations target distinct
subgroups of medulloblastoma. Nature 488, 43–48.
84 Cancer Cell 27, 72–84, January 12, 2015 ª2015 The Authors
Rudin, C.M., Hann, C.L., Laterra, J., Yauch, R.L., Callahan, C.A., Fu, L.,
Holcomb, T., Stinson, J., Gould, S.E., Coleman, B., et al. (2009). Treatment
of medulloblastoma with hedgehog pathway inhibitor GDC-0449. N. Engl. J.
Med. 361, 1173–1178.
Rutkowski, S., Gerber, N.U., von Hoff, K., Gnekow, A., Bode, U., Graf, N.,
Berthold, F., Henze, G., Wolff, J.E., Warmuth-Metz, M., et al. (2009).
Treatment of early childhood medulloblastoma by postoperative chemo-
therapy and deferred radiotherapy. Neuro-oncol. 11, 201–210.
Ryan, S.L., Schwalbe, E.C., Cole, M., Lu, Y., Lusher, M.E., Megahed, H.,
O’Toole, K., Nicholson, S.L., Bognar, L., Garami, M., et al. (2012). MYC family
amplification and clinical risk-factors interact to predict an extremely poor
prognosis in childhood medulloblastoma. Acta Neuropathol. 123, 501–513.
Schwalbe, E.C., Williamson, D., Lindsey, J.C., Hamilton, D., Ryan, S.L.,
Megahed, H., Garami, M., Hauser, P., Dembowska-Baginska, B., Perek, D.,
et al. (2013). DNA methylation profiling of medulloblastoma allows robust sub-
classification and improved outcome prediction using formalin-fixed biopsies.
Acta Neuropathol. 125, 359–371.
Shakhova, O., Leung, C., van Montfort, E., Berns, A., and Marino, S. (2006).
Lack of Rb and p53 delays cerebellar development and predisposes to large
cell anaplastic medulloblastoma through amplification of N-Myc and Ptch2.
Cancer Res. 66, 5190–5200.
Shih, D.J., Northcott, P.A., Remke, M., Korshunov, A., Ramaswamy, V., Kool,
M., Luu, B., Yao, Y.,Wang, X., Dubuc, A.M., et al. (2014). Cytogenetic prognos-
tication within medulloblastoma subgroups. J. Clin. Oncol. 32, 886–896.
Sturm, D., Witt, H., Hovestadt, V., Khuong-Quang, D.A., Jones, D.T.,
Konermann, C., Pfaff, E., Tonjes, M., Sill, M., Bender, S., et al. (2012).
Hotspot mutations in H3F3A and IDH1 define distinct epigenetic and biological
subgroups of glioblastoma. Cancer Cell 22, 425–437.
Swartling, F.J., Grimmer, M.R., Hackett, C.S., Northcott, P.A., Fan, Q.W.,
Goldenberg, D.D., Lau, J., Masic, S., Nguyen, K., Yakovenko, S., et al.
(2010). Pleiotropic role for MYCN in medulloblastoma. Genes Dev. 24, 1059–
1072.
Tabori, U., Baskin, B., Shago, M., Alon, N., Taylor, M.D., Ray, P.N., Bouffet, E.,
Malkin, D., and Hawkins, C. (2010). Universal poor survival in children with me-
dulloblastoma harboring somatic TP53 mutations. J. Clin. Oncol. 28, 1345–
1350.
Taketo, M., Schroeder, A.C., Mobraaten, L.E., Gunning, K.B., Hanten, G., Fox,
R.R., Roderick, T.H., Stewart, C.L., Lilly, F., Hansen, C.T., et al. (1991). FVB/N:
an inbred mouse strain preferable for transgenic analyses. Proc. Natl. Acad.
Sci. USA 88, 2065–2069.
Tamayo, P., Scanfeld, D., Ebert, B.L., Gillette, M.A., Roberts, C.W., and
Mesirov, J.P. (2007). Metagene projection for cross-platform, cross-species
characterization of global transcriptional states. Proc. Natl. Acad. Sci. USA
104, 5959–5964.
Taylor, M.D., Northcott, P.A., Korshunov, A., Remke, M., Cho, Y.J., Clifford,
S.C., Eberhart, C.G., Parsons, D.W., Rutkowski, S., Gajjar, A., et al. (2012).
Molecular subgroups of medulloblastoma: the current consensus. Acta
Neuropathol. 123, 465–472.
VanMaerken, T., Rihani, A., VanGoethem, A., De Paepe, A., Speleman, F., and
Vandesompele, J. (2014). Pharmacologic activation of wild-type p53 by nutlin
therapy in childhood cancer. Cancer Lett. 344, 157–165.
Workman, P., Aboagye, E.O., Balkwill, F., Balmain, A., Bruder, G., Chaplin,
D.J., Double, J.A., Everitt, J., Farningham, D.A.H., Glennie, M.J., et al.;
Committee of the National Cancer Research Institute (2010). Guidelines for
the welfare and use of animals in cancer research. Br. J. Cancer 102, 1555–
1577.
Zhukova, N., Ramaswamy, V., Remke, M., Pfaff, E., Shih, D.J., Martin, D.C.,
Castelo-Branco, P., Baskin, B., Ray, P.N., Bouffet, E., et al. (2013).
Subgroup-specific prognostic implications of TP53 mutation in medulloblas-
toma. J. Clin. Oncol. 31, 2927–2935.

Cancer Cell, Volume 27
Supplemental Information
Combined MYC and P53 Defects Emerge
at Medulloblastoma Relapse and Define Rapidly
Progressive, Therapeutically Targetable Disease
Rebecca M. Hill, Sanne Kuijper, Janet C. Lindsey, Kevin Petrie, Ed C. Schwalbe, Karen Barker, Jessica K.R. Boult, Daniel Williamson, Zai Ahmad, Albert Hallsworth, Sarra L. Ryan, Evon Poon, Simon P. Robinson, Ruth Ruddle, Florence I. Raynaud, Louise Howell, Colin Kwok, Abhijit Joshi, Sarah Leigh Nicholson, Stephen Crosier, David W. Ellison, Stephen B. Wharton, Keith Robson, Antony Michalski, Darren Hargrave, Thomas S. Jacques, Barry Pizer, Simon Bailey, Fredrik J. Swartling, William A. Weiss, Louis Chesler, and Steven C. Clifford
1
SUPPLEMENTAL DATA

2
Figure S1 (related to Figure 1). Analysis of enrichment and acquisition of molecular defects at relapse and patient survival following medulloblastoma recurrence (A) Frequency as determined by iFISH of intra-tumoral MYCN copy number defects at diagnosis (D) and relapse (R). (B) Frequency as determined by iFISH of intra-tumoral MYC copy number defects at diagnosis (D) and relapse (R). (C) CDKN2A (p14ARF) homozygous deletion at relapse (Illumina Omni-express SNP array; CDKN2A position, red). (D) Evolution of chromosome 17 defects and polyploidy by iFISH. (top left) 17p loss (green versus centromeric control (red)), (bottom left) balanced 17q, (top right) maintenance of 17p loss with development of polyploidy, (bottom right) acquisition of polyploidy and 17q gain (overall i(17q)). Scale bar indicates 5 µM. (E) Acquisition of microsatellite instability at relapse (diagnosis; normal heterozygous profiles and relapse; multiple peaks demonstrating instability). (F) Survival status of 29 relapsed medulloblastoma patients by treatment received. Infant, < 4.0 years at diagnosis; RT, radiotherapy. 1Two patients died from treatment complications. (G) Unadjusted Cox proportional hazard models assessing the prognostic significance (overall survival) of clinico-pathological variables at diagnosis in relapsing patients. STR, subtotal resection; GTR, gross total resection; LCA, large-cell/anaplastic; M+, M2+ disease; M-, M0/M1. (H) Kaplan-Meier curve (whole cohort) showing survival of infant patients following recurrence (p, log-rank test, Bonferroni corrected).

3
4
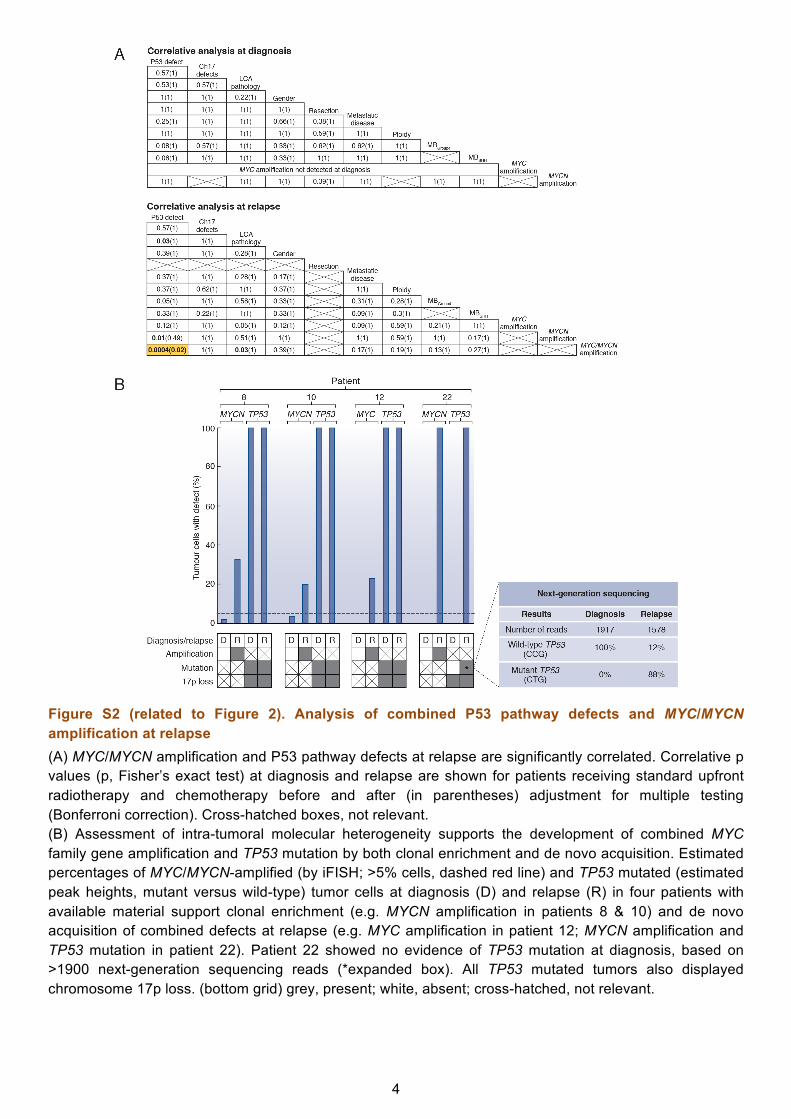
Figure S2 (related to Figure 2). Analysis of combined P53 pathway defects and MYC/MYCN amplification at relapse (A) MYC/MYCN amplification and P53 pathway defects at relapse are significantly correlated. Correlative p values (p, Fisher’s exact test) at diagnosis and relapse are shown for patients receiving standard upfront radiotherapy and chemotherapy before and after (in parentheses) adjustment for multiple testing (Bonferroni correction). Cross-hatched boxes, not relevant. (B) Assessment of intra-tumoral molecular heterogeneity supports the development of combined MYC family gene amplification and TP53 mutation by both clonal enrichment and de novo acquisition. Estimated percentages of MYC/MYCN-amplified (by iFISH; >5% cells, dashed red line) and TP53 mutated (estimated peak heights, mutant versus wild-type) tumor cells at diagnosis (D) and relapse (R) in four patients with available material support clonal enrichment (e.g. MYCN amplification in patients 8 & 10) and de novo acquisition of combined defects at relapse (e.g. MYC amplification in patient 12; MYCN amplification and TP53 mutation in patient 22). Patient 22 showed no evidence of TP53 mutation at diagnosis, based on >1900 next-generation sequencing reads (*expanded box). All TP53 mutated tumors also displayed chromosome 17p loss. (bottom grid) grey, present; white, absent; cross-hatched, not relevant.
5
6
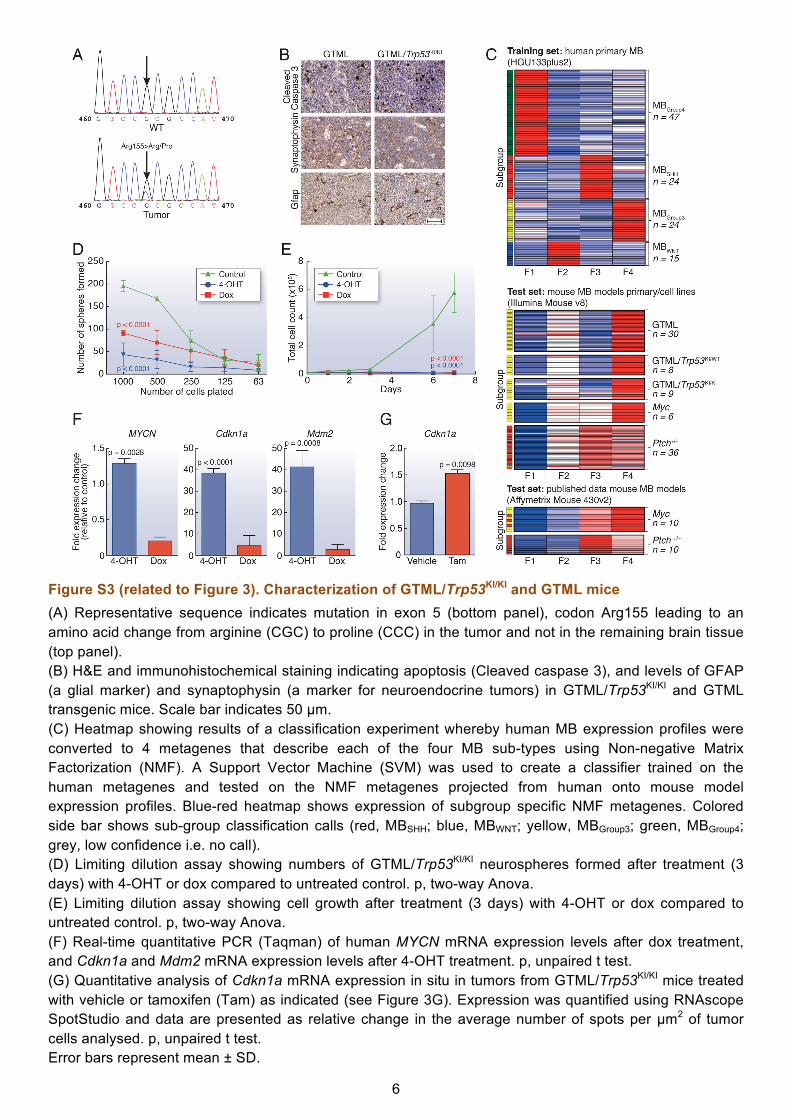
Figure S3 (related to Figure 3). Characterization of GTML/Trp53KI/KI and GTML mice (A) Representative sequence indicates mutation in exon 5 (bottom panel), codon Arg155 leading to an amino acid change from arginine (CGC) to proline (CCC) in the tumor and not in the remaining brain tissue (top panel). (B) H&E and immunohistochemical staining indicating apoptosis (Cleaved caspase 3), and levels of GFAP (a glial marker) and synaptophysin (a marker for neuroendocrine tumors) in GTML/Trp53KI/KI and GTML transgenic mice. Scale bar indicates 50 µm. (C) Heatmap showing results of a classification experiment whereby human MB expression profiles were converted to 4 metagenes that describe each of the four MB sub-types using Non-negative Matrix Factorization (NMF). A Support Vector Machine (SVM) was used to create a classifier trained on the human metagenes and tested on the NMF metagenes projected from human onto mouse model expression profiles. Blue-red heatmap shows expression of subgroup specific NMF metagenes. Colored side bar shows sub-group classification calls (red, MBSHH; blue, MBWNT; yellow, MBGroup3; green, MBGroup4; grey, low confidence i.e. no call). (D) Limiting dilution assay showing numbers of GTML/Trp53KI/KI neurospheres formed after treatment (3 days) with 4-OHT or dox compared to untreated control. p, two-way Anova. (E) Limiting dilution assay showing cell growth after treatment (3 days) with 4-OHT or dox compared to untreated control. p, two-way Anova. (F) Real-time quantitative PCR (Taqman) of human MYCN mRNA expression levels after dox treatment, and Cdkn1a and Mdm2 mRNA expression levels after 4-OHT treatment. p, unpaired t test. (G) Quantitative analysis of Cdkn1a mRNA expression in situ in tumors from GTML/Trp53KI/KI mice treated with vehicle or tamoxifen (Tam) as indicated (see Figure 3G). Expression was quantified using RNAscope SpotStudio and data are presented as relative change in the average number of spots per µm2 of tumor cells analysed. p, unpaired t test. Error bars represent mean ± SD.
7

8
Figure S4 (related to Figure 4). Treatment with the Aurora-A kinase inhibitor MLN8237 inhibits medulloblastoma cell growth in vitro increases survival in GTML/Trp53KI/KI mice (A) Limiting dilution assay showing numbers of GTML/Trp53KI/KI neurospheres formed after treatment (3 days) with GDC-0449 (blue) or MLN8237 (red) compared to untreated control (p, two-way Anova). (B) Limiting dilution assay showing cell growth after treatment with GDC-0449 (blue) or MLN8237 (red) compared to untreated control (p, two-way Anova). (C) Immunoblot analysis of MYCN, and phosphorylated Aurora-A (T288), Aurora-B (T232), Aurora-C (T198) and total Aurora-A protein levels in GTML/Trp53KI/KI neurospheres treated with MLN8237 at the indicated concentrations. (D) Immunohistochemical analysis of Gli1 expression in MLN8237, GDC-0449 and vehicle treated tumor tissues. Scale bars represent 50 µm or 100 µm (inset) as indicated. (E) Immunoblot analysis of MYCN, Gli1 and Sonic Hedgehog (SHH) protein levels in GTML/Trp53KI/KI neurospheres treated with GDC-0449 at the indicated concentrations. (F) In vivo compound measurement of GDC-0449 and MLN8237 in spleen, brain and tumor tissue. Error bars represent mean ± SD.
SUPPLEMENTAL EXPERIMENTAL PROCEDURES
Analysis of Molecular Subgroup Status by DNA Methylation Profiling
(A) Identification of subgroup membership using metagene patterns of the diagnostic and relapse samples within our study cohort. 5 metagenes (F1 to F5) were identified in the training cohort of 225 medulloblastomas using consensus NMF clustering; 2 metagenes (F3 and F4) identified the SHH subgroup, consistent with recent reports of heterogeneity within the SHH subgroup (Kool et al., 2014). Metagene projection (Tamayo et al., 2007) was employed to derive metagene values for the study cohort that were subsequently used to assign subgroup and assess classification confidence. Samples are shown in rows; samples confidently assigned to a subgroup are labelled by their assignation (red, MBSHH; blue, MBWNT; yellow, MBGroup3; green, MBGroup4). Samples within our study cohort that were unable to be confidently assigned (confidence score < 0.7) are labelled grey (MBNOS). High, intermediate and low metagene values are shown red, white and blue, respectively. (B) Comparison of metagene patterns for diagnostic and relapse samples within our study cohort, with metagene patterns from the training cohort. Bi-plot of principal component analysis of combined training, diagnostic and relapsing cohorts. Arrows show projections of five metagenes along first and second principal components. Individual cases are plotted by their principal component scores. Training cohort cases are shown as squares, diagnostic cohort cases as diamonds and relapsing cohort cases as circles. Additionally, cases are labelled by their assigned subgroup (red, MBSHH; blue, MBWNT; yellow, MBGroup3; green, MBGroup4. Cases with an unclear subgroup (confidence score < 0.7) are labelled grey (MBNOS)) and were not included in our subgroup analysis. Finally, training cohort cases are shown with transparency, to emphasise the members of our study cohort.
Analysis of TP53 Status in Clinical Samples
TP53 status was assessed by direct polymerase chain reaction (PCR) based DNA sequence analysis of exons 4-9 using the following FAST PCR conditions: 95ºC for 40s; 35 cycles of 94ºC for 0s, then 64ºC for 15s; 72ºC for 45s (see below for primer sequences). Cases positive for P53 nuclear staining on immunohistochemistry (IHC) with no apparent mutation had an extended screen of exons 2-11 (see below for primer sequences). One tumor pair (patient 22, Figure S2B) that showed acquisition of a TP53 mutation in exon 5 was assessed by next-generation sequencing using primers for exon 5 as previously described (Grossmann et al., 2011). Primer validation was performed according to manufacturer’s instructions (Fluidigm) and PCR products checked using a 2100 BioAnalyzer (Agilent Technologies). Barcoded PCR products were pooled and run in a single sequencing experiment on a Roche 454 FLX sequencer (454 Life Sciences).
9
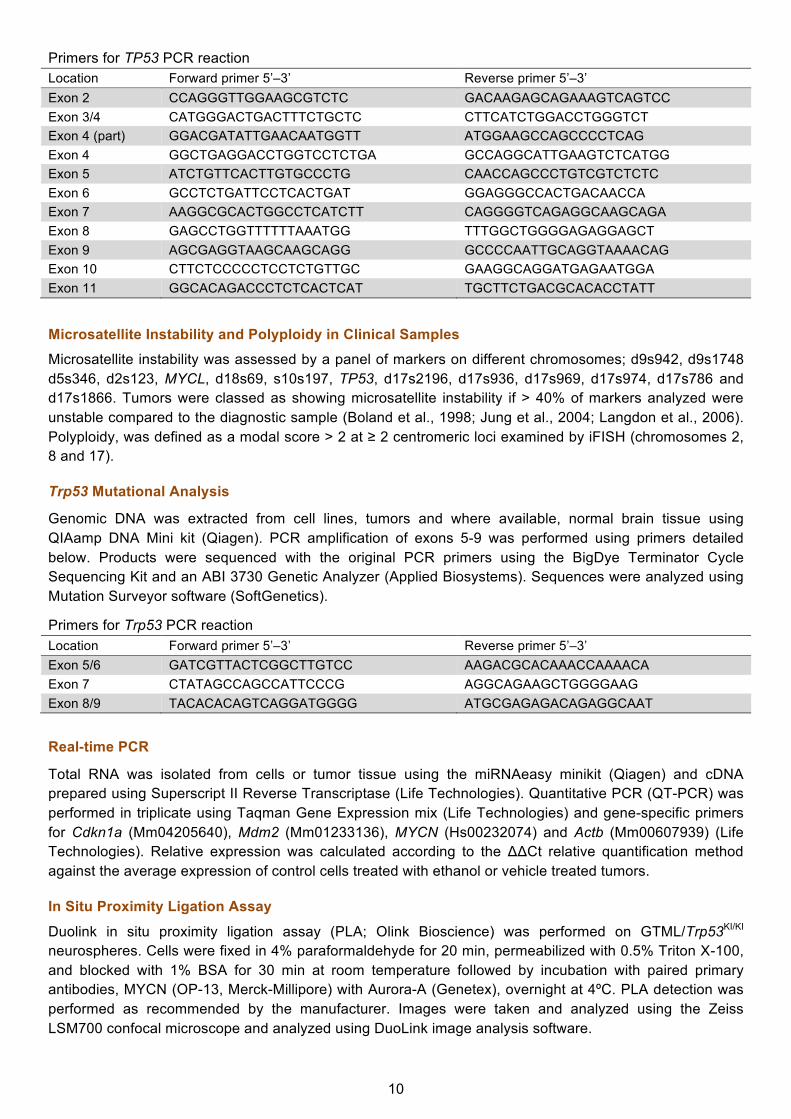
Primers for TP53 PCR reaction Location Forward primer 5’–3’ Reverse primer 5’–3’ Exon 2 CCAGGGTTGGAAGCGTCTC GACAAGAGCAGAAAGTCAGTCC Exon 3/4 CATGGGACTGACTTTCTGCTC CTTCATCTGGACCTGGGTCT Exon 4 (part) GGACGATATTGAACAATGGTT ATGGAAGCCAGCCCCTCAG Exon 4 GGCTGAGGACCTGGTCCTCTGA GCCAGGCATTGAAGTCTCATGG Exon 5 ATCTGTTCACTTGTGCCCTG CAACCAGCCCTGTCGTCTCTC Exon 6 GCCTCTGATTCCTCACTGAT GGAGGGCCACTGACAACCA Exon 7 AAGGCGCACTGGCCTCATCTT CAGGGGTCAGAGGCAAGCAGA Exon 8 GAGCCTGGTTTTTTAAATGG TTTGGCTGGGGAGAGGAGCT Exon 9 AGCGAGGTAAGCAAGCAGG GCCCCAATTGCAGGTAAAACAG Exon 10 CTTCTCCCCCTCCTCTGTTGC GAAGGCAGGATGAGAATGGA Exon 11 GGCACAGACCCTCTCACTCAT TGCTTCTGACGCACACCTATT
Microsatellite Instability and Polyploidy in Clinical Samples Microsatellite instability was assessed by a panel of markers on different chromosomes; d9s942, d9s1748 d5s346, d2s123, MYCL, d18s69, s10s197, TP53, d17s2196, d17s936, d17s969, d17s974, d17s786 and d17s1866. Tumors were classed as showing microsatellite instability if > 40% of markers analyzed were unstable compared to the diagnostic sample (Boland et al., 1998; Jung et al., 2004; Langdon et al., 2006). Polyploidy, was defined as a modal score > 2 at ≥ 2 centromeric loci examined by iFISH (chromosomes 2, 8 and 17).
Trp53 Mutational Analysis
Genomic DNA was extracted from cell lines, tumors and where available, normal brain tissue using QIAamp DNA Mini kit (Qiagen). PCR amplification of exons 5-9 was performed using primers detailed below. Products were sequenced with the original PCR primers using the BigDye Terminator Cycle Sequencing Kit and an ABI 3730 Genetic Analyzer (Applied Biosystems). Sequences were analyzed using Mutation Surveyor software (SoftGenetics).
Primers for Trp53 PCR reaction Location Forward primer 5’–3’ Reverse primer 5’–3’ Exon 5/6 GATCGTTACTCGGCTTGTCC AAGACGCACAAACCAAAACA Exon 7 CTATAGCCAGCCATTCCCG AGGCAGAAGCTGGGGAAG Exon 8/9 TACACACAGTCAGGATGGGG ATGCGAGAGACAGAGGCAAT
Real-time PCRTotal RNA was isolated from cells or tumor tissue using the miRNAeasy minikit (Qiagen) and cDNA prepared using Superscript II Reverse Transcriptase (Life Technologies). Quantitative PCR (QT-PCR) was performed in triplicate using Taqman Gene Expression mix (Life Technologies) and gene-specific primers for Cdkn1a (Mm04205640), Mdm2 (Mm01233136), MYCN (Hs00232074) and Actb (Mm00607939) (Life Technologies). Relative expression was calculated according to the ΔΔCt relative quantification method against the average expression of control cells treated with ethanol or vehicle treated tumors.
In Situ Proximity Ligation Assay
Duolink in situ proximity ligation assay (PLA; Olink Bioscience) was performed on GTML/Trp53KI/KI neurospheres. Cells were fixed in 4% paraformaldehyde for 20 min, permeabilized with 0.5% Triton X-100, and blocked with 1% BSA for 30 min at room temperature followed by incubation with paired primary antibodies, MYCN (OP-13, Merck-Millipore) with Aurora-A (Genetex), overnight at 4ºC. PLA detection was performed as recommended by the manufacturer. Images were taken and analyzed using the Zeiss LSM700 confocal microscope and analyzed using DuoLink image analysis software.
10
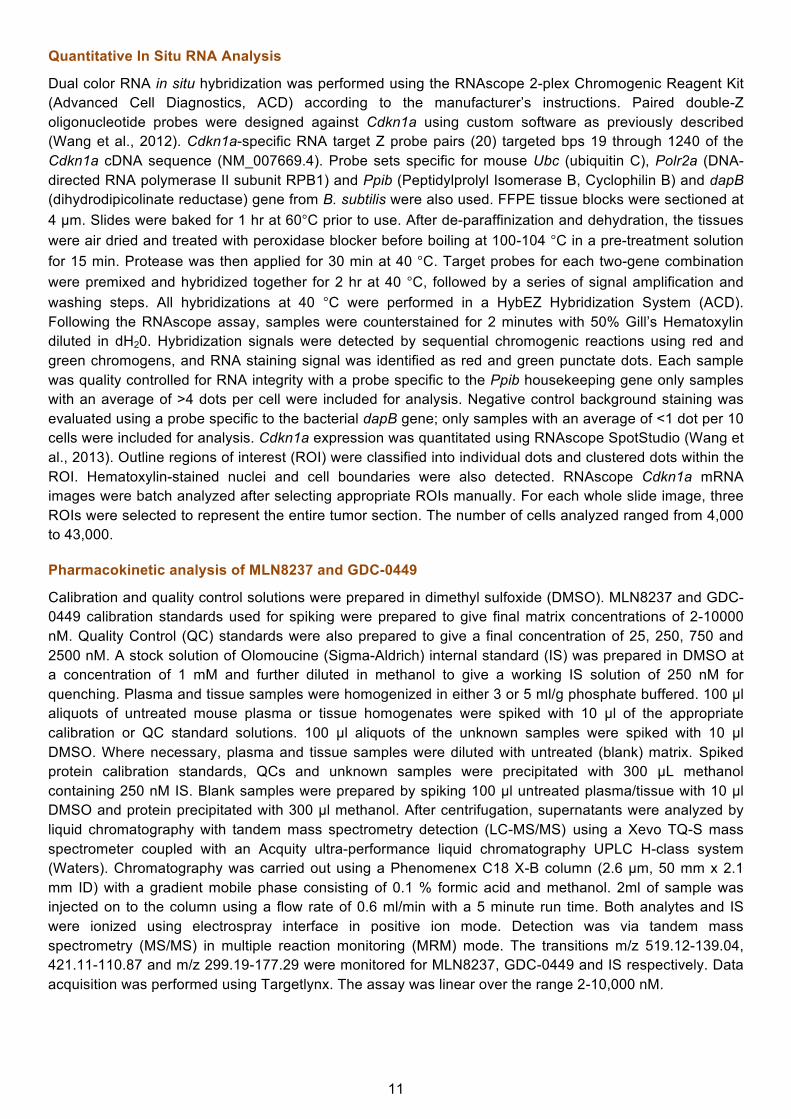
Quantitative In Situ RNA Analysis
Dual color RNA in situ hybridization was performed using the RNAscope 2-plex Chromogenic Reagent Kit (Advanced Cell Diagnostics, ACD) according to the manufacturer’s instructions. Paired double-Z oligonucleotide probes were designed against Cdkn1a using custom software as previously described (Wang et al., 2012). Cdkn1a-specific RNA target Z probe pairs (20) targeted bps 19 through 1240 of the Cdkn1a cDNA sequence (NM_007669.4). Probe sets specific for mouse Ubc (ubiquitin C), Polr2a (DNA-directed RNA polymerase II subunit RPB1) and Ppib (Peptidylprolyl Isomerase B, Cyclophilin B) and dapB (dihydrodipicolinate reductase) gene from B. subtilis were also used. FFPE tissue blocks were sectioned at 4 µm. Slides were baked for 1 hr at 60°C prior to use. After de-paraffinization and dehydration, the tissues were air dried and treated with peroxidase blocker before boiling at 100-104 °C in a pre-treatment solution for 15 min. Protease was then applied for 30 min at 40 °C. Target probes for each two-gene combination were premixed and hybridized together for 2 hr at 40 °C, followed by a series of signal amplification and washing steps. All hybridizations at 40 °C were performed in a HybEZ Hybridization System (ACD). Following the RNAscope assay, samples were counterstained for 2 minutes with 50% Gill’s Hematoxylin diluted in dH20. Hybridization signals were detected by sequential chromogenic reactions using red and green chromogens, and RNA staining signal was identified as red and green punctate dots. Each sample was quality controlled for RNA integrity with a probe specific to the Ppib housekeeping gene only samples with an average of >4 dots per cell were included for analysis. Negative control background staining was evaluated using a probe specific to the bacterial dapB gene; only samples with an average of <1 dot per 10 cells were included for analysis. Cdkn1a expression was quantitated using RNAscope SpotStudio (Wang et al., 2013). Outline regions of interest (ROI) were classified into individual dots and clustered dots within the ROI. Hematoxylin-stained nuclei and cell boundaries were also detected. RNAscope Cdkn1a mRNA images were batch analyzed after selecting appropriate ROIs manually. For each whole slide image, three ROIs were selected to represent the entire tumor section. The number of cells analyzed ranged from 4,000 to 43,000.
Pharmacokinetic analysis of MLN8237 and GDC-0449
Calibration and quality control solutions were prepared in dimethyl sulfoxide (DMSO). MLN8237 and GDC-0449 calibration standards used for spiking were prepared to give final matrix concentrations of 2-10000 nM. Quality Control (QC) standards were also prepared to give a final concentration of 25, 250, 750 and 2500 nM. A stock solution of Olomoucine (Sigma-Aldrich) internal standard (IS) was prepared in DMSO at a concentration of 1 mM and further diluted in methanol to give a working IS solution of 250 nM for quenching. Plasma and tissue samples were homogenized in either 3 or 5 ml/g phosphate buffered. 100 µl aliquots of untreated mouse plasma or tissue homogenates were spiked with 10 µl of the appropriate calibration or QC standard solutions. 100 µl aliquots of the unknown samples were spiked with 10 µl DMSO. Where necessary, plasma and tissue samples were diluted with untreated (blank) matrix. Spiked protein calibration standards, QCs and unknown samples were precipitated with 300 µL methanol containing 250 nM IS. Blank samples were prepared by spiking 100 µl untreated plasma/tissue with 10 µl DMSO and protein precipitated with 300 µl methanol. After centrifugation, supernatants were analyzed by liquid chromatography with tandem mass spectrometry detection (LC-MS/MS) using a Xevo TQ-S mass spectrometer coupled with an Acquity ultra-performance liquid chromatography UPLC H-class system (Waters). Chromatography was carried out using a Phenomenex C18 X-B column (2.6 µm, 50 mm x 2.1 mm ID) with a gradient mobile phase consisting of 0.1 % formic acid and methanol. 2ml of sample was injected on to the column using a flow rate of 0.6 ml/min with a 5 minute run time. Both analytes and IS were ionized using electrospray interface in positive ion mode. Detection was via tandem mass spectrometry (MS/MS) in multiple reaction monitoring (MRM) mode. The transitions m/z 519.12-139.04, 421.11-110.87 and m/z 299.19-177.29 were monitored for MLN8237, GDC-0449 and IS respectively. Data acquisition was performed using Targetlynx. The assay was linear over the range 2-10,000 nM.
11

Expression Microarray Analysis
Affymetrix HGU133plus2 expression profiles of primary tumors from 110 individuals with a diagnosis of medulloblastoma were taken from previously published studies (Fattet et al., 2009; Kool et al., 2008) (GSE12992 and GSE10327, respectively). Raw data were normalized and processed using gcRMA (Bioconductor/R). Processed data were converted to four metagenes representing the four sub-groups using non-negative matrix factorization (NMF) and these metagenes projected onto the mouse tumor/cell line expression profiles using an adaption of a previously described procedure (Tamayo et al., 2007) (scripts available upon request). Mouse expression profiles were generated using Illumina Mouse v8 arrays according to manufacturer’s instructions. Raw data were processed using the beadarray package (Bioconductor/R). Expression profiles from primary murine medulloblastoma samples and cell lines included a total of 47 from GTML-based mouse models, 6 from a Myc/Trp53-deficient mouse model (Kawauchi et al., 2012) (gifted by Martine Roussel, St. Jude Children’s Research Hospital) and 36 from Ptch+/– mice (Lastowska et al., 2013) (GSE43994). Also included were published Ptch+/– and Myc/Trp53-deficient mouse gene expression profiles (Kawauchi et al., 2012) (GSE34126 and GSE24628). Subgroup calls for mouse tumors were made using a support vector machine algorithm (SVM) trained on the four human subgroup metagenes and tested on the projected mouse metagenes.
SUPPLEMENTAL REFERENCES
Boland, C. R., Thibodeau, S. N., Hamilton, S. R., Sidransky, D., Eshleman, J. R., Burt, R. W., Meltzer, S. J., Rodriguez-Bigas, M. A., Fodde, R., Ranzani, G. N., and Srivastava, S. (1998). A National Cancer Institute Workshop on Microsatellite Instability for cancer detection and familial predisposition: development of international criteria for the determination of microsatellite instability in colorectal cancer. Cancer research 58, 5248-5257. Fattet, S., Haberler, C., Legoix, P., Varlet, P., Lellouch-Tubiana, A., Lair, S., Manie, E., Raquin, M. A., Bours, D., Carpentier, S., et al. (2009). Beta-catenin status in paediatric medulloblastomas: correlation of immunohistochemical expression with mutational status, genetic profiles, and clinical characteristics. The Journal of pathology 218, 86-94. Grossmann, V., Kohlmann, A., Zenger, M., Schindela, S., Eder, C., Weissmann, S., Schnittger, S., Kern, W., Muller, M. C., Hochhaus, A., et al. (2011). A deep-sequencing study of chronic myeloid leukemia patients in blast crisis (BC-CML) detects mutations in 76.9% of cases. Leukemia 25, 557-560. Jung, H. L., Wang, K. C., Kim, S. K., Sung, K. W., Koo, H. H., Shin, H. Y., Ahn, H. S., Shin, H. J., and Cho, B. K. (2004). Loss of heterozygosity analysis of chromosome 17p13.1-13.3 and its correlation with clinical outcome in medulloblastomas. J Neurooncol 67, 41-46. Kool, M., Jones, D. T., Jager, N., Northcott, P. A., Pugh, T. J., Hovestadt, V., Piro, R. M., Esparza, L. A., Markant, S. L., Remke, M., et al. (2014). Genome Sequencing of SHH Medulloblastoma Predicts Genotype-Related Response to Smoothened Inhibition. Cancer cell 25, 393-405. Kool, M., Koster, J., Bunt, J., Hasselt, N. E., Lakeman, A., van Sluis, P., Troost, D., Meeteren, N. S., Caron, H. N., Cloos, J., et al. (2008). Integrated genomics identifies five medulloblastoma subtypes with distinct genetic profiles, pathway signatures and clinicopathological features. PloS one 3, e3088. Lastowska, M., Al-Afghani, H., Al-Balool, H. H., Sheth, H., Mercer, E., Coxhead, J. M., Redfern, C. P., Peters, H., Burt, A. D., Santibanez-Koref, M., et al. (2013). Identification of a neuronal transcription factor network involved in medulloblastoma development. Acta Neuropathol Commun 1, 35. Soussi, T., Asselain, B., Hamroun, D., Kato, S., Ishioka, C., Claustres, M., and Beroud, C. (2006). Meta-analysis of the p53 mutation database for mutant p53 biological activity reveals a methodologic bias in mutation detection. Clinical cancer research : an official journal of the American Association for Cancer Research 12, 62-69. Wang, F., Flanagan, J., Su, N., Wang, L. C., Bui, S., Nielson, A., Wu, X., Vo, H. T., Ma, X. J., and Luo, Y. (2012). RNAscope: a novel in situ RNA analysis platform for formalin-fixed, paraffin-embedded tissues. The Journal of molecular diagnostics : JMD 14, 22-29. Wang, Z., Portier, B. P., Gruver, A. M., Bui, S., Wang, H., Su, N., Vo, H. T., Ma, X. J., Luo, Y., Budd, G. T., and Tubbs, R. R. (2013). Automated quantitative RNA in situ hybridization for resolution of equivocal and heterogeneous ERBB2 (HER2) status in invasive breast carcinoma. The Journal of molecular diagnostics : JMD 15, 210-219.
12