Column Elution Experiments on Volcanic Ash: Geochemical Implications for the Main Ethiopian Rift...
18
Column elution experiments on volcanic ash: geochemical implications for the 1 Main Ethiopian Rift waters 2 3 Tewodros Rango a,b , Nicolo Colombani a,c , Micol Mastrocicco a , Gianluca. Bianchini d , Luigi 4 Beccaluva a 5 6 a University of Ferrara, Department of Earth Science, Via Saragat 1, 44100 Ferrara, Italy 7 b Addis Ababa University, Department of Earth Sciences, P.O. Box 1176, Addis Ababa, Ethiopia 8 c University of Rome “La Sapienza”, Department of Earth Science, P.le A. Moro 5, 00185 Roma, Italy. 9 d School of Geography, Geology and the Environment, Kingston University, Penrhyn Road, Kingston-upon-Thames, 10 Surrey KT1 2EE, UK 11 12 Abstract 13 14 Column laboratory experiments were employed to asses the leaching behavior of pyroclastic ash 15 deposits collected in the central Main Ethiopian Rift (MER), where surface and groundwater 16 resources are affected by fluoride (F − ) pollution that is causing an endemic disease (fluorosis) on 17 the local community. 18 To elucidate its source and simulate the water-rock interaction processes, and to quantify the 19 distribution of F − within different grain sizes, the pyroclastic ash was analyzed by XRF, XRD and 20 SEM and separated into coarse and fine fractions. Then, three columns were respectively filled with 21 raw (unsieved), coarse and fine fraction and flushed with synthetic rain water in saturated 22 conditions. 23 Very fast F − leaching was observed on the fine fraction column at the start of the experiment while 24 in the other two columns F − was slowly released; additionally, a strong accumulation of F − was 25 found in the fine fraction. The effect was more pronounced in the fine column due to the available 26 effective adsorbing surface area in the fine grained fractions. Subsequent to elution experiments, the 27 columns were characterized via moment analysis of tracer test. Finally, flow and transport modeling 28 was employed to compute the amount of F − adsorbed onto solid phase, comparing the calculated 29 conservative transport of F − and the observed concentrations. 30 The results of this study suggest that fluoride is a fundamental constituent of the glass phase (ca 0.3 31 wt%) and that it is slowly released during the dissolution of the glassy particles. These processes are 32 more effective in the fine fraction, due to much higher reactive (specific) surface area. 33 34 Keywords: fluoride; leaching; contamination; transport; modelling; reactions. 35
Transcript of Column Elution Experiments on Volcanic Ash: Geochemical Implications for the Main Ethiopian Rift...

Column elution experiments on volcanic ash: geochemical implications for the 1
Main Ethiopian Rift waters 2
3
Tewodros Rangoa,b
, Nicolo Colombania,c
, Micol Mastrociccoa
, Gianluca. Bianchinid, Luigi 4
Beccaluvaa 5
6
a University of Ferrara, Department of Earth Science, Via Saragat 1, 44100 Ferrara, Italy 7 b Addis Ababa University, Department of Earth Sciences, P.O. Box 1176, Addis Ababa, Ethiopia 8 c University of Rome “La Sapienza”, Department of Earth Science, P.le A. Moro 5, 00185 Roma, Italy. 9 d School of Geography, Geology and the Environment, Kingston University, Penrhyn Road, Kingston-upon-Thames, 10
Surrey KT1 2EE, UK 11
12
Abstract 13
14
Column laboratory experiments were employed to asses the leaching behavior of pyroclastic ash 15
deposits collected in the central Main Ethiopian Rift (MER), where surface and groundwater 16
resources are affected by fluoride (F−) pollution that is causing an endemic disease (fluorosis) on 17
the local community. 18
To elucidate its source and simulate the water-rock interaction processes, and to quantify the 19
distribution of F−
within different grain sizes, the pyroclastic ash was analyzed by XRF, XRD and 20
SEM and separated into coarse and fine fractions. Then, three columns were respectively filled with 21
raw (unsieved), coarse and fine fraction and flushed with synthetic rain water in saturated 22
conditions. 23
Very fast F− leaching was observed on the fine fraction column at the start of the experiment while 24
in the other two columns F− was slowly released; additionally, a strong accumulation of F
− was 25
found in the fine fraction. The effect was more pronounced in the fine column due to the available 26
effective adsorbing surface area in the fine grained fractions. Subsequent to elution experiments, the 27
columns were characterized via moment analysis of tracer test. Finally, flow and transport modeling 28
was employed to compute the amount of F− adsorbed onto solid phase, comparing the calculated 29
conservative transport of F−
and the observed concentrations. 30
The results of this study suggest that fluoride is a fundamental constituent of the glass phase (ca 0.3 31
wt%) and that it is slowly released during the dissolution of the glassy particles. These processes are 32
more effective in the fine fraction, due to much higher reactive (specific) surface area. 33
34
Keywords: fluoride; leaching; contamination; transport; modelling; reactions. 35

2
1. Introduction 1
2
The outcropping lithologies in the central sector of the MER consist of volcanics (pyroclastic 3
products of felsic composition and subordinate basaltic lava flows) and sediments (Benvenuti et 4
al., 2002); the latter are characterized by fluvio-lacustrine and volcano-lacustrine facies and 5
represent weathered/reworked volcanic rocks and silicic tephra (Figure 1). 6
In particular, most of the rift floor is covered by silicic pyroclastic materials mainly consisting of 7
rhyolitic ignimbrites, interlayered with basalts and tuffs, associated with layered and unwelded 8
pumices (Di Paola, 1972; Kampunzu et al., 1991; Mohr, 1992; Peccerillo, et al., 2003). Ashes are 9
frequently found inter-bedded with ignimbrites and pumice layers. This pyroclastic material 10
(tephra) is the result of explosive volcanic eruptions. These volcanic products are the natural 11
persistent source of toxic elements in the rift environment. In the study area, one of the well known 12
toxic elements is fluorine. During eruptive volcanism, fluorine forming gases can adsorb on to the 13
tephra (Giggenback, 1996; Allard et al., 2000; Armienti et al., 1998, 2002, Cronin et al 2003). 14
Linked to these volcanic products, the natural waters of the Ethiopian Rift are characterized by 15
anomalous concentration of fluoride (Kilham and Hecky 1973; Chernet 1982; Calderoni et al. 1993; 16
Gizaw 1996; Darling et al. 1996) that mostly exceeds 1.5 mg/L, the tolerance limit for drinking 17
water (WHO 2006) which is causing prevalent endemic fluorosis disease. 18
Due to its detrimental effect to human health, in the past few decades, many geochemical studies 19
have been addressed to evaluate the extent of the fluoride problem and to elucidate its origin 20
(Chernet and Travi, 1993; Gizaw, 1996; Yirgu, 1999; Rango et al., 2008) as well as to investigate 21
the associated health problems (Lester, 1974; Olsson, 1979; Tekle-Haimanot et al., 1987; Tekle-22
Haimanot, 1990; Shiferaw and Teklehaimanot, 1999; Kloos and Tekle-Haimanot, 1999). 23
In spite of the well known fluoride health problem in the region, the geochemical processes 24
controlling the elevated fluoride concentration have still to be studied in detail. The previous studies 25
on the origin of fluoride were mainly based on the geochemistry of waters and didn’t investigate the 26
geochemical behaviour of the rift lithotypes that potentially represent the pristine source of most 27
dissolved elements. 28
To constrain these processes we characterized the chemical/mineralogical features of the main rift 29
lithotypes and we performed leaching experiments on columns filled by a pyroclastic ash which is 30
one of the major components of the MER aquifers. These experiments aim to simulate the elemental 31
extractability of water soluble ions with particular emphasis to the leaching (dissolution/desorption) 32
behaviour of fluoride during the water-ash interaction. The comparison between the amounts of 33
fluoride leached from different grain size fractions of the same sample provides further fundamental 34

3
information in the understanding of sources and geochemical behaviour of fluoride in the waters of 1
the MER, as well as east African rift system. To characterize the flow and transport properties at the 2
field or at laboratory scale, usually tracer test are employed (Ptak et al. 2004) and flow interruption 3
techniques are employed to assess physical non-equilibrium behaviour (Brusseaux et al. 1989, 4
1997). Moreover, the numerical transport modelling of the above mentioned tracer tests can help to 5
discern dilution and dispersion processes from reactions between the water and the solid phase 6
(Appelo et al. 1990). Thus, both tracer test with flow interruption and modelling were used to obtain 7
information on mobility of selected reactive and non reactive species such as F− and Cl
−. 8
9
10
Figure 1: Simplified geologic map of the study area modified from (Dainelli et al., 2001) with volcanic ash sampling 11
location. 12
13

4
2. Materials and methods 1
2
2.1. Sampling and analytical techniques 3
4
The main lithotypes outcropping in the MER have been collected and characterized through 5
petrographic observation at the transmitted light microscope (Rango, 2008b). More detailed 6
investigation was carried out on the pyroclastic fall deposit TW39 that consists of vitric ash 7
(including pumice fragments) and represents one the predominant volcanic products of the area. 8
The sample was sieved obtaining different grain size fractions, i.e. <63µm (fine grain ash), 63µm-9
2mm (coarse grain ash). These different grain fractions (raw, coarse and fine) were later used in the 10
column experiments simulating the water-rock interaction. 11
After a preliminary drying at 110 oC for 12 hours, the bulk rock chemical composition was 12
characterized by X-ray fluorescence spectrometry (XRF) on pressed powder pellets using a 13
wavelength-dispersive automated ARL Advant'X spectrometer with accuracy and precision (based 14
on the analysis of certified international standards) better than 3% for Si, Ti, Fe, Ca, K, and 7% for 15
Mg, Al, Mn, Na. 16
The mineralogical characterization was performed by X-ray diffraction (XRD) investigation and by 17
in situ analyses of single grains obtained with a Zeiss EVO 50 SEM in conjunction with an Oxford 18
Instruments INCA microanalysis suite. 19
Online parameters on the leaching solutions were determined with the multi-parameter instrument 20
HANNA Multi 340i which includes: a HIcell-31 pH combined electrode with a built-in temperature 21
sensor for pH measurement and a HIcell-21 electrode conductivity cell for EC measurements. 22
Leaching solutions were filtered through a 0.22 μm Dionex vials caps. The major cations, anions 23
(Na+, K
+, Ca
2+, Mg
2+, F
−, Cl
−, NO3
−, SO4
2−) and oxianions (acetate and formate) were determined 24
by an isocratic dual pump ion chromatography ICS-1000 Dionex, equipped with AS9-HC 4 x 250 25
mm high capacity column and ASRS-ULTRA 4mm self-suppressor for anions and CS12A 4 x 250 26
mm high capacity column and CSRS-ULTRA 4mm self-suppressor for anions. An AS-40 Dionex 27
auto-sampler was employed to run analysis, Quality Control (QC) samples were run every 10 28
samples. The standard deviation for all QC samples run was better than 4% whereas the accuracy is 29
reported as the average of the relative differences between the measured and known standards and it 30
was 5% for cations and anions. Charge balance errors in all analyses were less than 5% and 31
predominantly less than 3%. The detection limit was 2 μg/l for F− and lower than 50 μg/l for all the 32
analyzed anions and cations. 33
34
5
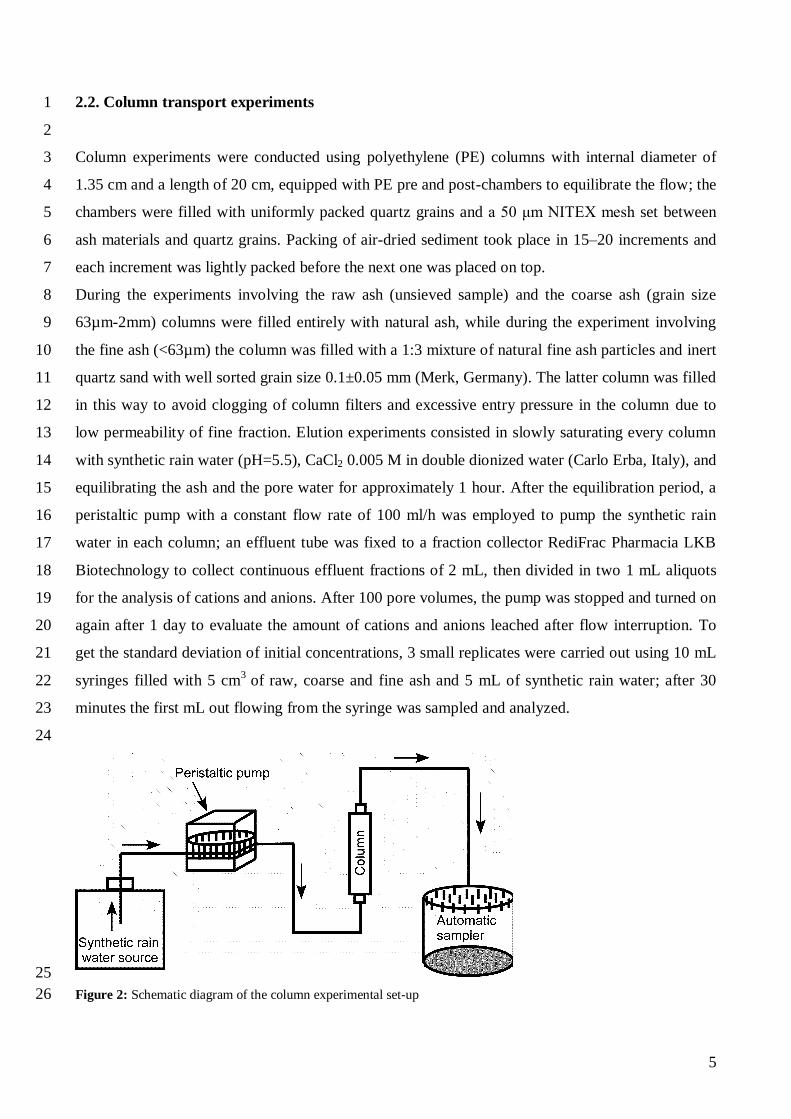
2.2. Column transport experiments 1
2
Column experiments were conducted using polyethylene (PE) columns with internal diameter of 3
1.35 cm and a length of 20 cm, equipped with PE pre and post-chambers to equilibrate the flow; the 4
chambers were filled with uniformly packed quartz grains and a 50 μm NITEX mesh set between 5
ash materials and quartz grains. Packing of air-dried sediment took place in 15–20 increments and 6
each increment was lightly packed before the next one was placed on top. 7
During the experiments involving the raw ash (unsieved sample) and the coarse ash (grain size 8
63µm-2mm) columns were filled entirely with natural ash, while during the experiment involving 9
the fine ash (<63µm) the column was filled with a 1:3 mixture of natural fine ash particles and inert 10
quartz sand with well sorted grain size 0.1±0.05 mm (Merk, Germany). The latter column was filled 11
in this way to avoid clogging of column filters and excessive entry pressure in the column due to 12
low permeability of fine fraction. Elution experiments consisted in slowly saturating every column 13
with synthetic rain water (pH=5.5), CaCl2 0.005 M in double dionized water (Carlo Erba, Italy), and 14
equilibrating the ash and the pore water for approximately 1 hour. After the equilibration period, a 15
peristaltic pump with a constant flow rate of 100 ml/h was employed to pump the synthetic rain 16
water in each column; an effluent tube was fixed to a fraction collector RediFrac Pharmacia LKB 17
Biotechnology to collect continuous effluent fractions of 2 mL, then divided in two 1 mL aliquots 18
for the analysis of cations and anions. After 100 pore volumes, the pump was stopped and turned on 19
again after 1 day to evaluate the amount of cations and anions leached after flow interruption. To 20
get the standard deviation of initial concentrations, 3 small replicates were carried out using 10 mL 21
syringes filled with 5 cm3
of raw, coarse and fine ash and 5 mL of synthetic rain water; after 30 22
minutes the first mL out flowing from the syringe was sampled and analyzed. 23
24
25
Figure 2: Schematic diagram of the column experimental set-up 26
6
Extra column volume was taken into account when the experimental elution curves were calculated 1
by correcting the arrival volumes of the effluents. Tracer tests were performed on every column 2
after elution experiments; a solution of 1 g/L of KCl dissolved into synthetic rain water was injected 3
for 0.8 minutes into the column and immediately afterward the synthetic rain water reservoir was 4
turned on. A small flow through cell was used to monitor KCl concentration via electrical 5
conductivity (EC) at the column outflow and KCl concentration (mg/L) of the effluent was obtained 6
from the measurement of EC for a series of known concentrations of KCl solutions. An additional 7
tracer test with flow interruption was performed on every column to examine the effect of diffusive 8
mass transfer on solute transport (Brusseau et al., 1989, 1997). The schematic diagram of the 9
column experiment is shown in Figure 2. 10
11
2.3. Moment analysis and numerical modelling 12
13
The breakthrough curves of saline tracer KCl were analysed with the method of moments (Eriksson 14
et al. 1997). The zeroth normalized moment, μ0, quantifies the fraction of tracer mass recovered in 15
the effluent. The normalized first moment μ1, which is the mean arrival time, gives the linear 16
retardation factor R; the normalized central second μ2 and third moments μ3, measure the spreading 17
around the centre of mass and the degree of asymmetry or skewness (S) of the breakthrough curve, 18
with S given by the ratio μ3/(μ2)1.5
(Vincent et al. 2007). 19
The finite difference USGS numerical code MODFLOW-2000 (Harbaugh et al., 2000) was 20
employed, to simulate saturated groundwater flow within the column experiments. The flow model 21
domain consisted of a single column and a single row with extent of 12 mm × 12 mm and of 50 22
layers 4 mm thick for a total column length of 200 mm. Flow boundary conditions consisted in an 23
injection well placed in the first cell with a constant flow rate of 100 ml/hour and a constant head in 24
the last cell, to maintain a constant flux within the column. The solute transport model MT3DMS 25
(Zheng and Wang, 1999) was employed in order to simulate tracer test breakthrough curves and 26
elution of conservative species. The classical formulation of the advection dispersion equation 27
(ADE) was solved by the TVD (third-order total-variation-diminishing method) scheme, which is 28
mass conservative. The TVD scheme solves the advection component independently from the other 29
terms in the transport equation. The only adjustable parameter in the TVD scheme is the Courant 30
number which represents the number of cells a particle will be allowed to move through in any 31
direction, in one transport step, this was set equal to 0.1 to ensure stability during the calculation 32
process (Zheng and Bennet 2005) 33

7
The injection of the tracer was simulated with a constant concentration boundary applied to the first 1
cell for 0.8 minutes with KCl concentration of 1000 mg/L. To simulate the elution of conservative 2
species, a flow and transport model was implemented with the same boundary conditions and 3
parameters of the one calibrated for tracer test. The only changes were the removal of the constant 4
concentration boundary and the imposed initial concentration of F−, set as the initial concentration 5
observed in the first sample collected from the effluent of each column. The comparison of the 6
calculated conservative F−
elution curve and the observed one from different particle fractions, 7
allowed the distinction between the readily water soluble F− and the sorbed F
− which was slowly 8
released from the porous matrix (Appelo et al. 1990). 9
10
6. Results and discussion 11
12
6.1. Geochemistry of pyroclastic ash 13
14
The XRF analysis was plotted on alkali silica diagram in order to characterize the geochemical 15
composition. The result showed that the sample is rhyolitic in composition (Table 1 and 2). 16
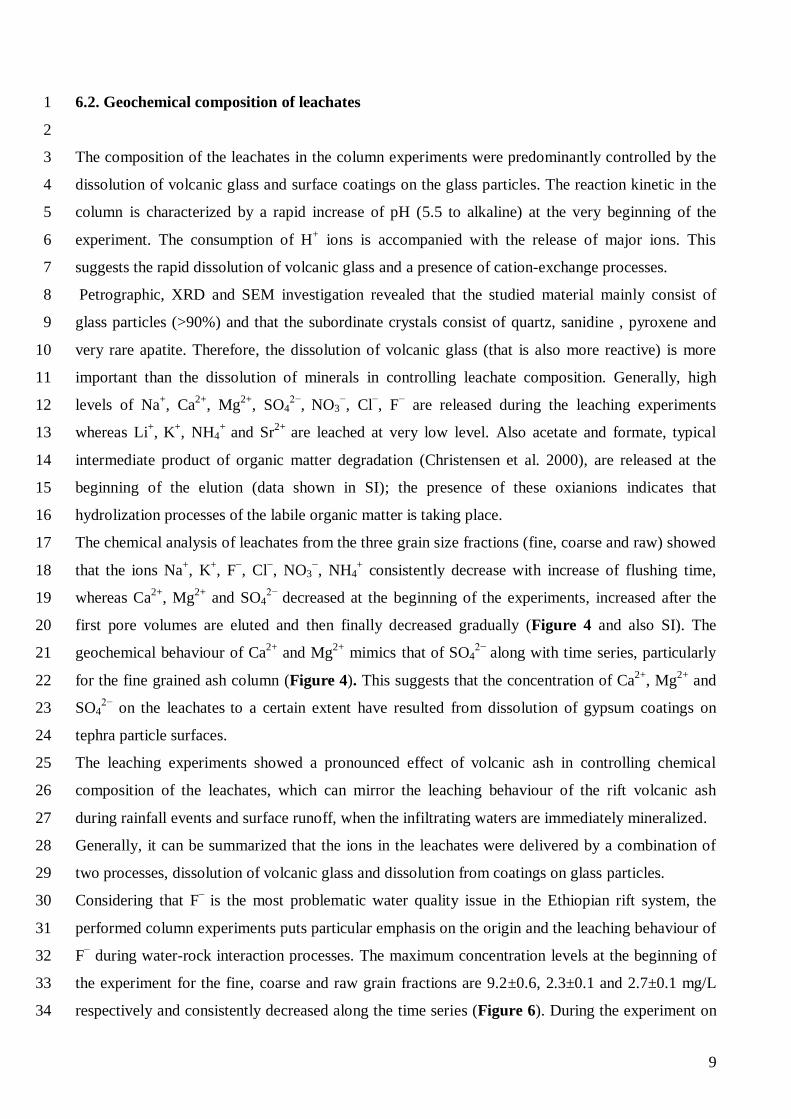
Moreover, XRD analysis was carried out on the raw, fine and coarse grain fraction of the ash to 17
identify the mineral phases and compare the different grain sizes. Both the raw (unsieved) and 18
coarse ash fractions contain glassy particles and subordinate crystals of quartz, sanidine, aegirina 19
pyroxene and extremely rare F-rich apatite; crystals are nearly absent in the fine fraction that is 20
dominated by the glassy grains (Figure 3 and 4). This suggested the dominant role of the vitric 21
phase in providing the soluble components in the leachate during the column experiments. 22
23
Table 1: Bulk XRF analysis of major oxides (wt%) of the pyroclastic ash. 24
Volcanic ash
Raw (<2mm)
Coarse grained
(63m-2mm)
Fine grained
(<63m)
SiO2 71.25 71.11 71.70
TiO2 0.40 0.39 0.36
Al2O3 9.40 9.17 9.09
Fe2O3 6.53 7.06 7.05
MnO 0.25 0.26 0.28
MgO 0.13 0.16 0.16
CaO 0.33 0.31 0.35
Na2O 2.66 2.62 2.03
K2O 4.29 4.27 4.33
P2O5 0.01 0.01 0.01
LOI 4.76 4.64 4.64
26
8
Table 2: Average (wt%) composition of the glass phase carried out by in-situ SEM microanalysis 1
of glass particles. 2
TW39 SiO2 TiO2 Al2O3 Fe2O3 MnO MgO CaO Na2O K2O F Cl
wt % 74.21 0.31 8.30 6.63 0.24 0.00 0.23 2.40 3.27 0.33 0.20
4
5
6
7
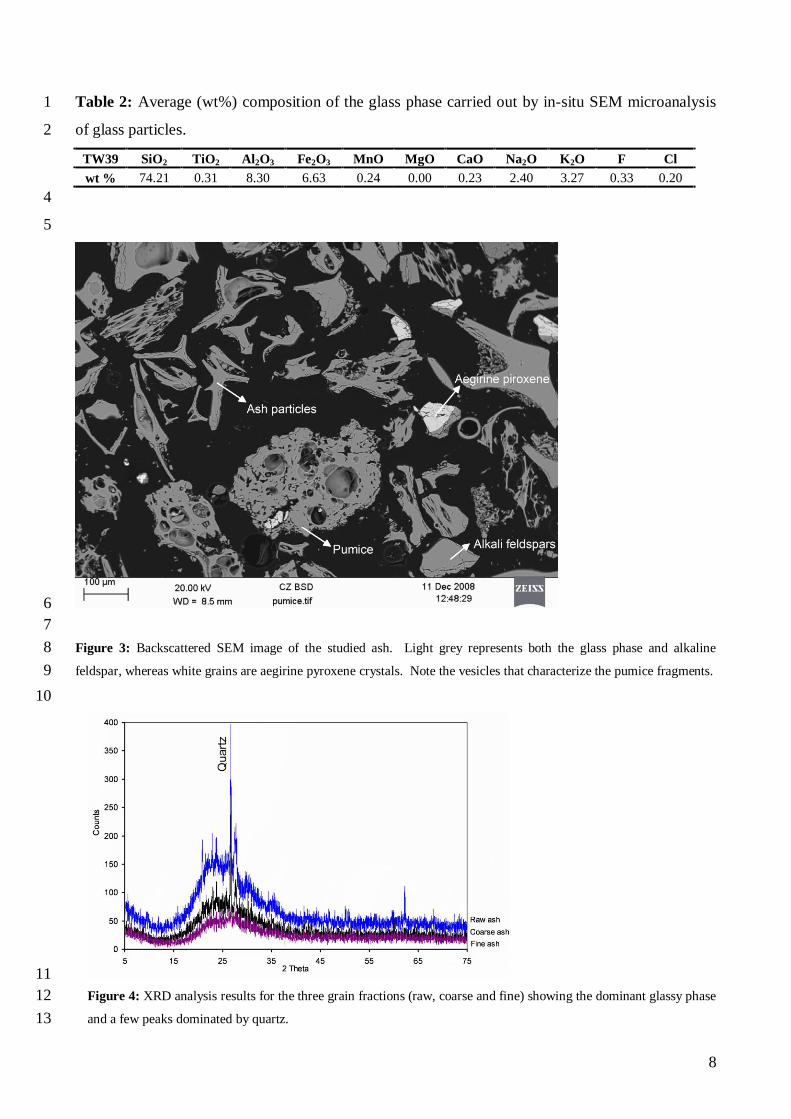
Figure 3: Backscattered SEM image of the studied ash. Light grey represents both the glass phase and alkaline 8
feldspar, whereas white grains are aegirine pyroxene crystals. Note the vesicles that characterize the pumice fragments. 9
10
11
Figure 4: XRD analysis results for the three grain fractions (raw, coarse and fine) showing the dominant glassy phase 12
and a few peaks dominated by quartz. 13
9
6.2. Geochemical composition of leachates 1
2
The composition of the leachates in the column experiments were predominantly controlled by the 3
dissolution of volcanic glass and surface coatings on the glass particles. The reaction kinetic in the 4
column is characterized by a rapid increase of pH (5.5 to alkaline) at the very beginning of the 5
experiment. The consumption of H+ ions is accompanied with the release of major ions. This 6
suggests the rapid dissolution of volcanic glass and a presence of cation-exchange processes. 7
Petrographic, XRD and SEM investigation revealed that the studied material mainly consist of 8
glass particles (>90%) and that the subordinate crystals consist of quartz, sanidine , pyroxene and 9
very rare apatite. Therefore, the dissolution of volcanic glass (that is also more reactive) is more 10
important than the dissolution of minerals in controlling leachate composition. Generally, high 11
levels of Na+, Ca
2+, Mg
2+, SO4
2−, NO3
−, Cl
−, F
− are released during the leaching experiments 12
whereas Li+, K
+, NH4
+ and Sr
2+ are leached at very low level. Also acetate and formate, typical 13
intermediate product of organic matter degradation (Christensen et al. 2000), are released at the 14
beginning of the elution (data shown in SI); the presence of these oxianions indicates that 15
hydrolization processes of the labile organic matter is taking place. 16
The chemical analysis of leachates from the three grain size fractions (fine, coarse and raw) showed 17
that the ions Na+, K
+, F
−, Cl
−, NO3
−, NH4
+ consistently decrease with increase of flushing time, 18
whereas Ca2+
, Mg2+
and SO42−
decreased at the beginning of the experiments, increased after the 19
first pore volumes are eluted and then finally decreased gradually (Figure 4 and also SI). The 20
geochemical behaviour of Ca2+
and Mg2+
mimics that of SO42−
along with time series, particularly 21
for the fine grained ash column (Figure 4). This suggests that the concentration of Ca2+
, Mg2+
and 22
SO42−
on the leachates to a certain extent have resulted from dissolution of gypsum coatings on 23
tephra particle surfaces. 24
The leaching experiments showed a pronounced effect of volcanic ash in controlling chemical 25
composition of the leachates, which can mirror the leaching behaviour of the rift volcanic ash 26
during rainfall events and surface runoff, when the infiltrating waters are immediately mineralized. 27
Generally, it can be summarized that the ions in the leachates were delivered by a combination of 28
two processes, dissolution of volcanic glass and dissolution from coatings on glass particles. 29
Considering that F−
is the most problematic water quality issue in the Ethiopian rift system, the 30
performed column experiments puts particular emphasis on the origin and the leaching behaviour of 31
F− during water-rock interaction processes. The maximum concentration levels at the beginning of 32
the experiment for the fine, coarse and raw grain fractions are 9.2±0.6, 2.3±0.1 and 2.7±0.1 mg/L 33
respectively and consistently decreased along the time series (Figure 6). During the experiment on 34

10
the fine ash fraction, the column was filled with 6.6 g (¼th) fine ash and
20 g (3/4
th) inert sand in 1
order to increase the column permeability for two main reasons (i) the experimental apparatus here 2
used was not able to produce a flow with elevated counter pressure and (ii) water percolation at 3
field conditions in very fine sediments is normally negligible with respect to coarse sediments 4
(Fetter 2004). Even at 1:4 ratios the fine fraction released 9.2 mg/L which is higher than the other 5
fractions. This suggested that much of the fluoride is concentrated and released from the finer 6
fractions. 7
8
9
10
11
Figure 5: Plots for the raw ash, the coarse ash and the fine ash leachate that show cations and anions concentration 12
variation along time series. 13
14
15
Figure 6: Column diagram showing the behaviour of F− leaching with time for the fine, coarse and raw ash leachates. 16

11
6.3. Tracer tests and model results 1
2
The main objectives of these tests were to determine if the physical equilibrium approach described 3
by the classical advection dispersion equation can be assumed or if non equilibrium processes 4
(preferential flows) were relevant for the column experiments. Once resolved this issue, the main 5
target was to quantify the physical parameters which deterministically describe the flow and 6
transport process. 7
8
Table 3: Moment analysis results for the three columns. 9
Parameter
μ0 μ1 μ2 S λL (cm) θ
Raw ash column 99.7 1.01 0.09 0.97 2.5 0.40
Coarse ash column 99.8 1.01 0.12 0.99 3.0 0.49
Fine ash column 100.2 0.99 0.03 0.69 0.6 0.45
11
Table 4: List of sediment grain size distribution, hydraulic conductivity, bulk density and effective 12
porosity. 13
Parameter
Raw ash
(<2 mm)
Coarse ash
(63 μm-2 mm)
Fine ash
(<63 μm)
Grain size (%) 100 71 29
Hydraulic conductivity (m/s) 1.9E-05 1.1E-04 1.1E-06
Bulk density (g/cm3) 1.18 1.68 1.61
Effective porosity 0.40 0.51 0.46
15
The mass recovery was near 100% for all tracer tests, and the centre of mass was recovered 16
approximately after 1 pore volume confirming the assumption of conservative transport for KCl. 17
Instead, the spreading around the centre of mass and the skewness were quite different: for instance, 18
μ2 and S of the fine ash column were very low as the predominant grain size was the inert sand used 19
to increase the column permeability; while μ2 and S of the other two columns were comparable. 20
Overall, the moment analysis confirmed the conservative behavior of the saline tracer used in the 21
tests and the higher spreading and tailing in the raw and coarse ash columns could suggest possible 22
preferential flow and diffusive mass transfer between mobile and immobile water zones. 23

12
To quantify this possible mechanism, on every column an additional tracer test with flow 1
interruption (not shown) was performed. The absence of concentration increase, after 30 minutes of 2
flow interruption, lead to exclude the substantial contribution of physical non equilibrium processes 3
in solute transport within the columns. Moreover, the total porosity measured gravimetrically and 4
the effective porosity determined by means of tracer testing gave similar results, thus their ratio 5
approached unity. This implies that there is no considerable partition between mobile and immobile 6
water within the column and there are no indications of preferential flow and corresponding 7
immobile water zones (Eriksson et al. 1997). 8
9
10
11
Figure 7: Calculated tracer concentration (black line) and observed (triangles) breakthrough curve for the raw ash 12
column, for the coarse ash column (gray line and circles) and for the fine ash column (black dashed line and crosses). 13
14
In Figure 7 are depicted the simulated and observed breakthrough curves of the non reactive tracer 15
(KCl) injected in every of the three columns after the elution experiments. The only parameter 16
adjusted during model calibration process was longitudinal dispersivity (λL), as hydraulic 17
conductivity was determined with constant head test and effective porosity (θ) was derived from: 18
A
vQ 19
where Q is the flow rate, A is the cross sectional area of the column and v is the measured velocity 20
of the tracer, calculated dividing the length of the column by the time required for the tracer centre 21
of mass to pass through the column. The elevated value for λL of raw and coarse ash columns is due 22
to the high tortuosity pathway that tracer particles encompass through these sediments, while for the 23

13
fine ash column the low value is representative of a homogeneous porous media, given by the inert 1
quartz employed. The model fit was satisfactory for all the columns with a correlation coefficient 2
(R2) of 0.998, 0.996 and 0.997 for the raw, coarse and fine ash columns respectively. 3
With the calibrated model, it has been possible to verify the amount of F- adsorbed onto different 4
grain size constituting the ash, just integrating the area of the observed elution of F- and subtracting 5
it to the integrated area of F-
calculated conservative elution. Form figure 8 is evident that the 6
amount of F- adsorbed is low and released very quickly from the matrix, especially comparing F
- 7
elution curve with Cl- curve, usually not retained by sediments (Griffioen 1992) except at very low 8
pH (< 4) where surface protonation reactions become important (Van Stempvoort et al. 1990). 9
10
11
12
Figure 8: Calculated (line) and observed (crosses) F- elution curve for the raw, coarse and fine ash column, in the upper 13
graphs; calculated (line) and observed (crosses) Cl- elution curve for the raw, coarse and fine ash column, in the lower 14
graphs. 15
16
The cumulative amount of F- eluted from the fine ash column was found to be 4.81 mg, considering 17
that the amount of sediment employed to built-up the column is 6.4 g and its bulk density is 1.1, a 18

14
release of 0.82 mg/cm3 of F
- from fine ash sediment can be calculated. The same computation gives 1
a F- release of 0.11 and 0.21 mg/cm
3 from the coarse ash and raw ash sediments, respectively. 2
3
7. Conclusions 4
5
The result of the study has demonstrated that the pyroclastic deposits are an important reservoir and 6
the ultimate source of fluoride in the water resource of the region. Leaching of fluoride was 7
significant, particularly at start of the column experiments. The highest measured concentration of 8
fluoride from the fine, coarse and raw grain fractions columns were 9.2±0.6, 2.3±0.1 and 2.7±0.1 9
mg/L respectively and gradually decreased over the duration of the experiment. The recorded 10
behaviour suggests that availability controlled mechanism for the release of fluoride in water, rather 11
than solubility controlled mechanism; the latter is characterized by constant concentrations reached 12
after an equilibration time and is typical of mineral weathering processes. The column experiment 13
on the volcanic ash using synthetic rain water has simulated the leaching behaviour of fluoride 14
during water-rock interaction processes. The total mass of leachable fluoride is resulted from F 15
concentrated in the fine fraction of the pyroclastic ash, which is released in major quantity from 16
amorphous vitric phase. The result has brought an important implication in the understanding of the 17
source and geochemical behaviour of fluoride in the natural waters of the rift. Here, we propose that 18
the finer fraction of volcanic ash is directly correlated to elevated leachable fluoride, for this reason 19
in case of new exploitations of groundwater resources we recommend to characterize at least the 20
grain size distribution at the field site scale, and to avoid locations with elevated fine (<63 μm) 21
grain size content. 22
23
Acknowledgements 24
25
This paper is based on the Ph.D. study of the first author at the University of Ferrara, where the 26
analyses have been carried out with the assistance of Umberto Tessari (for sediment grain size 27
analysis), Renzo Tassinari (XRF analysis) Massimo Verde (XRD analysis), and Richard Giddens 28
(SEM analysis). The work has been partially supported by ENVIREN project. 29
30
31
References 32
Allard, P., Aiuppa, A., Loyer, H., Carrot, F., Gaudry, A., Pinte, G., Michel, A., & Dongarra, G. (2000). Acid gas and 33
metal emission rates during long-lived basalt degassing at Stromboli volcano. Geophysical Research Letters, 27 (8), 34
1207–1210. 35

15
Appelo, C.A.J., Willemsen, A., Beekman, H. E., & Griffioen, J. (1990). Geochemical calculations and observations on 1
salt water intrusions. II validation of a geochemical transport model with column experiments. J. of Hydrology, 120, 2
225-250. 3
Armienta, M.A., Martin-Del-Pozzo A.L., Espinasa, R., Cruz, O., Ceniceros, N., Aguayo, A., & Butron, M.A.(1998). 4
Geochemistry of ash leachates during the 1994–1996 activity of Popocatepetl volcano. Appl. Geochem, 13, 841–5
850. 6
Armienta, M.A., De la Cruz-Reyna, S., Morton, O., Cruz, O, & Ceniceros, N. (2002). Chemical variations of tephra-fall 7
deposit leachates for three eruptions from Popocatepetl volcano. Journal of Volcanology and Geothermal Research, 8
113, 61-80. 9
Benvenuti, M., Carnicelli, S., Belluomini, G., Dainelli, N., Di Grazia, S., Ferrari, G.A., Iasio, C., Sagri, M., Ventra, D., 10
Balemwald Atnafu, & Seifu Kebede (2002). The Ziway-Shala basin (Main Ethiopian Rift, Ethiopia): a revision of 11
basin evolution with special reference to the late quaternary. Journal of African Earth Sciences, 35, 247-269. 12
Brusseau, M.L., Rao, P.S.C., Jessup, R.E. & Davidson, J.M. (1989). Flow interruption: a method for investigating 13
sorption non-equilibrium. Journal of Contaminant Hydrology, 4, 223–240. 14
Brusseau, M.L., Hu, Q., & Srivastava, R., (1997). Using flow interruption to identify factors causing non-ideal 15
contaminant transport. J. Contam. Hydrol, 24, 205–219. 16
Calderoni, G., Masi, U., & Petrone, V. (1993). Chemical features of spring waters from the East African Rift. A 17
reconnaissance study. In: Abbate, E., Sagri, M., & Sassi, P.P. (eds) Geology, mineral resources of Somalia and 18
surrounding regions. Istituto Agronomico Oltremare, Firenze, 699-710. 19
Chernet, T., & Travi, Y. (1993). Preliminary observations concerning the genesis of high flouride contents in the 20
Ethiopian Rift. In: Thorweiche U, Schandlmeier H (eds) Geoscientific research in Northeast Africa, Balkema, 21
Rotterdam, 8, 651–654. 22
Chernet, T. (1982). Hydrogeology of the lakes region, Ethiopia (Lakes Ziway, Langano, Abitata, Shalla and Awassa). 23
In: The Provisional Military Government of Socialist Ethiopia-Ministry of Mines and Energy, Ethiopian Institute of 24
Geological Surveys, Addis Ababa, pp. 97. 25
26
Christensen, T.H., Bjerg, P.L., Banwart, S. A., Jakobsen, R., Heron, G., Albrechtsen, H., 2000. Characterization of redox 27
conditions in groundwater contaminant plumes. J. Contam.Hydrol., 45: 165-241. 28
Cronin, S.J., Neall, V.E., Lecointre, J.A., Hedley, M.J., & Loganathan, P. (2003) Environmental hazards of fluoride in 29
volcanic ash: a case from Ruapehu volcano, New Zealand. J Volcanol Geotherm Res 121, 271–291. 30
Dainelli N, Benvenuti M, Sagri M. Geological map of the Ziway-Shala lakes basin (Ethiopia). 1:250000, Italian 31
Ministry for university and scientific and technological Research (MURST); 2001. 32
Darling, G., Gizaw, B., & Arusei, M. (1996). Lake-groundwater relationships and fluid-rock interaction in the East 33
African Rift Valley: isotopic evidence. Journal of African Earth Sciences, 22, 423-430. 34
Di Paola, G.M. (1972). The Ethiopian Rift Valley (between 7°00' and 8°40' lat. north). Bulletin Volcanology; 36:517-35
560. 36
Eriksson, Nils., Archana, Gupta., & Georgia, Destouni. (1997). Comparative analysis of laboratory and field tracer tests 37
for investigating preferential flow and transport in mining waste rock. Journal of Hydrology 194, 143–163. 38
Fetter, C. W. (2004). Applied Hydrogeology, 4rd Edition. Macmillan College, New York, 691 pp. 39
Giggenback, W.F. (1996). Chemical composition of volcanic gases. In: Scarpa RW, Tilling R.I. (eds.), Monitoring and 40
Mitigation of Volcanic Hazards. Springer, Berlin, pp. 221-256. 41

16
Gizaw, B. (1996). The origin of high bicarbonate and fluoride concentrations in waters of the Main Ethiopian Rift 1
Valley, East African Rift System. Journal of African Earth Sciences, 22(4), 391-402. 2
Griffioen, J. (1992). Cation-exchange and carbonate chemistry in aquifers foolowing groundwater flow. Ph. D. thesis, 3
Free University, Amsterdam, 182 pp. 4
Kampunzu A.B., & Mohr, P. Magmatic evolution and petrogenesis in the East African rift system. In: Kampunzu AB, 5
Lubala RT (Eds.), Magmatism in Extensional Structural Settings. Springer, Berlin, 1991, pp. 86–136. 6
Kilham, P., & Hecky, R.E. (1973). Fluoride: Geochemical and Ecological significance in East African Waters and 7
Sediments. Liminology and Oceanography, 18(6), 932-945. 8
Kloos, H., & Tekle-Haimanot, R. (1999). Distribution of fluoride and fluorosis in Ethiopia and prospects for control. 9
Tropical Medicine and International Health, 4, 355-364. 10
Harbaugh, A.W., Banta, E.R., Hill, M.C., & McDonald, M.G. (2000), MODFLOW-2000, The U.S. G. S. modular 11
ground-water model User guide to modularization concepts and the ground-water flow process, U. S. G. S., Open-12
file report 00-92. 13
Lester, F. (1974). Fluoride myelopathy, with a review of literature. Ethiop Med J, 12, 39–49. 14
Mohr, P. (1992). Nature of the crust beneath magmatically active continental rifts. Tectonophysics, 213, 269–284. 15
Olsson, B. (1979). Dental findings in high-fluoride areas in Ethiopia. Community Dent Oral Epidemiol, 7, 51–56. 16
Peccerillo, A., Barberio, M.R., Yirgu, G., Ayalew, D., Barbieri, M., & Wu, T.W. (2003). Relationships between mafic 17
and peralkaline acid magmatism in continental rift settings: a petrological, geochemical and isotopic study of the 18
Gedemsa volcano, central Ethiopian rift. Journal of Petrology, 44, 2003–2032. 19
Ptak, T., Piepenbrink, M., & Martac, E., (2004). Tracer tests for the investigation of heterogeneous porous media and 20
stochastic modelling of flow and transport-a review of some recent developments. Jour. of Hydrol., 294, 122–163. 21
Rango, T., Bianchini, G., Beccaluva, L., Ayenew, T., & Colombani, N. (2008). Hydrogeochemical study in the main 22
Ethiopian rift: new insights to source and enrichment mechanism of fluoride, Environ Geol, doi: 10.1007/s00254-23
008-1498-3. 24
Rango, T. (2008). Geochemical and isotopic composition of the central main Ethiopian rift waters: emphasis on the 25
study of source and genesis of fluoride, Unpublished PhD thesis, pp 136. 26
Shifera, G., & Tekle-Haimanot, R. (1999). A review of the defluoridation program of drinking water supplies of an 27
Ethiopian community. In: Dahl E, Nielsen LM, editors. Proceedings of the second international workshop on 28
fluorosis and defluoridation of water. Nazareth: International Society for Fluoride Research, pp. 160–167. 29
Tekle-Haimanot, R., Fekadu, A., & Bushra, B. (1987). Endemic fluorosis in the Ethiopian Rift Valley. Trop Geogr 30
Med, 39, 209–217. 31
Tekle-Haimanot, R. (1990). Neurological complication of endemic skeletal fluorosis with special emphasis on rediculo-32
myelopathy. Paraplegia, 28, 244–251. 33
Van Stempvoort, D. R., Reardon, E. J. And Frtz, P. (1990). Fractionation of sulphur and oxygen isotopes in sulphate by 34
soil sorption, Geochimica and Cosmochimica Acta, 54, 2817-2826. 35
Vincent, A., Benoit, P., Pot, V., Madrigal, I., Delgado-Moreno, L., & Labat, C. (2007). Impact of different and uses on 36
the migration of two herbicides in a silt loam soil: unsaturated soil column displacement studies. Europ. J. of Soil 37
Sci., 58, 320-328. 38
WHO. (2006). Guidelines for drinking-water quality. 1st Addendum to vol. 1. Recommendations, 3rd ed. Geneva: 39
World Health Organisation, pp. 595. 40

17
Yirgu, G., Dereje, A., Peccerillo, A., Barberio, M. R., Donati, C. & Donato, P. (1999). Fluorine and chlorine 1
distribution in the volcanic rocks from the Gedemsa volcano, Ethiopian Rift Valley. Acta Vulcanologica 11, 169–2
176. 3
Zheng, C.¸ & Bennett, G. D., (2002). Applied Contaminant Transport Modelling, 2nd Edition, John Wiley & Sons, New 4
York, 621 pp. 5
Zheng, C., & Wang, P. P., (1999). MT3DMS: A modular three-dimensional multispecies model for simulation of 6
advection, dispersion and chemical reactions of contaminants in groundwater systems; Documentation and User’s 7
Guide, Contract Report SERDP-99- 1; U.S. Army Engineer Research and Development Centre: Vicksburg, MS. 8
9
Supporting Information Available 10
11
Tables of major ions time series from each column experiment. 12
13
a) Raw-volcanic ash leachate major ions composition
Time (minutes) Acetate Formate Na+ NH4+ K
+ Mg
2+ Ca
2+ F
− Cl
− NO2
− NO3
− SO4
2−
1 0.72 1.21 36.2 0.63 6.51 5.02 14.82 2.65 45.12 0.32 60.9 16.8
3 0.81 1.33 22.6 0.47 5.64 0.77 2.56 2.23 36.58 0.02 46.9 14.7
6 0.12 0.04 6.61 0.35 3.17 0.27 1.36 1.22 18.45 − 23.97 9.12
9 0.06 0.02 4.83 0.13 2.39 0.17 1.22 1.12 8.79 − 11.87 4.59
12 − − 4.08 0.11 2.03 0.17 1.01 0.80 3.76 − 4.96 2.14
15 − − 4.03 0.36 2.16 1.01 3.52 0.66 2.48 − 3.22 1.43
18 − − 3.41 − 1.70 0.33 2.40 0.53 1.87 − 2.39 1.09
21 − − 3.10 0.07 1.56 0.21 2.94 0.46 1.54 − 1.97 0.85
24 − − 3.72 − 1.60 0.58 3.67 0.44 1.29 0.04 1.65 0.79
27 − − 2.12 − 1.08 0.42 7.50 0.36 3.08 − 1.38 8.71
30 − − 2.27 − 1.11 0.67 5.45 0.35 2.98 − 1.08 5.57
60 − − 1.01 0.09 0.77 5.32 3.64 0.23 6.53 − 0.43 23.3
90 − − 0.21 0.22 0.27 0.12 0.45 0.19 0.43 − 0.18 0.24
120 − − 0.20 − 0.23 0.09 0.74 0.08 − − − −
150 − − 0.48 − 0.38 0.17 0.25 0.01 − − − −
180 − − 0.23 − 0.22 0.12 0.24 0.01 − − − −
210 − − 0.20 − 0.13 0.02 0.13 0.01 − − − −
240 − − 0.11 − 0.09 − − 0.01 − − − −
270 − − − − − − − − − − − −
300 − − − − − − − − − − − −
330 − − − − − − − − − − − −
360 − − − − − − − − − − − −
390 − − − − − − − − − − − −
− = Below detection limits 14
15
16
b) Coarse-volcanic ash leachate major ions composition
Time (minutes) Acetate Formate Na+ NH4+ K
+ Mg
2+ Ca
2+ F
− Cl
− NO2
− NO3
− SO4
2−
1 0.21 0.36 65.0 3.50 1.20 7.00 23.0 2.31 65.0 − 101.0 45.0
3 0.12 0.12 64.0 3.47 1.19 7.32 21.5 2.31 66.4 − 105.5 45.8
6 0.08 0.35 31.8 1.24 0.46 2.71 5.17 2.14 33.3 0.03 38.1 21.3
9 − 0.31 9.79 0.68 0.21 1.74 2.58 1.66 10.9 − 8.64 7.26

18
12 − 0.21 6.27 0.48 0.12 1.17 4.28 1.20 5.41 − 7.91 21.6
15 − 0.13 5.37 0.31 0.10 7.76 16.2 0.95 2.69 − 1.58 15.6
18 − 0.12 6.57 0.32 0.08 11.7 19.9 0.75 1.40 − 3.46 13.3
21 − 0.10 3.04 0.08 0.07 10.5 9.19 0.85 3.86 0.02 3.81 4.26
24 − − 2.16 1.55 0.09 8.69 6.89 0.72 1.79 − 0.04 4.07
27 − − 3.85 − 0.05 6.79 5.44 0.40 8.68 0.14 1.72 6.24
30 − − 2.20 − 0.04 4.55 3.87 0.34 1.56 − 7.94 8.18
60 − − 2.57 − 0.04 2.90 2.41 0.26 1.47 − 2.83 6.50
90 − − 1.80 − 0.03 1.84 2.82 0.47 0.60 − 0.21 2.48
120 − − 1.88 − 0.03 1.85 3.42 0.10 0.78 0.13 1.22 7.14
150 − − 1.53 − 0.05 2.19 4.33 0.11 0.40 − 1.71 6.05
180 − − 1.55 − 0.03 1.75 2.15 0.10 1.58 − 3.36 4.69
210 − − 1.02 0.13 0.02 1.17 1.57 0.23 1.67 − 0.81 4.03
240 − − 0.70 0.05 0.03 0.45 1.70 0.18 1.21 − 1.27 4.21
270 − − 1.10 − 0.03 1.08 1.09 0.04 1.53 − 0.35 2.78
300 − − − − − − − − − − − −
330 − − − − − − − − − − − −
360 − − − − − − − − − − − −
390 − − − − − − − − − − − −
− = Below detection limits 1
2
c) Fine-volcanic ash leachate major ions composition
Time (minutes) Acetate Formate Na+ NH4+ K
+ Mg
2+ Ca
2+ F
− Cl
− NO2
− NO3
− SO4
2−
1 1.30 1.50 53.0 1.37 0.43 9.00 24.2 9.02 33.0 − 62.0 69.0
3 0.50 0.20 50.9 1.36 0.43 9.92 23.0 9.18 33.1 − 58.7 67.9
6 0.70 0.10 22.8 0.61 0.19 4.73 11.3 4.45 20.2 − 21.9 33.0
9 0.10 0.50 10.6 0.31 0.09 3.73 3.68 2.44 10.7 − 5.62 16.1
12 − 2.10 6.50 0.19 0.06 2.50 2.61 1.07 4.12 − 0.11 7.31
15 − 0.30 4.88 0.15 0.04 2.20 2.32 0.51 2.20 − 0.02 3.67
18 − 0.30 4.54 0.13 0.04 1.59 1.78 0.37 1.65 − 0.10 3.34
21 − 0.20 3.86 0.13 0.03 0.80 1.66 0.30 1.65 − 0.53 6.33
24 − − 2.93 0.16 0.03 0.54 1.64 0.29 2.49 − 0.67 9.08
27 − − 2.71 0.17 0.03 1.04 2.22 0.27 2.76 − 7.64 11.9
30 − − 3.89 0.21 0.03 3.91 3.37 0.49 1.86 − 6.16 15.4
60 − − 3.75 0.26 0.02 4.20 5.01 0.23 0.96 − 0.73 15.8
90 − − 4.64 0.29 0.02 6.70 12.3 0.10 1.55 − 2.12 18.7
120 − − 6.46 0.36 0.04 7.80 26.2 0.09 1.30 − 3.06 20.9
150 − − 1.61 0.28 0.05 7.77 18.6 0.07 1.33 − 9.48 20.2
180 − − 1.26 0.32 0.01 8.60 9.45 0.04 1.67 − 6.36 13.3
210 − − 2.97 0.25 0.02 7.87 8.72 0.08 1.56 − 0.79 4.70
240 − − 1.99 0.29 0.04 4.28 4.20 0.04 1.60 − 0.81 1.92
270 − − 1.68 0.15 0.01 2.01 3.58 0.12 3.27 − 4.64 1.57
300 − − 1.00 0.10 0.00 1.04 1.02 0.03 1.49 − 0.14 0.44
330 − − − − − − − − − − − −
360 − − − − − − − − − − − −
390 − − − − − − − − − − − −
− = Below detection limits 3
4
5