Geochemistry of Precarnbrian basaltic rocks from the Central African Republic (Equatorial Africa)
Upload
independentCategory
view
0download
0
Ple
ase
note
that
this
is a
n au
thor
-pro
duce
d P
DF
of a
n ar
ticle
acc
ept
ed fo
r pu
blic
atio
n fo
llow
ing
peer
rev
iew
. The
def
initi
ve p
ub
lish
er-a
uthe
ntic
ated
ve
rsio
n is
ava
ilab
le o
n th
e pu
blis
her
Web
site
1
Deep Sea Research Part II: Topical Studies in Oceanography November 2009, Volume 56, Issue 23, Pages 2313-2325 http://dx.doi.org/10.1016/j.dsr2.2009.04.012 © 2009 Elsevier Ltd All rights reserved.
Archimer Archive Institutionnelle de l’Ifremer
http://www.ifremer.fr/docelec/
Colonization patterns along the equatorial West African margin: Implications for functioning and diversity maintenance of bathyal and
abyssal communities
L. Menota, b, *, P. Crassousb, D. Desbruyèresb, J. Galéronb, A. Khripounoffb and M. Sibueta a Institut Océanographique, Rue Saint Jacques, Paris, France b Département DEEP/LEP, Ifremer, Centre de Brest, BP70, 29280 Plouzané, France *: Corresponding author : L. Menot, email address : [email protected]
Abstract: In the framework of the deep-sea environmental programme BIOZAIRE (Ifremer-Total), colonization trays were deployed for 283–433 days at three sites along the equatorial West African margin: ZA at 1300-m depth, ZC at 4000-m depth far from the Congo canyon and ZD at 4000-m depth close to the Congo canyon. The experiments aimed at determining the influence of depth and local environmental settings on macrofaunal colonization patterns and organic carbon degradation rates. The trays were filled with glass beads and this artificial substrate was enriched with ground particulate organic matter in a gradient of 0%, 0.34%, 1.02% and 3.43% organic carbon. The highest rates of organic carbon degradation ranged, according to the duration of the experiments, from 1.59 to 2.36 gC m−2 day−1 but were independent of depth or location. Colonization rates, conversely, varied by one order of magnitude between bathyal and abyssal experiments. The influence of experimental treatments on the structure of the colonizing macrofauna also varied according to location and depth. At ZA, colonization patterns were highly predictable and driven by a shift in dominance of opportunistic taxa along the enrichment gradient. To a lesser extent, this was also true at ZD, near the Congo canyon, while at ZC the treatments had no significant effect on the composition of the colonizing fauna. At abyssal depth, high rates of organic matter degradation associated with low rates of colonization suggested that pulse of organic matter would mainly benefit the resident community. At bathyal depth, high colonization rates of a specialized fauna might conversely play an important role in the functioning of the ecosystem. The regional and local coexistence of an opportunistic fauna via a spatial storage effect associated with dispersal might significantly contribute to the maintenance of high diversity on continental margins. Keywords: Biozaire; Colonization; Deep sea; Macrofauna; Organic enrichment; Diversity

1. Introduction
Since the first quantitative sampling of macrobenthic communities in the deep sea, ecologists have been intrigued by the elevated biodiversity of this resource-poor environment (Hessler and Sanders, 1967), apparently hardly reconcilable with basic principles in ecology like competitive exclusion (Hardin, 1960) and niche differentiation (Hutchinson, 1957). Several conceptual models have been proposed to explain the coexistence of species in the deep sea, the predominant ones focusing on local-scale processes (see Etter and Mullineaux, 2001; Snelgrove and Smith, 2002 for reviews). Sanders (1968) proposed that over evolutionary time the stability of the deep sea allowed for a fine partitioning of resources between species, according to feeding behavior or microhabitats. Etter and Grassle (1992), for example, found a positive relationship between macrobenthic diversity and grain-size heterogeneity, suggesting specialization on food-particle size. Jumars (1976) invoked niche diversification on biogenic heterogeneities at the scale of the individual. Grassle and Sanders (1973) also introduced a trade off between niche speciation and life-history. Relying on the “contemporaneous disequilibrium” model (Richerson et al., 1970), they suggested that small patches, created by various kinds of disturbances, are colonized by a succession of specialized fauna, from r-selected to k-selected species. This spatio-temporal mosaic differs from the “dynamic equilibrium” (Huston, 1979, 1994), also widely cited in the deep-sea benthic literature since Rex (1981), in that the later does not assume niche differentiation on the changing nature of disturbed patches. In the dynamic equilibrium model, high local species richness is maintained by a balance of rates of disturbance and rates of growth that allows avoiding or slowing down competitive exclusion. The importance of regional-scale processes as determinants of local species richness has been emphasized more recently (Gage, 2004; Levin et al., 2001). Considering the low densities of populations, the low dominance and vast number of rare species in deep-sea sediments, Gage (2004) questioned the high level of species interactions assumed by the aforementioned models. Levin et al. (2001) and Gage (2004) alternatively referred to the mass effect (Shmida and Ellner, 1984; Shmida and Wilson, 1985), as a major determinant for the co-existence of the long list of rare species typical of deep-sea mud samples. In this model, similar to a source-sink effect, each species is the best competitor in a particular patch or habitat but, due to recruitment limitation, any patch can also be “win by forfeit” by an inferior competitor (Hurtt and Pacala, 1995). Coexistence at local scale is thus maintained by recruitment limitation and local richness is a function of habitat or patch diversity at regional scale (Mouquet and Loreau, 2002). In the deep sea, probably more acutely than everywhere else, these hypotheses are difficult to test experimentally. Colonization and disturbance experiments were done with the main goal of testing the effect of local scale disturbances on diversity maintenance but generally provide little evidence that this mechanism alone could explain species coexistence (Snelgrove and Smith, 2002). Here, we set up experiments along the equatorial West African margin in order to compare colonization patterns of bathyal and abyssal macrobenthic communities in response to a gradient of organic enrichment. Food is the single most limiting resource in the deep sea and food inputs are known to be patchily distributed over the sea-floor (Gooday and Turley, 1990). The quantity, quality and spatio-temporal variations in the distribution of the trophic resource would thus likely be major determinants of species diversity under the assumption of interactive macrobenthic communities (Grassle, 1989). With this assumption in mind, year-long experiments were implemented in order to test if colonization rates would allow for a specialized fauna to take advantage of free resources. Indeed, while colonization rates are usually slow (Grassle and Morse-Porteous, 1987; Smith and Hessler, 1987), organic matter processing may occur in short time scales at both bathyal (Witte et al., 2003a) and abyssal depths (Aberle and Witte, 2003). These experiments were also replicated in space and time in order to test the predictability of the macrofaunal response to organic enrichment. The predictability of the response was assumed to provide further evidence of a highly specialized fauna living on variously enriched patches of
2

sediments. Finally, these experiments were implemented at bathyal depth and at abyssal depths - near (13 km) and far (200 km) from the Congo channel - in order to test the effect of contrasted environmental settings on colonization patterns.
2. Materials and methods
2.1. Study site
This experimental investigation form part of the pluridisciplinary environmental programme BIOZAIRE, conducted by Ifremer and supported by Total on deep-sea ecosystems of the Equatorial African margin. The experimental devices were moored at three sites along the West African margin (Figure 1). The site ZA, at 1300-m depth on the upper slope, was bordered by highly productive upwelling: to the north the Zaire river-induced upwelling, to the south the oceanic upwelling associated with the Angola dome and Angola-Benguela front and to east the coastal upwelling off Angola (van Bennekom and Berger, 1984). Organic carbon mineralization rate on this station, as deduced from benthic oxygen fluxes, was 13 g C.m-2.y-1 (Rabouille et al., submitted in this volume). Currents at 30 meters above bottom had a mean velocity of 7 cm.s-1 and maximal velocity of 27 cm.s-1, the frequency of currents above 15 cm.s-1 ranged from 5% in 2003 to 14% in 2000 (Vangriesheim et al. 2005, Vangriesheim, com. pers.) The sites ZC and ZD were both located at 4000 m depth. The site ZD, 13 km south of the Congo channel, was under the episodic influence of turbidite flows (Khripounoff et al., 2003). The Site ZC, 200 km southeast of the canyon, has been chosen as an abyssal reference, out of the influence of terrigenous inputs. At both sites, organic carbon mineralization rates were 7 g C.m-2.y-1 (Rabouille et al., submitted in this volume). Currents at 30 meters above bottom had a mean velocity of ca 3 cm.s-1 and most of the time did not exceed 5 cm.s-1. The frequency of currents above 5 cm.s-1 ranged from 6% at ZD, with a maximum velocity of 10 cm.s-1, to 15% at ZC, with a maximum velocity of 11 cm.s-1 (Vangriesheim et al., submitted in this volume). At both sites, macrofaunal densities consistently increased over the study period (Galéron et al., submitted in this volume). At all tree sites, organic carbon mineralization rates were about four times higher than organic carbon fluxes estimated from sediment traps, which suggested strong lateral inputs of organic matter along the equatorial West African margin (Rabouille et al., submitted in this volume).
2.2. Experimental design
The autonomous colonization lander (MAC, Module Autonome de Colonisation) was described by Desbruyères et al. (1980). A module is made of 16 cylindrical trays (20 cm diameter, 10 cm deep) arranged in four subunits (Figure 2). Each tray was covered by a screen of 5 mm square opening to avoid predation and physical disturbance of the substratum by fishes and large invertebrates. The experiments aimed at comparing the macrofaunal response pattern to increasing labile organic matter concentrations at bathyal and abyssal depths. Because experimental biases can not be avoided with such raised trays (Smith, 1985; Snelgrove et al., 1995), the objective was not to strictly mimic natural processes but instead to compare colonization patterns in a standardized way. For this reason, the trays were half filled with 660 g of an inert substrate made of glass beads (40-70 m diameter) that allowed ensuring a homogeneous mineral part of the substrate. Similarly, fish flour (Norseamink®) was chosen to supply a normalized source of labile organic carbon. The fish flour was mixed with glass beads and filtered seawater to obtain a homogenous mixture. The trays were then frozen, later filled with cold filtered seawater and frozen again until launching of the MAC. Four treatments were tested. A procedural control was left unenriched and three fish flour enrichments were used: a low concentration (5 g fish flour,
3

0.34 % organic carbon), a medium concentration (15 g fish flour, 1.02 % organic carbon) and a high concentration (50 g fish flour, 3.43 % organic carbon). The following abbreviations are used: procedural control = C, low enrichment = L, medium enrichment = M, and high enrichment = H. One tray of each treatment was set in each of the four MAC subunits (Figure 2). Each treatment was thus replicated four times. We aimed at conducting two experiments on two consecutives years on each of the three study sites. Two MACs however could not be recovered on site ZC. Only one experiment succeeded on this site. Details on location and durations of the experiments are given in table 1.
2.3. Collection and handling of samples
After recovery of a MAC, 5 cm3 subsamples were collected from each tray with a syringe for organic carbon analysis and frozen at –20°C. The remaining sediment was carefully washed through a 250 µm mesh sieve for macrofauna analyses. The sieve residues were fixed in 4% buffered formaldehyde for further sorting of the macrofauna. In the laboratory, the samples for organic carbon analysis were dried and treated with 2N HCl in order to remove carbonates. Organic carbon concentration was determined using a LECO WR12 analyzer on a weighted fraction of each sample. The samples for faunal analyses were stained with Rose Bengal before sorting of the fauna. The macrofauna sensu stricto was sorted and identified at the phylum level under a stereomicroscope and preserved in 70% ethanol. The Polychaeta were further identified at the family level, Mollusca at the class level and Crustacea at the subclass to order level.
2.4. Data Analyses
Variations in community composition were analysed using a Between-Group Principal Component Analysis (Dodélec and Chessel, 1987). Centred PCA were performed on sample x taxa matrices. Abundance data were transformed in order to use the Hellinger distance among samples rather than the Euclidean distance, normally preserved in PCA (Legendre and Gallagher, 2001). In the analysis of macrobenthic communities, the Hellinger distance offers several advantages over the Euclidean distance; in particular it gives a lower weight to dominant taxa and does not consider the double absence as an indicator of similarity between samples (Legendre and Gallagher, 2001). The samples were then clustered into their respective treatments for each experiment and between group analyses were run on the results of the PCA. This between-group PCA allows focusing on between treatment variability and test for the significance of differences between treatments using Monte-Carlo permutations (Dodélec and Chessel, 1987). The variance explains by the treatments (i.e. between-group inertia) has been used has an estimate of the predictability of colonization patterns. Multivariate analyses and tests were performed with the software ADE4 (Thioulouse et al., 1997).
3. Results
3.1. Organic carbon content
Organic carbon concentrations were low at the end of each experiment and for each treatment (Figure 3). Final organic carbon concentrations in the experimental trays were closed to the unenriched controls except in highly enriched trays, which presented visual and olfactory signs of anoxia. In these highly enriched treatments, 88% to 95% of the organic matter initially introduced has been degraded at the end of the experiments (Table 2). The highest rate was observed for the longer experiments (433 days) on the abyssal site ZD. The organic carbon mineralization deduced from the rates of organic matter degradation ranged
4

from 1.59 to 2.08 g C m-2 day-1 (Table 2). For similar duration of experiments, the mineralization rates were independent of sites and depths. Between-years variations in organic carbon concentrations for all treatments at sites ZA and ZD suggested variable natural inputs of particulate organic matter in the trays. This natural POC flux was particularly evident at site ZA during the experiment carried out in 2000 (Figure 3).
3.2. Colonization patterns
3.2.1. Bathyal site ZA
A total of 5739 individuals belonging to 43 taxa colonized the trays on site ZA (Table 3). The colonization rates were high, even in unenriched trays where densities were comparable to those found in natural sediments. Along the gradient of organic enrichment, the mean densities and mean number of taxa per treatment showed a classic response pattern (Figure 4). The mean densities increased from unenriched to moderately enriched treatments and sharply decreased towards the end of the gradient, in highly enriched and anoxic trays. The total and mean number of taxa decreased all along the gradient of enrichment for the experiment done in 2000 (Table 3, Figure 4). In 2001, the pattern was the same for total richness while the mean taxonomic richness remained constant from unenriched to moderately enriched treatments and decreased in highly enriched trays. The permutation test of the between-group analysis showed that the composition of the colonizing fauna significantly differed between treatments for each of the two experiments done in 2000 and 2001 (p<0.001). In each analysis, the between-group inertia contributed to 64% of the total inertia. The ordination of all samples grouped by treatments was consistent with the gradient of organic enrichment (Figure 5). The unenriched controls (C) and highly enriched treatments (H) were respectively isolated at the positive and negative ends of the first principal component axis. Along this same axis, the lightly (L) and moderately (M) enriched treatments had lower scores for the experiment done in 2000 than the experiment done in 2001, suggesting a higher enrichment in 2000 consistent with the higher concentrations in organic carbon observed at the end of this experiment (Figure 3). The taxa contributing mainly to the ordination patterns are shown on Figure 6. Along the gradient of organic enrichment, the polychaetes Opheliidae, Pholoidae and Spionidae were mainly characteristics of unenriched treatments then dominance shifted to Cirratulidae in lightly enriched treatments, Hesionidae and Dorvilleidae in moderately enriched treatments and the Isopoda in highly enriched treatments (Table 3). In lightly enriched treatments, a shift in dominance from Hesionidae in 2000 to Cirratulidae in 2001 explained the between-year variations in the ordination of this treatment in Figure 5.
3.2.2. Abyssal sites ZC and ZD
Thirty two taxa colonized the three MACs moored at abyssal depth, totalizing 501 individuals of the macrofauna (Table 4 and Table 5), an order of magnitude less than at the bathyal site ZA. The colonizing patterns along the gradient of organic enrichment were not as clear as on the bathyal site whether in terms of densities or taxonomic richness (ZC: Figure 7, ZD: Figure 8). At both site colonization rates were very low. The densities in the colonization trays never reached the densities observed in the background communities. The effect of organic enrichment on the composition of the colonizing fauna was not significant on the site ZC, far for the Congo canyon (permutation test of the between group analysis, p>0.05). A significant effect however was found on the site ZD, close to Congo canyon, for each year of experimentation (p < 0.001). The between-group inertia explained 50% and 42% of total inertia respectively for the experiments done in 2001 and 2002. The ordination of all samples and major taxa in the two first principal component axes of the between-group PCA are shown on Figure 9 and Figure 10 respectively. Although the
5

dispersion of samples around the barycentre of treatments was high, three clusters of treatments could be dissociated: a) the unenriched controls, b) the lightly enriched treatments associated with the moderately enriched treatment of 2002 and c) the highly enriched treatments associated with the moderately enrichment treatment of 2003. This shift of the two moderately enriched treatments was consistent with the higher organic carbon concentrations observed at the end of the 2003 experiment (Figure 3). For each of the three clusters, dominance patterns were as follow: a) Opheliidae, b) Capitellidae, c) Hesionidae and Amphipoda (Figure 10 and Table 4). 4. Discussion
These experiments aimed at determining the influence of depth and local environmental settings on macrofaunal colonization patterns and organic matter degradation rates along the equatorial West African margin. Overall, the results have shown clear differences in the colonization rates and in the structure of the colonizing fauna between bathyal and abyssal sites. One might argue that these differences result from variations in current velocity and consequently in variations in the hydrodynamic bias induced by trays protruding above the seafloor (Smith, 1985; Snelgrove et al., 1995). However, flume tests have shown that perturbations of the flow above raised trays were qualitatively similar in slow and fast flow while quantitatively, the size of eddies that formed in front of the trays and could enhance sedimentation out of the trays were slightly larger in fast flow (Snelgrove et al., 1995). A hydrodynamic bias could thus have reduced colonization rates at bathyal depth and decreased the size of the effect observed in these experiments. Nonetheless, the decoupling between colonization rates, that were still far higher at 1300 m than 4000 m depth, and the mineralization rates, that were in the same range irrespective of depth, suggest differences in both the functioning and the processes for diversity maintenance of bathyal and abyssal communities that are going to be discussed in the two next sections.
4.1. Implications for the functioning of bathyal and abyssal communities
Functional differences between bathyal and abyssal benthic communities in carbon mineralization have already been highlighted by short term incubation experimentations (Witte et al., 2003b). However, while these experiments concluded on lower mineralization rates at abyssal depth but an equally important contribution of the macrofauna to organic matter degradation, our longer term colonization experiments suggested instead that mineralization rates were independent of depth and that macrofaunal contribution was minor at abyssal depth. The outcomes of short-term incubations and long-term colonization experiments are not necessarily inconsistent but address different processes at different time scales. With the exception of highly enriched and anoxic treatments, all fish flour added in the trays had been degraded in 9.5 to 15 months, irrespective of depth. However, the kinetic of organic carbon consumption is unknown and might have varied between bathyal and abyssal experiments. Similar experiments, at 2100 m depth in the Bay of Biscay, had shown that 70% to 90% of fish flour was degraded in less than one to 6 months respectively (Mahaut, 1991). Fish flour was thus likely completely degraded before the end of Biozaïre’s experiments. As a consequence, any mineralization rate deduced from these experiments is underestimated because the time to complete degradation as well as the quantity of organic matter that had naturally settled during the time span of experimentations are unknown. Nevertheless, the best approximates, given by highly enriched trays in which most (89% to 95%) but not all of the fish flour has been consumed, yields carbon mineralization rates ranging from 1590 to 2360 mg C m-2 day-1 irrespective of depth. The highest percentage of degradation indeed was observed in the deepest but also the longest experiment. Mahaut (1991) reported even higher rates of up to 4250 mg C m-2 day-1 from the Meriadzec terrace at
6

2100 m depth. These rates were far higher than those deduced from short term experiments, in the abyss as well as on continental slopes (6 to 25 mg C.m-2.day-1 Moodley et al., 2002; Witte et al., 2003a; Witte et al., 2003b, Aspetsberger et al., 2007). Short term incubation experiments tracked the fate of 13C-labelled organic matter in dissolved inorganic carbon (respiration), bacterial and metazoan biomass but usually do not take into account all faunal size components nor all processes like dissolved organic carbon (Aspetsberger et al., 2007). In contrast, our experiments integrated all faunal groups and processes involved in organic matter degradation but did allow discriminating their relative role. Incubation experiments also lasted for 2 to 23 days. Focusing on short term benthic response to pluse organic matter, these experiments showed a latency in bacterial activity (Witte, 2003b), which might be related to the degree to which a community is accustomed, or not, to high food inputs (Aspetsberger et al., 2007). Our year-long experiments suggested that this initial latency was buffered over a longer time period. The mineralization of large quantity of labile organic matter then became independent of depth and mineralization rates were two orders of magnitude higher than those usually reported for the deep sea. While the experiments did not provide evidence of differential degradation rates according to depth, colonization rates varied markedly between bathyal and abyssal experiments. On the upper slope, the density of colonists in unenriched trays (3439 – 4872 ind.m-2) was in the range of that observed in background sediments (4379 ind.m-2). Macrofaunal densities were positively correlated to organic enrichment except where anoxia imposed harmful conditions for colonists. On the lower slope however, the density of colonists was an order of magnitude lower than at shallower depth (200 – 837 ind.m-2) and unrelated to organic enrichment. The densities in the trays were at best half those observed in background communities. The functional difference between bathyal and abyssal communities thus lies in the decreasing contribution of the macrofauna to carbon mineralization rates with depth, which is consistent with the overall decrease of macrobenthic biomass relative to smaller size-groups in the deep sea (Rex et al., 2006). Extrapolations of these results to natural processes however are limited by the fact that the experimental substrate was azoic and the experimental device prevented colonization by migration (Smith, 1985; Smith and Brumsickle, 1989). Witte et al. (2003b), for example, showed that the resident macrofauna responded without delay, and even faster than bacteria, to experimental enrichment in the Porcupine abyssal plain. A process that can not be mimicked in our colonization trays. Despite its limitations, the experiments still show that the annual supply of pelagic larvae to abyssal macrobenthic communities is very low and extremely slow compare to the kinetic of organic carbon degradation. A pulse of organic matter would thus mainly benefit to the resident macrofauna. Low larval supply would largely prevent its benefice to new recruits. Due to low food inputs and low densities, the mechanisms by which abyssal species can maintained viable population has been questioned (Rex et al., 2005). In this context, the quasi absence of opportunistic taxa proliferating on pulse resources might in fact contribute to the maintenance of a resident fauna. Colonization rates on the upper slope, on the other hand, were among the highest recorded in the deep sea. In contrast to abyssal depth, new recruits at bathyal depth would thus have the ability to exploit pulse of organic matter and have an important role in the functioning of the ecosystem.
4.2. Implications for diversity maintenance
The predictability of the macrofaunal response to organic enrichment varied according to depth and location. At abyssal depth and far from the Congo canyon, colonization patterns were rather unpredictable. The experiments provided little evidence that a component of the macrofauna has specialized on the exploitation of pulse organic matter supply. In the vicinity of the Congo canyon, the experimental organic enrichment significantly and repeatedly influenced the composition of the colonizing fauna. Local environmental settings might thus likely allow the maintenance of a specialized macrofauna. The colonization rates however were low; the
7

densities in the colonization trays never reached those of the background community. It remains unclear whether this specialized fauna could significantly contribute to the functioning of the ecosystem and the maintenance of diversity. Colonization experiments at abyssal depth have rarely been reported. Desbruyères et al. (1985) observed similarly low colonization rates at 4150 m depth in the Bay of Biscay. Interestingly, Desbruyères and Laubier (1988) described a new genus and species, Peinaleopolynoe sillardi, from organically enriched trays moored for 427 days at 4800 m depth in the Biscay abyssal plain. A second species in this genus was later described by Pettibone (1993) from a whale fall in the Santa Catalina Basin. Thus, while rare, taxa specializing on pulse organic matter are not absent from the abyss. At bathyal depth, the colonization patterns along the gradient of organic carbon concentrations were predictable in terms of abundance (unimodal) or taxonomic richness (decreasing) (Pearson and Rosenberg, 1978). The patterns in community composition were mainly driven by the succession in dominance of four taxa, the Cirratulidae, Hesionidae, Dorvilleidae and Isopoda, from slightly enriched to highly enriched trays. Hesionids and dorvilleids were rare in background samples but are usually common in organically enriched sediments and low oxygen conditions in the deep sea (Desbruyères et al., 1980; Grassle and Morse-Porteous, 1987; Levin, 1984; Levin et al., 1991; Snelgrove et al., 1996). Cirratulids mostly belong to the genus Caulleriella, which was not found in the surrounding community (L. Menot, pers. obs.) but again, was reported from an oxygen minimum zone in the Eastern Pacific (Levin et al., 1991) and dominated an unusual deep-sea community in a current-dominated system in the NW Atlantic (Blake and Grassle, 1994). At genus to family level, the response of the macrofauna was thus dominated by common deep-sea opportunists. Between 2000 and 2001, the shift in dominance of the cirratulids and hesionids in the low enrichment treatments was consistent with the natural input of organic matter recorded during the former year of experimentation, which supports the conclusion of a highly predictable response to enrichment and also shows that these taxa specialized on a narrow range of trophic conditions. The fauna colonizing the different treatments, from controls to moderately enriched trays, could be clearly differentiated while organic matter concentrations were equally low at the end of the experiments. The colonizing assemblages might be structured by an ancillary variable, like oxygen depletion, lasting longer than the enrichment itself. Alternatively, once settled, the dominant opportunists might preempt space and prevent settlement of potentially higher competitors. In competition-colonization models of diversity maintenance, preemption by fugitive species has been shown to increase the likelihood of species coexistence (Calcagno et al., 2006). In control trays, the natural supply of organic material coincided with enhanced colonization rates of the Opheliidae and Pholoidae, two among the top 5 dominant polychaete families in background sediments. Most of the opheliids were unidentified juveniles, which match the description given by Vanreusel et al. (2001). The pholoids all belonged to the same morphospecies of the genus Pholoe (L. Menot, pers. obs.), also found in background sediments at similar to lower densities than in our screened trays (Brind'Amour et al., submitted in this volume). Over a year, the influx of new recruits is thus large enough for a complete turn-over of the local population. Some mechanisms must act to limit the development of this dominant and successful colonizer species. As shown by Brind'Amour et al. (submitted in this volume), this species is spatially structured on the upper slope of the margin and its densities negatively co-varied with those of Scaphopoda and Bivalvia, which may suggest negative biotic interactions. Scaphopods and pholoids are predators and might compete for the same resources. In Grassle and Morse-Porteous’ (1987) colonization experiments, off New England at 1800 m depth, Pholoe anoculata was the only species among the 13 more abundant in the background community that achieved higher densities in screened trays than in background sediments. In unscreened trays however, the densities of this species were significantly lower. Predation might thus also control the population of this particular species although experimental artifact could not be ruled out (Grassle and Morse-Porteous, 1987). In experimental trays flushed with the ocean bottom at 900 m depth off U.S.
8

Virgin Islands, Snelgrove et al. (1996) similarly reported high colonization rates for one among the naturally dominant species. This pattern however remains unusual for deep-sea colonization experiments and the general case is that dominant species are slow colonizers, while colonizing assemblages are dominated by species rare or absent in background communities (Desbruyères et al., 1980; Desbruyères et al., 1985; Grassle and Morse-Porteous, 1987; Desbruyères and Laubier, 188; Levin and Smith, 1984; Snelgrove et al., 1992, 1994, 1996), except where a community is naturally dominated by opportunists (Levin and DiBacco, 1995). As a consequence of the low influx of recruits of dominant species, biotic interactions among macrofaunal species are unlikely to play a major role in structuring deep-sea benthic communities. Their role is furthermore expected to decrease with increasing depth. At bathyal depth, the rapid and specialized response of opportunistic taxa to disturbance, associated with their ability to pre-empt space for some time may enhance local species richness. At abyssal depth in contrast, due to the paucity of opportunistic taxa and the generally weak colonization rates in regards to high rates of organic matter degradation, the patchy distribution of organic material on the seafloor is unlikely to significantly enhance diversity. Overall, the results of these experiments are in agreement with Grassle and Sanders (1973) in that an opportunistic component of the bathyal macrofauna specialized on variously enriched food patches. They also match Huston’s (1979) model in that a trade off between rate of disturbance and rate of biological response probably fosters the co-existence of species on the continental slope. Grant (2000) questioned Huston’s model because its formulation implied intra-specific density dependent effects at low densities for the maintenance of rare species, which are unlikely to occur for deep-sea species. However, if we conceptually rephrased Huston’s model in the context of metacommunity models, rare species, like the opportunistic ones in colonization experiments, may become locally extinct at the patch-scale but can still coexist at larger scales because their habitat is persistent. This mechanism of local and regional coexistence in fact would rely on a spatial storage effect combined with dispersal (Amarasekare, 2003; Chesson, 2000).
5. Conclusion
These colonization experiments revealed similarities as well as differences in the functioning of bathyal and abyssal communities, which may have implications on mechanisms driving species coexistence in the deep sea. The similarity lied in comparable organic matter degradation rates at both depths while the dissimilarity lies in low and rather unpredictable response of the colonizing fauna on the lower slope versus high and predictable response on the upper slope. At bathyal depth, episodic and patchily concentrated inputs of organic matter may benefit to fugitive species, which biological traits allow for fast colonization, high growth rates and pre-emption of patches. This influx of species is hypothesized to foster local species richness in natural systems. Although these fugitive species may not persist at the scale of a single patch, local and regional coexistence might be maintained through dispersal and spatial storage effect, via source-sinks dynamics. Towards abyssal depth, due to low and unpredictable colonization rates, inputs of organic matter would more likely benefit to the resident macrofauna. As the main question for abyssal communities is how species can maintain viable populations? rather than how species can coexist?, the quasi absence of opportunists competing for pulse organic matter might in fact contribute to the local persistence of an abyssal fauna. The conclusions of these experiments are mainly concerned with a guild of opportunistic taxa and suggest that this guild decrease in diversity and abundance with depth. However, with the notable exception of a species of Pholoe, the low colonization rates of ambient species generally observed in deep-sea experiments also suggest that negative biotic interactions, including competitive exclusion, might be inexistent or occur at very slow rates thus contributing to the local maintenance of species richness.
9

Acknowledgements
We are grateful to the officers and crews of N.O. Le Suroît and N.O. L’Atalante for support at sea. LM would also like to thank Dr G.L.G. Paterson for his help with polychaete taxonomy and hospitality and the Urban Community of Brest for funding of the Ph.D. grant. The constructive comments of one anonymous reviewer are much appreciated. This research was carried out as part of the BIOZAIRE programme, co-funded by Ifremer and Total. This work contributes to the Census of Marine Life project COMARGE (Continental Margin Ecosystems on a worldwide scale).
References
Aberle, N., Witte, U., 2003. Deep-se macrofauna exposed to a simulated sedimentation event in the abyssal NE Atlantic: In situ pulse-chase experiments using super(13)C-labelled phytodetritus. Marine Ecology Progress Series 251, 37-47. Amarasekare, P., 2003. Competitive coexistence in spatially structured environments: a synthesis. Ecology Letters 6, 1109-1122. Aspetsberger, F., Zabel, M., Ferdelman, T., Struck, U., Mackensen, A., Ahke, A., Witte, U., 2007. Instantaneous benthic response to different organic matter quality: in situ experiments in the Benguela Upwelling System. Marine Biology Research 3, 342-356. Blake, J.A., Grassle, J.F., 1994. Benthic community structure on the U.S. South Atlantic slope off the Carolinas: spatial heterogeneity in a current-dominated system. Deep-Sea Research II 41 (4-6), 835-874. Brind'Amour, A., Menot, L., Galéron, J., Crassous, P., submitted. Spatial organization of a sedimentary macrobenthic community located on the West African Equatorial margin. Deep-Sea Research II. Calcagno, V., Mouquet, N., Jarne, P., David, P., 2006. Coexistence in a metacommunity: the competition-colonization trade-off is not dead. Ecology Letters 9, 897-907. Chesson, P., 2000. Mechanisms of maintenance of species diversity. Annual Revue of Ecology and Systematics 31, 346-346. Desbruyères, D., Bervas, J.Y., Khripounoff, A., 1980. Un cas de colonisation rapide d'un sédiment profond. Oceanologica Acta 3, 285-291. Desbruyères, D., Deming, J.W., Dinet, A., Khripounoff, A., 1985. Réactions de l'écosystème benthique profond aux perturbations : nouveaux résultats expérimentaux. In: Laubier, L., Monniot, C. (Eds.), Peuplements profonds du golfe de Gascogne : campagnes BIOGAS. IFREMER Service Documentation-Publications, Brest, pp. 193-218. Desbruyères, D., Laubier, L., 1988. Exploitation d'une source de matière organique concentrée dans l'océan profond : intervention d'une annélide polychète nouvelle. Comptes Rendus de l'Académie des Sciences de Paris (307). Dodélec, S., Chessel, D., 1987. Rythmes saisonniers et composantes stationnelles en milieu aquatique I.- Description d'un plan d'observation complet par projection de variable. Acta Oecologica, Oecologia Generalis 8, 403-426. Etter, R.J., Grassle, J.F., 1992. Patterns of species diversity in the deep-sea as a function of sediment particle size diversity. Nature 360, 576-578. Etter, R.J., Mullineaux, L.S., 2001. Deep-Sea Communities. In: Bertness, M.D., Gaines, S.D., Hay, M.E. (Eds.), Marine Community Ecology. Sinauer Associates, Inc., Sunderlands, Massachusetts, pp. 367-393. Gage, J.D., 2004. Diversity in deep-sea benthic macrofauna: the importance of local ecology, the larger scale, history and the Antarctic. Deep-Sea Research II 51 (14-16), 1689-1708.
10

Galéron, J., Menot, L., Renaud, N., Crassous, P., Khripounoff, A., Treigner, C., Sibuet, M., submitted. Spatial and temporal patterns of deep-sea macrofaunal communities in the Gulf of Guinea. Deep-Sea Research II. Gooday, A.J., Turley, C.M., 1990. Responses by benthic organisms to inputs of organic material to the ocean floor: a review. Philosophical transactions of the Royal Society of London. Series A: Physical sciences and engineering series A (331), 119-138. Grant, A., 2000. Deep-sea diversity: Overlooked messages from shallow-water sediments. Marine Ecology 21 (2), 97-112. Grassle, J.F., 1989. Species diversity in deep-sea communities. Trends in Ecology and Evolution 4 (1), 12-15. Grassle, J.F., Morse-Porteous, L.S., 1987. Macrofaunal colonization of disturbed deep-sea environments and the structure of deep-sea communities. Deep-Sea Research 34, 1911-1950. Grassle, J.F., Sanders, H.L., 1973. Life histories and the role of disturbance. Deep-Sea Research 20, 643-659. Hardin, G., 1960. The competitive exclusion principle. Science 131, 1292-1298. Hessler, R.R., Sanders, M.L., 1967. Faunal diversity in the deep-sea. Deep-Sea Research 14, 65-78. Hurtt, G.C., Pacala, S., 1995. The consequences of recruitment limitations: Reconciling chance, history and competitive differences between plants. Journal of Theoretical Biology 176, 1-12. Huston, M.A., 1979. A general hypothesis of species diversity. American Naturalist 113, 81-101. Huston, M.A., 1994. Biological diversity. The coexistence of species on changing landscapes. Cambridge University Press, Cambridge. Hutchinson, G.E., 1957. Concluding remarks. Cold Spring Harbor Symposia on Quantitative Biology, pp. 415-427. Jumars, P.A., 1976. Deep-sea species diversity: does it have a characteristic scale? Journal of Marine Research 34, 217-246. Khripounoff, A., Vangriesheim, A., Babonneau, N., Crassous, P., Dennielou, B., Savoye, B., 2003. Direct observation of intense turbidity current activity in the Zaire submarine valley at 4000 m water depth. Marine Geology 194 (3-4), 151-158. Legendre, L., Gallagher, E.G., 2001. Ecologically meaningful transformations for ordination of species data. Oecologia 129, 271-280. Levin, L.A., 1984. Life history and dispersal patterns in a dense infaunal polychaete assemblage: Community structure and response to disturbance. Ecology 65, 1185-1200. Levin, L.A., DiBacco, C., 1995. Influence of sediment transport on short-term recolonization by seamount infauna. Marine Ecology Progress Series 123, 163-175. Levin, L.A., Etter, R.J., Rex, M.A., Gooday, A.J., Smith, C.R., Pineda, J., Stuart, C.T., Hessler, R.R., Pawson, D., 2001. Environmental influences on regional deep-sea species diversity. Annual Revue of Ecology and Systematics 32, 51-93. Levin, L.A., Huggett, C.L., Wishner, K.F., 1991. Control of deep-sea benthic community structure by oxygen and organic-matter gradients in the eastern Pacific Ocean. Journal of Marine Research 49, 763-800. Levin, L.A., Smith, C.R., 1984. Response of background fauna to disturbance and enrichment in the deep sea: a sediment tray experiment. Deep-Sea Research 31, 1277-1285. Mahaut, M.-L., 1991. Modélisation à l'état stable du cycle du carbone dans le réseau trophique profond de la terrasse de Meriadzek (golfe de Gascogne), Université Paris VI. Moodley, L., Middelburg, J.J., Boschker, H.T.S., Duineveld, G.C.A., Pel, R., Herman, P.M.J., Heip, C.H.R., 2002. Bacteria and Foraminifera: key players in a short-term deep-sea benthic response to phytodetritus. Marine Ecology Progress Series 236, 23-29. Mouquet, N., Loreau, M., 2002. Coexistence in metacommunities: The regional similarity hypothesis. The American Naturalist 159, 420-426.
11

Pearson, T.H., Rosenberg, R., 1978. Macrobenthic succession in relation to organic enrichment and pollution of the marine environment. Oceanography and Marine Biology: an Annual Review 16, 229-311. Pettibone, M.H., 1993. Polynoid polychaetes associated with a whale skeleton in the bathyal Santa Catalina Basin. Proceedings of the Biological Society of Washington 106, 678-688. Rabouille, C., Caprais, J.C., Lansard, B., Crassous, P., Dedieu, K., Reyss, J.L., Khripounoff, A., submitted. In situ measurements of oxygen consumption and organic matter budget in the Southeast Atlantic continental margin close to the Congo Canyon. Deep-Sea Research II. Rex, M.A., 1981. Community structure in the deep-sea benthos. Annual Revue of Ecology and Systematics 12, 331-353. Rex, M.A., Etter, R.J., Morris, J.S., Crouse, J., McClain, C.R., Johnson, N.A., Stuart, C.T., Deming, J.W., Thies, R., Avery, R., 2006. Global bathymetric patterns of standing stock and body size in the deep-sea benthos. Marine Ecology Progress Series 317, 1-8. Rex, M.A., McClain, C.R., Johnson, N.A., Etter, R.J., Allen, J.A., Bouchet, P., Waren, A., 2005. A source-sink hypothesis for abyssal biodiversity. American Naturalist 165, 163-178. Richerson, P., Armstrong, R., Goldman, C.R., 1970. Contemporaneous disequilibrium, a new hypothesis to explain the "paradox of the plankton". Proceedings of the National Academy of Sciences 67, 1710-1710. Sanders, H.L., 1968. Marine benthic diversity: a comparative study. American Naturalist 102, 243-282. Shmida, A., Ellner, S., 1984. Coexistence of plant species with similar niches. Vegetatio 58, 29-55. Shmida, A., Wilson, M.V., 1985. Biological determinants of species diversity. Journal of Biogeography 12, 1-20. Smith, C.R., 1985. Colonization studies in the deep sea: are results biased by experimental designs? In: Gibbs, P.E. (Ed.), Nineteenth European Marine Biology Symposium. Cambridge University Press, pp. 183-190. Smith, C.R., Brumsickle, S.J., 1989. The effects of patch size and substrate isolation on colonization modes and rates in an intertidal sediment. Limnology and Oceanography 34, 1263-1277. Smith, C.R., Hessler, R.R., 1987. Colonization and succession in deep-sea ecosystems. Trends in Ecology and Evolution 2, 359-363. Snelgrove, P.V.R., Butman, C.A., Grassle, J.F., 1995. Potential flow artifacts associated with benthic experimental gear: Deep-sea mudbox examples. Journal of Marine Research 53, 821-845. Snelgrove, P.V.R., Grassle, J.F., Petrecca, R.F., 1992. The role of food patches in maintaining high deep-sea diversity: field experiments with hydrodynamically unbiased colonization trays. Limnology and Oceanography 37, 1542-1550. Snelgrove, P.V.R., Grassle, J.F., Petrecca, R.F., 1994. Macrofaunal response to artificial enrichments and depressions in a deep-sea habitat. Journal of Marine Research 52, 345-369. Snelgrove, P.V.R., Grassle, J.F., Petrecca, R.F., 1996. Experimental evidence for aging food patches as a factor contributing to high deep-sea macrofaunal diversity. Limnology and Oceanography 41, 605-614. Snelgrove, P.V.R., Smith, C.R., 2002. A riot of species in an environmental calm; The paradox of the species-rich deep sea. Oceanography and Marine Biology: an Annual Review 40, 311-342. Thioulouse, J., Chessel, D., Dolédec, S., Olivier, J.M., 1997. ADE-4: a multivariate analysis and graphical display software. Statistics and Computing 7, 75-83. Vangriesheim, A., Marie Treguier, A., Andre, G., 2005. Biweekly current oscillations on the continental slope of the Gulf of Guinea. Deep-Sea Research Part I: Oceanographic Research Papers 52, 2168-2183. Vangriesheim, A., Khripounoff, A., Crassous, P., submitted. Turbiditic events observed in situ along the Congo deep-sea channel. Deep-Sea Research II.
12

Vanreusel, A., Cosson-Sarradin, N., Gooday, A.J., Paterson, G.L.J., Galeron, J., Sibuet, M., Vincx, M., 2001. Evidence for episodic recruitment in a small opheliid polychaete species from the abyssal NE Atlantic. Progress in Oceanography 50, 285-301. Witte, U., Aberle, N., Sand, M., Wenzhöfer, F., 2003a. Rapid response of deep-sea benthic community to POM enrichment: an in situ experimental study. Marine Ecology Progress Series 251, 27-36. Witte, U., Wenzhöfer, F., Sommer, F., Boetius, A., Heinz, P., Aberle, N., Sand, M., Cremer, A., Abraham, W.-R., Jorgensen, B.B., Pfannkuche, O., 2003b. In situ experimental evidence of the fate of a phytodetritus pulse at the abyssal sea floor. Nature 424, 763-766.
Tables
Table 1: Location and duration of the colonization experiments
MAC n° Site Depth
(m)
Year Date of Mooring
(cruise)
Date of Recovery
(cruise)
Duration
(days)
1 ZA 1263 2000 28/03/00
(Zaiango-OBS-Biol)
05/01/01
(Biozaire 1)
283
5 ZA 3990 2001 07/01/01
(Biozaire 1)
19/11/01
(Biozaire 2)
316
4 ZC 3990 2000 31/03/00
(Zaiango-OBS-Biol)
- -
7 ZC 3988 2001 08/01/01
(Biozaire 1)
23/11/01
(Biozaire 2)
319
12 ZC 4000 2003 02/02/03
(Biozrecup)
- -
9 ZD 3958 2002 25/11/01
(Biozaire 2)
01/02/03
(Biozrecup)
433
11 ZD 4000 2003 01/02/03
(Biozrecup)
19/12/03
(Biozaire 3)
321
13

Table 2: Organic carbon degraded and corresponding organic carbon mineralization rates in highly enriched treatments for each experiment.
MAC n° Depth
(m)
Duration
(days)
Org-C Degraded
(% of initial concentration)
Org-C Mineralization
(gC m-2 day-1)
1 1263 283 88 2.36
5 3990 316 89 2.08
7 3988 319 90 2.07
9 3958 433 95 1.59
11 4000 321 93 2.13
14

15
Table 3: Mean densities (ind./314 cm²) and standard deviation of colonizing taxa in the two experiments deployed at site ZA in 2000 and 2001, BKG: mean densities of the same taxa in the background community (see Brind’Amour et al., submitted in this volume)
MAC MAC1 (2000) MAC5 (2001) Org-C initial 0% 0.34% 1.02% 3.43% 0% 0.34% 1.02% 3.43%
BKG
Acrocirridae 17.3 ±13.7 17.3 ±13.5 5.5 ±5.2 0.3 ±0.5 11.0 ±9.6 11.5 ±9.8 3- ±3- 0.3 ±0.5 0.5 Ampharetiae - - - - - - - - - - 0.3 ±0.5 0.3 ±0.5 - - 0.5 Amphinomidae 0.7 ±0.6 3.3 ±1.3 1.3 ±1.5 - - 3.0 ±2.4 2.5 ±1.3 3.0 ±1.2 - - 0.6 Capitellidae - - 8.0 ±2.2 8.8 ±9.6 1.3 ±1.5 0.5 ±0.6 23.8 ±9.2 12.5 ±1.9 1.5 ±3.0 2.5 Cirratulidae 12.3 ±11.2 43.8 ±30.2 1.3 ±1.9 - - 23.5 ±17.0 127.5 ±46.4 43.3 ±30.8 - - 4.9 Cossuridae 0.3 ±0.6 - - - - - - - - - - - - - - 2.2 Dorvilleidae 1.0 - 10.8 ±12.2 97.3 ±73.6 5.3 ±2.1 0.3 ±0.5 0.5 ±1.0 97.3 ±63.8 1.3 ±1.5 0.5 Fauveliopsidae 1.3 ±0.6 1.0 - - - - - - - - - 0.3 ±0.5 - - 0.9 Glyceridae 1.7 ±0.6 2.0 ±0.8 0.3 ±0.5 - - 4.0 ±2.2 4.0 ±2.2 1.3 ±0.5 0.3 ±0.5 2.5 Hesionidae 2.7 ±2.1 104.0 ±46.6 164.8 ±65.5 3.8 ±2.6 2.5 ±2.5 6.5 ±3.8 154.3 ±78.7 2.0 ±1.2 0.5 Lumbrineridae 1.0 ±1.0 - - - - - - - - 0.3 ±0.5 - - - - 2.4 Nephtyidae 1.3 ±2.3 0.3 ±0.5 - - - - 0.5 ±1.0 0.3 ±0.5 0.5 ±0.6 - - 2.8 Nereididae 1.0 ±1.0 - - - - - - 0.5 ±0.6 0.5 ±0.6 - - - - 0.6 Opheliidae 31.7 ±18.0 10.3 ±6.9 1.0 ±1.2 - - 13.3 ±8.5 7.5 ±5.0 1.8 ±1.7 0.3 ±0.5 4.5 Paraonidae - - 6.3 ±7.1 14.0 ±13.3 - - 0.3 ±0.5 - - 0.8 ±0.5 - - 8.9 Pholoidae 17.0 ±4.4 9.5 ±6.1 4.0 ±2.6 - - 5.8 ±3.6 3.0 ±1.4 4.3 ±2.4 - - 5.9 Phyllodocidae - - - - - - - - 0.3 ±0.5 0.3 ±0.5 - - - - 0.5 Polynoidae 0.7 ±0.6 0.3 ±0.5 0.3 ±0.5 0.8 ±1.0 1.3 ±1.0 1.0 ±0.8 0.8 ±1.0 0.5 ±0.6 0.0 Sabellidae - - - - - - - - 0.5 ±0.6 - - - - - - 1.0 Sigalionidae 5.0 ±1.7 0.5 ±1.0 0.8 ±1.0 - - 1.5 ±1.3 1.5 ±1.7 0.3 ±0.5 - - 0.6 Sphaerodoridae 0.3 ±0.6 - - - - 0.3 ±0.5 - - 0.3 ±0.5 - - 0.3 ±0.5 1.8 Spionidae 9.0 ±3.5 6.0 ±3.4 3.0 ±2.2 0.3 ±0.5 7.0 ±1.4 12.3 ±11.4 9.0 ±6.2 1.3 ±0.5 9.0 Syllidae 2.3 ±1.5 2.5 ±1.3 1.0 ±0.8 - - 2.0 ±2.4 1.0 ±1.4 0.8 ±0.5 - - 6.1 Terebellomorphe 0.3 ±0.6 0.3 ±0.5 - - - - - - - - - - - - 1.6 Amphipoda 1.0 ±1.0 3.3 ±5.3 - - 1.5 ±3.0 0.5 ±0.6 0.5 ±1.0 0.3 ±0.5 0.8 ±1.0 1.6 Aplacophora 2.7 ±0.6 0.8 ±1.0 - - - - 2.3 ±1.7 0.3 ±0.5 1.0 ±1.4 - - 4.1 Asteroidea 0.7 ±0.6 - - - - - - - - - - - - - - 0.4 Bivalvia 6.7 ±0.6 8.0 ±3.5 2.0 ±0.8 2.8 ±1.9 7.8 ±5.7 5.8 ±4.3 3.8 ±3.5 0.8 ±0.5 10.5 Cumacea 0.3 ±0.6 0.8 ±1.0 0.3 ±0.5 - - 2.8 ±1.9 0.3 ±0.5 0.8 ±1.0 - - 0.7 Echinoidea 0.3 ±0.6 - - - - - - - - - - - - - - 0.1 Echiura 2- ±16.0 - - 0.3 ±0.5 - - 2.8 ±2.2 - - - - - - 0.0 Gastropoda 3.3 ±1.5 3.0 ±2.2 1.3 ±1.0 0.3 ±0.5 4.0 ±2.9 3.0 ±2.9 2.3 ±2.6 0.8 ±1.0 0.7

MAC MAC1 (2000) MAC5 (2001) Org-C initial 0% 0.34% 1.02% 3.43% 0% 0.34% 1.02% 3.43%
BKG
Holothuroidea - - 0.3 ±0.5 - - - - 1.0 ±1.4 - - - - - - 0.5 Hydroida 0.7 ±0.6 0.3 ±0.5 0.3 ±0.5 - - - - - - - - - - 0.6 Isopoda 0.7 ±0.6 1.8 ±1.0 2.3 ±1.9 5.8 ±3.3 3.0 ±2.9 1.8 ±1.3 2.8 ±3.6 6.0 ±3.7 12.4 Nemertea 1.0 ±1.0 - - - - - - 0.3 ±0.5 0.8 ±1.5 0.3 ±0.5 - - 4.1 Nudibranchia 1.0 ±1.0 0.5 ±1.0 - - - - - - - - - - - - 0.0 Ophiuroidea - - - - - - - - 1.5 ±2.4 0.5 ±0.6 0.5 ±1.0 0.3 ±0.5 0.2 Opistobranchia - - 0.3 ±0.5 - - - - - - - - - - - - 0.0 Priapulida 0.3 ±0.6 - - - - - - - - - - - - - - 0.0 Scaphopoda 5.7 ±3.8 5.0 ±1.6 1.8 ±0.5 - - 2.0 ±1.4 4.8 ±1.9 1.8 ±1.5 - - 2.9 Sipuncula 1.0 ±1.0 0.3 ±0.5 0.3 ±0.5 - - 0.5 ±0.6 0.5 ±0.6 - - 0.3 ±0.5 13.9 Tanaidacea 1.0 - 5.3 ±2.5 3.5 ±1.0 2.8 ±1.3 2.3 ±0.5 1.5 ±2.4 3.0 ±2.4 1.0 ±2.0 15.2 Total densities 153.3 ±28.4 255.0 ±48.9 314.8 ±143.5 24.8 ±7.4 108.0 ±57.2 223.8 ±76.7 376.3 ±191.5 17.3 ±7.8 134.2Number of taxa 35 30 23 12 31 30 27 16
16

17
Table 4: Mean densities (ind./314 cm²) and standard deviation of colonizing taxa in the experiment deployed at site ZC in 2001. BKG: mean densities of the same taxa in the background community (see Galéron et al., submitted in this volume).
MAC MAC 7 (2001) Org-C initial 0% 0.34% 1.02% 3.43%
BKG
Acrocirridae 1.5 ±1.7 0.8 ±1.0 - - 0.3 ±0.5 0.6 Ampharetidae - - - - - - 0.3 ±0.5 1.3 Amphinomidae 0.5 ±0.6 0.5 ±1.0 - - - - 0.5 Capitellidae 0.3 ±0.5 0.3 ±0.5 - - 0.5 ±1.0 0.3 Chrysopetalidae - - - 1.7 ±2.1 0.0 Cirratulidae - - 0.5 ±0.6 - - 0.5 ±1.0 7.5 Dorvilleidae 3.3 ±4.0 3.8 ±3.2 3.3 ±2.8 2.0 ±1.8 0.5 Hesionidae 9.3 ±6.4 1.3 ±1.0 0.5 ±0.6 3.5 ±5.5 1.1 Lumbrineridae - - 0.3 ±0.5 - - - - 0.7 Maldanidae 0.3 ±0.5 - - - - - - > 0.1 Nereididae - - - - - - 0.3 ±0.5 1.8 Opheliidae 1.5 ±2.4 0.5 ±1.0 - - - - 1.1 Pholoidae 0.5 ±0.6 0.5 ±0.6 - - 0.3 ±0.5 0.4 Phyllodocidae 0.8 ±1.0 0.3 ±0.5 - - 0.5 ±1.0 0.3 Polynoidae - - - - - - 0.8 ±1.0 0.0 Spionidae 1.0 ±0.8 2.0 ±1.6 - - 0.5 ±0.6 3.3 Syllidae 0.3 ±0.5 - - - - - - 2.9 Polychaeta - - - - - - 0.3 ±0.5 Gastropoda - - - - 0.8 ±1.0 0.3 ±0.5 0.5 Bivalvia 5.5 ±6.9 0.3 ±0.5 0.8 ±0.5 0.3 ±0.5 19.3 Tanaidacea - - 0.3 ±0.5 0.3 ±0.5 0.5 ±1.0 11.0 Isopoda 1.3 ±1.5 - - - - 0.3 ±0.5 7.0 Decapoda - - - - 0.3 ±0.5 - - 0.0 Amphipoda - - - - - - 0.5 ±1.0 1.0 Chaetognatha 0.3 ±0.5 0.3 ±0.5 0.5 ±1.0 0.3 ±0.5 0.0 Appendicularia 0.3 ±0.5 0.5 ±1.0 - - - - 0.0 Total densities 26.3 ±16.2 11.8 ±6.6 6.3 ±4.8 13.3 ±9.2 61.3 Number of taxa 15 15 7 19
18
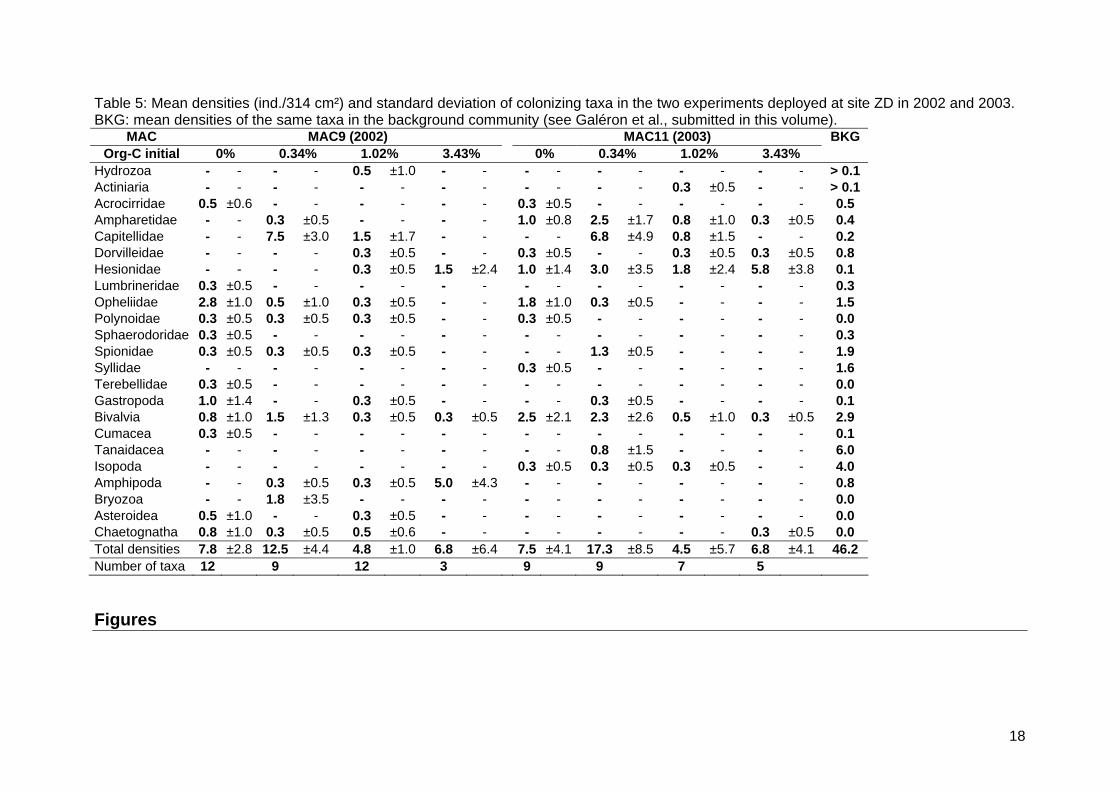
Table 5: Mean densities (ind./314 cm²) and standard deviation of colonizing taxa in the two experiments deployed at site ZD in 2002 and 2003. BKG: mean densities of the same taxa in the background community (see Galéron et al., submitted in this volume).
MAC MAC9 (2002) MAC11 (2003) Org-C initial 0% 0.34% 1.02% 3.43% 0% 0.34% 1.02% 3.43%
BKG
Hydrozoa - - - - 0.5 ±1.0 - - - - - - - - - - > 0.1 Actiniaria - - - - - - - - - - - - 0.3 ±0.5 - - > 0.1 Acrocirridae 0.5 ±0.6 - - - - - - 0.3 ±0.5 - - - - - - 0.5 Ampharetidae - - 0.3 ±0.5 - - - - 1.0 ±0.8 2.5 ±1.7 0.8 ±1.0 0.3 ±0.5 0.4 Capitellidae - - 7.5 ±3.0 1.5 ±1.7 - - - - 6.8 ±4.9 0.8 ±1.5 - - 0.2 Dorvilleidae - - - - 0.3 ±0.5 - - 0.3 ±0.5 - - 0.3 ±0.5 0.3 ±0.5 0.8 Hesionidae - - - - 0.3 ±0.5 1.5 ±2.4 1.0 ±1.4 3.0 ±3.5 1.8 ±2.4 5.8 ±3.8 0.1 Lumbrineridae 0.3 ±0.5 - - - - - - - - - - - - - - 0.3 Opheliidae 2.8 ±1.0 0.5 ±1.0 0.3 ±0.5 - - 1.8 ±1.0 0.3 ±0.5 - - - - 1.5 Polynoidae 0.3 ±0.5 0.3 ±0.5 0.3 ±0.5 - - 0.3 ±0.5 - - - - - - 0.0 Sphaerodoridae 0.3 ±0.5 - - - - - - - - - - - - - - 0.3 Spionidae 0.3 ±0.5 0.3 ±0.5 0.3 ±0.5 - - - - 1.3 ±0.5 - - - - 1.9 Syllidae - - - - - - - - 0.3 ±0.5 - - - - - - 1.6 Terebellidae 0.3 ±0.5 - - - - - - - - - - - - - - 0.0 Gastropoda 1.0 ±1.4 - - 0.3 ±0.5 - - - - 0.3 ±0.5 - - - - 0.1 Bivalvia 0.8 ±1.0 1.5 ±1.3 0.3 ±0.5 0.3 ±0.5 2.5 ±2.1 2.3 ±2.6 0.5 ±1.0 0.3 ±0.5 2.9 Cumacea 0.3 ±0.5 - - - - - - - - - - - - - - 0.1 Tanaidacea - - - - - - - - - - 0.8 ±1.5 - - - - 6.0 Isopoda - - - - - - - - 0.3 ±0.5 0.3 ±0.5 0.3 ±0.5 - - 4.0 Amphipoda - - 0.3 ±0.5 0.3 ±0.5 5.0 ±4.3 - - - - - - - - 0.8 Bryozoa - - 1.8 ±3.5 - - - - - - - - - - - - 0.0 Asteroidea 0.5 ±1.0 - - 0.3 ±0.5 - - - - - - - - - - 0.0 Chaetognatha 0.8 ±1.0 0.3 ±0.5 0.5 ±0.6 - - - - - - - - 0.3 ±0.5 0.0 Total densities 7.8 ±2.8 12.5 ±4.4 4.8 ±1.0 6.8 ±6.4 7.5 ±4.1 17.3 ±8.5 4.5 ±5.7 6.8 ±4.1 46.2 Number of taxa 12 9 12 3 9 9 7 5 Figures

ZD
ZCZA
ZDZD
ZCZCZAZA
Figure 1: Location of the three experimental sites along the Angolan margin.
19

A
B
C
DE
F
G
Figure 2 Diagram of autonomous colonization lander showing the aluminum frame (A) that held the experimental subunits (B), the acoustic release (F) and a weight (G). A subunit is a circular PVC cup (80 cm diam., 13 cm deep) covered by a lid punched of 4 openings (C and D) that contains 4 trays (20 cm diam., 10 cm deep). The lids are in closed position during launching, about 15 hours after the launch, a magnesium release device (E) allows the lids to rotate a 1/8th turn (the open position). Acoustic release of the weight induces a new 1/8th turn of the lids that come in close position when the lander lifts the bottom.
20

0.00
0.10
0.20
0.30
0.40
0.50
0.60
0.00 0.34 1.02 3.43
20022003
0.00
0.10
0.20
0.30
0.40
0.50
0.6020002001
0.00
0.10
0.20
0.30
0.40
0.50
0.60
Initial organic carbon concentrations (%)
Fin
al o
rgan
ic c
arb
on
co
nce
ntr
atio
ns
(%
)
Site ZA
Site ZC
Site ZD
Figure 3 Mean organic carbon concentrations according to initial enrichments at the end of experiments on sites ZA, ZC and ZD (bars: one standard deviation).
21

0
100
200
300
400
500
600
0.00 0.34 1.02 3.43
20002001
0
5
10
15
20
25
30
35
0.00 0.34 1.02 3.43
20002001
Initial organic carbon concentrations (%)
Ta
xo
no
mic
ric
hn
ess
(ta
xa/3
14c
m²)
De
ns
itie
s (i
nd
./314
cm
²)
Figure 4: Mean macrofaunal densities (top) and mean number of macrofaunal taxa (bottom) in colonization trays according to initial organic enrichment on the bathyal study site ZA (1300-m depth) (bars: one standard deviation).
22

C
LM
H
C
L
M
H
-0.51
0.42-0.52 0.61
Figure 5: Between-group Principal Component Analysis of the experiments on the bathyal study site ZA, ordinations of samples in the two first Principal Component axes (PC1: 52% and PC2: 25% of total inertia). The large circles denotes the barycentre of samples grouped by treatments (C: 0% Org-C, L: 0.34% Org-C, M: 1.02% Org-C, H: 3.43% Org-C). The colors indicate the year of the experiment (white circles: 2000; grey circles: 2001).
23

Acrocirridae (2%)
Capitellidae (3%)
Cirratulidae (21%)
Dorvilleidae (11%)
Hesionidae (19%)
Opheliidae (7%)
Pholoidae (3%)
Spionidae (2%)
Echiura (4%)
Isopoda (12%)
-0.56
0.57-0.44 0.53
Figure 6: Between-group Principal Component Analysis of the experiments on the bathyal study site ZA, ordinations of taxa in the two first Principal Component axes (PC1: 52% and PC2: 25% of total inertia). Only the taxa contributing to at least 2% of total inertia are shown, the contribution is given in brackets.
24

Initial organic carbon concentrations (%)
Ta
xo
no
mic
ric
hn
ess
(ta
xa/3
14c
m²)
Den
siti
es (
ind
./31
4 cm
²)
0
10
20
30
40
50
0.00 0.34 1.02 3.43
0
2
4
6
8
10
12
0.00 0.34 1.02 3.43
Figure 7: Mean macrofaunal densities (top) and mean number of macrofaunal taxa (bottom) in colonization trays according to initial organic enrichment on the abyssal study site ZC (4000-m depth) (bars: one standard deviation).
25

Initial organic carbon concentrations (%)
Tax
on
om
ic r
ich
nes
s (t
axa
/314
cm²)
De
nsi
ties
(in
d./3
14 c
m²)
0
5
10
15
20
25
30
0.00 0.34 1.02 3.43
20022003
0
1
2
3
4
5
6
7
0.00 0.34 1.02 3.43
20022003
Figure 8: Mean macrofaunal densities (top) and mean number of macrofaunal taxa (bottom) in colonization trays according to initial organic enrichment on the abyssal study site ZD (4000-m depth) (bars: one standard deviation).
26

-0.67
0.5-0.67 0.62
C
C
L
L
M
M
H
H
Figure 9: Between-group Principal Component Analysis of the experiments on the abyssal study site ZD, ordinations of samples in the two first Principal Component axes (PC1: 22% and PC2: 18% of total inertia). The large circles denotes the barycentre of samples grouped by treatments (C: 0% Org-C, L: 0.34% Org-C, M: 1.02% Org-C, H: 3.43% Org-C). The colors indicate the year of the experiment (white circles: 2002; grey circles: 2003).
27

Ampharetidae (7%)
Capitellidae (23%)
Hesionidae (20%)
Opheliidae (13%)
Spionidae (2%)
Bivalvia (4%)
Amphipoda (20%)
-0.67
0.54-0.55 0.69
Figure 10: Between-group Principal Component Analysis of the experiments on the abyssal study site ZD, ordinations of taxa in the two first Principal Component axes (PC1: 22% and PC2: 18% of total inertia). Only the taxa contributing to at least 2% of total inertia are shown, the contribution is given in brackets.
28
Copyright © 2022 FDOKUMEN