College Readiness and Digital Badges: A Middle School ...
117
Purdue University Purdue University Purdue e-Pubs Purdue e-Pubs Open Access Dissertations Theses and Dissertations 5-2018 College Readiness and Digital Badges: A Middle School Approach College Readiness and Digital Badges: A Middle School Approach Blake C. Nemelka Purdue University Follow this and additional works at: https://docs.lib.purdue.edu/open_access_dissertations Recommended Citation Recommended Citation Nemelka, Blake C., "College Readiness and Digital Badges: A Middle School Approach" (2018). Open Access Dissertations. 1859. https://docs.lib.purdue.edu/open_access_dissertations/1859 This document has been made available through Purdue e-Pubs, a service of the Purdue University Libraries. Please contact [email protected] for additional information.
-
Upload
khangminh22 -
Category
Documents
-
view
1 -
download
0
Transcript of College Readiness and Digital Badges: A Middle School ...

Purdue University Purdue University
Purdue e-Pubs Purdue e-Pubs
Open Access Dissertations Theses and Dissertations
5-2018
College Readiness and Digital Badges: A Middle School Approach College Readiness and Digital Badges: A Middle School Approach
Blake C. Nemelka Purdue University
Follow this and additional works at: https://docs.lib.purdue.edu/open_access_dissertations
Recommended Citation Recommended Citation Nemelka, Blake C., "College Readiness and Digital Badges: A Middle School Approach" (2018). Open Access Dissertations. 1859. https://docs.lib.purdue.edu/open_access_dissertations/1859
This document has been made available through Purdue e-Pubs, a service of the Purdue University Libraries. Please contact [email protected] for additional information.

COLLEGE READINESS AND DIGITAL BADGES:
A MIDDLE SCHOOL APPROACH by
Blake C. Nemelka
A Dissertation
Submitted to the Faculty of Purdue University
In Partial Fulfillment of the Requirements for the degree of
Doctor of Philosophy
Department of Curriculum & Instruction
West Lafayette, Indiana
May 2018
ii
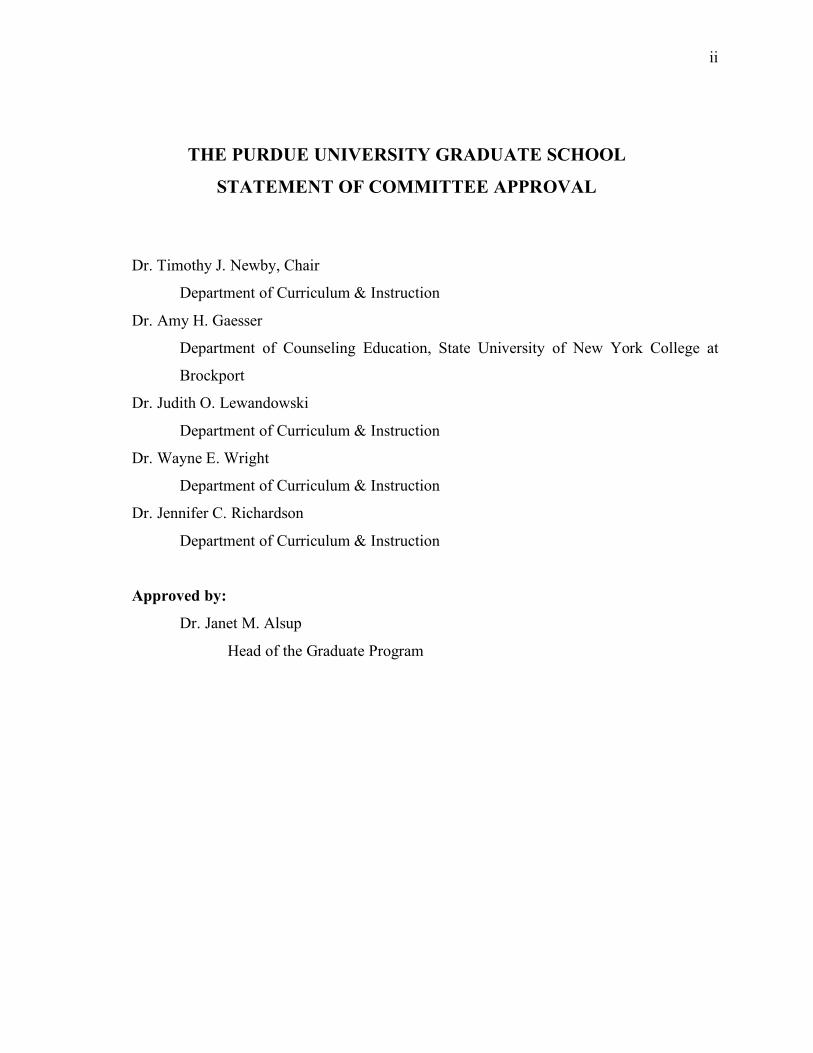
THE PURDUE UNIVERSITY GRADUATE SCHOOL
STATEMENT OF COMMITTEE APPROVAL
Dr. Timothy J. Newby, Chair
Department of Curriculum & Instruction
Dr. Amy H. Gaesser
Department of Counseling Education, State University of New York College at
Brockport
Dr. Judith O. Lewandowski
Department of Curriculum & Instruction
Dr. Wayne E. Wright
Department of Curriculum & Instruction
Dr. Jennifer C. Richardson
Department of Curriculum & Instruction
Approved by:
Dr. Janet M. Alsup
Head of the Graduate Program

iv
ACKNOWLEDGMENTS
First and foremost, I need to thank my wife, Staci, and our four children: Elsie (5), Max (3), Alice
(2), and Charlie (8 months). Countless evenings, early mornings, and Saturdays have been spent
away from you in the pursuit of this degree. You have been nothing but understanding and
supportive, especially since I was working full-time throughout the process. I love you!
Also, I would like to thank all other family members and friends for the constant encouragement
through visits, phone calls, and other messages.
Additionally, I would like to say thank you to all my faculty. You are certainly experts and I have
enjoyed learning from you. My advisor, Dr. Timothy Newby, has been particularly helpful. I
remember when I first moved my family to Indiana and you showed up when I was by myself
setting up the house and you brought Kentucky Fried Chicken. We sat at a table surrounded by
boxes and got to know one another. This act is representative of the person you are. Thank you for
always being there.
Lastly, I would like to thank all of the individuals who helped me with this study, particularly the
middle school student participants. Your optimism for your futures is contagious and I only hope
to continue to help you in the process of accessing education to change your lives.

v
TABLE OF CONTENTS
LIST OF TABLES....................................................................................................................vii
LIST OF FIGURES ................................................................................................................ viii
ABSTRACT ..............................................................................................................................ix
CHAPTER 1. INTRODUCTION................................................................................................1
Problem Statement ..................................................................................................................2
College Readiness...................................................................................................................3
Technology in Education.........................................................................................................4
Research Context and Design..................................................................................................6
Research Questions and Hypotheses........................................................................................9
Theoretical Framework .........................................................................................................11
Study Limitations Summary..................................................................................................12
Summary ..............................................................................................................................13
CHAPTER 2. LITERATURE REVIEW ...................................................................................15
College Readiness.................................................................................................................16
Access...............................................................................................................................17
High school vs. middle school readiness............................................................................18
Diversity ...........................................................................................................................19
Parenting/mentoring ..........................................................................................................20
Programmatic successes ....................................................................................................22
Digital Badges in Education..................................................................................................24
History and current state of badges ....................................................................................25
Badging for assessment and credentials .............................................................................27
Instructional badging.........................................................................................................29
Feedback...............................................................................................................................33
Mentoring .............................................................................................................................36
Motivation ............................................................................................................................36
Expectancy-value theory ...................................................................................................38
Self-determination theory ..................................................................................................39
Motivation and digital badges............................................................................................40

vi
Research Questions ...............................................................................................................44
Conclusion............................................................................................................................45
CHAPTER 3. METHODS ........................................................................................................47
Design & Research Questions ...............................................................................................47
Context..............................................................................................................................49
Participants....................................................................................................................50
Instruction .....................................................................................................................51
Data Collection .....................................................................................................................51
Software Platform .............................................................................................................51
Surveys .............................................................................................................................52
Feedback ...........................................................................................................................52
Feedback constraint .......................................................................................................53
Methodology Limitations ......................................................................................................55
Importance............................................................................................................................56
CHAPTER 4: RESULTS AND DISCUSSION .........................................................................57
College Readiness Knowledge ..............................................................................................58
Mentor(s) Identification ........................................................................................................62
Progress, Quality, and Feedback............................................................................................65
Motivation ............................................................................................................................79
Design Limitations................................................................................................................80
Badging Takeaways ..............................................................................................................82
Future Directions ..................................................................................................................83
REFERENCES .........................................................................................................................87
APPENDIX A...........................................................................................................................97
APPENDIX B.........................................................................................................................102
APPENDIX C.........................................................................................................................103
APPENDIX D.........................................................................................................................104
APPENDIX E.........................................................................................................................105
APPENDIX F .........................................................................................................................106
APPENDIX G.........................................................................................................................107
APPENDIX H.........................................................................................................................108

vii
LIST OF TABLES
Table 1– U.S. Census Bureau (2014) Educational Attainment Percentages..................................2
Table 2 – Principles of Good Feedback Practice........................................................................35
Table 3 – Common Motivation Theories in Education...............................................................37
Table 4 – Digital Badges and Motivational Theories .................................................................41
Table 5 – Average percentage of badges/modules earned for each of the three student groups, stratified by the number of badges/modules failed.....................................................................75

viii
LIST OF FIGURES
Figure 1 – Study Participants and Interventions...........................................................................9
Figure 2 – Conceptual Framework for Literature Review ..........................................................16
Figure 3 – Historical Badge Usage in a Changing World...........................................................27
Figure 4 – Open Badges Ecosystem ..........................................................................................31
Figure 5 – Badging Development Guidelines and Considerations..............................................32
Figure 6 – Badging for Instruction Process................................................................................33
Figure 7 – Coded quality of student responses to the question “What should middle school students be doing now to prepare for college?” .......................................................................................59
Figure 8 – Student improvement scores to the question “What should middle school students be doing now to prepare for college?” The plot displays the total improvement scores from the pre-to post-survey as a percentage of students for each group..........................................................60
Figure 9 – Number of mentors students talk with about college and their futures.......................63
Figure 10 – The increase in the number of mentors students say the talk with about college and their futures from the pre-survey to the post-survey. The plot displays the increases as a percentage of students for each group. ........................................................................................................64
Figure 11 – How helpful students viewed the feedback they received after completing the nine-week college readiness course, with the percent of students’ feedback responses grouped by the three student groups. .................................................................................................................66
Figure 12 – (a) shows the percentage of scores earned for each badge (on both the exercise sheets and video reflections) for students in the control group; (b) shows the percentage of scores earned for each module for students in the in-class study group; (c) shows the percentage of scores earned on the students’ first attempt for each badge (on both the exercise sheets and video reflections) for students in the digital badge study group. ..................................................................................67
Figure 13 – (a) shows the percentage of students who earned each badge (finishing both the exercise sheet and video reflection with passing scores of two or three) in the control (n = 20) and digital badge study (n = 17) groups; (b) shows the percentage of students who attempted each badge (finishing both the exercise sheet and video reflection with any score) in the control (n = 20) and digital badge study (n = 17) groups...............................................................................73
Figure 14 – “Do you plan to go to college one day?”.................................................................79
Figure 15 – Digital Badge Stakeholders ....................................................................................86

ix
ABSTRACT
Author: Nemelka, Blake C. PhD Institution: Purdue University Degree Received: May 2018 Title: College Readiness and Digital Badges: A Middle School Approach Committee Chair: Timothy J. Newby
Post-secondary education attainment results in higher salaries (Pew Research Center, 2014) and
an increase in positive societal benefits (Baum, Ma, & Payea, 2013). Nevertheless, only 31% of
U.S. citizens over the age of 25 have a bachelor’s degree (U.S. Census Bureau, 2014). While
tradition would dictate the preparation for going to college begins in the later high school years
(Gaertner & McClarty, 2015), a recent push has emerged for shifting the beginning of such
conversations to middle school (Curry, Belser, & Binns, 2013; Gaertner & McClarty, 2015;
Mattern, Allen, & Camara, 2016; Nemelka & Nemelka, 2016). Furthermore, advances in
educational technology, such as digital badging, have allowed for new ways to deliver instruction
and collect relevant data. The following study delineates a nine-week college readiness course
implementation with middle school students (n = 71) from a large public Midwestern middle
school with high proportions of low-income and underrepresented populations. Digital badging
served as one of the principle methods for instructional delivery and evaluation. The control group
(n = 20) received standardized feedback throughout the course, while the study group (n = 51)
received customized instructor feedback, either through digital badging (n = 17) or in the
classroom using modules (n = 34). Results suggest that after completing the course, middle school
students increase their ability to articulate proper principles and strategies to implement in an effort
to better prepare for future college access, are able to identify more mentors in their life to aid in
future educational attainment, and find feedback helpful in the process, with various types of
feedback discussed regarding the quantity and quality of curriculum scores.
Keywords: college readiness, digital badge(s), feedback, motivation, mentor(s), middle school(s)

1
CHAPTER 1. INTRODUCTION
The value of a college degree has been questioned over time and continues to be tested,
especially given the rising costs of tuition. From 2000 to 2013, the average amount of annual
tuition at a public four-year college in the United States rose by 87% while, during that same time
period, the median income for the average American household rose only 24% (Schoen, 2015).
Even though families are struggling to pay for higher education and some are questioning the
overall value because of the rising costs, the ultimate payoff still seems to be holding strong for
the majority of students and families. High school degree holders earn 62% of the average college
graduate (Pew Research Center, 2014). In a separate poll, the Pew Research Center (2014) data
suggest roughly nine in 10 college graduates ages 25 to 32 claim their bachelor’s degree has paid
off or will pay off in the future. While personal financial benefits are primarily the top discussion
point in college attainment discussions, they are not the only incentives to increase college
attainment rates.
In the latest edition of Education Pays (Baum, Ma, & Payea, 2013), the College Board, a
6,000+ member not-for-profit institution dedicated to helping over seven million students
transition to college, highlights the benefits of higher education for individuals and society. The
benefits range from family economics to individual health to declining public need programs.
Results from Baum et al. (2013) include, but are certainly not limited to the following:
• The 2012 unemployment rate for four-year college graduates ages 25 to 34 was 7.1
percentage points below that for high school graduates;
• In 2011, 12% of high school graduates ages 25+ lived in homes that relied on public
assistance, compared to just two percent of those with at least a bachelor’s degree. (p.
5-6)

2
While the cost/benefit analysis should continue to be monitored and tweaked to assure that
access to anyone who desires to go to college can do it affordably and within reason, most can
agree that the overall benefits continue to outweigh the alternatives. Therefore, an assumption of
this paper is a public imperative to get young people motivated to obtain a higher education.
However, the United States is far from accomplishing noteworthy college attainment statistics
given the wide array of barriers that exist related to finances, motivation, understanding processes,
demography, access, etc. This study focuses on educating young people, middle school students
in particular, on the processes and procedures of post-secondary education and the methods of
delivery involved in the motivation of student behavior.
Problem Statement
As outlined in Table 1, the U.S. Census Bureau (2014) reported the percentage of adults
25 and over with a bachelor’s degree was a little over 30%. While this was well above the five
percent mark from the 1947 poll, the fact remains that only slightly more than a quarter of adult
Americans have earned their bachelor’s degree.
Table 1– U.S. Census Bureau (2014) Educational Attainment Percentages
Education 25+ Years Old High school diploma or GED 88.31% Some college 58.57% Associates and/or Bachelor’s degree 41.89% Bachelor’s degree 31.96% Master’s and/or doctorate and/or professional degree 11.77% Doctorate and/or professional degree 3.27% Doctorate degree 1.77%
As the data are disaggregated by demography, such as race, the results do not improve. In
2009, 90% of non-Hispanic White citizens had high school diplomas while Black citizens were at

3
27% and Hispanic citizens were at 13% (U.S. Census Bureau, 2009). Given the statistics outlined
in Table 1, the aforementioned public imperative to increase college access among our younger
generations stands solidified as the overarching problem found within the framework of this paper.
The purpose of this paper is to better understand how young people can be influenced to improve
their future educational outcomes, recognize the mentors around them, and explore various
technological curriculum offerings, such as digital badges, and the effects of instructional
feedback. Such methodologies can be used to teach college readiness principles to young students
in an overall attempt to move forward in the direction of raising U.S. educational attainment rates.
The subsequent sections of this chapter will give overviews of college readiness, technology in
education, general research design and questions being asked in the included study, and limitations
to be noted with this particular study. Furthermore, chapter two will provide an overview of the
relevant literature, chapter three delineates the methods of the study, and chapter four will present
the research findings and provide discussion of the results, study limitations, and future research
opportunities.
College Readiness
Being college “ready” takes on many forms because of the uniqueness of individuals, both
those preparing for college and those defining “readiness” for students. The desired career and
subsequent educational path for each student varies just as much as the students’ family income,
quality of schooling, and personal motivations. However, having general conversations between
young people and mentors regarding setting goals, planning, managing time, focusing on grade
point averages (GPA), getting involved in extra- and co-curricular activities, serving others,
preparing for college entrance exams, getting real-world work experiences, managing money, and
going through the college application processes have been identified as crucial to the process

4
(Nemelka & Nemelka, 2016). Continuous feedback between mentors and students is an important
part to the college readiness path and, traditionally, college readiness conversations have been
happening in the United States school systems in the junior and senior years of high school
(Gaertner & McClarty, 2015). However, a recent push has been emerging in the literature
regarding the shifting of such conversations to middle school (Curry, Belser, & Binns, 2013;
Gaertner & McClarty, 2015; Mattern, Allen, & Camara, 2016; Nemelka & Nemelka, 2016).
Therefore, the target student audience (“students”) in this paper will be middle-school-aged
students (12 to 14 years old), noting that research for high school students and even adult learners
without college degrees exists and continues to be an important issue for further exploration.
Additionally, when the term “higher education” or “college” is referenced, it can mean anything
from a two-year community college to a public or private four-year institution. Another
assumption is that career discussions are parallel to the attainment of higher education. The various
arguments for institutional selection are outlined but, in general, should be considered as part of a
broader range of student/family factors such as income, career goals, and institutional fit, to name
a few. The main point is post-secondary education is assumed to be a precursor for more career
opportunities (Pew Research Center, 2014). With this assumption, the crusade for better learning
environments and more affordable technologies continues.
Technology in Education
Technology, in its many forms, has consistently influenced learning and continues
disrupting the industry because of cost savings (Christensen & Horn, 2011). Some of the most
influential historic innovations include, but are not limited to, the printing press, mechanical
calculators, graphite deposit pencils, radios, television, digital computers, and the Internet. The
Internet and its vast ability to deliver information instantaneously without regard for distance has
5
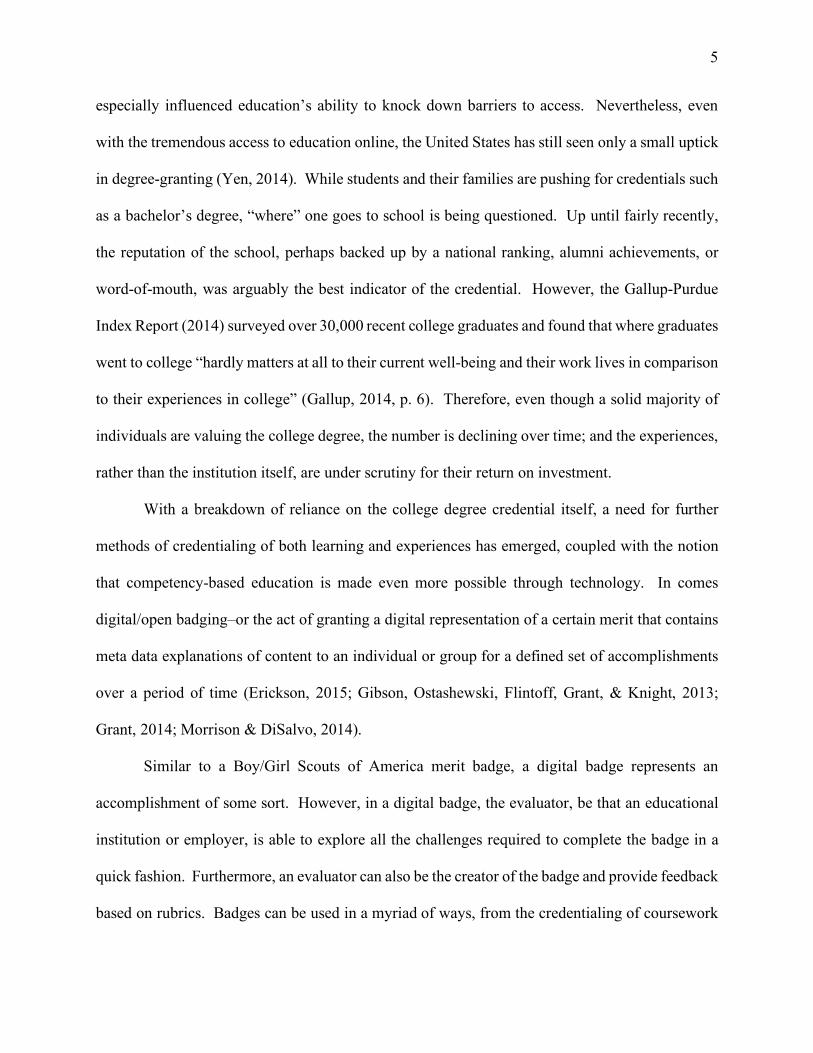
especially influenced education’s ability to knock down barriers to access. Nevertheless, even
with the tremendous access to education online, the United States has still seen only a small uptick
in degree-granting (Yen, 2014). While students and their families are pushing for credentials such
as a bachelor’s degree, “where” one goes to school is being questioned. Up until fairly recently,
the reputation of the school, perhaps backed up by a national ranking, alumni achievements, or
word-of-mouth, was arguably the best indicator of the credential. However, the Gallup-Purdue
Index Report (2014) surveyed over 30,000 recent college graduates and found that where graduates
went to college “hardly matters at all to their current well-being and their work lives in comparison
to their experiences in college” (Gallup, 2014, p. 6). Therefore, even though a solid majority of
individuals are valuing the college degree, the number is declining over time; and the experiences,
rather than the institution itself, are under scrutiny for their return on investment.
With a breakdown of reliance on the college degree credential itself, a need for further
methods of credentialing of both learning and experiences has emerged, coupled with the notion
that competency-based education is made even more possible through technology. In comes
digital/open badging–or the act of granting a digital representation of a certain merit that contains
meta data explanations of content to an individual or group for a defined set of accomplishments
over a period of time (Erickson, 2015; Gibson, Ostashewski, Flintoff, Grant, & Knight, 2013;
Grant, 2014; Morrison & DiSalvo, 2014).
Similar to a Boy/Girl Scouts of America merit badge, a digital badge represents an
accomplishment of some sort. However, in a digital badge, the evaluator, be that an educational
institution or employer, is able to explore all the challenges required to complete the badge in a
quick fashion. Furthermore, an evaluator can also be the creator of the badge and provide feedback
based on rubrics. Badges can be used in a myriad of ways, from the credentialing of coursework

6
to professional development training to gamification techniques used to motivate towards learning
transfer, with wide ranges of leaners. Badges can be shared easily, and because of the
transferability, instructors and learners are able to build upon learning experiences and connect
these experiences in ways traditional credentialing has not afforded–all while seeing the “map” in
a very aesthetically pleasing and interconnected way.
Research Context and Design
The intersection of middle school college readiness, instructor feedback, and digital badges
creates several exciting opportunities for research unexplored in the literature at the present time.
The following general questions are ones principally unanswered and serve as the foundation of
the finalized research questions outlined later in this section of the paper:
• What types of college readiness topics are appropriate for middle school students?
• Through the utilization of technology, how might college readiness be presented in an
age-appropriate way to middle schoolers?
• How are middle school students motivated towards college readiness, who do they
perceive as mentors in the process, and in what way can technology help or hinder such
motivation?
• What role does feedback (both inside and outside the classroom) play in presenting
college readiness curriculum to middle school students?
A large public Midwestern middle school has been identified as the site of this study. The
school has 71 seventh grade and eighth grade students taking a nine-week college readiness course
as an elective credit instead of an arts course, the other alternative to fulfill the elective credit. The
school has 1,200 total students between the seventh and eighth grade with 72% of the school
deemed as “low-income” because they are on a free or reduced-cost lunch plan and 48% of the

7
student population identify as non-White. Each student who signed up for the college readiness
course went through the curriculum in sections of about 25 students each. Of all the participants
studied (n = 71), it is noteworthy that all of them indicated they plan to engage in post-secondary
education upon the completion of high school. Additionally, 61% of the participants defined
themselves as “non-White” and 39% as “White.”
During the nine-week course, students followed a state-wide, standards-based curriculum
broken into six modules focused on topics such as self-exploration, college and career choice,
decision making, planning, and personal/employability skills development. Additionally, local
college admissions professionals and the committee overseeing this particular study have provided
digital badge curriculum which is also chunked into six modules for consistency in curriculum
scaffolding. The state-based curriculum and digital badge curriculum overlapped and was
completed in the classroom with at-home assignments included as well. Courses ran every
weekday for 50 minutes and were taught by one of two instructors who had similar training.
The study utilizes Passport™ as the badging platform (www.openpassport.org). Within
Passport™, the badge owner is able to develop badges with various “challenges.” The study
included a total of eight digital badges, each one outlined in Appendix A. The first and last badges
served as the study’s pre- and post-survey data collection mechanisms, and badges two through
seven follow the six modules referenced above. Badges two through seven each had a reading
assignment challenge, four video reflection question challenges, and an exercise sheet activity
challenge (Appendices B-G) to be turned in digitally through the badge platform. Due to
Children's Online Privacy Protection Rule (COPPA) regarding minors and educational technology,
Passport™ required students to be at least 13 years old to use the badging software (U.S. Federal
Trade Commission, 1998). Therefore, 37 of the 71 students (52%) used badges, while 34 students

8
(48%) were using a workbook to complete the nine-week course curriculum. The paper workbook
“modules” contained the exact same curriculum as the badges.
Feedback plays an important role as a principle independent variable in the study of the 71
total participants. The 12-year-old students (n = 34) used the traditional workbook instead of the
digital badging software due to the federal law mentioned previously, and all received in-class
feedback during the six modules from their instructor based on the rubric found in Appendix H.
Also, these 34 students were required, no matter their rubric score, to move along with their
instructor at the same pace during the six modules. The ability to split the 34 students into
standardized versus customized digital badge feedback was not possible and will be discussed in
the limitations section.
The 13- and 14-year-old students within the badging system (n = 37) were randomly
divided into two groups. About half of the students (n = 20) received standardized feedback to
their badge submissions (i.e., “Thank you for your submission. Please move on to the next
badge.”) and were considered the study’s control group. Their badges were completely open to
them with no prerequisite challenges and were also scored on the rubric found in Appendix H.
The digital badge study group (n = 17) had their badge answers scored on a rubric (Appendix H)
and, depending on their rubric score, were asked to repeat badge challenges if they scored zero or
one out of the three possible rubric points. If a student had to repeat a challenge, he/she was given
professional feedback to aid in the next submission.
For the purposes of data analysis, the students receiving feedback from an instructor in
class (n = 34) are considered as part of the overall study group (n = 51), given the instructors and
the badge reviewers received similar training and all 51 students received customized feedback,
just in different forms (electronically versus in-person). In an effort to explain the study

9
participants, Figure 1 visually demonstrates the breakdown between the control group, the in-class
study group, and the digital badge study group.
Figure 1 – Study Participants and Interventions
Research Questions and Hypotheses
In order to break down the general types of questions laid out at the beginning of this
section and formulate them into a measurable study while effectively covering the topic of middle
school college readiness using digital badges, a quantitative research design has been pursued. Of
all the possible questions to be answered, the following three research questions and hypotheses
will be analyzed throughout the remaining chapters:
1. To what extent does a nine-week college readiness course for middle school
students increase participants’ knowledge regarding proper principles and

10
strategies to implement in an effort to better prepare for future college access, and
how are the results differentiated by students who receive customized instructor
feedback in class or through a badging platform versus those who receive canned
feedback through a badging platform?
a. Hypothesis: Based on rubric scores (Appendix H), course participants (n =
71) will show a statistically significant increase in concept knowledge after
course completion, and those in the study groups receiving feedback (n =
51) will show a statistically significant difference over the standardized-
feedback control group (n = 20) in their ability to better articulate the proper
principles and strategies to implement in an effort to better prepare for
future college access.
2. After completing a nine-week college readiness course, will middle school students
increase the quantity of mentors at their disposal to aid in the college readiness
process, and how is this differentiated by those in the course receiving customized
feedback versus those who do not?
a. Hypothesis: There will be a statistically significant difference in the overall
number of student participants (n = 71) identifying more mentors at their
disposal after completing the course, as compared to before completing the
course, and the study groups (n = 51) will identify more mentors than the
control group (n = 20).
3. To what extent is instructor feedback viewed as helpful, and to what extent does
instructor feedback influence a middle school student’s curriculum progress and
quality of submitted work during a nine-week college readiness course, stratified

11
by in-class instructor feedback, badging software instructor feedback, or badging
software canned/standardized feedback?
a. Hypothesis: Participants (n = 71) will view all types of feedback
(customized or standard) helpful, but the study groups (n = 51) will have
outcomes that indicate customized feedback is more influential on a
students’ curriculum progress and quality of work submitted.
Theoretical Framework
With a major focus in the study on individual reflection, determination, goal setting, and
self-exploration, the theoretical framework chosen and explained in further detail in chapter two
is a combination of two theories of motivation: expectancy-value theory (Lewin, 1935; Atkinson,
1957; & Feather, 1982) and self-determination theory (Deci, Cascio, & Krusell, 1975; Ryan,
Mims, & Koestner, 1983). Expectancy-value theory postures that individuals set certain
expectations based on perceived and/or real value of outcomes. Therefore, if a middle school
student values post-secondary education already (and we know that 100% of the study participants
indicated they would like to attend college) or is taught to value it, motivation is increased to
achieve post-secondary education.
Self-determination theory explains the innate desire each individual has as it relates to a
certain achievement or desired achievement. When a student is naturally prone to a motivated
behavior, this could be explained through the lens of self-determination and is an interesting facet
to the study given the young ages of the students and measures of their backgrounds and
demography as they relate to their levels of motivation. Again, it is noteworthy to mention that
every student (n = 71) engaged in the study indicated a desire to obtain a post-secondary education.

12
Study Limitations Summary
The limitations to this study can be categorized into two main groups: the population and
the setting. The population included 71 middle school students who are 12, 13, or 14 years old.
Is a middle school student ready for this level of self-exploration? Can the curriculum and/or data
collection mechanism of digital badging (including video and written answers) for many of them
motivate students to give more thorough responses to the components of the study? Although
these are valid questions to be asking, the data analysis and discussion chapters assuage such
concerns. Additionally, the 71 students who elected into the college readiness course chose to
forgo an arts elective such as choir or band. Are students who have self-elected out of the arts at
a certain advantage or disadvantage as it relates to the study? Upon further discussion between
study and site administrators, the concern is not enough to change the participatory group given
sound reasoning that students who self-elect out may be more motivated towards career
discussions or may be less motivated in general and need such a course in their schedule of classes.
The setting of the study poses a couple of interesting limitations. First, the students went
through the course curriculum alongside peers inside of a classroom rather than at home.
Parent/guardian influence is strong (Hill and Wang, 2015), and a student could eventually be
conflicted. Also, the study groups (n = 51) receiving customized instructor feedback were sub-
divided into an in-class and digital badge group while the control group (n = 20) receiving
standardized feedback was one group. The original study did not include this plan; nevertheless,
federal regulations regarding digital content delivery to students under the age of 13 caused the
researcher to be flexible and include a second study group working with paper-based curriculum
materials. Another limitation to consider is the difference between the mentality and maturity of
a 12-year-old student and an older, 13- or 14-year-old student. The classroom instructors and site

13
administrators were clear about the dramatic differences in growth they see between a seventh-
grade student and an eighth-grade student. Despite such hiccups, chapter four indicates enough
solid results to build from going forward.
As it relates to feedback, the literature is unclear as to whether or not a student will see
feedback as a positive influence or a negative mark on performance through the badge curriculum.
However, as will be indicated in chapter four, the results of this study contribute to future
discussions on the matter of feedback.
Summary
Post-secondary education attainment has proven positive benefits for individuals and
society (Yen, 2014; Pew Research Center, 2014; Baum et al., 2013). However, only 31% of
Americans over the age of 25 have a bachelor’s degree (U.S. Census Bureau, 2014). Therefore,
getting young people motivated to attain college education, in whatever form that may take for
them and their desired career, is important to society and the following study aims at moving
forward this important endeavor.
Traditionally, college readiness has been pushed in the junior and senior years of high
school curriculum (Gaertner & McClarty, 2015), but there is a recent call for a middle school
implementation (Curry, Belser, & Binns, 2013; Gaertner & McClarty, 2015; Mattern et al., 2016;
Nemelka & Nemelka, 2016) in order to spur motivation in a setting where students have more time
to correct bad habits and behaviors to encourage future successes. Additionally, educational
technology has advanced in ways to increase cost-savings (Christensen & Horn, 2011) and digital
badging, especially, has opened doors to electronically package all the processes and
accomplishments related to students’ in-class and out-of-class learning (Erickson, 2015; Gibson et

14
al., 2013; Grant, 2014; Morrison & DiSalvo, 2014) and motivate students towards accomplishing
more (Halavais, 2012).
In order to study the intersection of middle school college readiness, the role of instructor
feedback, and digital badge curriculum delivery, specific research questions are being answered
in the study of 71 middle school students going through a nine-week college readiness course at a
large public Midwestern middle school with high percentages of low-income and underrepresented
students. The curriculum included statewide, standards-based content and, for the older students,
included an ancillary digital badge sequence (Appendix A). The study included a control group
(n = 20) who received standardized badge feedback and a study groups (n = 51) who received
customized feedback based on rubric scores found in Appendix H from either their instructor (12-
year-olds who weren’t allowed to use the software due to federal law; n = 34) or graduate students
trained by college admission professionals (13- and 14- years olds using the badge software; n =
17). A theoretical framework of motivation, in particular the expectancy-value (Lewin, 1935;
Atkinson, 1957; & Feather, 1982) and self-determination (Deci et al., 1975; Ryan, Mims, &
Koestner, 1983) theories, was used to approach the pre- and post-survey questions (Appendix A,
badges one and eight).
The overall aim of the study is to gain a better understanding of middle school students and
college readiness curriculum–broken down into the feedback and actual content delivery
mechanisms. As such research is pursued, the educational system is better able to help young
people learn about and be excited for their bright futures and the possibilities available to them.

15
CHAPTER 2. LITERATURE REVIEW
A post-secondary education is valuable to individuals in regard to their future finances
(Yen, 2014) and has positive effects on familial and societal outcomes (Baum et al., 2013).
Nevertheless, the U.S. Census Bureau (2014) statistics indicate only 31% of U.S. citizens 25 years
old or older have a bachelor’s degree. The numbers fall to 12% for master’s degrees and three
percent for doctorate and/or professional degrees (Pérez-Peña, 2012). In order to encourage young
people to have a post-secondary education mindset, schools and other public and/or private
organizations have begun developing research and practical programming surrounding the idea of
college readiness, and the implementation of such research and programming is beginning to
surface as early as the middle school years (Curry, Belser, & Binns, 2013; Gaertner & McClarty,
2015; Mattern, Allen, & Camara, 2016; Nemelka & Nemelka, 2016). Understanding the college
readiness literature landscape, the subsequent successes and concerns within the field, and the
motivational lenses through which the body of research is commonly viewed provides
opportunities for inquiry in an effort to better society.
Technology and education have reached a tipping point of constant integration and
continued evolution (Christensen & Horn, 2011). No matter the grade level or instructional
objectives, a myriad of potential technological solutions awaits. For example, digital badges in
education, especially their instructional usages, are a way technology allows educators to aid
students in the achievement and demonstration of learning outcomes. Badging not only allows for
the delivery of instruction, it also provides educators with the tools necessary to give feedback and
manipulate motivation (Besser, 2016).
Figure 2 delineates the conceptual framework being used for the review of the literature
regarding college readiness and digital badges in the middle school education space. Following
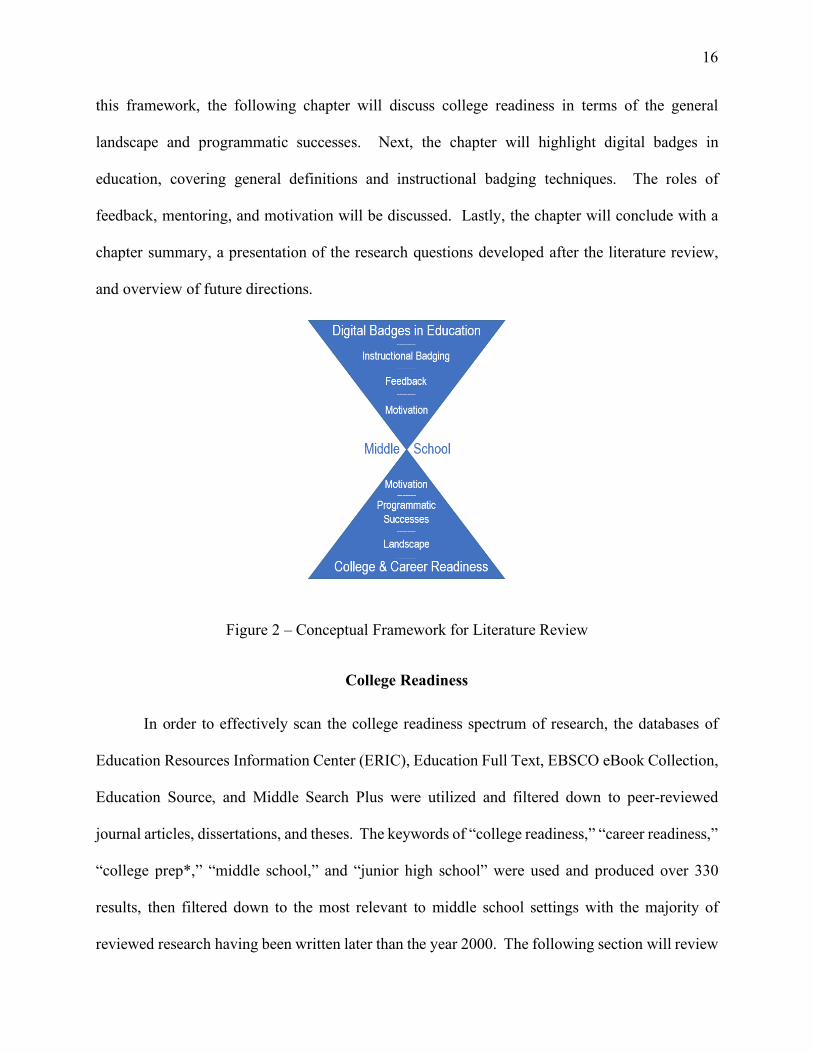
16
this framework, the following chapter will discuss college readiness in terms of the general
landscape and programmatic successes. Next, the chapter will highlight digital badges in
education, covering general definitions and instructional badging techniques. The roles of
feedback, mentoring, and motivation will be discussed. Lastly, the chapter will conclude with a
chapter summary, a presentation of the research questions developed after the literature review,
and overview of future directions.
Figure 2 – Conceptual Framework for Literature Review
College Readiness
In order to effectively scan the college readiness spectrum of research, the databases of
Education Resources Information Center (ERIC), Education Full Text, EBSCO eBook Collection,
Education Source, and Middle Search Plus were utilized and filtered down to peer-reviewed
journal articles, dissertations, and theses. The keywords of “college readiness,” “career readiness,”
“college prep*,” “middle school,” and “junior high school” were used and produced over 330
results, then filtered down to the most relevant to middle school settings with the majority of
reviewed research having been written later than the year 2000. The following section will review

17
the main categories that became apparent in the literature as well as delineate several programmatic
successes found to be effective in the realm of college readiness.
Access
Even though the benefits of holding a college degree are clear (Baum et al., 2013; Pew
Research Center, 2014; Yen, 2014), students continue to struggle with college access given the
major financial, demographic, and social capital barriers. Helping students conceptually
understand the benefits of higher education in all forms is a good first step for families and
educators in laying successful foundations. Nevertheless, an even greater hurdle exists after such
a decision is made in preparing each unique individual for higher education. Understanding
economic situations, race/ethnicity, and career goals/institutional fit becomes imperative as the
operationalization of college access is put into effect in an effort to continue and grow beyond the
31% mark (U.S. Census Bureau, 2011).
Baum et al. (2013) found that 82% of students with families whose income exceeded
$90,500 enrolled immediately in college after high school. The middle-income quintile ($34,060
to $55,253) drops to 65% and then to 53% for families with incomes below $18,300 (Baum et al.,
2013). The students who are not within each of these statistics may have had all the intentions of
getting a college education, but due to a lack of financial means and/or support, they are unable to
gain access to such benefits. Arguably, another finance-related reason for denied access is the
absence of training regarding the federal financial aid process and the overall aim of the federal
programs and the intentionally (and unintentionally) targeted recipients. Long and Riley (2007)
argue the United States financial aid policies, through loans, merit-based aid, and educational tax
breaks have pushed out the neediest students and ultimately diffuse the cost for the middle- and
upper-class students. Long and Riley (2007) call for an increase in need-based aid, that is monies

18
not required to pay back (grants) and/or subsidized loans, and point out the fact that students who
are already underrepresented in higher education are the most negatively affected by current
policy.
Race/ethnicity plays a major role in the college readiness literature, not just in the
economics of the argument but also in the general attainment space as well. The National Center
for Education Statistics (2013) indicated that 44% of White 18- to 24-year-olds were post-
secondary students in 2011, compared to 36% for Black students and 31% for Hispanic students.
Smith (2011) identifies diversity as one of the most dramatic societal changes in the twenty-first
century. Further bodies of research are needed for better preparing underrepresented students, and
educational institutions themselves, for growing diversity–especially in regards to college
readiness literature.
High school vs. middle school readiness
Transitioning the college readiness focus from high school to middle school is an idea
spurred by the data coming out of Gaertner and McClarty’s (2015) longitudinal data study from
the 1988 National Education Longitudinal Study (NELS). Essentially, Gaertner and McClarty
(2015) ran statistical analysis on six NELS factors: achievement, behavior, motivation, social
engagement, family circumstances, and school characteristics. Nearly 70% of the variance (n =
11,612) could be explained by middle school factors–most notably were motivation and behavior,
which contributed substantially to post-secondary access data. Traditionally, high school
outcomes such as grade point averages and standardized college entrance exam scores have guided
the college readiness and access discussions; nevertheless, Gaertner and McClarty’s (2015) data
points to a much-needed discussion regarding pre-screening for cognitive risk factors such as
behavior and motivation in the middle grades. When risk factors are explored earlier, interventions

19
can be implemented to ultimately aid in the increasing of such standards as GPA and college
entrance exam scores.
A caution to consider when moving more and more readiness research and practice to the
middle school levels is the need to distill and define complex college terminology to be
developmentally appropriate. Curry et al. (2013) call for more integration of advanced
terminology in the younger grades as competence becomes a precursor for achievement. Mattern
et al. (2016) believe a multidimensional middle school index of college readiness is possible, as
currently exists in high schools, with the large-scale data available on a national level.
Furthermore, researchers express concern that middle schools are focused too much on
standardized testing prep, and thus reading and writing are becoming a chore and not enjoyable in
the exploration of future careers (Burkins, Yaris, & Hoffmann-Thompson, 2016).
Diversity
The literature on college readiness generally includes a student’s socio-economic status
(SES), typically measured through annual household income and/or free or reduced-cost lunch
plans, and their racial/ethnic make-up as the two main points of diversity. Moreover, Castro (2013)
makes it clear that while seemingly successful college readiness practices are emerging, very few
consider the racial implications of their practices.
Working on college readiness curriculum with economically disadvantaged students
requires a need to break down barriers to school-based social and cultural capital, such as high
expectations and experiential learning, to help students plan and cope (Farmer-Hinton, 2008).
Once the information and access barriers are minimalized, a need for further discipline-specific
readiness strategies remains.
20
This study does not focus on economic or racial diversity. Nevertheless, the site chosen
for the study has above-average statistics for both indicators compared to their peers. Chapter 4
explores the findings of the study with mention of both economic and racial factors in hopes of
spurring future research focused on such indicators.
Parenting/mentoring
With diversity among the students comes diversity among the familial/parental structure at
home. According to the Pew Research Center (2014), 46% of U.S. individuals younger than 18
years old are living in a home with two married, heterosexual parents in their first marriage. The
“traditional” family is becoming less and less traditional. No matter the familial structure, the
content behind college readiness is rich for students to look through and utilize in preparation;
however, the best source of mentoring, whether in the home or not, has yet to be definitively proven
in the literature.
Hill and Wang (2015) studied seventh grade students (n = 1,452) and their parents’
parenting practices in the college readiness area and found that, by the eleventh grade, the
parenting practices of monitoring, warmth, and autonomy support had significant indirect effects
on post high school college enrollment. They particularly focused on measuring aspirations,
school engagement, and grade point averages.
Another point to consider in the literature regarding the parenting/mentoring happening
among young students and college readiness is the educational level of the parents. According to
the First-Generation Foundation (2010), about half of the college population is first-generation–
meaning they do not have at least one parent who obtained a college degree. The First-Generation
Foundation (2010) claims:

21
First-generation students are more likely to forgo a college education, or when they
do pursue post-secondary education, are older when they begin their studies, are
more likely to work for compensation, and are less likely to feel supported at home.
Ironically, students who are first in their families to attend college are less likely to
avail themselves of support services and resources than their counterparts. They are
less likely to enter competitive institutions, and, when they do, are more likely to
be academically underprepared. (p. 2)
The expectancy of going to college in the first place and then what to expect when at
college is harder to establish when a student does not have support at home and/or a parent/mentor
who has experienced college themselves. Nevertheless, Grolnick and Ryan (1989) is a seminal
piece within much of the motivational literature showing that students whose parents/mentors
provide autonomy-supportive environments and strive to relate to their students as much as
possible create more intrinsically motivating settings at home and/or at school.
According to Leonard (2013), one proposed solution to the lack of college readiness skills
in underachieving high school students is to offer authentic early college coursework to help build
confidence and momentum. Leonard (2013) studied traditional, suburban high school students (n
= 600) and a local community college. Students were striving to maximize college credit
accumulation while the study looked at parental involvement and influence. Through the analysis
of data from planning meeting notes, student surveys, and interviews with leaders, teachers,
parents, and students, parent engagement was found as an essential factor for recruitment and
enrollment, financial support, and emotional guidance as it relates to post-secondary education.

22
Programmatic successes
Practical application of college readiness is a relatively new research field, especially in
the middle grades. Most empirical research has been published in the last six years. The following
section will provide several examples of such research.
Allensworth, Gwynne, Moore, and de la Torre (2014) published five key findings they
found in Chicago, Illinois school systems within the middle grades as it relates to indicators of
college readiness and access. The findings include the following:
1. Middle grade attendance and GPA provide the best indication of how students will
perform in high school classes;
2. Students who are chronically absent or receiving Fs in the middle grades are at very
high risk of being off-track for graduation in ninth grade, and eventually dropping out
of school;
3. College readiness depends on very strong grades in middle school, as well as high
school;
4. Improving grades and attendance in the middle grades can have a large pay-off for high
school success; even more so than improving test scores;
5. High school selection matters for whether students graduate and earn the credentials
needed for college. (p. 1)
As shown through these findings, focusing on the middle grades is imperative to high
school success and increasing college readiness later. Families and educators have more time with
students to establish realistic yet challenging expectancies and prove the value. Once middle
school students go off-track, it is much more difficult to help them.

23
Cates and Schaefle (2011) studied participants (n = 187) involved in a common federally
funded at-risk student outreach program, GEAR UP. The number of hours spent in tutoring,
mentoring, advising, college visits, summer programs, field trips, and total participation were
studied. A discriminant analysis revealed a correlation with advising and college visits to state-
standard test scores. Students with fewer hours were less likely to have taken the tests.
Bernhardt (2013) highlights Claremont High School’s (San Diego, California) nationally
recognized in-school academic support program–the Advancement Via Individual Determination
(AVID) Program. The AVID program aims to provide cultural capital and college access to low
SES students with the implicit recognition that such students are rarely getting this type of
engagement at home, and thus the need for full college readiness principles immersion during
school hours is critical. Beginning in 1980, the AVID program has now reached approximately
4,800 schools in 48 states, the District of Columbia, and 16 countries/territories–serving nearly
half a million students (Bernhardt, 2013).
Radcliffe and Bos (2013) studied middle school and high school students (n = 100) in a
diverse school district with low college access rates relating to a college readiness curriculum
implementation with pre-service teachers. The researchers (Radcliffe & Bos, 2013) found
associated improvements in students’ academic-related perceptions, beliefs, and strategies,
positive personal achievement and goal orientation, rising perceptions of college, improving trends
in academic performance, and stronger perseverance in high school as compared to the control
group.
Martinez and McGrath (2015) present eight different middle schools and high schools
implementing successful college readiness programs across the country (with particular focus on
African American and Hispanic students), and encourage policy makers to support proposals for

24
programs in middle schools and high schools. Such programs should include a continued emphasis
on college readiness standards, professional learning for the instructors and class leaders, the
rethinking of educator preparation, creation of new assessments, and reconsidering how student
time is spent in an effort to put a heavier focus on college readiness curriculum (Martinez &
McGrath, 2015).
Middle school students visiting college campuses has proven to be an effective way for
students to imagine a future that includes a post-secondary education, develop college knowledge
(navigating campuses and the resources available to students), and cultivate positive feelings
towards higher education (Schaefer, 2014; Schaefer & Rivera, 2014). Programs such as The
Career Institute (Schaefer & Rivera, 2012) are built around this type of goal and expand students’
senses of possibilities in an effort to help them become more realistic and reflective about possible
career and college goals. Students are able to see parts of their own community they may have
only heard about but were not able to relate to until visiting in person.
The college readiness literature landscape has a clear problem of access to post-secondary
learning due to student motivational concerns, diversity-based barriers, lack of mentoring,
increasing anxiety-related issues, and simply starting too late in the preparation process. However,
several programmatic successes were outlined, and through the use of technology, such as digital
badges, more advancements are likely to be made.
Digital Badges in Education
Shifting from college readiness research to techniques for implementing such curriculum,
digital badges stand out as a solid option for study implementation and should also be reviewed in
the literature. The databases of Education Resources Information Center (ERIC), Education Full
Text, EBSCO eBook Collection, Education Source, and Middle Search Plus were utilized to search

25
literature in the field of digital badges and the searches were filtered down to peer-reviewed journal
articles and dissertations and theses. The keywords of “digital badge,” “open badge,” “micro-
credenti*,” “middle school,” and “junior high school” were used and produced around 40 results.
The subsequent section will give an overview of digital badges, their usages in instruction,
assessment, and credentialing, highlight several models of badging in practice, and review
feedback research.
History and current state of badges
Credentialing is tied to the evolution of symbols and comes in many forms, such as badges,
unique awards, trophies, certificates, plaques, pictures, clothing, and jewelry (Ellis, Nunn, &
Avella, 2016). The symbols involved with these and other credentialing methods suggest a
relationship, whether intentional or not, derived from an individual or groups of individuals, and
are based on their personal experiences (Bailey, 2008). Symbols and badges have predominately
been used by organizations as external tangibles as part of their operations (Ellis et al., 2016; Grant,
2016). Achievement of badges happens when value is placed on the credential by both the giver
and the receiver. However, one can drive the other. For example, organizations could drive a need
by incentivizing employees to work for a certain badge. Historically, the perceptions of the learner
or achiever of the badge were ignored and the badge merely existed as a way for the giver to
distinguish interactions with their constituents; common examples would be military ranks or
consumer designations (Ellis et al., 2016).
Halavais (2012) suggests badges have historically been used as a means to influence
behavior and, in the learning space, used to demonstrate nuggets of knowledge picked up outside
of one’s personal sphere of relationships. For example, the Boy and Girl Scouts of America
organizations use “merit badges” in the process of completing their highest achievements. In the

26
Boy Scouts, the Eagle Scout Award is the highest honor. A scout goes through a series of
experiences, pre-defined by a comprehensive manual, to achieve at least 21 merit badges out of
130+ offerings which include topics such as forestry, firefighting, and finger-printing. Using an
apprentice-type model, the scout must learn from subject matter experts and reflect upon the
knowledge gained in a series of steps that could take anywhere from several hours to several weeks
to complete.
Digital badges have been defined as digital representations of learning outcomes–
representing a certification, credential, competency, or soft skill (Grant, 2014, 2016; Janzow,
2014). The badge itself is merely a digital/graphical representation of a process needed to achieve
specific learning outcomes. Ford, Izumi, Lottes, and Richardson (2015) break down the categories
of representation to achievement, skill, or disposition. Over time, various types of groups and
organizations have come to understand the existence of badges, such as the scouting organizations
mentioned previously, and realize the benefits available to them through digital badging. In Figure
3, Ellis et al. (2016) categorizes the evolution of digital badges into six categories, influenced by
three modern trends: technology, globalization, and mobility.

-
27
Industry Business
Sports Education
Entertainment Group Programs
Technology: Offers a more objective andthorough method of identifying skill sets
and experiences
Globalization: Adopts cross cultural
programs usable worldwide
Mobility: Allows the individual to take all
experiences, trainings,
certifications, and awards with them
Figure 3 – Historical Badge Usage in a Changing World
Ellis et al. (2016) continues their assessment of badging in today’s world by recognizing
that the future is still to be determined, with a lack of experience in defining, creating, and utilizing
digital badges. However, one thing is clear. Up until now, the major focus of digital badging has
been the assessment and motivational credentialing pieces of the process.
Badging for assessment and credentials
As part of the important history of digital badges, former U.S. Secretary of Education, Arne
Duncan (2011), gave a speech at the fourth annual launch of the Digital Media and Learning
Competition. He stated, “Badges can help speed the shift from credentials that simply measure
seat time, to ones that more accurately measure competency…badges can help account for formal
and informal learning” (Duncan, 2011, p. 1). Lockley, Derryberry, and West (2016) also highlight
former Secretary Duncan’s speech and include the previous years’ Mozilla conference in

28
Barcelona, Spain as catalysts for driving excitement around badges. At the conference, several
key partnerships with major funding organizations such as the Bill & Melinda Gates Foundation
and the MacArthur Foundation were formed to provide incentives for new global digital badging
initiatives. Lockley et al. (2016) combine these two events with the Massive Open Online Courses
(MOOCs) movement to set up a well-incentivized environment where badges fit neatly as little
packages of assessment and credentialing of learning. Waters (2013) highlights digital badges as
emerging ways for educational institutions and organizations to better measure a students’
engagement with content inside and outside of the classroom.
Research on badges suggests that over-complication is harmful to the desirability of
accumulation (Easley & Ghosh, 2013; Gamrat, Bixler, & Raish, 2016; West & Randall, 2016).
Therefore, many of the common badge programs include the motivational assessment of
instruction and/or the credentialing of a skill or skillset rather than the actual delivery of instruction
itself. For example, a common professional development badge would be one similar to that
highlighted by Easley and Ghosh (2013) at Sheffield Business School at Sheffield Hallam
University. Student peer mentoring is a common practice at their school, and in years past, a paper
certificate was given to show completion of the program. However, researchers intervened with a
digital badging system for credentialing. Of the peer mentors (n = 89), 46 (52%) responding to a
survey regarding the new system, 57% of respondents (n = 26) reported claiming their badges
online, 73% (n = 19) of whom shared the badge online with common social media outlets such as
LinkedIn. Easley and Ghosh confirmed their belief that badges are perceived as ways to market
skills and experience in the job searching process, although many of the qualitative survey question
results suggested students would qualify their desire to market their badge by stating something
along the lines of, “…unless recognized by employers.” Nevertheless, a digital badge–whether

29
used to describe academic and/or non-academic experiences–affords users a more robust way of
detailing their interactions and achievements at the institution (Ostashewski & Reid, 2015).
Thomas, Fish, Karagory, and Kirby (2016) used digital badging at Purdue University’s
nursing school in the nurse hiring process after one administrator had several experiences where
the more qualified “on-paper” potential hire fell below the expectations of the program while the
average or even below-average candidate did not. Purdue wanted to ensure that their nurses were
credentialed in the most holistic way possible. A mandatory digital badge was created for the
sophomore class of nurses (n = 93) using Purdue’s home-grown badge platform, Passport™. The
mandatory badge focused on operational safety and interprofessional communication–a topic the
program felt worked nicely with a badge platform. Seven optional badges existed and “almost
50%” of the class went on to complete at least one or more optional badges. Thomas et al. (2016)
learned it is effective to begin small and expose the students to badging in a scaffold and hope to
continue their study further in the long-term hiring of their future nurses.
While the Sheffield Business School peer mentoring-based badge and the Purdue nursing
school badge are effective ways to provide additional credentialing and demonstration of learning
and experience options for students, they are two of dozens of examples in the literature where
learners are merely assessing knowledge rather than receiving it. Although the principle focus in
recent years has been upon the motivational credentialing and assessment processes and
procedures within digital badging, a shift backwards is needed to rediscover what was missed in
instructional opportunities.
Instructional badging
Badging has traditionally been viewed as an assessment and credentialing mechanism, but
an opportunity exists to use the badge process itself to deliver instruction in a badge “suite,”

30
“family,” “ecosystem,” or “platform” of some kind (Derryberry, Everhart, & Knight, 2016;
Gamrat, Bixler, & Raish, 2016; Itow & Hickey, 2016; Newby, Wright, Besser, & Beese, 2016).
Badging for instruction takes a look at a multitude of badges and how to utilize scaffolds to create
a holistic experience (Gamrat et al., 2016).
The ability to be able to deliver instructional content to students such as downloadable files
and digital media (video, images, voice-over, etc.) through current badging platforms exists in
spaces such as Mozilla Open Badges and Passport™ (Newby et al., 2016; Thomas et al., 2016).
Undoubtedly, others are rising and will continue to rise. Such a movement causes concern among
researchers, instructors, and developers of open badges because constituencies who are to receive
the badges, such as learners and their current and future employers, will have no context as to the
reputation of the credential until adoption has reached a certain popularity.
Nevertheless, as with any business model, a race to user adoption breeds innovation and
disruption (Christensen, 2011). Popularity among end-users dominates any industry, whether it is
the corner gas station competing with the across-the-street rival or Apple trying to compete with
Google in the smartphone business. As for the industry of education and the specific field of
digital and open badging, the need for understanding how stakeholders interact with the processes
and how developers should build existing and new platforms are discussed below in an effort to
assist those involved in the race to popularity and to aid them in doing so with sound research
findings in mind.
Derryberry et al. (2016) make the argument that a badging “ecosystem” ought to be created
in order to give more validity to not only the process but to the stakeholders involved. Their Open
Badges Ecosystem (Figure 4) tackles competency-based learning and delineates six sets of
stakeholders interacting through five components.

31
Figure 4 – Open Badges Ecosystem
As employers value the authentication process, job seekers/students will build a certain
motivation towards earning the specific types of badges in which they see employers starting to
value. Derryberry et al. (2016) frequently refer to badges as “currency,” and while currency has
value, the value is set by the stakeholders. “The next challenge is to articulate clearly the currency
of the ecosystem using badges as artifacts of valid assessments of well-defined competencies,
including transparent, portable evidence of a badge holder’s achievements” (Derryberry et al.,
2016, p. 15).
As instruction-based badge platforms development increases following such ecosystem
models as shown above in Figure 4, there are two models in the recent literature (Figure 5 and
Figure 6) which information technology and instructional design professionals are encouraged to
use when working with subject matter experts and the end-users. Each model can help guide the
back-end infrastructure, usability, the front-end design, and user experience.
The first of these models is found in Figure 5 (Newby et al., 2016). The researchers who
developed these guidelines and considerations model focus heavily on the prerequisite
information/analysis phase. Arguably, this phase is the most important in any major software
development project given the tremendous amount of time and resources needed to develop a
system as robust as a quality digital badging platform designed for not only instruction but also

32
PrerequisiteGuidelines
BadgeDevelopment
Activities/Considerations
for the assessment and credentialing components. Also, Newby et al. (2016) talked highly of a
Purdue home-grown system, Passport™. The system essentially allows all users to be within a
single platform which has positive levels of credibility at the institution, even helping with the
major research university getting their first competency-based degree program approval in early
2016 (Huchel, 2016). After discussing the prerequisite guidelines, Newby et al. (2016) outline a
set of five activities to be considered by designers in badge systems.
•Who will be the user(s)? •What is the purpose? •What are the conditions? •What are the expirationconditions?
•What is the deliverymechanism/platform?
•Motivational activities •Orientation activities •Information activities •Application activities •Evaluation activities
Figure 5 – Badging Development Guidelines and Considerations
The second instructional badging development model is found in Figure 6 (Gamrat et al.,
2016). Following a chronological approach, developers and designers worked with subject-matter
experts and end-users to move through various stages, which include goals, needs assessment,
content creation, expiration parameters, and structure/assessment–terms created by the author
based on the research presented. Gamrat et al. (2016) used the terminology “badge family,” where
there is a clear pathway and/or relationship between all badges within the system. Once one badge
is completed, the user can clearly identify the next steps and relationships of the learning outcomes.

33
Figure 6 – Badging for Instruction Process
As designers and developers use models such as the ones highlighted above, an expansion
of the possibilities found within the digital badge world will emerge. Rather than viewing badges
as purely tokens of gamification to be collected sporadically, learners and their current and future
employers or other stakeholders will assess the learning objectives and experiences to more
thoroughly vet an individual based on what it is they value and are looking for. Developers will
begin to create ecosystems of badge families that actually deliver the instruction within the system
itself, which, as Gamrat et al. (2016) point out, is more effective than having to integrate various
types of already existing content because all stakeholders are starting from a grassroots level of
understanding and possibilities.
Feedback
Feedback is a key part of formative assessment and mastery learning (Bloom, 1968, 1976;
Guskey, 2007; Kluger & DeNisi, 1996; Slavin & Karweit, 1984) and can be defined as the gap
between ideal and actual achievement according the individual providing the feedback
(Ramaprasad, 1983). Feedback is, essentially, a list of procedures used to inform the learner
(Kulhavy, 1977). Additionally, feedback is used with students as a way to apprise their processes,
to guide and mentor them, and to inform their own teaching and learning techniques (Besser,
2016).
34
In a two-year longitudinal study among 248 middle school students, Wentzel (1997) found
that perceived caring from teachers in fact predicted motivational outcomes. The teachers who
demonstrated “caring” were described by the participants as ones who displayed democratic
interaction methods, showed understanding of individual differences when developing
expectations, modeled a caring attitude toward the work they were engaged in, and provided
constructive feedback.
The role of feedback within technology must be reviewed when working with students
using digital badging software. Digital badge platforms are typically set up to give teacher-to-
student feedback in either an outcome (standardized, perhaps even automated) or cognitive
(customized, learner is provided with cues for ideal achievement) fashion (Balzer, Doherty, &
O’Connor, 1989). Besser (2016) outlines good feedback principles based on Nicol and
Macfarlane-Dick’s study (2006) in Table 2.

35
Table 2 – Principles of Good Feedback Practice
Principle Description Implementation Example
Clarify in Feedback helps to clarify LMS’s provide repository “Consider reviewing the performance what good performance
is and communicates the goals, criteria, and expectations of the task.
for written criteria. Digital Badge systems give students criteria and a place to complete the task within a single system.
objectives on page 1. Use these objectives to guide your essay writing.”
Facilitates self- Feedback gives students Self-assessment with “How might this task be used in assessment opportunities to self- rubrics. Asking students to your future profession? What (reflection) assess or reflect. reflect on practice and how
it relates to future goals/practice.
skills are transferred?”
Delivers high Feedback should Explicit information about “I really like how you provided quality information explicitly inform
students about the quality of their learning outcomes.
performance is required. Go beyond generic statements and give students clear areas on which to improve.
a detailed description of the learning environment. You took less time to explain your learners. Remember to include the age, grade level, and accommodations.”
Encourages teacher Teacher-student and Provide students with “I see that you are not and peer dialogue peer-student interactions
are promoted with feedback.
opportunities to clarify content and performance in and outside of the class. Technology tools are helpful in interacting across time and space.
understanding the topic. What is specifically causing you confusion? Let’s meet to discuss.”
Encourages Feedback should provide Feedback should not always “Well done! I can see that you positive opportunities to increase be critical. Provide have done a nice job clearly motivational students’ motivation and comments that point out explaining the topic and beliefs self-efficacy. when exceptional work has
been completed. This type of feedback can be used as a model to students in their future work.
providing detailed examples.”
Closes gap in Feedback delivers Communicating goals and “In this task you should have learning important information
regarding desired learning, perceived learning, and affords opportunities to decrease that gap.
objectives to students in conjunction with feedback gives students information about where they stand regard the learning process and if they need to make adjustment to meet those goals.
defined the topic and provided examples-you only defined the key words.”
Helps inform The process of providing Use student feedback as a “Thank you for sharing your teaching feedback and observing
how students apply that feedback gives instructors valuable information regarding their teaching and learning methods and strategies.
way to inform your instructional methods and strategies. If many students are unsure of something, reteach using a different approach or set of tools.
frustrations. Next time I will try to provide more visuals.”

36
Mentoring
At the Center for Research on Elementary and Middle Schools at Johns Hopkins
University, at-risk students have been defined as those with one or more of the following
descriptions: retention in grade level, poor attendance, behavioral problems, low socioeconomic
status or poverty, violence, low achievement, substance abuse, or teenage pregnancies (Slavin &
Madden, 2004). Adult mentoring among at-risk students in middle school has statistically
significant results in improving GPA’s, discipline referrals, and attendance rates (Johnson &
Lampley, 2010). Additionally, adult mentoring has been found to help students set more
obtainable goals, enhance their self-esteem, and provide a positive and influential person to look
to for guidance (Clasen & Clasen, 1997; Smink, 2000; Riley, 1998).
Converse and Lignugaris-Kraft (2009) evaluated school-based mentoring by studying an
18-week mentoring program for 45 middle school youth who were defined as “at-risk” due to
office referrals, unexcused absences, and school attitude. The researchers found significant,
positive, differences in students’ attitudes toward self, peers, teachers, and other school personnel
after the mentoring program. They also found that mentors fell into one of two categories: (1)
viewed positively mentors or (2) question-impact mentors. The viewed positively mentors
reported fewer office referrals, met more consistently with mentees, reported more relaxed
mentoring sessions, and shared food and played games for often with their students.
Motivation
Many theories of motivation exist and should be explored whether students are being
inspired to go to college or complete a digital badge. Schunk, Meece, and Pintrich (2013) explored
the history of motivation research and distill it down to two prominent conceptualizations of
motivation: (1) volition/will and (2) instincts. Volition/will indicates having a desire and realizing

37
such a desire. Instinct refers to “innate propensities such as imitation, anger, resentment, and
sympathy, which manifest themselves in behaviors” (Schunk et al., 2013, p. 19). Common theories
of motivation are found in Table 3 but do not represent an exhaustive list of the dozens of theories
found within the topic of educational research.
Table 3 – Common Motivation Theories in Education
Theory Name Key Individuals Basic Tenets
Attribution Theory Heider (1944) and Weiner (1979)
People seek to understand and master their environment. They attribute reasons for behaviors and outcomes to internal/external factors.
Expectancy-Value Theory
Lewin (1935), Atkinson (1957), and Feather (1982)
Motivation exists as a relationship between what an individual believes about their capabilities and the value placed on engagement in various activities.
Goal Orientation Theory
Murray (1938), Maslow (1943), and Dweck (1986)
Motivation is achieved because goals serve as impetus for behaviors or outcomes that individuals strive for (because of need or desire).
Self-Determination Theory
Deci et al. (1975); Ryan, Mims, & Koestner (1983)
Refers to the behavior that naturally occurs within one’s self as influenced by intrinsic and extrinsic motivation.
Social Cognitive Theory
Holt (1931) and Bandura (1986)
Motivation is a byproduct of an individual’s personal characteristics, behavioral tendencies, and the environmental factors at play.
Attribution theory helps explain college readiness, badging principles, and motivation
needed from the perspective of a current college student or graduate but does little to help on the
frontend when trying to help a middle school or high school student before going to college
(Heider, 1944; Weiner, 1979). Social cognitive theories, while they do take a more individualistic
approach to motivation, are almost too broad in nature and scope and do little in way of prescriptive
methodologies that could be used for students preparing for college and technologies that assist in
the process (Holt, 1931; Bandura, 1986). Lastly, goal orientation theories are not the best choice
to model in college readiness motivation because not all students come with the goal of going to

38
college, and even if that is a goal that can be instilled, the varying degrees of help along the way
could demotivate some students (Murray, 1938; Maslow, 1943; Dweck, 1986).
While middle and high school student college readiness can arguably be delineated through
each of the above motivational theories, the next section of this paper will argue that expectancy-
value theory is the most applicable to the age group in question and provides a theoretical
foundation for moving the needle in a positive direction for college access rates in U.S. school
systems. Moreover, the additional lens of self-determination theory is recommended given the
complements found between the two theories.
Expectancy-value theory
The work of Lewin (1935), Atkinson (1957), and Feather (1982) laid the ground work for
what is known today as expectancy-value theory–or the idea that students construct achievement
contexts through individual expectations and certain personal values placed upon actions/results.
Lewin’s (1935) “Level of Aspiration” looks at the goal or standard that individuals set for a task,
based on their past experiences and familiarity with the task. Participants in studies felt higher
satisfaction or dissatisfaction as it relates to a sort of pre-defined metric they personally set. For
example, two students can get the same grade on a quiz but have opposite reactions depending on
the original level of aspiration. Atkinson (1957) expanded upon achievement motivation by
combining needs, expectancies, and values. He proposed that behavior was a multiplicative
function of three major components: motives, probability of success, and incentive value. Building
upon such research, Schunk et al. (2013) stated, “Motives represented learned but stable and
enduring individual differences or dispositions and included two basic achievement motives: the
motive to approach success and the motive to avoid failure” (p. 49). Therefore, when motives to
succeed were high, research participants were extremely motivated; however, when motives to

39
avoid failure were high, participants went to great lengths to avoid failure at all costs. Atkinson
(1957) believed these two motives were independent from each other. Students were identified as
either high in one or the other, and this varied by task. Atkinson is also known for studying a
participants’ ability to predict the probability of success and failure and also establish pride in
one’s own accomplishment of tasks. In sum, Atkinson (1957) moved away from a mathematical
probability function that that of Lewin (1935) and, instead, focused on cognition and beliefs rather
than behavior or needs. Feather (1982) focuses on understanding and analyzing the actual value a
learner is placing upon a task and how the value might be measured in an effort to know where
motivation is occurring naturally and where it might be needed.
Schunk et al. (2013) outline the contemporary version of the expectancy-value theory with
major emphasis on the work of Eccles (1993) and Wigfield (1994) with similar focus on students’
expectations and perceived value structures but with more ties to personality, social, and
developmental psychological principles. The view is more rational and cognitive. Eccles and
Wigfield have high acclaim in the field given their focus on longitudinal studies within classrooms,
rather than perhaps a ring toss game as studied by Lewin and others. Eccles and Wigfield have
demonstrated over time that positive statistical correlations exist between students’
expectations/capabilities and actual achievement. They also recognize that values are closely tied
with choice of activity.
Self-determination theory
According to Deci et al. (1975) and Ryan, Mims, and Koestner (1983), self-determination
theory can be defined as the behavior that naturally occurs within one’s self as influenced by
intrinsic and extrinsic motivation (Ryan & Deci, 2000). Expectancy-value theory and self-
determination theory have been selected as two lenses through which the framework of this paper

40
can be viewed due to the complex and longitudinal nature of college and career readiness and the
need to be motivated more intrinsically than extrinsically–to which both these theories lend
themselves well.
Autonomy/choice literature is often related to self-determination theory (Iyengar &
Lepper, 1999). Ryan and Deci (2002) propose that autonomy refers to the perceived origin of
one’s own behavior and derives from interest and integrated values. In an earlier piece, Deci and
Ryan (2000) caution against using autonomy as a synonym with internal locus of control,
independence, and/or individualism, as it is more than that and even influenced by external factors
such as the environment (Ryan & Deci, 2002).
Forms of autonomous regulation have been found to correlate with better coping skills than
controlling forms of regulations (Hayamizu, 1997) such as deadlines (Amabile, DeJong, & Lepper,
1976), surveillance (Lepper, Greene, Carskaddon, & Gronner, 1975), and evaluation
(Harackiewicz, Manderlink, & Sansone, 1984). Inner experiences should be principally
acknowledged (Koestner, Ryan, Bernieri, & Holt, 1984) and can be seen through techniques such
as reflection in journal-like forms (Sheldon, Ryan, & Reis, 1996). Further, providing choice will
spur intrinsic motivation (Zuckerman, Porac, Lathin, Smith, & Deci, 1978).
Motivation and digital badges
Motivation is used frequently when discussing open badges because researchers have
suggested they strengthen learner motivation and enhance opportunities to increase motivation
(Gibson, 2013). Abramovich and Wardrip (2016) highlight several examples of effective
motivation in badging, including a frequent-flyer program and the video game console world. In

41
the latter example, systems like Microsoft’s Xbox give badges to players in a win-win strategy of
not only affording the player a way to display successes but also affording the company a way to
increase devotion to their console rather than a competitors’ because of the prospect of a player
losing badges. While commercial uses for badging should be looked at, learning motivation is
different. Table 4 highlights motivational theories referenced in the digital badge research and the
learning-based findings and concerns for each.
Table 4 – Digital Badges and Motivational Theories
Motivational Theories Sources Badge-Based Findings and Concerns
• Intrinsic vs. Extrinsic Motivation
1. Deci & Ryan, 2016
2. Lepper, Corpus, & Iyengar, 2005
1. Intrinsic = self-desire to learn; External = motivated by external source
2. Intrinsic motivation leads to larger learning gains
• Achievement Goal Theory 3. Maehr & Zusho, 2009; Pintrich, 2000
4. Cury, Elliot, Fonseca, & Moller, 2006
3. Competency-based aims set to be evaluated
4. Badge-earning motivation described on two interactive scales: approach to avoidance of tasks and mastery to performance within tasks
• Expectancy-Value Theory 5. Lewin, 1935; Atkinson, 1957; 5. Users construct achievement Feather, 1982 contexts through individual
expectations and personal values placed upon actions/results
6. Wigfield & Eccles, 2000 6. Suggests that earning a badge could motivate learners if the badge increases the expectation for learning the targeted material and if earning the badge increases how much they value the learning
• Self-Determination Theory o Cognitive Evaluation
Theory
7. Deci et al., 1975; Ryan et al., 1983
7. Negative impact of external motivators occurs if learners perceive the motivator as extrinsic from their actions; Badges could negatively impact learners’ motivation if the badge is seen as disconnected from the learning or “denied” with feedback (even though getting custom feedback could also be seen as a positive attribute)

42
Table 4 continued
• Classic Behaviorism 8. Watson (1913)
9. Blackburn, Porto & Thompson (2016); Kappes & Berto, 2015; Ertmer & Newby, 2013
10. Ostashewski & Reid, 2015
11. Hickey and McCaslin, 2001
8. Behavior explained through conditioning
9. At the corner stone of competency-based curriculum; Badges highlight the achievement of certain and specific competencies and skills.
10. Badges are evidence-based symbols earned when specific criteria, levels, and requirements are achieved
11. Need agnostic stance; Negative impact of rewards and competition results from lack of feedback and opportunity to improve; Behaviorist approaches are naïve and instructor should focus on act of participation rather than the reward structure
• Constructivism 12. Ertmer & Newby, 2013
13. Kappes & Betro, 2015
12. Equates learning with creating meaning from experience
13. Badges enable learners to select skills and competencies relevant to individual goals and circumstances
• Game Theory 14. Deterding, Khaled, Nacke, and 14. Use of game design elements Dixon, 2011 in a non-game environment of
context 15. Abramovich, Schunn, & 15. Badges share many of the same
Higashi, 2013 features of video-game models 16. Ostashewski & Reid, 2015 16. Badges act as a source of
positive feedback and reward when students accomplish particular tasks; Badges possess a social component in that learners can compete against one another in pursuit of badge achievement and evidence of learning can easily share with others; Badges are designed to foster a sense of accomplishment, motivating students to progress and continue to advanced material
17. Nicholson, 2012 17. Four main concerns: (1) badges can reduce long-term internal motivation when learners receive external rewards for a controlled activity; (2) For some, badges will become the ultimate goal rather than the learning itself; (3) Badges become frivolous,.

43
Table 4 continued
18. overwhelming, and ignored over time in the online gaming environment; and (4) badges have the potential to replicate standardized testing behavior
Many of the common motivational concerns are highlighted in Table 4, but other types of
concerns exist. Foster (2013) points out the infrastructure issues involved. Who will properly
gather, store, and maintain the data–properly assuring the promised reliability and transferability?
Will learners gather badges for the sake of completing early and/or the mere accumulation of
credentials instead of gathering badges for the accumulation of knowledge (Ellis et al., 2016;
Fontichiaro, 2014; Palloff & Pratt, 2001; Rice, 2014)?
Although the challenges exist, education continues to be under pressure, as mentioned
earlier. Christensen and Horn (2011) go as far as calling it a “crisis” where the centuries-old higher
education models are no longer viable and must change, and can be the ones to change, to meet
the needs of students, employers, and other stakeholders. Badges can bridge the gap between what
employers are demanding (better talent–or at least the ability to screen for better talent) and the
ability to showcase an individuals’ vast array of experiences. Berge and Muilenburg (2016) argue
that perceived value is principally the end goal, and once it is demonstrated to the stakeholders,
then badges can act as symbols that “indicate skills, accomplishments, characteristics, or
interest…used to document learning [and] are versatile and make comprehensive digital
information quickly accessible to earners and users” (p. 102 –103).

44
Research Questions
In an effort to further the work on both college readiness and digital badging, the ensuing
chapter will review the research design and methods utilized to answer the following questions
and confirm or deny the included hypotheses:
1. To what extent does a nine-week college readiness course for middle school
students increase participants’ knowledge regarding proper principles and
strategies to implement in an effort to better prepare for future college access, and
how are the results differentiated by students who receive customized instructor
feedback in class or through a badging platform versus those who receive canned
feedback through a badging platform?
a. Hypothesis: Based on rubric scores (Appendix H), course participants (n =
71) will show a statistically significant increase in concept knowledge after
course completion, and those in the study groups receiving feedback (n =
51) will show a statistically significant difference over the standardized-
feedback control group (n = 20) in their ability to better articulate the proper
principles and strategies to implement in an effort to better prepare for
future college access.
2. After completing a nine-week college readiness course, will middle school students
increase the quantity of mentors at their disposal to aid in the college readiness
process, and how is this differentiated by those in the course receiving customized
feedback versus those who do not?
a. Hypothesis: There will be a statistically significant difference in the overall
number of student participants (n = 71) identifying more mentors at their

45
disposal after completing the course, as compared to before completing the
course, and the study groups (n = 51) will identify more mentors than the
control group (n = 20).
3. To what extent is instructor feedback viewed as helpful, and to what extent does
instructor feedback influence a middle school student’s curriculum progress and
quality of submitted work during a nine-week college readiness course, stratified
by in-class instructor feedback, badging software instructor feedback, or badging
software canned/standardized feedback?
a. Hypothesis: Participants (n = 71) will view all types of feedback
(customized or standard) helpful, but the study groups (n = 51) will have
outcomes that indicate customized feedback is more influential on a
students’ curriculum progress and quality of work submitted.
Conclusion
The benefits of obtaining a college degree were presented; nevertheless, overcoming
economic hurdles, demography barriers, and finding institutional fit can prove itself a difficult
task. Once a student is motivated to access higher education, various motivational
theories/techniques can be used, including, but not limited to, expectancy-value theory, self-
determination theory, attribution theory, social cognitive theory, and goal orientation theory. A
case for expectancy-value and self-determination theories as the most effective choices is
presented because the motivation is individualized and relies heavily on self-evaluation and
attainment beliefs – both of which resonate with the previously laid out college readiness literature.
Families and educators are able to understand a student’s expectations and values and adequately
match the student with a future college plan that is right for them. Additionally, an understanding

46
of “self” and the cultural influences that could change this perception help educators guide students
effectively towards a successful future. As students learn to “expect” and “determine” that college
readiness is for them at an early age then they are more likely to realize the ultimate goal of post-
secondary access, institutional fit, and career placement.
47
CHAPTER 3. METHODS
After reviewing the literature on college readiness and digital badges in education,
especially as it relates to middle school settings, a clear gap begins to appear. No studies were
found that directly answer questions related to implementing such a curriculum with this targeted
age group that focuses not only on general college preparation principles and strategies but one
that incorporates the role of college preparation mentors and instructor feedback. Additionally, a
college readiness curriculum implementation among middle school students using digital badges
is brand new to the research. The following chapter will lay out a research design and methods
for the accomplishment of such a pursuit. Data collection and analysis techniques will be outlined
and limitations are addressed.
Design & Research Questions
In an effort to holistically study the ideas of college readiness, mentor identification,
instructor feedback, and digital badging in a middle school setting, the following study was
designed using a mixed-methods approach. According to Johnson and Christensen (2012), mixed
research studies vary depending on whether or not the researcher is putting a heavier emphasis on
either quantitative or qualitative methodologies. In this study, the three research questions below
have been designed in such a way that puts the heaviest emphasis on quantitative analysis, but with
several qualitative pre- and post-survey and curriculum answers being coded into quantifiable
measures using the rubric in Appendix H. The delivery is done in a concurrent fashion through
the use of pre- and post-survey instruments wrapped around a college readiness course
implementation through the Passport™ digital badge platform (Appendix A) for most of the

48
student participants. The literature review in chapter two helps set the stage for unanswered
questions in current research related to college readiness and badging.
The three research questions and hypotheses are:
1. To what extent does a nine-week college readiness course for middle school
students increase participants’ knowledge regarding proper principles and
strategies to implement in an effort to better prepare for future college access, and
how are the results differentiated by students who receive customized instructor
feedback in class or through a badging platform versus those who receive canned
feedback through a badging platform?
a. Hypothesis: Based on rubric scores (Appendix H), course participants (n =
71) will show a statistically significant increase in concept knowledge after
course completion, and those in the study groups receiving feedback (n =
51) will show a statistically significant difference over the standardized-
feedback control group (n = 20) in their ability to better articulate the proper
principles and strategies to implement in an effort to better prepare for
future college access.
2. After completing a nine-week college readiness course, will middle school students
increase the quantity of mentors at their disposal to aid in the college readiness
process, and how is this differentiated by those in the course receiving customized
feedback versus those who do not?
a. Hypothesis: There will be a statistically significant difference in the overall
number of student participants (n = 71) identifying more mentors at their
disposal after completing the course, as compared to before completing the

49
course, and the study groups (n = 51) will identify more mentors than the
control group (n = 20).
3. To what extent is instructor feedback viewed as helpful, and to what extent does
instructor feedback influence a middle school student’s curriculum progress and
quality of submitted work during a nine-week college readiness course, stratified
by in-class instructor feedback, badging software instructor feedback, or badging
software canned/standardized feedback?
a. Hypothesis: Participants (n = 71) will view all types of feedback
(customized or standard) helpful, but the study groups (n = 51) will have
outcomes that indicate customized feedback is more influential on a
students’ curriculum progress and quality of work submitted.
Context
A nine-week college readiness-based course was implemented at a large public middle
school in the Midwest region of the United States. The site has over 1,200 students who are
enrolled in either the seventh or eighth grade. The site is considered predominately low-income
because of the 1,200 students, 864 (72%), who qualify for free or reduced-cost lunch plans. In
terms of race/ethnicity, 576 (48%) of the students (n = 1,200) report as non-White. Of the 71
participants, 61% defined themselves as “non-White” and 39% as “White.” The offer to provide
a college readiness course within such a demography was welcome by site administrators and
teachers.
The nine-week course was broken into sections of 25 students, and it was taught each week
day in intervals of 50 minutes by one of two instructors. The instructors followed a state-based
standards curriculum broken into six modules focused on topics such as self-exploration, college

50
and career choice, decision making, planning, and personal/employability skills development.
Additionally, local college admissions professionals and the committee overseeing this particular
study have provided digital badge curriculum which is also chunked into six modules. The state-
based curriculum and digital badge curriculum overlapped for one instructor who had the 13- and
14-year-old students (n = 37) because the federal COPPA law dictates that students under the age
of 13 are not allowed to engage in certain technological platforms such as the one chosen for this
study.
In the second instructor’s classroom, the 12-year-old students (n = 34) followed a paper
workbook version of the same curriculum. All students (n = 71) received a pre- and post-survey
instrument, curriculum instruction from a teacher, and some sort of feedback, discussed below.
Participants
The study included 71 total participants from the seventh and eighth grades who self-
elected into the college readiness course over the choice of selecting an arts course such as band
or choir. The participants in the study have a signed parental consent form on file with their
instructor along with an assent form signed by themselves. Recruiting for the study took place in
the form of face-to-face information sessions with students during the first day of the class and
letters sent home. Once in the study, participants who were 12 years old (n = 34) were assigned
one instructor who used in-class presentations and a paper workbook for instructional delivery of
modules, and the 13- and 14-year-old student participants (n = 37) were assigned a different
instructor who used a digital badging platform for instructional delivery of badges.

51
Instruction
The in-class instructors for the course were two members of the teaching staff at the middle school
who had backgrounds in business and career education within middle school settings. The
instructors received similar training regarding the research design and implementation of the study.
Additionally, three graduate students with backgrounds in learning design and technology served
as the survey and digital badge reviewers/graders for the course and were trained by a college
admission professional to analyze survey data and give accurate feedback to curriculum responses
based on the rubric found in Appendix H. The instructors also used Appendix H as a rubric for
grading or, in some cases, their scores were converted to the rubric scores from their own, original
methods of grading.
Data Collection
There are two primary sources of data collection occurring within the study: (1) a pre- and
post-survey instrument to be required on the first and last days of each of the college readiness
courses (Appendix A, Badge 1 and Badge 8) from all participants (n = 71) and (2) the interactions
between each of the older student participants (n = 37) and their badge challenges (Appendix A,
Badges 2-7)–which consist of a reading exercise from a workbook, four reflection questions, and
one exercise sheet using Nemelka & Nemelka (2016) curriculum. The younger students (n = 34)
also followed this same curriculum but used a paper-based workbook with instructor feedback
happening in class.
Software Platform
The platform being used for the delivery of the digital badges for the older students (n = 37) during
the course is Passport™ (www.openpassport.org). This particular platform is produced by the

52
information technology department at a large public land-grant research institution in the Midwest.
Passport™ allows instructors to create and customize digital badges, and within each badge the
user finds various challenges that range from survey questions, to open-ended response fields to
digital media file uploading features. This platform was selected because of the flexibility afforded
across all mobile devices.
Mobile technologies provide interactivity, enhance understanding of material content, and
improve learning practices and opportunities to establish connections and relationships with
students (Ebrahim, Ezzadeen, & Alhazmi, 2015). Appendix A highlights each of the badges built
in the platform. Participants using the badge system were assigned a Windows Surface device to
utilize in class and at home.
Surveys
The pre- and post-surveys filled out by all participants (n = 71) were built using Qualtrics and
distributed to the younger students (n = 34) in a hyperlink emailed to them. The older students (n
= 37) accessed the Qualtrics survey through the Passport™ platform as the first and last badges
within the curriculum. Appendix A contains a breakdown of the specific questions being used
within each survey badge (Badge 1 and Badge 8), which are the same questions the younger
students saw when being directed to the survey from a hyperlink to their email address.
Feedback
Feedback in this study is the principle independent variable. Students were broken into
either a control group (n = 20), which received canned, generic feedback through an email
generated by the badging software or one of two study groups (n = 51), which received customized
instructor feedback through an email generated by the badging software (n = 17) or from an in-

53
class instructor (n = 34). The idea of “good” feedback was, in the instructor and graduate assistant
trainings, defined as feedback that followed the principles outlined in Table 2 (Besser, 2016; Nicol
& Macfarlane-Dick, 2006).
Feedback constraint
The control group was made up of all older students (13 and 14 years old) participating
using the badging platform. The study group (n = 51) is split into older students in the badging
platform (n = 17) and the younger students (12-year-old students) who weren’t allowed to be in
the badging platform (n = 34). The study group is larger than the control group because all the 12-
year-old students (n = 34) who were originally supposed to be broken into both groups ended up
all having to use the traditional workbook instead of the digital badging software due to the federal
COPPA law mentioned previously.
The ability to split these 34 students into standardized versus customized digital badge
feedback was not possible. Nevertheless, they received in-class instructor feedback, and survey
answers were still evaluated based on the rubric found in Appendix H. As highlighted in chapter
one, Figure 1 (repeated below) delineates the constraint to help breakdown the participants and
matching interventions.

54
Figure 1 (repeated) – Study Participants and Interventions
As seen in Figure 1 (repeated), there were a combined 37 13- and 14-year-old students
within the badging system from both the control and study groups. Within the badging system,
some of these students (n = 20) received standardized feedback to their badge submissions (i.e.,
“Thank you for your submission. Please move on to the next badge.”) and were able to move at
their own pace through the badges with no regard to prerequisite requirements. Appendix H was
used to score their submissions.
The other students within this badging group (n = 17) had their badge answers scored on a
rubric (Appendix H) and, depending on their rubric score, were asked to repeat badge challenges
if they scored zero or one out of the three possible rubric points. If a student had to repeat a
challenge, they were given professional feedback to aid in their next submission.

55
The younger study group participants (n = 34) received scores from their instructor based
on Appendix H but were not required to achieve certain scores to move to the next module
alongside their peers. Each participant in this group was asked to complete each module.
Methodology Limitations
Although the researcher had the same training sessions with the instructors of the course
and the three graduate assistants giving feedback to the students, those involved, especially the
graduate students, will have differences in opinion on topics as general as college readiness despite
the researcher’s best training efforts. However, the rubric in Appendix H helped keep such
limitations in check. Also, parents/guardians have a major influence (Hill & Wang, 2015) on the
student’s success in the curriculum. Therefore, sending a letter home to each participant and their
parent(s)/guardian(s) helped mitigate any worries with the limitation of the curriculum being in-
class versus in-home on certain assignments. All parties were well informed on the course
structure and homework requirements.
As stated earlier, the students who were in the college readiness course are those who are
not taking an arts elective such as band or choir. Such a self-election could be perceived as a
skewed sample. Also, digital badging is new to middle school settings, and despite thorough
training, students, especially low-income students, may not have the technological skill-set
required for understanding digital badge platforms such as Passport™. Data results support some
of this notion and will be discussed in chapter four.
Lastly, Passport™ is a fairly new platform and its abilities are limited. For example, the
researcher is not able to find out how much time each student spends on a certain badge challenge.
However, the data extrapolated is sufficient to address the research questions at hand.
Additionally, the literature is unclear as to whether or not a student will see feedback as a positive

56
influence or a negative mark on their performance through the badge curriculum. Nevertheless,
the results of this study will contribute greatly to the future discussions, as will be discussed in
chapter four.
Importance
This study is important for two reasons. First, there is no research on middle school
students and the implementation of digital badges using a college readiness curriculum and various
feedback methods. Therefore, the results from this study provide a valuable addition to the
literature in finding out more about this audience and their engagement with digital badges, their
instructor, and their overall perceptions on and learning of college readiness principles.
Secondly, college admissions offices are under increasing pressure to admit more diverse
students, particularly when looking at diversity through the lens of race/ethnicity, socio-economic
background, and previous extra- and co-curricular experiences (Jaschik, 2015). Therefore, digital
badge interactions of students using college readiness curriculum become valuable to institutions
of higher education as a way to quickly and thoroughly analyze an incoming student’s potential as
a form of micro-credentials supporting a traditional resume.
Finally, the exposure of college readiness principles to young students may have a lasting,
positive effect on college-going rates among the participants, which is especially important given
the high percentages of low-income and underrepresented students.

57
CHAPTER 4: RESULTS AND DISCUSSION
As stated in earlier chapters, the three research questions and hypotheses presented for
analysis in this study are the following:
1. To what extent does a nine-week college readiness course for middle school
students increase participants’ knowledge regarding proper principles and
strategies to implement in an effort to better prepare for future college access, and
how are the results differentiated by students who receive customized instructor
feedback in class or through a badging platform versus those who receive canned
feedback through a badging platform?
a. Hypothesis: Based on rubric scores (Appendix H), course participants (n =
71) will show a statistically significant increase in concept knowledge after
course completion, and those in the study groups receiving feedback (n =
51) will show a statistically significant difference over the standardized-
feedback control group (n = 20) in their ability to better articulate the proper
principles and strategies to implement in an effort to better prepare for
future college access.
2. After completing a nine-week college readiness course, will middle school students
increase the quantity of mentors at their disposal to aid in the college readiness
process, and how is this differentiated by those in the course receiving customized
feedback versus those who do not?
a. Hypothesis: There will be a statistically significant difference in the overall
number of student participants (n = 71) identifying more mentors at their
disposal after completing the course, as compared to before completing the
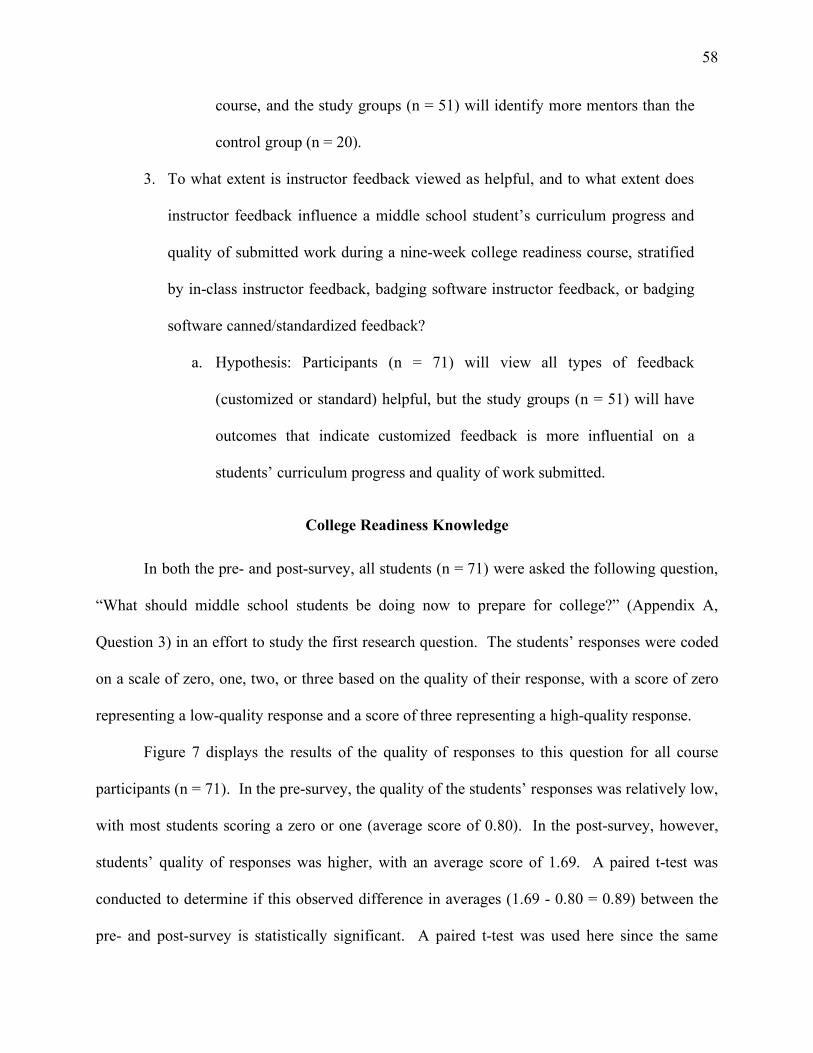
58
course, and the study groups (n = 51) will identify more mentors than the
control group (n = 20).
3. To what extent is instructor feedback viewed as helpful, and to what extent does
instructor feedback influence a middle school student’s curriculum progress and
quality of submitted work during a nine-week college readiness course, stratified
by in-class instructor feedback, badging software instructor feedback, or badging
software canned/standardized feedback?
a. Hypothesis: Participants (n = 71) will view all types of feedback
(customized or standard) helpful, but the study groups (n = 51) will have
outcomes that indicate customized feedback is more influential on a
students’ curriculum progress and quality of work submitted.
College Readiness Knowledge
In both the pre- and post-survey, all students (n = 71) were asked the following question,
“What should middle school students be doing now to prepare for college?” (Appendix A,
Question 3) in an effort to study the first research question. The students’ responses were coded
on a scale of zero, one, two, or three based on the quality of their response, with a score of zero
representing a low-quality response and a score of three representing a high-quality response.
Figure 7 displays the results of the quality of responses to this question for all course
participants (n = 71). In the pre-survey, the quality of the students’ responses was relatively low,
with most students scoring a zero or one (average score of 0.80). In the post-survey, however,
students’ quality of responses was higher, with an average score of 1.69. A paired t-test was
conducted to determine if this observed difference in averages (1.69 - 0.80 = 0.89) between the
pre- and post-survey is statistically significant. A paired t-test was used here since the same

59
students took both the pre- and post-surveys, as opposed to an independent two-sample t-test which
assumes students in one group are different and independent from students in the other group being
studied.
Figure 7 – Coded quality of student responses to the question “What should middle school students be doing now to prepare for college?”
The null hypothesis for this paired t-test is that the true average difference in quality of
responses is zero, and the difference observed in the average quality of responses between the pre-
and post-survey was due simply to chance. The alternative hypothesis is that the true average
difference in quality of response was less than zero, meaning the post-study had a significantly
better average quality of responses. In other words, the observed difference of quality of responses
(0.89) was not due to chance. The p-value from this paired t-test is less than 0.0001, which reflects
the very small probability that this difference was due to chance. This test provides very strong
evidence that the average student response in the post-survey was much better in terms of quality
than the average student response in the pre-survey.
While it is clear that students improved the quality of their responses after they took this
course, tests were conducted to determine if improvement scores differed with respect to group:

60
the control group receiving standardized computer-generated feedback (n = 20), the in-class study
group receiving customized instructor feedback with no prerequisites (n = 34), and the digital
badge study group receiving customized instructor feedback with prerequisites (n = 17).
Improvement scores were calculated as the students’ score on the post-survey minus their score on
the pre-survey. Figure 8 displays the improvement scores for each of these groups.
Figure 8 – Student improvement scores to the question “What should middle school students be doing now to prepare for college?” The plot displays the total improvement scores from
the pre- to post-survey as a percentage of students for each group.
The percentage of students with each improvement score is grouped by each of the three
student groups so that each groups’ bars add to up 100%. The majority of the control group
students either didn’t improve in the quality of their responses (improvement score equal to zero)
or they increased their improvement score by one. For the in-class study group, about half of these
students did not improve the quality of their responses (improvement score equal to zero), while
the other half did improve their score by one, two, or three points. Over 50% of students in the
digital badge study group had an improvement score of one, with about 30% having no
improvement, and a little under 20% increasing their score by two.

61
To determine if these observed differences are statistically significant, Fisher’s exact test
was conducted. Fisher’s exact test is the non-parametric equivalent to the classic chi-squared test
for independence. The null hypothesis for both the chi-square test and Fisher’s exact test, in this
case, is that improvement scores are independent of the students’ group. The alternative
hypothesis is that improvement scores and the students’ group are somehow related, or dependent.
Fisher’s exact test is used, as opposed to the chi-square test, since the sample sizes of the groups
are relatively small, and there are several improvement scores in which no, or very few, students
fall. The p-value computed from this test is 0.25, indicating there is no evidence to suggest the
improvement scores and the students’ group are associated with each other. In other words,
improvement scores seem to be no different depending on the group. It is interesting to note,
however, that there seems to be a moderately significant difference in median improvement scores
between males (n = 45) and females (n = 26) in the course. The median increase in the quality of
responses for females is one, while the median improvement score for males is zero. Here, a non-
parametric alternative to the independent t-test, the Mann Whitney U test, was used since the
number of females in the study is relatively small. While t-tests rely on asymptotic assumptions,
which are often not met with small samples sizes, the Mann Whitney U test, while being similar
to the t-test, does not rely on any asymptotic assumptions, making it well suited for this data.
Additionally, the Mann Whitney U test compares median improvement scores, as opposed
to average improvement scores, making it more robust against outliers. The null hypothesis for
this test is that the improvement score data for both the males and females come from the same
“population,” or that the true median improvement score is the same for both genders. The
alternative hypothesis is that the true median improvement score is different between genders. The

62
p-value from this test is 0.027, suggesting males and females have significantly different median
improvement scores.
Figure 7 shows course participants (n = 71) had better quality responses to the question,
“What should middle school students be doing now to prepare for college?” in the post-survey
than in the pre-survey. This result was shown to be statistically significant, which is as
hypothesized. After taking this nine-week college readiness course, these middle school students
appear to better understand and articulate what they should be doing now to prepare for college
and their futures.
It was also hypothesized that students in each of the three different groups would have
improved their scores differently depending on the group. It was assumed that students in the in-
class study group (n = 34) or students in the digital badge study group (n = 17), both of which
received customized feedback, would have improved more in the quality of their responses than
students who received the standardized, computer-generated feedback (n = 20) over the period of
this course. This, however, did not seem to be the case. There was no significant difference in
students’ improvement in the quality of their responses between these three groups (see Figure 8).
Since it is clear that the quality of responses did, indeed, improve after taking this course, it appears
that the course positively affected all students in this area, regardless of the type of feedback.
Mentor(s) Identification
To assess how many people middle school students are utilizing as college readiness
mentors, the students were asked, in both the pre- and post-surveys, “Who are the people in your
life that talk to you about college and your future career?” Students could check a number of listed
people as mentors, and they could also write in additional people with whom they talk about
college and their future career. The number of different mentors for each student was recorded

63
and analyzed. Figure 9 displays the number of mentors whom students said they communicate
with about college in both the pre- and post-survey (n = 71).
Figure 9 – Number of mentors students talk with about college and their futures.
The median number of mentors from the pre-survey is four, and the median number of
mentors from the post-survey is five. Overall, it appears students say they talk with slightly more
people on the post-survey than they did on the pre-survey. A paired t-test was performed that
suggests the average difference in the number of mentors from the pre- and post-test is, indeed,
significant (p = 0.0001). This indicates, with 95% confidence, that after completing this nine-
week course, students say they talk with, on average, between 0.5 and 1.4 more people than they
did prior to this course. An additional item of interest is to determine if an increase in the number
of mentors varies significantly depending on the group of students. The increase in the number of
mentors is calculated by subtracting the number of mentors stated in the pre-study from the number

64
of mentors stated in the post-study. Figure 10 shows the increase in the number of mentors for
each group of students.
Figure 10 – The increase in the number of mentors students say the talk with about college and their futures from the pre-survey to the post-survey. The
plot displays the increases as a percentage of students for each group.
The percentage of students with each increase number is grouped by each of the three
student groups so that each groups’ bars add to up 100%. The control group students are fairly
uniformly spread from saying they talk with two fewer mentors than they did before the course up
to saying they talk with three more mentors than they did prior to the course. Over 40% of the
students in the in-class study group increased the number of mentors they talk with by one.
Students in the digital badge group mostly either gained or lost one mentor, and a little over
40% of these students said they gained between two and eight more mentors after the course.
Fisher’s exact test was again performed to test if the increase in the number of mentors is
independent of student group. This test suggests that the increase in the number of mentors and
student group are most likely independent (p = 0.67). In other words, there is no evidence to

65
suggest one group is associated with higher increases in the number of mentors than another group
in the study.
As hypothesized for research question two, on average, students identified talking with
more people about college and their futures in the post-survey than the pre-survey (see Figure 9).
The median number of mentors identified in the post-survey is one more person than the median
number of mentors identified in the pre-survey. However, even if this nine-week college readiness
course influenced students to talk with one additional mentor, that could be a very meaningful
relationship that could positively influence and help the student in college readiness and future
career planning.
The second hypothesis was that students who received instructor feedback, either the in-
class study group (n = 34) or the digital badge study group (n = 17), would identify more mentors
in the post-study than students who received the standardized, computer-generated feedback (n =
20). The data did not support this hypothesis and, rather, indicates there is no significant difference
in the number of mentors students identified between the three groups (see Figure 10). Again, this
suggests this nine-week college readiness course influenced all students involved to communicate
with more people about college and their future careers, regardless of type of feedback.
Progress, Quality, and Feedback
In regards to research question three, students were asked in the post-survey, “How helpful
was instructor feedback to you on your homework?” Students could pick one of five numbers,
with one meaning the feedback was not at all helpful and five meaning the feedback was very
helpful. Figure 11 shows that students in the control group (n = 20), who received the standardized,
computer-generated feedback, mostly thought their feedback was helpful. Of the control group
students, 65% said the feedback they received was helpful (feedback response of a four or five),

66
and a little under 30% of them were neutral regarding feedback helpfulness (feedback response of
three). Students in the in-class study group (n = 34) were very pleased with the feedback they
received. Almost 90% of students who received in-class instructor feedback said this feedback
was helpful.
Figure 11 – How helpful students viewed the feedback they received after completing the nine-week college readiness course, with the percent of students’ feedback responses
grouped by the three student groups.
For students in the digital badge study group (n = 17), this number dropped to a little under
60% of students feeling their feedback was helpful. About 35% of these students were neutral
with respect to the helpfulness of the feedback they received. Although there appear to be some
interesting patterns with respect to students’ responses to the feedback and the students’ groups,
based on Fisher’s exact test, there is no evidence to suggest that these two measures are associated
with each other (p = 0.10). Overall, it appears the majority of all students who went through this
nine-week college readiness course felt the feedback they received was helpful, regardless of the
students’ group. An important question to consider is if students improved the quality of their

67
work as they progressed through the badges or in-class modules. Figure 12 displays the percentage
of scores that were received on the students’ first attempt for each badge or module for students in
each of the three groups.
(a) (b)
(c)
Figure 12 – (a) shows the percentage of scores earned for each badge (on both the exercise sheets and video reflections) for students in the control group; (b) shows the percentage of
scores earned for each module for students in the in-class study group; (c) shows the percentage of scores earned on the students’ first attempt for each badge (on both the exercise
sheets and video reflections) for students in the digital badge study group.

68
Figure 12(a) shows the percentage of scores received for each badge (on both the exercise
sheets and video reflections) for the control group students (n = 20) who received standardized,
computer-generated feedback, had no prerequisite badge requirements, and moved along at their
own pace. Note that five of these 20 students chose to never attempt even one badge module.
Such poor participation could be explained by the fact that this group received no feedback, even
from the beginning. None of the other 15 students attempted a badge more than once, so their first
attempt scores, as seen in the graph, are all the scores they received. Scores of zero, one, and two
were all common scores for all badges, and a score of three on any badge was rarely given to these
students. Furthermore, an increase is not seen in the percentage of scoring a two or three (a passing
score) as the course progressed for control group students. This is understandable since these
students did not need to receive a passing score to proceed to subsequent badges.
A generalized linear model was fit to these data to determine if there was a significantly
different increase or decrease in student scores on any of the badges. Due to the small sample size
and sparseness of the data, for the control group, scores were grouped into “failing” (scores of a
zero or one) and “passing” (scores of a two or three). With score as the response variable in the
model, a logistic regression with random intercepts was conducted where a separate intercept was
given for each student. This helped account for the correlation of scores among students. Scores
on badges two and four were the only pair where there was a significant difference in receiving a
passing or failing score. The odds of receiving a passing score are about 5.5 times higher on badge
two than on badge four (p = 0.02). Otherwise, students did not significantly improve or diminish
the quality of their work throughout the program.
Figure 12(b) shows the percentage of scores received for each module for the in-class study
group students (n = 34) who received in-class customized instructor feedback, had no prerequisite

69
module requirements, and moved along with their peers at the same pace. For the purpose of clean
data analysis, the modules have been mapped to the badges (two through seven) because
badge/module one was the pre-survey and badge/module eight was the post-survey. Since the
students in Figure 12(b) were all moving along at the same pace, students only attempted a module
once, so their first attempt scores, as seen in the graph, are all the scores they received. Strikingly,
the most common score received by these students is a three, across all modules. Very few students
received failing scores of a zero or one. Overall, students in this group received higher scores than
students in the control group. Additionally, students in this group seem relatively consistent in
having high quality responses, and as such, they did not seem to improve the quality of their
responses over the course of the program.
Again, a generalized linear model was fit to these data to determine if there were any
statistically significant differences between student scores on any of the badges/modules. Since
most of the scores received were a three, the sparseness of the data required scores to be grouped
into two different categories than how the control group scores were grouped. Here, scores of a
zero, one, and two were group together and compared to a score of three. A logistic regression
with random intercepts was conducted, and several badges/modules had significantly different
scores. First, a marginally significant result indicates the odds of receiving a score of a three
(compared to a zero, one, or two) are about 4.4 times higher on badge/module two than on
badge/module four (p = 0.057). This is similar to what was seen with the control group students.
Students seem to score poorly on badge/module four. Additionally, the odds of students receiving
a score of three are about 9.9 times higher on badge/module two than on badge/module six (p =
0.003). Students’ scores on this badge/module drop scientifically lower than the scores they got
when they started the program. Finally, the odds of students receiving a score of three are about

70
5.6 times higher on badge/module two than on badge/module six (p = 0.026). From Figure 12(b),
it is apparent that more scores of a two were given out for badge/module six than scores of three,
and this trend is not seen for any other badge/module.
Figure 12(c) shows the percentage of scores that were received for each badge (on both the
exercise sheets and video reflections) for students in the digital badge study group (n = 17) who
received customized instructor feedback, had prerequisite badge requirements, and moved along
at their own pace, repeating badges when necessary. These students did have the opportunity to
repeat a badge if they received non-passing scores, and several did repeat a badge, but Figure 12(c)
just displays the scores of the students’ first attempts on these badges. For students in this group,
the percentage of failing scores (zero or one) on the first three badges was rather substantial. On
the last three badges, however, most scores received were passing scores (two or three).
Additionally, the percentage of a score of three received on each badge increased as the course
progressed and these students in the digital badge study group seemed to improve the quality of
their responses over time more than students in the other two groups.
To determine if this observed increase in receiving a score of three throughout the program
was statistically significant, logistic regression with random intercepts model was fit to these data.
Again, do the small sample size and sparseness of the data, scores were grouped as they were for
the in-class study group students: scores of a zero, one, or two versus a score of a three. There
was no significant difference in scores from badge/module two to badge/module three and four.
However, as suggested by Figure 12(c), there was a drastic change in the odds of receiving a three
as students progressed through the last three badges/modules. The odds of receiving a score of a
three (compared to a zero, one, or two) are about 15.3 times higher on badge/module five than on
badge/module two (p = 0.006). Going from badge/module two to badge/module six, the odds of

71
receiving a score of three increase to being about 31.3 times higher (p = 0.0009). Finally, the odds
of receiving a score of a three are estimated to be 303.8 times higher on badge/module five than
on badge/module two (p < 0.0001). This trend is striking. It provides very strong evidence that
students drastically improve their scores from the beginning of the program to the end of the
program–specifically on the last three badge/module challenges.
Another important question is whether receiving customized feedback impacted the
progress of the students’ work for only the older students using the software (digital badge study
group), since the younger study group participants (in-class study group) were required to move
ahead to subsequent badges no matter their score. For each digital badge, there was an exercise
sheet and a video reflection for the students to complete. If a student completed both of these
assignments with a passing score (a two or a three), then the student earned the badge.
Figure 13(a) displays the percentage of students who earned each of the six badges in both
the control (n = 20) and digital badge study (n = 17) groups. Strikingly, a very small percentage
of students in the control group earned any of the six badges. The most completed badge was
badge two, with 15% of the students in the control group completing this badge. Additionally, not
one student in the control group completed badge four. There is a slight increase in percentage of
students who earned the later badges, which is possible since students in the control group had no
prerequisite requirements and could proceed to later badges without earning earlier badges.
Figure 13(a) also shows the percentage of students earning each of the six badges for
students in the digital badge study group was much higher than for students in the control group.
For instance, about 70% of students in the study group completed badge two, and the lowest
percentages of students earning a badge were about 40%. Additionally, the percentage of students
in the study group earning each badge declined during the first three badges and then leveled off

72
for the last three badges. This is expected since students in this group who did not earn a badge
could not move on to earn subsequent badges due to the prerequisite requirements.
As opposed to judging student progress based on the number of badges earned, another
method is to assess the number of badges attempted. An “attempt” is defined to be when a student
receives a score (not necessarily passing) on both the exercise sheet and video reflection of a badge.
Figure 13(b) shows the percentage of students who attempted each of the six badges in both the
control (n = 20) and digital badge study (n = 17) groups. Again, the younger students receiving
in-class instruction (n = 34) are removed from such analysis as their attempts were all required as
part of a guided, instructor-led curriculum plan.
Figure 13(b) shows the percentage of students in the control group who attempted a badge
is much higher than the percentage of control group students who earned a badge (see Figure
13(a)). Badge two was the most attempted badge, with 60% of the control group students receiving
scores on both the exercise sheet and video reflection. Badges four and five were the least
attempted, with only 30% of the control group students attempting these badges. Again, there is a
slight increase in attempts for badges six and seven, which is not unexpected since the control
group students had no prerequisite requirements.
Once again, the digital badge study group students have higher percentages than the control
group across all badges (see Figure 13(b)). This disparity between percentages, however,
diminishes for later badges. Badge seven was attempted an approximately equal number of times
by students in both the control and digital badge study groups. It is interesting that all digital badge
study students attempted badge one, followed by about 70% attempting badge three, a little under
50% attempting badge four, and about 40% attempting the remaining badges.

73
The percentage of digital badge study group students attempting the badges decreased as
the course progressed, presumably because they did not meet the prerequisite badge requirements.
Anecdotal instructor feedback supports the notion that the students who could not move on with
the class or on their own due to prerequisite badge requirements would oftentimes get discouraged,
even if the feedback provided was positively-worded and constructive.
(a) (b)
Figure 13 – (a) shows the percentage of students who earned each badge (finishing both the exercise sheet and video reflection with passing scores of two or three) in the control (n
= 20) and digital badge study (n = 17) groups; (b) shows the percentage of students who attempted each badge (finishing both the exercise sheet and video reflection with any
score) in the control (n = 20) and digital badge study (n = 17) groups
Table 5 shows the average percentage of badges/modules earned for each of the three
student groups, stratified by the number of badges/modules failed. For the control group (n = 20),
the effect sample size is 15 since five of the 20 students did not attempt any badges/modules. For
these students, as well as the digital badge study group (n = 17), failing a badge/module meant
they received a score of zero or one on either the exercise sheet or video reflection for that
badge/module. For the in-class study group (n = 34), failing a badge/module meant they scored a

74
zero or one on the badge/module (these students received one score for each badge/module; scores
were not broken down into exercise sheets and video reflections).
For the control group, Table 5 shows the majority of students (12 of the 15, 80%) failed at
least four of the six badges/modules. Since these students had no prerequisite requirements and
could attempt any badge/module at any time, this result is not surprising. Additionally, the average
percentage of badges/modules earned was also fairly low for students in this group. Students who
failed at least four badges/modules earned, on average, between 37% and 63% of their
badges/modules. Overall, the average percentage of badges/modules earned for all students in the
control group was 46% (this is found by taking a weighted average of the control group column of
Table 5 over the number of badges/modules failed).
Conversely, Table 5 shows the majority of the in-class study group students (25 out of the
34, 74%) did not fail a single badge/module. Of these students who did not fail a badge/module,
the average percentage of badges/modules earned was 94%. For the six students who failed one
badge/module (18%), the average percentage of badges/modules earned drops to 69%. The
average percentage of badges/modules earned for all students in the in-class study group was 85%–
markedly larger than for students in the control group. Perhaps the younger 12-year-old students
were more inclined to follow an instructors’ directions–especially one who was working alongside
them in a classroom setting.
For students in the digital badge group, Table 5 reveals the majority of these students failed
one or two of their badges (15 of the 17, 88%). Upon failing a badge, these students received
customized instructor feedback on ways to improve the quality of their responses. Further research
shows that, despite the given feedback, of the 15 students who failed a badge, eight (53%) of them
did not attempt that badge again, and consequently, they could not attempt additional badges due

75
to the prerequisite requirements. Of the seven (47%) who did attempt the failed badge again, six
(86%) of them went on to complete subsequent badges. As over half of the students who failed
one or more badges did not attempt that badge again, it is not surprising that the average percentage
of badges earned by students who failed one badge is only 33%. However, it is interesting that all
three (18%) of the students who failed two badges completed all six of their badges. Overall, the
average percentage of badges earned for all students in the digital badge study group is 49%–only
slightly larger than the average percentage of badges/modules earned by students in the control
group.
Table 5 – Average percentage of badges/modules earned for each of the three student groups, stratified by the number of badges/modules failed.
Average % of Badges Earned
Number of Badges
Failed
Control Group In-Class Study Group
Digital Badge Study Group
n n n 0 67% 1 94% 25 67% 2
1 0% 1 69% 6 33% 12
2 - - 50% 2 100% 3
3 50% 1 33% 1 - -
4 37% 5 - - - -
5 63% 4 - - - -
6 44% 3 - - - -
Figure 11 showed that the majority of all students in the college readiness course (n = 71)
thought the feedback they received, whether customized or standard, was helpful. This is as
hypothesized. Even the majority of students in the control group, receiving standardized,
computer-generated feedback, thought that feedback was helpful.

76
Despite the majority of students saying the feedback they received was helpful, Figure 12
suggests that the feedback they received may not have actually helped them in terms of the quality
of their responses in different instructional/feedback method scenarios. For example, students in
the digital badge study group (n = 17) increased their scores as the program progressed, until
receiving a score of three was the most common score given. This result shows the potential of
digital badges as excellent mechanisms for feedback in an effort to improve quality over time.
Nevertheless, both the control group students (n = 20) and the in-class study group students (n =
34) seemed to neither improve nor diminish the quality of their work as the program progressed.
Since both the in-class study group and the digital badge study group students received customized
feedback, the fact that students in the digital badge study group improved their scores throughout
the program is most likely attributed to their having the prerequisite requirements. These
prerequisite requirements would likely motivate students to improve their scores, as students with
the prerequisite requirements had to score relatively high in order to even move on to the next
badge. This suggests that perhaps having prerequisite requirements encouraged students to
improve the quality of their responses more so than feedback received.
Figure 13 also suggests how the prerequisite requirements may influence student
curriculum progress. While students in the digital badge study group both attempted and earned
more badges than students in the control group, the effect of the prerequisite requirements on the
digital badge study group is clearly reflected in the decrease in their attempt and earning rates.
Whereas, the control group, who had no prerequisite requirements, started and ended attempting
and earning more badges than they did during the middle of the course.
It is interesting, though, that the percentage of students who attempted each badge was not
very similar in the digital badge study group and the control group (Figure 13(b)). It was assumed

77
that both groups would start out with about the same attempt rate, and the students in the digital
badge group would either have a larger or smaller percentage of badge attempts than the control
group students as the course progressed. Since the baseline percentages are not the same for badge
two, it is unclear what caused the digital badge study group to attempt fewer badges as the program
progressed, and also what caused fewer control group students (vs. digital badge students) to
attempt badge two.
When considering the progress students made on their badges throughout the course, Table
5 illuminates several interesting things. First, the vast majority of control group students (n = 20)
failed at least four badges. Since these students had no prerequisite requirements, the scores these
students received would not hold them back or hinder their progress in any way, so there may have
been little motivation for them to receive high scores. Additionally, the standardized, computer-
generated feedback probably did little to encourage these students to improve the quality of their
work. The average percentage of badges earned for all students in this group was also fairly low
at 46%. Again, there was likely no motivating reason for students in the control group to finish
all their badges. They were not receiving personalized feedback, and their progress was at their
own pace.
Table 5 also reveals that the majority of students in the in-class study group (n = 34) did
not fail a single badge. Additionally, the average percentage of badges earned by students in this
group is a remarkably large 85%. This is a rather surprisingly large percentage since these students
were under no prerequisite requirements and were, therefore, not obligated to earn badges before
proceeding to additional badges. This indicates that the in-class instructor feedback may be the
main motivating factor for students to finish their badges. Students may be more motivated to earn
their badges if they have customized instructor feedback and are moving along at the same pace

78
as their peers. As an additional note on this subject, it is interesting that five of the students in the
control group (n = 20) did not even attempt a single badge. This further suggests students may
need more guidance and instruction than what the digital badge study group and the control group
received. A classroom teacher may increase student participation and progress more so than
electronic feedback and instruction.
Additionally, Table 5 shows the average percentage of badges earned by the digital badge
study group. Most of these students failed one badge. Since these students had prerequisite
requirements, which forced them to earn badges before they could progress to subsequent badges,
this low percentage suggests that students may have gotten discouraged after failing a badge and
receiving customized feedback, influencing them to not want to continue through the program.
This theory seems to not be supported, however, by the three students who failed two badges and
yet were resilient and completed all six of their badges. They may not have been set back by
failing or by receiving customized feedback.
Overall, it seems the prerequisite requirements hindered student progression, as was
expected. Feedback may have also decreased students’ progress for those in the digital badge
study group, as relatively few continued after receiving a low score and feedback on how to
improve. This analysis also suggests that students who are taught in the traditional manner, with
an in-class instructor and moving at the pace of the instructor and their peers, may both produce
better quality work and complete more of their work. Students who can move at their own pace
may not have the motivation necessary for them to finish their work. Additionally, this study may
suggest that sudents who do not have to meet some sort of quality measure are less likely to put
forth the effort to produce quality work.

79
Motivation
As stated in the literature review in chapter two, this particular study is looking at the
motivation of students through the lenses of the expectancy-value theory and self-determination
theory. The expectancy-value theory is defined in this study as motivation existing as a
relationship between what an individual believes about his or her capabilities and the value placed
on engagement in various activities (Lewin, 1935; Atkinson, 1957; Feather, 1982). The self-
determination theory is defined in this study as the behavior that naturally occurs within one’s self
as influenced by intrinsic and extrinsic motivation (Deci et al., 1975; Ryan et al.,1983).
Figure 14 displays the results found when asking the 71 student participants the question,
“Do you plan to go to college one day?” on both the pre- and post-surveys. The results suggest
that the individuals in this study believe college is something to be placed in their sites and some
sort of intrinsic, and possibly extrinsic, motivators exist. The student who indicated in the pre-
survey no plans to attend college ended up changing their mind, with 100% of the seventh and
eighth grade students stating they plan to attend college once they graduate from high school.
Figure 14 – “Do you plan to go to college one day?”

80
When searching for a site for this particular study, the socio-economic status of the students
was an important factor because the research team felt it was important to help students with the
most need. This particular site has over two-thirds of its over 1,200 middle school students on free
or reduced-cost lunch plans. Furthermore, the site administrators claim that fewer than half their
students end up in a college or university setting immediately upon graduating from high school.
Yet, in the younger grades, the motivation is there as evidenced by Figure 14. Therefore, the
ultimate purpose of this study (helping young students be inspired and motivated to attend college
one day) becomes even more important.
Design Limitations
The main limitation of this study was the relatively small number of students in each of the
three student groups. With more students in each group, there would have been more statistical
power to detect significant differences. Additionally, since there were not a lot of students in each
group, this caused the data to be very sparse. Commonly used parametric statistical methods
require relatively large sample sizes and non-sparse data.
The sparseness of this data set required nonparametric methods to be use for several
analyses, which are valid and readily available. However, this sparseness also made it impossible
to fit several models to the data that required more complex methods than simple nonparametric
models. It was necessary to collapse student scores into categories in order to reduce the
sparseness of the data. As such, the individual scores of a zero, one, two, or three were unable to
be compared; rather, scores of “passing” (zero or one) versus “failing” (two or three) were
compared for students in the control group.
Even further collapsing was required for students in the in-class study group and the digital
badge study group, where scores of a zero, one, or two were compared with a score of a three. A
81
larger sample size would have likely reduced the sparseness of the data and allowed a comparison
of the individual scores to be made, which could have been insightful.
Another limitation to mention is the lack of a pilot group testing measure and inter-rater
reliability comparisons among the instructors and graduate students involved. Similar training
sessions were conducted by college admissions professionals; nevertheless, providing a
quantifiable measure of assessment among the reviews could give better confidence as to the
scores. Figure 12 clearly shows that a difference in scores among the three groups being studied
and the influence of instructor or graduate-student scoring based on rubrics, like the one found in
Appendix H, could be a threat to the reliability of the data. Furthermore, the instructor assigned
by the school to the in-class study group was in their first year of teaching and seemed to be more
hesitant than graduate student reviewers to give constructive feedback with the younger student
population which, again, could be skewing data given the psychological differences between 12-,
13-, and 14-year-olds.
Two interesting observations occurred when considering the limitations of this study and
the data collection mechanisms, namely the badging software. First, this is perhaps the first time
that some of the students had to incorporate email into their daily homework routines to access
their feedback. Second, the serious lack of initial video reflections in both digital badge study
groups would suggest that perhaps something was of concern to the participants in this regard.
Maybe the idea of filming themselves around their peers was hard to do or the process of
uploading a video file, despite training, was a technological barrier to curriculum progress. More
than half of the completed videos did not show a students’ face when completing the reflection.
The reviewer could hear the student’s voice but was looking at a floor, ceiling, or other surrounding
82
object when listening to the reflection. This observation would support the notion that middle
school students may be feeling uncomfortable with recording themselves for some reason(s).
Badging Takeaways
Although each of the data analysis sections above have included commentary regarding
the potential meaning and impacts the results have, the following section focuses on the practical
implementation of the future of digital badging. A particular emphasis is placed on implementing
digital badging in middle school settings where the population ranges from 12 to 14 years old.
Prerequisite requirements within the scaffolding of a badging curriculum influenced the
quantity and quality of the badges attempted and completed within the study discussed above.
Having to pass one badge before being able to complete the next must be thoroughly explained to
the users. Additionally, middle school students may give up without any help after they have
received feedback which is corrective by nature. Feedback is not always viewed as positive in the
eyes of these young students.
Once a student begins using digital badges, they improve their quantity and quality over
time. This may indicate that students need extra guidance and direction towards to beginning of a
curriculum implementation in an effort to achieve better results later. The barrier to access at the
on-set seems to be worth it in the end based on the optimal progress seen in the study with both
the in-class and digital badge study groups.
Teacher feedback seems to be important to students, especially customized feedback.
While digital badges can certainly be implemented in an in-class setting, such as was done with
the in-class control group, there are situations where technology can aide in having live teacher
feedback in the curriculum delivery to replicate an in-class feel. For example, pre-recorded and/or
live video instruction could help a student feel as if the teacher is more present than what was

83
presented in this study with the digital badge study group who received their instructor feedback
via email delivery. Additionally, definitions and exercises of what “good” feedback looks like
would be beneficial to a future study such as this one. Each graduate assistant and instructor,
although they received the same training course, varied slightly in their style of feedback.
Nevertheless, “good” feedback was defined as feedback that followed the principles outlined in
Table 2 (Besser, 2016; Nicol & Macfarlane-Dick, 2006).
Future Directions
The evidence is clear that college readiness and digital badge research is modern and many
gaps in the literature still exist, especially as it relates to college readiness, mentoring, motivation,
and digital badging within the middle school grades. Based on chapter two’s literature review and
the results of this study, the following future directions should be considered by researchers:
• Further understanding the concept of constructive feedback and the positive and/or
negative perceptions from middle school students
• Understanding the implications of recorded video versus written reflections and the
impact each has on middle school students’ curriculum results/quality
• Which adult mentors have the greatest influence on middle school students and their
college readiness and how is such influence best manifested
• More empirical evidence to support the Gallup (2014) research indicating institutional
prestige is not as important as institutional fit
• Studies correlating standardized test scores with college GPA and career attainment
and income levels to shed light on the need for or future demise of entrance exams
• Influence of community-based organizations (recreation, religious, etc.) and their
effects on college access rates

84
• Finding ways to connect postsecondary positive outcomes to middle school and high
school students’ motivation to attend college
• Longitudinal studies with middle schools and high schools who are implementing
creative college readiness practices (college colors day, campus visits, etc.)
• Research on how to eliminate certain barriers to entry in postsecondary education–
particularly with the federal financial aid system (extremely complex) and college
application processes
• Research on state levels to assure each student has sufficient options within their home
state without having to pay out-of-state tuition if circumstances do not allow
• Exploring new ways to make community colleges more affordable or even free
• Studies showing whether or not choosing a particular major upon entering
postsecondary education leads to better graduation rates or, perhaps, higher major or
institutional transfer rates
• Exploring the impact of smartphone use (over half the students who completed
Appendix D’s exercise sheet in Badge 4 reported over two hours daily of phone time)
These and many other topics still exist within the college readiness and digital badge
research fields, and with more focus on students and postsecondary education, our society will see
an increase in educated individuals and reap the benefits that are sure to come to individuals and
communities. Additionally, the literature review (Chapter 2) provides evidence to support the
claim that digital badging can effectively measure the full experience and holistic learning
outcomes of students. After a review of the research on digital badges supporting the history,
explanations, and claims made in this chapter, one quote stood out above others:
Higher education is entering a new era, one in which some industry and nonacademic certifications are more valuable than degrees, transcripts are
85
becoming credentials in their own right, and colleges are using badges to offer assurances to employers about students’ abilities in ways that a degree no longer seems to do. (Blumenstyk, 2015, B4) A move towards a more holistic outlook on a student is certainly popular. University
admissions offices are beginning to question the value of college entrance exams as a major
indicator of success and even stop requiring it at top universities (George Washington University,
2015). The implications of some metrics can be seen as dangerous to diversity or never
comprehensive enough to measure the full potential of a student. Similar demands will reach
universities–not only on the inputs of admissions but also the outputs of graduates. Employers
will begin to value the ability to see more than an academic transcript.
Each of the stakeholders mentioned previously (institutions, faculty, designers, developers,
students, and employers) play a role in future successes. Also, each can be invested in the process
but frequently wait for the others’ turn. Currently, many designers and developers are putting
badges into practice with some support from faculty and institutions, but each could be improved,
and the demand from the employers could be there if better communication existed between those
offering the badges and employers’ human resource departments.
Figure 15 was created to visually show all of the aforementioned stakeholders and the
interconnected relationship they share, with each of their roles defined and implications and ideas
for future research for each contributor outlined. As the digital badge research improves and
stakeholders grasp on to the potential created through implementing digital and open badges,
students will benefit, and transparency will be created for the truly talented earners out there.

86
Figure 15 – Digital Badge Stakeholders

87
REFERENCES
Abramovich, S., Schunn, C., & Higashi, R. M. (2013). Are badges useful in education?: It
depends upon the type of badge and expertise of learner. Educational Technology
Research and Development, 61, 217-232.
Abramovich, S., & Wardrip, P. (2016). Impact of badges on motivation to learn. In Muilenburg,
L. Y. & Berge, Z. L. (Eds.), Digital badges in education: Trends, issues, and cases (53-
61). New York, NY: Routledge.
Allensworth, E. M., Gwynne, J. A., Moore, P., and de la Torre, M. (2014). Looking forward to
high school and college: middle grade indicators of readiness in Chicago public school.
Chicago, IL: University of Chicago Consortium on Chicago School Research.
Amabile, T. M., DeJong, W., & Lepper, M. R. (1976). Effects of externally imposed deadlines
on subsequent intrinsic motivation. Journal of Personality and Social Psychology, 34(1),
92-98.
Atkinson, J. W. (1957). Motivational determinants of risk taking behavior. Psychological
Review, 64, 359-372.
Bailey, E. (2008). Symbols: Historic and current uses. International Journal of Pharmaceutical
Compounding, 12(6), 505-507.
Balzer, W. K., Doherty, M. E., & O’Connor, R. (1989). Effects of cognitive feedback on
performance. Psychological Bulletin, 106(3), 410.
Bandura, A. (1986). Social foundations of thought and action: A social cognitive theory.
Englewood Cliffs, NJ: Prentice- Hall, Inc.
Baum, S., Ma, J., & Payea, K. (2013). Education pays 2013: The benefits of higher education for
individuals and society. College Board. Retrieved from
https://trends.collegeboard.org/sites/default/files/education-pays-2013-full-report.pdf.
Berge, Z. L., & Muilenburg, L. Y. (2016). In the eye of the beholder: Value of digital badges. In
Muilenburg, L. Y. & Berge, Z. L. (Eds.), Digital badges in education: Trends, issues, and
cases (102-108). New York, NY: Routledge.
Bernhardt, P. E. (2013). The Advancement via individual determination (AVID) program:
Providing cultural capital and college access to low-income students. School Community
Journal, 23(1), 203-222.

88
Besser, E. D. (2016). Exploring the role of feedback and its impact within a digital badge system
from multiple perspectives: A case study of preservice teachers (Doctoral dissertation).
Retrieved from ProQuest. (10151547)
Blackburn, R. D., Porto, S. C., & Thompson, J. J. (2016). Competency-Based Education and the
Relationship to Digital Badges. In Muilenburg, L. Y. & Berge, Z. L. (Eds.), Digital
badges in education: Trends, issues, and cases (30-38). New York, NY: Routledge.
Bloom, B. S. (1968). Learning for Mastery. Instruction and Curriculum. Regional Education
Laboratory for the Carolinas and Virginia, Topical Papers and
Reprints, Number 1. Evaluation comment, 1(2), n2.
Bloom, B. S. (1976). Human characteristics and school learning. New York, NY: McGraw-Hill.
Blumenstyk, G. (2015, September 18). Next: When a degree is just the beginning. The Chronicle
of Higher Education, B4-B7.
Burkins, J. A. N., Yaris, K. I. M. & Hoffmann-Thompson, K. (2016). College and career
readiness in middle school: From George Costanza to Oprah Winfrey. Voices from the
Middle, 24(2), 19-24.
Castro, E. L. (2013). Racialized readiness for college and career: toward an equity-grounded
social science of intervention programming. Community College Review, 41(4), 292-310.
Cates, J. T., & Schaefle, S. E. (2011). The relationship between a college preparation program
and at-risk students’ college readiness. Journal of Latinos & Education, 10(4), 320-334.
Christensen, C. (2011). Innovator’s dilemma. New York: HarperCollins Publishers Inc.
Christensen, C., & Horn, M. B. (2011). Colleges in crisis: Disruptive change comes to American
higher education. Harvard Magazine, 40-43. Retrieved from
http://harvardmagazine.com/2011/07/colleges-in-crisis
Clasen, J., & Clasen, J. (1997). Is mentoring necessary? Training and Development Journal,
39(4), 36-39.
Converse, N., & Lignugaris-Kraft, B. (2009). Evaluation of a school-based mentoring program
for at-risk middle school youth. Remedial and Special Education, 30(1), 33-46.
Curry, J. R., Belser, C. T., & Binns, I. C. (2013). Integrating postsecondary college and career
options in the middle level curriculum: Middle level educators must find ways to
integrate postsecondary education and career exploration throughout the curriculum.
Middle School Journal, 44(3), 26-32.

89
Cury, F., Elliot, A., Fonseca, D. D., & Moller, A. C. (2006). The social-cognitive model of
achievement motivation and the 2 x 2 achievement goal framework. Journal of
Personality and Social Psychology, 90(4), 666-679.
Deci, E. (1971). Effects of externally mediated rewards on intrinsic motivation. Journal of
Personality and Social Psychology, 18(1), 105-115.
Deci, E. L., Cascio, W. F., & Krusell, J. (1975). Cognitive evaluation theory and some comments
on the Calder and Staw critique. Journal of Personality and Social Psychology, 31(1), 81-
85.
Deci, E. L., & Ryan, R. M. (2000). The “what” and “why” of goal pursuits: Human needs and
the self-determination of behavior. Psychological Inquiry, 11(4), 227-268.
Derryberry, A., Everhart, D., & Knight, E. (2016). Badges and competencies: New currency for
professional credentials. In Muilenburg, L. Y. & Berge, Z. L. (Eds.), Digital badges in
education: Trends, issues, and cases (12-20). New York, NY: Routledge.
Deterding, S., Khaled, R., Nacke, L. E., & Dixon, D. (2011, May 7). Gamification: Toward a
definition. In CHI 2011 Gamification Workshop Proceedings (12-15).
Duncan, A. (Speaker). (2011). Digital badges for learning: Remarks at the 4th annual launch of
the digital media and learning competition [Speech transcript]. Retrieved from United
States Department of Education site: www.ed.gov/news/speeches/digital-badges-learning
Dweck, C. S. (1986). Motivational processes affecting learning. American Psychologist, 41(10),
1040-1048.
Easley, D., & Ghosh, A. (2013). Incentives, gamification, and game theory: An economic
approach to badge design. In Proceedings of EC’ 13. Retrieved from
www.arpitaghosh.com/papers/EC-final.pdf
Ebrahim, H. H., Ezzadeen, K. K., & Alhazmi, A. A. (2015). Acquiring knowledge through
mobile applications. International Journal of Interactive Mobile Technologies, 9(3), 71-
74.
Eccles, J. S. (1993). School and family effects on the ontogeny of children’s interests, self-
perceptions, and activity choice. In J. Jacobs (Ed.), Nebraska symposium on motivation:
Developmental perspectives on motivation (145-208). Lincoln, NE: University of
Nebraska Press.

90
Ellis, L. E., Nunn, S. G., & Avella, J. T. (2016). Digital badges and micro-credentials: Historic
overview, motivational aspects, issues, and challenges. In Ifenthaler, D., Bellin-Mularski,
N., & Mah, D. (Eds.), Foundation of digital badges and micro-credentials:
Demonstrating and recognizing knowledge and competencies (3-21). Switzerland:
Springer.
Erickson, C. C. (2015). Digital credentialing: A qualitative exploratory investigation of hiring
directors’ perceptions (Doctoral dissertation). Retrieved ProQuest. (3687720)
Ertmer, P. A., & Newby, T. J. (2013). Behaviorism, cognitivism, constructivism: Comparing
critical features from an instructional design perspective. Performance Improvement
Quarterly, 26(2), 43-71.
Farmer-Hinton, R. (2008). Social capital and college planning: Students of color using school
networks for support and guidance. Education and Urban Society, 41, 127-157.
Feather, N. T. (1982). Expectations and actions: Expectancy-value models in psychology.
Hillsdale, NJ: Erlbaum.
First Generation Foundation. (2010). Supporting first generation college students. Department of
Education. Retrieved from www.firstgenerationfoundation.org/.
Ford, E., Izumi, B., Lottes, J., & Richardson, D. (2015). Badge it!: A collaborative learning
outcomes based approach to integrating information literacy badges within disciplinary
curriculum. Reference Services Review, 43(1), 31-44.
Fontichiaro, K. (2014). Digital badges: Part 1. School Library Monthly, 30(7), 48.
Foster, J. C. (2013). The promise of digital badges. Techniques, 88(8), 30-34.
Gaertner, M. N. & McClarty, K. L. (2015). Performance, perseverance, and the full picture of
college readiness. Educational Measurement: Issues and Practice, 34(2), 20-33.
Gallup. (2014). Great jobs great lives. The 2014 Gallup-Purdue Index Report. Retrieved from
www.gallup.com/services/178496/gallup-purdue-index-inaugural-national-report.aspx.
Gamrat, C., Bixler, B, & Raish, V. (2016). Instructional design considerations for digital badges.
In Muilenburg, L. Y. & Berge, Z. L. (Eds.), Digital badges in education: Trends, issues,
and cases (71-81). New York, NY: Routledge.
George Washington University (2015, July 27). Standardized test scores will be optional for GW
applicants. GW Today. Retrieved from http://wtop.com/dc/2015/07/george-washington-
university-dropped-tests-admissions-requirements/

91
Gibson, D., Ostashewski, N., Flintoff, K., Grant, S., & Knight, E. (2013). Digital badges in
education. Education and Information Technologies, 20(2), 403-410.
Grant, S. L. (2014). Badges: Show what you know. Young Adult Library Services, 12(2), 28.
Grant, S. L. (2016). History and context of open digital badges. In Muilenburg, L. Y. & Berge,
Z. L. (Eds.), Digital badges in education: Trends, issues, and cases (3-11). New York,
NY: Routledge.
Grolnick, W. S., & Ryan, R. M. (1989). Parent styles associated with children’s self-regulation
and competence in school. Journal of Educational Psychology, 81(2), 143-154.
Guskey, T. R. (2007). Closing achievement gaps: revisiting Benjamin S. Bloom’s “Learning for
Mastery.” Journal of Advanced Academics, 19(1), 8-31.
Halavais, A. M. (2012). A genealogy of badges: Inherited meaning and monstrous moral hybrids.
Information, Communication and Society, 15(3), 354-373.
Harackiewicz, J. M., Manderlink, G., & Sansone, C. (1984). Rewarding pinball wizardry: Effects
of evaluation and cue value on intrinsic interest. Journal of Personality and Social
Psychology, 47(2), 287-300.
Hayamizu, T. (1997). Between intrinsic and extrinsic motivation: Examination of reasons for
academic study based on the theory of internalization. Japanese Psychological Research,
39(2), 98-108.
Heider, F. (1944). Social perception and phenomenal causality. Psychological Review, 51(3), 58-
74.
Hickey, D. T., & McCaslin, M. (2001). Comparative and sociocultural analyses of context and
motivation. In S. S. Volet & S. Järvelä (Eds.), Motivation in learning contexts:
Theoretical and methodological implications (33-56). Amsterdam: Pergamon/Elsevier.
Hill, N. E. & Wang, M.-T. (2015). From middle school to college: Developing aspirations,
promoting engagement, and indirect pathways from parenting to post high school
enrollment. Developmental Psychology, 51(2), 224-235.
Holt, E. B., & Brown, H. C. (1931). Animal drive and the learning process, an essay toward
radical empiricism. New York, NY: H. Holt and Co.
Huchel, B. L. (2016). Purdue’s first competency-based program receives final approval. Purdue
University. Retrieved from www.purdue.edu/newsroom/releases/2016/Q1/purdues-first-
competency-based-program-receives-final-approval.html
92
Itow, R. C., & Hickey, D. T. (2016). When digital badges work: It’s not about the badges, it’s
about the learning ecosystems. In Ifenthaler, D., Bellin-Mularski, N., & Mah, D. (Eds.),
Foundation of digital badges and micro-credentials: Demonstrating and recognizing
knowledge and competencies (411-442). Switzerland: Springer.
Iyengar, S. S., & Lepper, M. R. (1999). Rethinking the value of choice: A cultural perspective on
intrinsic motivation. Journal of Personality and Social Psychology, 76(3), 349-366.
Janzow, P. (2014). Connecting learning to jobs through digital badges. The Catalyst, 42(2), 9-11.
Jaschik, S. (2015, October 1). Pressure from all sides: The 2015 survey of admissions directors.
Inside Higher Ed. Retrieved from www.insidehighered.com/news/survey/pressure-all-
sides-2015-survey-admissions-directors.
Johnson, B., & Christensen, L. B. (2012). Educational research: Quantitative, qualitative, and
mixed approaches. Thousand Oaks, CA: SAGE Publications.
Johnson, K. C., & Lampley, J. H. (2010). Mentoring at-risk middle school students. SRATE
Journal, 19(2), 64-69.
Kappes, S., & Betro, V. C. (2015, July 26). Using Mozilla badges to certify XSEDE users and
promote training. In Proceedings of the 2015 XSEDE Conference: Scientific
Advancements Enabled by Enhanced Cyberinfrastructure (p. 14). ACM.
Kluger, A. N., & DeNisi, A. (1996). The effects of feedback interventions on performance: A
historical review, a meta-analysis, and a preliminary feedback intervention theory.
Psychological Bulletin, 119(2), 254.
Koestner, R., Ryan, R. M., Bernieri, F., & Holt, K. (1984). Setting limits on children’s behavior:
The differential effects of controlling vs. informational styles on intrinsic motivation and
creativity. Journal of Personality, 52(3), 233-248.
Kulhavy, R. W. (1977). Feedback in written instruction. Review of educational research, 211-
232.
Leonard, J. (2013). Maximizing college readiness for all through parental support. School
Community Journal, 23(1), 183-202.
Lepper, M., Greene, D., Carskaddon, G., & Gronner, P. (1975). Turning play into work: Effects
of adult surveillance and extrinsic rewards on children’s intrinsic motivation. Journal of
Personality and Social Psychology, 31(3), 479-486.

93
Lepper, M., Corpus, J., & Iyengar, S. S. (2005). Intrinsic and extrinsic motivational orientations
in the classroom: Age differences and academic correlates. Journal of Educational
Psychology, 97(2), 184-196.
Lewin, K. (1935). A dynamic theory of personality. New York, NY: McGraw Hill.
Lockley, A., Derryberry, A., & West, D. (2016). Drivers, affordances, and challenges of digital
badges. In Ifenthaler, D., Bellin-Mularski, N., & Mah, D. (Eds.), Foundation of digital
badges and micro-credentials: Demonstrating and recognizing knowledge and
competencies (55-70). Switzerland: Springer.
Long, B. T. & Riley, R. (2007). Financial aid: A broken bridge to college access? Harvard
Educational Review, 77(1), p. 39-63.
Maehr, M. L., & Zusho, A. (2009). Achievement goal theory: The past, present, and future. In K.
R. Wentzel & A. Wigfield (Eds.), Handbook of motivation at school. (77-104). New
York, NY: Routledge.
Martinez, M. & McGrath, D. (2015). Leaping the college-ready gap: What can be learned from
schools that focus on deeper learning. State Education Standard, 15(2), 15-20.
Maslow, A. H. (1943). A theory of human motivation. Psychological Review, 50(4), 370-396.
Mattern, K., Allen, J. & Camara, W. (2016). Thoughts on a multidimensional middle school
index of college readiness. Educational Measurement: Issues and Practice, 35(3), 30-34..
Morrison, B.B., & DiSalvo, B. (2014, March 5). Khan academy gamifies computer science. In
Proceedings of the 45th ACM technical symposium on Computer science education (pp.
39-44). ACM.
Murray, H. A. (1938). Explorations in personality. New York: NY: Oxford University Press.
Nemelka, B. & Nemelka, B. (2016). The middle school students guide to academic success: 12
conversations for college and career readiness. New York, NY: Simon & Schuster
Books for Young Readers.
Newby, T., Wright, C., Besser, E., & Beese, E. (2016). Passport to designing, developing and
issuing digital instructional badges. In Ifenthaler, D., Bellin-Mularski, N., & Mah, D.
(Eds.), Foundation of digital badges and micro-credentials: Demonstrating and
recognizing knowledge and competencies (179-201). Switzerland: Springer.

94
Nicol, D. J., & Macfarlane-Dick, D. (2006). Formative assessment and self-regulated learning: A
model and seven principles of good feedback practice. Studies in higher education, 31(2),
199-218.
Nicholson, S. (2012, March 1). Meaningful “badgification”. Retrieved from
http://bgnlab.ca/blog/2012/3/1/meaningful-badgification.html
Ostashewski, N., & Reid, D. (2015). A History and Frameworks of Digital Badges in Education.
In Reiners, T. & Wood, L. C. (Eds.), Gamification in Education and Business (187-200).
Switzerland: Springer.
Palloff, R. M., & Pratt, K. (2001). Lessons from the cyberspace classroom: The realities of
online teaching. San Francisco, CA: Jossey-Bass.
Pew Research Center. (2014). Fewer than half of U.S. kids today live in ‘traditional’ family. Pew
Research Center. Retrieved from www.pewresearch.org/fact-tank/2014/12/22/less-than-
half-of-u-s-kids-today-live-in-a-traditional-family/.
Pérez-Peña, R. (2012, February 23). U.S. bachelor degree rate passes milestone. New York
Times. Retrieved from www.nytimes.com/2012/02/24/education/census-finds-bachelors-
degrees-at-record-level.html?_r=0.
Pintrich, P. R. (2000). An achievement goal theory perspective on issues in motivation
terminology, theory, and research. Contemporary Educational Psychology, 25(1), 92-
104. New York, NY: Routledge.
Radcliffe, R. A. & Bos, B. (2013). Strategies to prepare middle school and high school students
for college and career readiness. Clearing House, 86(4), 136-141.
Ramaprasad, A. (1983). On the definition of feedback. Behavioral Science, 28(1), 4-13.
Rice, M. (2014). Ethical challenges of studying online learning curriculum. Curriculum and
Teaching Dialogue, 16(1/2), 131-134.
Riley, R. (1998). Goals 2000: Reforming education to improve student achievement.
Washington, DC: Department of Education.
Ryan, R., & Deci, E. L. (2000). Intrinsic and extrinsic motivations: Classic definitions and new
directions. Contemporary Educational Psychology, 25(1), 54-67.
Ryan, R., & Deci, E. L. (2002). An overview of self-determination theory: An organismic-
dialectical perspective. In E. L. Deci & R. M. Ryan (Eds.), Handbook of self-
determination research (3-36). Rochester, NY: University of Rochester Press.
95
Ryan, R., Mims, V., & Koestner, R. (1983). Relation of reward and interpersonal context to
intrinsic motivation: A review and test using cognitive evaluation theory. Journal of
Personality and Social Psychology, 45(4), 736-750.
Schaefer, M. B. & Rivera, L. M. (2012). College and career readiness in the middle grades.
Middle Grades Research Journal, 7(3), 51-66.
Schaefer, M. B. (2014). Facilitating college readiness through campus life experiences. RMLE
Online: Research in Middle Level Education, 37(7), 1-19.
Schaefer, M. B. & Rivera, L. M. (2014). Just chillin’ on the quad: Middle grades students in
college. Middle Grades Research Journal, 9(2), 91-107.
Schunk, D. H., Meece, J. R., & Pintrich, P. R. (2013). Motivation in education: Theory,
research, and applications. Upper Saddle River, NJ: Pearson.
Sheldon, K. M., Ryan, R. M., & Reis, H. T. (1996). What makes for a good day? Competence
and autonomy in the day and in the person. Personality and Social Psychology Bulletin,
22(12), 1270-1279.
Slavin, R. E., & Karweit, N. L. (1984). Mastery learning and student teams: A factorial
experiment in urban general mathematics classes. American Educational Research
Journal, 21(4), 725-736.
Slavin, R. E., & Madden, N. (2004). Studnets at-risk of school failure: The problem of its
dimensions. Johns Hopkins University, Center for Research on Elementary and Middle
Schools. Boston: Allyn and Bacon.
Smink, J. (2000). Mentoring programs for at-risk youth: A dropout prevention research report.
Clemson, SC: National Dropout Prevention Center.
Smith, D. G. (2011). The diversity imperative. In Altbach, P. G., Gumport, P. J., & Berdahl, R.
O. (Eds.), American higher education in the twenty-first century (465-490). Baltimore,
MD: The Johns Hopkins University Press.
Thomas, A., Fish, J., Karagory, P. M., & Kirby, K. (2016). Measuring nursing students’ mastery
of health care competencies. In Muilenburg, L. Y. & Berge, Z. L. (Eds.), Digital badges
in education: Trends, issues, and cases (156-165). New York, NY: Routledge.
U.S. Census Bureau. (2009). Educational attainment in the United States: 2009. United States
Census Bureau. Retrieved from www.census.gov/prod/2012pubs/p20-566.pdf.

96
U.S. Census Bureau. (2014). Educational attainment in the United States: 2014. United States
Census Bureau. Retrieved from: www.census.gov/data/tables/2014.
U.S. Federal Trade Commission (1998). Children's online privacy protection rule ("COPPA").
United States Federal Trade Commission. Retrieved from:
https://www.ftc.gov/enforcement/rules/rulemaking-regulatory-reform-
proceedings/childrens-online-privacy-protection-rule
Waters, J. K. (2013). Career/college readiness: Digital badges. T.H.E. Journal, 40(5), 14-19.
Watson, J. B. (1913). Psychology as the behaviorist views it. Psychological Review, 20, 158-177.
Weiner, B. (1979). A theory of motivation for some classroom experiences. Journal of Educational
Psychology, 71, 3-25.
Wentzel, K. R. (1997). Student motivation in middle school: The role of perceived pedagogical
caring. Journal of Educational Psychology, 89(3), 411-419.
West, R. E., & Randall, D. L. (2016). The case for rigor in open badges. In Muilenburg, L. Y. &
Berge, Z. L. (Eds.), Digital badges in education: Trends, issues, and cases (21-29). New
York, NY: Routledge.
Wigfield, A. (1994). Expectancy-value theory of achievement motivation: A developmental
perspective. Educational Psychology Review, 6(1), 49-78.
Wigfield, A., & Eccles, J. S. (2000). Expectancy-value theory of achievement motivation.
Contemporary Educational Psychology, 25(1), 68-81.
Yen, H. (2014, February 11). New study shows the value of a college education. Boston Globe.
Retrieved from www.bostonglobe.com/news/nation/2014/02/11/new-study-shows-value-
college-education/3IWWEOXwQEAcMFSy09msOK/story.html.
Zuckerman, M., Porac, J., Lathin, D., Smith, R., & Deci, E. L. (1978). On the importance of self-
determination for intrinsically motivated behaviour. Personality and Social Psychology
Bulletin, 4(3), 443-446.

97
APPENDIX A
Badge Questions or “Challenges” 1 – Pre-Survey
Read textbook pages 1-11 Pre-Survey Questions:
Question 1: Do you plan to go to college one day? (Yes/No)
Question 2: What is the main reason why you do or do not want to go to college? (Open-Ended)
Question 3: What should middle school students be doing now to prepare for college? (Open-Ended)
Question 4: Who are the people in your life that talk to you about college and your future career (check all that apply out of “Mom, Dad, Sibling, Grandparent, Aunt, Uncle, Cousin, Neighbor, Friend, Teacher, Counselor, Other (list))?
Question 5: What are these people doing to help you prepare for college? (Open-Ended)
Question 6: What is your first name? Question 7: What is your last name? Question 8: When is your birthday? Question 9: What is your gender? Question 10: What is your race/ethnicity? (Options
include: Asian, Black, Latino/Latina, White, and More than one race/ethnicity)
Badge 2 – Goals Read textbook pages 12-20 Video Reflection Questions:
A. What are the most important things you want to accomplish in life?
B. What would you like to improve in your life and what can you do to start improving today?
C. Where do you see yourself in six months, one year, three years, and five years from today?
D. How often do you need to meet with your parents/mentors to review your goals?
Exercise Sheet Upload: E. See Appendix B

98
Badge 3 – Planning & Preparation Read textbook pages 26-33 Video Reflection Questions:
A. What do you need to plan and prepare for in the next six months?
B. What helps you think and reflect? C. What resources are available to help you plan
better, and how can you use those resources to keep track of your goals?
D. How can your parents/mentors help you realize your goals?
Exercise Sheet Upload: E. See Appendix C
Badge 4 – Time Management Read textbook pages 38-45 Video Reflection Questions:
A. How could you better utilize your time? B. What type of planning tools are you currently
using and are there time-management devices or methods you are not utilizing?
C. What kinds of responsibilities or events do you tend to miss often and how can better time management help you overcome this?
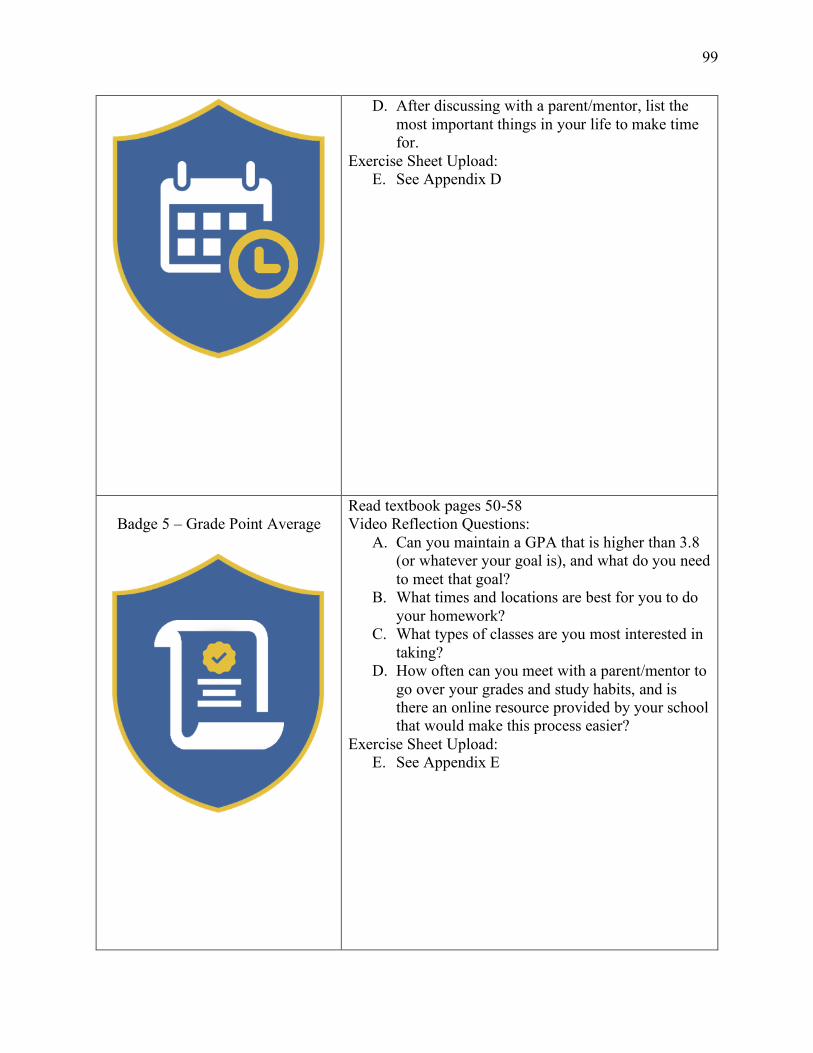
99
D. After discussing with a parent/mentor, list the most important things in your life to make time for.
Exercise Sheet Upload: E. See Appendix D
Badge 5 – Grade Point Average Read textbook pages 50-58 Video Reflection Questions:
A. Can you maintain a GPA that is higher than 3.8 (or whatever your goal is), and what do you need to meet that goal?
B. What times and locations are best for you to do your homework?
C. What types of classes are you most interested in taking?
D. How often can you meet with a parent/mentor to go over your grades and study habits, and is there an online resource provided by your school that would make this process easier?
Exercise Sheet Upload: E. See Appendix E
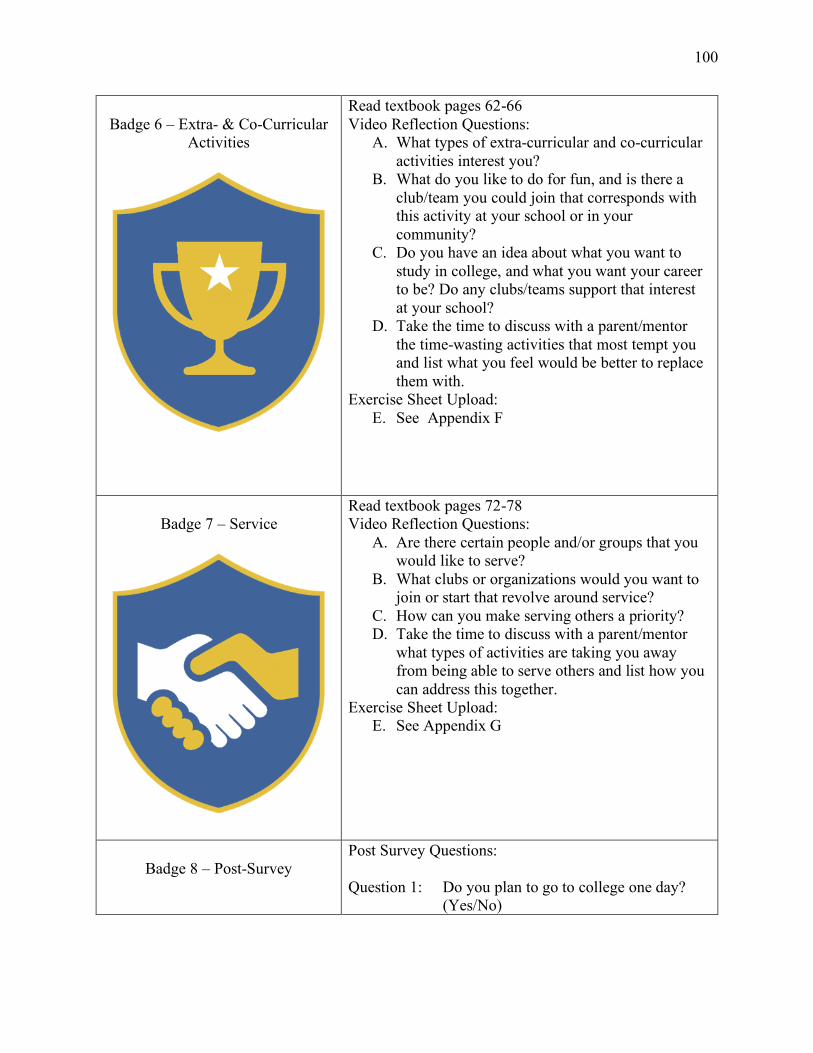
100
Badge 6 – Extra- & Co-Curricular Activities
Read textbook pages 62-66 Video Reflection Questions:
A. What types of extra-curricular and co-curricular activities interest you?
B. What do you like to do for fun, and is there a club/team you could join that corresponds with this activity at your school or in your community?
C. Do you have an idea about what you want to study in college, and what you want your career to be? Do any clubs/teams support that interest at your school?
D. Take the time to discuss with a parent/mentor the time-wasting activities that most tempt you and list what you feel would be better to replace them with.
Exercise Sheet Upload: E. See Appendix F
Badge 7 – Service Read textbook pages 72-78 Video Reflection Questions:
A. Are there certain people and/or groups that you would like to serve?
B. What clubs or organizations would you want to join or start that revolve around service?
C. How can you make serving others a priority? D. Take the time to discuss with a parent/mentor
what types of activities are taking you away from being able to serve others and list how you can address this together.
Exercise Sheet Upload: E. See Appendix G
Badge 8 – Post-Survey Post Survey Questions:
Question 1: Do you plan to go to college one day? (Yes/No)

101
Question 2:
Question 3:
Question 4:
Question 5:
Question 6:
Question 7:
Question 8: Question 9: Question 10:
What is the main reason why you do or do not want to go to college? (Open-Ended) What should middle school students be doing now to prepare for college? (Open-Ended) Who are the people in your life that talk to you about college and your future career (check all that apply out of “Mom, Dad, Sibling, Grandparent, Aunt, Uncle, Cousin, Neighbor, Friend, Teacher, Counselor, Other (list))? What are these people doing to help you prepare for college? (Open-Ended) How helpful did you find the feedback you received after completing a badge/chapter? (Five-point Likert) Please explain your answer to Question #8. (Open-Ended) What is your first name? What is your last name? When is your birthday?

102
APPENDIX B

103
APPENDIX C

104
APPENDIX D

105
APPENDIX E

106
APPENDIX F

107
APPENDIX G

108
APPENDIX H
Curriculum Reviewer Rubric
Rating 0 (Incomplete) 1 (Poor) 2 (Average) 3 (Excellent)
Readings: Readings: Readings: Readings: • Did not read • Based on the • Based on the • Based on the Video/In-Person responses to the responses to the responses to the Reflections: video/in-person video/in-person video/in-person • No videos reflections and/or reflections and/or reflections and/or
uploaded or in- exercise sheets, exercise sheets, exercise sheets, it person reflection answers do not answers is clear the completed incorporate any of incorporate a student did the
Exercise Sheets: the textbook little/some of the readings because • No sheets and/or state textbook and/or of the way the
uploaded or curriculum state curriculum student points turned in readings
Video/In-Person Reflections: • Videos/in-person
reflections are extremely short and do little to address the questions presented
Exercise Sheets: • Students give
one- or two-word answers and do not expound upon the activity and/or fill in all the required sections
readings Video/In-Person Reflections: • Video/in-person
reflection answers address the question but do not elaborate beyond a simple response that directly answers the question
Exercise Sheets: • Students fill in
the required sections of the sheet, but answers, where applicable, are brief
back to a reading moment
Video/In-Person Reflections: • Video/in-person
reflections are “long” for a 12-to 14-year-old person (over 1 minute per question) and you can tell the student developed several thoughts and connected to readings
Exercise Sheets: • Students filled in
all the sheets and answers were detailed and thoughtful