Cofactome analyses reveal enhanced flux of carbon into oil for potential biofuel production
11
Cofactome analyses reveal enhanced flux of carbon into oil for potential biofuel production Daniel M. Hayden 1 , Hardy Rolletschek 2 , Ljudmilla Borisjuk 2 , Jason Corwin 3 , Daniel J. Kliebenstein 3 , Asa Grimberg 4 , Sten Stymne 4 and Katayoon Dehesh 1,* 1 Department of Plant Biology, University of California Davis, Davis, CA, USA, 2 Leibniz-Institute for Plant Genetics and Crop Plant Research (IPK), Gatersleben, Germany, 3 Department of Plant Sciences, University of California Davis, Davis, CA, USA, and 4 Department of Plant Breeding and Biotechnology, Swedish University of Agricultural Sciences, Alnarp, Sweden Received 1 May 2011; revised 20 May 2011; accepted 24 May 2011; published online 21 July 2011. * For correspondence (fax 530 752 5410; e-mail [email protected]). SUMMARY To identify the underlying molecular basis of carbon partitioning between starch and oil we conducted 454 pyrosequencing, followed by custom microarrays to profile gene expression throughout endosperm development, of two closely related oat cultivars that differ in oil content at the expense of starch as determined by several approaches including non-invasive magnetic resonance imaging. Comparative transcriptome analysis in conjunction with metabolic profiling displays a close coordination between energy metabolism and carbon partitioning pathways, with increased demands for energy and reducing equivalents in kernels with a higher oil content. These studies further expand the repertoire of networks regulating carbon partitioning to those involved in metabolism of cofactors, suggesting that an elevated supply of cofactors, here called cofactomes, contribute to the allocation of higher carbon pools for production of oils and storage proteins. These data highlight a close association between cofactomes and carbon partitioning, thereby providing a biotechnological target for conversion of starch to oil. Keywords: oat endosperm, cofactome, non-invasive magnetic resonance imaging, metabolic profiling, custom microarray, 454 sequencing. INTRODUCTION Endosperm is the major starch storage organ that consti- tutes up to 95% of mature cereal seeds (Bartels and Thompson, 1986; Radchuk et al., 2009). Although endo- sperm of some cereals, including barley and wheat, contains low levels of oil (3%), oil accumulation is predominantly confined to the embryo and scutellum, organs with 15% oil but insignificant contribution to the total grain weight (Price and Parsons, 1975; Hargin et al., 1980; Neuberger et al., 2009). Exhaustive breeding and engineering efforts directed at the development of high-oil maize only led to increases in the size and oil concentration of the embryo and scutellum without a significant impact on the endosperm oil levels, maintained at <1% (Leng, 1961; Alexander et al., 1967; Shen et al., 2010; Alonso et al., 2011). Oat (Avena sativa) is unique among cereals, as there are oat varieties that contain up to 18% oil (Alexander et al., 1967 ; Price and Parsons, 1975; Alonso et al., 2011), mainly (up to 90%) deposited in the endosperm (Price and Parsons, 1979; Banas et al., 2007; Heneen et al., 2008; Heneen et al., 2009). Detailed examina- tion of two closely related oat cultivars, cv. Matilda and Freja, demonstrated their similarities in grain weight, and their differences in the composition of storage contents. Specifi- cally, in contrast to Freja, Matilda contains higher oil and protein levels at the expense of starch (Banas et al., 2007; Ekman et al., 2008), supporting the earlier findings that in oat the oil content is positively correlated with protein and is negatively correlated with starch content (Peterson and Wood, 1997). The differential developmental regulation of oil production between the endosperm of these two culti- vars was established by demonstrating that in Freja oil deposition is limited up to the mid-developmental-stage whereas in Matilda this process continues to maturity (Ekman et al., 2008). The fatty acid and starch biosynthetic pathways and their coordination have been studied extensively, and yet our understanding of the nature of the regulatory coordinating components is still fragmentary. Oat endosperm offers a suitable platform to identify the metabolic switches 1018 ª 2011 The Authors The Plant Journal ª 2011 Blackwell Publishing Ltd The Plant Journal (2011) 67, 1018–1028 doi: 10.1111/j.1365-313X.2011.04654.x
-
Upload
independent -
Category
Documents
-
view
1 -
download
0
Transcript of Cofactome analyses reveal enhanced flux of carbon into oil for potential biofuel production

Cofactome analyses reveal enhanced flux of carbon intooil for potential biofuel production
Daniel M. Hayden1, Hardy Rolletschek2, Ljudmilla Borisjuk2, Jason Corwin3, Daniel J. Kliebenstein3, Asa Grimberg4,
Sten Stymne4 and Katayoon Dehesh1,*
1Department of Plant Biology, University of California Davis, Davis, CA, USA,2Leibniz-Institute for Plant Genetics and Crop Plant Research (IPK), Gatersleben, Germany,3Department of Plant Sciences, University of California Davis, Davis, CA, USA, and4Department of Plant Breeding and Biotechnology, Swedish University of Agricultural Sciences, Alnarp, Sweden
Received 1 May 2011; revised 20 May 2011; accepted 24 May 2011; published online 21 July 2011.*For correspondence (fax 530 752 5410; e-mail [email protected]).
SUMMARY
To identify the underlying molecular basis of carbon partitioning between starch and oil we conducted 454
pyrosequencing, followed by custom microarrays to profile gene expression throughout endosperm
development, of two closely related oat cultivars that differ in oil content at the expense of starch as
determined by several approaches including non-invasive magnetic resonance imaging. Comparative
transcriptome analysis in conjunction with metabolic profiling displays a close coordination between energy
metabolism and carbon partitioning pathways, with increased demands for energy and reducing equivalents
in kernels with a higher oil content. These studies further expand the repertoire of networks regulating carbon
partitioning to those involved in metabolism of cofactors, suggesting that an elevated supply of cofactors, here
called cofactomes, contribute to the allocation of higher carbon pools for production of oils and storage
proteins. These data highlight a close association between cofactomes and carbon partitioning, thereby
providing a biotechnological target for conversion of starch to oil.
Keywords: oat endosperm, cofactome, non-invasive magnetic resonance imaging, metabolic profiling, custom
microarray, 454 sequencing.
INTRODUCTION
Endosperm is the major starch storage organ that consti-
tutes up to 95% of mature cereal seeds (Bartels and
Thompson, 1986; Radchuk et al., 2009). Although endo-
sperm of some cereals, including barley and wheat, contains
low levels of oil (�3%), oil accumulation is predominantly
confined to the embryo and scutellum, organs with�15% oil
but insignificant contribution to the total grain weight (Price
and Parsons, 1975; Hargin et al., 1980; Neuberger et al.,
2009). Exhaustive breeding and engineering efforts directed
at the development of high-oil maize only led to increases in
the size and oil concentration of the embryo and scutellum
without a significant impact on the endosperm oil levels,
maintained at <1% (Leng, 1961; Alexander et al., 1967; Shen
et al., 2010; Alonso et al., 2011). Oat (Avena sativa) is unique
among cereals, as there are oat varieties that contain up to
18% oil (Alexander et al., 1967; Price and Parsons, 1975;
Alonso et al., 2011), mainly (up to 90%) deposited in the
endosperm (Price and Parsons, 1979; Banas et al., 2007;
Heneen et al., 2008; Heneen et al., 2009). Detailed examina-
tion of two closely related oat cultivars, cv. Matilda and Freja,
demonstrated their similarities in grain weight, and their
differences in the composition of storage contents. Specifi-
cally, in contrast to Freja, Matilda contains higher oil and
protein levels at the expense of starch (Banas et al., 2007;
Ekman et al., 2008), supporting the earlier findings that in
oat the oil content is positively correlated with protein and
is negatively correlated with starch content (Peterson and
Wood, 1997). The differential developmental regulation of
oil production between the endosperm of these two culti-
vars was established by demonstrating that in Freja oil
deposition is limited up to the mid-developmental-stage
whereas in Matilda this process continues to maturity
(Ekman et al., 2008).
The fatty acid and starch biosynthetic pathways and their
coordination have been studied extensively, and yet our
understanding of the nature of the regulatory coordinating
components is still fragmentary. Oat endosperm offers
a suitable platform to identify the metabolic switches
1018 ª 2011 The AuthorsThe Plant Journal ª 2011 Blackwell Publishing Ltd
The Plant Journal (2011) 67, 1018–1028 doi: 10.1111/j.1365-313X.2011.04654.x

responsible for the coordination of carbon partitioning
between these two pathways.
Oils are the most abundant form of reduced carbon chains
in nature, having diverse utility in food and industrial
applications (Thelen and Ohlrogge, 2002). Rising cost of
petroleum together with increased environmental concerns
have recently led to an unprecedented demand for sustain-
able oils as renewable alternatives to fossil fuels and other
oil-based industrial applications. However, one of today’s
biggest challenges in plant oil production is the restricted
feedstock, since the supply of vegetable oils relies upon
limited amounts of a few crops (Durrett et al., 2008).
The knowledge derived from using oat as a platform for
identification of regulatory network switches involved in
carbon partitioning may bring to light new targets for the
generation of designer oil crops capable of redirecting
carbon flux from starch to oil, thereby overcoming the
current constraints in producing economically viable levels
of plant oil. Towards this goal, we have utilized a combina-
tion of 454 sequencing and custom microarray profiling in
parallel with metabolic profiling at developmental periods
with near-linear phase oil deposition in Matilda and Freja
endosperm. Collectively, these analyses established a close
association between energy metabolism and carbon alloca-
tion, and have expanded the repertoire of regulatory
networks involved in carbon partitioning to cofactor metab-
olism as a biotechnological target for conversion of starch
to oil.
RESULTS
Nuclear magnetic resonance studies display differential
lipid distribution patterns in oat endosperm
The development of Matilda and Freja seeds was compared
by phenotypic and metabolic analyses from early stages to
near maturity (Fig. 1a–g). The phenotypic comparison at
various stages of seed development (previously classified as
stages A to H) (Ekman et al., 2008), was combined with fresh
weight measurements at the corresponding stages (Fig. 1a).
These data established that the general course of growth is
extremely similar between the seeds of these two cultivars,
and therefore here we only present the data obtained from
Matilda seeds (Fig. 1a). However, the composition of the
storage compounds differs significantly between them, as
Matilda seeds accumulate higher levels of proteins and lip-
ids and lower levels of starch compared with Freja (Fig. 1b).
To determine whether the higher total protein level in
Matilda as compared with Freja is supported by an increase
in the levels of all or only a selected group of amino acids,
we examined the levels of free amino acids using the whole
oat kernel at the three developmental stages (C–E). These
analyses determined that an improved protein level in
Matilda is well supported by the elevated levels of 16 out
of the 19 free amino acids examined. The levels of glutamate
and glutamine remained unchanged between the two, while
cysteine exhibited higher levels in Freja than in Matilda
(Fig. 1c). The developmental decline in the level of most free
(a)
(b)
(c)
(d)
(f) (g)
(e)
Figure 1. Phenotypic and metabolic profiling combined with NMR analysis
display differential lipid distribution patterns and amino acid levels in oat
seeds.
(a) Oat seed phenotypes at sequential developmental stages days after
pollination (DAP) and their corresponding fresh weight measurements (mg
per seed).
(b) Levels (%w/w) of starch, lipid and proteins at three developmental stages
(C–E) represented in bold and highlighted by the grey box.
(c) Analysis of amino acid levels [lmol g)1 dry weight (DW)] at developmental
stages C–E in Matilda (orange) and Freja (blue) seeds. The measurement scale
varies for each amino acid; actual amounts are presented in Table S2.
(d) Cross and (e) longitudinal views of seeds at developmental stage D/E,
displaying chlorenchyma (ch), embryo (em), endosperm (en), nucelar
projection (np) and vascular region (vs). The dashed red line indicates the
cross-sectional area selected for presentation of the NMR data.
(f) Cross-section of lipid distribution patterns in Freja (upper panel) and
Matilda (lower panel) seeds at developmental stage C/D by non-invasive
NMR.
(g) Longitudinal view of lipid distribution in Matilda and Freja seeds by NMR
analysis. Lipid content is color coded as shown in color bar.
Conversion of starch to oil via cofactome alteration 1019
ª 2011 The AuthorsThe Plant Journal ª 2011 Blackwell Publishing Ltd, The Plant Journal, (2011), 67, 1018–1028

acids determined here may be representative of a general
pattern, as similar observations are reported for other seed
species (Rolletschek et al., 2002; Rolletschek et al., 2004b).
This suggests that the increased level of total protein is
sustained through ongoing storage throughout the devel-
opmental stages.
Next we examined whether the presence of different
levels of lipid in these two cultivars is solely a reflection of a
difference in the cellular content and/or is a manifestation
of differential lipid accumulation in different cell layers. For
these studies, we examined the lipid distribution patterns
within the intact seeds using non-invasive magnetic reso-
nance imaging (NMR) as described previously (Neuberger
et al., 2008, 2009). These NMR experiments were performed
on cross and longitudinal views of seeds at developmental
stage D/E, a stage with completely formed and distinctly
organized tissue structures (Fig. 1d). The analysis of the
cross-sections presented here is focused on the central part
of the seeds marked by the dotted red line (Fig. 1e),
whereas the longitudinal views display the entire length
of the seeds. Subsequent to data reconstruction, images of
lipid distribution patterns were generated in both cross and
longitudinal views of the intact seeds (Fig. 1f,g) as previ-
ously described (Neuberger et al., 2009). These data depict
endosperm as the predominant site of lipid accumulation in
both cultivars and highlight their distinct lipid distribution
patterns. In Freja, lipid deposits are detected exclusively in
the outermost layers of endosperm (i.e. the aleurone and
sub-aleurone), while in Matilda these deposits are present
in both the central and outermost layers of endosperm
(Fig. 1f,g).
Parallel time-indexed analysis reveals discordance between
transcript and core metabolite levels in sequential stages of
seed development
To capture the most complete transcriptional profiles of oat
endosperm during the full cascade of developmental events,
we employed a combination of 454 pyrosequencing coupled
with custom microarrays (Fig. 2). Initially, we focused on 454
pyrosequencing of Matilda endosperm transcripts at the two
previously identified developmental stages corresponding
to the time-index with maximum and minimum rates of oil
deposition (Ekman et al., 2008). From this data, 29 575 con-
tigs were constructed using custom PERL scripts. These
contigs were subsequently validated as probes for high-
resolution custom microarray profiling, from which a total of
27 570 were found suitable as probes by described criteria
(see Experimental Procedures and Fig. 2). These contigs
were employed in the preparation of the final microarrays
hybridized with cDNAs derived from RNA isolated from 15
sequential stages spanning from anthesis to mature endo-
sperms of both cultivars (Fig. 2). A combination of bioin-
formatics and mixed model ANOVA-based statistical analysis
determined that �10% of these contigs are significantly
and differentially expressed between Matilda and Freja
(Table S1). Among the differentially expressed contigs 55%
remained unassigned and the remaining 45% were assigned
to transcripts of genes associated mainly with metabolic
processes, protein synthesis, chromatin assembly and
transportation group genes.
In parallel with the expression profiling approach, we
examined the steady-state levels of selected core pathway
metabolites with known involvement in starch and lipid
metabolism during the three mid-developmental stages
(C–E) (Figs 2 and 3). The selection of these developmental
stages was based on a combination of the results from the
current as well as several previous studies that established
near-linear phase oil deposition in the oat endosperm during
this period (Ekman et al., 2008), and illustrated the promi-
nence of the enzymes involved in sucrose assimilation,
glycolysis and de novo fatty acid synthesis at these devel-
opmental stages in a number of oilseeds (Hajduch et al.,
2005; Hajduch et al., 2006; Hajduch et al., 2007).
Subsequent to the metabolic analysis, we utilized the
unsupervised statistical method, principal components
analysis (PCA), and tested the major sources of variance
within the combined transcriptome and metabolome data-
set available for the three developmental stages (C–E) of the
two oat genotypes Matilda and Freja. This analysis showed
that the first two PCA vectors contained over 99% of the total
variance, with PCA1 being 97.5% of the variance by itself.
However, neither vector was able to independently partition
genotype or developmental stage, suggesting that the
majority of information present in the dataset is only
obtainable by investigating the interaction of genotype
and developmental stage (Fig. S1a). Similar results were
obtained when solely focusing on the transcripts or metab-
olites in stages C, D and E or transcripts at all stages
(Fig. S1b,c, respectively). Thus, we proceeded to conduct
two-factor mixed ANOVA to identify the metabolites that
depend upon the interaction of genotype and development.
The ANOVA-based comparative analyses indicate that the
expression levels and patterns of only a few transcripts
within the core metabolic pathways are statistically different
between the two cultivars, while the steady-state levels of
several of the corresponding metabolites differ significantly
between them (Fig. 3). This discordance is most notable
between the levels of metabolites and the expression of their
respective genes in the glycolytic pathway and in the citric
acid cycle. Among the several outstanding examples are
higher levels of the glycolytic intermediates glucose, fruc-
tose and UDP-glucose in Matilda as compared with Freja,
while the expression levels of the gene encoding sucrose
synthase (SuSy), a sucrose-hydrolyzing enzyme primarily
associated with cereal endosperm (Emes et al., 2003), is
similar between the two. However, the expression level of
the gene encoding a second hydrolyzing enzyme, invertase
(Inv), is lower in Matilda, hypothetically an indication that
1020 Daniel M. Hayden et al.
ª 2011 The AuthorsThe Plant Journal ª 2011 Blackwell Publishing Ltd, The Plant Journal, (2011), 67, 1018–1028
sucrose degradation in Matilda is mainly catalyzed by
the energy-conserving route provided via SuSy. In addition,
the differences in the levels of hexose phosphates between
the two cultivars don’t correspond to the changes in the
transcript profiles of their respective genes encoding fructo-
kinase (FK), hexokinase (HK), and UDP-glucose pyrophos-
phorylase (UGP) enzymes. Moreover, the transcript patterns
of the gene encoding ADP-glucose pyrophosphorylase
(AGP) do not match the steady-state profile of the respective
product, ADP-glucose, that is metabolized from glucose
1-phopshate (glucose 1-P). This discrepancy is evident
throughout the glycolytic pathway to the penultimate step,
conversion of 2-phosphoglycerate (2-PG) to phosphoenol-
pyruvate (PEP), catalyzed by enolase. This discordance is
also well displayed between the expression profile of the
gene encoding pyruvate dehydrogenase, the enzymatic link
between glycolysis and the citric acid cycle, and levels of the
respective product, acetyl-CoA. This trend is further
extended to the apparent discordance between transcript
and metabolite levels of various steps of the citric acid cycle.
Freja Matilda
11MFT6
Serial Microarray Values for each Cultivar
Each Point RepresentsLog value for the geometric mean
for each probeset per contig
55mg15mg Endosperm Tissue Only
20mg 33mg Band color indicates
cultivar with higher
steady state metabolite levels
Abbreviated gene name represents assigned BLAST comparision for each contig
Represents number of characterizedtranscript paralogs for each gene type
Whole kernel
C
Log2
Endosperm DevelopmentKernel Development
2
6
16
Combined trasncriptome and metabolome analysis
Malonyl-CoA
Time-index of metabolite analysis
20mg 33mg
on whole kernel(C-E)
Time-index of metabolite analysison whole kernel(C-E)
Steady state metabolite analysis
Microarray AssistedProbe Validation
29 575
13
4 X 384k
454 pyrosequencing of matilda endosperm
712 040Total Fragments
460bp average contig size
29 575Total Contigs
2Slides
BLAST annotated
Contigs
Stage E/FStage C/D
1- Metabolites involved with carbon metabolism 2- Metabolites involved with cofactor metabolism
3- Energy and reducing equivalents
Probe validation
12 array X 135k Nimblegen custom slide
High resolution microarray analysis
Hybridized with endosperm RNA derived from 15 sequentail developmental stages for each cultivar. The results are presented as log2 graphs.
probe selected based on reliabilty±2 stdev of the mean
final probe number based on length of each contig
4 Nimblegen Custom Array2 replicate arrays for each
Probes per ContigRandomly distributed,
homologous regions screened
Mixed model ANOVAStatistical signifigance
Expression ~ Probe + Genotype + Adjusted Weight + Genotype:P-Value = Adjusted Weight + e.
2479
Number of Signifigantly Different Contigs
Specifically:
D E
Figure 2. Flowchart of the experimental design.
The flowchart depicts the developmental stages employed for 454 pyrosequencing, followed by microarray-assisted probe validation and subsequent high-
resolution microarray analysis performed on Freja and Matilda endosperm throughout the full developmental cascade. Steady-state metabolite analyses were
performed on three developmental stages, C–E. The levels of malonyl-CoA at the three developmental stages of Freja (blue) and Matilda (orange) seeds are
presented as an example. Two-factor mixed ANOVA was utilized to identify the metabolites that depend upon the interaction of genotype and development.
Conversion of starch to oil via cofactome alteration 1021
ª 2011 The AuthorsThe Plant Journal ª 2011 Blackwell Publishing Ltd, The Plant Journal, (2011), 67, 1018–1028

Higher steady-state levels of acetyl-CoA and several other
citric acid cycle metabolites, including isocitrate, 2-oxoglut-
arate and succinyl-CoA in Freja as compared to Matilda,
suggests a more rapid turnover of these metabolites in
Matilda. These data further imply a higher reliance of
Matilda endosperm on mitochondrial oxidative phosphory-
lation driven by oxidation of acetyl-CoA to meet the high
energy demands for enhanced accumulation of the energet-
ically costly storage product, oil. Subsequent measurements
of oxygen uptake rates lend support to the notion that
Matilda seeds do indeed tend to display a higher respiration
rate than Freja seeds. Specifically, the mean values of
oxygen uptake in oat seeds [measured as nmol (gfw min))1;
fw = fresh weight] at the three developmental stages (C–E)
were respectively 470, 348 and 423 in Freja, versus 649, 321
and 523 in Matilda.
Despite similar expression levels and patterns of most
fatty acid biosynthetic genes encoding the plastidial and
endoplasmic reticulum (ER) localized enzymes in both
cultivars, the steady-state levels of the primary substrates
Figure 3. Comparative transcriptome and metabolome analysis display discordance at sequential developmental stages of oat seeds.
Parallel transcriptome (endosperm) and metabolome (whole seed) of Freja (blue) and Matilda (orange) were analyzed at sequential stages of seed development.
Expression levels, presented on log2 graphs, are measurements of signal intensities derived from 15 serial microarray profiles for each putatively characterized
transcript per cultivar over the course of endosperm development. Gray shading in the transcriptome boxes depicts the developmental stages employed for
metabolite analysis. Steady-state analysis of metabolites at the three developmental stages C–E are displayed bound in blue (higher in Freja), orange (higher in
Matilda) or black (no difference) boxes. The red star indicates significantly differentially expressed genes with a P-value < 0.05 after adjusting for false discovery rate
(FDR) at the 0.2 level, in the two oat cultivars, using ANOVA analysis. Full names of genes and metabolites are provided in Table S4.
1022 Daniel M. Hayden et al.
ª 2011 The AuthorsThe Plant Journal ª 2011 Blackwell Publishing Ltd, The Plant Journal, (2011), 67, 1018–1028
for fatty acid synthesis, acetyl-CoA and malonyl-CoA, are
higher in Freja than in Matilda, suggesting the higher
turnover rate for enhanced oil accumulation in the latter.
The notion of higher turnover rate of primary fatty acid
substrates corresponds well to the exhausted levels of some
of their precursors including the glycolytic intermedi-
ates fructose-1,6-diphosphate, glyceraldehyde-3-phosphate
(GAP), dihydroxyacetone phosphate (DHAP) and phospho-
enolpyruvate (PEP) in Matilda. These data in part allude to a
prominent role for metabolic efficiency potentially achieved
by various post-transcriptional modifications impacting the
steady-state levels of proteins, and possible post-transla-
tional modification, ultimately resulting in improved enzy-
matic activities rather than altered expression levels of core
metabolic pathway genes in determining the oil content of
oat endosperm.
Parallel transcriptional and metabolic network analysis
highlights the association of cofactomes with carbon
partitioning
Energy metabolism is tailored to the specific demand of
the cell. Given the notable differences in the oil and pro-
tein content of the two cultivars, we therefore examined
the energy state of the seeds by measuring the steady-
state levels of energy and reducing equivalents at the
three developmental stages (C–E). Intriguingly, signifi-
cantly lower levels of di- and triphosphate nucleotides,
namely UDP/UTP, ADP/ATP, and CDP/CTP, combined with
higher levels of UMP, AMP, and CMP are present in high-
oil Matilda as compared with Freja (Fig. 4). The tran-
scriptional profiling of genes encoding enzymes involved
in purine and pyrimidine biosynthesis supported the
metabolic data. Specifically, the most notable highly ex-
pressed gene in Matilda versus Freja is that encoding
aspartate carbamoyltransferase, the enzyme catalyzing the
first step in UMP synthesis. The next most differentially
expressed genes in the two cultivars with a higher
expression in Matilda are those encoding phosphoribosyl
aminoimidazole (AIR) synthase and adenylosuccinate
synthase, enzymes of the de novo purine biosynthesis
pathway.
Steady-state levels of NADH and NADPH are notably
lower in Matilda compared with Freja, in contrast to the
levels of their oxidized equivalents, NAD+ and NADP+, that
are higher in Matilda than Freja (Fig. 4). This high demand
for oxidation of NADH may potentiate a higher citric acid
cycle flux, consistent with the greater demand for energy
and reducing equivalents for synthesizing lipid and protein
at the expense of starch in Matilda (Fig. 4).
In addition to the above noted differences, these cultivars
also differ in the levels of transcripts and metabolites
involved in cofactor metabolism, most notably those in
S-methyl methioinine (SMM), S-adenosyl methionine (SAM)
and folate biosynthetic pathways. In addition, the gene
encoding thiamine biosynthetic enzyme (Thi1) is also
significantly differentially expressed over the span of endo-
sperm development between the two cultivars (Fig. 4).
Within the folate biosynthetic pathway, expression levels
of the gene encoding a serine hydroxymethyltransferase
(SHMT), the enzyme that catalyzes the conversion of 5,10-
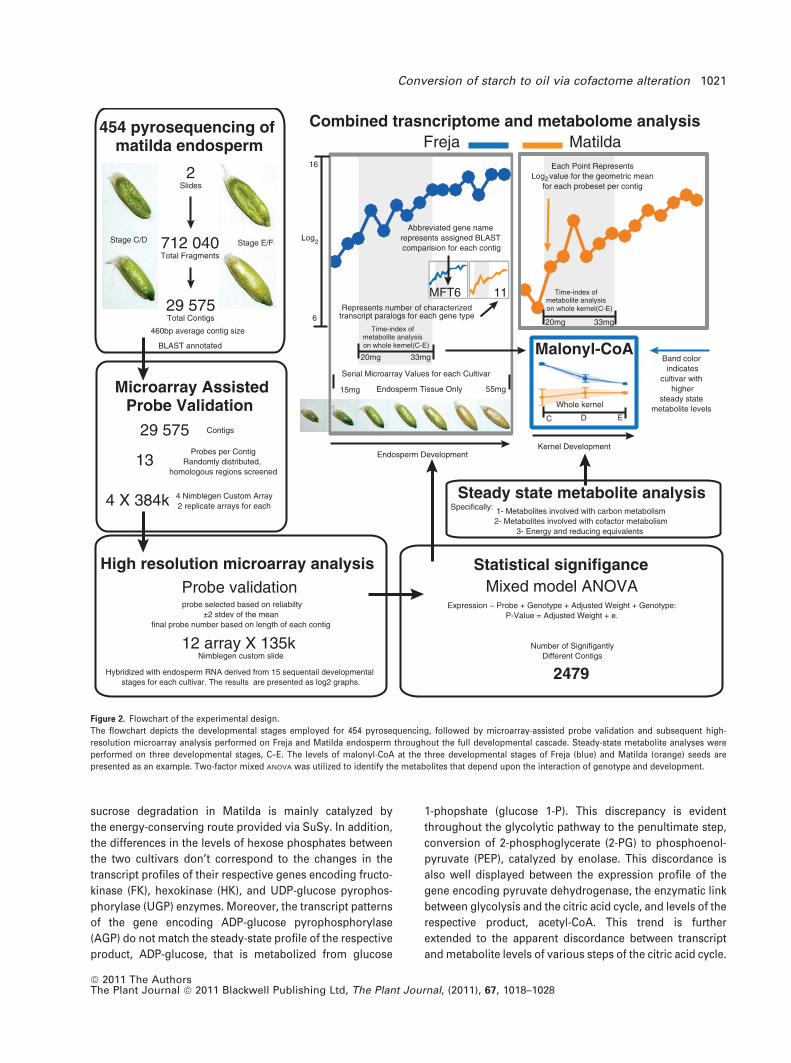
Figure 4. Parallel transcriptional and metabolic network analysis highlights association of cofactomes with carbon partitioning.
A simplified schematic representation of the interconnectedness of cofactor biosynthetic and recycling pathways with their respective selected transcript and
metabolite levels presented in different color schemes for each pathway. Dashed arrows represent pathways with additional steps to those graphically represented.
Larger boxes represent metabolites measured at three developmental stages (C–E), and smaller boxes represent the Freja (blue) and Matilda (orange) log2 graphed
transcriptome signal intensity of each corresponding contig matching the listed gene from 15 serial microarrays. Gray boxes within transcriptome graphs represent
the corresponding time period selected for metabolic analysis. Only transcripts whose alterations are statistically significant by ANOVA analysis are presented. The
red star indicates the cultivar with higher transcript levels of the designated genes with a P-value < 0.05 after adjusting for FDR at the 0.2 level. Full names of genes
and metabolites are provided in Table S4.
Conversion of starch to oil via cofactome alteration 1023
ª 2011 The AuthorsThe Plant Journal ª 2011 Blackwell Publishing Ltd, The Plant Journal, (2011), 67, 1018–1028

methylenetetrahydrofolate (5-methyl-THF) from unsubsti-
tuted tetrahydrofolate (Ravanel et al., 2001), is higher in
Matilda than in Freja. It is noteworthy that, in contrast to
Freja, this higher expression levels is maintained throughout
endosperm development in Matilda. Metabolic analyses
further validated the expression data, as the level of
5-methyl-THF metabolite is also higher in Matilda than in
Freja, suggesting an increased rate of synthesis or a
decreased rate of degradation potentially coupled to an
enhanced demand for methyl groups required for a myriad
of methylation reactions. Furthermore, as compared with
Freja, Matilda displays higher expression levels of the gene
encoding homocysteine methyltransferase, the enzyme that
transfers a methyl group to homocysteine to generate
methionine (Ranocha et al., 2001). The data also correspond
well to the enhanced levels of methionine as well as the
activated methyl cycle products including SAM, and
S-adenosylhomocysteine (AdoHyc) in Matilda with respect
to Freja.
The methionine-recycling pathway in Matilda is also
distinct from that of Freja, as evidenced by higher expres-
sion levels of the gene encoding 5¢-methylthioadenosine/
S-adenosylhomocysteine nucleosidase (MTAN), a methio-
nine-recycling enzyme (Siu et al., 2011), as well as higher
steady-state levels of the respective product deoxyadeno-
sine. In contrast, however, Matilda displays lower expres-
sion levels of the gene encoding S-adenosylmethionine
decarboxylase, the enzyme that catalyzes the decarboxyl-
ation of SAM to S-adenosyl-methioninamine, the substrate
used for production of polyamines (Roje, 2006).
Lastly, the expression level of Thi1 is initially low in both
cultivars, with notable increases detected only at develop-
mental stage C of Matilda endosperm, suggesting that this
increase is a response to metabolic events in the developing
Matilda endosperm, rather than contributing to them. Inter-
estingly however, despite this differential expression, the
levels of the resulting product thiamine diphosphate, the
active form of vitamin B1 and a key cofactor of the essential
enzymes involved in carbon metabolism, is similar between
the two cultivars.
DISCUSSION
To dissect the molecular basis of the metabolic shift result-
ing in enhanced levels of oil and protein synthesis in the oat
cultivar Matilda as compared with the closely related cultivar
Freja (Fig. 1), we employed global transcriptional analysis
capturing expression profiles of oat endosperm genes dur-
ing the full cascade of developmental events. In parallel, we
measured the steady-state levels of metabolites in the time
period of a near-linear phase of oil deposition coinciding
with the prominence of the core metabolic enzymes in a
number of oilseeds (Hajduch et al., 2005, 2006, 2007; Ekman
et al., 2008). Collectively, these data illustrate that Matilda
accumulates higher protein and oil and lower starch levels
compared with Freja, confirming the previous findings
(Banas et al., 2007; Ekman et al., 2008). These higher protein
levels are supported by the elevated levels of 16 of the 19
free amino acids examined (Fig. 1c). The lower levels of
cysteine in Matilda compared with Freja, are in part balanced
by higher levels of methionine (Fig. 4), and further suggest
potential compositional differences between the two culti-
vars with regard to cysteine-enriched polypeptides.
The NMR-based analysis further verified endosperm as
the predominant site of oil deposition, and established that
the difference in oil levels is not restricted to the cellular
content but also to the number of cell layers containing oil.
Specifically, lipid deposition in Freja is restricted to the outer
layers, whereas in Matilda lipids are present in both the
central and the outermost cell layers of the endosperm.
These distinct oil distribution patterns reflect a tightly and
delicately balanced coordination between carbon partition-
ing and developmental regulation.
Comparative analyses displayed an unexpected discor-
dance between the levels of a number of core metabolites
and their respective transcript levels in the endosperm of
Matilda and Freja. Surprisingly, the maintenance of steady
expression profiles of most core metabolic genes through-
out endosperm development in oat is in stark contrast to
other seeds including coffee (Joet et al., 2009), brassicas
(Niu et al., 2009), Medicago (Gallardo et al., 2007), maize
(Prioul et al., 2008), barley (Sreenivasulu et al., 2004) and
wheat (McIntosh et al., 2007), where the expression levels
peak at the onset of endosperm development and decline
gradually throughout the development. Collectively, these
findings suggest that oat has lost these distinct transcrip-
tional regulatory programs within the core metabolic path-
ways in favor of alternative strategies for improved
metabolic efficiency through concomitant alteration of
cofactors and energy metabolism status potentially
achieved by various mechanisms including post-transcrip-
tional modifications shown to impact the steady-state levels
of proteins (Hajduch et al., 2010), as well as post-transla-
tional modification and improved enzymatic activities.
Several studies have demonstrated that in conjunction
with enhanced oil accumulation in seeds there is an
improvement in substrate availability (acetyl-CoA, PEP and
malate) (Vigeolas et al., 2003; Rolletschek et al., 2004b;
Rolletschek et al., 2005a; Rolletschek et al., 2005b; Borisjuk
and Rolletschek, 2009). However, the evidence provided
here shows the exhaustion of some glycolytic intermediates
that serve as typical inputs for oil biosynthesis (DHAP, GAP
and PEP) as well as lower levels of immediate precursors,
acetyl-CoA and malonyl-CoA. Specifically, the lower levels
of PEP in Matilda as compared with Freja were unexpected.
The sequential conversion of PEP to pyruvate and acetyl-
CoA by the plastidic pyruvate kinases (PK) and the pyruvate
dehydrogenase (PDH) complex, respectively (Reid et al.,
1977; Lernmark and Gardestrom, 1994; Andre and Benning,
1024 Daniel M. Hayden et al.
ª 2011 The AuthorsThe Plant Journal ª 2011 Blackwell Publishing Ltd, The Plant Journal, (2011), 67, 1018–1028
2007; Andre et al., 2007; Flugge et al., 2011), constitute the
two key steps toward committing sufficient carbon to
support fatty acid synthesis utilized in part for triacylglycerol
production (Slabas and Fawcett, 1992; Ohlrogge and Jawor-
ski, 1997; Rawsthorne, 2002). In fact, because of the estab-
lished role of the plastidic pyruvate kinase in committing
sufficient carbon to support fatty acid synthesis, this enzyme
is now a target for the engineering of endosperm for
production of oil (Alonso et al., 2011). Therefore, it is
possible that higher levels, and/or enzymatically superior
PK and PDH enzymes, may have resulted in a more efficient
conversion of PEP to pyruvate and acetyl-CoA in Matilda.
In addition to lower PEP, as compared with Freja, Matilda
seeds contain lower levels of the immediate precursors of
fatty acids, acetyl-CoA and malonyl-CoA. This lower level of
glycolytic intermediates and fatty acid precursors is sugges-
tive of a rapid turnover of these substrates for oil biosyn-
thesis. This rapid turnover has to be supported by the energy
state, as the synthesis of fatty acids requires stoichiometric
amounts of ATP and acetyl-CoA, and NADPH and NADH for
each C2 addition to a growing acyl chain in the reactions
catalyzed by acetyl-CoA carboxylase and fatty acid synthe-
tase (Slabas and Fawcett, 1992). In chloroplasts, light energy
is used to provide the required ATP and reductant, and to
allow the operation of a Rubisco bypass flux that leads to
more efficient conversion of hexose to oil (Schwender et al.,
2004; Goffman et al., 2005). However, plastids of heterotro-
phic tissues such as endosperm (Neuhaus and Emes, 2000;
Olsen, 2001, 2004) need to import these cofactors or to
generate them intraplastidially through carbohydrate oxida-
tion or metabolite shuttles (Rawsthorne, 2002) in order to
convert their carbon supply with high efficiency despite
substantial futile cycles (Alonso et al., 2011). Thus, the
notion of a rapid turnover of the substrates for oil biosyn-
thesis is supported by the energy state that regulates the rate
of sucrose import (Vigeolas et al., 2003) and lipid biosyn-
thesis in developing seeds (Rolletschek et al., 2003; Vigeolas
et al., 2003; Rolletschek et al., 2004b; Rolletschek et al.,
2005b, 2007). Indeed, compared with Freja, the levels of
energy and reducing equivalents (ATP, NADH and NADPH)
are much lower in Matilda, while AMP, NAD+ and NADP+
levels are elevated, suggesting that rapid consumption of
these molecules in conjunction with the rapid turnover of
precursors of fatty acid biosynthesis support the increased
production of oil in Matilda seed. These data therefore
suggest the existence of a mechanism(s) within the Matilda
endosperm that, compared with Freja, partitions a larger
share of the products of respiratory metabolism towards the
production of energetically costly storage product, oil, at the
expense of starch.
Our finding further highlights a close association between
the metabolism of cofactors and carbon partitioning. This
notion is in agreement with the elevated levels of gene
expression and their corresponding metabolites involved in
the recycling and de novo biosynthetic pathways of cofac-
tors in Matilda. Amongst them are the SMM and SAM
pathways, followed closely by and interconnected with
those involved with folate biosynthesis, suggesting that
efficient metabolic processes supporting higher oil and
protein in Matilda are strongly associated with higher
demands for cofactors such as methyl groups. Another
example is the metabolism of THF, a mediator of one-carbon
metabolism, a process central to a large number of essential
cellular activities including methyl group biogenesis and the
synthesis of nucleotides, vitamins, and some amino acids.
One-carbon units are derived from the catabolism of three
donor molecules, namely serine, glycine and formate, which
are subsequently activated and compartmentalized by
attachment to THF for biosynthetic processes. In most
organisms however, serine is the principal one-carbon
donor contributing to the pool of 5,10-methylene-THF by
the action of the enzyme serine SHMT (Prabhu et al., 1996;
Piper et al., 2000; Li et al., 2003). The elevated expression
levels of SHMT in conjunction with increased levels of serine
lend support to the potential functional importance of THF-
mediated metabolism in supporting elevated levels of lipid
and protein in Matilda as compared with Freja. To a lesser
extent, the metabolic efficiency is correlated with pyrimidine
and purine biosynthesis pathways, as the building blocks for
nucleic acid synthesis, as the keys to energy metabolism,
and for the continued synthesis of many biosynthetic
products such as phospholipids (Traut and Jones, 1996;
Stasolla et al., 2003; Stasolla et al., 2004; Kafer et al., 2004).
Another metabolite of interest is thiamine diphosphate, a
cofactor in major metabolic pathways such as the citric acid
cycle, the pentose phosphate cycle and glycolysis, and thus
an essential constituent of all living cells (Suzuki et al., 2010).
In plant cells, thiamine diphosphate also acts as a cofactor
for the plastid localized isozymes pyruvate dehydrogenase
and transketolase (Chabregas et al., 2001). Similar levels of
thiamine diphosphate in Matilda and Freja, therefore, may
allude to the role of this cofactor in the activation of enzymes
involved in carbohydrate metabolism, as well as to its
functional participation in oil accumulation in an otherwise
starch-accumulating organ, the endosperm.
Two of the key coenzymes, lipoic acid and biotin, found in
all three domains of life require the fatty acid synthetic
pathway for their synthesis (Cronan and Lin, 2011). Fatty acid
biosynthesis is also dependent on biotin, because two of the
four subunits of acetyl-CoA carboxylase, an enzyme cata-
lyzing ATP-dependent carboxylation of acetyl-CoA to malo-
nyl-CoA, are biotinylated (Li and Cronan, 1992; Thelen et al.,
2000; Li et al., 2011). Biotin synthase, the last enzyme for
biotin synthesis, belongs to the family of AdoMet-dependent
enzymes that reductively cleave AdoMet into a deoxyade-
nosyl radical (Marquet et al., 2001). Lipoate synthase, an
enzyme that catalyzes the formation of two C–S bonds from
octanoic acid, has a very high sequence similarity with, and
Conversion of starch to oil via cofactome alteration 1025
ª 2011 The AuthorsThe Plant Journal ª 2011 Blackwell Publishing Ltd, The Plant Journal, (2011), 67, 1018–1028
is mechanistically related to, biotin synthase (Marquet et al.,
2001). Elevated levels of AdoMet in Matilda may allude to
higher levels of and/or activities of biotin synthase and
lipoate synthase. Our attempts to accurately measure biotin
levels were not successful; however, heightened levels of
lipoic acid in Matilda as compared with Freja may be one
consequence of enhanced synthesis of fatty acids in this
cultivar.
Thus far manipulation of enzyme levels through tran-
scriptional modulation of genes has had limited success in
enhancing oil levels in seeds (Roesler et al., 1997; Thelen
and Ohlrogge, 2002; Hills, 2004; Rolletschek et al., 2004a;
Vigeolas et al., 2011). The close association of an improved
cofactor pool, herein designated as the cofactome, with the
metabolic shift directed toward enhanced oil production
provides a novel insight into the regulatory networks
involved in carbon partitioning and offers a biotechnological
target for the conversion of starch to oil.
EXPERIMENTAL PROCEDURES
Plant material
Two closely related oat cultivars, Matilda and Freja (Svalov WeibullAB, http://www.swseed.com/sitebase/) were grown under a lightintensity of 200 lmol m)2 sec)1 in a 16-h light/8-h dark cycle at 21/18�C temperature and 70% humidity. Seed stages were determinedby the size and weight, color, texture and endosperm consistency aspreviously described (Ekman et al., 2008). Whole kernels as well asendosperm at designated developmental stages (Fig 1 and Fig S1),were harvested and immediately frozen in liquid nitrogen andstored at )80�C until use.
RNA extraction and high-throughput pyrosequencing
Total RNA was extracted using PureLink� Plant RNA Reagent (cat-alog no. 12322-012; Invitrogen, http://www.invitrogen.com/) asrecommended by the manufacturer. Removal of genomic DNA fromRNA samples was performed using the Plant RNeasy kit. (catalogno. 74904, 79254; Qiagen, http://www.qiagen.com/). The RNA forpyrosequencing and for preliminary 384k microarray analysis(Roche NimbleGen, http://www.nimblegen.com/) was preparedfrom a pool of endosperm collected from 40 to 100 kernels fromstage D/E [25–35 mg, 10–14 days post-anthesis (d.p.a.)], and stageG (48–52 mg, 20–22 d.p.a.), followed by double-stranded cDNAsynthesis (SuperScript Double-Stranded cDNA synthesis kit, cata-log no. 11917-010; Invitrogen, http://www.invitrogen.com/).
High-throughput pyrosequencing was performed at the W. M.Keck Center for Comparative and Functional Genomics (Universityof Illinois, Urbana, IL, USA), using the Roche/454 GSFLX titaniumplatform (http://www.biotech.uiuc.edu/centers/Keck/Highthrough-put/Roche_454_GS_FLX.html).
Pyrosequencing fragments were organized using custom PERLscripts, and sequences were aligned using the programs TGICL andCAP3 programs after the removal of contaminating sequences fromvector and cDNA construction primers. To further check the qualityof the sequences we used a custom PERL script and performed NCBIBlast as a method to identify and remove any remaining contam-inating sequences. Subsequently the sequences were clusteredtogether using TGICL and CAP3. BLASTX analysis was carried outusing oat target sequences searched against all rice and Arabidop-sis databases.
The custom 384 k microarray probes comprised 13 60merprobes for each of the 29 522 contigs obtained from 454 pyrose-quencing data analysis, using Roche NimbleGen recommendedmethods.
Design of the Roche NimbleGen custom microarrays
Initially, four 384 k feature microarrays were hybridized with cDNAgenerated from the same RNA pool initially used for the 454pyrosequencing experiments. The details of labeling, hybridization,scanning and normalization of the data are as described by Nim-bleGen. Contigs that showed no signal over these microarrays, andhad no BLAST references, as well as those probes whose valuesdiffered by two standard deviations from the mean were discarded.The probes which showed the most consistent expression nearthe mean using a custom PERL script were selected. Based on thelength of the contig, different numbers of probes were assigned.Specifically, contigs with a length of less than 200 bp were assignedthree 60mer probes, 200–300 bp had four probes, 300–400 bp hadfive probes, 400–500 bp had six probes, 500–600 bp had sevenprobes, 600–700 bp had eight probes and >700 bp had nine probes.Finally the selected probes representing the 27 575 contigs wereprinted on 12 · 135k feature arrays.
The final 12 · 135K arrays were processed for expression profil-ing using RNA samples isolated from the endosperm of kernels atsequential developmental stages (Fig. S1). Sample preparation,labeling, and array hybridizations were performed at UCSF SharedMicroarray Core Facilities using Agilent Technologies (http://www.arrays.ucsf.edu; http://www.agilent.com). Arrays werescanned using the Agilent microarray scanner and raw signalintensities were extracted with NimbleScan v2.6 software (Nimble-Gen). The presented experimental data consist of a file containingthe value for each individual probe per contig (Table S2). The valuesare log2 normalized (e.g. 20–216, or 1–65 536, becomes 0–16) andgraphs represent the values between 6 and 16.
Statistical analysis
To integrate the transcriptome and metabolome datasets, weconducted PCA using the combined metabolite and transcriptprofile data obtained from developmental stages C, D and E, asthese were the only stages to have both transcript and metabolitedata. To make the data comparable, the metabolite concentrationsand transcript levels were averaged among samples at the samedevelopmental stage for each genotype. This was also done toallow combination of the metabolite and transcript data whichwere collected from different samples. The PCA was run using theprcomp function in the R statistical analysis program suite (RDevelopment Core Team, 2011, http://www.R-project.org). Eigen-values from this analysis were extracted with the first six vectorshaving 97.5, 1.8, 0.6, 0.06, 0.009 and 0.002% of the total variance.The first two principal components were plotted on a two dimen-sional graph.
To estimate developmental progression of the samples, weutilized the adjusted per tissue weight within each sample as anumerical description of development. The development of seedswithin the two genotypes followed a similar linear progression. Toadjust for a 5% lower per tissue weight at each developmental stage,we multiplied the weight of the Matilda genotype by 1.05 to bringthe two genotypes to the same adjusted weight scale. To test fordifferential expression within a gene, we implemented a mixed-model ANOVA analysis in R. Gene expression for each gene contig (y)was modeled as a function of the variance that can be attributed tothe independent probe per contig (P), oat genotype (G), andadjusted weight (W) as follows:
1026 Daniel M. Hayden et al.
ª 2011 The AuthorsThe Plant Journal ª 2011 Blackwell Publishing Ltd, The Plant Journal, (2011), 67, 1018–1028

yijk¼lijkþPiþGjþWkþGj : Wkþei
Accounting for each probe within a contig in the model accountsfor differential hybridization among the individual probes. Withinthe mixed model, probe and genotype were fixed effects whileadjusted weight was a random effect. As we were only interested intesting for differential expression for a gene, we did not explicitlytest the probe · genotype interaction and let this potential errorcollapse into the random error term. This provides a more conser-vative estimate of differential gene expression due to genotype ordevelopment.
Nuclear magnetic resonance analysis
The NMR experiments were carried out as previously described(Neuberger et al., 2008, 2009) using a wide-bore (inner diameter89 mm) 17.6 T superconducting magnet (Bruker BioSpin GmbH,http://www.bruker-biospin.com/) with a custom-build NMR coil andan actively shielded gradient system (maximum strength 1 T m)1).Reconstruction and visualization of the data was performed usingin-house software (written in Java), while segmentation of individ-ual seeds and the determination of their total NMR-signal contentwas achieved using Amira (Visage Imaging GmbH, http://www.visageimaging.com/).
Metabolite analysis
Metabolite analyses were performed on freeze-dried caryopsesof stages C–E as previously described (Rolletschek et al., 2005a).Briefly the analyses of soluble sugars and free amino acids wereperformed by ion chromatography and HPLC as previouslydescribed (Rolletschek et al., 2004a). The remaining metaboliteswere measured by mass spectrometry coupled to liquid chroma-tography according to previous methods (Rolletschek et al., 2004a;Bajad et al., 2006) but modified as outlined (Table S3). Data werenormalized on the basis of the external standard 13C-succinate(Cambridge Isotope Laboratories, http://www.isotope.com/cil/index.cfm) added to the samples during the extraction (Table S3).
Respiration
Respiration was measured as total oxygen uptake of kernels kept inthe dark. Individual kernels were submerged in buffer [50 mM
sucrose, ¼ MS medium, 10 mM Gln, 10 mM Asn, 10 mM 2-(N-mor-pholine)-ethanesulfonic acid (MES), pH 6.8] in gas-tight closed 10 mlvessels equipped with an SP-PSt3 oxygen sensor and connected toa Fibox 3 oxygen meter (PreSens Precision Sensing GmbH, http://www.presens.de/). Oxygen concentration in the samples wasregistered during a time period of 60 min. From recorded data therespiration rate of seeds was calculated by linear regression.
ACKNOWLEDGEMENTS
We would like to thank Matt Wong for his contribution to bioinfor-matics, N. Heinzel (IPK) for help with mass spectrometry, and J.Fuchs (IPK) for NMR analysis. We also are grateful to Chevron forsupporting this work by the grant awarded to KD and SS. AG and SSare grateful for financial support from Vinnova and FORMAS.
SUPPORTING INFORMATION
Additional Supporting Information may be found in the onlineversion of this article:Figure S1. Principle component analysis.Table S1. Excel spreadsheet of transcriptome, representing datapoints for each of the 15 sequential endosperm arrays for both Frejaand Matilda.
Table S2. Metabolite levels measured in Freja and Matilda at threedevelopmental stages.Table S3. Mass spectrometry-based analysis of metabolites in oatcaryopses.Table S4. Full names of genes and metabolites.Please note: As a service to our authors and readers, this journalprovides supporting information supplied by the authors. Suchmaterials are peer-reviewed and may be re-organized for onlinedelivery, but are not copy-edited or typeset. Technical supportissues arising from supporting information (other than missingfiles) should be addressed to the authors.
REFERENCES
Alexander, D.E., Silvela, L., Collins, F. I. et al. (1967) Analysis of oil content of
maize by wide-line NMR. J. Am. Oil Chem. Soc. 44(10), 555–558.
Alonso, A.P., Val, D.L. et al. (2011) Central metabolic fluxes in the endosperm
of developing maize seeds and their implications for metabolic engineer-
ing. Metab. Eng. 13(1), 96–107.
Andre, C. and Benning, C. (2007) Arabidopsis seedlings deficient in a plastidic
pyruvate kinase are unable to utilize seed storage compounds for germi-
nation and establishment. Plant Physiol. 145(4), 1670–1680.
Andre, C., Froehlich, J.E. et al. (2007) A heteromeric plastidic pyruvate kinase
complex involved in seed oil biosynthesis in Arabidopsis. Plant Cell, 19(6),
2006–2022.
Bajad, S.U., Lu, W. et al. (2006) Separation and quantitation of water soluble
cellular metabolites by hydrophilic interaction chromatography-tandem
mass spectrometry. J. Chromatogr. A, 1125(1), 76–88.
Banas, A., Debski, H. et al. (2007) Lipids in grain tissues of oat (Avena sativa):
differences in content, time of deposition, and fatty acid composition.
J. Exp. Bot. 58(10), 2463–2470.
Bartels, D. and Thompson, R.D. (1986) Synthesis of messenger-Rnas coding
for abundant endosperm proteins during wheat-grain development. Plant
Sci. 46(2), 117–125.
Borisjuk, L. and Rolletschek, H. (2009) The oxygen status of the developing
seed. New Phytol. 182(1), 17–30.
Chabregas, S.M., Luche, D.D. et al. (2001) Dual targeting properties of the
N-terminal signal sequence of Arabidopsis thaliana THI1 protein to mito-
chondria and chloroplasts. Plant Mol. Biol. 46(6), 639–650.
Cronan, J.E. and Lin, S. (2011) Synthesis of the alpha,omega-dicarboxylic acid
precursor of biotin by the canonical fatty acid biosynthetic pathway. Curr.
Opin. Chem. Biol. 15, 407–413.
Durrett, T.P., Benning, C. et al. (2008) Plant triacylglycerols as feedstocks for
the production of biofuels. Plant J. 54(4), 593–607.
Ekman, A., Hayden, D.M. et al. (2008) Carbon partitioning between oil and
carbohydrates in developing oat (Avena sativa L.) seeds. J. Exp. Bot. 59(15),
4247–4257.
Emes, M.J., Bowsher, C.G. et al. (2003) Starch synthesis and carbon parti-
tioning in developing endosperm. J. Exp. Bot. 54(382), 569–575.
Flugge, U.-I., Hausler, R.E. et al. (2011) The role of transporters in supplying
energy to plant plastids. J. Exp. Bot. 62(7), 2381–2392.
Gallardo, K., Firnhaber, C. et al. (2007) A combined proteome and transcrip-
tome analysis of developing medicago truncatula seeds: evidence for
metabolic specialization of maternal and filial tissues. Mol. Cell Proteomics,
6(12), 2165–2179.
Goffman, F.D., Alonso, A.P. et al. (2005) Light enables a very high efficiency of
carbon storage in developing embryos of rapeseed. Plant Physiol. 138(4),
2269–2279.
Hajduch, M., Ganapathy, A. et al. (2005) A systematic proteomic study of seed
filling in soybean. Establishment of high-resolution two-dimensional ref-
erence maps, expression profiles, and an interactive proteome database.
Plant Physiol. 137(4), 1397–1419.
Hajduch, M., Casteel, J.E. et al. (2006) Proteomic analysis of seed filling in
Brassica napus. Developmental characterization of metabolic isozymes
using high-resolution two-dimensional gel electrophoresis. Plant Physiol.
141(1), 32–46.
Hajduch, M., Casteel, J.E. et al. (2007) Proteomic analysis of near-isogenic
sunflower varieties differing in seed oil traits. J. Proteome Res. 6(8), 3232–
3241.
Conversion of starch to oil via cofactome alteration 1027
ª 2011 The AuthorsThe Plant Journal ª 2011 Blackwell Publishing Ltd, The Plant Journal, (2011), 67, 1018–1028

Hajduch, M., Hearne, L.B. et al. (2010) Systems analysis of seed filling in
Arabidopsis: using general linear modeling to assess concordance of
transcript and protein expression. Plant Physiol. 152(4), 2078–2087.
Hargin, K.D., Morrison, W.R. et al. (1980) Triglyceride deposits in the starchy
endosperm of wheat. Cereal Chem. 57(5), 320–325.
Heneen, W.K., Karlsson, G. et al. (2008) Fusion of oil bodies in endosperm of
oat grains. Planta, 228(4), 589–599.
Heneen, W.K., Banas, A. et al. (2009) The distribution of oil in the oat grain.
Plant Signal. Behav. 4(1), 55–56.
Hills, M.J. (2004) Control of storage-product synthesis in seeds. Curr. Opin.
Plant Biol. 7(3), 302–308.
Joet, T., Laffargue, A. et al. (2009) Metabolic pathways in tropical dicotyle-
donous albuminous seeds: Coffea arabica as a case study. New Phytol.
182(1), 146–162.
Kafer, C., Zhou, L. et al. (2004) Regulation of pyrimidine metabolism in plants.
Front Biosci. 9, 1611–1625.
Leng, E.R. (1961) Predicted and actual responses during long-term selection
for chemical composition in maize. Euphytica, 10(3), 368–378.
Lernmark, U. and Gardestrom, P. (1994) Distribution of pyruvate dehydro-
genase complex activities between chloroplasts and mitochondria from
leaves of different species. Plant Physiol. 106(4), 1633–1638.
Li, S.J. and Cronan, J.E. Jr (1992) Putative zinc finger protein encoded by a
conserved chloroplast gene is very likely a subunit of a biotin-dependent
carboxylase. Plant Mol. Biol. 20(5), 759–761.
Li, R., Moore, M. et al. (2003) Investigating the regulation of one-car-
bon metabolism in Arabidopsis thaliana. Plant Cell Physiol. 44(3), 233–241.
Li, X., Ilarslan, H. et al. (2011) Reverse-genetic analysis of the two biotin-
containing subunit genes of the heteromeric acetyl-coenzyme A carbox-
ylase in Arabidopsis indicates a unidirectional functional redundancy. Plant
Physiol. 155(1), 293–314.
Marquet, A., Bui, B.T.S. et al. (2001) Biosynthesis of biotin and lipoic acid.
Vitam. Horm. 61, 51–101.
McIntosh, S., Watson, L. et al. (2007) SAGE of the developing wheat cary-
opsis. Plant Biotechnol. J. 5(1), 69–83.
Neuberger, T., Sreenivasulu, N. et al. (2008) Quantitative imaging of oil
storage in developing crop seeds. Plant Biotechnol. J. 6(1), 31–45.
Neuberger, T., Rolletschek, H. et al. (2009) Non-invasive mapping of lipids in
plant tissue using magnetic resonance imaging. Methods Mol. Biol. 579,
485–496.
Neuhaus, H.E. and Emes, M.J. (2000) Nonphotosynthetic metabolism in
plastids. Annu. Rev. Plant Physiol. Plant Mol. Biol. 51, 111–140.
Niu, Y., Wu, G.-Z. et al. (2009) Global analysis of gene expression profiles in
Brassica napus developing seeds reveals a conserved lipid metabolism
regulation with Arabidopsis thaliana. Mol. Plant, 2(5), 1107–1122.
Ohlrogge, J.B. and Jaworski, J.G. (1997) Regulation of fatty acid synthesis.
Annu. Rev. Plant. Physiol. Plant Mol. Biol. 48, 109–136.
Olsen, O.A. (2001) ENDOSPERM DEVELOPMENT: cellularization and cell fate
specification. Annu. Rev. Plant. Physiol. Plant Mol. Biol. 52, 233–267.
Olsen, O.A. (2004) Nuclear endosperm development in cereals and Arabid-
opsis thaliana. Plant Cell, 16(Suppl), S214–S227.
Peterson, D.M. and Wood, D.F. (1997) Composition and structure of high-oil
oat. J. Cereal Sci. 26(1), 121–128.
Piper, M.D., Hong, S.-P. et al. (2000) Regulation of the balance of one-carbon
metabolism in Saccharomyces cerevisiae. J. Biol. Chem.275(40),30987–30995.
Prabhu, V., Chatson, K.B. et al. (1996) 13C nuclear magnetic resonance
detection of interactions of serine hydroxymethyltransferase with C1-
tetrahydrofolate synthase and glycine decarboxylase complex activities in
Arabidopsis. Plant Physiol. 112(1), 207–216.
Price, P.B. and Parsons, J.G. (1975) LIPIDS OF 7 CEREAL-GRAINS. J. Am. Oil
Chem. Soc. 52(12), 490–493.
Price, P.B. and Parsons, J. (1979) Distribution of lipids in embryonic axis, bran-
endosperm, and hull fractions of hulless barley and hulless oat grain.
J. Agric. Food. Chem. 27(4), 813–815.
Prioul, J.L., Mechin, V. et al. (2008) A joint transcriptomic, proteomic and
metabolic analysis of maize endosperm development and starch filling.
Plant Biotechnol. J. 6(9), 855–869.
Radchuk, V.V., Borisjuk, L. et al. (2009) Spatiotemporal Profiling of Starch
Biosynthesis and Degradation in the Developing Barley Grain. Plant
Physiol. 150(1), 190–204.
Ranocha, P., McNeil, S.D. et al. (2001) The S-methylmethionine cycle in
angiosperms: ubiquity, antiquity and activity. Plant J. 25(5), 575–584.
Ravanel, S., Cherest, H. et al. (2001) Tetrahydrofolate biosynthesis in plants:
molecular and functional characterization of dihydrofolate synthetase and
three isoforms of folylpolyglutamate synthetase in Arabidopsis thaliana.
Proc. Natl. Acad. Sci. USA, 98(26), 15360–15365.
Rawsthorne, S. (2002) Carbon flux and fatty acid synthesis in plants. Prog.
Lipid Res. 41(2), 182–196.
Reid, E.E., Thompson, P. et al. (1977) Pyruvate dehydrogenase complex from
higher plant mitochondria and proplastids. Plant Physiol. 59(5), 842–848.
Roesler, K., Shintani, D. et al. (1997) Targeting of the Arabidopsis homomeric
acetyl-coenzyme A carboxylase to plastids of rapeseeds. Plant Physiol.
113(1), 75–81.
Roje, S. (2006) S-Adenosyl-L-methionine: beyond the universal methyl group
donor. Phytochemistry, 67(15), 1686–1698.
Rolletschek, H., Hajirezaei, M.R. et al. (2002) Antisense-inhibition of ADP-
glucose pyrophosphorylase in Vicia narbonensis seeds increases soluble
sugars and leads to higher water and nitrogen uptake. Planta, 214(6), 954–964.
Rolletschek, H., Weber, H. et al. (2003) Energy status and its control on
embryogenesis of legumes. Embryo photosynthesis contributes to oxygen
supply and is coupled to biosynthetic fluxes. Plant Physiol. 132(3), 1196–
1206.
Rolletschek, H., Borisjuk, L. et al. (2004a) Seed-specific expression of a bac-
terial phosphoenolpyruvate carboxylase in Vicia narbonensis increases
protein content and improves carbon economy. Plant Biotechnol. J. 2(3),
211–219.
Rolletschek, H., Weschke, W. et al. (2004b) Energy state and its control on seed
development: starch accumulation is associated with high ATP and steep
oxygen gradients within barley grains. J. Exp. Bot. 55(401), 1351–1359.
Rolletschek, H., Koch, K. et al. (2005a) Positional cues for the starch/lipid
balance in maize kernels and resource partitioning to the embryo. Plant J.
42(1), 69–83.
Rolletschek, H., Radchuk, R. et al. (2005b) Evidence of a key role for photo-
synthetic oxygen release in oil storage in developing soybean seeds. New
Phytol. 167(3), 777–786.
Rolletschek, H., Nguyen, T.H. et al. (2007) Antisense inhibition of the plastidial
glucose-6-phosphate/phosphate translocator in Vicia seeds shifts cellular
differentiation and promotes protein storage. Plant J. 51(3), 468–484.
Schwender, J., Goffman, F. et al. (2004) Rubisco without the Calvin cycle
improves the carbon efficiency of developing green seeds. Nature
432(7018), 779–782.
Shen, B., Allen, W.B. et al. (2010) Expression of ZmLEC1 and ZmWRI1
increases seed oil production in maize. Plant Physiol. 153(3), 980–987.
Siu, K.K., Asmus, K. et al. (2011) Mechanism of substrate specificity in
5’-methylthioadenosine/S-adenosylhomocysteine nucleosidases. J. Struct.
Biol. 173(1), 86–98.
Slabas, A.R. and Fawcett, T. (1992) The biochemistry and molecular biology
of plant lipid biosynthesis. Plant Mol. Biol. 19(1), 169–191.
Sreenivasulu, N., Altschmied, L. et al. (2004) Transcript profiles and deduced
changes of metabolic pathways in maternal and filial tissues of developing
barley grains. Plant J. 37(4), 539–553.
Stasolla, C., Katahira, R. et al. (2003) Purine and pyrimidine nucleotide
metabolism in higher plants. J. Plant Physiol. 160(11), 1271–1295.
Stasolla, C., Loukanina, N. et al. (2004) Alterations in pyrimidine nucleotide
metabolism as an early signal during the execution of programmed cell
death in tobacco BY-2 cells. J. Exp. Bot. 55(408), 2513–2522.
Suzuki, R., Katayama, T. et al. (2010) Crystal structures of phosphoketolase:
thiamine diphosphate-dependent dehydration mechanism. J. Biol. Chem.
285(44), 34279–34287.
Thelen, J.J. and Ohlrogge, J.B. (2002) Metabolic engineering of fatty acid
biosynthesis in plants. Metab. Eng. 4(1), 12–21.
Thelen, J.J., Mekhedov, S. et al. (2000) Biotin carboxyl carrier protein iso-
forms in Brassicaceae oilseeds. Biochem. Soc. Trans. 28, 595–598.
Traut, T.W. and Jones, M.E. (1996) Uracil metabolism–UMP synthesis from
orotic acid or uridine and conversion of uracil to beta-alanine: enzymes and
cDNAs. Prog. Nucleic Acid Res. Mol. Biol. 53, 1–78.
Vigeolas, H., van Dongen, J.T. et al. (2003) Lipid storage metabolism is limited
by the prevailing low oxygen concentrations within developing seeds of
oilseed rape. Plant Physiol. 133(4), 2048–2060.
Vigeolas, H., Huhn, D. et al. (2011). Non-symbiotic hemoglobin-2 leads to an
elevated energy state and to a combined increase in polyunsaturated fatty
acids and total oil content when over-expressed in developing seeds of
transgenic Arabidopsis plants. Plant Physiol. 155, 1435–1444.
1028 Daniel M. Hayden et al.
ª 2011 The AuthorsThe Plant Journal ª 2011 Blackwell Publishing Ltd, The Plant Journal, (2011), 67, 1018–1028