Coexistence Analysis of H2H and M2M Traffic in FiWi Smart Grid Communications Infrastructures Based...
12
IEEE TRANSACTIONS ON COMMUNICATIONS, to appear. Coexistence Analysis of H2H and M2M Traffic in FiWi Smart Grid Communications Infrastructures Based on Multi-Tier Business Models Martin L´ evesque, Frank Aurzada, Martin Maier, Senior Member, IEEE, and G´ eza Jo´ os Fellow, IEEE Abstract—In this paper, we study the performance of multi- tier integrated fiber-wireless (FiWi) smart grid communications infrastructures based on low-cost, simple, and reliable next- generation passive optical network (PON) with quality-of-service (QoS) enabled wireless local area networks (WLANs) in terms of capacity, latency, and reliability. We study the coexistence of human-to-human (H2H), e.g., triple-play traffic, and machine- to-machine (M2M) traffic originating from wireless sensors operating on a wide range of possible configurations. Our analysis enables the quantification of the maximum achievable data rates of both event- and time-driven wireless sensors without violating given upper delay limits of H2H traffic. By using experimental measurements of real-world smart grid applications we investigate the impact of variable H2H traffic loads on the sensor end-to-end delay performance. The obtained results show that a conventional Ethernet PON may cause a bottleneck and increase the delay for both H2H and M2M traffic. In contrast, by using a 10G-EPON or wavelength division multiplexing (WDM) PON the bottleneck arises in the wireless network. Furthermore, we study the interplay between time- and event-driven nodes and show that the theoretical upper bound of time-driven sensors decreases linearly as a function of the number of sensors, while with event-driven sensors the upper bound decrease is nonlinear and more pronounced. I. I NTRODUCTION T HE communications requirements of a wide range of potential smart grid applications have been recently quan- tified in terms of latency, bandwidth, reliability, and secu- rity [1]. The authors concluded that a fast and reliable smart grid communications infrastructure is necessary to enable real- time exchange of data among distributed elements. Although IEEE P2030 opted for a technology agnostic approach and thus doesn’t specify any communications technologies of choice, it is favorable to rely on the exceptionally low-latency character- istics of fiber optic facilities and wireless technologies, where fiber is available to some but not all points in the system [2]. In this paper, we focus on integrated fiber-wireless (FiWi) smart grid communications infrastructures based on next- generation Ethernet passive optical network (EPON) and wire- less local area network (WLAN) technologies. EPON com- bines the low cost and simplicity of Ethernet equipment with the completely passive (i.e., unpowered) network infrastructure of PONs, which render them inherently highly reliable. Beside legacy EPON, we explore the benefits of emerging high- speed time division multiplexing (TDM) PONs and multi- channel wavelength channel multiplexing (WDM) PONs of This work was supported by the FQRNT MERIT Short-term Research Scholarship Program and NSERC Strategic Project Grant No. 413427-2011. extended fiber reach, which represent the most promising candidates of next-generation optical access networks [3]. On the wireless side, we deploy quality-of-service (QoS) enabled high-throughput WLANs with service differentiation among multiple traffic classes as well as with emerging very high throughput (VHT) enhancements. More importantly, we pay particular attention to the fact that business models, arguably more than technological choices, play a key role in the roll-out of smart grid communications infrastructures. According to [4], utilities along with munic- ipalities are responsible for 22% of households passed with fiber-to-the-building/home (FTTB/H) in Europe. These invest- ments enable utilities and/or municipalities to (i) leverage their existing duct, sewer, and other infrastructure, (ii) create a new source of revenue in the face of ongoing liberalization of the energy sector, particularly in smart grids solutions, and (iii) provide services completely independent from incumbents’ infrastructures. Furthermore, it was recently shown in [5] that cooperation among different utilities in the roll-out phase may drive down the capital expenditures (CAPEX) of FTTB/H deployments by 17%. Innovative partnerships enable utilities and other players to share smart grid communications in- frastructures investments by transitioning from the traditional vertical network integration model towards splitting the value chain into a three-tier business model that consists of network infrastructure roll-out, network operation/maintenance, and service provisioning [4]. The objectives of this paper are as follows. We aim at providing deeper insights into the performance of multi- tier FiWi communications networks that are installed, oper- ated, and maintained by a single or multiple utilities and provide not only open-access triple-play service offerings, also known as human-to-human (H2H) services, but also enable the support of some of the aforementioned potential smart grid applications, e.g., grid integration of renewable energy resources [6]. The unpredictability of renewable en- ergy sources, in conjunction with other emerging and future smart grid applications such as grid-to-vehicle/vehicle-to-grid (G2V/V2G), creates challenging problems in the control and reliability of the power grid, which call for a multitude of geographically and temporally coordinated monitoring and control actions over time scales ranging from milliseconds to operational planning horizon [7]. Towards this end, different wireless sensor applications based on ZigBee or low-power WLAN technologies have been considered for the machine-to- machine (M2M) interconnection of a wide variety of devices 1
-
Upload
independent -
Category
Documents
-
view
2 -
download
0
Transcript of Coexistence Analysis of H2H and M2M Traffic in FiWi Smart Grid Communications Infrastructures Based...
IEEE TRANSACTIONS ON COMMUNICATIONS, to appear.
Coexistence Analysis of H2H and M2M Traffic inFiWi Smart Grid Communications Infrastructures
Based on Multi-Tier Business ModelsMartin Levesque, Frank Aurzada, Martin Maier, Senior Member, IEEE, and Geza Joos Fellow, IEEE
Abstract—In this paper, we study the performance of multi-tier integrated fiber-wireless (FiWi) smart grid communicationsinfrastructures based on low-cost, simple, and reliable next-generation passive optical network (PON) with quality-of-service(QoS) enabled wireless local area networks (WLANs) in termsof capacity, latency, and reliability. We study the coexistence ofhuman-to-human (H2H), e.g., triple-play traffic, and machine-to-machine (M2M) traffic originating from wireless sensorsoperating on a wide range of possible configurations. Our analysisenables the quantification of the maximum achievable datarates of both event- and time-driven wireless sensors withoutviolating given upper delay limits of H2H traffic. By usingexperimental measurements of real-world smart grid applicationswe investigate the impact of variable H2H traffic loads on thesensor end-to-end delay performance. The obtained results showthat a conventional Ethernet PON may cause a bottleneck andincrease the delay for both H2H and M2M traffic. In contrast, byusing a 10G-EPON or wavelength division multiplexing (WDM)PON the bottleneck arises in the wireless network. Furthermore,we study the interplay between time- and event-driven nodes andshow that the theoretical upper bound of time-driven sensorsdecreases linearly as a function of the number of sensors, whilewith event-driven sensors the upper bound decrease is nonlinearand more pronounced.
I. INTRODUCTION
THE communications requirements of a wide range ofpotential smart grid applications have been recently quan-
tified in terms of latency, bandwidth, reliability, and secu-rity [1]. The authors concluded that a fast and reliable smartgrid communications infrastructure is necessary to enable real-time exchange of data among distributed elements. AlthoughIEEE P2030 opted for a technology agnostic approach and thusdoesn’t specify any communications technologies of choice, itis favorable to rely on the exceptionally low-latency character-istics of fiber optic facilities and wireless technologies, wherefiber is available to some but not all points in the system [2].
In this paper, we focus on integrated fiber-wireless (FiWi)smart grid communications infrastructures based on next-generation Ethernet passive optical network (EPON) and wire-less local area network (WLAN) technologies. EPON com-bines the low cost and simplicity of Ethernet equipment withthe completely passive (i.e., unpowered) network infrastructureof PONs, which render them inherently highly reliable. Besidelegacy EPON, we explore the benefits of emerging high-speed time division multiplexing (TDM) PONs and multi-channel wavelength channel multiplexing (WDM) PONs of
This work was supported by the FQRNT MERIT Short-term ResearchScholarship Program and NSERC Strategic Project Grant No. 413427-2011.
extended fiber reach, which represent the most promisingcandidates of next-generation optical access networks [3]. Onthe wireless side, we deploy quality-of-service (QoS) enabledhigh-throughput WLANs with service differentiation amongmultiple traffic classes as well as with emerging very highthroughput (VHT) enhancements.
More importantly, we pay particular attention to the fact thatbusiness models, arguably more than technological choices,play a key role in the roll-out of smart grid communicationsinfrastructures. According to [4], utilities along with munic-ipalities are responsible for 22% of households passed withfiber-to-the-building/home (FTTB/H) in Europe. These invest-ments enable utilities and/or municipalities to (i) leverage theirexisting duct, sewer, and other infrastructure, (ii) create a newsource of revenue in the face of ongoing liberalization of theenergy sector, particularly in smart grids solutions, and (iii)provide services completely independent from incumbents’infrastructures. Furthermore, it was recently shown in [5] thatcooperation among different utilities in the roll-out phase maydrive down the capital expenditures (CAPEX) of FTTB/Hdeployments by 17%. Innovative partnerships enable utilitiesand other players to share smart grid communications in-frastructures investments by transitioning from the traditionalvertical network integration model towards splitting the valuechain into a three-tier business model that consists of networkinfrastructure roll-out, network operation/maintenance, andservice provisioning [4].
The objectives of this paper are as follows. We aim atproviding deeper insights into the performance of multi-tier FiWi communications networks that are installed, oper-ated, and maintained by a single or multiple utilities andprovide not only open-access triple-play service offerings,also known as human-to-human (H2H) services, but alsoenable the support of some of the aforementioned potentialsmart grid applications, e.g., grid integration of renewableenergy resources [6]. The unpredictability of renewable en-ergy sources, in conjunction with other emerging and futuresmart grid applications such as grid-to-vehicle/vehicle-to-grid(G2V/V2G), creates challenging problems in the control andreliability of the power grid, which call for a multitude ofgeographically and temporally coordinated monitoring andcontrol actions over time scales ranging from milliseconds tooperational planning horizon [7]. Towards this end, differentwireless sensor applications based on ZigBee or low-powerWLAN technologies have been considered for the machine-to-machine (M2M) interconnection of a wide variety of devices
1

IEEE TRANSACTIONS ON COMMUNICATIONS, to appear.
and appliances, giving rise to the so-called Internet of Things(IoT) [8], of which the smart grid represents an importantreal-world example. Practical deployment guidelines in termsof “safe distance” and “safe offset frequency” for the interfer-ence avoidance of coexisting ZigBee and WLAN networksfor smart grid applications were developed in [9]. In thispaper, however, we investigate the coexistence of H2H andM2M traffic over integrated FiWi smart grid communicationsinfrastructures based on next-generation EPON and WLANtechnologies by means of probabilistic analysis in termsof capacity, latency, and reliability. According to the IEEEP2030 standard, the main quality attributes of the customerand distribution domains of the communications technologyinteroperability architectural perspective (CT-IAP) of smartgrids are latency and reliability. On another note, the accessnetwork should be energy efficient, but it is important tonote that the main goal of smart grids is to use advancedcommunications networks to improve the efficiency of theunderlying power grid. In this paper, our goal is to quantifythe maximum achievable wireless sensor traffic rates withoutresulting detrimental impact on the latency performance ofconventional H2H traffic, which can be used as a theoreticalupper bound of coexisting M2M traffic for the realization ofemerging and future yet unforeseen smart grid applications.
The main contributions of this paper are as follows:
• Probabilistic modeling of time- and event-driven smartgrid sensors integrated with regular WLAN stations andnext-generation PONs allowing the calculation of the end-to-end delay, throughput, and reliability.
• Algorithm for finding the theoretical upper bounds ofM2M traffic for a given H2H delay threshold. The upperbounds may be used to set the maximum sensor data rate.
• Fine-grained investigation of different FiWi settings usingexperimental measurements of smart grid applicationsbased on IEC Standard 61850:
– Impact of varying H2H traffic for different PONflavors.
– Sensibility analysis of interplay between time- andevent-driven nodes.
• The analytical framework may also be used for the properdimensioning and planning of shared FiWi smart gridcommunications infrastructures: using the topology, MACsettings, and traffic load as inputs, the model is able toprovide the main network performance metrics as outputs.It may be extended by including economical costs inorder to compare the expected network performancewith required operating costs, giving rise to a powerfulnetwork design tool.
The remainder of the paper is structured as follows. TheFiWi smart grid communications infrastructures and wirelesssensors under consideration are described in Section II. Theircoexistence performance under H2H and M2M traffic isanalyzed in Section III. Section IV presents numerical andverifying simulation results. Section V concludes the paper.
Multiple subscribers
ONU
ONU
ONU
ONU
ONU
Single subscriber
Single subscriber
OLT
Splitter/combiner or
Wavelength multiplexer/demultiplexer
TDM or WDM
DMS
AP
AP
Sensor
Sensor
STA
STA
Sensor
Wireless link
Copper link
Fiber linkUU
RN
CombinerSplitter/
Fig. 1. Generic architecture of integrated FiWi smart grid communicationsinfrastructures.
II. FIWI SMART GRID COMMUNICATIONSINFRASTRUCTURES
Fig. 1 depicts the generic architecture of our consideredFiWi smart grid communications infrastructures. The fiberbackhaul consists of an EPON with its typical tree-and-branchtopology. The central optical line terminal (OLT) is located atthe root of the fiber tree and connects to the distribution man-agement system (DMS) of the underlying power distributionnetwork. Optical networks units (ONUs), the EPON customerpremises equipment, are attached to the fiber tree leaf nodes.An ONU either directly serves a single or multiple subscribersor hosts a collocated WLAN access point (AP) with associatedwireless sensors and stations (STAs).
More specifically, the fiber backhaul may be built by usinga legacy IEEE 802.3ah EPON, which uses a time-shareddownstream wavelength channel and another separate time-shared upstream wavelength channel, each operating at a datarate of 1 Gb/s. The remote node (RN) consists of an opticalpower splitter/combiner. In the upstream direction, bandwidthis dynamically assigned to individual ONUs by the OLT basedon a report-grant mechanism. Alternatively, high-speed 10+Gb/s TDM PONs or wavelength-broadcasting/routing WDMPONs may be used. IEEE 802.3av 10G-EPON offers highersymmetric and asymmetric data rates of up to 10 Gb/s, but isotherwise similar to EPON. A wavelength-broadcasting WDMPON leaves the splitter/combiner at the RN in place and de-ploys multiple wavelength channels. Each of these wavelengthchannels is broadcast to all connected WDM upgraded ONUsand is used for bidirectional transmission. Each WDM ONU isable to select a wavelength by using a tunable bandpass filterand reuses the downstream modulated signal coming from theOLT for upstream data transmission by means of remodulationtechniques. In the case of a wavelength-routing WDM PON,the splitter/combiner at the RN is replaced with a wavelengthmultiplexer/demultiplexer such that each of the WDM wave-length channels on the common feeder fiber is routed to adifferent distribution fiber. A given wavelength channel maybe dedicated to a single ONU (e.g., business subscriber) or betime shared by multiple wavelength-independent ONUs (e.g.,residential subscribers). Finally, long-reach WDM PONs with
2

IEEE TRANSACTIONS ON COMMUNICATIONS, to appear.
an extended optical range of up to 100 km may be used toachieve major cost savings by consolidating optical access andaggregation networks.
Each AP forms a separate WLAN zone that comprises itsassociated STAs and sensors. Each WLAN uses Enhanced Dis-tributed Channel Access (EDCA), specified in IEEE 802.11e,for QoS support. EDCA provides QoS-enabled STAs withservice differentiation by employing four different access cat-egories (ACs), each having a different arbitration inter-framespace (AIFS), a different minimum and maximum contentionwindow CWmin and CWmax, respectively, and a differentmaximum channel holding time per traffic class. Apart fromconventional IEEE 802.11 a/b/g/n WLANs with raw data ratesin the range of 54-600 Mb/s, we also consider emerging IEEE802.11ac VHT WLAN technologies that exploit physical layerenhancements to achieve raw data rates of up to 6900 Mb/s.
As for the wireless sensors, it is expected that besideraw data rates of 12 kb/s for basic voltage and currentsensors, computed quantities (i.e., phase amplitude, phaseangle, sequence components, etc.) will increase the bandwidthrequirements to about 200-500 kb/s, or up to 2-5 Mb/s formillisecond sampling in rapid fault detection systems [2]. Theymay operate at various cycles, including cycles as low as 10 or100 milliseconds, to estimate critical system parameters [7].The wireless sensors may be conventional ZigBee devices,offering low data rates of up to 250 kb/s, or may use ad-vanced IEEE 802.15.4 compliant signaling schemes to supportvariable data rates between 31.25 kb/s and 2 Mb/s [10].Alternatively, to reuse existing WLAN infrastructures and thusallow for key cost savings and faster deployments, emerginglow-power sensors based on IEEE 802.11 technology may beused for periodic or event-triggered data transmissions [8].
For improved security, the various PONs and WLANs mayapply IEEE standard 802.1AE and 802.11i, respectively, inconjunction with the aforementioned standards.
III. COEXISTENCE ANALYSIS
Recently, the first FiWi analytical framework was developedin [11] to evaluate the performance of integrated PONs andWLAN IEEE 802.11n/ac routing algorithms without takingany wireless sensors and service differentiation into account.In this work, the focus is on the wireless front-end for theintegration of wireless sensors, while the fiber backhaul isassumed to be the same as in [11].
Our analysis builds on the recently proposed novel method-ology to model the QoS performance of WLANs usingEDCA [12]. To gain insights into the performance of wirelesssensors coexisting with conventional STAs, we extend themethodology by incorporating the inhomogeneous and non-saturated cases, where WLAN nodes can be either wirelesssensors or STAs and which might be non-saturated, i.e., theymust not constantly have frames to send. Furthermore, weextend the analysis to the generalized case of multiple trafficclasses, where each WLAN node is equipped with multiplequeues for different traffic classes rather than a single one.
Furthermore, the analysis developed in this work accommo-dates both event- and time-driven sensors. In the case of event-driven sensors, all sensors compete for channel access using
TABLE IMAIN SYMBOLS OF THE COEXISTENCE ANALYSIS.
Symbol DescriptionL Average generated frame size in bps.C Set of traffic classes. For each class c, c ∈ C.N Set of FiWi nodes, corresponding to a total of one OLT,
O ONUs, and N wireless nodes, |N | = 1 +O + N .Sij Average number of frames generated from FiWi node
i ∈ N destined to FiWi node j ∈ N .λwii,c Average number of frames generated by the wireless node
i of class c.
Dd, Du Downstream and upstream average PON delays, respec-tively.
DTDM Transmission time of time-driven sensors.E Average cycle duration of event-driven wireless nodes.
Psucc Probability that the cycle ends with a successful trans-mission.
Tsucc, Tcoll Average time of a successful transmission and collision,respectively.
Wk,c,s Contention window value of queue c at wireless networknode k in backoff stage s.
Πk,c(s, j) Steady-state probability that queue c of node k is in thebackoff stage s with backoff counter value j, for the casewhen there is at least one frame waiting for transmission.
Πk,c(0, j, 0) Steady-state probability for the case when there is noframe waiting for transmission.
qk,c Probability that there is a frame in queue c of node k atthe beginning of a cycle.
pk,c Collision probability in any time slot of a frame of classc from node k.
Dwik,c Total wireless delay experienced by a frame in queue c
of node k for both time- and event-driven nodes.Dc Average end-to-end delay of traffic class c.Rc End-to-end probabilistic reliability of traffic class c.
EDCA, whereby time-driven sensors have dedicated periodicchannel access. For convenience, Table I summarizes the mainsymbols and their description used in our coexistence analysis.
A. Network Model
The PON consists of one OLT and O attached ONUs.The TDM PON carries one upstream wavelength channeland a separate downstream wavelength channel. We supposethat both the wavelength-broadcasting and the wavelength-routing WDM PONs carry Λ bidirectional wavelength chan-nels λ = 1, . . . ,Λ. In the wavelength-routing WDM PON, theO ONUs are divided into Λ sectors. We use λ to index thewavelength channel as well as the corresponding sector. Inour model, sector λ, λ = 1, . . . ,Λ, accommodates Oλ ONUs.Specifically, ONUs with indices o between
∑λ−1υ=1 Oυ and∑λ
υ=1Oυ belong to sector λ. Thus, sector λ = 1 comprisesONUs o ∈ S1 = {1, . . . , O1}, sector λ = 2 comprises ONUso ∈ S2 = {O1 + 1, . . . , O1 +O2}, and so on, while we assignthe index o = 0 to the OLT. The one-way propagation delaybetween OLT and ONUs of sector λ is τ (λ) (in seconds) andthe data rate of the associated wavelength channel λ is denotedby C(λ) (in bit/s). Hence, each sector of the wavelength-routingWDM PON is allowed to operate at a different data rateserving a subset of ONUs located at a different distance fromthe OLT (e.g., business vs. residential service areas). For easeof exposition, we assume that in the wavelength-broadcastingTDM and WDM PONs all wavelength channels operate at thesame data rate C (in bit/s) and that all ONUs have the one-
3
IEEE TRANSACTIONS ON COMMUNICATIONS, to appear.
way propagation delay τ (in seconds) from the OLT. All or asubset of the O ONUs are equipped with an AP to interfacewith wireless sensors and STAs. The WLAN is assumed tooperate at data rate r (in bit/s).
B. Traffic Model
We denote N for the set of FiWi smart grid communicationsinfrastructure nodes that act as traffic sources and destinations.Specifically, we consider N to contain the OLT, the O ONUs,and a given number of Ns wireless sensors and Nr STAs,totalling N = Ns + Nr wireless nodes. Hence, the numberof traffic sources/destinations is given by |N | = 1 + O + N .We define the traffic matrix S = (Sij), i, j ∈ N , where Sijrepresents the number of frames per second that are generatedat source node i and destined to node j (Sij = 0 for i = j).We allow for any arbitrary distribution of the frame lengthL and denote L and V ar(L) for the mean and variance ofthe length of each generated frame, respectively. The trafficgeneration is assumed to be ergodic and stationary.
Inter-ONU communications can be done only via the OLT,i.e., there is no direct communication among ONUs, neitheroptically nor wirelessly. However, each ONU equipped withan additional AP is able to directly communicate with itsassociated wireless sensors and STAs. For communicationswith the remaining wireless sensors and STAs, a given ONUhas to send traffic to the corresponding ONU serving thedestination wireless sensor or STA. Taking these communi-cations rules (or routing) into account, one can determine theamount of traffic in the optical and wireless parts for eachpair of source node i and destination node j of a given trafficmatrix S. Specifically, let Γij denote the number of framesper second to be sent between ONUs and OLT across thefiber infrastructure, whereby i and j may be any the O ONUsor the OLT. Furthermore, let λwii,c denote the number of framesper second to be sent from queue c of any wireless networknode i, whereby i may be any of the N wireless sensors andSTAs or their associated AP with collocated ONU.
C. Stability and Capacity Analysis
1) Fiber Backhaul: For the wavelength-routing WDMPON, we define the downstream traffic intensity in sector λ,λ = 1, . . . ,Λ, as follows [11, Eq. (2)]:
ρd,λ =L ·Rd,λ
C(λ), (1)
while the upstream traffic intensity is given by [11, Eq. (4)]
ρu,λ =L ·Ru,λ
C(λ). (2)
Rd,λ and Ru,λ represent the downstream and upstream trafficrates of wavelength λ and were derived in [11, Eqs. (2-4)].For stability, the normalized downstream and upstream trafficintensities have to satisfy ρd,λ < 1 and ρu,λ < 1, respectively[11, Eq. (5)].
Note that Rd,λ and Ru,λ account for the traffic comingfrom both the wireless and optical networks. For the wirelesscase of event-driven nodes when the retransmission limit is
reached, one needs to consider only successfully transmittedframes, that is, λwii,c ·rwii,c , where rwii,c represents the probabilisticreliability (to be derived shortly).
In the case of the wavelength-broadcasting TDM PON(Λ = 1) and WDM PON (Λ > 1), the normalized downstreamtraffic rate (intensity) ρd and normalized upstream trafficrate (intensity) ρu are derived as in [11, Eqs. (6-7)]. Thewavelength-broadcasting TDM and WDM PONs work stableif ρu < 1 and ρd < 1.
2) Wireless Front-end: The wireless front-end comprisesthe N wireless sensors and STAs as well as the subset ofONUs equipped with an AP, which we refer to as the wirelessnetwork nodes. The queue c at wireless network node i isstable if
Dwi,ai,c <
1
λwii,c, (3)
where Dwi,ai,c denotes the average access delay of queue c
of node i to the wireless channel (to be calculated shortlyin Section III-D). For stability, the normalized traffic rate(intensity) ρi,c at queue c of wireless network node i has tosatisfy
ρi,c = Dwi,ai,c · λ
wii,c < 1. (4)
The subsequent delay analysis of Section III-D applies onlyfor a stable network. Note that we consider a stable operatingsystem for which Eqs. (3) and (4) hold. Stability can beensured in practical setups through admission control.
D. Delay Analysis
1) Fiber Backhaul: In the wavelength-routing WDM PON,the OLT sends a downstream frame to an ONU in sectorλ by transmitting the frame on wavelength λ, which isreceived by all ONUs in the sector. We model all downstreamtransmissions in sector λ to emanate from a single queue asin [11].
Weighing the downstream delays Dd,λ in the differentsectors λ by their relative downstream traffic intensitiesρd,λ/
∑Λλ=1 ρ
d,λ yields the average downstream delay of thewavelength-routing WDM PON [11, Eq. (10)]:
Dd =1∑Λ
λ=1 ρd,λ
Λ∑λ=1
ρd,λ ·Dd,λ. (5)
For the upstream delay, we model each wavelength channelλ, λ = 1, . . . ,Λ, as a single upstream wavelength channelof a conventional EPON. The average upstream delay of thewavelength-routing WDM PON equals [11, Eq. (12)]:
Du =1∑Λ
λ=1 ρu,λ
Λ∑λ=1
ρu,λ ·Du,λ. (6)
Next, the average downstream (Dd) and upstream delays(Du) for the wavelength-broadcasting TDM PON (Λ = 1)and WDM PON (Λ > 1) can be calculated using [11, Eqs.(16-17)].
4
IEEE TRANSACTIONS ON COMMUNICATIONS, to appear.
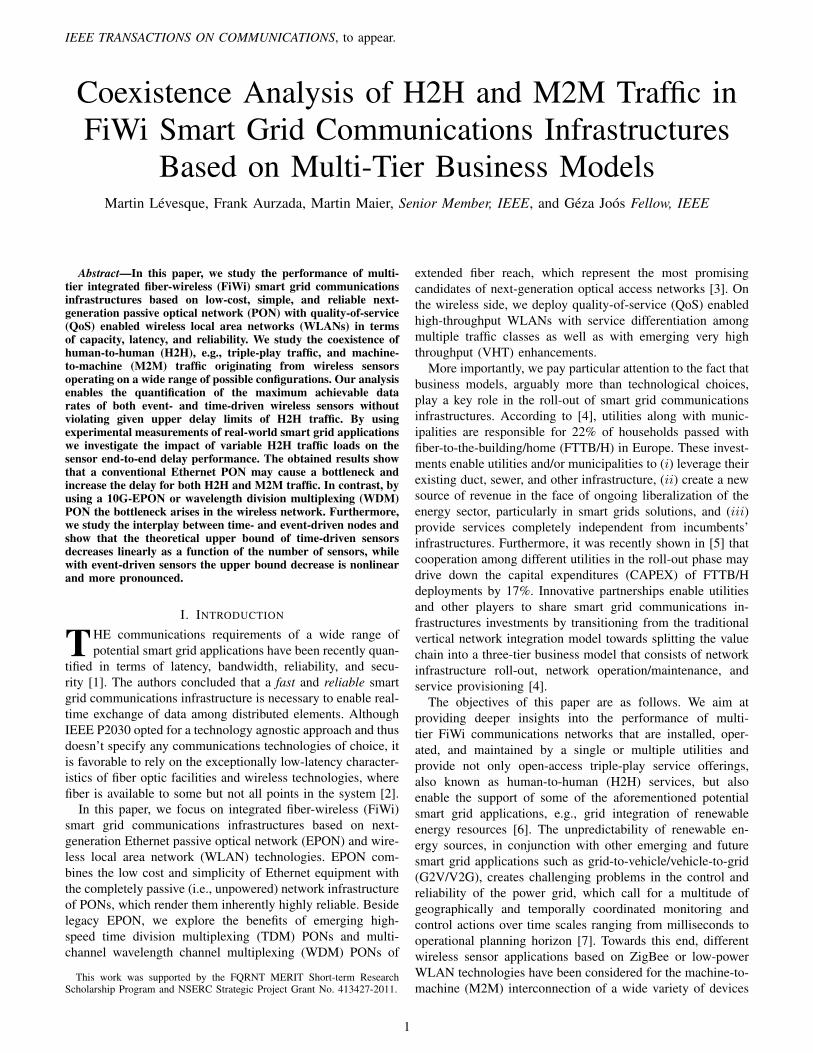
Fig. 2. Channel access cycle to model both time-/event-driven sensor andSTA transmissions.
2) Wireless Front-end: Similar to [12], time is divided intocycles, however each cycle consists of four components (ratherthan 3 in [12]): (i) average time division multiplexing (TDM)duration for time-based sensors (ii) a randomly chosen timeinterval for contention resolution on the wireless channel,followed by (iii) one successful transmission or collision, asdepicted in Fig 2. In contrast to [12], however, in each cycletypically only a subset of the wireless network nodes competefor channel access, while the others do not have any frameswaiting in their queues to be sent (i.e., non-saturated case).
Each wireless node is assumed to have C queues, oneper traffic class under consideration. Each separate queue c,c = 1, . . . , C, is assigned a priority in ascending order fromc = 1 to c = C. Let Wk,c,s denote the contention windowvalue of queue c at wireless network node k in backoff stages, where s = 0, 1, . . . , Rk,c, and Rk,c is the given retrylimit of queue c at node k. Furthermore, let Bk,c(i) be thesteady-state probability that queue c of wireless node k hasbackoff counter value i at the beginning of a cycle, where0 ≤ i ≤ maxs=0,1,...,Rk,c
Wk,c,s (to be computed shortly). Fornotational convenience, similarly to [12, Eq. (3)], we define
βk,c(i) =
0 i ≤ 0∑i−1j=0Bk,c(j) i > 0
1 i > maxs=0,1,...,Rk,cWk,c,s,
(7)where βk,c(i) denotes the steady-state probability that queuec’s backoff counter at node k has expired at backoff slot iin a cycle. Moreover, let δk,c ≥ 0 be an integer denoting theminimum number of backoff slots, in addition to its assignedAIFS number, queue c of node k has to wait until accessing thewireless channel, whereby δk,c = 0 represents the minimumwaiting time, i.e., DIFS plus zero backoff slots.
Next, we define qk,c as the probability that there is a framein queue c of node k at the beginning of a cycle (to becalculated shortly). Let then Qh,c(i) denote the probabilitythat from wireless network node h’s perspective no competingnode transmits before backoff slot i. The calculation of Qh,c(i)is different from [12] in that we extend it to multiple classesper node and also include the case that no frame may be in thequeues of other wireless network nodes (non-saturated case).Consequently, using our above introduced backlog probabilityqk,c we obtain
Qh,c(i) =∏k 6=h
C∏z=1
[(1− qk,z) + qk,z(1− βk,z(i− δk,z))]
·∏z<c
[(1− qh,z) + qh,z((1− βh,z(i− δh,z)) +
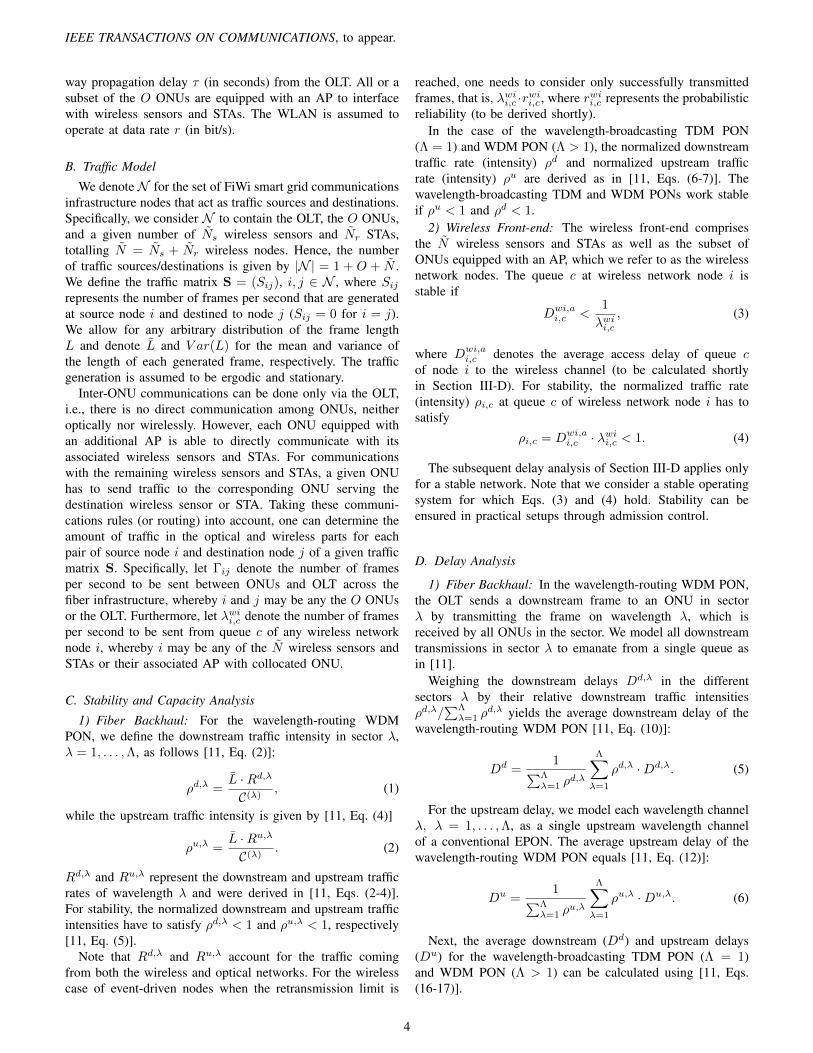
Fig. 3. Steady-state probabilities of the backoff counter value evolution inthe EDCA model under non-saturated conditions.
βh,z(i− δh,z)βh,c(i− δh,c))]·∏z>c
[(1− qh,z) + qh,z(1− βh,z(i− δh,z))]. (8)
Adopting a notation similar to [12], the probability Th,c(i) thatqueue c of wireless network node h sees the first transmissionin a cycle exactly at backoff slot i is defined as [12, Eq. (5)].
To derive the steady-state probability that queue c of nodek is in backoff stage s with backoff counter value j, we haveto define the following probabilities in order to account for thepossibility that there are no frames waiting for transmission atnode k, represented in the lower part in Fig. 3. Let
Πk,c(s, j), s ∈ {0, 1, . . . , Rk,c}j ∈ {0, 1, . . . ,Wk,c,s} (9)
be the probability that node k has a frame waiting in its queuec, is in backoff stage s, and has backoff counter value j. Byextending Eq. (12) in [12] to the multiple-queue per node case,we obtain for 0 < s ≤ Rk,c and 0 ≤ j ≤Wk,c,s
Πk,c(s, j) = Πk,c(s, j)(1−Qk,c(δk,c))
+
Wk,c,s−j∑r=1
Πk,c(s, j + r) · Tk,c(r − 1 + δk,c)
+
Wk,c,s−1∑i=1
[Πk,c(s− 1, i) · Tk,c(i+ δk,c) ·
1
Wk,c,s + 1
]. (10)
Contrary to Eq. (13) in [12], however, for s = 0 and 0 ≤ j ≤Wk,c,s we have
Πk,c(0, j) = Πk,c(0, j)(1−Qk,c(δk,c))
+
Wk,c,0−j∑r=1
Πk,c(0, j + r) · Tk,c(r − 1 + δk,c)
+
Wk,c,Rk,c∑i=0
qk,c
[Πk,c(Rk,c, i) · Tk,c(i+ δk,c)
5
IEEE TRANSACTIONS ON COMMUNICATIONS, to appear.
· 1
Wk,c,0 + 1
]+
Rk,c∑s=0
Wk,c,s∑i=0
qk,c
[Πk,c(s, i) ·
Qk,c(i+ 1 + δk,c) ·1
Wk,c,0 + 1
]+ Πk,c(0, j, 0) ·
(1− e−λ
wik,cE
), (11)
where E denotes the average duration of a cycle in steady state(to be calculated shortly) and Πk,c(0, j, 0) is the newly definedprobability (represented in the upper part in Fig. 3) that node khas no frame in its queue c (and therefore is in backoff stage0) and has backoff counter value j, j ∈ {0, 1, . . . ,Wk,c,0},which is given by
Πk,c(0, j, 0) =
Wk,c,Rk,c∑i=0
[Πk,c(Rk,c, i) · Tk,c(i+ δk,c) ·
1− qk,cWk,c,0 + 1
]+
Rk,c∑s=0
Wk,c,s∑i=0
[Πk,c(s, i) ·
Qk,c(i+ 1 + δk,c) ·1− qk,cWk,c,0 + 1
]+ Πk,c(0, j + 1, 0) · e−λ
wik,cE . (12)
After computing Πk,c(s, j) and Πk,c(0, j, 0), we are nowable to compute the above defined probability Bk,c(i) thatqueue c of wireless node k has backoff counter value j, 0 ≤j ≤ maxs=0,1,...,Rk,c
Wk,c,s, at the beginning of a cycle asfollows (extension of [12, Eq. (6)]):
Bk,c(j) =
Rk,c∑s=0
Πk,c(s, j) + Πk,c(0, j, 0). (13)
Next, let us calculate the probability that node k had asuccessful transmission in a cycle, provided that it had a framewaiting in its queue c, which is similar to [12, Eq. (16)] andgiven by
Psucc(k, c) =
Wk,c,max∑i=0
Bk,c(i) ·Qk,c(i+ 1 + δk,c), (14)
where Wk,c,max is the maximum contention window size ofnode k’s queue c and Bk,c(i) denotes the steady-state proba-bility that queue c of node k has backoff counter value i. Theprobability that the cycle ends with a successful transmissionis then given by
Psucc = 1−∏∀k
∏∀c
[1− Psucc(k, c)] . (15)
This in turn allows us now to compute the average durationof a cycle. In our calculation, we consider both event-drivenand time-driven sensors. Event-driven sensors contend forchannel access like any other STA after detecting an eventof importance, e.g., power outage. Conversely, time-drivensensors periodically send their measurements to the DMSin dedicated (contention-free) TDM slots without undergoingcontention for the wireless channel. Extending [12, Eq. (17)],
the average cycle duration is given by
E = ETDM
+ E[x] · σ+ Psucc · Tsucc + (1− Psucc) · Tcoll, (16)
where ETDM is the mean channel access time due to acontention-free period consisting of periodically recurringTDM slots for time-driven sensors in a given zone z. It isapproximated by
ETDM = PTDM,z · (Tsucc +DTDM ), (17)
whereby PTDM,z denotes the probability that a wireless nodehas to wait due to a TDM slot in a given zone z, which isgiven by
PTDM,z =∑
∀s sensors
λwis,sen ·DTDM
+1
(1/(∑∀s sensors λ
wis,sen −DTDM ))/Tsucc
(18)
with
DTDM = PHY Header + MAC Header/r+ E[Payload] + FCS/r + δ. (19)
Note that PTDM,z defines the interplay between cycles andTDM slots, whereby the transmissions of contending wirelessnodes are highly influenced by the recurring TDM slots oftime-driven sensors. Also note that PTDM,z = 0 (and thusETDM = 0) if all sensors in zone z are event driven.
Furthermore, σ denotes the duration of one time slot, whileTsucc and Tcoll represent the average time of a successfultransmission and collision, respectively. The calculation ofTsucc and Tcoll depends on the access mechanism in place(basic access or RTS/CTS access mechanism) and can be donein a straightforward fashion following the approach in [13],whereby DIFS needs to be replaced with the minimum AIFSafter a successful transmission and with EIFS after a collision.For instance, under the assumption of the RTS/CTS accessmechanism, collisions can occur only on RTS frames and wethus have
Tsucc = RTS/r + SIFS + δ + CTS/r + SIFS + δ
+ PHY Header + MAC Header/r+ E[Payload] + FCS/r + SIFS + δ + ACK/r+ AIFS + δ (20)
andTcoll = RTS/r + EIFS + δ, (21)
where δ denotes the propagation delay and E[Payload] is theaverage transmission time of a frame, which is equal to L/r.(Note that in IEEE 802.11 the parameters RTS, CTS, and ACKas well as the MAC Header and FCS are given in bits, whilethe other parameters are given in seconds.)
6

IEEE TRANSACTIONS ON COMMUNICATIONS, to appear.
Extending [12, Eq. (20)] to the nodal multiple-queue case,we obtain the second expectation in Eq. (16) as
E[x] =
maxk,c(Wk,c,max+δk,c)∑j=1
Q0(j), (22)
withQ0(j) =
∏∀k
∏∀c
[1− βk,c(j − δk,c)]. (23)
Furthermore, we can also calculate the above defined prob-ability qk,c that there is a frame in queue c of node k at thebeginning of a cycle. Clearly, we have
qk,c = 1− Pr[no frame waiting in queue c
of node k after a cycle]
= 1−
[(1− qk,c) ·
(1− 1− e−λ
wik,cE
1− PTDM,z
)
+ qk,c · Psucc(k, c)
]. (24)
By solving Eq. (24) for qk,c we obtain
qk,c =
(1− e−λ
wik,cE
)/(1− PTDM,z)(
1− e−λwik,cE
)/(1− PTDM,z) + Psucc(k, c)
. (25)
Next, we calculate the average access delay of wirelessnodes, including event-driven sensors, which comprises twodelay components. The first delay component, Dsen
k,c , is experi-enced when a given node senses the wireless channel busy withprobability Pwaitz without gaining successful channel access(with probability 1−Psucc(k, c)). In this event, the node waitsuntil the end of the transmission and then enters backoff stage0. Thus, we have
Dsenk,c = Pwaitz · (1−Psucc(k, c)) ·
(Tsucc +
Wk,c,0
2σ
)(26)
with
Pwaitz =
∑k EDCA node∈z
∑c λ
wik,c
1/Tsucc. (27)
The probability Pwaitz is approximated by the ratio of thetraffic load and the maximum achievable load 1/Tsucc. Thesecond delay component is the average backoff and contentiontime period Dback
k,c of queue c at node k and is obtained as
Dbackk,c =
Rk,c∑s=1
(pk,c)s · (1− pk,c) ·[
s(Tcoll + δk,cσ + Pwaitz · (1− Psucc(k, c))
· Tsucc)
+
s∑j=1
Wk,c,j
2
σ
], (28)
whereby the collision probability in any given time slot,similar to Eq. (24) in [12], is defined as
pk,c =
Wk,c,max+δk,c∑i=0
Tk,c(i)
Qk,c(i). (29)
Note that in Eq. (28), the delay at each stage s is characterizedby the collision duration, δk,c, sensing duration, and backoffduration.
The average access delay Dwi,ak,c for a frame successfully
transmitted from queue c of wireless node k is the sum ofthe aforementioned two delay components plus successfultransmission and is equal to
Dwi,ak,c = Dsen
k,c +Dbackk,c +
TsuccPsucc(k, c)
. (30)
By taking also the queueing delay into account, we obtainthe total wireless delay experienced by a frame in queue c ofnode k for both time- and event-driven nodes as follows:
Dwik,c =
{1
1/Dwi,ak,c −λ
wik,c
, for event-driven nodes.
DTDM , for time-driven nodes.(31)
3) End-to-End Delay: In this section, we compute theaverage end-to-end delay across both the fiber backhaul andwireless front-end. We distinguish the two cases of (i) regularH2H traffic (e.g., triple-play voice, video, and data traffic) and(ii) sensor M2M traffic.
• Regular H2H traffic: The average end-to-end delay forregular traffic class c, c = 1, . . . , C, is given by
Dc =1∑
∀i,j∈N\{Sensors} Sij
[ ∑∀ STAs i,j
or ONU/AP jin same zone
Sij ·Dwii,c
+∑∀ STA i
Si0(Dwii,c +Du
)+
∑∀ STA i
and ONU/AP jin other zones
Sij(Dwii,c +Du +Dd
)
+∑∀ STA i
and STA jin other zones
Sij(Dwii,c +Du +Dd +
DwiONU/AP j,c)
+∑∀ ONU i
Si0 ·Du +∑
∀ ONUs i,j
Sij(Du +Dd
)+
∑∀ ONU i
and STA jin other zones
Sij(Du +Dd +Dwi
ONU/AP j,c
)
+∑∀ ONU j
S0j ·Dd
+∑∀ STA j
S0j
(Dd +Dwi
ONU/AP j,c
) ], (32)
where Dd represents the average PON downstream delayand Du represents the average PON upstream delay.
7

IEEE TRANSACTIONS ON COMMUNICATIONS, to appear.
• Sensor M2M traffic: The average end-to-end delay forsensor traffic class c, c = 1, . . . , C, is given by
Dc =1∑
∀ sensor iand OLT,
ONUs, STAs j
Sij
[ ∑∀ sensor i
Dwii,c ·
∑∀ STAs j
in same zone
Sij
+∑∀ sensor i
Si0(Dwii,c +Du
)+
∑∀ sensor i
and ONU jin other zones
Sij(Dwii,c +Du +Dd
)
+∑∀ sensor iand STA j
in other zones
Sij(Dwii,c +Du +Dd +
DwiONU/AP j,c)
]. (33)
E. Reliability
We define reliability as the probability Θs that a sensortransmits frames successfully within the retry limit:
Θs =
{Rc for event-driven sensors,
1 for time-driven sensors, (34)
where
Rc =1∑
∀ sensor iand OLT,
ONUs, STAs j
Sij
[ ∑∀ sensor i
rwii,c ·∑∀ STAs j
in same zone
Sij
+∑∀ sensor i
Si0 · rwii,c +∑∀ sensor i
and ONU jin other zones
Sij · rwii,c
+∑∀ sensor iand STA j
in other zones
Sij · rwii,c · rwiONU/AP j,c
], (35)
withrwii,c = 1− (pi,c)
Ri,c+1. (36)
F. Theoretical Upper Bound of Permissible M2M Traffic
In order to find the theoretical upper bound of permissibleM2M traffic without violating a given delay limit of H2Htraffic, the sensor data rate, λwii,c, needs to be iterativelyincreased until the regular traffic delay reaches the delay limit.Assuming a delay limit of Lr, we find the theoretical upperbound of permissible M2M traffic iteratively by using thefollowing max function:
maxl∈[0..∞]
(λwi∀i,c := l
), Dc < Lr, (37)
where c denotes a regular traffic class and i indicates a sensor.By increasing the sensor data rate and updating the model forDc iteratively, the maximum sensor data rate not violating thegiven delay limit of H2H traffic is obtained.
G. Future Modeling ImprovementsIn this section, we outline further steps that might be
required to render our model more accurate for practicalsettings. First, in the wireless domain, no bit-error-ratio (BER)at the physical layer was considered. The BER modelingapproach proposed in [11, Eq. (24)] can be adapted to capturephysical impairments. Note that BER in the optical domaincan be considered negligible.
Furthermore, in the presented analytical model, we considerthat all sensors can reach an AP directly. However, in certainsensor applications we might need to install new sensors on-the-fly without direct access to an AP. Assuming that smartgrid sensors are typically static, the WLAN model can beextended to a multi-hop wireless mesh network with IEEE802.11s support following a similar modeling approach aspresented in [11, Eq. (39)].
Also, from a practical perspective, the obtained numericalresults should be compared with real-world measurements.The resultant performance differences, if any, can be usedto further improve the accuracy of our proposed analyticalframework.
IV. NUMERICAL AND SIMULATION RESULTS
A. ConfigurationsThe EDCA parameters are set to the default values given
in [12] and frames are first assumed to have a size of 1500bytes. STAs, ONUs, and OLT send unicast H2H traffic at rateαr uniformly distributed among each other with δk,c = 3,CWmin = 64, and CWmax = 256. Sensor M2M traffic at rateλwii,c is destined to the DMS with δk,c = 0, CWmin = 8, andCWmax = 256. The traffic matrix can therefore be describedas follows, whereby source nodes are listed vertically anddestination nodes horizontally:
0 . . . O + Nr . . . O + Nr + Ns
0 0 αr αr 0 0... αr αr αr 0 0O + Nr αr αr 0 0 0... λwii,c 0 0 0 0
O + Nr + Ns λwii,c 0 0 0 0
.
Our simulator is based on OMNeT++1 and uses thecommunication network package inet with extensions forWiFi EDCA, TDM/WDM PONs, and integrated WLAN-PON routing. The PON part is implemented correspondingto conventional EPON point-to-multipoint communicationswith REPORT-GRANT control messages. As for the WLANEDCA-based network, a finite state machine model is devel-oped and available in the inet2 package, which includes themain IEEE 802.11e states such as idle, defer, wait-AIFS, back-off, wait-ack, receive-ack, wait-SIFS, and receive. Furthermore,we developed the probabilistic analysis calculator in Pythonusing the scientific computing package NumPy3.
1The open source simulator OMNeT++ is available at http://www.omnetpp.org/.
2The INET framework is available at http://inet.omnetpp.org/.3For more information on NumPy please refer to http://www.numpy.org/.
8
IEEE TRANSACTIONS ON COMMUNICATIONS, to appear.
0
5
10
15
20
25
30
0 2 4 6 8 10 12
Dela
y (
ms)
Data rate per sensor (Mbps)
Adaptive delay limit
H2H M2M
Simulation
Fig. 4. Average end-to-end delay performance vs. data rate per sensor (event-driven sensors based on IEEE 802.11n).
0
5
10
15
20
25
30
0 5 10 15 20 25
Dela
y (
ms)
Data rate per sensor (Mbps)
Adaptive delay limit
H2H w/ event-driven sensors M2M w/ event-driven sensors
H2H w/ time-driven sensors M2M w/ time-driven sensors
Fig. 5. Average end-to-end delay performance vs. data rate per sensor (time-and event-driven sensors based on IEEE 802.11ac).
B. Reliability and Maximum M2M Traffic Rate with a Con-ventional TDM EPON
We first consider a 20 km long TDM EPON with 8 ONUs,each equipped with an AP serving 2 STAs and 2 sensors.
Figs. 4 and 5 depict the average end-to-end delay perfor-mance of H2H traffic (aggregate load fixed to 144 Mb/s) andM2M sensor traffic vs. data rate per sensor. Fig. 4 shows thecomparison between M2M and H2H traffic based on event-driven sensors and IEEE 802.11n, respectively. We observefrom the figure that analytical and simulation results matchclosely. Note that the delay of M2M traffic remains lowand flat for event- and especially time-driven sensors due toits smaller δk,c and CWmin. However, for increasing sensordata rates, the delay of H2H traffic may cross a given upperdelay limit, which is adaptive to meet different H2H trafficrequirements. For instance, for an upper delay limit of 2.5ms, the measured sensor data rates of 6.1, 12.7, and 19.7Mb/s (vertical arrows in Figs. 4-5) clearly show that higherpermissible sensor data rates can be achieved by using VHT
0.996
0.9965
0.997
0.9975
0.998
0.9985
0.999
0.9995
1
1.0005
0 50 100 150 200 250 300 350
Sensor
relia
bili
ty (
Θs)
Aggregate H2H traffic (Mbps)
Event-driven and 802.11nEvent-driven and 802.11ac
Time-driven and 802.11nTime-driven and 802.11ac
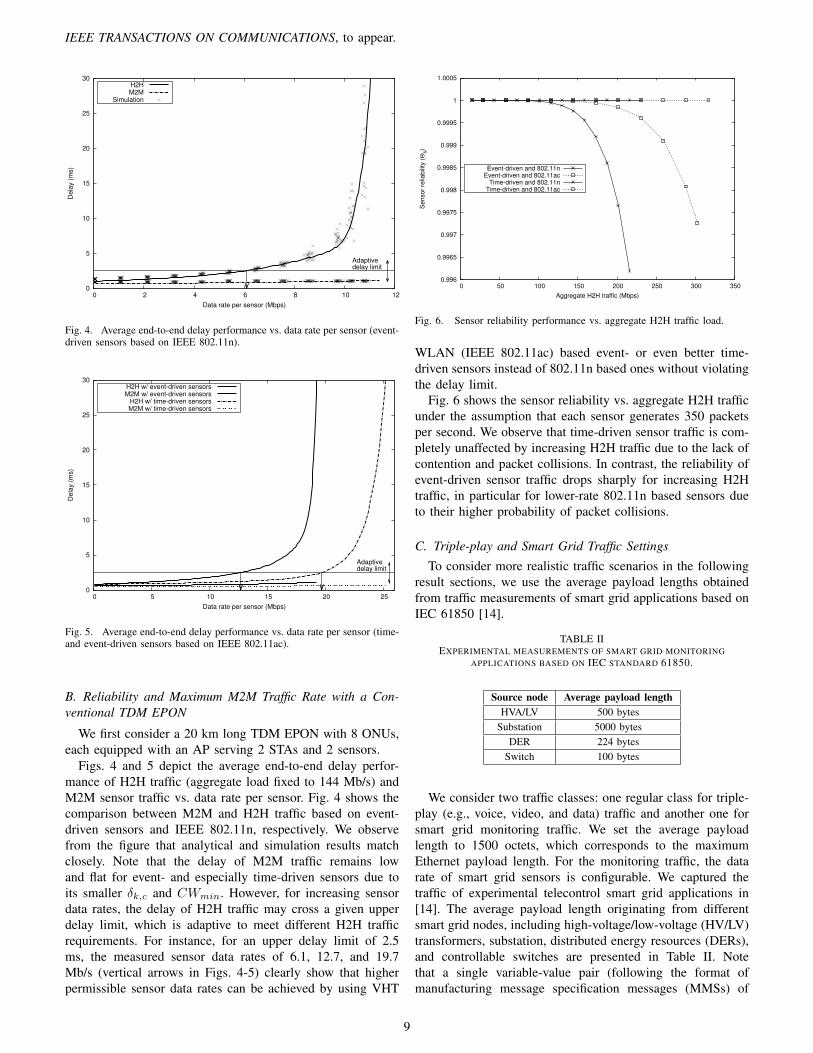
Fig. 6. Sensor reliability performance vs. aggregate H2H traffic load.
WLAN (IEEE 802.11ac) based event- or even better time-driven sensors instead of 802.11n based ones without violatingthe delay limit.
Fig. 6 shows the sensor reliability vs. aggregate H2H trafficunder the assumption that each sensor generates 350 packetsper second. We observe that time-driven sensor traffic is com-pletely unaffected by increasing H2H traffic due to the lack ofcontention and packet collisions. In contrast, the reliability ofevent-driven sensor traffic drops sharply for increasing H2Htraffic, in particular for lower-rate 802.11n based sensors dueto their higher probability of packet collisions.
C. Triple-play and Smart Grid Traffic Settings
To consider more realistic traffic scenarios in the followingresult sections, we use the average payload lengths obtainedfrom traffic measurements of smart grid applications based onIEC 61850 [14].
TABLE IIEXPERIMENTAL MEASUREMENTS OF SMART GRID MONITORING
APPLICATIONS BASED ON IEC STANDARD 61850.
Source node Average payload lengthHVA/LV 500 bytes
Substation 5000 bytesDER 224 bytes
Switch 100 bytes
We consider two traffic classes: one regular class for triple-play (e.g., voice, video, and data) traffic and another one forsmart grid monitoring traffic. We set the average payloadlength to 1500 octets, which corresponds to the maximumEthernet payload length. For the monitoring traffic, the datarate of smart grid sensors is configurable. We captured thetraffic of experimental telecontrol smart grid applications in[14]. The average payload length originating from differentsmart grid nodes, including high-voltage/low-voltage (HV/LV)transformers, substation, distributed energy resources (DERs),and controllable switches are presented in Table II. Notethat a single variable-value pair (following the format ofmanufacturing message specification messages (MMSs) of
9
IEEE TRANSACTIONS ON COMMUNICATIONS, to appear.
0.001
0.01
0 1 2 3 4 5
Sensor
dela
y (
in s
ec.)
Aggregate H2H traffic (Gbps)
EPON w/ 802.11n/ac 10G-EPON w/ 802.11n
10G-EPON w/ 802.11ac WDM PON (Λ = 40) w/ 802.11n
WDM PON (Λ = 40) w/ 802.11ac
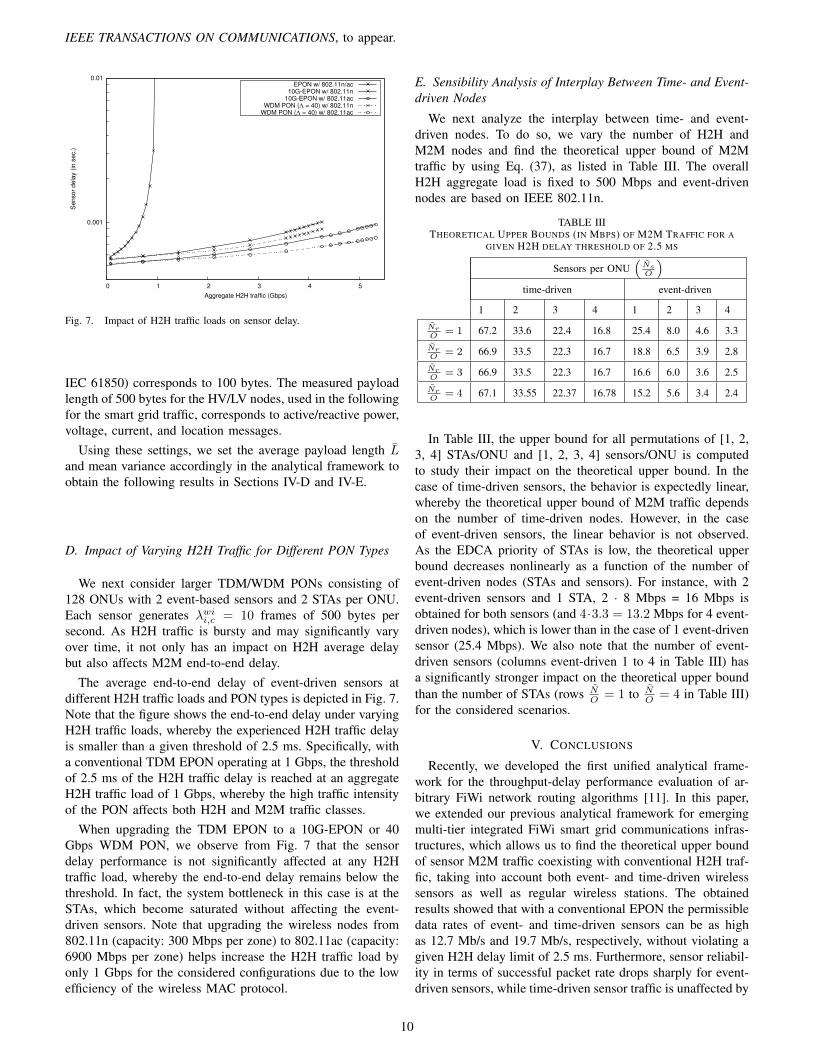
Fig. 7. Impact of H2H traffic loads on sensor delay.
IEC 61850) corresponds to 100 bytes. The measured payloadlength of 500 bytes for the HV/LV nodes, used in the followingfor the smart grid traffic, corresponds to active/reactive power,voltage, current, and location messages.
Using these settings, we set the average payload length Land mean variance accordingly in the analytical framework toobtain the following results in Sections IV-D and IV-E.
D. Impact of Varying H2H Traffic for Different PON Types
We next consider larger TDM/WDM PONs consisting of128 ONUs with 2 event-based sensors and 2 STAs per ONU.Each sensor generates λwii,c = 10 frames of 500 bytes persecond. As H2H traffic is bursty and may significantly varyover time, it not only has an impact on H2H average delaybut also affects M2M end-to-end delay.
The average end-to-end delay of event-driven sensors atdifferent H2H traffic loads and PON types is depicted in Fig. 7.Note that the figure shows the end-to-end delay under varyingH2H traffic loads, whereby the experienced H2H traffic delayis smaller than a given threshold of 2.5 ms. Specifically, witha conventional TDM EPON operating at 1 Gbps, the thresholdof 2.5 ms of the H2H traffic delay is reached at an aggregateH2H traffic load of 1 Gbps, whereby the high traffic intensityof the PON affects both H2H and M2M traffic classes.
When upgrading the TDM EPON to a 10G-EPON or 40Gbps WDM PON, we observe from Fig. 7 that the sensordelay performance is not significantly affected at any H2Htraffic load, whereby the end-to-end delay remains below thethreshold. In fact, the system bottleneck in this case is at theSTAs, which become saturated without affecting the event-driven sensors. Note that upgrading the wireless nodes from802.11n (capacity: 300 Mbps per zone) to 802.11ac (capacity:6900 Mbps per zone) helps increase the H2H traffic load byonly 1 Gbps for the considered configurations due to the lowefficiency of the wireless MAC protocol.
E. Sensibility Analysis of Interplay Between Time- and Event-driven Nodes
We next analyze the interplay between time- and event-driven nodes. To do so, we vary the number of H2H andM2M nodes and find the theoretical upper bound of M2Mtraffic by using Eq. (37), as listed in Table III. The overallH2H aggregate load is fixed to 500 Mbps and event-drivennodes are based on IEEE 802.11n.
TABLE IIITHEORETICAL UPPER BOUNDS (IN MBPS) OF M2M TRAFFIC FOR A
GIVEN H2H DELAY THRESHOLD OF 2.5 MS
Sensors per ONU(
NsO
)time-driven event-driven
1 2 3 4 1 2 3 4
NrO
= 1 67.2 33.6 22.4 16.8 25.4 8.0 4.6 3.3
NrO
= 2 66.9 33.5 22.3 16.7 18.8 6.5 3.9 2.8
NrO
= 3 66.9 33.5 22.3 16.7 16.6 6.0 3.6 2.5
NrO
= 4 67.1 33.55 22.37 16.78 15.2 5.6 3.4 2.4
In Table III, the upper bound for all permutations of [1, 2,3, 4] STAs/ONU and [1, 2, 3, 4] sensors/ONU is computedto study their impact on the theoretical upper bound. In thecase of time-driven sensors, the behavior is expectedly linear,whereby the theoretical upper bound of M2M traffic dependson the number of time-driven nodes. However, in the caseof event-driven sensors, the linear behavior is not observed.As the EDCA priority of STAs is low, the theoretical upperbound decreases nonlinearly as a function of the number ofevent-driven nodes (STAs and sensors). For instance, with 2event-driven sensors and 1 STA, 2 · 8 Mbps = 16 Mbps isobtained for both sensors (and 4·3.3 = 13.2 Mbps for 4 event-driven nodes), which is lower than in the case of 1 event-drivensensor (25.4 Mbps). We also note that the number of event-driven sensors (columns event-driven 1 to 4 in Table III) hasa significantly stronger impact on the theoretical upper boundthan the number of STAs (rows N
O = 1 to NO = 4 in Table III)
for the considered scenarios.
V. CONCLUSIONS
Recently, we developed the first unified analytical frame-work for the throughput-delay performance evaluation of ar-bitrary FiWi network routing algorithms [11]. In this paper,we extended our previous analytical framework for emergingmulti-tier integrated FiWi smart grid communications infras-tructures, which allows us to find the theoretical upper boundof sensor M2M traffic coexisting with conventional H2H traf-fic, taking into account both event- and time-driven wirelesssensors as well as regular wireless stations. The obtainedresults showed that with a conventional EPON the permissibledata rates of event- and time-driven sensors can be as highas 12.7 Mb/s and 19.7 Mb/s, respectively, without violating agiven H2H delay limit of 2.5 ms. Furthermore, sensor reliabil-ity in terms of successful packet rate drops sharply for event-driven sensors, while time-driven sensor traffic is unaffected by
10

IEEE TRANSACTIONS ON COMMUNICATIONS, to appear.
increasing H2H traffic. Using experimental measurements ofreal-world telecontrol smart grid applications, we studied theimpact of variable H2H traffic loads on the sensor delays. Wefound, with the considered configurations, that a conventionalEPON can cause the bottleneck and increase the delay forboth H2H and M2M traffic, while with 10G-EPON and WDMPON the bottleneck was located in the wireless network, thusdepicting future challenges to combine both fiber and wirelessnetworks efficiently. We also studied the interplay betweentime- and event-driven nodes. We found, with time-drivensensors, that the theoretical upper bound of M2M traffic islinearly dependent on the number of nodes, while with event-driven sensors the upper bound decreases nonlinearly moresignificantly compared with time-driven sensors.
REFERENCES
[1] V. C. Gungor, D. Sahin, T. Kocak, S. Ergut, C. Buccella, C. Cecati,and G. P. Hancke, “A Survey on Smart Grid Potential Applicationsand Communication Requirements,” IEEE Transactions on IndustrialInformatics, vol. 9, no. 1, pp. 28–42, Feb. 2013.
[2] V. K. Sood, D. Fischer, J. M. Eklund, and T. Brown, “Developinga Communication Infrastructure for the Smart Grid,” in Proc., IEEEElectrical Power & Energy Conference, Montreal, QC, Canada, Oct.2009, pp. 1–7.
[3] G. Kramer, M. De Andrade, R. Roy, and P. Chowdhury, “Evolutionof Optical Access Networks: Architectures and Capacity Upgrades,”Proceedings of the IEEE, vol. 100, no. 5, pp. 1188–1196, May 2012.
[4] “FTTH: Double Squeeze of Incumbents – Forced to Partner?” ArthurD. Little, 2010.
[5] M. Tahon, J. V. Ooteghem, K. Casier, L. Deschuttere, S. Verbrugge,D. Colle, M. Pickavet, and P. Demeester, “Cost allocation model for asynergetic cooperation in the rollout of telecom and utility networks,” inProc., Conference on Telecommunications Internet and Media Techno-Economics (CTTE), May 2011, Paper S3-2.
[6] F. R. Yu, P. Zhang, W. Xiao, and P. Choudhury, “CommunicationSystems for Grid Integration of Renewable Energy Resources,” IEEENetwork, vol. 25, no. 5, pp. 22–29, Sep. 2011.
[7] K. Moslehi and R. Kumar, “Smart Grid - A Reliability Perspective,” inProc., Innovative Smart Grid Technologies, Jan. 2010, pp. 1–8.
[8] S. Tozlu, M. Senel, W. Mao, and A. Keshavarzian, “Wi-Fi EnabledSensors for Internet of Things: A Practical Perspective,” IEEE Commu-nications Magazine, vol. 50, no. 6, pp. 134–143, Jun. 2012.
[9] P. Yi, A. Iwayemi, and C. Zhou, “Developing ZigBee DeploymentGuideline Under WiFi Interference for Smart Grid Applications,” IEEETransactions on Smart Grid, vol. 2, no. 1, pp. 110–120, Mar. 2011.
[10] S. Rickers, C. Spiegel, G. Bruck, P. Jung, R. Lee, S. Park, andJ. Yu, “Multi Data Rate Signaling based on IEEE 802.15.4,” in Proc.,International Symposium on Applied Sciences in Biomedical and Com-munication Technologies, Nov. 2010, pp. 1–4.
[11] F. Aurzada, M. Levesque, M. Maier, and M. Reisslein, “FiWi AccessNetworks Based on Next-Generation PON and Gigabit-Class WLANTechnologies: A Capacity and Delay Analysis,” IEEE/ACM Transactionson Networking (Early Access).
[12] I. Tinnirello and G. Bianchi, “Rethinking the IEEE 802.11e EDCAPerformance Modeling Methodology,” IEEE/ACM Transactions on Net-working, vol. 18, no. 2, pp. 540–553, Apr. 2010.
[13] G. Bianchi, “Performance Analysis of the IEEE 802.11 DistributedCoordination Function,” IEEE Journal on Selected Areas in Commu-nications, vol. 18, no. 3, pp. 535–547, Mar. 2000.
[14] M. Levesque and M. Maier, “Probabilistic Availability Quantification ofPON and WiMAX Based FiWi Access Networks for Future Smart GridApplications,” IEEE Transactions on Communications, vol. 62, no. 12,pp. 1958–1969, Jun. 2014.
PLACEPHOTOHERE
Martin Levesque received his M.Sc. in ComputerScience from UQAM, Quebec, Canada in 2010. Hethen obtained his Ph.D. degree in Telecommunica-tions from INRS, Universite du Quebec, in 2014.During summer 2013, he was a visiting scholar atEDF R&D in Clamart, France, where he researchedon advanced smart grid multi-simulations. He wasrecipient of master and doctoral scholarships whilepursuing his graduate studies. He served as a re-viewer of numerous major journals and is a memberof the IEEE IES Technical Committee on Smart
Grids. He is currently a Postdoctoral Researcher with University of Pittsburgh,Pittsburgh, PA, funded by the prestigious Postdoctoral Fellowship programfrom the Natural Sciences and Engineering Research Council of Canada(NSERC).
PLACEPHOTOHERE
Frank Aurzada studied mathematics at the Univer-sity of Jena, Jena, Germany, and the University ofYork, York, U.K. He received the Dipl.-Math. andPh.D. degrees in mathematics from the Universityof Jena in 2003 and 2006, respectively. He wasa Postdoctoral Researcher with TU Berlin, Berlin,Germany, from 2006 to 2012 and an Associate Pro-fessor with TU Braunschweig, Braunschweig, Ger-many, from 2012 to 2013. Since 2013, he has been aProfessor with the Technical University Darmstadt,Darmstadt, Germany.
PLACEPHOTOHERE
Martin Maier is a Full Professor with the Insti-tut National de la Recherche Scientifique (INRS),Montreal. He has joined INRS as an AssociateProfessor in May 2005. He received the MSc andPhD degrees both with distinctions (summa cumlaude) in electrical engineering from the TechnicalUniversity Berlin, Berlin, Germany, in 1998 and2003, respectively. He was a Visiting Researcher atthe University of Southern California (USC), LosAngeles, CA, in spring 1998 and Arizona StateUniversity (ASU), Tempe, AZ, in winter 2001. In
summer 2003, he was a Postdoc Fellow at the Massachusetts Institute ofTechnology (MIT), Cambridge, MA. Before joining INRS, Dr. Maier wasa Research Associate at CTTC, Barcelona, Spain, November 2003 throughMarch 2005. He was a Visiting Professor at Stanford University, Stanford,CA, October 2006 through March 2007. Dr. Maier was a recipient of thetwo-year Deutsche Telekom doctoral scholarship from June 1999 throughMay 2001. He is also a co-recipient of the 2009 IEEE CommunicationsSociety Best Tutorial Paper Award and the Best Paper Award presented atThe International Society of Optical Engineers (SPIE) Photonics East 2000-Terabit Optical Networking Conference. He served on the Technical ProgramCommittees of IEEE INFOCOM, IEEE GLOBECOM, and IEEE ICC, andis an Editorial Board member of the IEEE Communications Surveys andTutorials as well as ELSEVIER Computer Communications. He is a SeniorMember of IEEE.
11

IEEE TRANSACTIONS ON COMMUNICATIONS, to appear.
PLACEPHOTOHERE
Geza Joos received the M.Eng. and Ph.D. degreesfrom McGill University, Montreal, QC, Canada. Hehas been a Professor in the Department of Electricaland Computer Engineering Department at McGillUniversity since 2001. He holds an NSERC/Hydro-Quebec Industrial Research Chair on the Integrationof Renewable Energies and Distributed Generationinto the Electric Distribution Grid (since 2009) anda Canada Research Chair in Intelligent DistributionSystems (since 2011). His research interests arein distributed generation and renewable energy, ad-
vanced distribution systems and microgrids. He was previously with ABB, theUniversite du Quebec and Concordia University. He has consulting experiencein the areas of power electronic converters, with applications to power systems,and power system planning and operation. Dr. Joos is active in working groupsof the International Council on Large Electric Systems (CIGRE), dealingwith distribution systems and distributed generation, and of the IEEE Powerand Energy Society, dealing with power electronic applications to powersystems. He is a Fellow of the Canadian Academy of Engineering and ofthe Engineering Institute of Canada.
12