Cobre Panamá Project - Mining Data Online
236
Cobre Panamá Project Technical Report March 2019 1 Cobre Panamá Project Colón Province, Republic of Panamá NI 43-101 Technical Report March 2019 David Gray (QP) BSc(Geology), MAusIMM, FAIG, Group Mine and Resource Geologist, FQM (Australia) Pty Ltd Michael Lawlor (QP) BEng Hons (Mining), MEngSc, FAusIMM, Consultant Mining Engineer, FQM (Australia) Pty Ltd Robert Stone (QP) BSc(Hons), CEng, ACSM, Technical Manager, FQM (Australia) Pty Ltd
-
Upload
khangminh22 -
Category
Documents
-
view
0 -
download
0
Transcript of Cobre Panamá Project - Mining Data Online

Cobre Panamá Project Technical Report March 2019
1
Cobre Panamá Project Colón Province, Republic of Panamá NI 43-101 Technical Report
March 2019
David Gray (QP) BSc(Geology), MAusIMM, FAIG, Group Mine and Resource Geologist, FQM (Australia) Pty Ltd
Michael Lawlor (QP) BEng Hons (Mining), MEngSc, FAusIMM, Consultant Mining Engineer, FQM (Australia) Pty Ltd
Robert Stone (QP) BSc(Hons), CEng, ACSM, Technical Manager, FQM (Australia) Pty Ltd

Cobre Panamá Project Technical Report March 2019
2
TABLE OF CONTENTS
SUMMARY .................................................................................................................... 13
Project location and ownership ........................................................................................ 13
Project background ........................................................................................................... 13
Project approvals ............................................................................................................... 14
Project development status .............................................................................................. 15
Geology and mineralisation .............................................................................................. 16
Metallurgical summary ...................................................................................................... 16
Mineral Resource summary .............................................................................................. 17
Mineral Reserves summary ............................................................................................... 18
Production schedule .......................................................................................................... 20
Environmental and social summary .................................................................................. 22
Capital and operating cost estimates ................................................................................ 22
Economic analysis .............................................................................................................. 24
Conclusions and recommendations .................................................................................. 26
INTRODUCTION ............................................................................................................ 28
Purpose of this report ....................................................................................................... 28
Terms of reference ............................................................................................................ 28
Qualified Persons and authors .......................................................................................... 28
Principal sources of information ....................................................................................... 28
Site visits ............................................................................................................................ 29
Conventions and definitions .............................................................................................. 29
RELIANCE ON OTHER EXPERTS ....................................................................................... 31
PROPERTY DESCRIPTION, LOCATION AND TENURE ........................................................ 32
Project ownership ............................................................................................................. 32
Project description components ....................................................................................... 32
Project location ................................................................................................................. 32
Mineral tenure................................................................................................................... 33
Project concessions ........................................................................................................... 34
Royalties and taxation ....................................................................................................... 37
Environmental liabilities .................................................................................................... 37
Permitting .......................................................................................................................... 37
Factors and risks which may affect access or title ............................................................ 37
ACCESSIBILITY, CLIMATE, LOCAL RESOURCES, INFRASTRUCTURE AND PHYSIOGRAPHY ... 39
Accessibility ....................................................................................................................... 39
Cobre Panamá Project Technical Report March 2019
3
Climate and physiography ................................................................................................. 39
Seismic conditions ............................................................................................................. 39
Availability of power, water, personnel and areas for Project infrastructure .................. 40
Sufficiency of surface rights .............................................................................................. 41
HISTORY ....................................................................................................................... 43
Ownership and exploration ............................................................................................... 43
Previous Mineral Resource estimates ............................................................................... 45
Previous Mineral Reserve estimates ................................................................................. 45
Production from the property ........................................................................................... 46
GEOLOGICAL SETTING AND MINERALISATION ............................................................... 47
Regional geological setting ................................................................................................ 47
Local geological setting ..................................................................................................... 48
Mineralisation ................................................................................................................... 54
Botija.................................................................................................................................. 55
Colina ................................................................................................................................. 59
Valle Grande ...................................................................................................................... 61
Balboa ................................................................................................................................ 63
Minor deposits .................................................................................................................. 65
DEPOSIT TYPE ............................................................................................................... 68
EXPLORATION ............................................................................................................... 70
Initial discovery .................................................................................................................. 70
Historical regional surveys................................................................................................. 70
DRILLING ...................................................................................................................... 72
Introduction ....................................................................................................................... 72
Historical drilling ................................................................................................................ 73
Collar surveying ................................................................................................................. 77
Downhole surveying .......................................................................................................... 78
SAMPLE PREPARATION, ANALYSES AND SECURITY......................................................... 80
Historical data .................................................................................................................... 80
MPSA ................................................................................................................................. 81
QAQC ................................................................................................................................. 82
DATA VERIFICATION ..................................................................................................... 91
Historical data .................................................................................................................... 91
Data verification by the QP ............................................................................................... 91
Data verification prior to Mineral Resource estimation ................................................... 91

Cobre Panamá Project Technical Report March 2019
4
MINERAL PROCESSING AND METALLURGICAL TESTING .................................................. 92
Metallurgical testwork ...................................................................................................... 92
Recovery projections ......................................................................................................... 94
MINERAL RESOURCE ESTIMATES ................................................................................... 95
Introduction ....................................................................................................................... 95
Data for Mineral Resource modelling ............................................................................... 95
Data validation .................................................................................................................. 97
Geological and mineralisation models .............................................................................. 98
Data preparation for modelling ....................................................................................... 103
Statistical analysis ............................................................................................................ 103
Kriging neighbourhood analysis ...................................................................................... 117
Block model ..................................................................................................................... 118
Grade estimation ............................................................................................................. 119
Model validation.............................................................................................................. 120
Background model........................................................................................................... 126
Density estimates in the block model ............................................................................. 126
Mineral Resource classification and reporting ................................................................ 127
Mineral Resource estimate comparisons ........................................................................ 129
MINERAL RESERVE ESTIMATE ...................................................................................... 131
Introduction ..................................................................................................................... 131
Methodology ................................................................................................................... 131
Mine planning models ..................................................................................................... 131
Pit Optimisation ............................................................................................................... 131
Detailed pit designs ......................................................................................................... 142
Mineral Reserve statement ............................................................................................. 146
Mineral Reserve estimate comparisons .......................................................................... 148
MINING METHODS...................................................................................................... 150
Mining overview .............................................................................................................. 150
Mine planning considerations ......................................................................................... 154
Mining and processing schedules .................................................................................... 169
RECOVERY METHODS .................................................................................................. 181
Mineral processing overview .......................................................................................... 181
Process description.......................................................................................................... 181
Processing consumables .................................................................................................. 185
PROJECT INFRASTRUCTURE ......................................................................................... 186

Cobre Panamá Project Technical Report March 2019
5
Project overall layout ...................................................................................................... 186
Process plant ................................................................................................................... 186
Tailings management facility site .................................................................................... 190
Mining facilities ............................................................................................................... 190
Port site and power station ............................................................................................. 192
Power transmission ......................................................................................................... 194
Pipelines .......................................................................................................................... 195
Water supply ................................................................................................................... 195
Accommodation facilities ................................................................................................ 195
MARKET STUDIES AND CONTRACTS ............................................................................. 196
Product marketability ...................................................................................................... 196
Agreements for sale of concentrate ................................................................................ 196
Other contracts and agreements .................................................................................... 196
ENVIRONMENTAL STUDIES, PERMITTING, LAND, SOCIAL AND COMMUNITY IMPACT ... 197
Environmental setting ..................................................................................................... 197
Status of environmental approvals ................................................................................. 197
Environmental studies ..................................................................................................... 198
Summary of environmental impacts and management requirements ........................... 199
Social and community related requirements .................................................................. 201
Resettlement ................................................................................................................... 202
Mine closure provisions .................................................................................................. 202
CAPITAL AND OPERATING COSTS ................................................................................ 204
Capital costs ..................................................................................................................... 204
Operating costs................................................................................................................ 206
ECONOMIC ANALYSIS.................................................................................................. 214
Principal assumptions ...................................................................................................... 214
Cashflow model inputs .................................................................................................... 216
Cashflow model outcomes .............................................................................................. 217
Project value and sensitivity analysis .............................................................................. 217
ADJACENT PROPERTIES ............................................................................................... 220
Introduction ..................................................................................................................... 220
Regional mining and exploration..................................................................................... 220
Molejón ........................................................................................................................... 220
Palmilla ............................................................................................................................ 221
OTHER RELEVANT DATA AND INFORMATION .............................................................. 222

Cobre Panamá Project Technical Report March 2019
6
INTERPRETATIONS AND CONCLUSIONS ....................................................................... 223
Mineral Resource modelling and estimation .................................................................. 223
Mine planning and Mineral Reserve estimation ............................................................. 224
Processing ........................................................................................................................ 227
Environmental compliance .............................................................................................. 227
Permitting ........................................................................................................................ 228
RECOMMENDATIONS ................................................................................................. 229
Extensional drilling and grade control drilling ................................................................. 229
Mine planning and Mineral Reserves estimation............................................................ 229
Cost modelling ................................................................................................................. 229
Geotechnical engineering ................................................................................................ 229
Hydrogeology .................................................................................................................. 230
REFERENCES ............................................................................................................... 231
CERTIFICATES .............................................................................................................. 234

Cobre Panamá Project Technical Report March 2019
7
LIST OF FIGURES
Figure 1-1 Location of the Botija, Colina, Valle Grande, Balboa, Medio, Botija Abajo, and Brazo
deposits ......................................................................................................................... 14
Figure 1-2 Graph showing mining sequence .................................................................................. 22
Figure 4-1 Cobre Panamá Project location map (source: Rose et al, 2012) ................................... 33
Figure 4-2 Property location map – Mina de Cobre Panamá concessions .................................... 34
Figure 4-3 Location of open pits and facilities for the Cobre Panamá Project .............................. 36
Figure 5-1 Seismicity map (Tarr et al, US Geological Survey)......................................................... 40
Figure 5-2 Cobre Panamá site map ................................................................................................ 42
Figure 7-1 Plate tectonic map of the Caribbean region (from Kirkby et al, 2008) ......................... 47
Figure 7-2 Regional geology of Panamá (source: MPSA, 2014) ..................................................... 48
Figure 7-3 District-scale geology and structural map of the Cobre Project showing lithology and
structural lineaments (source: Rose et al, 2012) .......................................................... 49
Figure 7-4 Camp-scale geology of the Cobre Panamá Project with deposit pit outlines shown for
reference (source: Rose et al, 2012) ............................................................................. 50
Figure 7-5 Idealised cross-section of surfaced weathering zone. Vertical scale is approximate and
slightly exaggerated (from AMEC, 2007) ...................................................................... 53
Figure 7-6 Location map of mineralised zones .............................................................................. 56
Figure 7-7 Botija south-north geology cross-section at 538140 mN ............................................. 56
Figure 7-8 Detailed surface fault interpretation from field mapping and collated with drillhole
data ............................................................................................................................... 59
Figure 7-9 South-north section along 533,800 mN – Colina deposit ............................................. 60
Figure 7-10 Fault locations at Colina based on lithological and mineralisation offsets interpreted
from the geological model ............................................................................................ 61
Figure 7-11 Oblique section looking northwest through the Valle Grande deposit ........................ 62
Figure 7-12 Faults identified at Valle Grande................................................................................... 63
Figure 7-13 Geological plan of the Balboa deposit (Source: Rose et al, 2012) ................................ 64
Figure 7-14 Oblique section looking northeast through the Balboa deposit ................................... 64
Figure 7-15 Plan view of the Brazo and Botija Abajo deposits showing drillhole collars and surface
geology .......................................................................................................................... 66
Figure 9-1 Summary of soil geochemistry over Cobre Panamá (source: Rose et al, 2012) ........... 71
Figure 9-2 Plan of IP Chargeability at -150 m level (source: Rose et al, 2012) .............................. 71
Figure 10-1 Plan view of UNDP drill hole collar locations (Source: MPSA, 2014) ............................ 73
Figure 10-2 Plan view of PMRD (blue) and UNDP (red) collar locations (Source: MPSA, 2014) ...... 74
Figure 10-3 Drilling by Adrian Resources (pink), PMRD (blue) and UNDP (red) (source: MPSA,
2014) ............................................................................................................................. 75
Figure 10-4 Drilling by Teck – 1996 (green) and 1997 (yellow), Adrian (pink), PMRD (blue) and
UNDP (red) (Source: MPSA, 2014) ................................................................................ 75
Figure 10-5 Drillhole collar map with PTC holes coloured green (source: MPSA, 2014) ................. 76
Figure 10-6 MPSA (red) drill collar positions at Cobre Panamá; PTC (green), Teck (pink) and all
other companies (black) are shown for reference (source: MPSA, 2014) .................... 77
Figure 14-1 Location of the Botija, Colina, Valle Grande, Balboa, Medio, Botija Abajo, and Brazo
deposits ......................................................................................................................... 95
Figure 14-2 Sulphide domains as defined at Colina (top) and Balboa (bottom) .............................. 99

Cobre Panamá Project Technical Report March 2019
8
Figure 14-3 3D plan view of the northeast trending fault at Botija Abajo relative to the main
copper ore body positions .......................................................................................... 100
Figure 14-4 Copper (A) and Gold (B) domains at Colina (south-north section along 533,520 mE)102
Figure 14-5 Example of domains at Botija (north-south section along 538090 mE) ..................... 102
Figure 14-6 Histogram and cumulative distribution of sample lengths highlighting the dominant
1.5 m sample length .................................................................................................... 105
Figure 14-7 Boundary analysis at Balboa, Colina and Valle Grande .............................................. 106
Figure 14-8 Self organizing feature maps for silver (Ag), gold (Au), copper (Cu) and molybdenum
(Mo) at Botija; hot colours signify high values and vice versa .................................... 110
Figure 14-9 Self organizing feature maps for silver (Ag), gold (Au), copper (Cu) and molybdenum
(Mo) at Balboa; hot colours signify high values and vice versa .................................. 110
Figure 14-10 Self organizing feature maps for silver (Ag), gold (Au), copper (Cu) and molybdenum
(Mo) at Colina; hot colours signify high values and vice versa ................................... 111
Figure 14-11 Self organizing feature maps for silver (Ag), gold (Au), copper (Cu) and molybdenum
(Mo) at Valle Grande; hot colours signify high values and vice versa ........................ 111
Figure 14-12 Self organizing feature maps for silver (Ag), gold (Au), copper (Cu) and molybdenum
(Mo) at Medio; hot colours signify high values and vice versa ................................... 112
Figure 14-13 Variograms and models for Domain 330 at Botija for copper (top) and gold (bottom) ...
................................................................................................................................. 114
Figure 14-14 Variograms and models from Colina for copper (Domain 31, top) and gold (Domain
21, bottom) ................................................................................................................. 116
Figure 14-15 Kriging Neighbourhood Analysis to optimise block size ......................................... 119
Figure 14-16 Kriging Neighbourhood Analysis to optimise sample numbers .............................. 120
Figure 14-17 North-South cross section of Botija along 538,140 mE demonstrating the correlation
between the drillhole data and the ordinary kriged (OK) model ............................. 121
Figure 14-18 South-North cross section of Colina along 533,800 mE demonstrating the correlation
between the drillhole data and the ordinary kriged (OK) model ............................. 122
Figure 14-19 Oblique cross section looking northwest of Valle Grande demonstrating the
correlation between the drillhole data and the ordinary kriged (OK) model........... 122
Figure 14-20 Oblique cross section looking northeast through the Balboa deposit demonstrating
the correlation between the drillhole data and the ordinary kriged (OK) model .... 123
Figure 14-21 Example of validation trend plot for copper in Botija Domain 310 ........................ 125
Figure 14-22 Mineral Resource classification at Botija, highlighting measured resources within
closely drilled areas................................................................................................... 128
Figure 15-1 Botija Pit validation – Mineral Resource to mine planning models ............................ 132
Figure 15-2 Botija Pit optimisation results ..................................................................................... 138
Figure 15-3 Colina/Medio Pit optimisation results ........................................................................ 138
Figure 15-4 Valle Grande Pit optimisation results ......................................................................... 139
Figure 15-5 Balboa Pit optimisation results ................................................................................... 139
Figure 15-6 Botija Abajo, Brazo (BABR) Pit optimisation results ................................................... 140
Figure 15-7 Botija ultimate pit design ............................................................................................ 143
Figure 15-8 Colina ultimate pit design ........................................................................................... 144
Figure 15-9 Valle Grande ultimate pit design ................................................................................ 144
Figure 15-10 Balboa ultimate pit design ...................................................................................... 145
Figure 15-11 BABR ultimate pit design ........................................................................................ 145
Figure 15-12 Ultimate pit designs and waste dumps ................................................................... 147

Cobre Panamá Project Technical Report March 2019
9
Figure 16-1 Scheduled Botija Pit terrace layout, at end 2021 ....................................................... 150
Figure 16-2 Schematic cross section across a conveyor ramp ....................................................... 151
Figure 16-3 Schematic cross section across a trolley-assisted haulage ramp ................................ 152
Figure 16-4 Updated Botija Pit slope design sectors, 2018............................................................ 155
Figure 16-5 Updated Botija Pit slope design, cross section through south wall ............................ 156
Figure 16-6 Updated Botija Pit design, future conveyor route on north wall ............................... 157
Figure 16-7 Current south wall design for the Botija Pit ................................................................ 158
Figure 16-8 Proposed south wall design for the Botija Pit ............................................................. 159
Figure 16-9 Future Colina Pit access and development concepts ................................................. 159
Figure 16-10 Map showing the locations of existing and proposed piezometers and water wells
for the Botija Pit ........................................................................................................ 161
Figure 16-11 Installed horizontal drains, Botija Pit ...................................................................... 162
Figure 16-12 Starter pit drainage sumps, Botija Pit ..................................................................... 164
Figure 16-13 Proposed pit drainage sumps at the end of 2019, Botija Pit .................................. 165
Figure 16-14 Proposed pit drainage sumps at the end of 2023, Botija Pit .................................. 166
Figure 16-15 Diversion channel design, Botija Pit south wall crest ............................................. 167
Figure 16-16 Diversion channel progress, Botija Pit south wall crest, as at December 2018 ...... 168
Figure 16-17 View looking east along Botija Pit diversion channel ............................................. 168
Figure 16-18 Botija sediment pond 2 and 2a ............................................................................... 169
Figure 16-19 LOM scheduling – annual material movement tonnes ........................................... 172
Figure 16-20 LOM scheduling – annual plant feed tonnes .......................................................... 172
Figure 16-21 LOM scheduling – annual copper metal production............................................... 172
Figure 16-22 LOM scheduling – annual stockpile balance tonnes ............................................... 173
Figure 16-23 LOM scheduling – annual ore stockpile tonnes reclaimed into plant..................... 173
Figure 16-24 Graph showing mining sequence ............................................................................ 174
Figure 16-25 IPCC layout plan ...................................................................................................... 175
Figure 16-26 In-pit crusher requirements and relocations over time ......................................... 176
Figure 17-1 Process flow diagram .................................................................................................. 182
Figure 18-1 Project layout plan ...................................................................................................... 187
Figure 18-2 View looking SW over the Project processing plant, December 2018 ........................ 188
Figure 18-3 Photograph of as-built plant, December 2018 ........................................................... 189
Figure 18-4 View of the Botija Pit IPC4 .......................................................................................... 191
Figure 18-5 View of overland conveyors ........................................................................................ 191
Figure 18-6 Mining facilities ........................................................................................................... 193
Figure 18-7 View looking over the port site and power station .................................................... 194
Figure 23-1 Location of adjacent properties (SGS Canada Inc, 2013) ............................................ 220

Cobre Panamá Project Technical Report March 2019
10
LIST OF TABLES
Table 1-1 Cobre Panamá process recovery relationships and values ............................................... 17
Table 1-2 Cobre Panamá Mineral Resource statement, at 31st December 2018, using a 0.15%
copper cut-off grade ......................................................................................................... 18
Table 1-3 Cobre Panamá Stockpile Mineral Resource statement, at 31st December 2018 .............. 18
Table 1-4 Cobre Panamá Project Mineral Reserve statement, at 31st December 2018 ................... 19
Table 1-5 Cobre Panamá Project Stockpile Mineral Reserve statement, at December 2018 .......... 20
Table 1-6 Cobre Panamá Project life of mine production schedule ................................................. 21
Table 1-7 Development capital cost provisions ................................................................................ 23
Table 1-8 Mineral Reserve cashflow model summary ...................................................................... 25
Table 1-9 Mineral Reserves cashflow model average annual physicals and costs ........................... 25
Table 2-1 QP details .......................................................................................................................... 29
Table 2-2 Terms and definitions ....................................................................................................... 30
Table 4-1 MPSA mineral concessions under Law No. 9, 1997 [Geographic Coordinates – NAD27
UTM Zone 17 (Canal Zone)] .............................................................................................. 35
Table 6-1 Exploration and ownership history of Cobre Panamá (source: Inmet) ............................ 43
Table 6-2 Cobre Panamá Mineral Resource statement, at June 2015, using a 0.15% copper cut-off
grade ................................................................................................................................. 45
Table 6-3 Cobre Panamá Project Mineral Reserve statement, at June 2015 ................................... 46
Table 7-1 Description of the lithological units of the Cobre Panamá Project (adapted from Rose et
al, 2012) ............................................................................................................................ 52
Table 7-2 Alteration styles at the Cobre deposits (adapted from Rose et al, 2012) ........................ 54
Table 7-3 Vein classification at Cobre Panamá based on the work of Gustafson and Hunt (1975) at
El Salvador, Chile (modified from Gustafson and Hunt (1975)) ........................................ 58
Table 10-1 Summary of drilling by operator and area to August 2013 .......................................... 72
Table 10-2 Summary of drilling by area (current to August 2013) ................................................. 73
Table 11-1 CRM standards submitted with Cobre Panamá samples .............................................. 84
Table 11-2 CRM Standards extreme bias, Cu% ............................................................................... 84
Table 11-3 Blank failure rates ......................................................................................................... 85
Table 11-4 PTC pulp field duplicate statistics ................................................................................. 85
Table 11-5 PTC pulp field duplicate precision ................................................................................. 85
Table 11-6 MPSA core field duplicate statistics .............................................................................. 86
Table 11-7 MPSA core field duplicate precision ............................................................................. 86
Table 11-8 PTC coarse crush duplicate statistics – ALS Lima .......................................................... 86
Table 11-9 PTC coarse crush duplicate statistics – ALS Vancouver ................................................ 86
Table 11-10 MPSA coarse crush duplicate statistics ......................................................................... 87
Table 11-11 1996 check assay data summary, after AMEC (2007) ................................................... 87
Table 13-1 Cobre Panamá process recovery relationships and values ........................................... 94
Table 14-1 Number of holes and metres drilled for each deposit area .......................................... 96
Table 14-2 Factors applied to metal content to account for barren dyke material ....................... 98
Table 14-3 Domain codes for the drillhole data and block model ................................................ 104
Table 14-4 Summary statistics for copper %, gold g/t, molybdenum g/t and silver g/t per domain .
..................................................................................................................................... 107
Table 14-5 Top-cuts applied per domain ...................................................................................... 108
Table 14-6 Block model dimensions ............................................................................................. 118

Cobre Panamá Project Technical Report March 2019
11
Table 14-7 Validation statistics for the main domains of each deposit ........................................ 124
Table 14-8 Assigned average density values per material type .................................................... 127
Table 14-9 Cobre Panamá Mineral Resource statement, at 31st December 2018 above a 0.15%
Copper Cut-off Grade. Mineral Resources that are not Mineral Reserves do not have
demonstrated economic viability. Mineral Resources are inclusive of Mineral Reserves
..................................................................................................................................... 128
Table 14-10 Comparison of Mineral Resource estimate results as at December 2018 and the
previous results as at June 2015; copper cut-off grade was 0.15% ............................ 130
Table 15-1 Cobre Panamá process recovery relationships and values ......................................... 133
Table 15-2 Cobre Panamá overall slope angles for pit optimisation ............................................ 133
Table 15-3 Cobre Panamá metal costs for pit optimisation ......................................................... 135
Table 15-4 Dilution and recovery factors, Whittle optimisation .................................................. 136
Table 15-5 Cobre Panamá net return values ................................................................................ 137
Table 15-6 Cobre Panamá marginal cut-off grades ...................................................................... 137
Table 15-7 Cobre Panamá optimal pit shell inventories ............................................................... 140
Table 15-8 Cobre Panamá optimisation sensitivity analyses ........................................................ 141
Table 15-9 Cobre Panamá pit slope design criteria ...................................................................... 143
Table 15-10 Validation between pit shell and design ..................................................................... 146
Table 15-11 Cobre Panamá Project In-pit Mineral Reserve statement, at December 2018 .......... 148
Table 15-12 Cobre Panamá Project Stockpile Mineral Reserve statement, at December 2018 .... 148
Table 15-13 Comparison of Mineral Reserve estimate results as at December 2018 and the
previous results as at 2015 ......................................................................................... 149
Table 16-1 In-pit crusher capacity................................................................................................. 151
Table 16-2 Stockpile grade ranges ................................................................................................ 153
Table 16-3 Drilling and blasting parameters ................................................................................. 154
Table 16-4 Updated pit slope design parameters, 2018 ............................................................... 156
Table 16-5 LOM scheduling – summary of results ........................................................................ 171
Table 16-6 LOM scheduling – waste dump schedule.................................................................... 176
Table 16-7 LOM scheduling – ARD criteria ................................................................................... 178
Table 16-8 LOM scheduling – PAG and NAG waste volumes ........................................................ 178
Table 16-9 Mining equipment....................................................................................................... 179
Table 21-1 Development capital cost provisions .......................................................................... 204
Table 21-2 Closure cost provisions ............................................................................................... 206
Table 21-3 Fixed mining costs ....................................................................................................... 207
Table 21-4 Drill and Blast Variable Costs ...................................................................................... 207
Table 21-5 Incremental haul costs ................................................................................................ 207
Table 21-6 Reference bench RL mining costs ............................................................................... 207
Table 21-7 Overall average mining costs ...................................................................................... 208
Table 21-8 Applied mining costs ($/t) relationship, varying by depth .......................................... 208
Table 21-9 Process operating costs, pit optimisation vs cashflow model .................................... 210
Table 21-10 G&A operating costs, pit optimisation vs cashflow model ......................................... 211
Table 21-11 Metal costs, pit optimisation vs cashflow modelling .................................................. 212
Table 22-1 Consensus copper pricing information for cashflow modelling ................................. 214
Table 22-2 Consensus molybdenum pricing information for cashflow modelling ....................... 215
Table 22-3 Consensus gold pricing information for cashflow modelling ...................................... 215
Table 22-4 Consensus silver pricing information for cashflow modelling .................................... 215

Cobre Panamá Project Technical Report March 2019
12
Table 22-5 Mineral Reserve undiscounted cashflow model ......................................................... 218
Table 22-6 Mineral Reserve cashflow model average annual physicals and costs ...................... 219
Table 22-7 Mineral Reserve cashflow model sensitivity parameters ........................................... 219
Table 22-8 Mineral Reserve cashflow model, undiscounted cashflow sensitivity, from end 2018 ...
..................................................................................................................................... 219
Table 22-9 Mineral Reserve cashflow model, NPV8.5 sensitivity, from end 2018 ......................... 219
Table 23-1 Molejón Mineral Resource estimate (reference: Berhe Dolbear, 2011) .................... 221
Table 23-2 Palmilla Mineral Resource estimate (SGS Canada Inc, 2013) ..................................... 221

Cobre Panamá Project Technical Report March 2019
13
SUMMARY
This Technical Report on the Cobre Panamá Project (the property) has been prepared by Qualified
Persons David Gray, Michael Lawlor and Robert Stone of First Quantum Minerals Pty Ltd (FQM, the
issuer or the Company). This is the second Technical Report prepared by FQM as an issuer, in relation
to the subject property, and follows an initial report filed in July 2015 (FQM, July 2015).
The purpose of this Technical Report is to document updated Mineral Resource and Mineral Reserve
estimates for the property, and to provide a commentary on the current project development status
for the Cobre Panamá Project. The effective date for the Mineral Resource and Mineral Reserve
estimates is 31st December 2018.
Project location and ownership
The Cobre Panamá Project is located in the Donoso and Omar Torrijos Herrera Districts1 of Colón
Province, Republic of Panamá, approximately 120 km west of Panamá City. The centre of the Project
area occurs at latitude 8ᵒ50’ North and longitude 80ᵒ 38’ West. The Project is accessible from Panamá
City via the Pan-American Highway and secondary paved and gravel roads. The property forms the
major holding within a total of four concessions of approximately 12,995 hectares, and is the first large
scale mining project to be constructed in Panamá.
When the Company acquired Inmet Mining Corporation (Inmet) in April 2013, it also acquired an 80%
interest in Minera Panamá S.A. (MPSA), which held the Cobra Panamá Project concessions. At that
time, Korean Panamá Mining Company (KPMC), a 50:50 joint venture between Korea Resources
Corporation (Kores) and LS-Nikko Copper Inc. (LS-Nikko), held the remaining 20% share of MPSA. In
August 2017, the Company increased its effective ownership of MPSA to 90% by acquiring LS-Nikko’s
holding of KPMC.
Project background
The Cobra Panamá Project will involve large scale and conventional open pit mining at up to
approximately 83 Mbcm of ore and waste mined per annum. The multiple pits will be mined in an
optimised sequence, with ore crushed in-pit and conveyed overland to a nearby processing plant.
The processing plant design is based upon a conventional sulphide ore flotation circuit to an initial
nameplate throughput capacity of 85 Mtpa, expandable to 100 Mtpa capacity, and with differential
flotation to produce separate copper and molybdenum concentrate products. Plant tailings will be
directed into an area immediately to the north of the mine and plant site, and also into the depleted
Botija Pit at the cessation of mining. Figure 1-1 shows the location of each of the Cobre Panamá
deposits relative to each other.
Over a distance of 25 km, the copper concentrate product will be piped as a slurry to a port on the
northern side of the country (on the Caribbean Sea), from where it will be loaded onto vessels for
shipping to world markets. The molybdenum concentrate will be delivered to port by road and
shipped in containers.
1 Previously the Cobre Panamá Project was located completely within the Donoso District of Colón Province. Under Law No. 11 of 20th February 2018 of the National Assembly of the Republic of Panamá, the special district of Omar Torrijos Herreras was subdivided from Donoso District, and the Project now lies partly within each of the amended Districts.

Cobre Panamá Project Technical Report March 2019
14
Figure 1-1 Location of the Botija, Colina, Valle Grande, Balboa, Medio, Botija Abajo, and Brazo deposits
Project power will be generated by a coal-fired power station at the port and transmitted to the mine
site along a new access corridor, which also incorporates the concentrate pipeline. Surplus power can
be supplied into the national grid, as available.
Aspects of the Project have changed since those described in the Technical Report of July 2015 (FQM,
July 2015):
process commissioning and first concentrate production was then planned for Q4 2017
mine development is now proposed as a sequence of terraces, rather than phased cutbacks,
better suited to ultra class (UC) equipment productivity and pit water inflow management
the Mineral Resource model and estimate, and the Mineral Reserve estimate, have been
updated
the processing plant ramp-up profile and ultimate capacity have been changed and increased,
respectively
As at the end of 2018, the mine pre-strip had been completed to an extent sufficient to expose the
initial Botija orebody for process plant start-up. Two in-pit primary crushers had been installed, along
with their associated overland conveyors to the crushed ore stockpile at the plant site. The final stages
of construction and assembly on three semi autogenous (SAG) mills and two ball mills was also
completed by year end.
In February 2018, the Company announced the ramp-up expectations for the Project. Phased
commissioning will commence in 2019, continue to ramp-up during 2019 towards 85 Mtpa capacity
in 2021, and then to 100 Mtpa capacity by 2023. As a consequence of the increased capacity, the
expected Project life is now 36 years from 2019 to 2054.
The date for declaration of commercial production is expected to be announced in late 2019.
Project approvals
The Project Environmental and Social Impact Assessment (ESIA) was approved by the Autoridad
Nacional del Ambiente (National Authority of the Environment, ANAM; now referred to as
MiAmbiente) in December 2011. The approved Project was for a mining operation comprising open
pits at Botija, Colina, Medio and Valle Grande.
Since then, the Project definition and development scope has changed to include aspects that will
need to be addressed in a new ESIA, as follows:

Cobre Panamá Project Technical Report March 2019
15
mining of additional open pits at Balboa and Botija Abajo/Brazo (also referred to as the BABR
Pit)
construction of additional waste rock storage facilities and realignment of approved facilities
increased site clearing for development of additional open pits, waste rock storage facilities and
tailings expansion
impacts on subsistence farming, on possession rights and private properties, implying physical
and economic resettlement.
The expected timeframe for submitting the new ESIA for approval is mid-2024. The proposed
expansion of the Project will be subject to a high level of environmental and social impact assessment
by MPSA, in anticipation that the proposal will be similarly classified (Category III) by the Panamánian
Government. Environmental management and controls will be applied to the development of the
expansion areas that are equivalent to the controls for the existing Project.
Provided that the same process and assessment is conducted as has been for the existing Project, and
with similar commitments made, there are therefore no known reasons to indicate that there will be
environmental and permitting issues that could materially impact on expanded mining and tailings
disposal activities.
Project development status
The Project has two main development/operating areas: the mine and plant site, and the port and
power station at Punta Rincón on the Caribbean coast.
After commencing in 2015, the target for completion of the mining pre-strip at the Botija Pit was
essentially achieved by the end of 2018. The starter pit boxcut had been developed, as had the
excavation and formation of four in-pit primary crusher pockets. In-pit water management sumps had
been excavated and equipped, and the pit was progressing towards the formation of mining terraces
to suit the deployment of UC primary mining equipment.
The first UC rope shovel was assembled and began operating in March 2018, followed by the first of
the UC haul trucks in November 2018. At the end of 2018, two rope shovels and 16 UC trucks were
operating in the Botija Pit. An additional two rope shovels, three UC loaders and 14 UC trucks will be
progressively commissioned during 2019. In addition, an ongoing pioneering and intermediate scale
of mining equipment, comprising diesel hydraulic excavators plus 100 t capacity trucks and 40 t
capacity 6 x 6 trucks, continue to operate in the Botija Pit on pioneering works.
Grade control drilling was underway throughout 2018 and this incorporated a geometallurgical
sampling and testing programme to validate processing recovery projections for the initial production
years.
As at the end of 2018, inching and lining of one of the three SAG mills and two of the ball mills was
completed. Progress towards completion of other mechanical and structural works was well
advanced, as was progress on storage tanks, piping works, electrical installations and instrumentation.
The coastal Punta Rincón facilities include a deep water berth for concentrate and coal shipments, a
conventional ship loading wharf and a 300 MW coal fired power plant. In 2018, the first of the two
power station generators (150 MW) was synchronised to the national grid. The second generator is
expected to be connected to the grid in early 2019. A 120 km long dual circuit, 230 kV transmission

Cobre Panamá Project Technical Report March 2019
16
line connecting the Project facilities (including the power plant, mine and process plant) to the
national grid was completed in 2018 and was supplying backfeed electricity for early commissioning
activities.
A 25 km long access road has been constructed between the mine/plant site and Punta Rincón. The
port has been operational since 2015, and has enabled more than 100 vessel dockings for Project
equipment and consumables deliveries.
Geology and mineralisation
The Cobre Panamá Project consists of several copper (Cu) – gold (Au) – molybdenum (Mo) – silver (Ag)
porphyry mineralised systems, which were first discovered in Panamá during a regional geological
survey by a United Nations Development Programme team in 1968. Exploration by numerous
companies since, led to discovery of four large deposits (Botija, Colina, Valle Grande and Balboa) as
well as a number of smaller deposits (Botija Abajo, Brazo and Medio). A total of 1,813 diamond
drillholes totalling 348,775 m have been drilled from discovery to February 2018, with many of the
deposits drilled to a spacing of 50 m by 50 m, to 200 m by 200 m or greater. Reverse circulation (RC)
grade control drilling was started at the Botija deposit late in 2017. A total of 2,911 by 45 m deep RC
holes have been drilled at a spacing of 15 m by 15 m.
The deposits occur at the southern margin of a large granodiorite batholith of mid-Oligocene age (36.4
Ma). Mineralisation is hosted in granodiorite, feldspar-quartz-hornblende porphyry and some
andesite volcanics. Host lithologies and mineralisation are cross-cut by later dykes of either andesitic
or felsic composition. Hydrothermal alteration is primarily silica-chlorite, a form of propylitic
alteration. Local potassic alteration is noted to be found at Botija. Higher grade mineralisation is
associated with intense quartz stockworks.
The dominant copper bearing sulphide is chalcopyrite, with only minor bornite. Sulphide
mineralisation is disseminated or as micro-veinlets and quartz-sulphide stockworks. Traces of
molybdenite are commonly found in quartz veinlets. There is no evidence of supergene copper
enrichment at Botija, Colina, Valle Grande or Balboa. However, at Brazo, supergene mineralisation,
consisting of chalcocite-coated pyrite and rare native copper, occurs to a depth of at least 150 m.
Some local supergene gold enrichment has also been identified at Colina.
Metallurgical summary
The predominantly copper/molybdenum sulphide ore is amenable to conventional differential
flotation processing, with lesser gold and silver recovered into the copper and gravity concentrate.
Various metallurgical test work programmes have been undertaken on the Cobre Panamá Project
since 1968, commensurate with the various levels of preliminary feasibility and prefeasibility studies
that were completed up until 1998.
In 1997, an extensive programme of metallurgical testing was designed to confirm earlier studies on
the metallurgical response of the Botija and Colina ores. Work included grinding, flotation, dewatering
and mineralogical testing. Further testing was completed, including locked-cycle flotation testwork
and modal analysis to assist in defining grind requirements for both rougher and cleaner flotation.
Copper-molybdenum separation by means of differential flotation was also tested.

Cobre Panamá Project Technical Report March 2019
17
Confirmatory batch laboratory flotation testwork was conducted during 2014 by ALS Metallurgy in
Perth, Western Australia (ALS Metallurgy, 2014).
Based on all of this testwork, variable processing recovery relationships were determined for copper
and gold, whilst fixed recovery values were determined for molybdenum and silver. The design
recoveries vary for each deposit, as summarised in Table 1-1.
Table 1-1 Cobre Panamá process recovery relationships and values
During 2018, a confirmatory geometallurgical testwork programme was commenced using grade
control samples to validate the above processing recovery relationships, especially in regard to the
ore from initial mining horizons. At this time, however, an update to the processing recovery
relationships is not warranted.
Mineral Resource summary
Block model resource estimates for Botija, Valle Grande, Colina, Medio, Balboa, Botija Abajo and Brazo
were completed in January 2014 by consultants from Optiro Pty Ltd (Optiro) and by FQM geologists.
A review of sample preparation methodology, sample analyses and security was completed by Optiro
in support of these Mineral Resource estimates. Since these estimates, FQM has updated the Botija
Mineral Resource by including the added RC grade control drilling results. All of this work was
completed under the supervision of David Gray (QP) of FQM.
The Mineral Resource estimates have used drillhole sample assay results together with geology
models that relate to the spatial distribution of copper, molybdenum, gold, and silver mineralisation.
Block grade estimation parameters have been defined based on the geology, drillhole spacing, and
geostatistical analysis of the data. Block grade estimation is by ordinary kriging into an optimal panel
size, as considered appropriate for the distribution of sample data and the deposit type. Post-
processing by local uniform conditioning of the copper and gold panel estimates has provided
estimates based on a selective mining unit block size of 10 mE by 25 mN on 15 m benches or 15 mE
by 15 mN by 15 m benches; this is considered appropriate to the expected ultra class scale of mining.
Potentially deleterious elements [arsenic (ppm), bismuth (ppm), iron (%), sulphur (%), lead (ppm) and
zinc (ppm)] were also estimated by ordinary kriging.
The Mineral Resource estimates have been classified according to the drilling density, geological
confidence, and confidence in the panel grade estimate. They have been reported in accordance with
the Standards on Mineral Resources and Reserves of the Canadian Institute of Mining, Metallurgy and
Petroleum (the CIM Guidelines, 2014), which in turn complies with the guidelines of the Australasian
JORC Code (JORC, 2012). The resulting Mineral Resources have been stated for a 0.15% copper cut-
off grade as per Table 1—2. The Mineral Resources have been reported inclusive of the Mineral
Reserve. Botija Mineral Resources have been depleted of mining volume as at 31st December 2018.
Cu (%) Mo (%) Au (%) Ag (%)
Botija MAX(0,MIN(96,((5.8287*LOG(%Cu))+95.775))) 55.0% MIN(80,MAX(0,(15.993*LOG(Auppm))+92.138)) 47.3%
Colina MAX(0,MIN(96,((5.8287*LOG(%Cu))+95.775))) 55.0% MIN(80,MAX(0,(15.993*LOG(Auppm))+92.138)) 47.3%
Medio MAX(0,MIN(96,((5.8287*LOG(%Cu))+95.775))) 55.0% MIN(80,MAX(0,(15.993*LOG(Auppm))+92.138)) 47.3%
Valle Grande MAX(0,MIN(96,((5.8287*LOG(%Cu))+95.775))-4) 52.0% MIN(80,MAX(0,(15.993*LOG(auppm))+92.138)) 47.3%
Balboa MIN(96,((2.4142*LOG(cutpct))+92.655)) 55.0% MAX(0,MIN(80,(7.6009*LOG(auppm))+85.198)) 40.0%
Botija Abajo 6.6135*Ln(Cu%) + 92.953 55.0% 50.0% 30.0%
Brazo 6.6135*Ln(Cu%) + 92.953 55.0% 50.0% 30.0%
Recovery Deposit

Cobre Panamá Project Technical Report March 2019
18
Table 1-2 Cobre Panamá Mineral Resource statement, at 31st December 2018, using a 0.15% copper cut-off grade
Deposit Category Tonnes
(Mt) TCu (%)
Mo (%)
Au (g/t)
Ag (g/t)
Botija Measured 310 0.47 0.008 0.11 1.44
Botija Indicated 660 0.36 0.007 0.07 1.13
Colina Indicated 1,032 0.39 0.007 0.06 1.58
Medio Indicated 63 0.28 0.004 0.03 0.96
Valle Grande Indicated 602 0.36 0.006 0.04 1.37
Balboa Indicated 647 0.35 0.002 0.08 1.37
Botija Abajo Indicated 114 0.31 0.004 0.06 0.93
Brazo Indicated 228 0.36 0.004 0.05 0.81
Total Meas. plus Ind. 3,657 0.37 0.006 0.07 1.34
Botija Inferred 198 0.23 0.004 0.05 0.87
Colina Inferred 125 0.26 0.006 0.05 1.20
Medio Inferred 189 0.25 0.005 0.03 1.25
Valle Grande Inferred 363 0.29 0.005 0.03 1.14
Balboa Inferred 79 0.23 0.003 0.04 0.96
Botija Abajo Inferred 67 0.27 0.005 0.06 1.25
Brazo Inferred 76 0.21 0.003 0.01 0.73
Total Inferred 1,097 0.26 0.005 0.04 1.09
Table 1-3 Cobre Panamá Stockpile Mineral Resource statement, at 31st December 2018
Deposit Category Tonnes
(Mt) TCu (%)
Mo (%)
Au (g/t)
Ag (g/t)
Botija Indicated 3.3 0.22 0.004 0.04 1.18
Mineral Reserves summary
The detailed mine planning for the Project, including conventional optimisation processes, detailed
designs, surface layout planning and life of mine (LOM) production scheduling, was completed by FQM
staff under the supervision of Michael Lawlor (QP) of FQM.
At the outset, conventional Whittle Four-X software was used to determine optimal pit shells for each
of the various deposits. The optimisation process considered all mined ore to be processed in a
conventional sulphide flotation plant, with differential processes to produce separate copper and
molybdenum concentrates. The copper concentrate would contain gold and silver. The optimisations
were completed on a maximum net return (NR) basis, and with recoveries to metal in concentrate
based on different variable and fixed relationships for each deposit. The optimisation process
considered pit slope design criteria provided by a geotechnical consultant, in addition to mining and
process operating costs derived in detail by MPSA. The pit optimisations have not been updated for
this Technical Report.
Geological losses were built into the regularised mine planning models to account for the presence of
unmineralised dykes. These losses could be considered as “planned dilution”. In the Whittle
optimisation inputs, “unplanned dilution” and mining recovery factors were included to emulate
practical mining losses.

Cobre Panamá Project Technical Report March 2019
19
Following the optimisation, a series of pit designs were developed for the 2015 Technical Report (FQM,
July 2015) using the ultimate and selected intermediate pit shells. The design for the Botija ultimate
pit was updated in 2018. The ultimate pit designs were prepared in detail to match the pit shells as
close as possible. Specific design criteria were followed when incorporating ramps, berms, benches
and in-pit crusher pockets.
The pit development strategy has changed since the 2015 Technical Report; lesser pit shells are no
longer used to define phased pit designs. Intermediate pit development planning now follows a
terracing strategy which is considered to be more suited for the deployment of UC mining equipment
and for the high rainfall environment.
With the adoption of the terracing strategy, detailed life of mine production scheduling was then
completed to demonstrate an achievable mine plan. This allows the reporting of a Mineral Reserve
as stated in Table 1-4, and in accordance with the Standards on Mineral Resources and Reserves of
the Canadian Institute of Mining, Metallurgy and Petroleum (the CIM Guidelines, 2014), which in turn
complies with the guidelines of the Australasian JORC Code (JORC, 2012). In addition to the insitu
Mineral Reserve, there is an additional ore stockpile accumulated during the mining pre-strip. The
additional Mineral Reserve for the ore stockpile is listed in Table 1-5.
Table 1-4 Cobre Panamá Project Mineral Reserve statement, at 31st December 2018
As at the end of December 2018, the total Mineral Reserve inclusive of the stockpile inventory is
estimated as 3,147.1 million tonnes at 0.38% TCu, 59.36 ppm Mo, 0.07 g/t Au and 1.37 g/t Ag. The
estimate for the insitu pit inventory is entirely within the Measured and Indicated Mineral Resource
estimate.
The reported Mineral Reserve is based on an economic cut-off grade which accounts for the longer-
term copper metal price projection of $3.00/lb ($6,615/t).
Mtonnes TCu Mo Au Ag TCu metal Mo metal Au metal Ag metal
(%) (ppm) (ppm) (ppm) (kt) (kt) (koz) (koz)
BOTIJA Proved 323.2 0.45 75.98 0.11 1.43 1,467.0 24.6 1,106.3 14,886.7
Probable 641.4 0.35 68.28 0.08 1.13 2,220.2 43.8 1,512.4 23,357.7
Total P+P 964.6 0.38 70.86 0.09 1.23 3,687.2 68.4 2,669.6 38,188.5
COLINA & Proved
MEDIO Probable 981.3 0.39 66.98 0.06 1.61 3,870.5 65.7 1,986.8 50,646.8
Total P+P 981.3 0.39 66.98 0.06 1.61 3,870.5 65.7 1,986.8 50,646.8
VALLE GRANDE Proved
Probable 541.1 0.37 67.43 0.05 1.42 2,016.0 36.5 805.2 24,637.3
Total P+P 541.1 0.37 67.43 0.05 1.42 2,016.0 36.5 805.2 24,637.3
BALBOA Proved
Probable 437.1 0.35 16.10 0.08 1.36 1,509.0 7.0 1,126.9 19,168.2
Total P+P 437.1 0.35 16.10 0.08 1.36 1,509.0 7.0 1,126.9 19,168.2
BABR Proved
Probable 219.7 0.40 41.31 0.07 0.87 882.1 9.1 527.5 6,163.9
Total P+P 219.7 0.40 41.31 0.07 0.87 882.1 9.1 527.5 6,163.9
TOTAL Proved 323.2 0.45 75.98 0.11 1.43 1,467.0 24.6 1,106.3 14,886.7
Probable 2,820.5 0.37 57.48 0.07 1.37 10,497.7 162.1 6,009.6 123,918.1
Total P+P 3,143.7 0.38 59.38 0.07 1.37 11,964.7 186.7 7,116.0 138,804.8
Pit Class
MINERAL RESERVE AT 31st DECEMBER 2018 (Cu = $3.00/lb, Mo = $13.50/lb, Au = $1,200/toz, Ag = $16.00/toz)
Insitu Mining Inventory

Cobre Panamá Project Technical Report March 2019
20
Table 1-5 Cobre Panamá Project Stockpile Mineral Reserve statement, at December 2018
Production schedule
Features of the LOM mining and production schedule associated with the detailed pit designs are as
follows:
Mining (ie, the pre-strip period) commenced in July 2015 and processing commences in Q1
2019. From 2015, the Project life is 39 years to 2054.
The total material to be mined from all pits from the end of 2018, amounts to 6,306.1 Mt
(2,436.7 Mbcm), of which 3,143.7 Mt is ore (including high grade ore, medium grade ore, low
grade ore and saprock ore) and 3,157.8 Mt is waste (including saprolite, saprock waste and
mineralised waste).
The starting stockpile balance as at the end of 2018 is 3.3 Mt at a grade of 0.22% Cu.
The direct feed ore is 2,813.1 Mt at a grade of 0.39% Cu and 334.0 Mt at a grade of 0.21% Cu is
active and long term stockpile reclaim.
The direct feed ore from the open pits is 89% of the total plant feed tonnage.
The total high grade and medium grade ore mined to active stockpiles and reclaimed
throughout the Project life is 45.7 Mt at a grade of 0.31% Cu.
In addition, 239.9 Mt of low grade ore at a grade of 0.17% Cu is mined to stockpile and reclaimed
in the final ten years of the Project.
48.4 Mt of saprock ore is mined to stockpile from the outset of mining, but not reclaimed (with
a degraded recovery assignment) until the final two years of the Project.
The crusher feed ramps up from 47 Mtpa in 2019 to 85 Mtpa in 2021, and ultimately to 100
Mtpa in 2023 at which rate it remains until 2041.
The rate drops to 75 Mtpa between 2042 and 2053.
The average annual copper metal production in the first five years is 310.0 ktpa. For the next
five years, when processing at 100 Mtpa, the average annual copper metal production rises to
377.0 ktpa. Thereafter, the annual average is 275.1 ktpa.
The annual average by-product production is approximately 2,717 tonnes of molybdenum, 107
thousand ounces of gold and 1,701 thousand ounces of silver.
The overall life of mine strip ratio (tonnes) is 1 : 1.
Table 1-6 summarises the life of mine production schedule, whilst Figure 1-2 shows the life of mine
mining sequence. The mined ore and crusher feed grades and insitu metal in this table are diluted.
Mtonnes TCu Mo Au Ag TCu metal Mo metal Au metal Ag metal
(%) (ppm) (ppm) (ppm) (kt) (kt) (koz) (koz)
BOTIJA Proved
Probable 3.3 0.22 43.12 0.04 1.18 7.4 0.1 4.5 126.9
Total P+P 3.3 0.22 43.12 0.04 1.18 7.4 0.1 4.5 126.9
Stockpile Inventory
Pit Class
MINERAL RESERVE AT 31st DECEMBER 2018 (Cu = $3.00/lb, Mo = $13.50/lb, Au = $1,200/toz, Ag = $16.00/toz)

Cobre Panamá Project Technical Report March 2019
21
Table 1-6 Cobre Panamá Project life of mine production schedule
Year Mined Ore Grade Metal Crusher Feed Grade Metal
(Mt) (% Cu) (kt Cu) (Mt) (% Cu) (kt Cu) (%) (kt Cu) On (Mt) Off (Mt) Bal. (Mt) On (Mt) Off (Mt) Bal. (Mt) On (Mt) Off (Mt) Bal. (Mt) (Mt) Strip Ratio (Mbcm) (Mt)
<2019 3.3 0.22 7.4 3.3
2019 76.0 0.31 235.9 47.2 0.38 177.6 81.5 144.8 17.8 9.8 11.4 22.0 5.2 16.9 3.8 3.8 62.7 0.83 57.3 138.7
2020 94.2 0.36 340.8 81.6 0.40 323.1 91.0 293.9 2.6 10.0 4.0 19.8 36.7 0.3 4.1 74.7 0.79 67.9 169.0
2021 101.0 0.36 363.3 85.0 0.40 342.8 91.2 312.6 0.0 3.7 0.3 19.6 56.3 4.1 76.1 0.75 68.2 177.1
2022 109.8 0.40 438.3 90.2 0.45 406.8 91.9 373.7 1.4 1.2 0.5 19.4 75.7 4.1 94.2 0.86 77.8 204.0
2023 124.8 0.41 506.6 100.0 0.46 461.4 92.1 424.9 5.5 3.9 2.2 22.0 97.7 1.0 5.2 79.3 0.64 78.4 204.1
2024 109.1 0.42 455.2 100.0 0.44 436.7 91.9 401.5 0.2 2.3 6.0 103.7 3.0 8.1 100.4 0.92 81.4 209.5
2025 110.9 0.40 446.4 100.0 0.42 420.3 91.6 385.1 1.1 1.2 5.6 109.3 6.4 14.6 98.3 0.89 82.9 209.3
2026 123.8 0.38 466.3 100.0 0.41 412.5 91.2 376.0 1.4 2.6 16.1 125.4 6.3 20.9 85.3 0.69 79.9 209.1
2027 123.4 0.34 417.4 100.0 0.37 370.0 90.5 334.9 0.0 1.2 1.5 18.4 143.8 6.2 27.1 85.1 0.69 82.2 208.4
2028 108.2 0.41 445.1 100.0 0.42 423.5 91.5 387.5 2.3 3.8 3.5 147.2 2.4 29.5 100.9 0.93 80.0 209.1
2029 119.8 0.40 480.9 100.0 0.45 449.3 91.8 412.3 0.2 4.0 18.0 165.2 1.7 31.2 89.3 0.75 80.6 209.1
2030 116.3 0.38 438.6 100.0 0.42 417.3 91.3 380.8 3.3 0.6 18.3 183.5 1.3 32.4 88.0 0.76 79.4 204.3
2031 111.1 0.40 443.8 99.6 0.43 427.1 91.5 390.7 0.6 0.0 11.6 195.1 0.5 32.9 92.2 0.83 78.0 203.2
2032 102.8 0.43 446.0 100.0 0.44 439.5 91.6 402.6 1.8 1.8 0.8 195.9 0.3 33.2 101.4 0.99 78.3 204.2
2033 103.7 0.37 385.5 100.0 0.38 376.9 90.7 341.9 2.2 3.9 0.9 196.9 0.6 33.8 100.1 0.97 77.0 203.8
2034 102.8 0.37 383.8 99.7 0.38 381.6 90.8 346.3 3.9 0.0 6.9 203.7 0.1 33.9 101.4 0.99 76.9 204.2
2035 104.8 0.34 360.9 100.0 0.35 347.2 90.2 313.2 0.2 0.2 0.3 204.0 4.3 38.3 99.4 0.95 77.0 204.2
2036 110.6 0.36 395.1 100.0 0.37 372.2 90.6 337.1 2.0 2.2 7.0 211.0 1.5 39.8 94.2 0.85 77.2 204.7
2037 114.5 0.36 414.7 100.0 0.39 385.1 90.8 349.6 1.0 3.2 10.2 221.2 3.4 43.1 89.6 0.78 77.2 204.2
2038 101.6 0.38 381.6 100.0 0.38 377.1 90.8 342.4 2.0 1.1 0.8 222.0 2.8 45.9 102.6 1.01 78.7 204.2
2039 106.5 0.39 410.9 100.0 0.39 391.0 91.1 356.0 1.5 2.6 4.2 226.2 0.8 46.8 97.7 0.92 79.0 204.2
2040 105.6 0.33 347.7 100.0 0.34 340.4 90.2 307.1 1.2 1.5 6.3 232.5 0.5 47.3 99.1 0.94 80.6 204.7
2041 103.6 0.35 362.0 100.0 0.35 354.3 90.4 320.4 2.1 3.6 1.5 234.0 0.0 47.3 100.5 0.97 80.4 204.2
2042 81.9 0.33 268.4 85.0 0.33 279.6 89.7 250.9 3.4 0.2 234.0 0.3 47.5 122.2 1.49 80.7 204.1
2043 75.5 0.33 249.7 75.0 0.33 247.9 88.7 220.0 0.1 0.3 0.0 234.0 0.4 47.9 129.2 1.71 78.3 204.7
2044 63.1 0.34 214.7 75.0 0.31 233.6 88.1 205.8 0.0 0.3 11.9 222.1 0.0 47.9 130.2 2.06 77.4 193.3
2045 62.0 0.35 214.0 75.0 0.31 235.5 88.5 208.4 0.3 0.0 13.1 209.0 0.4 48.3 131.2 2.12 74.2 193.1
2046 50.7 0.36 180.5 75.0 0.29 219.2 89.2 195.5 0.0 0.0 0.7 25.0 184.7 0.0 48.3 131.7 2.60 72.7 182.5
2047 66.4 0.35 234.5 75.0 0.33 248.0 89.1 220.9 0.0 8.7 176.0 0.1 48.4 136.3 2.05 78.4 202.7
2048 66.3 0.39 256.7 75.0 0.36 270.6 89.4 241.9 8.7 167.3 48.4 109.4 1.65 67.1 175.7
2049 61.0 0.36 219.9 75.0 0.32 242.2 89.1 215.7 14.0 153.3 48.4 65.9 1.08 47.8 127.0
2050 56.7 0.40 229.4 75.0 0.34 258.6 89.5 231.3 18.3 135.0 48.4 37.0 0.65 35.4 93.7
2051 37.4 0.39 147.0 75.0 0.28 207.0 88.6 183.4 0.0 37.6 97.5 48.4 36.8 0.98 28.0 74.2
2052 27.2 0.31 84.7 75.0 0.21 161.0 88.1 141.8 47.8 49.7 48.4 14.6 0.54 15.8 41.8
2053 10.7 0.55 58.8 75.0 0.25 185.9 84.0 156.1 49.7 14.7 33.8 0.8 0.07 4.4 11.4
2054 0.0 33.8 0.33 110.3 71.8 79.2 33.8
Diluted 3,147.1 0.37 11,732.7 3,147.1 0.37 11,732.7 90.2 10,586.4 45.7 45.7 239.9 239.9 48.4 48.4 3,157.8 1.00 2,436.7 6,301.6
Waste Ore+WasteCu Metal Recovery HG/MG Stockpiles LG Stockpiles Saprock Ore Stockpiles

Cobre Panamá Project Technical Report March 2019
22
Figure 1-2 Graph showing mining sequence
Environmental and social summary
The Project site is located in the Donoso and Omar Torrijos Herrara Districts of Panamá, an area of
recognised high biodiversity which is subject to heavy tropical rainfall. The location is also relatively
isolated, undeveloped and sparsely populated (some 3,300 people in nearby villages and ranches).
Subsistence farming is the primary occupation for the local people and the area has been faced with
increasing deforestation and changes in land use. Due to the high annual rainfall, increased water
erosion and sedimentation have resulted.
Extensive environmental studies and social impact assessments were completed between 2007 and
2012 for the 2010 ESIA process. Over 600 impacts and management commitments are addressed in
the ESIA, during the construction, operations and closure phases.
An environmental management system (EMS) has been developed to include the environmental and
social management plans and commitments.
During 2017, MiAmbiente (the Panamánian environmental authority) announced the establishment
of the Donoso Multiple-Use Protected Area and a Management Plan was being developed by the
Government of Panamá.
In 2018, the Company continued to implement it’s environmental and management plans to meet
ESIA commitments. No material environmental incident was reported at Cobre Panamá up to 2018
and no notices of violation or penalties were imposed by any applicable regulatory authority.
Capital and operating cost estimates
Table 1-7 lists the development capital costs included in the Project cashflow model. $6,300 M is the
updated estimate for completion of the Project to 85 Mtpa capacity. This includes an amount of
$6,070 M which has been spent. The new estimate is a reduction from the $6,425 M that was
reported in the 2015 Technical Report (FQM, July 2015), and arises through a combination of
construction cost savings, construction synergies and productivity improvements.

Cobre Panamá Project Technical Report March 2019
23
Table 1-7 shows an additional capital cost in 2019 amounting to $240 M, required to enable
commencement of the expansion to 100 Mtpa capacity, along with initial development and
engineering work allowing mining to proceed to the Colina Pit2.
Table 1-7 Development capital cost provisions
$105 M of the $240 M in 2019 relates to site and other capital expenses, inclusive of allowances for:
completion of the Botija Pit pre-strip
a brought forward amount for completion of the Botija Pit diversion channel and an associated
water control embankment
pioneering mining equipment for the Colina pre-strip
Colina infill and geotechnical drilling
early deployment of trolley assist haulage and required infrastructure
mine dewatering expenses
additional spares
Table 1-7 lists the continuing plant expansion and related engineering cost estimates from 2020.
Listed site and other capital items from 2020 include allowances for miscellaneous infrastructure at
the port, power plant and accommodation facilities.
Sustaining capital cost allowances have been included in the Project cashflow model, for ongoing
mining, processing and G&A expenditure. The average annual sustaining capital figure is
approximately $69 M. A cashflow model closure cost provision for $124.2 M has been split over the
final six years of the Project.
A detailed derivation of operating and metal costs was originally completed by MPSA prior to the 2015
Technical Report (FQM, July 2015). This derivation has been updated to yield:
overall average ore mining cost = $1.94/t
overall average waste mining cost = $1.76/t
overall average processing operating cost (inclusive of port fixed cost) = $3.84/t processed
overall mine and plant fixed cost (equivalent G&A cost in variable terms) = $0.62/t processed
stockpile reclaim cost = $1.19/t reclaimed
copper metal cost:
= metal price x royalty + Cu metal cost
= $3.07 x 2% + $0.338 = $0.40/lb Cu
2 Initial Colina expenditure has been brought forward due to the sooner requirement of plant feed from Colina arising from the capacity expansion (ie, not envisaged in the 2015 Technical Report).
Capital Item < 2019 2019 2020 2021 2022 2023 2024 2025 2026 TOTAL
Development capital
Project capital for 85 Mtpa plant USD$M $6,070.0 $230.0 $6,300.0
100 Mtpa plant upgrades USD$M $90.0 $87.0 $110.0 $40.0 $327.0
Colina pioneering, access, engineering, IPC and OVC USD$M $45.0 $6.0 $45.0 $16.0 $112.0
River diversion works for Colina USD$M $33.0 $33.0 $34.0 $100.0
Site and other capital USD$M $105.0 $7.0 $12.0 $4.0 $2.0 $130.0
Total development capital USD$M $6,070.0 $470.0 $100.0 $122.0 $89.0 $18.0 $33.0 $33.0 $34.0 $6,969.0
Total development capital to end 2019, and from 2020 USD$M $6,969.0$429.0$6,540.0

Cobre Panamá Project Technical Report March 2019
24
molybdenum metal cost:
= metal price x royalty + Mo metal cost
= $8.83 x 2% + $1.334 = $1.46/lb Mo
gold metal cost:
= metal price x royalty + Au refining cost x Au payable
= $1,310 x 2% + $5.10 x 90% = $28.08/oz Au ($409.46/lb Au)
silver metal cost:
= metal price x royalty + Ag refining cost x Ag payable
= $18.87 x 2% + $0.44 x 90% = $0.73/oz Ag ($10.63/lb Ag)
The updated mining costs listed above take account of ore haulage to designed in-pit crusher
locations, and to waste dumping locations. The unit cost estimates include a factored allowance
reflecting the adoption of trolley-assisted haulage.
Economic analysis
An economic analysis in the form of a basic cashflow model to support the Mineral Reserve estimate
is summarised in Table 1-8 (the cashflow is listed annually in Item 22). Table 1-9 provides a summary
of the average annual physicals and unit costs. The model shows the indicative cashflow and does not
replace a more comprehensive financial model that exists for the Project. The annual revenues are
calculated from late 2018 consensus metal price projections, for which the long term values (beyond
2023) are as follows:
copper = $3.07/lb ($6,768/t)
molybdenum = $8.83/lb ($19,467/t)
gold = $1,310/oz
silver = $18.87/oz
The modelled overall average processing recoveries (after downrating in the initial production years) are:
copper = 90.2%
molybdenum = 53.4%
gold = 55.9%
silver = 45.0%
The modelled payable metal factors are:
copper = 96.15%
molybdenum = 86.20%
gold = 90.00%
silver = 90.00%
Mining, process and G&A operating costs for 2019, in addition to metal costs for that year, have been
expensed.

Cobre Panamá Project Technical Report March 2019
25
Table 1-8 Mineral Reserve cashflow model summary
Table 1-9 Mineral Reserves cashflow model average annual physicals and costs
< 2019 2019 to 2023 2024 to 2028 2029 to 2033 2034 to 2028 2039 to 2043 2044 to 2048 2049 to end
< Year 1 Year 1 to 5 Year 6 to 10 Year 11 to 15 Year 16 to 20 Year 21 to 25 Year26 to 30 Year 31 to end
MINING
Total ore Mt 3,143.7 505.7 575.4 553.7 534.2 473.1 308.5 193.0
Total waste (incl. MW not reclaimed) Mt 3,157.8 387.1 470.0 471.0 487.1 548.7 638.7 155.1
Total Mining Mt 6,301.6 892.8 1045.4 1024.7 1021.3 1021.9 947.3 348.2
Strip ratio W:O 1.0 1.3 1.2 1.2 1.1 0.9 0.5 1.2
Stockpile reclaim Mt 334.0 33.7 2.3 4.0 6.0 4.5 67.8 215.8
PIT TO MILL DIRECT
TOTAL t 2,813.1 370.3 497.7 495.6 493.7 455.5 307.2 193.0
Cu % 0.39 0.43 0.41 0.42 0.37 0.35 0.36 0.38
Mo ppm 60.19 75.05 68.77 76.62 70.09 48.03 26.51 24.29
Au ppm 0.07 0.09 0.09 0.07 0.05 0.06 0.07 0.08
Ag ppm 1.38 1.37 1.36 1.51 1.53 1.34 1.11 1.28
PIT TO STOCKPILE
TOTAL Mt 330.6 135.5 77.7 58.1 40.5 17.7 1.3 0.0
Cu % 0.21 0.21 0.23 0.17 0.22 0.25 0.22 0.15
Mo ppm 41.31 38.33 47.74 33.16 59.64 21.10 35.12 43.90
Au ppm 0.05 0.05 0.07 0.04 0.04 0.06 0.03 0.03
Ag ppm 1.02 0.93 1.06 0.94 1.29 1.11 1.06 0.59
STOCKPILE TO MILL
TOTAL Mt 334.0 33.7 2.3 4.0 6.0 4.5 67.8 215.8
Cu % 0.21 0.32 0.39 0.29 0.26 0.39 0.16 0.20
Mo ppm 41.38 62.63 63.33 62.73 48.20 35.22 34.04 39.68
Au ppm 0.05 0.07 0.05 0.03 0.03 0.05 0.04 0.05
Ag ppm 1.07 1.36 1.51 1.51 1.46 1.32 0.94 1.03
TOTAL FEED TO PLANT (after mining dil'n & recovery)
TOTAL Mt 3,147.1 404.0 500.0 499.6 499.7 460.0 375.0 408.8
Cu % 0.37 0.42 0.41 0.42 0.37 0.35 0.32 0.28
Mo ppm 58.19 74.02 68.74 76.51 69.83 47.91 27.87 32.41
Au ppm 0.07 0.09 0.09 0.07 0.05 0.06 0.07 0.07
Ag ppm 1.35 1.36 1.36 1.51 1.53 1.34 1.08 1.15
AVERAGE RECOVERIES
Cu % 90.2% 90.5% 91.4% 91.4% 90.6% 90.2% 88.9% 86.5%
Mo % 53.4% 50.2% 55.0% 55.0% 53.7% 52.4% 58.1% 49.1%
Au % 55.9% 57.4% 58.6% 53.8% 48.3% 52.9% 60.5% 58.0%
Ag % 45.0% 44.4% 47.3% 47.3% 47.3% 44.6% 39.9% 39.4%
METAL RECOVERED
Cu kt 10,586.4 1,549.9 1,885.0 1,928.3 1,688.7 1,454.4 1,072.6 1,007.5
Mo kt 97.8 15.0 18.9 21.0 18.7 11.5 6.1 6.5
Au koz 3,876.2 654.1 825.6 599.4 371.5 440.6 485.0 499.9
Ag koz 61,226.2 7,870.2 10,334.6 11,458.2 11,593.7 8,838.5 5,193.1 5,937.9
METAL PAYABLE
Cu kt 10,193.0 1,494.5 1,817.0 1,859.2 1,625.6 1,399.0 1,030.7 967.0
Mo kt 84.3 12.9 16.3 18.1 16.2 10.0 5.2 5.6
Au koz 3,488.5 588.7 743.0 539.5 334.4 396.5 436.5 449.9
Ag koz 55,103.6 7,083.2 9,301.2 10,312.3 10,434.3 7,954.6 4,673.8 5,344.1
GROSS REVENUE (based on varying concentrate grade)
Cu $M $69,693.1 $10,787.5 $12,304.3 $12,590.5 $11,008.6 $9,474.2 $6,979.6 $6,548.4
Mo $M $1,680.9 $291.0 $317.3 $352.9 $314.7 $193.8 $102.0 $109.3
Au $M $4,565.7 $767.8 $973.2 $706.6 $437.9 $519.4 $571.7 $589.2
Ag $M $1,030.2 $124.2 $175.5 $194.6 $196.9 $150.1 $88.2 $100.8
Subtotal - Gross Revenue $M $76,969.9 $11,970.5 $13,770.3 $13,844.5 $11,958.1 $10,337.4 $7,741.4 $7,347.8
CAPITAL COSTS
Development capital $M $6,300.0 $6,070.0 $230.0 $0.0 $0.0 $0.0 $0.0 $0.0 $0.0
Expansion capital $M $669.0 $569.0 $100.0 $0.0 $0.0 $0.0 $0.0 $0.0
Sutotal - Development Capital Costs $M $6,969.0 $6,070.0 $799.0 $100.0 $0.0 $0.0 $0.0 $0.0 $0.0
SUSTAINING COSTS
Sustaining (Mining, Processing, G&A) capital $M $2,493.9 $461.9 $420.9 $372.2 $371.3 $363.3 $326.3 $178.0
Closure and reclamation $M $124.2 $0.0 $0.0 $0.0 $0.0 $0.0 $0.0 $124.2
Subtotal - Sustaining Capital Costs $M $2,618.1 $461.9 $420.9 $372.2 $371.3 $363.3 $326.3 $302.2
OPERATING COSTS
Mining ore $M $6,136.8 $886.3 $1,149.0 $1,124.2 $1,007.5 $844.0 $643.5 $482.3
Mining waste $M $5,539.6 $661.4 $858.8 $830.5 $830.3 $906.1 $1,141.2 $311.4
Processing $M $12,088.2 $1,792.4 $1,902.7 $1,861.2 $1,861.6 $1,717.8 $1,409.9 $1,542.6
G&A $M $1,957.9 $551.7 $267.4 $253.6 $253.7 $233.5 $190.4 $207.5
Stockpile reclaim $M $397.3 $40.1 $2.7 $4.7 $7.1 $5.4 $80.6 $256.7
Subtotal - Operating Costs $M $26,119.9 $3,931.9 $4,180.6 $4,074.3 $3,960.3 $3,706.8 $3,465.6 $2,800.5
METAL COSTS (TCRCs AND ROYALTIES)
Cu $M $9,107.6 $1,312.2 $1,590.0 $1,618.2 $1,455.7 $1,268.8 $951.4 $911.2
Mo $M $315.5 $49.1 $60.8 $67.6 $60.3 $37.1 $19.5 $20.9
Au $M $108.8 $18.3 $23.2 $16.8 $10.4 $12.4 $13.6 $14.0
Ag $M $44.5 $5.5 $7.5 $8.4 $8.5 $6.4 $3.8 $4.3
Subtotal - Metal Costs $M $9,576.4 $1,385.2 $1,681.6 $1,711.0 $1,534.9 $1,324.8 $988.4 $950.6
CASHFLOW $M $31,686.5 -$6,070.0 $5,392.5 $7,387.2 $7,687.1 $6,091.6 $4,942.6 $2,961.2 $3,294.4
TOTALUNITMINERAL RESERVES - CASHFLOW SUMMARY
< 2019 2019 to 2023 2024 to 2028 2029 to 2033 2034 to 2028 2039 to 2043 2044 to 2048 2049 to end
< Year 1 Year 1 to 5 Year 6 to 10 Year 11 to 15 Year 16 to 20 Year 21 to 25 Year26 to 30 Year 31 to end
ANNUAL AVERAGES - PHYSICALS
Mining tonnage, ore plus waste Mtpa 180.0 178.6 209.1 204.9 204.3 204.4 189.5 69.6
Mill feed Mtpa 87.4 80.8 100.0 99.9 99.9 92.0 75.0 91.7
Cu recovered kt 294.1 310.0 377.0 385.7 337.7 290.9 214.5 167.9
Mo recovered kt 2.717 3.0 3.8 4.2 3.7 2.3 1.2 1.1
Au recovered koz 107.7 130.8 165.1 119.9 74.3 88.1 97.0 83.3
Ag recovered koz 1,700.7 1,574.0 2,066.9 2,291.6 2,318.7 1,767.7 1,038.6 989.6
ANNUAL AVERAGE UNIT COSTS
Mining ore $/t mined $1.94 $2.29 $2.44 $2.39 $2.07 $1.54 $1.01 $3.11
Mining waste $/t mined $1.76 $1.31 $1.49 $1.50 $1.55 $1.92 $3.70 $1.61
Processing (excluding sustaining) $/t processed $3.84 $4.44 $3.81 $3.73 $3.73 $3.73 $3.76 $3.77
G&A (excluding sustaining) $/t processed $0.62 $1.37 $0.53 $0.51 $0.51 $0.51 $0.51 $0.51
Stockpile reclaim $/t rehandled $1.19 $1.19 $1.19 $1.19 $1.19 $1.19 $1.19 $1.19
Metal costs (including royalties) $/t processed $3.04 $3.43 $3.36 $3.42 $3.07 $2.88 $2.64 $2.33
TOTALMINERAL RESERVES - CASHFLOW SUMMARY UNIT

Cobre Panamá Project Technical Report March 2019
26
The Project is cashflow positive from 2020 and payback on the $6,540 M capital spend occurs in 2024
(ie, payback on the capital inclusive of $6,070 M spent, $230 M of remaining capital for the 85 Mtpa
expansion, and $240 M for initial 100 Mtpa expansion costs and associated development and
engineering costs).
The total undiscounted cashflow for the Project, from the outset, is $31,686.5 M. As at 31st December
2018, the NPV of the projected gross operating income (ie, excluding the precious metal stream) and
capital expenditure of the Project is $14,307 M, calculated assuming mid-period cash flows.
The NPV is stated on the basis that the $6,070 M of historic capital spend for the development and
construction of the Project has been spent. In looking forward from the end of 2018, the adoption of
an 8.5% discount rate is considered appropriate and aligned with rates recommended by the
Company’s independent valuation experts. With the exclusion of the historic capital spend from the
discounted cashflow, the presentation of an IRR value is considered to be not applicable.
Conclusions and recommendations
It is the opinion of David Gray (QP), that the Mineral Resource classifications applied to the
mineralisation at Cobre Panamá fairly reflect the levels of geological and grade confidence. While
there are uncertainties with the geological and structural framework of the Cobre Panamá
mineralisation, the risk to the overall estimated tonnage and grade is considered to be low.
In the opinion of Michael Lawlor (QP), the Mineral Reserve estimate reflects an achievable longer term
mining plan and production sequence, and one which has taken account of a newly devised terrace
mining strategy.
There is considered to be minimal risk attributable to the mining method and primary equipment
selected for the Project. The method and equipment items are conventional and suitable for a large
scale, bulk mining operation. The terrace mining strategy is being implemented in recognition of the
need to provide spacious working areas suited to the deployment of ultra class mining equipment.
Furthermore, the layout of terraces within the design pits enables an improved means of managing
the potential for production disruptions due to prolonged rainfall events.
Uncertainty in operating and metal costs (ie, treatment costs, transport costs, and royalty charges), to
the extent identified, poses minimal risk to the selection of optimal pit shells as the basis for all
following pit design and production scheduling work supporting the Mineral Reserve estimate. Not
withstanding this, there is a need to continuously review the pit optimisations so that they reflect the
ongoing engineering and planning that is currently focussed on the siting of in-pit crushers and
associated infrastructure. Updates on operating and metal costs should be included in future
optimisations for completeness.
The 2015 Technical Report (FQM, July 2015) mentioned a need for operating cost review as the Project
proceeds into the operations phase. This has been done to some extent leading up to this Technical
Report, through the inclusion of short to medium term site budgeted costs in the current cashflow
model. It is recommended that this cost review procedure be continued as an item of continuous
improvement.
Mine geotechnical risks are considered to be manageable, largely through the adoption of the
terraced bench layout, and the ability to map and analyse available exposures on interim terrace
slopes before committing to final design slopes. Wide geotechnical berms are included in the overall

Cobre Panamá Project Technical Report March 2019
27
slope designs as a risk mitigation measure. The Botija Pit has benefited from a reappraisal of pit slope
design parameters now that pre-strip batters and slopes are exposed for mapping and structural
review. Geotechnical drilling will commence in 2019 at Colina (the next pit mined in sequence) to
provide new information updating that collected in earlier drilling programmes.
The drilling of horizontal drain holes in the Botija Pit has addressed the drained pit slope assumption
made in the mine geotechnical studies to date. Piezometers are to be installed in newly drilled vertical
bores to assess groundwater drawdown effectiveness. The continued drilling of horizontal drains and
the monitoring of piezometer information is endorsed. It is recommended that this information be
appraised before committing to expensive drilling and equipping of vertical dewatering bores.
The risk of surface water inflows to the pits has been mitigated by the design of surface diversions,
the proposed stepped pit terraces and a staged/booster pumping system from pit bottom. Work is
well advanced on the surface diversion channel for the Botija Pit, and planning and engineering work
is underway for a similar channel that will be required for the Colina Pit.
There is essentially no new information on the processing of Cobre Panamá ores which would warrant
a change to the metal recovery projections that were reported in the 2015 Technical Report (FQM,
July 2015).

Cobre Panamá Project Technical Report March 2019
28
INTRODUCTION
Purpose of this report
This Technical Report on the Cobre Panamá Project (the property) has been prepared by Qualified
Persons (QPs) David Gray, Michael Lawlor and Robert Stone of First Quantum Minerals Pty Ltd (FQM,
the issuer).
The purpose of this Technical Report is to document updated Mineral Resource and Mineral Reserve
estimates for the property, and to provide a commentary on the current development status for the
Cobre Panamá Project.
Terms of reference
This Technical Report covers all seven deposits of the Cobre Panamá Project and has been written to
comply with the reporting requirements of the Canadian National Instrument 43-101 guidelines:
‘Standards of Disclosure for Mineral Properties’ of April 2011 (the Instrument) and with the
‘Australasian Code for Reporting of Mineral Resources and Ore Reserves’ of December 2012 (the 2012
JORC Code) as produced by the Joint Ore Reserves Committee of the Australasian Institute of Mining
and Metallurgy, Australian Institute of Geoscientists and Minerals Council of Australia (JORC).
The effective date for the Mineral Resource and Mineral Reserve estimates is 31st December 2018.
Qualified Persons and authors
The Mineral Resource estimates were prepared under the direction and supervision of David Gray
(QP). Mr Gray of FQM meets the requirements of a Qualified Person according to his Certificate of
Qualified Person attached in Item 28. FQM personnel completed an updated estimate for Botija in
2018, and for the Botija Abajo and Brazo deposits in 2014. Optiro Pty Ltd prepared the Mineral
Resource estimates for the Colina, Valle Grande, Balboa and Medio deposits, and authored those
items of this Technical Report relating to geology and Mineral Resource estimation.
The Mineral Reserve estimates were prepared under the direction of Michael Lawlor (QP), with the
assistance of FQM staff. Mr Lawlor of FQM meets the requirements of a Qualified Person according
to his Certificate of Qualified Person attached in Item 28. Mr Lawlor takes responsibility for those
items not addressed specifically by the other QPs.
Metallurgical testing, mineral processing and process recovery aspects of this Technical Report were
addressed by Robert Stone (QP). Mr Stone of FQM meets the requirements of a Qualified Person
according to his Certificate of Qualified Person attached in Item 28.
Table 2-1 identifies which items of the Technical Report have been the responsibility of each QP.
Principal sources of information
Information used in compiling this Technical Report was derived from previous technical reports on
the property, and from the reports and documents listed in the References item (Item 27).

Cobre Panamá Project Technical Report March 2019
29
Table 2-1 QP details
Name Position NI 43-101 Responsibility
David Gray Group Mine and Resource Geologist,
Author and Qualified Person
BSc (Geology), MAusIMM, FAIG FQM (Australia) Pty Ltd Items 3 – 12, 14
Michael Lawlor Consultant Mining Engineer, Author and Qualified Person
BEng Hons (Mining), MEngSc, FAusIMM FQM (Australia) Pty Ltd Items 1, 2, 15 and 16, 18 to 26
Rob Stone Technical Manager, Author and Qualified Person
BSc (Hons), CEng, ACSM FQM (Australia) Pty Ltd Items 13 and 17
Ian Glacken Principal & Director, Optiro Pty Ltd
Contributing author
BSc (Hons)(Geology), MSc (Geology), MSc (Geostatistics), FAusIMM(CP), CEng, MIMMM, DIC
Items 3-12. 14
Site visits
The Qualified Persons (QPs) have visited the site, as follows:
David Gray last visited the Project in August 2018. Mr Gray inspected drill core and drilling sites,
reviewed geological, data collection and sample preparation procedures, and carried out
independent data verification.
Michael Lawlor last visited the Project in September 2018. Mr Lawlor visited all accessible areas
of the site.
Robert Stone was on site regularly through 2017 and continuously from Q3 2018, overviewing
technical aspects associated with the construction of the process plant, port and TMF, and also
involving himself with environmental control infrastructure requirements.
Conventions and definitions
Reference in this Technical Report to dollars or $, relates to United States dollars. Copper metal
production is reported in (metric) tonnes and (imperial) pounds, where the conversion factor is 1
tonne (t) = 2,204.62 pounds (lb). Gold and silver production is reported in (troy) ounces.
The conventional chemical abbreviation for copper of Cu is used throughout this report, whilst the
abbreviation for molybdenum is Mo, for gold is Au, and for silver is Ag. ASCu is used to denote Acid
Soluble Copper and TCu is used to denote Total Copper.
Where not explained in the text of this report, specific terms and definitions are as listed in Table 2-2.

Cobre Panamá Project Technical Report March 2019
30
Table 2-2 Terms and definitions
Term Definition Term Definition
bcm bank cubic metres µm, mm, cm, m, km microns, millimetres, centimetres, metres, kilometres
csv coma separated value NPV net present value
g, kg grams, kilograms oz ounces
g/t, kg/t grams per tonne, kilograms per tonne P80 80% passing
ha hectares pH potential of hydrogen
IRR internal rate of return Q1, Q2, Q3, Q4 quarter 1 to 4
kWh/t kilowatt hours per tonne t, kt, Mt tonnes, thousands of tonnes, millions of tonnes
lb pounds tpa tonnes per annum
LOM life of mine MW, LG, MG, HG mineralised waste, low grade, medium grade, high grade
Ma mega annum (million years) V, kV volts, kilovolts
masl metres above sea level W, MW watts, megawatts
mE, mN coordinates: metres East, metres North WGS Western Geodetic System

Cobre Panamá Project Technical Report March 2019
31
RELIANCE ON OTHER EXPERTS
The authors of this Technical Report do not disclaim any responsibility for the content contained
herein.

Cobre Panamá Project Technical Report March 2019
32
PROPERTY DESCRIPTION, LOCATION AND TENURE
Project ownership
In acquiring Inmet Mining Corporation (Inmet) in April 2013, the Company also acquired an 80%
interest in Minera Panamá S.A. (MPSA), which held the Cobre Panamá Project concessions. At that
time, the remaining 20% share of MPSA was held by Korean Panamá Mining Company (KPMC), a 50:50
joint venture between Korea Resources Corporation (KoRes) and LS-Nikko Copper Inc (LS-Nikko). In
August 2017, the Company increased its effective ownership of MPSA to 90% by acquiring LS-Nikko’s
holding of KPMC.
Project description components
The Cobre Panamá Project has the following primary components, aspects and the development
status of which are described in this Technical Report:
1. Seven open pit mines (with the first of these, at Botija, currently completing pre-strip) plus
associated waste dumps (also referred to as waste rock storage facilities or WRSFs)3.
2. Primary crushing carried out in pit, with crushed ore conveyed overland to stockpiles at the
plant site (IPCC technology).
3. A process plant comprising secondary and pebble crushing, semi-autogenous grinding (SAG)
and ball milling, and conventional flotation to produce separate copper and molybdenum
concentrate products.
4. An initial tailings management facility (TMF) located north of the open pits and plant site, with
the concept of subsequent tailings backfill into the depleted Botija Pit, and future expansion of
the initial TMF towards the north.
5. A port facility for the receival of construction materials and operating consumables (fuel,
reagents, coal, maintenance parts and spares), and the shipment of concentrates.
6. A coal-fired power generation plant at the port, and transmission line connecting the Project to
the national grid.
7. A slurry pipeline for the delivery of copper concentrate to the port, and an adjoining access road
and power transmission line.
Other Project attributes include:
owner procurement, construction and management (ie, self-perform)
owner mining
own power generation and transmission
own port facility
Project location
The Cobre Panamá Project is located in the Colón Province, approximately 120 km west of Panamá
City (Figure 4-1). Colón is in the north central part of the Republic of Panamá, bounded by the
Caribbean Sea to the north and the Coclé Province to the south. The Project area is characterised by
rugged topography with heavy rainforest cover.
3 ESIA approval is currently in place for four of the open pits.

Cobre Panamá Project Technical Report March 2019
33
The Project contains two main development sites; a mine and plant site located within the tenement
concession boundaries, and a port site at Punta Rincón, situated on the Caribbean coast, 25 km north
of the plant site, and approximately 100 km south-west of Colón City. The location of the processing
plant site is N8°50’ and W80°38’ and the location of the port site at Punta Rincón is N9°02’ and
W80°41’.
Figure 4-1 Cobre Panamá Project location map (source: Rose et al, 2012)
Mineral tenure
In February 1996, the Republic of Panamá and Minera Panamá SA (MPSA), a Panamánian subsidiary
of the Company, entered into a mining concessions contract in respect of the Cobre Panamá Project.
In February 1997, Contract Law No. 9 (Law No. 9) was passed by the Panamánian National Assembly.
Law No. 9 granted the status of national law to the mining concessions contract, establishing a
statutory legal and fiscal regime for the development of the Cobre Panamá Project. The legal regime
established by Law No.9 is supplemented by the Mineral Resources Code of Panamá. Law No. 9 had
an initial twenty year term ending in 2017 with provision for two consecutive twenty year extensions.
In December 2016, the Government of Panamá signed and issued Resolution No. 128 by which it
extended the Law No. 9 mineral concessions for a second twenty year term commencing on 1st March
2017 (through to 28th February 2037). MPSA remains eligible for consideration of a third twenty year
term commencing on 1st March 2037.
Under the mining concessions contract and Law No. 9, MPSA has the rights to explore for, extract,
exploit, beneficiate, process, refine, transport, sell and market the copper, gold and other minerals on
the Cobre Panamá concessions. MPSA is entitled to rights of way on state-owned lands and
easements, and to use surface lands on concessions adjacent to the Cobre Panamá concessions.
Furthermore, MPSA has the right to build upon, and to use and maintain such lands, in addition to
easements for building, maintaining and using facilities and installations that MPSA deems convenient
for the development of the Cobre Panamá concessions.

Cobre Panamá Project Technical Report March 2019
34
Project concessions
The property consists of four concessions totalling 12,955.1 hectares (Figure 4-2). The geographic co-
ordinates for each zone are provided in Table 4-1.
Figure 4-2 Property location map – Mina de Cobre Panamá concessions
Zona No. 1: Has a total area of 4,000 hectares and lies within the jurisdictions of Northern Coclé
and San José del General, Donoso District and within the jurisdiction of San Juan de Turbe, Omar
Torrijos District in the Province of Colón.
Zona No. 2: Has a total surface area of 6,600 hectares and lies within the jurisdiction of Northern
Coclé, Donoso District, Province of Colón.
Zona No. 3: Has a total surface area of 1,200 hectares and lies within the Jurisdiction of San José
del General, Donoso District and within the jurisdiction of San Juan de Turbe, Omar Torrijos
District in the Province of Colón. It is contiguous to the south of Zona No. 1.
Zona No. 4: Has a total surface area of 1,800 hectares and lies within the jurisdictions of Nueva
Esperanza and San Juan de Turbe, Omar Torrijos District in the Province of Colón. Zona No. 4 is
contiguous to the east of Zona No. 1 and contiguous to the east of Zona No. 3.
The Molejón sub-concession area formed part of the Zona No. 3 concession and related to the
property and mineral rights to develop the Molejón gold deposit on a stand-alone basis by
Petaquilla Minerals Ltd (PML). The Molejón sub-concession covers 644.9 hectares and is not
included in the 1,200 hectares of Zona No. 34.
4 PML formerly had the right to explore and mine gold deposits in the larger Zona No. 3 concession area provided that they did not interfere with MPSA’s ability to operate within the area. MPSA retained the right to develop any copper deposits on the Molejón sub-concession. Following a transaction dated May 2014, there is now complete separation of the current operations of PML’s Molejón Gold mine and the Cobre Panamá Project.

Cobre Panamá Project Technical Report March 2019
35
Table 4-1 MPSA mineral concessions under Law No. 9, 1997 [Geographic Coordinates – NAD27 UTM Zone 17 (Canal Zone)]
Zone Longitude Latitude Direction Distance
(m) Area (ha)
Zona No. 1 80°41'59.02" 8°51'25.11" East 8,000 4,000
80°37'38.15" 8°51'25.11" South 5,000
80°37'38.15" 8°48'42.07" West 8,000
80°41'59.02" 8°48'42.07" North 5,000 Zona No. 2 80°45'14.67" 8°54'40.76" East 6,000 6,600
80°41'59.02" 8°54'40.76" South 11,000
80°41'59.02" 8°48'42.07" West 6,000
80°45'14.67" 8°48'42.07" North 11,000 Zona No. 3 80°40'53.80" 8°48'42.07" East 6,000 1,200
80°37'38.15" 8°48'42.07" South 2,000
80°37'38.15" 8°47'36.85" West 6,000
80°40'53.80" 8°47'36.85" North 2,000 Zona No. 4 80°37'38.15" 8°50'52.55" East 3,000 1,800
80°36'00.48" 8°50'52.55" South 6,000
80°36'00.48" 8°47'36.85" West 3,000
80°37'38.15" 8°47'36.85" North 6,000
Molejón sub-concession (now excluded from Zona No. 3
80°40'53.82" 8°48'09.90" East 2,930 644.9
80°39'17.97" 8°48'09.70" North 700
80°39'17.92" 8°48'32.68" East 370
80°39'61.87" 8°48'32.67" South 450 80°39'06.20" 8°48'17.87" East 700 80°38'43.29" 8°48'17.84" North 150
Under Law No. 9, 1997, MPSA has exercised its rights to acquire or lease state lands located within the
proposed tailings storage area (Figure 4-3). MPSA has the land rights on the entire land polygon of
7,477.5 ha (shown as the orange line in Figure 4-3).
Most of the land required for the proposed port facilities at Punta Rincón, including land required for
construction and permanent use of the site, was acquired by MPSA during 1998 and 2000.
Mine expansion, including mining of the Balboa, Botija Abajo and Brazo deposits and adjacent waste
rock dumping, will require access to additional properties covering up to 6,800 ha. MPSA intends to
initiate the acquisition of these properties in accordance with the procedures established by Law No.
9 and other applicable Panamánian laws.
Where lands are occupied, which is the case for the mine expansion area, MPSA intends to adhere to
the International Finance Corporation’s Performance Standard 5 (IFC PS 5) in connection with
relocation and resettlement of affected persons and communities. Where Project infrastructure is
located within protected areas, such as the Donoso Multiple-Use Protected Area, MPSA will conform
to the requirements of IFC PS 6.

Cobre Panamá Project Technical Report March 2019
36
Figure 4-3 Location of open pits and facilities for the Cobre Panamá Project

Cobre Panamá Project Technical Report March 2019
37
Royalties and taxation
As governed by Law No. 9, MPSA is required to pay to the Government of Panamá, a 2% royalty on
“Negotiable Gross Production”. This is defined as “the gross amount received from the buyer due to
the sale (of concentrates) after deduction of all smelting costs, penalties and other deductions, and
after deducting all transportation costs and insurances incurred in their transfer from the mine to the
smelter”.
A land rental tax of 3 Panamánian Balboas (US$3.00) per hectare per year for the total concession area
also applies.
Under Law No. 9, corporate income tax payable at a rate of 25% on taxable earnings is exempted for
the period during which the Company has outstanding debt relating to the construction and
development of the Project.
In August 2012, MPSA entered into a precious metals stream agreement with a subsidiary of Franco-
Nevada Corporation for the delivery of by-product precious metals based on copper concentrate
production from the Cobre Panamá Project.
Environmental liabilities
The QPs of this Technical Report are unaware of any environmental liabilities currently existing on the
property.
Permitting
An Environmental and Social Impact Assessment (ESIA or Estudio de Impacto Ambiental Category III)
was submitted to the Panamánian environmental authority, Autoridad Nacional del Ambiente (ANAM
or the National Environmental Authority; now referred to as MiAmbiente) and was approved on
December 28th, 2011. This ESIA covers 7,586 hectares of the total concession, plus the port site and
the four mining areas at Botija, Colina, Medio and Valle Grande.
MPSA intends to expand this to cover the other mining areas at Balboa and BABR by submitting a new
ESIA for approval in mid-2024.
The proposed expansion of the Project will be subject to a high level of environmental and social
impact assessment by MPSA, in anticipation that the proposal will be similarly classified (Category III)
by the Panamánian Government. Environmental management and controls will be applied to the
development of the expansion areas that are equivalent to the controls for the existing
Project. Provided that the same process and assessment is conducted as has been for the existing
Project, and with similar commitments made, there are therefore no known reasons to indicate that
there will be environmental and permitting issues that could materially impact on mining and tailings
disposal activities expanding to the limits shown by the blue perimeter in Figure 4.3.
Factors and risks which may affect access or title
In September 2018 the Company became aware of a ruling of the Supreme Court of Panamá in relation
to the constitutionality of Law No. 9. The Company understands that the ruling of the Supreme Court
with respect to the constitutionality of Law No. 9 relates to the enactment of this law and does not
affect the legality of the MPSA mining concession contract itself, which remains in effect, and allows
continuation of the development and operation of the Cobre Panamá Project by MPSA.

Cobre Panamá Project Technical Report March 2019
38
The Supreme Court ruling is not yet in effect and is subject to various procedural processes. Based on
support from the Government of Panamá, the Chamber of Commerce and Industries of Panamá, the
Panamánian Mining Chamber, other Panamánian businesses and industry chambers, and its own legal
advice, the Company is confident of resolving the Law No. 9 clarification in the near to medium term.
The QPs of this Technical Report are unaware of any other significant factors and risks that may affect
access, title, or the rights or ability to perform work on the property.

Cobre Panamá Project Technical Report March 2019
39
ACCESSIBILITY, CLIMATE, LOCAL RESOURCES, INFRASTRUCTURE AND PHYSIOGRAPHY
Accessibility
Access to the property is via the southern Pan-American Highway from Panamá City to Penonomé,
heading north to La Pintada along surfaced all-weather roads and then along sealed roads from
Coclecito to the mine site. An extensive network of roads has been constructed around the Project
site including a 25 km long access road between the mine/plant site and the port at Punta Rincón.
Helicopter pads have been retained for occasional use. There is an existing airplane runway at
Coclecito, however, frequent thick cloud cover impedes aircraft visibility and therefore limits its
availability.
Climate and physiography
Climatic conditions in Panamá are equatorial with uniformly high temperatures (25°C to 30°C) and
relative humidity with little seasonal variation. Climatic regions are determined on the basis of rainfall
which can vary from less than 1,300 mm to 4,700 mm annually. In general, rainfall is much higher in
coastal areas, particularly on the Caribbean side of the continental divide. Heavy tropical rains are
prevalent throughout the year, with storms generally of short durations, ranging from 1.5 to 2 hours.
The concession zones are characterised by rugged topography with dense rainforest cover. The
topography is characterised by a relatively low elevation (less than 300 m) although ranging from 70
masl to 300 masl. Narrow ridges that parallel major geological structural trends are the dominant
landforms which are cross cut by numerous surface water drainage channels.
Elevations at the port site range from sea level to 60 masl with the terrain characterised as much
gentler.
Operations at the Project will be conducted year round and are not expected to be adversely affected
by the climatic conditions, despite the high rainfall.
Seismic conditions
Figure 5-1 indicates that relative to other areas of the isthmus, the Project site is located in an area
relatively unaffected by seismicity.
Work by the Universidad de Panamá, Instituto de Geociencias (IGC, 2013), confirms the tectonic
setting shown in Figure 5-1, but states that there is the potential for seismic activity of similar
magnitude to an earthquake that occurred in April 1991 at a location approximately 50 km from the
Project site. IGC completed a probabilistic seismic hazard study for the Project and provided a range
of peak ground acceleration parameters, at varying return periods, for the design of the tailings facility
and structures at the plant and port sites.

Cobre Panamá Project Technical Report March 2019
40
Figure 5-1 Seismicity map (Tarr et al, US Geological Survey)
Availability of power, water, personnel and areas for Project infrastructure
Power supply
Project power will be generated by a coal-fired, thermoelectric power station located at the port site,
and transmitted to the mine and plant sites along a new access corridor. Excess electricity and
backfeed supply is possible from the national grid.
Electric power into the mine is provided by a 34 kV transmission line ring main from the Botija
substation.
Water supply
The water requirements for the Project are expected to be amply met by rainfall alone due to the high
annual precipitation across the area. Collection and containment facilities will be required, much of
which will be within the tailings basin and surrounding the mine and plant areas.
All run-off from the active areas will be treated to remove solids and recycled to the process plant
where applicable.
Availability of personnel
The nearest sizeable communities to the Project are Coclecito and Villa del Carmen (~1,440 people),
located 8 km southeast of the proposed plant site. Smaller nearby communities are located at San

Cobre Panamá Project Technical Report March 2019
41
Benito (~200 people), Nuevo Sinai (~350 people), Chicheme (~300 people) and Rio Caimito (~240
people). Subsistence farming is the primary occupation of the local population, with no industrial
development in this part of Panamá. The city of Penonomé, the capital of the Colcé Province, is
located 49 km southeast of Coclecito.
Efforts have been made to hire a workforce from the local communities. However, as this region of
Panamá is relatively sparsely populated, additional personnel have been recruited from other areas
of the country. Skilled expatriate personnel have been required in the early stages of the Project, for
initial project management and to help establish the substantial training programmes required to
educate and train a national workforce.
As at December 2018 the operations workforce comprised 2,133 direct employees out of the
projected total of 3,421 full staff complement. A substantial training and development programme
for Panamánian employees in the operations team is underway.
Infrastructure
As there is no other industrial development in this region of Panamá, all current Project infrastructure
has been built by MPSA. This includes several camps on the mine and plant site, as well as several
smaller construction camps in other parts of the concession, including at the TMF and at Punta Rincón.
The main site camps are accessible by road and can collectively accommodate over 10,000 people.
Figure 5-2 depicts the current Project layout and infrastructure locations.
MPSA has constructed an extensive all-weather road network to improve access across the property.
This includes upgrades to existing roads, including the main access road from Llano Grande, as well as
building of an Eastern Access road to link in to the national road network.
Development of the Project required the construction of a port facility and an adjacent 300 MW power
plant at Punta Rincón, approximately 25 km north of the mine and plant area. An all-weather road
has also been constructed between Punta Rincón and the plant site. Other required developments
have included a 120 km long double circuit, 230 kV power transmission line connecting to the national
grid, pipeline infrastructure for both water and metallurgical concentrates, worker accommodation
and other support facilities (maintenance and storage areas, etc).
Sufficiency of surface rights
Land required for the provision of mine facilities, including waste rock storage and tailings facilities,
stockpiles, mill and port sites, has been acquired or leased by MPSA as per its rights under Law No. 9,
1997. Mine expansion will require the acquisition of an additional 6,800 ha beyond the current ESIA
polygon.

Cobre Panamá Project Technical Report March 2019
42
Figure 5-2 Cobre Panamá site map

Cobre Panamá Project Technical Report March 2019
43
HISTORY
Ownership and exploration
Copper-gold-molybdenum anomalism was first discovered in the Rio Petaquilla region of central
Panamá by a United Nations Development Programme (UNDP) team in 1968. The UNDP team were
conducting regional geological and geochemical surveys of the area. Further exploration by various
companies has since continued, leading to the discovery of four large porphyry deposits (Botija, Colina,
Valle Grande and Balboa) and a host of smaller mineralised porphyry systems (including Brazo, Botija
Abajo and Medio). One zone of epithermal gold mineralisation (Molejón Gold deposit) has also been
discovered. In 2009 the Project, formerly known as the Petaquilla Project, was renamed Mina de
Cobre Panamá, or Cobre Panamá.
Companies that have conducted exploration over the Project area include: United Nations
Development Programme (1968-1969), Panamá Mineral Resources Development Company (PMRD),
a Japanese consortium (1970-1980), Inmet – Adrian Resources – Teck (Formerly Teck Cominco) (1990-
1997), Petaquilla Copper (PTC)(2006-2008) and Minera Panamá S.A. (MPSA) (2007-2013). A total of
1,813 diamond drillholes (348,775 m) have been completed up to February 2018.
A brief summary of ownership and exploration across the Project area is summarised in Table 6-1.
Table 6-1 Exploration and ownership history of Cobre Panamá (source: Inmet)
Year Party Description
1968 UNDP
Regional geological and geochemical survey of central Panamá by the United Nations Development Programme (UNDP); widespread silicification and copper mineralisation discovered in the area of Colina and Botija deposits; silt samples and 200 line-km of soil samples revealed several copper and molybdenum anomalies, including Valle Grande, Botija Abajo, Brazo, and Medio; vertical field magnetics identified areas of magnetite alteration and magnetite destruction.
1969 UNDP 27 short (Winkie drill) holes and 10 long holes drilled in Botija, Colina, Vega (ie, part of Valle Grande), and Medio areas.
1969 PMRD Panamánian government tendered Cobre Concession exploration rights to international bidding; concession awarded to Panamá Mineral Resources Development Company (PMRD), a Japanese consortium.
1970-1976
PMRD
Geological mapping at Botija and Colina; 48 short (Winkie drill) and 51 long (diamond) holes drilled at Botija, Colina, Medio, and Vega (part of Valle Grande), totalling approximately 14,000 m. Botija and Colina deposits drilled on approximately 200 m centres.
1977 PMRD Preliminary reserves calculated and pre-feasibility report completed.
1978-1979
PMRD Feasibility work updated; unsuccessful negotiations with the Panamánian government over terms of production.
1980 PMRD Property abandoned by PMRD.
1990-1992
Minnova Property acquired by Minnova (later Inmet), 80%, and Georecursos International S.A., 20%. Exploration activity included regional lithogeochemical sampling.
1992-1993
Adrian
Adrian Resources Ltd. (Adrian) granted an option to earn 40% of Minnova’s interest through cash payments, work commitment, and production of a feasibility study. Adrian subsequently acquired Georecurso’s interest, bringing its total interest to 52%.
1992-1995
Adrian
Adrian carried out grid-based soil sampling and magnetic measurements, geologic mapping of selected areas, and drilling of approximately 396 diamond drill holes in Colina, Botija, and exploration targets. Investigation of Valle Grande deposit and discovery of epithermal Au mineralisation at Molejón, as well as identification or investigation of several other targets (Botija Abajo, Brazo, Faldalito (north west of Colina), Cuatro Crestas (part of Balboa), Lata, Orca (gold deposits, both NW of Colina)). Initiation of baseline environmental studies. Scoping study and pre-feasibility study produced.

Cobre Panamá Project Technical Report March 2019
44
Year Party Description
1994 Teck
Teck was granted the right to acquire half of Adrian’s share (26%) of the deposit by funding a feasibility study and arranging Adrian’s portion of the financing needed to bring the deposit into production.
1996 Teck Infill and deposit condemnation drilling and mapping for feasibility study carried out. Teck drilled 91 infill and 33 condemnation holes totalling 26,837 m. Feasibility study completed.
1997 Teck Infill and drilling for metallurgical samples to update feasibility study. Teck drilled 43 holes totalling 8,099 m. Feasibility study updated.
2005 MPSA Molejón Gold Agreement – shareholders transfer rights to any gold deposits on concession to Petaquilla Minerals Limited for a 5% NSR.
2007-2008
MPSA Activity resumes on copper deposits with the JV drilling condemnation, metallurgical, infill, and pit geotech holes. Lidar topo survey of concession.
2008 Inmet Inmet acquires Petaquilla Copper Ltd (PTC) including the 26% interest in MPSA, taking Inmet to 74% interest in MPSA.
2008 Inmet Inmet acquires Teck’s 26% interest in MPSA, taking Inmet to 100% interest in MPSA.
2009 MPSA
2007-2009: 288 holes (73,481 m) of infill, metallurgical, and condemnation drilling at Botija, Colina, Valle Grande, and Brazo deposits. Comminution testing. Condemnation of proposed tailings area and seismic, resistivity, and geotech drilling at port site and infrastructure locations.
2009 KORES/LS Nikko (KPMC)
KORES and LS Nikko Copper agree to option a 20% interest in MPSA.
2011 MPSA Discovery of Balboa deposit announced on March 11th.
2011 MPSA ESIA (Environmental Social Impact Assessment) approved by government of Panamá on December 28th – allows MPSA to proceed with the development of the Project.
2012 KPMC KPMC elects to exercise their option and acquires a 20% interest in the Cobre Panamá Project on January 10th.
2012 Inmet/MPSA Inmet Board of Directors makes production decision on May 18th to proceed with the development and construction of the Cobre Panamá Project.
2012 Inmet/ Franco-Nevada
August 20th, Franco Nevada acquires an interest in the precious metal stream in exchange for up to $1 Billion for Inmet to finance their portion of the development costs.
2013 FQM FQM purchases Inmet, acquiring an 80% stake in MPSA
2017 FQM FQM acquires an effective 90% stake in MPSA
Several pre-feasibility and feasibility studies have been completed on the Cobre Panamá Project.
These include:
A preliminary feasibility report prepared in 1977 by Panamá Mineral Resources Development
Co. Ltd. This was updated in 1979.
Adrian Resources Ltd. (a pre-cursor of Petaquilla Minerals Ltd and Petaquilla Copper Ltd)
commissioned Kilborn Engineering Pacific Ltd to complete a prefeasibility study in 1994. The
study was updated in 1995.
In November 1996, Teck Corporation commissioned H.A. Simons, now AMEC, to produce a
feasibility study which was subsequently updated in January 1998.
AMEC completed a Front End Engineering Design (FEED) Study Report in 2010.
A Basic Engineering Completion Report was completed in April 2012.
The 1998 Teck feasibility study was submitted to the Panamánian Ministry of Industry and Commerce
in May 1998 and was accepted as the official Feasibility Study to satisfy concession law requirements

Cobre Panamá Project Technical Report March 2019
45
outlined in Law No. 9 for the delivery of a feasibility study. At that time, the Project was owned by
Teck, Petaquilla Copper Ltd and Inmet Mining Corporation under the MPSA holdings.
In January 2017, the Company produced an internal Feasibility Study for the purposes of a due
diligence review undertaken by potential Project financiers.
Previous Mineral Resource estimates
Mineral Resource estimates were generated by the previous Project owner for the porphyry copper-
type deposits on the Cobre Panamá property including the Botija, Colina, Medio, Valle Grande, Balboa,
Brazo and Botija-Abajo mineralised zones. The last of these estimates were completed as part of the
original FEED study in December 2009, with some deposits updated in 2010 and 2012 as exploration
and delineation programmes evolved across the Project.
Table 6-2 lists the first Mineral Resource estimate produced by the Company for the 2015 Technical
Report (FQM, July 2015). The estimate was stated at a 0.15% Cu copper cut-off grade and was
inclusive of the Mineral Reserve.
Table 6-2 Cobre Panamá Mineral Resource statement, at June 2015, using a 0.15% copper cut-off grade
Previous Mineral Reserve estimates
A formal Mineral Reserve estimate was publically filed in an NI 43-101 Technical Report dated May
2010 (Rose at al, 2010), at an effective date of March 2010. The estimate was based on metal prices
of $2.00/lb Cu, $12.00/lb Mo, $750/oz Au and $12.50/oz Ag. The design and production schedule
upon which the Mineral Reserves was determined, accounted for the Botija, Colina and Valle Grande
mineralised zones.
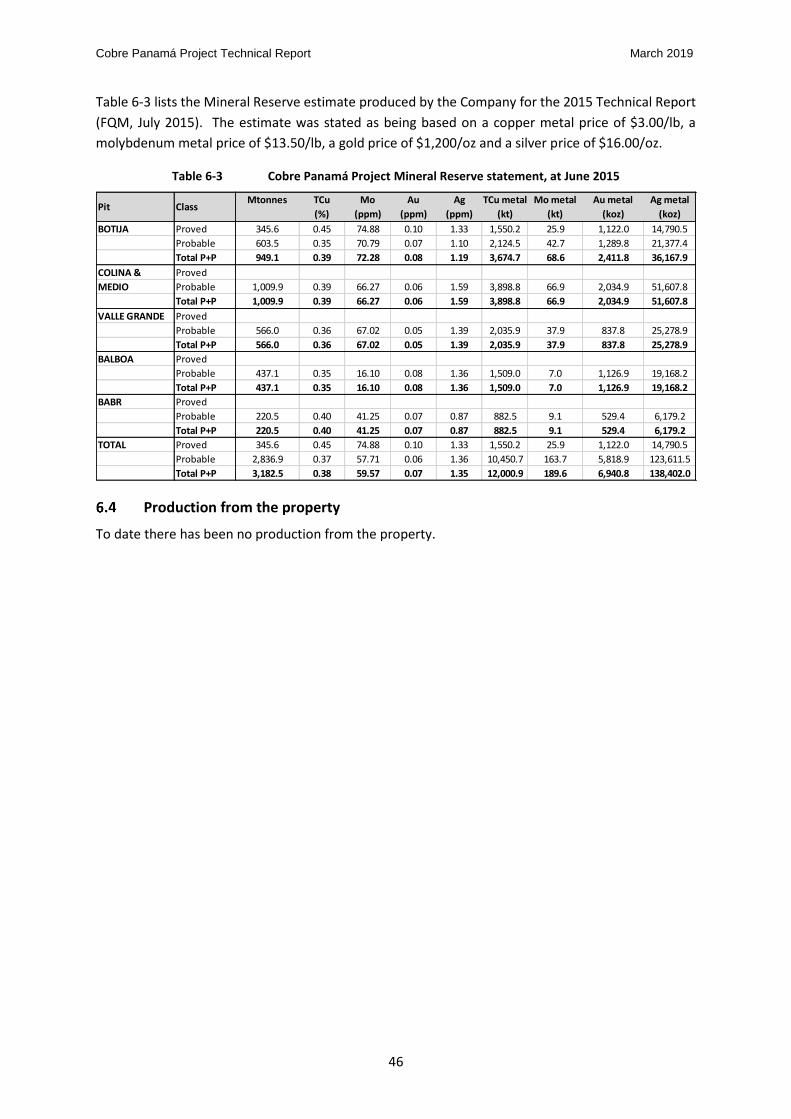
Cobre Panamá Project Technical Report March 2019
46
Table 6-3 lists the Mineral Reserve estimate produced by the Company for the 2015 Technical Report
(FQM, July 2015). The estimate was stated as being based on a copper metal price of $3.00/lb, a
molybdenum metal price of $13.50/lb, a gold price of $1,200/oz and a silver price of $16.00/oz.
Table 6-3 Cobre Panamá Project Mineral Reserve statement, at June 2015
Production from the property
To date there has been no production from the property.
Mtonnes TCu Mo Au Ag TCu metal Mo metal Au metal Ag metal
(%) (ppm) (ppm) (ppm) (kt) (kt) (koz) (koz)
BOTIJA Proved 345.6 0.45 74.88 0.10 1.33 1,550.2 25.9 1,122.0 14,790.5
Probable 603.5 0.35 70.79 0.07 1.10 2,124.5 42.7 1,289.8 21,377.4
Total P+P 949.1 0.39 72.28 0.08 1.19 3,674.7 68.6 2,411.8 36,167.9
COLINA & Proved
MEDIO Probable 1,009.9 0.39 66.27 0.06 1.59 3,898.8 66.9 2,034.9 51,607.8
Total P+P 1,009.9 0.39 66.27 0.06 1.59 3,898.8 66.9 2,034.9 51,607.8
VALLE GRANDE Proved
Probable 566.0 0.36 67.02 0.05 1.39 2,035.9 37.9 837.8 25,278.9
Total P+P 566.0 0.36 67.02 0.05 1.39 2,035.9 37.9 837.8 25,278.9
BALBOA Proved
Probable 437.1 0.35 16.10 0.08 1.36 1,509.0 7.0 1,126.9 19,168.2
Total P+P 437.1 0.35 16.10 0.08 1.36 1,509.0 7.0 1,126.9 19,168.2
BABR Proved
Probable 220.5 0.40 41.25 0.07 0.87 882.5 9.1 529.4 6,179.2
Total P+P 220.5 0.40 41.25 0.07 0.87 882.5 9.1 529.4 6,179.2
TOTAL Proved 345.6 0.45 74.88 0.10 1.33 1,550.2 25.9 1,122.0 14,790.5
Probable 2,836.9 0.37 57.71 0.06 1.36 10,450.7 163.7 5,818.9 123,611.5
Total P+P 3,182.5 0.38 59.57 0.07 1.35 12,000.9 189.6 6,940.8 138,402.0
Pit Class

Cobre Panamá Project Technical Report March 2019
47
GEOLOGICAL SETTING AND MINERALISATION
Regional geological setting
The Panamá Isthmus is a narrow strip of land that connects the North and South Americas at the
junction of several tectonic plates, including the Caribbean, Nazca, Cocos and continental North and
South American Plates. South vergent subduction and related arc volcanism, high-angle strike-slip
and block faulting, as well as north vergent thrust faulting are currently shaping the tectonically active
country (Mann, 1995). The Central American land bridge (which includes Costa Rica and Panamá) is a
complex assemblage of distinct crustal blocks and includes the Chorotega (southern Coast Rica and
western Panamá) and Choco (eastern Panamá) Blocks (Figure 7-1). The Chorotega and Choco Blocks
comprise island-arc segments underlain by Mesozoic oceanic crust (Escalante and Astorga, 1994) and
are separated by the left-lateral Canal Shear Zone.
Figure 7-1 Plate tectonic map of the Caribbean region (from Kirkby et al, 2008)
Within the Chorotega block, the island arc sequence consists of several distinct pulses of volcanism,
including Palaeocene-Eocene, mid-Oligocene, late Oligocene to early Miocene, and Pliocene-
Pleistocene ages. It is assumed that breaks between the volcanism were related to times of plate
reorganisation (de Boer et al, 1995). Intrusive rocks of Palaeocene-Eocene age lie along a tholeiitic
trend when plotted on an AFM plot; however, no porphyry mineralisation is recognised during this
period (Kesler et al, 1977) The suites of younger rocks are dominantly calc-alkaline in composition
and contain porphyry mineralisation ranging from Oligocene (including the Cobre Panamá deposits
~32Ma) to Pliocene (Cerro Colorado deposit ~5Ma). The regional geology map of Panamá is presented
in Figure 7-2.

Cobre Panamá Project Technical Report March 2019
48
Figure 7-2 Regional geology of Panamá (source: MPSA, 2014)
Interpretation of satellite imagery over the Project area within the Chorotega Block suggests that
major structural trends, expressed as topographic lineations, are orientated northeast and northwest
(Figure 7-3). Northwest-trending lineations are parallel to and related to the Canal Shear zone and
other large left-lateral shear zones in the region.
In the area of the Cobre Panamá deposits, the oldest rocks are submarine andesites, basalt flows and
tuffs, intercalated with clastic sedimentary rocks and reef limestones, of probably Eocene to early
Oligocene age. This suggests that the volcanic arc became emergent during the mid-Oligocene period,
with terrestrial flows and volcaniclastic rocks and lesser intercalated submarine tuffs. Miocene and
younger rocks comprise the bulk of volcanic rocks in western Panamá and consist of both terrestrial
and marine volcanic and volcanic-derived rocks of progressively more felsic composition (Rose et al,
2010).
Local geological setting
Lithology
Regional geological mapping in the Cobre concession and surrounding areas was first conducted in
1966 to 1969 by the United Nations Development Programme (UNDP). The region is underlain by
altered andesitic to basaltic flows and tuffs and clastic sedimentary rocks of presumed early to mid-
Tertiary age, intruded by the mid-Oligocene Petaquilla batholith which is granodiorite in composition.
Numerous satellite plutons of equigranular to porphyritic granodiorite, tonalite, quartz diorite and
diorite are found on the batholith margins, especially to the south. A detailed geological map for the
Rio Pito
Panama
City
Cobre Panamá
Cerro
Colorado
Cerro Chorcha
COLOMBIA
A
CO
STA
RIC
A
Caribbean Sea
LEGEND
Pacific Ocean
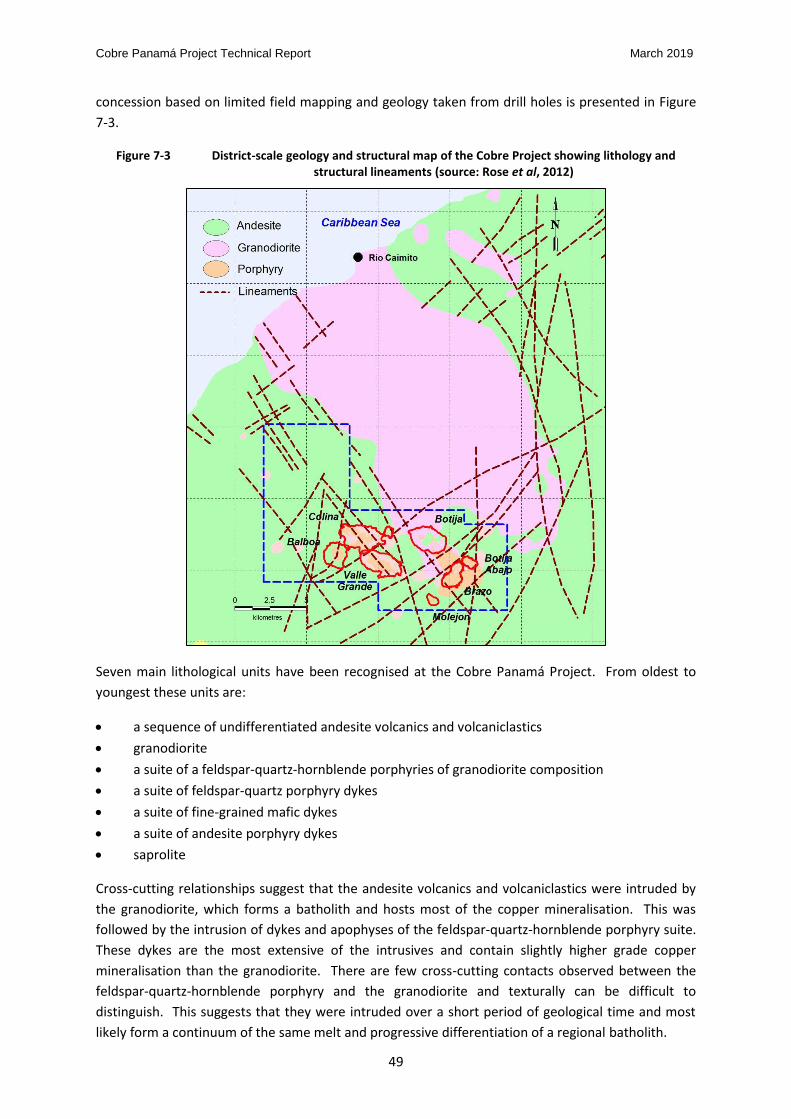
Cobre Panamá Project Technical Report March 2019
49
concession based on limited field mapping and geology taken from drill holes is presented in Figure
7-3.
Figure 7-3 District-scale geology and structural map of the Cobre Project showing lithology and structural lineaments (source: Rose et al, 2012)
Seven main lithological units have been recognised at the Cobre Panamá Project. From oldest to
youngest these units are:
a sequence of undifferentiated andesite volcanics and volcaniclastics
granodiorite
a suite of a feldspar-quartz-hornblende porphyries of granodiorite composition
a suite of feldspar-quartz porphyry dykes
a suite of fine-grained mafic dykes
a suite of andesite porphyry dykes
saprolite
Cross-cutting relationships suggest that the andesite volcanics and volcaniclastics were intruded by
the granodiorite, which forms a batholith and hosts most of the copper mineralisation. This was
followed by the intrusion of dykes and apophyses of the feldspar-quartz-hornblende porphyry suite.
These dykes are the most extensive of the intrusives and contain slightly higher grade copper
mineralisation than the granodiorite. There are few cross-cutting contacts observed between the
feldspar-quartz-hornblende porphyry and the granodiorite and texturally can be difficult to
distinguish. This suggests that they were intruded over a short period of geological time and most
likely form a continuum of the same melt and progressive differentiation of a regional batholith.

Cobre Panamá Project Technical Report March 2019
50
Figure 7-4 Camp-scale geology of the Cobre Panamá Project with deposit pit outlines shown for reference (source: Rose et al, 2012)
A second series of feldspar-quartz porphyry dykes have also intruded the area, but are volumetrically
minor and have not been identified at all the deposits. A set of volumetrically small, mafic dykes cross
cut the aforementioned lithologies; these are likely to be a final differentiation phase of the feeder
batholiths. Late-stage andesite dykes clearly cross-cut and post-date all other lithologies, exhibiting
well-developed chill margins which indicate that they intruded after the main porphyry event had
cooled. Surface weathering has allowed the development of a saprolite profile that is typical of
tropical environments.
Emplacement of the large porphyry bodies at Cobre Panamá was likely through magmatic stoping.
Evidence supporting this geological model includes:
the abundance of roof pendants
the flat-lying geometry of the lower porphyry contact at the majority of deposits
the proximity of a large batholith underlying the magma chamber
the presence of fracturing at the lower porphyry contact without significant displacement,
caused by the deflation of the underlying batholith allowing subsidence of the lower contact
It is interpreted that the feldspar-quartz-hornblende porphyry intruded the sequence in response to
cantilever subsidence of the lower contact of the intruding granodiorite (Cruden, 1998). At the major
deposits the feldspar-quartz-hornblende porphyry forms sill-like bodies, thought to have been fed
from high-angle feeder dykes; situated in the north of the deposit at Botija and Colina and to the
northwest at Valle Grande. The porphyry at Balboa intruded passively toward the south from a source
located northwest of the deposit and is also thought to be influenced by a high angle structure to the
west of the deposit.

Cobre Panamá Project Technical Report March 2019
51
A detailed description of each of these lithologies including the respective logging codes is presented
in Table 7-1.
Structure
Three generations of structures have been identified from mapping at the Cobre Panamá Project
(Model Earth, 2013). The earliest features trend east-west to northeast-southwest and are moderate
to north dipping features characterised by fracturing and a pervasive fracture cleavage with associated
faulting and shearing. These fault zones are typically wide (up to 200 m) zones of numerous,
anastomosing structures and are thought to be part of an early, pervasive tectonic fabric which is seen
in all rock types except the late stage mafic dykes. These features show consistent reverse movement
with some influence on mineralisation. It is interpreted that there may be a possible generic
relationship between the emplacement of mineralised porphyries and these early faults.
A second set of conjugate strike slip faults exist and are dominated by a series of northwest trending
sinistral faults with steep to moderate dips to the west which overprint the earliest structures.
Conjugate to these northwest trending faults are a series of northeast trending dextral faults with
moderate to steep dips to both the north and south. Overprinting relationships between these two
faults are unclear suggesting that they formed contemporaneously, as a conjugate set. These faults
are observed in mapping and in geophysical images.
Late-stage faulting is characterised by normal, east-west trending faults with steep dips to both the
north and south. Another set of northeast trending normal faults have also been identified. Both
these faults cross cut many of the older structures throughout the Project area.
Surficial geology
Most of the property area is covered by a thin layer (1cm to 10 cm) of black organic material which
overlies a thin layer (<1 m) of residual soil. This in turn overlies a 1 m to 20 m thick layer of orange to
white (oxidised) or green (reduced) saprolite (Figure 7-5). The depth of the saprolite layer is controlled
by lithology, elevation (hill or creek bottom) and proximity to major faults. The saprolite layer is
deeper over andesite relative to the intrusive rocks with the transition to relatively fresh rock
occurring within metres over andesite, to tens of metres over the intrusives (AMEC, 2007).
Saprolite and strongly weathered zones (saprock) may be several tens of metres thick (occasionally up
to 100 m) in the vicinity of large fault zones. Fresh, unoxidised rocks are only found at the base of
large creeks.

Cobre Panamá Project Technical Report March 2019
52
Table 7-1 Description of the lithological units of the Cobre Panamá Project (adapted from Rose et al, 2012)
Lithology Logging Code Description Andesite ANDS Light green, chlorite altered, fine-grained andesite that is weakly magnetic
and comprises mostly of massive flow units that are bounded by
fragmental flows. Lesser lapilli tuffs and volcaniclastic interbeds have also
been noted. The andesites have not been subdivided into individual
flows.
Granodiorite GRDR Mottled white-grey lithology with medium-grained equigranular
interlocking crystals of white feldspar, hornblende and quartz. The
granodiorite also contains subrounded to subangular, centimetric fine-
grained mafic xenoliths and occasional apilite dykes. White clay alteration
can produce a porphyritic texture by altering the groundmass surrounding
the feldspar crystals, producing a pseudo-porphyritic texture and
sometimes causing it to be logged as the feldspar-hornblende-quartz
porphyry.
Feldspar-
Hornblende-Quartz
Porphyry
FQHP Light grey porphyritic lithology with a crowed porphyry texture. There is
not always a large difference in the grainsize of the groundmass and the
phenocrysts. The porphyritic texture is best described as weak. The
groundmass is light grey, fine-grained, and contains feldspar with
subordinate mafics and quartz. Phenocrysts comprise crowded white
subhedral to euhedral feldspar (often plagioclase) phenocrysts, lesser
clear, glassy anhedral quartz "eyes" and minor hornblende.
Feldspar-Quartz
Porphyry
FQP Light grey porphyritic lithology with a light grey, aphanitic and siliceous
groundmass that contains crowded white subhedral to anhedral feldspar
phenocrysts and clear, glassy anhedral quartz “eyes” and very rarely bi-
pyramidal quartz phenocrysts. This lithology has so far been recognised at
the Botija and Brazo deposits only.
Feldspar-
Hornblende
Porphyry
FHP Light green-grey porphyritic lithology, probably of andesitic composition,
with a light grey, fine-grained groundmass containing dominant white
subhedral to euhedral feldspar (mostly plagioclase) with subordinate dark
green hornblende and lesser quartz. This porphyry contains sparse,
irregularly shaped, centimetric, medium-grained mafic xenoliths.
Mafic Dykes MD Dark green, pervasively chlorite altered, fine-grained mafic pyroxene
porphyry that occurs as dykes with clear chill margins noted locally.
Saprolite USAP, LSAP,
SPRC
At surface, most areas of the property are covered by a thin layer (1 cm to
10 m) of black organic material. This overlies a thin layer of residual soil
generally less than 1 m in thickness, which in turn overlies a 1 m to 20 m
thick layer of orange to white (oxidised) or green (reduced) saprolite. On
average, the saprolite layer is deeper over andesite relative to intrusive
rocks. The transition from saprolite to relatively fresh andesite typically
takes place over a range of less than a few metres, whereas the transition
zone from saprolite to relatively fresh granodiorite may involve several
tens of metres. This transition zone contains blocks of unaltered bedrock
and has been called “saprock.”

Cobre Panamá Project Technical Report March 2019
53
Figure 7-5 Idealised cross-section of surfaced weathering zone. Vertical scale is approximate and slightly exaggerated (from AMEC, 2007)
Alteration
Five types of alteration have been identified across the Cobre Panamá concession. These are
described in Table 7-2 and are detailed from the earliest (propylitic A) alteration progressing through
to assemblages that likely overlap or occur later in the development of the hydrothermal system.
It is interpreted that the two propylitic alteration assemblages as well as the potassic alteration were
formed early which is supported by paragenetic, cross-cutting and mineral texture relationships.
These alteration assemblages are associated with chalcopyrite, minor bornite and minor pyrite
mineralisation. These early alteration assemblages are also overprinted by phyllic alteration that
includes white and green sericite with ubiquitous pyrite and variable quartz veining and silicification.
Phyllic alteration is also observed to occur frequently with chalcopyrite mineralisation, by rarely with
bornite. Argillic alteration typically occurs within 300 m from surface. White clay found close to
oxidised sulphide suggests that it may be supergene in origin, perhaps after an earlier alteration phase.

Cobre Panamá Project Technical Report March 2019
54
Table 7-2 Alteration styles at the Cobre deposits (adapted from Rose et al, 2012)
Alteration style Description
Propylitic A alteration Chlorite dominated with accessory epidote, pyrite, and calcite. It is particularly well developed within the andesite volcanics.
Propylitic B (silica-chlorite) alteration
Exhibits chlorite and silica in approximately equal intensity, resulting in a much harder core than other alteration types. In porphyry lithologies chlorite generally affects ferro-magnesium phenocrysts while silicification appears to primarily affect the groundmass. Pyrite and sericite (often green-coloured) may also be present. Previous workers on the property have referred to this alteration type as silica-chlorite alteration. It appears to occur at depth within the deposits but is found at shallow levels in the peripheral zones.
Potassic alteration Occurs mainly as potassium feldspar selvedges to quartz ± sulphide veinlets and as irregular patches. Potassium feldspar flooding is rarely seen. Potassic alteration also occurs as fine-grained secondary biotite that alters ferro-magnesium minerals such as hornblende and magmatic biotite. Secondary biotite also occurs in discontinuous veinlets that commonly contain magnetite, chalcopyrite, and rare bornite. The amount of potassium feldspar or secondary biotite alteration is largely determined by the feldspar or biotite abundance in the protolith. Anhydrite veinlets of generally millimetric thickness are commonly associated with potassic alteration, especially in the deeper parts of the deposit. At depths of approximately 200 m from surface and shallower, the anhydrite appears to have hydrated to form gypsum. In addition, millimetric magnetite-only veinlets are uncommonly observed within the potassic alteration zone.
Phyllic alteration Occurs as sericite alteration of all rock-forming silicate minerals. Silicification and pyrite are also associated with this phase of alteration. Phyllic alteration occurs in the upper 150 m to 200 m of all of the deposits but is very irregular and/or difficult to map through different protoliths and earlier alteration facies. It can occur much deeper when phyllic fluids have been drawn down into permeable structural zones. Phyllic alteration occasionally occurs with chlorite, and both green and white sericite are found within this zone, likely related to distinct alteration events. Sericite is used as a collective term for white phyllosilicate and displays a wide range of grain size from very coarse, granular, millimetric muscovite, to very fine grained “silky” textured. It may be possible to subdivide these variations spatially because they are probably related to distinct alteration events. Phyllic alteration is ubiquitous, with quartz-pyrite veinlets that frequently contain minor chalcopyrite and have a white sericite-altered selvedge.
Argillic alteration Frequently occurs in the upper parts of the deposits from surface and is therefore largely coincident with the phyllic alteration zone. This can make visual distinction of clay or sericite dominant alteration a challenge. The clay minerals that have been visually identified range in colour from white to buff or light brown; kaolinite, smectite, and illite have been recognised.
Mineralisation
Supergene mineralisation
Oxidation of sulphides near the surface weathering profile has leached copper from the present-day
saprolite. Copper has been weakly and irregularly re-precipitated in the upper zones of the deposits.
Secondary sulphides are dominantly chalcocite with minor covellite and rare native copper. These
secondary minerals occur as fracture infills, coatings on primary sulphide minerals and disseminations.
Where these sulphides have been oxidised, malachite is the main copper oxide mineral.
Notably absent across the majority of the Cobre Panamá deposits is the presence of a significant zone
of enrichment. It is interpreted that this is likely due to removal by erosion of a previously well-
developed phyllic alteration zone which may have overlain these deposits. Phyllic alteration zones are
suitable host rocks for re-precipitation of copper as they can sufficiently neutralise the acidic fluids

Cobre Panamá Project Technical Report March 2019
55
required for leaching. A well-developed phyllic alteration zone is developed at Brazo, which
accompanies a significant secondary copper sulphide mineralisation zone.
Hypogene mineralisation
Hypogene mineralisation within the granodiorite and various porphyry lithologies consists of
disseminated sulphides, micro-veinlets, fracture fillings, veinlets and quartz-sulphide stockworks.
Veins have been classified in accordance with Gustafson and Hunt (1975) who described in detail
copper porphyry mineralisation at El Salvador, Chile, and which is summarised in Table 7-3.
Copper mineralisation occurs as chalcopyrite with lesser bornite. Throughout all deposits the
proportion of bornite relative to chalcopyrite appears to increase with depth. Molybdenite is present
in quartz “B” veinlets (Gustafson and Hunt, 1975). Pyrite is ubiquitous but the tenor increases in
association with phyllic and chlorite-silica alteration compared to other alteration assemblages.
Within the phyllic alteration zone, pyrite occurs as disseminations and within “D” veinlets (Gustafson
and Hunt, 1975) with quartz. Minor specularite and magnetite mineralisation occurs as dissemination
and veinlets in all deposits.
Mineralisation on the contacts between the andesite and feldspar-hornblende-quartz porphyry can
reach high copper tenor in zones of biotite hornfels. Chalcopyrite is the dominant sulphide with minor
pyrite and rare bornite, occurring in veinlets, blebs and disseminations. This style of mineralisation is
often cross-cut by quartz-sulphide veining.
A description of each deposit within the Cobre Panamá concession is provided in the following
sections. The location of all the mineralised zones is shown in Figure 7-6.
Botija
The Botija deposit is located in the northeast area of the Cobre Panamá concession. Botija is hosted
in several feldspar-quartz-hornblende porphyry dykes (up to four) which range in thickness from 20 m
to 200 m, and which have intruded the granodiorite and andesite host rocks. The porphyry
morphology at Botija suggests that it intruded from the north as a series of dykes that fed the central
apophysis, where they coalesced (Rose et al, 2012). In general, the dip of the more distinct dykes is
approximately 70° to the north.
Two irregular, keel shaped andesite roof pendants of approximately 500 m in diameter have been
identified at Botija (Rose et al, 2012), separated by approximately 300 m and reaching depths of
between 200 m to 300 m. A smaller pendant, up to 250 m along strike and extending to a depth of
150 m sits to the north of the deposit.
A geological model demonstrating the distribution of the main rock types was created based on south-
north cross sections spaced at between 50 m to 100 m intervals. A typical cross-section is presented
in Figure 7-7.

Cobre Panamá Project Technical Report March 2019
56
Figure 7-6 Location map of mineralised zones
Figure 7-7 Botija south-north geology cross-section at 538140 mN
Since previous studies by Halley (2013) and Model Earth (2013), work continues at Botija in order to
improve understanding of the geochemistry, mineralogy and controls on the mineralisation. Apart
from the start-up of reverse circulation (RC) grade control drilling at Botija, that now covers the top
45 m of mineralisation, an additional eight diamond drilled holes were completed for metallurgical
test work. Results from RC drilling have confirmed the position, size and grade tenor of the initial 45 m
of Botija mineralisation. Similarly, results from the metallurgical test work have confirmed lower
recoveries within the saprock horizon and consistent recovery behaviour for the fresh styles of
mineralisation.
The previous work by Halley (2013) was based on re-assay of almost 1,000 sample pulps from across
the deposit using a four-acid digest ICP-MS ultra trace method. Results were then used to validate
logging, map fractionation trends in the host porphyries, quantify alteration signatures and pathfinder
element haloes. Findings of the study are summarised below:
COLINA
VALLE
GRANDE BALBOA
BOTIJA
MEDIO
BRAZO
BOTIJA
ABAJO
Metres

Cobre Panamá Project Technical Report March 2019
57
Botija, and many of the other deposits at Cobre Panamá, have a sulphide and silicate alteration
zonation pattern that is typical of porphyry copper systems worldwide. However, the geometry
of the zonation is mushroom-shaped rather than cylindrical.
The highest copper tenors are associated with an area of potassic and/or strong sericite
alteration.
The central alteration zone is characterised by bornite alteration and is typically located in the
thickest part of the porphyry sill complexes.
Sulphide mineralogy domains can be defined by plotting samples on a Fe:Cu:S ternary plot and
then used to validate the geological logging.
The pathfinder elements (W, Sn, As and Sb) have a similar distribution pattern as seen in other
systems but the magnitude of the anomalism is much lower and subdued.
Elements such as Sc and V are useful in determining the bulk host rock composition, and can be
used to validate the logging of mafic (andesite) versus felsic (granodiorite and porphyry) rocks.
Geochemically, the granodiorite and porphyry host rocks are difficult to distinguish from one
another.
The andesite compositions vary greatly, suggesting a possible fractionation sequence.
Dykes are predominantly intermediate in composition and unrelated to the porphyries and
granodiorite.
Propylitic alteration is irregular, occurring sporadically across the deposit. Andesite tends to be
characterised by Propylitic A alteration. Potassic alteration is widespread in the central part of the
deposit and has a general association with porphyry and higher copper grades. Anhydrites (and its
supergene product gypsum) are commonly logged at Botija. Phyllic alteration is irregular, occurring
mainly in the central area of the deposit near surface and at depth. Argillic alteration is also irregular
typically occurring within 250 m of surface.
Detailed field mapping and interpretation of structures at Cobre Panamá was completed by Model
Earth Pty Ltd in September 2013. The main focus at Botija was to complete detailed mapping of the
deposit and its surroundings to better understand the geology, assist in focussing any exploration and
improve future mining (Model Earth, 2013).
Due to thick vegetation over much of the concession, most of the mapping concentrated on outcrops
of fresh rock exposures in gravel pits and quarries, some road cuttings and rarely in creeks and
streams. Outcrops of weathered material at surface consisted largely of saprolite and saprock;
however, relic textures were used to distinguish the parent rock types.
Mapping identified that structurally, the Botija deposit is characterised by low-angle faulting in both
the footwall and hanging wall of the deposit. The most notable is the Botija River Fault in the footwall
(Model Earth, 2013). This fault was found to be a wide zone, (~200m), with numerous discrete faults
which dip moderately to the north (~30°), all with a reverse sense of movement. A number of
northeast and northwest trending strike-slip faults were recorded in the Botija area (Model Earth,
2013). These are responsible for truncations and offsets in lithological contacts and earlier formed
structures. The reverse fault in the hangingwall of the deposit seems to be offset in a dextral sense
by a northeast trending dextral fault (Model Earth, 2013). All faults identified at Botija are presented
in Figure 7-8.

Cobre Panamá Project Technical Report March 2019
58
Table 7-3 Vein classification at Cobre Panamá based on the work of Gustafson and Hunt (1975) at El Salvador, Chile (modified from Gustafson and Hunt (1975))
Vein Type Silicate Assemblage and Texture Alteration Halo Structural Style Sulphide Assemblage and Texture
“A” Quartz-K-feldspar-anhydrite-sulphide with rare traces of biotite quartz content ranges from 50 to 90 %. Vein minerals are typically
fine grained and equigranular and evenly disseminated with the exception of K-feldspar which can occur as bands forming along the
edges or centre of the vein.
Halos of K-feldspar are more or less developed adjacent to most veins.
These halos may be variable in thickness, especially in K-feldspar
altered host rock.
"A" quartz veins are the earliest of all veins, often
cross cut by "B" quartz veins. Veins can be typically
randomly oriented and discontinuous, commonly segmented and "whispy". Widths range from 1 to 25 mm with strike continuity
from centimetres to several metres.
Disseminated chalcopyrite-bornite, with proportions usually similar to the background sulphide; locally,
traces of molybdenite.
“B” Quartz-anhydrite-sulphide, with K-feldspar characteristically absent. The quarts is
relatively coarse grained and tends to be elongated perpendicular to the walls,
occasionally approaching a "cockscomb" texture. Granular quartz, especially in
sheared bands is common. Vein symmetry of sulphides, anhydrite or granularity along
centrelines, margins or irregular parallel bands is typical but unevenly developed.
Lack of alteration halo is characteristic. Occasionally faint and irregular
bleached halos are present, but most are probably due to superimposed
veining.
Younger than "a" type veins and older then "D" veins. "B"
veins are characteristically regular and continuous, and tend to have flat attitudes.
Widths usually range from 5 to 50 mm with strike
continuity in the range of meters to tens of metres.
Molybdenite-chalcopyrite is characteristic. Traces of bornite
occur in some, but more commonly minor pyrite occurs in
contrast to bornite-chalcopyrite in the surrounding host rock.
Sulphides tend to be coarse grained and occupy banding
parallel to the vein contacts or cracks perpendicular to them.
“D” Sulphide-anhydrite with minor quartz (except where superimposed on "B" veins) and
occasional carbonate. Anhydrite locally forms coarse crystalline masses and is commonly
banded with the sulphides.
Feldspar-destructive halos are characteristic. Proximal Sericite or
sericite-chlorite halos may or may not be associated with distal halos of
kaolinite-calcite.
"D" veins cross cut all other veins. They are continuous
although locally irregular and interlacing but occupy systematic structural
patterns. Widths range from 1 to 75 mm with strike
continuity from meters to tens of metres.
Pyrite is usually predominant, with chalcopyrite, bornite, enargite,
tennantite, sphalerite and galena common. Minor molybdenite and
many other sulphides and occur locally. "Reaction" textures are
typical.

Cobre Panamá Project Technical Report March 2019
59
Figure 7-8 Detailed surface fault interpretation from field mapping and collated with drillhole data
Copper mineralisation at Botija is characterised by a quartz stockwork of “A” and “B” veinlets within
the central porphyry dyke complex and throughout the contact zones. This stockwork forms a locus
for high grade copper and molybdenum mineralisation (Gustafson and Hunt, 1975) and hosts most of
the chalcopyrite and some minor bornite mineralisation. The majority of molybdenite mineralisation
is predominantly associated with “B” type veins and is generally located in the lower copper grade
zones.
Colina
The Colina deposit is focused on a 3.0 km long by 1.2 km wide feldspar-quartz-hornblende porphyry
sill and dyke complex (lopolith) that trends east-southeast. A geological model demonstrating the
distribution of the main rock types was created based on north-south cross sections spaced at 100 m
intervals. An example of a cross section through the Colina deposit, demonstrating the geology,
faulting and mineralisation is presented in Figure 7-9.
The majority of the feldspar-quartz-hornblende porphyry comprises of 50 m to 200 m thick sills that
dip shallowly to the north and are often interconnected by dykes. Both felsic and mafic dykes are
logged across the deposit but due to inconsistencies of logging between drilling campaigns, as well as
the narrow nature of the dykes (especially the sub-vertical mafic dykes) it is difficult to model their
distribution with any great certainty.

Cobre Panamá Project Technical Report March 2019
60
Figure 7-9 South-north section along 533,800 mN – Colina deposit
At the base of the porphyry sills a transition to granodiorite often occurs, accompanied by an increase
in fracturing and in the general sense, adecline in copper tenor. These contacts are interpreted to
correspond to the lower stoped contact and the fracturing is largely due to tensional forces exerted
by the sinking granodiorite resulting in tensional failure. This area can have increased frequency of
mafic dykes, thought to be a result of the ingress of a highly residual and late-stage fractionated
magma. At the northern contact of the dyke, the contact between the granodiorite and andesite is
intermixed and the morphology and nature of the contact is complex.
Propylitic alteration generally affects the andesite in the periphery of the Colina deposit and the
andesite in the central part is frequently affected by silica-chlorite alteration. Phyllic alteration is
patchy and difficult to interpret as a continuous zone. In general, it is not associated with the higher-
grade part of the deposit. Potassic alteration is rare at Colina compared with Botija. Anhydrites (and
its supergene product gypsum) are also not as commonly logged as at Botija. This is thought to be
related to the lack of potassic alteration. Magnetite alteration is common in the western and northern
parts of the deposit. Where it is present, potassic alteration is logged as weak potassium feldspar with
patchy biotite alteration of mafic minerals.
Several faults have been modelled at Colina based on offsets observed in the geological modelling
(Figure 7-10). A thrust fault (red) intersecting the middle of the deposit strikes east-west and dips
steeply to the north and offsets the mineralisation and lithology up to 50 m vertically. At least two
normal, sub-vertical faults (light blue) have been modelled in the western area of the deposit,
offsetting the main part of the deposit from two northwest zones (previously the Fadalito deposit).
Faults shown in green (Figure 7-10) were used to truncate the mineralised wireframes and guide the
low grade mineralisation interpretation. These faults have a variety of orientations and can be seen
in regional geophysics. Two small faults (dark blue in Figure 7-10) have been used to make minor
adjustments to the gold domains at Colina. Offsets along these faults were sometimes difficult to
distinguish in the lithology and copper mineralisation.

Cobre Panamá Project Technical Report March 2019
61
Figure 7-10 Fault locations at Colina based on lithological and mineralisation offsets interpreted from the geological model
Copper mineralisation at Colina appears to be loosely associated with the feldspar-quartz-hornblende
porphyry, particularly in the thicker areas were the dykes coalesce and around the upper contact of
the sills. The best copper grade intercepts are often associated with intense magnetite, quartz-
magnetite and quartz veinlets containing chalcopyrite (Sillitoe, 2013). Pyrite and chalcopyrite with
lesser bornite occur mainly in these quartz-rich veinlets, frequently with molybdenite. Vein types have
not been systematically mapped at Colina but it is interpreted that they are spatially associated with
the contact areas of the porphyry sills and dykes especially in areas of high complexity. Contact
metamorphism along the andesite-porphyry boundary is characterised by strongly silicified or biotite-
altered zones. Within these zones, pyrite and chalcopyrite are generally found in veinlets, with lesser
blebs and disseminations. Molybdenite and magnetite have also been noted, associated with “B” type
veinlets (described in Table 7-3).
Secondary copper minerals, including chalcocite and covellite, have been observed at Colina, occurring
mainly as sooty coatings on chalcopyrite at the base of the saprolite or adjacent to structures
penetrating the underlying sulphide domains from surface. Locally, malachite has been observed
within zones where total oxidation of the sulphides has occurred.
A large blanket of depleted weathered material (both saprock and saprolite) covers Colina. Within
this horizon copper mineralisation is low grade and/or depleted, with no apparent supergene copper
enrichment. Localised gold enrichment within this zone has been identified and these zones have
been domained out for estimation purposes.
Valle Grande
The Valle Grande deposit is located to the southeast of Colina and is 3.2 km long and 1 km wide,
striking northwest-southeast (Figure 7-6). The deposit is focussed on an irregular feldspar-quartz-

Cobre Panamá Project Technical Report March 2019
62
hornblende porphyry lopolith. The geological model for Valle Grande was created using sectional
interpretations orientated 40° east of north along 100 m section spacings. An oblique cross section of
the Valle Grande geological model is presented in Figure 7-11.
Figure 7-11 Oblique section looking northwest through the Valle Grande deposit
The most commonly logged alteration type logged at Valle Grande is propylitic. This is likely due to
the dominance of andesite as the host rock. Silica-chlorite alteration is irregular, often occurring deep
within the feldspar-quartz-hornblende porphyry dyke. Potassic alteration distribution is erratic, and
often occurs at depths of at least 200 m. The most coherent areas of potassic alteration occur in the
central part of the dyke. Phyllic alteration is also irregular and is commonly associated with the contact
between the porphyry dykes and the adjacent host rocks. Argillic alteration is most common in the
top 150 m of the deposit, often as a continuous zone. Patchy argillic alteration has also been logged
at 200 m to 300 m below surface, but does not correlate well between drill sections.
Several faults have been identified at Valle Grande as presented in Figure 7-12. Mineralisation at Valle
Grande is displaced by the northeast–southwest fault (red). The northwest-southeast fault (green)
and the north northwest-south southeast fault (blue) were used to terminate the mineralisation
interpretations.
In general, high grade copper mineralisation at Valle Grande is concentrated along the flanks of an
early porphyry lopolith, following the porphyry-andesite contacts. In these areas, quartz-sulphide
veinlet densities are high and magmatic-hydrothermal breccias consisting of polymict clasts supported
in a matrix of quartz and chalcopyrite are common (Sillitoe, 2013). Conversely, in the central core of
the porphyry, vein densities are reduced in conjunction with the copper tenor.
Narrow, post-mineralisation andesite dykes have been logged at Valle Grande with many interpreted
to have a sub-vertical orientation.

Cobre Panamá Project Technical Report March 2019
63
Figure 7-12 Faults identified at Valle Grande
Balboa
The Balboa deposit was discovered in late 2010 after testing of a geophysical target located 500 m
northwest of the Cuatro Crestas locality. The deposit was drilled on a 100 m by 100 m grid during
2011. A geological plan is presented in Figure 7-13. A geological model was created based on 100 m
spaced cross sections throughout the deposit. A northwest-southeast orientated cross section along
line D-D’ is presented in Figure 7-14 demonstrating the distribution of the different lithologies, fault
offsets and the interpreted mineralisation.
Mineralisation at Balboa is dominantly hosted by a feldspar-quartz-hornblende porphyry that intrudes
the adjacent andesite at a low to moderate angle, emanating from the north-northwest (Love, 2011).
Mineralisation is best developed in the central portion of the porphyry but weakens towards the
contacts with the andesite. The porphyry can locally be described as a crowded feldspar porphyry,
with variable percentages of feldspar and lesser quartz phenocrysts which range in size from 1 mm to
4 mm.

Cobre Panamá Project Technical Report March 2019
64
Figure 7-13 Geological plan of the Balboa deposit (Source: Rose et al, 2012)
Figure 7-14 Oblique section looking northeast through the Balboa deposit
Near the surface of the central part of the deposit there is a massive, grey, weakly porphyritic unit
distinguished by variably silicified and vuggy cavities. Extending to a maximum depth of 150 m below
surface, this unit is relatively low grade, with variable pyrite alteration but demonstrates little
evidence of oxidation and hence is not thought to be a leach cap. It is locally referred to as porphyry
“B” within the logging, and is thought to be a potential lithology cap to the mineralisation.

Cobre Panamá Project Technical Report March 2019
65
Andesite rocks throughout Balboa demonstrate variable propylitic alteration. Mineralisation is weakly
developed in the andesite and is dominated by pyrite. Local hornfels alteration is present and is
characterised by increased biotite and magnetite.
Minor granodiorite is present but at depth. It is characterised as a massive, equigranular and typically
unaltered unit with common hornblende crystals.
A variety of intermediate to felsic dykes have intruded Balboa, both during and post mineralisation.
These are typically massive, unaltered and contain grey to green feldspar phenocrysts. Orientations
with the core are typically low to moderate suggesting that the dykes are steep to moderately dipping.
These dykes are found throughout the deposit but are more abundant at depth and to the north of
the deposit. Their overall abundance is estimated at 7 % with an average thickness of 6 m but with
some reaching 20 m thick.
Alteration at Balboa is currently not well understood as it does not display the typical alteration
mineral assemblages seen within other deposits of the Cobre Panamá concession. Potassic alteration
at Balboa is extremely limited, even within highly mineralised and stockwork-rich areas. Alteration
zones are dominated by pervasive silica and argillic assemblages of variable intensities. The presence
of magnetite is a common characteristic of the Balboa deposit compared with Botija where
subsequent overprinting alteration phases have reduced the magnetite content. Propylitic
assemblages of chlorite and epidote are common throughout all rock types. In summary the alteration
pattern at Balboa is described as silicic to argillic, grading out to propylitic. Local phyllic alteration
assemblages have also been logged, but do not form consistently across the deposit (Rose et al, 2012).
Balboa is cross cut on the western margin by a north-trending fault termed the West Fault (Figure
7-14). The stratigraphy to the west of the fault demonstrates a normal displacement of up to 300 m.
In the north-northwest of the deposit this fault intersects the main mineralised keel of the deposit
with some of the thickest and best mineralised intercepts are present suggesting that the West Fault
may be an important control on mineralisation at Balboa. Other small metre scale faults have also
been logged at Balboa but any offset across these structures has not been established.
Mineralisation at Balboa is dominated by chalcopyrite with traces of bornite which occurs as fine
grained dissemination within the host porphyry and quartz stockworks. The quartz stockworks form
distinctive “A” and “B” type veinlets (Table 7-3) and are present throughout the central, higher grade
zones of the deposit. The quartz veins can exhibit vuggy or open space textures but typically the
central portion of the veins are filled with chalcopyrite and/or bornite mineralisation. It is the
presence of these intense stockwork zones and massive chalcopyrite veins which distinguish Balboa
from the other Cobre Panamá deposits.
No significant supergene chalcocite or copper oxide mineralisation is present at Balboa.
Minor deposits
Medio
Medio is located immediately east-northeast of the Colina deposit and 2 km northwest of the Botija
deposit. Mineralisation at Medio was first discovered by the UNDP crews following anomalous
molybdenum in stream sampling in 1968. Drilling has delineated a 1.3 km by 800 m area of low to

Cobre Panamá Project Technical Report March 2019
66
moderate grade porphyry mineralisation. Mineralisation is associated with silicified and sericitised
porphyritic intrusive rocks and brecciated andesite volcanics (Rose et al, 2012). Copper tenor appears
to be strongly correlated to vein and fracture intensity.
Botija Abajo
Botija-Abajo is approximately 2.5 km southeast of Botija. Drilling, completed mainly by PTC identified
two deposit areas, Botija Abajo East and Botija Abajo West (Figure 7-15). Mineralisation is primarily
located within feldspar-quartz-porphyry with some mineralisation extending into the andesitic tuffs.
Alteration is dominantly argillic (kaolinite, quartz and pyrite with stockworks of quartz and
chalcedony).
The eastern area has marked shallow, sub-surface leached copper followed by supergene enriched
gold and chalcocite down to depths of 80 m, with hypogene copper to depths of 200 m below surface.
Drilling across the eastern deposit has focussed on the shallow mineralisation, with the hypogene
copper mineralisation still largely open at depth. The eastern area strikes approximately southeast
with a strike length of 650 m and width of 150 m. The western area is dominantly hypogene copper
(mainly chalcopyrite) and approximately 500 m by 350 m. Mineralisation extends to at least 150 m
below surface.
A major northeast trending fault seperates the east and west deposit areas. Most of the Botija Abajo
copper mineralisation remains open at depth.
Figure 7-15 Plan view of the Brazo and Botija Abajo deposits showing drillhole collars and surface geology

Cobre Panamá Project Technical Report March 2019
67
Brazo
The Brazo deposit (Figure 7-15) is located approximately 3 km south-southeast of Botija. Copper and
gold mineralisation was identified in a feldspar-quartz porphyry with dominant sericite alteration
during drilling by Adrian Resources. Pyrite and quartz occur throughout. The Brazo area is
characterised mainly by porphyry with very little granodiorite or andesite occurrences. The position
and extents of the Brazo deposit were confirmed and developed by additional drilling completed by
MPSA. Supergene processes have resulted in some chalcocite development within the first 150 m
below surface. Immediately below the supergene zone, chalcopyrite, pyrite and minor bornite occur
down to depths of 350 m. The Brazo deposit has an approximate area of 600 m by 700 m and remains
open to the east, northeast and at depth.

Cobre Panamá Project Technical Report March 2019
68
DEPOSIT TYPE
The mineralised zones on the Cobre Panamá property are examples of copper-gold-molybdenum
porphyry deposits (Lowell and Guilbert, 1970). Common features of a porphyry deposit include:
Large zones (> 10 km2) of hydrothermally altered rocks that commonly show a crudely
concentric zoned alteration pattern on a deposit scale of a central potassic (K-feldspar) core to
peripheral phyllic (quartz-sericite-pyrite), argillic (quartz-illite-pyrite-kaolinite) and propylitic
(quartz-chlorite-epidote) altered zones.
Generally low grade mineralisation consisting of a variety of sulphide mineralisation styles
including disseminated, fracture, veinlet and quartz stockworks. Higher grade mineralisation is
typically associated with increased densities of mineralised veins and fractures.
Mineralisation is also typically zoned, with a chalcopyrite-bornite-molybdenite core and
peripheral chalcopyrite-pyrite to pyrite domains.
Enrichment of primary copper mineralisation by late-stage hypogene high sulphidation
hydrothermal events can sometimes occur.
Important geological controls on mineralisation include igneous contacts, cupolas and the
uppermost, bifurcating parts of stocks and dyke swarms. Intrusive and hydrothermal breccias
and zones of intensely developed fracturing, due to coincident or intersecting multiple
mineralised fracture sets, commonly coincide with the highest metal concentrations.
It is the opinion of the QP, David Gray, that there is sufficient evidence from the exploration methods
employed and the development thereof to support the characteristics of a mineralised porphyry
deposit. The integrity and quality of diamond drilled data used during this Mineral Resource estimate
was verified by the issuer through check re-logging and re-sampling programmes. Specifically,
historical exploration has:
used stream sediment and soil geochemical sampling to identify the locality of mineralised
porphyry anomalies
the targets identified from stream and soil geochemical sampling were confirmed and
delinetated through diamond drilling, which has:
o initially defined key deposit extents through a wide spaced grid of holes
o larger deposits (Botija and Colina) were then infill drilled
o diamond drilling methods with complete hole sampling were employed in order to
maximise definition of the extensive scale porphyry style of mineralisation
o diamond drill core samples were of an appropriate length and sample mass for the
disseminated and veinlet style of porphyry sulphide mineralisation
o drilled holes were sub vertically oriented and then directed at appropriate angles to
otpimise definition of mineralisation shape and structures.
Sample analysis included a robust set of multi element data in order to identify and define the
characteristic altered and zoned behaviour typical to a porphyry deposit.
In addition, the issuer has developed the geology model for the Mineral Resource estimate and has
considered the relevant characteristics of a porphyry deposit that is relevant to the domains of
mineralisation, by modelling:

Cobre Panamá Project Technical Report March 2019
69
Alteration zones for gypsum and anhydrite.
Analysis of relative sulphide composition changes combined with grade changes as associated
with different porphyry rock types and alteration.
Each deposit model has considered the zoned nature of the prevailing mineralisation through
careful definition of these respective and differently mineralised volumes.
Domains of mineralisation include high grade copper and gold zones with chalcopyrite and
bornite dominated sulphide mineralisation. These zones are similarly associated with higher
degrees sericitic alteration.
Domains of mineralisation have been geostatistically analysed and estimated in order to
minimise domain mixing and grade smearing.
Post-mineralisation intrusives that have no mineralisation have been considered in the
volume models.

Cobre Panamá Project Technical Report March 2019
70
EXPLORATION
The following summary information describes the exploration work completed prior to Project
acquisition. Whilst no further exploration work has been carried out by the issuer since acquisition,
the information is provided in the context of it being relied upon for certain interpretative aspects of
the current Mineral Resource estimation update.
Initial discovery
Copper-gold-molybdenum porphyry style mineralisation was first discovered in Central Panamá
during a regional stream sediment survey by a United Nations Development Programme (UNDP) team
between 1966 and 1969. Follow up drilling by the UNDP in the 1969 led to the discovery of Botija
East, Colina and Valle Grande. Later exploration by several companies has since outlined four large
and several smaller deposits in the Cobre Panamá concession. An overview of the history of the
Project has been presented in Table 6-1. Significant results of the historical exploration are presented
below and additional information on the drill programmes is presented in Item 10.
Historical regional surveys
Adrian Resources completed soil and auger geochemical sampling across most of the concession
between 1992 and 1995. Line spacing was 200 m with more detailed coverage (50 m – 100 m) around
the known deposits. An approximate total of 8,000 soil samples were collected during this period at
depths of between 5 cm to 20 cm below surface. Analysis was completed by TSL in Saskatoon, Canada
for copper, gold and molybdenum. In addition, 3,600 auger samples were taken at depths ranging
from 50 cm to 90 cm where anomalous Cu and Mo were detected. Further details on these
programmes are presented in McArthur et al. (1995).
Between 1990 and 1992, Inmet (then Minnova) implemented reconnaissance-scale rock sampling
(890 samples) and grid-based rock (172 samples) and soil (265 samples) sampling of the rock
lithogeochemistry. Other sampling regimes included detailed sampling in areas of suspected
mineralisation by Adrian and reconnaissance and silt sampling during mapping fieldwork in areas
investigated for mine infrastructure locations by Teck. A summary map of the results is presented in
Figure 9-1 and shows that near-surface copper mineralisation is present across several areas of the
Cobre Panamá concession, including the upper Rio del Medio drainage and north of the Botija deposit.
Geophysical surveys collected over the Cobre Panamá project include a 105.2 km IP survey completed
by Arce Geofisco of Lima, Peru, for PTC in 2008. The survey was completed on north-south oriented
lines at a 200 m spacing using a pole-pole array with a spacing of 50 m and n=5. The survey
demonstrates a well-defined chargeability associated with the Botija deposit and the eastern edge of
the Valle Grande deposit with a number of smaller anomalies occurring along the southeastern trend
between Botija and Botija Abajo deposits (Figure 9-2).

Cobre Panamá Project Technical Report March 2019
71
Figure 9-1 Summary of soil geochemistry over Cobre Panamá (source: Rose et al, 2012)
Figure 9-2 Plan of IP Chargeability at -150 m level (source: Rose et al, 2012)

Cobre Panamá Project Technical Report March 2019
72
DRILLING
The following information describes the drilling activities carried out prior to Project acquisition as
well as by the issuer since acquisition. The information is provided in the context of it being relied
upon for the current Mineral Resource estimation update. The issuer has verified the drillhole core
logging data with check re-logging and has verified sample analysis with a programme of check
assaying.
Introduction
Since 1968 a number of drill programmes have been conducted over the concession area to test the
extent of porphyry copper mineralisation. Details of the drill programmes across the Cobre Panamá
Project area are summarised in Table 10-1 and Table 10-2.
Table 10-1 Summary of drilling by operator and area to August 2013
Programme Years BOTIJA COLINA-MEDIO VALLE GRANDE
No of holes Metres
No of holes Metres
No of holes Metres
UNDP 1968-1969 25 1,336.7 25 1,322.6 8 628.9
PMRD 1970-1976 20 5,249.3 30 7,236.2 1 207.1
Adrian 1992-1995 58 17,789.9 49 10,218.7 114 24,185
Teck 1996-1997 47 11,356 74 17,519.1 19 3,081.8
PTC 2006-2008 45 2,229.6 4 268.2 44 2,271.6
MPSA 2007-2018 259 57,520.2 95 27,630.6 79 15,854.7
Total 454 95,481 277 64,195 265 46,229
Programme BALBOA BOTIJA ABAJO - BRAZO OTHER TOTALS
No of holes Metres No of holes Metres No of holes Metres No of holes Metres
UNDP - - - - - - 58 3,288
PMRD - - - - - - 51 12,693
Adrian 5 669.3 30 5,064.5 140 18,063.8 396 75,991
Teck - - 7 600.7 20 2,385.8 167 34,943
PTC 22 3,272.6 193 2,2341 - - 308 30,383
MPSA 94 49,545.3 65 22,008.5 241 18,918 833 191,478
Total 121 53,487 295 50,015 401 39,368 1,813 348,775 NOTE: UNDP: United Nations Development Programme, PMRD: Panamá Mineral Resources Development, PTC: Petaquilla Copper, MPSA:
Minera Panamá SA
As at February 2018, 1813 holes had been drilled for 348,775 m. Since acquisition, the issuer has
drilled 8 diamond drilled holes across the Botija deposit as well as 2,911 by 45 m deep reverse
circulation grade control holes across Botija’s pre-strip area. End November 2018 was the cut-off
date for drilling data used for the Mineral Resource estimate described in Item 14.

Cobre Panamá Project Technical Report March 2019
73
Historical drilling
United Nations Development Programme (1967-1969)
From October 1968 to June 1969 the UNDP team drilled 58 holes (3,288 m) at Botija, Colina and Valle
Grande. Core recovery averaged 70%. No core exists from this phase of drilling, and geology from the
drill holes was used to develop the geological model. The assay information was not used in the
estimation process. A map of the UNDP drill hole collars is presented in Figure 10 1.
Table 10-2 Summary of drilling by area (current to August 2013)
Area Number of Holes Total Metres
Botija 454 95,481
Colina-Medio 277 64,195
Valle Grande 265 46,229
Balboa 121 53,487
Botija Abajo-Brazo 295 50,015
Port 55 1,248
Tailings 144 7,006
Plant 22 2,850
Botija S dump 21 2,983
Others 159 25,281
Total 1,813 348,775
Figure 10-1 Plan view of UNDP drill hole collar locations (Source: MPSA, 2014)
Panamá Mineral Resources Development (PMRD)
Between 1970 and 1976, PMRD drilled 51 holes (12,693 m) to test the extent of mineralisation in the
main deposits. Holes tested the Botija and Colina deposits using a drill spacing of approximately 200
m. One hole was drilled at Valle Grande. These holes have been re-surveyed. The assay and geological
information from these holes is included in the database and they have been used in the geological
COLINA
VALLE
GRANDE
BOTIJA

Cobre Panamá Project Technical Report March 2019
74
modelling for the Colina and Botija deposits. A map of the collar locations from this programme is
presented in Figure 10-2.
Core recovery averaged 95.5% (PMRD, 1977). Core recovery was poor in weathered intervals but
excellent in fresh rock. No drill core, sample rejects or pulps from this drilling campaign remains.
Adrian Resources (1992-1995) (Inmet-Adrian – Georecursos)
Adrian Resources, a Vancouver-based company, ran the project from 1992 to 1995 and drilled a total
of 396 drill holes for 75,991 metres (Figure 10-3). Drilling was completed using three F-1000 hydraulic
drills and one Longyear 38 by Falcon Drilling of Prince George, B. C. Helicopter transport around site
was supplied by Coclesana SA with the main operation based out of the Botija camp.
Core recoveries were generally poor in overburden (20% to 80%) but very good, near 100%, in fresh
material. Core diameter was thin-wall B (BTW) or NQ.
Figure 10-2 Plan view of PMRD (blue) and UNDP (red) collar locations (Source: MPSA, 2014)
At Botija, infill drilling was completed with vertical holes down to a spacing of 100 m. At Colina, vertical
holes concentrated on testing the southwest gold zone and the main deposit to a drill spacing of 200
m. Drill spacing at Valle Grande varied from 100 m to 200 m with most of the holes drilled with an
azimuth of 220° or 40° and a dip of -50° to intersect a hypothesised northwest-trending structural
grain. Successes included the discovery and drillout of the Moléjon Gold zone. Exploration drilling of
several smaller targets included Botija Abajo, Brazo and Medio.
Skeleton core from most holes is available and stored at the MPSA New Camp core storage facility.
During the period 1998 to 2006, exposure of the core boxes holding the original core to weather and
insects destroyed many boxes left at Colina Camp core racks. In 2006 efforts were made to recover
the core by placing it in new boxes but some uncertainty remains as to whether cores are in their
correct positions in the new boxes.
COLINA
VALLE
GRANDE
BOTIJA

Cobre Panamá Project Technical Report March 2019
75
Figure 10-3 Drilling by Adrian Resources (pink), PMRD (blue) and UNDP (red) (source: MPSA, 2014)
Teck (1996-1997)
Teck completed two phases of drilling across the Cobre Panamá concession as part of an infill drill
campaign consisting of 167 holes totalling 34,943 m. Drilling concentrated on the Botija, Colina, Valle
Grande and Moléjon deposits. Drilling commenced in 1996, with an initial 124 holes. The campaign
continued in 1997, with drilling aimed at collecting metallurgical test samples from both Botija and
Colina, as well as testing for higher grade zones at Valle Grande, exploration of Medio and step-out
and continued infill drilling at Moléjon.
A plan of the drill collars, with the Teck drilling colour coded by year, is presented in Figure 10-4.
Figure 10-4 Drilling by Teck – 1996 (green) and 1997 (yellow), Adrian (pink), PMRD (blue) and UNDP (red) (Source: MPSA, 2014)

Cobre Panamá Project Technical Report March 2019
76
Petaquilla Copper (2006-2008)
From 2006 to 2008 PTC drilled a total of 308 holes for 30,383 m using helicopter-supported Longyear
38 drills. Holes at Botija and Valle Grande assessed the potential for oxide copper mineralisation while
drilling at Botija Abajo assessed potential for gold mineralisation. In addition, several exploration
targets, including Brazo, Cuatro Cresta and Lata were drilled (Figure 10-5).
Figure 10-5 Drillhole collar map with PTC holes coloured green (source: MPSA, 2014)
MPSA (2007-2018)
During the period October 2007 to August 2013, MPSA drilled a total of 825 HQ holes totalling 188,996
m. Cabo Drilling Panamá Corp. provided the drilling services using a variety of drill machines.
Equipment moves were completed using helicopters provided by Heliflight Panamá S.A.
More recently (2017-2018), the 8 diamond holes and 2,911 reverse circulation (RC) holes across Botija
were drilled by the AKD International drilling company.
Drilling focussed on several key objectives:
increase the drill density at Botija, Colina, Valle Grande and Balboa to calculate Indicated
Mineral Resources
collect metallurgical test work samples from Botija (seven holes), Colina (five holes), Valle
Grande (four holes) and Brazo (one hole)
complete geotechnical holes at Botija and Colina
complete condemnation drilling at possible plant site locations and in the tailings dam area
start-up of RC grade control drilling across the Botija pre-strip area
Between 2011 and 2012 the Balboa deposit was discovered and a 94 hole drill out was completed.
COLINA BOTIJA
VALLE GRANDE
BOTIJA
ABAJO
BRAZO
CUATRO
CRESTAS

Cobre Panamá Project Technical Report March 2019
77
Core recovery data from MPSA, Teck and Adrian range from 1% to 100%, with an overall average of
93%. Less than 5% of the sample intervals have recoveries below 50%, whilst over 90% of the data
have recoveries above 80%.
A map of the MPSA drill collars over the Cobre Panamá concession is presented in Figure 10-6.
In addition to diamond drilling, MPSA started with RC drilling across the Botija pre-strip area as a pre-
cursor to future mining grade control. As at the end of November 2018, 2911 RC holes had been
completed. The RC holes have been drilled 45 m vertically on a 15 mE by 15 mN grid.
Figure 10-6 MPSA (red) drill collar positions at Cobre Panamá; PTC (green), Teck (pink) and all other companies (black) are shown for reference (source: MPSA, 2014)
Collar surveying
Before April 2009, all drillhole collars were surveyed in North American Datum 27 (NAD 27), Canal
Zone. Subsequent to this date, all historical collar locations were converted to and any new holes were
located using WGS 84, Zone 17N, which is the geographic projection for all engineering work on the
Project. WGS 84 coordinates are 19.7 m east and 207.1 m north of NAD 27, Canal Zone in the area of
the concession.
Pre-2006 drill programmes
A number of holes drilled by Adrian were located using global positioning system (GPS) surveys
conducted using a Trimble 4000 SE instrument and base station. Teck surveyed most holes in the
Botija, Colina, Valle Grande and Moléjon deposits by conventional methods (total stations). Locations
of many of the drillholes testing regional exploration targets are approximate, located using hip chain
and compass traverses from known locations or on hand-help GPS readings.
BOTIJA
ABAJO
BRAZO
BOTIJA COLINA
MEDIO
VALLE GRANDE
BALBOA

Cobre Panamá Project Technical Report March 2019
78
Petaquilla Copper (2006-2008)
Holes drilled by PTC were surveyed using hand-held GPS. In late 2009, MPSA re-surveyed 46 of the
177 holes drilled by PTC in the Botija Abajo and Brazo area using a Topcon HiPer Lite plus differential
GPS system and found no discernible difference between the two pickups. Coordinate conversion
discrepancies were noted by FQM database administrators early in 2014, which resulted in a
consistent 19 metre north south shift of some collars. All PTC drilled hole collars were re-surveyed by
FQM during early 2014 and have been corrected in the database.
MPSA (2007-2013)
Holes drilled by MPSA during 2007 and 2009 were located in the field using a GARMIN GPS-60CSx
hand-held GPS unit and were later confirmed using a differential GPS system and base station by
contractors GeoTi S.A. All of the MPSA holes have been surveyed in this manner, to an accuracy of
5 cm.
In 2008 GeoTi SA were contracted to re-survey 61 historical drillholes (11% of the database). All collar
co-ordinates were found to be within 5 m of the original historical co-ordinates except for one hole,
B96-33, which was 10 m southwest of the original location. The large majority of these holes were
adjusted southwest of the original survey position.
MPSA checked the location of another 29 holes using a hand-held Garmin GPS 60Csx during the 2007-
2009 field programmes. All locations were validated except Botija hole LBB-038, which was located in
the field 33 m west and 35 m south of the original historical surveyed collar coordinate. This hole was
corrected in the database.
Three drill holes collars at the Medio deposit were discovered in the field to be located in the wrong
places. They were re-surveyed by GeoTi SA and corrected in the MPSA database to the correct
positions (ME9669, ME9664, and ME97-03).
Since 2009 all MPSA drill holes were surveyed by GeoTi SA using a differential GPS system and base
station after the holes were completed.
Downhole surveying
Historical drilling
There are no records of downhole surveys for holes drilled prior to 1992.
Holes drilled between 1992 and 1997 by Adrian and Teck were surveyed downhole using a Tropari
device or acid tests. Vertical holes commonly only had one test near the bottom of the hole as
readings rarely deviated more than 1°. Inclined holes normally deviated with depth by several degrees
and required two to three tests per hole. Spurious results were discarded. Probable sources of error
include the abundance of magnetite in some area and rock types and possible equipment malfunction
due to corrosion in the tropical climate.
No downhole surveys were completed on the PTC drilling. Most of the holes are vertical and shallow,
and due to the HQ core size, significant deviation is unlikely.

Cobre Panamá Project Technical Report March 2019
79
MPSA
Downhole surveys were completed on all geotechnical holes using a Reflex Maxibor II instrument. All
resource holes greater than 300 m in depth were surveyed using the Maxibor instrument or the FLEXIT
smart-tool single shot at 60 m downhole increments. In 2011, MPSA purchased a REFLEX Gyro E596
downhole surveying instrument to negate the effect of magnetic interference. Holes deeper than 300
m were surveyed at 10 m intervals.

Cobre Panamá Project Technical Report March 2019
80
SAMPLE PREPARATION, ANALYSES AND SECURITY
Historical data
UNDP
No record of the sampling preparation, analyses and security used by UNDP remains. No core has
been recovered from this phase of drilling. Holes from this phase of drilling were not used to develop
the geological or resource model.
PMRD
The core from the PMRD drill programme was split with a mechanical splitter with samples being taken
at 2 m intervals downhole. Samples were pulverised and sent for assay at Direction General de
Recursos Minerales of Panamá where they were analyzed for Cu and Mo using atomic absorption.
Thirty duplicate umpire samples were assayed at the Central Research Lab of Mitsui Smelting and
Mining Limited for check assaying. The umpire results were slightly higher than the original Direction
General de Recursos Minerales results, but were reported to be within acceptable limits (Rose et al,
2012). The Mitsui results averaged 0.597% Cu and the Panamá results averaged 0.578% Cu.
Two PMRD holes were twinned by Adrian and Teck for grade comparison (Simons, 1996). Holes with
adjacent holes were also identified in the western part of Colina and Botija; some differences were
noted but generally the data was validated by nearby holes.
Adrian/Teck
Procedures in place during the Adrian/Teck drilling campaigns are summarized below:
Core was delivered to the core logging and sampling facility at Colina and marked into 1.5 m
intervals. Geological logging was completed by Canadian geologists hired by Adrian and
included collection of geological data, including lithology, alteration, mineralisation and
structure. Geotechnical logging was completed by Panamánian geologists hired by Georecursos
and included recovery and RQD values.
Samples were 1.5 m in length, measured from the collar of the hole. Samples were split using
a mechanical splitter with half of the core being archived and the other half crushed and split
with a Jones splitter. The archived core is no longer available. A one-eighth split weighing
approximately 250 g was taken for each interval for analysis. Rejects were stored on site in
plastic bags. Crushing and splitting equipment was cleaned using an air hose between each
sample.
Metallurgical samples averaged 4.5 m in length, but lengths were modified to observe changes
in lithology. Metallurgical samples were whole core sampled.
Analysis was completed at TSL Laboratories in Saskatoon, Canada. Copper analysis was
performed by acid digestion of a 0.5 gram sample and analysed by atomic absorption (AA).
Molybdenum analysis was performed by acid digestion of a 1 gram sample and analysed by AA.
A 30 gram aliquot was used for gold analysis by fire-acid with an AA finish and silver was
analysed using acid digestion of a 2 gram sample with AA.

Cobre Panamá Project Technical Report March 2019
81
Petaquilla Copper
Sample preparation, transport and analytical procedures for the PTC drilling are summarised below:
Core samples were transferred into metal trays and dried at 115°C in an electric drying oven for
three to six hours. In the event of interrupted power supply, samples were dried in a room
heated by wood-fired stoves to approximately 60°C.
After drying, samples were immediately sent to the crusher (a small BICO jaw crusher) where
the entire sample was crushed to approximately a 5 mm to 6 mm particle size. The crusher was
cleaned between sample by crushing a small amount of blank basalt, and cleaning with
compressed air.
Using a Jones Splitter or rifle splitter (12 mm openings) a 250 gram aliquot was taken, with the
reject material being stored in plastic bags, labelled and stored undercover on site. The sample
aliquot was placed in a small, durable plastic bags, labelled and heat sealed. Approximately 60
samples were then placed in large woven plastic (rice) bags which were tied and clearly marked
ready for dispatch.
The sample preparation facility was locked when not operational in order to monitor sample
integrity.
Samples were transported by truck to Panamá City from the PTC office at La Pintada on a twice
weekly basis. They were then shipped using FedEx to either SGS Laboratories in Lima, Perú, or
ALS Chemex in Vancouver, Canada.
Samples sent to SGS Laboratories in Lima, Perú were analysed for sequential copper, gold, silver,
total copper and molybdenum. Samples sent to ALS Chemex in Vancouver were analyzed for
gold using a 50g fire assay with a gravimetric finish and copper, silver, molybdenum and a
selection of multi-elements using ICP-MS.
MPSA
Sample preparation
Samples from diamond core and RC chips were placed within aluminium trays and dried in ovens for
12 hours at 90°C. Once dry, the entire sample (approximately 8 kg) was crushed in a Rocklabs Boyd
crusher to a -10 mesh (2 mm) particle size. Sieve tests were conducted regularly (at least twice a day)
to ensure that the material was being crushed to the appropriate size. The equipment was cleaned
after every sample using high-pressure air and after every tenth sample a coarse blank sample was
passed through the crusher.
The crushed sample material was split using a Jones rifle splitter and a 500 g aliquot taken for assay.
The aliquot was placed in a small plastic bag which was heat sealed and marked with a bar-coded
sample tag. The reject material was returned to the original sample bag and stored on site.
Assaying
The sample aliquots were shipped by air courier to ALS Chemex Lima in Lima, Perú, for analysis.
Umpire assay checks and secondary assay work was conducted by Acme Santiago in Santiago, Chile.
Both labs have ISO/IEC 17025-2005 certification.

Cobre Panamá Project Technical Report March 2019
82
Upon receipt of the samples by ALS Chemex, the bar code on the assay sample bag was scanned. Half
of the sample (250 grams) was pulverised using a LM5 pulveriser using low-chrome steel equipment
resulting in 85% of material passing 75 µm. Copper assays were conducted using atomic absorption
spectrometry (AAS) after a four-acid digestion (HF-HNO3-HClO4-HCL). Gold analyses were by fire assay
and AAS analysis on a 30 gram sample. Silver and molybdenum were included as part of a multi-
element ICP-AES analysis. Total sulphur was analyzed using a LECO induction furnace.
Near-surface samples were analysed for sequential copper to estimate the amount of leachable
copper. Sulphuric, cyanide and citric-acid soluble copper and residual copper values were reported
for each sample.
Residual pulps were stored at either ALS Chemex in Lima, Perú, or at a storage warehouse at FQM’s
Minera Antares office in Arequipa, Peru. Residual pulps were discarded after 3 years due to oxidation
and a reduced ability to repeat original assays. All MPSA drill core is however safely and securely
stored in warehouses located on the Cobre Panama site.
Sample security – chain of custody
All assay samples were kept in a locked facility on site until they were ready for shipment. Samples
for a given hole were batched once the entire hole had been logged and sampled. Samples were
collected into larger bags in batches of approximately 90 samples per bag. Samples to be assayed for
sequential copper were batched into bags of 20 to 25 samples. Several times a week, the samples
were dispatched by road to a secure warehouse in Penonomé by MPSA staff. While in storage,
generally for less than two days, samples were kept under locked conditions until picked up by DHL
cargo shipping. DHL then airfreighted the samples to ALS Chemex Laboratory in Lima, Peru.
QAQC
A detailed review of all the historical and current QAQC practices, QAQC data and historical QAQC
reports at Cobre Panamá has been undertaken in order to determine the accuracy, precision and bias
present in the drillhole assay data for the Project area.
FQM provided the QAQC data, historical NI 43-101 reports and recent data validation reports in order
for this review to be completed.
QAQC programme history
Since 1968 a number of drill campaigns have been conducted over the Cobre Panamá concession area
to test the extent of the porphyry copper mineralisation.
The establishment of a rudimentary QAQC system did not occur until the 1970s when PMRD initiated
a small programme of umpire check analyses. Thirty duplicate samples were sent to the Central
Research Lab of Mitsui Smelting and Mining Limited for check assay. The Direction General de
Recursos Minerales of Panamá assays were determined to be slightly lower, but within acceptable
limits. The Mitsui results averaged 0.597% Cu and the Panamá results averaged 0.578% Cu. Results
of this work were deemed satisfactory, (AMEC 2007).
Adrian continued with the check assay programme between 1992 and 1995, sending a small number
of check samples to XRAL, Canada for analysis of copper, and XRAL and ALS Vancouver, Canada for

Cobre Panamá Project Technical Report March 2019
83
analysis of gold. Francois-Bongarcon completed a review of the check pulp assay results for copper
and gold (Francois-Bongarcon, 1995). The repeatability of gold assays at XRAL and ALS Vancouver
were both very poor. Francois-Bongarcon concluded that the TLS – XRAL gold duplicate samples were
not correlated at all, and stated that this was either due to errors at one of the laboratories, or as a
consequence of severe errors during assay preparation. He concluded that “QA-QC procedures
urgently need to be audited and tightened up, and past problems need to be properly investigated
without delay”, and recommended further action to determine the cause of the bias. Following this
recommendation, Adrian (then Petaquilla Mining Limited) adopted detailed QAQC protocols designed,
implemented and monitored by AAT Mining Services, (Behre Dolbear, 2012).
During the period 1996 to 1997 Teck Cominco began to implement the new QAQC sampling
procedures, regularly inserting CRM standards into the sample submissions. Teck Cominco also
routinely submitted one in fifteen samples for umpire check analysis to ALS Vancouver.
Implementation of the QAQC sampling procedures began in earnest during the PTC drilling
programmes undertaken between 2006 and 2009. CRM standards, field duplicates, blanks and coarse
crush duplicates were regularly inserted into the assay submissions sent to ALS Lima, ALS Vancouver
and SGS Lima for assay. Several programmes of check analysis were also undertaken during this period
and included coarse umpire checks and pulp checks. Bruce Davis of BD Resource Consulting Inc.
undertook regular reviews of the PTC QAQC data. A detailed examination of all the available PTC
QAQC data has been undertaken as a part of the QAQC review.
MPSA has continued to collect and review the QAQC data since the beginning of the FEED programme
in October 2007. CRM standards, blanks, field duplicates, coarse crush duplicates and pulp umpire
checks have been routinely collected and submitted to ALS Lima and ACME Santiago Chile. Regular
reviews of the QAQC data have been undertaken by MPSA personnel and corrections made to the
database when an error was identified. In addition, Optiro completed a detailed review of all the
available MPSA QAQC data as a part of the QAQC review.
CRM standard performance
A total of twenty eight different CRM standards have been submitted for analysis with drillhole
samples collected by PTC and MPSA at Cobre Panamá (Table 11-1).
Detailed analysis of the CRM standard performance has been undertaken by drilling programme, assay
laboratory and assay method. Numerous CRM standard swaps and drillhole sample results have been
identified in the PTC QAQC data; however, once these errors have been corrected, the CRM standard
performance is acceptable. It is evident from the number of errors that the data was not reviewed by
PTC during the drilling programme and it is strongly recommended that FQM corrects the errors in the
corporate database.
The MPSA CRM standard performance is considerably better than that of PTC, with only a few CRM
standard swaps identified. Five copper CRM standards with bias outside accepted limits are present,
two CRM standards are in the low grade range, two in the medium grade range and one in the high
grade range (Table 11-1).

Cobre Panamá Project Technical Report March 2019
84
This indicates the possibility that the low grades are being overstated and the higher grades are being
understated in sample batches which have been assayed with these CRM standards; however, there
may still be sample swaps present in four of the five CRM standards.
Table 11-1 CRM standards submitted with Cobre Panamá samples
Standard ID Number
CDN-CGS-11 255
CDN-CGS-12 250
CDN-CGS-16 372
CDN-CGS-18 293
CDN-CGS-19 446
CDN-CGS-22 197
CDN-CGS-23 106
CDN-CGS-24 402
CDN-CGS-27 192
CDN-CGS-28 200
CDN-CGS-3 2
CDN-CM-1 520
CDN-CM-13 136
CDN-CM-15 177
CDN-CM-24 214
CDN-CM-4 216
CDN-CM-8 408
CDN-FCM-4 46
CDN-FCM-5 39
CDN-HLHZ 43
OREAS 152a 404
OREAS 153a 297
OREAS 50Pb 146
OREAS 51P 62
OREAS 52P 8
OREAS 52Pb 129
OREAS 53Pb 116
OREAS 54Pa 142
TOTAL 5,818
Table 11-2 CRM Standards extreme bias, Cu%
CRM standard ID Cu% Number of
standards submitted
Number of potential
swaps Expected
value Actual mean
Bias Type
CDN-CGS-16 0.112 0.116 3.80% LG 342 2
CDN-CGS-19 0.132 0.137 4.16% LG 437 5
CDN-CGS-28 2.089 2.016 -3.51% HG 200 0
OREAS 50 Pb 0.744 0.720 -3.20% MG 67 4
OREAS 54 Pa 1.550 1.498 -3.39% MG 68 1
Detailed review of the CRM standard data has identified minor problems with the labelling of CRM
standards; however, this is not considered to be problematic. It is recommended that any CRM
standard swaps which have been identified are corrected in the corporate database.
The recent RC grade control drillhole sampling at Botija has included eight CRM standards for Cu, Mo
and Au assaying. These include CDN-CGS-26, CDN-CM-29, CDN-CM-25 to 27, OREAS-503c, OREAS-
151b, OREAS-601. Anomalous standard behaviour was detected from OREAS-503c and OREAS-601
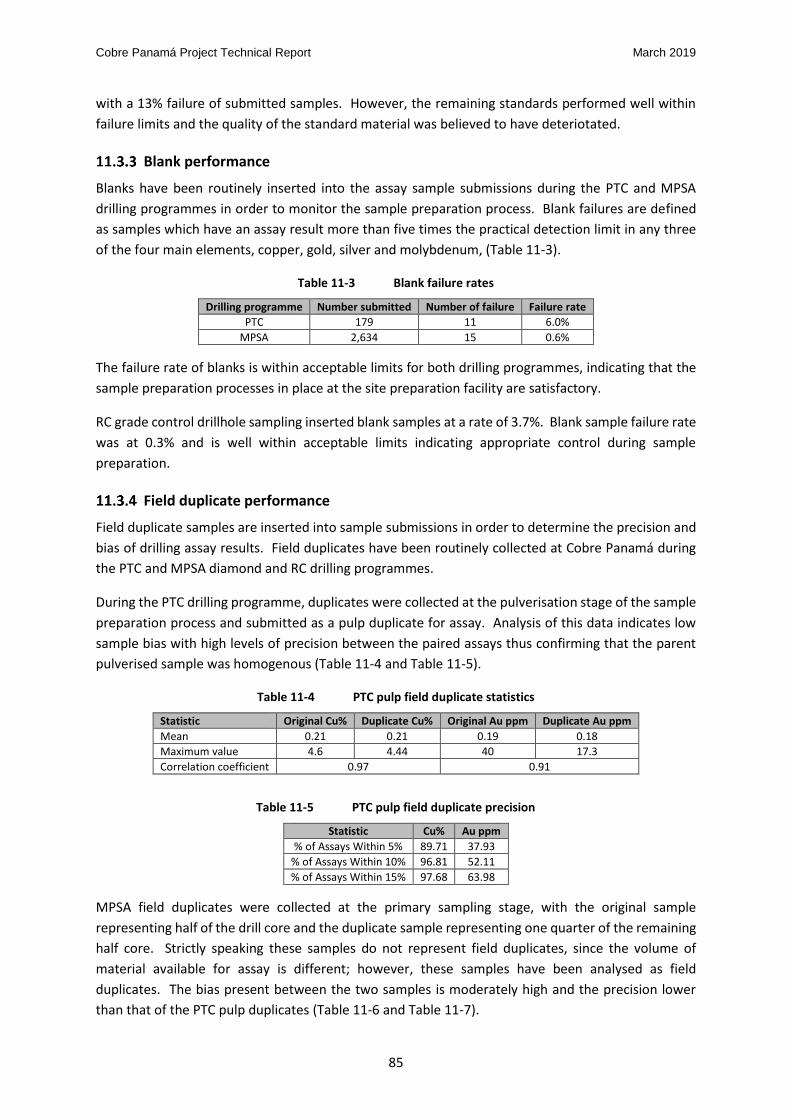
Cobre Panamá Project Technical Report March 2019
85
with a 13% failure of submitted samples. However, the remaining standards performed well within
failure limits and the quality of the standard material was believed to have deteriotated.
Blank performance
Blanks have been routinely inserted into the assay sample submissions during the PTC and MPSA
drilling programmes in order to monitor the sample preparation process. Blank failures are defined
as samples which have an assay result more than five times the practical detection limit in any three
of the four main elements, copper, gold, silver and molybdenum, (Table 11-3).
Table 11-3 Blank failure rates
Drilling programme Number submitted Number of failure Failure rate
PTC 179 11 6.0%
MPSA 2,634 15 0.6%
The failure rate of blanks is within acceptable limits for both drilling programmes, indicating that the
sample preparation processes in place at the site preparation facility are satisfactory.
RC grade control drillhole sampling inserted blank samples at a rate of 3.7%. Blank sample failure rate
was at 0.3% and is well within acceptable limits indicating appropriate control during sample
preparation.
Field duplicate performance
Field duplicate samples are inserted into sample submissions in order to determine the precision and
bias of drilling assay results. Field duplicates have been routinely collected at Cobre Panamá during
the PTC and MPSA diamond and RC drilling programmes.
During the PTC drilling programme, duplicates were collected at the pulverisation stage of the sample
preparation process and submitted as a pulp duplicate for assay. Analysis of this data indicates low
sample bias with high levels of precision between the paired assays thus confirming that the parent
pulverised sample was homogenous (Table 11-4 and Table 11-5).
Table 11-4 PTC pulp field duplicate statistics
Statistic Original Cu% Duplicate Cu% Original Au ppm Duplicate Au ppm
Mean 0.21 0.21 0.19 0.18
Maximum value 4.6 4.44 40 17.3
Correlation coefficient 0.97 0.91
Table 11-5 PTC pulp field duplicate precision
Statistic Cu% Au ppm
% of Assays Within 5% 89.71 37.93
% of Assays Within 10% 96.81 52.11
% of Assays Within 15% 97.68 63.98
MPSA field duplicates were collected at the primary sampling stage, with the original sample
representing half of the drill core and the duplicate sample representing one quarter of the remaining
half core. Strictly speaking these samples do not represent field duplicates, since the volume of
material available for assay is different; however, these samples have been analysed as field
duplicates. The bias present between the two samples is moderately high and the precision lower
than that of the PTC pulp duplicates (Table 11-6 and Table 11-7).
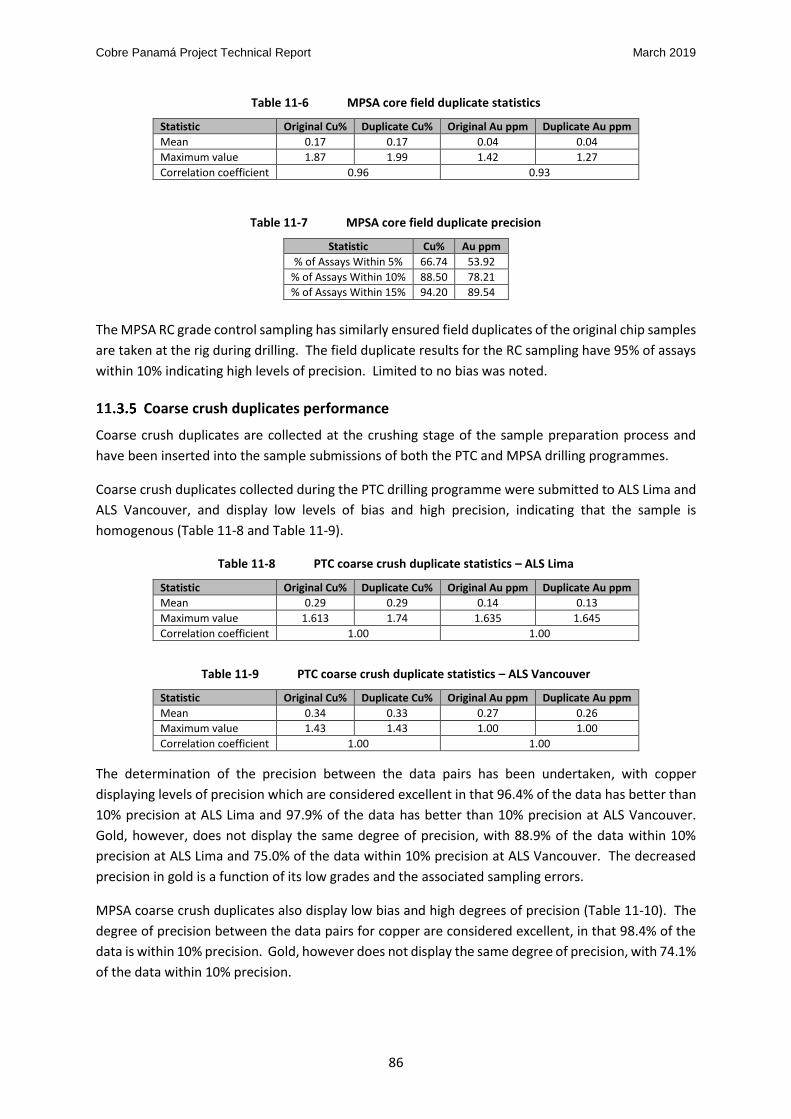
Cobre Panamá Project Technical Report March 2019
86
Table 11-6 MPSA core field duplicate statistics
Statistic Original Cu% Duplicate Cu% Original Au ppm Duplicate Au ppm
Mean 0.17 0.17 0.04 0.04
Maximum value 1.87 1.99 1.42 1.27
Correlation coefficient 0.96 0.93
Table 11-7 MPSA core field duplicate precision
Statistic Cu% Au ppm
% of Assays Within 5% 66.74 53.92
% of Assays Within 10% 88.50 78.21
% of Assays Within 15% 94.20 89.54
The MPSA RC grade control sampling has similarly ensured field duplicates of the original chip samples
are taken at the rig during drilling. The field duplicate results for the RC sampling have 95% of assays
within 10% indicating high levels of precision. Limited to no bias was noted.
Coarse crush duplicates performance
Coarse crush duplicates are collected at the crushing stage of the sample preparation process and
have been inserted into the sample submissions of both the PTC and MPSA drilling programmes.
Coarse crush duplicates collected during the PTC drilling programme were submitted to ALS Lima and
ALS Vancouver, and display low levels of bias and high precision, indicating that the sample is
homogenous (Table 11-8 and Table 11-9).
Table 11-8 PTC coarse crush duplicate statistics – ALS Lima
Statistic Original Cu% Duplicate Cu% Original Au ppm Duplicate Au ppm
Mean 0.29 0.29 0.14 0.13
Maximum value 1.613 1.74 1.635 1.645
Correlation coefficient 1.00 1.00
Table 11-9 PTC coarse crush duplicate statistics – ALS Vancouver
Statistic Original Cu% Duplicate Cu% Original Au ppm Duplicate Au ppm
Mean 0.34 0.33 0.27 0.26
Maximum value 1.43 1.43 1.00 1.00
Correlation coefficient 1.00 1.00
The determination of the precision between the data pairs has been undertaken, with copper
displaying levels of precision which are considered excellent in that 96.4% of the data has better than
10% precision at ALS Lima and 97.9% of the data has better than 10% precision at ALS Vancouver.
Gold, however, does not display the same degree of precision, with 88.9% of the data within 10%
precision at ALS Lima and 75.0% of the data within 10% precision at ALS Vancouver. The decreased
precision in gold is a function of its low grades and the associated sampling errors.
MPSA coarse crush duplicates also display low bias and high degrees of precision (Table 11-10). The
degree of precision between the data pairs for copper are considered excellent, in that 98.4% of the
data is within 10% precision. Gold, however does not display the same degree of precision, with 74.1%
of the data within 10% precision.

Cobre Panamá Project Technical Report March 2019
87
Table 11-10 MPSA coarse crush duplicate statistics
Statistic Original Cu% Duplicate Cu% Original Au ppm Duplicate Au ppm
Mean 0.190 0.191 0.043 0.044
Maximum value 5.63 5.43 2.69 2.81
Correlation coefficient 1.00 0.89
The results of the coarse crush duplicate analysis indicate that the sample has been adequately
homogenised during the crushing stage of the sample preparation process.
Umpire check laboratory performance
Check assaying has been undertaken to some degree during every drilling campaign undertaken at
Cobre Panamá. PMRD undertook the first programme of check analysis when it submitted samples
to the Central Research Laboratory of Mitsui Smelting and Mining Limited for analysis of copper. The
results were deemed to be satisfactory (AMEC, 2007).
Adrian re-submitted a batch of pulp samples to XRAL Canada and a batch to ALS Vancouver for analysis
of copper and gold. The results were mixed, with XRAL replicating the TSL copper assays adequately;
whereas there was considerable scatter and poor correlations between the TSL vs XRAL gold assays,
and the ALS Vancouver vs TSL gold assays. Francois-Bongarcon (1995) raised concerns about the data
and recommended the implementation of a detailed QAQC process, which was later undertaken by
Teck Cominco and PTC.
In 1996 Teck Cominco submitted one in 15 samples to ALS Vancouver for check assay analysis. Table
11-11 details the averages of the results from the two laboratories. The data suggests that there is a
small bias in the copper data, but the bias was considered to be insignificant by AMEC (2007). Gold
appears to be biased low at TSL relative to ALS Vancouver. Silver is biased somewhat high relative to
ALS Vancouver, but the bias is within the expected ranges.
Table 11-11 1996 check assay data summary, after AMEC (2007)
Element Number TSL mean grade ALS mean grade Difference
Cu% 1,563 0.56 0.57 1.8%
Au ppm 1,113 0.106 0.098 -7.5%
Ag ppm 1,087 2.0 2.1 5.0%
MoS ppm 1,038 218 240 10.1%
During the PTC drilling programme two batches of umpire check analysis were undertaken. A total of
1,111 samples were re-sampled and re-submitted to an umpire laboratory for check analysis of copper
and gold. One of the programmes replicated the original assay method used for copper, whilst the
other utilised a different assay method for copper. Both programmes delivered moderate to high
levels of correlation between the paired samples for copper; however, the gold results were
considerably worse. This is considered to be a function of the low grade nature of the gold
mineralisation at Cobre Panamá or the differences in the detection limits applied by the different
laboratories, and is not considered problematic.
MPSA routinely submits umpire check samples to a secondary laboratory for analysis and therefore
the dataset available for analysis was very large. Results indicate that the correlations between the
two datasets are very high for copper and moderately high for gold. The precision of copper is very
high, with 98.3% of the data within 10% precision for copper; however, gold is seen to be less precise,
with 57.9% of the data within 10% precision.

Cobre Panamá Project Technical Report March 2019
88
Twinned drillhole analysis
Twinned drillhole analysis has been undertaken several times during the life of the Cobre Panamá
Project. The initial review of twinned drillholes was undertaken by Teck in 1998 with a view to
comparing the Teck drilling to the earlier PMRD drilling. The results of this analysis were reported by
Simons (1998) in the Feasibility Study NI 43-101 report. Simons concluded that the methodology used
to derive the mean grade had not been well documented in the report, with the authors determining
that the analysis was ‘inconclusive’.
In 2007 AMEC compared ten sets of twinned drillholes at Colina and Botija. This programme compared
the results from the 1996 and 1997 Teck drill campaigns with earlier drill campaigns. The authors
reviewed the twin data using downhole grade profile plots and summary statistics. In conjunction
with other QAQC data and information, AMEC recommended that the UNDP drilling data not be used
for the purpose of resource estimation and that additional twinned drillhole drilling be undertaken to
cover all the historical drilling campaigns.
In 2010 Bruce Davis of BD Resource Consulting Inc. undertook a twinned drillhole study on behalf of
MPSA. Davis reviewed ten pairs of drillholes that were within 15 m of each other and drilled to a
reasonable depth below the saprolite cover at Colina and Botija. Davis (2010) states in conclusion:
“The correspondence of the QQ-plot and grade profile results suggests that the twin holes are giving
similar information about the spatial distribution of grade within the deposits. There is no indication
that one set of drilling is giving significantly different information from another set. There are a few
discrepancies among the various combinations of drill holes and metals, but there is no conclusive
evidence that the drilling from a particular campaign is not appropriate. The twin drillhole results
confirm the comparisons of declustered grades by drilling campaign which indicated no significant
differences exist among those campaigns. All the historical information has been vetted by QC
programmes, comparison of twin drillhole results, and the comparison of declustered grade
distributions over common areas. In my opinion, all drilling information assembled for building the
resource model is useful.”
Additional QAQC work
Numerous programmes of additional QAQC work have been undertaken at Cobre Panamá over the
life of the project.
An independent programme of check pulp duplicate sampling was undertaken in 2011 by Jeffrey
Jaacks of Geochemical Applications International LTD, on behalf of Freeport McMoran Exploration,
Geochemical Applications International Inc., (Freeport). This work was part of a due diligence project
undertaken on the Cobre Panamá project on behalf of Freeport. Thirty drillholes located in Botija,
Colina and Valle Grande were selected for re-analysis and review. A total of 700 pulp samples were
submitted for re-analysis to ALS La Serena, Chile for copper, gold, silver and molybdenum analysis.
QAQC samples were inserted into the sample submissions for each batch of forty samples and
included a minimum of one high grade CRM standard, one low grade CRM standard, one blank and
one set of pulp duplicates, (Jaacks and Candia, 2011). Jaacks and Candia concluded: “Copper check
analyses show good reproducibility with previous Inmet drill programme analyses. Ninety-five percent
of the original and check copper analyses are within ±10% of one another. Bias between the two sets
of data is less than 3 percent. The mean grade for the original set of analyses was 0.321 % Cu. The

Cobre Panamá Project Technical Report March 2019
89
mean grade for the check analyses is 0.331 %Cu. The check analysis programme validates earlier
copper analyses and there is no significant bias between the two sets of data. There is no significant
difference between the standard deviation or the mean grade of the original versus check analysis
data”.
Behre Dolbear completed a NI 43-101 technical report on the Botija Abajo Deposit in 2012, on behalf
of Petaquilla Minerals LTD (PML), formerly known as Adrian Resources. A total of 45 samples were
submitted to ALS Chemex for analysis of copper, gold and an additional 33 elements; however the
assaying methodologies utilised at ALS Chemex were different for the check samples. Gold was
assayed using a 50g sample by fire assay with gravimetric finish. Copper and other elements were
assayed using an aqua regia digest with an ICP analysis. The assaying methodologies utilised in the
check sampling programme are considered to be of better quality than those utilised in the assaying
of the original samples. The result of the check core duplicate sampling was “a very good correlation
between PML ALS Chemex core samples taken by the authors and assayed at ALS Chemex
Laboratories”.
FQM undertook a check sampling and assaying programme after concerns were raised about the lack
of comprehensive QAQC data for the 1995-1996 drilled Adrian/Teck drillholes. The remaining core
from drillholes completed at this time had been stored outside and were exposed to the elements. As
a function of this, the core trays had deteriorated and the remaining core had spilled onto the ground.
MPSA collected, re-labelled and placed the core into new trays for as many of the drillholes as possible.
The check sampling used the original sample lengths and sampled the remaining half core, as if it were
a field duplicate. Sample preparation was undertaken on site and samples dispatched to ALS Lima,
Peru for analysis. ALS Lima undertook four acid digest with atomic absorption (AA) final for copper,
fire assay analysis and AA final for gold, and ICP-AES for molybdenum and silver. QAQC samples were
inserted blind into the check assay sample submissions. Five CRM standards, five field duplicates and
ten blanks were submitted with the 168 duplicate samples. Gray (2013) concludes: “Accepting that
the most likely reason for imperfect correlation and sub-standard field duplicate precision is due to
incorrect interval labelling during salvage of the skeleton core, results were encouraging and
demonstrate similar low and high values across similar intervals for both duplicate values. Sample
assay results from the original Adrian and Teck campaigns are accepted as reasonable and
representative of the true metal grades and are able to be repeated at another reputable laboratory
given the correct duplicate sample intervals”.
Conclusions
Numerous programmes of QAQC sampling have been undertaken at Cobre Panamá by previous
owners and MPSA. Whilst a systemised programme of QAQC sampling was not fully implemented
until 2006, numerous programmes of check analysis were undertaken to compare each programme
of drilling to historic drilling undertaken by previous owners. Similarly, routine review of the QAQC
data and results did not occur until the MPSA drilling programmes. Reviews and corrections of any
errors identified are currently completed on a quarterly basis.
MPSA is currently importing and validating all the Cobre Panamá drillhole data into a corporate
database, including all the historic QAQC data collected over the life of the project. Errors identified
during this QAQC review will be investigated and corrected in the corporate database.

Cobre Panamá Project Technical Report March 2019
90
The copper QAQC results indicate that:
the assaying laboratories are reporting assays to acceptable levels of accuracy
standard failure rates are within acceptable levels
blank samples indicate that the sample preparation process is operating successfully and that
failure rates are low
field duplicate assays display low bias and moderate degrees of precision
coarse crush duplicates display low bias and high degrees of precision
umpire check samples display low bias and moderate degrees of precision
twinned drillholes display correlations between assays which are considered acceptable.
The gold QAQC results indicate that:
the assaying laboratories are reporting assays to acceptable levels of accuracy
standard failure rates are within acceptable levels
blank samples indicate that the sample preparation process is operating successfully and that
failure rates are low
field duplicate assays display moderate bias and moderate degrees of precision
coarse crush duplicates display moderate bias and moderate degrees of precision
umpire check samples display moderate bias and moderate degrees of precision
twinned drillholes display correlations between assays which are lower than copper, although
still considered acceptable.
It is considered that the QAQC results reviewed for this Technical Report indicate that the Cobre
Panamá drillhole assays are suitable for Mineral Resource estimation.

Cobre Panamá Project Technical Report March 2019
91
DATA VERIFICATION
Historical data
MPSA has carried out a number of programmes of checks on historical (i.e. pre-MPSA) data, including
re-logging, re-assaying, full database validations and collar location verfications. In particular,
verification of collar coordinates highlighted issues relating to grid conversions for the PTC holes. The
issues appear to highlight a constant offset for a number of hole collars, which have been corrected.
Given the magnitude of the offset (~18 m) relative to the drillhole and the Mineral Resource block
spacing, the Mineral Resource estimate will not be materially affected and the corrected collars will
be incorporated into the next update. MPSA also undertook a check assaying programme from core
skeletons, as described in Item 11. This demonstrated the integrity of the pre-MPSA data but the loss
of this drill core will remain a minor limitation for future refencing or check sampling. It has not
materially affected the Mineral Resource estimate.
Data verification by the QP
During respective site visits by David Gray (QP) and Ian Glacken (contributing author), a number of
collar positions, both MPSA and pre-MPSA, were field checked using a handheld GPS. These collar
locations were found to match the database locations within the accuracy of the GPS instrument.
In addition to this collar checking, the QP also supervised the checking of a number of holes and a
reasonable selection of original assay certificates against the database, and found no errors. The QP
has also supervised the validation of all drillhole database data for duplicates, gaps and overlaps. No
limitations were noted for the quality of the database data.
The QP has also verified the porphyry deposit type and style of mineralisation through investigation
of drill core and observation at the available outcropping mineralisation in road cuttings and the
various on-site quarries and excavations. No limitations were noted.
Data verification prior to Mineral Resource estimation
As part of the Mineral Resource estimation process, a number of data validation checks were made
upon the data. These included:
Visual investigation and checks of the relative magnitudes of downhole survey data were
completed in order to identify improperly recorded downhole survey values. No value
corrections were required.
The geology and assay dataset was examined for sample overlaps and/or gaps in downhole
logging data, with overlaps and duplication identified and removed.
Assay data for total copper, gold, molybdenum and silver were interrogated for values that were
out of expected limits.
The dataset was examined for sample overlaps and/or gaps in downhole survey, sampling and
geological logging data, with minor problems resolved.

Cobre Panamá Project Technical Report March 2019
92
MINERAL PROCESSING AND METALLURGICAL TESTING
The following information is largely reproduced from Rose et al (2013), with an update on
confirmatory work provided by Robert Stone (QP).
Metallurgical testwork
Metallurgical test work has been undertaken on the Cobre Panamá Project from 1968, commensurate
with the various levels of preliminary feasibility and prefeasibility studies that were completed in 1977,
1979 and 1994; as well as feasibility studies in 1994 (updated 1995), 1996 and 1998.
In 1997 an extensive programme of metallurgical testing was designed to confirm earlier studies on
the metallurgical response of the Botija and Colina material. Much of the testing was conducted by
Lakefield Research Ltd. (Lakefield) in Lakefield, Ontario, Canada. Work included grinding, flotation,
dewatering and mineralogical testing. In addition, further testing was completed by G&T Metallurgical
Services Ltd (G&T) in Kamloops, British Columbia, Canada. This included locked-cycle flotation
testwork and modal analysis to assist in defining grind requirements for both rougher and cleaner
flotation. Copper-molybdenum separation using differential flotation was conducted by International
Metallurgical and Environmental (IME), in Kelowna, British Columbia, Canada.
All testwork prior to (and including) 1997 was based on large composite samples, for which the results,
especially for flotation testing, could not be used for interpreting the variability of the response across
and between the different deposits. Between 2008 and 2009, a total of 16 fit-for-purpose holes were
drilled across the Botija, Colina and Valle Grande ore bodies in order to provide additional insight into
the variability within each deposit. Hole locations were selected to cover an even spread along the
major axes of the two deposits and to penetrate the major combinations of lithology and alteration
identified in the 1998 geological model and to replicate ore arsisings predicted during the early
operating years. Sample preparation, flotation testing and testing of flotation products were primarily
completed at G&T. SGS Mineral Services, in Lakefield, Ontario, Canada, and Philips Enterprises LLC, In
Golden, Colorado, USA, conducted much of the grinding testwork.
SGS Mineral Services in Lakefield, Ontario, Canada were hired to conduct an investigation into the
variability of the flotation response of samples at Botija and Colina (SGS, 2012) between May and
November 2011. Composite samples were prepared from drill core and based on rock type blends
that varied by copper grade. Botija composites were taken from the infill drilling programme in the
area of the proposed Botija starter pit and with grades varying from 0.3%, 0.4%, 0.5% and 0.8% Cu.
Colina composites were sourced from samples in cold storage at G&T laboratories in Kamloops with
grades of 0.3%, 0.5% and 0.6% Cu. Locked cycle testing was carried out to confirm simplification of a
cleaner flotation. A revised reagent protocol was tested to confirm concentrate grade and metal
recovery.
Between 2011 and 2012, further flotation and grinding studies on core samples from the Balboa and
Brazo deposits were conducted by Hazen Research in Golden, Colorado, USA (Hazen Research, Schultz,
2012a, b, c, d, e; Reeves, 2012). To represent Balboa, 27 composites for drill core with a total weight
of 4,487 kg were selected and to represent Brazo, 17 composites totalling 2,165 kg were selected.
Composites were crushed, coned, quartered and split to produce subsamples for grindability,
laboratory flotation work, mineralogical characterization, quantitative head chemical analysis, as well

Cobre Panamá Project Technical Report March 2019
93
as whole rock analysis. This testwork provided substantial advances in the knowledge and
understanding of the following:
a comprehensive suite of grindability parameters resulting in new throughput estimates
additional flotation response data for estimating concentrate production and operating costs
additional geological data
sample materials for marketing purposes
additional design data for solid-liquid separation, regrinding and pipeline design
a reduction in copper cleaning stages, while maintaining concentrate grade at improved metal
recovery levels; and
additional floatation response data for estimation copper, gold and molybdenum metal
recovery from the Balboa and Brazo deposits.
Grindability testwork
A large amount of grindability data was collected in 2009 to supplement earlier work. This data
confirmed preliminary assumptions of throughput rates and indicated that there were benefits to
adding a pebble-crushing circuit to each grinding line.
In 2011 and 2012, samples of Balboa and Brazo were provided to produce comminution data for these
two deposits. Work included obtaining data for Bond Ball Mill work index, Bond Rod Mill work index,
Bond Abrasion index, JK Drop weight and SMC evaluation.
Balboa Bond Work Index varied from 12.4 to 18.0 kWh/t, the Rod Mill work Index varied from 13.1
kWh/t to 19.6 kWh/t, while the abrasion index varied from 0.0760 g to 0.4129 g. The JK drop weight
A x b index varied from 34.5 to 87.2.
A fine primary grind in the range of 75 µm to 100 µm improves copper and gold recovery for all
composites tested from Balboa. Hazen Research conducted a generic evaluation of adding power to
the grinding circuit and was able to conclude that a P80 of less than 100 µm appears to be beneficial
to cash flow for a wide range of copper prices and ore grades.
Brazo Bond Work Index varied from 8.0 kWh/t to 14.6 kWh/t, the Rod Mill Work Index varied from 8.7
kWh/t to 16.4 kWh/t, and the Abrasion Index varied from 0.0922 g to 0.3729 g. The JK drop weight A
x b index varied from 44.0 to 87.9.
Confirmatory flotation testwork
Confirmatory batch laboratory flotation testwork was conducted during 2014 by ALS Metallurgy in
Perth, Western Australia (ALS Metallurgy, Steele, 2014). The laboratory flotation testwork was
conducted on a production composite sample prepared from core that represents the first two years
of mining from the Botija deposit. The sample was previously prepared by Hazen Research in Golden,
Colorado , USA for pilot plant testwork conducted in 2012 (Hazen Research, Schultz, 2013). The aim
of the testwork was to confirm or optimise the following flotation circuit design parameters:
Rougher flotation response to primary grind size variations, pulp density variations, pulp pH
variations and collector type variations.
Cleaner flotation response to regrind size variations.

Cobre Panamá Project Technical Report March 2019
94
The rougher grind optimisation testwork data indicates that the flotation of the copper and
molybdenum minerals are grind sensitive and copper and molybdenum recovery and flotation kinetics
generally improve with finer grind sizes. Furthermore, the molybdenum recovery decreases with grind
sizes finer than 125 µm indicating that the optimum grind P80 for recovering molybdenum in the bulk
rougher flotation circuit is 125 µm. However, the improvements in recovery of copper and
molybdenum with a decrease in the current grind P80 of 180 µm are not large enough to economically
justify the finer grind sizes.
A decrease in pulp pH from 9.5 to a natural pH of 7.8 had no effect on the selective flotation of copper
minerals in the rougher circuit. However, the molybdenum recovery in the rougher circuit improves
with the lower pH. This confirms previous testwork results conducted by Lakefield Research (Lakefield,
1997) and SGS (SGS, 2012) which indicated that raising the pH in the roughers did not significantly
impact the final copper concentrate grade or recovery.
Decreasing the pulp density in the rougher flotation circuit has no effect on the selective flotation of
copper minerals but does improve the grade recovery relationship of molybdenum. The improvement
in molybdenum flotation warrants a decrease in the design feed density of the rougher flotation circuit
from 35% w/w to 30% w/w solids.
Changes to the collector and promoter types showed no significant improvements to the flotation
performance of copper and molybdenum in the rougher circuit.
Selective flotation of copper in the cleaner circuits is grind sensitive as the grade recovery curve for
copper typically is improved with a finer regrind size. Although the final concentrate grade
continuously increases with a finer regrind size, copper recovery does starts decreasing with a regrind
P80 size finer than 35 µm. The flotation rate of molybdenum decreases with a decrease in regrind size
in the cleaner circuits.
Recovery projections
Based on the testwork described above, variable processing recovery relationships were determined
for copper and gold, whilst fixed recovery values were determined for molybdenum and silver. The
design recoveries vary for each deposit, as summarised in Table 13-1.
Table 13-1 Cobre Panamá process recovery relationships and values
During 2018 a confirmatory geometallurgical testwork programme was commenced using grade
control samples to validate the above processing recovery relationships, especially in regard to the
ore from initial mining horizons. At this time, however, an update to the processing recovery
relationships is not warranted.
Cu (%) Mo (%) Au (%) Ag (%)
Botija MAX(0,MIN(96,((5.8287*LOG(%Cu))+95.775))) 55.0% MIN(80,MAX(0,(15.993*LOG(Auppm))+92.138)) 47.3%
Colina MAX(0,MIN(96,((5.8287*LOG(%Cu))+95.775))) 55.0% MIN(80,MAX(0,(15.993*LOG(Auppm))+92.138)) 47.3%
Medio MAX(0,MIN(96,((5.8287*LOG(%Cu))+95.775))) 55.0% MIN(80,MAX(0,(15.993*LOG(Auppm))+92.138)) 47.3%
Valle Grande MAX(0,MIN(96,((5.8287*LOG(%Cu))+95.775))-4) 52.0% MIN(80,MAX(0,(15.993*LOG(auppm))+92.138)) 47.3%
Balboa MIN(96,((2.4142*LOG(cutpct))+92.655)) 55.0% MAX(0,MIN(80,(7.6009*LOG(auppm))+85.198)) 40.0%
Botija Abajo 6.6135*Ln(Cu%) + 92.953 55.0% 50.0% 30.0%
Brazo 6.6135*Ln(Cu%) + 92.953 55.0% 50.0% 30.0%
Recovery Deposit

Cobre Panamá Project Technical Report March 2019
95
MINERAL RESOURCE ESTIMATES
Introduction
Mineral Resource estimates have been generated for seven porphyry copper deposits identified
within the Cobre Panamá Project area: these are the Botija, Colina, Valle Grande, Balboa, Medio, Botija
Abajo, and Brazo deposits. The Mineral Resource estimates were prepared under the supervision of
David Gray (QP), with the assistance of Optiro and FQM staff.
This Item documents Mineral Resource estimates for the four most well-defined porphyry deposits
(Botija, Colina, and Valle Grande and Balboa) in addition to the three lesser-drilled deposits (Medio,
Botija Abajo and Brazo). The locations of these deposit areas are shown in Figure 14-1. The estimates
were developed during the period from November 2013 to January 2014 from 3D block models based
on geostatistical applications using commercial mining software, CAE Studio 3 (Datamine), developed
by CAE Mining, as well as in-house software developed by Optiro for the post-processing. The Botija
block model estimate was updated in December 2018 with the added reverse circulation drilling data.
Figure 14-1 Location of the Botija, Colina, Valle Grande, Balboa, Medio, Botija Abajo, and Brazo deposits
Data for Mineral Resource modelling
Topographic data
Detailed topographical data was provided by FQM in the form of a CAE Studio format triangulated
surface generated from point data at a spacing of 10 mE by 10 mN. This surface was generated from
detailed LIDAR information obtained by MPSA during April 2009. The surface initially provided by
FQM did not cover the western 770 m of the Balboa deposit area and a second surface file generated
from point data at a spacing of 15 mE by 15 mN was combined with the detailed topographic data to
provide complete coverage over all seven deposits. At Botija, additional topographic data was
collected by MPSA in order to reflect the level of stripping as at end December 2018.
COLINA
VALLE
GRANDE BALBOA
BOTIJA
MEDIO
BRAZO
BOTIJA
ABAJO
metres

Cobre Panamá Project Technical Report March 2019
96
Drillhole data
As detailed in Item 10, diamond drilling has been carried out since the late 1960s. All geological data
available from the diamond drilling and surface mapping has been used to generate a 3D geological
model for the Cobre Panamá project. Assay data used for the Mineral Resource estimates are from
diamond drilling campaigns undertaken by Adrian and Teck in the early to mid 1990s, PTC between
2006 and 2008 and, by MPSA since 2007. At Botija, from late 2017, additional reverse circulation
drilling and sampling was completed within the pre-strip areas as a pre-cursor to planned grade
control drilling.
Apart from Botija, no additional drilling has been completed at the respective deposits. As such
Mineral Resource estimates are unchanged for all deposits except Botija.
The majority of drillholes at Balboa, Botija, Colina, Medio, Botija Abajo and Brazo are vertical with
some inclined drillholes at Botija, in the south-eastern area of Balboa and the eastern area of Botija
Abajo. Drillhole spacing is generally 100 m throughout the deposits. The majority of the drillholes at
Valle Grande are inclined to the southwest or the northeast and are at a spacing of approximately
100 m. Reverse circulation drilling at Botija consists of 45 m deep holes drilled at a 15 mE by 15 mN
grid.
Exported text (csv) files were sourced directly from the Datashed database, containing the collar and
downhole survey data, geological logging data and assay data. All survey, logging and assay data were
validated prior to desurveying and drillhole collar elevations were elevated to the topographical
surface, for consistency. At Balboa, Colina and Medio, Valle Grande, Botija, Botija Abajo, 83%, 88%,
90%, 83% and 88% (respectively) of the surveyed collar elevations are within 2 m of the topographical
surface. At Brazo, only 35% of the surveyed collar elevations are within 2 m of the topographical
surface due to a constant shift in coordinate translation of the PTC holes collar coordinates. The shift
was determined to be 19 m in the north-south direction and was deemed to have minimal impact on
resource estimates of the much larger parent block sizes. FQM has, however, subsequently re-
surveyed these collar coordinates and updated the database for future Mineral Resource estimates.
Data was extracted for the Botija, Colina, Valle Grande, Balboa, Medio, Botija Abajo, and Brazo deposit
areas and was filtered based on parent company. The number of drillholes and total drilled length
used in the Mineral Resource estimates are listed in Table 14-1.
Table 14-1 Number of holes and metres drilled for each deposit area
Deposit Number of drillholes Metres
Colina and Medio 277 63,952
Botija 454 95,481
Botija RC drilling 2911 130,995
Botija Abajo and Brazo 295 50,015
Valle Grande 265 46,229
Balboa 121 53,487
Total 4,315 437,679
Geological logging data imported into the database includes lithological codes, alteration codes,
visually estimated pyrite, chalcopyrite, bornite and chalcocite percentages and vein density. RC chip
logging was restricted to lithology.

Cobre Panamá Project Technical Report March 2019
97
The assay database comes from four drilling campaigns: PMRD between 1970 and 1976, Teck and
Adrian in the early-mid 1990s, PTC between 2006 and 2008 and MPSA in 2007-2009. Only assay data
from holes drilled after 1990 was used for block grade estimation. The earlier PMRD drillholes were
assayed for copper and molybdenum, but not gold or silver. Data from these drillholes was used to
assist in the mineralisation interpretation, but was not included for the block grade estimation. The
Teck and Adrian, PTC and MPSA samples were analysed for copper, gold, molybdenum and silver.
Assay data was in the form of a series of text (csv) files, and was reformatted before being imported
into CAE Mining software. Values below detection limits for the drill data used for the resource
estimate were handled as follows:
PMRD – copper values of -1 and 0 were set to absent and copper values of -1 were set to 0.0005;
molybdenum values of -0.59 were set to absent.
Teck – copper values of 0 set to absent; silver values of -99 and 0 set to absent and -1 set to
0.05; molybdenum values of 0 and -2 were set to absent and values of -1 were set to 0.5; gold
values of -99 set to absent and gold values of -1 were set to 0.0025.
Adrian – copper, gold, and molybdenum values of 0 were set to absent; copper values of -1 and
-0.01 were set to 0.005; silver values of -11 were set to absent and silver values of -1 and -0.2
were set to 0.1; molybdenum values of -2 and -1 were set to 0.5; gold values of -1 and -0.005
were set to 0.0025.
PTC – copper values of 0 were set to absent and values of -1 were set to 0.0005; silver values of
-99 were set to absent and silver values of -1 were set to 0.1; molybdenum values of -99 were
set to absent and values of -1 were set to 0.5; gold values of -99 were set to absent and values
of -1 were set to 0.0025.
MPSA - copper values of -0.1 and -0.001 were set to 0.005; silver values of -1 and -0.2 were set
to 0.1; molybdenum values of -10 and -1 were set to 0.5; gold values of -0.005 were set to
0.0025.
FEED0709 - copper values of -1 were set to absent; copper values of -0.01 were set to 0.005 and
of -0.001 were set to 0.0025; silver values of -1 and -0.2 were set to 0.1; molybdenum values of
-1 were set to 0.5; gold values of -1 and -0.005 were set to 0.0025.
The top sections of two twin drillholes (VG95288A and VG95329) at Valle Grande were not assayed
where they were adjacent to drillholes with assays; for these sections the copper, molybdenum, silver
and gold values were set to absent.
Data validation
A series of data validations were completed prior to de-surveying the drillhole data into a three
dimensional format. These included:
Visual investigation and checks of the relative magnitudes of downhole survey data were
completed in order to identify improperly recorded downhole survey values. No value
corrections were required.
The geology and assay dataset was examined for sample overlaps and/or gaps in downhole
logging data, with overlaps and duplication identified and removed.

Cobre Panamá Project Technical Report March 2019
98
Assay data for total copper, gold, molybdenum and silver were interrogated for values that were
outside of expected limits.
The dataset was examined for sample overlaps and/or gaps in downhole survey, sampling and
geological logging data, with minor problems resolved.
Geological and mineralisation models
The Cobre Panamá Project area hosts seven deposits that contain significant amounts of copper and
minor molybdenum, gold, and silver resulting from mineralisation related to the intrusion of
porphyritic rocks into pre-existing host rocks of andesitic and granodioritic composition. The deposits
all occur within an area measuring approximately 10 km east-west by 4 km north-south.
Lithology
As discussed in Item 7, 3D interpretations of the distribution of the rock types at each of the seven
deposits were completed from drillhole and mapping information. These interpretations were used
to code the Mineral Resource blocks as granodiorite, porphyry, andesite, saprock and saprolite.
A number of post-mineral (barren) dykes have been identified in the drillhole logging, which are
generally less than 3 m wide and of variable strike. Together with the current drillhole spacing, it was
not possible to create reliable 3D models of the dykes. Statistical analysis of the drillhole data was
undertaken to determine adjustment factors for each of the deposits, based on the percentage of the
drillhole intersections that were within dyke material. For Valle Grande, vertical and inclined drillholes
both yielded similar (approximately 2% dyke material) percentages of intersections that are within
dyke material, suggesting that percentages determined in this way were representative of dyke
volumes relative to host rock volumes.
Mining is expected to be on a scale of 25 mE by 10 mN on 15 m bench heights; at this scale it will not
be possible to selectively mine the mineralised material and to exclude the barren dyke material.
Volume adjustment factors, as listed in Table 14-2, were applied to the metal content and the reported
Mineral Resource estimate has thus accounted for the barren dyke material.
Table 14-2 Factors applied to metal content to account for barren dyke material
Deposit Percentage dyke
material Factor applied to metal
content
Botija Balboa Colina
Valle Grande Medio
Botija Abajo Brazo
1.9% 7%
1.7% 2% 1% 0% 0%
0.981 0.93
0.983 0.98 0.99
1 1
Alteration
As discussed in Item 7, the database includes geological logging of alteration types. The alteration
intersections were reviewed to determine if a 3D interpretation of alteration types could be
generated. The distribution of the logged alteration types is spatially erratic and it was therefore not
possible to develop a 3D model of the alteration. Optiro recommends that the geological logging of

Cobre Panamá Project Technical Report March 2019
99
the alteration is reviewed, in conjunction with the geochemical data, to determine if it is possible to
develop a robust interpretation of the alteration for future Mineral Resource estimates.
Sulphides
Hypogene copper mineralisation consists primarily of chalcopyrite and minor bornite. A poorly
developed mixed zone of oxide copper minerals and secondary copper minerals such as chalcocite
and covellite exists in the saprock zone, overlying the hypogene mineralisation.
Three dimensional models were developed to encompass areas that are respectively dominantly
pyrite; mixed chalcopyrite and pyrite; chalcopyrite; and bornite. At Botija, Balboa, Colina, Valle
Grande and Medio the chalcopyrite domain is surrounded by a mixed chalcopyrite and pyrite domain
and both of these domains are encompassed by the pyrite domain. At Balboa and Botija a mixed
bornite and chalcopyrite domain was defined that is encompassed by the chalcopyrite-rich domain.
Botija Abajo and Brazo did not have sufficiently close drill data to confidently define zones of
continuous sulphide groupings. An example of the sulphide domains at Colina and Balboa are
presented in Figure 14-2, where Cpy = chalcopyrite, Py = pyrite and Bn = bornite.
Figure 14-2 Sulphide domains as defined at Colina (top) and Balboa (bottom)
Fault zones
As discussed in Item 7, faults have been modelled at Colina, Medio, Valle Grande, Balboa, Botija Abajo
and Brazo based on offsets observed in the geological and mineralisation modelling. While field
mapping and logging data at Botija suggests the presence of faulting, no major fault offsets controlling
Cpy-PyPy
Cpy
West Fault
Py Cpy-Py
Bn

Cobre Panamá Project Technical Report March 2019
100
mineralisation were observed. Continued FQM study through detailed logging, mapping, and RC
drilling, together with 3D modelling using collated data sets will facilitate a more confident fault model
for future Botija estimates.
At Colina several fault orientations were observed. The most significant fault is an east-west trending
thrust fault, dipping to the north. A hard boundary at the fault was used for estimation of both the
low and medium grade copper domains. Two sub-vertical normal faults offset the mineralisation to
the west (Faldalito prospect) and were also treated as hard boundaries (Figure 14-4). Smaller scale
faults have been used to truncate the small supergene gold domains but do not extend at depth and
were hence treated as soft domains for estimation. Bounding faults to the north and west of the
Colina deposit were used to truncate the overall mineralisation envelope. At Medio, a large, sub-
vertical strike slip fault was used to truncate and offset the mineralisation.
At Valle Grande the mineralisation is offset along the northeast-southwest fault illustrated in Figure
7-9 and a hard boundary was applied at this fault for grade interpolation. Balboa is cross cut on the
western margin by a north-trending fault termed the West Fault (Figure 7-13) and for grade
interpolation a hard boundary was applied at this fault.
A relatively minor volume of mineralisation along the western extents of Botija Abajo (Botija Abajo
West) is offset by a well developed northeast striking sub-vertical fault, identified from a strong linear
feature in the airborne magnetic imagery (Figure 14-3).
Figure 14-3 3D plan view of the northeast trending fault at Botija Abajo relative to the main copper ore body positions
Gypsum/Anhydrite front
Geological logging data and strontium sample assay data were used to develop a surface that
constrained the extent of a gypsum/anhydrite front at depth at Botija, Balboa, Colina, Valle Grande

Cobre Panamá Project Technical Report March 2019
101
and Medio. During weathering, the strontium contained in plagioclase feldspars is typically reduced
to below 100 ppm and as a result often coincides with the gypsum/anhydrite front. The presence of
anhydrite as opposed to weathered gypsum will decrease milling throughput and increase power
consumption. Moreover, weathered gypsum zones will reduce rock strength and may impact on slope
stability. Accordingly, the model was coded above or below this surface. There was insufficient drill
data at Botija Abajo and Brazo to permit confident delineation of the gypsum anhydrite front for these
deposit areas.
Mineralisation interpretation
Mineralisation at the Cobre Project tends to occur within the porphyritic rocks and extends into the
contact area of the adjacent plutonic/volcanic rocks. For each deposit, examination of the drillhole
intersections and grade inflections in log-probability plots was used to select nominal cut-off grades
used for the interpretation of low grade and medium grade copper domains. Additional gold domains
were defined at Balboa, Colina, Botija Abajo and Brazo.
At Balboa, copper mineralisation is dominantly hosted by a feldspar-quartz-hornblende porphyry that
intrudes the adjacent andesite and mineralisation is best developed in the central portion of the
porphyry. Nominal cut-off grades of 0.15% copper and 0.4% copper were used to model the low grade
and the medium grade domains respectively. In addition, a depleted copper/supergene gold cap was
interpreted to constrain ‘higher’ gold grades and depleted copper grades. The medium grade domain
was not applicable for molybdenum and a soft boundary was applied between the low and medium
grade domains for estimation of molybdenum grades. The low grade and medium grade domains
were used for grade estimation of copper, gold and silver. Mineralised domains are illustrated in
Figure 14-4.
Copper mineralisation at Colina tends to be associated with the feldspar-quartz-hornblende porphyry,
particularly in the thicker areas were the dykes coalesce and around the upper contact of the sills.
Nominal cut-off grades of 0.15% Cu and 0.4% Cu were used to model the low grade and the medium
grade domains respectively. Gold domains were interpreted based on a nominal 0.3 ppm cut-off
grade. Internal waste domains were defined where there were significant intervals of material below
a nominal cut-off grade of 0.15 % Cu. Mineralised domains for both copper and gold are illustrated in
Figure 14-4.
Copper mineralisation at Botija was based on nominal copper cut-off grades of 0.15% for low grade,
0.3% for medium grade and 0.7% for high grade mineralisation (Figure 14-5). Gold, molybdenum and
silver were each estimated within the same copper domains due to reasonable to good correlations
with copper grades. Mineralisation at Botija favours the early, intra-mineral and late stage porphyries.
In addition, the mid-southern portion of Botija is characterised by a sub-surface andesitic cap, which
has some lower grade mineralisation along its lower contact with the underlying mineralised
porphyry.

Cobre Panamá Project Technical Report March 2019
102
Figure 14-4 Copper (A) and Gold (B) domains at Colina (south-north section along 533,520 mE)
Domain codes; Depleted zone (10), Waste zone (999), Low grade copper and gold (south of fault – 1021, north of fault – 2021), Medium
grade copper (south of fault – 1031, north of fault – 2031), High grade hypogene gold – 40, High grade supergene gold – 90
Figure 14-5 Example of domains at Botija (north-south section along 538090 mE)
330
320
310
340
Low grade (0.1% Cu) domain - 330
Medium grade (0.3% Cu) domain - 320
High grade (0.7% Cu) domain - 320
Weathered profile

Cobre Panamá Project Technical Report March 2019
103
Copper mineralisation at Medio was interpreted based on a nominal copper cut-off grade of 0.15%
for the low grade mineralisation and 0.5% for the medium grade domains. Fault zones have been
interpreted at Medio. Due to the scarcity of data, soft boundary conditions were applied at Medio for
grade estimation.
At Valle Grande, copper mineralisation is generally concentrated along the flanks of the porphyry
lopolith, following the porphyry-andesite contacts. Nominal copper cut-off grades of 0.15% and 0.5%
were used to model the low grade and the medium grade domains respectively. Mineralised domains
for Valle Grande are illustrated in Figure 7-11. At Botija Abajo and Brazo, gold domains were defined
separately to the copper domains. The northern body of the Botija Abajo mineralisation has evidence
of supergene gold developing within a narrow horizon in upper leached copper horizon. Copper
mineralisation at Botija Abajo and Brazo used a nominal 0.15% copper cut-off. Molybdenum and
silver mineralisation were grouped with the copper domains for estimation.
The mineralisation domain codes developed for each deposit are listed in Table 14-3.
Data preparation for modelling
The de-surveyed assay drillhole data were selected within the mineralisation wireframes and each
sample interval was coded with a mineralisation domain code for estimation (Table 14-3). The coded
drillhole data was exported for compositing, statistical and geostatistical analysis, and grade
estimation.
Data compositing
The distribution of input sample lengths guided the selection of a 1.5 m composite sample length
(Figure 14-6). Approximately 80% of the data has a sample length within a few centimetres of 1.5 m.
All data was composited to intervals of 1.5 m within the mineralisation domains, per element, and
excluded the waste material from mafic and felsic dykes. This has ensured that the sample intervals
provide good resolution across domain boundaries, as well as honouring the original sample lengths.
Statistical analysis
Statistical analysis of the data, including spatial statistics, was carried out using Snowden Supervisor
software. Data distributions for copper, gold, molybdenum and silver were investigated by domain
with histograms and probability plots and statistical parameters for the composited copper, gold,
molybdenum and silver grades within each of the final domains are summarised in Table 14-4.
The objective of the mineralisation interpretations was to separate mixed populations and reduce
internal variability, thereby assisting with spatial analysis and providing a more robust estimate.
Molybdenum and silver histograms showed some evidence of possible detection limit artefacts
associated with the different generations of drilling.

Cobre Panamá Project Technical Report March 2019
104
Table 14-3 Domain codes for the drillhole data and block model
Deposit Element Domain description Domain
code
Botija
Cu,Au,Mo,Ag
Ultra low grade halo mineralisation Low grade Medium grade High grade
340 330 320 310
Balboa
Low grade west of West Fault 21
Medium grade, west of West Fault 22
Low grade, east of West Fault 31
Medium grade, east of West Fault 32
Near surface supergene, depleted copper, enriched gold 50
Colina
Cu,Mo
Main low grade, north fault block 2021
Main low grade, south fault block 1021
Mid-west low grade 22
West low grade 23
Main medium grade, north fault block 2031
Main medium grade, south fault block 1031
Mid-west medium grade 32
West medium grade 33
Depleted zone 10
Internal waste 999
Au,Ag High Grade – Hypogene 40
High Grade – Supergene 90
Valle Grande
Low grade, west of NE-SW Fault 1
Low grade, east of NE-SW Fault 2
Medium grade 3
Medio Cu, Mo, Ag
Low Grade - East 1
Low Grade - Main 2
Medium Grade - Main 3
Low Grade - West 4
Botija Abajo, Brazo
Cu,Mo,Ag
Medium grade, Brazo 321
Medium grade, Botija Abajo 322
Medium grade, Botija Abajo 324
Low grade, Brazo 331
Low grade, Botija Abajo 332
Low grade, Botija Abajo West 333
Low grade, Botija Abajo 334
Ultra low grade halo mineralisation 340
Au
Medium grade gold, Botija Abajo 322
Low grade gold, Brazo 331
Low grade gold, Botija Abajo 332
Botija Abajo West 333
Low grade gold, Botija Abajo 334
Supergene gold, Botija Abajo 335
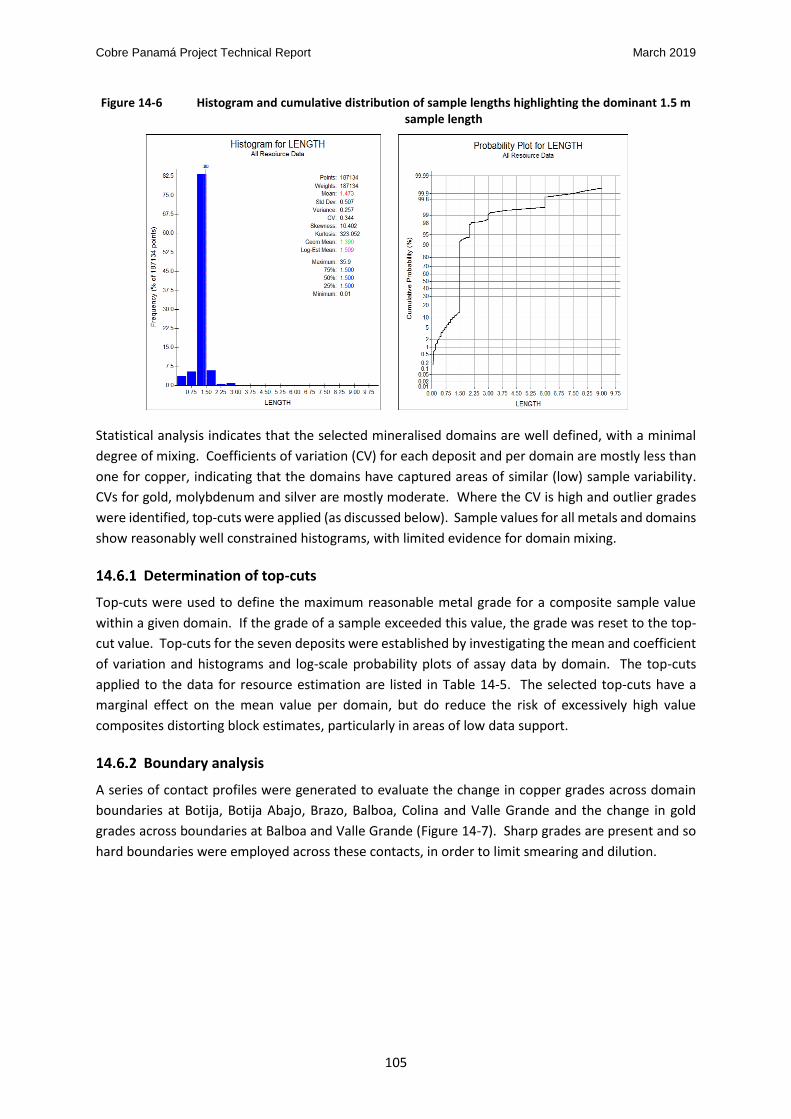
Cobre Panamá Project Technical Report March 2019
105
Figure 14-6 Histogram and cumulative distribution of sample lengths highlighting the dominant 1.5 m sample length
Statistical analysis indicates that the selected mineralised domains are well defined, with a minimal
degree of mixing. Coefficients of variation (CV) for each deposit and per domain are mostly less than
one for copper, indicating that the domains have captured areas of similar (low) sample variability.
CVs for gold, molybdenum and silver are mostly moderate. Where the CV is high and outlier grades
were identified, top-cuts were applied (as discussed below). Sample values for all metals and domains
show reasonably well constrained histograms, with limited evidence for domain mixing.
Determination of top-cuts
Top-cuts were used to define the maximum reasonable metal grade for a composite sample value
within a given domain. If the grade of a sample exceeded this value, the grade was reset to the top-
cut value. Top-cuts for the seven deposits were established by investigating the mean and coefficient
of variation and histograms and log-scale probability plots of assay data by domain. The top-cuts
applied to the data for resource estimation are listed in Table 14-5. The selected top-cuts have a
marginal effect on the mean value per domain, but do reduce the risk of excessively high value
composites distorting block estimates, particularly in areas of low data support.
Boundary analysis
A series of contact profiles were generated to evaluate the change in copper grades across domain
boundaries at Botija, Botija Abajo, Brazo, Balboa, Colina and Valle Grande and the change in gold
grades across boundaries at Balboa and Valle Grande (Figure 14-7). Sharp grades are present and so
hard boundaries were employed across these contacts, in order to limit smearing and dilution.

Cobre Panamá Project Technical Report March 2019
106
Figure 14-7 Boundary analysis at Balboa, Colina and Valle Grande
Balboa
Copper
Gold
Colina
Valle Grande
Botija
Medium grade
domain
Low grade
domain
Low grade
domain Medium grade
domain
Low grade
domain Medium grade
domain
Medium grade
domain
Low grade
domain
Low grade
domain Medium grade
domain
Low grade
domain
Medium grade
domain
Low grade
domain Medium grade
domain
Low grade
domain
Medium grade
domain

Cobre Panamá Project Technical Report March 2019
107
Table 14-4 Summary statistics for copper %, gold g/t, molybdenum g/t and silver g/t per domain
Domain
Copper Gold Molybdenum Silver
Number Mean CV Number Mean CV Number Mean CV Number Mean CV
Botija
310 2,624 0.89 0.32 2,345 0.21 0.72 2,608 134.77 1.21 2,208 2.26 0.58
320 7,135 0.56 0.44 6,013 0.12 0.73 7,110 106.07 1.27 4,099 1.60 0.71
330 26,610 0.22 0.66 18,777 0.05 1.17 26,604 49.99 1.65 8,631 0.92 0.84
335 8,345 0.13 0.76 6,560 0.03 1.87 8,346 25.16 1.77 4,052 0.57 0.97
340 6,761 0.05 1.42 6,290 0.02 2.45 6,763 11.61 2.82 6,228 0.36 1.75
Balboa
21 1,702 0.16 0.74 1,702 0.03 2.09 1,947 21.19 3.53
1,702 1.03 1.76
22 245 0.64 1.12 245 0.32 2.44 1,702 1.03 1.76
31 12,149 0.20 0.86 12,149 0.04 2.69 17,717 19.85 2.30
12,149 0.96 1.20
32 5,568 0.64 0.78 5,568 0.19 2.40 5,568 2.40 1.06
50 126 0.07 0.52 126 0.55 1.36 126 12.74 1.70 126 1.11 1.84
Colina
10 2,010 0.10 1.83 1685 0.06 1.33 2,010 41.6 1.95 1,686 1.49 11.6
21 12,790 0.31 0.64 17,673 0.06 2.51 12,792 59.3 2.01 17,771 1.65 1.77
22 374 0.28 0.60 455 0.06 0.87 374 47.6 1.40 455 1.59 0.76
23 939 0.31 0.60 1,034 0.08 0.93 939 30.9 1.83 1,034 1.44 0.76
31 8,524 0.62 0.53 17,673 0.06 2.51 8,528 97 1.45 - - -
32 132 0.80 0.58 - - - 132 108.4 2.50 - - -
33 140 0.60 0.53 - - - 140 17 1.74 - - -
40 - - - 481 0.39 0.76 - - - 482 2.5 0.70
90 - - - 190 0.51 0.66 - - - 190 1.11 1.62
999 316 0.06 1.42 247 0.02 1.88 312 16 2.41 247 0.39 1.12
Valle Grande
1 285 0.20 0.48 285 0.043 1.49 285 43.7 1.15 285 0.34 0.82
2 14,514 0.29 0.95 14,475 0.04 3.36 14,514 61.1 1.92 14,389 1.26 1.86
3 5,037 0.68 0.77 5,004 0.084 1.31 5,037 95.8 1.60 4,967 2.19 0.69
Medio
1 443 0.21 0.55 443 0.031 0.93 443 33.10 1.61 443 1.26 1.31
2 1523 0.22 0.75 1,524 0.032 1.14 1524 39.33 1.93 1,524 0.90 1.08
3 148 0.83 0.54 148 0.083 0.99 148 68.20 2.43 148 2.65 0.64
4 542 0.36 1.26 542 0.033 2.82 - - - 542 1.27 0.95
Botija Abajo
322 29,096 0.57 2.31 29,035 0.09 0.88 29,057 52.8 1.10 29,057 0.73 1.05
324 29,096 0.72 1.10
29,057 24.3 0.32 29,057 2.84 0.81
332 29,096 0.26 1.50 29,035 0.04 0.60 29,057 43.8 1.12 29,057 0.33 1.05
333 29,096 0.29 1.14 29,035 0.09 0.31 29,057 70.6 0.48 29,057 1.38 0.65
334 29,096 0.19 1.46 29,035 0.30 0.60 29,057 25.4 0.84 29,057 1.26 0.84
335
29,035 0.75 0.80
340 29,096 0.05 0.64 29,035 0.03 0.26 29,057 13.1 0.40 29,057 0.43 0.35
Brazo
321 29,096 0.56 1.82
29,057 45.70 0.86 29,057 0.91 0.93
331 29,096 0.21 1.32 29,035 0.18 1.07 29,057 38.87 0.64 29,057 0.67 0.61

Cobre Panamá Project Technical Report March 2019
108
Table 14-5 Top-cuts applied per domain
Deposit Domain Copper (%) Gold (ppm) Molybdenum (ppm) Silver (ppm)
Botija
310 5.0 1.8 2000 20.0
320 5.0 1.2 2000 18.0
330 1.0 0.8 1800 18.0
340 1.0 0.8 1600 18.0
Balboa
21 None 0.7 600 20.0
22 None 4.0 600 11.4
31 None 1.0 600 20.0
32 4.0 2.0 600 30.0
50 None 4.0 None 10.0
Colina
10 1.5 0.5 550 10
21 1.5 0.8 800 14.0
22 and 23 1.0 0.45 350 6.0
31 3.0 NA 1,200 NA
32 and 33 1.8 NA 600 NA
40 NA 1.5 NA 9.0
90 NA 1.7 NA 7.5
999 None 0.25 None None
Valle Grande
1 and 2 4.0 1.1 1,900 15.0
3 7.0 1.4 1,900 15.0
Medio
1 and 2 1.4 0.18 800 8
3 2.0 0.18 800 8
4 1.4 0.18 800 8
Brazo
321 3.0 None 570 15
331 1.4 2.1 810 23
Botija Abajo
322 1.7 0.77 350 8
324 4 None 810 35
332 1.6 0.62 300 4
333 2.1 5.8 1500 19
334 1.3 4 300 20
335 None 5 None None
340 1.2 None 300 24
Metal correlations – self organizing feature maps
Self-organising feature maps were generated using the copper, gold, molybdenum and silver data
from Balboa, Colina, Valle Grande and Medio to examine the relative metal associations within the
deposits as well their relative differences.
Self-organising feature maps (SOFM) are a pattern recognition technique based on neural networks.
The training phase of a SOFM consists of several iterations over the input patterns to gradually adjust
the synaptic weights in the lattice according to a well-defined rule. In this way, after repeated
iterations, the SOFM becomes tuned to the statistical regularities present in the input patterns,
developing the ability to create internal representations for assessing features of the input data.
Patterns are commonly analysed by colouring each neuron in the lattice with the components of the
weight vector. A set of maps is produced which allow examining features that tend to be distributed
in a similar way. These features may be used for gaining insight into the raw data and their groupings:
for instance, they can be used for domain definition, correlation analysis and pattern identification.

Cobre Panamá Project Technical Report March 2019
109
Patterns are commonly analysed by colouring each neuron in the lattice with the components of the
weight vector. A set of maps is produced which allow examining features that tend to be distributed
in a similar way. These features may be used for gaining insight into the raw data and their groupings:
for instance, they can be used for domain definition, correlation analysis and pattern identification.
At Botija (Figure 14-8), gold, silver and molybdenum have different patterns to copper suggesting poor
relationships. Despite this, there is some correlation of a more dominant high grade copper
population with higher grade gold and silver. There is also a higher grade molybdenum grouping,
which has some correlation with a separate moderate to higher grade copper. A high grade gold
grouping has little to no correlation with copper, silver or molybdenum and is likely to be associated
with a weak supergene or leach process.
At the Balboa, Colina and Valle Grande deposits copper, gold, molybdenum and silver grades per
composited sample from the drillhole database were used as a four dimensional input vector to a
SOFM. The self-organising feature maps obtained are shown in Figure 14-9 to Figure 14-12 and the
following observations are made:
The mineralisation relationships at all four deposits are different and that for all of the deposits
there is no relationship between the molybdenum mineralisation and the other three metals
(copper, gold and silver).
At Balboa there is a poor relationship between the copper, gold and silver mineralisation.
At Colina there are similarities in the gold and silver maps; these show no relationship to the
copper. This supports the definition of additional gold domains at Colina which were also
applied for silver estimation.
At Valle Grande there is a poor relationship between gold and silver; these show no relationship
to copper. Domain definition based on a low copper cut-off grade will capture the elevated
silver and molybdenum mineralisation and the majority of the gold mineralisation. An elevated
gold dataset is evident that is not associated with copper or silver mineralisation; examination
of the drillhole data indicated that this was within the saprolite domain and that there was
insufficient data to generate a separate sub-domain. This elevated gold mineralisation was
capture in the background model.
At Medio there are similarities between the copper and silver mineralisation and no relationship
between the copper and gold mineralisation. There is insufficient data at Medio to develop
mineralised domains based on gold. Domain definition based on a low copper cut-off grade will
capture the elevated gold, silver and molybdenum mineralisation.

Cobre Panamá Project Technical Report March 2019
110
Figure 14-8 Self organizing feature maps for silver (Ag), gold (Au), copper (Cu) and molybdenum (Mo) at Botija; hot colours signify high values and vice versa
Figure 14-9 Self organizing feature maps for silver (Ag), gold (Au), copper (Cu) and molybdenum (Mo) at Balboa; hot colours signify high values and vice versa

Cobre Panamá Project Technical Report March 2019
111
Figure 14-10 Self organizing feature maps for silver (Ag), gold (Au), copper (Cu) and molybdenum (Mo) at Colina; hot colours signify high values and vice versa
Figure 14-11 Self organizing feature maps for silver (Ag), gold (Au), copper (Cu) and molybdenum (Mo) at Valle Grande; hot colours signify high values and vice versa

Cobre Panamá Project Technical Report March 2019
112
Figure 14-12 Self organizing feature maps for silver (Ag), gold (Au), copper (Cu) and molybdenum (Mo) at Medio; hot colours signify high values and vice versa
Bivariate element relationships
The correlation coefficient between copper and gold (0.78) is good for Botija mineralisation. Silver is
also reasonably well correlated with copper (0.71). There is an average to good correlation between
copper and molybdenum (0.65), with molybdenum sometimes showing higher grades in the lower
copper grade areas.
At Botija Abajo and Brazo, copper, molybdenum and silver are spatially coincident in similar volumes
of the host rock despite both having poor correlations (<0.3) with copper. Correlation of copper and
gold at Botija Abajo and Brazo is average (0.54), but gold mineralisation is grouped into distinctly
different spatial volumes when compared to copper. The northern portion of Botija Abajo is noted
for having a supergene gold horizon that has developed within the near surface leached copper zone.
Accordingly, gold in these deposits was defined and estimated using separate volumes from copper.
At Balboa, correlation coefficients indicate a strong relationship (0.81) between gold and silver within
the low grade western domain (21). There is no correlation between the other metal combinations.
Correlation coefficients indicate a moderate to good relationship (0.56) between Cu and Ag within the
low grade eastern domain (31). There is no correlation between the other metal combinations.
Within the medium grade domains there are moderate correlations (of 0.56 to 0.77) between copper
and gold in domains 22 and 32, copper and silver in domains 22 and 32, and gold and silver in domain
32. There is no correlation between molybdenum and the other metals. Within the depleted copper
domain (50) there is no correlation between copper, gold, silver or molybdenum.
At Colina there is poor to moderate correlation between copper, gold, silver or molybdenum within
the low and medium grade domains. Correlation coefficients are all less than 0.45. Within the gold

Cobre Panamá Project Technical Report March 2019
113
domains there is a moderate correlation between copper and gold (0.58) in domain 40 and between
copper and silver (0.61) in domain 90.
At Valle Grande there is no correlation between copper, gold, silver or molybdenum within the low
grade domains. Within the medium grade domain there is a moderate to poor correlation between
copper and gold (0.53) and copper and silver (0.69).
Variograms, representing 3D grade continuity, were generated for copper, gold, molybdenum and
silver using composite data located within each of the mineralised domains at Botija, Balboa, Colina,
Valle Grande, Medio, Botija Abajo and Brazo. The following methodology was applied:
data was declustered prior to variogram modelling so as to remove the effect of closely spaced
samples
the principal axes of anisotropy were determined using variogram fans based on normal scores
variograms
directional normal scores variograms were calculated for each of the principal axes of
anisotropy
downhole normal scores variograms were modelled for each domain to determine the normal
scores nugget effect
variogram models were determined for each of the principal axes of anisotropy using the nugget
effect from the downhole variogram
the variogram parameters were standardised to a sill of one for copper, gold, molybdenum and
silver
the variogram models were back-transformed to the original distribution using a Gaussian
anamorphosis and used to guide search parameters and complete ordinary kriging estimation
the variogram parameters for copper and gold were standardised to the population variance
for each domain to permit post-processing of the copper and gold panel estimates to SMU
estimates.
At Botija, variograms for most elements have similar nugget values, ranging from 0.25 (for low grade
copper) to 0.35 (for low grade silver). Ranges of grade continuity were well defined from variography
and had clearly different anisotropy and orientations per metal. The longest ranges of copper grade
continuity (200 m to 300 m) were in the approximate east-west direction. Gold tended to have longer
ranges (greater than 400 m) of continuity and was more strongly anisotropic than copper.
Molybdenum and silver variogram models were similar to copper. An example of Botija variography
(for Domain 31) is shown in Figure 14-13.

Cobre Panamá Project Technical Report March 2019
114
Figure 14-13 Variograms and models for Domain 330 at Botija for copper (top) and gold (bottom)

Cobre Panamá Project Technical Report March 2019
115
At Colina, nugget values for each element were similar, ranging from 7% to 28% of the total variability.
For both copper and gold, the longest ranges of continuity within the main low grade domains were
oriented at between 1° and -7° to the east with a range of 130 m (copper) and 540 m (gold). For the
medium grade copper domain, the longest ranges of continuity was oriented down-dip at -2° to the
west with a range of 180 m. The high grade gold domain had a longest range of continuity of 250 m
oriented towards the east. In most domains, direction of anisotropy for molybdenum and silver
followed the respective copper and gold domains but the ranges were significantly different; longer
for molybdenum (between 185 m and 580 m) and shorter (between 100 m to 255 m) for silver. For
domains with insufficient samples to generate reasonably structured variograms, e.g. domains at the
western most part of the ore body, variograms from adjacent domains were applied. Typical
variograms from Colina for Domains 31 (copper) and 21 (gold) are depicted in Figure 14-14.
At Balboa, the western domains (21 and 22) had insufficient samples to generate reasonably
structured variograms, and so variograms generated for the eastern domains (31 and 32) were applied
to the western domain. For domain 50 there were insufficient samples to generate directional
variograms. Omni-directional variograms were generated, the overall geological orientation being
used to define the directions and the ranges were factored such that direction 1 was twice the omni-
directional range, direction 2 was the omni-directional range and direction 3 was half the omni-
directional range. This domain was classified as Inferred.
Variogram analysis at Valle Grande indicates that the copper, silver and molybdenum mineralisation
within the low grade domain have similar orientations and anisotropic ratios. The longest ranges of
continuity are oriented down-dip at -20ᵒ to -30ᵒ to the southwest and copper, silver and molybdenum
have long ranges of 300 m, 230 m and 310 m, respectively. Copper, silver and molybdenum have long
ranges of 215 m, 85.5 m and 270 m, respectively, oriented at 0ᵒ to -4ᵒ to the northwest. The ranges
of continuity perpendicular to the dip direction are 22 m for copper, 65 m for silver and 67 m for
molybdenum.
For the gold mineralisation the longest range of continuity, of 235 m, is oriented at -5ᵒ to the
northwest, and the down dip and perpendicular ranges are 110 m and 51 m respectively. Within the
medium grade domain the longest ranges of continuity are oriented along plunge at -3ᵒ to -6ᵒ to the
northwest; copper has a long range of 260 m and silver has a long range of 210 m. For gold the longest
range of continuity (280 m) is also oriented northwest-southeast, except that it plunges at -6ᵒ to the
southeast.
The mineralisation continuity dips to the southwest at -14ᵒ to -39ᵒ to the southwest with long ranges
of 100 m, 265 m and 180 m for copper, gold and silver respectively. The shortest ranges of continuity
(perpendicular to the dip) are 27 m for copper, 75 m for gold and 46 m for molybdenum. For the
molybdenum mineralisation the longest range of continuity, of 270 m, is oriented down-dip at -25ᵒ to
the southwest, and the along strike (northwest) and perpendicular ranges are 160 m and 46 m
respectively. Nugget effects are low and range from 7% to 16% of the total variability.

Cobre Panamá Project Technical Report March 2019
116
Figure 14-14 Variograms and models from Colina for copper (Domain 31, top) and gold (Domain 21, bottom)

Cobre Panamá Project Technical Report March 2019
117
Variograms generated for copper, gold, molybdenum and silver mineralisation at Medio were poorly
defined, particularly within the medium grade domain. Within the low grade domain the longest
ranges of mineralisation continuity (260 m, 280 m and 330 m for copper gold and silver respectively)
were interpreted along -5ᵒ to -19ᵒ to the southeast. The copper, gold and silver mineralisation was
interpreted to dip at -9ᵒ to -23ᵒ to the southwest and long ranges of 160 m, 240 m and 150 m were
modelled for copper, gold and silver respectively.
Variogram models for the perpendicular direction had short ranges of 6 m to 19 m and a long range
zonal component was modelled with ranges of 130 m to 220 m. Variogram ranges for the medium
grade domain are much shorter with ranges of 80 m to 100 m to the west, 45 to 80 m to the north and
8 m to 30 m in the perpendicular direction. Molybdenum data was combined for the low and medium
grade domains. Ranges of 380 m to the southeast, 130 m at -10ᵒ to the southwest and 160 m in the
perpendicular direction were modelled. Nugget effects are low to moderate and range from 14% to
24% of the total variability. Variograms across the respective deposit areas at Botija Abajo and Brazo
also had nugget values ranging from 0.09 (Botija Abajo north high grade copper) up to 0.31 (Botija
Abajo low grade molybdenum). Most nugget values were close to 0.2 and were clearly defined from
downhole variography. In contrast, directions of anisotropy and their respective ranges were poorly
defined, resulting in the need to use isotropic variography per element and domain. Short ranges of
47 m were obtained for copper mineralisation in the Botija Abajo north area. In contrast, molybdenum
had a long range of influence of 320 m in the Brazo area low grade domain. Variogram ranges for
most of the domains and respective metals at Botija Abajo and Brazo was between 80 m and 250 m.
Kriging neighbourhood analysis
A detailed kriging neighbourhood analysis (KNA) was undertaken at Botija and Valle Grande to
determine the optimal block size, each ellipse dimensions, minimum and maximum numbers of
samples to be used for grade estimation and the discretisation parameters. The optimal parameters
established from this study were applied to the estimates for Colina, Balboa, Botija Abajo and Brazo.
KNA was completed in CAE Studio and using Supervisor’s KNA analysis tools. These analyses used the
variogram parameters determined for copper within the high, medium and low grade domains. A
series of estimates were run with varying block sizes and the kriging efficiency (KE) and slope of
regression (RS) values were calculated. Once the block size was selected a second series of estimates
were run using a range of sample numbers and discretisation parameters.
Block configurations varying between 50 m and 100 m in the northing axis (Y) and easting axis (X) for
bench heights of 10 m, 15 m and 20 m were tested. The results (Figure 14-15) indicate that the kriging
efficiency and regression slope results are not sensitive to the block size, with overall small decreases
in kriging efficiency and regression slope with increasing block size. A block size of 50 mE by 50 mN
(approximately half the drillhole spacing at Botija, Balboa, Colina and Valle Grande) was selected to
provide local definition of the grade variability, and a block height of 15 m was selected to
accommodate the expected scale of mining.
The influence of the number of samples informing a block estimate was similarly tested. Block size
was set to 50 mE by 50 mN by 15 mRL, and the sample numbers were varied between 6 and 60. Based
on the results of this analysis (Figure 14-16), the minimum and maximum numbers of samples were
selected to be 24 and 44.
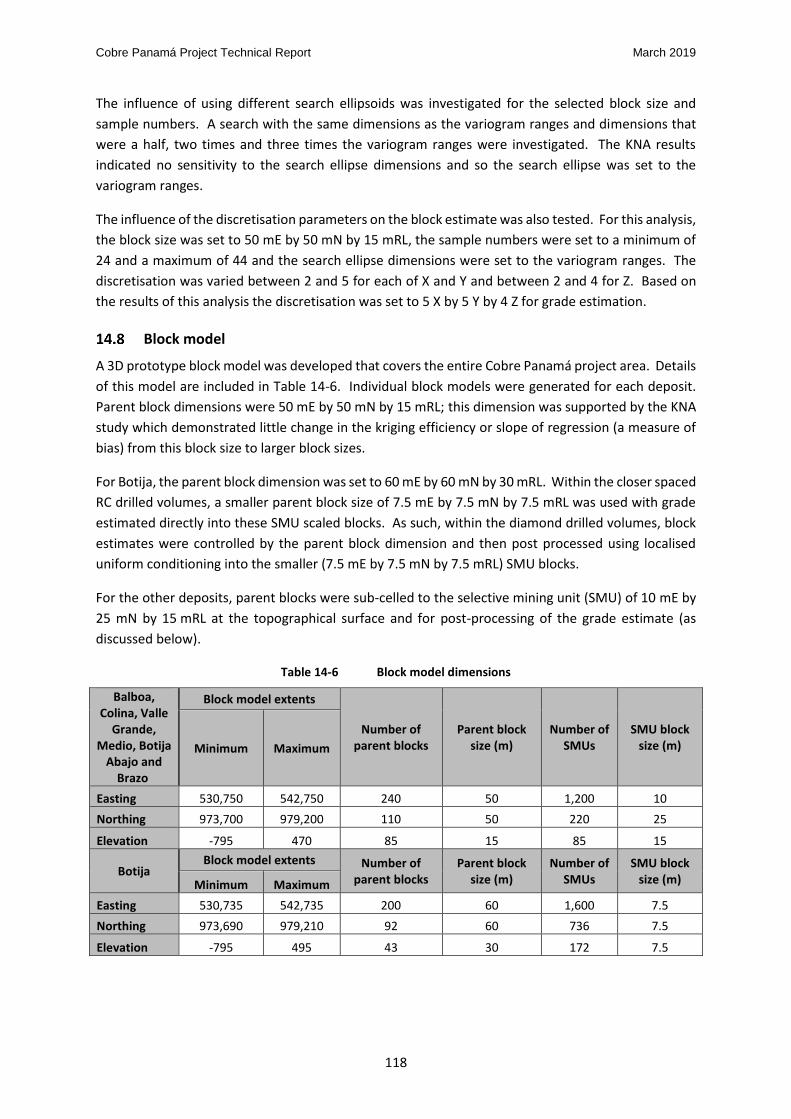
Cobre Panamá Project Technical Report March 2019
118
The influence of using different search ellipsoids was investigated for the selected block size and
sample numbers. A search with the same dimensions as the variogram ranges and dimensions that
were a half, two times and three times the variogram ranges were investigated. The KNA results
indicated no sensitivity to the search ellipse dimensions and so the search ellipse was set to the
variogram ranges.
The influence of the discretisation parameters on the block estimate was also tested. For this analysis,
the block size was set to 50 mE by 50 mN by 15 mRL, the sample numbers were set to a minimum of
24 and a maximum of 44 and the search ellipse dimensions were set to the variogram ranges. The
discretisation was varied between 2 and 5 for each of X and Y and between 2 and 4 for Z. Based on
the results of this analysis the discretisation was set to 5 X by 5 Y by 4 Z for grade estimation.
Block model
A 3D prototype block model was developed that covers the entire Cobre Panamá project area. Details
of this model are included in Table 14-6. Individual block models were generated for each deposit.
Parent block dimensions were 50 mE by 50 mN by 15 mRL; this dimension was supported by the KNA
study which demonstrated little change in the kriging efficiency or slope of regression (a measure of
bias) from this block size to larger block sizes.
For Botija, the parent block dimension was set to 60 mE by 60 mN by 30 mRL. Within the closer spaced
RC drilled volumes, a smaller parent block size of 7.5 mE by 7.5 mN by 7.5 mRL was used with grade
estimated directly into these SMU scaled blocks. As such, within the diamond drilled volumes, block
estimates were controlled by the parent block dimension and then post processed using localised
uniform conditioning into the smaller (7.5 mE by 7.5 mN by 7.5 mRL) SMU blocks.
For the other deposits, parent blocks were sub-celled to the selective mining unit (SMU) of 10 mE by
25 mN by 15 mRL at the topographical surface and for post-processing of the grade estimate (as
discussed below).
Table 14-6 Block model dimensions
Balboa, Colina, Valle
Grande, Medio, Botija
Abajo and Brazo
Block model extents
Number of parent blocks
Parent block size (m)
Number of SMUs
SMU block size (m) Minimum Maximum
Easting 530,750 542,750 240 50 1,200 10
Northing 973,700 979,200 110 50 220 25
Elevation -795 470 85 15 85 15
Botija Block model extents Number of
parent blocks Parent block
size (m) Number of
SMUs SMU block
size (m) Minimum Maximum
Easting 530,735 542,735 200 60 1,600 7.5
Northing 973,690 979,210 92 60 736 7.5
Elevation -795 495 43 30 172 7.5
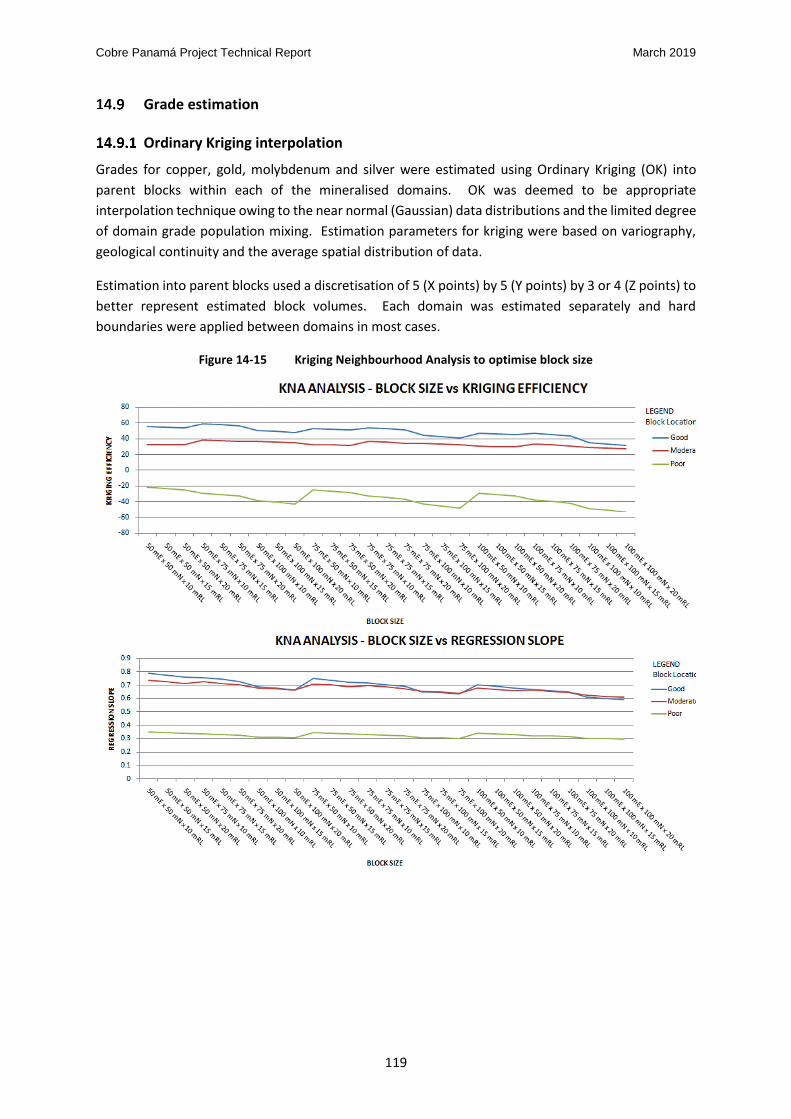
Cobre Panamá Project Technical Report March 2019
119
Grade estimation
Ordinary Kriging interpolation
Grades for copper, gold, molybdenum and silver were estimated using Ordinary Kriging (OK) into
parent blocks within each of the mineralised domains. OK was deemed to be appropriate
interpolation technique owing to the near normal (Gaussian) data distributions and the limited degree
of domain grade population mixing. Estimation parameters for kriging were based on variography,
geological continuity and the average spatial distribution of data.
Estimation into parent blocks used a discretisation of 5 (X points) by 5 (Y points) by 3 or 4 (Z points) to
better represent estimated block volumes. Each domain was estimated separately and hard
boundaries were applied between domains in most cases.
Figure 14-15 Kriging Neighbourhood Analysis to optimise block size

Cobre Panamá Project Technical Report March 2019
120
Figure 14-16 Kriging Neighbourhood Analysis to optimise sample numbers
Except for Balboa, the first pass search radii for mineralised domains were set to the respective metal
variogram ranges and a minimum of 24 samples was required for a single block estimate and a
maximum of 44 samples in order to limit grade smoothing. The dimensions of the second search were
set to twice the first, and the minimum number of samples was reduced to 16. The dimensions of the
third search were set to twice the second and the minimum number of samples was reduced to 6 for
Balboa, Colina/Medio and Valle Grande and 12 for Botija, Botija Abajo and Brazo. Most ore blocks
(greater than 89%, 83%, 91% and 92% at Botija, Colina, Valle Grande and Medio respectively) were
estimated within the first search radius.
At Balboa, the first pass search radii for low and medium grade mineralised domains were set to the
gold variogram ranges, as the gold variogram ranges were significantly longer than the copper
variogram ranges. For the supergene gold domain the first pass search radii were set to 150 m by 150
m by 90 m. For each mineralised domain, a minimum of eight samples were required for a single block
estimate and a maximum of 48 samples in order to limit grade smoothing. In addition a maximum of
six samples per drillhole were used for block grade estimation. The dimensions of the second search
were set to twice the first, and the dimensions of the third search were set to twice the second search
radii. Most blocks (98%) were estimated within the first search radius.
Model validation
Validation of the OK block grades included the following processes:
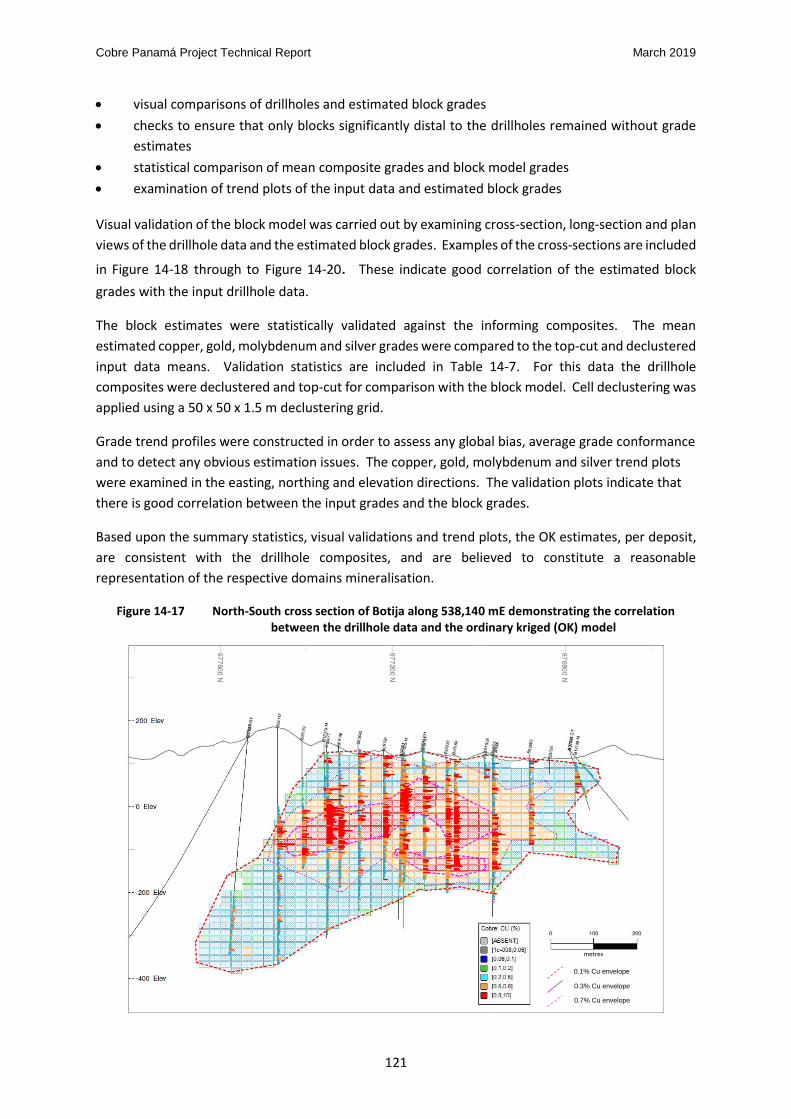
Cobre Panamá Project Technical Report March 2019
121
visual comparisons of drillholes and estimated block grades
checks to ensure that only blocks significantly distal to the drillholes remained without grade
estimates
statistical comparison of mean composite grades and block model grades
examination of trend plots of the input data and estimated block grades
Visual validation of the block model was carried out by examining cross-section, long-section and plan
views of the drillhole data and the estimated block grades. Examples of the cross-sections are included
in Figure 14-18 through to Figure 14-20. These indicate good correlation of the estimated block
grades with the input drillhole data.
The block estimates were statistically validated against the informing composites. The mean
estimated copper, gold, molybdenum and silver grades were compared to the top-cut and declustered
input data means. Validation statistics are included in Table 14-7. For this data the drillhole
composites were declustered and top-cut for comparison with the block model. Cell declustering was
applied using a 50 x 50 x 1.5 m declustering grid.
Grade trend profiles were constructed in order to assess any global bias, average grade conformance
and to detect any obvious estimation issues. The copper, gold, molybdenum and silver trend plots
were examined in the easting, northing and elevation directions. The validation plots indicate that
there is good correlation between the input grades and the block grades.
Based upon the summary statistics, visual validations and trend plots, the OK estimates, per deposit,
are consistent with the drillhole composites, and are believed to constitute a reasonable
representation of the respective domains mineralisation.
Figure 14-17 North-South cross section of Botija along 538,140 mE demonstrating the correlation between the drillhole data and the ordinary kriged (OK) model
metres
0.1% Cu envelope
0.3% Cu envelope
0.7% Cu envelope

Cobre Panamá Project Technical Report March 2019
122
Figure 14-18 South-North cross section of Colina along 533,800 mE demonstrating the correlation between the drillhole data and the ordinary kriged (OK) model
Figure 14-19 Oblique cross section looking northwest of Valle Grande demonstrating the correlation
between the drillhole data and the ordinary kriged (OK) model
metres
metres

Cobre Panamá Project Technical Report March 2019
123
Figure 14-20 Oblique cross section looking northeast through the Balboa deposit demonstrating the correlation between the drillhole data and the ordinary kriged (OK) model
Grade trend profiles were constructed in order to assess any global bias, average grade conformance
and to detect any obvious estimation issues. The copper, gold, molybdenum and silver trend plots
were examined in the easting, northing and elevation directions. The validation plots indicate that
there is good correlation between the input grades and the block grades. An example of trend
validation plots for copper in Domain 301 at Botija is presented in Figure 14-21.
Based upon the summary statistics, visual validations and trend plots, the OK estimates are consistent
with the drillhole composites, and are believed to constitute a reasonable representation of the
respective domains mineralisation.
metres

Cobre Panamá Project Technical Report March 2019
124
Table 14-7 Validation statistics for the main domains of each deposit
Botija
Copper Gold Molybdenum Silver
Domain 310 320 330 310 320 330 310 320 330 310 320 330
Composites 0.89 0.56 0.26 0.21 0.11 0.05 133 109 47 2.25 1.56 0.92
Declustered DH data 0.89 0.56 0.26 0.21 0.11 0.05 134 106 47 2.26 1.56 0.92
OK estimate 0.88 0.56 0.26 0.22 0.11 0.05 112 104 55 2.31 1.5 0.91
% Difference 0.62 -0.21 0.3 6.17 -0.59 -1.85 -16.1 -1.9 18.7 2.26 -3.51 -1.27
Balboa
Copper Gold Molybdenum Silver
Domain 31 32 31 32 21 & 22 31 & 32 31 32
Composites 0.2 0.64 0.04 0.173 20 20 0.959 2.38
Declustered DH data 0.2 0.62 0.039 0.155 19 20 0.948 2.325
OK estimate 0.21 0.62 0.042 0.159 21 22 0.951 2.351
% Difference 5.6 0.8 7.7 2.6 6.9 13 0.3 1.1
Colina
Copper Gold Molybdenum Silver
Domain 21 31 21 40 21 31 21 40
Composites 0.3 0.62 0.057 0.387 59 97 1.65 2.51
Declustered DH data 0.3 0.61 0.057 0.394 57 95 1.61 2.44
OK estimate 0.3 0.59 0.056 0.371 58 94 1.58 2.39
% Difference -1.1 -3.5 -2.2 -5.9 1.4 -1.6 -1.3 -2.2
Valle Grande
Copper Gold Molybdenum Silver
Domain 1 & 2 3 1 & 2 3 1 & 2 3 1 & 2 3
Composites 0.29 0.68 0.039 0.084 61 96 1.22 2.19
Declustered DH data 0.29 0.68 0.039 0.087 60 93 1.21 2.19
OK estimate 0.28 0.65 0.035 0.079 57 89 1.18 2.15
% Difference -3.5 -4 -10.6 -10.8 -6.3 -4.5 -3 -1.6
Medio
Copper Gold Molybdenum Silver
Domain 1 2 1 2 1 2 1 2
Composites 0.21 0.22 0.03 0.031 33 39 1.2 0.89
Declustered DH data 0.21 0.22 0.03 0.031 33 39 1.21 0.89
OK estimate 0.21 0.21 0.03 0.036 33 39 1.23 1.04
% Difference 0.1 -4.8 -0.2 16.1 0.1 -0.1 1.9 16.1
Botija Abajo
Copper Gold Molybdenum Silver
Domain 322 324 332 322 332 322 324 332 322 324 332
Composites 0.57 0.72 0.26 0.09 0.04 52.8 24.3 43.8 0.73 2.84 0.33
Declustered DH data 0.57 0.65 0.26 0.09 0.04 55.1 21.2 44 0.74 2.63 0.34
OK estimate 0.58 0.7 0.25 0.08 0.03 48.6 16 54.8 0.79 2.8 0.35
% Difference 1.05 7.54 -2.69 -7.16 -17.44 -11.81 -24.42 24.55 5.93 6.46 4.13
Botija Abajo (continued)
Copper Gold Molybdenum Silver
Domain 333 334 333 334 335 333 334 333 334
Composites 0.29 0.19 0.09 0.3 0.75 70.6 25.4 1.38 1.26
Declustered DH data 0.29 0.18 0.09 0.26 0.58 72.8 26.5 1.42 1.23
OK estimate 0.31 0.19 0.07 0.26 0.28 64.2 24.4 1.53 1.29
% Difference 5.17 4.44 -23.01 0 -52.24 -11.85 -8.03 7.75 4.72
Brazo
Copper Gold Molybdenum Silver
Domain 321 331 331 321 331 321 331
Composites 0.56 0.21 0.18 45.7 38.9 0.91 0.67
Declustered DH data 0.56 0.2 0.18 45.7 38.6 0.91 0.68
OK estimate 0.58 0.2 0.18 43.3 32.3 0.98 0.7
% Difference 3.2 0 2.23 -5.23 -16.31 8.13 2.94

Cobre Panamá Project Technical Report March 2019
125
Figure 14-21 Example of validation trend plot for copper in Botija Domain 310
Post-processing by Localized Uniform Conditioning
A localised uniform conditioning estimate (LUC) was generated for copper and gold at the Botija,
Colina, Valle Grande, Balboa and Medio deposits using Optiro’s proprietary LUC software. LUC was
not completed for Botija Abajo and Brazo due to wider-spaced drillhole data and relatively poor
variography.
Uniform conditioning (UC) is a geostatistical technique which is used to assess recoverable resources
inside a panel by using the estimated panel grade. UC provides an estimate of the proportion of SMUs
inside the panel that are above a cut-off grade and their corresponding average grade; however, it
does not provide information regarding the spatial distribution of SMU grades within the panel. LUC
is a post-processing technique that spatially locates the UC estimates of individual SMUs and thus
generates more detail from a panel scale UC estimate to assist with open pit optimisation and Mineral
Reserve estimation.
Within the LUC process, ordinary kriging is used to estimate grades into the individual SMU blocks to
determine a grade ranking for each of the SMU locations within each panel. Once the SMUs are ranked
for each panel, the UC derived metal and tonnage curves are divided into equal proportions based on
the number of SMUs in the panel. The grades of these equal proportions are then calculated and
Cobre Panamá Project Technical Report March 2019
126
assigned to the SMUs in ranked order. The product of the LUC process is a model comprising SMU
size blocks with grades assigned within each panel based on the local grade trends revealed by the
drilling data. The grades of the SMU size blocks within a panel have a variance that is compatible with
the SMU support scale and collectively, the metal contained by SMUs within each panel is identical to
the original metal content of the panel. LUC provides grades at SMU scale block sizes, and as such
provides a good representation of grade variability that may be encountered per panel.
For Balboa, Colina, Valle Grande, Medio, Botija Abajo and Brazo, the OK estimates of the panels (50 mE by 50 mN by 15 mRL) and LUC cell size, as well as composited drillhole data files and variogram models were used as input to LUC. The LUC estimate was based on grade variability at a scale of 10 mE by 12.5 mN by 7.5 mRL to provide a discretisation of 5X by 2Y by 2Z; these estimates were re-blocked to the SMU block size of 10 mE by 25mN by 15 mRL. It is important to note that the local accuracy of these LUC SMU block grades is poor and should not be relied upon spatially. Results were exported from the LUC process and merged with the OK panel grade estimates. Similarly, for Botija, the OK estimates of the panels (60 mE by 60 mN by 30 mRL) and LUC cell size, as
well as composited drillhole data files and variogram models were used as input to LUC. The LUC
estimate was based on grade variability at a scale of 7.5 mE by 7.5 mN by 7.5 mRL to provide a
discretisation of 5X by 5Y by 2Z; these estimates were re-blocked to the SMU block size of 7.5 mE by
7.5 mN by 15 mRL. It is important to note that the local accuracy of these LUC SMU block grades is
poor and should not be relied upon spatially. Results were exported from the LUC process and merged
with the OK panel grade estimates.
The LUC models were validated by:
visual comparisons of drillholes, OK panel grades and SMU block grades
checking that the average SMU grades within each parent block matched the parent block
grade
confirming that metal correlations in the SMU blocks were comparable with the correlations
observed in the drillhole data
checking that the contained copper and gold metal at a zero cut-off grade is the same for both
the OK panel models and the LUC models.
Background model
For each deposit model area a background model was generated to capture all mineralisation that
was not included in the interpretation of the mineralised domains. A categorical indicator model was
developed, using the drillhole intersections external to the mineralised domains, to identify blocks
that have a probability of ≥0.6 of containing mineralisation of ≥0.03% copper. Grades were estimated
into these low grade mineralised blocks using sample intervals of ≥0.03% copper that were not
included in the mineralised domain interpretations. Blocks with a probability of <0.6 of containing
mineralisation of ≥0.03% copper were identified as waste blocks and sample intervals with <0.03%
copper were used to estimate waste block grades.
Density estimates in the block model
Density was estimated into the panel scale blocks using ordinary kriging at Botija. For the other
deposits, bulk density sample data was not available for most of the MPSA drillhole samples and as a
result did not provide good spatial coverage for each deposit. Average density values were therefore

Cobre Panamá Project Technical Report March 2019
127
determined based upon the rock type and were assigned to the resource model. The density values
are listed in Table 14-8. A total of 3,708 sample density values were available for use in the Cobre
deposit estimates. Due to the lack of saprolite density measurements, a conservative value of 1.5
t/m3 was used.
Table 14-8 Assigned average density values per material type
Lithology domain Description Density (t\m3)
100 Granodiorite 2.60
200 Porphyry 2.64
300 Andesite 2.72
500 Saprock 2.54
600 Saprolite 1.50
999 Unknown – external to extents of drilling 2.65
Mineral Resource classification and reporting
The Mineral Resource estimates for the Botija, Colina, Balboa, Valle Grande, Medio, Botija Abajo and
Brazo deposits have been classified and reported in accordance with the Standards on Mineral
Resources and Reserves of the Canadian Institute of Mining, Metallurgy and Petroleum (the CIM
Guidelines, 2014), and also comply with the guidelines of the JORC Code (JORC, 2012). Table 1 criteria
of the JORC Code and supporting comments are listed in Appendix A.
Classification of the Mineral Resources was primarily based on confidence in drillhole data, geological
continuity, and the quality of the resulting kriged estimates. Geological confidence is supported by
diamond drill core and logging data and a good understanding of the local and regional geology.
Confidence in the kriged estimate is associated with drillhole coverage, analytical data integrity,
kriging efficiency and regression slope values.
Wireframe models were used to define areas with high confidence at Botija: Mineral Resources within
these areas were classified as Measured (Figure 14-22). Areas with moderate confidence were
defined at Botija, Colina, Balboa, Valle Grande, Medio, Botija Abajo and Brazo: these areas were
classified as Indicated. Mineral resources outside these areas were classified as Inferred.
Volume adjustment factors, as listed in Table 14-2 for dilution from dyke intrusives, were applied to
the metal content and the reported Mineral Resource estimate has accounted for this barren dyke
material. Mineral Resources have been reported at a 0.11% Cu cut-off grade in
Table 14-9. This cut-off grade is considered to be appropriate based on economic input mining
parameters and assumptions derived from deposits of similar type, scale, and location.

Cobre Panamá Project Technical Report March 2019
128
Figure 14-22 Mineral Resource classification at Botija, highlighting measured resources within closely drilled areas
Table 14-9 Cobre Panamá Mineral Resource statement, at 31st December 2018 above a 0.15% Copper Cut-off Grade. Mineral Resources that are not Mineral Reserves do not have demonstrated
economic viability. Mineral Resources are inclusive of Mineral Reserves
Deposit Category Tonnes (Mt) TCu (%) Mo (%) Au (g/t) Ag (g/t)
Botija Measured 310 0.47 0.008 0.11 1.44
Botija Indicated 660 0.36 0.007 0.07 1.13
Colina Indicated 1,032 0.39 0.007 0.06 1.58
Medio Indicated 63 0.28 0.004 0.03 0.96
Valle Grande Indicated 602 0.36 0.006 0.04 1.37
Balboa Indicated 647 0.35 0.002 0.08 1.37
Botija Abajo Indicated 114 0.31 0.004 0.06 0.93
Brazo Indicated 228 0.36 0.004 0.05 0.81
Total Meas. plus Ind. 3,657 0.37 0.006 0.07 1.34
Botija Inferred 198 0.23 0.004 0.05 0.87
Colina Inferred 125 0.26 0.006 0.05 1.20
Medio Inferred 189 0.25 0.005 0.03 1.25
Valle Grande Inferred 363 0.29 0.005 0.03 1.14
Balboa Inferred 79 0.23 0.003 0.04 0.96
Botija Abajo Inferred 67 0.27 0.005 0.06 1.25
Brazo Inferred 76 0.21 0.003 0.01 0.73
Total Inferred 1,097 0.26 0.005 0.04 1.09

Cobre Panamá Project Technical Report March 2019
129
To ensure that the reported resource exhibits reasonable prospects for eventual economic extraction,
the Mineral Resource statement (Table 14-9) was guided by the determination of a copper cut-off
grade that was derived from a pit shell generated from all metal grades from blocks classified in the
Measured and Indicated categories. This pit shell assumed a metal price of $3.00/lb copper, $13.50/lb
molybdenum, $1,200/troy ounce gold and $16.00/troy ounce silver and total operating costs of
$9.30/t.
There are no known factors related to environmental, permitting, legal, title, taxation, socioeconomic,
marketing, or political issues that are believed to materially affect the Mineral Resource.
Mineral Resource estimate comparisons
Apart from Botija, the respective deposit estimates of Mineral Resources for Cobre Panamá have not
changed since the previous June 2015 estimates. The updated Botija estimate took into consideration
the following changes since the previous (June 2015) estimate:
1. drillhole additions from infill metallurgical drilling at Botija (~8 holes),
2. addition of 2,911 reverse circulation grade control holes
3. continued geological mapping and 3D geology modelling
4. estimation into a smaller block size as per the selective mining unit (SMU)
The Botija deposit changes, as compared to the June 2015 estimates generally relate to reductions in
ore tonnages associated with the pre-stripping. The marginal increase in copper grade is due to the
reduced SMU block size from 15mN by 15mE by 15mRL to 7.5mN by 7.5mE by 15m RL. The Inferred
Mineral Resource tonnages for 2018 has increased by 23% when compared to June 2015. The
increase is due to an improved understanding of geological and grade continuity as associated with
the 2,911 RC drilled holes.
A detailed comparison of the 2018 and 2015 estimates is provided in Table 14-10.

Cobre Panamá Project Technical Report - DRAFT March 2019
130
Table 14-10 Comparison of Mineral Resource estimate results as at December 2018 and the previous results as at June 2015; copper cut-off grade was 0.15%
Deposit Category Tonnes (Mt) TCu (%) Mo (%) Au (g/t) Ag (g/t)
Dec-18 Jun-15 %Var Dec-18 Jun-15 %Var Dec-18 Jun-15 %Var Dec-18 Jun-15 %Var Dec-18 Jun-15 %Var
Botija Measured 310 336 -8% 0.47 0.46 3% 0.008 0.008 0% 0.11 0.10 9% 1.44 1.35 6%
Botija Indicated 660 672 -2% 0.36 0.35 2% 0.007 0.007 0% 0.07 0.06 16% 1.13 1.08 5%
Total Meas. plus Ind. 970 1,008 -4% 0.39 0.39 2% 0.007 0.007 0% 0.08 0.07 12% 1.23 1.17 5%
Botija Inferred 198 152 23% 0.23 0.23 0% 0.004 0.004 0% 0.05 0.05 0% 0.87 0.78 10%

Cobre Panamá Project Technical Report March 2019
131
MINERAL RESERVE ESTIMATE
Introduction
Detailed technical information provided under this item relates specifically to the Mineral Reserve
estimate completed to date and based on the Mineral Resource models and estimates as reported in
Item 14.
As part of the estimation process, the original pit optimisation work completed for the 2015 Technical
Report (FQM, July 2015) was reviewed. Along with more recent detailed pit designs completed by
FQM personnel, this review and design work was overseen and supervised by Michael Lawlor (QP) of
FQM.
To conform with NI 43-101 standards, the Mineral Reserve estimate is derived from Measured and
Indicated Resources only. The Measured and Indicated Mineral Resource estimates as listed in Table
14-9 are reported inclusive of the Mineral Reserve.
Methodology
The conversion of the Mineral Resource estimate to a Mineral Reserve estimate followed a
conventional approach, commencing with open pit optimisation techniques incorporating economic
parameters and other “modifying” factors.
The ultimate (optimal) pit outlines (shells) were used to create practical and detailed open pit designs
accounting for the siting of in-pit crushers, batters, berms and haul roads.
These pit designs then provided the bench by bench ore and waste mining inventories for the detailed
production schedule that demonstrates viable open pit mining. This schedule, which in turn provides
the physical basis for cash flow modelling, is described in Item 16.
Mine planning models
A mine planning model was produced from each of the Datamine Mineral Resource models described
in Item 14. For the purposes of the optimisation software, each mine planning model (except for
Botija) was regularised to 10 m x 25 m x 15 m (x, y z); the Botija planning model was regularised to 20
m x 50 m x 15 m (x, y z).
For subsequent production scheduling (Item 16), the planning model was regularised to a smallest
mining unit (SMU) block size, suitable for the scale of proposed ultra class primary mining equipment,
ie to dimensions of 100 m x 100 m x 15 m (x, y,z).
Each of the Surpac mine planning models was validated against its corresponding regularised
Datamine model, before proceeding. An example of one such validation, for Botija, is shown in Figure
15-1. As with this particular validation plot, all other model comparisons were essentially perfect.
Pit Optimisation
The original pit optimisation work completed for the 2015 Technical Report (FQM, July 2015) was not
updated for this Technical Report. Optimisation sensitivity analyses that were carried out in 2015
indicated that processing recovery and copper metal price were the most sensitive optimisation
variables. There has been no material change to these particular variables since that time. Whilst

Cobre Panamá Project Technical Report March 2019
132
further geotechnical work has been completed since 2015, specifically in relation to the Botija Pit, the
revised overall slope angles remain within the selected optimal shell outlines. Mine planning and
engineering work is on-going at this time, however, in respect of in-pit crusher siting and the impact
that particular siting scenarios will have on overall ultimate pit slope design. An iterative approach is
required between ultimate designs and optimisations to arrive at an acceptable final design.
Operating costs have been updated since 2015, as have metal costs (ie, treatment and refining charges
(TCRCs, plus royalties). Item 21 provides a description of these updates, whilst a commentary on the
impact of these to the original pit shell selection is provided in Item 15.4.5.
Figure 15-1 Botija Pit validation – Mineral Resource to mine planning models
Optimisation methodology
Conventional Whittle Four-X software was used to determine optimal pit shells for each of the
various deposits.
All mined ore will be processed in a conventional sulphide flotation plant, with differential processes
to produce separate copper and molybdenum concentrates. The copper concentrate will contain gold
and silver.
Against this background, optimisations were completed on a maximum net return (NR) basis, and with
recoveries to metal in concentrate based on different variable and fixed relationships for each deposit.
In general:
Net return = revenue from recovered metals – metal costs
where metal costs = the costs associated with treating and transporting the concentrate plus
the royalties payable
A mining block will be considered as ‘ore’ when the net return is greater than the processing cost.

Cobre Panamá Project Technical Report March 2019
133
Optimisation input parameters
Metal prices
The optimisation inputs for long term metal prices were as follows:
copper = $3.00/lb ($6,615/t)
molybdenum = $13.50/lb ($29,762/t)
gold = $1,200/oz
silver = $16.00/oz
Metal recoveries
The input processing recovery projections were the same as those listed in Item 13 (Table 15-1).
Table 15-1 Cobre Panamá process recovery relationships and values
The recovery from stockpiled saprock ore was reduced by 20% to simulate the potential leaching of
copper metal from material that may be stockpiled for up to thirty years before processing.
Pit slope design criteria
Pit optimisation input included overall slope design angles as listed in Table 15-2. The geotechnical
engineering basis for these design angles is outlined in Item 16.
Table 15-2 Cobre Panamá overall slope angles for pit optimisation
Cu (%) Mo (%) Au (%) Ag (%)
Botija MAX(0,MIN(96,((5.8287*LOG(%Cu))+95.775))) 55.0% MIN(80,MAX(0,(15.993*LOG(Auppm))+92.138)) 47.3%
Colina MAX(0,MIN(96,((5.8287*LOG(%Cu))+95.775))) 55.0% MIN(80,MAX(0,(15.993*LOG(Auppm))+92.138)) 47.3%
Medio MAX(0,MIN(96,((5.8287*LOG(%Cu))+95.775))) 55.0% MIN(80,MAX(0,(15.993*LOG(Auppm))+92.138)) 47.3%
Valle Grande MAX(0,MIN(96,((5.8287*LOG(%Cu))+95.775))-4) 52.0% MIN(80,MAX(0,(15.993*LOG(auppm))+92.138)) 47.3%
Balboa MIN(96,((2.4142*LOG(cutpct))+92.655)) 55.0% MAX(0,MIN(80,(7.6009*LOG(auppm))+85.198)) 40.0%
Botija Abajo 6.6135*Ln(Cu%) + 92.953 55.0% 50.0% 30.0%
Brazo 6.6135*Ln(Cu%) + 92.953 55.0% 50.0% 30.0%
Recovery Deposit
Overall Slope
Angle
(degrees)
1 41.8
2 42.0
3 40.3
4 38.4
5 40.3
6 41.0
7 41.0
8 41.1
9 41.9
10 42.0
11 41.1
SE, SW 1 39.5
NW, Pit Bottom 2 42.5
N, E, S 3 45.6
SSW 4 45.6
VG All 39.5
Low RQD All -
W 41.0
E 29.0
All Remaining 34.0
Balboa All 42.0
Colina
BABr
Pit LocationSector /
Wall Height
Botija
North Wall
South Wall
River Diversion
Diversion
Sectors
West Wall

Cobre Panamá Project Technical Report March 2019
134
Operating costs
Since the Project will be mill constrained, the process operating costs were input as the sum of the
fixed and variable costs. These costs are the same for each deposit (details are outlined in Item 21):
operating cost = $4.20/t
fixed cost (equivalent G&A cost in variable terms) = $1.25/t
total processing cost = $5.45/t
Variable mining costs comprising drill, blast, load and haul costs, on a bench by bench basis, were
derived by MPSA. These costs were estimated from first principles using haul profiles and productivity
estimates related to preliminary mine designs, production schedule, proposed equipment fleet and
concept ore/waste haulage destinations. There were two cost components:
a base mining cost, comprising drill, blast, load and haul costs up to a reference bench elevation,
and
an incremental mining cost, comprising haulage beyond the reference bench level, and to
respective ore tipping and waste dumping destinations.
For the ore hauls, there were three reference elevations at 120 mRL, 50 mRL, and -60 mRL, catering
for notional in-pit crushing elevations. For the waste hauls, there was one reference elevation, at 120
mRL. The base ore mining cost was $1.77/t and the base waste mining cost was $1.98/t. There were
two incremental mining costs, ie $0.035/t/bench for material hauled up to the reference elevation
and $0.023/t/bench for material hauled down to the reference bench. In these particular estimates,
the haulage costs component took no account of potential future savings from trolley-assisted
haulage.
From the above, the algorithm used for the Whittle input of depth incremented mining costs was:
ore mining ($/t) = 1.77 + 0.035 x (Bench RL – Reference RL) for up hauls
ore mining ($/t) = 1.77 + 0.023 x (Bench RL – Reference RL) for down hauls
waste mining ($/t) = 1.98 + 0.035 x (Bench RL – Reference RL) for up hauls
waste mining ($/t) = 1.98 + 0.023 x (Bench RL – Reference RL) for down hauls
The resulting weighted average variable mining costs were $2.20/t for ore and $1.92/t for waste.
Further details of these mining costs are outlined in Item 21. Item 21 also explains the basis for the
additional stockpiled ore reclaim cost, which although not included in the optimisation, is considered
in the production scheduling process (Item 16).
The operating cost of $4.20/t included a 4.5% allowance for sustaining capital costs ($0.18/t). The
G&A cost of $1.25/t included the same sustaining cost allowance rate ($0.05/t). An additional
allowance for sustaining capital for mining equipment was included, equivalent to $0.26/t mined.
Metal costs
In addition to royalties, metal costs for each of the copper and molybdenum concentrates comprise:
concentrate transport charges
concentrate refining charges
payable rates for each metal recovered into concentrate

Cobre Panamá Project Technical Report March 2019
135
Table 15-3 lists the metal costs adopted for the pit optimisation, inclusive of charges for gold and silver
in concentrate.
Table 15-3 Cobre Panamá metal costs for pit optimisation
The Panamánian government levies a royalty on each metal recovered5,6. From the above table,
therefore, the all-up metal costs adopted for pit optimisation were:
the copper metal cost is:
= metal price x royalty7 + Cu metal cost
= $3.00 x 5% + $0.277 = $0.43/lb Cu
the molybdenum metal cost is:
= metal price x royalty + Mo metal cost
= $13.50 x 5% + $0.091 = $0.77/lb Mo
the gold metal cost is:
= metal price x royalty + Au refining cost x Au payable
= $1,200 x 5% + $5.50 x 92% = $65.06/oz Au ($948.77/lb Au)
the silver metal cost is:
= metal price x royalty + Ag refining cost x Ag payable
= $16.00 x 5% + $0.40 x 90% = $1.16/oz Ag ($16.92/lb Ag)
5 As governed by Law No. 9, 1997, MPSA is expected to pay a 2% royalty on “Negotiable Gross Production” which is defined as “the gross amount received from the buyer due to the sale (of concentrates) after deduction of all smelting costs, penalties and other deductions, and after deducting all transportation costs and insurance…incurred in their transfer from the mine to the smelter”. 6 A tax of 3 Panamánian Balboas (US$3.00) per hectare per year for the total concession area will also apply, but was not adopted for pit optimisation input 7 In the optimisations for simplicity, and based on the rates set out in the Mining Code, a 5% royalty rate was adopted for all four metals.
Copper concentrate charges
Cu con grade, % 25.0%
Cu con overland freight, $/dmt $0.00
Cu con ocean freight, $/dmt $40.00
Cu con treatment, $/dmt $70.00
Cu refining, $/lb payable $0.07
Cu payable, % 96.43%
TCRCs, $/lb Cu payable $0.277
Molybdenum concentrate charges
Mo con grade, % 52.0%
Mo con overland freight, $/dmt $0.00
Mo con ocean freight, $/dmt $90.00
Mo con treatment, $/dmt $0.00
Cu removal charge, $/lb $0.00
Mo refining, $/lb payable $0.00
Mo payable, % 86.20%
TCRCs, $/lb Mo payable $0.091
Gold in concentrate charges
Au refining, $/oz payable $5.50
Au payable, % 92.00%
TCRCs, $/lb Au payable $5.060
Silver in concentrate charges
Ag refining, $/oz payable $0.40
Ag payable, % 90.00%
TCRCs, $/lb Ag payable $0.360

Cobre Panamá Project Technical Report March 2019
136
Mining dilution and recovery factors
Geological losses were built into the regularised mine planning models to account for the presence of
unmineralised dykes. These losses could be considered as “planned dilution”. In the Whittle
optimisation inputs, “unplanned dilution” and mining recovery factors were included to emulate
practical mining losses. In the absence of operational reconciliation information, the selected factors
(Table 15-4) are considered to be reasonable for bulk mining of large orebodies.
Table 15-4 Dilution and recovery factors, Whittle optimisation
Net return
To avoid confusion, the NR (ie, net return = recovery * (revenue – metal costs)) must be expressed in
units of metal grade. Since the metal grades are in % terms, this is $/10kg. In other words, the $/lb
costs must be multiplied by 2,204.62 and divided by 100.
Table 15-5 lists the notional NR values, based on overall average recoveries and model grades.
Marginal cut-off grades
Whittle optimisation software uses the following simplified formula to calculate the marginal cut-off
grade as listed in Table 15-6.
Marginal COG = (PROCOST x MINDIL)/(NR) where PROCOST is the sum of the processing cost plus the ore mining cost differential, and MINDIL is the mining dilution factor
MR model Dilution Recovery
Tonnes Grade Factor Tonnes Grade Factor Tonnes Grade
(Mt) (%Cu) (%) (Mt) (%Cu) (%) (Mt) (%Cu)
Botija 1,010 0.37 2 1,030 0.36 98 1,010 0.36
Colina & Medio 1,079 0.37 2 1,101 0.37 98 1,079 0.37
Valle Grande 603 0.35 2 615 0.34 98 603 0.34
Balboa 522 0.31 2 533 0.30 98 522 0.30
BABR 263 0.37 2 268 0.36 98 263 0.36
TOTAL 3,477 0.36 3,546 0.35 3,477 0.35
Unadjusted inventory Recovered inventoryDiluted inventory

Cobre Panamá Project Technical Report March 2019
137
Table 15-5 Cobre Panamá net return values
Table 15-6 Cobre Panamá marginal cut-off grades
Optimisation results
Figures 15-2 to 15-6 show the graphical results of pit optimisation. The optimal pit shells were selected
on a maximum net return (undiscounted) basis. Table 15-7 lists the inventories and cashflows from
each of the selected optimal shells. These cashflows do not include capital, depreciation or taxes.
Botija, Colina, Medio Valle Grande Balboa BABR
All Rock Types All Rock Types all Rock Types all Rock Types
Processing Parameters:
Mill throughput, tpd 202,740 202,740 202,740 202,740
Cu recovery, % 90.8% 86.4% 90.3% 87.3%
Mo recovery, % 55.0% 53.0% 55.0% 55.0%
Au recovery, % 54.2% 46.5% 68.6% 50.0%
Ag recovery, % 47.3% 47.3% 50.0% 30.0%
Average Grades:
Cu, % 0.37 0.35 0.31 0.37
Mo,ppm 66.93 65.95 15.65 40.48
Au , ppm 0.07 0.05 0.07 0.07
Ag, ppm 1.35 1.37 1.30 0.84
Price less Metal Costs:
Cu Metal Price, $/lb 3.00 3.00 3.00 3.00
Cu Metal Cost, $/lb 0.43 0.43 0.43 0.43
Cu Net Return, $/lb 2.57 2.57 2.57 2.57
Cu Net Return, $/lb (recovered) 2.34 2.22 2.32 2.25
Mo Metal Price, $/lb 13.50 13.50 13.50 13.50
Mo Metal Cost, $/lb 0.77 0.77 0.77 0.77
Mo Net Return, $/lb 12.73 12.73 12.73 12.73
Mo Net Return, $/lb (recovered) 7.00 6.75 7.00 7.00
CuEq Net Return, $/lb (recovered) 0.08 0.04 0.01 0.02
Au Metal Price, $/oz 1,200.00 1,200.00 1,200.00 1,200.00
Au Metal Cost, $/oz 65.06 65.06 65.06 65.06
Au Net Return, $/oz 1,134.94 1,134.94 1,134.94 1,134.94
Au Net Return, $/lb 16,550.83 16,550.83 16,550.83 16,550.83
Au Net Return, $/lb (recovered) 8,974.87 7,691.04 11,356.76 8,275.42
CuEq Net Return, $/lb (recovered) 0.10 0.03 0.10 0.04
Ag Metal Price, $/oz 16.00 16.00 16.00 16.00
Ag Metal Cost, $/oz 1.16 1.16 1.16 1.16
Ag Net Return, $/oz 14.84 14.84 14.84 14.84
Ag Net Return, $/lb 216.41 216.41 216.41 216.41
Ag Net Return, $/lb (recovered) 102.36 102.36 108.21 64.92
CuEq Net Return, $/lb (recovered) 0.02 0.01 0.01 0.00
Total Net Return, $/lb (recovered) 2.53 2.30 2.45 2.32
Total Net Return, $/10kg (recovered) 55.83 50.67 53.95 51.06
Botija, Colina, Medio Valle Grande Balboa BABR
All Rock Types All Rock Types all Rock Types all Rock Types
Marginal Cut-Off Grade:
PROCOST, $/t ore 5.45 5.45 5.45 5.45
MINDIL 1.02 1.02 1.02 1.02
TOTAL NET RETURN, $/10kg 55.83 50.67 53.95 51.06
C/O GRADE, Cu% 0.10 0.11 0.10 0.11

Cobre Panamá Project Technical Report March 2019
138
Figure 15-2 Botija Pit optimisation results
Figure 15-3 Colina/Medio Pit optimisation results

Cobre Panamá Project Technical Report March 2019
139
Figure 15-4 Valle Grande Pit optimisation results
Figure 15-5 Balboa Pit optimisation results

Cobre Panamá Project Technical Report March 2019
140
Figure 15-6 Botija Abajo, Brazo (BABR) Pit optimisation results
Table 15-7 Cobre Panamá optimal pit shell inventories
Optimisation sensitivity
Sensitivity to changed metal prices
A sensitivity analysis was completed, post cashflow modelling (Item 22), to assess the impact of
updated long term (concensus forecast) copper, molybdenum, gold and silver prices as follows:
gold = $3.07/lb ($6,772/t)
molybdenum = $8.83/lb ($19,467/t)
gold = $1,310/oz
silver = $18.87/oz
Ultimate Pits Botija Colina & Medio ValleGrande Balboa BABR TOTAL
Shell No 15 16 15 16 16
Plant Feed Mt 1,009.6 1,056.1 582.2 522.2 262.7 3,432.8
Feed Grade %TCu 0.36 0.37 0.35 0.30 0.36 0.35
Cu Metal Insitu kt 3,644.7 3,894.3 2,017.8 1,587.6 953.5 12,098.0
Waste Mt 648.2 617.2 498.5 790.7 239.0 2,793.6
Total Mined Mt 1,657.8 1,673.3 1,080.7 1,312.9 501.7 6,226.4
Strip Ratio 0.64 0.58 0.86 1.51 0.91 0.81
Recovered Cu kt 3,309.4 3,534.6 1,742.2 1,431.2 833.4 10,850.9
Recovered Mo kt 37.7 37.1 20.0 4.5 5.7 105.1
Recovered Au koz 1,341.6 1,111.5 390.5 812.0 274.1 3,929.6
Recovered Ag koz 17,310.9 24,616.9 11,960.8 8,459.3 2,073.3 64,421.3
Undisc. Cashflow M$ 12,343.6 13,060.3 5,448.9 3,244.3 2,598.1 36,695.2

Cobre Panamá Project Technical Report March 2019
141
The results as shown in Table 15-8 indicate minimal impact to the total net return due to these pricing
updates (yellow highlighted information). The marginal cut-off grade is unchanged.
Table 15-8 Cobre Panamá optimisation sensitivity analyses
Sensitivity to changed mining cost estimates
More detailed mining cost estimates were developed subsequent to the optimisations described
herein. Rather than being based on generic haulage profiles for a single open pit, these estimates
were produced with the benefit of comprehensive haul profiles within completed, individual open pit
and waste dump designs. Item 21 provides a commentary on these cost updates.
An optimisation sensitivity analysis using this new information showed marginal differences to the
optimal shells selected for the pit designs and Mineral Reserves process (with the exception of BABR,
which as discussed in Item 16, is not mined until after 2040).
Sensitivity to revised G&A, processing and metal cost estimates
In the same way that mining costs were revised subsequent to the optimisations, G&A costs,
processing costs and metal costs were also reviewed and updated for the cashflow model. Item 21
Opt'n
Copper
TCRCs, $/lb Cu payable $0.28 $0.28 $0.28 $0.28 $0.34
Metal price, $/lb $3.00 $3.07 $3.00 $3.00 $3.00
royalty rate, % 5.0% 5.0% 5.0% 5.0% 2.0%
Cu metal cost, $/lb Cu payable $0.43 $0.43 $0.43 $0.43 $0.40
Net return, $/lb (recovered) $2.34 $2.40 $2.34 $2.34 $2.36
Molybdenum
TCRCs, $/lb Mo payable $0.09 $0.09 $0.09 $0.09 $1.33
Metal price, $/lb $13.50 $8.83 $13.50 $13.50 $13.50
royalty rate, % 5.0% 5.0% 5.0% 5.0% 2.0%
Mo metal cost, $/lb Mo payable $0.77 $0.53 $0.77 $0.77 $1.60
Cueq Net Return, $/lb (recovered) $0.08 $0.05 $0.08 $0.08 $0.07
Gold
TCRCs, $/lb Au payable $5.06 $5.06 $5.06 $5.06 $4.59
Metal price, $/oz $1,200 $1,310 $1,200 $1,200 $1,200
royalty rate, % 5.0% 5.0% 5.0% 5.0% 2.0%
Au metal cost, $/oz Au payable $65.060 $70.560 $65.060 $65.060 $28.590
Au metal cost, $/lb Au payable $948.77 $1,028.98 $948.77 $948.77 $416.93
Cueq Net Return, $/lb (recovered) $0.10 $0.11 $0.10 $0.10 $0.10
Silver
TCRCs, $/lb Ag payable $0.36 $0.36 $0.36 $0.36 $0.40
Metal price, $/oz $16.00 $18.87 $16.00 $16.00 $16.00
royalty rate, % 5.0% 5.0% 5.0% 5.0% 2.0%
Au metal cost, $/oz Ag payable $1.160 $1.304 $1.160 $1.160 $0.718
Ag metal cost, $/lb Ag payable $16.92 $19.01 $16.92 $16.92 $10.46
Cueq Net Return, $/lb (recovered) $0.02 $0.02 $0.02 $0.02 $0.02
Total Net Return, $/lb (recovered) $2.53 $2.58 $2.53 $2.53 $2.56
Total Net Return, $/10kg (recovered) $55.83 $56.85 $55.83 $55.83 $56.37
Total Net Return, $/10kg (unrecovered) $61.50 $62.63 $61.50 $61.50 $62.10
Marginal cut-off grade
PROCOST, $/t ore $5.45 $5.45 $4.10 $4.60 $5.45
MINDIL $1.02 $1.02 $1.02 $1.02 $1.02
TOTAL NET RETURN, $/10kg $61.50 $62.63 $61.50 $61.50 $62.10
Recovery 90.8% 90.8% 90.8% 90.8% 90.8%
C/O Equivalent grade, % 0.10 0.10 0.07 0.08 0.10
Sensitivity analyses

Cobre Panamá Project Technical Report March 2019
142
provides a commentary on these particular cost updates whilst Table 15-8 shows the impact on the
marginal cut-off grade due to these changes (green highlighted information). In this table, PROCOST
is the sum of the G&A and processing costs. Relative to the $5.45/t ore adopted in the optimisation,
PROCOST for the cashflow model is shown as a range of $4.10/t ore and $4.60/t ore. Table 15-8 also
shows the revised TCRCs and royalty charges that were adopted for the cashflow model (blue
highlighted information).
The overall impact is that the lower marginal cut-off grade due to the operating cost changes suggests
some conservatism in the selection of the optimal pit shell. The changes to the metal costs (TCRCs
and royalties) have minimal impact on the total net return and the marginal cut-off grade.
Detailed pit designs
For the 2015 Technical Report (FQM, July 2015), the pit design approach was to produce a series of
phased pit designs using ultimate and selected intermediate pit optimisation shells. The approach has
changed in the lead-up to this Technical Report, to now reflect a mining progression through each pit
according to wide terraced benches, rather than by push back ‘phases’ which emulate intermediate
pit optimisation shells. Further information on this change of mining progression is provided in Item
16.
The ultimate pit designs continue to be based on the corresponding selected ultimate pit shells, and
according to the design and planning parameters listed below.
Design and planning parameters
Table 15-9 lists the detailed pit slope design criteria adopted during design for each of the Cobre
Panamá pits. This table expands upon the information in Table 15-28.
The following parameters relate to the design of the ultimate pits, allowing for inclusion of IPCC into
the layouts:
benches (interval between berms) are mined to a height of 15 m or 30 m in ore and waste
truck ramp width = 3.5 x truck width plus bund = 37.5 m
truck / dual conveyor ramp width = 55 m (refer to schematic in Figure 16-2)
all waste ramps = 55 m (allowing for future trolley-assisted haulage, refer to schematic in Figure
16-3)9
maximum conveyor incline angle = 1 : 3.7 = 15°
maximum haul ramp gradient = 1 : 10 = approximately 6°
Figures 15-7 to 15-11 show the ultimate pit designs produced from respective pit shell outlines. The
Botija Pit design has changed since that adopted for the 2015 Technical Report (FQM, July 2015). The
new design shown in Figure 15-7 includes a modified north wall which has reduced the waste volume
due to a revised positioning of the ultimate in-pit coveyor route.
8 Item 16.2.2 provides further information on pit slope design criteria, together with the findings from geotechnical reviews carried out after the original pit optimisations had been completed. 9 The future trolley-assist system will require wider up-haul ramps to cater for the catenary wire towers and triple traffic lanes, so have been designed at minimum 55 m width, with a 1:10 gradient.

Cobre Panamá Project Technical Report March 2019
143
Table 15-9 Cobre Panamá pit slope design criteria
Figure 15-7 Botija ultimate pit design
IR Angle
including
Drainage *
Drainage
Catch Bench
Width Stack Height IR Angle within Stack Bench Height Bench Face Angle Catch Bench Width
(degrees) (m) (m) (degrees) (m) (degrees) (m)
1 43.2 18.0 90 46.0 70 9
2 43.2 18.0 90 46.0 70 9
3 43.2 18.0 90 46.0 70 9
4 43.2 18.0 90 46.0 70 9
5 43.2 18.0 90 46.0 70 9
13 43.2 18.0 90 46.0 70 9
14 43.2 18.0 90 46.0 70 9
SE, SW 1 39.5 24 90 43.1 55 11
NW, Pit Bottom 2 42.5 24 90 46.6 60 11
N, E, S 3 45.6 24 90 50.2 65 11
SSW 4 45.6 24 90 50.2 65 11
VG All 39.5 24 90 43.1 30 55 11
Low RQD All - 24 60 36.2 15 55 10
W 41 - - 44.0 30 63 16
E 29 - - 31.5 15 55 14
All Remaining 34 - - 38.0 15 55 9
Balboa All 42 - - 45.0 30 68 18
65 - - - 32.5 68 5.8
60 - - - 30.0 68 6.6
55 - - - 34.0 68 5.4
50 - - - 35.0 68 5.1
45 - - - 36.0 68 4.9
40 - - - 37.5 68 4.5
35 - - - 39.5 68 4.0
30 - - - 40.2 68 3.9
25 - - - 40.2 68 3.9
20 - - - 40.2 68 3.9
65 - - - 29.5 68 6.8
60 - - - 30.0 68 6.6
55 - - - 31.0 68 6.3
50 - - - 32.0 68 6.0
45 - - - 33.0 68 5.7
40 - - - 34.0 68 5.4
35 - - - 36.0 68 4.9
30 - - - 38.5 68 4.3
25 - - - 40.2 68 3.9
20 - - - 40.2 68 3.9
Pit LocationSector /
Wall Height
Botija
North Wall
15
East Wall
South Wall
West Wall
Colina
Double
Benching
30 meters
BABr
Saprolite
Varies by
wall height (m)
Non- River
Diversion Areas
Benching
5 meters
Varies by
wall height (m)
River Diversion
Areas
Benching
5 meters

Cobre Panamá Project Technical Report March 2019
144
Figure 15-8 Colina ultimate pit design
Figure 15-9 Valle Grande ultimate pit design
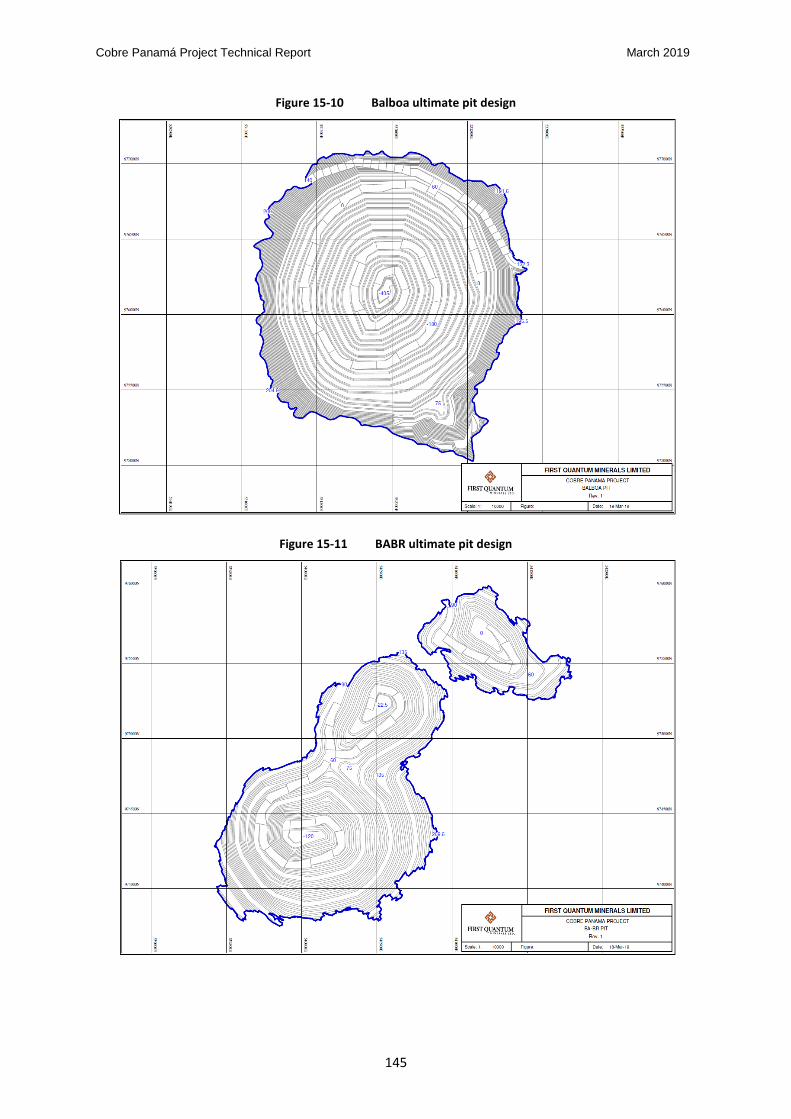
Cobre Panamá Project Technical Report March 2019
145
Figure 15-10 Balboa ultimate pit design
Figure 15-11 BABR ultimate pit design

Cobre Panamá Project Technical Report March 2019
146
Design efficiency
Table 15-10 provides a validation comparison between the ultimate pit designs and the shells upon
which those designs were based.
Table 15-10 Validation between pit shell and design
In an overall sense, for each pit, there is a reasonable validation between pit designs and the selected
ultimate shells. For the Botija Pit, the ultimate pit design has changed since that reported in the 2015
Technical Report (FQM, July 2015) and whilst the overall validation remains reasonable, there are
localised areas of the pit design which are outside of the original pit shell.
Item 16.2.3 describes mine planning and engineering work that is currently in progress, and which will
be considered for future Botija Pit optimisations. Iterative revisions to the pit optimisations and
designs will continue as further engineering work proceeds in relation to future, ultimate IPCC siting
scenarios for Botija and Colina.
Mine site layout
Figure 15-12 shows how the ultimate pits relate to each other. Additionally, this figure shows:
the location of the process plant site and overland ore conveying routes
the proposed locations of future IPC positions at Botija, Colina and Valle Grande
the waste dumps associated with the pits, located and sized to allow for expansion, if and when
Inferred Resources are converted to Mineral Reserve status
Mineral Reserve statement
As at the end of December 2018, the total Mineral Reserve inclusive of stockpile inventory is estimated
as 3,147.1 million tonnes at 0.38% TCu, 59.36 ppm Mo, 0.07 g/t Au and 1.37 g/t Ag. The estimate is
entirely within the Measured and Indicated Mineral Resource estimate reported in Table 14-9. A
breakdown by pit and classification is provided in Table 15-11. Table 15-12 lists the additional Mineral
Reserve inventory that is available on stockpiles which have accumulated during the pre-strip mining.
The reported Mineral Reserve is based on an economic cut-off grade which accounts for a longer-term
copper metal price projection of $3.00/lb ($6,615/t). The inventory reflects the ultimate pit designs
and the mining production schedule described in Item 16.3.

Cobre Panamá Project Technical Report March 2019
147
Figure 15-12 Ultimate pit designs and waste dumps

Cobre Panamá Project Technical Report March 2019
148
Table 15-11 Cobre Panamá Project In-pit Mineral Reserve statement, at December 2018
Table 15-12 Cobre Panamá Project Stockpile Mineral Reserve statement, at December 2018
The in-pit Mineral Reserve listed in Table 15-11 represents mining recovery of 86% and 88% of the
Measured plus Indicated Mineral Resource tonnage and insitu metal estimate, respectively. In total,
10% of the combined Mining inventory tonnage is classified as Proven with the remainder classified
as Probable.
Mineral Reserve estimate comparisons
Reflecting the updates to the Mineral Resource model and the comparisons made between the 2018
and 2015 estimates (Item 14.14 and Table 14-10), there are commensurate differences between the
respective Mineral Reserve estimates for each pit.
A comparison between the 2018 and 2015 estimates is provided in Table 15-13. Aside from the
modelling related differences described in Item 14 and applicable to the Botija deposit, the change in
Mineral Reserve tonnes for Botija and the other pits is partly attributable to a redefinition of ore
material types.
Mineral Reserve differences for the Botija Pit are also in part attributable to losses incurred during
pre-strip mining, offset against changes due to redefinition of ore material types. Further information
on the redefinition of ore types is provided in Item 16.1.5.
Mtonnes TCu Mo Au Ag TCu metal Mo metal Au metal Ag metal
(%) (ppm) (ppm) (ppm) (kt) (kt) (koz) (koz)
BOTIJA Proved 323.2 0.45 75.98 0.11 1.43 1,467.0 24.6 1,106.3 14,886.7
Probable 641.4 0.35 68.28 0.08 1.13 2,220.2 43.8 1,512.4 23,357.7
Total P+P 964.6 0.38 70.86 0.09 1.23 3,687.2 68.4 2,669.6 38,188.5
COLINA & Proved
MEDIO Probable 981.3 0.39 66.98 0.06 1.61 3,870.5 65.7 1,986.8 50,646.8
Total P+P 981.3 0.39 66.98 0.06 1.61 3,870.5 65.7 1,986.8 50,646.8
VALLE GRANDE Proved
Probable 541.1 0.37 67.43 0.05 1.42 2,016.0 36.5 805.2 24,637.3
Total P+P 541.1 0.37 67.43 0.05 1.42 2,016.0 36.5 805.2 24,637.3
BALBOA Proved
Probable 437.1 0.35 16.10 0.08 1.36 1,509.0 7.0 1,126.9 19,168.2
Total P+P 437.1 0.35 16.10 0.08 1.36 1,509.0 7.0 1,126.9 19,168.2
BABR Proved
Probable 219.7 0.40 41.31 0.07 0.87 882.1 9.1 527.5 6,163.9
Total P+P 219.7 0.40 41.31 0.07 0.87 882.1 9.1 527.5 6,163.9
TOTAL Proved 323.2 0.45 75.98 0.11 1.43 1,467.0 24.6 1,106.3 14,886.7
Probable 2,820.5 0.37 57.48 0.07 1.37 10,497.7 162.1 6,009.6 123,918.1
Total P+P 3,143.7 0.38 59.38 0.07 1.37 11,964.7 186.7 7,116.0 138,804.8
Pit Class
MINERAL RESERVE AT 31st DECEMBER 2018 (Cu = $3.00/lb, Mo = $13.50/lb, Au = $1,200/toz, Ag = $16.00/toz)
Insitu Mining Inventory
Mtonnes TCu Mo Au Ag TCu metal Mo metal Au metal Ag metal
(%) (ppm) (ppm) (ppm) (kt) (kt) (koz) (koz)
BOTIJA Proved
Probable 3.3 0.22 43.12 0.04 1.18 7.4 0.1 4.5 126.9
Total P+P 3.3 0.22 43.12 0.04 1.18 7.4 0.1 4.5 126.9
Stockpile Inventory
Pit Class
MINERAL RESERVE AT 31st DECEMBER 2018 (Cu = $3.00/lb, Mo = $13.50/lb, Au = $1,200/toz, Ag = $16.00/toz)

Cobre Panamá Project Technical Report March 2019
149
Table 15-13 Comparison of Mineral Reserve estimate results as at December 2018 and the previous results as at 2015
2018 2015 %Var 2018 2015 %Var 2018 2015 %Var
BOTIJA Proved 323.2 345.6 -6% 0.45 0.45 1% 1,465.3 1,550.2 -5%
Probable 644.7 603.5 7% 0.35 0.35 -2% 2,225.1 2,124.5 5%
Total P+P 967.9 949.1 2% 0.39 0.39 1% 3,690.4 3,674.4 0%
COLINA & Proved 0.0 0.0 0% 0.00 0.00 0% 0%
MEDIO Probable 981.3 1,009.9 -3% 0.39 0.39 2% 3,870.5 3,898.8 -1%
Total P+P 981.3 1,009.9 -3% 0.39 0.39 2% 3,870.5 3,898.8 -1%
VALLE GRANDE Proved 0.0 0.0 0% 0.00 0.00 0% 0%
Probable 541.1 566.0 -4% 0.37 0.36 4% 2,016.0 2,035.9 -1%
Total P+P 541.1 566.0 -4% 0.37 0.36 4% 2,016.0 2,035.9 -1%
BALBOA Proved 0.0 0.0 0% 0.00 0.00 0% 0%
Probable 437.1 437.1 0% 0.35 0.35 0% 1,509.0 1,509.0 0%
Total P+P 437.1 437.1 0% 0.35 0.35 0% 1,509.0 1,509.0 0%
BABR Proved 0.0 0.0 0% 0.00 0.00 0% 0%
Probable 219.7 220.5 0% 0.40 0.40 0% 882.1 882.5 0%
Total P+P 219.7 220.5 0% 0.40 0.40 0% 882.1 882.5 0%
TOTAL Proved 323.2 345.6 -6% 0.45 0.449 1% 1,465.3 1,550.2 -5%
Probable 2,823.9 2,836.9 0% 0.37 0.368 1% 10,502.6 10,450.7 0%
Total P+P 3,147.1 3,182.5 -1% 0.38 0.38 1% 11,967.9 12,000.9 0%
Pit ClassMtonnes %Cu TCu metal (kt)
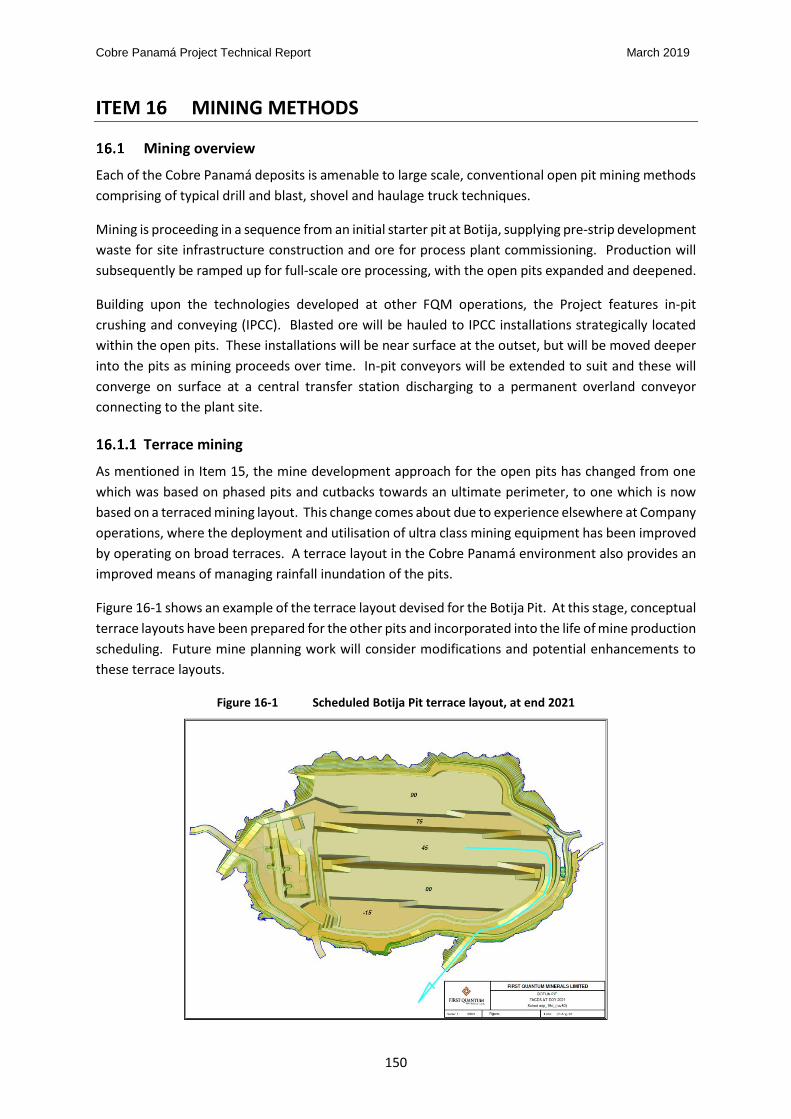
Cobre Panamá Project Technical Report March 2019
150
MINING METHODS
Mining overview
Each of the Cobre Panamá deposits is amenable to large scale, conventional open pit mining methods
comprising of typical drill and blast, shovel and haulage truck techniques.
Mining is proceeding in a sequence from an initial starter pit at Botija, supplying pre-strip development
waste for site infrastructure construction and ore for process plant commissioning. Production will
subsequently be ramped up for full-scale ore processing, with the open pits expanded and deepened.
Building upon the technologies developed at other FQM operations, the Project features in-pit
crushing and conveying (IPCC). Blasted ore will be hauled to IPCC installations strategically located
within the open pits. These installations will be near surface at the outset, but will be moved deeper
into the pits as mining proceeds over time. In-pit conveyors will be extended to suit and these will
converge on surface at a central transfer station discharging to a permanent overland conveyor
connecting to the plant site.
Terrace mining
As mentioned in Item 15, the mine development approach for the open pits has changed from one
which was based on phased pits and cutbacks towards an ultimate perimeter, to one which is now
based on a terraced mining layout. This change comes about due to experience elsewhere at Company
operations, where the deployment and utilisation of ultra class mining equipment has been improved
by operating on broad terraces. A terrace layout in the Cobre Panamá environment also provides an
improved means of managing rainfall inundation of the pits.
Figure 16-1 shows an example of the terrace layout devised for the Botija Pit. At this stage, conceptual
terrace layouts have been prepared for the other pits and incorporated into the life of mine production
scheduling. Future mine planning work will consider modifications and potential enhancements to
these terrace layouts.
Figure 16-1 Scheduled Botija Pit terrace layout, at end 2021

Cobre Panamá Project Technical Report March 2019
151
In-pit crushing and conveying of ore (IPCC)
The primary crushing circuit will comprise up to five semi-mobile, independent, gyratory crushers (3 x
ThyssenKrupp KB 63 x 89 and 2 x ThyssenKrupp KB 63 x 130) operating in open circuit. Each crusher
will be positioned in-pit and remote from the plant area, and crushed ore will be transported to the
plant by an overland conveyor.
For the purposes of considering crusher relocations in the mine production schedule (Item 16.3),
crusher productivity was considered on the basis of the parameters shown in Table 16-1. Under these
circumstances, the combined capacity of the five crushers is approximately 130 Mtpa and is in excess
of the ultimate milling rate.
Table 16-1 In-pit crusher capacity
The inpit haul road arrangement to accommodate a dual conveyor easement is shown in Figure 16-1.
Figure 16-2 Schematic cross section across a conveyor ramp
Trolley-assisted haulage
Trolley-assisted haulage is a concept that is being adopted during the early life of operations. The
primary truck haulage fleet is being delivered “trolley-assist ready” (TA). Additional pit ramp width
has been included in the detailed pit phase designs to allow for the physical placement of transformers
and catenary wire poles (Figure 16-3). In places, these ramps could be extended onto the waste
dumps.
ThyssenKrupp IPC KB 63 x 89 KB 63 x 130 Comments
Nominal productivity tph 3,600 5,040 for each crusher
Availability % 96% 96% routine crusher maintenance
Planned productivity tph 3,456 4,838
Utilisation % 75% 75% 18 hrs/day (discontinuous feed)
Daily capacity tpd 62,208 87,091
Operational downtime days/yr 24 24 adjacent blasting, belt maintenance
Annual capacity Mtpa 21.2 29.7

Cobre Panamá Project Technical Report March 2019
152
Figure 16-3 Schematic cross section across a trolley-assisted haulage ramp
Waste dumping
The planned waste dumps (referred to as “waste rock storage facilities”, WRSF) are located
surrounding the various pits, wherever space dictates, and in areas that have been largely sterilised
by exploratory drilling.
The dumps have been designed such that they do not encroach upon the ultimate limits of the
Measured+Indicated+Inferred resource pit shells, nor cross any major drainage paths. The dump
profiles have been designed with a 32° batter angle, a 30 m batter height, 26 m width berms, and
minimum 55 m wide ramps at 1:10 gradient. The overall angle of each ultimate dump slope is
approximately 22°.
Ore grade ranges, stockpiling and reclaiming
The life of mine (LOM) production schedule described in Item 16.3 requires a stockpile building and
reclaim strategy in order to balance the direct crusher feed from the pits and maintain a reasonable
overall feed tonnage and grade profile. Because of the IPCC concept, however, it makes sense to
minimise surface stockpile building and reclaim, and hence the scheduling process is an iterative one
to ensure that this is possible whilst also maintaining an orderly and practical ore and waste mining
sequence.
Table 16-2 lists the grade criteria adopted for mine production scheduling, for ore stockpiling and for
waste categorisation. The lithology types are 100 = saprolite, 400 = andesite, 500 = porphyry, 600 =
hornblende porphyry, 700 = felsic porphyry, 800 = granodiorite and 900 = felsic granodiorite.

Cobre Panamá Project Technical Report March 2019
153
Table 16-2 Stockpile grade ranges
The material type and grade range definition listed in Table 16-2 are a change from that described and
tabled in the 2015 Technical Report (FQM, July 2015). The definition was previously based on a block
by block net return calculation, whereas it is now based on average cut-off grade criteria pertaining
to net return calculations. This change was made on the basis of consistency with site practice
following the development of the grade control programme and the actual mark-out criteria for
digging blocks.
For the IPCC reason described above, high and medium grade ore is preferentially direct fed to the
crushers. However, some of this tonnage must be mined and stockpiled and hence, high and medium
grade ore stockpiles are considered to be “active” throughout the mine life. Space adjacent to the
Botija Pit western crest has been set aside as an initial location for these (refer to Figure 15-12). From
the production schedule in Table 16-5, the maximum size of these stockpiles is 11.4 Mt, reached in
2019. The maximum reclaim of 10.0 Mt from these piles occurs in 2020 when there will be four
crushers in the Botija Pit. This 10 Mt represents 12% of the crusher feed in that year.
Over the life of the mine, further active stockpiles will need to be positioned at convenient locations
adjacent to or within convenient a distance to near-surface crusher positions.
Long term low grade ore and saprock ore stockpiles are developed over the life of the mine and are
not reclaimed until the final years of operations. The low grade is deferred in preference to direct
feed of high and medium grade ore, whilst the saprock ore is deferred for reasons of lesser recovery.
The location for these long term stockpiles has not been identified explicitly (other than for a Botija
Pit long term stockpile site located on the southern waste dump), although it is expected that they
would form separate and discrete volumes within the ultimate waste dumps and close to the final
near-surface crusher positions.
Grade control
Conventional open pit grade control practices have been put into place, incorporating RC drilling and
sampling on a suitably designed drilling pattern and over multiple bench horizons. Blasthole sampling
may also be used, as required, to provide additional data for ore block boundary definition. Multi
Resource Approx. Av. 1
Class %Cu COG
Saprock Ore (SAPR_O) Meas+Ind > 100 >= 0.20
Fresh High Grade Ore (HIGH) Meas+Ind > 100 <= 900 >= 0.28
Fresh Medium Grade Ore (MED) Meas+Ind > 100 <= 900 >= 0.20 < 0.28
Fresh Low Grade Ore (LOW) Meas+Ind > 100 <= 900 >= 0.15 < 0.20
Mineralised Waste (MARG) Meas+Ind > 100 <= 900 >= 0.11 < 0.15
Saprolite (SAP) Meas+Ind+Inf 100 n/a
NAF Saprock Waste (SAPR_N) Meas+Ind+Inf > 100 < 0.20
PAF Saprock Wate (SAPR_P) Meas+Ind+Inf > 100 < 0.20
NAF Fresh Waste (NAF) Meas+Ind+Inf > 100 <= 900 < 0.11
PAF Fresh Waste (PAF) Meas+Ind+Inf > 100 <= 900 < 0.11
1. Estimated average COG based on block value criteria
Current descriptor
Ore/Waste classification
ORE
WASTE
Lithology

Cobre Panamá Project Technical Report March 2019
154
element sample assaying is being carried out on site. A grade control modelling process has been
implemented as the basis for designing dig blocks.
Drilling and blasting
Near-surface saprolite material is being mined essentially as free-dig. As and when required, bench
development that requires blasting will be blasted on bench heights of between 5 and 10 m and using
small diameter blast holes.
Below this horizon, production drilling and blasting will take-place in rock conditions requiring a range
of drilling/charging patterns and powder factors. Due to the mix of large and medium sized rotary
drills there will be large and medium diameter holes used to blast ore and waste.
Controlled blasting is being undertaken on final walls to prevent blast damage and to maintain wall
control. As shown in Table 16-3, the controlled blasting consists of a small diameter presplit hole
loaded with a decoupled charge. Adjacent to the presplit line, trim blasting consists of four to six rows
of medium sized holes.
Table 16-3 Drilling and blasting parameters
Production Development
Parameter Ore Waste Trim Presplit 5m Bench 10m
Bench
Burden (m) 6.8 8.5 6.0 NA 3.5 4.2
Spacing (m) 7.8 9.8 6.9 1.8 4.0 4.8
Bench Height (m) 15.0 15.0 15.0 15.0 5.0 10.0
Sub-Drill (m) 2.0 2.5 1.0 0.5 0.5 1.0
Stemming Length (m) 5.5 7.5 5.0 2.4 (Air) 2.5 3.0
Blast hole Diameter (mm) 251 311 200 165 115 127
Powder Factor (kg/m³) 0.85 0.72 0.64 0.50 0.53 0.59
In order to minimise vibration and fly-rock damage, appropriately engineered blast designs are
required near in-pit crushers and conveyors. Due to the favourable nature of the geology, it is
anticipated that minimal changes to the infrastructure designs will be required to mitigate the risk of
vibration and fly-rock.
Powder factors required to date have generally been lower than those in Table 16-3, but are expected
to increase with depth. Rock fragmentation characteristics to date have been encouraging.
Mine planning considerations
The following information relates to the detail that needed to be considered for designing surface
layouts and practical mining pits around the optimal pit shell outlines.
Mine design parameters
Basic mine design parameters relating to pit slope parameters and widths of haul roads are described
in Item 15. More detailed parameters have had to be considered for IPCC. ThyssenKrupp engineering
drawings provided the required excavation and installation dimensions for each semi-mobile crusher
installation at the Botija Pit.

Cobre Panamá Project Technical Report March 2019
155
Mine geotechnical engineering
The 2015 Technical Report (FQM, July 2015) provided a comprehensive summary of the then current
open pit slope design recommendations as provided by consultants Call & Nicholas Inc. (CNI, March
2013, Aprl 2013, June 2014 and May 2015), and AMEC Earth and Environmental (AMEC, February
2010). With the Botija Pit mining pre-strip having progressed since these recommendations were
drafted, and with the availability of saprolite, saprock and fresh rock exposures from which to map
and interpret geotechnical conditions, a review was subsequently completed by consultant Peter
O’Bryan and Associates (POB, October 2018).
This review was focussed on the exposed rock slopes for the Botija Pit south wall, and specifically to
the Zone 5 sector shown in Figure 16-4. The POB review resulted in some changes to the earlier
specifications, notably the bench height and face angle. Previously these were 30 m and 68o,
respectively; the new recommendations are 15 m and 70o, respectively. The berm width was changed
from 18 m to 9 m. The original 90 m stack height recommendation was maintained. Consequently,
the updated slope design parameters for Botija, and the unchanged parameters for all other pits, are
listed in Table 16-4.
Figure 16-4 Updated Botija Pit slope design sectors, 2018
Figure 16-5 shows a cross section through the Botija south wall slope, showing a modest steepening
of the overall slope by 1.5o. The crest line adjacent to the Botija River diversion channel (Item 16.2.6)
has moved towards the north and the channel easement is now wider.

Cobre Panamá Project Technical Report March 2019
156
Figure 16-5 Updated Botija Pit slope design, cross section through south wall
Table 16-4 Updated pit slope design parameters, 2018
IR Angle
including
Drainage *
Drainage
Catch Bench
Width Stack Height IR Angle within Stack Bench Height Bench Face Angle Catch Bench Width
(degrees) (m) (m) (degrees) (m) (degrees) (m)
1 43.2 18.0 90 46.0 70 9
2 43.2 18.0 90 46.0 70 9
3 43.2 18.0 90 46.0 70 9
4 43.2 18.0 90 46.0 70 9
5 43.2 18.0 90 46.0 70 9
13 43.2 18.0 90 46.0 70 9
14 43.2 18.0 90 46.0 70 9
SE, SW 1 39.5 24 90 43.1 55 11
NW, Pit Bottom 2 42.5 24 90 46.6 60 11
N, E, S 3 45.6 24 90 50.2 65 11
SSW 4 45.6 24 90 50.2 65 11
VG All 39.5 24 90 43.1 30 55 11
Low RQD All - 24 60 36.2 15 55 10
W 41 - - 44.0 30 63 16
E 29 - - 31.5 15 55 14
All Remaining 34 - - 38.0 15 55 9
Balboa All 42 - - 45.0 30 68 18
65 - - - 32.5 68 5.8
60 - - - 30.0 68 6.6
55 - - - 34.0 68 5.4
50 - - - 35.0 68 5.1
45 - - - 36.0 68 4.9
40 - - - 37.5 68 4.5
35 - - - 39.5 68 4.0
30 - - - 40.2 68 3.9
25 - - - 40.2 68 3.9
20 - - - 40.2 68 3.9
65 - - - 29.5 68 6.8
60 - - - 30.0 68 6.6
55 - - - 31.0 68 6.3
50 - - - 32.0 68 6.0
45 - - - 33.0 68 5.7
40 - - - 34.0 68 5.4
35 - - - 36.0 68 4.9
30 - - - 38.5 68 4.3
25 - - - 40.2 68 3.9
20 - - - 40.2 68 3.9
Pit LocationSector /
Wall Height
Botija
North Wall
15
East Wall
South Wall
West Wall
Colina
Double
Benching
30 meters
* Drainage benches on 90 m vertical intervals
10 metre wide bench at the base of the saprolite to allow room to contain saprolite slope failures
BABr
Saprolite
Varies by
wall height (m)
Non- River
Diversion Areas
Benching
5 meters
Varies by
wall height (m)
River Diversion
Areas
Benching
5 meters
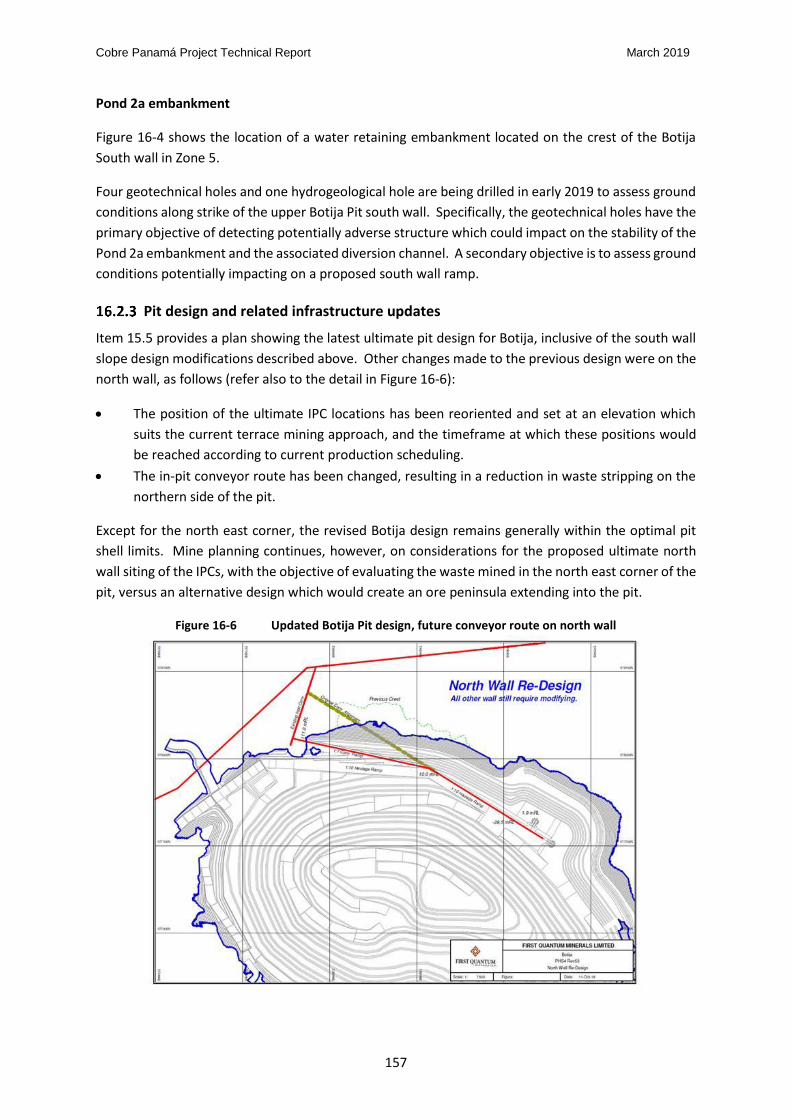
Cobre Panamá Project Technical Report March 2019
157
Pond 2a embankment
Figure 16-4 shows the location of a water retaining embankment located on the crest of the Botija
South wall in Zone 5.
Four geotechnical holes and one hydrogeological hole are being drilled in early 2019 to assess ground
conditions along strike of the upper Botija Pit south wall. Specifically, the geotechnical holes have the
primary objective of detecting potentially adverse structure which could impact on the stability of the
Pond 2a embankment and the associated diversion channel. A secondary objective is to assess ground
conditions potentially impacting on a proposed south wall ramp.
Pit design and related infrastructure updates
Item 15.5 provides a plan showing the latest ultimate pit design for Botija, inclusive of the south wall
slope design modifications described above. Other changes made to the previous design were on the
north wall, as follows (refer also to the detail in Figure 16-6):
The position of the ultimate IPC locations has been reoriented and set at an elevation which
suits the current terrace mining approach, and the timeframe at which these positions would
be reached according to current production scheduling.
The in-pit conveyor route has been changed, resulting in a reduction in waste stripping on the
northern side of the pit.
Except for the north east corner, the revised Botija design remains generally within the optimal pit
shell limits. Mine planning continues, however, on considerations for the proposed ultimate north
wall siting of the IPCs, with the objective of evaluating the waste mined in the north east corner of the
pit, versus an alternative design which would create an ore peninsula extending into the pit.
Figure 16-6 Updated Botija Pit design, future conveyor route on north wall

Cobre Panamá Project Technical Report March 2019
158
Subject to a hydrological engineering assessment, there is the potential to further reduce the waste
volume in the north east corner of the pit, lying outside of the optimal shell, by removing the designed
surface run-off diversion channel that is located above the ultimate crusher position.
An aspect of the Botija Pit design which also remains under review is the positioning of a permanent
waste haulage ramp on the south wall. In the current design (Figure 16-7), there is a temporary south
wall ramp and a permanent eastern wall ramp, both leading up onto the Botija waste dump [the dump
is also undergoing a design review].
In a proposed design (Figure 16-8), the south wall ramp arrangement has been altered to match a
modified waste dump layout and includes a permanent south wall ramp. The new dump layout suits
operational design changes to incorporate straight-line trolley assist ramps and an excision to
accommodate an enlarged sediment control pond. This proposed revised south wall design also
remains within the optimal pit shell limits.
Figure 16-7 Current south wall design for the Botija Pit

Cobre Panamá Project Technical Report March 2019
159
Figure 16-8 Proposed south wall design for the Botija Pit
Although not yet adopted in the current designs for the Colina Pit, concepts have been developed for
an alternative overland conveyor route extending from Botija, with potential impacts on the starter
pit for Colina, the location of initial IPCs and the surrounding waste dumps. A plan showing concepts
currently being evaluated are shown in Figure 16-9.
Figure 16-9 Future Colina Pit access and development concepts

Cobre Panamá Project Technical Report March 2019
160
The current overland conveyor design route, extending across to the future Colina starter pit and initial
IPC locations, follows a broadly curved path which is intended to skirt the perimeter that could apply
if the Colina Pit was ever expanded to include Inferred mineral resource. The disadvantage of this
route is the conveyor length, the need for a transfer facility mid-distance, and the need for a deep cut
into a ridgeline immediately to the east of Colina.
A proposed new straight-line route is shorter, does not require a transfer facility and necessitates a
shallower cut into the ridgeline. Mine planning work continues on the evaluation of this proposal.
Trade-off analyses will consider the value of future Inferred mineral resource that would be sterilised
if the straight-line conveyor route was adopted.
During 2019, sterilisation drilling is planned to commence on the Colina conveyor options and
proposed in-pit crusher locations.
Mine dewatering
A hydrogeological baseline investigation was completed as part of the ESIA (Golder, 2010) process.
This involved the drilling and aquifer testing of shallow vertical bores (to 50 m depth) in the vicinity of
infrastructure facilities, and drilling/testing of deeper bores within the footprint of the Botija Pit. In
addition to collecting static water level readings from exploration drill holes, Golder installed twelve
vibrating wire piezometers (VWPs) into the five cored drill holes at Botija. Since the work of Golder,
many of the installed piezometers have been destroyed by site construction works and prestrip
mining.
Initial groundwater modelling was completed to assess the impact on regional groundwater levels due
to open pit mining and potential seepage from the TMF. For the area adjacent to the Botija Pit, Golder
determined that there is moderate hydraulic conductivity in the upper 100 m of the deposit,
comprising alluvium, saprolite, saprock and upper bedrock, and a relatively low hydraulic conductivity
in the granodiorite and andesite bedrock below 100 m.
Piezometers
Since mid 2018, twelve boreholes ranging from 300 m to 400 m in length have been drilled. Each is
equipped with three to five VWPs. Overall, a total of 59 VWPs are installed in these boreholes. Figure
16-10 illustrates the location of the existing and proposed piezometers. The figure also shows the
locations of previously installed water-wells (ie, dewatering bores, shown with BPW designations).
HG-P1 and HG-P5 are the only two remaining piezometer bores installed by Golder.
The typical hydrographic response of VWPs installed along the western side of the Botija Pit is a strong
downward hydraulic gradient and a rapid response to ranfall events; there appears to be no pressure
build-up in the pit walls.

Cobre Panamá Project Technical Report March 2019
161
Figure 16-10 Map showing the locations of existing and proposed piezometers and water wells
for the Botija Pit
Dewatering bores
Two previously drilled production bores (BPW-01D and BPW-03D in Figure 16-10) are available for
pump testing. There is a significant network of VWPs proximal to these bores, hence new long term
tests are planned for 2019, to the extent that submersible pumps and ancillary equipment have been
purchased.
Despite this planned pump testing, it is envisaged that vertical dewatering bores will not become the
primary means of controlling groundwater inflow to the Botija Pit. Rather, it is expected that several
bores only will be required, and these would be located in critical areas such as below sediment pond
2a.
Horizontal drains
A number of horizontal drains were drilled in the Botija starter pit during 2017 to 2018. These drains
vary in length from less than 100 m and up to 250 m; their locations are shown in Figure 16-11. The
experience of these drains is that they are effective in draining the benches where installed, and
especially so after rainfall events. The widespread use of such drains was modelled and simulated by
NewFields (2016) when evaluating their effectiveness in producing the drained pit slope conditions
upon which the mine geotechnical consultants (CNI) based their recommended pit slope design
parameters.

Cobre Panamá Project Technical Report March 2019
162
Figure 16-11 Installed horizontal drains, Botija Pit
General observations regarding these horizontal drains are as follows:
the upper granodiorite is well-jointed and can transmit significant groundwater
groundwater recharge is transmitted rapidly to the pit
the drains are effective at capturing water prior to it reaching pit slopes
as the Botija Pit develops it is likely that a significant annual programme will be required
A further ten to fifteen horizontal drains are proposed to be drilled along the south wall of Botija
during 2019.
Summary
Considering the more recent work conducted to date and in relation to current operating horizons,
the following is observed in respect of the Botija Pit:
groundwater flow is localised to the pit; there is no observed regional groundwater flow
groundwater domain divides can be approximated to surface water divides
there is virtually no groundwater storage in any of the site rocks; the site consists of low porosity
crystalline rocks
local groundwater recharge flows quickly towards the pit and flows are estimated to be in the
range of:
peak groundwater inflow = ~150 to 180 L/s
average groundwater inflow = ~78 to 85 L/s
groundwater base-flow to the pit = ~40 to 70 L/s
future groundwater inflows into the Botija Pit will increase roughly in proportion to the pit
circumference

Cobre Panamá Project Technical Report March 2019
163
there appears to be no evidence for the need of a large scale conventional water well
“groundwater dewatering” programme for the Botija Pit, as this is primarily a surface water
management project
this does not preclude the drilling and installation of several test wells to assure that pit-slopes
are adequately dewatered/depressurised
groundwater characteristics below the anhydrite contact are less understood, although it is
foreseen that:
the anhydrite contact is likely to be a permeability boundary
more competent rock is expected below the anhydrite contact
deeper depressurisation efforts will likely focus on major structures
until sufficient VWP monitoring records are available, further numerical modelling is considered
to be unwarranted
It is expected that the installation of piezometers, horizontal drains and dewatering test wells will be
on-going throughout the life of Botija, particularly at lower mining horizons, and for all of the other
pits.
Pit water management
The water that is expected to be piped away from horizontal drains and pumped from dewatering
bores is not expected to be material in the context of the significant runoff into the pits from rainfall.
One of the reasons for moving away from the phased mining approach as described in the 2015
Technical Report (FQM, July 2015), was the recognition that the sequence of pit cutbacks led to the
formation of constained working areas into which ultra-class mining equipment would be deployed.
Moreover, these constrained spaces would have the unintended consequence of creating deep sumps
which when inundated, could curtail all production until the water was cleared.
In terms of pit water management, the benefit of a terrace layout was seen to be that a low terrace
could be maintained towards one side of each pit, with wide, ascending terraces then providing
multiple mining horizons for the ultra class equipment. In the event of a high intensity or prolonged
rainfall event, the low terrace could act as a sump and be pumped clear over a duration not impacting
on production from the higher terraces.
Since the 2015 Technical Report (FQM, July 2015) the proposed arrangement for staged pumping to
surface has changed from the then envisaged concept of vertical lifts at 90 m intervals into
intermediate sumps or day tanks positioned on wide berms. Details on the proposed new
arrangement are described below.
Short term pit water management
In the more immediate term, during the mining of the Botija Pit starter pit when a low terrace is yet
to be developed, the strategy has been to excavate sumps which ensure that the inpit crusher pockets
and beltway are never flooded. Figure 16-12 shows the location of sumps B1 and B2 that were
designed to protect this pit infrastructure. Sump B3 is a waste quarry mined for construction
materials.

Cobre Panamá Project Technical Report March 2019
164
The catchments feeding into the B1 and B2 sumps were relatively small during the duration of starter
pit mining. The mined capacity of these were 620,500 m3 and 438,500 m3, respectively, each with
installed pumping capacity sufficient to prevent the crusher pockets and beltway from being flooded.
Figure 16-12 Starter pit drainage sumps, Botija Pit
Figure 16-12 also shows pipelines leading away from each sump. Contact water collecting in sumps
B1 and B2 has been directed towards the del Medio catchment (sediment Pond E), whereas contact
water collecting in sump B3 has been directed northwards into the TMF basin. Contact water from
these sources does not find its way into the Botija River. The significance of where pit water is directed
to is explained in Item 16.3.5.
Longer term pit water management
Figure 16-13 shows the concept for managing pit water as the starter pit expands out into the initial
terraces formation. Features to note are:
by the end of 2019 the original B1 sump would likely be mined out, to be replaced by new B1
sump(s) where shown on the developing terraces
the B2 sump at this time would remain in place, continuing to protect the crusher pockets and
beltway from rainfall runoff in the northern pit catchment
the proposed pipelines serving sumps B2 and B3 would be unchanged, whereas new pipelines
would be established along ramps on the south wall leading up to surface and then to a
discharge point in the del Medio catchment

Cobre Panamá Project Technical Report March 2019
165
Figure 16-13 Proposed pit drainage sumps at the end of 2019, Botija Pit
Figure 16-14 shows a notional pit outline at the end of five years, in 2023. At this stage of terrace
development:
sumps B3 and the original B2 would have been mined out
terraces on the north side of the pit would be formed, and a new B2 sump positioned where
shown; a pit sump on this side of the pit would continue to be created as the pit deepens and
the northern pipeline would be extended to suit
the B1 sump would have moved to a lower elevation and the pipelines extended as shown
this sump would be positioned below the floor of the lowest terrace and in the event that it was
overtopped following a high intensity or prolonged rainfall event, the sump pumping rate would
need to be sufficient to remove water from the flooded terrace over a timeframe which is
deemed to be tolerable
in the meantime, production faces would remain accessible on higher terraces
The arrangement as shown in Figure 16-14 would be replicated as the pit is deepened, with in-line
booster pumps installed to cater for the increasing head. A similar pit water management strategy is
envisaged for the other Cobre Panamá pits.
An alternative strategy is also being evaluated involving booster pumping up the Botija Pit south wall,
with the advantage of less piping being required.
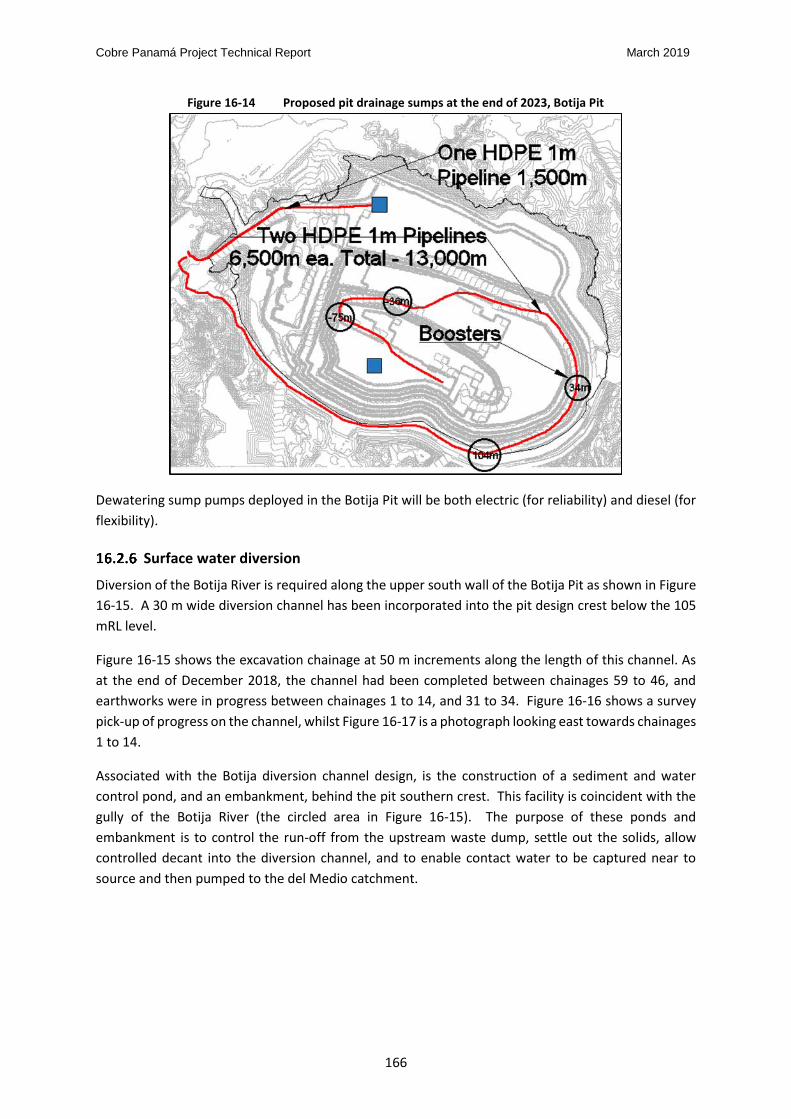
Cobre Panamá Project Technical Report March 2019
166
Figure 16-14 Proposed pit drainage sumps at the end of 2023, Botija Pit
Dewatering sump pumps deployed in the Botija Pit will be both electric (for reliability) and diesel (for
flexibility).
Surface water diversion
Diversion of the Botija River is required along the upper south wall of the Botija Pit as shown in Figure
16-15. A 30 m wide diversion channel has been incorporated into the pit design crest below the 105
mRL level.
Figure 16-15 shows the excavation chainage at 50 m increments along the length of this channel. As
at the end of December 2018, the channel had been completed between chainages 59 to 46, and
earthworks were in progress between chainages 1 to 14, and 31 to 34. Figure 16-16 shows a survey
pick-up of progress on the channel, whilst Figure 16-17 is a photograph looking east towards chainages
1 to 14.
Associated with the Botija diversion channel design, is the construction of a sediment and water
control pond, and an embankment, behind the pit southern crest. This facility is coincident with the
gully of the Botija River (the circled area in Figure 16-15). The purpose of these ponds and
embankment is to control the run-off from the upstream waste dump, settle out the solids, allow
controlled decant into the diversion channel, and to enable contact water to be captured near to
source and then pumped to the del Medio catchment.

Cobre Panamá Project Technical Report March 2019
167
Figure 16-15 Diversion channel design, Botija Pit south wall crest

Cobre Panamá Project Technical Report March 2019
168
Figure 16-16 Diversion channel progress, Botija Pit south wall crest, as at December 2018
Figure 16-17 View looking east along Botija Pit diversion channel

Cobre Panamá Project Technical Report March 2019
169
Construction details differ slightly from the design shown in Figure 16-18, nevertheless there are
essentially two ponds. The upper pond receives run-off directly from the waste dump and allows
solids to be settled out. Clear water overflows from the upper pond to the lower pond and from there
into the diversion channel. Clear water flowing along the western end of the channel also flows into
the lower pond. Pumps installed at the lower pond allow water levels and overflow to the eastern
channel to be minimised. The pumped water is piped to the del Medio catchment.
Figure 16-18 Botija sediment pond 2 and 2a
In future, diversion of the Petaquilla River will be required along the upper southwest wall of the
Colina Pit. Whilst hydrological studies and engineering have not yet been undertaken for the Colina
mining area, it is expected that a similar surface water management strategy will be adopted there.
Mining and processing schedules
With the completion of the detailed ultimate pit designs, detailed life-of-mine (LOM) production
scheduling was completed using MineSched software. Scheduling assumptions included:
minimum mining block size (x, y, z) for Botija = 100 m x 100 m x 15 m
minimum mining block size for all other pits = 200 m x 125 m x 15 m
mining flitch height = 15 m
maximum vertical advance rate = 60 to 75 m/year
terrace mining with horizontal lag distance of 100 m to 200 m
The schedule level of detail is monthly for 2019 and 2020, quarterly for 2021 to 2023, and annually
thereafter.

Cobre Panamá Project Technical Report March 2019
170
LOM schedule
Features of the LOM mining and production schedule as listed in Table 16-5 are as follows:
Mining (ie, the pre-strip period) commenced in July 2015 and processing commences in Q1
2019. From 2015, the Project life is 39 years to 2054.
The total material to be mined from all pits from the end of 2018, amounts to 6,306.1 Mt
(2,436.7 Mbcm), of which 3,143.7 Mt is ore (including high grade ore, medium grade ore, low
grade ore and saprock ore) and 3,157.8 Mt is waste (including saprolite, saprock waste and
mineralised waste).
The starting stockpile balance as at the end of 2018 is 3.3 Mt at a grade of 0.22% Cu.
The direct feed ore is 2,813.1 Mt at a grade of 0.39% Cu and 334.0 Mt at a grade of 0.21% Cu is
active and long term stockpile reclaim.
The direct feed ore from the open pits is 89% of the total plant feed tonnage.
The total high grade and medium grade ore mined to active stockpiles and reclaimed
throughout the Project life is 45.7 Mt at a grade of 0.31% Cu.
In addition, 239.9 Mt of low grade ore at a grade of 0.17% Cu is mined to stockpile and reclaimed
in the final ten years of the Project.
48.4 Mt of saprock ore is mined to stockpile from the outset of mining, but not reclaimed (with
a degraded recovery assignment) until the final two years of the Project.
The crusher feed ramps up from 47 Mtpa in 2019 to 85 Mtpa in 2021, and ultimately to 100
Mtpa in 2023 at which rate it remains until 2041.
The rate drops to 75 Mtpa between 2042 and 2053.
The average annual copper metal production in the first five years is 310.0 ktpa. For the next
five years, when processing at 100 Mtpa, the average annual copper metal production rises to
377.0 ktpa. Thereafter, the annual average is 275.1 ktpa.
The annual average by-product production is approximately 2,717 tonnes of molybdenum, 107
thousand ounces of gold and 1,701 thousand ounces of silver.
The overall life of mine strip ratio (tonnes) is 1 : 1.
Figures 16-19 to 16-23 depict the LOM schedule graphical results.

Cobre Panamá Project Technical Report March 2019
171
Table 16-5 LOM scheduling – summary of results
Year Mined Ore Grade Metal Crusher Feed Grade Metal
(Mt) (% Cu) (kt Cu) (Mt) (% Cu) (kt Cu) (%) (kt Cu) On (Mt) Off (Mt) Bal. (Mt) On (Mt) Off (Mt) Bal. (Mt) On (Mt) Off (Mt) Bal. (Mt) (Mt) Strip Ratio (Mbcm) (Mt)
<2019 3.3 0.22 7.4 3.3
2019 76.0 0.31 235.9 47.2 0.38 177.6 81.5 144.8 17.8 9.8 11.4 22.0 5.2 16.9 3.8 3.8 62.7 0.83 57.3 138.7
2020 94.2 0.36 340.8 81.6 0.40 323.1 91.0 293.9 2.6 10.0 4.0 19.8 36.7 0.3 4.1 74.7 0.79 67.9 169.0
2021 101.0 0.36 363.3 85.0 0.40 342.8 91.2 312.6 0.0 3.7 0.3 19.6 56.3 4.1 76.1 0.75 68.2 177.1
2022 109.8 0.40 438.3 90.2 0.45 406.8 91.9 373.7 1.4 1.2 0.5 19.4 75.7 4.1 94.2 0.86 77.8 204.0
2023 124.8 0.41 506.6 100.0 0.46 461.4 92.1 424.9 5.5 3.9 2.2 22.0 97.7 1.0 5.2 79.3 0.64 78.4 204.1
2024 109.1 0.42 455.2 100.0 0.44 436.7 91.9 401.5 0.2 2.3 6.0 103.7 3.0 8.1 100.4 0.92 81.4 209.5
2025 110.9 0.40 446.4 100.0 0.42 420.3 91.6 385.1 1.1 1.2 5.6 109.3 6.4 14.6 98.3 0.89 82.9 209.3
2026 123.8 0.38 466.3 100.0 0.41 412.5 91.2 376.0 1.4 2.6 16.1 125.4 6.3 20.9 85.3 0.69 79.9 209.1
2027 123.4 0.34 417.4 100.0 0.37 370.0 90.5 334.9 0.0 1.2 1.5 18.4 143.8 6.2 27.1 85.1 0.69 82.2 208.4
2028 108.2 0.41 445.1 100.0 0.42 423.5 91.5 387.5 2.3 3.8 3.5 147.2 2.4 29.5 100.9 0.93 80.0 209.1
2029 119.8 0.40 480.9 100.0 0.45 449.3 91.8 412.3 0.2 4.0 18.0 165.2 1.7 31.2 89.3 0.75 80.6 209.1
2030 116.3 0.38 438.6 100.0 0.42 417.3 91.3 380.8 3.3 0.6 18.3 183.5 1.3 32.4 88.0 0.76 79.4 204.3
2031 111.1 0.40 443.8 99.6 0.43 427.1 91.5 390.7 0.6 0.0 11.6 195.1 0.5 32.9 92.2 0.83 78.0 203.2
2032 102.8 0.43 446.0 100.0 0.44 439.5 91.6 402.6 1.8 1.8 0.8 195.9 0.3 33.2 101.4 0.99 78.3 204.2
2033 103.7 0.37 385.5 100.0 0.38 376.9 90.7 341.9 2.2 3.9 0.9 196.9 0.6 33.8 100.1 0.97 77.0 203.8
2034 102.8 0.37 383.8 99.7 0.38 381.6 90.8 346.3 3.9 0.0 6.9 203.7 0.1 33.9 101.4 0.99 76.9 204.2
2035 104.8 0.34 360.9 100.0 0.35 347.2 90.2 313.2 0.2 0.2 0.3 204.0 4.3 38.3 99.4 0.95 77.0 204.2
2036 110.6 0.36 395.1 100.0 0.37 372.2 90.6 337.1 2.0 2.2 7.0 211.0 1.5 39.8 94.2 0.85 77.2 204.7
2037 114.5 0.36 414.7 100.0 0.39 385.1 90.8 349.6 1.0 3.2 10.2 221.2 3.4 43.1 89.6 0.78 77.2 204.2
2038 101.6 0.38 381.6 100.0 0.38 377.1 90.8 342.4 2.0 1.1 0.8 222.0 2.8 45.9 102.6 1.01 78.7 204.2
2039 106.5 0.39 410.9 100.0 0.39 391.0 91.1 356.0 1.5 2.6 4.2 226.2 0.8 46.8 97.7 0.92 79.0 204.2
2040 105.6 0.33 347.7 100.0 0.34 340.4 90.2 307.1 1.2 1.5 6.3 232.5 0.5 47.3 99.1 0.94 80.6 204.7
2041 103.6 0.35 362.0 100.0 0.35 354.3 90.4 320.4 2.1 3.6 1.5 234.0 0.0 47.3 100.5 0.97 80.4 204.2
2042 81.9 0.33 268.4 85.0 0.33 279.6 89.7 250.9 3.4 0.2 234.0 0.3 47.5 122.2 1.49 80.7 204.1
2043 75.5 0.33 249.7 75.0 0.33 247.9 88.7 220.0 0.1 0.3 0.0 234.0 0.4 47.9 129.2 1.71 78.3 204.7
2044 63.1 0.34 214.7 75.0 0.31 233.6 88.1 205.8 0.0 0.3 11.9 222.1 0.0 47.9 130.2 2.06 77.4 193.3
2045 62.0 0.35 214.0 75.0 0.31 235.5 88.5 208.4 0.3 0.0 13.1 209.0 0.4 48.3 131.2 2.12 74.2 193.1
2046 50.7 0.36 180.5 75.0 0.29 219.2 89.2 195.5 0.0 0.0 0.7 25.0 184.7 0.0 48.3 131.7 2.60 72.7 182.5
2047 66.4 0.35 234.5 75.0 0.33 248.0 89.1 220.9 0.0 8.7 176.0 0.1 48.4 136.3 2.05 78.4 202.7
2048 66.3 0.39 256.7 75.0 0.36 270.6 89.4 241.9 8.7 167.3 48.4 109.4 1.65 67.1 175.7
2049 61.0 0.36 219.9 75.0 0.32 242.2 89.1 215.7 14.0 153.3 48.4 65.9 1.08 47.8 127.0
2050 56.7 0.40 229.4 75.0 0.34 258.6 89.5 231.3 18.3 135.0 48.4 37.0 0.65 35.4 93.7
2051 37.4 0.39 147.0 75.0 0.28 207.0 88.6 183.4 0.0 37.6 97.5 48.4 36.8 0.98 28.0 74.2
2052 27.2 0.31 84.7 75.0 0.21 161.0 88.1 141.8 47.8 49.7 48.4 14.6 0.54 15.8 41.8
2053 10.7 0.55 58.8 75.0 0.25 185.9 84.0 156.1 49.7 14.7 33.8 0.8 0.07 4.4 11.4
2054 0.0 33.8 0.33 110.3 71.8 79.2 33.8
Diluted 3,147.1 0.37 11,732.7 3,147.1 0.37 11,732.7 90.2 10,586.4 45.7 45.7 239.9 239.9 48.4 48.4 3,157.8 1.00 2,436.7 6,301.6
Waste Ore+WasteCu Metal Recovery HG/MG Stockpiles LG Stockpiles Saprock Ore Stockpiles

Cobre Panamá Project Technical Report March 2019
172
Figure 16-19 LOM scheduling – annual material movement tonnes
Figure 16-20 LOM scheduling – annual plant feed tonnes
Figure 16-21 LOM scheduling – annual copper metal production

Cobre Panamá Project Technical Report March 2019
173
Figure 16-22 LOM scheduling – annual stockpile balance tonnes
Figure 16-23 LOM scheduling – annual ore stockpile tonnes reclaimed into plant
Mining sequence
The sequencing concept for mining of the several Cobre Panamá pits is dictated by the relative grade
distribution across the deposits, the location of innitial mining in close proximity to the processing
plant (to minimise initial overland conveying infrastructure), the minimisation of initial waste
stripping, the orderly relocation of IPCs, and the achievement of as short a capital pay-back timeframe
as possible.
Hence, relative to this concept: 1. The Botija Pit will be mined first, followed by the Colina and Medio Pits. Mining in the Valle
Grande and BABR Pits will commence towards the end of Colina mining. The Balboa Pit will be
mined last.

Cobre Panamá Project Technical Report March 2019
174
2. Prestrip mining commenced in Botija in Q3 2015, so as to provide waste for construction
facilities such as the equipment assembly area, overland conveyor road and the MSA. From this
time, ore mined in the pre-strip excavations was stockpiled for reclaim at the commencement
of processing.
3. As part of the pre-strip, crusher pockets within the Botija boxcut were mined to enable the first
IPCs to be available by early 2019, for first ore production in Q1 2019.
4. On the completion of the boxcut, the Botija Pit is being mined using a terrace strategy where
the pit has a number of operating benches at different levels so as to enable efficient UC
equipment utilisation and an ability to continue mining without being impacted by rainfall
inundation.
5. For the majority of the schedule, the Botija Pit mining progression maintains a deepest point of
the pit on the southern wall toe, whilst mining advance progresses northwards.
6. Ore mining within the Colina Pit will commence in 2024 after completion of development works
for the installation of IPCs in that pit. It is expected that the same terrace mining concept used
at Botija will also be used at Colina.
7. The Medio Pit will be mined between 2029 and 2032.
8. The Valle Grande Pit will be mined in two phases from 2032 to 2045.
9. The BABR Pits will be mined in two phases from 2042 to 2051.
10. The Balboa Pit will be mined in two phases from 2038 to 2053.
Figure 16-24 shows the mining sequence and production profile.
IPCC sequence
The IPCC layout plan in Figure 16-25 shows the proposed locations of the crushers. Figure 16-26 shows
the number of crushers required each year and their relocations relative to the plan in Figure 16-25.
The Balboa ore would be hauled to the crushers in the Valle Grande Pit and there is assumed to be no
crushers at BABR towards the end of the mine life. The IPC installations would be at the opposite end
of the Project site, at Colina and Valle Grande, and hence BABR ore would be road hauled to another
crusher positioned conceptually on the Botija South dump (adjacent to the Botija Pit). This same
crusher could be used on LG and saprock stockpile reclaim.
Figure 16-24 Graph showing mining sequence

Cobre Panamá Project Technical Report March 2019
175
Figure 16-25 IPCC layout plan

Cobre Panamá Project Technical Report March 2019
176
Figure 16-26 In-pit crusher requirements and relocations over time
Low grade and saprock ore that is scheduled to be processed late in the mine life will be stockpiled in
a segregated location within an adjacent waste dump. The material is planned to be crushed at surface
locations proximal to these long term stockpiles and to the late-mined BABR Pit.
Waste dumping schedule
Table 16-6 shows the waste dumping destinations relative to the site layout plan shown in Figure 15-
12. The ultimate waste dump footprints have been designed to minimise clearing and water runoff
control requirements. This has been done by designing within water catchment boundaries, as far as
practicable. In addition, the designs make allowance for the volume occupied by stockpiled ore
material that would be rehandled to the crushers.
Table 16-6 LOM scheduling – waste dump schedule
The general waste dumping strategy is as follows:
Botija Pit:
In the early years of mining, waste would be hauled to the Botija North Dump and the Botija
South Dump (located adjacent to the south west of the pit) until the north dump is completed.
Thereafter, waste would be hauled to the Botija South Dump.
Colina Pit:
Waste material would be hauled to the Colina external dump located to the north of the pit
until it is full, from which time it would then be hauled to the Valle Grande external dump.
Dump Schedule
Volumes
Waste
(Mbcm)
Min Wst
(Mbcm)
Ore-> S/P
(Mbcm)
Total Insitu
(Mbcm)
Total Swelled
30% (Mblm)
Botija South
(Mlcm)
Botija North
(Mlcm)
Colina
(Mlcm)
Valle Grande
Expit (Mlcm)
BABR
(Mlcm)
Balboa
(Mlcm)
Colina
Bfill
(Mlcm)
Total
(Mlcm)
BOTIJA 201.7 26.9 70.1 298.7 388.3 299.6 88.7 388.3
COLINA 304.4 20.7 33.9 359.0 466.7 318.3 124.3 24.0 466.7
MEDIO 9.7 0.1 0.6 10.5 13.6 13.6 13.6
VALLE GRANDE 198.2 14.8 10.2 223.2 290.2 77.4 127.2 85.6 290.2
BABR 105.2 9.2 0.5 114.9 149.4 4.2 145.2 149.4
BALBOA 320.9 35.2 5.9 362.1 470.7 167.8 302.9 470.7
TOTAL 1,140.1 107.0 121.3 1,368.4 1,778.9 303.9 88.7 331.9 201.7 145.2 319.0 388.4 1,778.9
Dump Destination Volumes
Pit
Insitu Pit Volumes

Cobre Panamá Project Technical Report March 2019
177
When the Valle Grande external dump is completed, the remaining Colina waste would be
hauled to the Balboa pit external dump.
Medio Pit:
All waste would be hauled to the Colina external dump.
Valle Grande Pit:
Valle Grande waste material would be hauled to the Valle Grande external dump located to the
south east of the pit until it is full, then to the Balboa external dump until it is full, and finally to
the Colina inpit backfill void once that pit is completed.
Balboa Pit:
Waste material would be hauled to the external Balboa dump located north west of the Balboa
pit until it is full.
The remainder of the waste would then be hauled to the Colina inpit backfill.
BABR Pit:
Initial material from the smaller BABR Pit would be hauled to the external BABR dump adjacent
to the pit, and then the remaining material would be hauled to backfill the initial BABR pit and
create the ultimate external dump.
At the end of the pit life, a small amount of material would be hauled to the Boitija South dump
when the BABR dump is full.
Waste segregation
The ESIA (Item 20) included a geochemical evaluation of the mine materials and the development of
water quality models based on a site water balance and potential geochemical interactions with the
open pits, ore stockpiles, waste dumps and the TMF. Ecometrix (2014) produced a report in which a
geochemical characterisation, based on Acid Base Accounting (ABA) principles, is said to identify over
80% of the Botija waste rock as being potentially acid forming (PAG). In the Ecometrix report, the
Valle Grande waste is said to be significantly non-PAG (NAG)10.
The Ecometrix report provided a conceptual water management plan for the operations phase which
effectively involves collection of all contact water and the containment/direction of this water into
the TMF.
Since the time of the Ecometrix work, the acid rock drainage (ARD) potential for Botija ore and waste
types has continued to be reviewed and strategised. Piteau Associates (Piteau, 2018) have periodically
reviewed the geochemical sampling, and the static/kinetic testing that has taken place. Piteau has
also carried out water quality modelling and projections. Their analysis conclusions reiterate that
saprock has the greatest potential for ARD generation, and as such should be segregated from other
ore stockpiles and waste types.
10 Ore stockpiles are also described as being significantly PAG.

Cobre Panamá Project Technical Report March 2019
178
To enable the PAG and NAG volumes to be quantified during the mine planning and scheduling
process, criteria based on % sulphur values carried in the Mineral Resource model were used to make
the differentiation shown in Table 16-7.
Table 16-7 LOM scheduling – ARD criteria
Table 16-8 shows the life of mine waste schedule, in terms of PAG and NAG volumes defined by the %
sulphur criteria. Continuing updates to the mine plan and site layout will consider the segregation of
PAG and NAG waste and the control of run-off from the waste dumps.
Table 16-8 LOM scheduling – PAG and NAG waste volumes
Saprock ore and waste
Piteau (2018) expresses the view that negligible values of copper will remain in saprock ore that is
stockpiled for decades. This is despite the fact that the Mineral Reserves inventory includes long term
saprock ore stockpiles, for which reclaim is viable after a 20% reduction in processing recovery that is
intended to reflect degradation over time.
SPCT criteria ARD
S% cutoff potential
Saprock Ore (SAPR_O) > 100 >= 0.10 PAF
Fresh High Grade Ore (HIGH) > 100 <= 900 n/a PAF
Fresh Medium Grade Ore (MED) > 100 <= 900 n/a PAF
Fresh Low Grade Ore (LOW) > 100 <= 900 n/a PAF
Mineralised Waste (MARG) > 100 <= 900 n/a PAF
Saprolite (SAP) 100 n/a NAF
NAF Saprock Waste (SAPR_N) > 100 < 0.10 NAF
PAF Saprock Wate (SAPR_P) > 100 >= 0.10 PAF
NAF Fresh Waste (NAF) > 100 <= 900 < 0.30 NAF
PAF Fresh Waste (PAF) > 100 <= 900 >= 0.30 PAF
Ore/Waste classification
Current descriptor
ORE
WASTE
Lithology
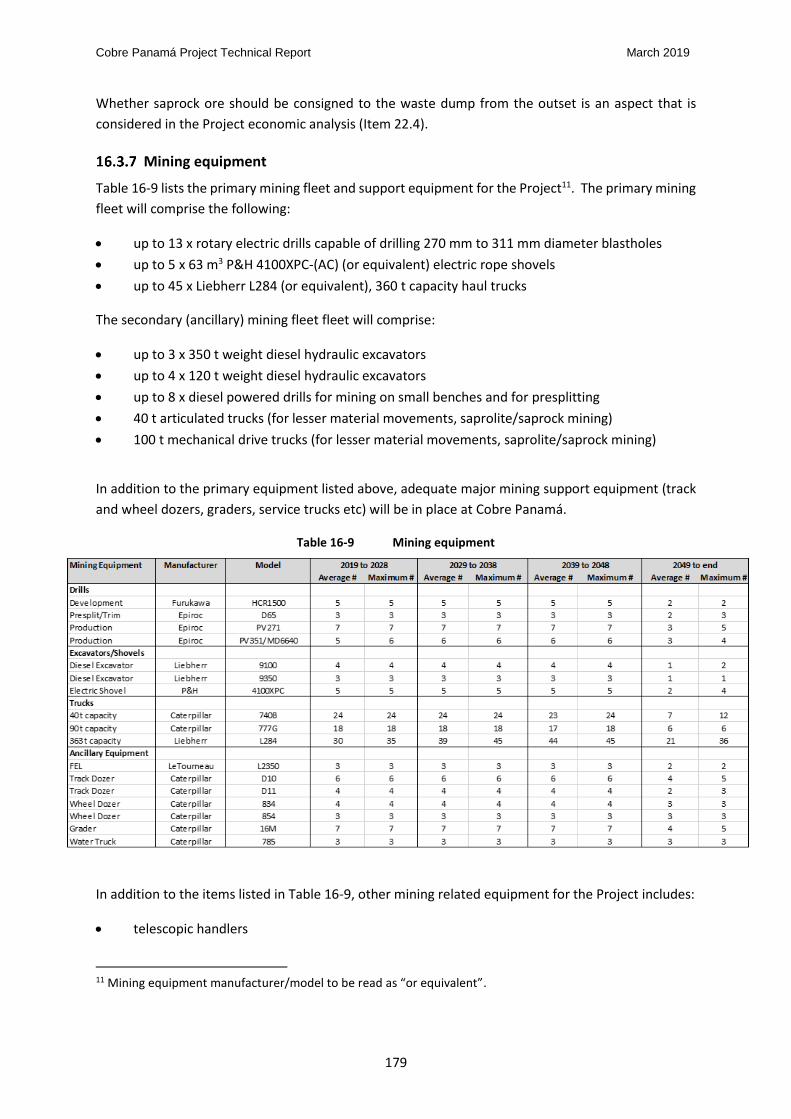
Cobre Panamá Project Technical Report March 2019
179
Whether saprock ore should be consigned to the waste dump from the outset is an aspect that is
considered in the Project economic analysis (Item 22.4).
Mining equipment
Table 16-9 lists the primary mining fleet and support equipment for the Project11. The primary mining
fleet will comprise the following:
up to 13 x rotary electric drills capable of drilling 270 mm to 311 mm diameter blastholes
up to 5 x 63 m3 P&H 4100XPC-(AC) (or equivalent) electric rope shovels
up to 45 x Liebherr L284 (or equivalent), 360 t capacity haul trucks
The secondary (ancillary) mining fleet fleet will comprise:
up to 3 x 350 t weight diesel hydraulic excavators
up to 4 x 120 t weight diesel hydraulic excavators
up to 8 x diesel powered drills for mining on small benches and for presplitting
40 t articulated trucks (for lesser material movements, saprolite/saprock mining)
100 t mechanical drive trucks (for lesser material movements, saprolite/saprock mining)
In addition to the primary equipment listed above, adequate major mining support equipment (track
and wheel dozers, graders, service trucks etc) will be in place at Cobre Panamá.
Table 16-9 Mining equipment
In addition to the items listed in Table 16-9, other mining related equipment for the Project includes:
telescopic handlers
11 Mining equipment manufacturer/model to be read as “or equivalent”.
Cobre Panamá Project Technical Report March 2019
180
crew buses and light vehicles for mine operations and maintenance personnel
fixed and mobile crushers for blasthole stemming and roadstone production
front end loaders, wheeled dozers and vibratory compactors for mine road construction and
maintenance
cable tractors, cable trees and cable handling equipment
150 t and 400 t lowbed trailers and prime movers
tool and equipment trucks for maintenace of field mine fleet
stemming trucks
mobile mixing units for blasting operations (contractor supply)
pit shovel motivator
lighting towers
diesel and electric sump dewatering pumps

Cobre Panamá Project Technical Report March 2019
181
RECOVERY METHODS
The following information is largely reproduced from Rose et al (2013), with updates provided by
Robert Stone (QP) of FQM.
Mineral processing overview
Ore from the several open pits will be treated in a conventional process plant to produce a copper
concentrate which will be pumped to the port, filtered and then loaded onto ships destined for world
markets. Additionally, a molybdenum concentrate will be produced which will be filtered and bagged
in the process plant before containerisation for export.
Aside from in-pit primary crushing, the processing plant will include conventional facilities, such as:
crushing (secondary and pebble) and grinding (SAG/ball) to liberate minerals from the ore
froth flotation to separate most of the copper and molybdenum minerals from minerals of no
commercial worth
differential flotation to separate the copper and molybdenum minerals from each other
storage of tailings and provision of reclaim water for the process
removal of water from the products
Process description
in 2019, following start-up, the concentrator will treat nominally 202,000 t/day of ore supplied from
the Botija Pit; this rate will increase up to 232,000 t/day by 2020. Eventually, and according to the
production schedule listed in Table 16-6, plant feed will be received from Colina, Valle Grande and the
other pits. From 2023 onwards, the scheduled concentrator ore throughput will be increased to a
nominal 246,575 t/day (where the design capacity will be up to 274,000 t/day allowing for 10% day-
to-day fluctuations in throughput). Those crushing, grinding, bulk rougher flotation, water, and air
systems which have not been predesigned for the expanded capacity will increase in capacity as
required.
The process plant is designed to process ore at a head grade of up to 0.65% Cu and 0.023% Mo. These
levels are higher than the highest sustained head grades of 0.46% Cu and 88.40 ppm Mo scheduled to
be mined in 2023 and 2029, respectively, but the design provides the flexibility to accommodate a
wide range of head grades over the Project life.
A simplified flow diagram is provided in Figure 17-1.
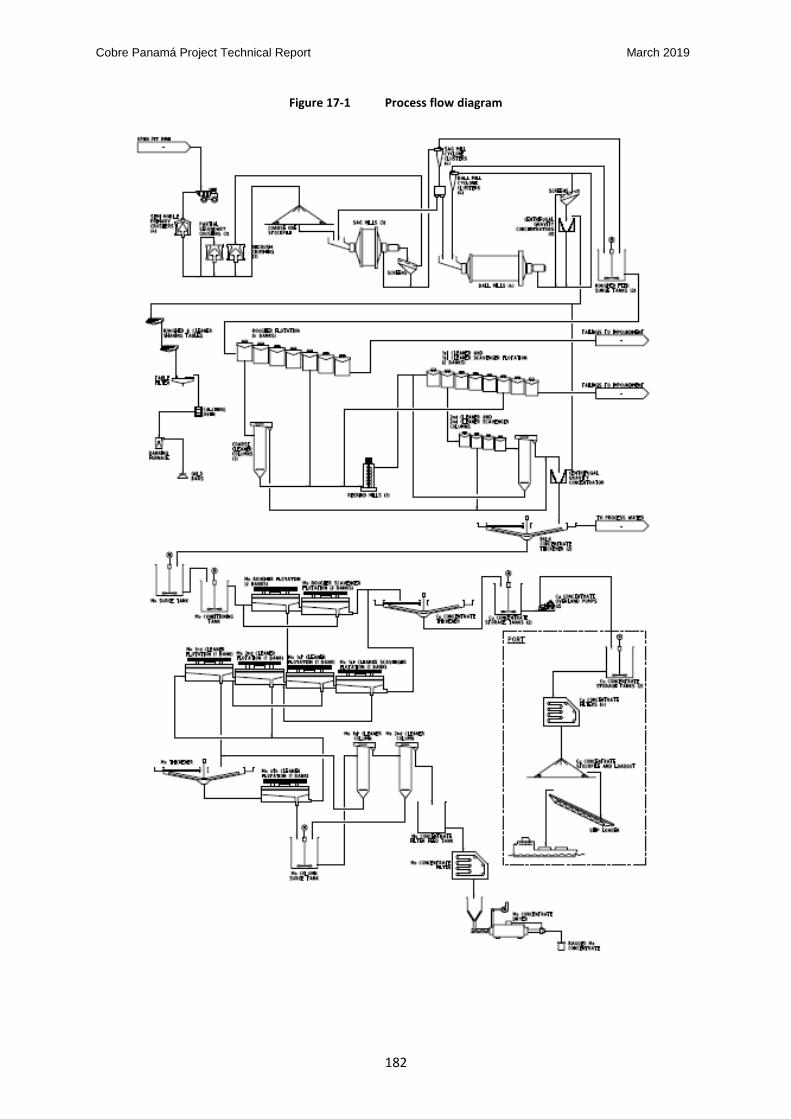
Cobre Panamá Project Technical Report March 2019
182
Figure 17-1 Process flow diagram

Cobre Panamá Project Technical Report March 2019
183
Crushing and grinding
The initial four primary gyratory crushers located in the Botija Pit are semi-mobile in-pit installations.
Crushed ore will be conveyed out of the pit to a surface transfer point, and thence by dual overland
conveyors to where it will discharge into either secondary crusher feed bins or bypass direct via apron
feeders to a coarse ore stockpile at the concentrator. Up to four secondary crushers may be installed
and ultilised depending on ore characteristics. Provision will be made at the surface transfer point to
accept crushed ore from the future mined sources (eg Colina). The coarse ore stockpile will hold a 2½-
day supply for the mill, 16 hours of which will be available to the reclaim feeders without the assistance
of a bulldozer.
Two trains of six apron feeders feeders and conveyors will draw ore from below the coarse ore
stockpile and feed two parallel wet-grinding lines, each consisting of a 28 MW semi-autogenous
grinding (SAG) mill and two 16.5 MW ball mills, all equipped with gearless drives. A third train of six
apron feeders and conveyors will feed to a third SAG mill linked to the other train of ball mills to
maximise their usage and enable maintenance of the treatment rate whilst also being able to operate
independently. By the end of 2019, the third train will be equipped with a 22 MW ball mill operating
in conjunction with the 28 MW SAG mill, whilst retaining linkage to the other two trains.
The SAG mill circuits will be closed by a combination of trommel screens followed by washing screens;
conveyors will deliver screen oversize to pebble crushers via metal removal systems. A dedicated
system for the recycling of reject balls is provided.
The pebble crushing circuits will include pebble bins, up to four cone crushers, and a bypass
arrangement. Crushed pebbles will return to the SAG mills via the stockpile feed conveyors. The
pebble crushing plant is located adjacent to the secondary crushers. A parallel pebble handling circuit
provides for standby and direct return of pebbles to stockpile, so as to support crusher and bin
maintenance.
Discharge from each SAG mill will be cycloned to recover the finished product whilst unfinished
product will be evenly split between two ball-mill circuits. The four ball-mill circuits will be closed by
hydrocyclones. The finished product from all cyclones will gravitate to two surge tanks, via in-stream
particle and chemical samples, prior to pumping to the flotation area.
Linked to the ball mill circuits will be two gravity gold recovery plants. A proportion of the ball mill
discharge will be pumped to the two gravity gold circuits comprising scalping screens and centrifugal
gravity concentrators. The centrifugal gravity concentrators will recover the free gold and direct it to
a gold plant for upgrading to bullion. Tails from the gravity concentrators will be returned to the
milling circuit.
Flotation
Ground slurry will be directed to a flotation circuit where a bulk sulphide concentrate, containing
copper, molybdenum, gold and silver values, will be collected and concentrated in a rougher followed
by cleaner flotation. A primary high grade concentrate from the first rougher cell will be collected and
cleaned directly in columns to produce a final product. The balance of concentrate from the

Cobre Panamá Project Technical Report March 2019
184
remainder of the rougher cells will be collected, fed into three regrind mills, and then cleaned in two
stages of mechanical cells followed by a one column stage to produce a final bulk concentrate.
The rougher and cleaner circuits will be installed to meet ultimate capacity, with no further additions
required.
The bulk concentrate will be thickened in conventional thickeners (with no flocculant) and pumped to
a differential flotation plant, where copper minerals will be depressed, and molybdenite floated into
a molybdenum concentrate.
The flotation circuits are fully equipped with on-stream chemical and particle analysis capability.
Concentrates
Copper/gold concentrate piped from the plant site will be filtered, reclaimed using a mechanical
reclaimer and loaded by closed conveyors on to bulk ore carriers. The filtrate water will be treated at
the port in a water treatment plant or aternatively pumped through a return pipeline to the TMF. The
concentrate will be filtered in automatic filter presses and when dry (8% to 9% moisture), will be
stored in a covered building with a capacity of 140,000 t.
The molybdenum concentrate will be filtered, dried, and packaged in containers for shipment to
offshore roasters. Tailings from the molybdenum flotation circuit will constitute the copper
concentrate, which will be thickened/pumped/piped approximately 25 km to a filter plant at the Punta
Rincón port site. If the molybdenum head grade is unsuitable, the molybdenum separation plant can
be readily bypassed.
Tailings disposal and process water reclaim
For the first approximate fourteen years of the operation, tailings containing silicate, iron sulphide
and other minerals from the rougher and cleaning steps will be deposited into the TMF located north
of the mine and plant. The TMF is of centre line/downstream construction.
The majority of the rougher tailings will be processed through cyclones and the coarse fraction used
to construct the TMF embankments. The finer rougher tailings fraction, together with the unused
cyclone coarser tailings, will be deposited within the TMF on beaches upstream of the embankments.
The tailings from the cleaner circuit will be deposited underwater to prevent generation of acid
drainage conditions.
After fourteen years of operations, the depleted Botija Pit would receive the cleaner tailings (ie,
deposited underwater), whilst the rougher tailings would continue to be deposited into the TMF for a
period sufficient to form a cover over the TMF. After that time, the rougher tailings would also be
diverted to the depleted Botija Pit and then ultimately to an expanded facility.
The timeframes for the tailings backfill will be reviewed as a function of new and updated mining and
processing schedules produced when approaching depletion of the Botija Pit.
Flyash run-off liquor from the power plant will primarily be treated in a water treatment plant at the
port, but may also be deposited into the TMF after being pumped up from the port site.

Cobre Panamá Project Technical Report March 2019
185
Reclaim water will be pumped from the TMF to a process water tank located to the north of the plant
site. A tee off from this line will provide water for the tailings cyclone plant. From the process water
tank, water will be either used in the milling plant, or boosted for general in-plant use. Excess water
from the TMF will be overflowed via a decant tower and tunnel into the Del Medio River.
Processing consumables
Table 21-3 (Item 21) provides a list of consumption rates for process plant reagents and power.
The plant is equipped with preparation facilities for all required liquid and solid reagents, including
frother, collector, promoter and lime. In addition, a ball charging system is provided in the milling
area for feeding balls into the respective mills.

Cobre Panamá Project Technical Report March 2019
186
PROJECT INFRASTRUCTURE
Project infrastructure information that was in the 2015 Technical Report (FQM, July 2015) was
summarised in the context of proposed infrastructure and construction works then in progress. Now
more than three years later, Project construction is nearing completion and plant start-up is imminent
during Q1 2019.
The planning and readiness effort for the operations phase is well underway and key management
personnel are in place. The operations readiness plan includes recruitment of staff, development of
operating systems, and training of Panamánian employees working in the port, power plant, mine and
process plant.
By December 2018, both the port and the first of the generators at the power station were running
under full operational employee control. The power transmission line was energised and supplying
backfeed power to the Project. Throughout 2019, further handover of commissioned areas in the
process plant and power station will continue.
Project overall layout
Figure 18-1 shows an overall layout plan for the Project, showing the location of the main
infrastructure components at the mining and processing sites, and showing the port site to the north.
Figure 18-2 is a recent photograph looking towards the south west, with the processing plant in the
foreground and the Botija Pit in the background.
Process plant
Figure 18-3 shows a view over the plant site, as at the end of December 2018.
The processing facilities are arranged broadly along a north-south axis with a low ridge running
through the centre. The milling trains are located in a valley on the south side of the ridge with all
other facilities to the north. The main plant process areas, except the mills, are located on either side
of a major north-south arterial pipe rack. To the north of this area the topography falls away and at a
lower level are located the reagents, secondary and pebble crushing areas.
This particular location was selected as being the most suitable from a design and geotechnical
perspective. This area allowed both the milling trains and the coarse ore stockpile to be founded on
fresh rock.
Located on the east side of the plant area is the Eastern Bypass road. This road originates off the
concession to the east and transgresses the plant site linking in to the port and mine access roads.
As at the end of 2018, inching and lining of one of three semi autogenous (SAG) mills and two ball mills
was completed. Progress towards completion of other mechanical and structural works was well
advanced, as was progress on storage tanks, piping works, electrical installations and instrumentation.

Cobre Panamá Project Technical Report March 2019
187
Figure 18-1 Project layout plan

Cobre Panamá Project Technical Report March 2019
188
Figure 18-2 View looking SW over the Project processing plant, December 2018

Cobre Panamá Project Technical Report March 2019
189
Figure 18-3 Photograph of as-built plant, December 2018

Cobre Panamá Project Technical Report March 2019
190
Tailings management facility site
The Project TMF is located where shown on Figure 18-1 and will eventually cover an area of
approximately 20 km2. This facility has required the construction of retaining walls on the northern
and eastern sides to enclose a storage basin, and as such will provide capacity for approximately 18
years of operation.
Figure 18-1 shows the proposed expansion footprint for the TMF, directly north of the existing facility.
Mining facilities
After commencing in 2015, the target for completion of the mining pre-strip at the Botija Pit was
essentially achieved by the end of 2018, to an extent sufficient to expose the initial Botija orebody for
process plant start-up. The starter pit had been developed, as had the excavation and formation of
four in-pit primary crusher pockets. Two in-pit primary crushers had been installed, along with their
associated overland conveyors to the crushed ore stockpile at the plant site.
The first UC rope shovel was assembled and began operating in March 2018, followed by the first of
the UC haul trucks in November 2018. As at the end of 2018, two rope shovels and 16 UC trucks were
operating in the Botija Pit. An additional two rope shovels, three UC loaders and 14 UC trucks will be
progressively commissioned during 2019. In addition, an ongoing pioneering and intermediate fleet
comprising diesel hydraulic excavators plus 100 t capacity and 40 t capacity 6x6 trucks continued to
operate in Botija on pioneer works.
As at the end of 2018, the first 750 m length of trolley ramp was delineated and procurement of
equipment for the trolley line was underway. Electric power into the mine to the trolley assist
locations is now provided by a 34 kV transmission line ring main from the Botija substation. At
December 2018, approximately 50% of the complete ring main was under construction and is
expected to be complete by the second half of 2019.
In-pit water management sumps had been excavated and equipped, and the pit was progressing
towards the formation of mining terraces to suit the deployment of UC primary mining equipment.
Grade control drilling was underway throughout 2018 and this incorporated a geometallurgical
sampling and testing programme to validate processing recovery projections for the initial production
years.
Inpit crushers and overland conveyors
Mining of the Botija starter pit has required the installation of four semi-mobile, in-pit crushers. Each
pair of crushers will feed onto an inclined conveyor exiting the pit and thence transferring to two
overland conveyors running along the north side of the Botija Pit to the secondary crushing plant.
Future development of the pit requires the crushers to be relocated deeper into the excavation,
requiring additional conveyors.
When Colina Pit is developed, a new conveyor system will be installed to allow two crushers to be
located to the South of Colina (and thus to the north of the Valle Grande Pit, providing accessibilty
from both). The conveyor system will comprise two conveyors linking into the tail end of one of the
intial overland conveyors.

Cobre Panamá Project Technical Report March 2019
191
Figure 18-4 shows a view of one of the two completed in-pit crushers, as at December 2018. The two
installations on the opposite side of the beltway remain under construction. Figure 18-5 is a view of
the overland conveyors.
Figure 18-4 View of the Botija Pit IPC4
Figure 18-5 View of overland conveyors
Mine services area
Mine mobile equipment will be maintained by a skilled maintenance labour workforce. Where
possible, all mining equipment will be maintained at the mine services area (MSA), or in circumstances
where machinery cannot be moved, maintenance will be carried out in the field.
The MSA includes the heavy equipment workshop, light vehicle workshop, mine maintenance
personnel offices, tyre shop, wash down bay, water services, refuelling station, go-line and mine
control facilities for the mining fleet.

Cobre Panamá Project Technical Report March 2019
192
Figure 18-6 shows the locations of these facilities, in addition to:
the location of the process plant site and overland ore conveying routes
the proposed locations of future IPC positions in the Botija Pit
the waste dump associated with the Botija Pit
The MSA facilities may be relocated in time, closer to the Colina, Valle Grande and Balboa Pits.
Explosives storage and preparation facilities
A temporary explosives magazine has been established for the construction and mining pre-strip
phase, located about 2 km north of the concentrator. This facility receives blasting agents trucked
from the off-loading and storage facilities at the port.
A new permanent magazine and emulsion mixing/preparation facilities are being constructed adjacent
to the existing facilties and at adequate capacity for the full scale mining operations. The new faciltiies
include a dispatch area for mobile mixing units delivering approximately 5 km into the mine.
Fuel and lubricant delivery and storage
A diesel fuel pipeline extends from the port to the Project site, and specifically to fuel storage and
dispensing facilities located within the MSA.
The refuelling station comprises fuel unloading pumps, diesel storage tanks, heavy vehicle fuel
dispensing pumps and bowsers, a light vehicle fuel dispensing pump and bowser, and fuel transfer
pumps to the plant area. Concrete pads are provided for fuel unloading and loading vehicles, and
storage tanks are installed in a fully concrete bunded area, with a sump pump which will discharge
any spillage or washdownto the oil/water separator sump.
The access roads to the refuelling station have been arranged such that the travel paths of the heavy
and light vehicles do not cross.
Port site and power station
The port site is located at Punta Rincón on the Caribbean Sea (Figure 18-7) and includes facilities for
concentrate storage and load-out to handymax/supramax sized vessels (up to 65,000 dwt), in addition
to coal receiving facilities, a barge berth, and inbound/outbound freight handling and storage.
The road distance between the port and the mine site is 25 km.

Cobre Panamá Project Technical Report March 2019
193
Figure 18-6 Mining facilities

Cobre Panamá Project Technical Report March 2019
194
Figure 18-7 View looking over the port site and power station
The port site includes logistics infrastructure for receiving and dispatch of consumables in bulk and in
containerised format arriving on regular and charter service vessels. Infrastructure includes:
office and administration facilities for Government of Panamá customs, immigration and marine
authority, and company personnel as part of the International Ship and Port Facility Security
Code licence requirements for the Punta Rincón port
bulk ammonium nitrate facilities for receiving, storage and dispatch by road transport to the
emulsion plant located approximately 2 km north of the plant site
bulk lime facilities for receiving, bag storage, bag breaking, silo storage and dispatch by bulk
road tankers to the lime reagent facilities in the plant
mill ball facilities for receiving, handling, and dispatch by road transport to the plant
reagent facilities for receiving containers and dispatch by road transport to the plant for
unloading and return of empty containers; and
laydown and other logistics yards for receiving, storage and dispatch of consumables and
equipment to the power plant, mine, process plant and other areas of the Project
The power station facilities include two 150 MW coal-fired generators (with provision for future
additional trains). This facility operates continuously, 24 hours per day. Coal is being received at the
port into a discharge hopper on shore. From there the coal is conveyed (under cover) to storage
stockpiles at the power station.
Power transmission
A dual cicuit 230 kV power transmission line has been erected between the power station at the port
and the Project site. There are interconnections to the plant switchyard and onward to the Llano
Sanchez substation (ie, the connection point to the national grid; a distance of approximately 120 km).
Electric power into the mine is provided by a 34 kV transmission line ring main from the Botija
substation.
Cobre Panamá Project Technical Report March 2019
195
Pipelines
Concentrate, concentrate filtrate return water, and fuel pipelines have been installed on surface
between the plant and port site. These are located along the side of the coast access road.
The process plant requires a number of large pipelines for water and tailings management. The tailings
lines (ie, six lines currently, with additional required as the Project expands) run alongside the coast
access road from the plant area to the north east corner of the TMF. At this point they pass through
a cyclone station and split onto the TMF walls.
Water supply
Potable water for the Project, including the port site, is obtained from local rivers and treated prior to
distribution.
During operations, process water will be reclaimed from the TMF and collected from pit dewatering
and surface drainage ponds. Water from the TMF will be pumped to the plant site by barge pumps
followed by two stages of booster pumps.
A seawater intake and discharge has been constructed at the port site to supply the power plant.
Accommodation facilities
Accommodation facilities have been built for the construction phase and comprise a number of camps
at the plant, TMF and port sites. The various camps are accessible by road and can collectively
accommodate over 10,000 people. These facilities will continue to be used during operations in a
modified format.
In addition, for the operations phase a number of onsite residential houses are being established for
housing Compnay personnel. As at the end of 2018, the first eight houses had been built at the Punta
Rincón port and additional houses are to be constructed according to requirements for attraction and
retention of staff.

Cobre Panamá Project Technical Report March 2019
196
MARKET STUDIES AND CONTRACTS
Product marketability
Based on Project metallurgical information, the primary metal product will be a clean standard grade
copper concentrate which could be used for blending in all smelter processes. The contained gold and
silver contents should not present any processing problems.
Agreements for sale of concentrate
Memoranda of understanding (MOU) have been negotiated and signed with eleven off-takers for the
sale of Project copper concentrate. Counterparties include most major purchasers of copper
concentrate from Europe, Asia and South America.
The MOU are adequate for up to 100% of the copper concentrate produced from the Project based
on expected ramp up. The MOUs include provisions for sales of a minor proportion of concentrate, or
indeed excess production, into the market at spot rates.
Other contracts and agreements
With production now imminent, all major supply contracts or arrangements are in place. This includes
coal, diesel, grinding media, mill liners, blasting services, lubricants, reagents, etc. All of the contracts
were competitively tendered and benchmarked against other Company operations, and can thus be
considered as being “within industry norms”. Raw material rates have been indexed against
appropriate independent indicies, and will be adjusted up or down as appropriate.
In August 2012, MPSA entered into a precious metals stream agreement with a subsidiary of Franco-
Nevada Corporation for the delivery of by-product precious metals based on copper concentrate
production from the Cobre Panamá Project. Under the terms of the agreement, this subsidiary will
provide pro-rata funding to MPSA in return for an amount of precious metals (gold and silver bullion)
deliverable to them and indexed to the copper concentrate produced from the Project over the life of
the operation.
The delivery of gold and silver bullion under the terms of this agreement is an obligation of FQM and
is therefore not considered as a deficit to the MPSA gold and silver revenues in the optimisations and
cashflow modelling carried out for the Mineral Reserves estimate reported herein.

Cobre Panamá Project Technical Report March 2019
197
ENVIRONMENTAL STUDIES, PERMITTING, LAND, SOCIAL AND COMMUNITY IMPACT
The following information is largely reproduced from the 2015 Technical Report (FQM, July 2015),
with updates authored by Michael Lawlor (QP) and reviewed by Anthony Petersen, MPSA
Environmental Manager.
Environmental setting
The Project site is located in a recognised area of high biodiversity, and is subject to heavy tropical
rainfall. The region forms part of the MesoAmerican Biological Corridor (MBC), connecting North and
South America.
The location is relatively isolated, undeveloped and sparsely populated. The nearest community to
the site is the village of Coclecito, located about 12 km southeast, whilst the provincial capital of
Penonomé is 49 km further southeast.
Subsistence farming is the primary occupation for the local people. The area has been faced with
increasing de-forestation, artisanal (small scale) mining, and changes in land use. Due to the high
annual rainfall, increased water erosion and sedimentation have resulted.
Status of environmental approvals
An Environmental and Social Impact Assessment (ESIA) was completed by Golder Associates (Golder,
2010) in September 2010. The 14,000 page (plus appendices) ESIA was approved by the Autoridad
Nacional del Ambiente (National Authority of the Environment, ANAM; now referred to as
MiAmbiente) on 28th December 2011 for the Project as then envisaged.
In 2017, the Company successfully obtained change approvals relating to the siting of the process
plant, the decant tower and tunnel at the TSF, and a number of above ground pipelines. The Company
also lodged the necessary environmental permits to begin commissioning and operation of the power
plant at the port.
In 2018, the Company successfully obtained permits for the power station water concession and the
process plant water concession. During 2018, the Company also lodged the necessary environmental
permits for water discharge from the power station and the TSF, the permit for the permanent
emulsion plant, and the occupation permits to operate the power plant and the processing plant.
The 2011 Project approval was for a mining operation comprising three open pits, at Botija, Colina
and Valle Grande. Since then the Project definition and development scope has changed to include
aspects that will need to be addressed in a new ESIA, as follows:
site clearing and mining of additional open pits, ie at Balboa and Botijo Abajo/Brazo
site clearing and formation of additional waste rock storage facilities
expansion of the tailings management facility
The expected timeframe for submitting the new ESIA for approval is mid-2014. The proposed
expansion of the Project will be subject to a high level of environmental and social impact assessment
by MPSA, in anticipation that the proposal will be similarly classified (Category III) by the Panamánian

Cobre Panamá Project Technical Report March 2019
198
Government. Environmental management and controls will be applied to the development of the
expansion areas that are equivalent to the controls for the existing Project.
Provided that the same process and assessment is conducted as has been for the existing Project, and
with similar commitments made, there are therefore no known reasons to indicate that there will be
environmental and permitting issues that could materially impact on expanded mining and tailings
disposal activities.
Environmental studies
Extensive environmental studies and social impact assessments were completed between 2007 and
2012 for the 2010 ESIA process. This work involved a number of independent experts and included
baseline studies on such as climatic conditions, fauna and flora, hydrology, hydrogeology, air and
water quality, cultural and socio-economic circumstances.
Project development components considered in these baseline studies included:
three open pit mines (Botija, Colina and Valle Grande)
mining facilities such as equipment maintenance workshops, fuel storage and dispensing,
explosives preparation and storage
a processing plant (ore concentrator) with an annual capacity of 74 Mt (expanding to 100 Mt)
processed
ore crushing, conveying and ore stockpile facilities in the vicinity of the processing plant
other site facilities such as a sewage treatment plant, waste incinerator and landfill areas
a tailings management facility (ie, tailings dam or TMF), in addition to tailings backfill into
depleted open pits
saprolite and waste rock storage facilities (ie, waste dumps or WRSF)
longer term ore stockpile(s)
potable and process water reservoirs
water diversion and sediment control structures
quarries for construction materials
camp, security and administration facilities
assay laboratory
site roads
port facilities, including a filtration plant and a coal-fired power station
power transmission lines
25 km of road between the mine and the port, plus site access roads
An environmental management system (EMS) has been developed to include environmental and
social management plans. The components of the EMS are:
Environmental Management System Framework
Environmental Monitoring Plan
Biodiversity Action Plan
Water Management Plan
Spill Prevention and Control Plan
Hazardous Materials Management Plan
Environmental Education and Training Plan

Cobre Panamá Project Technical Report March 2019
199
Erosion and Sediment Control Plan
Waste Management Plan
Air Quality and Noise Control
Port Management Plan
Environmental Recovery and Abandonment Plan
Archaeological Resources Management Plan
Specific plans developed for the construction phase include:
Construction Site Environmental Mitigation and Control Procedures
Construction Water Management Plan
The ESIA document (Golder, 2010) states that the Project will comply with Panamánian regulations
and also meet international standards, in respect of International Finance Corporation (IFC)
Performance Standards on social and environmental sustainability.
Biodiversity Action Plan
The Company has implemented its Biodiversity Action Plan in line with IFC Performance Standard 6,
to protect and conserve the sensitive biodiversity of the Project area. To this end and continuing
through the Project construction phase, collaboration has been maintained with the Kew Botanical
Gardens, the Missouri Botanical Gardens, the Smithsonian Tropical Research Institute, the Sea Turtle
Conservancy, the Peregrine Fund, and other specialists.
Site water management
The high rainfall intensity in the Project area has led to construction phase challenges due to erosion
and sediment runoff. These challenges have been managed by the construction of sedimentation
ponds and hydro-seeding of disturbed areas. During operations, all drainage from the open pit, waste
dumps and ore stockpiles will be collected and redirected for use as processing water. Surface water
flowing from river diversions will be monitored as required, before release to the environment.
Summary of environmental impacts and management requirements
Over 600 impacts and management commitments are addressed in the 2010 ESIA, during the
construction, operations and closure phases.
The main impacts and commitments listed in the ESIA conclusions (Golder, 2010) include (verbatim):
The Project will affect surface water and groundwater quality and quantity. All high magnitude
predicted effects are expected to be local in geographic extent.
The Project will affect air quality, including emissions of dust, SO2, NOx and greenhouse gases.
Available technologies to reduce these emissions will be employed.
The Project will result an in increase in noise in the immediate vicinity of Project activities.
Activities that have a high potential to create noise and vibration impacts will be limited to
daytime activities.
The Project will result in the temporary loss of approximately 5,900 ha of forest. Whilst the
majority of this area will be reclaimed to forest, the loss of the forest land base will last for
several generations. The loss will be counteracted by reforestation of lands off of the mine site,

Cobre Panamá Project Technical Report March 2019
200
economic development to slow existing deforestation rates from a baseline rate of 0.5% per
annum, and support for predicted areas management.
The Project has been designed to minimise the extent of spatial effects, including phased
development so that a minimal area is disturbed at any one time, progressive reclamation, and
backfilling of mine pits.
In addition to habitat loss, fauna will be affected by mortality during the clearing of natural
habitats, sensory disturbance, and by indirect effects due to changes in hunting and collecting.
Mitigation programmes have been designed to reduce these effects.
Flora and fauna species of concern identified in the assessment are to be found offsite in
candidate areas for conservation. Some species will also be relocated from the Project site to
other locations. Most importantly, the Project will not result in any species extinctions.
Freshwater species are also affected by habitat loss, primarily in the Rio del Medio River Basin,
and changes to water quality downstream of the Project. Water quality will be monitored and
water will be treated if necessary.
Marine species may be affected by habitat loss from wharf and port/power plant infrastructure
construction, or by direct mortality, sensory disturbance and changes in the amount of fishing
in the area. The Project will seek to protect hard bottom habitats when possible and
compensate with a new 0.5 ha offset hard bottom as required by the ESIA, in addition to
controling vessel traffic and underwater noise so as to minimise direct effects.
A plan has been established to create a conservation area within the concession, to provide
support for creation of conservation areas offsite and to provide management or funding
support as appropriate to existing and future designated protected areas.
The Project will create a biodiversity chair at a Panamánian institution of higher learning, and
already funds local and international non-governmental organisations (NGOs) to conduct
biodiversity related research.
The Project’s target is no net loss of biodiversity and MPSA will work cooperatively with
biodiversity experts to design and implement offset programmes to achieve this objective.
The Project is within the MBC. There will be some temporary loss of habitat and obstruction of
fauna moving along the corridor, but reforestation will promote fauna movements, and the
development of sustainable communities will help to slow future impacts to the MBC.
In terms of positive outcomes from the ESIA process and the Project development, in general, the
ESIA (Golder, 2010) lists the following (verbatim):
The extensive baseline characterisation programme undertaken over three years has added
important new information about the socio-environmental context of the Atlantic slope of
Panamá.
The Project will have considerable positive effects to local, regional and national economies,
through direct, indirect and induced job creation, procurement from local and other
Panamánian businesses, and through royalty and tax revenues. Income taxes, royalties and
other fees paid by MPSA to the national treasury are predicted to amount to US$1.6 billion over
the life of the Project.
Direct Project-related employment will occur locally, regionally and nationally. MPSA will
encourage the participation of local people. Total construction labour is estimated to annually
average over 3,000 workers during the construction phase. An annual average of about 2,000
workers will be directly employed during operations, with about 6,000 direct, indirect and

Cobre Panamá Project Technical Report March 2019
201
induced jobs sustained on an annual average over the life-of-mine. Training of workers will also
be a positive benefit to the region, and impart important life skills to the local population that
will contribute to the development of sustainable communities.
MPSA will establish a Community Development Foundation for the Project, through which most
of MPSA’s community development activities in the region will be conducted. MPSA will
initially develop and implement specific community development programmes during the
construction phase, with $3.6 million in 2010, rising to an estimated annual average of $5
million for the remainder of the construction phase.
The ESIA document (Golder, 2010) goes on to state that (verbatim):
A comprehensive stakeholder engagement programme was undertaken for the Project;
stakeholders were consulted beginning at an early stage and throughout the ESIA process.
Stakeholders expressed their interest and concerns about job opportunities, effects on water,
air, land and forests, livelihoods, in-migration and associated social change, along with their
hopes that the Project would generate community benefits such as improved health, education,
electricity and water supply.
A condition of the ANAM approval has been a Project commitment for:
a biodiversity protection programme over a 150,000 ha area
reforestation of over 7,375 ha outside of the Project area
reforestation of more than 3,100 ha within the Project area
A modification to the ESIA was prepared in late 2013 to condense the number of management
commitments into 370 items. This condensation represents only a change of form, rather than
substance, for the approved mitigation measures. The modification was approved by ANAM on 5th
December 2013.
During 2017 MiAmbiente announced the establishment of the Donoso Multiple-Use Protected Area
in Donoso District and a Management Plan was being developed for the area by the Government of
Panamá.
Environmental audits
The Project has been audited quarterly against ESIA commitments by a third party specialist and the
result provided to the Government of Panamá environmental regulator. As part of a due diligence
effort when the Company was contemplating project finance, the Project underwent an
environmental (and social) due diligence review by specialist consultants acting for the potential
lenders. Although some action items were identified, the Project was considered to be largely in
compliance with ESIA commitments.
Social and community related requirements
The significance of the Project to Panamá is reflected in that it will be the largest private sector
investment in the country’s history and will provide a substantial proportion of the country’s export
income. Commensurate with this level of national prominence, the Project is expected to provide
considerable social and community benefits, particularly in respect of local employment, provision of
schooling, technical and operator training, university funding, and professional development.

Cobre Panamá Project Technical Report March 2019
202
As part of the ESIA process, extensive community and stakeholder consultation has taken place. In
general, the Project has developed positive relationships with the provincial and national government,
as well as with the local community. This outcome has been achieved in circumstances of a relatively
impoverished community with essentially no history of mining. For example, a positive outcome of
the new mine access road development, with a direct benefit to over fourteen local communities, has
been the reduction in travel time from 24 hours to 4-6 hours. The road also allowed the state
electrical utility company to install power lines thus bringing 24 hour electricity supply for the first
time to these communities.
Arising from the consultation process, a consultant was appointed to produce a Social Development
Plan (SDP) for the twenty two impacted communities in the Donoso, Omar Torrijos Herrera and La
Pintada Provinces. Since adoption of the SDP in 2010, MPSA has continued to develop and review the
plan as community needs change over time. Since 2014, MPSA has worked to establish Community
Participatory Committees, with agenda items including water, sanitation, health, education (schools)
and commercial development programmes like the agro-extensionism whereas over 400 families now
provide fresh produce from their own lands to the mine camps resulting in sales of over $1.75 M per
year.
Resettlement
To 2018, there has been three community resettlement projects involving two indigenous
communities at Petaquilla and Chicheme, comprising 86 households, plus 46 farming families. For all
but nine of the 46 farming families, the resettlement plan provided compensation for the land claimed
under possessory rights. For the nine families, compensation provided for land, dwellings and crops.
Resettlement of the indigenous communities followed the International Finance Corporation
Performance Standards. The resettlement plan provided for the construction of entirely new
communities, including new houses (house for house was replaced), new schools, communal houses,
land title for the new lands (land for land was replaced) and compensation for the farms and crops
belonging to each family. Resettlement of the indigenous communities at Petaquilla and Chicheme
comprising 86 households was completed in January 2017, and now is in the ongoing phase of
livelihood and continued sustainable support.
The Company has performed a mid-term audit of the resettlement programme and will perform the
resettlement closure audit report in mid 2019. Both audits are part of the IFC compliance
requirements and any recommendations are reviewed and evaluated for compliance purposes. The
expanded mine footprint for Balboa, Botija Abajo and Brazo pits and associated TMF expansion will
require probable new resettlement processes with impacted communities, and this will be addressed
in the new ESIA process.
Mine closure provisions
The ESIA (Golder, 2010) refers to progressive rehabilitation, where possible, over the course of
operations. As buildings and other infrastructure are no longer required, they are to be
decommissioned, demolished and/or removed. Diverted water courses are to be reinstated where
possible and roads that are no longer required are to be scarified and revegetated.
The ESIA (Golder, 2010) mentions that effluent treatment and monitoring will be performed for a
period of three years, post-closure. At closure, the Colina and Valle Grande Pits will be flooded. The

Cobre Panamá Project Technical Report March 2019
203
Botija Pit, which will have been backfilled with tailings, will also be flooded. The WRSFs will be covered
with compacted saprolite and revegetated. The existing water management structures will be
modified to minimise the volumes of water required treatment or management. Detailed concepts
are described in the ESIA for the TMF, plant/mine site, port site and power plant at closure.
Golder (December 2017) subsequently produced an update to the mine closure provisions initially
estimated by MPSA in 2013. Details on these provisions are listed in Item 21.1.2.
The basis of the Golder update was:
a review of the anticipated surface water situation at the time of closure, drawing on water
balance and modelling information from a Piteau (2017) report
identification of closure related opportunities, threats and uncertainties
use of a database of unit costs and rates for such as infrastructure dismantling and demolition,
rehabilitation earthworks, water treatment, monitoring and inspections
itemisation of costs for specific areas of the operation, including the mine, waste dumps,
processing plant, TMF, port and power station
Golder (December 2017) provided closure cost estimates for differing circumstances, ie at an
unscheduled closure time, after a five year period of operations, and at the scheduled end of Project
life.
As at the end of 2018, MiAmbiente was reviewing the MPSA Environmental Liability Guarantee for an
updated registered Closure Plan with the Governemnt authority. The Environmental Liability
Guarantee was approved by MiAmbiente in January 2019.
The provisions and closure cost estimates will be periodically reviewed and updated by a specialist
consultant.

Cobre Panamá Project Technical Report March 2019
204
CAPITAL AND OPERATING COSTS
Capital costs
Project development capital
Table 21-1 lists the updated development capital costs included in the Project cashflow model. This
table also lists the estimated capital costs for ultimate capacity expansion to 100 Mtpa in 2023, and
for associated mine infrastructure and development costs.
Table 21-1 Development capital cost provisions
$6,300 M is the updated estimate for completion of the Project to 85 Mtpa capacity. Table 21-1 shows
estimated capital amounting to $240 M in 2019, required to enable commencement of the expansion
to 100 Mtpa capacity, along with initial development and engineering work allowing mining to
proceed to the Colina Pit12.
$105 M of the $240 M in 2019 relates to site and other capital expenses, inclusive of allowances for:
completion of the Botija Pit pre-strip
a brought forward amount for completion of the Botija Pit diversion channel and an associated
water control embankment
pioneering mining equipment for the Colina pre-strip
Colina infill and geotechnical drilling
early deployment of trolley assist haulage infrastructure
mine dewatering expenses
additional spares
The total capital estimate to the end of 2019 is therefore shown in Table 21-1 as $6,540 M.
Table 21-1 shows $404 M of capital allowances from 2020 for continuing plant expansion works and
for the development of the Colina Pit such that a starter pit will be ready for inpit crushing and
overland conveying of crushed ore to support the plant capacity expansion. Site and other capital
items from 2020, amounting to $25 M, include allowances for miscellaneous infrastructure at the
port, power plant and accommodation facilities.
12 Initial Colina expenditure has been brought forward due to the sooner requirement of plant feed from Colina arising from the capacity expansion (ie, not envisaged in the 2015 Technical Report).
Capital Item < 2019 2019 2020 2021 2022 2023 2024 2025 2026 TOTAL
Development capital
Project capital for 85 Mtpa plant USD$M $6,070.0 $230.0 $6,300.0
100 Mtpa plant upgrades USD$M $90.0 $87.0 $110.0 $40.0 $327.0
Colina pioneering, access, engineering, IPC and OVC USD$M $45.0 $6.0 $45.0 $16.0 $112.0
River diversion works for Colina USD$M $33.0 $33.0 $34.0 $100.0
Site and other capital USD$M $105.0 $7.0 $12.0 $4.0 $2.0 $130.0
Total development capital USD$M $6,070.0 $470.0 $100.0 $122.0 $89.0 $18.0 $33.0 $33.0 $34.0 $6,969.0
Total development capital to end 2019, and from 2020 USD$M $6,969.0$429.0$6,540.0

Cobre Panamá Project Technical Report March 2019
205
Estimate revision
The total Project capital of $6,425 M that was reported in the 2015 Technical Report (FQM, July 2015)
has reduced to a new estimate of $6,300 M, despite the increase of the initial production rate from
74 Mtpa to 85 Mtpa processed. This new amount includes the $6,070 M shown in Table 21-1, which
has been spent.
The reasons for the reduction are explained as follows:
1. The original capital cost estimate for the Project of $6,425 M, as listed in the 2015 Technical
Report (FQM, July 2015), was developed during 2013 and into 2014. A number of assumptions
were made in this particular estimate, including assumptions for unit rates that would be
applicable to the large volume of earthworks required, and levels of productivity expected for
the Project. Also at the time of the estimate preparation, commodity prices were at elevated
levels.
2. As the Project progressed from 2015 onwards, real construction data was able to be collected.
Significant effort was applied to mastering the earthworks in the difficult conditions, and this
focus and effort allowed some capital cost savings to be made. Additionally for the four years
of construction, there was a continued focus on productivity for all construction disciplines, and
on productivity improvements.
3. During 2016 and 2017 there was a significant downturn in commodity prices, and this presented
an opportunity to continue the procurement of various items required for the Project at lower
unit rates than had been included in the original capital cost estimate. Lower pricing was
obtained for a range of items over a substantial period of time including for example,
reinforcing steel for concrete work, structural steel, electrical cabling, piping and mechanical
equipment.
4. The scope of work required to expand the Project to 85 Mtpa provided synergies with existing
construction. For example: adding an eighth mill in addition to the seven mills already being
installed; and adding more flotation cells to a flotation circuit that had been designed to
accommodate easy expansion, etc.
The above combination of capital cost savings and synergies has allowed an expanded 85 Mtpa plant
to be constructed for less than the originally estimated cost of a 74 Mtpa plant.
Sustaining capital costs
Consistent with the 2015 Technical Report (FQM, July 2015), an allowance of $0.26/t mined has been
adopted as a sustaining capital cost allowance for mining. Allowances for process and G&A sustaining
costs have been adopted as 5% of the respective operating costs.
The allowance for mining equipment sustaining capital was determined by MPSA in January 2013. This
estimate has been reviewed and considered to be an appropriate continuing allowance, based on:
specified service life hours for each mining equipment item
calculated annual equipment requirements and annual operating hours
a detailed annual equipment replacement schedule linked to capital cost estimates
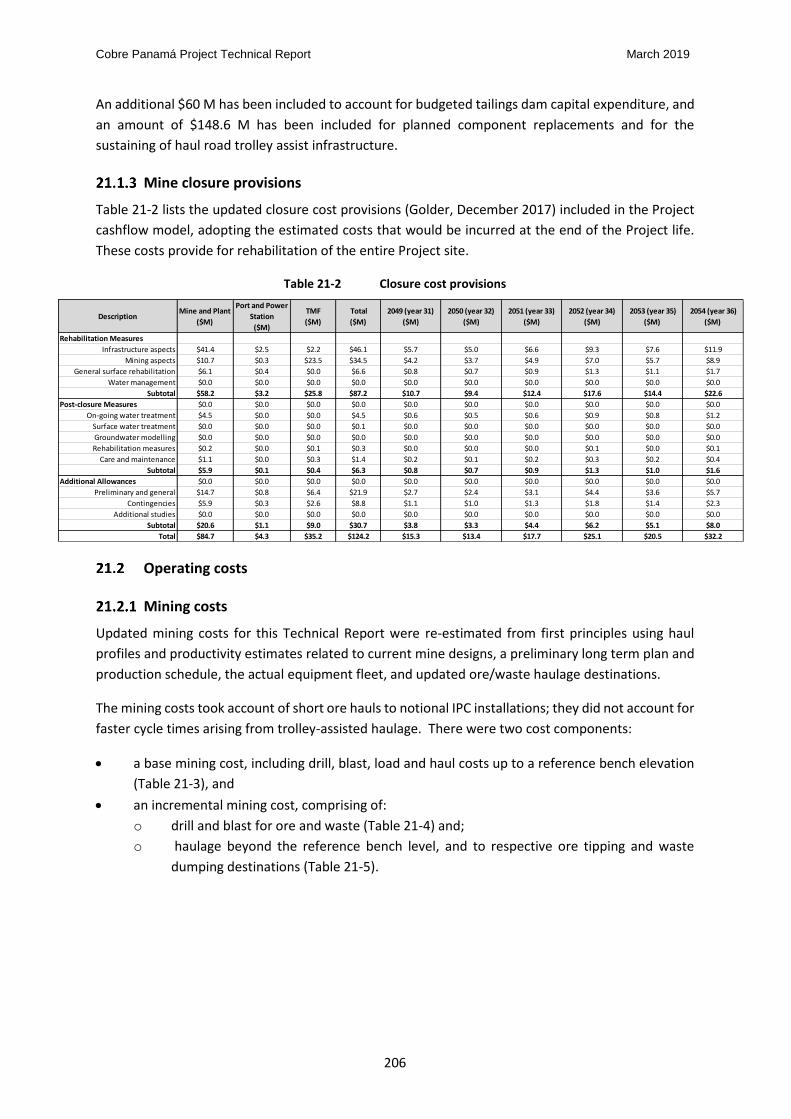
Cobre Panamá Project Technical Report March 2019
206
An additional $60 M has been included to account for budgeted tailings dam capital expenditure, and
an amount of $148.6 M has been included for planned component replacements and for the
sustaining of haul road trolley assist infrastructure.
Mine closure provisions
Table 21-2 lists the updated closure cost provisions (Golder, December 2017) included in the Project
cashflow model, adopting the estimated costs that would be incurred at the end of the Project life.
These costs provide for rehabilitation of the entire Project site.
Table 21-2 Closure cost provisions
Operating costs
Mining costs
Updated mining costs for this Technical Report were re-estimated from first principles using haul
profiles and productivity estimates related to current mine designs, a preliminary long term plan and
production schedule, the actual equipment fleet, and updated ore/waste haulage destinations.
The mining costs took account of short ore hauls to notional IPC installations; they did not account for
faster cycle times arising from trolley-assisted haulage. There were two cost components:
a base mining cost, including drill, blast, load and haul costs up to a reference bench elevation
(Table 21-3), and
an incremental mining cost, comprising of:
o drill and blast for ore and waste (Table 21-4) and;
o haulage beyond the reference bench level, and to respective ore tipping and waste
dumping destinations (Table 21-5).
DescriptionMine and Plant
($M)
Port and Power
Station
($M)
TMF
($M)
Total
($M)
2049 (year 31)
($M)
2050 (year 32)
($M)
2051 (year 33)
($M)
2052 (year 34)
($M)
2053 (year 35)
($M)
2054 (year 36)
($M)
Rehabilitation Measures
Infrastructure aspects $41.4 $2.5 $2.2 $46.1 $5.7 $5.0 $6.6 $9.3 $7.6 $11.9
Mining aspects $10.7 $0.3 $23.5 $34.5 $4.2 $3.7 $4.9 $7.0 $5.7 $8.9
General surface rehabilitation $6.1 $0.4 $0.0 $6.6 $0.8 $0.7 $0.9 $1.3 $1.1 $1.7
Water management $0.0 $0.0 $0.0 $0.0 $0.0 $0.0 $0.0 $0.0 $0.0 $0.0
Subtotal $58.2 $3.2 $25.8 $87.2 $10.7 $9.4 $12.4 $17.6 $14.4 $22.6
Post-closure Measures $0.0 $0.0 $0.0 $0.0 $0.0 $0.0 $0.0 $0.0 $0.0 $0.0
On-going water treatment $4.5 $0.0 $0.0 $4.5 $0.6 $0.5 $0.6 $0.9 $0.8 $1.2
Surface water treatment $0.0 $0.0 $0.0 $0.1 $0.0 $0.0 $0.0 $0.0 $0.0 $0.0
Groundwater modelling $0.0 $0.0 $0.0 $0.0 $0.0 $0.0 $0.0 $0.0 $0.0 $0.0
Rehabilitation measures $0.2 $0.0 $0.1 $0.3 $0.0 $0.0 $0.0 $0.1 $0.0 $0.1
Care and maintenance $1.1 $0.0 $0.3 $1.4 $0.2 $0.1 $0.2 $0.3 $0.2 $0.4
Subtotal $5.9 $0.1 $0.4 $6.3 $0.8 $0.7 $0.9 $1.3 $1.0 $1.6
Additional Allowances $0.0 $0.0 $0.0 $0.0 $0.0 $0.0 $0.0 $0.0 $0.0 $0.0
Preliminary and general $14.7 $0.8 $6.4 $21.9 $2.7 $2.4 $3.1 $4.4 $3.6 $5.7
Contingencies $5.9 $0.3 $2.6 $8.8 $1.1 $1.0 $1.3 $1.8 $1.4 $2.3
Additional studies $0.0 $0.0 $0.0 $0.0 $0.0 $0.0 $0.0 $0.0 $0.0 $0.0
Subtotal $20.6 $1.1 $9.0 $30.7 $3.8 $3.3 $4.4 $6.2 $5.1 $8.0
Total $84.7 $4.3 $35.2 $124.2 $15.3 $13.4 $17.7 $25.1 $20.5 $32.2
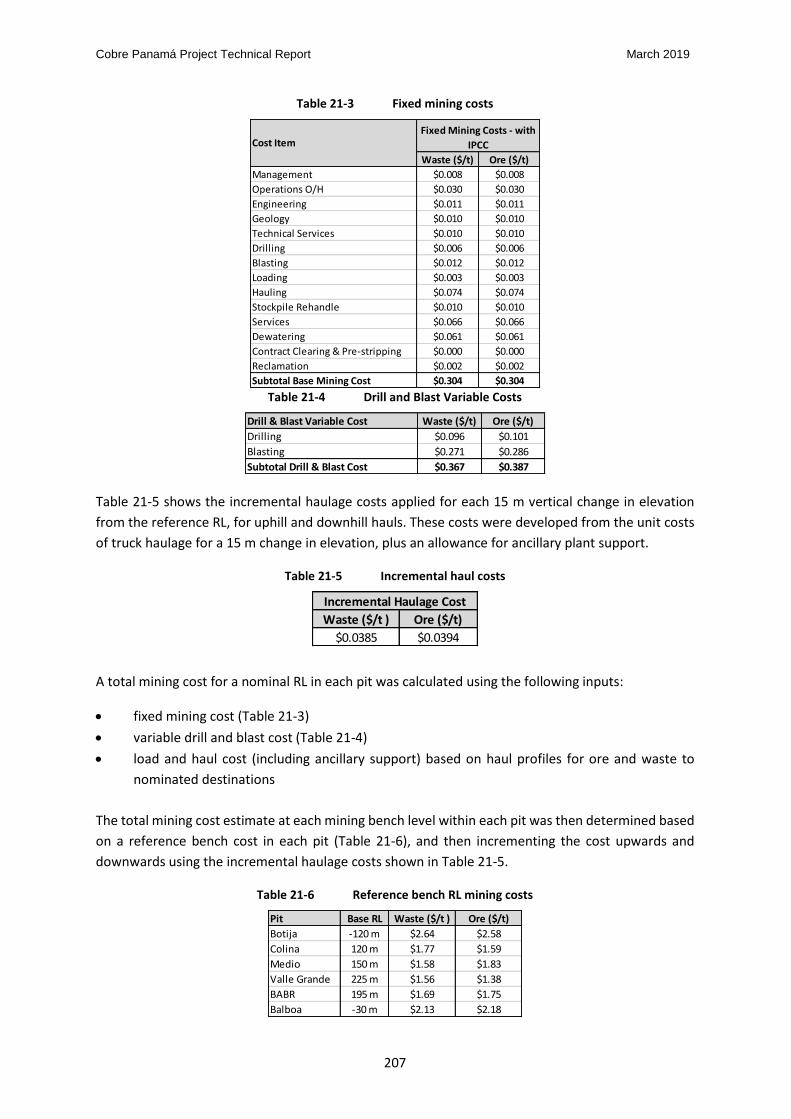
Cobre Panamá Project Technical Report March 2019
207
Table 21-3 Fixed mining costs
Table 21-4 Drill and Blast Variable Costs
Table 21-5 shows the incremental haulage costs applied for each 15 m vertical change in elevation
from the reference RL, for uphill and downhill hauls. These costs were developed from the unit costs
of truck haulage for a 15 m change in elevation, plus an allowance for ancillary plant support.
Table 21-5 Incremental haul costs
A total mining cost for a nominal RL in each pit was calculated using the following inputs:
fixed mining cost (Table 21-3)
variable drill and blast cost (Table 21-4)
load and haul cost (including ancillary support) based on haul profiles for ore and waste to
nominated destinations
The total mining cost estimate at each mining bench level within each pit was then determined based
on a reference bench cost in each pit (Table 21-6), and then incrementing the cost upwards and
downwards using the incremental haulage costs shown in Table 21-5.
Table 21-6 Reference bench RL mining costs
Waste ($/t) Ore ($/t)
Management $0.008 $0.008
Operations O/H $0.030 $0.030
Engineering $0.011 $0.011
Geology $0.010 $0.010
Technical Services $0.010 $0.010
Drilling $0.006 $0.006
Blasting $0.012 $0.012
Loading $0.003 $0.003
Hauling $0.074 $0.074
Stockpile Rehandle $0.010 $0.010
Services $0.066 $0.066
Dewatering $0.061 $0.061
Contract Clearing & Pre-stripping $0.000 $0.000
Reclamation $0.002 $0.002
Subtotal Base Mining Cost $0.304 $0.304
Cost ItemFixed Mining Costs - with
IPCC
Drill & Blast Variable Cost Waste ($/t) Ore ($/t)
Drilling $0.096 $0.101
Blasting $0.271 $0.286
Subtotal Drill & Blast Cost $0.367 $0.387
Waste ($/t ) Ore ($/t)
$0.0385 $0.0394
Incremental Haulage Cost
Pit Base RL Waste ($/t ) Ore ($/t)
Botija -120 m $2.64 $2.58
Colina 120 m $1.77 $1.59
Medio 150 m $1.58 $1.83
Valle Grande 225 m $1.56 $1.38
BABR 195 m $1.69 $1.75
Balboa -30 m $2.13 $2.18

Cobre Panamá Project Technical Report March 2019
208
The equivalent weighted average mining costs based on the above calculations are shown in Table
21-7. This table shows the average costs without and with adjustments to account for trolley-assisted
haulage. Experience at the Company’s Kansanshi operation in Zambia suggests a potential 25%
reduction in haulage costs with the implementation of trolley-assist. Table 21-7 shows the unadjusted
overall weighted average mining costs derived from the new incremental relationships, in addition to
adjusted overall weighted average mining costs assuming the following:
approximately 40% of the total mining costs are attributable to haulage
of this 40%, a saving of 25% could be expected for all waste hauls
of this 40%, a saving of 25% could be expected on around half of the ore hauls
Table 21-7 Overall average mining costs
The savings due to the application of trolley assist that are summarised in the above table have been
applied in each pit on an individual bench basis and then combined into a simple relationship to
estimate mining costs by depth in each pit as shown in Table 21-8.
Table 21-8 Applied mining costs ($/t) relationship, varying by depth
Although Table 21-3 shows a nominal allowance for ore rehandling, an estimated cost was included
in the cashflow modelling to account for active and longer term ore stockpile rehandling to suitably
located IPC positions. The unit cost of $1.19/t ore reclaimed was developed from the equipment
Unadjusted
total cost Haulage cost TA saving Total cost
BOTIJA $/t waste $2.30 $0.92 -$0.23 $2.07
$/t ore $2.33 $0.93 -$0.12 $2.22
$/t total $2.32 $0.93 -$0.17 $2.15
COLINA $/t waste $1.88 $0.75 -$0.19 $1.70
$/t ore $1.91 $0.76 -$0.10 $1.81
$/t total $1.90 $0.76 -$0.14 $1.76
MEDIO $/t waste $1.60 $0.64 -$0.16 $1.44
$/t ore $1.98 $0.79 -$0.10 $1.88
$/t total $1.75 $0.70 -$0.14 $1.61
VALLE GRANDE $/t waste $1.75 $0.70 -$0.17 $1.57
$/t ore $1.79 $0.71 -$0.09 $1.70
$/t total $1.77 $0.71 -$0.13 $1.64
BABR $/t waste $1.92 $0.77 -$0.19 $1.73
$/t ore $2.18 $0.87 -$0.11 $2.07
$/t total $2.05 $0.82 -$0.16 $1.89
BALBOA $/t waste $1.97 $0.79 -$0.20 $1.78
$/t ore $2.27 $0.91 -$0.11 $2.16
$/t total $2.09 $0.84 -$0.17 $1.92
ALL PITS $/t waste $1.97 $0.79 -$0.20 $1.78
$/t ore $2.11 $0.79 -$0.10 $2.01
$/t total $2.05 $0.82 -$0.15 $1.90
Pit UnitsAdjusted for trolley-assist
Botija
Colina
Medio
Valle Grande
BABR
Balboa 2.0106 - (Zelev * (0.0373/15))
OreWaste
1.9933- (Zelev * (0.0362/15))
2.0794 - (Zelev * (0.0346/15))
1.8331 - (Zelev * (0.0370/15))
2.2971 - (Zelev * (0.0757/15))
1.8410 - (Zelev * (0.0370/15))
2.2327 - (Zelev * (0.0458/15))
2.0984 -(Zelev * (0.0353/15))
1.8476- (Zelev * (0.0353/15))
1.7824 - (Zelev * (0.0363/15))
1.9327 - (Zelev * (0.0362/15))
1.8588 - (Zelev * (0.02722/15))
Cobre Panamá Project Technical Report March 2019
209
costs used in the mining cost model, development of haul cycle times for each potential stockpile
source and IPC destination, and material rehandled in the mining schedule.
Processing and G&A costs
Project operating costs were originally derived from total dollar, life of mine cost estimates produced
by MPSA in January 2013. The costs were subsequently adjusted to account for the proposed plant
throughput increase, and as shown in Tables 21-9 and 21-10 for processing and G&A costs,
respectively. The estimates are shown in unit cost terms, for the purposes of the original mine
optimisation/planning and for subsequent cashflow modelling to support the Mineral Reserve
estimate.
In the original MPSA estimates, a power cost was included for provision of excess generated electricity
back into the national grid. In the updated cost estimates, in circumstances of increased plant
throughput and power consumption, this cost has been removed.
Revised process operating and G&A cost estimates reflect updated estimates of:
consumption rates for grinding media, liners and reagents
electrical power consumption rates
unit costs for grinding media, liners and reagents, electrical power and maintenance parts
plant personnel numbers
annual assay costs
an allowance for tailings operation costs for such as piping and spiggotting
The original sustaining allowances were removed from the cashflow model operating cost estimates
and included as sustaining capital allowances.
The process operating costs shown in Table 21-9 are the estimated longer term average annual costs
when operating at 100 Mtpa capacity. For the purposes of the cashflow model, and to reflect the
shorter term budget produced by the site operating team, the average unit processing cost for 2019
to 2025 is $4.27/t processed (yielding an overall Project life average of $3.84/t processed). Similarly,
the G&A costs shown in Table 21-10 are also the estimated longer term average annual costs when
operating at 100 Mtpa capacity. The shorter term average unit G&A cost for 2019 to 2025 is $1.10/t
processed (yielding an overall Project life average of $0.62/t processed).
There is an additional fixed annual operating cost to be included in the cashflow model and that is
$10.3 Mpa for the port operations.

Cobre Panamá Project Technical Report March 2019
210
Table 21-9 Process operating costs, pit optimisation vs cashflow model
$/t $/t
Grinding media 0.81 0.55
SAG mill 0.401 kg/t milled 0.94 $/kg 0.38 0.316 kg/t milled 1.05 $/kg 0.31
Ball mill 0.381 kg/t milled 0.94 $/kg 0.36 0.230 kg/t milled 1.06 $/kg 0.23
Regrind mill 0.079 kg/t milled 0.94 $/kg 0.07 0.019 kg/t milled 0.52 $/kg 0.01
Liners 0.25 0.38
Gyratory crusher mantle liners 0.001 kg/t milled 4.43 $/kg 0.004 0.004 kg/t milled 5.00 $/kg 0.02
Gyratory crusher concave liners 0.001 kg/t milled 3.38 $/kg 0.004 0.004 kg/t milled 4.00 $/kg 0.02
Secondary crusher mantle 0.00 2,150 op hours life 0.03
Secondary crusher liners 0.00 2,150 op hours life 0.03
Pebble crusher mantle liners 0.001 kg/t milled 4.25 $/kg 0.005 2,500 op hours life 0.01
Pebble crusher bowl liners 0.001 kg/t milled 4.31 $/kg 0.005 2,500 op hours life 0.01
SAG Mill liners 0.052 kg/t milled 3.38 $/kg 0.171 0.055 kg/t milled 4.00 $/kg 0.21
Ball Mill Liners 0.021 kg/t milled 2.87 $/kg 0.059 0.022 kg/t milled 3.50 $/kg 0.07
Reagents 0.59 0.52
Sodium Hydrosulphide (NaHS) 10.165 kg/t dry concentrate 1.16 $/kg (0.0137 t conc / t ore) 0.16 7.624 kg/t dry concentrate 1.08 $/kg (0.0137 t conc / t ore) 0.18
Lime 0.987 kg/t ore 0.22 $/kg 0.22 0.987 kg/t ore 0.14 $/kg 0.13
Flotation Frother (MIBC) 0.028 kg/t ore 3.23 $/kg 0.09 0.028 kg/t ore 3.10 $/kg 0.08
Moly Frother 0.00 0.0008 kg/t ore 3.91 $/kg 0.00
Collector (SIPX) 0.031 kg/t ore 1.88 $/kg 0.06 0.035 kg/t ore 1.93 $/kg 0.07
Promoter (A3302) 0.010 kg/t ore 4.93 $/kg 0.05 0.026 kg/t ore 1.15 $/kg 0.03
Dispersant 0.00 0.090 kg/t ore 1.74 $/kg 0.02
Fuel Oil 0.028 kg/t dry concentrate 0.74 $/kg (0.0137 t conc / t ore) 0.00 0.028 kg/t dry concentrate 0.73 $/kg (0.0137 t conc / t ore) 0.00
Flocculant Plant and Port (AF303) 0.068 kg/t dry concentrate 3.03 $/kg (0.0137 t conc / t ore) 0.00 0.068 kg/t dry concentrate 3.21 $/kg (0.0137 t conc / t ore) 0.00
NaOH 0.000 kg/t ore 1.91 $/kg 0.00 0.008 kg/t ore 1.83 $/kg 0.01
Carbon Dioxide (CO2) 0.038 kg/t dry concentrate 0.48 $/kg (0.0137 t conc / t ore) 0.00 0.001 kg/t dry concentrate 0.40 $/kg (0.0137 t conc / t ore) 0.00
Anti-Scalant 0.008 kg/t ore 1.74 $/kg 0.01 0.00
Plant general operating supplies 0.05 $/t av. assumption 0.05 0.05 $/t av. assumption 0.05
Electricity 1.20 0.93
Mill 20.600 kWh/t milled 0.055 $/kWh 1.14 25.346 kWh/t milled 0.035 $/kWh 0.89
Site & Services 0.450 kWh/t milled 0.055 $/kWh 0.02 0.579 kWh/t milled 0.035 $/kWh 0.02
Port 0.700 kWh/t milled 0.055 $/kWh 0.04 0.646 kWh/t milled 0.035 $/kWh 0.02
Maintenance parts 0.68 $/t av. assumption 0.68 0.68 $/t av. assumption 0.50
Mobile equipment 0.10 $/t av. assumption 0.10 0.10 $/t av. assumption 0.10
Labour 34.00 $M/annum 100.00 Mtpa 0.34 34.00 $M/annum 100.00 Mtpa 0.32
Assay laboratory 1.08 $M/annum 100.00 Mtpa 0.01 1.08 $M/annum 100.00 Mtpa 0.02
Subtotal, plus 4.02 3.37
allowance for tailings operation 0.00 0.25
sustaining capex allowance 606.70 $M 3,352.12 Mt 0.18
power cost credit
TOTAL PROCESS OPERATING COST 4.20 TOTAL PROCESS OPERATING COST 3.62
Consumption rates Unit costs
Cashflow Model
Consumption rates Unit costs
Pit OptimisationProcessing costs

Cobre Panamá Project Technical Report March 2019
211
Table 21-10 G&A operating costs, pit optimisation vs cashflow model
$/t $/t
Finance 0.37 0.15
Labour 0.05 0.02
Services 0.04 0.02
Insurance 0.22 0.09
Other Operating Costs 0.06 0.02
External relations 0.04 0.01
Labour 0.01 0.01
Services 0.01 0.00
Other Operating Costs 0.01 0.00
Environment 0.11 0.05
Labour 0.02 0.01
Services 0.09 0.04
Other Operating Costs 0.01 0.00
Security 0.09 0.04
Labour 0.01 0.00
Services 0.08 0.03
Human Resources 0.16 0.07
Labour 0.04 0.02
Services 0.11 0.04
Other Operating Costs 0.02 0.01
Executive 0.09 0.03
Labour 0.04 0.02
Mobile Equipment 0.01 0.00
Services 0.01 0.00
Other Operating Costs 0.01 0.01
Site Services 0.30 0.12
Labour 0.14 0.06
Mobile Equipment 0.03 0.01
Fixed Equipment 0.04 0.02
Mine Allocation 0.05 0.02
Marine Services 0.04 0.02
Power 0.05 0.04
G&A 0.826 kWh/t milled 0.055 $/kWh 0.03 0.826 kWh/t milled 0.035 $/kWh 0.03
Site services 0.251 kWh/t milled 0.055 $/kWh 0.01 0.251 kWh/t milled 0.035 $/kWh 0.01
Subtotal, plus 1.20 0.51
sustaining capex allowance 181.02 $M 3,352.12 Mt 0.05
power cost credit
TOTAL G&A OPERATING COST 1.25 TOTAL G&A OPERATING COST 0.51
Cashflow Model
Consumption rates Unit costs Consumption rates Unit costsGeneral & Admin Costs
Pit Optimisation

Cobre Panamá Project Technical Report March 2019
212
Metal costs
In addition to royalties, metal costs for each of the copper and molybdenum concentrates comprise:
concentrate transport charges (ocean freight)
concentrate refining charges
payable rates for each metal recovered into concentrate
Table 21-11 lists the metal costs adopted for the pit optimisation described in Item 15. Table 21-11
also lists updated information that was available for subsequent cashflow modelling following a more
recent cost review by Metal Corp Trading AG.
Table 21-11 Metal costs, pit optimisation vs cashflow modelling
Opt'n Cashflow
Copper concentrate charges
Cu con grade, % 25.0% 26.8%
Cu con overland freight, $/dmt $0.00 $2.75
Cu con ocean freight, $/dmt $40.00 $48.50
Cu con treatment, $/dmt $70.00 $90.00
Cu refining, $/lb payable $0.07 $0.09
Cu payable, % 96.43% 96.15%
TCRCs, $/lb Cu payable $0.277 $0.338
Total metal cost
Metal price, $/lb $3.00 $3.07
royalty rate, % 5.0% 2.0%
Cu metal cost, $/lb Cu payable $0.43 $0.40
Molybdenum concentrate charges
Mo con grade, % 52.0% 52.0%
Mo con overland freight, $/dmt $0.00 $2.75
Mo con ocean freight, $/dmt $90.00 $90.00
Mo con treatment, $/dmt $0.00 $0.00
Cu removal charge, $/lb $0.00 $0.69
Mo refining, $/lb payable $0.00 $0.55
Mo payable, % 86.20% 86.20%
TCRCs, $/lb Mo payable $0.091 $1.334
Total metal cost
Metal price, $/lb $13.50 $8.83
royalty rate, % 5.0% 2.0%
Mo metal cost, $/lb Mo payable $0.77 $1.46
Gold in concentrate charges
Au refining, $/oz payable $5.50 $5.10
Au payable, % 92.00% 90.00%
TCRCs, $/lb Au payable $5.060 $4.590
Total metal cost
Metal price, $/oz $1,200 $1,310
royalty rate, % 5.0% 2.0%
Au metal cost, $/oz Au payable $65.060 $28.078
Au metal cost, $/lb Au payable $948.77 $409.46
Silver in concentrate charges
Ag refining, $/oz payable $0.40 $0.44
Ag payable, % 90.00% 90.00%
TCRCs, $/lb Ag payable $0.360 $0.398
Total metal cost
Metal price, $/oz $16.00 $18.87
royalty rate, % 5.0% 2.0%
Au metal cost, $/oz Ag payable $1.160 $0.729
Ag metal cost, $/lb Ag payable $16.92 $10.63

Cobre Panamá Project Technical Report March 2019
213
The updated estimates accounted for:
inclusion of a concentrate overland freight rate (for the distance between the plant site and
the port; previously omitted)
updated ocean freight rate for copper concentrate
updated copper treatment and refining charges
inclusion of a copper removal charge from the molybdenum concentrate (previously omitted)
inclusion of a molybdenum refining charge (previously omitted)
adjustment of the gold and silver payable percentages to reflect possible concentrate sales to
a range of customers in Europe, Japan, China, India and South Korea
correction of the royalty payment to be made on a net return basis (in conjunction with
revised long term metal price projections)

Cobre Panamá Project Technical Report March 2019
214
ECONOMIC ANALYSIS
Principal assumptions
In accordance with Part 2.3 (1) (c) of the Rules and Policies of Canadian National Instrument (NI) 43-
101, the economic analysis set out below does not include Inferred Mineral Resources.
The economic analysis in the form of a simple cashflow model is intended to support the Mineral
Reserve estimate, and in order to demonstrate a positive cashflow for each year of mining and
processing. The development capital costs, sustaining capital costs and longer term rehabilitation
costs are included in the model for completeness. The cashflow model forms part of a more
comprehensive Project financial model which extends to depreciation, tax, financing and inter-
company cashflows.
Production schedule
The production schedule forming the basis of the cashflow model is the same as that listed in Table
16-5 of Item 16.
Concensus metal pricing
The annual revenues in the cashflow model are calculated from late 2018 consensus pricing
information from a number of banks and financial service companies, as listed in Tables 22-1 to 22-4.
Table 22-1 Consensus copper pricing information for cashflow modelling
Pricing 2019E 2020E 2021E 2022E 2023E LT
Date ($/lb) ($/lb) ($/lb) ($/lb) ($/lb) ($/lb)
11 Dec '18 2.84 2.95 3.28 3.10
18 Dec '18 3.25 3.51 3.13 3.18 3.25 3.25
18 Oct '18 2.86 2.86 2.86 2.86 n/a 2.86
17 Dec '18 3.08 3.25 3.40 3.50 3.70
17 Dec '18 2.80 2.60 3.00
17 Dec '18 3.08 3.29 2.99
27 Nov '18 3.25 3.40 3.25
03 Dec '18 2.95 3.05 3.25
12 Dec '18 2.75 3.00 3.00
13 Dec '18 2.80 2.79 3.20
17 Dec '18 2.95 3.02 3.31 3.76 3.86 2.90
14 Dec '18 3.09 2.96 2.90 3.04 3.10 3.19
24 Dec '18 2.80 2.85 2.90 3.10
17 Dec '18 2.63 3.00 3.25 3.50 3.00
10 Oct '18 3.00 3.20 3.50 3.75 3.00
22 Oct '18 3.20 3.30 3.50 3.50 3.10
06 Dec '18 2.89 3.23 3.30 3.30 2.95
Average 2.95 3.07 3.21 3.38 3.48 3.07

Cobre Panamá Project Technical Report March 2019
215
Table 22-2 Consensus molybdenum pricing information for cashflow modelling
Table 22-3 Consensus gold pricing information for cashflow modelling
Table 22-4 Consensus silver pricing information for cashflow modelling
Pricing 2019E 2020E 2021E 2022E 2023E LT
Date ($/lb) ($/lb) ($/lb) ($/lb) ($/lb) ($/lb)
18 Dec '18 11.88 10.00 9.00 8.50 8.50 8.50
17 Dec '18 11.25 11.00 10.50 10.00 9.50
11 Dec '18 11.25 11.51 11.78
17 Dec '18 11.91 12.13 12.00 12.50 12.75 11.00
24 Dec '18 11.25 10.00 8.00 7.00
17 Dec '18 10.00 9.50 9.50 9.50 8.50
10 Oct '18 10.00 10.00 10.00 10.00 10.00
06 Dec '18 10.40 10.30 9.00 9.00 8.00
Average 10.99 10.56 9.97 9.92 10.25 8.83
Pricing 2019E 2020E 2021E 2022E 2023E LT
Date ($/oz) ($/oz) ($/oz) ($/oz) ($/oz) ($/oz)
11 Dec '18 1,269 1,300 1,300 1,350
18 Dec '18 1,283 1,250 1,530 1,200 1,200 1,200
18 Oct '18 1,222 1,259 1,305 1,344 1,385
17 Dec '18 1,300 1,300 1,300 1,300 1,300
17 Dec '18 1,252 1,300 1,300
17 Dec '18 1,210 1,280 1,300
27 Nov '18 1,250 1,300 1,300
12 Dec '18 1,300 1,300 1,300
13 Dec '18 1,241 1,278 1,400
17 Dec '18 1,219 1,313 1,319 1,363 1,425 1,250
14 Dec '18 1,295 1,295 1,290 1,300 1,300 1,301
24 Dec '18 1,200 1,250 1,300 1,350
17 Dec '18 1,300 1,300 1,300 1,300 1,300
10 Oct '18 1,300 1,300 1,300 1,300 1,300
06 Dec '18 1,300 1,325 1,350 1,375 1,300
Average 1,263 1,290 1,329 1,310 1,306 1,310
Pricing 2019E 2020E 2021E 2022E 2023E LT
Date ($/oz) ($/oz) ($/oz) ($/oz) ($/oz) ($/oz)
11 Dec '18 16.00 18.00 18.00 18.00
18 Dec '18 15.75 17.00 17.50 18.00 18.25 18.25
18 Oct '18 14.83 15.23 15.93 16.03 16.03
17 Dec '18 17.50 17.50 17.50 17.50 17.50
17 Dec '18 16.00 17.50 20.00
27 Nov '18 16.00 17.50 18.00
13 Dec '18 14.40 14.85 14.85 24.00
17 Dec '18 15.69 16.50 17.50 18.50 19.63 18.00
14 Dec '18 16.75 17.20 18.00 19.00 20.00 22.25
24 Dec '18 14.65 16.50 18.00 19.50
17 Dec '18 16.50 16.50 16.50 16.50 16.50
10 Oct '18 17.00 17.00 17.00 17.00 17.00
Average 15.92 16.77 17.08 17.50 18.85 18.87
Cobre Panamá Project Technical Report March 2019
216
Cashflow model inputs
Revenue inputs
In addition to the metal pricing information in Tables 22-1 to 22-4, other revenue related inputs to
the model are listed below.
The overall average recoveries (after mining dilution, and where metal recoveries for each individual block are calculated according to a recovery algorithm, where a copper recovery downrate is applied to initial processing years, and where stockpiled saprock ore has a further 20% downrate applied) are:
copper = 90.2%
molybdenum = 53.4%
gold = 55.9%
silver = 45.0%
The payable metal factors are:
copper = 96.15%
molybdenum = 86.2%
gold = 90.0%
silver = 90.0%
Capital costs
According to the itemisation shown in Table 21-1, the updated Project capital cost of $6,300 M was
included in the cashflow model, along with the $240 M estimated cost for 100 Mtpa expansion works
in 2019 (and inclusive of mine development and engineering work allowances). Additional capital
expenditure items as summarised in Table 21-1 and amounting to $429 M, were included in the model
for the Project expansion period from 2020.
Mining, processing and G&A sustaining capital costs according to the allowances described in Item
21.1 were also included in the model, except for 2019 (the first year of production). As per the
commentary in Item 21.1.3, a total sustaining allowance of $60 M was included for tailings dam works,
split evenly between 2019 and 2020. A $148.6 M allowance for planned component replacements
and for the sustaining of haul road trolley assist infrastructure was included for the period 2019 to
2026.
Operating and metal costs
With some differences for the initial schedule years, the modelled unit operating costs are essentially the same costs as summarised in Item 2113:
mining waste = $1.76/t waste (overall average for all pits)
mining ore = $1.94/t ore (overall average for all pits)
processing = $3.84/t ore (overall average)
G&A = $0.62/t ore (overall average)
13 Relative to the mining cost information in Table 21-7, the modelled overall average ore and waste mining costs differ due to the inclusion of site budgeted costs for the period 2019 to 2023. The modelled average processing and G&A costs differ for the same reason.

Cobre Panamá Project Technical Report March 2019
217
fixed cost for the port operations = $10.3 M per year
stockpile reclaim costs = $1.19/t reclaimed
The modelled metal costs (including TCRC’s and royalties) equate to the same costs as summarised in
Item 21:
copper = $0.40/lb
molybdenum = $1.46/lb
gold = $28.08/oz
silver = $0.73/oz
Mining, process and G&A operating costs for 2019, in addition to metal costs for that year, have been
expensed.
Cashflow model outcomes
The basic cashflow model to support the Mineral Reserve estimate is listed in Table 22-5. Table 22-6
summarises the average annual physicals and costs that relate to this model.
The Project is cashflow positive from 2020 and payback on the $6,540 M capital spend occurs in 2024
(ie, payback on the capital inclusive of $6,070 M spent, $230 M of remaining capital for the 85 Mtpa
expansion, and $240 M for initial 100 Mtpa expansion and associated development and engineering
costs) .
The total undiscounted cashflow for the Project, from the outset, is $31,686.5 M. As at 31st December
2018, the NPV of the projected gross operating income (ie, excluding the precious metal stream) and
capital expenditure of the project is $14,307 M, calculated assuming mid-period cash flows.
The NPV is stated on the basis that the $6,070 M of historic capital spend for the development and
construction of the Project has been spent. In looking forward from the end of 2018, the adoption of
an 8.5% discount rate is considered appropriate and aligned with rates recommended by the
Company’s independent valuation experts. With the exclusion of the historic capital spend from the
discounted cashflow, the presentation of an IRR value is considered to be not applicable.
Project value and sensitivity analysis
A sensitivity analysis was completed as part of the pit optimisation work described in Item 15.4.5. The
most sensitive optimisation variable is copper metal price (and recovery, since the magnitude of
impact is the same). Continuing this analysis, and based on the cashflow model, Table 22-7 lists a
number of Project variables and the base, minimum and maximum values of these adopted for further
sensitivity analysis. The base development cost is the forward capital spend from 2019 (ie, excluding
capital already spent). Table 22-8 summarises the impact on undiscounted cashflow of varying these
parameters by +/- 10%. Table 22-9 summarises the impact on Project NPV8.5.
As expected, copper price is the most sensitive of these variables; a 10% increase in average copper
price over the life of the Project would increase the cashflow by 18%, and increase the NPV8.5 by the
same percentage. A 10% reduction in the copper price over the life of the Project would reduce the
cashflow by 18% and decrease the NPV8.5 by the same percentage.

Cobre Panamá Project Technical Report March 2019
218
Table 22-5 Mineral Reserve undiscounted cashflow model
Year <2019 2019 2020 2021 2022 2023 2024 2025 2026 2027 2028 2029 2030 2031 2032 2033 2034 2035 2036 2037 2038 2039 2040 2041 2042 2043 2044 2045 2046 2047 2048 2049 2050 2051 2052 2053 2054 2055
MINING
Total ore Mt 3,143.7 76.0 94.2 101.0 109.8 124.8 109.1 110.9 123.8 123.4 108.2 119.8 116.3 111.1 102.8 103.7 102.8 104.8 110.6 114.5 101.6 106.5 105.6 103.6 81.9 75.5 63.1 62.0 50.7 66.4 66.3 61.0 56.7 37.4 27.2 10.7
Total waste (incl. MW not reclaimed) Mt 3,157.8 62.7 74.7 76.1 94.2 79.3 100.4 98.3 85.3 85.1 100.9 89.3 88.0 92.2 101.4 100.1 101.4 99.4 94.2 89.6 102.6 97.7 99.1 100.5 122.2 129.2 130.2 131.2 131.7 136.3 109.4 65.9 37.0 36.8 14.6 0.8
Total Mining Mt 6,301.6 138.7 169.0 177.1 204.0 204.1 209.5 209.3 209.1 208.4 209.1 209.1 204.3 203.2 204.2 203.8 204.2 204.2 204.7 204.2 204.2 204.2 204.7 204.2 204.1 204.7 193.3 193.1 182.5 202.7 175.7 127.0 93.7 74.2 41.8 11.4
Strip ratio W:O 1.00 0.83 0.79 0.75 0.86 0.64 0.92 0.89 0.69 0.69 0.93 0.75 0.76 0.83 0.99 0.97 0.99 0.95 0.85 0.78 1.01 0.92 0.94 0.97 1.49 1.71 2.06 2.12 2.60 2.05 1.65 1.08 0.65 0.98 0.54 0.07
Stockpile reclaim Mt 334.0 14.9 10.0 3.7 1.2 3.9 0.0 1.1 0.0 1.2 0.0 0.0 3.3 0.6 0.0 0.0 3.9 0.0 0.0 0.0 2.0 0.0 1.2 0.0 3.4 0.0 11.9 13.4 25.0 8.7 8.7 14.0 18.3 37.6 47.8 64.3 33.8
PIT TO MILL DIRECT
TOTAL Mt 2,813.1 32.3 71.6 81.3 88.9 96.1 100.0 98.9 100.0 98.8 100.0 100.0 96.7 99.0 100.0 100.0 95.8 100.0 100.0 100.0 98.0 100.0 98.8 100.0 81.6 75.0 63.1 61.6 50.0 66.3 66.3 61.0 56.7 37.4 27.2 10.7
Cu % 0.39 0.40 0.41 0.41 0.45 0.46 0.44 0.42 0.41 0.37 0.42 0.45 0.42 0.43 0.44 0.38 0.39 0.35 0.37 0.39 0.38 0.39 0.34 0.35 0.33 0.33 0.34 0.35 0.36 0.35 0.39 0.36 0.40 0.39 0.31 0.55
Mo ppm 60.19 79.38 73.65 71.27 78.04 75.08 69.45 73.55 61.93 62.78 76.11 88.40 76.73 78.48 72.25 67.27 64.82 61.04 68.16 76.03 80.39 69.15 55.53 35.63 47.13 27.51 29.58 33.74 20.41 22.28 25.69 21.89 25.69 28.69 23.24 17.87
Au ppm 0.07 0.09 0.09 0.08 0.09 0.09 0.10 0.10 0.09 0.07 0.08 0.08 0.08 0.07 0.07 0.05 0.05 0.04 0.05 0.04 0.05 0.05 0.05 0.06 0.05 0.09 0.06 0.06 0.09 0.07 0.08 0.07 0.08 0.07 0.07 0.16
Ag ppm 1.38 1.38 1.33 1.31 1.39 1.41 1.39 1.34 1.36 1.32 1.38 1.48 1.46 1.43 1.52 1.65 1.60 1.59 1.54 1.52 1.38 1.46 1.32 1.32 1.40 1.16 1.01 0.93 1.34 1.07 1.24 1.14 1.27 1.31 1.21 2.16
PIT TO STOCKPILE
TOTAL Mt 330.6 43.7 22.7 19.6 20.8 28.6 9.1 12.0 23.8 24.6 8.2 19.8 19.6 12.1 2.8 3.7 7.0 4.8 10.6 14.5 3.6 6.5 6.8 3.6 0.3 0.5 0.0 0.4 0.7 0.1 0.0 0.0 0.0 0.0 0.0 0.0
Cu % 0.21 0.24 0.20 0.16 0.17 0.22 0.20 0.26 0.23 0.21 0.26 0.16 0.16 0.15 0.23 0.23 0.18 0.29 0.22 0.20 0.27 0.31 0.20 0.21 0.30 0.33 0.44 0.23 0.16 0.52 0.00 0.00 0.00 0.15 0.00 0.00
Mo ppm 41.31 52.27 31.50 26.29 27.01 38.92 51.15 39.90 50.06 45.74 54.73 34.70 31.48 32.70 26.12 40.69 46.42 65.75 55.22 66.32 63.13 34.04 13.45 11.30 54.51 11.87 39.29 55.73 23.08 44.64 0.00 0.00 0.00 43.90 0.00 0.00
Au ppm 0.05 0.06 0.05 0.04 0.04 0.05 0.07 0.10 0.07 0.05 0.05 0.05 0.04 0.06 0.04 0.03 0.02 0.07 0.03 0.04 0.07 0.06 0.05 0.04 0.11 0.29 0.00 0.00 0.05 0.00 0.00 0.00 0.00 0.03 0.00 0.00
Ag ppm 1.02 1.04 0.92 0.74 0.80 1.00 1.07 1.16 1.00 0.94 1.45 1.01 0.88 0.68 1.42 1.34 1.28 1.27 1.23 1.30 1.49 1.37 1.00 0.82 0.66 1.66 0.97 0.93 1.17 0.79 0.00 0.00 0.00 0.59 0.00 0.00
STOCKPILE TO MILL
TOTAL Mt 334.0 14.9 10.0 3.7 1.2 3.9 0.0 1.1 0.0 1.2 0.0 0.0 3.3 0.6 0.0 0.0 3.9 0.0 0.0 0.0 2.0 0.0 1.2 0.0 3.4 0.0 11.9 13.4 25.0 8.7 8.7 14.0 18.3 37.6 47.8 64.3 33.8
Cu % 0.21 0.32 0.27 0.28 0.35 0.47 0.00 0.43 0.00 0.34 0.00 0.00 0.29 0.29 0.00 0.00 0.26 0.00 0.00 0.00 0.26 0.00 0.51 0.00 0.35 0.00 0.16 0.17 0.16 0.16 0.16 0.16 0.16 0.16 0.16 0.20 0.33
Mo ppm 41.38 65.35 50.66 50.80 60.81 94.96 0.00 38.73 0.00 86.16 0.00 0.00 62.73 62.73 0.00 0.00 35.06 0.00 0.00 0.00 73.64 0.00 51.08 0.00 29.74 0.00 34.17 33.62 34.17 34.06 34.13 34.13 34.13 34.13 34.13 39.76 58.83
Au ppm 0.05 0.07 0.07 0.07 0.06 0.09 0.00 0.06 0.00 0.05 0.00 0.00 0.03 0.03 0.00 0.00 0.03 0.00 0.00 0.00 0.02 0.00 0.05 0.00 0.05 0.00 0.04 0.05 0.04 0.04 0.04 0.04 0.04 0.04 0.04 0.05 0.09
Ag ppm 1.07 1.20 1.53 1.54 1.18 1.37 0.00 1.76 0.00 1.29 0.00 0.00 1.51 1.51 0.00 0.00 1.48 0.00 0.00 0.00 1.42 0.00 1.68 0.00 1.19 0.00 0.93 0.96 0.93 0.93 0.93 0.93 0.93 0.93 0.93 1.04 1.39
TOTAL FEED TO PLANT (after mining dilution & recovery)
TOTAL Mt 3,147.1 47.19 81.60 85.05 90.16 100.01 100.00 100.00 100.00 100.00 100.00 100.00 100.00 99.59 100.00 100.00 99.71 100.00 100.00 100.00 100.00 100.00 100.00 100.00 85.00 75.00 75.00 75.00 75.00 75.00 75.00 75.00 75.00 75.00 75.00 75.00 33.79
Cu % 0.373 0.38 0.40 0.40 0.45 0.46 0.44 0.42 0.41 0.37 0.42 0.45 0.42 0.43 0.44 0.38 0.38 0.35 0.37 0.39 0.38 0.39 0.34 0.35 0.33 0.33 0.31 0.31 0.29 0.33 0.36 0.32 0.34 0.28 0.21 0.25 0.33
Mo ppm 58.19 74.94 70.84 70.37 77.81 75.85 69.45 73.17 61.93 63.05 76.11 88.40 76.27 78.38 72.25 67.27 63.64 61.04 68.16 76.03 80.25 69.15 55.48 35.63 46.44 27.51 30.31 33.72 25.00 23.65 26.67 24.17 27.75 31.42 30.18 36.65 58.83
Au ppm 0.07 0.08 0.09 0.08 0.09 0.09 0.10 0.10 0.09 0.07 0.08 0.08 0.07 0.07 0.07 0.05 0.05 0.04 0.05 0.04 0.05 0.05 0.05 0.06 0.05 0.09 0.06 0.06 0.07 0.07 0.08 0.07 0.07 0.06 0.05 0.07 0.09
Ag ppm 1.35 1.32 1.35 1.32 1.39 1.41 1.39 1.35 1.36 1.32 1.38 1.48 1.46 1.43 1.52 1.65 1.60 1.59 1.54 1.52 1.38 1.46 1.32 1.32 1.39 1.16 1.00 0.93 1.20 1.06 1.20 1.10 1.19 1.12 1.03 1.20 1.39
AVERAGE RECOVERIES
Cu % 90.2% 81.5% 91.0% 91.2% 91.9% 92.1% 91.9% 91.6% 91.2% 90.5% 91.5% 91.8% 91.3% 91.5% 91.6% 90.7% 90.8% 90.2% 90.6% 90.8% 90.8% 91.1% 90.2% 90.4% 89.7% 88.7% 88.1% 88.5% 89.2% 89.1% 89.4% 89.1% 89.5% 88.6% 88.1% 84.0% 71.8%
Mo % 53.4% 14.9% 54.9% 55.0% 55.0% 55.0% 55.0% 55.0% 55.0% 55.0% 55.0% 55.0% 55.0% 55.0% 55.0% 55.0% 55.0% 54.8% 53.8% 53.3% 52.3% 52.0% 52.1% 52.4% 52.4% 54.3% 53.7% 58.5% 66.4% 59.2% 54.0% 60.7% 47.1% 51.3% 50.0% 48.3% 38.2%
Au % 55.9% 52.5% 56.3% 55.9% 58.9% 59.9% 61.4% 59.9% 59.7% 53.9% 56.0% 55.1% 54.8% 53.7% 54.2% 50.2% 50.9% 46.5% 50.6% 46.3% 46.5% 48.7% 50.5% 58.6% 49.8% 54.4% 57.8% 56.3% 61.4% 62.8% 62.7% 60.9% 63.3% 58.5% 57.5% 55.9% 47.0%
Ag % 45.0% 22.0% 47.2% 47.3% 47.3% 47.3% 47.3% 47.3% 47.3% 47.3% 47.3% 47.3% 47.3% 47.3% 47.3% 47.3% 47.3% 47.3% 47.3% 47.3% 47.2% 46.9% 46.5% 44.4% 45.7% 36.8% 36.0% 39.2% 45.7% 40.5% 37.5% 42.2% 38.7% 38.3% 39.4% 38.9% 38.7%
METAL RECOVERED
Cu kt 10,586.4 144.8 293.9 312.6 373.7 424.9 401.5 385.1 376.0 334.9 387.5 412.3 380.8 390.7 402.6 341.9 346.3 313.2 337.1 349.6 342.4 356.0 307.1 320.4 250.9 220.0 205.8 208.4 195.5 220.9 241.9 215.7 231.3 183.4 141.8 156.1 79.2
Mo kt 97.8 0.5 3.2 3.3 3.9 4.2 3.8 4.0 3.4 3.5 4.2 4.9 4.2 4.3 4.0 3.7 3.5 3.3 3.7 4.1 4.2 3.6 2.9 1.9 2.1 1.1 1.2 1.5 1.2 1.1 1.1 1.1 1.0 1.2 1.1 1.3 0.8
Au koz 3,876.2 65.1 125.8 125.1 157.2 181.0 201.4 184.3 180.5 116.1 143.3 133.8 130.7 125.1 125.9 84.0 86.2 63.8 87.7 66.3 67.5 73.1 73.3 111.9 67.5 114.8 78.6 76.8 107.0 104.5 118.1 95.8 110.4 81.7 73.3 92.8 45.9
Ag koz 61,226.2 440.9 1,674.3 1,707.2 1,906.2 2,141.6 2,112.6 2,049.0 2,062.3 2,009.1 2,101.7 2,247.6 2,227.1 2,171.6 2,309.5 2,502.3 2,424.6 2,414.5 2,343.9 2,307.2 2,103.4 2,206.6 1,972.8 1,890.3 1,738.5 1,030.3 867.0 880.4 1,326.2 1,032.4 1,087.1 1,117.0 1,108.8 1,030.9 979.5 1,121.7 579.9
CONCENTRATE GRADE
Cu % 26.8% 26.8% 27.3% 27.5% 28.6% 28.8% 28.2% 27.9% 27.7% 26.7% 27.9% 28.5% 27.8% 28.0% 28.3% 26.9% 27.0% 26.2% 26.7% 27.0% 26.9% 27.2% 26.0% 26.3% 25.7% 25.8% 25.3% 25.4% 24.9% 25.8% 26.5% 25.6% 26.1% 24.5% 23.1% 23.9% 25.7%
Mo % 52.0% 52.0% 52.0% 52.0% 52.0% 52.0% 52.0% 52.0% 52.0% 52.0% 52.0% 52.0% 52.0% 52.0% 52.0% 52.0% 52.0% 52.0% 52.0% 52.0% 52.0% 52.0% 52.0% 52.0% 52.0% 52.0% 52.0% 52.0% 52.0% 52.0% 52.0% 52.0% 52.0% 52.0% 52.0% 52.0% 52.0%
METAL PAYABLE
Cu kt 10,193.0 139.4 283.1 301.2 360.7 410.1 387.3 371.2 362.5 322.3 373.7 397.8 367.1 376.8 388.4 329.2 333.5 301.3 324.5 336.7 329.7 342.9 295.2 308.2 241.1 211.5 197.7 200.2 187.7 212.4 232.8 207.3 222.5 176.0 135.7 149.5 76.1
Mo kt 84.3 0.5 2.7 2.8 3.3 3.6 3.3 3.5 2.9 3.0 3.6 4.2 3.6 3.7 3.4 3.2 3.0 2.9 3.2 3.5 3.6 3.1 2.5 1.6 1.8 1.0 1.1 1.3 1.1 0.9 0.9 0.9 0.8 1.0 1.0 1.1 0.7
Au koz 3,488.5 58.6 113.2 112.6 141.4 162.9 181.2 165.9 162.5 104.5 129.0 120.4 117.7 112.6 113.3 75.6 77.6 57.4 79.0 59.6 60.7 65.8 65.9 100.7 60.8 103.3 70.8 69.1 96.3 94.0 106.3 86.3 99.4 73.5 66.0 83.5 41.3
Ag koz 55,103.6 396.8 1,506.9 1,536.5 1,715.5 1,927.4 1,901.3 1,844.1 1,856.1 1,808.2 1,891.5 2,022.9 2,004.4 1,954.4 2,078.6 2,252.1 2,182.1 2,173.1 2,109.5 2,076.5 1,893.1 1,986.0 1,775.5 1,701.3 1,564.6 927.3 780.3 792.3 1,193.6 929.2 978.4 1,005.3 997.9 927.8 881.6 1,009.5 521.9
GROSS REVENUE (based on varying concentrate grade
Cu $M $69,693.1 $907.9 $1,918.3 $2,133.0 $2,685.3 $3,143.1 $2,622.6 $2,514.0 $2,454.5 $2,182.9 $2,530.3 $2,694.0 $2,486.1 $2,551.3 $2,630.0 $2,229.0 $2,258.3 $2,040.2 $2,197.5 $2,280.2 $2,232.4 $2,322.4 $1,999.4 $2,087.4 $1,632.8 $1,432.2 $1,338.6 $1,355.7 $1,270.9 $1,438.1 $1,576.3 $1,403.7 $1,506.7 $1,191.6 $918.6 $1,012.6 $515.3
Mo $M $1,680.9 $11.0 $63.7 $62.4 $72.7 $81.3 $64.1 $67.6 $57.2 $58.2 $70.3 $81.6 $70.4 $72.1 $66.7 $62.1 $58.6 $56.2 $61.6 $68.0 $70.4 $60.4 $48.5 $31.3 $34.7 $18.8 $20.5 $24.8 $20.9 $17.6 $18.1 $18.5 $16.4 $20.3 $19.0 $22.3 $12.8
Au (assay deduction ignored) $M $4,565.7 $74.0 $146.1 $149.6 $185.3 $212.7 $237.4 $217.3 $212.8 $136.8 $168.9 $157.7 $154.1 $147.5 $148.4 $99.0 $101.6 $75.2 $103.4 $78.1 $79.6 $86.2 $86.4 $131.9 $79.6 $135.3 $92.7 $90.5 $126.2 $123.1 $139.2 $113.0 $130.2 $96.2 $86.4 $109.3 $54.1
Ag (assay deduction ignored) $M $1,030.2 $6.3 $25.3 $26.2 $30.0 $36.3 $35.9 $34.8 $35.0 $34.1 $35.7 $38.2 $37.8 $36.9 $39.2 $42.5 $41.2 $41.0 $39.8 $39.2 $35.7 $37.5 $33.5 $32.1 $29.5 $17.5 $14.7 $14.9 $22.5 $17.5 $18.5 $19.0 $18.8 $17.5 $16.6 $19.0 $9.8
Subtotal - Gross Revenue $M $76,969.9 $999.2 $2,153.3 $2,371.2 $2,973.4 $3,473.4 $2,960.0 $2,833.6 $2,759.5 $2,412.0 $2,805.2 $2,971.5 $2,748.4 $2,807.7 $2,884.3 $2,432.5 $2,459.7 $2,212.5 $2,402.3 $2,465.5 $2,418.1 $2,506.5 $2,167.7 $2,282.7 $1,776.7 $1,603.8 $1,466.5 $1,486.0 $1,440.5 $1,596.4 $1,752.1 $1,554.1 $1,672.1 $1,325.6 $1,040.7 $1,163.3 $592.0
CAPITAL COSTS
Development capital $M $6,300.0 $6,070.0 $230.0 $0.0 $0.0 $0.0 $0.0 $0.0 $0.0 $0.0
Expansion capital $M $669.0 $240.0 $100.0 $122.0 $89.0 $18.0 $33.0 $33.0 $34.0
Subtotal - Development Capital Costs $M $6,969.0 $6,070.0 $470.0 $100.0 $122.0 $89.0 $18.0 $33.0 $33.0 $34.0
SUSTAINING CAPITAL COSTS
Sustaining (Mining, Processing, G&A) $M $2,493.9 $80.0 $90.0 $90.0 $112.0 $90.0 $90.0 $90.0 $90.0 $75.4 $75.5 $75.5 $74.3 $73.9 $74.3 $74.2 $74.2 $74.2 $74.4 $74.2 $74.2 $74.2 $74.4 $74.2 $71.1 $69.2 $66.3 $66.2 $63.4 $68.7 $61.7 $49.0 $40.4 $35.3 $26.9 $19.0 $7.5
Closure and reclamation $M $124.2 $15.3 $13.4 $17.7 $25.1 $20.5 $32.2
Subtotal - Sustaining Capital Costs $M $2,618.1 $80.0 $90.0 $90.0 $112.0 $90.0 $90.0 $90.0 $90.0 $75.4 $75.5 $75.5 $74.3 $73.9 $74.3 $74.2 $74.2 $74.2 $74.4 $74.2 $74.2 $74.2 $74.4 $74.2 $71.1 $69.2 $66.3 $66.2 $63.4 $68.7 $61.7 $64.3 $53.8 $53.0 $52.0 $39.5 $39.6
MINE OPERATING COSTS
Mining ore $M $6,136.8 $136.0 $162.2 $171.6 $182.3 $234.2 $232.3 $227.6 $239.5 $238.2 $211.4 $240.6 $240.5 $235.4 $209.8 $197.9 $201.9 $209.5 $207.9 $214.5 $173.6 $182.5 $184.7 $178.6 $150.6 $147.6 $127.6 $123.3 $104.7 $140.1 $147.9 $143.3 $140.2 $97.5 $71.2 $30.1
Mining waste $M $5,539.6 $99.0 $128.6 $129.6 $155.5 $148.5 $186.2 $178.9 $148.4 $148.8 $196.4 $170.8 $154.8 $155.9 $177.4 $171.5 $180.7 $180.9 $162.8 $148.4 $157.5 $148.1 $159.6 $167.2 $204.6 $226.5 $223.4 $234.0 $231.8 $247.1 $204.8 $127.5 $73.6 $76.2 $32.1 $1.9
PROCESS AND G&A OPERATING COSTS
Processing $M $12,088.2 $264.7 $375.5 $369.3 $380.2 $402.6 $402.5 $382.5 $372.5 $372.5 $372.5 $372.5 $372.5 $371.0 $372.5 $372.5 $371.5 $372.5 $372.5 $372.5 $372.5 $372.5 $372.5 $372.5 $318.2 $282.0 $282.0 $282.0 $282.0 $282.0 $282.0 $282.0 $282.0 $282.0 $282.0 $282.0 $132.7
G&A $M $1,957.9 $122.0 $119.9 $115.2 $102.8 $92.0 $64.4 $50.8 $50.8 $50.8 $50.8 $50.8 $50.8 $50.6 $50.8 $50.8 $50.6 $50.8 $50.8 $50.8 $50.8 $50.8 $50.8 $50.8 $43.2 $38.1 $38.1 $38.1 $38.1 $38.1 $38.1 $38.1 $38.1 $38.1 $38.1 $38.1 $17.2
Stockpile reclaim $M $397.3 $17.8 $11.9 $4.4 $1.4 $4.6 $0.0 $1.3 $0.0 $1.4 $0.0 $0.0 $4.0 $0.8 $0.0 $0.0 $4.7 $0.0 $0.0 $0.0 $2.4 $0.0 $1.4 $0.0 $4.0 $0.0 $14.2 $15.9 $29.8 $10.4 $10.3 $16.6 $21.8 $44.7 $56.8 $76.5 $40.2
Subtotal - Operating Costs $M $26,119.9 $639.5 $798.2 $790.1 $822.2 $881.9 $885.4 $841.1 $811.2 $811.8 $831.1 $834.7 $822.6 $813.7 $810.6 $792.8 $809.4 $813.8 $794.0 $786.3 $756.8 $753.9 $769.0 $769.1 $720.6 $694.1 $685.3 $693.3 $686.3 $717.6 $683.1 $607.4 $555.7 $538.5 $480.3 $428.6 $190.0
METAL COSTS (INCLUDING ROYALTIES)
Cu $M $9,107.6 $123.9 $250.2 $267.0 $314.1 $357.0 $334.6 $323.7 $317.4 $289.2 $325.2 $341.4 $320.6 $326.9 $335.1 $294.1 $297.0 $274.0 $290.8 $299.5 $294.5 $304.0 $269.6 $279.1 $221.8 $194.3 $183.8 $185.9 $176.7 $195.1 $210.0 $191.4 $202.6 $167.4 $134.7 $145.0 $70.1
Mo $M $315.5 $1.7 $10.4 $10.7 $12.6 $13.7 $12.3 $13.0 $11.0 $11.2 $13.5 $15.6 $13.5 $13.8 $12.8 $11.9 $11.2 $10.8 $11.8 $13.0 $13.5 $11.6 $9.3 $6.0 $6.7 $3.6 $3.9 $4.8 $4.0 $3.4 $3.5 $3.5 $3.2 $3.9 $3.6 $4.3 $2.4
Au $M $108.8 $1.8 $3.5 $3.6 $4.4 $5.1 $5.7 $5.2 $5.1 $3.3 $4.0 $3.8 $3.7 $3.5 $3.5 $2.4 $2.4 $1.8 $2.5 $1.9 $1.9 $2.1 $2.1 $3.1 $1.9 $3.2 $2.2 $2.2 $3.0 $2.9 $3.3 $2.7 $3.1 $2.3 $2.1 $2.6 $1.3
Ag $M $44.5 $0.3 $1.2 $1.2 $1.3 $1.6 $1.5 $1.5 $1.5 $1.5 $1.5 $1.6 $1.6 $1.6 $1.7 $1.8 $1.8 $1.8 $1.7 $1.7 $1.5 $1.6 $1.4 $1.4 $1.3 $0.8 $0.6 $0.6 $1.0 $0.8 $0.8 $0.8 $0.8 $0.8 $0.7 $0.8 $0.4
Subtotal - Metal Costs $M $9,576.4 $127.7 $265.3 $282.5 $332.4 $377.3 $354.1 $343.3 $334.9 $305.1 $344.2 $362.5 $339.4 $345.8 $353.1 $310.2 $312.4 $288.3 $306.7 $316.0 $311.5 $319.2 $282.4 $289.7 $231.6 $201.9 $190.6 $193.4 $184.7 $202.2 $217.6 $198.4 $209.7 $174.4 $141.1 $152.7 $74.3
CASHFLOW $M $31,686.5 $6,070.0 $317.9 $899.8 $1,086.6 $1,617.8 $2,106.2 $1,597.4 $1,526.3 $1,489.3 $1,219.8 $1,554.4 $1,698.8 $1,512.2 $1,574.2 $1,646.4 $1,255.4 $1,263.7 $1,036.2 $1,227.2 $1,288.9 $1,275.6 $1,359.1 $1,042.0 $1,149.7 $753.3 $638.6 $524.3 $533.0 $506.2 $607.9 $789.7 $684.0 $852.9 $559.7 $367.3 $542.5 $288.1
TOTAL

Cobre Panamá Project Technical Report March 2019
219
Table 22-6 Mineral Reserve cashflow model average annual physicals and costs
Table 22-7 Mineral Reserve cashflow model sensitivity parameters
Table 22-8 Mineral Reserve cashflow model, undiscounted cashflow sensitivity, from end 2018
Table 22-9 Mineral Reserve cashflow model, NPV8.5 sensitivity, from end 2018
There is a view from the Company’s geochemistry consultants (Piteau, 2018), that the value of saprock
ore reclaimed from a long term stockpile may not be realised due to the degradation that could occur
over such a long period. The sensitivity of deleting the saprock ore reclaim from the cashflow
production schedule in the final two years of operation was therefore tested. Under these
circumstances, the Project value would be reduced by less than 0.5%.
Sensitivity parameter Base
Cu metal price ($/lb) $3.09 90% $2.78 110% $3.40
Mo metal price ($/lb) $9.04 90% $8.14 110% $9.95
Au metal price ($/oz) $1,308 90% $1,177 110% $1,439
Mine operating costs ($/t mined) $1.85 90% $1.67 110% $2.04
Plant operating costs ($/t processed) $3.84 90% $3.46 110% $4.23
G&A operating costs ($/t processed) $0.62 90% $0.56 110% $0.68
Metal costs (incl royalties) ($M) $9,576 90% $8,619 110% $10,534
Development capital ($M) $899 90% $809 110% $989
Sustaining capital ($M) $2,494 90% $2,245 110% $2,743
MaximumMinimum
$M at -10% $M Base $M at +10%
$30,927 $37,757 $44,586
$37,592 $37,757 $37,921
$37,309 $37,757 $38,204
$38,924 $37,757 $36,589
$38,965 $37,757 $36,548
$37,952 $37,757 $37,561
$38,714 $37,757 $36,799
$37,846 $37,757 $37,667
$38,018 $37,757 $37,495
Mo pric e
Mining costs
Copper price
Development capital
Au pric e
Sustaining capital
Processing costs
Metal costs
G & A costs
$M at -10% $M Base $M at +10%
$11,731 $14,307 $16,883
$14,240 $14,307 $14,374
$14,134 $14,307 $14,480
$14,727 $14,307 $13,887
$14,739 $14,307 $13,875
$14,394 $14,307 $14,220
$14,661 $14,307 $13,953
$14,388 $14,307 $14,226
$14,405 $14,307 $14,208Sustaining capital
Copper price
Mo pric e
Au pric e
Mining costs
Processing costs
G & A costs
Metal costs
Development capital

Cobre Panamá Project Technical Report March 2019
220
ADJACENT PROPERTIES
Introduction
The following information is reproduced in part from the 2015 Technical Report (FQM, July 2015). It
has not been verified by the QPs for this Technical Report and the information is not necessarily
indicative of the mineralisation on the Cobre Panamá property which is the subject of this Technical
Report.
Regional mining and exploration
The Cobre Panamá deposits are located within a cluster of adjacent mineral deposits associated with
intrusives and mineralisation related to granodiorite and andesite bodies, and a northwest-southeast
structural trend (Figure 23-1). These adjacent properties include the Molejón and Palmilla deposits,
being mined and explored respectively, by Petaquilla Minerals Ltd (PML) of Vancouver, Canada14.
Figure 23-1 Location of adjacent properties (SGS Canada Inc, 2013)
There are no adjacent copper-producing properties. The closest significant copper-producing
property is the Cerro Colorado porphyry copper deposit, located 120 km to the west.
Molejón
The Molejón gold deposit is located approximately 4 km south of the Botija deposit. The Molejón
area is underlain by Tertiary volcanics and subvolcanic andesites, which have been intruded by
feldspar-quartz porphyry dykes. Significant gold grades are associated with three northeast-trending
structurally controlled zones of quartz-carbonate breccia and adjacent altered zones that dip at a
shallow angle of 25° to the northwest. The main near-surface mineralised zone is approximately 10
14 MPSA now owns the PML rights to the Palmilla deposit.

Cobre Panamá Project Technical Report March 2019
221
m thick. The deposit is interpreted to be a low-sulphidation, quartz-adularia epithermal gold deposit.
Main zone veins locally exhibit typical banded cockade textures, and gold occurs as electrum.
Economic mineralisation comprises the oxidized portion of the breccia, feldspar quartz porphyry, and
feldspar andesite flows.
On May 8, 2012, PML released an updated NI 43-101 Technical Report for Molejón, in which Proven
and Probable reserves are summarized as shown in Table 23-1.
Table 23-1 Molejón Mineral Resource estimate (reference: Berhe Dolbear, 2011)
Palmilla
The Palmilla copper-gold-silver deposit is located 10 km northwest of the Cobre Panamá deposits and
15 km southwest of the port development at Punta Rincon. The Mineral Resource listed in Table 23-
2 has been reproduced from a 2013 NI 43-101 Technical Report (SGS Canada Inc., 2013).
Table 23-2 Palmilla Mineral Resource estimate (SGS Canada Inc, 2013)

Cobre Panamá Project Technical Report March 2019
222
OTHER RELEVANT DATA AND INFORMATION
There is no other relevant information or explanation required to make this Technical Report
understandable and not misleading.

Cobre Panamá Project Technical Report March 2019
223
INTERPRETATIONS AND CONCLUSIONS
Mineral Resource modelling and estimation
The Mineral Resource estimates for Botija have been updated prior to the issue of this Technical
Report. The Botija estimate has benefited from additional close spaced reverse circulation drilling in
the pre-strip areas. The resource estimates for the remaining Cobre Panama deposits remain
unchanged and were all preceded by revisions to the geological models which focussed on the roles
of structure, the phases of porphyry emplacement and the impacts of alteration in constraining
copper and gold grades. In addition to the geological work, the assay quality information generated
over the exploration and development history of Cobre Panamá was collated, analysed and
documented. A core duplicate sampling study executed since the last resource estimate has
supported assumptions and conclusions regarding the quality of the assay data.
Mineral Resource classification criteria remain unchanged from previous estimates and are based
upon data quality, assay quality, sample spacing, geological continuity and estimation metrics. Apart
from Botija there has been no change in the Mineral Resource classification. For Botija, the 2018
estimated combined Measured and Indicated Mineral Resource tonnes have reduced by 4% due to
pre-stripping depletions. The added RC data at Botija has however increased the copper grades by
2.8%. The current Mineral Resource tabulation has been guided by the application of a cut-off grade
derived from a series of pit shells based upon all resource categories.
In the opinion of David Gray (QP) the classifications applied to the mineralisation at Cobre Panamá
fairly reflect the levels of geological and grade confidence.
Uncertainty and risk
Geological and structural
While the Cobre Panamá total Mineral Resource is large by world standards, it has been split into
seven separate mineralisation occurrences, and in many areas the drill spacing remains relatively
wide. Notwithstanding this, the broad mineralised envelopes are well-known and have been precisely
defined. The influence of faulting on the mineralisation has been recognised since previous estimates,
but the precise position of many of the post mineralisation faults still remains unclear. To this extent
there are some risks associated with the geological interpretation. The full extents of each of the
mineralised systems has not been fully defined, and future extensional drilling may result in small to
moderate increases in resources and possibly some changes to the positions of mining infrastructure.
The risk in the overall tonnage and grade at Cobre Panamá is low.
Mineral Resource estimation
Risks associated with the Mineral Resource estimate largely pertain to the definition of the estimation
domains from the geological model and interpretation, and as such are low. The estimation approach
used reflects common practice among major mining houses and is believed to represent good to best
practice in a global context.

Cobre Panamá Project Technical Report March 2019
224
Mine planning and Mineral Reserve estimation
The Mineral Reserve estimate for the Cobre Panamá Project is the product of a thorough and
conventional process reflecting ultimate pit designs constrained by appropriate optimal pit shells.
The pit optimisation process incorporated the best available information at the time, including
variable processing recovery relationships determined from metallurgical testwork and analysis. Both
planned and unplanned mining dilution were considered in the Mineral Resource modelling and
optimisation process, respectively.
The pit optimisation work completed for the 2015 Technical Report (FQM, July 2015) has not been
updated for this Technical Report. Original optimisation sensitivity analyses indicated that processing
recovery and copper metal price were the most sensitive optimisation variables; there has been no
material change to these particular variables since that time. Notwithstanding this, recent sensitivity
analyses have been completed to assess the impact on the optimisations of updated operating costs
and metal costs (TCRCs and royalties). These latest analyses confirm the original indications.
The ultimate pit designs take account of the IPCC concept and incorporate detailed crusher pocket
layouts, haulage/tipping access and in-pit conveyor routes. Waste dumps and ore stockpiles have
been included into the mine site layout plan, and haulage simulations and waste dump planning have
been undertaken to optimise the mining fleet requirements and the mining/dumping sequence.
The in-pit development strategy has changed since that described in the 2015 Technical Report (FQM,
July 2015). In place of phased pit development, mine planning now focusses on the development of
terraced mining benches. From experience in the Company’s Zambian operations, broad terraces
rather than conical shaped pit phase cutbacks are considered to be more suited to the deployment of
ultra class mining equipment. Furthermore, in the prevailing high rainfall environment of Panamá,
the terraced bench strategy enables a means of better managing prolonged rainfall events and the
potential for production disruptions.
Volume comparisons between the design ultimate pits and the corresponding pit shells indicate
acceptable overall differences. There are localised zones however, for Botija Pit specifically, where
the current ultimate design pit is outside of the optimal shell limits. This is a primarily related to the
inclusion of IPCC infrastructure and the desire to minimise peninsulas within the pit which would
otherwise create situations of temporary ore sterilisation. Engineering and mine planning work
continues in this regard in order to arrive at a reasonable longer term crusher location within the
Botija Pit mine plan as it approaches the ultimate pit limits.
There are related engineering plans for modifying the Botija Pit ultimate design, and these include a
revision to the longer term in-pit conveyor route and the possibility of removing a surface run-off
diversion channel which has been designed for the north side of the pit. Planning is also in progress
for access to and the development of the Colina Pit, initial plant feed from which is currently scheduled
for 2024. Part of this continuing planning effort relates to the future siting of IPCC infrastructure for
Colina, taking into account similar planning considerations and constraints as those for the Botija
ultimate pit.
In the opinion of Michael Lawlor (QP), therefore, the Mineral Reserve estimate reflects an achievable
longer term mining plan and production sequence and one which has taken account of the newly
devised terraced mining strategy. This revised strategy allows the desired processing capacity and
plant feed grade to be achieved, whilst accounting for reasonable equipment usage profiles, longer

Cobre Panamá Project Technical Report March 2019
225
term in-pit crusher relocations, planned ore and waste haulage profiles, and a practical stockpile
building and reclaim strategy. As is conventionally required, short and medium term mine planning
effort will be necessary for implementing practical terrace bench and access layouts.
It is recognised that iterations to the mine and related infrastructure plans will continue and that
before committing to the ultimate mining limits, pit optimisations and Mineral Reserve estimates will
be updated accordingly.
Uncertainty and risk
Mining
There is considered to be minimal risk attributable to the mining method and primary equipment
selected for the Cobre Panamá Project. The method and equipment items are conventional and
suitable for a large scale bulk mining project. The change to a terraced mining strategy is considered
to be an enhancement to the effective utilisation of the ultra class equipment.
Mining, processing and metal costs
The mining costs that were originally estimated for pit optimisation and cashflow modelling as
reported for the 2015 Technical Report (FQM, July 2015), were updated for this Technical Report and
accounted for revised haulage profile definition and productivity information related to current mine
designs and the purchased equipment fleet. The revised mining cost estimates continue to make
allowance for potential trolley-assisted haulage savings (ie, faster cycle times and reduced fuel
consumption based on experience at the Company’s Kansanshi operations in Zambia).
Operating costs and metal cost inputs (ie, accounting for royalties, concentrate transport and refining
charges) for optimisation and cashflow modelling were originally determined from MPSA cost
estimates for a smaller ultimate scale of operations. The processing costs included general and
administration costs (G&A costs). Process and G&A costs have now been updated to account for the
changed scale of operations, and revised consumables consumption rates and unit costs.
In terms of operating cost uncertainty, the original optimisation sensitivity analyses indicated an
approximate -3% and -4.5% impact on net value due to a 10% increase in mining and process operating
costs, respectively. Sensitivity analyses were completed for the current cashflow model,
incorporating the operating cost estimate updates. These analyses confirmed that a 10% increase in
mining costs would impact on the undiscounted cashflow by -4%. The magnitude of impact would be
the same for processing costs, whereas 10% increases in G&A costs and metal costs, would result in a
-1% and -3% cashflow impact, respectively.
At these impact levels there is less risk to the selected pit shells, as the basis for all following pit design
and production scheduling work, due to reasonable variances in mining, processing and metal costs.
Optimal pit shell limits are more influenced by revenue related variables.
Future pit optimisations completed to reflect changes in mining strategy and infrastructure siting will
take account of continuing updates to operating and metal costs.

Cobre Panamá Project Technical Report March 2019
226
Mine geotechnical engineering
The geotechnical engineering completed by CNI (March and April, 2013) was based on limited data
drawn from drilling, mapping and laboratory testing. Additional geological structural information
provided to CNI after the pit designs had been completed allowed CNI to review the designs in the
context of these interpreted structures and modify their design recommendations accordingly.
As the Botija Pit pre-strip has progressed, pit wall batters have become progressively exposed in
various lithological units such as saprolite, saprock and fresh rock. A review consultant (Peter O’Bryan
and Associates) completed a reappraisal of the Botija Pit slope design parameters based on
geotechnical information gleaned from these exposures and from updated stability assessments and
calculations.
An outcome of this reappraisal has been the recommendation of an overall slope configuration,
inclusive of lower batter heights, which is marginally steeper than the original CNI recommendation.
Geotechnical risk for the Botija Pit overall slopes is managed by the continued recommended inclusion
of wide berms at 90 m vertical intervals.
With the exception of Colina, no specific mine geotechnical investigations have been completed for
the other Cobre Panamá deposits. The Botija Pit slope design parameters have been extrapolated to
these proposed pits and hence there is some uncertainty as to the applicability of this extrapolated
information.
Since the Botija and Colina Pits are to be mined first, it follows that actual operating experience will
allow for these extrapolated parameters to be refined before mining of the other pits commences.
Hydrogeology
The hydrogeological work that was addressed in the 2015 Technical Report (FQM, July 2015) has been
considerably enhanced through the establishment of a site water management team. Under the
supervision of this team, a number of new bores have been drilled and equipped with piezometers.
Two previously drilled production bores are expected to be pump tested during 2019, and the
drawdown response measured by the expanded array of piezometers. These measurements are
intended to provide the basis for subsequent hydrogeological modelling and drilling/equipping of new
production bores.
From operating experience in the Botija Pit pre-strip, it is apparent that an effective means of pit slope
depressurisation will be afforded by horizontal drain holes rather than by numerous vertical bores.
The volume of groundwater that is expected to be piped away from horizontal drains and pumped
from dewatering bores is not expected to be material in the context of the significant runoff into the
pits from rainfall events.
In terms of rainfall and runoff inflows to the Botija Pit, the terraced bench mining approach is
considered to be a more effective management approach to the risk of inundation, as opposed to the
previous mining strategy of phased pit cutbacks. The proposed arrangement of staged pumping from
the base of the deepening pit has also changed since the 2015 Technical Report. Booster pumping is
now being considered rather than staged pumping into holding dams/tanks located at intermediate
levels of the pit.

Cobre Panamá Project Technical Report March 2019
227
A major water course (the Botija River) is in the process of being diverted around the southern crest
of the Botija Pit. There is a geotechnical risk associated with the siting of this diversion channel, and
more specifically the diversion embankment site, immediately behind the southern crest of the open
pit. This risk is being managed by the excavation of the embankment foundation down to competent
rock and the engineered construction of the embankment itself.
Groundwater and rainfall inflow management practices at the other pits will likely follow the Botija
Pit precedent. A surface stream diversion channel will eventually be required at Colina, and
construction of diversion works at that site will likely be similar as for Botija.
Processing
The predominantly copper/molybdenum sulphide ore is amenable to conventional differential
flotation processing, with lesser gold and silver recovered into the copper concentrate.
Various metallurgical test work has been undertaken on the Cobre Panamá Project since 1968,
commensurate with the various levels of preliminary feasibility and prefeasibility studies that were
completed up until 1998. In 1997 an extensive programme of metallurgical testing was designed to
confirm earlier studies on the metallurgical response of the Botija and Colina ores, ie the first ores to
be mined and processed.
Confirmatory batch laboratory flotation testwork was conducted during 2014 by ALS Metallurgy in Perth, Western Australia. By virtue of the adopted conventional processing technology, the amount of test work (including
confirmatory testwork) completed, and the adoption of variable process recovery relationships, there
is considered to be minimal risk attributable to the processing of Cobre Panamá ores.
Based on results from recent geometallurgical sampling and testwork in the Botija Pit pre-strip, no
change to recommended processing recovery relationships is warranted.
Environmental compliance
Extensive environmental studies and social impact assessments were completed between 2007 and
2012 for the 2010 ESIA process. Over 600 impacts and management commitments are addressed in
the ESIA, during the construction, operations and closure phases.
The Project Environmental and Social Impact Assessment (ESIA) was approved by the Autoridad
Nacional del Ambiente (National Authority of the Environment, ANAM; now referred to as
MiAmbiente) in December 2011. The approved Project was for a mining operation comprising four
open pits, at Botija, Colina, Medio and Valle Grande. Since then the Project definition and
development scope has changed and the ESIA studies and documentation will need to be updated.
The expected timeframe for the submission of a new ESIA is mid- 2024.
An environmental management system (EMS) has been developed to include the environmental and
social management plans and commitments. From the construction into the operational phases, these
EMS plans have been updated to reflect changes in site and operational conditions.

Cobre Panamá Project Technical Report March 2019
228
Permitting
Mine expansion, including mining of the Balboa, Botija Abajo and Brazo deposits, and adjacent waste
dumping, will require access to additional properties covering up to 6,800 ha. MPSA intends to initiate
the acquisition of these properties in accordance with the procedures established by Law No. 9 and
other applicable Panamánian laws.

Cobre Panamá Project Technical Report March 2019
229
RECOMMENDATIONS
Extensional drilling and grade control drilling
It is recommended that extensional drilling is carried out to resolve the mineralisation boundaries of
the major orebodies in the Colina-Medio area. This is important to confirm the ultimate pit shells and
thus the mining and infrastructure (overland conveyor route, stockpiles, etc.) footprint. At Botija,
reverse circulation grade control drilling is recommended to continue at the 15 m grid spacing.
Mine planning and Mineral Reserves estimation
As an extension of the interpretive commentary in Item 25.2, there are several areas of continuous
improvement that are recommended. This work is recommended to be completed in conjunction
with the continuing engineering and mine planning studies for future mining infrastructure and
layouts, as follows:
review the ultimate pit designs to improve design efficiency (especially in terms of localised
zones requiring waste reduction)
optimise the IPC locations and conveyor alignments for future installations
optimise haul road alignments and waste dump development to suit the application of trolley
assisted haulage
optimise the inpit development and external dump development sequence in order to reduce
haulage requirements and improve operational efficiency
Cost modelling
In the 2015 Technical Report (FQM, July 2015) and as an item of continuous improvement, it was
recommended that all operating costs be reviewed and analysed in terms of the production scale and
profile described in the report. In particular, it was recommended that the mine operating costs
should be re-assessed against the now developed IPCC concepts for ore haulage to specific locations
over time, in successive iterations of LOM production plans and schedules.
These recommendations have been addressed to a certain extent, although continuing efforts will be
required as the Project proceeds into the operational phase. As a case in point, for the revised
operating cost estimates reported in this Technical Report, cognisance has been given to the inclusion
of budgeted costs for the short to medium term, as estimated by the mine operations team.
Geotechnical engineering
The review items and recommendations by geotechnical consultants CNI (2014, 2015) have been
followed up with confirmatory geotechnical mapping and observations of actual exposures in the
Botija Pit. This mapping and observational review work is recommended to continue, along with the
drilling and analysis of geotechnical information from proposed bores required to test the Botija Pit
south wall infrastructure. Planning and logistics are underway in relation to the recommended
geotechnical drilling for the Colina Pit access development and for the proposed initial IPC locations
at that pit.

Cobre Panamá Project Technical Report March 2019
230
Hydrogeology
The hydrogeological work programme involving piezometer installations and water level monitoring,
to be followed by groundwater modelling, is endorsed as a precursor before committing to expensive
production bore siting and drilling. Considering the favourable performance observed from the
installation of horizontal drains, a natural recommendation would be for the continued installation of
these as a means of depressurising pit slopes.

Cobre Panamá Project Technical Report March 2019
231
REFERENCES
ALS, 2014: Metallurgy Report A155473, metallurgical testwork conducted upon samples from the
Cobre Panamá Project, May.
AMEC, 2007. Petaquilla Project, Panamá NI 43-101 Technical Report; AMEC Report, 174 p.
AMEC Earth & Environmental, 2010. Open Pit Geomechanics, Mina De Cobre Project, Panamá SA.
Report to Minera Panamá SA, February.
Behre Dolbear, 2012. A technical report on the Botija Abajo Project – A satellite deposit of the Molejon
Mine. Prepared for Petaqulla Minerals LTD. September.
Call & Nicholas Inc., 2015. Geotechnical Review of the Botija Revision 14 Open-Pit Design. Report to
Minera Panamá SA, May.
Call & Nicholas Inc., 2014. Geotechnical Review of the Botija Revision 9 Open-Pit Design. Report to
Minera Panamá SA, June.
Call & Nicholas Inc., 2013. Geotechnical Slope Angle Study for the Proposed Botija Open Pit Mine.
Report to Minera Panamá SA, March.
Call & Nicholas Inc., 2013. Saprolite and Saprock Slope Angle Recommendations for the Mina De Cobre
Mining Project. Report to Minera Panamá SA, April.
CIM, 2014. Definition Standards – For Mineral Resources and Mineral Reserves, May.
Cruden, A., 1998. On the emplacement of tabular granites, Journal of the Geological Society, London.
Vol. 155, p. 853-862.
Davis, B., 2010. Memorandum – Analysis of twin drill holes, to Colin Burge of MPSA.
de Boer J.Z., M.S. Drummond, M.J. Bordelon, M.J. Defant, H. Bellon, and R.C. Maury, 1995. Cenozoic
Magmatic Phases of the Costa Rican Island Arc (Cordillera de Talamanca); in Geologic and Tectonic
Development of the Caribbean Plate Boundary in Southern South America, Mann, P, ed.; Geological
Society of America, Special Paper 295, p. 35-56.
Ecometrix Inc., 2014. DRAFT – 2014 Update to Predicted Water Quality of the TMF Discharge during
Operations at Mina de Cobre, Panama. Report to Minera Panamá S.A, April.
Escalante G., and Astorga A., 1994. Geology of Eastern Costa Rica and Northern Panama. Journal of
Geology, Central America, special volume Terremoto de Limon, p. 1-14.
First Quantum Minerals Ltd, 2015. Cobre Panamá Project. Colon Province, Republic of Panamá, NI 43-
101 Technical Report. July.
Francois-Bongarcon, D., 1995. Memorandum - Petaquilla check assays. Issued to Adrian Resources,
October.

Cobre Panamá Project Technical Report March 2019
232
Golder Associates, 2017. Closure Planning to inform and advance the Asset Retirement Obligation for
the Cobre Panama Project at Project Initiation, as at December 2017. Report to Minera Panamá S.A,
December.
Golder Associates, 2010. Environmental and Social Impact Assessment, Project Mina de Cobre
Panamá. Report to Minera Panamá S.A, September.
Gray, D., 2013. Results from check sampling of skeleton Adrian/Teck drill core. Internal report
prepared by FQM. August.
Gustafson, L.B. and Hunt, J.P., 1975. The porphyry copper deposit at El Salvador, Chile. Economic
Geology, v. 70, p. 857-912.
Halley, S., 2013. The geochemistry and mineralogy of the Botija Deposit, a powerpoint presentation
to MPSA.
Jaacks, J and Candia, W., 2011. Memorandum - Results of the Cobre Panama Project check analysis
programme. Issued to Freeport McMoran Exploration, Geochemical Applications International Inc.,
December.
JORC, 2012. Australasian Code for Reporting of Mineral Resources and Ore Reserves, Effective
December 2012. Prepared by the Joint Ore Reserves Committee of The Australasian Institute of Mining
and Metallurgy, Australian Institute of Geoscientists and Minerals Council of Australia (JORC).
Kesler, S.E., J.F. Sutter, J.J. Issigonis, L.M. Jones, and R.L. Walker, 1977. Evolution of Porphyry Copper
Mineralization in an Oceanic Island Arc: Panamá; Economic Geology, v. 72, p. 1142-1153.
Kirkby, M.X., Jones, D.S. and MacFadden, B.J., 2008. Lower Miocene Stratigraphy along the Panamá
Canal and Its Bearing on the Central American Peninsula. PLoS ONE, 3(7): e2791 DOI:
10.1371/journal.pone.0002791.
Lakefiled, 1997. The Recovery of Copper, Molybdenum and Gold from Petaquilla Project Samples.
Love, D.A., 2011: Rock types and geology of the Balboa area, Internal MPSA report.
Lowell, D.J. and Guilbert, J.M. 1970. Lateral and Vertical Alteration-Mineralization Zoning in Porphyry
Ore Deposits. Economic Geology vol. 65, pp 373-408.
McArthur, G.F., S. Harris, S. Kenwood, and D. Laudrum, 1995. 1994 Summary Report on the Petaquilla
Project; Adrian Resources Limited, Internal Report.
Mann, P. 1995. Preface: Geologic and Tectonic Development of the Caribbean Plate Boundary in
Southern South America. Geological Society of America, Special Paper 295, p. xi-xxxii.
Model Earth, 2013a. Mineralogical, metallurgical and physical property mapping in 3D. Report
prepared by Ian E. Neilson.
National Instrument (NI) 43-101, Standards of Disclosure for Mineral Projects, Supplement to the OSC
Bulletin, April 8.

Cobre Panamá Project Technical Report March 2019
233
O’Bryan, Peter and Associates, 2018. Cobre Panamá, Botija Open Pit Slope Analysis, Derivation of
Fresh Rock Design Parameters. Technical memorandum to First Quantum Minerals Ltd, October.
Panamá Mineral Resources Development Company, 1977. Preliminary Feasibility Report of the
Petaquilla Project; PMRD Internal Report, 42 p.
Piteau Associates South Africa, 2017. Preliminary Assessment of Post-Closure Water Balance and
Discharge Chemistry, Cobre Panamá Mine, Rev II. Memorandum report to First Quantum Minerals
Ltd, November.
Piteau Associates South Africa, 2018. Update of Acid Rock Drainage Risks and Management Strategy,
Cobre Panamá. Letter report to to Minera Panamá SA, February.
Reeves, R.A. 2012: Evaluation of Adding a Ball Mill to an SABC-B Grinding Circuit to increase Copper
Production. Hazen Research October 29, 2012.
Rose, W.L., Davis, B. and Sim, R., 2010. Mina de Cobre Panamá Project, Panamá, NI 43-101 Technical
Report. Unpublished report prepared by WLR Consulting, Inc, for Inmet Mining Corporation, May.
Rose, W.L., Davis, B. and Sim, R., 2012. Mina de Cobre Panama Project, Panama, NI 43-101 Technical
Report. Unpublished report prepared by WLR Consulting, Inc, for Inmet Mining Corporation.
Rose, W.L., Davis, B. and Sim, R., et al, 2013. 2012 Mineral Resource & Reserve Update Report.
Unpublished report prepared by WLR Consulting, Inc, for Inmet Mining Corporation, March.
Schultz, C.P. 2012a: Flotation Study on Copper-Gold-Molybdenum Ore Composites from the Balboa
Orebody in Panama. Hazen Research January 13, 2012.
Schultz, C.P. 2012b: Progress Report of Flotation Study on Copper – Gold-Molybdenum Ore composites
from the Brazo Orebody in Panama. Hazen Research May 22, 2012.
Schultz, C.P. 2012c: Gold Recovery in Rougher Flotation of Copper-Gold Molybdenum ore composites
from the Balboa and Brazo orebodies in Panama, Revision 1. Hazen Research September 20, 2012.
Schultz, C.P. 2012d: Flotation Study on Copper-Gold-Molybdenum ore Composites from the Brazo
Orebody in Panama. Hazen Research October 26, 2012.
Schultz, C.P. 2012e: Flotation Study on Copper-Gold-Molybdenum ore Composites from the Balboa
Orebody in Panama. Hazen Research October 29, 2012 (5).
Sillitoe, R. H., 2013. Comments on geological models for the Cobre Panama porphyry copper deposits,
Panama. March.
Simons 1998. Petaquilla Project Feasibility Study. Issued to Teck Cominco, January.
SGS, 2012, The Recovery of Copper and Gold from Samples of the Botija and Colina Deposits.
SGS Canada Inc., 2013. NI 43-101 Palmilla Deposit Resource Update, Rio Belencillo Zone 1 Concession,
Colon Province, Panamá. Report to Petaquilla Minerals Ltd, October 9.
Universidad de Panamá, Instituto de Geociencias, 2013. Evaluation of the Study, Probabilistic Seismic
Hazard Assessment (PSHA) for Cobre Panamá. Report to Minera Panamá S.A., September.

Cobre Panamá Project Technical Report March 2019
234
CERTIFICATES
David Gray First Quantum Minerals Ltd
24 Outram St, West Perth, Western Australia, 6005 Tel +61 8 9346 0100; [email protected]
I, David Gray, do hereby certify that:
1. I am the Group Mine and Resource Geologist employed by First Quantum Minerals Ltd.
2. This certificate applies to the technical report entitled “Cobre Panamá Project NI 43-101 Technical Report”, dated effective 29th March 2019 (the “Technical Report”).
3. I am a professional geologist having graduated with a Bachelor of Science degree with Honours (1988)
in Geology from Rhodes University in Grahamstown, South Africa.
4. I am a Member of the Australasian Institute of Mining and Metallurgy and a Fellow Member of the Australian Institute of Geoscientists (FAIG).
5. I have worked as a geologist for a total of twenty five years since my graduation from university. I have
gained over 15 years experience in production geology, over 5 years of exploration management of precious, base metal and copper deposits. Over the last ten years I have consulted to and held senior technical mineral resource positions in copper mining companies operating in Central Africa and worldwide.
6. I have read the definition of “qualified person” as set out in National Instrument 43-101 – Standards of
Disclosure for Mineral Projects (“NI 43-101”) and certify that, by reason of my education, affiliation with a professional association (as defined in NI 43-101) and past relevant work experience, I am a “qualified person” for the purposes of NI 43-101.
7. I most recently personally inspected the Cobre Panamá property described in the Technical Report in
August 2018.
8. I am responsible for the preparation of those portions of the Technical Report relating to geology, data collection, data analysis and verification and Mineral Resource estimation (namely Items 3 to 12 and 14).
9. I am not independent (as defined by Section 1.5 of NI 43-101) of First Quantum Minerals Ltd.
10. I have had prior involvement with the property that is the subject of the Technical Report. The nature
of my prior involvement has been in the assurance of sampling QAQC, optimisation of estimation methods and the development of geology and mineralisation models.
11. I have read NI 43-101 and Form 43-101F1 and the Technical Report has been prepared in compliance
with that instrument and form.
12. As of the date of this certificate, to the best of my knowledge, information and belief, the Technical Report contains all scientific and technical information that is required for it to be disclosed and to make the Technical Report not misleading.
Signed and dated this 29th dayof March 2019 at West Perth, Western Australia, Australia.
David Gray

Cobre Panamá Project Technical Report March 2019
235
Michael Lawlor First Quantum Minerals Ltd
24 Outram St, West Perth, Western Australia, 6005 Tel +61 8 9346 0100; [email protected]
I, Michael Lawlor, do hereby certify that:
1. I am a Consultant Mining Engineer employed by First Quantum Minerals Ltd.
2. This certificate applies to the technical report entitled “Cobre Panamá Project NI 43-101 Technical Report”, dated effective 29th March 2019 (the “Technical Report”).
3. I am a professional mining engineer having graduated with an undergraduate degree of Bachelor of
Engineering (Honours) from the Western Australian School of Mines in 1986. In addition, I have obtained a Master of Engineering Science degree from the James Cook University of North Queensland (1993), and subsequent Graduate Certificates in Mineral Economics and Project Management from Curtin University (Western Australia).
4. I am a Fellow of the Australasian Institute of Mining and Metallurgy.
5. I have worked as mining and geotechnical engineer for a period in excess of twenty five years since my
graduation from university. Within the last ten years I have held senior technical management positions in copper mining companies operating in Central Africa, and before that, as a consulting mining engineer working on mine planning and evaluations for base metals operations and development projects worldwide.
6. I have read the definition of “qualified person” as set out in National Instrument 43-101 – Standards of
Disclosure for Mineral Projects (“NI 43-101”) and certify that, by reason of my education, affiliation with a professional association (as defined in NI 43-101) and past relevant work experience, I am a “qualified person” for the purposes of NI 43-101.
7. I most recently personally inspected the Cobre Panamá property described in the Technical Report in
September 2018.
8. I am responsible for the preparation of those portions of the Technical Report relating to Mineral Reserve estimation and Mining, namely Items 15 and 16, respectively, and for Items 1, 2, and 18 to 26.
9. I am not independent (as defined by Section 1.5 of NI 43-101) of First Quantum Minerals Ltd.
10. I have had prior involvement with the property that is the subject of the Technical Report. The nature of my prior involvement has been in mine planning and the preparation of scoping studies, commencing in 2014.
11. I have read NI 43-101 and Form 43-101F1 and the Technical Report has been prepared in compliance
with that instrument and form.
12. As of the date of this certificate, to the best of my knowledge, information and belief, the Technical Report contains all scientific and technical information that is required for it to be disclosed and to make the Technical Report not misleading.
Signed and dated this 29th day of March 2019 at West Perth, Western Australia, Australia.
Michael Lawlor

Cobre Panamá Project Technical Report March 2019
236
Robert Stone First Quantum Minerals Ltd
24 Outram St, West Perth, Western Australia, 6005 Tel +61 8 9346 0100; [email protected]
I, Robert Stone, do hereby certify that:
1. I am Technical Manager employed by First Quantum Minerals Ltd.
2. This certificate applies to the technical report entitled “Cobre Panamá Project NI 43-101 Technical Report”, dated effective 29th March 2019 (the “Technical Report”).
3. I am a professional process engineer having graduated with an undergraduate degree of Bachelor of
Science (Honours) from the Camborne School of Mines in 1984.
4. I am a Member of the Institue of Materials, Minerals and Mining (UK). I have been a Chartered Engineer through the Institute of Materials, Minerals and Mining since 1991.
5. I have worked as process engineer and metallurgist for a period in excess of thirty years since my
graduation from university. For the last fifteen years I have been in the employ of First Quantum Minerals Ltd in both technical and managerial roles. Of these, seven years were as a manager of process plants producing copper in concentrate, copper as electrowon cathode, gold concentrate and cobalt metal by RLE. The remaining eight years were in a technical role as Consulting Process Metallurgist responsible for development of First Quantum Minerals Ltd projects worldwide including copper/cobalt in Central Africa, nickel in Australia and copper/molybdenum in Panama.
6. I have read the definition of “qualified person” as set out in National Instrument 43-101 – Standards of
Disclosure for Mineral Projects (“NI 43-101”) and certify that, by reason of my education, affiliation with a professional association (as defined in NI 43-101) and past relevant work experience, I am a “qualified person” for the purposes of NI 43-101.
7. I most recently personally inspected the Cobre Panamá property described in the Technical Report in
December 2018.
8. I am responsible for the preparation of those portions of the Technical Report relating to mineral processing/metallurgical testing and recovery methods, namely Items 13 and 17, respectively.
9. I am not independent (as defined by Section 1.5 of NI 43-101) of First Quantum Minerals Ltd.
10. I have had prior involvement with the property that is the subject of the Technical Report. The nature of my prior involvement has been in project planning and the preparation of engineering studies, commencing in 2013.
11. I have read NI 43-101 and Form 43-101F1 and the Technical Report has been prepared in compliance
with that instrument and form.
12. As of the date of this certificate, to the best of my knowledge, information and belief, the Technical Report contains all scientific and technical information that is required for it to be disclosed and to make the Technical Report not misleading.
Signed and dated this 29th day of March 2019 at West Perth, Western Australia, Australia.
Robert Stone