Coastal emissions of methyl bromide and methyl chloride along the eastern Gulf of Mexico and the...
10
Coastal emissions of methyl bromide and methyl chloride along the eastern Gulf of Mexico and the east coast of the United States Lei Hu, 1 Shari A. Yvon-Lewis, 1 Yina Liu, 1 Joseph E. Salisbury, 2 and Julia E. O’Hern 1 Received 17 March 2009; revised 3 September 2009; accepted 23 September 2009; published 20 February 2010. [1] Measurements of methyl bromide (CH 3 Br) and methyl chloride (CH 3 Cl) were made during the Gulf of Mexico and the East Coast Carbon (GOMECC) cruise in the summer of 2007. This was the first large-scale study of CH 3 Br and CH 3 Cl in the coastal ocean. The mean atmospheric mixing ratios were 10.1 ppt for CH 3 Br and 517 ppt for CH 3 Cl. Surface seawater concentrations ranged from 0.8 pM to 5.0 pM for CH 3 Br and from 61.5 pM to 179 pM for CH 3 Cl. Biological processes contribute to the elevated seawater concentrations of CH 3 Br, while a combination of biological processes and terrestrial sources may contribute to elevated seawater concentrations of CH 3 Cl. Vertical distributions show highest concentrations of CH 3 Br and CH 3 Cl in the subsurface seawater below the mixed layer due to high degradation rates near the surface. Good correlation of the production rates between CH 3 Br and CH 3 Cl suggests they have some common sources in the coastal ocean. After excluding the open ocean points, annual coastal emissions in the studied region were 0.01–0.06 Gg yr 1 for CH 3 Br and 0.3–1.6 Gg yr 1 for CH 3 Cl. By simple extrapolation, the global coastal emissions were estimated at 0.5–3.6 Gg yr 1 for CH 3 Br and 19–98 Gg yr 1 for CH 3 Cl. Including the coastal ocean emissions of CH 3 Br and CH 3 Cl will increase the estimate of global oceanic emissions by 1%–9% and 1%–8%, respectively. Citation: Hu, L., S. A. Yvon-Lewis, Y. Liu, J. E. Salisbury, and J. E. O’Hern (2010), Coastal emissions of methyl bromide and methyl chloride along the eastern Gulf of Mexico and the east coast of the United States, Global Biogeochem. Cycles, 24, GB1007, doi:10.1029/2009GB003514. 1. Introduction [2] CH 3 Br and CH 3 Cl are the most abundant brominated and chlorinated gases in the troposphere [Khalil et al., 1999; Schauffler et al. 1993, 1999]. The global averaged mixing ratio of CH 3 Br is 7.9 ppt (parts per trillion) [World Mete- orological Organization (WMO), 2007], representing >50% of total organic bromine in the troposphere [Schauffler et al., 1999], and the global averaged mixing ratio of CH 3 Cl in the troposphere is 540 ppt, accounting for over 15% of organic chlorine in the total tropospheric burden [Butler, 2000]. Both trace gases originate in large part from natural sources and are transported to the stratosphere, releasing bromine and chlorine, which then destroy ozone catalyti- cally. In the past 20 years, a lot of work has been done to quantify their sources and sinks. However, large uncertain- ties in their budgets remain. [3] The ocean, as one of the major sources and one of the major sinks [Butler and Rodriguez, 1996; Yvon-Lewis and Butler, 1997] for CH 3 Br, plays a significant role in its atmospheric budget. While the open ocean is a net sink for CH 3 Br with a net flux of 18 (±4) Gg yr 1 [Lobert et al., 1995, 1997; Moore et al., 1996; Groszko and Moore, 1998; King et al., 2000, 2002; Yvon-Lewis et al., 2004], the coastal ocean exhibited significant supersaturations during previous studies [Lobert et al., 1995; Groszko and Moore, 1998; King et al., 2000; Low et al., 2003; Sturrock et al., 2003]. However, there were only a few samples collected in the coastal ocean during the previous investigations, result- ing in a limitation of the data to represent the global coastal ocean area. [4] Until 1996 the largest source of CH 3 Cl to the atmo- sphere was thought to be the oceans [World Meteorological Organization (WMO), 2003]. However, most field studies and modeling work in recent years indicate that terrestrial plants in tropical regions are probably the largest source of CH 3 Cl and that the ocean source was overestimated [Li et al., 2001; Yoshida et al., 2004; WMO, 2007]. The global net flux from the ocean to the atmosphere was estimated to be in the range of 320 to 400 Gg yr 1 by Moore [2000]. Recalculation on the CH 3 Cl net sea-to-air flux was reported to be 350 Gg yr 1 by Yoshida et al. [2004], using the empirical relationship between saturation anomaly and sea surface temperature and the Comprehensive Ocean-Atmosphere Data Set (COADS) 2° 2° grid of physical properties. The net sea-to-air flux of CH 3 Cl is higher in the tropics than in the midlatitudes, and the ocean is a GLOBAL BIOGEOCHEMICAL CYCLES, VOL. 24, GB1007, doi:10.1029/2009GB003514, 2010 Click Here for Full Article 1 Department of Oceanography, Texas A&M University, College Station, Texas, USA. 2 Ocean Processes Analysis Laboratory, University of New Hampshire, Durham, New Hampshire, USA. Copyright 2010 by the American Geophysical Union. 0886-6236/10/2009GB003514$12.00 GB1007 1 of 10
Transcript of Coastal emissions of methyl bromide and methyl chloride along the eastern Gulf of Mexico and the...
Coastal emissions of methyl bromide and methyl chloride
along the eastern Gulf of Mexico and the east coast of the United States
Lei Hu,1 Shari A. Yvon-Lewis,1 Yina Liu,1 Joseph E. Salisbury,2 and Julia E. O’Hern1
Received 17 March 2009; revised 3 September 2009; accepted 23 September 2009; published 20 February 2010.
[1] Measurements of methyl bromide (CH3Br) and methyl chloride (CH3Cl) were madeduring the Gulf of Mexico and the East Coast Carbon (GOMECC) cruise in the summerof 2007. This was the first large-scale study of CH3Br and CH3Cl in the coastal ocean.The mean atmospheric mixing ratios were 10.1 ppt for CH3Br and 517 ppt for CH3Cl.Surface seawater concentrations ranged from 0.8 pM to 5.0 pM for CH3Br and from61.5 pM to 179 pM for CH3Cl. Biological processes contribute to the elevated seawaterconcentrations of CH3Br, while a combination of biological processes and terrestrialsources may contribute to elevated seawater concentrations of CH3Cl. Verticaldistributions show highest concentrations of CH3Br and CH3Cl in the subsurfaceseawater below the mixed layer due to high degradation rates near the surface. Goodcorrelation of the production rates between CH3Br and CH3Cl suggests they have somecommon sources in the coastal ocean. After excluding the open ocean points, annualcoastal emissions in the studied region were 0.01–0.06 Gg yr�1 for CH3Br and0.3–1.6 Gg yr�1 for CH3Cl. By simple extrapolation, the global coastal emissions wereestimated at 0.5–3.6 Gg yr�1 for CH3Br and 19–98 Gg yr�1 for CH3Cl. Includingthe coastal ocean emissions of CH3Br and CH3Cl will increase the estimate of globaloceanic emissions by 1%–9% and 1%–8%, respectively.
Citation: Hu, L., S. A. Yvon-Lewis, Y. Liu, J. E. Salisbury, and J. E. O’Hern (2010), Coastal emissions of methyl bromide and
methyl chloride along the eastern Gulf of Mexico and the east coast of the United States, Global Biogeochem. Cycles, 24, GB1007,
doi:10.1029/2009GB003514.
1. Introduction
[2] CH3Br and CH3Cl are the most abundant brominatedand chlorinated gases in the troposphere [Khalil et al., 1999;Schauffler et al. 1993, 1999]. The global averaged mixingratio of CH3Br is 7.9 ppt (parts per trillion) [World Mete-orological Organization (WMO), 2007], representing >50%of total organic bromine in the troposphere [Schauffler etal., 1999], and the global averaged mixing ratio of CH3Cl inthe troposphere is �540 ppt, accounting for over 15% oforganic chlorine in the total tropospheric burden [Butler,2000]. Both trace gases originate in large part from naturalsources and are transported to the stratosphere, releasingbromine and chlorine, which then destroy ozone catalyti-cally. In the past 20 years, a lot of work has been done toquantify their sources and sinks. However, large uncertain-ties in their budgets remain.[3] The ocean, as one of the major sources and one of the
major sinks [Butler and Rodriguez, 1996; Yvon-Lewis andButler, 1997] for CH3Br, plays a significant role in its
atmospheric budget. While the open ocean is a net sinkfor CH3Br with a net flux of �18 (±4) Gg yr�1 [Lobert etal., 1995, 1997; Moore et al., 1996; Groszko and Moore,1998; King et al., 2000, 2002; Yvon-Lewis et al., 2004], thecoastal ocean exhibited significant supersaturations duringprevious studies [Lobert et al., 1995; Groszko and Moore,1998; King et al., 2000; Low et al., 2003; Sturrock et al.,2003]. However, there were only a few samples collected inthe coastal ocean during the previous investigations, result-ing in a limitation of the data to represent the global coastalocean area.[4] Until 1996 the largest source of CH3Cl to the atmo-
sphere was thought to be the oceans [World MeteorologicalOrganization (WMO), 2003]. However, most field studiesand modeling work in recent years indicate that terrestrialplants in tropical regions are probably the largest sourceof CH3Cl and that the ocean source was overestimated[Li et al., 2001; Yoshida et al., 2004; WMO, 2007]. Theglobal net flux from the ocean to the atmosphere wasestimated to be in the range of 320 to 400 Gg yr�1 byMoore [2000]. Recalculation on the CH3Cl net sea-to-airflux was reported to be 350 Gg yr�1 by Yoshida et al.[2004], using the empirical relationship between saturationanomaly and sea surface temperature and the ComprehensiveOcean-Atmosphere Data Set (COADS) 2� � 2� grid ofphysical properties. The net sea-to-air flux of CH3Cl is higherin the tropics than in the midlatitudes, and the ocean is a
GLOBAL BIOGEOCHEMICAL CYCLES, VOL. 24, GB1007, doi:10.1029/2009GB003514, 2010ClickHere
for
FullArticle
1Department of Oceanography, Texas A&M University, CollegeStation, Texas, USA.
2Ocean Processes Analysis Laboratory, University of New Hampshire,Durham, New Hampshire, USA.
Copyright 2010 by the American Geophysical Union.0886-6236/10/2009GB003514$12.00
GB1007 1 of 10
net sink in the cold waters beyond the latitude of 50�[Khalil et al., 1999; Moore, 2000; Yvon-Lewis et al., 2004].In recent years, the coastal environment has receivedincreasing attention. Large sources of CH3Cl to the atmo-sphere were observed in coastal salt marshes and tropicalcoastal lands [Rhew et al., 2000; Yokouchi et al., 2000].However, the coastal oceanic emission of CH3Cl has notbeen investigated.[5] In this study, CH3Br and CH3Cl results are presented
from continuous underway measurements in the atmosphereand surface seawater and from depth profile measurementsalong the eastern coast of Gulf of Mexico and the east coastof the United States during the period from July to August2007. The measurements are used to calculate the CH3Brand CH3Cl production rates in and subsequent emissionfrom the coastal ocean and to assess the contribution of thecoastal region to the global atmospheric CH3Br and CH3Clbudgets.
2. Methods
[6] Measurements of CH3Br, CH3Cl, and a suite of otherhalocarbons were made during the Gulf of Mexico and the
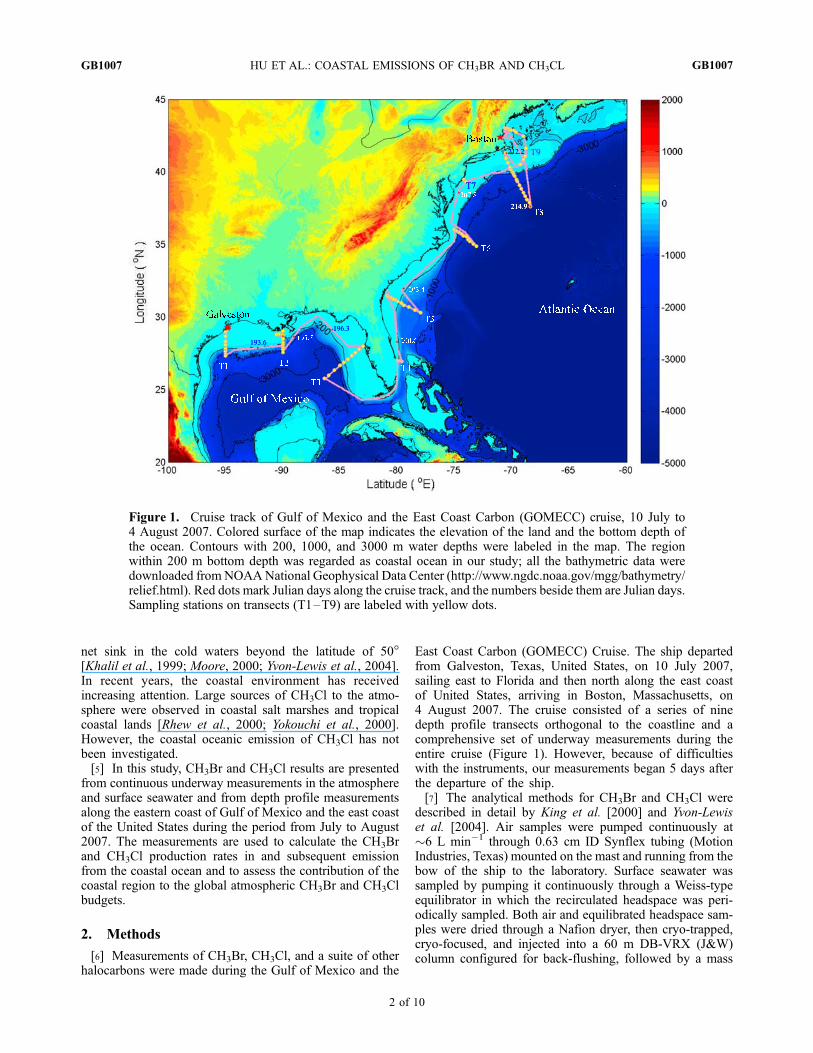
East Coast Carbon (GOMECC) Cruise. The ship departedfrom Galveston, Texas, United States, on 10 July 2007,sailing east to Florida and then north along the east coastof United States, arriving in Boston, Massachusetts, on4 August 2007. The cruise consisted of a series of ninedepth profile transects orthogonal to the coastline and acomprehensive set of underway measurements during theentire cruise (Figure 1). However, because of difficultieswith the instruments, our measurements began 5 days afterthe departure of the ship.[7] The analytical methods for CH3Br and CH3Cl were
described in detail by King et al. [2000] and Yvon-Lewiset al. [2004]. Air samples were pumped continuously at�6 L min�1 through 0.63 cm ID Synflex tubing (MotionIndustries, Texas) mounted on the mast and running from thebow of the ship to the laboratory. Surface seawater wassampled by pumping it continuously through a Weiss-typeequilibrator in which the recirculated headspace was peri-odically sampled. Both air and equilibrated headspace sam-ples were dried through a Nafion dryer, then cryo-trapped,cryo-focused, and injected into a 60 m DB-VRX (J&W)column configured for back-flushing, followed by a mass
Figure 1. Cruise track of Gulf of Mexico and the East Coast Carbon (GOMECC) cruise, 10 July to4 August 2007. Colored surface of the map indicates the elevation of the land and the bottom depth ofthe ocean. Contours with 200, 1000, and 3000 m water depths were labeled in the map. The regionwithin 200 m bottom depth was regarded as coastal ocean in our study; all the bathymetric data weredownloaded from NOAANational Geophysical Data Center (http://www.ngdc.noaa.gov/mgg/bathymetry/relief.html). Red dots mark Julian days along the cruise track, and the numbers beside them are Julian days.Sampling stations on transects (T1–T9) are labeled with yellow dots.
GB1007 HU ET AL.: COASTAL EMISSIONS OF CH3BR AND CH3CL
2 of 10
GB1007
spectrometer analysis. Air and equilibrator samples wereanalyzed alternately, �40 min per sample. Calibration gasstandards were analyzed after every fourth sample to cali-brate the system. Calibration standards were whole airstandards calibrated against standards from NOAA/ESRLGlobal Monitoring Division.[8] Discrete seawater samples at different depths in each
transect were collected from Niskin bottles into groundglass syringes and then loaded to the volume calibratedglass bulbs. They were measured by a Gas Chromatographyand Mass Spectrometry (GC-MS) system similar to the onedescribed above for the saturation anomaly measurements.This instrument has a custom-built purge system thatattaches to a Nafion dryer, with the rest of the analysisoccurring as described above. The difference between thesequences in the saturation anomaly measurements andthose in the depth profile measurements are the blankswhich were included after every third sample to monitorthe system when measuring the discrete samples.[9] Continuous underway chlorophyll a, chromophoric
dissolved organic matter (CDOM), and dissolved oxygen(DO) measurements were made in a black 80 L tankcontinuously flushed with the ship’s scientific seawater,in which the analytical instruments were submerged. AWetlabs ‘‘Ecopuck’’ instrument was used to measurestimulated fluorescence of chlorophyll a (mg L�1; lex =470 nm, lem = 695 nm) and CDOM as calibrated byquinine sulfate (QSU; lex = 370 nm, lex = 460 nm). Theinstrument was factory calibrated prior to the cruise. DOwas measured by an Aanderaa Optode sensor. The‘‘Optode’’ underwent a 4-point calibration prior to deploy-ment using Winkler titrations.
3. Results and Discussion
3.1. Air Mixing Ratios and Sea Surface Concentrations
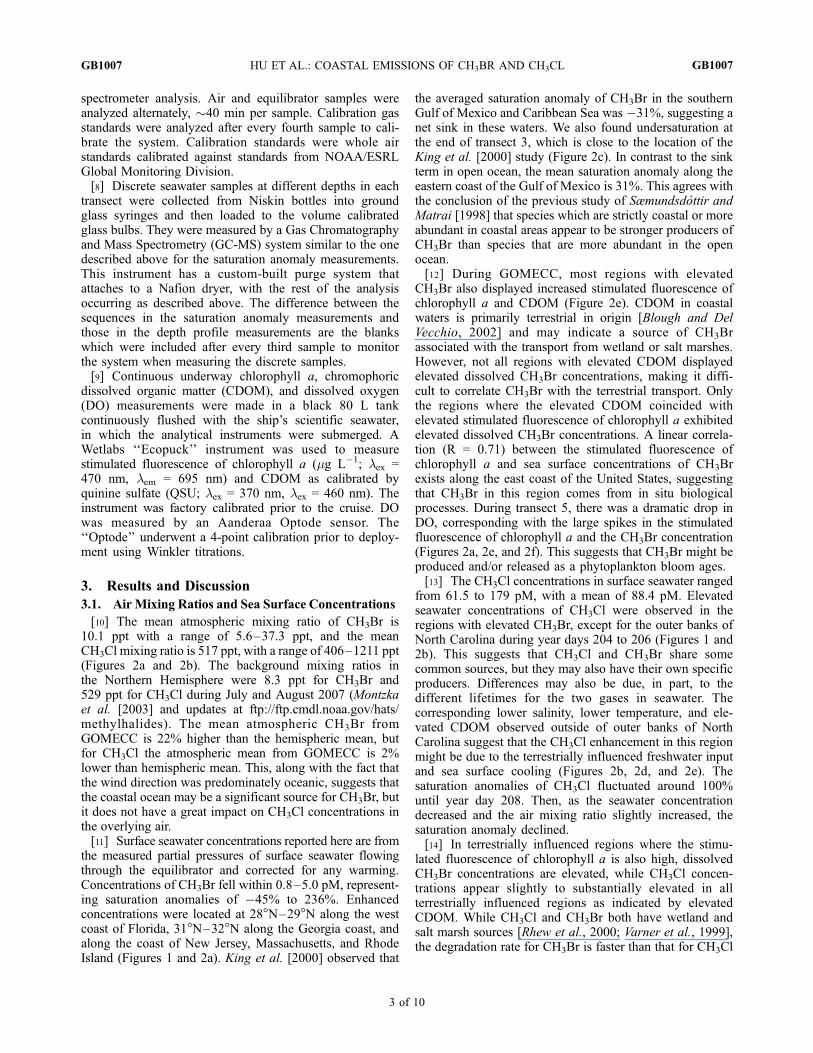
[10] The mean atmospheric mixing ratio of CH3Br is10.1 ppt with a range of 5.6–37.3 ppt, and the meanCH3Cl mixing ratio is 517 ppt, with a range of 406–1211 ppt(Figures 2a and 2b). The background mixing ratios inthe Northern Hemisphere were 8.3 ppt for CH3Br and529 ppt for CH3Cl during July and August 2007 (Montzkaet al. [2003] and updates at ftp://ftp.cmdl.noaa.gov/hats/methylhalides). The mean atmospheric CH3Br fromGOMECC is 22% higher than the hemispheric mean, butfor CH3Cl the atmospheric mean from GOMECC is 2%lower than hemispheric mean. This, along with the fact thatthe wind direction was predominately oceanic, suggests thatthe coastal ocean may be a significant source for CH3Br, butit does not have a great impact on CH3Cl concentrations inthe overlying air.[11] Surface seawater concentrations reported here are from
the measured partial pressures of surface seawater flowingthrough the equilibrator and corrected for any warming.Concentrations of CH3Br fell within 0.8–5.0 pM, represent-ing saturation anomalies of �45% to 236%. Enhancedconcentrations were located at 28�N–29�N along the westcoast of Florida, 31�N–32�N along the Georgia coast, andalong the coast of New Jersey, Massachusetts, and RhodeIsland (Figures 1 and 2a). King et al. [2000] observed that
the averaged saturation anomaly of CH3Br in the southernGulf of Mexico and Caribbean Sea was �31%, suggesting anet sink in these waters. We also found undersaturation atthe end of transect 3, which is close to the location of theKing et al. [2000] study (Figure 2c). In contrast to the sinkterm in open ocean, the mean saturation anomaly along theeastern coast of the Gulf of Mexico is 31%. This agrees withthe conclusion of the previous study of Sæmundsdottir andMatrai [1998] that species which are strictly coastal or moreabundant in coastal areas appear to be stronger producers ofCH3Br than species that are more abundant in the openocean.[12] During GOMECC, most regions with elevated
CH3Br also displayed increased stimulated fluorescence ofchlorophyll a and CDOM (Figure 2e). CDOM in coastalwaters is primarily terrestrial in origin [Blough and DelVecchio, 2002] and may indicate a source of CH3Brassociated with the transport from wetland or salt marshes.However, not all regions with elevated CDOM displayedelevated dissolved CH3Br concentrations, making it diffi-cult to correlate CH3Br with the terrestrial transport. Onlythe regions where the elevated CDOM coincided withelevated stimulated fluorescence of chlorophyll a exhibitedelevated dissolved CH3Br concentrations. A linear correla-tion (R = 0.71) between the stimulated fluorescence ofchlorophyll a and sea surface concentrations of CH3Brexists along the east coast of the United States, suggestingthat CH3Br in this region comes from in situ biologicalprocesses. During transect 5, there was a dramatic drop inDO, corresponding with the large spikes in the stimulatedfluorescence of chlorophyll a and the CH3Br concentration(Figures 2a, 2e, and 2f). This suggests that CH3Br might beproduced and/or released as a phytoplankton bloom ages.[13] The CH3Cl concentrations in surface seawater ranged
from 61.5 to 179 pM, with a mean of 88.4 pM. Elevatedseawater concentrations of CH3Cl were observed in theregions with elevated CH3Br, except for the outer banks ofNorth Carolina during year days 204 to 206 (Figures 1 and2b). This suggests that CH3Cl and CH3Br share somecommon sources, but they may also have their own specificproducers. Differences may also be due, in part, to thedifferent lifetimes for the two gases in seawater. Thecorresponding lower salinity, lower temperature, and ele-vated CDOM observed outside of outer banks of NorthCarolina suggest that the CH3Cl enhancement in this regionmight be due to the terrestrially influenced freshwater inputand sea surface cooling (Figures 2b, 2d, and 2e). Thesaturation anomalies of CH3Cl fluctuated around 100%until year day 208. Then, as the seawater concentrationdecreased and the air mixing ratio slightly increased, thesaturation anomaly declined.[14] In terrestrially influenced regions where the stimu-
lated fluorescence of chlorophyll a is also high, dissolvedCH3Br concentrations are elevated, while CH3Cl concen-trations appear slightly to substantially elevated in allterrestrially influenced regions as indicated by elevatedCDOM. While CH3Cl and CH3Br both have wetland andsalt marsh sources [Rhew et al., 2000; Varner et al., 1999],the degradation rate for CH3Br is faster than that for CH3Cl
GB1007 HU ET AL.: COASTAL EMISSIONS OF CH3BR AND CH3CL
3 of 10
GB1007
which may explain the lack of corresponding elevation inCH3Br where only CH3Cl and CDOM are elevated. Theelevated CH3Br is observed where the stimulated fluores-cence of chlorophyll a is also elevated suggesting that insitu production of CH3Br occurred in these regions but notin the other terrestrially influenced regions. This does notpreclude in situ CH3Cl production from occurring in thesame regions, but we cannot separate the terrestrial influ-ence from the possible in situ production for CH3Cl with theavailable data.
3.2. Water Column Distribution
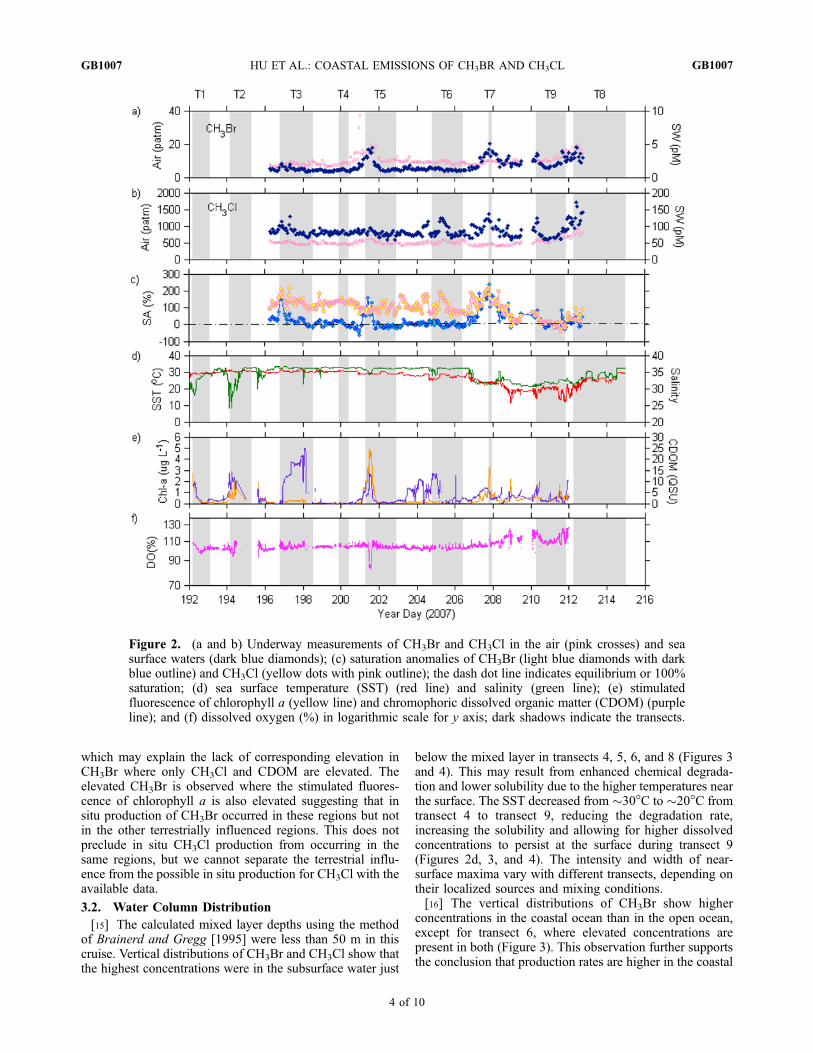
[15] The calculated mixed layer depths using the methodof Brainerd and Gregg [1995] were less than 50 m in thiscruise. Vertical distributions of CH3Br and CH3Cl show thatthe highest concentrations were in the subsurface water just
below the mixed layer in transects 4, 5, 6, and 8 (Figures 3and 4). This may result from enhanced chemical degrada-tion and lower solubility due to the higher temperatures nearthe surface. The SST decreased from �30�C to �20�C fromtransect 4 to transect 9, reducing the degradation rate,increasing the solubility and allowing for higher dissolvedconcentrations to persist at the surface during transect 9(Figures 2d, 3, and 4). The intensity and width of near-surface maxima vary with different transects, depending ontheir localized sources and mixing conditions.[16] The vertical distributions of CH3Br show higher
concentrations in the coastal ocean than in the open ocean,except for transect 6, where elevated concentrations arepresent in both (Figure 3). This observation further supportsthe conclusion that production rates are higher in the coastal
Figure 2. (a and b) Underway measurements of CH3Br and CH3Cl in the air (pink crosses) and seasurface waters (dark blue diamonds); (c) saturation anomalies of CH3Br (light blue diamonds with darkblue outline) and CH3Cl (yellow dots with pink outline); the dash dot line indicates equilibrium or 100%saturation; (d) sea surface temperature (SST) (red line) and salinity (green line); (e) stimulatedfluorescence of chlorophyll a (yellow line) and chromophoric dissolved organic matter (CDOM) (purpleline); and (f) dissolved oxygen (%) in logarithmic scale for y axis; dark shadows indicate the transects.
GB1007 HU ET AL.: COASTAL EMISSIONS OF CH3BR AND CH3CL
4 of 10
GB1007
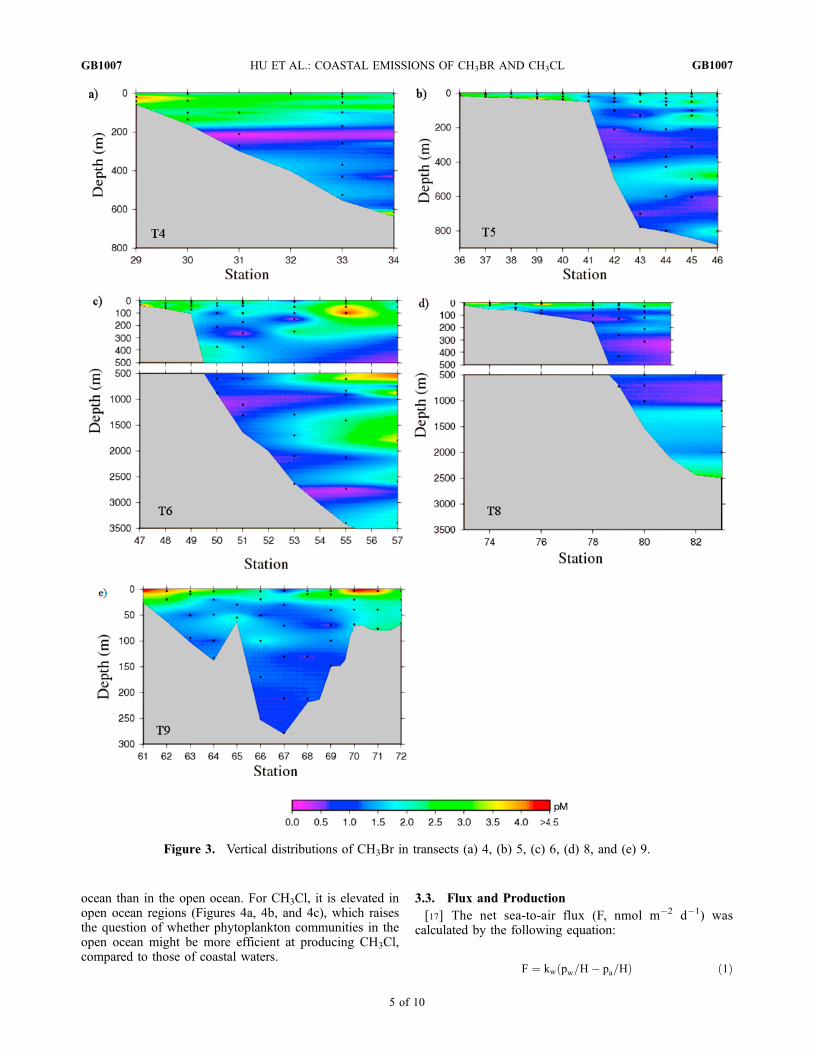
ocean than in the open ocean. For CH3Cl, it is elevated inopen ocean regions (Figures 4a, 4b, and 4c), which raisesthe question of whether phytoplankton communities in theopen ocean might be more efficient at producing CH3Cl,compared to those of coastal waters.
3.3. Flux and Production
[17] The net sea-to-air flux (F, nmol m�2 d�1) wascalculated by the following equation:
F ¼ kw pw=H� pa=Hð Þ ð1Þ
Figure 3. Vertical distributions of CH3Br in transects (a) 4, (b) 5, (c) 6, (d) 8, and (e) 9.
GB1007 HU ET AL.: COASTAL EMISSIONS OF CH3BR AND CH3CL
5 of 10
GB1007
where kw is gas transfer velocity, H is solubility (m3 atmmol�1), and pw and pa are the partial pressures (atm) in thesurface water and atmosphere. Wind speeds were measuredwith an anemometer at a height of 19 m above the sea level,then normalized to a height of 10 m using the equation ofLarge and Pond [1981] and Erickson [1993] to calculate the
gas transfer velocity [Wanninkhof, 1992]. The solubilities ofCH3Br and CH3Cl were calculated following the methodof De Bruyn and Saltzman [1997] and Moore [2000]. Thenet fluxes of CH3Br and CH3Cl are in the range of �3.5to 10.8 nmol m�2 d�1 and �5.9 to 348 nmol m�2 d�1.The CH3Br flux is controlled by the saturation state of the
Figure 4. Vertical distributions of CH3Cl in transects (a) 4, (b) 5, (c) 6, (d) 8, and (e) 9.
GB1007 HU ET AL.: COASTAL EMISSIONS OF CH3BR AND CH3CL
6 of 10
GB1007
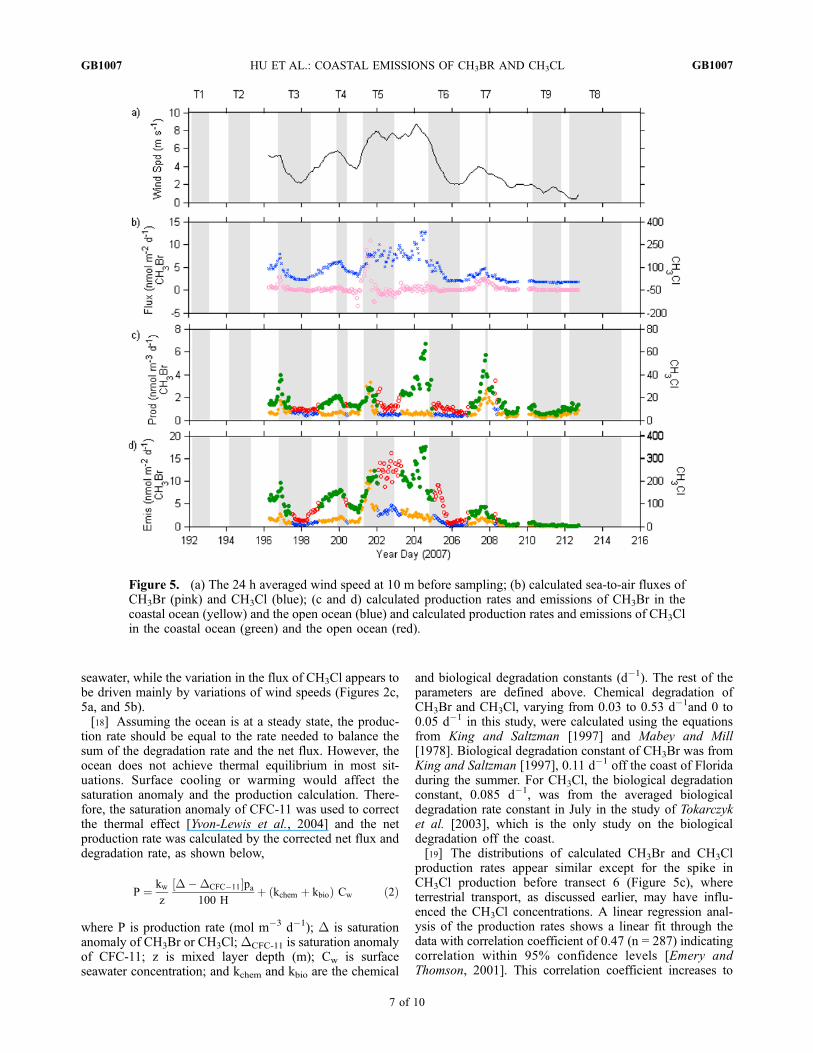
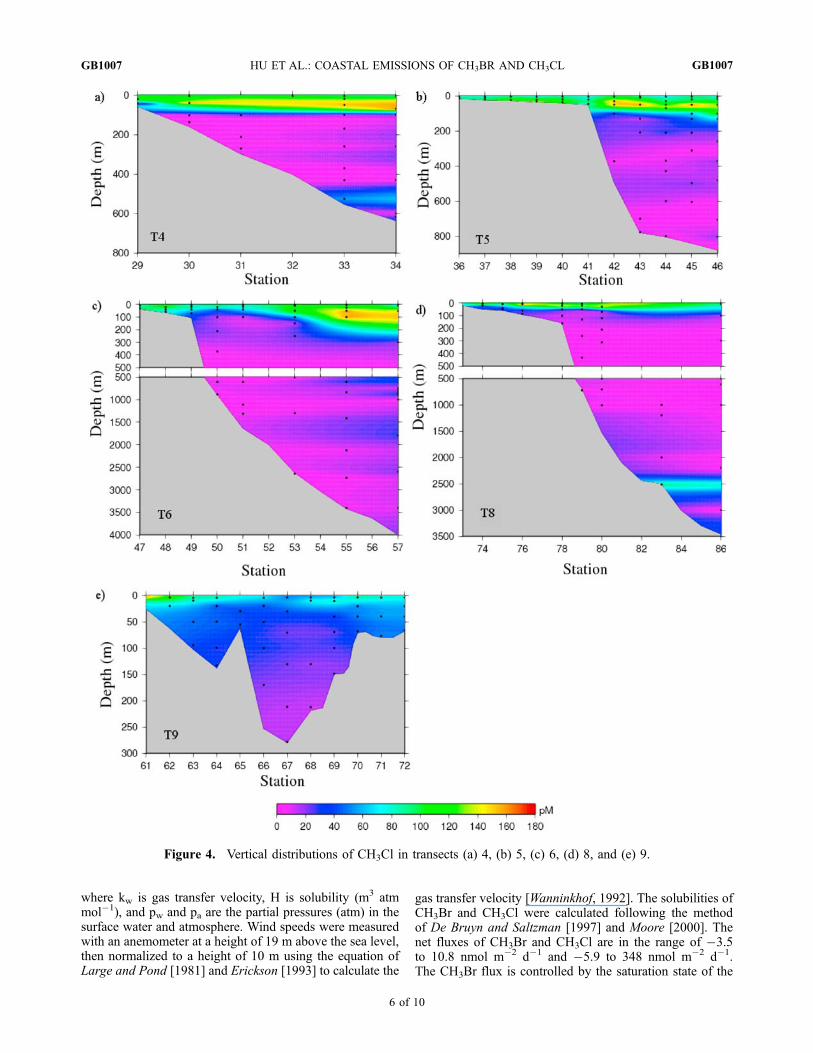
seawater, while the variation in the flux of CH3Cl appears tobe driven mainly by variations of wind speeds (Figures 2c,5a, and 5b).[18] Assuming the ocean is at a steady state, the produc-
tion rate should be equal to the rate needed to balance thesum of the degradation rate and the net flux. However, theocean does not achieve thermal equilibrium in most sit-uations. Surface cooling or warming would affect thesaturation anomaly and the production calculation. There-fore, the saturation anomaly of CFC-11 was used to correctthe thermal effect [Yvon-Lewis et al., 2004] and the netproduction rate was calculated by the corrected net flux anddegradation rate, as shown below,
P ¼ kw
z
D�DCFC�11½ �pa100 H
þ kchem þ kbioð Þ Cw ð2Þ
where P is production rate (mol m�3 d�1); D is saturationanomaly of CH3Br or CH3Cl;DCFC-11 is saturation anomalyof CFC-11; z is mixed layer depth (m); Cw is surfaceseawater concentration; and kchem and kbio are the chemical
and biological degradation constants (d�1). The rest of theparameters are defined above. Chemical degradation ofCH3Br and CH3Cl, varying from 0.03 to 0.53 d�1and 0 to0.05 d�1 in this study, were calculated using the equationsfrom King and Saltzman [1997] and Mabey and Mill[1978]. Biological degradation constant of CH3Br was fromKing and Saltzman [1997], 0.11 d�1 off the coast of Floridaduring the summer. For CH3Cl, the biological degradationconstant, 0.085 d�1, was from the averaged biologicaldegradation rate constant in July in the study of Tokarczyket al. [2003], which is the only study on the biologicaldegradation off the coast.[19] The distributions of calculated CH3Br and CH3Cl
production rates appear similar except for the spike inCH3Cl production before transect 6 (Figure 5c), whereterrestrial transport, as discussed earlier, may have influ-enced the CH3Cl concentrations. A linear regression anal-ysis of the production rates shows a linear fit through thedata with correlation coefficient of 0.47 (n = 287) indicatingcorrelation within 95% confidence levels [Emery andThomson, 2001]. This correlation coefficient increases to
Figure 5. (a) The 24 h averaged wind speed at 10 m before sampling; (b) calculated sea-to-air fluxes ofCH3Br (pink) and CH3Cl (blue); (c and d) calculated production rates and emissions of CH3Br in thecoastal ocean (yellow) and the open ocean (blue) and calculated production rates and emissions of CH3Clin the coastal ocean (green) and the open ocean (red).
GB1007 HU ET AL.: COASTAL EMISSIONS OF CH3BR AND CH3CL
7 of 10
GB1007
0.75 after we removed the spike in CH3Cl productionextending from year day 202.8 to 204.9. Scarratt andMoore [1998] tested nine phytoplankton species, most ofwhich are common in the open ocean, and found that CH3Cland CH3Br were produced in all cultures, except CH3Br wasabsent in cultures of Tetraselmis sp. and Isochrysis sp. Thisgood correlation between the calculated production rates ofCH3Br and CH3Cl in our study suggests that CH3Br andCH3Cl also have some common sources in the coastal ocean.
3.4. Estimating Total Coastal Emissions
[20] The area of the coastal ocean, defined as the areawith bottom depth less than 200 m, was determined frombathymetric data from the NOAA National GeophysicalData Center (http://www.ngdc.noaa.gov/mgg/bathymetry/relief.html). The mean value of the calculated productionrates of CH3Br for the coastal oceans in this study is0.76 nmol m�3 d�1, which is much higher than the globalopen ocean production rate, 0.15 nmol m�3 d�1 [Yvon-Lewiset al., 2002]. The calculated coastal CH3Cl production rateranges from 4.5 to 67 nmol m�3 d�1 with a mean value of18 nmol m�3 d�1.[21] Emission is defined as the amount of gas which is
produced in the ocean and emitted to the atmosphere. It iscalculated from the following equation:
E ¼ Puncorr 1� Rð Þz ð3Þ
where E is emission from the ocean (mol m�2 d�1); Puncorris uncorrected production rate, which is calculated fromequation (2) using the uncorrected saturation anomaly; andR is the fraction of gas entering the water that is destroyedbefore exiting to the atmosphere [Butler, 1994].[22] The entire cruise track was divided into four regions,
each spanning five degrees of latitude, to capture theregional variations. Regionally averaged emissions wereenhanced within the 30�N–35�N area (Table 1). The
calculated emission from the entire GOMECC coastalregion ranged from 0.01 to 0.06 Gg yr�1 for CH3Br and0.3 to 1.6 Gg yr�1 for CH3Cl (Table 1). The global coastalocean area is approximately 27.123 � 106 km2, accountingfor 7.4% of global ocean area [Menard and Smith, 1966].Assuming that the GOMECC area is representative of theglobal coastal ocean region, the extrapolated global coastaloceanic emissions range from 0.5 to 3.6 Gg yr�1 for CH3Brand from 19 to 98 Gg yr�1 for CH3Cl. Using the samemethod, the extrapolated global coastal ocean fluxes areestimated to be in the range of �0.9 to 3.4 Gg yr�1 and 12to 94 Gg yr�1for CH3Br and CH3Cl. For CH3Cl, the globalopen oceanic emission ranges from 1284 to 1364 Gg yr�1
as calculated from the global net flux of 320 to 400 Gg yr�1
[Moore, 2000], the partial atmospheric lifetime with respectto oceanic loss of 4.1 years [Tokarczyk et al., 2003] andits averaged global atmospheric mixing ratio, 536 ppt,from NOAA/ESRL Global Monitoring Division (ftp://ftp.cmdl.noaa.gov/hats/methylhalides). For CH3Br, it ismore complicated. With the decline in atmospheric concen-trations since the implementation of the Montreal Protocol,the global net flux of CH3Br has likely changed since theprevious global estimates of net flux were determined[Yvon-Lewis et al., 2009]. Comparing the extrapolatedcoastal ocean net fluxes determined in this study to theprephaseout global ocean net fluxes is not a valid compar-ison. However, the oceanic production rate and emissionare not functions of the atmospheric concentration and shouldnot have changed. Therefore the global oceanic emission of42 Gg yr�1 determined by Yvon-Lewis et al. [2009] remainsthe best estimate. Including the coastal oceanic emissions ofCH3Br and CH3Cl will increase the global oceanic emissionsby 1%–9% and 1%–8%, respectively.[23] The GOMECC data represent a much larger coastal
area than the few previous coastal studies covered [Bakeret al., 1999; Sturrock et al., 2003]. For CH3Br, the resultspresented here fall within the range of data reported in the
Table 1. Estimated Coastal Emissions of CH3Br and CH3Cl From This Study Along With a Global Extrapolation
Region Area (km2)
CH3Br CH3Cl
Emission(nmol m�2 d�1)
Annual Emission(Gg yr�1)
Emission(nmol m�2 d�1)
Annual Emission(Gg yr�1)
I (Latitude < 30�N) 1.82 � 105 1.5 (0.9–2.8) 0.01 (0.004–0.02) 119 (52–192) 0.4 (0.2–0.6)II (Latitude 30�35�N) 8.50 � 104 3.7 (0.9–12) 0.01 (0.003–0.04) 202 (63–349) 0.3 (1.0–5.4)III (Latitude 35�40�N) 6.58 � 104 1.4 (0.6–2.5) 0.003 (0.001–0.006) 95 (38–351) 0.1 (0.04–0.4)IV (Latitude > 40�N) 1.18 � 105 0.2 (0–0.5) 0.001 (0–0.002) 8.3 (1.1–28) 0.02 (0–0.06)GOMECC coastal total 4.52 � 105 - 0.02 (0.01–0.06) - 0.8 (0.3–1.6)
Global coastal ocean 27.123 � 106 - 1.4 (0.5–3.6) - 50 (19–98)
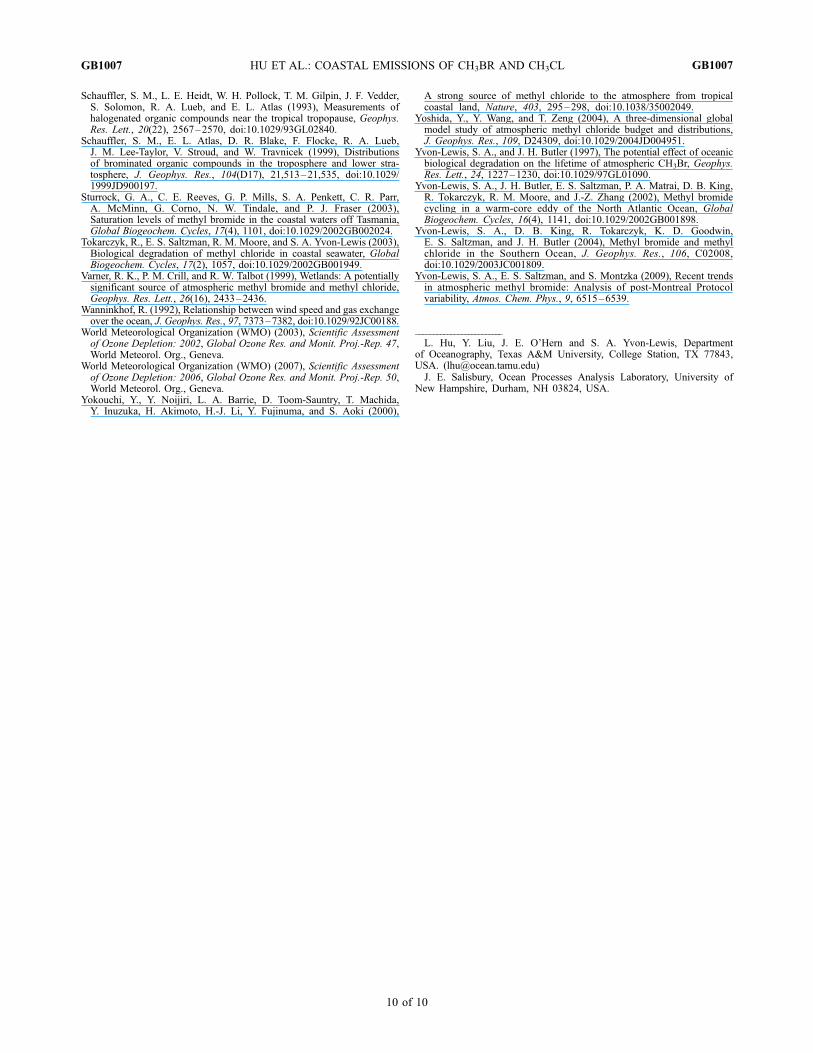
Table 2. Comparison of CH3Br Measurements in Different Coastal Regions
Region TimeAtmospheric
Mixing Ratio (ppt)Seawater
Concentration (pM)Saturation
Anomaly (%) Reference
GOMECC (Coastal) 10 Jul to 4 Aug 2007 10.5 (5.6–37.3) 1.9 (0.8–5.0) 30 (�45–236) This studyCoastal Nova Scotia Oct–Nov 1995 11.4–13.0 1.5–2.5 9 Groszko and
Moore [1998]Coastal water of the North Sea Feb 1996 to Feb1997 9.5–25.5 2–8.7 �60–200 Baker et al. [1999]Subtropical/temperate NE Pacific (coastal) 7 May to 7 Jul 2000 12.16 2.66 30 King et al. [2000]Coastal waters off Tasmania Mar 2000 to Sep 2002 6–24 0–26 �50–1200 Sturrock et al. [2003]
GB1007 HU ET AL.: COASTAL EMISSIONS OF CH3BR AND CH3CL
8 of 10
GB1007
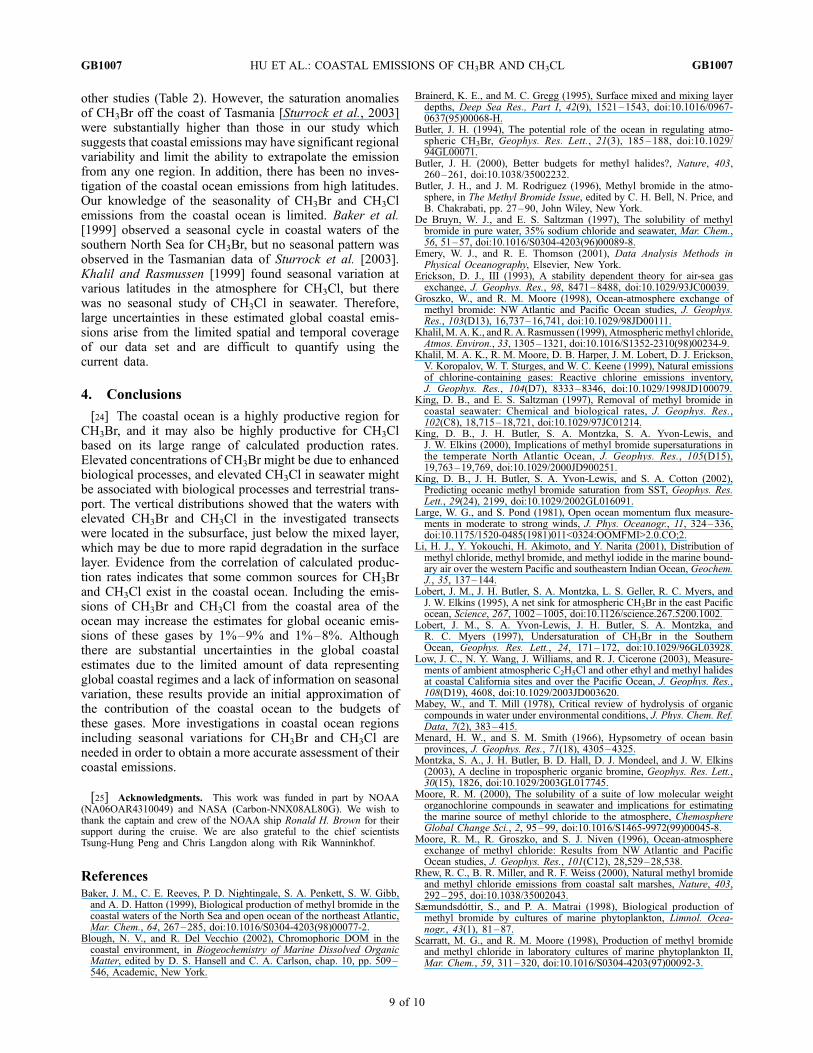
other studies (Table 2). However, the saturation anomaliesof CH3Br off the coast of Tasmania [Sturrock et al., 2003]were substantially higher than those in our study whichsuggests that coastal emissions may have significant regionalvariability and limit the ability to extrapolate the emissionfrom any one region. In addition, there has been no inves-tigation of the coastal ocean emissions from high latitudes.Our knowledge of the seasonality of CH3Br and CH3Clemissions from the coastal ocean is limited. Baker et al.[1999] observed a seasonal cycle in coastal waters of thesouthern North Sea for CH3Br, but no seasonal pattern wasobserved in the Tasmanian data of Sturrock et al. [2003].Khalil and Rasmussen [1999] found seasonal variation atvarious latitudes in the atmosphere for CH3Cl, but therewas no seasonal study of CH3Cl in seawater. Therefore,large uncertainties in these estimated global coastal emis-sions arise from the limited spatial and temporal coverageof our data set and are difficult to quantify using thecurrent data.
4. Conclusions
[24] The coastal ocean is a highly productive region forCH3Br, and it may also be highly productive for CH3Clbased on its large range of calculated production rates.Elevated concentrations of CH3Br might be due to enhancedbiological processes, and elevated CH3Cl in seawater mightbe associated with biological processes and terrestrial trans-port. The vertical distributions showed that the waters withelevated CH3Br and CH3Cl in the investigated transectswere located in the subsurface, just below the mixed layer,which may be due to more rapid degradation in the surfacelayer. Evidence from the correlation of calculated produc-tion rates indicates that some common sources for CH3Brand CH3Cl exist in the coastal ocean. Including the emis-sions of CH3Br and CH3Cl from the coastal area of theocean may increase the estimates for global oceanic emis-sions of these gases by 1%–9% and 1%–8%. Althoughthere are substantial uncertainties in the global coastalestimates due to the limited amount of data representingglobal coastal regimes and a lack of information on seasonalvariation, these results provide an initial approximation ofthe contribution of the coastal ocean to the budgets ofthese gases. More investigations in coastal ocean regionsincluding seasonal variations for CH3Br and CH3Cl areneeded in order to obtain a more accurate assessment of theircoastal emissions.
[25] Acknowledgments. This work was funded in part by NOAA(NA06OAR4310049) and NASA (Carbon-NNX08AL80G). We wish tothank the captain and crew of the NOAA ship Ronald H. Brown for theirsupport during the cruise. We are also grateful to the chief scientistsTsung-Hung Peng and Chris Langdon along with Rik Wanninkhof.
ReferencesBaker, J. M., C. E. Reeves, P. D. Nightingale, S. A. Penkett, S. W. Gibb,and A. D. Hatton (1999), Biological production of methyl bromide in thecoastal waters of the North Sea and open ocean of the northeast Atlantic,Mar. Chem., 64, 267–285, doi:10.1016/S0304-4203(98)00077-2.
Blough, N. V., and R. Del Vecchio (2002), Chromophoric DOM in thecoastal environment, in Biogeochemistry of Marine Dissolved OrganicMatter, edited by D. S. Hansell and C. A. Carlson, chap. 10, pp. 509–546, Academic, New York.
Brainerd, K. E., and M. C. Gregg (1995), Surface mixed and mixing layerdepths, Deep Sea Res., Part I, 42(9), 1521–1543, doi:10.1016/0967-0637(95)00068-H.
Butler, J. H. (1994), The potential role of the ocean in regulating atmo-spheric CH3Br, Geophys. Res. Lett., 21(3), 185 –188, doi:10.1029/94GL00071.
Butler, J. H. (2000), Better budgets for methyl halides?, Nature, 403,260–261, doi:10.1038/35002232.
Butler, J. H., and J. M. Rodriguez (1996), Methyl bromide in the atmo-sphere, in The Methyl Bromide Issue, edited by C. H. Bell, N. Price, andB. Chakrabati, pp. 27–90, John Wiley, New York.
De Bruyn, W. J., and E. S. Saltzman (1997), The solubility of methylbromide in pure water, 35% sodium chloride and seawater, Mar. Chem.,56, 51–57, doi:10.1016/S0304-4203(96)00089-8.
Emery, W. J., and R. E. Thomson (2001), Data Analysis Methods inPhysical Oceanography, Elsevier, New York.
Erickson, D. J., III (1993), A stability dependent theory for air-sea gasexchange, J. Geophys. Res., 98, 8471–8488, doi:10.1029/93JC00039.
Groszko, W., and R. M. Moore (1998), Ocean-atmosphere exchange ofmethyl bromide: NW Atlantic and Pacific Ocean studies, J. Geophys.Res., 103(D13), 16,737–16,741, doi:10.1029/98JD00111.
Khalil,M. A. K., and R. A. Rasmussen (1999), Atmospheric methyl chloride,Atmos. Environ., 33, 1305–1321, doi:10.1016/S1352-2310(98)00234-9.
Khalil, M. A. K., R. M. Moore, D. B. Harper, J. M. Lobert, D. J. Erickson,V. Koropalov, W. T. Sturges, and W. C. Keene (1999), Natural emissionsof chlorine-containing gases: Reactive chlorine emissions inventory,J. Geophys. Res., 104(D7), 8333–8346, doi:10.1029/1998JD100079.
King, D. B., and E. S. Saltzman (1997), Removal of methyl bromide incoastal seawater: Chemical and biological rates, J. Geophys. Res.,102(C8), 18,715–18,721, doi:10.1029/97JC01214.
King, D. B., J. H. Butler, S. A. Montzka, S. A. Yvon-Lewis, andJ. W. Elkins (2000), Implications of methyl bromide supersaturations inthe temperate North Atlantic Ocean, J. Geophys. Res., 105(D15),19,763–19,769, doi:10.1029/2000JD900251.
King, D. B., J. H. Butler, S. A. Yvon-Lewis, and S. A. Cotton (2002),Predicting oceanic methyl bromide saturation from SST, Geophys. Res.Lett., 29(24), 2199, doi:10.1029/2002GL016091.
Large, W. G., and S. Pond (1981), Open ocean momentum flux measure-ments in moderate to strong winds, J. Phys. Oceanogr., 11, 324–336,doi:10.1175/1520-0485(1981)011<0324:OOMFMI>2.0.CO;2.
Li, H. J., Y. Yokouchi, H. Akimoto, and Y. Narita (2001), Distribution ofmethyl chloride, methyl bromide, and methyl iodide in the marine bound-ary air over the western Pacific and southeastern Indian Ocean, Geochem.J., 35, 137–144.
Lobert, J. M., J. H. Butler, S. A. Montzka, L. S. Geller, R. C. Myers, andJ. W. Elkins (1995), A net sink for atmospheric CH3Br in the east Pacificocean, Science, 267, 1002–1005, doi:10.1126/science.267.5200.1002.
Lobert, J. M., S. A. Yvon-Lewis, J. H. Butler, S. A. Montzka, andR. C. Myers (1997), Undersaturation of CH3Br in the SouthernOcean, Geophys. Res. Lett., 24, 171–172, doi:10.1029/96GL03928.
Low, J. C., N. Y. Wang, J. Williams, and R. J. Cicerone (2003), Measure-ments of ambient atmospheric C2H5Cl and other ethyl and methyl halidesat coastal California sites and over the Pacific Ocean, J. Geophys. Res.,108(D19), 4608, doi:10.1029/2003JD003620.
Mabey, W., and T. Mill (1978), Critical review of hydrolysis of organiccompounds in water under environmental conditions, J. Phys. Chem. Ref.Data, 7(2), 383–415.
Menard, H. W., and S. M. Smith (1966), Hypsometry of ocean basinprovinces, J. Geophys. Res., 71(18), 4305–4325.
Montzka, S. A., J. H. Butler, B. D. Hall, D. J. Mondeel, and J. W. Elkins(2003), A decline in tropospheric organic bromine, Geophys. Res. Lett.,30(15), 1826, doi:10.1029/2003GL017745.
Moore, R. M. (2000), The solubility of a suite of low molecular weightorganochlorine compounds in seawater and implications for estimatingthe marine source of methyl chloride to the atmosphere, ChemosphereGlobal Change Sci., 2, 95–99, doi:10.1016/S1465-9972(99)00045-8.
Moore, R. M., R. Groszko, and S. J. Niven (1996), Ocean-atmosphereexchange of methyl chloride: Results from NW Atlantic and PacificOcean studies, J. Geophys. Res., 101(C12), 28,529–28,538.
Rhew, R. C., B. R. Miller, and R. F. Weiss (2000), Natural methyl bromideand methyl chloride emissions from coastal salt marshes, Nature, 403,292–295, doi:10.1038/35002043.
Sæmundsdottir, S., and P. A. Matrai (1998), Biological production ofmethyl bromide by cultures of marine phytoplankton, Limnol. Ocea-nogr., 43(1), 81–87.
Scarratt, M. G., and R. M. Moore (1998), Production of methyl bromideand methyl chloride in laboratory cultures of marine phytoplankton II,Mar. Chem., 59, 311–320, doi:10.1016/S0304-4203(97)00092-3.
GB1007 HU ET AL.: COASTAL EMISSIONS OF CH3BR AND CH3CL
9 of 10
GB1007
Schauffler, S. M., L. E. Heidt, W. H. Pollock, T. M. Gilpin, J. F. Vedder,S. Solomon, R. A. Lueb, and E. L. Atlas (1993), Measurements ofhalogenated organic compounds near the tropical tropopause, Geophys.Res. Lett., 20(22), 2567–2570, doi:10.1029/93GL02840.
Schauffler, S. M., E. L. Atlas, D. R. Blake, F. Flocke, R. A. Lueb,J. M. Lee-Taylor, V. Stroud, and W. Travnicek (1999), Distributionsof brominated organic compounds in the troposphere and lower stra-tosphere, J. Geophys. Res., 104(D17), 21,513–21,535, doi:10.1029/1999JD900197.
Sturrock, G. A., C. E. Reeves, G. P. Mills, S. A. Penkett, C. R. Parr,A. McMinn, G. Corno, N. W. Tindale, and P. J. Fraser (2003),Saturation levels of methyl bromide in the coastal waters off Tasmania,Global Biogeochem. Cycles, 17(4), 1101, doi:10.1029/2002GB002024.
Tokarczyk, R., E. S. Saltzman, R. M. Moore, and S. A. Yvon-Lewis (2003),Biological degradation of methyl chloride in coastal seawater, GlobalBiogeochem. Cycles, 17(2), 1057, doi:10.1029/2002GB001949.
Varner, R. K., P. M. Crill, and R. W. Talbot (1999), Wetlands: A potentiallysignificant source of atmospheric methyl bromide and methyl chloride,Geophys. Res. Lett., 26(16), 2433–2436.
Wanninkhof, R. (1992), Relationship between wind speed and gas exchangeover the ocean, J. Geophys. Res., 97, 7373–7382, doi:10.1029/92JC00188.
World Meteorological Organization (WMO) (2003), Scientific Assessmentof Ozone Depletion: 2002, Global Ozone Res. and Monit. Proj.-Rep. 47,World Meteorol. Org., Geneva.
World Meteorological Organization (WMO) (2007), Scientific Assessmentof Ozone Depletion: 2006, Global Ozone Res. and Monit. Proj.-Rep. 50,World Meteorol. Org., Geneva.
Yokouchi, Y., Y. Noijiri, L. A. Barrie, D. Toom-Sauntry, T. Machida,Y. Inuzuka, H. Akimoto, H.-J. Li, Y. Fujinuma, and S. Aoki (2000),
A strong source of methyl chloride to the atmosphere from tropicalcoastal land, Nature, 403, 295–298, doi:10.1038/35002049.
Yoshida, Y., Y. Wang, and T. Zeng (2004), A three-dimensional globalmodel study of atmospheric methyl chloride budget and distributions,J. Geophys. Res., 109, D24309, doi:10.1029/2004JD004951.
Yvon-Lewis, S. A., and J. H. Butler (1997), The potential effect of oceanicbiological degradation on the lifetime of atmospheric CH3Br, Geophys.Res. Lett., 24, 1227–1230, doi:10.1029/97GL01090.
Yvon-Lewis, S. A., J. H. Butler, E. S. Saltzman, P. A. Matrai, D. B. King,R. Tokarczyk, R. M. Moore, and J.-Z. Zhang (2002), Methyl bromidecycling in a warm-core eddy of the North Atlantic Ocean, GlobalBiogeochem. Cycles, 16(4), 1141, doi:10.1029/2002GB001898.
Yvon-Lewis, S. A., D. B. King, R. Tokarczyk, K. D. Goodwin,E. S. Saltzman, and J. H. Butler (2004), Methyl bromide and methylchloride in the Southern Ocean, J. Geophys. Res., 106, C02008,doi:10.1029/2003JC001809.
Yvon-Lewis, S. A., E. S. Saltzman, and S. Montzka (2009), Recent trendsin atmospheric methyl bromide: Analysis of post-Montreal Protocolvariability, Atmos. Chem. Phys., 9, 6515–6539.
�������������������������L. Hu, Y. Liu, J. E. O’Hern and S. A. Yvon-Lewis, Department
of Oceanography, Texas A&M University, College Station, TX 77843,USA. ([email protected])J. E. Salisbury, Ocean Processes Analysis Laboratory, University of
New Hampshire, Durham, NH 03824, USA.
GB1007 HU ET AL.: COASTAL EMISSIONS OF CH3BR AND CH3CL
10 of 10
GB1007