A Farm-level Approach to the Methyl Bromide Phase-out: Identifying Alternatives and Maximizing Net...
23
A Farm-level Approach to the Methyl Bromide Phase-out: Identifying Alternatives and Maximizing Net Worth Using Stochastic Dominance and Optimization Procedures Mark M. Byrd, Cesar L. Escalante, Michael E. Wetzstein, and Esendugue G. Fonsah Department of Agricultural and Applied Economics University of Georgia Selected Paper prepared for presentation at the Southern Agricultural Economics Association Annual Meetings Orlando, Florida, February 5-8, 2006 Abstract: Alternative fumigant and herbicide systems for Georgia’s pepper farms are analyzed relative to soon-to-be phased-out methyl bromide system. Stochastic dominance analyses identify two alternatives exceeding MeBr’s yield and financial efficiency. A programming model using simulation-optimization techniques provides important implications on the pepper farms’ economic viability under these alternative systems. Key Words: fumigant, herbicide, methyl bromide, multi-period programming, optimization, simulation, stochastic dominance Copyright 2006 by Mark M. Byrd, Cesar L. Escalante, Michael E. Wetzstein, and Esendugue G. Fonsah. Readers may make verbatim copies of this document for non-commercial purposes by any means provided that this copyright notice appears on all such copies.
-
Upload
independent -
Category
Documents
-
view
2 -
download
0
Transcript of A Farm-level Approach to the Methyl Bromide Phase-out: Identifying Alternatives and Maximizing Net...
A Farm-level Approach to the Methyl Bromide Phase-out: Identifying Alternatives and
Maximizing Net Worth Using Stochastic Dominance and Optimization Procedures
Mark M. Byrd, Cesar L. Escalante, Michael E. Wetzstein, and Esendugue G. Fonsah Department of Agricultural and Applied Economics
University of Georgia
Selected Paper prepared for presentation at the Southern Agricultural Economics Association Annual Meetings
Orlando, Florida, February 5-8, 2006
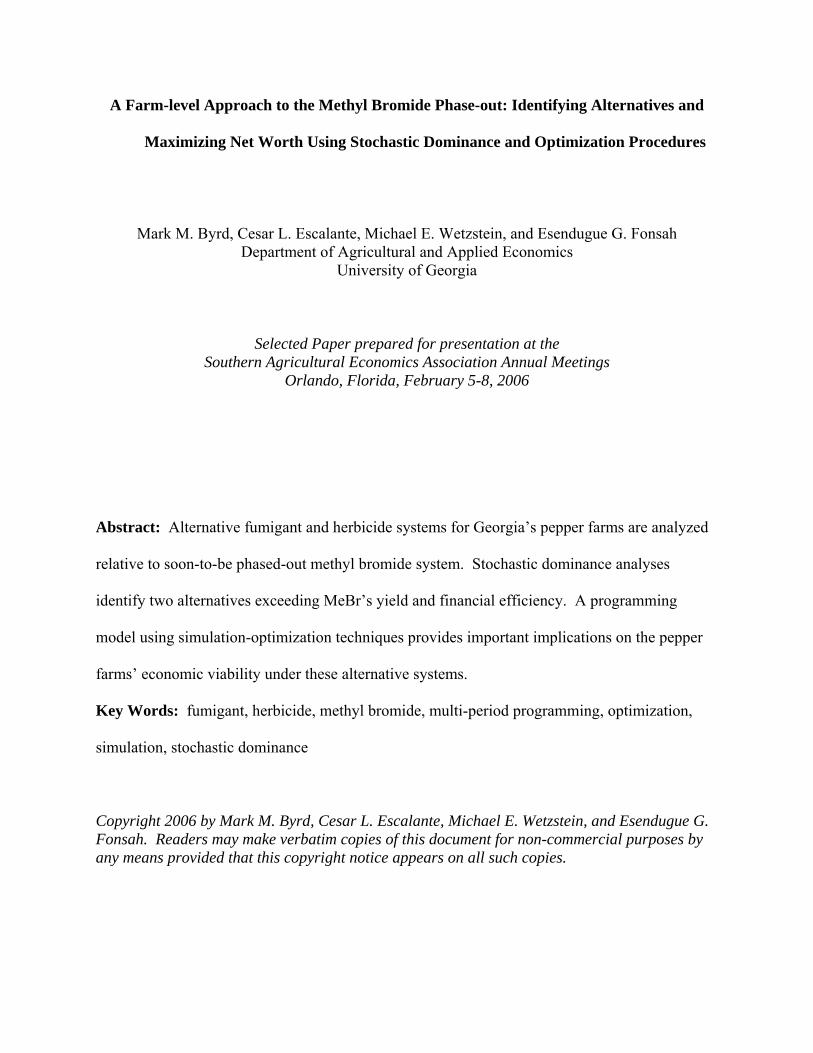
Abstract: Alternative fumigant and herbicide systems for Georgia’s pepper farms are analyzed
relative to soon-to-be phased-out methyl bromide system. Stochastic dominance analyses
identify two alternatives exceeding MeBr’s yield and financial efficiency. A programming
model using simulation-optimization techniques provides important implications on the pepper
farms’ economic viability under these alternative systems.
Key Words: fumigant, herbicide, methyl bromide, multi-period programming, optimization,
simulation, stochastic dominance
Copyright 2006 by Mark M. Byrd, Cesar L. Escalante, Michael E. Wetzstein, and Esendugue G. Fonsah. Readers may make verbatim copies of this document for non-commercial purposes by any means provided that this copyright notice appears on all such copies.

A Farm-level Approach to the Methyl Bromide Phase-out: Identifying Alternatives and
Maximizing Net Worth Using Stochastic Dominance and Optimization Procedures
On September 16, 1987, twenty-four nations ratified the Montreal Protocol on Substances
that Deplete the Ozone Layer. The goal of this international agreement was to assess the toxicity
of a variety of chemicals and create an index which identified substances causing significant
damage to the ozone layer. Methyl bromide (MeBr) was identified as one of the most toxic
contributors to ozone depletion, and it was recommended during the Ninth Meeting of the Parties
(1997) in Montreal, Canada that MeBr face an accelerated phase-out schedule.
Methyl bromide serves as an agricultural fumigant that is primarily used to control
weeds, nematodes, soil-borne pests, and diseases. It has been widely accepted by agricultural
producers because of its ease of use, cost, and effectiveness in most U.S. climates. However, a
controversy now surrounds the use of MeBr and its phase-out schedule as developed nations face
a complete elimination of the substance by 2005. Within the U.S., California and Florida
consume the largest amounts of MeBr as their combined total domestic usage is greater than
75% (Carpenter et al., 2000).
This study addresses the potential economic impact to Georgia bell pepper producers at
the farm level under the MeBr phase-out. Georgia ranks third in the U.S. in acreage of fresh
market vegetables planted, and vegetables are the second most valuable crop in Georgia with an
approximate farm-gate value of $901.2 million (Boatright and McKissick, 2003, p.59).
Vegetable growers in Georgia claim that eliminating MeBr will reduce yields and increase
production costs (Seabrook, 2005).
MeBr's contribution to agriculture, and its integral role in facilitating international trade
have lead to a general agreement that there needs to be allowances for “critical,” “quarantine,”

and “pre-shipment” uses. The Protocol states that a use of MeBr should qualify as “critical” only
if the nominating Party determines that its lack of availability would result in a significant
market disruption, and there are no technically and economically feasible alternatives available
that are acceptable from the standpoint of environment and health and are suitable to the crops
and circumstances of the nomination (UNEP, 2000). The phase-out schedule for developed
nations adheres to a 100% reduction by the year 2005 but allows for emergency uses after 2005.
Georgia producers must identify technically and economically feasible alternative
production methods as a replacement for MeBr. California and Florida have conducted
significant research examining alternatives and the economic impact resulting from the phase-
out. While Florida research has focused on preserving their market for fresh tomatoes,
California has focused on maintaining the production for fresh market strawberries. Because the
majority of experiments have focused on strawberries and tomatoes, yield data concerning other
vegetables had been limited (USDA ERS, 2001).
Unlike California, the main problem for Georgia and Florida producers has been the
control of nutsedge. Yellow and purple nutsedge are common weeds that thrive in the
southeastern U.S. due to its humid climate. In order to control for nutsedge, it is necessary to
apply a combination of plastic mulch, fumigants, and herbicides to crops such as tomato and
pepper (Gilreath et al., 2004). A list of fumigants such as metam sodium (MNa), chloropicrin
(teargas) (Pic), anhydrous ammonia (AHN4), and 1,3-dichloropropene (1,3-D) have been tested
in combination with the herbicides napropamide, metolachlor, and pebulate, and analyzed in
comparison to MeBr (Gilreath et al., 2003). Whereas these tests focused on identifying
comparable yield structures among alternative chemicals, the financial feasibility of these
substitutes was not a priority.

Empirical Framework
This study employs two analytical tools to analyze the comparative yield efficiency and
financial feasibility of three alternative fumigation-herbicide systems used in the field trials
conducted by UGA scientists in Tifton, Georgia relative to a base treatment method involving
MeBr. The first phase employs stochastic dominance analysis technique, a tool that considers
risk-return tradeoffs in identifying more efficient methods among alternative production plans.
The second phase employs optimization-simulation techniques in a multi-period programming
framework to determine the relative overall economic feasibility of optimal production and
financial plans prescribed under each of the production systems involving MeBr and its
substitutes.
Stochastic Dominance Analysis
Stochastic dominance analysis (SD) is an efficiency criteria used extensively by
agricultural economists to determine the risk efficient set of alternatives available to producers
when faced with uncertain outcomes. It allows for a ranking of alternatives based on a minimal
set of assumptions concerning producers' risk preferences. Researchers have developed multiple
variations of stochastic dominance but its two basic criterions are first-degree and second-degree
stochastic dominance.
In this analysis, we employ second-degree stochastic dominance (SSD) analysis, which
eliminates dominated or inefficient distributions from the first-degree stochastic dominance
(FSD) set (Anderson, 1977). This is accomplished by adding the assumption of risk aversion to
the decision making process with respect to agents' preferences.
Similar to FSD, SSD ranks alternative states by first interpreting their respective
probability density functions as cumulative probability distribution functions (CDFs). A

distribution may be considered dominant if it "lies more to the right in terms of differences in
area between the CDF curves cumulated from the lower values of the uncertain quantity
(Anderson, 1977, p. 284)." Huang and Litzenberger mathematically define the necessary and
sufficient conditions for SSD given two mutually exclusive distributions associated with assets
A1 and B1. A1 is determined to be dominant to B1 if and only if:
(1) E [ r~ A] ≥ E [ r~ B]; and
(2) S(y) ≡ ∫ ≤−y
BA dzzFzF0
0))()(( ]1,0[∈∀y
The inequality (1) describes the sufficient condition for SSD where the expectation associated
with the rate of return for asset A must be greater than or equal to the expected rate of return for
asset B. S(y), which describes the sum of the areas between the distributions, must be
continuous and negative. A necessary condition for A to be SSD over B is that S(y) must be
equivalent to the difference between the integrals of the two distributions A and B where (z)
represents a given state of wealth (Huang and Litzenberger, 1988). SSD works with a more
restrictive set of assumptions about risk preferences to determine the most efficient set of
alternatives, and this implies that any state which is FSD over another state is also guaranteed to
be SSD.
Risk-averse agents seeking to maximize utility will never prefer a dominated distribution
(Anderson, 1977). Therefore, a second-degree stochastically efficient set of alternatives will be
comprised of only non-dominated distributions, and any further reduction of this set will require
additional assumptions concerning risk preferences (Anderson, 1977).
Methodology and Data Sources
Four variables are separately considered in the stochastic dominance analysis. The first
method uses a more aggregate yield measure that disregards the pepper grade components of

total yield data. The second approach considers only the jumbo (fancy pepper grade) yield
component which expectedly are more highly priced than the regular U.S. 1 & 2 pepper grade.
The third variable considers gross revenues where the grade components of total yield are
weighted by the grades’ respective prices. Under this approach, the experimental yields are
extrapolated to acre-scale revenues using a factor based on the size of the experimental plots
(0.001 of an acre). The fourth variable measures the net returns per acre derived from the
extrapolated experimental yields and the corresponding variable and fixed costs for each acre of
pepper farm operations.
The yield data used in this study were obtained from field trials conducted in 2002 and
2003 at the experimental plots of the university’s Rural Development Center in Tifton, Georgia.
The Center's agricultural economists, plant pathologists, and horticulturalists determined a set of
fumigants and herbicides to be tested through research of the scholarly literature (Culpepper and
Langston, 2000). These field experiments addressed major pest control concerns of Georgia bell
pepper farmers, and aimed to determine an effective control for nutsedge, a weed that cannot be
controlled with black plastic mulching. The experiments analyzed two herbicide systems (no
herbicides versus the Command-Devrinol-Dual Magnum prescription) and several fumigant
options on 6’x 35’ experimental plots (Culpepper and Langston, 2000). Results of these field
trials determined the fumigants’ overall ability to control nutsedge growth. The herbicide system
contributed to nutsedge control by increasing containment rate from 24% to 27% (Culpepper and
Langston).
The three alternative fumigant systems considered in this study involve (C35 + KPAM,
Telone II + Chloropicrin, and C35 + Chloropicrin) and each were separately combined with a
commonly prescribed herbicide system consisting of Clomazone (Command), Napropamide

(Devrinol), and s-metolachlor (Dual Magnum). While KPAM serves as an abbreviated term for
Metham potassium, C35 identifies a Telone II and Chloropicrin combination, and Telone II
represents 1,3-Dichloropropene.
The Multi-Period Programming Model
In the second phase of the analysis, the financial and production decisions of a
representative Georgia pepper farm are analyzed using simulation-optimization techniques in a
mathematical programming framework. The mathematical programming model analytically
investigates the decision maker's problem by developing a set of algebraic expressions that
attempts to fully characterize the relationships among decision variables and constraints inherent
to the operation. More specifically, the producer's goal in this study is to optimize his or her
expected utility of accumulated net worth over a specified planning period by solving for the
optimal values for a set of decision variables unique to their operations. This study used a linear
programming (LP) model where," the decision variables were chosen such that a linear function
of the decision variables was optimized and a simultaneous set of linear constraints on the
decision variables was satisfied (McCarl and Spreen, 1994, p.21)."
The necessary components of an LP model are the decision variables, objective function,
and constraints. The resultant levels of a set of decision variables (xj), of which there are n (j=1,
2 …, n), quantify the amount employed of the respective unknowns (McCarl and Spreen, 1994).
The linear programming problem can be stated in matrix format as:
(3) Max Z = CX
s.t. AX ≤ b
X ≥ 0

where Z is a matrix of the total objective value, C is a column vector representing the
contribution of each unit of X to the objective function, A is the use of the items in the ith
constraint by one unit of xj, and b is the upper limit imposed by each constraint (McCarl and
Spreen, 1994). The final inequality imposes a non-negativity constraint on the decision
variables.
The LP model assumes risk-neutrality on the part of the decision maker because the
model strictly accounts for the net changes in final wealth regardless of the agent's risk
considerations (Gwinn, Barry, Ellinger; Barry and Willmann; Escalante and Barry). The model
operates under a five-year planning horizon in its determination of the producer's optimal net
accumulation of wealth or net income over this period. The final accumulation of net worth is
calculated by accruing the values of farmland, equipment, and cash balance at the end of the
planning horizon less all financing charges contracted over the same period (Gwinn, Barry,
Ellinger; Barry and Willmann; Escalante and Barry).
The model’s empirical properties resemble previous multi-period programming models
(Barry and Willmann; Gwinn, Barry and Ellinger) that define a large matrix of activities and
constraints where sub-matrices along the main diagonal elements correspond to the time periods
and off-diagonal elements provide information on transfers among the model’s activities. The
major activities include production and marketing, land and machinery investments, related
borrowing alternatives, farmland leasing under cash rent conditions, short-term borrowing, off-
farm investments, liquidity management, consumption, and taxation. The constraints establish
limits on land availability, machinery requirements, off-farm investments, consumption, and
borrowing levels. In order to capture the timing of certain cash flows within a particular year, the
model has two sub-periods in its cash transfer equations.

The final goal of optimizing a producer's net worth is predicated and works in
conjunction with a simulation procedure that begins with the analysis of a base-case
representative farm model. The base model accounts for the activity measures and financial
conditions of a typical producer’s operations. Adjustments to components of the base model
reveal variations in the profitability and cost structure of the farm’s operations. In this study,
modifications to the base model are conducted by adjusting the production method as defined by
the fumigants and herbicides employed as chemical controls on the farm. More specifically, the
production method using MeBr and an accompanying menu of herbicides is chosen to serve as
the base-case. The other three alternative fumigation methods, using the same herbicide system
as that in the MeBr system, are then tested against this base-case.
The Representative Georgia Pepper Farm
The simulation-optimization analysis is applied to a representative Georgia pepper farm
whose conditions define the initial resource, financial condition, and operating levels of the base
farm model considered in this study. The financial attributes of this base farm were constructed
according to the average financial operating conditions of approximately 50 farms registered
with the Georgia Farm Business Farm Management Association in 2001. The initial farm size of
this study’s representative farm is 362 acres, of which 300 acres are owned by the farm operator
and 62 acres are rented.
The farm’s pre-operating balance sheet declares a total farm asset value $1,843,234,
which includes $468,900 worth of machinery and equipment and farmland value of $645,000.
The farm’s assets were financed by current ($241,688), intermediate ($422,010) and long-term
($350,099) debts as well as the farm’s equity funds ($829,437). Based on these figures, the
firm’s debt-to asset ratio is 0.55.

The family’s annual living expenditures in the pre-operating year amount to $31,729,
excluding income taxes. That year, the farm generated a net farm income before tax of $20,171
plus a net non-farm income before tax of $13,180.
Results The results of the two analytical methods are presented in Tables 1, 2 and 3. The effect
of risk aversion on producers’ preferred rankings of alternative production systems is considered
in the stochastic dominance analysis. In this approach, two scenarios are modeled by setting the
risk aversion coefficients at 0.00004 and 0.004 (which are within the acceptable range
determined by Babcock, Choi, and Feinerman) to represent conditions of low and high risk
aversion, respectively. This approach complements the second analytical tool, the linear
programming model that does not involve a risk component, owing to the absence of historical
data on actual yield returns under the alternative fumigation-herbicide systems. Such data are
necessary to construct a variance-covariance matrix to represent risk in the multi-period
programming model.
Stochastic Dominance Rankings and Risk Aversion
Based on total experimental yields (Table 1), the C35-KPAM is the most preferred
production method under both low and high levels of risk aversion. This method produced the
highest mean yield of 36.33 lbs per plot, but has a high relative variability with its coefficient of
variation (CV) of 0.4737 ranking 2nd among the four production systems. MeBr, despite its low
relative variability (CV) of 0.4582, could not overtake C35-KPAM in the overall rankings due to
its mean yield of only 32.67 lbs. per plot. C35-Pic and T2-Pic are in 3rd and 4th places,
respectively, in the both the low and high risk aversion categories. While C35-Pic has the least

volatile yield results, its mean yield of 32.33 lbs per plot is too low to enable it to dominate C35-
KPAM in the preference rankings.
The preference ordering based on jumbo or fancy pepper grade alone reveals the
vulnerability of the MeBr method vis-à-vis the three other methods. MeBr’s mean jumbo yield
of 10.22 lbs per plot is eclipsed by the top two jumbo yields of 15.00 and 12.56 lbs per plot
delivered by the C35-KPAM and T2-Pic methods, respectively. The preference rankings are
identical in both the low and high risk aversion categories.
The gross revenue rankings introduce the price component to serve as weights for the
different pepper grades and, thus, capture variations in the pepper grade compositions in the four
production methods. Consistent with the total and jumbo yield rankings, C35-KPAM dominates
the other three production methods in the gross revenue rankings with its mean of $14,821 per
acre (highest mean) despite its highly variable revenue structure (CV of 0.4472). MeBr’s
second-place rank in terms of total yield is pulled down in the gross revenue rankings due to its
inferior yield structure of its jumbo yield, which commands a higher price than the US 1&2
pepper grade. MeBr is ranked third by the less risk averse decision maker while the more risk
averse considers it the least preferred method. C35-Pic, which consistently ranks third in both
total and jumbo yields, has the least variable gross revenue structure (CV of 0.3542) and ranks
second under both categories of risk aversion.
Rankings based on net returns expand the perspective on gross revenue analysis by
introducing the effect of cost structures. Table 1 provides supplemental information on the
applicable production costs (obtained from agricultural economists, crop scientists and
commercial suppliers of farm inputs in Tifton, Georgia) to better understand the derivation of net
returns. Farmers and analysts argue that MeBr’s advantage of cost efficiency is difficult to

match. The summary in Table 1 supports the argument that the MeBr method requires the least
fumigation cost per carton and fixed cost per acre. However, UGA researchers have prescribed
such methods as C35-KPAM and T2-Pic that nearly match MeBr's cost efficiency. For example,
C35-KPAM requires a slightly lower variable cost per carton of $9.61 versus MeBr’s $9.64.
Among the three alternative methods, T2-Pic’s fumigation cost per carton of $0.47 comes closest
to MeBr’s $0.35.
Factoring both gross revenue and cost structures into the equation, the net return rankings
favor C35-KPAM and T2-Pic over MeBr. C35-KPAM’s ranking is not surprising, considering
its consistently high placement in all previous categories of our analysis (total yield, jumbo yield
and gross revenues). T2-Pic, which ranks in the last two places in the gross revenue rankings, is
the most preferred method by the more risk averse decision-maker, mainly owing to this
method’s CV of 0.9630 (the lowest among the 4 methods). C35-Pic, the most expensive
production method based on the cost summary in Table 1, is the least preferred method under
both categories of risk aversion, and this cost disadvantage pulls down its second place finish in
the gross revenue rankings.
Optimal Production Plans
The LP model delivers solutions to the optimization problem for each period throughout
the five year time horizon. Additions and/or reductions to both the farm’s assets and liabilities
dictate adjustments to the final value of accumulated net worth. These adjustments can be made
through increases or decreases in the model’s decision variables representing land purchases,
cash-rented acreage, new equipment purchases, off-farm investments, incremental short-,
intermediate-, and long-term debt.

Each simulation of the four production methods began with an identical set of
assumptions concerning specific attributes of the representative farm. For example, beginning
land values and cash rent levels, equipment costs, family consumption, off-farm income and
yields on off-farm investments, depreciation schedules, and interest on credit facilities were
constant values at time T(0) for all methods. Variables such as the projected variable costs per
acre, gross returns per acre, overhead costs per acre, farm wage rates and net margins per acre
were forecast to increase due to inflation over the planning period.
Conveying the LP solutions for the production variables as five-year averages, the
summary in Table 2 indicates that the two dominant methods MeBr and C35-KPAM yield
similar solutions to the production problem over the planning period. The LP set an upper limit
constraint on total production of 1,000 acres per method. The more detailed yearly programming
solutions in Table 3 provide some interesting trends in production and financing decisions made
under the different production systems. For instance, while both MeBr and C35-KPAM
produced the limit of 1,000 acres each year (Table 2), the yearly results in Table 3 indicate that
the MeBr solutions prescribe a purchase of seven acres more and a renting of seven acres less
than the solutions prescribed for C35 + KPAM in year T(1).
Note that the solutions for land purchase activity measures are incremental measures that
express the additional acres purchased in excess of the initial endowment of 300 acres. The
values for acres rented do not accumulate during the planning period. Producers rent land for a
period of one year, and at the beginning of the next period must again decide how much acreage
to devote to renting. This figure is then carried over and added to purchases made during the
next period, with this process being repeated over the life of the planning period.

In year T(2) the model predicted that the farmer purchased an additional 93 acres under
the MeBr method, nine less than that purchased under C35-KPAM. However, the MeBr method
required renting of two more acres than the C35-KPAM solution in the same year. For the last
three years of the five-year period, the amount of land purchased and rented by each method
remained nearly identical. Finally, it is expected that relaxing the constraint on farm size would
result in increased production under MeBr and C35-KPAM. However, the results of the model
suggest growers would plant more under the C35 + KPAM method when compared to MeBr due
to a more favorable financial position over the planning period.
The model solutions for C35-Pic and T2-Pic suggested increases in production through
cash-renting although neither reached the 1,000 acre limit. Over the planning period, the C35-
Pic method required cash renting of an average of 586 acres per year while T2-Pic’s average
cash rented acres was 587 acres per year. No land purchases were prescribed for both of these
methods over the entire period. The farm size solutions for these methods were nearly identical.
These preferences for different farmland control strategies are reflected in the tenure
(proportion of owned land to total tillable acres) ratios reported in Table 2. The five-year
average ratios for MeBr and C35-KPAM (0.4530 and 0.4350, respectively) are higher than those
obtained for the other two production methods. These results indicate that the returns and cash
flow available to producers under the MeBr and C35-KPAM methods are more favorable and
encourage more investments in farmland relative to the other two methods.
Discrepancies among solutions for the financial decision variables were pronounced
between the methods MeBr and C35 –KPAM versus C35-Pic and T2-Pic. Each of the four farm
models began with an initial allocation of off-farm investments totaling $100,000. The former
two methods realized off-farm investments of approximately $1.5 million per year over five

years (Table 2). On the other hand, methods C35-Pic and T2-Pic were prescribed equal solutions
of $393,840 invested in off-farm activities per year when averaged over the planning period.
In terms of liquidity, all current ratio results are highly favorable as the farm relies less on
short-term credit to finance operating capital requirements and, at the same time, accumulates
off-farm investments that increase total current assets. C35-KPAM with a current ratio of 331.59
had the highest liquidity. MeBr was also highly liquid with a ratio of 310.72. The ratios for all
four methods were well above the critical value (around 2.0 times as established by some
analysts for certain enterprises) and indicated that each had the ability to quickly pay off short-
term debts.
Leverage positions, as measured by the debt-asset ratio, are likewise favorable under all
production methods. Debt-to-asset ratios ranged from less than one percent (.008 for C35-
KPAM) to a high of approximately .027 for T2-Pic.
The ratio of off-farm investments to total assets reveals that more money is allocated
outside of the primary revenue generating activities of the farm for MeBr and C35- KPAM
where off-farm investments represent about 3% of all assets. A slightly lower proportion (about
2%) is obtained for the other two methods.
Finally, the accumulated net worth of each simulated farm increased over the planning
horizon. The pre-operating net worth attributed to all methods was $829,437. The net worth
solution prescribed by the C35-KPAM model ranked first among all methods and indicated that a
producer employing this method would realize an average of $49.7 million over the planning
period. The net worth solution for MeBr determined in the first year of simulation was
approximately $11,688,000, and after five years increased to a maximum value of $80.8 million
in T (5), indicating an average five-year value of $46.7 million. Five-year average net worth

values for C35-Pic and T2-Pic were $17.5 million and $171.1 million, respectively. The
dominant net worth positions prescribed by the MeBr and C35-KPAM models can be attributed
to the gains resulting from greater production under these methods. A final comparison of the
solutions specified by the model establishes C35-KPAM as not only a viable, comparable
alternative to MeBr in terms of liquidity, leverage, and tenure, but also the preferred method in
terms of the accumulated value of net worth.
Summary and Conclusions
The two-year UGA field experiments have identified at least three production systems
involving combinations of three fumigant chemicals and a commonly prescribed herbicide
system that have effectively controlled pest and weed (especially nutsedge) growth.
Additionally, these systems have produced equal or higher yields than the MeBr system, which
has proven to be a reliable, affordable, and effective fumigant. This study extends the efficiency
analysis by utilizing stochastic dominance techniques to compare the production and financial
efficiencies of MeBr and alternative production systems. The analytical framework also
accounts for the effect of producers' risk attitudes on the efficiency rankings of the four methods.
Results of our analyses indicate that under both conditions of low and high risk aversion, only
the C35-KPAM method outperforms the MeBr method in total yields, although all three
alternative methods dominated the MeBr method in jumbo pepper production. With prices for
the different pepper grades applied as weights to generate gross revenues and further considering
all operating costs to calculate net enterprise returns, C35-KPAM was the only method that
consistently outperformed MeBr in terms of both gross revenues and net returns. Notably,
another alternative method, T2-Pic, dominated MeBr method in net returns. The C35-Pic
method produced the least favored risk-return profile for both the less and highly risk-averse

decision maker. The dominance of the C35-KPAM and T2-Pic methods in terms of net returns
can be attributed to their comparable production cost structure to the MeBr method as well as
their more favorable yield structure characterized by their ability to produce a larger proportion
of the highly-priced Jumbo peppers vis-à-vis the regular U.S. 1& 2 pepper variety.
The cost-return estimates under the four production methods were further analyzed using
simulation-optimization techniques under a multi-period programming framework. Results
indicate almost similar optimal production and financing plans for MeBr and C35-KPAM
methods. Under these methods, optimal farm size solutions are prescribed at the maximum
acreage limit set, with greater reliance on land ownership than cash renting. Optimal financing
plans for these methods include prudent debt management decisions where short-term credit
facilities and internally generated funds are used as complementary sources of financing for
operating capital requirements. Portions of retained earnings in each year are allocated to off-
farm investments to diversify the farm’s asset portfolio. Overall, liquidity and leverage positions
were maintained at favorable levels during the five-year period.
Our results suggest that economically viable alternatives exist for Georgia pepper
producers to replace MeBr. However, the successful adoption of these alternatives has yet to be
determined and could depend on two critical factors. First, producers have relied on the MeBr’s
ability to eradicate diseases, weeds, and pests over a wide range of environmental conditions and
growing conditions. Actual on-farm use of the suggested fumigants can only ascertain whether,
like MeBr, the alternatives are equally flexible and adaptable to different farm conditions (such
as irrigation levels, soil conditions, diseases, or pests not captured by the experiments).
Moreover, producers have already established the consistency of yields under MeBr over time.
Although alternatives have been found to be equally (at times even more) effective in

experimental trials, there is not enough information that they can deliver consistent yields over
the long-term.

REFERENCES
Anderson, J.R., J.L. Dillon, and B. Hardaker. Agricultural Decision Analysis, 1st ed. Ames, Iowa: Iowa State University Press, 1977. pp. 65-108. Babock, B. A., E. K. Choi and E. Feinerman. "Risk and Probability Premiums for CARA Utility Functions." Journal of Agricultural and Resource Economics 18(1993): 17-24. Barry, P. J. and D. R. Willman. “A Risk Programming Analysis of Forward Contracting with Credit Constraints.” American Journal of Agricultural Economics. 58(1976):62-70. Carpenter J., L. Gianessi, and L. Lynch. "The Economic Impact of the Scheduled U.S. Phaseout of Methyl Bromide." National Center for Food and Agricultural Policy, 2000. Culpepper, S. and D.B. Langston. "Replacement of Methyl Bromide by Integrating the Use of Alternative Soil Fumigants, Cultural Practices, and Herbicides for Tomato, Pepper, and Watermelon." Proposal for CSREES/IFAFS for Program Area Entitled Critical and Emerging Pest Management Challenges. Pro. No.14. (2000). Escalante, C.L. and P.J. Barry. “Risk Balancing in an Integrated Farm Risk Management Plan.” Journal of Agricultural and Applied Economics 33,3(December 2001):413-29. Gilreath, J.P., J.W. Noling, and B.M. Santos. "Methyl bromide alternatives for bell pepper (capsicum annuum) and cucumber (Cucumis sativas) rotations." Crop Protection. September 2003: pp.1-5. Gilreath, J.P., and B.M. Santos. "Efficacy of Methyl Bromide Alternatives on Purple Nutsedge Control (Cyperus rotundus) in Tomato and Pepper." Weed Technology. 18(2004): pp.141-145. Gwinn, A. S., P. J. Barry and P. N. Ellinger. “Farm Financial Structure under Uncertainty: An Application to Grain Farms.” Agricultural Finance Review. 52(1992): 43-56. Huang, C., and R. Litzenberger. Foundations for Financial Economics. Upper Saddle River, New Jersey: Prentice-Hall, 1988. McCarl, B.A., and T.H. Spreen. Applied Mathematical Programming Using Algebraic Systems. College Station, Texas: Texas A&M University, 1994. Seabrook, C. "Vegetable growers rely on ozone-depleting gas." The Atlanta Journal and Constitution. February, 2005. United Nations, Environment Programme. The Montreal Protocol on Substances that Deplete the Ozone Layer. New York, 2000.

University of Georgia, College of Agricultural and Environmental Sciences. 2003 Georgia Farm Gate Vegetable Survey Report. Compiled by Susan R. Boatright and John C. McKissick. SR-04-01 (pp.1-10) USDA, ERS. Vegetables and Melons Outlook. December 2001. http://www.ers.usda.gov/publications/so/view.asp?f=/specialty/vgs-bb/ (Last Accessed July 2005)

Table 1. Descriptive Statistics and Results of Second Degree Stochastic Dominance (SDSD) Analysis under Different Levels of Risk Aversion
Production Methods Measures/ Rankings MEBR C35 + KPAM T2 + PIC C35 + PIC
A. Based on Total Yield Mean yield (lbs./0.001 acre) 32.67 36.33 31.33 32.33 Standard Deviation 14.97 17.21 14.96 12.56 Coefficient of Variation 0.4582 0.4737 0.4774 0.3884 SDSD Rank, Low Risk Aversion 2 1 4 3 SDSD Rank, High Risk Aversion 2 1 3 4B. Based on Jumbo (Fancy Pepper Grade) Yield Mean yield (lbs/0.001 acre) 10.22 15.00 12.56 10.56 Standard Deviation 3.03 3.85 2.79 4.22 Coefficient of Variation 0.2966 0.2565 0.2221 0.3994 SDSD Rank, Low Risk Aversion 4 1 2 3 SDSD Rank, High Risk Aversion 4 1 2 3C. Based on Gross Revenues Mean revenues ($/acre)* 12,980.63 14,821.43 12,741.59 12,894.44 Standard Deviation 5,623.67 6,628.20 5,635.27 4,566.92 Coefficient of Variation 0.4332 0.4472 0.4423 0.3542 SDSD Rank, Low Risk Aversion 3 1 4 2 SDSD Rank, High Risk Aversion 4 1 3 2D. Based on Net Returns Fumigation cost per ctn** ($) 0.35 0.61 0.47 0.87 Variable cost per ctn** ($) 9.64 9.61 9.90 10.22 Fixed cost per acre ($) 860 920 879 954 Mean net returns ($/acre)* 5,579.21 6,694.25 5,851.59 3,910.07 Standard Deviation 5,623.67 6,628.20 5,635.27 4,566.92 Coefficient of Variation 1.0080 0.9901 0.9630 1.1680 SDSD Rank, Low Risk Aversion 3 1 2 4 SDSD Rank, High Risk Aversion 3 2 1 4
*Gross revenues and net returns were derived from enterprise budgets prepared for an acre of pepper farm operation. For purposes of this analysis, the yield results obtained from the 0.001 experimental plots were, therefore, extrapolated into one-acre operations to generate the gross revenue and net return estimates. ***A carton (ctn) is approximately equivalent to 28 lbs of pepper.

Table 2. Programming Solutions and Financial Ratios, Five-Year Averages
Production Methods Activity Measures/ Ratios MEBR C35 + KPAM C35 + PIC T2 + PIC
Farm Size (acres) 1,000 1,000 886 887Incremental land purchases (acres) 435 435 300 300Acres rented 565 565 586 587Incremental equipment purchases ($)
$0 $0 $22,416 $32,276
Off-farm Investments ($) $1,528,000 $1,520,800 $393,840 $393,840Current Assets ($) $45,485,200 $48,541,400 $9,857,504 $16,309,720Total Assets ($) $47,081,400 $50,137,600 $17,961,600 $17,622,800Current Liabilities ($) $146,386 $146,386 $156,714 $162,110Total Liabilities ($) $420,840 $420,840 $453,946 $469,268Net Worth ($) $46,660,800 $49,717,000 $17,507,660 $17,153,500
Tenure Ratio 0.4530 0.4350 0.3386 0.3382
Current Ratio 310.7210 331.5987 62.9012 100.6090
Debt-to-Asset Ratio 0.0089 0.0084 0.0253 0.0266Off-farm Investment-Total Assets Ratio 0.0325 0.0303 0.0219 0.0223
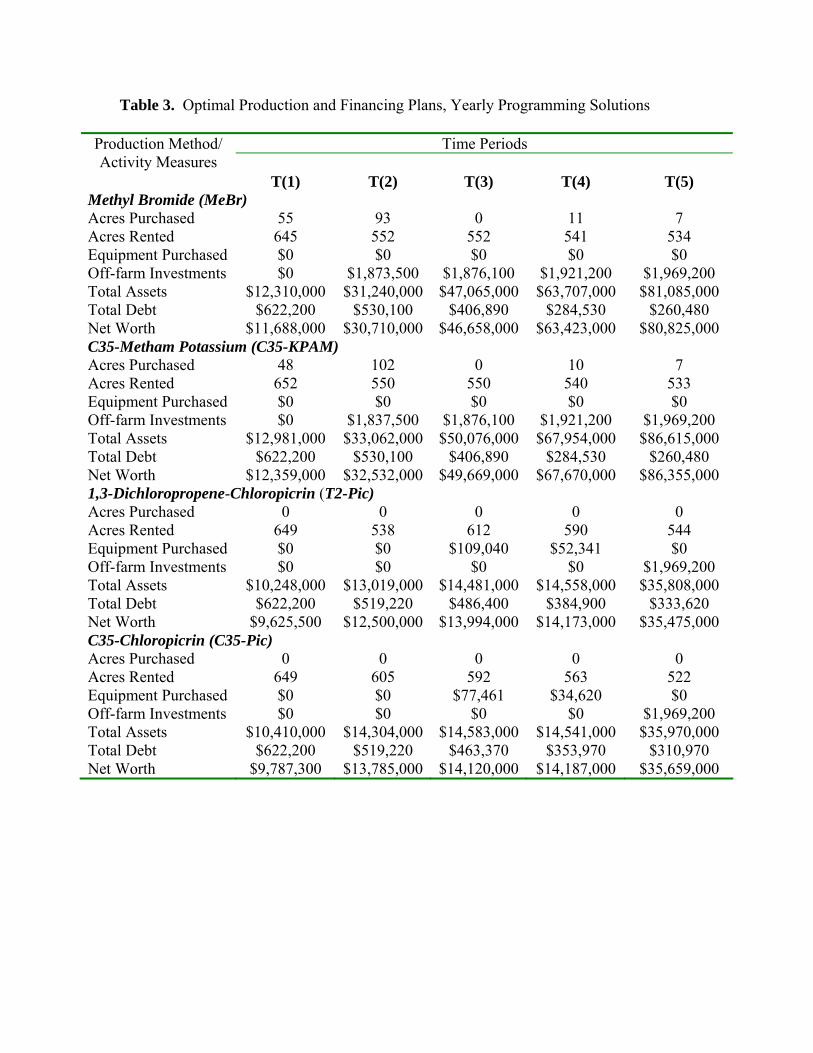
Table 3. Optimal Production and Financing Plans, Yearly Programming Solutions
Time Periods Production Method/ Activity Measures
T(1)
T(2)
T(3)
T(4)
T(5) Methyl Bromide (MeBr) Acres Purchased 55 93 0 11 7 Acres Rented 645 552 552 541 534 Equipment Purchased $0 $0 $0 $0 $0 Off-farm Investments $0 $1,873,500 $1,876,100 $1,921,200 $1,969,200 Total Assets $12,310,000 $31,240,000 $47,065,000 $63,707,000 $81,085,000 Total Debt $622,200 $530,100 $406,890 $284,530 $260,480 Net Worth $11,688,000 $30,710,000 $46,658,000 $63,423,000 $80,825,000 C35-Metham Potassium (C35-KPAM) Acres Purchased 48 102 0 10 7 Acres Rented 652 550 550 540 533 Equipment Purchased $0 $0 $0 $0 $0 Off-farm Investments $0 $1,837,500 $1,876,100 $1,921,200 $1,969,200 Total Assets $12,981,000 $33,062,000 $50,076,000 $67,954,000 $86,615,000 Total Debt $622,200 $530,100 $406,890 $284,530 $260,480 Net Worth $12,359,000 $32,532,000 $49,669,000 $67,670,000 $86,355,000 1,3-Dichloropropene-Chloropicrin (T2-Pic) Acres Purchased 0 0 0 0 0 Acres Rented 649 538 612 590 544 Equipment Purchased $0 $0 $109,040 $52,341 $0 Off-farm Investments $0 $0 $0 $0 $1,969,200 Total Assets $10,248,000 $13,019,000 $14,481,000 $14,558,000 $35,808,000 Total Debt $622,200 $519,220 $486,400 $384,900 $333,620 Net Worth $9,625,500 $12,500,000 $13,994,000 $14,173,000 $35,475,000 C35-Chloropicrin (C35-Pic) Acres Purchased 0 0 0 0 0 Acres Rented 649 605 592 563 522 Equipment Purchased $0 $0 $77,461 $34,620 $0 Off-farm Investments $0 $0 $0 $0 $1,969,200 Total Assets $10,410,000 $14,304,000 $14,583,000 $14,541,000 $35,970,000 Total Debt $622,200 $519,220 $463,370 $353,970 $310,970 Net Worth $9,787,300 $13,785,000 $14,120,000 $14,187,000 $35,659,000