
Seasonal cycles of nonmethane hydrocarbons and methyl chloride, as derived from firn air from...
11
Seasonal cycles of nonmethane hydrocarbons and methyl chloride, as derived from firn air from Dronning Maud Land, Antarctica K. A. Kaspers, 1 R. S. W. van de Wal, 1 J. A. de Gouw, 1,2 C. M. Hofstede, 1 M. R. van den Broeke, 1 C. H. Reijmer, 1 C. van der Veen, 1 R. E. M. Neubert, 3 H. A. J. Meijer, 3 C. A. M. Brenninkmeijer, 4 L. Karlo ¨f, 5 and J.-G. Winther 5 Received 12 February 2004; revised 19 May 2004; accepted 7 June 2004; published 28 August 2004. [1] This paper presents atmospheric concentrations of ethane, propane, acetylene, and methyl chloride, inferred from firn air by using a numerical one-dimensional firn diffusion model. The firn air was collected on the Antarctic plateau in Dronning Maud Land during the Norwegian Antarctic Research Expedition (NARE) 2000/2001. The influences of seasonal variations in temperature and pressure and the variation in accumulation rate were studied and are not negligible, but appear to cancel each other out if all variability is taken into account. This paper also demonstrates that firn air from the uppermost firn layer (30 m) can be used to derive seasonal cycles of these trace gases, without needing a year-round facility. These cycles display higher atmospheric mixing ratios during the Antarctic winter and lower atmospheric mixing ratios in summer. The cycles for the year 2000 show amplitudes of 140 ± 25 ppt for ethane, 30 ± 10 ppt for propane, 24 ± 6 ppt for acetylene, and 40 ± 20 ppt for methyl chloride. For ethane and propane the amplitudes and months of maximum atmospheric concentration (phase) are in reasonable agreement with year-round measurements at the South Pole and Baring Head (New Zealand). The amplitudes for methyl chloride and acetylene are significantly greater than seen in year-round measurements at the South Pole and at Neumayer (Antarctica), although the phase is in line. While biomass burning and removal by OH radicals can partially explain these large amplitudes, the exact cause still remains unclear for methyl chloride and acetylene. INDEX TERMS: 0365 Atmospheric Composition and Structure: Troposphere—composition and chemistry; 0368 Atmospheric Composition and Structure: Troposphere— constituent transport and chemistry; KEYWORDS: firn air, seasonal cycles, NMHC, methyl chloride Citation: Kaspers, K. A., et al. (2004), Seasonal cycles of nonmethane hydrocarbons and methyl chloride, as derived from firn air from Dronning Maud Land, Antarctica, J. Geophys. Res., 109, D16306, doi:10.1029/2004JD004629. 1. Introduction [2] This paper shows that it is possible to infer seasonal trace gas cycles from firn air samples instead of direct atmospheric measurements. This eliminates the need for a year-round operating facility to carry out atmospheric measurements. [3] Trace gas data from the Antarctic continent can help clarify the concentration variations of nonmethane hydro- carbons (NMHCs; in this paper, ethane (C 2 H 6 ), propane (C 3 H 8 ) and acetylene (C 2 H 2 )). NMHCs and methyl chloride play a major role in atmospheric photochemistry, which is the most important determinant of the atmosphere’s oxidizing capacity. Understanding the behavior of NMHCs and methyl chloride in the troposphere will not only improve our understanding of atmospheric photochemistry, but will also help clarify atmospheric transport processes [Scheeren et al., 2002]. [4] Although a number of measurements of NMHCs and methyl chloride have been carried out in the Southern Hemisphere (e.g., STRATOZ II flight campaign [Schmidt et al., 1982]) and during ship cruises [Rudolph et al., 1982; Bonsang and Lambert, 1985], only a few records were long enough to derive seasonal cycles. The earliest long-term measurements covering several seasonal cycles of NMHCs in the Southern Hemisphere, were made by Rudolph et al. [1989] and Bonsang et al. [1990] at Neumayer station, Antarctica and Amsterdam Island, respectively. In 1992, Rudolph et al. [1992] characterized marine boundary layer air conditions over the Antarctic coast of Dronning Maud Land and showed seasonal cycles and their year-to-year variations for NMHCs measured at Neumayer station from 1982 to 1990. More recently, Clarkson et al. [1997] published seasonal cycles for ethane and propane at the JOURNAL OF GEOPHYSICAL RESEARCH, VOL. 109, D16306, doi:10.1029/2004JD004629, 2004 1 Institute for Marine and Atmospheric Research Utrecht, Utrecht University, Utrecht, Netherlands. 2 Now at NOAA Aeronomy Laboratory, Boulder, Colorado, USA. 3 Centre for Isotope Research, University of Groningen, Groningen, Netherlands. 4 Max Planck Institute for Chemistry, Mainz, Germany. 5 Norwegian Polar Institute, Polar Environmental Centre, Tromsø, Norway. Copyright 2004 by the American Geophysical Union. 0148-0227/04/2004JD004629$09.00 D16306 1 of 11
-
Upload
independent -
Category
Documents
-
view
4 -
download
0
Transcript of Seasonal cycles of nonmethane hydrocarbons and methyl chloride, as derived from firn air from...

Seasonal cycles of nonmethane hydrocarbons and methyl chloride, as
derived from firn air from Dronning Maud Land, Antarctica
K. A. Kaspers,1 R. S. W. van de Wal,1 J. A. de Gouw,1,2 C. M. Hofstede,1
M. R. van den Broeke,1 C. H. Reijmer,1 C. van der Veen,1 R. E. M. Neubert,3
H. A. J. Meijer,3 C. A. M. Brenninkmeijer,4 L. Karlof,5 and J.-G. Winther5
Received 12 February 2004; revised 19 May 2004; accepted 7 June 2004; published 28 August 2004.
[1] This paper presents atmospheric concentrations of ethane, propane, acetylene, andmethyl chloride, inferred from firn air by using a numerical one-dimensional firn diffusionmodel. The firn air was collected on the Antarctic plateau in Dronning Maud Land duringthe Norwegian Antarctic Research Expedition (NARE) 2000/2001. The influences ofseasonal variations in temperature and pressure and the variation in accumulation ratewere studied and are not negligible, but appear to cancel each other out if all variabilityis taken into account. This paper also demonstrates that firn air from the uppermostfirn layer (30 m) can be used to derive seasonal cycles of these trace gases, withoutneeding a year-round facility. These cycles display higher atmospheric mixingratios during the Antarctic winter and lower atmospheric mixing ratios in summer. Thecycles for the year 2000 show amplitudes of 140 ± 25 ppt for ethane, 30 ± 10 ppt forpropane, 24 ± 6 ppt for acetylene, and 40 ± 20 ppt for methyl chloride. For ethane andpropane the amplitudes and months of maximum atmospheric concentration (phase) arein reasonable agreement with year-round measurements at the South Pole and BaringHead (New Zealand). The amplitudes for methyl chloride and acetylene are significantlygreater than seen in year-round measurements at the South Pole and at Neumayer(Antarctica), although the phase is in line. While biomass burning and removal by OHradicals can partially explain these large amplitudes, the exact cause still remains unclearfor methyl chloride and acetylene. INDEX TERMS: 0365 Atmospheric Composition and Structure:
Troposphere—composition and chemistry; 0368 Atmospheric Composition and Structure: Troposphere—
constituent transport and chemistry; KEYWORDS: firn air, seasonal cycles, NMHC, methyl chloride
Citation: Kaspers, K. A., et al. (2004), Seasonal cycles of nonmethane hydrocarbons and methyl chloride, as derived from firn air
from Dronning Maud Land, Antarctica, J. Geophys. Res., 109, D16306, doi:10.1029/2004JD004629.
1. Introduction
[2] This paper shows that it is possible to infer seasonaltrace gas cycles from firn air samples instead of directatmospheric measurements. This eliminates the need fora year-round operating facility to carry out atmosphericmeasurements.[3] Trace gas data from the Antarctic continent can help
clarify the concentration variations of nonmethane hydro-carbons (NMHCs; in this paper, ethane (C2H6), propane(C3H8) and acetylene (C2H2)). NMHCs and methyl chlorideplay a major role in atmospheric photochemistry, which
is the most important determinant of the atmosphere’soxidizing capacity. Understanding the behavior of NMHCsand methyl chloride in the troposphere will not onlyimprove our understanding of atmospheric photochemistry,but will also help clarify atmospheric transport processes[Scheeren et al., 2002].[4] Although a number of measurements of NMHCs and
methyl chloride have been carried out in the SouthernHemisphere (e.g., STRATOZ II flight campaign [Schmidtet al., 1982]) and during ship cruises [Rudolph et al., 1982;Bonsang and Lambert, 1985], only a few records were longenough to derive seasonal cycles. The earliest long-termmeasurements covering several seasonal cycles of NMHCsin the Southern Hemisphere, were made by Rudolph et al.[1989] and Bonsang et al. [1990] at Neumayer station,Antarctica and Amsterdam Island, respectively. In 1992,Rudolph et al. [1992] characterized marine boundary layerair conditions over the Antarctic coast of Dronning MaudLand and showed seasonal cycles and their year-to-yearvariations for NMHCs measured at Neumayer station from1982 to 1990. More recently, Clarkson et al. [1997]published seasonal cycles for ethane and propane at the
JOURNAL OF GEOPHYSICAL RESEARCH, VOL. 109, D16306, doi:10.1029/2004JD004629, 2004
1Institute for Marine and Atmospheric Research Utrecht, UtrechtUniversity, Utrecht, Netherlands.
2Now at NOAA Aeronomy Laboratory, Boulder, Colorado, USA.3Centre for Isotope Research, University of Groningen, Groningen,
Netherlands.4Max Planck Institute for Chemistry, Mainz, Germany.5Norwegian Polar Institute, Polar Environmental Centre, Tromsø,
Norway.
Copyright 2004 by the American Geophysical Union.0148-0227/04/2004JD004629$09.00
D16306 1 of 11

South Pole and at Baring Head, New Zealand. Khalil andRasmussen [1999] determined the seasonal cycle for methylchloride at the South Pole for the period 1983 to 1997.[5] The previous studies were all based on direct mea-
surements, but air stored in Antarctic firn preserves a recordof past atmospheric composition and can provide usefultrace gas data as well. Air at the firn surface diffuses intothis porous medium until the open pores are sealed off as aresult of the increasing density of the firn with depth. Owingto the decreasing diffusion rate of the air with depth,seasonal variations can only be observed in the upper partof the firn. By using a one-dimensional (1-D) numerical firndiffusion model, we were able to derive the seasonal cyclefor NMHCs and methyl chloride from firn air. We includedan investigation into the effects of local meteorologicalvariability on firn air diffusion, to make sure that the signalwe observed in the firn air is not due to meteorologicalvariations over a year.[6] This paper is organized as follows. In the next section,
we briefly describe the firn sampling procedure and firn airmeasurements, and then continue with a brief description ofthe diffusion model. In section 4, we discuss experiments toinvestigate the model’s sensitivity to seasonal variability inthe meteorological parameters (temperature, pressure andaccumulation). We then present the retrieved seasonalcycles for the NMHCs and methyl chloride.
2. Sampling and Analysis
[7] Firn air samples were all collected in January 2001(all samples within 6 days) at site M (75.00�S, 15.00�E,3453 m a.s.l.) on the Antarctic plateau in Dronning MaudLand during the NARE 2000/2001 expedition [Winther etal., 2002]. Owing to the low annual mean temperature(�51�C), pressure (615 hPa) and accumulation (5.0 cmw.e.a�1) at this site [Winther et al., 1997; van den Broeke etal., 1999], the density (r) of the firn increases only slowlywith depth. Pore close-off, where r becomes 830 kg m�3, islocated at 101 ± 1 m.[8] We used a firn air pumping system [Braunlich et al.,
2001] to sample firn air after every 8 m of drilling until poreclose-off. After 8 m of drilling, the drill was removed and a5-m-long inflatable rubber bladder was inserted to seal theborehole and prevent contamination from the surface. Two100-m-long 3/8-inch tubes made of perfluor alkoxy alkane(PFA) penetrated through the bladder and connected thebottom of the borehole with the pumping system at thesurface. Prior to the expedition, the complete system hadbeen tested under laboratory conditions, while samplingpure nitrogen; the amount of contamination was belowdetection limits. Samples were collected in 1.5 L electro-polished stainless steel canisters that, prior to the expedition,had been precleaned and filled with pure nitrogen in order toprevent contamination during transport. On site, the flaskswere flushed with 5 volumes of firn air to remove thepure nitrogen and then filled to a pressure of 2 bars, usingthe Parker two-stage metal bellow pump at a flow rate of12 L/min. The sampling procedure of the stainless steelcanisters took roughly 5 min, including flushing.[9] Before sampling, we measured the difference in CO2
concentration between the firn air and the surface airwith a LI-COR LI-6262 analyzer. The surface air was
sampled approximately 10 m upwind from the drill tentvia a 15-m-long 1/4-inch PFA tube, in order to preventcontamination from generators. We started collection ofsamples when the CO2 content of the firn air had stabilized.[10] The samples were transported to the Netherlands; the
time between sampling and analysis was 3 months. Weconducted storage tests before the expedition, in whichstainless steel canisters were filled with standard gases withknown concentrations of chlorocarbons and NMHCs andstored those in a freezer at �20�C for 2 months. Weobserved no significant gas loss or production.[11] The air in the stainless steel canisters was analyzed
by gas chromatography for CO2, NMHCs, chlorocarbons,CFCs, and aromatic compounds (see Scheeren et al. [2002]for details). A flame ionization detector was used forNMHCs (ethane, propane and acetylene) and aromaticcompounds (benzene and toluene), and an electron capturedetector was used for chlorocarbons (including CH3Cl) andCFCs. The precision of the analyses (1s) was 2% for CFC-12 and methyl chloride, and 5% for the NMHCs. Accura-cies were 5% for the NMHCs (12% for ethane), methylchloride and CFC-12, determined with standard commercialgas mixtures (PRAXAIR). The absolute concentrations inour PRAXAIR standards were checked by a comparisonwith NOAA/CMDL (S. A. Montzka; see Scheeren et al.[2002]). The detection limits for these gases are 15 ppt formethyl chloride and CFC-12 and 5 ppt for the NMHCs. Atthe detection limit, the precision (1s) is 50%.[12] Aromatic compounds such as benzene and toluene
were measured to determine the degree of sample contam-ination by the pumping system and during transport by ship.The values for the aromatic compounds were around thedetection limit (15 ppt for benzene and toluene, which isrelatively high). We can therefore rule out a large degree ofcontamination, but some contamination of the samplescould still have occurred. According to Investigation ofSulfur Chemistry in the Antarctic Troposphere (ISCAT)data, the concentrations of benzene and toluene at the SouthPole in the summer period are 5 to 10 ppt for benzene andless than 5 ppt for toluene.[13] We measured the d29N2 profile with depth in order to
constrain thermodiffusion as explained in section 3. Thed29N2 of the firn air samples (from the stainless steelcanisters) was obtained by correcting the measured nitrogenratio with laboratory working d29N2 standards. The Centrefor Isotope Research at Groningen, where the analyses werecarried out, adapted the method of Bender et al. [1994] andused a dedicated dual-inlet isotope ratio mass spectrometer(Micromass Optima) for the analysis of d29N2 (as well asd34O2, dAr/N2 and dO2/N2, simultaneously). The results aregiven on a per-mil scale relative to the uppermost sample ofthe profile.[14] Outliers in the measured isotopic ratios relative to the
model profile appear in the samples from 56 m and 80 mdepth (Figure 1; the error bars represent the 1s analyticalerror). We have been unable to find an analytical reason thatwould justify rejecting these outliers. Even though theanalytical error in Figure 1 is small, there is some scatterin the d29N2 profile. This scatter can be a result of storageartifacts and transport contamination. These nonanalyticalerrors have only a small effect on the concentration profilesof the NMHCs and methyl chloride because larger differ-
D16306 KASPERS ET AL.: SEASONAL VARIATIONS FROM FIRN AIR
2 of 11
D16306

ences in concentration and of larger analytical error (1s) ofthe measurements. The samples from 56 and 80 m did notproduce outliers for the mixing ratios of methyl chloride andthe NMHCs; the concentrations of benzene and toluenewere below the detection limit for these depths. The samplefrom 48 m did not contain enough air to measure d29N2 andis therefore absent in Figure 1.
3. Diffusion Model
3.1. Model Description
[15] The basic equations for gas diffusion in the openchannels of the firn layer are described in terms of the gasflux J(z,t) (where z is the depth in the firn layer, and where tis time; equation (1)), first introduced by Schwander et al.[1993]. From this equation, the concentration C(z,t) in thefirn layer can be determined.
J z;tð Þ ¼ JMolecular diffusion þ JGravity ¼ �D z;tð Þ@C z;tð Þ
@zþMgC z;tð Þ
RT z;tð Þ
� �
ð1Þ
Here, D(z,t) is the total diffusion coefficient, R is the gasconstant, g is the gravitational constant, T is the temperaturein K at a certain depth z in time t, and M is the molecular
mass (g/mol). The first term between the brackets, @Cz,t/@z,is the variation of the time-dependent concentration Cz,t
with depth z; the second term, MgC(z,t)/RT(z,t), describes theeffect of gravity on the diffusion (J(z,t)). The diffusioncoefficient is based on the following equations:
D z;tð Þ ¼D12Dm z;tð Þ
1þ 0:5g zð Þ 1� popen zð Þ� � ð2Þ
Dm z;tð Þ ¼ DmT0 ;P0
P0
P z;tð Þ
T z;tð Þ
T0
� �1:85
ð3Þ
P z;tð Þ ¼ P z¼0;tð Þ expMairgz
RT z;tð Þ
� �: ð4Þ
The total diffusion coefficient D(z,t) is a function of thespecies-characteristic diffusion coefficient D12 (relative toCO2), a correction term for atmospheric temperature andpressure Dm(z,t) (equation (3)), the open porosity profilepopen(z) and the tortuosity function g(z) [Schwander et al.,1993; Spahni et al., 2003; Fabre et al., 2000]. The openporosity profile is an inverse function of the density profileand was described by Schwander [1989] and Kaspers et al.[2004]. The 3-D structure of the porous firn layer isrepresented by g(z), which is the main tuning parameter inthe model, described for site M by Kaspers et al. [2004].The diffusion coefficient Dm(z,t) is expressed in equation (3),where DmTo,Po is a constant diffusion coefficient (12.2 �10�6 cm s�1: To = 253 K, Po = 1013 hPa) and P(z,t)
(expressed in equation (4)) is the pressure as function ofdepth and time, P(z=0,t) is the time-dependent surfacepressure (obtained from an automatic weather station(AWS) located at site M [van den Broeke et al., 1999]).The temperature profile T(z,t) is derived from equation (5)[van der Veen, 1999] as described below.
T z;tð Þ ¼ T z¼0;tð Þ � DT tð Þ exp �aT zð Þ ð5Þ
Here, T(z=0,t) is the time-dependent surface temperature(obtained from an AWS located at site M [van den Broeke etal., 1999]), DT(t) is the time-dependent temperaturedifference between the temperature in the firn layer andthe mean temperature at 10 m depth, and aT (5.0 � 10�3)[Grew and Ibbs, 1952] is the thermal diffusion factor. DT(t)follows from calibration of the model with d29N2, asdescribed below.[16] To calibrate the diffusion model for site M, we used
the measured CO2 concentration profile with depth in thefirn layer and the concentration history of CO2 in theatmosphere, as determined from the Siple Dome ice corefor the years 1750–1976 [Neftel et al., 1985; Stauffer et al.,1985] and from directly measured NOAA-CMDL SouthPole data for 1976 to the present. The model was calibratedfor site M by adjusting the tortuosity g(z) to fit the modeledCO2 profile to the measured profile to within 1s (2 ppm)[Kaspers et al., 2004]. The model consists of 300 layers inthe vertical; each layer contains the same amount of air,resulting in increasing layer thickness with increasing depth(0.5 m at pore close-off depth, 101 m). The age of CO2 at
Figure 1. Measured d29N2 profile with depth. The errorband represents the 1s precision. We assumed d29N2 to bezero at the surface. The modeled result, with thermaldiffusion included to take the effect of thermal changes inthe firn layer into account, is shown as a solid line. Fromthese analyses the temperature profile at site M wasobtained (Figure 2).
D16306 KASPERS ET AL.: SEASONAL VARIATIONS FROM FIRN AIR
3 of 11
D16306

pore close-off was 28 ± 3 years. Note that each trace gas hasa different pore close-off age because of its species-specificdiffusion coefficient D12.[17] We included the effect of thermal changes in the firn
layer during one year by means of a thermal diffusion termin the diffusion model, as proposed by Severinghaus et al.[2001] and rewrote equation (1) as
J z;tð Þ ¼ �D z;tð Þ@C z;tð Þ
@zþMgC z;tð Þ
RT z;tð Þþ W
@T tð Þ
@z
� �: ð6Þ
According to Severinghaus et al. [2001], the thermaldiffusion coefficient W for the South Pole is4.5 � 10�6 % K�1.[18] Figure 1 depicts the measured d29N2 depth profile.
Also shown are the model results, including thermaldiffusion, using a d29N2 ratio of zero at the surface andthe temperature-depth profile of equation (5) as inputparameters over 100 model years. The values for DT(t)and W were calculated by minimizing the differencebetween the modeled d29N2 profile and the measuredprofile. For site M, we calculated a value for W of 4.5 �10�6 % K�1, which is equal to the value of Severinghaus etal. [2001] for the South Pole. The temperature profile inFigure 2 is asymmetric, because of the seasonally varyingsurface temperature (Tz=0,t in equation (5)), which is typicalfor Antarctica [van den Broeke, 1998].[19] We did not explicitly account for wind pumping in
our model since the diffusion rate near the surface is alreadyvery high, which implies complete mixing above the firstlevel of the measurements (8 m). This result is consistentwith findings of Albert and Hawley [2002], who showed
that wind pumping only influences the first 4 to 5 m of thefirn layer.
3.2. Obtaining Time Series and Seasonal Cycles
[20] Our diffusion model is a numerical model working inthe forward mode, creating therefore a concentration profilewith depth. We calibrated the diffusion model for ourspecific site (site M) with the known CO2 atmospherichistory. Subsequently, we used an inverse method to obtaintimes series for the surface, from measured concentrationprofiles of NMHCs. This method was described in detail byKaspers et al. [2004] and first used by Butler et al. [1999].This procedure produces an error estimate based on the 1sprecision of the measured concentration profile.[21] For the measured concentration profile of CFC-12
with depth (Figure 3a), we assumed that the temporal historyof CFC-12 could be described by a Gaussian function:
CCFC�12; 0;tð Þ ¼ a exp � b t� cð Þ½ �2n o
ð7Þ
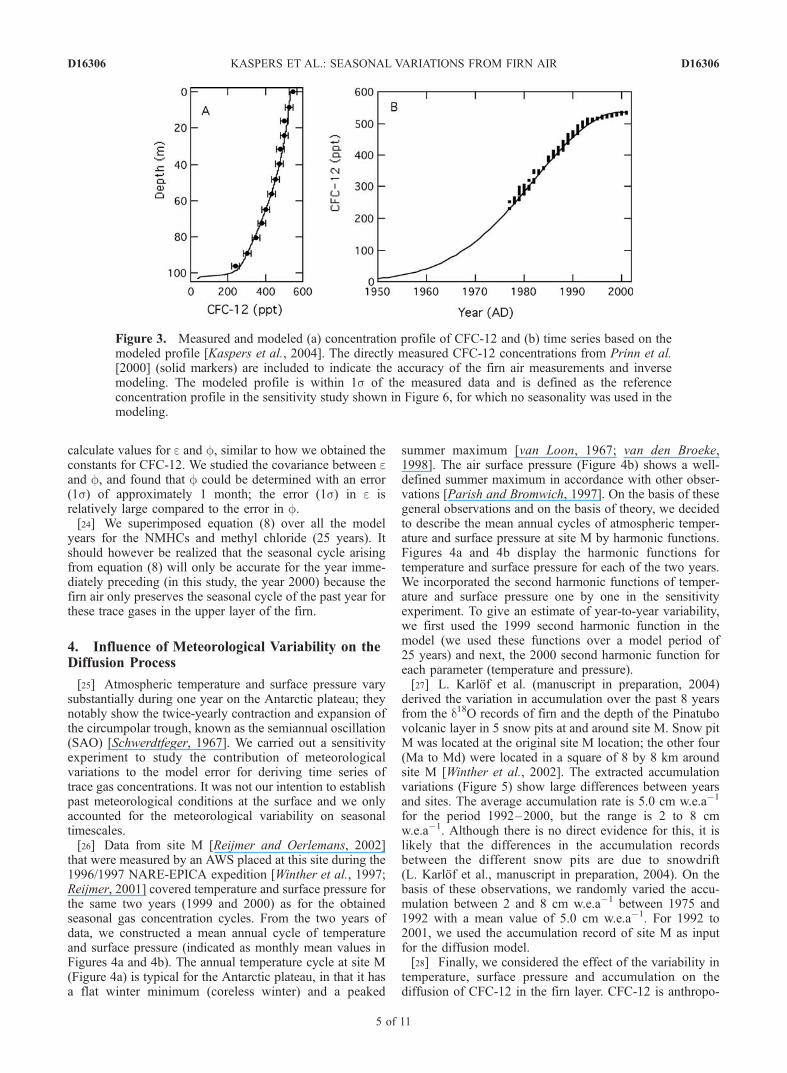
CCFC-12,(0,t) is the concentration of CFC-12 in the atmo-sphere over Dronning Maud Land as a function of time (t inyears). The constants a, b and c were found through aniterative process by using the model in forward mode. Witha least squares method the model performance wasevaluated, such that the difference between modeled andmeasured CFC-12 profile with depth was minimized. Allmodel results within the 1s precision of the measuredconcentration profile (Figure 3a) were accepted as solutionsfor the CFC-12 atmospheric history (Figure 3b). Figure 3bshows the solution yielding the best fit. To indicate theaccuracy of the method, we included the directly measuredCFC-12 concentrations from Prinn et al. [2000] (solidcircles) in Figure 3b. The derived CFC-12 time seriesdisplayed in Figure 3b (with a, b and c of 536 ppt, �1.6 �10�3 ppt yr�1 and 1 year, respectively) was used todetermine the influence of variations in meteorologicalparameters to the diffusion model in the sensitivity study(section 4).[22] For the time series of ethane, propane, acetylene and
methyl chloride, we used best fit functions, and linear timeseries instead of Gaussian functions (see Kaspers et al.[2004] for details). Such linear functions are more appropri-ate because previous studies with direct measurements byKhalil and Rasmussen [1999] and Clarkson et al. [1997]indicated a linear history for NMHCs and methyl chloridein the Southern Hemisphere. CFC-12 has a nonlinear historyas a result of its anthropogenic origin and emission regu-lations [Prinn et al., 2000].[23] We superimposed a sine function, as indicated in
equation (8), on the linear time series for ethane, propane,acetylene and methyl chloride. The sine function representsthe yearly variation in atmospheric concentration of thespecific gas.
S tð Þ ¼ e sin1
6p fþ n tð Þ� �� �
ð8Þ
Here, S(t) is the seasonal concentration difference from theannual mean concentration, e is a constant representing theseasonal amplitude, f is a constant representing the phaseshift of the seasonal cycle, and n(t) is the number of monthsas function of time. We used a least squares method for
Figure 2. Temperature profile in the firn layer at site M.This profile is a modeled result of equation (5). The dashedcurve on the left is the winter profile; the solid curve on theright is the summer profile.
D16306 KASPERS ET AL.: SEASONAL VARIATIONS FROM FIRN AIR
4 of 11
D16306
calculate values for e and f, similar to how we obtained theconstants for CFC-12. We studied the covariance between eand f, and found that f could be determined with an error(1s) of approximately 1 month; the error (1s) in e isrelatively large compared to the error in f.[24] We superimposed equation (8) over all the model
years for the NMHCs and methyl chloride (25 years). Itshould however be realized that the seasonal cycle arisingfrom equation (8) will only be accurate for the year imme-diately preceding (in this study, the year 2000) because thefirn air only preserves the seasonal cycle of the past year forthese trace gases in the upper layer of the firn.
4. Influence of Meteorological Variability on theDiffusion Process
[25] Atmospheric temperature and surface pressure varysubstantially during one year on the Antarctic plateau; theynotably show the twice-yearly contraction and expansion ofthe circumpolar trough, known as the semiannual oscillation(SAO) [Schwerdtfeger, 1967]. We carried out a sensitivityexperiment to study the contribution of meteorologicalvariations to the model error for deriving time series oftrace gas concentrations. It was not our intention to establishpast meteorological conditions at the surface and we onlyaccounted for the meteorological variability on seasonaltimescales.[26] Data from site M [Reijmer and Oerlemans, 2002]
that were measured by an AWS placed at this site during the1996/1997 NARE-EPICA expedition [Winther et al., 1997;Reijmer, 2001] covered temperature and surface pressure forthe same two years (1999 and 2000) as for the obtainedseasonal gas concentration cycles. From the two years ofdata, we constructed a mean annual cycle of temperatureand surface pressure (indicated as monthly mean values inFigures 4a and 4b). The annual temperature cycle at site M(Figure 4a) is typical for the Antarctic plateau, in that it hasa flat winter minimum (coreless winter) and a peaked
summer maximum [van Loon, 1967; van den Broeke,1998]. The air surface pressure (Figure 4b) shows a well-defined summer maximum in accordance with other obser-vations [Parish and Bromwich, 1997]. On the basis of thesegeneral observations and on the basis of theory, we decidedto describe the mean annual cycles of atmospheric temper-ature and surface pressure at site M by harmonic functions.Figures 4a and 4b display the harmonic functions fortemperature and surface pressure for each of the two years.We incorporated the second harmonic functions of temper-ature and surface pressure one by one in the sensitivityexperiment. To give an estimate of year-to-year variability,we first used the 1999 second harmonic function in themodel (we used these functions over a model period of25 years) and next, the 2000 second harmonic function foreach parameter (temperature and pressure).[27] L. Karlof et al. (manuscript in preparation, 2004)
derived the variation in accumulation over the past 8 yearsfrom the d18O records of firn and the depth of the Pinatubovolcanic layer in 5 snow pits at and around site M. Snow pitM was located at the original site M location; the other four(Ma to Md) were located in a square of 8 by 8 km aroundsite M [Winther et al., 2002]. The extracted accumulationvariations (Figure 5) show large differences between yearsand sites. The average accumulation rate is 5.0 cm w.e.a�1
for the period 1992–2000, but the range is 2 to 8 cmw.e.a�1. Although there is no direct evidence for this, it islikely that the differences in the accumulation recordsbetween the different snow pits are due to snowdrift(L. Karlof et al., manuscript in preparation, 2004). On thebasis of these observations, we randomly varied the accu-mulation between 2 and 8 cm w.e.a�1 between 1975 and1992 with a mean value of 5.0 cm w.e.a�1. For 1992 to2001, we used the accumulation record of site M as inputfor the diffusion model.[28] Finally, we considered the effect of the variability in
temperature, surface pressure and accumulation on thediffusion of CFC-12 in the firn layer. CFC-12 is anthropo-
Figure 3. Measured and modeled (a) concentration profile of CFC-12 and (b) time series based on themodeled profile [Kaspers et al., 2004]. The directly measured CFC-12 concentrations from Prinn et al.[2000] (solid markers) are included to indicate the accuracy of the firn air measurements and inversemodeling. The modeled profile is within 1s of the measured data and is defined as the referenceconcentration profile in the sensitivity study shown in Figure 6, for which no seasonality was used in themodeling.
D16306 KASPERS ET AL.: SEASONAL VARIATIONS FROM FIRN AIR
5 of 11
D16306

genic, very stable in the atmosphere (lifetime t = 100 years)[Seinfeld and Pandis, 1998] and has no seasonality. Weused the CFC-12 time series of Kaspers et al. [2004] in thesesensitivity experiments. Figure 3a shows the measured andmodeled profiles with depth for CFC-12, with the modeledprofile taken as reference, which was derived without anyseasonality in the meteorological model parameters.[29] Figure 6 is intended to show small differences
between the modeled concentration profiles of CFC-12 withmeteorological variations and the reference modeled con-centration profile of CFC-12 (Figure 3a, without anyseasonality in the model) versus depth. In these modeledprofiles, we have incorporated (seasonal) variations for onlyone term at a time (temperature, pressure or accumulation)and kept the others at their annual mean value. The effect ofthe incorporated (seasonal) variations is strongest for tem-perature and pressure and increases with depth. Variations inone of these parameters affect the diffusion in the firn layersignificantly. In the winter, when the pressure is low, thediffusion rate is increased (see equation (3)), because offewer collisions between molecules. The increased air fluxin the upper layer influences the concentration gradient; thiseffect becomes more pronounced deeper in the firn, wherediffusion depends only on molecular diffusion. Temperaturevariations in the summer lead to increased diffusion rates,whereas the diffusion rate is lower in the winter. Theinfluence of temperature and pressure variations becomesnegligibly low only very close to pore close-off, wherediffusion approaches zero; here, gravitational effects andvertical movement due to snow accumulation becomeimportant. In Figure 6 the effect of accumulation variabilityis visible near pore close-off. The pressure and temperaturevariations are therefore the most important parameters inthis study of the seasonal trace gas cycle. In general, thecombined meteorological profiles in Figure 6 show that(seasonal) variations in meteorological parameters haveonly a minor influence on diffusion in the firn layercompared to decadal mean meteorological parameters. The
small difference between the combined profile and thereference profile reflects that the effects of the seasonalvariations of temperature, pressure and accumulation on thediffusion process cancel each other out. This is particularlytrue in the upper 40 m, from which seasonality of tracegases are primarily derived.
5. Results: Derived Seasonal Cycles of MethylChloride and NMHCs
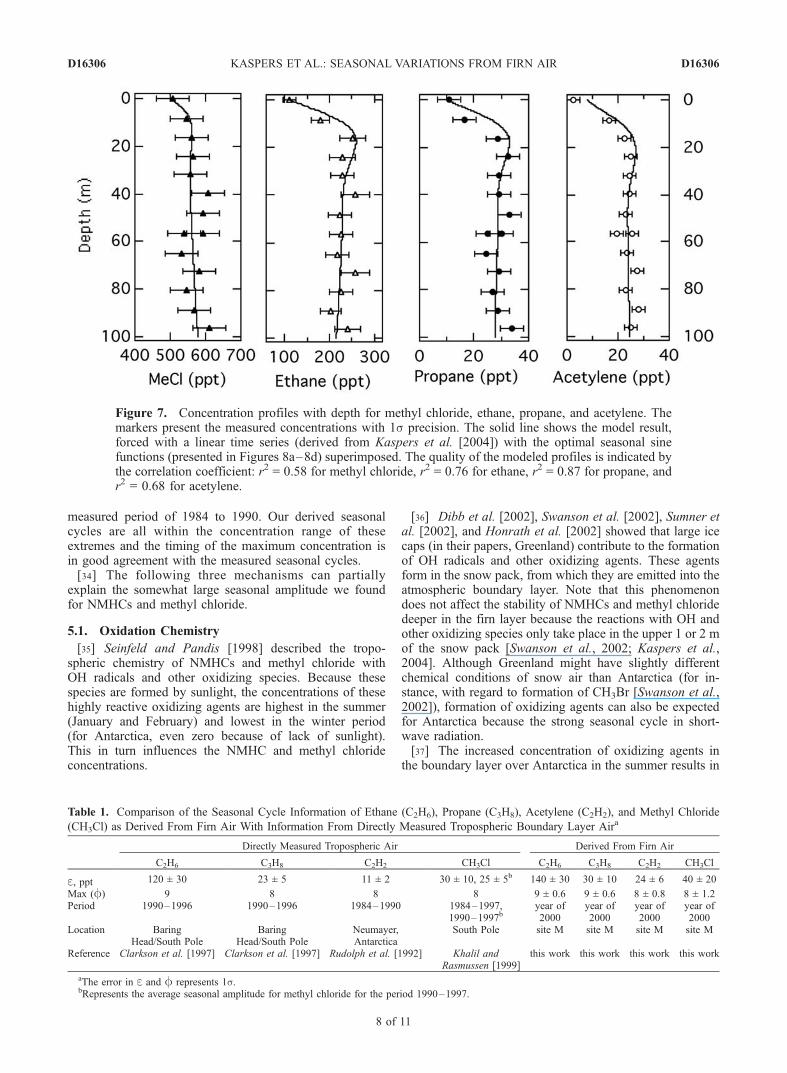
[30] Figure 7 presents the measured concentration profilesfor methyl chloride, ethane, propane and acetylene. The 8 m
Figure 4. (a) Seasonal temperature variation at site M and (b) seasonal pressure variation over the years1999 and 2000. The AWS data represent monthly mean values of the 2-m temperature and atmosphericsurface pressure. At the AWS the temperature and pressure were measured every 6 min and saved everyhour. The dashed lines represent second harmonic functions for the years 1999 and 2000. These secondharmonic functions were used in the sensitivity study to incorporate the meteorological seasonality.
Figure 5. Extracted accumulation record from d18Orecords taken from snow pits at site M during the NARE/EPICA expedition of 2000/2001. M represents the snow pitat the location at site M. Snow pits Ma to Md were locatedin an 8-km square around site M (L. Karlof et al.,manuscript in preparation, 2004).
D16306 KASPERS ET AL.: SEASONAL VARIATIONS FROM FIRN AIR
6 of 11
D16306

resolution equals approximately 0.3 years, according to thediffusion model, operating in forward mode; the samplefrom 32 m represents an age of 1.2 years. The strongdecrease in concentration from a depth of 30 m towardthe firn surface is due to diffusion during the summertimewhen the concentrations of methyl chloride and NMHCs arelow [Sturges et al., 2001]. If the firn samples had been takenin the winter period, the concentrations in the firn air wouldhave increased toward the surface. Rudolph et al. [1989]were the first to recognize the seasonal variation in trace gasconcentration in the troposphere over Antarctica. Rudolphet al. [1992], Clarkson et al. [1997], and Khalil andRasmussen [1999] observed the seasonality of trace gasconcentrations over Antarctica in later studies as well. Allthese studies showed low NMHC and methyl chlorideconcentrations in the Antarctic summer (as in our surfacemeasurements) and high concentrations in the Antarcticwinter. Deeper in the firn layer, the seasonal informationis lost because of diffusion, so these deeper measurements,from 40 m and beyond, represent the annual average
concentration. At pore close-off, the age for NMHCs is25 years [Kaspers et al., 2004]. For this reason, the seasonalinformation extracted from firn air only represents one year,the twelve months prior to sampling (in this study, the year2000). Our main goal is to develop a method to deriveseasonal information from firn air analyses. Only fourmeasurements in the firn layer of site M contain theseasonal information of trace gas concentrations and wecan therefore expect a large error in the derived seasonalcycles for NMHCs and methyl chloride from our data set.[31] Figure 7 also depicts profiles as computed with our
diffusion model using a sine function (equation (8)). Thequality of these profiles is indicated by the correlationcoefficient r2 (95% confidence) for the measured concen-trations and the modeled concentrations (which rangesbetween 0.58 for methyl chloride and 0.87 for propane).The strong decrease toward the surface is well captured. Wedid take the seasonal variability of surface temperature andsurface pressure into account, although the influence of thisvariability is small (Figure 6). If we neglect the seasonalvariability of surface temperature and pressure in the model,the error bar (1s) for the seasonal amplitude of the trace gasconcentrations increases by 10%, the mean value for theseasonal amplitude did not change. For the accumulation,we have used the annual average accumulation of 5.0 cmw.e.a�1 (L. Karlof et al., manuscript in preparation, 2004).[32] Table 1 lists the amplitude e and phase f of the
seasonal cycles for ethane, propane, acetylene and methylchloride as derived from firn air and a comparisonbetween our results and the average seasonal cycles basedon direct atmospheric measurements by Rudolph et al.[1992], Clarkson et al. [1997], and Khalil and Rasmussen[1999]. Overall, the derived phase (f) values agree wellwith earlier published seasonal cycles, with a maximum inthe winter period. However, the seasonal amplitudese derived from the firn air analyses are larger than thosemeasured directly. In particular for acetylene, the derivedamplitude is a factor two larger than previous studiesindicate. The derived seasonal amplitudes for ethane, pro-pane and methyl chloride are in agreement within theuncertainties, though the amplitude for methyl chloride is1.6 times larger than the seasonal amplitude obtained fromdirect atmospheric measurements carried out at the SouthPole for the period 1990 to 1997 [Khalil and Rasmussen,1999]. Note that for methyl chloride, Khalil and Rasmussen[1999] reported a decrease in seasonal amplitude in theirmeasured series for the South Pole after 1990 from 50 ppt toapproximately 20 ppt. This is in contrast with the seasonalamplitude of 40 ppt in this study.[33] In Figure 8 we present the derived seasonal cycles of
ethane, propane, acetylene and methyl chloride from firn airrepresenting the year 2000. The gray band represents allsolutions of equation (8) (e and f values given in Table 1),yielding modeled concentration profiles that are withinagreement of the measured concentration profile uncertainty(1s). Figure 8 includes two extreme measured seasonalcycles, which were obtained from the measured seriesdescribed in the papers of Rudolph et al. [1992] (acetylene),Clarkson et al. [1997] (ethane and propane), and Khalil andRasmussen [1999] (methyl chloride). For methyl chloride,the two extremes represent the greatest seasonal amplitudeand smallest seasonal amplitude for the South Pole over the
Figure 6. Difference from the reference concentrationprofile (CFC-12 profile presented in Figure 3a) plottedversus depth. The circles represent profiles for which onlythe seasonality of temperature at the surface was used (otherparameters at their annual mean value). The solid circlesrepresent the profile for which the 1999 temperature fitwas used, and the open circles represent the 2000 data ofFigure 4a. The squares represent profiles for which thesurface pressure seasonality of Figure 4b was included; thesolid squares represent 1999 data, and the open squaresindicate 2000 data. The profile due to the accumulationvariability is presented by solid triangles. When allmeteorological parameters (T, P, and A) are taken intoaccount, one obtains the thick solid line.
D16306 KASPERS ET AL.: SEASONAL VARIATIONS FROM FIRN AIR
7 of 11
D16306
measured period of 1984 to 1990. Our derived seasonalcycles are all within the concentration range of theseextremes and the timing of the maximum concentration isin good agreement with the measured seasonal cycles.[34] The following three mechanisms can partially
explain the somewhat large seasonal amplitude we foundfor NMHCs and methyl chloride.
5.1. Oxidation Chemistry
[35] Seinfeld and Pandis [1998] described the tropo-spheric chemistry of NMHCs and methyl chloride withOH radicals and other oxidizing species. Because thesespecies are formed by sunlight, the concentrations of thesehighly reactive oxidizing agents are highest in the summer(January and February) and lowest in the winter period(for Antarctica, even zero because of lack of sunlight).This in turn influences the NMHC and methyl chlorideconcentrations.
[36] Dibb et al. [2002], Swanson et al. [2002], Sumner etal. [2002], and Honrath et al. [2002] showed that large icecaps (in their papers, Greenland) contribute to the formationof OH radicals and other oxidizing agents. These agentsform in the snow pack, from which they are emitted into theatmospheric boundary layer. Note that this phenomenondoes not affect the stability of NMHCs and methyl chloridedeeper in the firn layer because the reactions with OH andother oxidizing species only take place in the upper 1 or 2 mof the snow pack [Swanson et al., 2002; Kaspers et al.,2004]. Although Greenland might have slightly differentchemical conditions of snow air than Antarctica (for in-stance, with regard to formation of CH3Br [Swanson et al.,2002]), formation of oxidizing agents can also be expectedfor Antarctica because the strong seasonal cycle in short-wave radiation.[37] The increased concentration of oxidizing agents in
the boundary layer over Antarctica in the summer results in
Figure 7. Concentration profiles with depth for methyl chloride, ethane, propane, and acetylene. Themarkers present the measured concentrations with 1s precision. The solid line shows the model result,forced with a linear time series (derived from Kaspers et al. [2004]) with the optimal seasonal sinefunctions (presented in Figures 8a–8d) superimposed. The quality of the modeled profiles is indicated bythe correlation coefficient: r2 = 0.58 for methyl chloride, r2 = 0.76 for ethane, r2 = 0.87 for propane, andr2 = 0.68 for acetylene.
Table 1. Comparison of the Seasonal Cycle Information of Ethane (C2H6), Propane (C3H8), Acetylene (C2H2), and Methyl Chloride
(CH3Cl) as Derived From Firn Air With Information From Directly Measured Tropospheric Boundary Layer Aira
Directly Measured Tropospheric Air Derived From Firn Air
C2H6 C3H8 C2H2 CH3Cl C2H6 C3H8 C2H2 CH3Cl
e, ppt 120 ± 30 23 ± 5 11 ± 2 30 ± 10, 25 ± 5b 140 ± 30 30 ± 10 24 ± 6 40 ± 20
Max (f) 9 8 8 8 9 ± 0.6 9 ± 0.6 8 ± 0.8 8 ± 1.2Period 1990–1996 1990–1996 1984–1990 1984–1997,
1990–1997byear of2000
year of2000
year of2000
year of2000
Location BaringHead/South Pole
BaringHead/South Pole
Neumayer,Antarctica
South Pole site M site M site M site M
Reference Clarkson et al. [1997] Clarkson et al. [1997] Rudolph et al. [1992] Khalil andRasmussen [1999]
this work this work this work this work
aThe error in e and f represents 1s.bRepresents the average seasonal amplitude for methyl chloride for the period 1990–1997.
D16306 KASPERS ET AL.: SEASONAL VARIATIONS FROM FIRN AIR
8 of 11
D16306

extra removal of NMHCs and methyl chloride. In the winterperiod, when no sunlight is present and therefore nooxidizing agents are formed, the NMHCs and methylchloride concentrations can remain high.[38] The oxidation conditions over a large ice sheet in
summer can partially explain large seasonal amplitudes.However, the methyl chloride record of the South Pole(Table 1) where the air is expected to undergo similarprocesses as in Dronning Maud Land indicates that oxida-tion alone is not enough to explain the large amplitudes thatwe found (particularly for acetylene and methyl chloride).[39] We can therefore acknowledge that the oxidation
conditions in the summer time over a large ice sheet willinfluence the seasonal variation of trace gas concentration,but the importance of this mechanism relative to othermechanisms is hard to assess.
5.2. Source Contribution and Transport
[40] The sources and transport mechanisms strongly in-fluence the seasonality of NMHCs and methyl chloride. Themain source for ethane and propane is the use of natural gaswhereas biomass burning is the largest source of methylchloride and acetylene. Both sources are strongest in thewinter period [Cros et al., 1988]. Although the emission ofNMHCs and methyl chloride can vary between years, as
indicated in the records of Rudolph et al. [1992], Clarksonet al. [1997], and Khalil and Rasmussen [1999], we have noevidence of increased biomass burning activity in the year2000 to explain the high seasonal amplitude of acetyleneand methyl chloride in our results.[41] Transport to Antarctica also plays an important role
for the NMHCs and methyl chloride because they haverelatively short atmospheric lifetimes. Both the location ofthe sources (mostly Africa and Southern America for ourpart of Antarctica) and transport result in spatial variability.Khalil and Rasmussen [1999] found a 10 ppt difference inseasonal amplitude for methyl chloride between three mea-sured records for the South Pole, Tasmania and SamoaSouthern Hemisphere.[42] Although these mechanisms might give an explana-
tion for the large seasonal amplitude we found for ethaneand propane, they probably only partly explain the alsorelatively large seasonal amplitudes for acetylene andmethyl chloride. The cause of the latter therefore remainspartly unclear.
6. Summary and Conclusions
[43] We have derived the seasonal variation in atmosphericconcentration of ethane, propane, acetylene and methyl
Figure 8. Calculated seasonal cycles of (a) methyl chloride, (b) ethane, (c) propane, and (d) acetylenefor the year 2000, based on firn air analyses. The gray band represents all solutions of equation (8)yielding concentration profiles 1s through the measured concentration profile presented in Figure 7. Thedotted and dashed lines represent the two extreme seasonal cycles, representing years with high measuredconcentration values (dashed lines) and years with low measured concentrations (dotted lines) during theperiod presented in Table 1. For methyl chloride the two extremes represent the largest seasonalamplitude (dashed line) and smallest seasonal amplitude (dotted line) of the measured period of 1984–1990 for the South Pole.
D16306 KASPERS ET AL.: SEASONAL VARIATIONS FROM FIRN AIR
9 of 11
D16306

chloride from firn air analyses in Dronning Maud LandAntarctica for the year 2000. To do so, we used sine functionssuperimposed on linear histories of atmospheric trace gasesconcentrations in a firn air diffusion model.[44] The period of maximum atmospheric concentrations
(f) of ethane, propane, acetylene and methyl chloride asderived from firn air is in good agreement with thatobtained from direct atmospheric measurements. The de-rived seasonal amplitudes for ethane and propane in thisstudy are in agreement, within the uncertainties, withearlier seasonal cycles, directly measured at the South Poleand Baring Head (New Zealand). The seasonal amplitudefor methyl chloride seems enlarged compared to directlyatmospheric measurement from the South Pole, in partic-ular when the last 10 years (the period 1990–1997) isconsidered. Our acetylene data show a significantly higherseasonal amplitude than the seasonal amplitude in directlymeasured atmospheric records [Rudolph et al., 1992;Khalil and Rasmussen, 1999]. Although three factors(variations in oxidation chemistry, sources and transport)can offer some explanation for the greater seasonal ampli-tude of acetylene and methyl chloride than directly mea-sured, the exact cause remains unclear.[45] We have also considered the influence of seasonal
variability in meteorological parameters (surface tempera-ture, pressure and the variability in accumulation) ondiffusion in the firn layer and tested this in a sensitivitystudy. The concentration profile of CFC-12 differed by atmost 20 ppt (just above pore close-off depth) from areference concentration profile of CFC-12, when we onlyconsidered the seasonality in surface temperature. The effectof the combined meteorological parameters was most pro-nounced deeper in the firn layer with the maximum devi-ation from the reference concentration profile just abovepore close-off. When taking the variability of the combinedmeteorological parameters (Tsurface, Psurface and A) intoaccount in the diffusion model, the deviation from thereference concentration profile of CFC-12 is only minor.Apparently, the deviations due to temperature and pressure(the two major parameters) cancel each other out. Never-theless, we did include the seasonality of temperature andpressure in our diffusion model for deriving the seasonalcycles of NMHCs and methyl chloride; there was only a10% increase of the 1s error bar when the seasonality oftemperature and pressure was not taken into account.[46] On the basis of this study, we can give the following
recommendations: (1) Recognize the valuable informationthe air stores in the upper layer of the firn, with respect toseasonal variability of trace gases. (2) To assess the seasonalinformation stored in the upper layer, more samples shouldbe taken in the upper part of the firn layer, to increase theaccuracy of the obtained seasonal cycles of trace gases.[47] More information about seasonal variations of trace
gases over Antarctic is needed as this information can beused in combination with sophisticated chemical transportmodels. With firn air analysis, the seasonal variations intrace gas concentrations over Antarctica can be obtainedwithout the need for an all-year-round facility.
[48] Acknowledgments. Words of gratitude go to the NorwegianPolar Institute (NPI) for their leadership and logistics during the NAREEPICA expedition 2000/2001. We also owe Jacob Schwander thanks for hisfirn diffusion model. Further, we would like to thank the staff of the
Instrumental Group Physics (Utrecht University), particularly Erik-Jan deJong, for their work on the drill, sampling canisters, and drill tent, as well asMichel Bolder and the other IMAU technicians for their work on the LicorCO2 analyzer. All the participants in the field are thanked for all theirassistance in the field. For sharing their expertise on methyl chloride,NMHCs, and atmospheric chemistry, we would like to thank Bert Scheerenand the other members of the atmospheric chemistry group of Institute forMarine and Atmospheric Research Utrecht (IMAU). This work is acontribution to the European Project for Ice Coring in Antarctica (EPICA),a joint European Science Foundation (ESF)/EC scientific program, fundedby the European Commission under the Environment and ClimateProgramme (1994–1998) contract ENV4-CT95-0074 and by nationalcontributions from Belgium, Denmark, France, Germany, Italy, Nether-lands, Norway, Sweden, Switzerland, and the United Kingdom. This isEPICA Publication 104. Additional funding was obtained from the Nether-lands Antarctic Programme of the Netherlands Organisation for ScientificResearch (NWO) and the budget from COACH, Cooperation on Oceanic,Atmospheric and Climate Change Studies, a collaboration of the Nether-lands Centre for Climate Research (KNMI, IMAU, RIVM) and the Max-Planck-Institut fur Meteorologie in Hamburg and Max-Planck-Institut furChemie in Mainz, Germany.
ReferencesAlbert, M. R., and R. L. Hawley (2002), Seasonal changes in snow surfaceroughness characteristics at Summit, Greenland: Implications for snowand firn ventilation, Ann. Glaciol., 35, 510–514.
Bender, M. L., P. P. Tans, J. T. Ellis, J. Orchado, and K. Habfast (1994), Ahigh precision isotope ratio mass spectrometry method for measuring theO2/N2 ratio of air, Geochim. Cosmochim. Acta, 58, 4751–4758.
Bonsang, B., and G. Lambert (1985), Non-methane hydrocarbons in anoceanic atmosphere, J. Atmos. Chem., 2, 257–271.
Bonsang, B., M. Kanakidou, and G. Lambert (1990), NMHC in the marineatmosphere: Preliminary results of monitoring at Amsterdam Island,J. Atmos. Chem., 11, 169–178.
Braunlich, M., O. Aballain, T. Marik, P. Jockel, C. A. M. Brenninkmeijer,J. Chappellaz, J.-M. Barnola, R. Mulvaney, and W. T. Sturges (2001),Changes in the global atmospheric methane budget over the last decadeinferred from 13C and D isotopic analysis of Antarctic firn air, J. Geo-phys. Res., 106(D17), 20,465–20,481.
Butler, J. H., M. Battle, M. L. Bender, S. A. Montzka, A. D. Clarke, E. S.Saltzman, C. M. Sucher, J. P. Severinghaus, and J. W. Elkins (1999), Arecord of atmospheric halocarbons during the twentieth century frompolar firn air, Nature, 399, 749–755.
Clarkson, T. S., R. J. Martin, and J. Rudolph (1997), Ethane and propane inthe southern marine troposphere, Atmos. Environ., 31, 3763–3771.
Cros, B., R. Delmas, D. Nganga, B. Clairac, and J. Fontan (1988), Seasonaltrends of ozone in equatorial Africa: Experimental evidence of photochem-ical formation, J. Geophys. Res., 93(D7), 8355–8366.
Dibb, J. E., M. Arsenault, M. C. Peterson, and R. E. Honrath (2002), Fastnitrogen oxide photochemistry in Summit, Greenland snow, Atmos.Environ., 36, 2501–2511.
Fabre, A., J.-M. Barnola, L. Arnaud, and J. Chappellaz (2000), Determina-tion of gas diffusivity in polar firn: Comparison between experimentalmeasurements and inverse modeling, Geophys. Res. Lett., 27(4), 557–560.
Grew, K. E., and T. L. Ibbs (1952), Thermal Diffusion in Gases, CambridgeUniv. Press, New York.
Honrath, R. E., Y. Lu, M. C. Peterson, J. E. Dibb, M. A. Arsenault, N. J.Cullen, and K. Steffen (2002), Vertical fluxes of NOx, HONO, and HNO3
above the snowpack at Summit, Greenland, Atmos. Environ., 36, 2629–2640.
Kaspers, K. A., et al. (2004), Analyses of firn gas samples from DronningMaud Land, Antarctica: Study of nonmethane hydrocarbons and methylchloride, J. Geophys. Res, 109, D02307, doi:10.1029/2003JD003950.
Khalil, M. A. K., and R. A. Rasmussen (1999), Atmospheric methyl chlor-ide, Atmos. Environ., 33, 1305–1321.
Neftel, A., E. Moor, H. Oeschger, and B. Stauffer (1985), Evidence frompolar ice cores for the increase in atmospheric CO2 in the past twocenturies, Nature, 315, 45–47.
Parish, T. R., and D. H. Bromwich (1997), On the forcing of seasonalchanges in surface pressure over Antarctica, J. Geophys. Res.,102(D12), 13,785–13,792.
Prinn, R. G., et al. (2000), A history of chemically and radiatively importantgases in air deduced from ALE/GAGE/AGAGE, J. Geophys. Res.,105(D14), 17,751–17,792.
Reijmer, C. H. (2001), Antarctic meteorology: A study with automaticweather stations, Ph.D. thesis, Utrecht Univ., Utrecht, Netherlands.
Reijmer, C. H., and J. Oerlemans (2002), Temporal and spatial variability ofthe surface energy balance in Dronning Maud Land, East Antarctica,J. Geophys. Res., 107(D24), 4759, doi:10.1029/2000JD000110.
D16306 KASPERS ET AL.: SEASONAL VARIATIONS FROM FIRN AIR
10 of 11
D16306

Rudolph, J., D. H. Ehhalt, A. Khedim, and C. Jebsen (1982), Latitudinalprofiles of some C2–C5 hydrocarbons in the clean troposphere over theAtlantic, in Proceedings of the 2nd Symposium on Composition of theNon-urban Troposphere, pp. 284–286, Am. Meteorol. Soc., Boston,Mass.
Rudolph, J., A. Khedim, and D. Wagenbach (1989), The seasonal variationof light non-methane hydrocarbons in the Antarctic troposphere, J. Geo-phys. Res., 94(D4), 13,039–13,044.
Rudolph, J., A. Khedim, T. Clarkson, and D. Wagenbach (1992), Long-term measurements of light alkanes and acetylene in the Antarctic tropo-sphere, Tellus, Ser. B, 44, 252–261.
Scheeren, H. A., J. Lelieveld, J. A. de Gouw, C. van der Veen, andH. Fischer (2002), Methyl chloride and other chlorocarbons in pollutedair during INDOEX, J. Geophys. Res., 107(D19), 8015, doi:10.1029/2001JD001121.
Schmidt, U., A. Khedim, F. J. Johnen, J. Rudolph and D. H. Ehhalt (1982),Two dimensional meridional distributions of CO2, CH4, N2O, CFCl3 andCF2Cl2 in the remote troposphere over the Atlantic Ocean, in Proceed-ings of the 2nd Symposium on Composition of the Non-urban Tropo-sphere, pp. 52–55, Am. Meteorol. Soc., Boston, Mass.
Schwander, J. (1989), The transformation of snow to ice and occlusion ofgases, in The Environmental Record in Glaciers and Ice Sheets, edited byH. O. and C. C. Langway, pp. 53–67, John Wiley, Hoboken, N. J.
Schwander, J., J.-M. Barnola, C. Andrie, M. Leuenberger, A. Ludin,D. Raynaud, and B. Stauffer (1993), The age of the air in the firn andice at Summit, Greenland, J. Geophys. Res., 98(D2), 2831–2838.
Schwerdtfeger, W. (1967), Annual and semi-annual changes of atmosphericmass over Antarctica, J. Geophys. Res., 72(14), 3543–3547.
Seinfeld, J. H., and S. N. Pandis (1998), Atmospheric Chemistry and Phys-ics, John Wiley, Hoboken, N. J.
Severinghaus, J. P., A. Grachev, and M. Battle (2001), Thermal fractiona-tion of air in polar firn by seasonal temperature gradients, Geochem.Geophys. Geosyst., vol. 2, Paper number 2000GC000146.
Spahni, R., J. Schwander, J. Fluckiger, B. Stauffer, J. Chappellaz, andD. Raynaund (2003), The attenuation of fast atmospheric CH4 variationsrecorded in polar ice cores, Geophys. Res. Lett., 30(11), 1571,doi:10.1029/2003GL017093.
Stauffer, B., G. Fischer, A. Neftel, and H. Oeschger (1985), Increase ofatmospheric methane recorded in Antarctic ice core, Science, 229, 1386–1388.
Sturges, W. T., H. P. McIntyre, S. A. Penkett, J. Chappellaz, J.-M. Barnola,R. Mulvaney, E. Atlas, and V. Stroud (2001), Methyl bromide, otherbrominated methanes, and methyl iodide in polar firn air, J. Geophys.Res., 106(D2), 1565–1606.
Sumner, A. L., et al. (2002), Atmospheric chemistry of formaldehyde in theArctic troposphere at polar sunrise, and the influence of the snowpack,Atmos. Environ., 36, 2553–2562.
Swanson, A. L., N. J. Blake, J. E. Dibb, M. R. Albert, D. R. Blake, and F. S.Rowland (2002), Photochemically induced production of CH3Br, CH3I,C2H5I, ethene, and propene within surface snow at Summit, Greenland,Atmos. Environ., 36, 2671–2682.
van den Broeke, M. R. (1998), The semiannual oscillation and Antarcticclimate, part 1: Influence on near-surface temperatures (1957–1979),Antarct. Sci., 10(2), 175–183.
van den Broeke, M. R., J.-G. Winther, E. Isaksson, J. F. Pinglot, L. Karlof,T. Eiken, and L. Conrads (1999), Climate variables along a traverse linein Dronning Maud Land, East Antarctica, J. Glaciol., 45(150), 295–302.
van der Veen, C. J. (1999), Fundamentals of Glacier Dynamics, A. A.Balkema, Brookfield, Vt.
van Loon, H. (1967), The half-yearly oscillation in the middle and highsouthern latitudes and the coreless winter, J. Atmos. Sci., 24, 472–486.
Winther, J.-G., M. R. van den Broeke, L. Conrads, T. Eiken, R. Hurlen,G. Johnsrud, L. Karlof, S. Onarheim, C. Richardson, and R. Schorno(1997), EPICA Dronning Maud Land pre site survey 1996/97, in Reportof the Norwegian Antarctic Research Expedition 1996/97, edited by J.-G.Winther, Nor. Polarinst. Medd., 148, 96–114.
Winther, J.-G., et al. (2002), European Project for Ice Coring in Antarctica(EPICA): Nordic traverse in 2000/01, in Norwegian Antarctic ResearchExpedition 2000/01, edited by J.-G. Winther, Nor. Polarinst. Rep. Ser.,120, 18–29.
�����������������������C. A. M. Brenninkmeijer, Max Planck Institute for Chemistry, Postfach
3060, D-55020, Mainz, Germany. ([email protected])J. A. de Gouw, NOAA Aeronomy Laboratory, 325 Broadway, R/AL7,
Boulder, CO 80303, USA. ([email protected])C. M. Hofstede, K. A. Kaspers, C. H. Reijmer, M. R. van den Broeke,
C. van der Veen, and R. S. W. van de Wal, Institute for Marineand Atmospheric Research Utrecht, Utrecht University, Princetonplein5, NL-3584 CC Utrecht, Netherlands. ([email protected]; [email protected]; [email protected]; [email protected]; [email protected]; [email protected])L. Karlof and J.-G. Winther, Norwegian Polar Institute, Polar Environ-
mental Centre, N-9296 Tromsø, Norway. ([email protected]; [email protected])H. A. J. Meijer and R. E. M. Neubert, Centre for Isotope Research,
University of Groningen, Nijenborgh 4, NL-9747 AG Groningen,Netherlands. ([email protected]; [email protected])
D16306 KASPERS ET AL.: SEASONAL VARIATIONS FROM FIRN AIR
11 of 11
D16306