Native Agriculture and Food Systems Initiative - First Nations ...
Agricultural Systems xxx (2013) xxx–xxx
Contents lists available at SciVerse ScienceDirect
Agricultural Systems
journal homepage: www.elsevier .com/locate /agsy
Co-innovation of family farm systems: A systems approachto sustainable agriculture
0308-521X/$ - see front matter � 2013 Elsevier Ltd. All rights reserved.http://dx.doi.org/10.1016/j.agsy.2013.02.009
⇑ Corresponding author. Tel.: +598 23584560; fax: +598 23542052.E-mail address: [email protected] (S. Dogliotti).
Please cite this article in press as: Dogliotti, S., et al. Co-innovation of family farm systems: A systems approach to sustainable agriculture. Agr. Syst.http://dx.doi.org/10.1016/j.agsy.2013.02.009
S. Dogliotti a,⇑, M.C. García a, S. Peluffo b, J.P. Dieste a, A.J. Pedemonte c, G.F. Bacigalupe c, M. Scarlato a,F. Alliaume d, J. Alvarez c, M. Chiappe c, W.A.H. Rossing e
a Departamento de Producción Vegetal, Facultad de Agronomía, UDELAR, Av. Garzón 780, 11200 Montevideo, Uruguayb Comisión Nacional de Fomento Rural, Dr. S. García Pintos 1138, 11800 Montevideo, Uruguayc Departamento de Ciencias Sociales, Facultad de Agronomía, UDELAR, Av. Garzón 780, 11200 Montevideo, Uruguayd Departamento de Suelos y Aguas, Facultad de Agronomía, UDELAR, Av. Garzón 780, 11200 Montevideo, Uruguaye Farming Systems Ecology group, Wageningen University, Droevendaalsesteeg 1, 6708 PB Wageningen, The Netherlands
a r t i c l e i n f o a b s t r a c t
Article history:Available online xxxx
Keywords:Smallholder agricultureLabour productivitySustainable developmentSoil degradationYield gapPlanning
Meeting the goals of sustainable growth of food production and reducing rural poverty requires assistingfamily farmers to develop more productive, profitable, resource efficient and environmentally friendlyfarms. Faced with decreasing product prices and increasing production costs during the last two decadesfamily farmers in south Uruguay tried to maintain their income by intensifying their farms, growing lar-ger areas of fewer crops and increasing the use of irrigation and agrochemicals. Soil degradation wasaggravated by this process, limiting crop yields, undermining the farmers’ aim of maintaining theirincome. A model-aided explorative study had shown that decreasing the area of vegetables, introducingcrop rotations, cover crops and manure applications, and including beef-cattle production would be abetter strategy. To test this hypothesis, a project was started at the end of 2004 and expanded in 2007,involving farmers, technical advisers and scientists in a co-innovation process that combined systemicdiagnosis and redesign of the farm systems, social learning and dynamic monitoring and evaluation.The project involved 14 farms representing a large range of variation in resource endowment. Main prob-lems found on all farms were deteriorated soil quality and low labour productivity, which resulted in lowincome and high work load. At the end of 2–5 years of redesign farmers had been able to implement mostinnovations planned. Irrespective of endowment with land, machinery, irrigation water or labourresources, re-design increased the per capita family income (FIp) and the income per hour of familylabour (IH) on 13 out of 14 farms, by 51% and 50%, respectively, averaged over all farms. Soil organic car-bon content had increased on 11 out of 14 farms and estimated erosion rates in vegetable fields hadhalved. Farmers considered ‘multi-year planning’ the most important change introduced into their prac-tice by the project. They concluded that the role of the extension service agents should change from mereconsultants of operational–tactical, crop-centred decisions to supporters of the process of farm planningand evaluation. The project showed that even on commercial farms operating under highly competitiveconditions, substantial improvements in economic and environmental indicators can be achieved when awhole farm strategic redesign is elaborated.
� 2013 Elsevier Ltd. All rights reserved.
1. Introduction
The larger part of the global rural population lives on familyfarms, which are responsible for more than half of the world’s foodproduction (FAO, 2011; IFAD, 2012). Meeting the goals of sustain-able growth of food production to provide for the increasing needsof the world’s population and the alleviation of poverty requiresassisting family farmers to develop farm systems that are moreproductive, profitable, resource efficient and environmentally
friendly (IFAD, 2011). However, in many regions of the world fam-ily farmers are threatened by decreasing economic returns, deteri-oration of the natural resource base, and lack of access to marketsand knowledge (Lipton, 2005; IFAD, 2011). Thus, ‘innovation’ infamily agriculture, understood as a process of technical and institu-tional changes at farm and higher levels that impacts on productiv-ity, sustainability, and poverty reduction, is required (Rölling,2009).
The south of Uruguay has the highest concentration of familyfarms in the country, many of them with vegetables as the mainsource of income, and the highest degree of soil erosion, with60–70% of the area classified as moderately to severely eroded
(2013),
2 S. Dogliotti et al. / Agricultural Systems xxx (2013) xxx–xxx
(MGAP, 2004). Around 88% of the farms with vegetable productionas the main source of income are family farms (Tommasino andBruno, 2005). During the past two decades the socio-economiccontext was unfavourable; decreasing product prices and increas-ing costs of energy and agro-chemicals reduced family incomeboth in an absolute sense and relative to the surrounding ruralpopulation. To maintain their income the strategy of most farmerswas to specialize and intensify their systems growing larger areasof fewer crops and increasing the use of irrigation and agro-chem-icals. Soil degradation was aggravated due to increased tillage, re-duced soil cover and organic matter supply, and lack of erosioncontrol measures. The state of the soil limits attainable crop yieldsand overall farm productivity and undermines farmers’ strategiesto maintain their income (Dogliotti et al., 2004). A major cause ofthis downward spiral is that the adaptation of farmers to changingconditions is mostly incremental, short-term oriented and onlyrarely involves strategic re-design of their rural livelihood strate-gies as a whole (IAASTD, 2009). As a result, livelihoods have be-come locked-in on unsustainable development tracks.
To identify options for sustainable development of vegetablefamily farms, we developed a whole-farm optimization modeland carried out a model-aided explorative study in earlier work.The study showed that decreasing the area of vegetable crops byintroducing long crop rotations with pastures, introducing greenmanures and animal manure applications during the inter-cropperiods, and integrating beef-cattle production into the farm sys-tem would be a better strategy than the farmers’ prevailing prac-tice of increasing the area of vegetables and specialising in a fewcrops (Dogliotti et al., 2005). These results strongly suggested thatthere is opportunity to increase farm systems performance both interms of productivity and impact on soil quality, even within theconstraints imposed by the current socio-economic context andfarm resource endowment.
To test this hypothesis we started a project at the end of 2004with funding of INIA (national agricultural research institute) andCUDECOOP (union of production cooperatives) and participationof CNFR (a major farmers’ union). The project was expanded in2007 with support of the European Union (EULACIAS) and partici-pation of Wageningen University. The project started from threebasic assumptions. Firstly, the sustainability problems describedabove cannot be solved by isolated adjustments or modificationsin some system components such as pest management or soil till-age. The relevance of the changes occurring in the socio-economiccontext and in the quality and availability of production resourcesat the farm level, requires the adaptation of the farm systems as awhole.
Secondly, it is possible to improve the sustainability of vegeta-ble and mixed vegetable-beef cattle family farms by changing theorganization and operation of the production systems, even in acontext of low resource endowment and limited access to markets,financing, services and information. In other words, there is en-ough room for manoeuvre inside the family farm systems to gen-erate significant improvements in sustainability. A per cropanalysis of the ‘yield gap’ provides insight into the main bio-phys-ical causes of yield variability in a region (Lobell et al., 2005; Titto-nell et al., 2008). However, farmers allocate their limited resourcesto the different production activities to optimize performance ofthe whole farm, and this may conflict with maximizing yields ofindividual crops.
The third assumption was that solutions to problems of this le-vel of complexity do not come as ‘take it or leave it’ validated pack-ages; they need to be designed with the direct involvement offarmers in all stages of the innovation process to ensure relevance,applicability and adoption (Gibbons et al., 1994; Masera et al.,2000; Leeuwis et al., 2002). Changes in agricultural practices to-wards more sustainable production systems are seen as a result
Please cite this article in press as: Dogliotti, S., et al. Co-innovation of family farmhttp://dx.doi.org/10.1016/j.agsy.2013.02.009
of a collective learning process of all actors involved in the processof change, including the researchers. We refer to this process as‘co-innovation’ (Rossing et al., 2010), an approach that combinescomplex systems theory, social learning and dynamic projectmonitoring and evaluation to stimulate strategic re-orientation offamily farm systems. A predecessor approach for systematic devel-opment of farming systems named ‘prototyping’ (Vereijken, 1997;Wijnands, 1999) has been criticized for not making an expliciteffort to take into account the existing diversity among farmersin resource endowment and strategy, and for being strongly dom-inated by researchers (Leeuwis, 1999). The approach used in thispaper involved farmers and other stakeholders from the beginningand in every phase of the process, and it was sensitive to differ-ences in farmers’ priorities and access to production resources.
The main objective of the project was to contribute to improv-ing the sustainability of family farms in south Uruguay by engagingfarmers and scientists in a joint innovation process. In this paperwe present the approach developed to diagnose and re-design veg-etable and mixed family farm systems and the impact on farm sus-tainability indicators after 2–5 years of system change.
2. Materials and methods
The study involved 20 families living on 14 farms located inMontevideo and Canelones provinces in south Uruguay, within aradius of approximately 60 km from Montevideo city. The climatein the area is temperate sub-humid with a mean annual tempera-ture of 16.4 �C, and a mean annual precipitation of 975 mm fairlyevenly distributed throughout the year but with major variationbetween years (Furest, 2008). Water deficits occur frequently be-tween October and March and water surpluses between May andAugust. Topography ranges from very gently undulating to undu-lating (slopes 0–6%).
The 14 farms were selected to represent a large range of varia-tion in resource endowment, soil quality and distance to the mar-ket. Willingness of the farmers to discuss strategic choices, andtheir involvement in local farmer’s groups were further importantselection criteria. The approach involved characterization anddiagnosis of the farm system’s sustainability, re-design, implemen-tation, and monitoring and evaluation of system evolution.
2.1. Characterization and diagnosis
During characterization and diagnosis we described the struc-ture and functioning of the farm systems based on the idea thata farm is composed of two interacting subsystems: the manage-ment subsystem and the production or bio-physical subsystem(Sorrensen and Kristensen, 1992). The management subsystem iscomposed of the persons who make decisions about the farm, theirobjectives, decision criteria and decision rules. The production sub-system includes the production resources: family and hired labour,energy and other inputs, machinery and infrastructure, soil areaand quality, and water availability; the allocation of these re-sources to different production activities in time and space; andthe desired and undesired results from the production activitiesin terms of performance indicators.
We studied the management system through two in-depthinterviews with the farmers and their families and by studyingtheir farm records. We assessed the management team (MT) com-position, the farm succession and life cycle stage, the type of book-keeping used, the distribution of tasks among MT members, theeducation level and the main sources of technical information.The production system was characterized through several inter-views with the farmers and by direct observations and measure-ments on the farms. Farm field sizes and their slopes were
systems: A systems approach to sustainable agriculture. Agr. Syst. (2013),
S. Dogliotti et al. / Agricultural Systems xxx (2013) xxx–xxx 3
measured using a theodolite and maps were created of each farm.We selected three to five fields with different topographic positionand/or use history as well as one or more relatively undisturbedareas on each farm to classify the soil types and to measure soilphysical and chemical properties. Soils were described followingthe FAO (2006) guidelines, and classified as Mollic Vertisols (Hype-reutric), Luvic/Vertic Phaeozems (Pachic), and Luvic Phaeozems(Abruptic/Oxyaquic) (IUSS Working Group WRB, 2006). Topsoiltexture ranged from silty clay loam to clayey. Soils of the selectedfields and at the reference sites were sampled and analysed everyautumn and spring during the project’s lifetime.
Diagnosis of each farm involved assessing critical points for sus-tainability, and drawing a problem tree (AUSAID, 2003). Criticalpoints were identified and assessed following the MESMIS frame-work (Masera et al., 2000). We identified indicators within thethree dimensions of sustainability (bio-physical, economic and so-cial) and classified them in four groups of sustainability attributes:(1) Productivity: the capacity of the system to produce the specificcombination of goods and services necessary to realize the objec-tives and goals of the stakeholders involved; (2) Stability: the pres-ence and effectiveness of negative feedback processes to controlthe internal positive loops that would lead to system self-deterio-ration; (3) Adaptability, Reliability, Resilience: the capability of thesystem to stand different types of changes in external variables ordriving forces; (4) Self-reliance: capability of the system to regu-late or control its interactions with the environment (Lopez-Rida-ura et al., 2005).
The problem trees were used to highlight in a graphic way ma-jor critical points perceived by both farmers and researchers, andto facilitate discussion with the farmers of the main causes andconsequences of these problems. The ‘root causes’ representedthe key points to be addressed during re-design to improve thefarm systems. Both, critical points tables and problem trees werediscussed with the farmers and adjusted to reach agreement onthe ‘root causes’ to be addressed during the re-design phase.
2.2. Re-design
The re-design procedure developed and applied in this studyconsisted of five consecutive steps.
2.2.1. Adjustment of field layout and erosion control support practicesIn this step we focused on problems related to the relationship
between the length and slope of the fields, the water run-off fromone field to another along the slopes or from neighbouring farms,and drainage problems on parts of fields. On small farms we lim-ited the field length to 35–50 m creating 2 m wide grassy paths be-tween fields. These paths were constructed at a lower level thanthe fields and acted as conduits for run-off. On larger farms we di-vided fields using parallel terracing with 40 m between terracesbuilt with an average slope of 1.5% according to the method pro-posed by Durán (2000). This work was done during the summerby the farmers themselves with their own or hired machinery.
2.2.2. Design of the cropping planIn this step we modified the selection of crops and the percent-
age of farm area for each crop to remedy at least one of the follow-ing root causes: the existing area of a crop or of a botanical familywas too large to safeguard soil health; the farm experienced ashortage of labour during some periods; the farm’s cash flow wasinsufficient during parts of the year; some of the existing cropswere not suitable for the soil types on the farm; the available re-sources were insufficient for some existing crops or for their sur-face areas; greater crop diversity was needed for biological ormarketing reasons. In the re-designs discussed with the farmerswe increased the area of grass-clover pastures or alfalfa whenever
Please cite this article in press as: Dogliotti, S., et al. Co-innovation of family farmhttp://dx.doi.org/10.1016/j.agsy.2013.02.009
possible to improve soil quality and to increase forage productionon farms with cattle.
2.2.3. Design of crop rotationsWe used ROTAT (Dogliotti et al., 2003) to design crop rotations
for each farm, based on simple agronomic rules. The number ofrotations designed per farm depended on several factors. Mostfarms with irrigation could only irrigate part of the farm, requiringone rotation for the irrigated part and another for the rain-fed partof the farm. On mixed vegetable-cattle farms the area with vegeta-bles usually was much smaller than the area for cattle grazing,requiring one vegetable-pastures rotation near the homesteadand another rotation with pastures and forage crops on the restof the farm. On many farms part of the fields were not suitablefor some of the vegetable crops, requiring two crop rotations. Weused maximum crop frequencies of 1 in 3 to 1 in 4 years, takinginto account prevailing soil borne diseases and the length of theintercrop period to give room to inclusion of green manure crops.
2.2.4. Design of inter-crop activitiesWe selected activities between main crops to protect the soil
from impaction of rain, to increase organic matter input and to re-duce expansion of weeds. The inter-crop activities included sum-mer and winter cover crops, the application of chicken manuremixed with rice husk before the most profitable vegetable crops,and soil solarisation of small areas on organic farms. The mixtureof chicken manure with rice husk was widely available in the re-gion at affordable price, since poultry breeding is concentrated inMontevideo and Canelones (DIEA-OPYPA-INIA, 2003) and rice huskis the standard bedding material used for broilers.
2.2.5. ‘Ex-ante’ evaluation of economic and environmental feasibilityThe farm plans were evaluated ‘ex-ante’ before discussing them
with the farmers. Gross margin, labour and input requirementswere estimated based on target yields and farm gate prices of in-puts and products using a spread sheet. Impact on soil erosionand soil organic matter balance was estimated using the modelsRUSLE (Renard et al., 1997) and ROTSOM (Dogliotti et al., 2004),respectively.
The plans were presented to the farmers in the form of mapsshowing the allocation of crops and inter-crop activities to fieldsfor a planning horizon of 3–4 years, and calendars with the mainmanagement activities per field. The plans were discussed withthe farmers and adjusted until an agreement was reached andimplementation started.
2.3. Monitoring and evaluation
We monitored the implementation of plans on each farm andadvised farmers during 2–3 weekly visits on adjustments to theplans in response to un-expected events or developments. Duringthe visits on-going activities were discussed with the farmers,and data were gathered on economic aspects, resource use, andcrop and animal management. After each year of implementationof the re-design plan and at the end of the project a report was pro-duced for each farm, which described the main economic and envi-ronmental results and was subsequently discussed with eachfarmer.
The time from the selection of the farms to the beginning ofimplementation of re-design plans was between 6 and 12 months.The plans were implemented, monitored and evaluated during4 years on the 5 farms that started the co-innovation process in2005 and during 2 years on the 9 farms that started in 2007. Theproject finished in July 2010.
systems: A systems approach to sustainable agriculture. Agr. Syst. (2013),
4 S. Dogliotti et al. / Agricultural Systems xxx (2013) xxx–xxx
3. Results
3.1. Characterization of the farms
The farms in the project represented a wide variation in re-source endowment (Table 2), soil quality and distance to the mar-ket. The distance to the main wholesale market in Montevideovaried from 15 to 70 km. Total labour availability varied between115 and 1084 h per ha per year. Three of the farms were organic.We found between 3 and 12 different species of vegetable cropsper farm. The organic farms and those closest to the main whole-sale market in Montevideo had the greater crop diversity. The maineconomic activity of all farms was vegetable production; on tenfarms animal production was an additional source of income.
There was little division of tasks among MT members, all wereinvolved in decision making and execution of operational tasks.Only on farm 3 specific operational decision making tasks were di-vided over members of the rather large MT. On most farms therewas a clear labour division between men and women: the tasksinvolving machinery, soil tillage and movement of heavy loadswere done by the men, while the women participated in manualwork (sowing, planting, weeding and harvest and post-harvest).Activities not related to agriculture but fundamental to the func-tioning of the household were mostly the responsibility of the wo-men. As a result the women worked fewer hours on the productionactivities than the men. Among the MT members, three were under30 years of age, seven from 30 to 39, twelve from 40 to 49 and ele-ven were 50 or more. Only four of the MT members had completeda vocational education, while six had done secondary school, and23 had completed just primary school. The farms were in all thestages of the life cycle and at different levels of transition of thefarm to the next generation (Table 2).
We distinguished four book-keeping styles. Farmers were moremotivated to keep records of economic flows and activities whenthere was more than one household on the farm in order to sup-port the division of income, or when they saw it as a way to im-prove the management of their main crops. However, no farmercalculated an annual economic balance of his farm, neither didthey have advisers to do that. As a result allocation of resourcesto different production activities was not based on a quantitativeevaluation of costs and benefits of different production activitiesbut on a general perception of costs and returns in cash and ex-pected market prices. Investments on the farms were strongly re-lated to cash surpluses during financially good years or to theopportunity presented by rural development projects providingsubsidies. Usually there was no quantitative evaluation of viabilityor impact of investments and there was very limited use of credit.
The main sources of technical information for most conven-tional farmers were the local agrochemical and seeds shops, whileorganic farmers mentioned field days and workshops organized bydifferent institutions. Specialized radio broadcasts were mentionedby all farmers as sources of information on market prices of prod-ucts and inputs, and also on technical information. The retailers ormiddle men were also relevant sources of information about mar-ket behaviour and prices of vegetable products.
3.2. Diagnosis of sustainability
Results of the farm diagnosis are presented in Tables 4–6 as the ‘ini-tial’ situation. We found the weakest points of the farms to be associ-ated with the productivity (Table 4) and stability attributes (Table 5) ofsustainability described in Table 1. Both physical and economic pro-ductivity were low. Yields of eighteen out of twenty-eight main cropswere less than half the attainable yield, resulting in RYMC values low-er than 0.50 (Table 4). Per capita family income (FIp) on ten farms was
Please cite this article in press as: Dogliotti, S., et al. Co-innovation of family farmhttp://dx.doi.org/10.1016/j.agsy.2013.02.009
lower than the average FIp in rural areas and small towns in the region.Labour productivity on nine farms was less than the opportunity costof labour, estimated as the cost of temporary hired labour in the re-gion. The financial input/output ratio exceeded 0.9 on eight farms,meaning that these farms were not able to make even the small invest-ments needed to maintain their assets.
We assessed a variety of quality-of-life indicators reflecting thequality of the homestead and its surroundings, access to health ser-vices and social security, etc., but we only found important differ-ences between farms and low values in the indicators ‘amount ofleisure time’ and ‘prevalence of work-related health problems’.Most farmers had long working days and took only half the dayoff on Sundays and holidays. Only a few of them were able to leavethe farm for a whole week or more per year. On eight farms at leastone member of the MT had had or had a health problem related tothe spine or a hernia caused by their work. We identified one caseof intoxication due to application of pesticides.
The main problem related to conservation of natural resourceswas the loss of soil fertility. We identified severe losses of soil or-ganic carbon (SOC), erosion rates that exceeded the tolerance levelof 5–7 Mg ha�1 yr�1 (Puentes and Szogi, 1983) by a factor of 2 to 6,and negative balances of soil organic matter in the vegetable fieldson all farms. On only two of the fields relative active SOC contentexceeded 0.5, and on 42 out of 53 fields relative active SOC wassmaller than 0.33, indicating that most vegetable fields were muchcloser to the lower limit of SOC than to the SOC content at theundisturbed references sites (Table 5). The erosion rate was lowerthan the tolerance level only in fields under pastures and foragecrops or with slopes less than 1%. Soil organic matter balanceswere positive only in fields under pasture with no tillage for morethan three years and in most fields of Farm 7, which was an organicfarm applying large amounts of chicken manure and rice husk andsowing cover crops as a common practice.
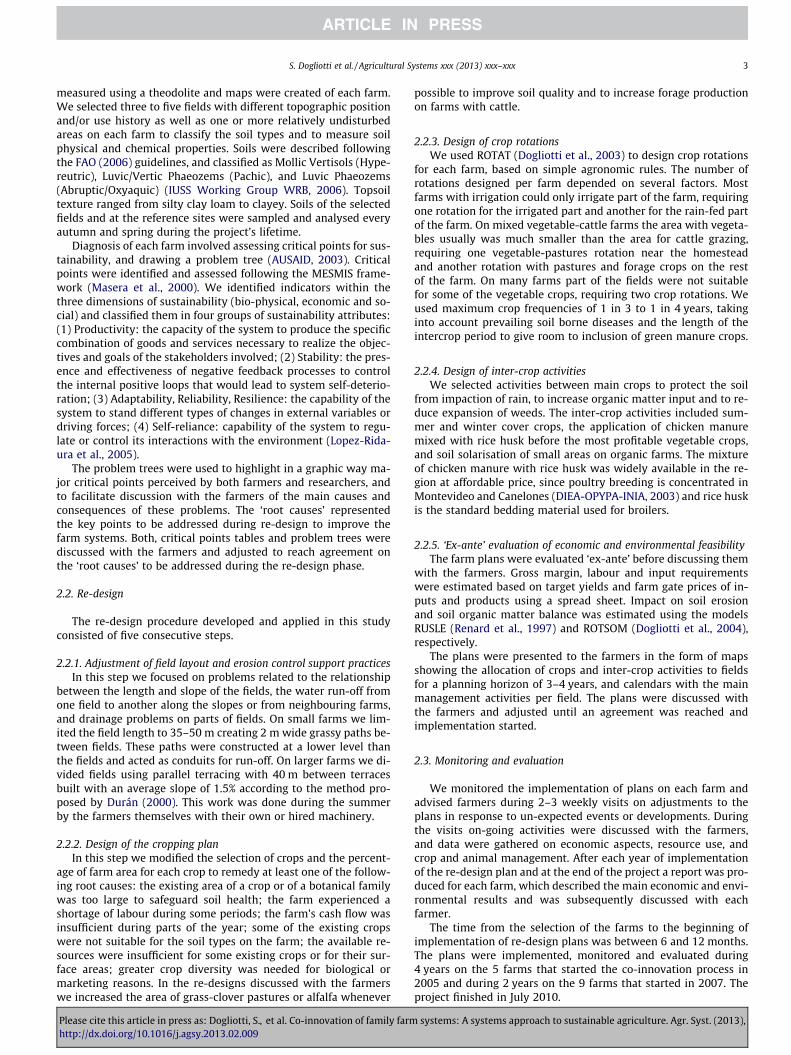
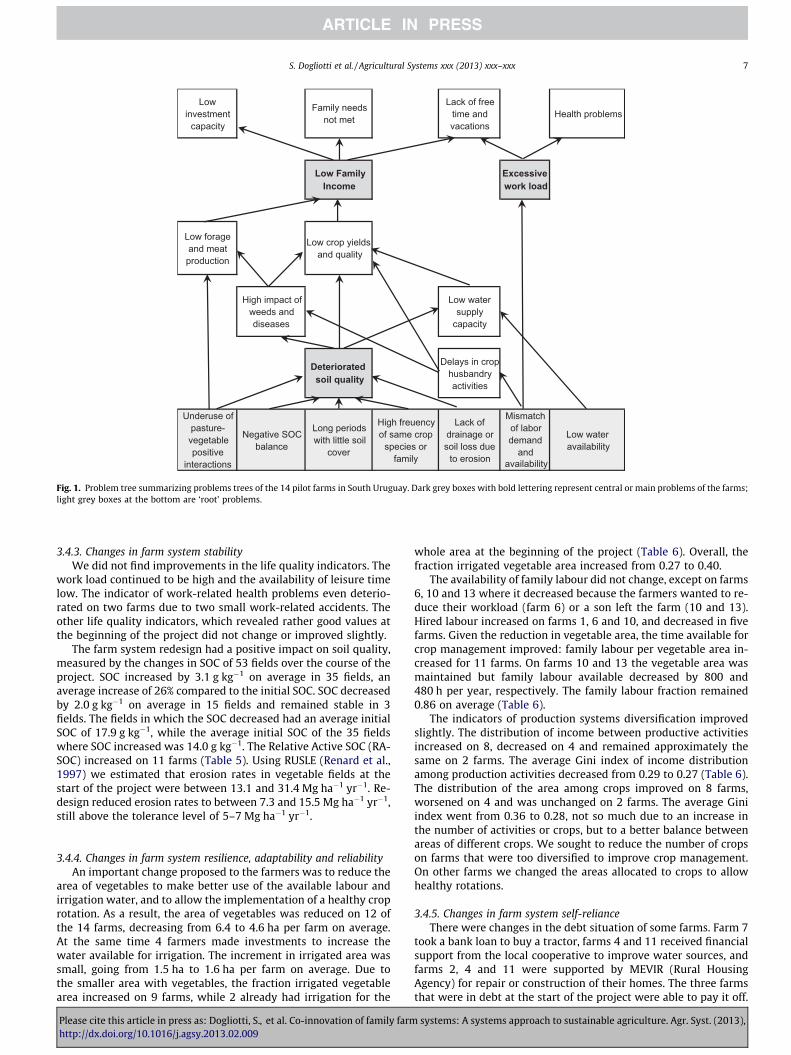
The problem trees brought out a number of important commonproblems and consequences for the performance of the farms, eventhough with different relative importance per farm. The farmersstressed as their main problems the low family income and the dete-rioration of soil fertility. Based on the farm characterization weadded excessive work load as a root cause of the poor quality of lifeof the families. Deterioration of soil fertility was a problem in itself,but it was also one of the root causes of low productivity and conse-quently low family income. A ‘summary problem tree’ which de-scribes cause – consequence relations found on the majority offarms is presented in Fig. 1. The main causes of low family income,excessive work load and deteriorated soil quality were:
� Mismatch between labour demand and availability in thecourse of the year resulting in major peaks in work load. Thismismatch also led to delays in crop management activitiesand consequently to crop yield losses.� Low water availability for irrigation of summer crops together
with deteriorated soil quality resulting in a low capacity to sup-ply water to vegetable crops and reduced crop yields. Farmersunderestimated the water requirements of their irrigated cropsand/or overestimated the capacity of their water sources, andplanted more area than they could irrigate properly.� Deterioration of soil fertility, explained by a combination of sev-
eral problems. Most vegetable crops provide little soil coverduring their growth period and leave little residue, which, com-bined with the standard practice of a clean fallow during theintercrop periods resulted in negative soil organic matter bal-ances and high risk of soil erosion. The decisions about alloca-tion of crops to fields were tactical; no farmer wasimplementing a planned crop rotation. This lack of planningled to high cropping intensity on some fields and high frequen-cies of the same crop or crop family, causing increasing impact
systems: A systems approach to sustainable agriculture. Agr. Syst. (2013),

Table 1Main critical points of 14 pilot farms in south Uruguay, classified by sustainability dimension, sustainability attributes, diagnosis criteria and the indicators used to quantify eachcritical point.
Sustainability attribute Diagnosis criterion Indicator Calculationmethod
Sustainabilitydimensions
Critical point
Productivity Production and economicefficiency
Relative yield of main crops(RYMC)
Actual Yld/Attainable Ylda
Bio-physical Low crop yields
Family income per capita (FIp) FIp/Average FIpb Economic Low family income (FI)Relative family income percapita (RFIp)Income per hour of labour (IH) FI/Family labour Economic Low labour productivityInput/output ratio Total costs/gross
productEconomic Low resource use efficiency
Stability Life quality Amount of leisure time c Social High work loadPrevalence of work relatedhealth problems
d Social Incidence of work related healthproblems
Natural resourcesconservation
Relative active SOC (RASOC) e Bio-physical Severe loss of soil fertility
SOM balance ROTSOM model Bio-physicalErosion risk RUSLE model Bio-physical
Resilience, adaptabilityand reliability
Production systemfragility
Irrigated fraction Irrigated/total veg.area
Bio-physical Low irrigation water availability
Family labour fraction (FLF) FL/total labour Social High family labour availabilityFamily labour per vegetable area(FLVA)
FL/total veg. area Bio-physical
Production systemdiversity
Income distribution amongproduction activities
Ginni Indexf Economic Diversity of income sources
Crop diversity in area Ginni indexg Bio-physical Diversity of crops
Self-reliance Financial and inputdependency
Solvency Total debt/Assets Economic Low indebtedness
External/total inputs Purchased/Totalinputs Costh
Economic Low dependency on externalinputs
Social and human capitalaccumulation
Degree of participation intraining activities
i Social Low participation in trainingactivities
Degree of participation ingroups and networks
j Social High participation in localgroups and networks
a We selected the two main crops per farm and we defined attainable yields as the rain-fed and irrigated yields obtained by best farmers in the region based on expertknowledge.
b Family income per capita (FIp) is defined as the sum of net profit and the value assigned to family labour divided by the number of family members. Average income percapita in small cities and rural areas is derived from national surveys of household incomes (INE, 2010).
c Leisure time index, 1 = 1 day per month; 2 = 2–4 days per month; 3 = 1 day per month and one week per year; 4 = 2–4 days per month and one week per year, 5 = morethan 2–4 days per month and one week per year.
d Work related Health index, 1 = one chronic un-treated problem, 2 = one chronic treated problem, 3 = more than one temporary problem during the past year, 4 = onetemporary problem during the past year, 5 = no problems.
e RASOC = ((Actual SOC – Min SOC)/(Max SOC – Min SOC)) * 100, determined in representative fields of each farm. Min SOC is an indicator of ‘stable’ SOC estimated basedon soil texture using the equation of Rühlmann (1999). Max SOC is the amount of carbon found in each soil type under the original vegetation of the region and un-disturbedconditions, based on Durán and García-Prechác (2007).
f Income distribution = (P
gross income from activity2i )/(total gross income)2, includes also off-farm sources of income.
g Crop diversity = (P
area crop2i )/(total crop area)2, includes vegetables, cereals, forage crops and pastures.
h Purchased inputs include hired labour, agrochemicals, fuel, electricity, etc. Total inputs include also family labour, seeds, manure, etc. produced on the farm, valued atfarm gate prices.
i Participation in training activities, 1 = zero, 2 = one MT member in one activity during the past year, 3 = one MT member in more than one activity, 4 = >1 MT member inone activity during the past year, 5 = >1 MT member in more than one activity.
j Groups and networks, 1 = few links with neighbours, no membership of any organization, 2 = good links with neighbours, no membership of any organization, 3 = fewlinks with neighbours, participates regularly in a local organization, 4 = good link with neighbours, participates regularly in a local organization, 5 = good link with neighboursand leader of local group or organization.
S. Dogliotti et al. / Agricultural Systems xxx (2013) xxx–xxx 5
of weeds and diseases on crop yields. Finally, on many farms thelayout of fields and the absence of erosion control support mea-sures increased soil erosion risk.
3.3. Re-design of farm production systems
Based on the ‘root problems’ described above, we proposed sys-tem re-design with three aims: to better match resource demandand supply, to adopt multi-year planning, and to rehabilitate the soil.
Matching resource demand and supply
� We reduced the area of vegetable crops to match the availabilityof and demand for labour and irrigation water and to allow theimplementation of a crop rotation with frequencies of the samespecies and families smaller than 1 in 3 to 4 years.
Please cite this article in press as: Dogliotti, S., et al. Co-innovation of family farmhttp://dx.doi.org/10.1016/j.agsy.2013.02.009
� We modified the selection of crop species and/or combinedearly, intermediate and late varieties of the same crop toimprove the distribution along the year of sowing, plantingand harvesting activities.
Multi-year planning
� We introduced crop rotation to stimulate farmers to increasetheir planning horizon of spatial and temporal allocation ofcrops to fields. We combined vegetable crops and 3–4 year pas-ture phases whenever possible.� Farmers usually thought of weeds as a problem of individual
crops, and control measures (mechanical or chemical) wereapplied during the crop growth period. We tried to make themthink of weeds as a field-specific problem to be reduced in the
systems: A systems approach to sustainable agriculture. Agr. Syst. (2013),
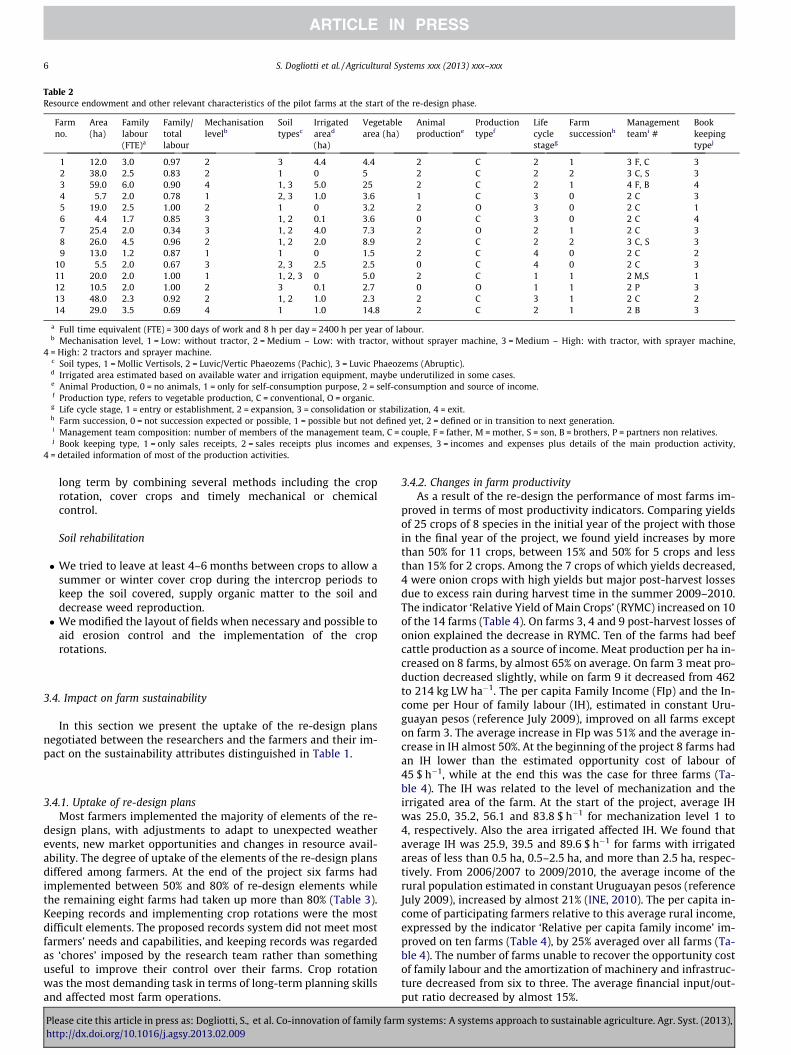
Table 2Resource endowment and other relevant characteristics of the pilot farms at the start of the re-design phase.
Farmno.
Area(ha)
Familylabour(FTE)a
Family/totallabour
Mechanisationlevelb
Soiltypesc
Irrigatedaread
(ha)
Vegetablearea (ha)
Animalproductione
Productiontypef
Lifecyclestageg
Farmsuccessionh
Managementteami #
Bookkeepingtypej
1 12.0 3.0 0.97 2 3 4.4 4.4 2 C 2 1 3 F, C 32 38.0 2.5 0.83 2 1 0 5 2 C 2 2 3 C, S 33 59.0 6.0 0.90 4 1, 3 5.0 25 2 C 2 1 4 F, B 44 5.7 2.0 0.78 1 2, 3 1.0 3.6 1 C 3 0 2 C 35 19.0 2.5 1.00 2 1 0 3.2 2 O 3 0 2 C 16 4.4 1.7 0.85 3 1, 2 0.1 3.6 0 C 3 0 2 C 47 25.4 2.0 0.34 3 1, 2 4.0 7.3 2 O 2 1 2 C 38 26.0 4.5 0.96 2 1, 2 2.0 8.9 2 C 2 2 3 C, S 39 13.0 1.2 0.87 1 1 0 1.5 2 C 4 0 2 C 2
10 5.5 2.0 0.67 3 2, 3 2.5 2.5 0 C 4 0 2 C 311 20.0 2.0 1.00 1 1, 2, 3 0 5.0 2 C 1 1 2 M,S 112 10.5 2.0 1.00 2 3 0.1 2.7 0 O 1 1 2 P 313 48.0 2.3 0.92 2 1, 2 1.0 2.3 2 C 3 1 2 C 214 29.0 3.5 0.69 4 1 1.0 14.8 2 C 2 1 2 B 3
a Full time equivalent (FTE) = 300 days of work and 8 h per day = 2400 h per year of labour.b Mechanisation level, 1 = Low: without tractor, 2 = Medium – Low: with tractor, without sprayer machine, 3 = Medium – High: with tractor, with sprayer machine,
4 = High: 2 tractors and sprayer machine.c Soil types, 1 = Mollic Vertisols, 2 = Luvic/Vertic Phaeozems (Pachic), 3 = Luvic Phaeozems (Abruptic).d Irrigated area estimated based on available water and irrigation equipment, maybe underutilized in some cases.e Animal Production, 0 = no animals, 1 = only for self-consumption purpose, 2 = self-consumption and source of income.f Production type, refers to vegetable production, C = conventional, O = organic.g Life cycle stage, 1 = entry or establishment, 2 = expansion, 3 = consolidation or stabilization, 4 = exit.h Farm succession, 0 = not succession expected or possible, 1 = possible but not defined yet, 2 = defined or in transition to next generation.i Management team composition: number of members of the management team, C = couple, F = father, M = mother, S = son, B = brothers, P = partners non relatives.j Book keeping type, 1 = only sales receipts, 2 = sales receipts plus incomes and expenses, 3 = incomes and expenses plus details of the main production activity,
4 = detailed information of most of the production activities.
6 S. Dogliotti et al. / Agricultural Systems xxx (2013) xxx–xxx
long term by combining several methods including the croprotation, cover crops and timely mechanical or chemicalcontrol.
Soil rehabilitation
� We tried to leave at least 4–6 months between crops to allow asummer or winter cover crop during the intercrop periods tokeep the soil covered, supply organic matter to the soil anddecrease weed reproduction.� We modified the layout of fields when necessary and possible to
aid erosion control and the implementation of the croprotations.
3.4. Impact on farm sustainability
In this section we present the uptake of the re-design plansnegotiated between the researchers and the farmers and their im-pact on the sustainability attributes distinguished in Table 1.
3.4.1. Uptake of re-design plansMost farmers implemented the majority of elements of the re-
design plans, with adjustments to adapt to unexpected weatherevents, new market opportunities and changes in resource avail-ability. The degree of uptake of the elements of the re-design plansdiffered among farmers. At the end of the project six farms hadimplemented between 50% and 80% of re-design elements whilethe remaining eight farms had taken up more than 80% (Table 3).Keeping records and implementing crop rotations were the mostdifficult elements. The proposed records system did not meet mostfarmers’ needs and capabilities, and keeping records was regardedas ‘chores’ imposed by the research team rather than somethinguseful to improve their control over their farms. Crop rotationwas the most demanding task in terms of long-term planning skillsand affected most farm operations.
Please cite this article in press as: Dogliotti, S., et al. Co-innovation of family farmhttp://dx.doi.org/10.1016/j.agsy.2013.02.009
3.4.2. Changes in farm productivityAs a result of the re-design the performance of most farms im-
proved in terms of most productivity indicators. Comparing yieldsof 25 crops of 8 species in the initial year of the project with thosein the final year of the project, we found yield increases by morethan 50% for 11 crops, between 15% and 50% for 5 crops and lessthan 15% for 2 crops. Among the 7 crops of which yields decreased,4 were onion crops with high yields but major post-harvest lossesdue to excess rain during harvest time in the summer 2009–2010.The indicator ‘Relative Yield of Main Crops’ (RYMC) increased on 10of the 14 farms (Table 4). On farms 3, 4 and 9 post-harvest losses ofonion explained the decrease in RYMC. Ten of the farms had beefcattle production as a source of income. Meat production per ha in-creased on 8 farms, by almost 65% on average. On farm 3 meat pro-duction decreased slightly, while on farm 9 it decreased from 462to 214 kg LW ha�1. The per capita Family Income (FIp) and the In-come per Hour of family labour (IH), estimated in constant Uru-guayan pesos (reference July 2009), improved on all farms excepton farm 3. The average increase in FIp was 51% and the average in-crease in IH almost 50%. At the beginning of the project 8 farms hadan IH lower than the estimated opportunity cost of labour of45 $ h�1, while at the end this was the case for three farms (Ta-ble 4). The IH was related to the level of mechanization and theirrigated area of the farm. At the start of the project, average IHwas 25.0, 35.2, 56.1 and 83.8 $ h�1 for mechanization level 1 to4, respectively. Also the area irrigated affected IH. We found thataverage IH was 25.9, 39.5 and 89.6 $ h�1 for farms with irrigatedareas of less than 0.5 ha, 0.5–2.5 ha, and more than 2.5 ha, respec-tively. From 2006/2007 to 2009/2010, the average income of therural population estimated in constant Uruguayan pesos (referenceJuly 2009), increased by almost 21% (INE, 2010). The per capita in-come of participating farmers relative to this average rural income,expressed by the indicator ‘Relative per capita family income’ im-proved on ten farms (Table 4), by 25% averaged over all farms (Ta-ble 4). The number of farms unable to recover the opportunity costof family labour and the amortization of machinery and infrastruc-ture decreased from six to three. The average financial input/out-put ratio decreased by almost 15%.
systems: A systems approach to sustainable agriculture. Agr. Syst. (2013),
Low investment
capacity
Family needs not met
Lack of free time and vacations
Health problems
Low Family Income
Excessive work load
Low forage and meat production
Low crop yields and quality
High impact of weeds and diseases
Low water supply
capacity
Deteriorated soil quality
Delays in crop husbandry activities
Underuse of pasture-vegetable positive
interactions
Negative SOC balance
Long periods with little soil
cover
High freuency of same crop
species or family
Lack of drainage or soil loss due
to erosion
Mismatch of labor demand
and availability
Low water availability
Fig. 1. Problem tree summarizing problems trees of the 14 pilot farms in South Uruguay. Dark grey boxes with bold lettering represent central or main problems of the farms;light grey boxes at the bottom are ‘root’ problems.
S. Dogliotti et al. / Agricultural Systems xxx (2013) xxx–xxx 7
3.4.3. Changes in farm system stabilityWe did not find improvements in the life quality indicators. The
work load continued to be high and the availability of leisure timelow. The indicator of work-related health problems even deterio-rated on two farms due to two small work-related accidents. Theother life quality indicators, which revealed rather good values atthe beginning of the project did not change or improved slightly.
The farm system redesign had a positive impact on soil quality,measured by the changes in SOC of 53 fields over the course of theproject. SOC increased by 3.1 g kg�1 on average in 35 fields, anaverage increase of 26% compared to the initial SOC. SOC decreasedby 2.0 g kg�1 on average in 15 fields and remained stable in 3fields. The fields in which the SOC decreased had an average initialSOC of 17.9 g kg�1, while the average initial SOC of the 35 fieldswhere SOC increased was 14.0 g kg�1. The Relative Active SOC (RA-SOC) increased on 11 farms (Table 5). Using RUSLE (Renard et al.,1997) we estimated that erosion rates in vegetable fields at thestart of the project were between 13.1 and 31.4 Mg ha�1 yr�1. Re-design reduced erosion rates to between 7.3 and 15.5 Mg ha�1 yr�1,still above the tolerance level of 5–7 Mg ha�1 yr�1.
3.4.4. Changes in farm system resilience, adaptability and reliabilityAn important change proposed to the farmers was to reduce the
area of vegetables to make better use of the available labour andirrigation water, and to allow the implementation of a healthy croprotation. As a result, the area of vegetables was reduced on 12 ofthe 14 farms, decreasing from 6.4 to 4.6 ha per farm on average.At the same time 4 farmers made investments to increase thewater available for irrigation. The increment in irrigated area wassmall, going from 1.5 ha to 1.6 ha per farm on average. Due tothe smaller area with vegetables, the fraction irrigated vegetablearea increased on 9 farms, while 2 already had irrigation for the
Please cite this article in press as: Dogliotti, S., et al. Co-innovation of family farmhttp://dx.doi.org/10.1016/j.agsy.2013.02.009
whole area at the beginning of the project (Table 6). Overall, thefraction irrigated vegetable area increased from 0.27 to 0.40.
The availability of family labour did not change, except on farms6, 10 and 13 where it decreased because the farmers wanted to re-duce their workload (farm 6) or a son left the farm (10 and 13).Hired labour increased on farms 1, 6 and 10, and decreased in fivefarms. Given the reduction in vegetable area, the time available forcrop management improved: family labour per vegetable area in-creased for 11 farms. On farms 10 and 13 the vegetable area wasmaintained but family labour available decreased by 800 and480 h per year, respectively. The family labour fraction remained0.86 on average (Table 6).
The indicators of production systems diversification improvedslightly. The distribution of income between productive activitiesincreased on 8, decreased on 4 and remained approximately thesame on 2 farms. The average Gini index of income distributionamong production activities decreased from 0.29 to 0.27 (Table 6).The distribution of the area among crops improved on 8 farms,worsened on 4 and was unchanged on 2 farms. The average Giniindex went from 0.36 to 0.28, not so much due to an increase inthe number of activities or crops, but to a better balance betweenareas of different crops. We sought to reduce the number of cropson farms that were too diversified to improve crop management.On other farms we changed the areas allocated to crops to allowhealthy rotations.
3.4.5. Changes in farm system self-relianceThere were changes in the debt situation of some farms. Farm 7
took a bank loan to buy a tractor, farms 4 and 11 received financialsupport from the local cooperative to improve water sources, andfarms 2, 4 and 11 were supported by MEVIR (Rural HousingAgency) for repair or construction of their homes. The three farmsthat were in debt at the start of the project were able to pay it off.
systems: A systems approach to sustainable agriculture. Agr. Syst. (2013),
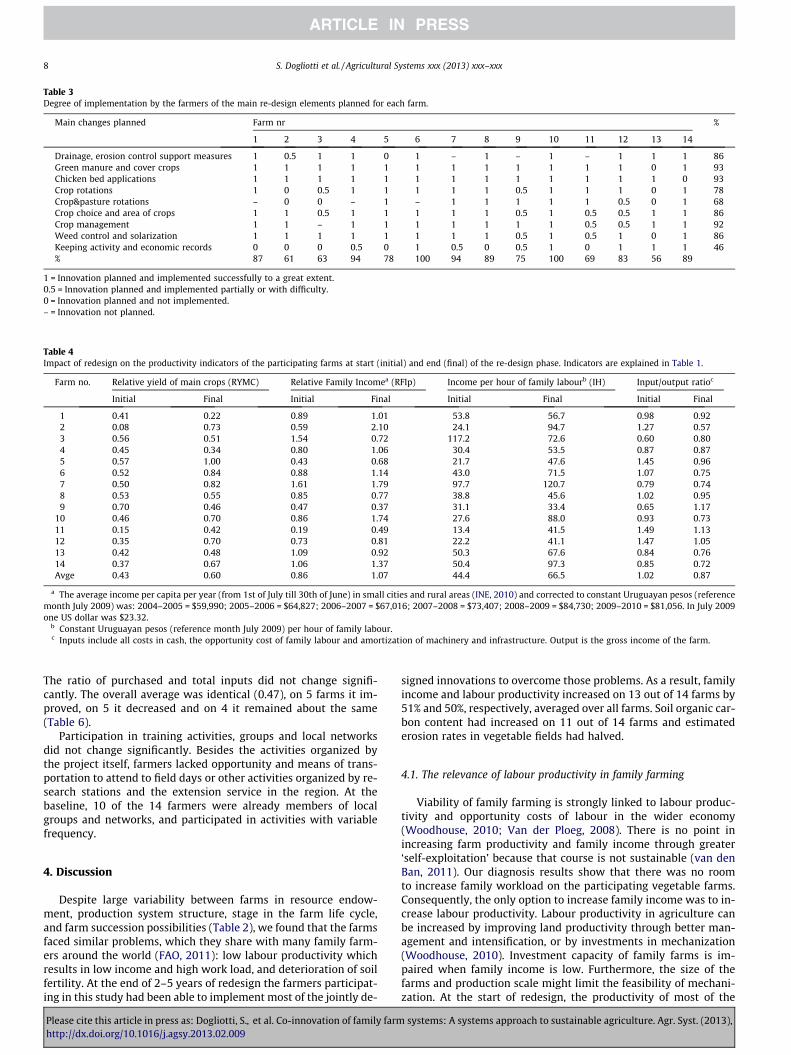
Table 3Degree of implementation by the farmers of the main re-design elements planned for each farm.
Main changes planned Farm nr %
1 2 3 4 5 6 7 8 9 10 11 12 13 14
Drainage, erosion control support measures 1 0.5 1 1 0 1 – 1 – 1 – 1 1 1 86Green manure and cover crops 1 1 1 1 1 1 1 1 1 1 1 1 0 1 93Chicken bed applications 1 1 1 1 1 1 1 1 1 1 1 1 1 0 93Crop rotations 1 0 0.5 1 1 1 1 1 0.5 1 1 1 0 1 78Crop&pasture rotations – 0 0 – 1 – 1 1 1 1 1 0.5 0 1 68Crop choice and area of crops 1 1 0.5 1 1 1 1 1 0.5 1 0.5 0.5 1 1 86Crop management 1 1 – 1 1 1 1 1 1 1 0.5 0.5 1 1 92Weed control and solarization 1 1 1 1 1 1 1 1 0.5 1 0.5 1 0 1 86Keeping activity and economic records 0 0 0 0.5 0 1 0.5 0 0.5 1 0 1 1 1 46% 87 61 63 94 78 100 94 89 75 100 69 83 56 89
1 = Innovation planned and implemented successfully to a great extent.0.5 = Innovation planned and implemented partially or with difficulty.0 = Innovation planned and not implemented.– = Innovation not planned.
Table 4Impact of redesign on the productivity indicators of the participating farms at start (initial) and end (final) of the re-design phase. Indicators are explained in Table 1.
Farm no. Relative yield of main crops (RYMC) Relative Family Incomea (RFIp) Income per hour of family labourb (IH) Input/output ratioc
Initial Final Initial Final Initial Final Initial Final
1 0.41 0.22 0.89 1.01 53.8 56.7 0.98 0.922 0.08 0.73 0.59 2.10 24.1 94.7 1.27 0.573 0.56 0.51 1.54 0.72 117.2 72.6 0.60 0.804 0.45 0.34 0.80 1.06 30.4 53.5 0.87 0.875 0.57 1.00 0.43 0.68 21.7 47.6 1.45 0.966 0.52 0.84 0.88 1.14 43.0 71.5 1.07 0.757 0.50 0.82 1.61 1.79 97.7 120.7 0.79 0.748 0.53 0.55 0.85 0.77 38.8 45.6 1.02 0.959 0.70 0.46 0.47 0.37 31.1 33.4 0.65 1.17
10 0.46 0.70 0.86 1.74 27.6 88.0 0.93 0.7311 0.15 0.42 0.19 0.49 13.4 41.5 1.49 1.1312 0.35 0.70 0.73 0.81 22.2 41.1 1.47 1.0513 0.42 0.48 1.09 0.92 50.3 67.6 0.84 0.7614 0.37 0.67 1.06 1.37 50.4 97.3 0.85 0.72Avge 0.43 0.60 0.86 1.07 44.4 66.5 1.02 0.87
a The average income per capita per year (from 1st of July till 30th of June) in small cities and rural areas (INE, 2010) and corrected to constant Uruguayan pesos (referencemonth July 2009) was: 2004–2005 = $59,990; 2005–2006 = $64,827; 2006–2007 = $67,016; 2007–2008 = $73,407; 2008–2009 = $84,730; 2009–2010 = $81,056. In July 2009one US dollar was $23.32.
b Constant Uruguayan pesos (reference month July 2009) per hour of family labour.c Inputs include all costs in cash, the opportunity cost of family labour and amortization of machinery and infrastructure. Output is the gross income of the farm.
8 S. Dogliotti et al. / Agricultural Systems xxx (2013) xxx–xxx
The ratio of purchased and total inputs did not change signifi-cantly. The overall average was identical (0.47), on 5 farms it im-proved, on 5 it decreased and on 4 it remained about the same(Table 6).
Participation in training activities, groups and local networksdid not change significantly. Besides the activities organized bythe project itself, farmers lacked opportunity and means of trans-portation to attend to field days or other activities organized by re-search stations and the extension service in the region. At thebaseline, 10 of the 14 farmers were already members of localgroups and networks, and participated in activities with variablefrequency.
4. Discussion
Despite large variability between farms in resource endow-ment, production system structure, stage in the farm life cycle,and farm succession possibilities (Table 2), we found that the farmsfaced similar problems, which they share with many family farm-ers around the world (FAO, 2011): low labour productivity whichresults in low income and high work load, and deterioration of soilfertility. At the end of 2–5 years of redesign the farmers participat-ing in this study had been able to implement most of the jointly de-
Please cite this article in press as: Dogliotti, S., et al. Co-innovation of family farmhttp://dx.doi.org/10.1016/j.agsy.2013.02.009
signed innovations to overcome those problems. As a result, familyincome and labour productivity increased on 13 out of 14 farms by51% and 50%, respectively, averaged over all farms. Soil organic car-bon content had increased on 11 out of 14 farms and estimatederosion rates in vegetable fields had halved.
4.1. The relevance of labour productivity in family farming
Viability of family farming is strongly linked to labour produc-tivity and opportunity costs of labour in the wider economy(Woodhouse, 2010; Van der Ploeg, 2008). There is no point inincreasing farm productivity and family income through greater‘self-exploitation’ because that course is not sustainable (van denBan, 2011). Our diagnosis results show that there was no roomto increase family workload on the participating vegetable farms.Consequently, the only option to increase family income was to in-crease labour productivity. Labour productivity in agriculture canbe increased by improving land productivity through better man-agement and intensification, or by investments in mechanization(Woodhouse, 2010). Investment capacity of family farms is im-paired when family income is low. Furthermore, the size of thefarms and production scale might limit the feasibility of mechani-zation. At the start of redesign, the productivity of most of the
systems: A systems approach to sustainable agriculture. Agr. Syst. (2013),
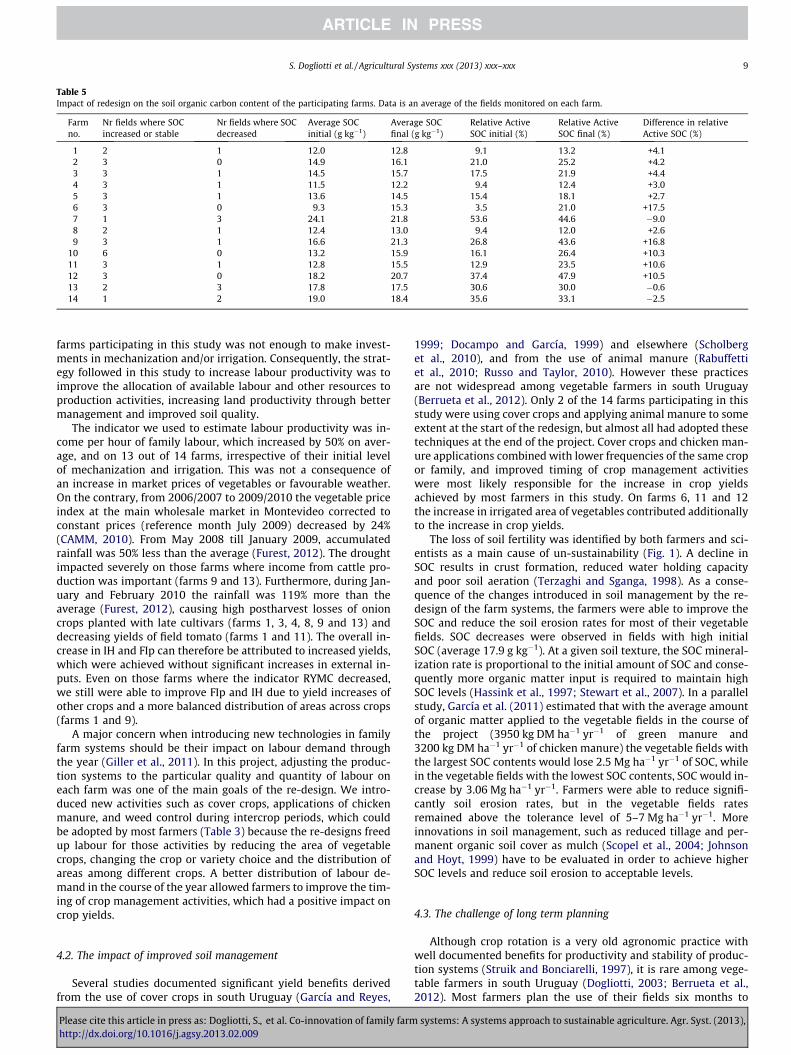
Table 5Impact of redesign on the soil organic carbon content of the participating farms. Data is an average of the fields monitored on each farm.
Farmno.
Nr fields where SOCincreased or stable
Nr fields where SOCdecreased
Average SOCinitial (g kg�1)
Average SOCfinal (g kg�1)
Relative ActiveSOC initial (%)
Relative ActiveSOC final (%)
Difference in relativeActive SOC (%)
1 2 1 12.0 12.8 9.1 13.2 +4.12 3 0 14.9 16.1 21.0 25.2 +4.23 3 1 14.5 15.7 17.5 21.9 +4.44 3 1 11.5 12.2 9.4 12.4 +3.05 3 1 13.6 14.5 15.4 18.1 +2.76 3 0 9.3 15.3 3.5 21.0 +17.57 1 3 24.1 21.8 53.6 44.6 �9.08 2 1 12.4 13.0 9.4 12.0 +2.69 3 1 16.6 21.3 26.8 43.6 +16.8
10 6 0 13.2 15.9 16.1 26.4 +10.311 3 1 12.8 15.5 12.9 23.5 +10.612 3 0 18.2 20.7 37.4 47.9 +10.513 2 3 17.8 17.5 30.6 30.0 �0.614 1 2 19.0 18.4 35.6 33.1 �2.5
S. Dogliotti et al. / Agricultural Systems xxx (2013) xxx–xxx 9
farms participating in this study was not enough to make invest-ments in mechanization and/or irrigation. Consequently, the strat-egy followed in this study to increase labour productivity was toimprove the allocation of available labour and other resources toproduction activities, increasing land productivity through bettermanagement and improved soil quality.
The indicator we used to estimate labour productivity was in-come per hour of family labour, which increased by 50% on aver-age, and on 13 out of 14 farms, irrespective of their initial levelof mechanization and irrigation. This was not a consequence ofan increase in market prices of vegetables or favourable weather.On the contrary, from 2006/2007 to 2009/2010 the vegetable priceindex at the main wholesale market in Montevideo corrected toconstant prices (reference month July 2009) decreased by 24%(CAMM, 2010). From May 2008 till January 2009, accumulatedrainfall was 50% less than the average (Furest, 2012). The droughtimpacted severely on those farms where income from cattle pro-duction was important (farms 9 and 13). Furthermore, during Jan-uary and February 2010 the rainfall was 119% more than theaverage (Furest, 2012), causing high postharvest losses of onioncrops planted with late cultivars (farms 1, 3, 4, 8, 9 and 13) anddecreasing yields of field tomato (farms 1 and 11). The overall in-crease in IH and FIp can therefore be attributed to increased yields,which were achieved without significant increases in external in-puts. Even on those farms where the indicator RYMC decreased,we still were able to improve FIp and IH due to yield increases ofother crops and a more balanced distribution of areas across crops(farms 1 and 9).
A major concern when introducing new technologies in familyfarm systems should be their impact on labour demand throughthe year (Giller et al., 2011). In this project, adjusting the produc-tion systems to the particular quality and quantity of labour oneach farm was one of the main goals of the re-design. We intro-duced new activities such as cover crops, applications of chickenmanure, and weed control during intercrop periods, which couldbe adopted by most farmers (Table 3) because the re-designs freedup labour for those activities by reducing the area of vegetablecrops, changing the crop or variety choice and the distribution ofareas among different crops. A better distribution of labour de-mand in the course of the year allowed farmers to improve the tim-ing of crop management activities, which had a positive impact oncrop yields.
4.2. The impact of improved soil management
Several studies documented significant yield benefits derivedfrom the use of cover crops in south Uruguay (García and Reyes,
Please cite this article in press as: Dogliotti, S., et al. Co-innovation of family farmhttp://dx.doi.org/10.1016/j.agsy.2013.02.009
1999; Docampo and García, 1999) and elsewhere (Scholberget al., 2010), and from the use of animal manure (Rabuffettiet al., 2010; Russo and Taylor, 2010). However these practicesare not widespread among vegetable farmers in south Uruguay(Berrueta et al., 2012). Only 2 of the 14 farms participating in thisstudy were using cover crops and applying animal manure to someextent at the start of the redesign, but almost all had adopted thesetechniques at the end of the project. Cover crops and chicken man-ure applications combined with lower frequencies of the same cropor family, and improved timing of crop management activitieswere most likely responsible for the increase in crop yieldsachieved by most farmers in this study. On farms 6, 11 and 12the increase in irrigated area of vegetables contributed additionallyto the increase in crop yields.
The loss of soil fertility was identified by both farmers and sci-entists as a main cause of un-sustainability (Fig. 1). A decline inSOC results in crust formation, reduced water holding capacityand poor soil aeration (Terzaghi and Sganga, 1998). As a conse-quence of the changes introduced in soil management by the re-design of the farm systems, the farmers were able to improve theSOC and reduce the soil erosion rates for most of their vegetablefields. SOC decreases were observed in fields with high initialSOC (average 17.9 g kg�1). At a given soil texture, the SOC mineral-ization rate is proportional to the initial amount of SOC and conse-quently more organic matter input is required to maintain highSOC levels (Hassink et al., 1997; Stewart et al., 2007). In a parallelstudy, García et al. (2011) estimated that with the average amountof organic matter applied to the vegetable fields in the course ofthe project (3950 kg DM ha�1 yr�1 of green manure and3200 kg DM ha�1 yr�1 of chicken manure) the vegetable fields withthe largest SOC contents would lose 2.5 Mg ha�1 yr�1 of SOC, whilein the vegetable fields with the lowest SOC contents, SOC would in-crease by 3.06 Mg ha�1 yr�1. Farmers were able to reduce signifi-cantly soil erosion rates, but in the vegetable fields ratesremained above the tolerance level of 5–7 Mg ha�1 yr�1. Moreinnovations in soil management, such as reduced tillage and per-manent organic soil cover as mulch (Scopel et al., 2004; Johnsonand Hoyt, 1999) have to be evaluated in order to achieve higherSOC levels and reduce soil erosion to acceptable levels.
4.3. The challenge of long term planning
Although crop rotation is a very old agronomic practice withwell documented benefits for productivity and stability of produc-tion systems (Struik and Bonciarelli, 1997), it is rare among vege-table farmers in south Uruguay (Dogliotti, 2003; Berrueta et al.,2012). Most farmers plan the use of their fields six months to
systems: A systems approach to sustainable agriculture. Agr. Syst. (2013),
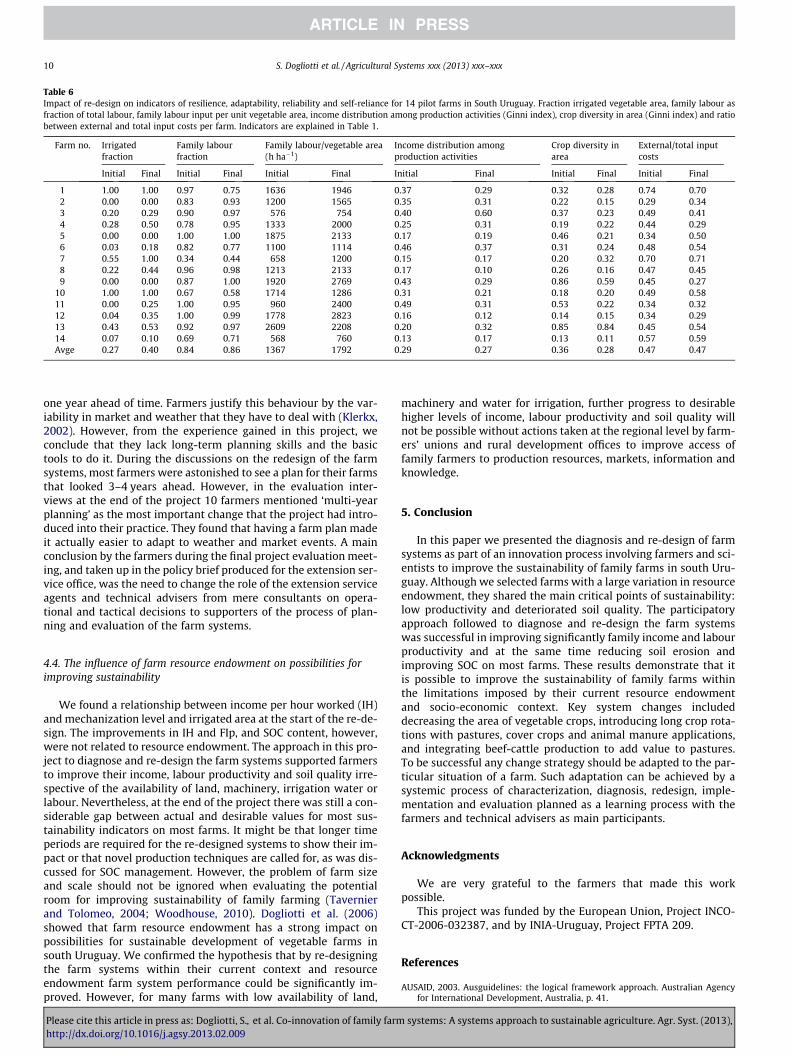
Table 6Impact of re-design on indicators of resilience, adaptability, reliability and self-reliance for 14 pilot farms in South Uruguay. Fraction irrigated vegetable area, family labour asfraction of total labour, family labour input per unit vegetable area, income distribution among production activities (Ginni index), crop diversity in area (Ginni index) and ratiobetween external and total input costs per farm. Indicators are explained in Table 1.
Farm no. Irrigatedfraction
Family labourfraction
Family labour/vegetable area(h ha�1)
Income distribution amongproduction activities
Crop diversity inarea
External/total inputcosts
Initial Final Initial Final Initial Final Initial Final Initial Final Initial Final
1 1.00 1.00 0.97 0.75 1636 1946 0.37 0.29 0.32 0.28 0.74 0.702 0.00 0.00 0.83 0.93 1200 1565 0.35 0.31 0.22 0.15 0.29 0.343 0.20 0.29 0.90 0.97 576 754 0.40 0.60 0.37 0.23 0.49 0.414 0.28 0.50 0.78 0.95 1333 2000 0.25 0.31 0.19 0.22 0.44 0.295 0.00 0.00 1.00 1.00 1875 2133 0.17 0.19 0.46 0.21 0.34 0.506 0.03 0.18 0.82 0.77 1100 1114 0.46 0.37 0.31 0.24 0.48 0.547 0.55 1.00 0.34 0.44 658 1200 0.15 0.17 0.20 0.32 0.70 0.718 0.22 0.44 0.96 0.98 1213 2133 0.17 0.10 0.26 0.16 0.47 0.459 0.00 0.00 0.87 1.00 1920 2769 0.43 0.29 0.86 0.59 0.45 0.27
10 1.00 1.00 0.67 0.58 1714 1286 0.31 0.21 0.18 0.20 0.49 0.5811 0.00 0.25 1.00 0.95 960 2400 0.49 0.31 0.53 0.22 0.34 0.3212 0.04 0.35 1.00 0.99 1778 2823 0.16 0.12 0.14 0.15 0.34 0.2913 0.43 0.53 0.92 0.97 2609 2208 0.20 0.32 0.85 0.84 0.45 0.5414 0.07 0.10 0.69 0.71 568 760 0.13 0.17 0.13 0.11 0.57 0.59Avge 0.27 0.40 0.84 0.86 1367 1792 0.29 0.27 0.36 0.28 0.47 0.47
10 S. Dogliotti et al. / Agricultural Systems xxx (2013) xxx–xxx
one year ahead of time. Farmers justify this behaviour by the var-iability in market and weather that they have to deal with (Klerkx,2002). However, from the experience gained in this project, weconclude that they lack long-term planning skills and the basictools to do it. During the discussions on the redesign of the farmsystems, most farmers were astonished to see a plan for their farmsthat looked 3–4 years ahead. However, in the evaluation inter-views at the end of the project 10 farmers mentioned ‘multi-yearplanning’ as the most important change that the project had intro-duced into their practice. They found that having a farm plan madeit actually easier to adapt to weather and market events. A mainconclusion by the farmers during the final project evaluation meet-ing, and taken up in the policy brief produced for the extension ser-vice office, was the need to change the role of the extension serviceagents and technical advisers from mere consultants on opera-tional and tactical decisions to supporters of the process of plan-ning and evaluation of the farm systems.
4.4. The influence of farm resource endowment on possibilities forimproving sustainability
We found a relationship between income per hour worked (IH)and mechanization level and irrigated area at the start of the re-de-sign. The improvements in IH and FIp, and SOC content, however,were not related to resource endowment. The approach in this pro-ject to diagnose and re-design the farm systems supported farmersto improve their income, labour productivity and soil quality irre-spective of the availability of land, machinery, irrigation water orlabour. Nevertheless, at the end of the project there was still a con-siderable gap between actual and desirable values for most sus-tainability indicators on most farms. It might be that longer timeperiods are required for the re-designed systems to show their im-pact or that novel production techniques are called for, as was dis-cussed for SOC management. However, the problem of farm sizeand scale should not be ignored when evaluating the potentialroom for improving sustainability of family farming (Tavernierand Tolomeo, 2004; Woodhouse, 2010). Dogliotti et al. (2006)showed that farm resource endowment has a strong impact onpossibilities for sustainable development of vegetable farms insouth Uruguay. We confirmed the hypothesis that by re-designingthe farm systems within their current context and resourceendowment farm system performance could be significantly im-proved. However, for many farms with low availability of land,
Please cite this article in press as: Dogliotti, S., et al. Co-innovation of family farmhttp://dx.doi.org/10.1016/j.agsy.2013.02.009
machinery and water for irrigation, further progress to desirablehigher levels of income, labour productivity and soil quality willnot be possible without actions taken at the regional level by farm-ers’ unions and rural development offices to improve access offamily farmers to production resources, markets, information andknowledge.
5. Conclusion
In this paper we presented the diagnosis and re-design of farmsystems as part of an innovation process involving farmers and sci-entists to improve the sustainability of family farms in south Uru-guay. Although we selected farms with a large variation in resourceendowment, they shared the main critical points of sustainability:low productivity and deteriorated soil quality. The participatoryapproach followed to diagnose and re-design the farm systemswas successful in improving significantly family income and labourproductivity and at the same time reducing soil erosion andimproving SOC on most farms. These results demonstrate that itis possible to improve the sustainability of family farms withinthe limitations imposed by their current resource endowmentand socio-economic context. Key system changes includeddecreasing the area of vegetable crops, introducing long crop rota-tions with pastures, cover crops and animal manure applications,and integrating beef-cattle production to add value to pastures.To be successful any change strategy should be adapted to the par-ticular situation of a farm. Such adaptation can be achieved by asystemic process of characterization, diagnosis, redesign, imple-mentation and evaluation planned as a learning process with thefarmers and technical advisers as main participants.
Acknowledgments
We are very grateful to the farmers that made this workpossible.
This project was funded by the European Union, Project INCO-CT-2006-032387, and by INIA-Uruguay, Project FPTA 209.
References
AUSAID, 2003. Ausguidelines: the logical framework approach. Australian Agencyfor International Development, Australia, p. 41.
systems: A systems approach to sustainable agriculture. Agr. Syst. (2013),

S. Dogliotti et al. / Agricultural Systems xxx (2013) xxx–xxx 11
Berrueta, C., Dogliotti, S., Franco, J., 2012. Análisis y jerarquización de factoresdeterminantes del rendimiento de tomate para industria en Uruguay.Agrociencia Uruguay 16 (2), 39–48.
CAMM, 2010. Indice de precios de hortalizas elaborado por la ComisiónAdministradora del Mercado Modelo de Montevideo. <http://www.mercadomodelo.net/indices/indepe.htm> (accessed 04.04.12).
DIEA-OPYPA-INIA, 2003. Encuesta avícola 2002. Serie Trabajos Especiales No. 30,May 2003. <http://www.mgap.gub.uy/portal/hgxpp001.aspx?7,5,110,O,S,0,MNU;E;31;1;MNU> (accesed February 2013).
Docampo, R., García, C., 1999. Sistemas de cultivos para la producción hortícolasostenible en la Región Sur. PRENADER Proyecto No. 35, Montevideo, Uruguay.
Dogliotti, S., 2003. Exploring options for sustainable development of vegetablefarms in South Uruguay. PhD Thesis, Wageningen University, The Netherlands.
Dogliotti, S., Rossing, W.A.H., Van Ittersum, M.K., 2003. ROTAT, a tool forsystematically generating crop rotations. Eur. J. Agron. 19, 239–250.
Dogliotti, S., Rossing, W.A.H., Van Ittersum, M.K., 2004. Systematic design andevaluation of crop rotations enhancing soil conservation, soil fertility and farmincome: a case study for vegetable farms in South Uruguay. Agric. Syst. 80, 277–302.
Dogliotti, S., Van Ittersum, M.K., Rossing, W.A.H., 2005. A method for exploringsustainable development options at farm scale: a case study for vegetable farmsin south Uruguay. Agric. Syst. 86, 29–51.
Dogliotti, S., Rossing, W.A.H., Van Ittersum, M.K., 2006. Influence of farm resourceendowment on possibilities for sustainable development: a case study forvegetable farms in South Uruguay. J. Environ. Manage. 78, 305–315.
Durán, J., 2000. An alternative model for soil systematisation. Agrociencia Uruguay4, 111–123.
Durán, A., García-Prechác, F., 2007. Suelos del Uruguay: Origen, Clasificación.Manejo y Conservación, Montevideo, Hemisferio Sur, p. 358.
FAO, 2006. Guidelines for Soil Description. 4th ed. Rome.FAO, 2011. Save and Grow: A Policymaker’s Guide to Sustainable Intensification of
Smallholder Crop Production. FAO, Rome, Italy, p. 102.Furest, J., 2008. Estadisticas Agroclimtológicas Mensuales 1971–2000. INIA
Las Brujas. <http://www.inia.org.uy/online/site/base_clima_esta_mens_vizu.php?bus=Las+Brujas&base=72> (accessed 04.04.12).
Furest, J., 2012. Base de datos climátológica, Estación Experimental INIA Las Brujas.<http://www.inia.org.uy/gras/> (accessed 04.04.12).
García, M., Reyes, C., 1999. Estudio de sistemas productivos hortícolas en el largoplazo, teniendo como base el manejo de suelos. PRENADER Proyect No. 35,Montevideo, Uruguay.
García, M., Alliaume, F., Mancassola, V., Dogliotti, S., 2011. Soil organic carbon andphysical properties in vegetable farms in South Uruguay. Agrociencia Uruguay15 (1), 70–81.
Gibbons, M., Limoges, C., Nowotny, H., Schwartzman, S., Scott, P., Trow, M., 1994.The New Production of Knowledge: The Dynamics of Science and Research inContemporary Societies. Sage Publications, London, Great Britain, p. 179.
Giller, K.E., Corbeels, M., Nyamangara, J., Triomphe, B., Affholder, F., Scopel, E.,Tittonell, P., 2011. A research agenda to explore the role of conservationagriculture in African smallholder farming systems. Field Crops. Res. 124, 468–472.
Hassink, J., Whitmore, A.P., Kubát, J., 1997. Size and density fractionation of soilorganic matter and the physical capacity of soils to protect organic matter. Eur.J. Agron. 7 (1–3), 189–199.
IAASTD, 2009. Agriculture at a Crossroads: Synthesis Report. Island Press,Washington, DC, 95 p.
IFAD, 2011. Rural Poverty Report 2011. IFAD, Rome, Italy, p. 317.IFAD, 2012. Sustainable smallholder agriculture: Feeding the world, protecting the
planet. IFAD, Rome, Italy, p. 45.INE, 2010. Instituto Nacional de Estadísticas: estimación de algunas medidas
descriptivas del ingreso del hogar y las personas – localidades pequeñas y zonasrurales. <http://www.ine.gub.uy/socio-demograficos/socioeconomicos2008.asp#localidades>.
IUSS Working Group WRB, 2006. World Reference Base for Soil Resources 2006.World Soil Resources Reports No. 103. FAO, Rome.
Johnson, A.M., Hoyt, G.D., 1999. Changes to the soil environment underconservation tillage. Hortechnology 9, 380–393.
Klerkx, L.W.A., 2002. Using information on farming and farmers in a model-basedexploration of horticultural production systems in the south of Uruguay. MScThesis, Wageningen University, The Netherlands.
Leeuwis, C., 1999. Integral design: innovation in agriculture and resourcemanagement. Mansholt Studies Series, nr. 15, Mansholt Institute, BackhuysPublishers, p. 277.
Leeuwis, C., Pyburn, R., Rölling, N., 2002. Wheelbarrows Full of Frogs: SocialLearning in Rural Resource Management, International Research andReflections. Koninklijke Van Gorcum, The Netherlands, p. 479.
Lipton, M., 2005. The Family Farm in a Globalizing World: The Role of Crop Sciencein Alleviating Poverty. 2020 Discussion Paper No. 40. Washington, DC:International Food Policy Research Institute, p. 29.
Please cite this article in press as: Dogliotti, S., et al. Co-innovation of family farmhttp://dx.doi.org/10.1016/j.agsy.2013.02.009
Lobell, D.B., Ortiz-Monasterio, J.I., Asner, G.P., Matson, P.A., Naylor, R.L., Falcon, W.P.,2005. Analysis of wheat yield and climatic trends in Mexico. Field Crops Res. 94,250–256.
Lopez-Ridaura, S., Van Keulen, H., Van Ittersum, M.K., Leffelaar, P.A., 2005.Multiscale methodological framework to derive criteria and indicators forsustainability evaluation of peasant natural resource management systems.Environ. Dev. Sust. 7, 51–69.
Masera, O., Astier, M., López-Ridaura, S., 2000. Sustentabilidad y manejo de recursosnaturales: el marco de evaluación MESMIS. Mundi-Prensa, México, p. 109.
MGAP – PRENADER, Programa Recursos Naturales y Desarrollo del Riego, 2004.Interpretación de la carta de erosión antrópica. División Suelos y Aguas, MGAP,Montevideo. <http://www.mgap.gub.uy/renare/SIG/ErosionAntropica/mapaindices.jpg> (accessed 04.04.12).
Puentes, R., Szogi, A., 1983. Manual para la utilización de la ecuacion universal deperdida de suelo en Uruguay. Serie: Normas de Conservación de Suelos, No 1.DSA, MAP, Montevideo, Uruguay, p. 80.
Rabuffetti, A., García, C., Docampo, R., Casanova, S., Moura, M., Smolark, C., Cabral,H., 2010. Evaluación agronómica y ambiental del estiércol de ave como fuentede nitrógeno en sistemas de producción intensiva. In: Seminario deactualización técnica: manejo de suelos para producción hortícolasustentable. Serie Actividades de Difusión 624, Montevideo, Uruguay, pp. 33–50.
Renard, K.G., Foster, G.R., Weesies, G.A., Mc Cool, D.K., Yoder, D.C., 1997. PredictingSoil Erosion by Water: A Guide to Conservation Planning with the RevisedUniversal Soil Loss Equation (RUSLE). Agriculture Handbook No. 703, UnitedStates Department of Agriculture.
Rölling, N., 2009. Pathways for impact: scientists’ different perspectives onagricultural innovation. Int. J. Agr. Sust. 7 (2), 83–94.
Rossing, W.A.H., Dogliotti, S., Bacigalupe, G.F., Cittadini, E., Mundet, C., MariscalAguayo, V., Douthwaite, B., Alvarez, S., 2010. Project design and managementbased on a co-innovation framework. In: Building Sustainable Rural Futures:The Added Value of Systems Approaches in Times of Change and Uncertainty –IFSA 2010, Viena, Austria, pp. 402–412.
Rühlmann, J., 1999. A new approach to estimating the pool of stable organic matterin soil using data from long-term field experiments. Plant Soil 213, 149–160.
Russo, V.M., Taylor, M., 2010. Frequency of manure application in organic versusannual application of synthetic fertilizer in conventional vegetable production.HortScience 45 (11), 1673–1680.
Scholberg, J.M.S., Dogliotti, S., Zotarelli, L., Cherr, C.M., Leoni, C., Rossing, W.A.H.,2010. Cover crops in agrosystems, innovations and applications. In: Lichtfouse,E. (Ed.), Sustainable Agriculture Reviews 4: Genetic Engineering, Biofertilisation,Soil Quality and Organic Farming, pp. 59–98.
Scopel, E., Da Silva, F.A.M., Corbeels, M., Affholder, F., Maraux, F., 2004. Modelingcrop residue mulching effects on water use and production of maize undersemiarid and humid tropical conditions. Agronomie 24, 383–395.
Sorrensen, J.T., Kristensen, E.S., 1992. Systemic Modelling: A research methodologyin livestock farming. In: Gibon, A., Mathron, G., Vissac, B. (Eds.), Global Appraisalof Livestock Farming and Study on their Organizational Level: Concepts,Methodology and Results. CEC Proceedings, pp. 45–57.
Stewart, C.E., Paustian, K., Conant, R.T., Plante, A.F., Six, J., 2007. Soil carbonsaturation: concept, evidence and evaluation. Biogeochemistry 86 (1–2), 19–31.
Struik, P.C., Bonciarelli, F., 1997. Resource use at the cropping system level. Eur. J.Agron. 7, 133–143.
Tavernier, E.M., Tolomeo, V., 2004. Farm typology and sustainable agriculture: doessize matter? J. Sust. Agric. 24 (2), 33–46.
Terzaghi, A., Sganga, J.C., 1998. Physical Characteristics of Main Agricultural Soils ofCanelones and Montevideo: Agronomic Interpretation. Technic Bulletin No. 8.M.G.A.P., Montevideo, Uruguay.
Tittonell, P., Shepherd, K.D., Vanlauwe, B., Giller, K.E., 2008. Unravelling the effectsof soil and crop management on maize productivity in smallholder agriculturalsystems of western Kenya – an application of classification and regression treeanalysis. Agric. Ecosyst. Environ. 123, 137–150.
Tommasino, H., Bruno, Y., 2005. Algunos elementos para la definición deproductores familiares, medios y grandes. In: Anuario 2005, OPYPA-MGAP,Montevideo, Uruguay, pp. 267–278.
Van den Ban, A., 2011. Increasing labour productivity in agriculture and itsimplications. J. Agric. Educ. Ext. 17 (5), 401–409.
Van der Ploeg, J.D., 2008. The New Peasantries. Struggles for Autonomy andSustainability in an Era of Empire and Globalization. London, Earthscan, p. 356.
Vereijken, P., 1997. A methodical way of prototyping integrated and ecologicalarable farming systems (I/EAFS) in interaction with pilot farms. Eur. J. Agron. 7,235–250.
Wijnands, F.G., 1999. A methodical way of prototyping more sustainable farmingsystems in interaction with pilot farms. In: Härdtlein et al. (Eds), Nachhaltigheitin der Landwirtschaft. Imitiatieven zum Umweltschutz. Band 15, SchmidtVerlag, Berlin, pp. 365–391.
Woodhouse, P., 2010. Beyond industrial agriculture? Some questions about farmsize, productivity and sustainability. J. Agrar. Change 10 (3), 437–453.
systems: A systems approach to sustainable agriculture. Agr. Syst. (2013),
Copyright © 2022 FDOKUMEN