An exploration of personal benefits reported by students of a ...
Upload
independentCategory
view
2download
0
Sallis et al. International Journal of Behavioral Nutritionand Physical Activity (2015) 12:30 DOI 10.1186/s12966-015-0188-2
REVIEW Open Access
Co-benefits of designing communities for activeliving: an exploration of literatureJames F Sallis1,2*, Chad Spoon1,2, Nick Cavill3, Jessa K Engelberg4, Klaus Gebel5, Mike Parker6,Christina M Thornton4, Debbie Lou1,2, Amanda L Wilson1,2, Carmen L Cutter1,2 and Ding Ding7
Abstract
To reverse the global epidemic of physical inactivity that is responsible for more than 5 million deaths per year, manygroups recommend creating “activity-friendly environments.” Such environments may have other benefits, beyondfacilitating physical activity, but these potential co-benefits have not been well described. The purpose of the presentpaper is to explore a wide range of literature and conduct an initial summary of evidence on co-benefits of activity-friendly environments. An extensive but non-systematic review of scientific and “gray” literature was conducted. Fivephysical activity settings were defined: parks/open space/trails, urban design, transportation, schools, and workplaces/buildings. Several evidence-based activity-friendly features were identified for each setting. Six potential outcomes/co-benefits were searched: physical health, mental health, social benefits, safety/injury prevention, environmentalsustainability, and economics. A total of 418 higher-quality findings were summarized. The overall summary indicated22 of 30 setting by outcome combinations showed “strong” evidence of co-benefits. Each setting had strong evidenceof at least three co-benefits, with only one occurrence of a net negative effect. All settings showed the potential tocontribute to environmental sustainability and economic benefits. Specific environmental features with the strongestevidence of multiple co-benefits were park proximity, mixed land use, trees/greenery, accessibility and street connectivity,building design, and workplace physical activity policies/programs. The exploration revealed substantial evidence thatdesigning community environments that make physical activity attractive and convenient is likely to produce additionalimportant benefits. The extent of the evidence justifies systematic reviews and additional research to fill gaps.
Keywords: Healthy communities, Physical activity, Built environment, Parks, Trails, Land use, Urban design, Schools,Workplace, Transportation
IntroductionPhysical inactivity accounts for 5 million deaths annuallyworldwide [1]. Most people are not sufficiently active,and physical activity is declining in many countries [2].This is a global problem with the biggest burden in lowand middle income countries [3]. Increasing physical ac-tivity is a priority of the United Nations through its non-communicable disease initiative [4].Physical activity has been engineered out of people’s
lives through urban planning and transportation invest-ments that favor travel by automobile, labor-saving de-vices at home and in the work place, and a proliferation
* Correspondence: [email protected] Living Research, University of California, San Diego, USA2Department of Family and Preventive Medicine, 3900 5th Avenue, Suite 310,San Diego, CA 92119, USAFull list of author information is available at the end of the article
© 2015 Sallis et al.; licensee BioMed Central. TCommons Attribution License (http://creativecreproduction in any medium, provided the orDedication waiver (http://creativecommons.orunless otherwise stated.
of electronic entertainment options [5,6]. Built environ-ments are worthy of special attention because they canaffect virtually all residents of a community for many de-cades. The United Nations [4], World Health Organization[7], national physical activity plans [8], U.S. Guide to Com-munity Preventive Services [9,10], U.S. Institute of Medi-cine [11], and other scientific groups worldwide [12,13]have identified creating built environments and imple-menting policies that support active living as essential forincreasing physical activity and improving health.Many decisions affecting physical activity environ-
ments occur at the local government level. Thoughmayors, city council members, and other officials workevery day to balance competing interests, they likely donot consider that environments supporting physical ac-tivity could produce additional benefits for their com-munities. For example, changing zoning codes to favor
his is an Open Access article distributed under the terms of the Creativeommons.org/licenses/by/4.0), which permits unrestricted use, distribution, andiginal work is properly credited. The Creative Commons Public Domaing/publicdomain/zero/1.0/) applies to the data made available in this article,
Sallis et al. International Journal of Behavioral Nutrition and Physical Activity (2015) 12:30 Page 2 of 10
mixed use developments can enhance property valuesand reduce carbon emissions [14,15]. Having parks inneighborhoods has been linked with physical and mentalhealth benefits [16].There is no resource that examines the wide range of
potential co-benefits of communities designed to sup-port active living, which can be called “activity-friendlyenvironments”. Therefore, the aim of the current studywas to compile evidence about the relation of activity-friendly environmental attributes to multiple potentialoutcomes. The expectation was that several co-benefitswould be documented, but negative effects were also in-cluded. The intent of the present exploration of the lit-erature was to provide an initial summary of theevidence on co-benefits that may be useful for determin-ing whether and which systematic reviews are justified,identifying areas for further research, and educating pol-icy makers about likely co-benefits.
MethodsThe present literature review covered diverse topicsacross multiple academic and practice fields, so dozensof systematic reviews were not feasible. Therefore anexploratory approach was taken to provide an initialoverview of the potential co-benefits of communities de-signed for active living. We searched both scientific andgray literature. Gray literature was included because weexpected many of the topic areas to be rarely addressedin the scientific literature but studied by governmentagencies and policy groups. The objective of the litera-ture exploration was not to systematically review orquantify all evidence, but to create a profile of the poten-tial multiple benefits, and negative effects, of each envir-onmental feature as a tool for policy-making and a guidefor future research.
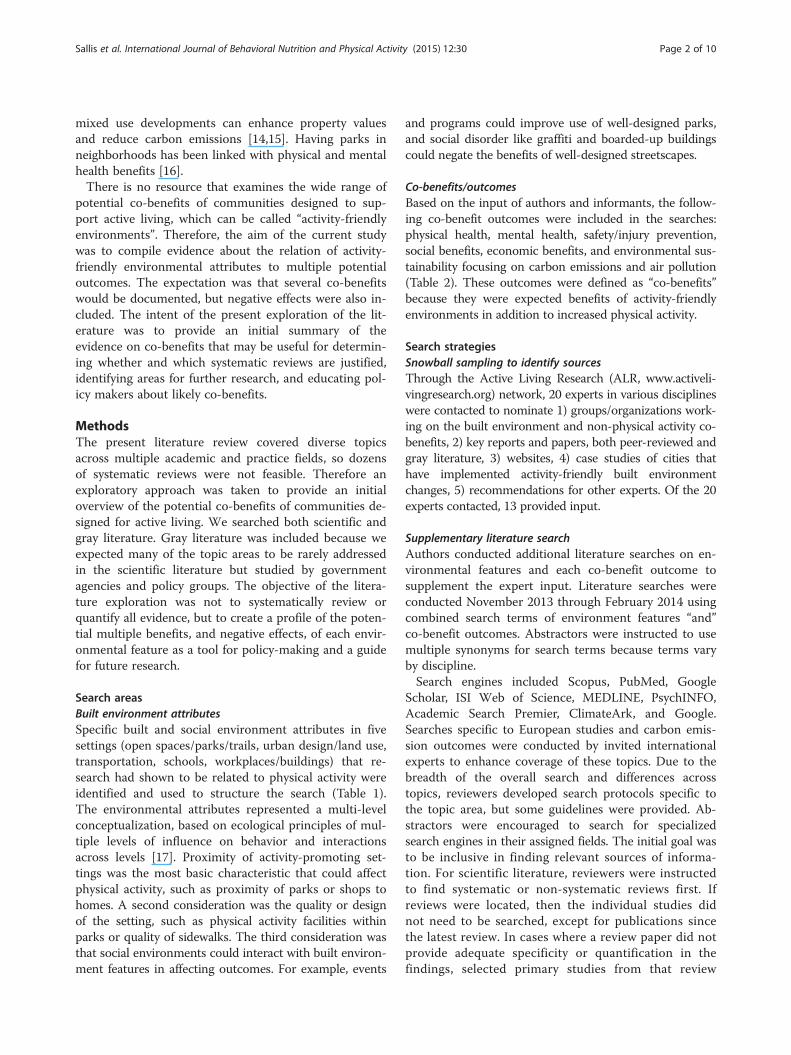
Search areasBuilt environment attributesSpecific built and social environment attributes in fivesettings (open spaces/parks/trails, urban design/land use,transportation, schools, workplaces/buildings) that re-search had shown to be related to physical activity wereidentified and used to structure the search (Table 1).The environmental attributes represented a multi-levelconceptualization, based on ecological principles of mul-tiple levels of influence on behavior and interactionsacross levels [17]. Proximity of activity-promoting set-tings was the most basic characteristic that could affectphysical activity, such as proximity of parks or shops tohomes. A second consideration was the quality or designof the setting, such as physical activity facilities withinparks or quality of sidewalks. The third consideration wasthat social environments could interact with built environ-ment features in affecting outcomes. For example, events
and programs could improve use of well-designed parks,and social disorder like graffiti and boarded-up buildingscould negate the benefits of well-designed streetscapes.
Co-benefits/outcomesBased on the input of authors and informants, the follow-ing co-benefit outcomes were included in the searches:physical health, mental health, safety/injury prevention,social benefits, economic benefits, and environmental sus-tainability focusing on carbon emissions and air pollution(Table 2). These outcomes were defined as “co-benefits”because they were expected benefits of activity-friendlyenvironments in addition to increased physical activity.
Search strategiesSnowball sampling to identify sourcesThrough the Active Living Research (ALR, www.activeli-vingresearch.org) network, 20 experts in various disciplineswere contacted to nominate 1) groups/organizations work-ing on the built environment and non-physical activity co-benefits, 2) key reports and papers, both peer-reviewed andgray literature, 3) websites, 4) case studies of cities thathave implemented activity-friendly built environmentchanges, 5) recommendations for other experts. Of the 20experts contacted, 13 provided input.
Supplementary literature searchAuthors conducted additional literature searches on en-vironmental features and each co-benefit outcome tosupplement the expert input. Literature searches wereconducted November 2013 through February 2014 usingcombined search terms of environment features “and”co-benefit outcomes. Abstractors were instructed to usemultiple synonyms for search terms because terms varyby discipline.Search engines included Scopus, PubMed, Google
Scholar, ISI Web of Science, MEDLINE, PsychINFO,Academic Search Premier, ClimateArk, and Google.Searches specific to European studies and carbon emis-sion outcomes were conducted by invited internationalexperts to enhance coverage of these topics. Due to thebreadth of the overall search and differences acrosstopics, reviewers developed search protocols specific tothe topic area, but some guidelines were provided. Ab-stractors were encouraged to search for specializedsearch engines in their assigned fields. The initial goal wasto be inclusive in finding relevant sources of informa-tion. For scientific literature, reviewers were instructedto find systematic or non-systematic reviews first. Ifreviews were located, then the individual studies didnot need to be searched, except for publications sincethe latest review. In cases where a review paper did notprovide adequate specificity or quantification in thefindings, selected primary studies from that review
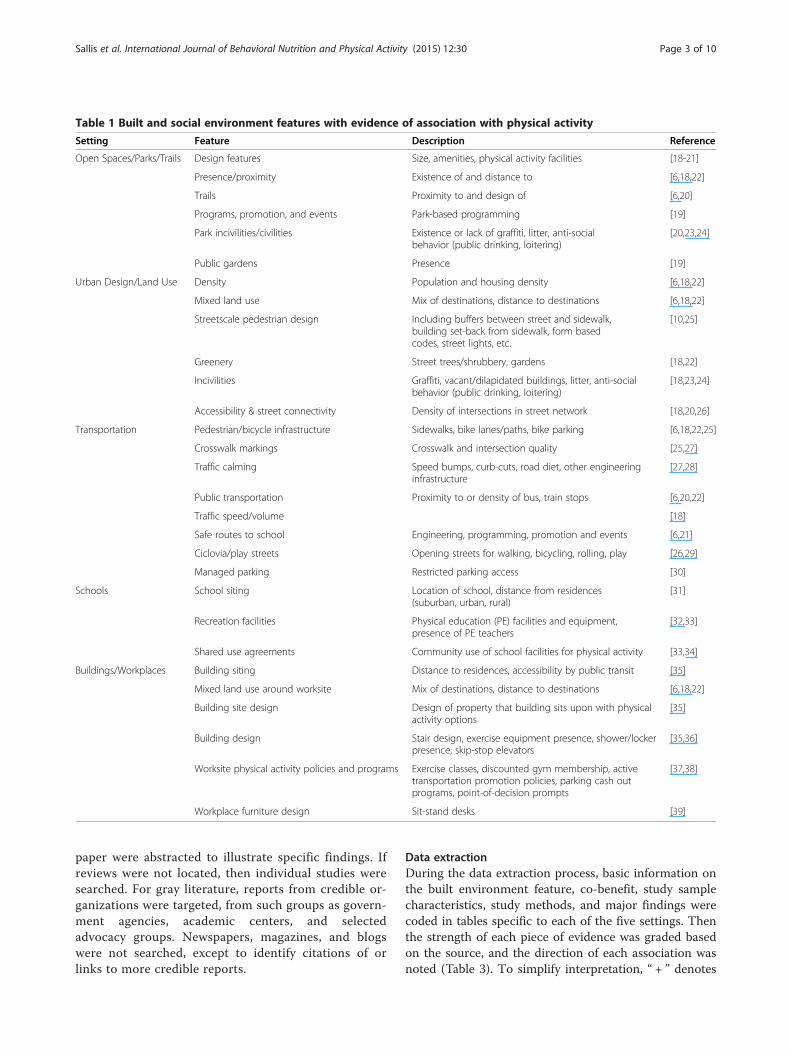
Table 1 Built and social environment features with evidence of association with physical activity
Setting Feature Description Reference
Open Spaces/Parks/Trails Design features Size, amenities, physical activity facilities [18-21]
Presence/proximity Existence of and distance to [6,18,22]
Trails Proximity to and design of [6,20]
Programs, promotion, and events Park-based programming [19]
Park incivilities/civilities Existence or lack of graffiti, litter, anti-socialbehavior (public drinking, loitering)
[20,23,24]
Public gardens Presence [19]
Urban Design/Land Use Density Population and housing density [6,18,22]
Mixed land use Mix of destinations, distance to destinations [6,18,22]
Streetscale pedestrian design Including buffers between street and sidewalk,building set-back from sidewalk, form basedcodes, street lights, etc.
[10,25]
Greenery Street trees/shrubbery, gardens [18,22]
Incivilities Graffiti, vacant/dilapidated buildings, litter, anti-socialbehavior (public drinking, loitering)
[18,23,24]
Accessibility & street connectivity Density of intersections in street network [18,20,26]
Transportation Pedestrian/bicycle infrastructure Sidewalks, bike lanes/paths, bike parking [6,18,22,25]
Crosswalk markings Crosswalk and intersection quality [25,27]
Traffic calming Speed bumps, curb-cuts, road diet, other engineeringinfrastructure
[27,28]
Public transportation Proximity to or density of bus, train stops [6,20,22]
Traffic speed/volume [18]
Safe routes to school Engineering, programming, promotion and events [6,21]
Ciclovia/play streets Opening streets for walking, bicycling, rolling, play [26,29]
Managed parking Restricted parking access [30]
Schools School siting Location of school, distance from residences(suburban, urban, rural)
[31]
Recreation facilities Physical education (PE) facilities and equipment,presence of PE teachers
[32,33]
Shared use agreements Community use of school facilities for physical activity [33,34]
Buildings/Workplaces Building siting Distance to residences, accessibility by public transit [35]
Mixed land use around worksite Mix of destinations, distance to destinations [6,18,22]
Building site design Design of property that building sits upon with physicalactivity options
[35]
Building design Stair design, exercise equipment presence, shower/lockerpresence, skip-stop elevators
[35,36]
Worksite physical activity policies and programs Exercise classes, discounted gym membership, activetransportation promotion policies, parking cash outprograms, point-of-decision prompts
[37,38]
Workplace furniture design Sit-stand desks [39]
Sallis et al. International Journal of Behavioral Nutrition and Physical Activity (2015) 12:30 Page 3 of 10
paper were abstracted to illustrate specific findings. Ifreviews were not located, then individual studies weresearched. For gray literature, reports from credible or-ganizations were targeted, from such groups as govern-ment agencies, academic centers, and selectedadvocacy groups. Newspapers, magazines, and blogswere not searched, except to identify citations of orlinks to more credible reports.
Data extractionDuring the data extraction process, basic information onthe built environment feature, co-benefit, study samplecharacteristics, study methods, and major findings werecoded in tables specific to each of the five settings. Thenthe strength of each piece of evidence was graded basedon the source, and the direction of each association wasnoted (Table 3). To simplify interpretation, “ + ” denotes

Table 2 Outcomes of activity-supportive built and socialenvironments examined in searches
Outcome/co-benefit Description
Physical health Chronic diseases, obesity
Mental health Depression, anxiety, wellbeing, quality of life
Social benefits Neighborhood/socialcohesion, human capital
Environmental sustainabilitybenefits
Carbon dioxide emissions,pollutants
Safety/Injury prevention Crime, violence, injury,pedestrian/bicycle andcar crashes
Economic benefits Land value, governmentalinfrastructure costs, realestate profitability, productivity/job performance, healthcare costs, economicperformance of cities
Sallis et al. International Journal of Behavioral Nutrition and Physical Activity (2015) 12:30 Page 4 of 10
that a physical activity-promoting environmental featurewas associated with a co-benefit in a “favorable” direc-tion. For example, having parks nearby was associatedwith better mental health or fewer carbon emissions.Similarly, “-” denoted that a physical activity-promotingfeature of the environment was inversely associated witha co-benefit. For example, higher residential density wasassociated with more air pollution. A code “0” repre-sented lack of significant association in either directionor inconsistent findings. Due to the number and diverse
Table 3 Scoring methods for summarizing the evidence
Score Type of evidence
4.5 Peer-reviewed, systematic review paper(including meta-analysis)
4 Peer-reviewed, non-systematic reviewpaper (from scientific literature)or non-peer-reviewed review paper(from gray literature)
3.5 Any (singular) peer-reviewed study
3 Any (singular) non peer-reviewed study,such as a technical report froma government agency or academic center
2 Non-analytic studies (for example, casereports, case series, simulations) or advocacyreport without a clear literature review
1 Expert opinion, formal consensus
Score Direction of association
+ A favorable association was found betweenfeature and co-benefit (feature was associatedwith “better” level of co-benefit
- An unfavorable association was found betweenfeature and co-benefit (feature was associatedwith “worse” level of co-benefit
0 (zero) No association or inconsistent evidence wasfound between feature and co-benefit
types of studies from different fields, it was not possibleto grade the quality of each study, as is done in system-atic reviews. Extraction tables were cross-checked byother staff for accuracy and clarity.
Synthesizing the findingsTo illustrate areas with strong evidence as well as re-search gaps, a matrix was created for each of the five set-tings that summarized evidence of associations betweenbuilt environment features and co-benefits. Using aquasi-quantitative approach, results were summarized bysumming the weighted evidence from each resource.Briefly, each piece of evidence was scored based on thesource and type of study/report (i.e., “weights”) and thedirection of association. The weighted scores for associa-tions in each direction were summed for each directionof effect category (“ + ”, “-”, “0”), and recorded in the on-line tables. Thus, there was a weighted score for eachdirection, such as 24 “ + ”, 7 “-”, and 4 “0”. “Net” scoreswere calculated by subtracting the weighted negativeand zero scores from the weighted positive scores. In thepreceding example, 24 minus (7 + 4) equals 13 (summaryscore). To be conservative, negative and zero findingswere subtracted from positive findings, so the summaryscores roughly indicated both the quantity and quality ofthe evidence. To make the summarization process evenmore conservative, only resources with quality scores of3 or above were included, as resources with a lowerscore, such as unreferenced advocacy documents andconsensus reports, lacked credibility.Cells in each summary table were labeled based on sum-
mary scores. Table 4 presents the summary labels. A netscore of 15 or above was considered strong evidence ([+++] or [−−-]), as this was equivalent to more than three sys-tematic reviews consistently supporting the association be-tween an environmental attribute and a co-benefit. Scoresof 10–14 ([++] or [−−]), and 4–9 ([+] or [−]), indicatedgood and moderate evidence, respectively. “Good” scoreswere equivalent to more than two reviews, and “moderate”scores were equivalent to at least one non-systematic
Table 4 Summary of scores and color codes for each levelof evidence
Level of evidence Range of scores Code
Strong evidence of positive effect 15 and above (+) [+++]
Good evidence of positive effect 10-14 (+) [++]
Moderate evidence of positive effect 4-9 (+) [+]
Insufficient evidence 3.5 (−) to 3.5 (+) [0]
Moderate evidence of negative or null effect 4-9 (−) [−]
Good evidence of negative or null effect 10-14 (−) [−−]
Strong evidence of negative or null effect 15 and above (−) [−−−]

Sallis et al. International Journal of Behavioral Nutrition and Physical Activity (2015) 12:30 Page 5 of 10
review. Finally, a net score of less than 4 was consideredinsufficient evidence and was not labeled.
ResultsAbstractors identified a total of 521 results from 221sources, coming from at least 17 countries. Four hun-dred eighteen of these results were from a source with aquality score of at least “3” and were used in the resultsreported here. The five setting-specific tables with notesabout each study and codes for findings are available on-line (Additional file 1).
Open spaces/parks/trailsTable 5 summarizes 69 findings from studies in the openspace/parks/trails setting. Of the 36 cells representing at-tribute by co-benefit combinations in the table, 3 hadstrong evidence of co-benefits, 3 had good evidence, and7 had moderate evidence. There was good to strong evi-dence for the association between park presence/prox-imity and all co-benefits, except for economic benefits.Moderate evidence supported that physical activity pro-motion programs in parks and open spaces were associ-ated with four co-benefits of mental health, socialbenefits, environmental benefits, and safety/injury pre-vention. Public gardens had moderate evidence of socialand safety/injury prevention benefits. There was goodevidence that trails had economic benefits. Overall, therewere 23 “blank cells” out of 36, indicating no or insuffi-cient evidence.
Urban designThere were 202 findings used in the summary of theurban design setting. Of 30 cells (Table 6), 8 had strongevidence of co-benefits, 5 had good evidence, and 6 hadmoderate evidence. In the urban design setting, 4 cellshad moderate or good evidence of negative effects andone cell had strong evidence for negative effects, whichwas mixed use and safety/injury prevention. Mixed use,greenery, street scale design, and accessibility and streetconnectivity had evidence of 4 to 5 co-benefits. With theexception of street-scale design, urban design featureshad strong evidence of environmental benefits. All urban
Table 5 Open spaces/parks/trails summary scores
Built environment attribute Physical health Mental heal
Presence, proximity [+++] 54 + 3.5(0) [+++] 88.5+
Design features [0] 3.5+
Trails
Physical activity programs/promotion [+] 4.5+
Incivilities
Public gardens
design features had evidence of economic benefits, andthe evidence was particularly strong for mixed use. Ofall urban design features, only greenery had strong evi-dence of mental health benefits. None had evidence ofsafety/injury prevention benefits. Residential density hadthe most complex pattern, with good evidence of nega-tive health effects, strong evidence of environmental sus-tainability benefits, and good evidence of economicbenefits.
Transportation systemsThere were 81 findings in the transportation systems cat-egory. Of 48 cells (Table 7), 5 had strong evidence of co-benefits, 2 had good evidence, and 6 had moderate evi-dence. Strong evidence of co-benefits was most apparentin the safety/injury prevention and economic domains.Pedestrian and bicycle facilities had the best evidence ofmultiple co-benefits, followed by lower traffic speed andvolume. Public transport had strong evidence of economicbenefits and mixed evidence of environmental sustainabil-ity benefits. Overall, 34 of 48 combinations of environ-mental feature and co-benefit had no or inadequateevidence, showing many research gaps.
SchoolsThere were 27 findings in the school setting category. Ofthe 18 cells in Table 8, two cells had strong evidence ofco-benefits, one had good evidence, and five had moderateevidence. Siting schools near the homes of students hadstrong evidence of environmental sustainability benefitsand moderate evidence of mental health and economicbenefits. Recreation facilities at schools and shared useagreements had evidence of multiple co-benefits.
Workplaces/buildingsThere were 39 findings in the workplace/building cat-egory. Of the 36 cells in Table 9, three cells had goodevidence of co-benefits and three had strong evidence.Specifically, building site design (mainly outdoor) fea-tures had strong evidence of physical and good evidenceof mental health benefits, and features of the buildingdesign had strong evidence of physical health and good
th Social benefits Environmentalsustainability
Safety/injuryprevention
Economicbenefits
[+++] 26.5 + 4(0) [++] 16 + 4(0) [++] 11+ [0] 7.5 + 4(0)
[+] 7.5+
[++] 11.5+
[+] 4+ [+] 4+ [+] 4+
[0] 3.5+
[+] 4.5+ [+] 4.5+

Table 6 Urban design summary scores
Built environmentattribute
Physical health Mentalhealth
Social benefits Environmentalsustainability
Safety/injuryprevention
Economic benefits
Residential density [−−] 19 + 21.5(0) 7.5- [−] 13.5 + 14.5(0) [+++] 88 + 21(0) 3.5- [−−] 4.5(0) 7.5- [++] 15 + 3.5(0)
Mixed land use [+] 28 + 17(0) 4- [0] 4.5 + 4- [+++] 33 + 11(0) [+++] 95 + 21(0) [−−-] 4.5(0) 11- [+++] 22.5 + 3.5(0) 4-
Streetscale pedestriandesign
[+] 7.5+ [+] 7.5+ [+] 7.5+ [+] 7+
Greenery [+++] 20.5 + 3.5(0) [+++] 26.5+ [++] 12+ [+++] 39.5+ [++] 12+
Accessibility & streetconnectivity
[++] 30 + 12(0) 7.5- [++] 14.5 + 3.5(0) [+++] 35.5 + 3.5(0) [−] 4.5(0) [+] 12.5 + 3.5(0)
Sallis et al. International Journal of Behavioral Nutrition and Physical Activity (2015) 12:30 Page 6 of 10
evidence of environmental sustainability and economicbenefits. Physical activity programs and policies withinworkplaces had strong evidence of economic benefits.For workplace and building features, the best evidencewas for physical health and economic benefits.
Overall summary of co-benefits by settingIn the final table, results were summed across featuresfor each of the five settings. These results are intendedto illustrate the overall potential for each setting to con-tribute to each co-benefit. Table 10 represents 418 find-ings. Of the 30 cells in the matrix, 22 had strongevidence of co-benefits and 2 had good evidence. Fivecells had inadequate evidence, and only one cell had evi-dence of a net negative effect. Open spaces/parks/trailswas the only setting with good to strong evidence of allsix co-benefits. Activity-friendly design features in allfive settings had strong evidence of environmental andeconomic benefits. Many gaps in the evidence existedfor the transportation and workplace/buildings settings,particularly regarding the outcome of safety/injury pre-vention. There was little evidence of negative conse-quences of activity-friendly environments. However, inthe urban design setting there was some evidence ofnegative physical health and safety/injury outcomes,mainly related to high residential density.
Table 7 Transportation systems summary scores
Built environment attribute Physical health Mental health Socia
Pedestrian/bicycle facilities [0] 3+ [+] 7+
Crosswalk markings
Traffic calming [0] 3.5+ [0] 3.5(0) [0] 3+
Public Transportation [0] 3.5-
Traffic speed/volume [0] 3.5+ [0] 3+
Safe routes to school [0] 3+
Ciclovia/play streets [+] 7+
Managed parking
DiscussionThe present exploration of diverse peer-reviewed andgray literature revealed substantial documentation thatdesigning communities that support physical activity forboth recreation and transportation purposes is likely toproduce a wide variety of additional benefits, rangingfrom mental health to environmental sustainability andeconomics. The present paper is the first attempt tocompile such a wide range of evidence, and the resultssupported multiple potential co-benefits of designing en-vironments for active living. This initial synthesis canguide future research and can serve as an interim toolfor evidence-based decision-making regarding planningand design of built environments. A longer report ver-sion of the present study, with additional detailed infor-mation about methods, findings and additional sectionson disparities and policy implications is presented online(Additional file 2).When the results from all features were combined, there
was impressive evidence of co-benefits in all settings, with22 of 30 cells having strong evidence. For all settings, therewas strong evidence for at least three of the six co-benefitsof activity-friendly design. Within each setting there wereseveral features that could be designed to create activity-friendliness. Thus, the present paper can be viewed as amenu of options that would allow designers and plannersto devise multiple combinations of features to achieve
l benefits Environmentalsustainability
Safety/injuryprevention
Economicbenefits
[+] 10.5 + 3.5(0) [+++] 27.5 + 4(0) [+++] 22.5 + 3.5(0)
[−−] 6(0) 4-
[0] 3 + 3- [+++] 23+ [0] 3+
[++] 28.5 + 17.5(0) [+++] 20 + 4-
[+++] 14+ [+] 7+ [+] 7+
[0] 3.5+ [+] 9.5 + 4(0)
[0] 3.5+
[++] 10.5+
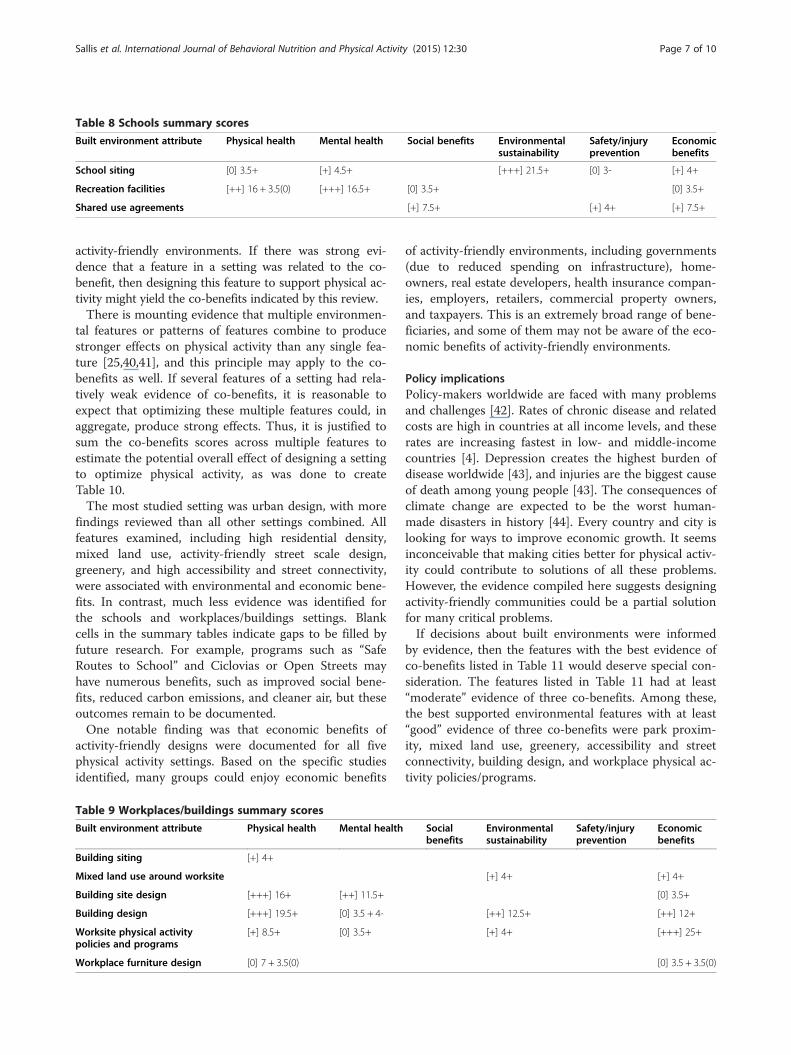
Table 8 Schools summary scores
Built environment attribute Physical health Mental health Social benefits Environmentalsustainability
Safety/injuryprevention
Economicbenefits
School siting [0] 3.5+ [+] 4.5+ [+++] 21.5+ [0] 3- [+] 4+
Recreation facilities [++] 16 + 3.5(0) [+++] 16.5+ [0] 3.5+ [0] 3.5+
Shared use agreements [+] 7.5+ [+] 4+ [+] 7.5+
Sallis et al. International Journal of Behavioral Nutrition and Physical Activity (2015) 12:30 Page 7 of 10
activity-friendly environments. If there was strong evi-dence that a feature in a setting was related to the co-benefit, then designing this feature to support physical ac-tivity might yield the co-benefits indicated by this review.There is mounting evidence that multiple environmen-
tal features or patterns of features combine to producestronger effects on physical activity than any single fea-ture [25,40,41], and this principle may apply to the co-benefits as well. If several features of a setting had rela-tively weak evidence of co-benefits, it is reasonable toexpect that optimizing these multiple features could, inaggregate, produce strong effects. Thus, it is justified tosum the co-benefits scores across multiple features toestimate the potential overall effect of designing a settingto optimize physical activity, as was done to createTable 10.The most studied setting was urban design, with more
findings reviewed than all other settings combined. Allfeatures examined, including high residential density,mixed land use, activity-friendly street scale design,greenery, and high accessibility and street connectivity,were associated with environmental and economic bene-fits. In contrast, much less evidence was identified forthe schools and workplaces/buildings settings. Blankcells in the summary tables indicate gaps to be filled byfuture research. For example, programs such as “SafeRoutes to School” and Ciclovias or Open Streets mayhave numerous benefits, such as improved social bene-fits, reduced carbon emissions, and cleaner air, but theseoutcomes remain to be documented.One notable finding was that economic benefits of
activity-friendly designs were documented for all fivephysical activity settings. Based on the specific studiesidentified, many groups could enjoy economic benefits
Table 9 Workplaces/buildings summary scores
Built environment attribute Physical health Mental health
Building siting [+] 4+
Mixed land use around worksite
Building site design [+++] 16+ [++] 11.5+
Building design [+++] 19.5+ [0] 3.5 + 4-
Worksite physical activitypolicies and programs
[+] 8.5+ [0] 3.5+
Workplace furniture design [0] 7 + 3.5(0)
of activity-friendly environments, including governments(due to reduced spending on infrastructure), home-owners, real estate developers, health insurance compan-ies, employers, retailers, commercial property owners,and taxpayers. This is an extremely broad range of bene-ficiaries, and some of them may not be aware of the eco-nomic benefits of activity-friendly environments.
Policy implicationsPolicy-makers worldwide are faced with many problemsand challenges [42]. Rates of chronic disease and relatedcosts are high in countries at all income levels, and theserates are increasing fastest in low- and middle-incomecountries [4]. Depression creates the highest burden ofdisease worldwide [43], and injuries are the biggest causeof death among young people [43]. The consequences ofclimate change are expected to be the worst human-made disasters in history [44]. Every country and city islooking for ways to improve economic growth. It seemsinconceivable that making cities better for physical activ-ity could contribute to solutions of all these problems.However, the evidence compiled here suggests designingactivity-friendly communities could be a partial solutionfor many critical problems.If decisions about built environments were informed
by evidence, then the features with the best evidence ofco-benefits listed in Table 11 would deserve special con-sideration. The features listed in Table 11 had at least“moderate” evidence of three co-benefits. Among these,the best supported environmental features with at least“good” evidence of three co-benefits were park proxim-ity, mixed land use, greenery, accessibility and streetconnectivity, building design, and workplace physical ac-tivity policies/programs.
Socialbenefits
Environmentalsustainability
Safety/injuryprevention
Economicbenefits
[+] 4+ [+] 4+
[0] 3.5+
[++] 12.5+ [++] 12+
[+] 4+ [+++] 25+
[0] 3.5 + 3.5(0)

Table 10 Overall co-benefits by setting summary scores
Built environmentattribute
Physical health Mentalhealth
Socialbenefits
Environmentalsustainability
Safety/injuryprevention
Economicbenefits
Open spaces/Parks/Trails
[+++] 57.5 + 3.5(0) [+++] 93+ [+++] 42.5 + 4(0) [+++] 20 + 4(0) [+++] 23+ [+++] 19 + 4(0)
Urban design [+++] 105 + 54(0) 19- [+++] 31 + 4- [+++] 80.5 + 29(0) [+++] 265.5 + 45.5(0) 3.5- [−−−] 13.5(0) 18.5- [+++] 69 + 10.5(0) 4-
Transportationsystems
[0] 7 + 3.5- [0] 3 + 3.5(0) [+++] 23+ [+++] 70 + 21(0) 3- [+++] 67 + 14(0) 4- [+++] 56 + 3.5(0) 4-
Schools [+++] 19.5 + 3.5(0) [+++] 21+ [++] 11+ [+++] 21.5+ [0] 4 + 3- [+++] 15+
Workplaces/Buildings
[+++] 55 + 3.5(0) [++] 18.5 +4-
[+++] 20.5+ [+++] 48 + 3.5(0)
Sallis et al. International Journal of Behavioral Nutrition and Physical Activity (2015) 12:30 Page 8 of 10
Strengths and limitationsThe strength of the literature exploration was thebreadth of topics explored. For each setting several fea-tures were identified that were related to physical activ-ity, and each of these features was evaluated for six typesof co-benefits. A quasi-quantitative approach was usedto code the level of evidence of 521 findings and weighteach finding by the quality of the source. To avoidbasing findings on lower quality evidence, such aspoorly-substantiated claims in advocacy documents,lower-quality evidence was not included in the numer-ical summaries.The main limitations were a consequence of the
breadth. Because of the large number of topics searched,it was not possible to conduct a systematic review. A re-quirement of systematic reviews is assessment of the
Table 11 Best evidence of environmental features withstrong multiple benefits (at least “moderate” evidence ofthree benefits)
Setting Built environmentattribute
Evidence
Open Spaces/Parks/Trails
Park presence/proximity
3 strong, 2 good
Programs, promotion,and events
4 moderate
Urban Design/Land Use
Mixed land use 3 strong, 1 moderate(1 strong negative)
Greenery 3 strong, 2 good
Streetscale pedestriandesign
4 moderate
Accessibility and streetconnectivity
1 strong, 2 good, 1 moderate(1 good evidence of negative)
Transportation Pedestrian/bicycleinfrastructure
2 strong, 2 moderate
Reduced traffic speedand volume
1 strong, 2 moderate
Schools School siting 1 strong, 2 moderate
Shared use agreements 3 moderate
Buildings/Workplaces
Building design 1 strong, 2 good
Physical activity policiesand programs
1 strong, 2 good
quality of each study, but this was not feasible given thenumber and diverse types of studies. It would have beenhelpful to code studies as being cross-sectional, longitu-dinal, or experimental in design. Existing reviews wereused whenever possible to reflect the best evidence inthe literature. Literature searches and coding were con-ducted by several investigators with a semi-structuredprocess. Therefore there were undoubtedly differencesacross topics in thoroughness of search and classificationof levels of evidence.The searches were limited to English language docu-
ments, but one-quarter of the findings were from coun-tries other than the US, and another quarter of findingswere from reviews that included international literature.Another limitation was publication bias that favors posi-tive findings, though this may have been counteredsomewhat by inclusion of gray literature, including tech-nical reports. The intent of the literature explorationwas to identify as many relevant sources as possible todetermine whether it is worthwhile to pursue the topicof co-benefits, but a weakness was that the quality ofeach source was merely categorized and not based on ananalysis of methodological quality.The summary scores are not intended to be inter-
preted literally as the actual strength of evidence, butthey provide a rough indication of the extent of evi-dence: pro, con, and neutral. If the net scores for thelevel of evidence are strong, there is reason to have con-fidence in the finding for a connection between a featureand an outcome because a strong rating required find-ings from multiple sources.
ConclusionsSubstantial evidence indicated that designing and creat-ing parks, communities, transportation systems, schools,and buildings that make physical activity attractive andconvenient is also likely to produce a wide range of add-itional benefits. Present findings provide new informa-tion to decision-makers in numerous sectors that couldchange the perceived benefits of activity-friendly designs.Benefits were found for environmental sustainability,economics, and multiple dimensions of health. Though
Sallis et al. International Journal of Behavioral Nutrition and Physical Activity (2015) 12:30 Page 9 of 10
the present review is not definitive, the large number ofsources identified for such policy-relevant issues pro-vides a compelling justification for more original re-search and systematic reviews of the very broad range oftopics. If “a good solution solves multiple problems,”then building places that support physical activity maybe considered a superlative solution.
Additional files
Additional file 1: Detailed Information About Each Study Coded.A spreadsheet of the five setting-specific tables with notes about eachreviewed report/study and codes for findings so sources and interpretationsare transparent to reviewers and readers. Available on the Active LivingResearch website [http://activelivingresearch.org/making-case-designing-active-cities].
Additional file 2: Making the Case for Designing Active Cities.A longer report version of the present study, with additional sections,available on the Active Living Research website [http://activelivingresearch.org/making-case-designing-active-cities]. The report gives more details onthe methods and findings as reported in the manuscript and includesadditional sections on disparities and public opinion on active livingenvironmental features.
Competing interestsThe authors declare the following potential competing financial interests.Sallis: Nike, Inc., director of grant that supported preparation of this paper.Santech, Inc., shareholder. No relation to current paper. Oregon chapter ofthe American Planning Association, consultant. No conflict. Thai HealthPromotion Foundation, consultant and speaker. No conflict. Cavill, Gebel,Parker, Ding: Nike, Inc., paid consultants for research work done inpreparation of this paper. Spoon, Engelberg, Lou, Thornton, Wilson, Cutter:no conflict.
Authors’ contributionsJS conceived of the study and its design, synthesized and interpreted dataand drafted the manuscript. CS managed and participated in literaturereviews, synthesized data and helped draft the manuscript. DD participatedin literature reviews, synthesized data and helped draft the manuscript. Allremaining authors completed literature reviews and synthesized data. Allauthors read and approved the final manuscript.
AcknowledgmentsThis project was supported by Nike, Inc and Active Living Research, aprogram of the Robert Wood Johnson Foundation.A longer version of the present study, with additional sections, is posted onthe Active Living Research website (http://activelivingresearch.org/making-case-designing-active-cities), along with the data tables with codes for eachfinding.Thanks to the content experts from multiple disciplines and sectors whoprovided input on the review process: Open Spaces/Parks/Trails: Ariane Rung,Louisiana State University, Andrew Mowen, The Pennsylvania StateUniversity, Zarnaaz Bashir, National Recreation and Park Association, KarlaHenderson, North Carolina State University; Urban Design/Land Use: AnneVernez Moudon, University of Washington, Andrew Dannenberg, Universityof Washington, Reid Ewing, University of Utah; Transportation: RobertCervero, University of California, Berkeley, Charlie Zegeer, University of NorthCarolina Highway Safety Research Center, Chris Kochtitzky, Centers forDisease Control and Prevention; Schools: Jeff Vincent, Center for Cities andSchools, Nisha Botchwey, Georgia Institute of Technology; Workplaces/Buildings: Gayle Nicoll, Ontario College of Art & Design.
Author details1Active Living Research, University of California, San Diego, USA.2Department of Family and Preventive Medicine, 3900 5th Avenue, Suite 310,San Diego, CA 92119, USA. 3Cavill Associates Ltd, 185A Moss Lane, Bramhall,Stockport, Cheshire SK7 1BA, UK. 4University of California San Diego/San
Diego State University, Public Health Joint Doctoral Program, 3900 5thAvenue, Suite 310, San Diego, CA 92119, USA. 5James Cook University,Centre for Chronic Disease Prevention, PO Box 6811, Cairns, QLD 4870,Australia. 6Progress Health Partnerships Ltd, 5 Elmfield Road, Wigan WN15RG, UK. 7The University of Sydney, Sydney School of Public Health, EdwardFord Building (A27), Sydney, NSW 2006, Australia.
Received: 26 November 2014 Accepted: 16 February 2015
References1. Lee IM, Shiroma EJ, Lobelo F, Puska P, Blair SN, Katzmarzyk PT. Effect of physical
inactivity on major non-communicable diseases worldwide: an analysis ofburden of disease and life expectancy. Lancet. 2012;380(9838):219–29.doi:10.1016/S0140-6736(12)61031-9.
2. Hallal PC, Andersen LB, Bull FC, Guthold R, Haskell WL, Ekelund U. Globalphysical activity levels: surveillance progress, pitfalls, and prospects. Lancet.2012;380(9838):247–57. doi:10.1016/S0140-6736(12)60646-1.
3. Ng SW, Popkin BM. Time use and physical activity: a shift away frommovement across the globe. Obe Rev. 2012;13(8):659–80.
4. United Nations. Political declaration of the high level meeting of theGeneral Assembly on the prevention and control of non-communicable dis-eases (Sixth seventh session); 2011 [http://www.un.org/ga/search/view_doc.asp?symbol=A/66/L.1]
5. Brownson RC, Boehmer TK, Luke DA. Declining rates of physical activity inthe United States: what are the contributors? Annu Rev Public Health.2005;26:421–43.
6. Sallis JF, Floyd MF, Rodriguez DA, Saelens BE. Role of built environments inphysical activity, obesity, and cardiovascular disease. Circulation.2012;125:729–37.
7. World Health Organization. Global strategy on diet, physical activity and health.Geneva, Switzerland: World Health Organization; 2004 [http://www.who.int/dietphysicalactivity/strategy/eb11344/strategy_english_web.pdf?ua=1]
8. Bornstein DB, Pate RR, Pratt M. A review of the national physical activityplans of six countries. J Phys Act Health. 2009;6 Suppl 2:S245–64.
9. Centers for Disease Control and Prevention. Strategies to prevent obesityand other chronic diseases: the CDC guide to strategies to increase physicalactivity in the community. Atlanta, GA: U.S. Department of Health andHuman Services; 2011 [http://www.cdc.gov/obesity/downloads/pa_2011_web.pdf]
10. Heath GW, Brownson RC, Kruger J, Miles R, Powell KE, Ramsey LT, et al. Theeffectiveness of urban design and land use and transport policies andpractices to increase physical activity: a systematic review. J Phys Act Health.2006;3 Suppl 1:S55–76.
11. Koplan JP, Liverman CT, Kraak VI. Preventing childhood obesity: health inthe balance. Washington, DC: National Academies Press; 2005.
12. Giles-Corti B, Foster S, Shilton T, Falconer R. The co-benefits for health ofinvesting in active transportation. N S W Public Health Bull. 2010;21:122–7.
13. National Institute for Health and Clinical Excellence. Promoting or creatingbuilt or natural environments that encourage and support physical activity.London: National Institute for Health and Clinical Excellence; 2008[http://www.pedestrians-int.org/content/45/72008_ph.pdf]
14. Frank LD, Sallis JF, Conway TL, Chapman JE, Saelens BE, Bachman W. Manypathways from land use to health: associations between neighborhoodwalkability and active transportation, body mass index, and air quality. J AmPlann Assoc. 2006;72:75–87.
15. Frank LD, Greenwald MJ, Winkelman S, Chapman JE, Kavage S. Carbonlessfootprints: promoting health and climate stabilization through activetransportation. Prev Med. 2010;50 Suppl 1:S99–105.
16. Di Nardo F, Saulle R, La Torre G. Green areas and health outcomes: asystematic review of the scientific literature. Ital J Public Health.2010;7(4):402–13.
17. Sallis JF, Owen N, Fisher EB. Ecological models of health behavior. In: GlanzK, Rimer BK, Viswanath K, editors. Health Behavior and Health Education:Theory, Research, and Practice. 4th ed. San Francisco, CA: Jossey-Bass; 2008.p. 465–86.
18. Ding D, Sallis JF, Kerr JK, Lee S, Rosenberg DE. Neighborhood environment andphysical activity among youth: a review. Am J Prev Med. 2011;41(4):442–55.
19. Godbey G, Mowen A, Ashburn VA. The benefits of physical activity providedby park and recreation services: the scientific evidence. Ashburn, VA:National Recreation and Park Association; 2010 [http://www.nrpa.org/

Sallis et al. International Journal of Behavioral Nutrition and Physical Activity (2015) 12:30 Page 10 of 10
uploadedFiles/nrpa.org/Publications_and_Research/Research/Papers/Godbey-Mowen-Research-Paper.pdf]
20. Sallis JF, Adams MA, Ding D. Physical activity and the built environment. In:Cawley J, editor. The Oxford Handbook of the Social Science of Obesity.New York, NY: Oxford University Press; 2011. p. 433–51.
21. Stewart O, Moudon AV, Claybrooke C. Multistate evaluation of safe routes toschool programs. Am J Health Promot. 2014;28(sp3):S89–96.
22. Bauman AE, Reis RS, Sallis JF, Wells JC, Loos RJF, Martin BW. Correlates ofphysical activity: why are some people physically active and others not?Lancet. 2012;380(9838):258–71. doi:10.1016/S0140-6736(12)60735-1.
23. Miles R. Neighborhood disorder, perceived safety, and readiness toencourage use of local playgrounds. Am J Prev Med. 2008;34(4):275–81.
24. Molnar BE, Gortmaker SL, Bull FC, Buka SL. Unsafe to play? neighborhooddisorder and lack of safety predict reduced physical activity among urbanchildren and adolescents. Am J Health Promot. 2004;18(5):378–86.
25. Cain KL, Millstein RA, Sallis JF, Conway TL, Gavand K, Frank LD, et al.Contribution of streetscape audits to explanation of physical activity in fourage groups based on the microscale audit of pedestrian streetscapes(MAPS). Soc Sci Med. 2014;116:82–92.
26. Sarmiento OL, Torres A, Jacoby E, Pratt M, Schmid TL, Stierling G. Theciclovia-recreativa: a mass-recreational program with public health potential.J Phys Act Health. 2010;7 Suppl 2:S163–80.
27. Badland H, Schofield G. Transport, urban design, and physical activity: anevidence-based update. Transport Res D-TR E. 2005;10(3):177–96.
28. Rothman L, Buliung R, Macarthur C, To T, Howard A. Walking and childpedestrian injury: a systematic review of built environment correlates of safewalking. Inj Prev. 2014;20:41–9.
29. Torres A, Sarmiento OL, Stauber C, Zarama R. The ciclovia and ciclorutaprograms: promising interventions to promote physical activity and socialcapital in Bogota, Colombia. Am J Public Health. 2013;103(2):e23–30.
30. United States Environmental Protection Agency, Development, Community,and Environment Division. Parking spaces/community spaces: finding thebalance through smart growth solutions. Washington, DC: U.S.Environmental Protection Agency; 2006 [http://www.epa.gov/smartgrowth/pdf/EPAParkingSpaces06.pdf]
31. McMillan TE. Walking and biking to school, physical activity, and healthoutcomes. A research brief. Princeton, NJ: Active Living Research, a NationalProgram of the Robert Wood Johnson Foundation; 2009[http://activelivingresearch.org/walking-and-biking-school-physical-activity-and-health-outcomes]
32. Davison KK, Lawson CT. Do attributes in the physical environment influencechildren’s physical activity? a review of the literature. Int J Behav Nutr PhysAct. 2006;3:19. doi:10.1186/1479-5868-3-19.
33. Spengler JO. Promoting physical activity through the shared use of schooland community recreational resources. A research brief. Princeton, NJ:Active Living Research, a National Program of the Robert Wood JohnsonFoundation; 2012 [http://activelivingresearch.org/promoting-physical-activity-through-shared-use-school-and-community-recreational-resources]
34. Lafleur M, Gonzalez E, Schwarte L, Banthia R, Kuo T, Verderber J et al.Increasing physical activity in under-resourced communities throughschool-based, joint-use agreements, Los Angeles County, 2010–2012. PrevChronic Dis 2013, 10; http://dx.doi.org/10.5888/pcd10.120270.
35. Zimring C, Joseph A, Nicoll GL, Tsepas S. Influences of building design andsite design on physical activity: research and intervention opportunities. AmJ Prev Med. 2005;28(2Suppl 2):186–93.
36. Nicoll G, Zimring C. Effect of innovative building design on physical activity.J Public Health Policy. 2009;30 Suppl 1:S111–23.
37. Crespo NC, Sallis JF, Conway TL, Saelens BE, Frank LD. Worksite physicalactivity policies and environments in relation to employee physical activity.Am J Health Promot. 2011;25(4):264–71.
38. Proper KI, Koning M, van der Beek AJ, Hildebrandt VH, Bosscher RJ, vanMechelen W. The effectiveness of worksite physical activity programs onphysical activity, physical fitness, and health. Clin J Sport Med.2003;13(2):106–17.
39. Alkhajah TA, Reeves MM, Eakin EG, Winkler EAH, Owen N, Healy GN. Sit-stand workstations: a pilot intervention to reduce office sitting time. Am JPrev Med. 2012;43(3):298–303.
40. Adams MA, Sallis JF, Kerr J, Conway TL, Saelens BE, Frank LD, et al.Neighborhood environment profiles related to physical activity and weightstatus: a latent profile analysis. Prev Med. 2011;52:326–31.
41. Sallis JF, Bowles HR, Bauman A, Ainsworth BE, Bull FC, Craig CL, et al.Neighborhood environments and physical activity among adults in 11countries. Am J Prev Med. 2009;36(6):484–90.
42. Frank LD, Saelens BE, Powell KE, Chapman JE. Stepping toward causation:do built environments or neighborhood and travel preferences explainphysical activity, driving, and obesity? Soc Sci Med. 2007;65(9):1898–914.
43. World Health Organization. Global health risks: mortality and burden ofdisease attributable to selected major risks. Geneva, Switzerland: WHO Press;2009 [http://www.who.int/healthinfo/global_burden_disease/global_health_risks/en/]
44. Intergovernmental Panel on Climate Change. Climate change 2014: impacts,adaptation, and vulnerability (IPCC working group II contribution to fifthassessment report). Cambridge, United Kingdom and New York, NY:Cambridge University Press; 2014 [http://ipcc-wg2.gov/AR5/report/]
Submit your next manuscript to BioMed Centraland take full advantage of:
• Convenient online submission
• Thorough peer review
• No space constraints or color figure charges
• Immediate publication on acceptance
• Inclusion in PubMed, CAS, Scopus and Google Scholar
• Research which is freely available for redistribution
Submit your manuscript at www.biomedcentral.com/submit
Copyright © 2022 FDOKUMEN