CNH INDUSTRIAL - UBI Banca
21
1 CNH INDUSTRIAL Initiation of Coverage NEUTRAL 15 October 2019 – 5:30 PM MARKET PRICE: EUR9.7 TARGET PRICE: EUR10.30 Capital goods Data Shares Outstanding (m): 1353.8 Market Cap. (EURm): 13,132 Enterprise Value (EURm): 14,624 Free Float (%): 72.9% Av. Daily Trad. Vol. (m): 3.9 Main Shareholder: EXOR NV (27.2%) Reuters/Bloomberg: CNHI.MI CNHI IM 52-Week Range (EUR) 7.6 10.5 Source: FactSet, UBI Banca estimates Performance 1m 3m 12m Absolute -4.2% 4.6% 0.3% Rel. to FTSE IT -3.7% 5.5% -13.4% Graph aerea Absolute/Relative 12M Source: FactSet Analysts Massimo Vecchio Senior Analyst [email protected] Tel. +39 02 62753016 Dario Fasani Analyst [email protected] Tel. +39 02 62753014 www.ubibanca.com/equity-research Future-ready but AG cycle is weak We initiate the coverage on CNH with a NEUTRAL rating based on the conviction that the company is in the position to benefit from the mobility of the future but that the visibility on the AG cycle is very low. CNH has a stronghold in LNG/CNG engines while heavily involved in developing alternative fuels, autonomous driving and connectivity. The latter will increase the weight of services and aftermarket revenues and this doesn’t seem to be included in consensus figures (UBI est. 10% above). Furthermore, CNH end-markets are more protected than cars from the entrance of tech giants and the company sell to professional operators which are mostly driven by Total Cost of Ownership and should accept price increases to satisfy their future mobility needs. The company recently announced the intention to spinoff its on-highway business: while this doesn’t bring upside due to multiples re-rating, in the long run will increase the strategic focus and could be preliminary to M&A. Our target price of EUR10.3 offers limited upside. > LNG/CNG trucks registrations doubled YTD in 2019. Fuel is the largest cost item for fleet operators (around 30% of TCO) and several OEM believes LNG/CNG is the winning technology for trucks for the next 10 years. Although the overall share is still low (2%, from 1% the year before) the sudden growth was such that we forecast the segment to represent 15/20% of the market by 2024 (also thanks to government incentives). > IVECO is the European leader in LNG/CNG trucks. IVECO can boast a >50% market share in the European LNG/CNG segment, in which Scania and Volvo have recently entered. Range is not an issue (IVECO S-WAY Natural Power offers a range of 1,600 Km with 460hp) while the initial extra-cost is compensated by a TCO 20% lower. The order book, as of 2Q19, was +70% YoY (one out of five heavy trucks produced). IVECO has a leading position in electric buses too, mostly with its Heuliez brand. > Europeans are ahead on LNG/CNG vs. Americans. This will help also on tractors. Some farmers are using the manure to produce bio-gas to fuel their tractors. CNH is already offering on-road tractors and will expand to off-road soon. We believe that Americans are way behind on gas-powered engines and this is an advantage for CNH. > We expect a 10.8% ‘18-22 Net Profit CAGR, and a flat AG market in ‘20. We are 10% above consensus and 3% below guidance (’20 EPS). > Main risks. Trade wars; regulations changes, adverse weather. Financials 2018 2019E 2020E 2021E Revenues (USDm) 29,706 29,360 30,109 31,213 EBITDA (USDm) 2,671 2,639 2,787 3,007 EBITDA margin (%) 9.0% 9.0% 9.3% 9.6% EBIT (USDm) 2,101 2,032 2,203 2,424 EPS (USD) 0.79 0.85 0.93 1.10 CFPS (USD) 1.56 1.50 1.33 1.42 DPS (USD) 0.198 0.232 0.275 0.325 Source: Company Data, UBI Banca Estimates Ratios (priced on 14 October 2019) 2018* 2019E 2020E 2021E P/E (x) 15.1 12.5 11.4 9.7 P/CF (x) 7.6 7.1 8.0 7.5 P/BV (x) 3.2 2.4 2.1 1.8 Dividend Yield 1.7% 2.2% 2.6% 3.0% EV/EBITDA (x) 6.8 6.1 5.7 5.1 Debt/Equity (x) 0.12 0.05 0.01 (0.03) Debt/EBITDA (x) 0.22 0.12 0.02 (0.09) Source: UBI Banca Estimates * based on average 2018 prices 7 8 9 10 11 12 13 CNH Industrial NV FTSE Italia All-Share
-
Upload
khangminh22 -
Category
Documents
-
view
0 -
download
0
Transcript of CNH INDUSTRIAL - UBI Banca

1
CNH INDUSTRIAL
Initiation of Coverage NEUTRAL
15 October 2019 – 5:30 PM MARKET PRICE: EUR9.7 TARGET PRICE: EUR10.30
Capital goods
Data
Shares Outstanding (m): 1353.8
Market Cap. (EURm): 13,132
Enterprise Value (EURm): 14,624
Free Float (%): 72.9%
Av. Daily Trad. Vol. (m): 3.9
Main Shareholder: EXOR NV (27.2%)
Reuters/Bloomberg: CNHI.MI CNHI IM
52-Week Range (EUR) 7.6 10.5
Source: FactSet, UBI Banca estimates
Performance
1m 3m 12m
Absolute -4.2% 4.6% 0.3%
Rel. to FTSE IT -3.7% 5.5% -13.4%
Graph aerea Absolute/Relative 12M
Source: FactSet
Analysts
Massimo Vecchio Senior Analyst [email protected] Tel. +39 02 62753016
Dario Fasani Analyst [email protected] Tel. +39 02 62753014
www.ubibanca.com/equity-research
Future-ready but AG cycle is weak
We initiate the coverage on CNH with a NEUTRAL rating based on the conviction that the company is in the position to benefit from the mobility of the future but that the visibility on the AG cycle is very low. CNH has a stronghold in LNG/CNG engines while heavily involved in developing alternative fuels, autonomous driving and connectivity. The latter will increase the weight of services and aftermarket revenues and this doesn’t seem to be included in consensus figures (UBI est. 10% above). Furthermore, CNH end-markets are more protected than cars from the entrance of tech giants and the company sell to professional operators which are mostly driven by Total Cost of Ownership and should accept price increases to satisfy their future mobility needs. The company recently announced the intention to spinoff its on-highway business: while this doesn’t bring upside due to multiples re-rating, in the long run will increase the strategic focus and could be preliminary to M&A. Our target price of EUR10.3 offers limited upside.
> LNG/CNG trucks registrations doubled YTD in 2019. Fuel is the largest
cost item for fleet operators (around 30% of TCO) and several OEM
believes LNG/CNG is the winning technology for trucks for the next 10
years. Although the overall share is still low (2%, from 1% the year before)
the sudden growth was such that we forecast the segment to represent
15/20% of the market by 2024 (also thanks to government incentives).
> IVECO is the European leader in LNG/CNG trucks. IVECO can boast a
>50% market share in the European LNG/CNG segment, in which Scania
and Volvo have recently entered. Range is not an issue (IVECO S-WAY
Natural Power offers a range of 1,600 Km with 460hp) while the initial
extra-cost is compensated by a TCO 20% lower. The order book, as of
2Q19, was +70% YoY (one out of five heavy trucks produced). IVECO
has a leading position in electric buses too, mostly with its Heuliez brand.
> Europeans are ahead on LNG/CNG vs. Americans. This will help also
on tractors. Some farmers are using the manure to produce bio-gas to
fuel their tractors. CNH is already offering on-road tractors and will
expand to off-road soon. We believe that Americans are way behind on
gas-powered engines and this is an advantage for CNH.
> We expect a 10.8% ‘18-22 Net Profit CAGR, and a flat AG market in
‘20. We are 10% above consensus and 3% below guidance (’20 EPS).
> Main risks. Trade wars; regulations changes, adverse weather.
Financials
2018 2019E 2020E 2021E
Revenues (USDm) 29,706 29,360 30,109 31,213
EBITDA (USDm) 2,671 2,639 2,787 3,007
EBITDA margin (%) 9.0% 9.0% 9.3% 9.6%
EBIT (USDm) 2,101 2,032 2,203 2,424
EPS (USD) 0.79 0.85 0.93 1.10
CFPS (USD) 1.56 1.50 1.33 1.42
DPS (USD) 0.198 0.232 0.275 0.325
Source: Company Data, UBI Banca Estimates
Ratios (priced on 14 October 2019)
2018* 2019E 2020E 2021E
P/E (x) 15.1 12.5 11.4 9.7
P/CF (x) 7.6 7.1 8.0 7.5
P/BV (x) 3.2 2.4 2.1 1.8
Dividend Yield 1.7% 2.2% 2.6% 3.0%
EV/EBITDA (x) 6.8 6.1 5.7 5.1
Debt/Equity (x) 0.12 0.05 0.01 (0.03)
Debt/EBITDA (x) 0.22 0.12 0.02 (0.09)
Source: UBI Banca Estimates * based on average 2018 prices
7
8
9
10
11
12
13
CNH Industrial NV FTSE Italia All-Share

CNH INDUSTRIAL 15 October 2019
2
Index
1
INVESTMENT CASE
4
2
SWOT ANALYSIS
5
3 FINANCIALS 6
3
VALUATION
10

CNH INDUSTRIAL 15 October 2019
3
Key Financials
(USDm) 2018 2019E 2020E 2021E
Revenues 29,706 29,360 30,109 31,213
EBITDA 2,671 2,639 2,787 3,007
EBIT 2,101 2,032 2,203 2,424
NOPAT 1,684 1,614 1,745 1,885
Free Cash Flow 606 616 685 791
Net Capital Employed 23,710 24,143 24,259 24,383
Shareholders’ Equity 5,068 5,976 6,953 8,094
Net Financial Position 600 314 42 (277)
Source: Company data, UBI Banca estimates
Key Profitability Drivers
2018 2019E 2020E 2021E
Net Debt/Ebitda (x) 0.22 0.12 0.02 (0.09)
Net Debt/Equity (x) 0.12 0.05 0.01 (0.03)
Interest Coverage (%) 7.3 8.6 9.2 10.2
Free Cash Flow Yield (%) 3.8% 4.3% 4.8% 5.5%
ROE (%) 21.1% 19.3% 18.2% 18.3%
ROI pre-tax (%) 41.5% 34.0% 31.7% 29.9%
ROCE (%) 20.6% 18.0% 17.9% 17.7%
Source: Company data, UBI Banca estimates
Key Valuation Ratios
2018 * 2019E 2020E 2021E
P/E (x) 15.1 12.5 11.4 9.7
P/BV (x) 3.18 2.42 2.08 1.78
P/CF (x) 7.6 7.1 8.0 7.5
Dividend Yield (%) 1.7% 2.2% 2.6% 3.0%
EV/Sales (x) 0.65 0.59 0.56 0.53
EV/EBITDA (x) 6.79 6.10 5.67 5.14
EV/EBIT (x) 11.45 10.39 9.23 8.03
EV/CE (x) 0.77 0.67 0.65 0.63
Source: Company data, UBI Banca estimates * Based on 2018 average price
Key Value Drivers
(%) 2018 2019E 2020E 2021E
Payout 25.2% 27.2% 29.4% 29.7%
NWC/Sales 6.1% 7.6% 7.6% 7.6%
Capex/Sales 2.0% 2.2% 3.5% 3.7%
Source: Company data, UBI Banca estimates

CNH INDUSTRIAL 15 October 2019
4
INVESTMENT CASE
We are initiating the coverage on CNH with a NEUTRAL rating based on the
following:
The strong position the company gained overtime on CNG/LNG propulsion, a
small but fast growing segment of the European truck market and a promising
one on worldwide tractors;
The focus the company is putting in developing new technologies and
adapting to the mobility of the future (in particular in Fuel Cell trucks);
The self-help initiatives the company is aggressively pursuing;
The proposed spin off of the on-highway business which should increase
strategic focus and ease M&A;
All this balanced by the low visibility on the AG cycle…
Compounded by the trade war which sees in the agricultural commodities one
of the main threats that China could play against USA.
Our target price of EUR10.3 (or USD11.4 at the current exchange rate of 1.10) is
the average of different valuation methods:
A peer group comparison;
An EVA valuation;
A SoP which makes sense in this case in view of the proposed spin off.
CNH INDUSTRIAL 15 October 2019
5
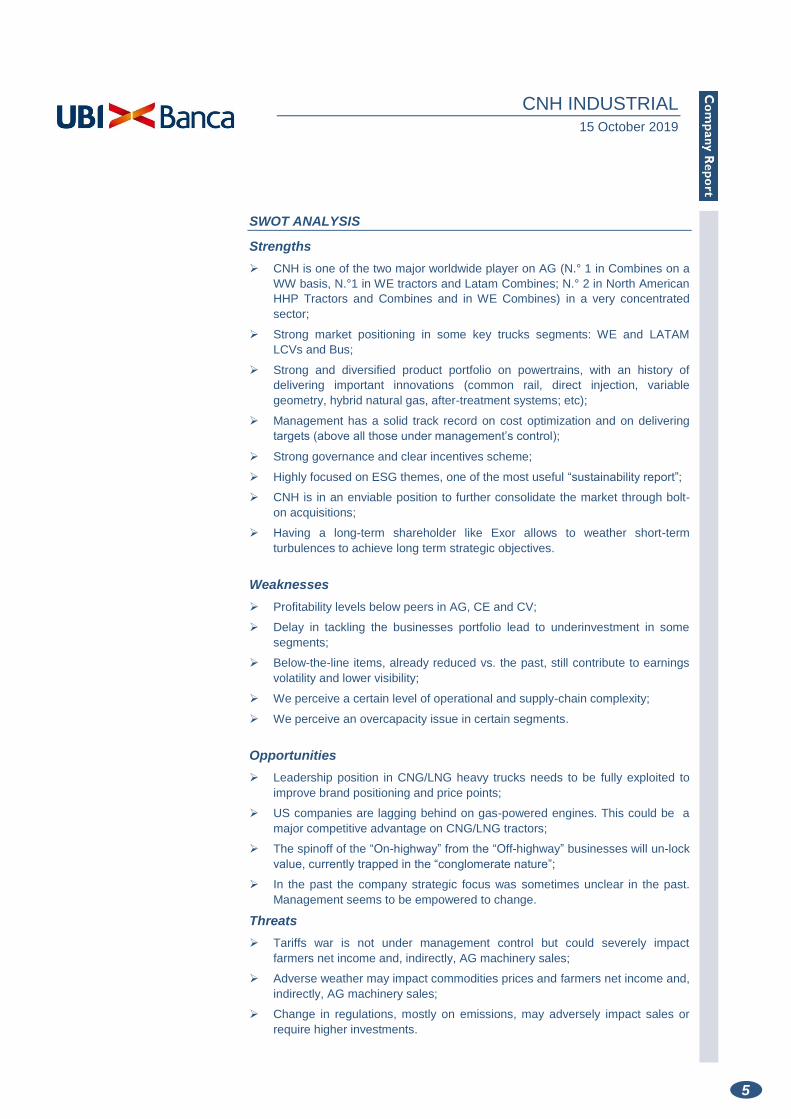
SWOT ANALYSIS
Strengths
CNH is one of the two major worldwide player on AG (N.° 1 in Combines on a
WW basis, N.°1 in WE tractors and Latam Combines; N.° 2 in North American
HHP Tractors and Combines and in WE Combines) in a very concentrated
sector;
Strong market positioning in some key trucks segments: WE and LATAM
LCVs and Bus;
Strong and diversified product portfolio on powertrains, with an history of
delivering important innovations (common rail, direct injection, variable
geometry, hybrid natural gas, after-treatment systems; etc);
Management has a solid track record on cost optimization and on delivering
targets (above all those under management’s control);
Strong governance and clear incentives scheme;
Highly focused on ESG themes, one of the most useful “sustainability report”;
CNH is in an enviable position to further consolidate the market through bolt-
on acquisitions;
Having a long-term shareholder like Exor allows to weather short-term
turbulences to achieve long term strategic objectives.
Weaknesses
Profitability levels below peers in AG, CE and CV;
Delay in tackling the businesses portfolio lead to underinvestment in some
segments;
Below-the-line items, already reduced vs. the past, still contribute to earnings
volatility and lower visibility;
We perceive a certain level of operational and supply-chain complexity;
We perceive an overcapacity issue in certain segments.
Opportunities
Leadership position in CNG/LNG heavy trucks needs to be fully exploited to
improve brand positioning and price points;
US companies are lagging behind on gas-powered engines. This could be a
major competitive advantage on CNG/LNG tractors;
The spinoff of the “On-highway” from the “Off-highway” businesses will un-lock
value, currently trapped in the “conglomerate nature”;
In the past the company strategic focus was sometimes unclear in the past.
Management seems to be empowered to change.
Threats
Tariffs war is not under management control but could severely impact
farmers net income and, indirectly, AG machinery sales;
Adverse weather may impact commodities prices and farmers net income and,
indirectly, AG machinery sales;
Change in regulations, mostly on emissions, may adversely impact sales or
require higher investments.

CNH INDUSTRIAL 15 October 2019
6
Financials
We estimate the CNH Group to post:
Sales 2018-22 CAGR of 2.3% and of 2.6% for 2018-24;
EBIT 2018-22 CAGR of 6.1% and of 7.0% for 2018-24;
Adj Net Income 2018-22 CAGR of 10.8% and of 11.6% for 2018-24;
Our numbers are below company’s 2022 guidance (by 12.4% at Adj EPS level)
and 2024 guidance (by 21.3% at Adj EPS level). To put it simply we are not
factoring-in the USD700 million EBIT increase in 2024 vs. 2018 obtained thanks
to top line growth:
Figure 1 – UBI vs. Guidance
(USDmn) 2019 2022 2024
Guidance UBI UBI vs Gui Guidance UBI UBI vs Gui Guidance UBI UBI vs Gui
Sales - Industrial activities 27/27,500 27,474 0.8% 31,200 30,499 -2.2% 35,100 32,773 -6.6%
EBITDA Adj. n.a. n.m. n.a. 3,432 3,137 -8.6% 4,563 3,853 -15.6%
% n.a. n.m. n.a. 11.0% 10.3% -6.5% 13.0% 11.8% -9.6%
EBIT Adj. n.a. n.m. n.a. 2,496 2,157 -13.6% 3,510 2,671 -23.9%
% n.a. n.m. n.a. 8.0% 7.1% -11.6% 10.0% 8.1% -18.5%
EPS - Adj f.d. 0.84/0.88 0.85 -1.6% 1.4 1.2 -12.4% 2.0 1.6 -21.3%
Operating cash flow n.a. n.m. n.a. 2,000 1,952 -2.4% 3,000 2,570 -14.3%
Net (Debt)/Cash (200)/(400) -314 -4.3% 300 560 -46.4% 1,700 1,670 -1.8%
ROIC n.a. n.m. n.a. 16.0% 17.6% -9.2% 20.0% 18.2% -9.1%
Source: Company data, UBI Banca estimates
We see the 2019-24 Business plan as a very interesting transparency exercise,
open and challenging. Overall our take is positive:
The financial metrics laid out are based on "mid cycle" industry volumes
reflecting 15-18 year average demand levels;
The “grow” target of 5% sales CAGR is more about regaining market share
and less about huge expectations for market growth;
The “perform and simplify” strategy together with the “Optimize and growth”
are underway with organization changes and, together with the 80/20 actions,
should deliver adj. EBIT growth of +400bps to 10% and adj. EPS of ~18%
CAGR;
The strategic initiatives mentioned in the previous bullet should result in a
smaller footprint with capital returns targeting a +600bps improvement in
ROIC to 20%.
A preliminary guidance was provided also on 2020 (USD0.95-USD1.00; consensus
is currently at USD0.84) which implies a nice 13.3% YoY growth vs. the FY2019
guidance (USD0.84/0.88).
Moving to the divisional target the majority of the growth should come from AG
(USD4 billion out of the USD8 billion sales increase in the 2018-24 period for the
group) while EBIT should more than double in CV (adding USD510 million) and
growth by 5x in CE (adding USD360 million):
AG is targeting a 5% sales CAGR, mostly thanks to market shares gains
(services driven by digital offerings, market share in Germany, plus cyclical ag
improvement). EBIT margin should grow by 500bps representing, in absolute
terms, the biggest contributor to the Group EBIT growth;

CNH INDUSTRIAL 15 October 2019
7
CE is targeting a 7% sales CAGR and a 9% EBIT margin (+570bps vs. 2018);
CV targets a 1% sales CAGR and a 380bps expansion in EBIT margin that
should reach the 7% level;
Powertrain is focused on increasing its propulsions portfolio as well as non-
captive sales. It targets a 5% sales CAGR and a 110bps improvement in EBIT
margin that should touch the 10% mark, after declining in 2022 from the
2018/19 levels.
At divisional level, our estimates are broadly aligned on AG and PWT but
significantly below on CV and CE. On those two divisions, while we project a nice
growth (>11% EBIT 2018-24 CAGR), we find difficult to assume:
For CV: such a high EBIT margin in a period of significant capex (peak margin
was a 7.7% in 2008 so difficult, but not impossible, to envisage a 7% in 2024);
For CE: such a significant revenues growth (peak revenues stood at USD5
billion in 2007 so low visibility of a USD4.6 billion number in 2024) and EBIT
margin (peak margin stood at 8.2% in 2007, difficult to have visibility on a 9%
in 2024) in a period of model line-up reshuffle.
In both cases, the majority of the improvement is defined as coming from self-help
(cost optimization, simplification, 80720, etc) and management has a solid truck
record in delivering on those topics. However, those measure delivers full benefits
when the top line is supportive. In case of a flattish top line cost optimization fail to
have a pass-through on EBIT but it is mostly given back to customers or suppliers.
Figure 2 – UBI vs. Divisional Guidance
(USDm, %) 2022 2024
Sales Guidance UBI UBI vs Gui Guidance UBI UBI vs Gui
AG 14,000 13,365 -4.5% 16,000 14,493 -9.4%
CE 3,800 3,277 -13.8% 4,600 3,407 -25.9%
CV 11,000 11,464 4.2% 12,000 12,057 0.5%
PWT 5,400 4,996 -7.5% 6,100 5,614 -8.0%
EBIT margin Guidance UBI UBI vs Gui Guidance UBI UBI vs Gui
AG 12.0% 10.8% -10.1% 14.0% 11.9% -15.0%
CE 6.0% 4.0% -33.3% 9.0% 5.0% -44.4%
CV 5.0% 4.0% -19.8% 7.0% 4.9% -29.6%
PWT 8.0% 8.5% 6.3% 10.0% 9.5% -5.0%
Source: Company data, UBI Banca estimates
Despite the fact that our estimates are below guidance we still remain above
consensus:

CNH INDUSTRIAL 15 October 2019
8
Figure 3 – UBI vs. Consensus estimates
(USDm) 2019 2020
Cons UBI % change Cons UBI % change
Sales - Industrial ops. 27,370 27,474 0.4% 27,697 28,196 1.8%
Sales - group 28,190 29,360 4.1% 28,304 30,109 6.4%
Operating profit - Ind. Ops. 1,639 1,549 -5.5% 1,649 1,712 3.8%
% 6.0% 5.6%
6.0% 6.1%
Operating profit - Group 1,874 2,032 8.4% 1,967 2,203 12.0%
% 6.6% 6.9%
6.9% 7.3%
Net results - res. 2,235 1,135 -49.2% 1,920 1,265 -34.1%
EPS - reported 14.27 0.85 -94.0% 0.84 0.93 11.7%
Net (Debt)/Cash (293) (314) -6.6% (90) (42) 111.8%
Source: FactSet, UBI Banca estimates
Looking in more details at the short term, our estimates are above consensus
almost on all items (with the exception of 2019 EBIT for industrial ops) anywhere
between 1% and 10% and still reflects the mid-point of the guidance (thus implying
a strong 2H19 with a +3.0% YoY growth in group revenues as opposed to a -5.4%
posted in 1H19).
Our estimates are predicated on the back of the followings:
During 2Q19 call management confirmed that the North American row crop
market is weak due to a pause in demand originated from the trade war and
the consequent decline in purchases from China. Despite this backdrop,
industry fundamentals remain solid:
o The performance of the used equipment portfolio remained healthy
both in volumes and pricing terms;
o The US administration has released construction to access the 2019
farmers aid package that, together with the 2018 disaster relief
support, contributes about USD30 billion over the last two years,
helping to provide stability to farmer and to support the replacement
cycle that had started before the trade war erupted.
While EU tractors are up YoY, EU combines are suffering from the spill over
impact from extremely dry weather conditions in Central and Northern Europe;
In South America and Brazil particularly, farmers had a gap in funding
between the early run-off of their 2018 Moderfrota program and the 2019 new
program. The new plan for 2019/2020 has been announced at the end of June
and confirms similar support level to that of the prior one. We would anticipate
that there is demand that has been pushed out into Q3, that would have come
during 2Q19 otherwise;
On Construction, demand has been flattish to slightly negative due to a
slowdown in investments related to the overall macro-slowdown.
Public/infrastructure is doing better than residential but still, for the FY, the
indication is that production will be below retail;
Trucks have been performing well both in EU (mostly for regulatory reasons,
new requirements around trucking drive activity) and Brazil. Bus as well are
positive and expected to continue to be also in 2H19. The company lost
market share as a result of the re-focus towards more profitable products like
LNG/CNG vehicles. Deliveries in natural gas-powered engine represent
now one out of five trucks produced in IVECO Spanish facility;
We expect pricing to remain supportive in all divisions, also thanks to a

CNH INDUSTRIAL 15 October 2019
9
disciplined inventory management;
On the cost side, while cost optimization initiatives (the 80/20 program) will be
supportive, raw materials, tariffs and R&D spending should more than balance
the savings;
When talking about AG production levels management, during 2Q19 call, stated
that it expects:
To underproduce retail demand by around 10% in 3Q19,
To overproduce in 4Q19;
So to end the FY2019 with a “slight under-production retail demand”.
Lastly, here below we present our 3Q19 preview:
(USDm) 3Q18A 3Q19E YoY
Group Revenues 6,686 6,760 -1.1%
Operating profit 444 365 -17.8%
margin 6.6% 5.4%
Reported Net Income 222 193 -13.0%
Adjusted Net income 222 191 -14.0%
Net Cash/(Debt) -1,989 -2,008 1.0%

CNH INDUSTRIAL 15 October 2019
10
VALUATION
Our target price of EUR10.3 (or USD11.4 at the current exchange rate of 1.10) is
the average of different valuation methods:
A peer group comparison;
An EVA valuation;
A SoP which makes sense in this case in view of the proposed spin off.
Figure 5 – Summary Valuation (USD)
Source: UBI Banca estimates
Upside to our rating/TP may be given by:
IVECO disposal before the spin-off: we believe this could be the case
because:
o Usually when a company plans some portfolio reshuffle (spinoffs,
IPO, etc) it signals the fact that the division is not 100% core and it is
exactly the time, for willing competitors, to present an offer. In this
specific case the timeline of the spinoff is long (to be completed 1st
January 2021);
o Rarity effect: the EU/US industry doesn’t count more than 5/6 players
so few options left to consolidate if the chance on IVECO is left
behind;
o Asian players may be looking at entering the EU market and IVECO
could be the best way to do it (also from a technological point of view
it could be the way to close a decade-long gap). For the same reason
a European player may try to avoid favoring additional competition in
its home market.
Our estimates are below company guidance: which was defined by the
management as conservative. Markets may be more benign than what we and
the company are assuming (AG cycles are more driven by the weather/price
of commodities rather than GDP growth);
All of the above may be amplified by the excellent positioning the company
has on the major trends in future mobility: CNG/LNG technology could be
a reason to buy IVECO; increase in productivity granted by new tractors may
11.3
11.5
11.2
11.4
SoP Peers EVA Average

CNH INDUSTRIAL 15 October 2019
11
support a replacement cycle, CNG/LNG tractors too may be a reason to prefer
CNH to Deere products.
Downside risk may be given by:
The AG cycle is really unpredictable and may be worse than expected: as
usual it is driven by weather conditions that impact supply/demand for
commodities but, in this case, trade talks may add volatility;
While our estimates are below company guidance they still see growth rates
not to be given for granted (>11% 2018-24 EBIT CAGR for both CE and
CV);
Self-help measure returns the maximum benefit onto EBIT when and if top line is growing or at least flat. In case of top line decline the USD1.1 billion incremental EBIT in the 2018-24 period may not materialize (or not entirely).
Peer group comparison and EVA valuation
The peer group selection for a company like CNH is quite straightforward: Deere,
Caterpillar, AGO for the off-highway business and Volvo, Paccar and Cummins for
the On-highway:
Figure 6 – Peer Group Multiples
Name TIER Price Currency Mkt Cap EV/EBITDA EV/EBIT P/E FCF Yield
bn 2019E 2020E 2021E 2019E 2020E 2021E 2019E 2020E 2021E 2019E 2020E 2021E
AGCO Corporation I 66.3 USD 5.1 7.5 x 6.9 x 6.3 x 11.2 x 10.1 x 9.0 x 14.4 13.1 12.2 5.2% 7.4% 7.9%
Deere & Company I 153.2 USD 48.2 20.9 x 18.7 x 16.1 x 27.1 x 22.7 x 20.9 x 17.0 15.2 13.5 4.9% 6.4% 6.6%
Caterpillar Inc. I 116.4 USD 65.5 6.6 x 6.8 x 6.9 x 8.3 x 8.5 x 8.4 x 10.9 10.7 10.2 8.0% 9.1% 10.2%
Volvo AB I 12.8 EUR 27.2 4.1 x 4.6 x 4.3 x 5.4 x 6.5 x 6.1 x 8.2 10.3 10.1 10.5% 9.4% 8.7%
PACCAR Inc II 63.0 USD 21.8 9.8 x 11.3 x 10.3 x 11.4 x 13.6 x 13.4 x 10.2 12.4 12.2 7.3% 7.6% 7.1%
TRATON SE II 22.6 USD 11.3 5.1 x 5.4 x 4.9 x 7.7 x 8.2 x 7.4 x 8.2 8.2 7.5 4.0% 4.4% 5.5%
Cummins Inc. II 148.5 USD 23.4 6.7 x 7.5 x 7.2 x 8.1 x 9.1 x 8.7 x 10.4 11.6 11.2 8.2% 7.8% 7.6%
Median
6.7 x 6.9 x 6.9 x 8.3 x 9.1 x 8.7 x 10.4 x 11.6 x 11.2 x 6.3% 7.5% 7.5%
TIER I - Average
9.8 x 9.3 x 8.4 x 13.0 x 11.9 x 11.1 x 12.6 x 12.3 x 11.5 x 7.1% 8.1% 8.3%
TIER II - Average
7.2 x 8.1 x 7.5 x 9.1 x 10.3 x 9.8 x 9.6 10.7 10.3 6.5% 6.6% 6.7%
CNH Industrial
10.67 USD 14,300 6.1 x 5.7 x 5.1 x 10.4 x 9.2 x 8.0 x 12.5 x 11.4 x 9.7 x 2.0% 1.9% 2.2%
Premium/(Disc.) to peers
-9.5% -18.0% -25.5% 25.9% 1.0% -7.5% 20.2% -1.6% -12.8% n.m. n.m. n.m.
Source: FactSet
Performances and multiples shows that the two laggards are Volvo and Caterpillar
(lower multiples, worst performances) due to the construction cycle peaking.

CNH INDUSTRIAL 15 October 2019
12
Figure 7 – Share price performance
Company Price Market cap Share performance
mn 1M 3M 6M 12M YTD 3 Years
AGCO Corp (USD) 66.3 5,057 -4.3% -3.8% 4.3% 38.3% 36.2% 42.9%
Deere (USD) 153.2 48,244 2.7% 4.3% 7.4% 19.4% 17.4% 95.1%
Caterpillar (USD) 116.4 65,507 -3.5% -5.3% -6.7% -5.2% 4.8% 46.1%
Volvo B (SKR) 12.8 27,189 -6.8% -8.1% -9.0% -7.7% 11.7% 28.8%
PACCAR (USD) 63.0 21,827 -2.4% -1.7% 1.1% 17.3% 26.1% 22.0%
TRATON SE (EUR) 22.6 11,300 -10.6% -16.2%
Cummins Inc. (USD) 148.5 23,436 -0.3% -2.3% 1.2% 18.2% 27.1% 30.0%
CNH Industrial (USD) 9.7 13,073 -4.2% 4.6% -0.7% 0.3% 20.1% 42.4%
FTSE Italia All-Share 137.6 330,925 -0.5% -0.9% 0.5% 13.8% 19.1% 30.1%
Average (ex CNH) -4.1% -5.2% -0.6% 12.4% 19.2% 47.0%
Source: FactSet
The resulting valuation shows a fair value, averaging 2019-21, of USD11.5:
Figure 8 – Peers comparison valuation
(USD, x ) 2019E 2020E 2021E
PE - Peers 12.6 12.3 11.5
CNH Adj. EPS 0.85 0.94 1.06
CNH Per Share value 10.7 11.6 12.2
Source: FactSet, UBI Banca estimates
As for EVA valuation, the company ROACE is 40% higher than its WACC, also
thanks to the ability to reduce the cost of debt. The resulting fair value therefore we
estimate being USD11.2:
Figure 9 – EVA Valuation
(USD, %, x)
Av. CE 24,350
Average cycle EBIT - post tax 1,678
Av. ROACE (2019-2022) 6.9%
WACC 5.0%
Risk free rate 2.5%
Beta 1.00
Market premium 4.5%
Cost of Equity 7.0%
Cost of debt 2.9%
% Sustainable Debt on CE 50%
ROACE/WACC 1.4
Av. CE 24,350
Implied EV 33,835
Net (Debt)/Cash -17,333
Pension liabilities -1,473
Implied Equity value 15,029
N.° of shares 1,340
Equity value p.s. (USD) 11.2
Equity value p.s. (EUR) 10.2
Source: UBI Banca estimates

CNH INDUSTRIAL 15 October 2019
13
Figure 17 – EVA Valuation – Sensitivity Analysis
ROACE
11.2 5.9% 6.9% 7.9%
WACC 4.5% 10.0 14.1 18.1
5.0% 7.6 11.2 14.9
5.5% 5.6 8.9 12.2
Source: UBI Banca estimates
Sum of the Parts valuation and the merit of On-Highway spinoff
While we don’t usually like to value industrial conglomerate based on their SoP, we
believe that in the case of CNH, with a spinoff of the on-highway business already
announced, this method may be very useful in assessing how much it could be
worth the entire group when, in 2021, the deal will be completed.
We believe that the best way to value the on and off-highway business is through a
P/E comparison with peers. This because:
Valuing the AG business comparing it with Deere on the EV/EBITDA or
EV/EBIT basis will not work. On the US market stocks are not looked through
those multiples and different accounting principles may impair the comparison;
For the sake of consistency, and in order to avoid double-counting, also the
on-highway should be looked through the lens of a P/E peers comparison
(despite the fact that European truck makers may be looked on EV multiples).
To assess the net income of the two divisions one should make assumptions
regarding:
The capital structure of the two businesses: we believe that, given the superior
capability of the off-highway to generate cash, this business will have more
leverage to start with;
Their tax rates: we presume on-highway will be higher (having all the plants
located in WE and the vast majority of the revenues). We therefore assume a
33% tax rate for the on-highway and a 23% for the off-highway.
Our assumptions are showed in the table below:

CNH INDUSTRIAL 15 October 2019
14
Figure 10 – Off-highway & On-highway – UBI Assumptions
(USDm) 2018A 2019E 2020E
Off-highway
Revenues 15,600 15,200 15,973
Adj. EBIT 1,000 913 1,053
Financial charges -368 -387 -432
Others -106 19 19
Pre tax 526 546 641
Tax rate 23% 23% 24%
Net Income 405 420 539
Net Debt/(Cash) 1,500 1,332 1,245
Free cash flow 348 337 475
On-highway
Revenues
Adj. EBIT 13,100 13,279 13,324
Financial charges 500 566 614
Others 16 11 -8
Pre tax 0 0 0
Tax rate 516 577 606
Net Income 33% 33% 33%
Net Debt/(Cash) 315 360 381
Free cash flow (900) (998) (1,151)
Source: Company data, UBI Banca estimates
Consequently we present our SoP that returns a fair value of USD11.3:
Figure 11 – SoP Valuation
Core Businesses Valuation method Implied 2019 Fair value Per share
2019-20 P/E EV/Sales Multiple (USDm) (USD)
Off-higway Deere/AGCO 0.45x $6,421 $4.8
On-highway Volvo, Paccar,
Traton, Cummins 0.21x $3,311 $2.5
FinCo ROE vs. P/BV 2.75x $5,469 $4.1
Total assets
15,200 11.30
Source: FactSet, UBI Banca estimates
At current market multiples, and based on our estimates, it is not clear that the
spinoff offers valuation upside.
CNH INDUSTRIAL 15 October 2019
15
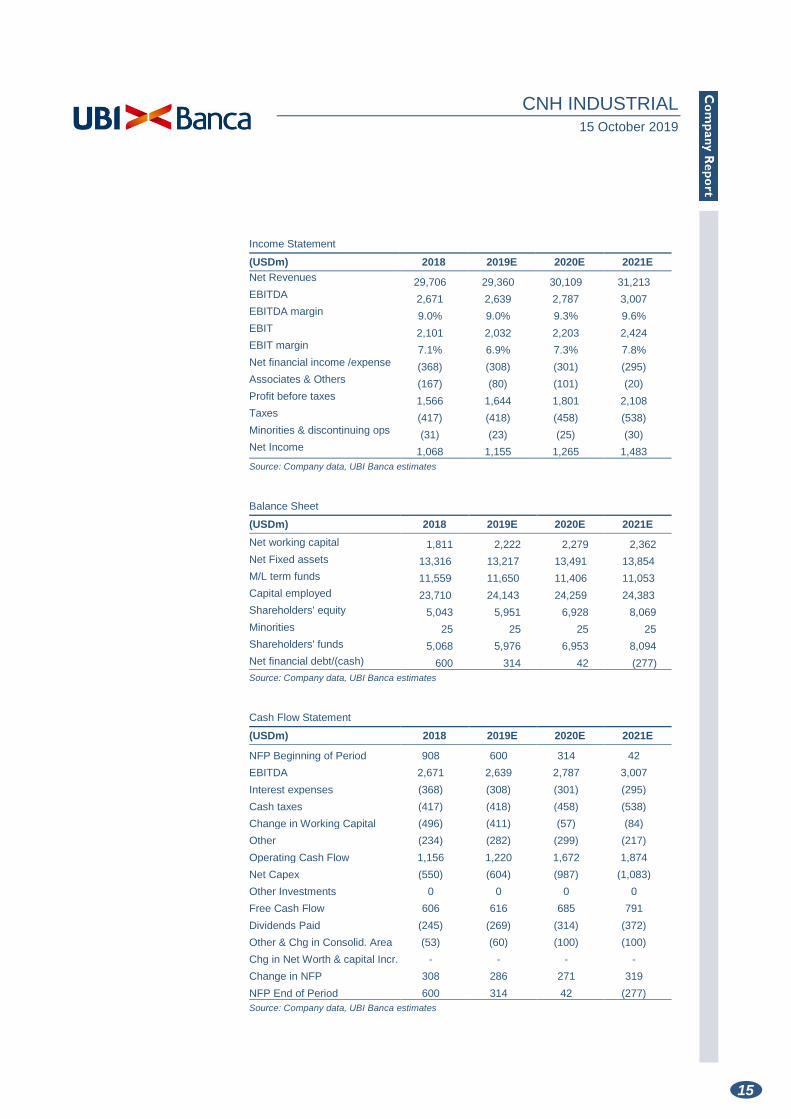
Income Statement
(USDm) 2018 2019E 2020E 2021E
Net Revenues 29,706 29,360 30,109 31,213 EBITDA 2,671 2,639 2,787 3,007 EBITDA margin 9.0% 9.0% 9.3% 9.6% EBIT 2,101 2,032 2,203 2,424 EBIT margin 7.1% 6.9% 7.3% 7.8% Net financial income /expense (368) (308) (301) (295) Associates & Others (167) (80) (101) (20) Profit before taxes 1,566 1,644 1,801 2,108 Taxes (417) (418) (458) (538) Minorities & discontinuing ops (31) (23) (25) (30) Net Income 1,068 1,155 1,265 1,483
Source: Company data, UBI Banca estimates
Balance Sheet
(USDm) 2018 2019E 2020E 2021E
Net working capital 1,811 2,222 2,279 2,362
Net Fixed assets 13,316 13,217 13,491 13,854
M/L term funds 11,559 11,650 11,406 11,053
Capital employed 23,710 24,143 24,259 24,383
Shareholders' equity 5,043 5,951 6,928 8,069
Minorities 25 25 25 25
Shareholders' funds 5,068 5,976 6,953 8,094
Net financial debt/(cash) 600 314 42 (277)
Source: Company data, UBI Banca estimates
Cash Flow Statement
(USDm) 2018 2019E 2020E 2021E
NFP Beginning of Period 908 600 314 42
EBITDA 2,671 2,639 2,787 3,007
Interest expenses (368) (308) (301) (295)
Cash taxes (417) (418) (458) (538)
Change in Working Capital (496) (411) (57) (84)
Other (234) (282) (299) (217)
Operating Cash Flow 1,156 1,220 1,672 1,874
Net Capex (550) (604) (987) (1,083)
Other Investments 0 0 0 0
Free Cash Flow 606 616 685 791
Dividends Paid (245) (269) (314) (372)
Other & Chg in Consolid. Area (53) (60) (100) (100)
Chg in Net Worth & capital Incr. - - - -
Change in NFP 308 286 271 319
NFP End of Period 600 314 42 (277)
Source: Company data, UBI Banca estimates

CNH INDUSTRIAL 15 October 2019
16
Financial Ratios
(%) 2018 2019E 2020E 2021E
ROE 21.1% 19.3% 18.2% 18.3%
ROI 41.5% 34.0% 31.7% 29.9%
Net Fin. Debt/Equity (x) 0.12 0.05 0.01 (0.03)
Net Fin. Debt/EBITDA (x) 0.22 0.12 0.02 (0.09)
Interest Coverage 7.3 8.6 9.2 10.2
NWC/Sales 6.1% 7.6% 7.6% 7.6%
Capex/Sales 2.0% 2.2% 3.5% 3.7%
Pay Out Ratio 25.2% 27.2% 29.4% 29.7%
Source: Company data, UBI Banca estimates,
Per Share Data
(USD) 2018 2019E 2020E 2021E
EPS 0.79 0.85 0.93 1.10
DPS 0.198 0.232 0.275 0.325
Op. CFPS 0.85 0.90 1.23 1.38
Free CFPS 0.45 0.45 0.51 0.58
BVPS 3.7 4.4 5.1 6.0
Source: Company data, UBI Banca estimates
Stock Market Ratios
(x) 2018 * 2019E 2020E 2021E
P/E 15.1 12.5 11.4 9.7
P/OpCFPS 13.9 11.8 8.6 7.7
P/BV 3.18 2.42 2.08 1.78
Dividend Yield (%) 1.7% 2.2% 2.6% 3.0%
Free Cash Flow Yield (%) 3.8% 4.3% 4.8% 5.5%
EV (USDm) 18,148 16,087 15,801 15,467
EV/Sales 0.65 0.59 0.56 0.53
EV/EBITDA 6.79 6.10 5.67 5.14
EV/EBIT 11.45 10.39 9.23 8.03
EV/Capital Employed 0.77 0.67 0.65 0.63
Source: Company data, UBI Banca estimates * Based on 2018 average price
Growth Rates
(%) 2018 2019E 2020E 2021E
Growth Group Net Sales 7.2% -1.2% 2.6% 3.7%
Growth EBITDA 15.1% -1.2% 5.6% 7.9%
Growth EBIT 28.2% -3.3% 8.4% 10.0%
Growth Net Profit 293.5% 8.1% 9.6% 17.2%
Source: Company data, UBI Banca estimates

CNH INDUSTRIAL 15 October 2019
17
Disclaimer
Analyst Declaration
This research report (the “Report”) has been prepared by Massimo Vecchio and Dario Fasani on behalf of UBI Banca S.p.A. (“UBI Banca”) in the context of the ancillary service provided by UBI Banca named “Investment research and financial analysis or other forms of recommendation relating to transactions in financial instruments” under Paragraph 5), Section B, Annex I of the Directive 2014/65/EU (“MiFID II”). UBI Banca is an Italian bank under art. 4 (1)(27) of MiFID II and it is supervised by the European Central Bank and duly authorised to provide investment services pursuant to Article 1, Paragraph 5, letter a), b), c), c-bis), e) and f) of the Legislative Decree 24 February 1998, n° 58 under the supervision of the Italian Authority for the financial markets (Consob). UBI Banca has its head office at Piazza Vittorio Veneto 8, 24122 Bergamo.
The analyst who prepared the Report, and whose name and role appear on the front page, certifies that:
a. The views expressed on the company, mentioned herein (the “Company”) accurately reflect his personal views, but do not represent the views or opinions of UBI Banca, its management or any other company which is part of or affiliated with UBI Banca group (the “UBI Banca Group”). It may be possible that some UBI Banca Group officers may disagree with the views expressed in this Report;
b. He has not received, and will not receive any direct or indirect compensation in exchange for any views expressed in this Report;
c. The analyst does not own any securities and/or any other financial instruments issued by the Company or any financial instrument which the price depends on, or is linked to any securities and/or any financial instruments issued by the Company.
d. Neither the analyst nor any member of the analyst’s household serves as an officer, director or advisory board member of the Company.
e. The remuneration of the analyst is not directly tied to transactions for services for investment firms or other types of transactions it or any legal person, part of the same group performs, or to trading fees it or any legal person that is part of the same group receives.
f. Massimo Vecchio is a member of AIAF.
General disclosure
This Report is for information purposes only. This Report (i) is not, nor may it be construed, to constitute, an offer for sale or subscription or of a solicitation of any offer to buy or subscribe for any securities issued or to be issued by the Company, (ii) should not be regarded as a substitute for the exercise of the recipient’s own judgement. In addition, the information included in this Report may not be suitable for all recipients. Therefore the recipient should conduct their own investigations and analysis of the Company and securities referred to in this document, and make their own investment decisions without undue reliance on its contents. Neither UBI Banca, nor any other company belonging to the UBI Banca Group, nor any of its directors, managers, officers or employees, accepts any direct or indirect liability whatsoever (in negligence or otherwise), and accordingly no direct or indirect liability whatsoever shall be assumed by, or shall be placed on, UBI Banca, or any other company belonging to the UBI Banca Group, or any of its directors, managers, officers or employees, for any loss, damage, cost, expense, lower earnings howsoever arising from any use of this Report or its contents or otherwise arising in connection with this Report.
CNH INDUSTRIAL 15 October 2019
18
The information provided and the opinions expressed in this Report are based upon information and data provided to the public by the Company or news otherwise public, and refers to the date of publication of the Report. The sources (press publications, financial statements, current and periodic releases, as well as meetings and telephone conversations with the Company’s representatives) are believed to be reliable and in good faith, but no representation or warranty, express or implied, is made by UBI Banca as to their accuracy, completeness or correctness. Past performance is not a guarantee of future results. Any opinions, forecasts or estimates contained herein constitute a judgement as of the date of this Report, and there can be no assurance that the future results of the Company and/or any future events involving directly or indirectly the Company will be consistent with any such opinions, forecasts or estimates. Any information herein is subject to change, update or amendment without notice by UBI Banca subsequent to the date of this Report, with no undertaking by UBI Banca to notify the recipient of this Report of such change, update or amendment.
This document was sent to the Issuer alone in the draft version for the sole purpose of verifying the correctness of the factual data contained therein and was subject to modification exclusively in relation to these factual elements.
Organizational and administrative arrangements to prevent conflicts of interests
UBI Banca maintains procedures and organizational mechanism (physical and non physical barriers designed to restrict the flow of information between the unit which performs investment research activity, and other units of UBI Banca) to prevent and professionally manage conflicts of interest in relation to investment research in accordance with art. 23 of Directive 2014/65/EU and under art. 34 (3) and art. 37 of the Regulation 2017/565/EU.
More specifically, UBI Banca has established, implements and maintains an effective conflicts of interests policy aimed at preventing and managing the potential conflicts of interest that could occur during the performance of the investment research services.
Insofar as the above mentioned organizational and administrative arrangements established by UBI Banca to prevent or manage potential conflicts of interests are not sufficient to ensure, with reasonable confidence, that risks of damage to the interests of the client will be prevented, UBI Banca engages to provide a clear disclosure of the specific conflicts of interests arising from the performance of investment research services, including a description of the sources of those conflicts and the steps undertaken to mitigate them, taking into account the nature of the client to whom the disclosure is being made. For further information please see UBI Banca’s website (www.ubibanca.com/equity-research - “Informativa sintetica sull’attività di ricerca”) and (www.ubibanca.com/Mifid - “Policy sintetica conflitti di interessi”). More details about the conflicts of interests policy will be provided by UBI Banca upon request.
Disclosure of interests and conflicts of interests pursuant to Delegated Regulation 2016/958/EU
In relation to the Company the following interest/conflict of interest have been found:
> UBI Banca may have long or short positions with the issuer
> UBI Banca has delivered corporate finance services to CNH N.V.. in the last 12 months
On the basis of the checks carried out no other interest/conflict of interest arose.
Frequency of updates
UBI Banca aims to provide continuous coverage of the companies in conjunction with the timing of periodical accounting reports and any exceptional event that occurs affecting the issuer’s sphere of operations and in any case at least twice per year. The companies for

CNH INDUSTRIAL 15 October 2019
19
which UBI Banca acts as Sponsor or Specialist are covered in compliance with regulations of the market authorities.
For further information please refer to www.ubibanca.com/equity-research
Valuation methodology
UBI Banca’s analysts value the Company subject to their recommendations using several methods among which the most prevalent are: the Discounted Cash Flow method (DCF), the Economic Value Added method (EVA), the Multiple comparison method, the SOP method and the NAV method.
The analysts use the above valuation methods alternatively and/or jointly at their discretion. The assigned target price may differ from their fair value, as it also takes into account overall market/sector conditions, corporate/market events, and corporate specifics (i.e. holding discounts) reasonably considered to be possible drivers of the company’s share price performance. These factors may also be assessed using the methodologies indicated above.
For further information please refer to www.ubibanca.com/equity-research.
Ranking system
UBI Banca’s analysts use an “absolute” rating system, not related to market performance. The explanation of the rating system is listed below:
Buy: if the target price is 15% higher than the market price, over the next 12 months.
Hold: if the target price is 15% below or 15% above the market price, over the next 12 months.
Sell: if the target price is 15% lower than the market price, over the next 12 months.
No Rating: the investment rating and target price have been suspended as there is not sufficient fundamental basis for determining an investment rating or target. The previous investment rating and target price, if any, are no longer in effect. Alternatively, No Rating is assigned in certain circumstances when UBI Banca is acting in any advisory capacity in a strategic transaction involving the Company.
Target price: the market price that the analyst believes that the share may reach within a one-year time horizon.
Market price: closing price on the day before the issue date of the report, appearing on the first page.
Distribution
Italy: This document is intended for distribution in electronic form to “Professional Clients” and “Qualified Counterparties” as defined by Legislative Decree 24 February 1998, n. 58 and by Consob Regulation n. 16190 dated 29.10.2007, as further amended and supplemented.
This Report has been released within 30 minutes from the timing reported on the front page.
IN THE UNITED KINGDOM, THIS DOCUMENT IS BEING DISTRIBUTED ONLY TO, AND IS DIRECTED ONLY AT PERSONS WHO (A) ARE (I) PERSONS FALLING WITHIN ARTICLE 19 OR ARTICLE 49 OF THE FINANCIAL SERVICES AND MARKETS ACT 2000 (FINANCIAL PROMOTION) ORDER 2005 (AND ONLY WHERE THE CONDITIONS CONTAINED IN THOSE ARTICLES HAVE BEEN, OR WILL AT THE RELEVANT TIME BE, SATISFIED) OR (II) ANY OTHER PERSONS TO WHOM IT MAY BE LAWFULLY COMMUNICATED; AND (B) ARE QUALIFIED INVESTORS WITHIN THE MEANING OF ARTICLE 2(1)(E) OF THE PROSPECTUS DIRECTIVE (DIRECTIVE 2003/71/EC), (ALL SUCH PERSONS BEING REFERRED TO AS "RELEVANT

CNH INDUSTRIAL 15 October 2019
20
PERSONS"). THIS DOCUMENT MUST NOT BE ACTED ON OR RELIED ON BY PERSONS WHO ARE NOT RELEVANT PERSONS. SWITZERLAND THIS REPORT DOES NOT CONSTITUE A PROSPECTUS WITHIN THE MEANING OF THE ARTICLE 652a OR ART. 1156 OF THE SWISS CODE OF OBLIGATIONS OR A LISTING PROSPECTUS WITHIN THE MEANING OF THE LISTING RULES OF THE SIX SWISS EXCHANGE OR ANY OTHER TRADING VENUES IN SWITZERLAND, OR A SIMILAR COMMUNICATION WITHIN THE MEANING OF ART. 752 OF THE SWISS CODE OF OBBLIGATIONS, AND HAS BEEN PREPARED WITHOUT REGARD TO THE SWISS LAWS AND REGULATIONS, AND DOES NOT CONSTITUTE AN OFFER TO SUBSCRIBE FOR, BUY OR OTHERWISE ACQUIRE ANY SECURITY OF THE COMPANY.
Copyright
This Report is being supplied solely for the recipient’s information and may not be reproduced, redistributed or passed on, directly or indirectly to any other person or published, in whole or in part, for any purpose without prior written consent of UBI Banca.
The copyright and intellectual property rights on the data are owned by UBI Banca Group, unless otherwise indicated. The data, information, opinions and valuations contained in this Report may not be subject to further distribution or reproduction, in any form or via any means, even in part, unless expressly consented by UBI Banca.
By accepting this Report the recipient agrees to be bound by all of the forgoing provisions.
Distribution of ratings
Equity rating dispersion in the past 12 months
Buy Hold Sell No Rating
89.8% 6.1% 2.1% 2.0%
Proportion on issuers to which UBI Banca has supplied investment banking services relating to the last 12 months
Buy Hold Sell No Rating
95.9% 100% 100% 100%
For further information regarding yearly and quarterly rating statistics and descriptions, please refer to www.ubibanca.com/equity-research.

CNH INDUSTRIAL 15 October 2019
21
SERVIZIO STUDI
Head of Research Department
Giovanni Barone
Industry Research
Macroeconomic and Financial Market Research
Equity Research
Enza De Vita
Francesca Pascali
Marco Cristofori
+39.02.6275 3015
Anna Cristina Visconti
Vincenzo Petrignano
Massimo Vecchio
+39.02.6275 3016
Paolo Manzoni
Oriana Cardani, CFA
Quantitative Analysis
Paolo Leoni
+39.02.6275 3017
Francesco Martinelli
Dario Fasani
+39.02.6275 3014
ECM & DCM
GLOBAL MARKETS SALES
Head of ECM & DCM
Head of Global Markets Sales
Marco Germano (Key Executive)
Alessandro Michele Ravogli
+39.02.7781 4651
Head of Sales ECM & DCM
Gisella Barisone (Key Executive)
Andrea Paolo Martini
+39.02.7781 4618
+39.02.7781.4341
Ilenia Osimi
Roberta Pupeschi
+39.02.7781 4682
Pierfrancesco Genoviva