CMS 2021 R3 Condition Monitoring Software - Brüel & Kjær ...
23
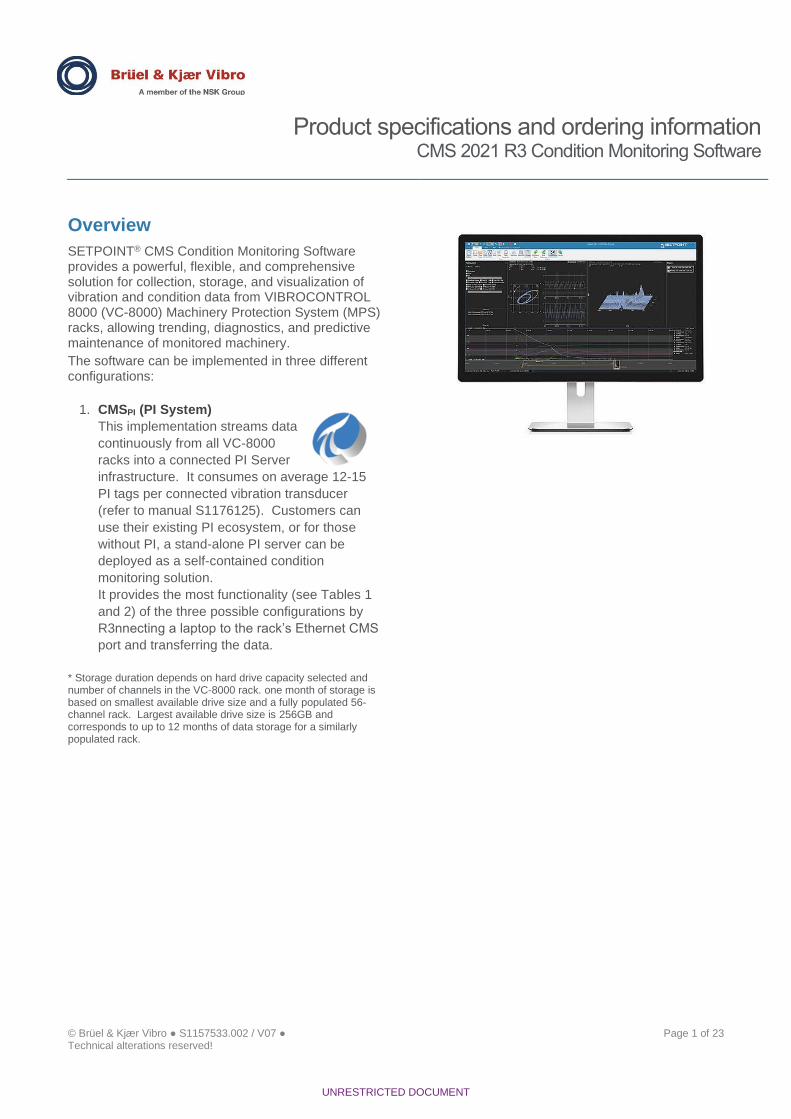
© Brüel & Kjær Vibro ● S1157533.002 / V07 ● Page 1 of 23 Technical alterations reserved! Product specifications and ordering information CMS 2021 R3 Condition Monitoring Software UNRESTRICTED DOCUMENT Overview SETPOINT ® CMS Condition Monitoring Software provides a powerful, flexible, and comprehensive solution for collection, storage, and visualization of vibration and condition data from VIBROCONTROL 8000 (VC-8000) Machinery Protection System (MPS) racks, allowing trending, diagnostics, and predictive maintenance of monitored machinery. The software can be implemented in three different configurations: 1. CMSPI (PI System) This implementation streams data continuously from all VC-8000 racks into a connected PI Server infrastructure. It consumes on average 12-15 PI tags per connected vibration transducer (refer to manual S1176125). Customers can use their existing PI ecosystem, or for those without PI, a stand-alone PI server can be deployed as a self-contained condition monitoring solution. It provides the most functionality (see Tables 1 and 2) of the three possible configurations by R3nnecting a laptop to the rack’s Ethernet CMS port and transferring the data. * Storage duration depends on hard drive capacity selected and number of channels in the VC-8000 rack. one month of storage is based on smallest available drive size and a fully populated 56- channel rack. Largest available drive size is 256GB and corresponds to up to 12 months of data storage for a similarly populated rack.
-
Upload
khangminh22 -
Category
Documents
-
view
0 -
download
0
Transcript of CMS 2021 R3 Condition Monitoring Software - Brüel & Kjær ...
© Brüel & Kjær Vibro ● S1157533.002 / V07 ● Page 1 of 23 Technical alterations reserved!
Product specifications and ordering information CMS 2021 R3 Condition Monitoring Software
UNRESTRICTED DOCUMENT
Overview
SETPOINT® CMS Condition Monitoring Software provides a powerful, flexible, and comprehensive solution for collection, storage, and visualization of vibration and condition data from VIBROCONTROL 8000 (VC-8000) Machinery Protection System (MPS) racks, allowing trending, diagnostics, and predictive maintenance of monitored machinery.
The software can be implemented in three different configurations:
1. CMSPI (PI System)
This implementation streams data
continuously from all VC-8000
racks into a connected PI Server
infrastructure. It consumes on average 12-15
PI tags per connected vibration transducer
(refer to manual S1176125). Customers can
use their existing PI ecosystem, or for those
without PI, a stand-alone PI server can be
deployed as a self-contained condition
monitoring solution.
It provides the most functionality (see Tables 1
and 2) of the three possible configurations by
R3nnecting a laptop to the rack’s Ethernet CMS
port and transferring the data.
* Storage duration depends on hard drive capacity selected and number of channels in the VC-8000 rack. one month of storage is based on smallest available drive size and a fully populated 56-channel rack. Largest available drive size is 256GB and corresponds to up to 12 months of data storage for a similarly populated rack.
Page 2 of 23 © Brüel & Kjær Vibro ● S1157533.002 / V07 Technical alterations reserved!
EN
UNRESTRICTED DOCUMENT
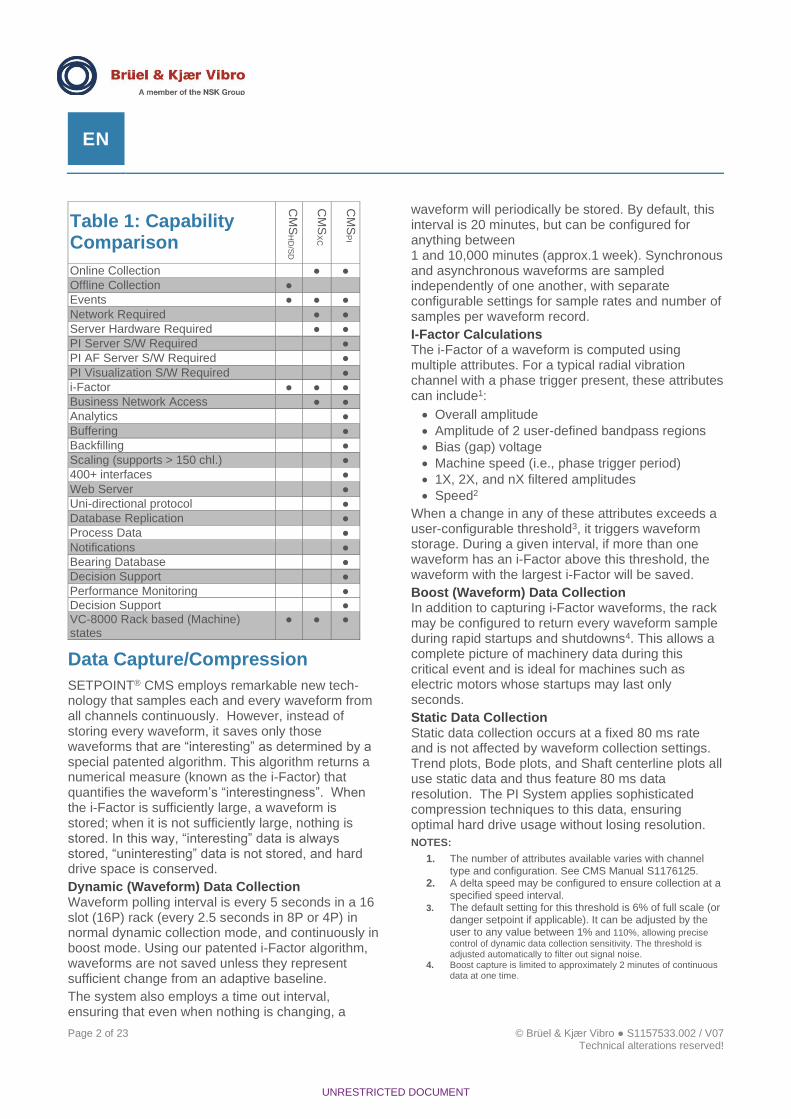
Table 1: Capability Comparison
CM
SH
D/S
D
CM
SX
C
CM
SP
I
Online Collection ● ●
Offline Collection ●
Events ● ● ●
Network Required ● ●
Server Hardware Required ● ●
PI Server S/W Required ●
PI AF Server S/W Required ●
PI Visualization S/W Required ●
i-Factor ● ● ●
Business Network Access ● ●
Analytics ●
Buffering ●
Backfilling ●
Scaling (supports > 150 chl.) ●
400+ interfaces ●
Web Server ●
Uni-directional protocol ●
Database Replication ●
Process Data ●
Notifications ●
Bearing Database ●
Decision Support ●
Performance Monitoring ●
Decision Support ●
VC-8000 Rack based (Machine) states
● ● ●
Data Capture/Compression
SETPOINT® CMS employs remarkable new tech-nology that samples each and every waveform from all channels continuously. However, instead of storing every waveform, it saves only those waveforms that are “interesting” as determined by a special patented algorithm. This algorithm returns a numerical measure (known as the i-Factor) that quantifies the waveform’s “interestingness”. When the i-Factor is sufficiently large, a waveform is stored; when it is not sufficiently large, nothing is stored. In this way, “interesting” data is always stored, “uninteresting” data is not stored, and hard drive space is conserved.
Dynamic (Waveform) Data Collection Waveform polling interval is every 5 seconds in a 16 slot (16P) rack (every 2.5 seconds in 8P or 4P) in normal dynamic collection mode, and continuously in boost mode. Using our patented i-Factor algorithm, waveforms are not saved unless they represent sufficient change from an adaptive baseline.
The system also employs a time out interval, ensuring that even when nothing is changing, a
waveform will periodically be stored. By default, this interval is 20 minutes, but can be configured for anything between 1 and 10,000 minutes (approx.1 week). Synchronous and asynchronous waveforms are sampled independently of one another, with separate configurable settings for sample rates and number of samples per waveform record.
I-Factor Calculations The i-Factor of a waveform is computed using multiple attributes. For a typical radial vibration channel with a phase trigger present, these attributes can include1:
• Overall amplitude
• Amplitude of 2 user-defined bandpass regions
• Bias (gap) voltage
• Machine speed (i.e., phase trigger period)
• 1X, 2X, and nX filtered amplitudes
• Speed2
When a change in any of these attributes exceeds a user-configurable threshold3, it triggers waveform storage. During a given interval, if more than one waveform has an i-Factor above this threshold, the waveform with the largest i-Factor will be saved.
Boost (Waveform) Data Collection In addition to capturing i-Factor waveforms, the rack may be configured to return every waveform sample during rapid startups and shutdowns4. This allows a complete picture of machinery data during this critical event and is ideal for machines such as electric motors whose startups may last only seconds.
Static Data Collection Static data collection occurs at a fixed 80 ms rate and is not affected by waveform collection settings. Trend plots, Bode plots, and Shaft centerline plots all use static data and thus feature 80 ms data resolution. The PI System applies sophisticated compression techniques to this data, ensuring optimal hard drive usage without losing resolution.
NOTES:
1. The number of attributes available varies with channel type and configuration. See CMS Manual S1176125.
2. A delta speed may be configured to ensure collection at a specified speed interval.
3. The default setting for this threshold is 6% of full scale (or danger setpoint if applicable). It can be adjusted by the user to any value between 1% and 110%, allowing precise
control of dynamic data collection sensitivity. The threshold is adjusted automatically to filter out signal noise.
4. Boost capture is limited to approximately 2 minutes of continuous data at one time.
© Brüel & Kjær Vibro ● S1157533.002 / V07 ● Page 3 of 23 Technical alterations reserved!
Product specifications and ordering information CMS 2021 R3 Condition Monitoring Software
EN
UNRESTRICTED DOCUMENT
Visualization Options
PI Vision is used only with CMSPI. It is a web server from OSIsoft® used in thousands of installations worldwide. It connects data sources (PI Servers) to visualization clients (web browsers) and
provides a rich suite of tools for visualizing non-waveform data. When used with SETPOINT® CMSPI, it serves as the platform for basic system navigation, machine train diagrams, machinery health monitor, asset hierarchy diagrams, alarm lists, statuses, and static data trends. When the user needs to view waveform data associated with one or more points, the CMS Display client is launched from within PI Vision web pages to bring up appropriate plots for the selected point(s).
PI ProcessBook is an alternative to PI Vision and is used only with CMSPI. It serves the same purpose as PI Vision, but is an older visualization client. While it does not support all of
the features of PI Vision, it is adequate for many users and is an appropriate choice for users with a large installed base of PI ProcessBook across their enterprise who are not yet ready to upgrade to PI Vision. It is not a web-based product and the client software on each user’s desktop is thus a licensed application, not merely a web browser.
CMS Display is used with all three configurations of CMS (CMSPI, CMSXC, and CMSHD/SD). It is a free download available at www.bkvibro.com. When
used with CMSPI, PI Vision or PI ProcessBook serves as the primary visualization environment where the user frequently builds “dashboards” with trends and statuses. CMS Display is used in these instances as a secondary “drill down” utility to examine detailed waveform data and specialized plot types used by vibration specialists. When used with CMSXC or CMSHD, CMS Display is the only visualization environment available. Its primary use is to allow vibration diagnosticians to visualize data and assess machinery condition details using the specialized plot types unique to vibration.
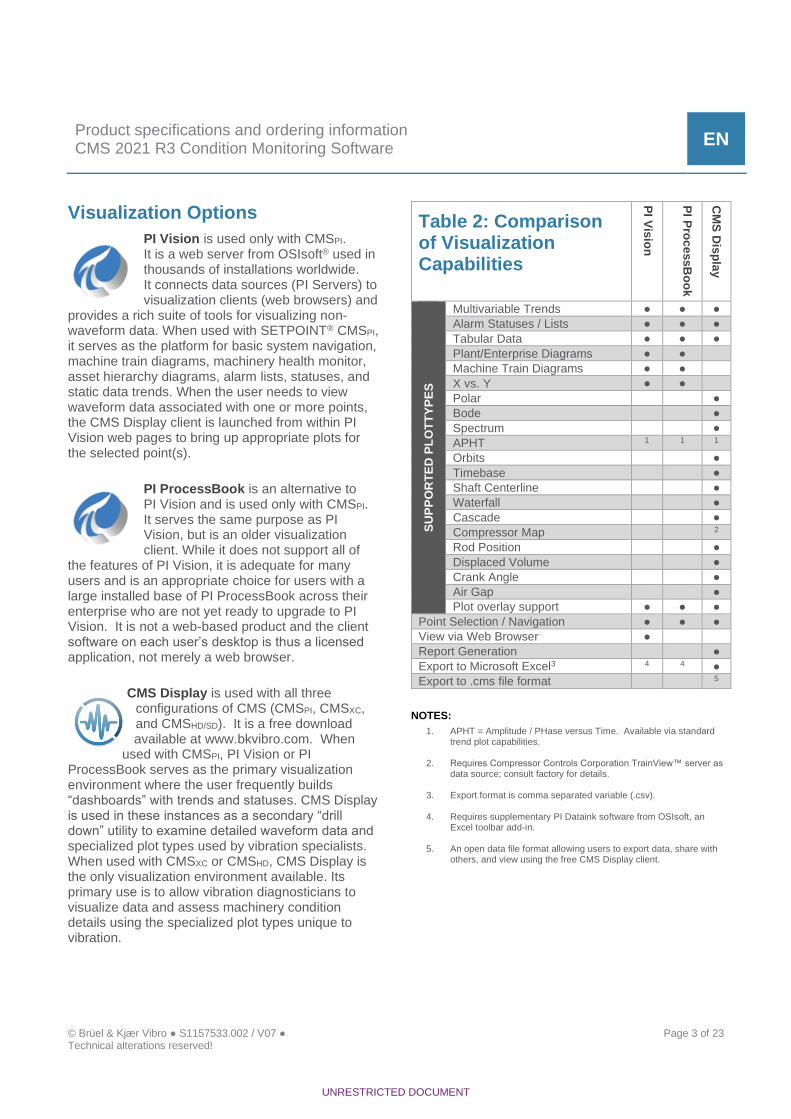
Table 2: Comparison of Visualization Capabilities
PI V
isio
n
PI P
roc
ess
Bo
ok
CM
S D
isp
lay
SU
PP
OR
TE
D P
LO
TT
YP
ES
Multivariable Trends ● ● ●
Alarm Statuses / Lists ● ● ●
Tabular Data ● ● ●
Plant/Enterprise Diagrams ● ●
Machine Train Diagrams ● ●
X vs. Y ● ●
Polar ●
Bode ●
Spectrum ●
APHT 1 1 1
Orbits ●
Timebase ●
Shaft Centerline ●
Waterfall ●
Cascade ●
Compressor Map 2
Rod Position ●
Displaced Volume ●
Crank Angle ●
Air Gap ●
Plot overlay support ● ● ●
Point Selection / Navigation ● ● ●
View via Web Browser ●
Report Generation ●
Export to Microsoft Excel3 4 4 ●
Export to .cms file format 5
NOTES:
1. APHT = Amplitude / PHase versus Time. Available via standard trend plot capabilities.
2. Requires Compressor Controls Corporation TrainView™ server as data source; consult factory for details.
3. Export format is comma separated variable (.csv).
4. Requires supplementary PI Dataink software from OSIsoft, an Excel toolbar add-in.
5. An open data file format allowing users to export data, share with others, and view using the free CMS Display client.
Page 4 of 23 © Brüel & Kjær Vibro ● S1157533.002 / V07 Technical alterations reserved!
EN
UNRESTRICTED DOCUMENT
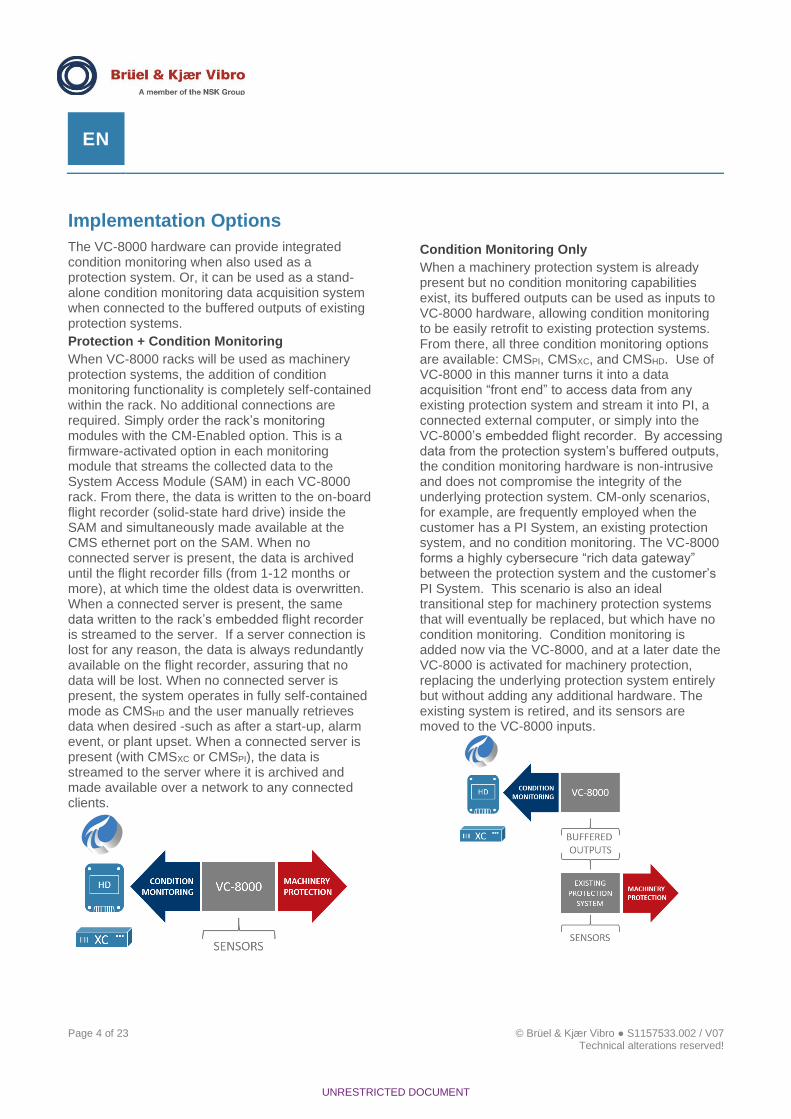
Implementation Options
The VC-8000 hardware can provide integrated condition monitoring when also used as a protection system. Or, it can be used as a stand-alone condition monitoring data acquisition system when connected to the buffered outputs of existing protection systems.
Protection + Condition Monitoring
When VC-8000 racks will be used as machinery protection systems, the addition of condition monitoring functionality is completely self-contained within the rack. No additional connections are required. Simply order the rack’s monitoring modules with the CM-Enabled option. This is a firmware-activated option in each monitoring module that streams the collected data to the System Access Module (SAM) in each VC-8000 rack. From there, the data is written to the on-board flight recorder (solid-state hard drive) inside the SAM and simultaneously made available at the CMS ethernet port on the SAM. When no connected server is present, the data is archived until the flight recorder fills (from 1-12 months or more), at which time the oldest data is overwritten. When a connected server is present, the same data written to the rack’s embedded flight recorder is streamed to the server. If a server connection is lost for any reason, the data is always redundantly available on the flight recorder, assuring that no data will be lost. When no connected server is present, the system operates in fully self-contained mode as CMSHD and the user manually retrieves data when desired -such as after a start-up, alarm event, or plant upset. When a connected server is present (with CMSXC or CMSPI), the data is streamed to the server where it is archived and made available over a network to any connected clients.
Condition Monitoring Only
When a machinery protection system is already present but no condition monitoring capabilities exist, its buffered outputs can be used as inputs to VC-8000 hardware, allowing condition monitoring to be easily retrofit to existing protection systems. From there, all three condition monitoring options are available: CMSPI, CMSXC, and CMSHD. Use of VC-8000 in this manner turns it into a data acquisition “front end” to access data from any existing protection system and stream it into PI, a connected external computer, or simply into the VC-8000’s embedded flight recorder. By accessing data from the protection system’s buffered outputs, the condition monitoring hardware is non-intrusive and does not compromise the integrity of the underlying protection system. CM-only scenarios, for example, are frequently employed when the customer has a PI System, an existing protection system, and no condition monitoring. The VC-8000 forms a highly cybersecure “rich data gateway” between the protection system and the customer’s PI System. This scenario is also an ideal transitional step for machinery protection systems that will eventually be replaced, but which have no condition monitoring. Condition monitoring is added now via the VC-8000, and at a later date the VC-8000 is activated for machinery protection, replacing the underlying protection system entirely but without adding any additional hardware. The existing system is retired, and its sensors are moved to the VC-8000 inputs.
© Brüel & Kjær Vibro ● S1157533.002 / V07 ● Page 5 of 23 Technical alterations reserved!
Product specifications and ordering information CMS 2021 R3 Condition Monitoring Software
EN
Features and Benefits
• Never miss important data There’s absolutely nothing worse than incurring a machinery trip, upset, or other event – only to find that the system failed to collect data when it was needed the most. This simply won’t happen with SETPOINT® CMS. We blend a completely unique (and patented) method of collecting waveform snapshots with ultra-fast (80 ms “fast trend”) capture of static data. We then examine the data to see if it reflects significant change from prior data, discarding data that reflects “no change” and keeping data that reflects “change”. The result is a perfectly tailored data profile that retains neither too much nor too little. Tiny but meaningful excursions in machine behavior that other systems miss are caught by SETPOINT®.
• Never lose collected data Other systems rely entirely on a network connection to a server, saving virtually no data in the rack itself. We’ve engineered a more robust architecture that doesn’t require redundant networks and servers. We store the data right in the rack on an embedded solid-state hard drive that holds a substantial amount of data – a minimum of one full month – ensuring that if a server or network goes down, the data won’t be “missing in action”. Its safely kept inside the rack for a month or more until the network and/or server is available again, allowing the data to be backfilled. This “belt and suspenders” approach using both local and server-based storage is an industry-first that reduces the amount of IT infrastructure required to achieve assurance against loss of data.
• Easily see when waveforms have been collected Our trend plots provide intuitive indicators showing exactly where waveforms have been collected. The trend’s tic marks indicating waveform collection are color coded so you distinguish synchronous from asynchronous samples, and the height of the tic mark even captures the “interestingness” of the data – in other words, how significantly it has changed relative to surrounding data.
• Unparalleled ease of data sharing We borrowed the concept behind the portable document format (.pdf) and extended it to vibration data for the first time. The concept is simple: customers should pay for the infrastructure that creates the data, not the application that views the data. With SETPOINT® CMS, once data has been collected, it can be saved in an innovative .cms format that preserves everything of interest: machinery hierarchy, configuration parameters, waveforms, static data, alarms – everything. Simply select the data points and data region of interest, save as a .cms file, and then share with anyone you want, anywhere in the world. To open, view, and interact with the data (including playing back recorded data), they simply download our free CMS Display application from the web – completely analogous to using a free PDF viewer. No more cumbersome licenses to administrate when trying to share data with people inside or outside of your organization.
• Simple, intuitive user interface We designed the user interface by looking at popular stock trading and audio editing software, borrowing the concept of a timeline and time slider to quickly navigate to the data range of interest. Once there, you can easily zoom in and out, drop a cursor, and see data in all of the powerful plot formats you need as a machinery diagnostic professional (see table on page 2 and plot thumbnails on pages X-Y).
• Suitable for both fluid-film and rolling element bearing diagnostics While rolling element bearing (REB) diagnostics rely primarily on spectral data and “power tools”, fluid film bearing diagnostics rely on a different set of tools like orbits, shaft centerline, and time waveforms. We don’t pit one method versus another because we understand that you have both types of machinery in your facilities. Our solution delivers all tools you need, whether multiple spectral cursors to show harmonics, differences, or other attributes – or enhanced time waveform and orbit analysis features.
Page 6 of 23 © Brüel & Kjær Vibro ● S1157533.002 / V07 Technical alterations reserved!
EN
• Plot overlays Did something change? Easily compare two plots by overlaying them – such as a startup from two separate times to compare a known good baseline data set with a that from a recently refurbished rotor. Did a resonance shift? An amplification factor? The frequency content of two spectra on the same bearing months apart? Plot overlay capabilities make this activity simple and intuitive.
• Elimination of vibration data “silos” Anybody can put slow-moving vibration trend data into PI, but nobody else can put all vibration data (including waveforms -the truth is in the waveforms) into PI. Why does this matter? Because it completely eliminates the need for a separate repository just for vibration data, reducing expensive separate infrastructure requirements and separate IT support for a completely different software platform. If you prefer to segregate process data servers from vibration data servers, you retain all the flexibility to do that – but those separate servers can now be based on the same system: your OSIsoft PI System, meaning fewer systems to learn, license, support, and secure.
• True “no-infrastructure” option We are the first company to offer all the benefits of condition monitoring without requiring so much as a single server or network. Our innovative flight recorder option captures all of the same data that would normally be streamed to a separate condition monitoring server, but retains it right in the VC-8000 rack. When something of interest occurs, simply retrieve the data from the rack using the removable SD card or by connecting a laptop. The basic flight recorder stores a full month of data; the flight recorder + features a higher capacity solid-state drive (SSD) capable of recording 12 months or more. For many users, remote access to data isn’t nearly as important as ensuring that the data has been captured so that data-driven decisions can be made. When online and/or remote access to data isn’t imperative, our no-infrastructure option is an industry first that gives you new flexibility in when and how you deploy condition monitoring, without the need to wait for networks, servers, cybersecurity solutions, or your IT department.
• All the Power of the PI System® CMSPI harnesses the full power of the OSIsoft PI system by delivering native process data integration, world-class cybersecurity, built-in tools for push alarm notifications and decision support, an ecosystem of more than 400 OSIsoft partners delivering advanced capabilities like performance monitoring, machinery learning, pattern recognition, and more.
• Unparalleled Event Resolution 80 ms data means trends give unmatched resolution; precise timing of changes can be seen, and cause/effect easily ascertained.
• Robust Cybersecurity The ports in our VC-8000 hardware have been certified to rigorous IEC 62443 criteria against network intrusions. In addition, the PI System® infrastructure used by CMSPI provides users with a robust, multi-layer security model that is considered best-in-class. It is specifically designed to work with firewalls, data diodes, and multi-tiered networks to meet industry’s most stringent data security requirements – even the nuclear power sector.
© Brüel & Kjær Vibro ● S1157533.002 / V07 ● Page 7 of 23 Technical alterations reserved!
Product specifications and ordering information CMS 2021 R3 Condition Monitoring Software
EN
UNRESTRICTED DOCUMENT
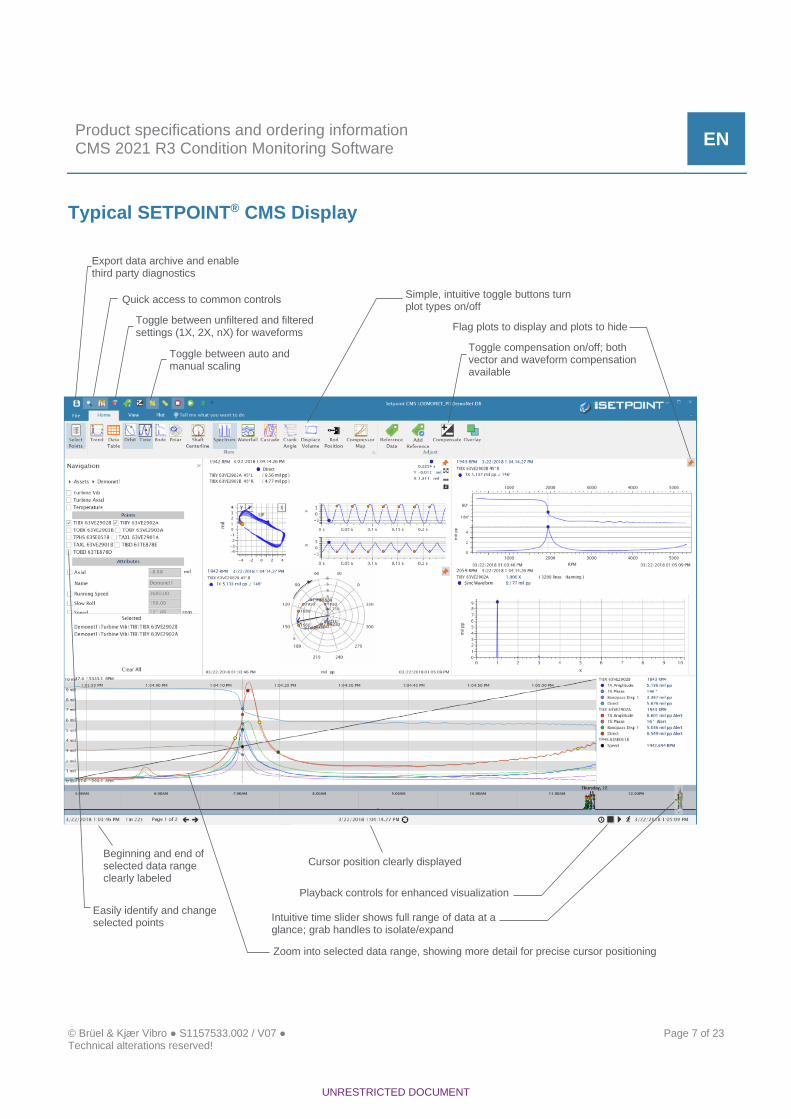
Typical SETPOINT® CMS Display
Beginning and end of selected data range clearly labeled
Toggle between auto and manual scaling
Intuitive time slider shows full range of data at a glance; grab handles to isolate/expand
Export data archive and enable third party diagnostics
Quick access to common controls
Toggle between unfiltered and filtered settings (1X, 2X, nX) for waveforms
Simple, intuitive toggle buttons turn plot types on/off
Flag plots to display and plots to hide
Toggle compensation on/off; both vector and waveform compensation available
Easily identify and change selected points
Cursor position clearly displayed
Playback controls for enhanced visualization
Zoom into selected data range, showing more detail for precise cursor positioning
Page 8 of 23 © Brüel & Kjær Vibro ● S1157533.002 / V07 Technical alterations reserved!
EN
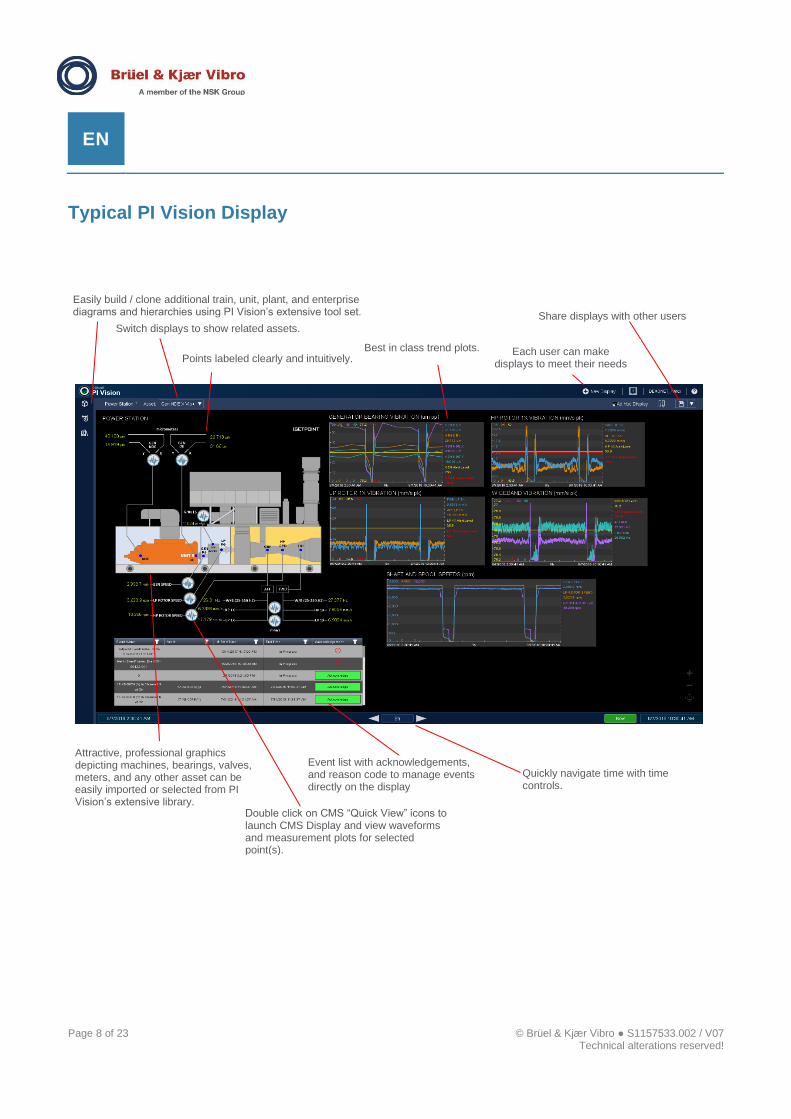
Typical PI Vision Display
Easily build / clone additional train, unit, plant, and enterprise diagrams and hierarchies using PI Vision’s extensive tool set.
Switch displays to show related assets.
Points labeled clearly and intuitively. Best in class trend plots. Each user can make
displays to meet their needs
Share displays with other users
Attractive, professional graphics depicting machines, bearings, valves, meters, and any other asset can be easily imported or selected from PI Vision’s extensive library.
Double click on CMS “Quick View” icons to launch CMS Display and view waveforms and measurement plots for selected point(s).
Event list with acknowledgements, and reason code to manage events directly on the display
Quickly navigate time with time controls.
© Brüel & Kjær Vibro ● S1157533.002 / V07 ● Page 9 of 23 Technical alterations reserved!
Product specifications and ordering information CMS 2021 R3 Condition Monitoring Software
EN
UNRESTRICTED DOCUMENT
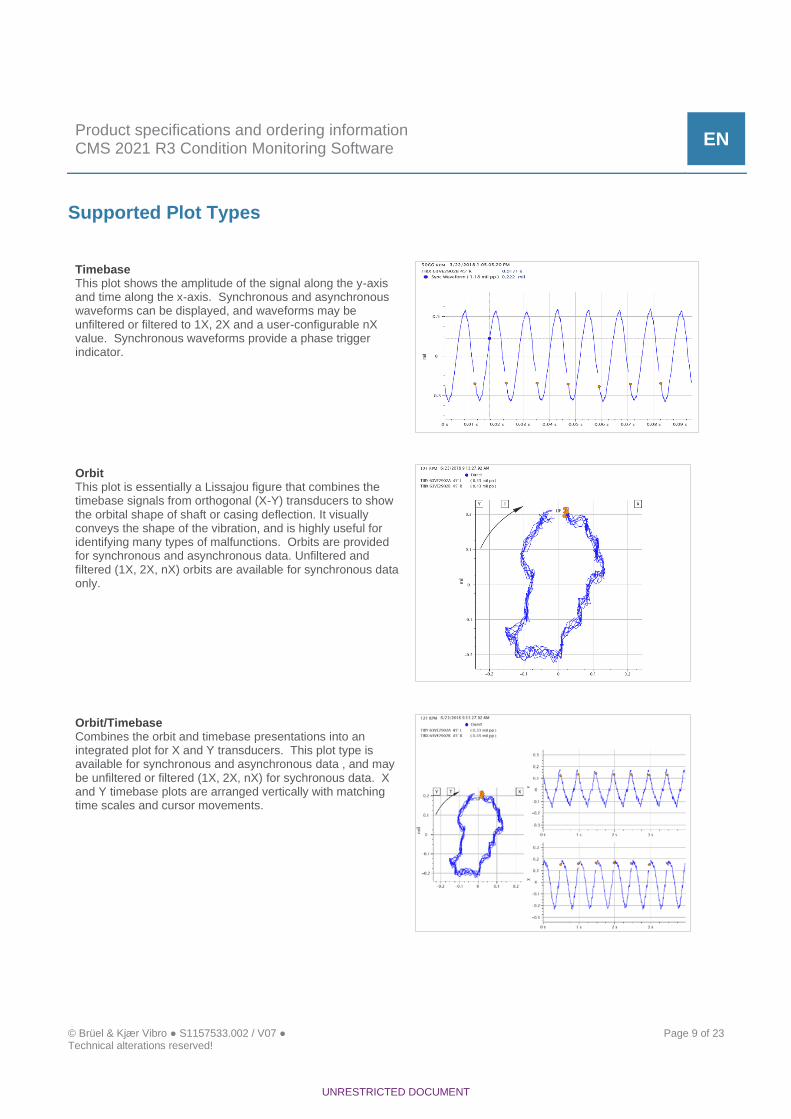
Supported Plot Types
Timebase This plot shows the amplitude of the signal along the y-axis and time along the x-axis. Synchronous and asynchronous waveforms can be displayed, and waveforms may be unfiltered or filtered to 1X, 2X and a user-configurable nX value. Synchronous waveforms provide a phase trigger indicator.
Orbit This plot is essentially a Lissajou figure that combines the timebase signals from orthogonal (X-Y) transducers to show the orbital shape of shaft or casing deflection. It visually conveys the shape of the vibration, and is highly useful for identifying many types of malfunctions. Orbits are provided for synchronous and asynchronous data. Unfiltered and filtered (1X, 2X, nX) orbits are available for synchronous data only.
Orbit/Timebase Combines the orbit and timebase presentations into an integrated plot for X and Y transducers. This plot type is available for synchronous and asynchronous data , and may be unfiltered or filtered (1X, 2X, nX) for sychronous data. X and Y timebase plots are arranged vertically with matching time scales and cursor movements.
Page 10 of 23 © Brüel & Kjær Vibro ● S1157533.002 / V07 Technical alterations reserved!
EN
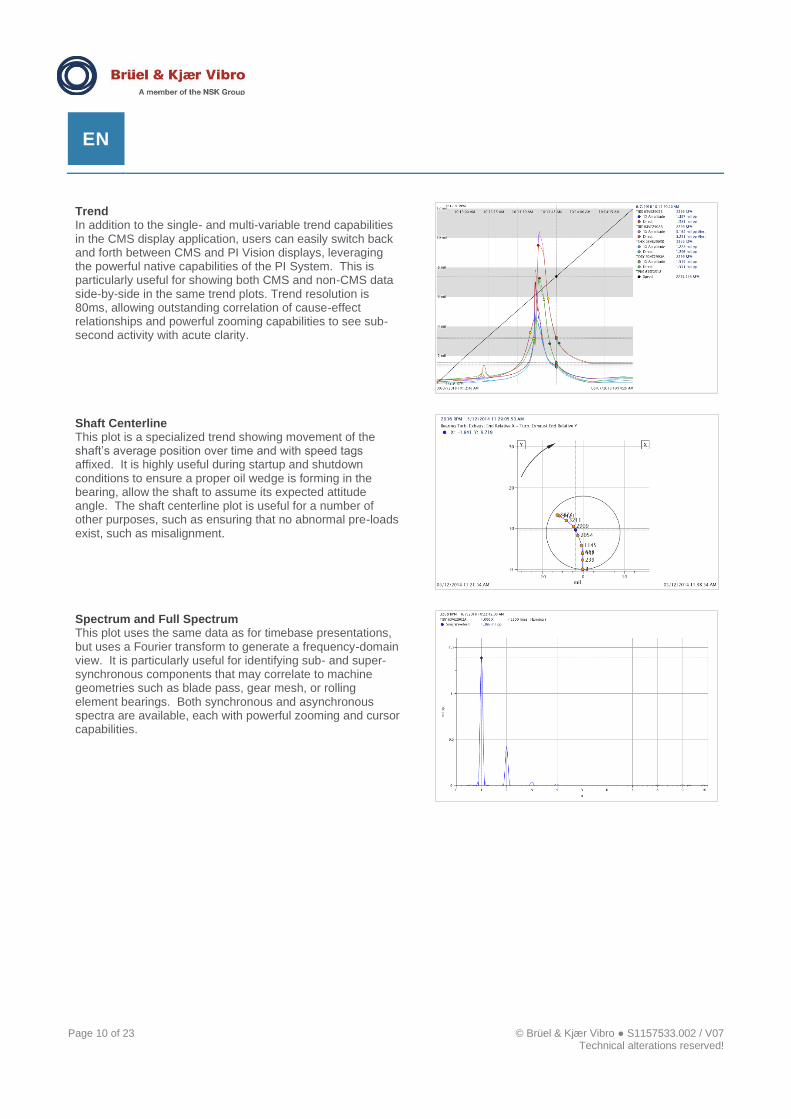
Trend In addition to the single- and multi-variable trend capabilities in the CMS display application, users can easily switch back and forth between CMS and PI Vision displays, leveraging the powerful native capabilities of the PI System. This is particularly useful for showing both CMS and non-CMS data side-by-side in the same trend plots. Trend resolution is 80ms, allowing outstanding correlation of cause-effect relationships and powerful zooming capabilities to see sub-second activity with acute clarity.
Shaft Centerline This plot is a specialized trend showing movement of the shaft’s average position over time and with speed tags affixed. It is highly useful during startup and shutdown conditions to ensure a proper oil wedge is forming in the bearing, allow the shaft to assume its expected attitude angle. The shaft centerline plot is useful for a number of other purposes, such as ensuring that no abnormal pre-loads exist, such as misalignment.
Spectrum and Full Spectrum This plot uses the same data as for timebase presentations, but uses a Fourier transform to generate a frequency-domain view. It is particularly useful for identifying sub- and super-synchronous components that may correlate to machine geometries such as blade pass, gear mesh, or rolling element bearings. Both synchronous and asynchronous spectra are available, each with powerful zooming and cursor capabilities.

© Brüel & Kjær Vibro ● S1157533.002 / V07 ● Page 11 of 23 Technical alterations reserved!
Product specifications and ordering information CMS 2021 R3 Condition Monitoring Software
EN
UNRESTRICTED DOCUMENT
Waterfall & Cascade The waterfall plot is a 3D trend of spectra with frequency on the x-axis, time on the y-axis, and amplitude on the z-axis. It allows spectral changes over time to be easily visualized. The cascade plot is similar, but the y-axis is machine rotative speed, allowing spectral changes during startup or shutdown conditions to be identified. 500 spectra can be presented in a single plot, and advanced features such as 3D surface contours, amplitude color coding, crosshair-type cursor movement and display, and 3D rotation enhance the ability to isolate data of interest. Using the cursor, a single spectrum can be selected and displayed in a separate window for even more powerful diagnostic capabilities.
Tabular This plot arranges data numeric values in row/column format, convenient for identifying a sample that will be used for compensation or other purposes. Data is also color-coded to indicate alarm status for easy identification of precise rpm or other conditions at which a channel entered or left an alarm status. Data can be sorted in ascending or descending order by simply clicking on a column header, similar to typical spreadsheet functionality.
Alarms and Events A sequence of events may be determined by using the event list in the SETPOINT® CMS client or PI Vision display. In CMS click on the event time stamp to center the data on that event. In PI Vision use the event list directly on displays to more easily manage events.
Bode A trend of vibration amplitude and phase versus shaft rotative speed, using cartesian coordinates, and highly useful for identifying critical speeds (resonances), amplification factors, and damping. 1X, 2X, and nX filtered bode plots are available and utilize data collected at 80ms resolution. Like trend plots, multiple channels can be overlaid on one another, useful for identifying differences in rotor system response in horizontal and vertical planes, or at different ends of the machine. Also, like trend plots, color-coded markers identify when the measurement entered or left an alarm condition.

Page 12 of 23 © Brüel & Kjær Vibro ● S1157533.002 / V07 Technical alterations reserved!
EN
Polar Although the polar plot uses the same underlying data as the Bode, it presents the data using polar coordinates instead of Cartesian. The two plot formats complement one another, as certain characteristics are easier to identify in polar coordinates than in Cartesian, and vice-versa. The screen capture at right, for example, contrasts the same data used for Bode plot representations (left) with their corresponding polar plot representations (right).
Crank Angle This specialized plot displays any dynamic measurement associated with the reciprocating machine as a function of the shaft crank angle.
Displaced Volume This plot is a pressure volume diagram where dynamic data associated with a recipicating machinery. An adiabatic curve may be overlayed to compare the theoretical curve to aid in diagnostics.
© Brüel & Kjær Vibro ● S1157533.002 / V07 ● Page 13 of 23 Technical alterations reserved!
Product specifications and ordering information CMS 2021 R3 Condition Monitoring Software
EN
UNRESTRICTED DOCUMENT
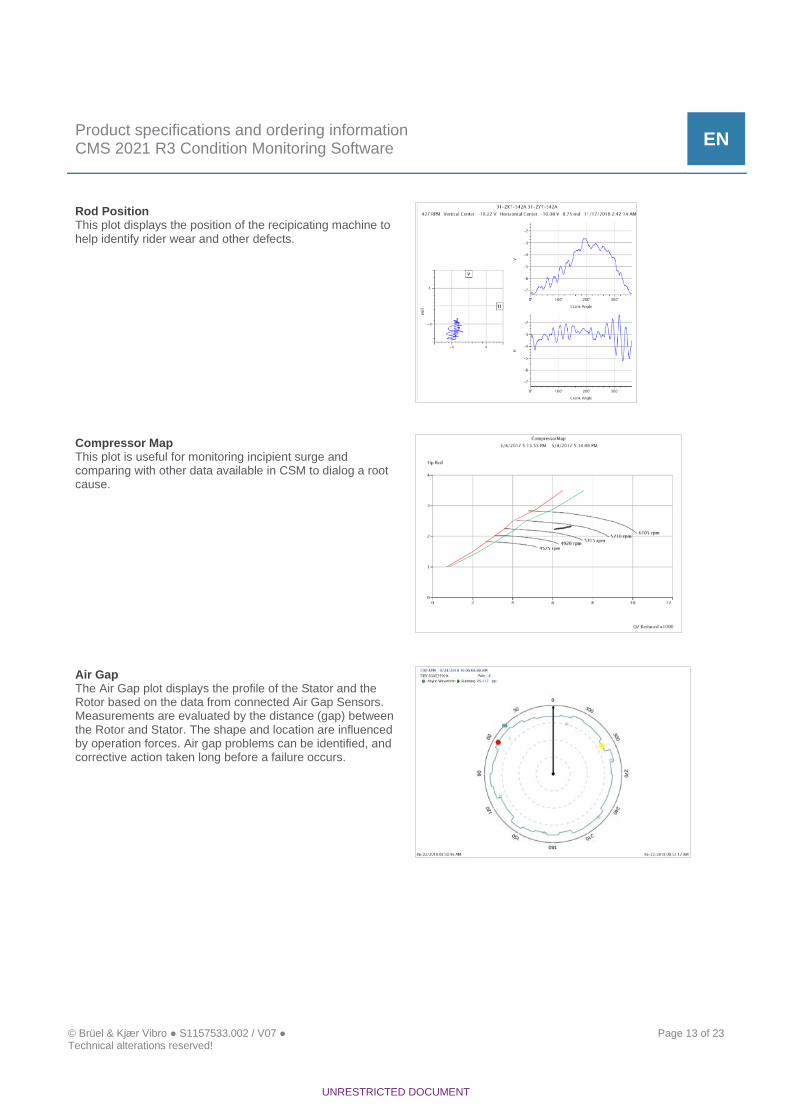
Rod Position This plot displays the position of the recipicating machine to help identify rider wear and other defects.
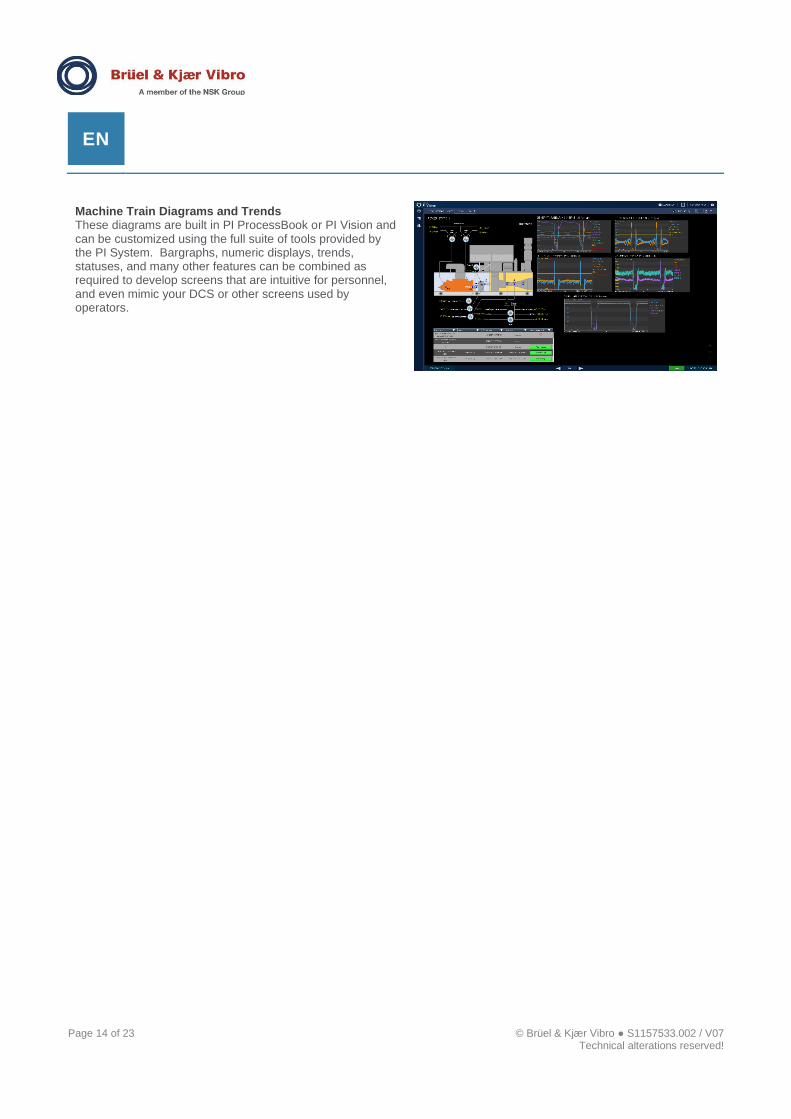
Compressor Map This plot is useful for monitoring incipient surge and comparing with other data available in CSM to dialog a root cause.
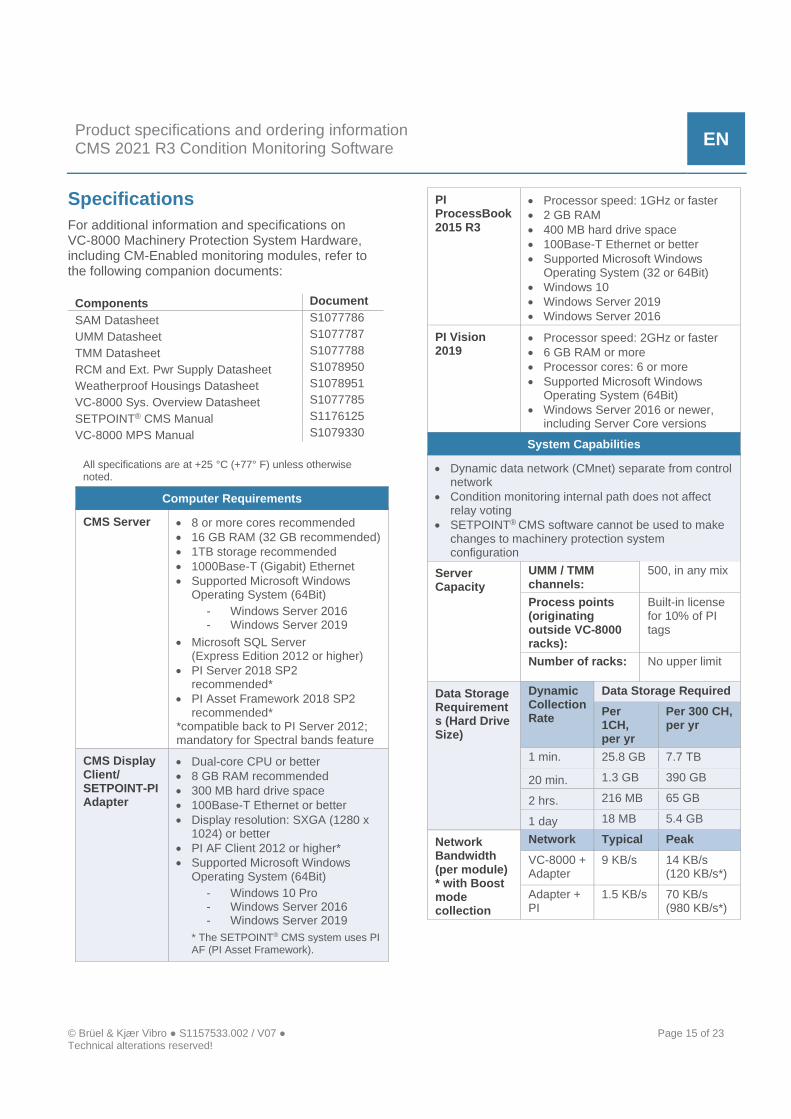
Air Gap The Air Gap plot displays the profile of the Stator and the Rotor based on the data from connected Air Gap Sensors. Measurements are evaluated by the distance (gap) between the Rotor and Stator. The shape and location are influenced by operation forces. Air gap problems can be identified, and corrective action taken long before a failure occurs.
Page 14 of 23 © Brüel & Kjær Vibro ● S1157533.002 / V07 Technical alterations reserved!
EN
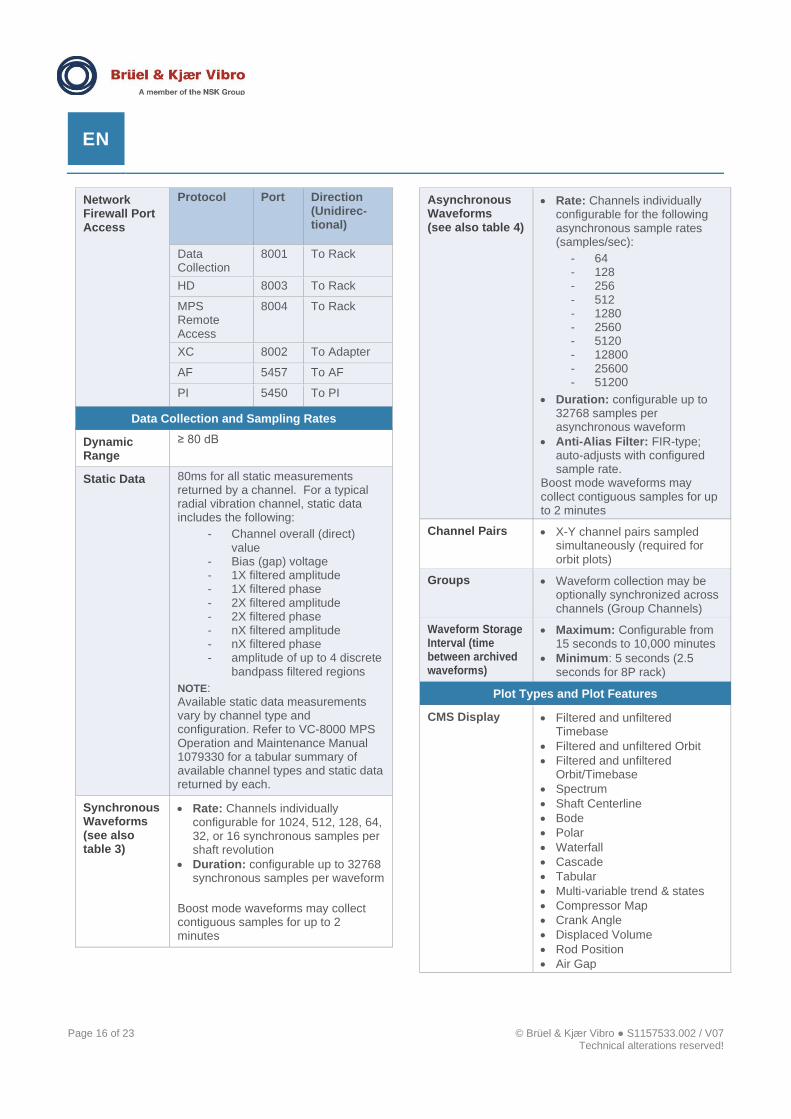
Machine Train Diagrams and Trends These diagrams are built in PI ProcessBook or PI Vision and can be customized using the full suite of tools provided by the PI System. Bargraphs, numeric displays, trends, statuses, and many other features can be combined as required to develop screens that are intuitive for personnel, and even mimic your DCS or other screens used by operators.
© Brüel & Kjær Vibro ● S1157533.002 / V07 ● Page 15 of 23 Technical alterations reserved!
Product specifications and ordering information CMS 2021 R3 Condition Monitoring Software
EN
Specifications
For additional information and specifications on VC-8000 Machinery Protection System Hardware, including CM-Enabled monitoring modules, refer to the following companion documents:
Components Document
SAM Datasheet S1077786
UMM Datasheet S1077787
TMM Datasheet S1077788
RCM and Ext. Pwr Supply Datasheet S1078950
Weatherproof Housings Datasheet S1078951
VC-8000 Sys. Overview Datasheet S1077785
SETPOINT® CMS Manual S1176125
VC-8000 MPS Manual S1079330
All specifications are at +25 °C (+77° F) unless otherwise noted.
Computer Requirements
CMS Server • 8 or more cores recommended
• 16 GB RAM (32 GB recommended)
• 1TB storage recommended
• 1000Base-T (Gigabit) Ethernet
• Supported Microsoft Windows Operating System (64Bit)
Windows Server 2016 Windows Server 2019
• Microsoft SQL Server (Express Edition 2012 or higher)
• PI Server 2018 SP2 recommended*
• PI Asset Framework 2018 SP2 recommended*
*compatible back to PI Server 2012; mandatory for Spectral bands feature
CMS Display Client/ SETPOINT-PI Adapter
• Dual-core CPU or better
• 8 GB RAM recommended
• 300 MB hard drive space
• 100Base-T Ethernet or better
• Display resolution: SXGA (1280 x 1024) or better
• PI AF Client 2012 or higher*
• Supported Microsoft Windows Operating System (64Bit)
Windows 10 Pro Windows Server 2016 Windows Server 2019
* The SETPOINT® CMS system uses PI AF (PI Asset Framework).
PI ProcessBook 2015 R3
• Processor speed: 1GHz or faster
• 2 GB RAM
• 400 MB hard drive space
• 100Base-T Ethernet or better
• Supported Microsoft Windows Operating System (32 or 64Bit)
• Windows 10
• Windows Server 2019
• Windows Server 2016
PI Vision 2019
• Processor speed: 2GHz or faster
• 6 GB RAM or more
• Processor cores: 6 or more
• Supported Microsoft Windows Operating System (64Bit)
• Windows Server 2016 or newer, including Server Core versions
System Capabilities
• Dynamic data network (CMnet) separate from control network
• Condition monitoring internal path does not affect relay voting
• SETPOINT® CMS software cannot be used to make changes to machinery protection system configuration
Server Capacity
UMM / TMM channels:
500, in any mix
Process points (originating outside VC-8000 racks):
Built-in license for 10% of PI tags
Number of racks: No upper limit
Data Storage Requirements (Hard Drive Size)
Dynamic Collection Rate
Data Storage Required
Per 1CH, per yr
Per 300 CH, per yr
1 min. 25.8 GB 7.7 TB
20 min. 1.3 GB 390 GB
2 hrs. 216 MB 65 GB
1 day 18 MB 5.4 GB
Network Bandwidth (per module) * with Boost mode collection
Network Typical Peak
VC-8000 + Adapter
9 KB/s 14 KB/s (120 KB/s*)
Adapter + PI
1.5 KB/s 70 KB/s (980 KB/s*)
Page 16 of 23 © Brüel & Kjær Vibro ● S1157533.002 / V07 Technical alterations reserved!
EN
Network Firewall Port Access
Protocol Port Direction (Unidirec-tional)
Data Collection
8001 To Rack
HD 8003 To Rack
MPS Remote Access
8004 To Rack
XC 8002 To Adapter
AF 5457 To AF
PI 5450 To PI
Data Collection and Sampling Rates
Dynamic Range
≥ 80 dB
Static Data 80ms for all static measurements returned by a channel. For a typical radial vibration channel, static data includes the following:
Channel overall (direct) value
Bias (gap) voltage 1X filtered amplitude 1X filtered phase 2X filtered amplitude 2X filtered phase nX filtered amplitude nX filtered phase amplitude of up to 4 discrete
bandpass filtered regions
NOTE: Available static data measurements vary by channel type and configuration. Refer to VC-8000 MPS Operation and Maintenance Manual 1079330 for a tabular summary of available channel types and static data returned by each.
Synchronous Waveforms (see also table 3)
• Rate: Channels individually configurable for 1024, 512, 128, 64, 32, or 16 synchronous samples per shaft revolution
• Duration: configurable up to 32768 synchronous samples per waveform
Boost mode waveforms may collect contiguous samples for up to 2 minutes
Asynchronous Waveforms (see also table 4)
• Rate: Channels individually configurable for the following asynchronous sample rates (samples/sec):
64 128 256 512 1280 2560 5120 12800 25600 51200
• Duration: configurable up to 32768 samples per asynchronous waveform
• Anti-Alias Filter: FIR-type; auto-adjusts with configured sample rate.
Boost mode waveforms may collect contiguous samples for up to 2 minutes
Channel Pairs • X-Y channel pairs sampled simultaneously (required for orbit plots)
Groups • Waveform collection may be optionally synchronized across channels (Group Channels)
Waveform Storage Interval (time between archived waveforms)
• Maximum: Configurable from 15 seconds to 10,000 minutes
• Minimum: 5 seconds (2.5 seconds for 8P rack)
Plot Types and Plot Features
CMS Display • Filtered and unfiltered Timebase
• Filtered and unfiltered Orbit
• Filtered and unfiltered Orbit/Timebase
• Spectrum
• Shaft Centerline
• Bode
• Polar
• Waterfall
• Cascade
• Tabular
• Multi-variable trend & states
• Compressor Map
• Crank Angle
• Displaced Volume
• Rod Position
• Air Gap
© Brüel & Kjær Vibro ● S1157533.002 / V07 ● Page 17 of 23 Technical alterations reserved!
Product specifications and ordering information CMS 2021 R3 Condition Monitoring Software
EN
UNRESTRICTED DOCUMENT
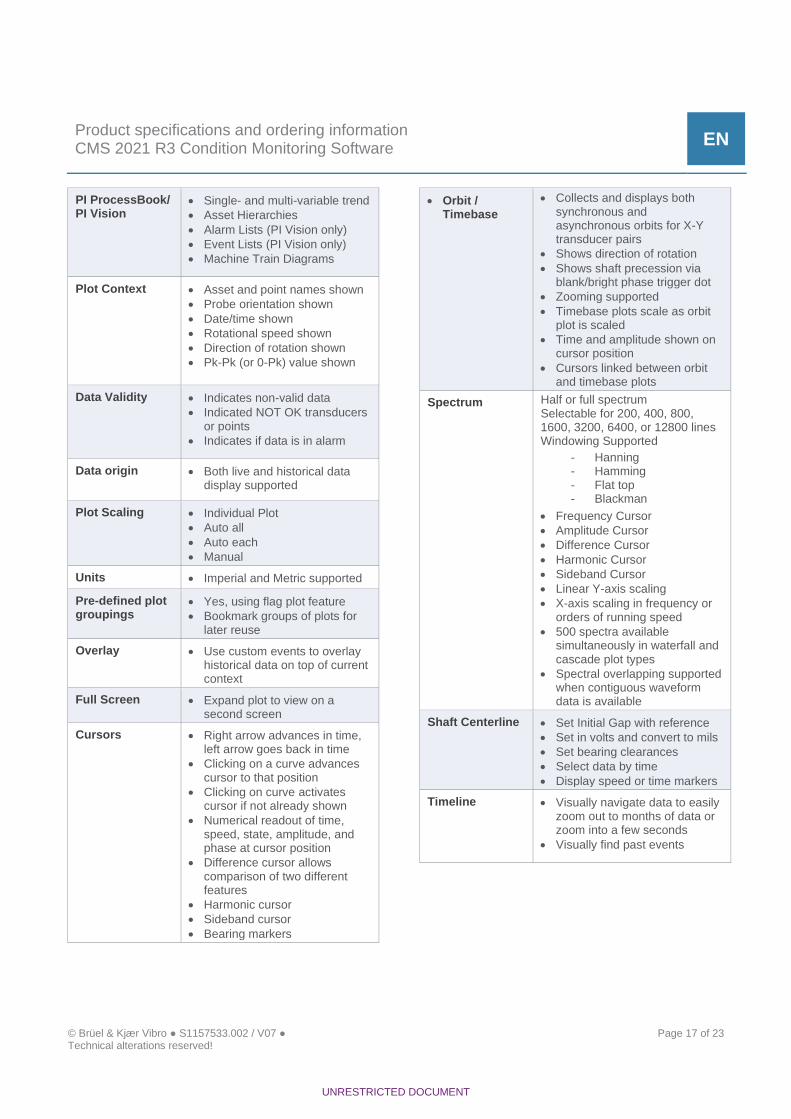
PI ProcessBook/ PI Vision
• Single- and multi-variable trend
• Asset Hierarchies
• Alarm Lists (PI Vision only)
• Event Lists (PI Vision only)
• Machine Train Diagrams
Plot Context • Asset and point names shown
• Probe orientation shown
• Date/time shown
• Rotational speed shown
• Direction of rotation shown
• Pk-Pk (or 0-Pk) value shown
Data Validity • Indicates non-valid data
• Indicated NOT OK transducers or points
• Indicates if data is in alarm
Data origin • Both live and historical data display supported
Plot Scaling • Individual Plot
• Auto all
• Auto each
• Manual
Units • Imperial and Metric supported
Pre-defined plot groupings
• Yes, using flag plot feature
• Bookmark groups of plots for later reuse
Overlay • Use custom events to overlay historical data on top of current context
Full Screen • Expand plot to view on a second screen
Cursors • Right arrow advances in time, left arrow goes back in time
• Clicking on a curve advances cursor to that position
• Clicking on curve activates cursor if not already shown
• Numerical readout of time, speed, state, amplitude, and phase at cursor position
• Difference cursor allows comparison of two different features
• Harmonic cursor
• Sideband cursor
• Bearing markers
• Orbit / Timebase
• Collects and displays both synchronous and asynchronous orbits for X-Y transducer pairs
• Shows direction of rotation
• Shows shaft precession via blank/bright phase trigger dot
• Zooming supported
• Timebase plots scale as orbit plot is scaled
• Time and amplitude shown on cursor position
• Cursors linked between orbit and timebase plots
Spectrum Half or full spectrum Selectable for 200, 400, 800, 1600, 3200, 6400, or 12800 lines Windowing Supported
Hanning Hamming Flat top Blackman
• Frequency Cursor
• Amplitude Cursor
• Difference Cursor
• Harmonic Cursor
• Sideband Cursor
• Linear Y-axis scaling
• X-axis scaling in frequency or orders of running speed
• 500 spectra available simultaneously in waterfall and cascade plot types
• Spectral overlapping supported when contiguous waveform data is available
Shaft Centerline • Set Initial Gap with reference
• Set in volts and convert to mils
• Set bearing clearances
• Select data by time
• Display speed or time markers
Timeline • Visually navigate data to easily zoom out to months of data or zoom into a few seconds
• Visually find past events

Page 18 of 23 © Brüel & Kjær Vibro ● S1157533.002 / V07 Technical alterations reserved!
EN
General Features
Event Notifier Available via PI Server for screen, e-mail, cell phone, web services, text, and other mediums
OPC Integration Available via PI Server
CMMS Connectivity
Available via PI Server
ERP Connectivity Available via PI Server
Local Time Support
Yes
Display Data Collection Status
Yes
Manually Start/Stop Data Collection
Yes
Supports Data exchange with Excel
Yes
Access Rights • User-Based
• Role-Based
• View-Only
• Administrator
Changes to access rights logged by user, date, and change
Hardware Alarms Superimposed on trend plots and time slider Shown in Alarm list
Software Alarms • Supported in PI AF
• Multi-state alarms (requires customization in PI AF Analytics)
• Shown in Alarm list
Data playback controls
Supported for both live and historical data
Advisor/ Decision Support
• Supported in PI AF Analytics
• Machinery rules may be customized by user
Portable Data Export CMS data to a file and share it with remote experts
Word Export Publish plots to a word document to share analysis results
Export Archive Data
From CMSXC or CMSHD databases export large amounts of data to archive it for future use
Document Management
Available via PI Server
(Machine) State • User added
• Automated (VC-8000 Rack based) State displays
Table 3: Synchronous Sampling (columns in blue are configurable)
Rate Max. Speed (rpm)
# of Samples
Shaft Revs
Spectrum Range, Resolution
Collection time at 3600 rpm
1024* spr
3,125 rpm
32768 64 400X, 0.03125X 0.53 s
512* spr
6,250 rpm
32768 128 200X, 0.0156X 1.07 s
128 spr
12,500 rpm
32768 256 50X, 0.0039X 4.26 s
64 spr 25,000 rpm
32768 512 25X, 0.002X 8.52 s
32 spr 50,000 rpm
32768 1024 12.5X, 0.001X 17.07 s
16 spr 100,000 rpm
32768 2048 6.25X, 0.0005X 34.13 s
spr=samples per shaft revolution X=orders of running speed
* Only applicable for Channel Type Recip Impact, Recip Cylinder Press and Recip Rod Position
Table 4: Asynchronous Sampling (columns in blue are configurable)
Rate Span # of Samples
Spectrum Lines
Resolution Time to Collect
64 sps 25 Hz 32768 12800 0.002 Hz, 0.1172 cpm
512 s
128 sps 50 Hz 32768 12800 0.0039 Hz 0.2344 cpm
256 s
256 sps 100 Hz 32768 12800 0.0078 Hz, 0.4688 cpm
128 s
512 sps 200 Hz 32768 12800 0.0156 Hz, 0.9375 cpm
64 s
1280 sps 500 Hz 32768 12800 0.0391 Hz, 2.344 cpm
25.6 s
2560 sps 1 kHz 32768 12800 0.0781 Hz, 4.688 cpm
12.8 s
5120 sps 2 kHz 32768 12800 0.1563 Hz, 9.375 cpm
6.4 s
12800 sps
5 kHz 32768 12800 0.3906 Hz, 23.438 cpm
2.56 s
25600 sps
10 kHz 32768 12800 0.7813 Hz, 46.875 cpm
1.28 s
51200 sps
20 kHz 32768 12800 1.5625 Hz, 93.75 cpm
640 ms
sps = samples per second

© Brüel & Kjær Vibro ● S1157533.002 / V07 ● Page 19 of 23 Technical alterations reserved!
Product specifications and ordering information CMS 2021 R3 Condition Monitoring Software
EN
UNRESTRICTED DOCUMENT
Ordering Information
Step 1: Ensure you have CM-enabled modules in your VC-8000 rack. If ordering a new machinery protection system rack, specify UMM-CM and TMM-CM modules in all slots from which condition monitoring data is desired, and ensure that an eSAM is present in rack slot 2. Refer to datasheet S1077785 for rack ordering information.
If using SETPOINT® CMS with an existing VC-8000 rack, use the hardware info tab on the front panel display or in the MPS Maintenance application to look for the presence of CM-ENABLED. If “CMS” status is present, and enabled your hardware already supports CMS communications. If this status is not present, your modules will require an upgrade to CM-ENABLED status. This can be done in the field via a Factory Authorized Service Provider, and prices can be quoted upon request to reflect your particular installation and location.
Step 2: Ensure that you have purchased PI Tag licenses for your UMM-CM and TMM-CM modules. Once CM-Enabled hardware is confirmed, your rack(s) can communicate with CMS Software. However, sufficient PI Tags must be licensed and available for storing the data supplied by the SETPOINT®-PI Adapter. Two types of tags can be used: Special SETPOINT® PI Tags and Standard PI Tags. SETPOINT® PI Tags can be ordered directly from B&K Vibro and are limited to use only for data originating in VC-8000 racks*. The advantage of SETPOINT® PI Tags is that they incorporate all necessary PI System Access (PSA) licensing required when SETPOINT® CMS data is written to and read from a PI Database.
Alternatively, Standard PI Tags can be purchased directly from OSIsoft or excess tags may already be present as part of your existing PI System. To use tags of this type with VC-8000 data, you must secure a separate PI System Access (PSA) license allowing the tags to be used in conjunction with a 3rd party application such as SETPOINT® CMS. Contact OSIsoft directly for details (www.osisoft.com). In addition, you must also confirm that you have a sufficient quantity of Standard PI Tags to store the data generated by your VC-8000 channels.
A single channel in the VC-8000 monitoring system can return multiple data types simultaneously and may consume anywhere from 2 to 29 PI tags to store its data, depending on channel type and channel configuration. For estimation purposes assume 23 tags per UMM channel, and 2 tags per TMM channel. Consult the SETPOINT® CMS Manual (doc S1176125) for a tabular summary of PI tag consumption versus channel type and channel configuration.
Page 20 of 23 © Brüel & Kjær Vibro ● S1157533.002 / V07 Technical alterations reserved!
EN
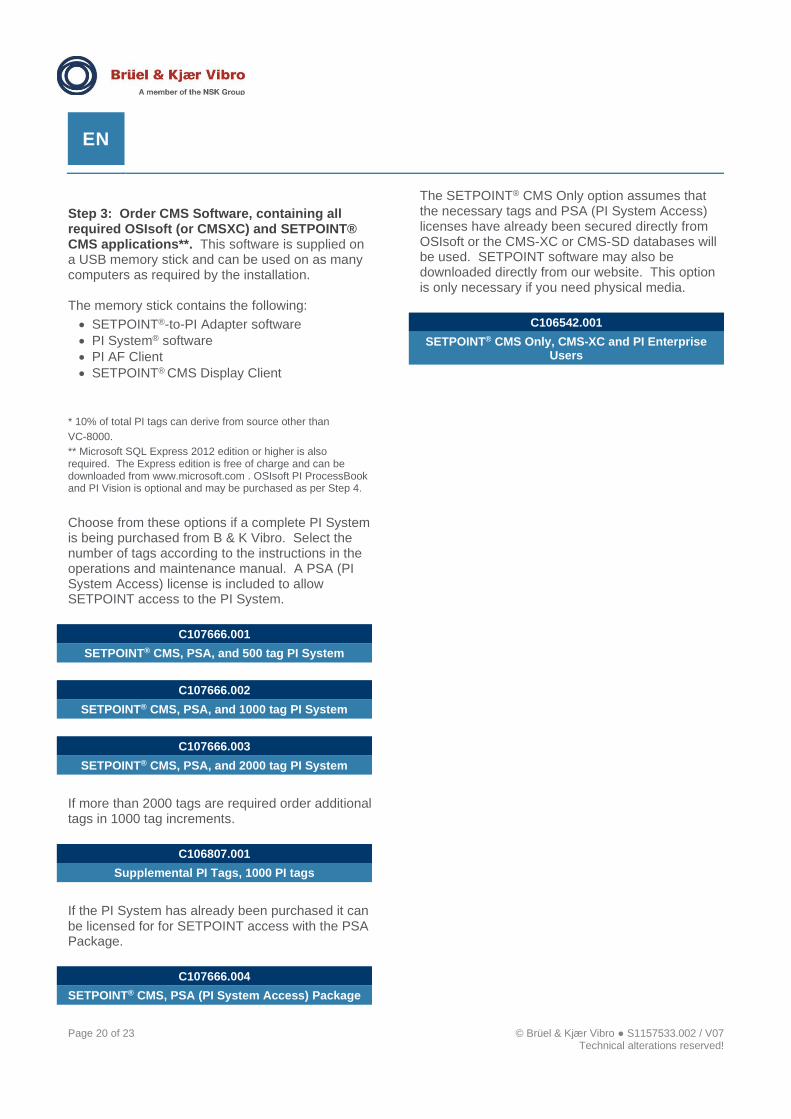
Step 3: Order CMS Software, containing all required OSIsoft (or CMSXC) and SETPOINT® CMS applications**. This software is supplied on a USB memory stick and can be used on as many computers as required by the installation. The memory stick contains the following:
• SETPOINT®-to-PI Adapter software
• PI System® software
• PI AF Client
• SETPOINT® CMS Display Client
* 10% of total PI tags can derive from source other than
VC-8000.
** Microsoft SQL Express 2012 edition or higher is also required. The Express edition is free of charge and can be downloaded from www.microsoft.com . OSIsoft PI ProcessBook and PI Vision is optional and may be purchased as per Step 4.
Choose from these options if a complete PI System is being purchased from B & K Vibro. Select the number of tags according to the instructions in the operations and maintenance manual. A PSA (PI System Access) license is included to allow SETPOINT access to the PI System.
C107666.001
SETPOINT® CMS, PSA, and 500 tag PI System
C107666.002
SETPOINT® CMS, PSA, and 1000 tag PI System
C107666.003
SETPOINT® CMS, PSA, and 2000 tag PI System
If more than 2000 tags are required order additional tags in 1000 tag increments.
C106807.001
Supplemental PI Tags, 1000 PI tags
If the PI System has already been purchased it can be licensed for for SETPOINT access with the PSA Package.
C107666.004
SETPOINT® CMS, PSA (PI System Access) Package
The SETPOINT® CMS Only option assumes that the necessary tags and PSA (PI System Access) licenses have already been secured directly from OSIsoft or the CMS-XC or CMS-SD databases will be used. SETPOINT software may also be downloaded directly from our website. This option is only necessary if you need physical media.
C106542.001
SETPOINT® CMS Only, CMS-XC and PI Enterprise Users
© Brüel & Kjær Vibro ● S1157533.002 / V07 ● Page 21 of 23 Technical alterations reserved!
Product specifications and ordering information CMS 2021 R3 Condition Monitoring Software
EN
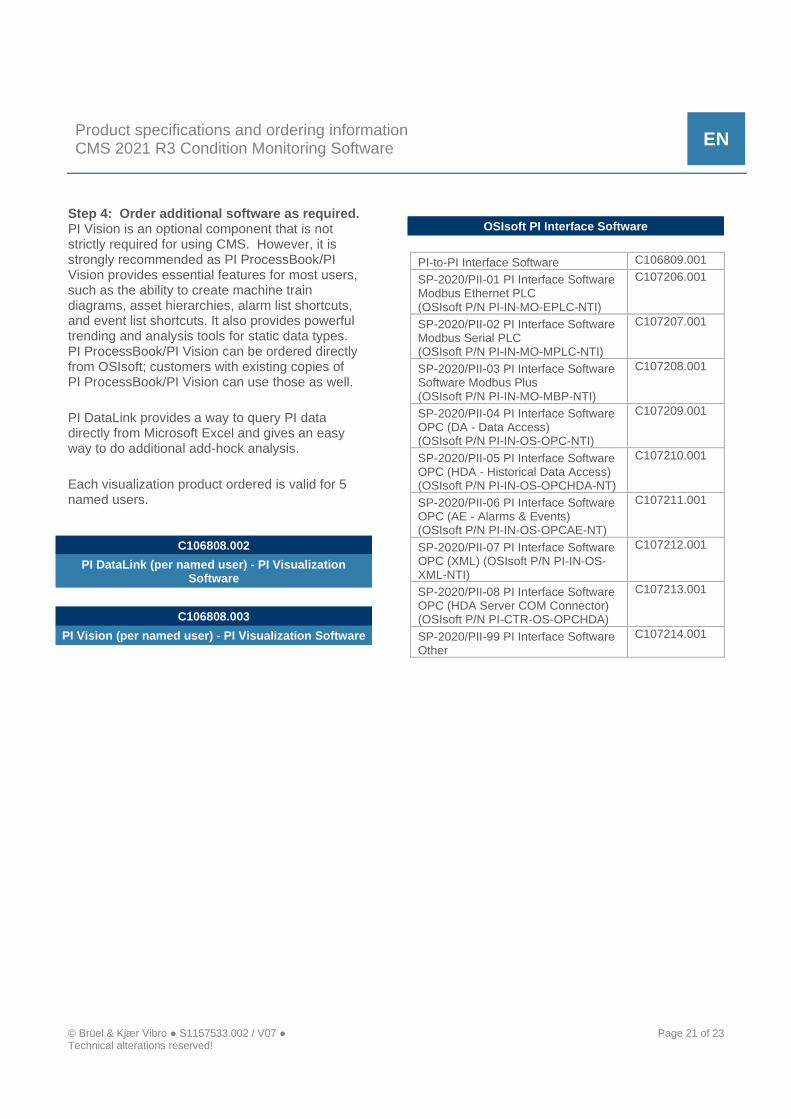
Step 4: Order additional software as required. PI Vision is an optional component that is not strictly required for using CMS. However, it is strongly recommended as PI ProcessBook/PI Vision provides essential features for most users, such as the ability to create machine train diagrams, asset hierarchies, alarm list shortcuts, and event list shortcuts. It also provides powerful trending and analysis tools for static data types. PI ProcessBook/PI Vision can be ordered directly from OSIsoft; customers with existing copies of PI ProcessBook/PI Vision can use those as well.
PI DataLink provides a way to query PI data directly from Microsoft Excel and gives an easy way to do additional add-hock analysis.
Each visualization product ordered is valid for 5 named users.
C106808.002
PI DataLink (per named user) - PI Visualization Software
C106808.003
PI Vision (per named user) - PI Visualization Software
OSIsoft PI Interface Software
PI-to-PI Interface Software C106809.001
SP-2020/PII-01 PI Interface Software Modbus Ethernet PLC (OSIsoft P/N PI-IN-MO-EPLC-NTI)
C107206.001
SP-2020/PII-02 PI Interface Software Modbus Serial PLC (OSIsoft P/N PI-IN-MO-MPLC-NTI)
C107207.001
SP-2020/PII-03 PI Interface Software Software Modbus Plus (OSIsoft P/N PI-IN-MO-MBP-NTI)
C107208.001
SP-2020/PII-04 PI Interface Software OPC (DA - Data Access) (OSIsoft P/N PI-IN-OS-OPC-NTI)
C107209.001
SP-2020/PII-05 PI Interface Software OPC (HDA - Historical Data Access) (OSIsoft P/N PI-IN-OS-OPCHDA-NT)
C107210.001
SP-2020/PII-06 PI Interface Software OPC (AE - Alarms & Events) (OSIsoft P/N PI-IN-OS-OPCAE-NT)
C107211.001
SP-2020/PII-07 PI Interface Software OPC (XML) (OSIsoft P/N PI-IN-OS-XML-NTI)
C107212.001
SP-2020/PII-08 PI Interface Software OPC (HDA Server COM Connector) (OSIsoft P/N PI-CTR-OS-OPCHDA)
C107213.001
SP-2020/PII-99 PI Interface Software Other
C107214.001

Page 22 of 23 © Brüel & Kjær Vibro ● S1157533.002 / V07 Technical alterations reserved!
EN
Step 5: Ensure that you have appropriate computers and peripherals required to host the software and interconnect all components. Installations will require suitable server machine(s) for hosting SETPOINT® CMS coreload software; suitable client machines for running SETPOINT® CMS Display and PI ProcessBook software; suitable network switches, routers, firewalls, and CAT 5/6 or fiber-optic cables; and other computing and networking infrastructure as may be required by your IT and/or Instrument & Control departments. B&K Vibro can also supply these components upon request. Our scope for many SETPOINT® CMS installations has included the following:
• Mid-grade server complete with all required coreload software installed and configured. A typical mid-grade server consists of a machine with 8 processor cores, 32GB RAM, a 1 TB RAID 5 hard drives, and a rail kit for mounting in a 19” rack. B&K Vibro can source any model or manufacturer desired to reflect your IT department standards. We can also install our software on a machine you supply, at your site or in one of our field service offices.
• Keyboard/Mouse/Monitor (KMM) A KMM is often supplied on a pull-out tray so that it can be retracted when not in use. Similar to a notebook computer in appearance, it contains a large folding screen and an attached keyboard with trackball mouse or other pointing device. The tray is designed for mounting in a 19” rack.
• Network Switches When multiple VC-8000 racks are interconnected as part of a single CMS installation, each rack is configured with a unique IP Address and connected via a switch to a common network backbone. B&K Vibro always uses network and switch components from well-known manufacturers like Hirschmann® or others as they are ruggedized for industrial use at elevated temperature and vibration levels; however, you may direct us to source any desired make and model, or you can supply your own.
• Step 6: Consider appropriate B&K Vibro services to install and configure all components. B&K Vibro can provide complete installation services in addition to all required hardware and software. This includes software configuration and PI Vision or PI ProcessBook screen design services.

Contact Brüel und Kjær Vibro GmbH
Leydheckerstrasse 10
64293 Darmstadt
Germany
Phone: +49 6151 428 0
Fax: +49 6151 428 1000
Brüel & Kjær Vibro A/S
Lyngby Hovedgade 94, 5 sal
2800 Lyngby
Denmark
Phone: +45 69 89 03 00
Fax: +45 69 89 03 01
BK Vibro America Inc
1100 Mark Circle
Gardnerville NV 89410
USA
Phone: +1 (775) 552 3110
Corporate E-Mail: [email protected] Homepage: www.bkvibro.com
CMS 2021 R3 Condition Monitoring Software ● © Brüel & Kjær Vibro ● 01/2022 ● S1157533.002 / V07 ●
Technical alterations reserved!