
C'MKRI ' jlletin 32 - CORE
190
C'MKRI ' jlletin 32 Kll. 1982 RESOURCES OF TUNAS AND RELATED SPECIES AND THEIR FISHERIES IN THE INDIAN OCEAN E. G. SILAS & P. P. PILLAI CENTRAL MARINE FISHERIES RESEARCH INSTITUTE (Indian Council ui Agricultural Research) P.B. No. 1912, Cochin 682 III8, India
-
Upload
khangminh22 -
Category
Documents
-
view
1 -
download
0
Transcript of C'MKRI ' jlletin 32 - CORE

C'MKRI
' jlletin 32
K l l . 1982
RESOURCES OF TUNAS AND
RELATED SPECIES AND THEIR
FISHERIES IN THE INDIAN OCEAN
E. G. SILAS & P. P. PILLAI
CENTRAL MARINE FISHERIES RESEARCH INSTITUTE
(Indian Council ui Agr icu l tu ra l Research)
P.B. No. 1912, Cochin 682 III8, India

CMFRI bulletin 32
APRIL 1982
RESOURCES OF TUNAS AND
RELATED SPECIES AND THEIR
FISHERIES IN THE INDIAN OCEAN
E. G. SILAS & P. P. PILLAI
CENTRAL MARINE FISHERIES RESEARCH INSTITUTE
{Indian Council of Agricultural Research)
J>.B. No. 1912, Cochin 682 018, India

Bulletins are issued periodically by Central Marine Fisheries Research Institute to interpret current knowledge in the various fields of research on marine fisheries
and allied subjects in India.
G
Copyright reserved
Edited and Published by
E. G. SILAS
Director
Central Marine Fisheries Research Institute
Cochin-682 018, India
Restricted circulation

Dr. Richard S. Shomura (left) noting the weight of a bigeye tuna (Co. 82 Kg) taken by the longline gear on board R/V ANTON BRUUN from the s3ulhsrn Indian Ocean.
(Photo by E. G. Silas)

CONTENTS
I. INTRODUCTION . . . . . . . . . . . , . . 1
II. TAXONOMY AND DISTRIBUTION OF TUNAS, TUNA-LIKE FISHES AND BILLHSHES IN THE INDIAN OCBAN 3
List of species Tunas and tuna-like fishes—Distinctive characteristics of the species Billfishes—Distinctive characteristics of the species
III. FISHING METHODS . . . . . . . . . . . , . . 24
Surface fishery School identification Pole and line (live-bait) fishery Purse seine fishery Surface trolling Fish aggregating devices (FAD)
Sub-surface fishery Longline fishery
Other methods of fishing Drift gillnet fishery Set nets Harpooning
IV. TUNA ENVIRONMENT . . . , , . , . , . . , . . 41
Temperature and oxygen Tuna migration Salinity Transparency Mixing process Oceanic islands and banks Submarine topography Food supply Satellite imagery
V. TUNA FISHERY IN THE INDIAN OCEAN : TREND IN THE EXPLOITATION OF THE STOCKS, PRESENT STATUS OF THE FISHERY AND RESOURCES OF TUNAS AND RELATED SPECIES . . . . . . 72
General review of the present trend of fishery Group-wise production of tunas, tuna-like species and billfishes Species-wise production of tunas, tuna-like fishes and billfishes Review of the level and status of participation in the Indian Ocean tuna fishery (country-
wise) Japanese longline fishery Taiwanese longline fishery
l-A V

Executive summary of tire state of stocks of tunas, tuna-like fishes and billfishes—current level of exploitation and potential for expansion
Yellowfin tuna Albacore Bigeye tuna Southern bluefin tuna Striped marlin Blue marlin Black marlin Sailfish Swordfish Skipjack tuna Other tunas and tuna-like fishes
Tuna fisheries in the Indian waters : present status Resources Crafts and gears Trend in all India catch State-wise catch Tuna landings at selected centres Future prospects
BAIT FISHES . . . . . . . . . . . . . . 136
Live-bait for pole and line fishery Fishing techniques Floating receivers Transportation Bait for tuna longline Culture of bait fishes
BY-CATCH . . . . . . . . . . . . . . 141
POST-HARVEST STORAGE, PROCESSING AND MARKETING . . . . . . . . 147
MANAGEMENT PLAN FOR THE TUNA FISHERY IN THE INDIAN OCEAN . . . . . . 151
Tuna fishery in the continental shelfwaters Surface fishery from the EEZ of island states Tuna fishery in the high seas Longlining from within and outside the EEZ Tuna fishery from the surface waters of the high seas Controls Surveillance Options open for tuna fishery development in the EEZ of India and the contiguous seas
Augmenting production Management Need for foreign expertise
THE NEED FOR AN INTERNATIONAL COMMISSION FOR THE CONSERVATION OF INDIAN OCEAN TUNA (ICCIOT) . . . . . . . . . . . . 16S
REFERENCES . . . . . . . . . . . . . . 165
APPENDIX I - I I I . . . . . . . . . . . . 172

PREFACE
In 1961,1 had an occasion to discuss with one of India's leading fishery technocrat and policy planner my researches on Indian tuna and tuna-like fishes. I was shocked when he retorted with a question whether we really had any tunas in our waters and if so whether they were only zoological curiosities. Such was the official attitude and my attempt to explain matters was just brushed aside. In January 1962, I convened an International Symposium on Scombroid Fishes at Mandapam Camp under the auspices of the Marine Biological Association of India and the Proceedings published in 1964 and 1967, combined with the scientific contributions sent from India to the FAO sponsored ' World Scientific Meeting on the Biology of Tunas and Related Species' held in July 1962 at California amply justifies that we do have sizeable tuna resources and India is placed in an advantageous position to exploit these from her waters and from the contiguous high seas. Unfortunately there has been an apathy on the part of our fishery planners to not even look at tuna fishingseriously, resulting in our lagging in this area offisheries as compared to some of the smaller nations who have limited facilities but are looking at development of tuna fisheries more positively. Indecision for some reason or other has been rampant and in the past two decades a stream of potential entrepreneurs from within and outside the country have turned up with propositions for entering on collaborative programmes in tuna fishery, but all these have been futile exercises ending only in conducted tours and dialogues. The indigenous production in our small scale fishery sector through the mechanisation and increasing effort through gill netting, purse seining, and pole and line fishing have augmented production of the coastal species of tunas and tuna-like fishes and tunas from the Lakshadweep from hardly 7800 tonnes in 1961 to 26,000 tonnes in 1979. However, we are practically at the same stage as in 1961 as far as exploitation of the resources of the Exclusive Economic Zone (EEZ) and contiguous high seas, beyond the inshore continental shelf waters are concerned. A few exercises of insufficient nature in longlining and purse seining have been carried out, but inadequacy of the gear and the cursory effort expended have given if at all only negative results. We are still deliberating on the pros and cons of entering tuna fisheries of the high seas. The two decades from the 1961 to 1981 have seen major shifts in the pattern of large scale commercial tuna fisheries in the Indian Ocean which was started by the Japanese longline fishery in 1952. The Republic of China (Taiwan) and the Republic of Korea have entered the fisheries in the 60's and early 70's respectively for longlining and a number of nations including non-Indian Ocean countries are now planning for longlining and purse seining for tunas in the Indian Ocean.
The declaration of the Exclusive Economic Zone by India in August, 1976 has given a flip to the efforts in organizing development programmes for the exploitation of fishes from beyond the continental shelf waters. The Government of India had permitted some joint venture programmes to come up, but these have by and large not helped in the overall development programmes. Recently, the Government of India has proclaimed a chartering policy with a view to accelerate the development of deep sea fishing in this country. Tunas being highly migratory species, any development programme should envisage also the scope of harvesting the resources not only from our EEZ but also from the contiguous high seas.
The time has come when whatever information is known about Indian Ocean tunas and tuna-like fishes, their ecology and fisheries including present levels of exploitation should be made available to the public forum so that it will be easily accessible to the fishing industry and those interested in commercial fisheries resources. Such a compendium would go a long way in educating our technocrats and policy planners to take decisions on development strategies, help in investment decisions and plan to see how India could become an important partner for sharing the tuna resources of the Indian Ocean. The fishing industry should also benefit from the same.
iii

I would like to place on record our indebtness to Dr. S. Jones who initiated the studies on Indian Tunas and to Late Dr. Wilbert M. Chapman for the great encouragement he gave for the studies on Indian Tunas in the early sixties. A close association of over three months with Dr. Richard S. Shomura on board the Research Vessel ' Anton Bruun' during its Vth cruise in the Indian Ocean during the International Indian Ocean Expedition from January-May, 1964 enabled me to have a deeper insight into the problems of tuna fisheries of the Indian Ocean. Most of the photographs published in this report were taken by me during this cruise which covered areas between 22°N and 48°S, and 55°E and 75°E. My sincere thanks are due to Dr. Shomura for the courtesies extended.
In the preparation of this report, help has been received in the form of literature, and the authors have had the benefit of personal discussions with a number of active workers in this field. Thanks are due to Dr. Shoji Ueyanagi, Far Seas Fisheries Reseach Laboratory, Shimizu, Japan ; Dr. J. A. Gulland and Dr. Francis J. Christy, Resources and Environment Division, FAO; Dr. Wayne J. Baldwin, Hawaii Institute of Marine Biology, University of Hawaii, Hawaii; Dr. R. F. Kearney, South Pacific Commission and Dr. Peter H. Pearse, Commissioner, Department of Fisheries and Oceans, Government of Canada. To Dr. K. P. P. Nambiar, MPEDA-India, Tokyo, Japan, we are appreciative of the interest he has shown in our work on tunas, and for the fruitful discussions and the information he has sent us. In order to make this-work more meaningful, some charts and maps from earlier publications are reproduced here and their sources are duly acknowledged.
I hear talks that foreign consultants are being invited to come to India to make a feasibility study of whether or not we should develop tuna fisheries of our EEZ and high seas. While we shall certainly require expertise in certain specific aspects of tuna fisheries particularly with an emphasis on training our personnel, it is highly doubtful with the information available with us, whether we should spend lakhs of Rupees on such wasteful exercises. I hope that this publication will create a greater awareness of the importance of our tuna resources and help stimulate investment decisions and formulate a national policy and programme for the development of tuna fisheries in this country.
E. G. SILAS
Director Central Marine Fisheries--
Research Institute Cochin
iv

I INTRODUCTION
With the new ocean regime coming into being, many of the countries including India have declared an EEZ •(Exclusive Economic Zone) which extends national jurisdiction to 200 miles from the coast. This has created a greater awareness of our responsibility towards the judicious exploitation of the living and nonliving resources coming under the extended jurisdiction. The problems of survey, assessment, utilization and management of the resources thus assumes priority. At the same time, the management of living resources, particularly the fishery resources receive both national and international importance. This is all the more so, as the exploitation of living resources has hitherto been confined to a narrow belt of the neritic waters. In the marine fisheries sector, with a decade of stagnation in world fish production, the declaration of the EEZ has given high hopes to some nations of substantially augmenting their fish production. To countries which had well established distant water fishing operations covering the EEZ of other countries, the continuation of such operations poses serious problems. The new ocean regime undoubtedly offers some of the developing countries an opportunity for developing and expanding their capabilities of harvesting fish from their EEZ through their own effort or through collaborative ventures.
With the declaration of EEZ in August, 1976 (Act No. 80 of 1976) India has added about 2 million km* of sea area under her jurisdiction. This has also placed tremendous responsibilities on the country to see that the resources are properly surveyed, assessed and judiciously utilised and protected. Some of the questions posed are : what are the new fishery resources in the EEZ ; what are the magnitude of the resources and how are they to be harvested economically; what are the type of fishing vessels to be used for exploiting the diverse resources; whether the catch will be marketable at remunerative prices ; infrastructure and shore facilities
needed to be provided for such operation, and so on These are some of the pressing questions posed by the development departments who seek information on data for decision making in investing in the exploitation of the resources. In some quarters there have been misconceptions among administrators and technocrats that the fishery resource may be uniformily distributed in biomas along the entire extent of the EEZ. On the other extreme we have views expressed that absolutely nothing is known about the fishery resources that maybe available in our EEZ outside the traditionally exploited zone to enable any type of investment decision to be taken for commercial exploitation. Yet another variant in thought is that ' no reliable information is available on our resources from the EEZ.' While we would not want to discuss the pros and cons of such views, we would like to mention that this work is presented to dispel some of the ignorance and bias prevailing in the vital area of development of tuna fishery by India. Dispassionately looking at our marine fishery resources in toto, it can be said that for a better utilization and augmentation of production from the EEZ, the following would be necessary:
— augmenting production through more efficient methods from the traditional small scale fisheries sector through improvement of craft and gear and diversification of fishing, closely linked with marketing; -
— utilisation of conventional and non-conventional resources, both demersal and pelagic, from the shelf waters lying beyond 30-40 fathoms— resources such as the threadfin bream and rock cods;
— exploitation of larger pelagics such as tunas and billfishes from the continental shelf waters and high seas;
-CMTW BULLETIN 3 2 1

— fishing for the squids and cuttlefishes from the shelf waters (squids and cuttlefishes) and adjacent oceanic waters (squids);
— utilisation of non-conventional deep-sea resources, particularly mesopelagics, bathypelagic fishes and crustaceans; and
— coastal aquaculture (mariculture).
All these are priority areas and for the better utilisation and management of the resources strategies have to be planned and developed and operations carried out on different scales. In the context of national priorities, fisheries development in these areas are to be stepped up almost concurrently for achieving the objectives.
In the scheme of our fisheries development thus there are,many priority areas. However, in the context of our policy for the EEZ, the development of tuna fishery has the highest priority, though until now it has not received the attention it deserves. There has been an appreciable increase in our landings of coastal species of tunas during the last 15 years. A similar trend is also seen in the landings of skipjack and young yellow-fin tuna in the pole and line fishery in the Lakshadweep Islands, with the introduction of small mechanised crafts. A well established tuna longline fishery exists in the Indian Ocean, which was started in 1952 by the Japanese, The late 1960's and the early 1970's saw the entry of the fleets of Taiwan and Republic of Korea into the Indian Ocean tuna longline fishery. In 1968 about 169,300 MT of yellowfin, bigeye, albacore and southern bluefin tunns were caught from the Indian Ocean by longlining. The catch of these four species now stands at 122,600 MT (1979).
In January, 1962, one of us (E.G.S.) convened a symposium on scombroid fishes at Mandapam Camp,
the Proceedings (1964 ; 1967) of which documented the~ state of art prevailing at that time and was indicative of the possibilities of the development of the tuna fisheries in the Indian Ocean. During the last two decades, while the tuna fisheries of the Indian Ocean has developed on certain lines and seen major shifts and new foreign entries into this sector, we have been discussing and debating on the possibilities of embarking on tuna fishing in the offshore waters and the high seas. At the Institute, even in the early sixties attention was focussed on this important resource and the need for development programmes to be taken up.
Often the lack of cent per cent resources data has been a cover for indecisions in policy planning at our end, while commercial scale operation of certain types of tuna fishing have been in full vogue in the Indian Ocean infringing also on our EEZ and results are well documented. Nowhere has tuna fisheries developed after a complete resources survey has been conducted. However, monitoring of the stocks is a must chiefly based on commercial catches supplemented by information from recruitment studies, tagging and so on. Tuna fishery is capital intensive with elements of risk, especially on account of the highly migratory habits of the species. A coherent national policy combined with initiative from the fishing industry is the need of the hour. Are we prepared to take the plunge ?
In view of the urgent need to have a proper information base to help understand the position, we have taken the task of preparing this report. Information from other ocean areas which are relevant to the present work is also included here, to help the reader understand the problem better. It is hoped that this over view of the situation on the resources of tunas and related fishes and their fishery in the Indian Ocean will be of help to our planners, decision makers and the fishing industry.
2 TUNA REsoimcik

II TAXONOMY AND DISTRIBUTION OF TUNAS, TUNA-LBKE FISHES AND
BILLFISHES IN THE INDIAN OCEAN
The published accounts since 1960 on the tunas and related fishes have already provided valuable information on the species of these scombroids occurring in the Indian Ocean, and also on the populations of certain species taken by the commercial and research operations (Collette, 1978 ; Collette and Gibbs, 1963 ; Collette and Chao, 1975 ; Gibbs and Collette, 1967 ; Iwai et al, 1965 ; Jones, 1963a, 1963b ; Jones and Silas, 1960, 1963a, 1963b, 1964; Klawe, 1980b; Mimura, 1963a, 1963b; Nair et al, 1970; Nakamura, 1965 ; Silas, 1963a, 1963b, 1963c, 1964; Silas et al, 1981; Williams, 1963a, 1963b; Yoshida and Otsu, 1963). More information is wanting on the underexploited groups of tuna-like fishes such as bonitos in the coastal and oceanic realms of the Indian Ocean (Uchida, 1581 ; Yoshida, 1979). Despite the fact that billfishes form part of the marine fishery resources and are commercially exploited by different countries of the Indo-Pacific, very little attention has been paid to study these fishes from the Indian Ocean (Beardsly et al, 1975; Jones and Silas, 1964; Kikawa, 1975; Morrow, 1964; Nakamura, 1975 ; Nakamura et al, 1968 ; Rivas, 1975 ; Ueyanagi and Wares, 1975; Palco-ef al, 1981). Since billfishes are also taken along with tunas especially in the longline and surface trolling, information on tunas and related fishes and billfishes are included in this report.
The present state of the scheme of classification is as follows :
The family Scombridae can be divided into two sub-, families, the Gasterochrismatinae and Scombrinae,. Gasterochrismatinae contains the aberrant species Gasterochrisma melampus Richardson. In the subfamily Scombrinae, the bonitos comprise a tribe Sardinia with five genera (Orcynopsis Gill, Cybiosarda Whitley, Sarda Cuvier, Gymnosarda Gill and Allothunnus Serventy) of which the genus Orcynopsis Gill is endemic to the eastern Atlantic. Higher tunas (Auxis Cuvier, Euthynnus Lutken, Katsuwonus Kishinouye and Thununs South) belong to the tribe Thunnini.
The more premitive mackerels (Tribe : Scombrini, Genera Scomber Linnaeus and Rastrelliger Jordan and Dickerson) and Spanish mackerels (Tribe: Scombero-morini, Genera Grammatorcynus Gill, Seomberomorus Lacepede and Acanthocybium Gill) are not dealt with m this report.
Different species of tunas and tuna-like fishes belonging to the tribes Thunnini and Sardini, and billfishes belonging to the families Istiophoridae and Xiphiidae having distribution in the Indian Ocean are tabulated below along with their English and Japanese names and abbreviations used by FAO :
Tribe THUNNINI Thunnus alalunga (Bonnaterre, 1788) T. alhacares (Bonnaterre, 1788) T. macdoyii (Castelnau, 1872)
FAMILY SCOMBRIDAE
TRUE TUNAS
English
Albacore Yellowfin tuna Southern bluefin tuna
Japanese
Binnaga Kibada Minami maguro
FAO abbreviation
ALB YFT SBF
^Gilla^mi&ttN 32 $

T. thymus (Linnaeus, 1758)
T. obesus (Lowe, 1839)
T. tonggol (Bleeker, 1851)
English
Northern bluefin tuna
Bigeye tuna
Longtail tuna
Japanese
Mebachi
Koshinaga
FAO Abbreviation
BFT
BET
LOT
TUNA-LIKE FISHES
Euthynnus affinis (Cantor, 1850)
Katsuwonus pelamis (Linnaeus, 1758)
prox Euthynnus Silas, Pillai and Muthiah, 1981
Auxis thazard (Lacepede, 1803)
A. rochei (Risso, 1810)
Tribe SARDINI Allothunnus fallal Serventy, 1948
Cybiosarda elegans (Whitley, 1935)
Sarda orientalis (Temminck and Schlegel, 1844)
Gymnosarda unicolor (Rflppel, 1838)
Little tunny
Skipjack tuna
Frigate tuna
Bullet tuna
Slender tuna
Leaping bonito
Oriental bonito/ Indo-Pacific bonito
Dogtooth tuna
Yaito
Katsuo
Hirasado
Marusado
Hagatsuo
Isomaguro
KAW
SKJ
FRI
BLT
SLT
LEB
BIP
DOT
FAMILY ISTIOPHORIDAE
Sub-family Tetrapturinae
Istiophorus platypterus
(Shaw and Nodder, 1792)
Tetrapturus angustirostris Tanaka, 1914 T. audax (Philippi, 1887)
Sub-family Makairinae
Makaira indica (Cuvier, 1831)
M. nigricans Lacepede, 1802
M. tenuirostratus (Deraniagala, 1951)
BILLFISHES
Sailfish
Shortbill spearfish
Striped marlin
Black marlin
Blue marlin
Bashokajiki
Fuwarai kajiki
Makajiki
Shirokajiki
Kurokajiki
SAI
SSP
MLS
BLM
BUM
Xiphias gladius Linnaeus, 1758
FAMILY XIPHIIDAE
SWORDFISH
: Broadbill awordfigh Mekajiki swo TUNA

Tunas and Tuna-like Fishes : Distinctive Characteristics of the Species
Li Tongue without dorsally projecting ridges
II
I.ii Tongue with a pair of projecting cartilagenous-ridges
V
II.i Gill rakers slender, 70-80 on first gill arch ; teeth on jaws minute, 40-45 on each side
Allothunnus fallai Serventy
Il.ii Gill rakers relatively large, 8-21 on first gill arch ; teeth on jaws large, 10-30 on each side
........in m.i First dorsal with 12-14 spines ; body without
spots or stripes; total second dorsal rays including dorsal finlets 19-21 ; caudal vertebrae 19 and total vertebral count 38
Gymnosarda unicolor (Riippel)
ITI.ii First dorsal with 16-19 spines; upper part of body with dark spots or dark horizontal stripes and the lower part with a few horizontal stripes; total second dorsal rays including finlets 22-27; caudal vertebrae range from 20-26 and total vertebrae 4448
IV
IV.i Tongue edentulous; 6-9 narrow dark horizontal bands on upper part of body and lower half of body silvery ; caudal vertebrae range from 20-22 and total vertebrae 44-45
Sarda orientalis (Temminck and Schlegel)
XV.ii Tongue with two patches of teeth ; upper part of body with conspicuous dark spots, linearly arranged; few longitudinal stripes on lower half of body; caudal vertebrae range from 23-26 and total vertebrae 47-48
Cybiosarda elegans (Whitley)
V.i First and second dorsal fins widely separated by distance exceeding length of base of first dorsal fin
VI
V.ii First and second dorsal fins contiguous or separated only by a narrow space not exceeding diameter of orbit
.......,vn
VLi Corselet of scales short, tapering abruptly along the lateral line behind the first dorsal; it is not more than 4-5 rows of scales wide in a line below second dorsal; gill rakers 39-42 ; pectoral fin extending posteriorly to a vertical line from anterior margin of dorsal scaleless area ; oblique to nearly horizontal dark wavy lines in the dorsal part of body
Auxis thazard (Lacepede)
VT.ii Corselet of scales long, continuing as a wide band along lateral line behind first dorsal; it
is more than 6 rows of scales wide in a line below second dorsal; gill rakers 40-47; pectoral fin not extending to the vertical line from anterior margin of dorsal scaleless area ; dark wavy lines in the dorsal part of body nearly vertical
Auxis rochei (Risso)
VTI.i Four to five dark conspicuous longitudinal stripes on lower half of body ; 15-16 spines in first dorsal fin ; gill rakers 53-63 on first arch
Katsuwonus pelamis (Linnaeus)
VH.ii Dark longitudinal lines absent" on belly ; 11-14 spines in first dorsal fin ; gill rakers 29-43 on first gill arch
vin Vlll.i Scales on body are confined to corselet and
lateral line ; few conspicuous black spots on sides of body below pectoral base and behind corselet; pectoral fin rays 26-27
* .Euthynnus affinis (Cantor)
VDI.ii Body completely covered with scales; conspicuous black spots or stripes absent on sides of body ; pectoral fin rays usually 30-36
IX
IX.i Pectoral fin very long, about one and half times head length, its tip reaching beyond the end of second dorsal fin base ; body deepest at or slightly before level of dorsal fin ; caudal fin with a narrow white posterior margin
Thunnus alalunga (Bonnaterre)
IX.ii Pectoral fins short to moderately long, not reaching end of second dorsal fin base ; body deepest near middle of first dorsal fin ; caudal fin without white posterior margin
...X
CMRI BUtLBTW 32 *

X.i Gill rakers 19-26 of which 13-19 are on lower limb; lower part of belly with pale streaks or spots, mostly horizontally oriented or without specific orientation ; finlets dusky and faintly tinged with yellow colour
Thunnus tonggol (Bleeker)
X.ii Gill rakers on first arch 23 or more ; lower part of belly either lacking in pale streaks or spots or when present they are vertically oriented ; finlets black coloured or yellowish
XI
Xl.i Pectoral fin long, more than 80% of head length ; gill rakers on first arch 23-34
XII
Xl.ii Pectoral fin short, less than 80% of head length ; gill rakers on first arch 31-43
XIII
XH.i Second dorsal and anal fins of large specimens elongated, length greater than 20% of fork length; liver without striations on ventral surface
Thunnus albacares (Bonnaterre)
Xll.ii Second dorsal and anal fins not elongated, length equal to 20 % of fork length or less in all sizes; liver straited on ventral surface
Thunnus obesus (Lowe)
XIII.i Number of gill rakers 34-43 (mean 38.4); caudal keels are dark; first ventrally directed parapophysis on 8th vertebra
Thunnus thynnus (Linnaeus)
Xlll.ii Number of gill rakers 31-40 (mean 33.7); caudal keel yellowish ; first ventrally directed parapophysis on 9th vertebra
Thunnus maccoyii (Castelnau)
The tfollowing species synopses has been prepared to facilitate field identification, based primarily on the literature and on the original information collected by the authors.
Synopses of Species
Thunnus alalunga (Bonnaterre, 1788): Albacore
(Figs. 1, 2 ; PI. II)
Body moderately robust and fusiform ; depth of body greatest near dorsal and anal fin origin ; eyes relatively large ; first gill arch with 25-32 gill rakers; a narrow inter
space separates the two dorsal fins ; second dorsal fin lower than first; 7-9 dorsal finlets; pectoral fin very long, usually 31 % of fork length or longer, posteriorly extending to base of second dorsal fin or even up to
Fig. 1. Albacore, Thunnus alalunga (Bonnaterre) (From Fischer and Whitehead, 1974).
second dorsal finlet; anal finlet 7-8 ; interpelvic process paired; scales small; caudal peduncle slender, bearing a strong keel laterally between two smaller keels ; ventral surface of liver striated ; other distinctive characters of this species are: (i) narrow white caudal fin maTgin,
30E 3QE <<•£ 5«'E ** '£ J i t IQE M E IQU'E HO \ I2Q'£ 13» 6
Thunnus alalunga
Presumed southern limit
aJrT a o ^ e ^ IIO'E, 120-E IJDE.
Fig, 2, Distribution of albacore in the Indian Ocean.
6 r? TUNA RESOURCES

(ii) dark anal finlets, and (iii) relatively long pectoral fin.
Upper part of the body of metalic blue colour ; lower sides and belly silvery; second dorsal fin and anal fin lightly yellow, former black tipped.
Cosmopolitan in tropical, subtropical and temperate waters of the Indo-Pacific (West and Central) and Atlantic oceans ; its distribution in the Indian ocean is between 5°N and about 35°S.
Common size: 40-100 cm
Thunnus albacares (Bonnaterre, 1788):
Yellowfin tuna
(Figs. 3, 4; PI. II)
Body elongate and fusiform; body depth less than 25 % of fork length ; caudal portion elongated ; first gill arch with 26-34 gill rakers; a narrow interspace separates the two dorsal fins; interpelvic process paired ; dorsal and anal fins very long in large specimens (over 20 % of the fork length) ; pectoral fins moderately long, usually reaching beyond second dorsal fin origin but not beyond the end of its base ; body with very small scales, but area of the corselet distinct with large scales ; caudal peduncle slender with a strong lateral keel between two smaller keels; ventral surface of the liver plain without any striations.
Fig. 3. Yellowfin tuna, Thunnus albacares (Bonnaterre) (From Fischer and Whitehead, 1974).
Metalic blue or blue-black above the belly; belly with about 20 broken nearly vertical pale lines ; dorsal and anal fins and dorsal and anal finlets with a narrow black border.
Cosmopolitan in the tropical and subtropical areas of the Indo-Pacific and Atlantic oceans; in the Indian Ocean, mainly distributed north of 30°S.
Fig. 4. Distribution of yellowfin tuna in the Indian Ocean.
Common size : 50-150 cm
Thunnus maccoyii (Castelnau, 1872) :
Southern bluefin tuna
(Figs. 5, 6 ,< PI. II)
Body large, fusiform and robust in front; first gill arch with 31-40 gill rakers; a narrow interspace separates the two dorsal fins; second dorsal fin higher than the first; 9-10 dorsal finlets; pectoral fin very short, less than 80 % of head length, scarcely reaching the interspace between the dorsal fins,' interpelvic process paired; anal finlets 8-9; scales very small; caudal peduncle with very strong lateral keel between two smaller keels ; swimbladder present; liver with striations on the ventral surface.
Dorsal side bluish black, lower side and belly silvery white; pale transverse lines alternating with dots on the sides of the body ; first dorsal fin with bluish yellow colour, second reddish brown ; anal fin and finlets dusky
mmsmzmm 32 £7

yellow, edged with black colour ; caudal keels yellow in adults.
Fig. 5. Southsrn bluefin tuna, Thunnus maccoyii (Castelnau) (From Fischer and Whitehead, 1974).
Distributed in the sub-tropical and temperate waters of the southern regions of the Indo-Pacific and_'Atlantic Oceans. In the Indian Ocean this species has been recorded from South Africa, eastern Indian Ocean, south of Java (Indonesia) and western Australia.
Common size : 160-200 cm
30~E 3Q ' f 4Q*E , BO'E BO'E 7Q g 60 £ COX 100 E t i p t I2QL i j n
Thunnus maccoyi
2 0 ' E 30*E «0*E S O I « 0 ' E 70'E BO'E OO'E I 0 0 - E H O ' £ taO'E U O t
Thunnus thynnus (Linnaeus, 1758): Northern bluefin tuna
(Figs. 7, 8)
Body streamlined, robust and slightly compressed in cross section ; pectoral fin very short, not reaching the origin of second dorsal fin and hardly 17-20% of fork
Fig. 7. Northern bluefin tuna, Thunnus thynnus (Linnaeus) (From Iwaii et al, 1965).
length; 8-9 dorsal finlets and 7-8 anal finlets ; first gill arch with 34-43 gill rakers ; first ventrally directed parapophysis situated on the eighth vertebra ; cutaneous
30 6 M t 4 o £ lO'E flO'E 7a I lO 'E flOE 100'E UO'E 120'E iSfTf
H
H
40 T ^ i " ^
30 r ^ '
Thunnus thynnus
\ W i \ * \ ^
,.-| \ 3 -" A
S
S J I 1 0 '
S j
s
s
60
r ' '
Y l _ /
•
i \
\J }
*1
*
j
VT* W (
^
^"
-&
rilfp
$
- > •
JTr flH •PL
20 "E 30 "E 40 'E 60 *£ 80 "£ 70'E BO'E 9C E I 00 E 1 i 0 'E 120'E I 30'E
Fig. 6. Distribution of southern bluefin tuna in the Indian Ocean. The area of surface fishery along south west Australian coast and the Great Australian Bight is also indicated.
Fig. 8. Distribution of northern bluefin tuna in the Indian Ocean (From Iwaii et al., 1965).
8 TUNA RESOURCES

blood vessels pass between 3rd and 4th ribs, liver densely striated, and with veins ventrally; most part of the head naked; cheek scales relatively large, rest of the body fully covered with fine scales; corselet of large scales present behind the head.
Dorsal side bluish black ; lower side and belly silvery white ; caudal keels dark.
Distributed in the subtropical and temperate waters of the Pacific and Atlantic Oceans, Mediterranean Sea and Black Sea. Klawe (1980) remarks that its occurrence is ' sporadic in the Eastern Indian Ocean.'.
Common size : 200-300 cm.
Thunnus obesus (Lowe, 1839) : Bigeye tuna
(Figs. 9, 10 ; PL II)
Body very broad, slightly compressed laterally; ventral margin of the body curved; caudal portion short; head and eye farily large ; first gill arch with 23-31 gill rakers; two dorsal fins, separated by a narrow interspace ; 8-10 dorsal finlets; pectoral fin moderately long in larger specimens, gradually tapering towards distal end and scarcely pass beyond the origin of second dorsal; in smaller specimens (about 1 m long) they reach the first dorsal finlet and the vertical through the middle of the anal fin; second dorsal and anal only a little
anal fin slight yellow; finlets bright yellowish, edged with black colour. .
Fig. 9. Bigeye tuna, Thunnus obesus (Lowe) (From Fischer and Whitehead, 1974).
higher than the first dorsal, and they are comparatively narrow and falciform; caudal fin widely expanded, wider than the height of the body ; interpelvic process paired ; 7-10 anal finlets ; scales in the corselet relatively large; caudal peduncle slender with a strong lateral keel between two smaller keels ; air bladder well developed and divided at anterior end ; ventral surface of the liver striated.
Back black to greenish blue, sides and belly silvery white; first dorsal fin deep yellow, second dorsal and
90 I _ 30 I I D E SO'C 60'C T° , 'E. B 0 E fl0 E ' O O ' t " O * '?*> C
Thunnus obtsus
30^1 ap"E . O X »0"E 60 C 30 E «0 i H E I 0 0 E H O E W O E I K I
Fig. 10. Distribution of bigeye tuna in the Indian Ocean,
Cosmopolitan in the tropical and sub-tropical waters of the Pacific, Atlantic and Indian Oceans. In the Indian ocean, this species is found mainly north of 30°S*
Common size : 60-180 cm
Thunnus tonggol (Bleeker, 1851) : Longtail tuna
(Figs. 11,12; PL I)
Body fusiform and rounded; caudal region comparatively long, longest in large specimens ; 19-26 gill rakers in the first gill arch; a narrow interspace separates the two dorsal fins ; second dorsal fin higher than the first dorsal; 9 dorsal finlets; pectoral fin moderately long, 22-31% of the body length in smaller specimens and 16-22% in larger specimens; interpelvic process paired; anal fin followed by 8 finlets; scales very small; a strong keel present in the caudal peduncle
CMFRI BULLETIN;^ 9

between two smaller keek; caudal keels very large; caudal lobes expanded; swimbladder absent or rudimentary ; liver without striations on the ventral side.
Fig. 11. Longtail tuna, Thunnus tonggol (Bleeker) (From Fischer and Whitehead, 1974).
30't 30 £ <0'E *iO £ 60 'E TQ t BO £ 80 E 100'E u p £ I j Q I 130 t
Thunnus tonggol
JOE 30'C 4 0 ' £ » ' E ftO'E 70'E «0'E t 0 '6 100'E H O E W O E D O ' I
Fig. 12. Distribution of longtail tuna in the Indian Ocean.
Dark blue or bluish black on the back ; lower sides and belly silvery white with pale spots and streaks oriented horizontally ; tips of second dorsal fin and anal fin tinged with yellow colour; dorsal and anal finlets yellowish with greyish margin.
Common size : 40-70 cm
Auxis rochet (Risso, 1810); Bullet tuna
(Figs. 13, 14 ; PI. I) .
Body elongated and rounded; dorsal outline moderately curved ; two dorsal fins, separated by a large
Fig. 13. Bullet tuna, Auxis rochei (Risso). Inter-pelvic process and extension of corselet are also indicated (From Fischer and Whitehead, 1974).
E ao'E « O * E 9o 'e ao 'E 70*5 B O ' E ao'E ' o o ' E ' ' Q ' E t3°'e-i l i g f e
Auxis rochei
— — Presumed southern limit
10
Fig. 14. Distribution of bullet tuna in the Indian Ocean.
TUNA RESOURCES

interspace, the length of which is slightly shorter than head length ; 8 dorsal finlets ; pectoral fin short, not reaching the vertical line beneath the anterior margin of scaleless area above the corselet; body naked except for the corselet of scales which taper gradually to 9-10 irregular scale rows at vertical through second dorsal; caudal peduncle with small lateral keels; interpelvic process single.
Upper part of the body bluish ; lower part silvery ; head with purple colour ; about 15 fairly broad, nearly vertical dark bars in the scaleless area.
Widely distributed in the tropical and subtropical parts of the Indian and Pacific oceans ; In the Indian Ocean, this species has been recorded from north of 40°S in the inshore waters and around oceanic islands.
Common size : 15-25 cm
Auxis thazard (Lacepede, 1803) : Frigate tuna
(Figs. 15, 16 ; PI. I)
Body robust, slightly compressed laterally; head large, tapering to a pointed snout; first dorsal fin with 10-12 spines, separated from the second by a large interspace which is atleast equal in length to the base of the first dorsal fin; 8 dorsal finlets ; pectoral fin short, reaching past vertical line from anterior margin of scaleless area above the corselet; interpelvic process single ; 7 anal finlets ; small pointed teeth present on both the jaws; lateral line without a distinct arch, slightly
Fig. 15. Frigate tuna, Auxis thazard (Lac6pede). Interpelvic process and extension of corselet are also indicated. (From Fischer and Whitehead, 1974).
curved and with small undulations ; body naked except for corselet; corselet well developed, with a posterior prolongation of scales (not more than five scales under the second dorsal fifl origin); central keel on each side of caudal fin base between two small lateral keels ; gill rakers close set, long and slender numbering 39-42.
Back bluish ; head dark, light brown below ; about 15 or more narrow, oblique to nearly horizontal black bars in the scaleless atea above lateral line.
E ao'E 40't >0'E «0'E 7Q-E lo'E »0'S IQO'E no'E tlo'E llfl'E
Auxis thazard
• Presumed southern limit
20'E 30*1 ' 40 ;1 »0"E *80 ' t 70'E ao'E SO'E 100'E MCE I20*E )30'E
Fig. 16. Distribution of frigate tuna in the Indian Ocean.
Distributed in the tropical and sub-tropical waters of the Indian and Pacific oceans ; often occurs in large schools in the inshore areas. From the Indian Ocean this species has been recorded in the area between west coast of Australia and east and south Africa.
Common size : 25-40 cm
Euthynnus affinis (Cantor, 1850) : Little tunny (Figs. 17, 18 ; PI. I)
Body elongate, fusiform and robust; first and second dorsal fins are separated by only a narrow interspace ;
CMFRI BULLETIN 32
2
11

anterior spines of first dorsal fin much higher than those in the middle, thus giving the fin a concave outline; second dorsal fin lower than the first; 8-10 dorsal finlets ; pectoral fin short, its tips not extending up to
Fig. 17. Little tunny, Euthynnus affinis (Cantor) (From Fischer and Whitehead 1974).
the interspace between the dorsal fins ; interpelvic process paired; anal fin followed by 6-8 finlets; body naked except for corselet and lateral line; caudal peduncle slender, with a prominant caudal keel laterally in between the two small keels at the base of caudal fin.
Fig. 18. Distribution of little tunny in the Indian Ocean.
12
Upper part of the body bluish black and lower part silvery white; characteristic black spots between pectoral and pelvic fins ; dorsal to the lateral line, behind the corselet there are a number of blue-black broken wavy lines directed backwards and upwards.
Distributed in the warm and tropical waters of the Indo-Pacific, sporadic in the eastern Pacific Ocean. In the Indian Ocean it is widespread from the east coast of Africa to western Australia and from around the oceanic islands.
Common size : 40-60 cm
prox Euthynnus sp. nov.? Silas, Pillai andMuthiah, 1981
(Fig. 19a, 19b)
Body fusiform and elongate ; lateral line single with a downward curve below second dorsal fin and steep rise above pectoral fin ; corselet well developed and with a blunt bulge adjacent to tip of pectoral fin ; dorsal fins more or less contiguous, a short gap separating the two ; first two spines of the first dorsal fin nearly equal in length and succeeding spines progressively shorter, thereby giving dorsal outline of the fin a concave shape ; second dorsal and anal lobes shorter, followed by 8 dorsal and 7 anal finlets; pectorals short, more than half of the head length ; shape of the pectorals is very peculiar in that it tapers to posterior tip abruptly and the rays present a triangular structure ; tip of pectorals reaches to below base of the 11th spine of first dorsal fin in the vertical plane. Inter-pelvic process long,
Fig. 19a. Euthynnus sp.nov. ? Silas, Pillai and Muthia (From Silas et. al., 1981).
divided asymmetrically ; posterior margin of operculum relatively straight; pre-operculum smoothly rounded in posterior outline ; gill rakers well developed on first arch with 13 numbers in the upper limb, 1 in angle and 29 in lower limb thus totalling to 43 ; ventral view of
TUNA RESOURCES

viscera follows the pattern of genus Euthynnus; total number of vertebrae is 40 (20 caudal and 20 pre-caudal) ; seventh vertebra from last caudal vertebra is squarish or ' box-like'.
Pattern of dorsal markings and those in the belly distinctive from any described species of tuna; four horizontal black stripes present on the dorsum on each side ; these stripes starts from the corselet and extend towards the caudal region; background colouration of the dorsal side bluish black with grey and silvery shades; belly silvery, marked with seven dark, thick, interrupted stripes extending from below the pectoral fin to the caudal region ; some of these stripes unite posteriorly above the posterior tip of anal base.
30'E 30 'E 40-E BO'E 80*E /O'E 80'E 80'E tOO'E 110*E 120*E 1 JQ'E
to
30' ^ * 1—•*
Euthynnus sp_ nov.
v \Nsv_-_ j
u ~ M \3
' 5
S\ 5 ^
5 ^A
s
.s
6 0 '
/ /
/
)
y
Hii
•7 /
\ r^
S \ 1
^ b
•
a * <T - v ;
*\ *
•
-4
' /
a r \
.
SB
u<
>
T
a %
1 S
/
5 '
} _JL
1
t^J
•
[*->
20 *E 30'E 40*E »0'E «0*E 70'E 80'E 90'E 100'E IIO'E 120'E. 130'£
Fig. 196. Occurrence of Euthynnus sp.nov.? in the Indian Ocean.
This specimen was described by Silas et ah, (1981). It appears to be an intergrade between what is observed in the genera Euthynnus and Katsuwonus for the following reasons:
(i) Presence of continuous horizontal stripes on the dorsal side and black stripes on the belly;
(ii) shape of the pectoral fin ;
(iii) configuration of the posterior margin of the scaly area;
(iv) number of gill rakers (43), and (v) vertebral number and the ' box-like' seventh
precaudal vertebra which is very unlike the condition seen in Euthynnus and more akin to Katsuwonus.
One specimen (56.2 cm), collected from off Mangalore in the depth between 5-11 m on 19-5-1980.
Katsuwonus pelamis (Linnaeus, 1758): Skipjack tuna
(Figs. 20, 21 ; PI. I)
Body robust, rounded and elongate; maxillary reaching nearly or quite opposite to middle of eye; a short interspace separates the two dorsal fins ; margin of first dorsal fin concave ; first dorsal spines 14-16 and the fin originates a little behind the insertion of pectoral; 7-9 dorsal finlets ; pectoral fin short; interpelvic process paired ; anal finlets 7-8 ; body scaleless except for corselet and lateral line ; corselet well denned ; lateral line with a downward curve below second dorsal; a strong keel present on each side of the base of caudal fin between two smaller keels ; margin of first dorsal fin concave ; no teeth on palatine, vomer or tongue.
Fig. 20. Skipjack tuna, Katsuwonus pelamis (Linnaeus) (From Jones and Silas, 1963a).
Backside with metalic blue colour tinged with violet; belly silvery ; three to five longitudinal, dusky to black stripes below lateral line on each side of the body.-
Cosmopolitan in the tropical and sub-tropical waters of the Indo-Pacific and Atlantic oceans. In the Indian Ocean this species has been recorded from off south and east coasts of Africa, Gulf of Aden, Red §ea, Lakshadweep Sea, Maldives, Gulf of Mannar, Secychelles, Mauritius, Reunion, Madagascar, seas
CMFRI BULLETIN 32 13

atound Sunda Archipelago, western Australia and in the oceanic waters.
1 0 t W i 40't I Q t «0 ' t /O ' j ; . , »0'C »°'E W E " O E 120'E Hft'E >'tt ' ' l l 1 - ' I V . I . nnini'M.1 h " " i » >' .i' i II1 . t . — — . — . • — . . • • "7, •,. , t ..,.., • •••—
Katsuwonus po/amis T7ji Known occurrence of *~ularvae and adults
•v io*4 4Q*i lo -e 1 70*C lO 'E SO'E 100'E HiTE 120'E IIO'E
Fig. 21. Distribution of larvae and adults of skipjack tuna in the Indian Ocean, with areas of common occurrence stippled.
Common size : 40-80 cm
Allothunnus fallai Serventy, 1948 : Slender tuna
(Figs. 22, 27)
Body elongate, with corselet of scales well developed ; jaw teeth very small, 40-45 on each side, very minute and compressed; tongue, vomer and palatine are edentulous ; gill rakers fine and numerous on the first arch,
numbering 72-80, which is more than in any scombroid fishes ; swim bladder absent.
Upper half of the body covered with scales; body bluish without distinct markings.
Distributed in the southern regions of the Indo-Pacific and Atlantic oceans. It is sporadic in the eastern Pacific Ocean.
Common size : 60-80 cm
Cybiosarda ekgans (Whitley, 1935): Leaping bonito
(Figs. 23, 27)
This species shows similarity to those of the genus Sarda in body proportions, but it has the tongue with teeth, first dorsal fin much higher than the second and spots above the lateral line ; jaws with curved conical teeth arranged in a single series ; villiform teeth on vomer; dorsal spines 16-18 ; gill rakers 12-15 ; a pair of lateral keels on each side of caudal keel; swim bladder absent.
Fig. 22. Slender tuna, Allothunnus fallai Serventy (From Col-lette and Chao, 1975).
Fig. 23. Leaping bonito, Cybiosarda ekgans (Whitley) (From Collette and Chao, 1975).
Dark spots above the lateral line and dark longitudinal stripes below.
Distributed in the coasts of eastern and western Australia between about 20°-35°S.
Common size : 35-45 cm
Sarda orientalis (Temminck and Schlegel, 1844) : Oriental bonito
(Figs. 24, 25; PI. I)
Body small and tender; mouth wide, upper jaw reaching to hind margin of the orbit or beyond; upper jaw with 12-20 teeth on each side and lower jaw with 10-17
14 TUNA RESOURCES

teeth ; vomer and tongue devoid of teeth ; gill rakers 8-13 on the first arch ; corselet narrow, extending up to the tip of the pectoral; two dorsal fins, which are more or less contiguous; first dorsal fin with 17-19 spines ; dorsal finlets 7-9 and anal finlets 6-7 ; pectoral
Fig. 24. Oriental bonito, Sarda orientalis (Temminck and Schlegel) (From Collette and Chao , 1975).
Back and upper sides of the body metalic blue ; lower side and belly silvery ; upper half of the body with about 8 bluish lines passing upwards; juveniles and young have varying number of dark, transverse bands, which in the older specimens get divided into narrow longitudinal stripes joining together in the upper part of the body.
Distributed in the coastal regions of the Indian Ocean and western Pacific ocean. In the Indian Ocean, previous distributional records of this species are from the east coast of Africa, Seychelles, Somalia Coast, Gulf of Aden, Red Sea, Arabian Sea and western Australia.
Common size : 30-50 cm
fin short with 23-25 soft rays ; interpelvic process paired ; body covered with minute scales,' anterior corselet with modified scales; keel on each side of the caudal peduncle between two smaller keels ; gill rakers fewer, numbering 8-14; swim bladder absent.
— — " . . . . — — — . . . . - . - . . . ' . ' • • ' •
20 E 30'E 40"E 50 'E fiO'E 70 E 80*E BO'E tQOE 1 1 0 E I 2 0 ' £ i l O ' 8
N
4
* SO
U
40 r W V.L
30 i ?
Sarda orientalis
z^r Presumed southern limit
2t W >
10' *&&
A
S i \ j
»
S I A
9
is
,r
[1
.*
Hi*
W &
5'
%-& •
i - f \
•
<f r
—"
' • * *\
» '1
V r *
is ^3
c y< ? \
V
r *
I
r
2 _
««
S J -
20 € 30"E 40 E » 0 * l CO'E ?0'E t o e BO'E I 0 0 ' E 110 £ 120'E 130'E
Gymnosarda unicolor (Riippel, 1838): Dogtooth tuna
(Figs. 26, 27)
Body elongate, fusiform and slender posteriorly; head elongated, longer than the depth of the body; snout pointed ; conical teeth well developed, large and conspicuous in both the jaws ; two distinct patches of villiform teeth on tongue; vomerine teeth absent; corselet small; body naked; lateral line prominent, arched over pectoral fin ; first dorsal fin with gradually sloping margin; pectoral fin with 25-28 rays, and shorter than head ; second dorsal and anal fin concave posteriority; 11-14 gill rakers; interpelvic process single; caudal peduncle with well developed median keel and two lower lateral keels.
Fig. 25. Distribution of oriental bonito in the Indian Ocean
Fig. 26. Dogtooth tuna, Gymnosrada unicolor (Riippel) (From Silas, 1963c).
Dark blue along dorsal side above pectoral; lower half of body silvery white ; first dorsal fin bluish green ; other fins and finlets dusky blue except distal portions of second dorsal and anal fins which are whitish.
Distributed in the Indian and Pacific oceans and Red Sea. In the Indian Ocean this species has been recorded
CMFRI BULLETIN 32 15
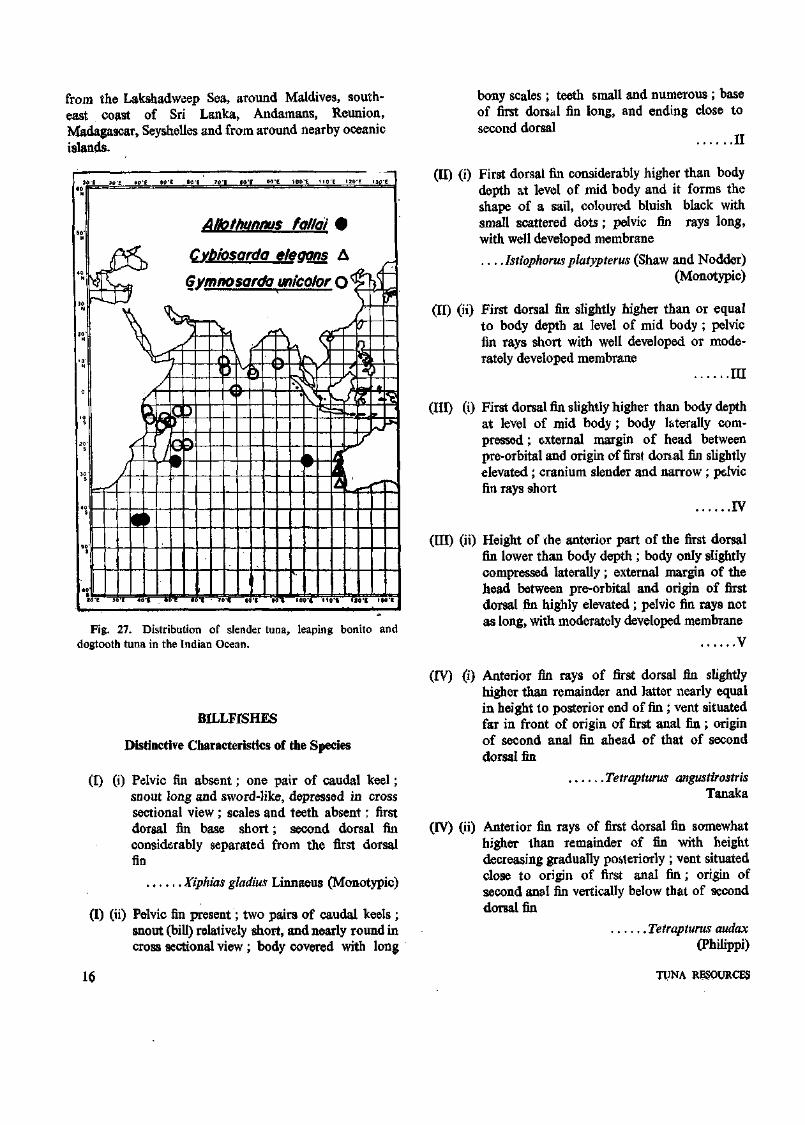
from the Lakshadweep Sea, around Maldives, southeast coast of Sri Lanka, Andamans, Reunion, Madagascar, Seyshelles and from around nearby oceanic islands.
aO'E 30-E *0'E 50"€ »0E 70 "i i0*€ SO'E 10<TE. t lO'E 120E
N
50-H
40 I vEfSr"^
30 1 ^ J
Allothunnus fallai •
^ Cvbiosarda eleaans A
Gymnosarda unicolor Q %
\ ^ M ^ \3
" JL
<t 1
T f\ S j
s
8
60
/
?\Ci ?& r
« • T
Y 7
i r a 2 w
J
-\ J
I
S
( \
^i
A 3? t V
i-r^.
^ i_ r
/
2> / '
•*
•\ j
*\ »
i \
<.
vV
»-
./
/
• — ,
ft %
V T 0 ?
i3gE
\
7
—<
/
^ <
J*
L*-fT
30'E 30'E 40"E . *0'E 60"E ' 70'6 flO'fi 60'S 100'4 t lO' t ISO'I flO'C
Fig. 27. Distribution of slender tuna, leaping bonito and dogtooth tuna in the Indian Ocean.
bony scales; teeth small and numerous ; base of first dorsal fin long, and ending close to second dorsal
II
(II) (i) First dorsal fin considerably higher than body depth at level of mid body and it forms the shape of a sail, coloured bluish black with small scattered dots; pelvic fin rays long, with well developed membrane
Istiophorus platypterus (Shaw and Nodder) (Monotypic)
(II) (ii) First dorsal fin slightly higher than or equal to body depth at level of mid body ; pelvic fin rays short with well developed or moderately developed membrane
Ill
(III) (i) First dorsal fin slightly higher than body depth at level of mid body ; body laterally compressed ; external margin of head between pre-orbital and origin of first donal fin slightly elevated ; cranium slender and narrow ; pelvic fin rays short
IV
(III) (ii) Height of the anterior part of the first dorsal fin lower than body depth ; body only slightly compressed laterally ; external margin of the head between pre-orbital and origin of first dorsal fin highly elevated ; pelvic fin rays not as long, with moderately developed membrane
V
BILLFISHES
Distinctive Characteristics of the Species
(I) (i) Pelvic fin absent; one pair of caudal keel; snout long and sword-like, depressed in cross sectional view ; scales and teeth absent; first dorsal fin base short; second dorsal fin considerably separated from the first dorsal fin
Xiphias gladius Linnaeus (Monotypic)
(I) (ii) Pelvic fin present; two pairs of caudal keels ; snout (bill) relalively short, and nearly round in cross sectional view ; body covered with long
(IV) (i) Anterior fin rays of first dorsal fin slightly higher than remainder and latter nearly equal in height to posterior end of fin ; vent situated far in front of origin of first anal fin ; origin of second anal fin ahead of that of second dorsal fin
. Tetrapturus angustirostris Tanaka
(IV) (ii) Anterior fin rays of first dorsal fin somewhat higher than remainder of fin with height decreasing gradually posteriorly ; vent situated close to origin of first anal fin; origin of second anal fin vertically below that of second dorsal fin
Tetrapturus audax (Philippi)
16 TUNA RESOURCES

(V) (i) Pectoral fin rigid and cannot be folded against side of body
Makaira indica (Cuvier)
(V) (ii) Pectoral fin can be folded back against side of body
VI
(VI) (i) Lateral line system simple without loops or reticulations; distance between first anal origin and lateral caudal keel is less than distance between origin of pelvic fin and origin of first anal fin ; chambers of swim bladder arranged in several tiers
Makaira tenuirostratus (Deraniagala)
(VI) (ii) Lateral line system with loops or reticulations; distance between first anal origin and lateral caudal keel is same as distance between origin or pelvic fin and origin of first anal fin; chambers of swim bladder arranged in a single layer
Makaira nigricans (Lacepede)
30 'E 30-E 4QE 50'E 6 0 E 70 E BO'E 90 E IQO'E 110E 130 E 13ft-E
Istiophorus platypterus
Presumed southern limit /r
30 'E JO*E 40'E SO'E «(TE 70'E «0"E flO'f 1 00 "E I I O ' E 120 -C 130"E
SYNOPSES OF SPECIES Fig. 29. Distribution of sailfish in the Indian Ocena.
Istiophorus platypterus (Shaw and Nodder, 1792) Sailfish
(Figs. 28, 29 ; Pi. Ill)
Body elongate and laterally compressed; snout long, round in cross sectional view; scales with blunt single point; lateral line curves above pectoral fin and
then continues as a straight line towards tail region; dorsal fin sail-like, with anterior rays markedly shorter than middle rays; it is bluish black in colour and with scattered dots ; ventral fin rays long, almost reaching vent; fin membrane well developed.
Sides of the body with 10-11 rows of stiiped crest patterns consisting of many light blue dots.
Distributed in the tropical waters of the Pacific and Indian oceans. In the Indian Ocean the southern latitudinal limit of this species is 40°s.
Fig. 28. Sailfish, Istiophorus platypterus (Shaw and Nodder) (From Nakamura et al, 1968). Common size: 100-240 cm
CWFRl BULLETIN 32 17

Makaira indica (Cuvier, 1831) : Black marlin
(Figs. 30, 31 ; PL III)
Body elongate, slightly compressed laterally ; bill long, circular in cross sectional view, tip of scales long and pointed; lateral line simple, obscure and consists of a single, unbranched line ; the most outstanding character of this species is that the pectoral
Fig. 30. Black marlin, Makaira indica (Cuvier) (From Naka-mura et al., 1968).
fins are rigid and cannot be folded flat against the side without breaking the joints; second dorsal fin situated a little forward to insertion of second anal fin ; chambers of swim bladder in several tiers.
Dorsal part of the body blackish or dark blue; ventral side silvery white ; no marks or blotches on the body.
Distributed in the tropical and temperate waters of the Indian and Pacific oceans; few doubtful records
20'E 30'£ 40'E 50'E 60*E 70'fc 80-E 90 E 100'E U O i HO*E UO'C
1 Fig. 31. Distribution of black marlin in the Indian Ocean.
from the Atlantic Ocean. Southern distributional limit of this species in the Indian Ocean is lat. 45°S.
Common size : 120-350 cm
18 TUNA RESOURCES

Makaira nigricans Lacepede, 1802 : Blue martin
(Figs. 32, 33)
Fig. 32. Blue matlin, Makaira nigricans Lacepede (From Nakamura et al, 1968).
Body elongate ; pectoral fin depressible, folds back against the sides of the body; anterior height of the first dorsal fin about equal to or longer than distance between origin of first dorsal fin and insertion of pectoral fin ; lateral line system loop-shaped ; chambers of swim bladder arranged in a single layer.
Dorsal side dark blue, ventral side silyery white; first dorsal fin dark blue; other fins blackish brown to dark blue.
Primarily distributed in the equatorial areas of the Indo-Pacific. In the Indian Ocean the southern limits of distribution of this species are about 40°S in the western south Indian Ocean and about 35°S in the eastern south Indian Ocean.
Common size : 120-300 cm
Fig. 33. Distribution of blue marlin in the Indian Ocean.
CMFRI eWU^TlN 32 19

Makaira tenuirostratus (Deraniagala, 1951)
(Figs. 34, 35)
Fig. 34. Makaira tenuirostratus (Deraniagala) (From Deraniagala, 1952).
Body elongate; pectoral fin flexible against the body; lateral line not visible externally; chambers of swim bladder in several tiers; sides of body much flattened; anterior part of body before the anal fin very much compressed laterally.
Dorsal side blackish blue, body sides slightly brownish with silvery white.
The validity of this species is yet to be established. In this context reference is invited to the following works : Jones and Silas, 1964 ; Devaraj, 1976.
Reported from around Sri Lanka, Gulf of Mannar and the south west coast of India.
Common size : 264 cm
20 TUNA UPSOUJICES
Fig. 35. Distribution of M. tenuirostratus in the Indian Ocean

Tetraptaras angustirostris Tanaka, 1914 : Shortbill Spearflsh
(Figs. 36, 37 ; PI. Ill)
Fig. 36. Shortbill spearflsh, Tetrapturus angustirostris Tanaka (From Nakamura et al, 1968).
Snout very short and round in cross sectional view; body laterally compressed and covered with slender bony scales with 3-5 cusps at tip ; first dorsal fin at anterior lobe is nearly same as body depth, then being evei ly high posteriorly ; second anal fin situated anterior to the second dorsal fin ; pectoral fin short and narrow ; vent situated far anterior to the origin of the first anal fin.
Dorsal side bluish gray, ventral side white to gray.
Widely distributed in the tropical and temperate oceanic waters of the Pacific and Indian oceans. The southern limit of the distribution of this species in the Indian Ocean is about 35°S latitude.
Common size : 100-180 cm
Fig. 37. Distribution of shortbill spearfish in the Indian Ocean.
CMFRI BULLETIN 32 21
yt 30 E *or *"> f «o t M f «o'F *oc roof _!±"J wo 6 na ' t
Tetrapturus angustirostris
Presumed southern limit
00 E 100'E 1lO'E IJO'E I3#'£

Tetrapturus audax (Philippi, 1887) : Striped Marlin
(Figs. 38, 39 ; PI. Ill)
Fig. 38. Striped marlin, Tetrapturus audax (Philippi) (From Nakamura et al, 1968).
t ir> I 40 t t o t «Q f. fO E tO'E 80'E tOO'E MO'E 130 E 13QC
Tetrapturus audax
Presumed southern limit
>oT so'f <o'e ocre ad'E *o*E I O ^ I O O E I O O E t t o ' E tao 'E 130'E
Fig. 39. Distribution of sjriped marlin i:i the Indian Ocean,
22
Snout long, almost round in cross sectional view ; height of the anterior portion of the first dorsal fin about the same as the body depth, but gradually decreasing in height posteriorly ; second anal fin and second dorsal fin in parallel position; pectoral fin narrow, with pointed tip; tips of first dorsal fin and first anal fin pointed; vent situated directly anterior to the origin of the first anal fin ; body densely covered with scales, the tips of which are pointed ; lateral lines on the sides curve over the pectoral fin and then continue as a straight line to the area of the caudal fin.
Fin membrane of the first dorsal fin dark blue ; back of body bluish dark ; about 10 or more cobalt coloured stripes present at the lateral side of the body.
Widely distributed in the tropical and temperate waters of the Indian and Pacific oceans. In the Indian Ocean southern latitudinal limits of this species are about 45°S in the western south Indian Ocean and about 35°S in the eastern south Indian Ocean.
Common size : 80-210 cm
TUNA RESOURCES

i i ;
&-*
T ^ , . ^
PLATE I. Coastal tunas and tuna-like fishes, a. Euthvnnus affinis (Cantor), b. Top : E. affinis (Cantor), Bottom : Euthynnussp. nov ? c. Thunnus lorggol (Bleeker). d. Top : Auxis thazard (Lacepede), Bottom : A.rochei (Risso) e. .SWa onentalis (Temminck and Schlegel). ./'. Katsuwonus pelamis (Linnaeus). (Photos a, c and e by E. G. Silas ; J by C. Muthiah ; d and / hy P. P. Pillai).

y>; £
PLATE It. Tuna longlining on hoard R/V. ANTON BRUUN in the Indian Ocean, a. Weighing of bigeye tuna Tlummis obesus (Lowe), b. Weighing of yellowfin tuna Thunnus albacares (Bonnaterre). c. Catch of bigeye tuna T. obesus (Lowe). </. Yellowfin tuna T. albacares (Bonnaterre). e. Alba/core T. alalimga (Bonnaterre). / . Top : Young bigeye tuna T. obesus (Lowe), Bottom : Young yellowfin (una T. albacares (Bonnaterre). g and h. Shark eaten yellowfin and bigeye tunas respectively. (Photos a to /; by E. G. Silas).

PLATE III. Billrishes in the longline catch. platyptenis (Shaw and Nodder), Makaira indica (Cuvier). e. Striped marlin Tetraptums audax (Philippi). (Photos a by P. P. Pillai on board M/V. PRASHIKSHANI; b to e by E. G. Silas on board R/V. ANTON BRUUN).
a. Young swordfish Xiphias gladius Linnaeus, b. Young sailfish Istiophorus c. Shortbill spearfish Tctraptums angustirostris Tanaka. d. Black marlin

PLATE IV. Tuna longlining. a. Lancet fish Alepisaums ferox. b. Alepisanrus brevirostris. c. Barracuda Sphyiaena barracuda, d. Trystis atun. e. Dolphin fish Coryphaena hippurus, female. /. same, male. g. Coryphaena equalis. h. Frozen Japanese saury Cololabis saira used as bait in tuna longlining. (Photos a to h by E. G. Silas on board R/V. ANTON BRUUN)

Xiphias gladius Linnaeus, 1758 : Broadbill Swordfish
(Figs. 40, 41 ; PI. Ill)
Fig. 40. Broadbill swordfish, Xiphias gladius Linnaeus (From Nakamura et al, 1968).
In this species upper jaw is conspicuously elongated and is in the form of a sword; it is depressed in cross sectional view ; base of first dorsal fin short and well separated from the base of second dorsal fin; pelvic fin absent; caudal peduncle with a single large keel on each side ; scale and teeth absent.
Dorsal side brownish black ; ventral side light brown ; first dorsal fin dark brown ; other fins from brown to dark brown.
A cosmopolitan species; abundant in the tropical open sea area ; the southern limit of tha distribution of this species in the Indian Ocean is about latitude 45°S-
Common size : 100-220 cm
Xiphias gladius
Presumed southern limit
C 70'C tO'C M'C lOO'E tlO'C I W C UO't
Fig. 41. Distribution of broadbill swordfish in the Indian Ocean.
CMFRI BULLETIN 32 23

m FISHING METHODS
Commercial fishing methods for tunas, tuna-like fishes and billfishes are of three major kinds, namely surface hooking, surface netting and sub-surface hooking. At present, surface fishery for tunas and billfishes is carried out by pole and line (live-bait) fishing, purse seining, surface trolling, drift gill-netting ; and deep sea fishing by longlining. Most of the inshore fishing is done by a variety of gears such as drift gillnets, shore seines and set nets. Billfishes occur as incidental catches in the tuna longline and they are also taken by harpooning in some parts of the world. In Italy, Japan and Spain 'tuna traps' were employed, but they are being replaced by set nets. Anchored floating bamboo rafts (Payaos) have been used for many years off certain islands off the Philippines as a tool for concentrating tunas and other fishes which are fished by traditional hook and line or by purse seining. Two important and commercially viable methods of surface fishery for tunas in the tropical waters are the purse seining, and pole and line fishery using live-baits.
Surface Fishery
Knowledge of the behavior pattern of tunas and billfishes, especially on their schooling behavior is of basic importance in the success of the surface fishery for these fishes. Information on different types of tunas schools, their association with other organisms and objects and on tuna hydrography have been accumulated in the past which assist in determining the areas of good fishing (Laevastu and Rosa, 1963 ; Blackburn, 1965; Green, 1967; Nakamura, 1969; Sharp, 1979; Evans et «/., 1981).
It has pieviously been reported that generally spscies of tunas move in mixed schools of two or more species often in association with dolphins, which may be due to the stimuli common to them such as food. Usually, tuna schools consist of fishes of the same size and as
the number of the fishes in the school decrease the larger they become. Further, some tunas school at night, the visual fixation point for schooling apparently being aided by the moon light or bioluminescence. Japanese fishermen distinguish tuna schools as 'mizumochi' and ' toromi' (densely packed underwater schools) and ' haragaeshi' (slow moving schools in which some tunas swim upside down).
York (1977) reported on the school identification of different species of tunas in the New Zealand waters, and according to him skipjack shoals first appear as ' flashers ' or * shiners' due to the sun reflecting on the silvery ventral and part lateral surfaces and this stage is often followed by the recognisable pattern of ' boiling' or ' foaming school'. When a skipjack school swims on the surface without actively feeding it appears as a flat spot or ' breezers' and the solid mass of fish underwater may appear as a 'black ball'. York (1977) stated that the schools of albacores are difficult to distinguish from the surrounding waters unless they are close inshore when the school will appear as a ' black ball'. In aerial school identification at low altitude, occasional ' finners' can be observed and at certain times they also appear as ' shiners' in the oceanic area. Yellowfin tuna schools with other tunas, mainly skipjack and occasional 'jumpers' exhibiting fins and finlets as yellow flashes can be observed during aerial surveys.
The pattern of ' boiling' and ' breezing' skipjack schools observed earlier by one of us (E.G.S.) in the Lakshadweep Sea is given in PI. VII.
In order to locate the tuna schools, the knowledge of their association with other organisms are made use of. Tunas are frequently found in association with fishes such as sharks (' whaleshark school') small prey fishes (' prey fish school'), live and dead whales ('whale associated school'), porpoises (' porpoise associated
24 TUNA RESOURCES

school') and birds ('sea bird school'). Tunas associated with the preyfish sometimes skip at the surface of the sea in its pursuit of prey. Tunas such as yellow-fin in the Pacific are often found in association with dolphins and porpoises such as the common dolphin {Delphinus delphis), spotted porpoise (Stenella attenuate!), spinner porpoise (S. longirostris) and striped porpoise (S. coeruleoalba), and it has been reported that tunas swim below the porpoises. The causative factor for such an association has been attributed to be food based. As a conservation measure to protect the porpoises during purse seining new purse seine systems called ' Bold contender' and ' Super apron' and ' backing down technique' have been introduced in the Pacific fishery recently.
Pole and line fishermen considerably depend on sighting bird flocks to locate tuna shoals. The behaviour of the birds are relied upon to determine the characteristics of the tuna schools such as the species, its size, state of feeding and depth and size of school.
Natural and artificial objects which drift in the sea often serve as attractants for tunas. They frequently congregate below objects such as logs, drift woods and floating vessels. Tuna schools sometimes wander as far as 16 km from such floating objects and then return to them (Nakamura, 1969). It has been postulated that the property of drifting objects as refuge for predators or as visual fixation point for schooling is the causative factor for such behaviour. Recently, it has been reported that tunas are fished in large numbers from around certain islands of the Philippines using ' Payaos', a floating raft made up of two layers of bamboo laced together in a ' v ' shape (Murdy, 1980). The vegetative growth on the coconut leaves hung from the 'Payaos' attracts small pelagic fishes which in turn attracts free swimming schools of tunas. Matsu-moto et ah, (1981) reported on the ' Fish Aggregating Devices' (FAD) moored in Hawaiin waters during 1977-79 and stated that these buoys successfully attracted numerous pelagic fishes including large schools of skipjack and small yellowfin tunas which were taken by commercial pole and line fishing.
Pole und line (live-bait) fishery
Pole and line live-bait fishery is mainly employed by the Japanese and American fishermen in the Pacific Ocean. Tuna clippers of the U.S.A. (East Pacific), the combination vessels of Japan and the pole and line fishing boats of Hawaii and France chiefly employ this technique to catch the younger ones of large tunas and other species such as skipjack, albacore, bonito and little tunny. This method has also become important
in the eastern tropical Atlantic and Bay of Biscay-In the Indian Ocean, pole and line fishing is being carried out in the Maldives, Lakshadweep Islands, Sri Lanka, northern Madagascar waters and south-east coast of Australia.
The fishing gear is a bamboo pole/fibre glass pole, 4.5 to 6.0 m in length, fitted with a line bearing a barbless hook. The line is made of hemp/cotton/ nylon/vinylon and is about 35-40 cm shorter than the length of the pole. Barbless hooks are commonly used, but artificial ' squid hooks' or baited hooks are more efficient when barbless hooks are used (Fig. 42).
Baiting habit of the tunas are relatively good in the morning and hence the time of sunrise is ideal for locating tuna schools. On reaching the fishing ground shoals are detected visually or by trolling tests, observing the colour of the water or locating the presence of flocks of sea birds diving. Tuna shoals are also located visually by searching for surface activities such as breezing, flashing or fining schools. When a promising shoal has been detected, it is attracted towards the slowly forward moving vessel by ' chumming' (action of throwing live-bait overboard). When the school rises to the bait, the vessel is stopped and fishing commences. The fishermen carryout the fishing from the platforms specially constructed along the bulwark below the deck level. When the baiting slackens, the live bait is attached to the barbless hooks. For larger fishes of more than 10 kg, two anglers work together by joining two poles to a single hook to bring in the fish.
Operational details of the pole and line fishery varies in different areas. Japanese fishermen purchase the live-bait from the dealers and carry them in the bait wells in the well deck basin in the forward of the vessel-Water circulation in the wells are maintained through the holes at the bottom of the tanks. ' Bait carrier vessels' also supply bait to the pole and line fishing vessels at the fishing ground. Fishing is carried out at the stern and sides of the vessel. Japanese fishermen use the sea water spray system during fishing which ruffles the surface, presumably presenting the impression of a shoal of small fishes to the tunas. This system also helps to conceal the shadows of the vessel and the fishermen. United States tuna fishermen catch bait-fishes prior to leaving for fishing operations. Live-bait are caught by lampara net during day and by lift nets during night, and are kept ir raised tanks at the quarter deck. Water circulation is maintained in the tanks by a powered pump. Fishing is carried out from the bulwark on the port side and around the stern. Water
CMFRI BULLETIN 32 25

spray system is not practised by the U.S. tuna fishermen. Recently, automation of the pole and line in the Japanese vessels and U. S. tuna clippers have been adopted which help in reducing the number of the crew.
In Japan, distant water pole and line fishery employ wooden or irteel vessels of 200 and 250 GT (35 m OAL) fitted with diesel engine of 1,000-3,000 hp. (Ben-Yami,
1980). Normally, 10-12 live-bait tanks each with a total holding capacity of 240-600 kg bait are arranged on the deck. Refrigeration facility includes 2-4 brine-freezer tanks (capacity 20-60 t per day at -18°C) and semi-airblast ' sharp freezer' (capacity 2-5 t per day
at -45° to -60°C.). Medium sized tuna pole and line vessels are generally of 30-100 GT fitted with 400-800 hp engine and with a speed of 10-11 knots. These vessels operate in the eastern Pacific, 1,000-2,000 km offshore. They are fitted with 5-6 live-bait tanks and are with a crew compliment of 20-25. Other medium type Japanese vessels consist of 39 GT type (OAL 19.5 m)
with a cruising range of 3,200 km and with a cruising speed of 8 knots. They are fitted with 250 hp engine and are provided with 3 bait wells. United States tuna clippers consist of small 20-40 m boats for operation in the coastal waters and larger 27-51 m boats
Fig. 42. Pole and line (live-bait) fishing gear. Different types of hooks andjiggsin use in the Indo-Pacific (part from Ben-Yami, 1980).
26 TUNA RESOURCES
(60-300 t) for fishing in the oceanic waters. Usually, they are fitted with 200-1,200 hp engine with 9-12 knots cruising speed.
Other vessels include Hawaiin skipjack pole and line fishing vessel (12-25 m OAL), those used in the European countries (12-20 m OAL), the vessels employed in the small scale Japanese pale and line boats (5-25 GT), Sri Lanka pole and line boats (4.5 m OAL), Lakshadweep non-mechanised * odis' (9.75-12.2 m OAL), mechanised boats used in Minicoy and Lakshadweep Islands (7.93-9.14 m OAL), Maldive ' dhoni' (4.90-6.10 m OAL) and the small boats used for pole and line fishery at Tahiti (10-11 m OAL). In Australia, the combination vessel ' pole-stern trawler' is being fabricated and put to use in the tuna pole and line fishery.
The major factors involved in the pole and line fishery are : (0 the supply of live-baits, their handling, maintenance and utilisation, and (ii) use of barbless hooks which facilitate baiting and unhooking in limited time. According to Sharp (1979) in some fisheries, where bait is collected in cooler waters (<26°C) they can be held in bait tanks for more than one month and in other fisheries, which are based on shorter trips and where the bait fishes are taken from tropical waters, the expectation ranges from less than one day to one week. Japanese pole and line fishermen commonly use Engraulis japonicus and Sardinopsis melanocera as live-baits whereas in the East Pacific pole and line fishery Cetengraulis mysticetus, Sardinops saga, Engraulis mordax and Sardinops caerulea are being commonly used by the U.S. tuna fishermen. Bait fishes generally used by Hawaiin fishermen are Stolephorus parpurensis and Paranesus insularum. The main problem facing the pole and line fishery is that large quantities of bait fishes must be readily available, and these should be collected from the coastal waters. It has been estimated that for catching one tonne of tuna, the baitfish requirement is about 50-150 kg depending on the quantities used for chumming and density of tuna shoals (Johnson, 1966). The problems involved in the fishery, transportation and maintenance of tuna live-baits have recently been discussed (Shomura, 1977; Ben-Yami, 1980) and is included in Chapter VI of this bulletin. It is noteworthy that one of the problems associated with the expansion of the existing pole and line fishing in the central and western tropical Pacific is the lack of adequate bait fish supply.
The small scale pole and line fishing for tunas in Minicty and nearby islands has earlier been reported by Hornell (1910), Ellis (1924), Mathew and Raroa-
chandran (1956), Jones (1958), Jones and Kumaran (1959), Verghese (1971), Puthran and Pillai (1972) and recently by Ben-Yami (1980). Christy et at, (1981) has reported on this fishery in Maldives. The special type of boats employed in this fishery in the Lakshadweep are generally of two sizes, viz, 7.93 m and 9.14m OAL. These are open, square stern, wooden boats fitted with engines of 10-40 hp. A mast of about 10 cm diameter and 3-4 m in length is also provided behind the forecastle deck for setting sail if the engine fails. A water tight wooden bait tank of about 1.0 x 0.8 x 0.8 ra average dimension is fitted in front of the engine room. Th« live-bait is kept in the bait tank by circulating sea water through the tank with the help of inlets and outlets. The space between the wooden partitions and th& hull is covered on the top by wooden planks both on the port side and starboard side thereby forming a narrow deck of 30-40 cm wide on both the sides. The space between the engine and the quarter deck is used as the fish hold.
For pole and line fishing in the Lakshadweep, poles of strong and flexible bamboo sticks of 3-4 m in length and with 35-40 mm diameter at the butt and 20-35 mm diameter at the tip are used. Polythene or nylon twine line is attached at the tip of the pole. The hook is attached to this line by a nylon, continuous monofilament of about 1/3 length of the pole. Barbless, lead coated hooks of two sizes are used in the tuna fishery. One end of the hook is flattened to avoid it from slipping from the knot due to the weight of the fish. The other end is pointed without a barb. • The total lengeh of the line along with the hook from the pole end is equal to that of the pole. A water splasher, mads of wooden pole (about 1.2 m long) and coconut spaihe (40 cm long) is also used during operation. The bait baskets used to scoop the fish from the bait tanks and throw it in to the sea during chumming consists of a circular cane frame of about 20 cm diameter and 10 cm in height to which is attached a circular net piece on one side (6 mm mesh). A circular plate of about 50 mm is attached to the centre of this scoop.
Prior to pole and line fishing, bait-fishes are collected by a ' bait net' of size 4.6 x 5.5 m and made of cotton twine. The mesh size at the centre of the net is about 6 mm and around the border about 8 mm. Usually, the bait fishes are collected in the early morning or on the previous evening. In order to attract the bait-fishes, fish meat paste is generally used. By this method of bait fishing it would normally takes about \\ to 2 Hrs to collect about one thousand bait specimens. After collecting enough bait-fishes, the fishing vessels
CTffRI BULLETIN 32 3
27

proceed from the lagoon to the fishing ground. When a shoal is detected the vessel is steered in that direction and the speed is maintained at 1.5 to 3.0 knots. During fishing operation the water splasher is used to splash water over the hooks in order to conceal them. Tunas are chummed near the boat by the live-bait which are thrown overboard. During biting, tunas take the live-bait and the hooks and are taken on board. At times tunas take live-bait without touching the hooks. On such occasions the bait is used on the hooks. Usually when the fast biting shoals are nearby, the vessels will be loaded within about 30 minutes. In the case of slow biting, it may take 3 to 4 Hrs to load the vessel. Under normal conditions the fishing is continued until dusk.
Purse seine fishery
Large scale purse seining for tunas is employed by the United States in the eastern Pacific Ocean. Japan employs this fishing method in the area off the east coast of Japan, off west Africa (two-boat seining) and
of a tuna pufse Seine net. Besides this a knowledge of the environmental parameters, especially the depth of the thermocline and surface wind speed are vitally necessary for the successful operation of tuna purse seine in open oceanic waters. Modern seines generally range in length from about 1,200 m to 1,600 m. The design depth of fishing is usually up to 80 m, but some nets are designed to fish to nearly 100 m. The gear consists of equal parts of monofilament nylon net laced together by steel zipper rings and nylon zipper ropes. Plastic floats are threaded along the nylon cork line in groups at fixed intervals. Lower lead line is made up of a continuous chain, hung at fixed places of joints of the net with bight of chains attached at intervals. Purse ring bridles holding purse rings are linked to these bights. Purse line, made up of stainless steel wire is passed through these rings. Monofilament nylon/vinylon/tetron are the materials used to construct the net (Fig. 43), Although the construction of the net is more or less standard, the size of the net varies depending upon the ecological condition
Hand rope
Fig. 43. A typical tuna purse seine net.
western South Pacific (one-boat seining). In the Atlantic, purse seining for tunas is chiefly confined to the equatorial waters. Norway, Argentina, France and Spain also employ this technique for catching tunaa and bonitos in the Atlantic Ocean and the Mediterranean Sea. Large scale purse seining, as is being carried out in the Pacific Ocean is non-existent in the Indian Ocean.
High laying out speed, quick sinking, capacity to withstand the force of impact of tunas and the final configuration during pursing are the necessary features
of the fishing ground and the behaviour pattern of different species of tunas. The two-boat bluefin tuna purse seiners of Japan use a net with cork and lead line with length of 2,500 m and a depth of 270 m. Japanese one-boat purse seiners in the western Pacific area, fishing skipjack and yellowfin use purse seine with corkline and leadline lengths of 2,000 m and a depth of 250 m. In the U.S. west coast purse seine fishery for yellowfin and albacore nets of more than 1,000 m length are commonly used. Norwegian purse seine fishing for bluefin tuna chiefly employs nets 670 m long and 100 m wide.
28 TUNA RESOURCES

Fig. 44. Single boat purse seine operation (From Anon, 1976).
CMfW BULLETIN 32 29

Tunas are located during scouting mainly by visual signs including sea-bird flocks and their behaviour. Some of the developments have resulted in purse seining at night also on ' fire balls' or bioluminescence created by the passing tuna shoals which gives the outline of the school. When a shoal has been located, and the vessel catches up with it, the seine net is laid to encircle the shoal with the help of a power boat (skiff). After setting is completed, the skiff hands over the hauling line and the end of the net to the purse seine vessel. Immediately the steel cable at the bottom of the net is pulled in and the net is closed like a pouch purse (Fig. 44). Power blocks which are hydraulically operated, hauls the net into the vessel. The net is then hauled in until the enclosed area is at a minimum. A power driven brailer transfers the catch abroad the vessel. Usually the fishes are refrigerated in the holds to a dry storage temperature of -12°C. In view of the developing demand for fresh tunas, the catch is also stored under refrigeration at -50°C using air-cooled freezers.
Purse seine vessels have a clear after deck with wheel house and accommodation well forward. The ideal speed of tuna purse seine vessels is 16 knots. Power blocks are mounted on heavy duty derricks and masts on board the vessel. The turn table for stacking the net is equipped at the stern. Three or four specially designed seine drum winches are also provided on the deck. A comparison of the gross tonnage of the purse seine vessels employed by different countries is given below :
Argentina France (Mediterranean) France (West Africa) U.S.A. Japan (One-boat) Japan (Two-boat)
Fish Bonito Tuna Tuna Tuna Tuna Tuna
GT 30- 200 15- 200
400- 450 500-1000
50- 500 30- 100
In recent years, vessels of 68 m OAL are employed by U.S.A. and France. Super seiners of more than 1000 GT are being built by the U.S.S.R. With the the introduction of synthetic material such as nylon and vinylon for netting, and hydraulically operated power blocks, it has become common in the U.S.A. to convert the tuna clippers into purse seine boats. In Japan, one-boat carrier type of seiners are becoming more prevalent than the two-boat seiners.
In view of the stress on the light purse seine gear by large shoals of tunas, the larger vessels are equipped with heavier and deeper nets in recent years. Further, the introduction of ' Marco' power blocks and heavier
net webbing helped the expansion of this fishery. The modern tuna super seiners are generally with a capacity of more than 1000 GT and can be at the sea for over 60 days fishing under rigorous conditions. A typical tuna seiner recently built in U.S.A. has an overall length of 68.59 m, a breadth of 12.50 m and a moulded depth of 5.79 m and the 17 brine wells have a capacity to hold 1200 tonnes of tuna. ' Marco' hydraulic system includes ' Marco' superseiner winches and a ' Marco' 54 inch power block with ' Powergrip'. The electronic navigational equipment includes the scanning sonar, radars, echosounder, weather-Fax, satellite receiver and radioequipments. For scouting tuna shoals, the ship carries a 300 turbine powered helicopter. Aluminium ' chase' speed boats are powered by inboard-outboard units (World fishing, 1980).
Surface Trolling
Surface trolling for tunas and billfishes is being conducted in the coastal waters of many countries, especially in the Pacific Coast of Japan, north-west coast of U.S.A., west coast of South Europe and in the coastal waters of some Asian countries. Basically, trolling is carried out by dragging one or several hooks (up to 16 lures) from the outriggers or the stern of a slowly moving vessel. The fish is hooked when it snaps at the lure and held by the mouth until it is taken aboard.
The outrigger poles are usually constructed of bamboo or wood since they should be light and reasonably flexible. The length and size of the pole varies in different countries. In Japan, poles are about 8-9 m, which tapers from 10 cm at the base to about 3.8 cm at the tip. Poles used in the north-west coast of U.S.A. are 7.5-18.0 m long and taper from 10.2 cm at the butt to 5.1 cm at the tip. The outrigger poles are generally arranged vertically along the mast of the vessel by means of sockets at the end of the pole. The lines are made of hemp rope/twisted nylon/monofilament nylon/dacron. Number and length of lines vary according to the type of operation. In order to absorb the shock caused when the fish strikes, a shock absorber is commonly used between the pole and tag line. A wire leader is also used before the jig in order to avoid the line being cut by the teeth of the fish. But, increased use of the synthetic material and steel trolling wires along with trolling gurdies to handle the fishing line eliminates these two. In recent years depressors are also attached to the line which enable operations at deeper layers. Hooks used are single or double ; barbed and barbless hooks are also used. Lures are generally made from feather, plastic and bone and are
30 TUNA RESOURCES

mostly in the form of artificial squids. Hooks are attached to these lures.
During operation the outrigger poles are lowered so that they are horizontal and the angle of the pole is adjusted according to the fishing operation (Fig. 45 a-c). The speed of the vessel is maintained at 1 or 2 knots during fishing. The hooking of the fish is indicated by a jerk in the outrigger and to take the fish the gurdy spool is used to wind the line. In those operations where the tag line and clip arrangements are employed, the trolling line is undipped when the joint of the tagline reaches the rail. Subsequently, empty leaders are undipped as hauling continues and the hooked fish is taken aboard.
boats are used in this fishery. Small boats measuring between 8.2 m and 8.8 m employ seven lines and the large boats of 9.1-10.4 m use 9 lines for trolling. Each of the lines is denoted by separate names starting from the outermost to the starboard side. Six of the troll lines are attached to the booms of varying size. The boom on the starboard side is 4.3-4.9 m long and carries 4 lines. The second boom is shorter, 3.0-3.7 m in length and carries 2 lines. The butt end of these booms rest on the side planks and the basal portions are rigged by ropes to keep them in position at an angle of about 40°-45° to the horizontal. Generally, the length of the troll lines attached to the booms are 33-46 m long where as the other lines may be 27-37 nt
POLE
Asmm
SWER AND ARTIFICIAL BAIT
Fig, 45, a-c, Different types of surface trolling gears and crafts. Fig. c Is the one which has been in vogue at Tuticorin (From Anon, 1975 and 1979 ; Silas, 1967).
Vessels of about 7 m with a crew strength of three to four persons conduct this fishing in Japan. In the U.S. west coast fishery, wooden vessels of 10-14 m are employed for surface trolling.
The regular seasonal fishery for tunas along the Tinnevelly Coast, Gulf of Mannar, which has been in vogue for over 50 years mainly using multiple troll has been described by Silas (1967). Two major types of
long and made of three-ply cotton, the diameter of which being 4.2 mm. Hooks of two different types are used measuring between 7 and 8 cm. Trolling is done with fish bait or with artificial coloured lures (Fig. 45c).
Anchored Fish Aggregating Devices (FAD)
As stated elsewhere in this report, the attraction of pelagic fishes including tunas to floating objects has
CMFRI BULLETIN 32 31

been investigated and reported on by several authors (Hunter and Mitchell, 1967, 1968 ; Inoue et al, 1968a, 1968b). Yamanaka et al. (1973, 1974) conducted experiments to study the association of skipjack to artificial floating platforms. Recently, Murdy (1980)
reported on the commercial harvesting of tunas from around tuna-attracting ' payaos' off Mindoro, Negros and Mindanao islands of the Philippines. Anchored floating bamboo rafis have been used for many years off these islands by tuna fishermen on a local
BUOY
—ANCHOR LINE
-•SWIVEL
MAIN ANCHOR
COUNTER WEIGHT
Fig. 46«. Tuna attracting ' payaos' used in Phillippines (From Murdy, 1980).
32 TUNA RESOURCES

level to concentrate schools of yellowfin, skipjack and little tunny. The aggregated tunas were traditionally caught from bancas by hooks and lines, but recently commercial purse seining has been introduced. The ' payaos' anchored in approximately 1,100 fathoms and are placed about 10 km apart for about one month (Fig. 46a). The raft, about 4 m long and 1.5 m at the widest end is made of two layers of bamboo lashed together in a ' V ' shape. The anchor line is attached to a tyre secured to the bamboo about three meters
9-LlGHT(50Fl ASHES/MINUTE)
T " KADAR REFLECTOR I
from the tip. The first 40 m of anchor line is made of wire and this is attached to a swivel connected to a counter-weight of 40 kg. The counter-weight act as a shock absorber and takes some of the strain off the anchor line. The main anchor, which weighs about 400 kg is connected by 5 m of nylon rope to the counteT-weight. In order to avoid the loss of anchor line and bamboo raft by currents and wind, a buoy is also secured to the swivel where the wire meets the nylon rope.
A wc'gh ed hanging line, usually of about 20-25 m long, with coconut leaves tied to it at 2 m interval serve as ' fish attracters'. The algal growth on the coconut leaves attracts small fishes, which in turn attract the free swimming tunas. Once they begin to concentrate, their number increases steadily and become high for a commercial harvest within 3 to 4 weeks. A caretaker who occasionally visit the ' payaos' notice the concentration of tunas and inform the owners of the ' payaos ' about the time of harvest.
£~ LIGHTI60 FLASHES PER MINUTE
V - RADAR REFLECTOR
Murdy (1980) described the method of purse seining carried out to commercially harvest tunas from this area. An average of 15 tonnes was taken and the major species were yellowfin, skipjack and little tunny. He also suggested steps to improve the system and to make it more durable and efficient.
Recently, Matsumoto et al, (1981) reported on the results of the projec* on Fish Aggregating Devices (FAD) moored in Hawaiin waters off the islands of
BATTERY-CASE
'/^POLYPROPYLENE ROPE NETTING
eouv-
2-55 GAL DRUMS
5' CHAIN
BATTERY COMPARTMENT
-40 ' DRAPE
~50'CHAIN
•CHAIN LINK WEIGHT
- S / 8 " POLYPROPYLENE
-50'CHAIN
LBS ^ L _ J i"PIPE,l2'LONG
^HAW LINK WEIGHT
RAFT - 4 » 12 (ALL SECTOR FILLED
WITH FOAM)
2 CHAIN,**'LOWS
1,200 LBS CONCRETE B'.OCK
DRAPE 40'-45' V i ^ " 0 * ROPE
15 LB W E 1 G H T ^ f l ( l " M E S H NETTING)
Fig. 466. ' Buoy type' and ' Raft type' Fish Aggregating Devices used in Hawaii (From Matsumoto et al., 1981).
CMFRI BULLETIN 32 33

Oahu, Lanai and Hawaii during May, 1977 to July, 1979. The objectives of the project were to develop and test anchored fish aggregating devices in the open ocean area ; to determine their effect on the skipjack pole and line fishery in Hawaii and to investigate the effect of buoy placement relative to distance from land, depth and bottom topography. 'Buoy type' and ' raft type' devices were used in the experiment (Fig. 46b). Results of the investigations indicate that these buoys successfully attract numerous pelagic fishes including large schooto of skipjack and small yellowfin tunas. Wahoo and dolphin fish appeared from one to three weeks after the buoys have been anchored and were taken by trolling around the buoys. Schools of tunas, small yellowfin, skipjack and little tunny generally appeared from two to five weeks after the buoys have been deployed. Commercial tuna pole and line fishermen were benefited greatly by taking large catches of tunas from around these FAD's. It is also reported that the buoys anchored in deep water within 2 miles of the 1,000 fathom ledge was particularly successful in attracting tuna shoals, when compared to the FAD's anchored at 6 and 15 miles shoreward of the 100 fathom ledge.
Dr. Siebren G. Venema, Fishery Resources Officer, FAO, Rome (personal discussion) informed one of us (E.G.S.) that trials of fish aggregation system is also being developed in Indonesian waters where floating objects are being anchored at depth of about 1,000 m. Christy et al., (1981) have stated that similar trials are contemplated in the near future in the Republic of Maldives. We feel that such a system could also be adopted in the Lakshadweep group of islands to enhance tuna production in the artisanal sector. However, a beginning has been made in setting up ' payao' type fish aggregating device in the Kavarathi of the Lakshadweep Islands by the Department of Fisheries in December, 1981, which throws up good possibilities for increasing tuna fish production in the small scale sector by the extension of this method to other islands also. This could also be tried along the east coast, particularly outside the shelf waters along Tamil Nadu and South Andhra Pradesh and off the Andaman -Nicobar Islands.
Sub-Surface Fishery
Longline Fishery
Longline fishing for tunas and billfishes is mainly employed by Japan, Taiwan and ROK in the world oceans and to a limited extent by Hawaii, Cuba, South Africa and French Oceania. This gear is designed to
34
fish deeper swimming tunas and billfishes which are randomly distributed in the 50-100 m depth (ordinary longline) and even up to 300 m depth (deep longline). The by-catches of this gear consist of pelagic sharks, lancet fishes and a variety of other epipelagic species of fishes.
The structure of longline gear varies according to the efficiency of the vessel, species of tuna sought for and oceanographic condition of the fishing ground. Fundamentally, the gear consists of a main line of continuous length which is supported by float lines-These float lines are, in turn connected to the buoys
A TYPICAL LONGLINE GEAR
o - Branch line
b - Sekiyama
c - Wire leader
d - Hook
Fig. 47. A typical longline gear and its parts.
TUNA RESOURCES

TABIE 1. General form of i una longline1
Part of longline Material length (ra) Number used in one 'Basket*.
Main line
B
r a
n
c
h
I
i
n
e
Branch line rope
Compound wire
Wire leader
Hook
Float line
Flag bouy
Radio buoy
Cremona/cotton and cremona coated with coal tar or synthetic resi/cotton lines with 2-3 ply thread of hard twist and vinyt6n line
Same as above or a little thinnsr
9 ply steel wire, with help, yarn or cotton or cremona coiled around
9 ply steel wire
Steel
Cremona
250 (200-400)
11 (5.15)
5.5 (6-8)
3.0 (1.5-3.0)
0.091
22.0 (20.0-30.0)
1
4 (3-6)
4 (3-6)
4 (3-6)
4 (3-6)
••
Flag, bamboo pole and float made of synthetic resin
2 or 3 for all baskets
1 Modified after Morita (1969). Figures in parenthesis indicate ranges.
TABLE 2. Examples of Japanese Longline gearl
Type of longline:
(Units: meters)
B.
The structure of 1 basket of the line : Length of mainline Length of branch linee:
Cotton/vinylon rope Ganged wire leader Wire leader Length of float line Number of hooks
Estimated maximum depth of each hook of the line shown above Hook No. 1 Hook No. 2 Hook No. 3 Hook No. 4 Hook No. 5 Hook No. 6
300 300 300 300 300 245 360 350
13.5 6.0
.. 1.5 18.5 5
86.5 .. 127.5 .. 148.5
127.5 86.5
10.5 6.0 2.0
19.5 5
85.0 126.0 147.0 126.0 85.0
12.0 8.0 2.5
20.0 5
89.5 130.5 151.5 130.5 89.5
11.5 6.0 1.5
16.5 5
82.5 123.5 144.5 123.5 82.5
12.0 7.0 2.0
22.0 5
90.0 131.0 152.0 131.0 90.0
12.0 8.0 2.0
18.0 4
84.5 123.0 123.0 84.5 ••
14.0 7.0 3.5
22.5 4
113.5 169.5 169.5 113.5
. .
12.0 7.0 2.5
25.0 6
92.5 136.5 168.5 168.5 136.5 92.5
* Source : Suda and Schaefer, 1965.
CMPRI BULLETIN 32 35

at the surface at fixed intervals. Branch lines are composed of three sections, viz., branch line rope, compound wire and wire leader. Baited hooks are attached to the wire leader. The construction details of a typical longline gear is given in Table 1 (Fig. 47).
Suda and Schaefer (1965) dealt with some examples of longline gear employed by the Japanese fishermen and stated that the types 1-5 (Table 2) are more prevalent. The estimated depths of hooks in different types of longline gear has also been included in their report. However, as illustrated by Nomura and Yamazaki (1975) different types of longline gears are used for fishing different species of tunas (Fig. 48).
by the total number of branch lines. The length of the mainline, the nature of operation, and the behaviour pattern of the fish sought for are taken into consideration to determine the number of branch lines to be fitted to the mainline. In the branch line, the length of branch line rope varies from 5-15 m ; the compound wire 4-8 m and the wire leader 1.5-3.0 m. Hooks are round in shape, about 9.1 cm long and made of galvanized steel with well developed angle which allows the fish to remain alive for a long time before being taken in.
Prior to the beginning of longline operation, measurements of vertical temperature structure and direction
Yellow fin tuna 0
[/ /
/
/
Fig. 48. Designs of longline gears employed for fishing different species of tunas and striped marlin (From Nomura and Yamazaki, 1975).
Sharp (1979) presented the average temperature structure in the Indian Ocean and opined that the longline hooks generally hang from 28°C to 15°C in the equatorial areas and between 20°-15°C in waters around 30°S.
An average longline will consist of about 300 baskets of line, fishing between 1500-2000 hooks per setting and extending up to 60 nautical miles. The length of the mainline per unit basket (200-400 m) is divided evenly
of the currents ate laken in order to locate productive fishing grounds. During the operation, the unit lines are joined together, bamboo poles attached to the floats, floatline connected to the mainline and the hooks are baited. Common baits used are squids, Pacific saury (Colalabis saira), mackerels (Scomber spp., Rastrel-liger sp.) and mackerel scad (Decapterus spp.). Shooting of the lines begins at early dawn, usually between 0300 and 0500 Hrs and is completed in 4 to 5 Hrs.
36 TUNA RESOURCES

Sets are cast from the stern of the vessel and the vessel speed is maintained at 8 knots per hour. After setting is completed, the vessel drifts until it comes to the end of the line. Hauling is done by the line hauler which also coils the mainline at the platform attached to the hauler. Completed sections are transferred to the stern of the vessel where they are stacked for re-shooting. It has been estimated that depending on the number of fishes caught, the average time required for hauling in 400 baskets is about 10-12 Hrs. Fishes are taken aboard through the opening of the bulwark and prepared for freezing.
Two types of vessels are used in the longline fishery. One is the ' combination boats' of 200-300 MT which is used for pole and line and longline fishery. The other type is used exclusively for longline fishery and
in these vessels the hold space is about 20-40% more than that in the former. The size of the vessel varies from 50-500 GT, but vessels of 200-400 GT are most common. Motherships larger than 1000 GT also are employed in the longline fishery. Larger motherships of 2000-3000 GT carry 5-6 wooden or FRP catcher boats of 15 m long, each of which can operate about 200-250 sets of lines. The distribution of the effort (number of sets and hooks) extended by the Japanese and Taiwanese longline fleets in the Indian Ocean in recent years is given in Tables 7, 8 and 9.
Recently, many innovations have been introduced in the longline fishery especially towards the automation of the operation. These include the hydraulically operated line hauler, reel type and tub type longlines, slow conveyor, guide stand, guide roller, gear conveyor system and the line winder (Fig. 49). Most of the longliners are fitted with fish detector. The vessels are also equipped with refrigerated holds capable of preserving the catch at -40° to -60°C. The possibility of utilising the silver carp (Hypophthalmichthys molitrix) and artificial preparations containing extracts of saury as longline bait are being investigated. The milkfish {Chanos chanos) with its brilliant silvery appearance and with fast growth rate can be cultured and utilized as a successful longline bait (Silas et al., 1982).
Ueyanagi (1974) reported about the 'Night longlining'
which is aimed mainly at fishing sword fish. The gear is set to fish at shallower depth at night by means of additional floats and gear parts. The bait used in this method is usually squids.
Another noteworthy development in the longline fishery is the introduction of' deep longline' for fishing tunas in the deeper layers (Fig. 50a). Suzuki et al., (1977) described this gear and compared the catches of tunas and billfishes by the regular and deep longline gears by the Japanese vessels in the western and central
GUIDE ROLLERS
UNESHOOTER
MAINLINE
GUIDE ROLLER ROPE CHUTE GUIDE ROLLERS LINE HAULER ~ SLOW CONVEYORy^. SIDE ROLLER
MAINLINE
WATER TANK
MAINLINE REELER
Fig. 49. Arrangements for shooting and hauling longline gear on board the longline vessel (From Yoshida, 1966).
CMFRI BULLETIN 32 37

equatorial Pacific. In this gear, hooks are deeply set by increasing the length of the mainline and by adjusting the lengths of the float line. Typical catenary curves of the ordinary longline (6 hooks) and deep longline (13 hooks) are shown in Fig. 50a. In the deep longline gear, the number of branch lines vary from 4-15. The number of baskets set per fishing operation normally range from 150-350 and on an average 2000 hooks are set per operation. The floatlines are of 20 m in length and the branch lines of 30 m. The distance between the branchlines is about 50 m. Recent investigation on the catches by regular and deep longline gears in the western and central equatorial Pacific area (Suzuki et al, 1979) indicate that bigeye tuna is the deepest inhabitant among tunas and billfishes and the hook rate of this species was relatively high in the deep longline. According to them the size of bigeye tuna taken by the deep longline gear tend to be larger than those by the regular longline gear, and the mean (average) length of this species was 125 cm in the former case and 119 cm in the latter,
I*—Common longline Verticol longllne-4
Fog. 50a. Catenary of ordinary and deep longline gears
(From Suzuki et al, 1977).
Recently, Shimamura and Soeda (1981) discussed the results of invesitigations carried out on the catches of tunas by deep layer tuna longlining around Hawaii islands (Fig. 50b). According to them fishing efficiency increased as the depth of hook was also increased. Mean hook-rate of bigeye and yellowfin tunas by the vertical longline was observed to be relatively high when compared to that by common longline. Mean length of bigeye tuna caught by these gears also evinced differences in that the fishes taken by the vertical long-line gear were relatively long (Mean length : 132.0 and 116.3 cm) as compared to those taken by ordinary longline (128.0 and 114.5 cm).
( V Seo surface ( V r ~ Floot
.Branch line i. Hop* 20m
T
Sinker 15ka>4
"Moin line "•Branch line ^HookdOhooki/boeket)
80m
Fig. 506. Schematic figures of ordinary and vertical longline gears (From Shimamura and Soeda, 1981).
Other Methods of Fishing
Drift gillnets, set nets and tuna traps employed for fishing tunas and billfishes are passive type of fishing gears as their effectiveness is mainly dependent upon the behaviour of the fish and the oceanographic conditions of the fishing ground.
Drift Gillnet Fishery
Drift gillnets are employed by many coastal countries of the world to catch shoaling pelagic fishes which swim at or near the surface. The gear is set anywhere from midwater to surface and in which fishes are gilled as they try to swim through. The upper part of the net is attached to the floatline and the lower part to the bottom lead line. Floats in the float line and weights in the lead line together maintain the vertical stretch of the net. Most popular materials used at present for the construction of the net is synthetic products, especially nylon with monofilament. The size of the net, twine and mesh vary according to the size of the fish sought for and it is also different from region to region. Several units of the net are joined together and set end to end which may extend for a long distance. For the smaller tunas and bonitos the mesh size of the net ranges from 6-15 cm, whereas for larger tunas and billfishes the mesh size used is 11-36 cm.
The material commonly used in the drift gillnets which are employed along the coastal waters of India is PA (nylon) and the mesh size of the net varies from 8-15 cm. Thermocole floats and concrete blocks
38 TUNA RESOURCES

(200 g) are used as floats and weights respectively, when completely set the net will have a length of 800 m and depth of about 66 m, with about 25-50 units laced together.
Vessels of different sizes are employed in the drift gillnet fishery but the common size ranges between 7-20 m.
During operations the net will either be set over the stern and hauled OVCT the sides or the net is set and hauled over the stern. After setting the net, the vessel drifts leeward to ensure that the net is stretched from end to end. For hauling the net, powered stern net hauler and net reel are employed in several countries.
Set Nets
Set nets are employed for fishing tunas and a variety of pelagic fishes in the coastlines where they regularly migrate. Set nets and traps are prevalent in the coastal waters of Japan (Teichiami), Mediterranean Coast, east coast of U.S.A. and the British Isles (Fig. 51).
The nets are set from the surface to the bottom. The mesh size and the size of twines vary according to the size of the fish, but large meshes are used for the leader net and small ones for the bag net. The fish on contacting the lead net tend to follow the twine and pass into the trap portion of the net. The trap portion is hauled in at regular intervals and the catch is taken aboard the vessel.
Relatively small crafts of 7 m OAL is used in this method of fishing. ' Combination vessels' varying in size from 7-18 m are also used in trap net fishing in several countries.
Harpooning
Harpooning for biilfishes are employed to a limited extent in the east Pacific area. This method of fishing for sword fish in the Mediterranean Sea is well known. The gear consists of a wooden pole of 4-6 m long, at the tip of which is attached a three-pronged steel shaft. Detachable harpoon is placed at the tip of this shaft.
CMERl BULLETIN 32
Fig. 51. Set net (tuna trap) (From Anon, 1979).
39

From the barb end of the pole a line of about 100-300 m long is attached to a buoy which is used to understand the movements of the fish after it has been struck. A retrieving line is provided at the base of the pole.
Vessels used in this type of fishery is made of wood with a prow of about 3-5 m long extending forward from the bow, from where harpooning is done. For spotting the fish, a crow's nest is often fitted on the
mast. The vessels employed in harpooning will have good speed and manoeuvarability.
On sighting the fish, the vessel is steered towards that position and the fish is harpooned. The hunting line and the buoy indicate the movement of the fish in water. The retreiving line is also allowed to run out until the fish is tired out. The catch is hauled in over the side. Recently, electric harpoons have been introduced which kill the fish instantly.
40 TUNA RESOURCES

IV TUNA ENVIRONMENT
Tunas and related fishes have very distinct behaviour patterns and their shoals are known to congregate in places where special ecological and environmental conditions prevail. Information on the ecology of tunas and related fishes and the influence of various oceanographic parameters on them is essential to explain and predict the temporal and spatial variation in their abundance, which in turn enable fishermen to locate productive fishing grounds and seasons. The effect of environmental properties on the distribution and abundance of tunas has been studied for the past 40 years and the results of factual observations are also available (Yabe, Yabuta and Ueyanagi, 1963 ; Howard, 1963 ; Laevastu and Rosa, 1963 ; Nakamura, 1969; Laevastu an Haela, 1970; Hanamoto, 1974,1975; Sharp, 1976,1978, 1979; Blackburn, 1965 q.v. for references). However, very little information is available on these from the Indian Ocean, and the accumulated information is based on the operations of commercial vessels and occasional studies made by the research vessels or reviews of the past studies chiefly by Nakamura et al., 1956; Nakamura 1969; Nakamura and Yamanaka, 1959; Yamanaka and Anraku, 1959 ; 1961; Yabe, Yabuta and Ueyanagi, 1963 ; Laevastu and Rosa, 1963 ; Blackburn, 1965 ; Nakagome, 1966, 1967 ; Nakamura, 1969; Inoue and Iwasaki, 1969; Silas 1969; Suda, 1971; Uda and Nakamura, 1973 and Sharp, 1979. Pertinent information available on this subject, largely based on published works is summarised in the present chapter giving emphasis to the Indian Ocean Area.
Tunas and billfishes are active swimmers and the vertical range of their distribution as noticed from conventional longline fishing operations is generally up to 160 m depth, but in deep longline operations bigeye is taken from still deeper waters going down to 250 m or more. Limits of spatial distribution of eggs, larvae and juveniles have been reviewed by earlier workers. It has been observed that species such as yellowfin,
bigeye, albacore and southern bluefin tunas which are taken by sub-surface hooking have a vertical distribution ranging from 0-150 m (Blackburn, 1965). It has also been observed that the bigeye tuna is the deepest inhabitant among the tunas studied. Other tunas and related fishes which are rarely taken by the longline gear are presumed to occur in the depth range of 0-70 m.
Blackburn (1965) classified tunas into three groups based on their known spatial distribution patterns. The first group comprises of yellowfin, bigeye, albacore, southern bluefin and skipjack tunas which show continuous distribution across major oceans. In the second group species, namely little tunny, bonitos, frigate and bullet tunas and longtail tuna are included which are common within a limited distance from some land and around island chains. The distribution of the species comprising the third category (slender tunny) does not agree with that of the above two categories. The spatial distribution patterns of different species of tunas and billfishes and the known areas of their concentration in the Indian Ocean are presented in a series of maps and have been discussed in Chapter II. It has been observed earlier that the tuna larvae also have a similar pattern of distribution as those of the adults but they are more concentrated in the tropical waters (Nishikawa et al, 1978).
Information on the direct and indirect influence of oceanic properties and oceanic features on the distribution of tunas and related fishes are also available. Blackburn (1965) reviewed this topic and suggested that' temperature and pelagic food supply have a direct major effect and in special situations dissolved oxygen and illumination influence their distribution '. Chemical nutrients and plankton biota affect their distribution through the production of forage organisms. According to him, oceanic features which play a major role
CMFRI BULLETIN 32 41

in the distribution and migration of tunas, mainly through their influence on temperature distribution and food supply are the ocean currents, convergence and divergence, fronts, upwelling, thermocline topography and temperature gradients in the thermocline, and position of islands, banks and land masses. However, Sharp (1979) opined that tunas are bound to swim continuously, which requires ' finite oxygen availability ' and hence their distribution in the ocean is controlled by low temperatures and low oxygen levels.
Temperature and Oxygen
Optimum water temperature for each species of tunas has been reasonably well established, and the ranges of temperature within which different species of tunas are distributed in the world oceans have been studied earlier. Laevastu and Rosa (1963) have reported on the temperature ranges of ' normal distribution' and * occurrence in commercial concentrations' of tunas which shows that eventhough the temperature ranges in which tunas are found are relatively wide, their main concentration occurs within a narrow range which are specific to each species (Table 3). Blackburn (1965)
analysed further available information and suggested that the upper limits of temperature for distribution and fishery for most of the species arc high in many cases. Recently, Sharp and Pirage (1978) and Sharp (1979) tabulated the ' preferred temperature ranges!' and ' habitat relative size' of different species of tunas and tuna-like fishes. The results of observations on theso lines are summarised in Table 3.
Most of the species of tunas respond directly to the temperature which forms the lower limit. In general, it may bo stated that certain upper and lower limiting temperatures determine the limits of range of tunas in the oceans. It is reflected in the pattern of the distribution of different species in the world oceans.
Tunas usually maintain their body temperatures higher than the temperature of the water in which they swim. Eventhough larger tunas have evolved thermoregulatory capabilities, smaller tunas have limited capacity for thermoregulation. Much studies have been conducted on the apparent thermal and oxygen limitations on the distribution of tunas and tuna-like
TABLE 3. Temperature range for distribution, preferred temperature and habitat relative size
Bonito
Little tunny
Frigate tuna
Skipjack tuna
Longtail tuna
Yellowfin tuna
Bigeye tuna
Albacore
Southern bluefin tuna
* Temperature range for
distribution CO
12-25 (15-22)
17-28 (18-23)
••
17-28 (19-23)
•'
18-31 (20-28)
11-28 (18-22)
14-23 (15-21)
• •
•* Preferred temperat
ure CO
Temperate/ Tropical
Tropcical
Tropical
15-29
25-32
23-32
11-15
14-18
5-20
*• Habitat relative
size
Coastal to pelagic, medium
Coastal to pelagic, medium
Coastal to pelagic, medium
Pelagic migrator, medium
Neritic, continental
Pelagic, large
Deep pelagic, large
Pelagic migrator, large
Migrator, south polar
* Source : Laevastu and Rosa, 1963 ; figures in parenthesis indicate the ' temperature range for fishery'. ** Source : Sharp and Pirage, 1978.
42 TUNA RESOURCES

fishes. Sharp (1979) presented an estimate of the ' boundary conditions' of temperature and oxygen for skipjack, yellowfin, bigeye and albacore tunas as follows :
Temperature 10 minutes tolerance preference
Species (°C) Oi limitation for small fish
(50 to 75 cm long)
Katsuwonus Pelamis 20-32 2.5 or 3.0 ml/L
T. albacares 23-32 1.5 or 2.5 ml/L
T.obesus 11-23 0.5 or 1.0 ml/L
T. alaiunga 15-22 1.7 or 1.4 ml/L
Several investigations have been conducted to understand the relation between the variations in sea surface temperature and availability of tunas. Based on the surface isotherms ' thermal equator' have been identified and the movements of the latter have been studied in relation to the fishing grounds of yellowfin tuna in the Indian Ocean (Inoue and Iwasaki, 1969). High surface temperature gradients where the optimum temperature zones are narrow are the places of concentration of albacore and southern bluefin tuna. The pattern of monthly distribution of sea surface temperature (isotherms) in the Indian Ocean Area (after Hasten-rith and Lamb, 1979) is presented in Fig. 52 a-l. However, it is understood that the influence of temperature between the limiting isotherms on the distribution of tunas is indirect and is through the availability of forage organisms, especially in the areas such as oceanic fronts where marked horizontal temperature differences are observed. In the tropical areas, localised differences in the surface temperature also may point to locate areas of current boundaries, upwelhng etc., where forage organisms for tunas accumulate.
Recently, Sharp (1979) discussed on the 'areas of potentially successful exploitation of tunas in the Indian Ocean with emphasis on surface methods' and presented three sets of charts depicting the 'average' monthly distribution of sea surface isotherm and oxygen in the Indian and West Pacific oceans. These charts were prepared ' in anticipation of the development of new tuna fieheries in this area' and hence it is felt opportune to reproduce the monthly distribution pattern of thermal and oxygen profiles in the Indian Ocean area presented by Sharp (1979) which would guide in locating productive tuna fishing grounds. Basic data (' average conditions' of temperature and oxygen dis
tribution) on the oceanographic observations available at the National Oceanographic Data Centre,* Scripps* Institution of Oceanography were compiled up to 1976, summarised by 5° square and graphically presented to | provide the monthly charts. However, these ' condi-; tions' are indicative and a general range of variability could be expected in all the parameters mentioned.
In the first set of charts (Fig. 53 a and b) the average position of sea surface isotherms are indicated.' Further, the zones where dissolved oxygen levels less than of 3.5, 2.5 and 1.5 ml/L emerge to depths more shallower than 15°C isotherm are also shown, the latter forming the major habitat limiting factor. The 15°C, 20°C and 23°C isotherms are presumed to be the lower normal boundary of the occurrence of albacore, skipjack and yellowfin tunas respectively. The oxygen values at 80 m level tend to decrease northwards towards the coastline, and according to Sharp (1979) the ' oxygen values likely act as a limiting feature for tuna distribution in the northern Indian Ocean area throughout the year'.
In the second set of charts (Fig. 54 a-c) Sharp (1979) presented the location of 20°C isotherm in the southern Indian Ocean which is the normal lower boundary zone of skipjack. The dotted area represent zones where 2.5 ml/L oxygen level rise to depths between ; 50 and 80 m, ' one of the habitat limitations which : seems to enhance skipjack vulnerability'. The cross- j hatched areas in the figures indicate regions where the oxygen levels are very low near the surface, which exclude tunas from such regions. The heavily cross-hatched areas have too little oxygeiv for skipjack tuna to survive at depths less than 50 m.
In the third set (Fig. 55 a-c) Sharp (1979) presented the areas of successful surface fishery for albacore and yellowfin tuna by plotting the thermal and oxygen profiles in the northern and southern Indian Ocean areas. In the same set of charts the longline vulnerability zones of albacore, yellowfin and bigeye tunas are also depicted.
Recently, Evans et ah, (1981) examined the influence of mean environmental conditions (dissolved oxygen and thermal structure) and the effect of surface winds on the vulnerability of skipjack tuna to surface gear in the area between 40°N to 40°S in the Atlantic Ocean. According to them, the depth of the 3.5 ml/1 dissolved oxygen layer and the depth of 18°G isotherm in combination provide viable constraints on Skipjack habitat. They have also indicated the areas of high potential skipjack vulnerability in the western Atlantic and outlined the areas where wind speed exceeds
CMFRI BUUOTIN 32 4
43

100* E
!!•• i l l i • r V '' i SEA SURFACE TEMPERATURE CC)
t ^ n - ^ v - February
i '•'' I • T " I SEA SURFACE TEMPERATURE CO
I 0 0 E
SURFACE TtUPCRATURE &}
Fig. 52 «-/. Pattern of monthly distribution of sea surface temperature (isotherms) in the Indian Ocean Area (From Hastenrith and Lamb, 1979).
44 TUNA RESOURCES

ioo# r
amfammvua^mkw-ftwmmmmmtf
SEA SURFACE TEMPERATURE CC)
JSS-L.
SEA SURFACE TEMPERATURE CC ) Sipltmbtr
100 E
J22_I_
Fig. 52 (continued), g-l,
CMBM BULLETIN "Hi 45

20» 4 0 ' «0» 80° 100* 120° I40» 0 *|
k« 40* lo* »6* dd* i*&« 14k' Fig. 53|a and 6. Zones in the Indian Ocean where dissolved oxygen levels less than of 3.5, 2.5 and 1.5 ml/L emerge to
depths shallower than 15°C. isotherms which become the significant habitat limiting features for tunas (see text for explanation) (From Sharp, 1979).
46 TUNA RESOURCES

. 20* 40* 60° 80* 100* 120* I40# 20* 40* 60* 90° 100° I20# I40-
Fig, 53 (continued), (b),
CMFRI BULLETIN 3J 47

20 40 60 80 100 120 140 20 40 60 80 100 120 140
Areas where 20° isotherm lying between 50 — 80 m depth
Areas where 2 5 ml/L 02
level emerge to 80- 50m depth Areas where Oxygen levels are very low near the surface
Fig. 54 a-c. Distribution of oxygen levels at depths in the Indian Ocean and the zones of vulnerability of skipjack tuna (see text for explanation) (From Sharp, 1979).
48 TUNA RESOURCES

%
1 \
• UPy
t
„ . \ •
T %
"^""SSJVWM^J.
s .-. . i—
JULY
>~Z**^'^
i
^^^0 *
—I iU.ii.inMA. -
20*
30*
20» 40* 60° 80" 100° 120* 140° ^ 20 # 40* 60" 80" IQQ" 120° I4Q»
Fig. 54 (continued), (b).
CMPW BVLLBTIN 32 49

30°
20»
I 0 #
0"
20°
3 0 '
40«
%
l\ A
' h • i ^ *
\ V
DECEMBER
'$k /^Hk& \£%M> NlilfcJ S » y V ^*tfpPr
4I&
•<&>*».*. •"** J 3
X 1 /
« *
^ 0
y '%•
% OS--
u~^-\ *
C l 20° 40« 60° 80° 100° 120° 140° 20° 40° 60° 80° 100° 120° 140°
Fig. 54 (continued), (c).
8 m/sec which would hamper the purse seine operations.
Vertical distribution patterns of tunas and their aggregation have been found to be associated with the vertical temperature distribution. Vertical profiles of potential temperature in different sectors of the Indian Ocean (after Wyrtki, 1971 are shown in a series of maps (Fig. 56 a-d). The isotherm profiles at 100 m, 200 m, 300 m, 400 m and 500 m in the Indian Ocean (after Wyrtki, 1971) are also shown in Figs. 57-61. The thermocline, a zone of rapid change in temperature, and the thermocline ridges have been found to be the places where tunas aggregate, mainly due to the accumulation of forage organisms in these areas. Bimonthly variations of the depth of the mixed layer (top of the thermocline) in the Indian Ocean (after Wyrtki, 1971) are presented in Fig. 62 a-f.
Longline method is suited best in the tropical waters where the depth of the mixed layer is usually deeper (100 m). Suda (1971) remarked that the average depth of the thermocline over the equatorial area in the Indian Ocean is around 100 m below the surface and the associated complex nature of the ridges and troughs in this area helps to explain the effective longline catch of bigeye tuna which is a deep layer swimmer in the equatorial waters north of 10°S. It is also observed that the thermocline ridges are the preferred places of albacore and bluefin tuna. Based on the examination
of the typical thermal sections in the Indian Ocean, Sharp (1979) opined that the longline hooks hang in the water layer with temperature from 28°C down to 15°C in the area near and south of the equator and from 20°C to below 15°C near the area 30°S. In the oceamc waters of the west coast of India, the thermocline structure is usually observed at a depth of 75-150 m, but during the peak south-west monsoon period, the depth of the mixed layer will be very shallow.
It has been observed earlier that in the tropics, purse seining and pole and line fishing methods aie successful along the eastern margins of the oceans where the mixed layer is shallow. The relationship between the thermocline and purse seine fishery has been studied by Green (1967) at San Diego and San Pedro areas, California, and he has remarked that purse seining for tunas has been most successful when a shallow upper mixed layer of the sea has been underlined by a thermocline with a sharp temperature gradient. According to him, sets where the top of the thermocline did not exceed 18.4 m were more successful than where it was deeper and greater success was obtained where the mean temperature gradient within the thermocline was sharpest (over 0.55°C/m). Thus it was concluded that the combination of sharp gradient and shallow thermocline gave the highest rate of success and the lowest rate of success was recorded in the combination of small gradients and deep thermocline for tuna purse
50 TUNA RESOURCES

AVERAGE INDIAN OCEAN 15 and 23 °C andl5ml/L Oz
JANUARY
20° 40° 60* 80° 100° 120° 140 20* 40° 60" 80° 100* 120° 1*0'
Areas where J5° isotherm
^ and 23° isotherm
y///////////A lies between 50 to 80 m depih
Areas where Oxygen availability at depths jgggjggjl which may preclude shoaler than 80m
the.abundance of yellowfin and albacore
Fig. 55 a-c. Areas of successful surface fishery for albacore (light cross hatched area north of 15°C isotherm) and yellowfin (heavy cross hatched area north of 23°C isotherm) tunas in the Indian Ocean ; longline vulnerability zones of albacore and yellowfin tunas (areas north of light and heavy cross hatched zones respectively) in the Indian Ocean are also indicated (From Sharp, 1979).
CMFW BULLETIN 32 $1

20° 40° 60° 80° 100" 120° 140" 20° 40° 60° 80" 100° 120° 140°
Fig. 55 (continued), (b).

20° 40° 60° 80° 100° 120* 140° 20° 40° 60° 80° 100 - 120* 140* Fig. 55 (continued), (c).
10 15 20 25 30
Fig. 56 a-d. Vertical profiles of potential temperature in different separately in Fig. 56(d).
sectors of the Indian Ocean; sector numbers are indicated (From Wyrtki, 1971).
CMPW BULLETIN 32 53

I l i i l . l l l l l
13
1 O O Q 0 0 . 0 0

2S Id
Fig. 56 (continued), (c).
00° 120° 140°
Fig. 56 (continued), (d).
CMFW BULLETIN 32 55,

t '^>* \\Q* '4Q* ^ Q J
30" 40° 50° 60" 70° 80° 90° 100° 110° 120° 130° '40°
Fig. 57. Pattern of isotherm profiles at 100 m depth in the Indian Ocean (From Wyrtki, 1971).
30° 40" 50° 60° 70° 80° 90° 100° 110° 120 130 140
30° 40° 50° 60° 70° 80° 90° 100° 110° 120° 130° 140°
Fig. 58. Pattern of isotherm profiles at 200 m depth in the Indian Ocean (From Wyrtki, 1971).
5$ TUNA RESOURCES

30° 40« 50° 60* 70° 80° 90° 100* 110° 120° 130" 140*
Fig. 59. Pattern of isotherm profiles at 300 m depth in the Indian Ocean (From Wyrtki, 1971).
30• 40* 50" 60* 70°" 80° 90* 100* MO* 120* 130* 140* 0*
30*
.$Q° 40" 50* 60° 70* ,80° 9 0 » ? 0 0 * 1 1 0 * 120" 130* 140*
Fig. 60. Pattern of isotherm profiles at 400 m depth in the Indian Ocean (From Wyrtki, 1971).
CMFW BULLETIN 3 2 57

30° 40" 50" 60" 70" 80" 90° 100° 110° 120" 130° 140°
Fig. 61. Pattern of isotherm profiles at 500 m depth in the Indian Ocean (From Wyrtki, 1971).
seine fishery. Bimonthly charts of the distribution pattern of temperature gradients in the thermocline in the Indian Ocean Area is presented in a series of figures (after Wyrtkij 1971), which would provide the information on the temporal variations in the nature of the temperature gradients in different areas (Fig. 63 u-f). In the absence of sufficient data on the surface fishery for tunas in the Indian Ocean, a correlation could not be attempted.
Factual observations and comprehensive analyses are also available on the influence of annual variations in the water temperature on the distribution of tunas. Significant landings of tunas have been reported near the temperature boundaries during years when temperatures were above the normal condition at the peripheries of their distribution range.
Tuna migration is influenced by temperature, food and breeding. Information has been collected during the past on the migratory pattern of tunas including the transoceanic ones. Corresponding to the fluctuations in the oceanic currents, non-seasonal migrations are also common. When strong southern wind prevails, the yellowfin tuna is found north of the equator. Similarly, congregations occur south of the equator when north-east wind prevails. Some examples of the extensive migration of tunas are given below :
Albacore
Northern bluefin
Skipjack
Yellowfin
Southern bluefin
Striped marlin
Back marlin
Area1
From Coast of California
Across Atlantic Ocean
From south-west Baja California
Across Pacific Ocean
Across Indian Ocean to Atlantic
From west coast of Mexico
From Australia
Distance travelled1
8500 Km
7700 Km
9500 Km
5000 Km
6560 Km
5550 Km
3300 Km
1 Source; Joseph, Klawe and Murphy, 1979.
It has recently been reported that one specimen of southern bluefin tuna of 61 cm long which was tagged and released off Albany has been recovered after 18 years from off South Africa, and the length of the fish at the time of recapture was 185 cm.
Recently, Lewis (1980) reported on the tagging of skipjack tuna in the Papua New Guinea Area during 1971-72 and stated that the movements of skipjack tagged in the eastern Bismarck Sea appear strongly directed rather than random, with periodic oscillation
% TUNA RESOURCES

30° 40° 50° 60° 70' 80* 90° 100° 110° 120° 130" 140
Fig. 62 a-/. Bimonthly variation of the depth of the mixed -layer in the Indian Ocean (From Wyrtki, 1971).
30° 40° 50" 60" 70° 80" 90° 100" 110° 120* 130' 140 .30°
40' 30* 40° 50* 60° TO* 80° 90* 100* 110* 120* 130° 140°
Fig. 62 (continued), (b).
CMFRI BOtlinN 32 5
59

30° 40" 50° 60° 70° 80° 90° 100° 110° 120° 130° 140
Fig. 62 (continued), (c).
~30° 40° 50° 60° 70° §0° §cf° 100* 110° 12 0° 130° 14b"
Fig. 62 (continued), (d).
60 TUNA RESOURCES

o° -
30° 40° 50° 6 0 " 70" 80° 90° 100° 110° 120° I3C- 140*
Fig. 62 (continued), (e).
iSSt tjQl—!40° ^ 3 0 .
30^ 4 0 3 5CT 50° 70T 80° 90° 100° NO0 120° 130° 140 40"
Fig. 62 (contiuued), (f).
CMFRI BULLETIN 32 61

30° 40" 50" 60° 70° 80" 90" 100* IIP* 120* 130* 140*
4 0 30° 40° 50° 60° 70" 80° 90° 100" 110" 120° 130* 140
Fig. 63 a-f. Bimonthly charts of the distribution of temperature gradient in the thermocline in the Indian Ocean (From Wyrtki, 1971).
30° tO° 50° 60° 70° 80° 90° 100° 110° 120° 130° 140
Fig. 63 (continued), (b).
62 TUNA RESOURCES

30° 40' 50° 60' 70' 80* 90* 100° lib' 120* l30'!' 140* . , , r \ -«
Temperature gradient in the ther/hoc/ine MAY a JUNE
v30«
2
K - — - - ^ , , „ ^ , 30 ' 40" 50' 60* 70* 8 0 ' 90'- I00*- M0° '120° 130'' 140
Fig. 63 (continued), (c).
U0»
1° 4A>
Fig. 63 (continued), (d).
CMPRI BULLETIN 32 5-A
43

Fig. 63 (continued), (e).
« ° * ' jb* 4o* 60* 60* 70* 80* 80* 100* 110* 120* 130* 140*
Fig. 63 (continued), (f).
64 TUNA RESOU&CES

between the Bismarck and Solmon seas to be a feature of these movements.
A group of scientists headed by Dr. Andrew Dizon of National Marine Fisheries Service, Honolulu, Hawaii, has been studying the possibility of whether tunas may synthesise internal ' magnets' to enable them to navigate accurately over long distances. They have found millions of magnetic crystals in the head of tunas ' with an extremely accurate magnetic map sense'. The magnetic crystals in the yellowfin, skipjack and little tunny were precisely and repeatedly located upon the frontal bone of the skull (Anon., 1980). These investigations have far reaching implications in enabling better understanding of the migratory behavior of tunas.
•Salinity
In the oceanic waters seasonal fluctuations in salinity are much less than that in the coastal areas and hence it is not a limiting factor for the distribution of tunas in the waters of the oceans. Low salinity affects the •distribution of tuna in the coastal waters and in the region with high land runoff, by limiting their distribution.
Transparency
Tunas live mostly in clear oceanic waters, and they locate their pray visually at close range. It was observed that the optimum transparency for tunas is 25-35 m depth because food will be scarce at transparencies beyond the range and the sight feeding will also be difficult. In view of this it has been felt that giUnetting and purse seining will be more successful in turbid waters. Surface fishing such as pole and line fishing in which visual response is involved will be effective in more transparent waters.
Mixing Processes
Productive tuna fishing grounds usually coincide with the regions where replenishment of the surface waters from elsewhere takes place by horizontal or vertical transport or mixing of the watermasses. Mixing along the horizontal plane is mainly by the ocean currents and that along vertical plane is by convergence, divergence, upwelling and so on.
Many factual observations and hypotheses have been published earlier on the effect of oceanic circulation on the distribution of tunas (Nakamura, 1969). However, much of these are based on speculation.
It has been postulated that the optimum current for good tuna fishing is 0.5—1.0 Knot. It was also observed
earlier that the pattern of distribution of tunas is indicative of the association of adults or ontogenic stages of different species with the particular current system. Generally they are distributed in great abundance along the axis of the current. Seasonal migrations of tunas from one current system to the other has also been reported. Abrupt abundance of different species of tunas in the fishing zones has been observed in the current boundaries. The abundant forage at the mixing zones of the areas of convergence and divergence within the current system may be the reason of such aggregation.
The pattern of surface currents, major current systems and boundaries of major current systems in the Indian Ocean Area are shown in Figs. 64 and 65. A perusal of the literature and examination of the pattern of distribution of different species of tunas in the Indian Ocean indicate that the yellowfin tuna is more abundantly distributed in the oceanic waters and in the Equatorial Current Area, Equatorial Countercurrent Area, Southwest monsoon drift Area and in the South Equatorial Current Area. Bigeye tuna occurs in the area north of the northern margin of the south equatorial current and in the area of the sub-tropical convergence. They live with the albacore in the subtropical gyre when they are immature and with yellowfin tuna in the northern boundary of South Equatorial Current Area. Albacore tuna in the Indian Ocean prefers temperate oceanic waters and occurs in the Indian Ocean central water mass and the sub-tropical convergence area. Their spawning ground is the South Equatorial Current Area and the young albacore concentrate in the southern parts of the sub-tropical gyre. The occurrence of the southern bluefin tuna is linked with the sub-antarctic water. They occur in abundance in the cold water pockets in the frontal zone, and show seasonal north and south migrations. Skipjack tuna occurs just off the coastal areas and on current boundaries. According to Suda (1971) the boundaries between the distribution of species are similar to the ' boundaries existing between the ocean currents, water-masses or ocean currents and watermasses'.
Aggregations of tunas are frequently observed in the vicinity of oceanic fronts which are the boundaries of watermasses. Fronts are the places of surface temperature discontinuities and at these places convergence usually takes place which results in the accumulation of plankton and in turn macro-organisms which are the preferred forage of tunas. Based on the information of the monthly distribution of temperature at sea surface, the areas of convergence and divergence in the Indian Ocean Area have been plotted and presented in
CMFM BULLETIN 32 65

o o o o o <• o e e o e • 3 0 4 0 50 60 70 SO 90 100 110 120 ISO 140
30
< 20
< 10
0*
ioc
20
30
• 2 0
40
ml ,„A„„„~-r C w n K r r T f e
40
0* 2 0 ° 40* 60°80° 100° 120* 140* 160* 180*
30 4 0 * 50° 6 0 ° 7 0 * 8 0 * 9 0 * 100*110* 120*130*140*
0 * gO* 40* 60* 80° 100 120* 140 ISO*
30° 40° 50* 60* 70* 80* 90* 100* 110 120 130 140 >*"Hm'tt^wi»iiJ^iiiii«j|l4uli»i>y^illliyiJ^iiii.;.;,:^EgK;
OCTOBER a
20
;BHsM
20* 40* 60° 8<* 100 120 140* 160* ied
Fig. 64. Pattern of surface current systems in the Indian Ocean (From Krey and Babenard, 1976)
30° 40* 50° 6 0 70* 8 0 ° 90* 100* MO* 120* 130*140°
0 * 2 0 * 4 0 * 60*80*100° 120* 140* 160* 18 0*
Fig. 66 a-c. It has been observed earlier that in the oceanic waters convergence zones are indicated by the presence of small fishes and divergence zones by discoloured water. Uda and Nakamura (1973) have presented the areas of major oceanic fronts in the Indian Ocean (Fig. 65). Ramamirtham (1981) studied the circulation patterns in the Maldive region between 71° and 80°E within the equator and 8°N during the
September-October period and stated that in association with the convergence and divergence phenomena occurring in this area, a large cyclonic gyre exists in the region north of Maldives and an anticyclonic one in the south. However, based on the available information it can be stated that the areas of abundance of different species of tunas and major current systems and fronts in the Indian Ocean can be correlated.
66 TUNA RESOURCES-

*• in20'E 30'E 40'E 50'E 60'E 70'E 80 £ 9 0 ' E I P O S I I O ' E 1 2 0 ' E t 3 0 ' E I 4 0 * E » S 0 ' £ HP'S
20'E 30'E 4 0 - E 5CTE 6 0 E 7 0 E 8 0 ' E 9 0 E l O p ' E 1 I 0 " E 120"E 1 3 0 ' E 1 4 0 ' E 1 5 0 ' E
Fig. 65. Major current systems and boundaries and oceanic fronts in the Indian Ocean (modified after Uda and Nakamura, 1973).
The direct influence of upwelling on tuna aggregation has yet to be established, although a good relation has been reported to exist between the production of forage organisms by the enrichment of the surface water by upwelling. Factual observations on the relation between upwelling situations and concentration of tunas are also available and have been summarised by Blackburn (1965). Different mechanisms have been described as the causative factors for the upwelling in the coastal and oceanic waters. The phenomenon may be caused either by : (i) A wind generated surface current deflected by about 45° to the wind in the northern hemisphere and 45° to the wind in the southern hemisphere. This deflection finally induce the sub-surface water move towards surface layers near the coasts (wind stirring or coastal upwelling induced by the wind) or (H) the prevailing current system may be the basic factor in inducing upwelling. The denser water occupyIhe left hand side of the current in the northern hemisphere and reverse is the case in the southern hemisphere. In order to fulfil the basic requirement, the denser sub-surface
water, would be induced upwards to occupy the left side of the current in the coastal areas. However, the former case occurs on a large scale in the eastern parts of the oceans. In the tropical waters, ridging and doming of the cold bottom water affects productivity and th'*s may result in the concentration of tunas in such areas.
Wyrtki (1961) and Rochford (1962) reported upwelling in the eastern Indian Ocean and Wooster et ul., (1967) and Cushing (1969) recorded the phenomenon-in the western Indian Ocean. Along the coasts of India, and around Minicoy the phenomenon of upwelling has been studied by various authors. Banse (1959, 1968) opined that along the SW coast of India the upwelling starts with the onset of monsoon and reaches the maximum intensity during July-August. Rao and Jayaraman (1966) reported upwelling around Minicoy during the last week of November and remarked that this would be due to the divergence currents in the vicinity of Minicoy. They also indicated that a possible relationship exists between the
CMFM BULLETIN 32 6?

68
Fig. 66. a~c. Areas of convergence and divergence in the Indian Ocean based on the pattern of monthly distribution of surface temperature.
TUNA RESOURCES

CMFRI BULLETIN 32
Fig. 66 (continued), (b).
6T

o«*
' E 30* 40* 50* 60* 70* 80* 90* 100* 110* 120* * 30* 40* SO* 60* 701* 80* 90* 100* 110* 12 0*
Fig. 66. (continued), (e)
70; TUNA RESOURCHS

upwelling around Minicoy and the peak season (December-March) for tuna fishery. Other studies on this phenomenon from the west coast of India are chiefly by Ramamirtham and Jayaraman (1960), Sharma (1966), Darbyshire (1967), Ramamirtham and Rao (1973) and Murty (1981).
Varadachari (1961) stated that during June to July, upwelling takes place along the Madras and Waltair coasts. Lafond (1954) also reported on upwelling along the Waltair Coast. The pattern of major current systems in the Indian Ocean and the major upwelling areas are indicated in Fig. 65. However, Suda (1971) examined the relation between the production of yellowfin and bigeye tunas by the longline fishery in the Arabian Sea area (Somalia Coast, SE Arabia and SW waters of India) and the upwelling in those regions and concluded that both the factors cannot be correlated. But in waters south of Great and Small Sunda islands, he found the productivity of tunas to be slightly better as compared to that of the former region. According to him, the relation between the upwelling and concentration of tunas is a complicated feature and the linkage may be connected with other factors such as method of fishing, ecological conditions and other environmental parameters. As stated by Blackburn (1965) (0 the time lapse in the transformation of primary organisms to the macro-organisms which are the forage items of tunas, and (H) the transportation of the biota during the above time of change from the areas of upwelling may be the reasons for the poor correlation between the tuna concentration and upwelling areas.
Oceanic Islands, Banks and Submarine Topography
Areas such as oceanic islands, sea mounts and continental slopes with high bottom topography are also good tuna fishing grounds as they affect the surface currents and internal waves giving rise to eddies, rise in thermocline levels, etc. Eddies could concentrate plankton and cyclonic eddies might increase its production. This may attract the macro-organisms which form the forage of tunas. Ramamirtham (1981) studied the influence of the Maldive Islands and the associated bottom topography in the formation of circulation patterns around the islands and concluded that the bottom configuration of this area is the reason for such circulation. A good fishery for skipjack exists in this area and the nearby Minicoy and Lakshadweep Islands where banks such as Eli Kalpeni and Suheli Par are situated. It may be concluded that the topographic features influence the hydrographic processes such as the internal waves on the slope areas, mixing around oceanic islands and sea mounts and these in
turn affect the production of tuna forage and hence the concentration of tunas in such areas.
Food Supply
Among the known factors which influence the distribution and concentration of tunas, the food supply is an important criteria next to temperature. Much information has been accumulated on the relation between the oceanic circulation and food supply in tropical and sub-tropical waters than in the temperate zones. In the tropics, the characteristically stable thermocline separate the upper mixed layer from the lower kyer,v but in certain places through upwelling, mixing or thermal anticline situation, nutrient replenishment in the euphotic zone takes place. Such productive areas can be considered as the places where tunas aggregate for forage. But as stated earlier, the influence of this phenomenon is an indirect one because of the time lag between the peak seasons of productivity of different trophic levels and spatial dispersion of production during the temporal change at trophic levels.
The abundant occurrence of forage organisms in the vicinity of oceanic islands, sea mounts and the eddies associated with the polar fronts and subtropical convergence and equatorial areas cause tuna aggregation n these areas.
Sea surface chlorophyll has been considered significant in the food relations of tunas since a steady state relation might be expected between the tuna forage and the chlorophyll through the food chain (Blackburn,
-1965). Emphasis has also been given in recent years, to the investigations of micro-nekton and macro-zoo-plankton and the relation between their congregation and tuna concentration. The significance and the role that the deep scattering layer plays as regards congregation of different planktonic organisms which also form forage for pelagic fishes including tunas and bill-fishes has been drawn attention to from the oceanic waters (Silas, 1969).
Satellite Imagery Some of the oceanic features such as the ocean
temperature, chlorophyl distribution, current boundaries, slicks and ocean fronts can be detected in satellite imagery and there is an urgent need to not only look into the data accumulated in the past but also scientifically planned data acquisition on these parameters, useful for understanding tuna environment on an ocean wide basis. Once these are mapped, seasonal variability can also be studied to understand the likely areas of concentration of tunas especially skipjack and young yellowfin tunas. The use of satellites as a further tool of studying migratory patterns of tunas using telemetric tags should also be further explored.
CMFRI BULLETIN 32 71

V TUNA FISHERY IN THE INDIAN OCEAN: TREND IN THE EXPLOITATION
OF THE STOCKS, PRESENT STATUS OF THE FISHERY AND RESOURCES OF TUNAS AND RELATED SPECIES
The state of the stocks of major species of tunas and billfishes of the Indian Ocean has been reviewed at the regional level by the IOFC/IPFC Working party of scientists earlier (FAO, 1968, 1969, 1979, 1980 a, b, 1981 a ; IPFC/IOFC, 1973, 1974,1975,1976, 1977 a, b,) and scientific communications and reports on the species synopsis, biology, population structure and status of diiferent species of tunas and billfishes taken by the long-line and other gears from the Indian Ocean are also available. (Nakamura et al, 1956 ; Rao, 1962 ; Jones, 1963 a, 19636, Jones and Silas, 1963 a, 1964 ; Mimura et al., 1963 a, 1963 b ; Robins, 1963 ; Silas, 1963 a, 1963 b ; Williams, 1963 a, 1963 b ; Yoshida and Otsu, 1963; Raju 1963; Thomas 1964 b; Silas, 1964; Kikawa, 1966 ; Mimura, 1967; Puskunov and Kharchenko, 1968: Kikawa et al., 1969: Morita and Koto, 1971; Kume et al, 1971; Honma and Suzuki, 1972; Hang et al, 1973 ; Suda, 1971,1972,1974 ; Sivasubramaniam, 1963 » Marcil'e and Suzuki, 1974; Howard and Starck II, 1965' Marcille and Stequart, 1976a, 19766 ; Pillai and Ueyanagi, 1977 ; Wetherall et al, 1978*, Suzuki 1979* ; Honma and Ueyanagi, 1979* ; FAO, 1980 a, 1980 6 ; Olson, 1980 ; Klawe, 1980 a ; FAO, 1981 ; Riggs, 1981 ;
* Working documents. 1 The main source of the data analysed during the present
study was the nominal catches published by the FAO periodically (1965-1979 data published in Volumes 40,42,44,46 and 48 during 1976, 1977, 1978, 1979 and 1980 a respectively). However, the revised catch statistics for individual species (FAO, 19806) show discrepencies from the earlier estimates of the landing of tunas, tuna-like fishes and billfishes. In order to comprehend the magnitude of the differences of the estimated total landings of different species in these two estimates, both the figures are presented in
Table 4. The nominal catches by species and countries for the period 1977-1979, used in this bulletin, are based on FAO catch statistics (1980a).
• Included under ' NEI * by FAO.
Yoshida, 1981). FAO Fish Report, Vol. 6 (4), 1963 ; Jones and Slas, 1964 and Nair et al., (1970) q.v. for additional references. Silas (1967) and Siias and Ummerkutty (1967) summarised records of parasites in tunas and billfishes and other scombroids. As stated earlier (Chapter I of this bulletin) all the commercially important species of tunas and billfishes such as the albacore,bigeye,yellowfin, southern bluefin, andskipjack tunas and the striped marlin, black marlin, blue marlin, sword fish, sailfish and shortbill spearfish are distributed in the Indian Ocean. Thecoastal species complex includes the little tunny, bonito, frigate and bullet tunas and the Iongtail tuna, the last said (Thunnus tonggol), the only true tuna occurring in our shelf waters regularly. The occurrence of species such as the dogtooth tuna, slender tunny and leaping bonito is less numerous in this area.
Longline fishery carried out by the non-Indian Ocean countries on a commercial scale, land a majority of true tunas while the inshore fishery employing a variety of gears land the coastal species of tunas and the young ones of some of the oceanic species. The present chapter summarises the status of the exploited tuna resources and the production of different species of tunas and related fishes in the Indian Ocean based on the analysis of the catch statistics published by the FAO (1976, 1977, 1978, 1979, 1980 a, 1980 b, 1981)1; available information on the effort and catch statistics by the Japanese longline fishery (Fishery Agency of Japan, for the years 1962-1979) and Taiwanese longline fishery catch statistics (FAO2, 1979 ; 1980 a; National Taiwan University, 1979 ; Yang, 1979). No detailed catch statistics and effort data were available on the tuna and.billfish catches by the vessels of the Republic of Korea (ROK), except those provided by the FAO (1976-1980 a). Concerning the catches of other species by the Indian Ocean littoral countries and the oceanic
72 TUNA RESOURCES

islands in the Indian Ocean, the catch statistics from various compilations by FAO (1974, 1977, 1978, 1979, 1980 a, 1980 6, 1981)1 and the data collected during the course of the present study were employed.
A general review of the recent trend in the world production of tunas, tuna-like fishes and billflshes3
(FAO, 1980 a, b; 1981) indicates that in 1979 their total estimated production was around 2-14 million MT, and the annual total catch ranged from 1.83 to 2.25 million MT between 1973 and 1979 with an average catch of 2.03 million MT during this period (Fig. 67). The total production of these groups from the Indian Ocean has been estimated as around 0.22 million MT in 1973, which was about 12% of the total world production of the same in that year. In 1979, their production was around 0.23 million MT, which was about 11 % of the production of these groups from the world oceans and the average catch during 1973-1979 was 0.24 million MT (range 0.22-0.26 million MT).
2000
500
6P^^6J6JJ^i ' ' — " *
• — • - > - • * • — i - * - * .
- i - ± - i - - i - - i - .
TUNAS, TUNA-LIKE FISHES' AND BILL FISHES
(1973-1979)
FROM THE WORLD OCEANS AND
INDIAN OCEAN
c 1973 74 75 '76 '77 '78 '79
YEARS
WORLD OCEANS
INDIAN OCEAN
Fig. 67. Trend in the world production of tunas, tuna-like fishes and billflshes (combined) and the trend of the same from the Indian Ocean, 1973-79.
6 0 '
40
20
0
ao
60
40
20
0
60
>U60
1 4 0 t~ 2 20 lu <o 0
U i 6 0
1-40
20
Total
SBF
ALB TFT
BET Bullet tuna*
(fSll\ Litllt tuna
BUM
SKJ
BLU
SAI
MLS
r^TB^f^Th^trrrl^ Billfithtl
Tuna lika fithas
W 74 75 76 TTvTn 73 74 79 76 -7T 76 7» 7S 74 75 76 77 78 7» YEARS
Fig. 68. Trend of production of different groups/species of tunas, tuna-like fishes and billflshes in the Indian Ocean in percentage of their world production, 1973-79.
The results of the analysis of the data on the landings of different species/species-groups of these scombroids, as presented in Fig. 68 in percentage of their world production during 1973-1979 reveals that with the exception of southern bluefin tuna, little tunny and other coastal species related to tunas (included under ' tuna-like fishes' by FAO) none of the species constitute more than 25 % of the total world production
b The group tunas, tuna-like fishes and billflshes mentioned in this report comprises of species such as Auxis thazard, A. rochei, Euthynnus afflnis, Katsuwonus pelamis, Thunnus albacares, T. obesus, T. alalunga, T. maccoyii, T. tonggol, Xiphias gladius, Makaira indica, M. nigricans, Tetrapturus audax, T. angustirostris, and Istiophoms platypterus. Other species of scombroids such as Scomberomorus commerson, S. guttatus and Scomberomorus spp., included in ' Table 8-36—FAO : Catches and landings, 1979' published in 1980 from the Indian Ocean are not accounted for in this report.
at any time of this period. It is also seen from the figures that the production of the major oceanic species of tunas such as yellowfin, bigeye and albacore in the Indian Ocean during the said period was less than 20 % of that from the world oceans. This indicates that more fishing effort by majority of the countries bordering the Indian Ocean has been oriented towards catching coastal tunas and allied species.
The group-wise annual production of tunas, tuna-like fishes and billflshes from the Indian Ocean during the period 1965-1979 is presented in Fig. 69. Their total annual catch from the Indian Ocean fluctuated between 0.16 and 0.26 million MT with relatively high production recorded in 1968 (0.26 million MT). In 1970, the total annual catch of these fishes was low (0.17 million MT) and subsequently there was a gradual increase in their total annual catch until 1977 (0.26
CMFRI BULLETIN 32 73

TABLE 4. Estimated catches of tunas, billfishes and tuna-like fishes from the Indian Ocean (Unit: 1000 MT)
Gear
Source
1965
1966
1967
1968
1969
1970
1971
1972
1973
1974
1975
1976
1977
1978
1979
Albacore
Longline
•FAO
. 14.7
. 14.2
. 21.0
. 16.0
. 21.3
. 13.5
. 10.1
. 12.7
. 22.8
. 27.7
. 10.7
. 12.5
. 12.1 .
. 13.1
. 12.2
**Status Rep.
12.4
17.3
23.7
17.4
21.9
15.2
10.2
11.7
22.3
28.3
11.2
14.9
11.4
••
••
Bigeye
Longline
FAO Status Rep.
16.9 20.2
18.0 26.4
24.7 27.0
35.1 38.7
24.2 27.4
17.6 24.8
21.4 22.8
19.8 18.1
16.7 16.0
26.4 27.7
38.3 39.7
27.8 29.8
33.7 36.8
49.1
31.6
Yellowfln
Longline & Surface
FAO
24.1
30.4
34.0
63.8
48.2
27.8
40.8
45.7
33.9
31.4
44.7
51.2
60.0
58.8
60.6
Status Rep.
34.4
56.8
44.8
88.1
61.7
42.6
50.9
47.4
41.2
43.5
51.4
56.4
70.5
• •
••
Southern bluefin
Surface Longline & surface
Status Rep.
3.6
5.4
6.2
7.9
7.4
6.0
5.6
10.9
18.6
13.9
20.2
20.5
• •
• •
••
FAO
21.7
13.4
27.9
25.1
28.1
22.0
26.2
25.1
26.8
30.6
22.1
28.2
26.8
17.3
18.2
Frigate & Bullet tunas
Surface
FAO
2.5
3.0
3.0
3.0
3.0
3.1
2.7
3.1
6.2
5.9
3.9
2.7
3.1
1.9
1.8
Little tunny
Surface
FAO
• •
• •
• •
• •
16.3
14.0
18.8
17.2
24.2
24.3
26.4
25.6
9.6
14.3
Skipjack
Surface
FAO
13.2
16.0
18.1
16.6
18.7
29.7
31.4
33.6
34.9
41.3
36.2
38.4
30.3
30.4
32.7
* Source : FAO (1976-1980a) *» Source : FAO (1980b)

TABLE 4 (Contd.)
Striped Marlin Blue Marlin
Gear Longline Longline
Source *FAO **Status FAO Status Rep. Rep.
1965
1966
1967
1968
1969
1970
1971
1972
1973
1974
1975
1976
1977
1978
1979
3.8
3.8
5.8
3.6
4.1
3.1
1.6
1.3
0.9
1.8
1.8
1.2
1.3
2.5
3.2
3.33
4.2
4.5
3.4
4.7
3.1
2.1
1.5
1.1
2.8
2.1
3.4
••
5.9
5.3
6.1
4.6
3.7
2.6
0.9
1.0
0.6
0.9
1.9
1.4
1.3
1.9
1.6
3.9
3.8
4.1
4.0
3.9
3.1
2.5
2.5
1.9
2.4
' 2.3
1.7.
• •
• Source : FAO (1976-1980a)
Black marlin Swordfish Salifish
Longline Longline Longline
FAO Status FAO Status FAO Status Rep. Rep. Rep.
0.8
0.2
1.2
1.7
0.9
1.5
2.5
0.6
0.2
0.4
0.4
0.8
0.3
0.6
0.4
1.3
1.4
1.5
2.5
2.3
1.8
1.4
0.9
0.7
1.3
1.2
0.5
1.8
1.5
2.4
2.4
2.8
2.2
1.6
1.3
1.2
1.3
1.6
1.2
1.2
2.3
2.2
1.3
1.4
1.8
2.0
2.3
2.3
1.6
1.6
1.1
1.8
1.3
1.1
1.2
0.8
2.2
2.0
1.3
1.1
2.5
0.5
0.2
0.2
1.1
0.7
0.3
0.4
1.2
1.2
1.3
2.0
1.6
1.2
1.0
1.3
1.1
0.4
0.7
1.0
0.6
••
••
*» Source: FAO (1980b)
CMFRI BULLETIN 32
6
75

80-
* 0 •
Tunas, tuna-like fishes, billflshes, 1965-1979', (Indian Ocean)
( S 3 Tunas %M Tuna-Ilk* fishes • Billfishes J
Fig. 69. Group-wise annual production of tunas, tuna-like species and billflshes from the Indian Ocean, 1965-79.
million MT). The trend of their total production and fluctuation (deviation from the mean value) during 1965-1979 is presented in Fig. 70. The high values observed in 1968 and 1977 were probably due to the increased landing of yellowfin tuna during those years.
Total tunas, billflshes, and tuna - like fishes.
-N 3 00
§ 2 50
O O 200 \ * I 50
<o I 00
0 50
X + 2S
/ V ,x: X-2S
1955 70 '75 79 YEARS
Fig. 70. Trend of total production and fluctuation of tunas, tuna-like fishes and billflshes (combined) indicated as deviation from the mean values, 1965-79.
Above average values were observed in their total porduction during the period 1974-1979.
The initial catches of tunas and related fishes by the longline fishery in the Indian Ocean during 1952 were taken entirely from the eastern Indian Ocean, but in 1958 the fishing activity had spread towards the warmer waters in the western Indian Ocean to the African Coast, and subsequently in the mid-1960's to the southern Indian Ocean as far as 50°S. An analysis of the production of these scombroids from the western and eastern Indian Ocean (as defined by FAO, approximately west and east of 80°E) during the period 1968-1979 has been made and the trend in their production during the 12 year's period presented in Figs. 71 a and b. The total catch of tunas, tuna-like fishes and billflshes during the said period from the western Indian Ocean was uniformly more than 60% of the total catch from the whole area. However, tuna-like fishes, comprising mainly of coastal species constituted more than 80% of the total catch of these fishes from the western Indian Ocean, but since 1974 a gradual increase in their landings from the eastern Indian Ocean is noticeable.
Species-wise production of tunas, tuna-like fishes and billflshes from the Indian Ocean during the 15 years period (1965-1979) is presented in Figs. 72 a and b.
76 TUNA RESOURCES

• " • • t o il ft..
tr?0'E 30'E 4Q-E SO'E BO'E »Q'E 8U't 9 0 ' 5 IQO'E IIO'E I 2 0 ' f I30'E ' 4Q'E 110 t ' " O ' E
20'E 30'E 40'E 80 -E OO'E 70'E 80"E »0 -E 100'E IIO'E I20*E 130 -E 1 40 E 1 S 0 E " 6 0 "I m-i?
Fig. 71a and b. Trend of production of tunas, tuna-like fishes and billfishes from the western and eastern Indian Ocean, 1968-79.
,20-E 30'E 40-E 50-E « 0 ' E . _ 7Q'E 86*f 90/E- iOO'E. " 0 " E t20 'E 130'E I4Q-E' 'SO'E _lgO;E.
20 -E 30'E 40-E 50'E 60'E 70'E 80'E BO7! foO 7 ! 110-E 120'E 130'E 1 4 0 E I 50'E I it
Fig. 71 (continued) (b).
CMFRI BULLETIN 32 77

The total estimated catch of albacore (T. alalunga) increased during the first decade of the fishery and in 1967 and 1969 the total production was around 24,000 and 22,000 MT respectively. The highest catch of 28,250 MT was recorded in 1974. Subsequently, the total production of this species declined and in recent years it was around 12,000 MT.
50-
40-
JO
20
10 Q Yiliowfirt
(Longiint) Yellow fin
(Surface.)
J N / A
Southern bluet in
(Surface)
U jJi »-« i /"J | M 5 t 9
0
the early phase of the fishery and in 1968 about 88,000 MT was taken from this area. Their total catch fluctuated between 37,000-67,000 MT during the period 1969-1974 and in 1979 about 60,650 MT was landed from the Indian Ocean.
The production of southern bluefin tuna (T. maccoyii) was relatively steady during the 1967-1976 period and the highest catch was recorded in 1974 (30,570 MT). In 1979, the total production of this species was around 18,200 MT.
Fig. 72 a and b. Species-wise production of tunas, tuna-like fishes and billfishes from the Indian Ocean, 1965-79.
The total bigeye (T. obesus) tuna catch increased steadily from 1965 till 1968 (38,700 MT) and then decreased in the ensuing years until r973 when only 15,000 MT were taken from the Indian Ocean. In the subsequent years (1974-1978) a rapid increase in the landings of this species was recorded which ranged from 26,400 MT in 1974 to 49,100 MT in 1978. In 1979 the total production of this species was estimated to be around 31,600 MT (FAO, 1980 b).
The total production (surface fishery and longline) of yellowfin tuna (T. albacares) recorded a steady rise in
Apart from the major species of tunas taken by the longline fishery and the young of 'true tunas' taken by the surface fishery, other species related to the tunas were also landed by the coastal fishery, chiefly by the
"Indian Ocean littoral countries and oceanic islands in the Indian Ocean (FAO, 1980 a). The completeness and reliability of the total catch statistics of these groups are open to question. The total production of skipjack (K. pelamis) rose steadily from 1965 and the highest catch of 41,300 MT was recorded in 1974. The landings during the subsequent four years fluctuated between 30,000-38,000 MT. In 1979, the estimated total catch
78 TUNA RESOURCES

PLATE V. Sharks in t u n a longlining. , . Head of makao shark, b. Shark eaten makao shark, c. Makao shark. d. Whitetip shark (Carchannus long imams) and thresher shark (A/opius vidpinus) being cut up e Great blue shark Pnonacc glauca. /.Thresher shark Alopius vulpinus, female, g. Makao, thresher and carchann.d sharks, h. white tip shark (C. longimanus), male. (Photos « to e zndg, h by E G Silas on board R/V. ANTON BRUUN ; / by E. G. Silas on board M/V. Klaus Sunnana of IFF) '

d*5aR;te» ,E>i: .... .•.'t"s:5#:.v'';' / :
WKfi
£«nUH
PLATE VI. a and b. Preparation of ' masmin' and ' hikimas' at Minicov. c. Modified small mechanised boat with bait well and fishing platform, d. Close up of bait tanks with bait fish, mainly Caesio sp. e. Purse seining in the Lakshadweep Sea from R/V. TUNA of IFP. / . Wooden ' flying fish bait' and method of harpooning fish in lagoons at Kavarathi, Lakshadweep islands. (Photos c to / by E. G. Silas).

PLATE VIT. Tuna shoals and purse seining in the Lakshadweep Sea. a. Sea bird concentration at Pitti Island b. and d. Sooty and noddy terns in Pitti Island, c. and / . ' Roiling • skipjack shoal followed by terns. e. and g. ' Breezing' shoal of skipjack, h. Purse seining for skipjack from R/V TUNA of IFP (Photos a to h by E. G. Silas).

"•*; T^sry
• - « ? -* •>
PLATE VIII. a. Japanese mothership and catcher boats in Port Louis Harbour in 1964. b. Stacking of longline gear on the upper dsck of Japanese tuna catcher boat at Port Louis Harbour, c. and d. Japanese long-
liners working in the Lakshadweep Sea. e. Two confiscated Iongliners of the Republic of Korea at Port Blair, Andamans. / . Confiscated Taiwanese wooden hulled boat at Port Blair, Andamans (Photos a t o / by E. G. Silas).
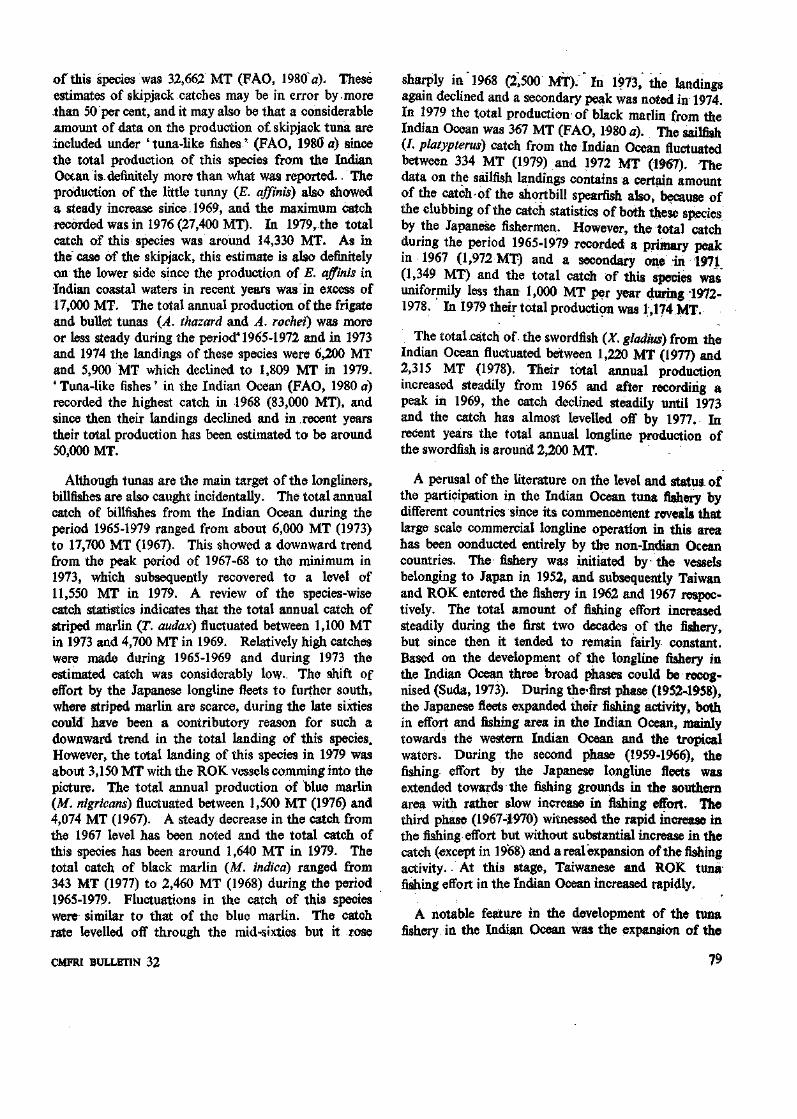
of this species was 32,662 MT (FAO, 1980 a)- These estimates of skipjack catches may be in error by.more than 50 per cent, and it may also be that a considerable amount of data on the production of skipjack tuna are included under ' tuna-like fishes' (FAO, 1980 a) since the total production of this species from the Indian Ocean is. definitely more than what was reported. The production of the little tunny (E. affinis) also showed a steady increase since. 1969, and the maximum catch recorded was in 1976 (27,400 MT). In 1979, the total catch of this species was around 14,330 MT. As in the case of the skipjack, this estimate is also definitely on the lower side since the production of E. affinis in Indian coastal waters in recent years was in excess of 17,000 MT. The total annual production of the frigate and bullet tunas {A. thazard and A. rochei) was more or less steady during the period* 1965-1972 and in 1973 and 1974 the landings of these species were 6,200 MT and 5,900 MT which declined to 1,809 MT in 1979. 4 Tuna-like fishes' in the Indian Ocean (FAO, 1980 a) recorded the highest catch in 1968 (83,000 MT), and since then their landings declined and in recent years their total production has been estimated to be around 50,000 MT.
Although tunas are the main target of the longliners, billfishes are also caught incidentally. The total annual catch of billfishes from the Indian Ocean during the period 1965-1979 ranged from about 6,000 MT (1973) to 17,700 MT (1967). This showed a downward trend from the peak period of 1967-68 to the minimum in 1973, which subsequently recovered to a level of 11,550 MT in 1979. A review of the species-wise catch statistics indicates that the total annual catch of striped marlin (T. audax) fluctuated between 1,100 MT in 1973 and 4,700 MT in 1969. Relatively high catches were made during 1965-1969 and during 1973 the estimated catch was considerably low., The shift of effort by the Japanese longline fleets to further south, where striped marlin are scarce, during the late sixties could have been a contributory reason for such a downward trend in the total landing of this species. However, the total landing of this species in 1979 was about 3,150 MT with the ROK vessels comming into the picture. The total annual production of blue marlin (M. nigricans) fluctuated between 1,500 MT (1976) and 4,074 MT (1967). A steady decrease in the catch from the 1967 level has been noted and the total catch of this species has been around 1,640 MT in 1979. The total catch of black marlin (M. indica) ranged from 343 MT (1977) to 2,460 MT (1968) during the period 1965-1979. Fluctuations in the catch of this species were similar to that of the blue marlin. The catch rate levelled off through the mid-sixties but it rose
sharply in 1968 (2,500 MT)." In 1973, the landings again declined and a secondary peak was noted in 1974. In 1979 the total production of black marlin from the Indian Ocean was 367 MT (FAO, 1980 a). The sailfish (/. platypterus) catch from the Indian Ocean fluctuated between 334 MT (1979) and 1972 MT (1967). The data on the sailfish landings contains a certain amount of the catch of the shortbill spearfish also, because of the clubbing of the catch statistics of both these species by the Japanese fishermen. However, the total catch during the period 1965-1979 recorded a primary peak in 1967 (1,972 MT) and a secondary one in 1971 (1,349 MT) and the total catch of this species was uniformity less than 1,000 MT per year during 1972-1978. In 1979 their total production was 1,174 MT.
The total catch of the swordfish (X. gladius) from the Indian Ocean fluctuated between 1,220 MT (1977) and 2,315 MT (1978). Their total annual production increased steadily from 1965 and after recording a peak in 1969, the catch declined steadily until 1973 and the catch has almost levelled off by 1977. In recent years the total annual longline production of the swordfish is around 2,200 MT.
A perusal of the literature on the level and status of the participation in the Indian Ocean tuna fishery by different countries since its commencement reveals that large scale commercial longline operation in this area has been conducted entirely by the non-Indian Ocean countries. The fishery was initiated by- the vessels belonging to Japan in 1952, and subsequently Taiwan and ROK entered the fishery in 1962 and 1967 respec* tively. The total amount of fishing effort increased steadily during the first two decades of the fishery, but since then it tended to remain fairly constant. Based on the development of the longline fishery in the Indian Ocean three broad phases could be recognised (Suda, 1973). During thefirst phase (1952-1958), the Japanese fleets expanded their fishing activity, both in effort and fishing area in the Indian Ocean, mainly towards the western Indian Ocean and the tropical waters. During the second phase (1959-1966), the fishing effort by the Japanese longline fleets was extended towards the fishing grounds in the southern area with rather slow increase in fishing effort. The third phase (1967-1970) witnessed the rapid increase in the fishing effort but without substantial increase in the catch (except in 1968) and a realexpansion of the fishing activity. At this stage, Taiwanese and ROK tuna fishing effort in the Indian Ocean increased rapidly.
A notable feature in the development of the tuna fishery in the Indian Ocean was the expansion of the
CMFRI BULLETIN 32 79

Ashing activities towards the southern Indian Ocean (south of 30°S) during the second phase (1959-1966), which was associated with a shift in the preference of species, largely by the Japanese fleets, from the tropical yellowfin and bigeye tunas to the more temperate species such as albacore and southern bluefin tunas. Japanese longliners concentrated their efforts to catch the southern bluefin tuna in view of its high demand in the production of sashimi. The longline fleets of Taiwan and ROK mainly concentrated their efforts in the fishing of yellowfin and bigeye tunas. In recent years, the albacore has become the target species for Taiwanese longliners.
A detailed analysis of the catch data of major species of tunas and billfishes taken by the longline gear by different countries has been made and the results presented in Fig. 73 a-c. The production by different countries are represented in the figures as percentage of the total annual catch of each species for the period 1952-1979. It is evident from the figures that the Japanese longline fleets were solely responsible for the production of different species of tunas and billfishes from the Indian Ocean during the first decade of the fishery. The percentage composition of the catches by Taiwanese and ROK fleets increased rapidly since 1962 and the subsequent decrease in the catches by the Japanese vessels have been balanced by the increased production by the other two fleets.
The trend of production of the four major species of tunas and five species of billfishes by the different countries conducting commercial longline operation in the Indian Ocean, during the years 1966, 1971, 1976 and 1979 are presented in Table 5. A progressive reduction in the share of Japanese longline fleet in the catches of yellowfin, bigeye and albacore tunas is evident from 1966 whereas they were responsible for producing more than 80% of the southern bluefin tuna during all the years. The landings of albacore tuna by the Taiwanese longline fleets rose rapidly sines 1966, and in 1979 they contributed to 71.6% of the total landings of this species from the Indian Ocean. ROK vessels showed steady progress in the production of most of the species of major tunas and in recent years their contribution has been estimated as 71.5% of the total catch of bigeye tuna, 15.7% of albacore tuna and 60.9 % of yellowfin tuna from the Indian Ocean.
As stated earlier, a declining trend in the total production of billfishes was noted since 1961 though in 1979 their catches rose to 11,550 MT (FAO, 1980 a). The dwindling in the catches of billfishes by the Japanese fleets can be attributed to their shift in the geographical area of operation since 1966, when they
began to focus their attention to catch the lucrative southern bluefin tuna in the area south of 30°S where the billfishes are caught sporadically. Eventhough a steady fall in their percentage contribution towards the production of billfishes from the Indian Ocean is evident from 1966, in recent years, a major share of the catches of striped marlin (68.0%) and sailfish (81.5%) were contributed by the Japanese longline fleet. The production of billfishes by the Taiwanese fleet rose steadily since 1966 and in 1979 they contributed to 52.0% of the total landings of swordfish and 50.9% of the total catches of black marlin from the Indian Ocean. ROK vessels also recorded increase in the billfish production and they were responsible for the landing of about 84.0% of the blue marlin from this area.
TABLE 5. Trend of production of major species of tunas and billfishes (% contribution) by the longline fleets of different countries in the Indian Ocean during 1966,
1971,1976 and 1979 *
Species
Yellowfin
Bigeye
Albacore
Southern bluefin
Sailfish
Black marlin
Blue marlin
Striped marlin
Sword fish
Country
Japan Taiwan ROK Others
Japan Taiwan ROK
Japan Taiwan ROK Others
Japan Taiwan ROK
Japan Taiwan ROK
Japan Taiwan ROK
Japan Taiwan ROK
Japan Taiwan ROK
Japan ROK Taiwan
1966
. 85.9
. 8.5 0.2
. 5.5
. 85.6 8.2
. 0.4
. 76.0 . 15.3 . 2.9 . 5.8
. 100.0
. 92.6
. 7.3
. 0.2
. 86.3
. 13.5
. 0.3
. 87.9
. 11.9
. 0.2
. 93.7
. 6.3
. 0.1
. 86.3
. 0.2
. 13.5
YEARS
1971
34.3 43.3 18.0 4.4
51.6 25.1 18.0
30.8 42.7 21.0 5.9
97.0
3.0
59.3 26.6 14.1
48.8 33.5 17.7
39.5 29.5 21.0
47.8 34.1 18.1
50.5 17.1 32.3
1976
18.6 13.4 68.0
10.3 11.2 74.4
7.8 59.7 26.0 6.7
2.0 2.0
33.2 43.4 23.3
42.0 16.3 22.6
29-8 22.6 48.6
20.8 34.1 45.1
28.1 37.2 34.7
1979
27.3 11.7 60.9
12.7 15.8 71.5
13.4 71.0 15.7
0.2
81.5 9.5 8.9
49.1 50.9
16.2 0.1
83.7
68.0 9.4
22.6
18.6 29.4 52.0
'Source: FAO(1971-1980a).
80 TUNA RESOURCES

100
80
60
40 h
20
0
100
80
»** 60
0
BIG EYE
I
ummmmmmmmm ALBACORE
40
20
100
80
6 0
4 0
20
YELLOWFIN
0 L
1952 54 56 58 60 62 64 66 68 70 72 74 76 78
mmmm Japanese catch 1 Tat wanes e • • • Korean
Other countries
a
73 a-c. Production of rmjor species of tunas and billfishes by longline operations by different countries as percentage of total catch of each species in the Indian Ocean, 19521979.

100
80
60
40
20
0
100-
^ 0 -
6 0 -
Uj 40
0: 20
A 0
100
80H
6 0
4 0 h
20
SOUTHERNBLUEFIN
K . . . 1 JU STRIPEDMARLIN
m
BLACKMARLIN
•HI
1952 54 56 58 60 62 64 66 68 70 72 74 7 6 , 7 8
\:^mm Japanese catch U
i ~2 Taiwanese ' M M Korean
Mother countries
Fig. 73 (b).
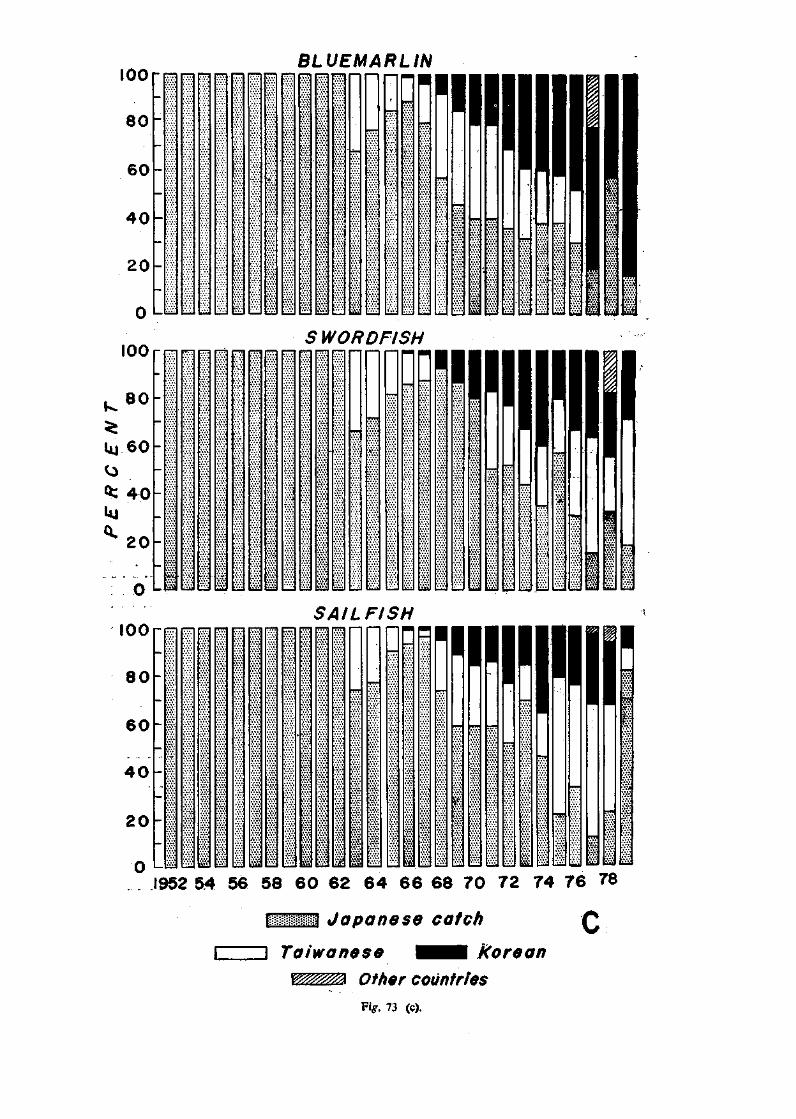
lOOr
8 0
60
40
20
BLUEMARLIN
: < •
_J L~J L*J _J L_I l—J L J L_) L J • _ Ltu L_ L_
SWORDFISH \C\C\
K 8 ° -^ : - " Uj 6 0 -
^ . ' ^ 4 0 -kj
Q. 2 0 -
• ^ : : • - " " • " " " " * \ \ \ \ \ : '• : • : • •
1 '• 'II 1
• ! * .
"
~ M. 1 ;S! _
ill J L—1 1' 1 uu) L-J L_J tujJ i • r [_ 1 ' ,J t—J L-JLhJ M M U&J £&
100
8 0
6 0
4 0
20
SAIL FISH
':-
ai: AU jfel JC
k
1952 54 56 58 60 62 64 66 68 70 72 74 76 78
mmm® Japanese catch Q
i i Taiwanese I ^ H Korean Other countries Vig. 73 (c).

The data on the production of tunas, tuna-like fishes and billfishes by the (/) non-Indian Ocean countries (longline operation), (ii) Indian Ocean rim countries and (iii) oceanic islands in the Indian Ocean Area during the years 1977-1979 has been analysed and results presented in Table 6. Sub-surface fishery by Japan, Taiwan, ROK and other countries accounted for about 106,580 MT (41.6%), 115,090 MT (47.6%) and 93,890 MT (40.4%) of the total tuna and billfish landings during 1977, 1978 and 1979 respectively. Surface fishery on an industrial scale employing pole and line (live-bait) or purse seine hardly exists in the Indian Ocean, though there are small scale live-bait fishery for skipjack around Maldive and Lakshadweep islands and for southern bluefin tuna oif the east and southern coasts of Australia. Surface yellowfin tuna
aje at present taken by Australia, India, Madagascar, Maldives, Pakistan, Sri Lanka, PDR Yemen, Seychelles and Oman. Species caught by the coastal countries bordering the Indian Ocean include small tunas such as skipjack, little tunny, bonito, frigate and bullet tunas in addition to the young ones of large-sized tunas. However, Indian Ocean rim countries and oceanic islands in the Indian Ocean contribute to 58.4%, 52.4% and 59.6% of the total production of tunas and tunalike fishes from the Indian Ocean during 1977, 1978 and 1979 respectively.
The specific fishing activities by major long-line fleets in the Indian Ocean are presented in the following section in order to understand the trend of the development of these fisheries and the quantum and pattern of the exploitation of tunas resources from this area.
TABLE 6. Estimated total production of tunas, tuna-like fishes and billfishes by (i) Non-Indian Ocean countries, (ii) Indian Ocean rim countries, and (iii) islands in the Indian Ocean1
Country 1977
Catch "/
(Unit
1978
i Catch
MT)
%
1979
Catch %
(0
00
(iii)
Japan ROK Taiwan USSR Egypt G.D.R.
Total (%)
S. Africa Tanzania Somalia P.D.R. Yemen Oman Pakistan India Thailand Indonesia Australia
Total (%)
Reunion Mauritius Comoros Seychelles Maldives Sri Lanka
Total (%)
23,705 60,882 21,484
473 30
106,574
48,371
30,093 65,602 17,891
488 14 2
29,886 45,021 18,767
33 175
2
41.6 115,090 47.6 93,884
18.9 46,319 19.1 49,846
40.4
2,624 3,465
14,775 8,280
12,129 16,314 1,636
32,369 9,647
6,116 3,465
12,802 8,280 7,464
17,193 2,095
16,035 6,998
3 6,935 3,465 4,704 8,280
14,044 23,273
1,710 19,314 6,701
101,239 39.5 80,448 33.3 88,429 38.1
323 2
1,500 220
22,800 23,526
445 37
1,500 360
20,200 23,777
445 21
1,500 435
24,700 22,745
21.5
Source: FAO (1977-1980a)
84 TUNA RESOURCES

Japanese Longline Fishery
Historical review of the Japanese longline fishery in the Indian Ocean has been made earlier by Naksmura et al., (1956) Kikawa et al, (1969), Honma and Suzuki (1972), Suda (1973; 1974), Ueyanagi (1974) and also has been briefly summarised in the earlier pages. The Japanese fishermen ventured into the Indian Ocean and established a fishery in the eastern equatorial area in 1952. Subsequently, from the yellow-fin tuna grounds around the lesser Sunda islands the operations expanded west-wards and reached the African Coast by 1956. The area north of the latitude 20°S was fully covered by 1968. The fishing activities expanded southwards to 30°S for the albacore tuna. In the eastern Indian Ocean, the fishery spread southwards in pursuit of southern bluefin tuna and by 1964 it had reached 40°S and the Japanese longline fishery covered the entire Indian Ocean Area north of 50°S by 1968 (Fig. 74). Thus, the boundaries of the Japanese longline fishery during 1964 and 1966 showed a continuous southward shift of the albacore fishery in the western Indian Ocean and the southern bluefin tuna fishery in the eastern sector of the Indian Ocean (Fig. 75). 1967 also saw a great deal of Japanese fishing effort from the Atlantic tuna fishery shifted to the Indian Ocean. However, the effort (number of hooks) expended by this fishery north of 30°S gradually decreased since 1967 and this was associated with an
Fig. 74. Expansion of Japanese longline fishery in the Indian Ocean since 1952 (From Honma and Suzuki, 1972).
TABLE 7. Annual distribution of effort (Sets & Hooks) expended by different tonnage classes of Japanese Longline fleet1
Tonnage 1969 1970 1971 1972 1973 1974 1975 1976 1977 1978 1979
-50 0.9 1538
0.6 1520
0.1 990
0.05 50
50-100 a b
0.9 1896
1.0 1604
1.4 1782
0.6 2190
1.8 1601
15 1622
6.1 1673
1.8 1413
4.8 1612
9.3 1645
5.1 1578
100-200 a b
8.9 2083
6.7 1932
6.2 2050
1 9 2083
5.2 2053
6.5 1982
7.6 1946
12 2105
1.7 2010
1.0 2143
2.8 2360
200- 67.8 2148
74.0 2136
77.8 2158
80.9 2154
89.6 1808
88.4 2080
86.3 2013
96.0 2296
93.6 2341
88.7 2380
911 2457
Mother ships
a b
a Foreign
based vessels b
Total Sets
12.8 2241
8.6 2430
13.3 3255
4.6 2409
12.2 6374
2.3 2252
15.4 7422
0.2 1530
3.4 5470
1 6 5495
1.0 3120
46,700 35,200 38,100 30,000 42,800 40,900 46,000 34,500 26,500 29,100 28,200
Total Hooks 101,115,000 78,181,000 88,793,000 72,195,000 79,506,000 85,630,000 91,235,000 78,190,000 60,569,000 66,546,000 67,546,000
a-Hooks(% of total)
CMFRI BULLETIN 32
b-No, of hooks per set : Anon (1965-1981).
85

PERCENTAGE DISTRIBUTION OF NOMINAL EFFORT (HOOKS) BY LATITUDE, INDIAN 0CEANJ960 - 1976
A - JAPANESE LONGLINE FISHERY. Z . Z Z Z </> if) CO W W W CO <0 CO tf>
« # . o o o ' o • • o
i o i n m _ l N C v j i o i o t t v i o i i i » i
o in i
o O CVJ
o O
I I „ - I ' « ' « o ° o • o
£ o o o m 2 £ N w Jo io * * / f ^ / ?
{ SCALE
EFFORT (x IP3 Hooks)
54,237
6 0 , 0 2 7 6 8 , 0 9 3 57, 4 2 0 6 8 , 8 7 2 7 9 , 8 4 8 8 9 , 5 6 6
126,305 118, 557 101, 107 7 8 , 170 8 8 , 5 9 8 7 2 , 1 0 5 7 9 , 3 2 6 8 5 , 617 9 1 , 207
7 9 , 914
Fig. 75. Effort expended by the Japanese longline fleets in the Indian Ocean since 1952. A marginal difference of not much significance may be noted in the effort expended (total number of hooks used) as given
in Table 7 (Anon, 1965-1981) and Fig. 75 (Based on data given by Wetherall et al, 1979).
TUNA RESOURCES

increase in the distribution of effort in the area south of 30°S from 1969 onwards (Ueyanagi and Honma, 1979) (Fig. 76). It is evident from the figure that the effort expended in the area north of 30°S in 1962 was around 67 million hooks which reached a peak in 1967 (86 million hooks) and rapidly declined to 152 million hooks in 1976. The number of hooks employed in the area south of 30°S in 1962 was 1.4 million hooks and in the subsequent years the effort expended in this area increased rapidly and reached about 63 million hooks in 1976.
• * North of 30'S
Fig. 76. Distribution of effort (number of hooks) in the Japanese longline fishery in the areas south and north of 30°S., 1962-77 (From Honma and Ueyanagi 1979).
Another recent development in the Japanese tuna longline fishery in the Indian Ocean is the introduction of the ' deep longline' to catch deeper swimming bigeye tuna. Kume and Morita (1979) reported on the efficiency of this gear in the Indian Ocean and Banda Sea and stated that the percentage composition of the deep longlines have increased steadily from 1974 and according to them the increased effectiveness of the deep longline gear is in the factor of 1.5 when compared with the ordinary longline.
Annual distribution of the total effort (number of sets and hooks) employed by the Japanese longline vessels of different tonnage classes during the period 1969-1979 is presented in Table 7 (Figs. 77, 78 a-d). Vessels of less than 50 tonnes are not in commercial operation in the Indian Ocean since 1971. Vessels of greater than 200 tonnes formed more than 67 % of the total fleet from 1-969 onwards and in 1979 they constituted 92% of the total Japanese longliners operating in the Indian Ocean area. An average of 2,000 hooks, per set are employed by these vessels. Motherships were in operation until 1974 and again in 1978, and the number of hooks per set varied between 2,200-7,400. Foreign based vessels were also in operation till 1972.
Fig. 77. Spatial distribution of longline fleets of Japan and Taiwan in the Indian Ocean, 1969 (From Suda, 1974).
A perusal of the catch-effort data of the Japanese longliners indicates that the growth of the longline fishery was accompanied by a steady fall in the hook rate, from 5 fish/100 hooks in 1962 to around 3/100 hooks in 1968 and 1 fish/100 hooks in 1979 (Fig. 79). The total effort expended was minimum in 1963 (57.4 million hooks) and maximum in 1967 (126.3 million hooks), but the catch rate did not improve accordingly. However, during the period 1967-1979, the effort expended by these fleets in the Indian Ocean fluctuated between 61.0 and 126.3 million hooks (Fig. 76). The total catch of tunas and billfishes by the Japanese longline fishery increased steadily during, the first decade of the commencement of the same in the Indian Ocean and formed about 3,444,000 fishes in 1962. After recording a decline in 1963, the total catch, again rose rapidly and reached the maximum in 1968 (3,775,000 fishes) and has since declined steadily to about 18 % of its peak value in 1979 (Fig. 79).
In the present study an analysis of the percentage composition, catch-effort relationship and hook-rates of different species in the Japanese longline fishery during 1962 to 1979 has been made and the results presented in a series of figures (Figs. 80-83; 84 a-j; 85 a-p ; 86 a-i). Yellowfin tuna constituted 40.5% of the total catch in 1962 and a gradual increase in their catch was recorded since then and in 1968 it formed
CWBI BOLLBTIN 32 8^:

•I »Q'« « f f t t ' l 100 1 H O I l t«*| 110'I i«fl'«
M* N
10"
»*
10" 9
' 8 '
10
40
I SO
1
%
o^
(
* r ^
• • 0
• 0
hi
• 0
io
e
• 0
4C
a
0
If 0
•
T
o
0
0
-te
*3
fc o
0
s 0
't
0
0
0
0
o
1
'
*— 0
0
0
0
0
0
o
<F
y 0
o
o1
IO_
0
o
0
0
0
0
0
•t
H 0
0
0
0
0
»
o
> o
o
o
0
' I
Sh 0.
0
o L i
0
OjO
0 0
0
i ol
0
0
t
o
2yx <? o'
o
o 'o
o
0
0 '
0
• I
0
• •
i o
•U
Sy o j ^ oto o o
0
•
0
0
0
• °
\k
r>»f--o o
, 0
°I o\
0
o
0
t . 0
Japanese
\oyj ^r
'Unit 10* 0 99 •100-199 #2do —
r°T^ 0 | 0
0 0 | |
"3\ / 0 0
0 0
N*T^
iv V
^
k
~} o o . o . o g i
1 1 1—1—21i— •E ')C'£ 'JO'E MCE
j
• s c
\ .
^t f
Fig. 78 a-rf. Distribution of estimited total Ashing effort (number of hooks) expended by the Japanese longline fleets in the
Indian Ocean during 1976,1977,1978 and 1979. In Fig. 78 a and b also the small open circles indicate the effort
(number of hooks) < 99 x IO4; small closed circles effort between 100—199 x IO4 and
large black circles show effort > 200 X IO4, as in Fig. 78 c & d.
88 TUNA RESOURCES

*0 3000
5 0 ' •.
V * 4 0 - X ^
3 0 -
.8 § 2 . 0 .
10-
Vw • TOTAL FOR TUNAS
AND BILLFISHES X TUNAS O BILLFISHES
\ ^
o- o o ft n C
1962 66 68 70 72 Y E A R S
Fig. 79. Total eifort expended, catch (group-wise) and total hook rate (%) of tunas and billfishes in the Japanese longline fishery in the Indian Ocean, 1962-79. Hatched portion indicates the number of tunas caught,
Billfish component is shown as open bar which amounts to less than S-10% of the total catch by number.
CMFRI BULLETIN 32 89

1967 B B U M I T \ / •SAI.SSP
MLS_^\ In •SKJ swo
1966 SAI,SSP
SKJ
1969 SAISSP
SKJ
1972 SAI,SSP
SKJ
"SAISSP I,1:!*" SKJ MBUM-
swo-
1975
„ SAI.SSP SKJ '
1978 BLM SAI.SSP
f H ^ ) Southern blueffn f l j l f Albacore &:$$ Big j eye Yellowfin
Fig. 80. Annual percentage composition of different species of tunas and 'billflshes in the Japanese longline fishery in the Indian Ocean, 1967-78.
TUNA RESOURCES

3600
•^ 3200
£ 2800
| 2 4 0 0
2000
1600
a: o 1200
^ 800
400
-
A3/
-i i i
62 /
/j / *%y
r4 I / i 65/ j
7Q*-y7\
/ / 74 7 2 \ / \ 76 V / 8
A 7Jr^ /Vie
^ 7 9 ^^. i i l l
/ 6 9
i i
68 /?
1/^*1
f
y^
o ^
L 1
0 20 4 0 60 . 8 0 100 120 EFFORT (Hooks xfO6)
1979
• BL.M •SAl.SSP * S K J
1600
-s 1400 *> *•» x 1200 « | 1000 t
8 0 0
I 600 O
»•» 4 0 0 <*
^ 2 0 0
-
E d i_
• i " j i
/ / / 6 6
/ / / / 7 6 5 /
/ / 64 / / / /7X/
/ jajT
77 7€ l 1 1—1 i 1-....J J
-
'69
•
A68
1 V
67
o>-
1 ,1,,, 0 20 4 0 6 0 8 0 100 J 2 0 ',
EFFORT (Hooks xlO6)
Fig. 81. Catch-effort relationship of all groups of tanas and billflshes (combined) and of yellowfin tuna (bottom, right) in the Japanese longline fishery in the Indian Ocean,- 1962-79 ; Radiating lines indicate hook-rates. Percentage composition of different species of tunas and billflshes in the Japanese longline fishery during 1979 is also indicated.
CMFRI BULLETIN 32 91 7

Fig. 82.
20 . 40 60 80 100 |20 0 20 40 60 80 100 0 20 40 60 80 100 120 EFFORT (Hooks * tOeJ
Catch-effort relationship of albacore, bigeye and southern bluefin tunas in the Japanese longline fishery in the Indian Ocean, 1962-79.
46.5% of the total catch of tunas and billfishes by these fleets. Subsequently, their percentage contribution to the fishery decreased and in recent years it was around 22.0%. The hook-rate of this species also showed a steady fall from>2 fish in 1962 t o < l during 1969-1971 and<0.5/100 hooks during 1972-1979.1
Albacore tuna contributed to 29.2% and 38.9% of the total production of tunas and billfishes in 1962 and 1964 respectively, and since then their percentage contribution decreased rapidly and in 1979 it formed only 5.9% of the total catch. The hook-rate of albacore was relatively high (>1.5 fish/100 hooks) during the early phase of the longline fishery which declined steadily and <0.5 after 1970. Bigeye tuna evinced annual fluctuation in their production and their percentage composition fluctated between 12.7% (1962) and 22.5% (1979). The annual hook-rate of this species was>1.0 fish per 100 hooks during 1962-1966 and was<0.5 during 1969-1979. The contribution of the southern bluefin tuna to the total production of tunas and billfishes by the Japanese longline fleet is noteworthy. Their percentage contribution rapidly increased since 1962 (11.6%) and in 1976 and 1979 it formed 57.7% and 39.6% of the total landings respectively. The total catch of this species fluctuated between a minimum of 232,000 fishes in 1978 and a maximum of 734,000 fishes in 1967. The annual hook-rate during the period 1962-1966 was around 0.5 and subsequently it was invariably low (<0.5 fish/100 hooks). Incidental
1 The hook-rates are given as percentage in the accompanying text figures.
catches of skipjack tuna constituted 0.1-2.9% of the total catches during the period 1962-1979. Their hook-rate was relatively low and was < 0.05 during the period studied. The percentage composition of billfishes in the annual catch during the period 1962-1979 was invariably less than 5 %. The hook-rate of striped marlin was<0.1 during 1965 and 1966, but was mostly between 0.01 and 0.06/100 hooks during the rest of the period. The hook-rates of broadbill spearfish, black marlin, blue marlin, sailfish and sword-fish were uniformily<0.1/100 hooks during 1962-1979.
Different estimates of the annual and spatial patterns of mean weight of tunas and billfishes from the Indian Ocean are given in Figs. 87 and 88 a-h.
Taiwanese Longline Fishery
Taiwanese longline fishery for tunas commenced in the Indian Ocean by the sixties, and since then their vessels started concentrating the fishing of tropical and sub-tropical species of tunas and billfishes. More effort was expended in the waters of the low latitudes in the Indian Ocean excepting the waters off the eastern African Coast and part of western Indian Ocean during 1967. Maximum effort (more than 20 x 10* hooks in the 5° square area) have been expended in the following areas during the early phase of the fishery : (/) north of 5°S and between 75°—95°E ; («) 5°N to 35°S and 35°—70°E in 1967. Subsequently, the fishing activity has expanded throughout the Indian Ocean Area and occupied the waters north of 40°S in both the western and eastern Indian Ocean during 1977 (Fig. 89 a-c).
92 TUNA RESOURCES

40
20-1
. swo
r% . ,
/
^ - ^ 6 3 - ^
,....., T
/
iT a /
— i — i —
'"""jjSg; •^6 pT»5
"1 1—
0 ^ -
68
O 0 1
T—i—r—1
100
8fr
60
40-„
20-
SAI.SSP
" ~ i ' "T—-r—-r
- ^ 6 3
—i—r
/
/ 67
6V' ^^y ) ^ y y "ft \70
\=L————fi:SL" •—?*-[ i' ,i i—i -i
20 40 6 0 80 iOO 120 ' 140 0 20 40 60 80 100 120 140
EFFORT ( Hooka xlO6 ) Fig. 83. Catch-effort relationship of skipjack tuna and different species of Wllfishes in the Japanese longHne fishery
in the Indian Ocean, 1962-79.
CMFW BTJLL811N 32 93

O'E laO't llO'E l«Q't HOE HP'S
i"J„'E *?' e ' 0 > l B0' t *°'E ' ° ' e *0'1 B0'K , M ' 1 "*'• '» • ' • <*o'< <<o't ita't i«
sa'
O'
s
JO 1
s
2
9 M9
» 9
© © ©
e 9 9
n 9 9 9
9 0 0
*f> fa 9 9 9 e 9 9 0
9 9
9 9 9 9 9 9 o 0
© e
e e e e e e o o e e
pv MpwiM Ll-FtoMry /
9 • 9 9 9 9 <v
e e
0 o 9 9 9 9 o e e ©
e e e o e
e e
A 9
© o 0 0 0 0
tf O
0
0 © » o o 0 0
0
• 0 0
o o e o © o
o © o o
o\
0 9 9 9 © 0 0 0
'
sV © © © 0
© © o
©= O o o O © o
L
P5 ©j
©
© 0
© ©
_ « V
BI8EYE
HOOK RATE!*/.)
AVERAGE FOR
\ . »7M9T»
'V
"^r ~T" ^ '
^57 \ \
0 o t-D
^
C J t 30 E ,0-E 50-E «0'E 70'E BO'E OO'E 100'E IIO'E 110 E 11 'E HO'E IJO'E itJ
s
to H
M
0'
ft
10'
•
10
to ' •
10'
#
w
•
O'f
e
i
(• 0
•t.
9 9 0
* 0
' •
m •
• I * • © o
•E
• 9 0
t o
s «4
f 1 •!•!•
© © 9 © o:
• i
© e • • • e © © 9 •
0
0 © © • A
*
© © » ©
•E
r v J
© © © © © © ©
© ©
JC
© © © • • © © © © ©
E
ap
© © © ©
© © ©
80
» ! ) • • • LL Fishfry ,
A •
9 ©, 0 0 O © © 9
•t
• 9 9 9 9 9 9 9 9 9 9 o
s
«) © © 0
© © ©
© 9
o\ j - V
© ^ © © i
© © © 0 0
10
© © © © © © 0
E
© © © © © o
11
© ©
«s *
fl - 9
r
*
• 8* ©
YELLOWRN
HOOK RATE ( V . )
AVERAGE FOR
' I 9 7 M 9 T 6
^tx^y*
» L r W O
E
o
i ja-t 13 » i i *
h v * ^
D
I '•> d E
V
1*6
;u.E JO F 4.1 E Jet SO E '0 E 80 t «»E
" *\f\ to- s C ^ -
^
s
3 0 '
..-•
. . •
©
<* o
©
|0
o © 0
r€ 99 \°W _ 3 *i
9 9 0
•
© o 0
* ' •9 c
0 C
0 C
0 C
© c o 0 C
0 C
o t
© c
0
I C E i 'e «O"'E''- lalt
} •
_©_ o
5 O
> 0
©1
3 O
} O
) . ) O
> o
- , OopontM L L
o o 0
O l
0
0
^ 0
0
9
o V j
o l o ol o 0 0
o
o o 0
o o o o o o o
,
4s © «
j t> C
0 C
o c
0 C
0 C
0
0 (
0 C
0 C
Fit
> o U >o > o ) O
o ) O
) 0
3 O
} O
> o
3 O
E l . n IJ0-E ,10-E l . « . » • ! 1 .
k i r y
^
o' 0
o 0
0
o 0
o
/^
0
0
o 0
o
L°_ 0
o O (
o c
o <
O (
o
Y —
-S\ p «
3 0
3 0
X
7
r
J ^ o
r
BROAD BILL SWORD FISH
HOOK RATE ( V . ) AVERAGE FOR
S I 9 T I - I 9 7 S
1)
3
< ^ 1 ^
-s i / V
*
K 3 J ^ 0 0 0
r v i L s i .
j i
s.
1
•r.
10
0'
10'
*
10' 1
8
Fig. 84 a-,/. Average hook-rate (%) of different species of tunas and billflshes in the Japanese longline fishery in the Indian Ocean, 1971-76.
94 TUNA RESOURCES

t „ i ' I "*o'*" *o-t ' 10 £ eo-E ' o ' i «o-e »o*e IOO-E nore na 'C n « f <«'C ' » ' * • i t j • N • ' \ * l|V "
to- \ % ^
s - ; , \ •••• - j
»*• >' • ' '
* r t J •
f °
» •
• "Jh"
0
f ' 0
0
)° 0 0
6.
o
[0
0 0
art* 0 0
0
e 0
T to 0 0
10
to o 0
«f>
0 0 0 0.
p 0
* 0
'»: 0
•
e 0 0 0 0 0
e of
0
- , JopOMM LL FMMry J
e e 0 Oj o
• o"
e
o
o> o
e 0 o
9
e •
•
e 0 0 0
• o
o
!
A 0
0 0 0 o
0
0 o
o o o 0 o o o
o
o of
M'E 40't SO'E ICC 10'E ! 10*1 t
0 0 0 o 0 0 0
'.: 0 0
• I
o" o 0
<r £ H 0 Oj
0 0 0 0
0 0
0 0
p 0
0
• >
0 0
A 0 o
«> °] 0
0
T BLUEMARLIN
HOOK RATE Oft) : AVEAAW COH
j .mn-tm
T\^ £ i fc \^ 0
' >*'
>
/ \ I ;
' y V I o • h£f
3 ( *
' ! ' •
10-1
to '
'8
'8
100'E 110"£ T » * l t W f . 14 '1 I IO ' I , ' i J V
P i: u
•
'1
«
O'I )«•« *0'C » »•:£:. * * « e r . - * « * t - - M ^ W E too'E' ' no'E r » ' B HWt ••• »*fr E- « o r • ia
M , \j\v
Ic3
. EwrfS 0 o 0
) 0
0 0
0
o1
£_
SJ 0 0
o
0 o
•
'o I O
0 0
[o 0 0 o1
0
0 o 0 o 9 o
o o
o o
« 0 o 0 0 o 0
0
o
0
Slhr-T' i—5iT—m —wr
JapoMH LL FittNry
• 0 0 6 Oj <v
o
e • o
• \ Ol 0 0 0 o 0
0
0
0 0 0 0
0
0
0
0 0 0 0
0 0
o
0
0 OlO
O o o 0
o o
0
0
o l / i
oo
0 0 0 0
0
0
*0 'H ' UTS N 1
tfl o 1
0
0
0
!JV' 0 0
0 o
0
o
0
9 0 o
0
e e •l 3 0
o
fl 0
!? 9
L
t
•LACK MARUN
HOOK RATE (V . )
AVERA8E FOR 1 l»T I - 187ft
f j
^ r ' ^ G S
r ^
.v
• rv Miil
j
^
h t W e " 0 - E "WE ' » t HOE ISO'E 1*
•e
JO
3
1 0 '
s
s
' 8 '
. < • '
" . •
'!'
'f
'8'
•
i )o*£ t o i ! ( i «oi »ot •«•« w: i «OOE no'E n o t j»"% »*at 'We i *
. . . - " ; - • a
'i
. ..
M o
• I "
•
h
i 0
jo
e 0
0
o
0 o
i' 0
ft*
^ T° o o
° 0
'•• , . e •
e 9 o 0 0
0
0
•i ' 4»«' w r i i
9 o o o o
o
. o
J a f m M t L L Fblrary j
9 9 o
5_ 0
~J
o o
v«
O' o o o o
o
o o
0 o 0 o
o
o
"
A 9
o o o 0
o
o
E
o. lo
S] s l°-o
•?
0 o
o o o o 0 o o
o 0
\ 1 /
." 0 o
0
0
\ r> J
o 0
o
. 6
. o
o
»
,x L> t o
o o
°I °1 0
< f. JB
6
T SKIPJACK
HOOK RATE CV.J
, AVERASE FOR ? 1971-1976 1 ft
^F St-S^ ^
F .' I MTS^V
H'A
\jrf~ / hr P 1
;< 'S
!!
'S'
6 '
•t
•i
—n n
r
1 >0 'E t o a - E H O E I I O ' E I 3 0 E 140 'E < so f '6
,. '
F/^. 84 (continued) W-
CMHU BULLETIN 32 95'

ALBACORE / " V f e — operation no eatch j( l j /
, * * HR O - ^ 0 0 4 y? / 4
„ jJL-U) (%) * ) - OA-2 '8 **r£±-S- i
*3XP • • - **— ¥*#{ "I Y\ ^« . / 1 T
V ^ A * f i ± I * t% f v o w ; "» W o o v i o' _4\ Ay > / o o o o ->W , si m »
/ ° °"° V t S ' l * *^r^" > ,. 1 o o O O l Oo*Hw-L , , V V n v i 1 \-A- °QtQQ Q l oo ~-»>]fVJ_ 1 i\ (iji °97 \
|| / " • « J W I " M A H . W / / I
I 0 ! * • O O ' r - f T V t / JBO ~+~ oBO "Vwj ' D o o o oo o o o o o oo o o o 3
L _L_. -.PL 1 ^ L u. to l MJf <ol *•'* *<5l re i io t « l io t no'l ( M l i w l t « ' i iH ' l <M-
r « .. j - J f t ^ ^ At B i ^ A W .tf. >l V 1 •$W ALBACORE £ } < # _ _ *:& \?' Z X\ ^ t * . C
Y> ^ * "V ^. /^T^' * M ^1 \ / ° \ \ N 1 „. T l i B d ' ^ k O V"v J ^ i T
^o9or^T:t:3v 3 5 a ~~z / O 0 * > ^ •* ( J . j _
* tZ ° * \J k>"r ffl *^r^,~ X oo o..,. o p o ^ - . - r TVrS *H * / ° U - w 1(V
~ I / ,w r -x " / " rt ~\ArK,-*WN.iv77i ""
"ofl •6S: rf-rv / , .. Bo • o o 1-«q -
D o O o o o o o o o o o o o o o o J
1 — _. - . —
J_ ^
• {«£& ALBACC "h^TT
1 / > r ^ r
/ o o o ' / o o o o o
o o o o o o o o _ A - o f o o o
" »' / f ' j £V .. / 'k*f ° . .BOBO Oc
v 'OOOo o o c /
t
" • . . « . « = = = = = «*=*= = « |PF I6ll *vi M>t tVt JO-t ••'! t C
*3 rVi -Ki • Y ^^ /"
^ r
A N- 2= - -•iO- -A^ K -> T e f V y 1 - / ^ '^r"*"-** -oot=f=>-..-<r Vr* v i
.QQ ° ~ IUA,-^ 7 ^ ^4/^ _
9 T « I - C C O I Q " J " T \
• o *"*• '^^ l 9 7 71 * Oo"oOP 1 -<T\2 f 0 O 0 O O -«o»r
o o o o o o ? -
f t
I' l«0'E MOI If t ' I l i f t 14 'K 1«'t '••
4 1
ffiT ^ I
""f ^4J3
Q j ! • • > ' ro
f 7^ V ^ \ >
\ ^ ,. '. Vl
' * *•' .
»•
0
I
O o
o o o
•it
o
,( \ I o o o Q
o 0 0
o o o o
s
o o
o o
fa A
o 0
n\
1 r
^5
o < oc
O (
H I
/'
o >o >
0 J
o o
kv V V
M
0 0
o o o o
V
S1 sS o1* 0
o O ( O (
TTl o
k * 7 1 1
o
y
/< \
1
/ * l -0
<& d 1
id 5 O
i *
:TrOeC.»77
^.r-f o
<?
•*-« tM-l l i f t I t
o o o o
p I • 1 1
T \,£
) o o
_ 1
1
h K "3
"
' * •
'v —
T^ft LH
Fig.85«-ifc Quarterly hook-rate (%) of albacore, (a-d), bigeye (e-A), yellowfin, (W) and striped marlin (m.p)fn (the Japanese longline fishery in the Indian Ocean, 1977.
96 TUNA RESOURCES

H i M't *** H I M i tft'C M l M l HOl HOI laot llfl-f 140 t IM'C HOI
n| BIGEYE ZZ*1[}
AST HR o - ~ -04 >diLi.__ t if**^"^ I t l •—0-5— 1-9 ,-^.,/n fil „ _
fv«i fli °o f^-'V -4U3 ^ • 20 c * r
V W - v >4 -•— •-• •t \ J \ * rs^r
* • \^Z A < I% N--£ •f ^ t t ^ ^ 1 0 ^ J | ^ri^rg^ j -ir ^ " « o i - ^ ^ ' % ^ * _
... \ f * ! • • isfe©..:,, ^\Z> v 1 _ / L ftftftQft ft! SO ^ - ^ 1 , . ' _ n «<^ i °VS ^X n £\L - * . \ -„ / 3JANrMAR.|077r "Pfl ° • ! i - f T K / J22 o»»_L ag_ _ * oo o o o oooo o o o o o o|o 0
,::: :: ±::::: n ____i_ : , X
I I 10't «o e M l t o t TOE toe *o'i tool no ' ! n o i u n i i « l iH ' l m i
zvsT Z.%„^' s „ ^J^us -.. BISEYE * - f i r 'iVTfl f ^ - ' V ••r1-1-7 « • V- 5 "" • ^ W^ JL - -\ ^V\ -A wr
\^d A t&\ N- 3= - -•s ^ | § k, Q J p J ^ 5 L _ __ I
# • # • v i A ' A2? . Z l - Q - - iN -Xs - . * ! I_ I
/ i Q . ^ • • " ^ ^ £ ' $ \ " * » -L_ 1ft t ftftftS* l / u ~ cJJH • •
.. L I T -#TWrJUN.»77] -'°H D*# [r#Pk / •» • • • ° r%Z' ' o o o o o o o o o o o o o o o o o -J
, s : : : : : : : : : : : : : : : : : : : : : i : : : : : : > l T l i , « t r * W * * l H ' ' ''-*W V C •"«••*' w t ' J . w V nee raU u U i « t m ^ .tt'41
H I M ( M't t t ' t M*E f t M't tOt I H 1 n g ( l » ' l tlO'E 140'f ' l « t I H I
/&£ BIGPYP >4Jl»*'
*I CS*» r }J ^v~ r-ILXj Y ^";
XV. W n C \ J \ i \ nrfr T \V^ A ^ \ C i „_ I ^ c A : JCJ-^SL. _ ; L • •* Jb\ ^ T JO> >B| ^N . r >w4.^ • jtlftS? ° t^fc'^i5' "^r^«^ -p* i i i f »» ° o •ftHoh-.- ' VT^ v ] / • • • • • o o »p P ,-^IN.-
^L ; Z ^ 7 ^ - ^ S . / **" • " A 3PCirDEC. I977T
nifef " • • " • ! r f - r H /~ r „ § 0 O O O O O l O O O • » A J '
o o.- oo o o o o o o o o o o 3 I
' • i t l t l u _ . - • • : i • it
Fig. 85 (continued), *-A
CMHU BULLEnN 32 97

io E 10 i WE WE we mi tWi WE IOO-E no't ut t utvi iwe m i i « t
"' 4
J ^ i ^ , YELLOWFIN
3^ ' f ^ ^ i
" vi
i
y
0
% t
S ^ k ^ ^
• • 0
s
...
0 0 o
- ( /
0
t
o •o
0
"Y" rt\
• I
# • o
o
*
0
•
0
•V
o
o
o
0
0
*s
)
ii
e l »
-
o 6
0
n
t-\
O
O
O J
5*
^
/-
1 n /*
w
^ >
/ V '
" \,
f\rt<.-Jurt.lv/ i
0 0
-
o o
^\/
0
J 1
0 J
» lf ' 11 •! «•'•* WE Wt TO* H I W l '001 (M0-I l » l "JOE 1401 I M I 'W '
» ' ( » '« 40'E 60E « - E *0't « t M"[ 100*1 IIO'I laO7! 110'B 14 'E IIO'I
I Of! 4.-t H I 411 >.'t M l ICE logj
Fig. 85 (continued), i-l.
98 TUNA RESOURCES

M
=3± STRIPED MARLIN
o — operation no cotcli
„ _ T O ) «M • - 0 4 - 0 - f . . . j N y y 1
<M r *"*-*—' , • • - 1-0— ?
' \ W-vV ^ ^
.« ^c3 J
• .
•» t 1 - 1
H
„ 3 0
M
*?y=i v
c
« • • !
^
)
i •E 4
o
'C
s
0 o
7
^ A
0 6 0
0
• f
V; Q o Q o
o
a
A
i> 0
0 0
0
•e
» • O
0
0
o c
• 0 '
s\ )
Ji •
o o
> 0
t o
XT' o 0
o
F
O
I t
o 0
*1 \
0 o Q
f
l yrj q
-a
-3' X V
m o
"
*
1
KO'f IS
/a £?• y
57* ^>\ ^ J A N T M A K . I V /
I
O ( 0 C
130
> ) O
1
0
I I E n o t i«-e i
vt n
r
'
>, ' \
7)-
iir-rt'
?
T
r £ * * aye «• ( w t u i rt-t H I »oe >MK IIO-I tt«c I N
801
M
«0 N
10'
10'
0*
s
5
10'
s
a
SO' s
•5 I
j J T C b STRIPED MARLIN ^ ^ VW XJV— T ^ t
\ r~ \ i a
0 o
o o o o o
y
0 •
•
2 0
s
0
F"i \
• 0
k j t> 0
o o
0
o
vc
0 0
o
o
o
o o
o
'} 3 %
I M ' t
Lra.
tr"
' J _l * 1
o /
c \ o o o
~
*••
^
AKKrJUN. 1977] ~
L^6J 0 o o o
_J
Pi o
a - K
o
M
3
-,
; , ;
!'
I M ' t
M Y
• t
•
we
T •
\i „ ^
"
! . ! •
! • s !
& 0
"'o
*s
• J l
' t f t 40 t 10 J "0 1 ' * t M I m i • « • ! m i '•»« t^J^
<
A?c ! S T R
_ \4t To _ / b o o i
/ r ooo l _ OOQC )-A- oC
I 1 /
r**l ° o o o OOO
•
IPED M A R U N
f /
^ ^ r
I 4 ! * T & -\Jr. JcO -*3 -
r ^ ^ ^
"te j ^ ^p^ raooooo1^-..,. ) O o 6 O O o^>* : ~ /
^ w 11 .me 0 0 a H J L ' S E
0 0 0 0 3 ^ - y •1 0 0 0 0 0 0 0
OO O O O O O O O
- ! "
» 0 t »0 E 1,00 E 110"E 110 E »1CI
4TY 1 v /L,-. ^ i-^
t i
ir^^>, -> M ^ . 'Vfc:
TJA^' -; ^ \ -
R l v 7 7 V - J
w . " "^5
3u
,. t nit lii'l1
» t H I H I M l J f t > • ! » J M l I M 1 11.1 I M IM1 i « I H ! - IM
' J j ^ «TRIPEO m
""VnT " * s _
's \ v~"Kvfrfv TC^T'*" 1
J - ^^ r
^ | , 5 g _ _ ,£ss£si™i B055O5DQQO
/ 0 O O O Q O 0 S\ 1
' -tit r*" »• ^ iopiT" , B o 0 0 " O O ' O O O
t:::::::::::::: i WT'""MT**VW , *»'t—iw;.».i •••« M I
/f Yi /S c
« U N / - n ^ r * r ?' - ^ >
\ ft** s~ s*~T/T
x M L „ 1 . j p J - ^ S t - •-" -r> ^ XW-^ j 7 L 4 _ i . _ _ . J^fc . ' -y £ " ^ r ^ - w f c • 3Bfcte«-,. n V ^ ^ ' v t : IQ. s^~*tyv .t _ Q$r ^X J . 0 g O C TrOEC..|977 f ; f 0 0 o ' ^ - p v i / " i ' l O O O O O O ^ 0 0 0 0 0 0 0 0 0 5
1
n -1*
tect tt«-i i » i (to'l \*o't i toi t i r t j
Fig. 85 (continued), tn-p.
08m BULLETIN 32 &l

•f
IB" N
ft
'J'
•o-i B ! « ^ «•• ' v 1 • £ ' *ot 'w^ ,,o,t ,,fl-t ' w ,*6't
°i 9
•!' i - ^
I 'J
•1
"i 1
o
0
PI
0
0
=s
e
6
If"
0
0
r* o
it a
0
Y ^ r° o 0
>.
0
0
0
o o
_ Joponm LL Flihery L.
o
o
o
0
o
0
o
*
0
o
a
0 0
o o
0
0
e
o
o o
p 0
oS
0
0
V
\V 0
0
e
0
o 0
• o
a
e
»
0
0
•I •\ 0
a
:» > j
• ID ' ! !• _ ,—,—___
Albacort
Z Ja*—Mcu
j~&.~" 0
V
• _ • i
• 0
• , * *
*s 'X«S e<0-4 , 0 - 5 - 2 9 • 3 0 4
> » 0
> 0
r v i
0
0
T o
e
v \ . l
*
\
/
D
V
Q
"A
fa
H
i
Jo-
10 9
40 s
10' 4t'C » ' • M ' l » 'E c o t tQ'C I M ' t I I O ' I H o t 1tO*E 140'l I IO-I 1&?
I * *
'!'
10' s
•J'
10' 9
40'
'« <•
^ X i
• 0
0
o
0
a
• o 0
r
• •
• ( /
0
•
0
r/ i _
'• a a
0
a a
a
- | * a a a
> • • a a a
a o a
,-r\
a a
> • •
a a
• a
o
a
a a a
a
a' 0
0
a
o
l i s i n
^0
e O
9
a
V
I M , ,„ ,«
Altacori
—1 »
i*|: o a
T o\ o
^ 1 X^S*
4 "S Nk ' V
L^»TaTa\z a
g
a 0 o o t
htr P 1
>X,
t»
i1
10
»•
s
10' s
10'
a
'%
>0*
T-»o-| W l «o-l to'C »0-I p-e i iat uo-i
Mr l i t1 iW
Ytllowfln tuna Hook-rattt%) Jan. —Mar.
1979
Fig. 86. a-l Quarterly hook-rate (%) of albacore (a-d), yellowfln (e-h), bigeye (/-/). southern bluefin (m-p) and striped martin (y-f) in tne Japanese longline fishery in the Indian Ocean. 1979.
100 TUNA RESOURCES

t- ' • • • • "
1 1 ^
'
• •
n E „f»
* 0 e
e
e
(
o c
»>• • o
/
>
•
fo • •
• o •
*ii
-
: * •
n • •
•
hrj-«
•iofom u, rumiy
• 0
•
• •
rl «
•
e
• • o •;
• ° p
•'
• •
• e
\ \ •
• •
V • • •
s
V
• o
• e
0
o
-J
^ i ^ ta • 0
°I °1 • •
.» • e
/
A,
> • o
0
• o
0
0tHjt0t»m P H»Bk-r*t*(%) \"
i Jm —Hit. > i$r»
w
r s n M T V
• & » - 1 9 • 2 0 4.
p 0
0
i 0
0
HA. * • 0
S^<-
o
*i io ' t %o'f l o e i "O'f 'Jo i ' l o i t * o t •
) j
'\.
1 ' . i
I t
ft'
*
*
l»
" W l l » t •#*« •§*«! • « »•«. W l M« M l » ' • ! .»'« . 1 .
^ . ^
• ' I , 1 ' H
*l 1 -
• r *
r* •
•
y ^ •
-
• •
, / •
7
4 • •
• • •
•
• • • •
• • • • •
• •
NT *
to • •
i «
• •
>| e
•
j g
•
• • • • • •
•
•
• » •
•
T l
•' 3» •
•
•
•
• •
• •
• 0
,\ 0
,-, 1 "W I *M
A 1 *
Uai
± I (*1 |» nl
" t^tr 3
i
IV
to
•0-
'«
, W
"f'fi intfT *•'* •?'* iifit*1, "'• *vt *•"* ""'' "*'* l , r l "°*c ,* r i '*•*'
••• * t w -* m
| '! ' n ^
i .
• n o
» • •
• o
e
e 0
0 '
0
•
1
•
r f i (1
• o
r( i
/ 0
• o
•
-
• e 0
•
•
• • • •
•
e • e
•
/ *s
•
e
«
rr\
• •
0 e • 0
" 1
0
• 0
• V
•'
• • 0
fv Jl -
JV «
• 0
0
• • o
0
• • • I / • 0
0
V
/
• • V"
T
n BiW MHO
'iti
fi: •»»• »W
5 •
w
>
— 1
6 0
* 0 0 0 %
»
%
• \
'!'
'%
•i
t
\^4-ZZ\ /L-* C_i ^aclIlJL^IZJf^I'i r. , i _ ^ j • _** '* ^ S y^S S. 1 £ ft ,_ - ,- _,... ^ i ' \ m ,4—
„ W £ £ • _ • • • S l f t i B . E . ' T.V * * 9- * * * m
» ^X/--*---. __•• ' 1 >-U_. _: __: --T - i i i ::: . :: :: 4 n v •• • ^ • •.1<n • • o o o o o o o o o ~ • • o o o o o o o o
M . • . • • 0 0
9 W - 0 K !
'.....' 1
•Vfc/tVS V ^
y'flU ' "" *
o T 3 - - T
ij,y •ait >U'I Ml'*
CMFRI BULLETIN 32
Fig. 86 (continued), g-J.
101

i| 11 r. .. *« so
1 : ^ • ' " X [ i
.-.: .. J ' '
S.i I
A M x
>
*E ie
0
• •
o
•
• *
•
0
O
^ /
•
•#
o
•
***
c
V 'o ,0_
>
M»
0
0
0
0
h=
e
0
o 0
0
1-
• • . •»
LSL
0
l O
e e
V
fo" o
- J *
V) 0
o o •
*
r
> o 0
i 0
0
0
0
0
6
6
0
0
0
0
•
IOC i 110'* IIO'E-
/
<3 ^ J 5j\ o' 0
e
•
0
7 ^
0
0
e
o
*f °1 o
IIO'E-' 140'E-'. fSO'tV M «
Southern bluefin tuna
Apr —June
IT4 -J
7* ^
* pS
i^rtins,/ 0
o • •
-
k
0
•t
^
T
j
-is n r
•%.
^ t
%
'£
5
b'
E WE 4(TE WE tO'E l<f
•j
j 1' •1 •i •t s
T"--'--'«"( W t ft
FT
i.
*f1 6
'.
0
1 )° p
0
(_/
0
( /
0 0
& rt't «"•{' f e - f w « ' 'OO'E I I O ' E ITO-E 130 E " i « r t w t ' • ' «
* a Y 7_
/ o •
o
" •
0
O
• 0
y 0
e
rf\
^
o
A
i
0
0
5$J o'
0
"oi
V>S-5 0
o
•
•
0 0
0
A >
/
• ^
.'/ //' Southern btueiiti tuna
Oct-Dec.
• » - , 0
0
°r A o
~> ! V^ : " - i ?
!„_
• • •
r\t
» • r
s.
r • T W E »0'E SO'E flO'E 70'E W E WE lOO'E UO'E' '30'E 1 WE 140't 1 WE '_»
;.
e
'V
'I •? :
»o-
j :,tv'-:--J
i " s:
r -M'f : w t *rr ' - w r ••"ffi- WIE moi irrt " r # P W ( -
\ ' ^
•a* * n 3
I !
* Ji h .i 6 ilhr
0
o
>
e
e
e c
a t
*A » a
- /
> -
• 1
'• • 0,
^
• * o
n » e
^ , JapamM LL Fiihify y
o a
,
\
...
« »
-
• e «
>
B
<»
•
-
•
;* •
• s
•
• 5" o
a
•
rt
g J
»• •»'
": '•'i
S !T I
• e
•!
..;
0
ft
0
« s
0*
0
N y < -o-OJ
•f 4 0
»
•: e
It"
»'! a 0
6
u-£ two
tii""?'™ JUL. •''*-, mdffn
V M ^ ^ « J
3 l J\m-^Uar £0 1979
Z4
/
.:. e e
0
« r1 ' X
< M
o<b-5 • 09 -09 •re's.
0
0
a
0
0
e
B
r X
, ;. j
j C
>
-—
i f 4o' i i o - i W E W E I D ' S w e io -E n o ' i - t j o ' i UO'E ' u o ' l t w i I M
TT
1 a
'8
1
'J'
I0* i
10"
u
'4
'J
1
'I
BO'
11
t 10-E =S£ •o.*i
M a 0
a
• e
a
y • e
r.
0 <
^ * or
/
ff
> O
oc
V
<£ 0
1*
• e 0
^,
•
.
k*
^
• • • 0
(n~
70-E
O
0
0 * •
"T
0
•
Y-
J i
"id O
0
1
* • i e
'E
• • 9
e 0
•
•
*
0
0
c
•
•t
*v «f
0
0
a
0
• a
1 io-E ue
\V O
O
*•
•
^ *9 9
O
•I ^ •
'E
* O
• lr
T
t /
I W * '«0 ' t >*0'E
^,p»r -^A/rtff
•i f
; • -
'Nd
"rt^'" •....u„^ , . \
\ **(*\
9
11
•
O'l
O
11
I*>' 0
.«. • • « , •
0
t*t
I ~^
re
J IS
^ 1
\>
w
»
'i
r;
!! i
Fig. 86 (continued), m-r.
xm TUNA RESOURCES J

The number of tuna longline vessels by size operated by the Taiwanese longline fishery during 1967-1978 indicates that the main size class of vessels shifted from 100-200 tonne type to 200-500 tonne type since 1970, and in recent years the latter class of vessels constitute more than 50% of the total vessels operating in the Indian Ocean.
Different size class vessels and the mothership operations make it difficult to monitor the number of boats operated at any one time in the Indian Ocean unless proper surveillance is developed. As regards the Taiwanese boats, the number of size classes operated in the Indian Ocean during 1967-1978 are indicated by Yang (1979) which is reproduced here in Table 8.
Annual distribution of the total efforts (sets, and hooks) and number of hooks per set according to different tonnage classes of vessels during 1971-1978 is presented in Table 9. The tuna longline vessels of the size class 200-500 tonne employed about 2,000 hooks per set while the number of hooks varied between 1,300-1,900 per set in vessels of less than 200 tonne class. Longline vessels of greater than 1,000 tonne size class employed 6,300-8,400 hooks per set during the fishing operation, especially during 1971-1974. The total number of vessels which conducted fishing operations in the Indian Ocean also decreased considerably since 1974. However, in 1978, 200-500 tonne class vessels constituted about 60% of the total vessels operated by Taiwan in the Indian Ocean.
Available data on the total effort, catch (in number and weight) and hook-rate during the period 1967-1978 were analysed and the findings are presented in Fig. 90.
The total effort (number of hooks) expended during the above period fluctuated widely. After an increase in the total fishing effort in 1969 (52.8 million hooks) the effort declined in 1973 (32.6 million hooks) and subsequently the effort expended increased and in 1974 about 53.0 million hooks were used by the Taiwanese in the Indian Ocean tuna fishery. A secondary decline was evident in the effort by the Taiwanese tuna longline fishery during 1975-1977 (33.0-37.0 million hooks). The relationship between the fishing effort (number of hooks) expended and the corresponding catch (in number and weight) has been analysed for the period 1967-1978 based on the available Taiwanese tuna longline data. The total catch of tunas and billfishes was highest in 1969 (49,291 MT) and lowest in 1967 (13,478 MT). However, catch in number was highest in 1968 (1869,000 fishes) and lowest in 1967 (537,000 fishes). Total hook-rate showed fluctuations during 1967-1975 and a declining trend was evident from 1968. when>4 fishes/100 hooks were caught while in recent years the hook rate has been between 2-3. The trend in catch in weight indicates that it was above 0.1 MT/I00 books in 1968 which showed fluctuations since then and in 1978 the hook-rate in terms of weight was less than 0.075 MT/100 hooks.
An analysis of the variation of the percentage composition of the different species of tunas and billfishes in the. Taiwanese longline fishery and the catch-effort relationships has been made based on the longline data available during the period 1967-1978 (Fig. 91 ; 92 ; 93 « and b % 94 ; 95 ; 96 a-x ; 97 a-g). Albacore
Fig. 86 (continued), s and t.
CMBM BULLETIN 32 ,103

SAi > sail fish SWO- sword fish BLM< black mar I'm MLS' striped marlin BUM' blue mar I in YFT: yellow fin BET: 6/gey« ALB> albacore
20
to
0 1 * *
ESTIMATED MEAN WEIGHT OF TUNAS AND BILLFISHES-
INDIAN OCEAN (1970-1977)
Japanese long liners Taiwanese long liners
Fig. 87. Mean weight of different species of tunas and billfishes taken by Japanese and Taiwanese longline fisheries in theIndian Ocean, 1970-77 (Data from Wetherall et al, 1979).
104 TUNA RESOURCES

*
•
*
4
*
t
t f ' l , , . M-l _ u 1
Wfl , M^M Wtn ^ 1 ,,'t^'t •«'! Ifn
'
•t t «
, j f lJUh A L o A C O K b
6k V L 5 ^ - _ ""• J j \ i ..
j Ttf
/ r'
J
* ^ i a
y M
1
f« ( S 2 1
*o 0
V s 3
2 1
1 O 0 2 i 6 • s s
X 2 2 2 2 2' 2 1
1
1 o o 2 2 1
1 5
3
I 3 2, 2 2 2
2 n I
•• 1 o : o : a i 3 S
I S
1 3
S
3
,
• O ' C
/
f 1 1 0
•o r i 1
3 1 1 ( ',
S
3
»
2 2 1 2 2 2
2 i;
i
• o 3 1
1 3
3
' l «
P\ J
1 1 2 2 1 I
1
• i
9 2 O
• 4
3
".
1 2
•7 A 14
1
' t
£ £ i<
— • o L"
1 r £ $ ^
.1
fe C i' f
' .- •'
— i~
^ M
Zj» n"
flu « >
r j!
• . . . .
k . « 1; .
! § * < " e_
XP
' r ^ * '
,
u ^
> i <>
• t '* 1 iM
" 3
w
*
• • •
•
. •
%
7\ \
-«lj
« ' ..
*:
*
1
—
-
•
; "?• " •
' . - , . •
- •
. *
C"*
' **. r
' i c •
1
Fl».88fl-ft. Mean weight of different species of tunas and billfishes taken by the Japanese longliae fishery from dMferent sectors in the Indian Ocean,
CMFKI BULLETIN 32 105

• M • D t '< f . • o l • 0 I t no f
pjr t SWORDFISW
OT \ \ W-\ ' \
*4
•i >
o
** *0 E
/ ^
-Ja
»i •*
F6
»0
»b
h-
• i
4 ^ 40
—
• f
JA ' *KJ 4 0
4 ^
-A U*
z\
O
*
»0
fr
•(
N N
W-: . 41 "l
"T - 5
•
3
•F
-
^
^y
y *
J ~Jl J M •* 3m
' *4 5<3 -
to (
^ ;
k\
'F
SEV
1
kj -—i 5
<•
^
t t 's
Fig. 88 (continue), e-h.
106 TUNA RESOURCES

' H
50 h
4B 1
K
* l (
•
10'E 30 E 40'E 80*1 *0 'E 70 £ tO'E *0*E 100'E HO'E i » i l | 0 * C ' t'4*'l
Taiwanese LL Fishery
\ . -9.9 < ^ p B •IOO-I99
\ W • -\ -
• \ ,
A
•
• ,A I
0'
s
s
0
/ /
•
( /
KV • •
• •
Y %. i
•
•
• •
• • • •:
• •
•
• •
•
•
•
•
XA \s * *
*
" • ' %.
• •
• "• . •
=• * '•
• •
• ..• •
• • * • • • •
-
V r - 1 M *
' .
•
^V
• •
ti
T
r \
•
V"
4
r ^
* V
7 "" \1 / O
L^ ••
* M ~
JO'E1 WE 40'E 10'E BO'C JO*E 10*6 WE 100'E MO'E W E 410*t*£l40"l
Jg'C'' Iff^ >0'£ 5Q'£ BQ-£ *Q/t , 0 'E fl0'E >QO'E j'<>'< ' » ' E HO'E l*0'g
Taiwanese LL Fishery
Fig, 89 a-c. Distribution of effort (number of hooks) expended by the Taiwanese longlirie fishery in the Indian Ocean, 1976,1977 and 1978.
CMFfcl BUUfrM 32 8
m

TABLE 8. Number of tuna longline vessels (Taiwanese), by size, in the Indian Ocean during 1967-1978
Year
1967
1968
1969
1970
1971
1972
1973
1974
1975
1976
1977
1978
105
152
172
171
157
119
125
177
59
58
71
86
-50
2
1
..
??..
'•-•• •
"•'•
• • • v - '•
..' • . . !
50-100
5
7
9
4
5
6 6
5
r.
. , -
I
Gross Tonnage
100-200 200-500
56
92
94
88
68
51
54
99
28 • 29
33
35
39
47
68
77 83
60
63
69
31
29
38 r
49
500-1000
2
2
1
1
1
1
.»
....'. ... •
.. ..._
1000-
1
3
1
1
1
1
1
1
Source: Yang, 1979.
TABLE 9. Annual distribution of effort (Sets & Hooks) expended by different tonnage class of Taiwanese Longline fleet (1971-1978) l
1971 1972 1973 1974 1975 1976 1977 1978
50-100
100-200
200-500
500-1000
1000-
Total Sets
Total Hooks
.. a b
.. a b
.. a b
.. a b
.. a b
••
0.4 1359
26.9 1772
62.9 2018
9.8 8405
2.7 1506
35.6 1912
53.3 2032
1.6 2582
6.8 7870
1.9 ,1467
26.7 1899
65.8 2072
0.9 2455
4.6 7381
1.5 1438
38.8 1840
58.1 2031
. r
1.6 6536
21,343 18,917 15,713 26,946
,.
25.6 1686
84.4 2063
. ,
24.9 1771
75.1 2100
••
••
29.8 1860
68.9 2105
1.3 2234
0.02 84
35.9 1886
61.8 2155
0.3 2554
2.0 6333
18,702 16,390 16,721 20,494
44,843,800 39,288,400 32,596,300 52,849,000 37,281,000 32,897,000 33,895,700 42,546,000
a Hooks (% of total) .
b No. of hooks per set
« Source: Anon (1971-79)
108 TUNA RESOURCES,

TOTAL FOR TUNAS AND BILLFISHES
*-*TUNAS O-O BILLFISHES
TUNAS
BILLFISHES
1967 68 69 70 71 '72>3 / 74 75 "76 77 78 YEARS *
Fig. 90, Total eflfort expended, group-wise, catch (in number and weight) and total hook rate (%) of tunas and billfishes in the Taiwanese longline fishery in the Indian Ocean, 1967-78. The billfish component which amounts to less than 20%
of the total catch by weight and number is shown on top of each bar in Fig. 90 b and c.
CMFRI BULLETIN 32 109

19 67 1968 1969
1970 I 971 1 9 7 2
1973 1974 1975
1976 1977 9 7 8
TUNAS BILLFISHES OTHERS
Fig. 91. Group-wise annual percentage composition of tunas and billflshes in the Taiwanese longline fishery in the Indian Ocean, 1967-78.
no TUNA RESOURCES

1969
1972
1975
978
Albacore B/geya Yoll ow fin
Fig. 92. Annual percentage composition of different species of tunas and billfishes in the Taiwanese longline fishery in the Indian Ocean, 1967-78.
CMFW BULLETIN 32 8-A

tuna became the target species since 1973 and constituted 36-57% of the total catch of Taiwanese fleets during 1973-1978. The hook-rate of this species showed wide fluctuations and during 1968-1972 it was around 0.5 to 1.2/100 hooks and since then it was around 1 to 2 fish/100 hooks. Bigeye tuna constituted
.16 24 32 40 Effort (xio*)
48 56 16 24 32 40 48 Effort (xio*)
Fig. 93 a and b. Catch-effort relationship of all groups (combined) (in number and weight) in the Taiwanese longline fishery in the Indian Ocean, 1967-78.
14-25% of the total catch during the period 1967-1978 and its hook-rate ranged between 0.25-0.50/100 hooks. Yellowfin tuna contributed 25-51% of the total catch until 1972, but after 1973 it declined to 11-21% of the total catch of tunas and billfishes by the Taiwanese fleets. The hook-rate also showed a steady fall from about 3 fish/100 hooks in 1968 to<0.25/100 hooks in 1974. Subsequently, the hook-rate of this species showed an increasing trend and in recent years it was around 0.5. The percentage composition of billfishes was invariably less than 5% during the period 1967-1978. In general, blue marlin was the main species caught before 1973, and it occupied 3 to 5% of the total catch during that period. Since 1974, striped marlin shared 2 to 5% of the total catch by the Taiwanese longline fleet. The hook-rate of striped marlin was between 0.025 to 0.10 fish/100 hooks during
1967-1978. The hook-rates of swordfish, blue marlin, black marlin and sailfish were uniformily less than 0.05 fish/100 hooks during this period.
An executive summary of the state of stocks of tunas, billfishes and tuna-like fishes is made in the following section in order to appraise the current level of exploitation of the different species and to assess the potential for expansion of tuna fishery in the Indian Ocean, based on the available data (FAO, 1976 ; IOFC, 1977a ; FAO, 1980 b) and the results of the analysis of the data conducted during the course of this study. A perusal of the existing literature on the production model analysis for stock assessment of different species including the one made recently (FAO, 1980 b) indicates that most of the cases are largely calculated based on the Japanese effort data. Catch-effort data for different
112 TUNA RESOURCES.

tooo
900
800
700
600
500 *»
• ^ 4 0 0
* 300 or w 2 0 0
2 => 100 Z
«
- ALB
-
-j
1 / - 1/ / • 1 / S -**"^
W£T~ V 1
kf
1 1
7
I 7 3 /
/ 7 « (
1 i . ,.,..!_
^ 7 4
78 / l / V
/r? / 7i \ / -
""* 0^2-
1 , 1 1 1 1 1
1000
J 1 — I — I — I I I ' I 0 8 16 24 32 4 0 48 56
E F F O R T ( H O O K S x 1 0 6 )
Fig. 94. Catch-efTort relationship of albacore, bigeye, and yellowfin tunas and striped martin in the Taiwanese longline fishery in the Indian Ocean, 1967-78.
CMiFRI JByfcfcETOJ.32 lHl

2 4
20
16
12 »~
2 8 X
c 4 UJ CD 2 n
• SWO
-
-
\
- / ^ ^ \£<T~~~~\ 1
* y ^ ^
i i
/ /** >\ .
/ 7 7 \ 7 5 /
7 6 ^ ^
i i i i i
69
/7I
1
-•>
/ 7 0
_ .<#
5" 74
^ ) 0 l
1 1
z
BM
•
•
/
_ / y<
7 / /
*y
\ i i .
^ 6 8 /
y^ y71 r 76 7 7 2
\A 73^^ 73 S^^L-—-——"
^ ^ " 7 5
1 1 1 1 1 1 ,1
#
769
^o°' - 7 4
^-o°*
1 , 1 1 ...
X o I -<
20
16
12
8
4
0
. BLM
< i
i i
i i
y ^ T " I
6 7 ^ > ^
i i i 76
i i i
6 8
i ,
o*
u.
7P*^
^ 5 ^ o i 78 i i i i
8 16 24 32 4 0 48 56 0 8 16 24 32 40 48 56
EFFORT (HOOKS x l 0 « )
Fig. 95. Catch-effort relationship of biilfishes in the Taiwanese longline fishery in the Indian Ocean, 1967-78.
m TUNA RESOURCE*

u»a ALBACORE
HOOK BATE (%)
AVERAGE FOR
1971-1976
»<>>.».«..«;t^-»A«i»;f.»;< • • • • • • • • • • • • • • •
« o « * * * « « * « t « *
i n * E j o t H E «o E OOE J o E 81) r an E 100 f I I O E U O ' E l l o * E " O ' E i w l > •
\ S \ \
J °» *
.. 9
w 'I
•x
-
ie e
e »
e e e
• * —
e 9
9
9 © j e © e
V &fO(
e 9
P 9
9
9
oT p
e ©
0
9
e e 0
0
e e e
0
o
©
e e
9
o
0
e "e
Taiwanese L L Fishery j
O
e e !*" e e o
o
e e e
e
©
e e e 0
o
e e e
e1
e 0
e e o
e e e
i e
©
s ©
91
9
9
-S\
©'©© « e ©
o]
0
"©,
e |©_
k 1
Vr. <©©:©!©
e e 0
e <e i©
« © ; © Oj
0
o
e1
O
0
9
9
o
0
o
e ,
©
0
e o
w e 9
A
P £ F
ele
BIGEYE
HOOK RATE <%>
AVERAGE FOR
) 1971 - 1978
• ^ r 1 "
ep-* ^P
\
L^n ._. "^ D
C
..
a 1 30 f «e - f l O ' t O o i " » 0 ' [ 1 0 E » 0 ' 6 ' O O ' t " O S t?0 € >10 E > * f l ' l 'SO € ' » 0
n '!
'!'
0
'%
'%
1
'%
w»
0'
'V
' I JO-E * 0 ' E - Wt- ; 1 0 - E l i v £ ••«!••= • *0 'E lOOE I I O ' E - U O ' t I 3 0 " t - 140*1 I S i V t - i »
\ ' ^ " M ^ \z
9J9
0
JO
0
0
0
0
lo
x> 0
0
Of
•^ 0
o
0
o
r©
© 0
0
lo
0
0
0
0
/ •
* ° 0
. 0
0
° 0
0
0
©
o
o
o 0
o 0
0
o
o
- . Taiwcnese L L Flertery Jrr-e v , J I \ . sv^rY 0
> 0
0
0
0
0
0
Oj
0
\ o
° o
o
o o
o
o
0
•
o
o
0
0
o
0
0
0
sl 9
o
o
o
o
o
0
0
o
o
e ©
o
o
0 o
o^b
0
0
o
0
0
0
0
o
0
o
o
0
o
0
o\
0'
0
0
o
0
0
0
'
0
0
o
e 0
0
0
0
0
-/
STRIPED MARUN
HOOK RATE (%)
AVERAGE FOR
J-S? 1971-1976
WJKI-j>jo o
_ jL
ol /"
<£•— * ^
h-iiv ' \r" ^
Lr-r -
(
w lh-l io- l »0*E t0'« lo ' I le'E 00*6 I t T I l!O l I 1 )01 110*1 141
3 t
'5
'.'
".
' . •
'!
*5
>i
i
"\
r ° f * '* J H ! ^ j
\ >
T ^
J
fi 0
0
10
o
0
0
o
Jo
0
0
it o
o
0
s. 7_
/. o
o
0
o 0
0
0
0
0
0
0
o
0
0
o
H 0
o
o
o
o
o
0
•
•r
0
0
0
0
0
o
0
0
T
0
0
0
0
0
0
0
0
0
afwaM
0
o
IO
0
o
0
J> 0
0
o
0
0
o
0
5 o 0
o
0
o
o
o
•
L
L L F I i
e 0
0
0
0
0
0
o
0
T
ItW
• 10*1 t i l
<r ^ J
0 '
o
0
0
o
o
0
o
0
.
' 1
o
o
o
11
0
o
°L \
(
•1
/
T
m o
p /
l»0'(£ - I « * t » M ' l
BLACK MARLW
! • *
HOOK RATE(%)
, 'AVERAGE FOR
) I 9 T I - I9T<
^ ^WJ
^ 1 < & X
l ^ - *
t ! 10
~\ 3 f
• x .
%
t
% I
Fig. 96 a-x. Average hook-rate (%) (1971-76) (a-*) and the quarterly distribution of hook-rate (%) during 1977 (f-x) of different species of tunas and billfishes in the Taiwanese longline fishery in the Indian Ocean.
CMFM BULLETIN 32 m

saDiijtosaarwnr; m
'/-<ff '(psnnijuoa) 96 'Sji
0 *
0 *
t oc
. V I
"y
m . 4 1 1
V
Sfcp
: !
i ,
3.091 1.
IT -i 5cq J
3,
*.( I I
[> - '
\ ^ / IjJL eg
s.
V \. T-T&
4
XZ»I* 0 3 0 - 1 3 0 '
R -
iNoav I T
Ml
V
M l
/
2LT
J2
i .
\ J
L-5
3
I I Js
• • • o
, V .
( ^ b i n
=4
•
• 0
« «
a_
• © 0
• #
• o
• • c ^
•
!•
K
• • 0
0
e • • • o
5*
• • 6
•
L
e • • « o
e1
• • • o
» i
»
e • f) ffl ~-l
/ / ^
/ o|
•/
J
"~
- V
. 0 1
s
s
/ " > 1
t7
,
n
^
M - T -ss= • » •
I.
8.
s . M
s
.01
e
01
V.
•A,
D 0
l l -' V ^
)
L>-
9 Z 6 I - U 6 I f
UOi 39VdHAV
HSI4Q1J
» i i D t i 1
DMS
0
0
* * •
%r J*
%
I Jo 0
0
t
o o Oj
o
o 0 0
0
0
0
o 0 0
0 oo
.
V ) 6
f . V J
s -''"^ **
p
o 0
0
0
o o 0
o 0
0
0
M o
0
0
0
0 0
o 0
0
0
0
0
©
0
0
0
o 0
0
0
o 0
or 0
o o o o 0
0
0
o o
h •H*U 1 1 HIUDMIO
o1
0
0 0
0
CL
o o 0
0
0
0
0 0
0
0
o 0
0
0
* "^
o o o o 0
o o o o
0
0
0
o 0
oj 0
0
0
o 0
o 0 0
0
0
0
o OJ
r ot. ton 1.011 -t-ort^ -i os. ^ i.o« f fc lP-^V i.'oo " i
o 0
0
0
0
0
0
4)o
1 o 0
9s
0
o| 0
0/
O
0
0
ol
o 0 v^~
\> Y
01 fir
'«
5.
S.
• J .
.5 ,
0
.!.
...

4H
j-tu '(panojjcoo) 95 -Sia
Z£ Niiaiina HUHO
.0*
3
J,
B
! i
«
* „
1 .
i t
=
^
J
H Q ^ N X
J s,,
).
' v .
?-
. D'-"""!
1 \
*
ll w k: 1 ""
(V . ) 31VM MOOH
NUM01
i t " V'cV J™"*"'
ia A
1 I f l
_/
* " •
3.
v J
1
I I I ] .
0
*Os,
0
0
^ r ° ,\
' it a.on s-
&
0
©
© © © ©
vJ
*
0
0
© © © © • $
J
© © © q ©
/
>•
9
0
\
1
\
So
©
•
l.Ot .
|,
•
I t
0
©
*
0
© 0
r~
/ h
}' **
3 .
0
© 0
- j i
© e
>»
e
1) \ j
s
/
1
p k i , -A
f
7
" \
L. I. \
L ,Q*
.5.
. M
.5,
.01
.0*
>>
t»t t.OO l .« l I.Blt I.'
l i t 'HVH-NW1
(V.)llVH MOON I
. 1 i V <*M«IJ 11 tt»UPM|PX , M S -A ' T W " ^ l ! * T t » n , W i i.'eti J.O'I j.oo1 1.04 i'.M 1.0* to* i.oo. i.o* i.ot i.
'," , ''," , '7* , '•,** , 'T , '•?', *'P

-» •€ • 0 t •a C «
\ ^ M H
A
. / I
^
S'=F U i
/ '
F
•
<
)
/
r
ff/ 0
!ii
Y 2
©
e
-
Lj=
e
—
0
IO E •fi E „ E I 0 0 E M O I 1
raiwqntse'LL Fishery
_Oj
I
•F io
e 0
•f
0
0
o
•
9
0
0
T
9 9 9 9 9
0 o
0
9 o
•
0
•E
•\ •
--
11
'i —
E
I C E
/ Ty
*~% ML
.2
130 E .'«0"C l » ' I • • ( .
STRIPED MARLIN
HOOK RATEIV.)
)JAN.-MAR.,19TT
,, 4 i J j xif "H: >q
• -optritfafl noc«rdi ^ ' 0 < O I O \
1.1
y. '
•f
h^Ki,
P E I S O E
•k
> • i
:
4
,
„
s
;•' s
)•
5
».
l I O C * 0 £ SOS 0 ' ' E 70 E l e ' t * 0 ( 100 I . M O E 110 E U O ' l ' « ! " • " '- Ox
•Nv ^
r
0
1 /
o
0
.
9 0
--e
0
9 9 9 ? \
-
0
0 9 ©
• 9 9
o o
*
o
\ T*
J 0
STRIPED MARLIN
t
HOOK RATE (V.) 1 -
« i fi, <^f ypo ' JJfi \ ^TZ~~\^>>1 -
"
( \
s*Jr ; j \ i
\ r-4*
' S
j ! >•>
L^ f r\* \ MS JT
S»*lE 3 t V l 4 f K i o ' t W E JB'E iO -E M ' E 1 M E t l * 1 * U f £ >JO'E 140 t ISO
i
' V; -
:f= 10
' E BITE
> \ ^ Vr /<
i
t o *
'ifft-^r 4C
0
/ 9
•1
o
• 4
9
o
i
^
0
0
• I
1
£
9 9
H"
EO'E
9 9
t
9
" t
• 0
H o
9 9
•
j /
i |
9 9
0
• t
* •
0
0
9 0
0
•
1
o o
9 o
0
0
•E
IOC E n o t i!«
<T •> J sjf 9' o
9
>0 • ( "
i \
•f
E
7" STRIPED MARLIN
HOOK RATEIV.)
.1111 Y-SFP 1077
' . * •
1*
>^n
t i O'E 13
" \*
*E
/
T
j .*
i » O ; E
^
/ 1*0
'•
* l
W
" • « •
i n -8
i n -
JO'
1
« 0 ' E
^ - SJ\ "»
' * 'F
/ ' 9
r E
o
9
50
L"T
0
o 0
0
o
0
•e
9 9 o o o o
ea
(
0 o 0
0
- * L -
0 o 9 0
0 0
10
A
' i
o 9
» 6
•E
• 0
K
o
o
00
/
i 9 91 9
o
E
e « o
o
0
9 o 0
0
!
• E -
E
V
•\ •
o
6 0
• 0
V
xV
o
'E »'
7
r A
E
">
•E
r
b
110 'E U O ' E i * " 6 <«o
STRIPED MARLIN
HOOK RATE (V.)
QCT.-DEC.,I977
3-3
u— /
'Z
^ i
^-U-^-1
\ ; ? (:
L^-n
i i 0 f • i p-t
a n
. 4 0 E
Oi !x
!
• • ; !
Fig. 96 (continued), s-x.
118 TUNA RESOURCES

vk. \Sm Tito**
.• ^fes_xft» L | T o o V S
. ,«£- — 0 0 i » . l Z_ * o # o o •
..; I?.* • o • • • ; o « Jx cy\» o o o o o o
>:_r/»»4» • • • t 3 j ! » » « x x o o „ / X X O X X X X . X X
_ > ^ ' X X X O X X X X X
X O X O O X X X X X
• ± L :
*u"F"hw"^4- *"*•'" • % > . / " " .<5, BU/EMARUf
1 * 3 ^ * 3 197*
l»*Q<JBl±&<L>, • • •o*s&^LL ' V T S • • • o L W*f A o o o . o - ; * j ^ H ; x o x o x r ; 50-% v o o x x " \ • 1 0 0 - ,_ [ x x x x '— a s s * 5 ^ — f-0 O O X X 1 ~^y-
-± 32 1. I 9
• « %
' . i -
*
\* )".
»
il*t
J, 1%. 97 a-g. Spedes-wise annual production of tunas and biUfishes by the Taiwanese longline fishery in the Indian Ocean, 1978.
CMFRI BULLETIN 32 mm

tf
"
'•
t o
' 1 lo -t- * 40'C B C T
X
E
0
0
0
• To
0
°/~
01
X
• Co" •
H j * *
o.
o 0
• •
• • • o o
o • • 0 0
o
—
t
0
X
0
• 0
X
0
0
0
X
' f t
0 0 X 0
• o
• 0
0
• 0
• o o • o X
X
to ram
X
• • 0
• 0
X
• 0
'. 14
m LI
A • 0
• • 0
o 0
0
X
o
o
• • • • • o X
X
o
• •
I
Fl
ft o
• • • 0
o 0
• • •
lo t
y MO't l l i - l
<T ^ )
»V 0"
0
0
o o 0
0
o
H
7
\V^ o • • • X
X
o
r
o •
o
r \
..*-
'!< I 1«0'I I M 1 I I
Numbtr of
$, SW0RDF1SH
^ 1978
^r •X*33 'J^ZlSi •>
ii 0 -49 V • 50-99 • 100-x_No. Catch
w 3
*
)
C *
\.
= £ 9
*
"
*
m s
i n
%
Fig. 97 (continued), (#).
species by the Taiwanese longline fleets in the Indian Ocean is available for the past few years (1967-1978) but detailed effort and catch statistics for ROK long-liners are not available. The effective fishing effort employed to estimate CPUE (abundance Index) in these analyses was computed chiefly from the Japanese catch statistics and extrapolated for the entire longline fishery on the basis of the total catch (Fig. 98). In this connection, it may be pointed out that although good statistics are available in the Japanese longline fishery; it no longer represents the fishery as a whole because of the uneven distribution of the effort over the fishing area by the Japanese fleet. The pattern of distribution of the fishing effort in recent years by the Japanese and Taiwanese longline fishery as presented in Figs. 78 and 89, and discussed elsewhere in this chapter support this assumption. Although the completeness and reliability of the assessment of potential yields and optimum fishing effort available in the earlier documents is open to queslion, the available information on these lines are summarised and discussed in the ensuing section.
on the Japanese longline catch statistics. It was earlier indicated that there are at least two yellowfin stocks in the Indian Ocean, the longitude 100°E separating the two (Morita and Koto, 1971). The CPUE in general showed a decreasing trend and the average catch rate in the entire eastern and western Indian Ocean areas declined to 30% of that in the early phase of the fishery (Suzuki, 1979). The fluctuation in the total catch (deviation from the mean value) of this species during 1965-1979 indicates that after a primary peak in 1968, the catches were below the average catch for the above 15 year's period till 1977 (Fig. 99 a). In recent years their production has risen to above average levels. The portion taken by the longline catch has decreased and that by surface fishery has increased (Fig. 72).
The major part of the longline catch of the yellowfin tuna consisted of 2.5 to 3.5 year old fish in the early phase of the fishery, but with the progressive development of the longline fishery some decreases in the average size was noced, and since 1965 proportion of 1.5 to 2.5 year old fish in the commercial catches had increased (Suda, 1974). The stock size of the 2 year old fish was high in the western Indian Ocean during 1962, 1968, 1971 and 1972 and in the eastern- Indian Ocean during 1962 and 1972 (Suzuki, 1979; also Fig. 100). According to bim, the 2-year old fish dominated in the area between N of 15°S and 40°-80°E in the western Indian Ocean and between 0°-20°S and 100° and 125°E in the eastern Indian Ocean during the above periods. No relationship between the stocks of this species and recruitment was evident in this study. However, the reduction in size can also be attributed to the shift in the longline operation by the Japanese fleets from the Central Indian Ocean Area where older year groups of yellowfin dominate (IOFC, 1977a). Due to the shifting pattern of the Japanese longline fishery, this stock would have been partly taken by the Taiwanese and ROK vessels for which size data is nol available.
TUNAS
Yellowfin tuna
Kurogane and Hiyama (1959), Morita and Koto (1971), Honma and Suzuki (1972), Huang et al.t (1973), Suda (1972, 1974) Marcille and Stequert! (1976 b) and recently Wetherall et al, (1979), Suzuki (1979), FAO (1980 b) and Riggs (1981) reported on the different aspects of the fishery and biology and stock status of Indian Ocean yellowfin tuna, based largely
Different estimates of MSY for yellowfin tuna are also available (Table 10). Suda (1974) computed the estimated maximum catch for yellow fin tuna as 35,000 tonnes. Wetherall et al., (1979) stated that with smoothing periods of 2 or 3 years, the MSY is about 43-45,400 MT. According to Suzuki (1979) the estimated MSY for this species in the Indian Ocean is about 39-58,000 MT, ' with best estimates of 38,658 t under 36,256 xlO3 effective hooks or 44,164 tonnes under infinite hooks.' According to FAO (1980 b) it is indicative that the MSY for yellowfin tuna is probably between 40-60,000 MT. In recent years, their total
120 TUNA RESOURCES

I > • I I I I I I I ' I I I I I I I i I I I I I YELLOWFIN TUNA
I I I I I I I I ' I I I I1 I I I I I SAILFISH
\ - South
ISSZ 55 • » TO YEARS
65 70 VCARS
Fig. 98. Abundance index (Kg/100 hooks) of yellowfin, bigeye and albacore tunas and blue marlin, black-marnn, Striped marlin., sailfish and swordfish in the Indian Ocean, 1952-1976 (After Wetherall etpl, 1979).
OfFM BULLETIN 32

- 9-00
8 0 0 <
7 0 0 -
H 600
o O 500 O O * 4 0 0 ' N * . : .
3 0 0 '
>2 0 0 '
I 0 0 '
0 -00-
Bigeye
x /
,A-\ A A X+2S
1965
v/ X-2S
'70 '75 '79 1965
YEA R S
Yellow fin
X + 2S
'70 '75
3
X-2S
'79
k:
4 00-
3 0 0 -
2 00-
Albac org- Southern blue fin
_ _ _ v _ [ s + « ]
o O I 0 0 ' o o \ 0 00
4-00«
<j 3 00-k.
<o 2 0 0 -
I 00-
000»
7-/v __ ^ [T*g ^\y—s\/
/v — CI] _ y Tl |x-2s
X - 2 S
Skigjack X + 2S Little tuna
1965
/
'70
V / dJ X+2S
^zr ^
X-2S VS '75 '79 1965
r E A R s '70 '75 *79
Fig. 99 a-d. Trend of total production and fluctuation of different species of tunas and billfishes in the Indian Ocean indicated as deviation from the mean values, 1965-79.
m TUNA RESOURCBS

£SsS3s= — i n -
* 0 0 0 '
2 0 0 -
300-
» - « • • - •"-
Bullet and Frigate tunas Blue mar/in
Block mar/in Sail fish
7N X i oo«
0 0 0 *
-E53 -vs. [*42SI
V"'\._/E - • - " _ ' - • • i - "^ -» - - - . • - . * |x-2S I ' — - | x ^ 2 S
1965 '70 '75 '79 1965 YEARS
'70 '75 '79
Striped martin
50O» -
H/V\ § 3 0 0
j . 2 0 0 -
2 ' - o o - _ _ .
0 00 1965 '70
- - - 1U>gS
Sword fish
f+Fs
X-2S
'75 '79 1965 '70 '75 '79
Fjg. 99 (continued), c and </.
CMFRI BULLETIN 32
9
123
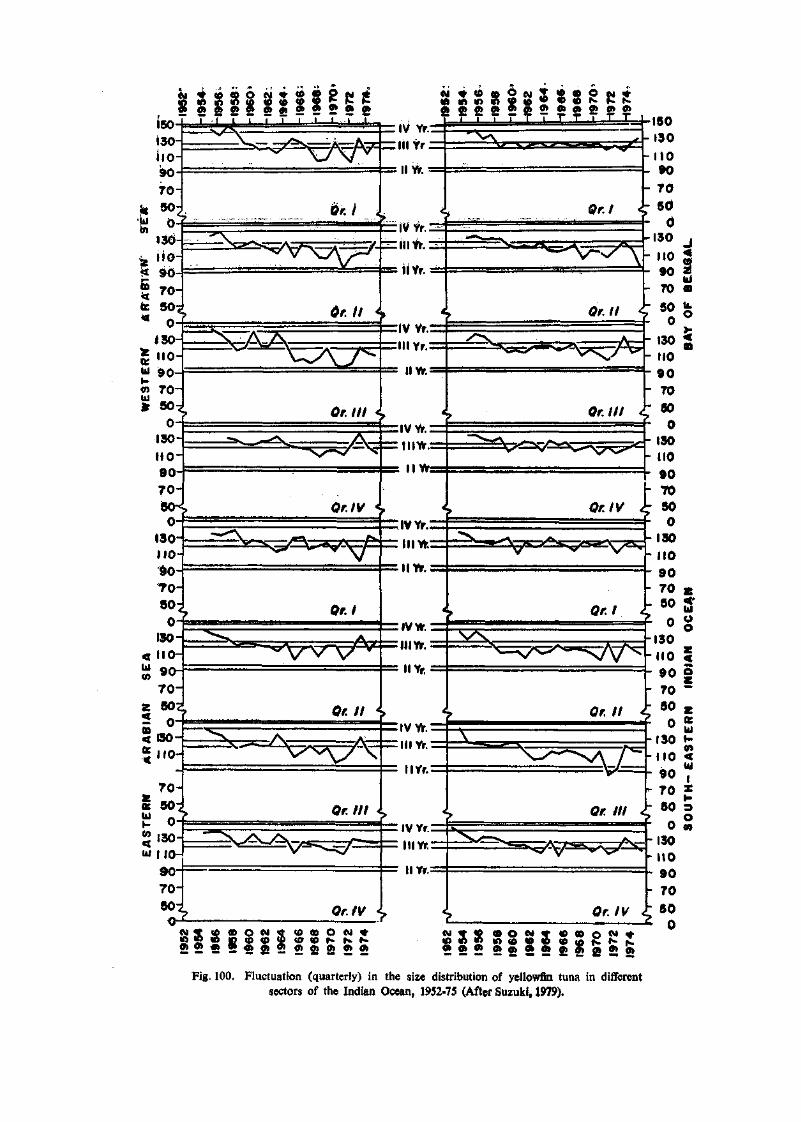
~ ~ T 7 i 7 7 7 t i 7 7
« IS B O (g t
» » •» 2 • £ o> o» o» o> 2 ® " ~ 7 r i ~
«fi • o » «D N 01 01 O)
r T ~ Si
Fig. 100. Fluctuation (quarterly) in the size distribution of yellowfin tuna in different sectors of the Indian Ocean, 1952-75 (After Suzuki, 1979).

jJroduction by the torigline fishery is around 29,150 MT (FAO, 1980 a). It has generally been agreed earlier tlat even if the fishing effort by the longline fishery is increased, no marginal increase in the catch can be expected (FAO, 1969; Honma and Suzuki, 1972; Suzuki, 1979). However, the development of the surface fishery may potentially increase the total production of the yellowfin tuna in the Indian Ocean, although it may reduce the abundance in the longline catches of this species. This trend needs close monitoring.
Atbacote
Koto (1969), IOFC/IPFC (1973), Suda (1972, 1974), IOFC (1977a), Morita (1977) and recently Wetherall et al., (1979) and FAO (1980 b) have reviewed the state of stock of this species in the Indian Ocean. Fluctuation in the total production of albacore tuna in the Indian Ocean during the period 1965-1979 suggests that the catch fluctuated markedly after 1965 and the maximum catch was recorded in 1974 (Fig. 99 b). In recent years, the total catch of this species has been below the average value for the 15 year period..
In the early years, fishing was carried out on older year class (6 yrs-f-) in the area north of 30°S and since then there was a steady increase in the fishery
for younger fish of 3-5 year old, chiefly by the Japanese longline vessels (Suda, 1974). In the beginning stages (1952-1965), CPUE increased considerably and then steadily since 1956 and along with increase in effort the average size of albacore also decreased, both of which may be due to the shift in preference by the Japanese longliners. In general, the catches also declined in 1971 but during 1973 and 1974 relatively high production has been recorded.
Different estimates of MSY for Indian Ocean alba
core are available (Table 10). Suda (1974) estimated 25-26,000 tonnes as the maximum catch and suggested a calculated maximum catch of 17-18,000 tonnes from the area north of 30°S without any significant exploitation of the immature group south of 30°S. Wetherall et al., (1979) based on the production model analysis calculated an MSY equal to about 17,800 MT at an infinitely high effective effort. FAO (1980 d) presented an MSY between 15-20,000 MT based on Japanese CPUE data. However, the average catch of this species from the Indian Ocean during the past 11 years was about 15,500 MT. It has also been concluded that the stock of albacore in the Indian Ocean is almost fully harvested and increase in fishing effort (longline) may not substantially increase the catch. An yield curve, prepared by Wetherall et al., (1979) appeared to
TABLE 10. Estimated MSY of different species of major turns in the Indian Ocean
(Unit: 1000MT)
Species IOFC
working party
(1969)
IOFC/IPFC working party (1972)
Suda Shimizu 1979 workshop Catch
(1974) (1979) (FAO, 1980a)
Yellowfin
Albacore
Bigeye
Southern bluefin
30-35
2fr25
22-28
35-40
30-35
2*25
30-32
3540
35
25-26 (17-18)*
28-30 (20.30)*
3540
43-45* 38.7 » 44.2 *
15-20*
59-60* 30.1-32.5 * 4641*» 30.3-60.6 •
61
12
32
IS
» Wetherall et al.t 1979 (Working document) 1 Suzuki, 1979 (Working document) * Kume & Morita, 1979 (Working document)
a Estimates of maximum potential catch (X033 MT) north of 30°s without significant exploitation of (he immature group south of30"S.
GtffRl WfcLBTOf'32 125

be asymptotic and there was little change, in the catch although effort doubled from 1966-1974 (Riggs, 1981). Based on the available information of the population structure and trend in the total production, it may be concluded that the catches of Indian Ocean albacore tuna could be increased if large scale surface fishing aimed at medium-sized fish becomes prevalent in the areas of their concentration.
Bigeye tuna
Sakamoto (1967), Kume et al, (1971), Marcille and stequert (1976 b) and recently Kume and Morita (1979), Wetherall et. al, (1979) and FAO (1980 b) reviewed the stock structure and other biological characteristics of the Indian Ocean bigeye tuna. Based on the average size composition, it has been postulated that the bigeye tuna in the area south of 30°S are chiefly immature fish (southern group) and the adult fishes dominate in the low latitudinal area (equatorial group) (Kume and Morita, 1979). However, pertinent data on the occurrence of more than one group (stock) of bigeye tuna across the Indian Ocean is wanting (FAO, 1980 b). The fluctuation in the production of bigeye tuna in the Indian Ocean during 1965-1979 suggests that after a productive period of 1968-1970, the catches dwindled in 1975 and since then the catches showed an increasing trend. Subsequently, maximum catch has been reported in 1978 (Fig. 99 a). Based on the size composition of this species in the Indian Ocean, Kume and Morita (1979) observed that small and medium sized fishes dominated in the areas of high concentration of this species and large-sized fishes were ' concentrated in the marginal regions of their distribution'. According to them, the abundance of 6, 5 and 4-year old in 1975-1976 decreased, on an average to l/5th, l/3rd and l/2nd level of the production of the same during 1955-1956 respectively.
Different estimates of the MSY of this species are available (Table 10). Suda (1974) gave an estimate of 28-30,000 MT under average condition of fishing. Kume and Morita (1979) conducted two sets of calculations to fit in the production model and to ascertain the MSY on this species. In case (I), in which the 1977 catch has been included, the MSY calculated was between 46-112,900 tonnes and in case (II) where the 1977 catch was excluded, the MSY ranged from 30,300-60,600 tonnes. Wetherall et. al, (1979) presented another set of MSY Values for the Indian Ocean bigeye tuna. After averaging one of two years, the estimated MSY by these authors was 59,00-60,000 MT at infinitely high effort; but smothing by 3 or 4 years, the MSY estimated was about 30,600-32,500 MT at
' effort slightly above the recent level'. As stated earlier, all the production models analysis made on Indian Ocean bigeye tuna are based on the Japanese effort statistics, for which good data are available, but it no longer represent the fishery as a whole because of the scattered effort over the fishing areas. However, the total production of this species in 1978 and 1979 from the Indian Ocean has been estimated to be 49,000 MT and 31,600 MT respectively.
The bigeye tuna (smaller size-groups) can be further exploited by the surface fishery such as the pole and line (iive-bait) fishery and surface trolling. Reliable catch statistics from different surface fishery from other areas in the Indian Ocean is not available. Kume and Morita (1979) stated that the percentage of the deep on gline gear employed in the Indian Ocean especially for the bigeye tuna has increased considerably since 1974 as follows :
No. of cruises % of deep longline Year examined gear
1974 92 1 1975 91 3 1976 50 4 1977 50 24
They have also indicated that the increased effectiveness of deep longline gear for bigeye tuna in the Indian Ocean as a factor of 1.5. Suzuki et al., (1977) compared the catches of regular and deep longline gears by the Japanese vessels from the western and central equatorial Pacific and stated that the hook-rates of bigeye tuna was invariably high in the deep longline and the ratio of the mean values between deep and regular longlines has been calculated as 1.79 for bigeye tuna. Further, he (Suzuki 1979) analysed the average length of the bigeye tuna taken by the deep longline gear in the same areas and concluded that the size of this species by the deep longline gear tended to be larger than those by the regular one, and the result of the statistical test in the means of average length for the regular vs deep gear indicated an observed value of 19.80, which was significant at 5 % level.
Based on the above facts, it appears that the stock of bigeye tuna in the Indian Ocean offers scope for further exploitation. According to Riggs (1981) the yield curve showed increasing catch with effort; effort levels wefe not high enough to indicate a maximum or asymptotic yield. As stated by the FAO (1980 b) an increase in the total catch could be obtained by
126 TUNA RESOURCES

increasing the longline fishing effort, but the CPUE will probably tend to decline gradually. However, the increased employment of deep longline gear coupled with the expansion of surface fishery might further the production of this species from the Indian Ocean.
Southern bluefin tuna
Southern bluefin tuna is the most heavily exploited species in the Indian Ocean. Suda (1974), Warashina and Hisada (1974), IPFC (1975), IOFC (1977), Shingu and Hisada (1979) and Olson (1980) have recently reviewed the stock of this species in the Indian Ocean. According to Olson (1980), by 1961 the catch of southern bluefin tuna reached its all-time peak of 1.2 million fish (74,000 MT) taken by only 33 million hooks. By 1964, the catch and effort fluctuated and 750,000 fish were caught by 35 million hooks. After 1964, the longline effort increased rapidly to about 85 million hooks in 1968, when only 150,000 fish were taken. The growth of longline fishery showed a slow trend after' 1969, which may be due to the implementation of a voluntary regulatory programme which involves the closure of certain areas during seasons when 5-ytar old fishes and juveniles as well as spawning adults aggregate (Shingu and Hisada, 1979) (Fig. 101). However, fluctua-
recent years larger fishes have been taken by the surface fishery off eastern Australia (IOFC, 1977a). According to Suda (1974), the abundance of the spawning stock in 1968 has decreased to l/7th of that in 1950's, but the decrease has not yet been reflected in any drop in the recruitment. However, the CPUE in the Australian surface fishery has been fairly steady.
Suda (1974) calculated an MSY level of 35-40,000 MT for this species (Table 10). A voluntary regu? latory plan has been applied for the Japanese fishery through ' closed areas' and ' closed seasons * from October, 1971. However, the landings of this species in recent years are between 17-26,800 MT which, on an average, represent 50% of the total production of this species from its distribution range in the South Indo-Pacific and South Atlantic.
BILLFISHES
The state of stocks of billfishes taken by the longline fishery in the Indian Ocean has been studied by Howard and Starck II (1965), Pillai and Ueyanagi (1977) and recently by Honma and Ueyanagi (1979). The current state of billfish production from the Indian Ocean has been reviewed recently by Wetherall et al, (1979),
HOE CLOSED
SEASON DEC-MAR.
CLOSED SEASON
OCT.-JAN. CLOSED SEASON MAY-JUL.
Fig. 101. Areas and seasons involved in Japan's voluntary regulatory programme for southern bluefin tuna (After Suda, 1973).
tioris in the total annual catch during the period 1965-1979 indicate that between 1967-1977 catches were more or less steady and in 1978 and 1979 the total production decreased considerably (Fig. 99ft). The abundance of the matured fish in the catches during recent years also decreased. (Suda, 1974). However, there are indications that the longline fishery is concentrated at the grounds with smaller fishes and in
FAO.(1980ft) and Yosbida (1981). Mixed reporting of the landings of blue marlin and black marlin, and those of sailfish and shortbill spearfish by the Japanese longliners make reliable stock assessment of these fishes difficult. Further, the detailed effort statistics are available for the Japanese and Taiwanese fishery only. However, a brief review of the trend of production of the different species of billfishes from the Indian Ocean
CMFRl BULLETIN 32 127

is made in the present study, projecting the status of the stocks based on available information.
Striped Marlin.
The trend of annual production of this species during 1965-1979 indicates that it fluctuated widely and the total catch was below the average value for the said period during 1971-1975, which was mainly due to the shift of effort by the Japanese longliners to further south (Fig. 99 c). The possibility of the existence of different stocks of the striped marlin in the Indian Ocean cannot be ruled out but there is no valid data to support this assumption. It has also been suggested that this species attains sexual maturity at 140-150 cm eye-fork length (Pillai and Ueyanagi, 1977). Two recent estimates of MSY are available for the Indian Ocean striped marlin. Honma and Ueyanagi (1979) estimated the MSY to be 3,000-3,500 tonnes, produced by an optimum effort of around 100 million hooks. WetheraU et. at., (1979) estimated the MSY as 3,500 MT and according to them ' the present level of fishing effort as a whole is indicated to be about half of the level of the optimum effort'. However, in 1979, the total catch of this species was around 3,150 MT (FAQ, 1980 a). • The potential for an increasiag production of striped marlin from the Indian Ocean appears to be possible (FAO, 1980 b).
Blue Marlin
Blue marlin is concentrated in the tropical waters and high catch rates are observed in the lower latitudinal areas. Geographic variations in the catch rate shows a single stock of this species. The trend of total production of this species indicates that from 1970 onwards the total annual catch decreased considerably and has usually been below 2,000 MT in recent years. (Fig. 99 c). The production model analysis for blue marlin suggested an MSY of 3,400-3,600 MT achievable with less effort than has recently been expended (Yoshida, 1981). According to Honma and Ueyanagi (1979) an increase in effort may result in a slight increase in the catch of this species.
Black Marlin
The total catch of this species during the period 1965-1979 reached a peak during 1968-1969 and since then declined to less than 500 MT in 1979 (FAO, 1980 a) (Fig. 99 c). No information on the stock structure of this species is available, although there are concentrations of the same in the eastern Indian Ocean, off South Africa and Saudi Arabia. WetheraU et. al, (1979) have estimated an MSY for this species as 1,400-1;500 MT.. Effort levels of 40-60 million hooks have produced the
catches which showed considerable variation about the equilibrium yield curve (Yoshida, 1981).
Swordfish
Total annual catch of this species fluctuated between 1,069 and 2,300 MT during 1965-1979. The annual total catch was below the mean value during 1971-1977 and in 1979 about 2,250 MT was taken from the Indian Ocean (Fig. 99 d). It is also suggested earlier that the stock of swordfish do not seem to have been affected by the present effort by the longline fishery, and their potential yield is estimated to be more than what was taken so far from this area.
Sailfish
The sailfish catch by the Japanese longline fleet has been mixedly reported along with shortbill spearfish and hence reliable stock assessment of this species is not possible. However, in 1967, maximum catch of this species was recorded and subsequently the total annual production declined and in 1979 its catch was around 1,170 MT (Fig. 99 c). As in the case of sword-fish, the sailfish stock has not been affected by the longline fishing effort and the potential yield of this species is relatively higher than the annual production so far recorded from the Indian Ocean (FAO, 1980 b).
Skipjack Tuna
Accurate information and catch statistics of the production of skipjack tuna by the Indian Ocean rim countries and oceanic islands in the Indian Ocean, in several cases is inadequate. However, during the period 1965-1979, the total annual catch of this species was above the average values during 1970-1978 (FAO, 1980 a) (Fig. 99 b). In 1979, their total catch was estimated to be 32,662 MT. The countries reporting on the catches of skipjack tuna in this area include Australia, Comoros, India, Indonesia, Japan, Taiwan, Korea, Maldives, Mauritius, Seychelles and Sri Lanka (Riggs, 1981). As discussed earlier, there is every indication that the total production of this species from the Indian Ocean must be more than what has been reported. There have been several estimates on the potential yield of skipjack tuna, and these estimates and the state of their production has recently been discussed (IOFC, 1977a) (Table 11). Effects of fishing on the stock of skipjack in this area is not apparent. One of the major deterrents in the development of the surface fishery for skipjack in the Indian Ocean is the non-availability of suitable bait fishes. Although, there has been a number of small scale tuna fisheries in several areas in the Indian Ocean, all of them have not been successful, mainly due to the failure to find
128 TUNA RESOURCES

the right specialized technique for the specific area. It may be concluded that the skipjack catches could be expanded considerably by increasing the surface fishery as there is evidence that the present catches are only a fraction of the potential from the whole Indian Ocean. The possibilities of purse seining needs serious consideration as live-bait pole and line fishery except in the small scale sector operating close to insular areas has limitations. So also in the longline fishery, -skipjack tunas form an insignificant fraction.
TABLE 11. The potential and current yields of tunas and related fishes in the Indian Ocean
Large tanas Present longline
fishery ' .
Possible addition from surface fishery
SHipjack
BillSshes
Small tunas
Potential*
125
50
. 225-400
10
100-200
510-785
Current*
no
25
60
8
20
223
1979 Catch**
92
•
30
33(?)
12
65(?)
232
* Estimates provided in IOFC/77/Inf.ll (Vth Session, Cochin, 1977).
** Nominal catches published by FAO (1980a). (?) Doubtful catenas; re-estimation is needed.
OTHEk TUNAS AND TUNA-LIKE FISHES
In view of the absence of commercial tuna fisheries on a substantial scale in the Indian Ocean, information of the catch statistics of species such as little tunny* frigate and bullet tunas, bonito and longtail tuna are inadequate. The landing figures of these species published earlier are largely based on the catches of some of these species by the coastal states in the Indian Ocean. The total annual production of E. ajfinis during the period 1970-1979 fluctuated between 9,690 and 26,420 MT (Fig. 99 b). However, the total production of this species in 1979 was estimated to be around 14,000 MT which is an underestimation. E. affinis occurs in varying quantities in the inshore fishery of Madagascar, Somalia, PDR Yemen, Pakistan, India, Maldives and Sri Lanka. FAO (1976) and IOFC (1977a) have concluded that the catches of little
tunny and longtail tuna could not be increased to a higher level. The changing pattern of the fishery in many of the Indian Ocean rim countries and oceanic islands in the Indian Ocean may help in increasing the production of this species.
The total annual catches of bullet and frigate tunas have periodically been reported by FAO (1980 a). Their production was relatively high during the 1973-74 period (6,200 and 5,900 MT respectively) and in recent years the total production of these species is around 1,900 MT. It has been reported earlier that Auxis was probably the most numerically abundant tuna-like fish from the Oceans and the potential of' small tunas' in the Indian Ocean has been estimated as anything between 100-200;000 MT (Table 11) (IOFC, 1977). The stale- of production and utilisation of these species, along with other small tunas have also been discussed earlier (FAO, 1976); A substantial increase in the production of these species could be expected by increasing the effort in the coastal fisheries.
Tuna Fisheries in the Indian Waters : Present Status
Recent trends in the tuna fisheries in India has been documented by SHar efa?.; in 1979. Tuna is one of the least exploited relkniree of Indian seas aceoantiag for hardly. IS2X oithe total marine fish catch in India at the 1979 level. Tuna resources of the EEZ of India have been exploited by the longliners of Japan, Taiwan and the Republic of Korea. It was observed that between 1975 and 1977 there has been a major input by Taiwanese effort in this fishery and about 2,000 MT oi major species of tunas have been taken
' from the HBZ of India in 1977. The average longline catch for the, period 1972-1977 indicate that the major species 5aken from tWsarea are yellowfin (42%), bigeye (23.8%) and striped marlin (18.7%) (Fig. 113). Exploitation of tuiia resources has received high priority ia the programme and plan for fishery development in many countries, and in India there is a growing interest for tapping this resource as a measure of diversifying fishing effort. :
Resources
The common species of tunas and billfishes occurring in the Indian seas are;
Euthymus affinis Auxis thazard A. rochei Surda orientalis Thunnus tonggol r albacares
(Little tunny) (Frigate tuna) (Bullet tuna) (Bonito) (Longtail tuna) (feBowfin tuna)
CMFRI BULLETIN 32 wk

T. obesus Katsuwonus pelamis Tetraptums audax Istiophoms platypterus Makaira indica
(Bigeye tuna) (Skipjack) (Striped marlin) (Sailfish) (Black marlin)
Of these species E. affinis constitutes more than 60 % of the catch of tunas in the mainland of India followed by A. thazard and A. rochei. In the Lakshadweep islands, the skipjack tuna (K. pelamis) forms the major catch.
The tuna fishery by the countries bordering the Indian Ocean shows that this is a much under-exploited resource. Reports published by FAO indicates that .the present day exploitation of the resources of shelf oriented species amount to about 49,000 MT (1979). There is an increasing demand for tunas for consumption in the internal markets. Estimates have shown that E. ttffinis, A. thazard, K. pelamis and T. tonggol are under-exploited and there is good possibility of increasing production manyfold (Silas etal,, 1976).
Crafts and Gears
Common crafts and gears used at present for tuna fishing at various centres are as follows;
Trend in All-India Tuna Catch
The All India tuna landings as estimated by the •Central Marine Fisheries Research Institute showed a progressive trend from 3,015 tonnes in 1970 to 19,322 tonnes in 1976 and a slight decline during 1972 and 1978. In 1979, the total tuna landings had increased and recorded an all time high catch of 26,595 tonnes.
Average tuna catch for the period 1970-1979 was 11,542 tonnes. The percentage contribution of tuna landings in the All-India marine fish production ranged from 0.3 (1970) to 1.92 (1979).
State-wise Tuna Catch
The state-wise distribution of tuna catch as well as the All-India catch for the period 1970 to 1979 are given in Fig. 102. It would be seen that during this ten year-period, Kerala State alone accounted for 55.3 % of the total tuna catch in the country. Tamil Nadu accounted for 14.8%. In other maritime states the catches were not significant. In Lakshadweep and Andaman and Nicobar Islands the tuna catches formed 11.4% and 0.2% respectively of the country's total tuna production during 1970-1979.
Centre Craft(s) Gear(s)
Ratnagiri and Malvan
Ooa
Mangalore
Calicut
Cochin
Minicoy
Neendakara
Vizhinjam
Tuticorin
Small mechanised boats; Country crafts with OB engine.
Small mechanised boats (14.5m. and 9.0-9.5 m) and dugout canoes
14.5 m mechanised boats (common) 9.7 m mechanised boats and Dugout canoes Dugout canoes
* 14.5 m mechanised boats (common) Mechanised pablo type boats, OAL 9.3-9.7 m with 16-38 HP engine
Special type mechanised boats; 7.93 and 9.14 m OAL, 10-40 h.b. with bait tank (1.6 x 0.8 x 0.8 m); Non-mechanised boats 12.5 m. length
Mechanised pablo type boats, OAL 8.3-9.7 m.
Dugout canoes and catamarans
' Tuticorin' type boats, non-mechanised, 6 m
Drift gill nets (Naijal, Vagrija!) which has three different mesh size, 115, 90 and 130 mm.
Purse seines (600 x 55 m); Drilft gill nets, mesh size 115-130 mm.
Purse seines (400-600 x 40-60 m); Drift gill nets, mesh size 110-130 mm.
Drift gill nets, mesh size 110-130 mm.
* Purse seines (400-600x40-60 m); Drift gill nets 120 x 8 m; mesh size 105-120 mm.
Pole and line, 3-4 m 35-40 mm, at the butt and 20-35 mm at the top ; polyth-iene rope; barbless hook with lead coating.
Drift gill nets; mesh size 105-120 mm.
Drift gill nets, Hooks and lines ; Shore seines
Drift gill nets, mesh size 140 mm; Hooks and lines ; Surface trolling.
* From 1980 onwards.
130 TUNA RESOURCES

ANNUAL DURING
LANDINGS (A LL INDIA) OF TUNAS
70 71 72 73 74 75 76 77 78 79
• . - • • H a l
L 4000 r LAKS«*DW€tr
2000 [
0 70 71 72 73 74 7.5 76 77 76 79 ,
4 0 0 0
2 0 0 0
0
MOM** » mcoatn
70 71 72 73 74 75 76 77 78 79
UNIT OF LANDINGS IN TONNES J
Fig. 102. Annual All-India and state-wise landings of tunas during 1970-79.
CMFftI BUIWTW 32 131

Tuna Landings at Selected Centres
The Central Marine Fisheries Research Institute furnishes the production figures of various species of marine fishes based on a multi-stage stratified random sampling technique after classifying important groups of fishes. For detailed biological investigations and collecting other parameters, the Institute has selected certain important centres for tuna investigations which would assist in monitoring the resources. The tuna landings at the different centres are given in Fig. 103 and discussed below:
Cochin
Prior to 1977 tuna catches at Cochin were insignificant with occasional catches in the experimental operations of purse seine conducted by the IFP bnd in the trtisanal fishery using hook and line and shore seine. The pablo type boats of 9:7 m OAL started operations with nylon drift gillnets in 1977 bringing good catches of tunas at the Fort Cochin. The Cochin Fishing Harbour was commissioned early in 1978 and in 1979 about 165 gill netters were registered. Drift gill nets of 10-15 cm. mesh size are now operated in the depth zone 35-40 m off Cochin.
The effort expended by these boats in 1978 and 1979 in presented in Fig. 103. The tuna catches proportionately increased or decreased with the fluctuations in effort. Month-wise catches during 1978 show a progressive trend from January with peak periods during May-July prior to the intensification of monsoon. For coasrtal tunas the immediate post-monsoon months are less productive.
Among the species of tunas landed by drift gillnets, E. affinis formed over 70 % and A. thazard, A. rochei, T. tonggol and S. orientalis formed the rest of the catches in the order of abundance.
The estimated total landings of tunas in 1979 were 1,235 tonnes. The landings were 12.8 tonnes in January which leaped to 411 tonnes in May and registered a fall during June (91.9 tonnes). A secondary peak in the landings was noted in July (383.2 tonnes), and in the subsequent months the catches were relatively low.
Calicut
In 1978 the total tuna catch was estimated at 69.5 tonnes as compared to 91.5 tonnes in 1977. Drift gill net was the main gear operated for tuna fishery and fishing was carried out in the depth zone 25-55 m. 98 % of the catch comprised of E. ajjinis. T. albacares occurred only during November (1.7 tonnes) and species such as A. thazard and T. tonggol occurred in very small quantities. During January to Decembro
(1979), 63.1 tonnes of E. affinis was landed with the best catch during January (11.6 tonnes).
Vizhinjam
Total catch of tunas landed at Vizhinjam during 1978 was estimated at 397.3 tonnes which showed a decrease of 4.5% from the landings during 1977 (416.0 tonnes). Of the total catch, 82.3 % was landed by drift gill nets, 17.6% by hooks and lines and 0.1% by boat seines. Peak period of tuna landing was observed to bi June. Species-wise, E. affinismi A. thazard contributed 73 % and 24% respectively of the total catch and the rest were composed of stray catches of S. orientalis, T. albacares and K. pelamis.
During 1979 total catch of tunas was estimated at 335.8 tonnes which showed a decrease of 15.5% from the landings during 1978. Of the total catch 75.3% was landed by drift gillnet, 24.5% by hooks and lines «nd the rest by shore seines. Peak landing of tunas was observed during October (122.1 tonnes), when maximum CPUE was realised.
Species-wise E. affinis, S. orientalis and A. thazard contributed 53.4%, 28.4% and 15.4% respectively.; A. rochei and T. albacares together formed 2.3 %of the total catch.
Tuticorin
At Tuticorin tuna landings were observed at five centres viz., Vaipar, Tuticorin, Punnakayal, Kayal-patnam and Veerapandiapatnam. At all these centres drift gill nets mainly accounted for tuna catches. Except at Veerapandiapatnam, hooks and lines were also operated. During 1978 the total catch of tunas from all the centres progressed from 0.65 tonnes in January to 164.9 tonnes in July, and during August 105.4 tonnes of tunas were landed. Thereafter the catches declined steadily.
During 1979, total catch of tunas landed was estimated at 370.1 tonnes with maximum catch during July (48.1 tonnes). The tuna catches increased from 1.4 tonnes in January to 178,2 tonnes in July and during the rest of the year tuna landings showed a declining trend. The period during June to September has been observed to be the most productive period for tuna fishery.
Species-wise E. affinis and A. thazard were the main components in the landings during 1979 forming about 59.7 % and 26.3 % of the total catch respectively. There is a definite change in the pattern of fishing in this area when compared to the catches that used to land from multiple surface trolling during the early nxties (Silas, 1967).
132 - TUNA RESOURCES

1978
160
I20h
-N 80 to Uj
5 40 2
4.0 J-0
T U T I C O R I N 1979
Catch ( Tonnes )
Cpue (Kg)
Effort (No of Units-Drift gill nets)
1978 V I Z H I N J A M
Hooks a lines Prift gill nets
J
Pig. 103.
F M A M J J A . S O N O 1979
0 ^ O J F M A M J J A S O N O
1979
MoMh-Tvhi cateh of tiinis (tonnes), eflfort expended (units) and CPUB (kg) at Cochin (1978, 1979), Calicut (1978, 1979), Tutiqorin (1978,1979) and Vizhinjam (1979).
CMF&J BULLETIN 32 133-

Future Prospects
Resource information collected -during the past clearly indicate the availability of coastal and oceanic species of tunas and allied fist es in the EEZ of India and contiguous seas. A resource survey is talked of in some quarters as a pre-requisite for considering whether it would be feasible to venture into tuna fishery. The long range migratory habit of the oceanic species and the fact that the commercial operations are already in vogue and considerable amount of data of indicative -nature on the occurrenceiand abundance of the different species are available, should weigh in favour of a positive decision for an immediate entry into tuna fishery in our EEZ and continguous high seas and not wait indefinitely for feasibility reports and resources surveys. This does not preclude the need for obtaining foreign expertise for specific areas, particularly •mtb a view of training our personnel in purse seining, long-lining and the specialised aspects of post-harvest technology and so on. The chartering/joint venture arrangements that may be entered into should also facilitate the above. Further, the proximity to relatively untapped fishing grounds for tunas of the high seas and the abundant semi-skilled and unskilled labour supply at a low wage level $oupled with the existing system of processing cost are in our favour.
The present status of production of tanas and allied fishes has been dealt with earlier in this section. However, based on the average yield of these -fitJies from the Indian waters during 1971-75, George ef al.,_ (1977) computed the potential exploitable yield of tunas and allied fishes from different regions around the mainland and oceanic islands within the EEZ of India as follows:
Projected exploi- Production in table potential 1979*
' yield of tunas and (Unit: tons) Regions ' allied fishes from
the 0-200 M area (Unit: tons)
NW Coast 10,000 2,214 (Gujarat and Maharashtra) SW Coast 60,000 17,850 (Goa, Kamataka and Kerala) Lower east coast 10,000 3,649 (Tamil Nadu and
Andhra Pradesh)
Upper east coast 10,000 31 (Orissa and West Bengal)
Lakshadwesp 50,000 2,749
Andaman and Nicobars 100,000 57
Total 240,000 26,595
* Source : Mar. Fish, lnfor. Sen., T & E Ser., No. 22, 1980,
However, we feel that the artisanal fishery as is developing today using drift gillnets and pole and line fishery using live-bait will need further encouragement combined with an active programme of post-harvest technology and marketing of tuna products within the country and for exports. A major thrust should be the development of purse seining for the surface swimming species such as skipjack and for tuna longlining especially deep longlining for tunas and bill fishes from our "EEZ and contiguous high seas. The prime step in the development of high seas tuna fishery by India would be to utilise the technological capacity of the
- vessels equipment and expertise (vide Chapter IX of this bulletin) of the developed nations through joint venture/charterjng arrangement.
The cardinal requirement in the phasing of the tuna fishery and industry is the need to maintain and improve production targets. The value of tunas and allied fishes "produced commercially in India in recent yejars is about j90 million Rupees. We suggest that by J 990, the production tempo of the tuna fishery development programme should achieve the following commercial productiontarget (p,135)in terms of quantity and value:
To^acbjeve these objectives, let us examine present constraint limits and additional requirements.
I (i) Except in the Lakshadweep there is no organised fishery for tunas in vogue in our country.
(ii) It is currently limited exclusively to the-small scale sector, where we envisage production could be more than doubled with improvement in the techniques as well as with increased effort.
(iii) Even for the present production, a proper internal marketing system has not been developed nor have we done any major improve-
•v4- ments in the post-harvest technology.
- (iv) Little has been done about exploring the possibility of export product potential for coastal
: i tunas most of which may come under the * red >\- meat' category.
(v) We are fighting shy of adopting capital intensive fishing operations such as purse seining and longlining. Foreign expertise in the fishery technology of both these types of operations are needed.
(vi) We even lack expertise on fishing fleet management which is vital for any successful distant water operation.
134 TUNA RESOURCES

Groups of fishes Areas of Fishery
Present level of commercial production
(Average for 1978 and 1979)
Proposed commercial production target
by 1990
Quantity (Tons)
Valus (Million Rs.)
Quantity (Tons)
Valus1
(Million Rs.)
Coastal species of tunas & skipjack
Young yellowfin & skipjack
Large oceanic tunas and billflshes
Small scale fishery sector (Drift gillnets, Pole and line and others)
Surface fishing (Purse seining)
Sub-surface fishing (Ordinary & deep longlining)
20,240 91.08
Total 20,240 91.08
45,000
50,000 +
20,000
115,000
202.5
450.0+
270.0+
922.5+or 92 crores
1 As per current prices
(vii) The industry is apparently not fully seized of the problems, and advantages of venturing into tuna fishery: Perhaps our own organisations which have to promote exports could have played a more effective role by'making available information known on matters such as type of vessels available for chartering, economics of operation of different categories of fishing vessels, and export possibilities of any additional yield of tunas through foreign collaboration ventures and so on. This we consider a lapse, since commercial tuna fishing is in vogue and it is not a question of entery into a hundred percent unknown area. Now it is left to the enterpreneur to seek these information from foreign sources.
(viii) A major share has to come from the charter arrangements that-may be concluded by the Government of India shortly. Needless to say* in licencing, attention will have to be given to the type of fishing operations, viz., purse seining, long living and as on from within an EEZ and continuous high seas.
II (0 F r o m these it would be evident that immediate attention should be paid for the development
- of small scale sector which would substantially increase production-through improvement of craft and gear and through improvements in
internal marketing as well as exports. A More intensive programme will be necessary in the shelf waters along the South east and south west coasts in India and the Wadge Bank. Fish aggregators of which mention has already been made.should be tried out not only'in the Lakshadweep and Andaman-Nicobar waters but also in the deeper neritic waters along the mainland.
(ii) Today we do not have a category of skilled personnel whom we can call as fishing masters. There is an urgent need to develop this category of personnel who could be responsible for the fishing operations and manage the onboard storage-cwtt-processing operations. This will in no way lessen the responsibilities of skipper/ captain and in some countries both are equated on par.
(iii) A crash training programme for personnel .on the operational side for the operation of large purse seines as well as deep longline will be necessary.
(iv) Immediate effort should be made to develop the operational facility for surface tuna fishing and concentrate efforts in areas such as the Andaman Sea which has a high potential for Surface species.
CMFRI BULLETIN 32 135

VI BAIT FISHES
Major baitfishes utilised in the tuna fishery can broadly be classified into two types viz., the live-bait used for chumming tunas in the pole and line fishery and the other preserved or artificial baits or lures used in the surface troll line and longline fishery. Trials have been made by the Southwest Fisheries Centre, Hawaii, on artificial baits of various colours to study the behaviour of tunas in the pole and line fishery. Up to now this method is not being adopted due to the unsatisfactory results. The significance of baitfishes as limiting factor in the successful production of tunas by pole and line bait-fishing method is generally understood. Further, one of the significant factors contributing to the tuna longline operation is the bait. In the present chapter, different aspects of live-bait fishery and the transportation of the live-baits practised by the traditional small scale pole and line fishery is presented and the utility of different species as bait in the tuna longline fishery is discussed, with particular reference to the Indian Ocean.
Live-bait for Pole and Line Fishery Recently, the live-bait fishing techniques in different
parts of the world has been compiled, various methods of handling and transportation of the same documented and the problems involved in the capture and culture of bait-fishes discussed (Shomura, 1977; Ben-Yami, 1980). In the Indian Ocean, distant water commercial pole and line fishing method is not employed at present and the small scale fisheries in the tropical waters are chiefly of shorter duration. Further, large scale fishing industry for live-bait is non-existent in this area, chiefly due to the small scale nature of the tuna live-bait fishery and in most cases live-baits are collected by the tuna fishing vessels either prior to the fishing trip or during the previous day.
Jones (1960 a j 1960 b ; 1964 a, 1964 b) listed and discussed about the species of Jive-baits used in the Minicoy pole and line fishery for tunas (Table 12). Thomas (1964 a) observed the seasonal fluctuation in
136
abundance of major bait-fish species at Minicoy during the fishing season of December, 1960 to April, 1961 and according to him the following species were present in the bait-fish catches in the order of abundance :
Lepidozygus tapeinosoma, Archamia lineolatus, Caesio caerulareus, Dipterygonotus leucogrammicus, Apogon spp., Apogon sangiensis, Caesio tile, Chromis caeruleus, Caesio chrysozona, Spratelloides delicatulus and S.japonicus.
Jones (1964 a) also presented the distribution and availability of the live-bait fishes around Minicoy and other islands in the Lakshadweep Archipelago.
Recently, Ben-Yami (1980) presented a guide to bait-fishes, for pole and line fishery from different geographical locations in the world oceans. He classified the bait-fish species distributed in the area 0°-30°N and 60°-90°E in the Indian Ocean according to their survival capacity and chumming quality as follows :
Species
Apagon semilineatus Archamia lineolata Allanetta forskali Paranesus duodecimal is P.piagttis Caesio coeruiartus Chanos chanos Tilapia mozambica Sardinella sirm Elops machnata Engraulis japonicus Stolephorus bataviensis S. buccaneeri S. indicus Mugiiidae Mullidae Chromis caeurleus
Survival capacity
*** . i * * *
*** . a
*** *»* ***
**** **** **** —
**** —
* *
** or *** **
***
Chumming quality
+ + + +
+ + + + —
*t r*T ir
+ + + + + + + + +
+ + + + + + + + + +
+ + + + + + +
—
+ or-f- + + —
* poor ; ** satisfactory; *** good **** excellent + poor ; + + satisfactory ; + + + good; + + + + excellent.
tUNA RESOURCES

TABLE 12. List of bait-fishes reported from the waters around Minicoy and Lakshadweep Islandsl
Albula vulpes (Linnaeus) Spratelloides delicatulus (Bennett) S. japonicus (Houttuyn) Sardinella melanura (Cuvier) Panchax panchax (Hamilton-Buchanan) Sphyraena obtusata (C. and V.) Crenlmugil crenilabis (Forskal) Valamugil seheli (Forskal) Ailanata forskali (Ruppel) Pranesus duodecimalis (C. and V.) Polynemus sexfiiis (C. and V.) Kuhlia taeniurus (C. and V.) Anthta cichlops (Bleeker) Archamia buruensis (Bleeker) A. lineolatus (C. & V.) Apogon frenatus Valenciennes Apogon endekataenia Bleeker A. bandanensts Bleeker A. sangiensis Bleeker A. quadrifasciatus (C. & V.) Traektnotusbailloni (Lacepede) Luttonus kasmira (Forskal) Dipterygonotus leucogrammicus Bleeker Caesio corulaureus Lacepede C. chrosozona C. & V. C. erythrogaster C. & V. C. tile C. & V. Mulloidichthys auriflamma (Forskal) Parupeneus barberinus (Lacepede) P. blfasciatus (Lacepede) P. macronema (Lacepede) Tilapia mossambka (Peters) Abudefduf biocellatus (Quoy and Gaimardi) Chromis caeruleus (C. &. V.) C. dimidiatus (Klunzinger) C. ternatensis (Bleeker) Dascyllus aruanus (Linnaeus) Lepidozygus tapeinosoma (Bleeker) Pomacentrus tripunctatus (C. & V.) Chelinius trllobatus Lac6pede Fissilabrus dimidiatus (C. & V.) Stethojulis albovitata (Bonnaterre) S. axillaris (Quoy and Gaimardi) S. trilineatus (Bloch and Schneider) Thalassoma hardwicki (Bennett)
1 Source : Jones (1964a).
Fishing Techniques Large scale bait-fish fishing by surrounding nets such
as the lampara net, as used by the U.S. tuna clippers is not practised in the Indian Ocean Area. However, small boat lift nets or drive-in nets are employed in the pole and line fishery at the Lakshadweep, Maldives and Sri Lanka.
?!he rectangular bait-fish net used at Minicoy in the Lakshadweep is of 4.5 x 5.5 m, with 6 mm and 8 mm stretched mesh netting at the centre and at the border respectively. A cotton cord of 3 mm. diameter is passed through the net and attached to the selvedge mesh. Poles of 6-8 m are also used in this fishery. Baitfishes are collected in the early morning or on the previous day evening. After locating the school of bait-fishes, 3-4 members of the crew each holding a pole vertically lowers the net from one side of the boat. The fish meat paste is rubbed on a coir padding and is made to spread over the water column between the net and the surface. When sufficient number of baitfishes are accumulated over the bait net, it is lifted with the help of poles and the fishes are transferred to the live-bait tank. In the Maldives, a fine meshed 7x7 m net is used and the fishing practice is similar to the one followed in the Lakshadweep Islands. In Sri Lanka, a lift net of about 10x12 m size and with 60. mm mesh netting (hemp) is used in the bait fishing. This net is also provided with a small meshed net over the heavier netting at the centre in order to protect the same from the rocky bottom. Usually two vessels are employed in the baitfiahing operation which is carried out during the morning. During fishing, the net is spread over the bottom, and after sufficient baitfishes are concentrated Over the net, it is quickly hauled up by ropes attached to the corners.
Drive-in method of fishing is also practised in the shallow waters in the Lakshadweep Sea. One end of the net is held in position and the other end is held upwards with two poles. The * scare line ', with palm leaves attached all along the length is used to drive the fish into the net. The trapped fishes are transferred to a floating tank or basket of bamboo which is towed to the fishing boat and later transferred to the pole and line fishing boat.
Floating Receivers
In countries such as Japan, where specialised live-bait tuna fishery exists, the baits are maintained in floating cages or pens till they are needed in tuna fishing. In the Indian Ocean Area where localised small-scale pole and line fishery for tunas exists, no such practice is in vogue. In the Lakshadweep and Minicoy, the baitfishes collected are kept in floating receivers or cages for transportation to the fishing vessels. In the Lakshadweep, an aluminium floating tank of size 1.8 x 1.0 x 1.0 m is also used to store live-baits. The sides of the tank are perforated for water exchange and floation is maintained by wooden poles attached to the sides. In Sri Lanka, square floating live-bait cage is also used in addition to the floating baskets. Baskets are of loosely
CMFKJ BULLETIN 32 137

woven cane. They are kept fth submerged in water. During fishing operation, these baskets are towed to the tuna fishing grounds and are used as live-bait tanks.
Transportation The Indian Ocean is the only one area where the
fishermen use the bilges of the boats, usually divided into compartments, for carrying bait to the tuna fishing grounds (Ben Yami, 1980). the complex tank system with well designed tank on the deck or below the deck are not employed to transport baitfishes in the small scale pole and line tuna fishing in this area.
In Sri Lanka, the 8.5 m mechanised boats carry the live-bait in towed baskets. At Minicoy and Laksha-dweep in the non-mechanised boats (9.75—12.2 m), the bilge in the middle of the boat is divided into compartments (4 or 5) to hold live-baits. The dividing walls of the compartments are perforated. Water circulation is maintained in such a way that when the vessel moves, water enters the middle compartment through the holes in the bottom of the hull, and then reaches the adjacent compartments, from where it is bailed out. Baits are kept in the middle compartment. In the mechanised boats (7.9—9.15 m) of this area, a water tight live-bait tank of size 1.6x0.8x0.8 m is fitted at the forward area of the engine room (PL VI). During tuna fishing operation, the live-bait is taken out of the tank by a bait scoop.
Suggested lines for future improvement and different economic factors connected with the fishery for live-baits are dealt with elsewhere in this bulletin. .
Bait for fund Longline
It is generally agreed that many species of fishes could be used as bait in the longline operation without a great loss of catch. The principal baits used in the longline fishery are saury (Cololabis saira) (PL IV) and squids (Loligo spp.). Fresh or frozen sardine (Sdrdi-nopsis melanostricta) is also commonly used as bait fish. Mackerel {Scomber sp,, Rastrelliger sp.) and Mackerel scad (Decapterus sp.) have also been used as alternate baits. In recent years, the silver carp (Hypoph-thalmichthys molitrix) as well as artificial preparations such as those infused with extracts of saury have also been experimented as longline bait. It has been observed earlier that Sardinella spp. has a tendency to drop off the hooks faster than other baits and hence it is considered as a supplementary bait to makerel, squids and flying fish (Sivasubramaniam, 1975).
Ba't preference of tunas have been studied earlier, but no decisive conclusion could be derived at because of the highly variable nature of the longline catch rates which masks the effect of the variety of the baits used. However, an analysis of the catch rate of different species of major tunas by the commercial longline operations by Japan using different baits such as saury, squid and other baitfish in the Indian Ocean during 1971-1976 indicate that the southern bluefin tuna arid albacore were caught in appreciable numbers when squid was used as bait. Yellowfin and bigeye tuna catches were relatively high in the operations where saury was employed as the bait (Table 13), However, no conclusion could be drawn on the bait preference
TABLE 13. Catch of different spicks of tunas by the Japanese longltne fishery using different baits*
Saury
Squid
Other baits and livebaits
71 72 73 74 75 76
71 72 73 74 , 75 76
71 72 73 74 75 76
1 Source: Anon (1965-1981)
138
Sets xOO
92 59 74
169 212 89
245 211 343 230 237 246
19 14 8 6
11 10
Hooks xOOO
20273 13196 14740 35417 42324 19468
51999 44812 60696 47213 47120 56960
3658 2900 1335 802
1791 1763
Southern bluefin
32 24 22 89 67 75
325 368 403 354 244 357
0 1 0 0 1 3
Albacore
63 26 45
115 55 50
111 62 97 63 22 46
3 2 1 2 2 2
Bigeye
105 84 81
150 185 53
96 21 28 24 10 8
19 26 14 6
10 13
Yellowfin
199 127 107 148 213
18
62 35 22 37 47 17
47 33
.23 , 13 17 0
TUNA RESOURCES

oi these species based on the results o^ the operation. oT the commercial vessels.
At present an indigenous longline fishery is lacking in the Indiari~Ocean except for the commercial longline operations which are being conducted by the vessels of Japan, South Korea and Taiwan, The establishment of this fishery by the Indian Ocean rim countries necessitates smooth supply of bait fishes. Sivasubramaniam (1975) examined the availability of sardines (Sardinella jussieu, S: sirm, S. longiceps, S. gibbosa), Dussumeria sp., Decapterus sp., Rastrelliger sp., Hirundichthys coramandaknsis and Loligo sp., and observed that sufficient quantities of baitfishes are available or can be obtained from the coastal waters of the Indian Ocean.; The average levels of production of different species of fishes that can be utilised as longline bait during 1976-79 areas follows :
1976-1979 1976-1979 average average
forl.O.* Production by ' ; India**
M.T. . „ tonnes
Mackerels .. .87,457 71,095 Sardines . . 356,555 232,089 Cephalopods . . 29,713 12,948 Flying fish . . 1,144 (?) 1,577
* FAO Catch statistics from the Indian Ocean (1976-1979) ** Catch statistics of marine fish landings, India, 1976-79
(CMFR Institu:e)
Culture of Bait-fishes
Baitfish is the most important critical factor in spelling the success or failure of the pole and line fishery for surface tunas. Inadequacy of baitfishes has resulted in the winding up of pole and line fishing operations using 4 large Japanese fishing vessels in the Republic of Seychelles recently. Problems facing the culture of baitfishes are complex and recently much attention has been paid to analyse the constraints and to evolve suitable measures for culturing baitfishes.
Gopalakrishnan (1976) discussed the status and problems of culture of baitfishes for skipjack fishery in the Pacific region. He reviewed the investigations carried out on the culture of potential live-bait species viz., tilapia, threadfin shad, mollies, sardine and other clupeids, anchovy, milkfish, mullets, cyprinids and bass and stressed the need for extended studies on the culture of potential live-bait species. Shomura (1977) presented a summary of the baitfish species cultured
for tuna fishing in the Pacific Ocean. According to him, the major requirements for potential culture species include high reproduction potential, capacity to spawn in captivity, wide tolerance to salinity, ability to obtain food low in the food chain and body lacking in spiny structures. Principal characteristics of species such as threadfin shad, tilapia, mollies, golden shiner and cardinal fish that have either been cultured or evince culture potential have also been summarised by him. Baldwin (1977 a) also reviewed the use of live-baits in the skipjack tuna fishery in the tropical Pacific with reference to their body length, body form, colouration, schooling behavior, survival and availability. He evaluated the biological data of the baitfishes belonging to 30 families based on the above lines and listed the geographical location of the baitfish species in the Pacific and non-Pacific localities.
The suitability of cultured topminnow, Poecila vittata as a live-bait fish for skipjack tuna in the Tropical Pacific has been discussed by Baldwin (19776), He stated that the utility of these fishes as baitfishes for new or expanding tuna pole and line fishery appears quite feasible. Recently, Baldwin (peisonal communi-caiton to E. G. Silas) opined that self-contained production system for topminnows (Poecila vittata. W& P. mexicans) using high density culture techniques, has been evolved. According to him, P. vittata is a highly suitable live-bait fish for skipjack tuna fishery and the breeding and rearing of the topminnow and the economics of production for commercial use have been worked out. Further, Herrick (1977) has indicated potential use of Poecila vittata to be promising and economically feasible.
Kearney and Gillett (1980) and Gillet and Kearney (1980) reported on the skipjack surveys conducted in connection with tagging programme at Pitcarin Island and French Polynesia and according to them Chanos chanos was an excellent bait fish with respect to both survival in bait tanks and attraction to tunas. At Pitcarin Island, 75 kg of bait {Chanos chanos) produced a survey catch of 3,361 kg of tuna, a ratio of 45 : 1 . This ratio has been found to be more favourable in commercial operations. Recently, Kearney and Rivkin (1981) examined the feasibility of baitfish culture for skipjack pole and line fishing in the south Pacific Commission Area based on the results of bait-culture projects in the western Samoa and Kirbati. They compared the use and culturing aspects of mollies and milkfish and according to them sea trials indicated milkfish are attractive to skipjack while mollies are acceptable when mixed with milkfish or wild bait. At the World Conference on Aquacuhure (European
CMFRI BULLETIN 32
10 139

Mariculture Society and World Mariculture Society) held in Venice, Italy during 21-25 September, 1981, different aspects of the culture of tilapia and milkfish have been discussed. The trials carried out in Japan with Tilapia zilli, especially in the South Pacific Area in the fishery for skipjack has shown that this species has good chumming qualities (Dr. T. Oyama, Freshwater Fisheries Research Sub-Station, Kagoshima, Japan, personal communication to E. G. Silas). This is a species which could also be cultured in the Lakshadweep Islands where there is a chronic shortage of goodbaitfish.
The use of anchovies as a bait has yet to be proven in our waters. Experiments on three species of anchovies viz., Stolephorus bataviensis, S. buccaneeri and 5. heterolobus carried out at the Central Marine Fisheries Research Institute indicated that S. heterolobus and S. buccaneeri could be used as live-bait due to their relative hardiness compared to the other species. However, the chumming quality of these species have not yet been tried out in this area. Ben-Yami (1980) have indicated that the chumming quality of Stolephorus bataviensis, S. buccaneeri, S. devisi, S. heterolobus and S. purpureus are very good.
It has been observed that in spite of the suitability of mackerels, sardines, flying fishes and squids as ideal
bait in the longline fishery, their availability and abundance show spatial and temporal fluctuations. In this connection, it is necessary to identify suitable species which could be obtained for most part of the year or which could be cultured economically. The milkfish (Chanos chanos) with its brilliant silvery appearance and with fast growth rate can be utilised as an ideal tuna longline bait. Recently, Silas et al. (1982) studied the spawning grounds of the milk fish and the seasonal abundance of the fry of this species along the east and south-west coasts of India and according to them the milk fish is a compatable, herbivorous, fast growing tropical euryhaline fish which can be cultured in a more economically viable manner in coastal saline and brackish water systems, either as monoculture or polyculture with other fishes and shell fishes. The culture experiments conducted during this study on their growth rate indicate that at a stocking density of 5,000, nos/ha, the fingerling of about 47 mm in total length and 1.2 g in weight will attain a size of 200 mm in total length and about 74 g in weight over a period of 72 days without supplementary feeding. The growth can still be accelerated by supplementary feeding. The economic feasibility of using milkfish as tuna longline bait (size : 200-250 mm ; 80-190 g) is evident from the fact that the price per Kg (12-13 Nos) of this fish is about Rs. 5 to Rs. 6.
140 TUNA RESOURCES

VII BY-CATCH
Information on the by-catch in the tuna fishery employing various gears is a pre-requisite in order to assess the operational efficiency and economy of these gears. Except for a few published works, very little information is available on these lines from the Indian Ocean. A brief review of the available information on tuna by-catch is presented below largely based on the results of studies conducted recently.
Tuna longline operations aimed at tunas and billfishes usually take a large number of other pelagic fishes which play only a lesssr role in the economy of the operation of the longline fishery. Major by-catches in the tuna longline fishery in the Indian Ocean include several species of pelagic sharks (Families Alopidae, Lamnidae, Carcharinidae), dolphin fish (Coryphaena hippurus, C. equalis), wahoo {Acanthocybium solandri), baraccuda (Sphyraena baraccuda), opah (Lampris regalis) and lancet fishes (Alepisaurus ferox and A. brevifostris) (Sivasubramaniam, 1964 ; Silas, 1967 ; Klawe, 1980 a).
A high concentration of pelagic sharks have been reported from the productive tuna longline fishing grounds in the Indian Ocean. The role of these fishes in the tuna longline operations in the Indian Ocean is discussed under the following two major heads :
(i) their concentration in different tuna fishing grounds, which reduce the fishing ability of the baited hooks which are taken by sharks, and
(ii) the damage cause by these fishes especially sharks to the hooked tunas and billfishes.
The following species of pelagic sharks are reported to have been taken by the tuna longline fishery from the Indian Ocean (Sivasubramaniam, 1964; Silas, 1967; Pillai and Honma, 1977):
Carcharinus longimanus C. brachyurus C. albimarginatus C. melanoptera Prionace glauca Isurus glaucus Lamna ditropis Alopias pelagicus A. profundus A. vulpinus Galeocerdo sp. Sphyrna zygaena
(Wh'te tip shark) (Silky shark) (Silver tip shark) (Black tip reef shark) (Blue shark) (Makao shark) (Salmon shark) (Thresher shark) (Bigeye thresher) (Thresher shark) (Tiger shark) (Hammerhead shark)
Mimura et ah, (1963 a ; 1963 b) Sivasubramaniam (1963, 1964) and recently Pillai and Honma (1978) reported on the distribution and seasonal abundance of pelagic sharks taken by the Japanese longline fishery in the Ind'an Ocean. The hook-rate of sharks and the pjrcentaga of tunas damaged by sharks were relatively high in the area north of 10°S especially west of 80°E and around Banda and Flores Sea (Mimura et ah, 1963 a, Table IV). According to Sivasubramaniam (1964) in the tuna fishing grounds in the Indian Ocean, especially in the area north of the equator the hook mtes of sharks were very high and their relative density declined latitudinally southwards. Pillai and Honma (1977) computed the seasonal pattern of abundance of the pelagic sharks (H.R. %) taken by the Japanese longline fishery in the Indian Ocean during 1972-1975 and concluded that the areas of high concentration occur (i) off the coast of southern and eastern Africa, (ii) western and eastern sectors of the Arabian Sea, and (iii) off western Australia. Seasonal pattern of their abundance indicate that high hook-rates were recorded from the coast of South Africa during November to July ; from the tropical waters off East Africa from October to April; from the western and eastern sectors of the Arabian Sea during January to July, and from the west coast of Australia almost year round (Fig. 104 a-I).
CMRU BULLETIN 32 141-

1 0 *
I f
*
f
I
10 1
S
40
N \
U, \ ^
-rrf
IT*
r >s
> J ^
• f
c \*
1/ 1
I
c \.
Y 1
hi /*
A
1
s -
•i )
V • * >
J / •
V
,1
^ ^ *
\ l
-\ J k
>i
)
"
f L
>i
J
VJ \>
^
i c / L
J
r L.
/ •
L
•y
v ^ i
>i
-\ )
\ )
<r •V *
i L
r K
r V.
r L
\f -H \ / \ /
,_ PELAGIC SHARKS TAKEN BY
) JAPANESE LON6LINE ^ FISHERY %<Av. I97B-I375I 3 f JANUARY
A\K
'J
J& 39 ^ H v -'6 - o oi "^ V A 0 0 Z - 0 0 9 OO 10-0-49 • 0 5 0 - 0 99 • 1 0 - 5 0
"• /? \ r
I \
n-F E 1
T
/
)
a in E
^
-
=
Jn'E 30 T. «0-E BO-E BO-E 70'E
l ^ \ d P ^ A -£^
/<-L ^/±- ^ t -j /L* £ i
r^ /lA, Q-T/ X-LU -« - i - A - t ^ -\_j
__- /K / . j ' N O • " W
,:±_±_i
• a1? «0"€ 100'E 1 1 ft • F 12fl't I30'E " n ' E 'SO-E
f • - f t
v/ Js L-" c J .J V ^ -'^22^^-1—SSrs^Ui*
-£V ^•t- -J"^*XIJH—r t : ;r ^tr- T' \ V i - v=vf~ \ T = ^ V7X T
/v / " * ' T T / T ^ A . /
I rK" ^ L _ _£^ - 4 v nhV -£*- - ^ ^ ^ ; ; r \ ?
80-E 90E tOO'E- 110'E 120'E 130-E UD E 1 ao E
T"
,
v, ,
Fig. 104 a-/. Average monthly distribution of the hook-rate (%)of pelagic sharks taken by the Japanese longline fishery in the Indian Ocean during 1972-75 (From Pillai and Honma, 1977).
142 TUNA RESOURCES

3 0 *
20* H
t o -
1 0 ' s
» •
SO' E 2
10 "E ' 1
\ d
^d /
•E
A L
• f
/ j
/
r
E
r K
c
^ r ( ,
1A
A
^ ^
0 5l> £
•E
•E
>l
r \. r\ \, t
L
t
1 L.
1 L.
r\ K
• t •• - •« • '
W e 7\ V, r
s~
w-r~ ,_ ir
\ S f
/ /
L / / /. /
i
r\ K
i i
\
i
^ •E
10 -B n o t
•\
t o
TV
/ L
r L
i
L
(\ \
L _
V^
130't H I * - T
«• • uo-t . 1 0
JUL*
r^fi^l * ^p7"x^r
>r i
s~ • * )
J
'F
f •%
>
\ i _
J
41
,
' f i
^ •P 1
40-£ 'Si
\.
'Si
u
'* 7»
s
X
I 0 i o ' t ao-i *Q'E eo'e no'e »O-E . 8£$ OO-E IOO-E M O E \%V% i » * e t « l , i w t , i lo*^
\ ~ " • ^
° s t »• sf % * jf
•°.»I 1 »Olf " *•%{ M S
I <f fe£ r
J* " VIA
4/ -<h •XT
-iX -\ 7
XX X.T
SO'E «0'E
Tf\rf A V , > L ^ C l
A T t i
^ t _ -* --££- i
-£ X-\T
- - £V • -( t r ^ •4X-^ r
-T^ r r "
" 3eO •A. '
vfcf P /±~ NJ^S
r t \ I, / v t7 r ^ s
^e- - £ * t » , X 7
' V -^w >.r ^ *
f ^ -£3 W A:5
TT
" % •
->•?
H
to
SEPTEMBER
I O -I I
/ a - d .Jfig <
/ *
{ r f f X
1- ^ f- - ^
g s j ^ A £11:,.
iTi i \ 7
tJ,
5 . •• ^ «r
tf
s
'S
'• , r • l «o
N
-rtl A:
_c X,
• \
) \ J . 1 " •
e oo •€
1 ' ' A
-Li " Z S
01
1 J -
*s
1
E »1
rs
/ •
V. d *. / /
E ^«s
A , \
x. ^r f> 7 ^.
,/ / r L «-<L c L r L
* L
•\ ^ > J > ) •\ )
•\
i n
r'tVi ,yl
1 f o e
j /1
r I IO' I ^s ^
NOVEMBER
J fi
WR ca ^ *
I [ L r - f?
K.
/
FT1
J
i
h*T j
*
^
;
Fig. 104 (continued), g-l.
^KfFRI B«p-ETIN 3? 143
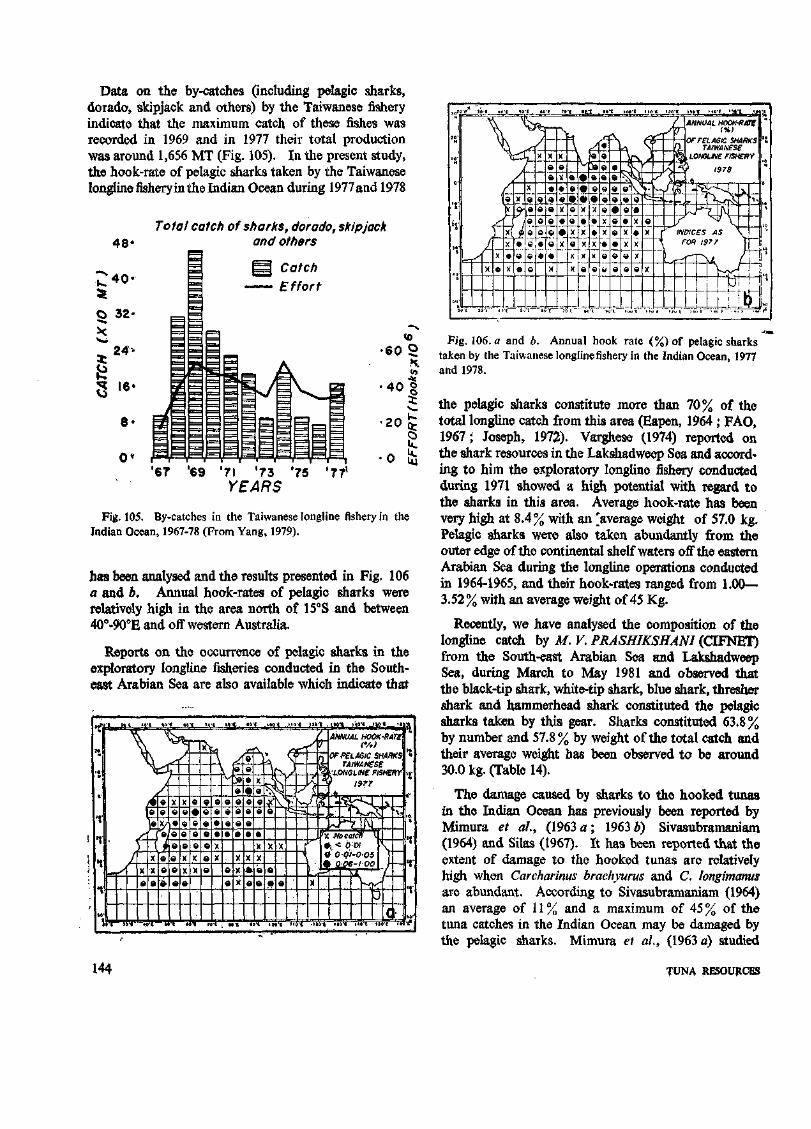
Data on the by-catches (including pelagic sharks, dorado, skipjack and others) by the Taiwanese fishery indicate that the maximum catch of these fishes was recorded in 1969 and in 1977 their total production was around 1,656 MT (Fig. 105). In the present study, the hook-rate of pelagic sharks taken by the Taiwanese longline fishery in the Indian Ocean during 1977 and 1978
48*
£ 4 0 -
O 32 •
^ 24-
3 ,6'
8-
0»
Total catch of sharks, dorado, skipjack and others
_J 1 £
1
=
B
s
=
i ^ B
B Catch - Effort
^ I^=*I
i a s
i <0
•60 2
• 4 0 |
•20 £
0 £ '67 '69 "71 '73 '75 '771
YEARS
Fig. 105. By-catches in the Taiwanese longline fishery in the Indian Ocean, 1967-78 (From Yang, 1979).
has been analysed and the results presented in Fig. 106 a and b. Annual hook-rates of pelagic sharks were relatively high in the area north of 15°S and between 40°-90°E and off western Australia.
Reports on the occurrence of pelagic sharks in the exploratory longline fisheries conducted in the Southeast Arabian Sea are also available which indicate that
„ •»* i'o •E . 0 E 00 E SO
\ ^ M \3
4
• '
30 £
X
E
X
0
'
VJ X
H r X
• X
E
a
•
*
Y 7_ r X
el 1® s a e e e
£
X
• a a 0
a a
•
«
""]
«
o
"a
•E
*0'E
y VL 0,
|X_
a « X
a
• X
J0
a a
• e a X
a X
X
E
- I t . E •«'E • M E
n\
L • : X
a X
x
a
a ie a e 9 X
a a X
X
e
a a 0 a 9 a a X
X
a a Q
a a
a • a a a e s
n o , 12S
rfA <3 lcJ
*v a] a a a X
X
a a
el
• T" a X
X
e
a X
X
. . V ' . a "-To-;-,—,v
i -
E
7 110 , i.o'E >19 E 1 *
ANNUAL HOOK-HATE • rx;
OF PELAGIC SHARKS TAIWANESE
LONOLINE FISHERY
? /^a
- L
_/" ^ x; t" ^
t
INDICES AS '
^
FOR 1977 ["
i ? 0 E i , E
/ h ^ i
rb" !
E ' • - , .
> H
• h
\% Ji
'S
'1 ,
"
r>
Fig. 106. a and 6. Annual hook rate (%) of pelagic sharks taken by the Taiwanese longline fishery in the Indian Ocean, 1977 and 1978.
the pelagic sharks constitute more than 70% of the total longline catch from this area (Eapen, 1964 ; FAO, 1967; Joseph, 1972). Varghese (1974) reported on the shark resources in the Lakshadweep Sea and according to him the exploratory longline fishery conducted during 1971 showed a high potential with regard to the sharks in this area. Average hook-rate has been very high at 8.4% with an "average weight of 57.0 kg. Pelagic sharks were also taken abundantly from the outer edge of the continental shelf waters off the eastern Arabian Sea during the longline operations conducted in 1964-1965, and their hook-rates ranged from 1.00— 3.52% with an average weight of 45 Kg.
Recently, we have analysed the composition of the longline catch by M. V. PRASHIKSHANI (CIFNET) from the South-east Arabian Sea and Lakshadweep Sea, during March to May 1981 and observed that the black-tip shark, white-tip shark, blue shark, thresher shark and hammerhead shark constituted the pelagic sharks taken by this gear. Sharks constituted 63.8% by number and 57.8% by weight of the total catch and their average weight has been observed to be around 30.0 kg. (Table 14).
The damage caused by sharks to the hooked tunas in the Indian Ocean has previously been reported by Mimura et al., (1963 a; 1963 b) Sivasubramaniam (1964) and Silas (1967). It has been reported that the extent of damage to the hooked tunas are relatively high when Carcharinus brachyurus and C. longimanus are abundant. According to Sivasubramaniam (1964) an average of 11% and a maximum of 45% of the tuna catches in the Indian Ocean may be damaged by the pelagic sharks. Mimura et al, (1963 a) studied
144 TUNA RESOURCES

TABLE 14. Tuna longline operations on board MIV PRASHIKSHANl (CIFNET):
Percentage composition of the catch by number {cruise-wise) l
(February-May, 1981)
Species group February March March April April May May Total
Yellowfln tuna Bigeye tuna Other tunas Billflshes Pelagic sharks Other fishes
12.5 .. . .
12.6 75.0
t • • •
7.5
25.4 52.2 14.9
25.0 5.0
25.0 45.0 100.0
3.1 6.3 9.4
46.9 34.3
3.2
12.9 74.2 9.7
5.9 . , , ,
52.9 41.2 , ,
8.3 0.7 0.7
17.7 63.8 8.7
Percentage composition of the catch by weight {Kg) (Cruise-wise)
Yellowfin tuna Bigeya tuna Other tunas Billflshes Pelagic sharks Other fishes
16.3
21.5 62.2
9.2
47.1 42.5
1.2
20.9 5.9
31.8 41.3 100.0
13.3 1.2
15.3 62.9 7.3
3.7 , ,
10.8 84.8 0.8
5.4 . ,
64.7 29.8 , t
10.5 1.7 0.1
29.0 57.8 0.8
4 Source : ClFNEf NJWS Lelfr, Vol. I, ND. 2, 1981.
the rate of damage to the tunas by sharks in the Indian Ocean and reported that the percentage of damage was high in the area north of 10°S and west of 80°E (0.09—0.18) and in the Banda Sea and Flores Sea (0.14—0.16) during 1958-1960. Silas (1967) observed the damage caused by pelagic sharks to the hooked tunas during the research cruise of ANTON BRUUN in the Indian Ocean and stated tha* the pelagic sharks, especially white-tip shark, silky shark, great blue shark, thresher shark and makao shark play an important role in the tuna longlining as they cause considerable damage to the hooked fish. The damage caused by sharks to the tunas and other pelagic sharks ,which was observed on board R/V ANTON BRUUN during January to May, 1964 is presented in Pis. II and V.
In view of the high incidence of pelagic sharks in the tuna longline operations in certain areas in the Indian Ocean, the economic utilisation of these fishes as profitably as tunas is an urgent necessity. Longline fishermen often discard the hooked sharks by cutting off the leader portion of the longline. Tanikawa (1971) reported on the utilisation of pelagic sharks in Japan as food products and raw material for fish sausage and ham. However, most of the body parts of these fishes such as fin, skin and flesh can be economically utilised for the production of food and other products.
Silas (1965, 1967) reported on the lancet fishes of the genus Akpisaurus Lowe taken by the longline gear from the Indian Ocean during the cruise of ANTON BRUUN (PI. IV). According to him, A. ferox was found to be fairly widespread both south and north of the equator up to 34°S, whereas the distribution of A. brevirostris was found to be restricted to between 24°16'S and 35°34'S latitudes along 55° and 75°E longitudes (Fig. 107). Recently, we have recorded A. ferox in the Lakshadweep Sea which were collected during the longline operations conducted by R/V PRASHIKSHANl during March-May, 1981. However, no quantitative data on the production of this species is available from the Indian Ocean Area.
Porpoises are often associated with yellowfin tuna in the Pacific Ocean, and they are taken there in jlarge numbers during the purse seine operations. The porpoise mortality increased considerably along with the development of purse seine fishery and strict control measures have been imposed by the U.S. Government. As a conservation measure to protect porpoises, a new system of purse seining called ' bold contender' has been introduced since 1975, which allow the porpoises to escape through the release area during the seining operation. Recently, many modifications have been made for this system and the ' Super apron' is one of them, which achieved record low porpoise killing. It
CltfF^I BULLETIN! 3? M*

has also been reported that the U.S. Government requires any country exporting tuna to U.S. to abide by the porpoise protection measures (FNI, 1981). The experience in the Pacific is to be considered as an eye opener to the prospective purse seine operations for tunas in the Indian Ocean also.
In the surface trolling fishery for tunas, several species of billfishes and other scombroids often occur as by-catches. Silas (1967) reported on the by-catches taken by the multiple trolling line fishery along the Tinneve'.ly Coast, and according to him apart from tunas, species such as striped marlin, black marlin, blue marlin, sailfish, seer fish and wahoo were also
0223YELLOWFIN £§£3BIGEYS |%%;g|ALBACORE ^ ^ f N D O M A G U R O
— ^ o ' o o o
50 60 70 80
Fig. 107. Distribution of the species of lancet fish {Alepisaurusft
landed by this gear, and all these fishes were marketed for local consumption. Data collected during the present study on the catches of surface trolling at Minicoy also indicate that the main by-catches in the tuna troll line fishery are wahoo and sailfish.
To sum up, there is need for a systematic analysis of the by-catch from tuna longlining and for developing suitable post-harvest technology for the utilization of these for production of value added products. Surely, the fins of pelagic sharks should find a ready market. The utilization of fish such as A.ferox should also be explored.
Efr^dALEPISAURUS FEROX
E23ALEPISAURUS BREVIR03TRIS i i i . I
50° 60° 70 80
ix and A. brevirostris) in the Indian Ocean (From Silas, 1965aj.
m TUNA RESOURCES

vm POST-HARVEST STORAGE, PROCESSING AND MARKETING
The marketing research and development on the tuna fishery products in the Indian Ocean has yet to be developed and what is available on these lines are the fragmentary information on the local consumption and on the processing in a limited scale by the Indian Ocean rim countries. Most of the larger tunas taken from the Indian Ocean by foreign vessels are either taken back to the home countries or processed and sent outside the Indian Ocean Region. In this Chapter, the current practices of storage and processing of tunas and allied fishes have been briefly reviewed and the trend in the tuna trade in the world market discussed.
Tuna fishing operations on a commercial scale require holding and freezing facilities for storage of fish prior to processing and marketing. General method of handling the fish practised are salt water chilling, icing or blast freezing. Salt water chilling is an ideal method for smaller vessels and in this system the salt water is cooled in a chilling tank (to about —1.1°C) and circulated through a fish holding tank. Blast freezing system can successfully freeze only limited quantities of fish. Icing the catch of tunas is practised in fishing trips not exceeding 3 or 4 days. In this method, fishes are stacked less than 1 m deep and about 8 cm layer of ice is placed on the floor of the hold with alternate layers of tunas and ice above them, in a proportion of one part of ice to three parts of tunas.
Most of the long range tuna longline vessels are equipped with refrigeration facilities which permit fish to be frozen rapidly to temperatures of—55°C or lower and with fish holds capable of holding the fish below —40°C. Southern bluefin tuna and striped marlin brought back to Japan under such refrigeration are acceptable as highly valued' sashimi' arid fish steaks.
In the pole and line fishery, the. small vessels operating in the coastal areas do not normally aim at preserving the catch on board because the fish are landed within a few hours of the capture. In most of the Indian
Ocean rim countries where day fishing is resorted to,* the fishes are iced and processed ashore. In the Japanese medium sized vessels, the tuna catch are transferred to the holds and stored in chilled water. Freezer cooled brine is pumped through pipes to keep the water at the desired temperature. Large ocean going tuna pole and line vessels keep the fishes in cold storages after refrigeration processes such as brine freezing or semi-air blast freezing. In most of the U.S. tuna clippers the catches are frozen in specially constructed wells using the brine spray method by which chilled saturated brine is circulated from the bottom of the well and sprayed over the mass offish and the fishes are kept at —7°C or lower (Ban Yami, 1980). Most of the purse seiners are also equipped with refrigeration facilities to hold the fish at —20° or —40°C.
Tuna and billfish meat are processed in different methods. Frozeii tuna products consist mainly of frozen whole body, frozen semi-dress, frozen dress and frozen fillets. Several systems are in practice for freezing tunas and related fishes. In the sharp freezing system, the fish fillets are frozen in cold air of —25°C to — 30°C, but it takes considerable time to freeze the inner parts of the products. However, semi-air blast freezing technique accelerate the process. Contact freezing is largely used for freezing the packed fillets, steaks etc. Usually, on tuna fishing vessels, immersion freezing is practised during which process the products to be frozen are dipped in cooled brine at —15CC.
Tuna meat is canned either in oil or in brine. Seasoned tuna meat, with or without oil is also produced from the waste tuna meat left after canning. During the process of canning, the cleaned body of fish are thoroughly washed and subsequently steamed till all parts are completely cooked. After a lapse of time, the scales, bones and non-edible parts are removed leaving only clean white meat which usually forms about 40% of the total body meat. The white meat is then
CMFRI BULLETIN 3 2 147

packed in cans and a good quality cotton seed oil or olive oil and refined salt is added. When canned in brine, a 5% solution of Sodium chloride solution is added instead of oil. The filled cans are vacuum sealed, washed and sterilized in the retort. In the process of the preparation of ' seasoned, tuna', the refined waste meat is packed into flakes and seasoned juice is added. The remaining processes are the same as for canning.
Tuna meat is also used in the preparation of fish sausage and ham. Another product from tuna meat is dried fish sticks such as the one prepared in Japan (Katsuo-fushi), Maldives (Maldive min) and Minicoy (Mas-min or Hikki mas). The product is prepared by boiling, smoking and drying fish fillets. Processing of Mas-min in the Lakshadweep has been described earlier by Jones and Kumaran (1959).
Based on their market value and utilisation, tunas can be grouped as follows : (l) white meat species (albacore); (ii) light meat species (yellowfin, skipjack, bigeye, southern bluefin, longtail tuna and juveniles of yellowfin and bluefin), and (iii) tuna-like fishes (bonito, frigate and bullet tunas). Albacore tuna has the highest market preference in the U.S.A. because of the colour and flavour of its meat. Canned and frozen tunas have good demand in the U.S.A. Suda (1971) and Ueyanagi (1974) reported on the utilisation of tunas and billfishes in Japan, which is the second largest market for tunas. A large part of the domestic consumption is in the form of ' sashimi' (thin slices of tuna or billfish meat), ' sushi' (ball of rice, seasoned with a weak solution of vinegar, salt and sugar topped by a s nail amount of tuna meat), fish steaks and basic ingusdieats for fish sausage and ham. The highly appreciated species for ' sashimi', ' sushi' and steaks are the southern bluefin tuna, bluefin tuna, bigeye and striped marlin followed by yellowfin tuna. T. tonggol, which occurs along the Indian Coast is scaled between yellowfin and skipjack as to its quality, texture and taste. In Japan, skipjack is consumed as fresh meat (40%), dried to make ' katsuo-fushi' (30-40%) and the remaining portion as canned products.
Ueyanagi (1974) reported on the principal utilisation of different species of billfishes as follows :
Striped marlin .. used as ' Sashimi' and ' Sushi'
Blue and Black marlins ' Sashimi' Swordfish Steak and
' Sashimi'
Sailfish .. used as ' Sashimi * (<30 kg.), also sausage and ham.
Spearfish (Short-bill) Steak, broiled or baked.
According to Ueyanagi (1974), the billfishes attained the status of quality fish following the Bikini bomb test in 1954, when tunas were found to be contaminated with radio activity. Since then these fishes have been used widely in the preparation of sausage and ham.
Other countries in the western Europe, which form the third largest market for tuna products, mainly Italy, West Germany, France, Spain, Switzerland, and U.K. entirely depend on either white meat or light meat species of tunas for their canneries.
The production, processing and marketing of tunas have been a large, mature and established part of the seafood industry. The development of this industry by any country requires a general understanding of the market demand and the fluctuations in the price trends. The world demand for tunas has been steadily increasing and this is evident from the quantum of utilisation of tunas and tuna products by major markets such as U.S.A., Japan and Western European countries (Fig. 108). Broadhead (1971) and Peckham (1974) summarised the ' anticipated market growth ' for tunas by major markets as follows :
Markets 1972* 1974** 1975* 1977«»
(.Unit: live-weight basis, x 1000 MT)
503 (647.5)
350 (368.5)
256 (239.8)
125
1234
710
370
270
100
1450
545
375
288
176
1384
750
390
300
110
1550
Source : » Broadhead (1971); ** Peckham (1974)
However, the figures of utilisation of tunas (given in parenthesis above) indicate that the utilisation of tunas in the U.S.A. and Japan in 1972 had already exceeded the anticipated demand.
Tunas, in the raw frozen form are being traded in the major markets of the world. The preference of
143 TUNA RESOURCES

different species in various world markets has been discussed earlier. A review of the price for albacore, yellowfin and skipjack during 1963-1973 (yearly averages) and in 1980 (Table 15) indicates that the prices of these spscies showed an increasing trend in the middle of 1960 and a sharp increase was recorded
in the markets in U.S.A. and Japan since 1966 (Peckham, 1974). In 1980, the price of albacore, yellowfin, skipjack and bonito per MT in the U.S.A. market has been around $1,610, $1,100-1,200, $1,000-1,100 and $550-580 respectively (Fishery Market News Report, U.S.A. 1981). Recently it has been
WESTERN EUROPE
'66 '67 YEARi
Fig. 108. Utilisation of tunas and tuna products by major markets, 1963-72 (From Peckham, 1974, modified).
TABLE 15. Yearly average prices (per MT) for selected species of tunas in U.S.A.* and Japan** during 1963-1973*** and the price for selected species
in the U.S.A. market in 1980+ (Unit: $)
Albacore Yellowfin Skipjack Year
U.S.A. Japan U.S.A. Japan U.S.A.
1963 . 1964 . 1965 . 1966 . 1967 . 1968 . 1969 . 1970 . 1971 . 1972 . 1973 .
1980 .
. 350
. 348
. 345
. 422
. 433
. 455
. 480
. 605
. 693
. 748
. 913
. 1610
339 345 327 474 472 469 538 747 713 769 943
290 284 308 403 310 341 356 413 462 486 535
1100-1200
317 331 344 495 431 404 421 580 678 630 716
235 221 231 292 223 288 303 358 410 446 502
1000-1100
* Average weighted ex-vessel price in California.
** Fish on board (FOB) price in Japan.
*** Source for the period 1963-1973 : Peckham, 1974,
+ Source for 1980: Fishery Market News Report,U.S.A. 1981.
TABLE 16. Monthly average ex-vessel prices of billfishes (U.S. dollars per short ton) at Yaizu
fish market, January, 1978-My, 1979. *
Month Striped marlin
Blue marlin
Black marlin
Sword-fish
1978 January February March April May June July August September October November December
1979 January February March April May
3,482 . 2,823 . 3,452 . 2,722 . 2,614
2,462 4,345
. 2,507
. 2,903
. 2,856
. 3,98t
. 2,698
4,141 . 4,046 . 4,095 . 2,316 . 2,489
2,009 2,326 2,299 2,515 2,112 1,991 2,122 2,275 2,039 2,412 3,165 2,323
1,933 2,027 2,510 2,658 2,626
2,605 2,070 2,025 2,082 1,929 2,090 2,272 1,638 1,943 2,055 2,202 1,934
2,744 2,059 1,871 1,730 1,818
• 2,423 2,503 2,647 2,833 2,343 2,263 2,658 2,826 2,769 2,793
• 2,590 2,703
2,455 2,440 2,580 2,232 2,129
1 Source: U.S. National Marine Fisheries Ssrvices, 1978-1979 (Yoshida, 1980).
500
| 400
I 300
200
too
• Striped marlin
* Blue marlin t Black marlin o Sword fish
1961 62 63 64 65 66 67 YEARS
68 69 70
Fig. 109. Price of different species of billfishes at the Yaizu Fish Market, Japan, 1961-70 (From Ueyanagi, 1974).
CMFRI BULLETIN 32 149

repotted that in January, 1982 a world record price for bluenn tuna was paid in Japan at the rate of $42.61 per kg. ($38,693.18 per short ton.) The price structure of billfishes in the world market has yet to be studied in detail. However, Ueyanagi (1974) reported on the trend of increase in prices for billfishes in Japan and stated that the average prices have increased from 1961, and a sharp increase was noted after 1966, especially for striped marlin, blue marlin, black marlin and swordfish (Fig. 109).
He opined that in recent years, the prices for billfishes have become comparable with those for tunas in Japan. According to Yoshida (1981) most of the Indian Ocean billfish catch is presumed to have been sold in Japan. He also presented the average monthly ex-vessel prices . for striped marlin, blue marlin, black marlin and sword-fish at Yaizu Fish Market, Japan, during January 1978 to May 1979, which is reproduced in Table 16. Striped marlin was the most valuable of the billfish species which was sold for $2,316 to $4,345 per short ton.
150 TUNA HESOURCES

IX MANAGEMENT PLAN FOR THE TUNA FISHERY IN THE INDUN OCEAN
At the Vth Session of the Indian Ocean Fishery Commission held at Cochin in October, 1977 the current management problems in the Indian Ocean tuna fishery was discussed. At the same meeting, a document entitled ' An immediate management problem for tuna in the IPFC/IOFC Region' was presented highlighting the need for the management of skipjack, southern bluefin tuna and other larger tunas, and the administrative machinery that may be necessary for developing such a management strategy. Since 1977, a number of island states as well as Indian Ocean littoral countries have declared the 200 mile Exclusive Economic Zone which has considerably changed the overall picture (Fig. 110). Hence any management programme for tuna fishery in the Indian Ocean may have to look at the following aspects in vitro :
— Management of coastal tuna fishery in the continental shelf waters
— Management of tuna fishery in the small scale sector in the regions around islands and archipelagoes
— Management of tuna fishery of the high seas — Catch and effort statistics, stock assessment and
monitoring of tuna stocks within and outside theEEZ
— Sharing of the stocks; International and Regional collaborative programmes in R & D
— Information on the environmental parameters " — Control and Surveillance, and — Legal and social aspects of management and
options open.
In the following pages we have highlighted some of the more important aspects for management pertinent to the Indian Ocean Area. Some of the points mentioned above have been dealt with under earlier sections and hence are not been discussed here.
Tuna Fishery in the Continental Shelf Waters
In the continental shelf waters bordering the littoral states in the Indian Ocean, organised fishing for tunas and tuna-like fishes are carried out by a few countries such as India, PDR Yemen, Sri Lanka, Indonesia, Australia and South Africa. Thunnus tonggol and often the young ones of T. albacares, along with tunalike fishes such as skipjack, bullet and frigate tunas and the little tunny occur in these waters. At present, there appears to be no danger of depletion of these stocks. The species are highly migratory and as the effort to be expended may differ from country to country, a monitoring system on the catch from the coastal waters of the entire Indian Ocean Area will be necessary. This will be evident from the long distance migratory pattern of tunas brought to light by the skipjack tagging programme of the South Pacific Commission (Kearney, 1981). A number of species synopses have been prepared in the recent past on the ' under-exploited species ' of tuna-like fishes from the Indian Ocean. However, there is lack of information on several parameters which are essential for understanding the spawning behaviour, recruitment and stock magnitude.
In India, average tuna landings (1969-1980) from the coastal waters accounts for about 9,000 tons, and 18,502 tons (catch from the Lakshadweep not included) were landed in 1980. There has been a steady increase from the landing in 1969 (2,780 tons) to 1980. We feel that there is considerable scope for increasing the catch of the under exploited species of tunas from the coastal waters of India, especially Euthynnus qffinis, Auxis thazard and A. rochei. However, the problem is the lack of local demand for the red meat tunas. It will be necessary to develop the market for these species in fresh, frozen and processed form if the catches have to be substantially increased.
CNPRJ BUUBXIN 32 151"

20 30°
30
T 60
IRAN PAKISTAN
OMAN
YEMEN
& KENYA.
A TANZANIA 4— T~ SEYCHELLES]
COMOROS - J j ,
MOZAMBIQUE
INDIA
9 0 "
1
BANGLADESH
nBURMA
>
MALDIVES?}
)SRI] CLANK/!
- ANDAMAN^ AND
NIC0BAR IS.
[2CT
INDIAN OCEAN EXCLUSIVE ECONOMIC
ZONE
30"
30%
BRITISH INDIAN OCEAN
9r\
§/ ) VMAURITIUS1 TERRITORY
REUNION
-0^ fi*
60°
FRENCH SOUTHERN AND ANTARCTIC LAND: o
CHRISTMAS ISLAND
30°
60° 20" 3 0 60 9 0 120
Fig. 110. 200-mile Exclusive Economic Zone (EEZ) of the littoral countries and island states in the Indian Ocean (From FAO 1981 b).
The bulk of the catch from the shelf waters by the small scale fishery sector is taken by the drift gillnets. Modernisation of this fishery will be one of the necessary steps towards augmenting production. Purse seines have also landed good catch from the shelf waters.Regu-lated purse seine fishery for tunas along the southwest and east coasts should also yield good results. There are indications from trial surface trolling that good concentration of Euthynnus qffinis is present even in the north eastern Bay of Bengal off Orissa Coast.
Traditionally, the inshore catches have been taken by shore seining, gillnetting and surface trolling, using non-mechanised boats such as canoes and catamarans. At selected centres, mechanisation is under way, and this would help in augmenting tuna production at such centres along the coasts of India. Encouraging results have been obtained along the Calicut Coast in gill-netting large pelagic fishes such as tunas and billfishes from further offshore in depth zones of 30-50 fathoms (Balan, 1981). Such operations, where canoes are
! # TUNA RESOURCES

towed for gillnetting in deeper waters could also be adopted seasonally in other areas. Under a planned development programme it would not be difficult to double the production from the present level from the shelf waters.
Production possibilities from shelf waters are fairly good in other areas of the ncritic waters bordering the Indian Ocean. It has been indicated that the catches of small tunas in the Malacca Strait increased from 6,400 tons to 15,000 tons recently. The tuna fishery of the shelf waters has considerable relevance to the small scale fishery sector and thereby their economy. Gillnetting for tunas also results in the landings of quality by-catch of other pelagics such as seerfishes, sharks, carangids and catfishes which fetch good prices at the landing centres. Hence any development programme in the small scale fishery sector should also aim at augmenting the catch of larger pelagics from of the shelf waters by improved crafts, methods of economic propulsion combined with alternate use energy and effective gears. This cannot be achieved and sustained without developing a good catch, effort and biological data acquisition system and tagging programme to understand the migratory movements of tunas.
The post-harvest technology for the better utilization of tunas harvested from the coastal waters has to be developed, beginning with proper on board preservation to maintain quality standards. The use of brine chilling tanks in smaller boats or medium sized purse seine boats should be considered along with upgrading onshore processing facilities. Improvement of the quality of the traditional smoked and cured products such as ' mas min' should also be examined for increasing the shelf-life of the products. Market studies with an extension programme may be initiated to understand the consumer preference within the country for processed products from tunas and billfishes.
In view of the importance of this fishery, there is an urgent need for developing quantitative assessments of the resources of small tunas and tuna-like fishes from the continental shelf waters of the Indian Ocean.
Surface Fishery from the EEZ of Island States
Skipjack forms the major tuna resource around the oceanic islands and the archipelagoes and the major effort expended is in the surface fishery using pole and line and live-bait. The constraints in this fishery are manyfold, starting from the availability of live-bait, desirable bait species, scouting time for tuna shoals, behaviour of the shoals, fuel-energy cost in running the boats and so on. As of to-day (1980) about 1,760
tons of skipjack, young yellowfin and occasionally little tunny are being landed by the surface fishery employing pole and line gear in the Lakshadweep Islands. Pole and line fishery is being conducted in the insular areas such as Maldives, Sri Lanka, Indonesia and Reunion. Trial fishing using pole and line and live-bait has been attempted in the Seychelles.
The problems of management are complicated by the remoteness of some of the areas and the consequent lesser development of infrastructure for the maintenance of fishing facilities such as boats, and the storage facilities for the catches. In many places, lack of processing facility is a major constraint and limited internal demand acts as a disincentive which may restrict the fishery only to that of a subsistence level.
Besides pole and line fishing, other methods such as drift gillnetting, surface trolling, and purse seining could also be carried out, but all these involve planned development programmes and an understanding of the seasonal distribution of the shoals and the environmental factors such as currents around the islands.
in Lakshadweep Islands, the pole and line live-bait fishery carried out for tunas involves day fishing only-Recent attempts in the Seychelles for distant water fishing using four large Japanese pole and line fishing vessels have not proved successful, mainly on account of the non-availability of live-bait in large quantities required for such operations. Unless species such as anchovies, juvenile sardines or the like which may abound in the continental shelf waters could be utilised as bait, large scale commercial pole and line live-bait fishing will have only a limited scope. On the other hand the fishery in the small scale sector could certainly be developed in most of the island areas. A good example is the mechanisation programme in the Lakshadweep Islands which has helped in improving the catches. A similar trend is also seen in the Maldives. The next stage of development would be the use of slightly larger vessels with greater operational range to fish around these islands for 4 to 5 days carrying enough live-bait and chilling and storing facilities for the catch. This may involve working out of sight of the islands and consequently the development of navigational skills in the operators.
This plan of development is inevitable in insular areas, but some research and development effort should go into the design of the vessel and the deck arrangement partially for the bait tanks and chilling and freezing/icing arrangements. The experience of pole and line surface fishery in Hawaii could be con-sdiered for planning such development programmes.
CMFRI BULLETIN 32 153

Since availability of the live-bait will be an eternal problem as for as this fishery is concerned, large scale culture of suitable bait fishes should receive priority. As mentioned elsewhere in this report, non-conventional species such as Chanos chanos (fingerlings), minnow {Poecilla vittata) and Tilapia zilli have been found to have good chumming quality and these are useful as baitfishes. More research effort is necessary in this direction. Proper research inventory of the bait fish species, their seasonal abundance, availability and chumming quality will have to be studied for different areas where such information is not available. The desirability of developing a separate system of collection, maintenance and supply of bait fishes to the fishing boats needs attention. This should free the tuna fishing boat crew from expending energy in fishing for live-bait and also increase the fishing time in the tuna fishing ground.
Even in the traditional small scale sector in the insular areas there is ample scope for innovation and improvements of the gear as well as the methods of water spraying instead of splashing. Spraying helps better chumming and also increases the crew compliment for fishing. Such improved techniques should be adopted in our small scale fishery sector in the Lakshadweep.
In view of the remoteness of many places and the constraints in the availability of fuel, the use of sail for the mechanised boats may have to be seriously considered when extensive scouting for shoals is necessary. In this connection attention is drawn to the recent development on the investigations on the low energy fishing vessels that have been summarised by Fyson (1981). Sail designs for existing mechanised boats should be developed and this may have an impact on reducing the cost of fishing.
Hardly any studies have been made in the Indian Ocean on-the behaviour and reaction of tunas to fishing methods adopted. Often sub-surface tuna shoals occur fairly close to the islands but cannot be chummed to the surface. Off the Queensland Coast of Australia, Japanese longliners have been using hand lines and poles for fishing such shoals from depths, especially during the season October-November {Williams, 1981). The vessels are 43-54 m well equipped longliners with storing capacity of 300-400 tonnes of frozen tuna at -55°C. Fibre glass or bamboo pole (3.0-3.3 m) with hand line (63-85 m) are used for fishing. Bait for handlines include fresh tuna hearts and frozen saury or mackerel. Chopped fish and baitfish, anchovies and squids are mixed and used for chumming tunas • It is interesting to note that these handlines are aimed
at fishing tunas that would not come close enough to the surface to be taken on poles. When the fish did not surface, poles are replaced by hand lines along one side of the vessel, fishing at depths of 30-40 m below the surface. It is reported that fishing speed was at the rate of up to 40 fishes per minute. Yellowfin caught by poling was generally smaller (75 cm) than those caught on handline (129 cm). This technique could probably be adopted in the small scale sector of the pole and line fishery of the Lakshadweep Sea, where often sub-surface skipjack shoals are present but do not respond to chumming with bait fish at the surface.
Earlier we have mentioned about the desirability of locating artificial aggregators such as the ' payayos' in the Philippines and Indonesia and the FAD's in the Hawaiin waters. The problem of maintaining fish aggregators is not new and at the same time not a simple one as it involves mooring at a depth of 1,000 m or more. A knowledge of the ocean current pattern in such areas is necessary. It is understood that some effort for setting up such floating objects by Sri Lanka did not meet with success. A beginning has been made in the Lakshadweep in December 1981. This brings up the question of efficiently harvesting the fishes congregating under them by purse seining or pole and line fishing (Murdy, 1980; Matsumoto et id., 1981).
Our information on sea-bird flocks, their behaviour especially feeding flocks are very meagre. More information on these gathered from experienced fishermen as well, could help to build up an information base which would be useful in scouting and locating fish shoals under different conditions (Nakamura, 1963 ; Silas, 1969).
Augmenting production from surface fishery for tunas through drift gillnetting offers good scope. Here again, the depth of operation, the relation of biolumi-nescence to the season of operation of such gear, the season when gillnetting could be used successfully and without conflict with other methods of fishing will have to be looked into.
Thus there is ample scope for improving the production of surface species of tunas such as skipjack from around insular areas with improvement in the small scale sector through modernisation of fishing methods and better infrastructure. At present, from the insular regions in the Indian Ocean the production of skipjack and other tuna-like fishes adds up to about 50,000 MT,.
We shall discuss tuna fishing by the long lines around the island states later in this chapter. The known
154 TUNA RESOURCES;

distribution of tuna-like fishes and the information on the fishery which are indicative enable u to suggest that we may be able to enhance the production to threefold from the insular areas with the planned development of the small scale fishery sector. In fact, we feel a potential yield of 200,000 MT of tunas from the insular areas including the island states with their EEZ of the Indian Ocean will be a reasonable estimate.
Tuna fishery in the high seas
This would involve management of the tuna fishery in the high seas within the EEZ of the coastal and island states as well as the stocks outside the jurisdiction of the states. We have already discussed the potential of the surface species of tunas from the EEZ of the insular states and archipelagoes. Hence, we should examine the position regarding the deep water tuna fisheries from within and outside the EEZ and management problems and the surface fishery in the high seas. The problem is further complicated by the highly migratory nature of the species involved. Further, investigations have shown the existence of discrete stocks of the same species in some areas of the ocean (yellowfin) or presence of a single species within the whole ocean (southern bluefin tuna). In the case of the latter, the matter is still more complex as there exists a surface fishery for southern bluefin tuna along the coast of Australia, which fish younger year class while the longline fishery taps the older groups. The development of surface fishery will result in the harvesting of young yellowfin which if not regulated will have an adverse effect on the fishery for adults which are taken by the longline gear. Except for the data on longline fishery there is hardly any information on the production of billfishes from the Indian Ocean. They are also highly migratory species and management measures for billfish resources may also have to be developed as for the high sea tunas.
Tuna fishery is also a multispecies fishery and the management of single or all species at the same or different levels of exploitation by different methods need further study.
At present the longline fishery is mainly carried out by non-local fleets from Japan, Taiwan and ROK. With the development of fishing capability by the coastal countries, either through joint venture programmes or unilaterally, the problem of limited entry into the fishery and the need for sharing of the stocks are bound to arise. As such, it would be seen that there is an urgent need for developing a proper management plan for the tuna fishery of the Indian Ocean keeping in view the
priority considerations for the oceanic species and the status of the stocks. Such a strategy should consider the following aspects :
a. Longlining from within and outside the EEZ
More information is available today on the longline fishery which has been summarised in the earlier part of this report. The new effort is towards developing deep longlining. A note of caution may be added here in that the available data indicate a reduction in size as well as age group of the yellowfin tuna (Suzuki, 1979). Continuous monitoring of the catch and effort of species taken by the longline fishery is needed. The longline fishery is also known to take the fish in ripe running condition, and restrictions on fishing spawning stocks will be necessary. In the exploitation of the southern bluefin tuna, some amount of voluntary restrictive measures are already in vogue in the feeding and spawning grounds of this species.
One of the constraints in the proper stock assessment studies is that the catch and effort data by the foreign fleets are only partly available. Information is still wanting on catch and effort by the tuna vessels by the ROK as will be evidenced by the catch statistics published by the FAO. However, as an example, the average catch rate by the longline gear for four major species of tunas from within and outside the EEZ of different countries in the Indian Ocean is presented in Table 17. The percentage composition of the catch of these species from these two areas of different islands in the Indian Ocean are given in Fig. 111.
The collection of information should be standardised to include uniform types of log books for catch and effort data and data on biology and environment for stock assessment. Unless these are instituted under controls, it will be virtually impossible to implement an effective monitoring system. The Government of India has developed a chartering policy which enables seeking collaborative arrangement for tuna fishing. All such arrangements which are licensed should take into consideration the use of standardised logs for use on board and the data collected should be fed into the National Fishery Data Centre.
Christy et al, (1980) have suggested the modality of controls while suggesting management plans for the fisheries of the EEZ of the Republic of Maldives. The Government of the Republic of Seychelles by promulgation of a Decree of the President of the Republic has indicated modalities of issue of licences for tuna longliners within its EEZ. While states may develop unilateral approaches towards licensing fishing from
CMFRI BULLETIN 3 2 11
155

TABLE 17. Average catches of four major species of tunas as percentage of totals inside the EEZ by leading countries *
Yellowfln Bigeye Albacore Southern bluefln
British Indian Ocean Territory
Cocos Is. Comoros Is. India Indonesia Maldives Mauritius Seychelles Somalia South Africa Tanzania
Others
Total inside .
Total inside EEZ . High Seas
6.8 3.1 3.2 3.3 6.3 3.7 9.0
31.9 3.6 6.4 4.4
81.7 18.3
loo.a
47.2
52.8
Australia British Indian-
Ocean Terr. Christmas Is. Cocos Is. Indonesia Maldives Mauritius Seychelles Somalia South Africa Tanzania
4.5
7.5 3.5 6.1
13.0 6.0 4.5
25.5 8.4 3.5 3.9
Australia Christmas Is. Cocos Is. French S.E.
Antarctic Indonesia Madagascar Mauritius Reunion South Africa
86.4 13.6
100.0
33.8
66.2
6.7 4.8 5.6
4.7 4.9
17.1 23.3 17.5 5.8
Australia French S.E.
Antarctic Prince
Edward Is. South Africa
90.4 9.6
100.0
17.8 82.2
72.6
5.8
10.6 10.7
99.7 0.3
100.0
18.9
81.1
Source : Klawe (1980 a)
their own EEZ by foreign fleets, the need for uniformity in data collection and acquisition are also important. The suggested proforma for fishing logs is given as appendix to this report (Appendix 1-3).
In the context of Japan's major effort on tuna longlining, it may be worthwhile to look into the details of the operational aspects of the tuna longline fishing vessels particularly those engaged in the southern bluefin tuna fishery in the waters around 40°S in the Indo-Pacific area.
D A T A
Gross tonnage Length Breadth Depth
Cost of vessel:
New vessel 2-Year's old 10-Year's old
•: 299 : 44 m : 8.2 m : 3.65 m
: 450-500 million Yen : 290-322 million Yen : 70 million Yen
(The costs of the vessel are aproximate, depending on the type of electronic equipments installed in the vessel. In order to avoid unhealthy competitions, recently it was decided by the Japan tuna and skipjack fishery Association to phase out some of the 878 long-liners in stages. The owners of the vessels affected by this reduction programme are being compensated by the members who continue operations).
Average catch : Average catch per day : Average unit price : Average income/voyage
of 15 to 18 months : Average catch per annum
per vessel : Average income :
200-250 MT/voyage 0.45-0.83 MT 2,000-2,800 Yen/Kg.
400-700 million Yen
130-200 MT 260-560 million Yen/
annum/vessel
(The duration of the voyage is from 450-540 days but the actual perioc of fishing operation is frc m 300-45O days only).
Number of crew Contract period
20 persons Entire voyage period
156 TUNA RESOURCES

Change of crew
Expenditure on crew per annum
In the event of some serious accident or sickness that affect more than three members at a time
80-170 million Yen on catch and price realisation
—Captain cum skipper is paid @ 10-20 million Yen per voyage
—Other members of the crew are paid @ 5-8 million Yen per voyage per head
Method (11)
Running expenses (Direct expenses including
fuel, bait, provisions, fishing gear, repairs and maintenance, spare parts, port duties, license fee, docking charges etc.)
Expenditurs on depreciation:
(Office overhead, insurance for vessel crew, interest an capital etc.)
40% of total income (@ 100-220 million Yen)
30% of total income
For taxation purpose, depreciation is normally computed in two methods:
(i) An amount equal to l/9th of the original cost of the vessel is kept apart and the balance is divided by 9 to arrive at ths quantum of depreciation per annum for a period of 9 years. The book value at the end of 9 years will be l/9th of the original cost.
(ii) The original cost minus l/9th of the same is multiplied by a fixed factor of 0.226 and the amount thus arrived at is the depreciation for the first one year. During the subsequent yeais, the original cost minus l/9th of the same minus depreciation for the previous years is multiplied by the factor of 0.226 to arrive at depreciation for the particular year.
Method (i)
Original Cost i A Amount not taken for
Depreciation : A Value taken for Cal
culating Depreciation : f A First Year Depreciation : | A-f 2nd year : 3rd year 4th year :
9th year : Book Value after 9 years : £ A
- 9 = V A -do--do--do-
-do-
3 •
I f A ( | A -
X 0.226 = 1 t n — a) X 0.226 = b
( | A - ( A + J ) ) x 0.226- c ( | A —(a + b + c)) x 0.226 = d §A — (.a + b + c + d + e+f+g + h)) x
0.226 = i i A — (a + b + 0 ) £A + (i
b. Tuna fishery from the surface waters of the high seas
We have estimates of coastal tunas and oceanic tunas which would form the surface fishery but these are mainly based on relative figures for such fishery for the Pacific or Atlantic Oceans or have been arbitrary estimates. The occurrence of larvae of tunas and tuna-like fishes in the Indian Ocean indicates that species such as skipjack occur over a wide area (Goburnova, 1963). There is hardly any useful information on the occurrence and distribution of early juvenile tuna. The same holds true for tuna-like fishes, namely Auxis spp., Euthynnus affinis and Sarda sp.
Insufficiency of such information hamper estimations of the recruitments and such vitally important assessments. While the cost of monitoring and collection of data on different species from the oceanic waters may be an expensive one, special ' skipjack survey programmes' could be developed for specified regions. International collaboration in such programmes could be encouraged. A conserted effort could be initiated on the lines successfully conducted by Dr. Robert Kearney and his group in the South Pacific Commission. A study of the albacore resource and possibility of developing a surface fishery for the same by purse seining need exploration.
For the proper development and management of the purse seine fishery, environmental parameters such as the thermocline structure and current pattern are prerequisites and these need mapping. The thermocline structure would have an important role in the development of fishery for surface species and more ocean wide information on this would be needed. The information given earlier in this report are only indicative of the prevailing conditions. Satellite imagery of sea surface characteristics will eventually form an important tool to pinpoint areas of concentration of surface shoaling tunas such as skipjack, young yellowfin and albacore.
The economic viability of making a distant water pole and line fishery for the surface tunas of the high
CMFRI BULLETIN 3 2 15?:?

&%\
C/> Uj
o o o
5: o
o
28
24
20
16
12
. 8
4
0
28
24-
20
16
12
8
4
0 •
&i?\
mm
ALB
£*?|
: P3-
\y
/—?'••
YFT
V V 1972 73 74 75 76 '77
24
?20 '
16-8 o ><
o
4«
0 •
£53
BET £31
r ¥
f r 1 7
£3 tm <£?'
G®
£ 3 !
SBF
<CT
/S3J i f i
!'•:•:
<C7 : ! « • • J
/
<c?.
£=31
/=?•
£=?J
<£?•
^ 1972 73 '74 '75 '76 '77
YFT
ALB BET
: • • • • . *
WM
mm e—i
SBF
• * ' * - * - ' * • ' • '
ALB-4//>ocor«
BEJ-Bigeye
YFT-Yellowfin
SBF- Southern bluefin
f=7j Catches inside 1—P Indian ocean EEZ
sr-n Catches outside | p Indian ocean EEZ
AVERAGE; CATCH V97&-77)
Fig. 111. Percentage composition of the longline catch of four major species of tunas from outside and within the
EEZ of different countries in ths Indian Ocean, 1972-77 (Data from Klawe, 1980 a).
158 TUNA RESOURCES

seas at present is remote with constraints on live-bait and so on. However, the regulation of surface fishery in the international waters of the high seas will have to receive serious considerations for a steady recruitment to the longline fishery and thus policies on these issues will have to be developed.
Controls
In tuna resource management, the controls will have to be chiefly on :
— Licencing and control over the catch and effort in the EEZ and high seas ;
— Controls over the methods of fishing, and
— Limited entry into the fishery.
In the case of tuna fishery in the Indian Ocean, there are no controls of any type in existence except in licensing of fishing vessels within the EEZ of some of the countries. Much remains to be done in this direction which will involve regional and international understanding and cooperation.
The priority area where controls should be necessary seems to be in the longline fishery which through the last decade has shown a steady fall in production (Fig. 98). An ocean-wide concern for such an occurrence of this resources is necessary. Within the EEZ, under controls we may also have to plan areas of fishing with diverse gears to prevent conflicts of interests, in other words limited entry into the fishery ; total allowable catch for species/resources ; closed seasons or any regulations in fishing gear designs such as mesh size.
75* 8 0 ' _ 85*
Fig. 112. EEZ of India (From George et al, 1977).
100*
<CMFM BULLETIN 32 11-A
159

TOTAL CATCH (%) BY
JAPANESE
KOREAN
TAIWANESE VESSELS
</)2000' UJ
O
J3 1500-
o 1000' l -< o
_j 500 ' <
1972 73 74 75 76 77
SAIL FISH*-
BLACKMARLIN+-
1972 l73 '74 7 5 '76 '77
*• SWORD FISH
STRIPED MAR LIN
BLUEMARLIN*
SKIPJACK
YELLOFIN
BIG E YE ALBACORE
PERCENTAGE COMPOSITION ( BY SPECIES) 1972 -1977 AVERAGE CATCH
Fig. 113. Amount of catch of tunas taken by the Japanese, Taiwanese and Republic of Korean longliners from the EEZ of India, 1972-77 (Data from Klawe, 1980 a).
160 TUNA RESOURCES

Surveillance
Surveillance has to be aimed at finding out number of fishing vessels that are exploiting the resource and any infringements. Fitting tuna vessels with transistorised radio transponders would enable position fixing of the vessels through satellite technology. Surveillance could be carried out by aerial reconnaissance or by our own defence/coast guard/fishing vessels. There is a need for developing such an integrated surveillance system and also a rapid transmission of information so that poaching could be curbed within our EEZ.
In Figs. 112 and 113 we have shown the EEZ of India and also the amount of the catch of tunas lifted by the Japanese, Taiwanese and ROK tuna longliners from our EEZ. Between 1975 and 1977 it will be seen that there has been a major input of Taiwanese effort in this fishery, and around 2,000 tonnes of quality tunas (1977) have been caught from the EEZ of India. The major components in the catch were yellowftn (42.0%), bigeye (23.8%) and striped marlin (18.7%) (average for the period 1972-1977).
Since we are looking at tuna resources as an ocean wide asset and it may not be possible for all the nations to carry out surveillance in their own EEZ due to the prohibitive cost involved, the feasibility of effective regional surveillance system involving sharing of cost may be an alternate mechanism worth considering in some areas.
Options Open for Tuna Fishery Development in the EEZ of India and the Contiguous High Seas
Due to the highly migratory habits of tunas and the different methods of fishing adopted, it would be desirable to outline here the options open for the development of tuna fishery in our EEZ and contiguous high seas. Tuna fishery is highly capital intensive and it is not the type of resource which would cater to a large internal market to feed the population as an additional protein source. While undoubtedly some amount of the coastal species will certainly find an internal market, it will not be economical to fish the tuna resources of the EEZ and the high seas with only an internal market in view. The problem is vitiated by the spiralling energy cost in such a capita' intensive fishery. Hence, logically the first major decision to be taken would be whether we should embark in a large way in tuna fishery with a view for augmenting exports as part of the overall strategy of diversification of exports of marine products. Our contention is that we should do so with the facilities available and those ichwh
could be acquired through chartering and joint venture programmes. This being so, we have options under two major heads opened up for the development of this fishery from our EEZ and the contiguous high seas. These would be (A) the options open for augmenting production, and (B) for management of the resources.
A. Augmenting Production
(i) Augmenting production of coastal species of tunas through diversification in the small scale fishery with greater use of drift gillnets and other suitable gears.
(ii) Surface fishery within the EEZ and the contiguous high seas for skipjack and other tunas and tunalike fishes using purse seine.
(iii) Augmenting production in the Lakshadweep and Andaman Seas and elsewhere a'ong the coast by use of artificial aggregators and fishing methods adoptable for the same.
(iv) Introduction of larger boats for live-bait pole and line fishery in the Lakshadweep for undertaking prolonged fishing trips and improvements in operational techniques.
(v) Bait fish culture and production for better development of pole and line fishing in the small scale fishery sector.
(vi) Fishing under licence from areas under the National Jurisdiction of other countries.
(vii) Entry into longline fishery and purse seining, initially through chartering or joint venture programmes from the EEZ and the high seas.
(viii) Better utilization of by catch.
(ix) Identification of productive areas for tuna fisheries, their spawning and feeding ground, and other special environmental features which help in locating tunas through techniques including satellite technology.
(x) Financial assistance for building up infrastructure and acquiring or constructing suitable fishing vesstls.
(xi) Development of alternate source of energy in tuna fisheries for making the operations "more viable and economical in the small scale sector.
(xii) Improvements in post-harvest technology, product development and marketing combined with infrastructure for increasing demand for tuna within the country and in the export market.
CMFM BULLETIN 3 2 161

B. Management Need for Foreign Expertise
(i) Development of a strong data base for resource information—acquisition of data, processing and dissemination.
(ii) Involvement in regional co-operative programmes in fishing and also sharing of the stocks, research and trade information.
(iii) International co-operation for the management of the tuna resources.
(iv) Within the EEZ limited entry into the fishery and sharing of stocks which would be in the effort that would be determined chiefly for gillnetting and purse seining for tunas in the continental shelf waters in the existing small scale fishery sector. National legislation for regulating the total effort in the fishery or the quantities to be removed would be necessary.
It should be evident that the feasibility of a country such as India taking to tuna fishery calls for no special foreign expert advise. In fact it is highly doubtful' whether we need any feasibility study at this juncture. On the other hand we will certainly benefit from foreign expertise in specific areas of tuna fisheries such as:
(i) Tuna fishing fleet management;
(ii) Purse seining;
(iii) Longlining, particularly deep longlining ;
(iv) Positioning and locating fish aggregating devices (FAD) and related fishing operations;
(v) Design of live-bait wells in medium size pole and line boats to operate for 2-5 days at sea.
(vi) Post-harvest technology and product development suited for different export markets.
162 TUNA RESOURCES

THE NEED FOR AN INTERNATIONAL COMMISSION FOR THE CONSERVATION OF INDIAN OCEAN TUNA
Many of the problems connected with the management of the tuna fishery transend national boundaries and EEZ. As discussed earlier, an effective implementation of monitoring, control and surveillance cannot be a function of only the coastal and island states of the Indian Ocean, as foreign countries, particularly Japan, Taiwan and Republic of Korea are also involved. Hence, a major international effort is necessary to see that the fisheries for the coastal and island states are developed and the tuna resources of the Indian'Ocean are properly managed without generating conflicts or developing protective/exclusive attitude which may impede long-term policies.
Today's state of affairs permits unlimited entry into the tuna fishery and added to this, estimates of catch and effort are not always available. Information for biological follow up work on parameters such as size composition of the catch are wanting. Since a single population may be spatially distributed over the entire ocean, management measures for only a part of the population will be a futile exercise. In the tuna fisheries a complex aspect is the harvesting of surface species by one or more methods (live-bait pole and line fishery ; purse seining) and the larger adults by a different method (Ionglining). The need for careful monitoring is evident from the experience gained from the expansion of the surface fishery in the Atlantic Ocean in 1960's which resulted in about 40 percent decline in the catches of yellowfin tuna in the longline fishery (Joseph and Greenough, 1979). To add to these another factor to contend with is the great mobility of the fishing fleets. Hence, it is desirable to have an ocean-wide organisation to effectively collect and disseminate data to help in the management programmes. To achieve this end international co-operation is needed.
It will be necessary to estimate the carrying capacity presently available in the Indian Ocean for tuna fishing along with the potential resources that could be tapped at levels of optimum sustainable yield. This would also need a centralised monitoring agency to estimate levels of abundance and effort expended and advise. The present mandate of the 'Indo-Pacific Fisheries Council' (IPFC) and ' Indian Ocean Fishery Commission ' (IOFC) will not be able to fulfil these objectives as in the working of these organisations under the U.N. there is even now an anomalous situation where non-U.N. members cannot be a party.
The existing mechanism and the one that was suggested at the IOFC meeting (1977) is shown in Fig. 114. This we feel has inadequacies and the time has come for developing a proper international approach for the management of the tuna stocks of the Indian Ocean.
We propose that this could be achieved better through an International Commission for the Conservation of Indian Ocean Tuna (ICCIOT). Such a Commission could play an important role in designing a coherent policy for Indian Ocean tuna fishery and help in funding and co-ordinating programmes on :
— Overall monitoring of the stocks including aerial survey.
— Catch and effort data acquisition including parameters for stock assessment.
— Larval abundance and Recruitment.
— Environmental variability.
— Identification of potential areas for development of surface and sub-surface fisheries.
-CMFBl BULLETIN 32 11-B
m

COUNTRIES-
—•Normally meet jointly
Recommendations
SCRS
Ad Hoc Scientific Groups
Joint Sub-Committee on Tuna Stock Assessment
Scientific Advice
Ad Hoc Sub-Committees
CTM = Committee on Tuna Management SCRSs Standing Committee on Research and Statistics
Fig. 114. Chart presenting the channels of communication between proposed bodies to be set up under IPFC and IOFC to deal with scientific and administrative aspects of tuna management research and statistics (From IOFC, 1977 b).
- Assist the states to develop control measures for managing stocks.
-Surveillance.
-Advice and assist island states on specialised problems in developing tuna fisheries including setting up of suitable fish aggregating devices.
- Evolve policies and modalities for regulating access to the fisheries.
-Advise the coastal and island states on stocks, levels of exploitation and types of effort most suitable.
- Better utilisation of by-catch.
- Conduct studies on economic and social aspects in the artisannal and small scale tuna fisheries to suggest planned development of the sector.
— Advise on problems on alternate use of energy in--fishing and post-harvest technology in tuna fisheries. This may also include development of" suitable technologies in islands and remote areas where infra-structure development involves using, alternate sources of energy.
For a long-term strategy of Indian Ocean tuna fishery management, an International Commission could be an effective mechanism. In this context the working of the Inter-American Tropical Tuna Commission (IATTC), International Commission for the Conservation of Atlantic tuna (ICCAT) and South Pacific Commission (SPC), to mention a few, may be seen for the positive results that have emerged in their functioning.
164 TUNA RESOURCES-

REFERENCES
ANON, 1965-1981. Annual Report of effort and catch statistics by area of Japanese tuna longline fishery, 1962-1979. Fish, /gemy Japcn, Res. Div. (Annual Publ.)
. 1971-1979. Annual catch satisfies of Taiwanese tuna longline fishery. Taiwan Fish. Bur. and National Taiwan Univ. Inst. Ocean. (Annual Publ.)
1975. Fisheries in Japan-Tuna. Japan Marine products photo materials Association, 4 : 173 pp.
— 1976. Fisheries in Japan—skipjack and mackerel. Ibid.,
5 : 169 pp.
1979. Fishing methods. Yamaha Fishery Journals :p. 3.
1980. Magnetic crystals may help tuna and other animals to navigate. Tuna Newsletter, SWFC NOAA, 73 : 2.
1982. Record price for bluefin tuna. Ibid., 77: 5.
BALAN, V. 1978. The sailfish fishery off Calicut during 1974-75 and 1975-76. Indian J. Fish., 25 (1 & 2) : 67-76.
BALDWIN, W. J. 1977a. A review of the use of live baitfishes to capture skipjack tuna, Katsuwonus pelamis in the tropical Pacific Ocean with emphasis on their behaviour, survival and availability. In : Shomura, R.S. (Ed.). Collection of bait fish Papers, 8-35. NOAA Tech. Rep., NMFS Circ. 408.
1977b. Suitability of cultured topminnow Poecilia vittata, family Poeciliidae, as a live baitfish for skipjack tuna, Katsuwonus pelamis, in the tropical pacific. Ibid., 149-155.
BANSE, K. 1959. On upwelling and bottom trawling off the southwest coast of India. J. mar. biol. Ass. India, 1:33-49.
1968. Hydrography of the Arabian Sea shelf of India and Pakistan and effects en demersal fishes. Deep-Sea Res.,
15: 45-79.
BAYLIFF, W. H. (Ed.) 1980. Synopses of biological data on eight species of sccmbrids. Inter-Amer. Trop. tuna Com. Spl. Rep.
No. 2, 530 pp.
BEARDSLEY, G. L. Jr., N. R. MERRETT AND W. J. RICHARDS 1975' Synopsis of the biology of the sailfish, Istiophorus platypterus (Shaw and Nodde 1971) In: Shomura R.S. and F. Williams (eds.) Proc. International Bill fish Symops., Kailua-Kona, Hawaii, 9-12 Aug., 1972. Pt. 3 : 95-120. NOAA Tech. Rep. NMFS SSRF-675.
BEM-YAMI, M. 1980. Tuna fishing with pole and line. FAO Fishing Manual. 150 pp., Fishing News Eooks Ltd., England.
BLACKBURN, M. 1965. Oceanography and the ecology of tunas. Oceanogr. Mar. Biol. Ann. Rev., 3 :299-322.
• •"' - . 1969. Outlook for Tuna Oceanography. Bull. Jap' Soc. Fish. Ocean (Special No.), pp. 221-225.
BLEEKER, P. 1851. Over eenige menwe geslachtew eh soorten van makreelachtige visshen van Indischen Archipel. Nat. Tijoliihr. Nederlandich Ir.die, 1:356-357.
BONNATERRE, J. P. 1788. Tablean Encylcpedique et methedique des trois regnes de la native. Ichthyology, Paris. 215 pp.
BROADHEAD, G. C. 1971. International trade—Tuna. IOFC\ DEVP1I14,27 pp. FAO, Rome.
CANTOR, T. E. 1850. Catalogue of Malayan Fishes. / . Roy. Asiat. Soc. Bengal, 18 : 983-1422
CASTELNAU, F. C. 1872. Contribution to the ichthyology of Australia. Proc. Zcol. Acclim. Soc. Victoria : 29-247.
CHRISTY, F. T., Jr. L. C. CHRISTY, W. P. ALLEN AND R. NAIR 1981. Maldives—Management of Fisheries in the Exclusive Economic Zone. Rep. FI: GCP/INT/334/NOR GCP/RAS/ 087/NOR. FA OIKorway Co-operative Programme, S9 pp. FAO,
Rome.
COLLETTE, B. B., 1978. Adaptations and sjsttmat.es of the mackerels and tunas, pp. 7-39. In: G. D. Sharp and A. E. Dizon (eds.). The Physiological ecology of tunas, 485 pp.,
. Academic Press, New York.
COLLETTE, B. B. AND R. H. GIBBS, Jr. 1963. A preliminary review of the fishes of the family scombridae. FAO Fish. Rep., 6 (1): 23-32.
COLLETTE, B. B. AND L. N. CHAO 1975. Systematics and morpbo> logy of the bonitos (Sarda) and their relatives (Scombridae' Sardini). Fish and Wildl. Sarv. Fish. Bull. U.S., 73 (3), 516-625-
CUSHING, D. 1969. Upwelling and fish production. FAO. Fish. Tech. Pap., 84 : 40 pp. FAO, Rome.
CUVIER, G. 1831. In: Cuvns, G. AND A. VALENCIENNES His-toire Naturelle des poissons, 8 : 375 pp.
DARBYSHIRE, M. 1967. The surface waters off the coast of Kerala, South-west India. Deep-Sea Res., 14 (3) : 295-320.
DERANIAGALA, P. E. P. 1951. The Istiophoridae and Xiphiidae of Ceylon. Ceylon J. Sci., 26 (2): 137-142.
DEVARAJ, M. 1976. Capsala laevis (Verril, 1874) on Makaira tenuirostratus (Deraniagala, 1951) with a discussion on host identity. J. mar. biol. Ass. India, 18 (2): 310-317.
EAFEN, P. K. 1964. Tuna longline operation in the west coast. Indian Seafood, 2 :13-19.
ELLIS, R.H. 1924. A short account of the Laccadive Island and Minicoy. Govt. Press, Madras, 30 pp.
EVANS, R. H. D. R. MCLAIN AND R. A. BAUER 1981. Atlantic skipiack tuna: Influence of mean environmental conditions on the vulnerability to surface fishing gear. Mar. Fish. Rev., 43(6): M l .
CMREU BULLETIN 32 m

F A O, 1967. Report to the Govt, of India on Exploratory tuna longline fishing off the southwest coast of India. UNDP No. TA-2274,46 pp.
, 1968. Report of the meeting of a group of experts on tuna stock assessment under the FAO Expert panel for the facilitation of tuna research, Miami, U.S.A. 12-16 August, 1968. FAO Fish. Rep., 6 1 : 45 pp.
, 1969. Report of the IOFC Working Party on stock assessment in relation to immediate problems of management in the Indian Ocean, Rome, 30 Sept.—3 Oct., 1969. Ibid., 82: 25 pp.
, 1976. FAO Expsrt panel for ths facilitation of tuna research, Ad hoc Committee Meeting of specialists to review the biology and status of stocks of small tunas. Honolulu, Hawai, U.S.A. 15-18 Dec, 75. The biology and status of stocks of small tunas. FAO Fish. Tech. pap., 154 : 21 pp.
1976-1979. Year book of Fishery statistics. Catches and landings. FAO, Rome, Vols. 40-46.
, 1980a. Year book of fishery statistics. Catches and landings. Ibid., Vol. 48, 312 pp.
, 1980b. State of selected stocks of tuna and billfish in the Pacific and Indian Ocean. FAO Fish. Tech. Paper No. 200, FIRM/T200, 88 pp.
, 1981a. Review of the state of World Fishery Resources, FAO Fish. Circ. No. 710, Rev. 2, F1RM/C 710 52 pp.
, 1981b. World fisheries and the law of the Sea. FAO Rome, 35 pp.
FISCHER, W. AND & P. J. P. WHITEHEAD (eds.), 1974. FAO species identification sheet for fishing purposes. Eastern Indian Ocean (Fishing area 57) and Western Central Pacific (Fishing area 71). Vol. 4, pag. var, FAO, Rome.
Fishery Market News Report 1981. Prices and receipts (Data sheet). Fisheries Development Analysis Branch, NMFS, USA.
FYSON, J. Y. 1981. Low energy fishing vessels—The use of sail power. ICLARM Newsletter, 4 (2): 16-17.
GEORGE, P. C , B. T. ANTONY RAJA AND K. C. GEORGE, 1977. Fishery Resources of Indian Economic zone. Silver Jubilee Souvenir, IFP, Oct. 1977, 79-116.
GIBBS, R. H., Jr. AND B. B. COLLETE, 1967. Comparative anatomy and systematics of the tunas, gsnus Thunnus. Fish and Wildl. Serv. Fish. Bull, 66 (1): 65-130.
GILLETT, R. D. AND R. E. KEARNEY, 1980. Second interim report on the activities of the Skipjack Survey and Asssssmsnt Programme in the waters of French Polynesia (13 Dec, 79-2 Feb., 1980), 5-7 Feb., 1980. Preliminary Country Rep. No. 21, 19 pp. SPC, Naumea, New Caledonia.
GREEN, R. E., 1967. Relationship of the thermocline to success of purse seining for tuna. Trans. Atner. Fish. Soc, 96 (2) : 126-130.
GOBURONOVA, N. N. 1963. Larvae of mackerel—like fish from the Indian Ocean (in Russian). Tr. Inst. Okeanol., 62 : 68-95.
GOPALAKRISHNAN, V. 1976. Status and problems of culture of baitfish for the skipjack fishery in the Pacific Region. In: T. V. R. Pillay and W. A. Dill (eds.), Advances in Aquaculture 58-62, FAO, Rome.
HANAMOTO, E. 1974. Fishery Oceanography of bigeye tuna-I. Depth of capture by tuna longline gear in the Eastern Tropical Pacific Ocean. La mer., 12 (3): 10-18.
1975. Fishery Oceanography of bigeye tuna-II. Thermocline and dissolved oxygen content in relation to tuna longline fishing grounds in the eastern tropical Pacific Ocean. Ibid., 13 (2): 58-71.
HASTENRITH, S. AND P. J. LAMB 1979. Climatic Atlas of the Indian Ocean. Pt. I. Surface climate and Atmospheric Circulation. 97 Charts, Univ. Wisconsin press.
HERRICK, S. F. Jr. 1977. Some economic and technological aspects related to commercial production of the topminnow Poecilia vittata. In : Shomura, R. S. (ed.) Collection of baitfish papers : 156-159, NOAA, Tech. Rep. NMFS Circ. 408.
HONMA, M. AND Z. SUZUKI 1972. Stock assessment of yellowfin tuna exploited by longline fishery in the Indian Ocean. 1959-1969. Bull. Far Seas Fish. Res. Lab., 7 : 1-26.
AND S. UEYANAGI 1979. Stock assessment of bill-fishes in the Indian Ocean. SAWS/BP/20 Prepared for the workshop on the assessment of selected tunas and billfishes stocks in the Pacific and Indian Oceans, Shimizu, 13-22, June, 1979.
HORNELL, J. 1910. Report on the results of a fishery cruise along the Malabar coast and the Laccadive Islands in 1908. Madras Fish. Bull., 4 : 71-126.
HOWARD, J. K. AND STARCK, II, 1975. Distribution and relative abundance of billfishes (Istiophoridae) of the Indian Ocean. Stud. Trop. Oceanogr. Miami, 13 : viii- 31 pp, 38 maps.
HOWARD, G. V. 1963. The matter of availability and harvest of tunas. FAO Fish. Rep., 6 (3): 1041-1076."
HUANG, C. C , L. SUN AND R. T. YANG. 1973. Age, growth and population structure of the Indian yellowfin tuna. / . Fish. Soc. Taiwan, 2 (1) : 16-30.
HUNTER, J. R. AND C T. MITCHELL, 1967. Association of fishes with flotsam in the offshore waters of Central America. Fish. Bull., 66 (1) : 41-48. -
1968. Field experiments on the attraction of pelagic fish to floating objects. / . Cons. perm. int. Explor. Mer., 31 (3): 42.
IPFC/IOFC 1973. Ad Hoc working party of Scientists on Stock Assessment of Tuna, Rome, 7-9 June, 1972. Report of the 1st session of the IPFC/IOFC Ad hoc working party of scientists on stock Assessment of Tuna. FAO Fish Rep., 137 : 17 PP-
IPFC 1974. Report on the Second Session of the IPFC/IOFC Ad Hoc Working Party of scientists on stock Assessment of Tuna, Nantes, France, 16-18 Sept., 1974. Ibid., 152: 19 pp.
1975. Report of Third joint meeting of the IPFC Special Committee on Management of Indo-Pacific Tuna, Illrd Session, and the IOFC, Committee on Management of Indian Ocean Tuna IVth Session, Mombasa, Kenya 18-19 July, 1975. Ibid., 174 : 47 pp.
IPFC/IOFC 1976. An immediate management programme of tuna in the IPFC/IOFC region. FAO, Rome. IPFC/IOFC: TM/76/4,12 pp.
IPFC 1977. Special committee on Management of Indo-Pacific Tuna, IVth Session and IOFC, Committee on Management of Indian Ocean Tuna IVth Session, Colombo, Srilanka, 29-30 Oct. 1976-Report. FAO. Fish. Rep., 190 : 12 pp.
IOFC 1977a. The tuna stocks of the Indian Ocean and their fisheries. IOFC, Vth Session, Cochin, Oct. 1977. IOFC/77/////. 11, July 1977,14 pp.
166 TUNA RESOURCES

1977b. Report of the second session of the IOFC Ad Hoc Committee of Nations on the mechanics of tuna research and management. Bangkok, Thailand, Dec. 1975 IOFC— Vth Session, Cochin, October, 1977. /OFC/77/10 July, 1977, 9 pp.
1977c. Current Management problems in the Indian Ocean area. /OFC/77/9, July 1977,4 pp.
INOUE, M. AMANO, Y. IWAZAKI AND M. YAMANTI 1968a. Studies on environments alluring skipjack and other tunas II. On the drift woods accompanied by skipjack and tuna. Bull. Jap. Soc. Sci. Fish., 34 (4): 442.
1968b. Studies on environments alluring skipjack and other tunas-III. Tagging experiments on the experimental drift woods as part of ecological study of tunas. Ibid., 34 (4): 453.
AND Y. IWAZAKI 1969. Movement of the thermal equator and the fishing grounds mainly for yellowfln tuna in the Indian Ocean. Ibid., 35 (10): 957-963.
IWAI, T., I. NAKAMURA AND K. MATSUBARA 1965. Taxonomic study of the tunas. Misaki Mar. Biol. Inst. Spl. Rep., 2,1-51 pp.
JONES, S. 1958. The tuna live-bait fishery of Minicoy. Indian J. Fish., 5 (2) : 300-307.
1960a. Spratelloides delicatulis (Bennett) as a potential live bait for tuna in the Laccadives. / . Mar. biol. Ass. lndia,2(l): 103-104.
1960b. Further notes on Spratelloides delicatulis (Bennett) as a tuna live-bait with a record of S. japonicus (Houttuyn) from the Laccadive Sea. Ibid., 2 (2) : 267-268.
1963a. Synopsis of biological data on the long corse-letted frigate mackerel Auxis thynnoides Bleeker, 1855. FAO, Fish. Rep., 6 (2): 782-810.
1963b. Synopsis of biological data on the northern bluefin tuna Kishinoella tonggol (Bleeker) 1851 (Indian Ocean).
. Ibid., 6 (2): 862-876.
1964a. A preliminary survey of the common tuna bait fishes of Minicoy and their distribution in the Laccadive Archipelago. Proc. Symp. Scombroid Fishes, Mar. Biol. Assoc. India, Symp. Ser. I, Pt. 2 : 643-680.
1964b. On the introduction of tilapia (Tilapia mossam-bica Peteys) as a tuna live-bait in the island of Minicoy in the Indian Ocean. Ibid, Part 2, 691-692.
. — AND M. KUMARAN 1959. The fishing industry of Minicoy Island with special reference to the tuna fishery. Indian J. Fish., 6 (1): 30-57.
JONES, S. AND E. G. SILAS 1960. Indian tunas—a preliminary review with a key for their identification. Ibid, 7 (2): 369-393.
1963a. Synopsis of biological data on skipjack Katsuwonus pelamis (Linnaeus) 1758 (Indian Ocean). FAO Fish. Rep., 3 (2) : 663-694.
1963b. Tuna and tuna-like fishes • from the Indian seas. Ibid., 6 (3): 1775-1796.
1964. A systematic review of the scombroid fishes of India. Proc. Sympos. Scombroid Fishes, Mar. Biol. Assoc. India, Sympos. Ser. I, Pt. I, : 1-105.
JOHNSON, PETER 1966. Tuna Fishing. Labor. Leaflet, (N.S.) 14: 24 pp. Fisheries Lab., Lowestoft, Suffork.
JOSEPH, K M. 1972. Some observations on the exploitation of the Indian Ocean tuna resources. Seafood exp. Jour., 4(8): 11-12.
JOSEPH, J. AND J. W. GREENOUGH 1979 International Management of Tuna, Porpoise and Billfish—Biological, legal and political aspects. Univ. Washington Press, Seattle, 253 pp.
JOSPEH, J., W. KALVE AND P. MURPHY 1981. Tuna and billfish— Fish without a country. Inter-Amer. Trop. Tuna Comm., 46pp.
KEARNEY, R. E. 1981. ' Survey arid assessment programme'. Ann. Rep. for the year ending 31 Dec., 1980. SPC, Noumea, July, 16pp.
AND R. D. GiLLETT 1980. Interim report on the activities of the skipjack survey and Assessment programme in the waters of the Pitcarin Island (2-5 Feb., 80). Skipjack Survey and Assessment Programme. Preliminary country Rep., 22 1 1-8. SPC, Noumea, New Caledonia.
— AND RIVKIN 1981. An examination of the feasibility of bait fish culture for skipjack pole and line fishing in the South Pacific Commission Area. Skipjack Survey and Assessment Programme, Tech. Rep. 4, 22pp. SPC, Noumea, New Caledonia.
KIKAWA, S. AND M. G. FERRARO 1966. Maturation and spawning of tunas in the Indian Ocean. Proc. Indo-Pacific Fish Com., 12 (ID : 65-78.
, T. KOTO, C. SHINGU AND Y. NISHIKAWA 1969. Status of tuna fisheries in the Indian Ocean as of 1968. Far Seas Fish. Res. Lab. S. Ser., 2, 22pp.
. 1975, Synopsis of the biology of the shortbill spearfish Tetrapturus angustirostrU Tanaka, 1914, in the Indo-Pacific areas. In : Shomura, R. S. and F. Williams (eds.) Proc. International Billfish Symp., Kailua-kona, Hawaii, 9-12 Aug., 1972. Pt. 3, 39-54. NO A A Tech. Rep. NMFS SSRF — 675.
KLAWE, W. L. 1980a. Longline catches of tunas within the 200 mile Economic Zone of the Indian and Western Pacific Oceans. IOPIIOFCIDEVI8QI4S, 86pp. FAO, Rome.
— 1980b. Classification of the tunas, mackerel, biHfishes and related species, and their geographical distribution. In : Baylif, W. F. (Ed.) Synopses of Biological data on eight species of scombroids. Inter. Amer. Trop. Tuna Comm. Spl. Rep, No. 2. pp. 7-15.
KOTO, T. 1969. Studies on the albecore XIV. Distribution and movement of the albacore in the Indian and Atlantic Oceans based on catch statistics of Japanese tuna longline fisheries. Bull. Far. Seas Fish. Res. Lab. 1: 115-129.
KREY, J. AND B. BABENARD 1976. Phytoplankton production. Atlas of the International Indian Ocean Expedition, Inst, fur Meereskunde, Kiel Univ., Dec. 76. p. 13.
KUME, S., Y. MORTTA AND T. OGI 1971. Stock structure of the Indian bigeye tuna, Thunnus obesus (Lowe), on the basis of distribution, size composition and sexual maturity. Bull. Far Seas Fish. Res. Lab., 4 :141-164.
and Y. MORITA 1979. Brief review of the Fishery biology of bigeye tuna in the Indian Ocean and its stock assessment. SAWS/BP/18. Prepared for the workshop on the assessment of selected tunas and billfish stocks in the Pacific and Indian oceans, Shimizu, Japan, 13-22 June, 1979.
KUROGANE, K. AND Y. HIYAMA 1959. Morphometric comparison of the yellowfin tuna from six grounds in the Indian Ocean. Bull. Jap. Soc. Sci. Fish., 24 (6, 7) : 487-499.
LACEPEDB (Comte), B.G.E.V. 1800-1802, Histoire naturelle de poissons dedice on citoyen Lacepide. Vols. I to 5.
CMFRI BULLEIN 32 m

LATOND 1954. On upwelling and fisheries. Curr. Sci., 24 : 258-259.
LAEVASTU, T. AND H. ROSA Jr. 1963. Distribution and relative abundance of tunas in relation to their environment. FAO Fish. Rep., 6 (3) : 1835-1851.
AND I. HAELA 1970. Fisheries oceanography—New Ocean environmental services. Fishing News (Books) L.H.V., London, 238pp.
LEWIS, A. D. 1980. Tagging of skipjack tuna (Katsuwonuspelamis) in Pappua New Guinea Waters, 1971-72. Res. Bull. 25, Dept. of Primary Industry, Port Morseby (25): 25pp.
LINNAEUS, C. 1758. Systema naturae sive regna tria systematice proposita per classes, ordines, genera et species, cum characteri-bus, diffentiis, synonymus locis etc. Edito dscima reformata, 1; 824 mp.
LOWE, R. T. 1839. A supplement to the synopsis of the fishes of Madeira. Proc. Zool. Soc. London, 7 : 76-92.
LUTKEN, C., 1880. Spolia Atlantica. Vidensk. Selskr. Skr., 5 Rackke, Copenhagen, 441-447.
MARCILLE, J. AND Z. SUZUKI 1974. Distribution of skipjack caught by Japanese tuna longline fishery in the Indian Ocean. Bull. Far Seas Fish. Res. Lab., 10 : 87-107.
—AND B. STEQUERT 1976 a. Etude preliminaire de la eroissance du lisato (Katsuwonus pelamis), dens louert de l'ocean Indian Tropical. Cah. O. R. S. T. O. M. Ser. Oceanogr., 14(2): 139-151.
AND 1976 b. Croissance des jeunes albacore-Thunnus albacares et patudos, Thunnus obesus de la cote nords onest de Madagascar. Ibid, 14 (2): 153-162.
MATHEW, M. J. AND T. B. RAMACHANDRAN 1956 Notes on the survey of fishing industry of the Laccadive and Aminidivi islands. Fisheries station Reports and year book, Madras, 1954-55 : 125-137.
MATSUMOTO, W. M., T. K. KAZAMA AND D. C. AASHAD 1981. Anchored Fish Aggregating devices in Hawaiin waters. Mar. Fish. Rev., 43 (9) : 1-13.
MIMURA, K. 1967. Present status of tuna longline fishery in the Indian Ocean (1959). Proc. Symp. Scombr. Fish., Mar. biol. Ass. India, Symp. Ser. I, Pt. 3 : 1139-1145.
— A N D H. NAKAMURA 1959. Tuna fishing grounds in the Indian Ocean and its adjacent seas. In : Average years fishing condition of tuna longline fisheries, 1958 Edn., 353-414.
AND Staff of NRFRL 1963a. Synopsis of biological data on yellowfin tuna, Neothunnus macropterus Temmineck and Schlegal, 1842. FAO Fish. Rep. 6 (2) : 319-349.
AND 1963 b. Synopsis on the biology of bigeye tuna Parathunnus mebachi Kishinouye 1923 (Indian Ocean) Ibid., 6 (2) : 350-379.
MORITA, S. 1977. On the relationship between the albacore stocks of the south Atlantic and Indian Oceans. ICCAT Document— SCRS/77/85, pp.6.
MORITA, T. 1969. Studies on the fishing gear of tuna longline. Mem. Fac. Fish. Kagoshima Univ., 18 : 145-215.
MORITA, Y. AND T. KOTO 1971. Some consideration of the population structure of yellowfin tuna in- the Indian Ocean based on longline fishery data. Bull. Far Seas Fish. Res. Lab., 4 : 125-140.
MORROW, J. E. 1964. Marlins, sailfish and spearfish of the Indian Ocean. Proc. Symp. Scombroid Fish., Mar. biol. Ass. India, Symp. Ser. I., Pt. 2 : 428-442.
M URDY, E.~ O. 1980. The commercial harvesting of Tuna-attracting Payaos. A possible boon for small scale fishermen. ICLARM Newsletter, 3 (1) : 10-13.
MURTY, A.V.S. 1981. Observations on coastal-water upwelling around India. In: J. Lighthill and R. P. Pearse (eds). Monsoon dynamics, pp. 523-528, Cambridge Univ. Press.
NAIR, R. V., K. V. RAO AND K. DORAIRAJ 1970. The tunas and tuna-like fishes of India. Bull. Cent. Mar. Fish. Res. Inst., 2 3 : 93pp.
NAKAGOME, J. 1966. On the cause of annual variation of catch of yellowfin tuna in the tropical western Indian Ocean-II. On the monthly and annual variation of surface water temperature in fishing ground and relation between those and the monthly and annual variation of hook rate. Bull. Jap. Soc. Scient. Fish., 32 (12): 987-991.
1967. On the cause of annual variation of catch of yellowfin tuna in the tropical western Indian Ocean—IV. Relation between abundance of year class and surface water temperature in spawning and nursery area. Ibid., 33(3) : 156-160.
NAKAMURA, E. L. 1969. A review of the field observations on tuna behaviour. In: A. Ben-Tuvia and W. Dickson (eds). Proc. FAO Conference on Fish Behavior in relation to Fishing techniques and technics, Oct. 19-27,1967. FAO Fish. Rep., 62 (2): 59-68.
NAKAMURA, I. 1974. Some aspects of the systematics and distribution of billfishes. In: Shomura, R. S. and F. Williams (eds.). Proc. of the International Billfish sym., Kailua-Kona, Hawaii 9-2 Aug. 1972. Pt. 2 : 45-53 NOAA Tech. Rep. NMFS. SSRF — 675.
1965. Relationships of fishes referable to the subfamily Thunninae on the basis of axial skeleton. Bull. Misaki mar. Biol. Inst., Kyoto Univ., 8 : 7-38.
NAKAMURA, H. 1969. Tuna distribution and migration. Fishing Newt (Books) Ltd., London, 76pp.
NAKAMURA, I. 1975. Synopsis of the biology of the black marlin Makaira indica (Cuvier), 1831. In : R. S. Shomura and F. William (Eds). Proc. International Billfish symp. Kailua-Kona, Hawaii, 9«12 Aug. 1972. Pt. 3 : 17-27. NOAA Tech. Rep. NMFS SSRF-675.
NAKAMURA, H. AND H. YAMANAKA 1959. Relationship between the distribution of tunas and the ocean structure. J. Oceanogr. Soc. Japan, 15(3): 143-149.
., Y. YABUTA AND K. MIMURA 1956. Longline fishing grounds in the Indian Ocean. Tech. Pap. Proc. Indo-Pacif. Fish. Comm., 6th session, 220 : 238.
NAKAMURA, I., T. IWAI AND K. MATSUBARA 1968. A review of the sailfish, spearfish, marlin and sword fish of the world. Misaki mar. biol Inst. Kyoto Univ., Spec. Rep., 4 : 1-95.
NlSHIKAWA, Y . , S. KlKAWA, M. HONMA AND S. UEYANAGI 1978. Distribution atlas of larval tunas, billfishes and related species-Results of larval surveys by R/V Shunyo Maru and Shoyo Maru, 1956-1975. Far Seas Fish. Res. Lab. S. Sar., 9 : 99 pp.
NOMURA, M. AND T. YAMAZAKI 1975. Fishing techniques. Japan International Co-operation Agency, Tokyo, 206 pp.
OLSON, R. J. 1980. Synopsis of biological data on the southern bluefin tuna Thunnus maccoyi (Castelnau) 1872. In: W. H. BaylifF (Ed.) Synopses of biological data on eight spp. of scomb-r oids. IATTC. Spl. Rep. No. 2 : 151-212.
168 TUNA RESOURCES

PALKO, R. J., G. L. BEARDSLEY AND W. J. RICHARDS, 1981 Synopsis of the biology of the swordfish Xiphias gladius Linnaeus. NOAA Technical Rep. NMFS Circular 441, 21 pp.
PECKHAM, C. J. 1974. International trade—Tuna. 10FC/DEV/ 40, 28 pp. FAO, Rome.
PHILLIPPI, R. A. 1887. Sobres los tiburones y alguros otros peces de chile. Anales Universiaded Chile, 7 1 : Ii48, Pis. 1-8.
PILLAI, P. P. AND S. UEYANAGI 1977. Distribution and biology of the striped marlin, Tetreapturus audax (Philippi) taken by the longline fishery in the Indian Ocean. Bull. Far Seas Fish. Res. Lab., 16 : 9-32.
PILLAI, P. P. AND M. HONMA 1978. Seasonal and areal distribution of the pelagic sharks taken by the tuna longline in the Indian Ocean; Bull. Far Seas Fish. Res. Lab., 16: 33-49.
PUSKUNOV, I. A. AND A. M. KARCHENKO 1968. Results of tuna fishery investigations in the Indian Ocean In: Soviet Fishery investigations in the Indian Ocean and adjacent waters I. Proc. All Union Res. Inst. Mar. Fish Ocean, 64 : 344-373.
PUTHRAN, V. A. AND V. N. PILLAI 1972. Pole and line fishing for tuna in Minicoy waters. Sea food Exp. Jour., 4 : 11-18.
RAJU, C. 1963. Spawning of the oceanic Skipjack Katsuwonus pelamis (Linnaeus) in the Laccadive Sea. FAO Fish. Rep., 6 (3): 1669-1682.
RAMAMIRTHAM, C. P. 1981. On Circulation of Indian Ocean waters east of Maldives during the post monsoon period. Indian J. Fish., 26 (1 & 2) : 82-89.
AND R. JAYARAMAN 1960. Hydrographic features of the continental shelf waters off Cochin during the years 1955 and 1959. / . mar. biol. Ass. India, 2 : 199-207.
RAMAMIRTHAM, C. P. and D. S. Rao 1973. On upwelling along the west coast of India. J. mar. biol Ass. India, 15 (2) 306-317.
RAO, K. V. NARAYANA, 1964. An account of the ripe ovaries of some Indian tunas. Proc. Symp. Scombroid Fishes., Mar. Biol. Ass. India, Symp. Ser. I. Pt. 2, 733-743.
RAO, L. V. AND R. JAYARAMAN 1966. Upwelling in the Minicoy region of the Arabian sea. Curr. Sci., 35 : 378-380.
RIGGS, F. V. 1981. Status report: Tunas in the Indian Ocean. NOAA Technical Mem., NMFS, NOAA-1M—mA¥S SWFC— 15, pp. 99-117.
Risso, A. 1810. Ichthyologic de Nice on Histoire naturalla de, poissons de department des Alpe Maritimes Paris. 358 pp.
RIVAS, L. K. 1975. Synopsis of biological data on blue marlin Makaira nigricans Lac^pede 1802. In: Shomura, R. S. and F. Williams (eds.) Proc. International Billfish symp. Kailua-Kola, Hawaii, 9-12 Aug., 1972. pt. 3, 1-16. NOAA Tech. Rep. NMFS SSRF-675.
ROBINS, J. P. 1963. Synopsis of biological data on bluefin tuna Thunhus thymus maccoyi (Castelnau), 1872. FAO Fish. Rep., 6(2) : 562-587.
ROCHFORD, D. J. 1962. Hydrology of the Indian Ocean IT. The surface waters of the southeast Indian Ocean and Arafura Sea in the spring and summer. Aust. J. Mar. Freshwat. Res., 13 : 226-251.
RUPPEL, E. 1938. Neue Wirbelthiere zu der Fauna von Abyssi-mien gehorig. Ftsche des Rothen Meers. Frankfurt Ann Main, 148 pp.
SAKAMOTO, H. 1967. Regional changes in the age composition of bigeye caught by longline gear in the Indian Oean. Rep. Nankai Reg. Fish. Res. Lab., 25 : 59-66.
SERVENTY, D. L. 1948. Allothunnusfallui, a new genus and species of tuna from New Zealand. Rec. Canterbury Mus., 5 (3): 131-135.
SHARMA, G. S. 1966. Thermoeline as an indicator of upwelling. J. mar. biol. Ass. India, 8 (1) : 1-19.
SHARP, G. D. 1976. Vulnerability of tunas as a function of environmental profile. In : Proc. Tuna Fishery Res. Conf., Far Seas Fisheries Research Lab., Japan, pp. 324-133.
1978. Behavioral and physiological properties of tuna and their effects on vulnerability to fishing gear, pp. 397-450 In : G. D. Sharp and A. E. Dizon (eds.) The Physiological ecology of tunas, 485 pp . . Academic Press, New York.
- 1979. Areas of potentially successful exploitation of tunas in the Indian Ocean with emphasis on surface methods. IOP, IOFCIDEVI19IA1, 55 pp., FAO Rome.
— AND-S. PIRAOE 1978., The distribution of red and white swimming muscles, their biochemistry and the biochemical phylogeny of selected scombroid fishes, pp. 41-78, In: G. D. Sharp and A. E. Dizon (eds.) The Physiological ecology of tunas, 485 pp., Academic Press, New York.
SHAW, G. AND F. P. NODDER 1792. The Naturalist's miscellany or coloured figures of natural subjects drawn and described — from nature, 24 volumes, London (1790-1813).
SHIMAMURA, T. AND H. SOEDA 1981. On the catch by deep layer tuna longline fishery. Bull. Jap. Soc. Sci. Ftsh., 47 (12): 1559-1565.
SHINGU, C. AND K. HISADA 1979. Recent status of the southern bluefin tuna stock. SAWS/BP/11. Prepared for the Workshop on the assessment of selected tunas and billfish stocks in the Pacific and Indian oceans, Japan, 13-22 June, 1979.
SHOMURA, R. S. (ed.) 1977. Collection of baitfish papers. NOAA Tech. Report, NMFS Circular 408. U. S. Dept. Commerce, NOAA, NMFS, 167 pp.
SILAS, E. G. 1963a. Synopsis of biological data on double lined mackerel, Grammatorcynus bicarinatus (Quoy and Gaimard) (Indo-Pacific). FAO Fish. Rep., 6 (2): 811-833.
1963b. Synopsis of biological data on oriental bonito Sarda orientalis (Temminck and Schlegel) 1842 (Indian Ocean). Ibid., 6 (2): 834-861.
1963c. Synopsis of biological data on dogtooth tuna Gymnosarda unicolor (Ruppel) 1838 (Indo-Pacific). Ibid. 6 (2): 877-899.
1964. Aspects of taxonomy and biology of the oriental bonito Sarda orientalis (Temminck and Schlegel). Proc. Symp. Scombroid Fishes, Mar. Biol. Assoc. India, Symp. Ser. I, Pt. 1, 283-308.
1965. On the lancet fishes of the genus Alepisaurus Lowe from the Indian Ocean. Curr. Sci., 34 (2) : 51-53.
1967a. Parasites of Scombroid fishes Pt. I. Monogene-tic trematodes, dignetic trematodes and cestodes. Proc. Symp. Scoimbroid Fishes, Mar. Biol. Ass. India Symp. Ser. I, Pt. 3, 799-875.
1967b. Tuna fishery of the Tinnevelly Coast, Gulf of Mannar. Ibid.,Pt. 3, 1083-1118.
1967c. Oceanic fisheries. Souvenir, 20/A Anniv. Cent. Mar. Fish, Res. Inst., Mandapam Camp, pp. 51-57.
CMFRI BUKLETIN'32 169-

: 1969a. Pelagic fisheries of the Indian Ocean. Indian Farming, Fish. Number, 19 (9): 63-66.
1969b. Exploratory fishing by R. V. VARUNA. Bull. Cent. Mar. Fish. Res. Inst., 12 : 1-86.
1972. Investigations on the Deep Scattering layers in the Laccadive Sea. Proc. Symp. Corals and Coral reefs, Mar. Biol. Ass. India, pp. 257-274.
AND A. N. P. UMMERKUTTY 1967. Parasites of Scom-broid fishes Pt. II. Parasitic Copepoda Proc. Symp. Scombroid Fishes, Mar. Biol. Ass. India, Symp. Ser. I, Pt. 3, 876-993
— , S. K. DHARMARAJA AND K. RENOARAJAN 1976. Exploited marine fishery resources of India. CMFRI bulletin, 27, 25 pp.
, M. S. RAJAGOPALAN AND P. P. PILLAI 1979. Tuna fisheries in India: Recent trends. Mar. Fish, lnfor. Serv. T & E Sen, 13 : 12 pp.
, P. P. PILLAI AND C. MUTHIAH 1981. Euthynnus sp. nov. ? or an inter-generic hybrid of tuna : an enigma. J. mar. biol. Ass. India, 18 (3): 411-420.
'• , G. MOHANRAJ, V. GANDHI AND A. THIRUNAVUKKA-RASU 1982. Spawning grounds and seasonal abundance of the mUkfish Chanos chanos (Forskal) fry along the east and southwest coasts of India. Proc. Symp. Coastal aquaculture, I I : (In Press)
SIVASUBRAMANIAN, K. 1963. On the sharks and other undesira-able species caught by tuna longline. Rec. Oceanogr. works Japan, 7 (1 ) : 73-81.
1964. Predation of tuna longline catches in the Indian Ocean by killer whales and sharks. Bull. Fish. Res. Stn. Ceylon, 17 (2) : 221-236.
1975. Small boat tuna longline fishing feasibility. IOFCIDEV11S129, 61 pp. FAO, Rome.
SIVASUBRAMANIAM, K. 1973. Co-occurrence and relative abundance of narrow and broad corseletted frigate mackerels Auxis thazard (Lacepede) and Auxis rochei (Risso) around Ceylon. Proc. Symp. Living resorces of the seas around India. pp. 537-547.
SUDA, A. 1971. Tuna fisheries and their resources in the Indian Ocean. Biology of Indian Ocean, Proc. IIOE Symp. Biol. pp. 431-449.
1973. WFCjIPFC Ad Hoc Working Party of scientists on stock assessment of tuna held in June, 1972, Rome : Observation on the recent status of tuna longline fishery in the Indian Ocean. Bull. Far. Seas Fish. Res. Lab., 1: 99-114.
1974. Recent status of resources of tuna exploited by longline fishery in the Indian Ocean. Bull. Far Seas Fish. Res. Lab., 10 : 29-64.
. AND M. B. SCHAEFER 1965. General review of the Japanese longline fishery in the eastern tropical Pacific Ocean, 1956-1962. Bull. IATTC, 9 (6) : 307-462.
SUZUKI, Z. 1979. Stock assessment of yellowfin tuna in the Indian Ocean. SAWS/BP/21. Prepared for the Workshop on the assessment of selected tuans and billfish stocks in the Pacific and Indian oceans, Shimizu, Japan, 12-22 June, 1979.
SUZUKI, Z., Y. WARASHINA AND M. KISHIDA 1977. The comparison of catches by regular and deep tuna longline gears in the western and central equatorial Pacific. Bull. Far Seas Fish. Res. Lab., 15 : 51-89.
AND K. KAMEKO 1979. The comparison of. length of catches by regular and deep longline gears fo bigeye, yellowfin and blue marlin in the western and central equatorial Pacific. SAWSIBPI16, Prepared for the workshop on the assessment of selected tunas and billfish stocks in the Pacific and Indian oceans, Shimizu, Japan, 13-22, June, 1979.
TANAKA, S. 1911-1914. Figures and descriptions of the fishes of Japan. Vols. 16-30, p. 324, Fig. 285, Daiichi Shain, Tokyo.
TANIKAWA, E. 1971. Marine products in Japan-Size, techno logy and research. Koseisha—Koseikaku Company, Tokyo, 507 pp.
TEMMINCK, C. J. AND H. SCHLEGEL 1850. Pisces In : Seibold, P. F. Fauna Japonica, sine descriptio animalium quae in itipere per. Japoniam suscepto annis, 1823-1830 collegit etc. pt. 3 : 73-112.
THOMAS, P. T. 1964a. A study of the fluctuations in the occurrence of the major tuna live-bait fishes of Minicoy. Proc. Symp. Scombroid Fishes, Mar. Biol. Ass. India, Symp. Ser. I, Pt. 2, 681-690.
19646. Size composition of the oceanic skipjack Katsuwonus pelamis (Linnaeus) and the yellowfin tuna Neo-thunnus macropterus (Temminck and Schlegel) from the Laccadive Sea around Minicoy during the season 1960-61. Ibid., Pt. 3, 1146-1153.
UDA, M. AND Y. NAKAMURA 1973. Hydrography in relation to tuna fisheries in the Indian Ocean. Spl. Publ., Mar. Biol. Ass. India, 276-292.
UEYANAGI, S. 1974. A review of the world commercial fisheries for billfishes. In : R. S. Shomura and F. Williams (eds.) Proc International Billfish Sympose., Kailua-Kona, Hawaii, 9-12,Aug., 1972, Pt. 2,1-11, NOAA Tech. Rep. NMFS SSRF-675.
AND P. G. WARES 1975. Synopsis of biological data on striped marlin, Tetrapturus audax (Philippi) 1887. Ibid., Pt. 3, 132-159.
VARADACHARI, V. V. R. 1961. On the process of upwelling and sinking on the east coast of India. Prof. Mahadevan Shastabdi-purthi Comem. vol., 159-162.
VARGHESE, G. 1971. Comparative merits of mechanised boats over non-mechanised boats.on oceanic skipjack tuna live-bait fishery. Seafood exp. Jour., 3 : 115-121.
1974. Shark resources of the Laccadive waters. Ibid., 6 : 65-68.
WARASHINA, Y. AND K. HISADA 1974. Preliminary evaluation of the effect of the voluntary regulation on stock of southern bluefin tuna and longline fishery. Bull. Far Seas Fish. Res. Lab., 10 : 193-220.
WBTHERALL, J. A., F. V. RIGGS AND M. Y. Y. YONG 1979. Some production model analyses of tuna and billfish stocks in the Indian Ocean. SWFC Admin. Rep., H-79-7, Nat. Mar. Fish. Serv., NOAA, Honolulu, Hawaii, 12 pp. Prepared for the workshop on the assessment of selected tunas and billfish stocks in the Pacific and Indian oceans, Shimizu, Japan, 13-22 June, 1979.
WHITLEY, G. P. 1935. Studies on Ichthyology, No. 9, Rec. Aust. Mus., 19 (4) : 215-250.
WILLIAMS, F. 1963a. Synopsis of biological data on frigate mackerel, Auxis thazard (Laclpede) 1802 (Indian Ocean). FAO Fish. Rep., 6 (2) : 157-166.
170 TUNA RESOURCES

19637. Synopsis of biological data on little tuna Euthvnnus affinis (Cantor) 1850 (Indian Ocean). Ibid, 6 (2) 167-179.
WILLIAMS, G. 1981. Potential for Australians in Coral Sea yellow fin tuna fishery. Australian Fish., 40 (3) : 2-5.
WOOSTER, W. S., M . K. SCHAEFER AND M . K . ROBINSON. 1967 Atlas of the Arabian Sea for fishery oceanography. Univ. Calif. IMR Ref. 67-12, 35 pp., 140 pis.
WYRTKI, K. 1961. Physical oceanography of the southeast Arabian waters. Naga Rep., 2 : 1-195.
1971. Oceanographic Atlas of the International Indian Ocean Expedition. National Science Foundation, U. S. Govt. Printing Office, Washington D.C., 531 pp.
YABE, H., Y. YABUTA AND S. UEYANAGI 1963. Comparative distribution of eggs, larvae and adults in relation to biotic and abiotic environmental factors. FAO Fish Rep., 6 (3): 979-1009.
YAMANAKA, H. AND N. ANRAKU 1959. Oceanographic studies on the fishing grounds of tunas in the Indian Ocean I. General Oceanographic conditions in relevant to distribution of tunas in the winter season. Rep. Nankai Rep. Fish. Res. Lab., 11: 147-164.
— AND 1961. Oceanographic studies on the fishing grounds of tunas in the Indian Ocean II. General oceanographic conditions in relevant to the distribution of tunas in summer. Ibid., 13: 1-19.
YAMANAKA, I. AND N. MORITA 1973. Ecological and behaviora studies on the skipjack tuna taken from the south Sea I. Experiments conducted on fishing using artificial floating platforms. Far Seas Fish. Res. Lab., Div. Oceanogr., 53 pp.
AND 1974. Ecological and behavioral studies on the skipjack tuna taken from the South Sea II. Experiments conducted on fishing using artificial floating platforms in 1973. Ibid., 38 pp.
YANG, RONO-TSONG 1979. Taiwan's tuna longline fishery in the Indo-Pacific Area, 1967-1978. Acta Oceanogr. Taiwanica, 10: 201-222.
YORK, A. G. 1977. Tuna investigations—Bay of plenty,' New Zealand, 1969-71. Fish. Tech. Rep., 151, 90 pp., New Zealand Min. Agr. Fish. Willington.
YOSHIDA, H. O. 1966. Tuna fishing vessels, gear and techniques in the Pacific Ocan. In : T. A. Mannar (Ed.) Proc. Governor's Conference on Central Pacific Fishery Resources, Honolulu, Hawaii, Feb., 1966. U. S. Bur. comm. Fish., pp. 67-89.
1981. Status Report: Billfishes in the Indian Ocean. NOAA Tech. Mem., NMFS, NOAA-TM-NMFS-SWFC-15, pp. 118-141.
AND T. OTSU 1963. Synopsis of biological data on albacore Thunnus germo (Lac6pede) 1800 (Pacific and Indian oceans). FAO Fish Rep., 6 (2) : 274-318.
CMFRJ BULUJTION 32 171

APPENDIX—I
POLE AND LINE (LIVE-BAIT) TUNA FISHERY—PROFORMA I
TOTAL CATCH
Skipjack kg.
Name of Vessel: Albacore kg.
Tonnage: Kind of bait: Yellowfin kg.
Port of departure: On Size of bait t Bigeye kg.
Port of arrival: On Amount of bait t Others kg.
Lat. Long.
Date:
Timet
Date:
Time:
Date:
Time: Date:
Time:
Date:
Time:
Date:
Time: Date:
Time:
Atmos. temp. Wind direction & Speed Surface temp. Current direction & Speed
Association of shoals Size of shoals State of bait-taking
Type and quantity of bait (scoops)
Fishing time From Fishing Time To Number of gears used
Skipjack (No) (Average Wt) Albacore (No) (Average Wt) Yellowfin including young fishes (No)
(Average Wt) Bigeye including young fishes (No)
(Average Wt) Other fishes
If shoals of bait fishes were found, their position and size
Remarks:
Note: Birds/dolphins and other associated organisms observed along with tuna shoals should be reported separately.
IV? f UNA RESGTJRbBS

APPENDIX—2
SEINER FISHING FOR TUNAS—PROFORMA H
DATE:
Name of Vessel:
Port of departure:
Port of arrival:
Tonnage of vessel:
Horse power:
Number of crew:
Location:
On:
On:
TOTAL CATCH
Skipjack
Albacore
Yellowfin
Bigeye
Others
Atmospheric temperature:
Sea surface tempreature:
Wind direction & velocity:
Current direction & velocity:
State of sea:
Thermocline: Top depth Bottom depth
Type of School: Time set made Time finished
Skipjack (No)
(Average weight)
Albacore (No)
(Average weight)
Yellowfin, including young fishes
(Average weight)
Bigeye. including young fishes
(Average weight)
Other fishes/associated organisms
Note: Birds/dolphins and other associated organisms observed along with tuna shoals should be reported separately.
CMFRI BULLETIN 32 ;V*3

APPENDIX—3
TUNA LONGLINE FISHERY—PROFORMA HI
Departure Arrival
Vessel: Base: On at On at Voyage No.:
A. FISHERY DATA
No. of baskets Total No. Bait Shooting time Hauling time CATCH COMPOSITION (Number of fish) Total Total shot of hooks From To From To Number Weight
a . I 1- Mi l* I1 1 i i i i i l f i l i i i i i i i l s i
B. HYDROGRAPHIC DATA
Position Wind Current Temperature Thermocline
Depth Lat. Long. Time of Direction Velocity Direction Velocity Atmosph. Surface Top Bottom Barometer State of Water Any other range of obser- depth depth reading Sea transpar- observation operation vation ency (specify)