Cluster observations of∂ Bz/∂ x during growth phase magnetotail stretching intervals
11
JOURNAL OF GEOPHYSICAL RESEARCH: SPACE PHYSICS, VOL. 118, 5720–5730, doi:10.1002/jgra.50550, 2013 Cluster observations of @B z /@x during growth phase magnetotail stretching intervals A. A. Petrukovich, 1 A. V. Artemyev, 1 R. Nakamura, 2 E. V. Panov, 2 and W. Baumjohann 2 Received 23 May 2013; revised 5 September 2013; accepted 6 September 2013; published 19 September 2013. [1] We study a statistics of @B z /@x in a thin stretching current sheet (substorm growth phases) observed by Cluster between 8 and 18 R E downtail. After 2005, spacecraft separation allowed to measure directly this derivative of B z along the tail axis. The near-tail events (within 14 R E ) exhibited a straight decrease of an initially large positive @B z /@x to 1–2 nT/R E . In the more stretched middle tail, usually the small |@B z /@x| < 0.5 – 1 nT/R E had no clear trend and fluctuated around zero with time scales 5–15 min. In general, negative @B z /@x were ubiquitous. At some onsets, larger negative @B z /@x < –1 nT/R E were associated with transient dipolarizations, propagating earthward. There was no clear association of local plasma sheet activity onset with any value of @B z /@x. We discuss relation of observations and recent modeling results. Citation: Petrukovich, A. A., A. V. Artemyev, R. Nakamura, E. V. Panov, and W. Baumjohann (2013), Cluster obser- vations of @B z /@x during growth phase magnetotail stretching intervals, J. Geophys. Res. Space Physics, 118, 5720–5730, doi:10.1002/jgra.50550. 1. Introduction [2] The large-scale tail magnetic structure emerges as a combination of the dipole field and the field of magneto- spheric and other currents, mostly of the cross-tail current. According to a classical scenario, the tail magnetic field stretches during energy accumulation (known as substorm growth phase) due to intensification of the cross-tail current, and the new configuration eventually becomes unstable [e.g., Baker et al., 1996]. The tail stretching could be described as a decrease of B z or @B z /@x, as well as an increase of j y (geocentric solar magnetospheric (GSM) coordinate system is used hereafter, see more in section 2). [3] For many years, the B z value (or magnetic field elevation), measurable by a single spacecraft, remained the only empirical quantitative characteristic of the magnetotail stretching. Cluster multispacecraft observations during the first years of operation allowed to determine on a regular basis magnetic gradient across a thin sheet (along a normal) and corresponding cross-tail current density, as well as to trace its dynamics in the course of substorms [Thompson et al., 2005; Runov et al., 2006; Petrukovich et al., 2007]. [4] After 2005, with larger separations between space- craft (up to 10,000 km), Cluster provided the possibility to measure one more parameter of interest: @B z /@x. The Cluster 1 Space Research Institute, Russian Academy of Sciences, Moscow, Russia. 2 Space Research Institute, Austrian Academy of Sciences, Graz, Austria. Corresponding author: A. A. Petrukovich, Space Research Institute, 84/32 Profsoyuznaya Str., Moscow 117997, Russia. ([email protected]) ©2013. American Geophysical Union. All Rights Reserved. 2169-9380/13/10.1002/jgra.50550 orbit evolved from year to year in such a way that the point, where the neutral sheet is crossed, was moving closer to Earth. As a result, from 2005 to 2009, Cluster scanned important downtail distances, –18 < X GSM < –8 R E , where the transition from taillike to dipolar magnetic configuration takes place. [5] Besides understanding of the general geometry, the @B z /@x dynamics recently attracted special attention. Nominally, @B z /@x is supposed to be always positive (B z growing earthward), but in some instances, negative values were observed in situ, as well as appeared in the empiri- cal and numerical models. Sergeev et al. [1996] suggested that enhanced magnetospheric convection (EMC) events produce a B z profile with a pileup in the middle tail. In more recent work, an example of “minimum B” was pre- sented by Saito et al. [2010]. Panov et al. [2012a] discov- ered such a configuration in a strongly bent tail, formed in a special combination of the dipole tilt and the solar wind flow direction. Both theory and simulations indicate that configurations with negative @B z /@x may be unstable and thus drive a substorm onset [Pritchett and Coroniti, 2010; Sitnov and Swisdak, 2011; Hu et al., 2011; Yang et al., 2011]. Additional information on this topic and refer- ences on the previous work can be found in Pritchett and Coroniti [2010]. [6] It should be noted that expected @B z /@x is rather small in the stretched tail, and with mesoscale variations of various sorts (vortices, flapping, bursty flows, etc.) (see, e.g., review by Sharma et al. [2008]), one can discover examples of any reasonable gradients. A growth phase (a stretching interval) in this sense is a convenient object, since it is a relatively quiet state with the dominating driven change and is also of special interest due to the substorm onset problem. Thus, this investigation concentrates on measuring @B z /@x and, in particular, its negatives, during growth phase. 5720
Transcript of Cluster observations of∂ Bz/∂ x during growth phase magnetotail stretching intervals

JOURNAL OF GEOPHYSICAL RESEARCH: SPACE PHYSICS, VOL. 118, 5720–5730, doi:10.1002/jgra.50550, 2013
Cluster observations of @Bz/@x during growth phase magnetotailstretching intervalsA. A. Petrukovich,1 A. V. Artemyev,1 R. Nakamura,2 E. V. Panov,2 and W. Baumjohann2
Received 23 May 2013; revised 5 September 2013; accepted 6 September 2013; published 19 September 2013.
[1] We study a statistics of @Bz/@x in a thin stretching current sheet (substorm growthphases) observed by Cluster between 8 and 18 RE downtail. After 2005, spacecraftseparation allowed to measure directly this derivative of Bz along the tail axis. Thenear-tail events (within 14 RE) exhibited a straight decrease of an initially large positive@Bz/@x to �1–2 nT/RE. In the more stretched middle tail, usually the small|@Bz/@x| < 0.5 – 1 nT/RE had no clear trend and fluctuated around zero with time scales5–15 min. In general, negative @Bz/@x were ubiquitous. At some onsets, larger negative@Bz/@x < –1 nT/RE were associated with transient dipolarizations, propagating earthward.There was no clear association of local plasma sheet activity onset with any value of@Bz/@x. We discuss relation of observations and recent modeling results.Citation: Petrukovich, A. A., A. V. Artemyev, R. Nakamura, E. V. Panov, and W. Baumjohann (2013), Cluster obser-vations of @Bz/@x during growth phase magnetotail stretching intervals, J. Geophys. Res. Space Physics, 118, 5720–5730,doi:10.1002/jgra.50550.
1. Introduction
[2] The large-scale tail magnetic structure emerges as acombination of the dipole field and the field of magneto-spheric and other currents, mostly of the cross-tail current.According to a classical scenario, the tail magnetic fieldstretches during energy accumulation (known as substormgrowth phase) due to intensification of the cross-tail current,and the new configuration eventually becomes unstable[e.g., Baker et al., 1996]. The tail stretching could bedescribed as a decrease of Bz or @Bz/@x, as well as an increaseof jy (geocentric solar magnetospheric (GSM) coordinatesystem is used hereafter, see more in section 2).
[3] For many years, the Bz value (or magnetic fieldelevation), measurable by a single spacecraft, remained theonly empirical quantitative characteristic of the magnetotailstretching. Cluster multispacecraft observations during thefirst years of operation allowed to determine on a regularbasis magnetic gradient across a thin sheet (along a normal)and corresponding cross-tail current density, as well as totrace its dynamics in the course of substorms [Thompson etal., 2005; Runov et al., 2006; Petrukovich et al., 2007].
[4] After 2005, with larger separations between space-craft (up to�10,000 km), Cluster provided the possibility tomeasure one more parameter of interest: @Bz/@x. The Cluster
1Space Research Institute, Russian Academy of Sciences, Moscow,Russia.
2Space Research Institute, Austrian Academy of Sciences, Graz,Austria.
Corresponding author: A. A. Petrukovich, Space Research Institute,84/32 Profsoyuznaya Str., Moscow 117997, Russia. ([email protected])
©2013. American Geophysical Union. All Rights Reserved.2169-9380/13/10.1002/jgra.50550
orbit evolved from year to year in such a way that thepoint, where the neutral sheet is crossed, was moving closerto Earth. As a result, from 2005 to 2009, Cluster scannedimportant downtail distances, –18 < XGSM < –8 RE, wherethe transition from taillike to dipolar magnetic configurationtakes place.
[5] Besides understanding of the general geometry,the @Bz/@x dynamics recently attracted special attention.Nominally, @Bz/@x is supposed to be always positive (Bzgrowing earthward), but in some instances, negative valueswere observed in situ, as well as appeared in the empiri-cal and numerical models. Sergeev et al. [1996] suggestedthat enhanced magnetospheric convection (EMC) eventsproduce a Bz profile with a pileup in the middle tail. Inmore recent work, an example of “minimum B” was pre-sented by Saito et al. [2010]. Panov et al. [2012a] discov-ered such a configuration in a strongly bent tail, formedin a special combination of the dipole tilt and the solarwind flow direction. Both theory and simulations indicatethat configurations with negative @Bz/@x may be unstableand thus drive a substorm onset [Pritchett and Coroniti,2010; Sitnov and Swisdak, 2011; Hu et al., 2011; Yang etal., 2011]. Additional information on this topic and refer-ences on the previous work can be found in Pritchett andCoroniti [2010].
[6] It should be noted that expected @Bz/@x is rather smallin the stretched tail, and with mesoscale variations of varioussorts (vortices, flapping, bursty flows, etc.) (see, e.g., reviewby Sharma et al. [2008]), one can discover examples of anyreasonable gradients. A growth phase (a stretching interval)in this sense is a convenient object, since it is a relativelyquiet state with the dominating driven change and is alsoof special interest due to the substorm onset problem. Thus,this investigation concentrates on measuring @Bz/@x and, inparticular, its negatives, during growth phase.
5720

PETRUKOVICH ET AL: @Bz/@x IN THE TAIL BY CLUSTER
2. Data, Methods, and Caveats
[7] The data set includes Cluster observations from 2005to 2009 with typical spacecraft separations of 1–2 RE andX distances between –8 and –17 RE. We looked for inter-vals of the quiet magnetotail with signatures of the thincurrent sheet, stretching, and substorm growth phase, endingwith activity onset. We used the procedure similar to that inthe previous publications [Petrukovich et al., 2007, 2009].Specific criteria were the following:
[8] 1. Proximity to the neutral sheet. All spacecraft shouldbe near the neutral sheet (|Bx| < 20 nT) most of the time.This requirement is generally equivalent to the condition onplasma-to-magnetic pressure ratio ˇ > 2–4 at the considereddowntail distances. The relatively strict criterion (as com-pared with more standard ˇ = 1) is necessary to ensurelocation in the embedded sheet [Petrukovich et al., 2011].
[9] However, the cases with larger |Bx| were not imme-diately excluded if some Cluster spacecraft were above andsome below the current sheet (simultaneously observed Bxwas with opposite signs) to avoid bias in the selected statis-tics. These events represent a subset with a very thin currentsheet, which is less likely to be observed with all spacecraftbeing inside it. In total, there were 14 (out of 58) such inter-vals and fortunately their characteristics were found to benot so different from that of the majority.
[10] 2. Growth phase. Based on the experience ofPetrukovich et al. [2007], growth phase statistics were ana-lyzed in all Cluster neutral sheet crossings visually andrequired that within the interval of interest at least one ofthe signatures of substorm growth phase should be observed:Bz decreases by at least 1–2 nT or (in case of stable Bz)current density larger than�1 nA/cm2. Plasma sheet shouldbe quiet within the interval (no bursty flows above 100 km/s,no activity onsets—see the next item). As it was found aposteriori, the data set includes growth phases of isolatedsubstorms with smaller Bz and those occurred after a previ-ous (strong) dipolarization with larger Bz. The latter are alsoof interest due to their similarity with enhanced convectionevents. A few events are likely quiet thin sheet intervals withno clear substorm signatures.
[11] 3. Onset. The “local” onsets, which were supposedto conclude the selected intervals, were identified visuallyas a significant dipolarization (Bz increases at least 2 nTand variations) detected by all four spacecrafts or/and(in several flank cases) as a clear change from steady Bzdecrease to steady increase. Some onsets were also with anion flow burst (this was not a criterion). In a few cases,smaller transient Bz increases and flow enhancements wereallowed inside the intervals, if these signatures were imme-diately followed by the continuing growth phase rather thenextended expansion.
[12] The unambiguous onset time definition is not alwayspossible in such kind of a study. Cluster spacecraft is sub-stantially separated along the tail axis, and dipolarizationswere often observed with a delay [e.g., Baumjohann et al.,1999; Nakamura et al., 2009, 2011]. In some cases, it wasconvenient to set a specific onset at a local current densitymaximum (rather than selecting a particular dipolarizationfront). The final uncertainty did not exceed several min-utes. This problem is further illustrated in section 3 withexamples.
Table 1. Event List and Coordinatesa
UT XGSM, YGSM, RE Type AL
2005/07/21 21:45–22:11 –11.52 –13.02 1 exp2005/07/29 09:55–10:12 –15.00 –11.38 1 act2005/08/19 11:35–12:24 –16.55 –5.77 1 no2005/08/26 12:30–13:18 –16.22 –3.70 1 no2005/08/28 20:18–20:26 –15.54 –3.79 1 act2005/08/28 22:30–23:21 –16.80 –3.67 1 exp2005/09/28 14:30–15:48 –13.68 3.82 0 exp2006/07/16 03:00–05:00 –10.31 –14.52 1 exp2006/07/30 13:00–15:35 –14.65 –11.94 1 exp2006/08/06 12:30–13:24 –14.27 –9.63 1 exp2006/08/08 19:00–21:11 –13.62 –9.36 1 no2006/08/11 09:00–10:11 –15.97 –8.95 1 no2006/08/15 22:30–23:17 –14.36 –7.69 0 no2006/08/16 01:00–04:00 –16.09 –7.74 1– no2006/08/18 09:00–09:36 –15.40 –6.65 1 exp2006/08/20 16:30–18:00 –15.02 –6.31 1 act2006/08/23 04:30–05:19 –16.55 –5.89 1 no2006/08/25 11:00–13:00 –15.73 –4.83 1– no2006/09/03 22:30–23:40 –15.71 –2.89 0 no2006/09/06 08:00–09:30 –16.14 –2.02 0 no2006/09/23 00:00–00:44 –16.07 2.22 1 no2006/09/25 07:00–08:39 –15.09 2.34 0 exp2006/09/27 14:30–15:15 –13.65 2.64 0 no2006/10/02 09:00–09:43 –13.67 3.66 1 act2006/10/04 17:12–17:41 –12.81 3.80 1 no2006/10/07 06:12–06:42 –14.82 5.22 0 exp2006/10/16 14:30–15:00 –11.71 6.05 0– act2006/10/21 08:30–10:00 –11.51 7.02 0– no2006/10/26 04:30–05:52 –11.59 8.91 1 no2007/10/01 07:00–07:57 –13.86 2.17 1 no2007/10/17 22:30–23:30 –12.54 6.23 0– no2007/10/27 08:30–09:05 –9.85 5.94 1– act2008/08/12 17:00–17:48 –11.80 –9.61 1– act2008/08/14 23:00–24:00 –9.40 –8.35 1– no2008/08/15 02:45–04:39 –13.29 –9.50 1 act2008/08/15 05:30–07:39 –14.79 –9.89 1 no2008/08/19 16:30–17:38 –9.38 –7.02 1 act2008/08/22 08:00–10:15 –15.31 –8.16 1 exp2008/08/26 21:00–23:26 –12.07 –6.52 1 no2008/08/31 14:30–15:26 –11.04 –4.95 1 no2008/08/31 16:00–16:18 –12.26 –5.35 0 exp2008/09/03 01:30–02:42 –13.22 –5.08 1 no2008/09/05 11:00–12:13 –13.75 –4.43 0 exp2008/09/05 12:40–14:00 –15.02 –4.67 1– no2008/09/14 20:48–21:18 –11.35 –2.75 1 act2008/10/11 03:30–04:05 –13.50 3.28 0 exp2008/10/18 04:00–06:20 –11.51 3.71 1 no2008/10/22 22:00–22:34 –10.30 4.15 0 exp2008/10/25 07:18–07:50 –10.25 4.29 1 no2008/10/27 16:00–17:33 –10.09 5.03 1 no2008/11/03 19:00–22:00 –9.54 6.73 1– no2008/11/06 04:00–06:24 –9.10 6.49 1 no2009/08/16 08:00–11:20 –10.34 –9.66 1 no2009/08/21 01:00–02:06 –8.74 –8.18 1 no2009/08/23 11:00–11:55 –9.88 –7.89 1 no2009/08/23 12:45–13:45 –11.56 –8.66 1 exp2009/09/04 10:00–12:00 –13.09 –6.63 1– no2009/09/09 00:00–01:46 –8.86 –4.91 1 no
aOnset time is given as the end. The “type” column shows event selectioncriteria: too large Bx is marked by “0”, Bx according to criteria—by “1”,no onset—by minus sign. AL associated geomagnetic activity is marked as“exp” for events with index intensification within 10 min from the plasmasheet onset, as “act” for events within ongoing geomagnetic activity, as “no”for quiet period with AL within 100 nT.
[13] The initial selection included 58 intervals 20–120 min long (Table 1). The interval end was fixed 10 minafter a local onset instant or when the spacecraft moved outfrom the inner sheet (criterion 1, |Bx| > 20 nT). The start
5721

PETRUKOVICH ET AL: @Bz/@x IN THE TAIL BY CLUSTER
Figure 1. Event 1: 31 August 2008. From top to bottom:Bx, Bz magnetic field, Vx ion velocity, jy current density,Bz derivative. (Top) Standard Cluster set of colors is used:C1 (black), C2 (red), C3 (green), C4 (blue).
of an interval was placed as early as possible taking intoaccount all requirements listed above. For an investigationof preonset conditions, we excluded 14 cases with too largeBx (explained in criterion (1) above) and 10 cases, when theinterval ended prematurely because the spacecraft movedout from the required sheet region before the onset. Theshorter event list includes 37 cases.
[14] A relation of the local (plasma sheet) onset definedabove with the classical (ground) substorm onset waschecked with AL index. From 48 events with identified localonsets, 15 corresponded to AL geomagnetic index intensifi-cations larger than 100 nT within 10 min, 10 events wereinside the interval of high AL with no clear enhancements,and for 23 local onsets, AL was within 100 nT (geomag-netic quietness). The latter cases could correspond to pseudobreakups or contracted oval substorms, during which plasmasheet activity is still substantial [e.g., Petrukovich et al.,1998, 2000].
[15] Cluster magnetic field (spin averages) measured byFGM (FluxGate Magnetometer) instrument [Balogh et al.,2001] and ion moments measured by CIS/HIA (ClusterIon Spectrometry (Hot Ion analyzer)) instrument [Reme etal., 2001] from the Cluster Active Archive were used. Allparameters were interpolated to a common time scale. Thegradients of all magnetic field components were computedwith the standard technique [Dunlop et al., 1988]. Thesegradients were used to determine @Bz/@x, current density, aswell as other parameters. The geometry of the magnetotail is
neither exactly cylindrical (to look for @Bz/@x) nor radial (tolook for @Bz/@r). Therefore, we calculated both variants andthe results appeared to be similar (in this presentation resultson @Bz/@x are shown).
[16] There is an important but often overlooked prob-lem that on a scale of spacecraft separation, the four-pointgradiometer provides correct gradient values only in thecase of a purely linear profile, i.e., with a constant gradient.If Cluster probes nonlinear profiles or transient changes(so that the disturbance front is detected by one spacecraftbut not yet by the others), then, depending on the specifictetrahedron configuration, the method may return a vectorpeculiarly rotated from the expected direction. In our studywe double-checked the conclusions on Bz profiles based onthe gradiometer with the more visual analysis, comparingBz at C2 and C4 (usually the most tailward and the mostearthward) spacecraft.
[17] Similar problems exist also with measuring the Bxgradient, since spacecraft separation during 2005–2009 isabout 2–10 thousand km and is substantially larger than thetypical thickness of the thin embedded sheet in the middletail (several thousand km) [e.g. Petrukovich et al., 2011].The gradiometer is then applied to an essentially nonlin-ear profile, resulting in underestimation of the peak value ofthe cross-tail current and bias the direction of the normal tothe sheet.
[18] An important issue for reliable calculation of @Bz/@xis the consideration of the sheet inclination. An intrinsiccoordinate system of a planar current sheet is the follow-ing: l—maximum magnetic variance direction, m—shearor cross-sheet current density direction, n—neutral sheetnormal. Of interest to sheet structure and stability issues is
Figure 2. Event 2: 28 August 2005. Notations and colorsare as in Figure 1.
5722

PETRUKOVICH ET AL: @Bz/@x IN THE TAIL BY CLUSTER
Figure 3. Event 3: 8 August 2006. Notations and colors areas in Figure 1.
actually the gradient of Bn magnetic field component normalto the current sheet. Thus, Bz GSM is a correct componentto look for only in a case of the horizontal (in GSM) sheet.Though sheet tilts in XZ GSM plane, mostly affecting theparameter in question are small (< 10ı), but Bn � |Bl| � |Bx|and even such small inclination may result in substantialdifference between Bz and Bn. Bl �10 nT effectively adds�1.7 nT to Bn with a ˛ = 10ı tilt:
Bz � Bn + tan˛ � Bx
[19] The first step to solve this problem is to account forthe model neutral sheet tilt, appearing when the dipole tilt isnot zero [Tsyganenko and Fairfield, 2004]. These tilts weregenerally within 5ı–10ı. This transformation from GSM tothe proper model sheet plane was applied to the observedmagnetic field data, but hereafter for simplicity, we keepthe same Bx, By, Bz notation for this slightly rotated frameof reference. Actually, this transformation had only minorinfluence on final statistical results.
[20] The contribution of dynamic sheet tilts (due to flap-ping, etc.) is substantially less clear. With the large space-craft separation during the years of interest, empirical tiltvalues, essentially based on direction of Bx gradient, areunreliable (see above). A simple working option could be toconsider the correlation between Bx � Bl and Bz: If correla-tion is high, one can suggest that it is due to an actual tilt andremove this linear trend (V. Sergeev, private communication,2012). However, it is not an ultimate solution. For example,in a growth phase, the observed Bx is often increasing dueto sheet thinning and the observed Bz is decreasing due to
stretching. Thus, Bz and Bx changes could be correlated evenfor a horizontal sheet. A more evident proof of the nonzerotilt would be the presence of correlated wavelike signature inboth Bx and Bz (due to a relative spacecraft/plasma motion),but it is less likely to happen. Besides these problems, thetilts could be even different or opposite at locations sepa-rated by a couple of RE and, of course, could change withtime. Therefore, the problem of determination of an actualtilt has no mathematically consistent solution for our dataset. We have to exclude significant tilt influence on @Bz/@xwith more case-specific arguments, for example consideringcorresponding changes in Bx.
[21] All problems with nonlinearity and tilts are expectedto aggravate for larger observed |Bx|; therefore, a stricterlimitation on Bx (criterion 1) helps also to decrease method-ical errors.
[22] Finally, one should mention the problem of accuracyof Bz offset determination, since it is close to the space-craft spin axis component, uncertainties in which could belarger. One can reasonably expect that the accuracy of offsetdetermination is about a fraction of nT.
3. Examples[23] Figure 1 shows near-Earth crossing of 31 August
2008 with the classical signatures of growth phase. Thepanels show Bx, Bz, Vx (ion velocity), jy (cross-tail currentdensity), and @Bz/@x. The location (at 15:30 UT) of thetail-most C2 spacecraft was (–12.8, –4.4, 2.3) RE, of the
Figure 4. Event 4: 20 August 2006. Notations and colorsare as in Figure 1.
5723

PETRUKOVICH ET AL: @Bz/@x IN THE TAIL BY CLUSTER
Figure 5. (Left) Locations of events. (Right) Cross-tail current density before onsets (5 min averages)along X, for Y > 0 and Y < 0.
Earth-most C4—(–10.4, –4.9, 2.3) RE. Bz at C4 (blue linein the second panel) was always larger than at C2 (redline), corresponding to a substantial earthward gradient. Bxvalues at C2 and C4 were similar and less than 10 nT, thusminimizing possible errors in Bz. The signatures of growthphase were gradual growth of cross-tail current density up to5 nA/cm2, decrease of Bz to less than 2 nT at all spacecraft,and decrease of (always positive) @Bz/@x from 2 to almost0.5 nT/RE.
[24] The local onset was registered around 15:27 UT(dashed vertical line) as a clear increase of Bz and decreaseof current density. Here it could be set alternatively 2–3 minlater, depending on how one treats the first signatures. Therewas no corresponding (to dipolarization) substantial ion flowburst, C1 and C3 registered only very slow tailward flow,which could be understood as the rebound of a nearby earth-ward flow. Unfortunately, the particle detector on C2 was notoperating. The electric field on C2 had no clear signature ofa convective flow (not shown here). There was no sign ofcorresponding activity in the AL index.
[25] This example clearly demonstrates the problemsarising with the gradient determination in a dynamicstructure at onset. During 15:27–15:30 UT, the tail-most Bz(red curve) jumped almost 2 times higher than that of allother spacecraft, which were still untouched by the incom-ing dipolarization. The gradiometer returned only a minornegative @Bz/@x � –0.5 nT/RE, while the straightforwardlytaken difference of Bz at C2 and C4 corresponds to a peakvalue about –1.5 nT/RE. The 3-D gradiometer calculation inthis case redistributed the increase of Bz mostly to @Bz/@y and@Bz/@z because of a specific tetrahedron configuration (notshown here).
[26] Figure 2 shows a midtail crossing from 28 August2005. At 23:30 UT, the most tailward located C2 spacecraftwas at (–17.8, –3.2, 0.4) RE, the most earthward located C4at (–16.4, –3.3, 0.34) RE.
[27] The growth phase (stretching) behavior could berevealed with the gradual decrease of Bz from 4 to 1–2 nT,and the relatively large cross-tail current density about 2–4 nA/cm2. The local onset was set around 23:21 UT (vertical
Figure 6. The @Bz/@x in the (left) beginning of intervals and (right) before onsets relative to X. Verticallines show standard deviation of gradient within 5 min of averaging.
5724

PETRUKOVICH ET AL: @Bz/@x IN THE TAIL BY CLUSTER
Figure 7. Pairs of Bz for C2 and C4 depending on X,averaged in 5 min bins (top) 10–15 min before onset,(middle) 0–5 min before onset, (bottom) 0–5 min after onset.The colors assignment is explained in the text.
line) near the moment of C2 Bz jump and the maximumcurrent density. At the same time, the AL index showed asmall activation on the background of ongoing activity (notshown here).
[28] There was no any stable difference between Bz(as measured on four spacecrafts), @Bz/@x was fluctuatingwithin ˙1 nT/RE around zero with a period of about 10–15min. Especially, we point out the interval 23:05–23:15 UT,when the clear negative @Bz/@x � –1 nT/RE was observed.Bz at the tail-most C2 (red line) was about 1 nT larger thanthose at the other spacecraft, whereas Bx was small andalmost the same at C2 and C4. Another increase of the tail-most Bz was right before the onset; however, here Bx valueswere substantially different and a tilt influence is possible.
[29] Figure 3 presents an example from 8 August 2006.At 21:00 UT, the most tailward located C2 was at (–14.7,–9.1, 1.1) RE, the most earthward located C4—at (–13.2,–9.1, 0.6) RE.
[30] The growth phase (stretching) behavior is identifiedas a gradual decrease of Bz from 5–7 to 3–4 nT and a
modestly large cross-tail current density about 1–2 nA/cm2.The local onset was set around 21:14 UT (vertical line) at thecurrent density maximum and near C2 Bz increase. At thistime, the AL index did not reveal any geomagnetic activity(not presented here).
[31] Again, there was no stable difference between Bz atdifferent spacecraft during this event. @Bz/@x started withpositive value of about 1–2 nT/RE but quickly decreasedto zero. At 19:30–19:40 UT, oppositely directed changes ofBz resulted in large transient gradients. Around the onset21:10–21:14 UT, Bz at C2 increased to 6 nT (red curve),whereas C4 Bz decreased, making @Bz/@x strongly nega-tive (<–2 nT/RE). Since Bx at C2 and C4 both increased,the Bz changes cannot be explained by the same sheet tilt.The only alternative could be a wavy sheet deformation withthe opposite sheet tilts.
[32] Finally, it is worth to note a substantially differentvalue of C3 Bz around onset. C3 was located right betweenC2 and C4, but 1–1.5 RE below. Thus, the difference inobserved Bz could be related to the substantial difference inBx, but the latter is essentially vanishing here. Alternatively,one can speculate about a transient sheet stretching (Bz dropsto zero) and a corresponding spike of earthward ion flowthat occurred between C2 and C4 (near C3). This event thusmay be understood as a very localized (1–2 RE wide) onset.Details of such interpretation will be addressed elsewhere.
[33] Figure 4 shows an event with no clear onset on 20August 2006. Some spacecraft left the required proximity ofneutral sheet at 18:10 UT before any onset was registered.At 17:00 UT, the most tailward located C2 was at (–16.0,–6.0, 1.4) RE, and the most earthward located C4 at (–14.7,–6.1, 1.8) RE. The growth phase (stretching) behavior couldbe revealed with the gradual decrease of Bz from more than10 to about 4 nT, and a modest increase of cross-tail currentdensity to 2 nA/cm2. This case could be interpreted as aninterval of thinning/stretching in a strongly dipolarized state,formed after a significant previous substorm (as revealed byAL, not shown here). The local onset was not identified inthis case.
[34] The @Bz/@x started with positive value of about2 nT/RE and gradually decreased down to negative values of�–1 nT/RE, when the stretching progressed. These changeswere in agreement with red and blue Bz curves in Figure 4.Therefore, for about 30 min, the configuration was observedwith 4–5 nT at the downtail location and about 3 nT 1.3 REcloser to the Earth. On the top of this general trend, @Bz/@xvaried with a period of about 15 min and a magnitude of˙1 nT/RE. Such relatively large amplitude of variations(contrary to the previous examples) was probably due torather large values of Bz in this event. Again, as in the previ-ous example, a substantially different value of Bz at C3 wasobserved but also with a substantial difference in Bx.
4. Statistics[35] Figure 5 (left) shows averaged spacecraft locations
in the YZ GSM plane for all 58 events. The midnight andpremidnight zones are not so well covered due to data gaps.The right panel shows statistics of jy depending on flank(Y) and X for all 58 events. Values were averaged withinthe last 5 min before onsets. The circled points correspondto 14 events with unreliable gradient estimation due to a
5725

PETRUKOVICH ET AL: @Bz/@x IN THE TAIL BY CLUSTER
Figure 8. Temporal evolution of (a) Bz and (c) @Bz/@x relative to onset for all events (in 5 min averages).Superposed epochs of temporal evolution of (b) Bz and (d) @Bz/@x relative to onset calculated for threespatial bins. On Figure 8d, solid lines correspond to @Bz/@x, dashed lines—to @Bz/@r.
large Bx and presumably larger current density in a thin-ner sheet. Current density values were within 1–5 nA/cm2,generally corresponding to the previous results [Petrukovichet al., 2007, 2009]. The presented cross-tail current densityapparently slightly decreases toward Earth, but this changeis marginally statistically significant.
[36] Figure 6 shows the distribution of @Bz/@x relative toX only for 37 events with onsets. On the left panel—for thebeginning of the intervals, on the right panel—before theonsets. The values were averaged in 5 min intervals. The ver-tical line at each point shows standard deviation in thecorresponding 5-min interval, important to assess degree ofvariability. @Bz/@x generally decreased closer to onset andtailward. In the near tail, the values are generally larger andpositive. In the middle tail (beyond�13–14 RE), most pointsare less than 0.5–1 nT/RE in magnitude and many are in thenegative zone. One point is out of scale in both panels (thevalue is about –5 nT/RE).
[37] Figure 7 is another representation of the preonsetconfiguration, allowing to assess also corresponding valuesof Bz and cross-check conclusions on @Bz/@x. We plot thevalues of C2 and C4 Bz for each event with respect to the Xcoordinate and connect these two points with a line. Theslope of the line then is a proxy for @Bz/@x, since C2 isthe tail-most spacecraft, while C4 is the Earth-most space-craft, and both usually have similar Y and Z coordinates. Wepresent 5 min averages for three epoch intervals: 15–10 minbefore onset, 5–0 min before onset and 0–5 min after onset.The former represents typical growth phase, while the twolatter—the onset-related configuration.
[38] With Figure 7, it is possible to distinguish threemain “groups” in our statistics, corresponding to the differ-ent tail configurations. The first group (blue lines) containsthe events within 13 RE with rather strong positive @Bz/@x.A representative of this type is Example 1 (Figure 1).The second group with mostly tailward location (red lines)includes cases with very small Bz about 1–2 nT and small(including negative) @Bz/@x. The difference between actuallymeasured Bz in such cases is only a fraction of nT. Arepresentative of this type is Example 2 (Figure 2). Thethird group are events with more intermediate location, withsomewhat larger Bz between 2 and 5 nT (green lines). Rep-resentatives of this type are Examples 3 and 4 (Figures 3and 4), though for the latter, the onset was not identified andthis event is not in Figure 7. The colors were assigned byvisual inspection of Figure 7 (top) and kept the same forthe two other epoch intervals (middle and bottom). Thereis a clear gap in Bz values between “red” and “green”groups, persisting in time throughout the growth phase andcloser to onset. This signature will be investigated in moredetail elsewhere.
[39] Of special interest in Figure 7 are observations oflarge negative @Bz/@x, when the tail-most (C2) Bz wasseveral nT larger than that at C4. These several events wereregistered more tailward, beyond 13 RE, and in the two near-onset intervals. A representative of this type is Example 3(Figure 3).
[40] Variability of the observed gradients in the courseof growth phase can be further assessed in Figure 8, wherewe show 5 min averages of Bz (Figure 8a) and @Bz/@x
5726

PETRUKOVICH ET AL: @Bz/@x IN THE TAIL BY CLUSTER
(Figure 8c) from 60 min until 10 min after the onsets for all37 events, as well as the superposed epoch averages in thethree radial bins (Figures 8b and 8d).
[41] The occurrence of negative @Bz/@x in Figure 8b isgenerally consistent with that in Figure 7. There were nonegative values for the statistics in the near tail. Manycurves for more tailward events are fluctuating around zero,becoming negative for 1–2 points (5–10 min). There wasno clear association of negative @Bz/@x with onset; it couldbe observed at any moment. The stronger negative values(<–1 nT/RE) were observed more often at onsets (see alsoFigure 7), but the numbers are not convincing. The totalamount of 5 min points with substantial negative @Bz/@x <–0.5 nT/RE in the range –60 to +10 min was equal to 37out of 459 available, and 16 of them were in the three latest“onset-related” bins. The values for @Bz/@x < –1 nT/RE were11 and 5, respectively.
[42] Figures 8b and 8d show average tail behavior at thedifferent downtail distances. Division in the three radialbins generally is almost equivalent (at least the averagedcurves are practically identical) to the groups in Figure 7,and thus, the same colors are used. With all uncertainties ofonset placement, both Bz and @Bz/@x averages increased afterzero epoch, proving that on average timing was reasonable.@Bz/@r was slightly more negative than @Bz/@x (cf. solid anddashed lines in Figure 8d), but the difference was vanishingcloser to the onsets as the tail stretching progressed.
[43] In the near-Earth zone, R < 14 RE (blue lines) averageBz and @Bz/@x decreased during growth phases. Bz was onaverage 4 nT at onset (while Example 1 showed a decrease to2 nT). Here the difference between X and R derivatives wasthe largest but also not principal. The midtail events behind17 RE (red lines) had zero average @Bz/@x with no clear trendmostly ˙0.5 nT/RE, while Bz decreased only in the first halfof growth phase until it reached 2 nT on average. A deeperminimum of @Bz/@x before and after onsets was createdby the several cases with the large negative values. At thedistances 14–17 RE, the third group (green line) exhibitsessentially intermediate behavior. The average Bz decreasedthroughout the whole growth phase to �3 nT, while the
Figure 9. Sheet evolution in coordinates Bz and @Bz/@x(only first and last points of each interval are shown).
Figure 10. The full sheet evolution (all 5 min pointsare shown excluding onset points) in coordinates Bz and@Bx/@z/@Bz/@x. Only 10 near-Earth events are presented withstable @Bz/@x.
average @Bz/@x reached the “ground” level below 0.5 nT/RE20 min before the onset. Since the total number of theevents is not large, specific point-to-point variations of thesesuperposed epoch curves are not statistically representative.
[44] Figure 9 shows the time history of each growthphase (all available 5 min points) in the coordinates Bz and@Bz/@x (the first and the last points connected). There isno one-to-one correspondence between Bz and @Bz/@x, thesame Bz corresponded to different @Bz/@x in different events.Figure 10 shows the full time history in the coordinates Bzand (@Bx/@z)/(@Bz/@x) for 10 near-Earth events (all pointsshown) with the stable positive @Bz/@x. The derivatives werecomparable for larger Bz, while the one-dimensional config-uration @Bx/@z � @Bz/@x developed quickly, when Bz wasbelow 4–6 nT.
[45] We also assessed possible changes in gradients, whenthe alleged dynamic sheet tilt was accounted for with a blindcorrelation method (see section 2). We computed correlationcoefficients between Bx and Bz, corresponding tilt angles in10 min intervals before onsets for 37 events. The unambigu-ous interpretation was possible only in 15 cases with bothcorrelation coefficients larger than 0.5 and with the samesign. Only in four cases the final sign of @Bz/@x was changed.Therefore, our statistical results do not depend critically onthe geometry assumptions.
5. Discussion and Conclusions[46] With Cluster observations during 2005–2009, we
investigated @Bz/@x dynamics in the thin stretching sheets(during growth phases) at the downtail distances –8 > X >–18 RE. We consider |@Bz/@x| � 0.5 nT/RE (less than 1 nT ofactual difference between spacecraft) as the minimal value,which it is possible to identify reliably in our data set. Atthe smaller level, one can not exclude substantial input fromsome mesoscale sheet variations, as well as other measure-ment uncertainties. To avoid more transient features, we alsoaverage in 5 min intervals.
5727
PETRUKOVICH ET AL: @Bz/@x IN THE TAIL BY CLUSTER
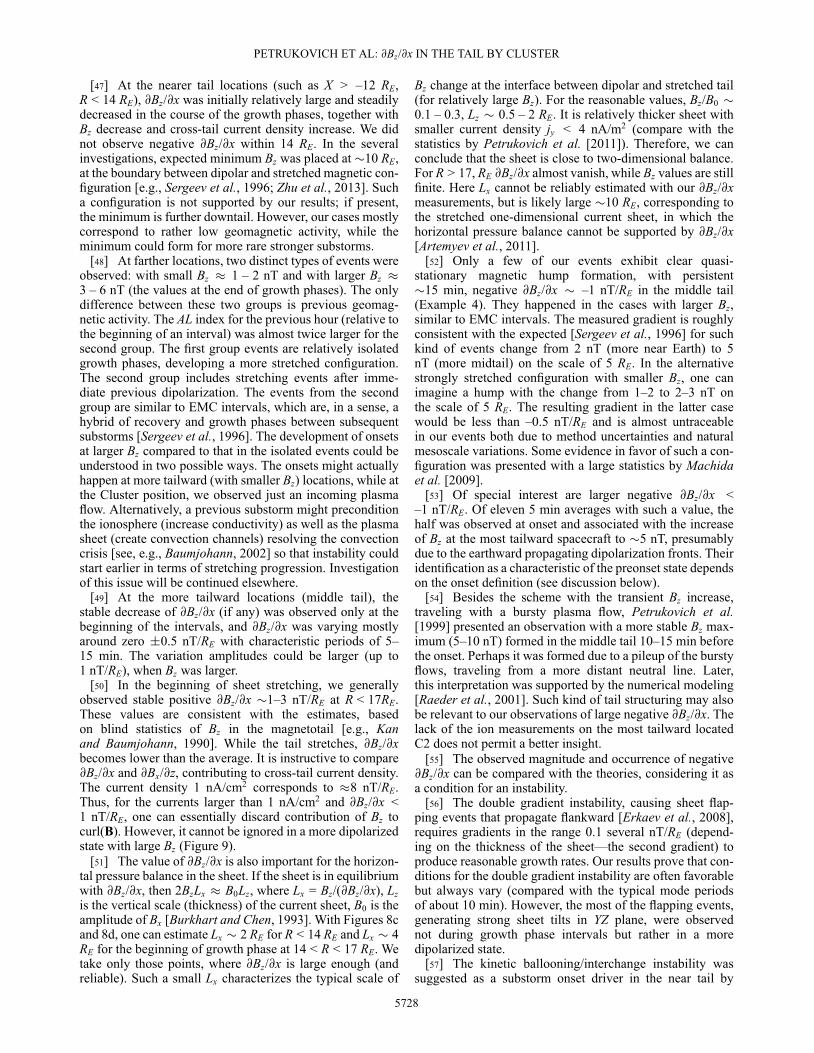
[47] At the nearer tail locations (such as X > –12 RE,R < 14 RE), @Bz/@x was initially relatively large and steadilydecreased in the course of the growth phases, together withBz decrease and cross-tail current density increase. We didnot observe negative @Bz/@x within 14 RE. In the severalinvestigations, expected minimum Bz was placed at �10 RE,at the boundary between dipolar and stretched magnetic con-figuration [e.g., Sergeev et al., 1996; Zhu et al., 2013]. Sucha configuration is not supported by our results; if present,the minimum is further downtail. However, our cases mostlycorrespond to rather low geomagnetic activity, while theminimum could form for more rare stronger substorms.
[48] At farther locations, two distinct types of events wereobserved: with small Bz � 1 – 2 nT and with larger Bz �3 – 6 nT (the values at the end of growth phases). The onlydifference between these two groups is previous geomag-netic activity. The AL index for the previous hour (relative tothe beginning of an interval) was almost twice larger for thesecond group. The first group events are relatively isolatedgrowth phases, developing a more stretched configuration.The second group includes stretching events after imme-diate previous dipolarization. The events from the secondgroup are similar to EMC intervals, which are, in a sense, ahybrid of recovery and growth phases between subsequentsubstorms [Sergeev et al., 1996]. The development of onsetsat larger Bz compared to that in the isolated events could beunderstood in two possible ways. The onsets might actuallyhappen at more tailward (with smaller Bz) locations, while atthe Cluster position, we observed just an incoming plasmaflow. Alternatively, a previous substorm might preconditionthe ionosphere (increase conductivity) as well as the plasmasheet (create convection channels) resolving the convectioncrisis [see, e.g., Baumjohann, 2002] so that instability couldstart earlier in terms of stretching progression. Investigationof this issue will be continued elsewhere.
[49] At the more tailward locations (middle tail), thestable decrease of @Bz/@x (if any) was observed only at thebeginning of the intervals, and @Bz/@x was varying mostlyaround zero ˙0.5 nT/RE with characteristic periods of 5–15 min. The variation amplitudes could be larger (up to1 nT/RE), when Bz was larger.
[50] In the beginning of sheet stretching, we generallyobserved stable positive @Bz/@x �1–3 nT/RE at R < 17RE.These values are consistent with the estimates, basedon blind statistics of Bz in the magnetotail [e.g., Kanand Baumjohann, 1990]. While the tail stretches, @Bz/@xbecomes lower than the average. It is instructive to compare@Bz/@x and @Bx/@z, contributing to cross-tail current density.The current density 1 nA/cm2 corresponds to �8 nT/RE.Thus, for the currents larger than 1 nA/cm2 and @Bz/@x <1 nT/RE, one can essentially discard contribution of Bz tocurl(B). However, it cannot be ignored in a more dipolarizedstate with large Bz (Figure 9).
[51] The value of @Bz/@x is also important for the horizon-tal pressure balance in the sheet. If the sheet is in equilibriumwith @Bz/@x, then 2BzLx � B0Lz, where Lx = Bz/(@Bz/@x), Lzis the vertical scale (thickness) of the current sheet, B0 is theamplitude of Bx [Burkhart and Chen, 1993]. With Figures 8cand 8d, one can estimate Lx � 2 RE for R < 14 RE and Lx � 4RE for the beginning of growth phase at 14 < R < 17 RE. Wetake only those points, where @Bz/@x is large enough (andreliable). Such a small Lx characterizes the typical scale of
Bz change at the interface between dipolar and stretched tail(for relatively large Bz). For the reasonable values, Bz/B0 �0.1 – 0.3, Lz � 0.5 – 2 RE. It is relatively thicker sheet withsmaller current density jy < 4 nA/m2 (compare with thestatistics by Petrukovich et al. [2011]). Therefore, we canconclude that the sheet is close to two-dimensional balance.For R > 17, RE @Bz/@x almost vanish, while Bz values are stillfinite. Here Lx cannot be reliably estimated with our @Bz/@xmeasurements, but is likely large �10 RE, corresponding tothe stretched one-dimensional current sheet, in which thehorizontal pressure balance cannot be supported by @Bz/@x[Artemyev et al., 2011].
[52] Only a few of our events exhibit clear quasi-stationary magnetic hump formation, with persistent�15 min, negative @Bz/@x � –1 nT/RE in the middle tail(Example 4). They happened in the cases with larger Bz,similar to EMC intervals. The measured gradient is roughlyconsistent with the expected [Sergeev et al., 1996] for suchkind of events change from 2 nT (more near Earth) to 5nT (more midtail) on the scale of 5 RE. In the alternativestrongly stretched configuration with smaller Bz, one canimagine a hump with the change from 1–2 to 2–3 nT onthe scale of 5 RE. The resulting gradient in the latter casewould be less than –0.5 nT/RE and is almost untraceablein our events both due to method uncertainties and naturalmesoscale variations. Some evidence in favor of such a con-figuration was presented with a large statistics by Machidaet al. [2009].
[53] Of special interest are larger negative @Bz/@x <–1 nT/RE. Of eleven 5 min averages with such a value, thehalf was observed at onset and associated with the increaseof Bz at the most tailward spacecraft to �5 nT, presumablydue to the earthward propagating dipolarization fronts. Theiridentification as a characteristic of the preonset state dependson the onset definition (see discussion below).
[54] Besides the scheme with the transient Bz increase,traveling with a bursty plasma flow, Petrukovich et al.[1999] presented an observation with a more stable Bz max-imum (5–10 nT) formed in the middle tail 10–15 min beforethe onset. Perhaps it was formed due to a pileup of the burstyflows, traveling from a more distant neutral line. Later,this interpretation was supported by the numerical modeling[Raeder et al., 2001]. Such kind of tail structuring may alsobe relevant to our observations of large negative @Bz/@x. Thelack of the ion measurements on the most tailward locatedC2 does not permit a better insight.
[55] The observed magnitude and occurrence of negative@Bz/@x can be compared with the theories, considering it asa condition for an instability.
[56] The double gradient instability, causing sheet flap-ping events that propagate flankward [Erkaev et al., 2008],requires gradients in the range 0.1 several nT/RE (depend-ing on the thickness of the sheet—the second gradient) toproduce reasonable growth rates. Our results prove that con-ditions for the double gradient instability are often favorablebut always vary (compared with the typical mode periodsof about 10 min). However, the most of the flapping events,generating strong sheet tilts in YZ plane, were observednot during growth phase intervals but rather in a moredipolarized state.
[57] The kinetic ballooning/interchange instability wassuggested as a substorm onset driver in the near tail by
5728

PETRUKOVICH ET AL: @Bz/@x IN THE TAIL BY CLUSTER
Pritchett and Coroniti [2010]. This scheme was supportedby THEMIS (Time History of Events and MacroscaleInteractions during Substorms) observations including sub-sequent instability signatures [Panov et al., 2012a]. Twomore events and a direct comparison with the Pritchett andCoroniti modeling were reported by Panov et al. [2012b].Sitnov and Swisdak [2011] and Sitnov et al. [2013] suggestedthat a configuration with a blob of plasma and an increasedBz, providing negative @Bz/@x closer to Earth, is unstable tothe tearing mode. In both theories, the required @Bz/@x was ofthe order of 1–2 nT/RE, comparable with our observations.However, in these models, rather large ratio of Bz/B0 � 0.4was implemented, which is rather untypical in the stretchedmiddle tail, where we observed negative @Bz/@x (B0 is themaximum of Bx).
[58] In the recent paper, Pritchett and Coroniti [2013]suggested that the instability can also develop with smallerBz change or even with constant Bz, provided that theentropy is decreasing downtail. Usage of the entropy termneeds additional justification in the stretched middle tailwith nonadiabatic ion trajectories and, in any case, itscalculation is critically model dependent via the flux tubevolume estimate. The model selected by Pritchett andCoroniti [2013] implements constant (beyond certain down-tail distance) Bz, constant flux tube volume, and pressuredecreasing downtail.
[59] A more empiric estimate of the entropy parameterbased on the Tsyganenko model was provided by Wolf et al.[2006]. Simplifying their equations ((6) and (7)) for theequatorial plane in the stretched tail, we ignore y � x andB2
z /2�0 � Pe (Pe is total pressure, V—flux tube volume).
PeV5/3 � x1.27P1/6e B–0.52
z
[60] Pe decreases downtail as the squared lobe magneticfield. For the latter, empirical indices (of the power law)vary from –0.66 to –1.47 [Fairfield and Jones, 1996]. Thus,changes in Pe with X have a minor influence, the entropyparameter at a given X is determined mostly by Bz andclearly increases downtail with decreasing Bz. Contrary toa standard configuration, our negative @Bz/@x < –0.5 nT/REwith the spatial scale of 1–2 RE is rather strong and makesthis entropy parameter to decrease downtail.
[61] A more detailed observational evidence is necessaryto prove a causal link of suggested instabilities with onset.Here we have to return to the problem of onset identification.Transient Bz increases, required to produce large gradient inour cases, are already signatures of some onset-type devel-opment elsewhere downtail. Whether these transients aresimply propagating earthward or creating unstable condi-tions in the near tail for a new intensification depends on thedefinition and on the thorough analysis of complementaryground auroral and/or geomagnetic data.
[62] In conclusion, the presented Cluster observationsallowed to investigate plasma sheet stretching in terms of@Bz/@x. Our findings generally conform with the classi-cal understanding of dynamics in the near and middle tail.The gradient observations could be later compared with 2-D modeling results, appearing right now [Malova et al.,2013, and references therein]. Negative @Bz/@x were foundonly in the middle tail mostly as variations and/or transientdipolarizations and do not necessarily have clear attributionto (all) onsets.
[63] Acknowledgments. The authors would like to acknowledgeCluster Active Archive and Cluster instrument teams, in particular FGMand CIS for excellent data. This work was supported in part by the RussianAcademy of science program P-22, the Russian Foundation for BasicResearch (project 10-05-91001). E.P., R.N., and W.B. were supported withAustrian Science Fund (FWF I429-N16 and P23862-N16). A.A.P. alsowould like to acknowledge hospitality of IWF.
[64] Masaki Fujimoto thanks the reviewer for their assistance inevaluating this paper.
ReferencesArtemyev, A. V., L. M. Zelenyi, A. A. Petrukovich, and R. Nakamura
(2011), Hot electrons as tracers of large-scale structure of magne-totail current sheets, Geophys. Res. Lett., 38, L14102, doi:10.1029/2011GL047979.
Baker, D. N., T. I. Pulkkinen, V. Angelopoulos, W. Baumjohann, and R. L.McPherron (1996), Neutral line model of substorms: Past results andpresent view, J. Geophys. Res., 101(A6), 12,975–13,010, doi:10.1029/95JA03753.
Balogh, A., et al. (2001), The Cluster magnetic field investigation:Overview of in-flight performance and initial results, Ann. Geophys., 19,1207–1217.
Baumjohann, W., M. Hesse, S. Kokubun, T. Mukai, T. Nagai, and A. A.Petrukovich (1999), Substorm dipolarization and recovery, J. Geophys.Res., 104(A11), 24,995–25,000, doi:10.1029/1999JA900282.
Baumjohann, W. (2002), Modes of convection in the magnetotail, Phys.plasmas, 9, 3665–3667.
Burkhart, G. R., and J. Chen (1993), Particle motion in x-dependent Harris-like magnetotail models, J. Geophys. Res., 98(A1), 89–97, doi:10.1029/92JA01528.
Dunlop, M. W., D. J. Southwood, K. H. Glassmeier, and F. M. Neubauer(1988), Analysis of multipoint magnetometer data, Adv. Space Res.,8(9–10), 273–277.
Fairfield, D. H., and J. Jones (1996), Variability of the tail lobefield strength, J. Geophys. Res., 101(A4), 7785–7791, doi:10.1029/95JA03713.
Erkaev, N. V., V. S. Semenov, and H. K. Biernat (2008), Magnetic doublegradient mechanism for flapping oscillations of a current sheet, Geophys.Res. Lett., 35, L02111, doi:10.1029/2007GL032277.
Hu, B., R. A. Wolf, F. R. Toffoletto, J. Yang, and J. Raeder (2011), Con-sequences of violation of frozen-in flux: Evidence from OpenGGCMsimulations, J. Geophys. Res., 116, A06223, doi:10.1029/2011JA016667.
Kan, J. R., and W. Baumjohann (1990), Isotropized magnetic-momentequation of state for the central plasma sheet, Geophys. Res. Lett., 17,271–274.
Machida, S., Y. Miyashita, A. Ieda, M. Nose, D. Nagata, K. Liou, T. Obara,A. Nishida, Y. Saito, and T. Mukai (2009), Statistical visualization ofthe Earth’s magnetotail based on Geotail data and the implied substormmodel, Ann. Geophys., 27, 1035–1046.
Malova, H. V., V. Yu. Popov, D. C. Delcourt, A. A. Petrukovich, and L. M.Zelenyi (2013), Radial structure of thin current sheets in the Earth’smagnetotail: Implications of quasi-adiabatic theory, J. Geophys. Res.Space Physics, 118, 3937–4710, doi:10.1029/2013JA018815.
Nakamura, R., A. Retino, W. Baumjohann, M. Volwerk, N. Erkaev, B.Klecker, E. A. Lucek, I. Dandouras, M. Andre, and Y. Khotyaintsev(2009), Evolution of dipolarization in the near-Earth current sheetinduced by earthward rapid flux transport, Ann. Geophys., 27,1743–1754.
Nakamura, R., et al. (2011), Flux transport, dipolarization, and current sheetevolution during a double-onset substorm, J. Geophys. Res., 116, A00I36,doi:10.1029/2010JA015865.
Panov, E. V., et al. (2012a), Kinetic ballooning/interchange instabilityin a bent plasma sheet, J. Geophys. Res., 117, A06228, doi:10.1029/2011JA017496.
Panov, E. V., V. A. Sergeev, P. L. Pritchett, F. V. Coroniti, R. Nakamura,W. Baumjohann, V. Angelopoulos, H. U. Auster, and J. P. McFadden(2012b), Observations of kinetic ballooning/interchange instability sig-natures in the magnetotail, Geophys. Res. Lett., 39, L08110, doi:10.1029/2012GL051668.
Petrukovich, A. A., et al. (1998), Two spacecraft observations of areconnection pulse during an auroral breakup, J. Geophys. Res., 103(A1),47–59.
Petrukovich, A. A., T. Mukai, S. Kokubun, S. A. Romanov, Y. Saito,T. Yamamoto, and L. M. Zelenyi (1999), Substorm-associated pressurevariations in the magnetotail plasma sheet and lobe, J. Geophys. Res.,104(A3), 4501–4513, doi:10.1029/98JA02418.
Petrukovich, A. A., W. Baumjohann, R. Nakamura, T. Mukai, and O. ATroshichev (2000), Small substorms: solar wind input and magnetotail
5729

PETRUKOVICH ET AL: @Bz/@x IN THE TAIL BY CLUSTER
dynamics, J. Geophys. Res., 105(A9), 21,109–21,117, doi:10.1029/2000JA900057.
Petrukovich, A. A., W. Baumjohann, R. Nakamura, A. Runov, A. Balogh,and H. Reme (2007), Thinning and stretching of the plasma sheet,J. Geophys. Res., 112, A10213, doi:10.1029/2007JA012349.
Petrukovich, A. A., W. Baumjohann, R. Nakamura, and H. Reme(2009), Tailward and earthward flow onsets observed by Cluster ina thin current sheet, J. Geophys. Res., 114, A09203, doi:10.1029/2009JA014064.
Petrukovich, A. A., A. V. Artemyev, H. V. Malova, V. Y. Popov, R.Nakamura, and L. M. Zelenyi (2011), Embedded current sheets inthe Earth’s magnetotail, J. Geophys. Res., 116, A00I25, doi:10.1029/2010JA015749.
Pritchett, P. L., and F. V. Coroniti (2010), A kinetic ballooning/interchangeinstability in the magnetotail, J. Geophys. Res., 115, A06301,doi:10.1029/2009JA014752.
Pritchett, P. L., and F. V. Coroniti (2013), Structure and consequences of thekinetic ballooning/interchange instability in the magnetotail, J. Geophys.Res. Space Physics, 118, 146–159, doi:10.1029/2012JA018143.
Raeder, J., R. L. McPherron, L. A. Frank, S. Kokubun, G. Lu, T. Mukai,W. R. Paterson, J. B. Sigwarth, H. J. Singer, and J. A. Slavin (2001),Global simulation of the Geospace Environment Modeling substormchallenge event, J. Geophys. Res., 106(A1), 381–395, doi:10.1029/2000JA000605.
Reme, H., et al. (2001), First multispacecraft ion measurements in and nearthe Earth’s magnetosphere with the identical Cluster ion spectrometry(CIS) experiment, Ann. Geophys., 19, 1303–1354.
Runov, A., et al. (2006), Local structure of the magnetotail current sheet:2001 Cluster observations, Ann. Geophys., 24, 247–262.
Saito, M. H., L.-N. Hau, C.-C. Hung, Y.-T. Lai, and Y.-C. Chou (2010),Spatial profile of magnetic field in the near-Earth plasma sheet prior todipolarization by THEMIS: Feature of minimum B, Geophys. Res. Lett.,37, L08106, doi:10.1029/2010GL042813.
Sergeev, V. A., R. J. Pellinen, and T. I. Pulkkinen (1996), Steady mag-netospheric convection: A review of recent results, Space Sci. Rev., 75,551–604.
Sharma, A. S., et al. (2008), Transient and localized processes in themagnetotail: A review, Ann. Geophys., 26, 955–1006.
Sitnov, M. I., and M. Swisdak (2011), Onset of collisionless mag-netic reconnection in two-dimensional current sheets and formationof dipolarization fronts, J. Geophys. Res., 116, A12216, doi:10.1029/2011JA016920.
Sitnov, M. I., N. Buzulukova, M. Swisdak, V. G. Merkin, and T. E. Moore(2013), Spontaneous formation of dipolarization fronts and reconnectiononset in the magnetotail, Geophys. Res. Lett., 40, 22–27, doi:10.1029/2012GL054701.
Thompson, S. M., M. G. Kivelson, K. K. Khurana, R. L. McPherron, J. M.Weygand, A. Balogh, H. Rème, and L. M. Kistler (2005), Dynamic Harriscurrent sheet thickness from Cluster current density and plasma measure-ments, J. Geophys. Res., 110, A02212, doi:10.1029/2004JA010714.
Tsyganenko, N. A., and D. H. Fairfield (2004), Global shape of the magne-totail current sheet as derived from Geotail and Polar data, J. Geophys.Res., 109, A03218, doi:10.1029/2003JA010062.
Wolf, R. A., V. Kumar, F. R. Toffoletto, G. M. Erickson, A. M. Savoie,C. X. Chen, and C. L. Lemon (2006), Estimating local plasma sheet PV5/3 from single-spacecraft measurements, J. Geophys. Res., 111, A12218,doi:10.1029/2006JA012010.
Yang, J., R. A. Wolf, and F. R. Toffoletto (2011), Accelerated thinning ofthe near-Earth plasma sheet caused by a bubble-blob pair, Geophys. Res.Lett., 38, L01107, doi:10.1029/2010GL045993.
Zhu, P., J. Raeder, C. C. Hegna, and C. R. Sovinec (2013), Nature ofaxial tail instability and bubble-blob formation in near-Earth plasmasheet, J. Geophys. Res. Space Physics, 118, 653–663, doi:10.1029/2012JA017972.
5730