Clinical Outcomes to Exercise Training in Type 1 Diabetes
33
University of Plymouth PEARL https://pearl.plymouth.ac.uk Faculty of Health: Medicine, Dentistry and Human Sciences School of Biomedical Sciences 2018-05 Clinical Outcomes to Exercise Training in Type 1 Diabetes: A Systematic Review and Meta-Analysis. Jewiss, D http://hdl.handle.net/10026.1/11035 10.1016/j.diabres.2017.11.036 Diabetes Research and Clinical Practice Elsevier All content in PEARL is protected by copyright law. Author manuscripts are made available in accordance with publisher policies. Please cite only the published version using the details provided on the item record or document. In the absence of an open licence (e.g. Creative Commons), permissions for further reuse of content should be sought from the publisher or author.
-
Upload
khangminh22 -
Category
Documents
-
view
3 -
download
0
Transcript of Clinical Outcomes to Exercise Training in Type 1 Diabetes

University of Plymouth
PEARL https://pearl.plymouth.ac.uk
Faculty of Health: Medicine, Dentistry and Human Sciences School of Biomedical Sciences
2018-05
Clinical Outcomes to Exercise Training
in Type 1 Diabetes: A Systematic
Review and Meta-Analysis.
Jewiss, D
http://hdl.handle.net/10026.1/11035
10.1016/j.diabres.2017.11.036
Diabetes Research and Clinical Practice
Elsevier
All content in PEARL is protected by copyright law. Author manuscripts are made available in accordance with
publisher policies. Please cite only the published version using the details provided on the item record or
document. In the absence of an open licence (e.g. Creative Commons), permissions for further reuse of content
should be sought from the publisher or author.
Accepted Manuscript
Clinical Outcomes to Exercise Training in Type 1 Diabetes: A Systematic Re-view and Meta-Analysis
D. Jewiss, C. Ostman, N. King, N.A. Smart
PII: S0168-8227(17)31108-7DOI: https://doi.org/10.1016/j.diabres.2017.11.036Reference: DIAB 7156
To appear in: Diabetes Research and Clinical Practice
Received Date: 10 July 2017Revised Date: 25 August 2017Accepted Date: 28 November 2017
Please cite this article as: D. Jewiss, C. Ostman, N. King, N.A. Smart, Clinical Outcomes to Exercise Training inType 1 Diabetes: A Systematic Review and Meta-Analysis, Diabetes Research and Clinical Practice (2017), doi:https://doi.org/10.1016/j.diabres.2017.11.036
This is a PDF file of an unedited manuscript that has been accepted for publication. As a service to our customerswe are providing this early version of the manuscript. The manuscript will undergo copyediting, typesetting, andreview of the resulting proof before it is published in its final form. Please note that during the production processerrors may be discovered which could affect the content, and all legal disclaimers that apply to the journal pertain.
1
Clinical Outcomes to Exercise Training in Type 1 Diabetes: A Systematic Review and
Meta-Analysis.
D. Jewissa, C. Ostman
a, N. King
b, N.A. Smart
a
a Schools of Rural Medicine and Science and Technology,
University of New England, Armidale, NSW 2351, Australia
b School of Biomedical and Healthcare Sciences, Plymouth University Peninsula Schools
of Medicine and Dentistry, Plymouth University, Plymouth, PL4 8AA, UK
Running head: Exercise training in type I diabetes: meta-analysis
Funding: This research did not receive any specific grant from funding agencies in the
public, commercial, or not-for-profit sectors.
Conflicts of interest: None declared
Word count: 5289
Address for correspondence:
Professor Neil A Smart, School of Science and Technology, University of New England,
Armidale, NSW 2351. Australia.
Email: [email protected]

2
ABSTRACT
Aims To establish the relationship between exercise training and clinical outcomes in
people with type I diabetes.
Methods Studies were identified through a MEDLINE search strategy, Cochrane
Controlled Trials Registry, CINAHL, SPORTDiscus and Science Citation Index. The search
strategy included a mix of key concepts related to exercise training; type 1 diabetes;
glycaemic control for trials of exercise training in people with type 1 diabetes. Searches were
limited to prospective randomized or controlled trials of exercise training in humans with
type 1 diabetes lasting 12 weeks or more.
Results In exercised adults there were significant improvements in body mass Mean
Difference (MD): -2.20 kg, 95% Confidence Interval (CI) -3.79 -0.61, p=0.007; body mass
index (BMI) MD: -0.39 kg/m2, 95% CI -0.75 -0.02, p=0.04; Peak VO2 MD: 4.08 ml/kg/min,
95% CI 2.18 5.98, p<0.0001; and, low-density lipoprotein cholesterol (LDL) MD: -0.21
mmol/L, 95% CI -0.33 -0.08, p=0.002. In exercised children there were significant
improvements in insulin dose MD: -0.23 IU/kg, 95% CI -0.37 -0.09, p=0.002; waist
circumference MD: -5.40 cm, 95% CI -8.45 -2.35, p=0.0005; LDL MD: -0.31 mmol/L, 95%
CI -0.55 -0.06, p=0.02; and, triglycerides MD: -0.21 mmol/L, 95% CI -0.42 -0.0, p=0.04.
There were no significant changes in glycosylated haemoglobin (HbA1C%), fasting blood
glucose, resting heart rate, resting systolic blood pressure or high density lipoproteins in
either group.
Conclusions Exercise training improves some markers of type 1 diabetes severity;
particularly body mass, BMI, Peak VO2 and LDL in adults and insulin dose, waist
circumference, LDL and triglycerides in children.
Keywords
3
Exercise Training, Meta-Analysis, Type I diabetes
Abbreviations
Body Mass Index (BMI)
CI – Confidence Interval
HDL – High Density Lipoproteins
LDL – Low Density Lipoproteins
HbA1C% - Glycosylated Hemoglobin
% HRmax - Heart Rate Peak
% VO2 Peak - Percentage of Peak Oxygen Uptake
MD – Mean Difference
INTRODUCTION
The clinically beneficial effects of lifestyle interventions have been shown in meta-analyses
in people with type II diabetes [1]. Substantial pooled data has demonstrated improvements in
peak VO2 [2] and glycaemic control [3] in individuals with type II diabetes. In the general
population, high intensity interval training has been shown to be more effective in regulating
glucose than continuous training at lower intensity [4]. Moreover, high intensity exercise
training has been shown to be superior to lower intensity exercise for improving
cardiorespiratory fitness (peak VO2) in heart failure patients [5-7]. Evidence of beneficial
effects of regular exercise training is sparse for people with Type I Diabetes (T1D).
While few trials of exercise training in T1D exits, it has been demonstrated that increased
physical activity is associated with an increased life expectancy and a lower risk of
4
complications in these patients [8]. More alarmingly an estimated 60% of adults with T1D do
not undertake the recommended 150 minutes of weekly levels of physical activity at
moderate (50-70% HRmax) to vigorous (>70% HRmax) intensity [9]. However, the clinical
implications of these guidelines are contentious and their effect on clinical outcomes are yet
to be established.
Poor compliance rate may be at least be partially explained by fear of an induced
hypoglycaemic episode and fitness levels [10]. While it has been shown that educational
interventions improve the associated fear of exercise induced hypoglycaemic event, no
appropriate evidence addresses the efficacy of the current recommendations and their
relationship to the clinical outcomes [10]. With T1D affecting adult, adolescent and
paediatric groups, the recommendations for children and adults in terms of physical activity
are very similar. We focused our work on establishing the clinical efficacy of the
recommendation for physical activity in all patients with Type 1 Diabetes.
We conducted a systematic analysis of all clinical randomized, controlled, aerobic exercise
training trials in people with type I diabetes. We aimed, via systematic review, to establish
the relationship between physical activity and its effect on clinical markers of glycaemic
control and cardiorespiratory fitness. Secondly, we wished to establish if exercise training
program parameters affected the size of change in clinical outcome measures. Finally, we
examined if our findings aligned with the current recommendations for physical activity.
MATERIALS AND METHODS
Search Strategy

5
Studies were identified through a MEDLINE search strategy (1985 to Aug 4, 2016),
Cochrane Controlled Trials Registry (1966 to Aug 4, 2016), CINAHL, SPORTDiscus and
Science Citation Index. The search strategy included a mix of MeSH and free text terms for
the key concepts related to exercise training, type 1 diabetes and glycaemic control for
clinical trials of exercise training in people with type 1 diabetes (see PubMed search strategy
in Supplementary file). We considered all types of physical training. Studies were included if
patients exhibited a diagnosis of type 1 diabetes. Searches were limited to prospective
randomized or controlled trials of exercise training in humans, lasting 12 weeks or more. No
restrictions were placed on the year, or language, of publication. Reference list of papers and
latest editions of relevant journals which were not available online were scrutinised for new
references. Full articles were read and assessed by two reviewers (DJ and CO) for relevance
and study eligibility. Disagreements on methodology were resolved by discussion, a third
reviewer (NS) adjudicated over any disputes. Study authors were contacted and requested to
provide further data if required.
Study selection
Included studies were randomized controlled trials of exercise training in people with type 1
diabetes. All published studies included in this systematic review were comparisons between
intervention groups and a sedentary control.
In addition to the studies identified through database searching, reference lists of identified
studies were scrutinized. Only the principal study with the greatest number of subjects was
included where multiple publications existed from the same dataset. After initial screening
we removed over-lapping, duplicates, duplicate data and irrelevant articles such as editorials
and discussion papers that did not match the inclusion criteria. We excluded studies where

6
the control group received additional intervention or did not have type 1 diabetes, non-
relevant studies; and those reporting only acute exercise testing responses. We excluded
studies from specific analyses if incomplete data was reported and the authors did not
respond to our requests to provide missing data.
Outcomes measures
We recorded the following data; percentage change in HbA1c%, BMI, body mass, Waist
Circumference, peak VO2, resting heart rate, resting systolic blood pressure, fasting blood
glucose, low density lipoproteins (LDL), high density lipoproteins (HDL), triglycerides and
daily insulin dose. We also recorded exercise training frequency, intensity, duration per-
session, length of exercise program, participant exercise adherence and completion rates.
Data Synthesis
From extracted data we calculated patient-hours of exercise training, mean difference change
in outcome measures and medical events.
Assessment of study quality
We assessed study quality with regard to: eligibility criteria specified, random allocation of
participants, allocation concealed, similarity groups at baseline, assessors blinded, outcome
measures assessed in 85% of participants and intention to treat analysis. The study quality
was assessed according to the validated TESTex scale which has a maximum score of 15
[11].
Data Synthesis

7
Revman 5.3 (Nordic Cochrane Centre, Denmark) was used to complete the meta-analysis and
generate forest plots. Pooled data are presented as mean differences. A minimum of three
intervention groups was required for forest plots. Some studies used more than one
intervention group, but the same people were only represented once in our forest plots.
Meta-analyses were completed for continuous data by using the change in the mean and
standard deviation of outcome measures. It is an accepted practice to only use post
intervention data for meta-analysis but this method assumes that random allocation of
participants always creates intervention groups matched at baseline for age, disease severity
etc. Change in post intervention mean was calculated by subtracting baseline from post
intervention values. Data required was either (i) 95% confidence interval data for pre-post
intervention change for each group or when this was unavailable (ii) actual p values for pre-
post intervention change for each group or if only the level of statistical significance was
available (iii) we used default p values e.g. p<0.05 becomes p=0.049, p<0.01 becomes
P=0.0099 and p = not significant becomes p=0.05.
Where appropriate data was divided into subgroups according to adults and children (under
18 years); and, pre and post 2000 studies. This was considered important because of
developmental changes to insulin formulations and insulin delivery technologies have evolved a
great deal over the past two decades. We believe these differences may lead to differences in key
parameters such as peak VO2 and because of possible chronological variations in the
technique used to measure some of the variables e.g. peak VO2. In many cases there was
insufficient studies/intervention groups to facilitate a complete analysis of all the
experimental groups.
Heterogeneity
8
Heterogeneity was quantified using the I2 test [12], as it does not inherently depend upon the
number of studies considered. I2 values range from 0% (homogeneity) to 100% (greater
heterogeneity); a CI that does not include 0% indicates that the hypothesis of homogeneity is
rejected, and an inference of heterogeneity is merited [12]. A random effects model was used
throughout.
Publication Bias
Egger plots [13] were provided to assess the risk of publication bias (see supplementary
files).
RESULTS
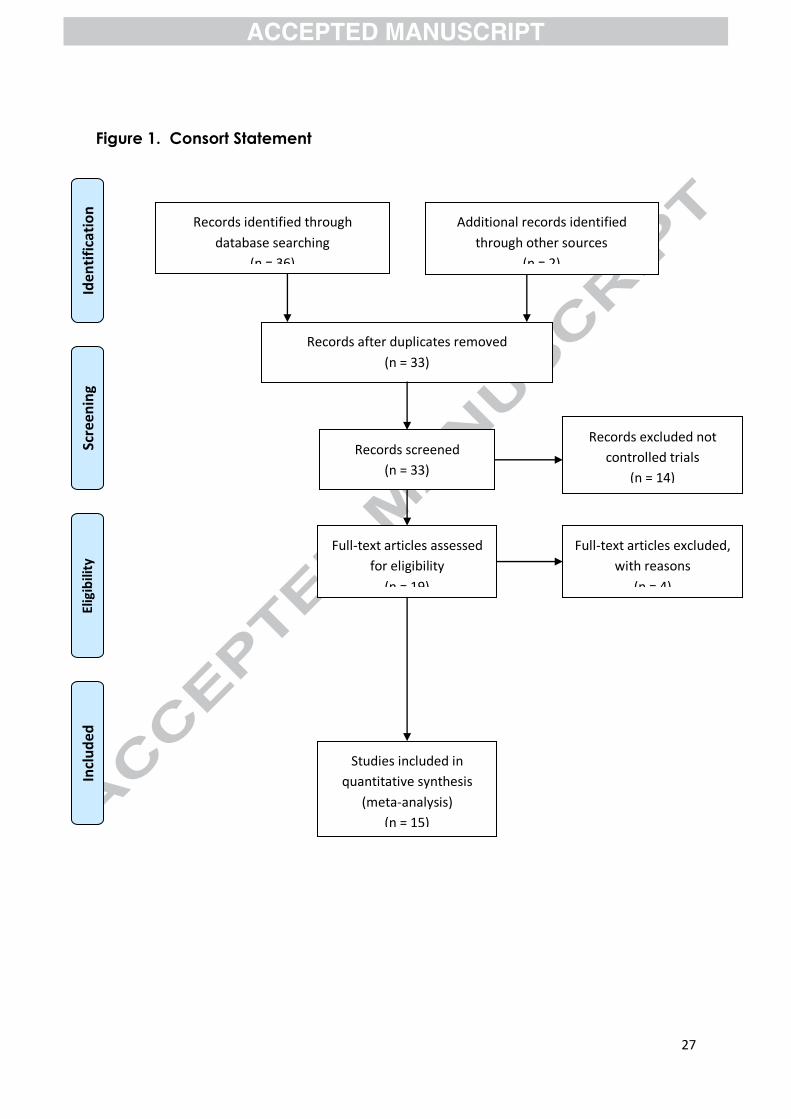
Our initial search identified 36 manuscripts. After removal of duplicates, 33 studies
remained, of which 14 were not randomised controlled trials. Out of the remaining 19 studies,
two were excluded due to a lack of proper randomisation, 2 were excluded due to a control
group consisting of those without diabetes, and another study was excluded for a non-
exercise intervention. This left 14 included studies [10, 14-27] for analysis. The search details
are provided in the CONSORT Statement, Figure 1.
Our analysis of the 15 studies (16 intervention groups) totalled 596 participants; 360 from
exercise groups and 236 from control groups. Five of the studies involved adults and 6 of the
studies were completed before 2000. The studies contain data from 9,251 patient-hours of
exercise training. Studies ranged in duration from 12-26 weeks (average 18.7 weeks, median
16 weeks), and 1-7 weekly exercise sessions (median =3) and session duration ranged from
20-120 minutes (median =47.5). Table 1. Summarizes the details of the included studies.
9
Meta-Analyses
All forest plots can be seen in the supplementary file.
HbA1C%
Eleven intervention groups provided data on HbA1C% of which 4 intervention groups were
in adults with the remainder in children and 4 studies were carried out prior to 2000. Results
show that there was no significant difference between exercise and control for either adults
MD: -0.08%, 95% CI: -0.38, 0.22; p = 0.6 (Chi2 = 13.96, df = 3, p = 0.003; I
2 = 79%); or,
children MD: -0.27%, 95% CI -0.73, 0.19; p = 0.25 (Chi2 = 22.97, df = 6, p = 0.0008; I
2 =
74%). There was also no significant difference between studies that were performed post-
2000 MD -0.11%, 95% CI -0.37, 0.16; p = 0.43 (Chi2 = 32.79, df = 6, p = 0.0001; I
2 = 82%);
and, studies that were performed pre-2000 MD: -0.15%, 95% CI -0.76, 0.46; p = 0.62 (Chi2 =
6.18, df = 3, p = 0.10; I2 = 51%).
Total daily insulin dose (IU/kg)
There was insufficient studies to pool data for total daily insulin dose in adults and in pre-
2000 studies. Four intervention groups studied this parameter in children, which showed that
exercise significantly lowered the total daily insulin dose MD: -0.23 IU/kg, 95% CI -0.37 -
0.09; p = 0.002 (Chi2 = 23.48, df = 3, p < 0.0001; I
2 = 87%). A similar significantly lowering
effect with exercise was measured in the 6 post-2000 intervention groups, where MD: -0.16,
95% CI -0.26, -0.05; p = 0.003 (Chi2 = 84.46, df = 5, p < 00001; I
2 = 94%).
Fasting blood glucose in children (mmol/L)
10
There was only sufficient intervention groups (3) to perform data pooling on fasting blood
glucose in children. Results show that there was no significant effect of exercise MD: -0.71
mmol/L, 95% CI -1.94, 0.52; p = 0.26 (Chi2 = 19.18, df = 2, p < 0.0001; I
2 = 90%).
Body mass (kg)
Sufficient data was available to perform data pooling in adults (3 intervention groups),
children (4 intervention groups) and post-2000 (5 intervention groups) studies. Results show
that exercise significantly reduced body mass in adults MD: -2.20 kg, 95% CI -3.79, -0.61; p
= 0.007 (Chi2 = 5.12, df = 2, p = 0.08; I
2 = 61%). In contrast, exercise significantly increased
body mass in children MD: 0.95 kg, 95% CI 0.17, 1.73; p = 0.02 (Chi2 = 2.12, df = 3, p =
0.55, I2 = 0%). Exercise did not significantly affect body mass in post-2000 studies MD: -
0.54, 95% CI = -2.1, 1.02; p = 0.5 (Chi2 = 17.95, df = 4, p = 0.001; I
2 = 78%).
BMI (kg/m2)
Sufficient data was available to perform data pooling in adults (3 intervention groups),
children (3 intervention groups) and post-2000 (6 intervention groups) studies. Results show
that exercise significantly reduced BMI in adults MD: -0.39 kg/m2, 95% CI -0.75, -0.02; p =
0.04 (Chi2 = 7.54, df = 2, p = 0.02; I
2 = 73%); but not in children MD: 0.29 kg/m
2, 95% CI -
0.03, 0.61; p = 0.07 (Chi2 = 1.92, df = 2, p = 0.38; I
2 = 0%). Exercise did not exert any
significant effect in post-2000 studies MD: -0.11 kg/m2, 95% CI -0.43, 0.21; p = 0.5 (Chi
2 =
18.83, df = 5, p = 0.002; I2 = 73%).
Waist circumference in children (cm)
Three intervention groups reported waist circumference in children and in post-2000 studies.
In children, results show that exercise significantly reduced waist circumference MD: -5.4
11
cm, 95% CI -8.45, -2.35; p = 0.0005 (Chi2 = 92.45, df = 2; p< 0.00001; I
2 = 98%). There was
insufficient data to perform pooling for adults and pre-2000 studies.
Peak VO2 (ml/kg/min)
Peak VO2 was reported in 4 adult studies and 3 studies on children. Results show that
exercise significantly increased peak VO2 in adults MD: 4.08 ml.kg-1
./min-1
, 95% CI 2.18,
5.98; p < 0.0001 (Chi2 = 4.88, df = 3, p = 0.18; I
2 = 39%); but, not in children MD: 1.95
ml.kg-1
./min-1
, 95% CI 0.04, 3.85; p = 0.05 (Chi2 = 0.96, df = 2, p = 0.62; I
2 = 0%). Four pre-
2000 and 3 post-2000 studies reported peak VO2. Results show exercise significantly
increased peak VO2 in both pre-2000 studies MD: 2.22 ml.kg-1
./min-1
, 95% CI 0.88, 3.57; p =
0.001 (Chi2 = 1.13, df = 3, p = 0.77; I
2 = 0%; and post-2000 studies MD: 3.1 ml.kg
-1./min
-1,
95% CI 0.29, 5.91; p = 0.03 (Chi2 = 3.47, df = 2; p = 0.18; I
2 = 42%).
Resting heart rate in adults (bpm)
There were insufficient data for pooling in children, pre-2000 and post-2000 studies
regarding resting heart rate. Three studies reported resting heart rate in adults. Results show
there was no significant difference in exercise compared to control MD: -4.11 bpm, 95% CI -
9.01, 0.8; p = 0.1 (Chi2 = 7.24, df = 2, p = 0.03; I
2 = 72%).
Resting systolic blood pressure in post-2000 studies (mmHg)
There were insufficient data for pooling in adults, children and pre-2000 studies. Results
show that there was no significant difference in exercise compared to control MD: -3.89
mmHg, 95% CI -11.61, 3.82; p = 0.32 (Chi2 = 0.2, df = 2, p = 0.91; I
2 = 0%).
LDL (mmol/L)

12
LDL was reported in 4 adults studies and in 3 (4 intervention groups) studies in children.
Exercise significantly reduced LDL in both adults MD: -0.21 mmol/L, 95% CI -0.33, -0.08; p
= 0.002 (Chi2 = 1.08, df = 3, p = 0.78; I
2 = 0%); and, in children MD: -0.31 mmol/L, 95% CI
-0.55, -0.06; p = 0.02 (Chi2 = 8.75, df = 3, p = 0.03; I
2 = 66%). LDL was also reported in 6
intervention groups post-2000. Results show that exercise led to a significant reduction in
LDL MD: -0.24 mmol/L, 95% CI -0.39, -0.09; p = 0.002 (Chi2 = 9.23, df = 5, p = 0.10; I
2 =
48%).
HDL (mmol/L)
HDL was reported in 4 adults studies and 3 (4 intervention groups) studies in children.
Exercise did not affect the plasma HDL concentration in either adults MD: 0.01 mmol/L,
95% CI -0.08, 0.10; p = 0.86 (Chi2 = 10.86, df = 3, p = 0.01; I
2 = 72%); or children MD: 0.15
mmol/L, 95% CI -0.07, 0.37; p = 0.17 (Chi2 = 22.13, df = 3, p < 0.0001; I
2 = 86%). HDL was
also reported in 5 (6 intervention groups) post 2000 studies, where exercise also did not affect
the plasma HDL concentration MD: 0.1 mmol/L, 95% CI -0.07, 0.28; p = 0.26 (Chi2 = 48.35,
df = 5, p < 0.00001; I2 = 90%).
Triglycerides (mmol/L)
Triglycerides were reported in 4 adult studies and 3 (4 intervention groups) studies in
children. Exercise did not affect triglycerides in adults MD: -0.1 mmol/L, 95% CI -0.31, 0.11;
p = 0.33 (Chi2 = 26.27, df = 3, p < 0.00001; I
2 = 89%). In contrast, exercise significantly
reduced triglycerides in children MD: -0.21 mmol/L, 95% CI -0.42, -0.01; p = 0.04 (Chi2 =
649.47, df = 3, p < 0.00001; I2 = 100%). In addition, triglycerides were measured in 5 (6
intervention groups) post 2000 studies. The MD was -0.25 mmol/L, 95% CI -0.43, -0.08; p =
0.004 (Chi2 = 649.95, df = 5, p < 0.00001; I
2 = 99%).
13
Effect of Exercise Time on Selected Outcome Measures
Table 2 shows changes in outcome measures stratified by weekly exercise time. Overall the
response was varied with regard to weekly exercise time.
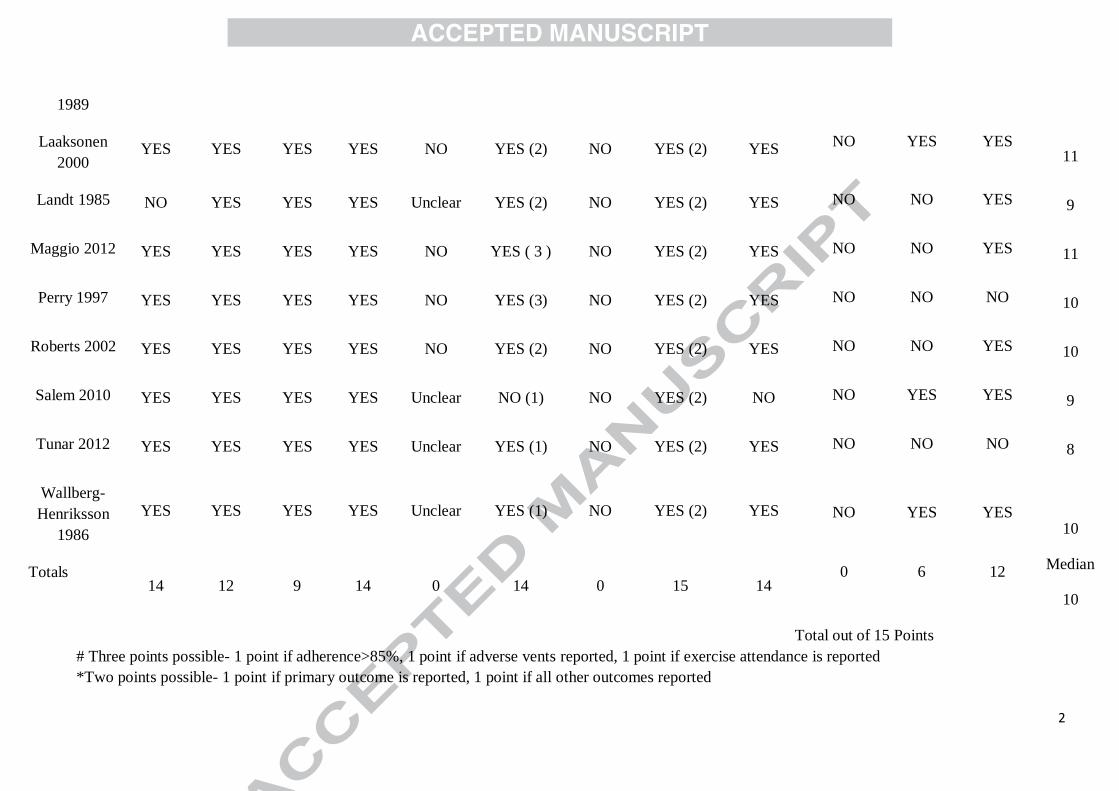
Study Quality
The TESTEX scale of study quality revealed a median score of 10 (out of a possible 15).
Study quality items that were not exhibited by more than 50% of studies were, assessor
blinding (0 studies), intention to treat analyses (0 studies), relative exercise intensity review
(6 studies) and activity monitoring of the control (non-exercise) groups (0 studies) (See Table
3).
DISCUSSION
Our work is the first to conduct a data pooling analysis of the effects of exercise training and
associated moderator variables on clinical markers of type I diabetes control. In children our
analyses showed improvements in total daily insulin dose, waist circumference, LDL and
triglycerides. In adults there were improvements in body mass, BMI, peak VO2, LDL and
triglycerides. Peak VO2 was also improved in studies carried out both pre- and post-2000,
whilst LDL and triglycerides decreased in post 2000 studies. There remains insufficient
published data to establish the moderating effect of exercise program duration for most of the
reported outcome measures, however it is likely that exercise program duration has a
moderating role.
Hba1C% did not show a significant change with exercise training. Given that the median
duration of included studies was 13 weeks, which is a similar duration to the life of a red

14
blood cell, it is possible that only partial changes in HbA1c% via exercise training are
possible in such a short timeframe. The pre-enrolment physical activity levels of the
participants in many of the included studies were unknown, therefore the expected benefit is
difficult to ascertain. However, the importance of sustained lifestyle changes to affect health
improvements should be reinforced as previous systematic reviews have suggested sedentary
behaviour in youths with Type 1 diabetes [28, 29].
Interestingly, exercise led to a significantly reduced body mass in adults, but a significantly
increased body mass in children. A similarly increasing effect on body mass with improved
hepatic insulin sensitivity has been reported in obese children in response to resistance
training [30]. In that study the increased body mass was associated with increased lean body
mass [30]. An increase in muscle mass may also explain the weight gain in studies conducted
on children in our analysis, particularly since we also showed a decreased waist
circumference in the studies conducted on children and a reduced total daily insulin dose. A
small, pooled analysis from 2014 suggests equivocal findings with respect to insulin dose
[31].
Our serum LDL results showed improvement in both adults and children with exercise. A
recent meta-analysis in participants with type 2 diabetes mellitus reported no change in serum
LDL [32], whilst an older meta-analysis reporting on apparently healthy elderly participants
had results favouring positive changes in LDL [33]. In contrast, a non-randomised controlled
trial has shown a reduction in LDL after exercise in children with type 1 diabetes [34].
The change in Peak VO2 in adults was in the order of 0.8 METs and this moderate effect is to
be expected in a known chronic disease group. Our analyses were however unable to identify
15
that at least 100 minutes of weekly activity is optimal for change in peak VO2. Previous work
has shown that intensity is the primary stimulus for improved cardiorespiratory fitness in
people with cardiac disease [6]. One may expect intuitively that increasing exercise program
duration would produce greater improvements in peak VO2. It is therefore perhaps surprising
that studies comparing shorter and longer exercise program durations have produced non-
uniform effects on peak VO2 [5, 6, 35]. The likely explanation for this phenomenon is that it
may be more difficult to get patients to continue to adhere to an exercise program in the
longer term.
Our sub-analyses produced conflicting results with respect to weekly exercise time, the more
time exercising, the better the effect on glycaemic control, however the less time, the better
effect on the lipids. It is remarkable that the exercise guidelines for type II diabetes were one
of the first to offer a sliding exercise prescription scale, based upon the manipulation of
intensity and weekly duration in order to keep work volume relatively constant [36]. These
guidelines suggest 270 weekly minutes of moderate intensity exercise but only 90 minutes of
vigorous intensity activity. Our work suggests a varied response to weekly exercise duration,
so the existence of a two-tiered exercise prescription could be related to total work, or energy
expended. Energy expenditure is the product of exercise duration, intensity and frequency.
We were unable to calculate energy expenditure in a sufficient number of the included studies
to shed more light on this.
Limitations
A major limitation of this work was that considerable heterogeneity meant that data pooling
was unjustified in a number of meta-analyses. We systematically attempted to identify
reasons for heterogeneity by grouping studies according to similarities in interventions and
16
exercise programs. We were able to reduce heterogeneity somewhat by limiting data pooling
to studies that did not use concurrent dietary interventions.For several of the studies included
in this meta-analysis we were unable to determine if medications held steady across the study
groups. Even if we knew of medication changes, we would need to assess individual patient
data for this to be meaningful. We are therefore unable to gauge the extent to which the
observed changes were attributable to any medication changes. A similar issue is true of
subjects who exhibited low or high resting heart rate, blood pressure and body mass as at group-level,
and not patient level, data analysis we are unable to make adjustments to analyses. The exercise
training programs varied greatly between studies with respect to exercise intensity, duration,
frequency and modality. The normal distribution of the Egger plots evidenced minimal risk of
publication bias.
Measures of lean and fat mass would have shed more light onto the role that body
composition plays in improving glycaemic control through exercise. We would like to have
conducted more moderator variable analyses but limited extracted data precluded this. We
were only able to consider program duration, and high/vigorous versus low/moderate exercise
intensity sub-analyses.
Conclusions
Exercise training improves some markers of type 1 diabetes severity; particularly body mass,
BMI, Peak VO2 and LDL in adults and insulin dose, waist circumference, LDL and
triglycerides in children.Our analysis support existing guidelines that for those who can
tolerate it, we were unable to determine if exercise at any intensity offered superior benefits.
Acknowledgements
17
None
References
[1] Chen, L., Pei, J. H., Kuang, J., Chen, H. M., Chen, Z., Li, Z. W. and Yang, H. Z. Effect of
lifestyle intervention in patients with type 2 diabetes: a meta-analysis. Metabolism, 64, 2 (Feb
2015), 338-347.
[2] Boule, N. G., Kenny, G. P., Haddad, E., Wells, G. A. and Sigal, R. J. Meta-analysis of the
effect of structured exercise training on cardiorespiratory fitness in Type 2 diabetes mellitus.
Diabetologia, 46, 8 (Aug 2003), 1071-1081.
[3] Snowling, N. J. and Hopkins, W. G. Effects of different modes of exercise training on
glucose control and risk factors for complications in type 2 diabetic patients: a meta-analysis.
Diabetes Care, 29, 11 (Nov 2006), 2518-2527.
[4] Jelleyman, C., Yates, T., O'Donovan, G., Gray, L. J., King, J. A., Khunti, K. and Davies,
M. J. The effects of high-intensity interval training on glucose regulation and insulin
resistance: a meta-analysis. Obes Rev, 16, 11 (Nov 2015), 942-961.
[5] Ismail, H., McFarlane, J. R., Dieberg, G. and Smart, N. A. Exercise training program
characteristics and magnitude of change in functional capacity of heart failure patients. Int J
Cardiol, 171, 1 (Jan 15 2014), 62-65.
[6] Ismail, H., McFarlane, J. R., Nojoumian, A. H., Dieberg, G. and Smart, N. A. Clinical
outcomes and cardiovascular responses to different exercise training intensities in patients
with heart failure: a systematic review and meta-analysis. JACC. Heart failure, 1, 6 (Dec
2013), 514-522.
[7] Jewiss, D., Ostman, C. and Smart, N. A. The effect of resistance training on clinical
outcomes in heart failure: A systematic review and meta-analysis. Int J Cardiol, 221 (Jul 5
2016), 674-681.
18
[8] Tielemans, S. M., Soedamah-Muthu, S. S., De Neve, M., Toeller, M., Chaturvedi, N.,
Fuller, J. H. and Stamatakis, E. Association of physical activity with all-cause mortality and
incident and prevalent cardiovascular disease among patients with type 1 diabetes: the
EURODIAB Prospective Complications Study. Diabetologia, 56, 1 (Jan 2013), 82-91.
[9] Plotnikoff, R. C., Taylor, L. M., Wilson, P. M., Courneya, K. S., Sigal, R. J., Birkett, N.,
Raine, K. and Svenson, L. W. Factors associated with physical activity in Canadian adults
with diabetes. Med Sci Sports Exerc, 38, 8 (Aug 2006), 1526-1534.
[10] Brazeau, A. S., Rabasa-Lhoret, R., Strychar, I. and Mircescu, H. Barriers to physical
activity among patients with type 1 diabetes. Diabetes Care, 31, 11 (Nov 2008), 2108-2109.
[11] Smart, N. A., Waldron, M., Ismail, H., Giallauria, F., Vigorito, C., Cornelissen, V. and
Dieberg, G. Validation of a new tool for the assessment of study quality and reporting in
exercise training studies: TESTEX. International journal of evidence-based healthcare, 13, 1
(Mar 2015), 9-18.
[12] Higgins JPT, T. S., Deeks JJ, Altman DG. Measuring inconsistency in meta-analysis.
British Medical Journal, 327, 7414 (2003), 557-560.
[13] Egger, M., Davey Smith, G., Schneider, M. and Minder, C. Bias in meta-analysis
detected by a simple, graphical test. BMJ, 315, 7109 (Sep 13 1997), 629-634.
[14] Campaigne, B. N., Gilliam, T. B., Spencer, M. L., Lampman, R. M. and Schork, M. A.
Effects of a physical activity program on metabolic control and cardiovascular fitness in
children with insulin-dependent diabetes mellitus. Diabetes Care, 7, 1 (Jan-Feb 1984), 57-62.
[15] Dahl-Jorgensen, K., Meen, H. D., Hanssen, K. F. and Aagenaes, O. The effect of
exercise on diabetic control and hemoglobin A1 (HbA1) in children. Acta Paediatr Scand
Suppl, 283 (1980), 53-56.
[16] D'Hooge, R., Hellinckx, T., Van Laethem, C., Stegen, S., De Schepper, J., Van Aken, S.,
Dewolf, D. and Calders, P. Influence of combined aerobic and resistance training on

19
metabolic control, cardiovascular fitness and quality of life in adolescents with type 1
diabetes: a randomized controlled trial. Clinical rehabilitation, 25, 4 (Apr 2011), 349-359.
[17] Fuchsjager-Mayrl, G., Pleiner, J., Wiesinger, G. F., Sieder, A. E., Quittan, M., Nuhr, M.
J., Francesconi, C., Seit, H. P., Francesconi, M., Schmetterer, L. and Wolzt, M. Exercise
training improves vascular endothelial function in patients with type 1 diabetes. Diabetes
Care, 25, 10 (Oct 2002), 1795-1801.
[18] Heyman, E., Toutain, C., Delamarche, P., Berthon, P., Briard, D., Youssef, H.,
DeKerdanet, M., and Gratas-Delamarche, A.Exercise training and cardiovascular risk factors
in type 1 diabetic adolescent girls. Pediatric Exercise Sci, 19, 408-419.
[19] Huttunen, N. P., Lankela, S. L., Knip, M., Lautala, P., Kaar, M. L., Laasonen, K. and
Puukka, R. Effect of once-a-week training program on physical fitness and metabolic control
in children with IDDM. Diabetes Care, 12, 10 (Nov-Dec 1989), 737-740.
[20] Laaksonen, D. E., Atalay, M., Niskanen, L. K., Mustonen, J., Sen, C. K., Lakka, T. A.
and Uusitupa, M. I. Aerobic exercise and the lipid profile in type 1 diabetic men: a
randomized controlled trial. Med Sci Sports Exerc, 32, 9 (Sep 2000), 1541-1548.
[21] Landt, K. W., Campaigne, B. N., James, F. W. and Sperling, M. A. Effects of exercise
training on insulin sensitivity in adolescents with type I diabetes. Diabetes Care, 8, 5 (Sep-
Oct 1985), 461-465.
[22] Maggio, A. B., Rizzoli, R. R., Marchand, L. M., Ferrari, S., Beghetti, M. and Farpour-
Lambert, N. J. Physical activity increases bone mineral density in children with type 1
diabetes. Med Sci Sports Exerc, 44, 7 (Jul 2012), 1206-1211.
[23] Perry, T. L., Mann, J. I., Lewis-Barned, N. J., Duncan, A. W., Waldron, M. A. and
Thompson, C. Lifestyle intervention in people with insulin-dependent diabetes mellitus
(IDDM). Eur J Clin Nutr, 51, 11 (Nov 1997), 757-763.

20
[24] Roberts, L., Jones, T. W. and Fournier, P. A. Exercise training and glycemic control in
adolescents with poorly controlled type 1 diabetes mellitus. J Pediatr Endocrinol Metab, 15,
5 (May 2002), 621-627.
[25] Salem, M. A., Aboelasrar, M. A., Elbarbary, N. S., Elhilaly, R. A. and Refaat, Y. M. Is
exercise a therapeutic tool for improvement of cardiovascular risk factors in adolescents with
type 1 diabetes mellitus? A randomised controlled trial. Diabetology & metabolic syndrome,
2, 1 (2010), 47.
[26] Tunar, M., Ozen, S., Goksen, D., Asar, G., Bediz, C. S. and Darcan, S. The effects of
Pilates on metabolic control and physical performance in adolescents with type 1 diabetes
mellitus. Journal of diabetes and its complications, 26, 4 (Jul-Aug 2012), 348-351.
[27] Wallberg-Henriksson, H. Repeated exercise regulates glucose transport capacity in
skeletal muscle. Acta Physiol Scand, 127, 1 (May 1986), 39-43.
[28] Quirk, H., Blake, H., Tennyson, R., Randell, T. L. and Glazebrook, C. Physical activity
interventions in children and young people with Type 1 diabetes mellitus: a systematic
review with meta-analysis. Diabet Med, 31, 10 (Oct 2014), 1163-1173.
[29] Kennedy, A., Nirantharakumar, K., Chimen, M., Pang, T. T., Hemming, K., Andrews, R.
C. and Narendran, P. Does exercise improve glycaemic control in type 1 diabetes? A
systematic review and meta-analysis. PLoS One, 8, 3 (2013), e58861.
[30] Van Der Heijden, G. J., Wang, Z. Y. J., Chu, Z. L., Toffolo, G., Manesso, E., Sauer, P. J.
J. and Sunehag, A. L. Strength exercise improves muscle mass and hepatic insulin sensitivity
in obese youth. Med Sci Sports Exercise, 42, (Nov 2010), 1973-1980.
[31] Yardley, J. E., Hay, J., Abou-Setta, A. M., Marks, S. D. and McGavock, J. A systematic
review and meta-analysis of exercise interventions in adults with type 1 diabetes. Diabetes
Res Clin Pract, 106, 3 (Dec 2014), 393-400.

21
[32] Huang, X. L., Pan, J. H., Chen, D., Chen J., Chen, F. and Hu, T. Efficacy of lifestyle
interventions in patients with type 2 diabetes: A systematic review and meta-analysis. Eur J
Intern Med, 27, (Jan 2016), 37-47.
[33] Schuit, A. J., Schouten, E. G., Miles, T. P., Evans, W. J., Saris, W. H. M. and Kok, F. J.
The effect of six months training on weight, body fatness and serum lipids in apparently
healthy elderly Dutch men and women. Int J Obesity, 22, (Sept 1998), 847-853.
[34] Michaliszyn, S. F. and Faulkner, M. S. Physical activity ans sedentary behavior in
adolescents with type 1 diabetes. Research in Nursing and Health, 33, 5, (Oct 2010), 441-
449.
[35] Cornelissen, V. A. and Smart, N. A. Exercise training for blood pressure: a systematic
review and meta-analysis. J Am Heart Assoc, 2, 1 (Feb 2013), e004473.
[36] Hordern, M. D., Coombes, J. S., Cooney, L. M., Jeffriess, L., Prins, J. B. and Marwick,
T. H. Effects of exercise intervention on myocardial function in type 2 diabetes. Heart, 95, 16
(Aug 2009), 1343-1349.
Figure Legends
Figure 1: Consort statement
Table Legends
Table 1: Characteristics of Included Studies
Table 2: Change in Outcome Measures Stratified by Weekly Exercise Time.
Table 3: TESTX Assessment of Study Quality of Included Studies

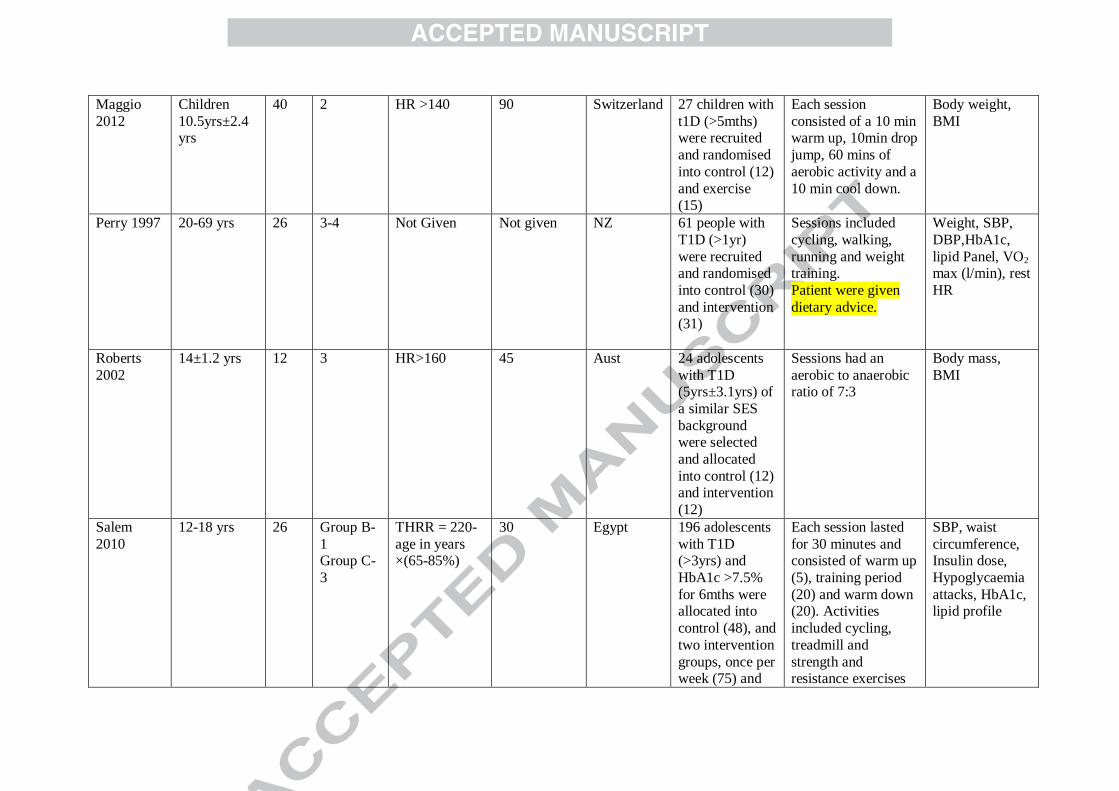
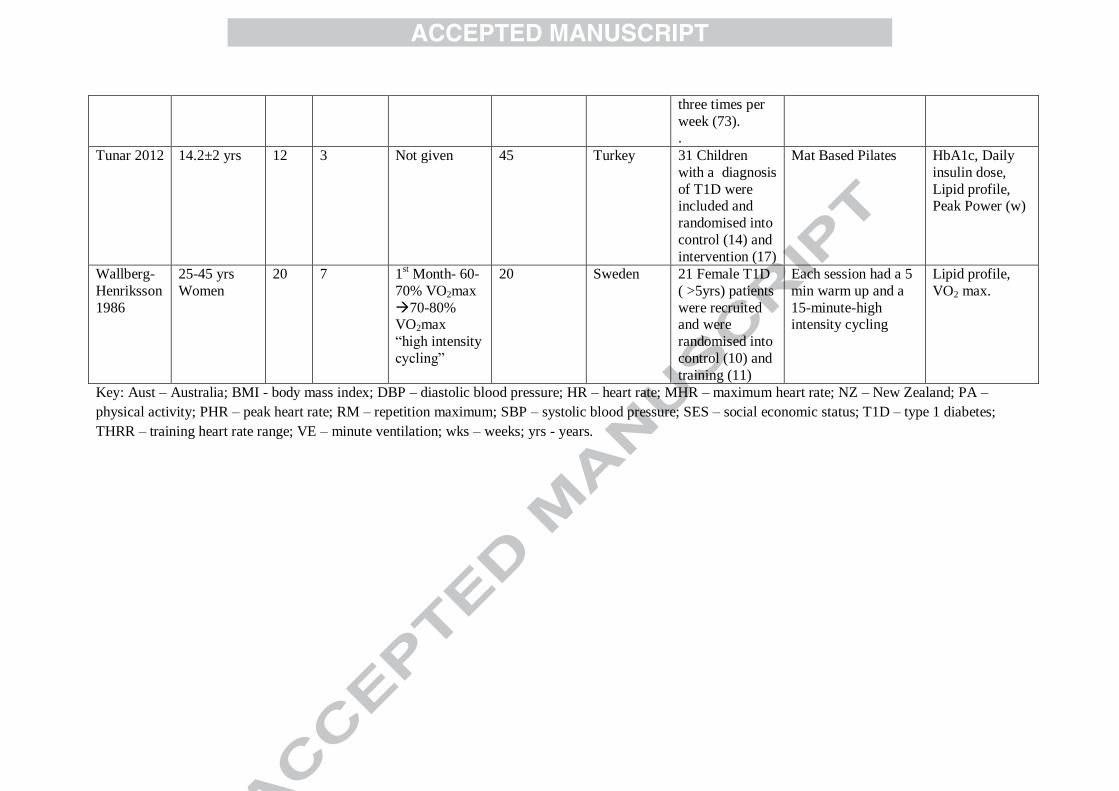
Table 1. Characteristics of Included Studies
Author Participants Wks Freq.
(Session.
Wk-1
)
Intensity Session
Time (min)
Country Participants Intervention Outcomes
Brazeau 2014
18-65 yrs 12 1 Not stated 60 PA, 30 Education
Canada 48 Patients with diagnosis of
T1D (>12mths)
and report less than 150min PA
per week were
randomised into control (25) and
Intervention
(23)
60 minutes of various exercise
including endurance,
flexibility and resistance. 30
minutes of PA
counselling and education
Body Weight, BMI, Waist
circumference,
Physical activity level (kcal),
VO2peak
(ml/kg/min), HR, SBP, DBP,
HbA1c%
Campaigne
1984
5-11 yrs 12 3 HR>160bpm
Vigorous -
76% Max HR
30 USA 19 children,
similar SES and
geographic location were
recruited. All
had a diagnosis of T1D
(>6mths), all
children were on an insulin
regime.
Children were
randomly assigned into
control (10) or
experimental (9).
Activity included
running, movement
to music etc.
Peak VO2, Peak
VE, Peak HR,
Fasting Blood glucose,
Hba1c%

Dahl-
Jorgensen 1980
9-15 yrs 20 2 Not Given 60 Norway 22 children who
had T1D were enrolled. They
were
randomised into
a control (8) and experimental
(14)
No Information
given
HbA1c
D’hooge
2011
10-18 yrs 20 2 60% PHR
75%PHR (wk
12) Resistance
20RM12RM
(wk12)
70 Belgium 16 adolescents
with T1D (>1yr)
were recruited into the study
and randomised
into control (8) and intervention
(8)
Each session
consisted of a warm
up (5min), Strength training of upper and
lower limbs and
abdominal muscles(30mins),
cycling (10mins),
running (10mins),
stepping (10mins) and a warm down
(5mins)
Weight, BMI,
waist
circumference, Peak VO2
(ml/min), Peak
HR, Blood glucose, HbA1c,
total daily
insulin dose.
Fuchsjager
-Maryl
2002
Adults
40±10 yrs
16 2-3 >60% Max
HR
Moderate
intensity
50 Austria 26 adults were
recruited 40±10
yrs who have
had T1D for 20±10 years.
They were
randomised into an intervention
arm (18) and a
control (8)
stationary cycling
training program
sessions 2-3 times
per week. (twice during first 2 weeks,
3 per week there
after)
BMI, Body
weight, Rest
HR, VO2max,
Lipid Panel, HbA1c%,
insulin dose.
Heyman 2007
Adolescent girls
26 3 80-90% MHR reserve
60(x2) and 120(x1)
France 16 adolescent girls with T1D were recruited
These sessions consisted of a combination of
Lipid panel, body mass

and participants were randomised into an intervention group (n=9) and a control (n=7)
strength and aerobic exercises at a ratio of 2:1.
Huttunen
1989
8-17yrs 13 1 HR >150bpm
Vigorous 72% max HR
60 Finland 34 Children
with T1D (>6mths)
produced 17 age
and sex matched pairs, after drop
out they were
allocated into control (16) and
intervention
(16).
The sessions
included running, jogging, gymnastics
and other active
games
VO2 max, Blood
glucose, HbA1c%
Laaksonen 2000
20-40 yrs men
12-16wk
Wk1(3) 4-5
Wk 1 20-30min 50-60%
VO230-
60min at 60-
80% VO2 “Mod Intensity
endurance
training”
20-60 Finland 42 men with T1D were
included and
randomized into
training (20) and control (22)
First week: 20-30 min running at 50-
60% VO2 mixed with
walking as necessary
3 times a week training was
gradually increased
on an individual basis, with a goal of
30-60 min running at
60-80% VO2 peak 4-5 times per week
VO2max, Daily insulin dose,
HbA1c, Plasma
glucose, BMI,
Lipid panel
Landt 1985 Adolescents 12 3 HR>160 for at
least 25mins
45 USA 15 adolescents
with T1D (>1yr)
were randomised into
exercise (9) and
control (6).
Each session
consisted of a 10 min
warm up, 25 min aerobic activity to
music and 10 min
cool down.
Weight, VO2
max
Maggio
2012
Children
10.5yrs±2.4 yrs
40 2 HR >140 90 Switzerland 27 children with
t1D (>5mths) were recruited
and randomised
into control (12)
and exercise (15)
Each session
consisted of a 10 min warm up, 10min drop
jump, 60 mins of
aerobic activity and a
10 min cool down.
Body weight,
BMI
Perry 1997 20-69 yrs 26 3-4 Not Given Not given NZ 61 people with
T1D (>1yr)
were recruited and randomised
into control (30)
and intervention (31)
Sessions included
cycling, walking,
running and weight training.
Patient were given
dietary advice.
Weight, SBP,
DBP,HbA1c,
lipid Panel, VO2 max (l/min), rest
HR
Roberts
2002
14±1.2 yrs 12 3 HR>160 45 Aust 24 adolescents
with T1D (5yrs±3.1yrs) of
a similar SES
background were selected
and allocated
into control (12) and intervention
(12)
Sessions had an
aerobic to anaerobic ratio of 7:3
Body mass,
BMI
Salem
2010
12-18 yrs 26 Group B-
1 Group C-
3
THRR = 220-
age in years ×(65-85%)
30 Egypt 196 adolescents
with T1D (>3yrs) and
HbA1c >7.5%
for 6mths were allocated into
control (48), and
two intervention
groups, once per week (75) and
Each session lasted
for 30 minutes and consisted of warm up
(5), training period
(20) and warm down (20). Activities
included cycling,
treadmill and
strength and resistance exercises
SBP, waist
circumference, Insulin dose,
Hypoglycaemia
attacks, HbA1c, lipid profile
three times per
week (73). .
Tunar 2012 14.2±2 yrs 12 3 Not given 45 Turkey 31 Children
with a diagnosis
of T1D were included and
randomised into
control (14) and
intervention (17)
Mat Based Pilates HbA1c, Daily
insulin dose,
Lipid profile, Peak Power (w)
Wallberg-
Henriksson
1986
25-45 yrs
Women
20 7 1st Month- 60-
70% VO2max
70-80% VO2max
“high intensity
cycling”
20 Sweden 21 Female T1D
( >5yrs) patients
were recruited and were
randomised into
control (10) and
training (11)
Each session had a 5
min warm up and a
15-minute-high intensity cycling
Lipid profile,
VO2 max.
Key: Aust – Australia; BMI - body mass index; DBP – diastolic blood pressure; HR – heart rate; MHR – maximum heart rate; NZ – New Zealand; PA –
physical activity; PHR – peak heart rate; RM – repetition maximum; SBP – systolic blood pressure; SES – social economic status; T1D – type 1 diabetes;
THRR – training heart rate range; VE – minute ventilation; wks – weeks; yrs - years.
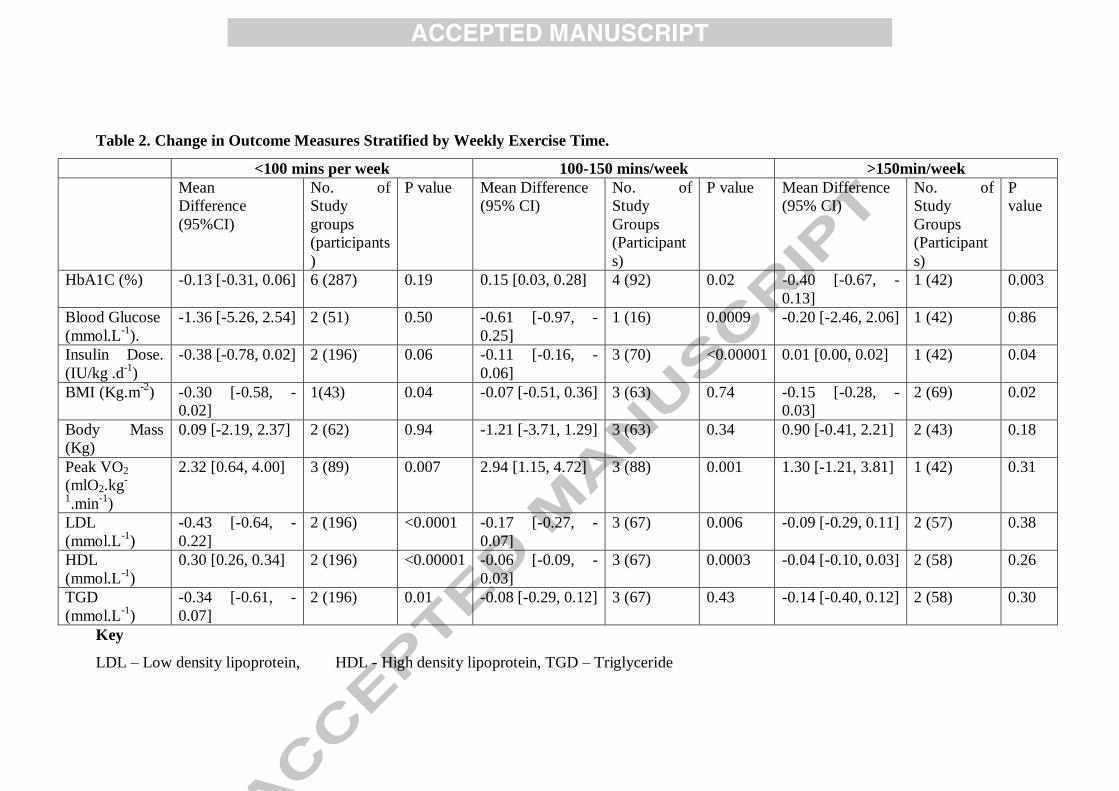
Table 2. Change in Outcome Measures Stratified by Weekly Exercise Time.
<100 mins per week 100-150 mins/week >150min/week
Mean
Difference
(95%CI)
No. of
Study
groups
(participants
)
P value Mean Difference
(95% CI)
No. of
Study
Groups
(Participant
s)
P value Mean Difference
(95% CI)
No. of
Study
Groups
(Participant
s)
P
value
HbA1C (%) -0.13 [-0.31, 0.06] 6 (287) 0.19 0.15 [0.03, 0.28] 4 (92) 0.02 -0.40 [-0.67, -
0.13]
1 (42) 0.003
Blood Glucose
(mmol.L-1
).
-1.36 [-5.26, 2.54] 2 (51) 0.50 -0.61 [-0.97, -
0.25]
1 (16) 0.0009 -0.20 [-2.46, 2.06] 1 (42) 0.86
Insulin Dose.
(IU/kg .d-1
)
-0.38 [-0.78, 0.02] 2 (196) 0.06 -0.11 [-0.16, -
0.06]
3 (70) <0.00001 0.01 [0.00, 0.02] 1 (42) 0.04
BMI (Kg.m-2
) -0.30 [-0.58, -
0.02]
1(43) 0.04 -0.07 [-0.51, 0.36] 3 (63) 0.74 -0.15 [-0.28, -
0.03]
2 (69) 0.02
Body Mass
(Kg)
0.09 [-2.19, 2.37] 2 (62) 0.94 -1.21 [-3.71, 1.29] 3 (63) 0.34 0.90 [-0.41, 2.21] 2 (43) 0.18
Peak VO2
(mlO2.kg-
1.min
-1)
2.32 [0.64, 4.00] 3 (89) 0.007 2.94 [1.15, 4.72] 3 (88) 0.001 1.30 [-1.21, 3.81] 1 (42) 0.31
LDL
(mmol.L-1
)
-0.43 [-0.64, -
0.22]
2 (196) <0.0001 -0.17 [-0.27, -
0.07]
3 (67) 0.006 -0.09 [-0.29, 0.11] 2 (57) 0.38
HDL
(mmol.L-1
)
0.30 [0.26, 0.34] 2 (196) <0.00001 -0.06 [-0.09, -
0.03]
3 (67) 0.0003 -0.04 [-0.10, 0.03] 2 (58) 0.26
TGD
(mmol.L-1
)
-0.34 [-0.61, -
0.07]
2 (196) 0.01 -0.08 [-0.29, 0.12] 3 (67) 0.43 -0.14 [-0.40, 0.12] 2 (58) 0.30
Key
LDL – Low density lipoprotein, HDL - High density lipoprotein, TGD – Triglyceride

1
Table 3. TESTex Assessment of Study Quality of Included Studies
Study
Eligibili
ty
Criteria
specified
Randoml
y
allocated
participants
Allocati
on
concealed
Groups
Similar at
baseline
Assessors
blinded
Outcome
Measures
assessed >85%
of
participants#
Intention
to treat
analysis
Reporting of
between group
statistical
comparisons
Point
measures
&
measures
of variability
reported*
Activity
Monitoring
in Control
Group
Relative
Exercise
Intensity
Review
Exercise
Volume &
Energy
Expended
Overall
TESTEx
Brazeau 2014 YES YES NO YES Unclear YES (2) NO YES (2) YES NO NO YES 9
Campaigne
1984 YES YES NO YES Unclear YES (1) NO YES (2) YES
NO NO YES 8
Dahl-
Jorgensen
1980
YES NO NO Unclear NO YES (1) NO YES (2) YES
NO NO NO
5
D’hooge
2011 YES YES NO YES Unclear YES (2) NO YES (2) YES
NO YES YES 10
Fuchsjager-
maryl 2002 YES NO Unclear YES Unclear YES (3) NO YES (2) YES
NO YES YES 10
Heyman
2007 YES YES YES YES NO YES (2) NO YES (2) YES
NO YES YES 10
Huttunen YES NO Unclear YES Unclear YES (2) NO YES (2) YES NO NO YES 8
2
1989
Laaksonen
2000 YES YES YES YES NO YES (2) NO YES (2) YES
NO YES YES 11
Landt 1985 NO YES YES YES Unclear YES (2) NO YES (2) YES NO NO YES 9
Maggio 2012 YES YES YES YES NO YES ( 3 ) NO YES (2) YES NO NO YES 11
Perry 1997 YES YES YES YES NO YES (3) NO YES (2) YES NO NO NO 10
Roberts 2002 YES YES YES YES NO YES (2) NO YES (2) YES NO NO YES 10
Salem 2010 YES YES YES YES Unclear NO (1) NO YES (2) NO NO YES YES 9
Tunar 2012 YES YES YES YES Unclear YES (1) NO YES (2) YES NO NO NO 8
Wallberg-
Henriksson
1986
YES YES YES YES Unclear YES (1) NO YES (2) YES
NO
YES
YES 10
Totals 14 12 9 14 0 14 0 15 14
0 6 12 Median
10
Total out of 15 Points
# Three points possible- 1 point if adherence>85%, 1 point if adverse vents reported, 1 point if exercise attendance is reported
*Two points possible- 1 point if primary outcome is reported, 1 point if all other outcomes reported
26
Highlights
Meta-analysis investigating exercise training in type 1 diabetes
Exercise reduced daily insulin, BMI, peak VO2 and resting heart rate
Exercise also reduced resting systolic blood pressure, LDL and triglycerides
No effect on HbA1C%, Fasting Blood Glucose, body mass or HDL
This could stimulate development of novel treatment regimes for type 1 diabetes
27
Figure 1. Consort Statement
Records identified through
database searching
(n = 36)
Scre
enin
g In
clu
ded
El
igib
ility
Id
enti
fica
tio
n
Additional records identified
through other sources
(n = 2)
Records after duplicates removed
(n = 33)
Records screened
(n = 33)
Records excluded not
controlled trials
(n = 14)
Full-text articles assessed
for eligibility
(n = 19)
Full-text articles excluded,
with reasons
(n = 4)
Studies included in
quantitative synthesis
(meta-analysis)
(n = 15)