CLIMATE SCIENCE - Groundwork Hudson Valley
13
Distance Learning Module for “Global, Local, Coastal: Preparing the Next Generation for a Changing Climate” 12 CLIMATE SCIENCE Unit I: What is “climate” and how do scientists study it? Earth’s climate system is complex. A combination of cosmic, atmospheric, biologic, and geologic systems and forces all contribute to our regional temperatures, seasonal changes, and annual precipitation. Generally, our climate represents at least a 30-year average of the seasonal weather for that region. Typically, short-term changes in our climate are cyclical and influenced by changes in the sun’s intensity, trade winds, and the ocean currents. El Niño and La Niña events are examples of short term climate fluctuations that affect precipitation and temperatures around the globe. Smoke from volcanic eruptions can also have a short-term effect on regional or even global temperatures by blocking out sunlight in the upper atmosphere. Long-term climate change is driven by major shifts in our planet’s energy balance due to variations in our orbit around the sun, the precise tilt of Earth’s axis, tectonic movement affecting land masses and ocean circulation, and large-scale changes in our atmosphere’s composition. These may either be cyclical, as is the case with the Milankovitch Cycle, or from a catastrophic event. The mass extinction of dinosaurs during the Cretaceous Period (65 m.y.a.) is theorized to be a result of a catastrophic energy shift from a large meteor impact that resulted in a pervasive dust cloud that blocked the sun and cooled the Earth rapidly. Unit 1: Climate Science explores the difference between climate and weather and the tools of the trade that scientists use to study Earth’s climate system in real-time. We will also examine how the global climate has changed throughout Earth’s history, looking at the magnitude of these changes as well as their time scale, to give perspective to the changes we are experiencing today. This unit is meant to broadly introduce students to the concepts of climate and weather, Earth’s energy balance, and have them interact with monitoring equipment and climate data. In the next unit, we will elaborate on climate cycles (ie: glacial and interglacial periods), the natural and anthropogenic forcings of climate change with special attention to the role that Earth’s atmosphere plays in our energy balance. Pre-requisite Next Generation Science Standards: MS—ESS1.A: The Universe and Its Stars Patterns of the apparent motion of the sun, the moon, and stars in the sky can be observed, described, predicted, and explained with models. MS—ESS1.B: Earth and the Solar System This model of the solar system can explain eclipses of the sun and the moon. Earth’s spin axis is fixed in direction over the short-term but tilted relative to its orbit around the sun. The seasons are a result of that tilt and are caused by the differential intensity of sunlight on different areas of Earth across the year.
-
Upload
khangminh22 -
Category
Documents
-
view
0 -
download
0
Transcript of CLIMATE SCIENCE - Groundwork Hudson Valley
Distance Learning Module for “Global, Local, Coastal: Preparing the Next Generation for a Changing Climate”
12
CLIMATE SCIENCE
Unit I: What is “climate” and how do scientists study it?
Earth’s climate system is complex. A combination of cosmic, atmospheric, biologic, and geologic systems and
forces all contribute to our regional temperatures, seasonal changes, and annual precipitation. Generally, our climate
represents at least a 30-year average of the seasonal weather for that region. Typically, short-term changes in our
climate are cyclical and influenced by changes in the sun’s intensity, trade winds, and the ocean currents. El Niño and
La Niña events are examples of short term climate fluctuations that affect precipitation and temperatures around the
globe. Smoke from volcanic eruptions can also have a short-term effect on regional or even global temperatures by
blocking out sunlight in the upper atmosphere. Long-term climate change is driven by major shifts in our planet’s
energy balance due to variations in our orbit around the sun, the precise tilt of Earth’s axis, tectonic movement
affecting land masses and ocean circulation, and large-scale changes in our atmosphere’s composition. These may
either be cyclical, as is the case with the Milankovitch Cycle, or from a catastrophic event. The mass extinction of
dinosaurs during the Cretaceous Period (65 m.y.a.) is theorized to be a result of a catastrophic energy shift from a large
meteor impact that resulted in a pervasive dust cloud that blocked the sun and cooled the Earth rapidly.
Unit 1: Climate Science explores the difference between climate and weather and the tools of the trade that
scientists use to study Earth’s climate system in real-time. We will also examine how the global climate has changed
throughout Earth’s history, looking at the magnitude of these changes as well as their time scale, to give perspective to
the changes we are experiencing today. This unit is meant to broadly introduce students to the concepts of climate and
weather, Earth’s energy balance, and have them interact with monitoring equipment and climate data. In the next unit,
we will elaborate on climate cycles (ie: glacial and interglacial periods), the natural and anthropogenic forcings of
climate change with special attention to the role that Earth’s atmosphere plays in our energy balance.
Pre-requisite Next Generation Science Standards:
MS—ESS1.A: The Universe and Its Stars
Patterns of the apparent motion of the sun, the moon, and stars in the sky can be observed, described, predicted, and
explained with models.
MS—ESS1.B: Earth and the Solar System
This model of the solar system can explain eclipses of the sun and the moon. Earth’s spin axis is fixed in direction over
the short-term but tilted relative to its orbit around the sun. The seasons are a result of that tilt and are caused by the
differential intensity of sunlight on different areas of Earth across the year.
Distance Learning Module for “Global, Local, Coastal: Preparing the Next Generation for a Changing Climate”
13
Key Concepts and Web-app Resources:
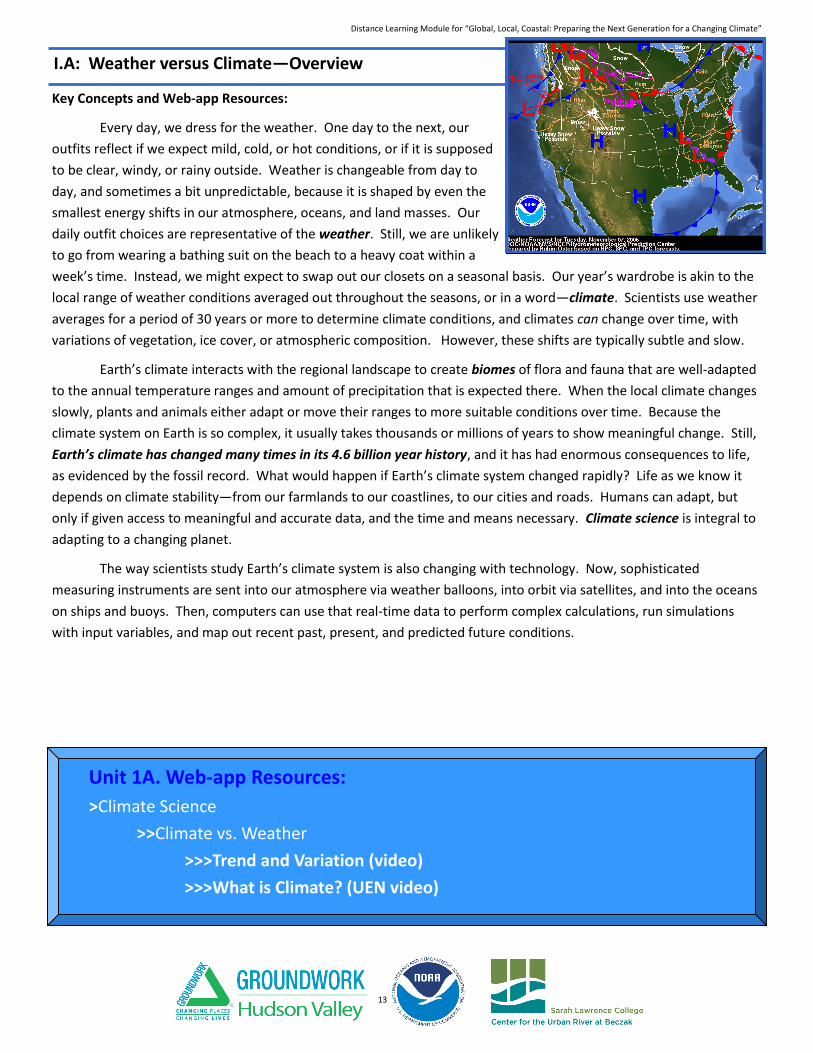
Every day, we dress for the weather. One day to the next, our
outfits reflect if we expect mild, cold, or hot conditions, or if it is supposed
to be clear, windy, or rainy outside. Weather is changeable from day to
day, and sometimes a bit unpredictable, because it is shaped by even the
smallest energy shifts in our atmosphere, oceans, and land masses. Our
daily outfit choices are representative of the weather. Still, we are unlikely
to go from wearing a bathing suit on the beach to a heavy coat within a
week’s time. Instead, we might expect to swap out our closets on a seasonal basis. Our year’s wardrobe is akin to the
local range of weather conditions averaged out throughout the seasons, or in a word—climate. Scientists use weather
averages for a period of 30 years or more to determine climate conditions, and climates can change over time, with
variations of vegetation, ice cover, or atmospheric composition. However, these shifts are typically subtle and slow.
Earth’s climate interacts with the regional landscape to create biomes of flora and fauna that are well-adapted
to the annual temperature ranges and amount of precipitation that is expected there. When the local climate changes
slowly, plants and animals either adapt or move their ranges to more suitable conditions over time. Because the
climate system on Earth is so complex, it usually takes thousands or millions of years to show meaningful change. Still,
Earth’s climate has changed many times in its 4.6 billion year history, and it has had enormous consequences to life,
as evidenced by the fossil record. What would happen if Earth’s climate system changed rapidly? Life as we know it
depends on climate stability—from our farmlands to our coastlines, to our cities and roads. Humans can adapt, but
only if given access to meaningful and accurate data, and the time and means necessary. Climate science is integral to
adapting to a changing planet.
The way scientists study Earth’s climate system is also changing with technology. Now, sophisticated
measuring instruments are sent into our atmosphere via weather balloons, into orbit via satellites, and into the oceans
on ships and buoys. Then, computers can use that real-time data to perform complex calculations, run simulations
with input variables, and map out recent past, present, and predicted future conditions.
I.A: Weather versus Climate—Overview
Unit 1A. Web-app Resources:
>Climate Science
>>Climate vs. Weather
>>>Trend and Variation (video)
>>>What is Climate? (UEN video)
Distance Learning Module for “Global, Local, Coastal: Preparing the Next Generation for a Changing Climate”
14
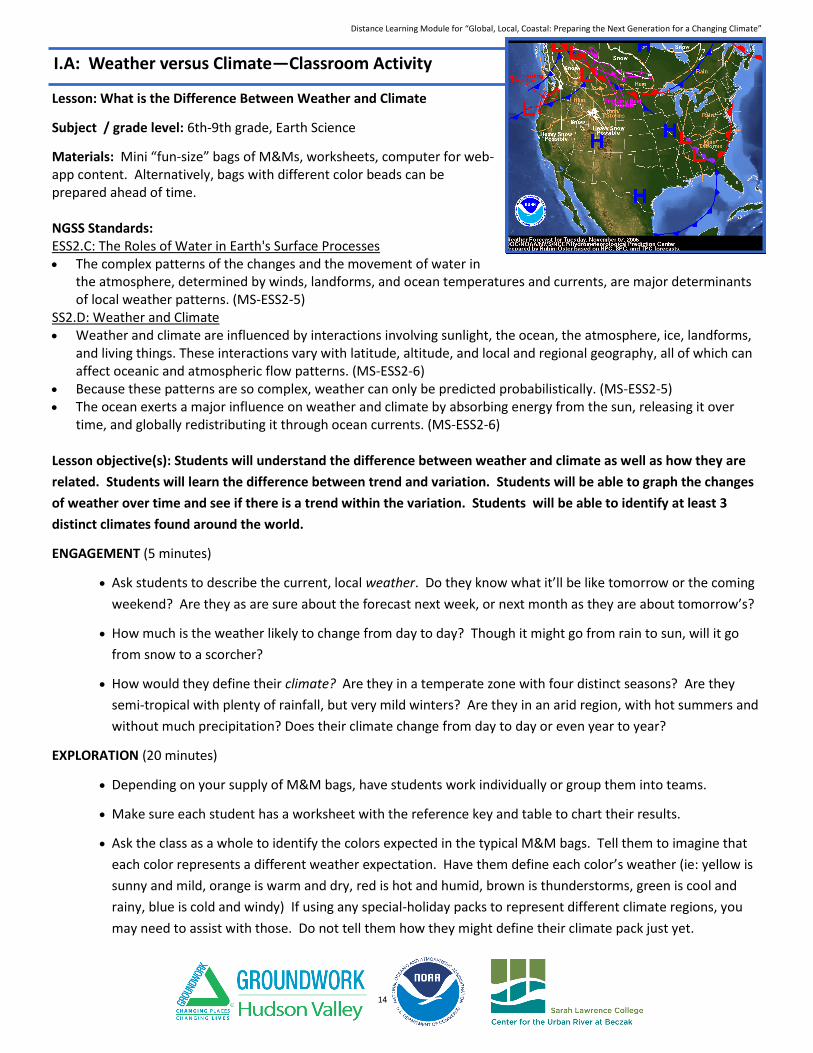
Lesson: What is the Difference Between Weather and Climate
Subject / grade level: 6th-9th grade, Earth Science
Materials: Mini “fun-size” bags of M&Ms, worksheets, computer for web-app content. Alternatively, bags with different color beads can be prepared ahead of time. NGSS Standards: ESS2.C: The Roles of Water in Earth's Surface Processes The complex patterns of the changes and the movement of water in
the atmosphere, determined by winds, landforms, and ocean temperatures and currents, are major determinants of local weather patterns. (MS-ESS2-5)
SS2.D: Weather and Climate Weather and climate are influenced by interactions involving sunlight, the ocean, the atmosphere, ice, landforms,
and living things. These interactions vary with latitude, altitude, and local and regional geography, all of which can affect oceanic and atmospheric flow patterns. (MS-ESS2-6)
Because these patterns are so complex, weather can only be predicted probabilistically. (MS-ESS2-5) The ocean exerts a major influence on weather and climate by absorbing energy from the sun, releasing it over
time, and globally redistributing it through ocean currents. (MS-ESS2-6)
Lesson objective(s): Students will understand the difference between weather and climate as well as how they are
related. Students will learn the difference between trend and variation. Students will be able to graph the changes
of weather over time and see if there is a trend within the variation. Students will be able to identify at least 3
distinct climates found around the world.
ENGAGEMENT (5 minutes)
Ask students to describe the current, local weather. Do they know what it’ll be like tomorrow or the coming
weekend? Are they as are sure about the forecast next week, or next month as they are about tomorrow’s?
How much is the weather likely to change from day to day? Though it might go from rain to sun, will it go
from snow to a scorcher?
How would they define their climate? Are they in a temperate zone with four distinct seasons? Are they
semi-tropical with plenty of rainfall, but very mild winters? Are they in an arid region, with hot summers and
without much precipitation? Does their climate change from day to day or even year to year?
EXPLORATION (20 minutes)
Depending on your supply of M&M bags, have students work individually or group them into teams.
Make sure each student has a worksheet with the reference key and table to chart their results.
Ask the class as a whole to identify the colors expected in the typical M&M bags. Tell them to imagine that
each color represents a different weather expectation. Have them define each color’s weather (ie: yellow is
sunny and mild, orange is warm and dry, red is hot and humid, brown is thunderstorms, green is cool and
rainy, blue is cold and windy) If using any special-holiday packs to represent different climate regions, you
may need to assist with those. Do not tell them how they might define their climate pack just yet.
I.A: Weather versus Climate—Classroom Activity

Distance Learning Module for “Global, Local, Coastal: Preparing the Next Generation for a Changing Climate”
15
EXPLORATION (continued)
Distribute the M&M bags. Optionally, you can have a few individuals or teams get a specialty pack. These
can be purchased seasonally in grocery stores, on amazon.com, or from the M&M online store. (Fall Harvest
pack is good for representing either arid or tropical climates, Baby Boy pack is good for representing tundra).
Following the worksheet directions, students should pull one M&M at a time out of the bag, and record the
associated weather condition as a new day each time, until they have completed 10 days on the table.
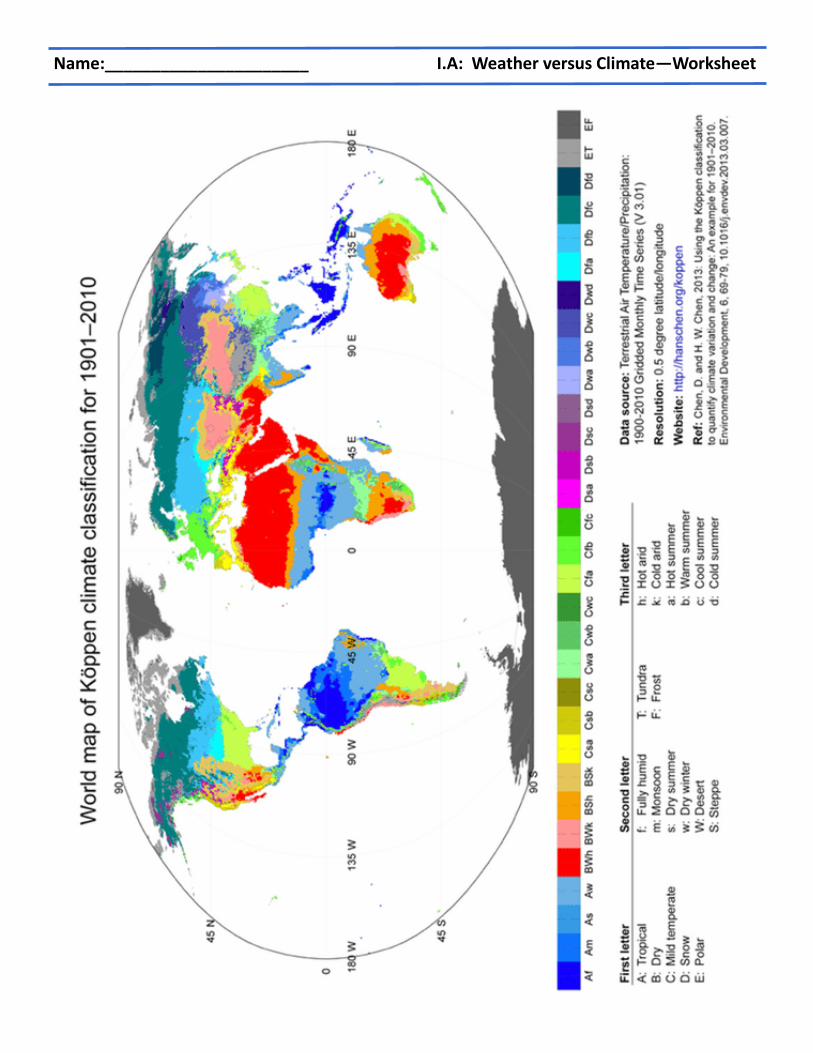
Students can continue using the worksheet, answering questions about percentage and what climate their
bag/selections may represent. They may use the Köppen Climate Classification map on the back of the
worksheet provided for reference.
EXPLANATION (15 minutes)
Have students present their conclusions to the classroom about the difference between weather and climate
and what their particular climate was based on the 10 M&M’s they drew.
Using the web-application, show them the following video on Trend and Variation:
>Climate Science>>Climate vs. Weather>>>Trend and Variation
(also found here: https://youtu.be/e0vj-0imOLw)
The dog represents the weather and the owner represents the climate. The dog is tethered to the owner via
a leash, so while his one movement to the next may vary, his range is fixed by the leash, and his general
direction over time is the same as the owner. Ask students if they can provide any additional analogies to
describe weather vs. climate? Ie: outfit vs. wardrobe; a play during the Superbowl vs. the team’s entire
football season averages; seashells washing onto shore vs. the whole beach.
Ask: How many years of weather data do you think is necessary to reliably determine a region’s climate?
Hint: We need to find a trend emerging from the day to day or season to season variations A: 30+ years.
ELABORATION (10+ minutes)
Though day to day weather is somewhat unpredictable, climate IS typically predictable. Why is climate
predictability so important? If they don’t offer, give them leading suggestions:
Agriculture: it helps farmer’s determine what they can grow year to year.
Seasonal Weather Extremes: It helps governments, communities, and emergency responders anticipate and prepare for extreme weather, like hurricanes, tornadoes, and heat waves.
Economy: tourism/hobby industries rely upon this for their businesses, like skiing, beach resorts, etc.
Using the web-application, show them the following video on Weather vs. Climate:
>Climate Science>>>Climate vs. Weather>>>What is Climate? (UEN Climate Science Series)
(also found here as Episode 2: https://www.uen.org/climate/videos.shtml)
Re-state the complexity of our climate system: “When energy from the Sun interacts with the atmosphere,
oceans, land, ice, clouds, and living things on earth, it creates the climate”
Ask: How do you think scientists know the global climate is changing? How do you think scientists can track
global changes given our climate system’s complexity? Why is rapid climate change a concern?
I.A: Weather versus Climate—Classroom Activity Page 2
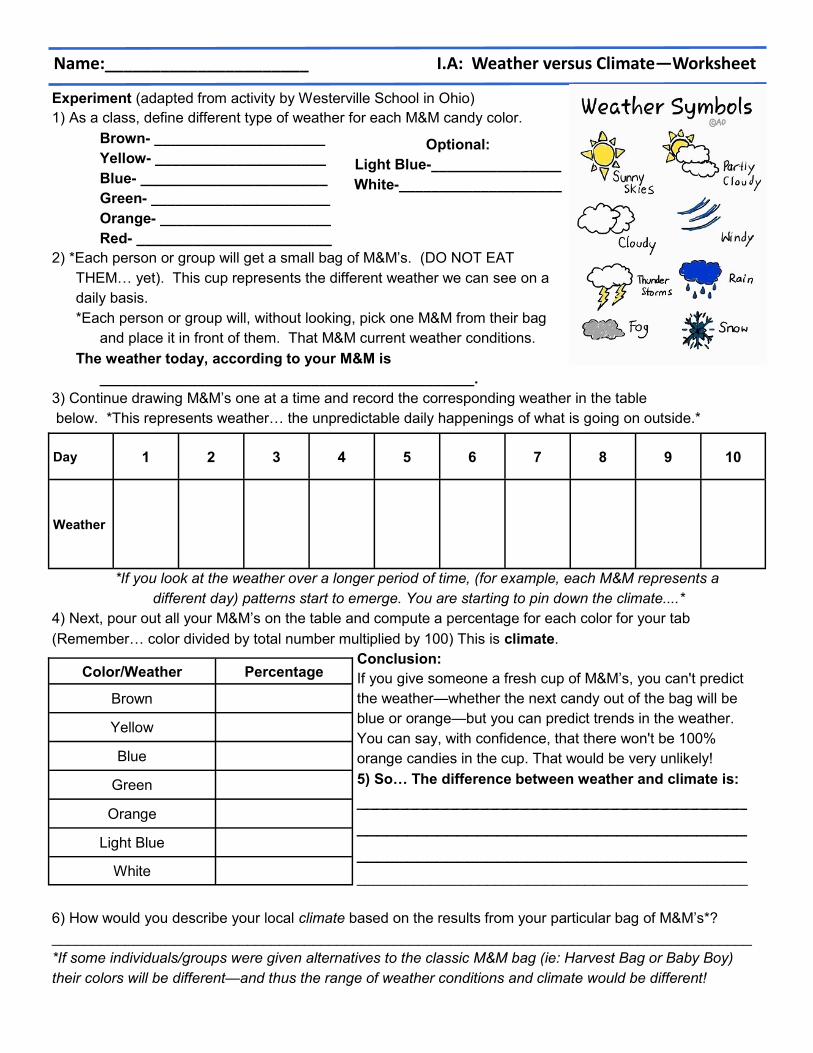
Experiment (adapted from activity by Westerville School in Ohio)
1) As a class, define different type of weather for each M&M candy color.
Brown- _____________________
Yellow- _____________________
Blue- _______________________
Green- ______________________
Orange- _____________________
Red- ________________________
2) *Each person or group will get a small bag of M&M’s. (DO NOT EAT
THEM… yet). This cup represents the different weather we can see on a
daily basis.
*Each person or group will, without looking, pick one M&M from their bag
and place it in front of them. That M&M current weather conditions.
The weather today, according to your M&M is
______________________________________________.
3) Continue drawing M&M’s one at a time and record the corresponding weather in the table
below. *This represents weather… the unpredictable daily happenings of what is going on outside.*
*If you look at the weather over a longer period of time, (for example, each M&M represents a
different day) patterns start to emerge. You are starting to pin down the climate....*
4) Next, pour out all your M&M’s on the table and compute a percentage for each color for your tab
(Remember… color divided by total number multiplied by 100) This is climate.
Conclusion:
If you give someone a fresh cup of M&M’s, you can't predict
the weather—whether the next candy out of the bag will be
blue or orange—but you can predict trends in the weather.
You can say, with confidence, that there won't be 100%
orange candies in the cup. That would be very unlikely!
5) So… The difference between weather and climate is:
_______________________________________
_______________________________________
_______________________________________
________________________________________________
6) How would you describe your local climate based on the results from your particular bag of M&M’s*?
______________________________________________________________________________________
*If some individuals/groups were given alternatives to the classic M&M bag (ie: Harvest Bag or Baby Boy)
their colors will be different—and thus the range of weather conditions and climate would be different!
Name:______________________ I.A: Weather versus Climate—Worksheet
Day 1 2 3 4 5 6 7 8 9 10
Weather
Color/Weather Percentage
Brown
Yellow
Blue
Green
Orange
Light Blue
White
Optional:
Light Blue-________________
White-____________________
Name:______________________ I.A: Weather versus Climate—Worksheet
Distance Learning Module for “Global, Local, Coastal: Preparing the Next Generation for a Changing Climate”
18
Key Concepts and Web-app Resources:
Data is a resource, much like water,
food, and even money. Having timely and
reliable climate data helps farmers, policy
makers, public health workers, and business
owners make critical decisions about how best
to invest their time, money, land, and human
resources each year. Modern scientific
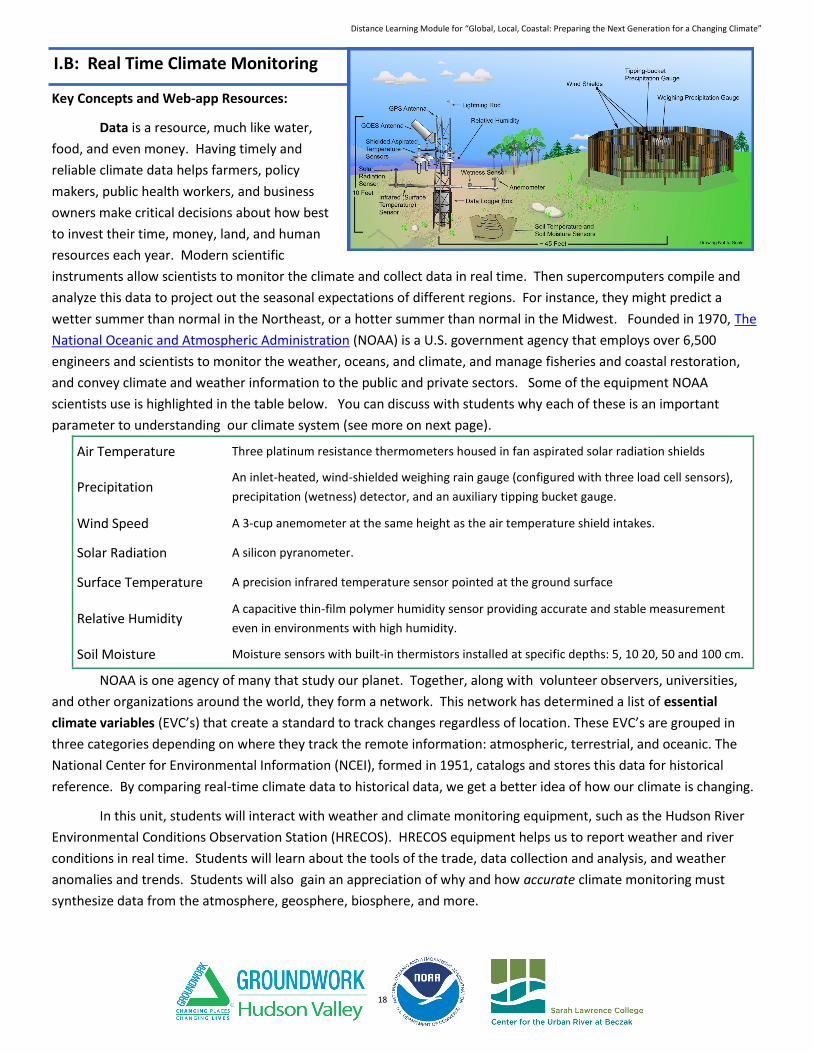
instruments allow scientists to monitor the climate and collect data in real time. Then supercomputers compile and
analyze this data to project out the seasonal expectations of different regions. For instance, they might predict a
wetter summer than normal in the Northeast, or a hotter summer than normal in the Midwest. Founded in 1970, The
National Oceanic and Atmospheric Administration (NOAA) is a U.S. government agency that employs over 6,500
engineers and scientists to monitor the weather, oceans, and climate, and manage fisheries and coastal restoration,
and convey climate and weather information to the public and private sectors. Some of the equipment NOAA
scientists use is highlighted in the table below. You can discuss with students why each of these is an important
parameter to understanding our climate system (see more on next page).
NOAA is one agency of many that study our planet. Together, along with volunteer observers, universities,
and other organizations around the world, they form a network. This network has determined a list of essential
climate variables (EVC’s) that create a standard to track changes regardless of location. These EVC’s are grouped in
three categories depending on where they track the remote information: atmospheric, terrestrial, and oceanic. The
National Center for Environmental Information (NCEI), formed in 1951, catalogs and stores this data for historical
reference. By comparing real-time climate data to historical data, we get a better idea of how our climate is changing.
In this unit, students will interact with weather and climate monitoring equipment, such as the Hudson River
Environmental Conditions Observation Station (HRECOS). HRECOS equipment helps us to report weather and river
conditions in real time. Students will learn about the tools of the trade, data collection and analysis, and weather
anomalies and trends. Students will also gain an appreciation of why and how accurate climate monitoring must
synthesize data from the atmosphere, geosphere, biosphere, and more.
I.B: Real Time Climate Monitoring
Air Temperature Three platinum resistance thermometers housed in fan aspirated solar radiation shields
Precipitation An inlet-heated, wind-shielded weighing rain gauge (configured with three load cell sensors),
precipitation (wetness) detector, and an auxiliary tipping bucket gauge.
Wind Speed A 3-cup anemometer at the same height as the air temperature shield intakes.
Solar Radiation A silicon pyranometer.
Surface Temperature A precision infrared temperature sensor pointed at the ground surface
Relative Humidity A capacitive thin-film polymer humidity sensor providing accurate and stable measurement
even in environments with high humidity.
Soil Moisture Moisture sensors with built-in thermistors installed at specific depths: 5, 10 20, 50 and 100 cm.
Distance Learning Module for “Global, Local, Coastal: Preparing the Next Generation for a Changing Climate”
19
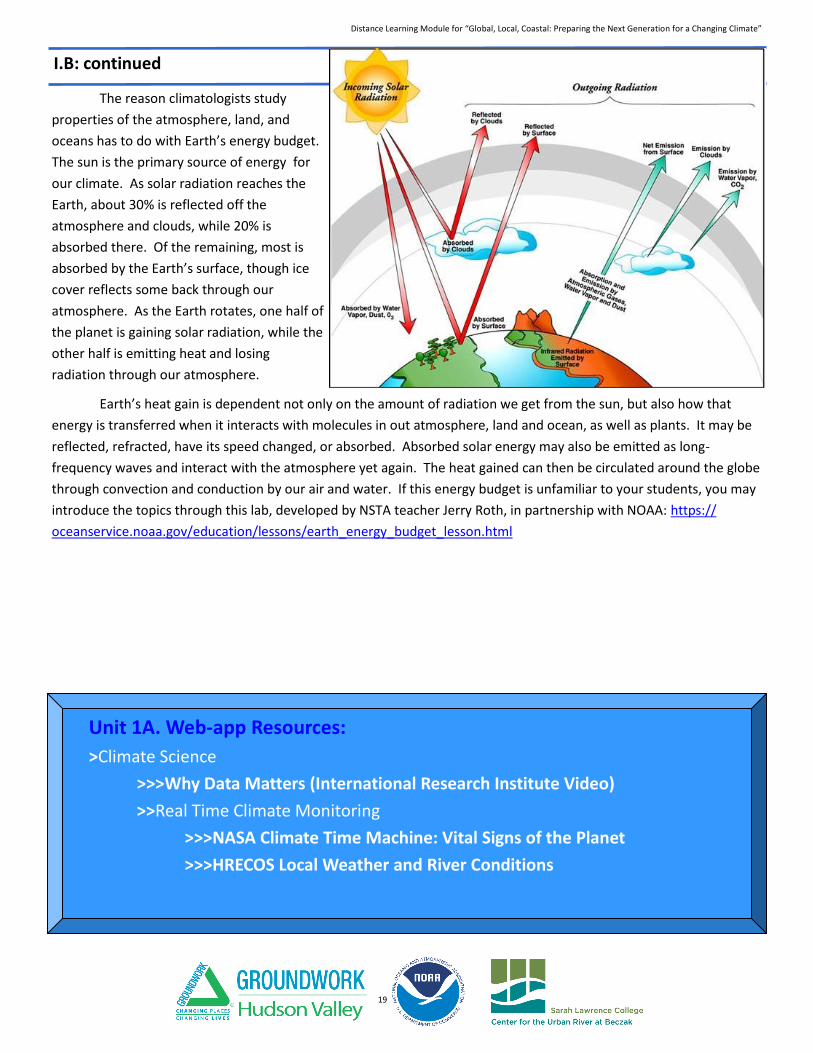
The reason climatologists study
properties of the atmosphere, land, and
oceans has to do with Earth’s energy budget.
The sun is the primary source of energy for
our climate. As solar radiation reaches the
Earth, about 30% is reflected off the
atmosphere and clouds, while 20% is
absorbed there. Of the remaining, most is
absorbed by the Earth’s surface, though ice
cover reflects some back through our
atmosphere. As the Earth rotates, one half of
the planet is gaining solar radiation, while the
other half is emitting heat and losing
radiation through our atmosphere.
Earth’s heat gain is dependent not only on the amount of radiation we get from the sun, but also how that
energy is transferred when it interacts with molecules in out atmosphere, land and ocean, as well as plants. It may be
reflected, refracted, have its speed changed, or absorbed. Absorbed solar energy may also be emitted as long-
frequency waves and interact with the atmosphere yet again. The heat gained can then be circulated around the globe
through convection and conduction by our air and water. If this energy budget is unfamiliar to your students, you may
introduce the topics through this lab, developed by NSTA teacher Jerry Roth, in partnership with NOAA: https://
oceanservice.noaa.gov/education/lessons/earth_energy_budget_lesson.html
I.B: continued
Unit 1A. Web-app Resources:
>Climate Science
>>>Why Data Matters (International Research Institute Video)
>>Real Time Climate Monitoring
>>>NASA Climate Time Machine: Vital Signs of the Planet
>>>HRECOS Local Weather and River Conditions
Distance Learning Module for “Global, Local, Coastal: Preparing the Next Generation for a Changing Climate”
20
Lesson: How can we monitor water quality parameters to track climate change?
Subject / grade level: 6th – 12th grade, Chemistry, Environmental Science
Materials: thermometers, hydrometers, turbidity tube, bucket, funnel, dissolved oxygen test kit (Salifert or LaMotte),
access to Internet and computers
NGSS Standards: MS-LS2-1. Analyze and interpret data to provide evidence for the effects of resource availability on
organisms and populations of organisms in an ecosystem.
MS-LS2-4. Construct an argument supported by empirical evidence that changes to physical or biological components
of an ecosystem affect populations.
HS-ESS3-5. Analyze geoscience data and the results from global climate models to make an evidence-based forecast of
the current rate of global or regional climate change and associated future impacts to Earth’s systems.
Lesson objective(s): Students will learn estuarine literacy, water quality field testing methods, and Hudson River water
quality changes over time relating to climate change
ENGAGEMENT
What is an estuary? Why is it important?
Ask students what they know about where they live and the type of water inside. Why is it important to keep testing
the water in an estuary?
Estuaries are dynamic water bodies that are in constant flux. Their water quality parameters will continuously
shift so it’s unusual that two measurements taken day after day, or even within a few hours, will be exactly
alike. Watch the CURB estuary model video with students to explore the natural and man-made aspects that
affect estuary health. Students should be familiar with estuarine vocabulary words listed on the worksheet
below.
EXPLORATION
EXPLANATION
Ask: What kinds of water quality tests do we need to do to measure the health of an estuary? What does the water
have to do with the health of animals in the habitat? How might they change over time?
Let’s think about why each parameter is important and the best way to measure it.
What does temperature measure? What is the best unit for us to use? How about the tool?
Temperature is the amount of heat in a substance. Using a thermometer, we measure the amount of heat in a
substance in degrees Celsius or Farenheit. The Celsius scale allows us to compare to the rest of the world,
while Fahrenheit, which is more familiar, can be used so we know what we’re talking about relative to our own
experience!
Will the temperature of the water be warmer, colder, or the same than the air around it? Why?
The water temperature depends on the season. Water has a high specific heat so it takes a lot longer to warm
and cool than the air (also the air is a gas and water is a liquid, so the density of the state of matter will affect
how quickly heat can pass through)
I.B: Monitoring Coastal Climate Data—Classroom Activity
Distance Learning Module for “Global, Local, Coastal: Preparing the Next Generation for a Changing Climate”
21
What does salinity measure? What is the unit we use? What does that mean? What is full ocean salinity and what
might we expect to find here in our estuary? What might affect the salinity? Can tides make a difference? How
about season? Weather?
Salinity is how many dissolved salt ions are in the water in parts per thousand (ppt). In other words, if you had
one thousand molecules of water, the salinity would represent how many molecules are actually dissolved salt
ions. We can measure salinity with a hydrometer or refractometer.
Ocean salinity is between 34 and 36 ppt and the Hudson River estuary is anything under 32ppt. We see higher
levels closer to the ocean. High tide will increase salinity as ocean water flows into the river; low tide will
reduce it, as the river “flushes out” into the ocean. Temperature and precipitation rates can affect salinity as
well. We also observe higher salinity in warmer weather due to evaporation changing concentrations. Summer
therefore has higher salinity, spring lower because of all the rainfall and snowmelt from the mountains running
down.
How does the hydrometer work? What do you know about the density of saltwater versus freshwater? Would that
cause the arrow to become buoyant at the level of salinity?
Saltwater is more dense than freshwater so it sinks to the bottom of the hydrometer, causing the plastic arrow
to become buoyant in the hydrometer. We are looking at the numbers on the left, not the specific gravity
(though that can also measure salinity in its own way).
What does turbidity measure? What does it really mean to measure turbidity, and why is it important for our
ecosystem? How does the turbidity tube work?
Turbidity is a measurement of suspended particles in the water, so we’re measuring how far you could see in
centimeters if you opened your eyes underwater. When we talk about turbidity in our region, we’re really
talking about plankton and suspended particles like sediment. If we see high levels of turbidity, that may be
good for our animals because it means they have lots of food to eat. Why might turbidity change? The amount
of sunlight can increase or decrease phytoplankton presence, big storms can move sediment around, tides can
bring it in or out. Turbidity is a good example of how different ecosystems can look very different, but does not
necessarily mean one is healthier than the other. For instance, turbidity is very low in the Caribbean, which
people often confuse with thinking that means the water is cleaner. However, it really just means the water is
clearer – there are not nearly as many plankton living in the tropics.
Why can we see the disk from the side, but not from the top with all the water in it?
All the water molecules piled on top of each other allow less light through than just the side of the tube
What does dissolved oxygen measure? Why is it important? What unit do we use?
Aquatic organisms still need to breathe oxygen, through their gills rather than lungs. There is less oxygen
available underwater than in the open air. Dissolved oxygen measures the availability of oxygen dissolved in a
sample of water in parts per million (ppm). A healthy amount is anything over 6-7ppm, though many
organisms in the estuary can survive with less, especially if they don’t move around much or live in the
sediment/low oxygen conditions.
I.B: Monitoring Coastal Climate Data—Classroom Activity page 2
Distance Learning Module for “Global, Local, Coastal: Preparing the Next Generation for a Changing Climate”
22
The Winkler Titration is a complex, yet easy-to-use method to find the amount of dissolved oxygen in water.
There are easier test kits that are less accurate, but this is the most precise.
ELABORATION
Students will actually test water quality themselves! Get a sample from the river or local waterway. Have
students practice taking all the parameter tests. If they get different answers, have them take the averages.
Then talk about what the data means, and how you can’t tell that much from one specific point in time, but
looking at datasets over time can give a much more extensive picture.
Which parameters would we expect to change over time that would reflect a changing climate? What
resources do we have to explore that?
Technology incorporation: have students explore the HRECOS data. Use this lesson plan and instructions to
graph temperature changes over time.
http://www.hrecos.org/index.php?option=com_content&view=article&id=126:using-real-time-data-temperatures-
impact-on-sea-level-rise&catid=36:lesson-plans&Itemid=59
EVALUATION
Students should be able to define all vocabulary in their own words on the worksheet attached.
Students should be able to answer the changes that might affect different parameters, and why.
Students will graph the water quality changes over time.
I.B: Monitoring Coastal Climate Data—Classroom Activity page 3
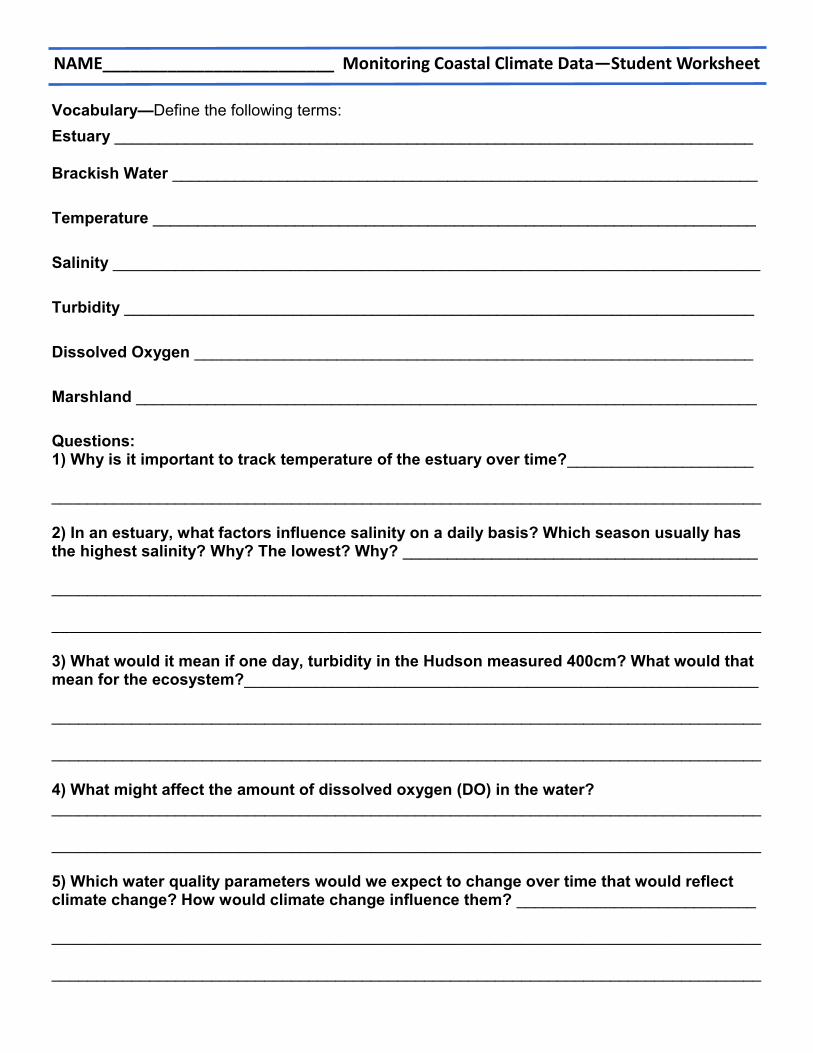
Vocabulary—Define the following terms:
Estuary ________________________________________________________________________
Brackish Water __________________________________________________________________
Temperature ____________________________________________________________________
Salinity _________________________________________________________________________
Turbidity _______________________________________________________________________
Dissolved Oxygen _______________________________________________________________
Marshland ______________________________________________________________________
Questions: 1) Why is it important to track temperature of the estuary over time?_____________________ ________________________________________________________________________________ 2) In an estuary, what factors influence salinity on a daily basis? Which season usually has the highest salinity? Why? The lowest? Why? ________________________________________ ________________________________________________________________________________ ________________________________________________________________________________ 3) What would it mean if one day, turbidity in the Hudson measured 400cm? What would that mean for the ecosystem?__________________________________________________________ ________________________________________________________________________________ ________________________________________________________________________________ 4) What might affect the amount of dissolved oxygen (DO) in the water? ________________________________________________________________________________ ________________________________________________________________________________ 5) Which water quality parameters would we expect to change over time that would reflect climate change? How would climate change influence them? ___________________________ ________________________________________________________________________________ ________________________________________________________________________________
NAME_________________________ Monitoring Coastal Climate Data—Student Worksheet
Distance Learning Module for “Global, Local, Coastal: Preparing the Next Generation for a Changing Climate”
24
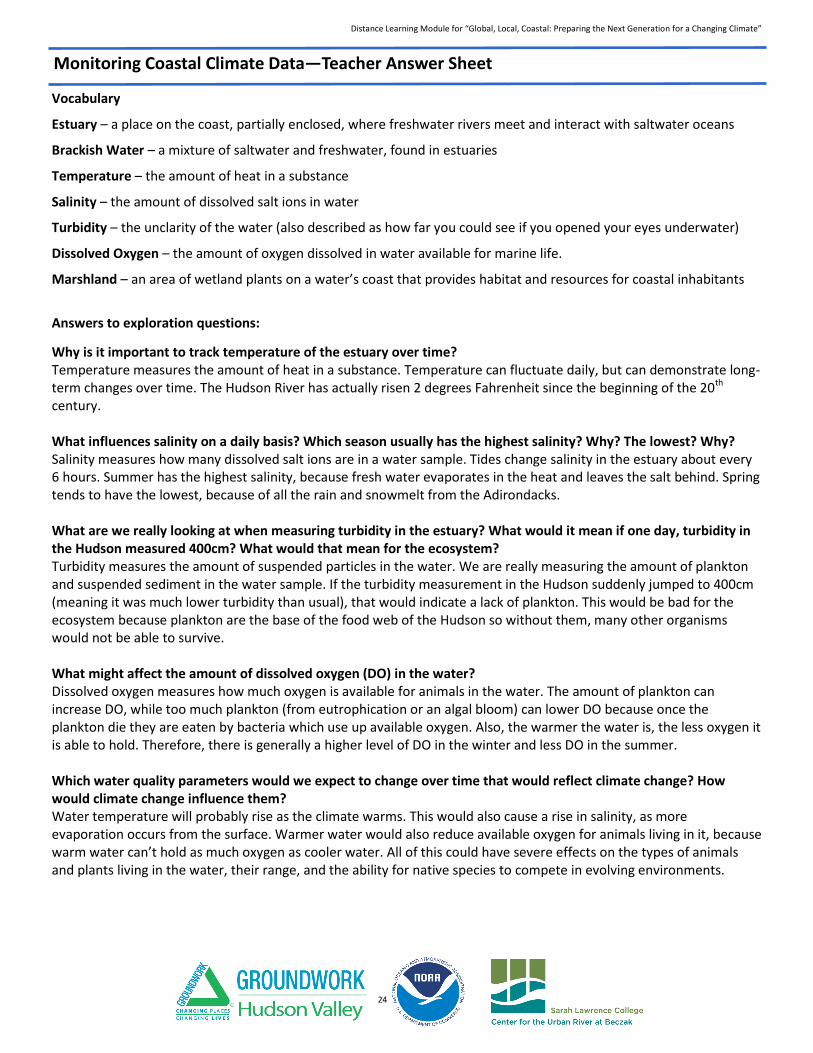
Vocabulary
Estuary – a place on the coast, partially enclosed, where freshwater rivers meet and interact with saltwater oceans
Brackish Water – a mixture of saltwater and freshwater, found in estuaries
Temperature – the amount of heat in a substance
Salinity – the amount of dissolved salt ions in water
Turbidity – the unclarity of the water (also described as how far you could see if you opened your eyes underwater)
Dissolved Oxygen – the amount of oxygen dissolved in water available for marine life.
Marshland – an area of wetland plants on a water’s coast that provides habitat and resources for coastal inhabitants
Answers to exploration questions:
Why is it important to track temperature of the estuary over time? Temperature measures the amount of heat in a substance. Temperature can fluctuate daily, but can demonstrate long-term changes over time. The Hudson River has actually risen 2 degrees Fahrenheit since the beginning of the 20th century. What influences salinity on a daily basis? Which season usually has the highest salinity? Why? The lowest? Why? Salinity measures how many dissolved salt ions are in a water sample. Tides change salinity in the estuary about every 6 hours. Summer has the highest salinity, because fresh water evaporates in the heat and leaves the salt behind. Spring tends to have the lowest, because of all the rain and snowmelt from the Adirondacks. What are we really looking at when measuring turbidity in the estuary? What would it mean if one day, turbidity in the Hudson measured 400cm? What would that mean for the ecosystem? Turbidity measures the amount of suspended particles in the water. We are really measuring the amount of plankton and suspended sediment in the water sample. If the turbidity measurement in the Hudson suddenly jumped to 400cm (meaning it was much lower turbidity than usual), that would indicate a lack of plankton. This would be bad for the ecosystem because plankton are the base of the food web of the Hudson so without them, many other organisms would not be able to survive. What might affect the amount of dissolved oxygen (DO) in the water? Dissolved oxygen measures how much oxygen is available for animals in the water. The amount of plankton can increase DO, while too much plankton (from eutrophication or an algal bloom) can lower DO because once the plankton die they are eaten by bacteria which use up available oxygen. Also, the warmer the water is, the less oxygen it is able to hold. Therefore, there is generally a higher level of DO in the winter and less DO in the summer. Which water quality parameters would we expect to change over time that would reflect climate change? How would climate change influence them? Water temperature will probably rise as the climate warms. This would also cause a rise in salinity, as more evaporation occurs from the surface. Warmer water would also reduce available oxygen for animals living in it, because warm water can’t hold as much oxygen as cooler water. All of this could have severe effects on the types of animals and plants living in the water, their range, and the ability for native species to compete in evolving environments.
Monitoring Coastal Climate Data—Teacher Answer Sheet