Climate Box textbook - United Nations Development Programme
258
-
Upload
khangminh22 -
Category
Documents
-
view
1 -
download
0
Transcript of Climate Box textbook - United Nations Development Programme
1
CLIMATE BOX
An interactive learning toolkiton climate change
Textbook
United Nations Development Programme2018

2
The authors:Vladimir Berdin (lead author, Sections 1.1.-1.4, 2.6, 2.8 and 3.5)Ekaterina Gracheva (Sections 3.1, 3.2 and 3.4)Yulia Dobrolyubova (overall editing, Sections 2.7, 2.9 and 2.10)D.Sc. Dmitry Zamolodchikov (Section 2.3)D.Sc. Pavel Konstantinov (Sections 1.1, 2.1, 2.4, 2.5, 2.9)D.Sc. Natalia Ryzhova (Section 2.2)D.Sc. Elena Smirnova (overall editing, Sections 3.2, 3.3, 3.4)
Pedagogical reviewers:D.Sc. Elena SmirnovaLyubov Kolotilina
Project сoordinator:Yulia DobrolyubovaLanguage editors:Elena ErmakovaBen William Hooson
Technical review:Terence John Carrington
Design and layout:Anna Alekperova, RA ILF LLCPrinted byRA ILF LLC, Office 1, Building 1, 10 Bolshsoi Kondratyevsky Lane, Moscow, 123056
Project managers:Natalia OlofinskayaD.Sc.Sergey TambievAntonina KhovanskayaElena Surovikina
Acknowledgements:Project team thanks all the advisors and scientific consultants who helped to prepare the Climate Box interactivelearning toolkit, particularly:
Alexey Kokorin (WWF) for valuable advice in preparation of the sections ‘Climate сhange’ and ‘How climate changeaffects the Arctic region‘;
Yulia Kalinicheva (WWF) аssistance in preparing the wall map and poster;
Alexey Soldatov (BSH Home Appliances LLC) and Olga Pegova (WWF) for their assistance in preparation of materialson the theme ‘Energy efficiency and energy saving’;
The following teachers at School № 9 Pereslavl-Zalessky (Yaroslavl region, Russia) who helped in work onthe Climate Box toolkit: Vera Zabavina, Svetlana Rudneva, Tatiana Gordeyeva, Svetlana Tokar, Galina Vorozhtsova,Olga Volodina, Tatiana Kukushkin, Galina Vasikova, Lyudmila Bubnova.
Climate Box: An interactive learning toolkit on climate change. / V. Berdin, E. Gracheva, Y. Dobrolyubova et al. –United Nations Development Programme, 2018. – 254, [2].
The Climate Box textbook is part of an interactive learning toolkit on climate change aimed at the primary and secondary school students and teachers specializing in natural sciences and environment studies. The toolkit was prepared by the United Nations Development Programme (UNDP) with financial support from the Global Environ-ment Facility, the Government of the Russian Federation and the Coca-Cola Company. Climate Box continues a se-ries of environmental toolkits for students, which also includes the Black Sea Box and Baikal’s Little Treasure Chest.
UDC 373.3 (5): 551,583BBK: 74.26:26.237K49ISBN978-5-9902971-2-8
© United Nations Development ProgrammeAll rights reserved. This publication may be reproduced for non-commercial, educational purposes without thewritten consent of the copyright holder on condition that the source is properly cited.
3
| About the Climate Box project
Climate change has been recognized by the United Nations as one of the most important global issues today. The problem is global because the effects of climate change are felt in all countries and regions of the world and because each one of us, in varying degrees, bears re-sponsibility for the changes, which are occurring on our planet. We are the ultimate consumers of goods and services, which require resources and energy, i.e. fossil fuels (oil, coal and natural gas), for their production. Production and consumption of fossil fuels cause emission of the so-called greenhouse gases into the atmosphere, which increases the greenhouse effect and global air temperatures. This is the carbon footprint that we leave on Earth.
To reduce the burden on the environment and reduce our carbon footprint, we need relevant knowledge. It is important that such knowledge and habits are instilled from an early age, so that everyone understands by the time he or she leaves school how important it is to take good care of the natural environment and resources.
With this aim in mind, the United Nations Development Programme (UNDP), with the support of the Global Environment Facility (GEF), the Government of the Russian Federation and the Coca-Cola Company, has developed the Climate Box: an interactive learning toolkit on climate change for students.
The Climate Box consists of:
• an illustrated textbook for students with educational materials and a variety of questionsand tasks for individuals and groups, as well as guidelines for teachers on use of the toolkitin lessons for students in different age groups;
• the Climate Quiz – a set of game cards;
• a wall map illustrating the possible effects of climate change on nature and mankind in various parts of the world by the end of the 21st century;
• a poster with tips on how to reduce your carbon footprint;
• a disk with all of the toolkit materials.
The main objective of the Climate Box is to provide students with important information on issues related to global climate change in an interesting, attractive and entertaining way, as well as recommendations to teachers on use of the toolkit in the school curriculum.
A big team of authors was working on the Climate Box, including the leading experts in climatology, geography, biology and economics, as well as professional writers of books for chil-dren. Experienced school teachers made an invaluable contribution to the project by helping to develop guidelines on classroom use of the toolkit by teachers.
It is important that the Climate Box was designed specifically for school students. The text-book is like an illustrated encyclopedia about climate, describing important and sometimes difficult issues in an entertaining way. Readers learn how the Earth's climate has changed from the earliest geological epochs, what climate changes are happening now, how these changes affect nature and humanity, whether we can adapt to the inevitable impacts, how to prevent the most dangerous consequences of global warming, and what is already being done in different regions of the world. A separate section of the book explains the reader how to reduce personal carbon footprint.

4
The textbook and other materials in the Climate Box have been designed in a way that lets young readers use them independently. Some topics focus on younger kids, and others –on secondary school students. Some readers will find the whole book of interest while others will be attracted by specific intriguing facts, illustrations or ideas for experiments. Everyone will find something new and interesting for him or herself in the Climate Box.
Success of the piloting phase of the Climate Box, appreciation of climate change experts, teaches and school children brought up an ambition to make it a truly international educa-tional kit uniting children and teachers across the borders.
By 2017, UNDP scaled-up implementation of the Climate Box project across eight coun-tries in Eastern Europe, Caucasus and Central Asia with an ambition of further replication. Digital versions of the toolkit are available to kids in English and in Russian languages on www.climate-box.com website and on mobile applications.
This revised 2018 English version of the Climate Box toolkit contains the most up-to-date information and includes feedback and recommendations received from teachers and experts in the participating countries.
We hope that the Climate Box will be an intriguing and useful source of information onclimate change for schoolchildren and will help them learn how to protect the natural world.
+2 оС
5
2030, 2050, 2100 – these are the years that are most often mentioned when we talk about man-made climate change, its impacts, and the need to adapt to the transformations that will happen in the future. Such times appear far away for most people – but not for you, for these waypoints on the time axis will be important for the new generation. What will I work in 2030? Where will I live in 2050? How will my children find a happy life in 2100? These questions are fundamental for today's students, from school to university.
Our generation is used to seek answers to such future-oriented questions by looking at ourselves, by getting the best education, by working hard, and by being creative and inventive. However, man-made climate change will change not only the living conditions on Earth – our only home – but will also more and more influence the options for our own life, the well-being of our families, and that of our neighbors close, far and wide. Climate change will become the most determinant factor of our living conditions.
This is why the Climate Box is timely. We need to know what determines our future, we need to understand how our decisions today impact not only ourselves over our own life horizon but how they will influence in multiple and complicated ways our children and grandchildren. The scientific knowledge on the human influence on Earth, on its climate and on all resources must be taught at the earliest stage. The sensitivity for these issues must be nurtured as early as possible. Instruction comes in many forms. The Climate Box offers a fresh and dynamic entry to this complex topic. By wrapping the most up-to-date scientific results into simple graphics, cartoons, and stories, the students are able to easily digest the knowledge through multiple channels. The Tasks in the Climate Box help to recall, evaluate and fix the understanding.
Globalization has brought us many benefits, but we are ill equipped to live, work and function in a globalized world. Our brain has trained for millennia to react and adapt to the changes that happen in our immediate environment. This has been essential for our survival. Evidently, our personal sensors do not go beyond what we see and hear. However, today our actions, foremost the consumption of energy from fossil fuels, the consumption of land reserves through deforestation and many other activities, have global consequences which threaten the survival of all of us.
Our survival kit, therefore, is in dire need of an upgrade. This upgrade comes from the science that provides us with the understanding of the changing climate and with the ability to estimate the possible futures depending on our choices today. It is in our hands today whether we will live in a world that is different from today, a warmer world with a changed climate, but still a home to which most people on Earth are able to adapt to, and to comfortably live in. Or whether, as a consequence of unchecked climate change, we will experience a fundamentally different world, much warmer than anything that humans and ecosystems can cope with, with sea level
Preface for Climate Box

6
higher by at least 1 meter, vast expanses of coastal land areas submerged and unlivable, glaciers wasted and the Arctic environment irreversibly altered, extreme weather events that harm the most vulnerable people, and many ecosystems that have ceased to provide their services. This other world is projected to result from "business-as-usual", a quite inappropriate and treacherous term, as it innocuously suggests that in 2050 or 2100, business as we know it today will still be carried out "as usual". The informed citizen knows already today, that this will not be the case in this scenario.
By knowing about these life-threatening consequences through science and instruction, by increased sensitivity and awareness through learning material such as the Climate Box, available at all levels of teaching, I hope that we prepare the next generation not to lose as much time as we did, and to take the right decisions.
Thomas Stocker
Co-Chair IPCC Working Group I 2008–2015Professor of PhysicsUniversity of Bern, Switzerland
7
CONTENTS
PART 1. The problem of climate change 111.1. Climate and weather 121.2. Types of climate and climate zones 141.3. How and why the climate changed in the past 24
1.3.1. Causes of climate change: millions of years 261.3.2. Causes of climate change: tens and hundreds of thousands of years 281.3.3. Causes of climate change: centuries 30
1.4. Climate change today 35
PART 2. How climate change affects the natural world and human beings.Can we adapt to the inevitable consequences of climate change? 47
2.1. How climate change affects… the weather 492.2. How climate change affects… plants and animals 582.3. How climate change affects… forests 762.4. How climate change affects… water resources 942.5. How climate change affects… agriculture 1032.6. How climate change affects… coastal regions 1092.7. How climate change affects… mountain regions 1192.8. How climate change affects… the Arctic region 1332.9. How climate change affects… cities and human health 1482.10. How climate change affects… social problems 158
PART 3. How to prevent dangerous climate change? 1693.1. ‘Green’ energy sources 170
3.1.1. What is energy? 1703.1.2. The main sources of energy 1713.1.3. Fossil fuels 1723.1.4. Nuclear energy 1763.1.5. Renewable energy sources 1783.1.6. Advantages and disadvantages of different energy sources 190
3.2. Energy efficiency and energy saving 1963.2.1. Environmentally friendly transport 2003.2.2. Household appliances and electrical devices 2053.2.3. Green construction. Passive and active buildings 2083.2.4. Green cities 212
3.3. Carbon footprint 2173.4. How can I help the planet? Reducing your carbon footprint 2213.5. Global cooperation on climate change and sustainable development 231
PART 4. Guidelines for teachers on the use of the Climate Box toolkit in schools 238
List of figures 252

8
par
t
The problem of climate change
10
1. The problem of climate change 11
1.1. Climate and weather 12
1.2. Types of climate and climate zones 14
1.3. How and why the climate changed in the past 24
1.3.1. Causes of climate change: millions of years 26
1.3.2. Causes of climate change:tens and hundreds of thousands of years 28
1.3.3. Causes of climate change: centuries 30
1.4. Climate change today 35

11
1. | The problem of climate change
Climate change is one of the most important issues of our time. Thirty years ago only scientists talked about climate change, but today it is evident to most of us. We notice that the weather has become warmer and that it is increasingly hard to predict what weather we can expect in any month of the year.
The fact that our planet's climate is changing, and changing rapidly, is clear beyond doubt. Judge for yourself: in the past 130 years the average temperature on Earth has risen by one degree Celsius. That may not seem much, but on a global scale it poses a serious threat to all life on our planet, from plants to animals and to ourselves. And you should remember: nearly one degree is the world average, but some regions, particularly the Arctic, are getting warmer much faster.
‘Climate change’ is a more accurate term than ‘global warming’ because higher temperatures are only a part of what climate change means for Earth. Changes in climate lead to a lossof equilibrium throughout the natural world: glaciers and permafrost melt, sea levels rise, floods, droughts and hurricanes occur more often, and the weather becomes harder to predict. Climate change leads to the extinction of many animals and plants, which cannot adapt to the new conditions, it hurts countries’ economies and threatens the health and even the lives of people.
The Earth is getting hotter!The average temperature on Earth has risen by 1 °C since the beginning of the 20th century. During the last17 years we have seen 16 of the warmest years since records began, and 2016 set an absolute record. In the northernhemisphere the period from 1983 to 2017 has been the hottestin the last 1,400 years.
Fig. 1.1. Map of observed changes in surfacetemperature on Earth from 1901 to 2016.
+2 оСChange of temperature (°C from 1901 to 2016)
12
There are different theories of why these changes are happening. Some researchers say they are due to the impact on our planet of astronomical processes (increased solar activity and changes in the slope of the Earth's axis), while others say that climate problems are the result of excessive consumption of natural resources by mankind. What is certain is that solar activity and changes in the slope of the Earth's axis are beyond our control, while excessive consumption and the climate-harming greenhouse gases which it causes are things we can do something about.
So what is really happening to our weather and climate? How did the Earth's climate change in the past and how is it changing now? What is to blame for the changes that are happening? What are greenhouse gases and what can we do about them? Let's try to find some answers to these questions.
1.1. | Climate and weather
People often complain about the weather, but they hardly ever complain about the climate. This is one of the examples: “October extinguished itself in a rush of howling winds and driving rain and November arrived, cold as frozen iron, with hard frosts every morning and icy drafts that bit at exposed hands and faces.” (J.K. Rowling, Harry Potter and the Order of the Phoenix). Writers and poets don’t write about the climate. And it’s easy to understand why. You can see the weather just by looking out of the window. We have to deal with the weather every day. But the climate is something much harder to grasp. Everyone – from scientists to politicians and businessmen – talks about how the climate is changing.
When you get back from a holiday with your parents somewhere far from home, the first thing people want to know is how the weather was. But when you recommend friends to go on holiday in the same place, you will probably tell them: ‘The climate there is very good.’
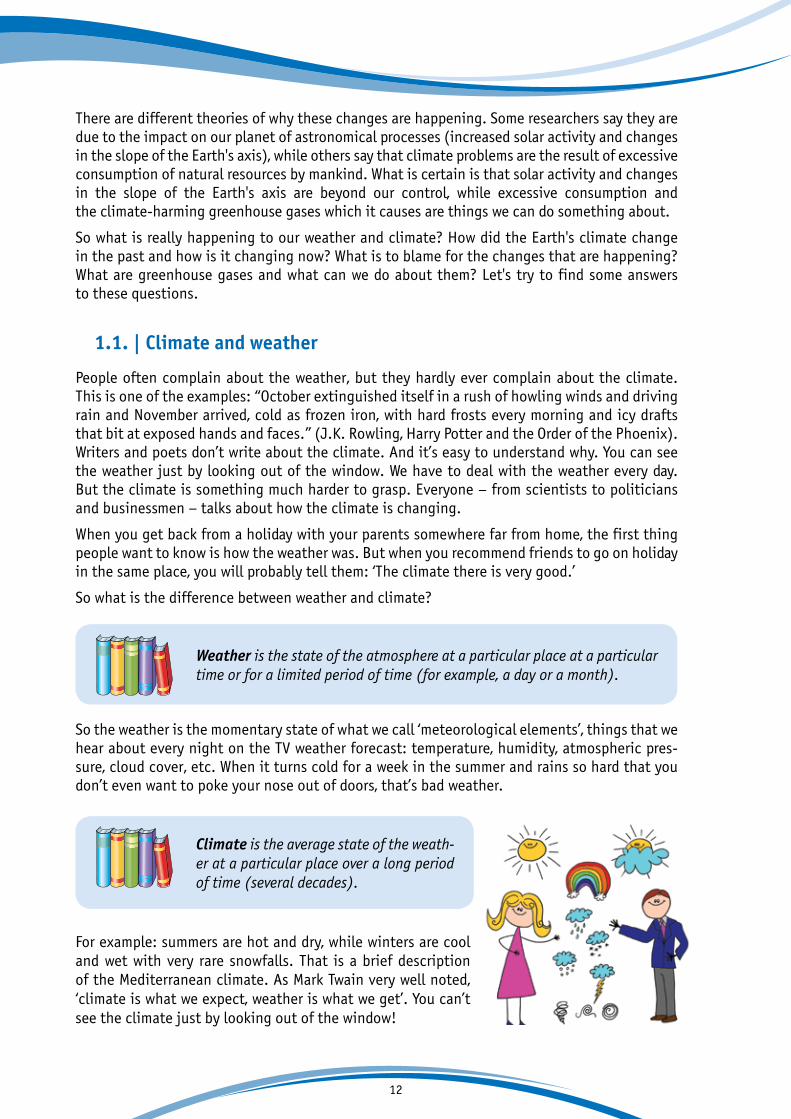
So what is the difference between weather and climate?
So the weather is the momentary state of what we call ‘meteorological elements’, things that we hear about every night on the TV weather forecast: temperature, humidity, atmospheric pres-sure, cloud cover, etc. When it turns cold for a week in the summer and rains so hard that you don’t even want to poke your nose out of doors, that’s bad weather.
For example: summers are hot and dry, while winters are cool and wet with very rare snowfalls. That is a brief description of the Mediterranean climate. As Mark Twain very well noted, ‘climate is what we expect, weather is what we get’. You can’t see the climate just by looking out of the window!
Climate is the average state of the weath-er at a particular place over a long period of time (several decades).
Weather is the state of the atmosphere at a particular place at a particular time or for a limited period of time (for example, a day or a month).
13
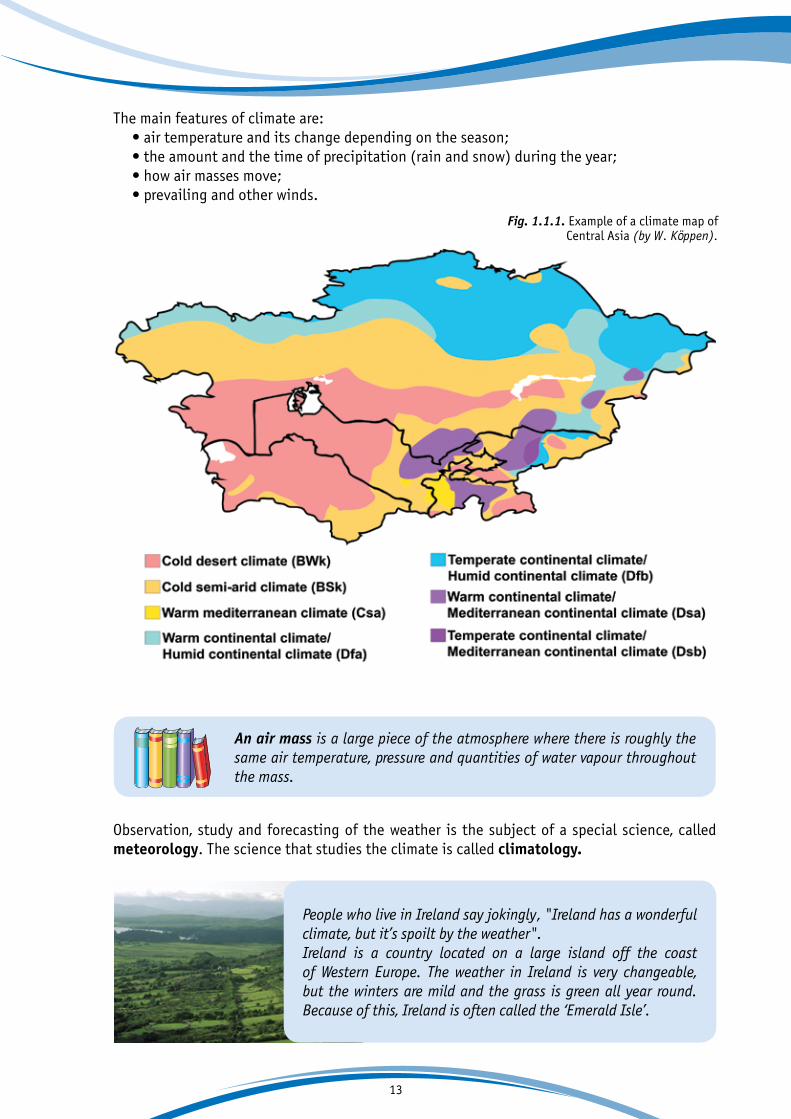
The main features of climate are:• air temperature and its change depending on the season;• the amount and the time of precipitation (rain and snow) during the year;• how air masses move;• prevailing and other winds.
Fig. 1.1.1. Example of a climate map of Central Asia (by W. Köppen).
An air mass is a large piece of the atmosphere where there is roughly the same air temperature, pressure and quantities of water vapour throughout the mass.
People who live in Ireland say jokingly, "Ireland has a wonderful climate, but it’s spoilt by the weather".Ireland is a country located on a large island off the coast of Western Europe. The weather in Ireland is very changeable, but the winters are mild and the grass is green all year round. Because of this, Ireland is often called the ‘Emerald Isle’.
Observation, study and forecasting of the weather is the subject of a special science, called meteorology. The science that studies the climate is called climatology.

14
What meteorological elements determine the weather?
Air temperature may be positive or negative. The dividing point between positive and negative air temperature is 0 °C, when water freezes and turns to ice.
Air humidity depends on the amount of water vapour in the air. When humidity is higher in the winter we feel colder. But when humidity is high and the air temperature is high, it feels stuffy.
Clouds are a cluster of tiny water droplets or ice crystals in the atmosphere.
Precipitation varies depending on whether it falls from clouds (rain, snow, frozen rain, hail) or forms on the surface of the ground and on objects (dew, frost, hoar frost, ice).
Visibility is the maximum distance, beyond which an observed object blends into the distance and cannot be distinguished.
Fogs are a cluster formed by the condensation of water vapour close to the ground.
Atmospheric pressure is pressure generated by the weight of air.
Wind is the horizontal movement of air caused by differences in atmospheric pressure.
1.2. | Types of climate and climate zones
Different parts of the Globe have different climates. In northern countries, when people look out of the window during winter and see snow everywhere, they are keen to go on holidays to tropical countries, where one can enjoy hot weather and swim in the warm sea all year round.
Since ancient times, scientists have divided Earth into climate zones depending on the height of the sun above the horizon and the length of the day. The word ‘climate’ comes from the Greek language in which it refers to the angle of inclination of the sun. Differences in the climate on our planet are primarily due to the fact that the sun’s heat is distributed unevenly over the Earth's surface. Nearness of the sea, atmospheric circulation, patterns of precipitation and other so-called ‘climate-forming fac-tors’ also have a major role in determining climate, and they, in turn, depend much on geographical latitude and on height above sea level.
15
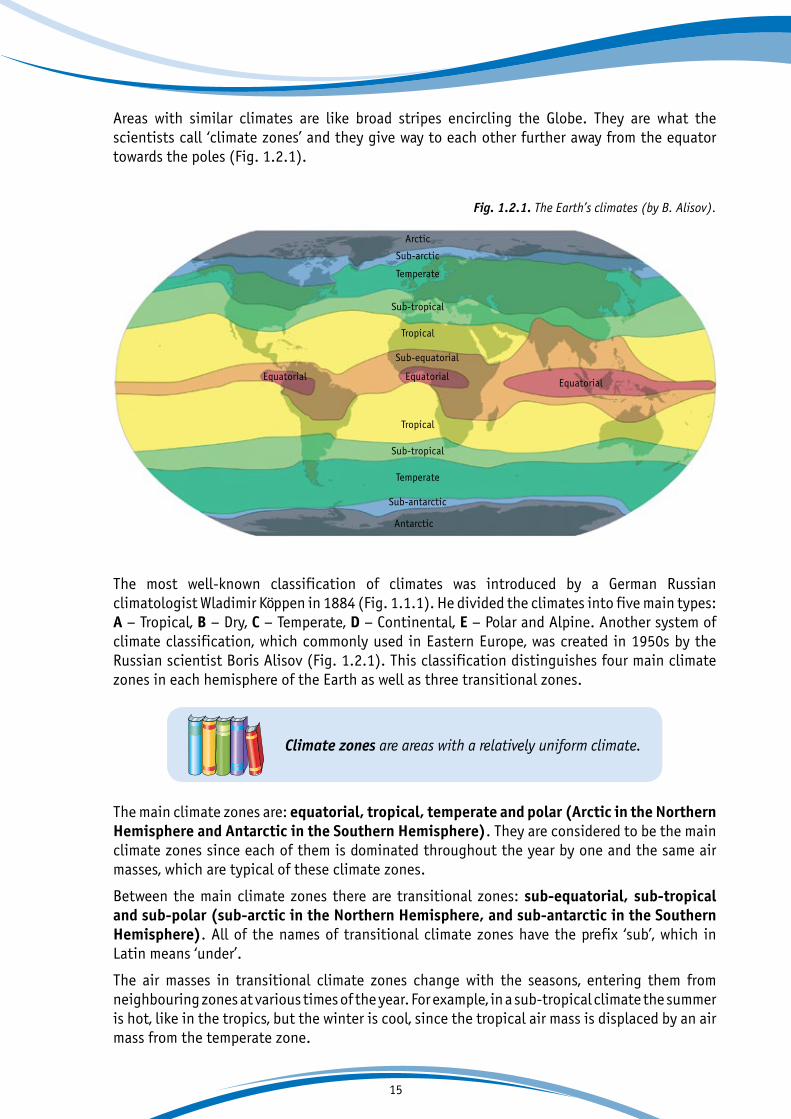
Areas with similar climates are like broad stripes encircling the Globe. They are what the scientists call ‘climate zones’ and they give way to each other further away from the equator towards the poles (Fig. 1.2.1).
Fig. 1.2.1. The Earth’s climates (by B. Alisov).
Arctic
Antarctic
Sub-arctic
Sub-antarctic
Temperate
Temperate
Sub-tropical
Sub-tropical
Tropical
Equatorial
Sub-equatorial
EquatorialEquatorial
Tropical
The most well-known classification of climates was introduced by a German Russian climatologist Wladimir K ppen in 1884 (Fig. 1.1.1). He divided the climates into five main types: A – Tropical, B – Dry, C – Temperate, D – Continental, E – Polar and Alpine. Another system of climate classification, which commonly used in Eastern Europe, was created in 1950s by the Russian scientist Boris Alisov (Fig. 1.2.1). This classification distinguishes four main climate zones in each hemisphere of the Earth as well as three transitional zones.
Climate zones are areas with a relatively uniform climate.
The main climate zones are: equatorial, tropical, temperate and polar (Arctic in the Northern Hemisphere and Antarctic in the Southern Hemisphere). They are considered to be the main climate zones since each of them is dominated throughout the year by one and the same air masses, which are typical of these climate zones.
Between the main climate zones there are transitional zones: sub-equatorial, sub-tropical and sub-polar (sub-arctic in the Northern Hemisphere, and sub-antarctic in the Southern Hemisphere). All of the names of transitional climate zones have the prefix ‘sub’, which in Latin means ‘under’.
The air masses in transitional climate zones change with the seasons, entering them from neighbouring zones at various times of the year. For example, in a sub-tropical climate the summer is hot, like in the tropics, but the winter is cool, since the tropical air mass is displaced by an air mass from the temperate zone.
16
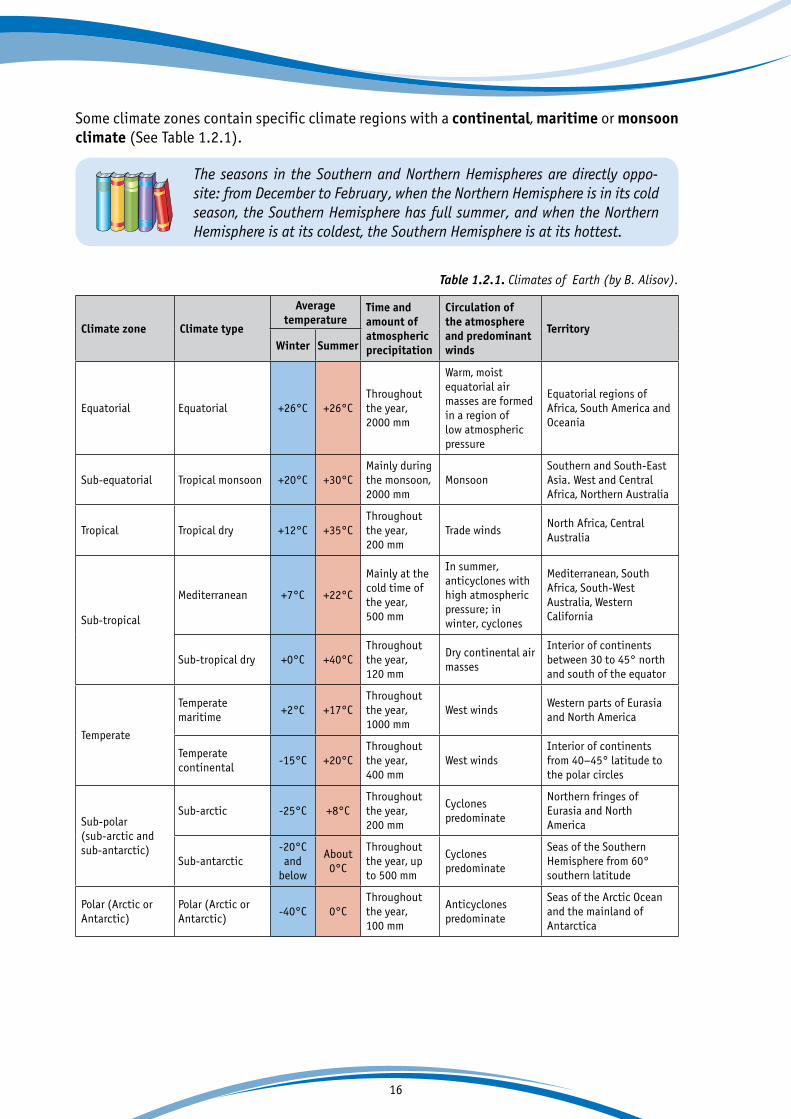
Some climate zones contain specific climate regions with a continental, maritime or monsoon climate (See Table 1.2.1).
Table 1.2.1. Climates of Earth (by B. Alisov).
Climate zone Climate type
Average temperature
Time and amount of atmospheric precipitation
Circulation of the atmosphere and predominant winds
TerritoryWinter Summer
Equatorial Equatorial +26°C +26°CThroughout the year,2000 mm
Warm, moist equatorial air masses are formed in a region of low atmospheric pressure
Equatorial regions of Africa, South America and Oceania
Sub-equatorial Tropical monsoon +20°C +30°CMainly during the monsoon, 2000 mm
MonsoonSouthern and South-East Asia. West and Central Africa, Northern Australia
Tropical Tropical dry +12°C +35°CThroughout the year,200 mm
Trade windsNorth Africa, Central Australia
Sub-tropical
Mediterranean +7°C +22°C
Mainly at the cold time of the year,500 mm
In summer, anticyclones with high atmospheric pressure; in winter, cyclones
Mediterranean, South Africa, South-West Australia, Western California
Sub-tropical dry +0°C +40°CThroughout the year, 120 mm
Dry continental air masses
Interior of continents between 30 to 45° north and south of the equator
Temperate
Temperate maritime
+2°C +17°CThroughout the year,1000 mm
West windsWestern parts of Eurasia and North America
Temperate continental
-15°C +20°CThroughout the year,400 mm
West windsInterior of continents from 40–45° latitude to the polar circles
Sub-polar (sub-arctic and sub-antarctic)
Sub-arctic -25°C +8°CThroughout the year,200 mm
Cyclones predominate
Northern fringes of Eurasia and North America
Sub-antarctic-20°C and
below
About 0°C
Throughout the year, up to 500 mm
Cyclones predominate
Seas of the Southern Hemisphere from 60° southern latitude
Polar (Arctic or Antarctic)
Polar (Arctic or Antarctic)
-40°C 0°CThroughout the year, 100 mm
Anticyclones predominate
Seas of the Arctic Ocean and the mainland of Antarctica
The seasons in the Southern and Northern Hemispheres are directly oppo-site: from December to February, when the Northern Hemisphere is in its cold season, the Southern Hemisphere has full summer, and when the Northern Hemisphere is at its coldest, the Southern Hemisphere is at its hottest.

17
A brief description of different climates
Equatorial climateAn equatorial climate is marked by hot and moist equatorial air masses. Air temperature is constant (+24–28 °C) and there is much rain throughout the year (from 1500 to 5000 mm). Rain falls faster than water can evaporate from the ground, so the soil in an equatorial climate is waterlogged and covered by a dense and high rainforest. An equatorial climate is found in northern parts of South America, the coast of the Gulf of Guinea, in the Congo river basin and the headwaters of the Nile in Africa, over the greater part of the Indo-nesian archipelago and the adjacent parts of the Indian and Pacific Oceans in Asia.
Sub-equatorial climateA sub-equatorial climate is marked by a rainy season in the summer, followed by a cool and dry season in the winter. Rainfall in a sub-equatorial climate is very uneven through the year. For example, in the city of Conakry (the capital of Guinea), there is just 15 mm of rain in December-March, but 3920 mm from June to September. This type of climate is found in some parts of the Indian Ocean, the west-ern Pacific Ocean, as well as in South Asia and trop-ical regions of Africa and South America.
Tropical climateA tropical climate is dominated by anticyclones with high pressure, giving clear weather nearly all the year round. There are two seasons: warm and cold. Temperatures can vary from +20 °C on the coast to +50 °C in the interior. The tempera-ture can also vary greatly within a single day: on a summer afternoon the air heats up to +40–45 °C, but it cools down at night to +10–15 °C. Deserts are often found in tropical climates, and the largest of them is the Sahara Desert in Africa. Deciduous forests (forests that lose their leaves in the winter) and savannas are common in wetter regions. Mexico, North and South Africa, Central Australia and the Arabian Peninsula have a tropical climate.
18
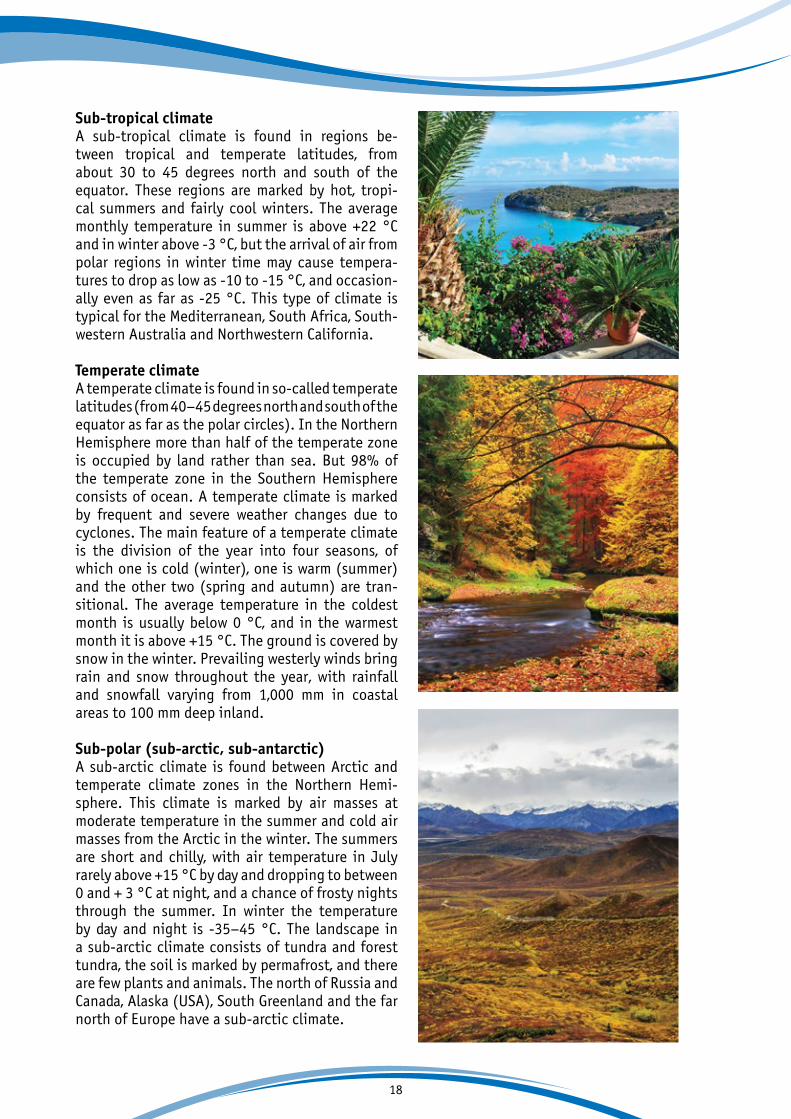
Sub-tropical climateA sub-tropical climate is found in regions be-tween tropical and temperate latitudes, from about 30 to 45 degrees north and south of the equator. These regions are marked by hot, tropi-cal summers and fairly cool winters. The average monthly temperature in summer is above +22 °C and in winter above -3 °C, but the arrival of air from polar regions in winter time may cause tempera-tures to drop as low as -10 to -15 °C, and occasion-ally even as far as -25 °C. This type of climate is typical for the Mediterranean, South Africa, South-western Australia and Northwestern California.
Temperate climateA temperate climate is found in so-called temperate latitudes (from 40–45 degrees north and south of the equator as far as the polar circles). In the Northern Hemisphere more than half of the temperate zone is occupied by land rather than sea. But 98% of the temperate zone in the Southern Hemisphere consists of ocean. A temperate climate is marked by frequent and severe weather changes due to cyclones. The main feature of a temperate climate is the division of the year into four seasons, of which one is cold (winter), one is warm (summer) and the other two (spring and autumn) are tran-sitional. The average temperature in the coldest month is usually below 0 °C, and in the warmest month it is above +15 °C. The ground is covered by snow in the winter. Prevailing westerly winds bring rain and snow throughout the year, with rainfall and snowfall varying from 1,000 mm in coastal areas to 100 mm deep inland.
Sub-polar (sub-arctic, sub-antarctic)A sub-arctic climate is found between Arctic and temperate climate zones in the Northern Hemi-sphere. This climate is marked by air masses at moderate temperature in the summer and cold air masses from the Arctic in the winter. The summers are short and chilly, with air temperature in July rarely above +15 °C by day and dropping to between 0 and + 3 °C at night, and a chance of frosty nights through the summer. In winter the temperature by day and night is -35–45 °C. The landscape in a sub-arctic climate consists of tundra and forest tundra, the soil is marked by permafrost, and there are few plants and animals. The north of Russia and Canada, Alaska (USA), South Greenland and the far north of Europe have a sub-arctic climate.
19
A sub-antarctic climate is found in the Southern Hemisphere between the temperate and Antarctic zones. The greater part of the sub-antarctic zone consists of ocean. Annual rain and snowfall in these regions is up to 500 mm.
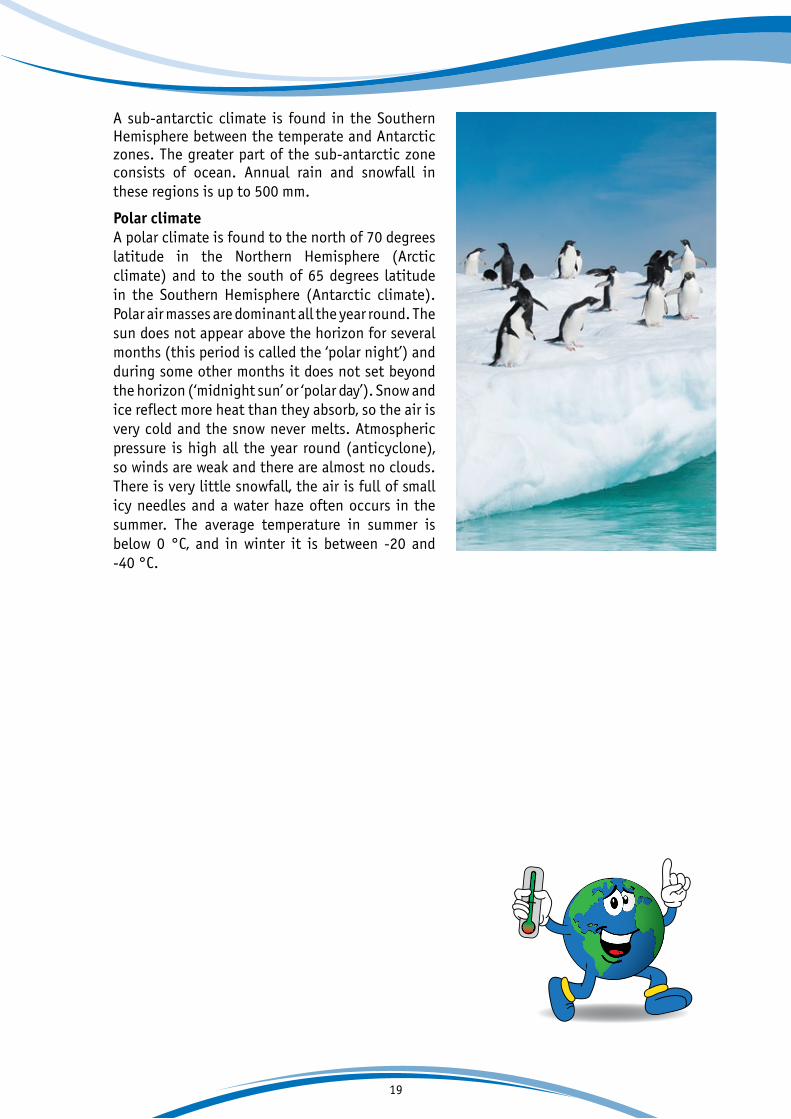
Polar climateA polar climate is found to the north of 70 degreeslatitude in the Northern Hemisphere (Arcticclimate) and to the south of 65 degrees latitude in the Southern Hemisphere (Antarctic climate).Polar air masses are dominant all the year round. The sun does not appear above the horizon for severalmonths (this period is called the ‘polar night’) and during some other months it does not set beyond the horizon (‘midnight sun’ or ‘polar day’). Snow and ice reflect more heat than they absorb, so the air is very cold and the snow never melts. Atmosphericpressure is high all the year round (anticyclone), so winds are weak and there are almost no clouds. There is very little snowfall, the air is full of small icy needles and a water haze often occurs in the summer. The average temperature in summer isbelow 0 °C, and in winter it is between -20 and-40 °C.
+2 оС
20
Where are the coldest and hottest places on Earth?
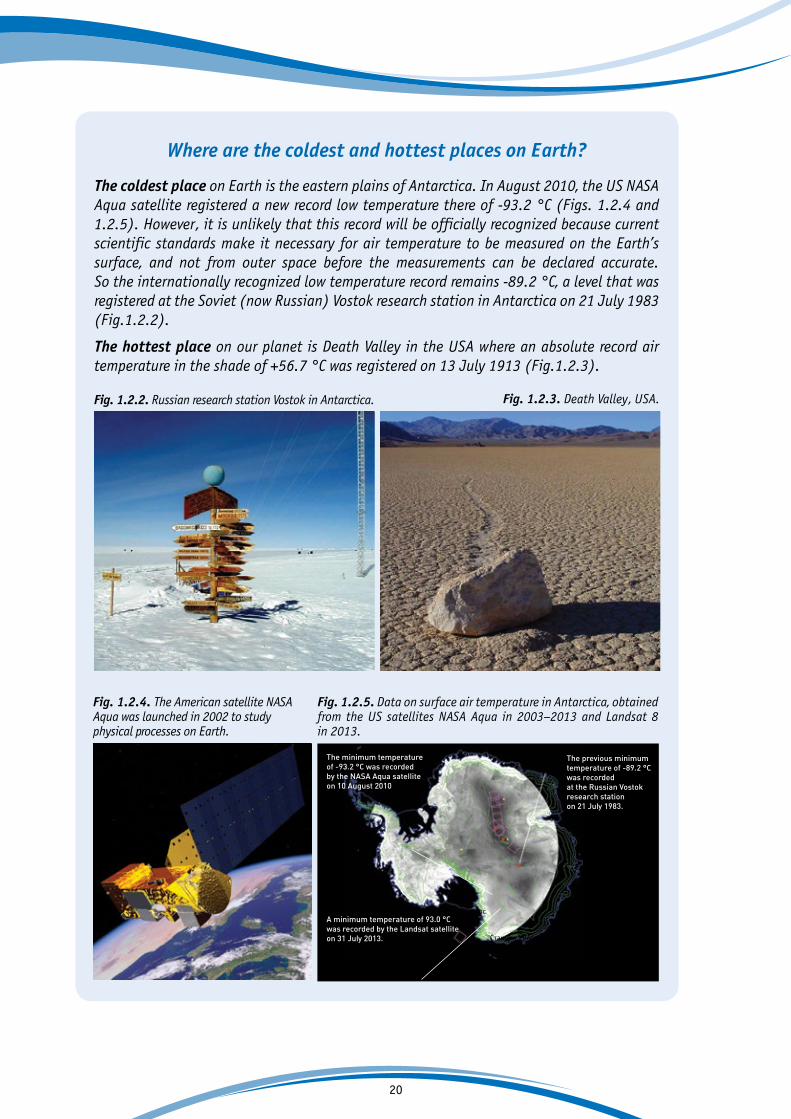
The coldest place on Earth is the eastern plains of Antarctica. In August 2010, the US NASA Aqua satellite registered a new record low temperature there of -93.2 °C (Figs. 1.2.4 and 1.2.5). However, it is unlikely that this record will be officially recognized because current scientific standards make it necessary for air temperature to be measured on the Earth’s surface, and not from outer space before the measurements can be declared accurate. So the internationally recognized low temperature record remains -89.2 °C, a level that was registered at the Soviet (now Russian) Vostok research station in Antarctica on 21 July 1983 (Fig.1.2.2).
The hottest place on our planet is Death Valley in the USA where an absolute record air temperature in the shade of +56.7 °C was registered on 13 July 1913 (Fig.1.2.3).
Fig. 1.2.4. The American satellite NASA Aqua was launched in 2002 to studyphysical processes on Earth.
Fig. 1.2.2. Russian research station Vostok in Antarctica. Fig. 1.2.3. Death Valley, USA.
Fig. 1.2.5. Data on surface air temperature in Antarctica, obtained from the US satellites NASA Aqua in 2003–2013 and Landsat 8 in 2013.
The previous minimum temperature of -89.2 °C was recorded at the Russian Vostok research station on 21 July 1983.
The minimum temperature of -93.2 °C was recorded by the NASA Aqua satellite on 10 August 2010
A minimum temperature of 93.0 °C was recorded by the Landsat satellite on 31 July 2013.
Южный Полюс
Станция «Восток»
21
Questions
1. When it is winter in the Northern Hemisphere, what time of the year is it in the Southern Hemisphere?
2. What is wind? What types of winds do you know? What are the differences between them? In which climates do they pre-dominate and why?
3. In which climate zone do you live? What do you know about the weather, which you usually have at different times of the year in your climate zone?
4. In which climate zones is it hardest of all for plants and animals to survive?
5. Where is it colder – at the North Pole or at the South Pole?

22
Task 1. Game
Materials: Cards showing various features of different types of climate: equatorial, tropical, temperate, polar.
This is a game for 12–24 people. Each player receives one card with one climate feature.
The challenge is to talk with the other players and bring to-gether all the features of one climate as a group of players. Each team then uses mime to show the other groups what sort of climate it has.
Task 2. The famous American writer Mark Twain once joked: ‘If you don’t like the weather in New England, just wait a few min-utes'.
What was it about the climate and weather in New England that the writer was making fun of?
Find New England on a map of the USA. Which climate zone is it in?
Task 3. What are ‘favourable’ and ‘unfavourable’ climatic conditions?
Divide into groups and choose one type of climate.
Make up play-acting and jokes about the type of climate that you chose.
Task 4. Game
Point of the game: To feel as if you are in an equatorial cli-mate and experience daily tropical rain.
How to play. The players stand in a circle. The leader stands in the centre of the circle and shows his movements to all the other players. As he makes a movement the leader slowly turns on his axis. He begins a new movement after all the players in the circle have started to imitate the previous movement. Each player only goes onto the next movement when the lead-er is opposite him. Meanwhile the other players continue with the previous movement.
Tasks

23
The sequence of movements. The leader and first player (then in turn the second, third player, etc.) join the palms of their hands and make slow circular motions with them. Then they click their fingers, then clap their hands, then slap their thighs and then stamp their feet. When the sequence ends, the ac-tions are all repeated in the reverse order. The effect is to imi-tate the sounds of a downpour of rain from start to finish.
Task 5. Crossword
Across:
1. One of the main seasons.2. The state of the atmosphere at a given time in a given place.3. Seasons come and go in one...4. Severe weather condition with strong wind.5. Frozen rain that falls in the form of small ice balls or lumps. 6. A long-term weather pattern at a certain period of the year. 7. One of the main features of weather.8. The main character of children's winter holidays, the old man whose arrival is always welcome.9. One of the climate types.10. Horizontal movement of the air, caused by difference of atmospheric pressure.11. The time of year that school children in Northern Europe like the most.12. A famous Italian composer, who wrote a series of works called The Four Seasons.13. The coldest continent.14. The main factor that determines climate.
1
2
3
45
6
7
8
9
10
1112
13
14
WEATHER&CLIMATE
+2 оС

24
1.3. | How and why the climate changed in the past
It is not hard to show that the Earth's climate has always been changing. Of course, the heroes of cartoons and computer games about dinosaurs and the ice age are made up, but dinosaurs really did exist, as we know from finding dinosaur bones and eggs. When these animals were alive, the climate on our planet on earth was much warmer than it is now. But there were cold periods, when the climate was much colder than now, and when glaciers reached as far south as Berlin or Chicago and were as high as a multistory building!
Over the hundreds of millions of years of the Earth's history the temperature on Earth has varied greatly – by about 10 °C (Fig. 1.3.1). That's a lot! If temperatures today were 10 °C warmer, then the climate in Stockholm would be quite different: the average temperature during the year in the Swedish capital would be what it is now at the Mediterranean coast, for example in Barcelona or Marseille. That would be nice, you think? But then in Southern Europe, it would be as hot as in Dubai. And on the Arabian Peninsula, it would be probably too hot for people to live!
Fig. 1.3.1. The temperature on Earth over the past 500 million years.
520
500
480
460
440
420
400
380
360
340
320
300
280
260
240
220
200
180
160
140
120
100
80
Degr
ees
war
mer
th
an t
he a
vera
ge in
196
1-19
90.
8
6
4
2
0
-2
Major ice cover on landPartial ice cover on land(between 500 and 100 million years agothe Antarctic continent was free of icefor most of the time)
Mass extinction of plants and animals(a ‘bio-catastrophe’) between370 and 240 million years ago.

25
How do scientists know what the climate was like in the past?Scientists assess what the temperature on Earth was in the past by studying rocks, sediments at the bottom of lakes, seas and oceans. Ice leaves traces on rocks, while sediments from what used to be ancient seas contain the remains of plants, which could only survive at cer-tain temperatures.
Scientists have an even better source of data to assess temperatures in the last million years: they use the ice of Antarctica. The ice contains air bubbles that give evidence of the gas composition in the atmosphere and the temperature on Earth in the past (Fig. 1.3.2). The longest data series (about 800,000 years) has been obtained at the Russian Antarctic station, Vostok.
Tree rings are a good source of information on climate change in past centuries. The rings from warm years are wider, but those from cold years are narrower. The shells of marine and freshwater mollusks are another good indicator of climate in the past.
The science that deals with the study of past climate is called paleo-climatology.
Fig. 1.3.2. Scientists extract a column of Antarctic ice, from which they will be able to determine the air temperature and carbon dioxide content in the atmosphere over hundreds of thousands of years.
26
1.3.1. | Causes of climate change: millions of years
Seeking to explain the major changes of the Earth’s climate that have occurred in the past half a billion years, scientists have looked at various geological, astronomical, biological, geomag-netic and cosmic factors. They even considered the possibility of visitors from other planets, who might have used some sort of climate weapons. But scientists found no trace of action by aliens. What they found was that the temperature on our planet in the last few hundred million years was determined by the location of the continents on the Globe!
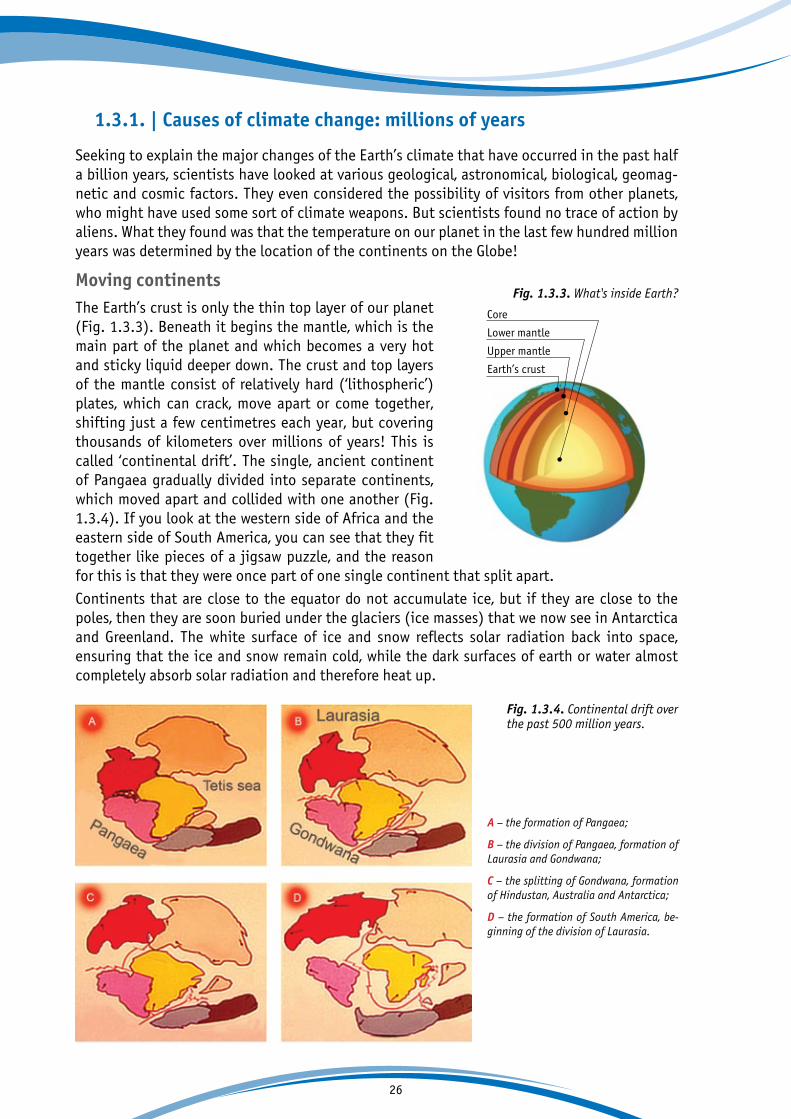
Moving continentsThe Earth’s crust is only the thin top layer of our planet (Fig. 1.3.3). Beneath it begins the mantle, which is the main part of the planet and which becomes a very hot and sticky liquid deeper down. The crust and top layers of the mantle consist of relatively hard (‘lithospheric’) plates, which can crack, move apart or come together, shifting just a few centimetres each year, but covering thousands of kilometers over millions of years! This is called ‘continental drift’. The single, ancient continent of Pangaea gradually divided into separate continents, which moved apart and collided with one another (Fig. 1.3.4). If you look at the western side of Africa and the eastern side of South America, you can see that they fit together like pieces of a jigsaw puzzle, and the reason for this is that they were once part of one single continent that split apart.
Continents that are close to the equator do not accumulate ice, but if they are close to the poles, then they are soon buried under the glaciers (ice masses) that we now see in Antarctica and Greenland. The white surface of ice and snow reflects solar radiation back into space, ensuring that the ice and snow remain cold, while the dark surfaces of earth or water almost completely absorb solar radiation and therefore heat up.
Fig. 1.3.4. Continental drift over the past 500 million years.
А – the formation of Pangaea;
B – the division of Pangaea, formation of Laurasia and Gondwana;
C – the splitting of Gondwana, formation of Hindustan, Australia and Antarctica;
D – the formation of South America, be-ginning of the division of Laurasia.
Fig. 1.3.3. What's inside Earth?
Core
Lower mantle
Upper mantle
Earth’s crust

27
When this occurs over a large area, it becomes the main factor influencing the climate of the entire planet. For most of the time in the last half a billion years the continents had less ice-cover than they have now, so the Earth’s climate was warmer.
When there was a major change in the climate, particularly when there was a cooling, so-called ‘bio-catastrophes’ occurred: whole species of living organisms died out and only those survived which were best suited to the new conditions.
One of these cold spells about 60 million years ago led to the disappearance of the last dino-saurs. This must have been a gradual process, lasting for more than a thousand years. The exact cause of the extinction of the dinosaurs is unknown, and there may have been several and not just one cause.
The white surface of ice and snow reflects solar radiation back into space, ensuring that the ice and snow remain cold, while the dark surfaces of earth or water almost completely absorb solar radiation and therefore heat up.
Why did the dinosaurs become extinct? Dinosaurs finally died out on Earth around 60 million years ago. Scientists are still unsure ex-actly why this happened.
One theory is that the dinosaurs were unable to compete with more ‘sophisticated’ living organ-isms. For example, with warm-blooded mammals, that were no larger than a squirrel, but which could eat the dinosaurs’ eggs or attack them by night, when the cold-blooded dinosaurs were un-able to move.
According to another theory, a huge meteorite struck the Earth in the area of the present Caribbean Sea, causing gigantic amounts of dust to spread through the Earth’s atmosphere, blotting out the rays of the sun for a considerable period of time. Birds, mammals and many other organisms adapted to the new temperatures, but dinosaurs did not.
There is one other version. It is known that for some reptiles (crocodiles, turtles) the temperature of the ground determines whether males or females will hatch from eggs that are laid in the sand along river banks and coasts. Biologists suggest that this dependence might also have applied for the dinosaurs, which were also reptiles, only very large ones. If the temperature was such that only females (or males) hatched from dinosaur eggs, the species would quickly disappear without any need for disasters or falling meteorites!
The change from an invariable, moist climate to a climate with seasonal changes (even small changes) could give short periods of cold nights when the huge reptile bodies of the dinosaurs were unable to retain sufficient warmth. Many of the animals would weaken and finally die.

28
But the most important climate event happened 50 million years ago, when the continents moved away from the poles. Snow and ice cover shrank, and temperatures rose to a level about 12 °C higher than nowadays. Then, ‘suddenly’, India, which had previously been a small, separate lithospheric plate, crashed into Eurasia. The Himalaya Mountains emerged at the place of the collision. The other plates moved around so that Antarctica took its place at the South Pole and was covered with a layer of ice (30–40 million years ago). The temperature on Earth began to fall sharply as the white ice of Antarctica began to reflect solar radiation back into space.
About 10 million years ago Greenland reached its present location and became covered by a layer of ice that lowered the temperature still further, to levels close to those we have today.
100 million years ago it was much warmer on Earth than today. 30–40 million years ago Antarctica became covered with ice and 10 million years ago the same happened to Greenland, causing temperatures to drop to their current level.
1.3.2. | Causes of climate change: tens and hundreds of thousands of years
We know that the temperature on Earth changes within each period of one million years. It has been found that, about every 100,000 years, we experience a relatively short warm period, while for the rest of the time the climate is much colder (so-called ‘glacial periods’ or ‘ice ages’). At present we are living in a warm period.
Fig. 1.3.5. Change of the temperature on Earth over the last 800,000 years relative to the average temperature.
4
2
0
-2
800 700 600 500 4000 300 200 100 0
Temperature °C
Chan
ge o
f tem
pera
ture
(°C)
Why does this happen? Scientists think that the alternation of ice ages and warm periods has astronomical causes (Fig. 1.3.6).
Every 41,000 years the tilt of the Earth's axis alters in a range between 22 degrees and 24.5 degrees (it is currently at 23.5 degrees). This variation makes the duration of polar night in polar regions longer in some periods and shorter in others. This makes no difference to the total amount of heat reaching the Earth from the Sun, but it has an effect on the severity and duration of the winter season.
29
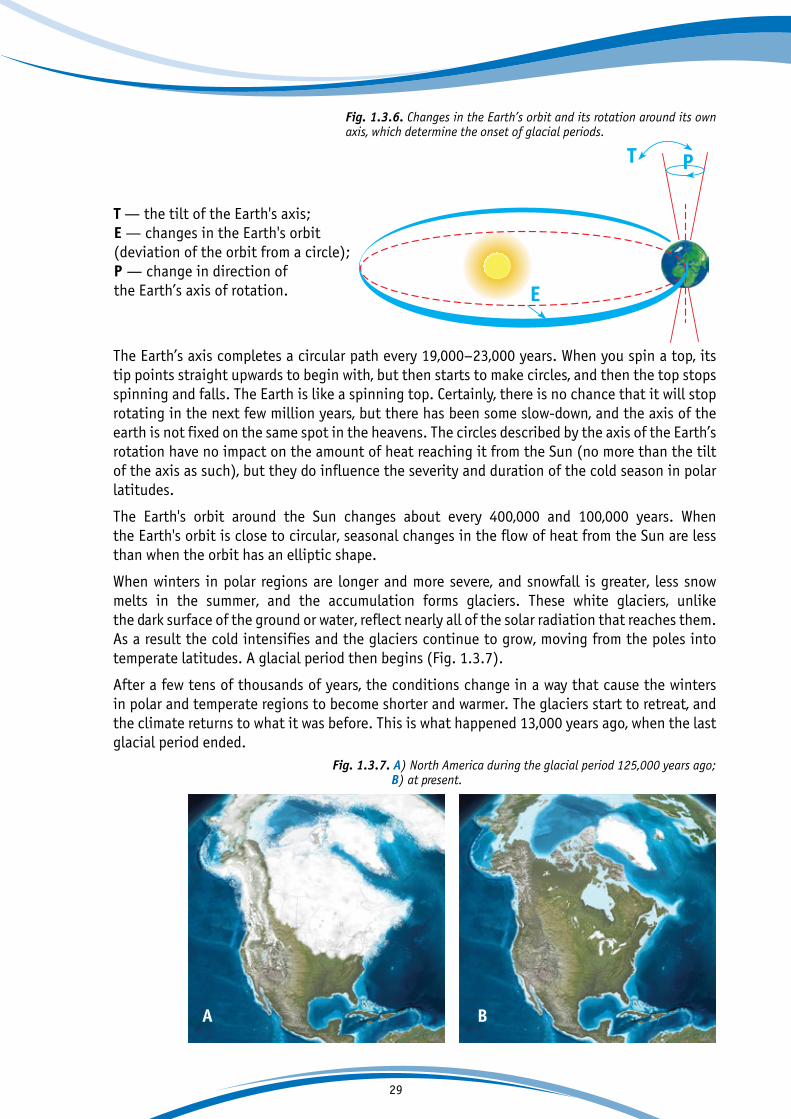
The Earth’s axis completes a circular path every 19,000–23,000 years. When you spin a top, its tip points straight upwards to begin with, but then starts to make circles, and then the top stops spinning and falls. The Earth is like a spinning top. Certainly, there is no chance that it will stop rotating in the next few million years, but there has been some slow-down, and the axis of the earth is not fixed on the same spot in the heavens. The circles described by the axis of the Earth’s rotation have no impact on the amount of heat reaching it from the Sun (no more than the tilt of the axis as such), but they do influence the severity and duration of the cold season in polar latitudes.
The Earth's orbit around the Sun changes about every 400,000 and 100,000 years. When the Earth's orbit is close to circular, seasonal changes in the flow of heat from the Sun are less than when the orbit has an elliptic shape.
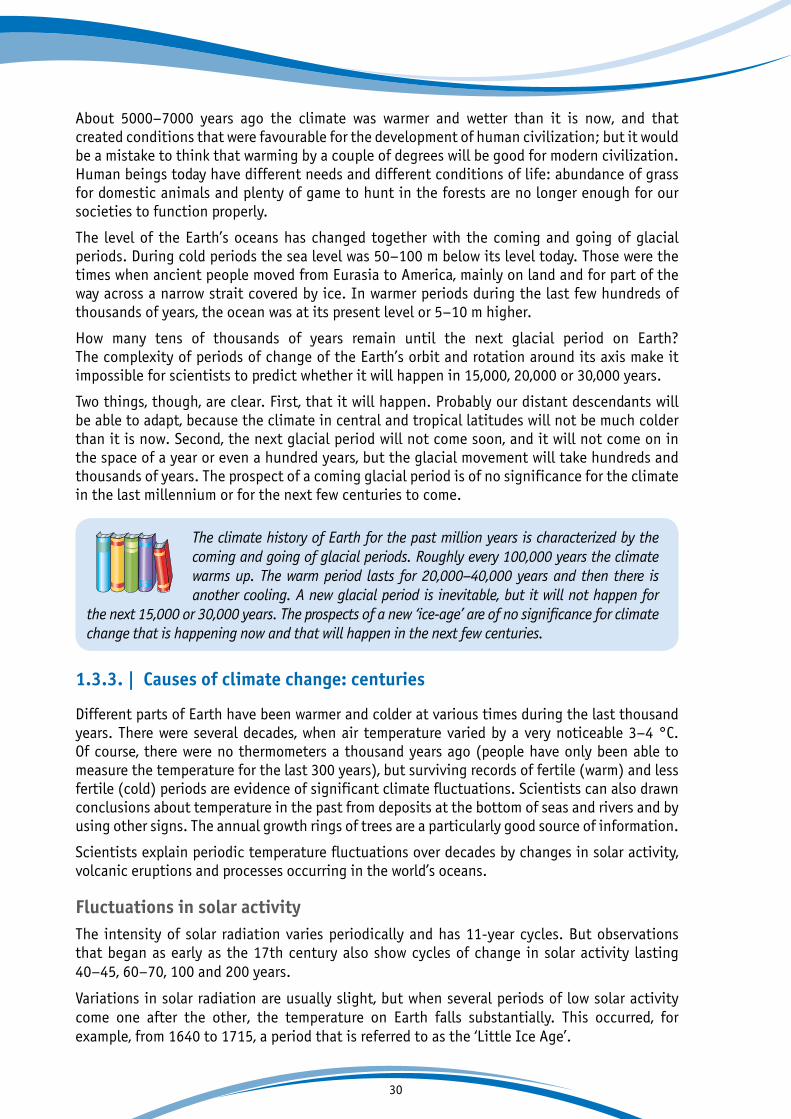
When winters in polar regions are longer and more severe, and snowfall is greater, less snow melts in the summer, and the accumulation forms glaciers. These white glaciers, unlike the dark surface of the ground or water, reflect nearly all of the solar radiation that reaches them. As a result the cold intensifies and the glaciers continue to grow, moving from the poles into temperate latitudes. A glacial period then begins (Fig. 1.3.7).
After a few tens of thousands of years, the conditions change in a way that cause the winters in polar and temperate regions to become shorter and warmer. The glaciers start to retreat, and the climate returns to what it was before. This is what happened 13,000 years ago, when the last glacial period ended.
Fig. 1.3.6. Changes in the Earth’s orbit and its rotation around its own axis, which determine the onset of glacial periods.
РТ
Е
T — the tilt of the Earth's axis; E — changes in the Earth's orbit (deviation of the orbit from a circle); P — change in direction ofthe Earth’s axis of rotation.
Fig. 1.3.7. А) North America during the glacial period 125,000 years ago; B) at present.
А B
30
About 5000–7000 years ago the climate was warmer and wetter than it is now, and that created conditions that were favourable for the development of human civilization; but it would be a mistake to think that warming by a couple of degrees will be good for modern civilization. Human beings today have different needs and different conditions of life: abundance of grass for domestic animals and plenty of game to hunt in the forests are no longer enough for our societies to function properly.
The level of the Earth’s oceans has changed together with the coming and going of glacial periods. During cold periods the sea level was 50–100 m below its level today. Those were the times when ancient people moved from Eurasia to America, mainly on land and for part of the way across a narrow strait covered by ice. In warmer periods during the last few hundreds of thousands of years, the ocean was at its present level or 5–10 m higher.
How many tens of thousands of years remain until the next glacial period on Earth? The complexity of periods of change of the Earth’s orbit and rotation around its axis make it impossible for scientists to predict whether it will happen in 15,000, 20,000 or 30,000 years.
Two things, though, are clear. First, that it will happen. Probably our distant descendants will be able to adapt, because the climate in central and tropical latitudes will not be much colder than it is now. Second, the next glacial period will not come soon, and it will not come on in the space of a year or even a hundred years, but the glacial movement will take hundreds and thousands of years. The prospect of a coming glacial period is of no significance for the climate in the last millennium or for the next few centuries to come.
The climate history of Earth for the past million years is characterized by the coming and going of glacial periods. Roughly every 100,000 years the climate warms up. The warm period lasts for 20,000–40,000 years and then there is another cooling. A new glacial period is inevitable, but it will not happen for
the next 15,000 or 30,000 years. The prospects of a new ‘ice-age’ are of no significance for climate change that is happening now and that will happen in the next few centuries.
1.3.3. | Causes of climate change: centuries
Different parts of Earth have been warmer and colder at various times during the last thousand years. There were several decades, when air temperature varied by a very noticeable 3–4 °C. Of course, there were no thermometers a thousand years ago (people have only been able to measure the temperature for the last 300 years), but surviving records of fertile (warm) and less fertile (cold) periods are evidence of significant climate fluctuations. Scientists can also drawn conclusions about temperature in the past from deposits at the bottom of seas and rivers and by using other signs. The annual growth rings of trees are a particularly good source of information.
Scientists explain periodic temperature fluctuations over decades by changes in solar activity, volcanic eruptions and processes occurring in the world’s oceans.
Fluctuations in solar activityThe intensity of solar radiation varies periodically and has 11-year cycles. But observations that began as early as the 17th century also show cycles of change in solar activity lasting 40–45, 60–70, 100 and 200 years.
Variations in solar radiation are usually slight, but when several periods of low solar activity come one after the other, the temperature on Earth falls substantially. This occurred, for example, from 1640 to 1715, a period that is referred to as the ‘Little Ice Age’.

31
This was the time when people in the Netherlands used to skate along the frozen canals of Am-sterdam in the wintertime. Soon afterward the cold snap came to an end and the use of skates became much less common (Fig. 1.3.8).
Fig. 1.3.8. Dutch people skating on a frozen canal. Engravings from the series ‘Fashionable characters’ by H. Fischer II (Netherlands, 1682–1702).
Volcanic eruptionsWhat natural phenomenon amazes us most by its power and energy? The answer, surely, is the eruption of a volcano. Do you think that volcanoes heat up the Earth's atmosphere or cool it down? At first glance, it seems that they must heat the atmosphere up. It is true that the hot lava and burning-hot gases raise the air temperature, but only near the volcano. What has the biggest impact on climate is not hot lava or gas, but volcanic ash. The eruption sends it high into the stratosphere, to altitudes of 10–15 km, where it stays for a long time. The ash blocks out some of the sun’s rays, as a result of which the whole planet gets colder.

32
Any powerful volcanic eruption, in which a column of ash reaches the stratosphere, causes short-term cooling a year later. For example, after the Napoleonic Wars in Europe, people wondered why the climate turned cold for a number of years. The reason was the eruption of the Tambora volcano in what is now Indonesia. The same thing happened in 1983 after the eruption of El Chichon in Mexico, and in 1992 after the eruption of Mount Pinatubo in the Philippines.
After 2–3 years the ash settles, and volcanoes cease to have an impact on the Earth's climate until the next major eruption throws ash into the stratosphere.
Such huge eruptions are rare, and most of the eruptions we hear about do not affect the Earth's climate. For example, the eruption of the volcano with the hard-to-pronounce name, Eyyafyad-layёkyudl, in Iceland in 2010 threw out a lot of ash, but only into the lower atmosphere. Aircraft all over Europe were grounded, but the ash from this Icelandic volcano settled quickly and did not spread around the globe.
Ocean currentsIt has been shown that the discovery a thousand years ago by Norwegian Vikings of Greenland coincided with a warm period. Hence the choice of name by the discoverers. Of course, even then Greenland was not completely green: glaciers covered the greater part of the island, as they do now, but the southern edge was ice-free and relatively warm. The reason for this was changes in ocean currents: when they are stronger the local climate becomes a little warmer; when they are weaker it gets colder. This behavior by ocean currents has been sufficient to cause warmer and colder periods in various parts of the world.
The Earth's climate has changed several times in the past. But never before has the average temperature of the planet changed as fast as it is changing now: by nearly 1 °C in 100 years. This unprecedented speed is not usual for natural processes. The fastest natural changes have always taken hundreds or thousands of years, which is a very slow rate of change by the meas-ure of human life. Catastrophes where climate changes drastically in the space of one or two years year might make a subject for a disaster movie, but they are far from reality and from what any scientist would forecast.
Fig. 1.3.9. Tambora Volcano on the island of Sumbawa in Indonesia. The massive eruption of 1815 caused the top part of the volcano to collapse, forming a crater 6 km wide and 1 km deep.
33
Questions
1. What has been the main factor of climate change over bil-lions of years?
2. What ice-cream flavour melts slower in the sun: whitevanilla or dark chocolate? Why? How does this illustrate pro-cesses that occur on Earth?
3. What major shift of lithospheric plates occurred 50 million years ago? What impact did it have on Earth as we now know it?
4. What do scientists use to find out the temperature and chemical composition of the atmosphere over the last800,000 years?
5. Why do glacial periods occur?
6. When did the last glacial period end? Will there be another? Could it begin next year?
7. How did ancient people cross from Eurasia to America? They had no boats and the width of the Bering Strait is now 86 km (you cannot see from one side to the other).
8. Do volcanoes heat up or cool down the Earth's atmosphere?

34
Task 1. Lay a sheet of tracing paper onto a map of the world, trace the outlines of Africa and South America and cut them out. Join up the cut-out continents.
Does it look as if they were once a single piece of land?What was that land called? What happened to it?How did that affect the Earth's climate? Why?
Task 2. ExperimentMaterials: Two small sheets of paper (white and black);two pieces of plasticine 4 cm long and 0.5 cm thick.
The experiment. Glue the pieces of paper together, so that the left half is white and the right half is black. Stickthe pieces of plasticine perpendicular to the sheet on its rear side, one piece on the white part and the other on the black. Place the sheet on its edge and hold it close to a lamp (prefer-ably a strong lamp). The lamp will illuminate the paper.
Which piece of plasticine fell first as the lamp heatedthe sheet of paper? Why?
Give an example of a similar process that occurs on Earth.
Task 3. You already know that the climate on Earth at the time of the dinosaurs was warmer than it is now. For the world to be as warm again as when the dinosaurs lived, Antarctica would have to move far enough away from the South Pole for all of its ice to melt.
Take a physical map of the world and, given its scale, calculate how far in kilometres Antarctica would have to move before its centre was at 40 degrees southern latitude.
Suppose that Antarctica moves at a speed of 2 cm per year. How many years would it take for a warming of the earth caused only by the motion of Antarctica that would be sufficientfor dinosaurs to live on earth again.
Tasks
+2 оС

35
1.4. | Climate change today
During the last century, the temperature on Earth began to rise in a strange way. In 100 years the planet became nearly one degree warmer! In the Northern Hemisphere the period from 1983 to 2017 has been the warmest in the last 1,400 years (Fig.1.4.1).
Fig. 1.4.1. The map shows by how many degrees the temperature had changed in different regions of the world by 2017, compared with its average value in 1961–1990.
Deviation of air temperature in 2016 (°C) compared with the mean temperature in the period from 1961 to 1990.
Scientists explain the current warming of the planet by an increase of what is called the ‘green-house effect’.
Fig. 1.4.2. The energy balance of Earth and the greenhouse effect.
Solar radiation passesthrough the clearatmosphere.
1
Part of the solar radiationis reflected by the Earth's surfaceand by the atmosphere.
2 3Part of the infrared radiation passes through the atmosphere, but most of it is absorbed and re-emitted in all directions by greenhouse gas molecules. The result of this is warming of the Earth's surface and the lower atmosphere.
Infra-red radiationis emittedby the Earth’s surface.
Most of the radiation is absorbed by the Earth's surface, which becomes warmer.
EARTH
Most of the radiation is absorbed by the Earth's surface, which becomes warmer.
EARTH

36
The greenhouse effect The greenhouse effect is the process by which gases, dust and water vapour in the atmosphere absorb the Earth’s heat and hinder its reflection from the surface of the Earth. When scientists first described this effect 200 years ago, they noted how the Earth's atmosphere acts like a greenhouse for growing vegetables. So the gases that absorb the Earth’s thermal radiation were called ‘greenhouse gases’. The greenhouse gases in the atmosphere are carbon dioxide, meth-ane (for convenience, we will refer to them by their chemical formulas, CO2 and CH4) and some others, as well as water vapour. They create an obstacle to infrared radiation from the Earth's surface. As a result the lower atmosphere warms up. Without the greenhouse effect, the average air temperature on the Earth's surface would not be +14 °C, as now, but -19 °C. The heat of the Earth would depart into space without warming the atmosphere. This would make it hard for life to exist on our planet.
Scientists have long predicted that by producing and burning coal, oil and gas, human beings would emit large amounts of CO2 and CH4, increasing the greenhouse effect. In the mid-20th century, the prediction was confirmed: the concentration of these gases all over the world began to increase rapidly (Fig. 1.4.3).
Fig. 1.4.3. Concentrations of carbon dioxide in the atmosphere over the past 400,000 years.
Data as of July 2013
1950
Concentrations of CO2 today
Years ago (0 = 1950)400 000
440420400380360340320300280260240220200180160
350 000 300 000 250 000 200 000 150 000 100 000 50 000 0
Conc
entr
atio
ns o
f CO2
in t
he a
tmos
pher
e(n
umbe
r of C
O 2 p
arti
cles
per
mill
ion
othe
r par
ticl
es)
Concentrations of CO2 in the atmosphere did not riseabove this line for at least 800,000 years… until the year 1950.Concentrations of CO2 in the atmosphere did not riseabove this line for at least 800,000 years… until the year 1950.
Greenhouse gases are the main cause of climate change today. As a result of human activities, primarily the burning of fossil fuels, the development of transport and deforestation, atmospheric concentrations of greenhouse gases such as carbon dioxide (CO2), methane (CH4) and nitrous oxide (N2O) have reached record levels – higher than at any time in the last 800,000 years
at least. The natural concentration of carbon dioxide in the atmosphere varied throughout history between 180 and 300 parts per million other particles. Today, concentrations of CO2 are 400 parts per million! Since the beginning of the industrial revolution (from the 1750s), the concentration of carbon dioxide in the atmosphere has increased by 40%, of methane by 120%, and of nitrous oxide by 20%! The suggestion that human activity leads to strengthen-ing of the greenhouse effect was first put forward by the Swedish scientist, Svante Arrhenius, as early as 1896.

37
Fig. 1.4.4. Change in the last 800,000 years compared with average:A, air temperature;B, concentrations of carbon dioxide (CO2);C, concentrations of methane (CH4);D, level of the ocean.
Calculated by the content of oxygen isotopes in Antarctic ice.
4
2
0
-2
800 700 600 500 400 300 200 100 0
Temperature
Tem
pera
ture
devi
atio
ns (
°C) А
300
250
200
800 700 600 500 400 300 200 100 0
СО2
CO2
(num
ber o
f par
ticl
espe
r mill
ion
othe
r par
ticl
es)
B
700
500
300800 700 600 500 400 300 200 100 0
СH4
CH4
(num
ber o
f par
ticl
espe
r bill
ion
othe
r par
ticl
es)
C
25
0
-25
-50
-75
-100
-125800 700 600 500 400 300 200 100 0
Level of the world ocean
Time (thousands of years ago)
Leve
l of t
hew
orld
oce
an (
m) D
Today’s level is taken as zero
The level of the oceans, shown in the bottom graph, has changed at the same time as tempera-ture and concentration of greenhouse gases. During cold periods sea level was 50–100 m lower than it is now, and in warm periods in the last 100,000 years, it was 5–10 m higher.

38
Is the increase in concentrations of CO2 due only to human activity or is it a natural process?
Every year, photosynthesis and respiration by living organisms produce amounts of carbon di-oxide, which are many times greater than emissions by mankind (Fig. 1.4.5). Eruptions by vol-canoes and the ‘breath’ of the ocean also play a part... But it has been shown using isotope analysis that the main cause of the greenhouse effect is nevertheless human activity. This can be established because molecules of carbon dioxide formed by the combustion of coal, oil and natural gas differ from the carbon dioxide molecules which are emitted by respiration of living organisms.
Isotope analysis. Atoms of the same substance may contain different amounts of certain particles, called neutrons. The number of neutrons in an atom indicates whether atmospheric carbon dioxide comes from the respira-tion of living organisms or from the combustion of coal, oil and natural gas.
Fig. 1.4.5. The CO2 cycle in nature.
Gas e
xcha
nge b
etween ocean and atm
osphere Ph
otosynthesis
~330
~140,000
~3,000 СО2
~45,000 as soil carbondioxide and fossil fuel
Photosynthesis
Accumulation of CO2
in the atmosphere
CO2 flows in billion tonnes per year
The Atmosphere
OCEAN
LAND
~12, ~18, ~6
~36
Soil respiration anddecomposition ~220
Plant respiration ~220
Rivers ~3
CO2 fromfossil fuel ~32
Breathing anddecomposition ~7
Deposition on the sea flooras CaCO3
+2 оС

39
The ocean, forests and soils of our planet ‘help’ mankind by absorbing half of all manmade CO2, but the other half accumulates in the atmosphere (Fig. 1.4.5) and increases the greenhouse effect. This causes the atmosphere and then the ocean to warm up (Fig. 1.4.7). Another impor-tant point to remember is that people have cut down a large share of the world's forests, so their ability to absorb CO2 from the atmosphere is now less than it was in the past.
Fig. 1.4.7. Changes of water temperature in the world ocean between 1901 and 2016.
Chan
ge in
wat
er t
empe
ratu
re (
°C)
Grey areas indicate zones that do not have enough reliable data.
Fig. 1.4.6. Increase in the average temperature on Earth between 1850 and 2016.
Tem
pera
ture
dev
iati
on fr
om t
he a
vera
ge fo
r 196
1–19
90 (
°C)
The blue, black and red lines are data from meteorological centres in the US and UK.The gray band represents the range of possible error, as estimated by British scientists.
1850 1900 1950 2000
0.5
-0.5
0.0

40
The ocean plays the most important role of all in shaping the Earth's climate. It contains more than 90% of the energy of the planet's climate system. If the temperature of the atmosphere was rising, but not that of the ocean, there would be much less cause for alarm. This would mean that the main link in the climate system remained affected. Unfortunately, the temperature of the world ocean is also rising year by year. So climatologists believe that cold winters or even a cooling of the air all over the planet could not signal a halt to global warming, because the amount of heat in the Earth's climate system as a whole continues to increase year by year, with most of the increase occurring in the ocean (Fig. 1.4.7).
In addition to changing the gas composition of the atmosphere, people pollute the air with aerosols, which consist of tiny particles. Pollution of the atmosphere is also caused by the various substances produced by emissions from power stations, cars and airplanes, forest fires and burning grass. Particles in the air obstruct the passage of sunlight, raising the air tempera-ture near the surface of Earth. When they settle on snow and ice, aerosol particles (especially particles of soot) reduce the ability of the surface to reflect the sun’s rays, which adds to the warming effect. So mankind both warms and cools the planet, but the impact of its actions towards global warming (by strengthening the greenhouse effect) is about three times greater than the cooling effect of human activity. Therefore, there is every reason to speak of ‘global warming’ caused by mankind.
As early as the 1970s the climatologist Mikhail Budyko carried out accurate forecasting of climate change and predicted that mankind would face problems by 2000 in the form of new and ‘strange’ changes in climate. He was right.
Fig. 1.4.8. Forecast changes of temperature and precipitation by the end of the 21st century according to two scenarios for global greenhouse gas emissions: the most favourable scenario (left) and the least favorable scenario (right).
Change of average surface air temperature in 2081–2100 compared with the average in 1986–2005
Change of annual precipitation in 2081–2100 compared with the average for 1986–2005
41
Since the time when people began to burn coal, the air temperature on the Earth's surface has risen by 1 °C, and 0.75 °C of that growth has occurred in the last 50 years (Fig. 1.4.6). At first glance, the change seems modest and does not seem to pose a threat. But we must remember that this is the average change for the whole planet and for all seasons of the year. The change in certain places has been much greater. Air temperatures in Russia have risen by 1.5 °C and in the Far North, in the Arctic, by as much as 2–3 °C (Fig. 1.4.1).
In some parts of Russia winters have become colder and not warmer. Looking at weeks and months, we find that the temperature might be 10 °C warmer for 2–3 weeks and then 9 °C colder than the average for that time of year in that region in the second half of the twentieth century, with an overall warming of 1–2 °C. What is most striking is not the overall change, but the fact that the weather has become much more changeable, with storm winds and heavy rainfall or snowfall.
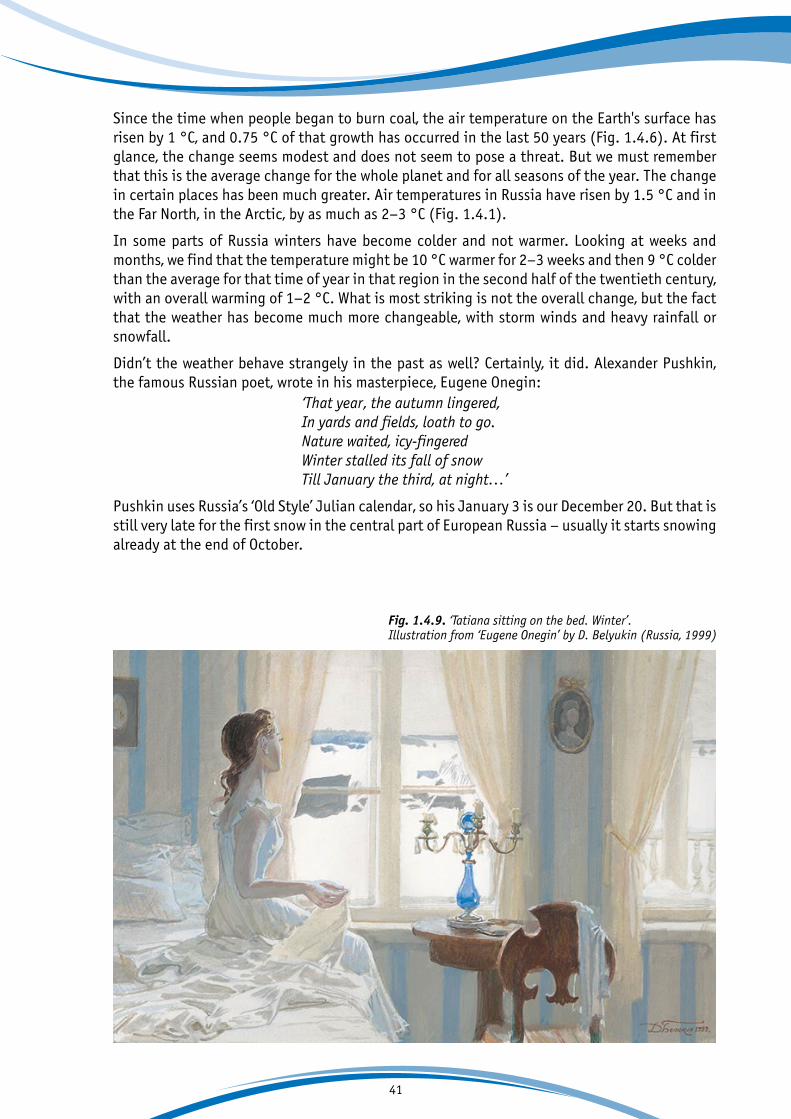
Didn’t the weather behave strangely in the past as well? Certainly, it did. Alexander Pushkin, the famous Russian poet, wrote in his masterpiece, Eugene Onegin:
Fig. 1.4.9. ‘Tatiana sitting on the bed. Winter’. Illustration from ‘Eugene Onegin’ by D. Belyukin (Russia, 1999)
‘That year, the autumn lingered,In yards and fields, loath to go.Nature waited, icy-fingeredWinter stalled its fall of snowTill January the third, at night…’
Pushkin uses Russia’s ‘Old Style’ Julian calendar, so his January 3 is our December 20. But that is still very late for the first snow in the central part of European Russia – usually it starts snowing already at the end of October.
42
In the 19th century too, there were warm days in the wintertime and cold spells in summer, storms and floods, heavy snowfalls and droughts, and even frozen rain, which covers everything with a thick crust of ice.
The key point is that such dangerous natural phenomena are now happening more often, and they will become even more frequent in the future. We will continue to experience periods of very cold weather, although, over time, they are likely to become less common. There will be some positive effects from global warming, but at present we see more negative effects.
Using computer models that take account of all the effects (both natural and human-induced), climatologists are able not only to explain what is happening now, but also to give a forecast for the whole of the 21st century. Depending on the level of greenhouse gas emissions, the tem-perature on Earth could rise dramatically during the current century. On a favourable scenario, the changes will be quite modest (1.5–2.0 °C) compared to the beginning of the 20th century. But in the worst case the climate on Earth could become 5.0 °C warmer. Northern Europe will warm more rapidly, and the temperature increase in the Arctic could be as great as 10 °C!This will have a major impact on levels of precipitation, the sea level, the frequency and severity of extreme weather events. How the 21st century ends will depend to a great extent on human activity.
Of course, the influence of the sun, volcanoes, ocean currents and other natural processes is also very significant. But the climate changes which they cause are of short duration and their role over long periods of time is small.
So most scientists agree that mankind has most probably played the biggest role in the climate change which has been taking place on Earth for the last 60 years (since the mid-20th century) and which will continue in the coming century.
+2 оС
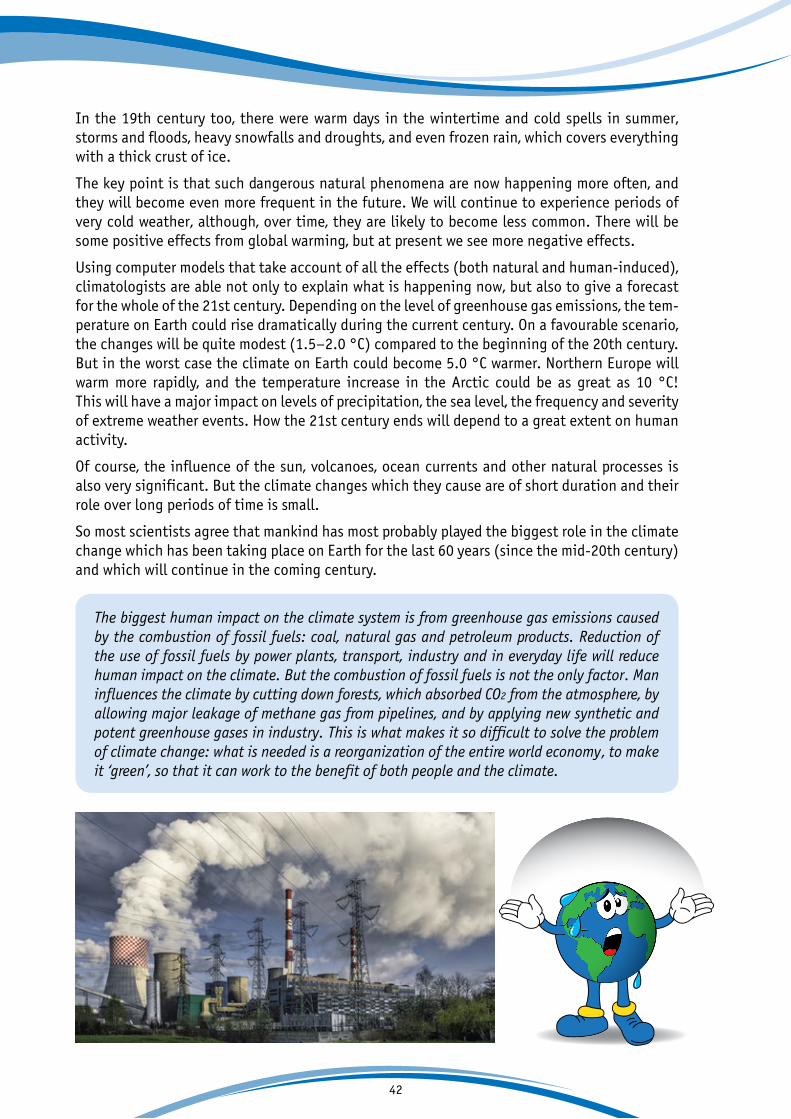
The biggest human impact on the climate system is from greenhouse gas emissions caused by the combustion of fossil fuels: coal, natural gas and petroleum products. Reduction of the use of fossil fuels by power plants, transport, industry and in everyday life will reduce human impact on the climate. But the combustion of fossil fuels is not the only factor. Man influences the climate by cutting down forests, which absorbed CO2 from the atmosphere, by allowing major leakage of methane gas from pipelines, and by applying new synthetic and potent greenhouse gases in industry. This is what makes it so difficult to solve the problem of climate change: what is needed is a reorganization of the entire world economy, to make it ‘green’, so that it can work to the benefit of both people and the climate.
43
Questions
1. Was there a greenhouse effect in the past? How was it caused?
2. Why has the temperature on Earth risen so much in the last 100 years?
3. Has the growth of CO2 concentrations in the atmosphere been due to natural causes or to human activity? How has this been proved?
4. Why can we say that mankind both heats and cools the planet? Which of the two effects is greater?
5. By how many degrees have temperatures risen over the past 50 years? Has the increase in Northern Europe been greater or less than in the world as a whole?

44
Tasks
Find a thick, cleanly sawn log or a large tree stump.
Look at the annual growth rings: you will see that some are narrow and others are wider.
The oldest growth rings are at the centre of the logor stump and the youngest are at the edge.
Wide rings mark warm years and narrow rings mark cold years. Count how many of the last 20 years were warm and how many were cold.
+2 оС

par
t
How climate change affects the natural worldand human beings Can we adapt to the inevitable consequences of climate change?
46
2. How climate change affects the natural world and human beings.Can we adapt to the inevitable consequences of climate change? 47
2.1. How climate change affects… the weather 49
2.2. How climate change affects… plants and animals 58
2.3. How climate change affects… forests 76
2.4. How climate change affects… water resources 94
2.5. How climate change affects… agriculture 103
2.6. How climate change affects… coastal regions 109
2.7. How climate change affects… mountain regions 119
2.8. How climate change affects… the Arctic region 133
2.9. How climate change affects… cities and human health 148
2.10. How climate change affects… social problems 158

47
2.| How climate change affects the natural world and human beings.
Can we adapt to the inevitable consequences of climate change?
Everything in nature is interconnected. Even a small change in one part of the natural world leads to changes in many other parts. So, as the temperature on the planet rises, we are seeing a large number of other, related changes. The level of the world ocean is rising, glaciers and permafrost are melting, the frequency and power of extreme weather events (heat waves, hur-ricanes, storms, floods and droughts) is increasing year by year. New and dangerous infectious diseases and various pests are appearing in places where they were unknown before now. These and other effects of climate change are dangerous to plants and animals, which cannot adapt quickly to such drastic changes. They also cause enormous economic damage, and present a threat to human health and even human life.
The recently published findings of the Intergovernmental Panel on Climate Change (IPCC) – the world’s most authoritative group of scientific climatologists - show that ongoing climate change could lead to even more dangerous consequences for man and for the natural world in the future.
To reduce the damage caused by climate change, humanity must take appropriate measures – so called ‘adaptation measures’ - in good time.
Adaptation means altering natural or manmade systems to take account of the actual or expected impact of climate change in a way that will make it possible to moderate the harm or take advantage of any benefits brought by climate change. For example, adaptation measures might include the con-
struction of buildings that are more resistant to extreme weather events, building dams to combat floods, developing new, drought-resistant crop varieties, etc.
48
2018
6
6
7
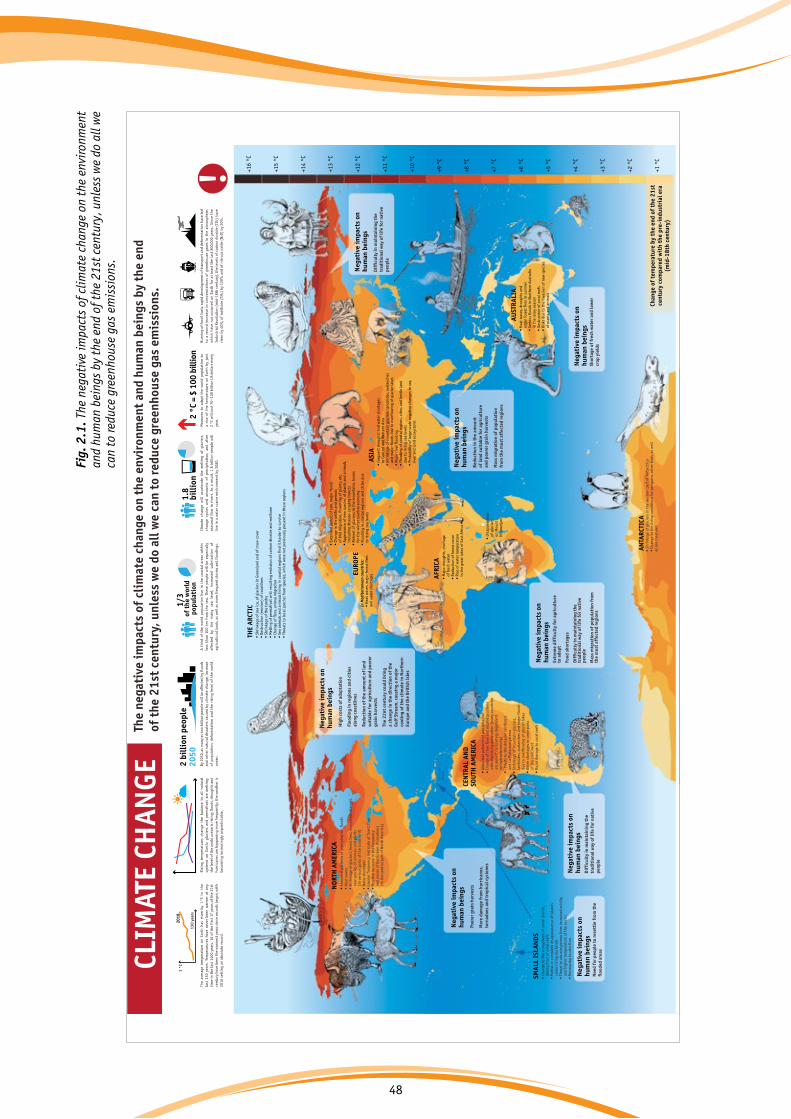
Fig.
2.1
. The
neg
ativ
e im
pact
s of
clim
ate
chan
ge o
n th
e en
viro
nmen
t an
d hu
man
bei
ngs
by th
e en
d of
the
21st
cen
tury
, unl
ess
we
do a
ll w
e ca
n to
redu
ce g
reen
hous
e ga
s em
issi
ons.

49
2.1. | How climate change affects... the weather
Scientists have noted that during the past 50 years the weather around the world has become much more extreme. We hear from time to time in the news of yet another natural disaster: a devastating hurricane in the Philippines, an unprecedented drought in Australia, severe floods in Europe, snowfall in Egypt for the first time in 122 years. Every day the temperature hits new records: in Europe we experience exceptionally hot summers, and then in winter temperatures can plunge suddenly from above zero to minus twenty.
Such freak weather conditions are referred to by scientists as weather anomalies. For example, unusually cold periods in the summer or a prolonged thaw during the winter are the most com-mon weather anomalies in the areas with temperate climate in the Northern hemisphere.
When weather anomalies pose a threat to the health, life and economic activity of people, they are extreme weather phenomena.
Weather anomalies are any deviation from the ‘usual’ weather in a particu-lar season, month or day, where ‘usual’ is to be understood as the average state of the weather in that region during a specific past period, most usu-ally 1961–1990.
Extreme weather (meteorological) phenomena are natural processes and events associ-ated with weather conditions that arise in the atmosphere, or on inland or ocean waters, and the effects of which can lead to the destruction of people, animals and plants, and can cause serious damage to the economy.
Extreme weather events include: prolonged heat or extreme cold, very strong wind, hurri-canes, tropical storms (typhoons), dust storms heavy rain, heavy snow, whirlwind or tor-nado, flood, drought, avalanches, landslides and many others.
Note: earthquakes, volcanic eruptions and tsunamis are not dependent on climate and weather, so they are not WEATHER phenomena!
Fig. 2.1.1. December rain instead of snow in Moscow is no longer a rarity.
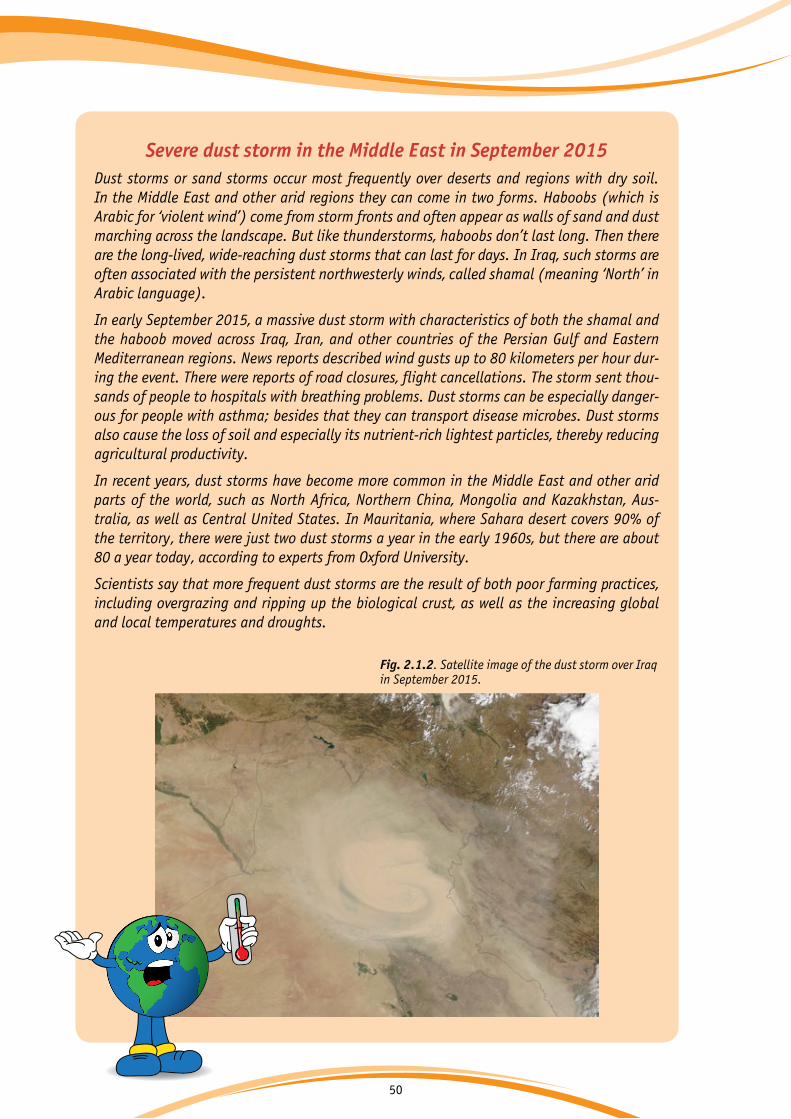
50
Severe dust storm in the Middle East in September 2015Dust storms or sand storms occur most frequently over deserts and regions with dry soil. In the Middle East and other arid regions they can come in two forms. Haboobs (which is Arabic for ‘violent wind’) come from storm fronts and often appear as walls of sand and dust marching across the landscape. But like thunderstorms, haboobs don’t last long. Then there are the long-lived, wide-reaching dust storms that can last for days. In Iraq, such storms are often associated with the persistent northwesterly winds, called shamal (meaning ‘North’ in Arabic language).
In early September 2015, a massive dust storm with characteristics of both the shamal and the haboob moved across Iraq, Iran, and other countries of the Persian Gulf and Eastern Mediterranean regions. News reports described wind gusts up to 80 kilometers per hour dur-ing the event. There were reports of road closures, flight cancellations. The storm sent thou-sands of people to hospitals with breathing problems. Dust storms can be especially danger-ous for people with asthma; besides that they can transport disease microbes. Dust storms also cause the loss of soil and especially its nutrient-rich lightest particles, thereby reducing agricultural productivity.
In recent years, dust storms have become more common in the Middle East and other arid parts of the world, such as North Africa, Northern China, Mongolia and Kazakhstan, Aus-tralia, as well as Central United States. In Mauritania, where Sahara desert covers 90% of the territory, there were just two dust storms a year in the early 1960s, but there are about 80 a year today, according to experts from Oxford University.
Scientists say that more frequent dust storms are the result of both poor farming practices, including overgrazing and ripping up the biological crust, as well as the increasing global and local temperatures and droughts.
Fig. 2.1.2. Satellite image of the dust storm over Iraqin September 2015.
+2 оС
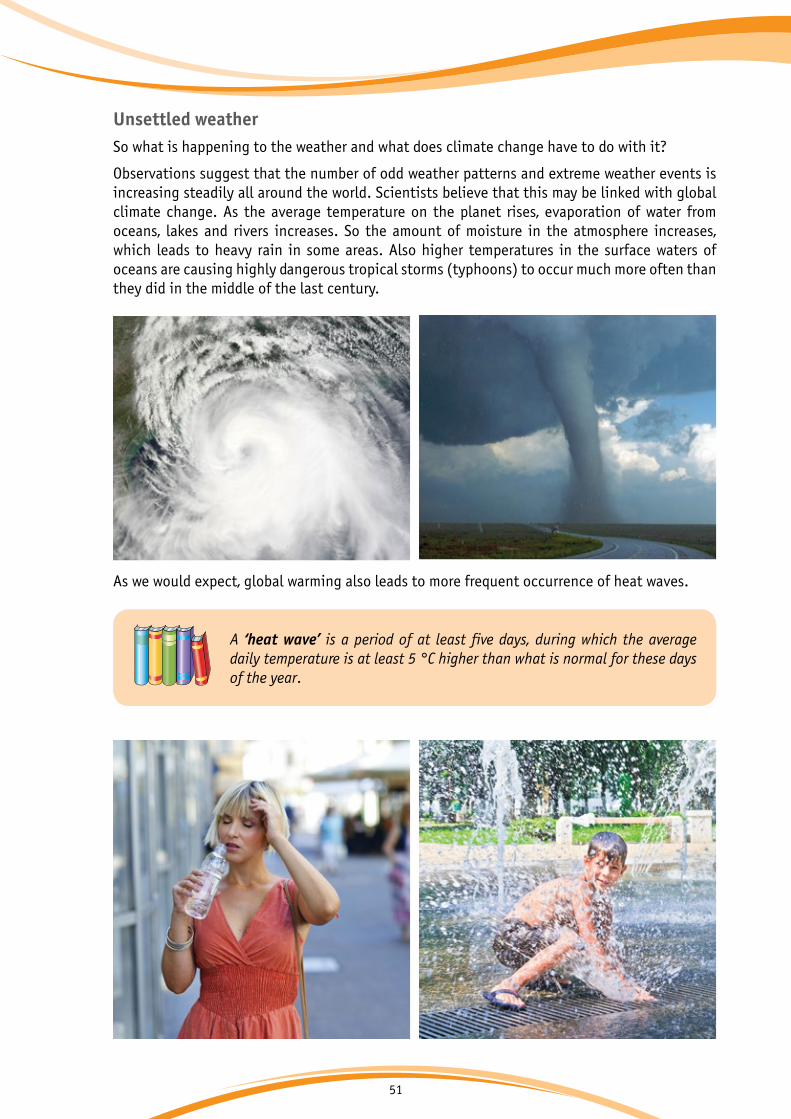
51
Unsettled weatherSo what is happening to the weather and what does climate change have to do with it?
Observations suggest that the number of odd weather patterns and extreme weather events is increasing steadily all around the world. Scientists believe that this may be linked with global climate change. As the average temperature on the planet rises, evaporation of water from oceans, lakes and rivers increases. So the amount of moisture in the atmosphere increases, which leads to heavy rain in some areas. Also higher temperatures in the surface waters of oceans are causing highly dangerous tropical storms (typhoons) to occur much more often than they did in the middle of the last century.
As we would expect, global warming also leads to more frequent occurrence of heat waves.
A ‘heat wave’ is a period of at least five days, during which the average daily temperature is at least 5 °C higher than what is normal for these days of the year.

52
The recent study published in the Nature magazine says that heat extremes that previously only occurred once every 1,000 days are happening every 200–250 days. However, the effects of warming will vary around the world. According to that study, weather events at the equator will become more extreme, meaning tropical countries already dealing with frail infrastructure and poverty will experience more than 50 times as many extremely hot days and 2.5 times as many rainy ones. But some already dry regions including the parts of the Mediterranean, North Africa, Chile, the Middle East and Australia will have higher risks of droughts and freshwater shortages.
But it is important to remember that unusual weather is not equivalent to climate change. For example, a very cold winter does not necessarily mean that the climate has become cooler. Data must be collected over a long period of time (about ten years or more) before we can speak of climate change.
Weather anomalies can cause huge damage to the world economy and lead to the lossof human lives.
Extreme weather phenomena in recent years
Russian Far East, 2013Europe, 2003USA, 2005
Brazil, 2005 Middle East, 2013 +2 оС

53
Heat wave in Europe, 2003. In 2003 France, Italy, Germany, Spain and a number of other Euro-pean countries were hit by the most powerful heat wave of recent times, which began in June and continued until mid-August. In northern France daytime temperatures were above 40 °C for at least a week. Specialists of the Earth Institute at Columbia University (USA) estimated that the intense heat cost more than 50,000 people in Europe their lives. The French National Health and Medicine Research Institute found that the mortality rate in France in the summer of 2003 was 60% higher than in previous years. The dire consequences of the extraordinary heat wave of 2003 prompted the French Ministry of Health to develop a special action plan for assessing and countering major impact from weather events on human health. Similar plans were subsequently developed in other countries of the European Union.
Drought in Brazil, 2005. The Amazon basin of Brazil suffered its worst drought for a century. The rivers dried up to such an extent that people could travel by foot and on bicycles where canoes and motorboats were usually the only means of transport.
Hurricane Katrina in the USA, 2005. Hurricane Katrina was one of the worst natural disasters in the history of the United States. Dams were broken, leading to an avalanche of water, which left the great city of New Orleans in ruins. 90% of residents in the south-eastern state of Loui-siana had to be evacuated. In recent years hurricanes and typhoons have begun to affect areas where they did not previously pose a threat.
Flooding in the Far East of Russia, 2013. The end of summer and beginning of autumn 2013 brought unusually large amounts of rainfall to the Russian Far East. The rain was concentrated in the basin of the Amur River. It lasted for about two months, causing extreme rise of water levels in the River. The amount of rain that had fallen in Amur Region by early August was equal to or greater than the amount for the full year. In some places the river level rose by as much as 9 metres! Nearly one hundred and fifty settlements on the Amur River were flooded, and 20,000 people had to leave their inundated homes to live in temporary settlements or with relatives elsewhere.
Cold wave in the Middle East, 2013. An abnormally cold spell paralyzed the Middle East and North Africa in December 2013 and led to loss of life. Snowfall caused schools and banks to close, hundreds of flights were delayed, and local residents were advised not to leave their homes.
Fig. 2.1.3. Heat wave in Europe in 2003. Red colouring shows areas where the average temperature in July 2003 was substantially higher than the average temperature in 2001.
ТTemperature anomaly
-10 -5 0 5 10
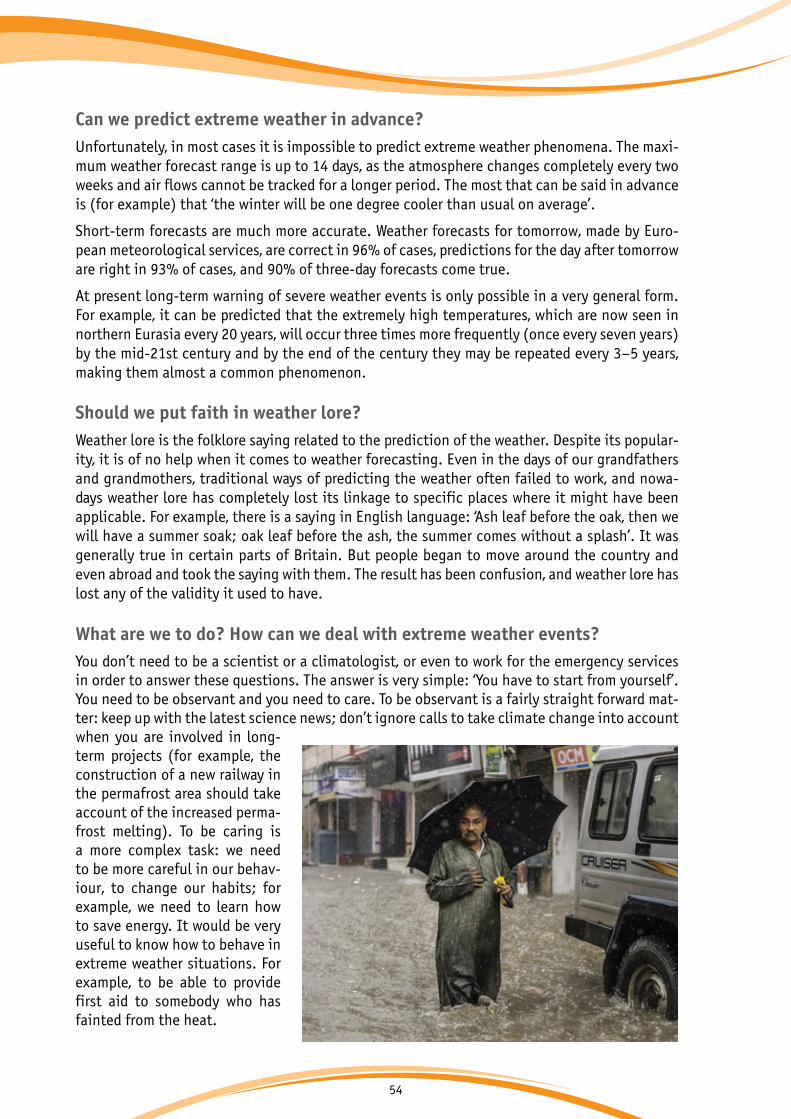
54
Can we predict extreme weather in advance? Unfortunately, in most cases it is impossible to predict extreme weather phenomena. The maxi-mum weather forecast range is up to 14 days, as the atmosphere changes completely every two weeks and air flows cannot be tracked for a longer period. The most that can be said in advance is (for example) that ‘the winter will be one degree cooler than usual on average’.
Short-term forecasts are much more accurate. Weather forecasts for tomorrow, made by Euro-pean meteorological services, are correct in 96% of cases, predictions for the day after tomorrow are right in 93% of cases, and 90% of three-day forecasts come true.
At present long-term warning of severe weather events is only possible in a very general form. For example, it can be predicted that the extremely high temperatures, which are now seen in northern Eurasia every 20 years, will occur three times more frequently (once every seven years) by the mid-21st century and by the end of the century they may be repeated every 3–5 years, making them almost a common phenomenon.
Should we put faith in weather lore? Weather lore is the folklore saying related to the prediction of the weather. Despite its popular-ity, it is of no help when it comes to weather forecasting. Even in the days of our grandfathers and grandmothers, traditional ways of predicting the weather often failed to work, and nowa-days weather lore has completely lost its linkage to specific places where it might have been applicable. For example, there is a saying in English language: ‘Ash leaf before the oak, then we will have a summer soak; oak leaf before the ash, the summer comes without a splash’. It was generally true in certain parts of Britain. But people began to move around the country and even abroad and took the saying with them. The result has been confusion, and weather lore has lost any of the validity it used to have.
What are we to do? How can we deal with extreme weather events? You don’t need to be a scientist or a climatologist, or even to work for the emergency services in order to answer these questions. The answer is very simple: ‘You have to start from yourself’. You need to be observant and you need to care. To be observant is a fairly straight forward mat-ter: keep up with the latest science news; don’t ignore calls to take climate change into account when you are involved in long-term projects (for example, the construction of a new railway in the permafrost area should take account of the increased perma-frost melting). To be caring is a more complex task: we need to be more careful in our behav-iour, to change our habits; for example, we need to learn how to save energy. It would be very useful to know how to behave in extreme weather situations. For example, to be able to provide first aid to somebody who has fainted from the heat.
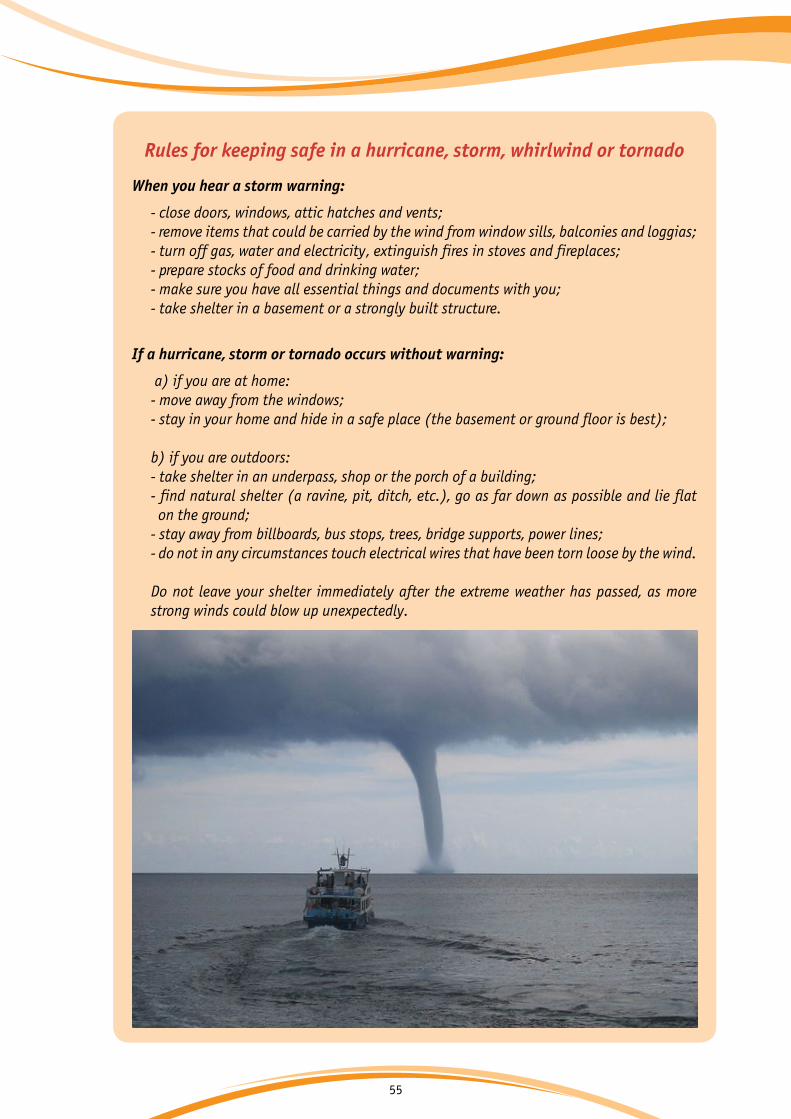
55
Rules for keeping safe in a hurricane, storm, whirlwind or tornado
When you hear a storm warning:
- close doors, windows, attic hatches and vents;- remove items that could be carried by the wind from window sills, balconies and loggias;- turn off gas, water and electricity, extinguish fires in stoves and fireplaces;- prepare stocks of food and drinking water;- make sure you have all essential things and documents with you;- take shelter in a basement or a strongly built structure.
If a hurricane, storm or tornado occurs without warning:
a) if you are at home:- move away from the windows;- stay in your home and hide in a safe place (the basement or ground floor is best);
b) if you are outdoors:- take shelter in an underpass, shop or the porch of a building;- find natural shelter (a ravine, pit, ditch, etc.), go as far down as possible and lie flat on the ground;- stay away from billboards, bus stops, trees, bridge supports, power lines;- do not in any circumstances touch electrical wires that have been torn loose by the wind.
Do not leave your shelter immediately after the extreme weather has passed, as more strong winds could blow up unexpectedly.

56
Questions
1. Is it harder to predict the weather for a large city or a small city? Why?
2. Imagine that your family wants to celebrate New Year out of doors. But what you do will depend on the weather: you might need to stay indoors if the weather is too bad. What is the earliest date when you will be able to predict the weather on December 31, at least roughly?
3. Why does extreme weather represent a danger to people?
4. Is an earthquake an extreme weather event?
5. Did the extreme weather events that we see nowadays (strong winds, floods, heat waves, etc.) also occur in the past?

57
Task
Find out from your geography teacher what are the main features of climate for your location.
What was last summer like: was it warmer or colder than usual?
+2 оС

58
2.2. | How climate change affects… plants and animals
BIODIVERSITY
What is biodiversity?
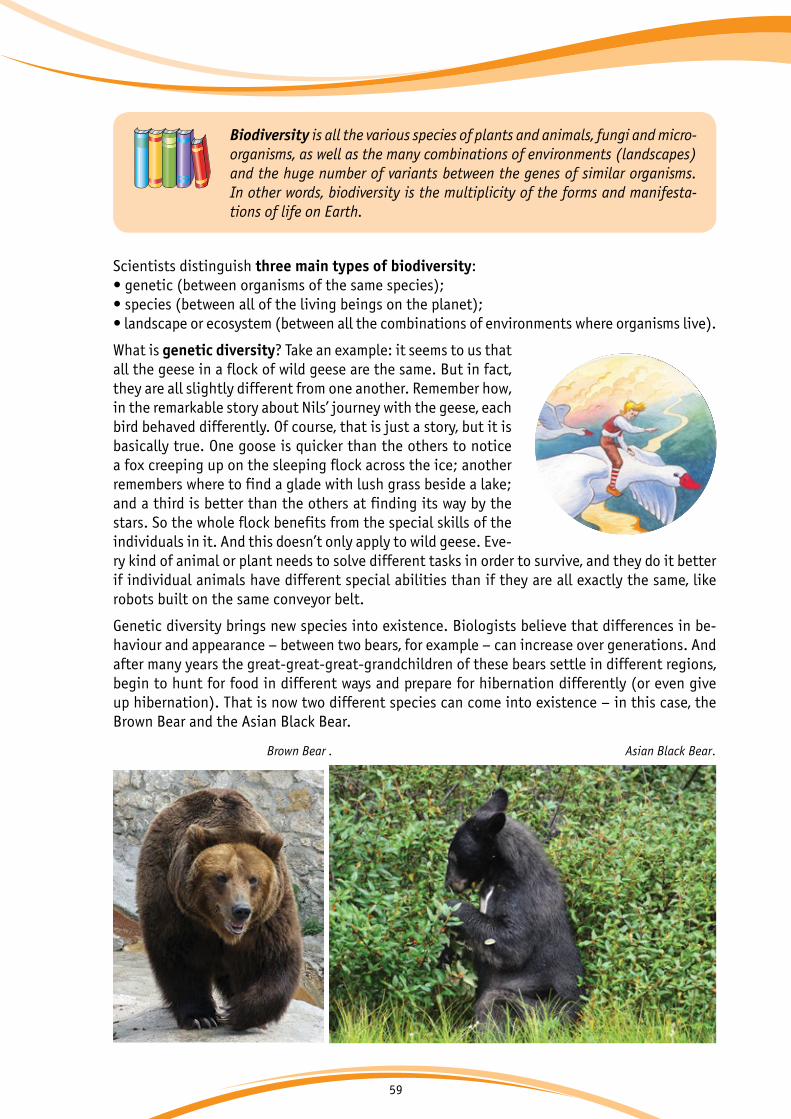
59
Biodiversity is all the various species of plants and animals, fungi and micro-organisms, as well as the many combinations of environments (landscapes) and the huge number of variants between the genes of similar organisms. In other words, biodiversity is the multiplicity of the forms and manifesta-tions of life on Earth.
Scientists distinguish three main types of biodiversity:• genetic (between organisms of the same species);• species (between all of the living beings on the planet);• landscape or ecosystem (between all the combinations of environments where organisms live).
What is genetic diversity? Take an example: it seems to us that all the geese in a flock of wild geese are the same. But in fact, they are all slightly different from one another. Remember how, in the remarkable story about Nils’ journey with the geese, each bird behaved differently. Of course, that is just a story, but it is basically true. One goose is quicker than the others to notice a fox creeping up on the sleeping flock across the ice; another remembers where to find a glade with lush grass beside a lake; and a third is better than the others at finding its way by the stars. So the whole flock benefits from the special skills of the individuals in it. And this doesn’t only apply to wild geese. Eve-ry kind of animal or plant needs to solve different tasks in order to survive, and they do it better if individual animals have different special abilities than if they are all exactly the same, like robots built on the same conveyor belt.
Genetic diversity brings new species into existence. Biologists believe that differences in be-haviour and appearance – between two bears, for example – can increase over generations. And after many years the great-great-great-grandchildren of these bears settle in different regions, begin to hunt for food in different ways and prepare for hibernation differently (or even give up hibernation). That is now two different species can come into existence – in this case, the Brown Bear and the Asian Black Bear.
Brown Bear . Asian Black Bear.
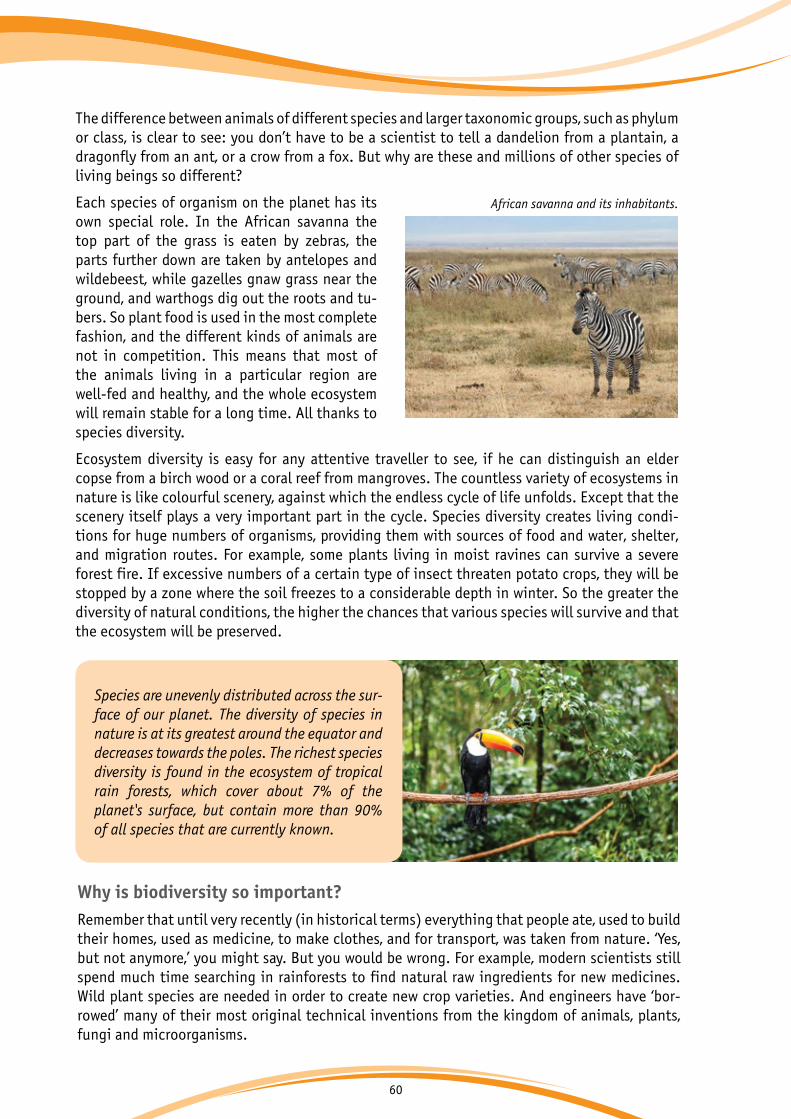
60
The difference between animals of different species and larger taxonomic groups, such as phylum or class, is clear to see: you don’t have to be a scientist to tell a dandelion from a plantain, a dragonfly from an ant, or a crow from a fox. But why are these and millions of other species of living beings so different?
Each species of organism on the planet has its own special role. In the African savanna the top part of the grass is eaten by zebras, the parts further down are taken by antelopes and wildebeest, while gazelles gnaw grass near the ground, and warthogs dig out the roots and tu-bers. So plant food is used in the most complete fashion, and the different kinds of animals are not in competition. This means that most of the animals living in a particular region are well-fed and healthy, and the whole ecosystem will remain stable for a long time. All thanks to species diversity.
Ecosystem diversity is easy for any attentive traveller to see, if he can distinguish an elder copse from a birch wood or a coral reef from mangroves. The countless variety of ecosystems in nature is like colourful scenery, against which the endless cycle of life unfolds. Except that the scenery itself plays a very important part in the cycle. Species diversity creates living condi-tions for huge numbers of organisms, providing them with sources of food and water, shelter, and migration routes. For example, some plants living in moist ravines can survive a severe forest fire. If excessive numbers of a certain type of insect threaten potato crops, they will be stopped by a zone where the soil freezes to a considerable depth in winter. So the greater the diversity of natural conditions, the higher the chances that various species will survive and that the ecosystem will be preserved.
African savanna and its inhabitants.
Species are unevenly distributed across the sur-face of our planet. The diversity of species in nature is at its greatest around the equator and decreases towards the poles. The richest species diversity is found in the ecosystem of tropical rain forests, which cover about 7% of the planet's surface, but contain more than 90% of all species that are currently known.
Why is biodiversity so important?Remember that until very recently (in historical terms) everything that people ate, used to build their homes, used as medicine, to make clothes, and for transport, was taken from nature. ‘Yes, but not anymore,’ you might say. But you would be wrong. For example, modern scientists still spend much time searching in rainforests to find natural raw ingredients for new medicines. Wild plant species are needed in order to create new crop varieties. And engineers have ‘bor-rowed’ many of their most original technical inventions from the kingdom of animals, plants, fungi and microorganisms.

61
But that is not the most important role of biodiversity. What is most important is that biodiver-sity creates a habitat for all living beings, including us. What exactly does that mean? For many millions of years everything that grows, runs, swims, crawls and flies on our planet, has adapted to the composition of the Earth's atmosphere. Changes to this ‘cocktail’ of gas might only be very slight. But even a slight reduction of the oxygen content in the air we breathe would make us and many other animals feel unwell. If oxygen levels fell even further, we would feel much worse. And what maintains the levels of oxygen in the atmosphere? Green plants!
The science of bionics offers solutions to engineering problems by using knowledge of the structure and functioning of living organisms. For example, the design of a new lining for the hulls of ships was based on studies of the structure of dolphin skin, and it has increased the speed at which ships can travel by 15-20%. The great artist and scientist, Leonardo da Vinci, was one of the founders of bionics: he tried to build an ‘ornithopter’, a flying machine with wings that flapped like those of a bird.
All plants and animals, micro-organisms and fungi form a highly intricate and finely adjusted system. Imagine that you and your friends spent two whole years on a spaceship flying to Mars and back. Think of all the different parts, devices and other equipment that the spaceship would contain! Can you think of our planet being like that spaceship? Each of its ‘parts’ was created by millions of years of evolution, the action of each part was tuned to work in harmony with thou-sands of other parts. What would happen if an error by one of the crew or a meteorite damaged several of the devices on the spaceship? You could replace them with other similar devices, at least for a while. But what if you then suffered some other space accident?
Biological diversity on Earth is quite similar. Every organism has an important job. One pro-cesses energy from the sun, another uses that processed energy to chase prey or escape from predators, a third breaks down dead wood or the remnants of dead animals, etc. Every one of them, from the vast baobab tree to the smallest lichen, from the mightiest whale to the lightest jellyfish are all-important components of life on planet Earth. And there are also organisms that we have yet to discover!
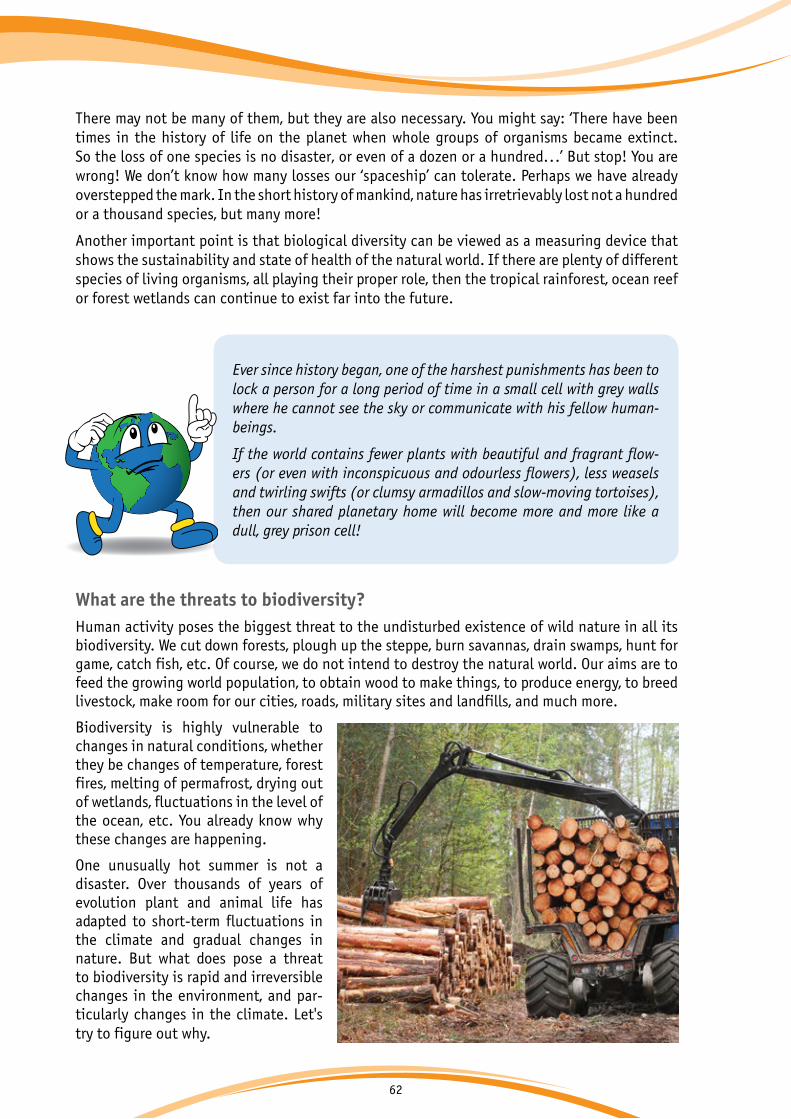
62
There may not be many of them, but they are also necessary. You might say: ‘There have been times in the history of life on the planet when whole groups of organisms became extinct.So the loss of one species is no disaster, or even of a dozen or a hundred...’ But stop! You are wrong! We don’t know how many losses our ‘spaceship’ can tolerate. Perhaps we have already overstepped the mark. In the short history of mankind, nature has irretrievably lost not a hundredor a thousand species, but many more!
Another important point is that biological diversity can be viewed as a measuring device that shows the sustainability and state of health of the natural world. If there are plenty of different species of living organisms, all playing their proper role, then the tropical rainforest, ocean reef or forest wetlands can continue to exist far into the future.
What are the threats to biodiversity?Human activity poses the biggest threat to the undisturbed existence of wild nature in all its biodiversity. We cut down forests, plough up the steppe, burn savannas, drain swamps, hunt for game, catch fish, etc. Of course, we do not intend to destroy the natural world. Our aims are to feed the growing world population, to obtain wood to make things, to produce energy, to breed livestock, make room for our cities, roads, military sites and landfills, and much more.
Biodiversity is highly vulnerable to changes in natural conditions, whether they be changes of temperature, forest fires, melting of permafrost, drying out of wetlands, fluctuations in the level of the ocean, etc. You already know why these changes are happening.
One unusually hot summer is not a disaster. Over thousands of years of evolution plant and animal life has adapted to short-term fluctuations in the climate and gradual changes in nature. But what does pose a threat to biodiversity is rapid and irreversible changes in the environment, and par-ticularly changes in the climate. Let's try to figure out why.
Ever since history began, one of the harshest punishments has been to lock a person for a long period of time in a small cell with grey walls where he cannot see the sky or communicate with his fellow human-beings.
If the world contains fewer plants with beautiful and fragrant flow-ers (or even with inconspicuous and odourless flowers), less weasels and twirling swifts (or clumsy armadillos and slow-moving tortoises), then our shared planetary home will become more and more like a dull, grey prison cell!
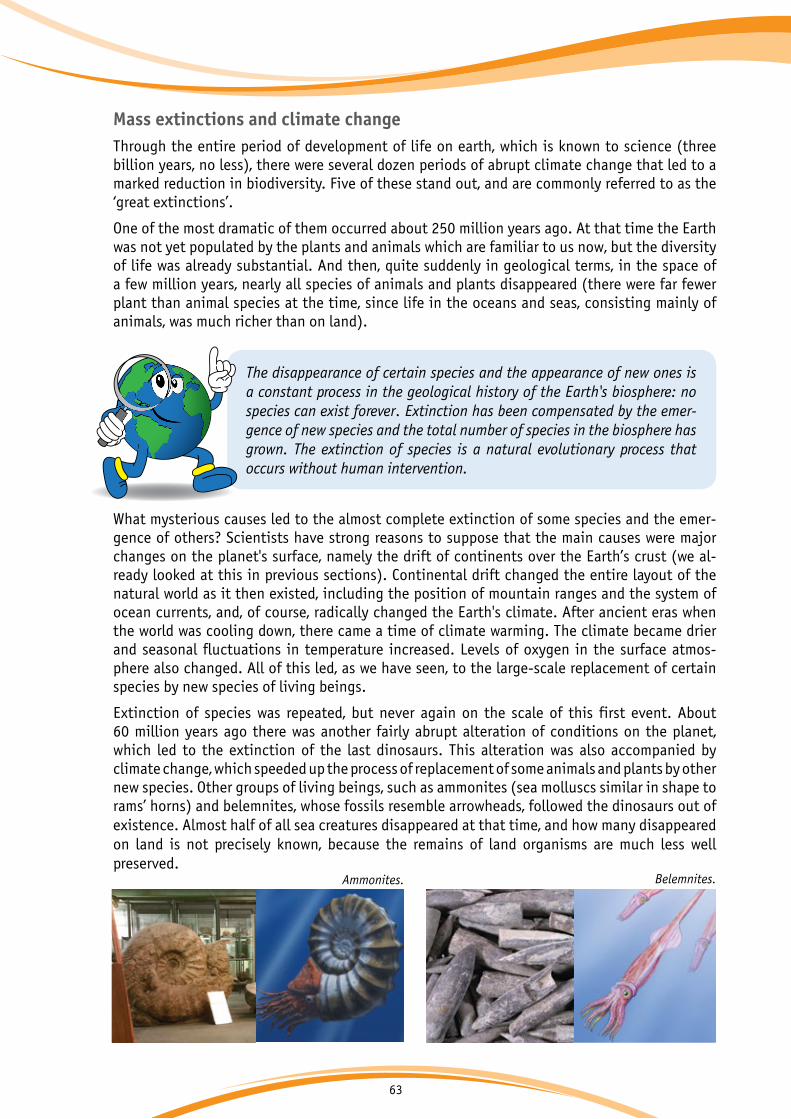
63
Mass extinctions and climate changeThrough the entire period of development of life on earth, which is known to science (three billion years, no less), there were several dozen periods of abrupt climate change that led to a marked reduction in biodiversity. Five of these stand out, and are commonly referred to as the ‘great extinctions’.
One of the most dramatic of them occurred about 250 million years ago. At that time the Earth was not yet populated by the plants and animals which are familiar to us now, but the diversity of life was already substantial. And then, quite suddenly in geological terms, in the space of a few million years, nearly all species of animals and plants disappeared (there were far fewer plant than animal species at the time, since life in the oceans and seas, consisting mainly of animals, was much richer than on land).
The disappearance of certain species and the appearance of new ones is a constant process in the geological history of the Earth's biosphere: no species can exist forever. Extinction has been compensated by the emer-gence of new species and the total number of species in the biosphere has grown. The extinction of species is a natural evolutionary process that occurs without human intervention.
+2 оС
Ammonites. Belemnites.
What mysterious causes led to the almost complete extinction of some species and the emer-gence of others? Scientists have strong reasons to suppose that the main causes were major changes on the planet's surface, namely the drift of continents over the Earth’s crust (we al-ready looked at this in previous sections). Continental drift changed the entire layout of the natural world as it then existed, including the position of mountain ranges and the system of ocean currents, and, of course, radically changed the Earth's climate. After ancient eras when the world was cooling down, there came a time of climate warming. The climate became drier and seasonal fluctuations in temperature increased. Levels of oxygen in the surface atmos-phere also changed. All of this led, as we have seen, to the large-scale replacement of certain species by new species of living beings.
Extinction of species was repeated, but never again on the scale of this first event. About60 million years ago there was another fairly abrupt alteration of conditions on the planet, which led to the extinction of the last dinosaurs. This alteration was also accompanied byclimate change, which speeded up the process of replacement of some animals and plants by other new species. Other groups of living beings, such as ammonites (sea molluscs similar in shape to rams’ horns) and belemnites, whose fossils resemble arrowheads, followed the dinosaurs out of existence. Almost half of all sea creatures disappeared at that time, and how many disappearedon land is not precisely known, because the remains of land organisms are much less wellpreserved.
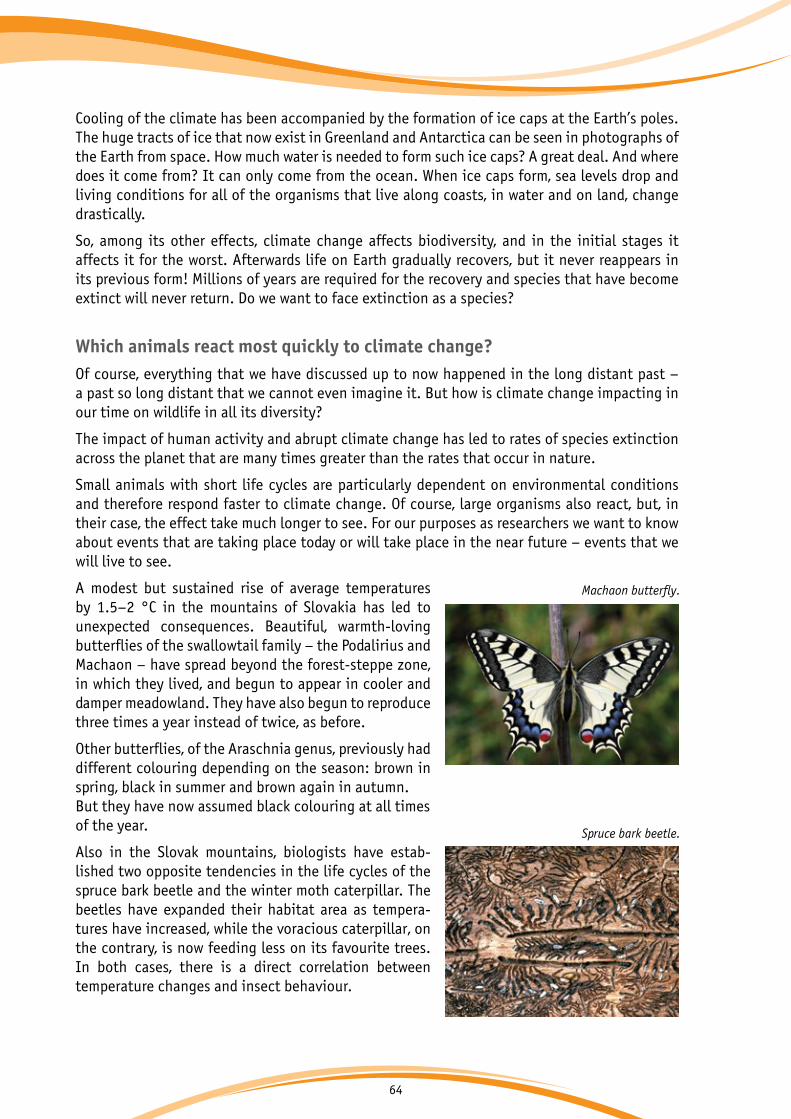
64
Cooling of the climate has been accompanied by the formation of ice caps at the Earth’s poles. The huge tracts of ice that now exist in Greenland and Antarctica can be seen in photographs of the Earth from space. How much water is needed to form such ice caps? A great deal. And where does it come from? It can only come from the ocean. When ice caps form, sea levels drop and living conditions for all of the organisms that live along coasts, in water and on land, change drastically.
So, among its other effects, climate change affects biodiversity, and in the initial stages it affects it for the worst. Afterwards life on Earth gradually recovers, but it never reappears in its previous form! Millions of years are required for the recovery and species that have become extinct will never return. Do we want to face extinction as a species?
Which animals react most quickly to climate change?Of course, everything that we have discussed up to now happened in the long distant past – a past so long distant that we cannot even imagine it. But how is climate change impacting in our time on wildlife in all its diversity?
The impact of human activity and abrupt climate change has led to rates of species extinction across the planet that are many times greater than the rates that occur in nature.
Small animals with short life cycles are particularly dependent on environmental conditions and therefore respond faster to climate change. Of course, large organisms also react, but, in their case, the effect take much longer to see. For our purposes as researchers we want to know about events that are taking place today or will take place in the near future – events that we will live to see.
A modest but sustained rise of average temperatures by 1.5–2 °C in the mountains of Slovakia has led to unexpected consequences. Beautiful, warmth-loving butterflies of the swallowtail family – the Podalirius and Machaon – have spread beyond the forest-steppe zone, in which they lived, and begun to appear in cooler and damper meadowland. They have also begun to reproduce three times a year instead of twice, as before.
Other butterflies, of the Araschnia genus, previously had different colouring depending on the season: brown in spring, black in summer and brown again in autumn.But they have now assumed black colouring at all timesof the year.
Also in the Slovak mountains, biologists have estab-lished two opposite tendencies in the life cycles of the spruce bark beetle and the winter moth caterpillar. The beetles have expanded their habitat area as tempera-tures have increased, while the voracious caterpillar, on the contrary, is now feeding less on its favourite trees. In both cases, there is a direct correlation between temperature changes and insect behaviour.
Machaon butterfly.
Spruce bark beetle.
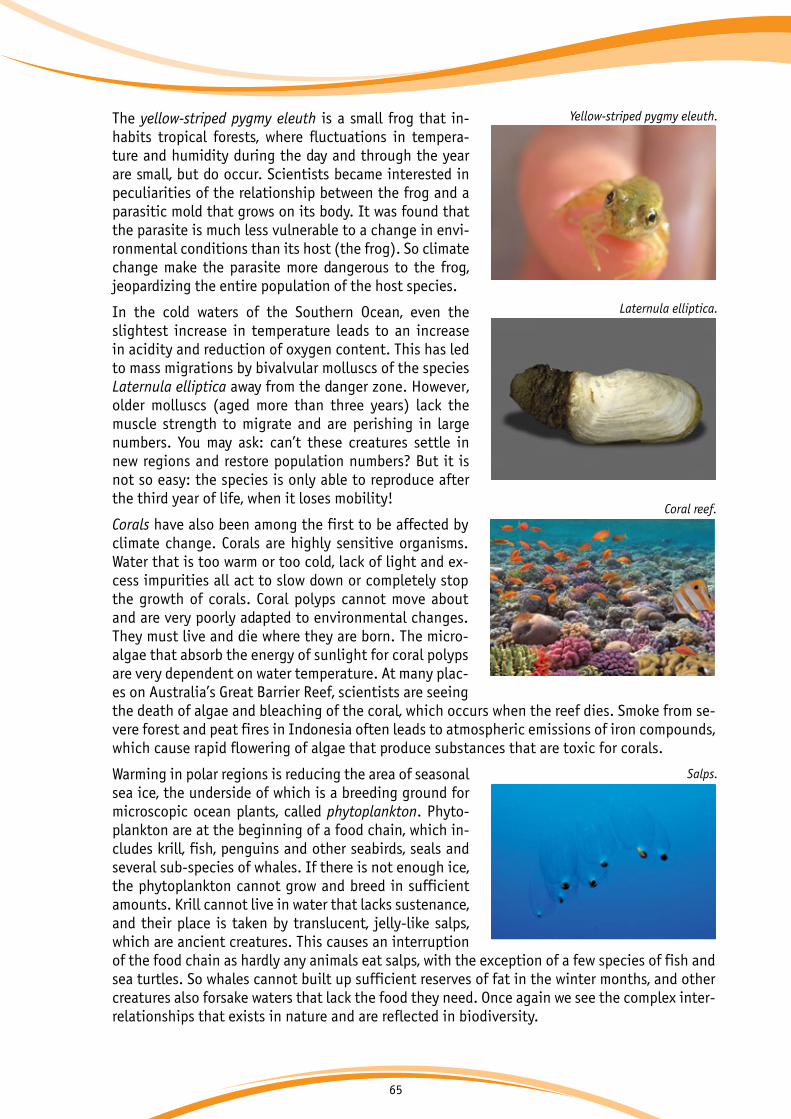
65
The yellow-striped pygmy eleuth is a small frog that in-habits tropical forests, where fluctuations in tempera-ture and humidity during the day and through the year are small, but do occur. Scientists became interested in peculiarities of the relationship between the frog and a parasitic mold that grows on its body. It was found that the parasite is much less vulnerable to a change in envi-ronmental conditions than its host (the frog). So climate change make the parasite more dangerous to the frog, jeopardizing the entire population of the host species.
In the cold waters of the Southern Ocean, even the slightest increase in temperature leads to an increase in acidity and reduction of oxygen content. This has led to mass migrations by bivalvular molluscs of the species Laternula elliptica away from the danger zone. However, older molluscs (aged more than three years) lack the muscle strength to migrate and are perishing in large numbers. You may ask: can’t these creatures settle in new regions and restore population numbers? But it is not so easy: the species is only able to reproduce after the third year of life, when it loses mobility!
Corals have also been among the first to be affected by climate change. Corals are highly sensitive organisms. Water that is too warm or too cold, lack of light and ex-cess impurities all act to slow down or completely stop the growth of corals. Coral polyps cannot move about and are very poorly adapted to environmental changes. They must live and die where they are born. The micro-algae that absorb the energy of sunlight for coral polyps are very dependent on water temperature. At many plac-es on Australia’s Great Barrier Reef, scientists are seeing the death of algae and bleaching of the coral, which occurs when the reef dies. Smoke from se-vere forest and peat fires in Indonesia often leads to atmospheric emissions of iron compounds, which cause rapid flowering of algae that produce substances that are toxic for corals.
Warming in polar regions is reducing the area of seasonal sea ice, the underside of which is a breeding ground for microscopic ocean plants, called phytoplankton. Phyto-plankton are at the beginning of a food chain, which in-cludes krill, fish, penguins and other seabirds, seals and several sub-species of whales. If there is not enough ice, the phytoplankton cannot grow and breed in sufficient amounts. Krill cannot live in water that lacks sustenance, and their place is taken by translucent, jelly-like salps, which are ancient creatures. This causes an interruption of the food chain as hardly any animals eat salps, with the exception of a few species of fish and sea turtles. So whales cannot built up sufficient reserves of fat in the winter months, and other creatures also forsake waters that lack the food they need. Once again we see the complex inter-relationships that exists in nature and are reflected in biodiversity.
Yellow-striped pygmy eleuth.
Laternula elliptica.
Coral reef.
Salps.
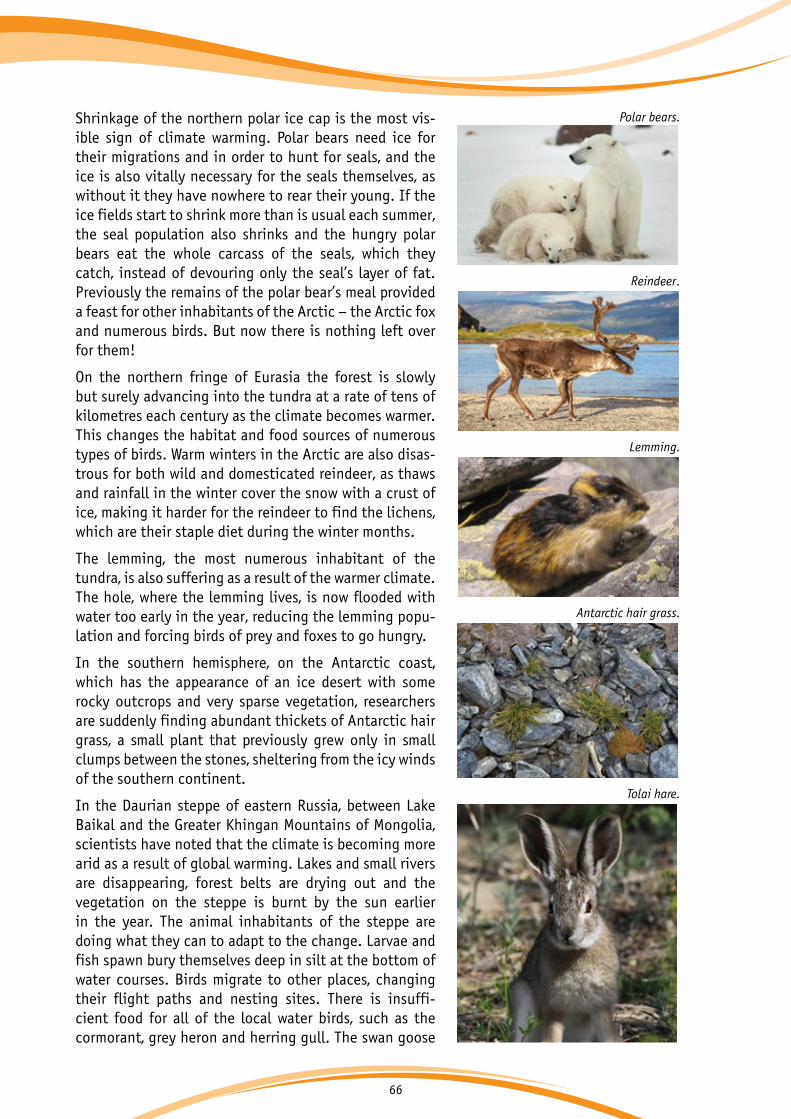
66
Shrinkage of the northern polar ice cap is the most vis-ible sign of climate warming. Polar bears need ice for their migrations and in order to hunt for seals, and the ice is also vitally necessary for the seals themselves, as without it they have nowhere to rear their young. If the ice fields start to shrink more than is usual each summer, the seal population also shrinks and the hungry polar bears eat the whole carcass of the seals, which they catch, instead of devouring only the seal’s layer of fat. Previously the remains of the polar bear’s meal provided a feast for other inhabitants of the Arctic – the Arctic fox and numerous birds. But now there is nothing left over for them!
On the northern fringe of Eurasia the forest is slowly but surely advancing into the tundra at a rate of tens of kilometres each century as the climate becomes warmer. This changes the habitat and food sources of numerous types of birds. Warm winters in the Arctic are also disas-trous for both wild and domesticated reindeer, as thaws and rainfall in the winter cover the snow with a crust of ice, making it harder for the reindeer to find the lichens, which are their staple diet during the winter months.
The lemming, the most numerous inhabitant of the tundra, is also suffering as a result of the warmer climate. The hole, where the lemming lives, is now flooded with water too early in the year, reducing the lemming popu-lation and forcing birds of prey and foxes to go hungry.
In the southern hemisphere, on the Antarctic coast, which has the appearance of an ice desert with some rocky outcrops and very sparse vegetation, researchers are suddenly finding abundant thickets of Antarctic hair grass, a small plant that previously grew only in small clumps between the stones, sheltering from the icy winds of the southern continent.
In the Daurian steppe of eastern Russia, between Lake Baikal and the Greater Khingan Mountains of Mongolia, scientists have noted that the climate is becoming more arid as a result of global warming. Lakes and small rivers are disappearing, forest belts are drying out and the vegetation on the steppe is burnt by the sun earlier in the year. The animal inhabitants of the steppe are doing what they can to adapt to the change. Larvae and fish spawn bury themselves deep in silt at the bottom of water courses. Birds migrate to other places, changing their flight paths and nesting sites. There is insuffi-cient food for all of the local water birds, such as the cormorant, grey heron and herring gull. The swan goose
Polar bears.
Reindeer.
Lemming.
Antarctic hair grass.
Tolai hare.

67
no longer nests in the region. Wolves, fox, badgers and even cranes are moving away in search of more water. Bird of prey, which need plenty of water to digest their diet of meat, are also migrating to more suitable regions. The Tolai hare finds itself short of grass in the summer-time, not only to feed on but also to hide from preda-tors! The Tabargan marmot and Daurian ground squirrel, both of them indigenous to the area, are well-adapted to drought, but are finding life in the new conditions diffi-cult, as they cannot move quickly enough to escape from grass fires, which are an increasingly frequent occurrence in the summertime. Burnt grass also means lack of winter forage for hoofed beasts, forcing large herds of antelope and gazelle to migrate from Mongolia to Russia. The few remaining watering places in the Daurian steppe are becoming overcrowded with animals in search of water, which increases the risk of disease. As the summers have become drier, the winters have experienced more snowfall, as a result of which the manul (a species of wild cat) cannot find food. The Daurian hedgehog is almost alone in benefiting from the change of climate: it needs more than five months of warmth for a suc-cessful life cycle, so it is expanding its presence in the new conditions.
National Parks: learning to preserve natureWhat is a national park? It is a protected area that can be visited by tourists, but where human activity is limited by definite rules. National parks are usually created in places where there are many different landscapes (both typical and unique), rare or endangered animals and plants, and unique geological or water phenomena. National parks are visited by adults and children, who can learn there about global environmental issues. National parks can be used to create nurseries for the breeding of rare species of plants and animals, which can then be sent out into areas outside the park.
Does climate change affect national parks? Unfortunately, global climate change leads to fires, droughts, increase of the temperature in the atmosphere and many other phenomena that can-not be kept at bay simply by declaring an area to be a national park.
The conditions for freshwater flora and fauna in the Everglades park in Florida (USA) vary de-pending on the influx of salty sea water from the nearby Florida Bay, a process that is being influenced by climate change. Scientists and staff of protected areas understand that such processes threaten the very existence of national parks, and the US Environmental Protection Agency together with the National Park Service have therefore set up a special programme: ‘Climate Friendly Parks’. The programme acquaints park staff and visitors with the causes and consequences of climate change and explains what they themselves can do to help solve global problems associated with climate change.
Manul.
Lahemaa national park (Estonia). Jasper national park (Canada). Kruger national park (South Africa).
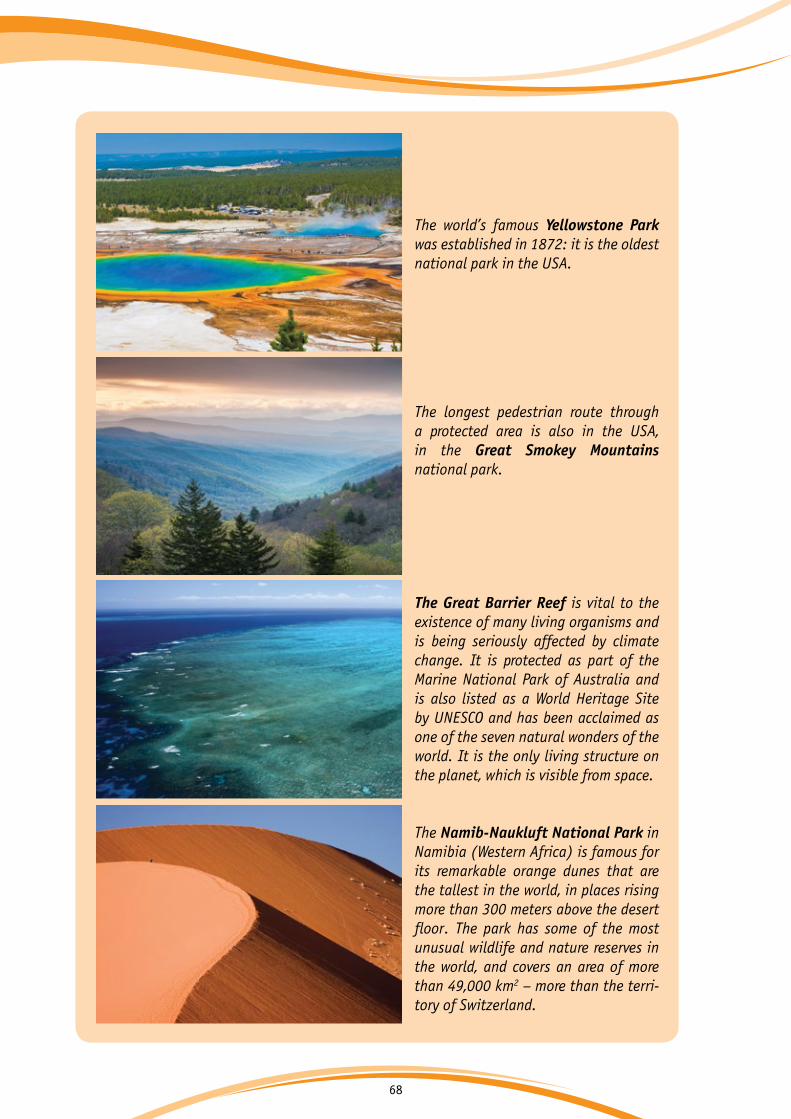
68
The world’s famous Yellowstone Park was established in 1872: it is the oldest national park in the USA.
The longest pedestrian route through a protected area is also in the USA, in the Great Smokey Mountains national park.
The Great Barrier Reef is vital to the existence of many living organisms and is being seriously affected by climate change. It is protected as part of the Marine National Park of Australia and is also listed as a World Heritage Site by UNESCO and has been acclaimed as one of the seven natural wonders of the world. It is the only living structure on the planet, which is visible from space.
The Namib-Naukluft National Park in Namibia (Western Africa) is famous for its remarkable orange dunes that are the tallest in the world, in places rising more than 300 meters above the desert floor. The park has some of the most unusual wildlife and nature reserves in the world, and covers an area of more than 49,000 km2 – more than the terri-tory of Switzerland.

69
Wildlife reserves: nature without manWildlife (biosphere) reserves are places where scientists can monitor and record changes in the natural world. In a wildlife reserve it is forbidden even to even pick berries, mushrooms or to catch fish. Such places are ideal for restoring populations of endangered species, which can then be released into suitable areas outside the reserve.
Biosphere reserves are often created in places where nature is not subject to any substantial human influence. They are used to safeguard typical local ecosystems as well as rare species and communities of animals and plants. For example, the ecosystem to be protected in taiga regions would be that of the taiga, while in a tropical region it would be the tropical rainforest. Conservation of the natural environment in such areas has global importance.
Biosphere reserves exist on all of the world’s continents. You have probably seen films about such areas in Africa. It is thanks to such biosphere reserves that the diverse natural world of the African continent is being kept alive for us today.
A wildlife (biosphere) reserve is a protected territory, where no human activity is permitted, with the exception of scientific activity.
Yugyd va national park (Russia).
Everglades national park (USA).Biosphere reserve Belovezhskaya Pushcha / Bialowieza Forest
(Belarus, Poland).

70
America’s Zion national park is a fine example of how to achieve environmental safety. About 20 buses,using low-emission gas fuel, carry visitors around the park, replacing about 5000 cars, which the visitors would otherwise bring with them. The result has been a significant reduction in greenhouse gas emissions. A ‘Green Center’ built at the park to welcome tourists obtains nearly a third of its energy needs from the sun and 80% of its lighting needs are provided by natural light. In the summer the air conditioning system uses special energy-efficient evaporators and in the winter a passive heating system, which uses a wall of heat-absorbing materials (stone, brick) facing the sun, maximizes heat retention.
The Taganay national park has recently installed the first eco-friendly energy supply system to be used at a protected natural area in Russia. One of the shelters at the park now obtains its electricity from wind en-ergy (wind turbines) and the sun (solar panels). The system automatically determines which of the two sources of energy – solar or wind – should be used at any moment. Previously this and other shelters and facilities at the park were dependent on gasoline-powered generators for their energy needs – an energysource that is both expensive and harmful for theenvironment. A new lighting system, powered by solar and wind energy, has been installed in Adler at the Yuzhniye Kultury section of the Sochi National Park in southern Russia.
All biosphere reserves participate in the Man and the Biosphereinternational programme, which is run by UNESCO and which supportsongoing, long-term studies of the environment. Studies are nowbeing carried out in many reserves of the impact of climate change on plant and animal life. Scientists working at the Caucasus bio-sphere reserve in Russia have found that forest cover on the slopes of mountains in the region is gradually moving higher as the climate becomes warmer.
+2 оС

71
Wildlife sanctuaries and areas of outstanding natural importanceThe point of wildlife sanctuaries is to protect, not the whole of the local natural environment, but only individual parts of it: for example, only plants or only animals, or perhaps some geo-logical features (rocks or caves). So limitations on human activity in such sanctuaries only refer to activity that threatens the protected parts of the environment.
Areas of outstanding natural importance are unique or typical natural areas and landmarks, which have special scientific, cultural, educational or health-related value. They may be lakes, trees, geological sites, or ancient parks. They are protected by prohibitions on types of human activity that could damage their integrity.
How do protected areas help to address the problems of climate change What is the contribution of a national park (and any other protected area) in addressing climate change? The most significant contribution is the reduction of emissions of carbon dioxide into the atmosphere. For example, some parks encourage tourists to use public buses powered by alternative fuel instead of polluting private cars. Park employees themselves also use forms of transport that have minimal impact on the environment. Parks may use energy from the wind, sun or hot springs to operate the premises where they receive visitors. Maximum use is made of natural lighting and LEDs, and power for offices is provided using solar panels. Tourists are offered souvenirs made from recycled materials, the park cafeteria serves dishes made from local products (products that do not have to be brought from a long way away, with resulting transport pollution, and that are made in an environmentally safe manner), and park premises are equipped with water-saving toilets. Information is provided, which teaches visitors how to behave in a way that is most environmentally efficient and least environmentally damaging.
Ecotourism: harmony between man and natureDo you enjoy walking and other outdoor activities? If yes, then you and your friends will enjoy travelling and discovering new places. Maybe you will even become ecotourists.
What is the difference between tourists and ecotourists? What sets them apart most of all is their attitude towards the environment. Ecotourism is a recent con-cept, that arose when people began to un-derstand how important that natural world is to us. There are different ways of relax-ing outdoors. You can simply drive into the forest or to the edge of a lake by car, switch on music at full volume, light a fire in the nicest place you can find, have plenty to eat and leave a pile of garbage behind you. But there are other tourists who are will-ing to climb to the top of a mountain just to see a wild animal, to find a rare plant, to listen to the birds singing, or to enjoy the sunset and the silence. Their main goal is to see and hear the natural world, which modern people so rarely witness. They don’t leave garbage – on the contrary, they often clear up other people’s garbage, and they make sure to obey all of the rules that are in place to protect the environment. Num-bers of ecotourists are growing year by year!

72
Ecotourism gives people the opportunity to see the environment in its untouched, natural state, to understand how diverse it is, how vulnerable to human activity, and to ponder the question: ‘What can I do for my planet?’ Ecotourists study the laws of nature and do things that help to maintain and preserve it, they try to reduce their environmental impact to a minimum. What is more: ecotourism firms give a part of their income to support the protection and study of the environment.
Many outstanding natural environments are located in remote places, in rural areas where peo-ple are relatively poor. Or in areas such as the jungles of South America or mountain regions along the border between Northern Thailand, Myanmar and Laos, which are inhabited by in-digenous people. Therefore ecotourists often learn not only about the natural world, but also about human culture. And ecotourism provides work and an additional source of income for the people who live in these regions.
So, ecotourism helps people to see the beauty and uniqueness of nature, to understand how everything in the world around them is connected, how many species of animals and plants live on our planet, and the extent to which the state of the environment depends on the actions of each person – teenagers and children as well as adults.
An eco-hotel in Costa Rica.
Ecotourism and climate change The connection between climate change and ecotourism is not immediately obvious. But there is a strong connection, and many travel organizations are paying special attention to it today. What does it mean to travel? Above all it means moving from one place to another by plane or ocean liner, train, car or bus. All these forms of transport use fuel and therefore pollute the environment. The best forms of transport for ecotourism are bicycles, walking, horseback riding and rafting. You can build your tourist route in a way that reduces vehicle travel to a minimum and choose more environmentally friendly means of transport instead. This reduces emissions of greenhouse gas and harmful substances into the atmosphere.
Some people who get tired of the noise, traffic jams and other annoyances of city life, go further than eco-tourism: they move permanently to the countryside, where they learn to grow local fruits and vegetables and to eat environmentally friendly food. Typically, the owners of such mini-farms use alternative energy sources, refuse to use chemical fertilizers and pesticides, and make their own compost from organic waste. Such eco-farms exist in many countries, but are especially popular in rural areas of Europe, Australia, New Zealand, USA and Canada.

73
What is the Red Book and what is it for?The Red Book is a list of rare and endangered species of animals, plants and fungi. The colour red reminds us of the risk to these species and the urgent need to protect and preserve them.
Living organisms all over the planet, which are in need of protection, are listed in the Interna-tional Red Book, the main copy of which is kept in the Swiss town of Morges. The book is pub-lished by the International Union for Nature Conservation (IUCN) and first appeared in 1963. This unusual book is designed more like a desk calendar than an ordinary book: as time passes, the situation of species already in the book changes and the names of new species of plants, an-imals and fungi are added to the book. So the Red Book is constantly changing and expanding.
For each species, which it contains, the Red Book provides information on the distribution, population numbers, habitat features, and measures required for conservation and many other details. The pages of the Book are marked with different colours. Pages describing extinct spe-cies are marked in black. These include, for example, the sea cow, the passenger pigeon and the dodo. Pages marked in red deal with endangered and very rare species (the Far-Eastern leopard, the Amur tiger, the snow leopard and the European bison). Animals, whose populations numbers are rapidly decreasing are listed on pages marked yellow (the polar bear, pink seagull, goitered gazelle). Animals and plants, which are rarely found in the wild are recorded on white pages. Species that have not been sufficiently studied because they live in remote places are recorded in grey, while the most encouragement is to be taken from green pages, which record species that people have succeeded in saving from extinction (they include the Eurasian beaver and the Eurasian elk).
Each country and region in the world also create their own lists of rare and protected species.
Before a particular species is included in the Red Book, scientists carry out intensive studies of the flora, fauna and fungi in relevant areas, find out the causes which threaten the species, describe their habitats and decide how they should be preserved. The Red Book does not only contain rare and endemic species (species found only in a specific territory), but a whole range of flowering, edible and medicinal plants.
Animals and plants may need to be protected for two groups of reasons: direct and indirect. Direct reasons for protection exist when people by their actions are destroying the animals and plants, through hunting, gathering medicinal plants, fishing or other collection of aquatic organisms. Indirect reasons relate to change of habitat, including that which is caused by global climate change. Such indirect reasons may include difficult acclimatization to climate change, the introduction of new species of plants (when the ‘newcomers’ displace native species, for any of various reasons) and the destruction of the plants that are a source of food for animals, etc.
74
Questions
1. Which of the Earth’s ecosystems is the richest in terms of species diversity.
2. What is meant by ‘direct’ and ‘indirect’ causes of the extinc-tion of living organisms? Give examples.
3. How would you and your friends begin a story in class about the importance of biodiversity? What arguments are the most persuasive for schoolchildren and which for adults?
4. Why is the Red Book red? What plants, animals and fungi do you know that have been listed in the Red Book? Why are they disappearing?Can we help to preserve them?What different colours are used on the pages of the Red Book?What are different colours used?Why does the Red Book become longer each time it is updat-ed?
5. How does global warming affect reindeer?
6. Who can fairly be called an ‘ecotourist’?

75
Task
Working together with the rest of your class, create your own Red Book. Each of you draws an animal, plant or fungus in need of protection on a page of a certain colour and explains his or her choice.
+2 оС

76
2.3. | How climate change affects… forests
What is a forest?Although ‘forest’ is a commonly used word, it is not easy to clearly define what it is. There are more than 800 different definitions for a forest around the world! But the most recognized ap-proach to identify a forest, used also by the United Nations Food and Agriculture Organization (FAO), includes such indicators as: 1) minimum height of trees of 5 m, 2) at least 10% for crown cover (proportion of the ground shaded by the crown of the trees) and 3) a minimum forest area size of 0.5 hectares. According to this definition there are just under 4 billion hectares of for-ests on Earth, covering in all about 30% of the total land area. About half of the world’s forest areas are located in three countries: Russia, Canada and Brazil.
Types of forestsForests are usually classified in terms of the predominant tree species (broadleaf, coniferous (needle-leaved), or mixed) and their leaf longevity (whether they are evergreen or decidious). The main forest types (see Fig. 2.3.1) are:
• Boreal forests (taiga) are generally evergreen and coniferous.
• Temperate forests include broadleaf deciduous forests, evergreen coniferous forests and a mix of both types. Warm temperate zones support broadleaf evergreen forests.
• Mediterranean forests are generally composed of evergreen broadleaf and sclerophyll trees. Sclerophyll means 'hard-leaved' in Greek, as such trees usually have small, dark leaves cov-ered with a waxy outer layer to retain moisture in the dry summer months. Coniferous forests also occur in this zone.
• Tropical and sub-tropical forests include moist broadleaf forests, dry broadleaf forests and coniferous forests.
Fig. 2.3.1. The main biomes of the world.
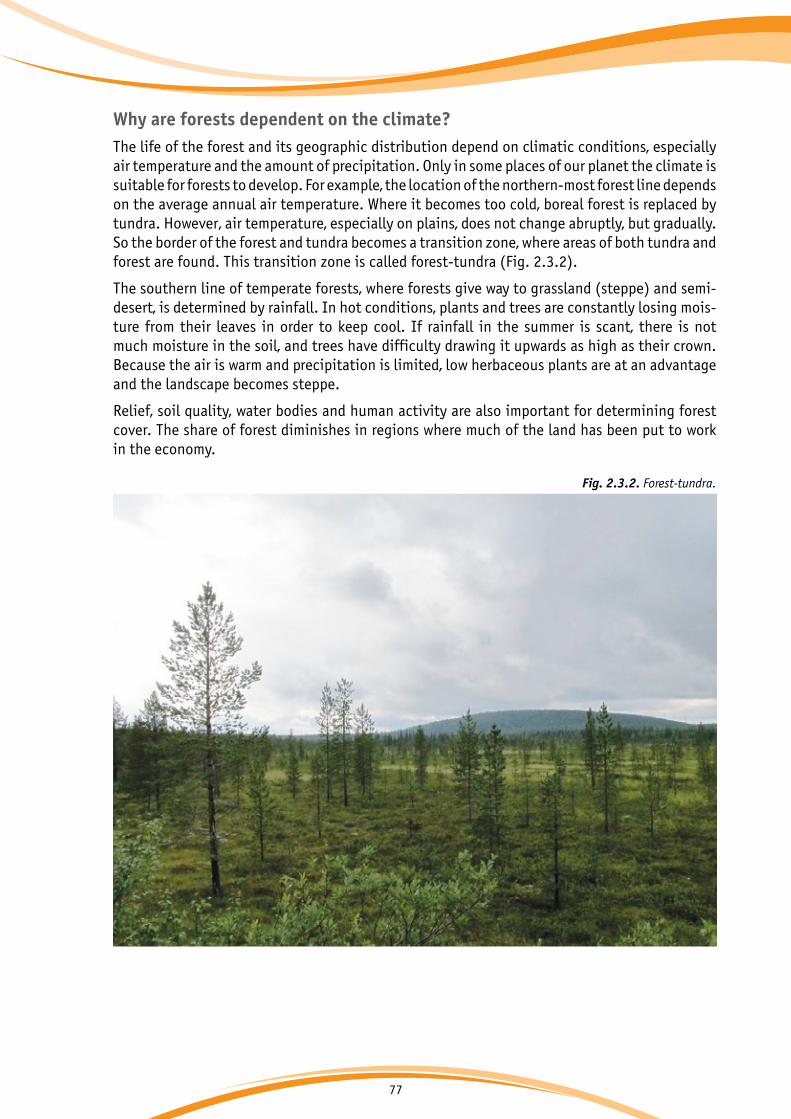
77
Why are forests dependent on the climate?The life of the forest and its geographic distribution depend on climatic conditions, especially air temperature and the amount of precipitation. Only in some places of our planet the climate is suitable for forests to develop. For example, the location of the northern-most forest line depends on the average annual air temperature. Where it becomes too cold, boreal forest is replaced by tundra. However, air temperature, especially on plains, does not change abruptly, but gradually. So the border of the forest and tundra becomes a transition zone, where areas of both tundra and forest are found. This transition zone is called forest-tundra (Fig. 2.3.2).
The southern line of temperate forests, where forests give way to grassland (steppe) and semi-desert, is determined by rainfall. In hot conditions, plants and trees are constantly losing mois-ture from their leaves in order to keep cool. If rainfall in the summer is scant, there is not much moisture in the soil, and trees have difficulty drawing it upwards as high as their crown. Because the air is warm and precipitation is limited, low herbaceous plants are at an advantage and the landscape becomes steppe.
Relief, soil quality, water bodies and human activity are also important for determining forest cover. The share of forest diminishes in regions where much of the land has been put to work in the economy.
Fig. 2.3.2. Forest-tundra.
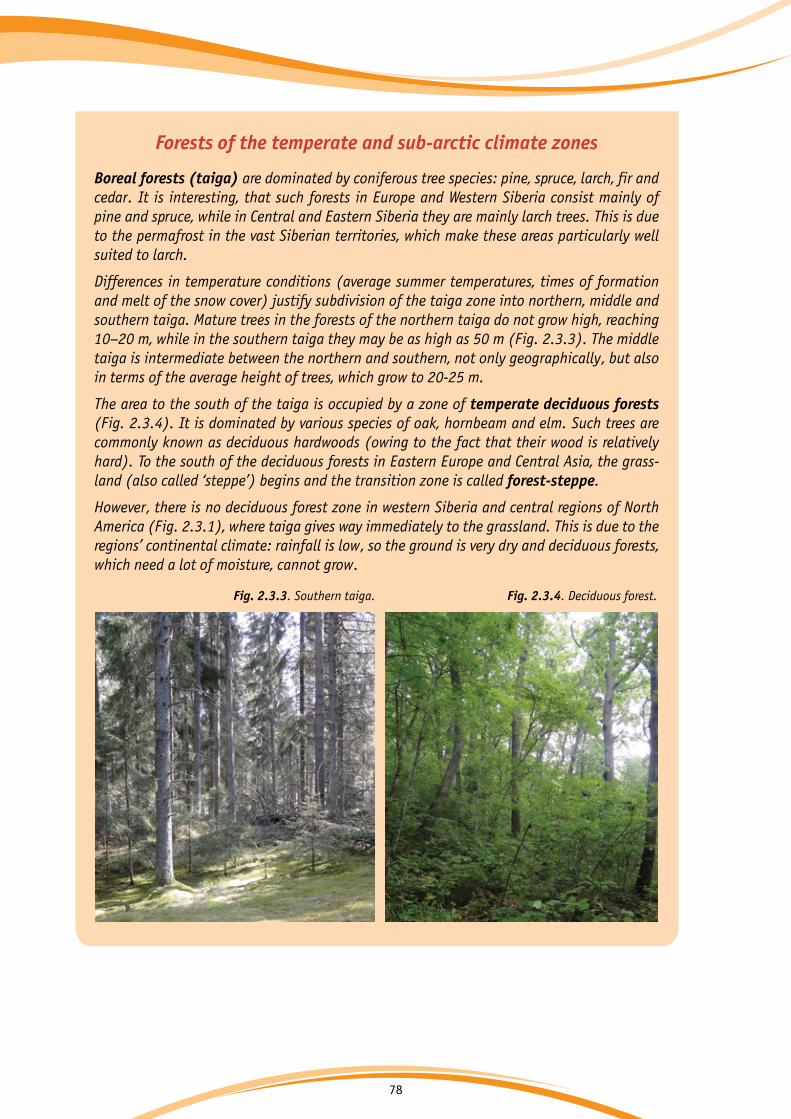
78
Forests of the temperate and sub-arctic climate zones
Boreal forests (taiga) are dominated by coniferous tree species: pine, spruce, larch, fir and cedar. It is interesting, that such forests in Europe and Western Siberia consist mainly of pine and spruce, while in Central and Eastern Siberia they are mainly larch trees. This is due to the permafrost in the vast Siberian territories, which make these areas particularly well suited to larch.
Differences in temperature conditions (average summer temperatures, times of formation and melt of the snow cover) justify subdivision of the taiga zone into northern, middle and southern taiga. Mature trees in the forests of the northern taiga do not grow high, reaching 10–20 m, while in the southern taiga they may be as high as 50 m (Fig. 2.3.3). The middle taiga is intermediate between the northern and southern, not only geographically, but also in terms of the average height of trees, which grow to 20-25 m.
The area to the south of the taiga is occupied by a zone of temperate deciduous forests (Fig. 2.3.4). It is dominated by various species of oak, hornbeam and elm. Such trees are commonly known as deciduous hardwoods (owing to the fact that their wood is relatively hard). To the south of the deciduous forests in Eastern Europe and Central Asia, the grass-land (also called ‘steppe’) begins and the transition zone is called forest-steppe.
However, there is no deciduous forest zone in western Siberia and central regions of North America (Fig. 2.3.1), where taiga gives way immediately to the grassland. This is due to the regions’ continental climate: rainfall is low, so the ground is very dry and deciduous forests, which need a lot of moisture, cannot grow.
Fig. 2.3.4. Deciduous forest.Fig. 2.3.3. Southern taiga.
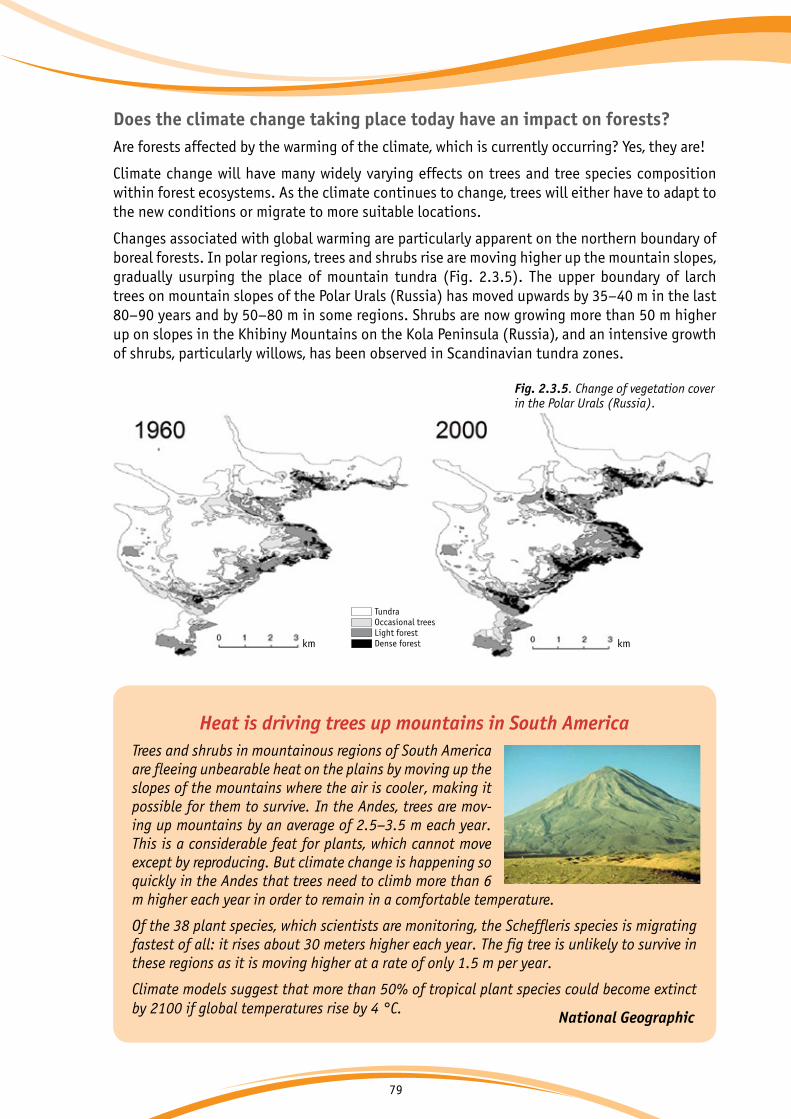
79
Does the climate change taking place today have an impact on forests?Are forests affected by the warming of the climate, which is currently occurring? Yes, they are!
Climate change will have many widely varying effects on trees and tree species composition within forest ecosystems. As the climate continues to change, trees will either have to adapt to the new conditions or migrate to more suitable locations.
Changes associated with global warming are particularly apparent on the northern boundary of boreal forests. In polar regions, trees and shrubs rise are moving higher up the mountain slopes, gradually usurping the place of mountain tundra (Fig. 2.3.5). The upper boundary of larch trees on mountain slopes of the Polar Urals (Russia) has moved upwards by 35–40 m in the last 80–90 years and by 50–80 m in some regions. Shrubs are now growing more than 50 m higher up on slopes in the Khibiny Mountains on the Kola Peninsula (Russia), and an intensive growth of shrubs, particularly willows, has been observed in Scandinavian tundra zones.
Heat is driving trees up mountains in South AmericaTrees and shrubs in mountainous regions of South America are fleeing unbearable heat on the plains by moving up the slopes of the mountains where the air is cooler, making it possible for them to survive. In the Andes, trees are mov-ing up mountains by an average of 2.5–3.5 m each year. This is a considerable feat for plants, which cannot move except by reproducing. But climate change is happening so quickly in the Andes that trees need to climb more than 6 m higher each year in order to remain in a comfortable temperature.
Of the 38 plant species, which scientists are monitoring, the Scheffleris species is migrating fastest of all: it rises about 30 meters higher each year. The fig tree is unlikely to survive in these regions as it is moving higher at a rate of only 1.5 m per year.
Climate models suggest that more than 50% of tropical plant species could become extinct by 2100 if global temperatures rise by 4 °C.
National Geographic
Fig. 2.3.5. Change of vegetation cover in the Polar Urals (Russia).
km km
TundraOccasional treesLight forestDense forest

80
The southern boundary of the temperate forests is also changing. Oak forests are gradually dis-appearing in the forest-steppe and steppe zones due mainly to summer droughts. In the region around Lake Baikal, by contrast, pine forests are advancing into steppe ecosystems, due to in-creased precipitation. So the southern forest line is shifting because of changes in the moisture levels rather than because of the increase of temperature.
The areas of Russian forests that are occupied by particular tree species have changed in recent decades and scientists believe that this is largely due to climate warming. For example, oak for-ests have diminished in southern regions, but are gaining ground further north, on the border between deciduous forests and the northern taiga.
Spruce forest (Fig. 2.3.6) is in retreat in nearly all parts of Russia. The root system of spruce trees is close to the surface, which makes the tree highly sensitive to increase in the frequency and duration of droughts. At the same time, many regions of Russia are seeing an increase in the area of birch forests. This phenomenon is well known to forestry specialists: it is due to the fact that, after a fire or the felling of coniferous trees, birch and other small deciduous species initially appear in their place , and some time is needed before new coniferous trees appear and begin to displace birch, aspen and alder. However, in recent decades, this last stage has not been occurring: conifers seem unable to regain ground lost to birch forest.
Most forecasts predict that forests in northern parts of Eurasia and North America will be more affected by global warming than forests elsewhere in the world, as their northern and southern boundaries are displaced. An increase of temperature by 2 °C will cause an increase in the total area of forest cover in Europe due to its advance of taiga into the present tundra zone. However, an increase of temperature by 4 °C will cause the southern forest boundary to retreat northward and this effect will be greater than the northward advance into the tundra zone (Fig. 2.3.7).
Fig. 2.3.6. Spruce forest.

81
Deforestation caused by climate change will affect almost the whole of Eastern Europe and Western Siberia. This is a worrying forecast, showing how serious a phenomenon the disappearance of forests may be if the worst-case scenario for global warming is realized.
Destruction of forests by fires, pests and extreme weatherAnother major threat to forests associated with climate change comes from large-scale fires and plagues of pests caused by hot weather in summer. Heat and other extreme weather events are often directly responsible for the destruction of forests.
Forest fires are usually started accidentally by people. But they can only take hold in certain conditions, namely, when the weather remains hot and dry for a number of days or weeks. The forest floor of dead leaves, pine needles, small branches, mosses, lichens and grasses growing under the forest canopy then becomes dry and catches light easily, and the fire can spread over large areas. This is called a ground fire.
When fire spreads in coniferous forests it often reaches the crowns of the trees. Pine needles and the small branches of fir and pine trees contain large amounts of resinous substances, so living trees can easily catch fire. A crown fire is the most dangerous and destructive, and can lead to the complete loss of an area of forest (Fig. 2.3.8)!
Fires cause great damage to the forest: a large number of trees perish, their growth is stunted, the variety of trees in the forest becomes poorer, and the spread of harmful insects pests is made easier. As the climate changes the risk of forest fires increases, because higher tempera-tures dry out woody materials more quickly. Also the warm season of the year, during which fires can occur, becomes longer.
Fig. 2.3.7. Forecast changes in forest cover in Europe by 2100, assuming global warming by 2 °C and by 4 °C.
Warming by 2 °C
Increase of forest cover
Increase of cover by shrubs
Increase of grass cover
Reduction of grass cover
Reduction of forest cover
Change of forest type
Warming by 4 °C
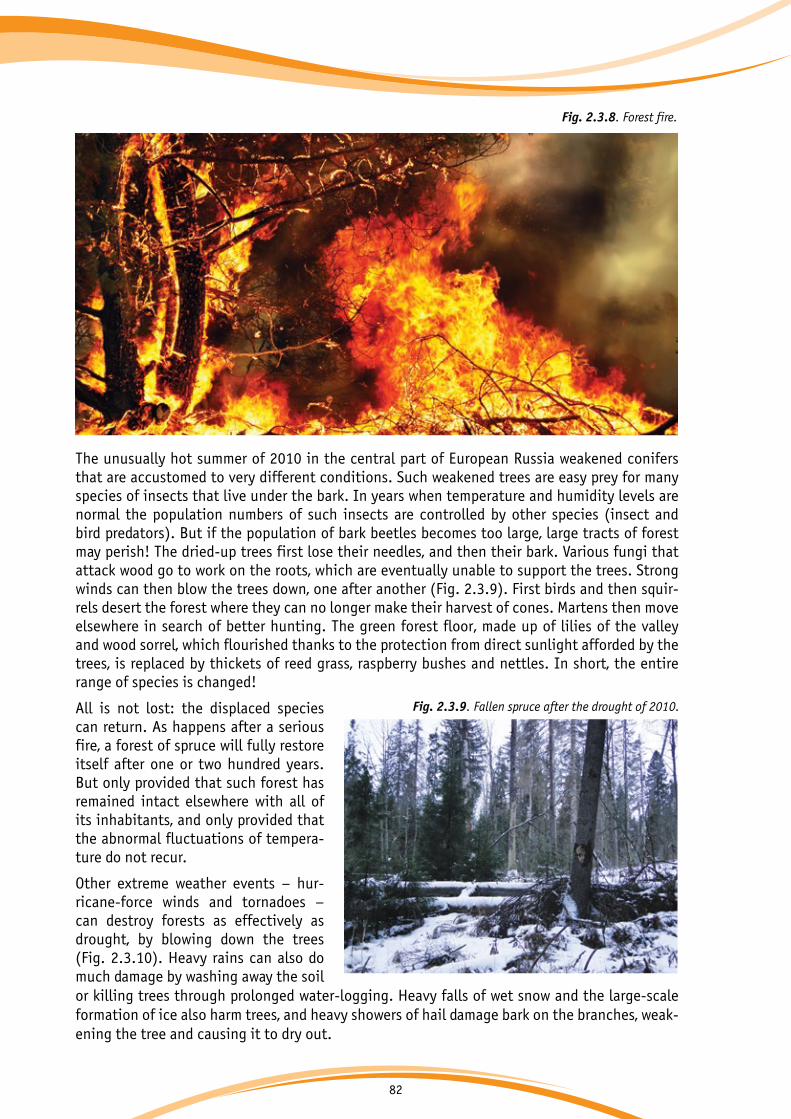
82
The unusually hot summer of 2010 in the central part of European Russia weakened conifers that are accustomed to very different conditions. Such weakened trees are easy prey for many species of insects that live under the bark. In years when temperature and humidity levels are normal the population numbers of such insects are controlled by other species (insect and bird predators). But if the population of bark beetles becomes too large, large tracts of forest may perish! The dried-up trees first lose their needles, and then their bark. Various fungi that attack wood go to work on the roots, which are eventually unable to support the trees. Strong winds can then blow the trees down, one after another (Fig. 2.3.9). First birds and then squir-rels desert the forest where they can no longer make their harvest of cones. Martens then move elsewhere in search of better hunting. The green forest floor, made up of lilies of the valley and wood sorrel, which flourished thanks to the protection from direct sunlight afforded by the trees, is replaced by thickets of reed grass, raspberry bushes and nettles. In short, the entire range of species is changed!
All is not lost: the displaced species can return. As happens after a serious fire, a forest of spruce will fully restore itself after one or two hundred years. But only provided that such forest has remained intact elsewhere with all of its inhabitants, and only provided that the abnormal fluctuations of tempera-ture do not recur.
Other extreme weather events – hur-ricane-force winds and tornadoes – can destroy forests as effectively as drought, by blowing down the trees (Fig. 2.3.10). Heavy rains can also do much damage by washing away the soil or killing trees through prolonged water-logging. Heavy falls of wet snow and the large-scale formation of ice also harm trees, and heavy showers of hail damage bark on the branches, weak-ening the tree and causing it to dry out.
Fig. 2.3.9. Fallen spruce after the drought of 2010.
Fig. 2.3.8. Forest fire.
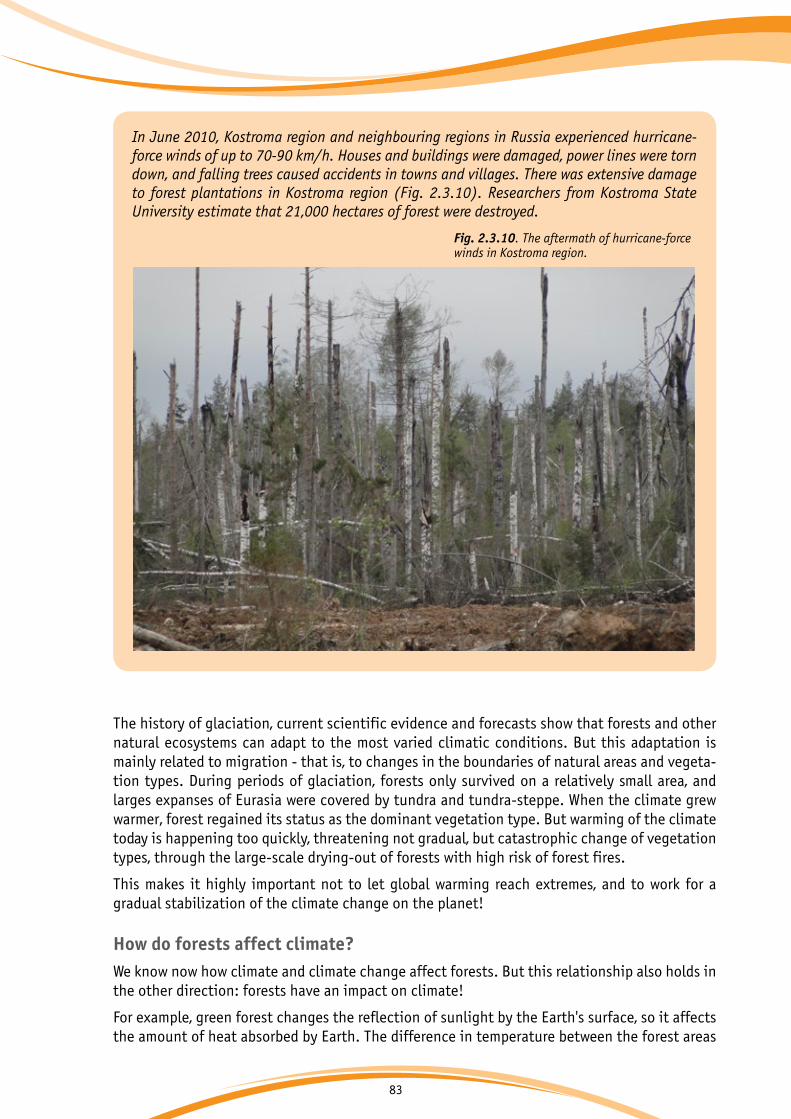
83
The history of glaciation, current scientific evidence and forecasts show that forests and other natural ecosystems can adapt to the most varied climatic conditions. But this adaptation is mainly related to migration - that is, to changes in the boundaries of natural areas and vegeta-tion types. During periods of glaciation, forests only survived on a relatively small area, and larges expanses of Eurasia were covered by tundra and tundra-steppe. When the climate grew warmer, forest regained its status as the dominant vegetation type. But warming of the climate today is happening too quickly, threatening not gradual, but catastrophic change of vegetation types, through the large-scale drying-out of forests with high risk of forest fires.
This makes it highly important not to let global warming reach extremes, and to work for a gradual stabilization of the climate change on the planet!
How do forests affect climate?We know now how climate and climate change affect forests. But this relationship also holds in the other direction: forests have an impact on climate!
For example, green forest changes the reflection of sunlight by the Earth's surface, so it affects the amount of heat absorbed by Earth. The difference in temperature between the forest areas
In June 2010, Kostroma region and neighbouring regions in Russia experienced hurricane-force winds of up to 70-90 km/h. Houses and buildings were damaged, power lines were torn down, and falling trees caused accidents in towns and villages. There was extensive damage to forest plantations in Kostroma region (Fig. 2.3.10). Researchers from Kostroma State University estimate that 21,000 hectares of forest were destroyed.
Fig. 2.3.10. The aftermath of hurricane-force winds in Kostroma region.
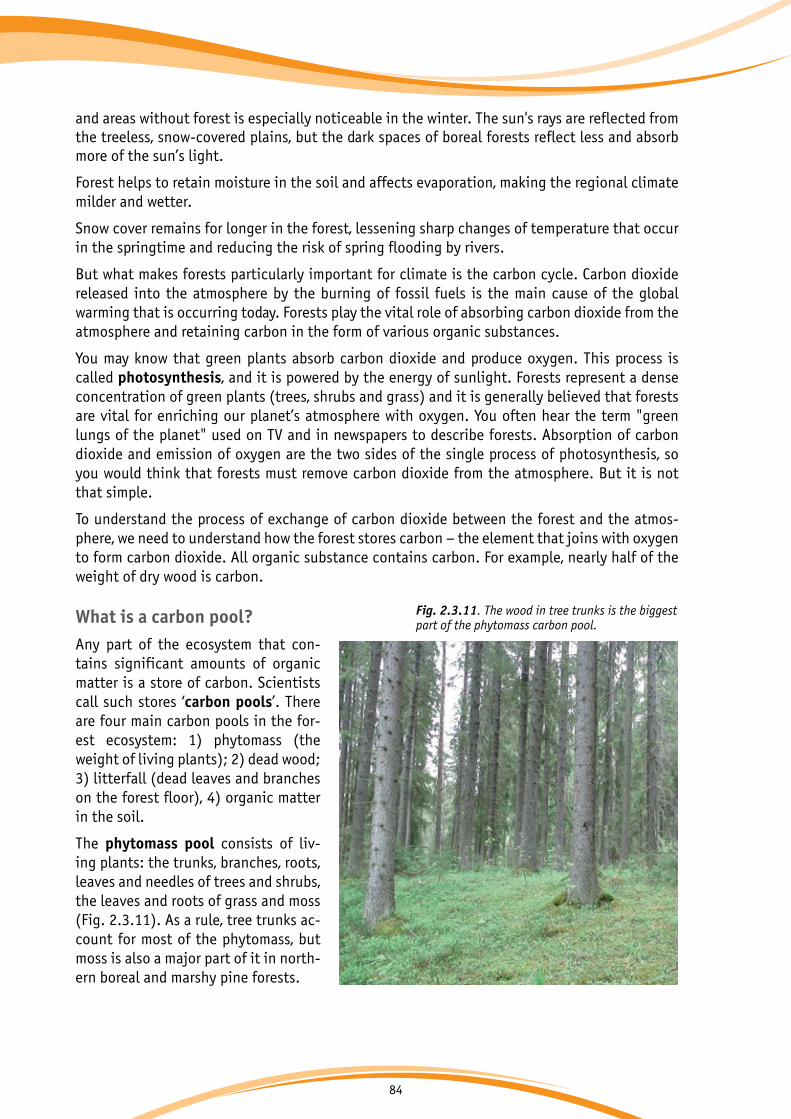
84
and areas without forest is especially noticeable in the winter. The sun's rays are reflected from the treeless, snow-covered plains, but the dark spaces of boreal forests reflect less and absorb more of the sun’s light.
Forest helps to retain moisture in the soil and affects evaporation, making the regional climate milder and wetter.
Snow cover remains for longer in the forest, lessening sharp changes of temperature that occur in the springtime and reducing the risk of spring flooding by rivers.
But what makes forests particularly important for climate is the carbon cycle. Carbon dioxide released into the atmosphere by the burning of fossil fuels is the main cause of the global warming that is occurring today. Forests play the vital role of absorbing carbon dioxide from the atmosphere and retaining carbon in the form of various organic substances.
You may know that green plants absorb carbon dioxide and produce oxygen. This process is called photosynthesis, and it is powered by the energy of sunlight. Forests represent a dense concentration of green plants (trees, shrubs and grass) and it is generally believed that forests are vital for enriching our planet’s atmosphere with oxygen. You often hear the term "green lungs of the planet" used on TV and in newspapers to describe forests. Absorption of carbon dioxide and emission of oxygen are the two sides of the single process of photosynthesis, so you would think that forests must remove carbon dioxide from the atmosphere. But it is not that simple.
To understand the process of exchange of carbon dioxide between the forest and the atmos-phere, we need to understand how the forest stores carbon – the element that joins with oxygen to form carbon dioxide. All organic substance contains carbon. For example, nearly half of the weight of dry wood is carbon.
What is a carbon pool?Any part of the ecosystem that con-tains significant amounts of organic matter is a store of carbon. Scientists call such stores ‘carbon pools’. There are four main carbon pools in the for-est ecosystem: 1) phytomass (the weight of living plants); 2) dead wood; 3) litterfall (dead leaves and branches on the forest floor), 4) organic matter in the soil.
The phytomass pool consists of liv-ing plants: the trunks, branches, roots, leaves and needles of trees and shrubs, the leaves and roots of grass and moss (Fig. 2.3.11). As a rule, tree trunks ac-count for most of the phytomass, but moss is also a major part of it in north-ern boreal and marshy pine forests.
Fig. 2.3.11. The wood in tree trunks is the biggest part of the phytomass carbon pool.
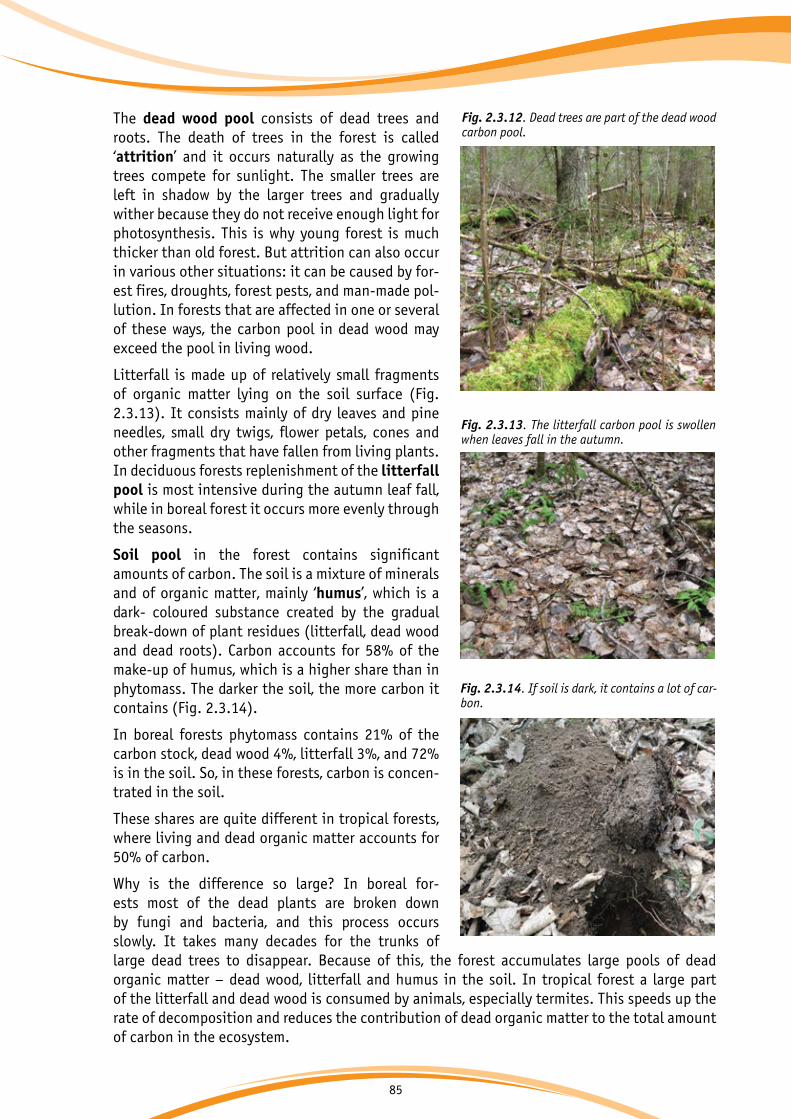
85
The dead wood pool consists of dead trees and roots. The death of trees in the forest is called ‘attrition’ and it occurs naturally as the growing trees compete for sunlight. The smaller trees are left in shadow by the larger trees and gradually wither because they do not receive enough light for photosynthesis. This is why young forest is much thicker than old forest. But attrition can also occur in various other situations: it can be caused by for-est fires, droughts, forest pests, and man-made pol-lution. In forests that are affected in one or several of these ways, the carbon pool in dead wood may exceed the pool in living wood.
Litterfall is made up of relatively small fragments of organic matter lying on the soil surface (Fig. 2.3.13). It consists mainly of dry leaves and pine needles, small dry twigs, flower petals, cones and other fragments that have fallen from living plants. In deciduous forests replenishment of the litterfall pool is most intensive during the autumn leaf fall, while in boreal forest it occurs more evenly through the seasons.
Soil pool in the forest contains significant amounts of carbon. The soil is a mixture of minerals and of organic matter, mainly ‘humus’, which is a dark- coloured substance created by the gradual break-down of plant residues (litterfall, dead wood and dead roots). Carbon accounts for 58% of the make-up of humus, which is a higher share than in phytomass. The darker the soil, the more carbon it contains (Fig. 2.3.14).
In boreal forests phytomass contains 21% of the carbon stock, dead wood 4%, litterfall 3%, and 72% is in the soil. So, in these forests, carbon is concen-trated in the soil.
These shares are quite different in tropical forests, where living and dead organic matter accounts for 50% of carbon.
Why is the difference so large? In boreal for-ests most of the dead plants are broken down by fungi and bacteria, and this process occurs slowly. It takes many decades for the trunks of large dead trees to disappear. Because of this, the forest accumulates large pools of dead organic matter – dead wood, litterfall and humus in the soil. In tropical forest a large part of the litterfall and dead wood is consumed by animals, especially termites. This speeds up the rate of decomposition and reduces the contribution of dead organic matter to the total amount of carbon in the ecosystem.
Fig. 2.3.12. Dead trees are part of the dead wood carbon pool.
Fig. 2.3.13. The litterfall carbon pool is swollen when leaves fall in the autumn.
Fig. 2.3.14. If soil is dark, it contains a lot of car-bon.
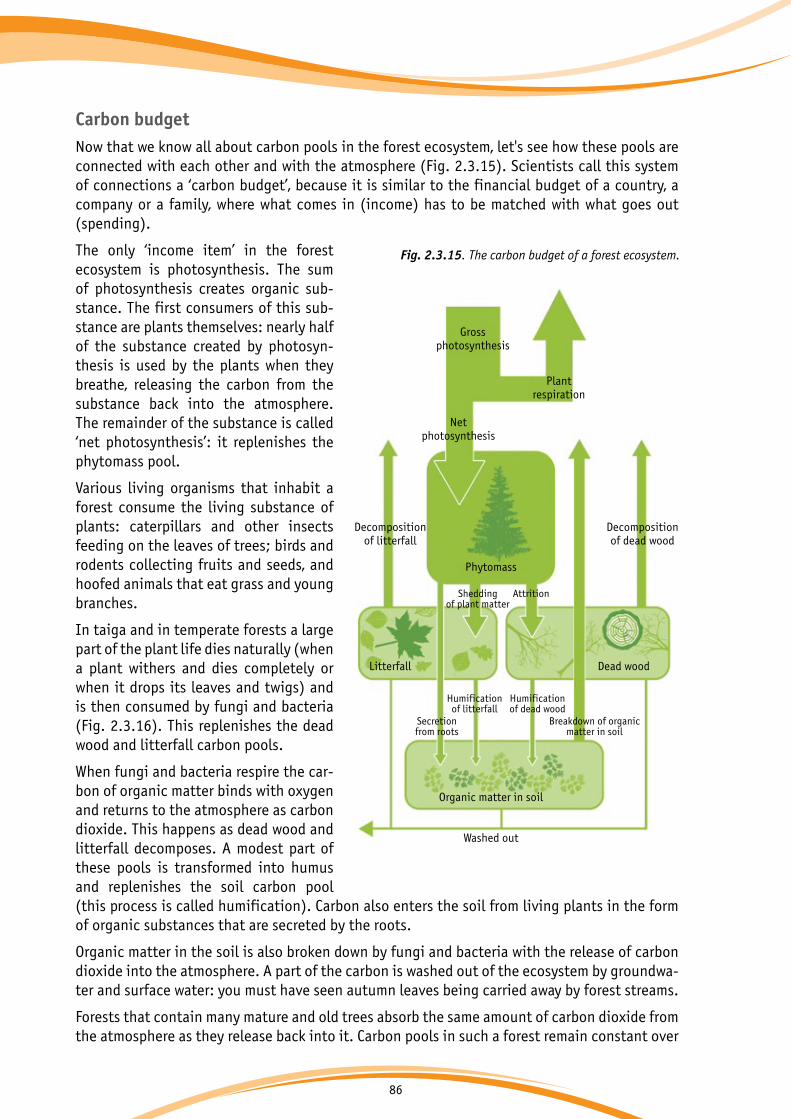
86
Carbon budgetNow that we know all about carbon pools in the forest ecosystem, let's see how these pools are connected with each other and with the atmosphere (Fig. 2.3.15). Scientists call this system of connections a ‘carbon budget’, because it is similar to the financial budget of a country, a company or a family, where what comes in (income) has to be matched with what goes out (spending).
The only ‘income item’ in the forest ecosystem is photosynthesis. The sum of photosynthesis creates organic sub-stance. The first consumers of this sub-stance are plants themselves: nearly half of the substance created by photosyn-thesis is used by the plants when they breathe, releasing the carbon from the substance back into the atmosphere. The remainder of the substance is called ‘net photosynthesis’: it replenishes the phytomass pool.
Various living organisms that inhabit a forest consume the living substance of plants: caterpillars and other insects feeding on the leaves of trees; birds and rodents collecting fruits and seeds, and hoofed animals that eat grass and young branches.
In taiga and in temperate forests a large part of the plant life dies naturally (when a plant withers and dies completely or when it drops its leaves and twigs) and is then consumed by fungi and bacteria (Fig. 2.3.16). This replenishes the dead wood and litterfall carbon pools.
When fungi and bacteria respire the car-bon of organic matter binds with oxygen and returns to the atmosphere as carbon dioxide. This happens as dead wood and litterfall decomposes. A modest part of these pools is transformed into humus and replenishes the soil carbon pool (this process is called humification). Carbon also enters the soil from living plants in the form of organic substances that are secreted by the roots.
Organic matter in the soil is also broken down by fungi and bacteria with the release of carbon dioxide into the atmosphere. A part of the carbon is washed out of the ecosystem by groundwa-ter and surface water: you must have seen autumn leaves being carried away by forest streams.
Forests that contain many mature and old trees absorb the same amount of carbon dioxide from the atmosphere as they release back into it. Carbon pools in such a forest remain constant over
Fig. 2.3.15. The carbon budget of a forest ecosystem.
Grossphotosynthesis
Plantrespiration
Netphotosynthesis
Decompositionof litterfall
Litterfall Dead wood
Decompositionof dead wood
Phytomass
Organic matter in soil
Washed out
Sheddingof plant matter
Humificationof litterfall
Humificationof dead wood
Secretionfrom roots
Breakdown of organic matter in soil
Attrition

87
time. They are like swimming pools: full to the brim and incapable of taking more, except that they are full to the brim with carbon and not water. But that is not to say that mature forests don’t play a role in regulating the gas composition of the atmosphere. The point is only that they are no longer actively absorbing, and have instead become the keepers of ‘stored’ carbon, i.e. carbon that can no longer contribute to the greenhouse effect.
The carbon budget of young, growing forests is different from that of mature forests. Young forests accumulate carbon, removing it from the atmosphere. This carbon builds up in pools. So it is only young forests that deserve to be called the ‘green lungs’ of the planet.
Differences in the impact of forests on the atmosphere
We have seen how young and old forests work differently: young, growing forests absorb carbon dioxide from the atmosphere and can thus partially compensate for emissions of this gas by the combustion of coal, gas and oil. Mature forests store enormous amounts of carbon in bound form, preventing the formation of carbon dioxide, which would contribute to the greenhouse effect. So, if we want to use forest to prevent cli-mate change, we need to: 1) plant new young forests, where there was no forest before; 2) take good care of existing forests.
In developed countries (the United States, the countries of the European Union, Russia and oth-ers) there are many young forests, which absorb carbon dioxide from the atmosphere. The econo-my in these countries is already fully formed, and forests are not longer being destroyed for the pur-poses of human industry. In recent decades many countries (the USA, Canada, countries of the Euro-pean Union and others) are also encouraging the owners of land to plant new forests.
Because boreal and temperate forests grow and absorb carbon over many decades and sometimes hundreds of years, carbon is now being accumulated thanks to renewal of the forest in many of the places where forest cover was severely reduced during the industrialization of the last century. The restoration of pine forest along Canada’s Pacific coast is a striking example of this (Fig. 2.3.17). At the beginning of the 20th century this territory was covered with huge conifer forests of Douglas Fir and Red Cedar, some of them as high as 80–90 m. By the middle of the 20th century, these forests had been cut down, and the giant stumps of felled trees more than 2 m in diameter can still be seen. Since then strict environmental laws have been established in Canada enabling the renewal of forest in former logging areas.
Fig. 2.3.16. Tinder fungus breaks down dead wood and returns carbon to the atmosphere.
Fig. 2.3.17. This giant tree stump in the forest of western Canada (British Columbia) is evidence of intensive tree harvesting in the first half of the 20th century.
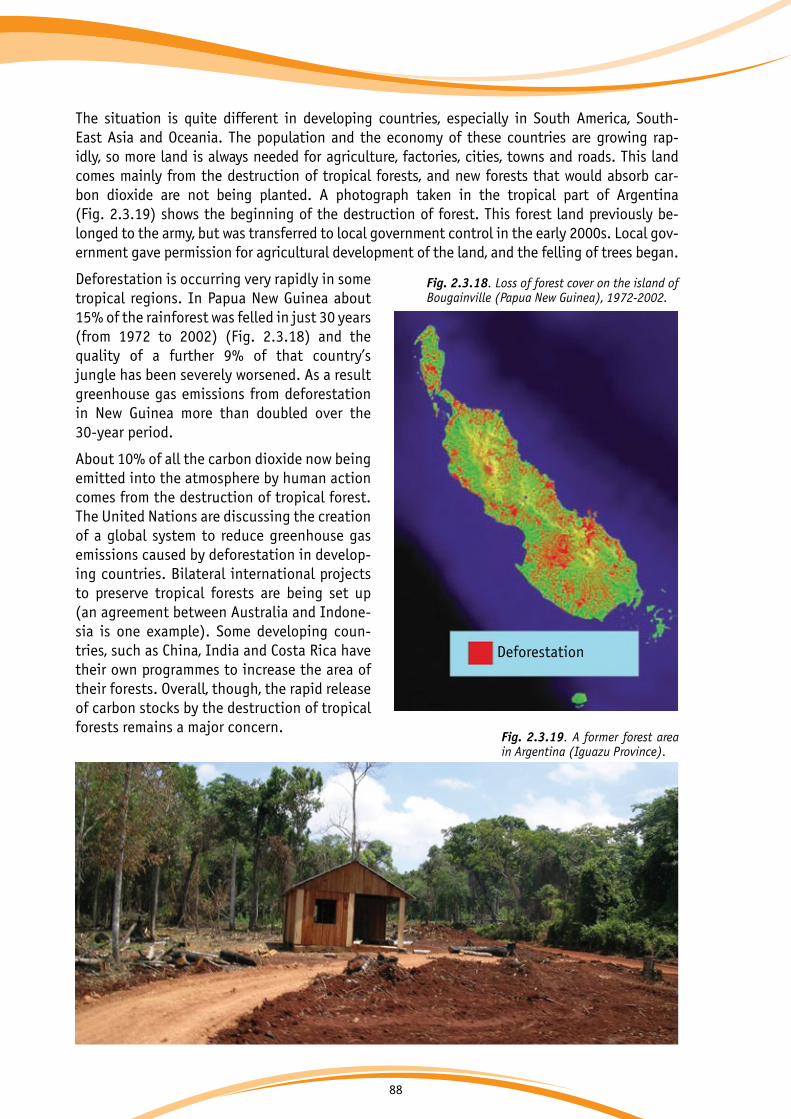
88
The situation is quite different in developing countries, especially in South America, South-East Asia and Oceania. The population and the economy of these countries are growing rap-idly, so more land is always needed for agriculture, factories, cities, towns and roads. This land comes mainly from the destruction of tropical forests, and new forests that would absorb car-bon dioxide are not being planted. A photograph taken in the tropical part of Argentina (Fig. 2.3.19) shows the beginning of the destruction of forest. This forest land previously be-longed to the army, but was transferred to local government control in the early 2000s. Local gov-ernment gave permission for agricultural development of the land, and the felling of trees began.
Deforestation is occurring very rapidly in some tropical regions. In Papua New Guinea about 15% of the rainforest was felled in just 30 years (from 1972 to 2002) (Fig. 2.3.18) and the quality of a further 9% of that country’s jungle has been severely worsened. As a result greenhouse gas emissions from deforestation in New Guinea more than doubled over the 30-year period.
About 10% of all the carbon dioxide now being emitted into the atmosphere by human action comes from the destruction of tropical forest. The United Nations are discussing the creation of a global system to reduce greenhouse gas emissions caused by deforestation in develop-ing countries. Bilateral international projects to preserve tropical forests are being set up (an agreement between Australia and Indone-sia is one example). Some developing coun-tries, such as China, India and Costa Rica have their own programmes to increase the area of their forests. Overall, though, the rapid release of carbon stocks by the destruction of tropical forests remains a major concern.
Fig. 2.3.19. A former forest area in Argentina (Iguazu Province).
Fig. 2.3.18. Loss of forest cover on the island of Bougainville (Papua New Guinea), 1972-2002.
Deforestation

89
The disappearance of tropical forestsTropical rainforests are among the most important ecosystems on the planet. Their eco-system is the richest in the world in terms of species diversity. Tropical forests are a source of timber, food and raw materials for medicines. They also play a very important role in regulating the Earth's climate. The disappearance of tropical forests leads to the loss of fertile topsoil, loss of biodiversity and disruption of the ecological balance over large areas of the planet.
Despite all the efforts that have been made until now, tropical forests are continuing to dis-appear very rapidly, particularly in South America and Africa. Losses from 2005 to 2010 were about 3.6 million hectares in South America and 3.4 million hectares in Africa.
Today tropical rainforests cover only 5% of the Earth's surface compared with 12% a hundred years ago. An area of forest larger than the whole of England (130,000 km2) is being cut down or burnt each year.
One of the main causes of deforestation is the conversion of forest into agricultural land in order to feed a growing world population. Rainforests are often replaced by plantations of coffee trees, coconut palms or rubber trees. Uncontrolled mining operations are another threat to tropical rainforests in South America.
Such major destruction of forest can be irreversible. If the felling of trees is limited to a small area, then the forest will return to that area after a few years, but if a large area of forest is cut down, it may never reappear: heavy rain will wash away essential nutrients in the soil and the hot sun will burn the top layer of soil, so that only weeds can grow there.
What can be done to save the forests? First of all, poor countries with large areas of tropical forest (primarily Peru, Ecuador and Indonesia) must be encouraged to pur-sue other economic activities, which do not involve the destruction of forest. Otherwise, the destruction of trees will continue for the sake of mining and food production.
Ecuador recently asked other countries through the United Nations to provide 3.6 billion US dollars for the preservation of 4000 km2 of tropical forest, but received no clear answer. The government then let the forest be destroyed so that the land could be used for oil produc-tion…
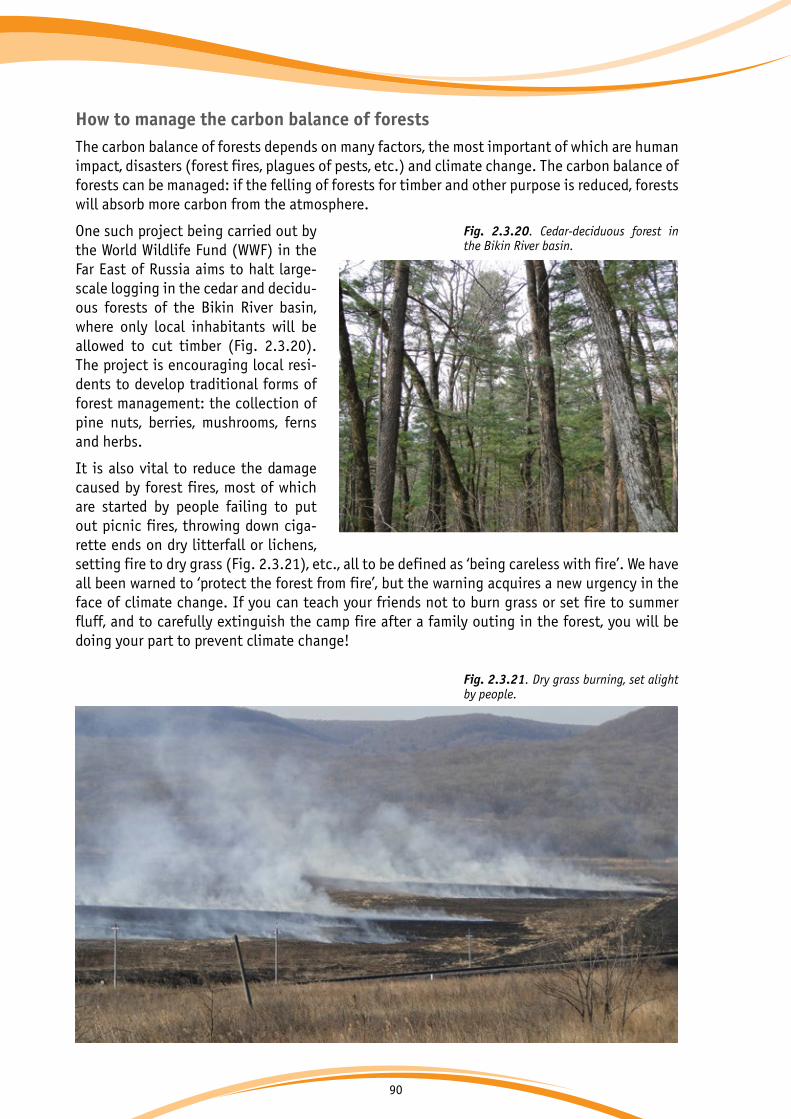
90
How to manage the carbon balance of forestsThe carbon balance of forests depends on many factors, the most important of which are human impact, disasters (forest fires, plagues of pests, etc.) and climate change. The carbon balance of forests can be managed: if the felling of forests for timber and other purpose is reduced, forests will absorb more carbon from the atmosphere.
One such project being carried out by the World Wildlife Fund (WWF) in the Far East of Russia aims to halt large-scale logging in the cedar and decidu-ous forests of the Bikin River basin, where only local inhabitants will be allowed to cut timber (Fig. 2.3.20). The project is encouraging local resi-dents to develop traditional forms of forest management: the collection of pine nuts, berries, mushrooms, ferns and herbs.
It is also vital to reduce the damage caused by forest fires, most of which are started by people failing to put out picnic fires, throwing down ciga-rette ends on dry litterfall or lichens, setting fire to dry grass (Fig. 2.3.21), etc., all to be defined as ‘being careless with fire’. We have all been warned to ‘protect the forest from fire’, but the warning acquires a new urgency in the face of climate change. If you can teach your friends not to burn grass or set fire to summer fluff, and to carefully extinguish the camp fire after a family outing in the forest, you will be doing your part to prevent climate change!
Fig. 2.3.20. Cedar-deciduous forest in the Bikin River basin.
Fig. 2.3.21. Dry grass burning, set alight by people.

91
Questions
1. What is taiga or boreal forest?
2. What species of tree is dominant in Eastern Siberian taiga and why is it dominant?
3. How has the border of the forest-tundra shifted in recent decades and why?
4. If temperatures rise by 4 °C before the end of this century, how will that affect forests?
5. How do human activities affect forests?
6. What are the major carbon pools in the forest ecosystem?
7. Can plants breathe?
8. Which organisms break down dead plant residues?
9. Can mature and old forests remove excess carbon dioxide from the atmosphere?
10. Why are tropical forests losing their carbon stocks?

92
Task 1. ExperimentObjective: To find out which trees and shrubs are most sensi-tive to warming.
Materials: branches of trees (before leaves appear), vases with water.
The experiment. The experiment is carried out a few weeks before the time when snow usually melts in your region. Cut a few branches from various trees and shrubs (birch, elm, wil-low, poplar, maple) outdoors. Put the branches in vases with water, and observe them regularly. Take note of how the buds grow, when they open, and how the leaves grow. Also meas-ures how buds develop on the trees outdoors. After leaves have appeared on trees outdoors, make a chart to plot growth in size of the buds and the leaves indoors and outdoors. You should find out which three species are more sensitive to a warmer environment (which of them react faster to warmth).
Task 2. Experiment
Objective: To find out which tree species contain more car-bon in their wood.
Materials: Pieces of various types of wood (oak, spruce, birch, aspen and others), a ruler, scales.
The experiment. Take the measurements of each piece of wood to calculate its volume (multiply the length by the width by the height) and weigh it. Divide the weight of each piece by its volume to find out how many grammes a piece of the wood with sides of 1 cm weighs. Divide the result by 2 and that will be the weight of the carbon in the piece of wood. Discuss the result and decide which tree species has the greater carbon pool. You can then judge which species is best to plant in order to reduce the greenhouse effect.
Tasks

93
Task 3. Experiment
Objective: To compare the amount of oxygen and carbondioxide emitted by plants in the light and in the dark.
Materials: Two large glass containers with air-tight lids and containing water (about a third of the volume of each con-tainer), cuttings of plants with large leaves, a splint, matches.
The experiment. Place a plant cutting inside each container and seal it. Put one container in a warm, bright place, cover the other with a cloth that keeps out the light. After 1–2 days use the lighted splint to see in which of the containers the flame burns brighter: do this immediately after removing the cover and until the gas in the container has been diffused. Notice the bright flash of flame on the splint, which you put into the ‘light’ container immediately after removing the cov-er and notice how the flame dimmed when you put the splint into the ‘dark’ container. The conclusion is that the plantproduces more oxygen than carbon dioxide when it is in the light, but more carbon dioxide than oxygen when it is in the dark.
+2 оС

94
2.4. | How climate change affects… water resources
Water in the natural worldWater has a special place among the vast number of chemical compounds that are found on our planet. It flows from the taps, we boil it in kettles and it fills rivers, lakes, seas and oceans.
Water can exist in various states: solid, liquid and gas. When the air temperature is below 0 °C, water freezes to a solid state and becomes ice. Water comes out of taps in a liquid state, and the jet of steam from a boiling kettle is water in its gaseous state. Incidentally, the water in the clouds that we see in the sky is very often in three states at once, and that is what determines the different forms that clouds can take.
Fig. 2.4.1. Noctilucent clouds in Sweden.
Noctilucent clouds are a particularly beauti-ful type of atmospheric formation. They are at an altitude of 76–85 km above the earth and are formed of nothing but ice crystals, which determines their fantastical appearance. Noctilucent clouds can only be seen at night in the polar latitudes, when they are illuminated by the sun, which has already fallen below the line of the horizon.
The science that studies water is called hydrology. It is believed that the first hydrological studies were carried out 5000 years ago by the ancient Egyptians on the River Nile: they measured the height of seasonal floods, by making marks on the walls of buildings, rocks or steps down to the river.
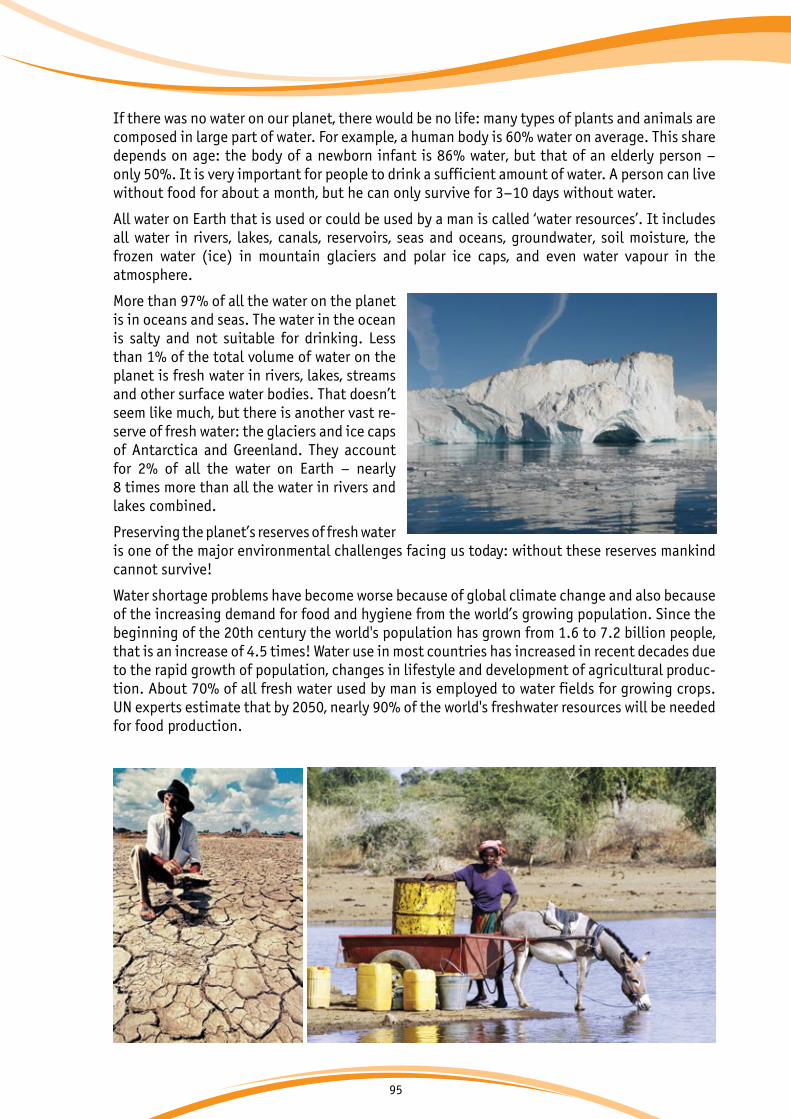
95
If there was no water on our planet, there would be no life: many types of plants and animals are composed in large part of water. For example, a human body is 60% water on average. This share depends on age: the body of a newborn infant is 86% water, but that of an elderly person – only 50%. It is very important for people to drink a sufficient amount of water. A person can live without food for about a month, but he can only survive for 3–10 days without water.
All water on Earth that is used or could be used by a man is called ‘water resources’. It includes all water in rivers, lakes, canals, reservoirs, seas and oceans, groundwater, soil moisture, the frozen water (ice) in mountain glaciers and polar ice caps, and even water vapour in the atmosphere.
More than 97% of all the water on the planet is in oceans and seas. The water in the ocean is salty and not suitable for drinking. Less than 1% of the total volume of water on the planet is fresh water in rivers, lakes, streams and other surface water bodies. That doesn’t seem like much, but there is another vast re-serve of fresh water: the glaciers and ice caps of Antarctica and Greenland. They account for 2% of all the water on Earth – nearly 8 times more than all the water in rivers and lakes combined.
Preserving the planet’s reserves of fresh water is one of the major environmental challenges facing us today: without these reserves mankind cannot survive!
Water shortage problems have become worse because of global climate change and also because of the increasing demand for food and hygiene from the world’s growing population. Since the beginning of the 20th century the world's population has grown from 1.6 to 7.2 billion people, that is an increase of 4.5 times! Water use in most countries has increased in recent decades due to the rapid growth of population, changes in lifestyle and development of agricultural produc-tion. About 70% of all fresh water used by man is employed to water fields for growing crops. UN experts estimate that by 2050, nearly 90% of the world's freshwater resources will be needed for food production.

96
UN experts also point out how unevenly drinking water is distributed across the continents: Asia is home to 60% of the world population, but it has only one third of the world’s water resources. According to the World Health Organization, nearly 800 million people worldwide (40% of them in Africa) do not have access to clean drinking water.
In September 2015, the United Nations adopted 17 Sustainable Development Goals and associ-ated targets. These included the target ‘By 2030, achieve universal and equitable access to safe and affordable drinking water for all’.
How does climate change affect water resources? All of the sources of fresh water on Earth (rivers, lakes, swamps, snow, glaciers, groundwater) are intimately related to climate. To a certain extent they are all a product of climate, although, of course, they all depend on different components of the natural world.
We already know that warming of the climate in many parts of the world will probably increase the frequency of heavy rains, causing disastrous flooding. In other areas, on the contrary, precipitation is expected to decrease, so that extreme droughts will happen more frequently. Unfortunately regions where the climate is already too wet will become even wetter and dry regions, especially regions in the central part of continents, will suffer increasingly from the effects of drought.
The Intergovernmental Panel on Climate Change notes that water shortages due to climate change will particularly affect arid regions of the world, most notably the Mediterranean coun-tries, the western United States, Southern Africa and northeast Brazil.
Fig. 2.4.2. Water availability change by 2050 compared with average 1961–1990.
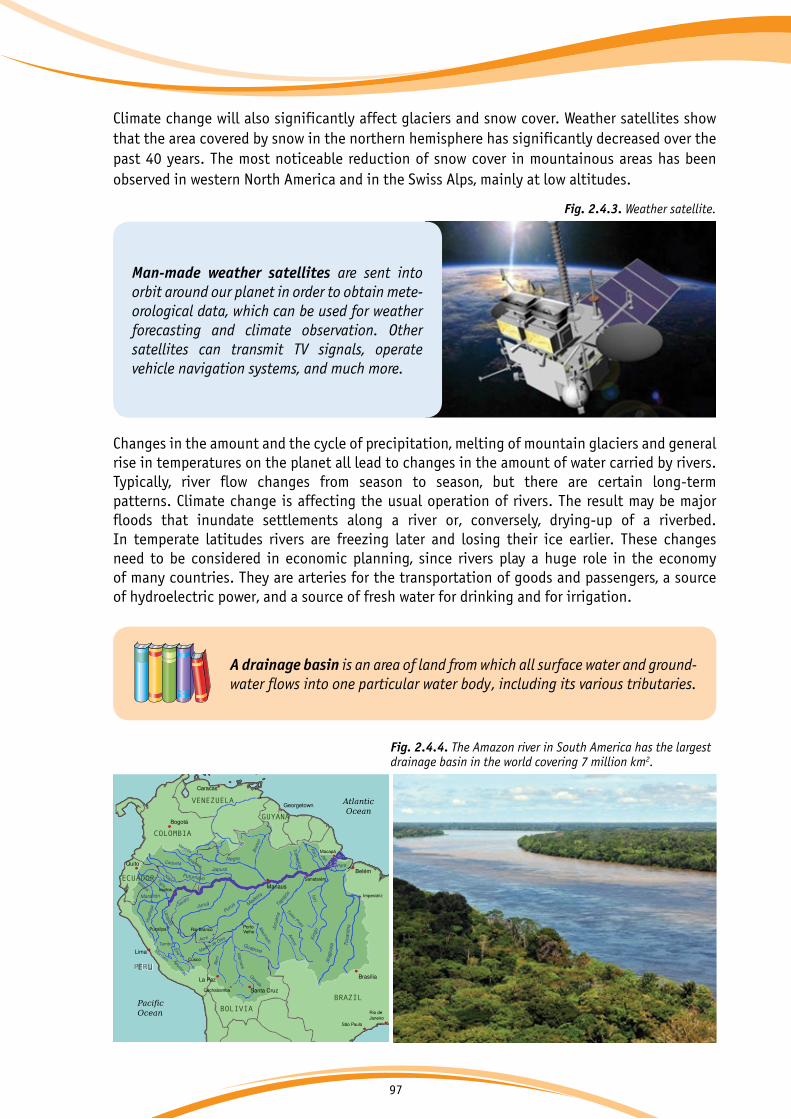
97
Climate change will also significantly affect glaciers and snow cover. Weather satellites show that the area covered by snow in the northern hemisphere has significantly decreased over the past 40 years. The most noticeable reduction of snow cover in mountainous areas has been observed in western North America and in the Swiss Alps, mainly at low altitudes.
Fig. 2.4.3. Weather satellite.
Man-made weather satellites are sent intoorbit around our planet in order to obtain mete-orological data, which can be used for weather forecasting and climate observation. Othersatellites can transmit TV signals, operatevehicle navigation systems, and much more.
A drainage basin is an area of land from which all surface water and ground-water flows into one particular water body, including its various tributaries.
Changes in the amount and the cycle of precipitation, melting of mountain glaciers and generalrise in temperatures on the planet all lead to changes in the amount of water carried by rivers.Typically, river flow changes from season to season, but there are certain long-termpatterns. Climate change is affecting the usual operation of rivers. The result may be majorfloods that inundate settlements along a river or, conversely, drying-up of a riverbed.In temperate latitudes rivers are freezing later and losing their ice earlier. These changes need to be considered in economic planning, since rivers play a huge role in the economyof many countries. They are arteries for the transportation of goods and passengers, a sourceof hydroelectric power, and a source of fresh water for drinking and for irrigation.
Fig. 2.4.4. The Amazon river in South America has the largest drainage basin in the world covering 7 million km2.

98
Fig. 2.4.5. The Nile is the world’s longest river.
Fig. 2.4.6. Baikal Lake is the largest reservoir of fresh water on Earth.
The countries that have the largest supply of fresh water in the world are Brazil (the world’s greatest river, the Amazon, flows through its ter-ritory), followed by Russia and Canada. However, the distribution of fresh water supplies around the world is extremely uneven. Around 700 mil-lion people in 43 countries suffer today from wa-ter scarcity. Even in water sufficient countries like Brazil or Russia there are areas that already experience water stress (Fig. 2.4.8). This natural ‘injustice’ will grow more marked over time due to climate change: regions that already suffer from water shortages, will become even more arid (Fig. 2.4.2 and 2.4.7).
Climate change will accelerate the melting of glaciers, change cycles and amounts of pre-cipitation, and alter seasonal flow in rivers. As a result, 1.8 billion people will live in condi-tions of water scarcity by 2080.
UNDP Human Development Report 2006
Fig. 2.4.7. Projected decline in water supply in the countiesof the USA: (a) without climate change effects and (b) with projected climate change effects.
a) b)

99
How can the risks be reduced? Until recently, it did not occur to people who are responsible for water management that cli-mate change would force them to review the whole system for managing water resources. Un-less proper measures are taken in good time, the damage caused by sudden and severe droughts, floods or reduction of freshwater resources could be enormous.
The first thing needed is steady improvement of weather forecasting. This will help to predict the probable occurrence of severe weather events, whether heavy rain or extreme drought, in advance.
Secondly, there are many technology and engineering solutions that can reduce risks to people and infrastructure, from the construction of new dams and reservoirs along rivers to help regu-late their flow to the creation of structures along river banks to protect the communities who live there from severe flooding.
Thirdly, we will have to reduce water consumption. This can be done, for example, by using rainwater or by using the same water twice for different needs. Special installations to convert salt water into fresh water by desalination are also promising (Fig. 2.4.9). Most of all we must remember to use water efficiently.
Fig. 2.4.8. Water shortages are already a problem in Southern Russia.
Fig. 2.4.9. A seawater desalination plant in the United Arab Emirates.

100
How the ancient Indians of Latin America adapted to a changing climate
The indigenous peoples of Central and South America lived mainly from the crops, which they grew around their settlements. In highland regions, where many ancient Indian civili-zations were focused, food production was limited due to the uneven distribution of water resources. There was no shortage of water during the rainy season, but how did these ancient peoples manage during the dry season?
The main source of water in the dry season was rivers flowing from mountain glaciers, but they only supply settlements along the river valleys. The ancient Indian tribes invented a range of technologies and contrivances to ensure year-round supplies of water in the mountains.
The Indians learnt to catch, filter and store rainwater, to build surface and underground irrigation channels, and invented devices for measuring the amount of water, which they had in storage. They even connected the river basins of the Pacific and Atlantic oceans. They also developed a system of weather forecasting, which could predict when the rainy season and the dry season were likely to begin, so that they could better organize the sowing and harvesting of crops.
The indigenous peoples of America used their engineering skills to straighten river beds and build bridges, both hanging bridges and bridges with supports rising from the river bed. The laid on piped water for everyday use and for religious ceremonies. The priests of the Chavin culture channelled water through pipes inside their temples to obtain a sound like the roar of a jaguar, an ani-mal which they worshipped as a god.
Water was also used to cut blocks of stone used in construction. Water was channelled into specially made channels in the stone and left to freeze at night in sub-zero temperatures, gradually cre-ating cracks that divided the stone into the regular shapes required for building.
So the Indians of Central and South America, who lived on a vast territory from modern Mexico in the north to Chile and Argentina in the south, were pioneers in the use of various tech-nologies that can be used for adapting to adverse climate conditions.
In today’s conditions of climate change and unpredictable weather patterns, it would be very useful to recall and modernize ancient adaptation techniques, taking account of the latest scientific knowledge.
Materials from B.K. Bates et al., Climate Change and Water Resources,
IPCC, Geneva, 2008.
Fig. 2.4.10. Water collection system in Nazca regions (southern coast of Peru) for underground aqueducts and distribution of groundwater.

101
Questions
1. What do we call the science that studies water?
2. Which country has the largest supply of fresh water in the world?
3. Which regions of the world will be particularly affected by water shortages and why?
4. What is the name of the river basin where your home town is located and what sea does it empty into?
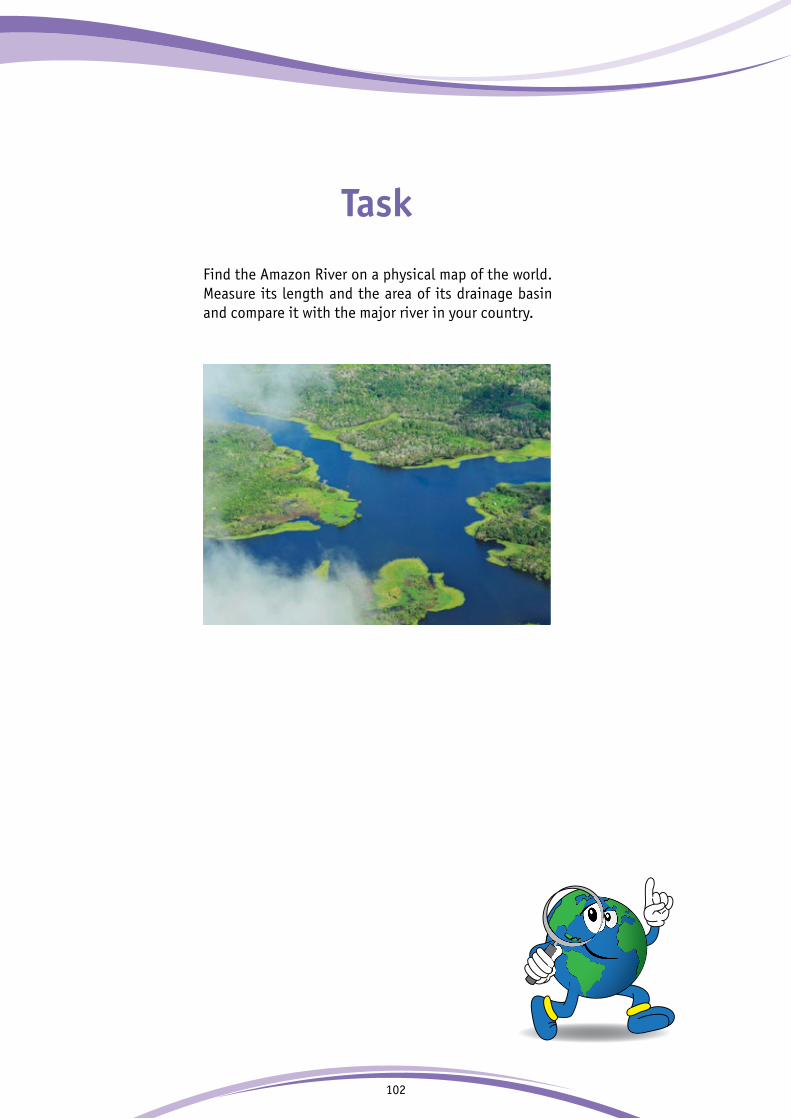
102
Task
Find the Amazon River on a physical map of the world. Measure its length and the area of its drainage basin and compare it with the major river in your country.
+2 оС

103
2.5. | How climate change affects… agriculture
One might think that climate change would help agriculture in the northern countries. But a warmer climate is not necessarily better. If it gets warmer in regions where it was previously too cold to grow wheat, it will also get warmer in regions where there was already an ideal climate for agriculture, and more heat means less moisture. So it will become much more difficult (or impossible) to grow crops in areas where they have been cultivated for centuries and where specific traditions of agriculture have taken shape.
Winter wheat is sown, not in the spring, like other wheat, but in late summer and early autumn, so that the seeds have time to germinate
and take root before the winter snows come. Then the wheat resumes its growth when the warmth of spring arrives and ripens somewhat earlier than crops that were only sown in the spring.
So the conditions for agriculture will become better in some places, but worse in others, and it is very difficult at this stage to predict the final outcome of such a ‘global shake-up’ for various countries.
It is important to remember that climate is not the only natural factor with impact on agriculture.
For example, one of the main cereal crops in North America, Europe and Siberia is winter wheat. Climate warming means that the zone with ideal climatic conditions for its cultivation will move to the north. But the soil in these new regions is not as good as in the regions where winter wheat is grown today. Improvement of the soil quality in more northerly regions will require much work and will be very expensive.

104
Climate change affects fruit and vegetable production. Stone fruits, particularly cherries, re-quire chill hours to bear fruit. Too few cold nights, and the trees are less likely to achieve suc-cessful pollination and will produce fewer fruits. Unusually timed cold weather can be just as disastrous. In 2012, the cherry industry of the Michigan State in the USA lost 90% of its tart cherry crop after a late freeze.
Countries with temperate and more severe climates, such as Canada and Russia, could face an-other challenge in the form of increased competition between forestry and agriculture. Climate change will make it possible to turn over land now occupied by forests to agriculture, which could speed up the felling of forests. Even in areas where conditions for agriculture are border-line (in the extreme north of the agricultural zone), productivity from one hectare of land under crops is still greater than from one hectare of forest land. So much thinking will have to be done before new territories are turned over to agriculture.
Agriculture everywhere in the world will have to adapt to the new climatic conditions. Experts of the International Food and Agriculture Organization believe that crop yields in many parts of the world will decline after 2030 due to climate change. Forecasts indicate that the most serious consequences are likely to occur in tropical regions, where further reduction of rainfall is likely.
Increasing occurrence of droughts, floods and rainfall fluctuations in sub-Saharan Africa will make feeding the local population there into one of the major challenges of coming decades. World Bank experts calculate that an increase of average global temperatures by 1.5–2 °C and reduction of rainfall will lead to 40-80% reduction in the amount of land suitable for crops of maize, millet and sorghum in sub-Saharan Africa by the 2030-2040s.
In Mexico drought is reducing the amount of land suitable for growing maize, which is that country’s main agricultural crop.
Cereals are a highly important group of plants, producing grain, which is a staple food of people, as well as a raw material for many industries and feed for farm ani-
mals. Cereal crops include wheat, rye, rice, oats, barley, maize, sorghum, millet, buckwheat, and many others.
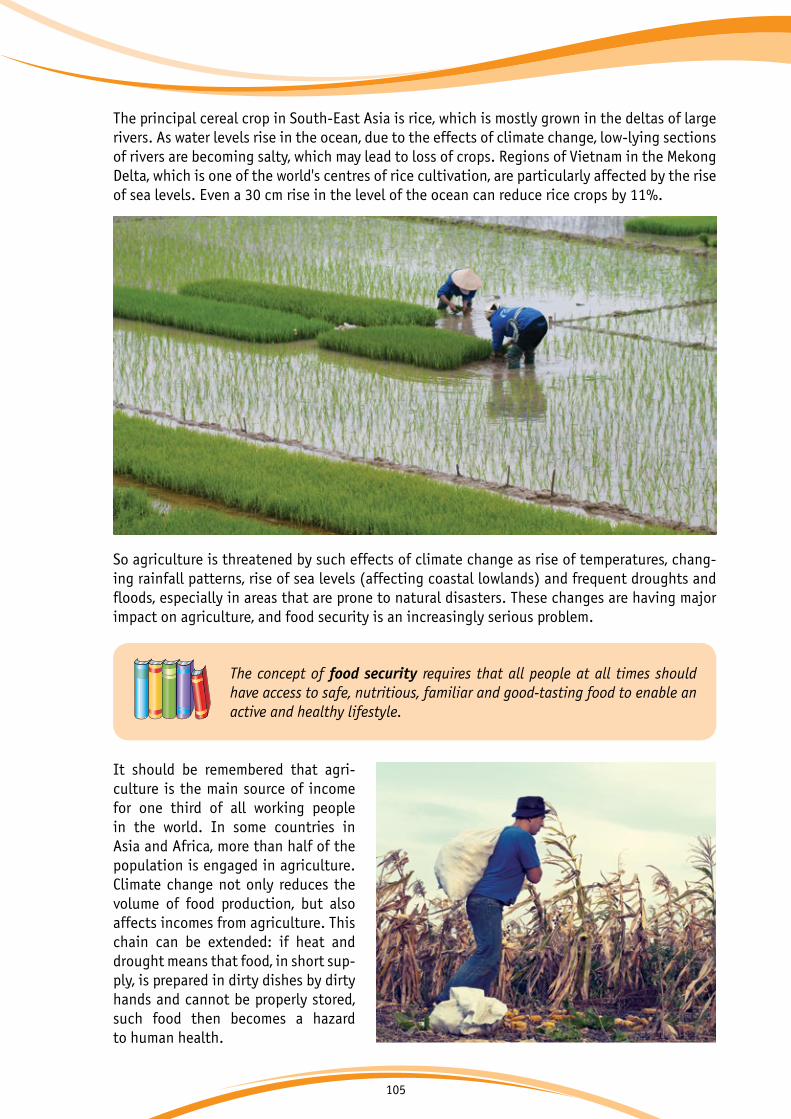
105
The principal cereal crop in South-East Asia is rice, which is mostly grown in the deltas of large rivers. As water levels rise in the ocean, due to the effects of climate change, low-lying sections of rivers are becoming salty, which may lead to loss of crops. Regions of Vietnam in the Mekong Delta, which is one of the world's centres of rice cultivation, are particularly affected by the rise of sea levels. Even a 30 cm rise in the level of the ocean can reduce rice crops by 11%.
The concept of food security requires that all people at all times should have access to safe, nutritious, familiar and good-tasting food to enable an active and healthy lifestyle.
So agriculture is threatened by such effects of climate change as rise of temperatures, chang-ing rainfall patterns, rise of sea levels (affecting coastal lowlands) and frequent droughts and floods, especially in areas that are prone to natural disasters. These changes are having major impact on agriculture, and food security is an increasingly serious problem.
It should be remembered that agri-culture is the main source of income for one third of all working people in the world. In some countries in Asia and Africa, more than half of the population is engaged in agriculture. Climate change not only reduces the volume of food production, but also affects incomes from agriculture. This chain can be extended: if heat and drought means that food, in short sup-ply, is prepared in dirty dishes by dirty hands and cannot be properly stored, such food then becomes a hazard to human health.

106
So even northern countries cannot expect climate change to bring benefits for agriculture, free of any disadvantages; and those who live in the temperate or colder climate can hardly expect to be growing oranges in the backyard in the near future. It is highly important to develop strategies that will help the agriculture and people who work in this sector to adapt to the pos-sible impacts (both positive and negative) of climate change and avoid major losses.
Climate change has already affected coffee growers
The international coffee organization, of which 77 coun-tries are members, says that climate warming is caus-ing damage to the coffee business. The 1°C temperature rises, which have been seen on the planet in the past100 years, have made a critical difference to coffee planta-tions.
Coffee growing is a major source of income for countries including Brazil, Indonesia and Costa Rica. Brazil alone grows more than 2 million tonnes of coffee beans each year. But higher temperatures, more frequent droughts and outbreaks of pests in areas where coffee is grown are reducing both the quantity and the quality of the coffee harvest.
Finding cooler locations for coffee growing is not a simple task: in tropical countries it requires moving upwards into the highlands and searching for suitable sites there. But the number of such sites is limited, they cost more than land on the plains, and the development of new plantations requires substantial investments.
All this means that a cup of coffee could become an luxury in the near future.
+2 оС
107
Questions
1. What is the difference between spring and winter wheat? Which is it better to plant in your region and why?
2. What cereal crops grow in your region?Are they threatened by climate change?
3. Why do rising sea levels represent a threat for rice pro-duction in South-East Asia?
4. What is food security? Explain it using an example.
5. What percentage of people around the worldare engaged in agriculture?

108
Task
With the help of your geography teacher, make a list of major crops that are cultivated in your region.
Find information on the yield of these crops in your area in recent years. Is it increasing or decreasing? Have there been crop failures during this time and what were they caused by?
Think how climate change might affect the yieldof these and other crops in your region. Couldthe new climate conditions make it possible to grow other crops?
+2 оС
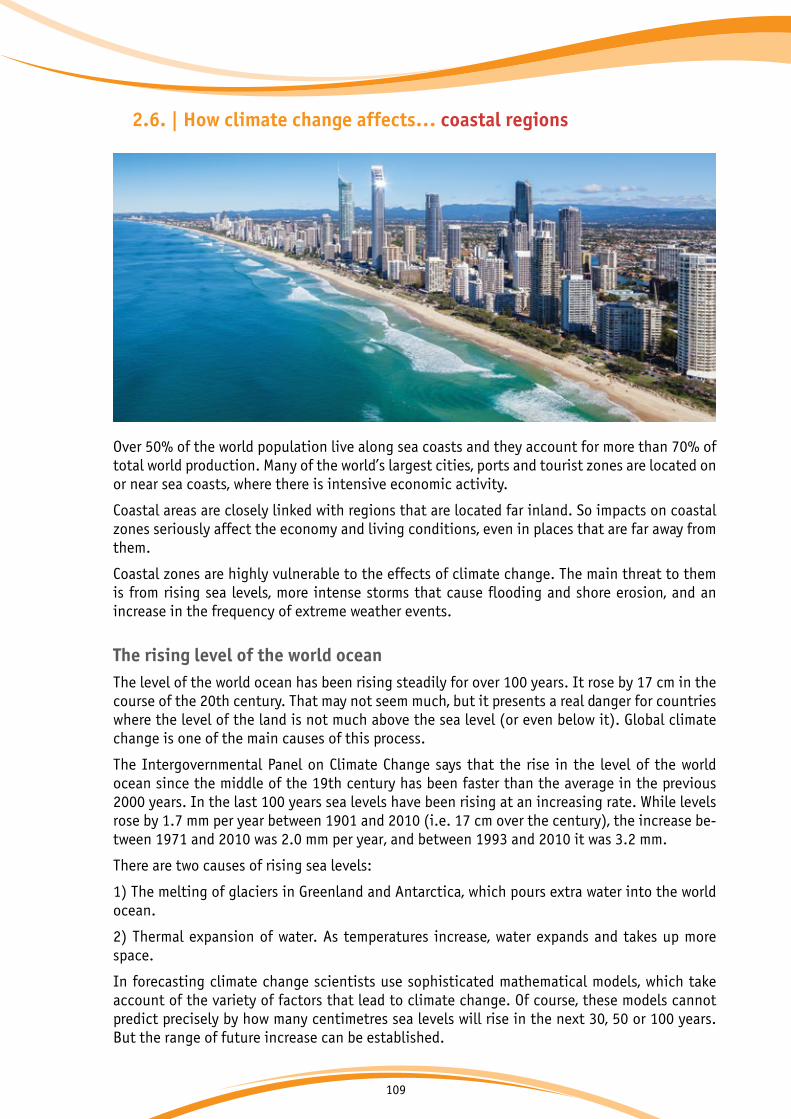
109
2.6. | How climate change affects… coastal regions
Over 50% of the world population live along sea coasts and they account for more than 70% of total world production. Many of the world’s largest cities, ports and tourist zones are located on or near sea coasts, where there is intensive economic activity.
Coastal areas are closely linked with regions that are located far inland. So impacts on coastal zones seriously affect the economy and living conditions, even in places that are far away from them.
Coastal zones are highly vulnerable to the effects of climate change. The main threat to them is from rising sea levels, more intense storms that cause flooding and shore erosion, and an increase in the frequency of extreme weather events.
The rising level of the world oceanThe level of the world ocean has been rising steadily for over 100 years. It rose by 17 cm in the course of the 20th century. That may not seem much, but it presents a real danger for countries where the level of the land is not much above the sea level (or even below it). Global climate change is one of the main causes of this process.
The Intergovernmental Panel on Climate Change says that the rise in the level of the world ocean since the middle of the 19th century has been faster than the average in the previous 2000 years. In the last 100 years sea levels have been rising at an increasing rate. While levels rose by 1.7 mm per year between 1901 and 2010 (i.e. 17 cm over the century), the increase be-tween 1971 and 2010 was 2.0 mm per year, and between 1993 and 2010 it was 3.2 mm.
There are two causes of rising sea levels:
1) The melting of glaciers in Greenland and Antarctica, which pours extra water into the world ocean.
2) Thermal expansion of water. As temperatures increase, water expands and takes up more space.
In forecasting climate change scientists use sophisticated mathematical models, which take account of the variety of factors that lead to climate change. Of course, these models cannot predict precisely by how many centimetres sea levels will rise in the next 30, 50 or 100 years. But the range of future increase can be established.
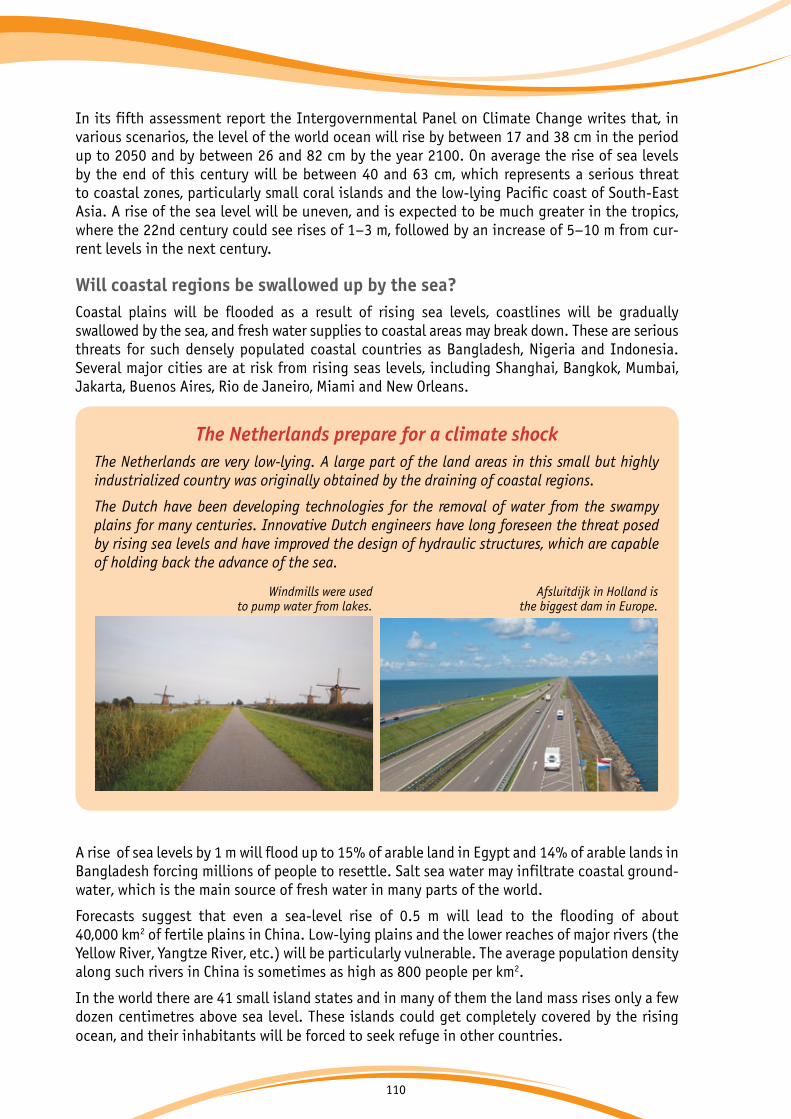
110
In its fifth assessment report the Intergovernmental Panel on Climate Change writes that, in various scenarios, the level of the world ocean will rise by between 17 and 38 cm in the period up to 2050 and by between 26 and 82 cm by the year 2100. On average the rise of sea levels by the end of this century will be between 40 and 63 cm, which represents a serious threat to coastal zones, particularly small coral islands and the low-lying Pacific coast of South-East Asia. A rise of the sea level will be uneven, and is expected to be much greater in the tropics, where the 22nd century could see rises of 1–3 m, followed by an increase of 5–10 m from cur-rent levels in the next century. Will coastal regions be swallowed up by the sea?Coastal plains will be flooded as a result of rising sea levels, coastlines will be gradually swallowed by the sea, and fresh water supplies to coastal areas may break down. These are serious threats for such densely populated coastal countries as Bangladesh, Nigeria and Indonesia. Several major cities are at risk from rising seas levels, including Shanghai, Bangkok, Mumbai, Jakarta, Buenos Aires, Rio de Janeiro, Miami and New Orleans.
The Netherlands prepare for a climate shockThe Netherlands are very low-lying. A large part of the land areas in this small but highly industrialized country was originally obtained by the draining of coastal regions.
The Dutch have been developing technologies for the removal of water from the swampy plains for many centuries. Innovative Dutch engineers have long foreseen the threat posed by rising sea levels and have improved the design of hydraulic structures, which are capable of holding back the advance of the sea.
Windmills were used to pump water from lakes.
Afsluitdijk in Holland is the biggest dam in Europe.
A rise of sea levels by 1 m will flood up to 15% of arable land in Egypt and 14% of arable lands in Bangladesh forcing millions of people to resettle. Salt sea water may infiltrate coastal ground-water, which is the main source of fresh water in many parts of the world.
Forecasts suggest that even a sea-level rise of 0.5 m will lead to the flooding of about 40,000 km2 of fertile plains in China. Low-lying plains and the lower reaches of major rivers (the Yellow River, Yangtze River, etc.) will be particularly vulnerable. The average population density along such rivers in China is sometimes as high as 800 people per km2.
In the world there are 41 small island states and in many of them the land mass rises only a few dozen centimetres above sea level. These islands could get completely covered by the rising ocean, and their inhabitants will be forced to seek refuge in other countries.

111
Storm warningStorms have recently become more frequent in coastal areas and at sea. Extreme storm winds, whether near the coast or in the open sea, cause ‘storm surges’ – a sudden rise in water levels in water bodies that are semi-open to the sea (bays, the lower reaches of rivers). Storm surg-es attack coastal regions and are often accompanied by extreme precipitation and flooding, threatening the movement of ships, work on oil and gas platforms and seaside tourism, as well as causing coastal erosion.
Fig. 2.6.1. Forecasts of coastal flooding on different continents, assuming a rise of sea levels by 5 m.
Flooded areas
Flooded areasFlooded areas
Flooded areas
Northern part of South America
Northwestern Europe
South-East Asia
The Caribbean
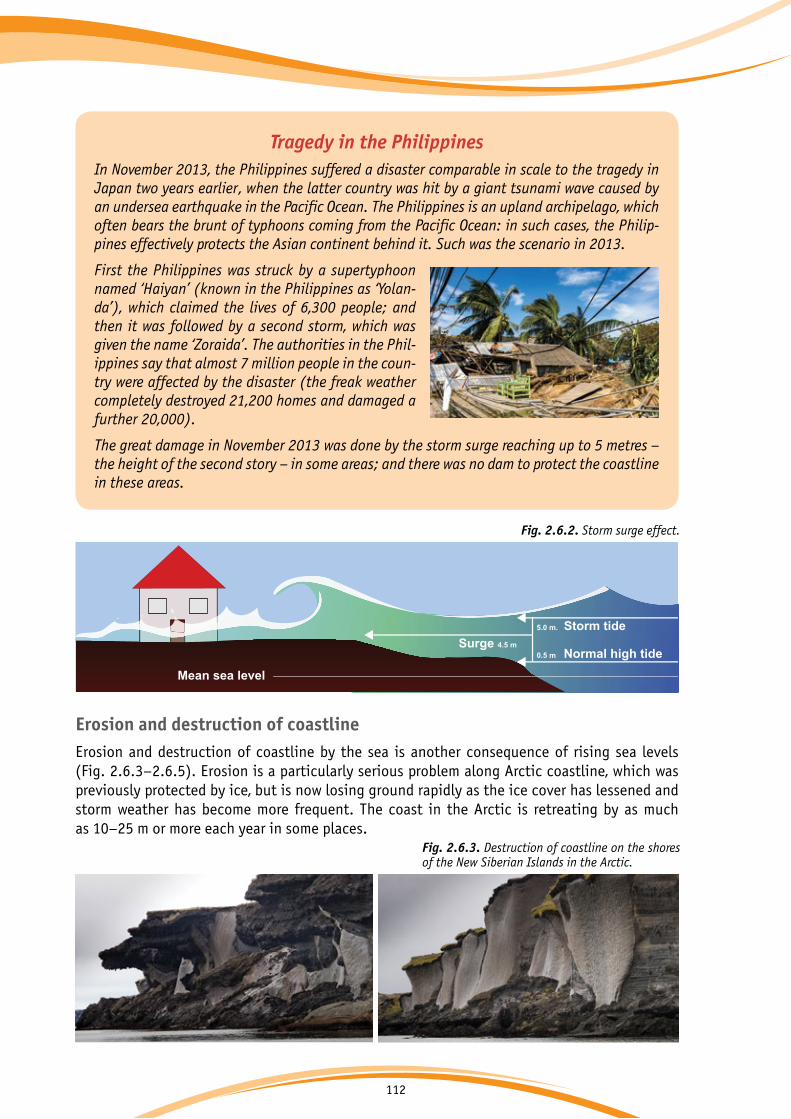
112
Erosion and destruction of coastlineErosion and destruction of coastline by the sea is another consequence of rising sea levels (Fig. 2.6.3–2.6.5). Erosion is a particularly serious problem along Arctic coastline, which was previously protected by ice, but is now losing ground rapidly as the ice cover has lessened and storm weather has become more frequent. The coast in the Arctic is retreating by as muchas 10–25 m or more each year in some places.
Tragedy in the PhilippinesIn November 2013, the Philippines suffered a disaster comparable in scale to the tragedy in Japan two years earlier, when the latter country was hit by a giant tsunami wave caused by an undersea earthquake in the Pacific Ocean. The Philippines is an upland archipelago, which often bears the brunt of typhoons coming from the Pacific Ocean: in such cases, the Philip-pines effectively protects the Asian continent behind it. Such was the scenario in 2013.
First the Philippines was struck by a supertyphoon named ‘Haiyan’ (known in the Philippines as ‘Yolan-da’), which claimed the lives of 6,300 people; and then it was followed by a second storm, which was given the name ‘Zoraida’. The authorities in the Phil-ippines say that almost 7 million people in the coun-try were affected by the disaster (the freak weather completely destroyed 21,200 homes and damaged a further 20,000).
The great damage in November 2013 was done by the storm surge reaching up to 5 metres – the height of the second story – in some areas; and there was no dam to protect the coastline in these areas.
Fig. 2.6.3. Destruction of coastline on the shores of the New Siberian Islands in the Arctic.
Mean sea level
0.5 m Normal high tide
5.0 m. Storm tideSurge 4.5 m
Fig. 2.6.2. Storm surge effect.
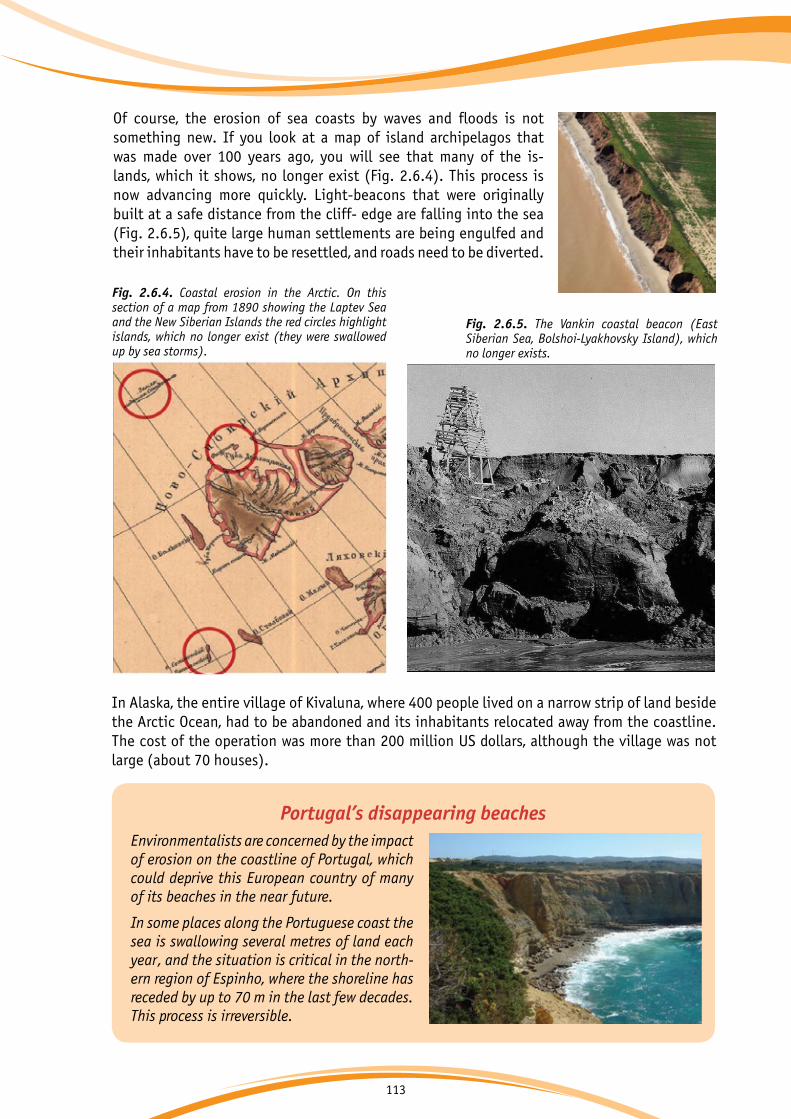
113
Of course, the erosion of sea coasts by waves and floods is not something new. If you look at a map of island archipelagos that was made over 100 years ago, you will see that many of the is-lands, which it shows, no longer exist (Fig. 2.6.4). This process is now advancing more quickly. Light-beacons that were originally built at a safe distance from the cliff- edge are falling into the sea (Fig. 2.6.5), quite large human settlements are being engulfed and their inhabitants have to be resettled, and roads need to be diverted.
Fig. 2.6.5. The Vankin coastal beacon (East Siberian Sea, Bolshoi-Lyakhovsky Island), which no longer exists.
Fig. 2.6.4. Coastal erosion in the Arctic. On this section of a map from 1890 showing the Laptev Sea and the New Siberian Islands the red circles highlight islands, which no longer exist (they were swallowed up by sea storms).
Portugal’s disappearing beachesEnvironmentalists are concerned by the impact of erosion on the coastline of Portugal, which could deprive this European country of many of its beaches in the near future.
In some places along the Portuguese coast the sea is swallowing several metres of land each year, and the situation is critical in the north-ern region of Espinho, where the shoreline has receded by up to 70 m in the last few decades. This process is irreversible.
In Alaska, the entire village of Kivaluna, where 400 people lived on a narrow strip of land beside the Arctic Ocean, had to be abandoned and its inhabitants relocated away from the coastline. The cost of the operation was more than 200 million US dollars, although the village was not large (about 70 houses).

114
Risk to coastal ecosystems As well as its impact on people and the economy, the rise of sea levels also affects both sea and land ecosystems along the coast.
The ecosystems of coastal lowlands are particularly vulnerable, since their level is typically only a few centimetres above that of the sea. Such lowlands are the habitat of many species of animals and plants, and they play a key role in the accumulation of nutrients. These ecosystems include salt marshes, which are flooded with sea water at high tide. Mangrove forests, which are commonly found in coastal lowlands that have a humid tropical climate, are also threatened by rising sea levels.
Global warming poses a significant threat to coral reefs, since the rise of water temperatures above a certain limit will lead to bleaching of the coral. Bleaching means that corals lose the symbiotic algae normally found in their tissues and become white as a result of stress. If bleach-ing is severe or prolonged, they can die. Such coral bleaching is already being observed in many places.
The ecosystems of corals reefsare in danger The temperature of water in the
ocean is rising due to climate change, leading to a reduction in the calcium content of sea water. Corals and other organisms living in reefs need calcium in order to build a skeleton.
The ocean absorbs one third of the excess carbon dioxide in the atmosphere. This leadsto increased acidity levels in shallow waters, as a result of which organisms living in the water find it harder to obtain the minerals and trace elements, which they needin order to survive.
20%of the world's coral reefshave disappeared overthe past few decades
360species of hard coral
live in Australia’sGreat Barrier Reef
of all species of marine organisms have life
cycles that are associated with coral
reef ecosystems
21%
of coral reefs are endangered
27%people have livelihoods that are directly
or indirectly dependenton coral reef ecosystems
25 million
of the bed of the world oceanconsists ofcoral reef
0.1%
СО2
Inner reef, lagoon
Reef crest
Front of reefSlope
Egrets
Oystercatcher
Pelican
Seaweed WrasseHard coral
Hardcoral
Seasponges
Anenomes
Butterfly fish
Clown fish
Angel fish
Seaweed Sea turtle
Parrot fish
PlanktonRockfish
Sea snakes
Dolphin
Cephalopods
Lucian
Surgeon fish
Crustaceans
1 2
Protected coral reefs
Fig. 2.6.6. Coral reef ecosystems at risk.
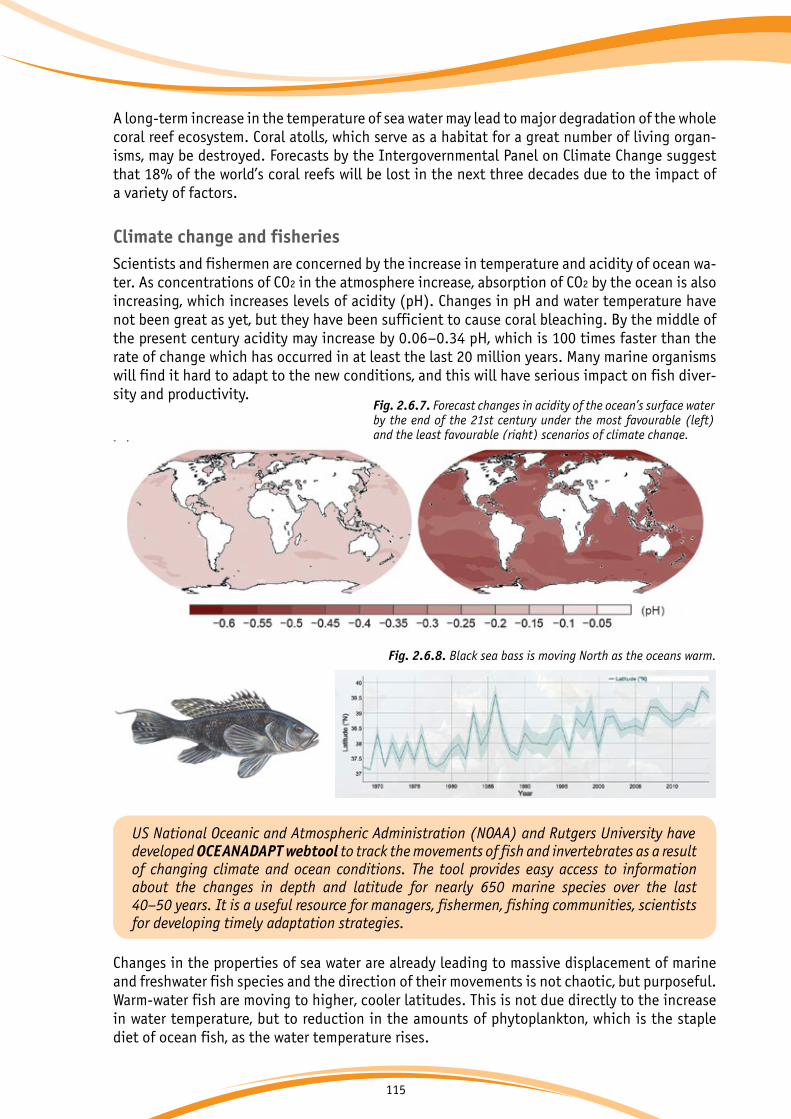
115
A long-term increase in the temperature of sea water may lead to major degradation of the whole coral reef ecosystem. Coral atolls, which serve as a habitat for a great number of living organ-isms, may be destroyed. Forecasts by the Intergovernmental Panel on Climate Change suggest that 18% of the world’s coral reefs will be lost in the next three decades due to the impact of a variety of factors.
Climate change and fisheriesScientists and fishermen are concerned by the increase in temperature and acidity of ocean wa-ter. As concentrations of CO2 in the atmosphere increase, absorption of CO2 by the ocean is also increasing, which increases levels of acidity (pH). Changes in pH and water temperature have not been great as yet, but they have been sufficient to cause coral bleaching. By the middle of the present century acidity may increase by 0.06–0.34 pH, which is 100 times faster than the rate of change which has occurred in at least the last 20 million years. Many marine organisms will find it hard to adapt to the new conditions, and this will have serious impact on fish diver-sity and productivity.
Fig. 2.6.7. Forecast changes in acidity of the ocean’s surface water by the end of the 21st century under the most favourable (left) and the least favourable (right) scenarios of climate change.
US National Oceanic and Atmospheric Administration (NOAA) and Rutgers University have developed OCEANADAPT webtool to track the movements of fish and invertebrates as a result of changing climate and ocean conditions. The tool provides easy access to information about the changes in depth and latitude for nearly 650 marine species over the last 40–50 years. It is a useful resource for managers, fishermen, fishing communities, scientists for developing timely adaptation strategies.
Changes in the properties of sea water are already leading to massive displacement of marine and freshwater fish species and the direction of their movements is not chaotic, but purposeful. Warm-water fish are moving to higher, cooler latitudes. This is not due directly to the increase in water temperature, but to reduction in the amounts of phytoplankton, which is the staple diet of ocean fish, as the water temperature rises.
Fig. 2.6.8. Black sea bass is moving North as the oceans warm.

116
It has been noted that numbers of cod off the coast of Greenland, and also of herring and Japa-nese and Adriatic sardines increase during periods of climate warming and are much reduced during cold periods.
Many fish species are currently being fished at the limits of capacity to restore their popula-tions, and there is concern that additional pressure from the need to adapt to climate change may push some species beyond their ability to reproduce in sufficient numbers to survive.
The loss of coastal habitats, including coral reefs and mangroves, is another major factor threat-ening fish productivity.
The World Food Organization notes that fish represent more than 15% of average protein intake for over 2.9 billion people. In small island states and some developing countries (Bangladesh, Cambodia, Equatorial Guinea, French Guiana, Gambia, Ghana, Indonesia and Sierra Leone) fish provide more than 50% of animal protein intake. The populations of these countries are dependent on fisheries, so that any reduction in local catches represents a serious problem.

117
Questions
1. Which country, Switzerland or the Netherlands,will suffer most if sea levels rise by more than half a metre?
2. Why are sea coasts being eroded more rapidly?
3. What happened to lost islands?
4. Give examples of the impact of climate change on coastal ecosystems.
5. Why are some fish species moving to northerly latitudes?

118
Task 1. Locate the Republic of the Maldives and Tuvalu on a physi-cal map of the world. Find their height above sea level and explain why a rise in the level of the world ocean is so danger-ous for them. Find island countries and coastal countries on various continents, which are also in danger of being fully or partially submerged by the sea in the next 50-100 years. Sug-gest ways of addressing the problem.
Task 2. Show on a contour map how the appearance of the continent of South America would change if sea levels rose by 100 m: use coloured pencils to colour areas of land that would dis-appear under the sea. Think of geographical names for these areas. What will happen to the animals and plants there: will they perish? Write down your suggestions in an exercise book.
Task 3. Using OCEANADAPT webtool (http://oceanadapt.rutgers.edu/), find out how different fish species in the USA have changed their usual habitat in the past 40–50 years. Which species had to move the most? Why are these movements hap-pening?
Task
+2 оС

119
2.7. | How climate change affects… mountain regions
What are mountains? “What are men to rocks and mountains?” exclaimed Elizabeth Bennet, the heroine of Jane Aus-ten’s ‘Pride and Prejudice’, excited about her forthcoming nature tour of pleasure in the sum-mer. And it is true that mountains are one of the greatest creations of nature. What can compare with the breathtaking feeling when you stand on the top of a mountain, with only the blue sky above, and below you the rest of the world that looks so tiny seen beyond the white clouds... At such moments you feel the beauty and power of nature, and at the same time its fragility.
Scientists define mountains as an elevated form of relief that rises above the surrounding plain. Unless they are volcanoes, mountains rarely stand alone, but usually form mountain ranges and ridges. Mountain ranges, in turn, add together to make mountainous countries or mountain systems.
Mountains may be high (above 3,000 m), of medium-height (1,000–3,000 m) and low (up to 1,000 m). Low mountains usually have rounded summits and gentle slopes, but high mountains have steep slopes and angular peaks.
Mountains and climateMountains play an important role in shaping the climate. They create a barrier to air masses, which cannot easily pass the high peaks. For this reason, different slopes of the same moun-tains often have different climate conditions, with more precipitation on one side than on the other. Average temperature and landscapes may also differ significantly.
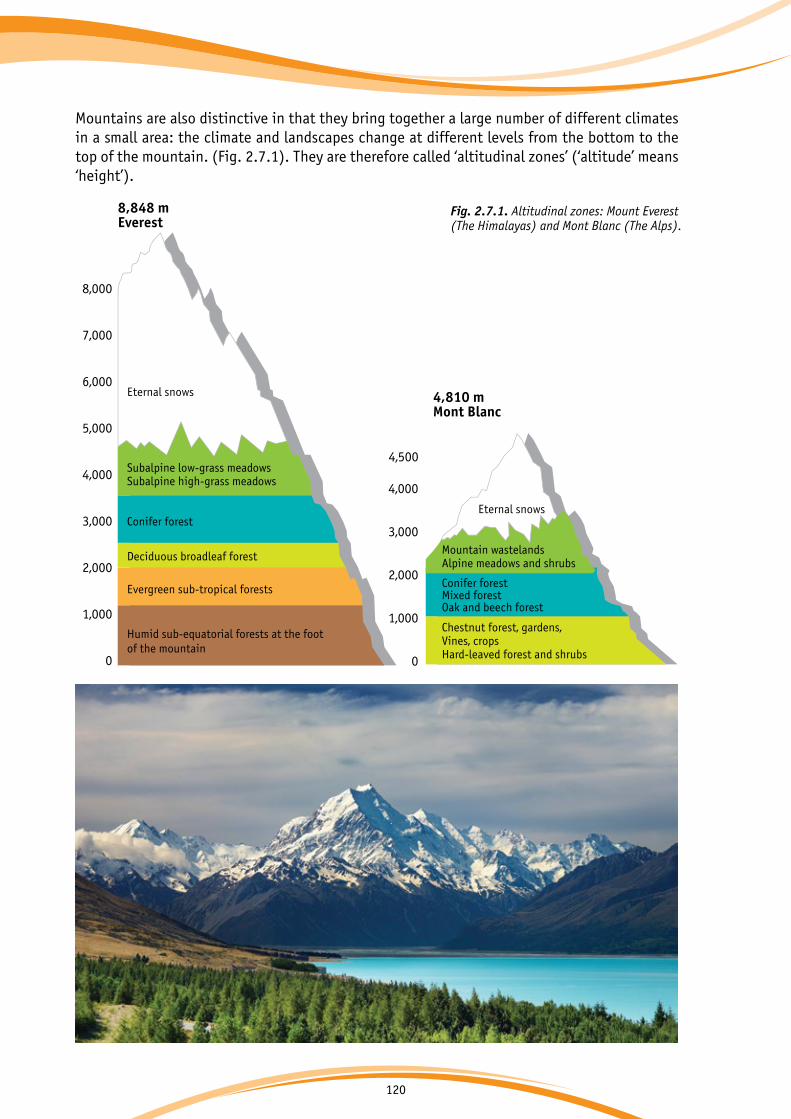
120
Mountains are also distinctive in that they bring together a large number of different climates in a small area: the climate and landscapes change at different levels from the bottom to the top of the mountain. (Fig. 2.7.1). They are therefore called ‘altitudinal zones’ (‘altitude’ means ‘height’).
4,000
3,000
2,000
1,000
0
8,000
7,000
6,000
5,000
4,000
3,000
2,000
1,000
0
Eternal snows
Eternal snows
Subalpine low-grass meadowsSubalpine high-grass meadows
Conifer forest
Mountain wastelandsAlpine meadows and shrubsDeciduous broadleaf forest
8,848 mEverest
4,810 mMont Blanc
Evergreen sub-tropical forests
Humid sub-equatorial forests at the footof the mountain
Conifer forestMixed forestOak and beech forest
Chestnut forest, gardens,Vines, cropsHard-leaved forest and shrubs
4,500
Fig. 2.7.1. Altitudinal zones: Mount Everest (The Himalayas) and Mont Blanc (The Alps).
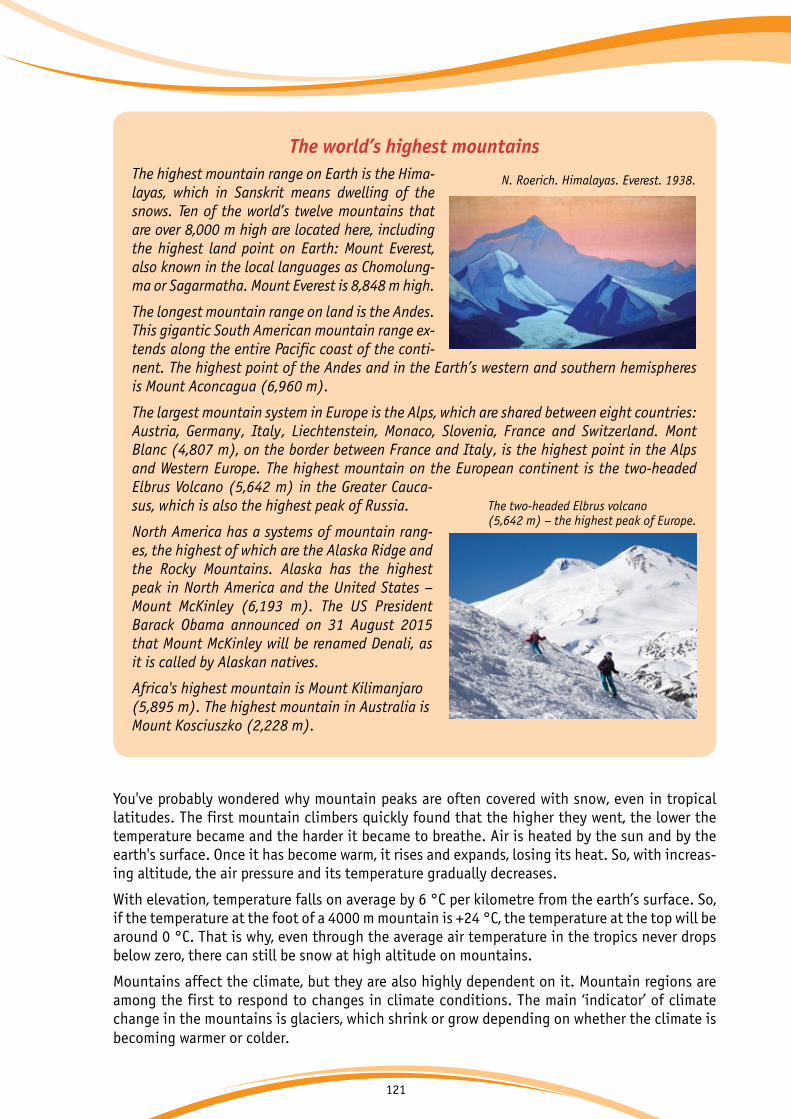
121
The world’s highest mountainsThe highest mountain range on Earth is the Hima- layas, which in Sanskrit means dwelling of the snows. Ten of the world’s twelve mountains that are over 8,000 m high are located here, including the highest land point on Earth: Mount Everest, also known in the local languages as Chomolung-ma or Sagarmatha. Mount Everest is 8,848 m high.
The longest mountain range on land is the Andes. This gigantic South American mountain range ex-tends along the entire Pacific coast of the conti-nent. The highest point of the Andes and in the Earth’s western and southern hemispheres is Mount Aconcagua (6,960 m).
The largest mountain system in Europe is the Alps, which are shared between eight countries: Austria, Germany, Italy, Liechtenstein, Monaco, Slovenia, France and Switzerland. Mont Blanc (4,807 m), on the border between France and Italy, is the highest point in the Alps and Western Europe. The highest mountain on the European continent is the two-headed Elbrus Volcano (5,642 m) in the Greater Cauca-sus, which is also the highest peak of Russia.
North America has a systems of mountain rang-es, the highest of which are the Alaska Ridge and the Rocky Mountains. Alaska has the highest peak in North America and the United States – Mount McKinley (6,193 m). The US President Barack Obama announced on 31 August 2015 that Mount McKinley will be renamed Denali, as it is called by Alaskan natives.
Africa's highest mountain is Mount Kilimanjaro (5,895 m). The highest mountain in Australia is Mount Kosciuszko (2,228 m).
N. Roerich. Himalayas. Everest. 1938.
The two-headed Elbrus volcano (5,642 m) – the highest peak of Europe.
You've probably wondered why mountain peaks are often covered with snow, even in tropical latitudes. The first mountain climbers quickly found that the higher they went, the lower the temperature became and the harder it became to breathe. Air is heated by the sun and by the earth's surface. Once it has become warm, it rises and expands, losing its heat. So, with increas-ing altitude, the air pressure and its temperature gradually decreases.
With elevation, temperature falls on average by 6 °C per kilometre from the earth’s surface. So, if the temperature at the foot of a 4000 m mountain is +24 °C, the temperature at the top will be around 0 °C. That is why, even through the average air temperature in the tropics never drops below zero, there can still be snow at high altitude on mountains.
Mountains affect the climate, but they are also highly dependent on it. Mountain regions are among the first to respond to changes in climate conditions. The main ‘indicator’ of climate change in the mountains is glaciers, which shrink or grow depending on whether the climate is becoming warmer or colder.
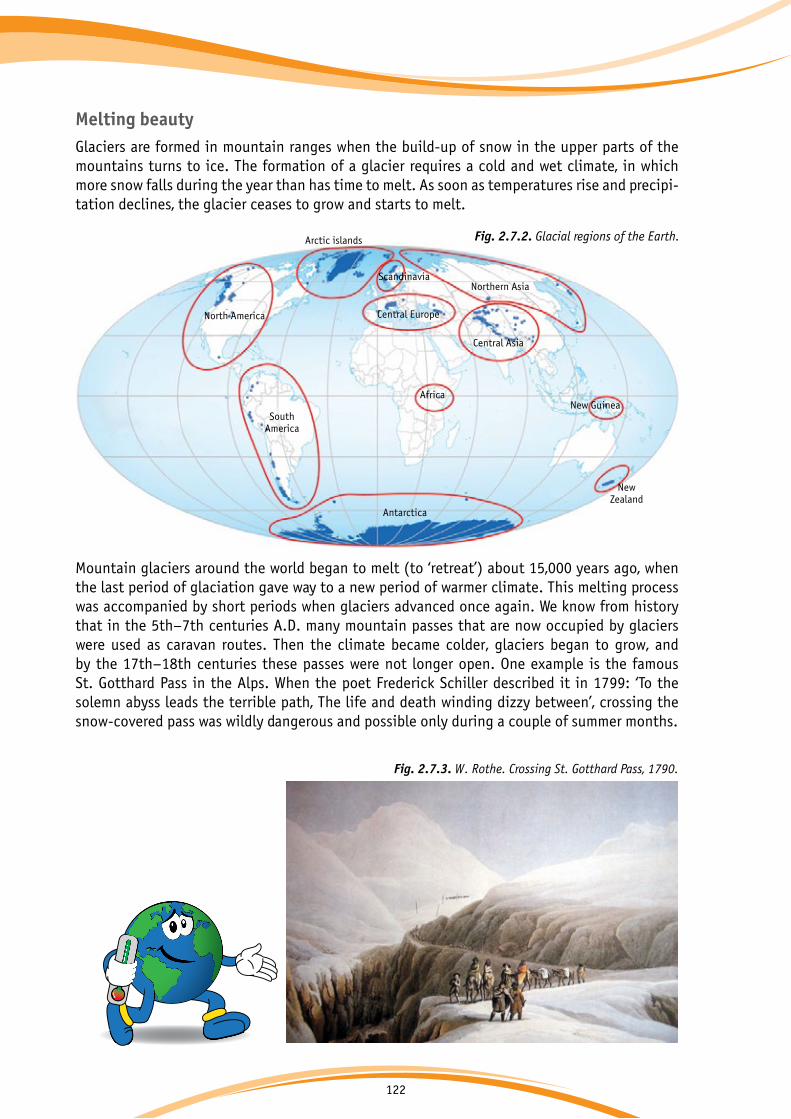
122
Melting beautyGlaciers are formed in mountain ranges when the build-up of snow in the upper parts of the mountains turns to ice. The formation of a glacier requires a cold and wet climate, in which more snow falls during the year than has time to melt. As soon as temperatures rise and precipi-tation declines, the glacier ceases to grow and starts to melt.
Arctic islands
ScandinaviaNorthern Asia
Central Asia
Central Europe
Africa
Antarctica
New Guinea
NewZealand
North America
SouthAmerica
Fig. 2.7.2. Glacial regions of the Earth.
Fig. 2.7.3. W. Rothe. Crossing St. Gotthard Pass, 1790.
Mountain glaciers around the world began to melt (to ‘retreat’) about 15,000 years ago, when the last period of glaciation gave way to a new period of warmer climate. This melting process was accompanied by short periods when glaciers advanced once again. We know from history that in the 5th–7th centuries A.D. many mountain passes that are now occupied by glacierswere used as caravan routes. Then the climate became colder, glaciers began to grow, and by the 17th–18th centuries these passes were not longer open. One example is the famousSt. Gotthard Pass in the Alps. When the poet Frederick Schiller described it in 1799: ‘To the solemn abyss leads the terrible path, The life and death winding dizzy between’, crossing the snow-covered pass was wildly dangerous and possible only during a couple of summer months.
+2 оС

123
Glaciers in the Himalayas are retreating by an average of 10–15 m per year. The Gangotri glacier, which is the source of the River Ganges, is melting particularly fast, retreating by 30 m each year. Gangotri is one of the main sources of water for the 500 million people who live along the Ganges River.
Glaciers in Peru are also retreating very fast. According to the most conservative estimates, their area has been re-duced by a third over the past 30 years.
The African volcano, Kilimanjaro, has suffered perhaps the worst of all: its famous ice cap, which was immortalized in Ernest Hemingway’s novel ‘The Snows of Kilimanjaro’ has almost entirely disappeared.
However, over the past 40 years, glaciers around the world have been retreating particularly fast (Fig. 2.7.4). Scientists are sounding the alarm: the rapid melting of mountain glaciers, which we are seeing today, does not coincide with a natural cycle. Reduction in volumes of mountain ice may lead to catastrophic consequences for the environment and the economy of mountain regions, as well as of plains around mountains, which are home to as many as one in six of the world's population.
0
-5
-10
-15
-20
-251945 1955 1965 1975 1985 1995 2005
Fig. 2.7.4. Change in the mass of mountain glaciers around the world, 1945–2005.
Fig. 2.7.5. This is how scientists study glaciers.
Fig. 2.7.6.The Gangotri glacier.
Fig. 2.7.7. The cap of ice and snow of Mount Kilimanjaro has almost melted.
1993 2000
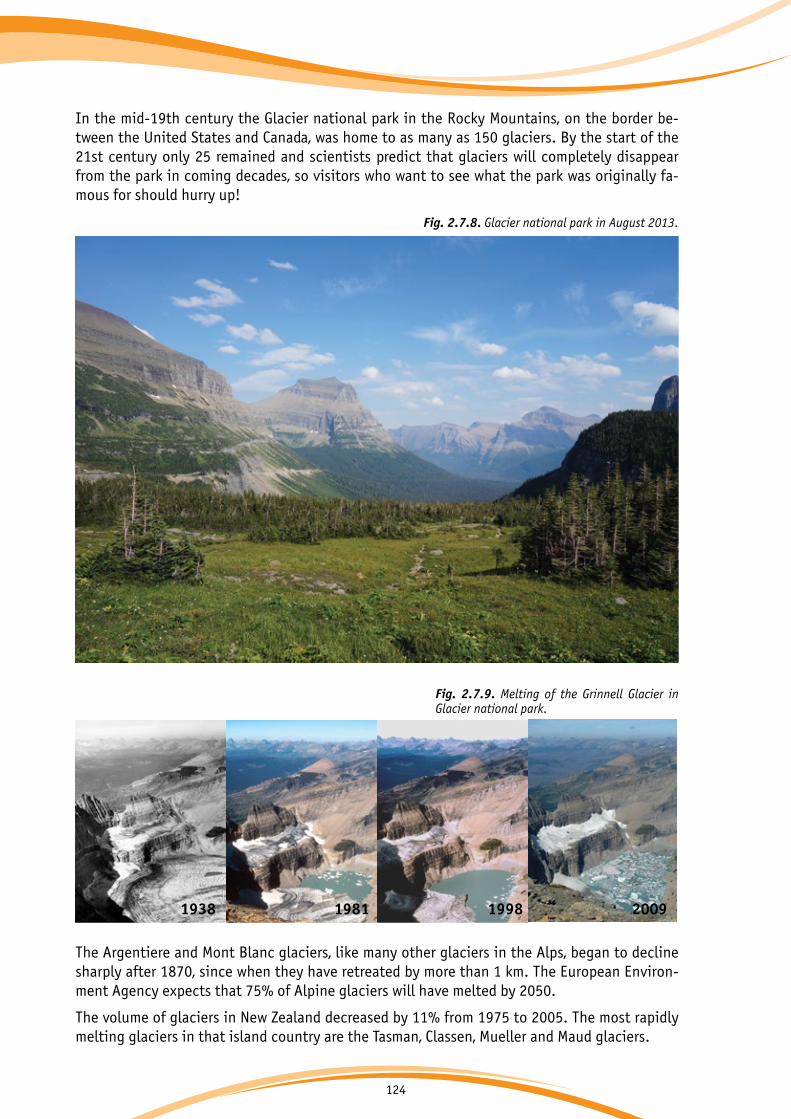
124
In the mid-19th century the Glacier national park in the Rocky Mountains, on the border be-tween the United States and Canada, was home to as many as 150 glaciers. By the start of the 21st century only 25 remained and scientists predict that glaciers will completely disappear from the park in coming decades, so visitors who want to see what the park was originally fa-mous for should hurry up!
Fig. 2.7.8. Glacier national park in August 2013.
The Argentiere and Mont Blanc glaciers, like many other glaciers in the Alps, began to decline sharply after 1870, since when they have retreated by more than 1 km. The European Environ-ment Agency expects that 75% of Alpine glaciers will have melted by 2050.
The volume of glaciers in New Zealand decreased by 11% from 1975 to 2005. The most rapidly melting glaciers in that island country are the Tasman, Classen, Mueller and Maud glaciers.
Fig. 2.7.9. Melting of the Grinnell Glacier in Glacier national park.
1938 1981 1998 2009
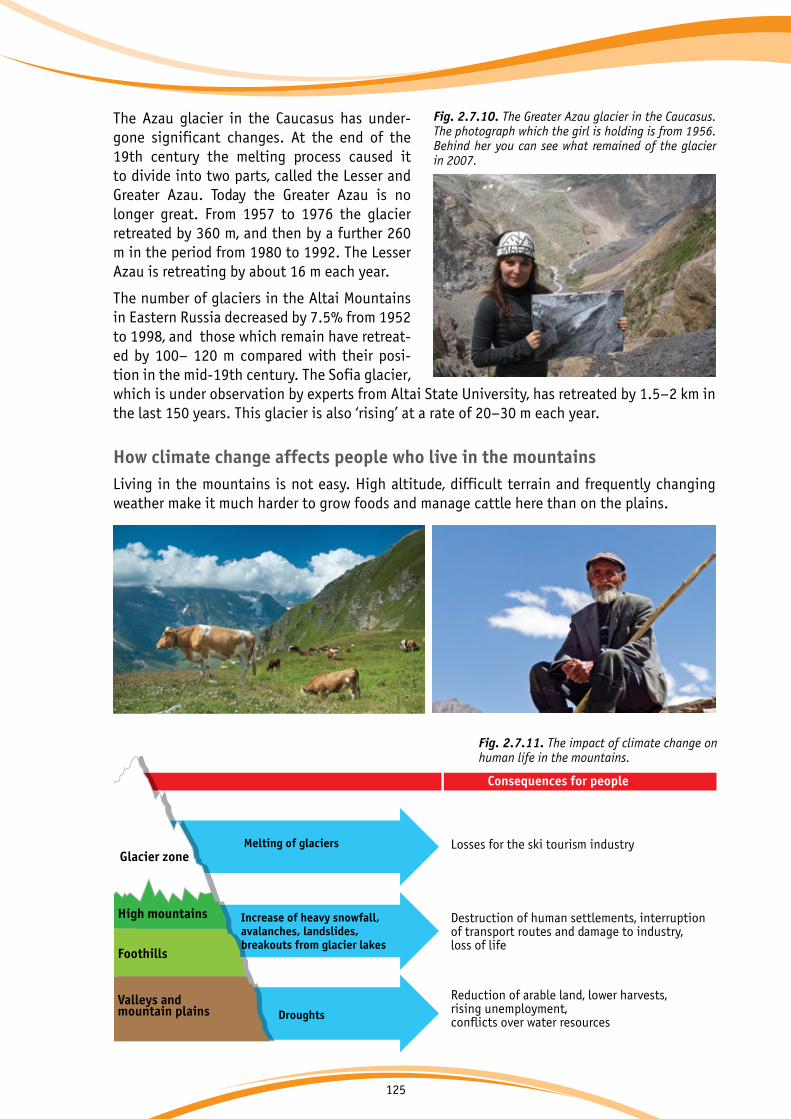
125
The Azau glacier in the Caucasus has under-gone significant changes. At the end of the 19th century the melting process caused it to divide into two parts, called the Lesser and Greater Azau. Today the Greater Azau is no longer great. From 1957 to 1976 the glacier retreated by 360 m, and then by a further 260 m in the period from 1980 to 1992. The Lesser Azau is retreating by about 16 m each year.
The number of glaciers in the Altai Mountains in Eastern Russia decreased by 7.5% from 1952 to 1998, and those which remain have retreat-ed by 100– 120 m compared with their posi-tion in the mid-19th century. The Sofia glacier, which is under observation by experts from Altai State University, has retreated by 1.5–2 km in the last 150 years. This glacier is also ‘rising’ at a rate of 20–30 m each year.
How climate change affects people who live in the mountainsLiving in the mountains is not easy. High altitude, difficult terrain and frequently changing weather make it much harder to grow foods and manage cattle here than on the plains.
Fig. 2.7.10. The Greater Azau glacier in the Caucasus. The photograph which the girl is holding is from 1956. Behind her you can see what remained of the glacier in 2007.
Изменение климата Consequences for people
Glacier zoneMelting of glaciers
Increase of heavy snowfall,avalanches, landslides,breakouts from glacier lakes
Droughts
High mountains
Foothills
Valleys andmountain plains
Losses for the ski tourism industry
Destruction of human settlements, interruption of transport routes and damage to industry,loss of life
Reduction of arable land, lower harvests,rising unemployment,conflicts over water resources
Fig. 2.7.11. The impact of climate change on human life in the mountains.
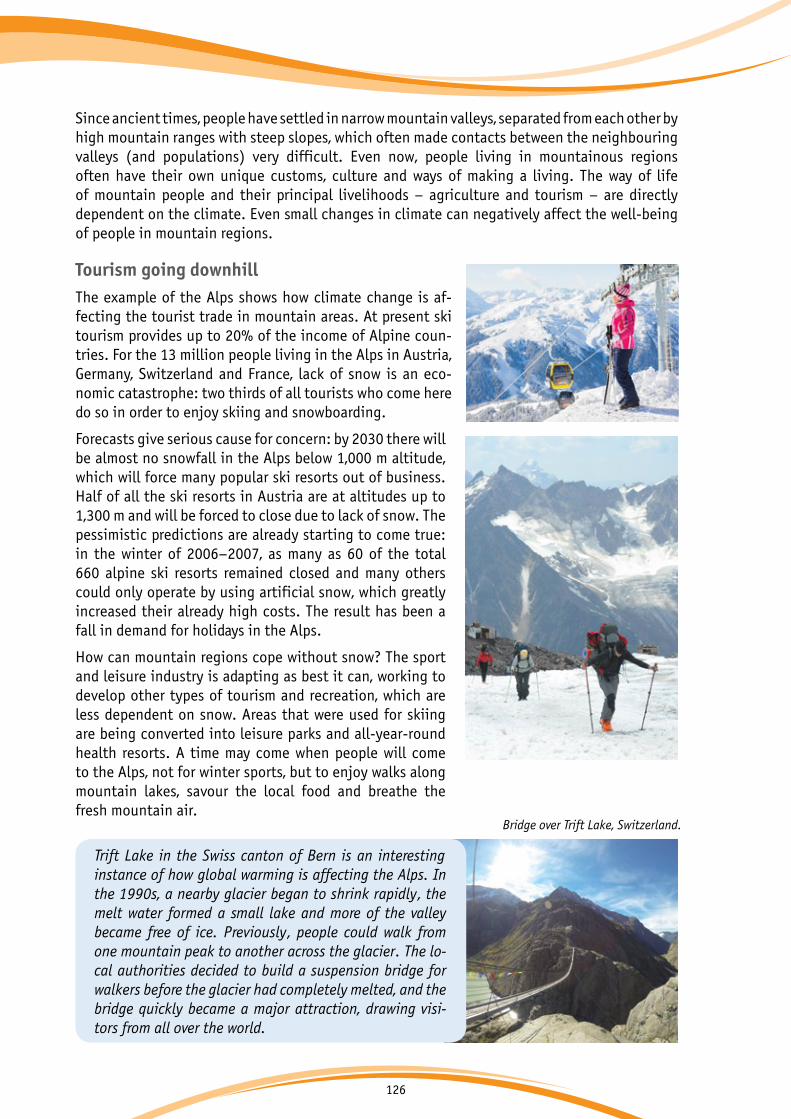
126
Since ancient times, people have settled in narrow mountain valleys, separated from each other by high mountain ranges with steep slopes, which often made contacts between the neighbouring valleys (and populations) very difficult. Even now, people living in mountainous regions often have their own unique customs, culture and ways of making a living. The way of life of mountain people and their principal livelihoods – agriculture and tourism – are directly dependent on the climate. Even small changes in climate can negatively affect the well-being of people in mountain regions.
Tourism going downhill The example of the Alps shows how climate change is af-fecting the tourist trade in mountain areas. At present ski tourism provides up to 20% of the income of Alpine coun-tries. For the 13 million people living in the Alps in Austria, Germany, Switzerland and France, lack of snow is an eco-nomic catastrophe: two thirds of all tourists who come here do so in order to enjoy skiing and snowboarding.
Forecasts give serious cause for concern: by 2030 there will be almost no snowfall in the Alps below 1,000 m altitude, which will force many popular ski resorts out of business. Half of all the ski resorts in Austria are at altitudes up to 1,300 m and will be forced to close due to lack of snow. The pessimistic predictions are already starting to come true: in the winter of 2006–2007, as many as 60 of the total 660 alpine ski resorts remained closed and many others could only operate by using artificial snow, which greatly increased their already high costs. The result has been a fall in demand for holidays in the Alps.
How can mountain regions cope without snow? The sport and leisure industry is adapting as best it can, working to develop other types of tourism and recreation, which are less dependent on snow. Areas that were used for skiing are being converted into leisure parks and all-year-round health resorts. A time may come when people will come to the Alps, not for winter sports, but to enjoy walks along mountain lakes, savour the local food and breathe the fresh mountain air.
Bridge over Trift Lake, Switzerland.
Trift Lake in the Swiss canton of Bern is an interesting instance of how global warming is affecting the Alps. In the 1990s, a nearby glacier began to shrink rapidly, the melt water formed a small lake and more of the valley became free of ice. Previously, people could walk from one mountain peak to another across the glacier. The lo-cal authorities decided to build a suspension bridge for walkers before the glacier had completely melted, and the bridge quickly became a major attraction, drawing visi-tors from all over the world.

127
The Pastoruri glacier in Peru is retreatingUntil recently tourists and professional climbers used to flock to the Pastoruri glacier, which towers over the Andes in Peru. But the glacier has shrunk by a quarter in the last 30 years and scientists predict that it may disappear altogether in the next few decades. A breathtaking landscape of snow and ice has given way to black cliffs. Local authorities have prohibited climbing due to instability of the rocks associated with the melting of the glacier.
The number of tourists who come to admire the Pastoruri glacier has decreased by three times since the beginning of the 1990s, which has had major impact on tourism in Peru and the income of local residents. But Peruvian entrepreneurs have not despaired: they now show off the remains of the glacier as a striking example of the results of climate change, and the region has been successful in attracting increasing numbers of environmentalists and curi-ous tourists.
But, of course, restoring the glacier itself is a much harder task than restoring the fortunes of local business.
Natural disasters in the mountainsDecline of the tourist business is not the most deadly threat to mountain people from global warming. They also have to fear natural disasters – avalanches, landslides and floods – which have become ever more frequent in the mountains as the climate changes and which pose a threat to human life as well as causing huge damage to the local economy.
An avalanche is a huge mass of snow that falls or slides off mountain slopes. Avalanches can have disastrous consequences. In February 1999, an avalanche with a weight of 170,000 tonnes completely destroyed the village of Galtur in Austria and claimed the lives of 30 people. At the beginning of March 2012 a series of avalanches in Afghanistan destroyed homes, killing more than 100 people.
A landslide is a tremendously powerful mass of mud and rocks, which suddenly slides down mountain river valleys. Landslides are usually caused by heavy rains or rapid snow melt. They can also be caused by the breakout of water from glacial lakes. Landslides, like avalanches, can cause massive destruction.
Retreat of the Pastoruri glacier in the Peruvian Andes.
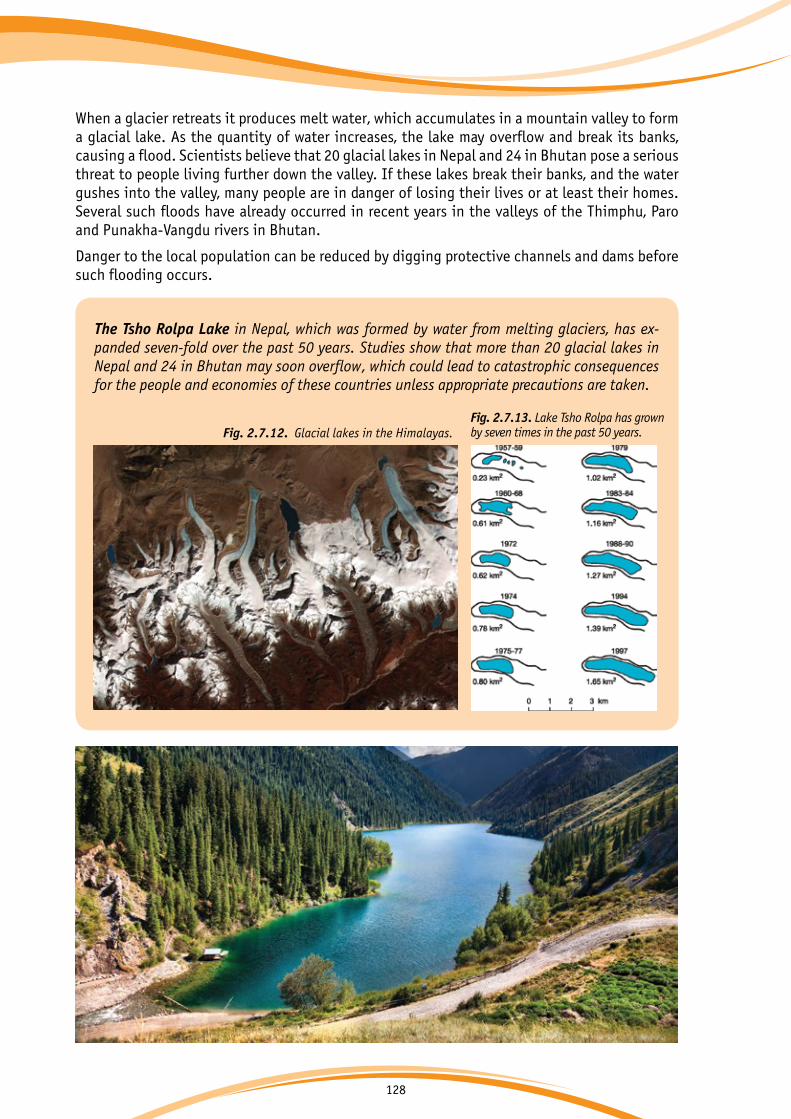
128
When a glacier retreats it produces melt water, which accumulates in a mountain valley to form a glacial lake. As the quantity of water increases, the lake may overflow and break its banks, causing a flood. Scientists believe that 20 glacial lakes in Nepal and 24 in Bhutan pose a serious threat to people living further down the valley. If these lakes break their banks, and the water gushes into the valley, many people are in danger of losing their lives or at least their homes. Several such floods have already occurred in recent years in the valleys of the Thimphu, Paro and Punakha-Vangdu rivers in Bhutan.
Danger to the local population can be reduced by digging protective channels and dams before such flooding occurs.
The Tsho Rolpa Lake in Nepal, which was formed by water from melting glaciers, has ex-panded seven-fold over the past 50 years. Studies show that more than 20 glacial lakes in Nepal and 24 in Bhutan may soon overflow, which could lead to catastrophic consequences for the people and economies of these countries unless appropriate precautions are taken.
Fig. 2.7.13. Lake Tsho Rolpa has grown by seven times in the past 50 years.Fig. 2.7.12. Glacial lakes in the Himalayas.

129
Reduction of fresh water stocksThe future reduction of fresh water stocks, both in mountain regions and in plains adjacent to mountains, presents a serious threat. Glaciers are one of the main sources of fresh water on Earth, since they are the source of many rivers. Reduction in volumes of ice will lead to water shortages in the regions around mountains, making conditions much worse for agriculture, min-ing and electric power generation. Shortage of fresh water in areas near mountains is already leading to serious political conflicts in some parts of the world.
Mountains have always been associated with danger and climate change on Earth may add to the risks. Rise of temperatures, change in amounts of precipitation, the melting of mountain glaciers and more frequent occurrence of unpredictable natural disasters could lead to cata-strophic consequences for the environment, people and economy of mountain regions and of the regions around mountain ranges.
130
Questions
1. How high has a mountain climber climbed if he is at a level where the temperature is -9 °C, while the temperature at the foot of the mountain is +18 °C?
2. Will snow remain at the top of a mountain, which is 5200 m high, if the air temperature at its foot is +30 °C on the hottest day of summer?
3. Why are mountain glaciers often called indicators of climate change?What happens to them when the air temperature changes?
4. Why is there often a great deal of ethnic diversity in mountain regions?
5. What are the main livelihoods of people living in mountain regions. How they are affected by climate change?

131
Task 1. Mark the highest peaks on each continent on a contour map of the world. Which mountain systems are they a part of? In which countries are they located?
Task 2. The beauty and the inaccessibility of mountains have always made them a source of inspiration for the greatest poets, writ-ers, artists and composers. Name some famous works of lit-erature or art, which show various mountain ranges or peaks. Choose any work that you particularly like and explain what the author would have to change if or he or she had lived in an era of global climate change. How could he or she do it.
Task
Katsushika Hokusai 'Inume Pass, Koshu'. Part of the series 'Thirty-six Views of Mount Fuji'. Japan, 1830.

132
Task 3. GameThe players divide into two teams.
Team №1 live in High Village, which is located in the Rapid River mountain valley. In recent years the melting of glaciers in the high mountains has caused the Rapid River to flood its banks on several occasions, causing problems for local resi-dents. So the local people want to build a dam on the river to protect themselves from floods and at the same time to pro-duce electricity and create new jobs. The mountain people are not rich, they have no money for the construction of the dam and live mainly from what they can grow and the animals they keep. In recent years, due to rising temperatures the people of High Village have begun to grow flowers and exotic fruits.
Team №2 live in the village of Cowgrazing, which is on the plain near the mountains, downstream on the Rapid River. The village is prosperous, its people are farmers and use water from the river for irrigation and for drinking. The people of Cowgrazing like exotic food, entertainment and travel. The lo-cal budget of Cowgrazing has plenty of money to finance new construction projects.
Members of the teams need to discuss the following questions (the teacher or one of the students can play the role of Minis-ter for Regional Development, who will manage the negotia-tions):
1) What will be the consequences for the village of Cowgraz-ing, if the people of High Village build a dam without consult-ing them?
2) On what terms can the village of Cowgrazing agree to the dam and provide money for its construction?
3) Can the people of High Village find ways to protect them-selves from the consequences of climate change without building a dam?
4) What new projects and types of business can the people of High Village and Cowgrazing work on together?
+2 оС
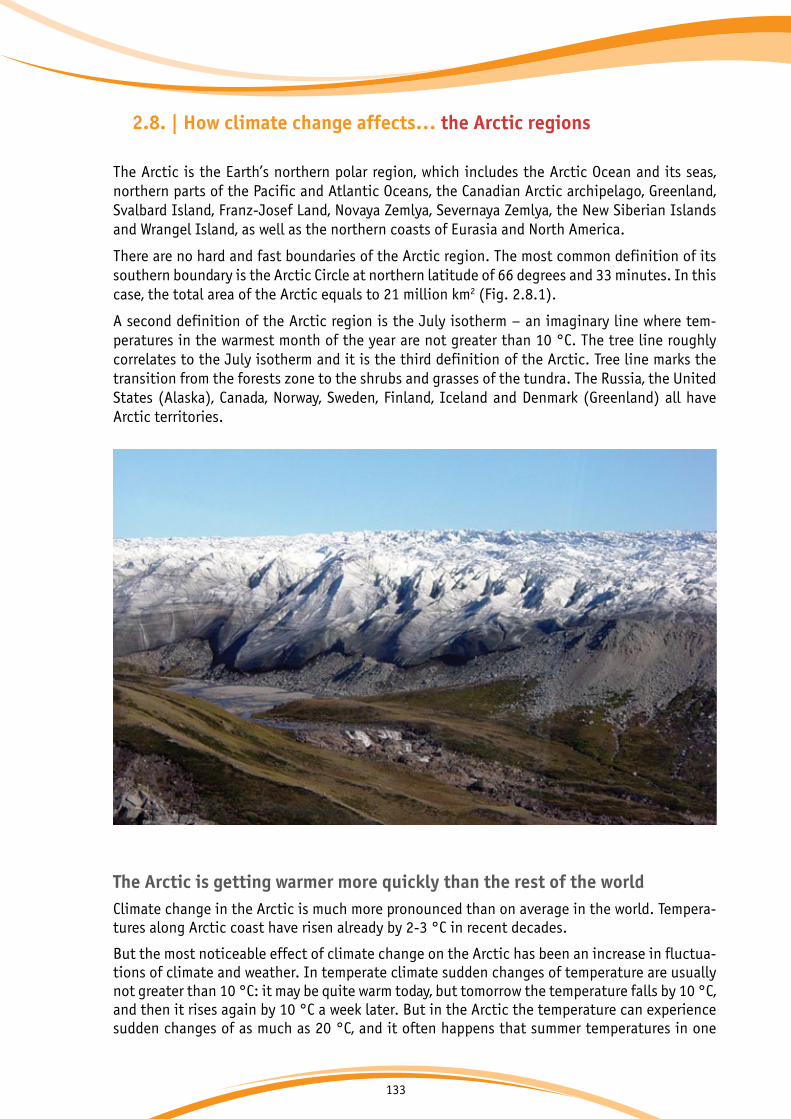
133
2.8. | How climate change affects… the Arctic regions
The Arctic is the Earth’s northern polar region, which includes the Arctic Ocean and its seas, northern parts of the Pacific and Atlantic Oceans, the Canadian Arctic archipelago, Greenland, Svalbard Island, Franz-Josef Land, Novaya Zemlya, Severnaya Zemlya, the New Siberian Islands and Wrangel Island, as well as the northern coasts of Eurasia and North America.
There are no hard and fast boundaries of the Arctic region. The most common definition of its southern boundary is the Arctic Circle at northern latitude of 66 degrees and 33 minutes. In this case, the total area of the Arctic equals to 21 million km2 (Fig. 2.8.1).
A second definition of the Arctic region is the July isotherm – an imaginary line where tem-peratures in the warmest month of the year are not greater than 10 °C. The tree line roughly correlates to the July isotherm and it is the third definition of the Arctic. Tree line marks the transition from the forests zone to the shrubs and grasses of the tundra. The Russia, the United States (Alaska), Canada, Norway, Sweden, Finland, Iceland and Denmark (Greenland) all have Arctic territories.
The Arctic is getting warmer more quickly than the rest of the worldClimate change in the Arctic is much more pronounced than on average in the world. Tempera-tures along Arctic coast have risen already by 2-3 °C in recent decades.
But the most noticeable effect of climate change on the Arctic has been an increase in fluctua-tions of climate and weather. In temperate climate sudden changes of temperature are usually not greater than 10 °C: it may be quite warm today, but tomorrow the temperature falls by 10 °C, and then it rises again by 10 °C a week later. But in the Arctic the temperature can experience sudden changes of as much as 20 °C, and it often happens that summer temperatures in one

134
Fig. 2.8.1. The Arctic and definition of its boundaries.
+2 оС
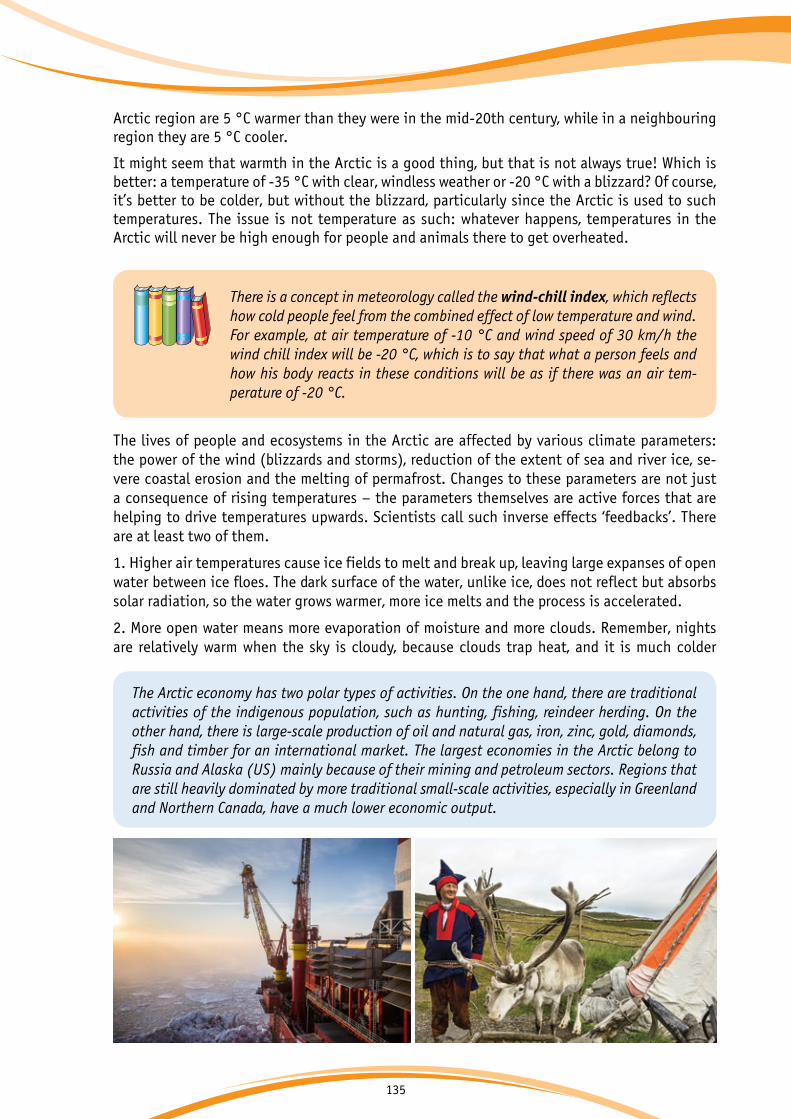
135
Arctic region are 5 °C warmer than they were in the mid-20th century, while in a neighbouring region they are 5 °C cooler.
It might seem that warmth in the Arctic is a good thing, but that is not always true! Which is better: a temperature of -35 °C with clear, windless weather or -20 °C with a blizzard? Of course, it’s better to be colder, but without the blizzard, particularly since the Arctic is used to such temperatures. The issue is not temperature as such: whatever happens, temperatures in the Arctic will never be high enough for people and animals there to get overheated.
The lives of people and ecosystems in the Arctic are affected by various climate parameters: the power of the wind (blizzards and storms), reduction of the extent of sea and river ice, se-vere coastal erosion and the melting of permafrost. Changes to these parameters are not just a consequence of rising temperatures – the parameters themselves are active forces that are helping to drive temperatures upwards. Scientists call such inverse effects ‘feedbacks’. There are at least two of them.
1. Higher air temperatures cause ice fields to melt and break up, leaving large expanses of open water between ice floes. The dark surface of the water, unlike ice, does not reflect but absorbs solar radiation, so the water grows warmer, more ice melts and the process is accelerated.
2. More open water means more evaporation of moisture and more clouds. Remember, nights are relatively warm when the sky is cloudy, because clouds trap heat, and it is much colder
There is a concept in meteorology called the wind-chill index, which reflects how cold people feel from the combined effect of low temperature and wind. For example, at air temperature of -10 °C and wind speed of 30 km/h the wind chill index will be -20 °C, which is to say that what a person feels and how his body reacts in these conditions will be as if there was an air tem-perature of -20 °C.
The Arctic economy has two polar types of activities. On the one hand, there are traditional activities of the indigenous population, such as hunting, fishing, reindeer herding. On the other hand, there is large-scale production of oil and natural gas, iron, zinc, gold, diamonds, fish and timber for an international market. The largest economies in the Arctic belong to Russia and Alaska (US) mainly because of their mining and petroleum sectors. Regions that are still heavily dominated by more traditional small-scale activities, especially in Greenland and Northern Canada, have a much lower economic output.
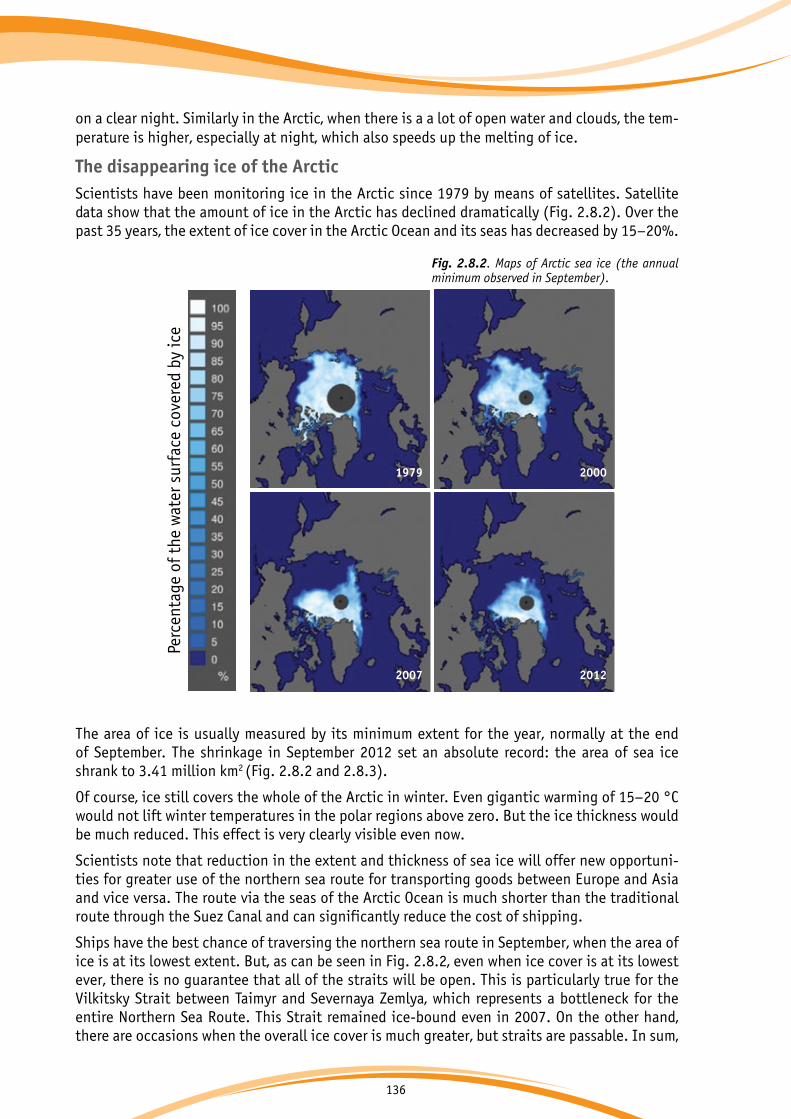
136
on a clear night. Similarly in the Arctic, when there is a a lot of open water and clouds, the tem-perature is higher, especially at night, which also speeds up the melting of ice.
The disappearing ice of the ArcticScientists have been monitoring ice in the Arctic since 1979 by means of satellites. Satellite data show that the amount of ice in the Arctic has declined dramatically (Fig. 2.8.2). Over the past 35 years, the extent of ice cover in the Arctic Ocean and its seas has decreased by 15–20%.
The area of ice is usually measured by its minimum extent for the year, normally at the end of September. The shrinkage in September 2012 set an absolute record: the area of sea ice shrank to 3.41 million km2 (Fig. 2.8.2 and 2.8.3).
Of course, ice still covers the whole of the Arctic in winter. Even gigantic warming of 15–20 °C would not lift winter temperatures in the polar regions above zero. But the ice thickness would be much reduced. This effect is very clearly visible even now.
Scientists note that reduction in the extent and thickness of sea ice will offer new opportuni-ties for greater use of the northern sea route for transporting goods between Europe and Asia and vice versa. The route via the seas of the Arctic Ocean is much shorter than the traditional route through the Suez Canal and can significantly reduce the cost of shipping.
Ships have the best chance of traversing the northern sea route in September, when the area of ice is at its lowest extent. But, as can be seen in Fig. 2.8.2, even when ice cover is at its lowest ever, there is no guarantee that all of the straits will be open. This is particularly true for the Vilkitsky Strait between Taimyr and Severnaya Zemlya, which represents a bottleneck for the entire Northern Sea Route. This Strait remained ice-bound even in 2007. On the other hand, there are occasions when the overall ice cover is much greater, but straits are passable. In sum,
Fig. 2.8.2. Maps of Arctic sea ice (the annual minimum observed in September).
1979 2000
2007 2012
Perc
enta
ge o
f the
wat
er s
urfa
ce c
over
ed b
y ic
e
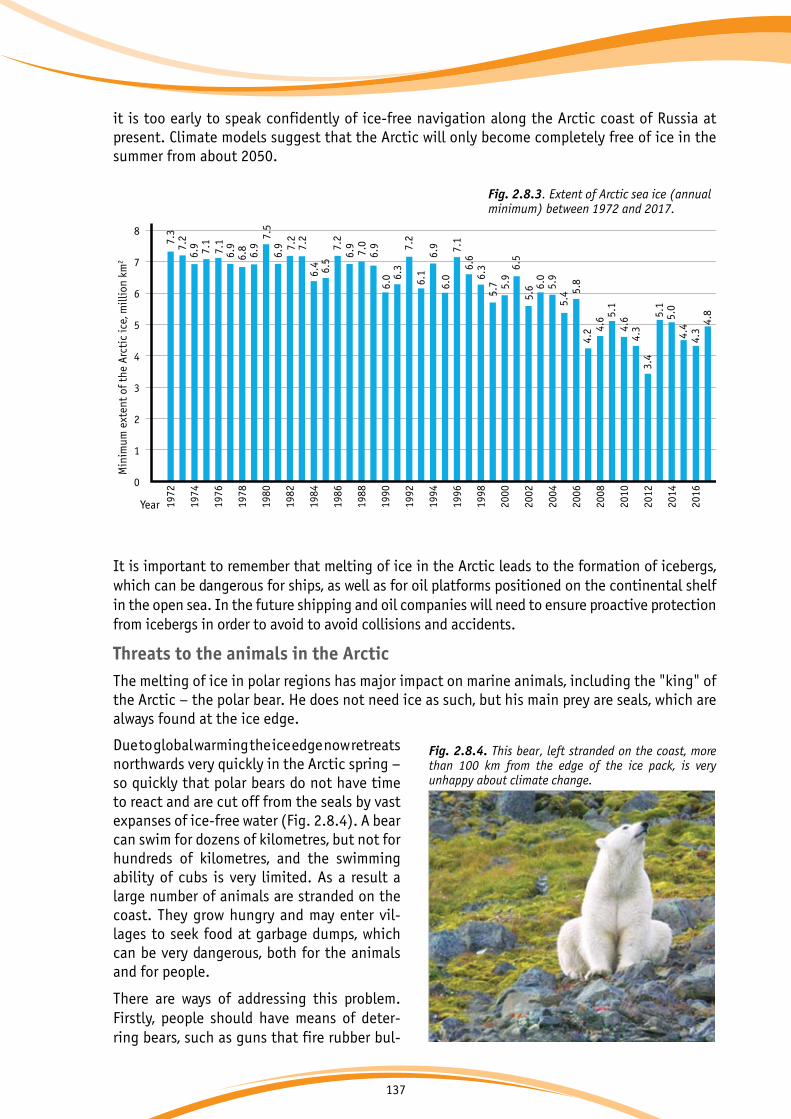
137
it is too early to speak confidently of ice-free navigation along the Arctic coast of Russia at present. Climate models suggest that the Arctic will only become completely free of ice in the summer from about 2050.
It is important to remember that melting of ice in the Arctic leads to the formation of icebergs, which can be dangerous for ships, as well as for oil platforms positioned on the continental shelf in the open sea. In the future shipping and oil companies will need to ensure proactive protection from icebergs in order to avoid to avoid collisions and accidents.
Threats to the animals in the ArcticThe melting of ice in polar regions has major impact on marine animals, including the "king" of the Arctic – the polar bear. He does not need ice as such, but his main prey are seals, which are always found at the ice edge.
Due to global warming the ice edge now retreats northwards very quickly in the Arctic spring – so quickly that polar bears do not have time to react and are cut off from the seals by vast expanses of ice-free water (Fig. 2.8.4). A bear can swim for dozens of kilometres, but not for hundreds of kilometres, and the swimming ability of cubs is very limited. As a result a large number of animals are stranded on the coast. They grow hungry and may enter vil-lages to seek food at garbage dumps, which can be very dangerous, both for the animals and for people.
There are ways of addressing this problem. Firstly, people should have means of deter-ring bears, such as guns that fire rubber bul-
Fig. 2.8.4. This bear, left stranded on the coast, more than 100 km from the edge of the ice pack, is very unhappy about climate change.
Min
imum
ext
ent
of t
he A
rcti
c ic
e, m
illio
n km
2
Year
8
7
6
5
4
3
2
1
0
1972
1974
1976
1978
1980
1982
1984
1986
1988
1990
1992
1994
1996
1998
2000
2002
2004
2006
2008
2010
2012
2014
2016
7.3 7.5
7.2
7.2
7.2
7.2
7.2
7.1
6.9
6.4
6.0
6.0
6.6
6.5
6.0
5.7
5.6
5.4
5.1
5.1
5.0
4.2
4.3
4.4
3.4
4.6
4.6
5.9
5.9
5.86.
16.3
6.36.
5
6.9
6.9
6.9
6.9
7.0
6.9
6.9
6.87.
17.
1
4.8
4.3
Fig. 2.8.3. Extent of Arctic sea ice (annual minimum) between 1972 and 2017.

138
lets. Secondly, villages should be kept clear of old food waste, which should be taken at least 1–2 km away from the village, so that the bears go there, and not to places where they are likely to meet people. Thirdly, a watch needs to be kept on the bears by men who are specially trained, armed and equipped to do so (with radios and satellite phones as part of their equipment). This would enable prevention both of bear attacks on humans and of poaching.
Although having to do without their favourite meal of seal, bears can find enough food to eat on the sea coast (dead birds, eggs and small animals). They can also hunt walruses, although a polar bear will not tackle an adult walrus: a weak, wounded animal or walrus calves are better prey. Bears will sometimes break into a walrus rookery, causing a panic in which the walruses press together and calves are crushed by the large males, leaving food for the bears. Such tac-tics are particularly successful if walruses have made their home not on a flat beach, but on a slope or on cliff ledges: as the large animals fall downwards they may crush younger animals beneath them.
Walruses are increasingly forced to choose such unsuitable places for their colonies, also due to the lack of ice. Walruses not only need ice floes, on which they can rest during migration without losing their strength. They also need shore ice. Previ-ously, there were large quantities of thick, coastal ice, part of it lying on the beach as a crust. Now there is much less of it, and storms are rapidly eroding suitable sites for walrus colonies! The animals are therefore forced to choose other places, where they are threatened not only by bears, but also by people.
There have been instances when thousands of walruses have appeared in new places (Fig. 2.8.5), including locations near to aerodromes. The sound of an approaching aircraft caused a panic stampede, in which dozens of animals were killed. To prevent this happening again, peo-ple at the aerodrome made noise on purpose before the arrival of planes, so that the walruses would take to sea. But such solutions require careful monitoring of the movement of walrus populations, with the deployment of people and equipment.
Fig. 2.8.5. A record number of some 35,000 walrus gathered on shore near Point Lay, Alaska in September 2014. They were look-ing for a place to rest from a long swim in the absence of sea ice.
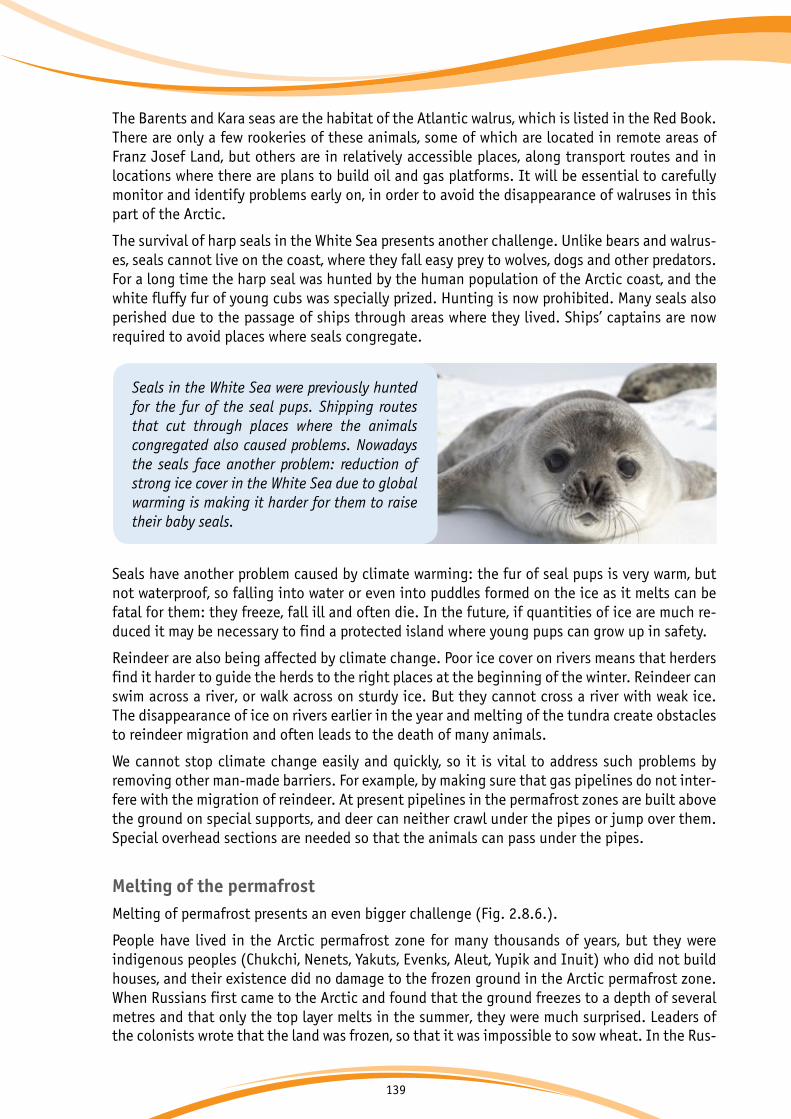
139
The Barents and Kara seas are the habitat of the Atlantic walrus, which is listed in the Red Book. There are only a few rookeries of these animals, some of which are located in remote areas of Franz Josef Land, but others are in relatively accessible places, along transport routes and in locations where there are plans to build oil and gas platforms. It will be essential to carefully monitor and identify problems early on, in order to avoid the disappearance of walruses in this part of the Arctic.
The survival of harp seals in the White Sea presents another challenge. Unlike bears and walrus-es, seals cannot live on the coast, where they fall easy prey to wolves, dogs and other predators. For a long time the harp seal was hunted by the human population of the Arctic coast, and the white fluffy fur of young cubs was specially prized. Hunting is now prohibited. Many seals also perished due to the passage of ships through areas where they lived. Ships’ captains are now required to avoid places where seals congregate.
Seals have another problem caused by climate warming: the fur of seal pups is very warm, but not waterproof, so falling into water or even into puddles formed on the ice as it melts can be fatal for them: they freeze, fall ill and often die. In the future, if quantities of ice are much re-duced it may be necessary to find a protected island where young pups can grow up in safety.
Reindeer are also being affected by climate change. Poor ice cover on rivers means that herders find it harder to guide the herds to the right places at the beginning of the winter. Reindeer can swim across a river, or walk across on sturdy ice. But they cannot cross a river with weak ice. The disappearance of ice on rivers earlier in the year and melting of the tundra create obstacles to reindeer migration and often leads to the death of many animals.
We cannot stop climate change easily and quickly, so it is vital to address such problems by removing other man-made barriers. For example, by making sure that gas pipelines do not inter-fere with the migration of reindeer. At present pipelines in the permafrost zones are built above the ground on special supports, and deer can neither crawl under the pipes or jump over them. Special overhead sections are needed so that the animals can pass under the pipes.
Melting of the permafrostMelting of permafrost presents an even bigger challenge (Fig. 2.8.6.).
People have lived in the Arctic permafrost zone for many thousands of years, but they were indigenous peoples (Chukchi, Nenets, Yakuts, Evenks, Aleut, Yupik and Inuit) who did not build houses, and their existence did no damage to the frozen ground in the Arctic permafrost zone. When Russians first came to the Arctic and found that the ground freezes to a depth of several metres and that only the top layer melts in the summer, they were much surprised. Leaders of the colonists wrote that the land was frozen, so that it was impossible to sow wheat. In the Rus-
Seals in the White Sea were previously hunted for the fur of the seal pups. Shipping routes that cut through places where the animals congregated also caused problems. Nowadays the seals face another problem: reduction of strong ice cover in the White Sea due to global warming is making it harder for them to raise their baby seals.
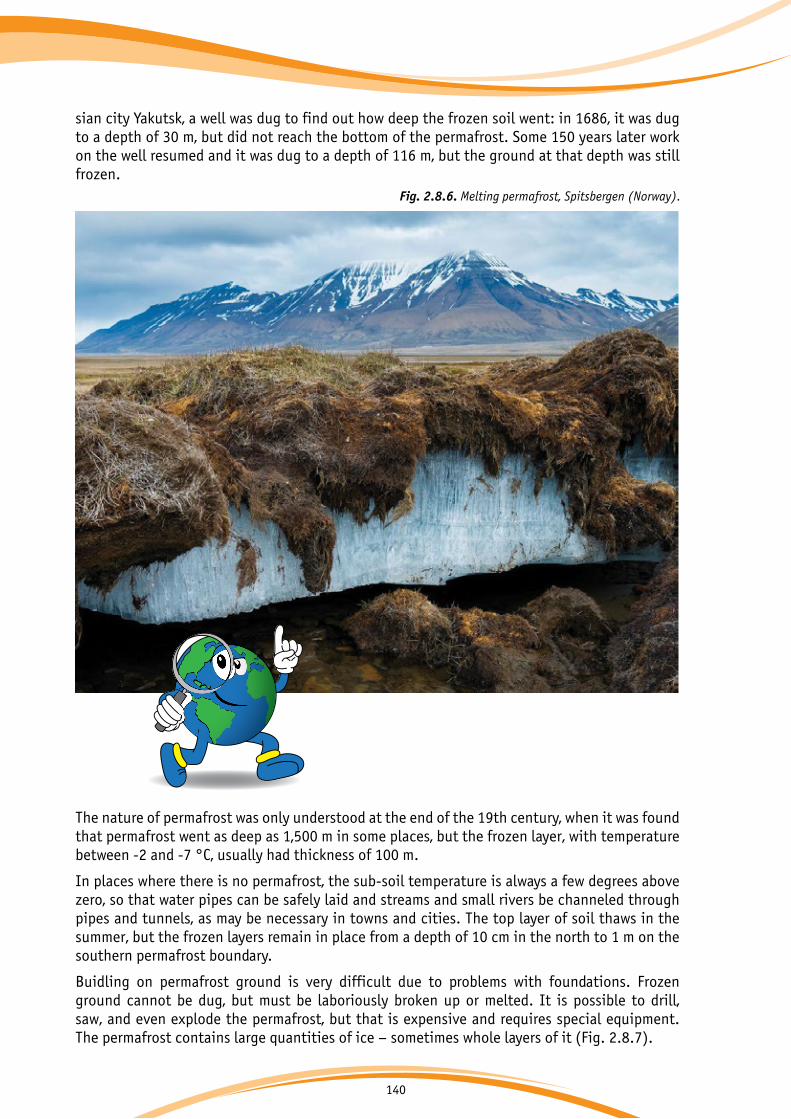
140
sian city Yakutsk, a well was dug to find out how deep the frozen soil went: in 1686, it was dug to a depth of 30 m, but did not reach the bottom of the permafrost. Some 150 years later work on the well resumed and it was dug to a depth of 116 m, but the ground at that depth was still frozen.
The nature of permafrost was only understood at the end of the 19th century, when it was found that permafrost went as deep as 1,500 m in some places, but the frozen layer, with temperature between -2 and -7 °C, usually had thickness of 100 m.
In places where there is no permafrost, the sub-soil temperature is always a few degrees above zero, so that water pipes can be safely laid and streams and small rivers be channeled through pipes and tunnels, as may be necessary in towns and cities. The top layer of soil thaws in the summer, but the frozen layers remain in place from a depth of 10 cm in the north to 1 m on the southern permafrost boundary.
Buidling on permafrost ground is very difficult due to problems with foundations. Frozen ground cannot be dug, but must be laboriously broken up or melted. It is possible to drill, saw, and even explode the permafrost, but that is expensive and requires special equipment.The permafrost contains large quantities of ice – sometimes whole layers of it (Fig. 2.8.7).
Fig. 2.8.6. Melting permafrost, Spitsbergen (Norway).
+2 оС

141
So, when the top of the permafrost melts in the summer, it forms a very weak ‘semi-liquid’ layer, which is incapable of supporting buildings, bridge supports or power lines. Such constructions have to rest on stilts, which go deep into frozen ground, reaching levels at which the ice never melts.
Further problems arise from the fact that the summer thaw is very uneven. The sur-face terrain is not flat, and the nature of the ground may alter just a few metres to the left or right. It might happen that more water ac-cumulates in a certain place during the warm season and cannot escape underground due to the permafrost. When the winter comes, the trapped water freezes into ice inclusions (lenses) and layers. Ice occupies more space than water, so the ground swells. Bumps and irregularities are formed, which can destroy buildings and roads (Figs. 2.8.8, 2.8.9).
The problems do not end there. As climate warming advances, a particularly warm year may cause thawing of the permafrost to a deeper level than usual, and the trapped water escapes. This creates empty spaces underground, the land subsides, and bridge supports, power lines or even a small building can collapse into the ground. This effect is called thermokarst. It is highly dangerous, and its widespread nature due to global warming could not be foreseen when build-ings were designed and built in the Arctic in the past (Figs. 2.8.10, 2.8.11).
Leakage of water into the ground due to human action adds to the risk. Further weakening of the permafrost due to global warming could lead to major thermakarst problems associated with leakage from water and drainage pipes, which was less dangerous when the permafrost was well established. Rules that need to be followed include clearing of snow from roofs and the areas around a building before it melts, as water should not be allowed to penetrates beneath the building.
Fig. 2.8.7. A vertical section of permafrost with ice layers.
As the climate changes and temperatures increase, the permafrost thaws to ever deeper lev-els in the summer. The depth of previously constructed piles may not be sufficient and they could begin to ‘float’, causing buildings to warp and collapse.
Fig. 2.8.9. A building destroyed by uneven bulging and subsidence above permafrost.
Fig. 2.8.8. A section of railway track damaged by permafrost effects.

142
What is to be done? We cannot stop climate change quickly, and the amount of damage done is increasing rapidly. Large amounts will have to be spent on direct freezing of soils, and on the design of more expensive buildings, which can cope with the new conditions.
Maintenance of permafrost in the Arctic can be ensured by relatively simple devices. Sometimes underground ventilation ducts are sufficient: very cold air from the surface freezes the ground to such low temperatures that it does not have time to thaw in the summer. This method is particularly suitable for roads, which are on raised embankments. The soil of the embankment can be kept frozen by laying pipes with about 20 cm diameter, 50 cm apart , from one side of the embankment to the other.
Ground can also be frozen using devices called thermosiphons – vertical tubes, hermetically sealed at both ends, with their lower part in the ground, and their upper part rising 2–3 m above the ground (Fig. 2.8.13). The tube is partially filled with a coolant (refrigerant), such as ammonia or liquid carbon dioxide. The thermosiphon freezes the ground in winter due to the temperature difference between the relatively warm ground (a few degrees below zero) and the air, which is 20–40 °C colder. The liquid refrigerant at the bottom of the pipe evaporates due to the higher soil temperature, causing the soil to cool. The re-frigerant vapour then rises upwards and con-denses in the cold atmosphere above ground, after which it flows back downwards and the process repeats. The thermosiphon thus transports cold underground, lowering the soil temper-ature by a few degrees more than would otherwise occur, and this is enough to ensure that the ground will not melt in the summer. The thermosiphon does not operate in the summer, because the air is warmer than the ground and the refrigerant inside the pipe does not circulate. During the summer the metal pipe conducts heat into the ground, but this effect is weaker than that achieved in the winter. This is a way of freezing the ground under roads and pipeline supports, and even under large buildings. But the thermosiphons much be installed no more than about 1 m apart (Fig. 2.8.13).
It would be wrong to think that thermosiphons offer an easy solution to the problem of melting permafrost. They need to be replaced often, and despite their simplicity, they are expensive. It has been estimated that permanent freezing of the ground under gas pipeline supports in Rus-sia would require spending of 10 billion US dollars!
Fig. 2.8.10. A collapsed building in the village of Chersky (Russia).
Fig. 2.8.11. The collapsed corner of a building in Yakutsk (Russia).
Fig. 2.8.12. Future permafrost thaw across the Arctic. Red areas indicate regions thawed by 2050, orange areas thawed by 2100 and yellow areas still frozen by 2100.
Alaska (USA)
Canada
Siberia (Russia)
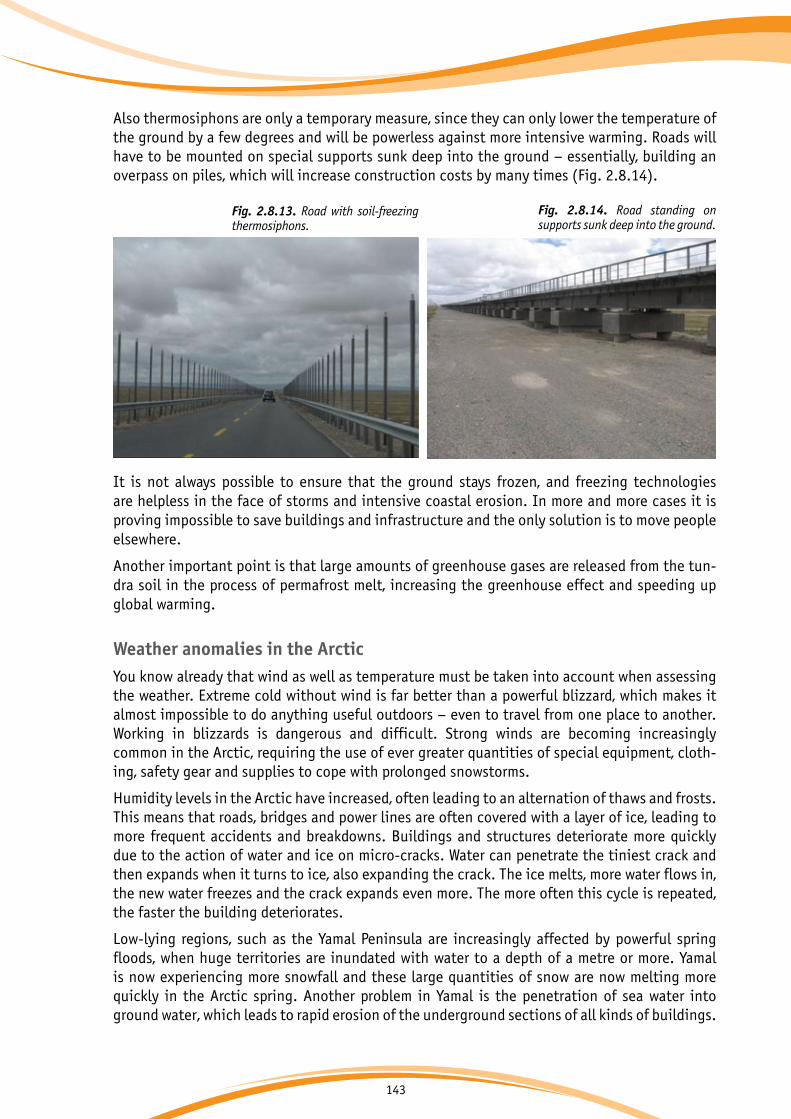
143
Also thermosiphons are only a temporary measure, since they can only lower the temperature of the ground by a few degrees and will be powerless against more intensive warming. Roads will have to be mounted on special supports sunk deep into the ground – essentially, building an overpass on piles, which will increase construction costs by many times (Fig. 2.8.14).
It is not always possible to ensure that the ground stays frozen, and freezing technologies are helpless in the face of storms and intensive coastal erosion. In more and more cases it is proving impossible to save buildings and infrastructure and the only solution is to move people elsewhere.
Another important point is that large amounts of greenhouse gases are released from the tun-dra soil in the process of permafrost melt, increasing the greenhouse effect and speeding up global warming.
Weather anomalies in the Arctic You know already that wind as well as temperature must be taken into account when assessing the weather. Extreme cold without wind is far better than a powerful blizzard, which makes it almost impossible to do anything useful outdoors – even to travel from one place to another. Working in blizzards is dangerous and difficult. Strong winds are becoming increasingly common in the Arctic, requiring the use of ever greater quantities of special equipment, cloth-ing, safety gear and supplies to cope with prolonged snowstorms.
Humidity levels in the Arctic have increased, often leading to an alternation of thaws and frosts. This means that roads, bridges and power lines are often covered with a layer of ice, leading to more frequent accidents and breakdowns. Buildings and structures deteriorate more quickly due to the action of water and ice on micro-cracks. Water can penetrate the tiniest crack and then expands when it turns to ice, also expanding the crack. The ice melts, more water flows in, the new water freezes and the crack expands even more. The more often this cycle is repeated, the faster the building deteriorates.
Low-lying regions, such as the Yamal Peninsula are increasingly affected by powerful spring floods, when huge territories are inundated with water to a depth of a metre or more. Yamal is now experiencing more snowfall and these large quantities of snow are now melting more quickly in the Arctic spring. Another problem in Yamal is the penetration of sea water into ground water, which leads to rapid erosion of the underground sections of all kinds of buildings.
Fig. 2.8.13. Road with soil-freezing thermosiphons.
Fig. 2.8.14. Road standing on supports sunk deep into the ground.
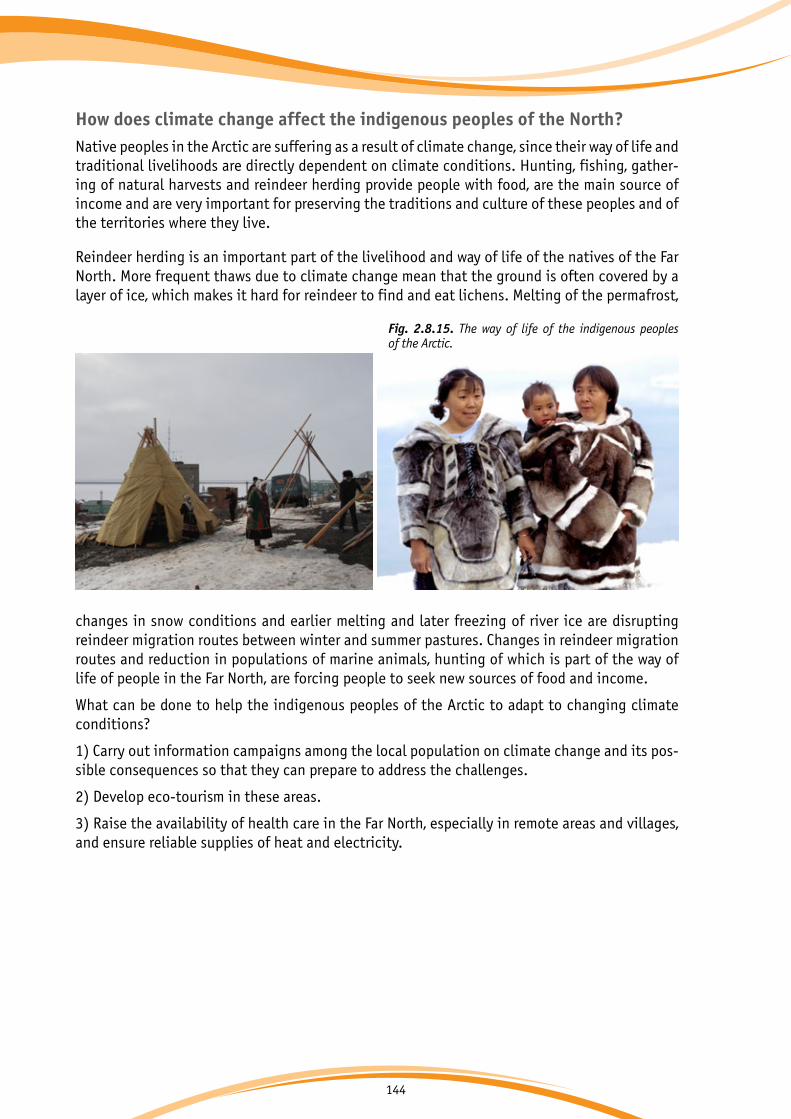
144
How does climate change affect the indigenous peoples of the North?Native peoples in the Arctic are suffering as a result of climate change, since their way of life and traditional livelihoods are directly dependent on climate conditions. Hunting, fishing, gather-ing of natural harvests and reindeer herding provide people with food, are the main source of income and are very important for preserving the traditions and culture of these peoples and of the territories where they live.
Reindeer herding is an important part of the livelihood and way of life of the natives of the Far North. More frequent thaws due to climate change mean that the ground is often covered by a layer of ice, which makes it hard for reindeer to find and eat lichens. Melting of the permafrost,
changes in snow conditions and earlier melting and later freezing of river ice are disrupting reindeer migration routes between winter and summer pastures. Changes in reindeer migration routes and reduction in populations of marine animals, hunting of which is part of the way of life of people in the Far North, are forcing people to seek new sources of food and income.
What can be done to help the indigenous peoples of the Arctic to adapt to changing climate conditions?
1) Carry out information campaigns among the local population on climate change and its pos-sible consequences so that they can prepare to address the challenges.
2) Develop eco-tourism in these areas.
3) Raise the availability of health care in the Far North, especially in remote areas and villages, and ensure reliable supplies of heat and electricity.
Fig. 2.8.15. The way of life of the indigenous peoples of the Arctic.
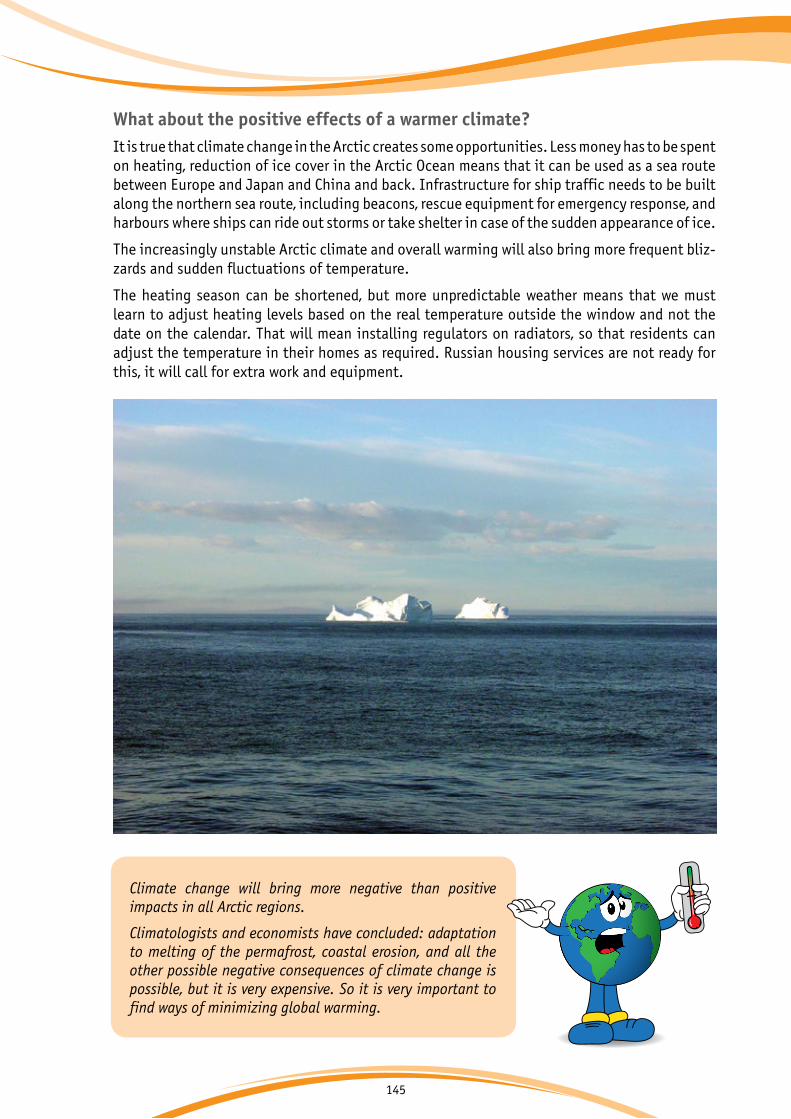
145
What about the positive effects of a warmer climate?It is true that climate change in the Arctic creates some opportunities. Less money has to be spent on heating, reduction of ice cover in the Arctic Ocean means that it can be used as a sea route between Europe and Japan and China and back. Infrastructure for ship traffic needs to be built along the northern sea route, including beacons, rescue equipment for emergency response, and harbours where ships can ride out storms or take shelter in case of the sudden appearance of ice.
The increasingly unstable Arctic climate and overall warming will also bring more frequent bliz-zards and sudden fluctuations of temperature.
The heating season can be shortened, but more unpredictable weather means that we must learn to adjust heating levels based on the real temperature outside the window and not the date on the calendar. That will mean installing regulators on radiators, so that residents can adjust the temperature in their homes as required. Russian housing services are not ready for this, it will call for extra work and equipment.
Climate change will bring more negative than positiveimpacts in all Arctic regions.
Climatologists and economists have concluded: adaptation to melting of the permafrost, coastal erosion, and all the other possible negative consequences of climate change is possible, but it is very expensive. So it is very important to find ways of minimizing global warming.
+2 оС

146
Questions
1. Where is climate warming happening faster: in the world asa whole or in the Arctic?
2. Why does the air temperature increase rapidly when ice fields in the Arctic break up in the spring to reveal open water?
3. Why are polar bears affected by shrinkage of the ice packs?Do they need ice?
4. What is the danger currently threatening seals in the White Sea?
5. Why is melting of the permafrost dangerous for buildings?
6. How does climate change affect the life of indigenouspeople in the Arctic? What could be done to help them adaptto the changing conditions?
147
Task 1. ExperimentPurpose of the experiment: To observe how the volume of water changes when it freezes.
Materials: Airtight glass bottle, water.
The experiment: Fill the glass bottle with water, seal it and put it in the freezer. What happened to the bottle when the water froze? Why did this happen? Draw a parallel with the processes caused by permafrost.
Task 2. ExperimentPurpose of the experiment: To observe changes in the physi-cal properties of materials when they freeze and thaw.
Materials: A plastic or paper box containing sour cream.
Note. Soil that has frozen and then thawed will not be the same as it was before freezing. Ice layers may appear in it, which will divide into water and soil when thawing occurs. Sour cream behaves in a similar way when it is first frozen and then thawed.
The experiment: Take a paper or plastic package of sour cream. Put it in the freezer. When the cream freezes, it will not be as a single piece: layers of ice will appear. When its thaws the sour cream divides into a white liquid and a thicker white substance (after it has been stirred this mixture regains the appearance of sour cream and it is perfectly eatable).
Task
+2 оС
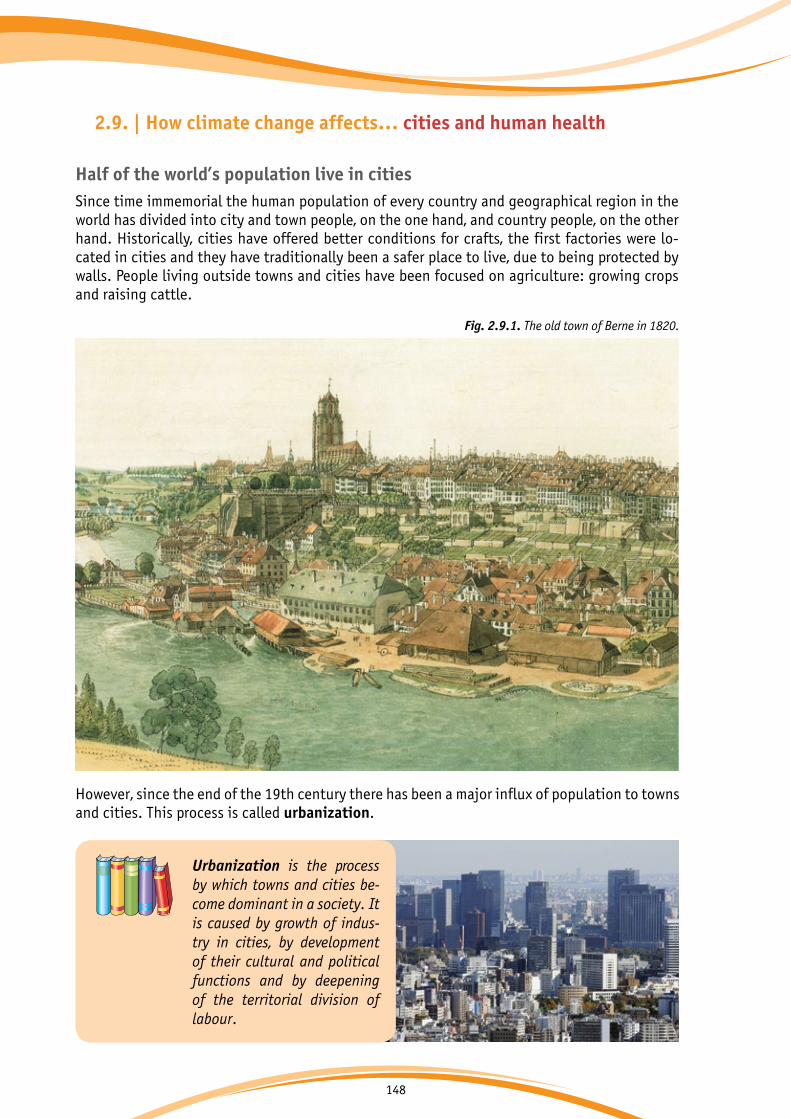
148
2.9. | How climate change affects… cities and human health
Half of the world’s population live in cities Since time immemorial the human population of every country and geographical region in the world has divided into city and town people, on the one hand, and country people, on the other hand. Historically, cities have offered better conditions for crafts, the first factories were lo-cated in cities and they have traditionally been a safer place to live, due to being protected by walls. People living outside towns and cities have been focused on agriculture: growing crops and raising cattle.
Fig. 2.9.1. The old town of Berne in 1820.
Urbanization is the process by which towns and cities be-come dominant in a society. It is caused by growth of indus-try in cities, by development of their cultural and political functions and by deepening of the territorial division of labour.
However, since the end of the 19th century there has been a major influx of population to towns and cities. This process is called urbanization.
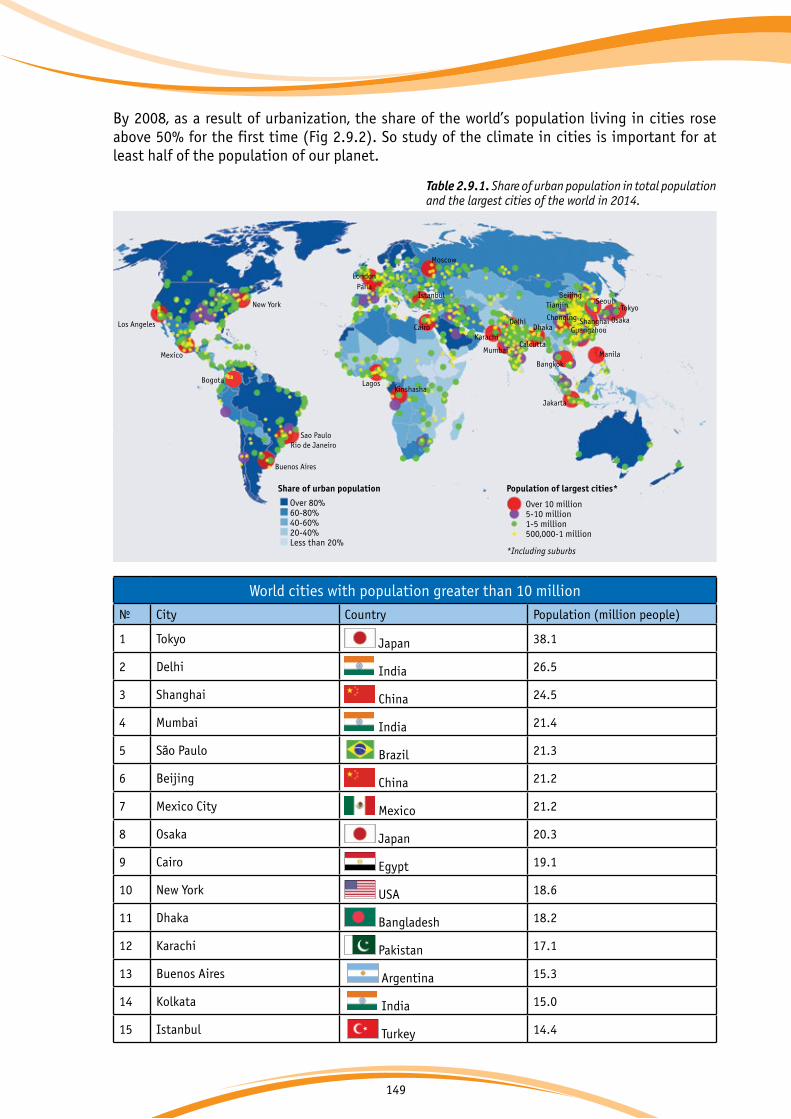
149
By 2008, as a result of urbanization, the share of the world’s population living in cities rose above 50% for the first time (Fig 2.9.2). So study of the climate in cities is important for atleast half of the population of our planet.
Jakarta
Moscow
Los Angeles
New York
Mexico
Sao PauloRio de Janeiro
Buenos Aires
Cairo
LondonParis
Istanbul
LagosKinshasha
Karachi
Delhi
MumbaiCalcutta
Dhaka
Tokyo
Osaka
Manila
Beijing
Shanghai
Tianjin
Chonqing
Guangzhou
Bogota
Over 80%60-80%40-60%20-40%Less than 20%
Over 10 million5-10 million1-5 million500,000-1 million
Share of urban population Population of largest cities*
*Including suburbs
Bangkok
Seoul
Table 2.9.1. Share of urban population in total population and the largest cities of the world in 2014.
World cities with population greater than 10 million
№ City Country Population (million people)
1 Tokyo Japan 38.1
2 Delhi India 26.5
3 Shanghai China 24.5
4 Mumbai India 21.4
5 São Paulo Brazil 21.3
6 Beijing China 21.2
7 Mexico City Mexico 21.2
8 Osaka Japan 20.3
9 Cairo Egypt 19.1
10 New York USA 18.6
11 Dhaka Bangladesh 18.2
12 Karachi Pakistan 17.1
13 Buenos Aires Argentina 15.3
14 Kolkata India 15.0
15 Istanbul Turkey 14.4
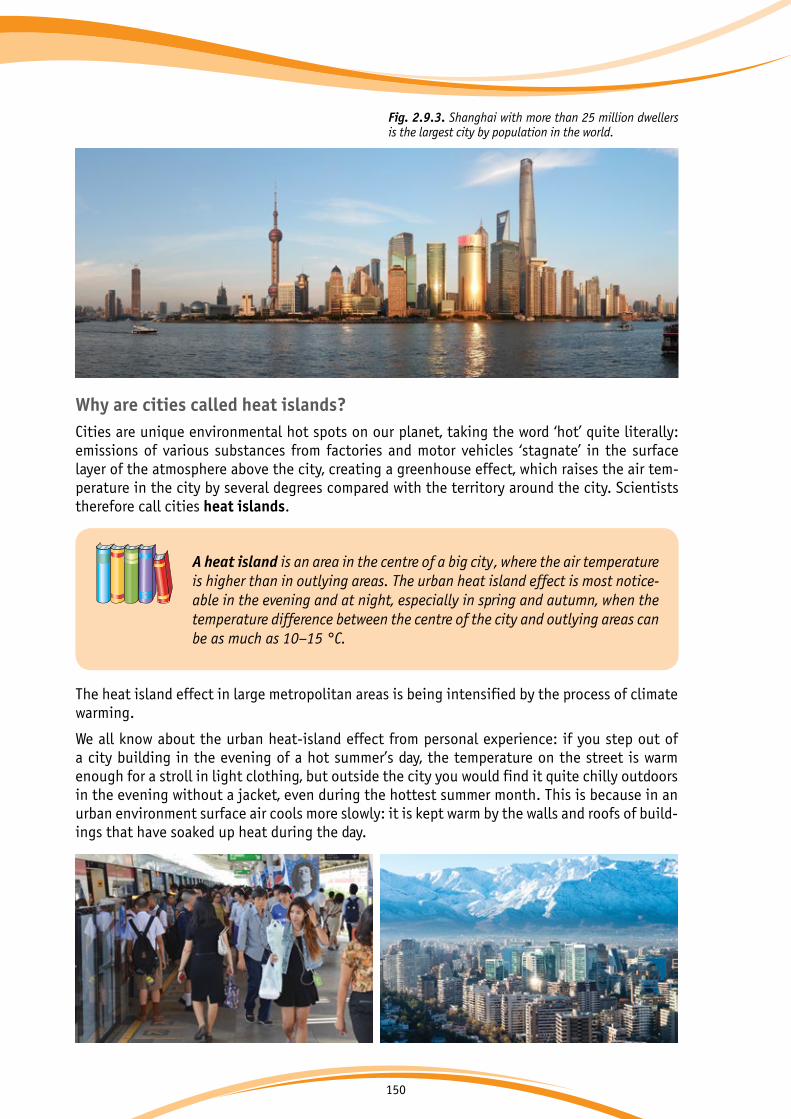
150
Why are cities called heat islands?Cities are unique environmental hot spots on our planet, taking the word ‘hot’ quite literally: emissions of various substances from factories and motor vehicles ‘stagnate’ in the surface layer of the atmosphere above the city, creating a greenhouse effect, which raises the air tem-perature in the city by several degrees compared with the territory around the city. Scientists therefore call cities heat islands.
A heat island is an area in the centre of a big city, where the air temperature is higher than in outlying areas. The urban heat island effect is most notice-able in the evening and at night, especially in spring and autumn, when the temperature difference between the centre of the city and outlying areas can be as much as 10–15 °C.
Fig. 2.9.3. Shanghai with more than 25 million dwellers is the largest city by population in the world.
The heat island effect in large metropolitan areas is being intensified by the process of climate warming.
We all know about the urban heat-island effect from personal experience: if you step out of a city building in the evening of a hot summer’s day, the temperature on the street is warm enough for a stroll in light clothing, but outside the city you would find it quite chilly outdoors in the evening without a jacket, even during the hottest summer month. This is because in an urban environment surface air cools more slowly: it is kept warm by the walls and roofs of build-ings that have soaked up heat during the day.
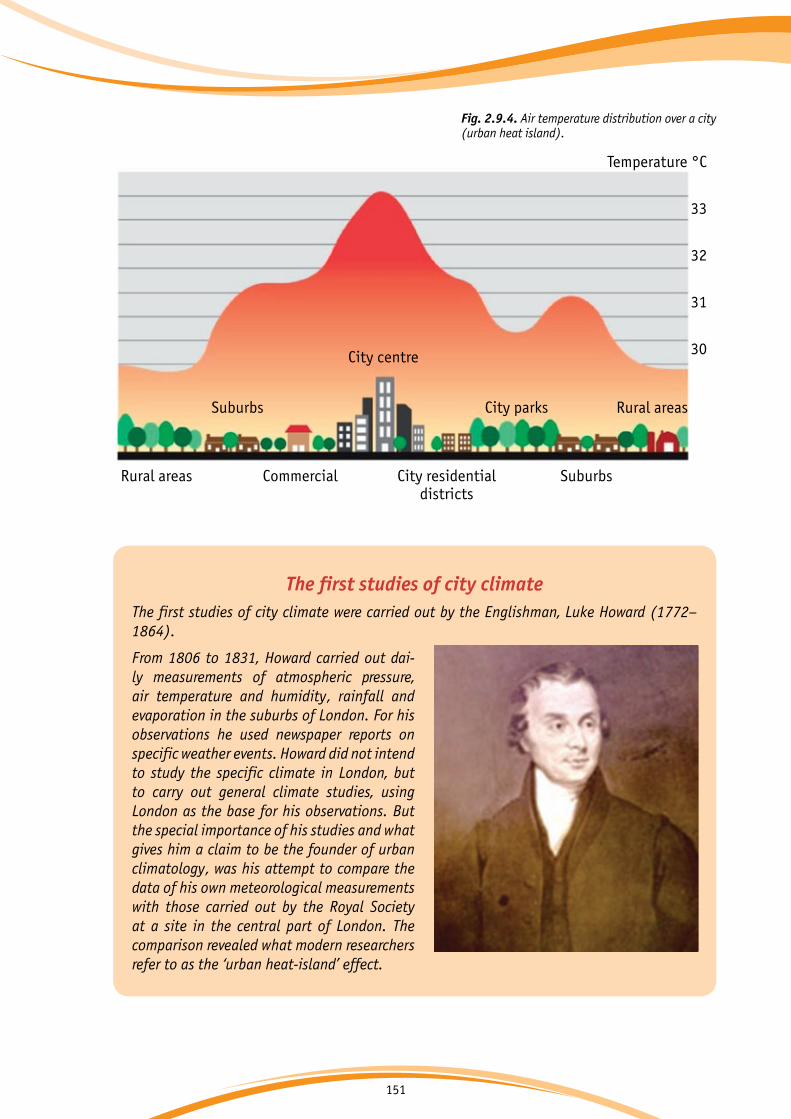
151
Temperature °C
33
32
31
30
Rural areas
Rural areasSuburbs
SuburbsCommercial
City centre
City residentialdistricts
City parks
Fig. 2.9.4. Air temperature distribution over a city (urban heat island).
The first studies of city climate The first studies of city climate were carried out by the Englishman, Luke Howard (1772–1864).
From 1806 to 1831, Howard carried out dai-ly measurements of atmospheric pressure, air temperature and humidity, rainfall and evaporation in the suburbs of London. For his observations he used newspaper reports on specific weather events. Howard did not intend to study the specific climate in London, but to carry out general climate studies, using London as the base for his observations. But the special importance of his studies and what gives him a claim to be the founder of urban climatology, was his attempt to compare the data of his own meteorological measurements with those carried out by the Royal Society at a site in the central part of London. The comparison revealed what modern researchers refer to as the ‘urban heat-island’ effect.

152
How does climate change affect the health of city dwellers?Climate change has substantial impact on human life and health. We already knew that our health depends on safe behaviour, heredity, occupation, environment, and access to health care, but it is now becoming clear that it also depends on climate change.
Climate change is particularly noticeable in cities, and most of all in large cities. For exam-ple, the increase in air temperature in Moscow over the last century has been more than 2 °C, while the increase in global average temperatures during the same period has been only 1 °C.Air temperature are also rising quickly in other major cities around the world (Fig. 2.9.5).
Hot summer nights in the city are particularly dangerous to health. If a heat wave lasts for more than a week, it can lead to heart problems and even death among el-derly people and people with poor health. The intense heat experienced in Europe in summer 2003 claimed the lives of 50,000 people.
Experts of the World Health Organization expect that global warming will cause periodsof extremely hot weather in cities to become more frequent, intense and long-lasting. It is well-known that fluctuations in pressure, temperature and humidity can make living conditions in cities uncomfortable, and there are ever more instances when excessive city heat takes a tragic toll among elderly, young children and people with poor health. Intense heat is accompanied by higher concentrations of pollen and other particles that cause allergies and asthma. People who live and work in the city centre and people, whose jobs require spending much time outof doors (road workers, construction workers, etc.) are particularly at risk on hot days.+2 оС
Fig. 2.9.5. Change in average annual daily maximum temperature in major Australian cities in 1980–2014. Linear trend, increase is per decade.
Average annual daily maximum temperature in Australian capital cities (linear trend, increase per decade, 1980–2014)

153
Timely forecasting of a coming heat wave is of great importance, since it gives medical person-nel a chance to prepare for it. The World Meteorological Organization recommends that such a warning forecast should be given at least two days before the period of intense heat actually begins.
The USA, Canada, France and some other countries have already taken steps to address the chal-lenges posed by the heat island effect in the context of global warming. For example, the US city of Philadelphia has advocated a system of ‘good offices’ during heat waves: the media regularly report on the changing weather conditions and offer advice on how to avoid heat-related ill-nesses. The number of a telephone hot line is published in the newspapers and is also displayed on a large screen with high visibility in the city centre. Emergency medical services and fire de-partments take on extra staff. Special air-conditioned premises are provided for elderly people, who are brought there by special, free-of-charge transport service to take a break from the heat.
Precautions to take in hot weather • Wear clothes made of natural fabrics: they help to prevent overheating by allowing the skin to breathe.• Keep a bottle of water with you, preferably water that is not too cold. A person should dink at least 3 litres of water a day in hot weather.• Keep out of direct sunlight so far as possible. The sun is at its strongest from midday until about 16.00 hours, so try to stay indoors during this time.• Always wear a hat or headpiece.• Do not buy perishable products: bacteria multiply very quickly in high-temperatures, so there is a risk of severe food poisoning.• Eat plenty of fruits, vegetables, various salads and cold soups.• Avoid oily and salty foods.• Do not overdo sport and physical training.• Stay relaxed: any nervous stress increases the risk of heat stroke, sun stroke and cardiovas-cular disorders.• Do not sit directly under air conditioning: the temperature difference between the hot streets and an air-conditioned room is very large, and such temperature swings can induce colds and pneumonia.
Temperatures that people from a hotter climate consider nor-mal can be termed a heat wave in cooler areas if they are outside the normal climate pattern. In the United States, for example, a heat wave definition varies depending on the region. In the Northeast states, it is typically defined as three consecutive days where the temperature reaches or exceeds 90 °F (+32.2 °C). In California, where the climate is hotter, heat wave has a higher threshold of 100 °F (+37.8 °C) for three or more consecutive days. The National Weather Service issues heat advisories and excessive heat warnings when unusual periods of hot weather are expected.
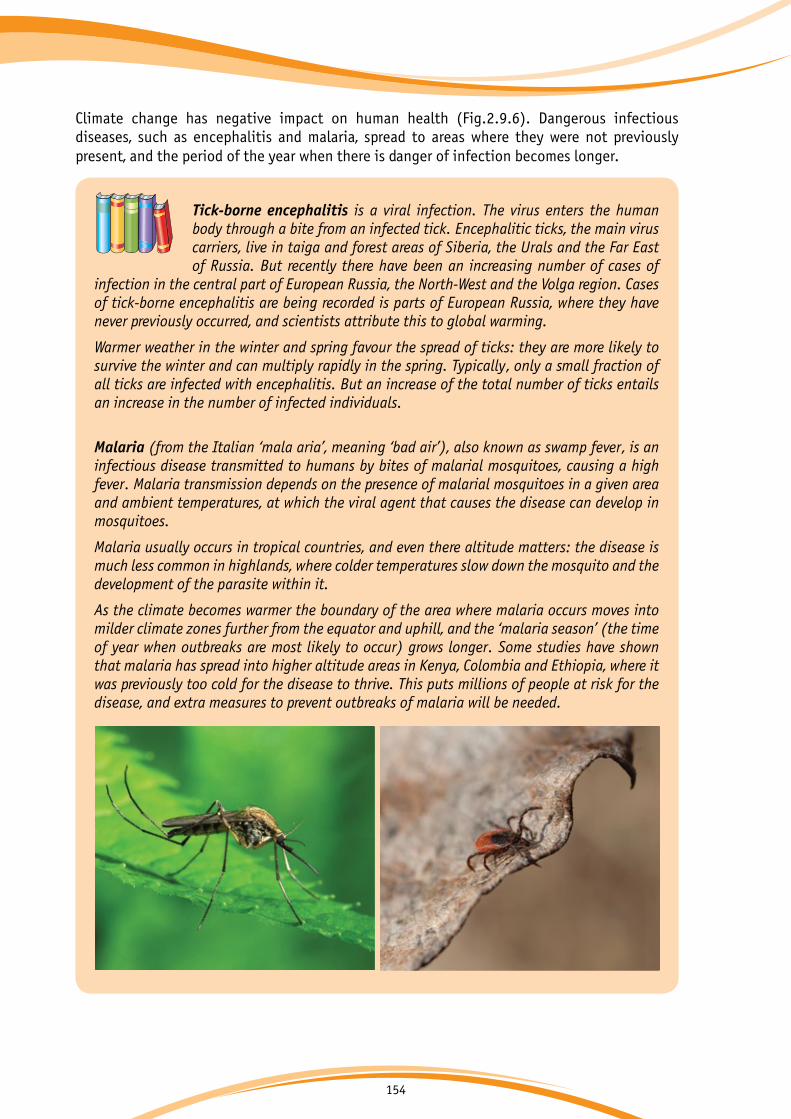
154
Climate change has negative impact on human health (Fig.2.9.6). Dangerous infectious diseases, such as encephalitis and malaria, spread to areas where they were not previously present, and the period of the year when there is danger of infection becomes longer.
Tick-borne encephalitis is a viral infection. The virus enters the human body through a bite from an infected tick. Encephalitic ticks, the main virus carriers, live in taiga and forest areas of Siberia, the Urals and the Far East of Russia. But recently there have been an increasing number of cases of
infection in the central part of European Russia, the North-West and the Volga region. Cases of tick-borne encephalitis are being recorded is parts of European Russia, where they have never previously occurred, and scientists attribute this to global warming.
Warmer weather in the winter and spring favour the spread of ticks: they are more likely to survive the winter and can multiply rapidly in the spring. Typically, only a small fraction of all ticks are infected with encephalitis. But an increase of the total number of ticks entails an increase in the number of infected individuals.
Malaria (from the Italian ‘mala aria’, meaning ‘bad air’), also known as swamp fever, is an infectious disease transmitted to humans by bites of malarial mosquitoes, causing a high fever. Malaria transmission depends on the presence of malarial mosquitoes in a given area and ambient temperatures, at which the viral agent that causes the disease can develop in mosquitoes.
Malaria usually occurs in tropical countries, and even there altitude matters: the disease is much less common in highlands, where colder temperatures slow down the mosquito and the development of the parasite within it.
As the climate becomes warmer the boundary of the area where malaria occurs moves into milder climate zones further from the equator and uphill, and the ‘malaria season’ (the time of year when outbreaks are most likely to occur) grows longer. Some studies have shown that malaria has spread into higher altitude areas in Kenya, Colombia and Ethiopia, where it was previously too cold for the disease to thrive. This puts millions of people at risk for the disease, and extra measures to prevent outbreaks of malaria will be needed.

155
Floods also pose an indirect threat to human health, since flooding disrupts water supply and sewerage systems, which increases the risk of intestinal diseases. Also, when flooding occurs in some parts of the world, it may bring poisonous snakes and crocodiles with it, as happened during the floods that occurred in Australia in 2011.
Psychological stress and depression can also be provoked by changes in the environment and lifestyles. You have probably noticed yourself that sometimes, when the weather is bad, you don’t want to go anywhere or do anything. So how will people feel if bad weather happens in-creasingly often?
How does climate change affect the urban economy?Extreme weather events can disrupt transport, electricity and water supply in cities. Flooding may inundate buildings, roads, railways, seaports and airports. Higher temperatures lead to fast-er deterioration of road surfaces, which need more frequent repairs. Sudden temperature drops in the winter cause the formation of ice that damages power lines, leaving homes, schools, hos-pitals and businesses without electricity.
Residents of northern countries may be able to reduce the cost of heating their homes as air temperature in the cold season rises. But cities in southern countries will face higher costs as there will be greater need for air conditioning in the summer.
Scientists have been studying the impact of climate change on cities in greater depth during the last decade. Such studies are essential, since correct understanding of the possible conse-quences of global warming will make it possible to offset some of the costs. For example, the cost of clearing up damage caused by a flood can be partly compensated by savings on heating in the winter.
• Temperature-related illness and mortality
• Health effects associated with air pollution
• Diseases associated with water and food
• Allergic diseases
• Diseases associated with insectsand rodents
• Impact of food or water shortages
• Psychological disorders related to lifestyle changes and migration
• Heat waves
• Extreme weather conditions
• Growth of average temperature andprecipitationin certain seasons
• Amounts andpatters ofprecipitationin certain seasons
Climate change
Fig. 2.9.6. Impacts of climate changeon human health.
+2 оС
156
Questions
1. Does more of the world’ population live in cities or outside cities?
2. Where is it warmer - in the city or in the city suburbs?
3. Why are heat islands bad for human health?
4. What are the negative impacts of global warming on human health?
5. What precautions should be taken in hot weather?

157
Task 1. If you take your summer holiday in the countryside, try placing a thermometer outdoors in the shade at the level of a person’s height above the ground, and write down the temperature it shows in the early morning (before the sun starts to raise the air temperature). Compare it with the forecast for night air temperatures in the nearest large city on the same day. Are the figures different? Why?
Task 2. Using textbooks, reference books and the Internet, find out and write down how you can help someone suffering from heat stroke, sunburn, frostbite, severe allergic reaction to pol-len, or someone who has been bitten by a tick. What preven-tive measures can you take to protect your health during a period of intense heat?
Tasks
+2 оС
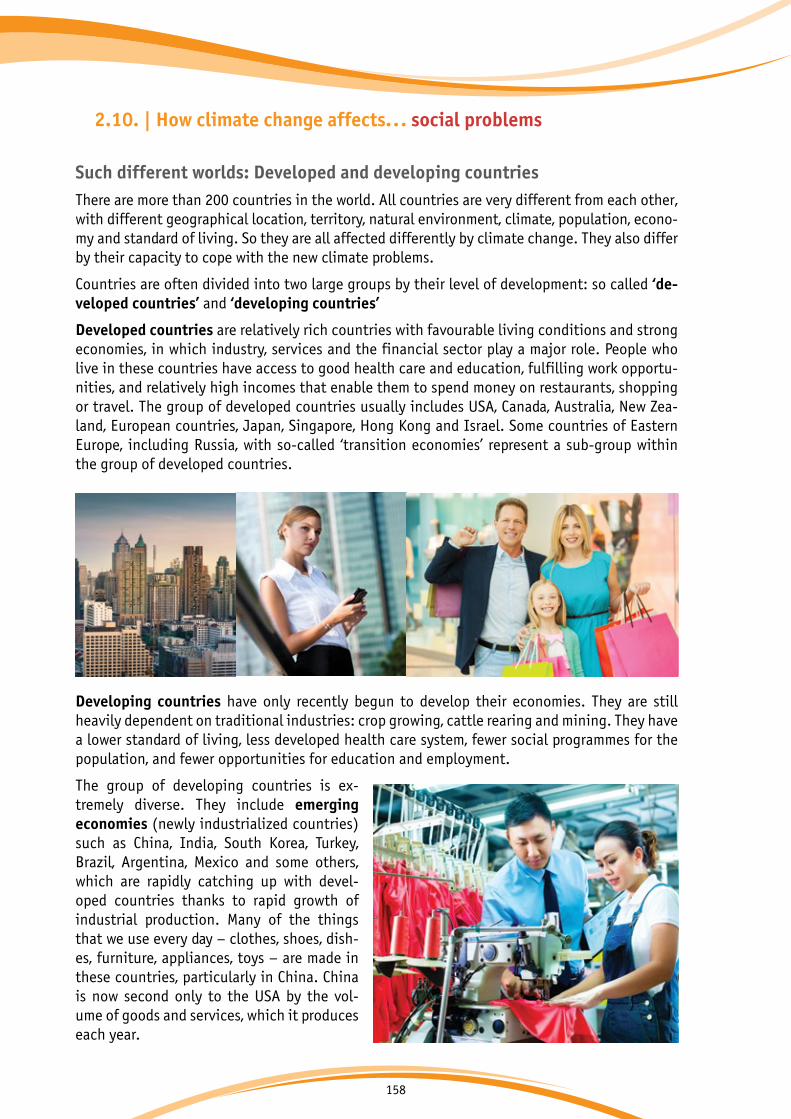
158
2.10. | How climate change affects... social problems
Such different worlds: Developed and developing countriesThere are more than 200 countries in the world. All countries are very different from each other, with different geographical location, territory, natural environment, climate, population, econo-my and standard of living. So they are all affected differently by climate change. They also differ by their capacity to cope with the new climate problems.
Countries are often divided into two large groups by their level of development: so called ‘de-veloped countries’ and ‘developing countries’
Developed countries are relatively rich countries with favourable living conditions and strong economies, in which industry, services and the financial sector play a major role. People who live in these countries have access to good health care and education, fulfilling work opportu-nities, and relatively high incomes that enable them to spend money on restaurants, shopping or travel. The group of developed countries usually includes USA, Canada, Australia, New Zea-land, European countries, Japan, Singapore, Hong Kong and Israel. Some countries of Eastern Europe, including Russia, with so-called ‘transition economies’ represent a sub-group within the group of developed countries.
Developing countries have only recently begun to develop their economies. They are still heavily dependent on traditional industries: crop growing, cattle rearing and mining. They have a lower standard of living, less developed health care system, fewer social programmes for the population, and fewer opportunities for education and employment.
The group of developing countries is ex-tremely diverse. They include emerging economies (newly industrialized countries) such as China, India, South Korea, Turkey, Brazil, Argentina, Mexico and some others, which are rapidly catching up with devel-oped countries thanks to rapid growth of industrial production. Many of the things that we use every day – clothes, shoes, dish-es, furniture, appliances, toys – are made in these countries, particularly in China. China is now second only to the USA by the vol-ume of goods and services, which it produces each year.
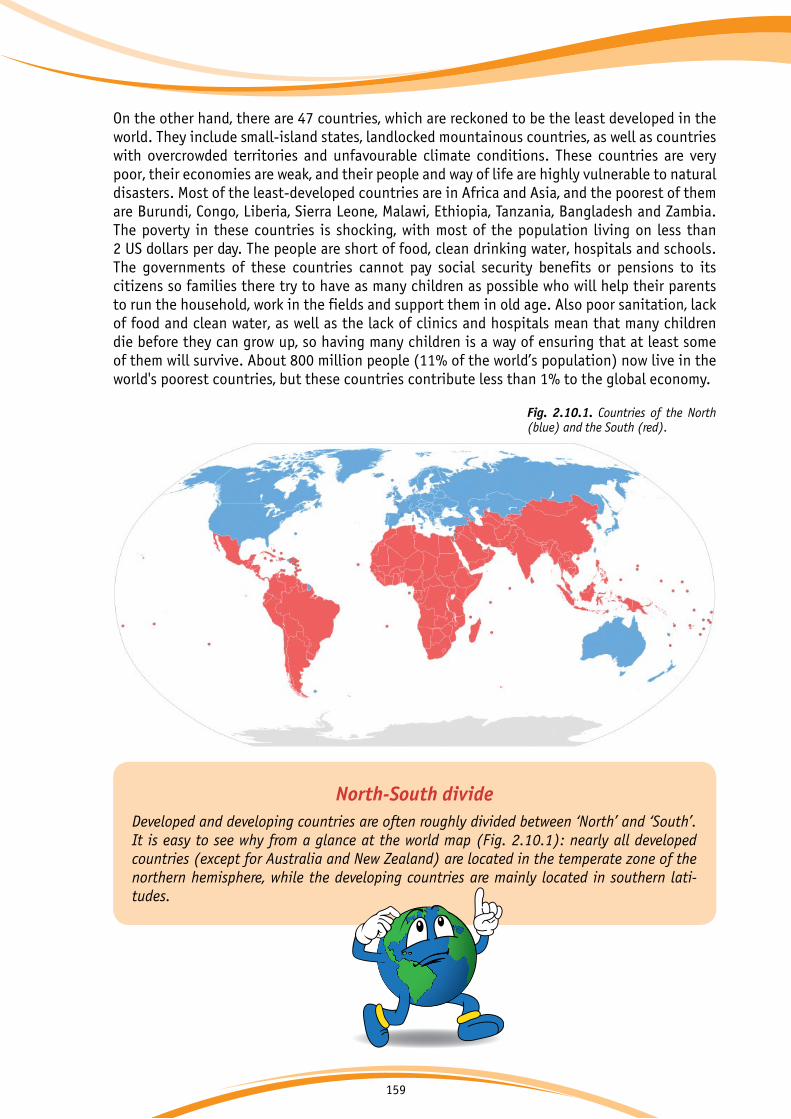
159
On the other hand, there are 47 countries, which are reckoned to be the least developed in the world. They include small-island states, landlocked mountainous countries, as well as countries with overcrowded territories and unfavourable climate conditions. These countries are very poor, their economies are weak, and their people and way of life are highly vulnerable to natural disasters. Most of the least-developed countries are in Africa and Asia, and the poorest of them are Burundi, Congo, Liberia, Sierra Leone, Malawi, Ethiopia, Tanzania, Bangladesh and Zambia. The poverty in these countries is shocking, with most of the population living on less than2 US dollars per day. The people are short of food, clean drinking water, hospitals and schools.The governments of these countries cannot pay social security benefits or pensions to its citizens so families there try to have as many children as possible who will help their parents to run the household, work in the fields and support them in old age. Also poor sanitation, lack of food and clean water, as well as the lack of clinics and hospitals mean that many children die before they can grow up, so having many children is a way of ensuring that at least some of them will survive. About 800 million people (11% of the world’s population) now live in the world's poorest countries, but these countries contribute less than 1% to the global economy.
North-South divideDeveloped and developing countries are often roughly divided between ‘North’ and ‘South’. It is easy to see why from a glance at the world map (Fig. 2.10.1): nearly all developed countries (except for Australia and New Zealand) are located in the temperate zone of the northern hemisphere, while the developing countries are mainly located in southern lati-tudes.
Fig. 2.10.1. Countries of the North (blue) and the South (red).
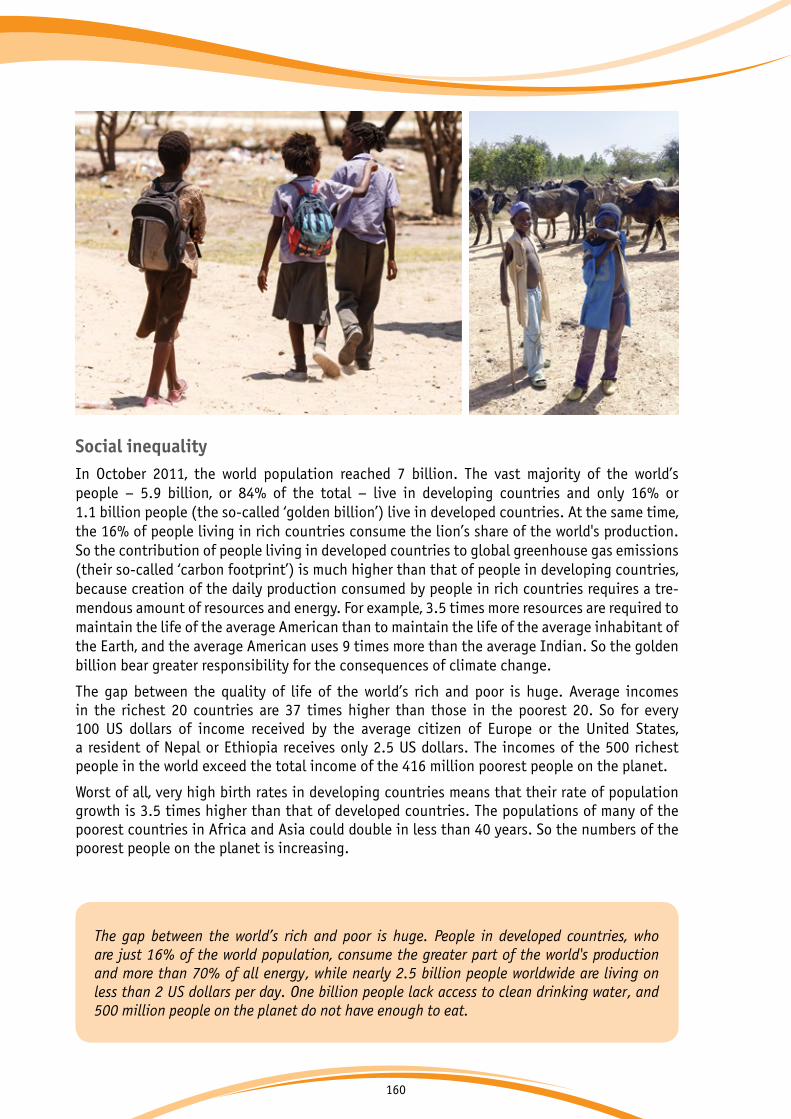
160
Social inequalityIn October 2011, the world population reached 7 billion. The vast majority of the world’s people – 5.9 billion, or 84% of the total – live in developing countries and only 16% or 1.1 billion people (the so-called ‘golden billion’) live in developed countries. At the same time, the 16% of people living in rich countries consume the lion’s share of the world's production. So the contribution of people living in developed countries to global greenhouse gas emissions (their so-called ‘carbon footprint’) is much higher than that of people in developing countries, because creation of the daily production consumed by people in rich countries requires a tre-mendous amount of resources and energy. For example, 3.5 times more resources are required to maintain the life of the average American than to maintain the life of the average inhabitant of the Earth, and the average American uses 9 times more than the average Indian. So the golden billion bear greater responsibility for the consequences of climate change.
The gap between the quality of life of the world’s rich and poor is huge. Average incomes in the richest 20 countries are 37 times higher than those in the poorest 20. So for every 100 US dollars of income received by the average citizen of Europe or the United States, a resident of Nepal or Ethiopia receives only 2.5 US dollars. The incomes of the 500 richest people in the world exceed the total income of the 416 million poorest people on the planet.
Worst of all, very high birth rates in developing countries means that their rate of population growth is 3.5 times higher than that of developed countries. The populations of many of the poorest countries in Africa and Asia could double in less than 40 years. So the numbers of the poorest people on the planet is increasing.
The gap between the world’s rich and poor is huge. People in developed countries, who are just 16% of the world population, consume the greater part of the world's production and more than 70% of all energy, while nearly 2.5 billion people worldwide are living on less than 2 US dollars per day. One billion people lack access to clean drinking water, and 500 million people on the planet do not have enough to eat.
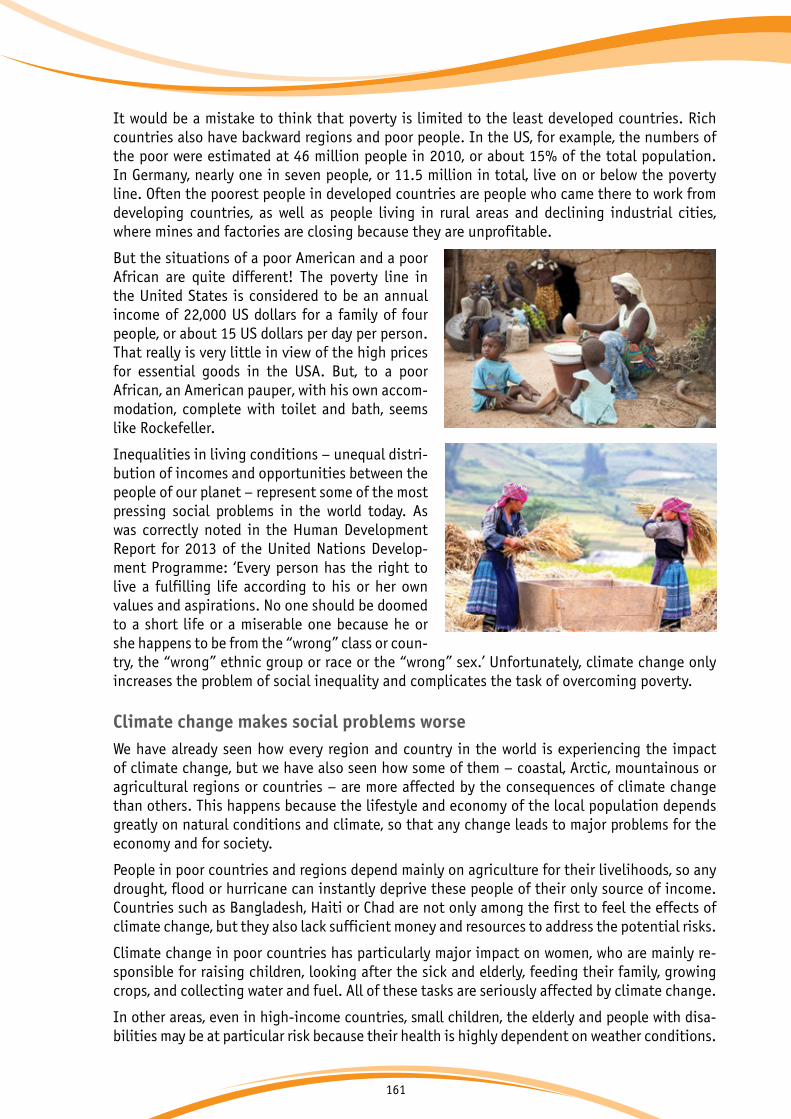
161
It would be a mistake to think that poverty is limited to the least developed countries. Rich countries also have backward regions and poor people. In the US, for example, the numbers of the poor were estimated at 46 million people in 2010, or about 15% of the total population. In Germany, nearly one in seven people, or 11.5 million in total, live on or below the poverty line. Often the poorest people in developed countries are people who came there to work from developing countries, as well as people living in rural areas and declining industrial cities, where mines and factories are closing because they are unprofitable.
But the situations of a poor American and a poor African are quite different! The poverty line in the United States is considered to be an annual income of 22,000 US dollars for a family of four people, or about 15 US dollars per day per person. That really is very little in view of the high prices for essential goods in the USA. But, to a poor African, an American pauper, with his own accom-modation, complete with toilet and bath, seems like Rockefeller.
Inequalities in living conditions – unequal distri-bution of incomes and opportunities between the people of our planet – represent some of the most pressing social problems in the world today. As was correctly noted in the Human Development Report for 2013 of the United Nations Develop-ment Programme: ‘Every person has the right to live a fulfilling life according to his or her own values and aspirations. No one should be doomed to a short life or a miserable one because he or she happens to be from the “wrong” class or coun-try, the “wrong” ethnic group or race or the “wrong” sex.’ Unfortunately, climate change only increases the problem of social inequality and complicates the task of overcoming poverty.
Climate change makes social problems worseWe have already seen how every region and country in the world is experiencing the impact of climate change, but we have also seen how some of them – coastal, Arctic, mountainous or agricultural regions or countries – are more affected by the consequences of climate change than others. This happens because the lifestyle and economy of the local population depends greatly on natural conditions and climate, so that any change leads to major problems for the economy and for society.
People in poor countries and regions depend mainly on agriculture for their livelihoods, so any drought, flood or hurricane can instantly deprive these people of their only source of income. Countries such as Bangladesh, Haiti or Chad are not only among the first to feel the effects of climate change, but they also lack sufficient money and resources to address the potential risks.
Climate change in poor countries has particularly major impact on women, who are mainly re-sponsible for raising children, looking after the sick and elderly, feeding their family, growing crops, and collecting water and fuel. All of these tasks are seriously affected by climate change.
In other areas, even in high-income countries, small children, the elderly and people with disa-bilities may be at particular risk because their health is highly dependent on weather conditions.
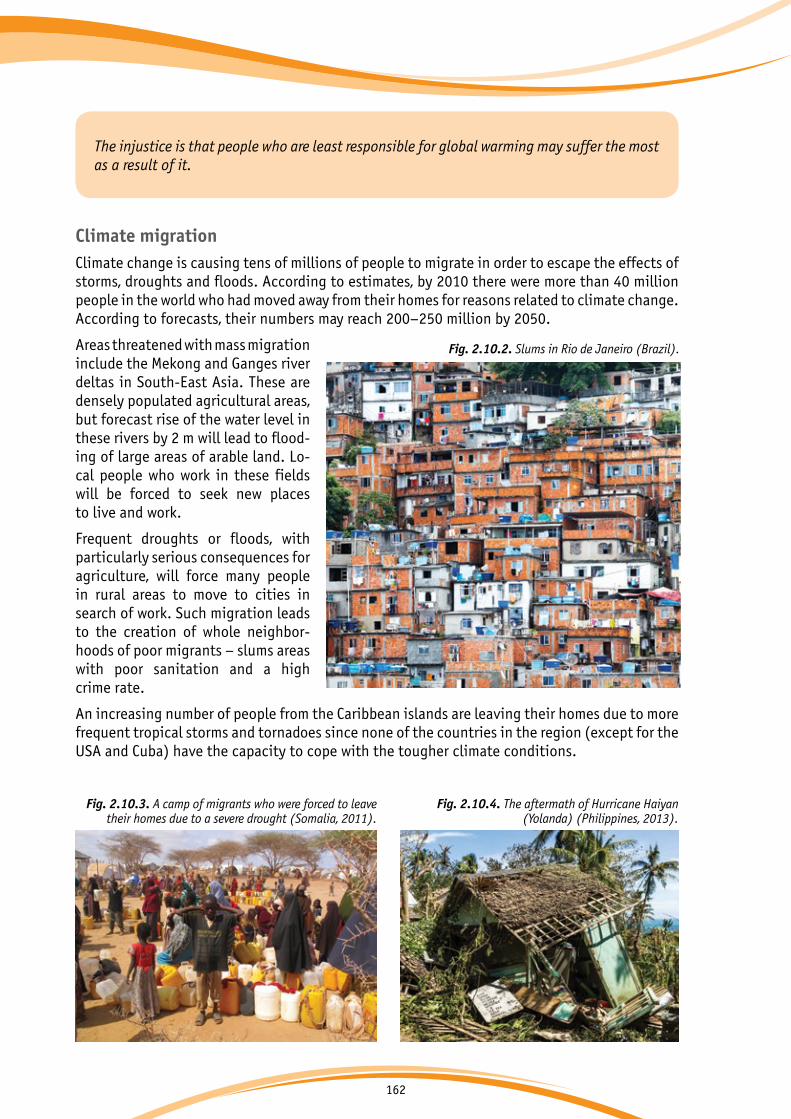
162
Climate migrationClimate change is causing tens of millions of people to migrate in order to escape the effects of storms, droughts and floods. According to estimates, by 2010 there were more than 40 million people in the world who had moved away from their homes for reasons related to climate change. According to forecasts, their numbers may reach 200–250 million by 2050.
Areas threatened with mass migration include the Mekong and Ganges river deltas in South-East Asia. These are densely populated agricultural areas, but forecast rise of the water level in these rivers by 2 m will lead to flood-ing of large areas of arable land. Lo-cal people who work in these fields will be forced to seek new places to live and work.
Frequent droughts or floods, with particularly serious consequences for agriculture, will force many people in rural areas to move to cities in search of work. Such migration leads to the creation of whole neighbor-hoods of poor migrants – slums areas with poor sanitation and a high crime rate.
An increasing number of people from the Caribbean islands are leaving their homes due to more frequent tropical storms and tornadoes since none of the countries in the region (except for the USA and Cuba) have the capacity to cope with the tougher climate conditions.
The injustice is that people who are least responsible for global warming may suffer the most as a result of it.
Fig. 2.10.2. Slums in Rio de Janeiro (Brazil).
Fig. 2.10.3. A camp of migrants who were forced to leave their homes due to a severe drought (Somalia, 2011).
Fig. 2.10.4. The aftermath of Hurricane Haiyan (Yolanda) (Philippines, 2013).
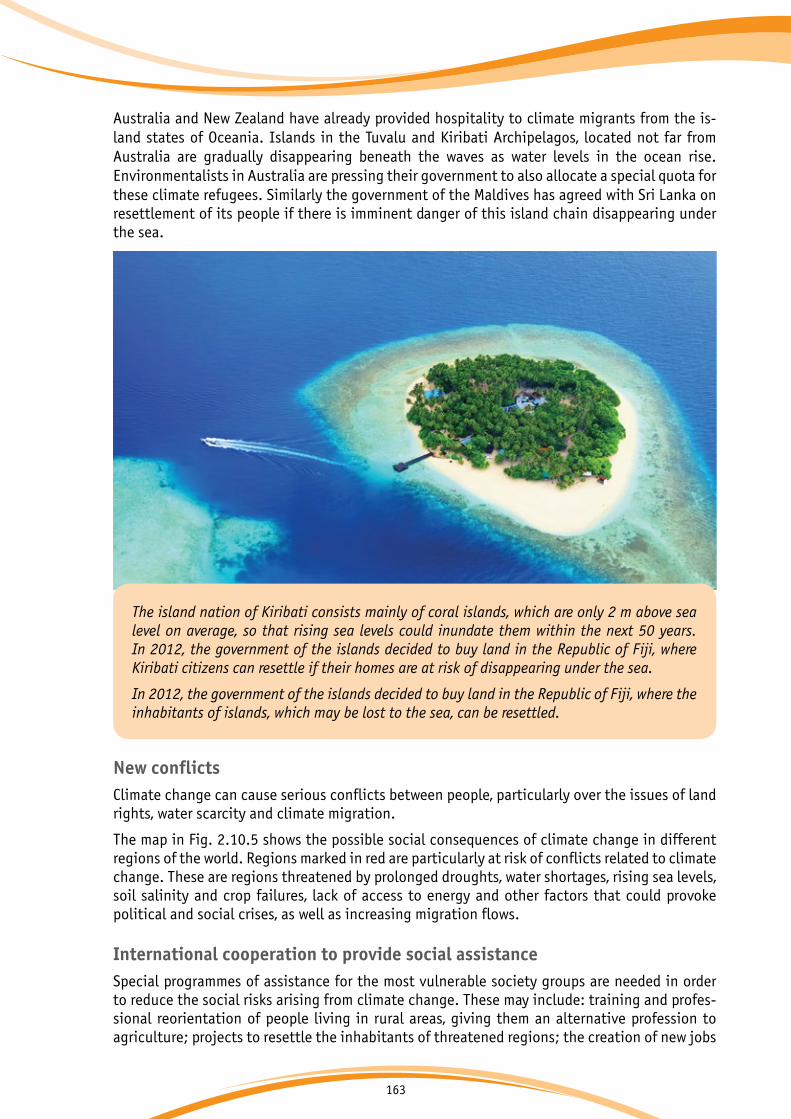
163
Australia and New Zealand have already provided hospitality to climate migrants from the is-land states of Oceania. Islands in the Tuvalu and Kiribati Archipelagos, located not far from Australia are gradually disappearing beneath the waves as water levels in the ocean rise. Environmentalists in Australia are pressing their government to also allocate a special quota for these climate refugees. Similarly the government of the Maldives has agreed with Sri Lanka on resettlement of its people if there is imminent danger of this island chain disappearing under the sea.
New conflicts Climate change can cause serious conflicts between people, particularly over the issues of land rights, water scarcity and climate migration.
The map in Fig. 2.10.5 shows the possible social consequences of climate change in different regions of the world. Regions marked in red are particularly at risk of conflicts related to climate change. These are regions threatened by prolonged droughts, water shortages, rising sea levels, soil salinity and crop failures, lack of access to energy and other factors that could provoke political and social crises, as well as increasing migration flows.
International cooperation to provide social assistance Special programmes of assistance for the most vulnerable society groups are needed in order to reduce the social risks arising from climate change. These may include: training and profes-sional reorientation of people living in rural areas, giving them an alternative profession to agriculture; projects to resettle the inhabitants of threatened regions; the creation of new jobs
The island nation of Kiribati consists mainly of coral islands, which are only 2 m above sea level on average, so that rising sea levels could inundate them within the next 50 years. In 2012, the government of the islands decided to buy land in the Republic of Fiji, where Kiribati citizens can resettle if their homes are at risk of disappearing under the sea.
In 2012, the government of the islands decided to buy land in the Republic of Fiji, where the inhabitants of islands, which may be lost to the sea, can be resettled.
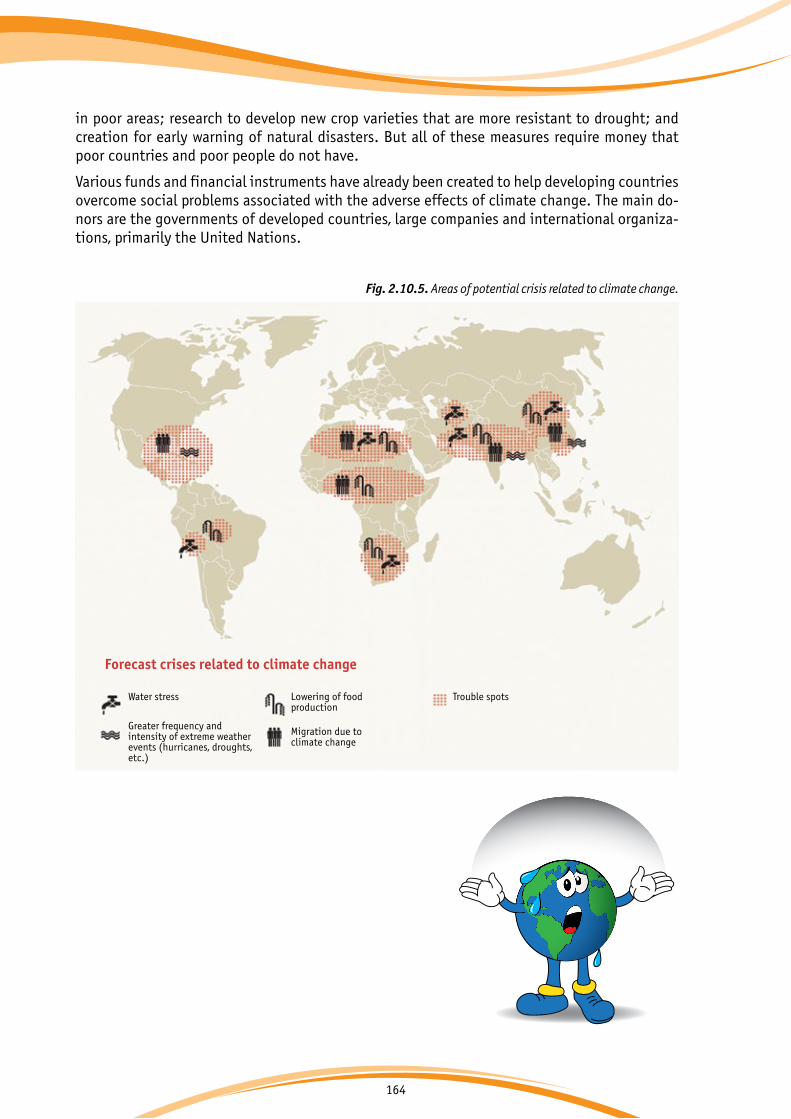
164
in poor areas; research to develop new crop varieties that are more resistant to drought; and creation for early warning of natural disasters. But all of these measures require money that poor countries and poor people do not have.
Various funds and financial instruments have already been created to help developing countries overcome social problems associated with the adverse effects of climate change. The main do-nors are the governments of developed countries, large companies and international organiza-tions, primarily the United Nations.
Fig. 2.10.5. Areas of potential crisis related to climate change.
Water stress Lowering of foodproduction
Trouble spots
Greater frequency and intensity of extreme weather events (hurricanes, droughts, etc.)
Migration due toclimate change
Forecast crises related to climate change
+2 оС

165
Questions
1. How are developed countries different from developing coun-tries?
2. Do most of the people in the world live in developed or devel-oping countries?
3. Which countries are most vulnerable to climate change? Why?
4. Why do the consequences of climate change have greatest im-pact on the world's poor?What social problems does climate change make worse?
5. Animals and plants cannot adapt to rapid changes in climate, but how about people?

166
Task 1. On a map of the world, underline the top 20 countries in terms of economic development and colour them in using a green crayon. On the same map underline the 20 main countries by volumes of greenhouse gas emissions (data can be found in Wikipedia) and colour them in red.
Are there a lot of coincidences? How many of the leading countries of the world are now a ‘dirty brown’, indicating that they cause the most harm to the Earth's climate?
Explain why these countries are the most to blame for ongo-ing climate change?
Task 2. Imagine that you are working for an international fund, which allocates money for projects to combat the consequences of climate change. What projects to help poor countries would you finance first and foremost?
Tasks
+2 оС

par
t
How to prevent dangerous climate change?

168
3. How to prevent dangerous climate change? 169
3.1. ‘Green’ energy sources 170
3.1.1. What is energy? 170
3.1.2. The main sources of energy 171
3.1.3. Fossil fuels 172
3.1.4. Nuclear energy 176
3.1.5. Renewable energy sources 178
3.1.6. Advantages and disadvantages of different energy sources 190
3.2. Energy efficiency and energy saving 196
3.2.1. Environmentally friendly transport 200
3.2.2. Household appliances and electrical devices 205
3.2.3. Green construction. Passive and active buildings 208
3.2.4. Green cities 212
3.3. Carbon footprint 217
3.4. How can I help the planet? Reducing your carbon footprint 221
3.5. Global cooperation on climate change and sustainable development 231

169
3. | How to prevent dangerous climate change?
You already know that the amount of greenhouse gases in the atmosphere has been increasing very rapidly in recent years (Fig.3.1.1). The natural content of carbon dioxide in the atmosphere has varied in the last few hundred thousand years (which have included periods of interglacial warming and glacial coolings) between 180 and 300 particles of CO2 per million other particles. In 2013, the level of CO2 in the atmosphere exceeded 400 parts per million for the first time in at least 800,000 years.
Everyone on the planet contributes to the current climate change by emitting greenhouse gases into the atmosphere year by year. We are the end-users of goods and services, the production of which requires energy, and energy comes mostly from non-renewable fossil fuels (oil, coal and natural gas). The production of goods and services accounts for 75% of all greenhouse gas emis-sions associated with human activities.
How can mankind reduce the concentration of greenhouse gases in the atmosphere? There are several main ways of doing this.
The first way is by switching to climate-friendly sources of energy. If we compare the different types of fossil fuel, the most environmentally friendly of them is natural gas.
But it is possible to produce energy without using fossil fuels at all. Since ancient times, people have used the heat of the sun, the power of wind and running water, and biomass. These are all renewable energy sources. Modern technologies make it possible to use them more widely.
The second way of reducing greenhouse gas emissions is to reduce our daily energy consumption, by inventing more fuel-efficient machines and changing our own habits.
The third way is to get plants to help us. Plants absorb carbon dioxide, so by reducing deforesta-tion, by planting new trees people can reduce the amount of greenhouse gases in the atmos-phere.
For the first time in the history of humanity,
1960
CO2 content in the atmosphere has risen above 400 parts per million other particles 400
390
380
370
360
350
340
330
320
310
1965 1970 1975 1980 1985 1990 1995 2000 2005 2010
400 parts per million other
particles on May 9,2013
Fig.3.1.1. Growth of carbon dioxide concentrationsin the atmosphere since 1960.

170
3.1. | ‘Green’ energy sources
3.1.1. | What is energy?
Everything that has ever been created in the world, by nature or by man, has been created using energy. In order to obtain anything, any form of energy, we have to get it from somewhere.
Consider a bar of chocolate. It came to the shop from the factory, where people produced and packaged it. To do this, they used cocoa beans and sugar, which were brought to the factory from fields where other people grow cocoa beans and sugar cane. All the people who worked on making our chocolate had to eat and buy clothes for themselves. All the machines and devices that were used to make the chocolate bar are made from materials (steel, plastic, etc.) that came from minerals (iron ore, etc.) taken from the earth and those machines are driven by energy. So everything that we have was made by using energy. Even we ourselves grew from a tiny embryo, which took the energy of chemical compounds for its growth!
So can it really be the case that we constantly take from nature and give nothing in return? Of course not! We convert the energy that we receive into other forms and return it to the world. So the energy itself never disappears, but only changes its state. The science that studies the most general laws of the transformation and transfer of mechanical and thermal energy is called ‘thermodynamics’, and the law of conservation of energy is the first law of thermodynamics.
Other laws of thermodynamics tell us that at the moment when energy changes its state, a small part of it is lost and dissipated and cannot be ‘gathered back’.
Let's see how people today use energy. Why are the consumption of energy and climate change so strongly interrelated?
And can humanity use energy to transform all life on Earth, making it green, flourishing and happy? Most importantly can we all start working towards this transformation today?
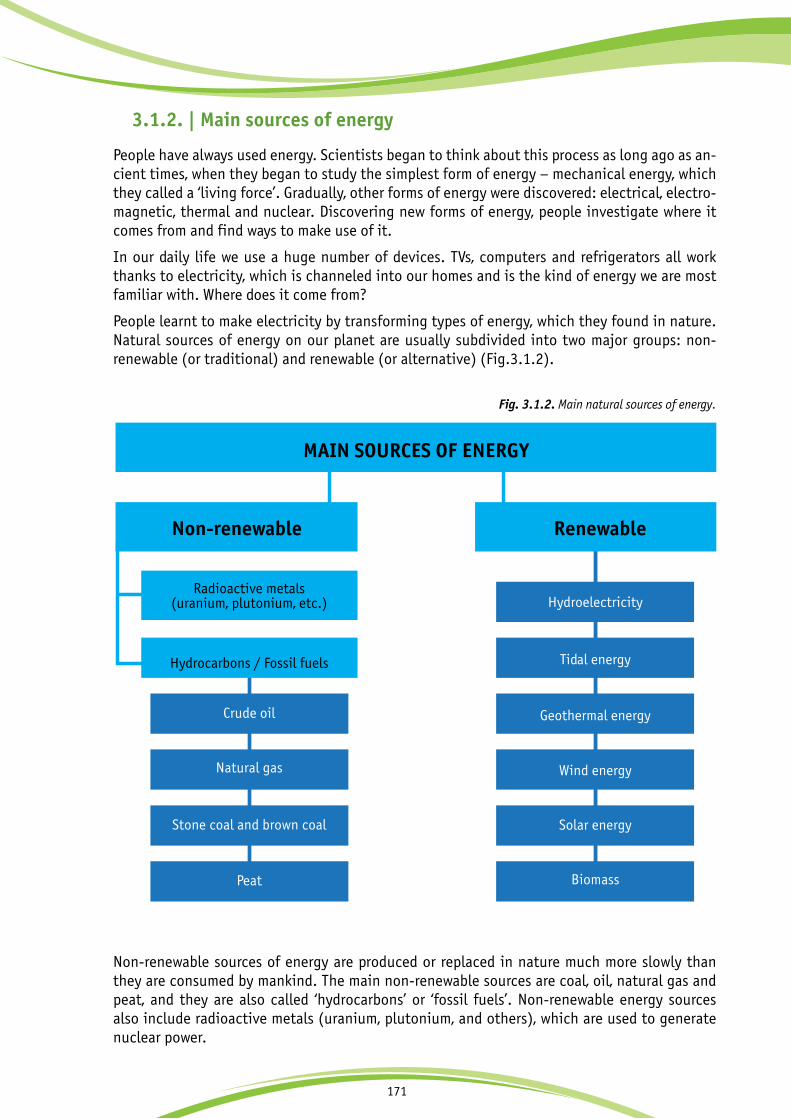
171
3.1.2. | Main sources of energy
People have always used energy. Scientists began to think about this process as long ago as an-cient times, when they began to study the simplest form of energy – mechanical energy, which they called a ‘living force’. Gradually, other forms of energy were discovered: electrical, electro-magnetic, thermal and nuclear. Discovering new forms of energy, people investigate where it comes from and find ways to make use of it.
In our daily life we use a huge number of devices. TVs, computers and refrigerators all work thanks to electricity, which is channeled into our homes and is the kind of energy we are most familiar with. Where does it come from?
People learnt to make electricity by transforming types of energy, which they found in nature. Natural sources of energy on our planet are usually subdivided into two major groups: non-renewable (or traditional) and renewable (or alternative) (Fig.3.1.2).
MAIN SOURCES OF ENERGY
Non-renewable
Radioactive metals(uranium, plutonium, etc.)
Hydrocarbons / Fossil fuels
Crude oil
Hydroelectricity
Tidal energy
Geothermal energy
Wind energy
Solar energy
Biomass
Natural gas
Stone coal and brown coal
Peat
Renewable
Fig. 3.1.2. Main natural sources of energy.
Non-renewable sources of energy are produced or replaced in nature much more slowly than they are consumed by mankind. The main non-renewable sources are coal, oil, natural gas and peat, and they are also called ‘hydrocarbons’ or ‘fossil fuels’. Non-renewable energy sources also include radioactive metals (uranium, plutonium, and others), which are used to generate nuclear power.

172
Renewable energy sources draw energy from processes that occur continuously in nature. Sun-light, wind, flowing water, rain, tides and heat rising from the earth can provide huge amounts of energy. What is more, these resources are practically inexhaustible: they will only run out in the unthinkably distant future when our solar system itself completes its life cycle.Biomass (plant fibre, animal waste, and charcoal derived from wood, which was widely used in the past) is also a renewable source of energy, as it is quickly replaced in nature.
3.1.3. | Fossil fuels
The evolution of living organisms on our planet progresses from the simple to the complex. There was a time when Earth was inhabited by simple organisms and plants, which absorbed the sun's energy and transformed it into live weight - into themselves. And the traces of their existence is still with us today: the energy gathered by these life forms, our predecessors, has not disappeared but continues to live in what we call ‘fossil fuels’, which are substances that have been formed from the remains of dead organisms. Crude oil, natural gas, coal and peat are fossil fuels.
Fossils fuels are the legacy of living beings that came before us on Earth and we should treat them sparingly and with gratitude. We must remember that no legacy is ever infinite. If we spend it unthinkingly, we will have nothing to leave to our children.
The combustion of hydrocarbon fuels – coal, oil or natural gas – can produce electricity. This process occurs at thermal power plants. The engine room of a thermal power plant is fitted with a boiler and the combustion of fuel heats the water in this boiler, converting it into steam. The vapour pressure of the steam makes the blade of a turbine rotate and the turbine then drives a generator, which generates electric current. The electricity is carried to homes and otherfacilities by power lines (Fig. 3.1.3).
Hydrocarbon energy sources (fossil fuels) are crude oil, coal, natural gas (including shale gas produced from coal and shale formations), shale oil and other flammable substances and minerals produced by underground or open-cast mining. Fossil fuels are formed over millions of years in the Earth's crust from the remains of living organisms. Their combustion extracts and uses their thermal energy.
+2 оС
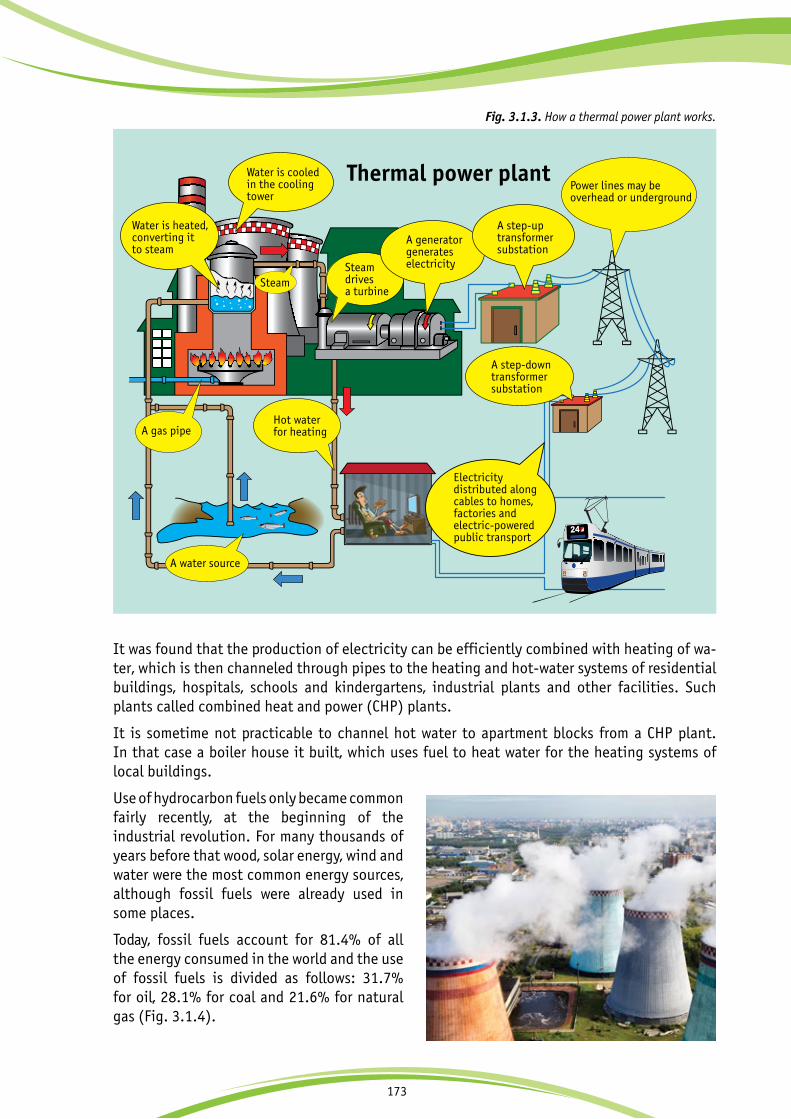
173
Water is cooledin the coolingtower
Water is heated,converting itto steam
Steamdrivesa turbine
Power lines may beoverhead or underground
A generatorgenerateselectricity
A step-uptransformersubstation
A step-downtransformersubstation
Hot waterfor heating
A water source
Steam
A gas pipe
Thermal power plant
Electricitydistributed alongcables to homes, factories andelectric-poweredpublic transport
Fig. 3.1.3. How a thermal power plant works.
It was found that the production of electricity can be efficiently combined with heating of wa-ter, which is then channeled through pipes to the heating and hot-water systems of residentialbuildings, hospitals, schools and kindergartens, industrial plants and other facilities. Such plants called combined heat and power (CHP) plants.
It is sometime not practicable to channel hot water to apartment blocks from a CHP plant.In that case a boiler house it built, which uses fuel to heat water for the heating systems oflocal buildings.
Use of hydrocarbon fuels only became commonfairly recently, at the beginning of theindustrial revolution. For many thousands of years before that wood, solar energy, wind and water were the most common energy sources,although fossil fuels were already used in some places.
Today, fossil fuels account for 81.4% of allthe energy consumed in the world and the useof fossil fuels is divided as follows: 31.7%for oil, 28.1% for coal and 21.6% for naturalgas (Fig. 3.1.4).
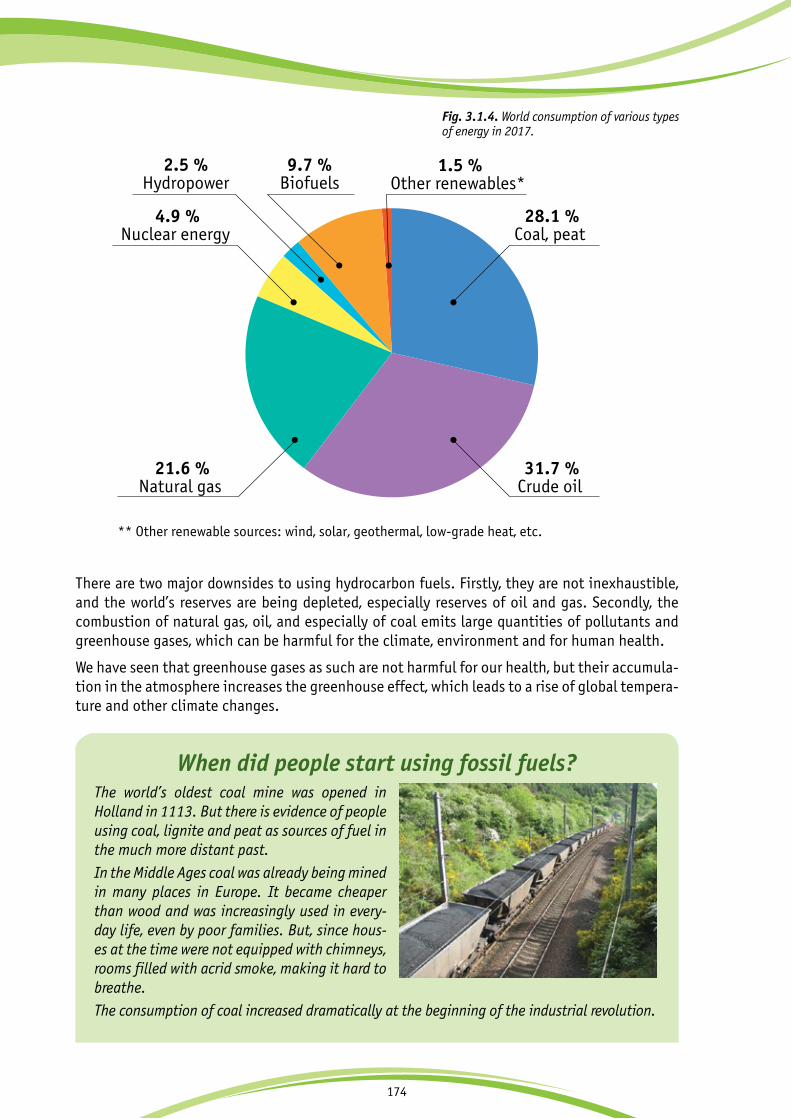
174
There are two major downsides to using hydrocarbon fuels. Firstly, they are not inexhaustible, and the world’s reserves are being depleted, especially reserves of oil and gas. Secondly, the combustion of natural gas, oil, and especially of coal emits large quantities of pollutants and greenhouse gases, which can be harmful for the climate, environment and for human health.
We have seen that greenhouse gases as such are not harmful for our health, but their accumula-tion in the atmosphere increases the greenhouse effect, which leads to a rise of global tempera-ture and other climate changes.
28.1 %Coal, peat
4.9 %Nuclear energy
2.5 %Hydropower
9.7 %Biofuels
1.5 %Other renewables*
31.7 %Crude oil
21.6 %Natural gas
** Other renewable sources: wind, solar, geothermal, low-grade heat, etc.
Fig. 3.1.4. World consumption of various types of energy in 2017.
When did people start using fossil fuels? The world’s oldest coal mine was opened in Holland in 1113. But there is evidence of people using coal, lignite and peat as sources of fuel in the much more distant past.
In the Middle Ages coal was already being mined in many places in Europe. It became cheaper than wood and was increasingly used in every-day life, even by poor families. But, since hous-es at the time were not equipped with chimneys, rooms filled with acrid smoke, making it hard to breathe.
The consumption of coal increased dramatically at the beginning of the industrial revolution.

175
Calculations by scientists have shown that the combustion of fossil fuels to produce energy substantially increases the greenhouse effect. For the sake of the climate, humanity must reduce consumption of hydrocarbons and use more climate-friendly sources of energy.
1,069
1,600
1,400
1,200
1,000
800
600
400
200
0 888 735 500
Gree
nhou
se g
as e
mis
sion
s(t
onne
s of
CO 2
-equ
ival
ent
per G
Wh)
Brown coal Black coal Oil Natural gas
Average volume of emissions.
Fig. 3.1.5. Emission of greenhouse gases from the use of various hydrocarbon sources of energy.
By the 19th century, 700 million tonnes of coal were being mined each year. Then people turned their attention to oil.
Crude oil was known to mankind since ancient times. How-ever, it only began to be used as a fuel in the middle of the 19th century after the American chemist Benjamin Silliman found that kerosene could be obtained from crude oil. The oil boom that followed was also driven by a new way of ex-tracting oil by means of boreholes instead of by simple dig-ging of wells.
Natural gas only came into widespread use as a fuel in the 20th century.
Table 3.1.
Pollutant emissions into the atmosphere from power plants using various fossil fuels in the European Union (grammes/gigajoule)
Fossil fuel type Dust Carbon monoxide (CO)
Nitrous oxide (NOx)
Sulphur dioxide (SO2)
Brown coal 3,254 89 183 1,361
Black coal 1,203 89 292 765
Oil 16 16 195 1,350
Natural gas 0.1 15 93 1

176
3.1.4. | Nuclear energy
Nuclear power plants produce almost zero greenhouse gas emissions. Could they be the answer to the climate change problem?
As time has passed, science has looked ever deeper into the structure of matter. First, it was found that all substances consist of many similar particles, called molecules. Then it wasdiscovered that the molecules themselves are constructed from a set of atoms. Different types of atoms were called ‘chemical elements’. They were numbered and listed in a table: Mende-leyev’s table of the elements.
Under certain conditions the molecules of various substances can break down into their atoms and form the molecules of new substances in a process called a ‘chemical reaction’. During a chemical reaction the energy that held the atoms together is released. The new compounds may require more or less energy, so that the chemical reaction may absorb energy from the space around it of may give off energy into the space. The combustion of fossil fuel is a chemicalreaction that produces heat.
But what would happen if the intervention is not in the struc-ture of the molecule, but in that of the atom? Scientists have found that the atom also consists of particles: it has a nucleus, made of protons and neutrons welded tightly together, around which electrons revolve. The nuclei of some chemical elements can break up. This produces, firstly, a large amount of heat en-ergy (which can be collected and used), and secondly, special particles that are called radiation. This phenomenon is called ‘radioactive decay’ or ‘radioactivity’.
Radioactivity is part of the nature of our planet. Levels of naturalradioactivity vary from 5 to 20 micro-roentgen per hour in various regions of the world. Such low doses of radiation are harmless and even necessary for human beings and the whole natural environment. However, at higher doses radiation can become deadly!
Proton
Neutron
Electron
In 1975, experts in the USA made the first attempt to calculate the probability of serious accidents at nuclear power plants. They found that such an accident could happen once every 10,000 years. And yet it was only four years before just such an accident occurred at the Three Mile Island nuclear power plant near the town of Harrisburg in the USA. Immedi-ate damage from the accident was estimated at 1 billion US dollars and indirect damage at100 billion US dollars, although only a few people were affected by radiation leakage. Sevenyears later, an accident occurred at a nuclear power station near the town of Chernobyl in the former Soviet Union, where nuclearscientists had also insisted that it could only happen once every 10,000 years.
Klaus Taube, the former head of the Germancompany, Interatom, has said that anystatistical estimates of the probability of an accident with meltdown of nuclear fuelelements has to be regarded as pseudo-scientific nonsense.
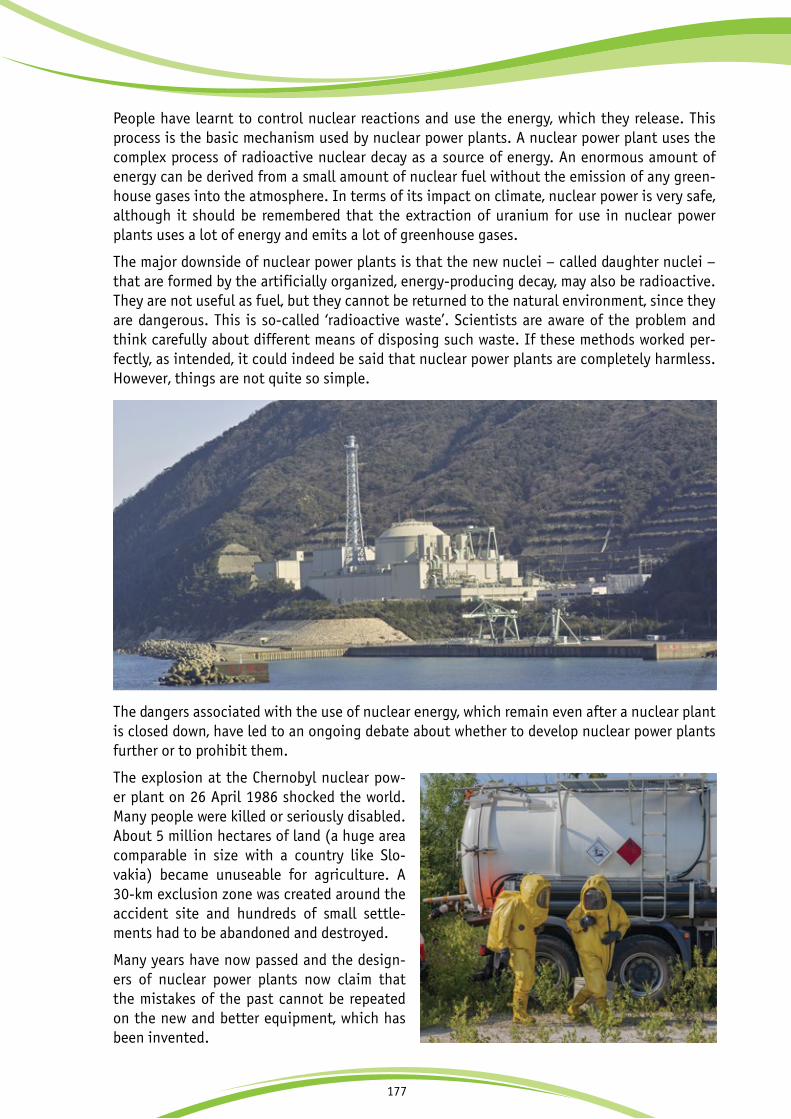
177
People have learnt to control nuclear reactions and use the energy, which they release. This process is the basic mechanism used by nuclear power plants. A nuclear power plant uses the complex process of radioactive nuclear decay as a source of energy. An enormous amount of energy can be derived from a small amount of nuclear fuel without the emission of any green-house gases into the atmosphere. In terms of its impact on climate, nuclear power is very safe, although it should be remembered that the extraction of uranium for use in nuclear power plants uses a lot of energy and emits a lot of greenhouse gases.
The major downside of nuclear power plants is that the new nuclei – called daughter nuclei – that are formed by the artificially organized, energy-producing decay, may also be radioactive. They are not useful as fuel, but they cannot be returned to the natural environment, since they are dangerous. This is so-called ‘radioactive waste’. Scientists are aware of the problem and think carefully about different means of disposing such waste. If these methods worked per-fectly, as intended, it could indeed be said that nuclear power plants are completely harmless. However, things are not quite so simple.
The dangers associated with the use of nuclear energy, which remain even after a nuclear plant is closed down, have led to an ongoing debate about whether to develop nuclear power plants further or to prohibit them.
The explosion at the Chernobyl nuclear pow-er plant on 26 April 1986 shocked the world. Many people were killed or seriously disabled. About 5 million hectares of land (a huge area comparable in size with a country like Slo-vakia) became unuseable for agriculture. A 30-km exclusion zone was created around the accident site and hundreds of small settle-ments had to be abandoned and destroyed.
Many years have now passed and the design-ers of nuclear power plants now claim that the mistakes of the past cannot be repeated on the new and better equipment, which has been invented.

178
However, in current conditions, when the climate is undergoing major changes, it is not possible to predict what exceptional natural phenomena may occur. During the construction of nuclear power plants in Japan the frequent occur-rence of earthquakes in that country was, of course, taken into account. Nevertheless, on 11 March 2011, a powerful earthquake and resulting tsunami led to the failure of all systems for normal and emergency cooling of the reactor core at a Japanese nuclear power plant, and thermal explosions ensued. A large amount of radioactive material was released into the sea and the air, and the effect was felt in many countries. Levels of radiation on the coastline where the Fukushima-1 nuclear power plant is located still exceeded normal levels by more than 100 times three years after the accident. As many as 80,000 people had to be moved away from the area. Despite assurances from the Japanese authorities that the situation had stabilized, more radioactive substances entered groundwater beneath the station two years after the accident and their concentrations grew, and there was further leakage from radioactive water tanks.
Nuclear energy is powerful energy, but it is also dangerous. The devastation it can cause if it runs out of control means that it is neither safe, nor cheap.
3.1.5. | Renewable energy sources
As we have already seen, renewable energy sources use natural processes and resources that are either virtually inexhaustible or are relatively quickly and naturally restored. They include sunshine, wind, flowing water, tidal energy and the heat of the earth. All these kinds of energy are often called ‘alternative’ or ‘green’ because, in contrast with hydrocarbon fuels, they do no damage to the environment and climate. They also include biomass, although it is a special case, for various rea-sons.
According to the International Energy Agency, about 20% of world production of electric energy now comes from renewable sources. Experts have pre-pared various scenarios for the development of re-newable energy in the future. According to the most favorable scenario, up to 60% of all the electricity can be generated from climate-friendly renewable sources by 2050.
The sunThe sun is the energy source provided by nature herself for the creation of life on Earth. So why not seek ways of using the sun's energy directly? The midday sun heats every square metre of the earth with capacity of about one megawatt.
Any room with windows grows warm when the sun shines. If the sun is shining in at your window, but it is quite chilly inside the house, open your curtains and wipe any dust off the window glass, and the sun will bring a little more heat into your room. In the old days in European villages, people used wooden shutters on windows. In the daytime the window was opened to let in light and at night it was closed with shutters to keep the captured warmth inside the house.
Fig. 3.1.6. Plant producing biofuelfrom biomass.
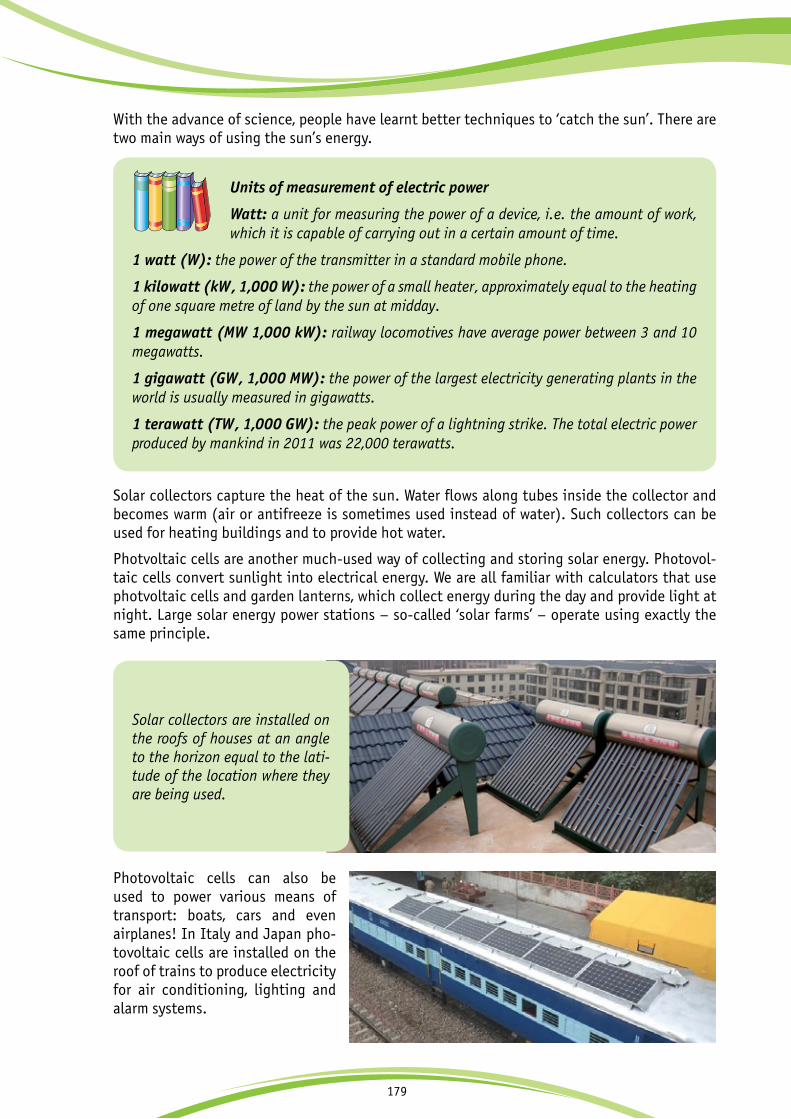
179
Photovoltaic cells can also be used to power various means of transport: boats, cars and even airplanes! In Italy and Japan pho-tovoltaic cells are installed on the roof of trains to produce electricity for air conditioning, lighting and alarm systems.
With the advance of science, people have learnt better techniques to ‘catch the sun’. There are two main ways of using the sun’s energy.
Solar collectors capture the heat of the sun. Water flows along tubes inside the collector and becomes warm (air or antifreeze is sometimes used instead of water). Such collectors can be used for heating buildings and to provide hot water.
Photvoltaic cells are another much-used way of collecting and storing solar energy. Photovol-taic cells convert sunlight into electrical energy. We are all familiar with calculators that use photvoltaic cells and garden lanterns, which collect energy during the day and provide light at night. Large solar energy power stations – so-called ‘solar farms’ – operate using exactly the same principle.
Units of measurement of electric power
Watt: a unit for measuring the power of a device, i.e. the amount of work, which it is capable of carrying out in a certain amount of time.
1 watt (W): the power of the transmitter in a standard mobile phone.
1 kilowatt (kW, 1,000 W): the power of a small heater, approximately equal to the heating of one square metre of land by the sun at midday.
1 megawatt (MW 1,000 kW): railway locomotives have average power between 3 and 10 megawatts.
1 gigawatt (GW, 1,000 MW): the power of the largest electricity generating plants in the world is usually measured in gigawatts.
1 terawatt (TW, 1,000 GW): the peak power of a lightning strike. The total electric power produced by mankind in 2011 was 22,000 terawatts.
Solar collectors are installed on the roofs of houses at an angle to the horizon equal to the lati-tude of the location where they are being used.

180
The main advantages of solar energy are that it is freely available, inexhaustible and safe. Solar installations do not emit greenhouse gases or pollutants, so this method of obtaining energy is harmless for the climate.
The disadvantages of solar energy are its strong dependence on the weather and time of day, and high construction costs due to the use of rare elements in solar panels. However, new technologies are gradually reducing the cost of solar installations and broadening the sphere of their application. There are problems associated with the disposal of used solar cells, since they contain some toxic substances. A market for the recycling of solar panels has not yet taken shape, and panels have useful lives of several decades. Another drawback is the consumption of energy and large amounts of clean water for the production of solar panels. Designers are work-ing on new, more environmentally friendly solar cells, and producers need to develop systems for the disposal and recycling of used panels.
Solar energy: hot water plus electricityUse of the sun’s heat to generate energy has long been common practice in countries with hot climates. In warm countries you can often see tanks of water on the roofs of houses, which are heated by sunlight to be used for everyday needs.
In Israel, every building has to be equipped with solar panels for water heating. The city of Freiburg in Germany is a showcase for the potential offered by solar power, which is used to meet the energy needs of whole neigh-bourhoods. Similar experiments are increasingly frequent all around the world.
Solar energy after sunset?The Solana power plant is located about 100 km south-east of the city of Phoenix in Arizona, USA. It can generate up to 280 MW of power using the rays of the sun and is one of the most powerful solar power plants in the world using parabolic mirror technology. But what makes the complex special is not its size, but its ability to continue generating electricity for 6 hours after the sun has gone down by means of special reservoirs that retain heat. This is a valuable feature, since the time after sun-set is the time of peak electricity consump-tion in the region.

181
Many experts view solar power as the energy of the future and as one of the main alternatives to traditional hydrocarbon energy sources. Governments in many countries support the devel-opment of solar energy, and private companies are investing much money in the construction of solar power plants. Although not renowned as a sunny country, Germany has become a world leader in the development of solar energy. Other leading countries in the field are Spain, Italy, France, the USA, Japan and China.
WindWind is another commonly used renewable energy source. The principle behind wind power is that mechanical energy (the energy of movement) can be converted into electrical energy. Min-iature windmills and wind-driven toys are fun to play with, but if you build huge wind turbines and place them together in a windy area, the rotation of turbines can generate electricity for public use.
Windmills were used since ancient times, but they became especially popular in medieval Europe. For a long time windmills and water mills were the only machines known to mankind. Windmills were mainly used to grind corn into flour, to process timber or for irrigation. In the Netherlands, windmills pumped water from land that had been reclaimed from the sea so that the land could be used for agriculture.
Modern wind turbines use a principle analogous to that of windmills.
Wind turbines are usually located in coastal areas, where there is constant wind, and it has recently become possible to build such installations at sea as well as on land. So-called ‘offshore wind farms’ are now built at a distance of 10–12 km or more from the coast. Wind turbine towers are set on pile foundations that are driven into the seabed to a depth of 30 m. The latest technolo-gies are for the construction of wind turbines installed on floating platforms.
The world’s largest offshore wind farmThe largest offshore wind farm in the world, called Walney Extension, has started operation in 2018. The wind farm is located at a distance of 14 km west of Walney Island in the Irish Sea, UK. The plant has total capacity of 659 MW and consists of 87 wind turbines. The wind farm has put an-other UK site – London Array, which was opened in 2013 – into the second place in the ranking of the world’s largest wind farms. London Array has 175 turbines and capacity of 630 MW.
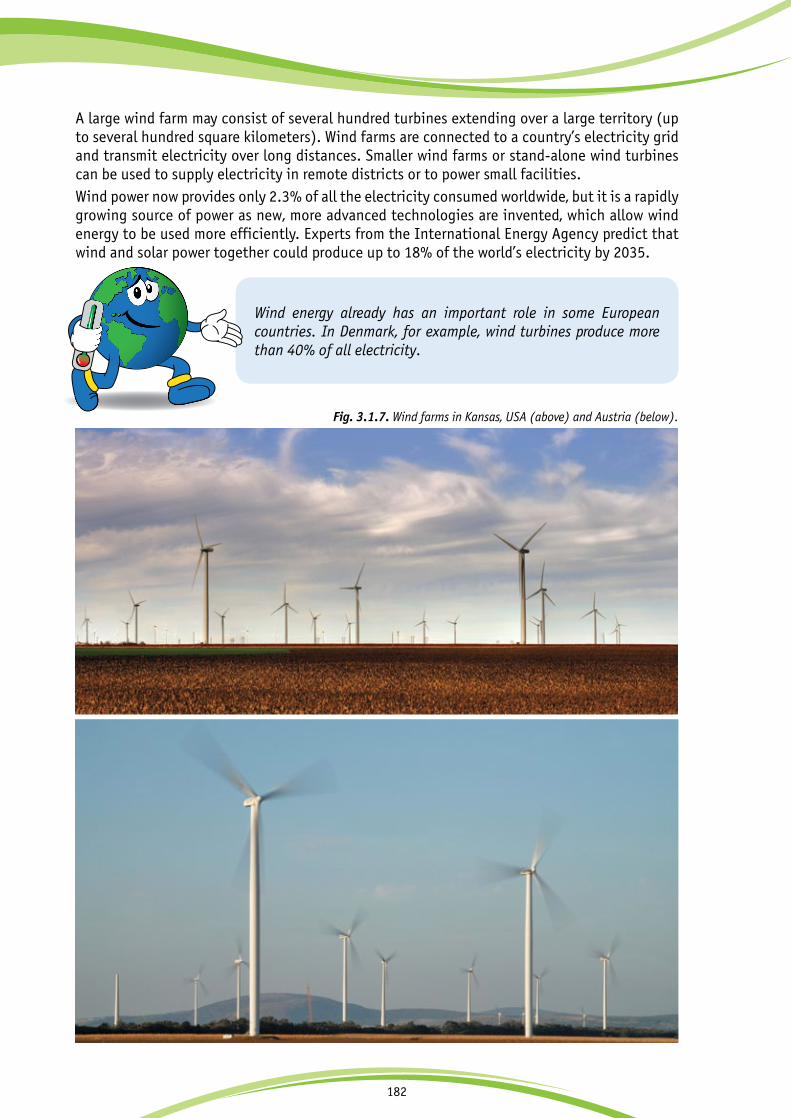
182
A large wind farm may consist of several hundred turbines extending over a large territory (up to several hundred square kilometers). Wind farms are connected to a country’s electricity grid and transmit electricity over long distances. Smaller wind farms or stand-alone wind turbines can be used to supply electricity in remote districts or to power small facilities.Wind power now provides only 2.3% of all the electricity consumed worldwide, but it is a rapidly growing source of power as new, more advanced technologies are invented, which allow wind energy to be used more efficiently. Experts from the International Energy Agency predict that wind and solar power together could produce up to 18% of the world’s electricity by 2035.
Wind energy already has an important role in some European countries. In Denmark, for example, wind turbines produce more than 40% of all electricity.
+2 оС
Fig. 3.1.7. Wind farms in Kansas, USA (above) and Austria (below).
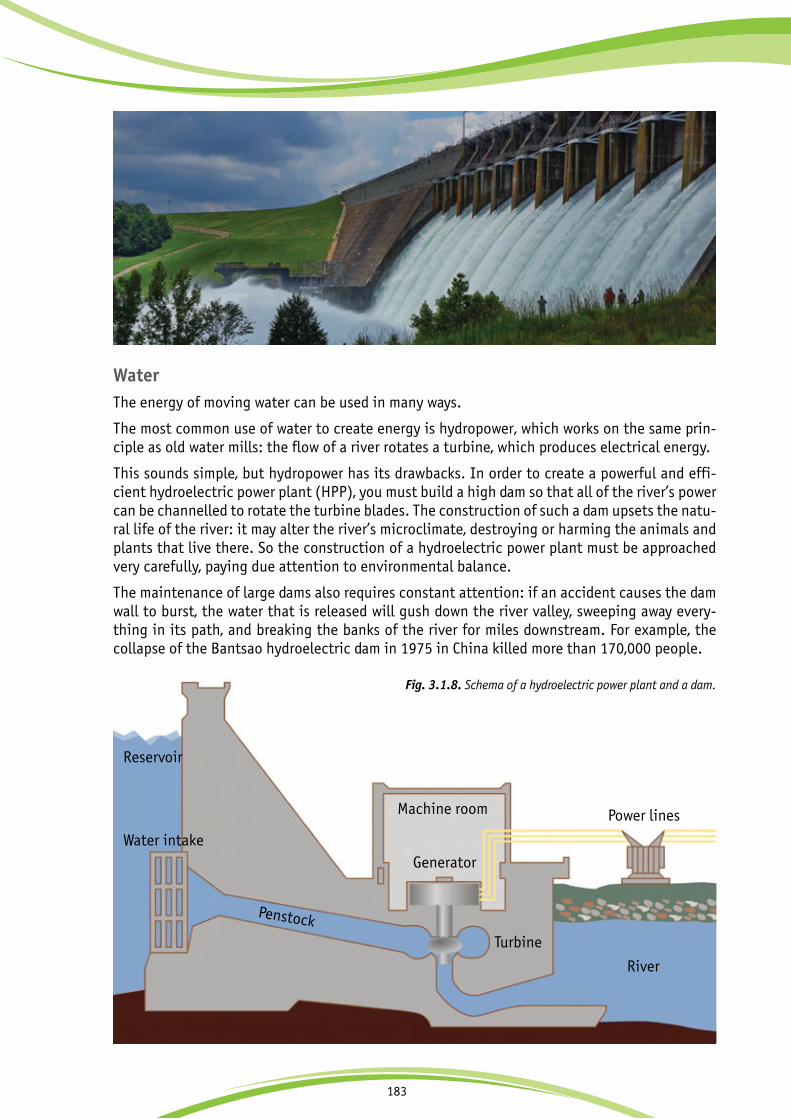
183
WaterThe energy of moving water can be used in many ways.
The most common use of water to create energy is hydropower, which works on the same prin-ciple as old water mills: the flow of a river rotates a turbine, which produces electrical energy.
This sounds simple, but hydropower has its drawbacks. In order to create a powerful and effi-cient hydroelectric power plant (HPP), you must build a high dam so that all of the river’s power can be channelled to rotate the turbine blades. The construction of such a dam upsets the natu-ral life of the river: it may alter the river’s microclimate, destroying or harming the animals and plants that live there. So the construction of a hydroelectric power plant must be approached very carefully, paying due attention to environmental balance.
The maintenance of large dams also requires constant attention: if an accident causes the dam wall to burst, the water that is released will gush down the river valley, sweeping away every-thing in its path, and breaking the banks of the river for miles downstream. For example, the collapse of the Bantsao hydroelectric dam in 1975 in China killed more than 170,000 people.
Power lines
River
Turbine
Generator
Machine room
Water intake
Reservoir
Penstock
Fig. 3.1.8. Schema of a hydroelectric power plant and a dam.

184
Small hydroelectric installations can operate with-out a dam (Fig. 3.1.9). They are built on small rivers or even on streams, and store energy in a battery. They have limited power but are adequate to meet the needs of a small farm or essential services at a wildlife reserve located by the river.
Hydropower is safer for the climate than the produc-tion of energy at thermal power plants and the cost of electricity generation at a hydropower plant is only about half of that at a thermal power plant. As a result many countries are trying to maximize the potential of their rivers for energy production and there are some countries where hydroelectricity provides 90% or even 100% of all electricity (Paraguay, Norway, Tajikistan, Uruguay, Uganda, Zambia, Cameroon and Brazil).
China has a strong commitment to hydroelectric power: up to half of all the world’s small hydropower plants have been built there as well as the biggest hydro plant in the world – the Three Gorges plant on the Yangtze River with capacity of 22.5 GW (Fig. 3.1.10). An even bigger plant, called Grand Inga, with capacity of 39 GW is planned on the Congo River in the Democratic Republic of Congo in Africa.
Fig. 3.1.9. Small hydropower plant on the Kokra river (Slovenia).
Fig. 3.1.10. Three Gorges hydropower plant (China).Fig. 3.1.11. Yacyreta Dam on the Parana river (Paraguay, Argentina)
Wave power stations use the energy of waves in the ocean, which is essentially the energy of a float bobbing up and down on the sea. Thus the churning power of the ocean, so dreaded by sailors in the past, can be made to serve us. The power of the waves is dozens of time greater than that of the wind, if it can be harnessed.
Tidal power plants use the extraordinary phenomenon of tides. All of the planets, stars and other celestial bodies are linked by gravity and affect one another. Earth revolves around the Sun and around its own axis, the Moon revolves around Earth, and the respective positions of the Sun, Earth and Moon change all the time. This affects the ocean.
A dam is built at a point across a bay where tides are strong. Initially it prevents the rising water level from entering the bay, until tide level is close to its maximum point. Then a valve is opened, and the ocean water rushes through with great force, turning a rotor. When the water level on both sides of the dam has equalized, the valve is closed again. When the time of low tide comes and the ocean is in full retreat, the trapped water presses to leave the bay, and is allowed back out through the valve, turning the rotor once again.

185
Geothermal energyGeothermal energy uses heat produced by the earth. It cannot strictly be called ‘renewable’, but the stocks of heat in the depths of our planet are immense. Evidence of the heat contained in the earth is visible in areas of volcanic activity, where hot underground water sometimes rises through cracks in the earth's surface and occasionally bursts upwards in the form of jets of wa-ter and steam known as ‘geysers’.
The world's largest tidal power plant is in France, at the mouth of the Rance River. It was also the first tidal power station in the world when it was built in 1967. The difference in level between high and low tide in this part of France averages 8 m and can be as great as 12 m. The plant has 24 generators with diameter of 5.35 m, each weighing 470 tonnes, capable of producing 240 MW of energy in total.
Experiments using wave energy have been attempted since the end of the 18th century: the first patent for a mill driven by wave power was taken out in 1799. But a long time was to pass before this form of power could be used on a large scale. The first wave power station was officially opened in 2008 in the Agucadoura region of Portugal, at a distance of 5 km from the coast. The station has 2.25 MW capacity.
In 2013 a Russian company presented the first Russian design for a system to generate elec-tricity from wave energy. The system is intended for mass production.

186
A borehole can be drilled to hot underwater lakes and their water can be used for heating or electricity generation, and also as a supply of hot water (if the chemical composition of the water is suitable). The particular difficulty associated with hydrothermal energy is that used water must be returned to the ground, since it often contains chemicals that would be harmful if released into rivers and lakes. Another problem is that use of water from underground lakes leaves voids, which could lead to surface subsidence.
Another possibility is to pump ordinary water from the surface via a borehole into hot zones under the ground, where it is heated by a ‘natural boiler’ to boiling point and returns to the surface through an adjacent borehole in the form of steam. This is called petrothermal energy. Petrothermal projects have been developed in the USA, Australia, Japan, Germany and France.
Низкопотенциальное тепло Существует прибор, который способен превращать слабое тепло в сильное. «Брат» этого прибора стоит почти в каждой квартире – это Low-grade heatThere is a device, which is capable of converting weak heat into strong heat. A close relative of this device – a re-frigerator – is to be found in almost every apartment.
Refrigerators rely on several princi-ples for their proper functioning. The
The most powerful and best-known group of geothermal power plants are located north of San Francisco in the United States. It is called ‘the Geysers’ and consists of 22 geothermal power plants with a to-tal installed capacity of 1,517 MW.
In the Philippines and Iceland, both countries with major active volcanoes, geothermal power plants provide about one quarter of all electricity consumption. New Zealand, Indonesia, Japan and Italy also make extensive use of geothermal energy.
Fig. 3.1.12. A pipe at a geothermal power station.

187
key principle is this: a liquid cooling agent (the refrigerant) absorbs heat from inside the refrigerator and a compressor then sucks and compresses the cooling agent under pressure, outside the refrigerator, so that (in ac-cordance with the laws of physics) the absorbed heat is emitted into the air of the room where the refrigerator is kept. This is why if we touch the outside rear part of a refrigerator, we find that it is hot. It is also the rea-son why a refrigerator should stand away from heating appliances and not directly in the sun – because it is important that the heat, which it emits, is quickly dissipated in the surrounding air and not retained on the exter-nal walls of the refrigerator.
The point of a refrigerator is to retain cold and get rid of heat, but the same operation can also be carried out in reverse, so that heat is retained and cold is discarded. A device which does this is called a heat pump. Heat pumps can absorb heat from weakly heated liquid, air or other substances. They can also ‘take up’ the heat of the earth at shallow depths. If in the winter you pass the warm air coming from your apartment or the used warm water draining out of the bath through a heat pump, a substantial part of the outgoing heat can be returned back to your apartment. How-ever, a heat pump cannot heat water to a very high temperature. The upper limit is usually no more than 50 or 60 °C, so it is used not as a self-sufficient energy source, but as supplement, which makes it possible to reduce fuel consumption for heating.BiomassThe living plants that we see around us today are using photosynthesis to accumulate energy from the sun in their bodies. A bonfire or the fire in a fireplace warms us, because a tree that people cut down for firewood spent years capturing energy from the sun and gathering carbon dioxide from the air. Trees have worked for us storing up energy when they were alive, and they finally yield that energy to us when they burn in a fire.
It takes nature several hundred million years to create fossil fuels, so (at the rate we are using them) they are not being replaced. But biomass fuel can be easily replaced: if we cut down an old tree for fuel, we can plant a new one in its place, and in a few decades it will grow into a new tree. Some of the plants and agricultural crops that are used to make fuel grow in one summer or even faster.
The concept of heat pumps was developed in the 19th century by the British scientist, William Thomson (Lord Kelvin) and was further improved by the Austrian, Peter Ritter von Rittinger. But the most important practical application of heat pumps was only developed later, in the 20th century. An inventor, R. Weber, who was carrying out experiments with a freezer chamber, touched the hot pipe of the chamber and began to wonder how this heat could be used. He thought of using the hot pipe to heat water, but that produced too much hot water, so he instead made a pipe coil to warm the air in the house. Then the inventor found a way of pumping heat from the ground. Soon he was able to sell the old coal burner, which his family had relied on, as it was no longer needed!
The British physicist, William Thomson (Lord Kelvin).
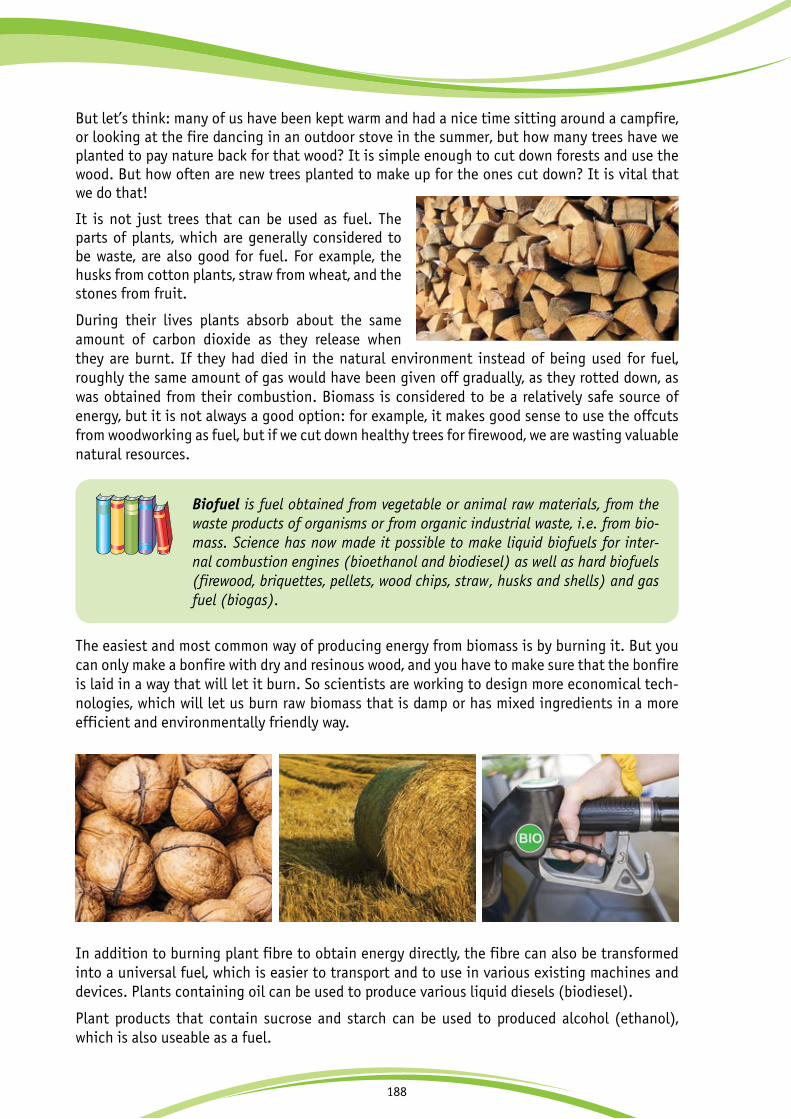
188
But let’s think: many of us have been kept warm and had a nice time sitting around a campfire, or looking at the fire dancing in an outdoor stove in the summer, but how many trees have we planted to pay nature back for that wood? It is simple enough to cut down forests and use the wood. But how often are new trees planted to make up for the ones cut down? It is vital that we do that!
It is not just trees that can be used as fuel. The parts of plants, which are generally considered to be waste, are also good for fuel. For example, the husks from cotton plants, straw from wheat, and the stones from fruit.
During their lives plants absorb about the same amount of carbon dioxide as they release when they are burnt. If they had died in the natural environment instead of being used for fuel, roughly the same amount of gas would have been given off gradually, as they rotted down, as was obtained from their combustion. Biomass is considered to be a relatively safe source of energy, but it is not always a good option: for example, it makes good sense to use the offcuts from woodworking as fuel, but if we cut down healthy trees for firewood, we are wasting valuable natural resources.
The easiest and most common way of producing energy from biomass is by burning it. But you can only make a bonfire with dry and resinous wood, and you have to make sure that the bonfire is laid in a way that will let it burn. So scientists are working to design more economical tech-nologies, which will let us burn raw biomass that is damp or has mixed ingredients in a more efficient and environmentally friendly way.
Biofuel is fuel obtained from vegetable or animal raw materials, from the waste products of organisms or from organic industrial waste, i.e. from bio-mass. Science has now made it possible to make liquid biofuels for inter-nal combustion engines (bioethanol and biodiesel) as well as hard biofuels (firewood, briquettes, pellets, wood chips, straw, husks and shells) and gas fuel (biogas).
In addition to burning plant fibre to obtain energy directly, the fibre can also be transformed into a universal fuel, which is easier to transport and to use in various existing machines and devices. Plants containing oil can be used to produce various liquid diesels (biodiesel).
Plant products that contain sucrose and starch can be used to produced alcohol (ethanol), which is also useable as a fuel.

189
Fermentation is another way to use biomass.
Farm animals, which eat and digest plants, produce manure, which can also be used to gener-ate energy. If manure and food waste is collected together in a closed container and the con-tainer is heated to 50–60 °C, bacteria will break down the organic matter to produce methane gas, which can be collected and used as fuel.
Amazing sources of energyAustralia now has the world's first electric generating fa-cility, that uses nutshells as a fuel. Its construction cost 3 million Australian dollars, but it should pay for itself quite quickly: the high-performance power plant can process up to 1680 kg of nutshells per hour to producing 1.5 MW of electricity.
Indian scientists have come up with another alternative energy source, using bananas, other fruits and vegetables, and their inedible parts (peel, seeds). Four batteries powered by these fuels can operate a wall clock, an electronic game or a pocket calculator. The novelty is designed primarily for people in rural areas who have an abundance of their own fruit and vegetables to recharge the batteries.
There is even a prospect that people in the not too distance future will be able to generate electricity from the movement of their own bodies. US researchers are developing special shoes with plastic inserts: when the person is walking his foot alternately presses and releases the insert, causing it to shrink and expand. This movement can be used to generate up to 3 watts of electricity, which is enough to listen to the radio or to music as you walk, saving on batteries.
Brazil is among world leaders in the production and use of ethanol from sugar cane. Etha-nol currently meets 18% of the country's automotive fuel needs.
Fig. 3.1.13. Bioethanol plantin Brazil.
Fig. 3.1.14. At a filling station in Brazil you can fill your car with biofuel.
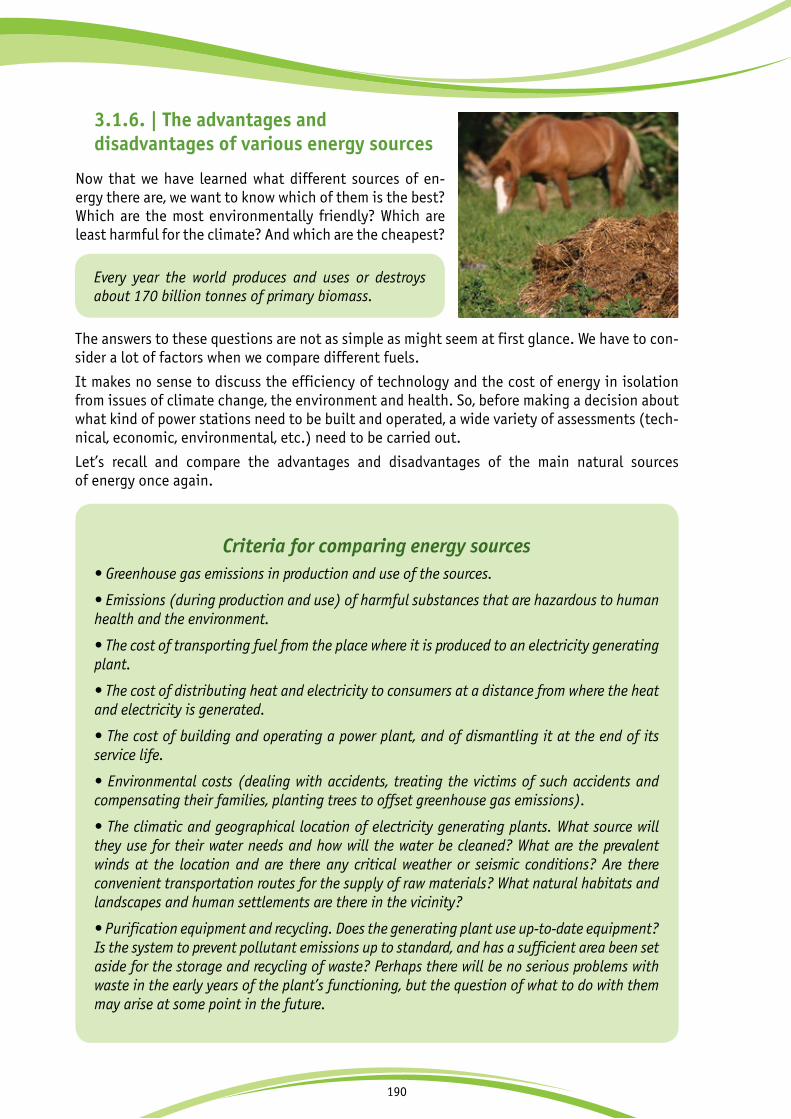
190
3.1.6. | The advantages and disadvantages of various energy sources
Now that we have learned what different sources of en-ergy there are, we want to know which of them is the best? Which are the most environmentally friendly? Which are least harmful for the climate? And which are the cheapest?
Every year the world produces and uses or destroys about 170 billion tonnes of primary biomass.
Criteria for comparing energy sources• Greenhouse gas emissions in production and use of the sources.
• Emissions (during production and use) of harmful substances that are hazardous to human health and the environment.
• The cost of transporting fuel from the place where it is produced to an electricity generating plant.
• The cost of distributing heat and electricity to consumers at a distance from where the heat and electricity is generated.
• The cost of building and operating a power plant, and of dismantling it at the end of its service life.
• Environmental costs (dealing with accidents, treating the victims of such accidents and compensating their families, planting trees to offset greenhouse gas emissions).
• The climatic and geographical location of electricity generating plants. What source will they use for their water needs and how will the water be cleaned? What are the prevalent winds at the location and are there any critical weather or seismic conditions? Are there convenient transportation routes for the supply of raw materials? What natural habitats and landscapes and human settlements are there in the vicinity?
• Purification equipment and recycling. Does the generating plant use up-to-date equipment? Is the system to prevent pollutant emissions up to standard, and has a sufficient area been set aside for the storage and recycling of waste? Perhaps there will be no serious problems with waste in the early years of the plant’s functioning, but the question of what to do with them may arise at some point in the future.
The answers to these questions are not as simple as might seem at first glance. We have to con-sider a lot of factors when we compare different fuels.
It makes no sense to discuss the efficiency of technology and the cost of energy in isolation from issues of climate change, the environment and health. So, before making a decision about what kind of power stations need to be built and operated, a wide variety of assessments (tech-nical, economic, environmental, etc.) need to be carried out.
Let’s recall and compare the advantages and disadvantages of the main natural sources of energy once again.

191
Oil
Oil is very easy to use, it can be transported over long distances through pipelines as well as in tanks. Oil is used for the production of rubber, plastics, dyes, detergents and other products.
Oil reserves are being depleted and the costs of producing oil are on the increase. Oil is highly flammable, and spillages of oil are disastrous for the environment, since it covers all living things with a thin film that is highly destructive for ecosystems. Such a spill in a river or the sea can spread over great distances. The combustion of oil produces large amounts of CO2.
Coal
Coal is a universal fuel: it can be used in any climate, at large and small power plants and even to heat water in boilers. It can be transported safely in open wagons, since it is not explosive.
Coal is the ‘dirtiest’ fuel for power generating. A coal-fired power plant with 1 MW capacity emits 36.5 billion m3 of hot gases containing dust and harmful substances each year. It also produces a large amount of ash, that has to be stored. And, most importantly, the amount of CO2 emissions from coal-fired power plants per unit of energy produced is the biggest in comparison with other hydrocarbon energy sources. Coal mining is also a dangerous business. The release of natural gases underground can lead to explosions that are fatal for coal miners. The salty and dirty water that is pumped out of coal mines often finds its way into rivers and lakes (on average 3 tonnes of water has to be pumped out per tonnee of coal produced), doing harm to plants and animals, and polluting local water and soil.
Natural gas
Natural gas is the cleanest and most environmentally friendly hydrocarbon fuel. It is easy to transport.
Gas is explosive, even in relatively small quantities. Greenhouse gas emissions from the combustion of natural gas are less than from other hydrocarbon fuels, but are still significant. Also, gas reserves are not infinite, although the development of shale gas technology has added to them.

192
Nuclear power
Nuclear power generation does not emit greenhouse gases. Stocks of nuclear fuel are quite large, since large amounts of energy can be obtained from a small amount of fuel.
Nuclear energy has to be produced at very large plants and can only be transported in the form of electricity (not heat), because the danger of radiation leaks makes it essential to position nuclear plants far away from any big city, where consumers of hot water and heat are concentrated. Nuclear power plants produce waste, which remains hazardous for many centuries and must therefore be disposed of in a special way. Although it produces zero greenhouse gas emissions, nuclear generating does produce spent, radioactive water. The main disadvantage of nuclear energy is that even minor accidents can have disastrous consequences.
The sun
Solar energy is renewable. It can be used in many places around the world. It produces no harmful pollutants or greenhouse gases.
Solar energy flows are uneven, additional batteries are needed to convert the energy flow at night or in cloudy weather. Solar cells remain expensive, although scientists are looking for ways to reduce the cost of their production. There are problems associated with the disposal of spent solar cells, since they contain harmful substances, and solar power plants take up large areas of land.
Wind
Wind power is renewable and produces no emissions of greenhouse gas and harmful pollutants.
Wind plants need constant strong wind. Additional batteries and transformers are required for a wind farm to be able to function during light wind. The rotation of the blades creates vibrations and noise that can frighten animals and create an annoyance to people, who may also object to the sight of giant windmills, which completely change the landscape. A system is also need to scare away birds, which could otherwise fall into the spinning blades.
Water
Hydropower, tidal power and wave power are renewable, freely available and create no emissions of greenhouse gases and pollutants.
Water power can only be produced where there are water bodies. The construction of large hydropower plants requires flooding of the land around the reservoir, which is a very difficult and expensive process. Construction of hydroelectric plants has negative impact on river and coastal ecosystems. Accidents at hydropower plants can lead to flooding of towns and villages downstream from the plant.
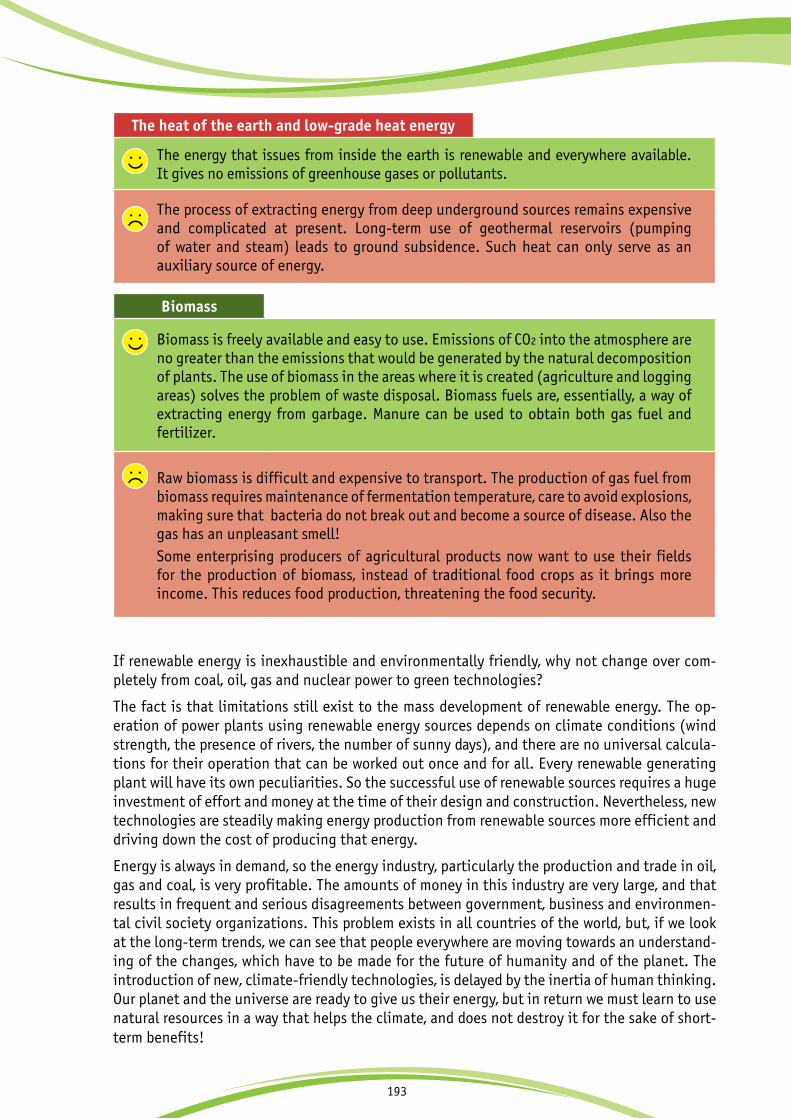
193
Biomass
Biomass is freely available and easy to use. Emissions of CO2 into the atmosphere are no greater than the emissions that would be generated by the natural decomposition of plants. The use of biomass in the areas where it is created (agriculture and logging areas) solves the problem of waste disposal. Biomass fuels are, essentially, a way of extracting energy from garbage. Manure can be used to obtain both gas fuel and fertilizer.
Raw biomass is difficult and expensive to transport. The production of gas fuel from biomass requires maintenance of fermentation temperature, care to avoid explosions, making sure that bacteria do not break out and become a source of disease. Also the gas has an unpleasant smell!Some enterprising producers of agricultural products now want to use their fields for the production of biomass, instead of traditional food crops as it brings more income. This reduces food production, threatening the food security.
The heat of the earth and low-grade heat energy
The energy that issues from inside the earth is renewable and everywhere available. It gives no emissions of greenhouse gases or pollutants.
The process of extracting energy from deep underground sources remains expensive and complicated at present. Long-term use of geothermal reservoirs (pumping of water and steam) leads to ground subsidence. Such heat can only serve as an auxiliary source of energy.
If renewable energy is inexhaustible and environmentally friendly, why not change over com-pletely from coal, oil, gas and nuclear power to green technologies?
The fact is that limitations still exist to the mass development of renewable energy. The op-eration of power plants using renewable energy sources depends on climate conditions (wind strength, the presence of rivers, the number of sunny days), and there are no universal calcula-tions for their operation that can be worked out once and for all. Every renewable generating plant will have its own peculiarities. So the successful use of renewable sources requires a huge investment of effort and money at the time of their design and construction. Nevertheless, new technologies are steadily making energy production from renewable sources more efficient and driving down the cost of producing that energy.
Energy is always in demand, so the energy industry, particularly the production and trade in oil, gas and coal, is very profitable. The amounts of money in this industry are very large, and that results in frequent and serious disagreements between government, business and environmen-tal civil society organizations. This problem exists in all countries of the world, but, if we look at the long-term trends, we can see that people everywhere are moving towards an understand-ing of the changes, which have to be made for the future of humanity and of the planet. The introduction of new, climate-friendly technologies, is delayed by the inertia of human thinking. Our planet and the universe are ready to give us their energy, but in return we must learn to use natural resources in a way that helps the climate, and does not destroy it for the sake of short-term benefits!
194
Questions
1. What sources of energy were used in ancient times?
2. What ways do you know of using solar panels?
3. List all of the factors you know that must be taken into ac-count if we are to determine the total cost of generating electric-ity from one or other source of energy.
4. Electric engines do not produce harmful emissions. So can we consider them to be the most environmentally friendly type of engine?
5. Flat solar cells are installed on the roofs of houses at an angle to the horizon equal to the latitude of the place where they are installed. Why do you think that is?
195
Task 1. ExperimentPurpose of the experiment: to built a light using renewable energy.
Materials: a transparent plastic bottle with water in it, a small table, blankets.
The experiment. Cover the table with blankets so that no light can penetrate into the little ‘house’ you have created under the table. Take the bottle of water and go right inside the little house. Push the bottle into the gap between the blankets. You now have a light bulb that lights up your dark house. A transparent plastic ruler, sandwiched between the palms of your hands, would give the same effect.
Task 2. Divide into groups by different ways of producing electricity. Each group should prepare a report to defend its way of pro-ducing energy, including information about problems associ-ated with all of the other ways.
Then prepare and hold a discussion about the benefits and harm caused by different types of power generating plants, making it relevant to the area where you live.
Tasks
+2 оС
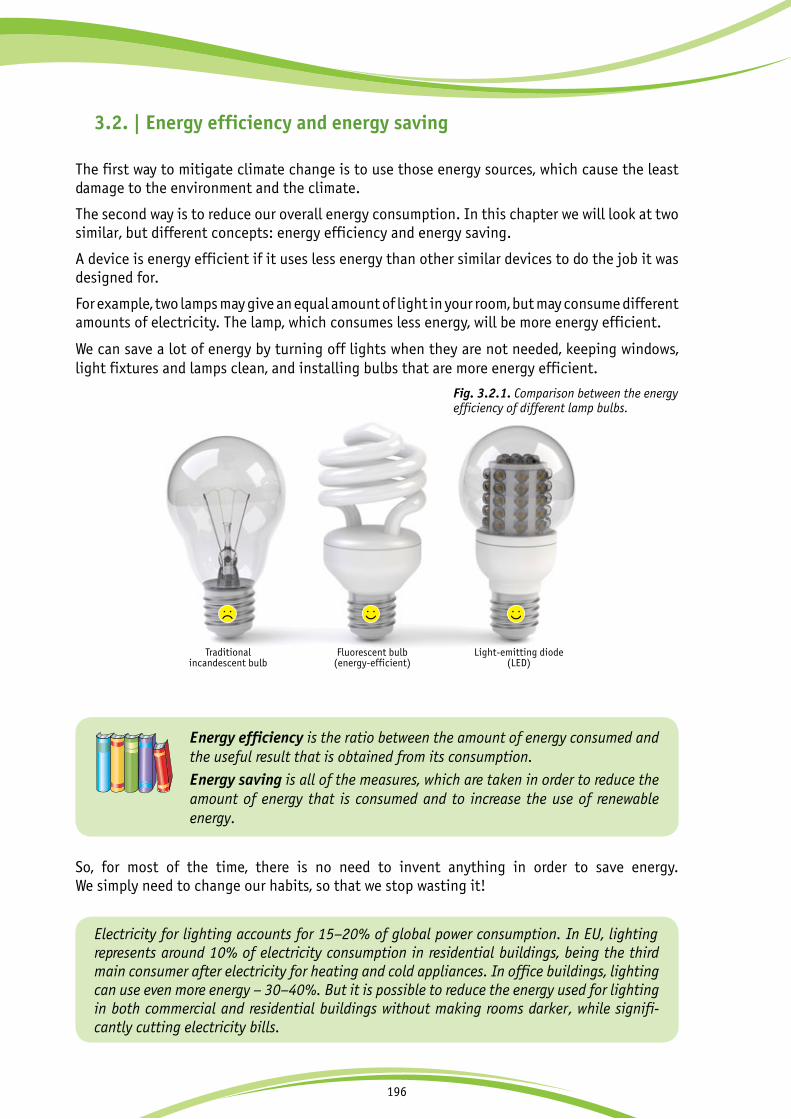
196
3.2. | Energy efficiency and energy saving
The first way to mitigate climate change is to use those energy sources, which cause the least damage to the environment and the climate.
The second way is to reduce our overall energy consumption. In this chapter we will look at two similar, but different concepts: energy efficiency and energy saving.
A device is energy efficient if it uses less energy than other similar devices to do the job it was designed for.
For example, two lamps may give an equal amount of light in your room, but may consume different amounts of electricity. The lamp, which consumes less energy, will be more energy efficient.
We can save a lot of energy by turning off lights when they are not needed, keeping windows, light fixtures and lamps clean, and installing bulbs that are more energy efficient.
Energy efficiency is the ratio between the amount of energy consumed and the useful result that is obtained from its consumption.
Energy saving is all of the measures, which are taken in order to reduce the amount of energy that is consumed and to increase the use of renewable energy.
Electricity for lighting accounts for 15–20% of global power consumption. In EU, lighting represents around 10% of electricity consumption in residential buildings, being the third main consumer after electricity for heating and cold appliances. In office buildings, lighting can use even more energy – 30–40%. But it is possible to reduce the energy used for lighting in both commercial and residential buildings without making rooms darker, while signifi-cantly cutting electricity bills.
So, for most of the time, there is no need to invent anything in order to save energy. We simply need to change our habits, so that we stop wasting it!
Fig. 3.2.1. Comparison between the energy efficiency of different lamp bulbs.
Traditionalincandescent bulb
Fluorescent bulb(energy-efficient)
Light-emitting diode(LED)
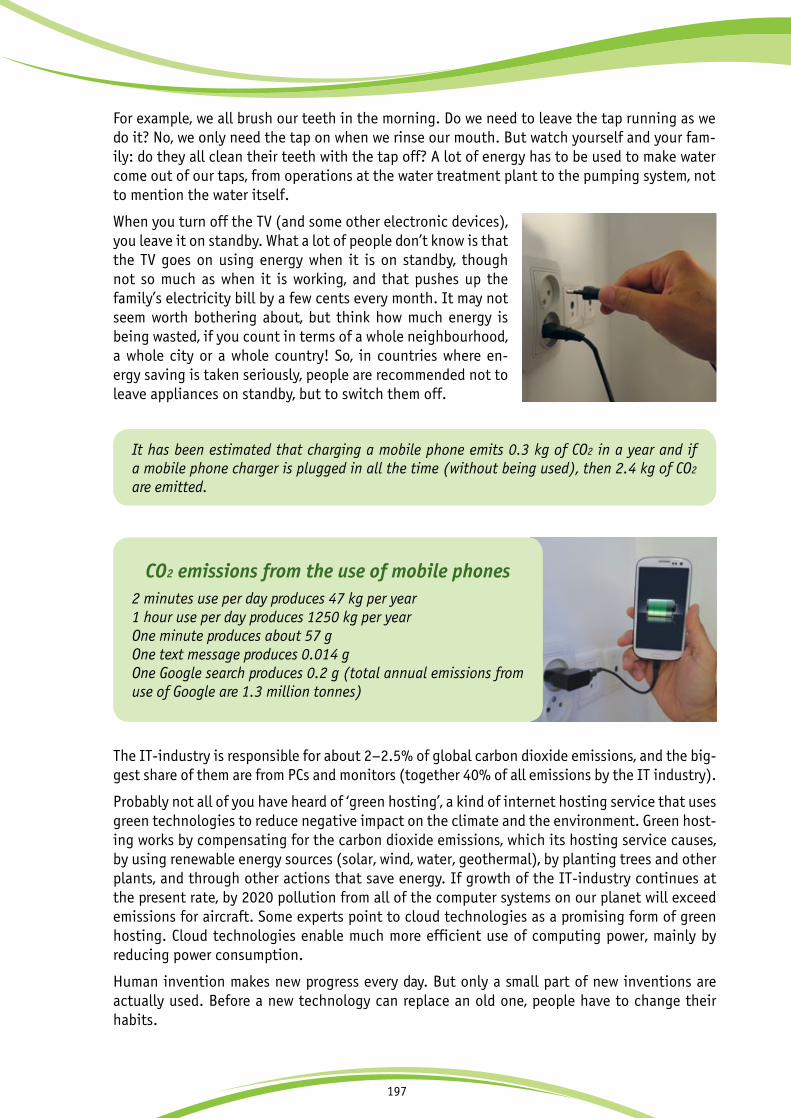
197
The IT-industry is responsible for about 2–2.5% of global carbon dioxide emissions, and the big-gest share of them are from PCs and monitors (together 40% of all emissions by the IT industry).
Probably not all of you have heard of ‘green hosting’, a kind of internet hosting service that uses green technologies to reduce negative impact on the climate and the environment. Green host-ing works by compensating for the carbon dioxide emissions, which its hosting service causes, by using renewable energy sources (solar, wind, water, geothermal), by planting trees and other plants, and through other actions that save energy. If growth of the IT-industry continues at the present rate, by 2020 pollution from all of the computer systems on our planet will exceed emissions for aircraft. Some experts point to cloud technologies as a promising form of green hosting. Cloud technologies enable much more efficient use of computing power, mainly by reducing power consumption.
Human invention makes new progress every day. But only a small part of new inventions are actually used. Before a new technology can replace an old one, people have to change their habits.
For example, we all brush our teeth in the morning. Do we need to leave the tap running as we do it? No, we only need the tap on when we rinse our mouth. But watch yourself and your fam-ily: do they all clean their teeth with the tap off? A lot of energy has to be used to make water come out of our taps, from operations at the water treatment plant to the pumping system, not to mention the water itself.
When you turn off the TV (and some other electronic devices), you leave it on standby. What a lot of people don’t know is that the TV goes on using energy when it is on standby, though not so much as when it is working, and that pushes up the family’s electricity bill by a few cents every month. It may not seem worth bothering about, but think how much energy is being wasted, if you count in terms of a whole neighbourhood, a whole city or a whole country! So, in countries where en-ergy saving is taken seriously, people are recommended not to leave appliances on standby, but to switch them off.
CO2 emissions from the use of mobile phones2 minutes use per day produces 47 kg per year 1 hour use per day produces 1250 kg per year One minute produces about 57 gOne text message produces 0.014 gOne Google search produces 0.2 g (total annual emissions from use of Google are 1.3 million tonnes)
It has been estimated that charging a mobile phone emits 0.3 kg of CO2 in a year and if a mobile phone charger is plugged in all the time (without being used), then 2.4 kg of CO2 are emitted.

198
The first thing is to find the time to get acquainted with the new invention.
Secondly, you need to spend money and effort to take out the old machine and replace it with a new one, and to teach people how to use it. This effort and money will certainly be repaid with profit, but not straight away, and not everyone wants to go to this trouble for a gain they will only receive in the future.
Thirdly, people who earn money by selling the old technology do not want to lose their business, particularly if it brought more money than the new technology. They might even do what they can to obstruct the new invention, preventing it being widely used, persuading people that it is harmful, or even threatening the inventor.
A summary of all energy-efficient technologies would require a thick volume. Whatever walk of life you follow in the future, good knowledge of the equipment you use and support for efforts to make it better will be all important. And you should remember that the way forward is not al-ways by making machines more efficient – a lot also depends on how people’s work is organized.
Energy efficiency and energy saving are very important. For families they mean savings on gas and electricity bills. For electricity companies they mean reduction of fuel costs, giving cheaper electricity. For the country they mean spending less on resources, and making industry more productive and competitive. For the climate they mean a reduction of greenhouse gas emis-sions into the atmosphere.
Cloud technologiesIt is not only the real world that is changing, but also the virtual world. Internet users have recently been given a new tool, called ‘cloud computing’, which is already used by Facebook, Twitter, and the ‘engines’ that drive services such as Google Docs, Gmail and the like.
Most websites and server applications run on specific computers or servers. The сloud is a network of computers constituting a system that lets people use certain applications or store data. You could call it a global, virtual computer where applications run independently of each individual computer with its specific configuration.
As broadband Internet develops, it becomes less and less important to have an application installed on your own computer. Because all ‘clouds’ are configured to work together, the total power of these computers is available to the applications as if the application was running on just one individual computer. An increasing share of today's software is based on web technologies, and ‘clouds’ are just taking up the baton in order to lift the advantages of web applications to a new level.
CLOUD
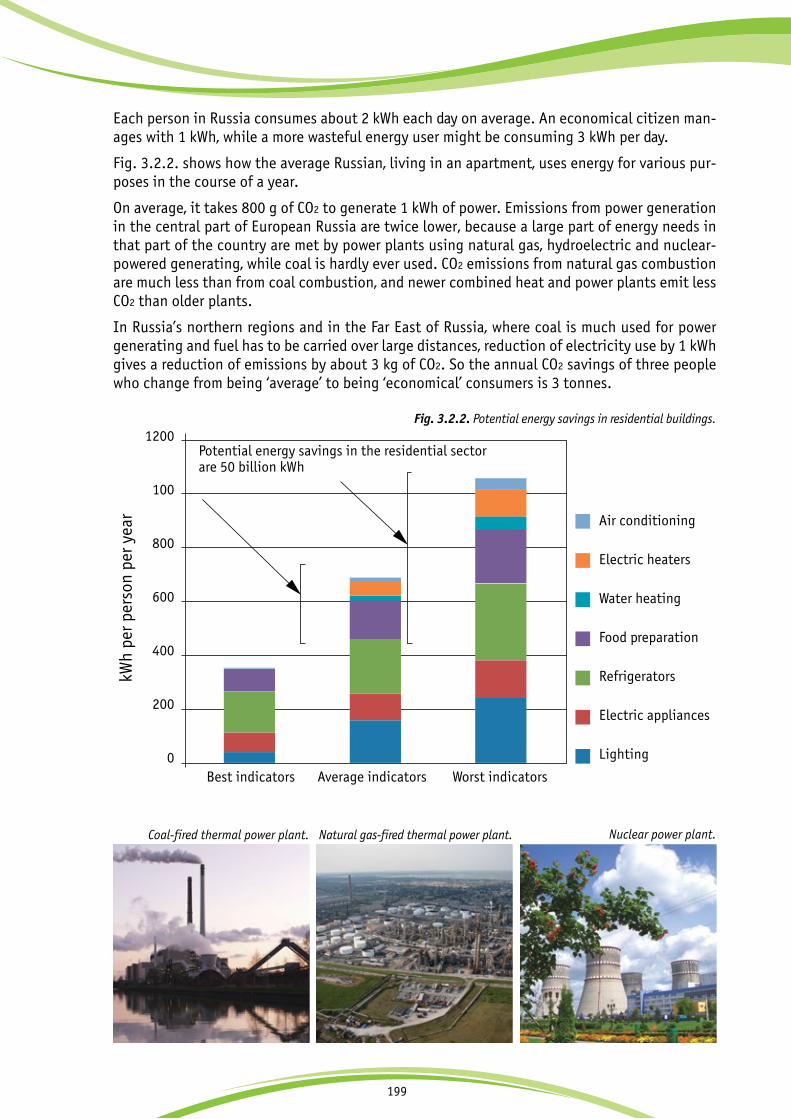
199
Each person in Russia consumes about 2 kWh each day on average. An economical citizen man-ages with 1 kWh, while a more wasteful energy user might be consuming 3 kWh per day.
Fig. 3.2.2. shows how the average Russian, living in an apartment, uses energy for various pur-poses in the course of a year.
On average, it takes 800 g of CO2 to generate 1 kWh of power. Emissions from power generation in the central part of European Russia are twice lower, because a large part of energy needs in that part of the country are met by power plants using natural gas, hydroelectric and nuclear-powered generating, while coal is hardly ever used. CO2 emissions from natural gas combustion are much less than from coal combustion, and newer combined heat and power plants emit less CO2 than older plants.
In Russia’s northern regions and in the Far East of Russia, where coal is much used for power generating and fuel has to be carried over large distances, reduction of electricity use by 1 kWh gives a reduction of emissions by about 3 kg of CO2. So the annual CO2 savings of three people who change from being ‘average’ to being ‘economical’ consumers is 3 tonnes.
1200
100
800
600
400
200
0Best indicators Average indicators
kWh
per p
erso
n pe
r yea
r
Worst indicators
Potential energy savings in the residential sectorare 50 billion kWh
Air conditioning
Electric heaters
Water heating
Food preparation
Refrigerators
Electric appliances
Lighting
Fig. 3.2.2. Potential energy savings in residential buildings.
Coal-fired thermal power plant. Natural gas-fired thermal power plant. Nuclear power plant.
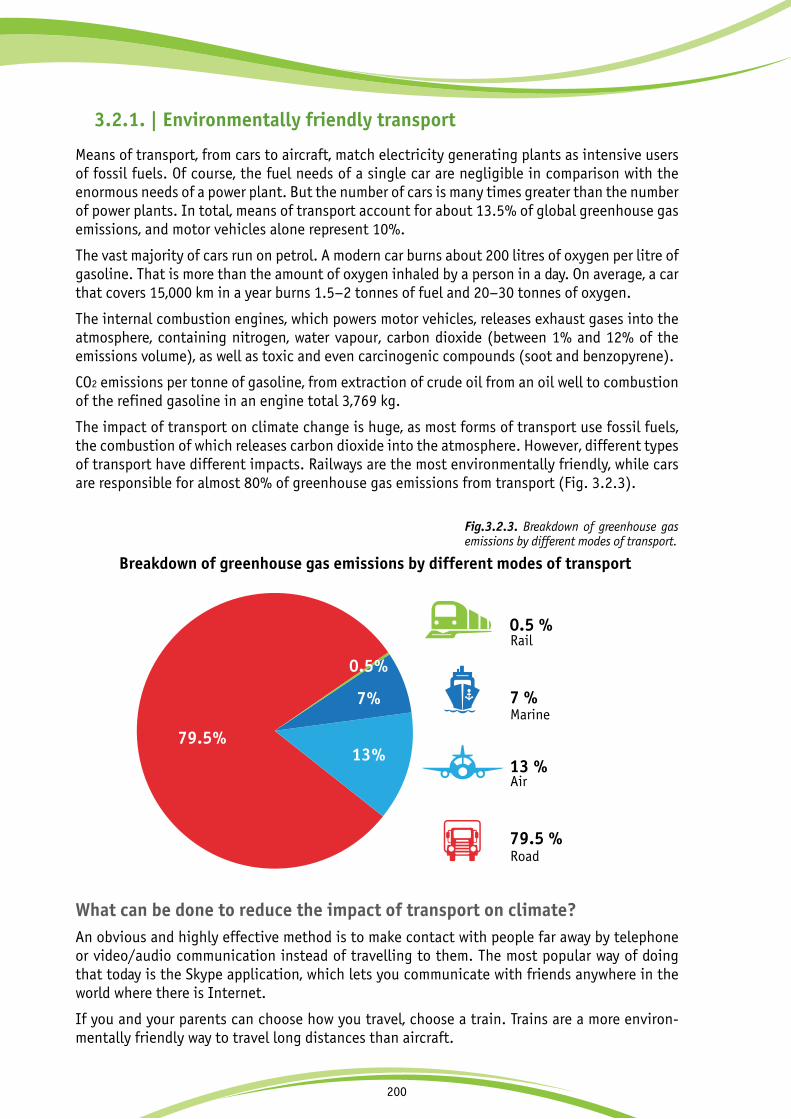
200
3.2.1. | Environmentally friendly transport
Means of transport, from cars to aircraft, match electricity generating plants as intensive users of fossil fuels. Of course, the fuel needs of a single car are negligible in comparison with the enormous needs of a power plant. But the number of cars is many times greater than the number of power plants. In total, means of transport account for about 13.5% of global greenhouse gas emissions, and motor vehicles alone represent 10%.
The vast majority of cars run on petrol. A modern car burns about 200 litres of oxygen per litre of gasoline. That is more than the amount of oxygen inhaled by a person in a day. On average, a car that covers 15,000 km in a year burns 1.5–2 tonnes of fuel and 20–30 tonnes of oxygen.
The internal combustion engines, which powers motor vehicles, releases exhaust gases into the atmosphere, containing nitrogen, water vapour, carbon dioxide (between 1% and 12% of the emissions volume), as well as toxic and even carcinogenic compounds (soot and benzopyrene).
CO2 emissions per tonne of gasoline, from extraction of crude oil from an oil well to combustion of the refined gasoline in an engine total 3,769 kg.
The impact of transport on climate change is huge, as most forms of transport use fossil fuels, the combustion of which releases carbon dioxide into the atmosphere. However, different types of transport have different impacts. Railways are the most environmentally friendly, while cars are responsible for almost 80% of greenhouse gas emissions from transport (Fig. 3.2.3).
0.5 %
0.5%
Rail
Marine
Air
Road
7 %7%
13 %13%
79.5 %
79.5%
Breakdown of greenhouse gas emissions by different modes of transport
Fig.3.2.3. Breakdown of greenhouse gas emissions by different modes of transport.
What can be done to reduce the impact of transport on climate?An obvious and highly effective method is to make contact with people far away by telephone or video/audio communication instead of travelling to them. The most popular way of doing that today is the Skype application, which lets you communicate with friends anywhere in the world where there is Internet.
If you and your parents can choose how you travel, choose a train. Trains are a more environ-mentally friendly way to travel long distances than aircraft.
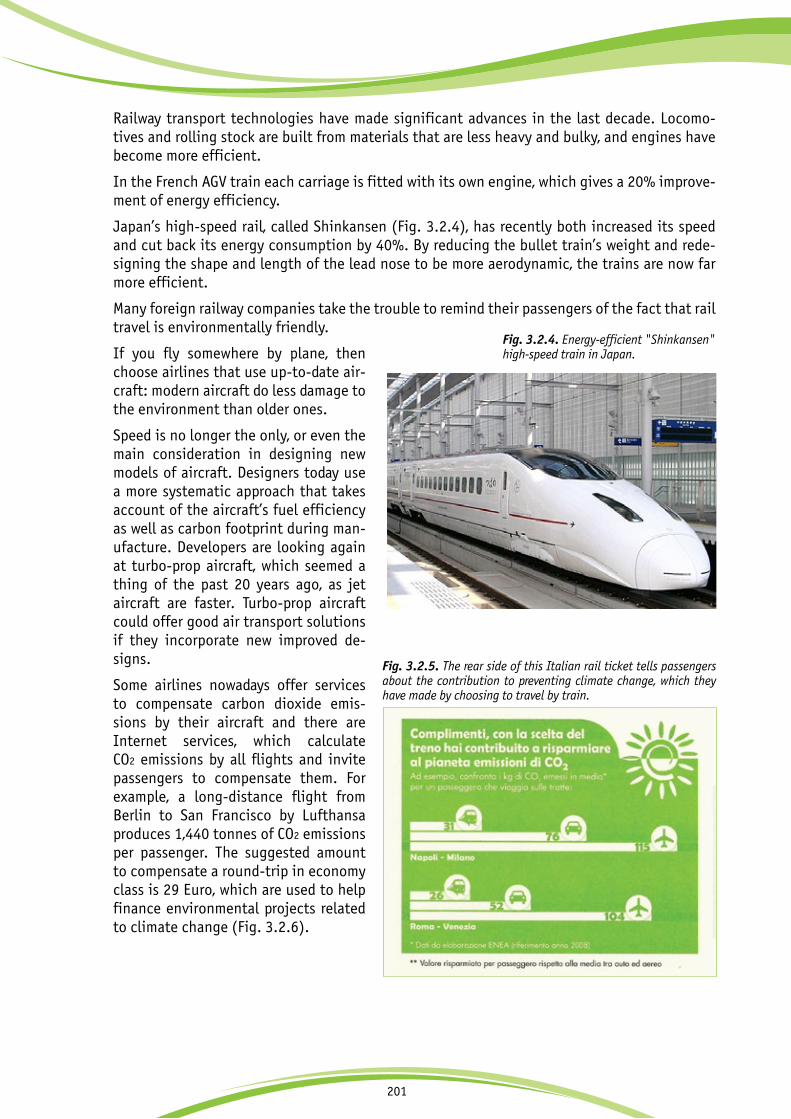
201
Railway transport technologies have made significant advances in the last decade. Locomo-tives and rolling stock are built from materials that are less heavy and bulky, and engines have become more efficient.
In the French AGV train each carriage is fitted with its own engine, which gives a 20% improve-ment of energy efficiency.
Japan’s high-speed rail, called Shinkansen (Fig. 3.2.4), has recently both increased its speed and cut back its energy consumption by 40%. By reducing the bullet train’s weight and rede-signing the shape and length of the lead nose to be more aerodynamic, the trains are now far more efficient.
Many foreign railway companies take the trouble to remind their passengers of the fact that rail travel is environmentally friendly.
If you fly somewhere by plane, then choose airlines that use up-to-date air-craft: modern aircraft do less damage to the environment than older ones.
Speed is no longer the only, or even the main consideration in designing new models of aircraft. Designers today use a more systematic approach that takes account of the aircraft’s fuel efficiency as well as carbon footprint during man-ufacture. Developers are looking again at turbo-prop aircraft, which seemed a thing of the past 20 years ago, as jet aircraft are faster. Turbo-prop aircraft could offer good air transport solutions if they incorporate new improved de-signs.
Some airlines nowadays offer services to compensate carbon dioxide emis-sions by their aircraft and there are Internet services, which calculate CO2 emissions by all flights and invite passengers to compensate them. For example, a long-distance flight from Berlin to San Francisco by Lufthansa produces 1,440 tonnes of CO2 emissions per passenger. The suggested amount to compensate a round-trip in economy class is 29 Euro, which are used to help finance environmental projects related to climate change (Fig. 3.2.6).
Fig. 3.2.5. The rear side of this Italian rail ticket tells passengers about the contribution to preventing climate change, which they have made by choosing to travel by train.
Fig. 3.2.4. Energy-efficient "Shinkansen" high-speed train in Japan.
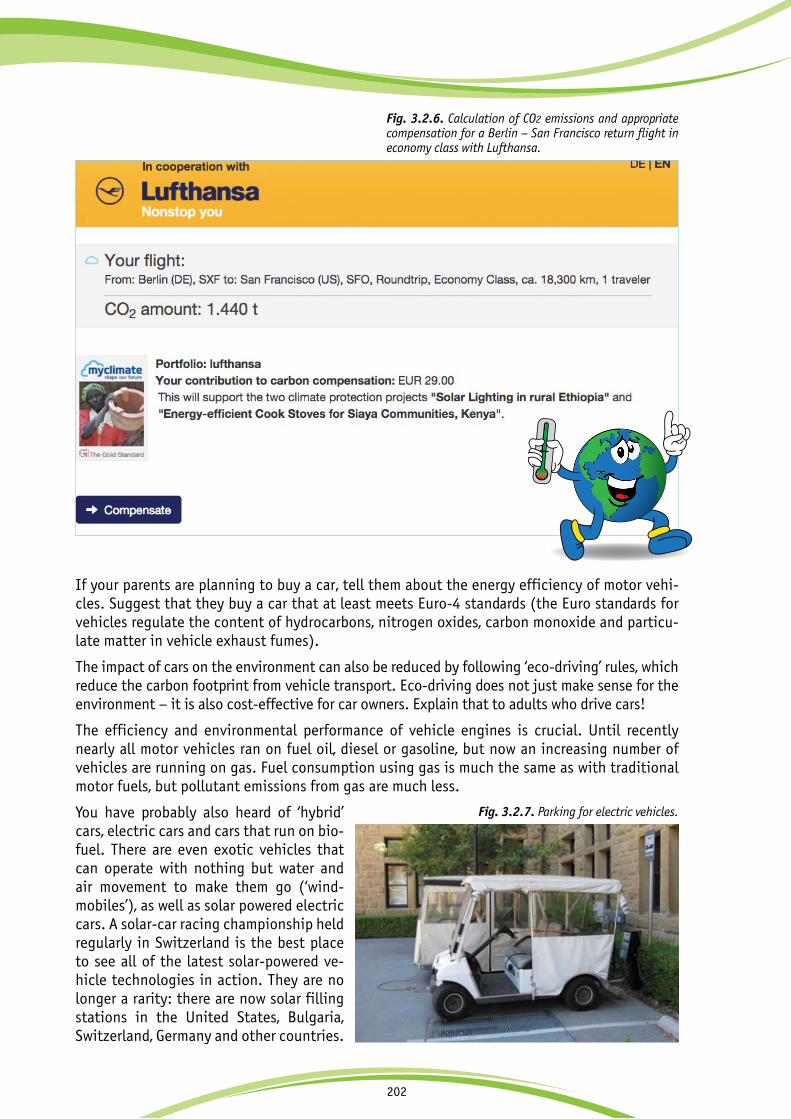
202
If your parents are planning to buy a car, tell them about the energy efficiency of motor vehi-cles. Suggest that they buy a car that at least meets Euro-4 standards (the Euro standards for vehicles regulate the content of hydrocarbons, nitrogen oxides, carbon monoxide and particu-late matter in vehicle exhaust fumes).
The impact of cars on the environment can also be reduced by following ‘eco-driving’ rules, which reduce the carbon footprint from vehicle transport. Eco-driving does not just make sense for the environment – it is also cost-effective for car owners. Explain that to adults who drive cars!
The efficiency and environmental performance of vehicle engines is crucial. Until recently nearly all motor vehicles ran on fuel oil, diesel or gasoline, but now an increasing number of vehicles are running on gas. Fuel consumption using gas is much the same as with traditional motor fuels, but pollutant emissions from gas are much less.
You have probably also heard of ‘hybrid’ cars, electric cars and cars that run on bio-fuel. There are even exotic vehicles that can operate with nothing but water and air movement to make them go (‘wind-mobiles’), as well as solar powered electric cars. A solar-car racing championship held regularly in Switzerland is the best place to see all of the latest solar-powered ve-hicle technologies in action. They are no longer a rarity: there are now solar filling stations in the United States, Bulgaria, Switzerland, Germany and other countries.
Fig. 3.2.6. Calculation of CO2 emissions and appropriate compensation for a Berlin – San Francisco return flight in economy class with Lufthansa.
Fig. 3.2.7. Parking for electric vehicles.
+2 оС

203
Eco-driving rules: how to reduce a vehicle’s carbon footprint
• Turn off the engine at stops and in stationary traffic jams.
• Look after your car properly: the correct adjustment of the wheels reduces fuel consumption by 5–10%, and regular maintenance of the vehicle saves up to 10% of fuel.
• Check tire pressure regularly: even in urban environments tire pressure 25% below the recommended level requires 10% more fuel to make the car move off.
• Use climate control and air conditioning sparingly. Do not use them if temperature outside the car makes them unnecessary. Don’t open the car windows if the climate control is operating.
• Brake smoothly to use the car’s inertia to best effect, reducing fuel use.
• Carry passengers. This is called ‘carpooling’. If you give a lift to 3–4 people who are going the same way, you reduce emissions by 3–4 times.
• Stay in the same lane: weaving from lane to lane increases fuel consumption and therefore carbon dioxide emissions.
• Start out early, avoid travelling at peak travel times, plan your route in advance.
• Drive at a moderate and steady speed. Use the brake pedal less and use the vehicle’s momentum more, brake and accelerate smoothly, think about the situation on the road ahead (don’t accelerate if there is a red light in sight). Smooth driving saves fuel.
• Do not carry excess loads on the roof. At speed of 120 kmh an empty luggage carrier on the roof increases fuel consumption by 5–10%, a ski-carrier adds 10–20%, a bicycle adds 30%, and carrying a case full of luggage takes 35–40% more fuel.
A modern electric car.

204
Nowadays, all of the leading car manufacturers, from Toyota to Audi, Ferrari and Rolls Royce are designing cars that are environmentally friendly. Fuel consumption and impact on the environ-ment has become as important to buyers as quality, safety and price. Companies are competing with each other in the effort to save energy and reduce negative impact on the environment.
Greenhouse gas emissions in a city can be reduced by encouraging people to use public trans-port instead of cars. But that is only possible if public transport is fast and convenient, serves all parts of the city, links the centre with the suburbs and can offer a more reliable and cheaper alternative to private cars. Transfer of public transport to gas, hybrid and electric engines can greatly reduce greenhouse gas emissions and improve air quality in cities.
Carpool: sharing journeys by car Carpooling means carrying other people (including strangers) in your car, usually on regular (daily) journeys.
It is a good way of reducing pressure on the transport system in cities.
Carpooling dates from the 1940s when the US government was trying to save fuel for the World War II needs by requiring car owners to carry passengers on any journey. The policy was successful in reducing fuel use, but its impact was limited because most of the car owners at the time were well-off people who were unwilling to share their cars with strangers.
In the 1970s the city of Los Angeles introduced separate lanes on roads for use by carpoolers. Nowadays they exist all over North America and in Europe as well (they are marked by road signs and a white rhombus on the road surface). Carpooling reduces the number of cars on the roads, takes away excess demand for parking places and cuts down greenhouse gas emissions. The gains for passengers are evident: they spend less on fuel, vehicle repairs and parking.
Fig. 3.2.8. Special carpool lanes on roads in the USA.

205
3.2.2. | Household appliances and electrical devices
Many countries have a special system for labelling of household appliances by their energy ef-ficiency.
The European energy label is obligatory for certain electrical household appliances and light bulbs sold in the EU since 1995 (Fig. 3.2.9).
The label is intended to let consumers compare the energy efficiency and some other features of similar products made by one or several manufacturers. The most energy-efficient products are those in energy efficiency classes ‘A’ or ‘A +’, ‘A++’ and ‘A+++’.
Bicycles: the most environmentally friendly transport Bicycles are the most environmentally friendly and healthy form of transport. Scientists have calculated that a person who travels to school or work every day by bicycle instead of using a car saves a tonne of greenhouse gas emissions every year.Bicycles are the preferred means of transport in the Netherlands, Denmark, Norway,Sweden and Germany. In Copenhagen one in three people commute to work by bicycle.In Amsterdam, 40% of people use a bicycle every day, and the total length of bicycle lanes in the city is 400 km.
+2 оС

206
Energy Star is a system of energy efficiency certification, which was developed by the US Environmental Protection Agency (EPA) in 1992 for computer monitors with low power consumption. Monitors that meet certain energy efficiency criteria have the right to bear the Energy Star label and as many as 98% of all computers today do so. Use of the label has been extended, so that 65 other types of goods, from appliances to buildings, are now assessed using the Energy Star system (today in the USA more than 1.4 million buildings and over 20,000 factories are Energy Star certified).
In 2002, the Energy Star programme enabled Americans to reduce greenhouse gas emissions by 53.5 million tonnes of CO2 (equivalent to the annual emissions of 14 million cars) and to save 5.3 megawatts of electricity, worth 7 billion US dollars in total. By 2012 reduction of green-house gases thanks to Energy Star had risen to 254.7 million tonnes.
Fig. 3.2.10. The US Energy Star label.
Fig. 3.2.9. New energy efficiency labelling for refrigerators sold in the European Union.
Energy efficiency class
Annual energy consumption by the device in kWh, a standardized measurement assuming 24-hour operation during 365 days
1 Total useful space (litres) for storing fresh produce2 Total useful space (litres) for storing
frozen produce3 Noise level (decibels) 321

207
An energy efficiency label doesn’t just tell the consumer about the energy efficiency of a device, but also about what it can do. After all, the main task of a washing machine is to wash and rinse clothes, and its ability to save energy is secondary, though important. In recent years consum-ers have been increasingly keen to choose devices and technologies that not only do their job well, but also use less energy and resources and thereby save the consumer money (Fig. 3.2.11).
The impact of an electrical appliance on human health is at least as important as its energy con-sumption. We also have to remember that such side effects might not be immediately evident: health hazards from new inventions might only be detected after some time. The discovery of such problems doesn’t mean that a new technology cannot be used: a design improvement might be enough to put the problem right. But we must approach new technologies carefully: without prejudice, but with caution.
For example, a new device that has recently gained popularity is the induction cooker, which is very easy to use and very economical in its consumption of energy, since it only heats the bottom of the pan and not the whole space around it. However, the impact of eddy-current magnetic fields on human beings has not yet been properly studied.
60
50
40
30
20
10
0
G
А
FEDCB
AB
CD
EF
G
AA+A++
1992
2000
2006
Mar
ket
shar
e by
uni
t sa
les
per
year
(%
)
Energy Efficiency
Most efficient
Ener
gy e
ffic
ienc
yla
belli
ng in
EU
cou
ntri
es
Manufacturer model
Least efficient
Fig. 3.2.11. Impact of energy-efficiency labelling and minimum energy-efficiency standards on the EU market for refrigerators and freezers.

208
3.2.3. | Green construction. Passive and active buildings
People have different lifestyles – not every fam-ily has a car or a complete set of home appliances. But everyone needs a roof over their head. So the idea of building an energy-efficient home has always been of interest. Peasant huts in Europe and the tents of nomadic peoples were built using special know-how, even if was not always given scientific expression. A masonry heater, which was traditionally used in houses in Eastern, Northern Europe and North Asia, was a fine example of energy efficiency. The thick walls retained heat and the chimney with its different sections extracted heat from the smoke before it left the building.
Coming back to more recent history, in 1974 a sharp jump in oil prices made it much more ex-pensive to provide buildings with energy and heat, inspiring architects and engineers to take a new look at building design. Houses started using new environmentally friendly technologies and alternative energy sources. Special demonstration buildings were built to show what could be achieved, and governments in some countries actively encouraged such projects.
The World Green Building Council was for-mally established in 2002 with the aim to facilitate the global transformation of the building industry towards sustainability. The Council unites more than 30,000 prop-erty and construction companies from 80 countries. Its members are constantly seeking new ways to reduce the amount of resources needed at all stages of the life of a building: during its construction and use, when it is repaired and when it is finally dismantled. Green construction strives to reduce greenhouse gas emissions and water pol-lution, minimize waste, and to protect nearby natural habitats. Such buildings are somewhat more expensive to build, but the extra invest-ments pays for itself in 5–10 years.
Energy-saving buildings are called ‘passive’ or ‘active’, depending on their efficiency. A passive building may not need any heating or may consume just a tenth of the energy that an ordinary building needs. But an active building not only requires very little energy, but it actually pro-duces energy – perhaps even surplus energy to feed into the central electricity grid. Another expression, which you may hear, is ‘smart building’. What this means is that the building in question automatically analyzes its energy consumption and carries out automatic control of various energy-using systems in the building.
Fig.3.2.12. A number of low-energy buildings have been constructed in the Viikki district of Helsinki (Finland). Panels that store energy from the sun have been built into the facades.

209
Environmental certificates for buildings Environmental certification standards for buildings have become widespread in recent years. The best-known and most used systems in the world are BREEAM (UK), LEED (USA) and DGNB (Germany).
The BREEAM environmental certification system was developed in 1990, and more than 200,000 buildings worldwide have now received certificates. The criteria for certification are the quality of building management, the health and well-being of its residents, energy efficiency, transport, water, materials, waste, use of the land plot where the building stands, and the pollution that it generates.
The LEED environmental certification system was devised in 1998 with six groups of criteria: sustainable site development, water consumption efficiency, energy efficiency, air protection, materials and resources, internal environment quality, and innovations. Buildings can qualify for four levels of certification: Certified, Silver, Gold and Platinum, depending on how many criteria they meet.
The DGNB system of environmental certification, which was introduced in 2009, uses an integrated planning concept to assess ecology, economy, socio-cultural and functional aspects, as well as a building’s location.
Passive buildings One of the main objectives of a passive building in northern countries is to reduce heat loss. Ideally, a passive house is heated solely by the heat given off by the people who live there and by the appliances that are used there. If additional heat-ing is needed, preference is given to renewable energy sources.
Bricks made from recycled materials are often used for the construction of such a house.
It is not only building’s walls that require thermal insulation, but also its floors, ceilings, attic, basement... even the foundations. It is important to ensure that the design does not permit so-called ‘cold bridges’: apparently minor details and connecting points in the construction that can drain heat out of a generally well-insulated building. These techniques can reduce the heat loss from a building by almost 20 times!
The first LEED Platinum building in the Middle East
Originally constructed in 1995, the head office building of Dubai Chamber of Commerce and Industry is a shining example of how an existing, high energy and water consuming high-rise building can be transformed into a healthy, green skyscraper.
Between 1998 and 2013, energy and water consumption per person in the building was reduced by 63% and 92% respec-tively saving almost 5.8 million US dollars through low and no-cost initiatives. After the renovation, the building achieved the Energy Star label and LEED Platinum level.
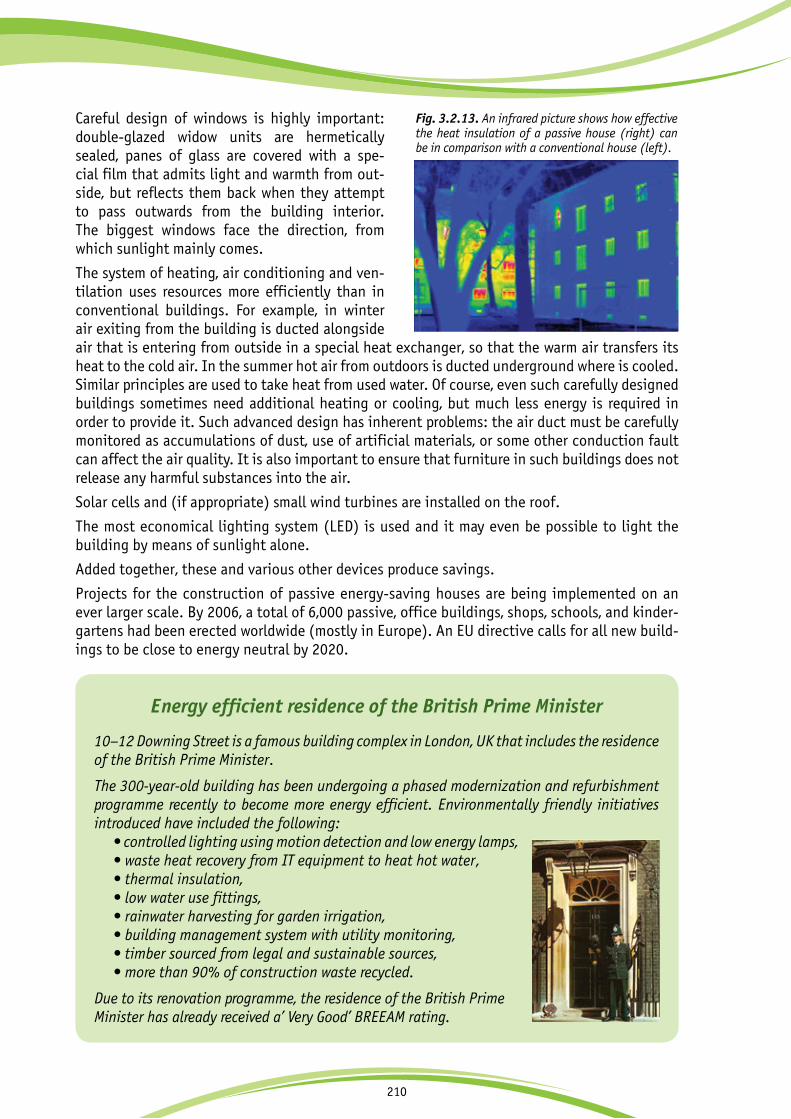
210
Careful design of windows is highly important: double-glazed widow units are hermetically sealed, panes of glass are covered with a spe-cial film that admits light and warmth from out-side, but reflects them back when they attempt to pass outwards from the building interior. The biggest windows face the direction, from which sunlight mainly comes.
The system of heating, air conditioning and ven-tilation uses resources more efficiently than in conventional buildings. For example, in winter air exiting from the building is ducted alongside air that is entering from outside in a special heat exchanger, so that the warm air transfers its heat to the cold air. In the summer hot air from outdoors is ducted underground where is cooled. Similar principles are used to take heat from used water. Of course, even such carefully designed buildings sometimes need additional heating or cooling, but much less energy is required in order to provide it. Such advanced design has inherent problems: the air duct must be carefully monitored as accumulations of dust, use of artificial materials, or some other conduction fault can affect the air quality. It is also important to ensure that furniture in such buildings does not release any harmful substances into the air.
Solar cells and (if appropriate) small wind turbines are installed on the roof.
The most economical lighting system (LED) is used and it may even be possible to light the building by means of sunlight alone.
Added together, these and various other devices produce savings.
Projects for the construction of passive energy-saving houses are being implemented on an ever larger scale. By 2006, a total of 6,000 passive, office buildings, shops, schools, and kinder-gartens had been erected worldwide (mostly in Europe). An EU directive calls for all new build-ings to be close to energy neutral by 2020.
Fig. 3.2.13. An infrared picture shows how effective the heat insulation of a passive house (right) can be in comparison with a conventional house (left).
Energy efficient residence of the British Prime Minister 10–12 Downing Street is a famous building complex in London, UK that includes the residence of the British Prime Minister.
The 300-year-old building has been undergoing a phased modernization and refurbishment programme recently to become more energy efficient. Environmentally friendly initiatives introduced have included the following:
• controlled lighting using motion detection and low energy lamps,• waste heat recovery from IT equipment to heat hot water,• thermal insulation,• low water use fittings,• rainwater harvesting for garden irrigation,• building management system with utility monitoring,• timber sourced from legal and sustainable sources,• more than 90% of construction waste recycled.
Due to its renovation programme, the residence of the British Prime Minister has already received a’ Very Good’ BREEAM rating.
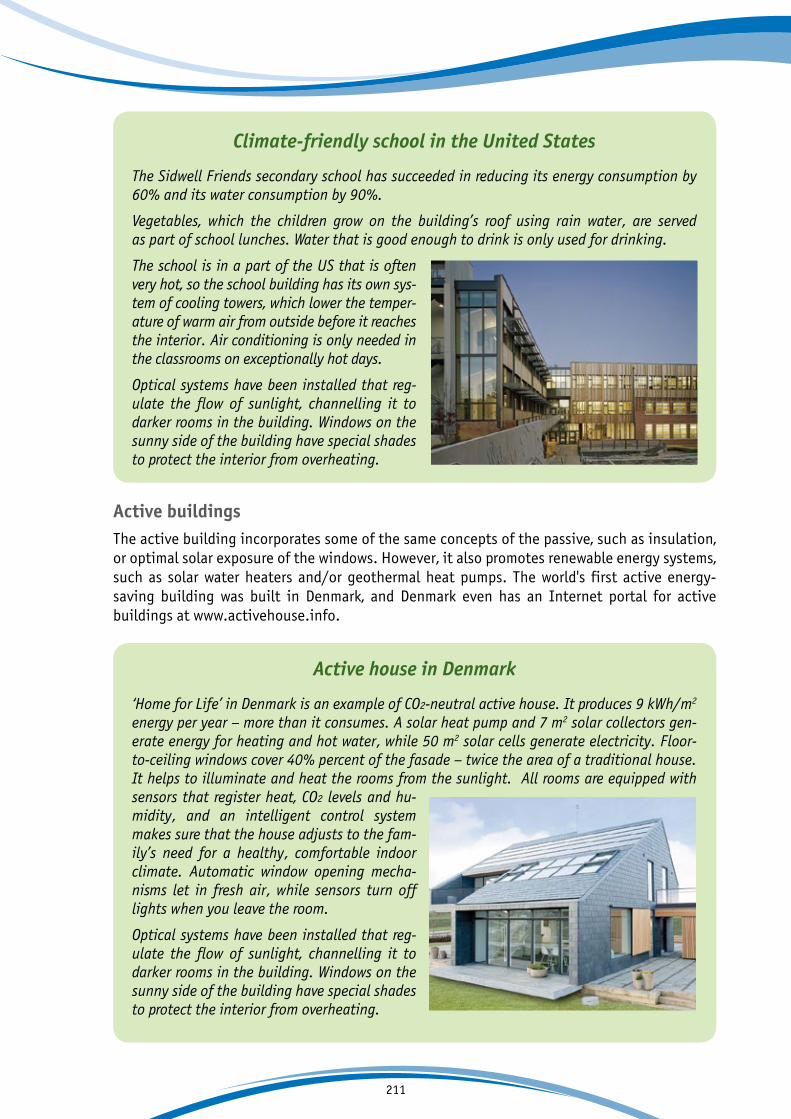
211
Active buildingsThe active building incorporates some of the same concepts of the passive, such as insulation, or optimal solar exposure of the windows. However, it also promotes renewable energy systems, such as solar water heaters and/or geothermal heat pumps. The world's first active energy- saving building was built in Denmark, and Denmark even has an Internet portal for active buildings at www.activehouse.info.
Climate-friendly school in the United States The Sidwell Friends secondary school has succeeded in reducing its energy consumption by 60% and its water consumption by 90%.
Vegetables, which the children grow on the building’s roof using rain water, are served as part of school lunches. Water that is good enough to drink is only used for drinking.
The school is in a part of the US that is often very hot, so the school building has its own sys-tem of cooling towers, which lower the temper-ature of warm air from outside before it reaches the interior. Air conditioning is only needed in the classrooms on exceptionally hot days.
Optical systems have been installed that reg-ulate the flow of sunlight, channelling it to darker rooms in the building. Windows on the sunny side of the building have special shades to protect the interior from overheating.
Active house in Denmark
‘Home for Life’ in Denmark is an example of CO2-neutral active house. It produces 9 kWh/m2
energy per year – more than it consumes. A solar heat pump and 7 m2 solar collectors gen-erate energy for heating and hot water, while 50 m2 solar cells generate electricity. Floor-to-ceiling windows cover 40% percent of the fasade – twice the area of a traditional house. It helps to illuminate and heat the rooms from the sunlight. All rooms are equipped with sensors that register heat, CO2 levels and hu-midity, and an intelligent control system makes sure that the house adjusts to the fam-ily’s need for a healthy, comfortable indoor climate. Automatic window opening mecha-nisms let in fresh air, while sensors turn off lights when you leave the room.
Optical systems have been installed that reg-ulate the flow of sunlight, channelling it to darker rooms in the building. Windows on the sunny side of the building have special shades to protect the interior from overheating.
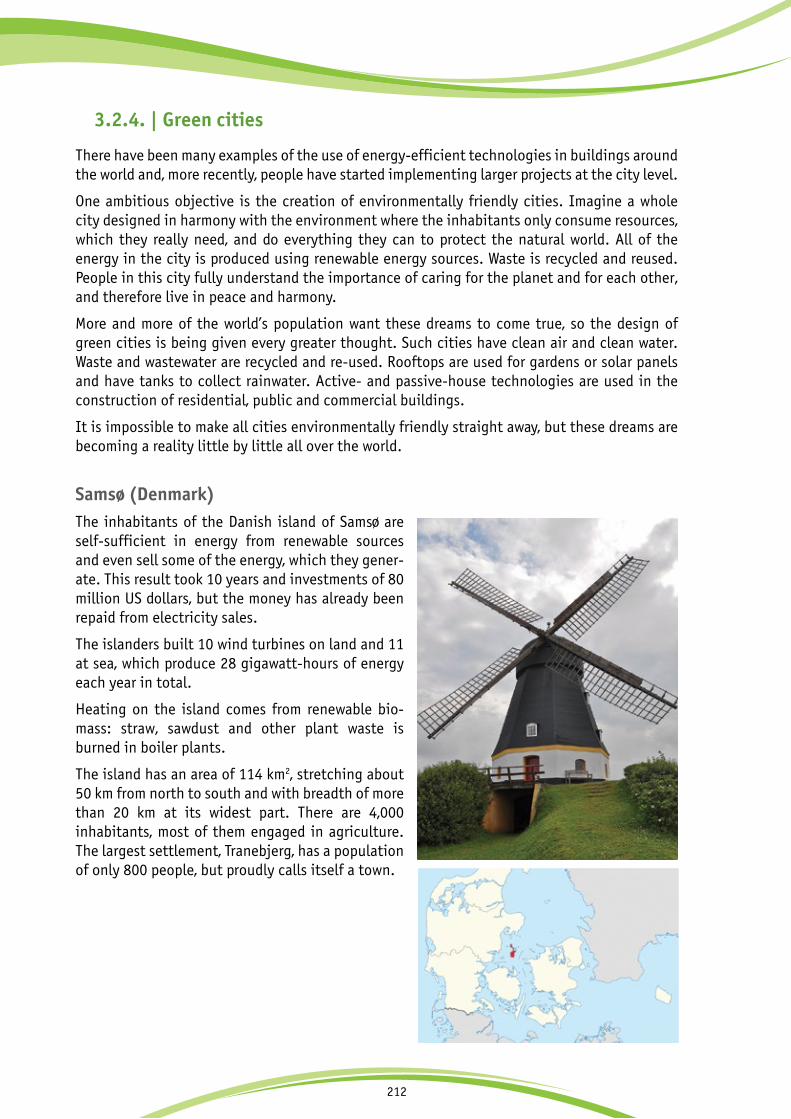
212
3.2.4. | Green cities
There have been many examples of the use of energy-efficient technologies in buildings around the world and, more recently, people have started implementing larger projects at the city level.
One ambitious objective is the creation of environmentally friendly cities. Imagine a whole city designed in harmony with the environment where the inhabitants only consume resources, which they really need, and do everything they can to protect the natural world. All of the energy in the city is produced using renewable energy sources. Waste is recycled and reused. People in this city fully understand the importance of caring for the planet and for each other, and therefore live in peace and harmony.
More and more of the world’s population want these dreams to come true, so the design of green cities is being given every greater thought. Such cities have clean air and clean water. Waste and wastewater are recycled and re-used. Rooftops are used for gardens or solar panels and have tanks to collect rainwater. Active- and passive-house technologies are used in the construction of residential, public and commercial buildings.
It is impossible to make all cities environmentally friendly straight away, but these dreams are becoming a reality little by little all over the world.
Sams (Denmark)The inhabitants of the Danish island of Sams are self-sufficient in energy from renewable sources and even sell some of the energy, which they gener-ate. This result took 10 years and investments of 80 million US dollars, but the money has already been repaid from electricity sales.
The islanders built 10 wind turbines on land and 11 at sea, which produce 28 gigawatt-hours of energy each year in total.
Heating on the island comes from renewable bio-mass: straw, sawdust and other plant waste is burned in boiler plants.
The island has an area of 114 km2, stretching about 50 km from north to south and with breadth of more than 20 km at its widest part. There are 4,000 inhabitants, most of them engaged in agriculture. The largest settlement, Tranebjerg, has a population of only 800 people, but proudly calls itself a town.

213
Masdar City (United Arab Emirates) Masdar City (‘masdar’ in Arabic means ‘source’) is a new eco-city in the United Arab Emirates (UAE). It is located in the Emirate of Abu Dhabi, 17 km from the capital and close to the international airport.
The idea of building a green city in the desert was put forward by the government of Abu Dhabi. The project with a total budget of 22 billion US dollars was launched in 2006 and is due for completion in the near future. The new city is expected to have a population of 45,000-50,000 people and about 60,000 more will commute to work in Masdar every day. Most of the companies and industrial plants there will specialize in the development and pro-duction of environmentally friendly technologies and products. Vehicle transport is not permitted in Masdar City: residents will move around on foot, by bicycle, by public transport or using new, com-puter-controlled taxis. A high wall is being built around the city to protect it from the hot desert wind, and its streets will have abundant shade.
Masdar city is designed to be a hub for clean tech-nology companies. The Masdar Institute of Science and Technology has been operating in the city since September 2010. The city also hosts the headquar-ters of the International Renewable Energy Agency (IRENA).
Treasure Island (San Francisco, California, USA)Treasure Island is an artificial island created in Cali-fornia in 1939 as the site for a new airport. These plans were changed with the coming of the World War II, and the island was instead used as a military base, which remained there until 1996. Now Treas-ure Island is being used as a testing site for green construction. It is expected that 13,500 people will live there, and they will produce their electricity using solar panels, which will be installed on 70% of all the roofs of buildings by 2020, providing up to 30 gigawatt-hours of electricity each year. Electric-ity will also be generated using wind power. Citizens will be able to buy fruits and vegetables from an or-ganic farm on the island, all cars will be eco-friendly and buildings will be energy efficient. Buildings on the island are certified under the LEED energy efficiency standard.

214
Sherford (England) Sherford in England is a new eco-friendly town, designed in traditional English style. The project is scheduled for completion by 2020 and has the support of Prince Charles. All of Sherford’s build-ings will be made from environmentally friendly materials, produced in England and not more than 80 km from the construction site. This will reduce the carbon footprint from construction work, as it will not be necessary to transport materials over long distances, emitting greenhouse gases from the combustion of vehicle fuels.
Sherford will be laid out in a way that makes it easy to move by foot and on bicycles easily and quickly, so that the inhabitants will have no need for motor transport in some parts of the town. Space on rooftops will also be used for solar panels and for growing plants.
The City of Vancouver (Canada)The City of Vancouver (Canada) is known as one of the most environmentally friendly cities in North America. As a next step, the city has adopted an ambitious plan to become the greenest city in the world. The plan, which was developed by the city authorities in collaboration with local people, in-cludes such measures as a shift toward 100% re-newable energy power by 2050, zero waste program, expanding walking and cycling network, developing green buildings and public transportation, expand-ing green areas, as well as increasing farmers mar-kets and community gardens. Moreover, the city ad-ministration has established a two million US dollar Greenest City Fund in collaboration with The Van-couver Foundation to support community-led pro-jects to green Vancouver. With all these measures fully implemented, the City of Vancouver aims to reduce community-based greenhouse gas emissions by 80% below 2007 levels by 2050.
+2 оС

215
Questions
1. What time of day is the peak of electricity consumption?
2. Do you think that hot countries need to worry about saving energy?
3. How does a city need to be designed if it wants to be a ‘green’ city?
4. Where do you think your home loses most of its heat in winter and coolness in summer? How could this be avoided?
5. What is the difference between ‘passive’, ‘active’ and ‘smart’ buildings?
216
Task 1. Ask your parents to let you see the electricity bills for your house or apartment for the past year, write down how many kilowatt-hours were used and build a graph.
Find out how much electricity is used by your main household appliances: refrigerator, washing machine, vacuum cleaner, TV, lights, etc. You can do this by: 1) finding the power of each device in the technical information that came with it; 2) cal-culating roughly how many hours a day the device operates; 3) multiplying that time by the number of days in a month; 4) multiplying the power of the device by the time it operates.
Draw a second graph on the same piece of paper, summariz-ing total power consumption by your domestic appliances. Analyze the graph, see which appliances use more power and think why that is. Together with your parents, think what you can do to reduce energy consumption.
Task 2. Draw a large map of an environmentally friendly city where you would want to live. What will it be called? Where in the world will it be? How will its streets be laid out? Will motor vehicles be allowed to drive around the city? What companies and industries will it have (if any)? Where will the residential district be located and why will it be located there? Draw what your own home in this city will look like. What sort of a build-ing will it be and what will it be made from? Write an essay about this.
Task 3. Find out about the environmental initiatives in various cities around the world from the ‘Sustainable Cities’ page in Wiki-pedia and other online resources. Find detailed information about the current status of any ecological city and give a re-port about this city in school.
Tasks
+2 оС
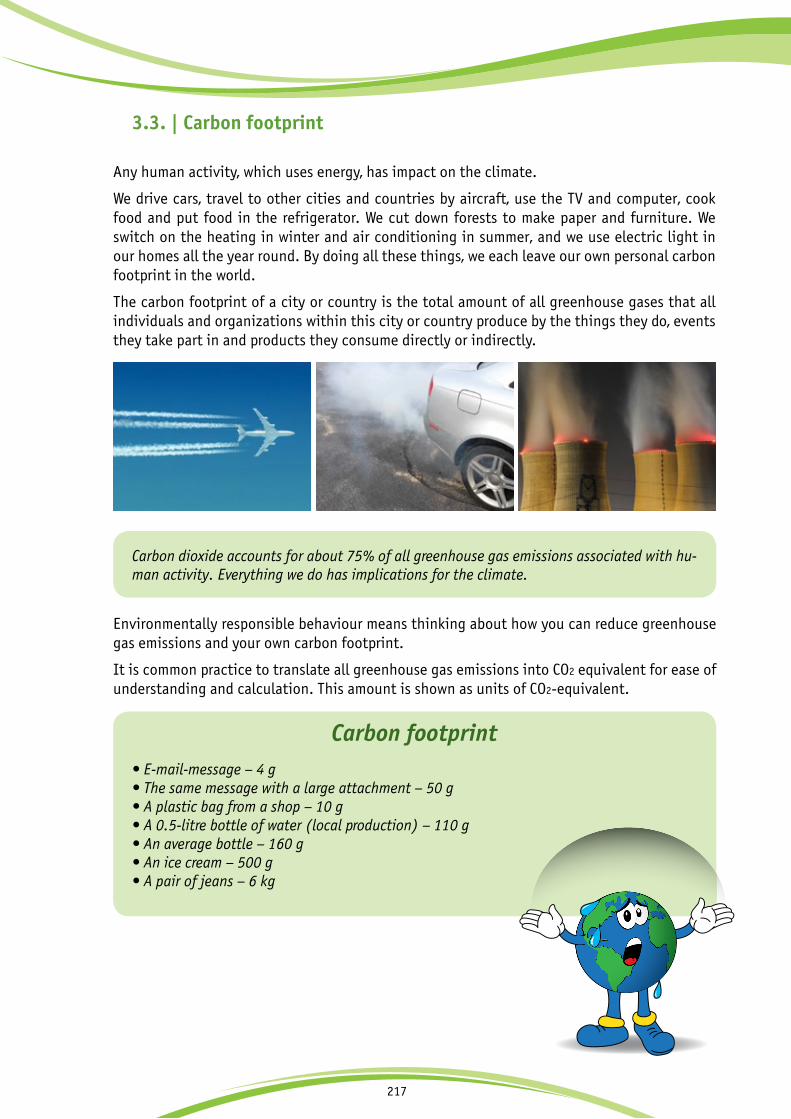
217
3.3. | Carbon footprint
Any human activity, which uses energy, has impact on the climate.
We drive cars, travel to other cities and countries by aircraft, use the TV and computer, cook food and put food in the refrigerator. We cut down forests to make paper and furniture. We switch on the heating in winter and air conditioning in summer, and we use electric light in our homes all the year round. By doing all these things, we each leave our own personal carbon footprint in the world.
The carbon footprint of a city or country is the total amount of all greenhouse gases that all individuals and organizations within this city or country produce by the things they do, events they take part in and products they consume directly or indirectly.
Carbon dioxide accounts for about 75% of all greenhouse gas emissions associated with hu-man activity. Everything we do has implications for the climate.
Carbon footprint• E-mail-message – 4 g• The same message with a large attachment – 50 g• A plastic bag from a shop – 10 g• A 0.5-litre bottle of water (local production) – 110 g• An average bottle – 160 g• An ice cream – 500 g• A pair of jeans – 6 kg
+2 оС
Environmentally responsible behaviour means thinking about how you can reduce greenhouse gas emissions and your own carbon footprint.
It is common practice to translate all greenhouse gas emissions into CO2 equivalent for ease of understanding and calculation. This amount is shown as units of CO2-equivalent.

218
Direct emissions are amounts of carbon dioxide created by the use of fossil fuels. For example, the amount of greenhouse gases emitted during operation of a factory or a vehicle engine.
Indirect emissions are the amount of CO2 released into the atmosphere when energy is pro-duced and transported in order to make the products that you buy and the services that you need. This is the part of the carbon footprint, which we can influence: we can think twice and not buy disposable cups, think twice and walk instead of going by car, think twice and not use the washing machine at half load.
Calculating the size of our carbon footprint (especially indirect emissions) is difficult, because we have to take account of many different factors and find a lot of information. In addition, the carbon footprint of a product will always be the same for the producer, but it will be differ-ent for different consumers because transport and other costs of delivering the product to the consumer have to be taken into account.
For example, the carbon footprint of an apple from the garden, eaten under the tree where it grew, is 0 g of CO2. If you buy apples grown in your region in season (i.e. in summer and early autumn), the carbon footprint of an apple is 10 g of CO2. The carbon footprint of an imported apple (for example, one brought from Italy) will be 150 g of CO2.
Environmentally responsible firms offset their carbon footprint by planting trees and obtaining certificates from reputable carbon-offsetting companies.
Examples of carbon neutral labels.
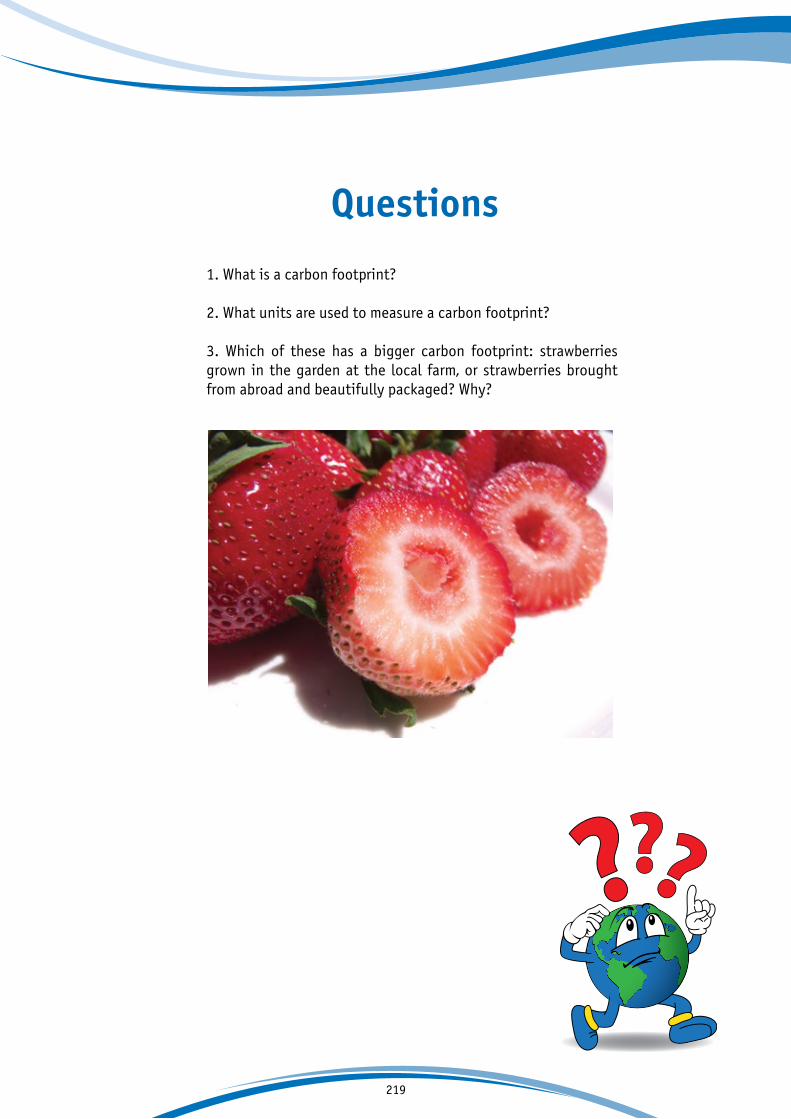
219
Questions
1. What is a carbon footprint?
2. What units are used to measure a carbon footprint?
3. Which of these has a bigger carbon footprint: strawberries grown in the garden at the local farm, or strawberries brought from abroad and beautifully packaged? Why?

220
Task 1. Test, ‘My carbon footprint’A. When you buy fruits and vegetables in a shop, what do you usually choose:– local, unpackaged produce (1 point);– unpackaged produce from the southern regions of your country (2 points);– unpackaged produce from France, the Netherlands, Argentina and other countries (3 points);– imported produce, individually pre-packed (4 points)?
B. The bag you use for shopping is:– linen or cotton (1 point);– paper (2 points);– a plastic bag that I take from home (3 points);– a plastic bag that I take or buy when I pay for goods in the shop (4 points).
C. When you buy drinks, what sort of container are they usually in?– paper (1 point);– glass (2 points);– aluminum (3 points);– plastic (4 points)?
D. What book do you prefer to read:– a new one, bought in a shop (4 points);– an electronic one (3 points);– one that has already been read (2 points);– one from the library (1 point)?
E. When you give someone a present, do you prefer:– bright and attractive wrapping paper, whatever it is made of (4 points);– paper with an environmental label to show that it is recyclable (2 points);– a used box or bag that I specially decorate (2 points);– to give the present without packaging (1 point)?
TasksAnswers to the test ‘My carbon footprint’:From 5 to 7 points: Great! You have the carbon footprint of a mouse! You can be proud of yourself – all you need to do now is persuade others to be like you.From 8 to 10 points: You have the carbon footprint of a cat’s paw! But don’t sit purring – you could do even better.From 11 to 13 points: The carbon footprint of a horse’s hoof! Put on your harness and get down some energy saving.From 14 to 16 points: An elephant’s carbon footprint! Better put all that weight into saving energy.

221
3.4. | How can I help the planet? Reducing your carbon footprint
Greenhouse gases influence the planet’s climate, and emissions of greenhouse gases depend on our habits. Let's see how we can reduce our carbon footprint and help the planet. Indoor air temperature and comfortable temperatures In northern countries almost all buildings need heating and heat insulation. Most heating systems in the old buildings were built at a time when prices for heat energy were low and energy efficiency was not a priority. In many cities thermal energy is generated by burning gas or coal, which causes greenhouse gas emissions that affect the climate.
Alternative ways of producing heat energy include solar collectors and heat pumps, but these technologies remain expensive and are not easy to apply for an old multistorey apartment building.
The easiest solution is to improve heat insulation. Heat loss depends on two factors: the differ-ence in temperature between indoors and outdoors and the heat insulating properties of walls, ceilings, windows and floors. Buildings lose a significant part of their heat through the ventila-tion system. Heat loss can also occur due to latent defects, design errors, poor quality of the construction, and due to ageing of the building and of thermal insulation materials.
It is possible to see how well walls, ceilings and windows retain heat, and to detect where leak-age of heat is occurring by means of thermal imaging, carried out by a special visual recording device that shows the temperature distribution on any surface, such as the wall of a house. The temperature distribution is shown on the display (and recorded in the memory) of the device camera as a colour field, where a certain temperature corresponds to a certain colour. Alongside the image there is always a scale showing the correspondence between colours on the picture and specific temperature ranges.
The greatest heat loss in any prefabricated building occurs at the joints between the panels of the outer wall. The quality of window installation can be decisive for levels of heat loss, even in new and renovated buildings.
Fig. 3.4.1. A five-storey apartment building from the 1960s ‘glows’ where heat floods out at the joints between prefabricated panels. The only remedy (short of demolition) is full-scale repair of the facade using the latest heat- retaining plasters.
Fig. 3.4.2. Heat loss on the corner of this brick building is intense at the junction of balcony glazing and the wall, and also where ceilings meet the walls.
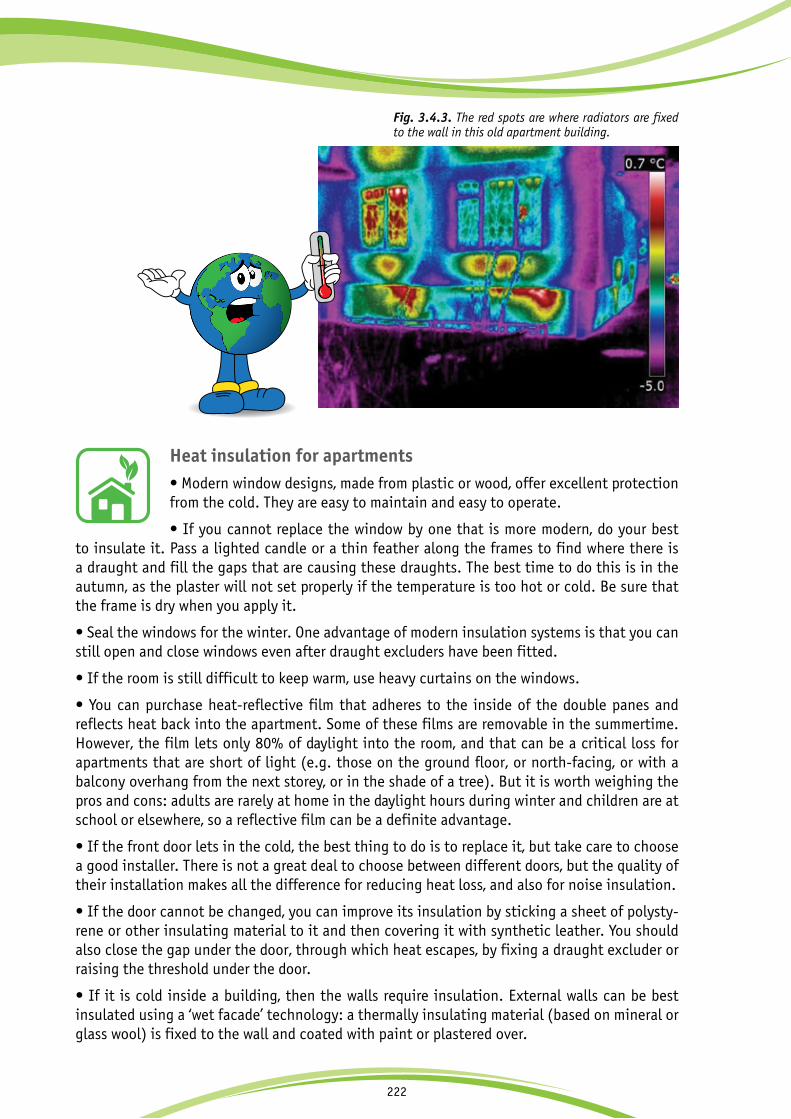
222
Heat insulation for apartments• Modern window designs, made from plastic or wood, offer excellent protection from the cold. They are easy to maintain and easy to operate.
• If you cannot replace the window by one that is more modern, do your best to insulate it. Pass a lighted candle or a thin feather along the frames to find where there is a draught and fill the gaps that are causing these draughts. The best time to do this is in the autumn, as the plaster will not set properly if the temperature is too hot or cold. Be sure that the frame is dry when you apply it.
• Seal the windows for the winter. One advantage of modern insulation systems is that you can still open and close windows even after draught excluders have been fitted.
• If the room is still difficult to keep warm, use heavy curtains on the windows.
• You can purchase heat-reflective film that adheres to the inside of the double panes and reflects heat back into the apartment. Some of these films are removable in the summertime. However, the film lets only 80% of daylight into the room, and that can be a critical loss for apartments that are short of light (e.g. those on the ground floor, or north-facing, or with a balcony overhang from the next storey, or in the shade of a tree). But it is worth weighing the pros and cons: adults are rarely at home in the daylight hours during winter and children are at school or elsewhere, so a reflective film can be a definite advantage.
• If the front door lets in the cold, the best thing to do is to replace it, but take care to choose a good installer. There is not a great deal to choose between different doors, but the quality of their installation makes all the difference for reducing heat loss, and also for noise insulation.
• If the door cannot be changed, you can improve its insulation by sticking a sheet of polysty-rene or other insulating material to it and then covering it with synthetic leather. You should also close the gap under the door, through which heat escapes, by fixing a draught excluder or raising the threshold under the door.
• If it is cold inside a building, then the walls require insulation. External walls can be best insulated using a ‘wet facade’ technology: a thermally insulating material (based on mineral or glass wool) is fixed to the wall and coated with paint or plastered over.
Fig. 3.4.3. The red spots are where radiators are fixed to the wall in this old apartment building.
+2 оС

223
• Another way of retaining heat is by careful arrangement of furniture. Place wardrobes along the coldest walls: they will serve as an additional barrier against cold penetrating into the room. The furniture in the room should not hinder the circulation of warm air, so do not put any furniture near to the radiator.
• The easiest and cheapest way to insulate the floor is to put down linoleum on a felt base. But do not use glue, or the felt will lose its insulating properties. Also, you can lay an insulating film or a special insulating material under any floor surface.
• The most obvious way to improve the quality of heating in a room is to replace old radiators with modern bimetallic radiators. This must be done before the start of the heating season. When buying new radiators, choose those with adjusters.
• If replacement it is not possible, the old radiators can be made to operate more efficiently. Remove old paint, scrape the surface and paint them in dark colors: a dark and smooth surface gives 5-10% more heat. You can also take a sheet of plywood, paint it with silver paint or cover it with metal foil and place it behind the radiator to reflect heat back into the room instead of heating the walls. It is also important to keep radiators free of dust, which hinders heat trans-fer. Make sure that curtains and furniture are not preventing the flow of heat from the radiator into the room.
• Don’t overheat your room! Wear something warmer rather than overheating the air.
• When you ventilate the apartment, do it quickly and completely: open the window and door wide to make air circulate.
CookingYour electric cooker is the most powerful appliance in your home: with all of the burners and the oven switched on, it can consume up to 20 kilowatts of power, which is 10 times more than a large electric kettle or iron.
• Remember that the bottoms of the pots and pans, which you use on the cooker, must be smooth and thick. It takes up to 40% longer to cook food in a pan with an uneven or concave bottom.
• The pan should be the same size as the burner, to avoid heat loss.
• Use a lid! Energy consumption is 2.5 times greater when you cook food in an open dish.
• You can often turn off the burner on an electric cooker five minutes before the food is ready: the residual heat will complete the cooking process.
• Special appliances (coffee makers, pressure cookers, multicookers) can prepare food using 30–40% less energy than an ordinary cooker and in half the time.
• If you pour water over the cereal a few hours before cooking porridge, it will cook more quickly and contain more vitamins. Buckwheat can be soaked for about an hour, rice for longer, and beans or peas can be left to soak overnight. This also save you time – if food cooks more quickly, you don’t have to spend time watching it.
• Don’t use too much water when you are boiling food.
• Don’t fill the kettle to the brim if you only need enough water for one cup.

224
RefrigeratorsThe refrigerator is the most energy-intensive appliance in your home, and the size of your electricity bill depends to a large extent on how good it is and how you use it. A modern refrigerator uses three or even five time less energy than
one manufactured 20 years ago with the same size and features, especially if the old seals have lost their elasticity, so that warm air is getting into the refrigerator. For an economical family of one or two people, a new refrigerator can lower electricity bills by 1.5 times.
• Before opening the fridge, think what you need from it. Just a few seconds is enough for warm air from the room to displace the cold air inside it.
• If the fridge is large, it is a good idea to fill it up with jams and pickles: when you open the fridge warm air quickly displaces the cold air, but if the fridge is full, then less warm air gets in.
• Never put food into the fridge when it is still warm! And position the fridge as far as possible away from radiators, the cooker and direct sunlight.
• Make sure that containers with produce are covered when you put them into the fridge so that moisture does not evaporate and condense on the fridge walls.
• If the fridge needs to be defrosted manually, do it often.
Lighting • You can make energy savings of up to 40% by the use of modern lighting equip-ment.
• Spotlighting in places where we work or read often works better than powerful ceiling lights. Use portable lamps and fixtures.
• A smooth white surface reflects 80% of the light directed at it, while a dark green surface reflects only 15%, and a black surface just 9%. When choosing furniture, wallpaper and curtains for a room, give preference to lighter colors.
• There is a very simple and highly effective way of improving lighting efficiency: wipe the dust from light bulbs and glass windows regularly.
• Most of the daylight comes into a room through the upper part of the window, so it is particu-larly important not to block it.
AppliancesEnergy consumption can be reduced by learning how to make better use of house-hold appliances.
• When choosing new audio, video or computer equipment, give preference to those with lower power consumption. Of course, purchase decisions in the family are up to parents, but you can always help them to decide by telling them what you know – they may well take notice.
• Turn all electrical appliances right off when you are not using them. When you turn off the TV using a console, it goes into ‘sleep’ mode, which uses less electricity, but still some electricity.
• Do not leave chargers for mobile devices permanently plugged in.
• Use high-quality plug extensions with wide-gauge cords. Narrow cords will grow warm, which means that electricity is being lost as heat instead of powering your devices.

225
Water consumption• Wash in the shower and only take a bath on special occasions
• 10 drops per minute from the tap add up to 263 litres of water in a year. Mend a leaky tap.
• There are different types of tap. Taps with rubber washers may leak more often, but that little piece of rubber is easy to replace. Ball and ceramic taps may last a very long time, but only if the pipe that carries water to them has filters installed, because the polished parts in such taps are very sensitive to rust particles in the water. Ceramic taps must be closed gently. Thermostatic taps, which appeared on the market fairly recently, are more expensive, but they can adjust the water temperature quickly and accurately, which reduces unnecessary expense.
• Get into the habit of closing a tap when you don’t need water to run continuously. Some fami-lies peel potatoes and do the washing under running water, but these tasks can be done just as well using basins or buckets. Washing dishes is easier if you wash them all together and then rinse them all together. Modern sinks often have plugs, so you can use the sink itself as a basin.
Washing and ironing• When you wash clothes in the washing machine, there is no need to heat the water to 90 °C and run a full cycle: that is only necessary for very dirty items. For linen or only slightly soiled clothes, an economy wash cycle is quite sufficient (every machine offers a choice of economy or quick washes) and modern deter-gents contain enzymes that ensure a proper wash even at low temperatures. Such a wash uses nearly 10 times less power than a half-hour wash at 90 °C.
• Wait until you have a full load before using the washing machine – it is uneco-nomical to wash one pair of jeans.
• Make sure that the items to be washed are spread evenly in the drum of the machine. Otherwise the machine will not be able to provide rapid rotation of the drum. If the load is evenly spread, there will be less strain on the machine, the wash cycle will take less time and parts of the washing machine will last longer.
• When ironing washed clothes, sort them by different materials: you can start with lower tem-peratures and then move on to things that require high temperatures, and small items can be left for ironing after the iron has been turned off.
• Some things do not need ironing – it is enough to hang them neatly on clothes hangers.
Recycling and re-usingWe are used to seeing an abundance of things around us, but they do not appear from nowhere. Everything we use has been produced using energy and by the work of many people. Waste from the production of things and ever larger rubbish tips worsen our living conditions and have negative impact on the climate.
• Before you buy something new, think to yourself whether you really need it. Perhaps you only need it for a short time and would be as well borrowing it from someone else.
• Look after things to make them last longer.
• If you have something that you don’t need any longer, think whether it could be useful to somebody else. We can give toys or clothes, which we have grown out of, to the kindergarten, the orphanage or just to other children we know. There are sites on the Internet, where people

226
offer things they don’t need for free and other people are often ready to take them. Packing tubes or boxes can be turned into something new, old dolls and toys can be restored, and there are people who can fix a broken appliance and make it work again.
• You can donate old books that you won’t read again to the library or to book-exchanges, which have become popular in recent years: these are special shelves in some bookshops and libraries where you can bring any book of your own and exchange for it a book that someone else has brought there.
• If a thing is completely broken, the material from which it is made can be recycled. You can check in the Internet, whether there is any reception point in your town or city for recyclable objects – you may be lucky and find such a point near to where you live. You can also put up some notices to bring together the people who live in your neighbourhood for recycling of waste and unwanted items, or team up with friends, or talk to the teachers at school. Together, you might gather enough plastic, paper and metal to make a trip to the recycling centre worth-while.
• Take your own bags when you go shopping, so that you don’t have to use new ones at the checkout (save that convenience for when you really need it). Plastic bags for shopping are now freely available in shops, and they are sometimes convenient and necessary, but you can always tell the checkout staff that you don’t need them. A number of countries are now introducing a charge for plastic bags which makes it worth your while to take your own bags to use.
• It makes sense to buy everyday goods that keep for a long time (detergent, shampoo, some cereals, etc.) in large bulk packages. Remind your parents of that.
Metal recycling bales.

227
Paper made entirely from virgin pulp
Paper made entirely from recycled
materialsSaving
Timber 3 tonnes 0 tonnes 3 tonnes
Energy 11,140 kilowatt-hours 6,450 kilowatt-hours
4,690 kilowatt- hours
Greenhouse gas emissions 2,581 kg of CO2 1,625 kg of CO2 956 kg of CO2
Waste water 72,000 litres 39,100 litres 33,100 litres
Solid waste 1,033 kg 506 kg 528 kg
If we save 1 tonne of paper, we also save 13 tonnes of oil, 4,100 kilowatt-hours of electricity and 32 tonnes of water. The production and printing of one sheet of A4 paper generates 28 g of CO2, and copying a single sheet of A4 creates 380 g of CO2.
Table.3.4.1. Comparison between paper entirely produced from virgin pulp and paper entirely produced from recycled materials (per tonne of paper).
Energy savings in production using recycled materialsAluminum – 95% Copper – 70–85% Lead – 60–80%Zinc – 60–70% Magnesium – 95% Steel – 70%Paper – 64% Plastic – 80–88% Glass – 68%
So you can reduce your carbon footprint by using less energy and not wasting energy and water, by not buying things you don’t need and things with excess packaging, by getting your rubbish recycled, by walking and using a bicycle whenever possible, by buying locally-produced food. And finally, remember that our main allies in helping the climate are plants. Take care of them and plant new ones whenever and wherever you can.
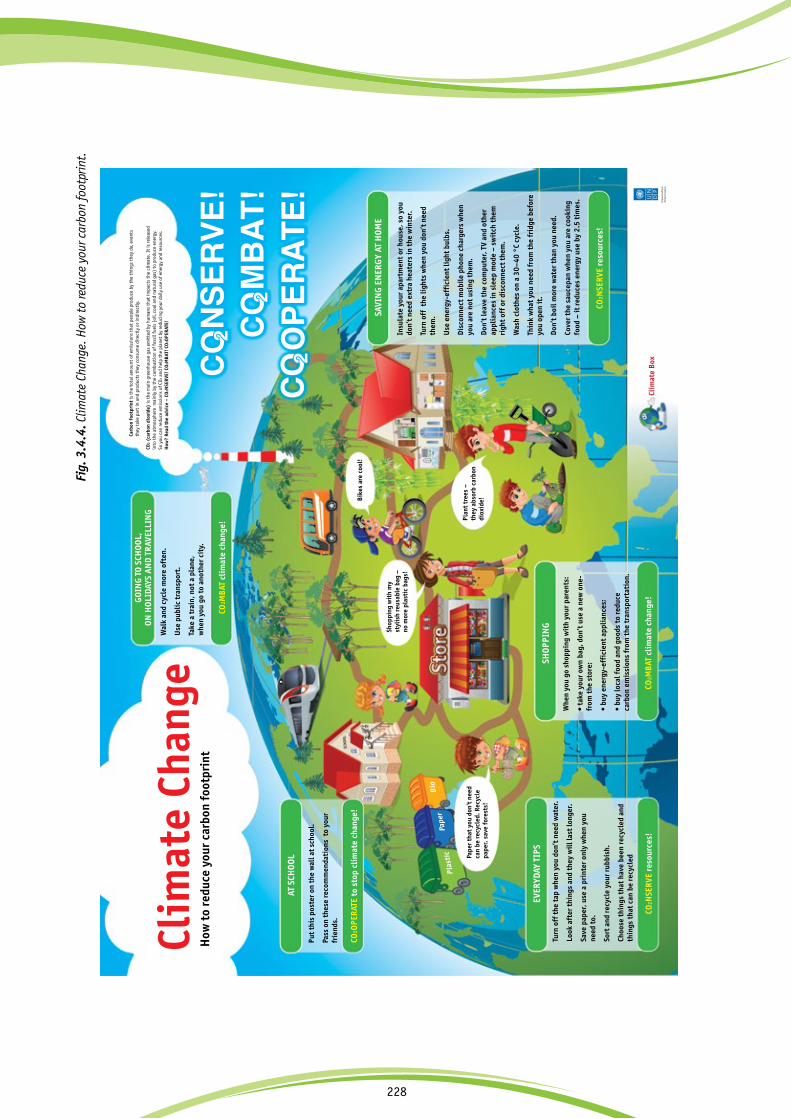
228
Fig.
3.4
.4. C
limat
e Ch
ange
. How
to re
duce
you
r car
bon
foot
prin
t.
229
Questions
1. It's cold outside, and the heating isn’t working in-doors. Which pieces of advice will be most useful for keeping warm at home and why?
1) wear a warm sweater and socks;2) put a carpet under your feet;3) have something to eat;4) drink hot tea;5) turn on an electric heater;6) dance, jump or run;7) light a fire in the stove or fireplace;8) take a hot bath;9) sit in the sun.
2. What is more economical and when is it more eco-nomical – taking a bath or taking a shower?
3. Can installation of water meters help to save energy? Why?
4. Do we use energy when we use water in an apartment building? What sort of energy do we use?
5. What do you already do in your home to save energy?
6. What important things do you need to remember when using a fridge?

230
Task 1. Draw a table with four columns. Use the first column to note down cases of inefficient energy use that you see around you (on the street, at home, at school). In the second column ex-plain how energy could be saved or used more efficiently in all these cases. In the third column, write down cases you have seen of efficient energy use. And in the fourth column, write down one occasion each day when you personally used energy more efficiently and did the planet some good. Compare your table with the tables of your classmates. Make a report on the results.
Task 2. Go through all your things (preferably with your parents), find out where they came from and mark that place on the world map. Put things you bought or were given, but don’t use, into a separate group. Calculate how far they travelled to reach you. Now you can make a chart (diagram, map) of what you have found out, showing where things were made, what use they are to you (necessary, unnecessary, useful from time to time, good for recycling, good for making something else out of, etc.).
Task 3. Divide the class into seven groups, each group draws a straw to select a focus group: younger students; older students; housewives; pensioners; industrialists; politicians; teachers. Each group has to develop a project to promote energy saving and energy efficiency for its focus group. Your tasks are:
1) to think of a slogan or slogans for an information campaign;
2) to design a poster to encourage energy saving in your group;
3) to develop a programme that will help your focus group to grasp the principles of energy saving and to carry them out.
Put some original ideas into your programme – from a puppet show to publishing a book, to proposals for reform of the state (depending on the focus group).
After the projects have been presented, display the bestposters at school.
Tasks
+2 оС
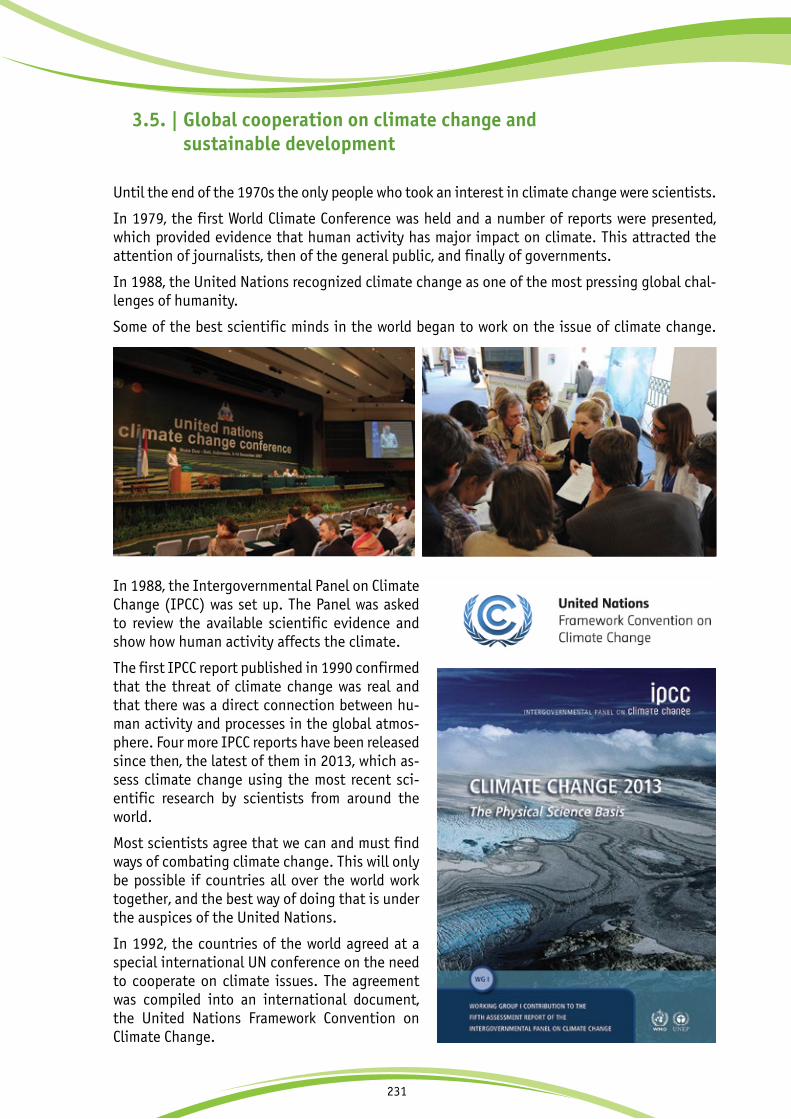
231
3.5. | Global cooperation on climate change and sustainable development
Until the end of the 1970s the only people who took an interest in climate change were scientists.
In 1979, the first World Climate Conference was held and a number of reports were presented, which provided evidence that human activity has major impact on climate. This attracted the attention of journalists, then of the general public, and finally of governments.
In 1988, the United Nations recognized climate change as one of the most pressing global chal-lenges of humanity.
Some of the best scientific minds in the world began to work on the issue of climate change.
In 1988, the Intergovernmental Panel on Climate Change (IPCC) was set up. The Panel was asked to review the available scientific evidence and show how human activity affects the climate.
The first IPCC report published in 1990 confirmed that the threat of climate change was real and that there was a direct connection between hu-man activity and processes in the global atmos-phere. Four more IPCC reports have been released since then, the latest of them in 2013, which as-sess climate change using the most recent sci-entific research by scientists from around the world.
Most scientists agree that we can and must find ways of combating climate change. This will only be possible if countries all over the world work together, and the best way of doing that is under the auspices of the United Nations.
In 1992, the countries of the world agreed at a special international UN conference on the need to cooperate on climate issues. The agreement was compiled into an international document, the United Nations Framework Convention on Climate Change.

232
The Climate Convention only set out general actions to limit and reduce greenhouse gas emis-sions. So, in 1995, at the first Conference of the Parties to the Convention (i.e. the countries that had signed the Convention), it was decided to prepare a further international documentto regulate concrete actions by the Parties into the 21st century.
The negotiations to prepare this new docu-ment were very complex and difficult. But the countries came to agreement. And in December 1997 in Japan, they adopted a new international treaty named the Kyoto Protocol after the city of Kyoto where it was signed.
The Kyoto Protocol was revolutionarybecause it contained commitments by de-veloped countries not to exceed a certain level of greenhouse gas emissions in the period from 2008 to 2012 relative to 1990, which was taken as the baseline.
For example, the European Union pledged to reduce its emissions by 8%, Japan by 6%, and Russia and Ukraine not to exceed the level of their emissions in 1990.
The United States, which had the largest amount of greenhouse gas emissions in the world, took an active part in the negotiations on the Kyoto Protocol, but later, in 2001, refused to sign it.
So at the end of 2012 there were two international treaties in force: the Climate Convention, as an international document defining the general strategy for humanity to combat climate change, and the Kyoto Protocol, which established specific commitments of industrialized countries,such as the European Union, and countries with transition economies, such as Russia or Ukraine.
The period of the commitments made by industrialized countries and transition countries expired at the end of 2012 and a new round of negotiations was needed for the next period, beginning in 2013. In 2013, developed countries agreed on further commitments to reduce greenhouse gas emissions in the period from 2013 to 2020, promising more substantial reductions than before.
But, for various reasons, the attitude of a number of countries towards the Kyoto Protocol has changed. The US, Canada, Japan, New Zealand and Russia have not joined the agreements for2013–2020. Their argument is that the world has altered since the 1990s, and now almost all the growth in emissions does not come from developed countries, but from major developing countries (China, India, Brazil, South Africa and others), whose emissions are not regulated by the Kyoto Protocol.
+2 оС

233
So we can distinguish several stages of mankind's efforts to address climate change:
• 1992 - Climate Convention, when countries agreed to formulate planned actions to return emissions to 1990 levels;
• 2008-2012 - the first commitment period of the Kyoto Protocol – with 37 developed countries and the European Community committed to reduce greenhouse gas emissionsto an average of 5% against 1990 levels;
• 2013-2020 – the second commitment period of the Kyoto Protocol – developed countries committed to reduce greenhouse gas emissions by at least 18% below 1990 levels. However, the composition of countries in the second commitment period is different from the first period;
• 2015 – Adoption of the Paris Agreement that includes Nationally Determined Contributions (NDCs) of countries with ambitious long-term measures to curb greenhouse gas emissions.
• After 2020 – Paris Agreement enters into force.
In December 2015, the countries met at the United Nations Climate Change Conference in Paris to achieve a new universal agreement on climate that will be implemented from 2020 and will be applicable to all the nations of the world. In preparation for Paris, governments submitted their climate pledges called “nationally determined contributions” (NDCs) outlining their mid- and long-term national emission reduction targets. The goal is to limit global average temperature below 2 °C above pre-industrial levels.
The Paris, conference looked at a broad range of climate change challenges and solutionsincluding mitigation of greenhouse gas emissions, adaptation to climate change impacts, as well as technological and financial support for such actions. The Paris Agreement is only a legalframework for climate change actions beyond 2020, while more detailed decisions on itsimplementation are to come in the next few years.
Effective international cooperation can help the world develop along a 2°C pathway and adapt to the climatic changes which are already happening as a result of past and ongoing green-house gas emissions. It can also help countries grasp the many opportunities and benefitsassociated with the transition to low-carbon and climate resilient economies.
International cooperation on climate change is closely linked with the other principal concern of humanity – how to achieve sustainable development for global prosperity. Sustainable devel-opment requires mutually supporting actions in three domains: economic, social and environmental. And climate change impacts all three of them.
234
At the United Nations General Assembly in September 2015, 193 countries adopted the 2030 Development Agenda and 17 Sustain-able Development Goals (SDGs). Goal 13 aims at 'Taking urgent action to combat climate change and its impacts' (Fig. 3.5.1).
Fig. 3.5.1. 17 Sustainable Development Goals of the United Nations
Many other SDGs also relate to climate change, for example Goal 7 'Ensure access to affordable, reliable, sustainable and modern energy for all’.
In our modern world of technological progress about 1.3 billion people, 80% of them in rural areas, have no access to electricity. These people, the world’s poorest, make up more than 18% of the total 7 billion people now living on the planet.
Even more people, about 3 billion, use traditional biomass (wood and firewood) for cooking and heating. According to the World Health Organization, pollutants emitted into the atmosphere from the combustion of biomass in inefficient cooking devices, may be causing the premature death of 1.5 million people every year, or more than 4,000 a day. That is more than the total num-ber of people who die each day from malaria, tuberculosis and AIDS combined. These desperately poor people live in Africa, south of the Sahara Desert (the largest desert in the world), and also in southern Asia and Latin America.
This problem has been called ‘energy poverty’.
Providing clean, efficient, affordable and reliable energy services is the key aspect of global prosperity, and by efficient use of energy resources we can combat climate change. Conversely, a focused climate policy promotes the rational and efficient use of energy resources.
Changes of behaviour and thinking of households and individuals are very important for these efforts. Everybody can make a personal contribution to lessening the impact of climate change by switching to more sustainable consumption patterns, such as cycling, eating a healthy diet, high in fruit and vegetables that are in season and produced locally, to reduce the amount of waste we produce, re-use materials where possible, as well as saving electricity and water.
Sustainabledevelopment

235
Tasks
Task 1. In this set of tasks you can try yourself in the role of an in-ternational negotiator. Read the ‘10 tips for an international negotiator’ and learn them by heart.
10 tips for an international negotiator1. Focus on the issue that is being discussed. Don’t get divert-ed from it. Don’t pursue side tracks or jump to other topics.
2. Try to find and distinguish the key idea, and focus on con-tent, not on form.
3. Paraphrase what the other person has said and check that you understood him or her correctly (‘If I'm not mistaken, you mean that...’, ‘Do I understand rightly that ...’).
4. Ask questions.
5. Respect the silence of the person you are talking too, don’t rush to fill pauses in the conversation.
6. Interpret information both from the point of view of your own culture, and from the point of view of a foreign culture.
7. Try not to read your own meaning into someone else's be-haviour.
8. Don’t hurry to make assessments and value judgments.
9. Learn to recognize non-verbal messages of the person you are talking to (facial expressions, gestures, posture, intona-tion, etc.).
10. Don’t jump to conclusions based on a single gesture or sign.
It is interesting that one of the most successful strategies in dealing with people from other cultures is simply to imi-tate them. Copying the way your negotiating partner behaves significantly increases the chances of a positive outcome for both sides. So being a chameleon can help you to succeed in international negotiations. In any case, courtesy, respect for person you are talking to and his or her culture, and open-ness in communication can work wonders. The same applies in daily life.

236
+2 оС
Task 2. Game
Imagine that you are taking part in the United Nations Con-ference on Climate Change and you are going to discuss the problems of different countries related to climate change.
Prepare a brief welcome speech that the head of your state will read to all the Conference participants. The speech should mention:
– the climate and main natural resources of your country;
– how people in your country live;
– the chief sectors of your country’s economy;
– the impact of climate change on nature, people and the economy;
– what your country expects the Conference to achieve.
After the welcome speech the Conference participants express their views on how to prevent the negative impacts of climate change on the environment and on people in the countries taking part in the Conference.
At the end of the game, the participants select a winner –the student who made the most contribution to the discus-sion, and who said the most relevant, well-argued and inter-esting things.
Task 3. You are a governmental officer of a small island state in the Pacific region. Currently, you are preparing a proposal to apply for international financial support to help your country cope with the negative impacts of climate change. Reflect the fol-lowing issues in your finding proposal:
1) What expected effects of global warming represent the greatest threat to your country?
2) What is to be done if rising sea levels threaten to engulfthe whole of your island?
3) What international organizations and states will you apply to for help?
4) How do you plan to preserve the culture of your country,if your island disappears under the sea?

par
t
Guidelines for teacherson the use of the Climate Boxtoolkit in schools
238
4. | Guidelines for teachers on the use of the Climate Box toolkit in schools
The Climate Box is an interactive learning toolkit on climate change addressed at secondary and primary school students and their teachers of natural sciences and environmental studies.
The materials have been prepared by the UNDP with the support of the GEF, the Ministry of Natural Resources and Environment of Russia, and the Coca-Cola company. Climate Box continues the series of toolkits for school students, which have already been prepared and presented by UNDP and its partners: Black Sea Box and Baikal’s Little Treasure Chest.
Objectives of the Climate Box:
– to inform students about the world around them, the interrelations between a man and the environment;– to promote the ideas of conservation and respect for nature;– to instill an environmental culture of responsible consumption in the younger generation, to develop energy- and resources-saving skills among young people;– to assist teachers in preparing and conducting lessons on themes directly or indirectly related to climate change.
The Climate Box interactive toolkit contains:
– an illustrated textbook for students with learning materials, interactive and individual tasks, and questions on the theme of climate change;– guidelines for teachers on how to use the toolkit in lessons with children of different ages;– the Climate Quiz – a set of game cards;– a map entitled ‘Climate change: The negative impacts on the environment and human be-ings, unless we do all we can to reduce greenhouse gas emissions’;– a poster entitled ‘Climate change: how to reduce your carbon footprint’;– a disc with all of the textbook materials in electronic form.
The Climate Box textbookThe textbook consists of three sections: ‘The problem of climate change’; ‘How climate change affects the natural world and human beings. Can we adapt to the inevitable consequences of climate change?’; and ‘How to prevent dangerous climate change’. The book helps students to develop knowledge and skills for distinguishing different types of climate and natural zones; explains the relationship of the geographical components of natural systems; teaches how to distinguish, describe and explain the essential features of geographical features and weather phenomena and how they can change as a result of natural and manmade impacts; explains the use of alternative energy sources; teaches rules of conduct in case of extreme weather; and teaches the sparing use of resources in the home, at school and outdoors. The information in each section of the textbook can provide a useful supplement to many aspects of educational programmes.
Charts on pp. 241–252 indicate how to link the Climate Box to national curricula. These guidelines clearly have a focus on the Russian educational programme, however they contain valuable information that would be useful for other countries’ curricula, many of which are similar in format to the Russian one.
The textbook contains many interesting and informative facts about natural anomalies, examples of the consequences of climate change impacts on coastal, mountain and Arctic regions, forests,
239
cities and countries, and gives students the opportunity to independently analyze the informa-tion and to build hypotheses and forecasts about natural processes and phenomena of relevance to the region where they live.
The guidelines will help teachers to give their pupils a scientific understanding of the world around them, to develop their intellectual abilities and desire for knowledge. The textbook helps students to view the world from the point of view of an astronomer, geographer and ecologist. Colourful and attractive illustrations, charts and graphs help to consolidate an understanding of evolution (by reference to climate change events in the past and the shape of our planet today), spatial differences in the processes of climate formation, geographical features of the natural complexes of different continents and oceans, conservation practices, natural and manmade causes of environmental problems, measures to preserve the natural world and protect people from natural and man-made disasters, the greenhouse effect and biodiversity, and the carbon footprint of human beings on Earth.
Questions and tasks provided in the textbook offer an opportunity to use all of this knowledge in practice.
The textbook can be used in work with students from 8 years old, but is particularly suitable for students aged 10–13 years old, both as part of the main curriculum and for extracurricular activities.
Teachers are advised to use the textbook materials taking account of what their students are cur-rently focused on, and their needs, interests and abilities. Some children will find the whole of the text to be of interest, while others may be attracted by specific facts, illustrations or ideas for experiments. We are optimistic that every student will find something new and interesting in the textbook. We suggest that teachers take a creative approach to the toolkit, using the materials in activities outside the classroom and in extracurricular activities: these may be outdoor activi-ties, environmental actions, subject weeks, competitions and quizzes, and study circles.
The team of authors sincerely hopes that the Climate Box toolkit will encourage students, teachers and parents to alter their lifestyle towards greater environmental awareness.
Educational programmesPrimary education
• The School 2100 educational programme. The world around us. Authors: A.A. Vahhrushev, D.D. Danilov, A.S. Rautian and others.
• The Harmony educational programme. The world around us. Author: O.T. Poglazova.
• The Russian School educational programme. The world around us. Author: A.A. Pleshakov.
Secondary education
• Natural Science. Class 5. Authors: A.A. Pleshakov, N.I. Sonin• Biology. Classes 6–9. Authors: N.I. Sonin, V.B. Zakharov, E.T. Zakharova• Biology. Classes 10–11. Authors: I.B. Agafonov, V.I. Sivoglazov• Geography. Classes 6–9. Authors V.P. Dronov and others• Geography. Classes 10–11. Author: V.P. Maksakovsky• Chemistry. Classes 8–11. Authors: O.S. Gabrielyan• Physics. Classes 7–9. Authors: A.V. Peryshkin, E.M. Gutnik• Physics. Classes 10–11. Author: L.E. Gendenshtein• Environment, Health and Safety. Classes 5–9. Author: I.K. Toporov

240
PRIMARY EDUCATION
Sectionin the Climate Box textbook
The World Around Us
School 2100 programme Harmony programme Russian School programme
Part 1. The problem of climate change
1.1. Climate and weather
Class 2• Theme: Weather and climate• Theme: Natural zones
Class 3• Theme: Air, its properties and what it contains
Class 2• Theme: Different types of clouds
Class 3• Theme: Natural phenomena and nature• Theme: Temperature and temperature measurement • Outdoor activity: Observing autumn changes in nature• Theme: Weather forecasting• Outdoor activity: Observing winter changes in nature• Theme: Winter changes in water and sky• Outdoor activity: Observing spring changes in nature• Theme: Spring changes in water and sky• Theme: Summer changes in water, sky, plants and animals.Rules to stay safe in the summer vacation
Class 4• Theme: Natural areas of Russia• Theme:Natural environment where I live
Class 2• Theme: Temperature and the thermometer • Theme: What is weather
1.2 Climate types and climate zones
Class 2• Theme: Natural zones• Theme: The climate on Earth• Theme: Natural environment zones
Class 4• Theme: The harsh Arctic• Theme: The vulnerable tundra• Theme: Blazing deserts• Theme: Mountains• Theme: Natural areas of Russia• Theme: The continent of Eurasia, its nature and peoples• Theme: Africa and its nature. Africa researchers • Theme: America. Discovery of America. North and South America• Theme: Australia, its unique plants and animals• Theme: Antarctica, its discovery by Russian explorers, its harsh environment
Class 4• Theme: Distribution ofsolar heat on Earthand its impact on livingnature• Theme: Natural zonesof our country: Arctic deserts, tundra, forest, steppe, deserts, subtropics• Theme: Natural featuresof each zone • Theme: How the economy depends on naturalconditions. The environmentalproblems of each natural zone

241
PRIMARY EDUCATION
Sectionin the Climate Box textbook
The World Around Us
School 2100 programme Harmony programme Russian School programme
1.3. How and why the climate changed in the past –
Class 4• Theme: The science of astronomy. Earth – a planet in the solar system• Theme: The sun and the stars. The influence of the sun on Earth• Theme: World tour
–
1.4. Climate change today
–
Class 2• Theme: Human-beings as a part of nature
Class 3• Theme: The air and what it contains• Theme: The movement of air. How air is used
Class 4• Theme: Past and presentthrough the eyes of an ecologist. Understanding ofthe modern environmentalproblems of the planet
Part 2. How climate change affects the natural world and human beings.Can we adapt to the inevitable consequences of climate change?
2.1. How climate change affects the weather
–
Class 2• Theme: Thunder storms. Keeping safe in a thunder storm • Theme: Natural bodies and phenomena• Theme: Water on Earth. Oceans and seas. Keeping safe at sea
Class3• Theme: Unusual natural phenomena. Keeping safe in extreme weather events• Theme: Summer changes in sky and water. Keeping safe in the summer holidays
Class 4• Theme: Natural environment where I live
–
2.2. How climate change affects plants and animals
Class 2• Theme: Natural environment zones
Class 2• Theme: The continent of Eurasia. Studies of Asia. The natural world of the continent and its people• Theme: Africa and its natural world• Theme: The natural world of northern and southern continents• Theme: The continent’s harsh natural world
Class 2• Theme: What different plants are there: trees, shrubs and grasses. How are they distinguished• Theme: What different animals are there:insects, fish, birds and beasts. How are they distinguished.• Theme: Russia’s Red Book:Recognizing different plants and animals; measures fortheir protection
Class 3• Theme: Plants and their diversity• Theme: Reproduction and growth of animals. The role of animals in nature and human life. Human impact on the animal world

242
PRIMARY EDUCATION
Section in the Climate Box
textbook
The World Around Us
School 2100 programme Harmony programme Russian School programme
2.3. How climate change affects forests
–
Class 4• Theme: Russia, country of forests• Theme: Natural environment where I live
Class 3• Theme: Connections in nature• Theme: The soil and its composition. Living creatures in soil. Understanding how soil is made and the role of living organisms
2.4. How climate change affects water resources
Class 3• Theme: Bodies and substances• Theme: Water and its properties
Class 2• Theme: Water on Earth. Oceans and seas• Theme: The value of rivers for people• Theme: Freshwater reservoirs. The river and its parts• Theme: The importance of water for life on Earth. Pollution of water spaces
Class 3• Theme: Structure and properties of substances• Theme: The water cycle in nature
Class 2• Theme: Air and water, their importance for plants, animals and a man• Theme: Air and water pollution. Protecting air and water from pollution • Theme: Wild plants and crops. House plants and how to care for them
Class 3• Theme: Water and its properties. Three states of water. The water cycle in nature
2.5. How climate change affects agriculture – – –
2.6. How climate change affects coastal regions –
Class 2• Theme: The Earth’s surface. Continents and oceans –
2.7. Howclimate change affectsmountainregions
Class 3• Theme: Rocks and minerals
Class 2• Theme: Varieties of mountains• Theme: Volcanoes. Keeping safe in the mountains• Theme: The nature of mountains
–
2.8. How climate change affects Arctic regions –
Class 4• Theme: Natural zone. The harsh Arctic –
2.9. How climate change affects cities and human health
–
Class 2• Theme: Russian cities.Cities with one million inhabitants• Theme: People in the city and the country. Problems of the modern city
Class 2• Theme: The city where we live and its main features
2.10. How climate change affects social problems
– – –

243
Primary Education
Section in the Climate Box textbook
The World Around Us
School 2100 programme Harmony programme Russian School programme
Part 3. How to prevent dangerous climate change?
3.1. ‘Green’ energy sources
3.1.1. What is energy
3.1.2. The main sources of energy
Class 3• Theme: Energy as the source of movement• Theme: The diverseforms of energy• Theme: Electricity, sunlight and falling water are energy phenomena
– –
3.1.3. Fossil fuels Class3• Theme: Peat, stonecoal, oil and natural gas – fossil fuels and where they come from
– –
3.1.4. Nuclear energy –– –
3.1.5. Renewable energy sources
–
Class 2• Theme: The movement of air.How air can be used –
3.1.6. Advantages and disadvantages of different energy sources
–
Class 2• Theme: The sun - the closest planet to Earth
Class 3• Theme: Minerals and fossil fuels, their exploration and mining
• Theme: Fossil fuels. Environmental problems from their production and transportation
–
3.2. Energy efficiency and energy saving
3.2.1. Environmentally friendly transport
3.2.2. Household appliances and electrical devices
–
Class 2• Theme: Types of transport.Air and water pollution caused by transport
–
3.2.3. Green construction. Passive and active buildings
3.2.4. Green cities–
Class 4• Theme: Construction materials
–

244
PRIMARY EDUCATION
Section in the Climate Box
textbook
The World Around Us
School 2100 programme Harmony programme Russian School programme
3.3. Carbon footprint
3.4. How can I help the planet. Reducing your carbon footprint
Classes 2-4• Theme: Learning to solvelife tasks• Theme: How to live inharmony with nature• Theme: Our littleplanet Earth
– –
3.5. Global cooperation on climate change and sustainable development
– – –
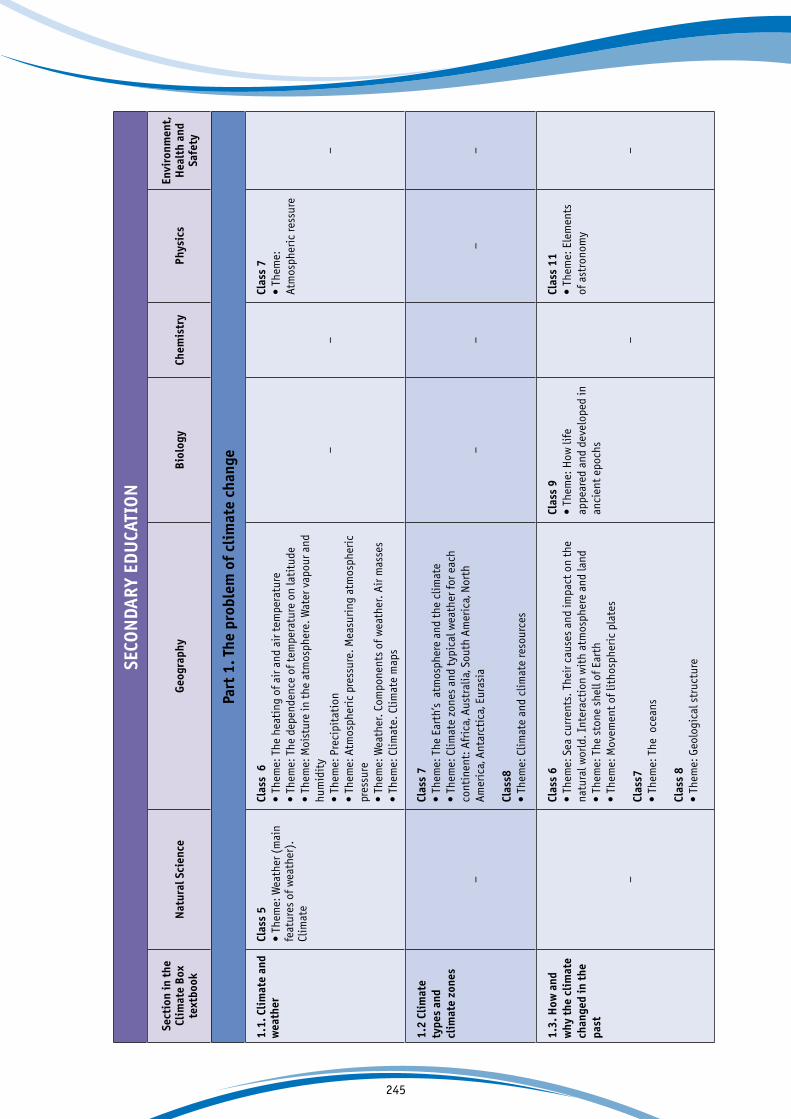
245
SECO
NDA
RY E
DU
CATI
ON
Sect
ion
in t
he
Clim
ate
Box
te
xtbo
okN
atur
al S
cien
ceG
eogr
aphy
Bio
logy
Chem
istr
yPh
ysic
sEn
viro
nmen
t,
Hea
lth
and
Safe
ty
Part
1. T
he p
robl
em o
f cl
imat
e ch
ange
1.1.
Cli
mat
e an
d w
eath
er
Clas
s 5
• Th
eme:
Wea
ther
(m
ain
feat
ures
of w
eath
er).
Cl
imat
e
Clas
s 6
• Th
eme:
The
hea
ting
of a
ir a
nd a
ir t
empe
ratu
re•
Them
e: T
he d
epen
denc
e of
tem
pera
ture
on
lati
tude
•
Them
e: M
oist
ure
in t
he a
tmos
pher
e. W
ater
vap
our a
nd
hum
idit
y•
Them
e: P
reci
pita
tion
• Th
eme:
Atm
osph
eric
pre
ssur
e. M
easu
ring
atm
osph
eric
pr
essu
re•
Them
e: W
eath
er. C
ompo
nent
s of
wea
ther
. Air
mas
ses
• Th
eme:
Clim
ate.
Clim
ate
map
s
––
Clas
s 7
• Th
eme:
At
mos
pher
ic re
ssur
e
–
1.2
Clim
ate
type
s an
d cl
imat
e zo
nes
–
Clas
s 7
• Th
eme:
The
Ear
th’s
atm
osph
ere
and
the
clim
ate
• Th
eme:
Clim
ate
zone
s an
d ty
pica
l wea
ther
for e
ach
cont
inen
t: A
fric
a, A
ustr
alia
, Sou
th A
mer
ica,
Nor
th
Amer
ica,
Ant
arct
ica,
Eur
asia
Clas
s8•
Them
e: C
limat
e an
d cl
imat
e re
sour
ces
––
––
1.3.
How
and
w
hy t
he c
lim
ate
chan
ged
in t
he
past
–
Clas
s 6
• Th
eme:
Sea
cur
rent
s. T
heir
cau
ses
and
impa
ct o
n th
e na
tura
l wor
ld. I
nter
acti
on w
ith
atm
osph
ere
and
land
• Th
eme:
The
sto
ne s
hell
of E
arth
• Th
eme:
Mov
emen
t of
lith
osph
eric
pla
tes
Clas
s7•
Them
e: T
he o
cean
s
Clas
s 8
• Th
eme:
Geo
logi
cal s
truc
ture
Clas
s 9
• Th
eme:
How
life
ap
pear
ed a
nd d
evel
oped
in
anci
ent
epoc
hs
–
Clas
s 11
• Th
eme:
Ele
men
ts
of a
stro
nom
y
–
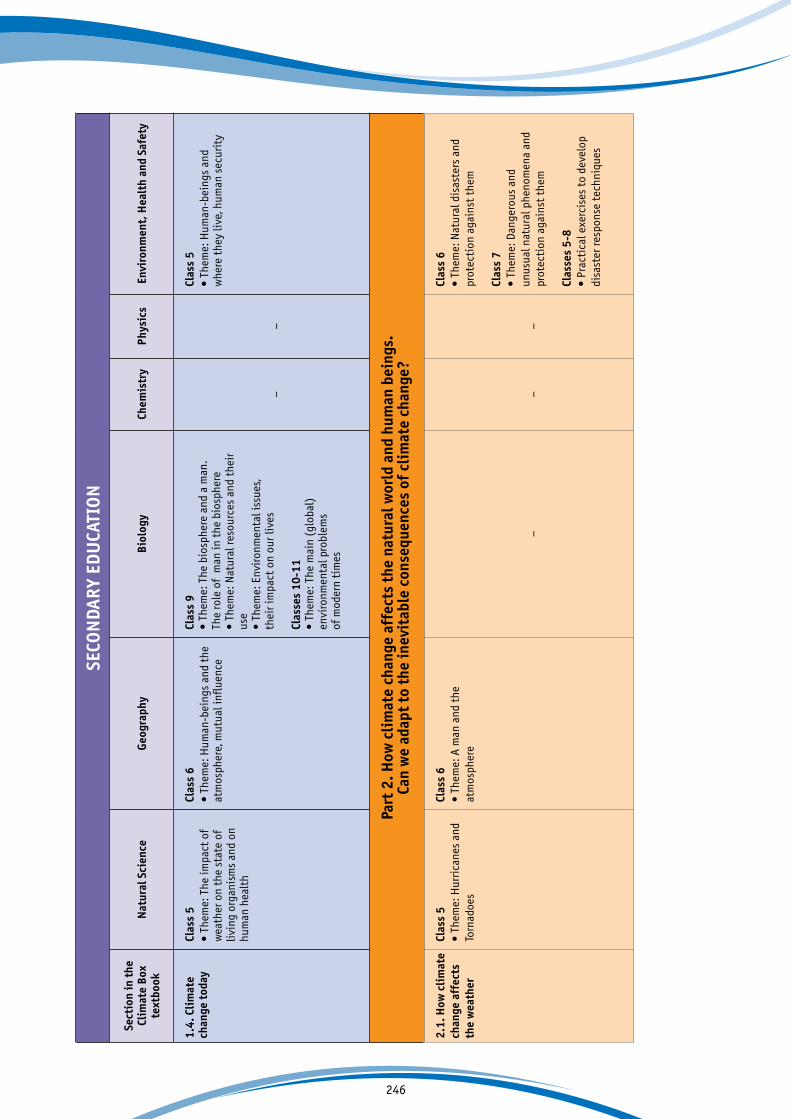
246
SECO
NDA
RY E
DU
CATI
ON
Sect
ion
in t
he
Clim
ate
Box
text
book
Nat
ural
Sci
ence
Geo
grap
hyB
iolo
gyCh
emis
try
Phys
ics
Envi
ronm
ent,
Hea
lth
and
Safe
ty
1.4.
Cli
mat
e ch
ange
tod
ay
Clas
s 5
• Th
eme:
The
impa
ct o
f w
eath
er o
n th
e st
ate
of
livin
g or
gani
sms
and
on
hum
an h
ealt
h
Clas
s 6
• Th
eme:
Hum
an-b
eing
s an
d th
e at
mos
pher
e, m
utua
l inf
luen
ce
Clas
s 9
• Th
eme:
The
bio
sphe
re a
nd a
man
. Th
e ro
le o
f m
an in
the
bio
sphe
re•
Them
e: N
atur
al re
sour
ces
and
thei
r us
e •
Them
e: E
nvir
onm
enta
l iss
ues,
thei
r im
pact
on
our l
ives
Clas
ses
10-1
1•
Them
e: T
he m
ain
(glo
bal)
envi
ronm
enta
l pro
blem
sof
mod
ern
tim
es
––
Clas
s 5
• Th
eme:
Hum
an-b
eing
s an
d w
here
the
y liv
e, h
uman
sec
urit
y
Part
2. H
ow c
lim
ate
chan
ge a
ffec
ts t
he n
atur
al w
orld
and
hum
an b
eing
s.Ca
n w
e ad
apt
to t
he in
evit
able
con
sequ
ence
s of
cli
mat
e ch
ange
?
2.1.
How
cli
mat
e ch
ange
aff
ects
th
e w
eath
er
Clas
s 5
• Th
eme:
Hur
rica
nes
and
Torn
adoe
s
Clas
s 6
• Th
eme:
A m
an a
nd t
he
atm
osph
ere
––
–
Clas
s 6
• Th
eme:
Nat
ural
dis
aste
rs a
nd
prot
ecti
on a
gain
st t
hem
Clas
s 7
• Th
eme:
Dan
gero
us a
nd
unus
ual n
atur
al p
heno
men
a an
d pr
otec
tion
aga
inst
the
m
Clas
ses
5-8
• Pr
acti
cal e
xerc
ises
to
deve
lop
disa
ster
resp
onse
tec
hniq
ues
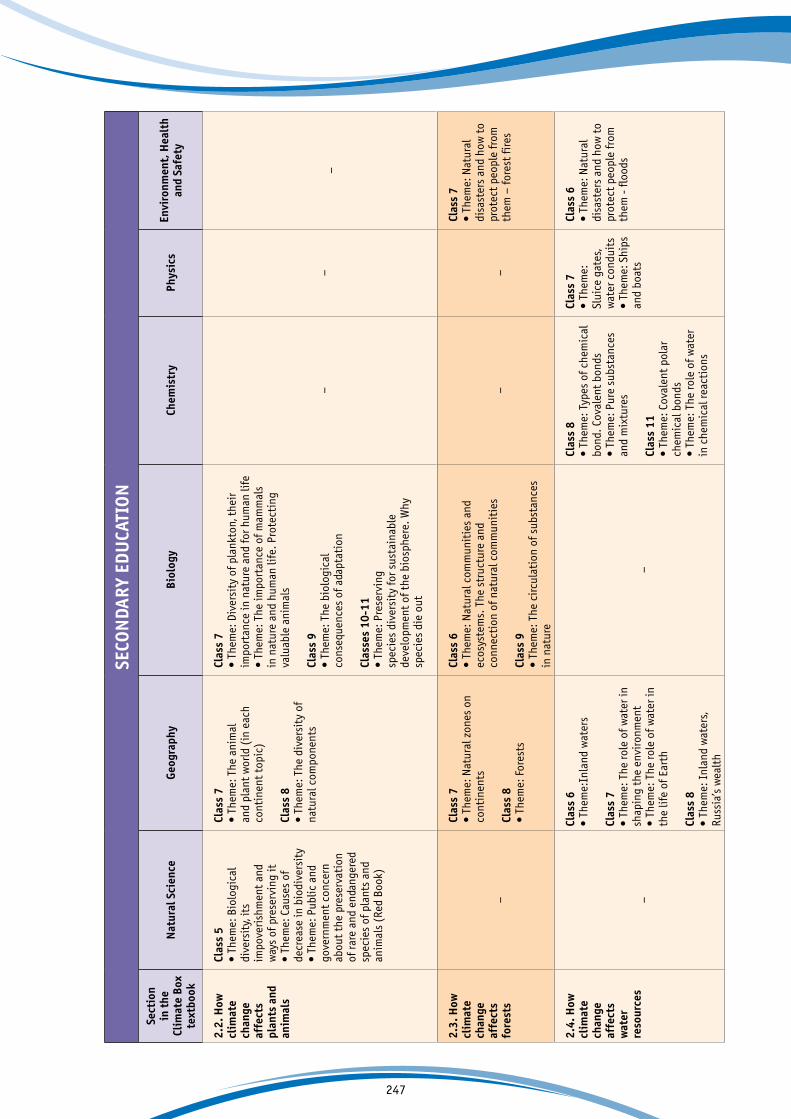
247
SECO
NDA
RY E
DU
CATI
ON
Sect
ion
in t
he
Clim
ate
Box
text
book
Nat
ural
Sci
ence
Geo
grap
hyB
iolo
gyCh
emis
try
Phys
ics
Envi
ronm
ent,
Hea
lth
and
Safe
ty
2.2.
How
clim
ate
chan
geaf
fect
s pl
ants
and
an
imal
s
Clas
s 5
• Th
eme:
Bio
logi
cal
dive
rsit
y, it
s im
pove
rish
men
t an
d w
ays
of p
rese
rvin
g it
•
Them
e: C
ause
s of
de
crea
se in
bio
dive
rsit
y•
Them
e: P
ublic
and
go
vern
men
t co
ncer
n ab
out
the
pres
erva
tion
of
rare
and
end
ange
red
spec
ies
of p
lant
s an
d an
imal
s (R
ed B
ook)
Clas
s 7
• Th
eme:
The
ani
mal
an
d pl
ant
wor
ld (
in e
ach
cont
inen
t to
pic)
Clas
s 8
• Th
eme:
The
div
ersi
ty o
f na
tura
l com
pone
nts
Clas
s 7
• Th
eme:
Div
ersi
ty o
f pla
nkto
n, t
heir
im
port
ance
in n
atur
e an
d fo
r hum
an li
fe
• Th
eme:
The
impo
rtan
ce o
f mam
mal
sin
nat
ure
and
hum
an li
fe. P
rote
ctin
g va
luab
le a
nim
als
Clas
s 9
• Th
eme:
The
bio
logi
cal
cons
eque
nces
of a
dapt
atio
n
Clas
ses
10-1
1•
Them
e: P
rese
rvin
g sp
ecie
s di
vers
ity
for s
usta
inab
lede
velo
pmen
t of
the
bio
sphe
re. W
hy
spec
ies
die
out
––
–
2.3.
How
clim
ate
chan
geaf
fect
s fo
rest
s–
Clas
s 7
• Th
eme:
Nat
ural
zon
es o
n co
ntin
ents
Clas
s 8
• Th
eme:
For
ests
Clas
s 6
• Th
eme:
Nat
ural
com
mun
itie
s an
dec
osys
tem
s. T
he s
truc
ture
and
co
nnec
tion
of n
atur
al c
omm
unit
ies
Clas
s 9
• Th
eme:
The
cir
cula
tion
of s
ubst
ance
s in
nat
ure
––
Clas
s 7
• Th
eme:
Nat
ural
di
sast
ers
and
how
to
prot
ect
peop
le fr
om
them
– fo
rest
fire
s
2.4.
How
cl
imat
e ch
ange
affe
cts
wat
erre
sour
ces
–
Clas
s 6
• Th
eme:
Inla
nd w
ater
s
Clas
s 7
• Th
eme:
The
role
of w
ater
in
shap
ing
the
envi
ronm
ent
• Th
eme:
The
role
of w
ater
in
the
life
of E
arth
Clas
s 8
• Th
eme:
Inl
and
wat
ers,
Russ
ia’s
wea
lth
–
Clas
s 8
• Th
eme:
Typ
es o
f che
mic
al
bond
. Cov
alen
t bo
nds
• Th
eme:
Pur
e su
bsta
nces
an
d m
ixtu
res
Clas
s 11
• Th
eme:
Cov
alen
t po
lar
chem
ical
bon
ds•
Them
e: T
he ro
le o
f wat
er
in c
hem
ical
reac
tion
s
Clas
s 7
• Th
eme:
Sl
uice
gat
es,
wat
er c
ondu
its
• Th
eme:
Shi
ps
and
boat
s
Clas
s 6
• Th
eme:
Nat
ural
di
sast
ers
and
how
to
prot
ect
peop
le fr
om
them
- fl
oods
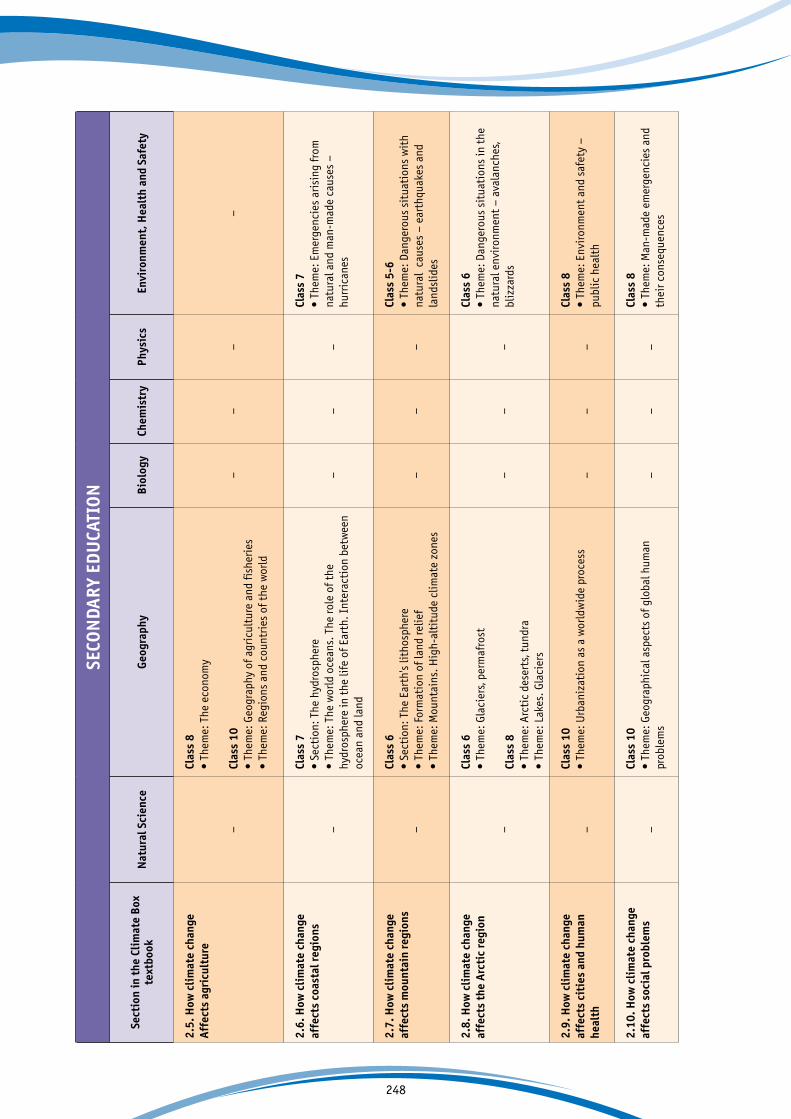
248
SECO
NDA
RY E
DU
CATI
ON
Sect
ion
in t
he C
lim
ate
Box
text
book
Nat
ural
Sci
ence
Geo
grap
hyB
iolo
gyCh
emis
try
Phys
ics
Envi
ronm
ent,
Hea
lth
and
Safe
ty
2.5.
How
cli
mat
e ch
ange
Aff
ects
agr
icul
ture
–
Clas
s 8
• Th
eme:
The
eco
nom
y
Clas
s 10
• Th
eme:
Geo
grap
hy o
f agr
icul
ture
and
fish
erie
s •
Them
e: R
egio
ns a
nd c
ount
ries
of t
he w
orld
––
––
2.6.
How
cli
mat
e ch
ange
af
fect
s co
asta
l reg
ions
–
Clas
s 7
• Se
ctio
n: T
he h
ydro
sphe
re•
Them
e: T
he w
orld
oce
ans.
The
role
of t
he
hydr
osph
ere
in t
he li
fe o
f Ear
th. I
nter
acti
on b
etw
een
ocea
n an
d la
nd
––
–
Clas
s 7
• Th
eme:
Em
erge
ncie
s ar
isin
g fr
om
natu
ral a
nd m
an-m
ade
caus
es –
hu
rric
anes
2.7.
How
cli
mat
e ch
ange
af
fect
s m
ount
ain
regi
ons
–
Clas
s 6
• Se
ctio
n: T
he E
arth
's lit
hosp
here
• Th
eme:
For
mat
ion
of la
nd re
lief
• Th
eme:
Mou
ntai
ns. H
igh-
alti
tude
clim
ate
zone
s
––
–
Clas
s 5-
6•
Them
e: D
ange
rous
sit
uati
ons
wit
h na
tura
l ca
uses
– e
arth
quak
es a
nd
land
slid
es
2.8.
How
cli
mat
e ch
ange
af
fect
s th
e A
rcti
c re
gion
–
Clas
s 6
• Th
eme:
Gla
cier
s, p
erm
afro
st
Clas
s 8
• Th
eme:
Arc
tic
dese
rts,
tun
dra
• Th
eme:
Lak
es. G
laci
ers
––
–
Clas
s 6
• Th
eme:
Dan
gero
us s
itua
tion
s in
the
na
tura
l env
iron
men
t –
aval
anch
es,
bliz
zard
s
2.9.
How
cli
mat
e ch
ange
af
fect
s ci
ties
and
hum
an
heal
th–
Clas
s 10
• Th
eme:
Urb
aniz
atio
n as
a w
orld
wid
e pr
oces
s –
––
Clas
s 8
• Th
eme:
Env
iron
men
t an
d sa
fety
–
publ
ic h
ealt
h
2.10
. How
cli
mat
e ch
ange
af
fect
s so
cial
pro
blem
s–
Clas
s 10
• Th
eme:
Geo
grap
hica
l asp
ects
of g
loba
l hum
an
prob
lem
s –
––
Clas
s 8
• Th
eme:
Man
-mad
e em
erge
ncie
s an
d th
eir c
onse
quen
ces
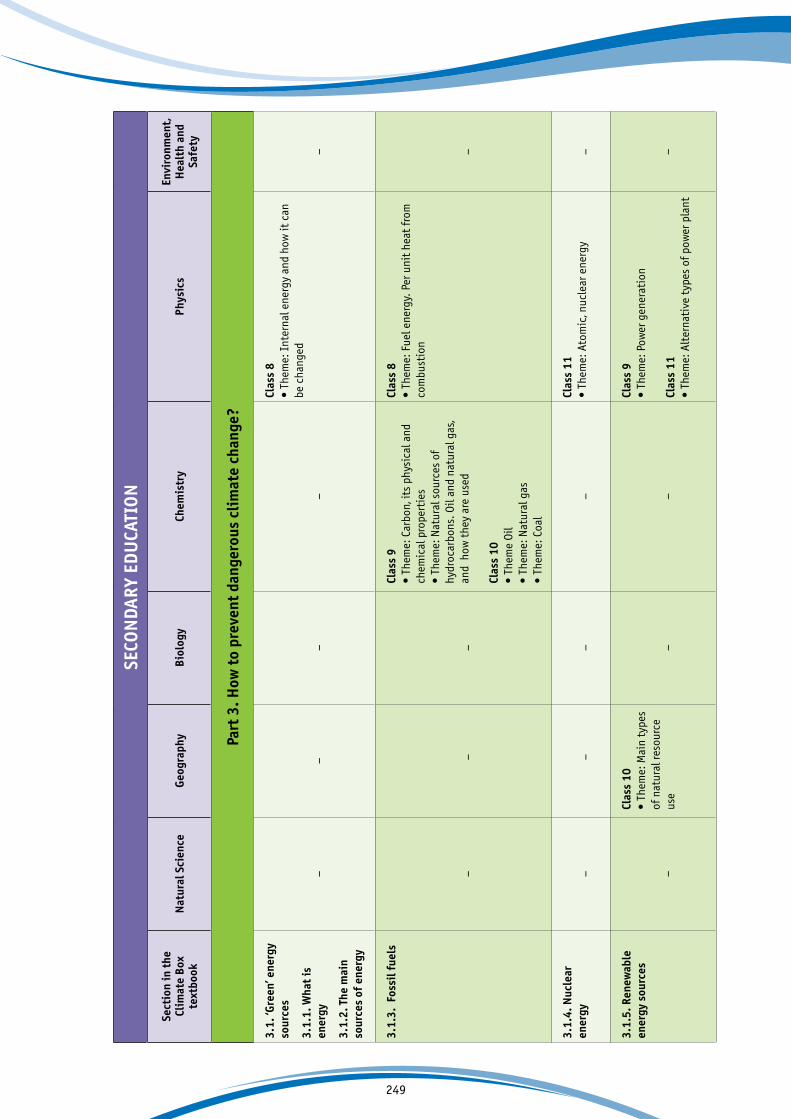
249
SECO
NDA
RY E
DU
CATI
ON
Sect
ion
in t
he
Clim
ate
Box
text
book
Nat
ural
Sci
ence
Geo
grap
hyB
iolo
gyCh
emis
try
Phys
ics
Envi
ronm
ent,
H
ealt
h an
d Sa
fety
Part
3. H
ow t
o pr
even
t da
nger
ous
clim
ate
chan
ge?
3.1.
‘Gre
en’ e
nerg
y so
urce
s
3.1.
1. W
hat
is
ener
gy
3.1.
2. T
he m
ain
sour
ces
of e
nerg
y
––
––
Clas
s 8
• Th
eme:
Int
erna
l ene
rgy
and
how
it c
an
be c
hang
ed
–
3.1.
3. F
ossi
l fue
ls
––
–
Clas
s 9
• Th
eme:
Car
bon,
its
phys
ical
and
ch
emic
al p
rope
rtie
s•
Them
e: N
atur
al s
ourc
es o
f hy
droc
arbo
ns. O
il an
d na
tura
l gas
, an
d h
ow t
hey
are
used
Clas
s 10
• Th
eme
Oil
• Th
eme:
Nat
ural
gas
• Th
eme:
Coa
l
Clas
s 8
• Th
eme:
Fue
l ene
rgy.
Per
uni
t he
at fr
om
com
bust
ion
–
3.1.
4. N
ucle
ar
ener
gy
––
––
Clas
s 11
• Th
eme:
Ato
mic
, nuc
lear
ene
rgy
–
3.1.
5. R
enew
able
en
ergy
sou
rces
–
Clas
s 10
• Th
eme:
Mai
n ty
pes
of n
atur
al re
sour
ce
use
––
Clas
s 9
• Th
eme:
Pow
er g
ener
atio
n
Clas
s 11
• Th
eme:
Alt
erna
tive
typ
es o
f pow
er p
lant
–
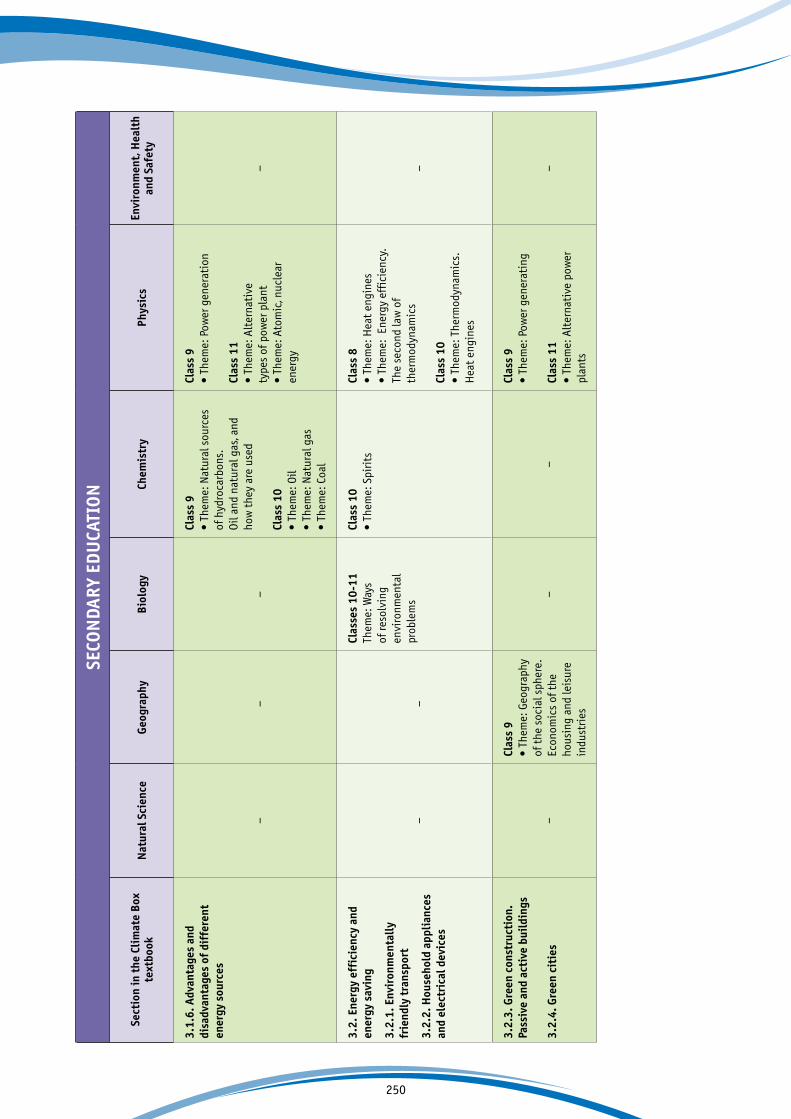
250
SECO
NDA
RY E
DU
CATI
ON
Sect
ion
in t
he C
lim
ate
Box
text
book
Nat
ural
Sci
ence
Geo
grap
hyB
iolo
gyCh
emis
try
Phys
ics
Envi
ronm
ent,
Hea
lth
and
Safe
ty
3.1.
6. A
dvan
tage
s an
d di
sadv
anta
ges
of d
iffe
rent
en
ergy
sou
rces
––
–
Clas
s 9
• Th
eme:
Nat
ural
sou
rces
of
hyd
roca
rbon
s.Oi
l and
nat
ural
gas
, and
ho
w t
hey
are
used
Clas
s 10
• Th
eme:
Oil
• Th
eme:
Nat
ural
gas
• Th
eme:
Coa
l
Clas
s 9
• Th
eme:
Pow
er g
ener
atio
n
Clas
s 11
• Th
eme:
Alt
erna
tive
type
s of
pow
er p
lant
• Th
eme:
Ato
mic
, nuc
lear
en
ergy
–
3.2.
Ene
rgy
effi
cien
cy a
nd
ener
gy s
avin
g
3.2.
1. E
nvir
onm
enta
lly
frie
ndly
tra
nspo
rt
3.2.
2. H
ouse
hold
app
lian
ces
and
elec
tric
al d
evic
es
––
Clas
ses
10-1
1Th
eme:
Way
s of
reso
lvin
g en
viro
nmen
tal
prob
lem
s
Clas
s 10
• Th
eme:
Spi
rits
Clas
s 8
• Th
eme:
Hea
t en
gine
s•
Them
e: E
nerg
y ef
fici
ency
. Th
e se
cond
law
of
ther
mod
ynam
ics
Clas
s 10
• Th
eme:
The
rmod
ynam
ics.
H
eat
engi
nes
–
3.2.
3. G
reen
con
stru
ctio
n.
Pass
ive
and
acti
ve b
uild
ings
3.2.
4. G
reen
cit
ies
–
Clas
s 9
• Th
eme:
Geo
grap
hy
of t
he s
ocia
l sph
ere.
Ec
onom
ics
of t
he
hous
ing
and
leis
ure
indu
stri
es
––
Clas
s 9
• Th
eme:
Pow
er g
ener
atin
g
Clas
s 11
• Th
eme:
Alt
erna
tive
pow
er
plan
ts
–

251
SECO
NDA
RY E
DU
CATI
ON
Sect
ion
in t
he C
lim
ate
Box
text
book
Nat
ural
Sci
ence
Geo
grap
hyB
iolo
gyCh
emis
try
Phys
ics
Envi
ronm
ent,
H
ealt
h an
d Sa
fety
3.3.
Car
bon
foot
prin
t
3.4.
How
can
I h
elp
the
plan
et. R
educ
ing
your
car
bon
foot
prin
t
––
Clas
s 9
• Th
eme:
Nat
ure
cons
erva
tion
and
ra
tion
al u
se o
f na
tura
l res
ourc
es
Clas
ses
10-1
1•
Them
e: H
ow t
o be
have
in t
he n
atur
alen
viro
nmen
t.N
atur
e co
nser
vati
on
and
rati
onal
use
of
natu
ral r
esou
rces
Cla
ss 8
• Th
eme:
Phy
sica
l and
ch
emic
al p
heno
men
a.
Chem
ical
reac
tion
s
Clas
s 9
• Th
eme:
Hal
ogen
s•
Them
e: N
itri
c ac
id s
alts
• Th
eme:
Bio
logi
cally
impo
rtan
t su
bsta
nces
-
prot
eins
, fat
s an
d ca
rboh
ydra
tes
• Th
eme:
Che
mic
al p
ollu
tion
of
the
env
iron
men
t a
nd it
s co
nseq
uenc
es
Clas
s 10
• Th
eme:
Pro
tein
s•
Them
e: N
ucle
ic a
cids
• Th
eme:
Med
icin
es
Clas
s 11
• Th
eme:
Liq
uid
and
solid
st
ates
of s
ubst
ance
s
Clas
s 9
• Th
eme:
Ene
rgy
Clas
s 11
•
Them
e: A
lter
nati
ve t
ypes
of
ener
gy
–
3.5.
Glo
bal c
oope
rati
on
on c
lim
ate
chan
ge a
nd
sust
aina
ble
deve
lopm
ent
–
Clas
ses
10-1
1•
Them
e: G
eogr
aphi
cal
aspe
cts
of g
loba
l hum
an
prob
lem
s in
the
pas
t an
d pr
esen
t, an
d w
ays
of
reso
lvin
g th
ose
prob
lem
s
Clas
ses
10-1
1•
Them
e: T
he
cons
eque
nces
of
hum
an a
ctiv
ity
for
the
envi
ronm
ent
Clas
s 9
• Th
eme:
Rel
atio
nshi
ps
betw
een
orga
nism
and
en
viro
nmen
t–
–
252
| List of Illustrations
Front cover. Photo: BigRoloImages, Shutterstock.com.
P. 5. Photo: courtesy of T.Stocker.
P. 9. Photo: J. Swanepoel, Shutterstock.com.
P. 11. Fig. 1.1.: NASA, https://data.giss.nasa.gov/gistemp/maps/
P. 13. Fig. 1.1.1.: Peel, M. C., Finlayson, B. L., and McMahon, T. A. Updated world map of the Köppen-Geiger climate classification (Central Asia). Retrieved from Wikipedia. Photo (bottom): Shutterstock.com.
P. 14. Fig.: Shutterstock.com.
P. 15. Fig. 1.2.1.: Wikipedia.
P. 17. Photo (top): R. Loesche, Shutterstock.com. Photo (centre): Semork, Shutterstock.com. Photo (bottom): apdesign, Shutterstock.com.
P. 18. Photo (top): A. Latsun, Shutterstock.com. Photo (centere): rdonar, Shutterstock.com. Photo (bottom): Susan R. Serna, Shutterstock.com.
P. 19. Photo: axily, Shutterstock.com.
P. 20. Fig. 1.2.2.: I. Frolov, Arctic and Antarctic Institute. Fig. 1.2.3.: J. Sullivan, Wikipedia. Fig. 1.2.4.: NASA. Fig. 1.2.5.: T. Skambos, National
Research Centre for Snow and Ice, USA.
P. 23. Crossword: Authors’ elaboration based on the Russian version by S. Korshchikova.
P. 24. Fig. (left): M. Anton, Public Library of Science, posted on Wikipedia. Photo (right): H. Grobe, Wikipedia. Fig. 1.3.1.:
A.O. Kokorin, E.V. Smirnova, D.G. Zamolodchikov. Climate Change. Book for High School Teachers. - Moscow: WWF, 2013. 220 pp.
P. 25. Photo (left and top right): M. Dunn, NOAA Climate Program Office, NABOS 2006 Expedition. Photo (bottom right): L. Koenig, NASA.
P. 26. Fig. 1.3.3.: A. Alekperov. Fig. 1.3.4.: http://school-collection.lyceum62.ru.
P. 27. Fig.: Catmando, Shutterstock.com.
P. 28. Fig. 1.3.5.: J. Hansen and M. Sato, 2011: Paleoclimate implications for human-made climate change. In Climate Change: Inferences from Paleoclimate and Regional Aspects. Berger, Andre; Mesinger et al. - Springer, 2012. - 270 pp. http://www.springer.com/.
P. 29. Fig. 1.3.6.: Climate Change 2013: The Physical Science Basis. Contribution of Working Group I to the Fifth Assessment Report of the IPCC. T. Stocker, D. Qin, G.-K. Plattner et al. www.ipcc.ch. Fig. 1.3.7.: R. Blakey, http://www.cpgeosystems.com.
P. 31. Fig. 1.3.8.: http://www.britishmuseum.org. Photo: A. Jack, Shutterstock.com.
P. 32. Fig. 1.3.9.: http://earthobservatory.nasa.gov/. Photo: Y. Kumsri, Shutterstock.com.
P. 35. Fig. 1.4.1.: The World Meteorological Organization (WMO), 2017: https://library.wmo.int/opac/doc_num.php?explnum_id=3414. Fig. 1.4.2.: Climate Change 2013: The Physical Science Basis. Contribution of Working Group I to the Fifth Assessment Report of the IPCC. / T. Stocker, D. Qin, G.-K. Plattner et al. www.ipcc.ch.
P. 36. Fig. 1.4.3.: http://climate.nasa.gov/evidence/.
P. 37. Fig. 1.4.4.: J. Hansen and M. Sato, 2011: Paleoclimate implications for human-made climate change. In Climate Change: Inferences from Paleoclimate and Regional Aspects. Berger, Andre; Mesinger at al. - Springer, 2012. - 270 pp. http://www.springer.com/.
P. 38. Fig. 1.4.5.: A.O. Kokorin, E.V. Smirnova, D.G. Zamolodchikov, Climate Change. Book for High School Teachers. - Moscow: WWF, 2013. - 220 pp.
P. 39. Fig. 1.4.6.: The World Meteorological Organization, 2017: https://library.wmo.int/opac/doc_num.php?explnum_id=3414. Fig. 1.4.7. NASA, https://data.giss.nasa.gov/gistemp/maps/.
P. 40. Fig. 1.4.8.: Climate Change 2013: The Physical Science Basis. Contribution of Working Group I to the Fifth Assessment Report of the IPCC./ T. Stocker, D. Qin, G.-K. Plattner et al. www.ipcc.ch.
P. 41. Fig. 1.4.9.: D. Belyukin, http://www.belukin.ru/
P. 42. Photo: A. Tikhonov, Shutterstock.com.
P. 44. Photo: H. Grobe, Wikipedia.
P. 45. Photo: scenery2, Shutterstock.com.
P. 47. Photo (top left): P. Steib, Shutterstock.com. Photo (top right): Wutthichai, Shutterstock.com. Photo (bottom left): Siriporn-88, Shutterstock.com. Photo (bottom right): P. Litovchenko.
P. 48. Fig. 2.1.: A. Alekperova, V. Berdin, Y. Dobrolyubova, Y. Kalinicheva, A. Kokorin.
P. 49. Fig. 2.1.1.: V. Kantor.
P. 50. Fig. 2.1.2.: NASA image by J. Schmaltz, LANCE/EOSDIS Rapid Response, http://earthobservatory.nasa.gov/IOTD/view.php?id=86539.
P. 51. Photo (top left): http://earthobservatory.nasa.gov/. Photo (top right): T. Shoemake, Shutterstock.com. Photo (bottom left): D. Bertonceli, Shutterstock.com. Photo (bottom right): B. Sosnovy, Shutterstock.com.
P. 52. Photo (top left): R.A. Mansker, Shutterstock.com. Photo (top centre): ChameleonsEye, Shutterstock.com. Photo (top right): Website of the President of the Russian Federation, kremlin.ru. Photo (bottom left): W. Dias / Agencia Brasil, Wikipedia. Photo (bottom right): B. Dyakovsky, Shut-terstock.com.
P. 53. Photo (left): R. Bayer, Shutterstock.com. Fig. 2.1.3.: R. Stockli and R. Simmon using data of the MODIS Land Science Team, NASA,http://earthobservatory.nasa.gov/.
P. 54. Photo: D.J. Rao, Shutterstock.com.
P. 55. T. Th. Walther, Wikipedia.
P. 57. Photo: ChameleonsEye, Shutterstock.com.
P. 58. Collage: A. Alekperova.
P. 59. Fig. (top): http://34374.info/wp-content/uploads/2011/07/nils.jpg. Photo (left): S. Tulinov. Photo (right): Simm, Wikipedia.
P. 60. Photo (top): M.M. Karim, Wikipedia. Photo (bottom): MarcusVDT, Shutterstock.com.
P. 61. Collage: A. Alekperova, based on illustrations from Wikipedia.
P. 62. Photo: Kletr, Shutterstock.com.

253
P. 63. Photo (first): Xocolatl, Wikipedia. Photo (second): N. Tomura, Wikipedia. Photo (third): Wilson44691, Wikipedia. Photo (fourth): D. Bogdanov, Wikipedia.
P. 64. Photo (top): jamon jp, Wikipedia. Photo (bottom). P. Kapitola, State Phytosanitary Administration, Bugwood.org.
P. 65. Photo (first): Fraan, Photobucket.com. Photo (second): Smithsonian National Museum of Natural History. Photo (third): Vlad61, Shutterstock.com. Photo (fourth): S. Baron, Wikipedia.
P. 66. Photo (first): S. Uryadnikov, Shutterstock.com. Photo (second): martinhlavacek79, Shutterstock.com. Photo (third): Argus fin, Wikipedia. Photo (fourth): D. Charman, http://blogs.exeter.ac.uk/antarcticpastclimate/2013/01/20. Photos (fifth): edmon, Shutterstock.com.
P. 67. Photo (top): elitravo, Shutterstock.com. Photo (bottom left): M. Opp, Wikipedia. Photo (bottom center): Silky, Shutterstock.com. Photo (bot-tom right): freestock.ca.
P. 68. Photo (first): Lorcel, Shutterstock.com. Photo (second): MarkVanDykePhotography, Shutterstock.com. Photo (third): G. Yim, Shutterstock.com. Photo (fourth): L. Galuzzi
P. 69. Photo (top): S. Myatyashev, http://stasmat.livejournal.com/15402.html?thread=77610. Photo (bottom left): Forestry department Rothaarge-birge. Photo (bottom right): M. Manske, Wikipedia.
P. 70. Photo (first): SNEHIT, Shutterstock.com. Photo (second): http://www.destination360.com/north-america/us/utah/zion-national-parklodg-ing. Photo (third): http://www.taganay.org. Photo (fourth): A. Martynova, Shutterstock.com.
P. 71. Photo: http://pohod.h12.ru/FOTOAlbom/Taganay/f_t_21.jpg.
P. 72. Photo (left and right): http://www.laparios.com/.
P. 73. Photo: IUCN
P. 76. Fig. 2.3.1.: Source: MA 2005. Map designed by Emmanuelle Bournay, Paris.
P. 77. Fig. 2.3.2.: http://blog.pershyn.name/2011/09/2011.html.
P. 78. Fig. 2.3.3 and 2.3.4.: D. Zamolodchikov.
P. 79. Fig. 2.3.5.: Shiyatov, 2009. Photo (bottom): El Misti, Wikipedia.
P. 80. Fig. 2.3.6.: J.F. Stuefer, Wikipedia.
P. 81. Fig. 2.3.7.: Fishlin et al., 2007.
P. 82. Fig. 2.3.8.: www.rosleskhoz.gov.ru. Fig. 2.3.9.: D. Zamolodchikov.
P. 83. Fig. 2.3.10.: D. Zamolodchikov.
P. 84. Fig. 2.3.11.: D. Zamolodchikov.
P. 85. Fig. 2.3.12 and 2.3.13.: V. Kaganov. Fig. 2.3.14.: D. Zamolodchikov.
P. 86. Fig. 2.3.15.: D. Zamolodchikov.
P. 87. Fig. 2.3.16.: V. Kaganov. Fig. 2.3.17.: D. Zamolodchikov.
P. 88. Fig. 2.3.18.: D. Zamolodchikov. Fig. 2.3.19.: The State of the Forests of Papua New Guinea, 2008.
P. 89. Photo: A. Fedorov, Shutterstock.com.
P. 90. Fig. 2.3.20 and 2.3.21.: D. Zamolodchikov.
P. 94. Photo (top): T. Spider, Shutterstock.com. Fig. 2.4.1.: http://www.astronet.ru/db/msg/1224153.
P. 95. Photo (top): S. Tulinov. Photo (bottom left): L. Nunes, Wikipedia. Photo (bottom right): G. Paire, Shutterstock.com.
P. 96. Fig. 2.4.2.: UNEP, http://www.unep.org/dewa/vitalwater/article155.html.
P. 97. Fig. 2.4.3.: Federal State Unitary Enterprise NPO Lavochkina. Fig. 2.4.4: Wikipedia (left). N. Palmer, International Center for Tropical Agricul-ture (CIAT), http://flickr.com/photos/38476503@N08/5641586406 (right).
P. 98. Fig. 2.4.5.: E. Harrison, National Geographic Magazine, Volume 31 (1917), page 272 (left). Rjruiziii, Wikipedia (right). Fig, 2.4.6.: Katvic, Shut-terstock.com. Fig. 2.4.7.: Water Supply report by National Climate Assessment, USA. http://nca2014.globalchange.gov/report.
P. 99. Fig. 2.4.8.: A. Bezlepkin. Fig. 2.4.9.: Octal, Wikipedia.
P. 100. Fig. 2.4.10.: BK Bates et al. Climate change and water resources. IPCC Technical Paper. – Geneva 2008.
P. 102. Photo: N. Palmer, Wikipedia.
P. 103. Photo (top): V. Salman, Shutterstock.com. Photo (bottom): Ratikova, Shutterstock.com.
P. 104. Photo (top left): R. Jary, Shutterstock.com. Photo (top right): Gleizes, Greenpeace. http://www.greenpeace.org/. Photo (bottom): I. Stru-kov, Shutterstock.com.
P. 105. Photo (top): J. Tran, Shutterstock.com. Photo (bottom): A. Bondarets, Shutterstock.com.
P. 106. Photo (from left): D. Henry, Shutterstock.com. Photo (right): Stasis Photo, Shutterstock.com.
P. 108. Photo: B. Jevtic, Shutterstock.com.
P. 109. Photo: zstock, Shutterstock.com.
P. 110. Photo (left): S. Tulinov. Photo (right): JaySi, Shutterstock.com.
P. 111. Fig. 2.6.1.: R. Rowley, J. Kostelnick, D. Braaten et al. Risk of rising sea level to population and land area. 2007. Photo: Z. Pereira da Mata, Shutterstock.com.
P. 112. Photo: R. Whitcombe, Shutterstock.com. Fig. 2.6.2.: Wikipedia. Fig. 2.6.3.: A. Kolotilin, WWF Russia.
P. 113. Photo (top): N. Mitchell, Shutterstock.com. Fig. 2.6.4.: Evaluation report ‘Key environmental and socio-economic effects of climate change in permafrost areas: a forecast based on synthesis of observations and modelling’. Ed. O. Anisimov. - SPb.: State Hydrological Institute, 2009. Fig. 2.6.5.: M. Grigoriev (ibid). Photo (bottom): LippertPhotography, Shutterstock.com.
P. 114. Photo: AlinaMD, Shutterstock.com. Fig. 2.6.6.: http://peakwatch.typepad.com/.a/6a00d83452403c69e20154358c6598970c-pi.
P. 115. Fig. 2.6.7.: Climate Change 2013: The Physical Science Basis. Contribution of Working Group I to the Fifth Assessment Report of the IPCC./ T. Stocker, D. Qin, G.-K. Plattner et al. www.ipcc.ch. Fig. 2.6.8.: graph: http://oceanadapt.rutgers.edu/, picture of black sea bass: Encyclopaedia Britannica, http://global.britannica.com/media/full/530475/132944.
P. 116. Photo (from left): ermess, Shutterstock.com. Photo (right): withGod, Shutterstock.com.
P. 118. Photo: S. Ilyas, Wikipedia.

254
P. 119. Photo: momanuma, Shutterstock.com.
P. 120. Fig. 2.7.1.: A. Alekperova and Yu. Dobrolyubova using materials from http://900igr.net/datai/geografija. Photo: D. Pichugin, Shutterstock.com.
P. 121. Fig. (top): Wikipedia. Photo (bottom): A. Egorov, Shutterstock.com.
P. 122. Fig. 2.7.2.: The World Glacier Monitoring Service (WGMS). Fig. 2.7.3.: Wikipedia.
P. 123. Fig. 2.7.4.: The World Glacier Monitoring Service (WGMS). Fig. 2.7.5.: M. Hёltsle, University of Zurich, the World Glacier Monitoring Service (WGMS). Fig. 2.7.6.: NASA. Fig. 2.7.7.: NASA.
P. 124. Fig. 2.7.8.: Y. Dobrolyubova. Fig. 2.7.9.: Archive of Glacier National Park.
P. 125. Fig. 2.7.10.: V. Kantor. Photo (left): A. Gl, Shutterstock.com. Photo (right): M. Topchiy, Shutterstock.com. Fig. 2.7.11. A. Alekperova, Y. Dobrolyubova G. Tushinskaya.
P. 126. Photo (top): M. Topchiy, Shutterstock.com. Photo (middle): V. Kantor. Photo (bottom): L. Gridinoc, Wikipedia.
P. 127. Photo (left): ANA Peru. Photo (right): Dtarazona, Wikipedia.
P. 128. Fig. 2.7.12.: NASA. Fig. 2.7.13.: Contribution of Working Group II to the Fourth Assessment Report of the IPCC, 2007. M. Parry, O. Canziani, J. Palutikof et al. - Cambridge University Press, Cambridge, United Kingdom and New York, NY, USA. Photo: Pikoso.kz, Shutterstock.com.
P. 129. Photo: D. Lynch, Shutterstock.com.
P. 131. Photographic reproduction: Wikipedia.
P. 133. Photo: S. Dobrolyubov.
P. 134. Fig. 2.8.1.: http://www.athropolis.com/map2.htm.
P. 135. Photo (left): Gazprom, http://media.gazprom-neft.ru/pictures/production/category688/category689/AVD43214.jpg.htm. Photo (right): Vlada Z, Shutterstock
P. 136. Fig. 2.8.2.: National Snow and Ice Data Center (USA), http://nsidc.org/data/seaice_index/.
P. 137. Fig. 2.8.3.: Polar Research Center. http://psc.apl.washington.edu/wordpress/research/projects/arctic-sea-ice-volume-anomaly. Fig. 2.8.4.: A. Kokorin, WWF Russia.
P. 138. Photo: J. McDonald, Shutterstock.com. Fig. 2.8.5.: C. Accardo, AP Photo/NOAA.
P. 139. Photo: D. Pilipenko, Shutterstock.com.
P. 140. Fig. 2.8.6.: J. Shaw, http://www.johnshawphoto.com/.
P. 141. Fig. 2.8.7.: N. Shiklomanov. Evaluation report: ‘Key environmental and socio-economic impacts of climate change in permafrost areas: a forecast based on synthesis of observations and modelling’. Ed. O. Anisimov. SPb.: State Hydrological Institute, 2009. Fig. 2.8.8.: ibid. Fig. 2.8.9.: D. Drozdov, ibid.
P. 142. Fig. 2.8.10.: V. Romanovsky, ibid. Fig. 2.8.11.: M. Grigoriev, ibid. Fig. 2.8.12.: V. Romanovsky, Past and Present and Future Changes in Permafrost and Implications for a Changing Carbon Budget. Environmental Science Seminar Series, 2008, American Meteorological Society.
P. 143. Fig. 2.8.13. and 2.8.14.: N. Shiklomanov, Evaluation report: Key environmental and socio-economic impacts of climate changes in perma-frost areas: a forecast based on the synthesis of observations and modelling. Ed. O. Anisimov. SPb.: State Hydrological Institute, 2009.
P. 144. Photo (left): G. Baturova (left); Photo (right): A. Walk, Wikipedia.
P. 145. Photo: S. Dobrolyubov
P. 148. Fig. 2.9.1.: F. Schmidt, Ellen J. Beer et al. (eds.), Berns grosse Zeit. Photo (below): KPG_Payless, Shutterstock.com.
P. 149. Fig. 2.9.2.: A. Alekperova and Y. Dobrolyubova using materials from World Urbanization Prospects 2014 - Highlights. - UN, 2014. Table 2.9.1.: A. Alekperova using The World’s Cities in 2016, UN. http://www.un.org/en/development/desa/population/publications/pdf/urbanization/the_worlds_cities_in_2016_data_booklet.pdf
P. 150. Fig. 2.9.3.: Pjt56, Wikipedia. Photo (left): 1000 Words, Shutterstock.com. Photo (right): P. Rogat, Shutterstock.com.
P. 151. Fig. 2.9.4.: US Global Change Research Program (USGCRP), 2009. Reproduction of the painting (bottom): Wikipedia.
P. 152. Fig. 2.9.5.: Centre for Health Research School of Medicine, http://climatehealthcluster.org/wp-content/uploads/2013/06/Bambrick_Hi-lary_080813.pdf.
P. 153. Photo: ChameleonsEye, Shutterstock.com.
P. 154. Fig. 2.9.6.: B. Revich. Photo (from left): SW_Stock, Shutterstock.com. Photo (right): A. Ruzhin, Shutterstock.com.
P. 155. Fig. 2.9.5.: A. Haynes and others. Climate change and human health - impacts, vulnerability and adaptation. Proceedings of the World Climate Change Conference, Moscow 2003. - Moscow, 2004.
P. 157. Photo: D. Bertonceli, Shutterstock.com.
P. 158. Photo (top left): WorldWide, Shutterstock.com. Photo (top center): P. Date, Shutterstock.com. Photo (top right): g-stockstudio, Shutter-stock.com. Photo (bottom): Kzenon, Shutterstock.com.
P. 159. Fig. 2.10.1.: Wikipedia.
P. 160. Photo (from left): S. DCruz, Shutterstock.com. Photo (right): G. Paire, Shutterstock.com.
P. 161. Photo (top): H. Conesa, Shutterstock.com. Photo (bottom): P. HaSon, Shutterstock.com.
P. 162. Fig. 2.10.2.: T. Hakala, Shutterstock.com. Fig. 2.10.3.: S. Gulec, Shutterstock.com. Fig. 2.10.4.: R. Whitcombe, Shutterstock.com.
P. 163. Photo: VVO, Shutterstock.com.
P. 164. Fig. 2.10.5.: UNDP report, Charting a New Low-Carbon Route to Development. - Moscow: UNDP, 2009.
P. 167. Pavel L Photo, Shutterstock.com.
P. 169. Fig. 3.1.1.: from materials of keelingcurve.uesd.edu.
P. 170. Photo: wang song, Shutterstock.com.
P. 171. Fig. 3.1.2.: A. Alekperova, E. Gracheva, Yu. Dobrolyubova.
P. 172. Photo: huyangshu, Shutterstock.com.
P. 173. Fig. 3.1.3.: A. Alekperova. Photo: N. Vinokurov, Shutterstock.com.
P. 174. Fig. 3.1.4.: Key World Energy Statistics 2017, IEA. www.iea.org. Photo: K. Black, Wikipedia.

255
P. 175. Photo: courtesy Greenpeace. Fig. 3.1.5.: http://www.world-nuclear.org/.
P. 176. Fig.: A. Alekperova. Photo: overcrew, Shutterstock.com.
P. 177. Photo (top): KPG Payless2, Shutterstock.com. Photo (bottom): M. Lisner, Shutterstock.com.
P. 178. Photo (top): wellphoto, Shutterstock.com. Fig. 3.1.6.: Dinga, Shutterstock.com.
P. 179. Photo (top): CSIRO, http://www.scienceimage.csiro.au/pages/about/. Photo (bottom): Northern Railways, http://www. nr.indianrailways.gov.in/.
P. 180. Photo (top): Chixoy, Wikipedia. Photo (bottom): http://www.abengoasolar.com/.
P. 181. Photo (top): Y. Dobrolyubova. Photo (centre): courtesy of Greenpeace. Photo (bottom): D. Dixon, Geograph project collection: https://www.geograph.org.uk/photo/2391702
P. 182. Fig. 3.1.7.: Wikipedia (both photos).
P. 183. Photo: Arnold C., Wikipedia. Fig. 3.1.8.: Wikipedia.
P. 184. Fig. 3.1.9. M. Grmek, Wikipedia. Fig. 3.1.10.: Le Grand Portage, Wikipedia. Fig. 3.1.11.: Wikipedia.
P. 185. Photo (both top): http://oceanrusenergy.ru/Gallery. Photo (bottom): Dani 7C3, Wikipedia.
P. 186. Photo (top): S. Tulinov. Fig. 3.1.12.: courtesy of Greenpeace.
P. 187. Photo: Wikipedia.
P. 188. Photo (top): Wikipedia. Photo (bottom left): K. Stuchelova, Shutterstock.com. Photo (bottom centre): images72, Shutterstock.com. Photo (bottom right): Bildagentur Zoonar GmbH, Shutterstock.com.
P. 189. Fig. 3.1.13.: RSabbatini, Wikipedia. Fig. 3.1.14.: Natecull, Wikipedia. Photo (bottom first): indogolotus, Shutterstock.com. photo (second bottom): Dickelbers, Wikipedia.
P. 190. Photo: Hestemoj, Wikipedia.
P. 196. Fig. 3.2.1.: A. Alekperova.
P. 197. Photos (both): A. Alekperova.
P. 199. Fig. 3.2.2.: Energy Efficiency in Russia: Hidden Reserves. - Moscow: CENEF, WB, IFC, 2008. Photo (left): Arnold Paul, Wikipedia. Photo (centre): US Federal Emergency Management Agency, Wikipedia. Photo (right): V. Dyakov, Wikipedia.
P. 200. Fig. 3.2.3.: A. Alekperova using materials from the French Agency for Environmental and Energy Management (ADEME), 2005.
P. 201. Fig. 3.2.4.: MK Products, Wikipedia. Fig. 3.2.5: ENEA.
P. 202. Fig. 3.2.6.: https://lufthansa.myclimate.org/en. Fig. 3.2.7.: E. Smirnova.
P. 203. Photo: NRMA Motoring and Services, Wikipedia.
P. 204. Fig. 3.2.8.: Photo (left): Wikipedia. Photo (right): Floydian, Wikipedia.
P. 205. Photo: (top left): P. van der Sluijs. Photo: (top right): Sacramento Seersucker Ride, http://flickr.com/photos/56052306@N06/17107186918. Photo (below): ehedaya, Wikipedia.
P. 206. Fig. 3.2.9.: A. Alekperova and Y. Dobrolyubova based on materials from Wikipedia. Fig. 3.2.10.: Wikipedia.
P. 207. Fig. 3.2.11.: UNDP, 2011.
P. 208. Photo (above): Wikipedia. Fig. 3.2.12.: Green Building Council of Finland, http://figbc.fi/en/building-sector/.
P. 209. Photo (top): courtesy of Greenpeace. Logos: Wikipedia. Photo (below): A. Hodge, http://www.usgbc.org/.
P. 210. Fig. 3.2.13.: courtesy of E. Gracheva. Photo (below): British Prime Minister's Office, https://www.gov.uk.
P. 211. Photo (top): www.sidwell.edu. Photo (bottom): http://www.activehouse.info/cases/home-life.
P. 212. Photo: Wikipedia.
P. 213. Photo (first and second): J. Seifert, Wikipedia. Photo (third): US Navy National Museum of Naval Aviation. Photo (fourth): NASA.
P. 214. Photo (top): G. Jones, Wikipedia. Photo (bottom): ecstaticist, Wikipedia.
P. 217. Photo (left and centre): Wikipedia. Photo (right): Courtesy of Greenpeace.
P. 218. Photos: http://www.climate-kic.org/, http://wmsbf.org/, http://memoenglish.ru/, http://originalcarbon.com/why-offset/, http://www.environnet.in.th/
P. 219. Wikipedia
P. 221. Fig. 3.4.1. and 3.4.2.: F. Urban, How we heat the street // Real Estate Bulletin, January 18, 2012. http://www.bn.ru/ articles / 2012/01/18 / 89218.html.
P. 222. Fig. 3.4.3.: F. Urban, How we heat the street // Real Estate Bulletin, January 18, 2012. http://www.bn.ru/articles/2012/01/18 / 89218.html.
P. 226. Photo: Wikipedia.
P. 227. Photo: C. Hutchingson, Wikipedia.
P. 228. Fig. 3.4.4.: A. Alekperova, V. Berdin, Yu. Dobrolyubova, Y. Kalinicheva, A. Kokorin.
P. 231. Photo (top left): Yu. Dobrolyubova. Photo (top right): Wikipedia. Logo: Wikipedia. Cover: www.ipcc.ch.
P. 232. Photo (above): T. Yamanaka – AFP/Getty Images, available at http://global.britannica.com/event/Kyoto-Protocol. Photo (below): P. Souza, Official White House Photo, posted on Wikipedia.
P. 233. Logo: http://www.cop21paris.org/about/cop21. Photo: UN, http://www.un.org/sustainabledevelopment.
P. 234. Picture (above): http://hssmi.org/research-themes/sustainable-manufacturing/. Fig. 3.5.1.: http://www.un.org/sustainabledevelop-ment/sustainable-development-goals/.
P. 237. Photo: E. Harrison, Wikipedia.
256
Vladimir Berdin, Yulia Dobrolyubova, Ekaterina Gracheva, Pavel Konstantinov, Natalia Ryzhova, Elena Smirnova, Dmitry Zamolodchikov
Climate BoxAn interactive learning toolkit
on climate change
Textbook
Approved for printing in 2018. Format 60x84/8. 6.7 standard print sheets.27.9 conditional print sheets.Offset paper. Offset printing.1,000 copies. Order № 1257
RA ILF publicationsOffice 1, Building 1, 10 Bolshoi Kondratyevsky Lane, 123056, Moscow
©UNDP, 2018