Clean Water State Revolving Fund (CWSRF)
154
ANNUAL REPORT State Fiscal Year 2019-20 (July 1, 2019 through June 30, 2020) CLEAN WATER STATE REVOLVING FUND and The Water Quality, Supply, and Infrastructure Improvement Act of 2014 (Prop 1) and The California Drought, Water, Parks, Climate, Coastal Protection, and Outdoor Access for All Act of 2018 (Prop 68) California State Water Resources Control Board Division of Financial Assistance • 1001 I Street • Sacramento, CA 95814
-
Upload
khangminh22 -
Category
Documents
-
view
2 -
download
0
Transcript of Clean Water State Revolving Fund (CWSRF)
ANNUAL REPORT
State Fiscal Year 2019-20 (July 1, 2019 through June 30, 2020)
CLEAN WATER STATE REVOLVING FUND
and
The Water Quality, Supply, and Infrastructure Improvement Act of 2014
(Prop 1)
and
The California Drought, Water, Parks, Climate, Coastal Protection, and Outdoor Access for All Act of 2018 (Prop 68)
California State Water Resources Control BoardDivision of Financial Assistance • 1001 I Street • Sacramento, CA 95814
OUR VISIONAbundant clean water for human uses and environmental protection to sustain
California’s future.
OUR MISSIONTo preserve, enhance, and restore the quality
of California’s water resources and drinking water for the protection of the environment, public health, and all beneficial uses, and to ensure proper water resource allocation
and efficient use, for the benefit of presentand future generations.
About the State and Regional Water Boards
The State Water Resources Control Board (State Water Board) was created in 1967. Its comprehensive authority over allocation, planning, and enforcement enables the State Water Board to protect California's water quality and drinking water.
The State Water Board consists of five full-time salaried members, each filling a different specialty position. Each Board member is appointed to a four-year term by the Governor and confirmed by the Senate.
There are nine Regional Water Quality Control Boards (Regional Water Boards). The Regional Water Boards develop and enforce water quality objectives and implement plans that protect the beneficial uses of the state's waters, recognizing local differences in climate, topography, geology, and hydrology.
Each Regional Water Board has seven part-time members, also appointed by the Governor, and confirmed by the Senate. Regional Water Boards develop "basin plans" for their hydrologic areas, issue waste discharge permits, take enforcement action against violators, and monitor water quality.
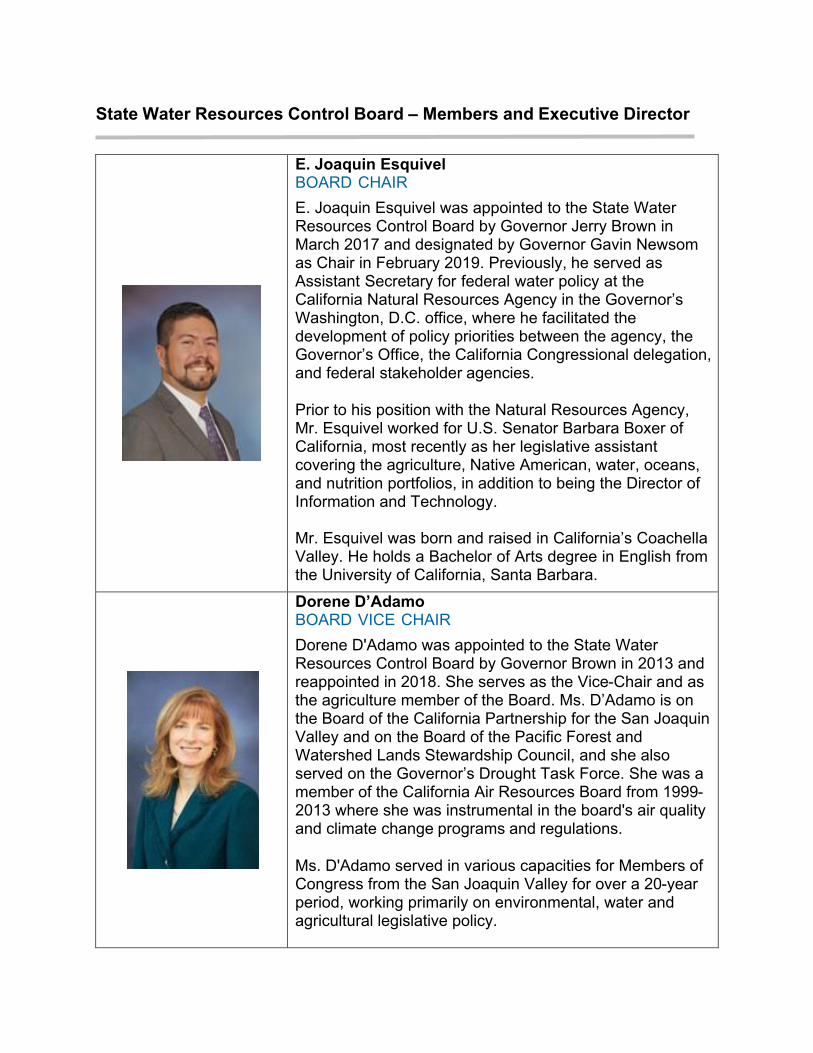
State Water Resources Control Board – Members and Executive Director
E. Joaquin EsquivelBOARD CHAIRE. Joaquin Esquivel was appointed to the State Water Resources Control Board by Governor Jerry Brown in March 2017 and designated by Governor Gavin Newsom as Chair in February 2019. Previously, he served as Assistant Secretary for federal water policy at the California Natural Resources Agency in the Governor’s Washington, D.C. office, where he facilitated the development of policy priorities between the agency, the Governor’s Office, the California Congressional delegation, and federal stakeholder agencies.
Prior to his position with the Natural Resources Agency, Mr. Esquivel worked for U.S. Senator Barbara Boxer of California, most recently as her legislative assistant covering the agriculture, Native American, water, oceans, and nutrition portfolios, in addition to being the Director of Information and Technology.
Mr. Esquivel was born and raised in California’s Coachella Valley. He holds a Bachelor of Arts degree in English from the University of California, Santa Barbara.Dorene D’AdamoBOARD VICE CHAIRDorene D'Adamo was appointed to the State Water Resources Control Board by Governor Brown in 2013 and reappointed in 2018. She serves as the Vice-Chair and as the agriculture member of the Board. Ms. D’Adamo is on the Board of the California Partnership for the San Joaquin Valley and on the Board of the Pacific Forest and Watershed Lands Stewardship Council, and she also served on the Governor’s Drought Task Force. She was a member of the California Air Resources Board from 1999- 2013 where she was instrumental in the board's air quality and climate change programs and regulations.
Ms. D'Adamo served in various capacities for Members of Congress from the San Joaquin Valley for over a 20-year period, working primarily on environmental, water and agricultural legislative policy.
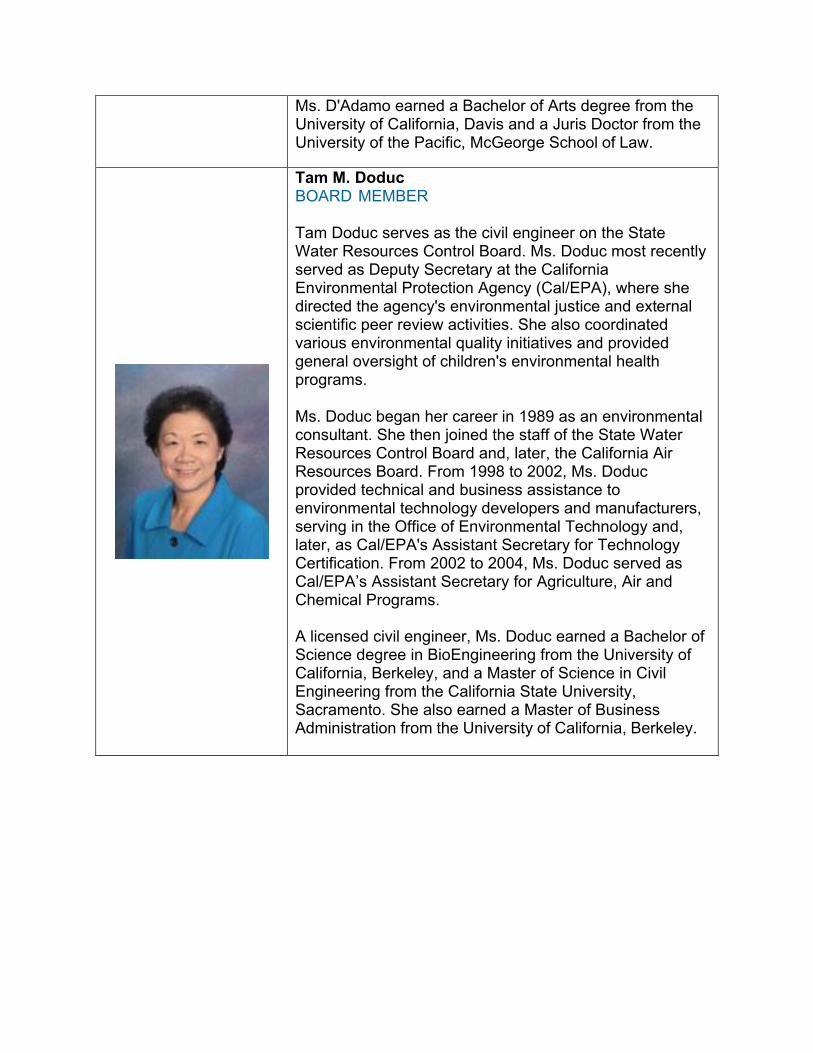
Ms. D'Adamo earned a Bachelor of Arts degree from the University of California, Davis and a Juris Doctor from the University of the Pacific, McGeorge School of Law.
Tam M. DoducBOARD MEMBER
Tam Doduc serves as the civil engineer on the State Water Resources Control Board. Ms. Doduc most recently served as Deputy Secretary at the California Environmental Protection Agency (Cal/EPA), where she directed the agency's environmental justice and external scientific peer review activities. She also coordinated various environmental quality initiatives and provided general oversight of children's environmental health programs.
Ms. Doduc began her career in 1989 as an environmental consultant. She then joined the staff of the State Water Resources Control Board and, later, the California Air Resources Board. From 1998 to 2002, Ms. Doduc provided technical and business assistance to environmental technology developers and manufacturers, serving in the Office of Environmental Technology and, later, as Cal/EPA's Assistant Secretary for Technology Certification. From 2002 to 2004, Ms. Doduc served as Cal/EPA’s Assistant Secretary for Agriculture, Air and Chemical Programs.
A licensed civil engineer, Ms. Doduc earned a Bachelor of Science degree in BioEngineering from the University of California, Berkeley, and a Master of Science in Civil Engineering from the California State University, Sacramento. She also earned a Master of Business Administration from the University of California, Berkeley.
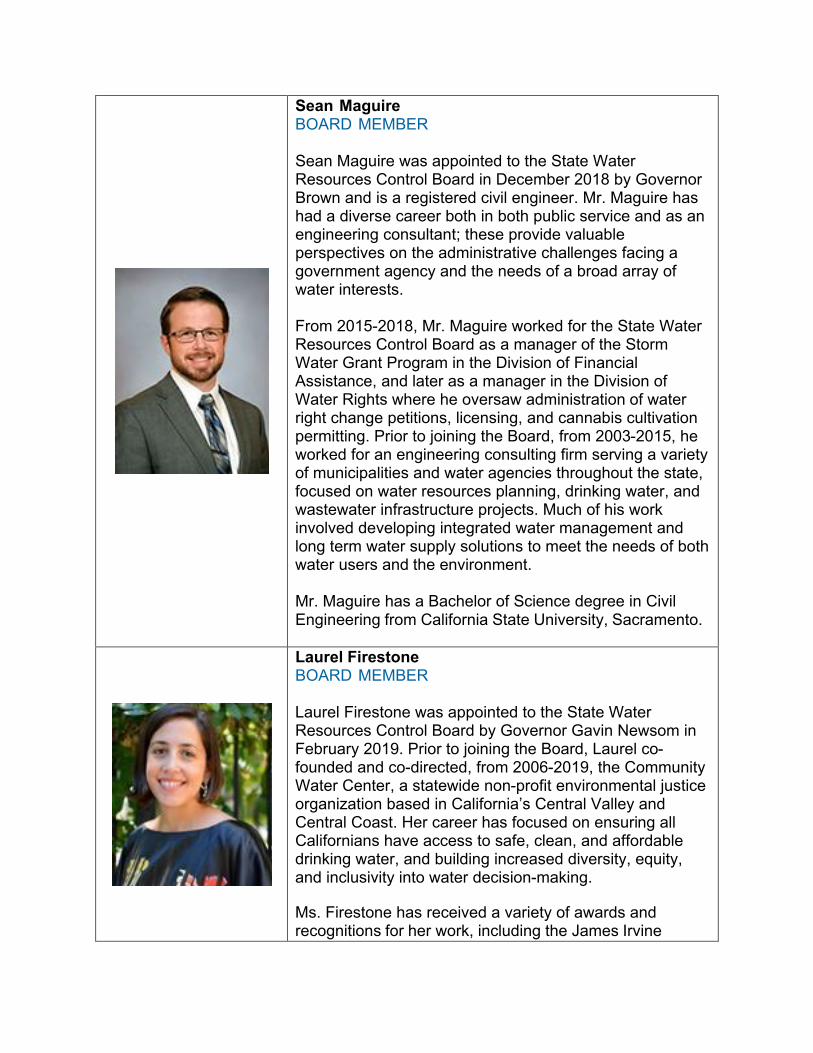
Sean MaguireBOARD MEMBER
Sean Maguire was appointed to the State Water Resources Control Board in December 2018 by Governor Brown and is a registered civil engineer. Mr. Maguire has had a diverse career both in both public service and as an engineering consultant; these provide valuable perspectives on the administrative challenges facing a government agency and the needs of a broad array of water interests.
From 2015-2018, Mr. Maguire worked for the State Water Resources Control Board as a manager of the Storm Water Grant Program in the Division of Financial Assistance, and later as a manager in the Division of Water Rights where he oversaw administration of water right change petitions, licensing, and cannabis cultivation permitting. Prior to joining the Board, from 2003-2015, he worked for an engineering consulting firm serving a variety of municipalities and water agencies throughout the state, focused on water resources planning, drinking water, and wastewater infrastructure projects. Much of his work involved developing integrated water management and long term water supply solutions to meet the needs of both water users and the environment.
Mr. Maguire has a Bachelor of Science degree in Civil Engineering from California State University, Sacramento.
Laurel FirestoneBOARD MEMBER
Laurel Firestone was appointed to the State Water Resources Control Board by Governor Gavin Newsom in February 2019. Prior to joining the Board, Laurel co- founded and co-directed, from 2006-2019, the Community Water Center, a statewide non-profit environmental justice organization based in California’s Central Valley and Central Coast. Her career has focused on ensuring all Californians have access to safe, clean, and affordable drinking water, and building increased diversity, equity, and inclusivity into water decision-making.
Ms. Firestone has received a variety of awards and recognitions for her work, including the James Irvine
Foundation’s Leadership Award in 2018, and the Gary Bellow Public Service Award by the Harvard Law School in 2013.
Ms. Firestone served on the Tulare County Water Commission from 2007-2012, as well as a variety of state policy advisory committees. She has partnered with universities to develop research and clinical programs to further the human right to water, and written articles and publications related to drinking water and the environment.
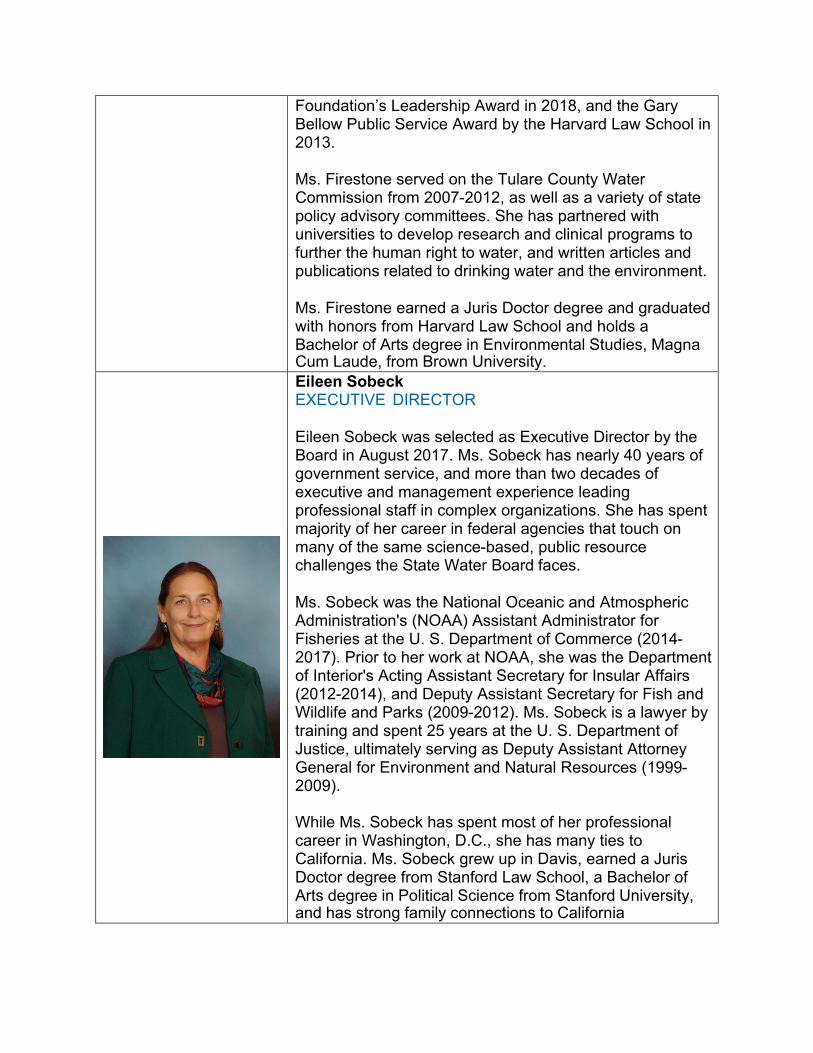
Ms. Firestone earned a Juris Doctor degree and graduated with honors from Harvard Law School and holds a Bachelor of Arts degree in Environmental Studies, MagnaCum Laude, from Brown University.Eileen SobeckEXECUTIVE DIRECTOR
Eileen Sobeck was selected as Executive Director by the Board in August 2017. Ms. Sobeck has nearly 40 years of government service, and more than two decades of executive and management experience leading professional staff in complex organizations. She has spent majority of her career in federal agencies that touch on many of the same science-based, public resource challenges the State Water Board faces.
Ms. Sobeck was the National Oceanic and Atmospheric Administration's (NOAA) Assistant Administrator for Fisheries at the U. S. Department of Commerce (2014- 2017). Prior to her work at NOAA, she was the Department of Interior's Acting Assistant Secretary for Insular Affairs (2012-2014), and Deputy Assistant Secretary for Fish and Wildlife and Parks (2009-2012). Ms. Sobeck is a lawyer by training and spent 25 years at the U. S. Department of Justice, ultimately serving as Deputy Assistant Attorney General for Environment and Natural Resources (1999- 2009).
While Ms. Sobeck has spent most of her professional career in Washington, D.C., she has many ties to California. Ms. Sobeck grew up in Davis, earned a Juris Doctor degree from Stanford Law School, a Bachelor of Arts degree in Political Science from Stanford University,and has strong family connections to California
TABLE OF CONTENTSI. INTRODUCTION ................................................................................................ 10 II. FINANCIAL RESULTS ...................................................................................... 11
A. Cumulative Financial Activity .............................................................................. 11 B. Net Position ........................................................................................................ 11 C. Revenues and Contributions .............................................................................. 12 D. Disbursements and Expenses ............................................................................ 12 E. Service Charges ................................................................................................. 13 F. Credit Risk for the CWSRF ................................................................................. 14
III. PROGRAMMATIC RESULTS ............................................................................ 15 A. Projects Help with a Variety of Infrastructure Needs ........................................... 15 B. Projects Achieve Multiple Benefits ...................................................................... 17 C. Highlights of Projects Funded by CWSRF in SFY 2019-20 ................................ 22
IV. PROGRAM HIGHLIGHTS AND UPDATES ....................................................... 25 A. Projects Produce Widespread Cost Reductions ................................................. 25 B. Updated Sustainable Lending Capacity .............................................................. 25 C. Small Community Funding Program Update....................................................... 25 D. Technical Assistance .......................................................................................... 26 E. Water Recycling Funding Program Update ........................................................ 26 F. CWSRF Results and Leveraging Activity ............................................................ 27 G. Reducing Rollovers and Normalizing Operations ............................................... 27 H. COVID-19 Impacts ............................................................................................. 28 I. Marketing Updates ............................................................................................. 28
V. ACRONYMS ....................................................................................................... 29 VI. EXHIBITS ........................................................................................................... 30
Exhibit A: SFY 2019-20 Projects Funded by Needs Category ............................... 31 Exhibit B: SFY 2019-20 CWSRF FFATA Projects ................................................. 34 Exhibit C: SFY 2019-20 CWSRF/Prop 1-SCG Projects ........................................ 35 Exhibit D: SFY 2019-20 IUP Non-Funded Projects ............................................... 40 Exhibit E: Cumulative CWSRF Revenue Bond (Green Bond) Funded Projects Update ................................................................................................................... 66 Exhibit F: DBE Reporting Results.......................................................................... 82 Exhibit G: SFY 2019-20 CWSRF Green Project Reserve Projects ....................... 83 Exhibit H: SFY 2019-20 Additional Subsidy Projects (Principal Forgiveness) ....... 84 Exhibit I: CWSRF Projects with Financing Servicing Fees .................................... 85
VII. APPENDICES .................................................................................................... 92

Appendix A: Short-Term Goals ............................................................................ A-1 Appendix B: Long-Term Goals ..............................................................................B-1 Appendix C: Operating Agreement and Capitalization Grant Conditions ............. C-1 Appendix D: Program Evaluation Report (PER)................................................... D-1 Appendix E: SFY 2019-20 CWSRF Audited Financial Statements ......................E-1
10 | P a g e
I. INTRODUCTION
The California State Water Resources Control Board (State Water Board), Division of Financial Assistance (DFA) presents the Clean Water State Revolving Fund (CWSRF) annual report for State Fiscal Year (SFY) 2019-20. It describes how the State Water Board met the objectives identified in the SFY 2019-20 CWSRF Intended Use Plan (IUP) (https://www.waterboards.ca.gov/water_issues/programs/grants_loans/docs/cwsrf_iup_ sfy2019_20_final.pdf).
The federal Clean Water Act provides each state the opportunity to establish a CWSRF to help achieve the goal of clean water. The CWSRF is capitalized with federal and state funds and revolves in perpetuity using the repayments and earnings from financed projects and other investments. The State Water Board has historically provided affordable CWSRF financing for publicly owned treatment works, non-point source (NPS) projects, and estuary projects. More information about California’s CWSRF program can be found on the State Water Board’s CWSRF website at http://www.waterboards.ca.gov/cwsrf.
Through the CWSRF program, the State Water Board has protected and promoted the health, safety, and welfare of Californians since 1989. Every project financed through the CWSRF program is directly related to improving water quality, public health, or both, and many CWSRF recipients use their financing to remedy water quality violations and associated enforcement actions by the Regional Water Quality Control Boards (Regional Water Boards). The State Water Board provided approximately $599 million in new CWSRF financing to 23 projects in SFY 2019-20. The projects funded in 2019- 20 include a variety of project types eligible under the CWSRF.
11 | P a g e
II. FINANCIAL RESULTS
To satisfy federal requirements and ensure the accuracy of the State Water Board’s financial management of the CWSRF, audited financial statements for the year ending June 30, 2020 were completed December 15, 2020, and are included as Appendix E in this report. This section provides important financial highlights about the CWSRF as of June 30, 2020, including a discussion on the credit risk of the CWSRF.
A. Cumulative Financial Activity
As of June 30, 2020, $11.519 billion in cumulative CWSRF funds were available for CWSRF financial assistance and other eligible purposes. As of June 30, 2020, the State Water Board had committed approximately 103 percent (103%) of these available CWSRF funds to projects through binding commitments (executed financing agreements). Similarly, as of June 30, 2020, the State Water Board had disbursed approximately 84 percent (84%) of these available CWSRF funds to financing recipients or expended these funds for other eligible program purposes. Cumulative program activity from inception through the end of SFY 2019-20 is described below in Table 1.
Table 1: Cumulative CWSRF Activity Since Inceptionas of June 30, 2020
Activity Life of ProgramNumber of Financing Agreements 850Value of All Financing Agreements $11.875 billionCumulative Financing Disbursements $9.639 billion
B. Net Position
The net positions of the CWSRF program as of June 30, 2019 and June 30, 2020 are shown in Table 2 below.

12 | P a g e
Table 2: CWSRF Statement of Net Position(Dollars in Thousands)
June 30, 2020 June 30, 2019Assets
Current Assets $1,116,130 $1,214,457Other Assets $4,595,160 $4,420,093
Total Assets $5,711,290 $5,634,550Liabilities
Current Liabilities $118,805 $115,671Non-Current Liabilities $1,225,508 $1,329,849
Total Liabilities $1,344,313 $1,445,520Net Position
Restricted $ 2,370,205 $2,345,727Unrestricted $ 1,996,772 $1,843,303
Total Net Position $ 4,366,977 $4,189,030
C. Revenues and Contributions
The total revenues and contributions for SFY 2019-20 were $237 million. Revenues for this period are further summarized in Table 3 below.
Table 3: SFY 2019-20 CWSRF Revenues(Dollars in Thousands)
Loan Interest Income $66,600Net Investment Income* $14,027Capitalization Grant - Principal Forgiveness $23,136Capitalization Grant - Loans $132,782State Match $65
*This revenue is not an operating revenue
D. Disbursements and Expenses
Total disbursements and expenses for SFY 2019-20 were approximately $802 million. Total disbursements do not include matching funds provided by financing recipients.Disbursements and expenses for this period are provided in Table 4 below.
13 | P a g e
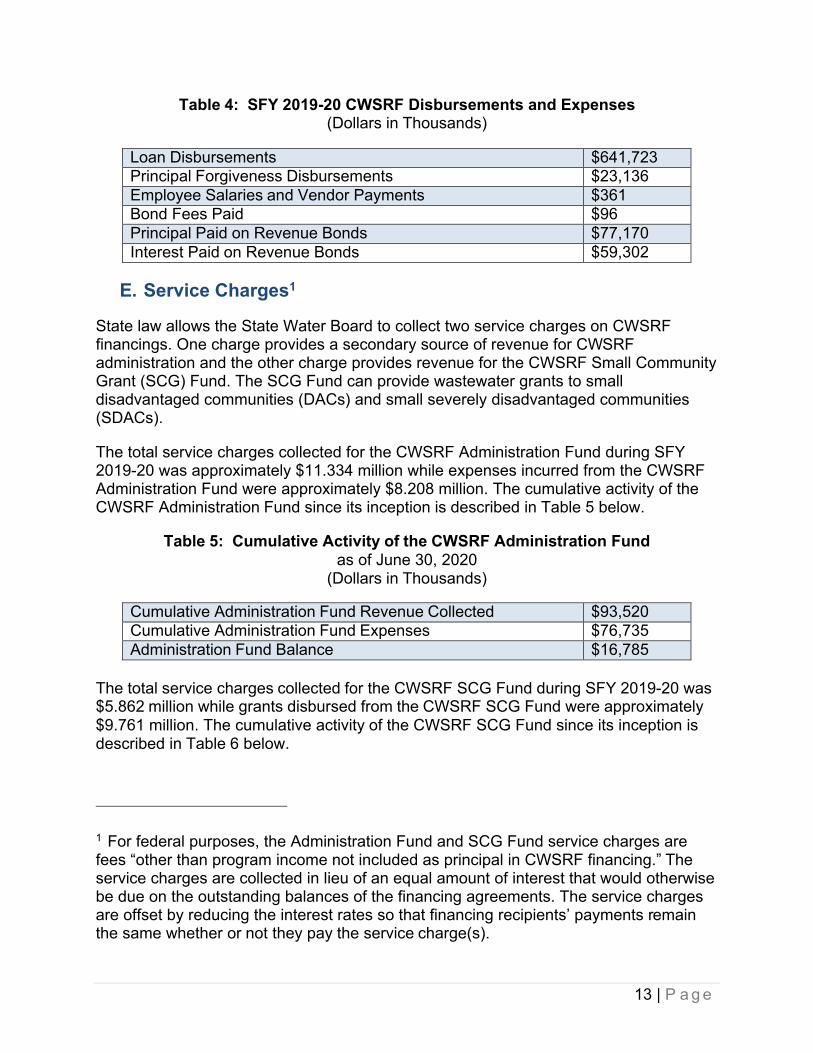
Table 4: SFY 2019-20 CWSRF Disbursements and Expenses(Dollars in Thousands)
Loan Disbursements $641,723Principal Forgiveness Disbursements $23,136Employee Salaries and Vendor Payments $361Bond Fees Paid $96Principal Paid on Revenue Bonds $77,170Interest Paid on Revenue Bonds $59,302
E. Service Charges1
State law allows the State Water Board to collect two service charges on CWSRF financings. One charge provides a secondary source of revenue for CWSRF administration and the other charge provides revenue for the CWSRF Small Community Grant (SCG) Fund. The SCG Fund can provide wastewater grants to small disadvantaged communities (DACs) and small severely disadvantaged communities (SDACs).
The total service charges collected for the CWSRF Administration Fund during SFY 2019-20 was approximately $11.334 million while expenses incurred from the CWSRF Administration Fund were approximately $8.208 million. The cumulative activity of the CWSRF Administration Fund since its inception is described in Table 5 below.
Table 5: Cumulative Activity of the CWSRF Administration Fundas of June 30, 2020
(Dollars in Thousands)
Cumulative Administration Fund Revenue Collected $93,520Cumulative Administration Fund Expenses $76,735Administration Fund Balance $16,785
The total service charges collected for the CWSRF SCG Fund during SFY 2019-20 was$5.862 million while grants disbursed from the CWSRF SCG Fund were approximately$9.761 million. The cumulative activity of the CWSRF SCG Fund since its inception is described in Table 6 below.
1 For federal purposes, the Administration Fund and SCG Fund service charges are fees “other than program income not included as principal in CWSRF financing.” The service charges are collected in lieu of an equal amount of interest that would otherwise be due on the outstanding balances of the financing agreements. The service charges are offset by reducing the interest rates so that financing recipients’ payments remain the same whether or not they pay the service charge(s).
14 | P a g e
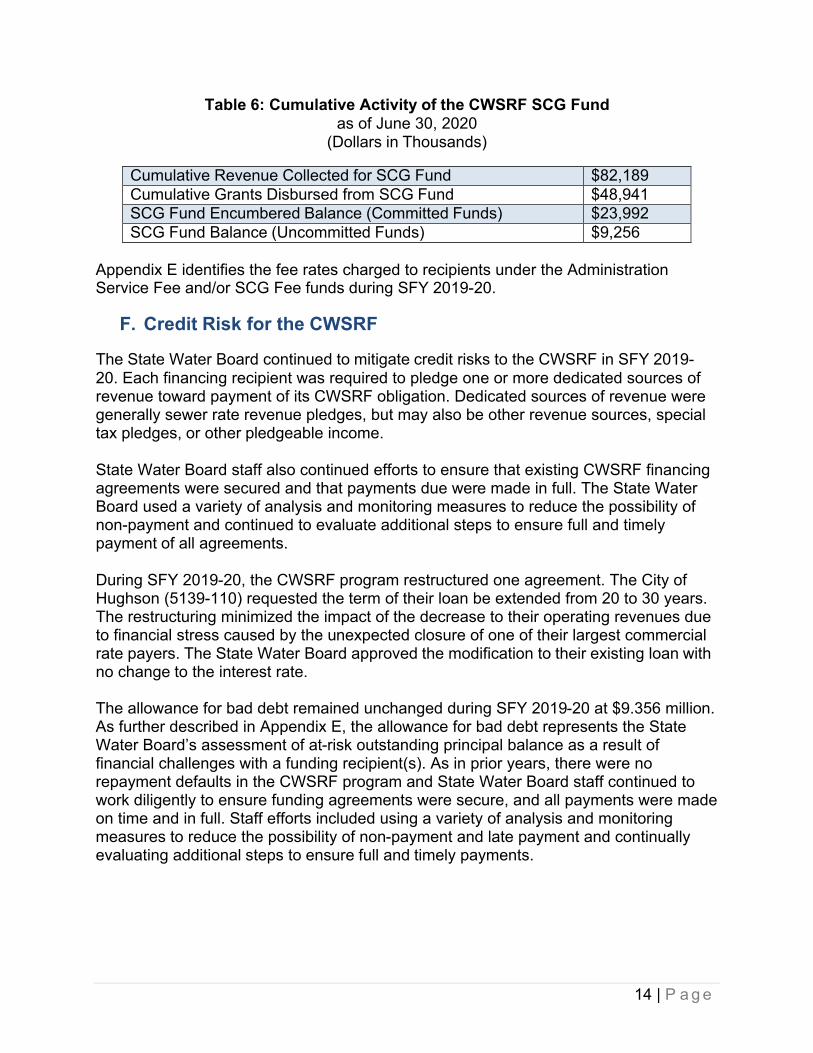
Table 6: Cumulative Activity of the CWSRF SCG Fundas of June 30, 2020
(Dollars in Thousands)
Cumulative Revenue Collected for SCG Fund $82,189Cumulative Grants Disbursed from SCG Fund $48,941SCG Fund Encumbered Balance (Committed Funds) $23,992SCG Fund Balance (Uncommitted Funds) $9,256
Appendix E identifies the fee rates charged to recipients under the Administration Service Fee and/or SCG Fee funds during SFY 2019-20.
F. Credit Risk for the CWSRF
The State Water Board continued to mitigate credit risks to the CWSRF in SFY 2019-20. Each financing recipient was required to pledge one or more dedicated sources of revenue toward payment of its CWSRF obligation. Dedicated sources of revenue were generally sewer rate revenue pledges, but may also be other revenue sources, special tax pledges, or other pledgeable income.
State Water Board staff also continued efforts to ensure that existing CWSRF financing agreements were secured and that payments due were made in full. The State Water Board used a variety of analysis and monitoring measures to reduce the possibility of non-payment and continued to evaluate additional steps to ensure full and timely payment of all agreements.
During SFY 2019-20, the CWSRF program restructured one agreement. The City of Hughson (5139-110) requested the term of their loan be extended from 20 to 30 years. The restructuring minimized the impact of the decrease to their operating revenues due to financial stress caused by the unexpected closure of one of their largest commercial rate payers. The State Water Board approved the modification to their existing loan with no change to the interest rate.
The allowance for bad debt remained unchanged during SFY 2019-20 at $9.356 million. As further described in Appendix E, the allowance for bad debt represents the State Water Board’s assessment of at-risk outstanding principal balance as a result of financial challenges with a funding recipient(s). As in prior years, there were no repayment defaults in the CWSRF program and State Water Board staff continued to work diligently to ensure funding agreements were secure, and all payments were made on time and in full. Staff efforts included using a variety of analysis and monitoring measures to reduce the possibility of non-payment and late payment and continually evaluating additional steps to ensure full and timely payments.
15 | P a g e
III. PROGRAMMATIC RESULTS
The contributions of the CWSRF to water quality are diverse and difficult to quantify. Rather than being a weakness of the program, this indicates the program’s strength and versatility in addressing a wide range of water quality and related issues. The data and graphics below summarize the environmental and other benefits derived from the CWSRF projects funded during SFY 2019-20. The data supporting this summary has been transmitted to the United States Environmental Protection Agency (USEPA) via the Clean Water Benefits Reporting System (CBR) database. The data indicate the CWSRF protected or restored a wide range of beneficial water uses and provided other related benefits.
A. Projects Help with a Variety of Infrastructure Needs
The State Water Board funds projects from the CWSRF to address a broad range of water quality objectives. Figure 1 below illustrates the categories of projects specifically funded in SFY 2019-20. The categories include various types of wastewater infrastructure, with wastewater treatment, sewer collection, energy efficiency, and renewable energy categories representing most of the total funding in SFY 2019-20.This demonstrates the CWSRF’s importance in maintaining and improving California’s wastewater infrastructure.

16 | P a g e
Figure 1: CWSRF Funding by Project Categories*
*Percentages were calculated based on total funding amounts for each category in SFY 2019-20.
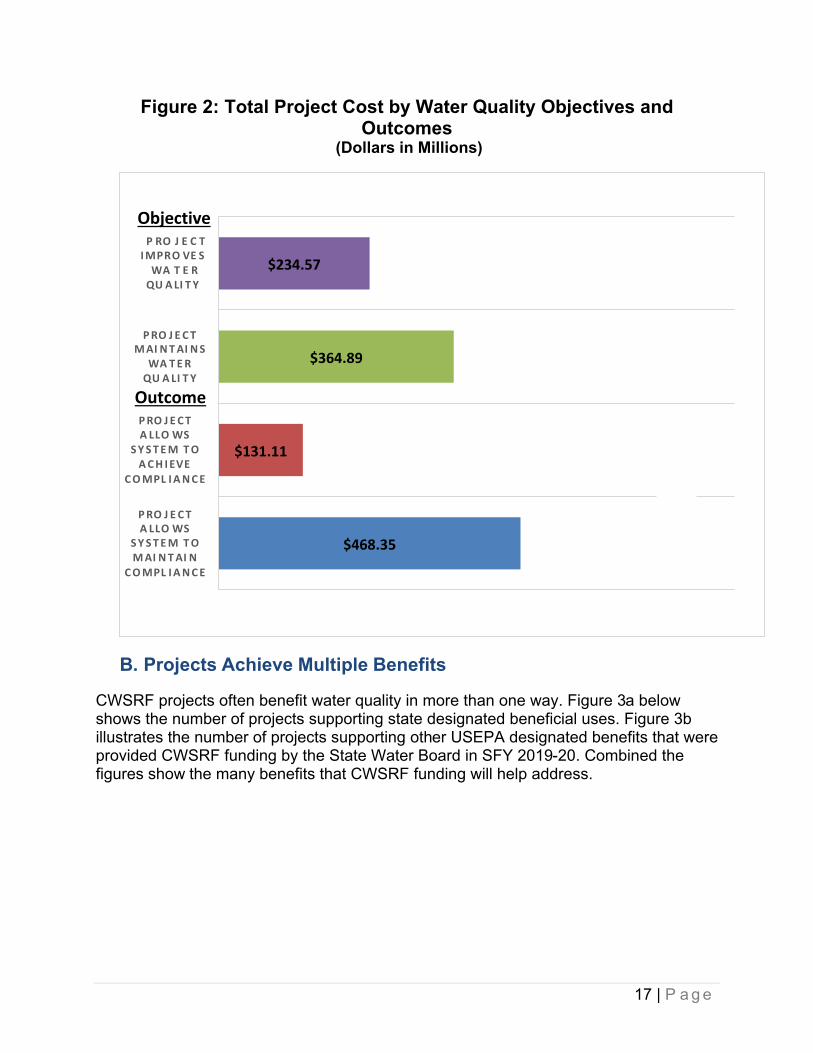
Many of the water quality projects undertaken today are expensive and large. This reflects the level of assistance needed to continue to improve water quality. Figure 2 below shows the total project cost for different water quality objectives and outcomes. The State Water Board’s ability to fund such large projects through the CWSRF is one of its greatest strengths. Many agencies may not be able to secure such large funding amounts from one provider if the CWSRF were not available.
1.12% 0.66%4.67%
12.08%
43.78%- SecondaryTreatment
21.79%- AdvancedTreatment
15.90%- Energy Efficiency
43.78%15.09%
21.79%
12.08%- RenewableEnergy
4.67%- Sewer SystemRehabilitation
1.12%- Water Reuse
0.66%- Plannning andAssessments
17 |
Figure 2: Total Project Cost by Water Quality Objectives and Outcomes
(Dollars in Millions)
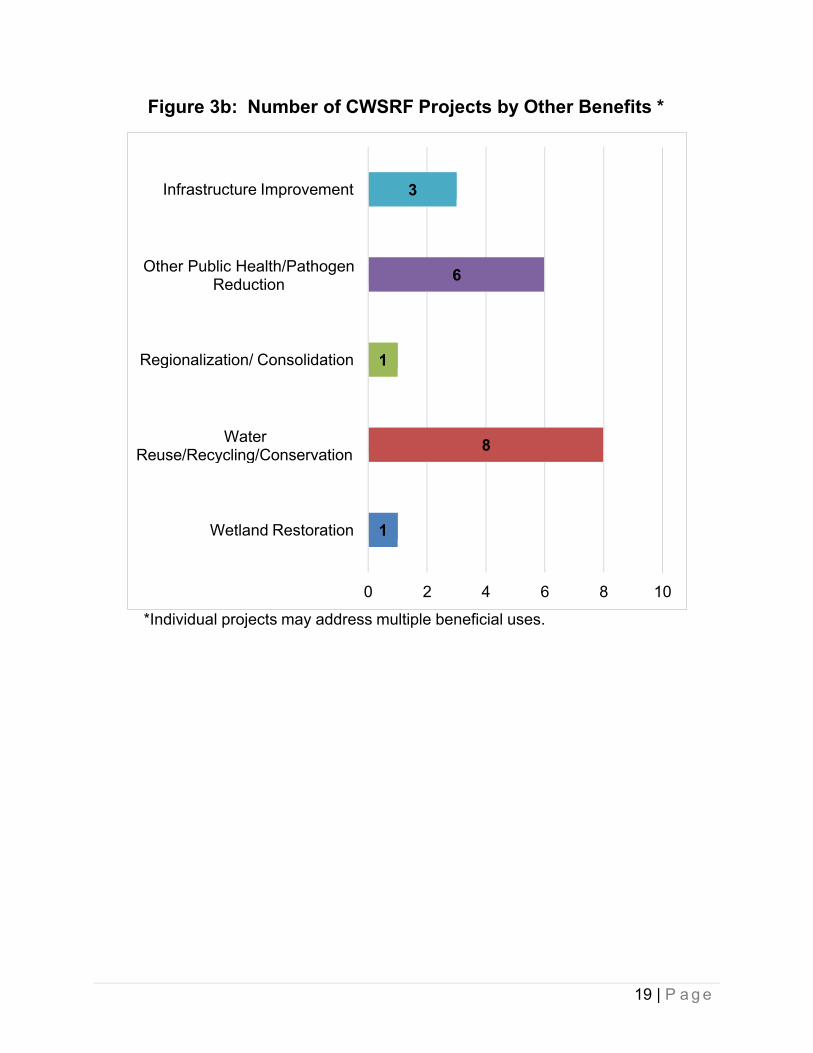
B. Projects Achieve Multiple Benefits
CWSRF projects often benefit water quality in more than one way. Figure 3a below shows the number of projects supporting state designated beneficial uses. Figure 3b illustrates the number of projects supporting other USEPA designated benefits that were provided CWSRF funding by the State Water Board in SFY 2019-20. Combined the figures show the many benefits that CWSRF funding will help address.
P a g e
ObjectiveRO J E C T
I MPRO VE SWA T E R
QU A LI T Y
P
$234.57
P RO J E C TM AI N T AI N S
WA T E RQU A LI T Y
OutcomeRO J E C T
A LLO WSS Y S T E M T O
A C H I EVEC O MPL I A N C E
P
$364.89
$131.11
P RO J E C TA LLO WS
S Y S T E M T OM AI N T AI N
C O MPL I A N C E
$468.35

18 | P a g e
Figure 3a: Number of CWSRF Projects by Beneficial Uses*
*Individual projects may address multiple beneficial uses
AGRICULTURAL SUPPLY (AGR)AQUACULTURE (AQUA)
COLD FRESHWATER HABITAT (COLD)ESTUARINE HABITAT (EST)
FRESHWATER REPLENISHMENT (FRSH)GROUNDWATER RECHARGE (GWR)HYDROPOWER GENERATION (POW)
INDUSTRIAL PROCESS SUPPLY (PRO)INDUSTRIAL SERVICE SUPPLY (IND)
MARINE HABITAT (MAR)MIGRATION OF AQUATIC ORGANISMS…
MUNICIPAL AND DOMESTIC SUPPLY…NAVIGATION (NAV)
NONCONTACT WATER RECREATION…OCEAN COMMERCIAL AND SPORT…
RARE, THREATENED, OR…SHELLFISH HARVESTING (SHELL)SPAWNING, REPRODUCTION OR…
WARM FRESHWATER HABITAT (WARM)WATER CONTACT RECREATION (REC-1)
WILDLIFE HABITAT (WILD)
183
11677
414
163
1217
1123
814
51516
2321
19 | P a g e
Infrastructure Improvement
Other Public Health/PathogenReduction
Regionalization/ Consolidation
WaterReuse/Recycling/Conservation
Wetland Restoration
0 2 4 6 8 10
Figure 3b: Number of CWSRF Projects by Other Benefits *
3
6
1
8
1
*Individual projects may address multiple beneficial uses.
20 | P a g e
6.67% 0.01% 0.01%
10.86%
51.36%-Municipal andDomestic Supply(MUN)31.09%-IndustrialService Supply (IND)
10.86%-Water ContactRecreation (REC-1)
51.36% 6.67%-AgriculturalSupply (AGR)
31.09%0.01%-WarmFreshwater Habitat(WARM)0.01%-FreshwaterReplenishment (FRSH)
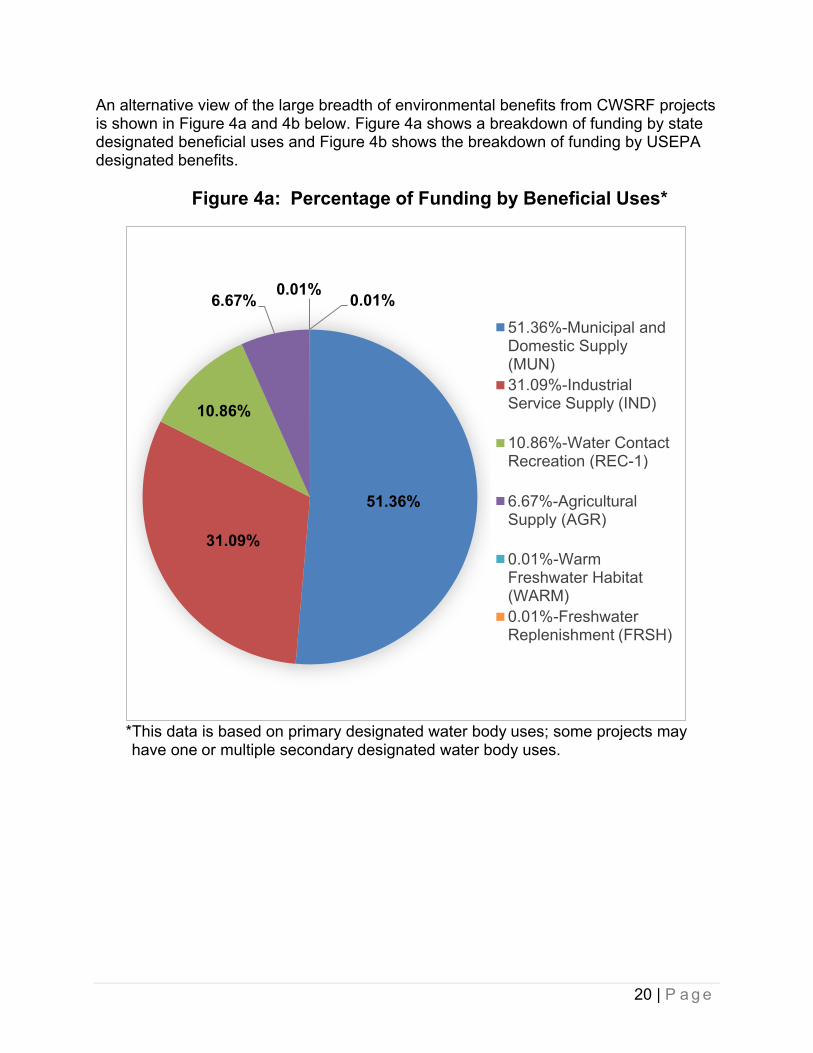
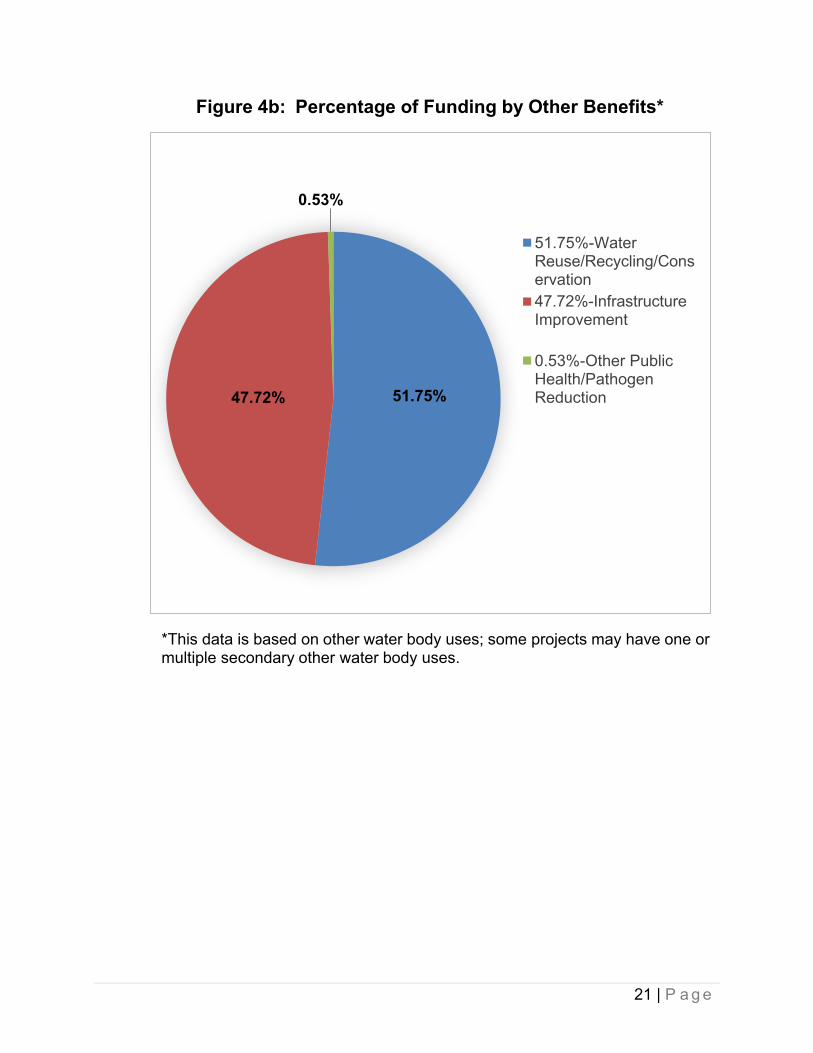
An alternative view of the large breadth of environmental benefits from CWSRF projects is shown in Figure 4a and 4b below. Figure 4a shows a breakdown of funding by state designated beneficial uses and Figure 4b shows the breakdown of funding by USEPA designated benefits.
Figure 4a: Percentage of Funding by Beneficial Uses*
*This data is based on primary designated water body uses; some projects may have one or multiple secondary designated water body uses.
21 | P a g e
0.53%
51.75%-WaterReuse/Recycling/Conservation47.72%-InfrastructureImprovement
47.72% 51.75%
0.53%-Other PublicHealth/PathogenReduction
Figure 4b: Percentage of Funding by Other Benefits*
*This data is based on other water body uses; some projects may have one or multiple secondary other water body uses.
22 | P a g e
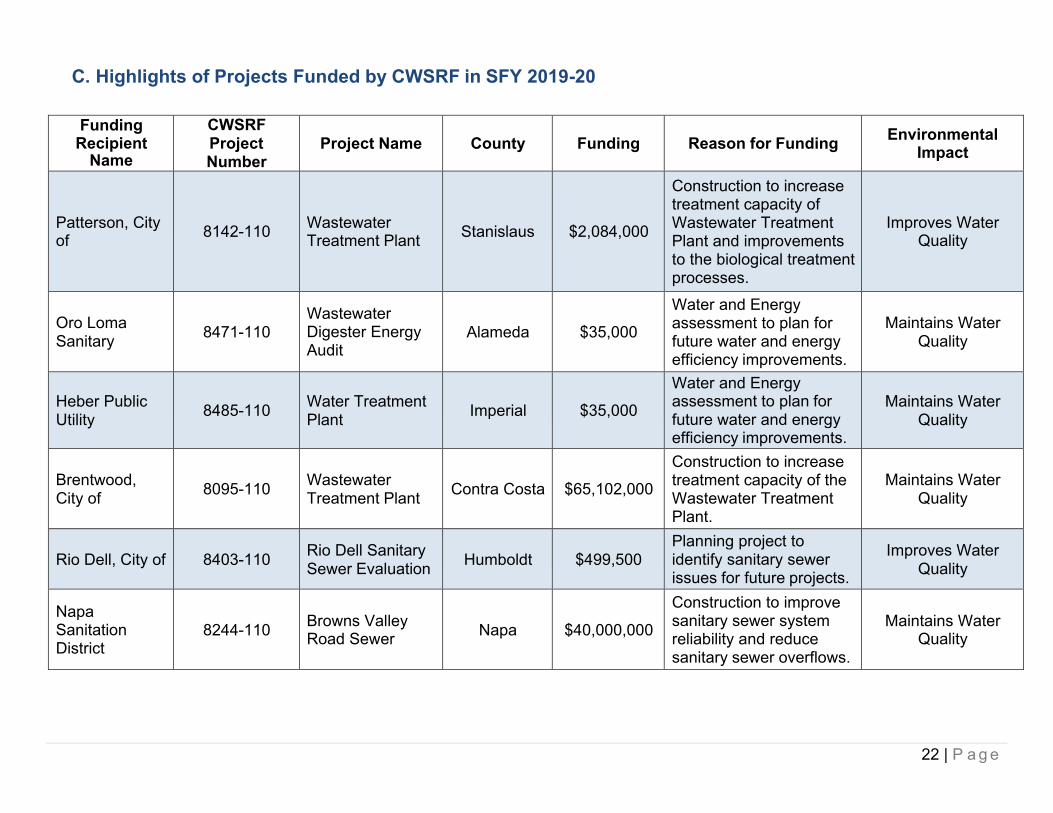
C. Highlights of Projects Funded by CWSRF in SFY 2019-20
Funding Recipient
Name
CWSRFProject Number
Project Name County Funding Reason for Funding Environmental Impact
Patterson, City of 8142-110 Wastewater
Treatment Plant Stanislaus $2,084,000
Construction to increase treatment capacity of Wastewater Treatment Plant and improvements to the biological treatment processes.
Improves Water Quality
Oro Loma Sanitary 8471-110
Wastewater Digester Energy Audit
Alameda $35,000
Water and Energy assessment to plan for future water and energy efficiency improvements.
Maintains Water Quality
Heber Public Utility 8485-110 Water Treatment
Plant Imperial $35,000
Water and Energy assessment to plan forfuture water and energy efficiency improvements.
Maintains Water Quality
Brentwood, City of 8095-110 Wastewater
Treatment Plant Contra Costa $65,102,000
Construction to increase treatment capacity of the Wastewater Treatment Plant.
Maintains Water Quality
Rio Dell, City of 8403-110 Rio Dell Sanitary Sewer Evaluation Humboldt $499,500
Planning project to identify sanitary sewer issues for future projects.
Improves Water Quality
Napa Sanitation District
8244-110 Browns Valley Road Sewer Napa $40,000,000
Construction to improve sanitary sewer system reliability and reduce sanitary sewer overflows.
Maintains Water Quality
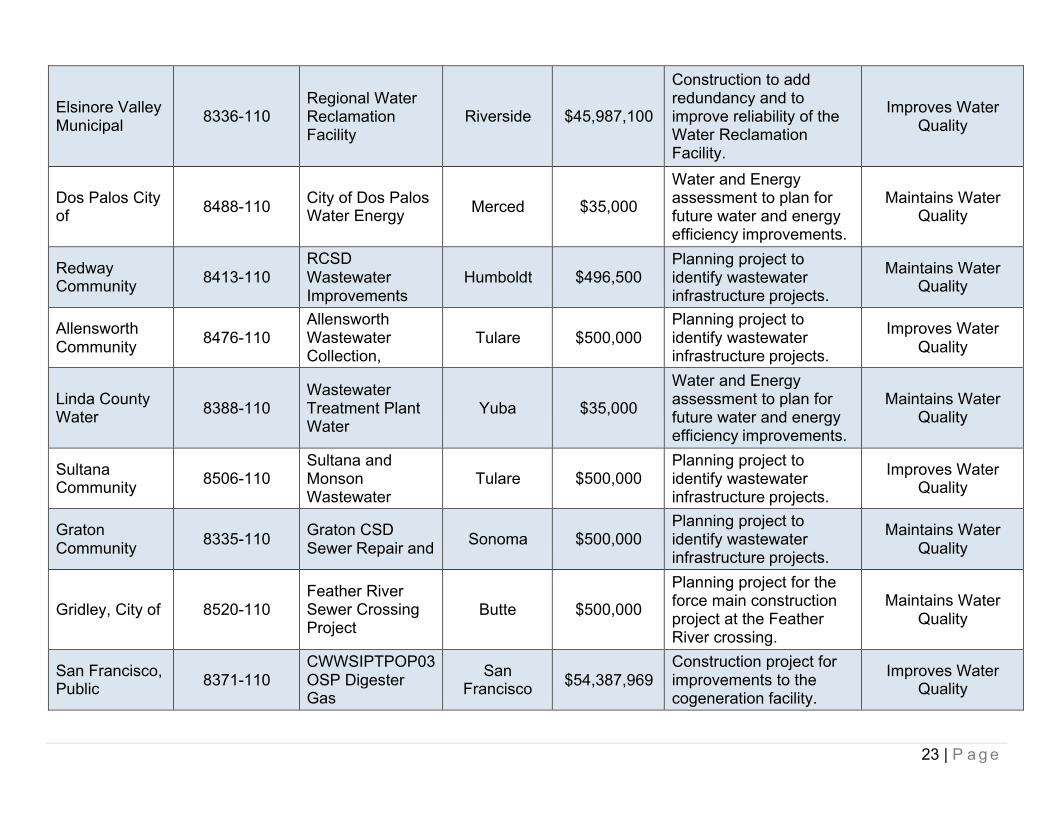
23 | P a g e
Elsinore Valley Municipal 8336-110
Regional Water Reclamation Facility
Riverside $45,987,100
Construction to add redundancy and to improve reliability of the Water Reclamation Facility.
Improves Water Quality
Dos Palos City of 8488-110 City of Dos Palos
Water Energy Merced $35,000
Water and Energy assessment to plan for future water and energy efficiency improvements.
Maintains Water Quality
Redway Community 8413-110
RCSDWastewater Improvements
Humboldt $496,500Planning project to identify wastewater infrastructure projects.
Maintains Water Quality
Allensworth Community 8476-110
Allensworth Wastewater Collection,
Tulare $500,000Planning project to identify wastewater infrastructure projects.
Improves Water Quality
Linda County Water 8388-110
Wastewater Treatment Plant Water
Yuba $35,000
Water and Energy assessment to plan for future water and energy efficiency improvements.
Maintains Water Quality
Sultana Community 8506-110
Sultana and Monson Wastewater
Tulare $500,000Planning project to identify wastewater infrastructure projects.
Improves Water Quality
Graton Community 8335-110 Graton CSD
Sewer Repair and Sonoma $500,000Planning project to identify wastewater infrastructure projects.
Maintains Water Quality
Gridley, City of 8520-110Feather River Sewer Crossing Project
Butte $500,000
Planning project for the force main construction project at the Feather River crossing.
Maintains Water Quality
San Francisco, Public 8371-110
CWWSIPTPOP03OSP Digester Gas
San Francisco $54,387,969
Construction project for improvements to the cogeneration facility.
Improves Water Quality
24 | P a g e
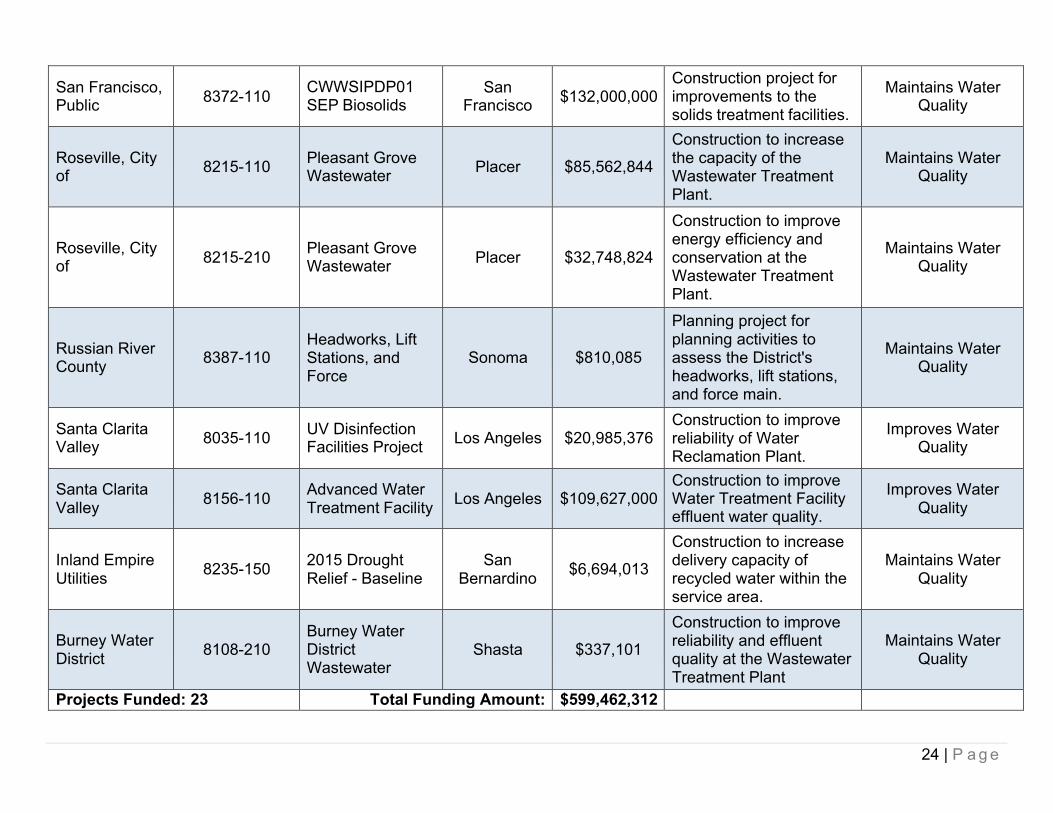
San Francisco, Public 8372-110 CWWSIPDP01
SEP BiosolidsSan
Francisco $132,000,000Construction project for improvements to the solids treatment facilities.
Maintains Water Quality
Roseville, City of 8215-110 Pleasant Grove
Wastewater Placer $85,562,844
Construction to increase the capacity of the Wastewater Treatment Plant.
Maintains Water Quality
Roseville, City of 8215-210 Pleasant Grove
Wastewater Placer $32,748,824
Construction to improve energy efficiency and conservation at the Wastewater Treatment Plant.
Maintains Water Quality
Russian River County 8387-110
Headworks, Lift Stations, and Force
Sonoma $810,085
Planning project for planning activities to assess the District's headworks, lift stations, and force main.
Maintains Water Quality
Santa Clarita Valley 8035-110 UV Disinfection
Facilities Project Los Angeles $20,985,376Construction to improve reliability of Water Reclamation Plant.
Improves Water Quality
Santa Clarita Valley 8156-110 Advanced Water
Treatment Facility Los Angeles $109,627,000Construction to improve Water Treatment Facility effluent water quality.
Improves Water Quality
Inland Empire Utilities 8235-150 2015 Drought
Relief - BaselineSan
Bernardino $6,694,013
Construction to increase delivery capacity of recycled water within the service area.
Maintains Water Quality
Burney Water District 8108-210
Burney Water District Wastewater
Shasta $337,101
Construction to improve reliability and effluent quality at the Wastewater Treatment Plant
Maintains Water Quality
Projects Funded: 23 Total Funding Amount: $599,462,312
25 | P a g e
IV. PROGRAM HIGHLIGHTS AND UPDATES
In SFY 2019-20, the State Water Board strived to resume financing CWSRF projects quickly and efficiently to reach the program’s full potential as a water quality tool and continued to pair CWSRF financing with other appropriated financing sources to achieve the overall objectives of the State Water Board. This section highlights significant achievements of the program and noteworthy factors that affected the CWSRF program in SFY 2019-20.
A. Projects Produce Widespread Cost Reductions
· Recipients received approximately $208.87 million in CWSRF subsidy. The subsidy is the amount of funds saved by recipients due to the reduced interest rate and/or principal forgiveness on CWSRF financing.
· Funded projects directly served 2,303,890 people and will indirectly serve 2,971,671 people statewide.
B. Updated Sustainable Lending Capacity
The CWSRF’s Municipal Advisor, in cooperation with DFA staff, updated the CWSRF’s estimated lending capacity calculations for the SFY 2020-21 IUP. The Municipal Advisor’s calculations showed that the CWSRF can operate at an estimated sustainable loan level of approximately $586 million per year for the next 20 years. The estimate is significantly below the previously estimated $1.0 billion loan capacity used in the 2018- 19 and 2019-20 IUPs. Stakeholders expressed concern during public comment on the 2020-21 IUP about the lower estimate given the sizeable unmet demand on the CWSRF program. DFA staff met with stakeholders to provide transparency on the capacity calculation process and to identify opportunities and actions that may increase the sustainable lending capacity of the program. Additional changes in policy or practice may be needed in the future to manage the program effectively and provide stakeholders and the State Water Board with the best possible results.
C. Small Community Funding Program Update
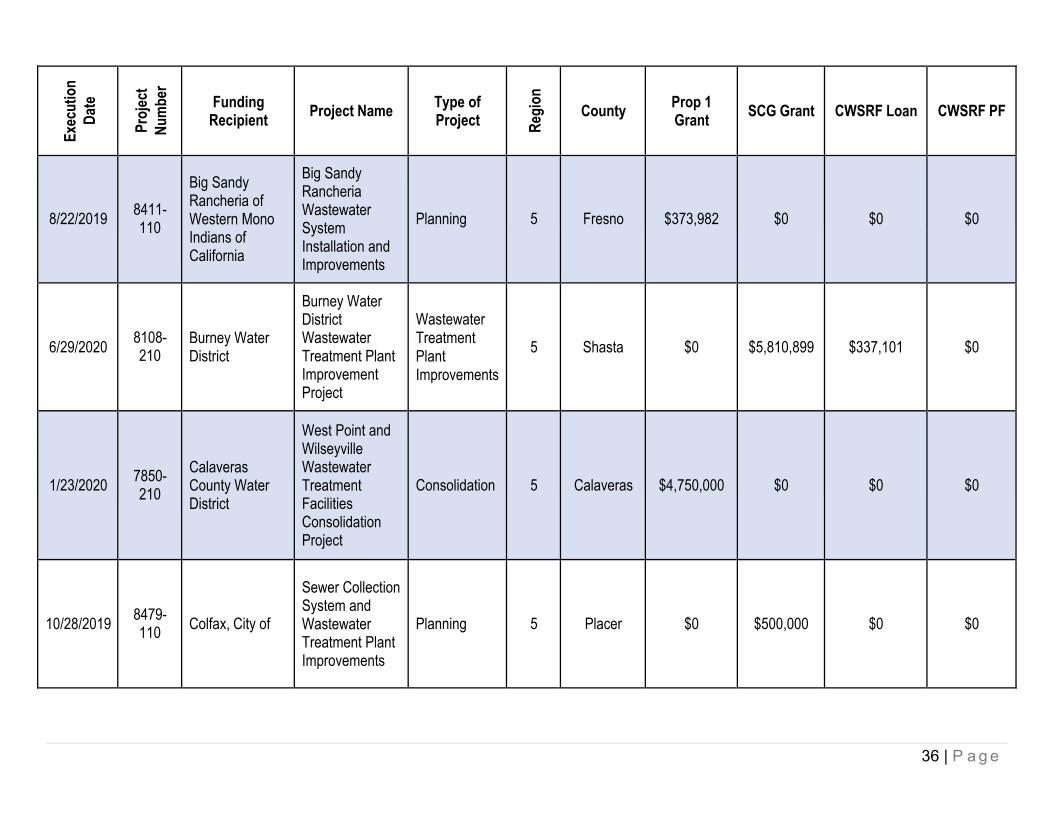
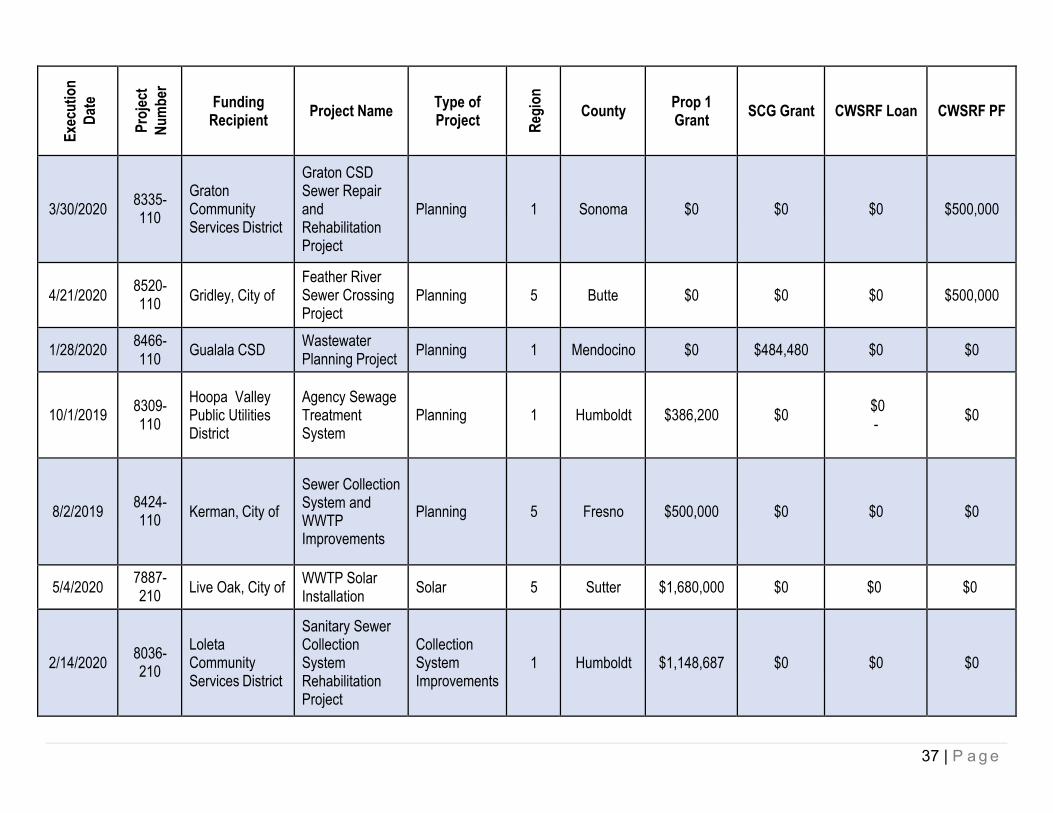
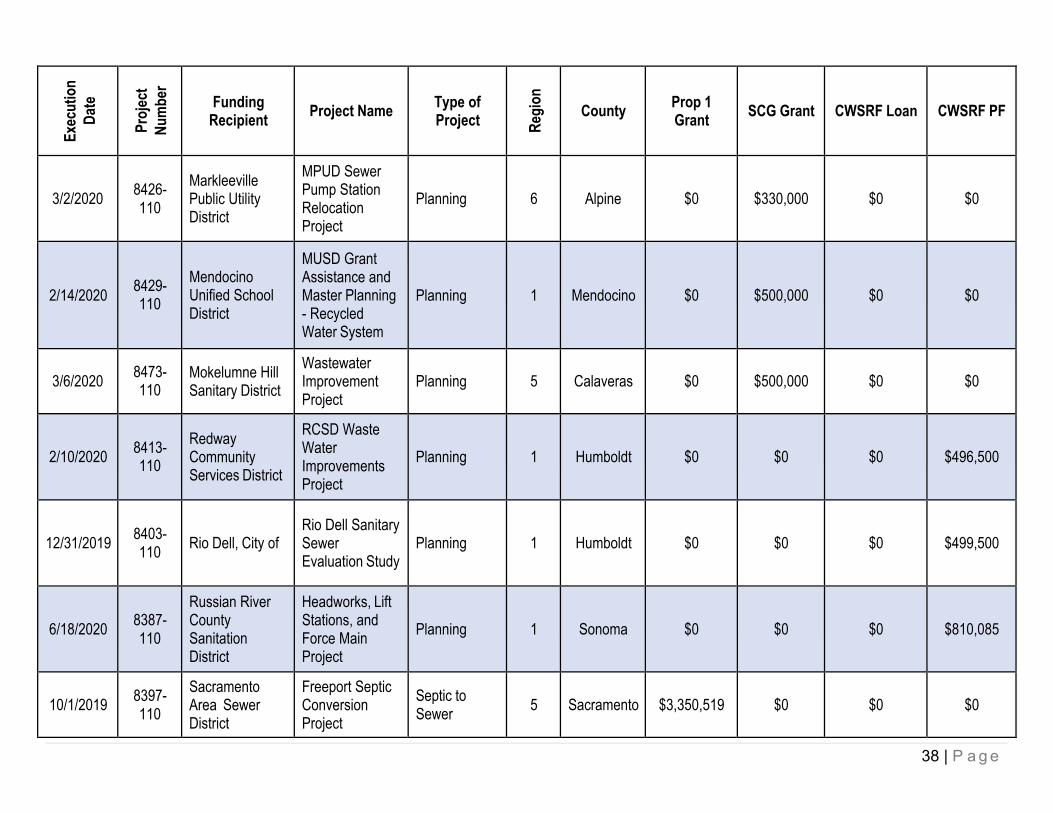
The State Water Board continued to implement and award funding in SFY 2019-20 to small disadvantaged community projects using Proposition 1 (Prop 1) SCG-Wastewater (WW) funds, SCG Fee funds, and CWSRF Principal Forgiveness. As of June 30, 2020, approximately $224.1 million of the $241.8 million in available Prop 1 SCG funds have been committed (executed agreements) to eligible projects. Approximately $30.1 million in Prop 1 SCG, $13.4 million in SCG Fee funding, and $3.8 million in Principal Forgiveness was awarded to small DACs in SFY 2019-2020. The list of small DAC funded projects is included as Exhibit C.
The State Water Board continued to commit SCG-WW funds at a fast pace and will continue to commit available SCG funds in SFY 2020-2021. The SCG-WW funding approach was fully integrated into the SFY 2019-20 IUP. However, SCG Fee funds are
26 | P a g e
now declining at a rate that requires the State Water Board to assess additional SCG Fees on CWSRF loans to meet SCG funding demands. This decline has been occurring because the SCG Fee is derived from interest payments on CWSRF loans that inherently decline over time as interest owed on outstanding loans declines. This decline in SCG Fee revenue has been further compounded by pre-payments on CWSRF loans in SFY 2019-20 and the resulting loss in future SCG Fee revenue. The State Water Board anticipates assessing additional SCG Fees in the near future to compensate for this loss of revenue that benefits small DACs.
D. Technical Assistance
DFA continued to provide a suite of technical assistance to small DACs and SDACs funded under Prop 1 in SFY 2019-20. In general, this technical assistance helped those communities address infrastructure improvements to correct system deficiencies and prevent pollution. It also helped them ensure compliance with water quality objectives; create more stable and sustainable community governance with enhanced public awareness of wastewater issues; improve asset management, fiscal planning, and accountability so that they can be financially sound and creditworthy financial assistance applicants; and assist small DACs and SDACs in completing their applications for CWSRF-SCG financing.
E. Water Recycling Funding Program Update
The State Water Board continued to implement and award funding in SFY 2019-20 to projects using Prop 1 water recycling funds. As of June 30, 2020, the State Water Board had been appropriated $568.75 million of Prop 1 and $74.0 million of Prop 68 water recycling local assistance funding. Approximately $451.5 million of Prop 1 water recycling funds ($305.2 million for grants and $146.3 million for loans) had been committed (executed agreement) as of June 30, 2020 to 50 projects. As of June 30, 2020, approximately $110.0 million in Prop 1 and $74 million in Prop 68 local assistance funds remained for projects. In SFY 2019-20 specifically, the State Water Board did not execute any new Prop 1 or Prop 68 water recycling local assistance agreements. DFA expects that all the remaining Prop 1 and $40 million of Prop 68 local assistance water recycling funds will be committed to projects during SFY 2020-21.
The Water Recycling Funding Program (WRFP) is part of the State Water Board’s long- standing commitment to recycling wastewater. The Prop 1 water recycling financing represents a significant investment by the State Water Board and the California voters to offset or augment fresh water supplies and make California’s water supply more sustainable and resilient. Together, the 50 projects receiving Prop 1 water recycling financing are expected to deliver 193,700 acre-feet per year (AFY) in recycled water once they are fully operational. Roughly 52,700 AFY are planned for agricultural irrigation, 28,400 AFY for urban irrigation, 5,500 AFY for commercial and industrial users, and 107,100 AFY will be used to recharge groundwater basins.
27 | P a g e
F. CWSRF Results and Leveraging Activity
One measure of SRF success is the ratio of cumulative executed agreements to cumulative federal capitalization. As of June 30, 2019, California’s CWSRF has executed $3.42 worth of agreements for every $1.00 of federal capitalization. Three states with comparable levels of federal capitalization, New York, Ohio, and Texas, had executed from $3.21 to $3.77 for every $1.00 in federal capitalization. The 2020-21 Fundable List, as adopted by the State Water Board, includes an additional $2.7 billion in potential new loan commitments, and if all of these selected projects receive an executed agreement by June 30, 2021, as planned, the ratio of funded projects is estimated to rise to $4.08 for every $1.00 in federal capitalization. The State Water Board authorized DFA to lower the Cutoff Score to 13, and if all the projects scoring 13 also receive an executed agreement, the estimated ratio will be approximately 4.25.
The CWSRF’s outstanding commitments as of June 30, 2020 totaled approximately$2.3 billion. DFA determined that additional CWSRF bonds were not needed in SFY 2019-20. Based on the cash flow analysis in the SFY 2020-21 IUP, however, additional capital will be needed in SFY 2020-21 to finance an additional $3.3 billion in new projects. This will likely be achieved in the form of municipal bonds, a WIFIA or SWIFIA loan, or additional capitalization from EPA.
The State Water Board has authorized the issuance of up to $2.2 billion in CWSRF revenue bonds. The CWSRF program sold bonds in 2016, 2017, and 2018, and all the proceeds of these sales have been disbursed to eligible recipients. Exhibit E provides a detailed listing of the use of Series 2016, 2017 and 2018 CWSRF Revenue Bond proceeds.
Currently, the CWSRF has approximately $1.3 billion par in bonds outstanding, so additional debt can be issued utilizing the CWSRF’s existing authority. DFA will continue to evaluate its cash flows and future capitalization levels to determine if it should request that the State Water Board increase the leveraging limit for the CWSRF consistent with the SRF Debt Management Policy.
G. Reducing Rollovers and Normalizing Operations
The rollout of the Financial Information System for California (FI$Cal), the new statewide accounting, budget, cash management, and procurement system, resulted in a significantly lower number of new clean water financing agreements during SFYs 2018-19 and 2019-20 and a significant rollover of projects to the SFY 2020-21 Fundable List. The high level of rollovers affected the addition of new projects to the Fundable List in the SFY 2020-21 Intended Use Plan; only five new projects were added to the Fundable List by the State Water Board when it adopted the Fundable List in June 2020. The Board, however, did authorize the Deputy Director of DFA to lower the Cutoff Score to 13 and add an additional 18 scored projects to the Fundable List if good progress is being made to reduce the backlog of rollover projects and fund all ready to proceed disadvantaged community wastewater projects for which DFA has the necessary grant funding by June 30, 2021.
28 | P a g e
As of early 2020, DFA has adapted to FI$Cal, and the last three months of SFY 2019- 20 were a positive early indicator that the pace of new financing agreements will begin to normalize in SFY 2020-21. For SFY 2019-20, DFA executed 23 agreements for approximately $600 million in financing. Moreover, between May 1, 2020 and June 30, 2020, DFA executed 41 new CWSRF, Drinking Water State Revolving Fund (DWSRF), and complementary funding source agreements. This pace of new agreements is similar to DFA’s pace of new agreements before the introduction of FI$Cal. DFA’s evaluated lowering the Cutoff Score to 13 and successfully executing agreements for additional projects by June 30, 2021. On November 4, 2020, DFA announced that the Deputy Director had lowered the Cutoff Score to 13 and added an additional 18 projects to the Fundable List.
H. COVID-19 Impacts
The actions taken to address the COVID-19 pandemic have also affected SRF operations during the latter part of SFY 2019-20 and may have additional consequences for the program in the future. Although the State Water Board has received two (2) requests for CWSRF loan forbearance or modification, no loans pledged to the repayment of SRF bonds have requested forbearance or modification of their terms or payment schedules. The State Water Board’s staff continues to monitor the impacts of COVID-19 on the revenues and expenses of agencies with outstanding SRF debt.
The potential exists for state or federal stimulus funding as part of efforts to recover from COVID-19. The State Water Board continues to monitor developments at the state and federal levels that might result in the availability of additional CWSRF capital or complementary funds and is planning accordingly. These additional funds, should they become available, may require an IUP amendment or additional guidance from the State Water Board. Additional state or federal funding would be committed consistent with any guidelines or requirements associated with their authorization.
I. Marketing Updates
State Water Board staff continued to participate in the California Financing Coordinating Committee (CFCC) funding fairs during SFY 2019-20. The funding fairs provide members of the public and infrastructure development professionals current information on funding options available for different project types.
State Water Board staff also participated in the League of California Cities 2019 Annual Expo Conference.
29 | P a g e
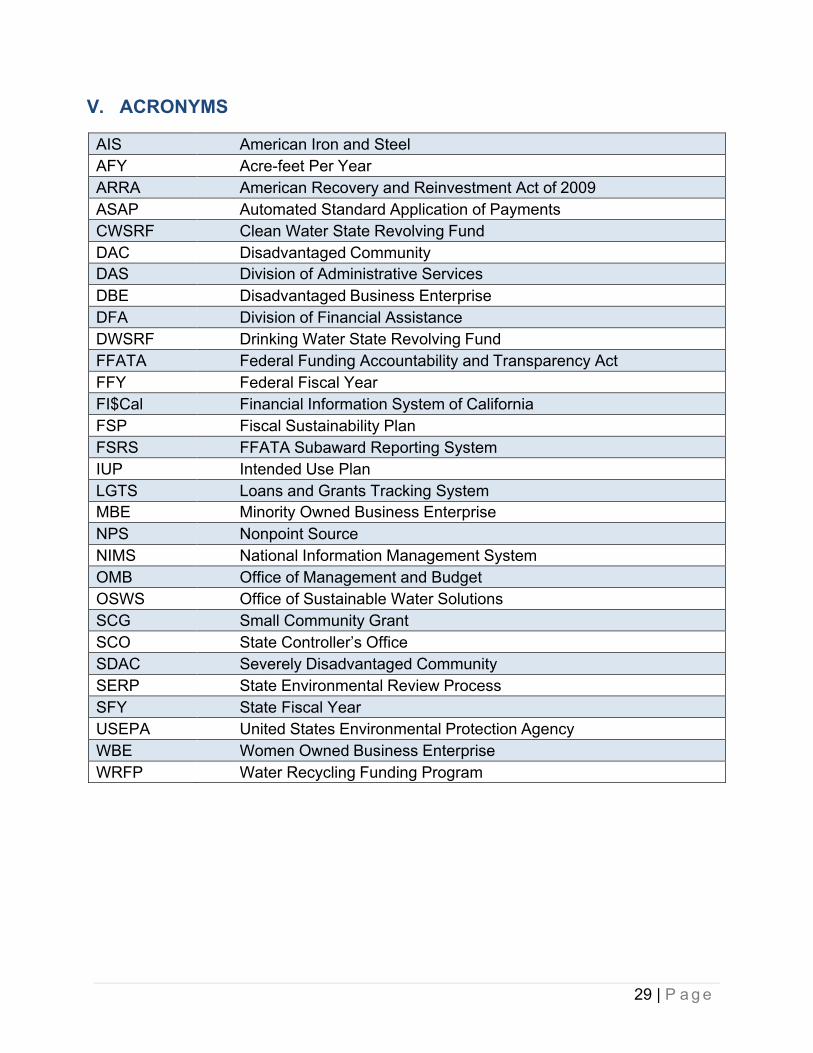
V. ACRONYMS
AIS American Iron and SteelAFY Acre-feet Per YearARRA American Recovery and Reinvestment Act of 2009ASAP Automated Standard Application of PaymentsCWSRF Clean Water State Revolving FundDAC Disadvantaged CommunityDAS Division of Administrative ServicesDBE Disadvantaged Business EnterpriseDFA Division of Financial AssistanceDWSRF Drinking Water State Revolving FundFFATA Federal Funding Accountability and Transparency ActFFY Federal Fiscal YearFI$Cal Financial Information System of CaliforniaFSP Fiscal Sustainability PlanFSRS FFATA Subaward Reporting SystemIUP Intended Use PlanLGTS Loans and Grants Tracking SystemMBE Minority Owned Business EnterpriseNPS Nonpoint SourceNIMS National Information Management SystemOMB Office of Management and BudgetOSWS Office of Sustainable Water SolutionsSCG Small Community GrantSCO State Controller’s OfficeSDAC Severely Disadvantaged CommunitySERP State Environmental Review ProcessSFY State Fiscal YearUSEPA United States Environmental Protection AgencyWBE Women Owned Business EnterpriseWRFP Water Recycling Funding Program
30 | P a g e
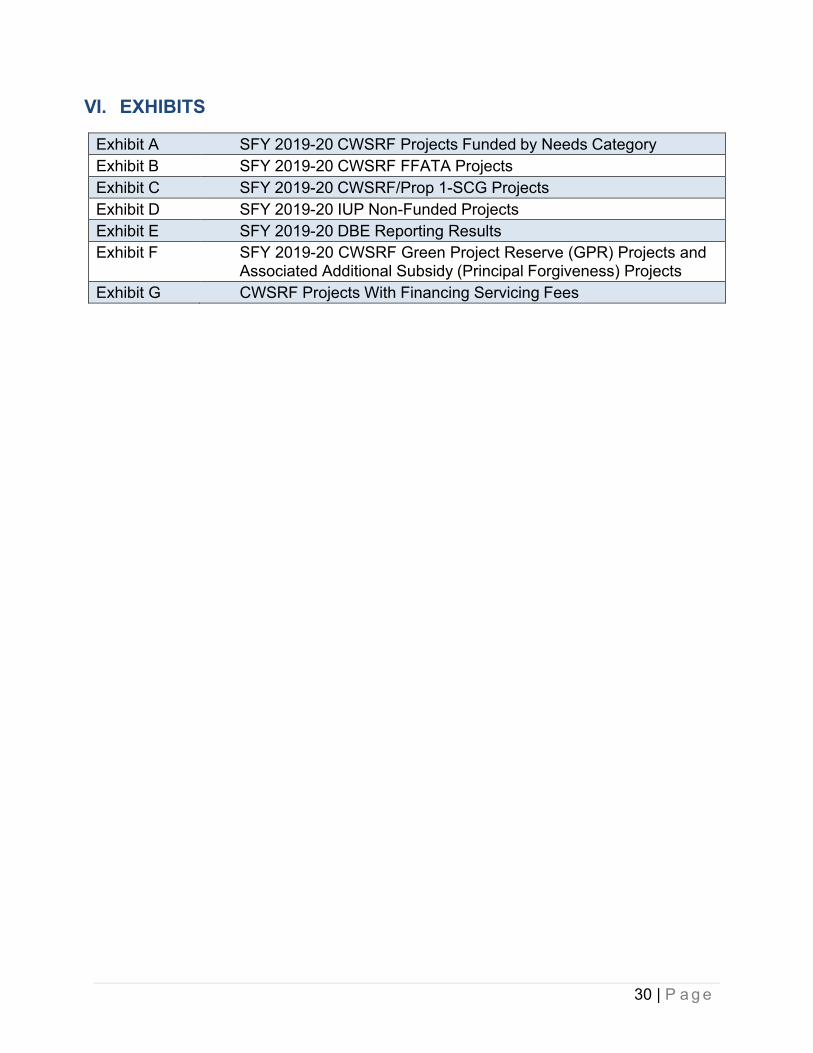
VI. EXHIBITS
Exhibit A SFY 2019-20 CWSRF Projects Funded by Needs CategoryExhibit B SFY 2019-20 CWSRF FFATA ProjectsExhibit C SFY 2019-20 CWSRF/Prop 1-SCG ProjectsExhibit D SFY 2019-20 IUP Non-Funded ProjectsExhibit E SFY 2019-20 DBE Reporting ResultsExhibit F SFY 2019-20 CWSRF Green Project Reserve (GPR) Projects and
Associated Additional Subsidy (Principal Forgiveness) ProjectsExhibit G CWSRF Projects With Financing Servicing Fees

31 | P a g e
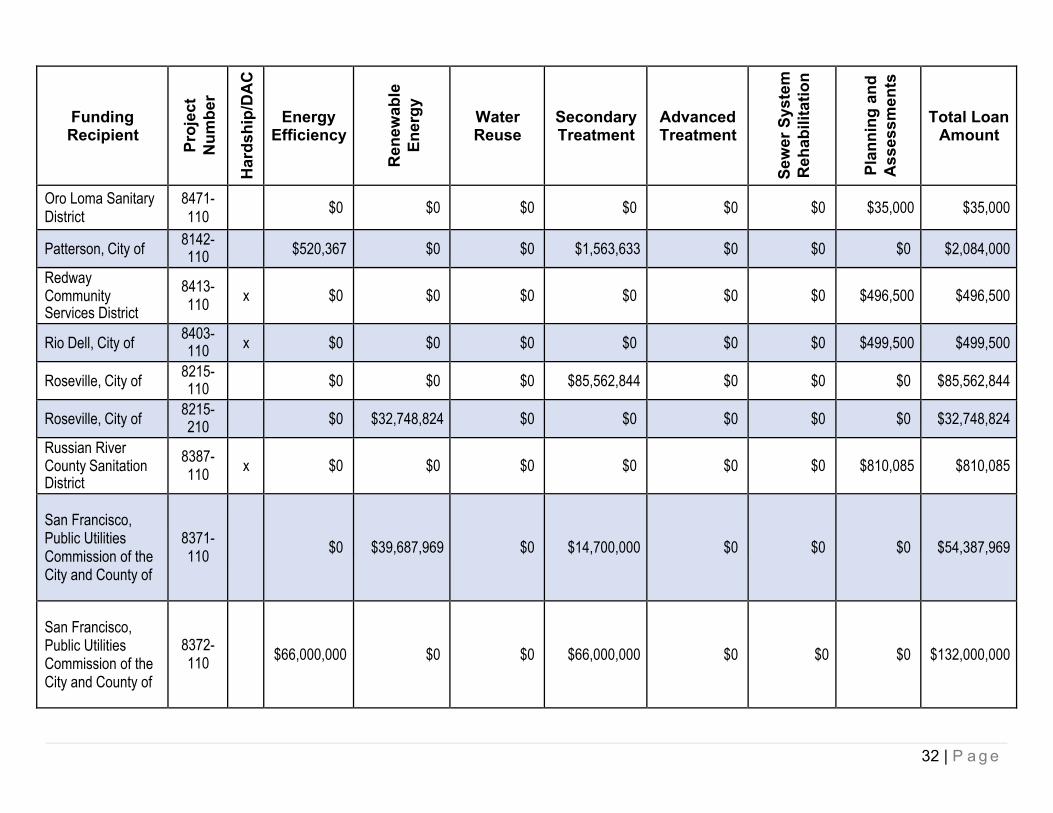
Exhibit A: SFY 2019-20 Projects Funded by Needs Category
Funding Recipient
Proj
ect
Num
ber
Har
dshi
p/D
AC
Energy Efficiency
Ren
ewab
le
Ener
gy Water Reuse
Secondary Treatment
Advanced Treatment
Sew
er S
yste
m
Reh
abili
tatio
n
Plan
ning
and
A
sses
smen
ts
Total Loan Amount
Allensworth Community Services District
8476-110 x $0 $0 $0 $0 $0 $0 $500,000 $500,000
Brentwood, City of 8095-110 $7,712,000 $0 $0 $57,390,000 $0 $0 $0 $65,102,000
Burney Water District
8108-210 x $0 $0 $0 $337,101 $0 $0 $0 $337,101
Dos Palos City of 8488-110 $0 $0 $0 $0 $0 $0 $35,000 $35,000
Elsinore Valley Municipal Water District
8336-110 $9,108,100 $0 $0 $36,879,000 $0 $0 $0 $45,987,100
Graton Community Services District
8335-110 x $0 $0 $0 $0 $0 $0 $500,000 $500,000
Gridley, City of 8520-110 x $0 $0 $0 $0 $0 $0 $500,000 $500,000
Heber Public Utility District
8485-110 $0 $0 $0 $0 $0 $0 $35,000 $35,000
Inland Empire Utilities Agency
8235-150 $0 $0 $6,694,013 $0 $0 $0 $0 $6,694,013
Linda County Water District
8388-110 x $0 $0 $0 $0 $0 $0 $35,000 $35,000
Napa Sanitation District
8244-110 $12,000,000 $0 $0 $0 $0 $28,000,000 $0 $40,000,000
32 | P a g e
Funding Recipient
Proj
ect
Num
ber
Har
dshi
p/D
AC
Energy Efficiency
Ren
ewab
le
Ener
gy Water Reuse
Secondary Treatment
Advanced Treatment
Sew
er S
yste
m
Reh
abili
tatio
n
Plan
ning
and
A
sses
smen
ts
Total Loan Amount
Oro Loma Sanitary District
8471-110 $0 $0 $0 $0 $0 $0 $35,000 $35,000
Patterson, City of 8142-110 $520,367 $0 $0 $1,563,633 $0 $0 $0 $2,084,000
Redway CommunityServices District
8413-110 x $0 $0 $0 $0 $0 $0 $496,500 $496,500
Rio Dell, City of 8403-110 x $0 $0 $0 $0 $0 $0 $499,500 $499,500
Roseville, City of 8215-110 $0 $0 $0 $85,562,844 $0 $0 $0 $85,562,844
Roseville, City of 8215-210 $0 $32,748,824 $0 $0 $0 $0 $0 $32,748,824
Russian River County SanitationDistrict
8387-110 x $0 $0 $0 $0 $0 $0 $810,085 $810,085
San Francisco, Public Utilities Commission of the City and County of
8371-110 $0 $39,687,969 $0 $14,700,000 $0 $0 $0 $54,387,969
San Francisco, Public Utilities Commission of the City and County of
8372-110 $66,000,000 $0 $0 $66,000,000 $0 $0 $0 $132,000,000
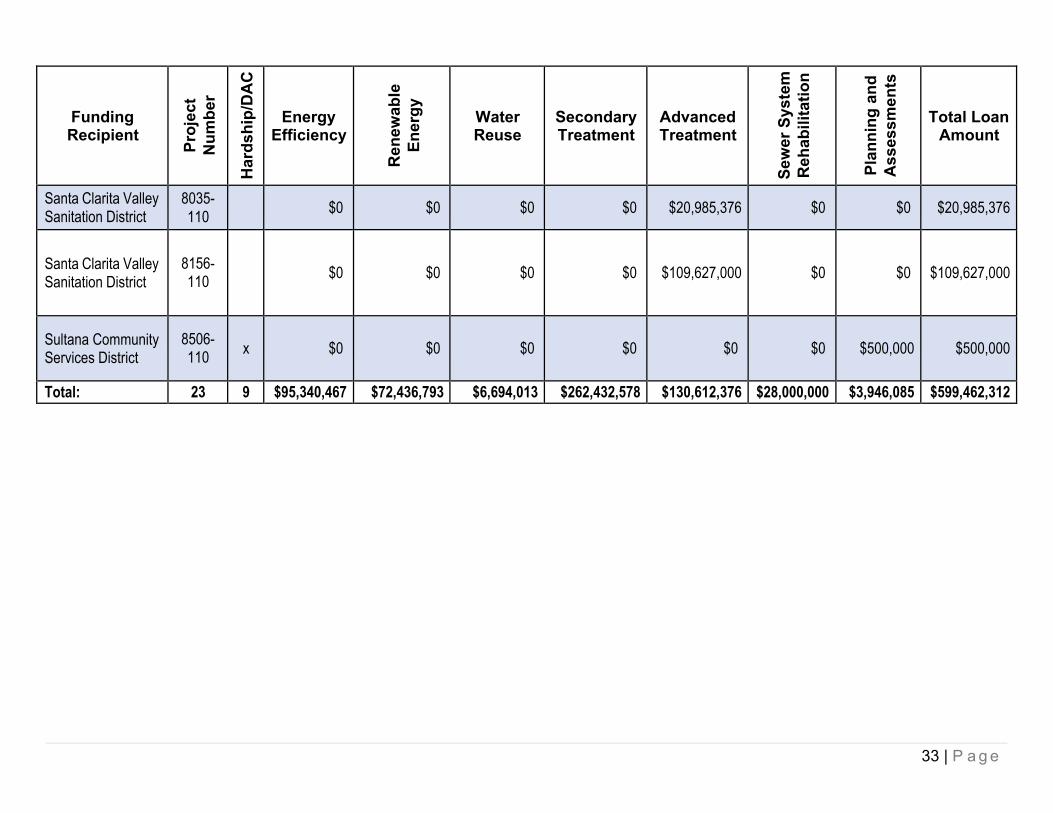
33 | P a g e
Funding Recipient
Proj
ect
Num
ber
Har
dshi
p/D
AC
Energy Efficiency
Ren
ewab
le
Ener
gy Water Reuse
Secondary Treatment
Advanced Treatment
Sew
er S
yste
m
Reh
abili
tatio
n
Plan
ning
and
A
sses
smen
ts
Total Loan Amount
Santa Clarita Valley Sanitation District
8035-110 $0 $0 $0 $0 $20,985,376 $0 $0 $20,985,376
Santa Clarita Valley Sanitation District
8156-110 $0 $0 $0 $0 $109,627,000 $0 $0 $109,627,000
Sultana Community Services District
8506-110 x $0 $0 $0 $0 $0 $0 $500,000 $500,000
Total: 23 9 $95,340,467 $72,436,793 $6,694,013 $262,432,578 $130,612,376 $28,000,000 $3,946,085 $599,462,312
34 | P a g e
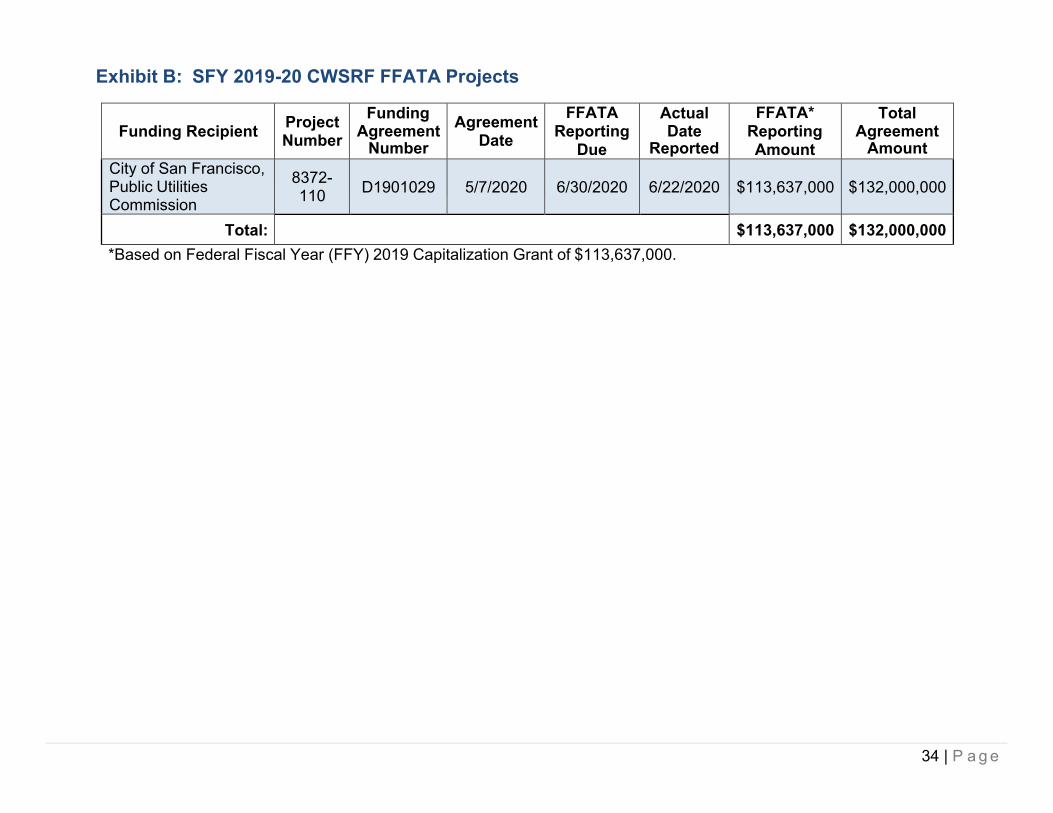
Exhibit B: SFY 2019-20 CWSRF FFATA Projects
Funding Recipient Project Number
Funding Agreement
NumberAgreement
DateFFATA
Reporting Due
Actual Date
Reported
FFATA*Reporting Amount
Total Agreement
AmountCity of San Francisco,Public Utilities Commission
8372-110 D1901029 5/7/2020 6/30/2020 6/22/2020 $113,637,000 $132,000,000
Total: $113,637,000 $132,000,000*Based on Federal Fiscal Year (FFY) 2019 Capitalization Grant of $113,637,000.
35 | P a g e
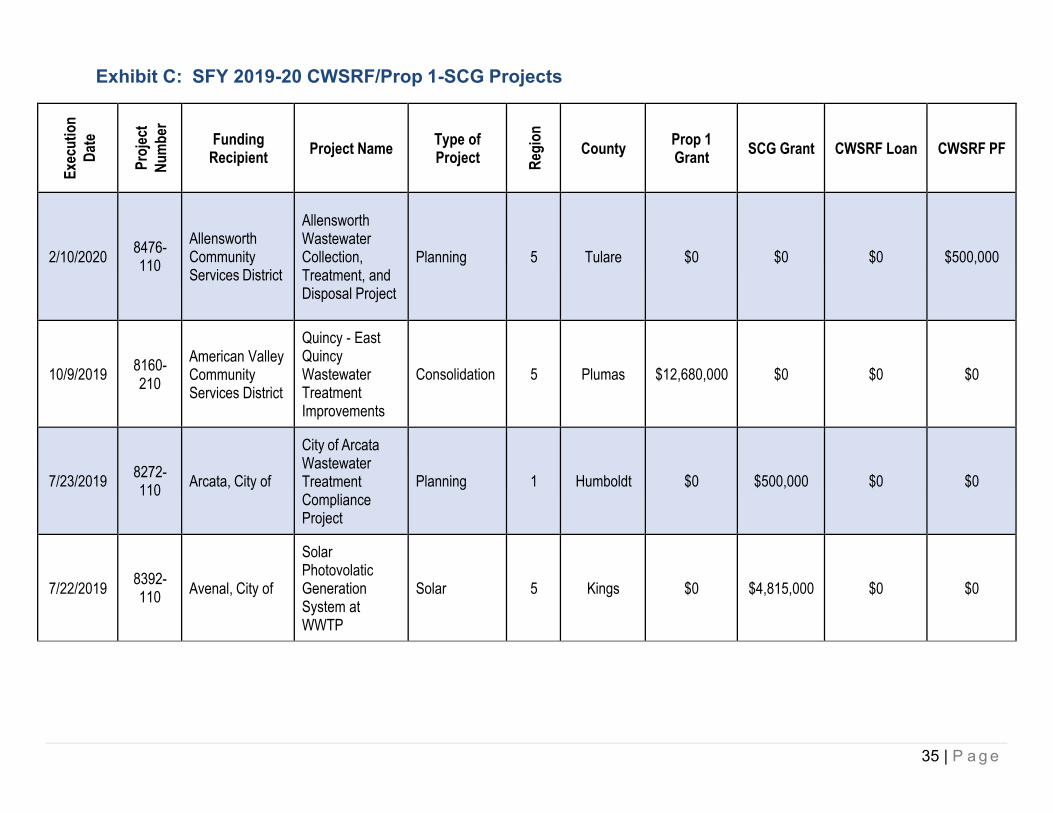
Exhibit C: SFY 2019-20 CWSRF/Prop 1-SCG ProjectsEx
ecut
ion
Date
Proj
ect
Num
ber
Funding Recipient Project Name Type of
Project Regi
on
County Prop 1 Grant SCG Grant CWSRF Loan CWSRF PF
2/10/2020 8476-110
Allensworth Community Services District
Allensworth Wastewater Collection, Treatment, and Disposal Project
Planning 5 Tulare $0 $0 $0 $500,000
10/9/2019 8160-210
American Valley Community Services District
Quincy - East Quincy Wastewater Treatment Improvements
Consolidation 5 Plumas $12,680,000 $0 $0 $0
7/23/2019 8272-110 Arcata, City of
City of Arcata Wastewater Treatment Compliance Project
Planning 1 Humboldt $0 $500,000 $0 $0
7/22/2019 8392-110 Avenal, City of
Solar Photovolatic Generation System at WWTP
Solar 5 Kings $0 $4,815,000 $0 $0
36 | P a g e
Exec
utio
n Da
te
Proj
ect
Num
ber
Funding Recipient Project Name Type of
Project Regi
on
County Prop 1 Grant SCG Grant CWSRF Loan CWSRF PF
8/22/2019 8411-110
Big Sandy Rancheria of Western Mono Indians of California
Big Sandy Rancheria Wastewater System Installation and Improvements
Planning 5 Fresno $373,982 $0 $0 $0
6/29/2020 8108-210
Burney Water District
Burney Water District Wastewater Treatment Plant Improvement Project
Wastewater Treatment Plant Improvements
5 Shasta $0 $5,810,899 $337,101 $0
1/23/2020 7850-210
Calaveras County Water District
West Point and Wilseyville Wastewater Treatment Facilities Consolidation Project
Consolidation 5 Calaveras $4,750,000 $0 $0 $0
10/28/2019 8479-110 Colfax, City of
Sewer Collection System and Wastewater Treatment Plant Improvements
Planning 5 Placer $0 $500,000 $0 $0
37 | P a g e
Exec
utio
n Da
te
Proj
ect
Num
ber
Funding Recipient Project Name Type of
Project Regi
on
County Prop 1 Grant SCG Grant CWSRF Loan CWSRF PF
3/30/2020 8335-110
Graton Community Services District
Graton CSD Sewer Repair and Rehabilitation Project
Planning 1 Sonoma $0 $0 $0 $500,000
4/21/2020 8520-110 Gridley, City of
Feather River Sewer Crossing Project
Planning 5 Butte $0 $0 $0 $500,000
1/28/2020 8466-110 Gualala CSD Wastewater
Planning Project Planning 1 Mendocino $0 $484,480 $0 $0
10/1/2019 8309-110
Hoopa Valley Public Utilities District
Agency Sewage Treatment System
Planning 1 Humboldt $386,200 $0 $0- $0
8/2/2019 8424-110 Kerman, City of
Sewer Collection System and WWTPImprovements
Planning 5 Fresno $500,000 $0 $0 $0
5/4/2020 7887-210 Live Oak, City of WWTP Solar
Installation Solar 5 Sutter $1,680,000 $0 $0 $0
2/14/2020 8036-210
Loleta Community Services District
Sanitary Sewer Collection System Rehabilitation Project
Collection System Improvements
1 Humboldt $1,148,687 $0 $0 $0
38 | P a g e
Exec
utio
n Da
te
Proj
ect
Num
ber
Funding Recipient Project Name Type of
Project Regi
on
County Prop 1 Grant SCG Grant CWSRF Loan CWSRF PF
3/2/2020 8426-110
Markleeville Public Utility District
MPUD Sewer Pump Station Relocation Project
Planning 6 Alpine $0 $330,000 $0 $0
2/14/2020 8429-110
Mendocino Unified School District
MUSD Grant Assistance and Master Planning- Recycled Water System
Planning 1 Mendocino $0 $500,000 $0 $0
3/6/2020 8473-110
Mokelumne Hill Sanitary District
Wastewater Improvement Project
Planning 5 Calaveras $0 $500,000 $0 $0
2/10/2020 8413-110
Redway Community Services District
RCSD Waste Water Improvements Project
Planning 1 Humboldt $0 $0 $0 $496,500
12/31/2019 8403-110 Rio Dell, City of
Rio Dell Sanitary Sewer Evaluation Study
Planning 1 Humboldt $0 $0 $0 $499,500
6/18/2020 8387-110
Russian River County Sanitation District
Headworks, Lift Stations, and Force Main Project
Planning 1 Sonoma $0 $0 $0 $810,085
10/1/2019 8397-110
Sacramento Area Sewer District
Freeport Septic Conversion Project
Septic to Sewer 5 Sacramento $3,350,519 $0 $0 $0

39 | P a g e
Exec
utio
n Da
te
Proj
ect
Num
ber
Funding Recipient Project Name Type of
Project Regi
on
County Prop 1 Grant SCG Grant CWSRF Loan CWSRF PF
11/27/2019 8399-110
San Miguel Community Services District
San Miguel Wastewater Project
Planning 3 San Luis Obispo $250,000 $0 $0 $0
3/5/2020 8085-310
Shasta, County of
CSA 17Collection System Improvement Project
Collection System Improvements
5 Shasta $2,836,000 $0 $0 $0
3/18/2020 8506-110
Sultana Community Services District
Sultana and Monson Wastewater Management Project
Planning 5 Tulare $0 $0 $0 $500,000
6/16/2020 8247-210
Tuolumne City Sanitary District
TCSD WWTPImprovement Project
Wastewater Treatment PlantImprovements
5 Tuolumne $1,682,148 $0 $0 $0
12/30/2019 8430-110 Weed, City of
Wastewater Treatment Facilities Improvements
Planning 1 Siskiyou $500,000 $0 $0 $0
$30,137,536 $13,440,379 $337,101 $3,806,085
40 | P a g e
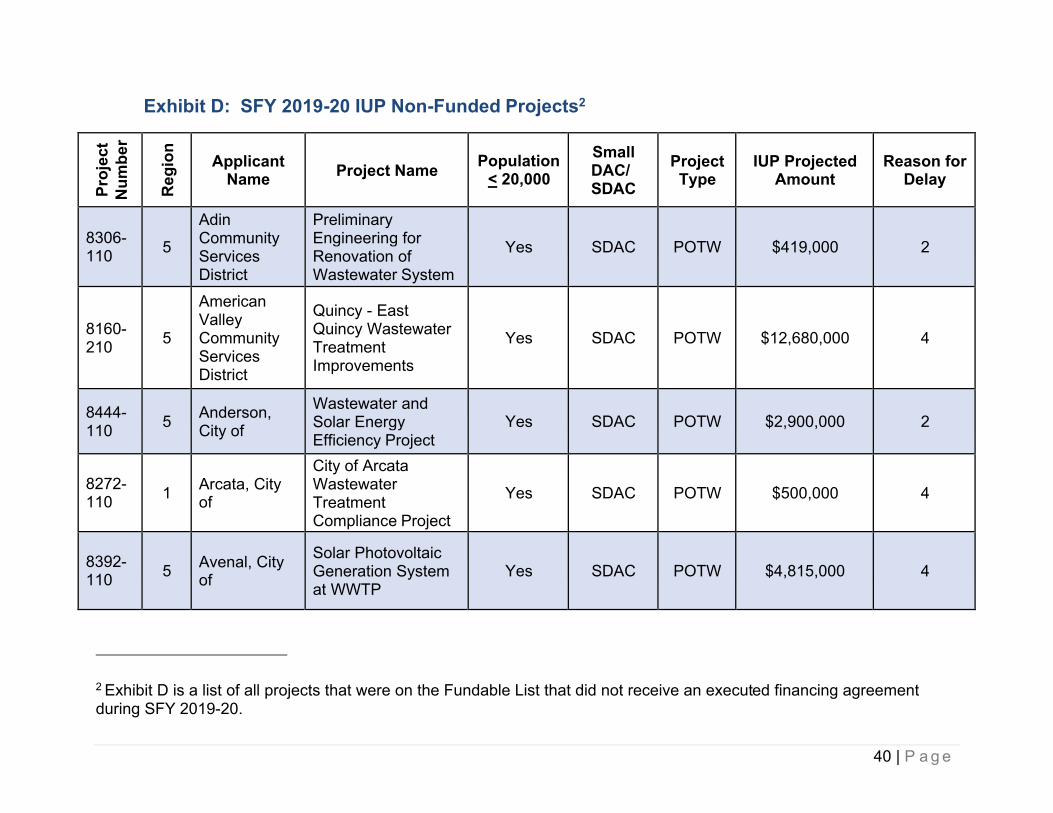
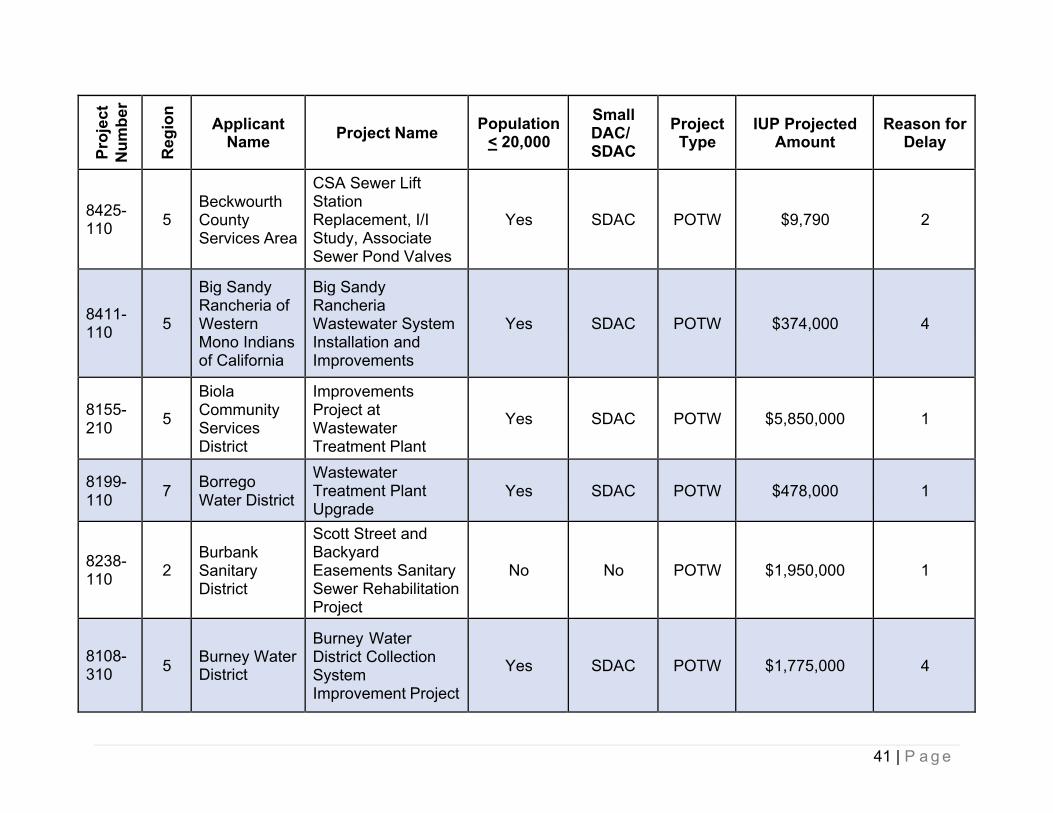
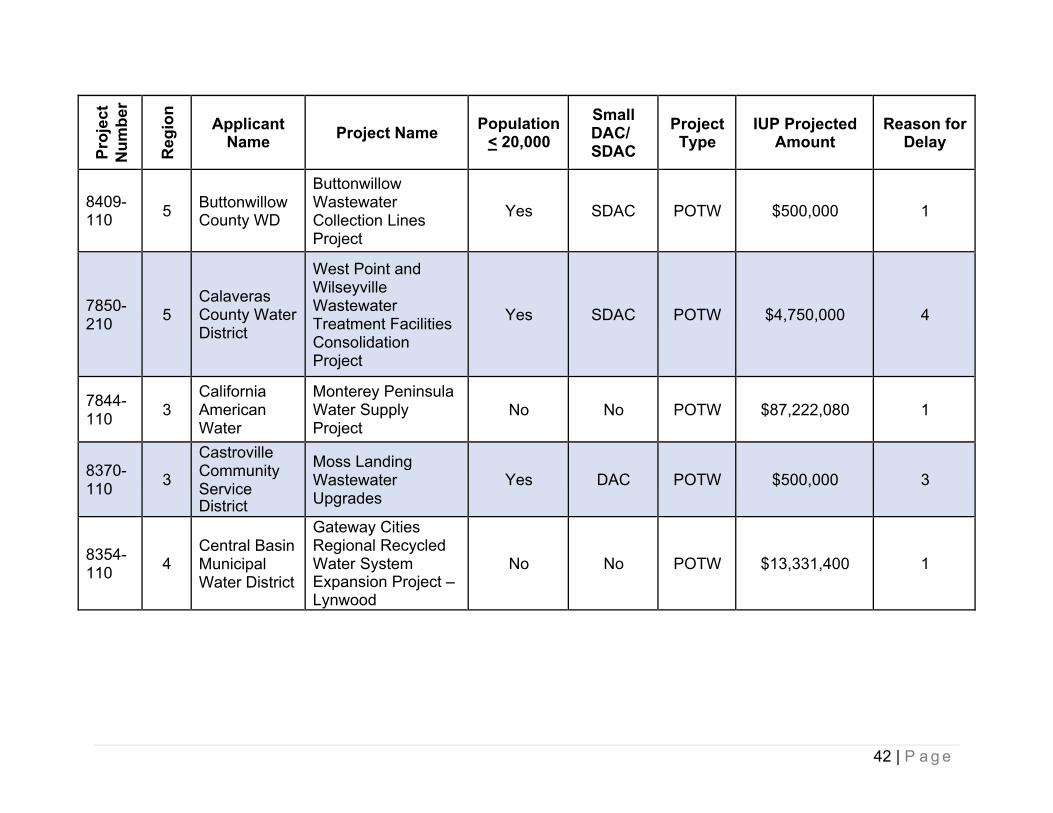
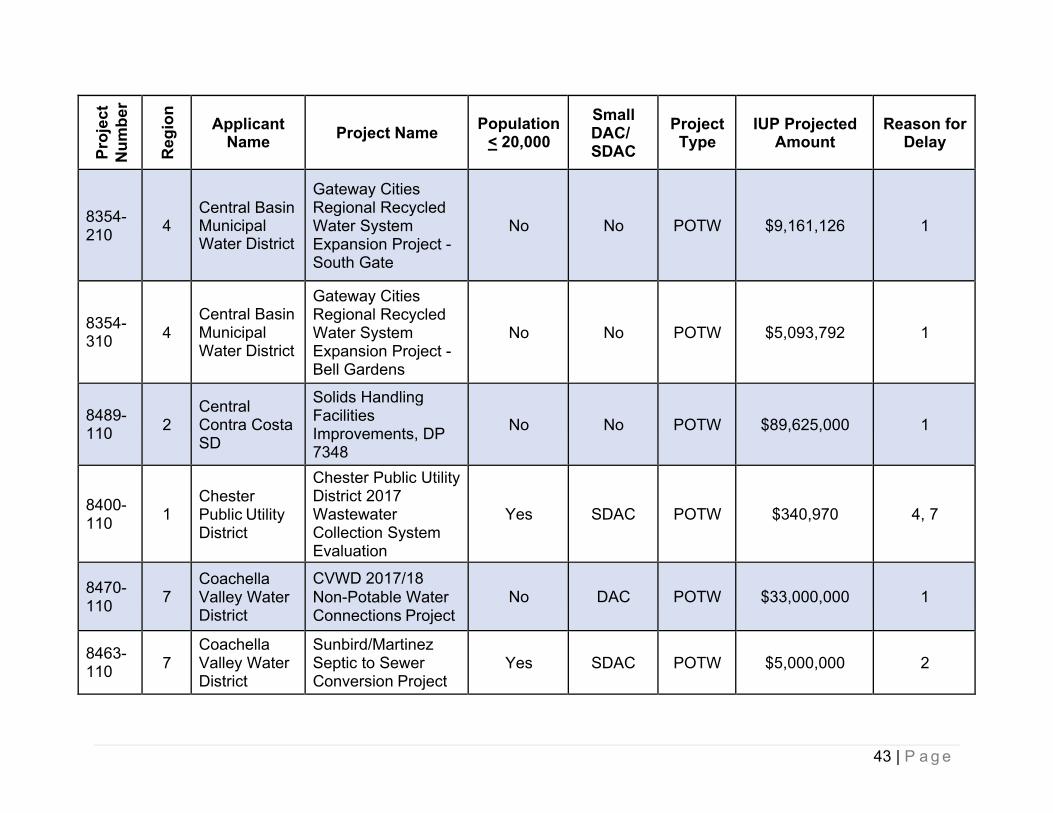
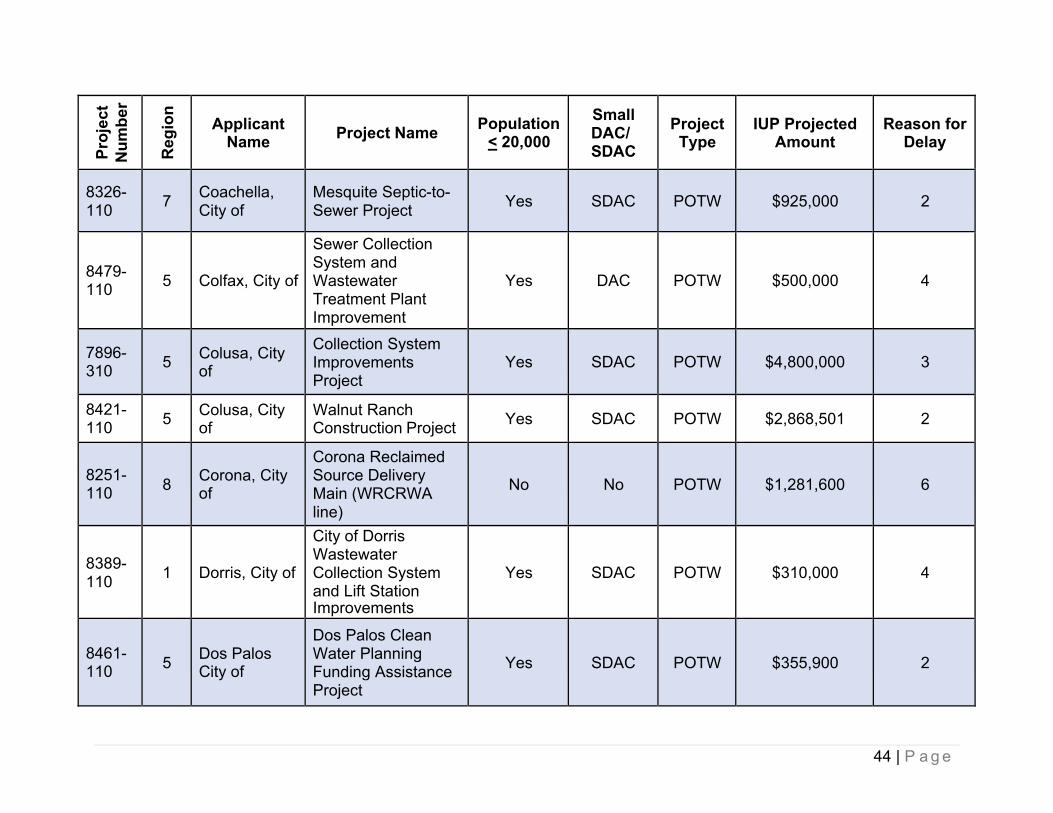
Exhibit D: SFY 2019-20 IUP Non-Funded Projects2 Pr
ojec
t N
umbe
r
Reg
ion
Applicant Name Project Name Population
< 20,000Small DAC/ SDAC
Project Type
IUP Projected Amount
Reason for Delay
8306-110 5
Adin Community Services District
Preliminary Engineering for Renovation of Wastewater System
Yes SDAC POTW $419,000 2
8160-210 5
American Valley Community Services District
Quincy - East Quincy Wastewater Treatment Improvements
Yes SDAC POTW $12,680,000 4
8444-110 5 Anderson,
City of
Wastewater and Solar Energy Efficiency Project
Yes SDAC POTW $2,900,000 2
8272-110 1 Arcata, City
of
City of Arcata Wastewater Treatment Compliance Project
Yes SDAC POTW $500,000 4
8392-110 5 Avenal, City
of
Solar Photovoltaic Generation System at WWTP
Yes SDAC POTW $4,815,000 4
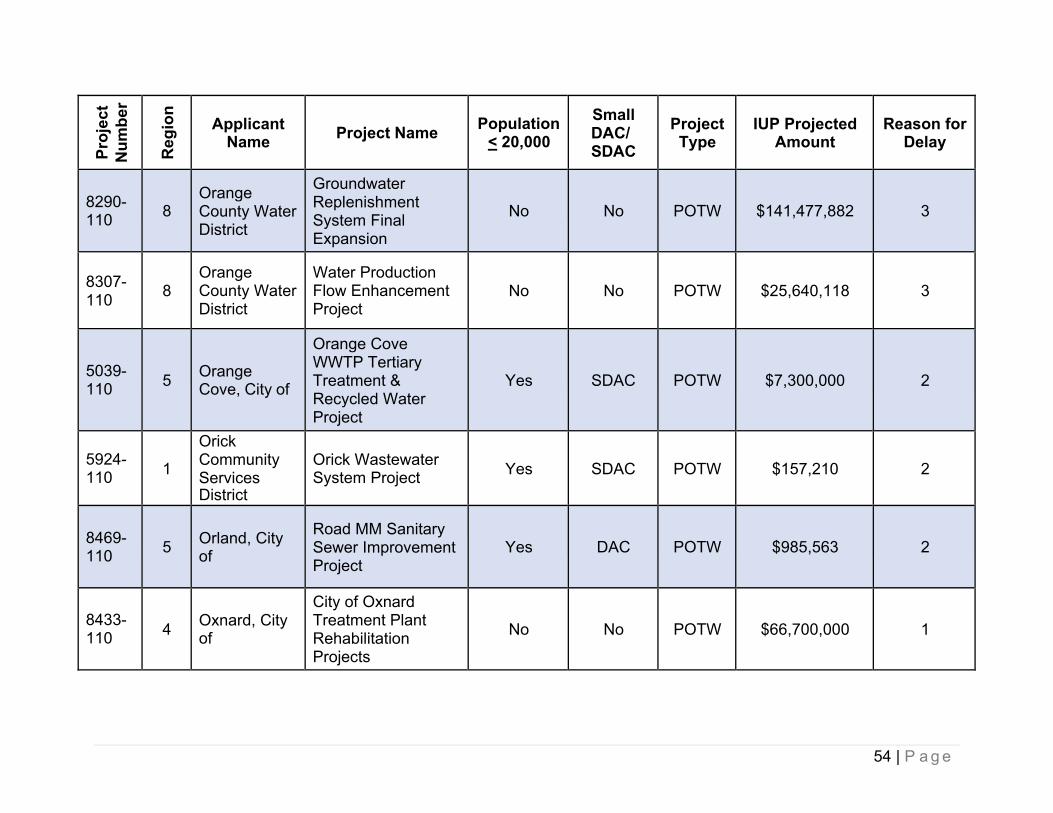
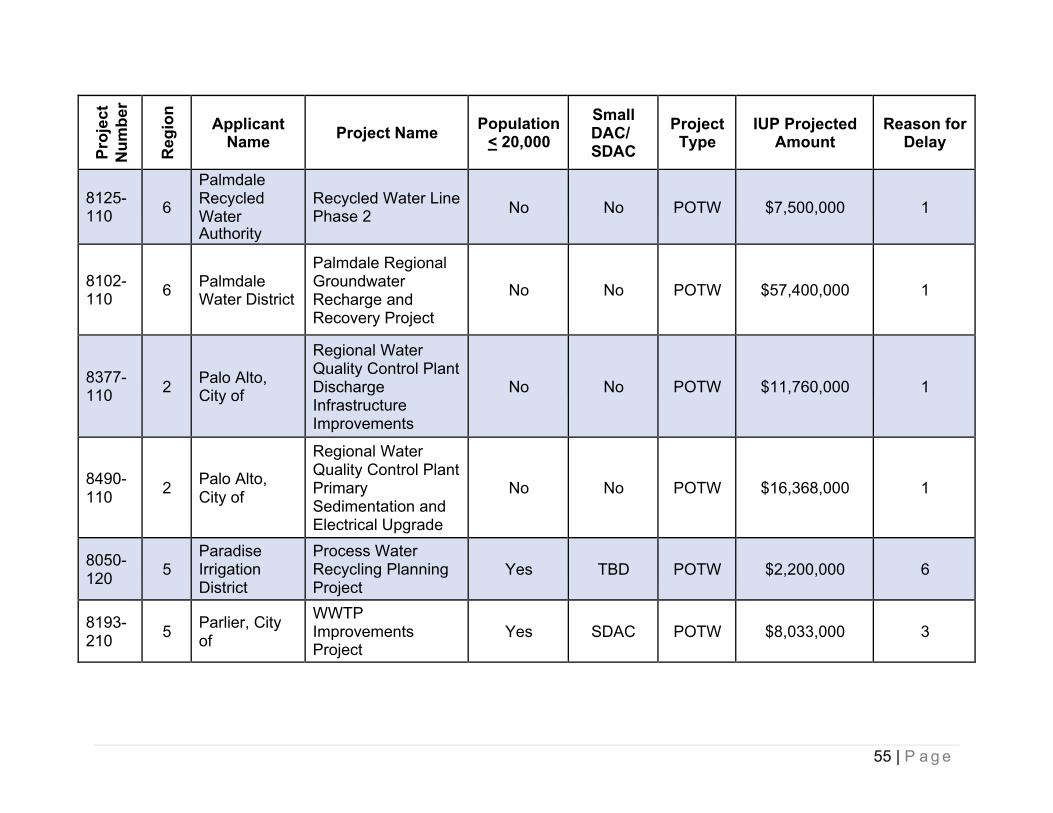
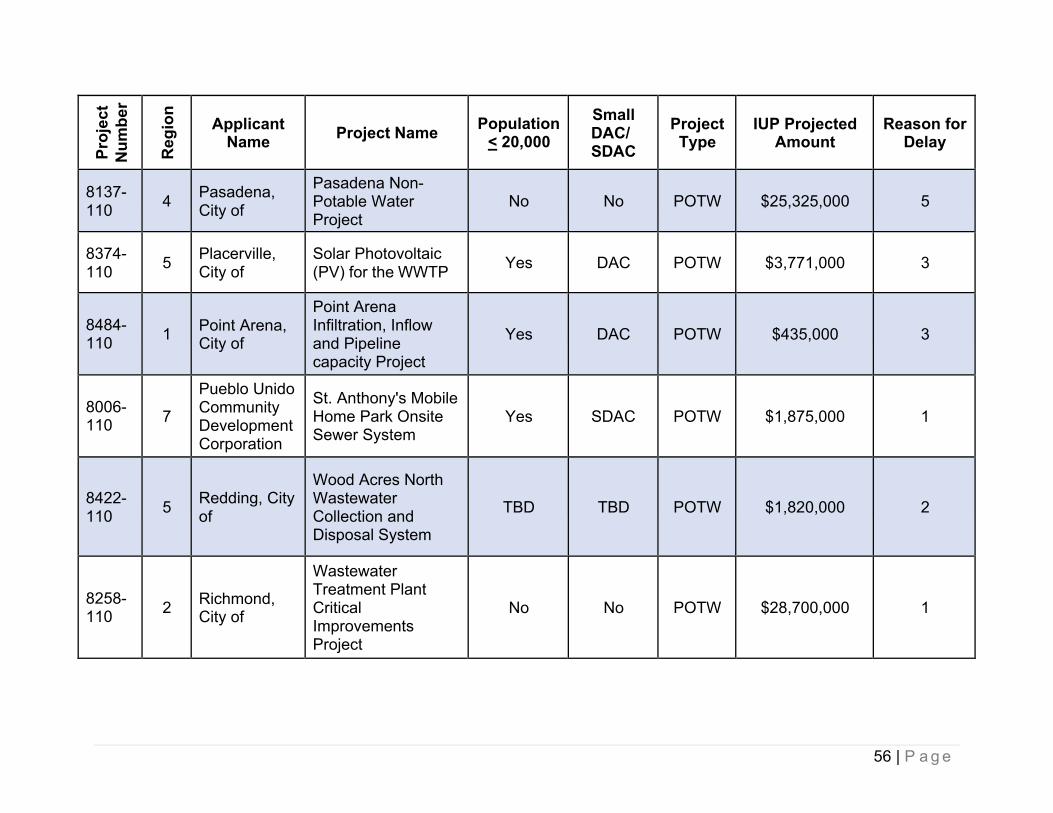
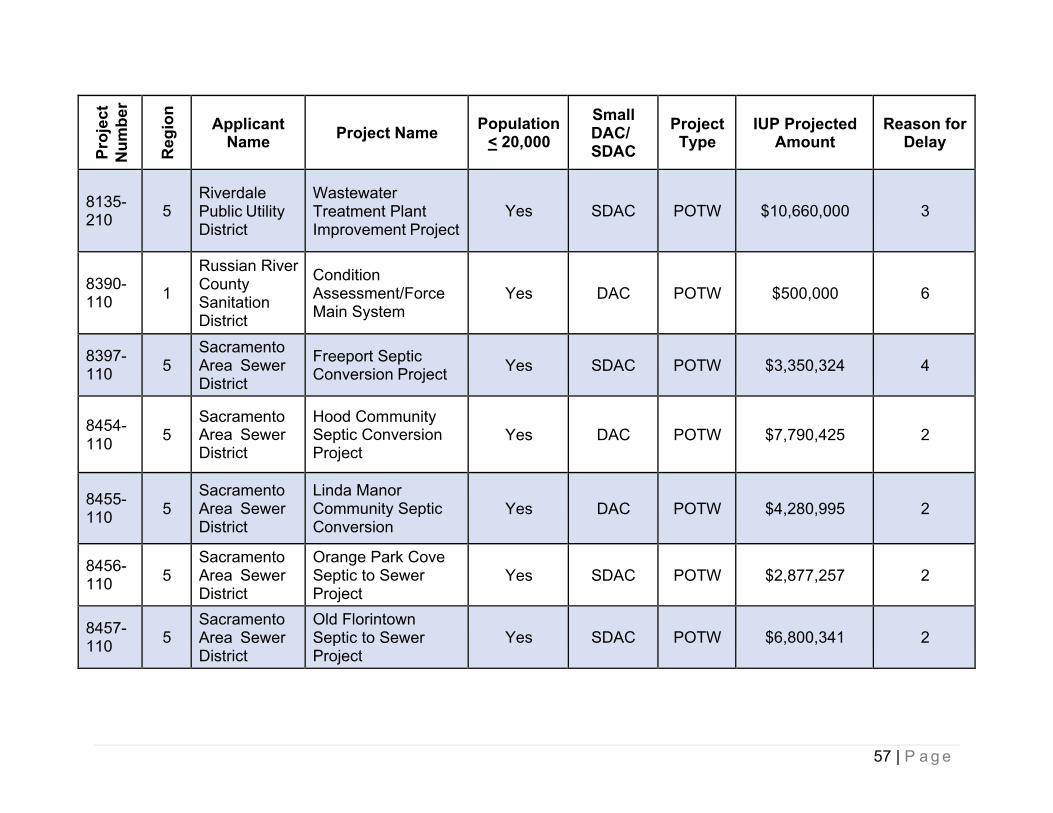
2 Exhibit D is a list of all projects that were on the Fundable List that did not receive an executed financing agreement during SFY 2019-20.
41 | P a g e
Proj
ect
Num
ber
Reg
ion
Applicant Name Project Name Population
< 20,000Small DAC/ SDAC
Project Type
IUP Projected Amount
Reason for Delay
8425-110 5
Beckwourth County Services Area
CSA Sewer Lift Station Replacement, I/I Study, Associate Sewer Pond Valves
Yes SDAC POTW $9,790 2
8411-110 5
Big Sandy Rancheria of Western Mono Indians of California
Big Sandy Rancheria Wastewater System Installation and Improvements
Yes SDAC POTW $374,000 4
8155-210 5
Biola Community Services District
Improvements Project at Wastewater Treatment Plant
Yes SDAC POTW $5,850,000 1
8199-110 7 Borrego
Water District
Wastewater Treatment Plant Upgrade
Yes SDAC POTW $478,000 1
8238-110 2
Burbank Sanitary District
Scott Street and Backyard Easements Sanitary Sewer Rehabilitation Project
No No POTW $1,950,000 1
8108-310 5 Burney Water
District
Burney Water District Collection System Improvement Project
Yes SDAC POTW $1,775,000 4
42 | P a g e
Proj
ect
Num
ber
Reg
ion
Applicant Name Project Name Population
< 20,000Small DAC/ SDAC
Project Type
IUP Projected Amount
Reason for Delay
8409-110 5 Buttonwillow
County WD
Buttonwillow Wastewater Collection Lines Project
Yes SDAC POTW $500,000 1
7850-210 5
Calaveras County Water District
West Point and Wilseyville Wastewater Treatment Facilities Consolidation Project
Yes SDAC POTW $4,750,000 4
7844-110 3
California American Water
Monterey Peninsula Water Supply Project
No No POTW $87,222,080 1
8370-110 3
Castroville Community ServiceDistrict
Moss Landing Wastewater Upgrades
Yes DAC POTW $500,000 3
8354-110 4
Central Basin Municipal Water District
Gateway Cities Regional Recycled Water SystemExpansion Project – Lynwood
No No POTW $13,331,400 1
43 | P a g e
Proj
ect
Num
ber
Reg
ion
Applicant Name Project Name Population
< 20,000Small DAC/ SDAC
Project Type
IUP Projected Amount
Reason for Delay
8354-210 4
Central Basin Municipal Water District
Gateway Cities Regional Recycled Water System Expansion Project - South Gate
No No POTW $9,161,126 1
8354-310 4
Central Basin Municipal Water District
Gateway Cities Regional Recycled Water System Expansion Project - Bell Gardens
No No POTW $5,093,792 1
8489-110 2
Central Contra Costa SD
Solids Handling Facilities Improvements, DP 7348
No No POTW $89,625,000 1
8400-110 1
Chester Public Utility District
Chester Public Utility District 2017 Wastewater Collection System Evaluation
Yes SDAC POTW $340,970 4, 7
8470-110 7
Coachella Valley Water District
CVWD 2017/18Non-Potable Water Connections Project
No DAC POTW $33,000,000 1
8463-110 7
Coachella Valley Water District
Sunbird/Martinez Septic to Sewer Conversion Project
Yes SDAC POTW $5,000,000 2
44 | P a g e
Proj
ect
Num
ber
Reg
ion
Applicant Name Project Name Population
< 20,000Small DAC/ SDAC
Project Type
IUP Projected Amount
Reason for Delay
8326-110 7 Coachella,
City ofMesquite Septic-to- Sewer Project Yes SDAC POTW $925,000 2
8479-110 5 Colfax, City of
Sewer Collection System and Wastewater Treatment Plant Improvement
Yes DAC POTW $500,000 4
7896-310 5 Colusa, City
of
Collection System Improvements Project
Yes SDAC POTW $4,800,000 3
8421-110 5 Colusa, City
ofWalnut Ranch Construction Project Yes SDAC POTW $2,868,501 2
8251-110 8 Corona, City
of
Corona Reclaimed Source Delivery Main (WRCRWAline)
No No POTW $1,281,600 6
8389-110 1 Dorris, City of
City of Dorris Wastewater Collection System and Lift StationImprovements
Yes SDAC POTW $310,000 4
8461-110 5 Dos Palos
City of
Dos Palos Clean Water Planning Funding Assistance Project
Yes SDAC POTW $355,900 2
45 | P a g e
Proj
ect
Num
ber
Reg
ion
Applicant Name Project Name Population
< 20,000Small DAC/ SDAC
Project Type
IUP Projected Amount
Reason for Delay
8398-110 4 Downey, City
of
Green Street Project in Four Arterial Streets
No No POTW $9,789,248 6
8391-110 5
Earlimart Public Utility District
Interceptor and Sewer Relief Pipelines Project
Yes SDAC POTW $500,000 2
8356-110 2
East Bay Municipal Utility District
South Interceptor 3rd Street Rehabilitation Project Phase 2
No No POTW $27,301,000 1
8364-110 8
Eastern Municipal Water District
Automated Metering Infrastructure Replacement
No No POTW $4,000,000 5
8440-110 3
El Paso de Robles, City of
Paso Robles Recycled Water Distribution System
No No POTW $19,414,000 1
8491-110 8
Elsinore Valley MunicipalWater District
Sedco Hills Septic to Sewer Planning Yes SDAC POTW $500,000 1
8059-110 9 Escondido,
City of
Recycled Water Easterly Agricultural Reverse Osmosis Facility and Pump Station
No No POTW $29,000,000 1
46 | P a g e
Proj
ect
Num
ber
Reg
ion
Applicant Name Project Name Population
< 20,000Small DAC/ SDAC
Project Type
IUP Projected Amount
Reason for Delay
8112-110 9 Escondido,
City of
Recycled Water Easterly Agriculture Distribution System
No No POTW $4,300,000 1
8124-210 5 Firebaugh,
City of
Wastewater Treatment Plant Improvements
Yes SDAC POTW $6,858,000 7
8493-110 5 Firebaugh,
City ofRecycled Water Project Yes DAC POTW $500,000 2
8405-110 1 Forestville
Water District2018 Sewer System Improvements Yes DAC POTW $2,850,459 1
8325-110 5
Franklin County Water District
Solar Photovoltaic Generation at Franklin CWD WWTP
Yes DAC POTW $712,500 2
8423-110 3
Freedom County SanitaryDistrict
Freedom Sewer Rehabilitation Project
Yes DAC POTW $6,000,000 1
8224-110 3 Gonzales,
City of
Natural Treatment and Reclamation at City of Gonzales WWTP
Yes DAC POTW $6,927,386 2
8385-110 3 Gonzales,
City ofSewer Extension to Alpine Court Yes SDAC POTW $250,000 3
47 | P a g e
Proj
ect
Num
ber
Reg
ion
Applicant Name Project Name Population
< 20,000Small DAC/ SDAC
Project Type
IUP Projected Amount
Reason for Delay
8410-110 5
GrenadaSanitary District
Grenada Sewer System Yes DAC POTW $230,000 3
8480-110 5 Gridley, City
ofLittle Avenue Force Main and Lift Station Yes DAC POTW $1,316,617 2
8109-210 5
Groveland Community Services District
Downtown Groveland and Big Oak Flat Sewer Collection System Improvements
Yes DAC POTW $5,845,568 1
8466-110 1 Gualala CSD Wastewater
Planning Project Yes SDAC POTW $500,000 4
8358-110 5 Gustine, City
ofWater Meter Replacement Project Yes DAC POTW $1,600,000 3
8396-110 8 Hemet, City
ofSewer Main Replacement Project No No POTW $8,000,000 1
8313-110 6
Herlong Public Utility District
West Patton Sewer Collection System Yes DAC POTW $2,624,583 1
7860-110 7 Hi-Desert
Water District
Septic System Abatement & Private Lateral Installation
Yes DAC POTW $45,200,000 7
48 | P a g e
Proj
ect
Num
ber
Reg
ion
Applicant Name Project Name Population
< 20,000Small DAC/ SDAC
Project Type
IUP Projected Amount
Reason for Delay
8431-110 7 Hi-Desert
Water DistrictPhase II and III Planning Project TBD DAC POTW $0 2
8309-110 1
Hoopa Valley Public Utilities District
Agency Sewage Treatment System Yes SDAC POTW $387,200 4
8052-210 5
Housing Authority of the County of San Joaquin
Housing Authority Thornton Wastewater Improvements
Yes SDAC POTW $4,727,500 6
8235-110 8
Inland Empire Utilities Agency
2015 Drought Relief- RP-1158 Recycled Water Pump Station Upgrades
No No POTW $4,000,000 3
8235-120 8
Inland Empire Utilities Agency
2015 Drought Relief- RP-5 Recycled Water Pipeline Bottleneck
No No POTW $2,755,000 3
8167-110 8
Inland Empire Utilities Agency
Joint IEUA - JCSDRegional Water Recycling Program Phase I
No No POTW $32,000,000 1, 3
8173-210 8
Inland Empire Utilities Agency
RP-5 Expansion Construction Project No No POTW $101,530,000 1
49 | P a g e
Proj
ect
Num
ber
Reg
ion
Applicant Name Project Name Population
< 20,000Small DAC/ SDAC
Project Type
IUP Projected Amount
Reason for Delay
8260-110 8
Inland Empire Utilities Agency
Distribution System/ Wineville/Jurupa/RP- 3 Recharge Improvements (PID 23a)
No No POTW $11,742,550 1
8414-110 8
Inland Empire Utilities Agency
Lower Day Basin Improvement Project No No POTW $2,855,332 1
8415-110 8
Inland Empire Utilities Agency
Montclair Basin Improvement Project No No POTW $1,273,857 1
7886-110 5 Isleton, City
of
Wastewater Treatment System Improvements Project
Yes SDAC POTW $485,000 4,7
8167-120 8
Jurupa Community Services District
Joint IEUA - JCSDRegional Water Recycling Program
No No POTW $20,460,000 1, 3
8424-110 5 Kerman, City
of
Sewer Collection System and WWTP Improvements
Yes DAC POTW $500,000 4

50 | P a g e
Proj
ect
Num
ber
Reg
ion
Applicant Name Project Name Population
< 20,000Small DAC/ SDAC
Project Type
IUP Projected Amount
Reason for Delay
7659-210 5 Kern, County
of
South Shafter Sewer Project - Private Laterals and Septic Abandonment
Yes SDAC POTW $3,397,320 2
8359-110 5
Kettleman City CommunityServices District
Kettleman City Waste Water Improvement Project
Yes TBD POTW $500,000 2
8138-210 1
Klamath Community Services District
Klamath CSD Wastewater System Renovation
Yes SDAC POTW $5,500,000 2
8394-110 9 La Mesa, City
of
Parkway Drive and Alvarado Road Trunk Sewer Phase 3 Upgrade Project
Yes No POTW $7,000,000 3
8477-110 5
Lake Berryessa ResortImprovement District
Groundwater Inflow Mitigation Yes TBD POTW $2,000,000 2
8065-110 5
Lake County Sanitation District
Middletown Wastewater Treatment Plant
Yes SDAC POTW $1,600,000 2
51 | P a g e
Proj
ect
Num
ber
Reg
ion
Applicant Name Project Name Population
< 20,000Small DAC/ SDAC
Project Type
IUP Projected Amount
Reason for Delay
8367-110 5
Lanare Community Services District
Lanare Wastewater Collection, Treatment, and Disposal Project
Yes SDAC POTW $370,000 1
8373-110 1
Laytonville County Water District
Laytonville Wastewater Project Yes SDAC POTW $250,000 2
7887-210 5 Live Oak, City
ofWWTP Solar Installation Yes SDAC POTW $1,680,000 4
8036-210 1
Loleta Community Services District
Sanitary Sewer Collection System Rehabilitation Project
Yes SDAC POTW $1,163,978 4
8036-310 1
Loleta Community Services District
Loleta Wastewater Treatment and Disposal System Improvements
Yes SDAC POTW $5,103,192 2
8495-110 4 Long Beach
Water Dept
Sewer Collection Systems Improvements
No No POTW $2,600,000 6
8154-110 4
Los Angeles CountySanitation District No. 2
Carson JWPCP - Effluent Outfall Tunnel Project
No No POTW $127,230,000 1, 3
52 | P a g e
Proj
ect
Num
ber
Reg
ion
Applicant Name Project Name Population
< 20,000Small DAC/ SDAC
Project Type
IUP Projected Amount
Reason for Delay
8360-110 5 Lost Hills
Utility District
Wastewater Treatment Plant Expansion
Yes DAC POTW $401,500 2
7211-210 5 Madera,
County ofFairmead Septic to Sewer Project Yes SDAC POTW $9,594,837 2
8369-110 5 Madera,
County of
Madera CSA No. 3 - Parksdale Sewer Project
Yes DAC POTW $500,000 2
8206-210 5 Maricopa,
City of
Sewer Collection System Improvements Project
Yes SDAC POTW $7,378,169 1
8426-110 6
Markleeville Public Utility District
MPUD Sewer Pump Station Relocation Project
Yes SDAC POTW $330,000 4
8276-110 5 McFarland,
City of
City of McFarland Wastewater Treatment Plant Expansion
Yes SDAC POTW $12,000,000 1
53 | P a g e
Proj
ect
Num
ber
Reg
ion
Applicant Name Project Name Population
< 20,000Small DAC/ SDAC
Project Type
IUP Projected Amount
Reason for Delay
8429-110 1
Mendocino Unified School District
MUSD Grant Assistance and Master Planning - Recycled Water System
Yes SDAC POTW $500,000 4
8453-110 5
Midway Community Services District
Midway Community Services District Sewer Collection System Rehabilitation
Yes SDAC POTW $222,250 2
8473-110 5
Mokelumne Hill Sanitary District
MHSD Wastewater Improvement Project Yes SDAC POTW $500,000 4
8185-210 3 Morro Bay,
City ofWater Reclamation Facility Project No No POTW $105,105,167 1
8145-210 5 Newman, City
of
Newman Wastewater Facility Land Application Expansion for McPike 1 Project
Yes SDAC POTW $2,685,000 1
8236-110 8 Ontario, City
Of
City of Ontario Recycled Water Distribution System Project
No No POTW $22,639,084 2
54 | P a g e
Proj
ect
Num
ber
Reg
ion
Applicant Name Project Name Population
< 20,000Small DAC/ SDAC
Project Type
IUP Projected Amount
Reason for Delay
8290-110 8
Orange County Water District
Groundwater Replenishment System Final Expansion
No No POTW $141,477,882 3
8307-110 8
Orange County Water District
Water Production Flow Enhancement Project
No No POTW $25,640,118 3
5039-110 5 Orange
Cove, City of
Orange Cove WWTP Tertiary Treatment & Recycled Water Project
Yes SDAC POTW $7,300,000 2
5924-110 1
Orick Community ServicesDistrict
Orick Wastewater System Project Yes SDAC POTW $157,210 2
8469-110 5 Orland, City
of
Road MM Sanitary Sewer Improvement Project
Yes DAC POTW $985,563 2
8433-110 4 Oxnard, City
of
City of Oxnard Treatment Plant Rehabilitation Projects
No No POTW $66,700,000 1
55 | P a g e
Proj
ect
Num
ber
Reg
ion
Applicant Name Project Name Population
< 20,000Small DAC/ SDAC
Project Type
IUP Projected Amount
Reason for Delay
8125-110 6
Palmdale Recycled WaterAuthority
Recycled Water Line Phase 2 No No POTW $7,500,000 1
8102-110 6 Palmdale
Water District
Palmdale Regional Groundwater Recharge and Recovery Project
No No POTW $57,400,000 1
8377-110 2 Palo Alto,
City of
Regional Water Quality Control Plant Discharge Infrastructure Improvements
No No POTW $11,760,000 1
8490-110 2 Palo Alto,
City of
Regional Water Quality Control Plant Primary Sedimentation and Electrical Upgrade
No No POTW $16,368,000 1
8050-120 5
Paradise Irrigation District
Process Water Recycling Planning Project
Yes TBD POTW $2,200,000 6
8193-210 5 Parlier, City
of
WWTPImprovements Project
Yes SDAC POTW $8,033,000 3
56 | P a g e
Proj
ect
Num
ber
Reg
ion
Applicant Name Project Name Population
< 20,000Small DAC/ SDAC
Project Type
IUP Projected Amount
Reason for Delay
8137-110 4 Pasadena,
City of
Pasadena Non- Potable Water Project
No No POTW $25,325,000 5
8374-110 5 Placerville,
City ofSolar Photovoltaic (PV) for the WWTP Yes DAC POTW $3,771,000 3
8484-110 1 Point Arena,
City of
Point Arena Infiltration, Inflow and Pipeline capacity Project
Yes DAC POTW $435,000 3
8006-110 7
Pueblo Unido Community Development Corporation
St. Anthony's Mobile Home Park Onsite Sewer System
Yes SDAC POTW $1,875,000 1
8422-110 5 Redding, City
of
Wood Acres North Wastewater Collection and Disposal System
TBD TBD POTW $1,820,000 2
8258-110 2 Richmond,
City of
Wastewater Treatment Plant Critical Improvements Project
No No POTW $28,700,000 1
57 | P a g e
Proj
ect
Num
ber
Reg
ion
Applicant Name Project Name Population
< 20,000Small DAC/ SDAC
Project Type
IUP Projected Amount
Reason for Delay
8135-210 5
Riverdale Public Utility District
Wastewater Treatment Plant Improvement Project
Yes SDAC POTW $10,660,000 3
8390-110 1
Russian River County Sanitation District
Condition Assessment/Force Main System
Yes DAC POTW $500,000 6
8397-110 5
Sacramento Area Sewer District
Freeport Septic Conversion Project Yes SDAC POTW $3,350,324 4
8454-110 5
Sacramento Area Sewer District
Hood Community Septic Conversion Project
Yes DAC POTW $7,790,425 2
8455-110 5
Sacramento Area Sewer District
Linda Manor Community Septic Conversion
Yes DAC POTW $4,280,995 2
8456-110 5
Sacramento Area Sewer District
Orange Park Cove Septic to Sewer Project
Yes SDAC POTW $2,877,257 2
8457-110 5
Sacramento Area Sewer District
Old Florintown Septic to Sewer Project
Yes SDAC POTW $6,800,341 2
58 | P a g e
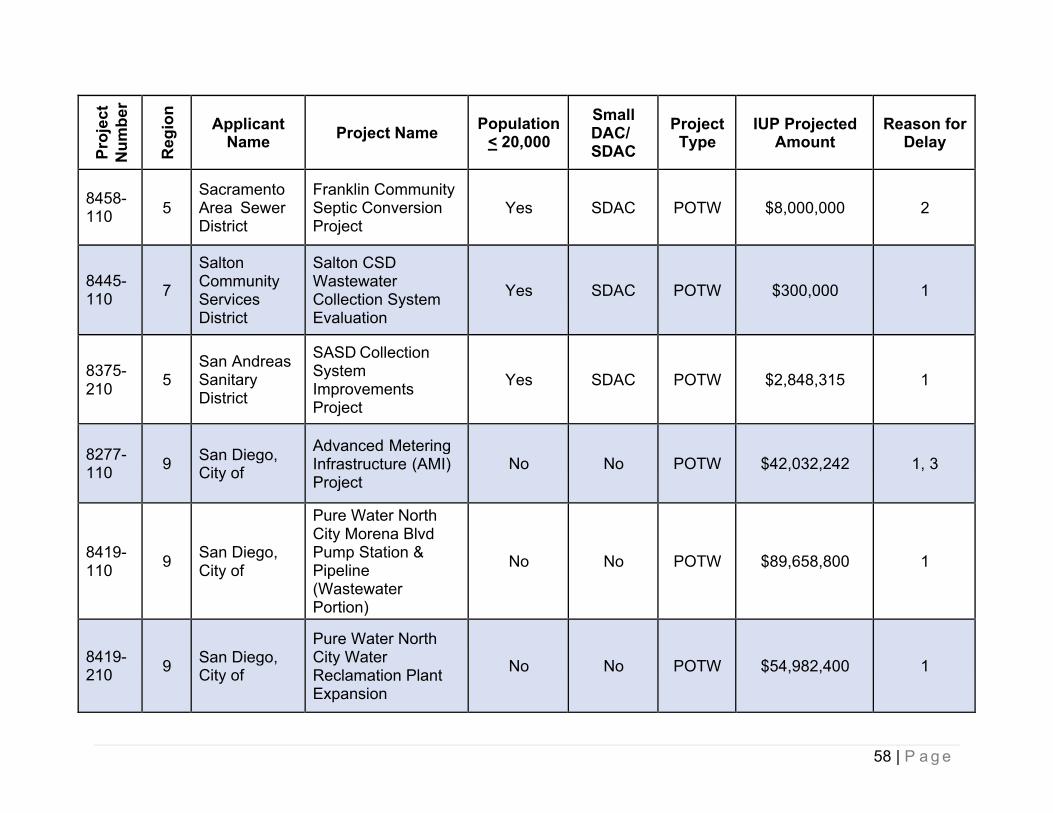
Proj
ect
Num
ber
Reg
ion
Applicant Name Project Name Population
< 20,000Small DAC/ SDAC
Project Type
IUP Projected Amount
Reason for Delay
8458-110 5
Sacramento Area Sewer District
Franklin Community Septic Conversion Project
Yes SDAC POTW $8,000,000 2
8445-110 7
Salton Community Services District
Salton CSD Wastewater Collection System Evaluation
Yes SDAC POTW $300,000 1
8375-210 5
San Andreas Sanitary District
SASD Collection System Improvements Project
Yes SDAC POTW $2,848,315 1
8277-110 9 San Diego,
City of
Advanced Metering Infrastructure (AMI) Project
No No POTW $42,032,242 1, 3
8419-110 9 San Diego,
City of
Pure Water North City Morena Blvd Pump Station & Pipeline (Wastewater Portion)
No No POTW $89,658,800 1
8419-210 9 San Diego,
City of
Pure Water North City Water Reclamation Plant Expansion
No No POTW $54,982,400 1
59 | P a g e
Proj
ect
Num
ber
Reg
ion
Applicant Name Project Name Population
< 20,000Small DAC/ SDAC
Project Type
IUP Projected Amount
Reason for Delay
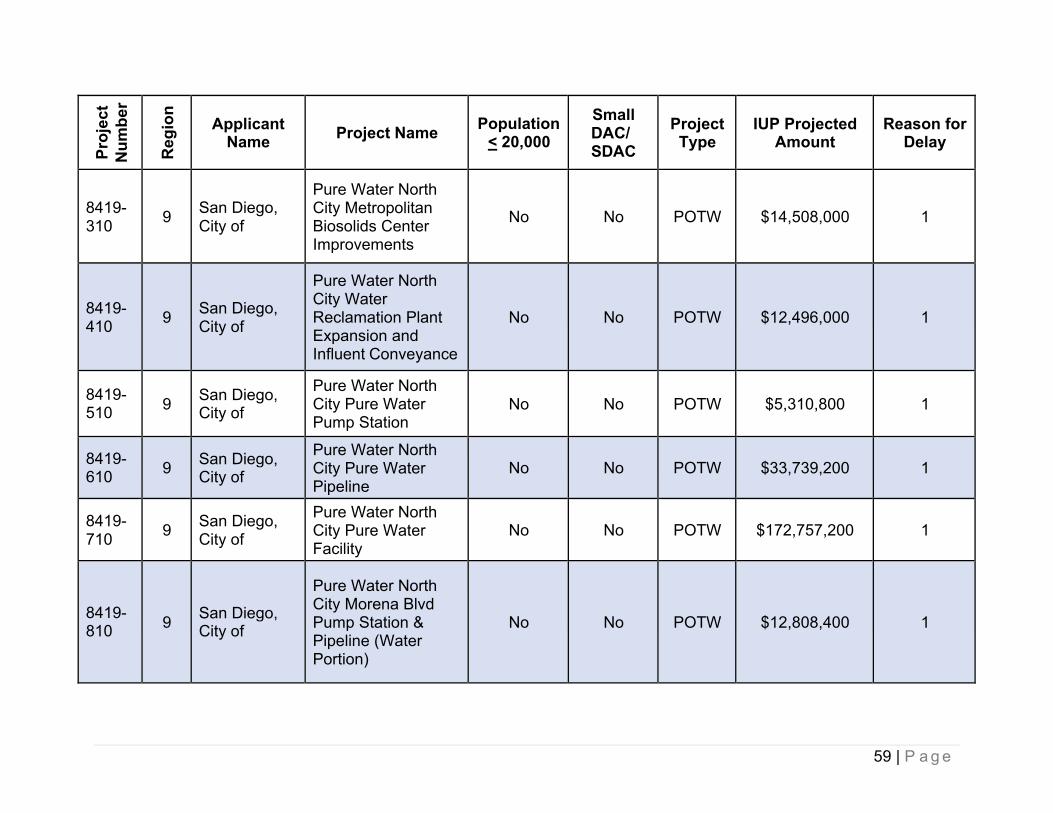
8419-310 9 San Diego,
City of
Pure Water North City Metropolitan Biosolids Center Improvements
No No POTW $14,508,000 1
8419-410 9 San Diego,
City of
Pure Water North City Water Reclamation Plant Expansion and Influent Conveyance
No No POTW $12,496,000 1
8419-510 9 San Diego,
City of
Pure Water North City Pure Water Pump Station
No No POTW $5,310,800 1
8419-610 9 San Diego,
City of
Pure Water North City Pure Water Pipeline
No No POTW $33,739,200 1
8419-710 9 San Diego,
City of
Pure Water North City Pure Water Facility
No No POTW $172,757,200 1
8419-810 9 San Diego,
City of
Pure Water North City Morena Blvd Pump Station & Pipeline (Water Portion)
No No POTW $12,808,400 1
60 | P a g e
Proj
ect
Num
ber
Reg
ion
Applicant Name Project Name Population
< 20,000Small DAC/ SDAC
Project Type
IUP Projected Amount
Reason for Delay
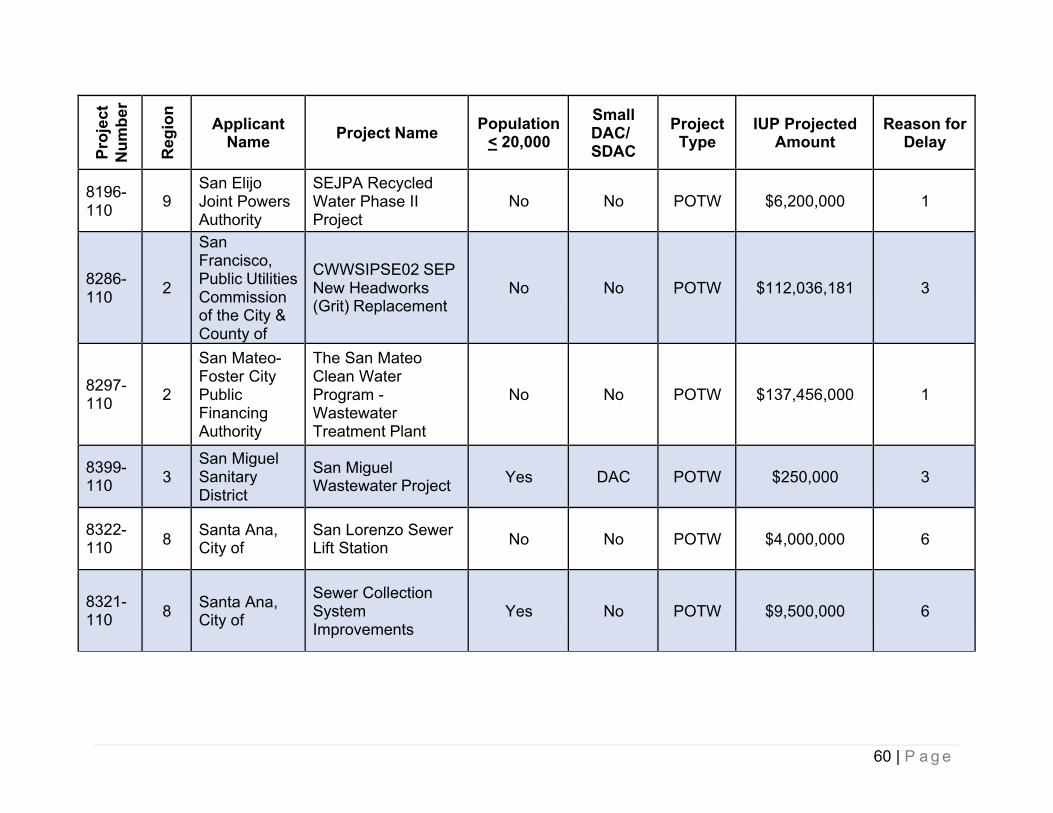
8196-110 9
San Elijo Joint Powers Authority
SEJPA Recycled Water Phase II Project
No No POTW $6,200,000 1
8286-110 2
San Francisco, Public Utilities Commissionof the City & County of
CWWSIPSE02 SEPNew Headworks (Grit) Replacement
No No POTW $112,036,181 3
8297-110 2
San Mateo- Foster City Public Financing Authority
The San Mateo Clean Water Program - Wastewater Treatment Plant
No No POTW $137,456,000 1
8399-110 3
San Miguel Sanitary District
San Miguel Wastewater Project Yes DAC POTW $250,000 3
8322-110 8 Santa Ana,
City ofSan Lorenzo Sewer Lift Station No No POTW $4,000,000 6
8321-110 8 Santa Ana,
City of
Sewer Collection System Improvements
Yes No POTW $9,500,000 6
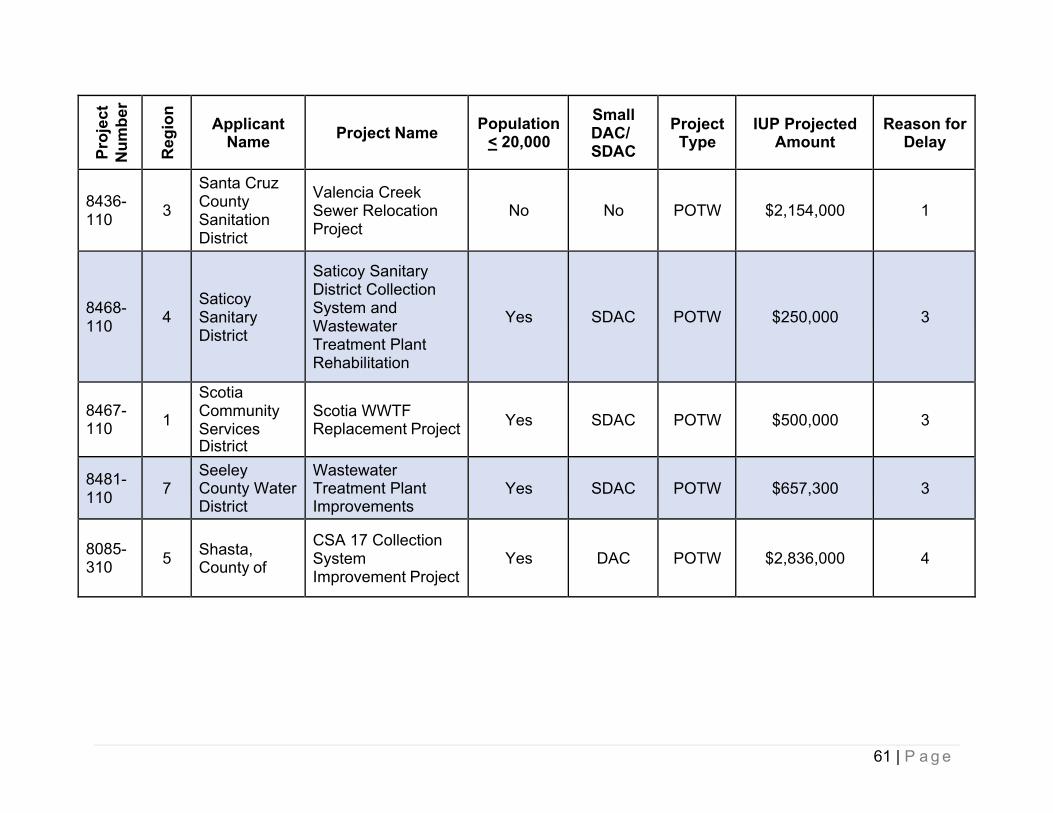
61 | P a g e
Proj
ect
Num
ber
Reg
ion
Applicant Name Project Name Population
< 20,000Small DAC/ SDAC
Project Type
IUP Projected Amount
Reason for Delay
8436-110 3
Santa Cruz County Sanitation District
Valencia Creek Sewer Relocation Project
No No POTW $2,154,000 1
8468-110 4
Saticoy Sanitary District
Saticoy Sanitary District Collection System and Wastewater Treatment Plant Rehabilitation
Yes SDAC POTW $250,000 3
8467-110 1
Scotia Community ServicesDistrict
Scotia WWTF Replacement Project Yes SDAC POTW $500,000 3
8481-110 7
Seeley County Water District
Wastewater Treatment Plant Improvements
Yes SDAC POTW $657,300 3
8085-310 5 Shasta,
County of
CSA 17 Collection System Improvement Project
Yes DAC POTW $2,836,000 4
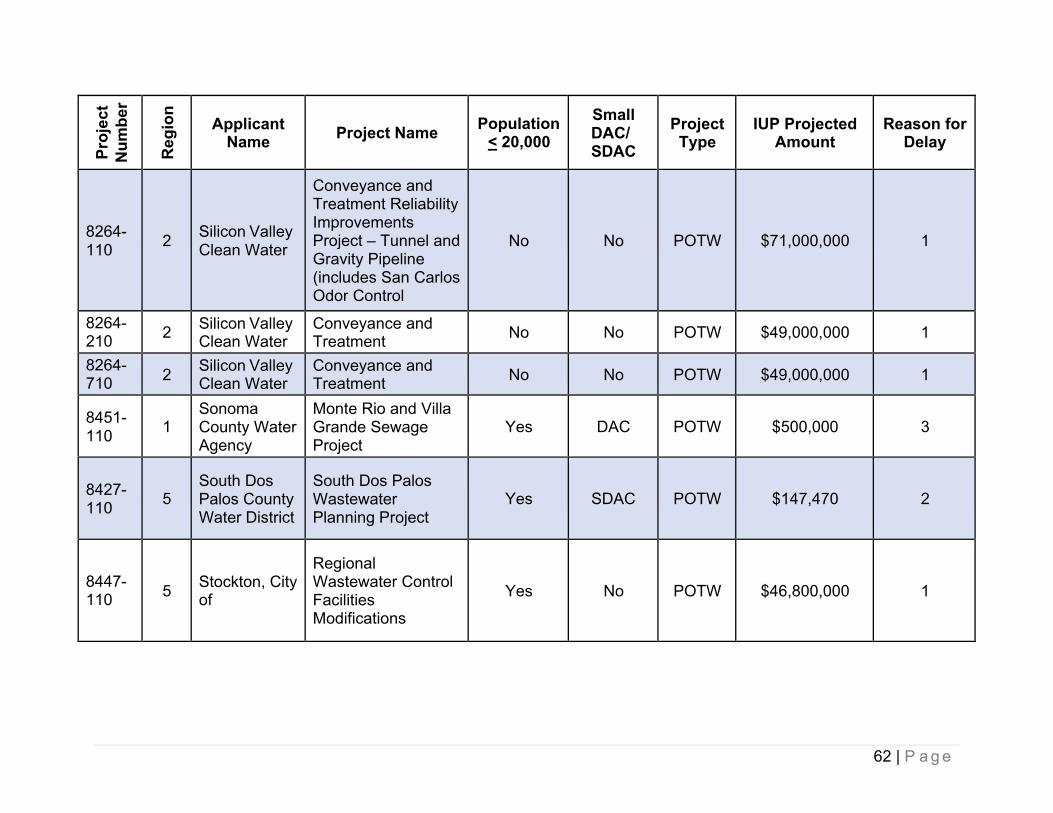
62 | P a g e
Proj
ect
Num
ber
Reg
ion
Applicant Name Project Name Population
< 20,000Small DAC/ SDAC
Project Type
IUP Projected Amount
Reason for Delay
8264-110 2 Silicon Valley
Clean Water
Conveyance and Treatment Reliability Improvements Project – Tunnel and Gravity Pipeline (includes San Carlos Odor Control
No No POTW $71,000,000 1
8264-210 2 Silicon Valley
Clean WaterConveyance and Treatment No No POTW $49,000,000 1
8264-710 2 Silicon Valley
Clean WaterConveyance and Treatment No No POTW $49,000,000 1
8451-110 1
Sonoma County Water Agency
Monte Rio and Villa Grande Sewage Project
Yes DAC POTW $500,000 3
8427-110 5
South Dos Palos County Water District
South Dos Palos Wastewater Planning Project
Yes SDAC POTW $147,470 2
8447-110 5 Stockton, City
of
Regional Wastewater Control Facilities Modifications
Yes No POTW $46,800,000 1
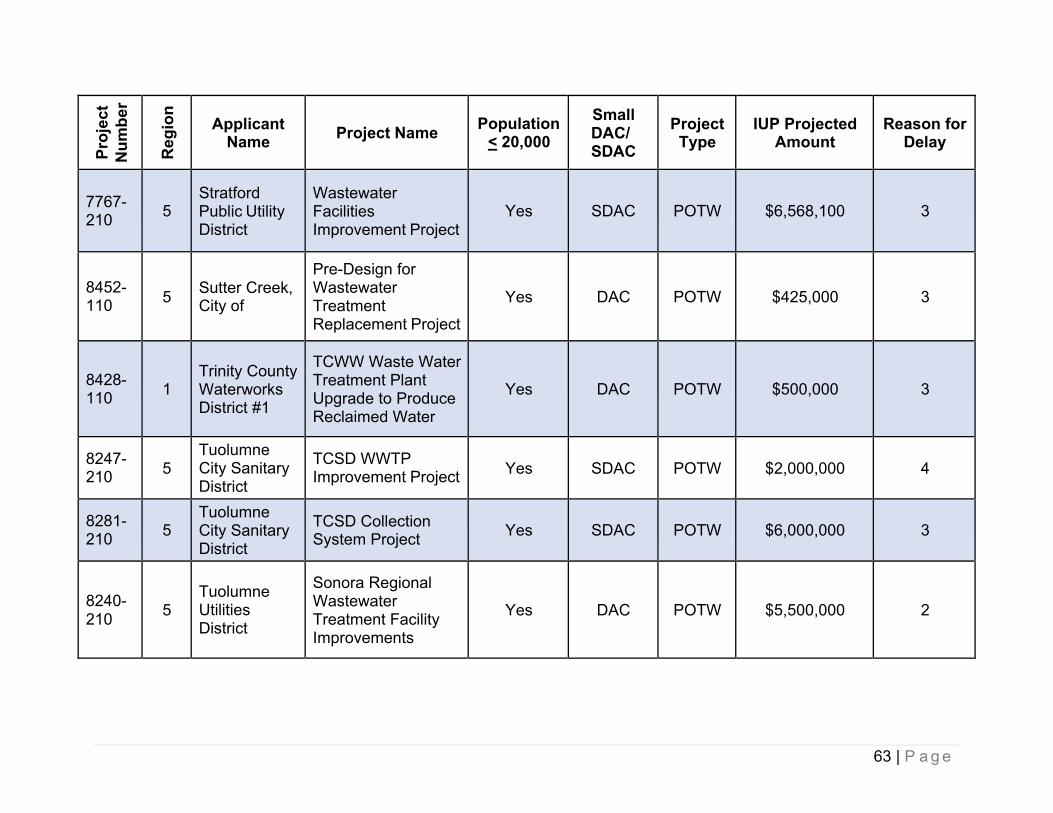
63 | P a g e
Proj
ect
Num
ber
Reg
ion
Applicant Name Project Name Population
< 20,000Small DAC/ SDAC
Project Type
IUP Projected Amount
Reason for Delay
7767-210 5
Stratford Public Utility District
Wastewater Facilities Improvement Project
Yes SDAC POTW $6,568,100 3
8452-110 5 Sutter Creek,
City of
Pre-Design for Wastewater Treatment Replacement Project
Yes DAC POTW $425,000 3
8428-110 1
Trinity County Waterworks District #1
TCWW Waste Water Treatment Plant Upgrade to Produce Reclaimed Water
Yes DAC POTW $500,000 3
8247-210 5
Tuolumne City Sanitary District
TCSD WWTPImprovement Project Yes SDAC POTW $2,000,000 4
8281-210 5
Tuolumne City Sanitary District
TCSD Collection System Project Yes SDAC POTW $6,000,000 3
8240-210 5
Tuolumne Utilities District
Sonora Regional Wastewater Treatment Facility Improvements
Yes DAC POTW $5,500,000 2
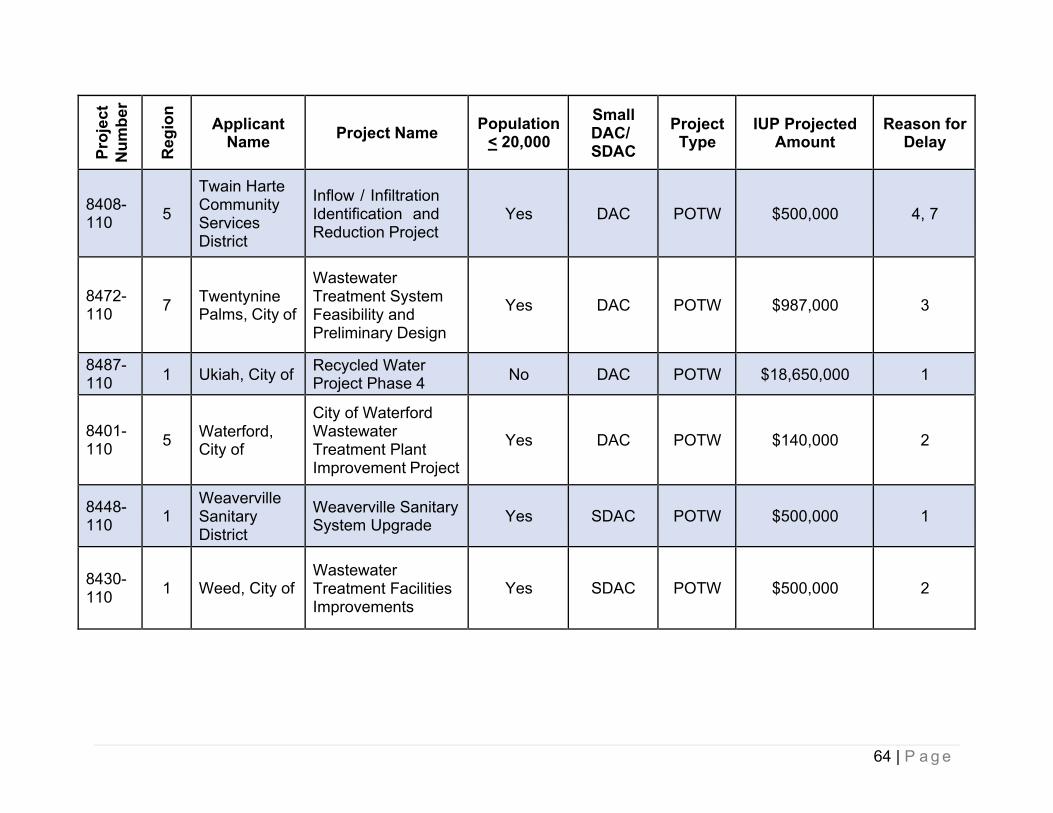
64 | P a g e
Proj
ect
Num
ber
Reg
ion
Applicant Name Project Name Population
< 20,000Small DAC/ SDAC
Project Type
IUP Projected Amount
Reason for Delay
8408-110 5
Twain Harte Community Services District
Inflow / Infiltration Identification and Reduction Project
Yes DAC POTW $500,000 4, 7
8472-110 7 Twentynine
Palms, City of
Wastewater Treatment System Feasibility and Preliminary Design
Yes DAC POTW $987,000 3
8487-110 1 Ukiah, City of Recycled Water
Project Phase 4 No DAC POTW $18,650,000 1
8401-110 5 Waterford,
City of
City of Waterford Wastewater Treatment Plant Improvement Project
Yes DAC POTW $140,000 2
8448-110 1
Weaverville Sanitary District
Weaverville Sanitary System Upgrade Yes SDAC POTW $500,000 1
8430-110 1 Weed, City of
Wastewater Treatment Facilities Improvements
Yes SDAC POTW $500,000 2
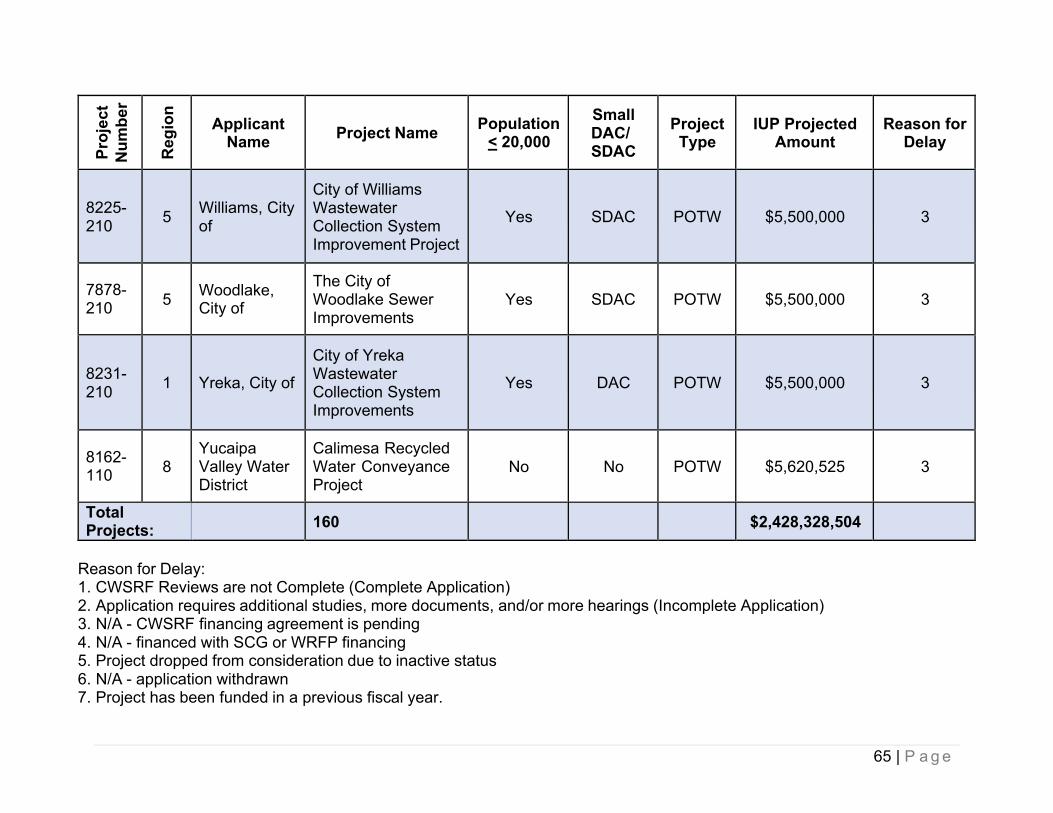
65 | P a g e
Proj
ect
Num
ber
Reg
ion
Applicant Name Project Name Population
< 20,000Small DAC/ SDAC
Project Type
IUP Projected Amount
Reason for Delay
8225-210 5 Williams, City
of
City of Williams Wastewater Collection System Improvement Project
Yes SDAC POTW $5,500,000 3
7878-210 5 Woodlake,
City of
The City of Woodlake Sewer Improvements
Yes SDAC POTW $5,500,000 3
8231-210 1 Yreka, City of
City of Yreka Wastewater Collection System Improvements
Yes DAC POTW $5,500,000 3
8162-110 8
Yucaipa Valley Water District
Calimesa Recycled Water Conveyance Project
No No POTW $5,620,525 3
Total Projects: 160 $2,428,328,504
Reason for Delay:1. CWSRF Reviews are not Complete (Complete Application)2. Application requires additional studies, more documents, and/or more hearings (Incomplete Application)3. N/A - CWSRF financing agreement is pending4. N/A - financed with SCG or WRFP financing5. Project dropped from consideration due to inactive status6. N/A - application withdrawn7. Project has been funded in a previous fiscal year.
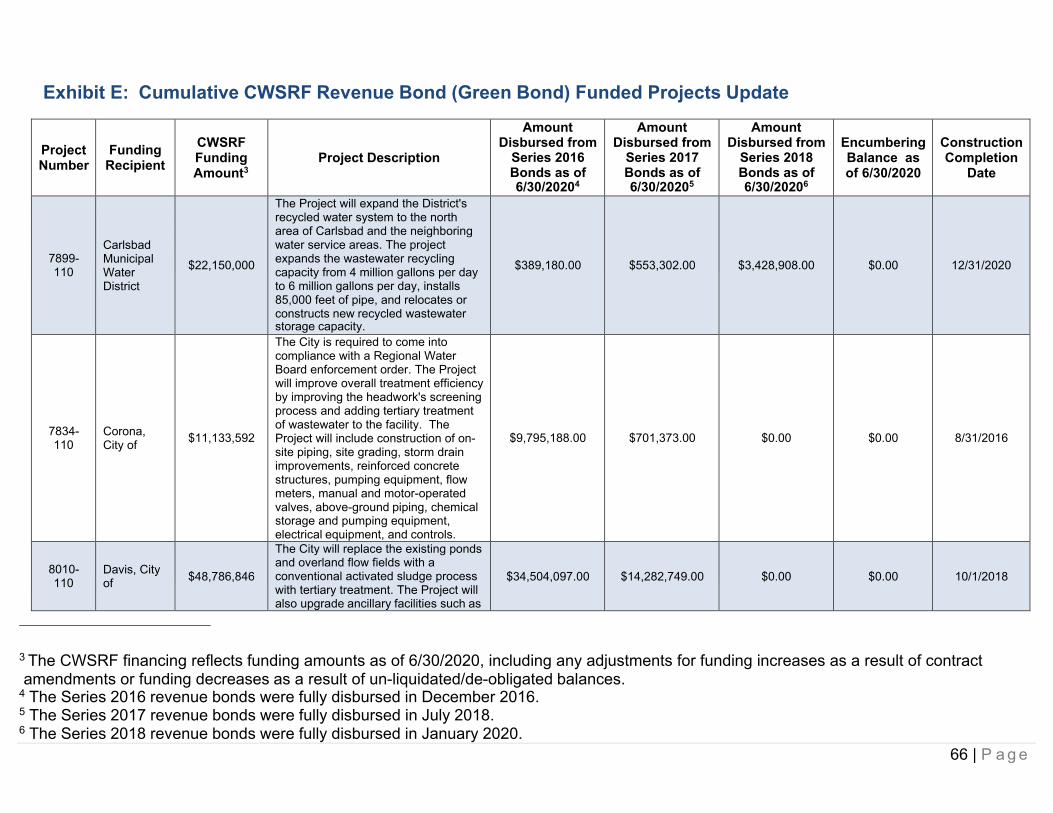
66 | P a g e
Exhibit E: Cumulative CWSRF Revenue Bond (Green Bond) Funded Projects Update
Project Number
Funding Recipient
CWSRFFunding Amount3
Project Description
Amount Disbursed from
Series 2016 Bonds as of6/30/20204
Amount Disbursed from
Series 2017 Bonds as of6/30/20205
Amount Disbursed from
Series 2018 Bonds as of6/30/20206
Encumbering Balance as of 6/30/2020
Construction Completion
Date
7899-110
Carlsbad Municipal Water District
$22,150,000
The Project will expand the District's recycled water system to the north area of Carlsbad and the neighboring water service areas. The project expands the wastewater recycling capacity from 4 million gallons per day to 6 million gallons per day, installs 85,000 feet of pipe, and relocates or constructs new recycled wastewaterstorage capacity.
$389,180.00 $553,302.00 $3,428,908.00 $0.00 12/31/2020
7834-110
Corona, City of $11,133,592
The City is required to come into compliance with a Regional Water Board enforcement order. The Project will improve overall treatment efficiency by improving the headwork's screening process and adding tertiary treatment of wastewater to the facility. The Project will include construction of on- site piping, site grading, storm drain improvements, reinforced concrete structures, pumping equipment, flow meters, manual and motor-operated valves, above-ground piping, chemicalstorage and pumping equipment, electrical equipment, and controls.
$9,795,188.00 $701,373.00 $0.00 $0.00 8/31/2016
8010-110
Davis, City of $48,786,846
The City will replace the existing ponds and overland flow fields with a conventional activated sludge process with tertiary treatment. The Project will also upgrade ancillary facilities such as
$34,504,097.00 $14,282,749.00 $0.00 $0.00 10/1/2018
3 The CWSRF financing reflects funding amounts as of 6/30/2020, including any adjustments for funding increases as a result of contract amendments or funding decreases as a result of un-liquidated/de-obligated balances.
4 The Series 2016 revenue bonds were fully disbursed in December 2016.5 The Series 2017 revenue bonds were fully disbursed in July 2018.6 The Series 2018 revenue bonds were fully disbursed in January 2020.
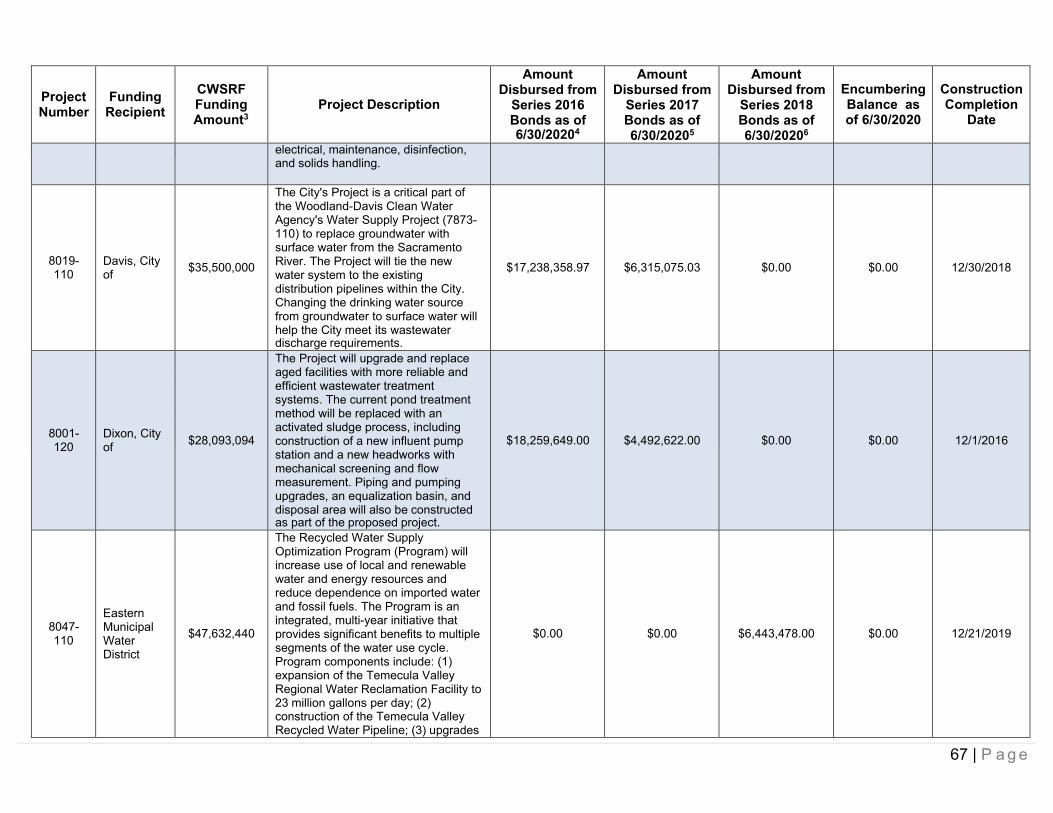
67 | P a g e
Project Number
Funding Recipient
CWSRFFunding Amount3
Project Description
Amount Disbursed from
Series 2016 Bonds as of6/30/20204
Amount Disbursed from
Series 2017Bonds as of 6/30/20205
Amount Disbursed from
Series 2018Bonds as of 6/30/20206
Encumbering Balance as of 6/30/2020
Construction Completion
Date
electrical, maintenance, disinfection,and solids handling.
8019-110
Davis, City of $35,500,000
The City's Project is a critical part of the Woodland-Davis Clean Water Agency's Water Supply Project (7873- 110) to replace groundwater with surface water from the Sacramento River. The Project will tie the new water system to the existing distribution pipelines within the City. Changing the drinking water source from groundwater to surface water will help the City meet its wastewaterdischarge requirements.
$17,238,358.97 $6,315,075.03 $0.00 $0.00 12/30/2018
8001-120
Dixon, City of $28,093,094
The Project will upgrade and replace aged facilities with more reliable and efficient wastewater treatment systems. The current pond treatment method will be replaced with an activated sludge process, including construction of a new influent pump station and a new headworks with mechanical screening and flow measurement. Piping and pumping upgrades, an equalization basin, and disposal area will also be constructedas part of the proposed project.
$18,259,649.00 $4,492,622.00 $0.00 $0.00 12/1/2016
8047-110
Eastern Municipal Water District
$47,632,440
The Recycled Water Supply Optimization Program (Program) will increase use of local and renewable water and energy resources and reduce dependence on imported water and fossil fuels. The Program is an integrated, multi-year initiative that provides significant benefits to multiple segments of the water use cycle.Program components include: (1) expansion of the Temecula Valley Regional Water Reclamation Facility to 23 million gallons per day; (2)construction of the Temecula Valley Recycled Water Pipeline; (3) upgrades
$0.00 $0.00 $6,443,478.00 $0.00 12/21/2019
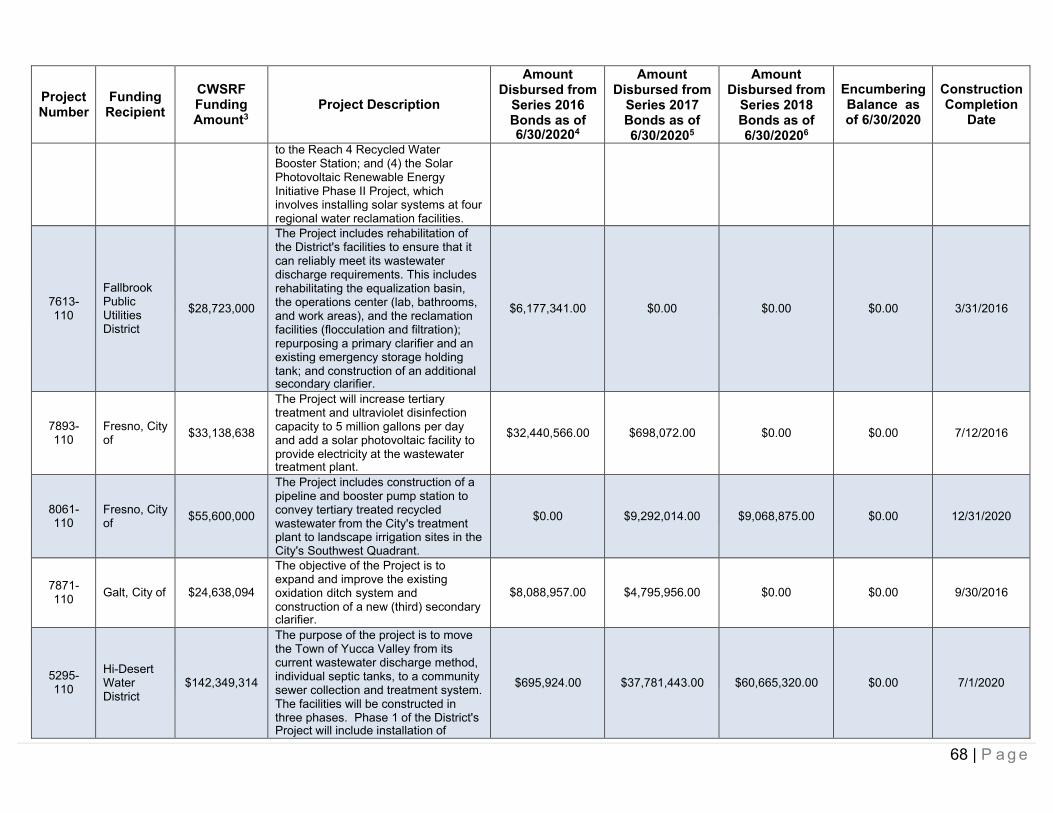
68 | P a g e
Project Number
Funding Recipient
CWSRFFunding Amount3
Project Description
Amount Disbursed from
Series 2016 Bonds as of6/30/20204
Amount Disbursed from
Series 2017Bonds as of 6/30/20205
Amount Disbursed from
Series 2018Bonds as of 6/30/20206
Encumbering Balance as of 6/30/2020
Construction Completion
Date
to the Reach 4 Recycled WaterBooster Station; and (4) the Solar Photovoltaic Renewable Energy Initiative Phase II Project, whichinvolves installing solar systems at four regional water reclamation facilities.
7613-110
Fallbrook Public Utilities District
$28,723,000
The Project includes rehabilitation of the District's facilities to ensure that it can reliably meet its wastewater discharge requirements. This includes rehabilitating the equalization basin, the operations center (lab, bathrooms, and work areas), and the reclamation facilities (flocculation and filtration); repurposing a primary clarifier and an existing emergency storage holding tank; and construction of an additionalsecondary clarifier.
$6,177,341.00 $0.00 $0.00 $0.00 3/31/2016
7893-110
Fresno, City of $33,138,638
The Project will increase tertiary treatment and ultraviolet disinfection capacity to 5 million gallons per day and add a solar photovoltaic facility to provide electricity at the wastewatertreatment plant.
$32,440,566.00 $698,072.00 $0.00 $0.00 7/12/2016
8061-110
Fresno, City of $55,600,000
The Project includes construction of a pipeline and booster pump station to convey tertiary treated recycled wastewater from the City's treatmentplant to landscape irrigation sites in the City's Southwest Quadrant.
$0.00 $9,292,014.00 $9,068,875.00 $0.00 12/31/2020
7871-110 Galt, City of $24,638,094
The objective of the Project is to expand and improve the existing oxidation ditch system and construction of a new (third) secondaryclarifier.
$8,088,957.00 $4,795,956.00 $0.00 $0.00 9/30/2016
5295-110
Hi-Desert Water District
$142,349,314
The purpose of the project is to move the Town of Yucca Valley from its current wastewater discharge method, individual septic tanks, to a community sewer collection and treatment system. The facilities will be constructed in three phases. Phase 1 of the District'sProject will include installation of
$695,924.00 $37,781,443.00 $60,665,320.00 $0.00 7/1/2020

69 | P a g e
Project Number
Funding Recipient
CWSRFFunding Amount3
Project Description
Amount Disbursed from
Series 2016 Bonds as of6/30/20204
Amount Disbursed from
Series 2017Bonds as of 6/30/20205
Amount Disbursed from
Series 2018Bonds as of 6/30/20206
Encumbering Balance as of 6/30/2020
Construction Completion
Date
approximately 77 miles of sewerpipeline in the central portion of the Town, a wastewater treatment facility (WWTF), and water reclamation (groundwater) recharge ponds. The WWTF system will convey an annual average flow of one million gallons per day (mgd) of wastewater to the proposed WWTF. This first phase of the project will provide the core infrastructure for expansion of the collection, treatment and disposalsystem needed for Phases 2 and 3.
5402-110
Hillsboroug h, Town of $10,172,759
The Project includes upsizing approximately 10,000 feet of existing trunk sewer on Crystal Springs Road and El Cerrito Ave. Increasing the sizeof the trunk sewer will eliminate sewage overflows in this area.
$6,982,206.00 $2,020,809.00 $1,169,744.00 $0.00 9/15/2016
7885-110
Inland Empire Utilities Agency
$23,847,573
The District will rehabilitate the tunnel and sewer pipeline to eliminate the risk of tunnel failure that could result in worker injuries, damage to the existing 24-inch sewer pipeline, and release of sewage onto the beach and into the ocean. The Project will improve the existing tunnel access points and enlarge and reinforce the tunnel with a structural concrete liner to stabilize the tunnel and prevent collapse. The existing 24-inch pipeline will be retained and encased in concrete throughout the length of the tunnel for future emergency and maintenance use, and a new pipeline will be installed on the tunnel floor above theexisting pipeline.
$236,823.00 $16,744,827.00 $4,391,450.00 $0.00 2/28/2019
7694-110
Los Angeles County SanitationDistrict No. 2
$41,510,796
The Long Beach Main Pumping Plant was constructed in 1947 and has been modified several times since then. The facility is near the end of its useful life.USEPA issued a compliance order in September 2003, requiring the District
$16,109,563.00 $6,233,869.00 $2,844,341.00 $0.00 11/30/2017
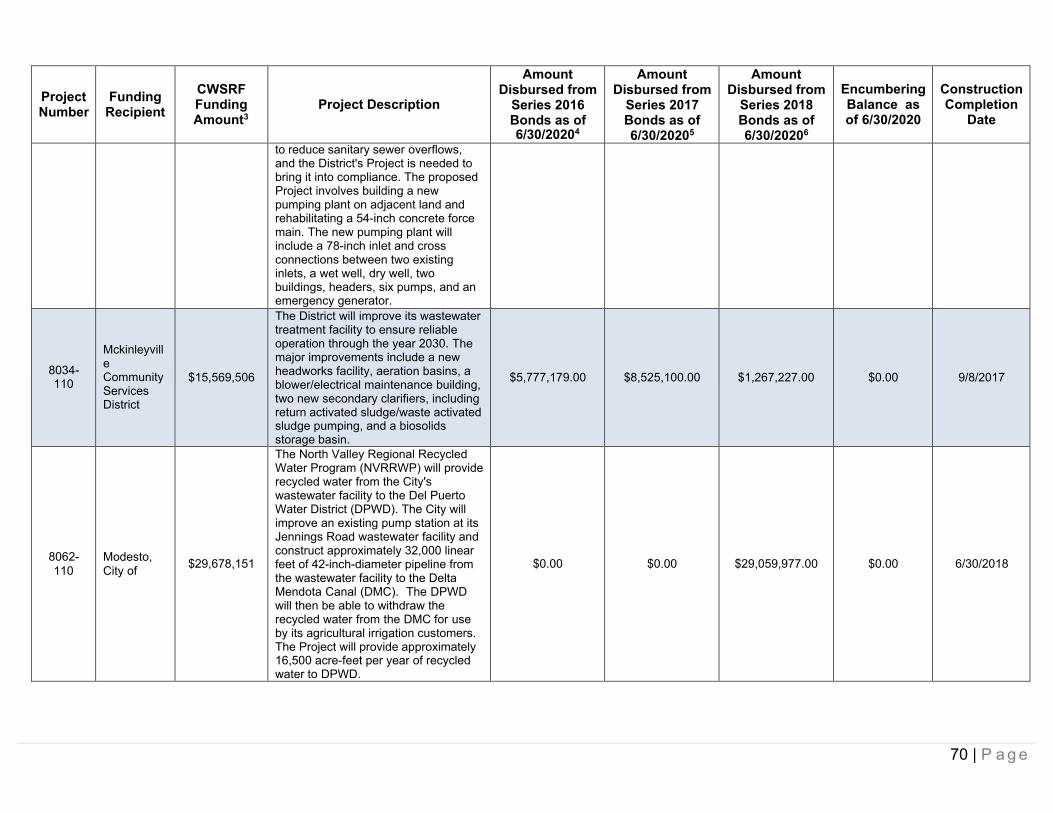
70 | P a g e
Project Number
Funding Recipient
CWSRFFunding Amount3
Project Description
Amount Disbursed from
Series 2016 Bonds as of6/30/20204
Amount Disbursed from
Series 2017Bonds as of 6/30/20205
Amount Disbursed from
Series 2018Bonds as of 6/30/20206
Encumbering Balance as of 6/30/2020
Construction Completion
Date
to reduce sanitary sewer overflows,and the District's Project is needed to bring it into compliance. The proposed Project involves building a new pumping plant on adjacent land and rehabilitating a 54-inch concrete force main. The new pumping plant will include a 78-inch inlet and cross connections between two existing inlets, a wet well, dry well, twobuildings, headers, six pumps, and an emergency generator.
8034-110
Mckinleyvill e Community Services District
$15,569,506
The District will improve its wastewater treatment facility to ensure reliable operation through the year 2030. The major improvements include a new headworks facility, aeration basins, a blower/electrical maintenance building, two new secondary clarifiers, including return activated sludge/waste activatedsludge pumping, and a biosolids storage basin.
$5,777,179.00 $8,525,100.00 $1,267,227.00 $0.00 9/8/2017
8062-110
Modesto, City of $29,678,151
The North Valley Regional Recycled Water Program (NVRRWP) will provide recycled water from the City's wastewater facility to the Del Puerto Water District (DPWD). The City will improve an existing pump station at its Jennings Road wastewater facility and construct approximately 32,000 linear feet of 42-inch-diameter pipeline from the wastewater facility to the Delta Mendota Canal (DMC). The DPWD will then be able to withdraw the recycled water from the DMC for use by its agricultural irrigation customers. The Project will provide approximately16,500 acre-feet per year of recycled water to DPWD.
$0.00 $0.00 $29,059,977.00 $0.00 6/30/2018
71 | P a g e
Project Number
Funding Recipient
CWSRFFunding Amount3
Project Description
Amount Disbursed from
Series 2016 Bonds as of6/30/20204
Amount Disbursed from
Series 2017Bonds as of 6/30/20205
Amount Disbursed from
Series 2018Bonds as of 6/30/20206
Encumbering Balance as of 6/30/2020
Construction Completion
Date
5175-210
Modesto, City of $124,829,278
This is the second phase of a five phase Project to construct a 27.5 million gallon per day (mgd) tertiary wastewater treatment system. The second phase will bring the tertiary treatment capacity to 12.6 mgd. The Project consists of three aeration basins, six membrane bioreactors, ultraviolet disinfection systems, pump stations, structures, and auxiliary equipment. Completion of the Project will allow the City to discharge tertiary treated effluent to the San JoaquinRiver year-round.
$4,227,012.03 $5,278,174.00 $0.00 $0.00 12/1/2015
8024-110
Pleasanton, City of $11,317,177
The City's Project includes a recycled water distribution system with 13 miles of new pipelines in existing developed areas, as well as adding treatment capacity at the Dublin-San Ramon Services District wastewater treatment facility. The Project is estimated to replace 1,303 acre-feet per year ofpotable water demand with recycled water.
$8,629,306.00 $1,618,033.00 $0.00 $0.00 10/31/2016
8025-110
Sacramento Regional County Sanitation District
$41,828,976
The Project is the first phase of the District's Echo Water Project. The Echo Water Project will upgrade the Sacramento Regional Wastewater Treatment Plant to comply with the NPDES permit requirement to remove ammonia from its discharge to protect the Sacramento-San Joaquin Delta downstream. The plant is the largest wastewater discharger to the Delta, and the Delta is a significant source of California's water and a critical ecosystem. The Project will also substantially increase water recycling opportunities for agricultural and landscape irrigation and industrial process water by producing highlytreated water that meets wastewater reuse standards. Use of recycled
$37,156,368.00 $4,672,608.00 $0.00 $0.00 9/15/2016
72 | P a g e
Project Number
Funding Recipient
CWSRFFunding Amount3
Project Description
Amount Disbursed from
Series 2016 Bonds as of6/30/20204
Amount Disbursed from
Series 2017Bonds as of 6/30/20205
Amount Disbursed from
Series 2018Bonds as of 6/30/20206
Encumbering Balance as of 6/30/2020
Construction Completion
Date
water helps preserve scarce watersupplies, especially during drought conditions. The Project scope includes temporary and permanent infrastructure, demolition of existing buildings and infrastructure, and construction of new facilities to support construction activities associated with the Project.
8025-120
Sacramento Regional County Sanitation District
$138,672,372
The Project is the second phase of the District's Echo Water Project. The scope of this phase includes deepening and lining of the emergency storage basins (ESB). The ESB currently store partially or fully treated wastewater under a variety of circumstances. The proposed improvements and modifications to theESB will ensure continued operational flexibility and permit compliance.
$44,474,338.00 $71,468,044.00 $9,396,133.00 $0.00 6/30/2019
8025-130
Sacramento Regional County Sanitation District
$2,861,737
The Project is the third phase of the District's Echo Water Project. This phase of the Project will expand the existing 12 kV electrical switchgear to include new sections with circuit breakers to feed power to the Echo Water Project. The existing transformer has adequate capacity, but new switchgear will be installed into the existing substation in space that was prepared as part of the originalsubstation expansion in the late 1990s.
$1,962,640.00 $899,097.00 $0.00 $0.00 11/30/2016
8025-140
Sacramento Regional County Sanitation District
$21,465,759
The Project is the fourth phase of the District's Echo Water Project. This phase will improve the disinfection facilities at the plant to meet stricter discharge limits. The District is converting the existing chlorine gas system to a liquid system and willupgrade the disinfection contact basin as part of its tertiary treatment efforts.
$15,508,322.00 $5,559,910.00 $0.00 $0.00 8/15/2017
73 | P a g e
Project Number
Funding Recipient
CWSRFFunding Amount3
Project Description
Amount Disbursed from
Series 2016 Bonds as of6/30/20204
Amount Disbursed from
Series 2017Bonds as of 6/30/20205
Amount Disbursed from
Series 2018Bonds as of 6/30/20206
Encumbering Balance as of 6/30/2020
Construction Completion
Date
8025-150
Sacramento Regional County Sanitation District
$53,490,845
The Project is the sixth phase of the District's Echo Water Project. The scope of this phase will create the Biological Nutrient Removal (BNR) facility. The BNR will nitrify and denitrify the plant's wastewater in atwo-stage process.
$0.00 $36,441,686.00 $10,240,582.00 $0.00 5/31/2019
8025-160
Sacramento Regional County Sanitation District
$533,142,603
The Project is the fifth phase of the District's Echo Water Project. The scope of this phase will create the Nitrifying Sidestream Treatment (NST) facility to intercept and treat internal return flows from the solids storage basin and the biosolids recycling facility. These internal flows account for approximately 20% of the ammonia load into the District's plant. The NST facility reduces the ammonia in the main plant's effluent by converting the ammonia in the sidestreams to nitrates. The treated, nitrate-rich product from the NST facility will then be pumped to the interceptors upstream of the plant. The nitrate-rich product will help with odor control, thus reducing the need for chlorine or other chemicals to control odors at theinfluent structure.
$0.00 $185,824,963.08 $159,240,870.00 $0.00 5/14/2021
8025-170
Sacramento Regional County Sanitation District
$35,696,952
The Project is the seventh segment of the District's Echo Water Project. The Echo Water Project will upgrade the Sacramento Regional Wastewater Treatment Plant to comply with the NPDES permit requirement to remove ammonia from its discharge to protect the Sacramento-San Joaquin Delta downstream. The plant is the largest wastewater discharger to the Delta, and the Delta is a significant source of California's water and a critical ecosystem. The Project will also substantially increase water recyclingopportunities for agricultural and
$0.00 $0.00 $24,059,762.00 $0.00 12/27/2019
74 | P a g e
Project Number
Funding Recipient
CWSRFFunding Amount3
Project Description
Amount Disbursed from
Series 2016 Bonds as of6/30/20204
Amount Disbursed from
Series 2017Bonds as of 6/30/20205
Amount Disbursed from
Series 2018Bonds as of 6/30/20206
Encumbering Balance as of 6/30/2020
Construction Completion
Date
landscape irrigation and industrial process water by producing highly treated water that meets wastewater reuse standards. Use of recycled water helps preserve scarce water supplies, especially during drought conditions. The Project will upgrade the existing Return Activated Sludge (RAS) pumping system to convey RAS from the existing Secondary Sedimentation Tanks (SSTs) to the new Biological Nutrient Removal(BNR) Facility.
8025-180
Sacramento Regional County Sanitation District
$564,657,506
The Project is the eighth and last segment of the District's Echo Water Project. The Echo Water Project will upgrade the Sacramento Regional Wastewater Treatment Plant to comply with the NPDES permit requirement to remove ammonia from its discharge to protect the Sacramento-San Joaquin Delta downstream. The plant is the largest wastewater discharger to the Delta, and the Delta is a significant source of California's water and a critical ecosystem. The Project will also substantially increase water recycling opportunities for agricultural and landscape irrigation and industrial process water by producing highly treated water that meets wastewater reuse standards. Use of recycled water helps preserve scarce water supplies, especially during drought conditions. The Project will filter and disinfect wastewater to meet California's water recycling regulations. The design is also based on meeting applicable effluent limitations and performance specifications fordisinfected effluent coliform and filter effluent turbidity.
$0.00 $0.00 $13,727,288.00 $0.00 5/1/2023
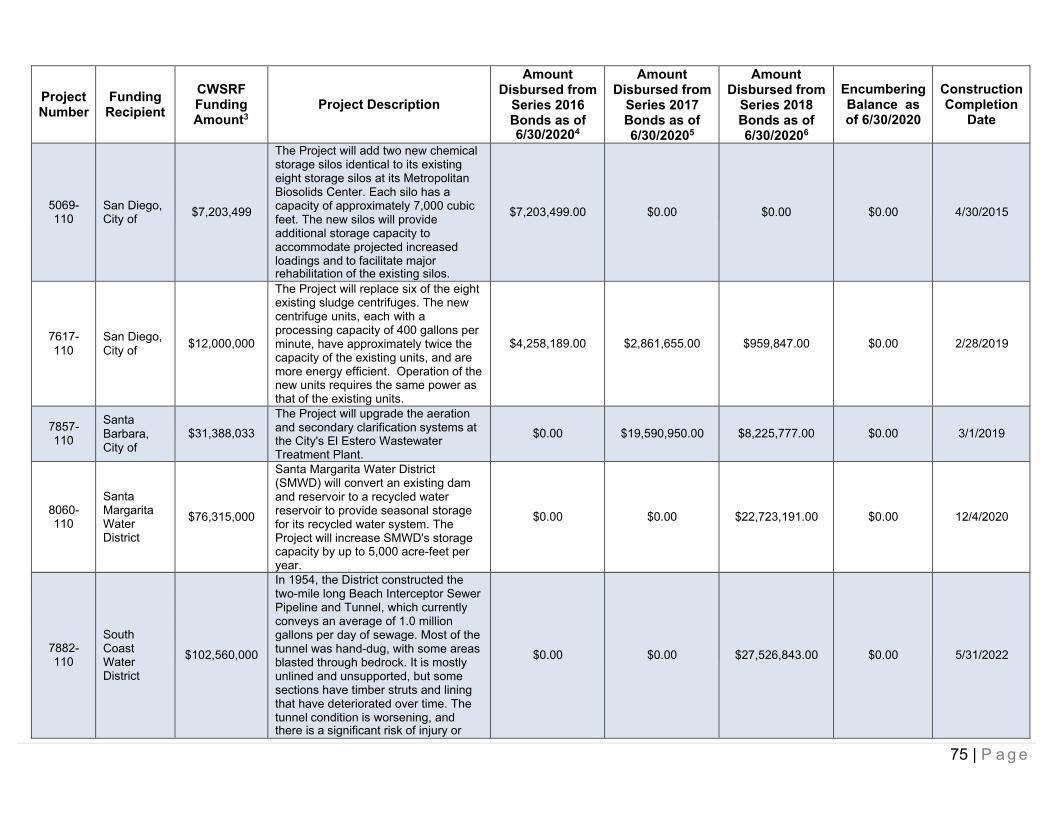
75 | P a g e
Project Number
Funding Recipient
CWSRFFunding Amount3
Project Description
Amount Disbursed from
Series 2016 Bonds as of6/30/20204
Amount Disbursed from
Series 2017Bonds as of 6/30/20205
Amount Disbursed from
Series 2018Bonds as of 6/30/20206
Encumbering Balance as of 6/30/2020
Construction Completion
Date
5069-110
San Diego, City of $7,203,499
The Project will add two new chemical storage silos identical to its existing eight storage silos at its Metropolitan Biosolids Center. Each silo has a capacity of approximately 7,000 cubic feet. The new silos will provide additional storage capacity to accommodate projected increased loadings and to facilitate majorrehabilitation of the existing silos.
$7,203,499.00 $0.00 $0.00 $0.00 4/30/2015
7617-110
San Diego, City of $12,000,000
The Project will replace six of the eight existing sludge centrifuges. The new centrifuge units, each with a processing capacity of 400 gallons per minute, have approximately twice the capacity of the existing units, and are more energy efficient. Operation of thenew units requires the same power as that of the existing units.
$4,258,189.00 $2,861,655.00 $959,847.00 $0.00 2/28/2019
7857-110
Santa Barbara, City of
$31,388,033The Project will upgrade the aeration and secondary clarification systems atthe City's El Estero Wastewater Treatment Plant.
$0.00 $19,590,950.00 $8,225,777.00 $0.00 3/1/2019
8060-110
Santa Margarita Water District
$76,315,000
Santa Margarita Water District (SMWD) will convert an existing dam and reservoir to a recycled water reservoir to provide seasonal storage for its recycled water system. The Project will increase SMWD's storagecapacity by up to 5,000 acre-feet per year.
$0.00 $0.00 $22,723,191.00 $0.00 12/4/2020
7882-110
South Coast Water District
$102,560,000
In 1954, the District constructed the two-mile long Beach Interceptor Sewer Pipeline and Tunnel, which currently conveys an average of 1.0 million gallons per day of sewage. Most of the tunnel was hand-dug, with some areas blasted through bedrock. It is mostly unlined and unsupported, but some sections have timber struts and lining that have deteriorated over time. The tunnel condition is worsening, andthere is a significant risk of injury or
$0.00 $0.00 $27,526,843.00 $0.00 5/31/2022
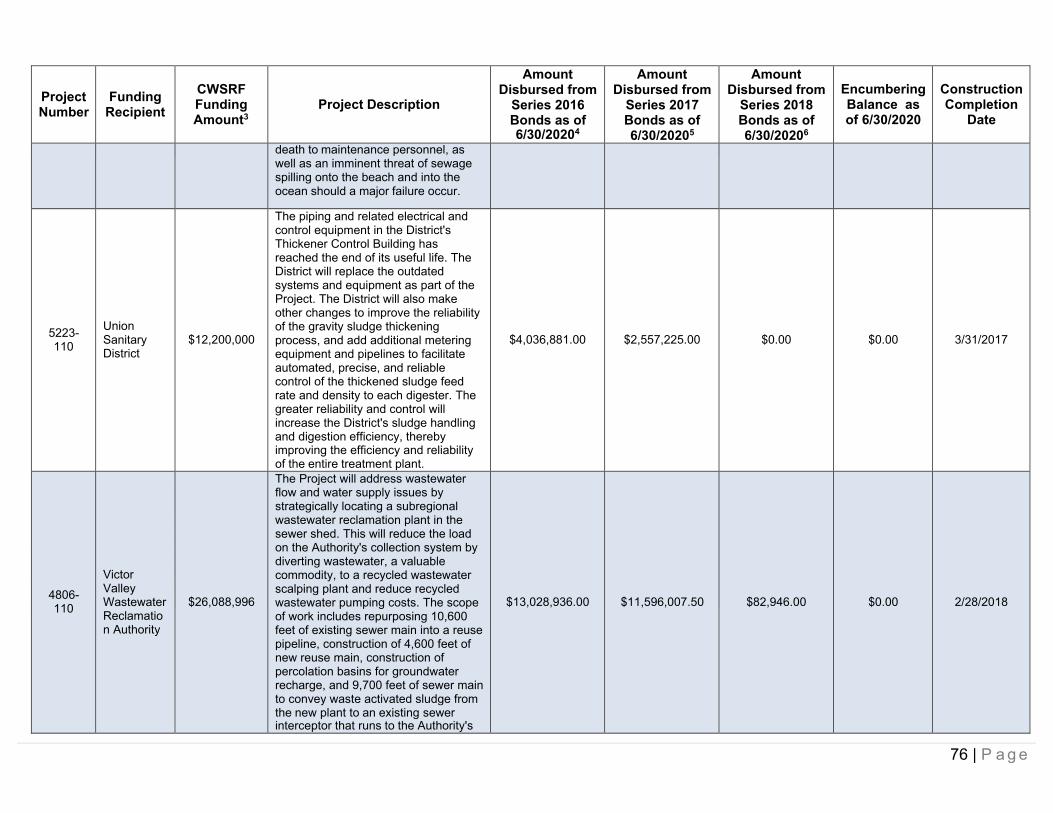
76 | P a g e
Project Number
Funding Recipient
CWSRFFunding Amount3
Project Description
Amount Disbursed from
Series 2016 Bonds as of6/30/20204
Amount Disbursed from
Series 2017Bonds as of 6/30/20205
Amount Disbursed from
Series 2018Bonds as of 6/30/20206
Encumbering Balance as of 6/30/2020
Construction Completion
Date
death to maintenance personnel, aswell as an imminent threat of sewage spilling onto the beach and into the ocean should a major failure occur.
5223-110
Union Sanitary District
$12,200,000
The piping and related electrical and control equipment in the District's Thickener Control Building has reached the end of its useful life. The District will replace the outdated systems and equipment as part of the Project. The District will also make other changes to improve the reliability of the gravity sludge thickening process, and add additional metering equipment and pipelines to facilitate automated, precise, and reliable control of the thickened sludge feed rate and density to each digester. The greater reliability and control will increase the District's sludge handling and digestion efficiency, therebyimproving the efficiency and reliability of the entire treatment plant.
$4,036,881.00 $2,557,225.00 $0.00 $0.00 3/31/2017
4806-110
Victor Valley Wastewater Reclamatio n Authority
$26,088,996
The Project will address wastewater flow and water supply issues by strategically locating a subregional wastewater reclamation plant in the sewer shed. This will reduce the load on the Authority's collection system by diverting wastewater, a valuable commodity, to a recycled wastewater scalping plant and reduce recycled wastewater pumping costs. The scope of work includes repurposing 10,600 feet of existing sewer main into a reuse pipeline, construction of 4,600 feet of new reuse main, construction of percolation basins for groundwater recharge, and 9,700 feet of sewer main to convey waste activated sludge from the new plant to an existing sewerinterceptor that runs to the Authority's
$13,028,936.00 $11,596,007.50 $82,946.00 $0.00 2/28/2018
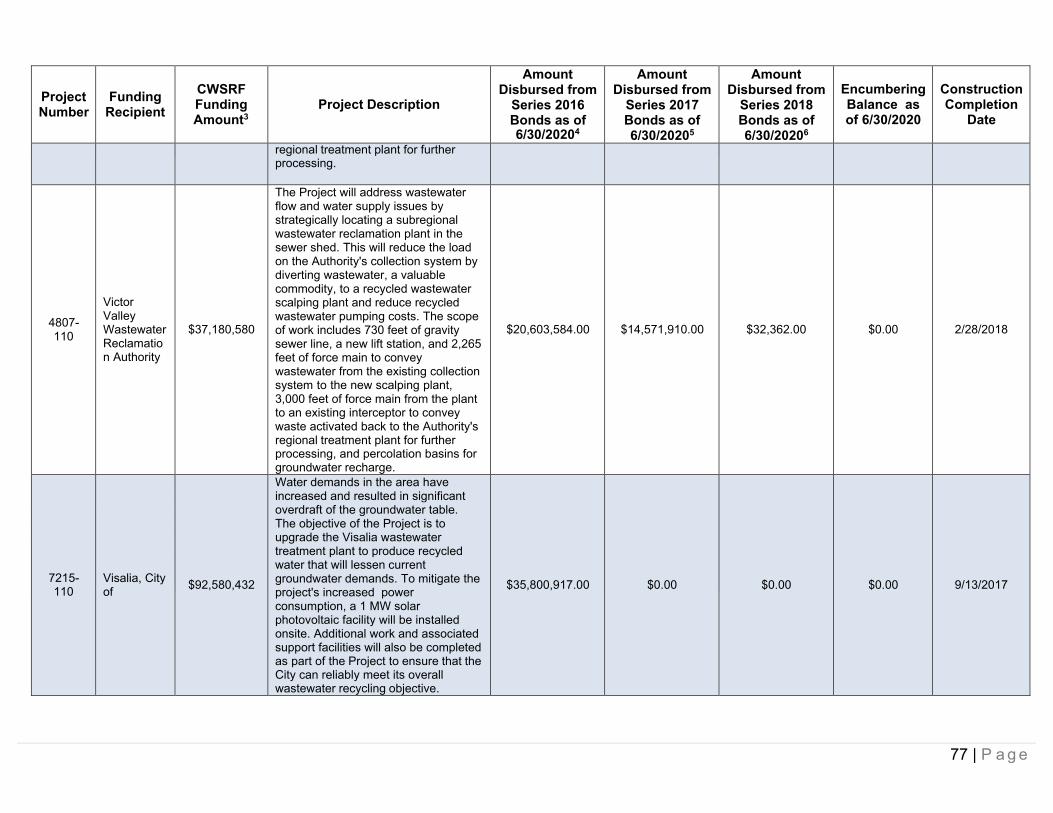
77 | P a g e
Project Number
Funding Recipient
CWSRFFunding Amount3
Project Description
Amount Disbursed from
Series 2016 Bonds as of6/30/20204
Amount Disbursed from
Series 2017Bonds as of 6/30/20205
Amount Disbursed from
Series 2018Bonds as of 6/30/20206
Encumbering Balance as of 6/30/2020
Construction Completion
Date
regional treatment plant for furtherprocessing.
4807-110
Victor Valley Wastewater Reclamatio n Authority
$37,180,580
The Project will address wastewater flow and water supply issues by strategically locating a subregional wastewater reclamation plant in the sewer shed. This will reduce the load on the Authority's collection system by diverting wastewater, a valuable commodity, to a recycled wastewater scalping plant and reduce recycled wastewater pumping costs. The scope of work includes 730 feet of gravity sewer line, a new lift station, and 2,265 feet of force main to convey wastewater from the existing collection system to the new scalping plant, 3,000 feet of force main from the plant to an existing interceptor to convey waste activated back to the Authority's regional treatment plant for furtherprocessing, and percolation basins for groundwater recharge.
$20,603,584.00 $14,571,910.00 $32,362.00 $0.00 2/28/2018
7215-110
Visalia, City of $92,580,432
Water demands in the area have increased and resulted in significant overdraft of the groundwater table. The objective of the Project is to upgrade the Visalia wastewater treatment plant to produce recycled water that will lessen currentgroundwater demands. To mitigate the project's increased power consumption, a 1 MW solar photovoltaic facility will be installed onsite. Additional work and associated support facilities will also be completed as part of the Project to ensure that theCity can reliably meet its overall wastewater recycling objective.
$35,800,917.00 $0.00 $0.00 $0.00 9/13/2017
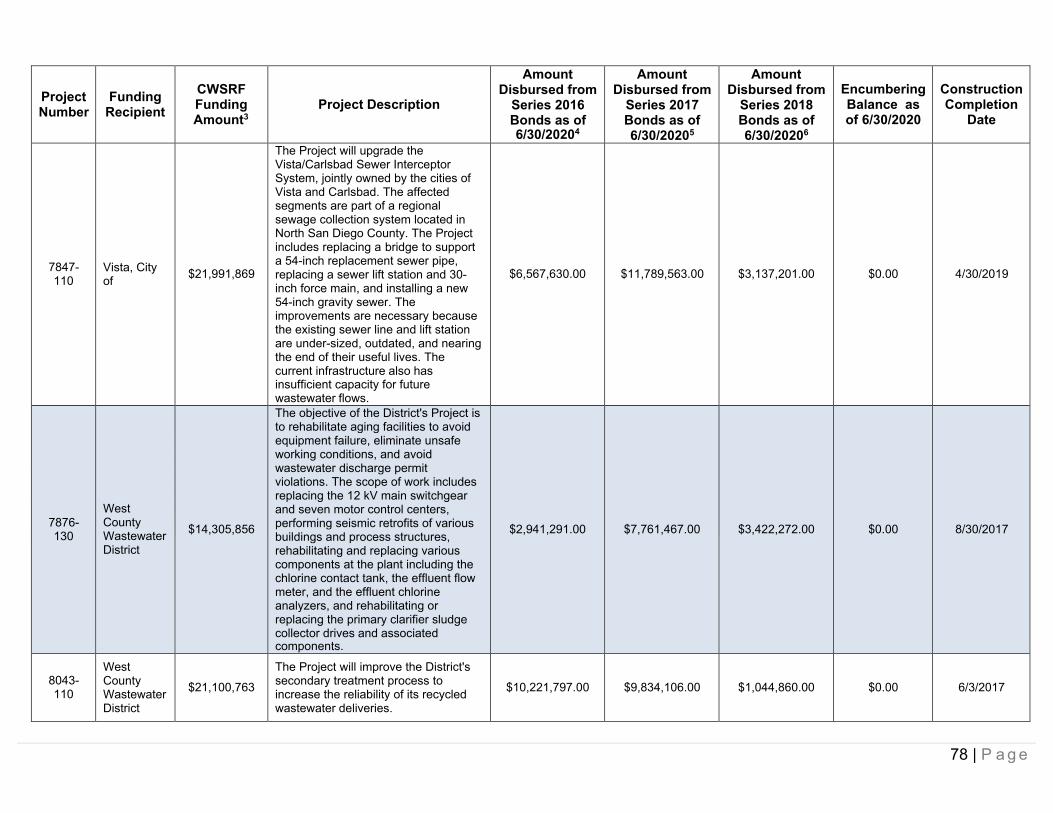
78 | P a g e
Project Number
Funding Recipient
CWSRFFunding Amount3
Project Description
Amount Disbursed from
Series 2016 Bonds as of6/30/20204
Amount Disbursed from
Series 2017Bonds as of 6/30/20205
Amount Disbursed from
Series 2018Bonds as of 6/30/20206
Encumbering Balance as of 6/30/2020
Construction Completion
Date
7847-110
Vista, City of $21,991,869
The Project will upgrade the Vista/Carlsbad Sewer Interceptor System, jointly owned by the cities of Vista and Carlsbad. The affected segments are part of a regional sewage collection system located in North San Diego County. The Project includes replacing a bridge to support a 54-inch replacement sewer pipe, replacing a sewer lift station and 30- inch force main, and installing a new 54-inch gravity sewer. The improvements are necessary because the existing sewer line and lift station are under-sized, outdated, and nearing the end of their useful lives. The current infrastructure also hasinsufficient capacity for future wastewater flows.
$6,567,630.00 $11,789,563.00 $3,137,201.00 $0.00 4/30/2019
7876-130
West County Wastewater District
$14,305,856
The objective of the District's Project is to rehabilitate aging facilities to avoid equipment failure, eliminate unsafe working conditions, and avoid wastewater discharge permit violations. The scope of work includes replacing the 12 kV main switchgear and seven motor control centers, performing seismic retrofits of various buildings and process structures, rehabilitating and replacing various components at the plant including the chlorine contact tank, the effluent flow meter, and the effluent chlorine analyzers, and rehabilitating or replacing the primary clarifier sludge collector drives and associatedcomponents.
$2,941,291.00 $7,761,467.00 $3,422,272.00 $0.00 8/30/2017
8043-110
West County Wastewater District
$21,100,763
The Project will improve the District's secondary treatment process to increase the reliability of its recycled wastewater deliveries.
$10,221,797.00 $9,834,106.00 $1,044,860.00 $0.00 6/3/2017
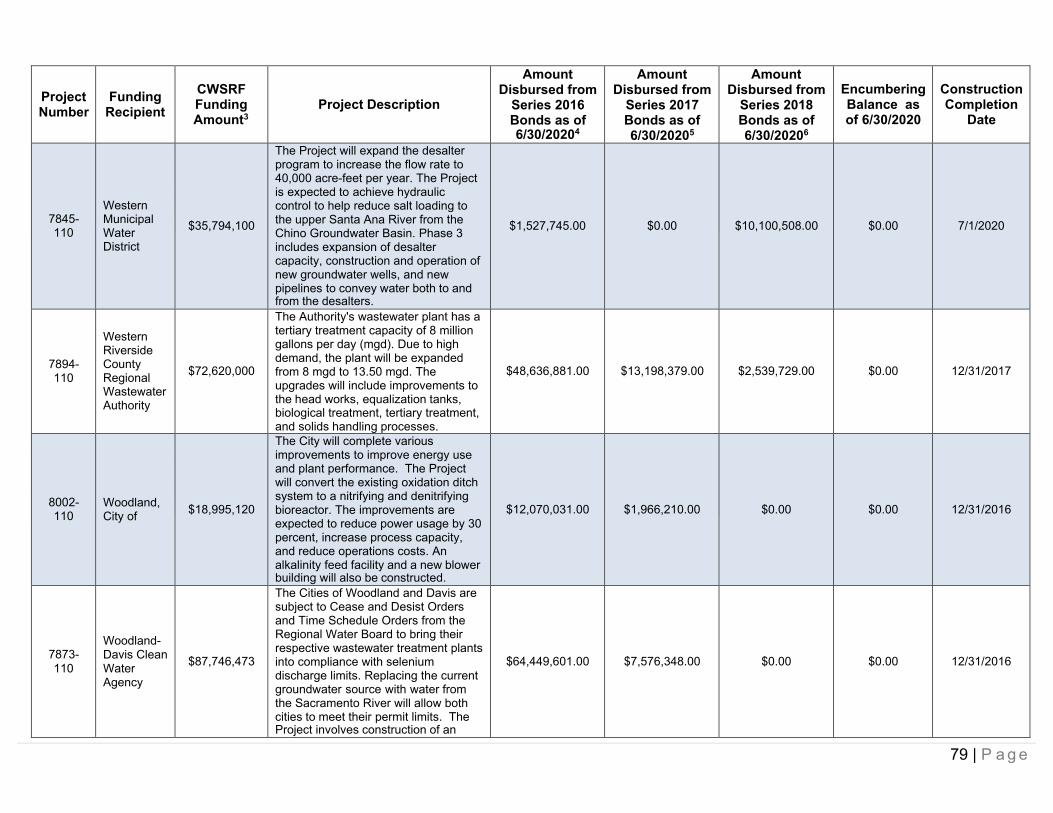
79 | P a g e
Project Number
Funding Recipient
CWSRFFunding Amount3
Project Description
Amount Disbursed from
Series 2016 Bonds as of6/30/20204
Amount Disbursed from
Series 2017Bonds as of 6/30/20205
Amount Disbursed from
Series 2018Bonds as of 6/30/20206
Encumbering Balance as of 6/30/2020
Construction Completion
Date
7845-110
Western Municipal Water District
$35,794,100
The Project will expand the desalter program to increase the flow rate to 40,000 acre-feet per year. The Project is expected to achieve hydraulic control to help reduce salt loading to the upper Santa Ana River from the Chino Groundwater Basin. Phase 3 includes expansion of desalter capacity, construction and operation of new groundwater wells, and new pipelines to convey water both to andfrom the desalters.
$1,527,745.00 $0.00 $10,100,508.00 $0.00 7/1/2020
7894-110
Western Riverside County Regional Wastewater Authority
$72,620,000
The Authority's wastewater plant has a tertiary treatment capacity of 8 million gallons per day (mgd). Due to high demand, the plant will be expanded from 8 mgd to 13.50 mgd. The upgrades will include improvements to the head works, equalization tanks,biological treatment, tertiary treatment, and solids handling processes.
$48,636,881.00 $13,198,379.00 $2,539,729.00 $0.00 12/31/2017
8002-110
Woodland, City of $18,995,120
The City will complete various improvements to improve energy use and plant performance. The Project will convert the existing oxidation ditch system to a nitrifying and denitrifying bioreactor. The improvements are expected to reduce power usage by 30 percent, increase process capacity, and reduce operations costs. An alkalinity feed facility and a new blowerbuilding will also be constructed.
$12,070,031.00 $1,966,210.00 $0.00 $0.00 12/31/2016
7873-110
Woodland- Davis Clean Water Agency
$87,746,473
The Cities of Woodland and Davis are subject to Cease and Desist Orders and Time Schedule Orders from the Regional Water Board to bring their respective wastewater treatment plants into compliance with selenium discharge limits. Replacing the current groundwater source with water from the Sacramento River will allow both cities to meet their permit limits. TheProject involves construction of an
$64,449,601.00 $7,576,348.00 $0.00 $0.00 12/31/2016
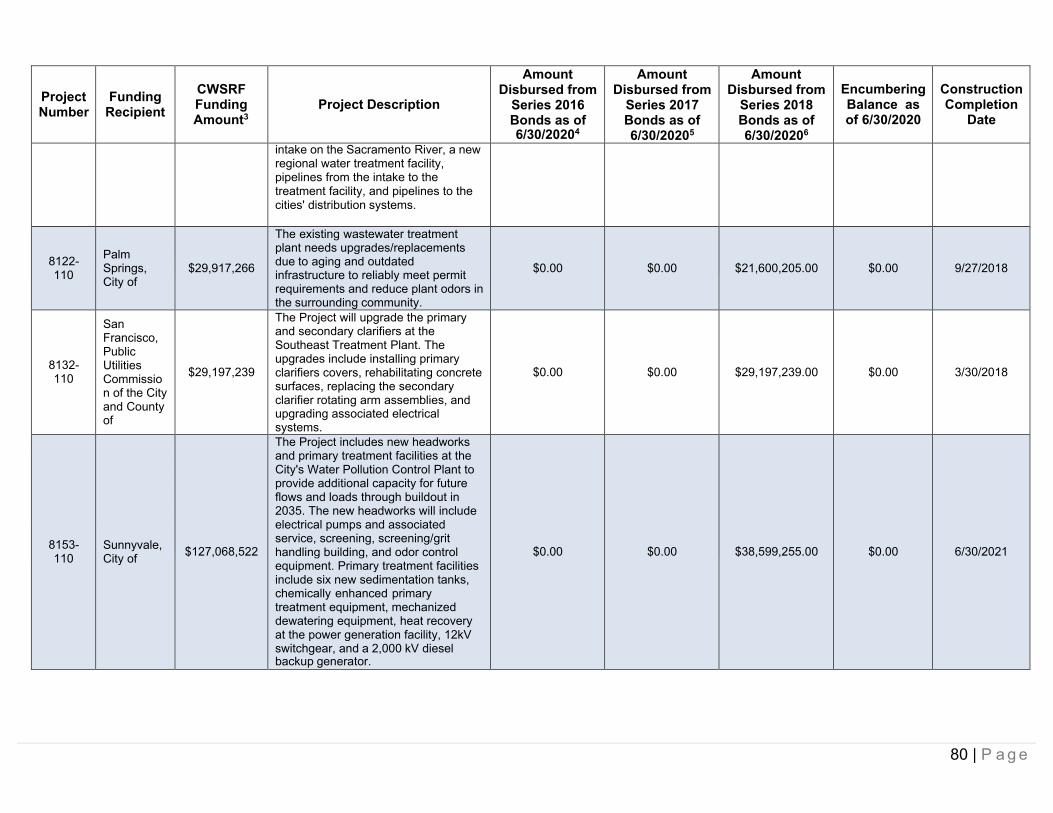
80 | P a g e
Project Number
Funding Recipient
CWSRFFunding Amount3
Project Description
Amount Disbursed from
Series 2016 Bonds as of6/30/20204
Amount Disbursed from
Series 2017Bonds as of 6/30/20205
Amount Disbursed from
Series 2018Bonds as of 6/30/20206
Encumbering Balance as of 6/30/2020
Construction Completion
Date
intake on the Sacramento River, a newregional water treatment facility, pipelines from the intake to the treatment facility, and pipelines to the cities' distribution systems.
8122-110
Palm Springs, City of
$29,917,266
The existing wastewater treatment plant needs upgrades/replacements due to aging and outdated infrastructure to reliably meet permit requirements and reduce plant odors in the surrounding community.
$0.00 $0.00 $21,600,205.00 $0.00 9/27/2018
8132-110
San Francisco, Public Utilities Commissio n of the City and County of
$29,197,239
The Project will upgrade the primary and secondary clarifiers at the Southeast Treatment Plant. The upgrades include installing primary clarifiers covers, rehabilitating concrete surfaces, replacing the secondary clarifier rotating arm assemblies, andupgrading associated electrical systems.
$0.00 $0.00 $29,197,239.00 $0.00 3/30/2018
8153-110
Sunnyvale, City of $127,068,522
The Project includes new headworks and primary treatment facilities at the City's Water Pollution Control Plant to provide additional capacity for future flows and loads through buildout in 2035. The new headworks will include electrical pumps and associated service, screening, screening/grit handling building, and odor control equipment. Primary treatment facilities include six new sedimentation tanks, chemically enhanced primary treatment equipment, mechanized dewatering equipment, heat recovery at the power generation facility, 12kV switchgear, and a 2,000 kV dieselbackup generator.
$0.00 $0.00 $38,599,255.00 $0.00 6/30/2021
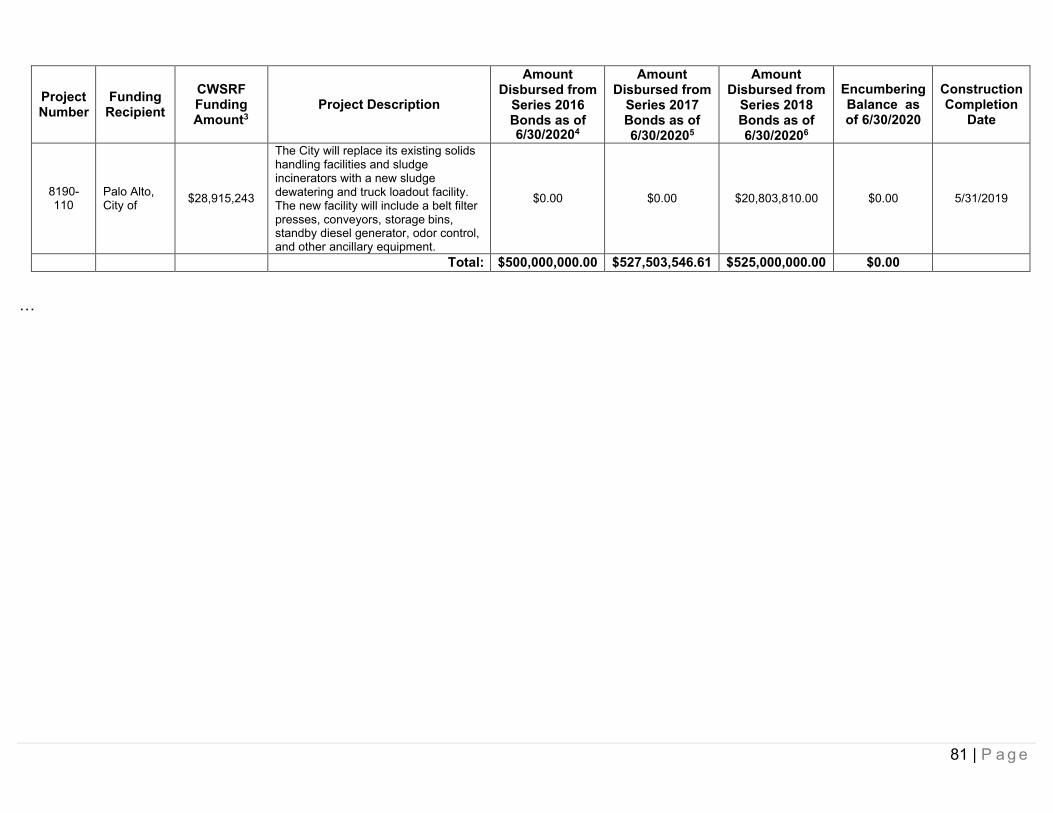
81 | P a g e
Project Number
Funding Recipient
CWSRFFunding Amount3
Project Description
Amount Disbursed from
Series 2016 Bonds as of6/30/20204
Amount Disbursed from
Series 2017Bonds as of 6/30/20205
Amount Disbursed from
Series 2018Bonds as of 6/30/20206
Encumbering Balance as of 6/30/2020
Construction Completion
Date
8190-110
Palo Alto, City of $28,915,243
The City will replace its existing solids handling facilities and sludge incinerators with a new sludge dewatering and truck loadout facility. The new facility will include a belt filter presses, conveyors, storage bins,standby diesel generator, odor control, and other ancillary equipment.
$0.00 $0.00 $20,803,810.00 $0.00 5/31/2019
Total: $500,000,000.00 $527,503,546.61 $525,000,000.00 $0.00
…
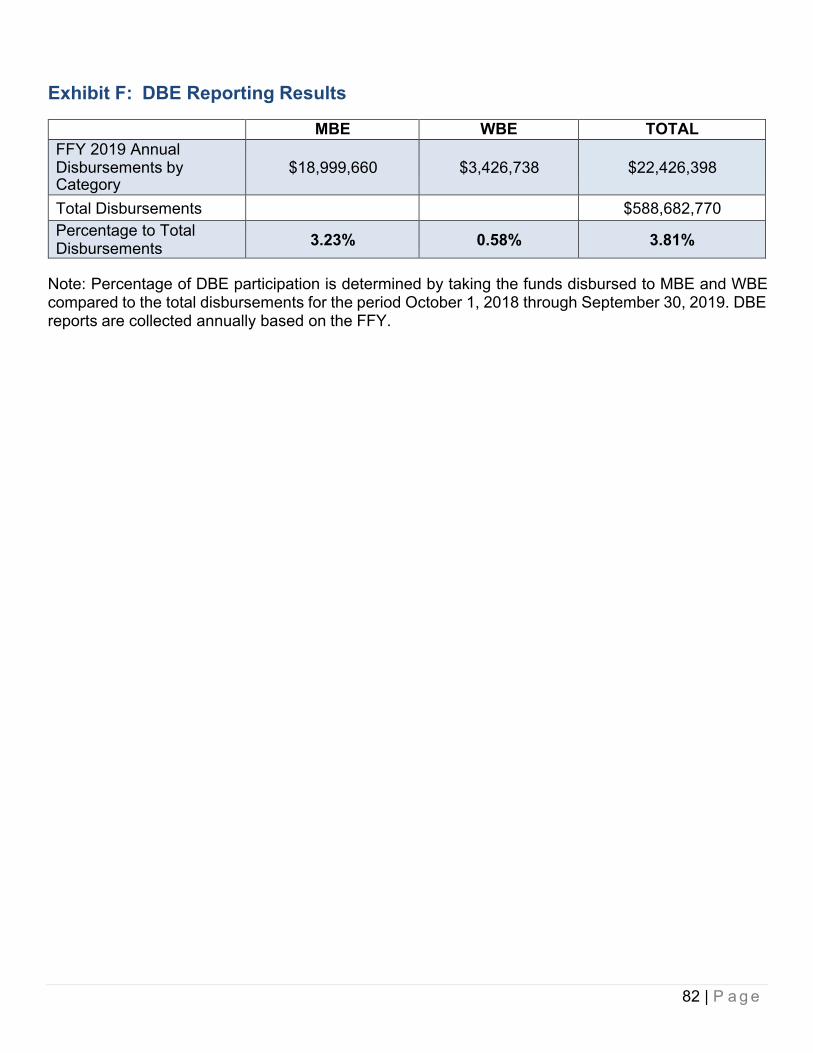
82 | P a g e
Exhibit F: DBE Reporting Results
MBE WBE TOTALFFY 2019 Annual Disbursements byCategory
$18,999,660 $3,426,738 $22,426,398
Total Disbursements $588,682,770Percentage to Total Disbursements 3.23% 0.58% 3.81%
Note: Percentage of DBE participation is determined by taking the funds disbursed to MBE and WBE compared to the total disbursements for the period October 1, 2018 through September 30, 2019. DBE reports are collected annually based on the FFY.
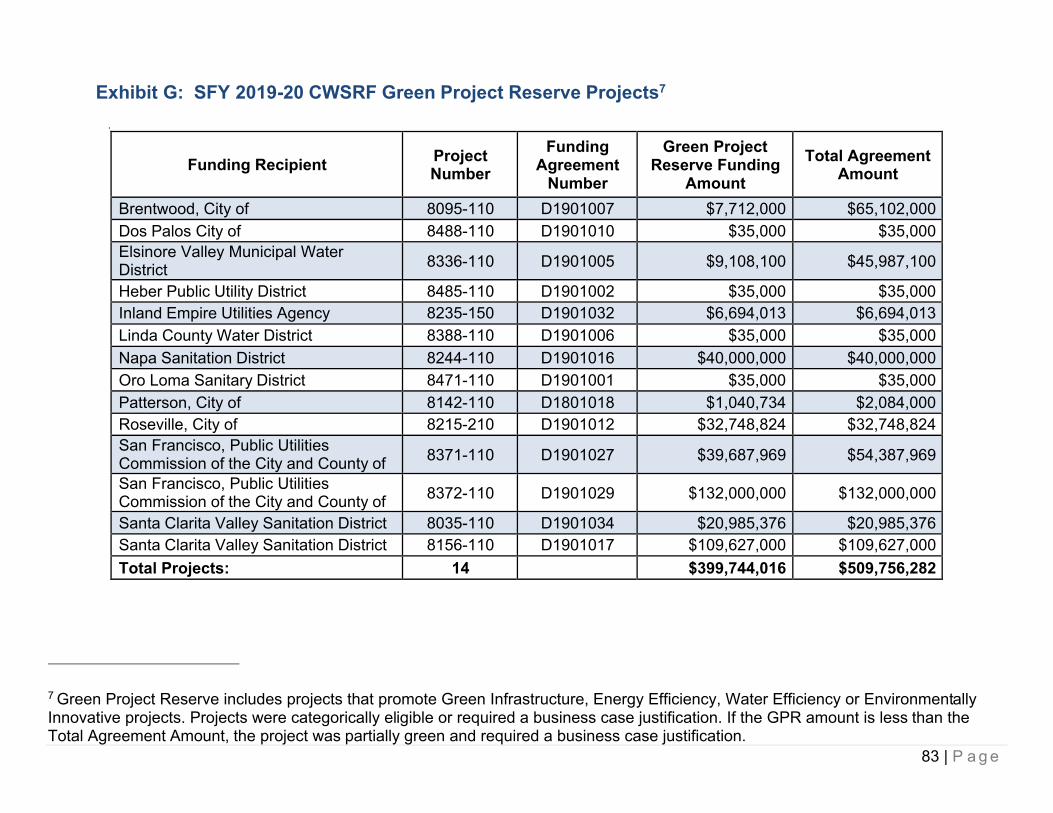
83 | P a g e
Exhibit G: SFY 2019-20 CWSRF Green Project Reserve Projects7
.
Funding Recipient Project Number
Funding Agreement
Number
Green Project Reserve Funding
AmountTotal Agreement
Amount
Brentwood, City of 8095-110 D1901007 $7,712,000 $65,102,000Dos Palos City of 8488-110 D1901010 $35,000 $35,000Elsinore Valley Municipal Water District 8336-110 D1901005 $9,108,100 $45,987,100
Heber Public Utility District 8485-110 D1901002 $35,000 $35,000Inland Empire Utilities Agency 8235-150 D1901032 $6,694,013 $6,694,013Linda County Water District 8388-110 D1901006 $35,000 $35,000Napa Sanitation District 8244-110 D1901016 $40,000,000 $40,000,000Oro Loma Sanitary District 8471-110 D1901001 $35,000 $35,000Patterson, City of 8142-110 D1801018 $1,040,734 $2,084,000Roseville, City of 8215-210 D1901012 $32,748,824 $32,748,824San Francisco, Public Utilities Commission of the City and County of 8371-110 D1901027 $39,687,969 $54,387,969
San Francisco, Public Utilities Commission of the City and County of 8372-110 D1901029 $132,000,000 $132,000,000
Santa Clarita Valley Sanitation District 8035-110 D1901034 $20,985,376 $20,985,376Santa Clarita Valley Sanitation District 8156-110 D1901017 $109,627,000 $109,627,000Total Projects: 14 $399,744,016 $509,756,282
7 Green Project Reserve includes projects that promote Green Infrastructure, Energy Efficiency, Water Efficiency or Environmentally Innovative projects. Projects were categorically eligible or required a business case justification. If the GPR amount is less than the Total Agreement Amount, the project was partially green and required a business case justification.
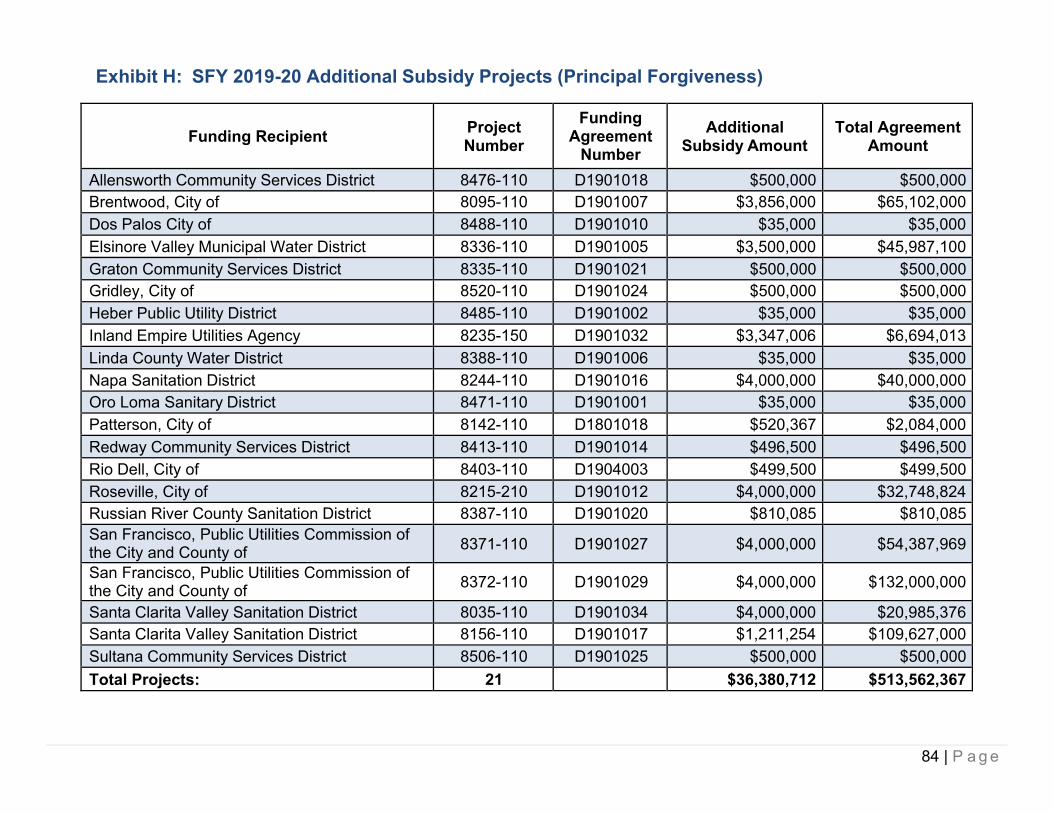
84 | P a g e
Exhibit H: SFY 2019-20 Additional Subsidy Projects (Principal Forgiveness)
Funding Recipient Project Number
Funding Agreement
NumberAdditional
Subsidy AmountTotal Agreement
Amount
Allensworth Community Services District 8476-110 D1901018 $500,000 $500,000Brentwood, City of 8095-110 D1901007 $3,856,000 $65,102,000Dos Palos City of 8488-110 D1901010 $35,000 $35,000Elsinore Valley Municipal Water District 8336-110 D1901005 $3,500,000 $45,987,100Graton Community Services District 8335-110 D1901021 $500,000 $500,000Gridley, City of 8520-110 D1901024 $500,000 $500,000Heber Public Utility District 8485-110 D1901002 $35,000 $35,000Inland Empire Utilities Agency 8235-150 D1901032 $3,347,006 $6,694,013Linda County Water District 8388-110 D1901006 $35,000 $35,000Napa Sanitation District 8244-110 D1901016 $4,000,000 $40,000,000Oro Loma Sanitary District 8471-110 D1901001 $35,000 $35,000Patterson, City of 8142-110 D1801018 $520,367 $2,084,000Redway Community Services District 8413-110 D1901014 $496,500 $496,500Rio Dell, City of 8403-110 D1904003 $499,500 $499,500Roseville, City of 8215-210 D1901012 $4,000,000 $32,748,824Russian River County Sanitation District 8387-110 D1901020 $810,085 $810,085San Francisco, Public Utilities Commission of the City and County of 8371-110 D1901027 $4,000,000 $54,387,969
San Francisco, Public Utilities Commission of the City and County of 8372-110 D1901029 $4,000,000 $132,000,000
Santa Clarita Valley Sanitation District 8035-110 D1901034 $4,000,000 $20,985,376Santa Clarita Valley Sanitation District 8156-110 D1901017 $1,211,254 $109,627,000Sultana Community Services District 8506-110 D1901025 $500,000 $500,000Total Projects: 21 $36,380,712 $513,562,367
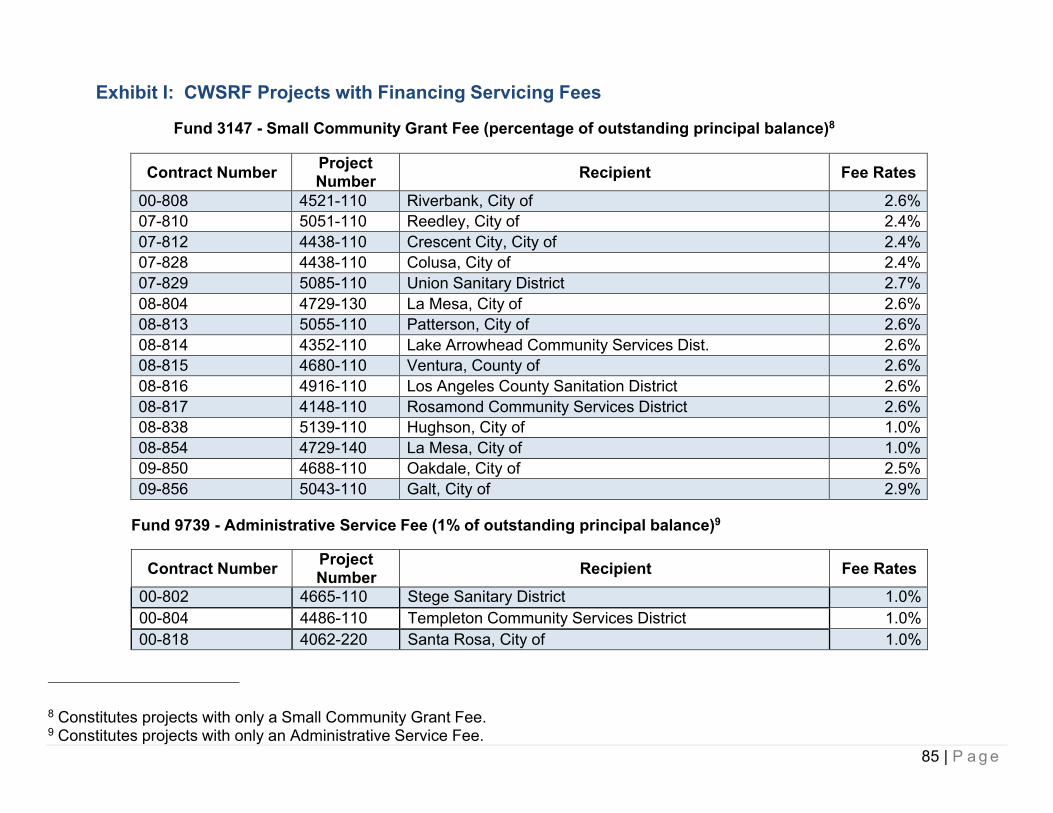
85 | P a g e
Exhibit I: CWSRF Projects with Financing Servicing Fees
Fund 3147 - Small Community Grant Fee (percentage of outstanding principal balance)8
Contract Number Project Number Recipient Fee Rates
00-808 4521-110 Riverbank, City of 2.6%07-810 5051-110 Reedley, City of 2.4%07-812 4438-110 Crescent City, City of 2.4%07-828 4438-110 Colusa, City of 2.4%07-829 5085-110 Union Sanitary District 2.7%08-804 4729-130 La Mesa, City of 2.6%08-813 5055-110 Patterson, City of 2.6%08-814 4352-110 Lake Arrowhead Community Services Dist. 2.6%08-815 4680-110 Ventura, County of 2.6%08-816 4916-110 Los Angeles County Sanitation District 2.6%08-817 4148-110 Rosamond Community Services District 2.6%08-838 5139-110 Hughson, City of 1.0%08-854 4729-140 La Mesa, City of 1.0%09-850 4688-110 Oakdale, City of 2.5%09-856 5043-110 Galt, City of 2.9%
Fund 9739 - Administrative Service Fee (1% of outstanding principal balance)9
Contract Number Project Number Recipient Fee Rates
00-802 4665-110 Stege Sanitary District 1.0%00-804 4486-110 Templeton Community Services District 1.0%00-818 4062-220 Santa Rosa, City of 1.0%
8 Constitutes projects with only a Small Community Grant Fee.9 Constitutes projects with only an Administrative Service Fee.

86 | P a g e
Contract Number Project Number
Recipient Fee Rates
00-825 4062-170 Santa Rosa, City of 1.0%00-831 4062-250 Santa Rosa, City of 1.0%01-803 4053-110 McCloud Community Services District 1.0%01-810 4062-160 Santa Rosa, City of 1.0%01-813 6036-110 Santa Cruz, County of 1.0%01-811 4062-230 Santa Rosa, City of 1.0%01-814 4062-150 Santa Rosa, City of 1.0%02-821 4812-110 Napa Sanitation District 1.0%02-826 4845-110 Santa Margarita Water District 1.0%02-827 4802-110 Corona, City of 1.0%03-846 4783-110 Los Angeles County Sanitation District 1.0%03-847 4783-210 Los Angeles County Sanitation District 1.0%04-802 6085-110 The Nature Conservancy 1.0%04-814 4450-110 Coachella Sanitary District 1.0%04-815 4252-510 La Canada Flintridge, City of 1.0%05-809 4665-210 Stege Sanitary District 1.0%05-810 4200-110 Yucaipa Valley Water District 1.0%05-811 4729-110 La Mesa, City of 1.0%06-810 4899-110 Inland Empire Utilities Agency 1.0%07-815 4632-110 Alturas, City of 1.0%07-816 4728-120 South San Francisco, City of 1.0%07-818 4729-120 La Mesa, City of 1.0%07-824 4903-110 Novato Sanitary District 1.0%08-845 5100-110 Eastern Municipal Water District 1.0%09-800 5098-110 Linda County Water District 1.0%09-814 5044-110 Palo Alto, City of 1.0%09-848 4831-110 Santa Cruz County Sanitation District 1.0%09-853 5208-110 Fairfield-Suisun Sewer District 1.0%09-857 5539-110 Los Angeles County Sanitation District 1.0%09-858 5490-110 Del Mar, City of 1.0%
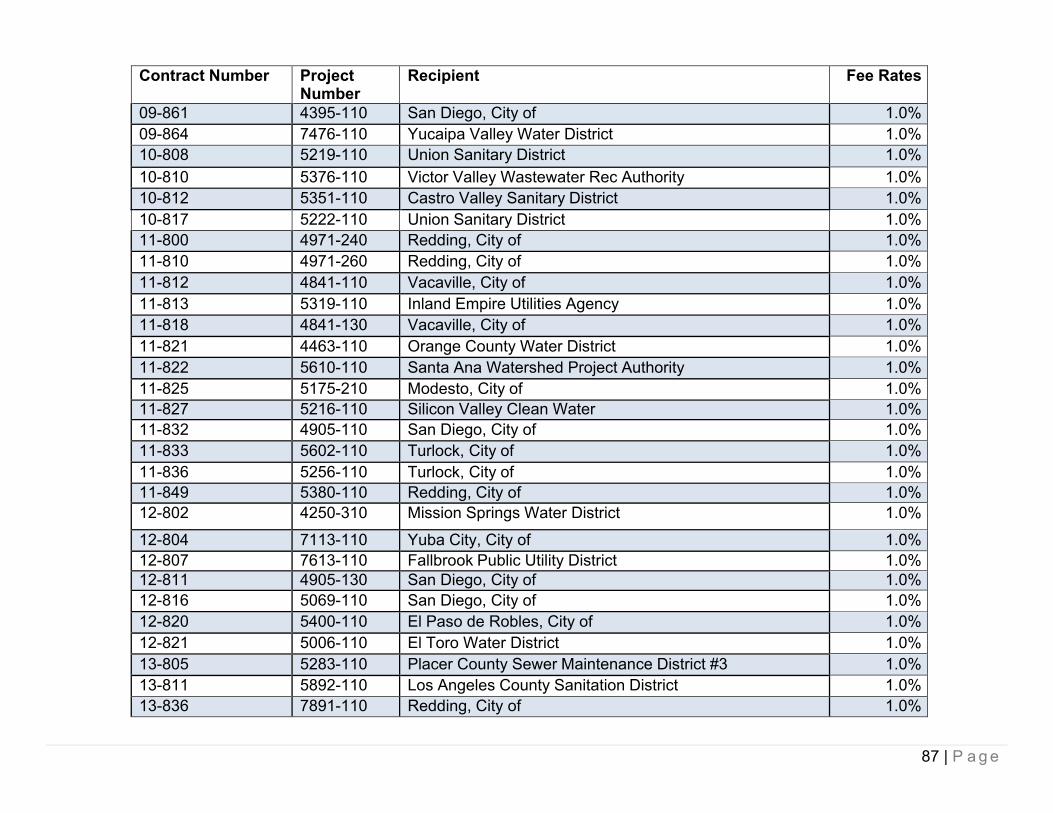
87 | P a g e
Contract Number Project Number
Recipient Fee Rates
09-861 4395-110 San Diego, City of 1.0%09-864 7476-110 Yucaipa Valley Water District 1.0%10-808 5219-110 Union Sanitary District 1.0%10-810 5376-110 Victor Valley Wastewater Rec Authority 1.0%10-812 5351-110 Castro Valley Sanitary District 1.0%10-817 5222-110 Union Sanitary District 1.0%11-800 4971-240 Redding, City of 1.0%11-810 4971-260 Redding, City of 1.0%11-812 4841-110 Vacaville, City of 1.0%11-813 5319-110 Inland Empire Utilities Agency 1.0%11-818 4841-130 Vacaville, City of 1.0%11-821 4463-110 Orange County Water District 1.0%11-822 5610-110 Santa Ana Watershed Project Authority 1.0%11-825 5175-210 Modesto, City of 1.0%11-827 5216-110 Silicon Valley Clean Water 1.0%11-832 4905-110 San Diego, City of 1.0%11-833 5602-110 Turlock, City of 1.0%11-836 5256-110 Turlock, City of 1.0%11-849 5380-110 Redding, City of 1.0%12-802 4250-310 Mission Springs Water District 1.0%12-804 7113-110 Yuba City, City of 1.0%12-807 7613-110 Fallbrook Public Utility District 1.0%12-811 4905-130 San Diego, City of 1.0%12-816 5069-110 San Diego, City of 1.0%12-820 5400-110 El Paso de Robles, City of 1.0%12-821 5006-110 El Toro Water District 1.0%13-805 5283-110 Placer County Sewer Maintenance District #3 1.0%13-811 5892-110 Los Angeles County Sanitation District 1.0%13-836 7891-110 Redding, City of 1.0%
88 | P a g e
Contract Number Project Number
Recipient Fee Rates
14-810 7894-110 Western Riverside County Regional WW Authority 1.0%14-817 7893-110 Fresno, City of 1.0%14-832 8025-110 Sacramento Regional County Sanitation District 1.0%93-805 6006-110 Davis, City of 1.0%93-810 6022-110 Pacheco Water District 1.0%93-819 4330-110 Goleta Sanitary District 1.0%94-806 4108-110 Cambria Community Services District 1.0%96-805 6014-110 San Luis Water District 1.0%96-820 4360-110 Davis, City of 1.0%97-804 4001-220 Los Angeles County Sanitation District 1.0%97-809 4505-110 Placerville, City of 1.0%97-813 6031-110 Mammoth Lakes, Town of 1.0%97-814 4648-110 Rialto, City of 1.0%97-830 4001-230 Los Angeles County Sanitation District 1.0%98-813 4262-110 Humboldt County Res. Imp. Dist. 1 1.0%98-818 4001-250 Los Angeles County Sanitation District 1.0%98-837 4452-110 Santa Ana Watershed Project Authority 1.0%99-802 4704-110 Windsor, Town of 1.0%99-805 4610-110 Vacaville, City of 1.0%99-807 4679-110 Los Angeles, County of 1.0%99-811 4429-120 Thousand Oaks, City of 1.0%D1501005 8025-140 Sacramento Regional County Sanitation District 1.0%D1501008 8004-140 Rodeo Sanitary District 1.0%D1501012 8034-110 McKinleyville Community Service District 1.0%D1501014 7824-110 La Mesa, City of 1.0%D1501015 8082-110 Sacramento Regional County Sanitation District 1.0%D1501016 8101-110 Orange County Water District 1.0%D1501017 7831-110 Eastern Municipal Water District 1.0%D1501020 8004-150 Rodeo Sanitary District 1.0%D1501021 8026-110 Pacific Grove City 1.0%
89 | P a g e
Contract Number Project Number
Recipient Fee Rates
D1601005 8062-110 Modesto, City of 1.0%D1601011 8189-110 Los Angeles County Sanitation District No. 2 1.0%D1601013 8205-110 Los Angeles County Sanitation District No. 2 1.0%D1601015 7896-210 Colusa, City of 1.0%D1601019 8164-110 El Torro Water District 1.0%D1601021 8166-110 Piedmont, City of 1.0%D1701003 8132-110 San Francisco, Public Utilities Commission of the City and
County of1.0%
D1701006 8211-110 Santa Monica, City of 1.0%D1701010 8115-110 Escondido, City of 1.0%
3147 and 9739 (percentage of outstanding principal balance)10
Contract Number Project Number Recipient Fee Rates
SCG Admin00-801 4610-120 Vacaville, City of 1.7% 1.0%00-805 4596-110 Hilmar County Water District 1.6% 1.0%00-806 4685-110 Sacramento, City of 1.6% 1.0%00-809 4708-110 Redding, City of 1.6% 1.0%00-815 4465-110 Yreka, City of 1.6% 1.0%00-816 4062-140 Santa Rosa, City of 1.6% 1.0%00-819 4086-110 Lake County Sanitation District 1.6% 1.0%01-802 4173-110 Laguna County Sanitation District 1.4% 1.0%01-804 4655-110 Piedmont, City of 1.4% 1.0%01-815 4771-110 Union Sanitary District 1.4% 1.0%01-817 4062-240 Santa Rosa, City of 1.6% 1.0%
10 Constitutes projects with both a Small Community Grant Fee and Administrative Service Fee.
90 | P a g e
Contract Number Project Number
Recipient Fee Rates
SCG Admin
01-821 4800-110 Redlands, City of 1.5% 1.0%
01-825 4790-110 Vallejo Sanitation & Flood District 1.5% 1.0%02-804 4252-410 La Canada Flintridge, City of 1.4% 1.0%02-809 4846-130 Inland Empire Utilities Agency 1.5% 1.0%02-810 4772-110 Burlingame, City of 1.5% 1.0%02-811 6061-120 Napa, County Of, Flood Control and Water 1.5% 1.0%02-816 4801-110 North San Mateo County Sanitation District 1.5% 1.0%02-817 4655-120 Piedmont, City of 1.5% 1.0%02-818 4307-110 San Luis Obispo, City of 1.5% 1.0%02-823 4007-610 Alameda, City of 1.6% 1.0%02-824 4728-110 South San Francisco, City of 1.5% 1.0%02-825 4658-110 Victor Valley Wastewater Rec Authority 1.5% 1.0%03-801 4695-110 Escondido, City of 1.4% 1.0%03-804 4657-110 Tahoe-Truckee Sanitation Agency 1.6% 1.0%03-806 4528-210 Benicia, City of 1.6% 1.0%03-811 4655-130 Piedmont, City of 1.5% 1.0%03-848 4783-310 Los Angeles County Sanitation District 1.3% 1.0%05-803 4693-110 Petaluma, City of 1.4% 1.0%05-808 4844-110 North Marin Water District 1.4% 1.0%06-801 4823-110 Sonoma Valley County Sanitation District 1.3% 1.0%06-802 6090-110 The Conservation Fund 1.3% 1.0%07-813 5053-110 Union Sanitary District 1.4% 1.0%07-817 6093-110 St. Helena, City of 1.4% 1.0%07-819 4971-210 Redding, City of 1.4% 1.0%07-820 4790-120 Vallejo Sanitation & Flood District 1.4% 1.0%07-825 4303-110 East Bay Municipal Utility District 1.4% 1.0%07-826 4971-220 Redding, City of 1.6% 1.0%07-836 4470-110 Colfax, City of 1.4% 1.0%
91 | P a g e
Contract Number Project Number
Recipient Fee Rates
SCG Admin09-851 5152-110 Burlingame, City of 1.9% 1.0%10-801 7245-110 El Toro Water District 1.7% 1.0%10-805 6601-110 Yolo County Flood Control and Water Conservation Dist. 1.7% 1.0%10-818 5571-110 Delta Diablo 1.6% 1.0%10-820 5160-110 Sunnyslope County Water District 1.6% 1.0%10-835 5533-110 Burbank, City of 1.6% 1.0%10-838 5310-110 Seal Beach, City of 1.6% 1.0%10-842 5310-120 Seal Beach, City of 1.6% 1.0%11-809 4971-230 Redding, City of 1.6% 1.0%97-812 4504-110 Chico, City of 1.6% 1.0%97-815 4155-110 San Elijo Joint Powers Authority 1.5% 1.0%97-817 4251-110 Colton, City of 1.5% 1.0%97-827 4614-110 South San Francisco, City of 1.6% 1.0%97-829 4441-120 Sacramento, City of 1.2% 1.0%98-810 4243-110 Wasco, City of 1.6% 1.0%98-811 6050-110 Merced, County of 1.6% 1.0%98-816 4429-110 Thousand Oaks, City of 1.4% 1.0%98-817 4001-260 Los Angeles County Sanitation District 1.4% 1.0%98-826 6026-110 South Lake Tahoe, City of 1.6% 1.0%98-828 6061-110 Napa, County Of, Flood Control and Water 1.4% 1.0%98-830 4529-110 Banning, City of 1.6% 1.0%99-809 4452-120 Santa Ana Watershed Project Authority 1.7% 1.0%99-819 4666-110 American Canyon, City of 1.7% 1.0%99-825 4452-130 Santa Ana Watershed Project Authority 1.6% 1.0%99-829 4616-110 Calistoga, City of 1.6% 1.0%99-830 4452-140 Santa Ana Watershed Project Authority 1.6% 1.0%
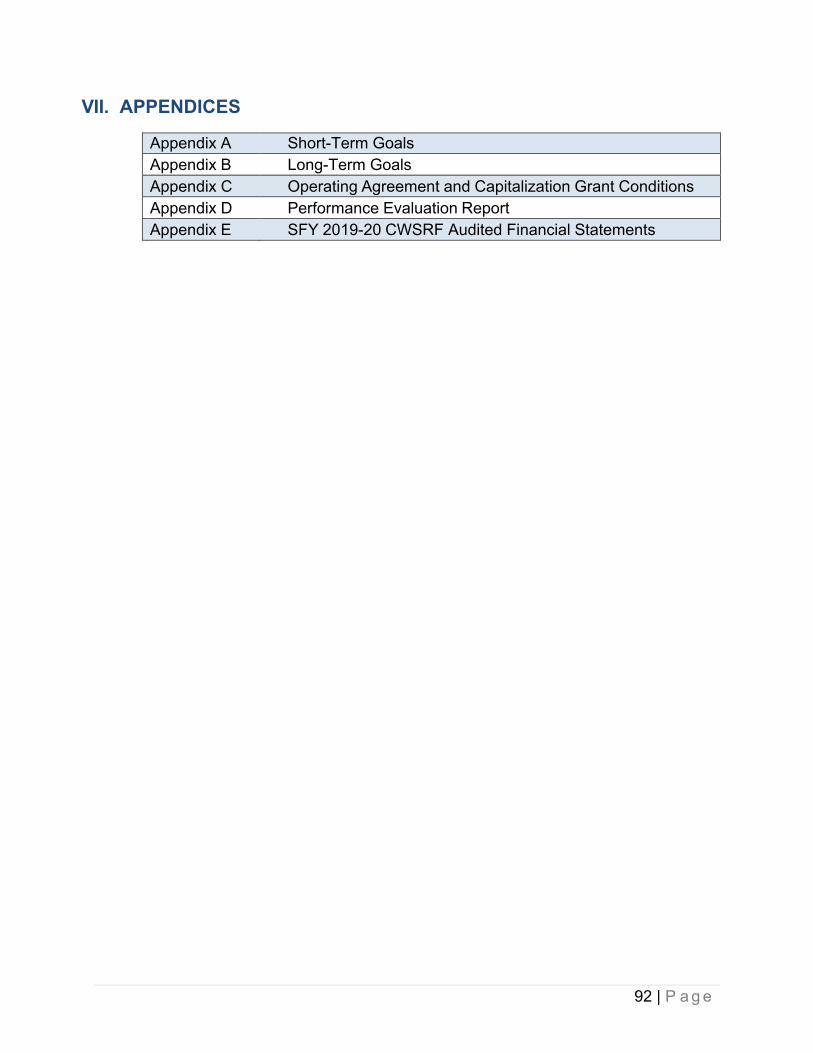
92 | P a g e
VII. APPENDICES
Appendix A Short-Term GoalsAppendix B Long-Term GoalsAppendix C Operating Agreement and Capitalization Grant ConditionsAppendix D Performance Evaluation ReportAppendix E SFY 2019-20 CWSRF Audited Financial Statements
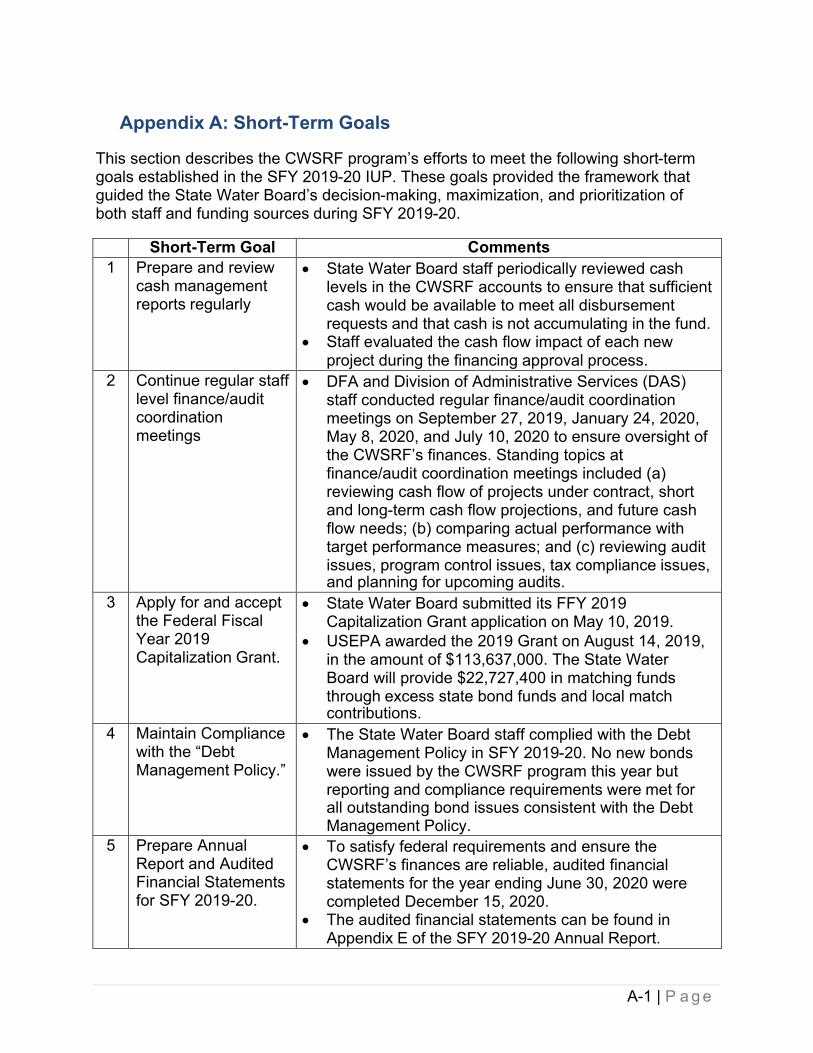
A-1 | P a g e
Appendix A: Short-Term Goals
This section describes the CWSRF program’s efforts to meet the following short-term goals established in the SFY 2019-20 IUP. These goals provided the framework that guided the State Water Board’s decision-making, maximization, and prioritization of both staff and funding sources during SFY 2019-20.
Short-Term Goal Comments1 Prepare and review
cash management reports regularly
· State Water Board staff periodically reviewed cash levels in the CWSRF accounts to ensure that sufficient cash would be available to meet all disbursement requests and that cash is not accumulating in the fund.
· Staff evaluated the cash flow impact of each new project during the financing approval process.
2 Continue regular staff level finance/audit coordination meetings
· DFA and Division of Administrative Services (DAS) staff conducted regular finance/audit coordination meetings on September 27, 2019, January 24, 2020, May 8, 2020, and July 10, 2020 to ensure oversight of the CWSRF’s finances. Standing topics at finance/audit coordination meetings included (a) reviewing cash flow of projects under contract, short and long-term cash flow projections, and future cash flow needs; (b) comparing actual performance with target performance measures; and (c) reviewing audit issues, program control issues, tax compliance issues,and planning for upcoming audits.
3 Apply for and accept the Federal Fiscal Year 2019 Capitalization Grant.
· State Water Board submitted its FFY 2019 Capitalization Grant application on May 10, 2019.
· USEPA awarded the 2019 Grant on August 14, 2019, in the amount of $113,637,000. The State Water Board will provide $22,727,400 in matching funds through excess state bond funds and local matchcontributions.
4 Maintain Compliance with the “Debt Management Policy.”
· The State Water Board staff complied with the Debt Management Policy in SFY 2019-20. No new bonds were issued by the CWSRF program this year but reporting and compliance requirements were met forall outstanding bond issues consistent with the Debt Management Policy.
5 Prepare Annual Report and Audited Financial Statements for SFY 2019-20.
· To satisfy federal requirements and ensure the CWSRF’s finances are reliable, audited financial statements for the year ending June 30, 2020 were completed December 15, 2020.
· The audited financial statements can be found in Appendix E of the SFY 2019-20 Annual Report.
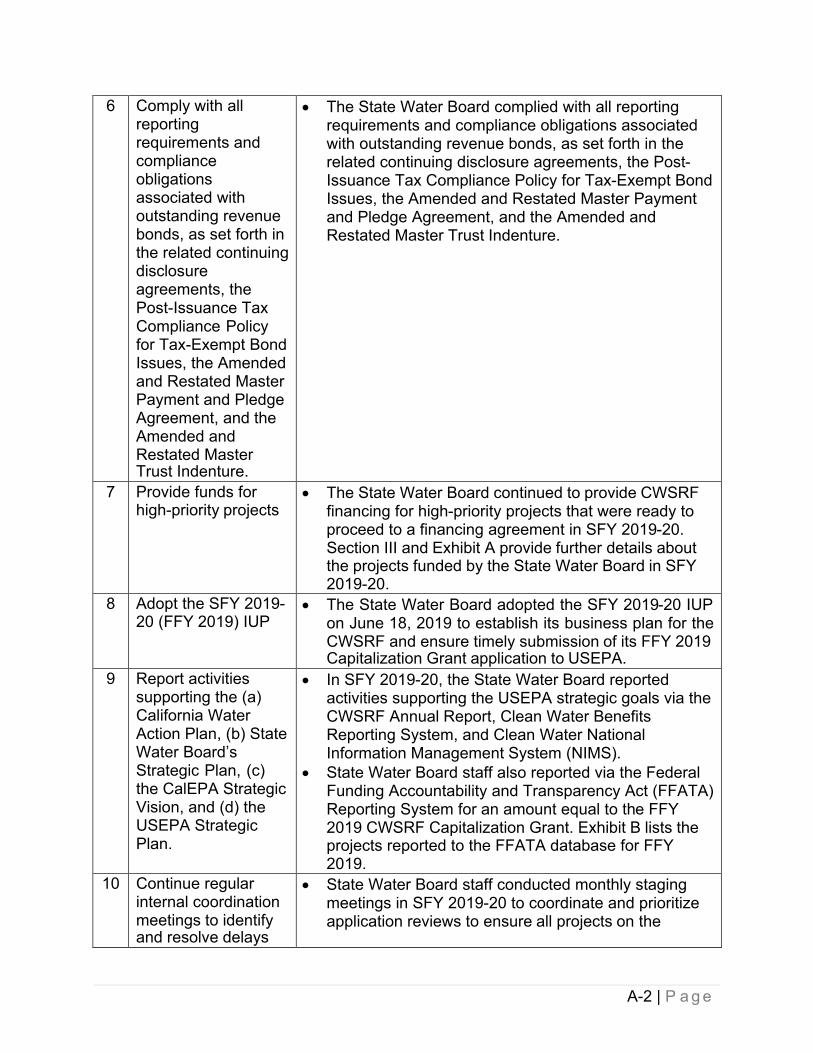
A-2 | P a g e
6 Comply with all reporting requirements and compliance obligations associated with outstanding revenue bonds, as set forth in the related continuing disclosure agreements, thePost-Issuance Tax Compliance Policy for Tax-Exempt Bond Issues, the Amended and Restated Master Payment and Pledge Agreement, and the Amended and Restated MasterTrust Indenture.
· The State Water Board complied with all reporting requirements and compliance obligations associated with outstanding revenue bonds, as set forth in the related continuing disclosure agreements, the Post- Issuance Tax Compliance Policy for Tax-Exempt Bond Issues, the Amended and Restated Master Payment and Pledge Agreement, and the Amended and Restated Master Trust Indenture.
7 Provide funds for high-priority projects
· The State Water Board continued to provide CWSRF financing for high-priority projects that were ready to proceed to a financing agreement in SFY 2019-20. Section III and Exhibit A provide further details aboutthe projects funded by the State Water Board in SFY 2019-20.
8 Adopt the SFY 2019- 20 (FFY 2019) IUP
· The State Water Board adopted the SFY 2019-20 IUP on June 18, 2019 to establish its business plan for the CWSRF and ensure timely submission of its FFY 2019Capitalization Grant application to USEPA.
9 Report activities supporting the (a) California Water Action Plan, (b) State Water Board’s Strategic Plan, (c) the CalEPA Strategic Vision, and (d) the USEPA Strategic Plan.
· In SFY 2019-20, the State Water Board reported activities supporting the USEPA strategic goals via the CWSRF Annual Report, Clean Water Benefits Reporting System, and Clean Water National Information Management System (NIMS).
· State Water Board staff also reported via the Federal Funding Accountability and Transparency Act (FFATA) Reporting System for an amount equal to the FFY 2019 CWSRF Capitalization Grant. Exhibit B lists theprojects reported to the FFATA database for FFY 2019.
10 Continue regular internal coordination meetings to identifyand resolve delays
· State Water Board staff conducted monthly staging meetings in SFY 2019-20 to coordinate and prioritize application reviews to ensure all projects on the
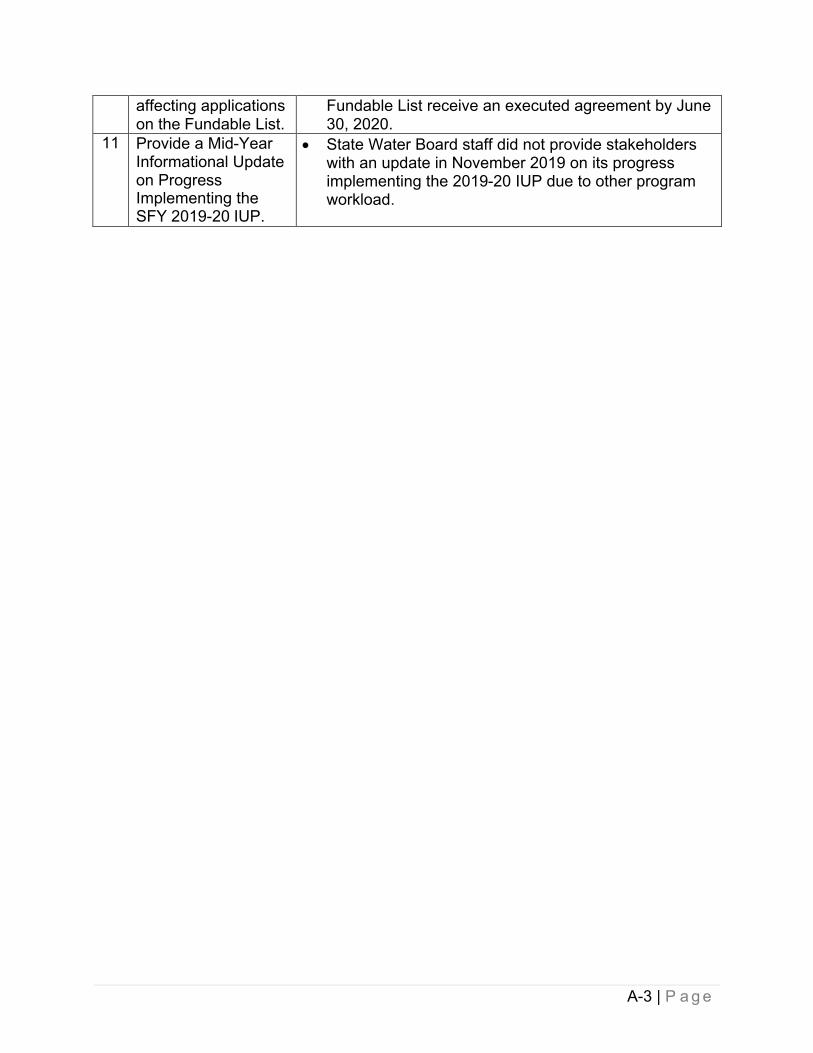
A-3 | P a g e
affecting applications on the Fundable List.
Fundable List receive an executed agreement by June 30, 2020.
11 Provide a Mid-Year Informational Update on ProgressImplementing the SFY 2019-20 IUP.
· State Water Board staff did not provide stakeholders with an update in November 2019 on its progress implementing the 2019-20 IUP due to other program workload.
B-1 | P a g e
Appendix B: Long-Term Goals
This section discusses the State Water Board’s efforts to meet the following long-term goals for the CWSRF program established in the SFY 2019-20 IUP. These long-term goals also provided a framework that guided the State Water Board’s decision-making, maximization, and prioritization of both staff and funding sources during SFY 2019-20.
Long-Term Goal Comments1 Maximize cash flow:
For maximum benefit, CWSRF disbursements should equal the Program’s receipts, less the minimum$25 million balance and restricted assets.
· State Water Board executed additional financing agreements that will use future CWSRF receipts and help preclude the growth of the CWSRF’s cash balance.
· State Water Board continued to monitor individual projects to ensure that cash was being requested on a regular basis; projects that had not requested funds for significant periods of time were prompted to submit disbursement requests.
· Throughout the year, the State Water Board received cash through a variety of sources, and disbursed cash for a variety of projects and program expenses. DFA also continued to monitor projects and their disbursements to ensure that final disbursements aremade within six (6) months of construction completion to ensure that funds are disbursed timely.
2 Use revenue and capital effectively
· DFA continued to monitor cash and financing forecasts to determine whether additional capital would be needed.
· The State Water Board did not need additional capitalduring 2019-20, and no additional CWSRF bonds were sold in SFY 2019-20.
3 Maintain financial integrity.
· State Water Board staff analyzed the creditworthiness of all applicants to ensure CWSRF is repaid on time and in full and imposed special conditions where appropriate on applicants to lower the credit risk.
· Approvals and transactions associated with individual CWSRF projects were documented in each project’s file. In general, a hard-copy file was established and maintained for each project and duplicate electronic records were also maintained for each project in the Loans and Grants Tracking System (LGTS), the CWSRF’s data management system.
· Each approval and transaction in SFY 2019-20required multiple reviews and sign-offs from staff and management to ensure accuracy and validity. Written
B-2 | P a g e
internal procedures for the CWSRF program were also maintained.
· State Water Board staff also surveilled financing recipients with outstanding obligations. Recipients are generally required to provide ongoing financial information after loan closing for at least five years, or longer in some cases, or to complete public outreach if there was significant public disapproval during their rate setting process.
· DFA staff maintained its “watch list” of financing recipients and potential applicants that show signs of financial weakness. Financial weakness was assessed using the financing recipients’ annual financial statements, a variety of news outlets, and periodic interactions with applicants, the Regional Water Boards, and the public.
· CWSRF monitored payments of all outstanding agreements in SFY 2019-20 to identify late payments and prevent delinquent payments, that is payments greater than 10 days past the payment due date, especially payments on agreements that have been pledged to repay CWSRF revenue bonds.
· State Water Board staff prepared financial statements for the CWSRF, and the financial statements were audited by an independent auditor in accordance with Government Auditing Standards. A copy of the audited financial statements is included in this report (Appendix E).
· Designated State Water Board supervisors and managers were required to file an annual “Statement of Economic Interest” with the California Fair Political Practices Commission. In addition, State Water Board supervisors and managers completed conflict ofinterest training and are required to complete ethics training biennially.
4 Achieve compliancestatewide with water quality objectives.
· The State Water Board continued its efforts to set andenforce water quality objectives. The State Water Board provided financial assistance from the CWSRF to correct pollution problems to help meet these objectives. The environmental benefits of the projects that received CWSRF financing during SFY 2019-20are summarized in Section III of this report.
5 Achieve sustainablewater resource management.
· State Water Board continued to make California’s water supply more sustainable and resilient. One CWSRF project funded during SFY 2019-20 was a
B-3 | P a g e
water recycling project that helped offset or augment fresh water supplies.
· Fourteen (14) projects funded during SFY 2019-20 met the USEPA’s “Green Project Reserve” criteria. Green projects reduce the environmental footprint of water and wastewater treatment, collection, and distribution; help utilities adapt to climate change; enhance water and energy conservation; adopt more sustainable solutions to wet weather flows; and promote innovative approaches to water management problems.
· All applicants for CWSRF infrastructure financing are required to certify the existence, or current development of, fiscal sustainability plans (FSP). A certified FSP includes an inventory of critical treatment works assets; an evaluation of the condition and performance of the assets; a certification that the applicant evaluated and will be implementing water and energy conservation; and a plan for maintaining, repairing, and replacing the treatment works and funding those activities.
· All public agencies that received CWSRF funds were required to certify they have performed a cost and effectiveness analysis and selected a project to maximize the efficient use, reuse, and recapture of water. Financed projects must maximize conservation of water and energy and consider the costs of construction, operation, and maintenance over the life of the project, as well as replacement of the project.
· State Water Board applied water conservation requirements to recipients and required compliance with several specific state water management laws, where applicable, including urban water management planning, agricultural water management planning,Delta Plan compliance, and water metering requirements.
6 Financeinfrastructure that will achieve or maintain compliance with federal and state water qualityrequirements.
· State Water Board financed approximately $599million of infrastructure improvements during SFY 2019-20, which will support the Regional Water Boards’ efforts to implement water quality control plans in their respective regions. Water quality control plans are developed on a watershed basis.
7 Assist with the StateWater Board’s Plan for California's
· The State Water Board did not fund any projects inSFY 2019-20 that will help address non-point source estuaries.
B-4 | P a g e
Nonpoint Source Pollution Control Program and estuary Comprehensive Conservation and Management Plans
8 Invest in small SDACs and small DACsdisproportionately affected by pollution and water contamination consistent with the Capacity Development Strategy.
· The Office of Sustainable Water Solutions (OSWS) was established on March 27, 2015 as a result of the Governor signing Assembly Bill 92. OSWS is part of State Water Board’s DFA. OSWS was created to promote permanent and sustainable drinking water and wastewater solutions to ensure effective and efficient provision of safe, clean, affordable, and reliable drinking water and wastewater treatment services, focusing on addressing financial and technical assistance needs, particularly for small disadvantaged communities. OSWS manages the Small Community Funding Program and provides small disadvantaged and small severely disadvantaged communities low interest loans and principal forgiveness through the CWSRF program and grants through the CWSRF Small Community Grant Fund (CWSRF-SCG) and Small Community Grant Wastewater (SCG-WW) programs utilizing federal and state funds respectively.
· The CWSRF-SCG continued to provide grant funds to small DACs in SFY 2019-20 for projects that addressed pollution and water contamination. In summary, twenty (20) projects totaling $43.578 million of CWSRF-SCG and related SCG-WW grants were awarded in SFY 2019-20. See Exhibit C for the list of projects for small DACs that were funded in SFY 2019- 20.
· OSWS continued to implement the State Water Board’s combined technical, managerial and financial capacity development strategy for small and/or DAC wastewater and drinking water communities. The combined strategy provides an overview of the challenges the communities face, including failing septic systems, failing and undersized wastewater treatment plants, higher per capita costs, lower household incomes for DACs, and prohibitive rates. The combined strategy also discusses options and offered solutions to help address the communities’ pollution and water contamination issues. Theseinclude offering grants, principal forgiveness, and
B-5 | P a g e
reduced interest rates for new infrastructure financing and providing technical assistance. Additional information on technical assistance provided to small DACs in SFY 2019-20 is described in Section IV(C). DFA staff initiated the stakeholder process to update the combined strategy in SFY 2018-19 but did not complete the process. Instead, staff time has been focused on developing and implementing the newly created Safe and Affordable Funding for Equity andResilience (SAFER) program.
9 Support the state’s greenhouse gas reduction and climate adaptation goals to the maximum extent practicable consistent with the State Water Board’s water quality objectives.
· The State Water Board worked to meet its sustainability objectives by helping funding recipients adapt to climate change. The State Water Board adopted Resolution No. 2017-0012 on March 7, 2017, outlining a comprehensive response to climate change for all the State Water Boards’ activities and programs. In response, DFA considered the potential effects of climate change on the viability of funded projects. Also, consistent with the California Air Resources Board’s Climate Change Scoping Plan, the State Water Board looked for actions to incentivize sustainable water-related infrastructure and water quality protection and improvement projects.
· DFA continued to evaluate information provided by applicants through the climate change worksheet required as part of all CWSRF funding applications. The climate change worksheet considers the impacts of climate change on projects being considered for CWSRF funding.
· DFA provides technical assistance where appropriate to support water and wastewater systems’ efforts to prepare for and mitigate the impacts of climate change including preparing and implementing climate adaptation plans, implementing drought resiliency and preparedness efforts, improving public health outcomes and providing access to safe and affordable drinking water, and efficiently and sustainably managing their drinking water systems and resources.
· DFA ensured that applications and environmental reviews for potential projects evaluated the impacts related to climate change and accounted for potential mitigation measures, including potential effects of climate change on the viability of funded projects, and worked with applicants to ensure that mitigation and adaptation measures are implemented as fully aspracticable.
B-6 | P a g e
· DFA provided CWSRF principal forgiveness to four water/energy audits during SFY 2019-20. The purpose of a water or energy audit is to encourage public agencies to evaluate their current practices, identify potentially inefficient water or energy use, and developa plan to improve consumption of these valuable resources.
10 Provide good customer service with a special emphasis on assisting smallSDACs and DACs.
· DFA continued to emphasize good customer service, especially assisting small SDACs and DACs with technical assistance and staff dedicated to helping these communities.
11 Ensure that the application forms and review procedures are clear, flexible, up-to- date, and efficient.
· In SFY 2019-20, State Water Board updated its CWSRF application forms and instructions to ensure that they met the accessibility requirements of California Government Code Sections 7405, Section 11135, Section 508 of the Rehabilitation Act, and AB 434, which requires each state agency to post on their home page a signed certification that the agency'sInternet Web site is in compliance with specified accessibility standards.
12 Clearly communicate to applicant their statuses and expectations for funding.
· DFA regularly updated the CWSRF Application Status Report posted on its Web site.
· Each application submitted to DFA was also assigned a Project Manager to assist the applicant through the application process. The Project Manager is the applicant’s primary source of information regarding theapplication’s status and timeframe for funding.
13 Ensure staff is well trained and ready to help applicants resolve all issues needed to receive financing.
· CWSRF management conducted regular staff meetings and training sessions to ensure that staff received up-to-date information about the current policies and procedures affecting the CWSRF program.
C-1 | Pa g e
Appendix C: Operating Agreement and Capitalization Grant Conditions
The State Water Board agreed to several conditions in the CWSRF Operating Agreement and the CWSRF Federal Capitalization Grant Agreements. These conditions were met as described below.
1. Assistance Activity
The State Water Board continued to provide CWSRF funding for activities in SFY 2019-20 that were eligible under Section 603(c) of the Clean Water Act. In summary, a total of $599.46 million in new CWSRF funding was awarded to 23 projects in SFY 2019-20. CWSRF funds were provided to eligible recipients to enhance wastewater treatment, collection systems, or wastewater recycling. The projects and eligible recipients funded in SFY 2019-20 are detailed in Exhibit A.
However, in SFY 2019-20, 178 projects listed on the Fundable List were not funded. Exhibit D lists these projects and the reasons why they did not receive CWSRF or other complementary funding in SFY 2019-20. The high demand for water quality improvement funding in California requires the State Water Board to prioritize projects based upon their water quality benefits as well as the recipient’s readiness to proceed to a funding agreement.
2. Eligible Categories of Projects and Financing Terms
The State Water Board offered funding to all eligible categories of projects in SFY 2019-20. The types of assistance included installment sales agreements, loans, and purchase of debt for the construction of treatment works.Additional subsidy in the form of principal forgiveness was also provided to those applicants that met the conditions specified by the State Water Board in Section III.C.2. of the SFY 2019-20 IUP.
The State Water Board offered planning, design, and construction financing during SFY 2019-20. Planning and design financing was provided in the form of principal forgiveness. Construction or implementation financing was generally amortized for periods up to 30 years or the useful life of the project if less than 30 years.
The standard interest rate applied to financing agreements was established at the time the project’s financing agreement was prepared. The interest rate was one-half the state’s most recent general obligation bond rate, rounded up to the nearest one-tenth of a percent (0.1%). However, small DACs and SDACs, NPS, and estuary management projects were generally offered a lower interest rate, not less than zero percent (0%), under certain conditions where necessary to make a project affordable as directed by the State Water Board in the IUP. Finally, although the CWSRF is over-matched, as explained
C-2 | Pa g e
in the next section, the State Water Board offered the zero percent (0%) CWSRF local match financing option during SFY 2019-20, but no agreements were executed for local match financing due to the current low interest rate environment.
3. Provide a State Match
The State Water Board met its match requirement by identifying state funds equal to at least 20 percent (20%) of each capitalization grant amount. As of SFY 2019-20, the total capitalization grant amount awarded to the State Water Board for the CWSRF program was $3.376 billion. Of this amount,$280 million did not require the 20 percent (20%) match because the funds were from the American Recovery and Reinvestment Act of 2009 (ARRA). As of June 30, 2020, the State Water Board has drawn $2.959 billion in CWSRF federal grants that required a 20 percent (20%) match. The required match for federal grants drawn by the State Water Board was approximately $591.9 million.
California uses a combination of state general obligation bonds repaid from non-CWSRF sources and funds contributed by CWSRF applicants to meet the 20 percent (20%) match requirement. A total of approximately $638.4 million in matching funds has been contributed to the CWSRF; therefore, California contributed approximately $46.6 million more to its CWSRF than is required to match grants drawn as of June 30, 2020.
Note: The National Information Management System Report includes all state match contributed to the CWSRF.
4. Binding Commitments within One Year
The State Water Board continued to commit CWSRF funding to projects in an amount equal to or greater than 120 percent (120%) of each federal quarterly payment within one year of that payment. As of June 30, 2020, executed funding agreements totaled approximately $11.8 billion, or approximately 349% of the total $3.38 billion in federal payments received as of June 30, 2020.
5. Expeditious and Timely Expenditure
The State Water Board continued to make timely and expeditious use of CWSRF funds, especially federal capitalization grant funds. As of June 30, 2020, the State Water Board had $23.0 million in undisbursed FFY 2018 CWSRF Capitalization Grant and $113.3 million of FFY 2019 CWSRF Capitalization Grant funds. The undisbursed funds were substantially reserved for principal forgiveness. This undisbursed balance continues the
C-3 | Pa g e
State Water Board’s practice of having federal fund balances of less than the equivalent of two capitalization grants.
This timely and expeditious use of CWSRF federal capitalization grant funds was substantially achieved through cash-flow modeling and the over- commitment of CWSRF funds in SFY 2019-20 and prior fiscal years. The over-commitment of funds, and expeditious and timely expenditures, is expected to continue in the future given the high demand for CWSRF funding.
The timely and expeditious use of CWSRF funds was also satisfied through the prompt and efficient processing of CWSRF reimbursement claims, albeit the CWSRF disbursement rate was below average in SFY 2019-20 due to the State Water Board’s implementation of FI$Cal. To ensure timely reimbursement, CWSRF claims were generally reviewed and paid within 45 days from receipt of a complete claim. This period, however, was somewhat longer in the last few months of the fiscal year due to the longer year-end transition period associated with FI$Cal. Prior to FI$Cal implementation, DFA staff reviewed and approved complete disbursement claims generally within 25 days, and then routed the requests to DAS for processing. DAS generally processed requests within eight calendar days of receiving the claim, and the State Controller’s Office (SCO) generally issued a check (warrant) within seven calendar days to the funding recipient. The implementation of FI$Cal has added additional processing time to the disbursement of funds within DFA, DAS and the State Controller’s Office. This change in claims processing times are expected to normalize in SFY 2020-21 but remain longer than historical averages for the foreseeable future.
The State Water Board also continued to draw federal funds in SFY 2019-20 from the United States Treasury via the Automated Standard Application for Payments (ASAP) system as warrants were issued by SCO. ASAP is a request and delivery system of federal funds developed by the Financial Management Service of the United States Treasury and the Federal Reserve Bank. By using ASAP, the State Water Board draws funds from USEPA for expenditures incurred by the CWSRF program in an expeditious and timely manner. Draw requests are made within one week of an issued warrant.Requested funds are also deposited electronically the next business day to account(s) specified by the State Water Board.
To further enable the timely and expeditious use of CWSRF funds, the State Water Board primarily funded CWSRF reimbursement claims first with federal funds, if available, to ensure the prompt liquidation of federal capitalization grants. However, as of June 30, 2020, approximately $52 million of CWSRF financings had been encumbered to the approximately $136 million in available CWSRF federal capitalization grant funds, constituting a 38% commitment ratio. This lower encumbrance ratio was the result of uncommitted principal forgiveness that has been reserved for projects benefiting small DACs. It is anticipated this available principal forgiveness will
C-4 | Pa g e
continue to be encumbered in SFY 2020-21 to facilitate the timely and expeditious use of federal funds.
6. Disadvantaged Business Enterprise (DBE) Objectives and Davis-Bacon and American Iron and Steel (AIS) Requirements
The State Water Board negotiated a total fair share DBE objective with the US EPA for the CWSRF program. For FFY 2019, the objective was two percent (2%) for the Minority Owned Business Enterprises (MBE) and one percent (1%) for Women Owned Business Enterprises (WBE) participation for a combined three percent (3%) goal. Funding recipients for SFY 2019-20 reported participation as 3.23 percent (3.23%) for MBE and 0.58 percent (0.58%) for WBE. The overall DBE participation was 3.81 percent (3.81%).Exhibit E provides a detailed analysis of DBE participation. The State Water Board will continue to monitor participation to ensure that the “positive effort process” is followed by funding recipients.
All CWSRF funded projects were required to comply with Davis-Bacon prevailing wage requirements in SFY 2019-20. Each funding agreement included provisions requiring applicants to follow Davis-Bacon requirements. DFA conducted a variety of surveillance activities throughout SFY 2019-20 to ensure each recipient’s compliance with Davis-Bacon requirements.Surveillance activities included (1) reviewing recipient and sub-recipient reports and compliance certifications; (2) tracking compliance with federal annual monitoring requirements; and (3) annually reviewing quarterly site inspection reports to verify the adequacy of site inspections and control activities.
CWSRF funding recipients were also required to use AIS products in SFY 2019-20 pursuant to USEPA guidelines for projects involving the construction, alteration, maintenance, or repair of a public treatment works funded after January 16, 2014, unless a national or project specific waiver from the USEPA applied. Each funding agreement included provisions requiring applicants to follow AIS requirements. DFA also examined recipient records for AIS certifications and/or any AIS waivers during project inspections.
7. Use of Capitalization Grant Administration Allowance and Administrative Cost Expenditures
In accordance with federal requirements, CWSRF funds can be used for

C-5 | Pa g e
administration of the CWSRF program11. In SFY 2019-20. the State Water Board had three (3) options to determine the maximum amount of CWSRF funds that could be expended for administration of the CWSRF program as presented in Table 7 below. The State Water Board may also expend revenue derived from CWSRF fees deposited to the CWSRF Administration Fund12 to administer the CWSRF program.
Table 7: CWSRF Administration Expenditure Options
Option CWSRF Administration Allowance Options
Maximum CWSRF Administration Allowance for SFY 2019-20
A $400,000 $400,000
B
4% of all grant awards (including FFY 2019 CWSRF Capitalization Grant) less prior years’ CWSRF administrativeexpenses
$36,789,757
C 1/5% of CWSRF Net Position (as of June 30, 2020) $8,733,954
As of June 30, 2020, the cumulative administrative expenditures from both the CWSRF and the CWSRF Administration Fund were $175.2 million. In SFY 2019-20 specifically, the total administrative expenditure from the CWSRF and the CWSRF Administration Fund was $8.47 million.
The State Water Board elected to fund administrative costs from the CWSRF during SFY 2019-20 in the amount of $257,000 for administrative expenses attributable to vendor contracts. The cumulative administration cost incurred by the State Water Board from the CWSRF as of June 30, 2020 was approximately $98.5 million. This amount was $36.5 million less than the four percent (4.0%) upper limit of all CWSRF grant awards, or approximately $135 million, as of June 30, 2020. Therefore, the State Water Board has complied with Section 603(d)(7) of the Clean Water Act.
Other administration expenses, namely personnel costs, were paid from the CWSRF Administration Fund in SFY 2019-20, in the amount of $8.208
11 Per section 603 (d)(7) of the Federal Pollution Control Act (Clean Water Act) the CWSRF may be used “for the reasonable costs of administering the fund and conducting activities under this subchapter, except that such amounts shall not exceed 4 percent of all grant awards to such fund under this subchapter, $400,000 per year, or 1/5 percent per year of the current valuation of the fund, whichever amount is greatest, plus the amount of any fees collected by the State for such purpose regardless of the source.”12 The CWSRF Administration Fund is held outside the CWSRF and is not subject to the limitations of Section 603(d)(7) of the CWA. All expenditures from the CWSRF Administration Fund are subject to the annual state budget process.
C-6 | Pa g e
million. As of June 30, 2020, the cumulative expenses of the CWSRF Administration Fund were approximately $76.7 million. The balance of the CWSRF Administration Fund was approximately $16.7 million as of June 30, 2020. The CWSRF Administration Fund is funded through administrative service fees on existing CWSRF repayable financings, as further described in Section II(A).
8. Additional Subsidy and Green Project Reserve Requirements
In accordance with USEPA requirements, a portion of each CWSRF capitalization grant must be used for additional subsidy and the Green Project Reserve. Table 8 shows the minimum and maximum additional subsidy established by USEPA. The State Water Board has directed DFA to use the maximum allowable additional subsidy in the form of principal forgiveness for every annual capitalization grant awarded by USEPA. Table 8 also shows the additional subsidy amounts committed and uncommitted by capitalization grant as of June 30, 2020. Additionally, Table 8 shows the disbursement of additional subsidy by capitalization grant as of June 30, 2020 based on USEPA’s capitalization grant disbursement policies. In conclusion, of the total$326.17 million allocated by the State Water Board for additional subsidy, a total of $85.05 million of additional subsidy remains uncommitted and a total of $134.66 million remains undisbursed as of June 30, 2020.
Table 9 shows the minimum amounts of Green Project Reserve that must be awarded by capitalization grant per USEPA requirements. It also shows the amounts of Green Project Reserve funding committed and disbursed by capitalization grant to CWSRF projects as of June 30, 2020. In conclusion, the State Water Board was required to provide a minimum of $131.8 million in Green Project Reserve funding. A total of $1.6 billion has been committed and $1.32 billion has been disbursed to Green Projects. Both amounts exceed the minimum GPR requirement.
Exhibits F and G identifies the 14 CWSRF projects funded from the Green Project Reserve and with the 21 additional subsidy (principal forgiveness) projects in SFY 2019-20.
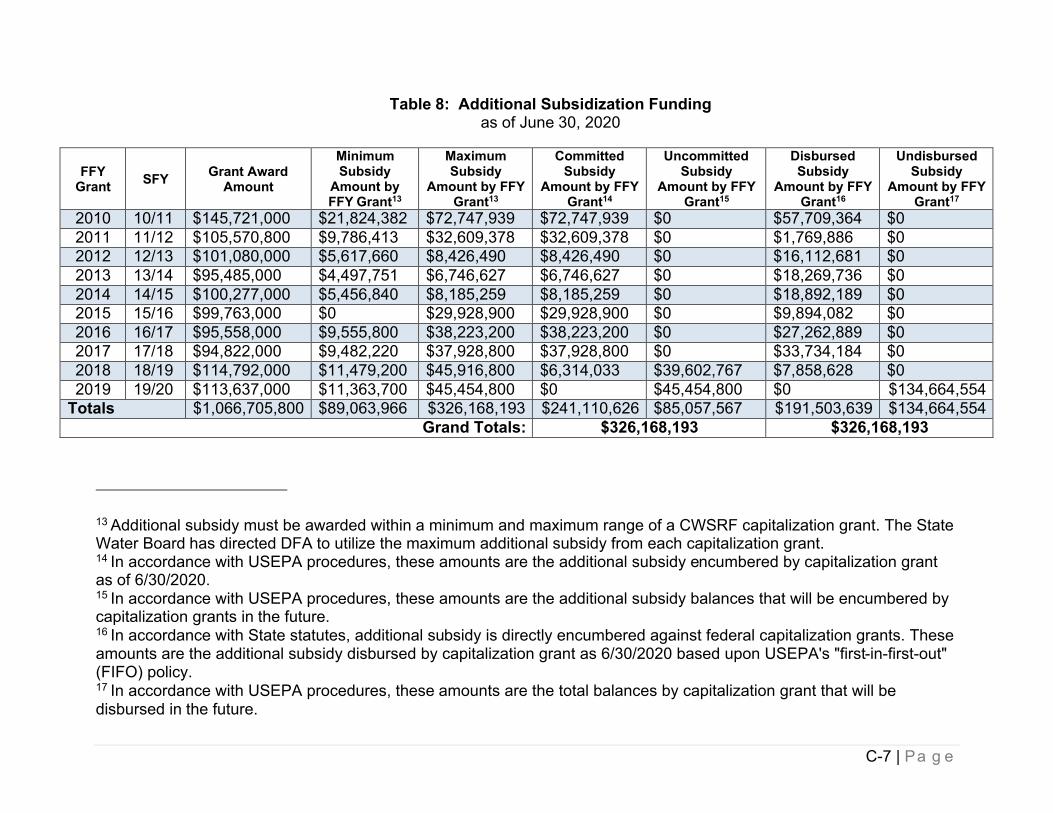
C-7 | Pa g e
Table 8: Additional Subsidization Fundingas of June 30, 2020
FFYGrant SFY Grant Award
Amount
Minimum Subsidy
Amount by FFY Grant13
Maximum Subsidy
Amount by FFY Grant13
Committed Subsidy
Amount by FFY Grant14
Uncommitted Subsidy
Amount by FFY Grant15
Disbursed Subsidy
Amount by FFY Grant16
Undisbursed Subsidy
Amount by FFY Grant17
2010 10/11 $145,721,000 $21,824,382 $72,747,939 $72,747,939 $0 $57,709,364 $02011 11/12 $105,570,800 $9,786,413 $32,609,378 $32,609,378 $0 $1,769,886 $02012 12/13 $101,080,000 $5,617,660 $8,426,490 $8,426,490 $0 $16,112,681 $02013 13/14 $95,485,000 $4,497,751 $6,746,627 $6,746,627 $0 $18,269,736 $02014 14/15 $100,277,000 $5,456,840 $8,185,259 $8,185,259 $0 $18,892,189 $02015 15/16 $99,763,000 $0 $29,928,900 $29,928,900 $0 $9,894,082 $02016 16/17 $95,558,000 $9,555,800 $38,223,200 $38,223,200 $0 $27,262,889 $02017 17/18 $94,822,000 $9,482,220 $37,928,800 $37,928,800 $0 $33,734,184 $02018 18/19 $114,792,000 $11,479,200 $45,916,800 $6,314,033 $39,602,767 $7,858,628 $02019 19/20 $113,637,000 $11,363,700 $45,454,800 $0 $45,454,800 $0 $134,664,554
Totals $1,066,705,800 $89,063,966 $326,168,193 $241,110,626 $85,057,567 $191,503,639 $134,664,554Grand Totals: $326,168,193 $326,168,193
13 Additional subsidy must be awarded within a minimum and maximum range of a CWSRF capitalization grant. The State Water Board has directed DFA to utilize the maximum additional subsidy from each capitalization grant.14 In accordance with USEPA procedures, these amounts are the additional subsidy encumbered by capitalization grant as of 6/30/2020.15 In accordance with USEPA procedures, these amounts are the additional subsidy balances that will be encumbered by capitalization grants in the future.16 In accordance with State statutes, additional subsidy is directly encumbered against federal capitalization grants. These amounts are the additional subsidy disbursed by capitalization grant as 6/30/2020 based upon USEPA's "first-in-first-out" (FIFO) policy.17 In accordance with USEPA procedures, these amounts are the total balances by capitalization grant that will be disbursed in the future.
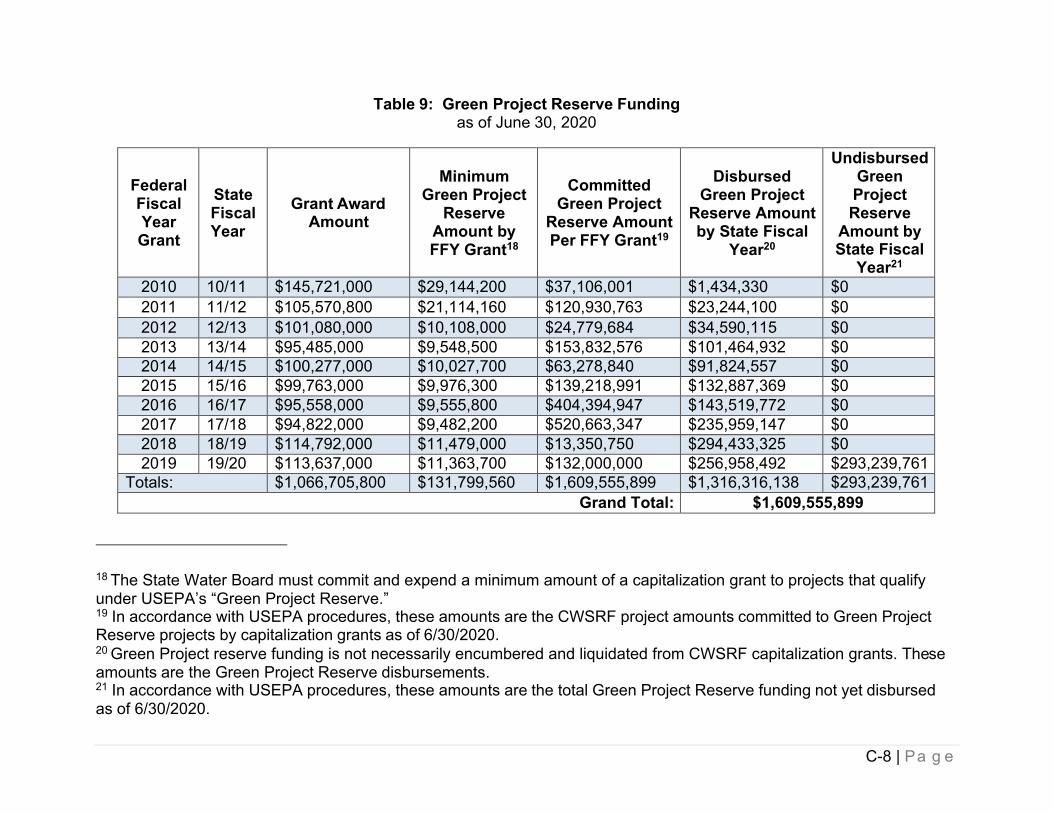
C-8 | Pa g e
Table 9: Green Project Reserve Fundingas of June 30, 2020
Federal Fiscal Year Grant
State Fiscal Year
Grant Award Amount
Minimum Green Project
Reserve Amount by FFY Grant18
Committed Green Project
Reserve Amount Per FFY Grant19
Disbursed Green Project
Reserve Amount by State Fiscal
Year20
Undisbursed Green Project Reserve
Amount byState Fiscal
Year21 2010 10/11 $145,721,000 $29,144,200 $37,106,001 $1,434,330 $02011 11/12 $105,570,800 $21,114,160 $120,930,763 $23,244,100 $02012 12/13 $101,080,000 $10,108,000 $24,779,684 $34,590,115 $02013 13/14 $95,485,000 $9,548,500 $153,832,576 $101,464,932 $02014 14/15 $100,277,000 $10,027,700 $63,278,840 $91,824,557 $02015 15/16 $99,763,000 $9,976,300 $139,218,991 $132,887,369 $02016 16/17 $95,558,000 $9,555,800 $404,394,947 $143,519,772 $02017 17/18 $94,822,000 $9,482,200 $520,663,347 $235,959,147 $02018 18/19 $114,792,000 $11,479,000 $13,350,750 $294,433,325 $02019 19/20 $113,637,000 $11,363,700 $132,000,000 $256,958,492 $293,239,761
Totals: $1,066,705,800 $131,799,560 $1,609,555,899 $1,316,316,138 $293,239,761Grand Total: $1,609,555,899
18 The State Water Board must commit and expend a minimum amount of a capitalization grant to projects that qualify under USEPA’s “Green Project Reserve.”19 In accordance with USEPA procedures, these amounts are the CWSRF project amounts committed to Green ProjectReserve projects by capitalization grants as of 6/30/2020.20 Green Project reserve funding is not necessarily encumbered and liquidated from CWSRF capitalization grants. These amounts are the Green Project Reserve disbursements.21 In accordance with USEPA procedures, these amounts are the total Green Project Reserve funding not yet disbursedas of 6/30/2020.
C-9 | Pa g e
9. Federal Cross-Cutters
The State Water Board ensured that CWSRF financing recipients comply with applicable federal laws, known as “cross-cutters” through a variety of program procedures.
CWSRF financing agreements included a list of applicable federal statutes and requirements taken from the most recent capitalization grant. Every financing recipient agreed to comply with these federal requirements by signing the financing agreement.
The State Water Board Staff updated the State Environmental Review Process (SERP), and the USEPA Region 9 Administrator approved it on July 24, 2020. The State Water Board Staff reviewed CWSRF projects consistent with the approved SERP. While the SERP generally follows the requirements of the California Environmental Quality Act, each applicant was also required to complete and submit an Evaluation Form for Federal Environmental Coordination (Evaluation Form) along with relevant supporting federal environmental cross- cutters documents. The State Water Board Staff reviewed the completed Evaluation Form and the supporting federal environmental cross-cutters documents to assure compliance with the federal environmental cross-cutters requirements. Staff coordinated with the USEPA, Region 9 to initiate consultations with relevant federal agencies on projects with known (or suspected) effects under federal environmental regulations, consistent with the SERP approved by the USEPA.
DFA also required compliance with DBE and Davis-Bacon wage requirements for all CWSRF financing, except planning and design financing, and required Single Audit Act (Office of Management and Budget [OMB] Circular A-133 and 2 CFR Part 200, subpart F, and updates or revisions, thereto) compliance and reporting on all recipients that received $750,000 or more in federal funds in any one year. DFA also required compliance with AIS requirements beginning in 2014, as required by the Consolidated Appropriations Act of 2014 (Public Law 113-76) and by the Clean Water Act, unless the project qualified for a waiver.
As of October 1, 2010, FFATA, along with associated OMB directives, requires non-ARRA recipients of federal dollars to report recipient and sub-recipient information into the FFATA Subaward Reporting System (FSRS) by the end of the month following recipient or sub-recipient award greater than or equal to$25,000. The CWSRF program began reporting FFATA data in FFY 2011, on an equivalency basis, by choosing financing agreements that equaled the total CWSRF grant amount received from USEPA. The CWSRF program continued to report FFATA financing agreement data, on an equivalency basis, to the FSRS as described in Exhibit B.
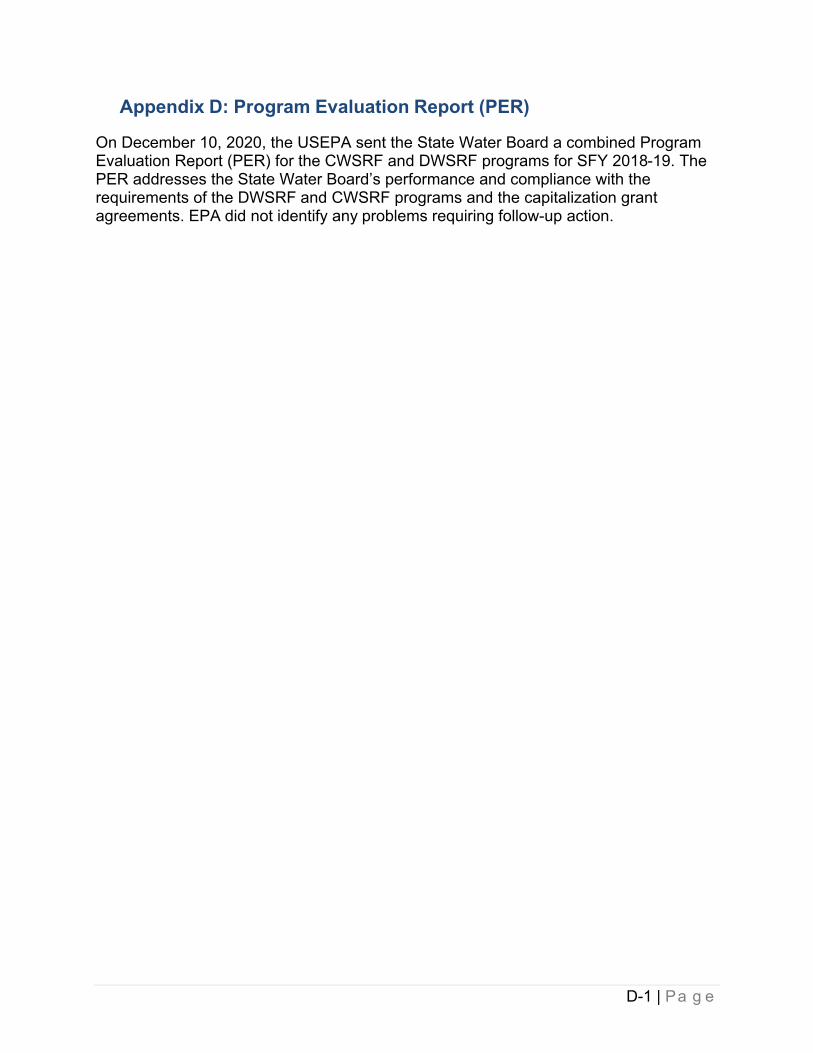
D-1 | Pa g e
Appendix D: Program Evaluation Report (PER)
On December 10, 2020, the USEPA sent the State Water Board a combined Program Evaluation Report (PER) for the CWSRF and DWSRF programs for SFY 2018-19. The PER addresses the State Water Board’s performance and compliance with the requirements of the DWSRF and CWSRF programs and the capitalization grant agreements. EPA did not identify any problems requiring follow-up action.
E-1 | P a g e
Appendix E: SFY 2019-20 CWSRF Audited Financial Statements
CALIFORNIA STATE WATER RESOURCES CONTROL BOARD
WATER POLLUTION CONTROL REVOLVING FUNDSacramento, California
FINANCIAL STATEMENTS and SINGLE AUDIT REPORTS
June 30, 2020 and 2019
Table of Contents
PAGE
INDEPENDENT AUDITORS’ REPORT ........................................................................................ I
MANAGEMENT’S DISCUSSION AND ANALYSIS .................................................................... IV
BASIC FINANCIAL STATEMENTS ............................................................................................. 1
Statements of Net Position ............................................................................................... 2Statements of Revenues, Expenses and Changes in Net Position .................................. 3Statements of Cash Flows ................................................................................................ 4Notes to Financial Statements .......................................................................................... 5
SINGLE AUDIT REPORTS ........................................................................................................ 21
Schedule of Expenditures of Federal Awards ................................................................. 22Notes to the Schedule of Expenditures of Federal Awards ............................................. 23Independent Auditors’ Report on Internal Control Over
Financial Reporting and on Compliance and Other Matters Based on an Audit of Financial Statements Performed inAccordance with Government Auditing Standards .................................................... 24
Independent Auditors’ Report on Compliance for Each Major Federal Program and Report on Internal Control OverCompliance Required by the Uniform Guidance ....................................................... 26
Schedule of Findings and Questioned Costs .................................................................. 29Summary Schedule of Prior Year Findings ..................................................................... 30
I
INDEPENDENT AUDITORS’ REPORT
Board of DirectorsCalifornia State Water Resources Control Board Water Pollution Control Revolving Fund Sacramento, California
Report on the Financial StatementsWe have audited the accompanying financial statements of the California State Water Resources Control Board, Water Pollution Control Revolving Fund (Water Pollution Control Revolving Fund), an enterprise fund of the State of California, as of and for the years ended June 30, 2020 and 2019, and the related notes to the financial statements, which collectively comprise the entity’s basic financial statements as listed in the table of contents.
Management’s Responsibility for the Financial StatementsManagement is responsible for the preparation and fair presentation of these financial statements in accordance with accounting principles generally accepted in the United States of America; this includes the design, implementation, and maintenance of internal control relevant to the preparation and fair presentation of financial statements that are free from material misstatement, whether due to fraud or error.
Auditors’ ResponsibilityOur responsibility is to express an opinion on these financial statements based on our audits. We conducted our audits in accordance with auditing standards generally accepted in the United States of America and the standards applicable to financial audits contained in Government Auditing Standards, issued by the Comptroller General of the United States. Those standards require that we plan and perform the audit to obtain reasonable assurance about whether the financial statements are free from material misstatement.
An audit involves performing procedures to obtain audit evidence about the amounts and disclosures in the financial statements. The procedures selected depend on the auditors’ judgment, including the assessment of the risks of material misstatement of the financial statements, whether due to fraud or error. In making those risk assessments, the auditor considers internal control relevant to the entity’s preparation and fair presentation of the financial statements in order to design audit procedures that are appropriate in the circumstances, but not for the purpose of expressing an opinion on the effectiveness of the entity’s internal control.
II
Board of DirectorsCalifornia State Water Resources Control Board Water Pollution Control Revolving Fund
Accordingly, we express no such opinion. An audit also includes evaluating the appropriateness of accounting policies used and the reasonableness of significant accounting estimates made by management, as well as evaluating the overall presentation of the financial statements.
We believe that the audit evidence we have obtained is sufficient and appropriate to provide a basis for our audit opinion.
OpinionIn our opinion, the financial statements referred to above present fairly, in all material respects, the respective financial position of the California State Water Resources Control Board, Water Pollution Control Revolving Fund as of June 30, 2020 and 2019, and the respective changes in financial position and cash flows thereof for the years then ended in accordance with accounting principles generally accepted in the United States of America.
Other MattersAs discussed in Note 1 – Definition of Reporting Entity, the basic financial statements of the California State Water Resources Control Board, Water Pollution Control Revolving Fund are intended to present the financial position, changes in financial position and cash flows of only that portion of the financial reporting entity of the California State Water Resources Control Board that is attributable to the transactions of the California State Water Resources Control Board, Water Pollution Control Revolving Fund. They do not purport to, and do not, present fairly the financial position of the California State Water Resources Control Board or the State of California as of June 30, 2020 and 2019, and the changes in their financial position and their cash flows, where applicable, for the years then ended, in conformity with the accounting principles generally accepted in the United States of America. Our opinion is not modified with respect to this matter.
Required Supplementary InformationAccounting principles generally accepted in the United States of America require that the management’s discussion and analysis on pages IV through X be presented to supplement the basic financial statements. Such information, although not a part of the basic financial statements, is required by the Governmental Accounting Standards Board who considers it to be an essential part of financial reporting for placing the basic financial statements in an appropriate operational, economic, or historical context. We have applied certain limited procedures to the required supplementary information in accordance with auditing standards generally accepted in the United States of America, which consisted of inquiries of management about the methods of preparing the information and comparing the information for consistency with management’s responses to our inquiries, the basic financial statements, and other knowledge we obtained during our audit of the basic financial statements. We do not express an opinion or provide any assurance on the information because the limited procedures do not provide us with sufficient evidence to express an opinion or provide any assurance.

III
Board of DirectorsCalifornia State Water Resources Control Board Water Pollution Control Revolving Fund
Other InformationOur audits were conducted for the purpose of forming an opinion on the financial statements that collectively comprise the California State Water Resources Control Board, Water Pollution Control Revolving Fund’s basic financial statements. The schedule of expenditures of federal awards, as required by Title 2 U.S. Code of Federal Regulations Part 200, Uniform Administrative Requirements, Cost Principles, and Audit Requirements for Federal Awards, is presented for purposes of additional analysis and is not a required part of the basic financial statements.
The schedule of expenditures of federal awards is the responsibility of management and was derived from and relates directly to the underlying accounting and other records used to prepare the basic financial statements. Such information has been subjected to the auditing procedures applied in the audit of the basic financial statements and certain additional procedures, including comparing and reconciling such information directly to the underlying accounting and other records used to prepare the basic financial statements or to the basic financial statements themselves, and other additional procedures in accordance with auditing standards generally accepted in the United States of America. In our opinion, the information is fairly stated, in all material respects, in relation to the basic financial statements as a whole.
Other Reporting Required by Government Auditing StandardsIn accordance with Government Auditing Standards, we have also issued our report dated December 15, 2020, on our consideration of the Water Pollution Control Revolving Fund’s internal control over financial reporting and on our tests of its compliance with certain provisions of laws, regulations, contracts, and grant agreements and other matters. The purpose of that report is solely to describe the scope of our testing of internal control over financial reporting and compliance and the results of that testing, and not to provide an opinion on the effectiveness of the Water Pollution Control Revolving Fund’s internal control over financial reporting or on compliance. That report is an integral part of an audit performed in accordance with Government Auditing Standards in considering Water Pollution Control Revolving Fund’s internal control over financial reporting and compliance.
aCliftonLarsonAllen LLP
Greenwood Village, Colorado December 15, 2020
IV
California State Water Resources Control Board Water Pollution Control Revolving Fund
State Revolving Fund Program
Management’s Discussion & Analysis
The following Management’s Discussion and Analysis is a required supplement to the California State Water Resources Control Board’s (State Water Board), Water Pollution Control Revolving Fund (Clean Water State Revolving Fund program) (CWSRF) financial statements. It describes and analyzes the financial position of the CWSRF providing an overview of the CWSRF’s activities for the years ended June 30, 2020 and 2019. We encourage readers to consider the information presented here in conjunction with information that is in the financial statements and notes, which follow this section.
Financial Highlights· Net position increased by $177.9 million to a total of $4.4 billion in 2020, which was
$116.4 million more than the increase of $61.5 million in 2019. The larger increase in net position is a direct result of higher capital contributions during the year from the U.S. Environmental Protection Agency (EPA).
· Capital contributions increased by $122 million to $155.9 million as compared to $33.9 million in 2019. The increase in capital contributions was mostly a result of capital available from EPA capitalization grants for loan disbursements. Capital contributions from EPA capitalization grant funds that were forgiven increased by $1.7 million to $23.1 million as compared to $21.4 million in 2019.
· Cash and cash equivalents increased by $52 million in 2020 as compared to a decrease of $425 million in 2019. The increase in 2020 was mostly the result of an increase in early payoffs of loan receivables.
· Loans receivable increased by $28 million to $4.8 billion in 2020 and increased by $400 million in 2019. The smaller increase in 2020 mostly reflects an increase in early payoffs of loan receivables.
· Restricted portion of net position increased by $24.5 million to $2.4 billion in 2020 as compared to a decrease of $76 million in 2019. The increase in 2020 mostly reflects an increase in restricted cash due to early payoffs of loan receivables. The decrease in 2019 reflects the decrease in notes receivables for loans pledged to the Series 2012, 2016, 2017, and 2018 Revenue bonds as a result of repayments received and the related debt service payments.
V
Using this Annual Financial ReportThe financial statements included in this annual financial report are those of the CWSRF. As discussed in Note 1, Definition of Reporting Entity, the basic financial statements of the CWSRF are intended to present the financial position, changes in financial position, and cash flows of only that portion of the financial reporting entity of the State Water Board that is attributable to the transactions of the CWSRF. They do not purport to present the financial position of the State Water Board or the State of California (State) as of June 30, 2020 and 2019 and the change in their financial positions and their cash flows for the years then ended.
Overview of Financial StatementsThis discussion and analysis is an introduction to the CWSRF financial statements and accompanying notes to financial statements. This report also contains required supplementary information and other supplementary information.
The financial statements of the CWSRF are presented as a special purpose government engaged only in business type activities - providing loans to other governmental entities. The statements provide both short-term and long-term information about the CWSRF’s financial position, which assists the reader in assessing the CWSRF’s economic condition at the end of the fiscal year. These statements are prepared using the accrual basis of accounting. The financial statements include the following three statements:
· The Statements of Net Position present information on all of the CWSRF’s assets, deferred outflows of resources, liabilities and deferred inflows of resources with the difference reported as net position. Over time, increases or decreases in net position are expected to serve as a useful indicator of whether the financial position of the CWSRF is improving or deteriorating.
· The Statements of Revenues, Expenses, and Changes in Net Position present information which reflects how the CWSRF’s net position changed during the past year. All changes in the net position are reported as soon as the underlying event giving rise to the change occurs, regardless of the timing of the cash flows. Thus, revenues and expenses are reported in the statement for some items that will only result in cash flows in future fiscal periods.
· The Statements of Cash Flows report the CWSRF’s cash flows from operating activities, noncapital financing activities, and investing activities.
The Notes to Financial Statements provide additional information that is essential to a full understanding of the data provided in the financial statements. These notes can be found immediately following the financial statements.

VI
Net PositionIn 2020, the CWSRF’s net position continued to strengthen increasing by $177.9 million, or 4.2%, to $4.4 billion at June 30, 2020 as compared to an increase of $61.5 million, or 1.5%, the previous year. The increase in net position was $116.4 million higher than in the previous year, mostly reflecting the higher level of capital contributions from EPA capitalization grants.
The current portion of the CWSRF’s liabilities was $119 million in 2020 and $116 million in 2019. Current liabilities primarily correspond to continuing principal payments for the Series 2016, 2017 and 2018 Revenue Bonds. Noncurrent liabilities decreased by $104.3 million in 2020 as compared to a decrease of $100.4 million in 2019. The decrease in 2020 and 2019 is a result of the ongoing principal payments of the Series 2016, 2017, and 2018 Revenue Bonds.
A segment of the CWSRF’s net position is subject to external restriction due to the debt service requirements of the Series 2012, 2016, 2017 and 2018 Revenue Bonds. The net position that is restricted increased in 2020 by $24.5 million to $2.4 billion, or 1.0%, as compared to a decrease in 2019 of $76 million to $2.3 billion, or 3.2%. The increase in 2020 was primarily due to an increase in early payoffs of pledged loan receivables. The decrease in 2019 was primarily due to ongoing debt service payments.
Of the total restricted net position, $2.029 billion in 2020 and $2.087 billion in 2019 represent the balance of outstanding loans that were pledged as security to the Series 2012, 2016, 2017 and 2018 Revenue Bond debt service. The principal and interest received during the fiscal year from these loans is used to make the semi-annual debt service payments on the revenue bonds.
The CWSRF received total payments on pledged loans of $532.8 million ($507.0 million of principal and $25.8 million of interest) in 2020 of which the debt service payment was $136.4 million ($77.1 million of principal and $59.3 million of interest). In 2019, the CWSRF received total payments on pledged loans of $189.2 million ($155.6 million of principal and $33.6 million of interest) of which the debt service payments were $122.1 million ($58.8 million of principal and $63.3 million of interest).
The remaining $341.4 million of restricted net position in 2020 and $258.3 million in 2019 represent pledged loan repayments, which are restricted for future loan disbursements and/or debt service payments. Any excess of principal and interest received over the required debt service may be used for future loan disbursements and/or released from restriction in the event that certain criteria are met.
VII
Table 1Net Position(in thousands)
June 30,2020 2019 2018
ASSETSCash and cash equivalents $ 844,214 $ 791,849 $ 1,217,225Loans receivable 4,836,799 4,808,306 4,408,127All other assets 30,277 34,395 32,805
Total assets 5,711,290 5,634,550 5,658,157
LIABILITIESCurrent liabilities 118,805 115,671 100,318Noncurrent liabilities 1,225,508 1,329,849 1,430,322
Total liabilities 1,344,313 1,445,520 1,530,640
NET POSITIONRestricted
Debt service 341,425 258,323 211,650Security for revenue bonds 2,028,780 2,087,404 2,210,416
Subtotal restricted assets 2,370,205 2,345,727 2,422,066
Unrestricted 1,996,772 1,843,303 1,705,451 Total net position $ 4,366,977 $ 4,189,030 $ 4,127,517
Changes in Net PositionProgram revenue for the CWSRF in 2020 was $66.6 million of which $26 million is restricted for debt service. Program revenue in 2019 was $67.2 million of which $30.6 million was restricted for debt service. In 2020, program revenue decreased by $0.6 million or 0.96% and in 2019 increased by $3 million or 4.76%. In 2020, program revenue reflects a decrease in outstanding restricted receivables and the interest earned on those receivables. In 2019, program revenue reflects an increase in outstanding receivables and the interest earned year over year on those receivables.
In 2020, general revenue was $14 million, which was a decrease of $5.5 million or 28%, when compared to $19.5 million in 2019. In 2019, general revenue increased $6.6 million or 51% compared to $12.9 million in 2018. The decrease in investment income during 2020 mostly reflects reduced earnings as a result of lower interest rates earned on the cash on deposit, while the increase in investment income during 2019 mostly reflects increased earnings as a result of higher interest rates earned on the cash on deposit.
Total expenses decreased by $0.6 million in 2020 as compared to an increase of $3.8 million in 2019. The decrease in 2020 was primarily due to a decrease in revenue bond expenses. The increase in 2019 was primarily due to an increase in revenue bond expenses.
VIII
Total capital contributions increased by $122 million, or 359.6% in 2020 when compared to 2019. In 2019, total capital contributions decreased by $38.9 million or 53.4% when compared to 2018.
In 2020, EPA capitalization grant contributions increased by $120.3 million or 969% when compared to 2019. In 2019, EPA capitalization grant contributions decreased by $33.8 million or 73% when compared to 2018. The 2020 increase was primarily due to an increase in available contributions from EPA capitalization grants. The 2019 decrease was primarily due to a decrease in available contributions from EPA capitalization grants.
In 2020, EPA capitalization grant contributions for principal forgiveness loans increased by $1.7 million when compared to 2019. In 2019, EPA capitalization grant contributions for principal forgiveness loans decreased by $5.1 million when compared to 2018. The 2020 increase was primarily due to an increase in principal forgiveness disbursements. The 2019 decrease was primarily due to a decrease in principal forgiveness disbursements. The loans made with these funds were forgiven as disbursed and must be repaid if certain loan conditions are not met.
Table 2Changes in Net Position (in thousands)
Year Ended June 30,2020 2019 2018
RevenuesProgram revenues:
Loan interest income $ 66,600 $ 67,243 $ 64,185General revenues:
Investment income 14,027 19,585 12,950 Total revenues 80,627 86,828 77,135
ExpensesProgram expenses:
Administrative expenses 257 506 393Capitalization Principal Forgiveness expense 23,136 21,433 26,510Revenue bond interest expense 35,270 37,313 26,587Revenue bond issuance costs - - 1,951
Total expenses 58,663 59,252 55,441
Increase in net position beforecontributions 21,964 27,576 21,694
Capital contributions:EPA capitalization grant 132,782 12,420 46,261EPA capitalization grant Principal Forgiveness 23,136 21,433 26,510State and other contributions 65 84 43
Subtotal capital contributions 155,983 33,937 72,814
Change in net position 177,947 61,513 94,508
Net position - beginning of year 4,189,030 4,127,517 4,033,009Net position - end of year $ 4,366,977 $ 4,189,030 $ 4,127,517
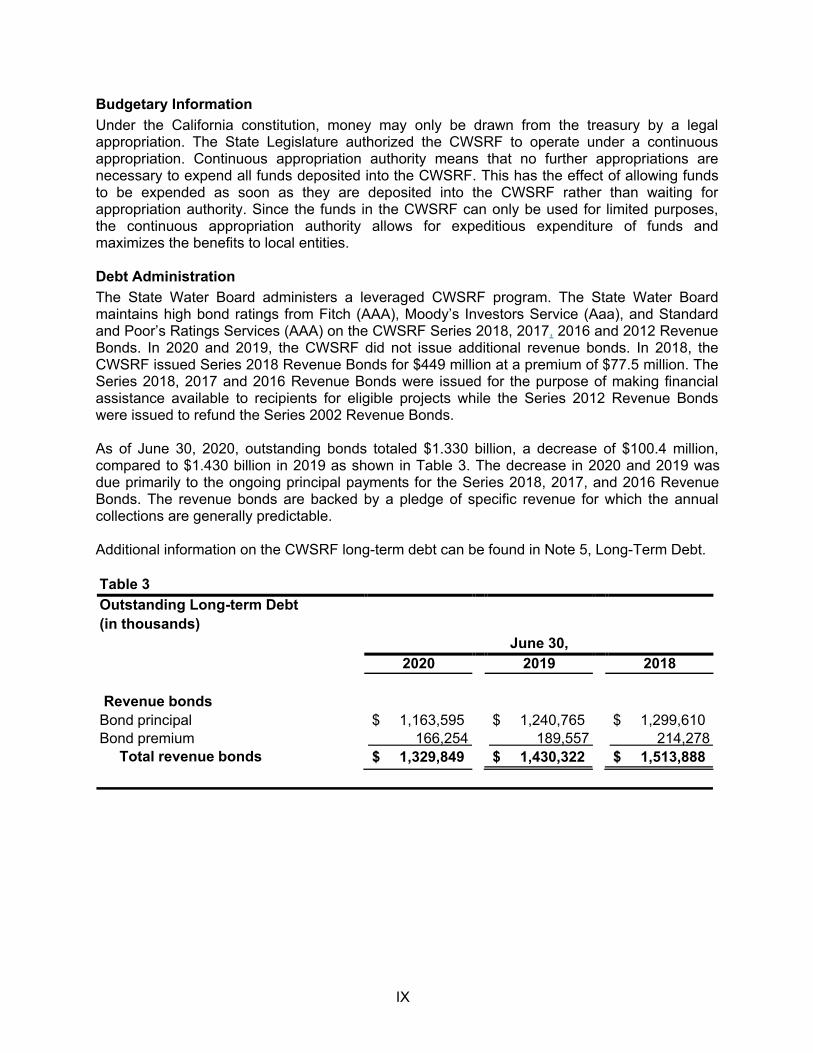
IX
Budgetary InformationUnder the California constitution, money may only be drawn from the treasury by a legal appropriation. The State Legislature authorized the CWSRF to operate under a continuous appropriation. Continuous appropriation authority means that no further appropriations are necessary to expend all funds deposited into the CWSRF. This has the effect of allowing funds to be expended as soon as they are deposited into the CWSRF rather than waiting for appropriation authority. Since the funds in the CWSRF can only be used for limited purposes, the continuous appropriation authority allows for expeditious expenditure of funds and maximizes the benefits to local entities.
Debt AdministrationThe State Water Board administers a leveraged CWSRF program. The State Water Board maintains high bond ratings from Fitch (AAA), Moody’s Investors Service (Aaa), and Standard and Poor’s Ratings Services (AAA) on the CWSRF Series 2018, 2017, 2016 and 2012 Revenue Bonds. In 2020 and 2019, the CWSRF did not issue additional revenue bonds. In 2018, the CWSRF issued Series 2018 Revenue Bonds for $449 million at a premium of $77.5 million. The Series 2018, 2017 and 2016 Revenue Bonds were issued for the purpose of making financial assistance available to recipients for eligible projects while the Series 2012 Revenue Bonds were issued to refund the Series 2002 Revenue Bonds.
As of June 30, 2020, outstanding bonds totaled $1.330 billion, a decrease of $100.4 million, compared to $1.430 billion in 2019 as shown in Table 3. The decrease in 2020 and 2019 was due primarily to the ongoing principal payments for the Series 2018, 2017, and 2016 Revenue Bonds. The revenue bonds are backed by a pledge of specific revenue for which the annual collections are generally predictable.
Additional information on the CWSRF long-term debt can be found in Note 5, Long-Term Debt.
Table 3Outstanding Long-term Debt(in thousands)
June 30,2020 2019 2018
Revenue bondsBond principal $ 1,163,595 $ 1,240,765 $ 1,299,610Bond premium 166,254 189,557 214,278
Total revenue bonds $ 1,329,849 $ 1,430,322 $ 1,513,888
X
Economic Conditions and OutlookIn 2020, new binding loan commitments (encumbrances) were $732 million which is a 231% increase when compared to new commitments made in 2019. The increase in 2020 financing activity indicates a normalization of lending after implementation of California’s new statewide Financial Information System, Fi$Cal. There continues to be a significant demand for CWSRF financing which reflects the need in California for additional infrastructure improvements and the generally positive capacity of wastewater agencies to finance those improvements. A steady demand in CWSRF financing activity is anticipated in the near term.
Capitalization grant funds from EPA continue to be an important component of cash flows for financing activities. For the grant year 2020, the EPA allocated $113 million to the CWSRF which was equal to the 2019 grant allocation. Presently available information indicates that the 2021 grant will be approximately equal to the 2020 grant, but this amount could change as a result of ongoing congressional budget negotiations.
Additionally, the CWSRF continues to maintain a large loan portfolio that generates significant program revenues for financing activity and administrative expenses. CWSRF program staff and its financial advisors continuously monitor the demand for new loans and market conditions to determine their likely effects on the CWSRF and to be prepared to quickly sell a revenue bond if needed to meet required cash flows.
Economic conditions changed during 2020 due to the impacts associated with the COVID-19 virus. The CWSRF continues to monitor these impacts on local entities revenues and to diligently work with and surveil loan recipients to ensure full repayment of all loans.
Requests for InformationThis financial report is designed to provide interested parties with a general overview of the CWSRF finances. Questions concerning the information provided in this report or requests for additional information should be addressed to Ms. Heather Bell, Manager, Accounting Branch, Division of Administrative Services, P.O. Box 100, Sacramento, California 95812 or [email protected].
1
BASIC FINANCIAL STATEMENTS
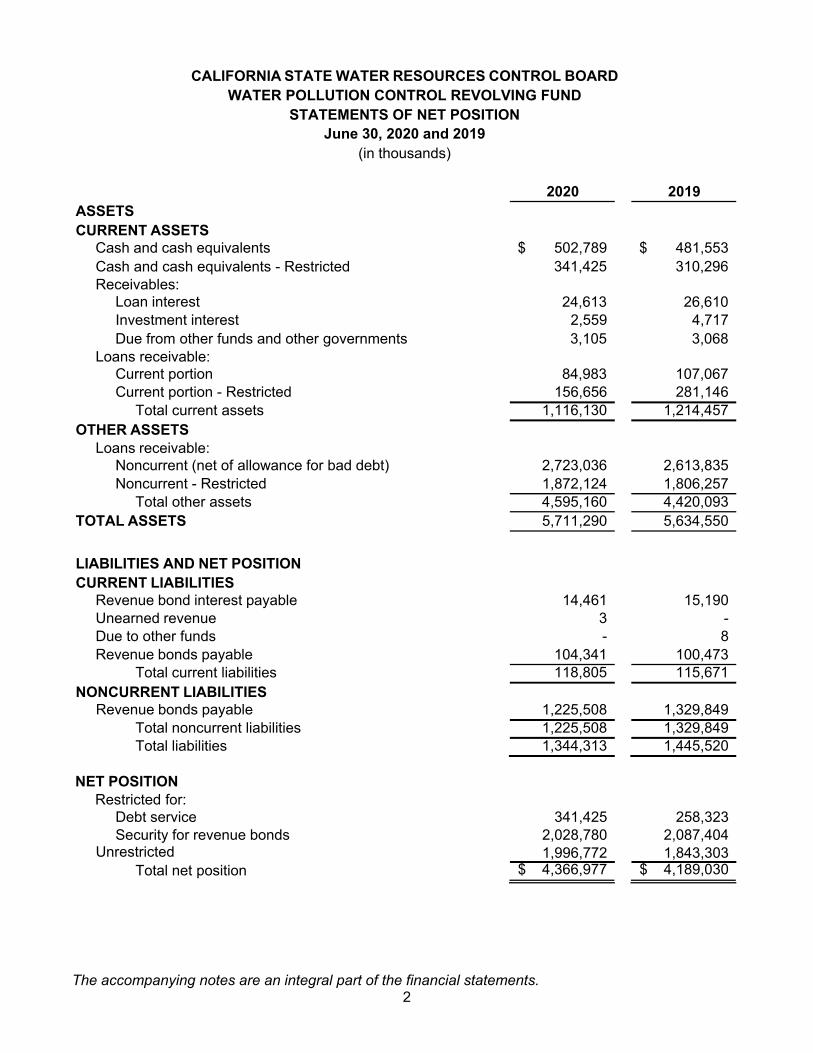
The accompanying notes are an integral part of the financial statements. 2
CALIFORNIA STATE WATER RESOURCES CONTROL BOARD WATER POLLUTION CONTROL REVOLVING FUND
STATEMENTS OF NET POSITIONJune 30, 2020 and 2019
(in thousands)
2020 2019ASSETSCURRENT ASSETS
Cash and cash equivalents $ 502,789 $ 481,553Cash and cash equivalents - Restricted Receivables:
Loan interest
341,425
24,613
310,296
26,610Investment interest 2,559 4,717Due from other funds and other governments
Loans receivable:Current portion
3,105
84,983
3,068
107,067Current portion - Restricted 156,656 281,146
Total current assets 1,116,130 1,214,457OTHER ASSETS
Loans receivable:Noncurrent (net of allowance for bad debt) 2,723,036 2,613,835Noncurrent - Restricted 1,872,124 1,806,257
Total other assets 4,595,160 4,420,093TOTAL ASSETS 5,711,290 5,634,550
LIABILITIES AND NET POSITIONCURRENT LIABILITIES
Revenue bond interest payable 14,461 15,190Unearned revenue 3 -Due to other funds - 8Revenue bonds payable 104,341 100,473
Total current liabilities 118,805 115,671NONCURRENT LIABILITIES
Revenue bonds payable 1,225,508 1,329,849Total noncurrent liabilities 1,225,508 1,329,849Total liabilities 1,344,313 1,445,520
NET POSITIONRestricted for:
Debt service 341,425 258,323Security for revenue bonds 2,028,780 2,087,404
Unrestricted 1,996,772 1,843,303Total net position $ 4,366,977 $ 4,189,030
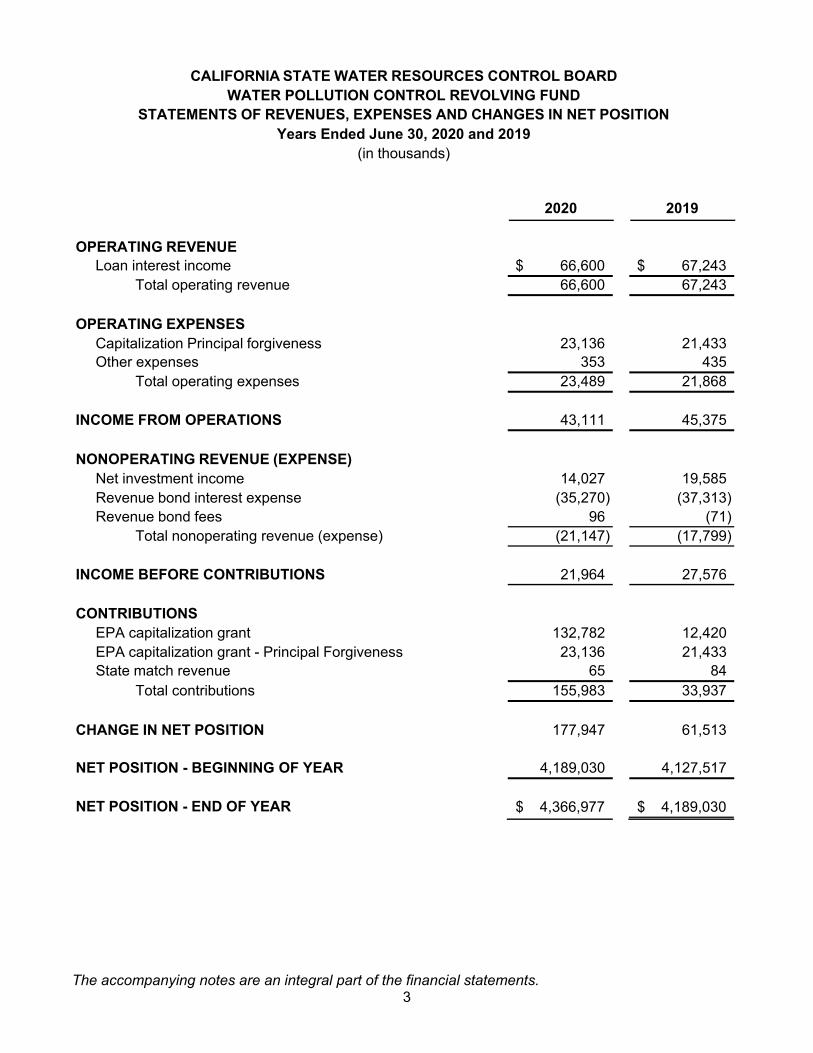
The accompanying notes are an integral part of the financial statements. 3
CALIFORNIA STATE WATER RESOURCES CONTROL BOARD WATER POLLUTION CONTROL REVOLVING FUND
STATEMENTS OF REVENUES, EXPENSES AND CHANGES IN NET POSITIONYears Ended June 30, 2020 and 2019
(in thousands)
2020 2019
OPERATING REVENUELoan interest income $ 66,600 $ 67,243
Total operating revenue 66,600 67,243
OPERATING EXPENSESCapitalization Principal forgiveness 23,136 21,433Other expenses 353 435
Total operating expenses 23,489 21,868
INCOME FROM OPERATIONS 43,111 45,375
NONOPERATING REVENUE (EXPENSE)Net investment income 14,027 19,585Revenue bond interest expense (35,270) (37,313)Revenue bond fees 96 (71)
Total nonoperating revenue (expense) (21,147) (17,799)
INCOME BEFORE CONTRIBUTIONS 21,964 27,576
CONTRIBUTIONSEPA capitalization grant 132,782 12,420EPA capitalization grant - Principal Forgiveness 23,136 21,433State match revenue 65 84
Total contributions 155,983 33,937
CHANGE IN NET POSITION 177,947 61,513
NET POSITION - BEGINNING OF YEAR 4,189,030 4,127,517
NET POSITION - END OF YEAR $ 4,366,977 $ 4,189,030
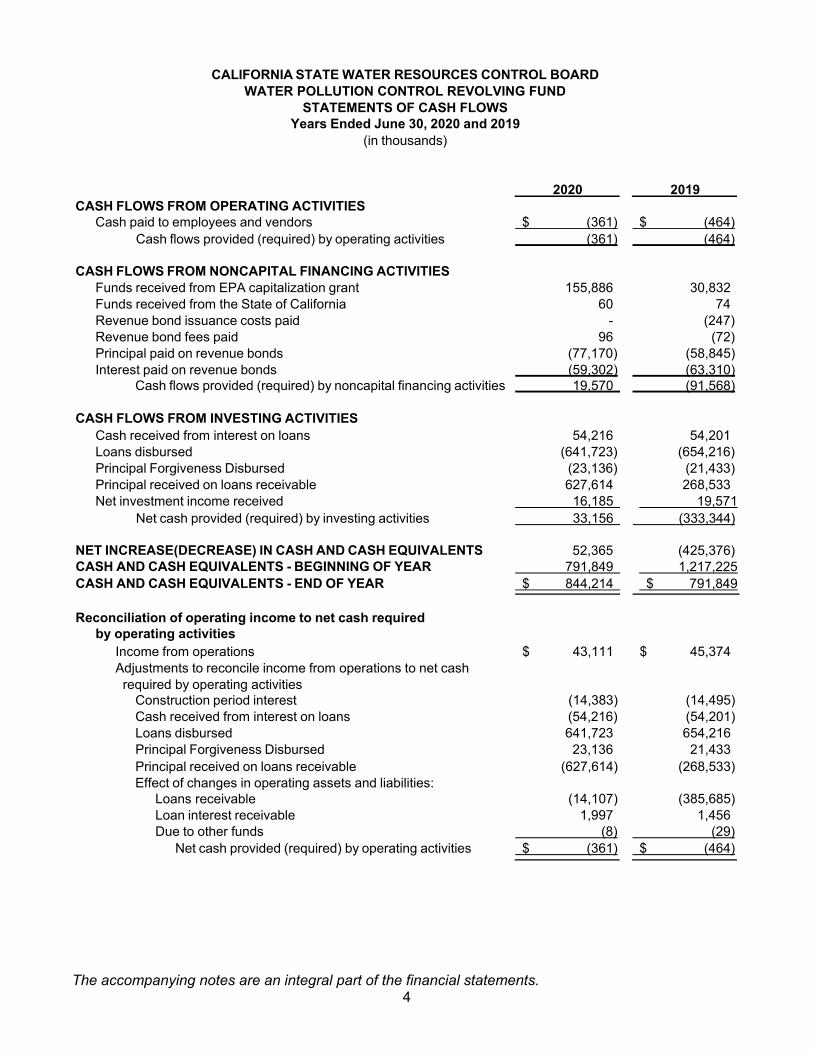
The accompanying notes are an integral part of the financial statements. 4
CALIFORNIA STATE WATER RESOURCES CONTROL BOARD WATER POLLUTION CONTROL REVOLVING FUND
STATEMENTS OF CASH FLOWSYears Ended June 30, 2020 and 2019
(in thousands)
2020 2019CASH FLOWS FROM OPERATING ACTIVITIES
Cash paid to employees and vendors $ (361) $ (464)Cash flows provided (required) by operating activities (361) (464)
CASH FLOWS FROM NONCAPITAL FINANCING ACTIVITIESFunds received from EPA capitalization grant 155,886 30,832Funds received from the State of California 60 74Revenue bond issuance costs paid - (247)Revenue bond fees paid 96 (72)Principal paid on revenue bonds (77,170) (58,845)Interest paid on revenue bonds (59,302) (63,310)
Cash flows provided (required) by noncapital financing activities 19,570 (91,568)
CASH FLOWS FROM INVESTING ACTIVITIESCash received from interest on loans 54,216 54,201Loans disbursed (641,723) (654,216)Principal Forgiveness Disbursed (23,136) (21,433)Principal received on loans receivable 627,614 268,533Net investment income received 16,185 19,571
Net cash provided (required) by investing activities 33,156 (333,344)
NET INCREASE(DECREASE) IN CASH AND CASH EQUIVALENTS 52,365 (425,376)CASH AND CASH EQUIVALENTS - BEGINNING OF YEAR 791,849 1,217,225 CASH AND CASH EQUIVALENTS - END OF YEAR $ 844,214 $ 791,849
Reconciliation of operating income to net cash required by operating activities
Income from operationsAdjustments to reconcile income from operations to net cash required by operating activities
Construction period interest
$ 43,111
(14,383)
$ 45,374
(14,495)Cash received from interest on loans (54,216) (54,201)Loans disbursed 641,723 654,216Principal Forgiveness Disbursed 23,136 21,433Principal received on loans receivableEffect of changes in operating assets and liabilities:
Loans receivable
(627,614)
(14,107)
(268,533)
(385,685)Loan interest receivable 1,997 1,456Due to other funds (8) (29)
Net cash provided (required) by operating activities $ (361) $ (464)
5
CALIFORNIA STATE WATER RESOURCES CONTROL BOARD WATER POLLUTION CONTROL REVOLVING FUND
NOTES TO FINANCIAL STATEMENTSJune 30, 2020 and 2019
(Dollar Amounts Expressed in Thousands)
NOTE 1 - DEFINITION OF REPORTING ENTITY
The California State Water Resources Control Board, Water Pollution Control Revolving Fund (Fund) was established pursuant to Title VI of the Federal Clean Water Act of 1987 (Act). The Act established the State Revolving Fund (CWSRF) program to replace the construction grants program (Title II of the Act) to provide loans at reduced interest rates to finance the construction of publicly owned water pollution control facilities, non-point source pollution control projects, and estuary management plans. Instead of making grants to communities that pay for a portion of building wastewater treatment facilities, the CWSRF provides for low interest loans and/or subsidies in the form of principal forgiveness loans to finance the entire cost of qualifying projects. The CWSRF provides a flexible financing source that can be used for a variety of pollution control projects, including non-point source pollution control projects, and developing estuary conservation and management plans. Loans made must be repaid within 30 years or less. All repayments, including interest and principal, must remain in the Fund.
Since 1989, the Fund has been capitalized by a series of grants from the U.S Environmental Protection Agency (EPA). States are required to provide matching funds equal to 20 percent of the Federal capitalization grant amount in order to receive the grants from the EPA. As of June 30, 2020 and 2019, the EPA has awarded cumulative capitalization grant funding of $3,095,794 and $2,982,157, respectively to the State of California (State), for which the State is required to provide $619,159 and $ 596,431, respectively, of cumulative matching funding to the Fund. In addition, in February 2009, the EPA awarded $280,285 in ARRA grant funding for which there is no State Match requirement.
The Fund is administered by the California State Water Resources Control Board (Board), a part of the California Environmental Protection Agency, through the Division of Financial Assistance (Program). The Board’s primary responsibilities with the CWSRF include obtaining capitalization grants from the EPA, soliciting potential applicants, negotiating loan agreements with local communities, reviewing and approving disbursement requests from loan recipients, managing the loan repayments, and conducting inspection and engineering reviews to ensure compliance with all applicable laws, regulations, and program requirements. The Board consists of five member positions, which are appointed by the Governor and confirmed by the Senate.
The Board administers the CWSRF program by charging the Fund or the Administrative Fund for time spent on CWSRF activities by employees of the Board, and the Fund reimburses the State for such costs in the following month. The charges include the salaries and benefits of the employees, as well as indirect costs allocated to the Fund based on direct salary costs. Employees charging time to the Fund are covered by the benefits available to State employees. The Fund is also charged indirect costs through the cost allocation plan for general State expenses.
Reporting EntityThe Fund follows the Governmental Accounting Standards Board (GASB) accounting pronouncements which provide guidance for determining which governmental activities, organizations and functions should be included within the financial reporting entity. GASB pronouncements set forth the financial accountability of a governmental organization’s elected governing body as the basic criterion for including a possible component governmental organization in a primary government’s legal entity. Financial accountability includes, but is not limited to, appointment of a voting majority of the organization's governing body, ability to impose its will on the organization, a potential for the organization to provide specific financial benefits or burdens and fiscal dependency.
6
CALIFORNIA STATE WATER RESOURCES CONTROL BOARD WATER POLLUTION CONTROL REVOLVING FUND
NOTES TO FINANCIAL STATEMENTSJune 30, 2020 and 2019
(Dollar Amounts Expressed in Thousands)
NOTE 1 - DEFINITION OF REPORTING ENTITY (CONTINUED)
The activities of the Fund are included in the State’s Comprehensive Annual Financial Report as an enterprise fund using the accrual basis of accounting.
NOTE 2 - SUMMARY OF SIGNIFICANT ACCOUNTING POLICIES
The accounting policies of the Fund conform to generally accepted accounting principles as applicable to a governmental unit accounted for as a proprietary enterprise fund. The enterprise fund is used since the Fund’s powers are related to those operated in a manner similar to a for profit business where an increase in net position is an appropriate determination of accountability.
Basis of AccountingThe Fund’s records are maintained on the accrual basis of accounting. Under the accrual basis of accounting revenue is recognized when earned and expenses are recognized when the liability is incurred. Assets and liabilities associated with the operations of the Fund are included in the Statements of Net Position.
Operating Revenues and ExpensesThe Fund distinguishes between operating revenues and expenses and nonoperating items in the Statements of Revenues, Expenses and Changes in Net Position. Operating revenues and expenses generally result from carrying out the purpose of the Fund of providing low interest loans to communities and providing assistance for prevention programs and administration. Operating revenues consist of loan interest repayments from borrowers. Operating expenses include principal forgiveness, direct salary costs and benefits expenses, allocated indirect costs and bad debt allowance. All revenues and expenses not meeting this definition are reported as nonoperating revenues and expenses or capital contributions.
In accordance with generally accepted accounting principles, monies received from the EPA and the State are recorded as capital contributions. In certain circumstances, local communities have contributed the State’s matching share in exchange for reduced interest rate loans, as discussed in Note 4.
When both restricted and unrestricted resources are available for use, it is the Fund’s policy to use restricted resources first, then unrestricted resources as they are needed.
BudgetsUnder the California constitution, money may only be drawn from the Treasury by legal appropriation. The State Legislature authorized the CWSRF to operate under a continuous appropriation. Continuous appropriation authority means that no further appropriations are necessary to expend all funds deposited into the CWSRF. Therefore, the Fund operations are not included in California’s annual budget.
7
CALIFORNIA STATE WATER RESOURCES CONTROL BOARD WATER POLLUTION CONTROL REVOLVING FUND
NOTES TO FINANCIAL STATEMENTSJune 30, 2020 and 2019
(Dollar Amounts Expressed in Thousands)
NOTE 2 - SUMMARY OF SIGNIFICANT ACCOUNTING POLICIES (CONTINUED)
Use of Estimates in Preparing Financial StatementsThe preparation of financial statements in conformity with generally accepted accounting principles requires management to make estimates and assumptions that affect the reported amounts of assets and liabilities and disclosures of contingent assets and liabilities at the date of the financial statements and the reported amounts of revenues, expenses, gains, losses and other changes during the reporting period. Actual results could differ from those estimates.
Cash and Cash EquivalentsNearly all monies of the Fund are deposited with the California State Treasurer’s office, which is responsible for maintaining these deposits in accordance with California State law. The Fund considers all such deposits to be cash equivalents. According to State law, the Treasurer is responsible for maintaining the cash balances and investing excess cash of the Fund, as discussed in Note 3. Consequently, management of the Fund does not have any control over the investment of the excess cash. Investment earnings on these deposits are received quarterly. The statement of cash flows considers all funds deposited with the Treasurer to be cash or cash equivalents, regardless of actual maturities of the underlying investments.
Loans ReceivableLoans are funded by capitalization grants from the EPA, State matching funds, local contributions, revenue bond proceeds, loan repayments and fund earnings. Loans are advanced to local agencies on a cost reimbursement basis. Interest is calculated from the date that funds are advanced. After the final disbursement has been made, the loan agreement is adjusted for the actual amounts disbursed and interest accrued during the project period (Construction Period Interest). Loans are amortized over periods up to 30 years. Loan repayments must begin within one year of construction completion or one year from the initial loan disbursement, depending upon the type of loan agreement, and are made on an annual and semi-annual basis.
Loans funded by principal forgiveness are advanced to local agencies on a cost reimbursement basis and forgiven as each disbursement occurs. Loan agreements require repayment of the forgiven loan if all program requirements are not met.
Allowance for Bad DebtsThe allowance for bad debts is established as losses are estimated to have occurred through a provision for bad debts charged to earnings. Loans receivable are charged against the allowance for bad debts when management believes that the uncollectibility of the principal is probable. The allowance for bad debts was $9,356 at June 30, 2020 and June 30, 2019.
Due to Other FundsDue to other funds represents amounts payable to other funds reported within the California State Water Resources Control Board that are not included in these financial statements.
Revenue Bond Issue Costs and Original Issue PremiumIn accordance with GASB 65, revenue bond issue costs are expensed when incurred. Revenue bond original issue premium is being amortized over the term of the bonds using the effective interest method.
8
CALIFORNIA STATE WATER RESOURCES CONTROL BOARD WATER POLLUTION CONTROL REVOLVING FUND
NOTES TO FINANCIAL STATEMENTSJune 30, 2020 and 2019
(Dollar Amounts Expressed in Thousands)
NOTE 3 - CASH AND CASH EQUIVALENTS
The California State Treasurer’s Office administers a pooled investment program for the State. This program enables the State Treasurer’s Office to combine available cash from all funds and to invest cash that exceeds current needs. The necessary disclosures for the State’s pooled investment program are included in the Comprehensive Annual Financial Report of the State of California.
Nearly all monies of the Fund are deposited with the State Treasurer’s Office and are considered to be cash equivalents. The Treasurer is responsible for maintaining the cash balances in accordance with California laws, and excess cash is invested in California’s Surplus Money Investment Fund, which is part of the Pooled Money Investment Account. The Treasurer is required to maintain a mix of investment portfolios in order to allow funds to be withdrawn at any time to meet normal operating needs, without prior notice or penalty.
The investments allowed by State statute, bond resolutions and investment policy resolutions restrict investments of the pooled investment program to investments in U.S. Government securities, negotiable certificates of deposit, bankers’ acceptances, commercial paper, corporate bonds, bank notes, mortgage loans and notes, other debt securities, repurchase agreements, reverse repurchase agreements, equity securities, real estate, mutual funds, and other investments. The Fund’s proportionate share of the investment income, based on the average daily balance for the period, is credited to the Fund quarterly. The Treasurer charges all funds of the State an administrative fee, which reduces the interest earned by each fund. All cash and investments are stated at fair value. Details of the investments can be obtained from the State Treasurer’s Office.
At June 30, 2020 and 2019, the Fund’s cash deposits had a respectively.
Investments held by the State Treasurer are stated at fair value.
carrying balance of $18,680 and $18,
Investments 2020 2019
Treasury/Trust Portfolio $ 825,534 $ 791,831
Total cash deposits and investments $ 844,214 $ 791,849
The State Treasurer is responsible for investing funds of the Treasury/Trust Portfolio and managing the credit risk, custodial credit risk, concentration of credit risk, interest rate risk and foreign currency credit risk of the Portfolio. Refer to the State’s Pooled Investments disclosure in the June 30, 2020 and 2019, Comprehensive Annual Financial Reports for disclosure related to the risks applicable to the Portfolio.
9
CALIFORNIA STATE WATER RESOURCES CONTROL BOARD WATER POLLUTION CONTROL REVOLVING FUND
NOTES TO FINANCIAL STATEMENTSJune 30, 2020 and 2019
(Dollar Amounts Expressed in Thousands)
NOTE 3 - CASH AND CASH EQUIVALENTS (CONTINUED)
Cash deposits and investments are reflected on the June 30, 2020 and 2019 statements of net position as follows:
2020 2019
Cash and cash equivalents $ 502,789 $ 481,553Cash and cash equivalents - Restricted 341,425 310,296 Total cash deposits and investments $ 844,214 $ 791,849
Cash and investments in the amount of $0.00 and $51,973, representing unspent revenue bonds proceeds, at June 30, 2020 and 2019, respectively, were restricted for future loan disbursements. Additionally, cash and investments in the amount of $341,291 and $258,323 representing various reserve accounts required by the revenue bonds, at June 30, 2020 and 2019, respectively, were restricted for future loan disbursements and debt service.
NOTE 4 - LOANS RECEIVABLE
Loans are made to qualified agencies for projects that meet the eligibility requirements of the Federal Clean Water Act of 1987 and any subsequent amendments. Loans are financed with capitalization grants, State match, local contributions, revenue bond proceeds and revolving loan funds. Interest rates vary between 0 percent and 4.0 percent and loans are repaid over 30 years or less starting one year after the project is completed. Interest rates are established in the original loan agreements and are generally 50 percent of the State’s General Obligation Bond Rate at the time the loan agreement is prepared. Local match loans have an effective interest rate of 1.8 percent. Certain communities are offered special interest rates as low as 0.0 percent. Interest earned during the construction period is calculated from the date funds are disbursed until the project is completed.
As of June 30, 2020 and 2019, the Fund had total binding commitments of $11,962,051 and$11,230,463, respectively, since program inception. As of June 30, 2020, the remaining commitment on these loans amounted to $2,314,068, of which $52,245 is federal funds. The federal loan commitments included capitalization funds of $50,519, which will be forgiven. As of June 30, 2019, the remaining commitment on these loans amounted to $2,254,007, of which $42,032 is federal funds. The federal loan commitments included capitalization funds of $37,746, which will be forgiven. Principal forgiveness loans are forgiven as disbursed but must be repaid if the recipient fails to meet the program requirements.
At June 30, 2020 and 2019 the unpaid balance on all loans receivable outstanding amounted to$4,836,799 and $4,808,306, respectively.
10
CALIFORNIA STATE WATER RESOURCES CONTROL BOARD WATER POLLUTION CONTROL REVOLVING FUND
NOTES TO FINANCIAL STATEMENTSJune 30, 2020 and 2019
(Dollar Amounts Expressed in Thousands)
NOTE 4 - LOANS RECEIVABLE (CONTINUED)
Estimated maturities of the loans receivable and interest payments thereon, at June 30, 2020 are as follows:
Year Ending June 30, Interest Principal Total
2021 $ 48,805 $ 241,639 $ 290,4442022 46,487 238,479 284,9662023 43,324 235,685 279,0092024 40,211 215,229 255,4402025 37,335 207,963 245,2982026-2030 148,667 884,755 1,033,4222031-2035 94,831 684,265 779,0962036-2040 54,492 431,988 486,4802041-2045 29,246 314,285 343,5312046-2050 7,508 220,986 228,494 Total $ 550,906 3,675,274 $ 4,226,180 Loans not yet in repayment 1,170,881Allowance for bad debt (9,356)Total loans receivable $ 4,836,799
Restricted Loans ReceivableAt June 30, 2020 and 2019, $2,028,779 and $2,087,404, respectively, of loans receivable were pledged as security for the revenue bonds outstanding (see Note 5). The principal and interest received during the fiscal year from these loans is to be used to make the annual debt service payments on the revenue bonds. During the year ended June 30, 2020 the Fund received $507,003 and $25,828 of principal and interest, respectively, on these loans. During the year ended June 30, 2019 the Fund received $155,638 and $33,586 of principal and interest, respectively, on these same loans. Any excess of the principal and interest received over the debt service payments required may be used for future loan disbursements and/or released from restriction upon approval by the Trustee in the event certain requirements are met.
Local Match LoansThe Fund has offered reduced interest rates on loans to recipients that have agreed to contribute funds that can be used to match federal contributions. In order to obtain one of these loans, the local agency contributes one-sixth or 16.7 percent of the total loan principal. The borrower then repays 100 percent of the loan principal including the contributed amount (see Note 6).
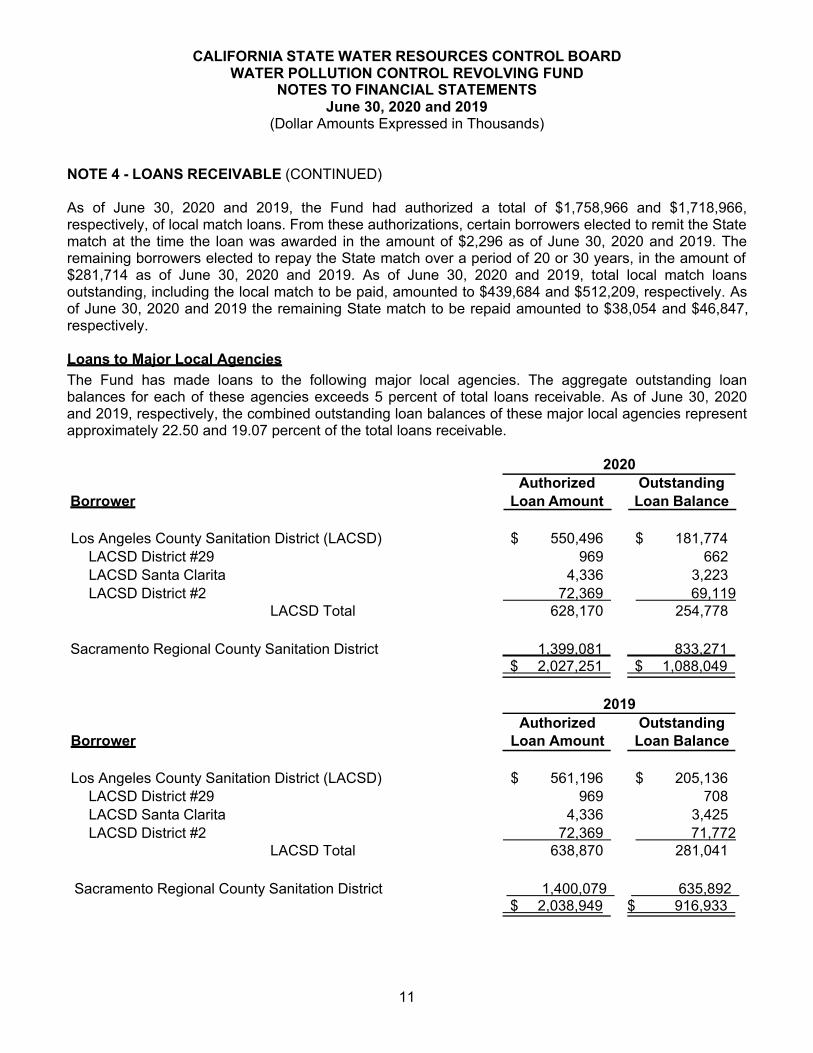
11
CALIFORNIA STATE WATER RESOURCES CONTROL BOARD WATER POLLUTION CONTROL REVOLVING FUND
NOTES TO FINANCIAL STATEMENTSJune 30, 2020 and 2019
(Dollar Amounts Expressed in Thousands)
NOTE 4 - LOANS RECEIVABLE (CONTINUED)
As of June 30, 2020 and 2019, the Fund had authorized a total of $1,758,966 and $1,718,966, respectively, of local match loans. From these authorizations, certain borrowers elected to remit the State match at the time the loan was awarded in the amount of $2,296 as of June 30, 2020 and 2019. The remaining borrowers elected to repay the State match over a period of 20 or 30 years, in the amount of$281,714 as of June 30, 2020 and 2019. As of June 30, 2020 and 2019, total local match loans outstanding, including the local match to be paid, amounted to $439,684 and $512,209, respectively. As of June 30, 2020 and 2019 the remaining State match to be repaid amounted to $38,054 and $46,847, respectively.
Loans to Major Local AgenciesThe Fund has made loans to the following major local agencies. The aggregate outstanding loan balances for each of these agencies exceeds 5 percent of total loans receivable. As of June 30, 2020 and 2019, respectively, the combined outstanding loan balances of these major local agencies represent approximately 22.50 and 19.07 percent of the total loans receivable.
Authorized2020
OutstandingBorrower Loan Amount Loan Balance
Los Angeles County Sanitation District (LACSD) $ 550,496 $ 181,774LACSD District #29 969 662LACSD Santa Clarita 4,336 3,223LACSD District #2 72,369 69,119
LACSD Total 628,170 254,778
Sacramento Regional County Sanitation District 1,399,081 $ 2,027,251
833,271 $ 1,088,049
2019Authorized Outstanding
Borrower Loan Amount Loan Balance
Los Angeles County Sanitation District (LACSD) $ 561,196 $ 205,136LACSD District #29 969 708LACSD Santa Clarita 4,336 3,425LACSD District #2 72,369 71,772
LACSD Total 638,870 281,041
Sacramento Regional County Sanitation District 1,400,079 635,892 $ 2,038,949 $ 916,933
12
CALIFORNIA STATE WATER RESOURCES CONTROL BOARD WATER POLLUTION CONTROL REVOLVING FUND
NOTES TO FINANCIAL STATEMENTSJune 30, 2020 and 2019
(Dollar Amounts Expressed in Thousands)
NOTE 5 - LONG-TERM DEBT
On March 8, 2018, the Fund issued $449,225 of California Infrastructure and Economic Development Bank, Clean Water State Revolving Fund Revenue Bonds, Series 2018, dated February 1, 2018 with coupon rates of 5 percent at a yield of 2.57%. These serial bonds are due annually in varying amounts through 2048. The interest on the bonds is due semi-annually on April 1 and October 1. The bonds maturing on or after October 1, 2028 are subject to redemption prior to their respective stated maturities at the option of the Fund on any date on or after April 1, 2028. The bonds were issued to provide funding for the issuance of additional revolving fund loans by the Fund.
On March 23, 2017, the Fund issued $450,000 of California Infrastructure and Economic Development Bank, Clean Water State Revolving Fund Revenue Bonds, Series 2017, dated March 1, 2017 with coupon rates of 2 to 5 percent at a yield of 2.24%. These serial bonds are due annually in varying amounts through 2036. The interest on the bonds is due semi-annually on April 1 and October 1. The bonds maturing on or after October 1, 2027 are subject to redemption prior to their respective stated maturities at the option of the Fund on any date on or after April 1, 2027. The bonds were issued to provide funding for the issuance of additional revolving fund loans by the Fund.
On April 28, 2016, the Fund issued $410,735 of California Infrastructure and Economic Development Bank, Clean Water State Revolving Fund Revenue Bonds, Series 2016, dated April 1, 2016 with coupon rates of 2.5 to 5 percent at a yield of 1.57%. These serial bonds are due annually in varying amounts through 2035. The interest on the bonds is due semi-annually on April 1 and October 1. The bonds maturing on or after October 1, 2026 are subject to redemption prior to their respective stated maturities at the option of the Fund on any date on or after April 1, 2026. The bonds were issued to provide funding for the issuance of additional revolving fund loans by the Fund.
On December 3, 2012, the Fund issued $68,940 of California Infrastructure and Economic Development Bank, Clean Water State Revolving Fund Refunding Revenue Bonds, Series 2012, dated November 1, 2012, with coupon rates of 2 to 4 percent at a yield of .058%. These serial bonds are due annually in varying amounts through 2018. The interest on the bonds is due semi-annually on April 1 and October 1. The Series 2012 bonds shall not be subject to redemption prior to maturity. The bonds were issued to refund the Series 2002 Revenue Bonds.
At the time of issuance of the Series 2018 revenue bond, the Fund increased the pledged pool by $671 million to $2.293 billion of the Fund’s outstanding loans as security for all outstanding bonds when compared to the Series 2016 pledged pool of $1.622 billion (see Note 4). The principal and interest received during the fiscal year from these loans is to be used to make annual debt service payments on the revenue bonds. Any excess of the principal and interest received over the debt service payments required may be used for future loan disbursements and/or released from restriction upon approval by the Trustee in the event that certain requirements are met.
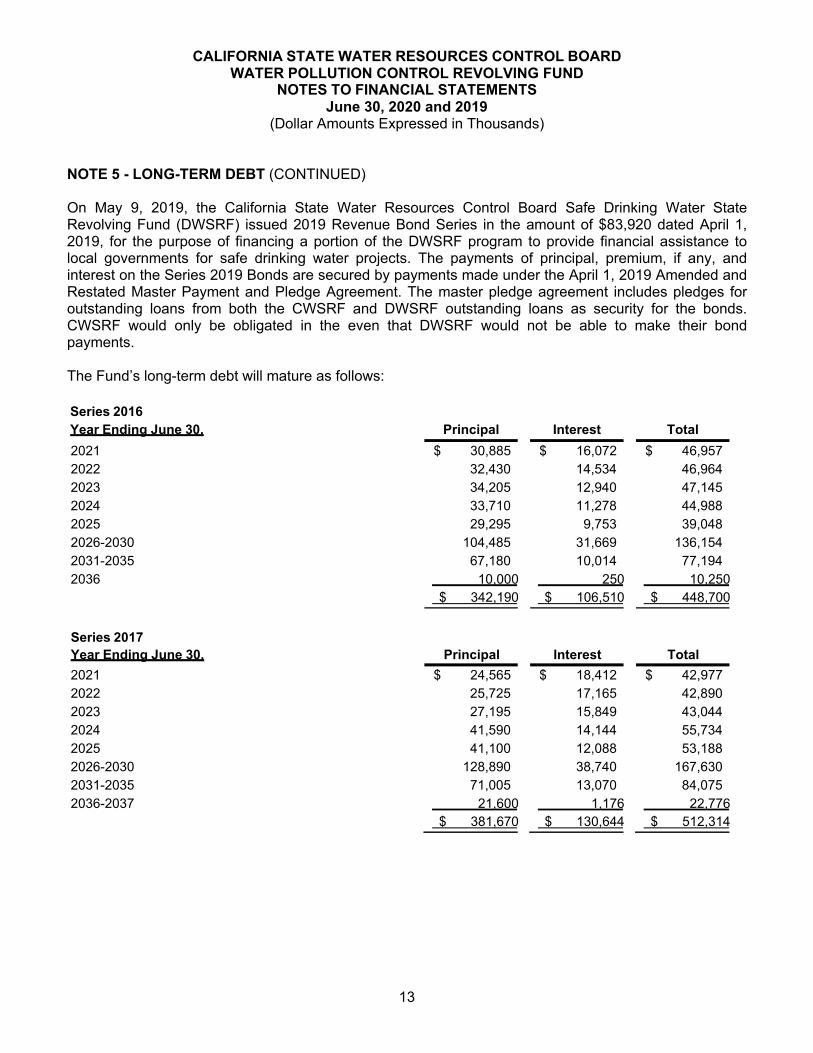
13
CALIFORNIA STATE WATER RESOURCES CONTROL BOARD WATER POLLUTION CONTROL REVOLVING FUND
NOTES TO FINANCIAL STATEMENTSJune 30, 2020 and 2019
(Dollar Amounts Expressed in Thousands)
NOTE 5 - LONG-TERM DEBT (CONTINUED)
On May 9, 2019, the California State Water Resources Control Board Safe Drinking Water State Revolving Fund (DWSRF) issued 2019 Revenue Bond Series in the amount of $83,920 dated April 1, 2019, for the purpose of financing a portion of the DWSRF program to provide financial assistance to local governments for safe drinking water projects. The payments of principal, premium, if any, and interest on the Series 2019 Bonds are secured by payments made under the April 1, 2019 Amended and Restated Master Payment and Pledge Agreement. The master pledge agreement includes pledges for outstanding loans from both the CWSRF and DWSRF outstanding loans as security for the bonds. CWSRF would only be obligated in the even that DWSRF would not be able to make their bond payments.
The Fund’s long-term debt will mature as follows:
Series 2016Year Ending June 30, Principal Interest Total2021 $ 30,885 $ 16,072 $ 46,9572022 32,430 14,534 46,9642023 34,205 12,940 47,1452024 33,710 11,278 44,9882025 29,295 9,753 39,0482026-2030 104,485 31,669 136,1542031-2035 67,180 10,014 77,1942036 10,000 250 10,250
$ 342,190 $ 106,510 $ 448,700
Series 2017Year Ending June 30, Principal Interest Total2021 $ 24,565 $ 18,412 $ 42,9772022 25,725 17,165 42,8902023 27,195 15,849 43,0442024 41,590 14,144 55,7342025 41,100 12,088 53,1882026-2030 128,890 38,740 167,6302031-2035 71,005 13,070 84,0752036-2037 21,600 1,176 22,776
$ 381,670 $ 130,644 $ 512,314
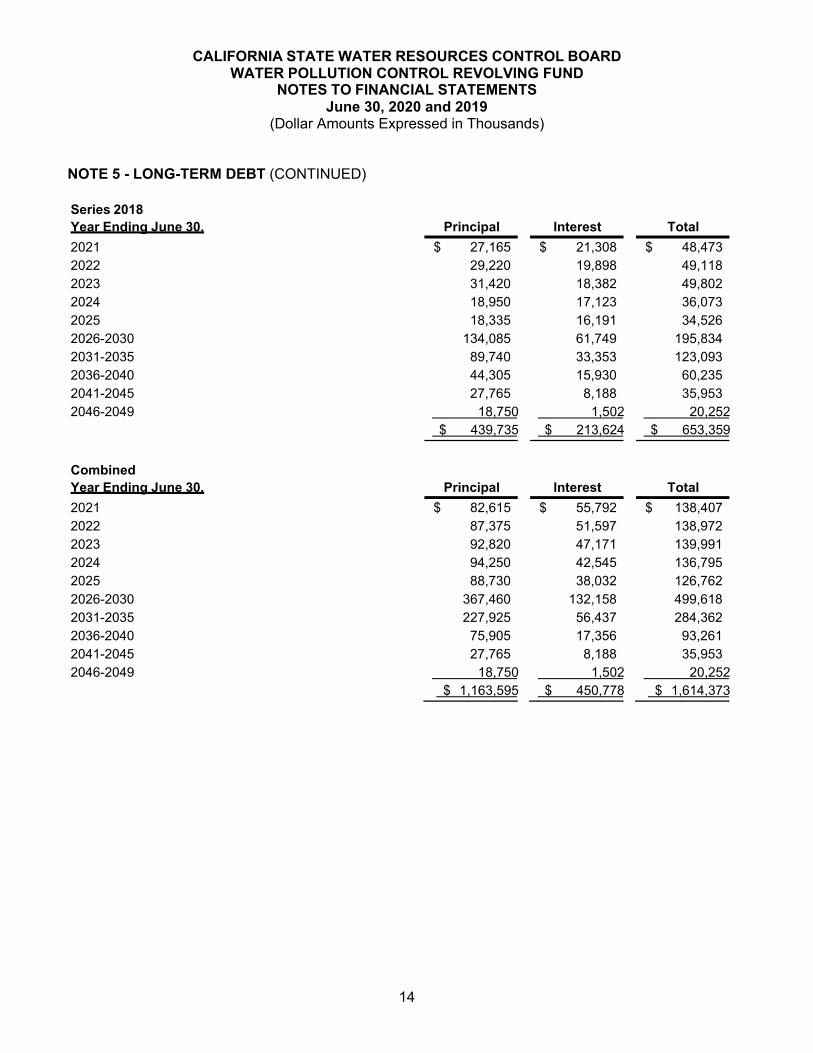
14
CALIFORNIA STATE WATER RESOURCES CONTROL BOARD WATER POLLUTION CONTROL REVOLVING FUND
NOTES TO FINANCIAL STATEMENTSJune 30, 2020 and 2019
(Dollar Amounts Expressed in Thousands)
NOTE 5 - LONG-TERM DEBT (CONTINUED)
Series 2018Year Ending June 30, Principal Interest Total2021 $ 27,165 $ 21,308 $ 48,4732022 29,220 19,898 49,1182023 31,420 18,382 49,8022024 18,950 17,123 36,0732025 18,335 16,191 34,5262026-2030 134,085 61,749 195,8342031-2035 89,740 33,353 123,0932036-2040 44,305 15,930 60,2352041-2045 27,765 8,188 35,9532046-2049 18,750 1,502 20,252
$ 439,735 $ 213,624 $ 653,359
CombinedYear Ending June 30, Principal Interest Total2021 $ 82,615 $ 55,792 $ 138,4072022 87,375 51,597 138,9722023 92,820 47,171 139,9912024 94,250 42,545 136,7952025 88,730 38,032 126,7622026-2030 367,460 132,158 499,6182031-2035 227,925 56,437 284,3622036-2040 75,905 17,356 93,2612041-2045 27,765 8,188 35,9532046-2049 18,750 1,502 20,252
$ 1,163,595 $ 450,778 $ 1,614,373
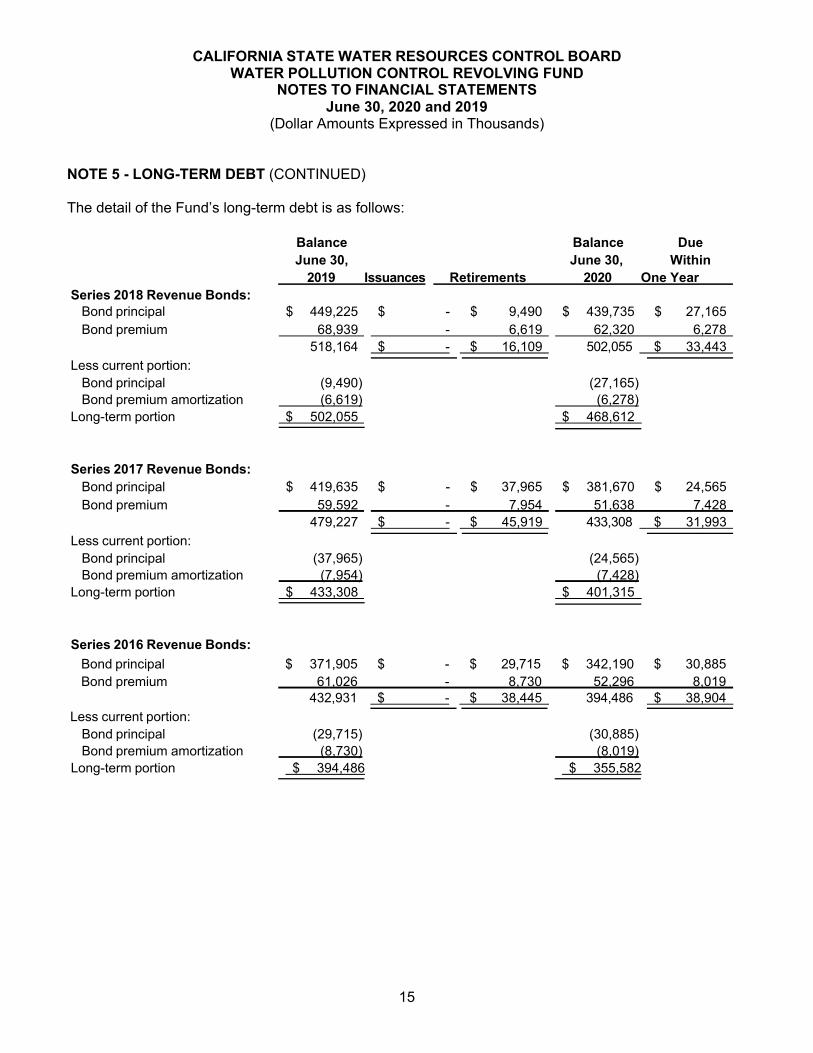
15
CALIFORNIA STATE WATER RESOURCES CONTROL BOARD WATER POLLUTION CONTROL REVOLVING FUND
NOTES TO FINANCIAL STATEMENTSJune 30, 2020 and 2019
(Dollar Amounts Expressed in Thousands)
NOTE 5 - LONG-TERM DEBT (CONTINUED)
The detail of the Fund’s long-term debt is as follows:
Balance Balance DueJune 30, June 30, Within
2019 Issuances Retirements 2020 One YearSeries 2018 Revenue Bonds:
Bond principal $ 449,225 $ - $ 9,490 $ 439,735 $ 27,165Bond premium 68,939 - 6,619 62,320 6,278
518,164 $ - $ 16,109 502,055 $ 33,443 Less current portion:
Bond principal (9,490) (27,165)Bond premium amortization (6,619) (6,278)
Long-term portion $ 502,055 $ 468,612
Series 2017 Revenue Bonds:Bond principal $ 419,635 $ - $ 37,965 $ 381,670 $ 24,565Bond premium 59,592 - 7,954 51,638 7,428
479,227 $ - $ 45,919 433,308 $ 31,993 Less current portion:
Bond principal (37,965) (24,565)Bond premium amortization (7,954) (7,428)
Long-term portion $ 433,308 $ 401,315
Series 2016 Revenue Bonds:Bond principal $ 371,905 $ - $ 29,715 $ 342,190 $ 30,885Bond premium 61,026 - 8,730 52,296 8,019
Less current portion:432,931 $ - $ 38,445 394,486 $ 38,904
Bond principal (29,715) (30,885)Bond premium amortization (8,730) (8,019)
Long-term portion $ 394,486 $ 355,582
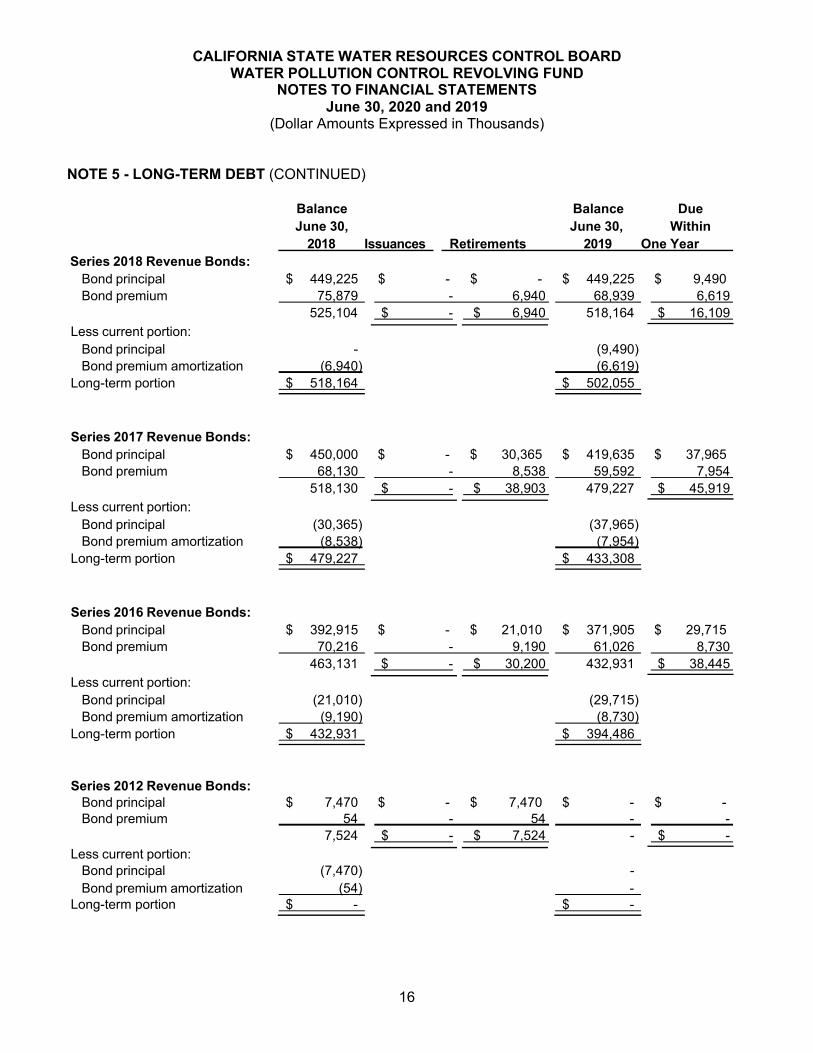
16
CALIFORNIA STATE WATER RESOURCES CONTROL BOARD WATER POLLUTION CONTROL REVOLVING FUND
NOTES TO FINANCIAL STATEMENTSJune 30, 2020 and 2019
(Dollar Amounts Expressed in Thousands)
NOTE 5 - LONG-TERM DEBT (CONTINUED)
Series 2018 Revenue Bonds:
Balance Balance DueJune 30, June 30, Within
2018 Issuances Retirements 2019 One Year
Bond principal $ 449,225 $ - $ - $ 449,225 $ 9,490Bond premium 75,879 - 6,940 68,939 6,619
525,104 $ - $ 6,940 518,164 $ 16,109 Less current portion:
Bond principal - (9,490)Bond premium amortization (6,940) (6,619)
Long-term portion $ 518,164 $ 502,055
Series 2017 Revenue Bonds:Bond principal $ 450,000 $ - $ 30,365 $ 419,635 $ 37,965Bond premium 68,130 - 8,538 59,592 7,954
518,130 $ - $ 38,903 479,227 $ 45,919 Less current portion:
Bond principal (30,365) (37,965)Bond premium amortization (8,538) (7,954)
Long-term portion $ 479,227 $ 433,308
Series 2016 Revenue Bonds:Bond principal $ 392,915 $ - $ 21,010 $ 371,905 $ 29,715Bond premium 70,216 - 9,190 61,026 8,730
463,131 $ - $ 30,200 432,931 $ 38,445 Less current portion:
Bond principal (21,010) (29,715)Bond premium amortization (9,190) (8,730)
Long-term portion $ 432,931 $ 394,486
Series 2012 Revenue Bonds:Bond principal $ 7,470 $ - $ 7,470 $ - $ -Bond premium 54 - 54 - -
7,524 $ - $ 7,524 - $ - Less current portion:
Bond principal (7,470) -Bond premium amortization
Long-term portion(54)
$ - -
$ -
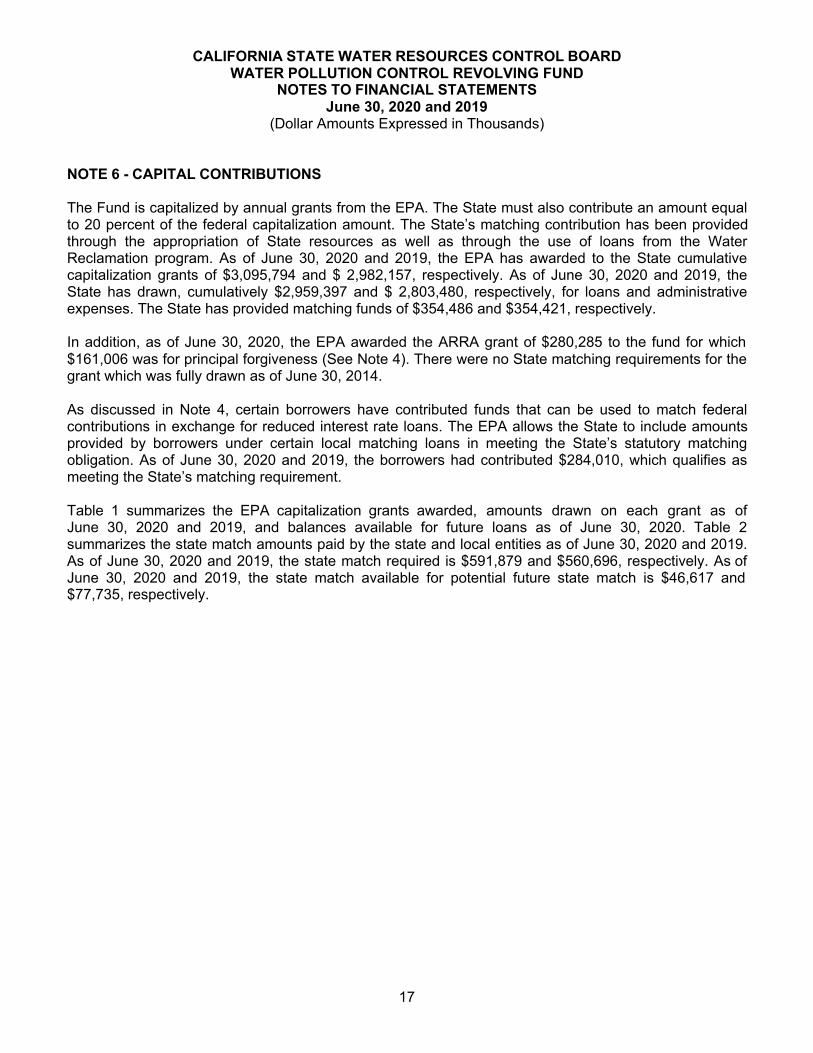
17
CALIFORNIA STATE WATER RESOURCES CONTROL BOARD WATER POLLUTION CONTROL REVOLVING FUND
NOTES TO FINANCIAL STATEMENTSJune 30, 2020 and 2019
(Dollar Amounts Expressed in Thousands)
NOTE 6 - CAPITAL CONTRIBUTIONS
The Fund is capitalized by annual grants from the EPA. The State must also contribute an amount equal to 20 percent of the federal capitalization amount. The State’s matching contribution has been provided through the appropriation of State resources as well as through the use of loans from the Water Reclamation program. As of June 30, 2020 and 2019, the EPA has awarded to the State cumulative capitalization grants of $3,095,794 and $ 2,982,157, respectively. As of June 30, 2020 and 2019, the State has drawn, cumulatively $2,959,397 and $ 2,803,480, respectively, for loans and administrative expenses. The State has provided matching funds of $354,486 and $354,421, respectively.
In addition, as of June 30, 2020, the EPA awarded the ARRA grant of $280,285 to the fund for which$161,006 was for principal forgiveness (See Note 4). There were no State matching requirements for the grant which was fully drawn as of June 30, 2014.
As discussed in Note 4, certain borrowers have contributed funds that can be used to match federal contributions in exchange for reduced interest rate loans. The EPA allows the State to include amounts provided by borrowers under certain local matching loans in meeting the State’s statutory matching obligation. As of June 30, 2020 and 2019, the borrowers had contributed $284,010, which qualifies as meeting the State’s matching requirement.
Table 1 summarizes the EPA capitalization grants awarded, amounts drawn on each grant as of June 30, 2020 and 2019, and balances available for future loans as of June 30, 2020. Table 2 summarizes the state match amounts paid by the state and local entities as of June 30, 2020 and 2019. As of June 30, 2020 and 2019, the state match required is $591,879 and $560,696, respectively. As of June 30, 2020 and 2019, the state match available for potential future state match is $46,617 and$77,735, respectively.
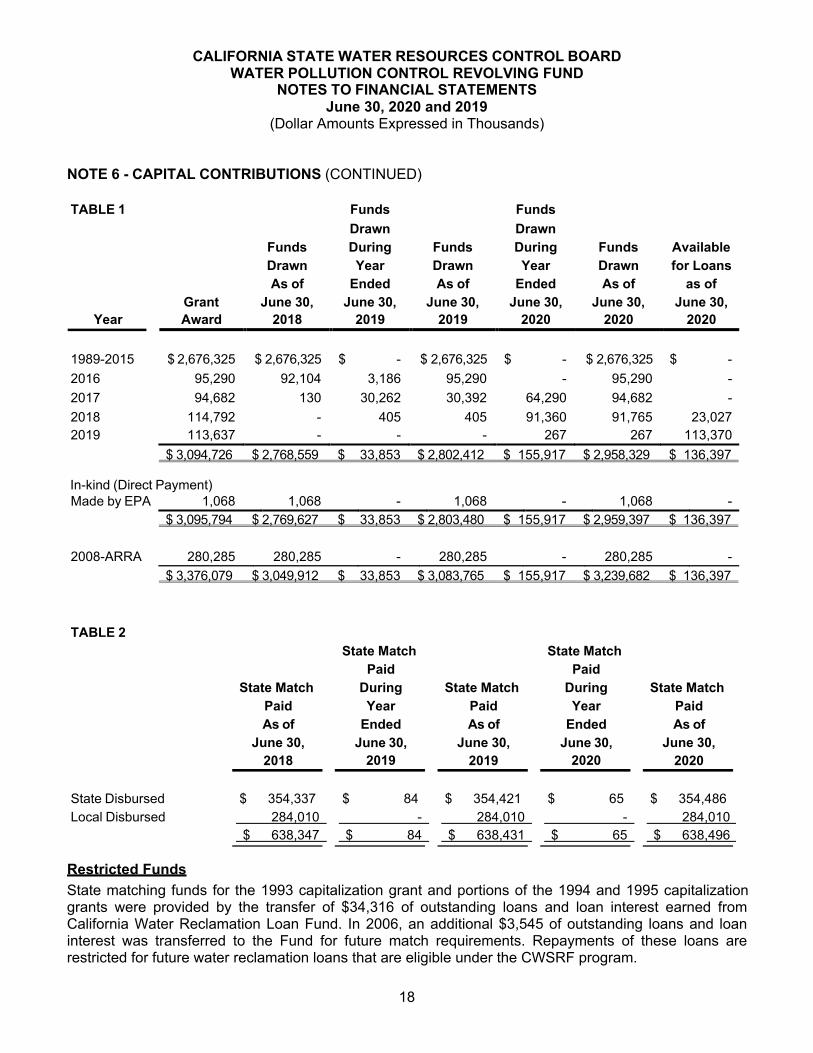
18
CALIFORNIA STATE WATER RESOURCES CONTROL BOARD WATER POLLUTION CONTROL REVOLVING FUND
NOTES TO FINANCIAL STATEMENTSJune 30, 2020 and 2019
(Dollar Amounts Expressed in Thousands)
NOTE 6 - CAPITAL CONTRIBUTIONS (CONTINUED)
TABLE 1 Funds Funds
FundsDrawnDuring Funds
DrawnDuring Funds Available
Drawn Year Drawn Year Drawn for LoansAs of Ended As of Ended As of as of
Grant June 30, June 30, June 30, June 30, June 30, June 30,Year Award 2018 2019 2019 2020 2020 2020
1989-2015 $ 2,676,325 $ 2,676,325 $ - $ 2,676,325 $ - $ 2,676,325 $ -2016 95,290 92,104 3,186 95,290 - 95,290 -2017 94,682 130 30,262 30,392 64,290 94,682 -2018 114,792 - 405 405 91,360 91,765 23,0272019 113,637 - - - 267 267 113,370
$ 3,094,726 $ 2,768,559 $ 33,853 $ 2,802,412 $ 155,917 $ 2,958,329 $ 136,397
In-kind (Direct Payment)Made by EPA 1,068 1,068 - 1,068 - 1,068 -
$ 3,095,794 $ 2,769,627 $ 33,853 $ 2,803,480 $ 155,917 $ 2,959,397 $ 136,397
2008-ARRA 280,285 280,285 - 280,285 - 280,285 -$ 3,376,079 $ 3,049,912 $ 33,853 $ 3,083,765 $ 155,917 $ 3,239,682 $ 136,397
TABLE 2State Match State Match
State MatchPaid
During State MatchPaid
During State MatchPaid As of
June 30,2018
Year Ended
June 30,2019
Paid As of
June 30,2019
Year Ended
June 30,2020
Paid As of
June 30,2020
State Disbursed $ 354,337 $ 84 $ 354,421 $ 65 $ 354,486Local Disbursed 284,010 - 284,010 - 284,010
$ 638,347 $ 84 $ 638,431 $ 65 $ 638,496
Restricted FundsState matching funds for the 1993 capitalization grant and portions of the 1994 and 1995 capitalization grants were provided by the transfer of $34,316 of outstanding loans and loan interest earned from California Water Reclamation Loan Fund. In 2006, an additional $3,545 of outstanding loans and loan interest was transferred to the Fund for future match requirements. Repayments of these loans are restricted for future water reclamation loans that are eligible under the CWSRF program.
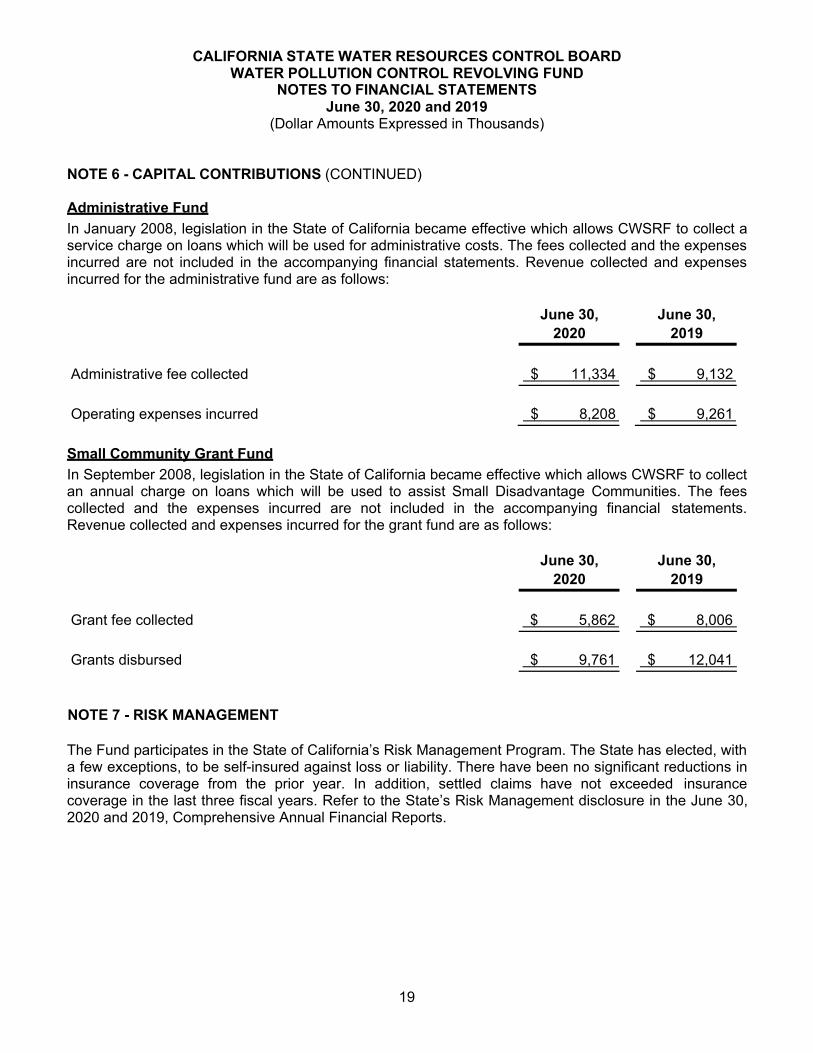
19
CALIFORNIA STATE WATER RESOURCES CONTROL BOARD WATER POLLUTION CONTROL REVOLVING FUND
NOTES TO FINANCIAL STATEMENTSJune 30, 2020 and 2019
(Dollar Amounts Expressed in Thousands)
NOTE 6 - CAPITAL CONTRIBUTIONS (CONTINUED)
Administrative FundIn January 2008, legislation in the State of California became effective which allows CWSRF to collect a service charge on loans which will be used for administrative costs. The fees collected and the expenses incurred are not included in the accompanying financial statements. Revenue collected and expenses incurred for the administrative fund are as follows:
June 30,2020
June 30,2019
Administrative fee collected $ 11,334 $ 9,132
Operating expenses incurred $ 8,208 $ 9,261
Small Community Grant FundIn September 2008, legislation in the State of California became effective which allows CWSRF to collect an annual charge on loans which will be used to assist Small Disadvantage Communities. The fees collected and the expenses incurred are not included in the accompanying financial statements. Revenue collected and expenses incurred for the grant fund are as follows:
June 30,2020
June 30,2019
Grant fee collected $ 5,862 $ 8,006
Grants disbursed $ 9,761 $ 12,041
NOTE 7 - RISK MANAGEMENT
The Fund participates in the State of California’s Risk Management Program. The State has elected, with a few exceptions, to be self-insured against loss or liability. There have been no significant reductions in insurance coverage from the prior year. In addition, settled claims have not exceeded insurance coverage in the last three fiscal years. Refer to the State’s Risk Management disclosure in the June 30, 2020 and 2019, Comprehensive Annual Financial Reports.
20
CALIFORNIA STATE WATER RESOURCES CONTROL BOARD WATER POLLUTION CONTROL REVOLVING FUND
NOTES TO FINANCIAL STATEMENTSJune 30, 2020 and 2019
(Dollar Amounts Expressed in Thousands)
NOTE 8 - NET POSITION
Governmental Accounting Standards Board Statement provides for three components of net position: net investment in capital assets, restricted and unrestricted. As of June 30, 2020 and 2019, the Fund had no net position invested in capital assets.
Restricted net position includes net position that is restricted for use, either externally imposed by creditors, grantors, contributors, or laws and regulations of other governments, or imposed by law through constitutional provisions or enabling legislation. At June 30, 2020 and 2019, the Fund had restricted net position of $341,425 and $258,323, respectively, representing amounts received from borrower loan repayments on pledged loans. As of June 30, 2020 and 2019 pledged loans restricted for future bond debt service payments were $2,028,779 and $2,087,404, respectively, representing loans receivable pledged as security for the revenue bonds (see Note 5).
Unrestricted net position consists of net position that does not meet the definition of invested in capital assets or restricted. Although the Fund reports unrestricted net position on the face of the statements of net position, unrestricted net position is to be used by the Fund for the payment of obligations incurred by the Fund in carrying out its statutory powers and duties and is to remain in the Fund.
This information is an integral part of the accompanying financial statements.
21
SINGLE AUDIT REPORTS
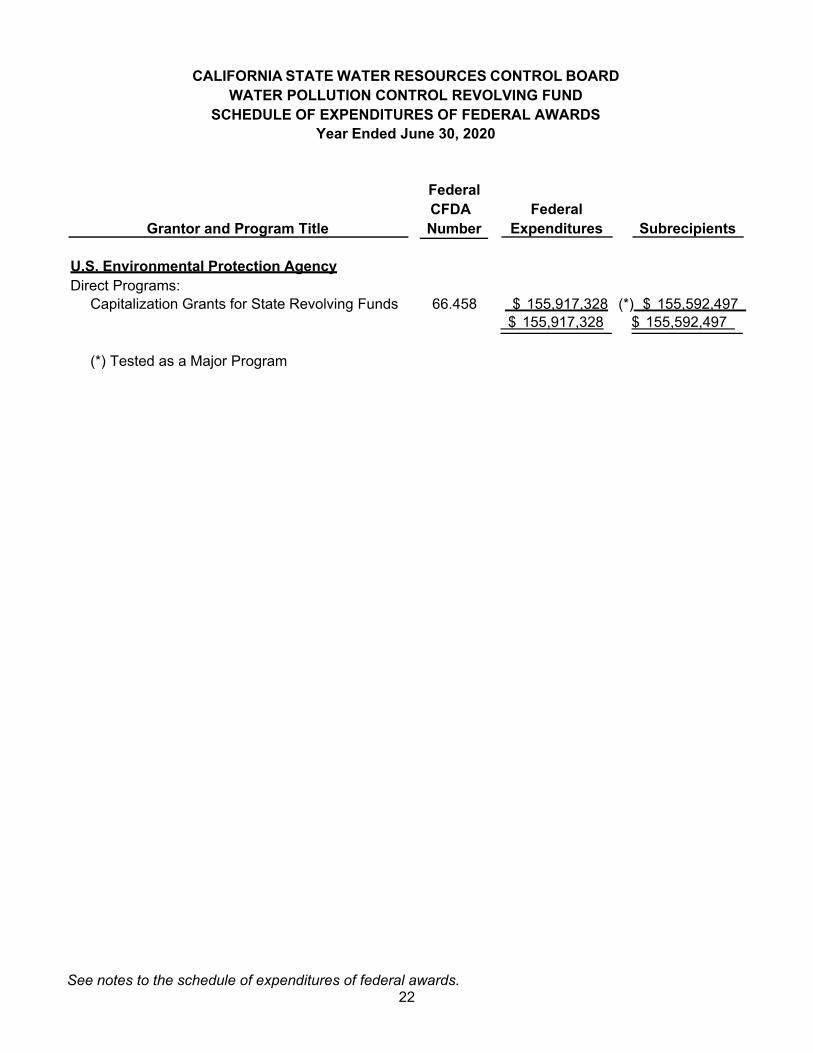
22
CALIFORNIA STATE WATER RESOURCES CONTROL BOARD WATER POLLUTION CONTROL REVOLVING FUND
SCHEDULE OF EXPENDITURES OF FEDERAL AWARDSYear Ended June 30, 2020
Federal CFDA
Grantor and Program Title Number
U.S. Environmental Protection AgencyDirect Programs:
Capitalization Grants for State Revolving Funds 66.458
FederalExpenditures Subrecipients
$ 155,917,328 (*) $ 155,592,497 $ 155,917,328 $ 155,592,497
(*) Tested as a Major Program
See notes to the schedule of expenditures of federal awards.
23
CALIFORNIA STATE WATER RESOURCES CONTROL BOARD WATER POLLUTION CONTROL REVOLVING FUND
NOTES TO THE SCHEDULE OF EXPENDITURES OF FEDERAL AWARDSYear Ended June 30, 2019
NOTE 1 - BASIS OF PRESENTATION
The accompanying schedule of expenditures of federal awards (Schedule) includes the federal grant activity of the California State Water Resources Control Board, Water Pollution Control Revolving Fund (Fund) under programs of the federal government for the year ended June 30, 2020. The information in this Schedule is presented in accordance with the requirements of 2 CFR Part 200, Uniform Administrative Requirements, Cost Principles, and Audit Requirements for Federal Awards (Uniform Guidance).
NOTE 2 – SUMMARY OF SIGNIFICANT ACCOUNTING POLICIES
ExpendituresExpenditures reported on the Schedule are presented on the accrual basis of accounting and are recognized following the cost principles contained in the Uniform Guidance, wherein certain types of expenditures are not allowable or are limited as to reimbursement. Negative amounts shown on the Schedule represent adjustments or credits made, in the normal course of business, to amounts reported as expenditures in prior years. The Fund has elected not to use the ten percent de minimis indirect cost rate allowed under the Uniform Guidance.
NOTE 3 - LOANS TO SUBRECIPIENTS
Capitalization Grants for Clean Water State Revolving Fund CFDA# 66.458 include $155,592,497 of expenditures that were disbursed as loan awards to qualifying subrecipients, which includes $23,135,616 of principal forgiveness loans.

24
INDEPENDENT AUDITORS’ REPORT ON INTERNAL CONTROL OVER FINANCIAL REPORTING AND ON COMPLIANCE AND OTHER MATTERS
BASED ON AN AUDIT OF FINANCIAL STATEMENTS PERFORMED IN ACCORDANCE WITH GOVERNMENT AUDITING STANDARDS
Board of DirectorsCalifornia State Water Resources Control Board Water Pollution Control Revolving Fund Sacramento, California
We have audited, in accordance with the auditing standards generally accepted in the United States of America and the standards applicable to financial audits contained in Government Auditing Standards issued by the Comptroller General of the United States, the financial statements of the California State Water Resources Control Board, Water Pollution Control Revolving Fund (Water Pollution Control Revolving Fund), an enterprise fund of the State of California, as of and for the year ended June 30, 2020, and the related notes to the financial statements, which collectively comprise Water Pollution Control Revolving Fund’s basic financial statements, and have issued our report thereon dated December 15, 2020.
Internal Control Over Financial ReportingIn planning and performing our audit of the financial statements, we considered Water Pollution Control Revolving Fund’s internal control over financial reporting (internal control) to determine the audit procedures that are appropriate in the circumstances for the purpose of expressing our opinions on the financial statements, but not for the purpose of expressing an opinion on the effectiveness of Water Pollution Control Revolving Fund’s internal control. Accordingly, we do not express an opinion on the effectiveness of Water Pollution Control Revolving Fund’s internal control.
A deficiency in internal control exists when the design or operation of a control does not allow management or employees, in the normal course of performing their assigned functions, to prevent, or detect and correct, misstatements on a timely basis. A material weakness is a deficiency, or a combination of deficiencies, in internal control such that there is a reasonable possibility that a material misstatement of the entity’s financial statements will not be prevented, or detected and corrected on a timely basis. A significant deficiency is a deficiency, or a combination of deficiencies, in internal control that is less severe than a material weakness yet important enough to merit attention by those charged with governance.
25
Board of DirectorsCalifornia State Water Resources Control Board Water Pollution Control Revolving Fund
Our consideration of internal control was for the limited purpose described in the first paragraph of this section and was not designed to identify all deficiencies in internal control that might be material weaknesses or significant deficiencies. Given these limitations, during our audit we did not identify any deficiencies in internal control that we consider to be material weaknesses. However, material weaknesses may exist that have not been identified.
Compliance and Other MattersAs part of obtaining reasonable assurance about whether Water Pollution Control Revolving Fund’s financial statements are free from material misstatement, we performed tests of its compliance with certain provisions of laws, regulations, contracts, and grant agreements, noncompliance with which could have a direct and material effect on the determination of financial statement amounts. However, providing an opinion on compliance with those provisions was not an objective of our audit, and accordingly, we do not express such an opinion. The results of our tests disclosed no instances of noncompliance or other matters that are required to be reported under Government Auditing Standards.
Purpose of this ReportThe purpose of this report is solely to describe the scope of our testing of internal control and compliance and the results of that testing, and not to provide an opinion on the effectiveness of the entity’s internal control or on compliance. This report is an integral part of an audit performed in accordance with Government Auditing Standards in considering the entity’s internal control and compliance. Accordingly, this communication is not suitable for any other purpose.
aCliftonLarsonAllen LLP
Greenwood Village, Colorado December 15, 2020
26
INDEPENDENT AUDITORS’ REPORT ON COMPLIANCE FOR EACH MAJOR FEDERAL PROGRAM AND REPORT ON INTERNAL CONTROL
OVER COMPLIANCE REQUIRED BY THE UNIFORM GUIDANCE
Board of DirectorsCalifornia State Water Resources Control Board Water Pollution Control Revolving Fund Sacramento, California
Report on Compliance for Each Major Federal ProgramWe have audited California State Water Resources Control Board, Water Pollution Control Revolving Fund’s (Water Pollution Control Revolving Fund) compliance with the types of compliance requirements described in the OMB Compliance Supplement that could have a direct and material effect on each of Water Pollution Control Revolving Fund’s major federal programs for the year ended June 30, 2020. Water Pollution Control Revolving Fund’s major federal programs are identified in the summary of auditors’ results section of the accompanying schedule of findings and questioned costs.
Management’s ResponsibilityManagement is responsible for compliance with federal statutes, regulations, and the terms and conditions of its federal awards applicable to its federal programs.
Auditors’ ResponsibilityOur responsibility is to express an opinion on compliance for each of Water Pollution Control Revolving Fund’s major federal programs based on our audit of the types of compliance requirements referred to above. We conducted our audit of compliance in accordance with auditing standards generally accepted in the United States of America; the standards applicable to financial audits contained in Government Auditing Standards, issued by the Comptroller General of the United States; and the audit requirements of Title 2 U.S. Code of Federal Regulations Part 200, Uniform Administrative Requirements, Cost Principles, and Audit Requirements for Federal Awards (Uniform Guidance). Those standards and the Uniform Guidance require that we plan and perform the audit to obtain reasonable assurance about whether noncompliance with the types of compliance requirements referred to above that could have a direct and material effect on a major federal program occurred. An audit includes examining, on a test basis, evidence about Water Pollution Control Revolving Fund’s compliance with those requirements and performing such other procedures as we considered necessary in the circumstances.
27
Board of DirectorsCalifornia State Water Resources Control Board Water Pollution Control Revolving Fund
We believe that our audit provides a reasonable basis for our opinion on compliance for each major federal program. However, our audit does not provide a legal determination of Water Pollution Control Revolving Fund’s compliance.
Opinion on Each Major Federal ProgramIn our opinion, Water Pollution Control Revolving Fund complied, in all material respects, with the types of compliance requirements referred to above that could have a direct and material effect on each of its major federal programs for the year ended June 30, 2020.
Report on Internal Control Over ComplianceManagement of Water Pollution Control Revolving Fund is responsible for establishing and maintaining effective internal control over compliance with the types of compliance requirements referred to above. In planning and performing our audit of compliance, we considered Water Pollution Control Revolving Fund’s internal control over compliance with the types of requirements that could have a direct and material effect on each major federal program to determine the auditing procedures that are appropriate in the circumstances for the purpose of expressing an opinion on compliance for each major federal program and to test and report on internal control over compliance in accordance with the Uniform Guidance, but not for the purpose of expressing an opinion on the effectiveness of internal control over compliance. Accordingly, we do not express an opinion on the effectiveness of Water Pollution Control Revolving Fund’s internal control over compliance.
A deficiency in internal control over compliance exists when the design or operation of a control over compliance does not allow management or employees, in the normal course of performing their assigned functions, to prevent, or detect and correct, noncompliance with a type of compliance requirement of a federal program on a timely basis. A material weakness in internal control over compliance is a deficiency, or a combination of deficiencies, in internal control over compliance, such that there is a reasonable possibility that material noncompliance with a type of compliance requirement of a federal program will not be prevented, or detected and corrected, on a timely basis. A significant deficiency in internal control over compliance is a deficiency, or a combination of deficiencies, in internal control over compliance with a type of compliance requirement of a federal program that is less severe than a material weakness in internal control over compliance, yet important enough to merit attention by those charged with governance.
Our consideration of internal control over compliance was for the limited purpose described in the first paragraph of this section and was not designed to identify all deficiencies in internal control over compliance that might be material weaknesses or significant deficiencies. We did not identify any deficiencies in internal control over compliance that we consider to be material weaknesses. However, material weaknesses may exist that have not been identified.
28
Board of DirectorsCalifornia State Water Resources Control Board Water Pollution Control Revolving Fund
The purpose of this report on internal control over compliance is solely to describe the scope of our testing of internal control over compliance and the results of that testing based on the requirements of the Uniform Guidance. Accordingly, this report is not suitable for any other purpose.
aCliftonLarsonAllen LLP
Greenwood Village, Colorado December 15, 2020
29
CALIFORNIA STATE WATER RESOURCES CONTROL BOARD WATER POLLUTION CONTROL REVOLVING FUND
SCHEDULE OF FINDINGS AND QUESTIONED COSTSYear Ended June 30, 2020
PART I - SUMMARY OF AUDITORS’ RESULTS
Financial StatementsType of auditors’ report issued: UnmodifiedInternal control over financial reporting:
Material weakness(es) identified? yes Ö noSignificant deficiency(ies) identified
not considered to be material weaknesses? yes Ö none reportedNoncompliance material to financial statements
noted? yes Ö no
Federal AwardsInternal control over major program:
Material weakness(es) identified? yes Ö noSignificant deficiency(ies) identified
not considered to be material weaknesses? yes Ö none reported
Type of auditor’s report issued on compliancefor major program: Unmodified
Any audit findings disclosed that are required to be reported in accordance with2 CFR 200.516(a)? yes Ö no
Identification of major programs:CFDA Number(s) Name of Federal Program or Cluster
66.458 Capitalization Grants for State Revolving Funds
Dollar threshold used to distinguish betweenType A and Type B programs: $3,000,000
Auditee qualified as low-risk auditee? Ö yes no
PART II - FINDINGS RELATED TO FINANCIAL STATEMENTS
Our audit did not disclose any matters required to be reported in accordance with Government Auditing Standards.
PART III - FINDINGS RELATED TO FEDERAL AWARDS
Our audit did not disclose any matters required to be reported in accordance with 2 CFR 200.516(a).
30
CALIFORNIA STATE WATER RESOURCES CONTROL BOARD WATER POLLUTION CONTROL REVOLVING FUND
SUMMARY SCHEDULE OF PRIOR YEAR AUDIT FINDINGSYear Ended June 30, 2020
PART IV - PRIOR YEAR FINDINGS
There were no prior year audit findings required to be reported under Government Auditing Standards or 2 CFR 200.516(a).