Clean Development Mechanic In China - World Bank Document
214
CLEAN DEVELOPMENT MECHANISM IN CHINA T AKING A PROACTIVE AND SUSTAINABLE APPROACH THE GOVERNMENT OF THE PEOPLE’S REPUBLIC OF CHINA THE WORLD BANK 2 ND EDITION Public Disclosure Authorized Public Disclosure Authorized Public Disclosure Authorized Public Disclosure Authorized Public Disclosure Authorized Public Disclosure Authorized Public Disclosure Authorized Public Disclosure Authorized
-
Upload
khangminh22 -
Category
Documents
-
view
3 -
download
0
Transcript of Clean Development Mechanic In China - World Bank Document

CLEAN DEVELOPMENTMECHANISM IN CHINA TAKING A PROACTIVE AND SUSTAINABLE APPROACH
THE GOVERNMENT OF THE
PEOPLE’S REPUBLIC OF CHINATHE WORLD BANK
2ND EDITION
Pub
lic D
iscl
osur
e A
utho
rized
Pub
lic D
iscl
osur
e A
utho
rized
Pub
lic D
iscl
osur
e A
utho
rized
Pub
lic D
iscl
osur
e A
utho
rized
Pub
lic D
iscl
osur
e A
utho
rized
Pub
lic D
iscl
osur
e A
utho
rized
Pub
lic D
iscl
osur
e A
utho
rized
Pub
lic D
iscl
osur
e A
utho
rized
Administrator
30245


CLEAN DEVELOPMENTMECHANISM IN CHINA TAKING A PROACTIVE AND SUSTAINABLE APPROACH
�
The World BankMinistry of Science and Technology, P.R. ChinaThe Deutsche Gesellschaft für Technische Zusammenarbeit,German Technical Cooperation Unit (GTZ),Federal Ministry of Economic Cooperation and DevelopmentSwiss State Secretariat for Economic Affairs

The International Bank for Reconstruction and Development/ THE WORLD BANK1818 H St., N.W.Washington, D.C. 20433
June 2004 (1st Edition)September 2004 (2nd Edition)
All rights reserved
Cover design by Circle Graphics
Photos by Circle Graphics and Anne Arquit Niederberger
This publication is a joint product of staff from the Chinese Ministry of Science and Technology(MOST), The Deutsche Gesellschaft für Technische Zusammenarbeit, German Technical Cooper-ation unit (GTZ) of the Federal Ministry for Economic Cooperation and Development, SwissState Secretariat for Economic Affairs (SECO), the World Bank, and others (see acknowledg-ments). While consultations have been considerable, the judgments herein do not necessarily reflectthe views of their respective governing bodies, or when applicable, the countries there represented.
Notes
All tons are metric tons.
All dollars are U.S. dollars.
Currency name = Renminbi (RMB)
Currency unit = Yuan
1 Yuan = 100 fen
Y 1.00 = $0.12 (as of February 2004)
$1.00 = Y 8.28 (as of February 2004)
C = Carbon
CO2 = carbon dioxide
CO2 values can be converted to C values by multiplying the CO2 value by 12/44 (the ratio of themolecular weight of C to CO2).

iiiC D M I N C H I N A
ABBREVIATIONS AND ACRONYMS ix
FOREWORD xiii
ACKNOWLEDGMENTS xv
EXECUTIVE SUMMARY xvii
INTRODUCTION xix
International and Domestic Context for CDM in China xixOngoing CDM-related Activities in China xxiChina CDM Study Background xxv
TECHNICAL SUMMARY xxixMethodological Guidelines and Institutions for CDM xxixFindings of Project Case Studies xxxiiiPotential CDM in China xxxv
PART 1: CDM METHODOLOGY AND CASE STUDIES 11 Objectives, Methodologies, and Approach of Part I 3
Objectives 3Methodological Approach 4Key Issues 5
2 Institutional Framework and Methodological Guidelines for CDM 7Relevant Institutions and CDM Project Cycle 7Project Boundary and Leakage Evaluation 9Baseline Setting 14Additionality Assessment 25Project-Based Emission Reduction Cost Calculation 30Institutional Arrangements for Facilitating CDM in China 36
3 Findings from CDM Case Studies 41Basic Considerations: The Power Market 41Selection of Case Study Projects 43
Table of Contents
�

Brief Description of the Six Case Study Projects 49Discussion of Results from Six Case Studies 60CDM: Chances, Benefits, Barriers, and Uncertainties 69Cross Comparison of Findings with Results from Other Studies 72Conclusions and Recommendations 73
PART II: CHINA’S CDM POTENTIAL 814 Objectives, Methodologies, and Approach in
Evaluating China’s CDM Potential 83Objectives 83The Challenge 83Brief Description of Methodological Framework and Approach 84
5 Analysis of China’s CDM Potential 91Marginal Abatement Cost Curves 91Global Carbon Market Analysis under Different Scenarios 96China’s CDM Potential by Major Sectors 109Analysis of Demand-Side Barriers 114Conclusion 118
6 Impact Assessment of CDM Implementation on China’s Socioeconomic Development 121Methodological Framework of IPAC-SGM 121Main Assumptions and Energy Demand 122Impact Assessment of CDM Implementation on GDP 125Model Limitations and Conclusion 125
7 Policy Insights and Recommendations 127Policy Insights 127Recommendations 132
Epilogue: CDM Conference Report 139Introduction 139Context for CDM in China 139Interim Measures and Implications for CDM in China 140Overcoming Barriers to CDM Implementation in China 141The Power Sector 142Future Activities in Cooperation with Foreign Partners 143
ANNEXES
A1 Decisions by the COP and the CDM EB after COP 7 up to the 12th CDM EB Meeting Relevant to Methodological Issues 145
A2 Detailed Description of the CDM Institutions 153A3 Detailed Description of the CDM Project Cycle 157A4 Interim Measures for Operation and Management
at Clean Development Mechanism Projects in China 161
REFERENCES 169
CD-ROM USER GUIDE
C O N T E N T S
C H I N A C D M S T U D Yiv

CD-ROM (Attachment)
MAIN REPORT ANNEXES TO MAIN REPORT
AI Six CDM Case StudiesAII Project Development Documents (PDDs)
AIII Methodological Annexes to Chapter 5 and 6AIV Matrix of Major International-Funded CDM Studies in ChinaAV Relevant Materials from Other CDM projects in China
AVI Key Literature on CDM in ChinaAVII Participants and Minutes from CDM Stakeholder Meetings
AVIII Project Participants (Persons and Institutions)AVIX Written CDM Conference Materials
AX Video Presentation of the CDM Conference
FIGURESI.1 CO2 Emissions in China from 1990 to 2002 xxiI.2 CO2 Emissions by Sector xxiiI.3 Overview of Main Outputs and Inter-linkages Among Tasks 1,2, and 3 xxvii
T.1 MACs for Carbon in 2010 from IPAC-Emission Model xxxviT.2 Annex II Countries ER Demand Under the KP and the Market Offset
Share by Three Kyoto Mechanisms xxxviiiT.3 Distribution of Carbon Emission Reductions among Domestic Action (DA), JI,
ET, and CDM under the Base Scenario xxxviiiT.4 Marginal Abatement Cost Curves by Sectors xxxix
2.1 CDM Institutions 82.2 Manufacturing Process for CDM/JI Emission Reductions 92.3 Project Boundary Considering the Whole Life 122.4 Possible Baseline Trajectory and Emission Reductions
of a CDM Project Activity 152.5 Decision Tree for Baseline Determination 202.6 Output and Input in Baseline Scenario 312.7 Output and Input of CDM Projects 31
3.1 Location of China’s CDM Project Activities with Case Studies 723.2 Specific Investment Costs of the CDM Case Studies in China 763.3 Total CO2 Emission Reductions Related to the Incremental Costs of Emissions
Reduction (ICER) of the CDM Case Studies 76
4.1 Framework of IPAC Emission Model 854.2 Structure of IPAC-AIM Technology Model 864.3 Linkage Framework of the Models 90
5.1 MACs for carbon dioxide in 2010 (from IPAC-emission model) 945.2 MACs for Carbon Dioxide in 2010 (from EPPA) 94
C O N T E N T S
C H I N A C D M S T U D Y v

5.3 MACs for Carbon Dioxide-only in 2010 (from GTEM) 955.4 MACs for all GHGs in 2010 (from GTEM) 955.5 Comparison of MACs for the U.S. from Different Sources
(carbon dioxide only) 965.6 Comparison of MACs for OECD (without U.S.) from Different Sources
(carbon dioxide only) 965.7 Comparison of MACs for EFSU from Different Sources
(carbon dioxide only) 975.8 Comparison of MACs for China from Different Sources
(carbon dioxide only) 975.9 Comparison of Emission Reduction Requirements in 2010 for
Different Regions from Different Sources with Sink Credits Deducted 1005.10 Distribution of Kyoto Mechanism Profits among Regions
($ Billions, 2000 prices) 1025.11 Global and China’s Potentials and Price under Different BAU
Projections and MACs 1035.12 Impact of Different Factors on Carbon Price 1065.13 Impact of Different Factors on Global CDM Potential 1065.14 Impact of Different Factors on China’s CDM Potential 1075.15 Carbon Emissions for Three Different Scenarios in IPAC-AIM
Technology Model 1095.16 Share of Carbon Emissions by End-use Sector for the Market Scenario 1105.17 Marginal Abatement Cost Curves by Sector 1105.18 Emission Reduction Potential by Sector 1115.19 Impact of Transaction Cost and CER Price on Commercial Viability
of CDM Projects 1125.20 Comparing Bottom-up Emission Abatement Potential (50$/tC) with
Top-down Estimated CDM Potential (22$/tC), 2010 113
6.1 GDP Change by CDM Implementation in China 126
TABLESI.1 Structure of Primary Energy Consumption in China xxiI.2 Key Information in Ongoing CDM Study Activities in China, 2004 xxiii
T.1 Key Methodological Terms in the CDM Process xxxT.2 Key Data on the Investigated Case Studies xxxiv T.3 Cost and Priority Ranking of Project Type xxxvT.4 Annex II Countries GHG Reduction Demand, Market Share
by KP Mechanisms and Their Domestic Actions, and Estimated CER Price Range xxxvii
1.1 Selected Case Studies 6
2.1 The Spectrum of Baseline Methods 162.2 Variation in Calculated Carbon Offsets under Different Baselines 16
C O N T E N T S
C H I N A C D M S T U D Yvi

2.3 Pros and Cons of Different Baseline Methods 172.4 General Information about CDM/AIJ Project Case Studies in China 192.5 Project Types and Corresponding Baseline Methods 192.6 Carbon Intensity Scenarios 232.7 Characteristics of Additionality Assessment from Different Aspects 292.8 Calculation of ICER and ICERT in the Case Studies 332.9 Estimation of Transaction Cost of CDM Project Activity (US$) 353.1 Shares of Installed Power Capacity and Power Generation in
the Provinces where Potential CDM Project Activities are Located (2001) 423.2 Efficiency of Thermal Power Generation and Power Transmission Losses 423.3 Major Characteristics of Power Sector Relevant to CDM 443.4 List of 25Potential CDM Project Activities by Technology Category 453.5 Set of Criteria for the Evaluation of Promising CDM Projects 503.6 The Ranked Projects and the Pipeline of CDM Project Activities 513.7 Major Parameters for Huaneng-SC 533.8 Major Parameters for GSCC-TriGen 543.9 Data and Information to Verify GHG Emission Reductions 543.10 Major Parameters for BJ3TPP-GSCC 553.11 Standard Technical Specifications for 300MW Thermal Power Plant 563.12 Data to be Recorded and Gathered for the CDM Project 563.13 Major Parameters for SH-Wind-Farm Project 573.14 Major Parameters for Taicang-Biogas Project 583.15 Major Parameters for Zhuhai-LFG Project 593.16 Baseline Setting of the Six Case Study Projects 613.17 Impact of Different Baseline Approaches on CO2 Emission Reduction 633.18 Additionality Assessment Summary for Six Cases 653.19 Major Emission Reduction and ICER Data of the CDM Case Studies 673.20 Summary of Chances and Benefits from CDM Based on the Findings of
Six Case Studies 703.21 Overview of Perceived Barriers and Suggested Mitigation Measures based
on the Six Case Studies 713.22 Overview and Summary Table Comprising Other CDM
Project Case Studies 743.23 Cost and Priority Ranking of Project Types 78
4.1 Classification of Energy End-use Sectors and Subsectors 864.2 Major Technologies Considered in the Model 87
5.1 Population of the Nine Regions 925.2 GDP of the Nine Regions 925.3 Reference Primary Energy Demand for the Nine Regions from
IPAC-Emission Model (EJ) 935.4 Reference Carbon Emissions from Fossil Fuel Combustion for
the Nine Regions (from IPAC-Emission Model) (GtC) 935.5 MACs Approximation of Coefficients for CO2
(from IPAC-Emission Model) 93
C O N T E N T S
C H I N A C D M S T U D Y vii

5.6 Kyoto Target using all GHG Emissions in 1990 (MtC) 975.7 Kyoto Target using Carbon Dioxide Emissions only in 1990 (MtC) 985.8 Business-as-usual Projections from Different Models for 2010 (MtC) 985.9 Reduction Requirements to Achieve the Kyoto Target for 2010 (MtC) 985.10 Credits from Carbon sequestration for Domestic Action and
JI Projects, (MtC) 995.11 Reduction, Marginal Cost, and Total Abatement Cost for Annex I
without CDM, JI, and ET 1015.12 Modeling Results for the Base Scenario 1015.13 Impact of BAU Projections and MACs on Carbon Market 1035.14 Impact of Implementation Rate on Carbon Market 1045.15 Impact of U.S. Participation Rate on Carbon Market 1045.16 Impact of CDM’s Transaction Cost on Carbon Market 1055.17 Impact of Supplementarity on Carbon Market 1055.18 A Comparison of Assumptions for the Base, High, and Low Scenarios 1075.19 Comparisons of Future Carbon Market for Different Scenarios 1085.20 Assumption for China’s Future Population (million) 1095.21 Assumptions for China’s Future GDP Growth (%) 1095.22 Share of Emission Reductions by Sector 1115.23 Project Size and Transaction Cost 1125.24 Contribution of Different Sectors to the 21.6 MtC CDM Potential
Resulting from CERT Analysis 1135.25 Technologies Contributing to GHG Emission Reductions in the
Short and Middle Term 1155.26 Annex II Countries Emission Reduction Requirements, CDM Market Size,
and CER Price Range Estimated 1195.27 Annex II Countries GHG Reduction Demand and its Market Offset
Share among Kyoto Mechanisms and the Domestic Actions by Annex II Countries in Basic Scenario 119
6.1 Production Sectors and Subsectors 1226.2 Population Assumed in IPAC-SGM, thousands 1236.3 GDP Assumption in IPAC-SGM, million Yuan (in 1990 price) 1236.4 Commercial Primary Energy Consumption (Mtce) 1246.5 Net Foreign Investment Increase Caused by CDM, (in million US$) 1246.6 Annual Change in Efficiency Improvement Assumption as a
Result of CDM in IPAC-SGM 1256.7 Investment in Power Sector, billion $ 1256.8 Value Added in Machinery Sector, billion $ 1256.9 CDM Impact on China’s GDP 126
BOXES
3.1 Baseline Setting and “Power Shortage” 643.2 Five-Year Power Development Planning in China 65
C O N T E N T S
C H I N A C D M S T U D Yviii

3-E Energy, Environment and Economy (Institute at Tsinghua University)AAUs Assigned Amount UnitsABARE Australian Bureau of Agricultural and Resource EconomicsAC Alternating CurrentADB Asian Development BankAIJ Activities Implemented JointlyAIM Asian-Pacific Integrated ModelALGAS Asian Least-Cost Greenhouse Gas Abatement StrategyAMI Agro-Meteorology Institute (of CAAS)BAU Business As UsualBJ3TPP Beijing No. 3 Thermal Power PlantBP British PetroleumBOF Basic Oxygen FurnaceC5 China-Canada Cooperation on Climate ChangeCAAS Chinese Academy of Agricultural SciencesCASS Chinese Academy of Social SciencesCCAP Center for Clean Air PolicyCDM Clean Development MechanismCDM M&P CDM Modalities and Proceduresce coal equivalentCERs Certified Emission ReductionsCERT Carbon Emission Reduction Trading ModelCERUPT Certified Emission Reduction Unit Procurement TenderCFBC Circulating Fluidized Bed CombustionCGE Computable General EquilibriumCHP Combined Heat and PowerCH4 MethaneCHN ChinaCO2 Carbon DioxideCOD Chemical Oxygen Demand
ixC D M I N C H I N A
Abbreviations and Acronyms
�

COP Conference of the PartiesCOP/MOP Conference of the Parties serving as Meeting of the Parties to the Kyoto ProtocolCP Capacity of electric powerDA Domestic ActionDAE Dynamic Asian EconomiesDC Direct CurrentDNA Designated National AuthorityDOE Designated Operational EntityDTE Department of Thermal Engineering (at Tsinghua University)EASES Environment and Social Development Department of the East Asia and Pacific
Region (the World Bank). EB Executive Board of CDMEE Energy EfficiencyEEC European UnionEEX Energy Exporting countriesEF Emission FactorEFSU Eastern Europe and the former Soviet UnionEIA/USDOE Energy Information Administration/U.S. Department of Energy EIT Economies in TransitionEM GHG EmissionsEN Energy ConsumptionEPPA Emission Prediction and Policy Assessment ModelER GHG Emission ReductionERB Edmonds-Reilly-BarnsERI Energy Research Institute, NDRCERUs Emission Reduction UnitsET Emission TradingETH Zürich Swiss Federal Institute of TechnologyEU European UnionFDI Foreign Direct InvestmentFSU Former Soviet UniongC gram carbonGCCI Global Climate Change Institute (at Tsinghua University) GDP Gross Domestic ProductGEF Global Environment FacilityGHG Greenhouse GasGSCC Gas-Steam Combined CycleGTEM Global Trade and Environment ModelGTZ Gesellschaft fur Technische ZusammenarbeitGW GigawattHFCs HydrofluorocarbonsICER Incremental Cost for Emission ReductionIEE Institute of Environmental Economics (at Renmin University)IGCC Integrated Gasification Combined CycleIMET Italian Ministry of Environment and Territory
A B B R E V I A T I O N S A N D A C R O N Y M S
C D M I N C H I N Ax

IND IndiaINET Institute of Nuclear and New Energy Technology (at Tsinghua University).IPAC Integrated Policy Analysis Model for ChinaIPCC Inter-Governmental Panel on Climate ChangeIPP Independent Power ProducerIRR Internal Rate of ReturnJI Joint ImplementationJPN JapanKP Kyoto ProtocolkVA kilo-Volt AmperekWh kilo-Watt tourLA Latin AmericaLFG Landfill GasLULUCF Land Use, Land Use Change and ForestryMAC Marginal Abatement CostME Middle EastMFA Ministry of Foreign AffairsMOA Ministry of AgricultureMOF Ministry of FinanceMOST Ministry of Science and TechnologyMP Methodology PanelMPa Mega PascalMT Million TonsMtce Million Tons of Coal EquivalentMtoe Million Tons of Oil EquivalentMVP Monitoring and Verification PlanMW MegawattN2O Nitrous OxideNC National CommunicationNCCC National Coordination Committee for Climate ChangeNDRC National Development and Reform Commission of China (former SDPC)NEDO New Energy and Industrial Technology Development Organization, JapanNGCC Natural Gas Combined CycleNGO Nongovernmental OrganizationNOx Nitrogen oxidesNPC National Project CoordinatorNPC The National People’s CongressNPV Net Present ValueNSS National Strategy Study Program (sponsored by the World Bank)O&M Operation and MaintenanceODA Official Development AssistanceOE Operational EntityOECD Organisation for Economic Co-operation and DevelopmentOECD-P Pacific parts of OECDOECD-W European and Canadian parts of OECD
A B B R E V I A T I O N S A N D A C R O N Y M S
C D M I N C H I N A xi

OHF Open Hearth Furnace OOE Other OECD countries PCF Prototype Carbon FundPDD Project Design DocumentPFBC Pressurized Fluid Bed CombustionPFCs PerfluorocarbonsPNNL Pacific-Northwest National LabPPA Power Purchase AgreementPR-I 1st Progress Report (or PRI) of the China CDM study projectPR-II 2nd Progress Report (or PRII) of the China CDM study projectR&D Research and DevelopmentRMB Ren Min Bi (Chinese Currency)RMUs Removal Units ROW Rest of the World SA South AsiaSC Steering CommitteeSC Super-CriticalSD Sustainable DevelopmentSDPC State Development Planning Commission (now NDRC)SECO Swiss State Secretariat for Economic AffairsSEA South and East AsiaSEPA State Environmental Protection Administration of ChinaSERC State Electricity Regulatory CommissionSETC State Economic and Trade CommissionSF6 Sulfur HexafluorideSGM Second Generation ModelSH ShanghaiSICP Sino-Italian Co-operation Program for Environmental ProtectionSO2 Sulfur DioxideTAG Technical Advisory GroupTce Ton of Coal EquivalentToe Ton of Oil EquivalentTOR Terms of ReferenceTRT Top Gas Pressure Recovery TurbineTWh Terawatt-hourUNCED United Nations Conference on Environment and DevelopmentUNDP United Nations Development ProgrammeUNFCCC United Nation Framework Convention on Climate ChangeUS United StatesVAT Value Added TaxWB The World Bank
A B B R E V I A T I O N S A N D A C R O N Y M S
C D M I N C H I N Axii

The Clean Development Mechanism (CDM)offers important opportunities for sustainabledevelopment in China. The energy sector, in par-ticular, could benefit through new approaches inenergy efficiency and renewable energies. Emis-sions reduction options, which can be trans-ferred to industrialized countries to meet theirobligations under the Kyoto Protocol, are alsoavailable in other sectors.
The CDM sets out a challenging and complexprocedure to be applied in country-specific cir-cumstances. China still has to decide on adetailed national approach for the CDM. Inaddition, policy issues will also influence theCDM approach. When initiating this study-project in late 2001, the four principal spon-sors—the Chinese Ministry of Science andTechnology; the Deutsche Gesellschaft für Tech-nische Zusammenarbeit (German TechnicalCooperation GTZ), on behalf of the FederalMinistry for Economic Cooperation and Devel-opment; the Swiss State Secretariat for EconomicAffairs (SECO); and the World Bank—thereforerealized this would be a challenging task.
The study’s sponsors also realized that estab-lished CDM methodology could be challengedin the face of China’s varied economic condi-tions and potentially critical role in the interna-tional climate change regime. From the outset,the Chinese Government emphasized that the
study should have a strong upfront focus onCDM case study development in order to opti-mize its operational relevance. Since other stud-ies also were under way in China, the sectorfocus was narrowed to the electric power gener-ation sector.
Furthermore, the Chinese Government ex-pressed keen interest in obtaining scientificallybased projections of China’s potential positionin an international carbon trading market underdifferent scenarios. The study also needed toinclude estimates of CDM’s possible impact onChina’s national economy.
Based on this analysis, the study came to anumber of conclusions.
First, the study questions the conventionalwisdom that a rather large pool of cheap carbondioxide reduction options are available in China,at least in the power sector. The potential sharefor China in the world carbon trading marketstill appears large—perhaps on the order of50 percent in the long run. At the same time,there are large differences in emission reductioncosts among sectors, indicating that only a lim-ited part of the studied sectors—the low-costsectors—may immediately be relevant for CDMapplication. These factors suggest that Chinamay not completely dominate the market.
Second, there is a strong need for capacitybuilding through actual CDM project develop-
xiiiC D M I N C H I N A
�
Foreword

ment and in transferring this knowledge to theprovinces and local areas in China where CDMprojects are being developed. It is important tostrengthen the linkages between the central gov-ernment’s interest in CDM and local initiatives.
Since the Kyoto Protocol—and thus CDM—may become a reality, China has many chal-lenges ahead in capitalizing on possible CDMoptions. China is now soundly engaged in for-mulating a CDM policy that responds to many
of the issues reflected in this report. We areconvinced that China will—as it has in somany other cases of international coopera-tion—shape and implement a policy thatwisely integrates the achievements of interna-tional agreements with specific Chinese devel-opment demands.
We believe this study-project was an impor-tant step that will help China’s efforts to developa proactive and sustainable approach to CDM.
NOTE TO THE 2ND EDITION
Immediately following the publication of thefirst edition of this report, it was presented at theChina CDM Conference in July 2004. At thisevent, the Government of China also presentedand discussed the Interim Measures for Operationand Management of CDM Projects in China,which was put into effect the day before the con-ference. The conference became a forum to discussChina’s CDM potential among the main Chi-nese and international institutions—including
enterprises—working on CDM application inChina. This second edition adds the main out-comes from the conference, including writtenmaterial and video clips of important presenta-tions and discussions, as well as the new interimmeasures. It also includes some corrections andmodifications to the original text. This editionalso is in response to the unexpectedly largeaudience that has requested information aboutpossible CDM application in China.
F O R E W O R D
C D M I N C H I N Axiv
Maria Teresa Serra Hans-Peter Egler Arno Tomowski Wang XiaofangSector Director Head of Trade and Director, Infrastructure Director General, EASES, World Bank Clean Tech. Div., SECO & Environment, GTZ Rural & Social Dev. Dep.,
MOST

This report is the result of a collaborative re-search effort by joint Chinese and internationalstaff. In order to coordinate the work by a largenumber of Chinese research staff from differentChinese institutions, a Chinese research associa-tion was established under the overall coordina-tion of the Global Climate Change Institute(GCCI) at Tsinghua University. Additionalresearchers came from Ernst Basler & Partners,a World Bank consultant; INTEGRATION, aGTZ consultant; the World Bank; the DeutscheGesellschaft für Technische Zusammenarbeit(GTZ); and MOST. For an overview of projectparticipants, refer to Annex 8 in the CD-ROMattachment.
We would like to express our deepest grati-tude to the Governments of Switzerland andGermany, which provided the funds to carry outthe study, publish the findings, and present thestudy results to a larger audience. Without theirsupport, the CDM capacity building project andthe study would not have been possible.
Within the Chinese research association, awide range of technical research institutionscontributed substantially to this effort, includingthe Energy Research Institute (ERI) of theNational Development and Reform Commis-sions (NDRC); the Institute of EnvironmentalEconomics (IEE) at the Renmin University; theInstitute of Energy, Environment and Economy
(3-E), the Institute of Nuclear and New EnergyTechnology (INET), and the Department ofThermal Engineering (DTE), all at TsinghuaUniversity; the Department of Resource Con-servation and Comprehensive Utilization ofNDRC (formerly part of SETC); the Agro-Meteorology Institute (AMI) of the ChineseAcademy of Agricultural Sciences (CAAS); andthe Electric Power Division of NDRC (formerlypart of SDPC).
Researchers in the association included WuZhongxin (GCCI, Vendor Manager), Liu De-shun (GCCI, National Project Director), DuanMaosheng (GCCI, team leader for methodologychapter), Zou Ji (IEE), Li Yu’e (AMI), Su Ming-shan (GCCI), Wang Yanjia (GCCI), Ma Yuqing(INET, team leader for case studies), Hao Wei-ping (NDRC), Zhao Yong (INET), ZhaoXiusheng (INET), Gu Shuhua (INET), ZhangXiliang (INET), Lu Chuanyi (3-E), Tong Qing(3-E), LuYingyun (3-E), Wei Zhihong (3-E,team leader for CDM modeling), Jiang Kejun(ERI), and Chen Wenying (3-E). The team hasalso been supported by other technical experts inthe association from local institutions and indus-tries, including Beijing Zheng Dong Electronic-Electricity Co. Ltd., Beijing MunicipalCommission of Development Planning, Shang-hai Wind Power Co. Ltd., Beijing Jingjin Ther-mal Electric Power Co. Ltd., Guangzhou Light
xvC D M I N C H I N A
�
Acknowledgments

Industry Design Institute, QinBei Super CriticalProject Construction, Huaneng Group Co.,Shanghai Meishan Iron and Steel Co. (Nanjing)and Beijing Third Thermal Power Plant.Researchers in the Ernst Basler & PartnersINFRAS team included Othmar Schwank (teamcoordinator), Markus Sommerhalder, GerardSarlos, Juerg Fuessler and Juerg Gruetter. For theINTEGRATION team, researchers includedAndreas Oberheitmann (team coordinator), GertOljeklaus, Fenno Brunken, and Gunther Haupt.
The work was coordinated by a project steer-ing committee (SC), which included representa-tives from the MOST, GTZ, SECO, and theWorld Bank.1 SC participants included Lu Xuedu(MOST, SC Chairman), Holger Liptow (GTZ,Climate Protection Programme), Paul Suding,and Xu Zhiyong (GTZ-China), Gerrard Burger-meister and Zhang Huihui (Swiss Embassy inBeijing), Peter J. Kalas and Eduardo Dopazo(World Bank), Jostein Nygard (World Bank TaskTeam Leader), and Andrea De Angelis (ItalianMinistry of Environment and Territory).2 Projectoperations have mainly been managed by LiuDeshun, Jostein Nygard, and Holger Liptow.
As part of the research process, several work-shops were arranged that included external par-ticipants from other government agencies and
Chinese enterprises; refer to Annex 7 in theCD-ROM attachment for participants and min-utes from stakeholder meetings.
A technical advisory group (TAG) for thestudy—including Zhou Dadi (ERI), Ma Aimin(NDRC), Pan Jiahua (Chinese Academy ofSocial Sciences-CASS), Anne Arquit Nieder-berger (Policy Solutions), and Michael Rumberg(TÜV Süddeutschland)—presented their reportto the SC in December 2003. Thereafter, theTAG actively assisted in drafting the institu-tional and concluding parts of the report.
Additional inputs, comments, and review ofthe text draft were provided by Gao Feng (MFA),Li Liyan (NDRC), Zhang Zhonxiang (East-WestCenter), Franck Lecocq, Neeraj Prasad, DanielHoornweg, Todd Johnson, Masaya Inamuro,Liu Feng, Nuyi Tao, Salvador Rivera, ChandraShekhar Sinha, Andres Liebenthal, RobertCrooks, Robin Broadfield (World Bank staff) andQi Zhai (World Bank intern).
The report was edited by Robert Livernash(consultant). Circle Graphics did the design andmanaged the typesetting. Production was super-vised by Denise Marie Bergeron. Photos havebeen provided by Circle Graphics and AnneArquit Niederberger.
A C K N O W L E D G M E N T S
C D M I N C H I N Axvi
1 NDRC, Ministry of Finance (MOF) and Ministry of For-eign Affairs (MFA) have also participated in several of thecritical study review meetings.
2 IMET, through their representative in the Sino-ItalianCooperation Program for Environmental Protection, par-ticipated in the SC based upon a separate activity focusingon CDM application in energy efficiency in buildings andindustrial production projects. The result from this studyis being published separately.

xviiC D M I N C H I N A
The China CDM study analyzes key method-ological issues related to the Clean DevelopmentMechanism from China’s perspective. It includessix case studies of potential CDM projects—fivepower generation projects and one landfill gasproject—and evaluates China’s CDM potentialthrough 2010.
Based on the analytical results and experiencegained through the China CDM study, and con-sidering both the evolution of the internationalCDM regime and China’s particular national cir-cumstances, this report outlines a Chinese CDMapproach that:
• Emphasizes sustainable CDM by ensuring thecontribution of CDM project activities to sus-tainable development in China.
• Takes a proactive approach to take early advan-tage of CDM opportunities during the firstcommitment period.
The recommended approach is based on thefollowing main insights from the methodologi-cal, case study, and modeling work undertakenby the study team:
• Implementation of the CDM in China candeliver significant local economic and sustain-able development co-benefits.
• China’s CDM potential represents a substan-tial component of the global carbon market.
• CDM projects must be identified and devel-oped within the next couple of years for China
to capitalize on its CDM potential during thefirst commitment period from 2008 to 2012.
• Chinese enterprises face barriers to CDM devel-opment and implementation in practice.
Based on the assessment of the significance ofCDM opportunities for China, the study consid-ers barriers to CDM project implementation,including needs for capacity building based onChina’s special circumstances and interests. Inaddition, the study makes a number of recom-mendations for decision makers regarding:
• China’s CDM strategy, policy, and implementa-tion plans: adopt a proactive and sustainableCDM policy.
• Urgent steps to facilitate CDM transactions: pro-vide basic services to allow CDM in China;ensure that critical capacity is developed; andencourage CDM project identification andimplementation.
• Longer-term considerations: consolidate results/enhance synergies across CDM initiatives andundertake follow-up analysis on key issues.
Combining a top-down with a bottom-upapproach, the study sought to analyze China’s realcircumstances. The study presents a comprehen-sive package of conclusions and recommendationsto the Chinese Government, potential project pro-ponents, and the interested national and inter-national audience.
Executive Summary
�


C D M I N C H I N A xix
INTERNATIONAL AND DOMESTICCONTEXT FOR CDM IN CHINA
Introduction to the CDM
The Clean Development Mechanism (CDM) isone of the three flexible mechanisms establishedunder the Kyoto Protocol (KP 1997). The CDMallows developed countries listed in Annex 1 ofthe United Nations Framework Convention onClimate Change (UNFCCC) to invest in green-house gas (GHG) emission reduction projects innon-Annex 1 developing countries and to claimthe resulting Certified Emission Reductions(CERs) to assist them in compliance with theirbinding GHG emission reduction commitmentsunder the Protocol. At the same time, CDM proj-ect activities contribute to sustainable develop-ment in the host developing countries. The CDMis thus conceived as a project-based win-winmechanism that can provide increased flexibility(temporal, geographical, sectoral) to developedcountries, which can reduce their overall cost ofcompliance with Kyoto commitments, while pro-viding the CDM project hosting partners withadditional funds and advanced technology.
At the Seventh Session of the Conference ofthe Parties to the UNFCCC (COP-7) convenedin Marrakech in November 2001, a package ofhigh-level political decisions on Kyoto Protocol
issues (in particular, the CDM) was adopted asdocumented in the Marrakech Accords. Thisagreement paved the way for Annex I Parties toratify the Kyoto Protocol and thus bring it intoforce. The Marrakech Accords elaborated themodalities and procedures for the CDM, includ-ing institutional, methodological, technical, andprocedural aspects, with a view to a prompt startto CDM project implementation, even beforeentry into force of the Kyoto Protocol. Under theMarrakech mandate, the CDM Executive Board(EB) and affiliated panels—such as the Method-ology Panel, Small-Scale CDM Panel, and Oper-ational Entity Accreditation Panel—were estab-lished to make the CDM operational.
China’s Climate Change and otherRelated Policies
China signed the UN Framework Convention onClimate Change in 1992, but climate policieshave not been high on the agenda of governmentdecision makers, and no explicit climate mitiga-tion or adaptation policies are in place. China’spursuit of sustainable development, however, hasin many respects been consistent with climate pro-tection. China takes active part in internationaland domestic activities regarding global climatechange. Furthermore, China ratified the KyotoProtocol in August 2002, making the country
Introduction
�
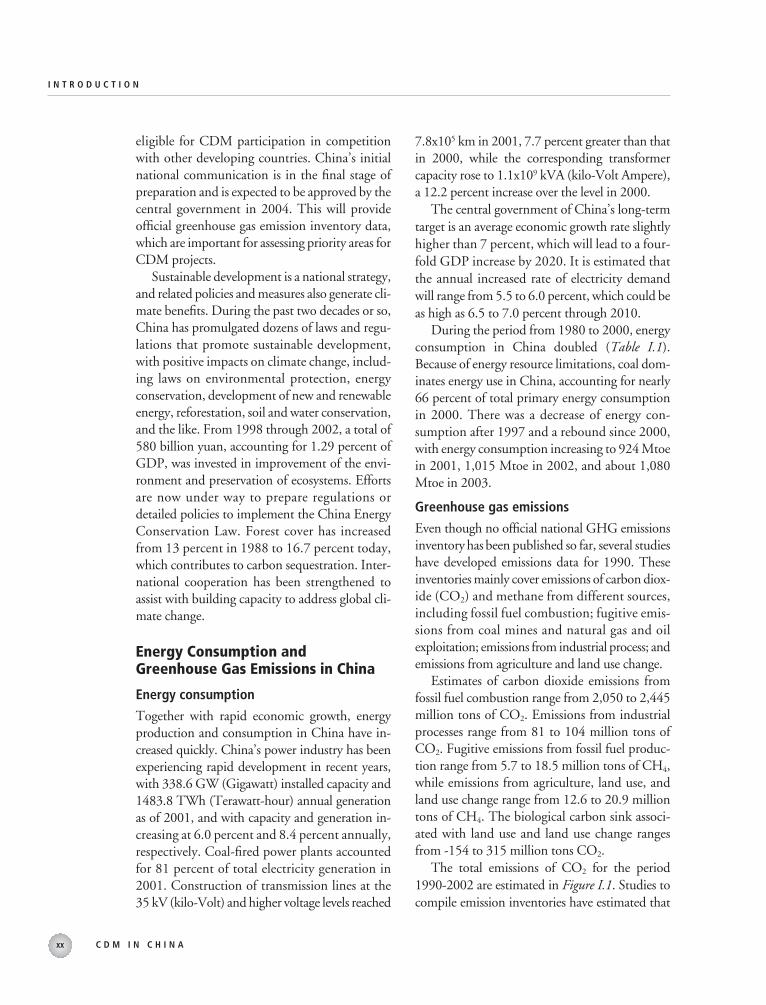
7.8x10⁵ km in 2001, 7.7 percent greater than thatin 2000, while the corresponding transformercapacity rose to 1.1x10⁹ kVA (kilo-Volt Ampere),a 12.2 percent increase over the level in 2000.
The central government of China’s long-termtarget is an average economic growth rate slightlyhigher than 7 percent, which will lead to a four-fold GDP increase by 2020. It is estimated thatthe annual increased rate of electricity demandwill range from 5.5 to 6.0 percent, which could beas high as 6.5 to 7.0 percent through 2010.
During the period from 1980 to 2000, energyconsumption in China doubled (Table I.1).Because of energy resource limitations, coal dom-inates energy use in China, accounting for nearly66 percent of total primary energy consumptionin 2000. There was a decrease of energy con-sumption after 1997 and a rebound since 2000,with energy consumption increasing to 924 Mtoein 2001, 1,015 Mtoe in 2002, and about 1,080Mtoe in 2003.
Greenhouse gas emissions
Even though no official national GHG emissionsinventory has been published so far, several studieshave developed emissions data for 1990. Theseinventories mainly cover emissions of carbon diox-ide (CO2) and methane from different sources,including fossil fuel combustion; fugitive emis-sions from coal mines and natural gas and oilexploitation; emissions from industrial process; andemissions from agriculture and land use change.
Estimates of carbon dioxide emissions fromfossil fuel combustion range from 2,050 to 2,445million tons of CO2. Emissions from industrialprocesses range from 81 to 104 million tons ofCO2. Fugitive emissions from fossil fuel produc-tion range from 5.7 to 18.5 million tons of CH4,while emissions from agriculture, land use, andland use change range from 12.6 to 20.9 milliontons of CH4. The biological carbon sink associ-ated with land use and land use change rangesfrom -154 to 315 million tons CO2.
The total emissions of CO2 for the period1990-2002 are estimated in Figure I.1. Studies tocompile emission inventories have estimated that
I N T R O D U C T I O N
C D M I N C H I N Axx
eligible for CDM participation in competitionwith other developing countries. China’s initialnational communication is in the final stage ofpreparation and is expected to be approved by thecentral government in 2004. This will provideofficial greenhouse gas emission inventory data,which are important for assessing priority areas forCDM projects.
Sustainable development is a national strategy,and related policies and measures also generate cli-mate benefits. During the past two decades or so,China has promulgated dozens of laws and regu-lations that promote sustainable development,with positive impacts on climate change, includ-ing laws on environmental protection, energyconservation, development of new and renewableenergy, reforestation, soil and water conservation,and the like. From 1998 through 2002, a total of580 billion yuan, accounting for 1.29 percent ofGDP, was invested in improvement of the envi-ronment and preservation of ecosystems. Effortsare now under way to prepare regulations ordetailed policies to implement the China EnergyConservation Law. Forest cover has increasedfrom 13 percent in 1988 to 16.7 percent today,which contributes to carbon sequestration. Inter-national cooperation has been strengthened toassist with building capacity to address global cli-mate change.
Energy Consumption andGreenhouse Gas Emissions in China
Energy consumption
Together with rapid economic growth, energyproduction and consumption in China have in-creased quickly. China’s power industry has beenexperiencing rapid development in recent years,with 338.6 GW (Gigawatt) installed capacity and1483.8 TWh (Terawatt-hour) annual generationas of 2001, and with capacity and generation in-creasing at 6.0 percent and 8.4 percent annually,respectively. Coal-fired power plants accountedfor 81 percent of total electricity generation in2001. Construction of transmission lines at the35 kV (kilo-Volt) and higher voltage levels reached

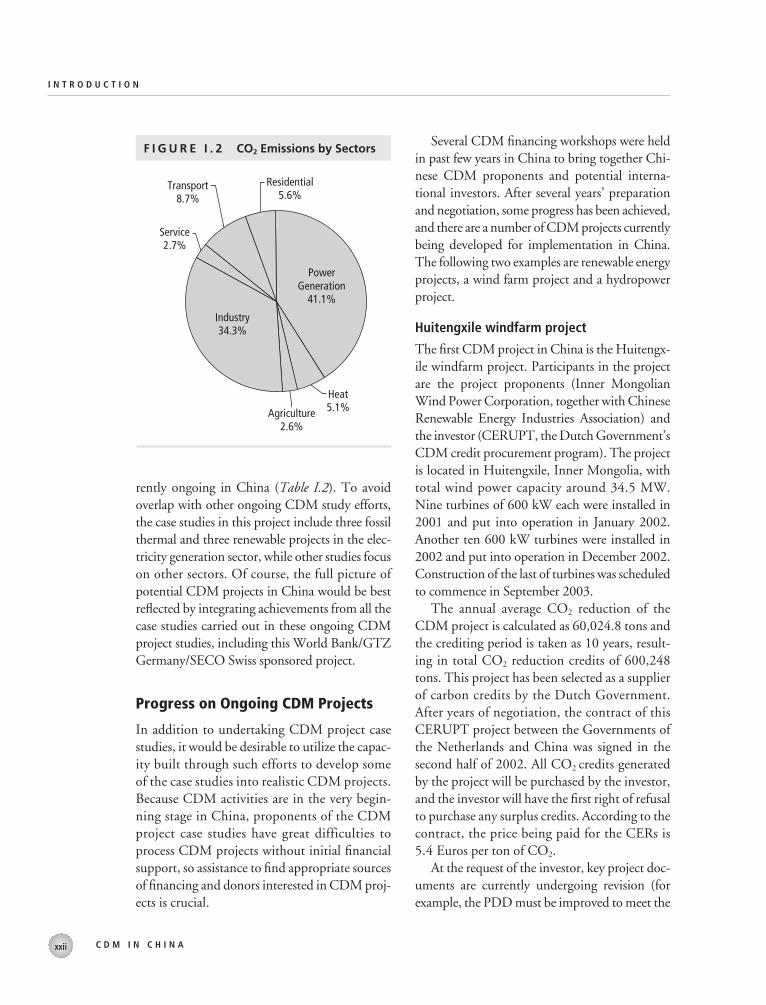
emissions from fossil fuel combustion account foraround 80 percent of total emissions. The break-down of CO2 emissions from fossil fuel combus-tion is calculated and presented in Figure I.2.Carbon dioxide emissions from the power gener-ation sector represent the biggest share of primaryenergy consumption (41 percent). Taking accountof other GHGs (N2O, HFCs, PFCs and SF6), theshare of CO2-equivalent emissions captured by thepower generation sector would be lower.
Not all power sector technologies are suitablefor CDM project activities. In this study, tech-nologies to be evaluated in the case studies wereselected according to their contribution to theoverall attractiveness of projects in a CDM proj-ect pipeline, including their (a) potential to reduceGHG emissions significantly; (b) local environ-mental benefits; and (c) the availability of dataregarding the status of project progress.
The case studies selected thus cover a consid-erable share of the total emission reductionpotential in the Chinese power sector.
ONGOING CDM-RELATED ACTIVITIES IN CHINA
Overview of the Various Initiatives
A number of major CDM activities (capacitybuilding, analysis, case studies, pilot CDM pro-jects) sponsored by international donors are cur-
I N T R O D U C T I O N
C D M I N C H I N A xxi
T A B L E I . 1 Structure of Primary Energy Consumption in China
Shares(%)
Energy Consumption Natural
(Mtoe) Coal Oil Gas Hydropower Nuclear
1980 422 72.2 20.7 3.1 4.0 01990 691 76.2 16.6 2.1 5.1 02000 912 65.9 24.5 2.5 6.7 0.4
Source: State Statistical Bureau
F I G U R E I . 1 CO2 Emissions in China from 1990 to 2002
–1000
–500
0
500
1000
1500
2000
2500
3000
1990 1991 1992 1993 1994 1995 1996 1997 1998 1999 2000 2001 2002Year
Emis
sion
s (T
g-CO
2)
Coal CombustionOil CombustionGas CombustionBiofuel CombustionCement ProductionBiomass BurningCarbon Uptake
rently ongoing in China (Table I.2). To avoidoverlap with other ongoing CDM study efforts,the case studies in this project include three fossilthermal and three renewable projects in the elec-tricity generation sector, while other studies focuson other sectors. Of course, the full picture ofpotential CDM projects in China would be bestreflected by integrating achievements from all thecase studies carried out in these ongoing CDMproject studies, including this World Bank/GTZGermany/SECO Swiss sponsored project.
Progress on Ongoing CDM Projects
In addition to undertaking CDM project casestudies, it would be desirable to utilize the capac-ity built through such efforts to develop someof the case studies into realistic CDM projects.Because CDM activities are in the very begin-ning stage in China, proponents of the CDMproject case studies have great difficulties toprocess CDM projects without initial financialsupport, so assistance to find appropriate sourcesof financing and donors interested in CDM proj-ects is crucial.
Several CDM financing workshops were heldin past few years in China to bring together Chi-nese CDM proponents and potential interna-tional investors. After several years’ preparationand negotiation, some progress has been achieved,and there are a number of CDM projects currentlybeing developed for implementation in China.The following two examples are renewable energyprojects, a wind farm project and a hydropowerproject.
Huitengxile windfarm project
The first CDM project in China is the Huitengx-ile windfarm project. Participants in the projectare the project proponents (Inner MongolianWind Power Corporation, together with ChineseRenewable Energy Industries Association) andthe investor (CERUPT, the Dutch Government’sCDM credit procurement program). The projectis located in Huitengxile, Inner Mongolia, withtotal wind power capacity around 34.5 MW.Nine turbines of 600 kW each were installed in2001 and put into operation in January 2002.Another ten 600 kW turbines were installed in2002 and put into operation in December 2002.Construction of the last of turbines was scheduledto commence in September 2003.
The annual average CO2 reduction of theCDM project is calculated as 60,024.8 tons andthe crediting period is taken as 10 years, result-ing in total CO2 reduction credits of 600,248tons. This project has been selected as a supplierof carbon credits by the Dutch Government.After years of negotiation, the contract of thisCERUPT project between the Governments ofthe Netherlands and China was signed in thesecond half of 2002. All CO2 credits generatedby the project will be purchased by the investor,and the investor will have the first right of refusalto purchase any surplus credits. According to thecontract, the price being paid for the CERs is5.4 Euros per ton of CO2.
At the request of the investor, key project doc-uments are currently undergoing revision (forexample, the PDD must be improved to meet the
I N T R O D U C T I O N
C D M I N C H I N Axxii
F I G U R E I . 2 CO2 Emissions by Sectors
PowerGeneration
41.1%
Heat5.1%Agriculture
2.6%
Industry34.3%
Service2.7%
Transport8.7%
Residential5.6%

C D M I N C H I N A xxiii
TA
BL
E I
.2K
ey In
form
atio
n o
n O
ng
oin
g C
DM
Stu
dy
Act
ivit
ies
in C
hin
a, 2
004
Do
no
rW
B/G
TZC
anad
a (C
5)Ja
pan
(3-
E)A
DB
BP
UN
DP
Stu
dy
met
ho
do
log
ies
app
lied
Sect
ors
Reg
ion
s
Key
issu
es
add
ress
ed
Cas
e st
ud
ies
Mac
ro m
od
els
Wo
rksh
op
sEc
on
om
y-w
ide
mo
del
ing
an
d c
ase
stu
die
s; P
ow
erg
ener
atio
n s
ecto
r(f
oss
il, r
enew
able
s)ca
se s
tud
ies
Bei
jing
, Hen
an,
Gu
ang
do
ng
Jian
gsu
, Sh
ang
hai
Glo
bal
Mo
del
ing
CD
M m
eth
od
olo
gy
app
licab
ility
,C
DM
po
ten
tial
MA
C,
CER
Pri
ceIm
pac
t an
alys
is, p
ol-
icy
insi
gh
ts, a
nd
reco
mm
end
atio
ns
Ben
efits
an
d b
arri
ers
for
CD
M
Staf
f tr
ain
ing
, ou
t-re
ach
, cas
e st
ud
ies
Ren
ewab
les,
urb
antr
ansp
ort
atio
n a
nd
sin
k
Nin
gxi
a
Aw
aren
ess
and
o
utr
each
Ad
apta
tio
n a
nd
imp
acts
Nat
ion
al
com
mu
nic
atio
ns
CD
M
Reg
ion
al o
nsi
te s
ur-
vey
and
exp
ert
inte
rvie
w o
n
Elec
tric
po
wer
sec
tor
No
rth
Ch
ina
(3 p
rovi
nce
s, H
ebei
,In
ner
Mo
ng
olia
,Sh
anxi
)
Esti
mat
ing
th
ep
ote
nti
al a
nd
co
sto
f C
DM
in C
hin
a
Cas
e st
ud
y
Ren
ewab
les
Gan
su, G
uan
gxi
Cap
acit
y b
uild
ing
Cas
e st
ud
y
Elec
tric
po
wer
sect
or
Gu
ang
do
ng
Polic
y, r
egu
lato
ryan
d t
ech
nic
alst
ud
y to
eva
lu-
ate
the
CD
Mp
ote
nti
al
Cas
e st
ud
y
Ren
ewab
les,
en
erg
yef
fici
ency
an
d c
oal
-b
ed m
eth
ane
Acr
oss
Ch
ina
1. C
DM
Po
licy
Bu
ildin
gSu
pp
ort
,2.
CD
M T
rain
ing
Pac
k-ag
e D
evel
op
men
tan
d Im
ple
men
tati
on
3. P
rep
are
CD
M p
re-
feas
ibili
ty s
tud
ies
and
pilo
t p
roje
ctfa
cilit
atio
n4.
Dev
elo
p C
DM
Pro
ject
web
site
an
d p
rovi
de
on
-go
ing
tec
hn
ical
sup
po
rt a
nd
m
ain
ten
ance (co
nti
nu
ed)

C D M I N C H I N Axxiv
TA
BL
E I
.2K
ey In
form
atio
n o
n O
ng
oin
g C
DM
Stu
dy
Act
ivit
ies
in C
hin
a, 2
004
(Co
nti
nu
ed)
Do
no
rW
B/G
TZC
anad
a (C
5)Ja
pan
(3-
E)A
DB
BP
UN
DP
Tim
e p
erio
dO
bje
ctiv
es
Ou
tpu
t
2002
-200
4C
apac
ity
bu
ildin
g,
dev
elo
pm
ent
of
met
ho
do
log
ical
gu
idel
ines
fo
rC
DM
in C
hin
a,as
sess
men
t b
y ca
sest
ud
ies,
ass
essm
ent
of
the
Ch
ina
CD
Mm
arke
t in
th
eg
lob
al c
on
text
Fin
al r
epo
rt o
n t
he
stu
dy
fin
din
gs
Six
case
stu
dy
rep
ort
s an
d P
DD
sFi
nal
stu
dy
wo
rk-
sho
pTr
ain
ing
in P
DD
pre
par
atio
n
2002
-200
4C
apac
ity
bu
ildin
g,
po
vert
y re
du
ctio
n,
and
co
ntr
ibu
te t
oC
anad
a’ s
inte
r-n
atio
nal
clim
ate
chan
ge
ob
ject
ives
1.In
form
atio
n o
nC
DM
ru
les
&
pro
ced
ure
s2.
Cas
e st
ud
ies
3.M
eth
od
olo
gic
alan
alys
is a
nd
p
olic
y ad
vice
2001
-200
5Pr
om
oti
ng
CD
M,
met
ho
do
log
y,G
HG
ER
po
ten
tial
san
d c
ost
s o
f C
DM
in C
hin
a
Sect
ora
l CD
M P
ote
n-
tial
s, P
DD
2002
-200
3C
apac
ity
bu
ildin
g
for
smal
l-sc
ale
CD
M p
roje
cts
PDD
Cas
e st
ud
y re
po
rt
2002
-200
3C
DM
cas
e st
ud
y
PDD
Stu
dy
rep
ort
2004
-200
6C
DM
po
licy
reco
mm
en-
dat
ion
s, c
apac
ity
bu
ildin
g, C
DM
cas
est
ud
y, C
DM
ou
trea
ch
1.A
sses
smen
t o
f C
DM
in C
hin
a2.
CD
M t
rain
ing
m
ater
ials
3.Th
ree
CD
M P
DD
s4.
A C
DM
web
site

requirements and standards issued by CDMExecutive Board with respect to baseline method-ology, monitoring methodology, and plan). Asthis CERUPT project is a pioneer CDM projectin China, the cumulative experience gained frompreparation of the necessary documents, sub-mission to the host country’s designated agencyfor approval, the price negotiation process, andproject implementation and monitoring will bevery helpful for promoting CDM projects infuture years.
Xiaogushan hydropower plant
The second CDM project in China is the Xiao-gushan hydropower plant (XHP) project. Theproject proponent is the Xiaogushan HydropowerCompany and the investor is the Prototype Car-bon Fund (PCF) of the World Bank (WB). TheXHP project is located in Zhangye in GansuProvince. It is a run-of-river power plant with atotal hydropower capacity of 98 MW and includesa diversion weir, intake tunnel, power plant, a roadconnecting the weir and power plant, and 110 kVtransmission line for power evacuation. Theproject construction started in early 2003 andwill be completed in early 2005. All compo-nents of the project lie within the same sparselypopulated county. The project will contributeto easing power supply shortages, protectingthe environment, and removing poverty inlocal regions.
The annual average CO2 reduction of theCDM project is calculated as 372,300 tons, thecredit period is taken as 10 years and the totalCO2 reduction credit produced by the projectamounts to 3,723,000 tons. Recommended bythe National Climate Change CoordinationOffice of China, the WB selected XHP as one ofthe potential PCF projects in China. In October2003, the Chinese side completed the ProjectConcept Note and submitted it to WB, whichsent a team of WB officials and internationalexperts in November 2003 to Gansu Province fora site visit to collect relevant data and informa-
tion. While preparing the necessary reports andsending them to the World Bank, the proponent(XHP) and the Bank were also processing a State-ment of Intent for creating the PCF project. Forthis XHP project, the CO2 price was set throughnegotiation at around $4 per ton of CO2. Con-sidering the closing date of PCF, the ERPA(Emission Reduction Purchase Agreement) ofPCF XHP is expected to be signed in the fourthquarter of 2004.
CHINA CDM STUDY BACKGROUND
In 1997, the World Bank launched the NationalStrategy Study Program (NSS) together with thegovernment of Switzerland. Since then, the Pro-gram has expanded to include other donor coun-tries, including Germany, Italy, Finland, andAustralia, to assist its partner developing countriesin exploring the opportunities and benefits of par-ticipating in CDM projects. One form of assis-tance is to support country studies that developCDM methodologies and analyze GHG emissionreduction potentials in different regions by iden-tifying promising CDM technology categoriesand project-type options with cheap GHG emis-sion reduction costs. The program also would liketo assist the partner countries to explore possiblepolicies and measures and to create a soundenabling environment and platform to enhancecapacity building for the CDM and overcomeexisting barriers to CDM project implementa-tion, based on the partner country’s real circum-stances and interests.
The study program also focuses on CDMproject case studies leading to development ofCDM Project Design Documents (PDD) andpreparation of proposals for feasible CDM projectoptions in the selected sectors.
Based on common understanding and inter-ests, the World Bank/GTZ Germany/SECOSwiss reached an agreement with MOST onbehalf of the Chinese Government to carry out theproposed China CDM Study project funded bythe Governments of Switzerland and Germany.1
I N T R O D U C T I O N
C D M I N C H I N A xxv

Motivation and Objectives of the Study
The China CDM Study was developed to meetthe following needs for China:
1. There is a need for China’s academic and con-sultant institutions to develop a better under-standing of CDM methodologies and how toprepare better applications for CDM projectsbased on China’s real circumstances.
2. At the micro level, there is a need for China’sproject participants (public and private sec-tors) to learn how to identify, develop, andimplement an eligible CDM project in thewhole project cycle. A practical way to meetthe need is “learning by doing” through CDMproject case studies.
3. At the macro level, there is a need for China’spolicymakers to know the potential demandfor CERs in the world carbon trade market,as well as price trends. In order to formulateappropriate CDM strategy and policy forChina, they also need to know the least-costCERs/CDM supply potential and priorityareas by technology and sector in China, aswell as their policy implications and theimpact of CDM on China’s economy.
Hence, the overall concept of the ChinaCDM Study project is to enhance capacity build-ing in implementation of CDM at the level ofindividual projects (micro level), while simulta-neously developing CDM strategy and policy atthe macro level for the Chinese side. The overallobjectives of the study are to:
• Better understand CDM methodological andtechnical issues in order to provide technicaladvice on how best to apply the CDM method-ology guidelines to real CDM projects in China.
• Build up capacity and experiences in CDMproject development through typical casestudies in the electric power generation sector(fossil, renewable) in China, with a view towardpreparing eligible CDM PDDs and establish-
ing a project pipeline with industries in Chinaand abroad.
• Better understand the market opportunitiesand economic benefits for China when partici-pating in CDM by identifying China’s CERssupply potential; analyzing marginal abatementcost curves (MAC) and priority technology andsector areas; simulating the market price trendsof CERs and China’s market share in the worldCDM carbon market under selected scenarios;assessing the impacts of CDM on China’s eco-nomic development; and evaluating barriers, soas to identify the policy implications of CDMfor China.
In general, these objectives also mean an over-all far-reaching objective: to enhance overallcapacity building for China to participate inCDM. The structure of the study follows theseobjectives.
Structure of the Study Report
The Chinese Government and World Bank/GTZ Germany/SECO Swiss agreed that the con-tent of the study is based on the real needs andinterests of the Chinese side. The project activi-ties were structured as three tasks:
• Task 1: Methodological and technical issuesfor CDM.
• Task 2: CDM project case studies.• Task 3: Analysis of China’s CDM potential
and impacts on economic development.
Meanwhile, inter-linkages between the threetasks were established to support each other. Thelinkages are illustrated in Figure I.3.
The inter-linkage between Task 1 and Task 2was established in such a way that Task 1 pro-vided technical training and assistance to Task 2regarding methodological and technical issues inthe case studies, and discussed with Task 2 theappropriate application of related CDM method-ologies in case studies. Task 2 then ensured that
I N T R O D U C T I O N
C D M I N C H I N Axxvi

Task 3: CER supply/demand, price, CDM impact on development
T3: CERT: Global CER demand,price, China’s market share
Task 2 Mainstreaming key tech- nologies for CDM pipeline; Demonstration of whole CDM project cycle
Task 1 Streamlining CDM methodologies
T3 AIM: bottom up GHG emissions & CER supply potential by major sector, key technologies
T3: economic impact ofCDM
T3/1 interaction T2/3 interaction
T1/2 interaction
each of the CDM methodological issues addressedby Task 1 was studied in-depth in one selectedcase study, in cooperation with Task 1.
Moreover, as far as the inter-linkage betweenTask 3 and Task 2 is concerned, the linkage isestablished in such a way that Task 3 providedresults of the IPAC-AIM technology modelregarding CO2 emission mitigation potential inChina and their share by sectors for 2010, as wellas the priority list of technology options for CO2
emission reductions, including the advancedelectric power technologies. Task 3 also suppliedthe marginal abatement cost analysis for most keysectors, including the power generation sector.This information proved to be a useful referencefor Task 2 to identify and select appropriate sec-tors, and then energy technologies suitable forthe CDM project case study in the electric powersector.
The final report is divided into two Parts.Part I covers the CDM Methodology and CaseStudies, which contains the results of Task 1and Task 2. Part II covers China’s CDM poten-tial and an impact assessment of CDM onChina’s socioeconomic development, whichcovers the results of Task 3, as well as conclu-sions and recommendation.
Study Partners
The China CDM Study was primarily conductedby Chinese experts from the leading institutionsin cooperation with the international experts des-ignated by the World Bank/GTZ Germany/SECO Swiss under the general guidance of aSteering Committee, consisting of MOST ofChina (Chair) and supported by other concerned
I N T R O D U C T I O N
C D M I N C H I N A xxvii
F I G U R E I . 3 Overview of Main Outputs and Inter-linkages Among Tasks 1, 2, and 3

agencies, including the GTZ of Germany, theGovernment of Switzerland, the World Bank,and the SICP of Italy.
The national expert team is divided into threetask teams responsible for the three tasks. Recom-mended by the Steering Committee, the GlobalClimate Change Institute (GCCI), TsinghuaUniversity, is designated as the National ProjectCoordinator (NPC) unit, and the GCCI, INET,and 3-E institutes of Tsinghua University areselected as the executing agencies responsible forTasks 1, 2, and 3, as well as for the organization ofthe national expert teams in cooperation withother local institutions and industries. Therefore,the GCCI represents a role as an association,involving several competent institutions andindustrial experts within and outside TsinghuaUniversity under the project framework, as shownin Annex VIII on the CD-ROM. The domesticexperts could thus fully use their interdisciplinaryexpertise and knowledge in the association co-ordinated by the NPC. The role of the inter-national experts is to provide advisory suggestions,relevant information, and necessary technicalassistance, as stipulated by the TOR and requested
by the project coordinator. The list of the nationaland international experts team can be found inAnnex VIII on the CD-ROM.
The role of the Steering Committee was toguide the project team, perform overall monitor-ing of the study activities, make decisions regard-ing essential components of the study, and adoptthe inception report, the progress reports, and thefinal report. The member list of the Steering Com-mittee is also in the Annex VIII on the CD-ROM.
In addition, a Technical Advisory Group con-sisting of three Chinese and two internationalexperts performed an in-depth, on-site peer reviewof the draft final report, and international experts,the World Bank, and the German GTZ alsoreviewed and provided comments at various stagesof report preparation. Representatives of severalChinese Government ministries provided com-ments on key elements of the report before it wasfinalized.
Endnote/Reference1. Italy joined the World Bank/GTZ Germany/SECO
Swiss China CDM Study Project later, but its work isseparately developed.
I N T R O D U C T I O N
C D M I N C H I N Axxviii

C D M I N C H I N A xxix
The China CDM Study was supervised by theMinistry of Science and Technology of the Chi-nese Government and supported by the SwissGovernment, the German Agency for TechnicalCooperation (GTZ), and the World Bank. Theobjectives of the study were to:
• Project China’s CDM supply potential and pri-oritize under different scenarios the technologyoptions for CER supply
• Estimate the size of the global CDM marketand factors influencing China’s market oppor-tunities, as well as the likely range of economicbenefits
• Contribute to a better understanding of themethodological issues related to application ofCDM under China’s national circumstances
• Build capacity and experience in CDM proj-ect development through investigation of sixcase studies from the electrical power and therenewable energy sectors
• Assess the impacts of CDM on China’s eco-nomic development and related barriers
• Identify policy implications of CDM and framerecommendations forpolicymakers accordingly.
METHODOLOGICAL GUIDELINESAND INSTITUTIONS FOR CDM
In the first part of the study, a series of method-ological issues were investigated. There are vari-
ous stages and studies that are required for a proj-ect to realize revenues from the CDM market.The correct application of these methodologieswill ensure that a proposed CDM project activityresults in real, measurable, and long-term green-house gas emission reduction benefits. A betterunderstanding of methodological and technicalissues related to CDM projects (in particular base-lines and additionality) would provide guidancefor case studies conducted at the sectoral level.The findings in this study will help CDM projectproponents in the country make well-informeddecisions at various stages of project developmentand implementation.
Table T.1 provides a brief overview of themost important terms in the CDM process andtheir definitions by the Conference of the Partiesor—if not defined by UNFCCC bodies—thedefinition used in this study. Following that, themethodological results of the study are presented.
Project Boundary and Leakage
A rational project boundary is essential toaccurately measure the emission reductionbenefits of a CDM project activity and to mit-igate leakage. Leakage can be caused by activ-ity shifting, which happens when people (orcapital) change location; changes in productprice; life-cycle emissions shifting, such as an
Technical Summary
�

project on the existing supply of and demandfor goods and services, and seek to change thissupply/demand or meet this supply/demandthrough alternative actions. Using project de-sign to avoid leakage is more difficult wheneconomic goods (e.g., energy or timber) areinvolved.
• Extension of project boundary. Tracking house-hold energy use after installation of a moreefficient appliance, for example could catchleakage resulting from homeowner perceptionsthat energy has become less expensive. Someobservers have carried this argument further,asserting that global energy models should berun on individual projects to identify their netglobal impacts. Unfortunately, the impacts ofindividual projects, however real, will rarely, ifever show up at the level of aggregation associ-ated with a global model.
T E C H N I C A L S U M M A R Y
C D M I N C H I N Axxx
upstream or downstream emissions increasecaused by the project; and change in GHGfluxes resulting from ecosystem-level changesin surrounding areas.
Four principles are useful in identifying emis-sion sources and sinks that should be included inthe project boundary: (1) comprehensiveness ofthe boundary, or balancing the comprehensivenessin boundary definition and the accompanyingcost; (2) control over emissions and maintenanceof proper incentives; (3) avoidance of doublecounting (credits can only be issued once for aproject activity); and (4) materiality of emission,or setting a threshold for “significant”.
Taking these principles into account, leakagecan be mitigated by various means:
• Rational project selection and design. A devel-oper can evaluate the likely impacts of the
T A B L E T . 1 Key Methodological Terms in the CDM Process
Project boundary“. . . shall encompass all anthropogenic emissions by sources and/or removals by sinks of greenhouse
gases under the control of the project participants that are significant and reasonably attributableto the CDM project activity.”
Leakage“Net change of anthropogenic emissions by sources of greenhouse gases which occurs outside the
project boundary, and which is measurable and attributable to the CDM project activity.”
Baseline“The baseline for a CDM project activity is the scenario that reasonably represents the anthropogenic
emissions by sources of greenhouse gases that would occur in the absence of the proposed projectactivity. A baseline shall cover emissions from all gases, sectors and source categories listed inAnnex A within the project boundary.”
Additionality“A CDM project activity is additional if anthropogenic emissions of greenhouse gases by sources are
reduced below those that would have occurred in the absence of the registered CDM project activity.”
Project-based incremental emission reduction costBased on economic theory, the calculation method of project-based emission reduction cost for a CDM
project depends on the cost allocation options among the domestic benefits (such as products and/orservice) and the CER benefits from different points of view; that is, the cost could be defined as anincremental cost for achieving the CERs or for achieving domestic benefits. The CDM is designed toprovide benefits for both project investor and host. It should help non-Annex I (developing) countriesachieve sustainable development, and help Annex-I (industrialized) countries fulfill their quantitativeobligations under the Kyoto Protocol. According to this share of benefits, there has to be a subse-quent cost-share arrangement. Since it is easy to measure the project costs and complicated to mea-sure the benefits, this study views this issue from the cost perspective; that is, CDM project developerswill bear additional costs other than those that occur in the baseline scenario.

• Development of non-project specific leakage bench-marks or coefficients. This approach would createand apply a series of project-level national orinternational leakage coefficients that can beused to adjust the estimate of project benefits ina more standardized way to account for leakage.
Baseline
Project-specific baseline methodologies have beenused most widely in past AIJ projects, in bothChina and elsewhere. A project-specific baselineimplies low costs for data collection in the shortterm, less data collection work, and universalapplicability, while it implies less transparencyand in the long term a high cost of data collec-tion. Standardized baselines have opposite impli-cations. Standardized baselines would be suitablefor new construction projects, projects with sim-ple and easy-to-measure output, and projects withsingle technologies. A project-specific baseline issuitable for technical retrofit projects, projects thatfocus on better management to improve energyefficiency, and projects with diversified output. Inpractice, project-specific baselines are used mostcommonly.
Baselines can also be categorized as either sta-tic, quasi-dynamic, or dynamic. Dynamic base-lines may be necessary considering factors such astechnological progress, energy efficiency improve-ments, or changes in the regulatory or legal envi-ronment, fuel price, fuel availability, or productstructure.
Although various baseline methodologieshave been proposed by different sources and dis-cussed in this study, it does not necessarily meanthat all of them could be appropriate choices forCDM projects hosted by China. Some conclu-sions include:
• A balanced choice of baseline is an importantprerequisite for project integrity. To choose themost appropriate baseline methodology for aCDM project activity, one needs to strike agood balance among different considerations,
such as the real situation, transparency, accu-racy, verifiability, and transaction cost.
• National baselines are not appropriate. Chinais a large country with significant differencesbetween regions, so baseline methodologiesbased on national average data are not an appro-priate choice. If the project boundary permits,those based on regional data could strike a goodbalance among different considerations as adefault value.
• Project-specific baselines are the best option. Mostprojects adopted project-specific baselines, inpart because of the lighter workload for datacollection compared to multi-project baselines,as well as the fact that baseline data were easierto get because there were currently existing sim-ilar projects under construction or under designin the same region, and because of the low costof data collection.
Project proponents planning to undertakeCDM projects in China should take these obser-vations into account.
Additionality
Additionality assessment is important in the senseof safeguarding the environmental integrity of theKyoto Protocol. Various institutions are involvedin the additionality assessment process. Cooper-ation among these institutions is a necessity toreduce costs and increase the accuracy of addi-tionality assessment. Technically, the additional-ity of a CDM project activity can be demonstratedfrom various aspects, including emissions aspect,financial aspect, investment barrier, technologybarrier, or other barriers. Based on the method-ological analysis, this study makes the followingrecommendations for additionality assessment:
• Meeting of efficiency criteria. They should reflectas much as possible specific circumstances of theproject to be assessed, and reflect to some extentgeneral situations of a specific sector/regionwhere the project is to be located. In addition,
T E C H N I C A L S U M M A R Y
C D M I N C H I N A xxxi

C D M I N C H I N A
they should have rational or even limited datarequirements, very limited system errors, rela-tively low uncertainties, acceptable transactioncost, and very limited subjective judgment.
• Use of integrated approaches. The results ofassessment from different aspects for a sameproject activity could be different, so the addi-tionality should be assessed from an integratedpoint of view.
Although various additionality criteria havebeen proposed, this does not mean that all thecriteria could or should be applied in a proposedCDM project activity, nor does it mean that aproject activity should pass all the assessmentsbefore it could be viewed as additional.
Project-based Incremental Costs forEmission Reduction
One of the objectives of a CDM project is to gen-erate emission reduction benefits compared to thebaseline project. The incremental costs for emis-sion reduction (ICER) only cover the costs goingbeyond the baseline project, such as a coal-firedpower plant that would be replaced by a gas gen-eration unit under the CDM. The CDM isintended to help Annex I countries fulfill theirquantitative obligations toward the Kyoto Proto-col and at the same time to help non-Annex Icountries to achieve sustainable development.The cost-sharing arrangement may follow thisshare of benefits. From the methodological pointof view, this study considered the following:
• Generally, the above-mentioned cost sharing ap-proach means that the incremental costs are borneby the project investor. Additionally, assum-ing adequate data availability, the calculationmethod of incremental emission reduction costper unit of CERs is preferred, as discussedbelow and applied in the case studies.
• The ICER method is applied in this study. Thisstudy uses the incremental cost for emissionreduction (ICER) method to calculate GHG
emission reduction costs. It identifies the majorparameters necessary for the calculation. Thiscost serves as one of the criteria for project pro-ponents to determine whether or not to acceptan offered price for CERs.
• Depending on the evaluation of the circum-stances, other methods are possible. Based on thedistribution of risks and benefits, other cost-sharing arrangements could be applied.
Transaction Costs
CDM provides an opportunity for project devel-opers to sell certified emission reductions (CERs)that are generated when the project commencesoperation. It primarily provides revenue streamsfor a project activity that need to be contractedon or around the time of financial closure of theproject. In its simplest form, CDM thus does notprovide financing for projects.
In the context of CDM, transaction costs referto all expenditures made by buyers and sellersof CERs to complete a transaction for exchangeof CERs. The transaction cost associated with aCDM project activity includes project search cost;project document development cost; negotiationcost; validation cost; registration cost; monitor-ing cost; verification and certification cost; andshare of proceeds. Methodologically, the follow-ing recommendations regarding the transactioncosts should be taken into account by projectproponents:
• Since the economic impact of transaction costs isconsiderable, the concept should be clear. Giventhe complexity of CDM projects, it is impor-tant to understand the components and signif-icance of any possible transaction costs that arelikely to be involved in the initiation and imple-mentation of CDM projects. As part of a mar-ket process, the costs of CER generation andassociated transaction costs will—to a largeextent—influence the CDM market.
• The main factors affecting transaction costs haveto be observed closely. In general, transaction
T E C H N I C A L S U M M A R Y
xxxii

costs depend on the volume of CER trade,which depends on the project size; the numberof parties and project sites involved in a project;the enabling environment within the host andthe investor countries; and CDM methodolog-ical, contractual, or project financing issues.
A case study project involving power genera-tion and the anaerobic treatment of effluent pro-vides an example of estimating the transactioncost, and the estimated transaction cost is about$0.8/t-CO2 equivalent currently. These costs inthe mid-term future may be reduced to about$0.6/tCO2 equivalent, but do not fully accountfor the cost of time inputs by the project devel-oper and the investor. Transaction costs associ-ated with prevailing low prices for carbon offsetswill act as a significant barrier for potential CDMproject deals to reach the market.
FINDINGS OF PROJECT CASE STUDIES
The study has conducted case studies that couldlead to CDM deals. This effort in capacity build-ing was undertaken in order to achieve the fol-lowing objectives:
• To learn how to identify and select promisingCDM projects in the electric power and renew-able energy areas by applying eligibility cri-teria and procedures for the CDM projectselections
• To build up capacity and experience in thedevelopment of CDM projects in the wholeproject cycle by carrying out several CDM proj-ect case studies in the selected areas
• To demonstrate the applicability of the CDMmethodology and operation procedures basedon China’s real circumstances
• To establish a pipeline of promising CDMprojects and prepare feasible CDM projectdesign documents.
The case studies selected were intended to presenta relevant distribution of projects, both in terms of
geographical coverage and in terms of projecttypes. The study outline targeted the energy sec-tor. Further, given the emphasis on capacity build-ing and the agreed focus on the power sector andproject development, the study team also endeav-ored to consider projects for which the method-ological basis is relatively less developed. Guidedby the steering committee and findings from pre-vious studies, a long list of possible CDM cases wasdeveloped for the fossil-fuel-based power genera-tion and renewable energy sectors in China, whichhave substantial potential for CDM activities. Eli-gibility criteria and indicators were then evaluatedfor the long list, resulting in six CDM case studies.Their key features are displayed in Table T.2.
A case study report was developed for eachcase addressing baseline, additionality, credit-ing period, and local environmental and socio-economic impacts, as well as stakeholders’ com-ments, perceived barriers, and risks, (see annex AIon the CD-ROM). Six project design documentswere prepared, (see annex AII on the CD-ROM).In general, the case studies are in compliance withthe methodologies regulated by the ExecutiveBoard of CDM, while specific measures are takento consolidate the quality of the study, such as:
• The latest decisions made by the CDM Exec-utive Board are reviewed and adopted asappropriate
• New methodologies and PDDs published atthe UNFCCC web site are studied and takenas references
• Intensive inter-task communication contrib-uted to make the six cases robust and consis-tent with each other
• Rules and good practices for economic assess-ment (as issued by concerned governmentalagencies) were followed
• Close interaction and technical training pro-vided to the industries involved contributed tobuilding capacity in terms of project develop-ment and future implementation of such CDMactivities.
The case studies applied state-of-the-artmethodologies for design of CDM projects in
T E C H N I C A L S U M M A R Y
C D M I N C H I N A xxxiii

C D M I N C H I N A
the power sector. The main methodologicalfindings were as follows:
• Physical project boundary is preferred. It isshown in the case studies that the physicalboundary CDM project is usually a good choiceto set the project and system boundary forGHG calculation. Leakages in these CDM casescould be omitted because of the lesser quantitycompared to direct emissions, although differ-ent potential sources of leakages might be inexistence.
• Baseline determination is critical. Baselines typi-cally vary according to different technology andproject design characteristics. The followingissues should be considered:•• A PDD offering a portfolio of possible base-
line options is important and necessary. Theconservative principle, stipulated by the Mar-rakech Accords and relative decisions madeby EB, usually is the most important criteriain selecting an appropriate baseline and incalculating emission reductions. While theapproaches defined in 48(b) and 48(c) ofDecision 17/CP7 are followed more fre-quently than that in 48(a), two methodolo-gies are incorporated in the determination ofbaselines in the case studies: “operating mar-gin” and “built margin.”
•• Based on the real circumstances in China,approach 48.a) is not appropriate as a powerbaseline for China’s fast growing economy.
•• The operating margin is the most appropri-ate baseline methodology in the case ofsmall renewable energy power generation—depending on the requirements for a pre-dictable, and reliable power supply.
•• The built margin is the most appropriatebaseline methodology for large-scale projects.
• Additionality is the key parameter determiningCDM market potential. Additionality can be jus-tified in terms of technology, financial perfor-mance, and other factors. The case studiesshow that those advanced technologies withhigher electricity generation cost and lowermarket share could be qualified CDM choices,as not accepted broadly in the business asusual.
The technology assessment presented in TableT.3 intends to promote further discussion amongall stakeholders on the findings of the case studies.The development of a larger project pipelinewould take into consideration parameters such asconcentration on projects perceived as “low” riskand technological advancement in the respectivesectors. Also important is the assessment of miti-
T E C H N I C A L S U M M A R Y
xxxiv
T A B L E T . 2 Key Data on the Investigated Case Studies
CO2-equivalent emission reduction
Case study Installed capacity per year (1000t)
1. Huaneng-Qinbei Supercritical Coal-Fired Power Project (Phase II)
2. Beijing Dianzicheng Gas-fired Combined Cycle Tri-generation Project
3. Gas-Steam Combined Cycle Power Project (Phase II) in Beijing No. 3 Thermal Power Plant (BJ3TPP)
4. Shanghai Wind Farm Project (Phase II)5. Anaerobic Treatment of Effluent and Power Generation
in Taicang Xin Tai Alcohol Co. Ltd.6. Landfill Gas Recovery Power Generation Project in
Zhuhai, Guangdong Province
1136 MW
128 MW
404 MW
20 MW4 MW
1.7 MW
876
534
650
3627
72

gation cost; the assessment of the project devel-oper’s risks associated with demonstration ofadditionality; the related technological and finan-cial risks; as well as stakeholders’ views based onsuch criteria and other barriers. Table T.3 showsthe perceived interaction of risks and costs.Through wider analysis of results obtained by dif-ferent groups of project proponents, a more con-sistent assessment of technology priority forCDM could be established.
The six CDM case studies investigated in thisstudy cover a total annual reduction potential ofabout 2.5 MtCO2 equivalents. The incrementalcost for emission reduction (ICER) ranges be-tween $3.60 and $50/tCO2. The economicincentive available from a CER price in the rangeof $5.20 to $6.50/tCO2 will not be sufficient tomake renewable energy projects such as windpower a commercially viable technology option.
• High fuel prices (e.g. natural gas for gas tur-bines), higher capital costs, and less operationhours (e.g. for wind generation units) result inan ICER in four of six cases significantlyabove the $10/tCO2 threshold. Comprehen-sive financing packages and efforts to make theCDM project cycle shorter and the transactioncost lower would be needed to make somerenewable CDM options more attractive.
• Besides substantial benefits of emission reduc-tion, these CDM projects will create beneficial
impacts on the local environment and socio-economic system and thus make contributionsto the sustainable development of the hostingarea and the hosting country.
CDM POTENTIAL IN CHINA
Addressing global climate change poses a signifi-cant challenge to China’s policymakers for strate-gically assessing the opportunities of the emergingcarbon offset market at the macro and micro lev-els. What are the economic, social, and environ-mental benefits of participating in the CDMregime? The potential supply and demand forCERs in the global carbon market, carbon pricetrends, and how best bring to the market ChineseCERs are questions pursued in Part II of thestudy. What are the priority areas for carboninvestments, especially in the energy-relatedsectors? To answer these questions, an energy-economy model framework was developed thatconsists of energy technology models (IPAC-emission and IPAC-AIM technology), a carbonmarket equilibrium model (CERT), and a com-putable general equilibrium model (IPAC-SGM).The model system works out future carbon emis-sion projections and generates marginal abate-ment cost curves for different regions in theworld. It addresses equilibrium carbon quotaprices in the world carbon market and the possiblecarbon trade, and then examines carbon reduction
T E C H N I C A L S U M M A R Y
C D M I N C H I N A xxxv
T A B L E T . 3 Cost and Priority Ranking of Project Types
Barriers and associated risk for demonstrating additionality
Abatement cost Low risk +/- High risk
Medium to high cost> 10 USD/t CO2
Low cost< 10 USD/tCO2
• Wind power• Biogas
• Landfill methane gasrecovery
• Biomass gasification• Tri-generation• Fuel switch: Gas
combined cycle• Energy efficiency in
industry• Supercritical coal

0
100
200
300
400
500
600
700
0 100 200 300 400 500 600 700Emission reductions (MtC)
Mar
gina
l aba
tem
ent c
ost (
US$
/tC 2
000) USA
OECD-P
OECD-W
EFSU
China
S.E. Asia
ME
Africa
LA
C D M I N C H I N A
potentials by major sectors as well as technologypriorities for CDM in China.
The model system’s results provide the policyimplications for CDM potential in China, andthe impact of CDM on China’s economy. Itwould be helpful for China’s climate change pol-icymakers to formulate appropriate CDM strat-egy and policy for China.
The reference scenario used in this study wasdeveloped based on results of related studies andprojections up to 2010. World carbon emissionsfrom fossil fuel combustion are by 2010 expectedto grow by 36.5 percent from the 1990 level. By2010, renewable energy may account for 7.8 per-cent of total primary energy demand globally.The annual average energy efficiency improve-ment rate is assumed as 1.18 percent from 2000 to2010. In a reference scenario, the greenhouse gasemissions from China’s energy sector were pro-jected to increase from 3080 MtCO2 in 2000 to4000 MtCO2, with coal contributing a significant
share to the increasing demand from the powerand industry sectors.
Marginal abatement cost curves were calculatedby the IPAC emission model for nine regions ofthe world by introducing progressively higher car-bon taxes (Figure T.1). Other top-down studiessuch as EPPA and GTEM have projected a sig-nificantly flatter MAC curve for China than theIPAC emission model does. Factors contributingto this are more efficient technologies entering thebuilt margin during the 1990s, and further effi-ciency gains contributing to reduce the growthtrend for GHG emissions up to 2010. In IPAC,China has a relatively low reference carbon emis-sion projection.
Based on the IPAC emission model projec-tion, the Annex II countries’ reduction require-ment is estimated on the order of 1371 MtCO2,taking into consideration forest managementsink credits and the assumed voluntary U.S. par-ticipation in the carbon offset market (10 per-
T E C H N I C A L S U M M A R Y
xxxvi
F I G U R E T . 1 MACs for Carbon in 2010 from IPAC-Emission Model

cent participation rate). The projection forpotential hot air supply from countries witheconomies in transition (EITs) is 800MtCO2.Through application of the results for both, theemission projection and MACs from the IPACemission model feeding into the CERT model,the CDM market size in 2010 is estimated inthe base scenario to be 164 MtCO2. Theseresults were obtained assuming a limited scale of10 percent voluntary U.S. participation1 in theglobal carbon offset market, price leadership ofEFSU, 30 percent CDM implementation ratesfor all non-Annex I Parties, 50 percent supple-mentarity for the EU, and $0.54/tCO2 transac-tion cost associated with CDM deals. Priceleadership of EFSU and hence the Russian rati-fication of the Kyoto Protocol is the main fac-tor leading to a significant CDM market size aswell as carbon offset price in projected range.Table T.4 shows the results of this study, com-paring them with findings of other WB-NSScompleted since 2001 as well as with the out-come of selected carbon offset market studiescompleted in 2003.
Based on three market scenarios, this studyestimated China’s energy-related CDM marketpotential2 in the year 2010 at between 24.9-111.6MtCO2, based on an equilibrium certificate priceof $5.20 to $6.50/tCO2. Under all three scenar-
ios, China captures nearly 50 percent of the totalmarket CDM demand (estimated at between 52-240 MtCO2). The largest share of the carbon off-set market goes to JI and hot air. A number ofEastern European countries use hot air to tradeERUs under JI. The disaggregated information isshown in Figure T.2.
Figures T.2 and T.3 highlight that China’sshare in the global carbon market is 11 percent,and around 50 percent in the CDM market.China’s CDM potential of 79.2 MtCO2 for2010 is, however, still substantial. Supplying thisamount of CERs would require a significantnumber of newly built larger power projects(300MW-600MW) registered as CDM projects,as well as several dozen to as many as 100 re-newable power projects put into operation by2006–07. It is important to note that besidesreductions in CO2 from electricity generation,CDM potentials from other energy end-useand from abatement of other gases and othersource and sink categories must also be taken intoaccount in estimating China’s total CDM poten-tial and its impact on market dynamics.
Sensitivity analysis performed on the basescenario resulted in an even wider range of esti-mates. Chinese CDM potential is estimated at0–211 MtCO2, with an equilibrium price esti-mated at $0–7.30/tCO2. This can be attributed
T E C H N I C A L S U M M A R Y
C D M I N C H I N A xxxvii
T A B L E T . 4 Annex II Countries GHG Reduction Demand, Market Share by KP Mechanismsand Their Domestic Actions, and Estimated CER Price Range
Annex II reduction requirement CDM market size CER price range
Mt CO2 (2010) MtCO2 (2010) USD/CO2
IPAC Emission model, without U.S.IPAC Emission model, US voluntary
participation (10%) Grubb 2003Selected WB-NSS* studies
completed since 2001EU Trading Scheme study
(Criqui and others 2003) **
* Vietnam, Peru, Indonesia** assuming 50 percent of reduction requirement met by domestic action in EU 15
12431371
415–1250**1300–(3000)
11402
0–1610–164
50–180300–(2000)
330–360
0–60–7
0–13.81.7–(10)
6–12

C D M I N C H I N A
to uncertainty in the following factors (in order ofimportance): business-as-usual emissions projec-tions (demand side and supply of hot air) andmarginal abatement costs of potential buyers and
sellers; the market structure (competition vs. priceleadership); the fraction of CDM potential thatis actually realized by 2010 (implementationrate); the assumed participation rate of the UnitedStates; the way in which countries choose to oper-ate supplementarity; and the level of transac-tion costs.
The present early CDM market is buyer-dominated. The preference of investors for “highquality” and “low risk” projects is likely to shapethe market for carbon offsets. In reality, therewill be no one uniform carbon price for differenttransferable emission units (RMUs, CERs, ERUs,and AAUs). Relevant market observers see evi-dence for a likely price differentiation between theproject-based mechanisms JI and CDM on theone hand and ET (trading AAUs) on the other.In the real world, the global CDM market maybe smaller than the projected 164 Mt-CO2/year,while the CER price could, considering the pre-vailing uncertainties about the ratification of theKyoto Protocol, also be higher than projected byCERT, if the Protocol is ratified late and falls intothe $7 to $12 /tCO2 range.
By applying the bottom-up IPAC-AIMtechnology model, a significant carbon reduc-
T E C H N I C A L S U M M A R Y
xxxviii
CDM/China,79.2MT-CO2,
11%CDM/
SE&S Asia,56MT-CO2,
7.8%
CDM/LA&Africa,
28.6MT-CO2,4%
ET(AAU/Hot air),226MT-CO2,
31.3%
JI,331.8MT-CO2,
46%
F I G U R E T . 2 Annex II Countries ERDemand Under the KPand the Market OffsetShare by Three KyotoMechanisms
0
20
40
60
80
100
120
140
MtC
CDM,LA
CDM,Africa
CDM,ME
CDM,China
JI CDM,SEA&SA
Hotair
DA,OECD-W
DA,OECD-P
DA,USA
F I G U R E T . 3 Distribution of Carbon Emission Reductions among Domestic Action (DA), JI,ET, and CDM under the Base Scenario

tion potential (760 MtCO2/year) was identi-fied by sectors in the $13.60/tCO2 range, consis-tent with China’s sustainable energy developmentstrategy. The efforts undertaken in this study tolink the top-down projected CDM potential forChina of 79 MtCO2 with sectors and technologiesfor CDM did underscore the significant role thatbarriers such as deal size, transaction cost, andtime lag play in a project-based mechanism. Theevaluation of consistency between the two mod-els applied revealed that MAC curve-basedapproaches estimating the CER supply potentialat a given CER price would substantially overesti-mate the potential CDM deal flow. A significantamount of abatement measures are economicallyfeasible at (for example) $5/tCO2 from small-scaleindustry. The commercial and residential sec-tors are unlikely to reach the CDM market dueto high transaction costs associated with smallertrade volumes.
The marginal abatement cost (MAC) analysisby sectors (Figure T.4 ) displays that the industry/power generation sector has a relatively flat mar-ginal abatement cost curve compared with other
sectors, like the rural/urban commercial and resi-dential or transportation sectors. Based on expertjudgment, the power generation sector couldaccount for around 50 percent of total CDMpotential in China. China’s power generation sec-tor contributed 24 percent of the total carbonemissions of the energy sector in 2000, and is stillexpected to contribute 26 percent by 2010. Con-sidering the options for demonstrating technologyadditionality and cost effectiveness, significantCDM potential also exists in various other sectors:steel making and the cement sector (10 percent);the chemical industry such as ammonia produc-tion, calcium, soda ash (5 percent); industries suchas glass sector, brick production, aluminum, cop-per, zinc&lead, paper making, ethylene, transport,service sector, urban and rural residential (15 per-cent); and projects abating non-CO2 GHGs in theindustrial sector (10 percent).
The advanced technologies for mitigation inthe power sector were identified as fuel-switchingto combined cycle gas power plants; windpower; landfill gas conversion to power; andhydropower.
T E C H N I C A L S U M M A R Y
C D M I N C H I N A xxxix
F I G U R E T . 4 Marginal Abatement Cost Curves by Sectors
0
20
40
60
80
100
120
140
0 50 100 150 200 250 300 350 400 450 500Accumulated Emission Reduction, Mt-C
COst
, US$
/t-C
Agriculture
Industry
Transport
Service
Urban
Rural
Note: The industry sector, displaying the flattest MAC, includes the power sector

C D M I N C H I N A
Technologies that may prove to have signifi-cant potential and other environmental benefitsbut could not be covered within the methodologyof this study are coal-bed methane recovery; bio-mass-based cogeneration; biogas from agricultural,industrial, and urban waste; power generationfrom municipal solid waste; and non-CO2 emis-sion abatement technologies (methane, HFCs).
As might be expected, the study showed thatthe Clean Development Mechanism will nothave a significant impact on overall economicgrowth in China in the timeframe considered (upto 2010–2020). The profits from the estimatedrange of CER sales (25 to117 MtCO2) wouldbe $77 million to $311 million per year. They aresmall and have essentially no significant effect onGDP Growth. CDM implementation, however,will be beneficial for energy project proponentsand relevant stakeholders in China, who will beable to familiarize themselves with an emergingmarket, strengthen investment portfolios, tech-
nology progress and environmental side benefits,and contribute to regional and local sustainabledevelopment.
Endnotes/References1. The climate change strategy of the United States
announced by President Bush on February 14, 2002, setsa voluntary target for the nation to achieve an 18 percentreduction in emissions intensity between 2002-12, whichwill allow absolute emissions to increase 13 percent overthe same period. Under the Bush plan, emissions in 2012would be 29 percent above the 1990 level and 36 percentabove the U.S.’s Kyoto target. The corresponding busi-ness as usual levels would be +15 percent, +31 percent,and +38 percent, respectively. If the voluntary target isachieved, the “implementation rate” would be 5 percent((38-36)/ 38)*100). There is a significant uncertainty inBAU projections across Annex I countries, which alsoinfluences the availability of hot air.
2. Source: Criqui, P. and others 2003; external trading en-larged EU 128 MtCO2e; external trading rest of Annex B242 MtCO2, EU internal trade with 10 new EU states36 MtCO2e, domestic action Annex B 734 MtCO2e
T E C H N I C A L S U M M A R Y
xl

CDM METHODOLOGY AND CASE STUDIES
I
�


C D M I N C H I N A 3
OBJECTIVES
The main focus of this study is to identify the pre-requisites and existing barriers to development andimplementation of the Clean DevelopmentMechanism in China, as well as to analyze theneed for capacity building based on the partnercountry's special circumstances and interests.
The provisions of the Kyoto Protocol, as wellas the relevant decisions of the Conferences ofthe Parties, prescribe various preconditions to bemet for projects to be eligible as a CDM activity.To meet these preconditions, methodologicaland technical issues for CDM include:
• Learning how to develop appropriate base-line methodologies by applying the baselineapproaches set out in the CDM modalitiesand procedures in the Marrakech Accords andthe relevant clarifications and guidance by theCDM Executive Board
• Understanding and applying dynamic base-lines to determine the crediting period of aCDM project activity from the options pro-vided in the Marrakech Accords
• Determining project boundaries by usingappropriate principles and approaches, andidentifying and estimating the leakage of aCDM project activity
• Developing an approach to assess and testthe additionality of proposed CDM projectsin China, taking into account the recentguidance and clarifications given by the EB
• Learning how to estimate the incrementalemission reduction cost of CDM projects, andestimating how the revenues from CER trad-ing could improve the financial performanceof the CDM project.
In order to build practical experience withrespect to technology options and CDM method-ological issues, the analysis includes six casestudies in the power and renewable energy sec-tors. These studies will help build the capacityof Chinese stakeholders to participate in CDMproject activities—within the context of theprovisions of the Marrakesh Accords and sub-sequent decisions, as well as China's currentpriorities and long-term goals for sustainabledevelopment.
The CDM project case studies are intendedto help:
• Learn how to identify and select promisingCDM projects in the electric power sector andthe renewable energy field by applying eligi-bility assessment criteria and procedures forthe CDM project selections
Objectives, Methodologies, andApproach of Part I
1
�

• Build capacity and experience in the develop-ment of CDM projects through the wholeproject cycle
• Demonstrate the applicability of the CDMmethodology and operational procedures basedon China's real circumstances
• Establish a pipeline of promising CDM projectsand prepare CDM project design documents.
In Chapter 1, the study develops a suitablemethodological approach and addresses a seriesof key issues for the implementation of CDM inChina.
METHODOLOGICAL APPROACH
CDM has primarily two objectives: (1) assist-ing non-Annex I Parties in achieving sustain-able development; and (2) assisting Annex IParties in realizing their quantified emissionlimitation and reduction commitments. EachCDM project activity is intended to result inreal, measurable, and long-term greenhouse gasemission reduction benefits that are additionalto any that would occur in the absence of theproject activity. To assess whether a proposedCDM project activity could meet these require-ments, several methodological issues need to beaddressed. Against the background of the needsfor capacity building, and based on China'sspecial circumstances and interests, the subse-quent methodological approaches of this studyare (a) to develop methodological guidelines forCDM project development in China; and (b) touse case studies to assess these methodologicalguidelines.
In the following section, we will describe thesetwo components.
Development of MethodologicalGuidelines for CDM in China
The development of guidelines for specificmethodological and technical issues includesthe description of the concept, the analysis of
its application under specific circumstances inChina, and recommendations either for theCDM process in general or its application inChina. The methodological guidelines reflectthe most important prerequisites and method-ological issues for CDM in China, includingbaseline, project boundary and leakage, addi-tionality, and project-based emission reductioncosts. The methodological approach of the study(a) follows official documents, especially relevantdecisions adopted by the CDM Executive Board;(b) reviews currently available achievements;(c) combines a theoretical study with practicalapplication in case studies; and (d) considersChina's specific circumstances.
Official documents released by the Confer-ence of the Parties and its subsidiary bodiesprovide basic rules for the CDM regime, whichare the basis and starting point for this research.This study fully follows the Kyoto Protocol,the Bonn Political Agreements, the MarrakechAccords, and the CDM Executive Board deci-sions. For instance, when discussing the dynamicbaseline issue, we understand that the MarrakechAccords provide for such possibilities. Whendiscussing the possible criteria for additionalityassessment, we are aware that the internationalagreements provide very limited specific guidanceon this issue. The host-country governments mayhave their own criteria, and the opinions of dif-ferent governments may diverge. Furthermore,great efforts have been made in this study toreflect all relevant decisions adopted by the CDMExecutive Board.
As a result of various efforts, there have alreadybeen significant achievements in our understand-ing of CDM methodological issues; and theyserve as a good basis for this study. Review andunderstanding of the current achievements canmake the discussion more pertinent and instruc-tive, save time and effort, and avoid discussingissues that are already generally settled. Forexample, the baseline section includes a compre-hensive review of the literature and summarizestheir major findings, including possible baseline
C D M M E T H O D O L O G Y A N D C A S E S T U D I E S
C D M I N C H I N A4
determination methods, their pros and cons,and their applicability.
As part of the efforts to make the recom-mendations as practical and sound as possible,the study combines theoretical analysis withpractical application of methodologies in selectedcase studies. To achieve the aims of this method-ological approach, various analytical instrumentsare used, such as (a) decision trees for the baselinedetermination; (b) flow charts for the projectboundary consideration; (c) uniform overviewtables for the description of the case studies;and (d) standardized calculation formulas forthe calculation of the incremental costs of emis-sion reductions.
To make the study more useful, China's spe-cific circumstances are fully considered in thediscussion and methodology development.
Assessment of the MethodologicalGuidelines by Case Studies
The assessment of the methodological guidelineswill apply the methodology to the real circum-stances of the case studies—taking their regionaland site-specific conditions into account. Thefindings will be based on different instruments,including:
• Sensitivity analysis, which assesses the impactof changes in exogenous factors on the eligi-bility of the project, GHG emission reduc-tions, incremental costs, or other importantdimensions
• Standardized comparison of the case studies,environmental impact assessments, and esti-mation of uncertainties within different mon-itoring activities.
On the basis of the analysis of the case studiesand comparison with the results of other ongo-ing CDM studies, the study presents recommen-dations regarding the policies and measures thatshould be undertaken to tackle the perceivedchallenges, as well as the likely benefits.
KEY ISSUES
Based on the objectives of the study, Chapters 2and 3 below are expected to facilitate a betterunderstanding of CDM methodological issuesby Chinese experts and government officials.Chapter 2 presents a general analysis of the keyCDM methodological issues and analyzes theapplicability of different methodologies underChina's specific circumstances. Chapter 3 appliessome methodologies to selected case studies, andincludes some recommendations on the appro-priate choice and application of methodologies.
Several key methodological issues are addressedin Chapter 2, including:
Baseline
According to the Marrakesh Accords, the baselinefor a CDM project activity is the scenario that rea-sonably represents the anthropogenic emissionsby sources of greenhouse gases that would occurin the absence of the proposed project activity. Abaseline should cover emissions from all gases,sectors, and source categories listed in Annex Awithin the project boundary. To define the base-line scenario, which does not actually exist andthus could not be observed, three approacheshave been put forward based on different consid-erations. To use these approaches, different base-line methods have been proposed. They varygreatly in terms of integration or standardization,and have their own advantages and disadvantages.In this part, different baseline determinationmethods are assessed. Dynamic baselines are alsodiscussed in detail, and we make some recom-mendations on the selection of appropriate meth-ods based on China's real circumstances.
Project boundary and leakage
The project boundary refers to a project's spatialscope and should encompass all anthropogenicemissions by sources of greenhouse gases underthe control of the project participants that are sig-nificant and reasonably attributable to the CDMproject activity. Leakage is the net change of
O B J E C T I V E S , M E T H O D O L O G I E S , A N D A P P R O A C H O F P A R T I
C D M I N C H I N A 5
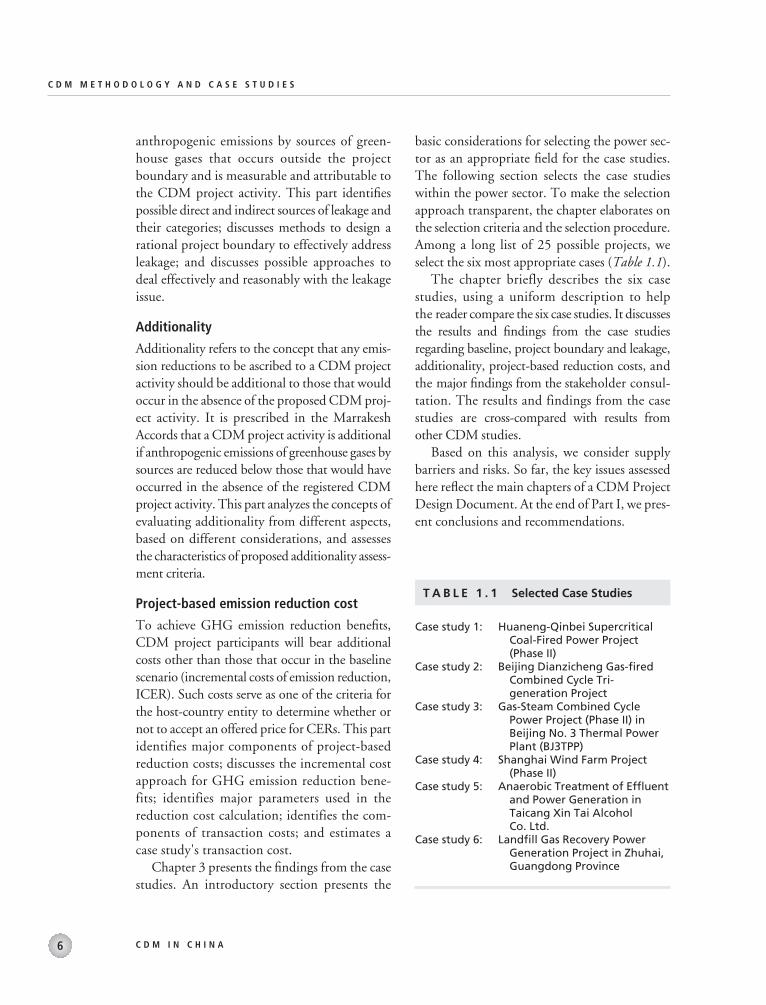
anthropogenic emissions by sources of green-house gases that occurs outside the projectboundary and is measurable and attributable tothe CDM project activity. This part identifiespossible direct and indirect sources of leakage andtheir categories; discusses methods to design arational project boundary to effectively addressleakage; and discusses possible approaches todeal effectively and reasonably with the leakageissue.
Additionality
Additionality refers to the concept that any emis-sion reductions to be ascribed to a CDM projectactivity should be additional to those that wouldoccur in the absence of the proposed CDM proj-ect activity. It is prescribed in the MarrakeshAccords that a CDM project activity is additionalif anthropogenic emissions of greenhouse gases bysources are reduced below those that would haveoccurred in the absence of the registered CDMproject activity. This part analyzes the concepts ofevaluating additionality from different aspects,based on different considerations, and assessesthe characteristics of proposed additionality assess-ment criteria.
Project-based emission reduction cost
To achieve GHG emission reduction benefits,CDM project participants will bear additionalcosts other than those that occur in the baselinescenario (incremental costs of emission reduction,ICER). Such costs serve as one of the criteria forthe host-country entity to determine whether ornot to accept an offered price for CERs. This partidentifies major components of project-basedreduction costs; discusses the incremental costapproach for GHG emission reduction bene-fits; identifies major parameters used in thereduction cost calculation; identifies the com-ponents of transaction costs; and estimates acase study's transaction cost.
Chapter 3 presents the findings from the casestudies. An introductory section presents the
basic considerations for selecting the power sec-tor as an appropriate field for the case studies.The following section selects the case studieswithin the power sector. To make the selectionapproach transparent, the chapter elaborates onthe selection criteria and the selection procedure.Among a long list of 25 possible projects, weselect the six most appropriate cases (Table 1.1).
The chapter briefly describes the six casestudies, using a uniform description to helpthe reader compare the six case studies. It discussesthe results and findings from the case studiesregarding baseline, project boundary and leakage,additionality, project-based reduction costs, andthe major findings from the stakeholder consul-tation. The results and findings from the casestudies are cross-compared with results fromother CDM studies.
Based on this analysis, we consider supplybarriers and risks. So far, the key issues assessedhere reflect the main chapters of a CDM ProjectDesign Document. At the end of Part I, we pres-ent conclusions and recommendations.
C D M M E T H O D O L O G Y A N D C A S E S T U D I E S
C D M I N C H I N A6
T A B L E 1 . 1 Selected Case Studies
Case study 1: Huaneng-Qinbei Supercritical Coal-Fired Power Project (Phase II)
Case study 2: Beijing Dianzicheng Gas-fired Combined Cycle Tri-generation Project
Case study 3: Gas-Steam Combined Cycle Power Project (Phase II) in Beijing No. 3 Thermal Power Plant (BJ3TPP)
Case study 4: Shanghai Wind Farm Project (Phase II)
Case study 5: Anaerobic Treatment of Effluentand Power Generation in Taicang Xin Tai Alcohol Co. Ltd.
Case study 6: Landfill Gas Recovery Power Generation Project in Zhuhai, Guangdong Province
C D M I N C H I N A 7
As a sequel to the United Nations Conference onEnvironment and Development (UNCED) in1992, theCleanDevelopment Mechanism processand subsequent methodology was developed fromthe provisions in Article 12 of the 1997 KyotoProtocol, the subsequent Marrakesh Accords, anddecisions of the CDM Executive Board.
To help support capacity building in Chinaand provide a transparent analytical frameworkfor the assessment of the case studies, this chap-ter provides some methodological backgroundand guidance to the case studies. For example:
— We provide an overview of the CDM-relatedinstitutional framework to help readers whoare not familiar with the CDM terminologyand process
— We analyze the relevant methodological issuesfor implementing the CDM in China
— We describe the institutional arrangementsprovided by the Chinese Government tofacilitate CDM in China.
This chapter could be used as a handbook forthe practical application of the CDM in China.
RELEVANT INSTITUTIONS AND CDM PROJECT CYCLE
The international CDM regime is complex,involving organizations at different levels. An
overview of the institutional framework in Fig-ure 2.1 shows the essence of some methodologi-cal issues, as well as how these issues have andcould be addressed at the international level.
There are a number of milestones in the inter-national community’s efforts to address global cli-mate change, including the 1992 United NationsFramework Convention on Climate Change(UNFCCC), the 1997 Kyoto Protocol, and morerecently the 2001 Bonn Agreement and the 2001Marrakech Accords.
The UNFCCC is the fundamental basis forinternational cooperation on climate change. Itset an objective for the international communityand outlined the principles to guide actions takenby the Parties to achieve the objective.
The Kyoto Protocol sets quantitative emissionslimitation and reduction commitments for AnnexI Parties. The Protocol’s Article 12 establishes theClean Development Mechanism (CDM). TheCDM has two purposes: (1) to assist Parties notincluded in Annex I in achieving sustainabledevelopment and in contributing to the ultimateobjective of the UNFCCC; and (2) to assist Par-ties included in Annex I in achieving compliancewith their quantified emission limitation andreduction commitments under Article 3.
The Bonn Political Agreements and the Mar-rakech Accords marked the completion of theBuenos Aires Plan of Action and the end of four
Institutional Framework andMethodological Guidelines for CDM
2
�

Board) and other stakeholders (industry, non-governmental organizations etc.) provide com-ments on the proposed project and act as anintermediary between the investor and the hostof the CDM project.
At the second level, institutions are acting onbehalf of the primary participants, such as theoperational entities contracted by project devel-opers for validation and certification purpose,supporting institutions of the Executive Board,technology suppliers and contractors, or brokersand traders (Oberheitmann 1999). A detaileddescription of the relevant institutions can befound in the Annex.
There are various stages and studies that arerequired for a CDM project. The main steps in theprocess are (a) preparation of a project design doc-ument, a baseline study, and the monitoring plan;(b) validation; (c) negotiation of project arrange-ments, construction, and startup; (d) registration;
C D M M E T H O D O L O G Y A N D C A S E S T U D I E S
C D M I N C H I N A8
years of international negotiations on the prin-ciples, guidelines, and rules for the Kyoto Mech-anisms, including the CDM, which are crucialto the entry into force of the Kyoto Protocol. Atthe 7th Conference of the Parties, the CDMExecutive Board was established. According tothe Marrakech Accords, institutions involved inthe international CDM regime include projectproponents, COP/MOP, the CDM ExecutiveBoard, operational entities, Parties, supportinginstitutions, and other stakeholders.
There are different participants at differentlevels in the CDM process. The first level includesthe primary participants in the investing countryand the host country (project proponents suchas private companies, national governments asthe UNFCCC-Parties), who are carrying outthe project or are directly involved in nationalproject approval. The UNFCCC bodies andinstitutions (COP/MOP, CDM Executive
Recommendations
Approval
Credits
Share of proceeds
Validation,verification and
certification.
Assignments
Recommendations
OperationalEntity
COP/MOP
CDM EB
Parties
Investing entity
Host entity
Project proponents
Mutualagreements
Otherstakeholders
Supporting institutions(Meth Panel,Accreditation Panel, Small-scale Panel)
CDMProject
PDD
Comments
Investment
Designation
Application
Guidance
Registration
F I G U R E 2 . 1 CDM Institutions

(e) monitoring, verification and certification; and(f) issuance of CERs.
The project cycle in Figure 2.2 describes themanufacturing process for CDM/JI emissionreductions. A detailed description of the shownCDM project cycle can be found in the Annex 3.
Based on the experience of the Prototype Car-bon Fund (PCF), it can take up to three and a halfyears from the preparation and review of a projectto the certification of project emission reductions.In other words, a project beginning in 2004might not reach the certification stage until 2007or even 2008. Such a long time scale puts consid-erable time pressure on the Chinese Governmentto develop a project pipeline and the necessaryinstitutions for implementing the CDM in Chinato assure that a reasonable time is left for imple-
menting a project within the first commitmentperiod. The time frame presented is only an aver-age; single projects can be completed in less time.
PROJECT BOUNDARY AND LEAKAGE EVALUATION
When a CDM project is being designed, one ofthe most important tasks is to set a reasonableboundary for the project to determine the proj-ect’s emissions and possible leakage. Otherwise,given a reasonable amount of determination costs,the emission reductions or other environmentalbenefits of the project could be overestimated.
This chapter includes a description of the con-cept and regulations, leakage sources and leakagetreatment, and subsequent recommendations.
I N S T I T U T I O N A L F R A M E W O R K A N D M E T H O D O L O G I C A L G U I D E L I N E S F O R C D M
C D M I N C H I N A 9
F I G U R E 2 . 2 Manufacturing Process for CDM/JI Emission Reductions
Preparation and Review of the Project• Project Idea Note• Project Concept Note• Project Concept Document (or equivalent)
Baseline Study and Monitoring andVerification Plan (MVP)• Project Design Document• Baseline study and ER projections• Monitoring and Verification Plan
Validation process• Validation protocol and report
Negotiation of Project Agreements• Project Appraisal and related documentation• Term sheet• Emissions Reduction Purchase Agreement
Construction and start up• Initial verification report
Periodic verification& certification• Verification report• Supervision report
Project completion
Up to21 years
1–3years
3 months 2 months
2m
onths
3 months
Source: Carbon Finance Strategy of the World Bank, a presentation by Michael Rubino at KfW Conference. Berlin,May 21, 2003.

Concept, Rules, and Regulations;Leakage Sources and theirCategories
A project boundary is defined in the UNFCCCdocuments for the reduction purposes of esti-mating the project’s net GHG reduction impact.It encompasses all anthropogenic emissions bysources and/or removals by sinks of greenhousegases under the control of the project partici-pants that are significant and reasonably attrib-utable to the CDM project activity (UNFCCC2001b). To some extent, the possibility of leak-age is a function of the size of the project bound-ary; the larger the boundary, the greater thelikelihood that all impacts will be accountedfor. Hence, one approach to mitigate leakage isto set an acceptably large project boundary.
Leakage is defined as the net change of anthro-pogenic emissions by sources of greenhouse gasesthat occurs outside the project boundary, andthat is measurable and attributable to the CDMproject activity (UNFCCC 2001b).
Leakage concerns have arisen most promi-nently with forest protection activities. However,the basic concept extends to all types of carbonmitigation activities, since they invariably affectthe demand for or supply of products that emitor sequester GHGs. A shift in either the demandfor or supply of a GHG emitting product such ascoal will, in an unhindered market, affect theproduct’s price. These altered market prices willaffect the level of product consumption outsidethe project boundary. The fundamental chal-lenge is to determine under what conditions this“price effect” is significant and warrants account-ing. In December 2003, COP 9 dealt with theproject boundary and leakage issues in theLULUCF context. More complex definitions ofproject boundary and leakage are described in therules and procedures for afforestation and refor-estation CDM project (UNFCCC 2003a).
The magnitude of leakage is determined bymany factors, such as changes in relevant regula-tions and laws, the trend in autonomous effi-
ciency improvements, and changes in other basicvariables such as development of markets for aproject’s products.
Leakage can be caused by (Schwarze and others2002):
Activity shifting. A project or policy can dis-place an activity or change the likelihood of anactivity outside the project boundary. One exam-ple of negative activity-shifting leakage would bea high-efficiency boiler project that displaces oldlow-efficiency boilers, which are then used inother places.
Market effects. A project or policy can altersupply, demand, and the equilibrium price ofgoods or services, causing changes in emittingactivities elsewhere. For example, a boiler effi-ciency project that decreases coal consumptioncould result in a slight downward shift in coalprices, which could then stimulate an increase incoal consumption.
Market-driven leakage is caused by a change inthe price of goods, whereas activity shifting hap-pens when human or other capital changes loca-tion. These two leakage types may in some casesbe inversely related. If a project displaces peopleand activities to adjacent areas, market leakagemay diminish. This is because activity-shiftingleakage moves economic activity, while marketleakage occurs through net changes in productionfor a given regional distribution of activities.
Two other types of leakage also bear men-tioning.
Life-cycle emissions shifting. Mitigation activi-ties may increase emissions in upstream ordownstream activities. For example, a renewableenergy power project will not include the emis-sions caused by the production of equipment.
Ecological leakage. This refers to a change inGHG fluxes caused by ecosystem-level changesin surrounding areas. The ecological leakagegenerally occurs in sink projects.
There are currently no explicit CDM Execu-tive Board decisions on project boundary andleakage.
C D M M E T H O D O L O G Y A N D C A S E S T U D I E S
C D M I N C H I N A10

Reasonable Project Boundary andLeakage Treatment
To avoid leakage and ensure GHG emissionsreduction performance, it is important to identifya reasonable project boundary before undertakingthe CDM project design. All direct GHG emis-sions in both the CDM and the baseline casesshould be covered in the project boundary. The-oretically, it is essential to define a project bound-ary that is large enough to form a GHG “bubble”system, so that all upstream and downstreamindirect effects on GHG emissions are covered inthe project boundary in both the CDM projectand baseline cases [Liu Deshun 2000].
In practice, such exercises are often not feasible,especially when projects are affected by micro-economic pressures, have possible macroeconomiceffects, or may conflict with territory principles.The project boundary is usually defined as thephysical site of both the CDM project and thebaseline project in a project-specific manner. Insome cases, when the CDM project activities areassociated with mutually connected energy net-works or pipeline systems—for example, electricpower grids and natural gas distribution systems—the project boundary should be extended to them,in order to avoid easily definable leakage. Figure2.3 gives an example of project boundary settingwith the life cycle analysis approach. CurrentCDM rules and procedures do not require that allupstream and downstream effects are included inthe leakage analysis of a proposed CDM projectactivity.
In order to set a reasonable boundary anddetermine leakage, the following issues shouldbe considered.
Comprehensiveness of the boundary. The widerthe boundaries, the more complete the account-ing of a project’s emissions impacts, but thegreater the costs. Several options could be con-sidered for helping proponents resolve the ten-sion between cost and comprehensiveness inboundary definition. The first option is to simplyexclude projects whose emissions impacts cannot
be quantified because the necessary measure-ment, monitoring, and verification would beprohibitively expensive. A second option is toestablish a cost limit beyond which the propo-nent is not required to further expand the proj-ect boundary—for example, if measurement,monitoring, and verification costs exceed 10 per-cent of total project costs. However, if importantuncertainties regarding indirect or off-site emis-sions still remain, it may be questionable as towhether the project should proceed. A thirdoption, where potential significant boundaryeffects cannot be readily addressed through accept-able, cost-effective methods, is to request that pro-ponents hold in reserve a fraction of their claimedreductions subject to the future development ofadequate monitoring and verification methods(Lasco, Michealowa, and Miline 2001).
Control over emissions. All the controllableemissions should be involved inside the systemboundary. By including those emissions overwhich the proponent can exercise control, proj-ect boundaries can provide opportunities andincentives to achieve emissions reductionswhether on-site or off-site. For example, narrowboundaries could create perverse incentives ifcredits were claimed for activities that simplyoutsource emissions (for example, by replacingon-site with grid electricity generation that wasnot accounted for). Control over emissions canbe defined in two ways.
The first option is to equate control with pro-ponents’ ownership or management of facilities.This interpretation implies that a consumer (ofa fuel, electricity, commodity, or other product)has no control over the off-site emissions result-ing from the production, processing, transport,disposal, etc, because those stages in a product’slifecycle are out of control. The second option is“control over whether or not emissions occur.”This interpretation is consistent with life cycle or“footprint” analysis, implying that consumers ofa product control off-site emissions to the extentthat those emissions are a consequence of theamount of product consumed.
I N S T I T U T I O N A L F R A M E W O R K A N D M E T H O D O L O G I C A L G U I D E L I N E S F O R C D M
C D M I N C H I N A 11

The second definition more effectively con-veys the proper incentives for mitigation activi-ties and might be more appropriate in the con-text of a credit trading regime. The “ownership/management” definition might be preferable inthe context of an anticipated allowance tradingregime.
Materiality of emissions. According to the def-inition of leakage, emissions sources and sinksshould be analyzed only if they will significantlyaffect the project’s total GHG emission impacts.“Significant” can be indicated by “materiality.”For example, a guideline could be issued to statethat impacts must be included that present a50 percent or greater likelihood of accounting formore than 5 percent of the project’s total claimedreductions. Such a materiality threshold mightassist proponents in knowing which effects could
be neglected, but it might be difficult to apply inpractice without simple estimates, access todefault data, or expert judgment.
Avoidance of double counting. Multiple pro-ponents should not get credits for the same emis-sions reductions. This is an important problemin determining leakage. For a simple example,one proponent switching a boiler from coal tobiomass use might claim upstream benefits forreducing coal-bed methane emissions, while asecond project developer might claim credits formethane capture at coal mines.
The potential for double counting could bedealt with in several ways. The simplest would beto exclude off-site emissions from consideration,thereby eliminating most of the potential for proj-ect boundaries to overlap. Important effects couldthereby be neglected, however. A second option
C D M M E T H O D O L O G Y A N D C A S E S T U D I E S
C D M I N C H I N A12
Energy Raw materials
Energy(products) Pollutants
Transmission and distributionof the products
Tri-generation process
Trans. and storage ofraw material
Exploitation of raw material Equipments and site
Equipments
Equipments and site
Equipments
Recycle and abandon
Recycle and abandon
Recycle and abandon
Recycle and abandon
F I G U R E 2 . 3 Project Boundary Considering the Whole Life

would be to require proponents to review poten-tial project activities that might affect reportedindirect emissions estimates. Double countingwill be avoided if the baseline is consistent withthe project. Good project registration across vari-ous incentive programs, as is being designed forgreen power program, could greatly assist in thistask. A third option is to ensure monitoring andverification of claimed off-site and indirect emis-sions reductions.
Generally, there are three methods to reduceleakage:
Mitigate leakage through project design. Leak-age sometimes can be addressed in project selec-tion and design. For example, a developer canevaluate the likely impacts of the project on theexisting supply of and demand for goods and ser-vices, and seek to change this supply/demand ormeet this supply/demand through alternativeactions. Using project design to avoid leakage ismore difficult when economic goods such asenergy or timber are involved.
Extend the project monitoring boundary. Ex-panding the project boundary can sometimescatch potential leakage. Tracking householdenergy use after installation of a more efficientappliance, for example, could catch leakage result-ing from homeowner perceptions that energy hasbecome less expensive. Some observers have car-ried this argument further, asserting that globalenergy or timber models should be run on in-dividual projects to identify their net globalimpacts. Unfortunately, the impacts of individualprojects, however real, will rarely (if ever) show upat the level of aggregation associated with a globalmodel.
The developer can attempt to predict whereleakage is likely to occur, monitor leakage impactsover time, and adjust the estimate of project ben-efits accordingly.
Develop non-project specific leakage benchmarksor coefficients. This approach would create andapply a series of project-level national or inter-national leakage coefficients that can be used toadjust the estimate of project benefits in a more
standardized way to account for leakage (IPCC,2000). Its applicability is premised on a condi-tion that project-specific leakage assessments arealmost impossible to perform. Although in somesense less site-specific than a project-level leakagereview, the benchmarking approach would bemuch easier to apply at the project level, andcould avoid the potentially overwhelming ana-lytical problem of being called upon to expandprojects’ boundaries further and further to dealwith leakage concerns.
In a specific project, the following steps canbe followed to address the leakage issue.
First, the possible emissions outside the proj-ect boundary should be determined. As statedabove, they may be caused by activity shifting,market effects, life cycle effects, or ecologicaleffects.
Second, adjust the project boundary accord-ing to the controllable principle. The projectboundary should also be adjusted if there aredouble counting problems. Hence, the leakagesinvolved in the case are known.
Third, identify the cost-effective solutions foreach type of leakage. Generally speaking, leakagecaused by activity shifting can be determinedthrough the tracing of the project activities; leak-age caused by market effects can be omitted, sinceit is generally too small to be considered; and leak-age caused by life-cycle effects should be dealtwith according to the real situation.
Fourth, the leakage emissions and then CERscan be determined.
Recommendations
To reduce possible leakage, it is very important toset a proper project boundary. Furthermore, leak-age of certain types of activities is more significantthan others. However, the identification and cal-culation of leakage is usually very complex, so it isnot very cost-effective to calculate leakage on aproject-by-project basis. It is very necessary anduseful to develop leakage coefficients for certaintypes of project activities, so that leakage could be
I N S T I T U T I O N A L F R A M E W O R K A N D M E T H O D O L O G I C A L G U I D E L I N E S F O R C D M
C D M I N C H I N A 13

estimated easily and cost-effectively. Leakage fac-tors for certain types of activities should be devel-oped based on the Chinese situation. However,in the case that Chinese data are not available,data from other sources such as the IPCC couldbe used.
Whether or not a source of emissions consti-tutes leakage depends on whether or not it is“significant,” so it is important to set a bench-mark for “significant.” With this benchmark, theproject proponents could judge clearly whetheror not a specific source of leakage could be omit-ted, and whether or not a project’s emissionreduction benefits should therefore be adjustedaccordingly.
BASELINE SETTING
Baseline setting is of fundamental importance toevery CDM project activity. It has direct and sig-nificant impacts on almost every aspect of a proj-ect, since it describes the situation without theproject activities. Hence, the baseline is the yard-stick for the calculation of the project-relatedemission reductions. This study provides a de-scription of the concept, rules and regulations, anassessment of different baseline methods, theapplicability of different methods, a detailed studyof dynamic baselines, and recommendations.
Concept, Rules, and Regulations
There have been various definitions of baseline inthe past (Matsuo 2000; Ellis 1999; NVROM2001). The Marrakech Accords established a cleardefinition of baseline: “The baseline for a CDMproject activity is the scenario that reasonably rep-resents the anthropogenic emissions by sources ofgreenhouse gases that would occur in the absenceof the proposed project activity. A baseline shallcover emissions from all gases, sectors and sourcecategories listed in Annex A within the projectboundary.” (Annex A of the Kyoto Protocol liststhe greenhouse gases that are considered in the
Protocol—CO2, CH4, N2O, HFCs, PFCs, andSF6—and the sectors/source categories of green-house gases, including energy, industrial pro-cesses, solvent and other product use, agriculture,and waste.) Since 2001, the CDM ExecutiveBoard has formulated a series of decisions regard-ing baseline setting for CDM projects (see Annex1). If a CDM project is applying a new baselinemethod, it has to be submitted by the project pro-ponents to the Executive Board for approval. Priorto the thirteenth EB meeting held in March 2004,nine methodologies—including landfill gas recov-ery and biogas cogeneration—had been approved.Further information on baseline and monitoringmethodologies approved and/or under considera-tion can be obtained on the UNFCCC websitehttp://cdm.unfccc.int/methodologies.
A baseline is actually an emissions trajectory inthe baseline scenario, and a function of such vari-ables as time, product of output, and emissionsintensity. An ideal baseline should be environ-mentally credible, transparent and verifiable, sim-ple and inexpensive to determine, and provide areasonable level of certainty regarding credits forinvestors. In practice, any baseline determinationis likely to involve a trade-off among these criteria.
Baseline setting is a key step in the process ofidentifying emission reductions of a CDM proj-ect activity. A higher emissions baseline is moreattractive to both CDM project hosts andinvestors because of the larger amount of CERsand higher return on investment.
There are several ways to describe the baselinein terms of emissions. Figure 2.4 shows the pos-sible baselines and GHG emissions of a proposedCDM project activity along with the project life-time. Shapes of the baseline trajectory are deter-mined by the characteristics of baseline scenariosand could be represented by different types oftime functions. The first figure illustrates a sce-nario under which the baselines stay unchangedduring the whole crediting period. The secondfigure illustrates a scenario under which the base-line emissions change during the crediting period.
C D M M E T H O D O L O G Y A N D C A S E S T U D I E S
C D M I N C H I N A14

Assessment of Different BaselineSettings
Emission reductions expected from a proposedCDM project could be calculated by subtractingproject emissions from the baseline. The Mar-rakech Accords provide three general baselineapproaches for a CDM project activity: (1) exist-ing actual or historical emissions, as applicable;(2) emissions from a technology that representsan economically attractive course of action,taking into account barriers to investment; or(3) the average emissions of similar projectactivities undertaken in the previous five yearsin similar social, economic, environmental, andtechnological circumstances, and whose perfor-mance is among the top 20 percent of theircategory. People have various interpretations ofthese approaches, and the possibility is still opento choose different methodologies based on thereal circumstances. The following methods areoften discussed:
• Project-specific baseline methods• Multi-project baseline methods• Technology benchmark baseline methods• “Top-down” sectoral baseline methods• “Top-down” nationwide baseline methods• Hybrid baseline methods
Classification of baseline methods
Different baseline methods have different indica-tions for application. In general, project-specificbaselines present non-standardized and disaggre-gated characteristics, while benchmark baselinescould be designed and applied at different levelsof project aggregation, such as one technologycategory in several similar projects, in one sector,in one region, or even in one country.
From a standardization point of view, baselinemethods could be classified as either standard-oriented or project-oriented. Multi-project base-line methods, technology benchmark baselinemethods, sector-level or “top-down” sectoral base-line methods, and nationwide baseline methods
I N S T I T U T I O N A L F R A M E W O R K A N D M E T H O D O L O G I C A L G U I D E L I N E S F O R C D M
C D M I N C H I N A 15
Baseline
Crediting period
Emis
sion
s (to
n-c) Emission reductions
Baseline
CDM project
Crediting period
Emis
sion
s (to
n-c)
Emission reductions
Year
Year
F I G U R E 2 . 4 Possible Baseline Trajectory and EmissionReductions of a CDM Project Activity
can be viewed as standard-oriented. Hybridbaseline methods are actually a combination ofproject-oriented methods and standard-orientedones. With standard-oriented methods, baselinesare developed using some standardized parame-ters, such as the average emissions intensity of aspecific electric power grid or the technical para-meters of a specific type of technology. In thecase of project-specific methods, baselines aredeveloped with specific parameters of a relevantproject activity. For example, when a gas-firedpower plant replaces a coal-fired one, the coal-fired plant could be taken as the baseline project.Thus, such specific parameters of the project asenergy efficiency, load curve, load factors, opera-tion hours, type of coal delivered, and even com-bustion condition have to be considered inbaseline development.
Table 2.1 compares project-specific base-linemethods and standardized ones (Lazarus 1999).

The aggregation level of a baseline is usually inparallel with its standardization level; that is, themore standardized, the more aggregated, and viceversa. A project-specific baseline is the least aggre-gated type, while multi-project and technologybenchmark baselines seek to standardize emissionlevels or rates and are applicable to multiple pro-jects of a similar type. Between these two types ofbaseline, there is a gray area called hybrid baselinesthat would be more aggregated and standardizedthan project-specific baselines, while less aggre-gated and standardized than multi-project (bench-mark) baselines (Ellis 1999).
Standardized baseline approaches seem to beattractive to many people and organizations (IEA,
OECD, 2000; Ellis and Bosi 1999) and some ofthem are even advocating sector-level, area-level,or industry-level baselines (Baumert 1998; Har-grave and others 1999). While acknowledgingsome possible merits of these approaches, weare not of the view that sector-level, area-level, orindustry-level baselines would be a good choicefor CDM projects—at least for some project typesto be hosted by China, considering the scale andcomplex structure of China’s industries and verydifferent situations in different areas. Further-more, the Chinese government is also of the viewthat the baseline should be set on a project-specificbasis. Table 2.2 lists some of the pros and cons ofdifferent baseline methods.
Baseline experience
The UNFCCC secretariat listed 95 AIJ pro-jects (UNFCCC, 1998) in its second synthesisreport on activities implemented jointly, mostof which have used project-specific baselines(Ellis 1999).
The US/Russia Rusafor Project (Michaelowa1998) used a hybrid baseline with both site-specific data and technology-based data. An AIJproject—hosted by the Czech Republic andfunded by the Government of Switzerland—used four baseline approaches (Basler 1999)and two types of projects—fuel switching (coalto biomass) and energy efficiency improve-ments. Table 2.2 shows the significant differencein results with different baseline methods.
Table 2.3 reveals that assumptions have sig-nificant effects on the emission reduction bene-fits of a specific project. For example, in the caseof fuel switching, emission reduction benefits ofthe project could vary by a factor of 2.5 whendifferent baselines (technology-based baseline vs.project-specific baseline) are used. However, wecannot draw a simple conclusion from the tableregarding which type of baseline is the most con-servative. The Marrakech Accords provide clearguidance on baseline determination.
The Center for Clean Air Policy (CCAP) alsoconducted a qualitative analysis on the impacts of
C D M M E T H O D O L O G Y A N D C A S E S T U D I E S
C D M I N C H I N A16
T A B L E 2 . 1 The Spectrum of Baseline Methods
Benchmark methods Project-specific methods
“perfectly standardized” “completely un-standardized”Same baseline for each Different baseline for each project
projectUniform, rigid Tailored, ad hocAdditionality test reflects Additionality test reflects
only emission intensity emissions intensity and level ofactivity
Based on category-wide Based on site-specific informationinformation
Aims to be credible for Aims to be credible for individual family of projects projects
T A B L E 2 . 2 Variation in Calculated Carbon Offsetsunder Different Baselines
Project type
Offsets under different baselines (t CO2) Fuel switch Cogeneration
Project-specific 175,000 41,000Technology-based 430,000 43,000Sectoral-based 180,000 21,000Top-down 195,000 22,000
Source: Adapted from Basler 1999
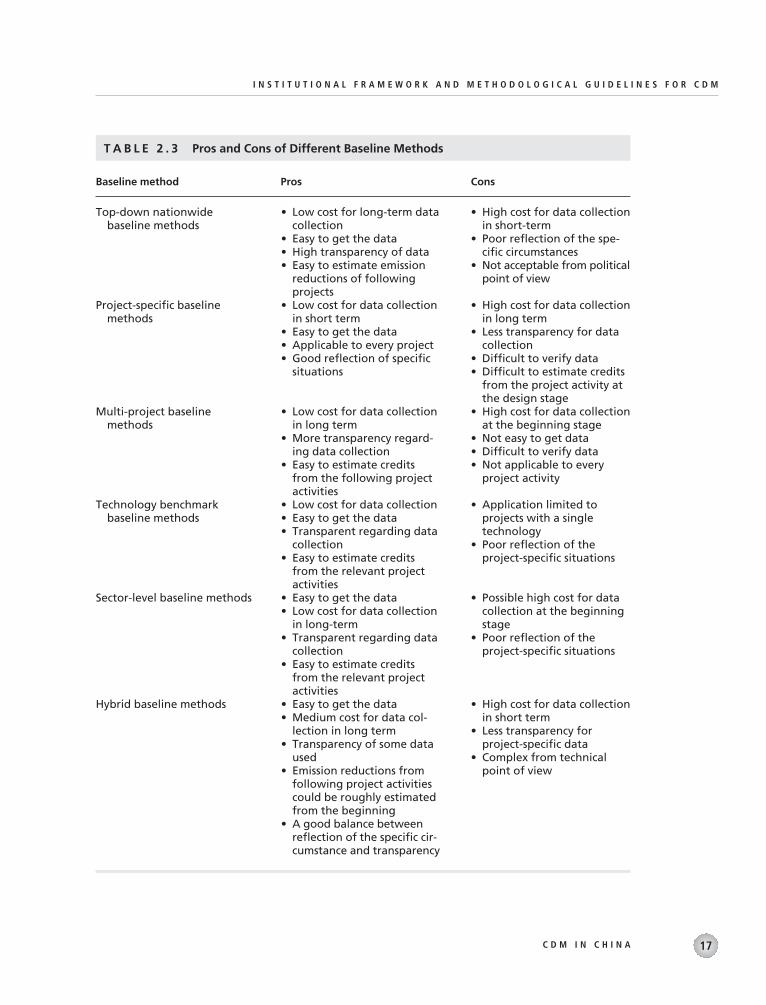
I N S T I T U T I O N A L F R A M E W O R K A N D M E T H O D O L O G I C A L G U I D E L I N E S F O R C D M
C D M I N C H I N A 17
T A B L E 2 . 3 Pros and Cons of Different Baseline Methods
Baseline method Pros Cons
Top-down nationwide baseline methods
Project-specific baseline methods
Multi-project baseline methods
Technology benchmark baseline methods
Sector-level baseline methods
Hybrid baseline methods
• Low cost for long-term datacollection
• Easy to get the data• High transparency of data• Easy to estimate emission
reductions of followingprojects
• Low cost for data collectionin short term
• Easy to get the data• Applicable to every project• Good reflection of specific
situations
• Low cost for data collectionin long term
• More transparency regard-ing data collection
• Easy to estimate creditsfrom the following projectactivities
• Low cost for data collection• Easy to get the data• Transparent regarding data
collection• Easy to estimate credits
from the relevant projectactivities
• Easy to get the data• Low cost for data collection
in long-term• Transparent regarding data
collection• Easy to estimate credits
from the relevant projectactivities
• Easy to get the data• Medium cost for data col-
lection in long term• Transparency of some data
used• Emission reductions from
following project activitiescould be roughly estimatedfrom the beginning
• A good balance betweenreflection of the specific cir-cumstance and transparency
• High cost for data collectionin short-term
• Poor reflection of the spe-cific circumstances
• Not acceptable from politicalpoint of view
• High cost for data collectionin long term
• Less transparency for datacollection
• Difficult to verify data• Difficult to estimate credits
from the project activity atthe design stage
• High cost for data collectionat the beginning stage
• Not easy to get data• Difficult to verify data• Not applicable to every
project activity
• Application limited to projects with a single technology
• Poor reflection of the project-specific situations
• Possible high cost for datacollection at the beginningstage
• Poor reflection of the project-specific situations
• High cost for data collectionin short term
• Less transparency for project-specific data
• Complex from technicalpoint of view

C D M M E T H O D O L O G Y A N D C A S E S T U D I E S
C D M I N C H I N A18
different baselines on an AIJ project in Decin,Czech Republic (CCAP 1999). Results show thatdifferent baseline assumptions can significantlyaffect the amount of credits to be generated—sometimes by a factor of three.
More and more projects now are using multi-project baselines, in which the assumptionsdiverge based on the specific sectors and nations.
Multi-project baselines, based on existing elec-tricity capacity and recent capacity additions, arealso used in a study focusing on projects in thepower sectors of Brazil, India, and Morocco (Bois2000). Recent capacity additions included suchitems as all source and only fossil fuels, source-specific, sub-national, and load-specific. Theimplications of different assumptions, in terms ofstringency, are different for different countries.The source-specific multi-project baseline, partic-ularly in the case of coal, may result in perverseincentives, but might promote a cleaner use ofcoal reserves. Developing a separate multi-projectbaseline for peak-load electricity may be desirable,as those plants are typically different from base-load plants.
Similar studies have also been conducted inthe fields of transportation (Salon 2001) andenergy efficiency improvement (Violette 2000).The former study set up a sub-sector technicalbaseline for a transportation project and consid-ered the modification of the historical baseline toallow a mode-shifting project. A single-regiontransportation baseline and worldwide regionalbaseline were also discussed. Taking lighting andmotors as examples, the energy efficiency studyanalyzed data needs, quality, and availability forbaseline calculation. Based on seven cases, thestudy discussed the issues of determining stan-dard baseline performance, standard calculationand data protocols, and of standardizing operat-ing and performance parameters.
Two conclusions can be drawn from theabove-mentioned cases in terms of applicabilityof different baseline methods.
Multi-project baseline methods are suitable forprojects with the following characteristics: (a) a
new construction project; (b) output that is sim-ple and easy to measure; and (c) adoption of a sin-gle technology.
Project-specific baseline methods are suitablefor projects with the following characteristics:(a) technical retrofit projects; (b) energy effi-ciency improvement through better manage-ment; and (c) output that is diversified by usingmultiple processes and energy flows.
Applicability of DifferentMethodologies Under China’sCircumstances
A survey was conducted to review baseline devel-opment practice in China. The information for10 cases was collected and is summarized inTable 2.4. Table 2.5 shows the relationship be-tween baseline methods and types of project.
The following observations could also be madefrom the investigation.
• No case study in China adopted a nationwidebaseline because of the significant disparities insocioeconomic development, technical level,natural resources, and weather conditionsamong different regions and sectors. If the proj-ect boundary permits, regional baselines couldbe an option as a default value (e.g. the averageCO2-factor of the regional grid).
• Only a small portion of projects adopted multi-project baselines because of the huge data col-lection demands.
• Most projects adopted project-specific baselinesfor the following reasons: (a) lighter workloadfor data collection compared to multi-projectbaseline; (b) easy-to-get baseline data because ofthe currently existing similar projects underconstruction or under design in the sameregion; and (c) low cost for data collection.
• For some types of projects, a technology bench-mark baseline could be the best choice consid-ering data collection and cost reduction.
• For energy efficiency projects, identifying theappropriate project boundary is a difficult point
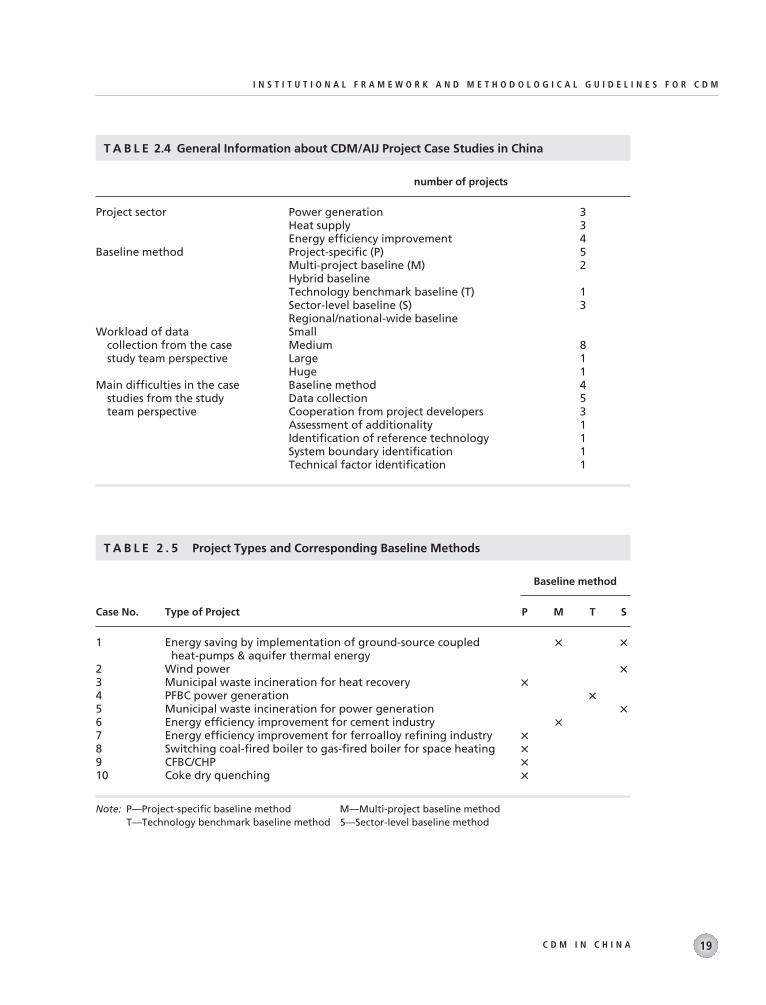
I N S T I T U T I O N A L F R A M E W O R K A N D M E T H O D O L O G I C A L G U I D E L I N E S F O R C D M
C D M I N C H I N A 19
T A B L E 2.4 General Information about CDM/AIJ Project Case Studies in China
number of projects
Project sector Power generation 3Heat supply 3Energy efficiency improvement 4
Baseline method Project-specific (P) 5Multi-project baseline (M) 2Hybrid baselineTechnology benchmark baseline (T) 1Sector-level baseline (S) 3Regional/national-wide baseline
Workload of data Smallcollection from the case Medium 8study team perspective Large 1
Huge 1Main difficulties in the case Baseline method 4
studies from the study Data collection 5team perspective Cooperation from project developers 3
Assessment of additionality 1Identification of reference technology 1System boundary identification 1Technical factor identification 1
T A B L E 2 . 5 Project Types and Corresponding Baseline Methods
Baseline method
Case No. Type of Project P M T S
1 Energy saving by implementation of ground-source coupled � �heat-pumps & aquifer thermal energy
2 Wind power �3 Municipal waste incineration for heat recovery �4 PFBC power generation �5 Municipal waste incineration for power generation �6 Energy efficiency improvement for cement industry �7 Energy efficiency improvement for ferroalloy refining industry �8 Switching coal-fired boiler to gas-fired boiler for space heating �9 CFBC/CHP �10 Coke dry quenching �
Note: P—Project-specific baseline method M—Multi-project baseline methodT—Technology benchmark baseline method S—Sector-level baseline method

Proposed CDM project activity
Yes
Yes
Develop baseline with theselected methodology
Submit a new baseline methodologyproposal to the CDM EB for approval
Are there any approvedmethodologies for similar
projects?
Are any of themethodologies applicable?
Select from the three baselineapproaches the most suitable one
No
No
Approved by the EB
C D M M E T H O D O L O G Y A N D C A S E S T U D I E S
C D M I N C H I N A20
F I G U R E 2 . 5 Decision Tree for Baseline Determination
because most such projects consume secondaryenergy.
• For projects with GHG emissions besidesCO2, the lack of related research makes it dif-ficult to calculate the emissions and identifytechnical factors.
• Workload for data collection is one of thedecisive factors affecting the choice of baselineapproaches.
• Constrained by budget, data availability, andtime schedule, etc., only one case study adoptedmore than one kind of baseline methods.
A decision tree for baseline setting is shownin Figure 2.5.
Dynamic Baseline
Concept
Baselines, according to whether or not they arefixed during the crediting period of a proposed
CDM project activity, could be classified as eitherstatic/constant/fixed or dynamic. However, thereare no commonly accepted definitions of staticand dynamic, and the views diverge.
Some researchers (Michaelowa 1999) believethat a baseline is static if either constant emissionsor a constant emissions benchmark are assumedthroughout the crediting period of the project,and that a baseline is dynamic if only changingemissions (not due to changes in activity levels) ora changing benchmark are assumed. Some prefera broader dynamic definition, which include abaseline with changing emissions caused by thechanges of output level. And some others (Ellisand Bosi 1999; Chomitz 1998) would like to seean even narrower definition, which includes onlya baseline that is revised during the lifetime of theproject activity without specifications at the out-set on how the revision(s) will be made.
Baselines with changing emissions could alsobe divided into dynamic and quasi- dynamic.For a dynamic baseline, either the emission lev-

els change for other reasons than changes inactivity levels or a changing benchmark is used,while the changing rate is not pre-specified. Aquasi-dynamic baseline varies through time witha trend indicator that would be specified fromthe beginning of the project. To be more accu-rate and to help the analysis, this study classifiesbaselines into three types: static, quasi-dynamic,and dynamic. Although in some cases, emissionsin a dynamic baseline could rise due to specificreasons, it is likely that in most cases the emis-sions will decrease.
Desirability
Static and dynamic baselines have their ownadvantages and disadvantages. Which type tochoose in a specific project depends on the specificcircumstances and main considerations of theproject developers. In some cases, dynamic base-lines could better reflect the real situation thanstatic ones and thus are more suitable. Chomitz(1998) argues that dynamic baselines are espe-cially desirable in two circumstances: (1) inreplacement/retrofit projects, when retirement ofthe existing facility is sensitive to unpredictablechanges in prices or interest rates; or (2) whenemissions are volatile because of variable and un-predictable facility loads.
Willems (2000) suggests that it may be impor-tant to use a dynamic baseline in sectors where therate of change in performance is relatively high;where the baseline is inherently dynamic (e.g. inthe case of a reforestation project on land wherethe carbon stock is naturally regenerating, but ata lower rate); or where the crediting period and/orthe time between setting and revising a baseline isrelatively long.
According to the Marrakech Accords, abaseline methodology should be selected from(a) existing actual or historical emissions; (b) emis-sions from a technology that is economicallyattractive; or (c) the average emissions of similarproject activities undertaken in the previous fiveyears, in similar circumstances, and whose per-formance is among the top 20 per cent of their
category. The Accords also provide two optionsfor crediting period: (1) a maximum of sevenyears, which may be renewed at most two times,provided that for each renewal a designatedoperational entity determines and informs theexecutive board that the original project baselineis still valid or has been updated, taking accountof new data where applicable; or (2) a maximumof 10 years, with no option of renewal. With thechange of environments, the economic perfor-mance of technologies and thus the average emis-sions of projects will change. Therefore, the lattertwo options imply the possibility and necessityof dynamic baseline emission rates. Besides, thevariation in output of a CDM project activitycould also cause a change in baseline emissionsduring the crediting period.
At its ninth meeting, the CDM ExecutiveBoard decided that for an electricity generationCDM project, the baseline emission rates couldbe calculated ex post provided that (a) properjustification was provided; and (b) baseline emis-sion rates calculated ex ante were reportedexplicitly in the draft CDM-PDD.
Most of the experience obtained to dateregarding baseline determination comes from theAIJ pilot phase. Although static baselines are usedin most of the AIJ projects, dynamic ones are alsoavailable. The France/Czech cement productionproject in Cizkovice uses a baseline that will berevisited after the first five years of project oper-ation, and many AIJ projects supported by theGovernment of Switzerland revised their emissionbaselines between the first and subsequent reportsto the UNFCCC.
Factors causing the change of baseline emissions
Many factors could possibly cause the change ofbaseline emissions of a CDM project activity.Generally speaking, most factors will make thebaseline emissions decline with time. Therefore,the emission reduction benefits of a CDM proj-ect activity, when measured against a dynamicbaseline, usually shrink with time.
I N S T I T U T I O N A L F R A M E W O R K A N D M E T H O D O L O G I C A L G U I D E L I N E S F O R C D M
C D M I N C H I N A 21

Technologies evolve continuously in theirown way and are not necessarily associated withGHG mitigation considerations. However, inmost cases, autonomous technology developmentcould improve the energy efficiency and thusreduce the carbon intensity of some technologies,installations, sectors, and/or industries. This willinevitably make baseline emissions change withtime. For example, during the lifetime of a CDMproject activity, the old equipment or technology,which is used in the baseline case, could be re-placed by new equipment or technology evenwithout the incentives from CDM. Therefore,the baseline should be re-estimated. A dynamicbaseline would more accurately reflect what theemissions will be without the project activity.
Energy efficiency improvements could happenautonomously with time and thus reduce theemissions intensity of related products or services.This is not necessarily associated with technologydevelopment. The improvement in managementand the optimization of load and operation couldalso result in higher energy efficiency. Energy effi-ciency improvements will reduce the emissions ina baseline scenario; a dynamic baseline is neces-sary, especially in case of a high changing rate.Otherwise, excess credits will be issued and envi-ronmental integrity undermined.
A change in the regulatory or legal environ-ment—such as a renewable energy developmentplan, a new environmental policy, or new envi-ronmental standards—could change the BAUscenario, and thus make dynamic baselines anecessity. For example, a wind energy project iscarbon free and usually should be eligible to gen-erate emission reduction credits at lease for aperiod of 10 years, which is allowed by the Mar-rakech Accords. If the host country governmentalready has a plan to develop a wind energy proj-ect in the same site as the wind CDM project—perhaps five years later—the CDM project activityis eligible to generate credits for only five years.Subsequently, it should become a baseline project.
In most cases, project operators could choosethe most suitable fuel type from several available
types. Cost is always an important consideration.Changing fuel prices could change the economiccompetitiveness of different types of fuels andthus the decision of project operators on fueltype. In the same manner, it could possibly causethe change of energy consumption structure incertain industries/sectors, especially the energy-intensive industries/sectors. Different fuels couldbe obviously different in emissions intensity, sothe baseline or the emissions benchmark couldalso change with fuel price. Fuel switching alwaysmeans additional equipment or retrofit invest-ment, so little price change may not cause signif-icant fuel switching. However, when fuel pricechanges happen, the baseline should be revisitedand possibly reassessed.
Even in the case of no fuel switching, a changein fuel prices could also cause a change in base-line emissions. For example, in the case of lowenergy prices, project operators may be unwill-ing to implement an energy conservation planbecause the organizational cost might be higherthan the benefits from energy conservation. Withthe increase in energy prices, the situation maychange. Economic benefits from energy savingmay accelerate the technological retrofitting pro-cess in some factories, sectors and/or industries,and thus change the baseline scenario.
Changes in resource availability sometimesmay also make it necessary to set a dynamic base-line. For example, in an area where the only avail-able fuel is coal, the reference fuel for energyconservation projects should be coal, and thus thebaseline should be emissions from the energy uti-lization of coal. If other fuels such as natural gasor diesel oil are available, the energy consumptionstructure of the area will change, and thus thereference fuels should be different. The possibledifferences between the carbon intensities of dif-ferent fuels could therefore change the baseline.
When new technologies are available, theywould compete with conventional ones in thesame market, and thus could possibly change thetechnology structure of that market. If conven-tional technologies and new ones have different
C D M M E T H O D O L O G Y A N D C A S E S T U D I E S
C D M I N C H I N A22

emissions intensities, the emissions benchmarkof specific industries and/or sectors will change.It is also possible that new technologies becomethe new conventional technologies, and the oldconventional ones are phased out.
Different products could differ in emissionintensities, and therefore the change of productstructure could possibly change the overall emis-sions feature of certain industries, sectors, and/orregions, and thus the baseline.
These are some of the external macro factorsthat could cause a change in the baseline. Microinherent factors could also cause a change ofbaseline. For example, it is likely that the longera boiler has been used, the lower its energy effi-ciency. Therefore, when this boiler is used to rep-resent the baseline scenario, the emissions willlikely change with the boiler’s service time.
Characteristics of dynamic baselines
Dynamic baselines need to be re-estimated atcertain intervals if some significant changes rele-vant to the project activity have taken place dur-ing the crediting, and thus could reflect moreprecisely what will happen in the baseline sce-nario than static ones. In cases such as improvedenergy efficiency or stricter environmental regu-lations, the baseline could be adjusted down-wards and thus fewer credits would be issued.This could help to safeguard a project’s environ-mental integrity.
However, compared with static baselines,dynamic ones usually mean more baseline esti-mation work, more validation work, and a heav-ier monitoring, reporting, and data collectionburden. All of these will inevitably increase aproject’s transaction costs.
If a static baseline is used in a proposed projectactivity, the investors could know in advance theamount of credits they would get from that proj-ect, and thus could make their decisions withsome certainty. In the case of a dynamic baseline,the investors could not know the amount of cred-its in advance, as they could not know what wouldpossibly happen during the lifetime of the projectactivity and thus how the baseline would be ad-justed. This will increase uncertainty for investorsand make a CDM project less attractive.
In most circumstances, dynamic baselinesmean that the baseline will decrease with time.However, it is possible that the emissions may risein specific cases. For example, in an area wherenuclear power accounts for a large part of totalelectricity production, the average carbon inten-sity of electricity production in that area may riseif the nuclear power is phased out while renewableenergy could not fully satisfy the demand gap. TheMarrakech Accords allow a baseline that includesa scenario where future emissions are projected torise above current levels. Table 2.6 illustrates sucha scenario, under which the average carbon inten-sity of power generation is used as the baseline.
I N S T I T U T I O N A L F R A M E W O R K A N D M E T H O D O L O G I C A L G U I D E L I N E S F O R C D M
C D M I N C H I N A 23
T A B L E 2 . 6 Carbon Intensity Scenarios
Average carbon Renewable Fossil fuel intensity of
sources sources Nuclear power generation
Carbon intensity of 0 300 gC/kWh 0power generation
Composition of the power Original 10 50 40 150 gC/kWhgeneration (%)
Changed 20 60 20 180 gC/kWh
Source: GCCI calculation.

For simplicity, imagine that electric power in acertain area comes from three types of sources:renewable sources, fossil fuel sources, and nuclearsources, and related carbon intensities are alsogiven. Under the original market structure, theaverage carbon intensity of power generation inthat area is 150 gC/kWh. If the share of the fossilsources increases, the average could increase to180 gC/kWh.
Set dynamic baselines in an affordable way
In the Marrakech Accords, two alternative ap-proaches are provided for crediting period selec-tion: (1) a maximum of seven years, which may berenewed at most two times; or (2) a maximum often years with no option of renewal. If the seven-year period is selected, the baseline will be revis-ited at the interval no longer than seven yearsduring the crediting lifetime of the project activ-ity, and there is the possibility that a dynamicbaseline will be developed.
When updating the baseline for a project activ-ity, all the above-mentioned factors should betaken into consideration to make the revisionmore precise. Failing to do so may potentiallyinflate the baseline, whereas a too rigorous processmay mean more transaction costs and uncer-tainties for investors and could thus hinder theirdecision at the beginning. Too-short updatingintervals may create similar concerns for investors.A trade-off has to be made between differentconsiderations.
Quasi-dynamic baselines and mixed ones couldbe good choices. In the case of quasi-dynamicbaselines, the baseline will change during the cred-iting lifetime of the project activity, while the rateis specified at the very outset. This could accom-modate both the environmental concern and thedesire of some certainty by investors. There aretwo options for the mixed baselines. One option isthat the baseline will be re-estimated at a prede-fined interval, while between two estimations thebaseline is fixed. The other option is that duringtwo estimations, the baseline is not a fixed one, buta quasi-dynamic one.
One of the major challenges of using thisapproach is how to update the baseline. First ofall, there should be a careful study of related legaland regulatory environments to see if any signif-icant changes have already taken place. If therehave, the baseline shall be updated accordingly.Secondly, the market should be analyzed to seewhether the baseline technology could still rep-resent the most attractive choice for investors orwhether the situation has changed. If it is stillattractive, the baseline could remain unchanged.Otherwise, a new baseline should be developed.This process is actually similar to developing abaseline at the outset.
Another significant challenge lies in the diffi-culty of defining a rational changing rate for thebaseline. If a clear historical change trend can beobserved in a sector, area, and/or industry, thistrend may serve as a reference for the futurechange. Otherwise, a subjective trend will haveto be set. Actually, technological progress oftenhappens unexpectedly, so subjective judgment isunavoidable in this process.
Dynamic baselines are not always a goodchoice. Where a large investment has been avoidedand the lifetime of the project could be muchlonger than the crediting period, such as the powerplant, it is unlikely that a newly built one will bereplaced in a short term. Therefore, a static base-line is more rational than a dynamic one.
Recommendations
Although various baseline methodologies havebeen proposed by different sources and discussedin this chapter, it does not necessarily mean thatall of them could be appropriate choices forCDM projects hosted by China. Choosing themost appropriate baseline methodology for aCDM project activity requires striking a balanceamong different considerations, such as the realsituation, transparency, accuracy, verifiability,and transaction cost.
Theoretically, the higher or broader the level atwhich the baseline methodology is determined,
C D M M E T H O D O L O G Y A N D C A S E S T U D I E S
C D M I N C H I N A24

the more transparent the methodology and theresult because it is much easier to get and verifyaggregated rather than disaggregated data. How-ever, such a choice also usually means a higher ini-tial baseline determination cost, a lower cost forfollowing projects, and a lower average cost in thecase of a large number of CDM projects.
China is a large county with significant differ-ences between different regions in aspects such asnatural resources, technology development, andsocioeconomic development. Baseline method-ologies based on national average data couldoverestimate the GHG emission reduction bene-fits of projects to be implemented in economicallyand technologically advanced areas, while under-estimating the benefits for potential projects inother areas. Therefore, such methodologies arenot appropriate for CDM projects in China.
Baseline methodologies based on regional datacould reflect to a large extent the real situationwhere the project is to be implemented, reduce toa certain extent the transaction cost of baselinedetermination, and retain an acceptable level oftransparency. They are thus an attractive option.
A baseline associated with the average emis-sions of similar project activities whose perfor-mance is among the top 20 per cent in its categoryis not an attractive and appropriate choice forsome types of CDM project activities, at leastunder China’s current situation. Take power pro-jects as an example. In China’s current powermarket, some high-efficiency projects, such asnatural gas-fired projects, are to be built asdemonstrations. However, in a specific area, thereare only a limited number of newly planned orbuilt power plants, and one such project couldaccount for a large portion of the newly addedcapacity in that area. Baseline methodology basedon this approach could possibly underestimatethe baseline and thus not provide enough incen-tives to CDM project proponents. Further-more, the CDM Executive Board decided at its8th meeting that: “Project participants wishing touse this approach and a related approved method-ology shall assess the applicability and use the most
conservative of the following options: (a) The out-put-weighted average emissions of the top 20 percent of similar project activities undertaken in theprevious five years in similar circumstances;(b) The output-weighted average emissions ofsimilar project activities undertaken in the previ-ous five years under similar circumstances that arealso in the top 20 per cent of all current operatingprojects in their category (i.e. in similar circum-stances as defined above).” Such an exerciserequires a large amount of data about the wholemarket. However, most of the data are consideredconfidential/internal and are not publicly avail-able in China. This will inevitably increase thetransaction cost and restrict the transparency andverifiability of the methodologies.
Data availability will be one of the most seri-ous challenges that project developers have toface during baseline determination in China, be-cause of the poor statistical basis of the country,limited publicly available information, and lesstransparent statistical data.
In comparison with static baselines, dynamicbaselines usually mean more data requirementsand less transparency. Furthermore, such method-ologies also mean more uncertainties for projectproponents and thus are not currently attractiveand appropriate when the CDM is still in itsinfancy. In the case of a dynamic baseline, theamount of available historical data will haveobvious effects on the projections of future sce-narios and thus the emissions baseline to be usedin the project. However, more historical datawould not necessarily mean a more rational rep-resentation of the current trend.
ADDITIONALITY ASSESSMENT
This section discusses three points about addi-tionality: the concept, the assessment criteria,and the procedures for additionality assessment.Additionality represents the environmental ben-efit of the project by proving the project mandateis fulfilled with regard to the baseline and gener-ating the unit of economic transaction, i.e. certi-
I N S T I T U T I O N A L F R A M E W O R K A N D M E T H O D O L O G I C A L G U I D E L I N E S F O R C D M
C D M I N C H I N A 25

fied emissions reductions (Oberheitmann 1999).Hence, it is a core element of the CDM. Here wedescribe the concept of additionality, its assess-ment criteria, and recommendations.
Concept and Importance ofAdditionality
Concept, rules and regulations
According to the Marrakech Accords, “a CDMproject activity is additional if anthropogenicemissions of greenhouse gases by sources arereduced below those that would have occurred inthe absence of the registered CDM project activ-ity” (UNFCCC 2001b). Based on that, the CDMExecutive Board has (as of December 2003) for-mulated further decisions on how to demonstratethe additionality of a proposed CDM projectactivity (see below; for details refer to Annex 1).
Assessing whether a proposed CDM projectactivity is additional involves two issues: (1) iden-tifying the baseline scenario in the absence of theproposed project activity; and (2) explaining whythe project’s emissions will be reduced below thebaseline, or why the emission reductions to beachieved by the proposed CDM project activitywill not otherwise happen.
Significance of additionality
Additionality assessment is a very important stepin assuring that the proposed CDM project activ-ity will result in real, measurable, and long-termGHG emissions reduction benefits, and that thesereductions are additional to any that would occurin the absence of the certified project activity. Ithas two particularly significant aspects.
Safeguard integrity of the Kyoto Protocol. Oncespecific criteria have been established, an addi-tionality test becomes an effective instrument tomanage the operation of CDM projects. Withrelated assessment criteria, designated opera-tional entities could distinguish clearly and moreeasily between projects with real and additionalreductions in emissions and those without, andthus assure that CERs are awarded only to eligi-
ble project activities and safeguard the integrityof the Kyoto Protocol.
Spill-over benefits to the host country. CDMproject activities that have passed the addition-ality assessment could really promote sustain-able development of the host countries and thuscreate spill-over benefits to those countries, suchas improvement of local environmental quality,transfer of environmentally sound technologiesfrom developed countries, more public or pri-vate investment from developed countries, andthe elimination of market barriers in hostcountries.
Additionality Assessment Criteria
Generally speaking, ideal criteria for assessingthe additionality of a proposed CDM projectactivity should reflect as much as possible spe-cific circumstances of the project to be assessed;reflect to some extent general situations of a spe-cific sector/region where the project is to belocated; require rational or even limited data;have limited system errors; have relatively loweruncertainties; have acceptable cost; and havelimited or even no subjective judgment.
Until now, there is no consensus by the inter-national community on specific criteria for addi-tionality assessment. Some guidance has alreadybeen provided by the COP and the CDM Exec-utive Board.
In the Marrakesh Accords, paragraphs 43 and44 stipulate that:
43. A CDM project activity is additional ifanthropogenic emissions of greenhouse gases by sourcesare reduced below those that would have occurred inthe absence of the registered CDM project activity.
44. The baseline for a CDM project activity isthe scenario that reasonably represents the anthro-pogenic emissions by sources of greenhouse gases thatwould occur in the absence of the proposed projectactivity. A baseline shall cover emissions from allgases, sectors and source categories listed in AnnexA within the project boundary. A baseline shall bedeemed to reasonably represent the anthropogenic
C D M M E T H O D O L O G Y A N D C A S E S T U D I E S
C D M I N C H I N A26

emissions by sources that would occur in the absenceof the proposed project activity if it is derived usinga baseline methodology referred to in paragraphs37 and 38 above.
At its 9th meeting, the CDM EB requiredthat project participants should refrain from pro-viding glossaries or using key terminology notused in the COP documents and the CDM glos-sary (environmental/investment additionality).
At its 10th meeting, the EB provided furtherclarification on additionality:
1. As part of the basis for determining thebaseline scenario an explanation shall bemade of how, through the use of themethodology, it can be demonstratedthat a project activity is additional andtherefore not the baseline scenario.
2. Examples of tools that may be used todemonstrate that a project activity isadditional and therefore not the baselinescenario include, among others:(a) A flow-chart or series of questions
that lead to a narrowing of potentialbaseline options; and/or
(b) A qualitative or quantitative assess-ment of different potential optionsand an indication of why the non-project option is more likely; and/or
(c) A qualitative or quantitative assess-ment of one or more barriers facingthe proposed project activity (such asthose laid out for small-scale CDMprojects); and/or
(d) An indication that the project type isnot common practice (e.g. occurs inless than [<x%] of similar cases) inthe proposed area of implementa-tion, and not required by a Party’slegislation/regulations.
Project participants could use these four toolsprovided by the EB and other tools they deemnecessary to demonstrate the additionality of aproposed CDM project activity. Terminologies
that were once widely used in the past—such asemissions additionality and technology addition-ality—will be avoided in this report. However, itis still necessary to demonstrate various aspects ofthe project’s additionality. Therefore, we proposeand discuss a series of additionality assessment cri-teria, though they are not necessarily suitable forevery project. These criteria deal with emissionsaspects, financial aspects, investment barriers,technology barriers, and other barriers.
Emissions aspects. Paragraphs 43 and 44 of theMarrakech Accords provide a clear indicationregarding how to demonstrate additionality fromthe emissions perspective.
It is widely agreed that an emissions-relatedcriterion is most important because of its directand quantitative characteristics as well as univer-sal applicability. The comparison between emis-sions of a CDM project and the baseline gives aclear and quantitative understanding of the emis-sions reduction benefits of a proposed CDM proj-ect activity, and this comparison can and must beundertaken for any CDM project to be imple-mented in any sector and country.
The index to scale the emissions level is rathersimple: the amount of GHG emissions. But it issometimes more convincing to calculate theGHG emissions rate (i.e. tCO2/GWh) insteadof the total amount (e.g. tCO2). This is also a requirement put forward by the EB at its 8th meeting. For example, in the case of a thermalpower plant, two possible indexes—CO2 emis-sions per unit of electricity supply, or CO2 emis-sions per unit of heat supply—could be used toassess the project’s additionality from an emissionsperspective.
Data requirements for an emissions-basedadditionality assessment are relatively simple: onlytechnical data are necessary, while data regardingcost, investment, revenues, and market barrier arenot necesssary. And when necessary, CO2 emis-sions associated with electricity or heat produc-tion could even be estimated, with formula anddefault emissions factors recommended by rele-vant organizations such as the IPCC.
I N S T I T U T I O N A L F R A M E W O R K A N D M E T H O D O L O G I C A L G U I D E L I N E S F O R C D M
C D M I N C H I N A 27

Financial aspects. From a financial point ofview, additionality requires that public fundingfor CDM project activities from developedcountry parties should be clearly additional tothe financial obligations of Annex I parties underthe Convention and the Kyoto Protocol, as wellas not result in the diversion of official develop-ment assistance (ODA). Therefore, funds fromODA should not be used to finance the acquisi-tion of CERs. However, public funds could beused for capacity building in both the public andprivate sectors of the host countries, with a focuson creating an enabling environment for CDMproject activities.
However, it is actually very difficult to imple-ment this criterion for additionality assessmentbecause it is almost impossible to set a baselinefor any international funds. Judgment of a proj-ect’s additionality from the financial perspectiveis thus actually a process of political negotiationand judgment.
Investment barriers. From an investment pointof view, a proposed CDM project activity is addi-tional only if it is less attractive from the investor’sviewpoint compared with the baseline project,when revenues from the emission reduction cred-its are not taken into consideration. Otherwise,the proposed project will happen anyway, regard-less of the incentives from the CDM, and thuswill be the baseline case.
To measure and compare the attractiveness ofthe baseline project and the proposed CDM proj-ect, and thus assess quantitatively the additional-ity of a proposed project from the investmentpoint of view, some indicators should be used.Indicators often used to describe the economicperformance of a project activity—includinginternal rate of return (IRR), payback period, netpresent value (NPV) and project cost—could beused to evaluate the additionality of a proposedCDM project activity from the investment aspect.The specific criterion is that the economic perfor-mance of the proposed project activity should beworse than that of the baseline project.
Assessing the additionality from the invest-ment aspect requires substantial financial dataregarding both the baseline project and the pro-posed CDM project. These data in many caseswill be considered confidential by the projectproponents. This is especially true for large-sizeprojects. Therefore, such an assessment will in-evitably encounter many practical difficulties,which makes it even more necessary to assess theadditionality of a proposed CDM project activ-ity from other perspectives.
Technology barriers. Technologies used inCDM projects must be environmentally safeand not commercially available or viable in thehost country market. This is to ensure thatCDM projects will lead to the transfer of high-quality technologies to host countries, not thedumping of old, second-hand technologies intothese countries’ markets. The transfer of tech-nologies under the CDM should also be addi-tional to the technology transfer obligations ofAnnex II countries in other areas.
The technological assessment process shouldinclude:
• An assessment of commercially available rele-vant technologies in order to determine theemissions intensity of the technology to beused in the baseline scenario
• An assessment of the market penetration ofrelevant technologies in the region.
The evaluating indices for technological eval-uation are a comprehensive system, in whichsome indices are quantitative, while others arequalitative. Three types of indices should benoted for assessment of additionality from a tech-nological point of view: (1) indices describingtechnological characteristics; (2) indices describ-ing economic characteristics, including fixed cost,investment of infrastructure, and price of productor output; and (3)indices describing other char-acteristics, such as imperfect markets, special lawsor regulations, or environmental barriers.
C D M M E T H O D O L O G Y A N D C A S E S T U D I E S
C D M I N C H I N A28

The most notable drawback of such an assess-ment may be its high cost. Furthermore, somerequired data are usually viewed as confidentialby related stakeholders and thus are not publiclyavailable. In addition, the rate of technologicaladvancement is very rapid, so it is necessary toupdate periodically the database of conventionaltechnologies, which is actually a difficult exercise.
Other barriers. To assess whether a projectwould have occurred anyway, one has to identifybarriers a CDM project may face as completelyas possible, and then assess how these barrierswould influence the implementation of theproject. Because the identification of barriers issometimes a difficult and subjective process, theprogram-related assessment criteria are not applic-able to any project. In fact, it could be consideredas the base for other assessment criteria on con-dition that there is sufficient information.
The following aspects need to be consideredwhen assessing the additionality of a proposedCDM project activity:
• Regulatory check: Does the project meet allthe existing legal/regulatory requirements?
• Economic performance check: Without finan-cial incentives from emission reductions, howcompetitive is the project in the local market?
• Barrier removal and market transformationcheck: Does the project introduce innovative
financing, raise awareness regarding newproducts, technologies and practices, increasedemand, or increase competitive pressure fortechnological change in the local market?
Table 2.7 summarizes the characteristics ofadditionality assessments.
Recommendations
In choosing the most suitable additionality assess-ment criteria, it is necessary to strike a balancebetween safeguarding environmental integrityand practicability.
Although various criteria have already beenproposed to assess the additionality of a proposedCDM project activity, this does not mean that allthese criteria could or should be applied in a pro-posed CDM project activity, nor does it meanthat a project activity should pass all these assess-ments before it could be viewed as additional.
The availability of data, especially economicand financial data, will be one of the most seriouschallenges in the process of assessing the addi-tionality of a specific project activity, becausedetailed data are usually viewed as confidential bythe project developers.
The results of an assessment from differentaspects for the same project activity could be dif-
I N S T I T U T I O N A L F R A M E W O R K A N D M E T H O D O L O G I C A L G U I D E L I N E S F O R C D M
C D M I N C H I N A 29
T A B L E 2 . 7 Characteristics of Additionality Assessment from Different Aspects
Criteria characteristics Emission aspect Investment barrier Financial aspect Technology barrier
Applicability H L L HQuantitative H H M MQualitative L M M MAccuracy H M L MUncertainty M M H MDynamic H L M HCost M L M HData needs M H M HIndex amount M M M H
Note: H: to a high extent M: to a medium extent L: to a low extent

ferent, so additionality should be assessed froman integrated point of view. It is useful to reachan agreement with the international communityregarding which types of additionality assess-ment are necessary and which are not.
PROJECT-BASED EMISSIONREDUCTION COST CALCULATION
The calculation method for project-based emis-sion reduction costs for a CDM project dependson the cost allocation options among the domes-tic benefits (such as products and/or service) andthe CERs benefits; that is, the cost could bedefined as an incremental cost for achieving theCERs or for achieving domestic benefits.
The CDM is designed to provide benefits forboth project investor and host. It should helpnon-Annex I countries to achieve sustainabledevelopment, and help Annex-I countries fulfilltheir quantitative obligations under the KyotoProtocol. Given this sharing of benefits, therehas to be a subsequent cost-sharing arrange-ment. Since it is easy to measure the projectcosts and complicated to measure the benefits,this study views this issue from the cost per-spective. One of the objectives of a CDM proj-ect is to generate environmental benefits thatexceed the baseline. The incremental costs foremission reduction (ICER) only cover the coststhat are greater than the baseline project; forexample, a coal-fired power plant would bereplaced by a biogas electricity generation unitunder the CDM. Generally, this means that the incremental costs are borne by the projectinvestor. Owing to data availability, we preferthe calculation method of incremental emissionreduction cost per unit of CERs, as discussedbelow and applied in the case studies. If thecost-sharing option is based on an ICER calcu-lation, the investors from Annex-I countries willobtain much of the total social surplus from theCDM project transaction. Applying the Nashbargaining solution would result in a different
allocation of risks and benefits (He and Su2004).
The CERs price is not the same as the project-based incremental emission reduction cost. Theprice of CERs is determined by the market equi-librium process, which is affected by demand andsupply and by the market structure. The carbonmarket is fragmented. On the supply side, there isa considerable competition among CERs, ERUs,sink credits, and inexpensive AAUs from Russiaand the Ukraine. On the demand side, U.S., par-ticipation in the Kyoto process, as well as a furtherincrease of GHG emissions in Europe over theirAAUs (Spain, Netherlands, etc.), would signifi-cantly increase the CER market (Oberheitmann2003).
In very limited cases, the GHG abatementcost in developing countries may be the marketprice. Thus there are net benefits from the CDMproject. The share of the benefits mainly dependson negotiation power and the attitude of differ-ent project participants toward risk. In the nextsection we discuss the method for project-basedreduction calculations, including major compo-nents of project-based reduction costs, the majorparameters for the ICER calculation, the assess-ment of proposed calculation approaches andprocedures, and recommendations. The applica-tion of the method is illustrated in the case studiesin Chapter 3.
Major Components of Project-basedReduction Cost
For a CDM project, investors from Annex I coun-tries who claim the CERs as a return and the proj-ect’s hosting entity are the two main players. Theycooperate to produce domestic socioeconomicand environmental benefits, and at the same timeglobal environmental benefits in the form ofCERs from the project activity.
With the incremental cost for emissionreduction (ICER) method, the incremental costfor CER benefits can be calculated using formula(2-1), as illustrated in Figures 2.6 and 2.7.
C D M M E T H O D O L O G Y A N D C A S E S T U D I E S
C D M I N C H I N A30

in whichICERT represents the present value of the
total incremental cost of CER benefits for aCDM project over the project cycle (calculationperiod);
CcdmDCT represents the total discounted directcost of the CDM project activity, i.e.
where CcdmDCi is the annual direct cost of theCDM project activity in the ith year, using thediscount rate r,
Cbls DCT represents the total discounted directcost of the baseline scenario, i.e.
C DCTC DC
rbsl
bsl ii
i
N
=+( )=
∑1
2 31
( )-
C DCTC DC
rcdm
cdm ii
i
N
=+( )=
∑1
2 21
( )-
ICERT C DCT C DCT
CTRN
cdm bsl= −( )+ ( )2 1-
where CbslDCi is the annual direct cost in thebaseline scenario in the ith year.
CTRN represents the total discounted trans-action cost of the CDM project, which nor-mally would take place during the whole CDMproject cycle. Because the transaction costs areonly calculated in the biogas case study (#6),the CTRN term does not occur in formulas 2-5 to 2-8.
N is the calculation period. Determination ofN depends on the crediting period of projectactivity and the lifetime of the main infrastruc-ture or equipment components. From a practi-cal point of view, it can be the crediting period,or the lifetime of the main infrastructure orequipment components.
Major Parameters for ICERCalculation
Parameters related to direct costcomponents
The ICER for per unit of GHG emission reduc-tions accruing from the CDM project activitycan be derived as follows in a bottom-up man-ner (King 1995):
Defining ERi as the GHG emission reduc-tions1 produced by the CDM project activity inthe ith year, i.e.
define ICERi as the incremental cost for the unitof GHG emission reductions in the ith year, i.e.
thus, the present value of the total incrementalcost for CERs benefit for a CDM project couldbe represented as;
ICERT C DCT C DCTcdm bsl= −
ICERC DC C DC
ER
C DC C DC
EMBSL EMCDM
icdm i bsl i
i
cdm i bsl i
i i
=−( )
=−( )
−( ) ( )2 5-
ER EMBSL EMCDMi i= − , and (2-4)
I N S T I T U T I O N A L F R A M E W O R K A N D M E T H O D O L O G I C A L G U I D E L I N E S F O R C D M
C D M I N C H I N A 31
Domesticbenefits inbaseline
Directcost in
baseline Baselinescenario
Domesticbenefits
Directproduction
cost
CERbenefit
Transactioncost
CDMProject
F I G U R E 2 . 7 Output and Input of CDM Projects
F I G U R E 2 . 6 Output and Input in Baseline Scenario

If we define ICER as the average of ICERi overthe lifetime of the CDM project in the sense thatthe present value of the total incremental cost forCER benefit for a CDM project would keep (??)equivalent (formula 2-7),
thus we have
in which ER is the discounted total GHG emis-sion reduction between the baseline scenario andCDM project over the lifetime of the project. Itis relevant to note that if the crediting period isshorter than the lifetime of the project, the quan-tity of ERi can be zero for i larger than the lengthof the crediting period. The incremental costs areonly calculated throughout the crediting periodand affect the cost-effectiveness of the CDMproject for the project investor within this period.For the same purpose, the project owner mayannualize the incremental costs over the wholelife cycle beyond 2012, as his planning horizonis much longer.
The concept of ICER is the uniform basis forall six case studies, while the specific calculationmethods may slightly differ according to theirspecial circumstances. Table 2.8 gives an overviewof the yearly incremental costs for emission reduc-tion (ICER) and net present value of the totalICER (ICERT) calculation in the six case studies.
ICERTICER ER
r
ICERER
r
ICER ER
ii
i
N
ii
i
N
= ×
+( )
= ×+( )
= ×
=
=
∑
∑
1
1
2 8
1
1
( )-
ICERC DCT C DCT
ERcdm bsl=
−( )( )2 7-
ICERTC DC C DC
r
ICER ER
r
cdm i bsl ii
i
N
i ii
i
N
=−( )
+( )
= ×
+( )
=
=
∑
∑
1
12 6
1
1
( )-
Five of six case studies use the general concept.The tri-generation case study, however, has toapply an arithmetical mean concept as there is adifferent baseline for power generation and for theheat generation in winter and cooling generationin summer.
The ICER calculation method is based on thenormal project financial analysis method ratherthan the economic analysis of a project. In thiscontext, some external benefits and costs, such associal and local environmental costs and benefitswhich may be available qualitatively only, arenot estimated in the calculation of project-basedincremental emission reduction cost, while thesebenefits could be taken into account in the eco-nomic analysis of a project. This is also becausethat the cost associated with emission reductionsis calculated from the project proponents’ per-spective, while in China, most of the externalbenefits achieved by a project activity could notbe internalized, due to the lack of necessary mar-ket or administrative measures.
ICER can provide some important informa-tion related to the cost effectiveness of a CDMproject to both project developers and policy-makers, although the ICER is not always themost important consideration for CDM projectdevelopers. The parameters related to the directcost components can be presented as following:
CcdmDCT, the total discounted direct cost ofthe CDM project activity can be broken downinto initial capital investment cost and operationalcost. The operational cost can be further brokendown into sub-components, including energycost, maintenance cost, labor cost, and other oper-ational cost, as defined in the formula (2-9)
in which
CcdmINVi represents annually averaged capitalinvestment cost of the CDM project in the ith
year;
C DCT
C INV C ENEC MNT C LAB
C OTR
rcdm
cdm i cdm i
cdm i cdm i
cdm ii
i
N
=
++ +
+
+( )=∑
12 9
1
( )-
C D M M E T H O D O L O G Y A N D C A S E S T U D I E S
C D M I N C H I N A32

I N S T I T U T I O N A L F R A M E W O R K A N D M E T H O D O L O G I C A L G U I D E L I N E S F O R C D M
C D M I N C H I N A 33
TA
BL
E 2
.8C
alcu
lati
on
of
ICER
an
d IC
ERT
in t
he
Cas
e St
ud
ies
No
.C
ase
Stu
dy
ICER
ICER
TA
pp
roac
h
1 2 3 4 5 6
Qin
bei
Sup
ercr
itic
alC
oal
-Fir
edPo
wer
Pla
nt
Bei
jing
Elec
tro
nic
Cit
y Tr
i-g
ener
atio
n1
Bei
jing
No
.3
Ther
mal
Po
wer
Pla
nt
Shan
gh
aiW
ind
Far
m
Taic
ang
Xin
Ta
i Alc
oh
ol
Co
. Ltd
.2
Zhu
hai
Lan
dfi
ll G
as R
eco
very
ICER
CD
CT
CD
CT
ERcd
mb
sl=
−(
)IC
ERT
CD
CC
DC
r
ICER
ER
r
cdm
ib
sli
iiN
ii
iiN
=−
()
+(
)=
×
+(
)=
=∑
∑1
11
1
ICER
CD
CT
CD
CT
ERcd
mj
bsl
j
j
=−
()
=∑ 1
2
ICER
TC
DC
CD
C
r
ICER
ER
r
cdm
ij
bsl
ij
ii
ij
ij
ijN
ij
=−
()
+(
)=
×
+(
)=
==
=∑
∑∑
∑,
,,
,
11
12
112
1
2
ICER
CD
CT
CD
CT
ERcd
mb
st=
−(
)IC
ERT
CD
CC
DC
r
ICER
ER
r
cdm
ib
sli
iiN
ii
iiN
=−
()
+(
)=
×
+(
)=
=∑
∑1
11
1
ICER
CD
CT
CD
CT
ERcd
mb
sl=
−(
)IC
ERT
CD
CC
DC
r
ICER
ER
r
cdm
ib
sli
iiN
ii
iiN
=−
()
+(
)=
×
+(
)=
=∑
∑1
11
1
ICER
CD
CT
CD
CT
ERcd
mb
sl=
−(
)IC
ERT
CD
CC
DC
r
ICER
ER
r
cdm
ib
sli
iiN
ii
iiN
=−
()
+(
)=
×
+(
)=
=∑
∑1
11
1
ICER
CD
CT
CD
CT
ERcd
mb
sl=
−(
)IC
ERT
CD
CC
DC
r
ICER
ER
r
cdm
ib
sli
iiN
ii
iiN
=−
()
+(
)=
×
+(
)=
=∑
∑1
11
1
Gen
eral
ap
pro
ach
Ari
thm
etri
cal m
ean
app
roac
h
Gen
eral
ap
pro
ach
Gen
eral
ap
pro
ach
Gen
eral
ap
pro
ach
Gen
eral
ap
pro
ach
1)G
ener
atio
n o
f h
eat
in w
inte
r an
d c
oo
l in
su
mm
er.
2)In
th
e b
iog
as c
ase
stu
dy,
th
e tr
ansa
ctio
n c
ost
s b
een
tak
en in
to a
cco
un
t. F
or
the
calc
ula
tio
n o
f th
e IC
ER a
nd
ICER
T, t
he
form
ula
has
to
be
exte
nd
ed b
y th
e re
spec
tive
CTR
N t
erm
.

CcdmENEi represents energy cost of the CDMproject in the ith year;
CcdmOTRi represents other operational cost inCDM project in the ith year;
CcdmMNTi represents maintenance cost of theCDM project in the ith year;
CcdmLABi represents labor cost of the CDMproject in the ith year; and
r represents real discounted rate;i represents the ith year in the life time of the
CDM project.
Similarly the total discounted direct cost of thebaseline scenario can be broken down as definedin formula (2-10)
in which the sub-components are defined as thesame as in the formula (2-3) but with footnotesfor the baseline scenario.
Formula (2-9) and (2-10) show that theenergy cost will affect the direct cost for a CDMproject and the baseline scenario. If the energyprice is subsidized, the application of the dis-torted energy price in the calculation will affectthe result of project-based incremental emissionreduction costs. Generally speaking, if the fuelprice in the baseline scenario is subsidized, theincremental reduction cost will be overestimated.On the other hand, if the fuel price in the CDMproject is subsidized, the project reduction costwill be underestimated. So the sensitivity analy-sis would be very useful to assess the impact ofthe key price parameters on the competitivenessof a CDM project.
Parameters related to transaction cost components
Several NSS country studies and UNFCCCreports on AIJ and CDM have identified trans-action costs as one of the major obstacles toaccess the potential benefits from a CDM proj-
C DCT
C INV C ENEC MNT C LAB
C OTR
rbsl
bsl i bsl i
bsl i bsl i
bsl ii
i
N
=
+ ++
+
+( )=∑
12 10
1
( )-
ect. The process to develop simplified modalitiesand procedures for a small-scale CDM projectalso supports the above argument.
The transaction cost is a commonly used eco-nomic term to measure the costs incurred duringthe business trade process. It may involve differ-ent components in different business contexts.From a practical point of view, in a CDM proj-ect the transaction cost could include those costsincurred during the whole CDM project cyclefor the purpose of the CERs transaction, such asproject search cost (CSER), project documentsdevelopment cost (CPDD), negotiation cost(CNEG), validation cost (CVAL), registrationcost (CREG), monitoring cost (CMON), verifi-cation and certification cost (CVER), and shareof proceeds for adaptation (SOPA).2 Therefore,the total transaction cost for a proposed CDMproject can be calculated as in formula (2-11)
“Anaerobic Treatment of Effluent and PowerGeneration in Taicang Xin Tai Alcohol Co.Ltd.” project was taken as an example to esti-mate the transaction cost of a CDM projectactivity.3 The estimation of the transaction costwas mainly based on results of a questionnairesurvey among the technical experts involved inthis project. The results are listed in Table 2.9.
The result shows that the transaction cost foreven this small- to medium-sized project is stillrather high, at least currently—about $0.80/tCO2e at current value. However, it is expectedthat the transaction cost will decrease with moreexperience in the future, and will be reduced toabout $0.60/t-CO2 e for this kind of project.
The transaction cost associated with a CDMproject activity depends on various factors, in-cluding the scale of the project (Michaelowa andothers 2003), the specific technology applied,and whether suitable approved methodologiesare already available. Considering that this case
CTRN CSER CPDD CNEG
CVAL CREG CMON
CVER SOPA
= + +
+ + +
+ + ( )2 11-
C D M M E T H O D O L O G Y A N D C A S E S T U D I E S
C D M I N C H I N A34

is a rather small CDM project, the transactioncost estimate may not be suitable for projects ofother types or scales. It is clear that transactioncost will be one of the significant barriers forCDM project development, and that the trans-action cost of CDM projects will decrease withtime, experience, and the availability of moreapproved methodologies. It should be noted thatthe transaction cost considered in this compo-nent is not exhaustive, and some elements asso-ciated with the transaction cost (such as hostcountry approval cost) are not discussed here.
Assessment of Proposed CalculationApproaches and Procedures
The calculation method for the incremental costof the emission reduction of a CDM project canbe traced back to the incremental cost approachdeveloped by the Global Environment Facility(GEF).
To design the financial mechanism, GEFfinanced a program called PRINCE, or the Pro-gram for Measuring Incremental Cost for theEnvironment. The incremental cost approach isapplied in cost-benefit analysis and project eco-nomic analysis when environmental benefits are
achieved. Based on the PRINCE work, GEFdeveloped an incremental cost approach forGHG emission reductions (Mintzer 1993).
The incremental cost approach for GHGreductions has been applied to GEF-funded pro-jects since 1993. In a working paper, King (1995)pointed out that “international financing for onlythe net incremental cost of a project with bothdomestic and global benefits is the cost allocationrule that requires the lease amount of inter-national finance.”
Participants in AIJ projects also applied theincremental cost approach for GHG emissionreductions during the AIJ Pilot Phase (AIJPP).
There are various GHG emission reductioncost calculation methods, with different pros andcons, but the incremental cost method (ICER) is straightforward, practical, financially work-able, and widely used by the project developers and investors in the CDM project evaluation.Whichever method is used, revenue from CERstrading is mainly determined by carbon marketprices.
The procedure for calculation of the ICERcould be summarized as following:
• Calculate the total direct production cost ofthe proposed CDM project
I N S T I T U T I O N A L F R A M E W O R K A N D M E T H O D O L O G I C A L G U I D E L I N E S F O R C D M
C D M I N C H I N A 35
T A B L E 2 . 9 Estimation of Transaction Cost of CDM Project Activity (US$)
Present Cost expected cost levelItem level (US $) in 2008–2012 (US$)
Once Project search cost 35,000 15,000Project documents
development cost 33,000 20,000Negotiation cost 30,000 10,000Validation cost 22,000 15,000Registration cost 10,000 10,000
Annual Monitoring cost 50,00 5,000Verification and
certification cost 8,000 8,000Share of proceeds
for adaptation 2,000* 2,000Discounted total transaction cost 225,203 165,203
Source: GCCI estimates. This is estimated with the assumption of a price of $3.6/t-CO2 e.

• Determine the reasonable baseline scenario,keeping in mind that the baseline scenarioshould provide the same production/servicelevel as the CDM project activities
• Calculate the total direct production cost inthe baseline case
• Calculate the GHG emission reductions overthe lifetime of the project
• Calculate the incremental cost associated withthe production of emission reductions for theproposed CDM project over its lifetime
• Calculate the averaged incremental cost perunit of the emission reductions for the pro-posed CDM project
• Estimate the transaction cost for the proposedCDM project.
Recommendations
Using an appropriate method to calculate the costof the emission reductions accrued from CDMproject activities is critical to measure the costeffectiveness of CER trade. We recommend usingthe ICER method. The ICER method combinedwith other financial indicators—such as NPV,IRR, payback period, and CERs price—couldprovide key messages on the financial perfor-mance of the CDM project and its attractivenessto CDM investors. In particular, these financialindicators could show the competitiveness of theproposed CDM project compared with the base-line scenario, which is helpful to demonstrate theadditionality of the CDM project activity.
CDM project activities may be parts of a largeproject, with the other parts having nothing todo with GHG emission reductions. In this case,the project boundary should be well defined toexclude those non-CDM parts of the large proj-ect, and the domestic cost and benefits of thoseparts are also excluded from ICER calculation.
Although there are many uncertainties in theestimation of the transaction cost, the analysisand the current exercise show that there aremany factors existing in the CDM project cyclethat may result in high transaction costs, con-
sidering the complexity of the CDM regime. Werecommended that the CDM methodologiesshould be simplified and standardized in orderto reduce the transaction cost.
The marginal abatement cost (MAC) approachis also used in Chapter 4 to analyze the incre-mental cost of GHG emission reductions. TheMAC approach is at a macro level, whereas theICER approach is at the project level, and theresults gained from these two approaches are dif-ferent and not comparable. It is worthwhile tounderstand the differences between them. Theyuse (a) data from different sources and levels;and (b) different cost components for MAC andICER, thus leading to the different estimates. Inaddition, they are used for different purposesand have different policy implications.
INSTITUTIONAL ARRANGEMENTSFOR FACILITATING CDM IN CHINA
In order to engage in the CDM, certain institu-tional prerequisites should be put in place, mostnotably a designated national authority (DNA)for the approval of CDM project activities. Inaddition, the policies, procedures, and regula-tions under which the DNA will operate shouldbe specified.
The CDM market is currently a “buyer’smarket” and is expected to remain so for theforeseeable future (see Part II for further infor-mation). If it were to seize the opportunity toexperiment with the CDM and ultimately playa significant role in this emerging market, Chinacould actively promote the CDM by:
• Ensuring an attractive climate for CER pur-chase agreements or CDM investment
• Keeping transaction costs as low as possible• Facilitating the development of viable CDM
projects.
This, in turn, may require steps to improvecross-sectoral policy integration across min-istries; to adopt conditions (e.g., laws, incentives,standards, training) for the market uptake of
C D M M E T H O D O L O G Y A N D C A S E S T U D I E S
C D M I N C H I N A36

advanced technologies, in particular renewablepower generation; to provide clear operationalprocedures for project developers; and to buildcapacity among the range of societal groups thatare part of the CDM process (government,enterprises that emit greenhouse gases, localstakeholders, and financial services companies).
Institutional Prerequisites for the CDM
Countries that wish to engage in CDM projectsmust have ratified the Kyoto Protocol andappointed designated national authority for theCDM. As part of the required CDM validationprocess, the DNA of each country involved in theCDM project must provide the project partici-pants written approval of voluntary participation;in the case of host countries, this approval mustconfirm that the project activity assists the coun-try in achieving sustainable development. It is theprerogative of the host country to select an appro-priate DNA and to establish the necessary insti-tutional framework, procedures, and regulationsfor approval of CDM project activities. Consid-erable general guidance is available on the cri-teria, requirements, and process for designatingthe national authority (see, for example, IISD2002).
The Chinese Government approved the KyotoProtocol in August 2002. To facilitate CDM proj-ect activities in China, Chinese government agen-cies have already formulated Interim Measures forthe Management of CDM Project Development. It isexpected that these measures will be publishedduring the first half of 2004.5 According to thisproposal, various agencies will be involved in themanagement of CDM in China. In general, threelevels of responsibility are foreseen:
(1) National Coordination Committee forClimate Change (“the Committee”)
The NCCCC is a high-level, inter-agency Com-mittee, comprised of representatives of 15 gov-ernment agencies.4 This committee was founded
in 1990, reorganized in 1998, and is responsiblefor the formulation and coordination of China’simportant climate change-related policies andmeasures at the strategic level. Currently, thechairman of the National Development andReform Commission (NDRC) serves as the headof the committee, and the committee office islocated in NDRC. With respect to CDM, thecommittee is responsible for the review and coor-dination of important CDM policies and mea-sures, which, according to the Interim Measuresincludes:
• Review of China’s national policies, criteria,and standards on CDM project activity
• Approval of members of the National CDMProject Board (see below)
• Review of other issues, when necessary.
(2) National CDM Project Board (“the Board”)
Under the authority of the NCCCC, the NationalCDM Project Board has the following mainresponsibilities:
• Review CDM project proposals and approveCDM projects
• Report to the Coordination Committee onthe implementation of CDM project activitiesand make recommendations
• Put forward China’s rules and procedures forCDM project activities.
The NDRC and the Ministry of Science andTechnology (MOST) function as co-chairs andthe Ministry of Foreign Affairs (MFA) serves asvice-chair of the Board, which includes fouradditional government agencies.6
(3) Designated National Authority for the CDM (DNA)
According to the proposed measures, NDRCwill be designated as the Chinese nationalauthority for the CDM and thus provide officialwritten approval of CDM project activities on
I N S T I T U T I O N A L F R A M E W O R K A N D M E T H O D O L O G I C A L G U I D E L I N E S F O R C D M
C D M I N C H I N A 37

behalf of the Chinese Government. However,the NDRC can only issue DNA approval forprojects that have been recommended by theBoard. Acting as the DNA for the CDM inChina, the NDRC is responsible for:
• Acceptance of the CDM project proposal• preliminary screening of the CDM project
proposal• Approval of CDM project activities, together
with the MOST and MFA, according to thereview result of the Board
• Issuance of official DNA approval for CDMprojects on behalf of the Chinese Government
• Addressing other related foreign affairs.
Interim Procedures for CDM ProjectDevelopment in China
General requirements
According to the proposed interim measures,China has the following general requirements onCDM project activities to be hosted by China:
• They shall conform to China’s sustainabledevelopment strategy and policies, as well asthe general requirements of economic andsocial development programs.
• The implementation of CDM project activi-ties in China shall result in no new obligationsfor China other than those under the Con-vention and the Protocol.
• They must be approved by the Chinese Gov-ernment.
• Funds used in CDM project activities fromdeveloped country Parties shall be additionalto the current ODA and other financial oblig-ations under the Convention.
• They shall promote transfer of environmen-tally friendly technology.
• Implementation shall ensure transparent, effi-cient, and traceable responsibilities.
• Currently, the priority areas for CDM coopera-tion are energy efficiency improvement, renew-
able energy development, methane recovery, aswell as coal bed methane uses.
Application and Approval Procedures
The proposed interim measures stipulate thateach potential CDM project shall adhere to theregular Chinese project approval process, inaccordance with China’s related laws, rules, andregulations. In addition, potential CDM projectactivities proposed by a project developer aresubject to a domestic CDM project approvalcycle to obtain official Chinese DNA approval.The approval process includes the following:
a) The project developer submits applicationfor approval of proposed CDM projectactivity to NDRC, directly or throughrelated agencies and local governments,and also delivers CDM PDDs togetherwith other required materials.
b) NDRC will invite external experts to eval-uate the proposed project activities andsubmit a report to the Board for itsapproval.
c) The National CDM Project Board reviewsCDM project proposal and informsNDRC of eligible projects.
NDRC, MOST, and MFA approve jointly theproject activity, and then NDRC issues officialapproval of the activity and notifies the decision tothe project developer. The provisional rules stipu-late that the project developer must subsequentlysign a contract with a designated operational entity(OE) for independent validation of the proposedproject activity. Furthermore, when the projectdeveloper receives the registration notice from theCDM Executive Board, it shall notify the govern-ment for record-keeping purposes.
According to the proposed measures, the devel-oper of a CDM project to be hosted by China isobligated, inter alia, to:
C D M M E T H O D O L O G Y A N D C A S E S T U D I E S
C D M I N C H I N A38

a) Submit to the NDRC an application forCDM project cooperation, including aCDM PDD and other required materials
b) Report on the construction of the projectc) Implement the CDM project activity,
and compile and implement a green-house gas emissions monitoring plan and ensure the CERs generated from the project are real, measurable, andadditional
d) Provide the necessary material and mon-itoring records for record-keeping
e) Assist the NDRC and the Board ininvestigating related issues
f) Protect state secrets and confidentialbusiness information.
Implementation and monitoring of CDM project activity
The interim rules further stipulate that, duringimplementation and monitoring of the CDMproject activity: (a) NDRC supervises the imple-mentation of the CDM project activity toimprove implementation quality; (b) the CDMproject developer shall submit project imple-mentation and monitoring reports; and (c) the
NDRC records the CERs issued by the CDMExecutive Board to CDM project activities.
Endnotes1. As in the biogas case study, the average CO2 intensity of
the grid was used, for the calculation of the emissionreductions (ERi) the on-site emissions were denominatedwith EMELECbsl,,i
on, and the emissions in the CDMproject denominated with EMELECCcdm,i.
2. In this study we have not discussed the transfer cost andregistry cost related to CERs trading, which have beendiscussed by Michaelowa and others (2003) as well asMichaelowa and Jotzo (2003).
3. Since transaction cost is quite uncertain, we just esti-mate the transaction cost for this case as an example.
4. The agencies are: National Development and ReformCommission, Ministry of Commerce, Ministry of Sci-ence and Technology, China Meteorological Adminis-tration, Ministry of Foreign Affairs, State EnvironmentalProtection Administration, Ministry of Finance, Min-istry of Construction, Ministry of Communications,Ministry of Water Resources, Ministry of Agriculture,State Forestry Administration, Chinese Academy of Sci-ences, State Oceanic Administration, and Civil AviationAdministration of China.
5. The final interim measures that were adopted by theChinese Government and went into effect on 30 June2004 are contained in Annex 4.
6. State Environmental Protection Administration, ChinaMeteorological Administration, Ministry of Finance,and Ministry of Agriculture.
I N S T I T U T I O N A L F R A M E W O R K A N D M E T H O D O L O G I C A L G U I D E L I N E S F O R C D M
C D M I N C H I N A 39


C D M I N C H I N A 41
Chapter 3 discusses the six case studies that werepart of the China CDM study. Based on the re-sults of the case studies, we make recommenda-tions to facilitate the process of CDM projectdevelopment in China.
BASIC CONSIDERATIONS: THE POWER MARKET
Current Status of the Power Sector in China
China’s installed power capacity in the year 2001was 338.6 GW, with an annual power generationof 1483.8 TWh. During the 2000–01 period,capacity increased by 6.0 percent and power gen-eration by 8.4 percent. The Government ofChina is aiming for long-term sustainable devel-opment with an average annual growth rate of theeconomy slightly above 7 percent. It is estimatedthat the electricity demand growth rate in thefuture will vary between 5.5 percent and 6 percentannually. Until 2010 the growth rate could be ashigh as 6.5 percent to 7 percent per year.
China’s power sector has been growing rapidlyin recent years. The real growth rate of power gen-eration was 9 percent in 2001 and 11.7 percent in2002. This rate is much higher than the one esti-mated in the 10th Five-Year Plan. In the summerof 2003, about 20 provinces faced a shortage
of electricity, including Guangdong Province,Shanghai City, Jiangsu Province, and HenanProvince. Government managers of the powersector are revising the power development plan byadding an extra 30 GW capacity by 2005, whichwill result in a total generation capacity of 430 GW.
The construction of transmission lines of35 kV and higher voltage levels reached 7.8 ×10⁵ km in 2001, 7.67 percent greater than 2000.The corresponding transformer capacity rose to1.1 × 109 kVA, a 12.2 percent increase com-pared to the year 2000.
In 2001, 81 percent of China’s power wasgenerated in coal-fired power plants. The fuelgeneration mix in each of the areas with potentialCDM project activities is given in more detail inTable 3.1.
In these areas, coal is the dominant fuel in thepower sector. Moreover, there are only a fewapplications of advanced technologies such asclean coal, nuclear, super-critical coal-fired units,as well as high-voltage DC transmission. The ab-sence of new renewable power generation in thetable is due to its very small share within thepower generation mix.
The coal intensity and thermal efficiency ofcoal-fired power generation in these areas (and therespective loss rate for electricity transmission) areshown in Table 3.2. The difference between exist-
Findings from CDM Case Studies3
�

nationwide operating power generation compa-nies. The grid facilities for electricity transmissionand distribution are assigned to the State GridCorporation and China South Grid Corporation.
Unbundling of power generation from elec-tricity transmission and distribution has providedincentives for the power generation companies toinvest in conventional coal-fired power plants.This technology has competitive advantages suchas lower fuel costs, a shorter plant construc-tion period, availability of reliable domestictechnology, and standard management. The fivenational-level operating power generation com-panies have been competing against each otherand investing in coal-fired plants all over thecountry.
Early in 2003, the State Electricity Regula-tory Commission (SERC) was set up to shapeand oversee the new power market. SERC ischarged with:
• Issuing market rules• Submitting suggestions on price adjust-
ments to the respective governmental pric-ing departments
• Issuing and managing licenses for power busi-nesses and monitoring the compliance ofquality standards
• Resolving disputes between the participants inthe power market
C D M M E T H O D O L O G Y A N D C A S E S T U D I E S
C D M I N C H I N A42
ing thermal efficiency and advanced technol-ogy is measurable; for example, a 45 percentefficiency rate for state-of-the-art super-criticalthermal generation technology compared to35.1 percent in the Shanghai area. Transmis-sion losses are 2 to 3 percent higher than thosein developed countries.
Power Market Initiatives
China’s power sector is presently undergoing aninstitutional reform that was launched at the endof 2002. Power generation assets, which used tobe owned by the former State Power Corpora-tion, are now being separated and assigned to five
T A B L E 3 . 1 Shares of Installed Power Capacity and Power Generation in the Provinceswhere Potential CDM Project Activities are Located (2001)
Installed Capacity Annual Generation
Hydro Thermal Coal Gas Diesel Hydro Thermal Area (%) Total (%) (%) (%) (%) (%) (%)
North China 6.2 93.8 93.6 0.2 0.0 1.2 98.8Shanghai 0.0 100 95.1 4.9 0.0 0.0 100.0Jiangsu 0.2 99.8 99.5 0.3 0.0 0.1 99.9Henan 13.7 86.3 85.9 0.4 0.0 4.5 95.5Guangdong 23.0 77.0 53.2 8.4 15.4 14.9 85.1
Average 8.6 91.4 85.5 2.8 3.1 4.1 95.9
Data source: State Power Corporation, Statistics of the Power Sector 2001.
T A B L E 3 . 2 Efficiency of Thermal Power Generationand Power Transmission Losses
Coal Intensity Thermal Transmission Area (gce/kWhe) Efficiency (%) Loss Rate (%)
North China 384 32.0 6Shanghai 350 35.1 7Jiangsu 378 32.5 8Henan 410 30.0 7Guangdong 363 33.8 7
Average 377 33.0 7
Data source: State Power Corporation, Statistics of the Power Sector 2001.

• Monitoring the enforcement of social policyobligations.1
SERC also has the leading role for the imple-mentation of the overall power reform and hasjust completed an initial draft of regional marketrules. The Northeast Power Grid and the EastPower Grid are the first two pilot grids to estab-lish regional power markets. It is anticipatedthat—at the national level—separating powergeneration from the electricity grid will beachieved during the 10th Five-Year Plan (that is,by 2005). The set-up of regional power marketswill follow thereafter.
According to the market rules, power generat-ing companies will compete on the basis of meritorder in the power market. Government subsidiesare considered discriminatory interventions thatcould injure the fairness of the market. For renew-able energy, such as wind farms, the removal ofthe subsidy will place an additional financialburden on the investor; that is, higher powerproduction costs would lead to higher marginalabatement costs for a CDM project activity. Com-petition will also be a big challenge for natural-gas-fired power plants because of the present highprice level of natural gas.
Technological Upgrade Priorities
To meet increasing electricity demand, while atthe same time dealing with the challenges of pro-tecting the domestic and global environment,options exist to increase the share of less-pollutingpower generation technologies and improve theefficiency of power generation, transmission, dis-tribution, and consumption. The governmentplans to optimize the structure of thermal plantswith respect to unit mix, technology, and geo-graphic distribution and to support technologi-cal upgrades and rehabilitation.
The number of small coal-fired power unitswill be reduced. The current policy is aiming fora total reduction of 25 GW. Conventional smallthermal units are controlled strictly in order to
improve the share of large units with better char-acteristics. Active promotion of cogeneration andmulti-purpose generation will help to improvethe urban environment and energy efficiency.Additional power plants will be 300 MW andlarger units with high parameters, efficient, andquality performance. Power plants located closeto mines will be constructed in Shanxi, InnerMongolia, and other energy bases in northwestChina. These plants will transmit power to theeast and coastal provinces, optimize resource allo-cation in a broader domain, and facilitate na-tional wide interconnection. The governmentwill introduce super critical units as well as cleancoal generation projects, such as Circulating Flu-idized Bed Combustion (CFBC) and other tech-nologies. Introduction and digestion of externaladvanced technologies will speed up the pace ofdomestic industrialization of CFBC boilers anddesulphurization equipment.
Major Characteristics of the PowerSector Relevant for CDM
Based on present knowledge and the likely devel-opment of the power market, Table 3.3 providessome major findings and conclusions regardingpromising starting points for CDM project activ-ities. The case studies in this report help to vali-date these preliminary findings and conclusions.
SELECTION OF CASE STUDYPROJECTS
Approach
The case study projects were selected in foursteps:
1. Compilation of a long list with potentialCDM projects. The respective projects wereselected by expert recommendations from thepower and renewable sector, and are also basedon suggestions from governmental authoritiesand CDM experts. Furthermore, the results of
F I N D I N G S F R O M C D M C A S E S T U D I E S
C D M I N C H I N A 43

C D M M E T H O D O L O G Y A N D C A S E S T U D I E S
C D M I N C H I N A44
T A B L E 3 . 3 Major Characteristics of Power Sector Relevant to CDM
Findings Conclusions
Coal dominates as fuel for power generation.Gas as a fuel at present (2004) is about threetimes more costly.
Several different companies are in charge of theoperation of power generation plants as wellas electricity transmission and distribution.
Power grids are increasingly interconnectednationwide.
Removal of subsidies for renewable energy inthe power market will result in higher powergeneration costs for renewables and higherprices for the respective electricity.
Because of the ongoing new organization ofthe power market (unbundling, more compa-nies) and the not-yet established market rules,it is for the time being difficult to predict thebehavior of market stakeholders.
The reform of the power market may lead tomore competition between power generationcompanies. This means an increased focus andincentive for cost-effective power generation.At present, this favors coal-fired power plants(coal-fired power plant technology is proven,domestically available, and offers compara-tively low fuel costs).
According to the current policy, additionalpower plants will be based on 300 MW andlarger units. The number of existing smallcoal-fired power units will be reduced.
In recent years power demand has rapidlyincreased in response to the rapid growth ofthe economy. A strong increase in powerdemand is also expected in the coming years.
Gas as fuel for power generation is most likelynot to be baseline. However, there are somenatural gas fired power plants. Therefore,natural gas may be part of a baseline in spe-cific cases, e.g. because of dispatch arrange-ments or political incentives.
The new ownership arrangement within thepower sector may make the coordination offuture CDM project activities more challeng-ing. On the other hand, the entry of privatesector participants may also be an opportunityfor CDM.
Baseline definition and displaced power emis-sion factors have to take into account inter-provincial and maybe nationalinterconnections, not only local power gener-ation facilities.
In terms of CDM, this would lead to higherabatement costs for renewable energy, but itwould also mean a higher probability forrenewable energies to qualify for CDM, i.e. toqualify as additional.
For an interested international investor theseuncertainties may be perceived as risk andprovide a barrier until stable, more pre-dictable circumstances exist.
Also, the projection of ex-ante electricity emis-sion factors may be more difficult.
There is a high probability that coal-fired powerplants will be a baseline for the coming years.However, this may differ from province toprovince, depending mainly on the local avail-ability of coal as fuel. Therefore, the priorityfor potential CDM project activities might beswitching to cleaner fuels (natural gas) in con-ventional power generation or to new renew-able power generation technologies such assmall hydro, wind farms, biomass digestion etc.
Small- and medium-sized power generationunits, e.g. for renewable power plants, have agood probability not to be baseline and toqualify as additional.
New, additional power plant capacity will beneeded and built. Therefore, CDM approach48.a seems not to be the appropriate baselineapproach.

former research work, such as country studiesand ALGAS, have been taken into account.
2. Uniform description of the CDM projectactivities on the long list. Data and informa-tion were gathered to compare the projects.
3. Development of a set of criteria to assesspotential CDM projects.
4. Evaluation of potential CDM projects byapplying the selection criteria. The 25 projectswere rated by applying a set of criteria. Theprojects were evaluated and rated by 15 expe-rienced experts. The ranking of the projects isbased on professional judgment, the defined(weighted) criteria, and takes into accountChina’s specific conditions.
Long List for the Identification andSelection of CDM Case StudyProjects
The 25 possible CDM projects are listed by theirtechnology categories in Table 3.4. The threecategories are:
1. Power generation by gas-steam combined cycletechnology. Gas-steam combined cycle plantscan achieve efficiencies up to 60 percent, thehighest in the power sector today. In mostcases, natural gas will be used as fuel. If suchplants replace coal-fired power plants, CO2
emissions are further reduced due to the lowercarbon content of the fuel. The investment
F I N D I N G S F R O M C D M C A S E S T U D I E S
C D M I N C H I N A 45
T A B L E 3 . 4 List of 25 Potential CDM Project Activities by Technology Category
Range of Replication Abatement Potential
CDM Project Activity Costs1) until No. Project Project Site Characteristics [US$/CO2] 20122)
I. Gas-Steam Combined Cycle for Power Generation Projects1
2
3
4
5
The Second Phase ofGas-Steam CombinedCycle for power gen-eration project in Beijing Third ThermalPower Plant
Beijing “Electronic City”CHP tri-generationproject
Beijing Caoqiao Gas-Steam CombinedCycle for Power Generation
Lanzhou Gas-SteamCombined Cycle forPower Generationproject
Gas-Steam CombinedCycle for Power Gen-eration project ofTianjin First ThermalPower Plant
Yungan, Changxindian,Beijing
Jiuxianqiao, ChaoyangDistrict, Beijing
Caoqiao Village, FlowerTownship, Fentai Dis-trict, Beijing
Lanzhou of Gansuprovince
Tianjin 1st Coal GasPlant
2 × 300 MW Gas-SteamCC Generating, Units1 × 300 MW unit willbe built in the firstphase, with theannual gas consump-tion of 2.67 × 10⁸ Nm3
2 × 42 MW gas turbinegenerating units
2 × 200 MW Gas-SteamCC Generating units
Total installed capacitywill be 1.2 GW, 4 ×300 MW gas-steamcombined cycle gen-erating units will beinstalled
1 × 300 MW gas-steamcombined cycle gen-erating units
15
25
10–20
10–18
10–20
3
3
3
3
3
(continued )

C D M M E T H O D O L O G Y A N D C A S E S T U D I E S
C D M I N C H I N A46
6
7
8
9
II. Coal-Fired Super-Critical Power Generation Projects10
11
12
13
III. Renewable Energy Case Projects14
T A B L E 3 . 4 List of 25 Potential CDM Project Activities by Technology Category (Continued )
Range of Replication Abatement Potential
CDM Project Activity Costs1) until No. Project Project Site Characteristics [US$/CO2] 20122)
Xiaoshan Zhejiang Gas-Steam CombinedCycle for Power Generation
Zhengzhou-Henan Gas-Steam CombinedCycle for Power Generation
Qinzhou-Guangxi Gas-Steam CombinedCycle for Power Generation
Jingbian-Shaanxi Gas-Steam CombinedCycle for Power Generation
Second Phase of theHuaneng-QinbeiSuper-critical PowerPlant
Wangqu Super-CriticalCoal-fired Power Generation
Nanyang-HenanYahekou Super-Critical ThermalPower Plant
Suizhong-LiaoningSuper-Critical ThermalPower Plant
Beijing ChaoyangGarbage-incineratingPower Generation
Xiaoshan City, Zhejiang Province
Zhengzhou ThermalPower Plant
Qinzhou, GuangxiProvince
Jingbian, ShaanxiProvince
Jiyuan City, HenanProvince
Changzhi City, ShanxiProvince
Yahekou, NayangCounty, HenanProvince
Suizhong, LiaoningProvince
Gaoantun, ChaoyangDistrict, Beijing
2 × 300 MW gas-steamcombined cycle gen-erating units
2 × 300 MW gas-steamcombined cycle gen-erating units
1.4 GW gas-steam com-bined cycle generat-ing units
2 × 300 MW gas-steamcombined cycle gen-erating units
2 × 600 MW coal-firedsuper-critical powergenerating units willbe installed in twophases
2 × 600 MW super-critical generatingunits will be installedin the first-phase project
2 × 600 MW super-criti-cal coal-fired powergeneration
3.2 GW, 2 × 800 MWsuper-critical generat-ing units will beinstalled in the firstphase
Garbage disposalamounts to 1600 tons/day in the first-phaseproject, a 25 MW generating unit. Theannual electricity sup-ply to the grid is225 GWh.
10–20
10–20
10–20
10–20
8.5
12–20
8–18
12–20
25–40
3
3
3
3
4
4
4
4
4
(continued )
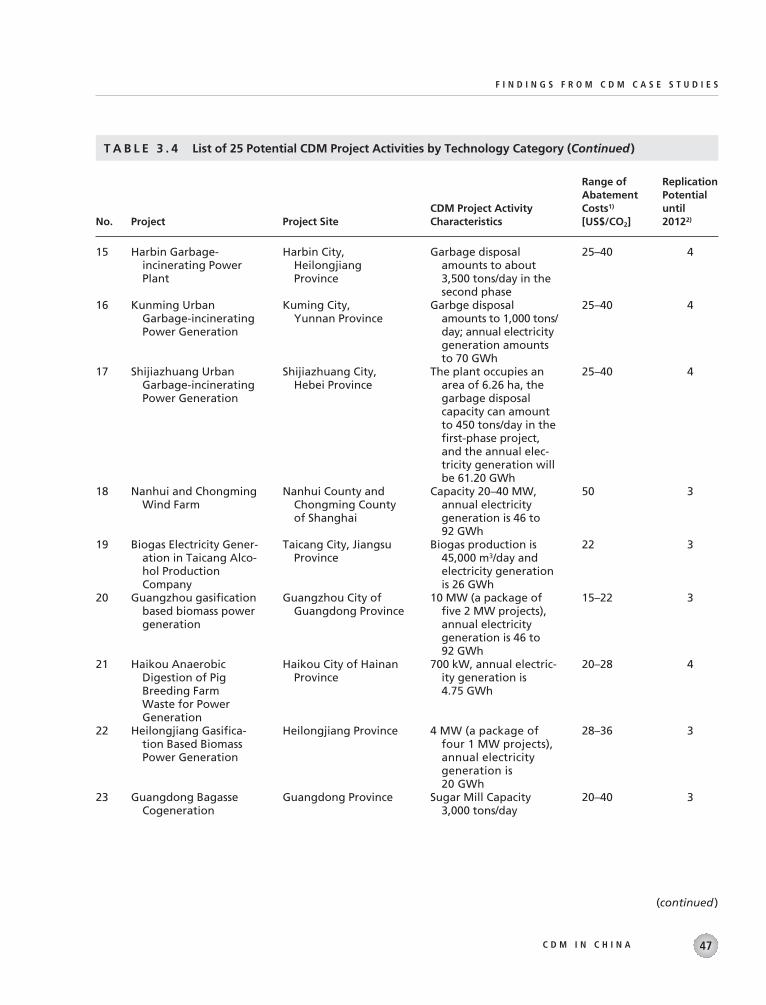
F I N D I N G S F R O M C D M C A S E S T U D I E S
C D M I N C H I N A 47
15
16
17
18
19
20
21
22
23
T A B L E 3 . 4 List of 25 Potential CDM Project Activities by Technology Category (Continued )
Range of Replication Abatement Potential
CDM Project Activity Costs1) until No. Project Project Site Characteristics [US$/CO2] 20122)
Harbin Garbage-incinerating PowerPlant
Kunming UrbanGarbage-incineratingPower Generation
Shijiazhuang UrbanGarbage-incineratingPower Generation
Nanhui and ChongmingWind Farm
Biogas Electricity Gener-ation in Taicang Alco-hol ProductionCompany
Guangzhou gasificationbased biomass powergeneration
Haikou AnaerobicDigestion of PigBreeding Farm Waste for Power Generation
Heilongjiang Gasifica-tion Based BiomassPower Generation
Guangdong BagasseCogeneration
Harbin City, HeilongjiangProvince
Kuming City, Yunnan Province
Shijiazhuang City,Hebei Province
Nanhui County andChongming Countyof Shanghai
Taicang City, JiangsuProvince
Guangzhou City ofGuangdong Province
Haikou City of HainanProvince
Heilongjiang Province
Guangdong Province
Garbage disposalamounts to about3,500 tons/day in thesecond phase
Garbge disposalamounts to 1,000 tons/day; annual electricitygeneration amountsto 70 GWh
The plant occupies anarea of 6.26 ha, thegarbage disposalcapacity can amountto 450 tons/day in thefirst-phase project,and the annual elec-tricity generation willbe 61.20 GWh
Capacity 20–40 MW,annual electricity generation is 46 to 92 GWh
Biogas production is45,000 m3/day andelectricity generationis 26 GWh
10 MW (a package offive 2 MW projects),annual electricity generation is 46 to 92 GWh
700 kW, annual electric-ity generation is 4.75 GWh
4 MW (a package offour 1 MW projects),annual electricitygeneration is 20 GWh
Sugar Mill Capacity3,000 tons/day
25–40
25–40
25–40
50
22
15–22
20–28
28–36
20–40
4
4
4
3
3
3
4
3
3
(continued )

cost of combined cycle plants is lower than thecost of coal-fired plants with the same capac-ity, which makes this technology economi-cally attractive.
2. Power generation by coal-fired super-criticaltechnology. Advanced super-critical hard-coal-fired steam power plants are still built and inoperation with net efficiencies of up to 46 per-cent depending on site-specific conditions,including environment protection measures.Further improvement potential is expectedby applying ultra super-critical live steamparameters (over 30 MPa and 700°C, doublereheating). As hard-coal is (and will be) themain primary energy carrier in China in thefuture, in particular for large power plants,increasing the efficiency of coal-fired powerplants has significant benefits in terms of envi-ronmental protection and CO2 emissionreductions.
3. Power generation by renewable energy technolo-gies. One main characteristic of renewableenergy power plants is that CO2 emissions andfuel costs in most cases are zero. Municipalsolid waste incineration plants use the energyin the waste to generate power and help save
land resources by reducing the need for land-fills. Centrally located municipal solid wasteincineration plants can be built as power gen-eration plants only, as well as cogenerationplants for district heating. Renewable energypower plants based on wind, photovoltaic,biomass, and landfill gas are of small capac-ity in comparison to fossil fuel-fired powerplants, and therefore are normally not centrallylocated. The power generation costs are mainlydetermined by investment costs, the lifetimeof the plants, and the operational hours. In thecase of photovoltaic and wind plants, the oper-ational hours are determined by the solar irra-diation and the wind situation.
Criteria for the Evaluation ofProjects on the Long List
For the compilation of the project pipeline aswell as for the selection of the case study projects,we applied a multi-factor methodology. The cri-teria focused on those projects that could a)qualify for CDM; b) get the support of nationalauthorities and stakeholders; c) interest interna-tional investors; and d) be good candidates for
C D M M E T H O D O L O G Y A N D C A S E S T U D I E S
C D M I N C H I N A48
24
25
1) Estimated range of abatement costs based on present state of knowledge and on the results of the case study projects consideringdifferent, site-specific conditions. Each specific, potential CDM project activity has to be looked at separately and the specific abatementcosts may differ from those stated above.2) 4 very high replication potential, 3 high replication potential, 2 medium replication potential, 1 low replication potential
T A B L E 3 . 4 List of 25 Potential CDM Project Activities by Technology Category (Continued )
Range of Replication Abatement Potential
CDM Project Activity Costs1) until No. Project Project Site Characteristics [US$/CO2] 20122)
Xingfeng of Guang-dong LandfillMethane Recovery forPower Generation
Landfill Gas Recoveryfor Power Generation
Guangdong Province
Zhuhai City, GuangdongProvince
20 × 0.97 MW Landfillmethane recovery forpower generation
2 × 0.97 MW Landfillmethane recovery for power generation
8–20
5
4
4

case studies. The respective criteria are given inTable 3.5.
Selection of Promising CDM Projectsfrom the Long List
Table 3.6 provides the result of the CDM proj-ect activity evaluation. The selection is basicallythe result of domestic expert judgment. Theconsulted experts are experienced and havetaken into account China’s specific conditionsfor their judgment.
As mentioned above, the ranked projects onthe long list are also the basis for the selection ofthe projects for the case studies. The first sixCDM projects are taken for case studies.
Major Findings
In the course of identifying promising CDMproject activities and their subsequent evalua-tion, there were several challenges.
• Provincial- and city-level authorities are not yetfully aware of CDM opportunities. Most energygeneration projects have to be approved bypublic authorities such as the SDRC. In theirdecision process on projects, authorities donot take into account the possibility of addi-tional revenues through the generation andselling of CERs. Therefore, projects thatbecome viable only with the inclusion of CERrevenues are not approved because publicauthorities are unaware of the additional rev-enue streams from CDM. This significantlyreduces the number of candidate CDM pro-jects in China.
• It is difficult to obtain essential data to describeand evaluate potential CDM projects. In orderto have a sound basis for the project descrip-tion, specific information and data are neededthat usually only the potential project host canprovide. For several reasons, this was difficult.First, since the Kyoto Protocol has not yet
entered into force, some of the stakeholdersprefer to wait and see if CDM will take off.Second, some of the potential project hostsprefer an earlier return on their up-frontinvestment. The time between the revenuesfrom CER and the initial investment is con-sidered too long. Third, the CDM projectcycle is regarded as very complex, requiringmuch effort and high transaction costs.
• Close cooperation with the project host is manda-tory. Contact and cooperation with possibleproject hosts is a prerequisite to get adequateinformation and data needed for the identifi-cation of possible CDM project activities or itsvalidation. In order to build up a reasonableand representative portfolio of candidate pro-jects, industry and technology providers haveto be informed of the opportunities for addi-tional revenue streams from the CDM.
• Knowledge of CDM within China is concen-trated in major cities on the east coast. CDMactivities, related know-how, and awarenessare concentrated in eastern cities. Moreover,CDM at present is mainly a topic withinnational-level institutions; there is little dis-cussion at the provincial and local levels. Thisreduces the potential for dissemination ofCDM project activities in the country.
• Using synergies among ongoing CDM activitieshas significant potential for capacity buildingand the transfer of knowledge. At present, manyCDM activities are taking place in Chinainvolving many institutions and foreign donors.There is great potential in coordinating andusing synergies among these activities to shareknow-how and lessons learned. Establishing aregulatory process would provide a muchstronger basis for CDM project developmentin China.
BRIEF DESCRIPTION OF THE SIXCASE STUDY PROJECTS
This section describes the main characteristics ofthe case study projects. For more detailed infor-
F I N D I N G S F R O M C D M C A S E S T U D I E S
C D M I N C H I N A 49

C D M I N C H I N A50
TABLE 3.5 Set of Criteria for the Evaluation of Promising CDM Projects
ID Criteria Notes
I. CDM Eligibility1
2
3
II. National Perspective4
5
6
7
8
III. International Investors’ Perspective9
10
11
IV. Project Developer’s Perspective12
13
1) Sustainable strategy according to the 10th Five-Year-Plan (2001-2005): i) Adhering to the basic state policy on fam-ily planning. ii) Protecting natural resources and using them properly. iii) Improving ecological conservation andstrengthening environmental protection.
GHG emission reduction
Investment barrier
Market penetration of thetechnology in China
Suitability to national sus-tainable developmentstrategy1
Significant GHG emissionreduction potential
Technology and know-howtransfer
Local environmental benefits
Local social benefits
Low marginal incrementalreduction costs
Creating a good image
Low project risk
Project progress status
Project developer’s interest
CDM case project activities should bring about real, measur-able, and long-term reductions in GHG emissions. The GHGemission reductions of the CDM case project activity mustbe justified as additional to what would occur in theabsence of the CDM project activity.
The financial performance of the CDM case project invest-ment is not competitive with the baseline, unless the addi-tional investment from CDM investors is involved with CERsas a return. The CERs are not funded by ODA or GEF funds.
The technology to be applied in the CDM project activity isinternationally proven technology but has not yet beencommercialized and is not prevalent in China.
The CDM project technology should be compatible and sup-portive of the priority strategy of sustainable developmentfor the power sector or/and other sectors.
The CDM project technology should have a large replicationand market potential in China, as well as a significant GHGemission mitigation potential.
The CDM project activity should be a demonstration to pro-mote technology transfer and its localization in China.
The CDM project activity should generate strong local envi-ronmental benefits, such as a reduction in emissions ofSO2, NOx, and TSP, and the conservation of naturalresources like land and water.
The CDM case project activities should contribute to socialacceptance and development through the creation of jobs,amelioration of working conditions, as well as safety,training, and capacity building.
One important factor to attract interest from the side of inter-national investors is competitive marginal incrementalabatement costs of GHG emission reductions and CER prices.
The CDM project activity should put international investor ina positive light. The engagement in CDM project activitiescan be used for communication in order to create a goodimage, especially in the present early phase of the emerg-ing CDM market.
In order to get a CDM deal, the risk perception of interestedinternational stakeholders is a key issue. The project shouldhave a high probability to actually generate the expectedamount of CERs. This risk includes aspects such as reliabilityof the technology, capability of management and opera-tion staff, and financial status of the project host.
Those projects that have normally received preliminaryapproval by the state governing body.
The preliminary information on technological and economicaspects of the projects should be available; developers wouldlike to provide this information for CDM assessment.

C D M I N C H I N A 51
T A B L E 3 . 6 The Ranked Projects and the Pipeline of CDM Project Activities
Ranking No. Project Name Project Description Score
1
23
4
5
6
7
8
9
10
11
12
13
14
1516
17
18
19
20
21
22
23
24
25
2
181
25
19
10
22
3
4
21
5
20
6
24
237
8
9
15
16
12
17
13
14
11
Beijing “Electronic City” CHP
Nanhui and Chongming Wind FarmSecond phase of Beijing Third
Thermal Power PlantLandfill Power Generation in Zhuhai
CityBiogas Power Generation in Taicang
Alcohol Production CompanySecond phase of Huaneng-Qinbei
Thermal Power PlantHeilongjiang biomass gasification
for power generationBeijing Caoqiao Gas-Steam Com-
bined Cycle for Power GenerationLanzhou Natural Gas-Fired Power
PlantHaikou anaerobic digestion of pig
breeding farm waste for powergeneration
Tianjin First Thermal Power Plant
Guangzhou biomass gasification forpower generation
Xiaoshan, Zhejiang Gas-Steam Com-bined Cycle for Power Generation
Guangdong Landfill MethaneRecovery for Power Generation
Guangdong Bagasse CogenerationZhengzhou-Henan Gas-Steam Com-
bined Cycle for Power GenerationQinzhou-Guangxi Gas-Steam Com-
bined Cycle for Power GenerationJingbian-Shaanxi Gas-Steam Com-
bined Cycle for Power GenerationSecond phase of Harbin Garbage-
incinerating Power GenerationKunming Urban Garbage-incinerating
Power Generation.Nanyang-Henan Yahekou Thermal
Power PlantShijiazhuang Urban Garbage-
incinerating Power Generation
Suizhong-Liaoning Thermal PowerPlant
Beijing Chaoyang Garbage-incinerating Power Generation
Wangqu Super-Critical Coal-firedPower Generation
2 × 42 MW Natural gas-steam com-bined cycle tri-generation
20 MW wind farm1 × 300 MW Natural gas-steam com-
bined cycle2 × 0.97 MW landfill methane recov-
ery for power generation4.1 MW biogas power generation
2 × 600 MW coal-fired super-criticalpower generating units
4 MW (4 × 1 MW) biomass gasifica-tion for power generation
2 × 200 MW gas-steam combinedcycle power generation units
4 × 300 MW gas-steam combinedcycle power generation units
700 kW; annual power generation is4.75 GWh
1 × 300 MW gas-steam combinedcycle generating units
10 MW (5 × 2 MW); annual electric-ity generation is 46–92 GWh
2 × 300 MW gas-steam combinedcycle generating units
20 × 0.97 MW landfill methanerecovery for power generation
Sugar Mill Capacity 3’000 tons/day2 × 300 MW gas-steam combined
cycle generating units1.4 GW gas-steam combined cycle
generating units2 × 300 MW gas-steam combined
cycle generating unitsWaste disposal quantity 3’500
tons/day for power generationWaste disposal quantity 3’000
tons/day for power generation.2 × 600 MW super-critical coal-fired
power generationWaste disposal quantity to 450 tons/
day (1. Phase); power generationwill be 61.20 GWh/a
2 × 800 MW super-critical generat-ing units
Waste disposal quantity 1300 tons/day (1. Phase), 25 MW generatingunit, Power generation 136 GWh/a.
2 × 600 MW super-critical generatingunits will be installed in the first-phase project
5.00
4.924.90
4.88
4.85
4.78
4.72
4.70
4.70
4.66
4.60
4.52
4.50
4.48
4.464.40
4.40
4.40
4.38
4.38
4.29
4.28
3.99
3.56
3.37
mation, see the case study reports in Annex 1 onthe CD-ROM. The six case study projects are:
• Case 1. Huaneng-Qinbei Supercritical Coal-Fired Power Project (Phase II). In case 1, thesuper-critical coal-fired generators are used toreplace common sub-critical generators. Emis-sion reductions are caused only by increasinggenerating efficiency. Therefore, the declin-ing fuel rate is the key measure to increaseCERs.
• Cases 2 and 3. Beijing Dianzicheng Gas-firedCombined Cycle Tri-generation Project; Gas-Steam Combined Cycle Power Project (Phase II)in Beijing No.3 Thermal Power Plant (BJ3TPP).In cases 2 and 3, coal-fired generators will bereplaced by gas-fired generators with low carbonfuel. These two CDM projects realize emissionreductions through fuel switching and efficiencyincreases.
• Case 4. Shanghai Wind Farm Project (Phase II).Case 4 uses wind as renewable energy for powergeneration to substitute coal to reduce CO2
emissions. For renewable energy generationCDM projects, the annual full load operatingtime is one of the most important impact fac-tors affecting emission reductions.
• Case 5. Anaerobic Treatment of Effluent andPower Generation in Taicang Xin Tai AlcoholCo. Ltd. Case 5 uses biogas as renewableenergy for power generation to substitutecoal to reduce CO2 emissions. For renewableenergy generation CDM projects, annualfull load operating time is one of the mostimportant impact factors affecting emissionreductions.
• Case 6. Landfill Gas Recovery Power Genera-tion Project in Zhuhai, Guangdong Province.Case 6 is a project that captures CH4 pro-duced in a landfill. The CH4 is used as fuelfor power generation. This power will re-place coal-fired electricity and thereforereduce CO2 emissions. In this project, devel-oping advanced CH4 recovery technologycan increase CERs.
Huaneng-Qinbei Super-Critical Coal-Fired Power Project (Phase II)
Project information. This project is a coal-firedsuper-critical steam power plant with an installedcapacity of 2×600 MW and a net efficiency of41.37 percent. The main steam pressure and tem-perature are 24.2 MPa and 566°C respectively.It is a copy of the Phase I plants, which are stillunder construction. The Phase I plants will beerected partly by imported technology with theassistant of foreign companies, whereas the PhaseII plants will be erected by domestic industrycompletely. Sulfur oxide as well as nitrogen oxidereduction facilities are not applied. Besides afurther increase of the live steam parameters toaround 30 MPa and 610°C (up to efficiencies ofabout 45 percent), the application of environ-mental protection measures provides the poten-tial for further improvements. For more infor-mation, see the case study report in Annex 1.
Baseline setting. For a fair comparison with thestate-of-the-art technology in China, we used asub-critical coal-fired power plant with a net effi-ciency of 35.4 percent that could currently beerected by domestic industry.
Crediting period. Due to the expected rate ofenhancement of the power plant capacity anduncertainty of the rate of improvement in tech-nology in China, we chose a crediting period of3 × 7 years. This provides flexibility to readjustthe annual amount of CO2 emission reductionsand the incremental cost of emission reductions.
Major parameters and results are shown inTable 3.7.
Monitoring plan and activity. In this projectthe monitoring process will be based on mea-surements. Therefore, the annual coal input andthe net electricity generation will be measuredand specified. Furthermore, uncertainties con-cerning the coal quantities and the accuracy ofthe measurements will be analyzed and evalu-ated. The monitoring process will be conductedby the technical staff of the plant.
Other useful notes. The possible stakehold-ers encompass several parties in relation to this
C D M M E T H O D O L O G Y A N D C A S E S T U D I E S
C D M I N C H I N A52

super-critical power plant, including governmentsat both central and local levels, coal vendors, andbanks, as well as local residents. In general, theyhave responded positively to the construction ofthis interesting project, but local residents prefer tokeep the land for current use rather than convert-ing it into other nonagricultural purposes. Thiscould create potential barriers to the implementa-tion of the project. Fortunately, the proposedCDM case entails a smaller land occupation thanthe baseline project. This project also features lowtechnical and financial risks if the technologicallocalization progresses rapidly and is successful.
Beijing Dianzicheng Gas-SteamCombined Cycle Tri-GenerationProject
Project information. This project involves a gas-steam combined cycle for tri-generation of heat,cooling, and electricity to displace 98 conven-tional coal-fired boilers in Beijing. It is supposedto greatly enhance energy efficiency and improvethe capital’s environmental quality. With Beijing’srapid socioeconomic development, energy de-mand for residential heating in winter, coolingin summer, and industrial use will continue toincrease over the coming decade. The commis-sioning of this project could help meet both thecurrent thermal load and future demand in 2005for the extended heating zone in a more envi-ronmentally sound way.
Baseline setting. The baseline consists of twoparts: (1) the North China Power Grid for ther-mal electricity generation over the creditingperiod between 2006 and 2015; and (2) a mix ofexisting coal-fired heating boilers (347 GWhth/year) for current heat supplies, and four sets of52.5MW gas-fired boilers (528 GWhth/year) fornewly increased loads.
Crediting period. Coal-fired boilers and cogen-eration plants for heating service will eventuallycease to exist with more stringent enforcement ofurban environmental standards in Beijing. Naturalgas-based heat supplies are expected to increase
F I N D I N G S F R O M C D M C A S E S T U D I E S
C D M I N C H I N A 53
T A B L E 3 . 7 Major Parameters for Huaneng SC
Baseline CDM Huaneng-SC Unit Project Project
Technical DataInstalled net-capacity MW 1136 1136Full load operation time h/year 5500 5500Electricity generation GWh/year 6250 6250Fuel consumption GWhf/year 17649 15107Net efficiency % 35.4 41.37
Economic DataCapital Investment Mill.Yuan 5460.72 6331.01Specific Investment Yuan/kW 4805 5571Fuel costs Yuan/kWhf 0.018 0.018Discount rate % p.a. 8 8Crediting period years 3×7Lifetime years 25 25Depreciation time years 15 15O&M costs Yuan/kWe p.a. 283.26 247.81
Environmental DataCoal-CO2 emission factor—measure in kWhf g CO2/kWhf 345 345
equivalent—measure in kWhe g CO2/kWhe 973 833
equivalentOther GHGs as CO2- g CO2/kWhf — —
equivalentsCO2 emission reductions kg CO2/kWhe — 0.140
per kWh of electricity generation
CO2-emission reductions Mt-CO2 — 12.264over a 3 × 7-year crediting period
CO2 emission reductions Mt-CO2/a — 0.876per year
Incremental cost per Yuan/kWhe — 0.010kWh of electricity generation
CO2 emission reduction Yuan/t CO2 — 70.04costs US$/t CO2 — 8.47
Year (for technical, economic data): 2000
Notes (these notes apply to all six comparative tables):1/:kWhf: thermal value of fossil fuels measured in kWh equivalent.kWhe: unit of electricity generation.kWhth: unit of heat generation measured in kWh equivalent.2/:fuel cost is measured per unit of its thermal value.3/:emission factor of fossil fuels is measured per unit of its thermal value.4/: operational cost includes the labor cost.5/: default exchange rate = 8.27 RMB/US$.6/:if 3×7 years of crediting period is applied, it refers to the first 14 years.

and displace these plants, so a fixed 10-year cred-iting period was chosen for the project.
Major parameters and results are shown inTable 3.8.
Monitoring plan and activity. The followingdata and information should be recorded to ver-ify the GHG emission reductions (Table 3.9).
For part of the baseline reference, we gatheredsome key information related to the North ChinaPower Grid, including the CO2 emission per unitpower generated over the crediting period (2006–2015). In the case study, specific CO2 emissionsare extrapolated (based on the coal consumptiontrend) to be 999.39 g-CO2/kWh. This numbercan be checked against the actual data logged inthe monitoring process.
For the heating baseline of the original coal-fired small boilers, average CO2 emissions perunit of heat supply over the crediting period of2006 to 2015 should be well monitored.
Other useful notes. The possible stakeholdersinvolved in this CDM project include the StateDeveloping and Planning Commission, PRC;Beijing Municipal Commission of DevelopmentPlanning, PRC; CDM project investors; ThePower Design Institute of North China; TheNorth China Power Grid Company; the BeijingNatural Gas Company; and commercial banks.
The stakeholders all support this proposedproject, since each of them can benefit from theCDM project. The only perceived risk is theprohibitively high price of natural gas, which is
C D M M E T H O D O L O G Y A N D C A S E S T U D I E S
C D M I N C H I N A54
T A B L E 3 . 8 Major Parameters for GSCC TriGen
Baseline CDM GSCC-TriGen Unit Project Project
Technical DataInstalled net-capacity MW 128 128/a
Full load operation time h/year 4281 4281Power generation: GWh/year
Electricity 548 548Heat 875 875Total 1423 1423
Fuel consumption: GWhf/year 1883Coal-fired boilers 694Natural gas boilers 551Coal for power grid 1566Total 2811
Net efficiency: % 67Electricity generation 33.7Heat supply 70Total 56
Economic DataCapital Investment mill.Yuan 734.72
Electricity 675Heat 114Total 789
Specific Investment Yuan/kW 5104 5754/a
Fuel costs Yuan/kWhf 0.038 0.143Discount rate % p.a. 8 8Crediting period years — 10Lifetime years 25 25Depreciation time years 15 15O&M costs Yuan/kWe p.a. 333 1258
Environmental DataFuel-CO2 emission factor g-CO2/kWhf 349 201Other GHGs as CO2 g-CO2/kWhf — —
equivalentsCO2 emission reductions kg-CO2/kWhe — 0.686
per kWh kg-CO2/kWhth 0.183CO2 emission reductions Mt-CO2 — 5.3585
over a 10-year crediting period
CO2 emission reductions Mt-CO2/a — 0.53585per year
Incremental cost per Yuan/kWh — 0.2017kWh of electricity and heat generation
CO2 emission reduction Yuan/t-CO2 — 206.29costs $/t-CO2 — 24.94
Year (for technical, economic data): — 2000
Note:a/ The capacity is 133 MW, the self service rate is 4 percentb/ The specific investment costs are 5524 RMB/kWe, the self service rate is 4 percent
T A B L E 3 . 9 Data and Information toVerify GHG Emission Reductions
Items Unit
Net electricity generation to MWh/yrNorth China power grid
Net heat supply to heat-users TJ/yrTotal natural gas consumption Mm3/yrCarbon content of natural gas %Caloric value of natural gas MJ/m3

now being negotiated with relevant governmentagencies for a better solution.
BJ3TPP Gas-Steam Combined Cycle (Phase II)
Project information. With the current pace ofeconomic growth, load demand and the peak-valley gap keep increasing in part of the Beijing-Tianjin-Tangshan power grid. For example, be-tween 1992 and 1997, the peak load increased by8 percent annually, while the peak-valley gapwidened by 10 percent per year. It is expected thatthe lowest load rate will be 55 percent in 2005. Soit is necessary and important to install some newpeak-load generating units to improve the per-formance of the local power grid and help boostthe capital’s economic growth and environmen-tal preservation. This new BJ3TPP project is a300 MW class gas/steam turbine combinedcycle plant to be commissioned in the nearfuture.
Baseline setting. The planned BJ3TPP gas-steam combined cycle project will replace a coal-fired thermal power plant that would haveotherwise been built, so the most likely baselinewould be an advanced 300MW coal-fired tech-nology plant. For a more in-depth analysis ofpossible alternative situations, four baseline sce-narios were developed for further discussion.The most reasonable and realistic scenario waschosen.
Crediting period. It is reasonably believed thatgas-fired power plants may still remain anadvanced option beyond the current baselineranges and could produce additional environ-mental benefits. Nevertheless, there are manyuncertainties regarding natural gas use for elec-tricity generation in the near future, includingsupply sources, pipeline access, gas pricing, com-petition from alternative fossil fuels, and envi-ronmental legislation and enforcement. A 3 ×7-year crediting period was chosen in order tohave the possibility for adjustment.
Major parameters and results are shown inTable 3.10.
Monitoring plan and activity. This project needsto be monitored to verify the actual CO2 emissionsin the implementing process. The following datarelated to the baseline project is based on the tech-nical specifications, while the data about therunning CDM project should be recorded andchecked during the operation period. As shown inTables 3.11 and 3.12, the following data can befound from the domestic standard technical spec-
F I N D I N G S F R O M C D M C A S E S T U D I E S
C D M I N C H I N A 55
T A B L E 3 . 1 0 Major Parameters for BJ3TPP-GSCC
Baseline CDM BJ3TPP-GSCC Unit Project Project
Technical DataInstalled net-capacity MW 404.3 404.3Full load operation time h/year 3500 3500Electricity generation GWh/year 1413.6 1413.6Fuel consumption GWhf/year 4038.8 2425.42Net efficiency % 35 57
Economic DataCapital Investment mill.Yuan 1,454.40 1,600.75Specific Investment Yuan/kW 4,848 4,106Fuel costs Yuan/kWhf 0.03563 0.116–0.143Discount rate % p.a. 8 8Crediting period years — 3 × 7Lifetime years 25 25Depreciation time years 15 15O&M costs Yuan/kWe p.a. 141.22 131.74
Environmental DataFuel-CO2 emission factor g-CO2/kWhf 326 198.66Other GHGs as CO2- g-CO2/kWhf — —equivalentsCO2 emission reductions kg CO2/kWhe — 0.460per kWh of electricity generationCO2 emission reductions Mt-CO2 — 9.1over a 3 × 7-year crediting periodCO2 emission reductions Mt-CO2/a — 0.65per yearIncremental cost per Yuan/kWhe — 0.086kWh of electricity generationCO2 emission reduction Yuan/t CO2 — 124.08
costs $/t CO2 — 15.00
Year (for technical, economic data): 2000

ifications for a typical 300MW thermal powerplant. These data have to be checked against thetechnical specifications.
With the availability of those critical datalisted in the table, total annual CO2 emissionscan be rigorously calculated.
Other useful notes. The stakeholders in thisproject include the State Planning and Develop-ment Commission (SDPC); Beijing MunicipalPlanning and Development Commission (BJM-PDC); State Environmental Protection Agency(SEPA); Beijing Municipal Environmental Pro-tection Bureau (BJMEPB); Beijing MunicipalWater Resource Administration (BJMWRA);Beijing No. 3 Thermal Power Plant; natural gascompanies; Bejijng-Jingfeng Thermal PowerCo., Ltd; international vendors for gas turbines;and domestic partners for cooperation.
All of these stakeholders support this gas-steam combined cycle case study and are willingto set this CDM project in motion. With thetransfer of advanced international gas turbinetechnology, the only risk for implementation isthe prohibitively high operational and mainte-nance costs and localization of the importedtechnologies. However, with the clean develop-ment mechanism up and running, the CER-based revenues are expected to help bring downthe O&M costs. With the progress of Sino-foreign technical cooperation, the technologiescould become more localized and well adoptedwith a good prospect of wider application inChina.
Shanghai Wind Farm Project (Phase II) (SH-Wind Farm)
Project information. Wind power is a promisingopportunity to switch to clean energy use.Shanghai is China’s largest city, but 64.5 percentof its energy mix comes from coal. Such anenergy structure causes serious local environ-mental stress, and undermines its status as aninternational city. Shanghai is favorably locatedon the Yangtse River, the biggest river of China,and is adjacent to the sea. It boasts huge poten-tial for wind power; theoretical capacity is ratedat 3000MW, with enough local space for gener-ator installation. The Shanghai municipal gov-ernment is pushing forward with technologicaldevelopment for new energy to sustain theregion’s rapid economic.
Baseline setting. To justify the selection of themost conservative and reasonable baseline forthis wind-farm CDM case project, six scenarioswere developed for an in-depth comparativeanalysis.
The final choice is scenario-6—“Coal Base-line on the Future Shanghai Power Grid” (48b).This is a mix of existing and increased coal-firedelectricity from the future Shanghai power gridto be replaced by the output from this wind-farm project.
C D M M E T H O D O L O G Y A N D C A S E S T U D I E S
C D M I N C H I N A56
T A B L E 3 . 1 1 Standard Technical Specifications for 300MWThermal Power Plant
Parameter Unit
Annual operational hour hour/yearAnnual electricity generation kWh/yearOperational efficiency %Calorific value of coal MJ/tAnnual coal consumption t
T A B L E 3 . 1 2 Data to be Recorded and Gathered for the CDM Project
Parameter Unit
Annual operation time hour/yearAnnual electricity generation kWh/yearAnnual natural gas consumption m3/yearOperational efficiency %Compositions of natural gas

Crediting period. A period of 3×7 years hasbeen chosen as the crediting period. It is assumedthat wind power will not be the baseline for powergeneration for a long time, and so will qualify asadditional and generate CERs.
Major parameters and results are shown inTable 3.13.
Monitoring plan and activity. The output perminute from each wind turbine will be logged atthe control center by the computer system,which can be automatically processed to providestatistical data on the annual generation of elec-tric power. The Shanghai Power Company willbe responsible for keeping the output record.
Other useful notes. Important stakeholdersinclude the national and municipal governments,Shanghai Wind Generation Co. Ltd., ShanghaiPower Co. Ltd., foreign investors, and localresidents.
Most stakeholders support the implementa-tion of this proposed CDM project. Some powercompanies prefer that wind farms be part of thegrid connection.
Anaerobic Treatment of Effluents forPower Generation (Taichang-Biogas)
Project information. Wastewater control and treat-ment have long been a difficult challenge across thecountry. Despite all the efforts made so far, there isstill a long way to go to achieve the established tar-gets, particularly for small private enterprises inChina. Taichang Xintai Alcohol Co. Ltd. is analcohol producer in Taicang City, JiangsuProvince. The plant is supposed to be the biggestwater polluter in the city. The wastewater dis-charged from the plant contributes approximately70 percent of the city’s total COD concentration.The main river is severely polluted by the untreatedeffluents, affecting both the quality of life of localpeople and the city’s investment environment.
With the introduction of the anaerobic fer-mentation technology, the treated wastewaterwould meet local environmental standards, and thebiogas can be used for power generation. So thisproject could help integrate environmental protec-
tion with waste resource utilization. The projectconsists basically of a biogas reactor, a gas enginepower generation system, and a power transmis-sion system connected with the local power grid.
Baseline setting. Seven baseline scenarios weredeveloped for an analysis of alternative situa-tions, as shown below:
• Scenario-1: GHG emissions based on existingor historical power production (48a)
• Scenario-2: Built margin single plant or singlespecific technology (48b)
F I N D I N G S F R O M C D M C A S E S T U D I E S
C D M I N C H I N A 57
T A B L E 3 . 1 3 Major Parameters for SH Wind Farm
Baseline CDM SH-WindFarm Unit Project Project
Technical DataInstalled net-capacity MW — 20Full load operation time h/year — 2000Electricity generation GWh/year — 40Fuel consumption GWhf/year — N/ANet efficiency % — N/A
Economic DataCapital Investment mill.Yuan — 182.57Specific Investment Yuan/kW — 9128Fuel costs Yuan/kWhf 0.0467 —Discount rate % p.a. — 8Crediting period years — 3 × 7Lifetime years — 25Depreciation time years — 15O&M costs Yuan/kWe p.a. — 193.24
Environmental DataCoal-CO2 emission factor g-CO2/kWhf 327 0Other GHGs as CO2 g-CO2/kWhf — —
equivalentsCO2 emission reductions kg-CO2/kWhel — 0.91
per kWh of electricity generation
CO2 emission reductions Mt-CO2 — 0.5082over a 3 × 7-year crediting period
CO2 emission reductions Mt-CO2/a — 0.0363per year
Incremental cost per Yuan/kWhel — 0.372kWh of electricity generation
CO2 emission reduction Yuan/t CO2 — 411.73costs $/t CO2 — 49.79
Year (for technical, economic data): 2000

• Scenario-3: Built margin mix of power plants(48b)
• Scenario-4: Operating margin (48b)• Scenario-5: Mixed coal operating margin (48b)• Scenario-6: East China grid coal operating
margin (48b)• Scenario-7: Best recent addition (48c)
Since the size of local coal-fired power plants israther small, with higher coal intensity than in theEast China Power Grid, and currently 83 per-
cent of the electricity on the Taicang Power Gridcomes from the East China Power Grid, scenario6 was considered more conservative and the mostappropriate choice.
Crediting period. The control measures andenvironmental standards on water pollution willapparently be intensified over the coming years inChina, and local governments will be more seri-ous about implementing the regulations. Thecrediting period is fixed for 10 years starting fromJanuary 2005, since the biogas installation is morelikely to become normal (like the Taicang Alco-hol Company) in 10 years.
Major parameters and results are shown inTable 3.14.
Monitoring plan and activity. For part of theCDM project, the project output will be moni-tored and recorded on-site at the control centerby a computer system, and can also be checkedagainst the electricity purchase invoice.
With regard to the baseline, the followingparameters will be needed for emission calcula-tions: (a) total electricity generated from the coal-fired power plants on the East China Power Grideach year, and (b) total coal consumption by thecoal-fired power plants on the East China PowerGrid each year.
Other useful notes. The most important stake-holders include the Jiangsu province govern-ment, Taicang city government, Taichang XinTai Alcohol Co. Ltd., Taicang Power Company,international investors, and local residents.
Most stakeholders support the implementationof this proposed CDM project. Some power com-panies prefer the reliability of grid connection. Inaddition, the perceived financial risks are closelyrelated to the alcohol market situation and com-pany business performance, while the technicalrisks may encompass gas quality for reliability andspecial skills for production and maintenance.
Zhuhai Landfill Gas Recovery forPower Generation Project
Project information. This is a renewable energycase study that explores the potential of landfill
C D M M E T H O D O L O G Y A N D C A S E S T U D I E S
C D M I N C H I N A58
T A B L E 3 . 1 4 Major Parameters for Taicang Biogas Project
Baseline CDM Taichang-Biogas Unit Project Project
Technical DataInstalled net-capacity MW — 4.0Full load operation time h/year — 7680Electricity generation GWh/year 29.1 29.1Fuel consumption GWhf/year 82.9Net efficiency % 35.1 27.53
Economic DataCapital Investment mill.Yuan — 45Specific Investment Yuan/kW — 11250Fuel costs Yuan/kWhf 0.228 0.392Discount rate % p.a. — 8Crediting period years — 10Lifetime years — 20Depreciation time years 15 15O&M costs Yuan/kWe p.a. — 1180
Environmental DataCoal-CO2 emission factor g-CO2/kWhf 327Other GHGs as CO2 g-CO2/kWhf —
equivalentsCO2 emission reductions kg CO2/kWhe 0.921
per kWh of electricity generation
CO2 emission reductions Mt-CO2 0.2676over a 10-year crediting period
CO2 emission reductions Mt-CO2/a0.02676per year
Incremental cost per Yuan/kWhe 0.165kWh of electricity generation
CO2 emission reduction Yuan/t CO2 179.2costs $/t CO2 21.67
Year (for technical, economic data): 2000

gas recovery for power generation. The project’sother benefits include urban environmental pro-tection, fugitive gas capture for energy reuse andland-use improvement, and methane (CH4) mit-igation. Such an LFG recovery project is of par-ticular importance for China, where cheap andlarge quantities of CH4 are discharged fromurban landfills. The methodological study in thisproject is expected to shed more light on similarcases across the country.
Baseline setting. At present, three types ofGHF emission baselines are considered: (1) LFGrecovery baseline, which assumes the current sit-uation, 100 percent of methane emissions fromthe landfill site; (2) power generation fuel sub-stitution baseline, which assumes the GHGemissions when generating the sam electricityquantity from the power grid; and (3) flaringbaseline, which assumes zero flaring of LFG.Compared to the emission reductions from LFGrecovery, those from the fuel substitution forpower generation are so small in amount as to benegligible; only the parts from the LFG recoveryand flaring are of great account.
Crediting period. Since the landfill gas in thiscase could be recovered as long as the comingdecade, a 10-year period has been fixed for thecrediting of this project starting from January2005.
Major parameters and results are shown inTable 3.15.
Monitoring plan and activity. The followingelements should be well monitored for verifica-tion of GHG emission reduction acquired fromthe proposed CDM project: (a) emission reduc-tions from methane combustion in flares; and(b) emission reductions from methane combus-tion in generators.
Other useful notes. Important stakeholders in-clude the Zhuhai municipal government,, ZhuhaiNew Fangzhou Environment Technic Corpora-tion (Project Owner), Guangzhou Yufeng EnergyEnvironment Technic Corporation (Project De-signer), Zhuhai Power Company, and state banksand foreign investors.
In general, they all support launching this use-ful project, with multiple benefits expected foreach participant. The only partners to be affectedwould be some power companies, but suchimpacts would be negligible due to the small sizeof this project. Some technical and financial risksmay still exist, including the technical maturityand localization as well as the prohibitively highupfront costs. CDM may serve as an importantvehicle to overcome these uncertainties.
F I N D I N G S F R O M C D M C A S E S T U D I E S
C D M I N C H I N A 59
T A B L E 3 . 1 5 Major Parameters for Zhuhai LFG Project
Baseline CDM Zhuhai-LFG Unit Project Project
Technical DataInstalled net-capacity MW — 1.74Full load operation time h/year — 5000Electricity generation GWh/year — 8.7Fuel consumption GWhf/year 24.22 16.41Net efficiency % 35 34.42
Economic DataCapital Investment mill.Yuan — 23.20Specific Investment Yuan/kW — 13333Fuel costs Yuan/kWhf — 0Discount rate % p.a. 8 8Crediting period years — 10Lifetime years 10 10Depreciation time years 10 10O&M costs Yuan/kWe p.a. — 824.7
Environmental DataCoal-CO2 emission factor g-CO2/kWhf 910 0Other GHGs as CO2 g-CO2/kWhf 4361.78 4042.87
equivalentsGHGs as CO2 equivalents kg-CO2/kWhe — 8.33
reductions per kWh of electricity generation
CO2 emission reductions Mt-CO2 — 0.7247over a 10-yearcrediting period
CO2 emission reductions Mt-CO2/a — 0.072per year
Incremental cost per Yuan/kWhe — 0.30kWh of electricity generation
CO2 emission reduction Yuan/t CO2 — 32.61costs $/t CO2 — 3.94
Year (for technical, economic data): 2000

DISCUSSION OF RESULTS FROM SIX CASE STUDIES
Baseline Setting
General procedure and steps of baselinesetting in the six case studies
The procedure and main steps for setting thebaseline followed the decisions and guidance pro-vided by the CDM Executive Board. The mainssteps were:
• Clarification of the baseline system bound-aries, taking into account the limits and scopeof the CDM project activity
• Compilation and analysis of main determin-ing factors that influence the baseline
• Definition of possible baseline scenarios• Consultations with experts• Evaluation and selection of the most appro-
priate baseline approach• Identification and description of possible base-
line methodologies• Evaluation and selection of the most appro-
priate baseline methodology, including thecalculation of baseline GHG emissions.
Overall comparison of the baseline settingover six case studies
The major data on the baseline setting for eachcase study is stated in Table 3.16.
The baseline setting takes into account thelatest definitions and guidelines. At the time ofthe CDM Case Study, they were:
• The baseline for a CDM project activity is thescenario that reasonably represents the anthro-pogenic emissions by sources of greenhousegases that would occur in the absence of theproposed project activity.
• A baseline approach is the basis for a baselinemethodology. The Executive Board agreedthat the three approaches identified in sub-paragraphs 48 (a) to (c) of the CDM modali-ties and procedures be the only ones applicableto CDM project activities.
• A methodology is the application of anapproach (as defined in paragraph 48 of theCDM modalities and procedures) to an indi-vidual project activity, reflecting aspects suchas sector and region.
Also used in the context of the baseline settingwere the methods of “operating margin” and“built margin.” These can be defined according to“OECD, IEA: Practical Baseline Recommenda-tions for Greenhouse Gas Mitigation Projects inthe Electric Power Sector. May 2002.” as follows:
• The operating margin method presumes thata CDM project’s activity predominant effectis to modify the operation of existing powerplants.
• The built margin method makes a “best guess”as to what type of power facility would haveotherwise been built had the project not beenimplemented, or built sooner, insofar as GHGmitigation projects are likely to delay ratherthan displace other new plants, respectively.
Major findings and lessons learned onbaseline setting from the case studies
Baseline approach 48.a is not appropriate as thepower baseline for fast-growing economies such asChina. China’s economy is expected to keep grow-ing at around 8 percent annually. Power demandincreases with the growth of GDP. Therefore,additional power plant capacity is needed. At thesame time, new power generation technology islikely to develop, resulting in higher energy effi-ciency rates, a shift in fuel mix, or changes inthe use of renewable energies. The future mixof operated power plants and the resulting GHGemissions will differ from the current period.Therefore, 48.a is not the appropriate approachfor setting the power generation baseline. Accord-ingly, the baseline approach 48.a has not beenchosen as the power baseline.
Baseline approach 48.b was selected as the powerbaseline in all six case studies. Data requirementsare a barrier for baseline approach 48.c. The resultsof the baseline settings show that—for the power
C D M M E T H O D O L O G Y A N D C A S E S T U D I E S
C D M I N C H I N A60

F I N D I N G S F R O M C D M C A S E S T U D I E S
C D M I N C H I N A 61
CD
M P
roje
ct A
ctiv
ity
(as
add
itio
nal
info
rmat
ion
)Lo
cati
on
of
the
CD
M
pro
ject
Typ
e o
f te
chn
olo
gy
Scal
e o
f p
roje
ctPo
wer
gri
d
to b
e co
nn
ecte
d
Sele
cted
Bas
elin
eB
asel
ine
com
po
nen
ts
Bas
elin
e A
pp
roac
h
Bas
elin
e M
eth
od
olo
gy
TA
BL
E 3
.16
Bas
elin
e Se
ttin
g o
f th
e Si
x C
ase
Stu
dy
Pro
ject
s
Cas
e N
ame
Hu
anen
g-S
CG
SCC
-Tri
Gen
BJ3
TPP-
GSC
CSH
-Win
d F
arm
Taic
ang
-Bio
gas
Zhu
hai
-Lan
dfi
ll g
as
Jiyu
an C
ity,
Hen
an P
rovi
nce
Sup
er-c
riti
cal c
oal
-fi
red
fo
r p
ow
er
gen
erat
ion
2 ×
600
MW
Hen
an P
rovi
nce
gri
d
1.p
ow
er
48 b
)
Bu
ilt m
arg
in
Bei
jing
Gas
-ste
am c
om
-b
ined
cyc
le, t
ri-
gen
erat
ion
133
MW
No
rth
Ch
ina
gri
d
1.p
ow
er2.
hea
tin
g c
oal
3.h
eati
ng
gas
1.48
b)
2.48
a)
3.48
b)
Op
erat
ing
mar
-g
ins
for
all
bas
elin
es
Bei
jing
Gas
-ste
am c
om
-b
ined
cyc
le f
or
po
wer
g
ener
atio
n30
0 M
W
No
rth
Ch
ina
gri
d
1.p
ow
er
48 b
)
Bu
ilt m
arg
in
Shan
gh
ai
Win
d p
ow
er
gen
erat
ion
20 M
W
East
Ch
ina
gri
d
1.p
ow
er
48 b
)
Op
erat
ing
mar
gin
Taic
ang
Cit
y,Ji
ang
suPr
ovi
nce
.B
iog
as p
ow
erg
ener
atio
n
4.1
MW
East
Ch
ina
gri
d
1.p
ow
er
48 b
)
Op
erat
ing
mar
gin
Zhu
hai
Cit
y,G
uan
gd
on
gPr
ovi
nce
LFG
rec
ove
ry f
or
po
wer
g
ener
atio
n
1.94
MW
Gu
ang
do
ng
pro
vin
ce g
rid
1.la
nd
fill
2.to
rch
1.48
a),
2.48
a). (c
on
tin
ued
)
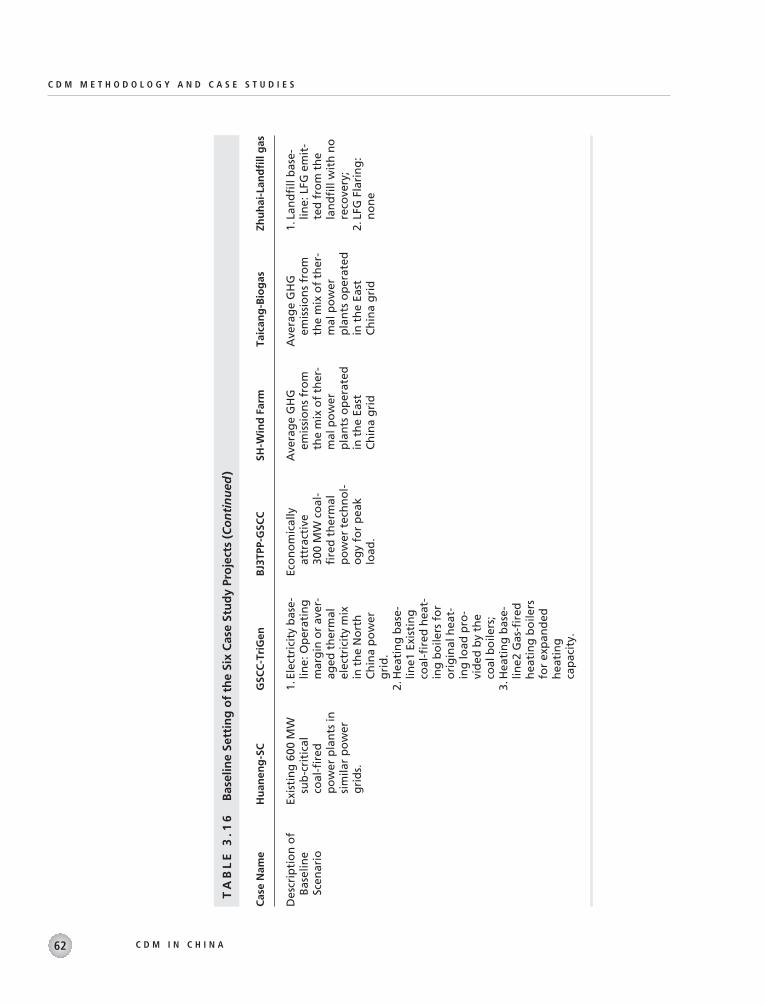
C D M M E T H O D O L O G Y A N D C A S E S T U D I E S
C D M I N C H I N A62
Des
crip
tio
n o
f B
asel
ine
Scen
ario
TA
BL
E 3
.16
Bas
elin
e Se
ttin
g o
f th
e Si
x C
ase
Stu
dy
Pro
ject
s(C
on
tin
ued
)
Cas
e N
ame
Hu
anen
g-S
CG
SCC
-Tri
Gen
BJ3
TPP-
GSC
CSH
-Win
d F
arm
Taic
ang
-Bio
gas
Zhu
hai
-Lan
dfi
ll g
as
Exis
tin
g 6
00 M
Wsu
b-c
riti
cal
coal
-fire
dp
ow
er p
lan
ts in
sim
ilar
po
wer
gri
ds.
1.El
ectr
icit
y b
ase-
line:
Op
erat
ing
mar
gin
or
aver
-ag
ed t
her
mal
elec
tric
ity
mix
in t
he
No
rth
Ch
ina
po
wer
gri
d.
2.H
eati
ng
bas
e-lin
e1 E
xist
ing
coal
-fire
d h
eat-
ing
bo
ilers
fo
ro
rig
inal
hea
t-in
g lo
ad p
ro-
vid
ed b
y th
eco
al b
oile
rs;
3.H
eati
ng
bas
e-lin
e2 G
as-fi
red
hea
tin
g b
oile
rsfo
r ex
pan
ded
hea
tin
g
cap
acit
y.
Eco
no
mic
ally
attr
acti
ve
300
MW
co
al-
fire
d t
her
mal
po
wer
tec
hn
ol-
og
y fo
r p
eak
load
.
Ave
rag
e G
HG
emis
sio
ns
fro
mth
e m
ix o
f th
er-
mal
po
wer
pla
nts
op
erat
edin
th
e Ea
stC
hin
a g
rid
Ave
rag
e G
HG
emis
sio
ns
fro
mth
e m
ix o
f th
er-
mal
po
wer
pla
nts
op
erat
edin
th
e Ea
stC
hin
a g
rid
1.La
nd
fill
bas
e-lin
e: L
FG e
mit
-te
d f
rom
th
ela
nd
fill
wit
h n
ore
cove
ry;
2.LF
G F
lari
ng
:n
on
e

baseline only—approach 48.b was the most ap-propriate. Baseline approach 48.c was also a validoption, but the data requirements for this ap-proach are difficult. Power plant utilities wereoften reluctant to assist or provide the necessarydata. This may be because of the uncertaintiesregarding the development of a CDM marketaccording to the Kyoto Protocol, lack of infor-mation on CDM, or because of other priorities.Furthermore, in the case of large-scale fossil fuelpower plants, not many similar projects wereundertaken in the previous five years in similarsocial, economic, environmental, and technolog-ical circumstances.
Operating margin is regarded as the most appro-priate baseline methodology in the case of small,renewable energy power generation projects. Thekey issue is the standard set for a reliable power sup-ply. For all three cases with renewable power gen-eration, the operating margin methodology wasselected as most appropriate. In the Shanghaiwind farm case, the power generation depends onthe wind situation. In the case of the alcoholplant, the power generation is related to the pro-
duced alcohol quantity, or to the resulting CODcontent in the effluent. In the case of the landfill,the power generation is mainly dependent on thedisposed waste quantity and quality, as well as onthe degradable process determined by tempera-ture and humidity. As a result, the power sup-plied to the public grid will be unreliable anddifficult to predict. In order to have a reliable andpredictable power supply, which generally is ex-pected on the demand side, a back-up of (nearly)the same conventional power generation capac-ity has to be built and be available to compensatefor the volatile power supply of the renewableenergies. Therefore, neither built margin norcombined margin was considered appropriate,since there won’t be a delay or an impact on newpower plant capacity additions.
In a power grid system with relatively new powerplants, the type of baseline approach and baselinemethodology has a limited impact on the baselineemissions. The wind farm project is an example.The results of the calculation for different base-line approaches and methodologies are stated inTable 3.17.
F I N D I N G S F R O M C D M C A S E S T U D I E S
C D M I N C H I N A 63
T A B L E 3 . 1 7 Impact of Different Baseline Approaches on CO2 Emission Reduction
48.a Historical and present data
(Static) (Dynamic)
Shanghai Shanghai regional National regional National Shanghai National sectoral sectoral sectoral sectoral prevailing prevailing baseline baseline baseline baseline technology technology
Power generation (GWhel/yr) 40 40 40 40 40 40Fuel intensity of net 351 392 346.7 361.1 344 360
generation (gce/kWhel)Fuel consumption (GWhth/yr) 114.3 127.6 105.9 109.4 112.0 117.2Rate of fuel combustion (%) 94.4 94.4 94.4 94.4 94.4 94.4CO2-emissions factor of 0.938 1.048 0.927 0.965 0.919 0.962
Baseline (kg-CO2e/kWhel)CO2-emission reduction (t-CO2/yr) 37,520 41,902 37,049 38,287 36,771 38,482
(%) 102.0 114.0 100.8 104.1 100 104.7
Note: Base year for technical data is 2000. CO2e = CO2 equivalents.
48.b Attractive technology

The prevailing power generation technologyin the Shanghai power grid (as well as in thenational power grid) is 600 MW or 300 MWcoal-fired units. The regional sector baseline isdefined as the average fuel intensity of the powergrid in Shanghai, and the national sector baselineas national average fuel intensity. The CO2 emis-sions from wind power generation are zero. Theresults show that CO2 emissions reductions inthe Shanghai grid are higher than the ones in thenational grid, i.e. the coal-fired power generationtechnology level of Shanghai is advanced com-pared to the national level. Over the 2010–2030period, the similar CO2 emissions reductions ofprevailing technology and dynamic baseline be-tween Shanghai and the national level is due tothe same sector technology policy, which willeven out differences over time.
approaches and assessment methods have beenapplied to these six case study projects. The addi-tionality check for a CDM project activity shouldverify whether the prospective project meets therequirements of the “reductions in emissions thatare additional to any that would occur in theabsence of the certified project activity.”
Based on the assessments and analyses in linewith the established criteria or principles, all theselected case study projects meet the additional-ity criteria (Table 3.18).
Major findings within the additionality assessment
Impact of governmental strategies and developmentplans on additionality. It is a normal practice forthe Chinese government to map out, or updateon a regular basis, a five-year plan and long-termdevelopment programs. The plans state goals forscience and technology development, coveringenergy supply schemes and advanced or efficientenergy technology, R & D projects, transfers,and applications. These initiatives are aimed atpushing ahead the technological progress ofenergy supply and efficiency improvements, aswell as meeting increasing energy demand andsupporting national economic growth in a moresustainable way.
Projects listed in the “five-year plan” willarguably be built anyway, even in the absence ofCDM. Projects or programs listed high on thedevelopment agenda generally are the top priori-ties set out by the central authorities for the nearfuture, but that does not necessarily mean theseprojects will eventually be implemented. A poten-tial CDM project listed in the plan may face avariety of barriers or hit a snag in the implement-ing process due to insecure financing resources oremerging technological challenges.
It is important to note that the five-year plan-ning process is more directive than mandatory.In other words, the planning makes clear the pri-orities and willingness of the government, or thedevelopment target, which may not constitutethe obligations for actors in the sector. Especially,
C D M M E T H O D O L O G Y A N D C A S E S T U D I E S
C D M I N C H I N A64
B O X 3 . 1 Baseline Setting and “Power Shortage”
Due to China’s economic growth and thetime-consuming erection of new powerplants, in the future China is likely facesevere power shortages. These power short-ages may go far beyond most CDM project’screditing period. For the time being, there isno adequate baseline approach or methodol-ogy that takes into account such long-termpower shortage conditions. The condition ofadditionality cannot exist, since these poten-tial CDM project activities do not displace thepower from another power plant. There is aneed to develop a (simplified) baselinemethodology that can be applied to thesespecific situations.
Additionality Assessment of the CDM Case Studies
Basis for the additionality assessment and overview of results
The guiding principles for assessing additionalityhave been primarily laid out in Article 12, para-graph 5(c), of the Kyoto Protocol, as well as inparagraphs 43–44 of the Marrakesh Accords andin the 9th and 10th EB meetings. The relevant
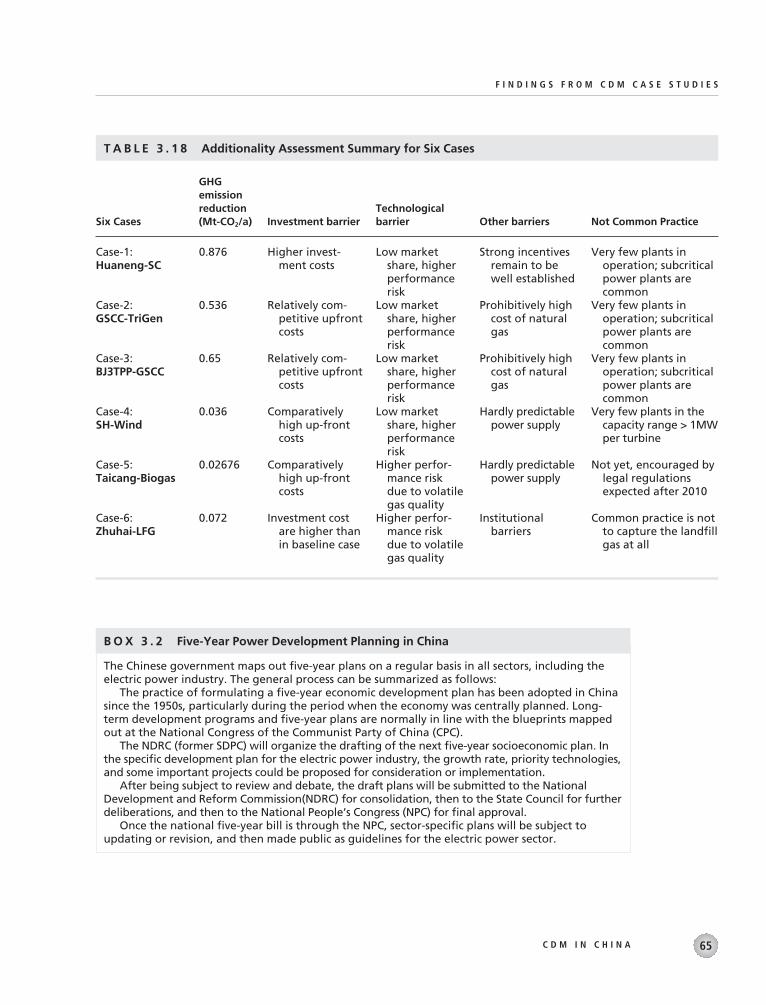
F I N D I N G S F R O M C D M C A S E S T U D I E S
C D M I N C H I N A 65
T A B L E 3 . 1 8 Additionality Assessment Summary for Six Cases
GHG emission reduction Technological
Six Cases (Mt-CO2/a) Investment barrier barrier Other barriers Not Common Practice
Case-1:Huaneng-SC
Case-2:GSCC-TriGen
Case-3:BJ3TPP-GSCC
Case-4:SH-Wind
Case-5:Taicang-Biogas
Case-6:Zhuhai-LFG
0.876
0.536
0.65
0.036
0.02676
0.072
Higher invest-ment costs
Relatively com-petitive upfrontcosts
Relatively com-petitive upfrontcosts
Comparativelyhigh up-frontcosts
Comparativelyhigh up-frontcosts
Investment costare higher thanin baseline case
Low marketshare, higherperformancerisk
Low marketshare, higherperformancerisk
Low marketshare, higherperformancerisk
Low marketshare, higherperformancerisk
Higher perfor-mance risk due to volatilegas quality
Higher perfor-mance risk due to volatilegas quality
Strong incentivesremain to bewell established
Prohibitively highcost of naturalgas
Prohibitively highcost of naturalgas
Hardly predictablepower supply
Hardly predictablepower supply
Institutional barriers
Very few plants in operation; subcriticalpower plants arecommon
Very few plants in operation; subcriticalpower plants arecommon
Very few plants in operation; subcriticalpower plants arecommon
Very few plants in thecapacity range > 1MWper turbine
Not yet, encouraged bylegal regulationsexpected after 2010
Common practice is notto capture the landfillgas at all
B O X 3 . 2 Five-Year Power Development Planning in China
The Chinese government maps out five-year plans on a regular basis in all sectors, including theelectric power industry. The general process can be summarized as follows:
The practice of formulating a five-year economic development plan has been adopted in Chinasince the 1950s, particularly during the period when the economy was centrally planned. Long-term development programs and five-year plans are normally in line with the blueprints mappedout at the National Congress of the Communist Party of China (CPC).
The NDRC (former SDPC) will organize the drafting of the next five-year socioeconomic plan. Inthe specific development plan for the electric power industry, the growth rate, priority technologies,and some important projects could be proposed for consideration or implementation.
After being subject to review and debate, the draft plans will be submitted to the NationalDevelopment and Reform Commission(NDRC) for consolidation, then to the State Council for furtherdeliberations, and then to the National People’s Congress (NPC) for final approval.
Once the national five-year bill is through the NPC, sector-specific plans will be subject toupdating or revision, and then made public as guidelines for the electric power sector.

the projects listed in the planning document maybe or may not be developed in reality, dependingon whether the necessary resources are availableor not. Taking the super-critical technology as anexample, being listed as one of the priority areasin the five-year planning document means it issupported by the government, but there is noguaranteed financial assistance or other aid.
Early action needed in order to take advantage ofCDM. The projects that are submitted to the gov-ernment for their approval are in most cases at anearly stage and still need to secure external (finan-cial) resources and technical assistance. However, ifthe proposed projects get officially approved, thenthis generally implies that the financial resources forimplementation could have been promised orsecured. On the other hand, the project proposalcould be possibly turned down even with the avail-ability of financing sources, due to the problems oftechnological choices or regional balance.
It is therefore important to identify potentialCDM project activities that are in line with thegovernment’s priorities—by, for example, beinglisted in the Five-Year-Plan—and are at the timeof project development not (yet) economically fea-sible. The identification of those projects shouldoccur before the submission of a project to gov-ernment authorities for approval. Furthermore,projects that are not economically viable at firstsight may improve their economic performancewith CDM, and hence have a higher probabilityto be approved by the government.
Power tariffs or fuel price have an important im-pact on additionality. Power tariffs and fuel pricesplay an important role in the context of addi-tionality. In many cases, renewable and advancedenergy technologies, which either have unafford-able O&M costs or entail prohibitively higher up-front investments, would appear economicallyuncompetitive with other conventional options.For instance, the front-end investments for launch-ing the BJ3TPP Gas-Steam Combined Cycleand the Beijing Dianzicheng Gas-Steam Tri-generation projects are supposed to be roughlyequal or even lower than their coal-fired counter-
parts. However, the overall economic perfor-mance of GSCC power plants turns out to be lesscompetitive, with the current price of natural gasthree times that for coal (even considering thefavorable terms granted by the Beijing municipalgovernment). The common practice is thereforeto choose a coal-fired power plant rather than atoo-expensive GSCC installation, which requiresadditional capital to cover the running cost.
Newly installed environmental regulations andlegislation can remove a project’s additionality,depending on the region; early action is needed tomake use of a longer crediting period and higheramount of CERs. With China’s rapid socio-economic development, the importance of en-vironmental protection has been increasinglyrecognized. The National People’s Congress(NPC) of China has made great efforts in environ-mental legislation in order to improve air qualityand stem the increasing nationwide environmentaldegradation. This is particularly true in many largecities and environmentally fragile regions.
In Beijing, for example, more stringent envi-ronmental codes and standards have been im-posed by the municipal government in the lead-upto the Olympic Games in 2008. As part of thiseffort, coal-derived CO2 emissions and other pol-lutants have been strictly controlled. The OlympicAction Plan has been formulated to develop re-sponse measures for clean air quality. This initia-tive is only one of many government-sponsoredefforts to push the use of those advanced andenergy-efficient technologies. Therefore, the op-portunity to launch certain CDM project activi-ties is limited until they are common practice;that is, the baseline case.
Dilemma of data availability vs. additionality or“the chicken and egg challenge” in the context ofCDM in China. In the course of the work on thecase studies, it has sometimes been difficult to getthe data needed to prepare a PDD. However, thePDD is essential for CDM since the EB is goingto approve or reject a potential CDM projectactivity based on the PDD. On the other hand,each large new (or retrofit) power plant project
C D M M E T H O D O L O G Y A N D C A S E S T U D I E S
C D M I N C H I N A66
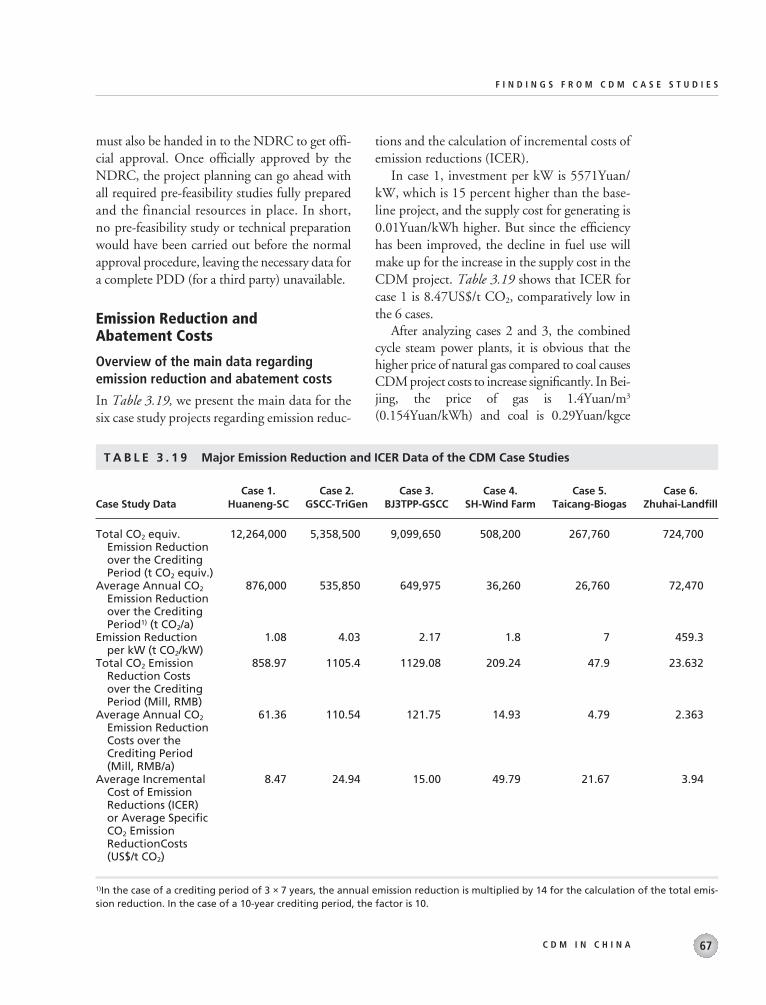
must also be handed in to the NDRC to get offi-cial approval. Once officially approved by theNDRC, the project planning can go ahead withall required pre-feasibility studies fully preparedand the financial resources in place. In short,no pre-feasibility study or technical preparationwould have been carried out before the normalapproval procedure, leaving the necessary data fora complete PDD (for a third party) unavailable.
Emission Reduction and Abatement Costs
Overview of the main data regardingemission reduction and abatement costs
In Table 3.19, we present the main data for thesix case study projects regarding emission reduc-
tions and the calculation of incremental costs ofemission reductions (ICER).
In case 1, investment per kW is 5571Yuan/kW, which is 15 percent higher than the base-line project, and the supply cost for generating is0.01Yuan/kWh higher. But since the efficiencyhas been improved, the decline in fuel use willmake up for the increase in the supply cost in theCDM project. Table 3.19 shows that ICER forcase 1 is 8.47US$/t CO2, comparatively low inthe 6 cases.
After analyzing cases 2 and 3, the combinedcycle steam power plants, it is obvious that thehigher price of natural gas compared to coal causesCDM project costs to increase significantly. In Bei-jing, the price of gas is 1.4Yuan/m3
(0.154Yuan/kWh) and coal is 0.29Yuan/kgce
F I N D I N G S F R O M C D M C A S E S T U D I E S
C D M I N C H I N A 67
T A B L E 3 . 1 9 Major Emission Reduction and ICER Data of the CDM Case Studies
Case 1. Case 2. Case 3. Case 4. Case 5. Case 6. Case Study Data Huaneng-SC GSCC-TriGen BJ3TPP-GSCC SH-Wind Farm Taicang-Biogas Zhuhai-Landfill
Total CO2 equiv. 12,264,000 5,358,500 9,099,650 508,200 267,760 724,700Emission Reduction over the Crediting Period (t CO2 equiv.)
Average Annual CO2 876,000 535,850 649,975 36,260 26,760 72,470Emission Reduction over the Crediting Period1) (t CO2/a)
Emission Reduction 1.08 4.03 2.17 1.8 7 459.3per kW (t CO2/kW)
Total CO2 Emission 858.97 1105.4 1129.08 209.24 47.9 23.632Reduction Costs over the Crediting Period (Mill, RMB)
Average Annual CO2 61.36 110.54 121.75 14.93 4.79 2.363Emission Reduction Costs over the Crediting Period (Mill, RMB/a)
Average Incremental 8.47 24.94 15.00 49.79 21.67 3.94Cost of Emission Reductions (ICER)or Average Specific CO2 Emission ReductionCosts (US$/t CO2)
1)In the case of a crediting period of 3 × 7 years, the annual emission reduction is multiplied by 14 for the calculation of the total emis-sion reduction. In the case of a 10-year crediting period, the factor is 10.

(0.03536Yuan/kWh). The coal price is just 23 percent of the gas price. In the CDM project,fuel cost accounts for 52 percent of the total gen-eration cost; in the baseline project, the percentageis only 38 percent. Therefore, the generation costper kWh of the CDM project is 72 percent higherthan that of the baseline project. However, the low initial investment of the CDM project—4106Yuan/kW, compared to a baseline cost of4848Yuan/kWh—can to some extent counteractthe high ER cost. The ICER of case 3 is $15/t CO2.
Case 4 is phase II of the 20MW Shanghaiwind farm project. As is shown in Table 3.19, theaverage specific CO2 emission cost of case 4 is$50/tCO2. The main reason why the ICER is sohigh is because of the high initial investment,reaching 9128Yuan/kW. The data was obtainedfrom the phase I Shanghai wind farm project.With the rapid development of the wind powergeneration market, investment per kW has de-clined to around 7,000Yuan, 23 percent lowerthan the data used in calculation. Similar to case 5,the key factor in declining incremental abatementcost is to decrease initial investment. Anotherimportant factor is the annual operating hours ofthe wind farm. In Shanghai, 2,000 hours of full-load electricity is connected to the grid, whichis less than the 2,300 to 2,500 hours in InnerMongolia and Sinkiang. The less annual supply,the less CO2 ER, and ICER will increase.
Case 5—a renewable energy generationproject—deals with the anaerobic treatment ofeffluent and power generation at the TaicangXin Tai Alcohol Co. The capacity of this CDMproject is only 4MW, but the initial investmentis as high as 45 million Yuan. Its specific invest-ment is 11,250Yuan/kW, much higher than for-mer cases, because effluent treating equipmenthas been involved as well as biogas generatingequipment. In addition, the operating cost ofeffluent treatment is also very expensive, about4.5 million Yuan yearly. After combining thesetwo parts, the biogas generating cost reaches0.392 Yuan/kWh, 56.8 percent higher thanaverage cost of the grid, which is 0.25Yuan/kWh.The case 5 ICER is $21.67/tCO2, a little higher
than that of cases 2 and 3. Analysis shows thatdecreasing initial investment and operating costsare the key factors in the declining incrementalabatement cost of such projects.
Case 6 concerns landfill methane recoveryfor power generation in Zhuhai City. The mainpart of the emission cost is the initial investment,23.2 million Yuan, and investment per kW canreach 13,300Yuan. Key factors to decrease ICERare designing reasonable recovery systems andlowering investment. Total emission cost in thiscase is about 23.20 million Yuan, and annualCO2 emission saving is 72,470 t because of thelarge greenhouse effect of CH4. The ICER is thena comparatively low $3.94/tCO2.
Analysis of driving factors on incrementalcost of emission reductions
Impacts of crediting period on ICER. Cases 2, 5,and 6 have selected a fixed crediting time of 10 years. Cases 1, 3, and 4 have selected a renew-able crediting period of 3 × 7 years. The longerthe crediting period, the higher the total emissionreductions and profits from the CDM projectactivity. However, long crediting periods alsobring some problems, such as uncertainty, espe-cially to the cases that take the average fuel rate ofthe grid as baselines. In the coming 20 years,China’s GDP will about 7 percent annually, soelectrical generation will grow at about the samerate. Clean coal technology, fuel replacement,and renewable energy generation will be devel-oped mainly in order to protect the environment.Furthermore, out-dated mid-sized and smallcoal-fired plants will be phased out rapidly. It canbe anticipated that the fuel structure on the gridin China will change significantly in the future,which causes uncertainty for CERs.
Impacts of coal prices and gas prices on ICER.The coal price in China is lower than the worldmarket price. China has an abundance of coal res-ources. Coal takes 67 percent of primary energyin China, and is more than 80 percent of fuel firedfor electrical generation. Because of the low coalprice, when CDM projects choose the average
C D M M E T H O D O L O G Y A N D C A S E S T U D I E S
C D M I N C H I N A68

fuel rate of the grid as baselines, ICER results willbe relatively high. Cases 1, 2 and 5 are located inHenan province, Beijing, and Shanghai, wherecoal prices are $24.9/toe, $53.4/toe and $65.3/toe respectively. But in Japan, England, and theOECD, the prices are $110.2/toe, $97.76/toe,and $61/toe (Data from IEA Energy Prices andTaxes). The average international market price isat least 20 percent higher than the price in China.In case 3, when the OECD coal price serves as anopportunity cost in the sensitive analysis, theresult shows that if the price is 34 percent higher,the ICER will be 39 percent lower, changing from$25/toe to $15.3/toe. On the contrary, naturalgas prices in China are higher than world marketprice. Data from IEA Energy Prices and Taxesreveals that price of gas in China is $0.17/m3
(1.40Yuan/m3), almost twice the American priceof $0.09/m3. Case 3 also provides sensitive analy-sis in this direction. If the gas price declines from1.4Yuan/m3 to 1.13Yuan/m3, the ICER willchange from $30/tCO2 to $15/tCO2, decreasing50 percent. After analyzing this, it is clear that coaland natural gas prices have a big impact on ICER.
Relevance of power purchase agreement (PPA)for ICER. Many countries have set regulations andpolicies to promote the development of renewableenergy generation. For example, in Germany,PPAs with public utilities provide higher tariffsfor green power supplied into the grid, such as forwind parks. Although the Chinese governmenthas not announced such regulations, some docu-ments have been developed to promote renewableenergy. In 2003, the NDRC approved two 100MW wind farms in Rudong county, Jiangsuprovince and in Huilai county. Guangdongprovince would invite public bidding to constructthe plants. The owner of the wind farm and localpower company could also negotiate a favor-able fixed price (this is PPA). In the near future,10 wind farms will be constructed. The availabil-ity of higher price PPAs and bidding may decreasethe ICER considerably, and may render windprojects more competitive compared to othertechnologies.
Findings and Conclusion
After analyzing the most important driving fac-tors on ICERs in the six cases, the main findingsand conclusions are as follows:
• Due to high natural gas prices and low carbonprices in China, the ICER in fuel-switchingCDM project activities is rather high.
• ICERs in renewable energy generation CDMproject activities could be reduced if the initialinvestment is lower and the full-load operat-ing hours of the plant higher.
• Improving the landfill methane capturing ratein the respective CDM project activity maydecrease ICERs.
• If CDM projects choose the average fuel rateon the grid as a baseline, the coal price will havea significant impact on ICERs.
• Power purchase agreements (PPAs) will help toimprove the economic performance of renew-able energy generation projects, as well as de-crease their ICERs.
• As a potential CDM activity, advanced coal-fired generator technology provides a highamount of CERs and low ICER.
• Renewable energy generation projects havehigh potential emission reductions, while theirinitial investments are very high. However,with policy support (such as PPA) such pro-jects are promising.
• With lower gas prices in China, fuel switchingmay become an interesting CDM projectactivity.
CDM: CHANCES, BENEFITS,BARRIERS, AND UNCERTAINTIES
Chances and Benefits for ChinaDeriving from CDM
Besides the obvious reduction of greenhouse gasemissions and the mitigation of climate change,CDM has other benefits for China. Based on the
F I N D I N G S F R O M C D M C A S E S T U D I E S
C D M I N C H I N A 69

six case studies, Table 3.20 lists the chances andbenefits. The right side of the table providesselected examples from the case studies. (Formore detailed information, refer to the separatecase study reports in Annex 1 on the CD-ROM.)
The benefits derived from CDM and CDMitself fits and supports all three major objectivesof China’s energy policy; that is, to reduce theenvironmental impacts of coal fired generationby 1) diversifying the fuel mix; 2) promotingenergy efficiency and clean coal technologies;and 3) promoting renewable energy.
Barriers for the Preparation andImplementation of CDM andRespective Mitigation Measures
In the course of the elaboration of the casestudies, different barriers were encountered.These barriers represent the present status atthe end of 2003. However, there also exist a set of measures to tackle and overcome the barriers, given the commitment of the gov-ernment and all other involved stakeholders(Table 3.21).
C D M M E T H O D O L O G Y A N D C A S E S T U D I E S
C D M I N C H I N A70
T A B L E 3 . 2 0 Summary of Chances and Benefits from CDM Based on the Findings of Six Case Studies
Chances and Benefits from CDM for China Selected examples from the Case Study Projects
Economical Chances and BenefitsIncrease in tax revenues
Transfer of state-of-the-art technology to Chinathat would stimulate scientific and technolog-ical progress
Additional revenues coming from CER improvethe financial performance of a project
Help to start up new domestic industry sectors
Expand employment
Ecological BenefitsReduction of GHG emission and mitigation of
climate changeImprovement of local air, water, and ground-
water quality
Diversification of electricity generation sources
Saving natural resources by the use of renewableenergies
Support and help to accelerate the developmentof renewable energies
Social BenefitsCreation of new jobsAwareness raising for environmental challenges
at the local levelImproving household living standards
17% VAT for power sale, business tax for projectimplementation (5% of turnover), 33%income tax for employees
Gas engine and turbine for biogas use for theeffluent treatment Taicang Alcohol plantcoming from the United States
All case studies
Manufacturing of wind turbines larger than 1 MW (e.g. by franchising system)
All case studies
In all case studies
a) Reduction of SO2 emissions, NOx emissionsand particulates.
b) Improvement of water quality of Taicangriver
Fuel switch from coal to natural gas, renewableenergies such as wind, biomass
Power generation by landfill gas, gas fromanaerobic digestion and wind
Wind, landfill gas
In all six case studiesInformation and education center on site of the
wind power plant in ShanghaiSwitch from coal to gas for heating boiler in
households in the case study project #3

Stakeholders Perspective onRequirements to Facilitate CDM in China
An important uncertainty is whether and whenthe Kyoto Protocol will enter into force. Anotheruncertainty is how the EB may consider baselineand monitoring methodologies proposed forlarger-scale energy efficiency and large fossil-fuel-
based projects. By 2007–8, the opportunity tostart larger-scale CDM projects may have passedbecause of the uncertainty regarding the 2nd com-mitment period, since by then less then 7 yearswould fall into the first commitment period. Acommercial bank in this situation would prefer tofinance projects that are economically viable.Larger-scale no-regrets projects would in turn facedifficulties in demonstrating additionality.
F I N D I N G S F R O M C D M C A S E S T U D I E S
C D M I N C H I N A 71
T A B L E 3 . 2 1 Overview of Perceived Barriers and Suggested Mitigation Measures basedon the Six Case Studies
Challenge, Barrier Mitigation Measure
Stakeholder BarriersThe central government (NDRC, MOST, SEPA,
MOA, MOF, MOFA, China MeteorologyBureau, MOT etc.) is familiar with CDM. How-ever, on the provincial and city level, knowl-edge and awareness of CDM is low.
Improving the energy efficiencies of powerplants and enlarging the share of renewableenergies are stated objectives, but govern-mental support has not been provided.
Since the Kyoto Protocol has not entered intoforce, the designated national authority has-n’t been established yet.
Local residents near future large power plantsmay be worried about the increase of air pol-lution or the loss of land.
Financial–Technical ChallengesThe level of transaction cost of the (potential)
CDM project activity (costs for negotiation,validation, monitoring, and verification) isexpected to be high, above all for small-scaleCDM project activities.
Some CDM project activities may involve tech-nology transfer from abroad. Other CDM proj-ect activities will work with fuel of varyingquality. Therefore, some time could beneeded to sustain reliable operation of therespective plants.
Environmental ChallengesMethane leaks in the natural gas pipeline.
Information and promoting CDM at the provin-cial and local level. These can be done by sev-eral means, such as by workshops, or carryingout of CDM pilot projects.
a) Governmental incentives, e.g. lower value-added tax for renewable energies (for exam-ple, a 6% VAT for small-scale hydropowerinstead of 17%).
b) Binding and favorable regulation on tariffsof electricity purchased by power companieswhen the electricity is coming from renew-able energies.
Establish DNA and provide guidance for theCDM procedure in China.
Suitable financial subsides for inhabitants.
a) Bundling of small-scale CDM projectsb) Enabling unilateral CDM projects, i.e. the
project is developed, financed, and imple-mented by the project host only
a) Introduce experienced technicians (includingintroduce technicians from foreign countries)
b) Strict quality control during manufacturingof equipment and erection of plants
c) Thorough commissioning of the plant, docu-mentation and training of the designatedoperations staff.
. . .

Based on the stakeholder assessment andfocusing on the CDM potential in the first com-mitment period, the subsequent main require-ments are as follows:
• Transparent, simple, and straight-forwardCDM procedures for project developers
• Maximum certainty regarding the amount ofCERs and approval by the EB
• Short time between preparing PDDs, the offi-cial approval of the CDM project activity bythe EB, and the CER revenues
• Assessment and minimization of risks associ-ated with CDM project activities.
CROSS COMPARISON OF FINDINGS WITH RESULTS FROM OTHER STUDIES
Figure 3.1 and Table 3.22 provide an overview ofCDM Case Study projects in China. On onehand, there are the six case studies that have beenconducted within the present study; on the otherhand, there are case study projects from otherstudies. These further case studies are the BP-1project (sponsored by British Petrolium) theADB-1 to ADB-7 case studies (sponsored bythe Asian Development Bank), as well as the 3E1,3E2 and 3E3 case studies (sponsored by NewEnergy and Industrial Technology Development
C D M M E T H O D O L O G Y A N D C A S E S T U D I E S
C D M I N C H I N A72
WB/GTZ1
WB/GTZ2, WB/GTZ3,3E3
WB/GTZ4
WB/GTZ5
WB/GTZ6,BP1
ADB1
ADB2
ADB3
ADB4
ADB5
ADB6
ADB7
3E1 3E2
F I G U R E 3 . 1 Location of China’s CDM Project Activities with Case Studies
Note: status at the end of 2003

Organization NEDO, Japan). All together, 17case studies have been considered. One is basedon coal, four are based on natural gas, and theother 12 are based on renewable energy and waste.Two of the waste utilization processes are relatedto industrial processes.
Figure 3.2 shows the specific investment costsof the case studies with available data.
The first four case studies are based on fossilfuels; the others are renewable energy power gen-eration projects. The average specific investmentcosts of the fossil-fuel projects are about half ofthe investment costs of the renewable energyprojects. This is mainly due to the much highercapacities of the fossil power generation projects.In the case of the renewable energy projects, theoperational costs are very low due to the fact thatthe fuel costs are (almost) zero.
Figure 3.3 shows the emission reductions andthe costs of CO2 emission reductions of the casestudies. (Note that we did not check the data fromthe other case studies.) The figure is divided intothe sectors A, B, C, and D. In sector “A,” the proj-ect case studies with high CO2 emission reductionquantities and low ICER are indicated. Projectswithin this sector have the highest priority asCDM projects. In this sector, you can find theBP-1 project, a fuel-switching natural gas com-bined cycle power plant; the WB/GTZ1 project,a coal-fired super-critical steam turbine powerplant; and the 3E3 project, a plant related to anindustrial process. No renewable energy-basedproject is in sector “A.”
The case studies in sector “B” are character-ized by relatively low CO2 emission reductionquantities and low ICER. This sector includes anindustrial-process-related plant (3E2) and a smalllandfill gas-to-energy power plant (WB/GTZ6).The landfill gas plant has very low ICER, but thespecific investment costs are the highest of all casestudy projects as shown in Figure 3.3.
In sector “C,” there is only one project (3E1),a natural gas-fired combined cycle.
Sector “D” projects have relatively high ICERand at the same time a relatively low emission
reduction potential. In sector “D” there are twonatural-gas based projects, a cogeneration proj-ect (WB/GTZ2), a combined cycle project (WB/GTZ3), and two renewable-based projects. Thewind project (WB/GTZ4) has the highest ICERof all case studies shown and simultaneously a lowquantity of CO2 emission reduction potential.
Generally speaking, renewable-energy-basedprojects have a comparatively low CO2 emissionreduction potential as a single project, but a veryhigh replication potential. The large-scale fossilfuel power plants have a comparatively higherpotential for CO2 emission reductions.
CONCLUSIONS ANDRECOMMENDATIONS
Based on the application of the CDM method-ologies in the selected six case studies in the elec-tric power sector and the renewable energy fields(for power generation), the major conclusionsand recommendations are as follows.
The Applicability of CDMMethodology under the SpecificConditions of China
Project system boundary and leakages
All case studies selected the physical boundary ofthe projects as defined in the CDM Glossary. Formost cases, the one-step upstream and down-stream leakages were evaluated. The results showthat normally in comparison with total emissionsduring the project lifetime, the leakage could beneglected. These findings could be applicable inmost other projects as a simple and workableapproach to deal with the on-site direct projectemissions reductions within the project bound-ary and leakage issues.
Baseline setting
There are three kinds of baseline approaches iden-tified by the Executive Board, paragraphs 48a to48c, which build the basis for baseline method-ology. In a fast-growing economy like China’s,
F I N D I N G S F R O M C D M C A S E S T U D I E S
C D M I N C H I N A 73

additional power plant capacity is needed, whileat the same time autonomous development intechnology by means of higher efficiencies isexpected. The 48a approach is consequently notchosen for the power baseline of the six case stud-ies under investigation. For approach 48c, thedata requirements are too much and the uncer-tainties regarding improvements in technologyover the crediting period—as well as the develop-
ment of a CDM market according to the KyotoProtocol—are very high.
Operating Margin is regarded as the mostappropriate baseline methodology in the case ofsmall, renewable energy power generation pro-jects. The key issue is the standard set for a reliablepower supply.
In a power grid system with relative new powerplants, the type of baseline approach and baseline
C D M M E T H O D O L O G Y A N D C A S E S T U D I E S
C D M I N C H I N A74
T A B L E 3 . 2 2 Overview and Summary Table Comprising Other CDM Project Case Studies
WB/GTZ1 WB/GTZ2 WB/GTZ3 WB/GTZ4 WB/GTZ5 WB/GTZ6 BP-1
Project Name
Project Location
Sector
CDM Project Activity
Baseline Approach
Crediting Period
CapacityEnergy
Generation
CO2-Reduction
InvestmentICER
Default exchange rate = 8.27 RMB/US$1/ medium scenario, annual operating time:4000hr, in 2010.2/ CO2-emission reduction/Energy Generation, calculated by Zheng Zhaoning3/ static investment costs4/ medium scenario, annual operating time:4000hr. discount rate: 8%5/ calculated by Zheng Zhaoning based on the CO2 emission intensity per unit electricity generation
[City, Province]
[According to IPCC]
[Brief descrip-tion]
[48.a; 48.b; 48.c]
[years]
[MWe][GWhe/a][MWhth/a]
[Mt CO2/a]
[Mil. US$][US$/t CO2]
Huaneng-Qinbei
Wulongkou Jiyuan,Henan
energy
Super-criticalcoal-firedpowergenera-tion
48 b)
Renewable3×7
2×6006,250
0.88
765.548.47
BeijingDianzicheng
Beijing
energy
Gas-firedCom-binedCycle Tri-gen-eration
1.48 b)2.48 a)3.48 b)Fixed 10
133548875
0.536
88.8424.94
BJ3TPP
Beijing
energy
Gas-SteamCom-binedCyclePower
48 b)
Renewable3 × 7
4001413.6
0.65
193.5615.0
SH-WindFarm
Shanghai
energy
Windpowergen-eration
48 b)
Renewable3 × 7
2040
0.036
22.0849.79
Taichang-Biogas
Taichang,Jiangsu
waste
Powerfrom theanaero-bic treat-ment
48 b)
Fixed 10
4.129.1
0.027
5.4421.7
Zhuhai-LFG
ZhuhaiCity,Guang-dong
waste
Landfill Gas forPower
1.48 a)2.48 a)
Fixed 10
1.748.7
0.072
2.813.94
Zhuhai II
ZhuhaiCity,Guang-dong
energy
CombinedCyclePowerGen-eration
48 a)
Fixed 10
3×70084001
3.701
914.873
11.624
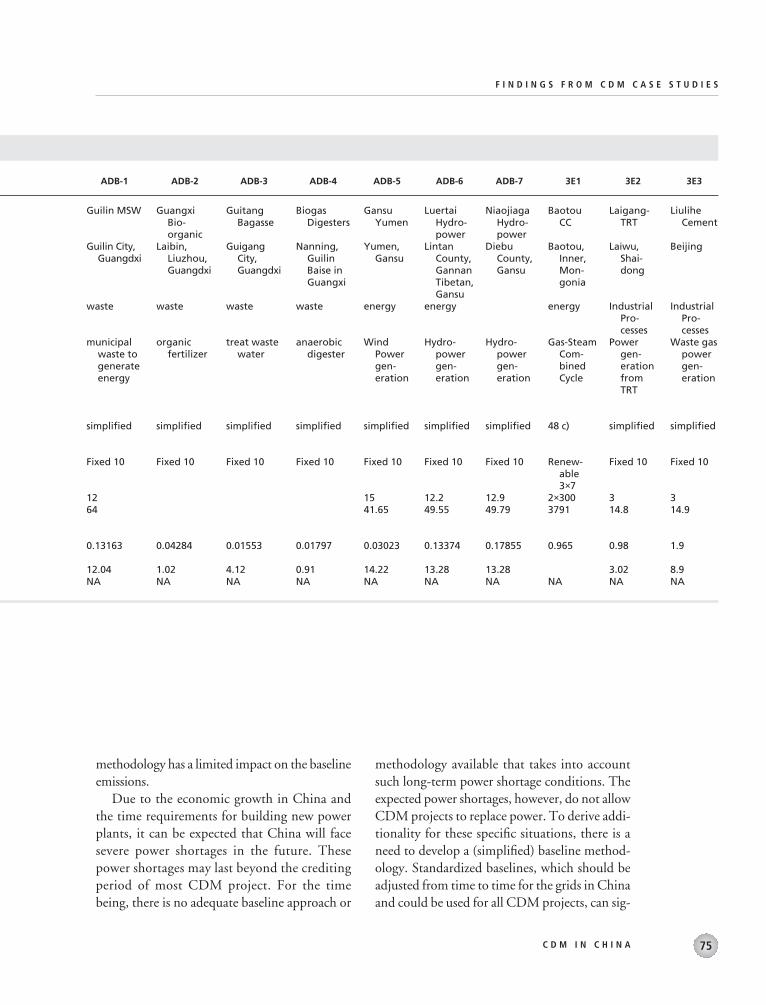
methodology has a limited impact on the baselineemissions.
Due to the economic growth in China andthe time requirements for building new powerplants, it can be expected that China will facesevere power shortages in the future. Thesepower shortages may last beyond the creditingperiod of most CDM project. For the timebeing, there is no adequate baseline approach or
methodology available that takes into accountsuch long-term power shortage conditions. Theexpected power shortages, however, do not allowCDM projects to replace power. To derive addi-tionality for these specific situations, there is aneed to develop a (simplified) baseline method-ology. Standardized baselines, which should beadjusted from time to time for the grids in Chinaand could be used for all CDM projects, can sig-
F I N D I N G S F R O M C D M C A S E S T U D I E S
C D M I N C H I N A 75
ADB-1 ADB-2 ADB-3 ADB-4 ADB-5 ADB-6 ADB-7 3E1 3E2 3E3
GuangxiBio-organic
Laibin,Liuzhou,Guangdxi
waste
organic fertilizer
simplified
Fixed 10
0.04284
1.02NA
GuitangBagasse
GuigangCity,Guangdxi
waste
treat wastewater
simplified
Fixed 10
0.01553
4.12NA
BiogasDigesters
Nanning,GuilinBaise inGuangxi
waste
anaerobicdigester
simplified
Fixed 10
0.01797
0.91NA
GansuYumen
Yumen,Gansu
energy
WindPowergen-eration
simplified
Fixed 10
1541.65
0.03023
14.22NA
LuertaiHydro-power
LintanCounty,GannanTibetan,Gansu
energy
Hydro-powergen-eration
simplified
Fixed 10
12.249.55
0.13374
13.28NA
NiaojiagaHydro-power
DiebuCounty,Gansu
Hydro-powergen-eration
simplified
Fixed 10
12.949.79
0.17855
13.28NA
Baotou CC
Baotou,Inner,Mon-gonia
energy
Gas-SteamCom-binedCycle
48 c)
Renew-able 3×7
2×3003791
0.965
NA
Laigang-TRT
Laiwu,Shai-dong
IndustrialPro-cesses
Power gen-erationfrom TRT
simplified
Fixed 10
314.8
0.98
3.02NA
LiuliheCement
Beijing
IndustrialPro-cesses
Waste gaspowergen-eration
simplified
Fixed 10
314.9
1.9
8.9NA
Guilin MSW
Guilin City,Guangdxi
waste
municipalwaste togenerateenergy
simplified
Fixed 10
1264
0.13163
12.04NA
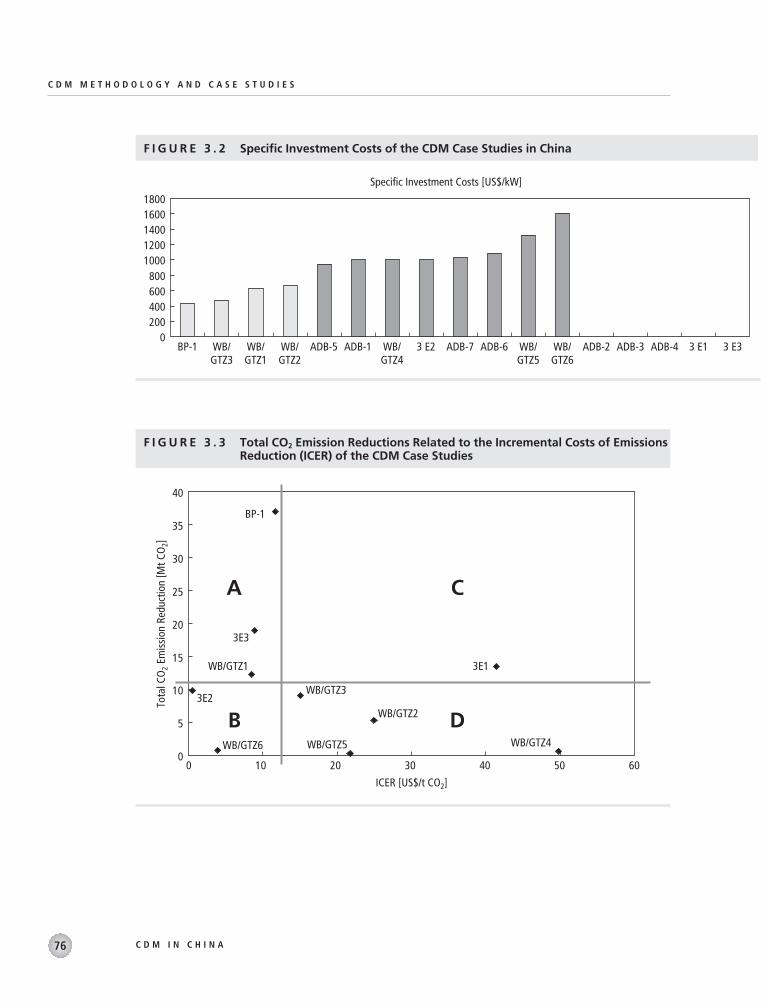
C D M M E T H O D O L O G Y A N D C A S E S T U D I E S
C D M I N C H I N A76
F I G U R E 3 . 2 Specific Investment Costs of the CDM Case Studies in China
F I G U R E 3 . 3 Total CO2 Emission Reductions Related to the Incremental Costs of EmissionsReduction (ICER) of the CDM Case Studies
Specific Investment Costs [US$/kW]
0200400600800
10001200140016001800
3 E33 E1ADB-4ADB-3ADB-2WB/GTZ6
WB/GTZ5
ADB-6ADB-73 E2WB/GTZ4
ADB-1ADB-5WB/GTZ2
WB/GTZ1
WB/GTZ3
BP-1
0
5
10
15
20
25
30
35
40
0 10 20 30 40 50 60
ICER [US$/t CO2]
Tota
l CO
2 Em
issi
on R
educ
tion
[Mt C
O2]
BP-1
A
WB/GTZ3
WB/GTZ2
WB/GTZ6 WB/GTZ5 WB/GTZ4
C
DB
WB/GTZ1 3E1
3E2
3E3

nificantly reduce the work load for setting upCDM projects.
Additionality
One might argue that projects listed in the Five-Year-Plans will be built anyway, even in theabsence of CDM. For a potential CDM projectthat is listed in the plan, it has to be shown thatthe project would not receive the necessary financ-ing, even though it is part of the Five-Year-Plan(This may be a criteria of exemption from theproject pipeline).
Early action is needed in order to catch theopportunities provided by CDM. Therefore, it isnecessary to identify potential CDM projectactivities that are in line with the government pri-orities listed in the Five-Year-Plan, and are at thetime not (yet) economically feasible for projectdevelopment. These projects should be identifiedbefore the submission of a project to the govern-ment authorities for approval. Furthermore, pro-jects that are not economically viable at first sightmay improve their economic performance withCDM, and hence have a higher probability to beapproved by the government.
Benefits from CDM and Barriers forits Implementation
Benefits from CDM to China
Beside the obvious goals of CDM projectactivities—the reduction of GHG emissions andmitigation of climate change—there are othersignificant benefits for China. These include thea) transfer of state-of-the-art technology to Chinathat will stimulate scientific and technologicalprogress; b) additional revenues coming fromCER that will improve the financial performanceof a project; c) help to start up new, domesticindustry sectors; d) improvements in local air,water, and groundwater quality; e) diversificationof electricity generation sources; f) support andhelp to accelerate the development of renewableenergies; and g) creation of new jobs.
The benefits derived from CDM support allthree major objectives of China’s energy policywithin the 10th Five-Year Plan; that is, to reducethe environmental impacts of coal-fired genera-tion by 1) diversifying the fuel mix; 2) promot-ing energy efficiency and clean coal technologies;and 3) promoting renewable energy.
Barriers for the implementation of CDM in China
The barriers and possible risks for CDM imple-mentation in China have been analyzed systemati-cally. There are potential barriers at different levels.
For the stakeholders, important barriers in-clude the following: a) the central government isknowledgeable about CDM, but there is relativelylittle awareness of CDM at the provincial and locallevels; b) the government has stated its objectivesto improve the energy efficiencies of power plantsand enlarge the share of renewable energy, but hasnot yet provided the needed support; c) powerutilities are crucial in order to get the data to cre-ate a solid baseline, but the utilities only benefitfrom CDM when it involves their own plants.
The present prevailing uncertainty concernsthe date when the Kyoto Protocol will enter intoforce. Since the Kyoto Protocol has not yet en-tered into force, the DNA (designated nationalauthority) hasn’t been established yet. There is aneed for transparent, simple, and straight-forwardCDM procedures for project developers.
Different factors affect the financial perfor-mance of a CDM project activity. Some of themare perceived as risk, such as uncertainties abouttechnology performance, electricity tariffs, andadditional revenues from CER. In addition, thelevel of transaction cost of the CDM project activ-ity is expected to be high, especially for small-scaleCDM project activities.
CDM Project Activity Opportunities for China
The incremental costs of emission reduction(ICER) of the six cases are $3.94/t CO2 for
F I N D I N G S F R O M C D M C A S E S T U D I E S
C D M I N C H I N A 77

Zhuhai-Landfill gas, $8.47 for the Huanengsuper-critical power plant, $15 for the gas-steamcombined cycle trigeneration, $21.67 for Taicangbiogas, $24.94 for BJ3TPP-GSCC, and $49.79for the Shanghai wind farm. The case studiesshow that the low ICER results from either largeGWP of methane or high efficiency improve-ment. On the other hand, high ICERs result fromhigh initial investment costs, comparatively shortannual operation hours of a plant, or high naturalgas prices.
In general, it seems that most of the ICER ishigher than that the current market price andanticipated level of abatement cost in China.However, the current low market price of CERsdoes not reflect the future CER market price,given the uncertainty of the Kyoto Protocol’sentry into force. On the other hand, sensitiv-ity analysis shows there may be some room fordecreasing ICERs, since the value of some para-meters is expected to decline, such as natural gasprices or longer crediting periods.
This study has investigated 6 CDM casestudies from the power sector with a total reduc-tion potential of about 2.2 MtCO2 equivalentannually at the weighted average ICER of $15/
t-CO2eq. The technology assessment presentedin Table 3.23 intends to facilitate further discus-sion among all stakeholders on the findings ofthis investigation.
The development of a larger project pipelinewould take into consideration the parameterssuch as concentration on projects perceived as“low” risk as well as technological advancementin the respective sectors. Other important issuesinclude the assessment of abatement cost; assess-ment of the project developer’s risks associatedwith demonstration of additionality; the relatedtechnology and financial risks; and stakeholders’views based on the above mentioned criteria.Table 3.23 shows the interaction of risks andcosts. Through wider analysis of results obtainedby different groups of project proponents, wecould establish a more consistent assessment oftechnology priorities for CDM. The table is spe-cific to this WB/GTZ-aided project only, not ageneric conclusion.
Recommendations to Facilitate CDM in China
These recommendations are based on the find-ings of the six case studies and the lessons learnedfrom the interactions with different stakehold-ers. The recommendations should facilitateCDM in China by making opportunities pro-vided by CDM more visible, removing perceivedbarriers, and setting incentives that supportCDM.
Regulations, incentives. Provide lower, prefer-able taxes on electricity sales to the public gridfrom renewable energy sources.
Issue a directive for power utilities that a cer-tain share (e.g., 5 percent) of their power gener-ation has to come from renewable energy sources.
Tools. Generate a power baseline for regionswith high potential for CDM project activities.Investigate and generate simplified baselines forpower shortage situations
Information, communication. Promote CDMin target provinces and cities through workshops,
C D M M E T H O D O L O G Y A N D C A S E S T U D I E S
C D M I N C H I N A78
T A B L E 3 . 2 3 Cost and Priority Ranking of Project Types
Barriers and associated risk for demonstrating additionality
Abatement cost low risk +/- higher risk
Medium to high cost≥ 10 US$/
t CO2
Low cost< 10 US$/tCO2
Wind powerBiogas
Landfill Methane gas recovery
Biomass gasification
TrigenerationFuel switch:
Gas combined cycle
Energy efficiency in industry
Supercriticalcoal

case studies, and training courses to improveknowledge and know-how about CDM. Estab-lish a roundtable to make use of experiencesgained from the different ongoing CDM activi-ties, with a focus on case studies.
Institutional arrangements. Integrate CDMinto the existing application and approval cycleof power plant projects in China, taking intoaccount the opportunities of CER from CDMto improve the economic viability of a project atan early stage.
Set up an arrangement for power utilities toget the data and information needed for a solidbaseline.
Endnotes/References1. E.g. monitor that also remote areas are going to be sup-
plied with electricity, not only urban areas.2. Sustainable strategy according to the 10th Five-Year-Plan:
i) Adhering to the basic state policy on family planning. ii) Protecting natural resources and using them properly.iii) Improving ecological conservation and strengtheningenvironmental protection.
F I N D I N G S F R O M C D M C A S E S T U D I E S
C D M I N C H I N A 79

CHINA’S CDM POTENTIAL
II
�


C D M I N C H I N A 83
OBJECTIVES
In Part II, we assess the potential supply of CERsin China and their marginal abatement cost curve(MAC) in view of the supply and demand poten-tial in the world carbon market. This analysis isintended to improve our understanding of theopportunities and the economic benefits for Chinaprovided by participating in the CDM regime.
The specific objectives are as follows:
• To assess global carbon trading supply anddemand based on selected scenarios under theKyoto Protocol
• To determine the potential supply of CERsfrom CDM projects in China under differentscenarios
• To assess the impacts of CDM implementa-tion on China’s economic development andidentify opportunities and economic benefitscreated by CDM in China
• To make recommendations on key CDM pol-icy implications for China
• To build capacity in the application of analyt-ical methods and modeling tools in China forCDM carbon trade economics and policyassessment.
THE CHALLENGE
An important challenge for China’s policymakersis to understand at the macroeconomic level the
opportunities and economic benefits of partici-pating in the CDM regime; that is, understand-ing the potential supply and demand for CERs inthe world carbon trade market, price trends, howto better use and manage potential Chinese CDMprojects, and how to promote technology trans-fer and sustainable development, especially inthe energy sector. To answer these questions, thisstudy employed several energy-economy models,including two energy technology models (IPAC-Emission model and IPAC-AIM/Technologymodel), a carbon market equilibrium model(CERT), and a computable general equilibriummodel (IPAC-SGM). The model system willproject future carbon emissions and generatemarginal abatement cost curves for differentregions in the world; address the possible carbontrade and equilibrium carbon quota price with aview to better understand the role of CDM in theworld carbon market; examine carbon reductionpotential by major sectors; and identify technol-ogy priorities for CDM in China. The model sys-tem will also provide insights into the policyimplications of CDM in China and the impact ofCDM on China’s economy. Since there havebeen few comparable studies, using these model-ing tools to analyze CDM price, potential, andimpact is a difficult challenge.
The 7th Conference of the Parties adopted apackage of decisions on Kyoto Protocol issues,
Objectives, Methodologies, andApproach in Evaluating China’s
CDM Potential
4
�

especially on CDM. These decisions are docu-mented in the Marrakech Accords. This politicalachievement should pave the way for Annex IParties to ratify the Kyoto Protocol and thusbring it into force soon. Under the politicalagreement, the CDM regime was elaborated inprinciple at the technical and procedural levels,which will enable CDM to become operationalwhen the Protocol enters into force. Other emerg-ing post-COP7 issues include the impact of theUnited States’ withdrawal, the offsetting effectof carbon sequestration in Russia’s forests onRussia’s target emissions, the potential for thedevelopment of carbon sink projects, the partic-ipation rate of the major developing countries,and possible CDM market structures. Some ofthese issues, which are critical for China’s inter-ests, can be addressed by using the modelingapproach in this study.
BRIEF DESCRIPTION OFMETHODOLOGICAL FRAMEWORKAND APPROACH
The IPAC Emission Model
The IPAC emission model was a global modeldeveloped for greenhouse gas emission scenarios.It divides the world into nine regions: (1) theUnited States (US); (2) Pacific OECD (OECD-P); (3) Europe OECD and Canada (OECD-W);(4) Eastern Europe and the former SovietUnion (EFSU); (5) Middle East (ME); (6) China;(7) other Asia (Southeast Asia); (8) Africa; and(9) Latin America (LA). Major emission sources—including energy activities, industries, land use,agriculture, and forests—can be simulated inthe model framework. The model consists ofthree modules: a macroeconomy module, end-use module, and land-use module, as shown inFigure 4.1. The macroeconomy module wasdeveloped based on the Edmonds-Reilly-Barns(ERB) model (Edmonds and others 1983), amacroeconomic partial-equilibrium model thatforecasts long-term energy demand. It uses GDP
and population as future development drivers,combined with other energy-related parametersto forecast energy demand based on the supplyand demand balance. The end-use module isoriginally a part of the Asian-Pacific IntegratedModel (AIM), a bottom-up energy-technologymodel that was developed by the National Insti-tute for Environment Studies and Kyoto Univer-sity of Japan. The land-use module was developedfrom the Agriculture Land Use Model developedby Pacific-Northwest National Lab (PNNL) toestimate GHG emissions from land use.
The macroeconomy module calculates futureenergy service demand for three end-use sectors—industry, commercial/residential, and transport—based on exogenous future potential GDP growth.The end-use module calculates energy technologyefficiency and final energy demand from the cur-rent period to 2030. After 2030, the macro econ-omy module calculates energy demand for thethree energy end-use sectors and energy reserveand its relative cost. In the long term, technologyprogress is the main basis of energy demand.
The IPAC-AIM Technology Model
The IPAC-AIM technology model is a single-region model for China. It includes three mod-ules: (1) an energy service demand projectionmodule; (2) an energy efficiency estimationmodule; and (3) a technology selection module.It is a typical bottom-up type model. The struc-ture of this model is given in Figure 4.2. Thedemand sector is divided into industrial, agri-cultural, service, residential, and transportation.These sectors are further divided into sub-sectors(Table 4.1). For both the demand and supplyside, more than 400 technologies are considered,including existing as well as future technologies(Table 4.2). Future sector output services (suchas steel output) are a key driver. In order to pro-vide these output services, a group of technolo-gies will be selected. Energy demand could thenbe calculated for these technologies. The modelsearches for the least-cost technology mix to
C H I N A ’ S C D M P O T E N T I A L
C D M I N C H I N A84

O B J E C T I V E S , M E T H O D O L O G I E S , A N D A P P R O A C H I N E V A L U A T I N G C H I N A ’ S C D M P O T E N T I A L
C D M I N C H I N A 85
M/ Em is si on- Ri nk ag e
Socio-Economic Scenarios
GHGs Emissions
Cropland
Pasture
Forest
Biomass Farm
Other Land
Land Input
GDP Population LifestyleResource Base
Goods andService Price
AIM/Climate Model
AIM/Impact Model
Bottom-up Model
BiomassEnergy
Demand
Feed
back
Land Equilibrium Model
OtherInputs
GDP
Population
Goods &Service
Demand
Goods &ServiceSupply
SocialEnergy
Efficiency
Endo UseEnergy
Efficiency
TechnologyChange
FoodConsumption
Pattern
IndustrialProcessChange
IndustrialProduction
SocialEnergy
EfficiencyChange
PrimaryEnergySupply
ExploitationTechnology
Energy Price
EnergyConversionTechnologyEfficiency
EnergyConversionTechnology
Final EnergySupply
Final EnergyDemand
End UseTechnology
End UseTechnologyEfficiency
EnergyService
Demand
Energy-Economic Model
GDP
Population
ResourceBase
EnergyResource
IPAC-Emission
F I G U R E 4 . 1 Framework of IPAC Emission Model

meet the given energy service demand. Policiesand countermeasures for technology selection,progress, and energy price could be simulated inthe model. Data for these technologies were col-lected from reports, journals, and publications,and by consulting experts. The data is continu-ously updated to include new information.
The CERT Model
The CERT (Carbon Emission Reduction Trad-ing) model was developed in 2001 by GrütterConsulting together with ETH Zürich on behalfof the World Bank (Kappel and others 2002).CERT is a partial equilibrium model to simulatethe emerging market of GHG emission reduc-tions. It uses inputs of GHG emission projec-tions and marginal abatement cost curves fromother models.
For whatever market considered, CERT addsup the quantities (x-axis) potentially supplied and
C H I N A ’ S C D M P O T E N T I A L
C D M I N C H I N A86
F I G U R E 4 . 2 Structure of IPAC-AIM Technology Model
Energy Energy Technology Energy Service
- Oil- Coal- Gas- Solar- (Electricity)
- Boiler- Power generation- Blast furnace- Air conditioner- Automobile
- Heating- Lighting- Steel products- Cooling- Transportation
Energy Database for China
- Energy type- Energy price- Energy constraints- CO2 emission factor
Technology Database for China
- Technology price- Energy consumption- Service supplied- Share- Lifetime
- Population growth- Economic growth- Industrial structure- Employees- Lifestyle
Socio-economic Scenario for China
Service DemandsService Demands TechnologySelection
Energy ConsumptionCO2 Emissions
T A B L E 4 . 1 Classification of Energy End-use Sectorsand Subsectors
Sectors Sub-sectors
Agriculture
Industry
Household
Service
Transportation
Irrigation, farming, agricultural products pro-cessing, fisheries, animal husbandry
Iron & steel, non-ferrous, building materials,chemical industry, petrochemical industry,papermaking, textiles
Urban: space heating, cooling, lighting, cooking and hot water, household electricappliance
Rural: space heating, cooling, lighting, cooking and hot water, household electricappliance
Space heating, cooling, lighting, cooking andhot water, electric appliance
Passenger: railway, highway, waterway, airway
Freight: railway, highway, waterway, airway

O B J E C T I V E S , M E T H O D O L O G I E S , A N D A P P R O A C H I N E V A L U A T I N G C H I N A ’ S C D M P O T E N T I A L
C D M I N C H I N A 87
T A B L E 4 . 2 Major Technologies Considered in the Model
Classification Technologies (equipment)
Iron & steel
Non-ferrous metal
Building materials
Chemical industry
Petrochemical industry
Papermaking
Textile
Coke oven, sintering machine, blast furnace, open hearth furnace(OHF), basic oxygen furnace (BOF), AC-electric arc furnace, DC- electric arc furnace, ingot casting machine, continuous cast-ing machine, continuous casting machine with rolling machine,steel rolling machine, continuous steel rolling machine, cokedry quenching, coke wet quenching, electric power generatedwith residue pressure on top of blast furnace (TRT), coke ovengas, OHF gas and BOF gas recovery, cogeneration
Aluminum production with sintering process, aluminum produc-tion with combination process, aluminum with Bayer, electrolyticaluminum with upper-insert cell, electrolytic aluminum with side-insert cell, crude copper production with flash furnace, crudecopper production with electric furnace, blast furnace, reverbera-tor furnace, lead smelting-sintering in blast furnace, lead smelt-ing with closed blast furnace, zinc smelting with wet method,zinc smelting with vertical pot method
Cement: Mechanized shaft kiln, ordinary shaft kiln, wet processkiln, lepol kiln, ling dry kiln, rotary kiln with pro-heater, dryprocess rotary kiln with pre-calciner, self-owned electric powergenerator, electric power generator with residue heat
Brick & Tile: Hoffman kiln, tunnel kilnLime: Ordinary shaft kiln, mechanized shaft kilnGlass: Floating process, vertical process, Colburn process, smelterSynthetic ammonia production: Converter, gasification furnace,
gas-making furnace, synthetic column, shifting equipment ofsulphur removing
Caustic soda production: Electronic cell with graphite process,two-stage effects evaporator, multi-stage effects evaporator,rectification, ion membrane method
Calcium carbine production: Limestone calciner, closed carbinefurnace, open carbine furnace, residue heat recovery
Soda ash production: Ammonia & salt water preparation, lime-stone calcining, distillation column, filter
Fertilizer production: Organic products production, residue heatutilization
Atmospheric & vacuum distillation, rectification, catalyzing &cracking, cracking with hydrogen, delayed coking, light carboncracking, sequential separator, naphtha cracker, de-ethaneseparator, diesel cracker, de-propane cracker, residue heat utilization from ethylene
Cooker, distillation, washing, bleaching, evaporator, crusher, de-watering, finishing, residue heat utilization, black liquor recov-ery, cogenerator, back pressure electric power generator,condensing electric power generator
Cotton weaving, chemical fiber, wool weaving & textiles, silk,printing & dyeing process, garment making, air conditioner,lighting, space heating
(continued)

Machinery
IrrigationFarming worksAgricultural products process
FisheryAnimal husbandryResidential space heating
Residential coolingResidential lightingResidential cooking & hot water
Electric applianceSpace heating in service sector
CoolingLightingCooking & hot waterElectric appliancePassenger & freight transport
Common technologies
Power generation
C H I N A ’ S C D M P O T E N T I A L
C D M I N C H I N A88
T A B L E 4 . 2 Major Technologies Considered in the Model (Continued )
Classification Technologies (equipment)
Ingot process: cupola, electric arc furnace, fanForging process: coal-fired pre-heater, gas-fired pre-heater, oil-
fired pre-heater, steam hammer, electric-hydraulic hammer,pressing machine
Facilities for heat processing: Coal-fired heat processing furnace,oil-fired heat processing furnace, gas-fired heat processing furnace, electric processing furnace
Cutting process: Ordinary cutting, high-speed cuttingDiesel engine, electric induct motorTractor, other agricultural machineryDiesel engine, electric induct motor, processing machine, coal-
fired facilitiesDiesel engine, electric induct motorDiesel engine, electric induct motor, other machinesHeat supplying boiler in thermal power plant, district heating
boiler, dispersed boiler, small coal-fired stove, electric heater,brick bed linked with stove (Chinese KANG)
Air conditioner, electric fanIncandescent lamp, fluorescent lamp, kerosene lampGas burner, bulk coal-fired stove, briquette-fired stove, kerosene
stove, electric cooker, cow dung-fired stove, firewood-firedstove, methane-fired stove
Television, cloth washing machine, refrigerator, othersHeat supplying boiler in the thermal power plant, district heating
boiler, dispersed boiler, electric heaterCentral air conditioner system, air conditioner, electric fanIncandescent lamp, fluorescent lampGas burner, electric cooker, hot water pipeline, coal-fired stoveDuplicating machine, computer, elevator, othersRailway (passenger & freight): Steam locomotive, internal com-
bustion engine locomotive, electric locomotiveHighway (passenger & freight): Public diesel vehicle, public gaso-
line vehicle, private vehicle, large diesel freight truck, largegasoline vehicle, small freight truck.
Waterway (passenger & freight): Ocean-going ship, coastal ship,inland ship.
Aviation (passenger & freight): Freight airplane, passenger air-plane
Electric motor, frequency adjustable electric motor, coal-firedboiler, high efficiency coal-fired boiler, natural gas-fired boiler,oil-fired boiler
Low parameter coal-fired generator, high pressure critical coal-fired generator, super critical coal-fired generator, PFBC, IGCC,natural gas-fired generator, NGCC, nuclear generator, wind tur-bine, hydropower, solar power generation, oil-fired generator,biomass power generation, landfill power generation

those potentially demanded at each price (y-axis)across the constituent regions. As one varies theprice, the demand and supply curves for this mar-ket are described, and their intersection indicatesthe market clearing price on the y-axis (Kappeland others 2002). The market is cleared for thefirst commitment period in 2008–2012, and theyear 2010 is taken as a representative value forthat period.
CERT incorporates a variety of switches, suchas implementation rate, transaction cost, supple-mentarity, participation rate of the United States,and market structure to analyze the impact ofdifferent factors on the market.
The implementation rate is the percentage ofCERs actually implemented by non-Annex Icountries. An implementation rate below 100 per-cent means that not all possible projects (MACs)will be realized. If the implementation rate is setover 100 percent, then banking of projects prior tothe period 2008–2012 is assumed. The calculationof the implementation rate is performed by calcu-lating a proportional upward or downward shiftin the supply curve (Kappel and others 2002).
Transaction costs are added to the cost of thecredits (Kappel and others 2002).
Supplementarity is modeled as an import ceil-ing (restrictions to the amount an Annex B coun-try can import to comply with its reductioncommitment). Supplementarity means an AnnexB country can import a certain percentage of thereduction requirement. In this case, the demandcurve of the market would be changed.
The U.S. withdrawal from the Kyoto Proto-col would significantly shrink the carbon mar-ket. States such as California might use the threemechanisms defined in the Kyoto Protocol—JI,CDM, and ET—to help realize some of theirdomestic air quality regulations. The participa-tion rate of the United States could be simulatedin CERT 1.3. Limited participation by theUnited States leads to a corresponding reductionin the BAU-Kyoto target; the parameters of theMAC for the United States are adjusted accord-ingly (Kappel and others 2002).
Three kinds of market structures could besimulated in CERT 1.3: perfect competition,monopoly, and price leadership. In the perfectcompetition market, all countries' marginal abate-ment cost would be equal to the equilibrium price,which would reflect the lowest cost of global emis-sion reductions. For example, since economies intransition (EITs) have sufficiently large amountsof greenhouse emissions to control the marketprice, the model could simulate an EIT monop-oly. The calculation is made by maximizingrevenues for EITs plus non-Annex B nations.However, if EITs restrict their offer to controlthe price, a trade-off problem would develop inwhich a high price would lead to a large quantityof free-riders who sell at this price, thus enlargingthe offer and limiting the sales and the income ofEITs. While a working cartel is not expected—too many countries are involved and partial inter-ests are diverse—an oligopolistic situation or someform of price leadership is much more probable(Kappel and others 2002).
In the CERT model, the world is grouped into12 regions: six for Annex I parties, including theUnited States, Japan (JPN), European Union(EEC), other OECD countries (OOE), the for-mer Soviet Union (FSU), and other Economies inTransition (EIT); and the other six for non-Annex I Parties, including China (CHN), India(IND), Brazil (BRA), Energy Exporting countries(EEX), dynamic Asian Economies (DAE), andthe rest of the world (ROW). When applying thecarbon emission projections and marginal abate-ment cost curves from the IPAC emission modelin CERT, the world can be easily regrouped to beconsistent with the regional division in the IPACemission model.
Linkages Between Models
The IPAC emission model generates referenceemission scenarios for the year 2010 and MACsfor the nine regions. With the reference emis-sion scenarios and MACs from the IPAC emis-sion model and other models, the CERT model
O B J E C T I V E S , M E T H O D O L O G I E S , A N D A P P R O A C H I N E V A L U A T I N G C H I N A ’ S C D M P O T E N T I A L
C D M I N C H I N A 89

calculates the world carbon price, China’s poten-tial CERs supply volume (referred to as CDMpotential in the following text), and profits fromselling CERs when demand and supply reachesequilibrium in the world carbon market. Researchresults from the IPAC-AIM technology model areused to provide a picture of China’s CDM poten-tial by sectors, and technology priorities byassuming various technologies for CDM basedon the study for emission reduction potential in
China. China’s profits from CDM (from theCERT model) are passed to the IPAC-SGMmodel (introduced in chapter 6) to analyze theimpact of CDM on China’s economy.
Because CDM is a project-based tradingmechanism, it is a challenge to simulate CDM inthe overall analysis. So far there is no good modelto cover all the issues targeted in this study. So weused several models for this purpose. We facedchallenges to maintain good consistency amongthese models, because there is no hard linkamong them and the models have differentpurposes. There are no specific parameters forCDM in these models. Simulation for CDM inthese models is given by assumptions for CDM.Another difficulty concerns the differences inmodel methodology and the structure of themodels. This caused the difference in the baselinescenario in the IPAC emission model, IPAC-AIM technology model, and IPAC-SGM model,even though similar assumptions were used forthese models. Therefore the modeling study triesto understand limited aspects of CDM. TheIPAC-AIM technology model is weakly linkedwith other models used in this study because ofdifferences in model characteristics and structure.The IPAC-AIM technology model is only usedto identify the potential distribution of CDMprojects by sector. In the IPAC emission model,1990 is the base year, while data for 2000 washarmonized to follow actual data.
Figure 4.3 displays the linkage framework ofthe models.
C H I N A ’ S C D M P O T E N T I A L
C D M I N C H I N A90
IPAC-Emission model
CERT model
(1) BAU projections for the nine regions (1) MACs for the nine regions
(0) BAU projectionsand MACs from other models
(2) World equilibrium carbon price (2) China’s CDM potential
IPAC-SGM model
(4) CDM’s impacton China’s
economy, etc.
IPAC-AIM/ Technology model
(3) China’s CDMdistribution by
sector CDMtechnologypriorities
F I G U R E 4 . 3 Linkage Framework of the Models

C D M I N C H I N A 91
MARGINAL ABATEMENTCOST CURVES
Reference Emission Scenarios
The reference scenario used in this study wasdeveloped from the results of related studiesand projects up to 2010. Results from the AIM project—a collaboration among variousAsian countries, including Japan, China, India,Korea, Indonesia, and Thailand—were used inthe IPAC emission model. Other sources ofinformation—including national communica-tions to UNFCCC, the International EnergyAgency’s World Energy Outlook, and the U.S.Department of Energy’s International EnergyOutlook—were used to prepare a reference sce-nario. The quantified key scenario drivers andassumptions for the world and nine regions arelisted in Tables 5.1 and 5.2.
Data used for the model were also collectedfrom several other sources, including the Inter-national Energy Agency’s energy statistics year-book, the United Nations Food and AgricultureOrganization’s agricultural statistics yearbook,the World Bank’s population forecast, the Inter-national Institute of Applied Systems AnalysisGDP forecast, and national statistical yearbooks.
The modeling results for the reference sce-nario of energy demand and carbon emissions
(from fossil fuel combustion only) from the IPACemission model are shown in Tables 5.3 and 5.4.By 2010, world carbon emissions from fossil fuelcombustion are expected to grow 36.5 percentfrom the 1990 level. For Annex I Parties, growthis forecast to be 5.5 percent. By 2010, renewableenergy is forecast to account for 7.8 percent oftotal global primary energy demand. Energy effi-ciency is expected to improve at an annual aver-age rate of 1.18 percent from 2000 to 2010. InChina, coal’s share declines from 71 percent in2000 to 62 percent in 2010, suggesting a shiftfrom coal to natural gas and oil.
Note: Since most references for the modelingwork in this chapter apply tons Carbon (tC) ratherthan carbon dioxide (CO2), the tC unit will beapplied throughout the chapter. Since the Tech-nical Summary uses the conventionally appliedCO2, the equivalent CO2 value is added in abracket behind the tC value. CO2 values can beconverted to C values by multiplying the CO2
value by 12/44 (the ratio of the molecular weightof C to CO2).
Marginal Abatement Cost Curves
Using the IPAC emission model, marginal abate-ment cost curves (MACs) are derived by intro-ducing progressively higher carbon taxes on thebasis of the reference emission scenario and
Analysis of China’s CDM Potential5
�

Figure 5.1 displays the results for the MACsin the nine regions for the year 2010.
Because of their high reference emissions,China and the United States have the flattest mar-ginal abatement cost curves. The Middle East,Africa, and Latin America have the steepestmarginal abatement cost curves. The MiddleEast, where oil and gas are the dominant energysources, and Latin America, where relativelyclean energy sources such as hydropower and bio-gasoline are widely used in countries such asBrazil, show higher reduction costs and less reduc-tion potential.
Comparison of MACs from Different Sources
The MAC curves for different regions in theworld could also be observed from several othermodels, like the Emission Prediction and Pol-icy Assessment model (EPPA) model developedby MIT’s Joint Program on the Science andPolicy of Global Change, and the Global Tradeand Environment model (GTEM) developedby the Australian Bureau of Agricultural andResource Economics (ABARE). Both the EPPAand GTEM models are recursive computablegeneral equilibrium models of the world econ-omy (Ellerman and others 1998; Tulpule andothers 1998).
Figures 5.2, 5.3, and 5.4 display the MACscurves for different regions from EPPA for CO2
only, from GTEM for both CO2 only and allGHGs respectively based on the formula andcoefficients given in Annex 3.
Figures 5.5, 5.6, and 5.7 compare the MACsfor the United States, OECD other than theU.S., and EFSU from different sources. For theUnited States, the MAC from the IPAC emissionmodel is quite close to that from EPPA when thereduction amount is less than 550MtC (2,017MtCO2), but becomes steeper than that fromEPPA when the reduction amount is larger than550MtC. The GTEM model results in the steep-est curve for the United States. For OECD with-
C H I N A ’ S C D M P O T E N T I A L
C D M I N C H I N A92
T A B L E 5 . 1 Population of the Nine Regions
Population (billions) 1990 2000 2010
OECD total 0.86 0.92 0.94USA 0.25 0.28 0.30Europe OECD and Canada 0.46 0.48 0.49Pacific OECD 0.14 0.15 0.15Eastern Europe and Former
Soviet Union 0.41 0.42 0.42Pacific Asia 1.14 1.29 1.35China 1.14 1.29 1.35South and south-east Asia 1.56 1.86 2.13Rest of World 2.75 3.38 4.02Middle East 0.13 0.17 0.22Africa 0.63 0.83 1.09Latin America 0.43 0.51 0.58World 5.16 6.00 6.73
recording the resulting quantity of abated emis-sions. The MACs from the IPAC emission modelcould be represented as:
MC = aQ2 + bQ
Where MC is marginal abatement cost forthe year 2010, in 1990$/tC, and Q is the abate-ment amount in MtC. The coefficients of a, b,and R2 are given in Table 5.5.
T A B L E 5 . 2 GDP of the Nine Regions
GDP (Trillion $, 1990$) 1990 2000 2010
OECD total 16.30 21.07 24.47USA 5.50 7.52 8.95Europe OECD and Canada 7.58 9.50 11.03Pacific OECD 3.28 4.05 4.49Eastern Europe and Former
Soviet Union 1.08 0.96 1.36Pacific Asia 0.47 1.23 2.31China 0.47 1.23 2.47South and south-east Asia 1.03 2.06 3.64Rest of World 2.96 4.73 7.69Middle East 0.45 0.62 0.92Africa 0.39 0.53 0.86Latin America 1.08 1.52 2.28World 20.87 27.99 35.98

out the U.S., the IPAC emission model providesthe flattest MAC. For EFSU, when the reductionamount is less than 350MtC (1,283 MtCO2) theMACs from IPAC emission, EPPA, and GTEMare very close. When the reduction amount islarger than 350MtC, the MACs from IPACemission and EPPA are still very close, whileGTEM’s is much steeper.
Figure 5.8 compares the MACs for Chinafrom different sources. The MAC from the IPACemission model is much steeper than those fromGTEM and EPPA.
BAU emission projections are the basis forderiving MACs from models. In the IPACemission model, China’s 2010 BAU emissionsare projected to be 1094MtC (4011 MtCO2)—assuming some abatement countermeasures suchas energy efficiency improvements, hydropowerdevelopment, nuclear development, and effi-ciency improvements. These improvements areconsistent with China’s energy development strat-egy. EPPA projects BAU emissions as high as1792MtC (6571 MtCO2) for China. To furtherreduce emissions from a relatively low BAUwould elevate abatement costs. But even withsimilar BAU projections, the MACs generatedfrom various models could also be different.
The main reasons for the disparity in MACsgenerated from different models could be sum-marized as follows:
Differences in modeling approach and modelstructure. EPPA and GTEM are top-town CGEmodels, while IPAC emission is a partial generalequilibrium model with a focus on energy sys-tems. In CGE models, the revenues from carbontaxation are normally recycled to the economy. Inaddition, trade and income effects are taken intoaccount, while the energy system models consideronly the adjustment achieved in the energy sys-tem. Although MACs from energy system modelsdon’t take into account the full range of impactsof reduction policies, they will be close to abate-ment costs incurred at a microeconomic level.
Different basic assumptions. Different basicassumptions for factors such as GDP growth,
A N A L Y S I S O F C H I N A ’ S C D M P O T E N T I A L
C D M I N C H I N A 93
T A B L E 5 . 3 Reference Primary Energy Demand for theNine Regions from IPAC Emission Model (EJ)
1990 2000 2010
USA 69.5 82.7 89.5Pacific OECD 66.1 70.1 73.4Europe OECD and Canada 22.1 24.5 25.5Eastern Europe and Former
Soviet Union 69.3 53.9 60.6China1 28.2 38.4 54.4South and Southeast Asia 17.1 25.7 45.5Middle East 10.6 15.4 21.0Africa 7.9 10.4 14.9Latin America 14.1 18.1 22.5World 304.9 337.5 408.6
T A B L E 5 . 4 Reference Carbon Emissions from FossilFuel Combustion for the Nine Regions(from IPAC Emission Model) (GtC)
1990 2000 2010
USA 1.33 1.50 1.62Pacific OECD 0.47 0.46 0.47Europe OECD and Canada 1.11 1.20 1.24Eastern Europe and Former
Soviet Union 1.25 0.95 1.06China 0.66 0.84 1.09South and Southeast Asia 0.33 0.49 0.86Middle East 0.18 0.26 0.36Africa 0.15 0.20 0.28Latin America 0.22 0.29 0.37World 6.02 6.68 8.22
T A B L E 5 . 5 MACs Approximation of Coefficients forCO2 (from IPAC Emission Model)
USA OECD-P OECD-W EFSU —
a 0.0008 0.0075 0.0017 0.0012 —b −0.0079 0.2223 −0.0841 0.0773R2 0.9913 0.9963 0.9892 0.9959
China S.E. Asia M.E. Africa L.A.
a 0.0008 0.0014 0.0265 0.0018 0.0003b 0.1596 0.2358 1.4692 1.9744 1.7344R2 0.9972 0.9988 0.999 0.9975 0.9

C H I N A ’ S C D M P O T E N T I A L
C D M I N C H I N A94
0
100
200
300
400
500
600
700
0 100 200 300 400 500 600 700Emission reduction (MtC)
Mar
gina
l aba
tem
ent c
ost (
US$
/tC 2
000) USA
OECD-P
OECD-W
EFSU
China
S.E. Asia
ME
Africa
LA
0
100
200
300
400
500
600
700
800
900
1000
1100
1200
0 100 200 300 400 500 600 700Emission reduction (MtC)
Mar
gina
l aba
tem
ent c
ost (
US$
/tC 2
000)
USA
JPN
EEC
OOE
EET
FSU
CHN
IND
BRA
EEX
DAE
ROW
F I G U R E 5 . 1 MACs for carbon dioxide in 2010 (from IPAC emission model)
F I G U R E 5 . 2 MACs for carbon dioxide in 2010 (from EPPA)
Note: The original results from IPAC emission model are expressed in 1990 $/tC, but converted into 2000 $/tC usingdeflators of 1.196 for 1990 and 1.495 for 2000. This allows easier comparison with the results from different models.
Note: The original results from EPPA are expressed in 1985 $/tC but converted into 2000 $/tC using deflators of 1 for1985 and 1.495 for 2000. This allows for easier comparison with the results from different models.

A N A L Y S I S O F C H I N A ’ S C D M P O T E N T I A L
C D M I N C H I N A 95
F I G U R E 5 . 4 MACs for all GHGs in 2010 (from GTEM)
0
100
200
300
400
500
600
700
800
900
1000
1100
1200
0 100 200 300 400 500 600 700Emission reduction (MtC)
Mar
gina
l aba
tem
ent c
ost (
US$
/tC 2
000)
USA
JPN
EEC
OOE
EET
FSU
CHN
IND
BRA
EEX
DAE
ROW
1200
1100
1000
900
800
700
600
500
400
300
200
100
00 100 200 300 400 500 600 700
Emission reduction (MtC)
Mar
gina
l aba
tem
ent c
ost (
US$
/tC 2
000)
USA
JPN
EEC
OOE
EET
FSU
CHN
IND
BRA
EEX
DAE
ROW
F I G U R E 5 . 3 MACs for carbon dioxide only in 2010 (from GTEM)
Note: The original results from GTEM are expressed in 1995 $/tC but converted into 2000 $/tC using deflators of 1.36for 1995 and 1.495 for 2000. This allows for easier comparison with the results from different models.
Note: The original results from GTEM are expressed in 1995 $/tC but converted into 2000 $/tC using deflators of1.36 for 1995 and 1.495 for 2000. This allows for easier comparison with the results from different models.
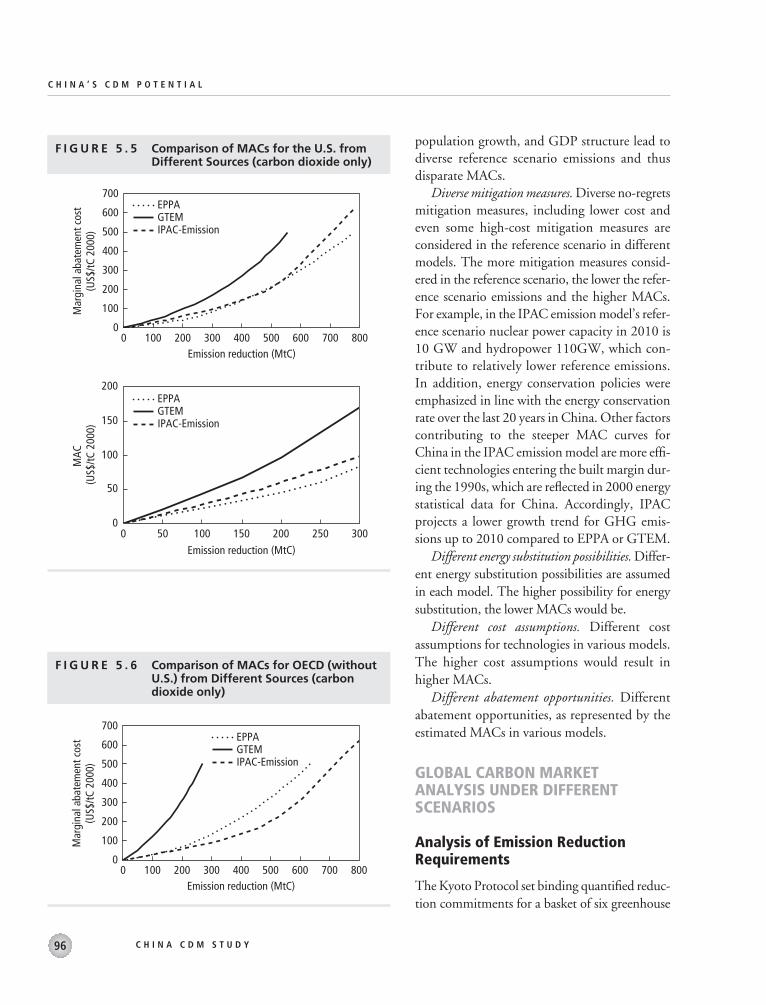
population growth, and GDP structure lead todiverse reference scenario emissions and thusdisparate MACs.
Diverse mitigation measures. Diverse no-regretsmitigation measures, including lower cost andeven some high-cost mitigation measures areconsidered in the reference scenario in differentmodels. The more mitigation measures consid-ered in the reference scenario, the lower the refer-ence scenario emissions and the higher MACs.For example, in the IPAC emission model’s refer-ence scenario nuclear power capacity in 2010 is10 GW and hydropower 110GW, which con-tribute to relatively lower reference emissions.In addition, energy conservation policies wereemphasized in line with the energy conservationrate over the last 20 years in China. Other factorscontributing to the steeper MAC curves forChina in the IPAC emission model are more effi-cient technologies entering the built margin dur-ing the 1990s, which are reflected in 2000 energystatistical data for China. Accordingly, IPACprojects a lower growth trend for GHG emis-sions up to 2010 compared to EPPA or GTEM.
Different energy substitution possibilities. Differ-ent energy substitution possibilities are assumedin each model. The higher possibility for energysubstitution, the lower MACs would be.
Different cost assumptions. Different costassumptions for technologies in various models.The higher cost assumptions would result inhigher MACs.
Different abatement opportunities. Differentabatement opportunities, as represented by theestimated MACs in various models.
GLOBAL CARBON MARKETANALYSIS UNDER DIFFERENTSCENARIOS
Analysis of Emission ReductionRequirements
The Kyoto Protocol set binding quantified reduc-tion commitments for a basket of six greenhouse
C H I N A ’ S C D M P O T E N T I A L
C H I N A C D M S T U D Y96
0
100
200
300
400
500
600
700
0 100 200 300 400 500 600 700 800Emission reduction (MtC)
Mar
gina
l aba
tem
ent c
ost
(US$
/tC 2
000)
EPPAGTEMIPAC-Emission
EPPAGTEMIPAC-Emission
0
50
100
150
200
0 50 100 150 200 250 300Emission reduction (MtC)
MAC
(U
S$/tC
200
0)
0
100
200
300
400
500
600
700
0 100 200 300 400 500 600 700 800Emission reduction (MtC)
Mar
gina
l aba
tem
ent c
ost
(US$
/tC 2
000)
EPPAGTEMIPAC-Emission
F I G U R E 5 . 5 Comparison of MACs for the U.S. from Different Sources (carbon dioxide only)
F I G U R E 5 . 6 Comparison of MACs for OECD (withoutU.S.) from Different Sources (carbon dioxide only)

gases (CO2, CH4, N2O, SF6, PFCs, and HFCs)for the Annex I Parties during the period 2008 to2012. Each Annex I Party has its own reductiontarget ranging from an 8 percent reduction to a10 percent increase from the 1990 base year. Theaverage reduction commitment is 5.2 percent forall Annex I Parties.
Table 5.6 shows the Kyoto target using totalemissions of the six GHG gases in 1990, whileTable 5.7 shows the Kyoto target using CO2
emissions only in 1990. There is a significantdifference between applying all GHG emissionsor CO2-only emissions to set the Kyoto target.
Table 5.8 compares BAU projections from dif-ferent sources for the year 2010, including threescenarios (low, medium, and high) generated bythe U.S. Department of Energy’s Energy Infor-mation Administration in its latest InternationalEnergy Outlook, the EPPA model, the GTEMmodel, the second national communications,and the IPAC emission model (EIA/USDOE2002; Grütter, 2002; UNFCCC 1998).
With the projected carbon emissions andthe Kyoto target, emission reduction require-ments are calculated in Table 5.9. The reductionrequirements range from 378 to 641 MtC (1,386-2,380 MtCO2) for the United States, 24 to 85MtC (88-312 MtCO2) for Japan, 9 to 308 MtCfor the EEC, and 53 to 117 MtC (194-429MtCO2) for OOE. All model results show thatthe former Soviet Union and other Economies inTransition would have a surplus assigned amount(termed hot air-see the Technical Summary for adiscussion of hot air), but the range varies sharplyfrom 42MtC to 397MtC (154-1,456 MtCO2).Total reduction requirements for Annex Icountries differ from 387MtC to 951MtC(1,419-3,487 MtCO2), but shrink to 162MtCto 333MtC (594-1,221 MtCO2) after the UnitedStates’ withdrawal. The minus values indicate thatthe surplus assigned amount for the Economies inTransition is larger than Annex II Parties’ emis-sion reduction requirements, and no emissionreduction measure is needed to achieve the Kyototarget. The total reduction requirements from
A N A L Y S I S O F C H I N A ’ S C D M P O T E N T I A L
C D M I N C H I N A 97
0
100
200
300
400
500
600
700
0 100 200 300 400 500 600 700Emission reduction (MtC)
Mar
gina
l aba
tem
ent c
ost
(US$
/tC 2
000)
EPPAGTEMIPAC-Emission
F I G U R E 5 . 7 Comparison of MACs for EFSU from Different Sources (Carbon dioxide only)
EPPAGTEMIPAC-Emission
0
100
200
300
400
500
600
700
0 100 200 300 400 500 600 700 800Emission reduction (MtC)
Mar
gina
l aba
tem
ent c
ost
(US$
/tC 2
000)
F I G U R E 5 . 8 Comparison of MACs for China from Different Sources (carbon dioxide only)
T A B L E 5 . 6 Kyoto Target using all GHG Emissions in1990 (MtC)
All Allwith without
USA JPN EEC OOE FSU EET USA USA
1534 311 1056 330 1112 348 4691 3157
(Note: 1990 emissions are taken from the second National Communication,and the reduction commitments are taken from the Kyoto Protocol)

C H I N A ’ S C D M P O T E N T I A L
C D M I N C H I N A98
T A B L E 5 . 8 Business-as-usual Projections from Different Models for 2010 (MtC)
EIA EIA EIA IPAC- GTEM all NC allLow Medium High EPPA GTEM NC Emission GHGs GHGs
USA 1795 1835 1887 1864 1870 1669 1624 2060 1946JPN 312 343 359 373 341 369 385 389OOE 311 331 347 305 309 286 428 383EEC 964 1013 1066 1142 951 889 1161 1065OECD-P 477OECD-W 1246FSU 540 587 641 735 631 810 810 1029EET 207 226 243 274 240 292 296 321EFSU 926All with USA 4129 4335 4543 4693 4341 4315 4272 5140 5133All without USA 2334 2500 2656 2829 2472 2646 2648 3080 3187
Note: All projections are for CO2-only, except for GTEM and NC, which are all GHGs.
T A B L E 5 . 9 Reduction Requirements to Achieve the Kyoto Target for 2010 (MtC)
EIA EIA EIA IPAC- GTEM all NC allLow Medium High EPPA GTEM NC Emission GHGs GHGs
USA 549 589 641 618 624 423 378 526 412JPN 24 55 71 85 53 1 74 78OOE 81 101 117 75 79 56 98 53EEC 130 179 232 308 117 55 105 9OECD-P 100OECD-W 271FSU −325 −278 −224 −130 −234 −55 −302 −83EET −72 −53 −36 −5 −39 13 −52 −27EFSU −218All with USA 387 593 801 951 599 573 530 449 442All without USA −162 4 160 333 −24 150 152 −77 30
T A B L E 5 . 7 Kyoto Target using Carbon Dioxide Emissions only in 1990 (MtC)
All Allwith without
USA JPN EEC OOE OECD-P OECD-W FSU EET EET USA USA
1246 288 230 834 377 975 865 279 1144 3742 2496
(Note: 1990 emissions are taken from the second National Communication, and the reduction commitments aretaken from the Kyoto Protocol)

A N A L Y S I S O F C H I N A ’ S C D M P O T E N T I A L
C D M I N C H I N A 99
the IPAC emission model are 530MtC (1,943MtCO2) with U.S. participation and 152MtC(557 MtCO2) without U.S. participation.
The Bonn Agreements (FCCC 2001), Mar-rakesh Accords, and the Marrakesh Declaration(FCCC 2001) define two categories of eligibleactivities for sinks under Article 3.3 and 3.4 ofthe Kyoto Protocol: (1) forests, includingafforestation, reforestation, and deforestation;and (2) agriculture, covering revegetation, crop-land management, and grazing land manage-ment. A specific cap for each Annex I Party touse the credit from carbon sequestration result-ing from forest activities from both domesticactions and JI projects is stipulated in the deci-sions of both COP-6 and COP-7 (Appendix Z),as shown in Table 5.10. These sink credits aresimulated as zero cost sinks and the reductionrequirements for each Annex I countries/regionsare deducted by these sink credits in CERT.
Figure 5.9 compares the emission reductionrequirements in 2010 for different regions fromdifferent sources with sink credits deducted.
Grubb (2003) analyzed supply-demand bal-ance in the Kyoto system and concluded that car-bon emissions for the EU, Japan, and Canadamight be 84 to 239MtC (308-876 MtCO2) abovetheir Kyoto allocation. Grubb estimated carbonemission credits in the range of 106 to 196 MtC(389-719 MtCO2) for Russia, 67 to 87 MtC (246-319 MtCO2) for the Ukraine, 45 to 75 MtC (165-275 MtCO2) for the Accession 10, and 24 to36 MtC (88-132 MtCO2) for other EITs. In theGrubb analysis, the total carbon credits providedby EITs ranges from 242 to 394MtC (887-1455
MtCO2), which is close to EIA’s projections (260to 397MtC, or 9,553-1,456 MtCO2) but higherthan IPAC emission’s projection (218MtC, or799 MtCO2). Grubb also estimates 30MtC(110 MtCO2) of managed forest allowance forthe EU plus Japan and Canada, and 40MtC(147 MtCO2) for EITs. These numbers are veryclose to the data shown in Table 5.10.
In this study, the emission projection fromthe IPAC emission model will be used in thebase scenario for carbon market analysis.
Global Carbon Market Simulationwith Application of CERT
Apart from the BAU projection in each Annex Icountry/region and MACs for each Annex I andnon-Annex I country/region in the year 2010,several other parameters should be set beforeusing CERT to analyze the global carbon marketfor the first commitment period. A base scenariowas designed in this study with the followingmain assumptions:
• Reference carbon emission and MACs fromIPAC emission
• A 2 percent CERs for adaptation fund asstipulated in the Marrakech Accords andMarrakech Declaration.
• Transaction costs of $2/tC ($0.54/t-CO2) forCDM and $1/tC ($0.27/t-CO2) for JI. This isbased on the PCF’s transaction cost experiencefor current CDM projects, and assumes that theCDM procedure—including validation andregistration, monitoring, verification and certi-
T A B L E 5 . 1 0 Credits from Carbon sequestration for Domestic Action and JI projects, (MtC)
All Allwith without
USA JPN EEC OOE OECD-P OECD-W FSU EET EFSU USA USA
28 13 13.11 5.17 13.2 18.08 34.83 3.76 39 97.87 69.87
Source: UNFCCC, 2001.

fication, and issuance—is more complex thanJI. (U.S. dollars are in 2000 constant prices.)
• An implementation rate of 30 percent for allnon-Annex I countries based on the combinedconsideration of non-Annex I countries’ absorp-tion capacity, the complex procedure for CDMprojects, and an early start for CDM projectsbefore 2008.
• A 10 percent participation rate by the UnitedStates—considering that various U.S. statessuch as California, New Hampshire, Massa-chusetts, New Jersey, Oregon, and Wisconsinwould realize their domestic carbon reductiontargets through CDM, JI, or ET.
• A 50 percent supplementarity rate for the EUbased upon declarations of the EU and variousmember states—including the Netherlandsand Germany—to introduce voluntary sup-plementarity levels; 0 percent is assumed for
other Annex I countries/regions, through thisdoesn’t mean that they will not take anydomestic action. In CERT, the percentage ofdomestic actions in the reduction commit-ments for these countries will be determinedby the marginal abatement cost curves.
• Price leadership of EFSU and price followersfor other suppliers.
Moreover, in assessing China’s CDM poten-tial this study modeled supply-side competitionbased solely on differences in national marginalabatement cost curves under perfectly functioningequilibrium market conditions. All developingcountries were assigned the same implementationrate (capacity to identify, develop, and implementpotential CDM projects); all CDM projects wereassumed to have the same level of transactioncosts; and no consideration was given to the rela-
C H I N A ’ S C D M P O T E N T I A L
C D M I N C H I N A100
F I G U R E 5 . 9 Comparison of Emission Reduction Requirements in 2010 for Different Regions from Different Sources with Sink Credits Deducted
–400
–200
0
200
400
600
800
1000
USA JPN OOE EEC FSU EET OECD-P OECD-W EFSU All withUSA
Allwithout
USA
MtC
EIA LowEIA MediumEIA HighEPPAGTEM
NCGTEM, all GHGsNC, all GHGsIPAC/AIM

tive attractiveness of China as a host for CDMprojects. In the real world, the attractiveness ofChina as a CDM host will depend on many fac-tors, not necessarily a theoretical market clearingprice, or the aggregate marginal abatement cost orincremental cost of individual Chinese projects.
Table 5.11 shows the marginal abatement costand total abatement cost for Annex I countries/regions under IPAC emission projections andMACs without CDM, JI, and ET. The reduc-tion requirements are 86MtC (315 MtCO2) forOECD-P, 252MtC (924 MtCO2) for OECD-W,and 35MtC (128 MtCO2) for the U.S. (at a 10 percent participation rate, or 350MtC(1,283 MtCO2) at 100 percent. Sink credits,shown in Table 5.10, are deducted from the cor-responding number in Table 5.9.
The marginal cost was calculated using theformula MC = aQ2 + bQ. The coefficients of a,b are from Table 5.5; the dollar deflators are1.196 for 1990 and 1.495 for 2000. The totalcost was calculated using the following formula:
For partial U.S. participation, a and b shouldbe adjusted accordingly as follows:
The marginal abatement cost for the U.S.(10 percent participation rate), OECD-P, andOECD-W is high and in the range of $93–119/tC ($23-32/tCO2). Their total abatement costis as high as $12.4 billion.
Table 5.12 and Figure 5.10 display the mod-eling results of the carbon market for the base sce-nario. With the three mechanisms, domesticreduction for U.S. (10 percent), OECD-P andOECD-W would drop sharply from 374MtC(1,371 MtCO2) to only 177MtC (649 MtCO2)
a a
participation rateb b
participation rate
adjusted original
adjusted original
=
( )=
( )
�
�
�
�
1 495 1 196
11 495 1 196
1
2
. .
. .
TC aQ bQ dQ aQ bQQ
= +( ) = +∫ 2
0
3 213
12
due to the cheaper abatement cost in non-AnnexI countries and EITs as well as zero cost of hotair. The market price is expected to be $22/tC($6/tCO2). Thus, the total cost for these threeregions to achieve the reduction requirementwould decrease to only $5.5 billion, with cost sav-ing of $6.9 billion. The amount of hot air used forEFSU would be only 61.6MtC (226 MtCO2),
A N A L Y S I S O F C H I N A ’ S C D M P O T E N T I A L
C D M I N C H I N A 101
T A B L E 5 . 1 1 Reduction, Marginal Cost, and Total Abatement Cost for Annex I without CDM, JI, and ET
Marginal Cost Total CostReduction (MtC) ($/tC, 2000 price) (M$, 2000 price)
U.S. (10%) 35 119 1369OECD-P 86 93 3015OECD-W 252 108 7998Total 374 12382
T A B L E 5 . 1 2 Modeling Results for the Base Scenario
Carbon Carbon Profitsa
amount amount (MUS$, (MtC) (MtCO2) 2000 price)
Domestic action 177.1 649.4USA 15.0 55.0 845OECD-P 34.8 127.6 1670OECD-W 127.3 466.8 4801
Hot air 61.6 225.9 2495b
EFSU 61.6 225.9JI 90.5 331.8EFSU 90.5 331.8
CDM 44.7 163.9 514S.E. Asia 15.3 56.1 178China 21.6 79.2 257Middle East 2.7 9.9 30Africa 2.4 8.8 23Latin America 2.7 9.9 27
Total 374.0 1371.3Price ($/tC, 2000 price) 22.0Price ($/t-CO2,
2000 price) 6.0
aProfits mean cost savings for Annex II countries, and revenues from sellingminus abatement costs for EITs and Non-Annex I countries.bThis number is the total profits for EFSU from both JI and hot air.
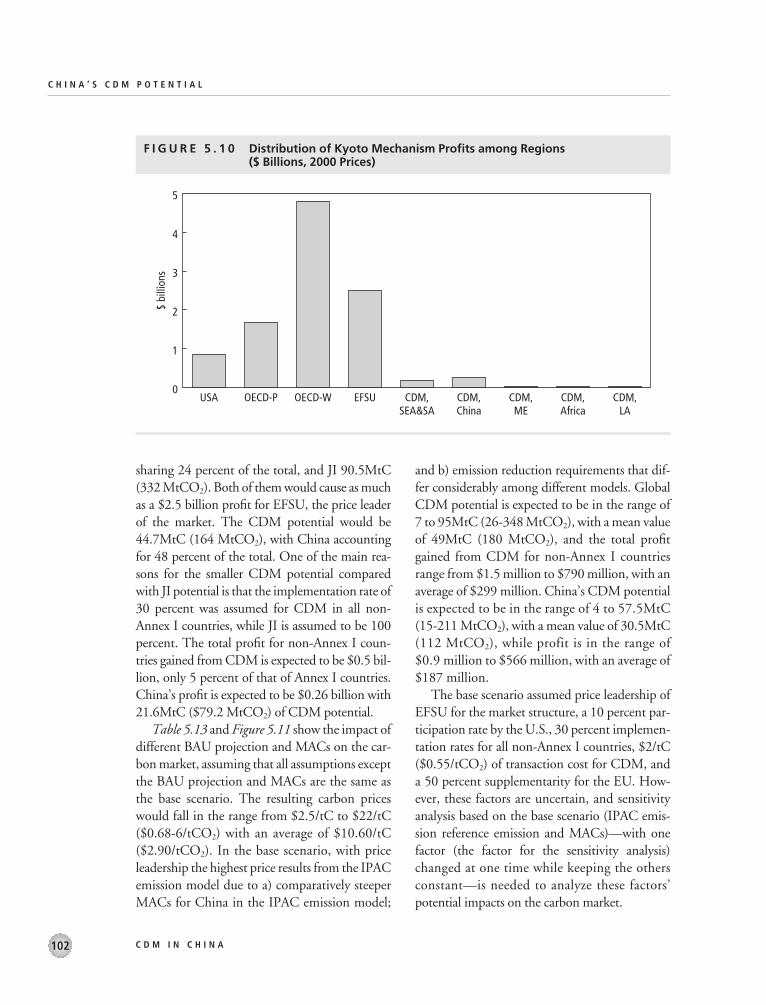
sharing 24 percent of the total, and JI 90.5MtC(332 MtCO2). Both of them would cause as muchas a $2.5 billion profit for EFSU, the price leaderof the market. The CDM potential would be44.7MtC (164 MtCO2), with China accountingfor 48 percent of the total. One of the main rea-sons for the smaller CDM potential comparedwith JI potential is that the implementation rate of30 percent was assumed for CDM in all non-Annex I countries, while JI is assumed to be 100percent. The total profit for non-Annex I coun-tries gained from CDM is expected to be $0.5 bil-lion, only 5 percent of that of Annex I countries.China’s profit is expected to be $0.26 billion with21.6MtC ($79.2 MtCO2) of CDM potential.
Table 5.13 and Figure 5.11 show the impact ofdifferent BAU projection and MACs on the car-bon market, assuming that all assumptions exceptthe BAU projection and MACs are the same asthe base scenario. The resulting carbon priceswould fall in the range from $2.5/tC to $22/tC($0.68-6/tCO2) with an average of $10.60/tC($2.90/tCO2). In the base scenario, with priceleadership the highest price results from the IPACemission model due to a) comparatively steeperMACs for China in the IPAC emission model;
and b) emission reduction requirements that dif-fer considerably among different models. GlobalCDM potential is expected to be in the range of7 to 95MtC (26-348 MtCO2), with a mean valueof 49MtC (180 MtCO2), and the total profitgained from CDM for non-Annex I countriesrange from $1.5 million to $790 million, with anaverage of $299 million. China’s CDM potentialis expected to be in the range of 4 to 57.5MtC(15-211 MtCO2), with a mean value of 30.5MtC(112 MtCO2), while profit is in the range of$0.9 million to $566 million, with an average of$187 million.
The base scenario assumed price leadership ofEFSU for the market structure, a 10 percent par-ticipation rate by the U.S., 30 percent implemen-tation rates for all non-Annex I countries, $2/tC($0.55/tCO2) of transaction cost for CDM, anda 50 percent supplementarity for the EU. How-ever, these factors are uncertain, and sensitivityanalysis based on the base scenario (IPAC emis-sion reference emission and MACs)—with onefactor (the factor for the sensitivity analysis)changed at one time while keeping the othersconstant—is needed to analyze these factors’potential impacts on the carbon market.
C H I N A ’ S C D M P O T E N T I A L
C D M I N C H I N A102
$ bi
llion
s
CDM,LA
CDM,Africa
CDM,ME
CDM,China
CDM,SEA&SA
EFSUOECD-WOECD-PUSA0
1
2
3
4
5
F I G U R E 5 . 1 0 Distribution of Kyoto Mechanism Profits among Regions ($ Billions, 2000 Prices)

A N A L Y S I S O F C H I N A ’ S C D M P O T E N T I A L
C D M I N C H I N A 103
T A B L E 5 . 1 3 Impact of BAU Projections and MACs on Carbon Market
Global CDM China CDMPrice Potentialsa Potentialsa China’s profits
BAU projections MACs ($/tC, 2000 price) (MtC) (MtC) (M$, 2000 price)
IPAC emission IPAC emission 22.0 44.7 21.6 256.8EPPA EPPA 13.0 95.3 57.5 397.7GTEM GTEM 9.2 35.7 25.4 96.2EIA Medium growth EPPA 6.2 45.3 27.1 63.9EIA High growth EPPA 10.2 76.5 46.1 229.1EIA Low growth EPPA 2.5 6.9 4.0 0.9EIA Medium growth GTEM 11.8 47.0 33.3 175.6EIA High growth GTEM 19.8 79.2 55.2 565.6EIA Low growth GTEM 4.0 10.6 7.6 7.4GTEM, all GHGs GTEM, all GHGs 7.4 48.9 27.1 76.8
Average 10.61 49.0 30.5 187.0Standard Deviation 6.36 28.0 18.1 181.6
Note: The BAU projections and MACs are all for CO2-only except the last scenario (GTEM, all GHGs).a CDM potentials derived from CERT are potential traded volumes of CERs when the market is clearing.
0
20
40
60
80
100
120
MtC
0
5
10
15
20
25
US$/tC
Global CDMChina CDMPrice
IPAC GTEMGHGs
GTEMEPPAEIA H,GTEM
EIA L,GTEM
EIA M,GTEM
EIA H,EPPA
EIA L,EPPA
EIA M,EPPA
F I G U R E 5 . 1 1 Global and China’s CDM Potentials and Price under DifferentBAU Projections and MACs
Note: EIA L(M, H) means EIA Low(Medium, High) growth.
If the market structure is perfect competition,and all other parameters remain the same as thebase scenario, then the modeling result would pro-vide zero price and zero traded CDM volumes. Allavailable hot air of 257MtC (942 MtCO2) wouldbe used.
CDM’s complex operation process or projectcycle—from validation and registration, to moni-
toring, verification, certification, and issuance—would slow CDM implementation speed andlessen CDM credits. However, a prompt start ofCDM projects—resulting in banking of CERsprior to 2008—would enlarge CDM potential. Inorder to analyze the impact of these two factors, aswell as the limited absorption capacity of non-Annex I Parties on the carbon market, we com-

pleted a sensitivity analysis of implementationrates. The result is shown in Table 5.14. Increas-ing implementation rates will lower the equilib-rium price, while elevating CDM potential. Ifall non-Annex I countries’ implementation ratesdecrease to only 10 percent, then the carbon pricewould go up to $24.3/tC ($6.60/tCO2), butglobal and China CDM potentials would shrinkto only 16.3MtC (60 MtCO2) and 7.8MtC(28.6 MtCO2) respectively. If all non-Annex Icountries’ implementation rates are increased to50 percent, then the market price would fall to$18.2/tC, while global and China CDM poten-tials would rise to 62.3MtC (228.4 MtCO2) and30.3MtC (111.1 MtCO2) respectively. China’sshare of CDM potential in the total would notchange, remaining around 50 percent, if all non-Annex I countries’ implementation rates are thesame. Under the price leadership of EFSU, theimplementation rate has a larger impact on CDM
potential than on the equilibrium price. Thus,increasing the implementation rate from 10 per-cent to 50 percent would increase China’s profitsfrom $108.5 million to $277.6 million in spite ofthe lower market price.
The participation rate of the United Stateswill have an important impact on the totalreduction requirement and demand for the car-bon market, and consequently further influencethe price of the carbon market and CDM poten-tial. Table 5.15 shows the impact of USA’s par-ticipation rate on carbon market under the priceleadership of EFSU. It could be found that par-ticipation rate of USA has less impact on thecarbon market (price and CDM potentials etc.)than implementation rate does. If the U.S. par-ticipation rate varies from 0 to 30 percent, theequilibrium price will be around $20–22/tC($5.5-6/tCO2), while traded CDM volumesfor China are in the range of 19.8–21.6MtC
C H I N A ’ S C D M P O T E N T I A L
C D M I N C H I N A104
T A B L E 5 . 1 4 Impact of Implementation Rate on Carbon Market
Global CDM China CDMImplementation Price Potentials Potentials China’s profitsRate (%) ($/tC, 2000 price) (MtC) (MtC) (M$, 2000 price)
10 24.3 16.3 7.8 108.520 22.7 30.6 14.8 185.030 22.0 44.7 21.6 256.840 20.6 56.1 27.2 294.150 18.2 62.3 30.3 277.6
T A B L E 5 . 1 5 Impact of U.S. Participation Rate on Carbon Market
U.S. Global CDM China CDMParticipation Price Potentials Potentials China’s profitsRate (%) ($/tC, 2000 price) (MtC) (MtC) (M$, 2000 price)
0 21.7 44.0 21.3 247.65 21.3 43.3 20.9 238.8
10 22.0 44.7 21.6 256.820 19.9 40.8 19.8 208.130 21.2 43.1 20.9 236.6

(72.6-79.2 MtCO2). However, if the marketstructure is perfect competition, the U.S. partic-ipation rate will have a large impact on the car-bon market; for example, by increasing the U.S.participation rate from 0 to 30 percent, the equi-librium price would increase from 0 to $4.40/tC($0-1.20 tCO2).
The transaction cost would depend on theexecutive board’s administrative cost, designedoperational entities’ charge, and the cost for thewhole process—including project searching, proj-ect design, validation and registration, monitor-ing, verification and certification, and issuance.Transaction costs can differ according to the spe-cific project. The rule of simplified modalitiesand procedures for small-scale projects wouldlessen their transaction costs. Table 5.16 displaysthe results of a sensitivity analysis of transactioncosts on the carbon market under the price lead-ership of EFSU. Increasing transaction costs ofthe CDM will decrease CDM potential. How-ever, the impact of transaction costs on the equi-librium price is limited under the price leadership
of EFSU. By varying the transaction cost from $1to $5/tC ($0.27-1.36/tCO2), the price almostremains the same, while global CDM potentialdrops from46.2MtC(169.4 MtCO2) to 37.7MtC(138.2 MtCO2) and China’s CDM potentialfrom 22.3MtC (81.8 MtCO2) to 18.4MtC(67.5 MtCO2).
Although COP-7 decided on no compulsorysupplementarity level, various countries are con-sidering introducing voluntary supplementaritylevels, especially in the EU. Like various partici-pation rates for the United States, different sup-plementarity levels for Annex I countries wouldincrease demand for a carbon market, and accord-ingly effect carbon market prices and CDMpotential. The impact of supplementarity on thecarbon market is shown in Table 5.17 under theprice leadership of EFSU. If there were no supple-mentarity for all Annex I countries, then the pricewould decrease to $18.1/tC ($4.90/tCO2) andChina’s CDM potential would decrease to18.1MtC (49.5 MtCO2). If 50 percent supple-mentarity is applied to all Annex I countries, then
A N A L Y S I S O F C H I N A ’ S C D M P O T E N T I A L
C D M I N C H I N A 105
T A B L E 5 . 1 6 Impact of CDM’s Transaction Cost on Carbon Market
Global CDM China CDMTransaction cost Price Potentials Potentials China’s profits($/tC, 2000 price) ($/tC, 2000 price) (MtC) (MtC) (M$, 2000 price)
1 21.9 46.2 22.3 277.92 22 44.7 21.6 256.85 21.3 37.7 18.4 173.3
T A B L E 5 . 1 7 Impact of Supplementarity on Carbon Market
Global CDM China CDMPrice Potentials Potentials China’s profits
Supplementarity % ($/tC, 2000 price) (MtC) (MtC) (M$, 2000 price)
EU 50 22.0 44.7 21.6 256.8All 50 20.9 42.5 20.6 229.1All 0 18.1 37.1 18.1 168.4

the price would be $20.9/tC ($5.70/tCO2) andChina’s CDM potential would be 20.6MtC(75.5 MtCO2).
Figures 5.12, 5.13, and 5.14 summarize theimpact of these factors on the carbon price, globalCDM potential, and China’s CDM potential.
The impact of different factors on the carbonmarket can be roughly ordered from high tolow as BAU projections and MACs, the marketregime, the implementation rate, supplementar-ity, the U.S. participation rate (0 to 30 percent),and transaction costs.
C H I N A ’ S C D M P O T E N T I A L
C H I N A C D M S T U D Y106
0
20
40
60
80
100
MtC
Lowest 6.9 0.0 16.3 40.8 37.7 37.1
Highest 95.3 44.7 62.3 44.7 46.2 44.7
BAU, MACs Marketstructure
Implementationrate
USAparticipation
Transactioncost Supplementarity
0
5
10
15
20
25U
S$/tC
, 200
0 pr
ice
Lowest 2.5 0.0 18.2 19.9 21.3 18.1
Highest 22.0 22.0 24.3 22.0 22.0 22.0
BAU, MACs Marketstructure
Implementationrate
USAparticipation
Transactioncost Supplementarity
F I G U R E 5 . 1 2 Impact of Different Factors on Carbon Price
F I G U R E 5 . 1 3 Impact of Different Factors on Global CDM Potential

For the equilibrium quota price, global andChina CDM potential, the sensitivity analy-sis estimates are $0–24.30/tC ($0-6.60/tCO2),$0–95.30/tC ($0-26/tCO2), and $0–57.50/tC($0-15.70/tCO2) respectively. The zero priceand zero CDM potential is provided by the caseof perfect competition. The highest estimation ofglobal as well as China’s CDM potential wasderived from EPPA BAU projection and EPPAMACs. One of the main reasons for this is thatEPPA projected the lowest available hot air(135MtC, or 495 MtCO2). The highest price of$24.30/tC ($6.60/tCO2) is provided by the low-est implementation rate assumed in the analysis;that is, 10 percent. Increasing the implementa-tion rate will decrease the equilibrium price,while enhancing CDM potential. The U.S. par-ticipation rate and supplementarity are importantfactors influencing carbon market demand. If themarket is characterized by perfect competition,demand will significantly influence the equilib-rium price and CDM potential. However, underthe price leadership of EFSU, which owns a largeamount of hot air, the demand will have limitedimpact on the market. In the CERT simulation,the transaction cost has a relatively low impact on
the carbon market. Since transaction costs arestrongly sensitive to project size, the computationin CERT does not accurately display the realimpacts of transaction costs on market dynamics.
Apart from the base scenario, the High andLow CDM scenarios were designed to present areasonable range of China’s traded CDM vol-umes. The reference carbon emission and MACsfrom the IPAC emission model were also appliedto both the High and Low CDM scenarios. Allparameters—except transaction cost, implemen-tation rate, and U.S. participation rate—are thesame for the three scenarios. Table 5.18 comparesthese three parameters for the Base, High, andLow CDM scenarios.
A N A L Y S I S O F C H I N A ’ S C D M P O T E N T I A L
C D M I N C H I N A 107
0
10
20
30
40
50
60
MtC
Lowest 4.0 0.0 9.8 18.4 18.1
Highest 57.5 21.6
7.81
30.3 21.6 22.3 21.6
BAU, MACs Marketstructure
Implementationrate
USAparticipation
Transactioncost Supplementarity
F I G U R E 5 . 1 4 Impact of Different Factors on China’s CDM Potential
T A B L E 5 . 1 8 A Comparison of Assumptions for theBase, High, and Low Scenarios
Transaction Implementation U.S. ParticipationScenarios Cost ($/tC) Rate (%) Rate (%)
Base 2 30 10High CDM 2 50 30Low CDM 5 10 5

(1,247 MtCO2) for Annex II Parties without theU.S., and 374 MtC (1,371 MtCO2) for AnnexII Parties with 10 percent U.S. participation. Intotal, there are 257MtC (942 MtCO2) of surplusAAUs and sink credits available from EITs.
GHG emission reduction requirements are themain determining factor for the shape of the futurecarbon market, followed by the marginal abate-ment cost curves for both market supply anddemand. The IPAC emission, EPPA, and GTEMmodels all illustrate that China has a relatively flatmarginal abatement cost curve (expressed in costsvs. reduction amount) compared with other coun-tries, owing to her large emission base as well as rel-atively cheap reduction costs. However, themarginal abatement cost curve for China from theIPAC emission model is much steeper than thosefrom EPPA and GTEM. In the IPAC emissionmodel, the relatively low reference carbon emis-sion projection—with a lot of carbon reductioncountermeasures, which is consistent with China’ssustainable energy development strategy—is oneof the main contributors to the discrepancy.
With the reference emission projections andMACs from the IPAC emission model—togetherwith the assumptions of price leadership of theEFSU for the future carbon market structure, a10 percent U.S. participation rate, 30 percentimplementation rates for all non-Annex I Parties,50 percent supplementary for the EU, and $2/tC($0.55/tCO2) of transaction cost for CDM—theCERT simulation shows $22/tC ($6/tCO2) forthe future equilibrium carbon price; 21.6MtC(79Mt-CO2)ofChina’s CDM potential, account-
C H I N A ’ S C D M P O T E N T I A L
C D M I N C H I N A108
T A B L E 5 . 1 9 Comparisons of Future Carbon Market for Different Scenarios
Global CDM China CDMPrice Potentials Potentials China’s profits
Scenario ($/tC, 2000 price) (MtC) (MtC) (M$)
Base 22.0 44.7 21.6 256.8High CDM 19.2 65.5 31.8 310.8Low CDM 23.7 14.1 6.8 76.6
Table 5.19 compares the modeling results forthe Base, High CDM, and Low CDM scenarios.The High CDM scenario provides $19.20/tC($5.20/tCO2) of equilibrium price, lower thanthe Base, and 31.8MtC (116.6 MtCO2) of CDMtraded volumes for China, around 10MtC higherthan the Base. The Low CDM scenario results inthe highest equilibrium price of $23.7/tC ($6.50/tCO2), and only 6.8MtC (24.9 MtCO2) ofCDM traded volumes for China. China’s prof-its range from $76.6 to $310.8 million, andglobal traded CDM volumes from 14.1 to65.5MtC (51.7-240 MtCO2).
Discussion of Results from MarketSimulation with Application of CERT
The IPAC emission model shows carbon reduc-tion requirements of 371MtC (1,360 MtCO2)for Annex II Parties (without the U.S.), close toEIA’s latest medium-growth projection (335MtC,or 1,228 MtCO2). The projection of hot air car-bon supply for EITs from the IPAC emissionmodel is 218MtC (799 MtCO2), lower thanEIA’s latest projections (260–397MtC, or 953-1,456 MtCO2). The IPAC emission model pro-jected that U.S. carbon reduction requirementswould be 378MtC (1,386 MtCO2). This ismuch lower than EIA’s projections, but quiteclose to the projection based on national com-munications (423MtC, or 1,551 MtCO2).
Taking into account sink credits, the IPACemission model provides reduction requirementsof 690 MtC for all Annex II Parties, 340 MtC

ing for around 50 percent of the total CDMpotential; and $0.26 billion profit for Chinagained from CERs. With the reference emissionprojections and MACs from the IPAC emissionmodel, the estimation of possible China CDMpotential will fall in the range of 6.8–31.8MtC(25–117MtCO2).
CHINA’S CDM POTENTIAL BY MAJOR SECTORS
China’s Carbon Emissions and MACsby Sector
The IPAC-AIM technology model is an energymodel for China with a detailed disaggregationof sectors and detailed description of technology.This model identifies carbon emissions, MACs,and carbon reduction potential by sector. TheIPAC-AIM technology model was developed incollaboration with Japan’s National Institute forEnvironment Studies. For the last several yearsthis model was used to simulate emission scenar-ios up to 2030 for China, and identify the contri-bution from technologies for emission reduction.Policies to promote advanced technologies werealso discussed using this model. These results,which identify CDM potential for sectors, arebased on the study for emission reduction poten-tial in China in ERI by the IPAC modelingteam. Technologies suitable for CDM collabo-ration were specified in the modeling study.Tables 5.20 and Table 5.21 display the basicassumptions for future population and GDPgrowth respectively.
Figure 5.15 provides the modeling results ofcarbon emissions for three scenarios—technologyfrozen, market, and policy—from the IPAC-AIMtechnology model. The Technology Frozen sce-nario assumed that the future technology mixwould stay the same as in 2000 (no technologyselection in the model). The Market scenarioassumed technology would be introduced basedon the market, which means technologies will beselected by model based on least cost. The Policyscenario used a $12.10/tC ($3.30/tCO2) car-
A N A L Y S I S O F C H I N A ’ S C D M P O T E N T I A L
C D M I N C H I N A 109
T A B L E 5 . 2 0 Assumptions for China’sFuture Population (million)
1990 2000 2010
Total 1141 1284 1393Urban 302 413 531Rural 840 872 862
T A B L E 5 . 2 1 Assumptions for China’sFuture GDP Growth (%)
1990–2000 2000–2010
GDP Growth rate 9 7.9
F I G U R E 5 . 1 5 Carbon Emissions for Three Different Scenarios in IPAC-AIM Technology Model
600700800900
1000110012001300140015001600
Year
Mt-
C
PolicyMarketFrozen
2000 2002 2004 2006 2008 2010
bon tax and investment of the carbon tax rev-enues as subsidies for selected technologies.2 Inthe IPAC-AIM technology model, technologyfixed costs, energy costs, and other operationalcosts are included. These emission scenarioswere used to identify emission reduction poten-tial by sectors.3 The CDM potential results for2010 by sector are given by identifying tech-nologies for CDM projects in each sector.

which presents the reduction cost by sectors inChina. In this figure, axis Y is the average cost forCO2 emission reductions. Subsidies in four costcases are expressed here. Axis X is the accumulatedCO2 reduction from 2000 (when the subsidybegins) to 2010, compared with the market case.
China’s Emission AbatementPotential by Sector
The study from the IPAC-AIM technology modelidentified the potential for CDM projects in vari-ous sectors, including steel-making, cement, glass,brick production, ammonia production, calcium,soda ash, aluminum, copper, zinc and lead, papermaking, ethylene, transport, services, urban resi-dential, rural residential, and power generation. Incontrast to emission reduction potential analysis,this analysis for CDM potential considered tech-nology additionality (advanced technologies, espe-cially technologies that are not mature in China),cost effectiveness, and possible penetration ofadvanced technologies. Technology additionalityis a focal point for CDM project collaboration inChina. Advanced technologies are one of theobjectives of CDM to support sustainable devel-opment in developing countries. Advanced tech-nologies or clean technologies are the key forfuture GHG mitigation and local air pollutantemission reductions. Widespread adoption ofadvanced technologies in China could contributewidely to environmental protection and local eco-nomic and sustainable development. Comparedwith technologies already widely used and pro-duced in China, some advanced technologies cur-rently used in the developed world could be muchmore effective in meeting the objectives of CDM.Therefore a group of technologies suitable forCDM projects was identified in the model. Theselection of advanced technologies for CDM pro-jects is based on emission reduction potential andlocal availability.4 The methodology used in thismodel reflects abatement cost only, and does nottake into consideration factors such as CER pricesor transaction costs, as simulated in the CERTmodel.
C H I N A ’ S C D M P O T E N T I A L
C D M I N C H I N A110
0
10
20
30
40
50
60
70
80
90
100
2000 2002 2004 2006 2008 2010Year
Perc
ent
RuralUrbanTransportServiceIndustry
0
200
400
600
800
1000
1200
0 50 100 150 200 250 300 350 400 450 500Accumulated Emission Reduction, Mt-C
COst
, US$
/t-C
AgricultureIndustryTransportServiceUrbanRural
F I G U R E 5 . 1 6 Share of Carbon Emissions by End-useSector for the Market Scenario
F I G U R E 5 . 1 7 Marginal Abatement Cost Curves by Sectors
The market scenario is taken as the base sce-nario to analyze carbon emissions and MACs bysectors. Figure 5.16 shows the share of carbonemissions by sector for the Market scenario.
The study based on the IPAC-AIM technol-ogy model on cost analysis is given in Figure 5.17,
Note: CO2 emissions from end-use sectors includes emissions from electric-ity by accounting for energy use in the power generation sector

The reduction potential by sector was simu-lated with a wider cost range of up to $50/tC($13.60/tCO2). Figure 5.18 and Table 5.22shows emission reduction potential by sectors withcosts less than $50/tC ($13.60/tCO2).
The IPAC-AIM technology model results indi-cate that (in 2010) the difference in carbon emis-sions between the policy scenario (with carbon taxand investment of revenues as subsidies) and mar-ket scenario (the baseline scenario) is 138MtC/a(506 MtCO2).
The Influence of Transaction Costs onCDM Potential
The technology-based analysis of emission reduc-tion potential reveals that top-down approachesbased on MAC curves estimating the CER sup-ply potential at a given CER price substantiallyoverestimate the potential CDM deal flow.This is largely because a considerable amount ofsmaller scale carbon offset projects with an abate-ment potential below 10,000t CO2/year havebeen included in this emission reduction poten-tial. But such small-scale projects are not eco-nomically viable and are unattractive for foreigninvestors because of their high transaction cost.
Even if the absolute transaction costs forsmall-scale CDM projects seem low, the ratio ofthe transaction cost to the total project cost is
very high compared to large-scale projects, asshown in Table 5.23.
This section links the top-down CDM poten-tial projected for China (79 MtCO2, or 21.6MtC) with priority technologies for CDM. Thisanalysis underscores the significant role transac-tion costs play in a project-based mechanism. Atan assumed CER price of 5 $/tCO2, a minimal
A N A L Y S I S O F C H I N A ’ S C D M P O T E N T I A L
C D M I N C H I N A 111
–10
0
10
20
30
40
50
60
70
80No CostLess than US$50/t-C
OtherPowerRuralUrbanTransportCommercePaperCopperAluminumGlassBrickCementCalciumFertilizerEthyleneAmmoniaSteel
MtC
/a
F I G U R E 5 . 1 8 Emission reduction potential by sector
T A B L E 5 . 2 2 Share of EmissionReductions by Sector
Sector Share (%)
Steel 10.7Ammonia 4.4Ethylene 1.2fertilizer 1.0Calcium 0.0Cement 10.4Brick 6.8Glass 0.4Aluminum 0.6Copper 0.3Paper 0.4Commerce 4.4Transport 7.7Urban 3.3Rural 8.1Power Generation Sector 37.3Other 2.9

deal size of close to 10,000tCO2/year is requiredto make a CDM project commercially viable. Forthis, based upon expert judgements and investorviews, the discounted total CER revenues shouldbe at least twice the amount of the transactioncost (Figure 5.19). The lower band in Figure 5.19illustrates the range of possible transaction costsfor CDM projects related to their project sizes intCO2/a (hatched area). The upper band (rangebetween the dashed lines) and above shows thearea where CER revenues should be (twice theamount of the transaction costs) for a project tobe commercially viable. Given that, a significantnumber of small-scale CDM projects with lessthan 10,000 tCO2 annual abatement potential—
in the industry, transport, rural, urban, and com-mercial sectors (demand-side management)—would not be commercially attractive as CDMproject because the transaction costs will be ashigh as $2–20/tCO2. Transaction costs for small-size projects makes smaller emission reductionoptions economically unfeasible, although abate-ment costs may fall into the CER price range ofup to $6/t CO2 ($22/t C). The deal-size thresh-old is very sensitive to the CER price, As indicatedby Figure 5.19.
China’s CDM Potential by Sector
The emission reduction potential by sectors—at a cost of $50/tC ($13.60/tCO2)—reflects themitigation potential induced by switching over toadvanced lower carbon intensive technologies.The technical abatement potential is estimated at170 MtC (624 MtCO2) in 2010; however, theCER market potential is substantially less thanthis for several reasons, including (a) only about50 percent or 85 MtC/year (312 MtCO2) of thetotal CO2 reduction potential can be achieved atcosts below $22/tC ($6/tCO2); (b) it is assumedthat transaction costs for smaller projects(<10,000 tCO2 emission reductions per year) willbe prohibitive to their implementation under theCDM at the range of market prices estimated inthis study; (c) not all of the emission reductionpotential will meet the additionality criterion forCDM approval, and (d) not all of the remainingpotentially viable and eligible CDM projectopportunities can be implemented to generateCERs by 2010, due to various barriers (such as thetime lag from CDM dealmaking until the start ofoperations, the lack of awareness of CDM oppor-tunities, the failure of the Kyoto Protocol to enterinto force so far, and lack of project preparationcapacity).
Figure 5.20 compares the results of two mod-els—the IPAC emission model and CERT on theone hand, and the bottom-up IPAC-AIM tech-nology model on the other. As the IPAC-AIMtechnology model does take into considerationno-regrets options, while the IPAC emission
C H I N A ’ S C D M P O T E N T I A L
C D M I N C H I N A112
T A B L E 5 . 2 3 Project Size and Transaction Cost
Reduction Transaction CostProject size (t CO2/y) ($/t CO2)
Very large > 200,000 0.1Large 20,000–200,000 0.4–1.3Small 2,000–20,000 13Mini 200–2,000 130Micro < 200 1,300
(Source: Michaelowa/Jotzo, 2003)
0.1
0.2
0.3
0.4
0.5
10000 20000 30000
Transaction cost
Project viability/CER Revenues
10US$/t-CO2 5US$/t-CO2 3.5US$/t-CO2
Tran
sact
ion
Cost
/CER
Rev
enue
MU
S$
Project size t-CO2/a
F I G U R E 5 . 1 9 Impact of Transaction Cost and CER Priceon Commercial Viability of CDM Projects
Note: (transaction data source5: section 3-6-2, crediting period 7-10 years)

model does not, the MAC curve in the IPAC-AIM technology model is flatter. At $22/tC($6/tCO2), the IPAC-AIM/technology MACcurve projects an abatement potential of around85 MtC (312 MtCO2), while the IPAC MACprojects 72 MtC (264 MtCO2). In addition, theIPAC-AIM technology model suggests—withsome CDM-eligible no-regrets options—theabatement potential would be around 170 MtC(624 MtCO2). By application of the CERTmodel using the IPAC MAC curves, and assum-ing a 30 percent implementation rate of CDMprojects, the deal size at $22/tC has been esti-mated at 21.6 MtC. The 30 percent implemen-tation rate taken into account is the dimension Bin Figure 5.20. Hence, Figure 5.20 provides evi-dence that the emission reduction potential iden-tified through the IPAC-AIM technology model(170 MtC/year, or 624 MtCO2) at $50/tC cost($13.60/tCO2), and the CDM potential iden-tified by application of the CERT model—21.6 MtC/ year or 79.2 MtCO2 at $22/tC($6/tCO2)—seem to be in plausible and consis-tent relation with each other. This cross-checkprovides evidence that the 30 percent implemen-tation rate assumed for the CERT base scenario(based on IPAC) is a plausible assumption, alsotaking into consideration that some no-regretsabatement potential could qualify for CDM.
Table 5.24 gives a preliminary idea of the dis-tribution of CDM potential by sector that isfeasible at a cost of $22/tC ($6/tCO2). This esti-mate relates to the cost of technologies, not to themarket price. The study has estimated the shareof CDM project potential for selected sectorsbased on the sectoral distribution displayed intable Table 5.24. Sectors contained in the IPAC-SGM model used for impact analysis (see chap-ter 6) were assessed by expert judgment; the studyauthors took into consideration criteria such as:
• The price of CERs from the CERT model andthe sectoral MAC curves (Figure 5.17 )
• Size of sector, sector risk, and expression ofinterest by stakeholders to go for CDM proj-ect deals
• The minimal deal size (which would put thesmall-scale commercial and residential sectorat a disadvantage)
• Risks associated with demonstration of addi-tionality of the potential CDM project type/technology.
A N A L Y S I S O F C H I N A ’ S C D M P O T E N T I A L
C D M I N C H I N A 113
50
22
21.6 50 72 85 100 150 170 200
US$
/tCB
IPAC EmissionModel
IPAC-AIM TechnologyModel
MtC
F I G U R E 5 . 2 0 Comparing Bottom-up Emission Abatement Potential (50$/tC) with Top-down Estimated CDM Potential(22$/tC), 2010
T A B L E 5 . 2 4 Contribution of Different Sectors to the21.6 MtC CDM Potential Resulting fromCERT Analysis
Amount (MtC/a)Sector Share (%) 2008–2012 average
Steel Making 10 2.16Cement 10 2.16Chemical Industry 5 1.08Power Generation 50 10.8Other sector 15 3.24Non-CO2 project 10 2.16Total 100 21.6
B = Barriers reducing the share of abatement potential at equilibrium pricewhich is CDM-able (deal size, time lag, demonstration of additionality ect.)
Because project proponents have recentlygiven much attention to the power sector, andthe related MAC curve is flatter than the onesfor other sectors, the study has allocated ahigher share in the power sector. The shares ofCDM potential in different sectors are assumedas 50 percent for the power generation sector,10 percent for both the steelmaking and cementsectors, 5 percent for the chemical industry, and15 percent for the other industry sectors. Tenpercent of China’s CDM potential was allocatedto non-energy non-CO2 CDM projects from theindustry sector. The calculated distribution ofthe annual 21.6 MtC (79.2 MtCO2) CDMpotential (CERT base scenario) to the varioussectors is shown in Table 5.24.
The allocation of CDM potential to non-CO2
projects not covered by the IPAC/AIM technol-ogy model is justified as follows: Michaelowa(2003) has estimated the emission reductionpotential in methane from gas flaring in China tobe 1–2 percent of total CER sales. In addition,China has a significant potential for HFC-23decomposition, which can be based on methodol-ogy AM0001 already approved by the CDMExecutive Board. Accordingly, an allocation of 10percent of China’s CDM potential to non-CO2
projects seems plausible. The sector split as dis-played in Table 5.24 should be seen as tentative. Itwill require a more detailed analysis that is beyondthe reach of the model applied in this study.
Technology Priority for CDM
The major energy and industry sector technolo-gies suitable for CDM and significantly con-tributing to emission reductions are listed inTable 5.25. Within the reduction potential of85 MtC (312 MtCO2) estimated through theIPAC-AIM technology model (at a referencescenario CER price of $22/tC or $6/tCO2) thetotal of deals qualifying for CDM is significantlylower because of (a) the transaction cost of suchdeals; and (b) the consideration of project addi-tionality. Accordingly, the CDM potential in
2010 in China is projected as 21.6 MtC/a (79.2MtCO2) (Table 5.25).
ANALYSIS OF DEMAND-SIDE BARRIERS
The global carbon market size and price is influ-enced by a whole range of factors. The key factorsinclude the uncertainty of emission projectionsup to 2010; MACs of countries and sectors; themarket regime; the CDM implementation rate,which is influenced by supply-side factors suchas the host-county regulatory environment (tax-ation); expected carbon price and transactioncosts; the level of domestic action undertaken byAnnex I parties; and the mitigation efforts inAnnex I parties not ratifying the Kyoto Protocol(United States and Australia).
The IPAC emission model calculates totalreduction requirements for Annex I Parties of374 MtC (1,371 MtCO2) (based on the referencescenario, with an assumed CDM potential imple-mentation rate of 30 percent, and with 10 percentU.S. participation). The global CDM marketsize in 2010 is accordingly projected at 44.7 MtC(164 MtCO2), of which China could imple-ment close to 50 percent of the total (21.6MtC, or 79.2 MtCO2). The CERT sensitivityanalysis shows that China’s CDM potentialwould vary from 0 to 57.5MtC (211 MtCO2).The respective CER price would range from $0 to$24.30/tC (or $6.60/tCO2).
Other recent publications on market andCER price development divert only slightly fromthe IPAC/CERT model projections made in thisstudy. Grubb (2003) compared different mod-els’ estimations for the equilibrium carbon priceunder Kyoto, and found a price ranging from$55 to $190/tC ($15 to 52/tCO2) with U.S.participation, and “close to zero” to $50/tC($13.6/tCO2) without any U.S. participation. Inhis medium-range estimation, the price falls from$55/tC ($15/tCO2) to $18/tC ($5/tCO2) with-out the U.S. Depending on CER prices, the esti-mates of CDM supply spanned a range between
C H I N A ’ S C D M P O T E N T I A L
C D M I N C H I N A114

15 and 50 MtC (54 to 180 MtCO2) per year,after the withdrawal of the U.S. By comparison,Haites (1998), the U.S. government (1998),Austin (1998), and Ellermann and others (1998)all provided higher estimates of the size ofCDM of 27 to 572MtC (99-2,108 MtCO2),273 to 723MtC (1,001-2,651 MtCO2), 397 to 503MtC (1,456-1,844 MtCO2), and 100 to188MtC (367-689 MtCO2) respectively. Thelower values in the estimates mainly result fromscenarios with supplementarity restrictions (citedin Grubb 2003). Grubb (2003) also indicatedthat due to the project-based nature of the CDMand various related institutional, legal, and finan-cial barriers, far lower estimates of CDM poten-tial resulted than when generating them from“top-down” assessments based on marginal sup-
ply curves of the costs of limiting GHG emis-sions in developing countries.
The present, early carbon offset market hasbeen shaped by deals affected by the DutchCERUPT Programme and the World Bank’sPrototype Carbon Fund and is buyer-dominated.The pricing is so far largely dependent on thebuyers’ willingness to pay, the types of projects togenerate emission reductions, the price signal inthe market, and the risk-sharing between buyersand sellers. Accordingly, the price for CERs iscurrently in the range of $10 to $20/tC ($2.5 to$5/tCO2), which is close to the evaluation basedon the IPAC emission model and CERT.
• Through the World Bank’s Prototype CarbonFund, the CERUPT Programme, Japanese
A N A L Y S I S O F C H I N A ’ S C D M P O T E N T I A L
C D M I N C H I N A 115
T A B L E 5 . 2 5 Technologies Contributing to GHG Emission Reductions in the Short andMiddle Term
Sector Technologies
Steel Industry
Chemical Industry
Paper Making
TextileNon-ferrous metal
Building Materials
MachineryResidential
Service
Transport
Common Use Technology
Power generation
Large-size equipment (coke oven, blast furnace, basic oxygen furnace),coke dry quenching, continuous casting machine, TRT, continuousrolling machine, coke oven gas, OH gas and blast furnace gas recovery,DC-electric arc furnace
Large-size equipment for chemical production, waste-heat recoverysystem, ion membrane technology, existing improved technologies
Cogeneration systems, residue heat utilization, black liquor recoverysystem, continuous distillation system
Cogeneration systems, shuttleless loom, high-speed printing and dyeingReverberator furnace, waste-heat recovery system, QSL for lead and
zinc productionDry process rotary kiln with pre-calciner, electric power generator with
residue heat, Colburn process, Hoffman kiln, tunnel kilnHigh-speed cutting, electric-hydraulic hammer, heat preservation furnaceCooking by gas, centralized space heating system, energy-saving electric
appliances efficient lighting, solar thermal for hot water, insulation ofbuildings, energy-efficient windows
Centralized space heating systems, centralized cooling-heating systems,cogeneration systems, energy-saving electric appliances, efficient lighting
Diesel truck, low energy-use car, electric car, natural gas car, electricrailway locomotives
High-efficiency boiler, fluid bed combustion technology, high efficiencyelectric motor, speed adjustable motor, centrifugal electric fan,energy-saving lighting
Super critical unit, natural gas combined cycle, pressurized fluid bedcombustion boiler, wind turbine, integrated gasification combinedcycle, small-scale hydropower, biomass-based power generation
Industries activities, and initiatives by severalother market players, about two dozen CDMprojects could possibly be registered by theend of 2004.
• The European Emission Trading Scheme (EUETS) may open for carbon offsets from JI andCDM projects from 2005 onwards. A recentstudy on the impacts of linking JI and CDMcredits to the EU ETS has estimated the mar-ket potential for JI and CDM to maximally100 MtC (360 MtCO2) in 2010 with a CERprice of $43/tC ($12/tCO2) (Criqui andKitous 2003).6 China is expected to be thelargest CDM credit supplier (55 percent of allCERs). But the access of the 10 new EU mem-ber states is likely to make JI projects particu-larly attractive under the EU ETS, as therespective transaction cost seems to be lowerunder JI than under CDM.
• Some market observers see evidence for a likelyprice differentiation between the project-basedmechanisms JI and CDM on one hand, andET (trading AAUs) on the other hand (Grubb2003). There is also a private and public sectordemand for “green carbon offsets” emergingfrom renewable energy CDM and JI projects,some of it complying with the “gold standard”proposed by WWF. On the other hand, Grubb(2003) expects that a significant part of thecarbon offset demand from countries such asCanada or Japan would choose the least-costoption; that is, emission trading (AAUs).
The literature research and analysis done bythe study team provide ample evidence for alarge uncertainty with regard to CDM potentialsas well as the carbon offset price. So far, only asmall proportion of the potential CDM marketsize has taken shape yet. The factors influencingthe pace at which the carbon offset demanddevelops further are therefore highly relevant forunderstanding prevailing market incentives andbarriers. Unless the demand for CERs does pickup significantly until 2006 the IPAC-projectedglobal CDM potential in 2010 of 44.7MtC/yr
(164 MtCO2/yr) and the projected potential inChina (21.6 MtC or 79.2 MtCO2) will be diffi-cult to be realized on an average during the firstcommitment period. So, in essence, the globalCDM market in reality is likely to be smaller thanthe projected 44.7MtC/yr (164 MtCO2/yr), butthe CER price could be higher than projectedby CERT and fall into the $20 to $40/tC ($5to $10/tCO2) range.
The following institutional and method-ological parameters seem to have a significantinfluence on buyers’ preferences and the actualCER price:
• Crucial for the further development of theCDM market is an early entrance into force ofthe Kyoto Protocol, as only CDM projectscoming into operation before 2006 will bene-fit from a full 7-year crediting period up to2012. Some domestic regulations in Annex Icountries are still awaiting parliamentary rati-fication, which is scheduled to follow when theKyoto Protocol has been ratified by Russia aswell. Another decisive factor for a CDM mar-ket will also be second commitment period tar-gets (if any), which will influence bankingdecisions and thereby affect the carbon marketduring the first commitment period.
• The uncertainty regarding the carbon offsetdemand and prices emerging under JI andCDM as well as the uncertain availability ofassigned amounts (AAU) on the emission trad-ing market make market intermediaries and thefinancial sector still standing rather aloof withregard to upfront investments. Associated withthis is a comparatively low level of involvementand CDM awareness of commercial banks andfinancial intermediaries. The institutions offer-ing carbon finance services do compete withina still comparatively small market—at least ifcompared to the requirements of a 44.7MtC/yr(164 MtCO2/yr) CDM market in 2008.
• Considering the considerable size of transactioncosts, many potential investors from Annex Icountries make carbon trading investments a
C H I N A ’ S C D M P O T E N T I A L
C D M I N C H I N A116

second priority and first look for carbon offsetswithin the enterprise. But Lecoq and Capoor(2003) report an increasing participation offirms in the carbon offset market, in particularfrom Japan. On the other hand, the businesscommunity in Europe is heavily engaged in thediscussions on National Allocation Plans forthe EU-ETS, and does not share their govern-ments’ views that it is beneficial or urgent to getinvolved in an early action with regard to pro-curement of CERs or ERU options. The busi-ness community thinks that there is still time tomake decisions. In most Annex I countries, theKyoto regulatory framework is still at a stage ofvoluntary measures. The political process tomake it legally binding is ongoing. This largelyexplains the “we cross the bridge when we reachthe river” attitude still prevailing in the corpo-rate sector within key Annex I economies.
• Significant amounts of private non-carboncapital are required to make proposed CDMdeals bankable and reach the respective finan-cial closure. As long as the CER-based revenuestream is associated with a significant projectrisk, the financial sector prefers investments inhighly profitable and larger-scale projects. Butin such projects, carbon finance risks are per-ceived as higher and more sensitive due touncertainty about project completion dates.Important project risks perceived by investorsare the regulatory framework, the neededclearances from the legal systems in hostcountries, transaction costs, and uncertaintiesabout whether CERs will be taxed in China.
• Uncertainty also prevails on how additionalitycan be demonstrated through appropriate meth-ods in more demanding but attractive sectors forbusiness, such as energy efficiency in industry.For sectors with significant GHG abatementpotentials and significant sustainable develop-ment benefits—but with more demandingCDM methodological issues, such as demand-side management in commercial and residentialbuildings, energy efficiency in small-scale indus-try, rural electrification or transport—publicfinance is likely be required to get such projects
to the market. At present, demand is channeledto renewable energy projects, where additional-ity can be justified comparatively easily andwhere a project size of 5 to 50 MW does notpose significant project risks. However, suchprojects would account for only a small fractionof the GHG abatement potential in large devel-oping economies such as China.
Various groups of stakeholders do apply dif-fering strategies in selecting technologies andprioritizing their project pipeline for CDMinvestments. The EU emission trading schemeand other national regulations potentially offeradditional incentives for private investment in thecarbon offset market. Key stakeholders shapingthe demand in today’s “buyers market” includea) OECD governments, b) large institutional andinternational agencies, c) the corporate sector, andd) the NGO sector. For example:
• Many EU member states and other OECDgovernments are in the process of establishingdomestic emission trading systems and/or JI/CDM programs.
• Many governments are launching their ownERU and CER procurement programs, includ-ing the Dutch CERUPT, the Finish small-scale CDM program, the Danish CDM/JIinitiative, the German JI/CDM fund (throughKFW), and more recently the programs ofAustria, Sweden, and Australia.
• Government and multilateral funds have so farplayed central roles on the buyer side in poten-tial CDM project transactions. To date, AnnexI governments are investing in CDM mainlybecause of country-level compliance. Govern-ments also are putting aside funds for invest-ment in emerging private undertakings aswell, creating public-private-partnerships. Thiscould help attract private investments to carbonfunds, and thus support such funds through adifficult introductory phase, when uncertaintyabout the status of the Kyoto Protocol still putsoff many potential CDM investors.
A N A L Y S I S O F C H I N A ’ S C D M P O T E N T I A L
C D M I N C H I N A 117
• Institutional buyers such as the World Bank’sPrototype Carbon Fund, IFC, the Asian Devel-opment Bank, or the EBRD are partly actingon behalf of OECD governments or on behalfof large corporations. They play an importantrole as market-place facilitators.
• Funds support the development of the marketby promoting pilot projects and the acquisi-tion of the first verified and certified emissionreductions. By establishing certificate poolsfor investors and buyers from the public andprivate sector, such initiatives are importantefficiency instruments to reach the Kyoto Pro-tocol’s emission reduction targets.
• Large Japanese and European GHG emittersfrom energy-intensive industries and the powersector are in the process of making direct invest-ments into the emerging CDM and JI market,or are developing their own carbon offset port-folio.
• Multinational corporations, committed tomitigate their carbon risks and demonstratingtheir corporate responsibility toward environ-ment issues, are in the process of developingtheir own carbon offset portfolio.
• Commercial banks and large financial sectorplayers are still significantly underrepresentedin the market place. They may assess the riskassociated with an early involvement as stillbeing too high.
• Project developers and brokers, such as specialdepartments in internationally operating enter-prises and specialized consulting companies,together with NGOs are the most active stake-holders in the current global carbon market.
CONCLUSION
The Kyoto Protocol set a GHG emission target forthe first commitment period for Annex I Parties.But the real emission reduction to be achievedunder the Protocol by Annex I Parties is uncer-tain due to projected economic developmentand the related future growth of GHG emis-sions. GHG emission projections for the year2010—the year taken as representative of the
first commitment period—differ, largely becauseof differences in modeling approaches, modelstructures, and assumptions.
Based on the IPAC emission model projec-tion, the Annex II countries’ reduction require-ments are estimated on the order of 374 MtC(1371 Mt-CO2), taking into consideration for-est management sink credits and the assumedvoluntary U.S. participation in the carbon offsetmarket (10 percent participation rate). Throughapplication of the results for both the emissionprojection and MACs from the IPAC emissionmodel into the CERT model—and assumingEFSU price leadership for the future carbon mar-ket, a 10 percent participation rate by the UnitedStates, 30 percent implementation rates for allnon-Annex I Parties, 50 percent supplementaryfor EU, and a $2/tC ($0.55/tCO2) of transactioncost for CDM—the CDM market size in 2010is estimated to be 44.7 MtC (164 MtCO2).Table 5.26 shows the results of this study, com-paring it with findings of selected other WB-NSScompleted since 2001 as well as with the out-come of selected carbon offset market studiescompleted in 2003.
As shown in Table 5.27, China’s share in theglobal carbon market is 11 percent and in the globalCDM market around 50 percent. China’s CDMpotential is 21.6 MtC (79.2 Mt-CO2) for 2010,which is substantial. Supplying this amount ofCERs would require a significant number of newlybuilt larger power projects (300MW-600MW)registered as CDM projects, as well as up to 100operating renewable power projects by 2006/07. Inaddition to reductions in CO2 from electricity gen-eration, projects in other categories—includingabatement of other gases and other source and sinkcategories—should also be taken into account inestimating China’s total CDM potential and itsimpact on market dynamics.
The current market price for carbon offsetscertified as per Kyoto rules is in the $3 to $5/tCO2 range. This range is close to the results ofthe scenario evaluation based on the IPAC emis-sion model and CERT ($0 to $7/tCO2). Theprice resulting from these models is an equilib-
C H I N A ’ S C D M P O T E N T I A L
C D M I N C H I N A118

rium price under a ratified Kyoto regime. Inreality, there will not be one uniform carbonprice for different transferable emission units(RMUs, CERs, ERUs and AAUs), and even nota common price for the same transferable emis-sion units resulted from different kinds of pro-jects in various countries. The preference ofinvestors for “high-quality,” “low-risk” projects
might affect the price of their credits. Grubb(2003) as well as Criqui and Kitous (2003) forthe EU emission trading system tried to assessthe effect of a differentiated carbon offset mar-ket (Table 5.26). Simulations in which Euro-pean market participants give a clear preferenceto JI/CDM credits conclude that under such aregime CER prices may increase by up to $6 to
A N A L Y S I S O F C H I N A ’ S C D M P O T E N T I A L
C D M I N C H I N A 119
T A B L E 5 . 2 6 Annex II Countries Emission Reduction Requirements, CDM Market Size, and CER Price Range Estimated
Annex II Countries reduction requirement CDM market size CER price range
Mt CO2 (2010) MtCO2 (2010) USD/CO2
IPAC emission model, 30%CDM implementation rate,without U.S. participation 1,243 0–161 0–6
IPAC emission model, 30% CDM implementation rate,10% U.S. participation 1,371 0–164 0–7
Selected WB-NSS* studiescompleted since 2001 1,300–(3,000) 300–(2,000) 1.7–(10)
International EnergyOutlook, EIA/USDOE 2002 860–1,540 80–465 —
Supply-demand balancestudy, Grubb 2003 415–1,250** 50–180 0–13.8
EU Emission Trading Study(Criqui et al, 2003) 1,1407 330–360 6–12
Transaction cost study,Michaelowa/Jotzo, 2003 1,105 363 < 4
*Vietnam, Peru, Indonesia**Assuming 50 percent of reduction requirement met by domestic action in the 15 EU member states
T A B L E 5 . 2 7 Annex II Countries GHG Reduction Demand and its Market Offset Shareamong Kyoto Mechanisms and the Domestic Actions by Annex II Countriesin Basic Scenario
GHG reduction by: Mt-CO2 (2010) Mt-C (2010) Allocation (%)
Total reduction requirement 1371.3 374.0Domestic action Annex II 649.4 177.1Subtotal Kyoto Mechanisms 721.6 196.8 100.0ET: AAU/hot air with EITs; 225.9 61.6 31.3JI 331.8 90.5 46.0CDM 163.9 44.7 22.7CDM, China’s share 79.2 21.6 11.0CDM, SE&S Asia 56.1 15.3 7.8CDM, LA & Africa + mid. East 28.6 7.8 4.0

$12/tCO2. Such pricing for CERs would in-creasingly help to cover the incremental abate-ment and transaction costs of CDM projects.Negotiations between investors and host coun-tries should target this CER price frame, whichdoes more realistically reflect the on-the-groundabatement cost of robust additional projects.
China’s power generation sector contributed 36percent of the total carbon emissions of the energysector in 2000. This share is expected to increase to38 percent by 2010. As the MACs of China’spower generation sector (IPAC-AIM technologymodel) display a relatively flat marginal abatementcost curve compared to other sectors (such as trans-portation and other industries), it is expected thatthe power sector will capture a major share of thepotential CDM market in China. If the powergeneration sector accounts for around 50 percentof the projected CDM potential of 79.2 Mt CO2/aby 2010, supplying this amount of CERs wouldrequire a considerable number of newly built largerpower projects (registered as CDM projects,assuming the capacity range of new fossil fuel-based power projects is around 300MW-600MW)as well as some 100 operating renewable powerprojects by 2006/2007. The priority technologiesfor this sector are identified as:
• Fuels switching to combined cycle gas powerplants
• Wind power• Landfill methane gas conversion to power• Hydropower.
Technologies that may prove to have signifi-cant potential and other environmental benefitsbut could not be covered within the methodol-ogy of this study are:
• Coal bed methane recovery• Biomass-based cogeneration• Biogas from agricultural, industrial, and urban
waste• Power generation from municipal solid waste• Non-CO2 emission abatement technologies
(methane, HFCs).
Besides the power sector, the steel, cement,and chemical industries show the second largest
abatement potential. Priority technologies in thissector proposed for further investigation are:
• Equipment for coke dry quenching• DC-electric arc furnace• Waste heat recovery systems (chemical industry)• CFBC-boilers for process heat• Dry process rotary kiln with pre-calciner
(cement industry)• Biofuels for the transport sector• Demand-side management, for example using
advanced electrical motors.
The scope of this study was confined to theenergy sector and related CO2 emissions; non-CO2 emissions from the industrial energy sectorwere not covered under this study. Other non-CO2 GHG emissions, such as HFCs, may offersignificantly lower-cost abatement potential.
References1. Recent energy data show a rapid increase in energy use
and production in China. Some newly developed energyscenarios forecast higher energy demand in 2010 and2020. This adds uncertainty to the energy demand fore-cast in China.
2. The effect is roughly equivalent to a carbon tax of $50/tC3. The carbon emission from the IPAC-AIM technology
model is higher than that from the IPAC emission modelbecause of different assumptions about emissions in 2000,technology trends, and scenarios. The scenario used in theIPAC-AIM technology model is not well linked with thereference scenario from the IPAC emission model becauseof different study purposes. This needs to be improved,especially by following recently published data.
4. In the Kyoto Protocol, there is no specific requirementfor technology selection in CDM projects, as this couldincrease the cost of replacement.
5. The annual part of transaction costs was estimated byexpert judgment to be on the order of $1/tCO2 for aproject size of 10’000 tCO2/a and fall to $0.5/tCO2 for30’000 tCO2/a. The annual transaction cost may stabi-lize for 500’000 tCO2/a at $0.2/tCO2.
6. Additional evidence: The delegates at the Annual GeneralMeeting of the International Emission Trading Association(IETA) on October 30, 2003 estimated the carbon price in2010 at $14.3/tCO2e (www.carbonpoint.com)
7. The external trading enlarged EU 128 MtCO2e; exter-nal trading for the rest of Annex B 242 MtCO2; EUinternal trade with 10 new EU states 36 MtCO2e;domestic action Annex B 734 MtCO2e.
C H I N A ’ S C D M P O T E N T I A L
C D M I N C H I N A120

C D M I N C H I N A 121
METHODOLOGICAL FRAMEWORK OFIPAC-SGM
Framework of IPAC-SGM
In order to analyze the socioeconomic impact ofCDM implementation in China, a computablegeneral equilibrium (CGE) model, IPAC-SGM,was selected from the IPAC model family. CGEmodels play an important role in policy assess-ment. Many modeling teams use CGE modelsfor simulation of economic activities and policyimplementation. IPAC-SGM projects economicactivity, energy consumption, and carbon emis-sions for 12 world regions. To better fit China’scircumstances, IPAC-SGM was revised with datafor some non-market-based sectors such as bio-mass, nuclear, and hydropower. It is designedspecifically to address issues associated with energyactivities and global change, with a special empha-sis on providing estimates of the following:
• Environmentally important emissions associ-ated with human activities, especially fromenergy activities
• The consequences of global environmentalchange, with particular emphasis on humanactivities
• The economic consequences of actions to miti-gate and adapt to global environmental change.
The model has nine production sectors andeleven consumption sectors. It focuses on energyproduction, capital stocks, and a suite of anthro-pogenic greenhouse gases (Table 6.1). The modelwas developed in recognition of the fact thatenergy production and use is the most importantset of human activities associated with greenhousegas emissions.
Some of the sectors, such as electricity gener-ation, also contain subsectors. Each productionsector in the IPAC-SGM model represents aunique product with its own unique equilibriumprice. Subsectors within a sector represent dif-ferent ways of producing the same product. Forexample, there are many technologies for gener-ating electricity, which are represented by theseveral electricity subsectors.
Methodology of CDMImplementation Analysis by IPAC-SGM
Because there are few similar studies that assessthe impacts of CDM implementation on Chi-nese economic development, several assumptionswere made in using the IPAC-SGM model. Forexample:
• Foreign investment increase due to sale of CERs.A simple assumption was made that total
Impact Assessment of CDM Implementation on China’s
Socioeconomic Development
6
�

ity by applying the localized advanced tech-nology, so as to enhance the competitiveness ofChina’s economy. The impact assessment ofthe CDM-driven technology transfer on tech-nology progress will be focused on middle- andlong-term effects over several decades. The tar-get year of this simulation is 2030.
• Extension of productivity in the machinery man-ufacturing sector. Localization of transferredtechnologies will increase the production activ-ities for machinery manufacturing in China.
MAIN ASSUMPTIONS AND ENERGY DEMAND
Major assumptions for IPAC-SGM in this sim-ulation include the following:
• Population growth. We assumed that the fertil-ity rate, death rate, and birth rate (and futuretrends) occurring currently in Japan would besimilar to that in China by 2030. This popula-tion scenario is similar to that in the IPAC
C H I N A ’ S C D M P O T E N T I A L
C D M I N C H I N A122
income from sales of CERs would be a netincrease in foreign investment for sectors inIPAC-SGM. Parameters for investment willbe changed to include the increase in foreigninvestment.
• Technology progress in China due to technol-ogy transfer through CDM. CDM projects leadto transfer of advanced technology to China inthe period 2005–10. It was assumed that theCDM investment attracted by the 1st com-mitment period will be taking place early inorder to benefit fully from a 7-year creditingperiod up to 2012. Technology progress in thisperiod was calculated based on the scale ofCDM projects and location of these CDMprojects by sectors. We assumed that CDMproject investment will promote technologytransfer to China, followed by the localizationof advanced technology in China. This willtherefore impact technology progress after 2010and could have a larger impact because of muchmore technology diffusion. Technology diffu-sion will increase domestic production capac-
T A B L E 6 . 1 Production Sectors and Subsectors
Sector No. Sector Sub-sectors
1 Agriculture2 Other sectors3 Crude oil production4 Natural gas production5 Coal production6 Coke production7 Products from coal8 [Hydrogen fuel]9 Heat supply10 Wood production11 Electricity generation Oil, Gas, Coal, Biomass, Nuclear, Hydro, Solar/Wind12 Oil refining13 Distributed gas14 Chemicals15 Cement16 Primary metals17 Food processing18 Other industry and construction19 Passenger transport [by transport mode]20 Freight transport [by transport mode]

emission model. Table 6.2 gives the populationscenario in IPAC-SGM.
• GDP growth. The government target was basi-cally followed, in which GDP per capita in2050 will reach the level of developed countriesin early 1990. The IPAC model adopted a sim-ilar economic growth trend, which is includedin IPAC-SGM (Table 6.3).
• Technology progress. It is assumed that the effi-ciency improvement trend observed in the past20 years in China, but—based on research re-sults from other studies—with a declining ratein the future.
• Energy demand and mix. Using the above as-sumptions, a baseline energy demand scenario
was developed using the IPAC-SGM model(Table 6.4). This provided a baseline energy sce-nario for this analysis. No large-scale use of bio-mass and modern renewable energy is assumed.
• Net foreign investment increase from CDEMimplementation. Selling CDM/CERs to devel-oping countries could bring additional foreigninvestment funding to China. Here it is as-sumed that the CDM leads to a net incremen-tal increase in foreign investment1 compared tothe baseline foreign investment (Table 6.5).The value for 2010 is the product of the equi-librium market price and China’s CDMpotential derived from the CERT model. It isassumed that the investment will start to flow
I M P A C T A S S E S S M E N T O F C D M I M P L E M E N T A T I O N O N C H I N A ’ S S O C I O - E C O N O M I C D E V E L O P M E N T
C D M I N C H I N A 123
T A B L E 6 . 2 Population Assumed in IPAC-SGM, thousands
Year Tot.Pop Working AGE Man Working AGE Female Working AGE Total Employed
1990 1067931 358554 343661 702215 4769281995 1165023 397988 380687 778675 5288572000 1244045 426376 407488 833863 5663402005 1309099 453367 431687 885055 6011082010 1357580 489652 466795 956446 6495962015 1399020 514309 489518 1003828 6817762020 1440727 526122 499638 1025760 6966712025 1475316 524281 496482 1020763 6932782030 1495370 529332 500471 1029804 699418
Data source: Energy Year Book 2002, for data from 1990 to 2000.
T A B L E 6 . 3 GDP Assumption in IPAC-SGM, million Yuan (in 1990 price)
GDP GDP per Government Net Growth Capita,
Year Consumption Investment expenditure Export GDP Rate 1000 yuan
1990 1000291 473131 61373 218566 1753362 3.2181995 1351561 804618 214707 218569 2589454 0.081 4.92000 2256274 1351287 472525 218560 4298645 0.107 7.592005 3624311 1945574 696229 218566 6484680 0.086 10.792010 5519115 2621077 1055124 284134 9479450 0.079 14.5932015 7759009 3245157 1393635 369374 12767175 0.061 18.7272020 10315084 3958638 1731273 369401 16374397 0.051 23.5052025 12954654 4710539 2057167 369375 20091735 0.042 28.9812030 15979505 5773584 2493823 369376 24616288 0.041 35.196

ogy transfer by CDM projects. The assumptionin technology progress rate used in IPAC-SGMis given in Table 6.6.
• Localization of advanced technologies. In thesimulation, advanced technologies transferredthrough CDM projects could be localized,which is critical for further diffusion in China.Localization of advanced technologies con-tributes to local economic development andenvironmental protection. In the IPAC model,it is assumed that localization of technologystarted five years later than CDM project im-plementation, and that localization will intro-duce earlier diffusion of these technologies inthe period from 2010 to 2030. The technol-ogy diffusion rate will converge to the baselinediffusion rate after 2030. This will increaseenergy efficiency improvements after 2010(see Annex 3 in the CD-ROM attachment forassumptions).
• Productivity increase in the machinery manufac-turing sector. Table 6.7 provides an overview ofthe expenditures for technology imports to thepower generation sector. Based on this informa-tion, it is assumed that half of the expenditurefor technology imports (foreign investment) willbe shifted to domestic purchases.
Table 6.8 provides the value added from machin-ery manufacturing as a share of total industry
C H I N A ’ S C D M P O T E N T I A L
C D M I N C H I N A124
T A B L E 6 . 4 Commercial Primary Energy Consumption (Mtce)
Natural Other Year Crude Oil Gas Coal Biomass Nuclear Hydro Renewables Total
1990 164.00 20.64 753.73 0.00 0.03 15.96 0.00 954.361995 229.50 27.32 983.40 0.00 0.10 20.15 0.00 1260.472000 320.50 32.57 889.55 0.00 0.44 27.32 0.27 1270.652005 392.42 40.71 1166.06 0.00 1.13 36.78 0.64 1637.732010 484.74 48.52 1301.00 0.00 1.91 46.12 1.25 1883.542015 590.33 57.59 1474.87 0.03 2.73 56.09 1.86 2183.492020 701.46 65.77 1637.01 0.27 3.31 63.58 3.00 2474.402025 814.98 73.70 1781.94 0.58 3.34 62.94 4.12 2741.612030 948.70 84.10 1972.43 1.23 3.65 68.07 5.64 3083.82
Note: Traditional biomass use is not included here
T A B L E 6 . 5 Net Foreign InvestmentIncrease Caused by CDM, (in million US$)
Net foreign investment increase
2005 237.62010 475.22015 356.42020 237.6
from 2005 onwards in order to generate theprojected CER volumes in 2010, beginningwith incremental CDM investments in 2005 athalf the level of 2010. After 2010, it is assumedthat the foreign investment in CDM will gen-erally decrease—as other policies that limitemissions (both domestically and internation-ally) are put in place and decrease the volumeof CDM transactions—and will end by 2030.It is also assumed that the CDM will continueto operate after 2010.
• Technology progress by CDM implementation.CDM projects will have a positive impact onthe technology improvement rate. Accordingto the results from CDM potential analysisby sectors, the power generation sector andenergy-intensive sectors will benefit from ad-vanced technology diffusion through technol-

(around 10 percent). This added value share willincrease from 2010 onwards. In the simulation,it is assumed that capital productivity in themachinery manufacture sector will increase 0.1 percent annually from 2010 to 2030.
IMPACT ASSESSMENT OF CDMIMPLEMENTATION ON GDP
Taking into account the incremental foreignCDM investment, efficiency improvements, andtechnology localization (which lowers the cost ofmanufacturing capital goods), the model simula-tion leads to an increase in GDP of 0.03 percentin 2010, 0.34 percent in 2020, and 0.52 percentin 2030 (Table 6.9).
After that, the effects of technology will gen-erally disappear, because technologies transferredby CDM will be introduced into the baseline sce-nario. The GDP increase peaks in approximately2030 to 0.52 percent compared with the baselinescenario (Figure 6.1). Over the entire 25-yearperiod up to 2030, the CDM leads to a GDPincrease of 0.68 percent, compared with the basecase without CDM. On an annualized basis, therate of increase in GDP over this period due tothe CDM is 0.022 percent.
The analysis only considers macro-level, aggre-gate effects of increased CDM investment onGDP. Macroeconomic feedbacks at the sec-toral level—such as on competitiveness, struc-tural change, energy costs, or access to capital/capital cost—are not taken into account.
MODEL LIMITATIONS ANDCONCLUSION
This study of the economic impact of CDM im-plementation in China is a preliminary researchactivity. So far, there are few similar studies.There were limitations in the overall methodol-ogy framework, including parameter assumptionsfor foreign investment, efficiency improvements,and localization of technologies. There were alsolimits in how the results in the CERT and IPAC-
AIM technology models could be applied to theIPAC-SGM model. Given these limits, we madesimplified assumptions about the impact of CDMimplementation. Critical limitations in the mod-eling assumptions include:
• Net increase of foreign investment for CDMimplementation. In this study, we assumes that
I M P A C T A S S E S S M E N T O F C D M I M P L E M E N T A T I O N O N C H I N A ’ S S O C I O - E C O N O M I C D E V E L O P M E N T
C D M I N C H I N A 125
T A B L E 6 . 6 Annual Change in Efficiency ImprovementAssumption as a Result of CDM in IPAC-SGM
% increase Base case* with CDM due to 2005 (%) 2005+t (%) CDM (%)
Steel Making 4.0 0.2 5.0Cement 6.0 0.3 5.0Chemical Industry 4.4 0.1 2.3Power Generation 0.07— gas fired plants 0.8 0.1 12.5— coal fired plants 0.2 0.06 25.0Other sector 5.0 0.2 4.0
*This table gives a snapshot of base case efficiency improvements for theyear 2005 for comparison with the CDM effect; the full time series for thebase case is available in the CD-ROM attachment.
T A B L E 6 . 7 Investment in Power Sector, billion $
1995 1996 1999 2000
Total Investment 12.6 15.4 22.2 25.7Foreign investment 0.9 1.4 2.7 2.5
Source: China Year Book 2002.
T A B L E 6 . 8 Value Added in MachinerySector, billion $
1997 1999 2001
Total 240.1 261.1 343.0Machinery (1) 26.1 27.4 36.2
Notes: (1) including ordinary machinery, special purposeequipment, and electric equipment and machinery.

CDM transactions would result in a net in-crease in foreign investment. In some cases,there may be tradeoffs between CDM invest-ment and conventional FDI investment, suchthat CDM investment would not be additionalto baseline FDI investment.
• CDM profit treated as investment. It is assumedthat CDM profits are reinvested in the econ-omy. In reality, profits could be used for otherpurposes.
• CDM transactions may take the form of CERsales. This would put more of the burden forproject finance (and risk) on the project ownerand may have different economic impacts thanCDM investment. This issue requires furtherstudy.
• The IPAC-SGM model assumed a technologyprogress rate. Because this is a CGE model,there is an indirect linkage between technologyprogress in the IPAC-SGM model and tech-nology progress in the IPAC-AIM technologymodel.
Despite analytical uncertainties, some pre-liminary observations from the study include thefollowing:
• CDM implementation could contribute toChina’s economic development by extendingforeign investment, localization of advancedtechnologies, and technology efficiency im-provement in China. Major contributions fromCDM implementation in China to the localeconomy include a net increase of foreigninvestment in China by CDM projects, tech-nology efficiency improvements, and localiza-tion of advanced technologies.
• CDM implementation could have long-termbenefits for China. The results show GDPincreases by 0.03 percent in 2010, 0.34 per-cent in 2020, and 0.52 percent in 2030. Thisshows the early introduction of technologiesand localization effects.
• Further study is necessary to determine theimpact of CDM implementation. By reviewingrelated studies on the impact of CDM projects,we observed ancillary benefits from CDMimplementation. Several studies ( Jiang andothers 1998; Guo and others 2003) present theco-benefits on local air pollution abatementand health impacts from the introduction ofclean technology to China. CDM projectscould help bring clean technologies to China.This should be further analyzed within theIPAC-SGM model.
Endnote/Reference1. The prevailing CDM transaction type at present is not
direct investment in a CDM project, but the sale of CERsthrough carbon purchase agreements. This analysis sug-gests that there are different development implications forthese two transaction types.
C H I N A ’ S C D M P O T E N T I A L
C D M I N C H I N A126
T A B L E 6 . 9 CDM Impact on China’s GDP
GDP GDP Increase % GDPbase with in GDP increase case CDM from due to (B $) (B $) CDM (B $) CDM
2005 750.6 750.62010 1109.2 1109.6 0.4 0.0332020 1965.5 1972.2 6.7 0.342030 3025.2 3040.8 15.6 0.52GDP increase 2005–2030 2274.6 2290.2 15.6 0.68Annual growth rate 0.022
increase in GDP for the period 2005–2030
F I G U R E 6 . 1 GDP Change by CDM Implementation in China
0.000.100.200.300.400.500.60
1990 1995 2000 2005 2010 2015 2020 2025 2030Year
Perc
ent

C D M I N C H I N A 127
POLICY INSIGHTS
The Rationale for a Sustainable andProactive CDM
Based on the knowledge and experience gainedthrough the China CDM study, and consideringboth the evolution of the international CDMregime and the particular national circumstancesof China, this chapter outlines the justificationfor a Chinese CDM approach that:
• Emphasizes sustainable CDM by ensuring thecontribution of CDM project activities to sus-tainable development in China
• Takes a proactive approach to take early advan-tage of CDM opportunities during the firstcommitment period.
Significance of CDM opportunities forChina: Local co-benefits
CDM projects will contribute to greenhousegas emission reductions and help developedcountry parties meet part of their commitmentsunder the Climate Convention and the KyotoProtocol. In addition, they will assist China inachieving sustainable development by absorb-ing additional financial resources and promot-ing technology transfer.
CDM will not have a significant impact onoverall economic growth rates in China in the
short to medium term (up to 2010). Assumingthe Kyoto Protocol enters into force soon, somepositive macroeconomic effects are nonethelessapparent, including:
• An increase in net foreign investment (viaCDM deal inflows to China) up to $475 mil-lion annually in 2010 (including both incre-mental abatement cost and profit)
• Higher rates of efficiency improvement in theenergy end-use and electricity generation sec-tors, resulting in greater resource productivity
• A CDM contribution of about 0.5 percent ofGDP annually in the year 2030 as a result ofCDM investments made from 2005 to 2030,mainly due to the transfer and localization ofadvanced technology that is not yet maturein China. In the 2005–2010 timeframe, totalincremental CDM investments of $1.78 bil-lion (base case) result in a corresponding GDPincrease of $2.13 billion. In other words, everydollar invested in Chinese CDM projects booststhe Chinese economy, measured in GDP terms,through 2010 by an additional $0.20 (as aresult of technology localization and efficiencyimprovements). This multiplier effect is ex-pected to increase over time as technologylocalization advances.
In addition, CDM can have a range of sus-tainable development co-benefits in line with
Policy Insights and Recommendations
7
�

price of $5.2 to $6.5/tCO2. The marginal abate-ment cost curves for energy end-use sectors usedin this analysis are rather preliminary, but someno-cost measures in the industrial end-use sectorwere identified. Project developers are likely tofind many more CDM opportunities in the var-ious end-use sectors that are competitive underprevailing market conditions, but this study onlylooked in detail at power generation options.
Based on three carbon market scenarios, thisstudy estimated China’s energy-related CDMmarket potential in the year 2010 at between 25and 117 MtCO2 annually, based on an equilib-rium certificate price of $5.2–6.5/tCO2.3 Underall three scenarios, China captures nearly 50 per-cent of the total market CDM demand (esti-mated at between 52 and 240 MtCO2), resultingin CER profits4 of $77–$311 million annually in2010. If a market structure of perfect competi-tion is assumed, the model results provide closeto zero price and CER trade volumes. The esti-mated CDM potential refers to reductions inCO2 from electricity generation and energy end-use only (which account for over 80 percent oftotal CO2 emissions). CDM potential for othergases (such as HFC 23 decomposition) and othersource and sink categories must also be taken intoaccount in estimating China’s total CDM poten-tial and its impact on market dynamics.
Sensitivity analysis indicates that the largestsources of uncertainty in these estimates (in orderof importance) are (a) the amount of surplusallowances in EIT countries; (b) business-as-usualemissions projections (demand side) and mar-ginal abatement costs of potential buyers and sell-ers; (c) the level of supply-side competition in themarket (competition vs. price leadership); (d) thefraction of CDM potential that is actually realizedby 2010 (implementation rate); (e) the trade-offbetween hot air supply and the amount of carbonoffsets reaching the market in the form of JI cred-its; (f ) the assumedparticipation rate of the UnitedStates; (g) the way in which countries choose tooperationalize supplementarity; and (h) the levelof transaction costs.
C H I N A ’ S C D M P O T E N T I A L
C D M I N C H I N A128
China’s domestic policy priorities, includingpositive effects1 on:
• Local economic development—promotinglocal economies through technology localiza-tion, increasing local tax revenue, creating new(skilled) jobs, and building local capacity
• Resource efficiency—more efficient use ofenergy and using waste for energy generation
• Local environment—reductions in air pollu-tants such as sulphur dioxide, nitrous oxide anddust;2 improved water quality, including reduc-tions in organic oxygen demand; and nature/forest conservation.
Properly selected and designed CDM projectscan provide financial leverage to speed technologyprogress in the electricity generation and energyend-use sectors. The resulting co-benefits canhave significant long-term effects on economicgrowth and China’s quality of life. However, notall projects that generate real, measurable, andlong-term greenhouse gas reductions also makean unambiguous contribution to local sustainabledevelopment, so it is imperative that potentialprojects be carefully selected to be consistent withChina’s sustainable development strategy andAction Plan, which is a high priority of thegovernment.
China’s critical role in the global carbon market
Three fossil and three renewable case studies thatrepresent a good cross-section of electricity gen-eration options in China were analyzed. Four ofthem had average specific abatement costs at orabove $10/tCO2, and would likely not be com-petitive under current market conditions. Takingadvantage of synergies with existing governmenttechnology progress programs could enhance thefinancial viability of CDM projects that employadvanced technologies.
The top-down modeling results for the energysector as a whole, on the other hand, indicate sig-nificant potential below the modeled equilibrium

In assessing China’s CDM potential, this studymodeled supply-side competition based solely ondifferences in national marginal abatement costcurves under perfectly functioning equilibriummarket conditions. Future work will have to con-sider the nature of emerging carbon markets (frag-mented, illiquid, non-standardized, risk-averse),the implications of different CDM transactiontypes (equity investment in CDM projects, for-ward contracts to purchase CERs, trade in CERson secondary markets), the differing motivationsof market players, and how China can competesuccessfully under these real-world conditions.
Time pressure to capitalize on CDM opportunity
The shape of the international climate policyregime for the post-2012 period will determinewhether CERs generated after 2012 have valuefor China and other host countries. If the KyotoProtocol were to enter into force in time, negoti-ations on commitments for subsequent periodsfor Annex I Parties—which will take the form ofamendments to Annex B of the Kyoto Protocol—would be launched by the end of 2005. If thispath is followed, and commitments can be nego-tiated successfully, the CDM will likely be partof the future policy mix, under a continuationof the Kyoto regime. Otherwise, and this risk issubstantial, the validity and value of CERs after2012 is uncertain.
As a result, investors are only interested at pres-ent in making financial commitments to CDMprojects for CERs generated through 2012. If weassume that the CDM projects to be implementedby China have a 7-year crediting time, these pro-jects would have to be operational by the end of2005 to capture the full value of the project’s eli-gible CERs during the first commitment period.As large power projects generally have construc-tion times of several years or more, it is clear thatsome of the value of the potential CDM projectswould not be generated in time to enter intoinvestors’ calculations.
To be competitive, therefore, China may haveto act rapidly and focus on projects that can be
implemented over the next couple of years, havelow specific abatement costs, and/or have credit-ing times that do not extend far beyond 2012.Other strategic options are to use CDM invest-ment (or proceeds from sales of CERs, dependingon the transaction model) merely to supplementgovernment initiatives to introduce advancedtechnologies (clean coal, new and renewable tech-nologies, energy efficiency) without the expecta-tion of full incremental cost recovery.
In order for the Chinese Government to lever-age CDM investment/CER proceeds in supportof its technology promotion activities, a transpar-ent baseline methodology to demonstrate theadditionality of such efforts is required. Identify-ing CDM opportunities linked to energy sectorand municipal infrastructure projects that receivegovernment subsidies to promote technology pro-gress or sustainable development could be onemeans of rapidly developing viable CDM projects.
To take full advantage of the modeled CDMpotential in the power sector, up to several hun-dred projects—including a considerable num-ber of larger, newly built fossil power projects(i.e., capacity range:300–600MW),aswell as some100 renewable electricity generation projects—would have to be registered as CDM projects andunder operation by 2005/6.
Furthermore, some potential CDM projects,such as the super-critical coal-fired power plantproject analyzed as a case study, may lose theirCDM eligibility in a rather short timeframe, asthe underlying technologies come into wide-spread use and must be considered in the base-line. In other words, delay in moving forwardwith CDM implementation can result in irre-versible loss of opportunities.
Identification and Removal of CDM Barriers
Chinese enterprises face barriers to CDMimplementation in practice
As identified in the course of the case study workand through industry stakeholder consultations
P O L I C Y I N S I G H T S A N D R E C O M M E N D A T I O N
C D M I N C H I N A 129

(see Annex 7 in the attached CD-ROM), projectdevelopers are currently confronted with myriadsignificant barriers to CDM implementation.Some barriers are faced by all project developersacross the world. China alone cannot removesuch barriers; including:
• Uncertainty whether and when the KyotoProtocol will/may enter into force
• Uncertainty about carbon offset prices in theemerging global carbon market for the Kyotomechanisms, which makes it difficult for enter-prises to assess in a robust way the potential netfinancial benefits from CDM transactions
• Low CER price offers in the current buyer-driven market, which limits the volume ofpotential projects for which CDM financingactually covers the incremental cost of addi-tional climate protection projects
• Uncertainty regarding international approvalprocedures
• Complexity of the CDM project cycle. Mostenterprises, particularly smaller ones (which areprevalent in China), simply do not have therequired capacity; that is, a range of technical/engineering/economic know-how to preparePDDs, command of English, and experiencewith monitoring systems.
However, some barriers could be removed,including:
• Institutional and legal systems in China toenable project developers to enter into CDMproject activities (such as DNA to give formalapproval to CDM projects; transparent andunambiguous rules on project eligibility andprocedures for project approval; CDM prop-erty rights; CER taxation policy; laws andincentives for renewable energy projects)
• Lack of awareness among decisionmakers in thefinancial sector and enterprises regarding cli-mate change (greenhouse gas emissions, reduc-tion potentials, Kyoto/CDM framework), plusknowledge and skills to evaluate CDM risks
and opportunities (such as taking into accountthe additional requirements for monitoring,reporting, and verification of CDM projects)
• The challenge of reconciling the need todemonstrate the additionality of CDM projectactivities within the 5-year planning process
• Lack of incentives for utility participation ascrucial stakeholders for power sector CDMdeals, as grid-connected power projects requiredata on the greenhouse gas emissions of theexisting power grid (baseline, leakage). How-ever, these enterprises have no financial in-centive to deliver the necessary data for CDMproject developers, as they are generally notpartners in the CDM deal.
Although some potential CDM projects areunder development, and some Chinese enter-prises are eager to initiate CDM projects, otherChinese enterprises are not fully aware of CDMopportunities or are waiting for additional assis-tance before launching actual CDM projects,even though there is interest in learning more(capacity building, engaging in pilot projectsunder low-risk arrangements), even in the periodbefore major uncertainties can be removed andthe institutional framework is established. In dia-logue with the private sector, the governmentshould explore how to overcome these barriers.
China’s actions to facilitate CDM
Whether China will be able to achieve its fullCDM potential will depend on China’s compet-itive position in the carbon market. These incen-tives might include creating attractive investmentor carbon purchase arrangements from the per-spective of CDM investors or CER buyers; ensur-ing efficient institutional arrangements and stateassistance to lower transaction costs; adoptingfavorable conditions for the uptake of advancedtechnologies, in particular, renewables; and pro-viding incentives and capacity building to fosterrapid development of CDM projects that can beoffered at competitive prices. The current initia-tives of the National Peoples Congress to create a
C H I N A ’ S C D M P O T E N T I A L
C D M I N C H I N A130

law for the promotion of renewable energy and torevise the electricity and energy-saving laws arepromising and should offer points of entry for theCDM.
Despite the uncertainties surrounding theKyoto Protocol’s entry into force and CDM costsand benefits, opportunities exist to facilitate theremoval of some of the main barriers to CDMimplementation, and China is beginning to acton them:
• Several studies and capacity building pro-grams have been carried out in China withinternational assistance. They have proven ben-eficial to enhance awareness on climate changeand CDM among governmental and indus-trial audiences, as well as to analyze CDMopportunities.
• Although the DNA of China has not been offi-cially announced, the current “Climate ChangeOffice” in the National Development and Re-form Commission has been mandated to per-form the tasks of the DNA in the pre-validationphase of CDM project development. A draftinterim regulation to formally designate China’sDNA and to define the domestic approval pro-cedures for CDM projects is under preparationand expected to be adopted in the first halfof 2004.
• The government is also developing additionalbilateral cooperation programs with foreigngovernments and international organizationsin facilitating the development and implemen-tation of CDM projects.
• A national CDM website is under developmentand will be ready soon to provide both domes-tic and foreign CDM developers the necessaryinformation.
• China has a member on the CDM ExecutiveBoard for 2004–06, had an alternate memberon the CDM Executive Board for 2001–03,and has a member on the CDM ExecutiveBoard’s Methodology Panel. These advantageshave been used to disseminate relevant infor-mation, in particular the updated progress inthese two bodies.
Progress is also being made internationallywith respect to both institutional arrangementsand CDM investment promotion and financing/carbon purchase vehicles. In the recommendationthat follow, we propose specific steps that the Gov-ernment of China could take to facilitate CDMproject activities.
Thoughts on Priority Sectors andProject Types
One of the general requirements for CDM proj-ect approval under the current Chinese interimarrangements is that the CDM project activityshould promote the transfer of environmentallyfriendly technology. In addition, energy effi-ciency improvements and new and renewableenergy are listed as priority areas for CDM coop-eration. In general, the central government’s maingoals are technology progress (advanced technol-ogy, localization) and broader contributions tosustainable development, rather than merelyattracting additional foreign investment.
In addition to political priorities, however,CDM potential (volume, price) must also betaken into account in considering priority sectorsand project types. Through the IPAC-AIM tech-nology model simulation of the entire Chineseeconomy, the study concluded that the largestCDM potential would exist in the electric powersector, which attributed to China 50 percentof the total CDM potential of 25–117Mt CO2
annually per year in 2010. The case studies dem-onstrate that under prevailing market conditions,the added value of CER sales under current mar-ket prices will be insufficient to cover the incre-mental costs of four of the six power projectsanalyzed. Only the landfill gas recovery and powergeneration project ($3.9/tCO2) and perhaps thesupercritical coal-fired project ($8.5/tCO2) wouldappear viable CDM projects on their own.5
In the provinces in which the six case studyprojects are located, the share of thermal powergeneration ranges from 85 to 100 percent, mostof which is coal-fired. As the use of advanced
P O L I C Y I N S I G H T S A N D R E C O M M E N D A T I O N
C D M I N C H I N A 131

technology can increase the efficiency of coal-fired power generation significantly, it would belogical to seek ways to ensure that new thermalpower generation is as efficient as possible. How-ever, at current market prices, the additionalfinancial incentive that could be derived fromsales of CERs is simply insufficient to encourageenterprises in the energy supply sector (backedby the incremental cost calculations for the casestudies) to reconsider alternative, climate-friendlyproject designs for mid- to large-scale electricpower generation projects, which they wouldhave excluded at the outset of their project designprocess (due to factors such as lack of access tocapital to cover incremental costs, insufficientreturn on investment, high transaction costs, orhigh risk). To overcome this dilemma, energysupply companies suggested that CDM financ-ing could be applied in the context of clean andefficient energy demonstration projects that arepromoted by the Chinese Government throughpreferential policy/regulations, financial incen-tives, subsidies, etc. (see Annex 7 in the attachedCD-ROM). It should be possible to demonstratethe additionality of such projects, as the tech-nologies concerned are neither widely imple-mented nor commercially viable under currentnational circumstances in China. Such combinedincentives could make selected climate-friendlyelectricity generation projects attractive to proj-ect owners, because they would be sufficient tocover both the incremental and transaction costsassociated with CDM project activities. CDMalone cannot cover the full incremental costs ofmost mitigation projects in the energy supplysector. And with additional CDM finance, thelimited government financial incentives couldhave a bigger demonstration impact, also withregard to co-benefits associated with promotionof cleaner technologies.
In addition to the power sector, it is assumedthat China’s CDM potential is distributed amongthe steel and cement industries (10 percent ofCDM potential each), the chemical industry(5 percent), other industries and end-use sectors
(15 percent collectively), and non-CO2 projects(remaining 10 percent of total potential). Furtherin-depth analysis of emission reduction potentialacross sectors and for individual technologyoptions is needed to improve the reliability ofthese estimates.
Further work is also needed to assess the rela-tive attractiveness of sectors and generic projecttypes. It might be instructive to qualitatively assessfactors such as the ease of baseline setting (dataavailability, complexity of project, grid data), easeof demonstrating additionality, the incrementalcosts, the total amount of greenhouse gas re-ductions, project ownership characteristics, thepotential for replication, and the contribution tosustainable development for the detailed casestudies prepared under this study, as well as forother projects evaluated under other cooperationprograms.
RECOMMENDATIONS
China’s CDM Strategy, Policy, andImplementation Plans
Based on the current state of advancement ofChina’s CDM strategy, policy and implementa-tion, and the insights gained from the ChinaCDM study, it is recommended that China:
Adopt a proactive and sustainable CDM policy
Sustainable CDM
The main driver for China’s participation in theCDM is the promise of local sustainable develop-ment benefits in support of China’s sustainabledevelopment strategy, which is a high priority ofthe government. This study has shown that prop-erly selected and designed CDM projects canprovide financial leverage to speed technologyprogress (access to advanced technologies, tech-nology localization, and diffusion) in the electric-ity generation and energy end-use sectors. Theresulting co-benefits can have significant long-term effects on economic growth and quality of
C H I N A ’ S C D M P O T E N T I A L
C D M I N C H I N A132
life in China. Yet not all projects that might beeligible under the CDM make an unambiguouscontribution to local sustainable development,so it is imperative that the Chinese Governmentproject approval process encourage this policycoherence, for example, by providing clear guid-ance on project eligibility to potential projectdevelopers.
To achieve sustainable CDM we recommend:
• Defining the desired performance outcome ofthe approval process as precisely as possible.Initially, some experimentation with the fullrange of approaches to sustainable developmentassessment—such as positive or negative tech-nology or project category lists; decision analysisframeworks for multi-criteria analysis of proj-ects; inclusion of SD indicators/performancestandards in CDM project MVPs; and applica-tion of standards, such as the Gold Standard—could be considered. However, it is importantthat the performance indicators at the outsettake into account such practical issues as trans-action costs to government and other stake-holders, human resource requirements, cred-ibility, and replicability/certainty to projectdevelopers/investors. So the evaluation systemshould be transparent, robust, and lean. Basedon early experience gained, the government maywish to limit or prescribe acceptable approaches(for example, at the time the CDM Directive isfinalized).
• Influencing the international rules for theCDM. As a major player in the CDM mar-ket, China has the opportunity to ensure thatCDM rules reflect Chinese circumstances andare supportive of domestic policy priorities.One example is the consideration of the addi-tionality of new and renewable power genera-tion or energy efficiency projects that receivefinancial support from the Chinese Govern-ment6 (see discussion on the application ofCDM finance to demonstration projects).
• Building awareness among host country proj-ect proponents of the sustainable development
implications of benefit-sharing and CER pric-ing arrangements between buyers and sellers,and promoting the consideration by projectproponents of these aspects in their negotia-tion of CDM deals.
• Integrating CDM into the sustainable develop-ment strategy and action planning in the sectors(especially the energy sector and energy inten-sive industrial sectors). Such initiatives could onone hand ensure maximizing the CDM bene-fits in achieving the sustainable development,and on the other hand, could ensure not losingthe CDM opportunity for China during thefirst commitment period, which need to prepareand initiate considerable number of CDM pro-jects in the earlier stage. Many relevant energyprograms or initiatives (such as clean and ef-ficient energy action plan, renewable energypromotion initiative, fuel switching power pro-jects, localization program of the super criticalpower technology, etc.) are already in place thatcould be a source of projects potentially eligibleunder the CDM. In the absence of the CDM,those demonstration projects, which contributeto climate protection, are dependent on Chi-nese Government financial support. Until theyare widely introduced and as long as they re-quire significant Government subsidies to befinancially viable, they could demonstrate addi-tionality under the CDM, but this is a limitedwindow of opportunity.
• Developing a strategy to enhance the contribu-tion of the CDM to advanced technologydemonstration in the energy sector. For exam-ple, the accelerated introduction of clean coaltechnologies in the coming decades, includ-ing overcoming the substantial barriers to theirintroduction, is needed. Similarly, renewableenergy projects depend on effective regula-tions that require electricity grid operators topurchase electricity at guaranteed prices, as isalready the case in some deregulated markets.Levying lower VAT taxes on electricity sup-plied to the grid by renewable energy projectscould also improve the economic viability of
P O L I C Y I N S I G H T S A N D R E C O M M E N D A T I O N
C D M I N C H I N A 133

potential CDM projects. Synergies between theCDM and domestic policy priorities appear tobe underutilized by the responsible authoritiesat present.
Proactive CDM implementation
This study has shown that China must act rapidlyto facilitate generation of a substantial pipeline ofCDM projects—on the order of hundreds in thepower generation sector alone—within the nextseveral years if it is to capture its potential CDMmarket share. In addition, some attractive CDMopportunities will disappear in the mid-term dueto technology localization.
A proactive approach to capture CDM oppor-tunities could involve, for example, the screeningof projects during normal project permittingand/or approval procedures by government offi-cials for potential CDM projects and notificationof CDM opportunities to the project owners.This would capture CDM opportunities at anearly enough stage to make it feasible to integrateadditional CDM project preparation and approvaltasks in the normal project cycle. It also impliesactive government efforts to raise awareness ofCDM opportunities, build the essential capacityfor CDM implementation by governments andenterprises, promote international rules that sup-port China’s CDM strategy, and create an institu-tional and regulatory framework that is effective,but keeps transaction costs to a minimum.
Immediate Steps to Facilitate CDM Transactions
To implement a proactive and sustainable CDMstrategy that will allow China to capitalize onCDM opportunities during the first commitmentperiod of the Kyoto Protocol, China will have todevelop a comprehensive plan of action that willaddress the need to:
Provide basic services to allow CDM in China
The Government of China should considerannouncing its policy and putting in place its
interim regulation soon.7 The governmentshould also consider establishing the necessaryinstitutional arrangements to allow the officialapproval of CDM projects, as required for vali-dation under the Kyoto Protocol, and issue pro-cedures for project developers.8
Clear rules are one of the major prerequisitesfor private sector initiative in developing CDMproject ideas. Such an institutional frameworkhas already been elaborated, but needs to be offi-cially approved and publicly announced, beforeprojects can be officially processed. It is also essen-tial to create a regulatory framework/legal systemfor CDM business operation in the carboncredit market. The regulatory framework/legalsystem should preferably not be separate or inde-pendent from the current existing system, but mayjust add some CDM-related components or termsas a supplementary appendix. Industrial stake-holders insist that given the new nature of theCDM trading business, they are not able to parti-cipate in CDM project activities without govern-ment documentation to secure their legal interests.
Furthermore, the government must keepinformed of CDM developments and build andmaintain adequate capacity to approve and regu-late the CDM process, as well as to analyze out-standing CDM policy issues from a strategicperspective.
Ensure that critical capacity is developed
Based on the current status of CDM in China, aparticularly critical focus at present should beon continued capacity building, including localpublic awareness, local promotion centers, andintermediate agents. Following up on previousassessments (such as World Bank 2003), theChina CDM study identified comprehensiveinstitutional, financial, technological, and humanresources needs for capacity building and policyinitiatives. Through the case study analysis, whichinvolved cooperation with power plant ownersin five different regions, it became evident thatknowledge of climate change, the Kyoto Proto-col, and the CDM was much lower—or non-
C H I N A ’ S C D M P O T E N T I A L
C D M I N C H I N A134

existent—in areas far from Beijing. To buildawareness throughout China would be a massiveundertaking, and may not be effective or realistic,given time and resource constraints. Instead, train-ing to encourage CDM project preparation effortsshould be directed at promising sectors or proj-ect technology types.
Given the unique nature and complexity of theCDM, which is still at an early stage, we recom-mend building a modest CDM “infrastructure”that is aimed at building and/or strengtheninglocal capacity for CDM project development andimplementation. This infrastructure should:
• Facilitate the organizational development andnetworking of CDM technical support centers/entities, which should be professional and expe-rienced institutions to provide consultantservices for identification of eligible CDM pro-jects and PDD development for the projectproponents, who could thus avoid doing thiscomplicated job on their own.
• Establish a CDM business center network,which could help project proponents to estab-lish a project pipeline and to carry out CDMbusiness activities in the whole CDM projectcycle. Project proponents could thus save sig-nificant transaction costs and reduce CDMrelated risks.
• Bridge foreign investors and local partners.Given that several bilateral or multilateral CDMfunds have been or will be in place to providefinancial support to the qualified CDM projectproposals, we recommend building bridgesbetween foreign investors and local partners topromote promising project options in priorityareas with significant GHG emission reductionpotential.
• Establish and further improve as soon as pos-sible the critical national capacity to develophigh quality PDDs for Executive Board reviewof methodology.
• Enhance the institutional framework and CDMmanagement at the national and local levels.This would include assistance to design a data-
base for CDM project proposals, to establish aCDM web site, and to build capacity for thenegotiation of CDM project deals.
• Build awareness at the strategic level amongdecisionmakers at state-owned and privateenterprises of CDM opportunities, perhapsin collaboration with business associations/networks.
• Enhance viable CDM project development bylocal promotion centers and intermediateagents.
• Enhance the CDM financing modality and car-bon offset deal-making in the carbon market.
• Elaborate negotiation models for sharing ofrisks, costs, and benefits of CDM projects withAnnex B investors. In addition, enhance nego-tiation skills to maximize the local benefits ofCDM transactions in host countries.
Co-financing options and partnerships forthese initiatives could be sought from multi- andbi-lateral development cooperation programs,the local and foreign private sector, and centersof excellence.
Encourage CDM project identification and implementation
Although the case studies for the current ChinaCDM study were originally performed as a meansof building understanding of CDM concepts andmethods and providing an opportunity for hands-on application of this know-how to real projectideas, they may also provide information thatcould lead to the rapid identification of demon-stration CDM projects. The same may be true ofsimilar study projects analyzed under othercooperation programs.
As suggested above, China should considerhow to apply CDM financing in the context ofclean and efficient energy demonstration pro-jects promoted by the Chinese Government (atthe national, provincial, and municipal levels)through preferential policy/regulations, financialincentives, and subsidies. It should be possible todemonstrate the additionality of such projects,
P O L I C Y I N S I G H T S A N D R E C O M M E N D A T I O N
C D M I N C H I N A 135

as the technologies concerned are neither widelyimplemented nor commercially viable undercurrent national circumstances in China. Suchprojects could be launched without delay andshould receive high priority, since rules for suchprojects are under consideration by the CDMExecutive Board.
New CDM proposals initiated by the pri-vate sector should also be encouraged. To quicklycapture CDM opportunities, we recommend(1) reaching out to international corporate sectorkey players, who have already announced theirinterest to go for JI/CDM as part of their companyemission trading; and (2) screening through nor-mal project permitting and or approval proce-dures for potential CDM projects and notifyingproject owners accordingly. This would raiseawareness and capture CDM opportunities at anearly enough stage to make it feasible to inte-grate additional CDM project preparation andapproval tasks into the normal project cycle. Itwould also focus efforts on project ideas thatare already well-developed and likely viable forimplementation in the 2005– 07 timeframe.
In addition to awareness-raising at the level ofdecisionmakers and basic CDM skill training fortechnical experts (see above), a China CDM Busi-ness Guide for potential project developers andowners, drafted with their needs and capacities inmind, could help them identify and pursue CDMproject opportunities. The CDM is quite com-plex, and many private sector decisionmakers areoverwhelmed. While large companies generallyhave the resources and can build the skills todevote to project development, smaller compa-nies and institutions might not. Such a guideshould provide comprehensive, yet concise infor-mation on how to identify, analyze, and developprojects; manage risks; obtain project financing;seek domestic and international project approvals;and implement and monitor CDM projects. Itwould also lower transaction costs for potentialCDM investors/CER purchasers. For this task,China can build on the most relevant material
from among similar guides that have already beendeveloped by other CDM host countries, some ofwhich would require only minor modificationsto be relevant and appropriate in the Chinesecontext.9
Longer-term Considerations
Consolidate results / enhance synergiesacross CDM initiatives
As summarized in the previous section, manyCDM-related activities are currently ongoing inChina, ranging from capacity building, to policyanalysis and project development. A great, largelyuntapped synergy potential thus exists among thevarious activities that could be further developed,for example, through sharing and disseminatingthe know-how gained and lessons learned. Studiesof CDM potential, such as the present one—which have each tended to focus on a differentsector, region, or project type—should be consol-idated to ensure consistency of results and toobtain an overall picture of Chinese CDM poten-tial. Appropriate local CDM networks, knowledgemanagement systems, and know-how transferplatforms could foster the desired consolidationand synergies among diverse CDM stakeholders,and would also provide a much stronger basis forCDM project development.
The numerous CDM activities in China in-volve many institutions, individual experts,foreign donors, and, increasingly, private enter-prises. A professional knowledge managementsystem and an outcome-oriented (performance-based) system to manage CDM-related capacitybuilding initiatives could ensure optimal use ofscarce resources.
Undertake follow-up analysis on key issues
As is often the case, the research conducted underthe China CDM study has raised many additionalissues that require further study. Although theymay have a long lead time (data requirements,study duration), some of them are quite urgent, as
C H I N A ’ S C D M P O T E N T I A L
C D M I N C H I N A136

they are linked to CDM implementation issues,and should be initiated as soon as possible. Theissues identified over the course of the ChinaCDM study range from work on outstandingdomestic and international CDM policy issuesto questions of the practical implementation ofCDM projects in China, but this list is onlyindicative:
Policy issues
• Advantages and disadvantages and possiblemodalities for CDM co-financing of govern-ment-subsidized advanced technology andrenewable energy demonstration projects.
• International and Chinese CER taxation policy.• Development and testing of multi-criteria
decision-analysis systems to ensure transparent,consistent, and efficient project approval pro-cedures that ensure the consistency of CDMprojects with China’s sustainable developmentpriorities. Such systems have already been testedby other host countries and could offer a start-ing point.
• Sustainable development implications of apply-ing the CDM to projects to reduce the emissionof greenhouse gases with high global warmingpotential, such as HFC-23 and N2O.
Chinese CDM potentials and priorities
• Improve the robustness of (regional and coun-trywide) marginal abatement cost curves forChina. Evaluate results considering up to dateinternational MAC information.
• A combination of capacity building and analy-sis to work with government officials to estab-lish technology priorities, building on previouscooperation in specific sectors, such as electric-ity generation, steel, and chemicals. This couldlead to CDM handbooks and targeted capac-ity building for priority sectors and projecttypes.
• Development and application of tools to qual-itatively and/or quantitatively evaluate thelocal sustainable development co-benefits ofpotential/actual CDM projects.
CDM transaction costs and incentives for enterprises
• Explore opportunities to reduce transactioncosts—for example, by developing regional,grid-level baselines for power projects, or base-line methodologies for the most promisinglarge power project types, taking advantage ofinternational donor support.
• Investigate the potential contribution of CDMto project finance under two basic models:(1) up-front investment by CER buyers, com-bined with Power Purchase Agreements (PPA)on GHG emission reduction credits; and (2) using CDM CERs PPA as a financial guar-antee to apply for soft loans from domesticbanks.
• Evaluate approaches to effectively bundlesmaller-scale climate mitigation projects (energyefficiency, energy-to-waste, and renewable en-ergy projects in power generation; small-scaleindustry; rural and urban transport; and com-mercial sectors), for which transaction costswould otherwise be prohibitive to commercialinvestors.
• Investigate models and develop Chinesestrategies for CDM benefit and risk sharingamong project partners, considering appro-priate price formation modalities, given thevolatility in CER prices over time.
Endnotes/References1. With the exception of GDP effects and carbon dioxide
emission reductions, the study did not quantify theseimportant co-benefits at the macro level. Some of thecase studies, however, did provide quantitative estimateson reduction potentials in air pollutants such as SO2,NOx, and dust, and one involved methane emissionreductions as the main source of CERs.
2. These emission reductions will also contribute to betterhealth conditions.
3. In the light of the bottom-up analysis, the upper boundof the projected CDM potential of 117 MtCO2 is diffi-cult to achieve, mainly due to the short time span avail-able up to 2010 (time lag associated with technologydiffusion) and the constraints in the development of asufficiently large pipeline of CDM projects.
P O L I C Y I N S I G H T S A N D R E C O M M E N D A T I O N
C D M I N C H I N A 137

4. In practice, sharing the producer surplus (which resultswhen the equilibrium price exceeds the incrementalabatement cost) between the host country project ownerand the CDM investor/CER buyer is a matter of nego-tiation and will affect the profit achieved by the formerand the cost savings to the latter.
5. It is anticipated that the specific abatement costs for super-critical plants will drop in the future, as increased localmanufacturing of power plant components reduces capi-tal investment cost.
6. The CDM Executive Board will be considering re-commendations from its Methodology Panel (in whichChina is represented) on avoiding perverse incentivesassociated with CDM baseline methodologies that woulddisadvantage or create disincentives for countries thatimplement domestic policies intended to reduce localenvironmental externalities in ways that also result in lowerGHG emissions. Many of China’s energy technologypromotion efforts fit this definition and such demon-
stration projects may represent a viable channel to facil-itate rapid CDM project identification and investmentin China’s energy supply sector, so China should activelycontribute to the work of the Methodology Panel on thispoint.
7. This was already initiated at a side event at the COP9 inMilan in December 2003.
8. Such an institutional framework consists of three mainentities: (1) the National Coordination Committee forClimate Change; (2) a National CDM Project Board;and (3) a designated national authority. Similarly, thegeneral requirements for CDM project approval, as wellas the approval procedure, have been outlined in detail,but not yet approved.
9. See, for example: Spalding-Fecher, Randall, 2002: TheCDM Guidebook—A Resource for Clean DevelopmentMechanism Project Developers in Southern Africa. CapeTown: Energy and Development Research Centre, Uni-versity of Cape Town.
C H I N A ’ S C D M P O T E N T I A L
C D M I N C H I N A138
C D M I N C H I N A 139
INTRODUCTION
To present the results of this study, the ChineseGovernment—in cooperation with the WorldBank, the GTZ, and supported by the Govern-ments of Germany and Switzerland—hosted aninternational conference in Beijing on July 1 and2, 2004 (see Annexes IX and X in the CD-ROMattachment). The meeting marked the conclu-sion of the study and provided an opportunityfor Chinese and international experts to discuss:
• The main results and recommendations of theChina CDM Study
• The current development of carbon marketsand the Clean Development Mechanism
• China's new policies and institutional arrange-ments for CDM application
• Proactive strategies to remove CDM imple-mentation barriers
• Future plans for both formal and informationcooperation.
July 1st proved to be a significant day for theCDM in China. In addition to the China CDMconference, which was attended by about 250Chinese and international experts, the ChineseNational Climate Change Coordination Com-mittee (NCCCC) held its annual meeting, andnew “Interim Measures for the Management ofCDM Project Activities” in China went into
effect (see Annex 4). The interim measures provided for the official designation of theNational Development and Reform Commis-sion (NDRC) as the Chinese National Author-ity for the CDM, thus paving the way for hostcountry approval of Chinese CDM projects.Conference participants were able to interactwith the newly appointed Chinese DNA con-tact person, Mr. Gao Guangsheng (Director General, NCCCC, NDRC), as well as otherNCCCC members.
CONTEXT FOR CDM IN CHINA
Anthropogenic climate change is intimatelylinked to sustainable development, and par-ticipants at the conference—ranging from gov-ernment authorities to development banks,academic researchers, and private sector repre-sentatives from a range of sectors—expressed theview that climate change is an issue that will bewith us for a long time to come.
“The lifetime of the CDM will be longer than that of the
Kyoto Protocol, which is only a first step (until to 2012);
climate change mitigation is a long-term task.”
Gao Guangsheng, NCCCC, NDRC
Whether or not the Kyoto Protocol will bethe international framework of choice in the
EpilogueCDM Conference Report
�

system on January 1, 2005, provided sufficientfoundation for the Government of China toadopt a proactive policy toward the CDM thatis consistent with recommendations in theChina CDM Study.
“We are at a critical juncture in China with respect to
both reform efforts and sustainable development chal-
lenges. The CDM can help overcome some of the severe
bottle-necks, such as electricity shortages, that may oth-
erwise prevent us from attaining our goal of an all
around well off society by 2020. Thus China can take
advantage of the CDM to facilitate the necessary scien-
tific approach to development.”
Gao Feng, Department of Foreign Affairs
In general, participants expressed confidenceand optimism about future CDM development,noting the greater than anticipated conferenceparticipation, the active interest shown by bothChinese and foreign experts, the broad repre-sentation of stakeholder groups, the tremendouslearning that had gone on in a very short time,the fact that the Chinese Government had putin place the necessary institutional prerequisitesfor CDM implementation, and the significantopportunities that the CDM offers to makeprogress on climate change. The China CDMStudy was regarded by Chinese authorities to beof great significance to China, and the confer-ence marked a turning point from study toimplementation.
INTERIM MEASURES ANDIMPLICATIONS FOR CDM IN CHINA
Statements made by officials confirmed that theChinese Government has fully embraced a“proactive and sustainable” approach to theCDM and is providing significant support. Thereferred interim management measures repre-sent a crucial first step. According to the Chineseauthorities, the rationale for adopting interimrules, as opposed to more permanent arrange-ments, is to retain flexibility to fine-tune rules,
C H I N A ’ S C D M P O T E N T I A L
C D M I N C H I N A140
period after the first commitment period ends in2012 is less certain, but Chinese authorities andother participants nonetheless expressed theirfirm belief that the Clean Development Mecha-nism would play an important role in futureglobal efforts to mitigate climate change. Chinaand other developing countries thus intend toseek to integrate the CDM into future agree-ments beyond 2012 and to promote and expandcarbon markets.
Policy remarks by the chairman and membersof the China NCCCC, as well as a panel dedi-cated to a discussion of “Challenges and Oppor-tunities for China CDM,” demonstrated thatChina regards the CDM as an important instru-ment to enable developing countries to fulfilltheir "common, but differentiated responsibil-ity" under the UNFCCC to reduce their green-house gas emissions, while at the same timeaddressing local sustainable development chal-lenges.
“The CDM will be an essential tool for equitable climate
change mitigation . . . China has taken a major decision
to enter into CDM by issuing rules of the game.”
Maria Teresa Serra, The World Bank
To realize the promise of the CDM, however,carbon markets must expand significantly,which is only possible if the United States, Aus-tralia, and others eventually participate. Chineseauthorities expressed their gratitude to themember states of the European Union for theirleadership in the global effort to mitigate globalclimate change. Without ratification of theKyoto Protocol by either the United States orthe Russian Federation, the value of CertifiedEmission Reductions (CERs) is largely depen-dent on demand from the EU Emission TradingScheme (EU-ETS), which is therefore crucial tocarbon market development.
The conviction that the CDM is a “win-win”proposition and that carbon markets will expandin the future, coupled with the EU plan toimplement a Community-wide emission trading

based on experience gained through the imple-mentation of CDM projects, before they arefinalized in a planned CDM ManagementDecree to be approved by the State Council.This approach balances the desire to act rapidlyto implement CDM projects with prudence anda “learning-by-doing” approach to ensure sus-tainable development benefits.
“CDM development in China has moved from theory to
project level implementation.”
Wang Zhongjing, International Department,
Ministry of Finance
Sun Cuihua (Division Director, NCCCC,NDRC), provided an overview of the InterimMeasures for the Management of CDM ProjectActivities in China, including general rules,admission requirements, institutional arrange-ments, project approval procedures, and severalother miscellaneous items (see annex 4). Theseprovisions are largely consistent with the pre-liminary information published in the ChinaCDM Study, with two notable additions, whichraised particular concerns among foreign partic-ipants and potential investors and intermedi-aries, namely:
• The requirement that the project developer*shall be a wholly China-owned or China-con-trolled enterprise
• The plan to regulate the sharing of benefitsbetween the project developer* and the Chi-nese Government (with the benefits to beowned solely by the project developer prior tothe determination).
The Chinese authorities believe that greaterconsideration of these important issues is neededand that final decisions should be based on prac-tical experience.
“The intent [of the Interim Measures] is to reflect the
spirit of the CDM, not to create barriers to CDM invest-
ment . . . The door is not closed for CDM hosting by
100% foreign owned enterprises, but the issue requires
further consideration, and we welcome your views on
these difficult issues.”
Lu Xuedu, Division of Resources and Environment,
Ministry of Science and Technology
The idea behind the concept of benefits shar-ing between enterprises and the state, for exam-ple, is that priority projects with high sustainabledevelopment benefits, such as renewable energyprojects, will not be “taxed” at all, whereas pro-jects with relatively low sustainable developmentbenefits and low costs (such as HFC-23 decom-position at under $1 per ton of CO2e) wouldhave to deliver some revenues to the state. Manyparticipants viewed this provision as an eco-nomic instrument to allow China to channelCDM investment to priority CDM projects,thereby retaining responsibility for ensuring thesustainable development benefits of CDM pro-jects that apply baseline methodologies that havealready been approved by the CDM ExecutiveBoard. Participants noted that the key to thesuccess of such an approach is transparency, con-sistency, and predictability, as well as the actionsof other host countries.
OVERCOMING BARRIERS TO CDMIMPLEMENTATION IN CHINA
Participants benefited from a lively panel discus-sion dedicated to “Industrial Sector Views onBarriers to and Incentives for CDM,” as well asthe active participation of many representativesof private enterprises throughout the conference.The key barriers to CDM implementation aredivided between those specific to the Chinesecontext and more universal barriers.
Among the serious universal barriers to activeengagement of the private sector in the CDM,participants highlighted a lack of marketdemand—linked to continuing internationaland Annex I domestic regulatory uncertaintyand a lack of political will for some major play-ers to participate—as well as complex/uncertain
P O L I C Y I N S I G H T S A N D R E C O M M E N D A T I O N
C D M I N C H I N A 141

rules, high transaction costs (in particular, withrespect to small-scale projects), and a lack of up-front funds for project development.
“The potential for CER financing of projects that would
otherwise have been left aside (e.g. renewables) needs to
be seen against perceived market and regulatory risk.”
Kai-Uwe B. Schmidt, Cooperative Mechanisms,
UNFCCC Secretariat
Many Chinese players (and the China CDMStudy) pointed out that current “market prices”(< $5/t CO2) are simply too low to cover the fullincremental costs of implementing many typesof CDM projects, and that the CDM thereforecan only facilitate additional climate mitigationin combination with other incentives. Despitethe significant mitigation cost savings that theCDM can represent for some investors, it isunlikely that the demand side will be willing toshare these savings with host countries, given the availability of EU emission allowances at7–8/ton CO2e.
As a result, Chinese authorities have beenreluctant to encourage industry to enter into theCDM. Awareness of climate change and theCDM are concentrated in a small pool of experts,centered geographically on Beijing, and CDMhas yet to be demonstrated in practice in China.Recent efforts to overcome information barriersincluded the launch of a China CDM web site(www.cdm.ccchina.gov.cn), the establishment ofCDM centers at the provincial level (such as theNingxia CDM Service Center), and the develop-ment of new CDM training programs in cooper-ation with international partners.
Enterprises in China also mentioned the“paradox of additionality” (i.e., the fact that atlow CER prices, projects that are clearly addi-tional are not viable, as the CDM does little toraise IRR to levels required for host governmentand financial institution approval) and the needto clarify how CDM approval procedures can beintegrated into existing domestic approvalprocesses. More needs to be done by govern-
mental authorities to clarify the role that CDMcan play in implementing priority sustainabledevelopment projects; for example, the role ofsmall-scale CDM in alleviating poverty in ruralChina, the CDM contribution to renewableenergy projects, the use of advanced coal-firedpower plant technologies, or energy efficiency/energy auditing efforts.
Although the China CDM study only inves-tigated case studies in the power sector (seebelow), private sector participants expressedinterest in exploring CDM potential in othersectors, such as industry (e.g., chemicals,cement), commercial and residential buildings,and sinks.
THE POWER SECTOR
Despite the critical importance of the powersector for China’s future development and its dominant impact on Chinese greenhouse gasemissions (approximately 40 percent), the sec-tor was prominent in its absence. This reflectsreservations about the CDM due to a range offactors:
• Lack of awareness of the CDM at the strategiclevel. Although some individual power plantoperators have shown an interest in exploringCDM opportunities, strategic decisions at thecorporate level are needed.
• Uncertainty and skepticism about the finan-cial benefits of CDM, coupled with up-frontCDM project development costs.
• Recognition that the CDM—under currentmarket conditions—can only add a small per-centage to a major power project's IRR.
• Lack of government guidance on the CDMproject approval process in relation to existingrequirements for Chinese power plantapproval (which may run counter to addition-ality, as projects must be financially viable andemploy proven technology to receive NDRCapproval).
C H I N A ’ S C D M P O T E N T I A L
C D M I N C H I N A142

“Recent and projected electricity shortfalls are being
met by mass production of coal-fired power stations
manufactured in China, and no one is looking at
CDM opportunities . . . There is an urgent need for
strategic awareness raising and institutional capacity
building.”
Paul Suding, GTZ (German Technical Cooperation),
Beijing
Due to pressures resulting from increasingpower shortages, which threaten China’s eco-nomic development, and the frantic pace ofpower plant construction, the CDM has notbeen considered a priority, but participantspointed to the strategic significance of this sec-tor and the need to give immediate considera-tion to means of leveraging the CDM tocontribute to a more sustainable energy supply.Engaging the power sector is also a prerequisitefor developing standardized, regional baselines,which would help lower transaction costs. Bothaspects require government leadership.
FUTURE ACTIVITIES IN COOPERATIONWITH FOREIGN PARTNERS
Another panel—“Efforts to Promote CDM byDonor Organizations and Buyers”—demon-strated that there was readiness on all sides tocontinue cooperation. Donors (e.g., UNDPCDM Capacity Building Program, ADB CDMFacility, METI Japan, GTZ), buyers (e.g., Ger-man KfW Carbon Fund, Italian Carbon Fund,World Bank Carbon Finance funds), and inter-mediaries expressed interest/willingness to pur-chase CERs in China, now that rules of the gamehave been published.
“The objective of China’s future CDM actions is to
build gradually an excellent cooperation environment,
including clear policies, transparent and efficient man-
agement service and capable technological consultancy
for CDM project cooperation and implementation with
foreign partners.”
Lu Xuedu, Division of Resources and Environment,
Ministry of Science and Technology
P O L I C Y I N S I G H T S A N D R E C O M M E N D A T I O N
C D M I N C H I N A 143


C D M I N C H I N A 145
Decisions by the COP and theCDM EB after COP 7 up to the
12th CDM EB Meeting Relevant toMethodological Issues
A1
�
A N N E X
Meeting Issues Decisions
EB 3rd Further clarification ondefinitions of eligiblesmall-scale CDM project activities (Annex 2)
1. Renewable energy (15MW): an indicative list of energysources/eligible project activities; output defined asinstalled/rated capacity as indicated by the manufacturer; MW asMW(e) (not MW(p) or MW(th));
2. Energy efficiency improvement project activities: an indicativelist of eligible project activities/sectors;
3. 15 GWh=54TJ
4. Other types: shall not exceed total direct emissions of 15kt of CO2
equivalent annually and must reduce GHG emissions.
5. Three types of project activities are mutually exclusive; for a proj-ect activity with more than one component to benefit from SMP,each component shall meet the threshold criterion of eachapplicable type;
Background:
(i) Renewable energy project activities with a maximum output capacity equivalent of up to 15 megawatts (or anappropriate equivalent);
(ii) Energy efficiency improvement project activities that reduce energy consumption, on the supply and/or demandside, by up to the equivalent of 15 gigawatt/hours per year;
(iii) Other project activities that both reduce anthropogenic emissions by sources and directly emit less than 15 kilotonsof carbon dioxide equivalent annually;
EB 5th Baseline and additionality (Annex 3)
1. Paragraph 43 of the CDM modalities and procedures stipulate thata CDM project activity is additional if its emissions are below thoseof its baseline. The definition of a baseline is contained in para-graph 44 of the CDM modalities and procedures. The ExecutiveBoard agreed that no further work is required regarding this issue.
Background:
43. A CDM project activity is additional if anthropogenic emissions of greenhouse gases by sources are reduced belowthose that would have occurred in the absence of the registered CDM project activity.
(continued )

A N N E X 1
C D M I N C H I N A146
Meeting Issues Decisions
(continued )
Background:
44. The baseline for a CDM project activity is the scenario that reasonably represents the anthropogenic emissions bysources of greenhouse gases that would occur in the absence of the proposed project activity. A baseline shallcover emissions from all gases, sectors, and source categories listed in Annex A within the project boundary. Abaseline shall be deemed to reasonably represent the anthropogenic emissions by sources that would occur inthe absence of the proposed project activity if it is derived using a baseline methodology referred to in para-graphs 37 and 38 above.
EB 5th
COP8
Baseline approaches /Methodology
Simplified Modalities &Procedures
Simplified Modalities &Procedures
A methodology is an application of the approaches, defined inparagraph 48 of the CDM modalities and procedures, to anindividual project (reflecting aspects such as sector and region).It further agreed that no methodology should be excluded apriori so that project participants have the opportunity to propose any methodology. In considering paragraph 48, theExecutive Board agreed that, in the cases below, the followingapplies:
(a) Case of a new methodology: In developing a baselinemethodology, the first step is to identify the most appropriateapproach for the project activity and then an applicablemethodology.
(b) Case of an approved methodology: In opting for an approvedmethodology, project participants implicitly choose anapproach.
The board agreed that the three approaches identified in para-graph 48 (a) to (c) are the only ones applicable to CDM projectactivities.
Establishing a baseline in a “transparent and conservative manner”means that assumptions are explicitly explained and choices are substantiated. In case of uncertainty regarding values ofvariables and parameters, values that generate a lower baselineprojection shall be used. The board agreed that no further workis required.
If the maximum reference value of a small-scale CDM project activ-ity is exceeded on an annual average basis during any verifiedperiod, CERs should be issued only up to the maximum value.
Modalities and procedures are simplified as follows:
(a) Project activities may be bundled or portfolio bundled at thefollowing stages in the project cycle: the project design docu-ment, validation, registration, monitoring, verification, and cer-tification. The size of the total bundle should not exceed thelimits stipulated in paragraph 6 (c) of decision 17/CP.7.
(b) The requirements for the project design document are reduced.(c) Baselines methodologies by project category are simplified to
reduce the cost of developing a project baseline.(d) Monitoring plans are simplified, including simplified monitoring
requirements, to reduce monitoring costs.(e) The same operational entity may undertake validation, and ver-
ification and certification.

A N N E X 1
C D M I N C H I N A 147
Meeting Issues Decisions
COP8(continued)
EB 8th
Simplified Modalities &Procedures (continued)
Information relevant tobaseline methodologyto be included in thePDD
I. TYPE I - RENEWABLE ENERGY PROJECTSI. A. Electricity generation by the userI. B. Mechanical energy for the userI. C. Thermal energy for the userI. D. Renewable electricity generation for a grid
II. TYPE II - ENERGY EFFICIENCY IMPROVEMENT PROJECTSII. A. Supply side energy efficiency improvements – transmission
and distributionII. B. Supply side energy efficiency improvements – generationII. C. Demand-side energy efficiency programs for specific
technologiesII. D. Energy efficiency and fuel switching measures for industrial
facilitiesII. E. Energy efficiency and fuel switching measures for buildings
III. TYPE III - OTHER PROJECT ACTIVITIESIII. A. AgricultureIII. B. Switching fossil fuelsIII. C. Emission reductions by low-greenhouse gas emitting vehiclesIII. D. Methane recovery and avoidance
When proposing a new baseline methodology, the following infor-mation elements shall be covered and reported through annex 3of the CDM-PDD:
(a) Basis for determining the baseline scenario:• Explanation of how the baseline is chosen, taking into
account paragraph 45 (e)• Underlying rationale for algorithm/formulae (e.g. marginal vs.
average, etc.)• Explanation of how, through the methodology, it is demon-
strated that a project activity is additional and therefore notthe baseline scenario (section B4 of the CDM-PDD)
(b) Formulae/algorithms shall specify:• Type of variables used (e.g. fuel(s) used, fuel consumption
rates, etc.)• Spatial level of data (local, regional, national, etc.)
(continued )
A simplified baseline and monitoring methodology listed in Appendix B (of the simplified M&P) may be used for asmall-scale CDM project activity if the project participants are able to demonstrate to a designated operationalentity that the project activity would otherwise not be implemented due to the existence of one or more of thebarriers listed in attachment A of Appendix B. ( (a) Investment barrier: a financially more viable alternative to theproject activity would have led to higher emissions; (b) Technological barrier: a less technologically advanced alter-native to the project activity involves lower risks due to the performance uncertainty or low market share of thenew technology adopted for the project activity and so would have led to higher emissions; (c) Barrier due to pre-vailing practice: prevailing practice or existing regulatory or policy requirements would have led to implementa-tion of a technology with higher emissions; (d) Other barriers: without the project activity, for another specificreason identified by the project participant, such as institutional barriers or limited information, managerialresources, organizational capacity, financial resources, or capacity to absorb new technologies, emissions wouldhave been higher.) Where specified in Appendix B for a project category, quantitative evidence that the projectactivity would otherwise not be implemented may be provided instead of a demonstration based on the barrierslisted in attachment A to appendix B.

A N N E X 1
C D M I N C H I N A148
Meeting Issues Decisions
EB 8th
(continued)
EB 9th
Information relevant tobaseline methodologyto be included in thePDD (continued)
Additional guidance onthe “average emissions”approach
Proposed project activities applying morethan one methodology
Circumstances andmodalities foroperationalizingparagraph 47 of theCDM modalities andprocedures
Guidance regarding the treatment of“existing” and “newlybuilt” facilities
Further clarification forproject participants fordrafting a proposal for anew methodology
• Project boundary (gases and sources included, physical delineation)
• Vintage of data (relative to project crediting period)
(c) Data sources and assumptions:• Where the data are obtained (official statistics, expert judgment,
proprietary data, IPCC, commercial and scientific literature, etc.)• Assumptions used
1. Project participants wishing to select the “average emissions”approach shall elaborate in their submission of a proposed newbaseline methodology, inter alia, on:(a) How they determine “similar social, economic, environmen-
tal and technological circumstances.”(b) How they assess the “performance among the top 20 per cent
of their category” defined as greenhouse gas emissions per-formance (in terms of CO2equ emissions per unit of output).
5. Project participants wishing to use this approach and a relatedapproved methodology shall assess the applicability and use themost conservative of the following options:(a) The output-weighted average emissions of the top 20 per
cent of similar project activities undertaken in the previousfive years in similar circumstances.
(b) The output-weighted average emissions of similar projectactivities undertaken in the previous five years under similarcircumstances that are also in the top 20 per cent of all cur-rent operating projects in their category (i.e. in similar cir-cumstances as defined above).
If a proposed CDM project activity comprises different “sub-activities”requiring different methodologies, project participants may for-ward the proposal using one CDM-PDD but shall complete themethodologies sections (sections A.4.2, A.4.3, A.4.4. and B to E ofthe CDM-PDD) for each “sub-activity.”
7. Paragraph 47 stipulates that “the baseline shall be defined in away that CERs cannot be earned for decreases in activity levelsoutside the project activity or due to force majeure.”
8. An output- or product-linked definition of baseline values (i.e.CO2equ. per unit of output) shall be applied, unless the projectparticipants can demonstrate why this is not applicable and pro-vide an appropriate alternative.
If a proposed CDM project activity seeks to retrofit or otherwise mod-ify an existing facility, the baseline may refer to the characteristics(i.e. emissions) of the existing facility only to the extent that theproject activity does not increase the output or lifetime of theexisting facility. For any increase of output or lifetime of the facilitywhich is due to the project activity, a different baseline shall apply.
1. Decision tree: When drafting a proposed new baseline method-ology, project participants shall follow the following steps:(a) Choose and justify why one of the approaches listed in para-
graph 48 of CDM M&P is considered to be the most appropriate.(continued )

A N N E X 1
C D M I N C H I N A 149
Meeting Issues Decisions
EB 9th
(continued)Further clarification for
project participants fordrafting a proposal for anew methodology(continued)
(b) Elaborate a proposal for a new methodology, i.e. an appli-cation of the selected approach to a project activity, reflecting aspects such as sector, technology and region.The Board agreed that no methodology is to be excluded a priori so that project participants have the opportunity to propose any methodology which they consider appropriate.
(c) Describe the proposed new methodology in Annexes 3 and 4of the CDM-PDD taking into account guidance given by theBoard at its fifth and eighth meeting as well as the informa-tion provided in the CDM PDD Glossary of Terms.
(d) Demonstrate the applicability of the proposed methodology,and, implicitly, that of the approach, to a project activity byproviding relevant information in a draft CDM-PDD.
2. In accordance with the Board’s guidance at its eighth meeting, aproposed new methodology shall explain how a project activityusing the methodology can demonstrate that it is additional.Project participants shall therefore describe how to develop the baseline scenario and “how the baseline methodologyaddresses...the determination of project additionality.” In addi-tion, the methodology shall provide elements to calculate theemissions of the baseline. The project participants shall ensureconsistency between the elaboration of the baseline scenarioand the procedure and formulae to calculate the emissions ofthe baseline.
3. Drafting quality: Proposals should be written in a concise andclear manner. Important procedures and concepts should besupported by equations and diagrams. Non-essential informa-tion should be avoided. The Annexes 3 and 4 to the CDM-PDDshall not contain information which is related to the applica-tion of the proposed new methodology to the project activityfor illustrative purposes. Project participants shall refrain from providing glossaries or using key terminology not used in the COP documents and the CDM glossary (environmental/investment additionality), and from rewriting the CDM-PDDinstructions.
4. Provide complete Annexes 3 and 4: All algorithms, formulae,and step-by-step procedures for applying the methodologyshall be included here. These Annexes shall provide stand-alone replicable methodologies, and avoid reference to anysecondary documents if they wish to convey essential informa-tion, except where considered absolutely necessary (e.g. model documentation).
5. Avoid repetitions: Do not unnecessarily repeat in the mainCDM-PDD Sections A-E, submitted as a demonstration of theapplication of the proposed new methodology, text andmethodological explanations already provided in the Annexes.The CDM-PDD Sections A-E are meant to provide informationon the application of the methodology(ies) to the project activity.
(continued )

A N N E X 1
C D M I N C H I N A150
Meeting Issues Decisions
EB9th
(continued)
EB 10th
Further clarification forproject participants fordrafting a proposal for anew methodology(continued)
Clarification on baselinemethodologies forelectricity generationCDM projects
Clarification onadditionality
Clarifications fordescribing a proposednew methodology andjustifying the selectionof the most appropriateapproach
6. Data requirements and sources: Clearly specify data requirementsand sources, as well as procedures to be followed if expecteddata are unavailable. For instance, the methodology could pointto a preferred data source (e.g. national statistics for the past 5years), and indicate a priority order for use of additional data(e.g. using longer time series) and/or fall back data sources to pre-ferred sources (e.g. private, international statistics, etc.). UseInternational System Units (SI units).
7. Titles: Provide an unambiguous title for a proposed methodol-ogy. Avoid project-specific titles. The title, once approved, shouldallow project participants to get an indication of the applicabilityof an approved methodology.
9. Electricity generation: Justification of exclusion of hydropowerfrom operating margin in the case of hydro-dominated grids:If an electricity generation CDM project activity which uses anoperating margin methodology is connected to a primarilyhydropowered grid, project participants who want to excludehydropower from the operating margin must justify this explicitly.
1. As part of the basis for determining the baseline scenario, anexplanation shall be made of how, through the use of themethodology, it can be demonstrated that a project activity isadditional and therefore not the baseline scenario.
2. Examples of tools that may be used to demonstrate that a proj-ect activity is additional and therefore not the baseline scenarioinclude, among others:(a) A flow-chart or series of questions that lead to a narrowing
of potential baseline options; and/or(b) A qualitative or quantitative assessment of different poten-
tial options and an indication of why the non-project optionis more likely; and/or
(c) A qualitative or quantitative assessment of one or more bar-riers facing the proposed project activity (such as those laidout for small-scale CDM projects); and/or
(d) An indication that the project type is not common practice (e.g. occurs in less than [<x%] of similar cases) in the proposedarea of implementation, and not required by a Party’s legislation/regulations.
3. Developers of a new baseline methodology shall select theapproach from paragraph 48 of the CDM modalities and proce-dures that is most consistent with the context of applicable proj-ect types, and most consistent with the underlying algorithmsand data sources used in the proposed baseline methodology,and justify the choice on this basis.
4. Proponents of methodologies have indicated some apparentoverlap between approaches (a), (b), and (c) of paragraph 48 ofthe CDM modalities and procedures. Since paragraph 48 stipu-lates that only one approach should be chosen, developers areadvised to select the one that most closely reflects the process
(continued )

A N N E X 1
C D M I N C H I N A 151
Meeting Issues Decisions
EB 10th
(continued)
EB 11th
Clarifications fordescribing a proposednew methodology andjustifying the selectionof the most appropriateapproach (continued)
Clarifications on ex postcalculation of baselines
Link between baseline and monitoringmethodologies
Approval of baseline andmonitoringmethodologies
Amendments toprocedures forsubmission andconsideration of aproposed newmethodology
Amendment to proceduresfor registration of aproposed CDM activity
used for calculating baseline emissions or baseline emissionrates. The tool used in order to demonstrate additionality (seeparagraph 2 above) does not need to be linked to one of thethree approaches of paragraph 48 of the CDM modalities andprocedures.
6. “The ex post calculation of baseline emission rates may only beused if proper justification is provided. Notwithstanding, thebaseline emission rates shall also be calculated ex-ante andreported in the draft CDM-PDD in order to satisfy the require-ments for identification of the elements of a baseline methodol-ogy agreed by the Executive Board at its eighth meeting.”
7. A strong link between baseline and monitoring methodologiesare to be provided. New baseline and monitoring methodologiesshall be proposed and approved together. If project participantswould like to use different combinations of approved baselineand monitoring methodologies, they shall submit a proposal forconsideration of the Meth Panel and approval by the Board.
Baseline and monitoring methodologies contained in followingprojects have been approved:
1. Salvador da Bahia landfill gas project”HFC decomposition project in Ulsan
(a) Within ten working days after the receipt of the preliminary rec-ommendation of the Meth Panel by the designated operationalentity (DOE), the project participants may submit, via the DOE,clarifications to the Meth Panel, through the secretariat, ontechnical issues concerning the proposed new methodologyraised in the preliminary recommendation by the Meth Panel.Technical clarifications provided by the project participantsshall include revisions in annexes 3 and 4 of the CDM-PDD inhighlighted form. Clarifications provided by the project partici-pants shall be made available to the Executive Board and to thepublic soon after they have been received by the secretariat;
(b) If project participants do not provide any clarification related tothe preliminary recommendation by the Meth Panel within theten-day period, or if the preliminary recommendation by theMeth Panel is in favor of approving the proposed new method-ology, it shall be considered as a final recommendation, for-warded to the Executive Board and made publicly available.
A “request for registration” (as defined in paragraph 40 (f) of theCDM modalities and procedures) shall be made publicly availablethrough the UNFCCC CDM web site for a period of eight (8) weeks.The secretariat shall announce a request for registration of a pro-posed CDM project activity on the UNFCCC CDM web site and inthe CDM news facility. The announcement shall specify where therequest for registration can be found, the name of the proposedCDM project activity and the first and last day of the eight-weekperiod. The secretariat shall notify the DOE requesting a registra-tion when the request for registration has been posted.
(continued )

EB 11th
(continued)
COP9
EB 12th
C D M I N C H I N A152
Meeting Issues Decisions
Amendment to procedureson public availability of the CDM projectdesign document andfor receiving commentsas referred to in para-graphs 40 (b) and (c) ofthe CDM modalities andprocedures
Additional clarifications to the validationrequirements to bechecked by a designatedoperational entity
Approval of baseline and monitoringmethodologies
Modalities and proceduresfor afforestation andreforestation projectactivities under theClean DevelopmentMechanism in the firstcommitment period ofthe Kyoto Protocol
Amendment to AppendixB of the simplifiedmodalities andprocedures for small-scale CDM projectactivities
Approval of baseline andmonitoringmethodologies
Comments from the public will be kept publicly available until thedesignated operational entity (DOE) issues a request for registra-tion or communicates to the secretariat that it does not intend tovalidate the project activity.
In issuing a validation opinion in the validation report regardingparagraph 37 (d) of the CDM modalities and procedures, the DOEshall include a statement of the likelihood of the project activityto achieve the anticipated emission reductions stated in the CDM-PDD. This statement will constitute the basis for the calculation ofthe registration fee.
Baseline and monitoring methodologies contained in followingprojects have been approved:
1. NovaGerar landfill Gas to Energy Project2. Durban Landfill-gas-to-electricity project3. Graneros Plant Fuel Switching Project4. A.T. Biopower rice husk power project
As contained in FCCC/SBSTA/2003/L.27.
1. The reference to “solar water pumps” in paragraph 1 of sectionI.A is deleted and kept only under paragraph 9 of section I.B.
2. The following provision is added in paragraph 6 of section I.A:“A small-scale project proponent may, with adequate justifica-tion use a higher emissions factor from Table I.D.1.”
3. The following provision shall replace paragraph 29 (a) (ii) in sectionI.D: “The “build margin” is the weighted average emissions (in kgCO2equ/kWh) of recent capacity additions to the system, whichcapacity additions are defined as the greater (in MWh) of mostrecent1 20per cent2 of existing plants or the 5 most recent plants.”
4. The reference to the metering of energy use under monitoring inparagraph 69 in section II.E is deleted.
5. The title of section III.D is changed to “Methane Recovery.”
6. The following new section is added after section III.D: “MethaneAvoidance.” The Board requested the Meth Panel to furtherdevelop recommendations on simplified methodologies for thisnew section.
Baseline and monitoring methodologies contained in the followingprojects have been approved:
1. Methodologies proposed for Vale do Rosario Bagasse Cogeneration;2. CERUPT Methodology for Landfill Gas Recovery;3. Methodologies proposed for El Gallo Hydro-electric Project

C D M I N C H I N A 153
PROJECT PROPONENTS
The project proponents—any private or publicentities in the investing and host countries oreven third parties such as international organi-zations who are entitled to engage in a CDMproject—play the most important role in theCDM process. For example, proponents:
• Design, invest in, and may operate the CDMproject and receive the CERs as investors.
• May develop or might entrust other institu-tions to formulate the Project Design Docu-ment, including a baseline study, monitoringprocedures, and an environmental impactassessment.
• May cooperate with nongovernmental organi-zations (in the investingand/or thehost country)and receive comments by other stakeholders.
• Have to implement the monitoring plan.
COP/MOP
The Conference of the Parties serving as themeeting of the Parties to the Kyoto Protocol(COP/MOP) provides guidance to the CDM.More specifically, it provides guidance to theExecutive Board by taking decisions on (a) rulesof procedure of the Board; (b) designation ofoperational entities accredited by the Board; and(c) other recommendations made by the Board.
The COP/MOP also has other responsi-bilities, such as reviewing annual reports of theBoard; reviewing the regional and subregionaldistribution of designated operational entitiesand promoting accreditation of such entitiesfrom developing country Parties; reviewing theregional and subregional distribution of CDMproject activities and take appropriate deci-sions; and assisting in arranging funding of CDMproject activities.
At COP8 and COP9, the COP adopted guid-ance to the Executive Board on several majorissues, as contained in relevant decisions(UNFCCC, 2002(a); UNFCCC, 2003).
CDM EXECUTIVE BOARD
Article 12 of the Kyoto Protocol provides forthe establishment of a CDM Executive Board:“The Clean Development Mechanism shall besubject to the authority and guidance of theConference of the Parties serving as the meetingof the Parties to this Protocol and be supervisedby an executive board of the Clean Develop-ment Mechanism.”
In Bonn, it was agreed (UNFCCC, 2001(a))that the Board shall comprise ten members fromParties to the Kyoto Protocol, as follows: onemember from each of the five United Nationsregional groups; two other members from the
Detailed Description of the CDM Institutions
A2
�
A N N E X

According to the rules of procedures of theexecutive broad, a quorum of the board requiresat least two thirds of the members, representinga majority of members from Annex I Parties anda majority of members from non-Annex I Parties.Decisions by the board shall be taken by consen-sus whenever possible, and as a last resort by athree-fourths majority of the members presentand voting at the meeting.
By the end of July 2003, the Board had con-vened 10 meetings, and numerous methodology-relevant decisions had been adopted. At its thirdmeeting, the Board established the Small-scaleCDM Project Activities Panel (SSC Panel) toassist it in developing simplified modalities andprocedures for small-scale CDM project activities,as well as the Meth Panel to assist it in relevantmethodological work. At its fourth meeting, theExecutive Board established the CDM Accredita-tion Panel to assist it in the development of pro-cedures of accrediting operational entities.
A summary of decisions by the Board that arerelevant to methodological issues up to its tenthmeeting is provided in Annex 1. The Execu-tive Board decisions are regularly updated onwww.unfccc.int/cdm.
Operational Entity
An operational entity is a legal entity that shall beaccredited by the executive board, designated bythe COP/MOP and selected by CDM projectparticipants to perform such functions as valida-tion, verification, and/or certification. Functionsof the operational entity are closely related to thequality of CDM project activities, the amount ofcredits issued to the project participants, and thusthe environmental integrity of the Kyoto Proto-col. Therefore, a legal entity has to meet a series ofrequirements before it can be accredited by theExecutive Board and designated by the COP/MOP to perform the functions of an operationalentity.
A N N E X 2
C D M I N C H I N A154
Parties included in Annex I; two other membersfrom the Parties not included in Annex I; andone representative of the small-island developingstates. In Marrakech, it was decided further thatan alternate for each member of the executiveboard should be elected.
In order to facilitate a prompt start of theCDM, members of the Board as well as theiralternates were elected, from Parties to the Con-vention, by the seventh session of the Conferenceof the Parties. To prevent members whose coun-tries have not ratified or acceded to the KyotoProtocol from serving on the executive board,it was decided that upon the entry into force ofthe Kyoto Protocol, any such member shall bereplaced.
In COP7, delegates from South Africa, Iran,the Russian Federation, Brazil, France, Antiguaand Barbuda, Costa Rica, Morocco, Japan,and Denmark were elected members of theCDM Executive Board. Delegates from Senegal,Malaysia, Georgia, Chile, Switzerland, Samoa,Saudi Arabia, China, Canada, and Norway wereelected alternates of members of the CDM exec-utive board. Five members as well as five alter-nates will server a term of 3 years; the others willserve a term of 2 years.
According to the Marrakech Accords, theExecutive Board will supervise the CDM, underthe authority and guidance of the COP/MOP. Inthis context, the board assumes a series of impor-tant responsibilities, such as making recommen-dations to the COP/MOP on further modalitiesand procedures for the CDM; approving newmethodologies related to baselines, monitoringplans and project boundaries; reviewing provi-sions with regard to simplified modalities, proce-dures, and the definitions of small-scale projectactivities; reviewing the accreditation standards ofoperational entities and being responsible for theaccreditation of operational entities; and develop-ing, maintaining, and making publicly available arepository of approved rules, procedures, method-ologies and standards.

In accordance with the agreed accreditationstandards for operational entities, some of themost important requirements for an operationalentity are (a) necessary technical, environmental,and methodological expertise and competence toperform validation, verification, and certificationfunctions; (b) financial stability, insurance cover-age, and resources required for its activities; (c) suf-ficient arrangements to cover legal and financialliabilities arising from its activities; (d) docu-mented internal procedures; (e) a managementstructure to ensure the implementation of theentity’s functions; (f) work in a credible, indepen-dent, nondiscriminatory, and transparent manner;and (g) adequate arrangements to safeguard confi-dentiality of the information obtained from CDMproject participants.
In performing its functions, an operationalentity also faces some risks. If significant deficien-cies are identified in the validation, verification, orcertification report completed by one operationalentity and a review reveals that excess CERs wereissued, the operational entity shall acquire andtransfer an amount of reduced tons of carbondioxide equivalent equal to the excess CERs issuedto a cancellation account. Furthermore, any costrelated to the review shall be borne by the opera-tional entity.
The executive board will confirm whether toreaccredit each operational entity every threeyears, on the basis of the results of review and spot-checking, and may recommend to the COP/MOP to suspend or withdraw the designation ofa designated operational entity if it has found thatthe entity no longer meets the accreditation stan-dards or other related provisions.
Parties
Parties involved in CDM projects also playimportant roles. An involved Annex I Party needsto issue a written certificate of voluntary partici-pation in the project activity; an involved host
Party needs to issue a written certificate of volun-tary participation in the project activity, and alsoconfirm that the project activity could promotesustainable development of the host country.
To utilize Kyoto mechanisms, a Party mustmeet some requirements. For non-Annex I Par-ties, the requirements are simple: it shall designatea national authority for the CDM, and it shall bea Party to the Kyoto Protocol. For Annex I Par-ties, the requirements are comparatively complex.Besides the two requirements for non-Annex IParties, an Annex I Party has to comply withthe following requirements if it is to use CERsto contribute to compliance with part of itscommitments:
• Its assigned amount has been calculated andrecorded
• It has in place a national system for the estima-tion of anthropogenic emissions by sources andanthropogenic removals by sinks of all green-house gases not controlled by the MontrealProtocol
• It has in place a national registry• It has submitted annually the most recent
required inventory• It has submitted supplementary information
on assigned amounts.
Whether or not an Annex I Party is eligible toparticipate in CDM is to be decided by theenforcement branch of the compliance commit-tee, in accordance with certain procedures andmechanisms approved by the COP/MOP.
Supporting Institutions
To effectively perform its functions, the Boardneeds assistance from supporting institutions.The secretariat of the Convention provides admin-istrative and daily assistance to the Board, such asarranging meetings; receiving relevant applica-tions on behalf of the Board; providing relevant
A N N E X 2
C D M I N C H I N A 155

technical assistance; and presiding over the Boardmeeting where necessary.
Other Stakeholders
The Marrakech Accords provide for the pos-sibility that other stakeholders could activelyparticipate in the process of CDM project devel-
opment and implementation. They could pro-vide comments on the proposed project activity.The project proponents are also required toinvite com- ments by local stakeholders, providea summary of the comments received, and pro-vide a report to the designated operational en-tity on how they accounted for any commentsreceived.
A N N E X 2
C D M I N C H I N A156

C D M I N C H I N A 157
Preparation of a Project DesignDocument
The results and methodologies used in the quan-tification of greenhouse gas benefits will need tobe presented in a Project Design Document.The main contents of the PDD are:
1. Description of the CDM project2. Approved or new methodologies on deter-
mining the baseline3. Crediting period4. Additionality5. Environmental assessment6. Stakeholder comments7. Monitoring plan
Annex 1 notes six reports of the projects cho-sen as case studies. They are structured accord-ing to the requirements of the project designdocuments. The scope of the reports, however,are more detailed and so far go beyond the PDDrequirements.
Validation
To be a CDM project, the first evaluation processa proposed project activity has to go through isvalidation. This is a process of independent eval-uation of a project activity by a designated oper-ational entity, contracted by the project partici-
pants, against the requirements of the CDM, onthe basis of the project design document.
During the process of validation, the desig-nated operational entity will review the projectdesign document and any supporting documen-tation to decide whether certain requirementshave been met, including participation require-ments for the involved Parties have been met;comments by local stakeholders have been invited,summarized, and properly taken into account;documentation on the analysis of the environ-mental impacts of the project activity has beensubmitted; the project activity will result in anadditional reduction in anthropogenic emissionsof greenhouse gases; and documentation thatproper baseline and monitoring methodologieshave been used.
Based on the results of the review and com-ments received from other sources, the desig-nated operational entity shall make a decision onwhether the project activity should be validatedand notify the project participants of its determi-nation. And if it determines the proposed projectactivity it valid, it shall submit to the ExecutiveBoard a request for registration.
Registration
Registration is the formal acceptance by theExecutive Board of a validated project as a CDM
Detailed Description of the CDM Project Cycle
A3
�
A N N E X

and sent to the designated operational entityfor validation.
Verification and Certification
Based on the monitoring data, which need tobe further verified, the emission reductions of aCDM project activity can be calculated.
Verification is the periodic independent reviewand ex post determination by the designated oper-ational entity of the emission reductions of aregistered CDM project activity during the veri-fication period.
To perform the function of verification, thedesignated operational entity may review per-formance records, interview with project partic-ipants and local stakeholders, test the accuracyof monitoring equipment, and review monitor-ing results. If it concludes that the monitoringmethodologies have been applied correctly andtheir documentation is complete and transparent,it will provide a verification report to the projectparticipants, the Parties involved, and the Exec-utive Board.
Certification is the written assurance by thedesignated operational entity that, during a spec-ified time period, a project activity achieved theemission reductions as verified. Based on its ver-ification report, the designated operational entityshall complete a written certification report andinform relevant stakeholders of its decision.
Issuance of CERs
The subsequent step to the certification is the issuance of Certified Emission Reductions(CERs). Actually, the certification report deliv-ered to the Executive Board constitutes a requestfor issuance of CERs equal to the verified amountof emission reductions.
If a Party involved in the project activity orat least three members of the Executive Boardrequest a review of the proposed issuance of CERs,within 15 days from the date the Board receives
A N N E X 3
C D M I N C H I N A158
project activity and is the prerequisite for the verification, certification, and issuance ofCERs.
The proposed CDM project activity will beconsidered as being registered eight weeks afterthe date of receipt by the Executive Board of therequest for registration, unless a Party involvedin the project activity or at least three membersof the Executive Board request a review. Thereview by the Executive Board will be restrictedto issues associated with the validation require-ments and be finalized no later than the secondmeeting following the request for review.
Even if a proposed project activity is notaccepted, it can be reconsidered for validationand subsequent registration thereafter if appro-priate revisions have been made.
Monitoring
After being registered, a CDM project is now eli-gible to generate emission reductions. To deter-mine the emission reductions, it is necessary tomonitor the operating process of the project, i.e.collect and archive all the necessary data andinformation to determine the emission reduc-tions. Data quality of the monitoring process iscrucial to ensure the accurate calculation ofemission reductions of a registered CDM proj-ect. Therefore, the project participants shallinclude in the project design document themonitoring plan, which needs the validation ofthe designated operational entity before it can beimplemented in the project.
Data and information to be collected andarchived in the monitoring process include datanecessary for estimating anthropogenic emissionsoccurring within the project boundary; data nec-essary for determining the baseline; and data onleakage.
The project participants shall implementthe approved monitoring plan. Any revision to the previously approved monitoring planshall be justified by the project participants
the request a review will be conducted by theBoard. Otherwise, the request shall be consideredas approved.
In the case of request for a review, the Boardshall decide at the next meeting of the receipt ofrequest whether to perform a review. If a reviewis to be conducted, the contents shall be limitedto issues of fraud, malfeasance, or incompetenceof the designated operational entities and shall
be completed within 30 days from the date ofdecision to perform a review.
When the issuance is decided by the Board,certain quantity of CERs corresponding to theshare of proceeds will be forwarded to the appro-priate accounts in the CDM registry and theremaining CERs will be forwarded to the reg-istry accounts of Parties and project participantsinvolved, in accordance with their request.
A N N E X 3
C D M I N C H I N A 159


C D M I N C H I N A 161
I. GENERAL PROVISIONS
Article 1 These interim measures are formulatedin accordance with the provisions of the UnitedNations Framework Convention on ClimateChange (hereinafter referred to as “the Con-vention”) and its Kyoto Protocol (hereinafterreferred to as “the Protocol”) ratified andapproved by China respectively, and the relevantdecisions adopted by the Conference of the Par-ties, with a view to strengthening the effectivemanagement of Clean Development Mecha-nism (hereinafter referred to as “CDM”) pro-jects by the Chinese Government, protectingChina’s rights and interests, and ensuring theproper operation of CDM projects.
Article 2 According to the Protocol, CDM isa project-based mechanism under which devel-oped-country Parties cooperate with develop-ing-country Parties in order to meet part of theGHG emission reduction obligations of thedeveloped-country Parties. The purpose of thismechanism is to assist developing-country Par-ties in achieving sustainable development and incontributing to the realization of the ultimateobjective of the Convention, as well as to assistdeveloped-country Parties in achieving compli-ance with their quantified GHG emission limi-tation and reduction commitments. The core ofthe CDM is to allow developed-country Parties,
in cooperation with developing-country Parties,to acquire “certified emission reductions (here-inafter referred to as “CERs”)” generated by theprojects implemented in developing countries.
Article 3 CDM projects to be implementedin China shall be approved by relevant depart-ments under the State Council.
Article 4 The priority areas for CDM proj-ects in China are energy efficiency improve-ment, development and utilization of new andrenewable energy, and methane recovery andutilization.
Article 5 In accordance with the relevant deci-sions of the Conference of the Parties, the imple-mentation of CDM projects shall ensuretransparency, high efficiency, and accountability.
II. PERMISSION REQUIREMENTS
Article 6 CDM project activities shall be consis-tent with China’s laws and regulations, sustain-able development strategies and policies, and theoverall requirements for national economic andsocial development planning.
Article 7 The implementation of CDM proj-ect activities shall conform to the requirementsof the Convention, the Protocol, and relevantdecisions by the Conference of the Parties.
Article 8 The implementation of CDM proj-ect activities shall not introduce any new obli-
Interim Measures for Operation and Management
of Clean Development Mechanism Projects in China
A4
�
A N N E X

Board members are the State EnvironmentalProtection Administration, China Meteorologi-cal Administration, Ministry of Finance, andMinistry of Agriculture. The Board has the fol-lowing responsibilities:
1. To review CDM project activities, mainlyfrom the following aspects:(1) Participation qualification;(2) Project design document;(3) Baseline methodology and emission
reductions;(4) Price of CERs;(5) Terms relating to funding and technol-
ogy transfer;(6) Crediting period;(7) Monitoring plan; and(8) Expected sustainable development effec-
tiveness.2. To report to the Committee on the overall
progress of CDM project activities, issuesemerged, and further recommendations; and
3. To make recommendations on the amend-ments to this CDM interim measures.
Article 16 NDRC is China’s DesignatedNational Authority for CDM, with the follow-ing responsibilities:
1. To accept CDM project application;2. To approve CDM project activities jointly
with MOST and MFA, on the basis of theconclusion made by the Board;
3. To issue a written approval letter on behalf ofthe Government of China;
4. To supervise the implementation of CDMproject activities;
5. To establish the CDM project managementinstitute referred to in Article 13 above, inconsultation with other departments; and
6. To deal with other relevant issues.
Article 17 A Project owner, which refers tothe Chinese-funded or Chinese-holding enter-prises, shall:
A N N E X 4
C D M I N C H I N A162
gation for China other than those under theConvention and the Protocol.
Article 9 Funding for CDM projects from thedeveloped-country Parties shall be additional totheir current official development assistance andtheir financial obligations under the Convention.
Article 10 CDM project activities shouldpromote the transfer of environmentally soundtechnology to China.
Article 11 Chinese-funded or Chinese-hold-ing enterprises within the territory of China areeligible to conduct CDM projects with foreignpartners.
Article 12 CDM project owners shall submitto the Designated National CDM Authority thefollowing documents: CDM project design doc-ument, certificate of enterprise status, generalinformation of the project, and a description ofthe project financing.
III. INSTITUTIONAL ARRANGEMENTFOR PROJECT MANAGEMENT ANDIMPLEMENTATION
Article 13 A National CDM Board (hereinafterreferred to as “the Board”) is hereby establishedunder the National Climate Change Coordina-tion Committee (hereinafter referred to as “theCommittee”), and a CDM project managementinstitute will be established under the Board.
Article 14 The Committee is responsible forthe review and coordination of important CDMpolicies. More specifically, it has the followingresponsibilities:
1. To review national CDM policies, rules, andstandards;
2. To approve members of the Board; and3. To review other issues deemed necessary.
Article 15 The National Development andReform Commission (NDRC) and Ministry ofScience and Technology (MOST) serve as co-chairs of, and Ministry of Foreign Affairs (MFA)serves as the vice chair of, the Board. Other

1. Undertake CDM project negotiations withforeign partners;
2. Be responsible for construction of the projectand report periodically to NDRC on theprogress;
3. Implement the CDM project activity underthe supervision of NDRC; develop andimplement a project monitoring plan toensure that the emission reductions are real,measurable, long-term, and additional;
4. Contract designated operational entities tovalidate the proposed project activity and to verify emission reductions of the projectactivity under the guidance of NDRC; pro-vide necessary information and monitoringrecords, and submit the information toNDRC for record purposes; and protect stateand business confidential information inaccordance with relevant laws and regula-tions;
5. Report to NDRC on CERs issued;6. Assist NDRC and the Board in investigating
relevant issues and respond to the inquiries;and
7. Undertake other necessary obligations.
IV. PROJECT PROCEDURES
Article 18 Procedures for the application andapproval of CDM projects:1. The Project owner, or together with its for-
eign partner, submits to NDRC projectapplication, and documents as required byArticle 12 above. Relevant departments andlocal governments may facilitate such projectapplication;
2. NDRC entrusts relevant organizations forexpert review of the applied project, whichshall be concluded within 30 days;
3. NDRC submits those project applicationsreviewed by the experts to the Board;
4. NDRC approves, jointly with MOST andMFA, projects based on the conclusion madeby the Board, and issues approval letteraccordingly;
5. NDRC will make a decision on project appli-cation within 20 days (excluding the expertreview time) as of the date of accepting theapplication. The time limit for decision-making may be extended to 30 days, withthe approval of the Chair or the Vice-chairof NDRC, if a decision could not be madewithin 20 days. The project applicantshould be informed of such a decision andits reasons.
6. Project owner invites designated operationalentity to validate the project for registration;and
7. Project owner shall report to NDRC on theapproval decision by the CDM ExecutiveBoard within 10 days as of the date of receiv-ing the notice from the Executive Board.
Article 19 Existing other relevant rules andprocedures for the approval of construction pro-jects shall apply to CDM projects.
Article 20 Procedures for the project imple-mentation, monitoring and verification:
1. Project owner is responsible for presentingNDRC and designated operational entityproject implementation and monitoringreports;
2. NDRC supervises the implementation of theproject to ensure the quality of the activity;
3. Contracted designated operational entityverifies the emission reductions of the projectactivity and submits certification report tothe CDM Executive Board, which will thenissue CERs for the projects and inform itsdecision to the project participants; and
4. NDRC or other organizations entrusted byNDRC will put the CERs issued by theCDM Executive Board in file and record.
V. OTHER PROVISIONS
Article 21 Developed-country Parties men-tioned above refer to Parties included in AnnexI of the Convention.
A N N E X 4
C D M I N C H I N A 163

Article 22 CDM Executive Board men-tioned above refers to the board as defined inArticle 12 of the Protocol for the purpose ofsupervising CDM.
Article 23 Operational entity mentionedabove refers to the entity as defined in Article 12of the Protocol for the purpose of validation aswell as verification and certification of CDMproject activities.
Article 24 Revenue from the transfer ofCERs shall be owned jointly by the Government
of China and the project owner, with allocationratio of the revenue to be decided by the Gov-ernment of China. Before the decision, the rev-enue belongs to the project owner.
Article 25 NDRC, in consultation withMOST and MFA, is responsible for the inter-pretation of these interim measures.
Article 26 These interim measures take effectas of June 30, 2004.
Source: Office of National CoordinationCommittee on Climate Change
A N N E X 4
C D M I N C H I N A164

C D M I N C H I N A 165
1. AIM Project Team. 1996. “A Guide to the AIM/End-use Model.” AIM Interim Paper, IP-95-05, Tsukuba,Japan.
2. Arquit Niederberger, Anne, and Lichia Yiu. 2003.“Management Systems for Capacity Building.” JointImplementation Quarterly 9(3): 8-9.
3. Austin, D. and others. 1998. “Opportunities forFinancing Sustainable Development via the CDM.”Discussion draft, November 7, 1998.
4. Basler, Ernst, and others. 1999. “Conversion of Heat-ing Centers.” Activities Implemented Jointly (AIJ)study prepared for the Swiss Federal Office for ForeignEconomic Affairs, Zurich.
5. Baumert, Kevin. 1998. The Clean Development Mech-anism: Understanding additionality. Washington, D.C.,and London: Center for Sustainable Development inthe Americas, Foundation for International Environ-mental Law and Development, and World ResourcesInstitute.
6. Beghin, John, Sebastein Dessus, David Roland-Holst,and Dominique van der Mensbrugghe. 1995. “ChineseCGE Model for the Trade and Environment ProgramTechnical Specification.” Paris: OECD DevelopmentCenter.
7. Bois, Martina. 2000. “An Initial View on Methodolo-gies for Emission Baselines: Electricity Generation CaseStudy.” IEA information paper. Paris: IEA Energy andEnvironment Division.
8. CCAP (Center for Clean Air Policy). 1999. “Optionsfor Determining Baselines and Additionality underArticle 6 JI. Presentation at SBSTA 10.
9. China Year Book 2001. 2002. Beijing: China StatisticPublishing House.
10. China Power Industry Year Book 2001. 2002. Beijing:China Power Industry Year Book Publishing House.
11. Chomitz, Kenneth M. 1998. ”Baseline for greenhousegas reductions: problems, precedents, solutions.” Paper
prepared for the World Bank Carbon Offsets Unit.Washington. D.C.
12. Criqui, P., and A. Kitous. 2003. “Kyoto ProtocolImplementation, Impacts of Linking JI and CDMCredits to the European Emission Allowance TradingScheme (KPI-ETS).” Paper prepared for the Direc-torate General Environment.
13. Edmonds, J., M. Wise, and D. Barns. 1995. “CarbonCoalitions: The cost and effectiveness of energy agree-ment to alter trajectories of atmospheric carbon diox-ide emissions.” Energy Policy 23:309-335.
14. Edmonds, J., M. Wise, R. Sands, R. Brown, and H. Kheshgi. 1996. “Agriculture, Land Use, and Com-mercial Biomass Energy: A Preliminary IntegratedAnalysis of the Potential Role of Biomass Energy for Reducing Future Greenhouse Related Emis-sions.” Washington, D.C.: Pacific Northwest NationalLaboratory.
15. Edmonds, J., H.M Pitcher, D. Barns, R. Baron, andM.A. Wise. 1994. “Modeling Future Greenhouse Gas Emissions: The Second Generation ModelDescription.” Washington: D.C.: Pacific NorthwestLaboratory.
16. Ellerman, A. D., H. D. Jacoby, and A. Decaux. 1998.“The Effects on Developing Countries of the KyotoProtocol and CO2 Emission Trading.” MIT GlobalChange Joint Program Report No. 41. Cambridge,MA: MIT.
17. Ellis, J., and M. Bosi. 1999. “Options for project emission baselines.” OECD and IEA InformationPaper. Paris: OECD. http://www.ghgprotocol.org/docs/options.pdf.
18. Ellis, Kane. 1999. “Option for Project Emission Base-lines.” OECD and IEA Information Paper. Paris:OECD.
19. Grubb, M. 2003. “The Kyoto-Marrakech System: aStrategic Assessment Module 1: The real-world eco-
References
�

35. Korppoo, A. 2003. “Forging alliance with Russia: theexample of a Green Investment Scheme.” Climate Pol-icy 3: 67–76.
36. Lazarus, Michael, and others. 1999. Evaluation ofBenchmarking as an Approach for Establishing CleanDevelopment Mechanism Baselines. Boston: Tellus Insti-tute. www.tellus.org
37. Lasco, Rodel D., Axel Michealowa, Mary Miline, andothers. 2001. “A shared Research Agenda for Land use,Land use Change, Forestry and the Clean Develop-ment Mechanism.” Paper prepared for an internationalworkshop held March 6-8, 2001, Bogor, Indonesia.
38. Lecoq, F. and K. Capoor. 2003. State and Trends of the Carbon Market. PCFplus Research Report. www.prototypecarbonfund.org
39. Liu, Deshun, Peter Rogers. 2000. “Baseline Determi-nation for Green Gas Abatement by the Clean Devel-opment Mechanism and Joint Implementation underthe Kyoto Protocol.” In Prodipto Ghosh, ed., Imple-mentation of the Kyoto Protocol. . Manila: Asian Devel-opment Bank.
40. Loschel, A. and ZhongXiang Zhang. 2002. “The Eco-nomic and Environmental Implications of the U.S.Repudiation of the Kyoto Protocol and the SubsequentDeals in Bonn and Marrakech.” Paper presented atInternational Workshop on Climate Policy in Asia,Tokyo, December 17-18, 2001.
41. Matsuo, Naoki. 2000. “What is and How to Set Base-lines for CDM Project.” Paper presented at the 10thAsia-Pacific Seminar on Climate Change TechnicalIssues in Designing CDM, July 10-13, 2000.
42. Michaelowa, Axel. 1999. “Baseline setting in the AIJpilot phase.” In Bundesumweltministerium, Wuppertal-Institut, eds. Reports on AIJ projects and contributions tothe discussion of the Kyoto Mechanisms. Berlin: 82-93.
43. Michaelowa, Axel. and Markus Stronzik. 2002.“Transaction Costs of the Kyoto Mechanisms.”HWWA Discussion paper No. 175, Hamburg.
44. Michaelowa, Axel. 1998. “Joint Implementation- thebaseline issue: economic and political aspects.” GlobalEnvironmental Change: 8 (1).
45. Michaelowa, Axel, Marcus Stronzik, Frauke Ecker-mann, and Alistair Hunt. 2003. “Transaction costs ofthe Kyoto Mechanisms.” Climate Policy (3): 261–278.
46. Michaelowa, A., and F. Jotzo. 2003. “Impacts of trans-action costs and rigidities on the share of the CDM inthe global greenhouse gas market.” Paper prepared forthe meeting of the Ausschuss Umweltökonomie imVerein für Sozialpolitik, Rostock, March 1-3, 2003.
47. Mintzer, I.M. 1993. “Implementing the FrameworkConvention on Climate Change: Incremental Costsand the Role of the GEF.” Global Environment Facil-ity Working Paper 4. Washington, D.C.: GEF.
48. Nakicenovic et al. 2001. IPCC Special Report on Emis-sion Scenario. Cambridge, UK: Cambridge UniversityPress.
R E F E R E N C E S
C D M I N C H I N A166
nomics of the Kyoto-Marrakech system and implica-tions for AAU availability.” The Royal Institute ofInternational Affairs (RIIA) research paper. London:RIIA.
20. Gruetter, J., 2000. “CERT (Carbon Emission Reduc-tion Trading) Model” www.ghgmarket.info.
21. Guo, Xiaomin, and others. 2003. “Progress Report ofChinese Environmental Cost Model.” World Bankand SEPA collaboration research project report.
22. Haites, E. 1998. “Estimate of the Potential Market forCooperative Mechanisms in 2010.” Toronto.
23. Hargrave, Tim, and others. 1999. Options for simpli-fying baseline setting for Joint Implementation andClean Development Mechanism Projects. Proceedingsof the Workshop on Baseline for CDM. Tokyo, Japan,February 25-26.
24. He, J.K. and M.S. Su. 2004. System Design for NaturalResources Management with Case Studies. Beijing: ChinaSocial Science Publishing House.
25. Hu, X., K. Jiang, and J. Liu. 1996. “Application ofAIM/Emission Model in P.R. China and PreliminaryAnalysis on Simulated Results.” AIM Interim Paper,IP-96-02, Tsukuba, Japan.
26. IEA and OECD. 2000. Emission baselines: estimatingthe unknown. Paris: OECD.
27. Intergovernmental Panel on Climate Change (IPCC).2000. Land Use, Land-Use Change and Forestry: A Spe-cial Report of the IPCC. R. T. Watson, I.R. Noble, B. Bolin, N. H. Ravindranath, D.J. Verardo, and D.J. Dokken, eds. Cambridge, UK: Cambridge Uni-versity Press.
28. Jiang, K., X. Hu, Y. Matsuoka, and T. Morita. 1998.“Energy Technology Changes and CO2 Emission Sce-narios in China.” Environment Economics and PolicyStudies 1:141-160.
29. Jiang, K., T. Masui, T. Morita, and Y. Matsuoka.2000a. “Long-term GHG Emission Scenarios of Asia-Pacific and the World.” Techological Forecasting &Social Change 61(2-3).
30. Jiang, K., T. Morita, T. Masui, and Y. Matsuoka.2000b. “Global Long-Term GHG Mitigation Emis-sion Scenarios based on AIM.” Environment Economicsand Policy Studies Vol.3.
31. Jiang,K., T. Morita, T. Masui, and Y. Matsuoka. 1999.“Long-Term Emission Scenarios for China.” Environ-ment Economics and Policy Studies 2:267-287.
32. Jiang, K., X. Hu, Y. Matsuoka, and T. Morita. 1998.“Energy Technology Changes and CO2 Emission Sce-narios in China.” Environment Economics and PolicyStudies 1:141-160.
33. Kappel, R., P. Staub, and J. Gruetter. 2002. UsersGuide CERT 1.3. www.ghgmarket.info.
34. King, K.1995. “The Incremental Costs of Global Envi-ronmental Benefits.” Global Environment FacilityWorking Paper no. 5. Washington D.C.: GEF.

49. Nondek, L., M. Maly, V. Splitek, and J. Pretel. 2001.“Joint Implementation in the Context of EuropeanUnion Accession: The Case of the Czech Repub-lic.” PCFplus Report 7, Washington, D.C.: PCF.(http://prototypecarbonfund.org/docs/JI_and_EU_Accession. pdf)
50. Nondek, Lubomir and Anne Arquit Niederberger.“Statistical Analysis confirms Kyoto Capacity BuildingNeeds.” Climate Policy (in preparation).
51. NVROM (Ministry of Housing, Spatial Planning and the Environment of the Netherlands). 2001. Op-erational Guidelines for Baseline Studies, Validation,Monitoring and Verification of Clean DevelopmentMechanism Project Activities, Volume 2a, www.carboncredit.nl.
52. Oberheitmann, Andreas. 1999. “Some Remarks onAdditionality and Incentives in Activities ImplementedJointly, Joint Implementation and the Clean Develop-ment Mechanism.” RWI-Papiere, No. 59. Essen.
53. Oberheitmann, Andreas. 2003. WTO and the KyotoProcess – Possible effects on China´s energy policy andtrade. In Doris Fischer und Andreas Oberheitmann, eds.China im Zeichen von Globalisierung und Entwicklung –Herausforderungen für die statistische Analyse undempirische Forschung. Berlin: DIW-Sonderheft Nr. 173.
54. PCF (Prototype Carbon Fund). 2003. Annual Report2003. Washington, D.C.: The World Bank.
55. Salon, Deborah. 2001. “An Initial View on Method-ologies for Emission Baselines: Case Study on Trans-port.” OECD and IEA information paper. Paris:International Energy Agency.
56. Santafé De Bogotá, 2000. National Strategy Study ForImplementation Of the CDM In Columbia. Final Reportfor WB Study.
57. Schwarze, Reimund, John Niles, and Jacob Olander.2002. “Understanding and Managing Leakage inForest-Based Greenhouse Gas Mitigation Projects.”http://www.conserveonline.org/2003/01/g/en/leakage_english.pdf.
58. Tulpule, V., S. Brown, and others. 1998. “An Eco-nomic Assessment of the Kyoto Protocol Using theGlobal Trade and Environment Model.” OECDWorkshop on “The Economic Modeling of ClimateChange: Background Analysis for the Kyoto Protocol,”Paris.
59. UNFCCC (United Nations Framework Conventionon Climate Change). 1998. Second National Commu-nications. See www.unfccc.int.
60. UNFCCC. 2001. The Marrakesh Accords and the Mar-rakesh Declaration. See www.unfccc.int.
61. UNFCC. 2003. “Modalities and procedures for theafforestation and reforestation project activities underthe clean development mechanism in the first commit-ment period of the Kyoto Protocol.” FCCC/SBSTA/2003/L.27.
62. UNFCCC. 1998. “Review of the Implementation ofCommitments and of other Provisions of the Conven-tion. Activities Implemented Jointly: Review ofProgress under the Pilot Phase (Decision 5/CP.1).”Second Synthesis Report on Activities ImplementedJointly, FCCC/CP/1998/2.
63. UNFCCC. 1999. “Mechanism Pursuant to Articles 6,12 and 17, Of The Kyoto Protocol, Synthesis of pro-posals by Parties on principles, modalities, rules and guidelines.” Subsidiary Body For Scientific andTechnological Advice, Tenth session, Bonn, May 31–June 11, 1999.
64. UNFCCC. 2000a. “Report of the Conference of theParties on the first part of its sixth session.” (Vol. V)Presented at the Hague, November 13–25, 2000.FCCC/CP/2000/5/Add.3.
65. UNFCCC. 2000b. “Uniform Reporting Format:Activities Implemented Jointly Under the Pilot Phase.”Swiss Energy Efficiency Project (Bucina a.s., Zvolen),http://unfccc.int/program/coop/aij/aijact00/chesvk- 01.htm.
66. UNFCCC. 2001a. “Report of the Conference of theParties on the second part of its sixth session held inBonn from July 16–27, 2001.” FCCC/CP/2001/5.
67. UNFCCC. 2001b. “Report of the Conference of theParties on its seventh session.” FCCC/CP/2001/13/Add.2.
68. UNFCCC. 2002a. “Report of the Conference of theParties on its eighth session.” FCCC/CP/2002/7/Add.3.
69. UNFCCC. 2002b. Subsidiary Body for Scientific andTechnological Advice. “Methodological Issues Activi-ties Implemented Jointly under the Pilot Phase: Uni-form Reporting Format, Submissions from Parties ontheir experience with the pilot phase.” Item 4 (c) of theprovisional agenda, Sixteenth session, Bonn, June5–14, 2002.
70. UNIDO. 2000. “Determining Baselines and Addi-tionality for CDM Projects.” http://www.unido.org/doc/331158.htmls
71. U.S. Administration. 1998. “The Kyoto Protocol andthe President’s Policies to Address Climate Change.”Washington, July 1998.
72. U.S. Department of Energy. 2002. InternationalEnergy Outlook, 2002. Washington, D.C.: EnergyInformation Administration.
73. Violette, Daniel. 2000. “An Initial View on Method-ologies for Emission Baselines: Case Study on EnergyEfficiency.” IEA and OECD information paper. Paris:Hagler Bailly Services, Inc..
74. Willems, Stéphane. 2000. “Framework for baselineguidelines.” OECD Information Paper.
75. World Bank, 2003. Capacity Building for the Kyoto Pro-tocol (Workshop Report). Washington, DC: TheWorld Bank, 2003.
R E F E R E N C E S
C D M I N C H I N A 167


C D M I N C H I N A 169
The attached CD-ROM contains all materialsfrom the China CDM Study. It includes a PDFversion of the full report, material integral to thereport that was not included in the printed ver-sion, as well as selected reference materials. Thispage provides an overview of its contents.
CLEAN DEVELOPMENT MECHANISMIN CHINA – TAKING A PROACTIVEAND SUSTAINABLE APPROACH
This is a PDF version of the full printed report(2nd edition).
ANNEXES TO THE REPORT
The CD-ROM contains the following Annexes,which are in addition to those four annexes(1–4) included in the main report:
Annex I: Six CDM Case StudiesAnnex II: Project Development Docu-
ments (PDDs) for each CaseStudy
Annex III: Methodological Annexes toChapter 5 and 6
Annex IV: Matrix of Major International-Funded CDM Studies in China
Annex V: Relevant Materials from OtherCDM Projects in China
Annex VI: Key Literature on CDM inChina
Annex VII: Participants and Minutes fromCDM Stakeholder Meetings
Annex VIII: Project Participants (Personsand Institutions)
Annex IX: Written China CDM Confer-ence Materials
Annex X: Video Presentations of theCDM Conference
Annexes I-III are an integral part of thereport. Due to the nature of this study, the mate-rials produced were too extensive to publish inprinted form, but the materials in Annexes I andII present the detailed case study analyses andcompleted PDDs for the six case studies investi-gated. Annex III provides an in-depth explana-tion of the technology, economic, and marketmodels used in the study and the assumptionsmade in modeling work.
Annexes IV, VII, IX and X provide moredepth on some of the material presented in themain body of the report. Annex IV is a moredetailed version of Table I.2, which provides anoverview of CDM activities in China. AnnexVIII contains documentation from two stake-holder consultation meetings to discuss thestudy’s preliminary findings, one with govern-ment officials (Annex VII-1, Minutes PolicyDialogue Meeting; Annexes VII-2 to VII-6, pre-
User Guide to the CD-ROM
�

sentations of some of the important presenta-tions and discussions at the international con-ference.
The remaining annexes are reference mater-ial. Annex V provides some further informationabout three other major CDM study initiativesin China, while Annex VI provides references tokey literature on CDM application in China.Annex VIII lists the people and institutionsinvolved in the study.
U S E R G U I D E
C D M I N C H I N A170
sentation materials, mainly in Chinese) and theother with industrial stakeholders (Annex VII-10, Workshop Minutes Stakeholder Meeting;Annexes VII-7 to VII-9, presentation materials,mainly in Chinese). Annex IX includes theagenda and all PowerPoint presentations madeat the international Conference “Clean Develop-ment Mechanism in China—Taking a Proactiveand Sustainable Approach,” held on July 1 and 2,2004 in Beijing. Annex X provides video pre-


Ministry of Science and Technology, Department of Rural and Social Development,15B, Fuxing Road, Beijing, 100862, P. R. ChinaTel. + 86 (10) 5888.1436, Fax + 86 (10) 5888.1441,
www.most.gov.cn
The World Bank Environment Department (ENV), Carbon Finance, 1818 H Street, Washington, DC 20433, USA Tel. + 1 (202) 473.8971, Fax + 1 (202) 522.2130,
www.worldbank.org/nss
Environment Sector Unit (EASEN), East Asia and Pacific Region,1818 H Street, Washington, DC 20433, USATel. + 1 (202) 458.2717, Fax + 1 (202) 522.1666,
www.worldbank.org/eap
Deutsche Gesellschaft für Technische Zusammenarbeit, The German Technical Cooperation, Environmental Management,Water, Energy and Transport, Project Climate Change, Dag-Hammarskjold-Weg 1-5, Postfach 51 80, 65726 Eschborn, Germany Tel. + 49 (61) 9679.4103, Fax + 49 (61) 9679.6320,
www.gtz.de
Swiss State Secretariat for Economic Affairs, Trade and Clean Technology Cooperation, Effingerstrasse 1, 3003 Bern, Switzerland Tel. + 41 (31) 32 0799, Fax + 41 (31) 322 8630,
www.seco-cooperation.ch
Tsinghua University, Global Climate Change Institute, Energy Science Building, Beijing 100084, P.R. ChinaTel. + 86 (10) 6277.2752. Fax + 86 (10) 6277.1150,
www.inet.tsinghua.edu.cn