Clawiter Road Industrial Project - City of Hayward
169
Clawiter Road Industrial Project Initial Study prepared by City of Hayward 777 B Street Hayward, California 94541 Contact: Elizabeth Blanton, Associate Planner prepared with the assistance of Rincon Consultants, Inc. 449 15 th Street, Suite 303 Oakland, California 94612 December 2020
-
Upload
khangminh22 -
Category
Documents
-
view
5 -
download
0
Transcript of Clawiter Road Industrial Project - City of Hayward
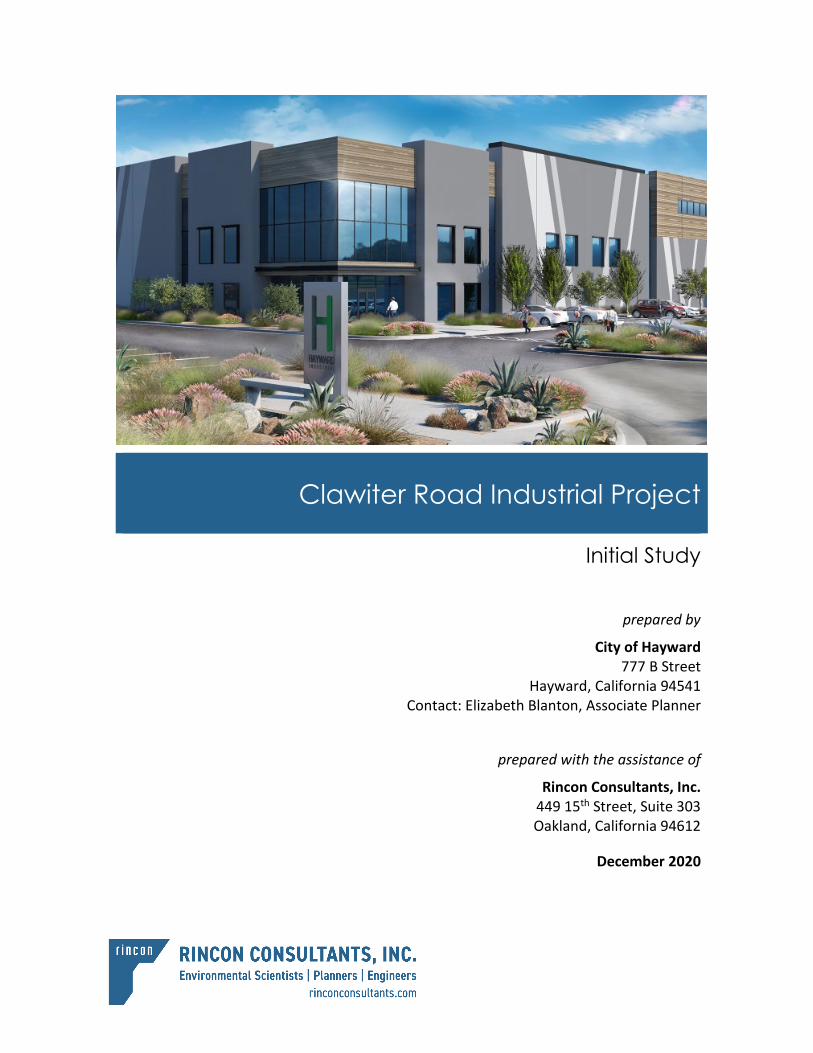
Clawiter Road Industrial Project
Initial Study
prepared by
City of Hayward 777 B Street
Hayward, California 94541 Contact: Elizabeth Blanton, Associate Planner
prepared with the assistance of
Rincon Consultants, Inc. 449 15th Street, Suite 303 Oakland, California 94612
December 2020
Clawiter Road Industrial Project
Initial Study
prepared by
City of Hayward 777 B Street
Hayward, California 94541 Contact: Elizabeth Blanton, Associate Planner
prepared with the assistance of
Rincon Consultants, Inc. 449 15th Street, Suite 303 Oakland, California 94612
December 2020

This report prepared on 50% recycled paper with 50% post-consumer content.
Table of Contents
Initial Study i
Table of Contents
Initial Study ............................................................................................................................................. 1 1. Project Title ......................................................................................................................... 1 2. Lead Agency Name and Address ......................................................................................... 1 3. Contact Person and Phone Number ................................................................................... 1 4. Project Location .................................................................................................................. 1 5. Project Sponsor’s Name and Address ................................................................................. 1 6. General Plan Designation .................................................................................................... 1 7. Zoning.................................................................................................................................. 1 8. Surrounding Land Uses and Setting .................................................................................... 4 9. Description of Project ......................................................................................................... 4 10. Required Approvals ...........................................................................................................14 11. Other Public Agencies Whose Approval is Required ........................................................14 12. Have California Native American Tribes Traditionally and Culturally Affiliated with
the Project Area Requested Consultation Pursuant to Public Resources Code Section 21080.3.1? ............................................................................................................14
Environmental Factors Potentially Affected .........................................................................................15
Determination ......................................................................................................................................15
Environmental Checklist .......................................................................................................................17 1 Aesthetics ..........................................................................................................................17 2 Agriculture and Forestry Resources ..................................................................................21 3 Air Quality .........................................................................................................................23 4 Biological Resources ..........................................................................................................45 5 Cultural Resources ............................................................................................................51 6 Energy ...............................................................................................................................55 7 Geology and Soils ..............................................................................................................61 8 Greenhouse Gas Emissions ...............................................................................................69 9 Hazards and Hazardous Materials ....................................................................................81 10 Hydrology and Water Quality ...........................................................................................99 11 Land Use and Planning ....................................................................................................103 12 Mineral Resources ..........................................................................................................107 13 Noise ...............................................................................................................................109 14 Population and Housing ..................................................................................................129 15 Public Services .................................................................................................................131 16 Recreation .......................................................................................................................135 17 Transportation ................................................................................................................137 18 Tribal Cultural Resources ................................................................................................143
City of Hayward Clawiter Road Industrial Project
ii
19 Utilities and Service Systems ..........................................................................................147 20 Wildfire............................................................................................................................151 21 Mandatory Findings of Significance ................................................................................153
References ..........................................................................................................................................157 Bibliography ................................................................................................................................157 List of Preparers ..........................................................................................................................162
Tables Table 1 Project Summary ................................................................................................................. 8 Table 2 Health Effects Associated with Non-Attainment Criteria Pollutants ................................24 Table 3 BAAQMD Air Quality Significance Thresholds ..................................................................26 Table 4 BAAQMD Odor Screening Distances .................................................................................28
Table 5 Project Consistency with Applicable Control Measures of 2017 Plan ..............................29 Table 6 Project Construction Emissions.........................................................................................31 Table 7 Estimated Average Daily Operational Emissions ..............................................................33 Table 8 Estimated Annual Operational Emissions .........................................................................33
Table 9 Mitigated Average Daily Operational Emissions – 600 Annual Hours of Generator Operation ..........................................................................................................................35
Table 10 Mitigated Annual Operational Emissions – 600 Annual Hours of Generator Operation ..........................................................................................................................36
Table 11 Mitigated Average Daily Operational Emissions – Compliance with BAAQMD Regulation 2, Rule 2 ..........................................................................................................37
Table 12 Mitigated Annual Operational Emissions – Compliance with BAAQMD Regulation 2, Rule 2 ............................................................................................................................38
Table 13 Health Risks from Generator Operation (50 Hours Per Year at 1,210 Feet) .....................43 Table 14 Cumulative Impacts – MEIR ..............................................................................................44
Table 15 Electricity Consumption in the PG&E Service Area in 2018 ..............................................56 Table 16 Natural Gas Consumption in PG&E Service Area in 2018 .................................................56 Table 17 Proposed Project Construction Energy Usage ..................................................................57 Table 18 Net New Operational Energy Usage .................................................................................58
Table 19 Power Usage Effectiveness Factors and Efficiency Levels ................................................59 Table 20 PG&E Energy Intensity Factors..........................................................................................71 Table 21 Combined Annual Emissions of GHGs ...............................................................................74 Table 22 Stationary Source GHG Emissions .....................................................................................75 Table 23 General Plan Consistency ................................................................................................104
Table 24 AASHTO Maximum Vibration Levels for Preventing Damage .........................................112 Table 25 Human Response to Steady State Vibration ...................................................................112 Table 26 Human Response to Transient Vibration ........................................................................112
Table of Contents
Initial Study iii
Table 27 City of Hayward Exterior Noise Compatibility Standards ...............................................114 Table 28 Project Site Noise Monitoring Results – Short Term ......................................................115 Table 29 Project Site Noise Monitoring Results – Long Term .......................................................116
Table 30 Sound Level Monitoring Traffic Counts ..........................................................................117 Table 31 Vibration Levels Measured during Construction Activities .............................................118 Table 32 Existing and Future Traffic Volumes ...............................................................................120 Table 33 Operational Noise Levels ................................................................................................123
Table 34 Traffic Noise Levels .........................................................................................................126 Table 35 Estimated Project Vehicle Trip Generation .....................................................................138 Table 36 Estimated Solid Waste Generation .................................................................................150
Figures Figure 1 Regional Location ................................................................................................................ 2 Figure 2 Project Site Location ........................................................................................................... 3 Figure 3a Site Photographs ................................................................................................................. 5 Figure 3b Site Photographs ................................................................................................................. 6 Figure 4 Proposed Site Plan .............................................................................................................. 9
Figure 5 Proposed Building 1 and Building 4 North and West Representative Elevations .............10 Figure 6 Proposed Rendering of Building 1 and Building 2 Southwest Elevation ...........................11 Figure 7 Location of MEIR and Cancer Risk Contours .....................................................................42 Figure 8 Operational Noise Level Contours ..................................................................................124 Figure 9 On-site Transportation Noise Contours ..........................................................................125
Appendices Appendix A Air Quality and Greenhouse Gas Modeling Worksheets Appendix B Health Risk Assessment Appendix C Landscape Plan and Tree Protection Plan Appendix D Cultural Resources Study
Appendix E Energy Calculation Worksheets Appendix F Geotechnical Investigations Appendix G Sound Level Measurement Data, Construction Noise Modeling Outputs, and
Mechanical Equipment Specification Sheets Appendix H CEQA Transportation Analysis Appendix I Tribal Correspondence

City of Hayward Clawiter Road Industrial Project
iv
This page intentionally left blank.
Initial Study
Initial Study 1
Initial Study
1. Project Title Clawiter Road Industrial Project
2. Lead Agency Name and Address City of Hayward Planning Division 777 B Street Hayward, California 94541
3. Contact Person and Phone Number Elizabeth Blanton, Associate Planner [email protected] (510) 583-4206
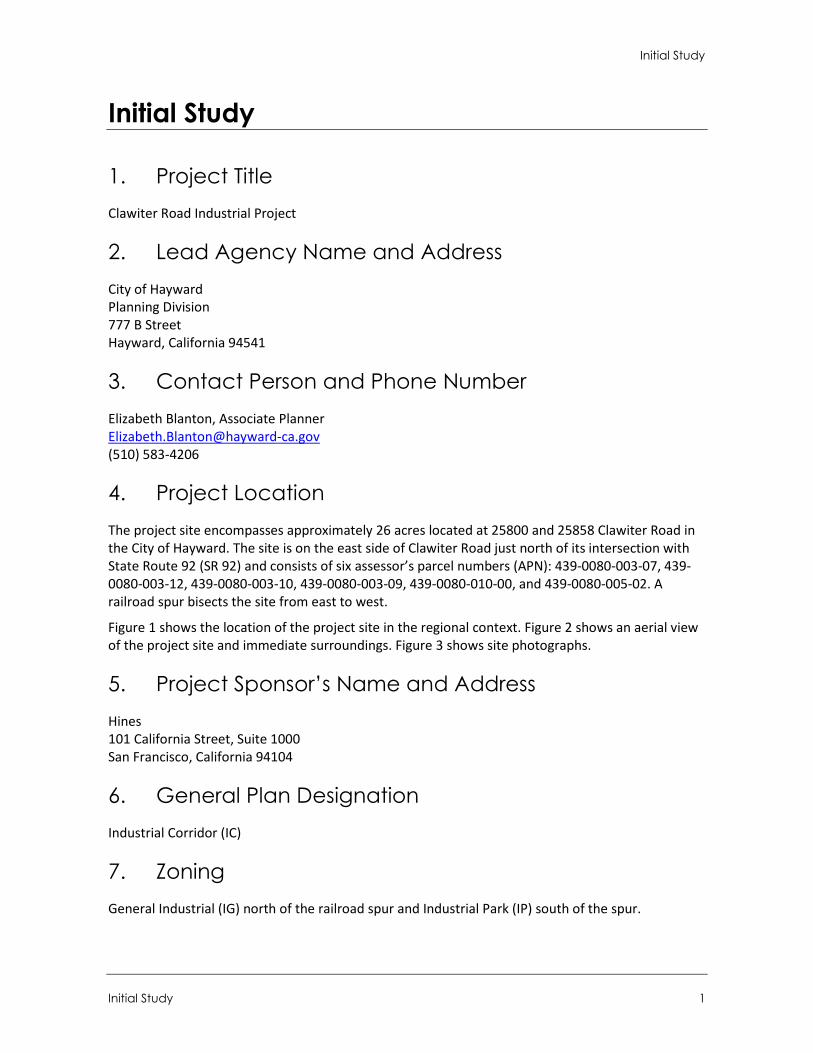
4. Project Location The project site encompasses approximately 26 acres located at 25800 and 25858 Clawiter Road in the City of Hayward. The site is on the east side of Clawiter Road just north of its intersection with State Route 92 (SR 92) and consists of six assessor’s parcel numbers (APN): 439-0080-003-07, 439-0080-003-12, 439-0080-003-10, 439-0080-003-09, 439-0080-010-00, and 439-0080-005-02. A railroad spur bisects the site from east to west.
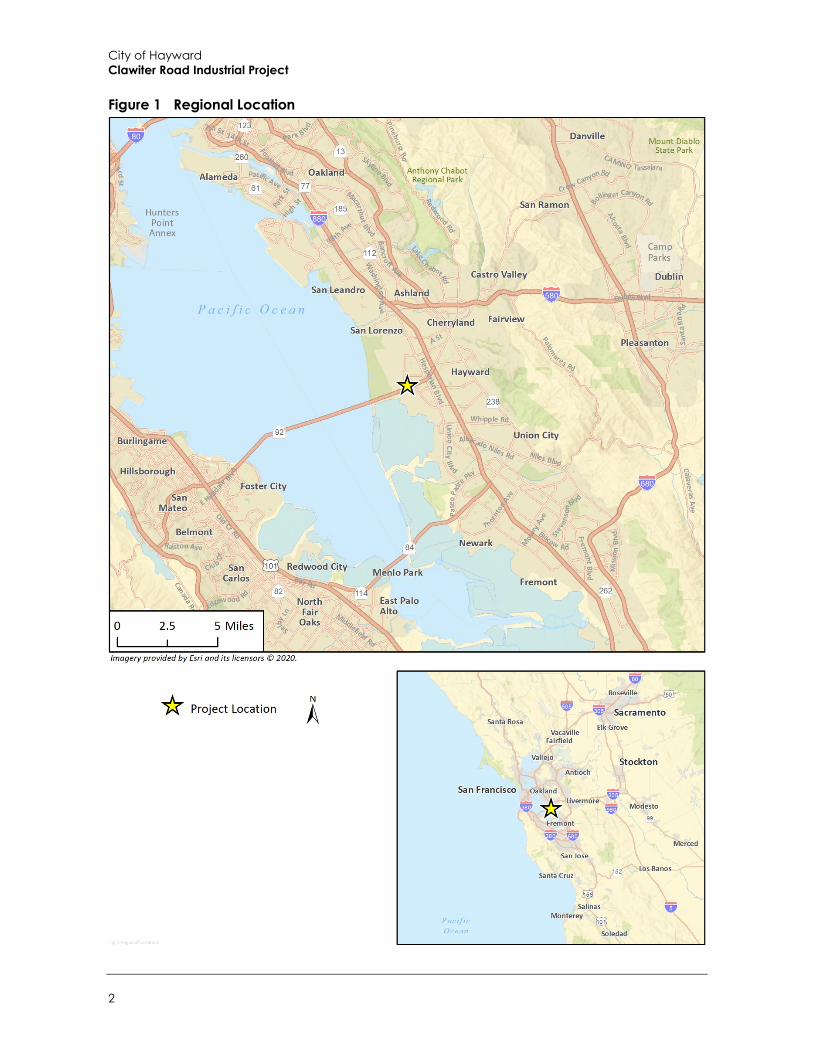
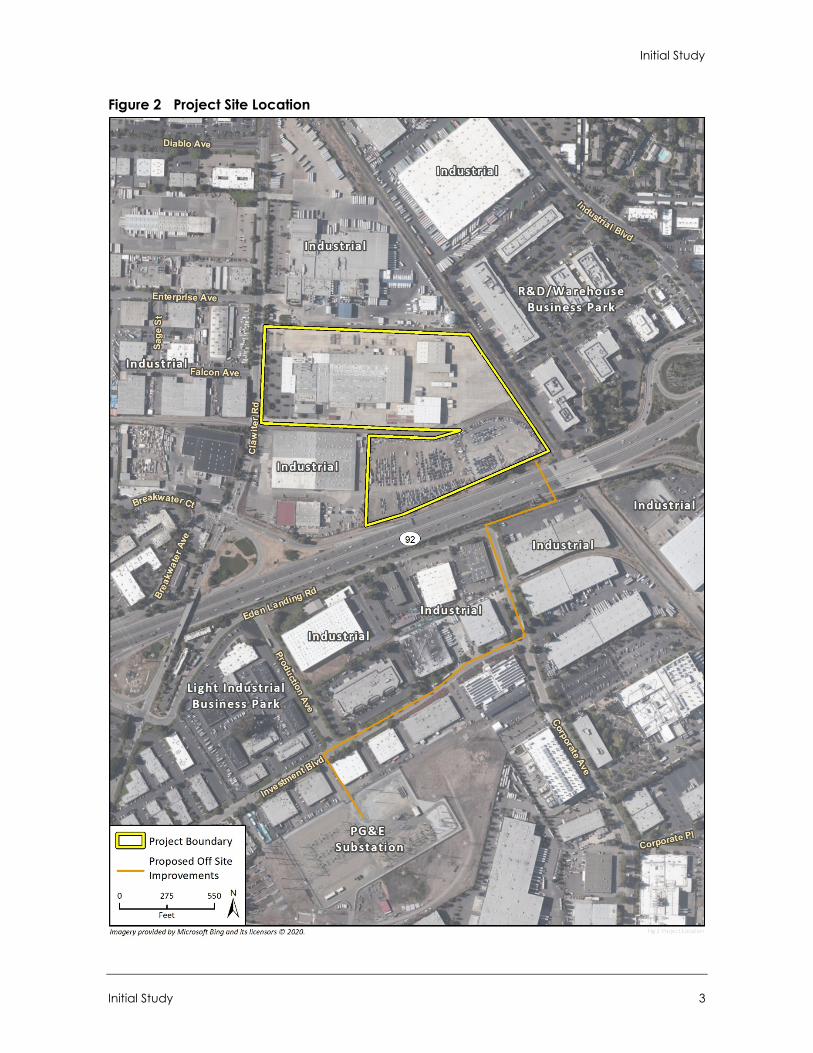
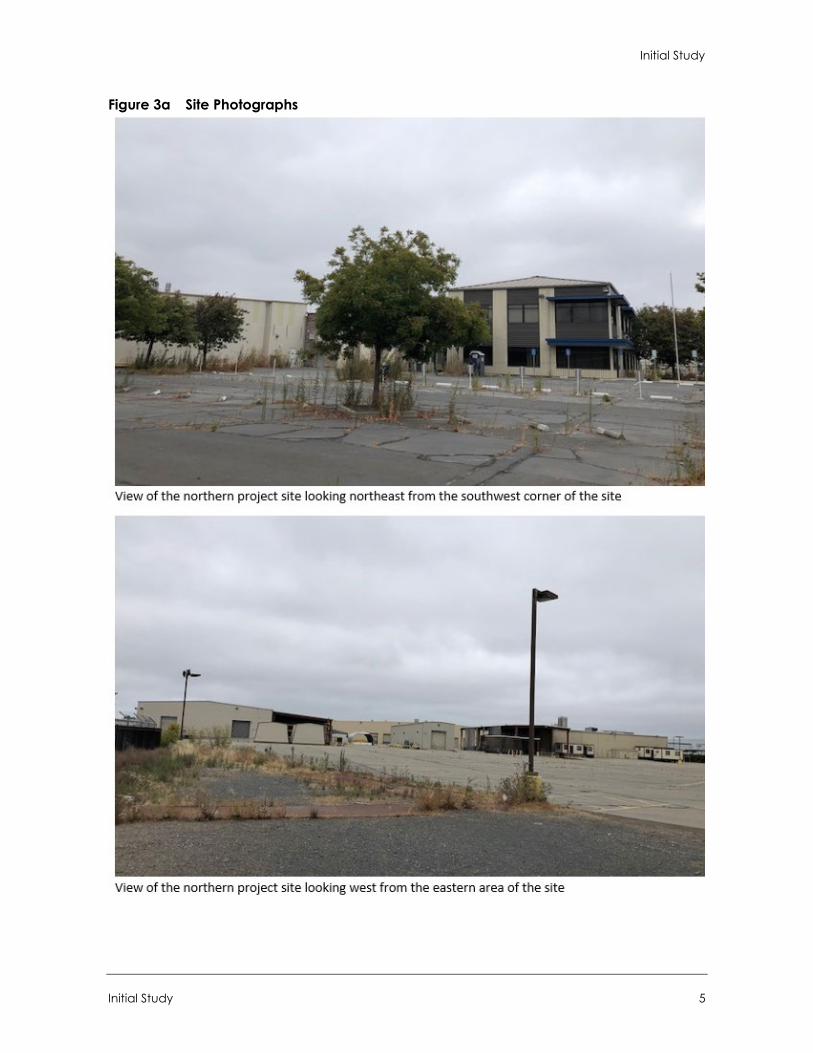
Figure 1 shows the location of the project site in the regional context. Figure 2 shows an aerial view of the project site and immediate surroundings. Figure 3 shows site photographs.
5. Project Sponsor’s Name and Address Hines 101 California Street, Suite 1000 San Francisco, California 94104
6. General Plan Designation Industrial Corridor (IC)
7. Zoning General Industrial (IG) north of the railroad spur and Industrial Park (IP) south of the spur.
City of Hayward Clawiter Road Industrial Project
2
Figure 1 Regional Location
Initial Study
Initial Study 3
Figure 2 Project Site Location
City of Hayward Clawiter Road Industrial Project
4
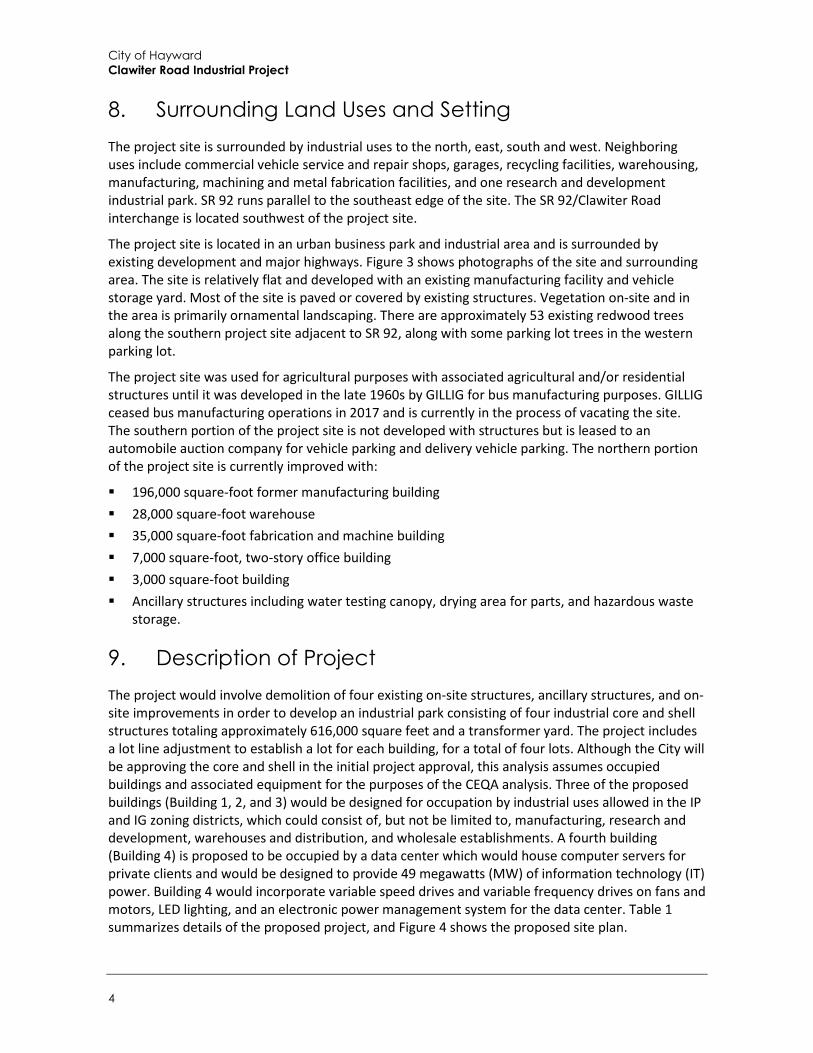
8. Surrounding Land Uses and Setting The project site is surrounded by industrial uses to the north, east, south and west. Neighboring uses include commercial vehicle service and repair shops, garages, recycling facilities, warehousing, manufacturing, machining and metal fabrication facilities, and one research and development industrial park. SR 92 runs parallel to the southeast edge of the site. The SR 92/Clawiter Road interchange is located southwest of the project site.
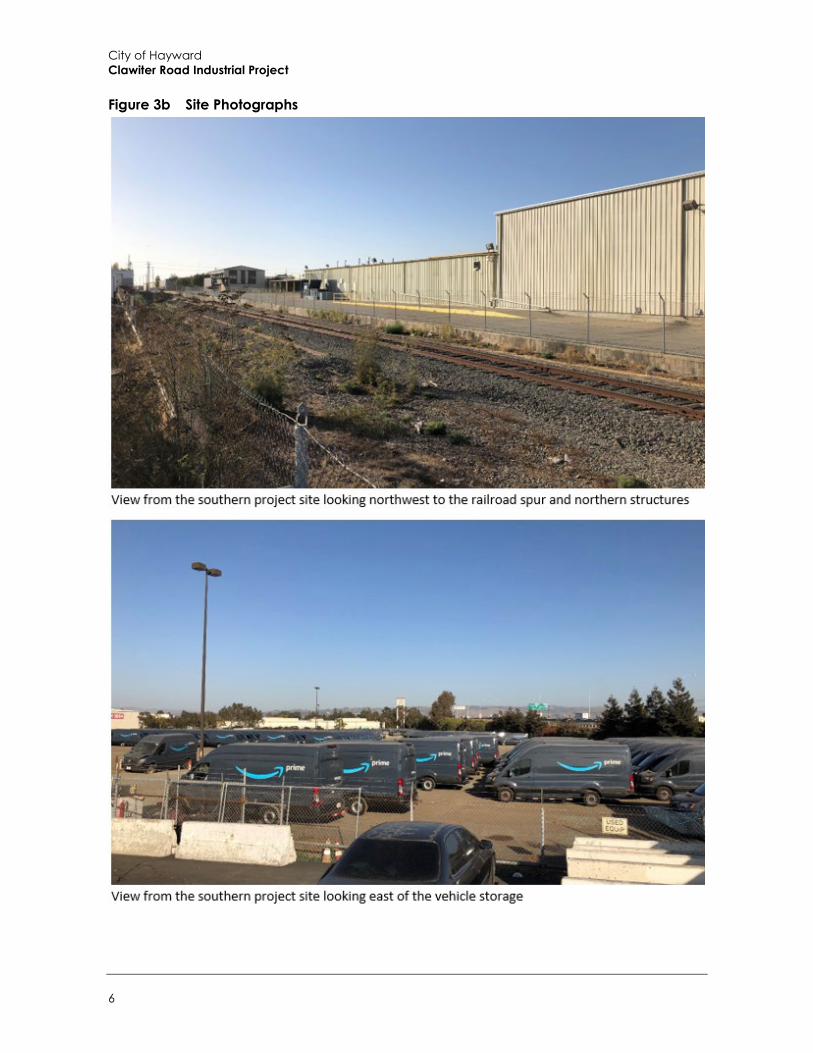
The project site is located in an urban business park and industrial area and is surrounded by existing development and major highways. Figure 3 shows photographs of the site and surrounding area. The site is relatively flat and developed with an existing manufacturing facility and vehicle storage yard. Most of the site is paved or covered by existing structures. Vegetation on-site and in the area is primarily ornamental landscaping. There are approximately 53 existing redwood trees along the southern project site adjacent to SR 92, along with some parking lot trees in the western parking lot.
The project site was used for agricultural purposes with associated agricultural and/or residential structures until it was developed in the late 1960s by GILLIG for bus manufacturing purposes. GILLIG ceased bus manufacturing operations in 2017 and is currently in the process of vacating the site. The southern portion of the project site is not developed with structures but is leased to an automobile auction company for vehicle parking and delivery vehicle parking. The northern portion of the project site is currently improved with:
196,000 square-foot former manufacturing building 28,000 square-foot warehouse 35,000 square-foot fabrication and machine building 7,000 square-foot, two-story office building 3,000 square-foot building Ancillary structures including water testing canopy, drying area for parts, and hazardous waste
storage.
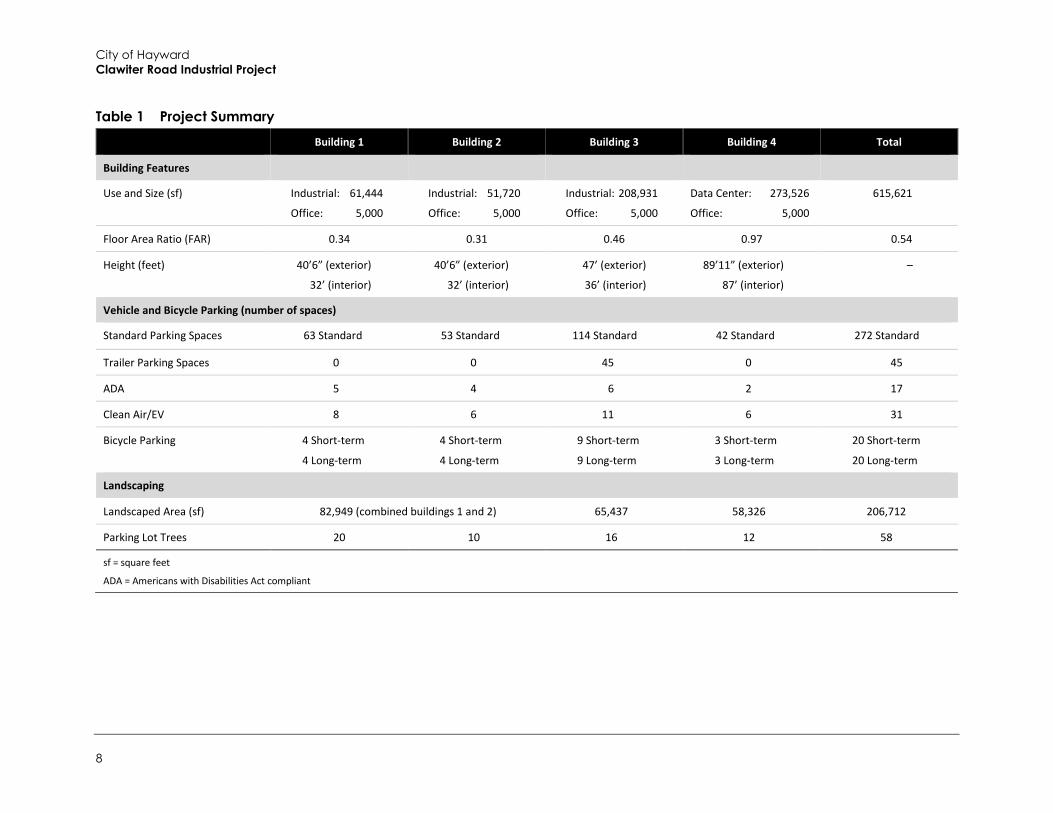
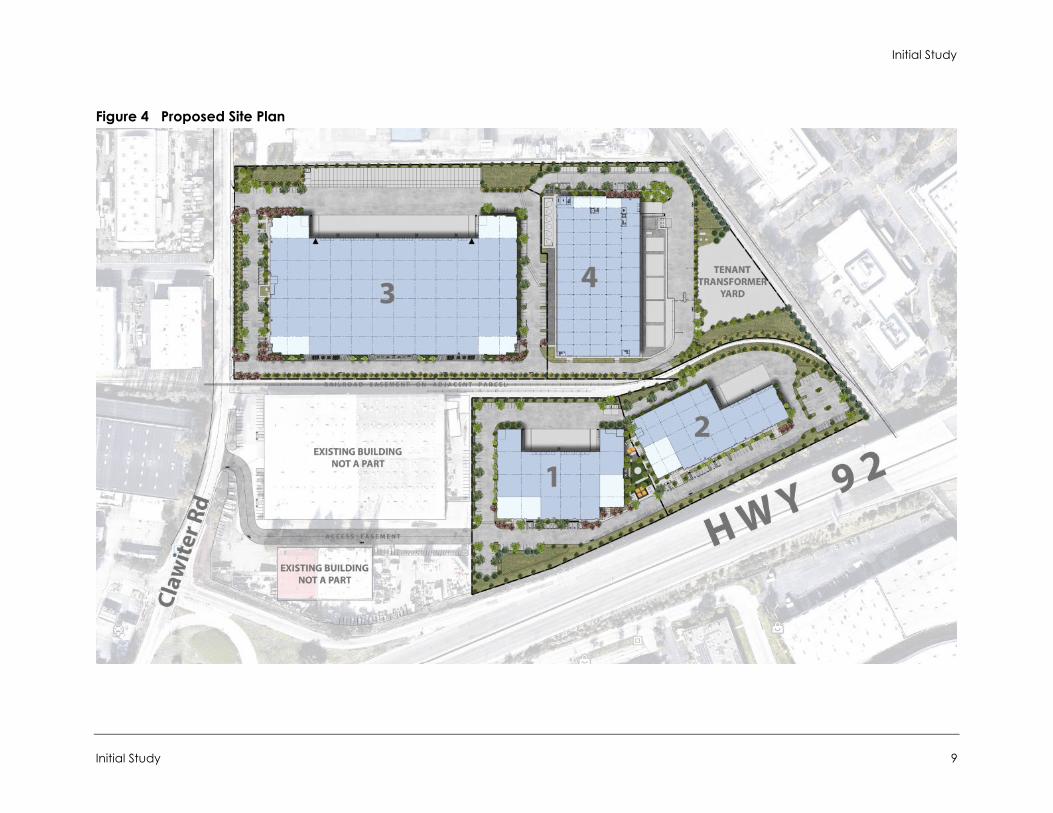
9. Description of Project The project would involve demolition of four existing on-site structures, ancillary structures, and on-site improvements in order to develop an industrial park consisting of four industrial core and shell structures totaling approximately 616,000 square feet and a transformer yard. The project includes a lot line adjustment to establish a lot for each building, for a total of four lots. Although the City will be approving the core and shell in the initial project approval, this analysis assumes occupied buildings and associated equipment for the purposes of the CEQA analysis. Three of the proposed buildings (Building 1, 2, and 3) would be designed for occupation by industrial uses allowed in the IP and IG zoning districts, which could consist of, but not be limited to, manufacturing, research and development, warehouses and distribution, and wholesale establishments. A fourth building (Building 4) is proposed to be occupied by a data center which would house computer servers for private clients and would be designed to provide 49 megawatts (MW) of information technology (IT) power. Building 4 would incorporate variable speed drives and variable frequency drives on fans and motors, LED lighting, and an electronic power management system for the data center. Table 1 summarizes details of the proposed project, and Figure 4 shows the proposed site plan.
Initial Study
Initial Study 5
Figure 3a Site Photographs
City of Hayward Clawiter Road Industrial Project
6
Figure 3b Site Photographs
Initial Study
Initial Study 7
The project would also involve the construction of a new 49 megavolt amps (MVA) transformer yard at the northeast portion of the site. The transformer yard would connect to the nearby Pacific Gas and Electric (PG&E) Eastshore Power Substation located 0.4 miles south of the project site via two transmission lines traveling in one route to the substation, as shown in Figure 2 and detailed below under Off-site Improvements. The transformer yard would distribute power to the data center and would include four 34.5-kilovolt (kV) feeders between the transformer yard and the data center’s 35kV switchgear. The transformer yard would cover approximately 34,000 square feet north of Building 2 and east of Building 4, adjacent to the existing railroad right of way and railroad spur, as seen in Figure 4. The components of the transformer yard would range from 18 to 70 feet in height.
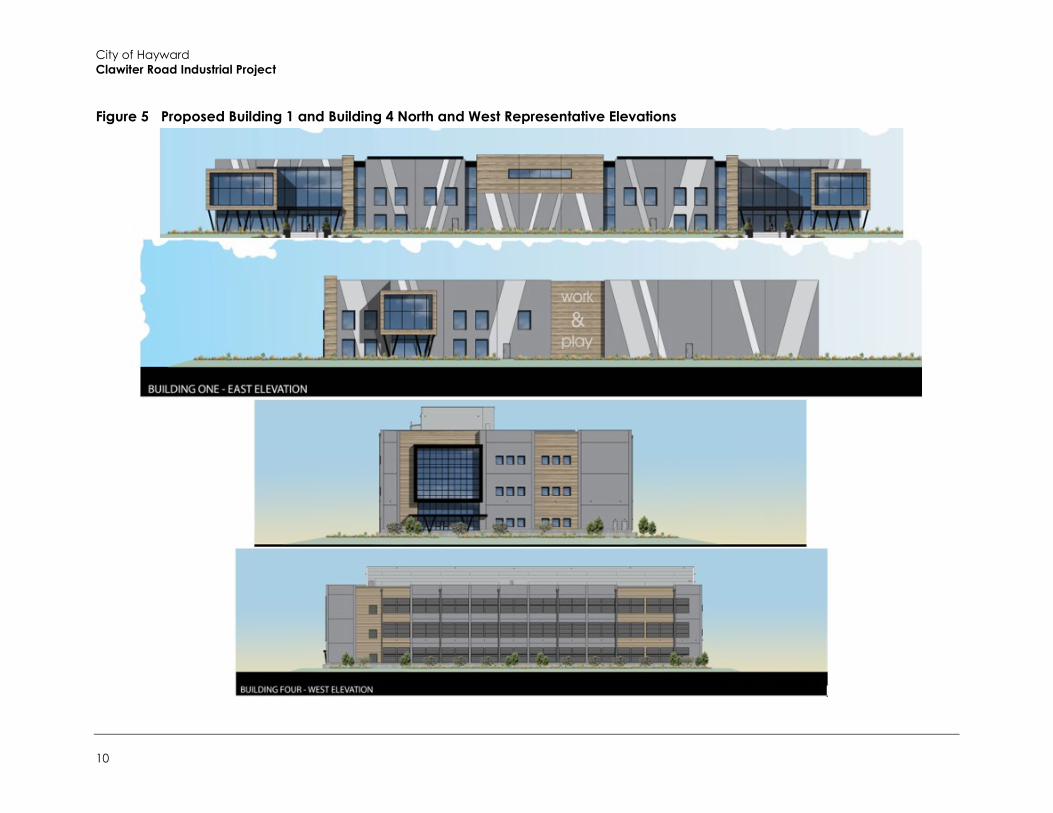
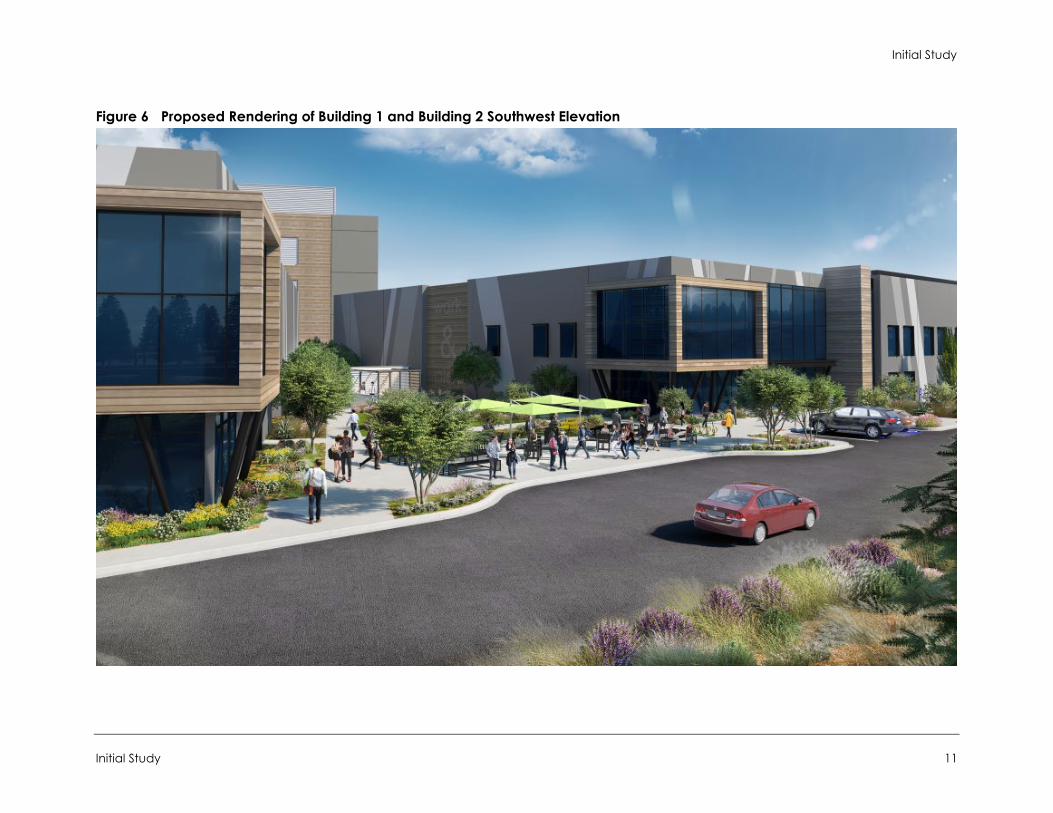
Building Architecture and Design Buildings 1 through 3 would be single-story concrete tilt up structures. Building 4 would be a three story streel structure with custom metal panels. Proposed elevations of the structures are shown in Figure 5 and a rendering of the project is shown in Figure 6. Building 4 would provide rooftop screening walls that would extend to a height of 108 feet to screen mechanical equipment on the roof which would house the air and ventilation infrastructure for the building’s evaporative cooling system.
The buildings would have various architectural details to increase the level of design and visual interest on elevations which are visible from SR 92 and Clawiter Road. The buildings would have multiple building materials and colors on their elevations, including areas of glass, wood siding, concrete in various neutral colors, metal, and various glazing. The buildings would include articulation in plane and parapet heights and would have pronounced main entries. Figure 5 shows representative elevations of the proposed one-story and three-story buildings. The project would include a gateway sign along Clawiter Road consisting of the Hayward “H,” and would provide a public art feature facing SR 92 between Buildings 1 and 2.
Access and Parking Access to buildings 3 and 4 north of the railroad easement would be provided by two driveways on Clawiter Road. The driveways would be approximately 35 feet in width, as per the Hayward Standard Detail 110, and would be in similar locations as the existing driveway entrances to the site. Access to buildings 1 and 2 would also be provided off Clawiter Road, through an existing ingress/egress access easement from the adjacent property, as shown in Figure 4. Due to the railroad spur separating the northern and southern portions of the project site, connectivity within the site between the two northern buildings and two southern buildings is infeasible. However, emergency access between the northern and southern project sites across the railroad spur is proposed.
Building 3 would provide over 180 feet of turning area in the northern driveway for trucks accessing one of the 26 proposed loading docks. As detailed in Table 1, 320 vehicle parking spaces and 45 trailer parking spaces would be provided throughout the project site. Of the 320 vehicle spaces, 19 would be ADA accessible and 31 would be clean air/electric vehicle (EV) charging spaces.
City of Hayward Clawiter Road Industrial Project
8
Table 1 Project Summary Building 1 Building 2 Building 3 Building 4 Total
Building Features
Use and Size (sf) Industrial: 61,444
Office: 5,000
Industrial: 51,720
Office: 5,000
Industrial: 208,931
Office: 5,000
Data Center: 273,526
Office: 5,000
615,621
Floor Area Ratio (FAR) 0.34 0.31 0.46 0.97 0.54
Height (feet) 40’6” (exterior)
32’ (interior)
40’6” (exterior)
32’ (interior)
47’ (exterior)
36’ (interior)
89’11” (exterior)
87’ (interior)
–
Vehicle and Bicycle Parking (number of spaces)
Standard Parking Spaces 63 Standard 53 Standard 114 Standard 42 Standard 272 Standard
Trailer Parking Spaces 0 0 45 0 45
ADA 5 4 6 2 17
Clean Air/EV 8 6 11 6 31
Bicycle Parking 4 Short-term
4 Long-term
4 Short-term
4 Long-term
9 Short-term
9 Long-term
3 Short-term
3 Long-term
20 Short-term
20 Long-term
Landscaping
Landscaped Area (sf) 82,949 (combined buildings 1 and 2) 65,437 58,326 206,712
Parking Lot Trees 20 10 16 12 58
sf = square feet
ADA = Americans with Disabilities Act compliant
Initial Study
Initial Study 9
Figure 4 Proposed Site Plan
City of Hayward Clawiter Road Industrial Project
10
Figure 5 Proposed Building 1 and Building 4 North and West Representative Elevations
Initial Study
Initial Study 11
Figure 6 Proposed Rendering of Building 1 and Building 2 Southwest Elevation
City of Hayward Clawiter Road Industrial Project
12
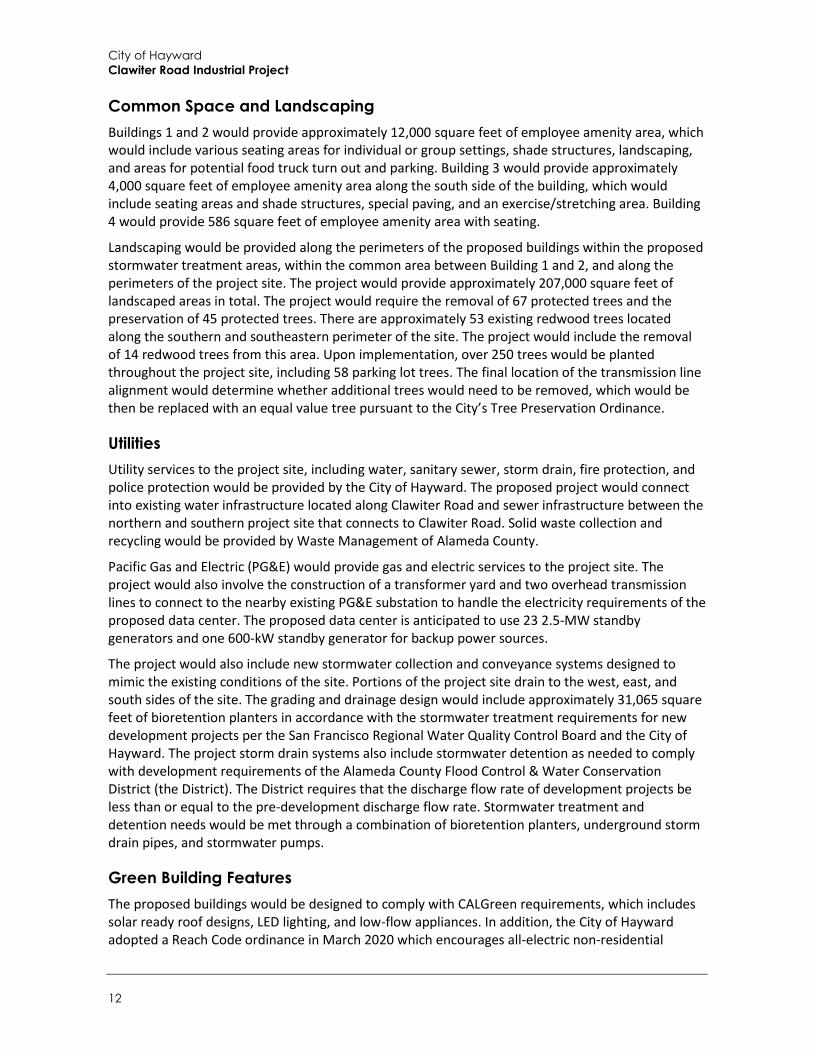
Common Space and Landscaping Buildings 1 and 2 would provide approximately 12,000 square feet of employee amenity area, which would include various seating areas for individual or group settings, shade structures, landscaping, and areas for potential food truck turn out and parking. Building 3 would provide approximately 4,000 square feet of employee amenity area along the south side of the building, which would include seating areas and shade structures, special paving, and an exercise/stretching area. Building 4 would provide 586 square feet of employee amenity area with seating.
Landscaping would be provided along the perimeters of the proposed buildings within the proposed stormwater treatment areas, within the common area between Building 1 and 2, and along the perimeters of the project site. The project would provide approximately 207,000 square feet of landscaped areas in total. The project would require the removal of 67 protected trees and the preservation of 45 protected trees. There are approximately 53 existing redwood trees located along the southern and southeastern perimeter of the site. The project would include the removal of 14 redwood trees from this area. Upon implementation, over 250 trees would be planted throughout the project site, including 58 parking lot trees. The final location of the transmission line alignment would determine whether additional trees would need to be removed, which would be then be replaced with an equal value tree pursuant to the City’s Tree Preservation Ordinance.
Utilities Utility services to the project site, including water, sanitary sewer, storm drain, fire protection, and police protection would be provided by the City of Hayward. The proposed project would connect into existing water infrastructure located along Clawiter Road and sewer infrastructure between the northern and southern project site that connects to Clawiter Road. Solid waste collection and recycling would be provided by Waste Management of Alameda County.
Pacific Gas and Electric (PG&E) would provide gas and electric services to the project site. The project would also involve the construction of a transformer yard and two overhead transmission lines to connect to the nearby existing PG&E substation to handle the electricity requirements of the proposed data center. The proposed data center is anticipated to use 23 2.5-MW standby generators and one 600-kW standby generator for backup power sources.
The project would also include new stormwater collection and conveyance systems designed to mimic the existing conditions of the site. Portions of the project site drain to the west, east, and south sides of the site. The grading and drainage design would include approximately 31,065 square feet of bioretention planters in accordance with the stormwater treatment requirements for new development projects per the San Francisco Regional Water Quality Control Board and the City of Hayward. The project storm drain systems also include stormwater detention as needed to comply with development requirements of the Alameda County Flood Control & Water Conservation District (the District). The District requires that the discharge flow rate of development projects be less than or equal to the pre-development discharge flow rate. Stormwater treatment and detention needs would be met through a combination of bioretention planters, underground storm drain pipes, and stormwater pumps.
Green Building Features The proposed buildings would be designed to comply with CALGreen requirements, which includes solar ready roof designs, LED lighting, and low-flow appliances. In addition, the City of Hayward adopted a Reach Code ordinance in March 2020 which encourages all-electric non-residential
Initial Study
Initial Study 13
buildings and has more advanced standards than California Building Code (CBC) requirements. The project would comply with the Reach Code checklist and requirements, including those related to the provision of Electric Vehicle Charging Stations (EVCS).
The buildings would be designed with white roofing to reduce heat absorption and cooling demand. In addition, two percent skylights on the buildings would reduce lighting demand during daytime hours.
Building 4 would use an evaporative cooling system which would eliminate the need for cooling towers and would allow the data center to accommodate a wider temperature range compared to typical data centers. Building 4 would also have a dual plumbing system to allow for future connection to the City’s purple pipe reclaimed water system.
The Building 4 tenant is committed to working with the local utility to procure a 100 percent renewable energy mix by 2025. In addition, the Building 4 tenant is committed to achieving net-zero carbon by 2040. The analysis in Section 4 below does not account for these commitments, as a conservative approach.
Off-site Improvements The transformer yard would require construction of two PG&E overhead 230kV transmission lines connecting to the PG&E Eastshore Substation 0.4 miles to the south, as shown in Figure 2. The transmission lines would be supported by approximately six to ten steel poles, ranging in height from 85 to 145 feet. The typical distance between structures would be 700 to 900 feet. The transmission line poles would require a foundation ranging 7 to 10 feet in diameter and 45 feet in depth. The transmission line length would be approximately 0.6 to 0.8 miles, along the alignment shown in Figure 3. The transmission lines would be included in a PG&E project submitted to the California Public Utilities Commission (CPUC).
Construction and Grading Construction of the structures and on-site facilities is expected to occur over approximately 15 months and would involve the following general phases:
1. The first phase of construction would involve demolition and removal of the existing improvements and structures on-site, which would take approximately three months.
2. The second phase would include initial site preparation to remove remnant concrete foundations and remaining miscellaneous debris and vegetation within the development area to prepare it for rough grading, which would take approximately one month.
3. The third phase would include grading of the site to prepare it for construction activities, which would involve up to approximately 29,000 cubic yards (CY) of soil exported from the site. This phase would take approximately two months.
4. The fourth phase would involve construction and painting of the industrial park structures and on-site amenities, which would take approximately eight months.
5. The fifth phase would involve paving and striping of the parking areas, as well as the installation of site landscaping, lighting, and signage, which would take approximately one month.
Construction of the on-site transformer yard and off-site transmission line improvements would start in 2022 and last approximately eight months.
City of Hayward Clawiter Road Industrial Project
14
For Buildings 1, 2, and 3, because the topography of the site is generally flat, and no underground structures are proposed, minimal subsurface excavation would be required. For Building 4, excavation for utilities would extend to depth of up to 15 feet below the proposed base elevation.
10. Required Approvals The following approvals and permits from the City of Hayward would be required for the proposed project:
Major Site Plan Review Conditional Use Permit Lot Line Adjustment Demolition Permit Grading Permit Building Permit Water and Wastewater Connection Approval
11. Other Public Agencies Whose Approval is Required California Public Utilities Commission: Transformer yard approval California Public Utilities Commission: Transmission line approval
12. Have California Native American Tribes Traditionally and Culturally Affiliated with the Project Area Requested Consultation Pursuant to Public Resources Code Section 21080.3.1?
On September 15, 2020, the City of Hayward sent the Ione Band of Miwok Indians an Assembly Bill (AB) 52 notification letter via certified mail. Under AB 52, Native American tribes have 30 days to respond and request further project information and request formal consultation. The City did not receive a request for formal consultation under AB 52. Copies of AB 52 correspondence for this project are included in Appendix I.
Environmental Factors Potentially Affected
Initial Study 15
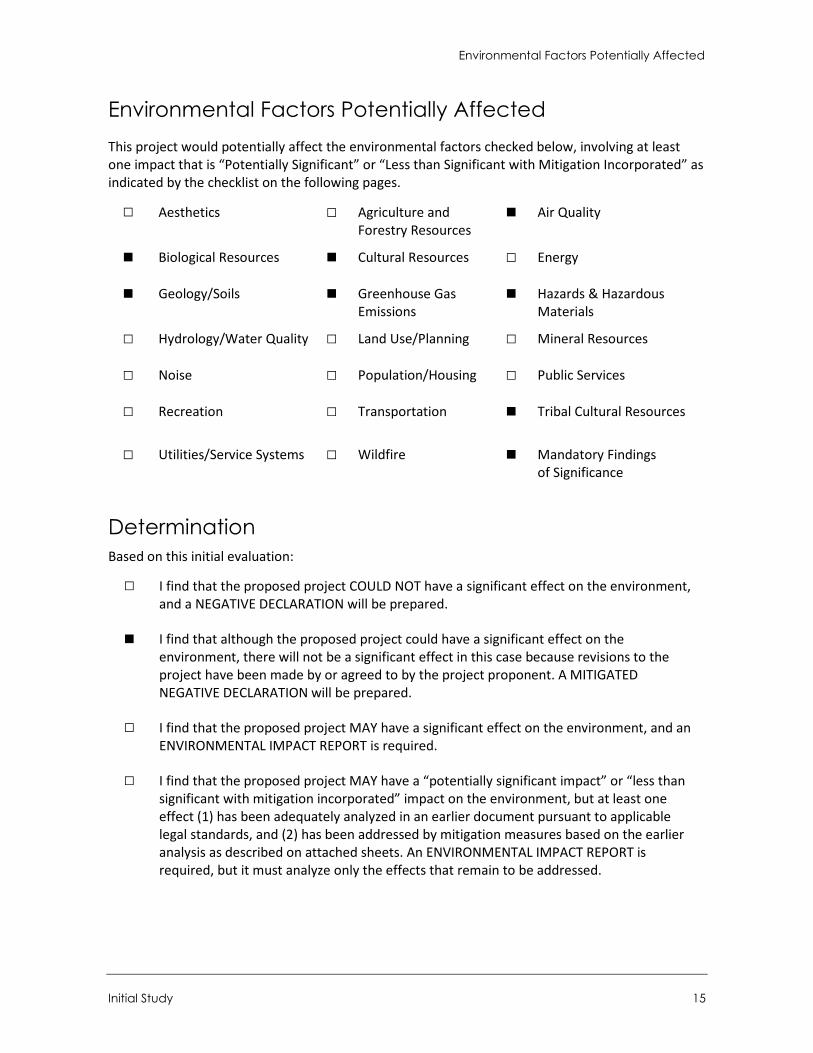
Environmental Factors Potentially Affected This project would potentially affect the environmental factors checked below, involving at least one impact that is “Potentially Significant” or “Less than Significant with Mitigation Incorporated” as indicated by the checklist on the following pages.
□ Aesthetics □ Agriculture and Forestry Resources
■ Air Quality
■ Biological Resources ■ Cultural Resources □ Energy
■ Geology/Soils ■ Greenhouse Gas Emissions
■ Hazards & Hazardous Materials
□ Hydrology/Water Quality □ Land Use/Planning □ Mineral Resources
□ Noise □ Population/Housing □ Public Services
□ Recreation □ Transportation ■ Tribal Cultural Resources
□ Utilities/Service Systems □ Wildfire ■ Mandatory Findings of Significance
Determination Based on this initial evaluation:
□ I find that the proposed project COULD NOT have a significant effect on the environment, and a NEGATIVE DECLARATION will be prepared.
■ I find that although the proposed project could have a significant effect on the environment, there will not be a significant effect in this case because revisions to the project have been made by or agreed to by the project proponent. A MITIGATED NEGATIVE DECLARATION will be prepared.
□ I find that the proposed project MAY have a significant effect on the environment, and an ENVIRONMENTAL IMPACT REPORT is required.
□ I find that the proposed project MAY have a “potentially significant impact” or “less than significant with mitigation incorporated” impact on the environment, but at least one effect (1) has been adequately analyzed in an earlier document pursuant to applicable legal standards, and (2) has been addressed by mitigation measures based on the earlier analysis as described on attached sheets. An ENVIRONMENTAL IMPACT REPORT is required, but it must analyze only the effects that remain to be addressed.
City of Hayward Clawiter Road Industrial Project
16
□ I find that although the proposed project could have a significant effect on theenvironment, because all potential significant effects (a) have been analyzed adequatelyin an earlier EIR or NEGATIVE DECLARATION pursuant to applicable standards, and (b)have been avoided or mitigated pursuant to that earlier EIR or NEGATIVE DECLARATION,including revisions or mitigation measures that are imposed upon the proposed project,nothing further is required.
Signature Date
Elizabeth Blanton Associate Planner
Printed Name Title
December 4, 2020
Environmental Checklist Aesthetics
Initial Study 17
Environmental Checklist 1 Aesthetics
Potentially Significant
Impact
Less than Significant
with Mitigation
Incorporated
Less than Significant
Impact No Impact
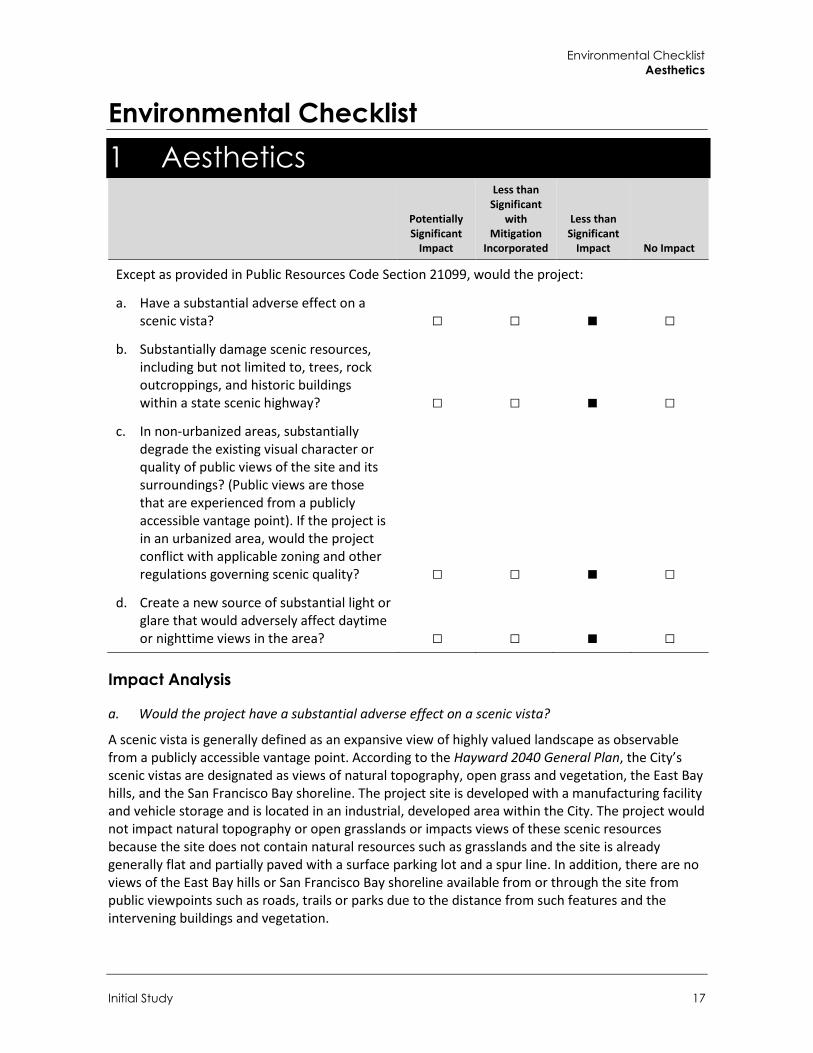
Except as provided in Public Resources Code Section 21099, would the project:
a. Have a substantial adverse effect on a scenic vista? □ □ ■ □
b. Substantially damage scenic resources, including but not limited to, trees, rock outcroppings, and historic buildings within a state scenic highway? □ □ ■ □
c. In non-urbanized areas, substantially degrade the existing visual character or quality of public views of the site and its surroundings? (Public views are those that are experienced from a publicly accessible vantage point). If the project is in an urbanized area, would the project conflict with applicable zoning and other regulations governing scenic quality? □ □ ■ □
d. Create a new source of substantial light or glare that would adversely affect daytime or nighttime views in the area? □ □ ■ □
Impact Analysis
a. Would the project have a substantial adverse effect on a scenic vista?
A scenic vista is generally defined as an expansive view of highly valued landscape as observable from a publicly accessible vantage point. According to the Hayward 2040 General Plan, the City’s scenic vistas are designated as views of natural topography, open grass and vegetation, the East Bay hills, and the San Francisco Bay shoreline. The project site is developed with a manufacturing facility and vehicle storage and is located in an industrial, developed area within the City. The project would not impact natural topography or open grasslands or impacts views of these scenic resources because the site does not contain natural resources such as grasslands and the site is already generally flat and partially paved with a surface parking lot and a spur line. In addition, there are no views of the East Bay hills or San Francisco Bay shoreline available from or through the site from public viewpoints such as roads, trails or parks due to the distance from such features and the intervening buildings and vegetation.
City of Hayward Clawiter Road Industrial Project
18
The proposed transmission line route would also not impact scenic vistas because the route travels through developed areas with no natural topography, open grassland, or views of the shoreline. The East Bay Hills can be seen from SR 92 but the hillsides are far in the distance and views are already partially obstructed by existing transmission lines. Therefore, impacts would be less than significant.
LESS THAN SIGNIFICANT IMPACT
b. Would the project substantially damage scenic resources, including but not limited to, trees, rock outcroppings, and historic buildings within a state scenic highway?
The closest designated state scenic highway is a portion of I-580 at the northern edge of the City, approximately 4.5 miles north of the project site (California Department of Transportation [Caltrans] 2019). The project site is not visible from I-580, and therefore the proposed project would not damage scenic resources from there.
In addition to I-580, SR 92 is designated as an Alameda County scenic highway in the Alameda County Scenic Route Element, and the project site is adjacent to and visible from SR 92. There are no rock outcroppings or historic buildings which would be impacted by the project. The project would remove 67 protected trees on-site, including 14 redwood trees along the southern project site adjacent to SR 92. However, the redwood trees that would be removed are in low health and the remaining on-site trees that would be removed would be replaced by approximately 250 on-site trees. The proposed transmission lines would also not impact scenic resources from SR 92 because the route is in a developed area with no scenic resources and there are existing transmission lines traveling across SR 92 to the nearby PG&E substation. Therefore, the project’s impacts on scenic resources would be less than significant.
LESS THAN SIGNIFICANT IMPACT
c. Would the project, in non-urbanized areas, substantially degrade the existing visual character or quality of public views of the site and its surroundings? (Public views are those that are experienced from a publicly accessible vantage point). If the project is in an urbanized area, would the project conflict with applicable zoning and other regulations governing scenic quality?
The project is in an urbanized area. Construction of the project would alter the visual character of the project site by increasing the building coverage over existing conditions with new structures and installing two overhead transmission lines. However, the surrounding area is developed with industrial structures and existing overhead transmission lines, which is similar to the proposed project. The project would improve the existing visual character of the site with an updated industrial development with structures that incorporate various building materials and colors in the building elevations, including areas of glass, IPE wood siding, concrete in various neutral colors, metal, and various glazing, as shown in Figure 5. In addition, the project would provide landscaping along the perimeters of the proposed buildings and the project site. Over 250 trees would be planted throughout the project site as part of the project, including 58 parking lot trees, which would also improve the character of the site compared to existing conditions.
As detailed under Table 1, Buildings 1 through 3 would range from 38 to 43 feet in height, which would not exceed the maximum allowable height of 75 feet in the IG and IP zones. Building 4 would be approximately 88 feet in height, which would exceed the 75 height limits. The project requires Major Site Plan Review, and pursuant to Section 10-1.1604 of the Hayward Municipal Code (HMC), building height may be increased through Major Site Plan Review approval upon findings that the
Environmental Checklist Aesthetics
Initial Study 19
increase is necessary to provide a more beneficial site layout or will result in public benefits/amenities that could not be achieved under current zoning standards. As shown in Figure 4, Building 4 would be located on the north-east side of the site and set back from Clawiter Road and SR 92. Building 4 would also include roof-top screening walls consistent with the design of the building to screen the mechanical equipment. This building design with the increased building height would include a greater setback from Clawiter Road as well as roof screening.
The proposed project would also include a transformer yard, which would require construction of two PG&E overhead 230kV transmission lines connecting to the PG&E Eastshore Substation. The transformer yard would be sited away from Clawiter Road and away from SR 92, behind three of the proposed buildings and near the existing railroad right of way and railroad spur. The overhead transmission line infrastructure would resemble the existing transmission lines in the area and those connected to other data centers in the vicinity.
Upon approval of the requested discretionary actions, development of the proposed project would comply with City zoning standards, including height regulations, yard and lot area, and front and side setbacks. Therefore, the proposed project would not conflict with applicable zoning and other regulations governing scenic quality. Impacts would be less than significant.
LESS THAN SIGNIFICANT IMPACT
d. Would the project create a new source of substantial light or glare that would adversely affect daytime or nighttime views in the area?
The project site is in an urbanized area with moderate to high levels of existing light typical of industrial areas and highways. The surrounding industrial, commercial, and roadway uses generate light and glare along all sides of the project site. Primary sources of light adjacent to the project site include interior and exterior lighting associated with the existing industrial and commercial buildings, vehicle headlights, and streetlights. The primary source of glare adjacent to the project site is the sun’s reflection from the on-site vehicle storage yard and metallic, glass and light-colored surfaces on buildings.
The project would introduce new sources of light and glare to the area by increasing the number and size of buildings on the site which would have windows, exterior lighting, parking lot lighting, and internal lighting. No highly-reflective glass or metallic elements are proposed as part of the proposed project. Building 1 and Building 2 would be located adjacent to SR 92, which travels east and west, and could impact drivers from sun reflection during the morning or afternoon. Building 2 would not impact drivers as it would be located lower in elevation than SR 92 due to the nearby overpass. Building 1’s southern and western elevation would have limited windows, which are consistent with the surrounding development, and would be partially blocked by existing redwoods and proposed landscaping along the southern project site.
The project would also introduce light and glare from headlights from vehicles entering and exiting the project. However, the project would replace an existing source of glare in the area from the existing on-site vehicle storage lot. The project would be required to comply with Section 10-1.1606 of the HMC, which requires light from the project to be confined to the property and not create light or glare upon adjacent properties or public rights-of-way. The sources of light and glare from the project would be generally similar to existing sources of light and glare on and surrounding the site and would be consistent with other uses in the area. Therefore, the project would not create a new source of substantial light or glare and impacts would be less than significant.
LESS THAN SIGNIFICANT IMPACT

City of Hayward Clawiter Road Industrial Project
20
This page intentionally left blank.
Environmental Checklist Agriculture and Forestry Resources
Initial Study 21
2 Agriculture and Forestry Resources
Potentially Significant
Impact
Less than Significant
with Mitigation
Incorporated
Less than Significant
Impact No Impact
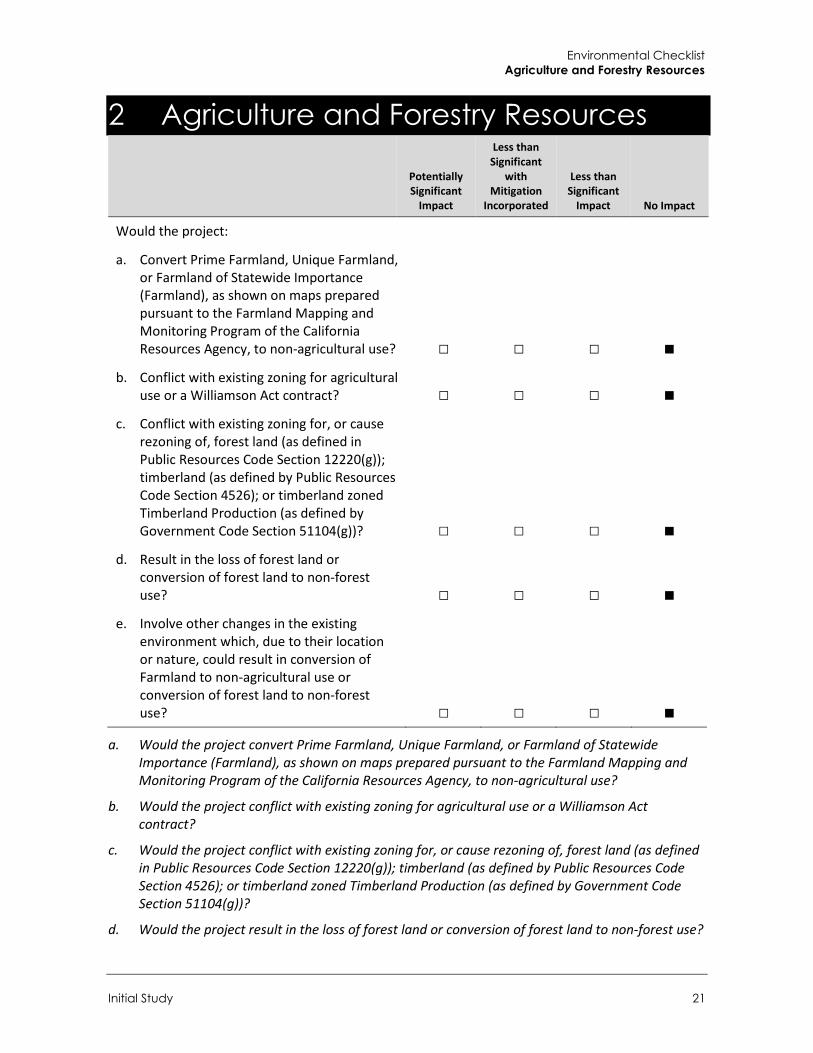
Would the project:
a. Convert Prime Farmland, Unique Farmland, or Farmland of Statewide Importance (Farmland), as shown on maps prepared pursuant to the Farmland Mapping and Monitoring Program of the California Resources Agency, to non-agricultural use? □ □ □ ■
b. Conflict with existing zoning for agricultural use or a Williamson Act contract? □ □ □ ■
c. Conflict with existing zoning for, or cause rezoning of, forest land (as defined in Public Resources Code Section 12220(g)); timberland (as defined by Public Resources Code Section 4526); or timberland zoned Timberland Production (as defined by Government Code Section 51104(g))? □ □ □ ■
d. Result in the loss of forest land or conversion of forest land to non-forest use? □ □ □ ■
e. Involve other changes in the existing environment which, due to their location or nature, could result in conversion of Farmland to non-agricultural use or conversion of forest land to non-forest use? □ □ □ ■
a. Would the project convert Prime Farmland, Unique Farmland, or Farmland of Statewide Importance (Farmland), as shown on maps prepared pursuant to the Farmland Mapping and Monitoring Program of the California Resources Agency, to non-agricultural use?
b. Would the project conflict with existing zoning for agricultural use or a Williamson Act contract?
c. Would the project conflict with existing zoning for, or cause rezoning of, forest land (as defined in Public Resources Code Section 12220(g)); timberland (as defined by Public Resources Code Section 4526); or timberland zoned Timberland Production (as defined by Government Code Section 51104(g))?
d. Would the project result in the loss of forest land or conversion of forest land to non-forest use?
City of Hayward Clawiter Road Industrial Project
22
e. Would the project involve other changes in the existing environment which, due to their location or nature, could result in conversion of Farmland to non-agricultural use or conversion of forest land to non-forest use?
The project site is located in an urbanized area of Hayward and is designated for Industrial Corridor land use in the City’s General Plan. Neither the project site nor adjacent properties are identified as any of the farmland types under the Farmland Mapping and Monitoring Program or enrolled in Williamson Act contracts, nor do they support forest land or resources (California Department of Conservation [DOC] 2016). The project site is not located on or adjacent to agricultural land or forest land and the project would not involve development that could result in the conversion of farmland to non-agricultural uses. For these reasons, the proposed project would have no impact with respect to conversion of Prime Farmland, Unique Farmland, or Farmland of Statewide Importance to non-agricultural use; conflict with existing agricultural zoning or Williamson Act contract; result in the loss of forest land or conversion of forest land to non-forest use; or other conversion of farmland to non-agricultural use.
NO IMPACT
Environmental Checklist Air Quality
Initial Study 23
3 Air Quality
Potentially Significant
Impact
Less than Significant
with Mitigation
Incorporated
Less than Significant
Impact No Impact
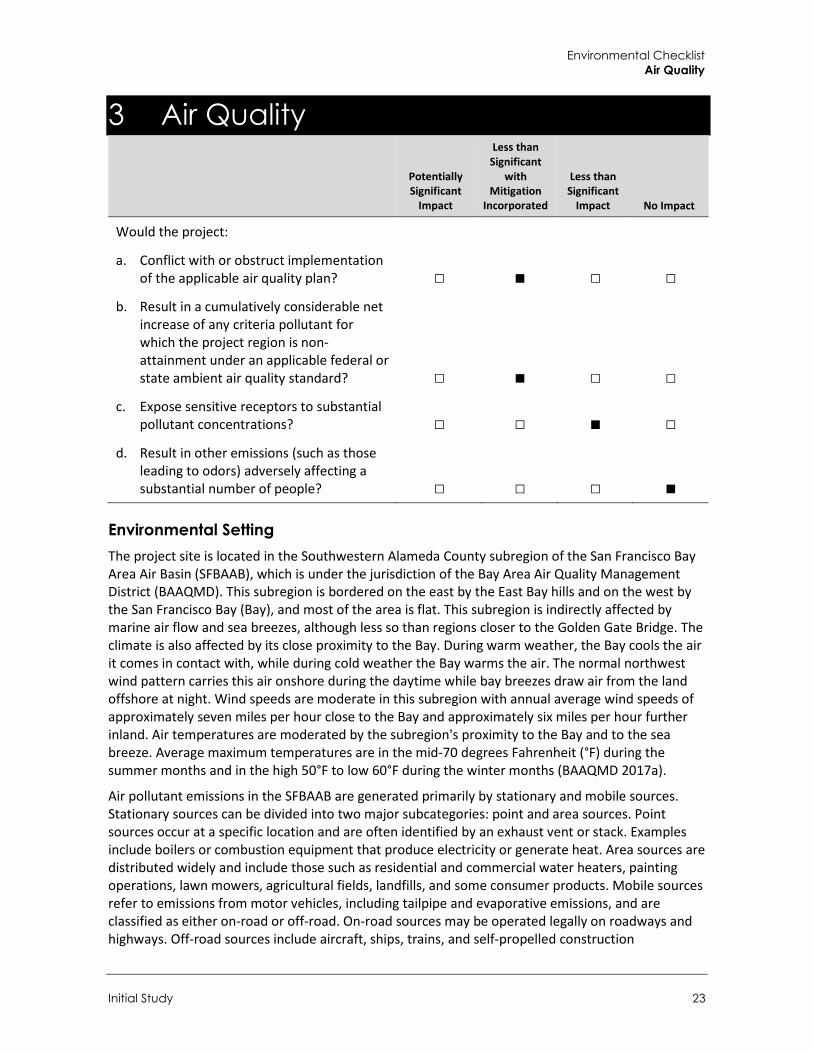
Would the project:
a. Conflict with or obstruct implementation of the applicable air quality plan? □ ■ □ □
b. Result in a cumulatively considerable net increase of any criteria pollutant for which the project region is non-attainment under an applicable federal or state ambient air quality standard? □ ■ □ □
c. Expose sensitive receptors to substantial pollutant concentrations? □ □ ■ □
d. Result in other emissions (such as those leading to odors) adversely affecting a substantial number of people? □ □ □ ■
Environmental Setting The project site is located in the Southwestern Alameda County subregion of the San Francisco Bay Area Air Basin (SFBAAB), which is under the jurisdiction of the Bay Area Air Quality Management District (BAAQMD). This subregion is bordered on the east by the East Bay hills and on the west by the San Francisco Bay (Bay), and most of the area is flat. This subregion is indirectly affected by marine air flow and sea breezes, although less so than regions closer to the Golden Gate Bridge. The climate is also affected by its close proximity to the Bay. During warm weather, the Bay cools the air it comes in contact with, while during cold weather the Bay warms the air. The normal northwest wind pattern carries this air onshore during the daytime while bay breezes draw air from the land offshore at night. Wind speeds are moderate in this subregion with annual average wind speeds of approximately seven miles per hour close to the Bay and approximately six miles per hour further inland. Air temperatures are moderated by the subregion's proximity to the Bay and to the sea breeze. Average maximum temperatures are in the mid-70 degrees Fahrenheit (°F) during the summer months and in the high 50°F to low 60°F during the winter months (BAAQMD 2017a).
Air pollutant emissions in the SFBAAB are generated primarily by stationary and mobile sources. Stationary sources can be divided into two major subcategories: point and area sources. Point sources occur at a specific location and are often identified by an exhaust vent or stack. Examples include boilers or combustion equipment that produce electricity or generate heat. Area sources are distributed widely and include those such as residential and commercial water heaters, painting operations, lawn mowers, agricultural fields, landfills, and some consumer products. Mobile sources refer to emissions from motor vehicles, including tailpipe and evaporative emissions, and are classified as either on-road or off-road. On-road sources may be operated legally on roadways and highways. Off-road sources include aircraft, ships, trains, and self-propelled construction
City of Hayward Clawiter Road Industrial Project
24
equipment. Air pollutants can also be generated by the natural environment such as when high winds suspend fine dust particles (BAAQMD 2017a).
Air pollution sources in this subregion include light and heavy industry, and motor vehicles, and pollution potential is relatively high during the summer and fall. When the Pacific high pressure system dominates, low mixing depths and Bay and ocean wind patterns can concentrate and carry pollutants from other cities to this area, adding to the locally-emitted pollutant mix. The polluted air is then pushed up against the East Bay hills. In the wintertime, the air pollution potential in southwestern Alameda County is moderate. Increasing motor vehicle traffic and congestion in the subregion may increase Southwest Alameda County pollution as well as that of its neighboring subregions (BAAQMD 2017a).
Regulatory Setting The U.S. Environmental Protection Agency (U.S. EPA) has set primary national ambient air quality standards (NAAQS) for ozone (O3), carbon monoxide (CO), nitrogen dioxide (NO2), sulfur dioxide (SO2), particulate matter with diameters of up to ten microns (PM10) and up to 2.5 microns (PM2.5), and lead (Pb). Primary standards are those levels of air quality deemed necessary, with an adequate margin of safety, to protect public health. In addition, California has established health-based ambient air quality standards (known as the California ambient air quality standards [CAAQS]) for these and other pollutants, some of which are more stringent than the federal standards.
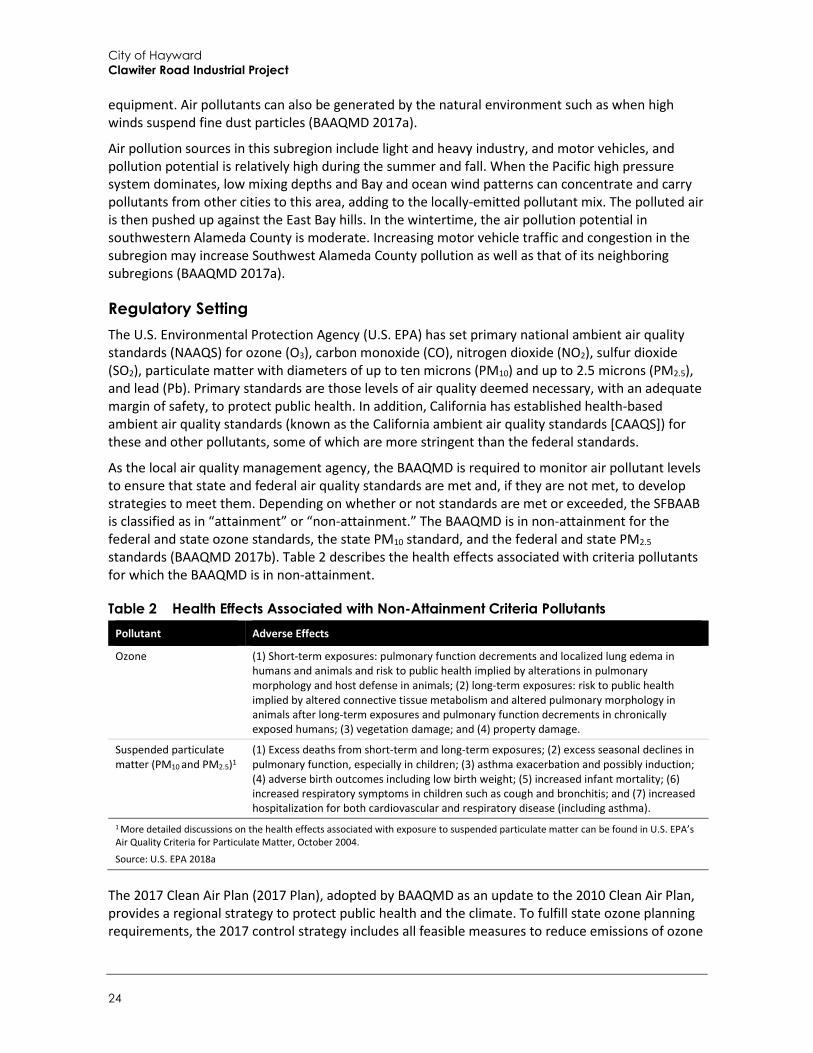
As the local air quality management agency, the BAAQMD is required to monitor air pollutant levels to ensure that state and federal air quality standards are met and, if they are not met, to develop strategies to meet them. Depending on whether or not standards are met or exceeded, the SFBAAB is classified as in “attainment” or “non-attainment.” The BAAQMD is in non-attainment for the federal and state ozone standards, the state PM10 standard, and the federal and state PM2.5 standards (BAAQMD 2017b). Table 2 describes the health effects associated with criteria pollutants for which the BAAQMD is in non-attainment.
Table 2 Health Effects Associated with Non-Attainment Criteria Pollutants Pollutant Adverse Effects
Ozone (1) Short-term exposures: pulmonary function decrements and localized lung edema in humans and animals and risk to public health implied by alterations in pulmonary morphology and host defense in animals; (2) long-term exposures: risk to public health implied by altered connective tissue metabolism and altered pulmonary morphology in animals after long-term exposures and pulmonary function decrements in chronically exposed humans; (3) vegetation damage; and (4) property damage.
Suspended particulate matter (PM10 and PM2.5)1
(1) Excess deaths from short-term and long-term exposures; (2) excess seasonal declines in pulmonary function, especially in children; (3) asthma exacerbation and possibly induction; (4) adverse birth outcomes including low birth weight; (5) increased infant mortality; (6) increased respiratory symptoms in children such as cough and bronchitis; and (7) increased hospitalization for both cardiovascular and respiratory disease (including asthma).
1 More detailed discussions on the health effects associated with exposure to suspended particulate matter can be found in U.S. EPA’s Air Quality Criteria for Particulate Matter, October 2004.
Source: U.S. EPA 2018a
The 2017 Clean Air Plan (2017 Plan), adopted by BAAQMD as an update to the 2010 Clean Air Plan, provides a regional strategy to protect public health and the climate. To fulfill state ozone planning requirements, the 2017 control strategy includes all feasible measures to reduce emissions of ozone
Environmental Checklist Air Quality
Initial Study 25
precursors (reactive organic gases [ROG] and nitrogen oxides [NOX]) and reduce transport of ozone and its precursors to neighboring air basins. In addition, the 2017 Plan builds upon and enhances the BAAQMD’s efforts to reduce emissions of fine particulate matter and toxic air contaminants (TACs; BAAQMD 2017c).
In 2006, the U.S. EPA reduced the national 24-hour PM2.5 standard regarding short-term exposure to fine particulate matter from 65 micrograms per cubic meter (µg/m3) to 35 µg/m3. Based on air quality monitoring data for the 2006-2008 cycle showing that the region was slightly above the standard, the U.S. EPA designated the SFBAAB as non-attainment for the 24-hour national standard in December 2008. This triggered the requirement for the BAAQMD to prepare a State Implementation Plan (SIP) submittal to demonstrate how the region would attain the standard. However, data for both the 2008-2010 and the 2009-2011 cycles showed that PM2.5 levels in the Basin currently meet the standard. On October 29, 2012, the U.S. EPA issued a proposed rule-making to determine that the SFBAAB now attains the 24-hour PM2.5 national standard. Based on this, the SFBAAB is required to prepare an abbreviated SIP submittal, which includes an emission inventory for primary (directly-emitted) PM2.5, as well as precursor pollutants that contribute to formation of secondary PM in the atmosphere; and amendments to BAAQMD New Source Review (NSR) to address PM2.5 (adopted December 2012). However, key SIP requirements to demonstrate how the region will achieve the standard (i.e., the requirement to develop a plan to attain the standard) will be suspended as long as monitoring data continues to show that the SFBAAB attains the standard. In addition to preparing the “abbreviated” SIP submittal, the BAAQMD has prepared a report entitled Understanding Particulate Matter: Protecting Public Health in the San Francisco Bay Area (BAAQMD 2012). The report helps guide the BAAQMD’s on-going efforts to analyze and reduce PM in the Bay Area in order to better protect public health.1 The SFBAAB will continue to be designated as nonattainment for the federal 24-hour PM2.5 standard until such time as the BAAQMD elects to submit a “redesignation request” and a “maintenance plan” to the U.S. EPA, and the U.S. EPA approves the proposed redesignation.
A number of communities within the Bay Area experience relatively high exposure to TACs as compared to other communities. For this reason, the BAAQMD established the Community Air Risk Evaluation (CARE) program in 2004 to identify impacted communities. The project site is located in the Western Alameda County impacted community of the BAAQMD’s Community Health Protection Program. The BAAQMD prioritizes these impacted communities in the design and implementation of air pollution mitigation strategies via the Clean Air Communities initiative (BAAQMD 2014).
Sensitive Receptors Ambient air quality standards have been established to represent the levels of air quality considered sufficient, with a margin of safety, to protect public health and welfare. They are designed to protect that segment of the public most susceptible to respiratory distress, such as children under 14; the elderly over 65; persons engaged in strenuous work or exercise; and people with cardiovascular and chronic respiratory diseases. The BAAQMD defines sensitive receptors as facilities or land uses that include members of the population that are particularly sensitive to the effects of air pollutants, such as children, the elderly, and the chronically ill (BAAQMD 2017). These facilities include residences, schools, and hospitals. The nearest sensitive receptors to the project site are residences located approximately 0.2 mile to the east and a school, the California Crosspoint
1 PM is made up of particles that are emitted directly, such as soot and fugitive dust, as well as secondary particles that are formed in the atmosphere from chemical reactions involving precursor pollutants such as oxides of nitrogen, sulfur oxides, volatile organic compounds, and ammonia.
City of Hayward Clawiter Road Industrial Project
26
Academy, located approximately 0.2 mile to the north. The City of Hayward has not yet adopted environmental justice policies or associated thresholds as part of their General Plan; however, the project site is located in an area defined as a disadvantaged community per Senate Bill (SB) 1000 and California Health and Safety Code Section 39711 (California Office of Environmental Health Hazard Assessment 2018).
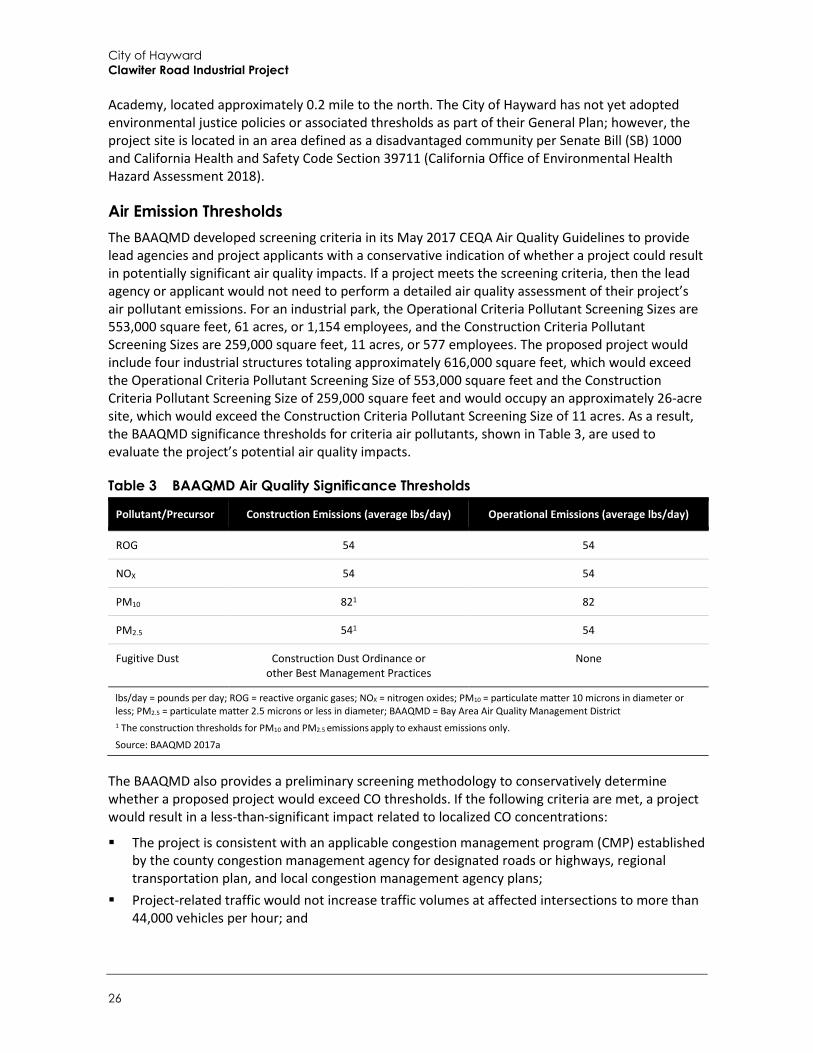
Air Emission Thresholds The BAAQMD developed screening criteria in its May 2017 CEQA Air Quality Guidelines to provide lead agencies and project applicants with a conservative indication of whether a project could result in potentially significant air quality impacts. If a project meets the screening criteria, then the lead agency or applicant would not need to perform a detailed air quality assessment of their project’s air pollutant emissions. For an industrial park, the Operational Criteria Pollutant Screening Sizes are 553,000 square feet, 61 acres, or 1,154 employees, and the Construction Criteria Pollutant Screening Sizes are 259,000 square feet, 11 acres, or 577 employees. The proposed project would include four industrial structures totaling approximately 616,000 square feet, which would exceed the Operational Criteria Pollutant Screening Size of 553,000 square feet and the Construction Criteria Pollutant Screening Size of 259,000 square feet and would occupy an approximately 26-acre site, which would exceed the Construction Criteria Pollutant Screening Size of 11 acres. As a result, the BAAQMD significance thresholds for criteria air pollutants, shown in Table 3, are used to evaluate the project’s potential air quality impacts.
Table 3 BAAQMD Air Quality Significance Thresholds
Pollutant/Precursor Construction Emissions (average lbs/day) Operational Emissions (average lbs/day)
ROG 54 54
NOX 54 54
PM10 821 82
PM2.5 541 54
Fugitive Dust Construction Dust Ordinance or other Best Management Practices
None
lbs/day = pounds per day; ROG = reactive organic gases; NOX = nitrogen oxides; PM10 = particulate matter 10 microns in diameter or less; PM2.5 = particulate matter 2.5 microns or less in diameter; BAAQMD = Bay Area Air Quality Management District 1 The construction thresholds for PM10 and PM2.5 emissions apply to exhaust emissions only.
Source: BAAQMD 2017a
The BAAQMD also provides a preliminary screening methodology to conservatively determine whether a proposed project would exceed CO thresholds. If the following criteria are met, a project would result in a less-than-significant impact related to localized CO concentrations:
The project is consistent with an applicable congestion management program (CMP) established by the county congestion management agency for designated roads or highways, regional transportation plan, and local congestion management agency plans;
Project-related traffic would not increase traffic volumes at affected intersections to more than 44,000 vehicles per hour; and
Environmental Checklist Air Quality
Initial Study 27
Project-related traffic would not increase traffic volumes at affected intersections to more than 24,000 vehicles per hour where vertical and/or horizontal mixing is substantially limited (e.g., tunnel, parking garage, bridge underpass, natural or urban street canyon, below-grade roadway).
For health risks associated with TAC and PM2.5 emissions, the BAAQMD May 2017 CEQA Air Quality Guidelines state a project would result in a significant impact if the any of the following thresholds are exceeded (BAAQMD 2017a):
Non-compliance with Qualified Community Risk Reduction Plan; Increased cancer risk of > 10.0 in a million; Increased non-cancer risk of > 1.0 Hazard Index (Chronic or Acute); or Ambient PM2.5 increase of > 0.3 µg/m3 annual average
In addition, a project would have a cumulatively considerably impact associated with health risks from TAC and PM2.5 emissions if the aggregate total emissions of all past, present, and foreseeable future sources within a 1,000 foot radius of the fenceline of the source plus the project’s contribution exceed any of the following thresholds (BAAQMD 2017a):
Non-compliance with Qualified Community Risk Reduction Plan; Increased cancer risk of > 100.0 in a million; Increased non-cancer risk of > 10.0 Hazard Index (Chronic or Acute); or Ambient PM2.5 increase of > 0.8 µg/m3 annual average
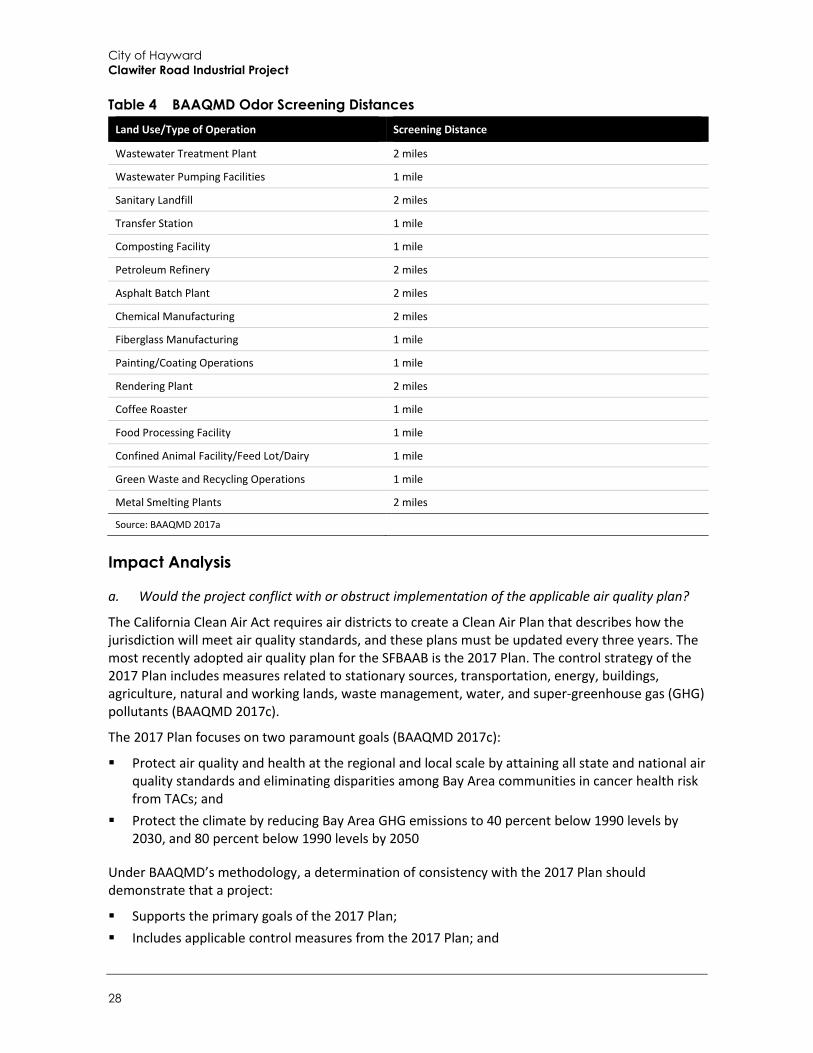
The BAAQMD provides recommended odor screening distances for the siting of new odor sources, which are shown in Table 4. A significant impact would potentially occur if the project would site a new odor source within the specified distances of existing sensitive receptors.
City of Hayward Clawiter Road Industrial Project
28
Table 4 BAAQMD Odor Screening Distances Land Use/Type of Operation Screening Distance
Wastewater Treatment Plant 2 miles
Wastewater Pumping Facilities 1 mile
Sanitary Landfill 2 miles
Transfer Station 1 mile
Composting Facility 1 mile
Petroleum Refinery 2 miles
Asphalt Batch Plant 2 miles
Chemical Manufacturing 2 miles
Fiberglass Manufacturing 1 mile
Painting/Coating Operations 1 mile
Rendering Plant 2 miles
Coffee Roaster 1 mile
Food Processing Facility 1 mile
Confined Animal Facility/Feed Lot/Dairy 1 mile
Green Waste and Recycling Operations 1 mile
Metal Smelting Plants 2 miles
Source: BAAQMD 2017a
Impact Analysis
a. Would the project conflict with or obstruct implementation of the applicable air quality plan?
The California Clean Air Act requires air districts to create a Clean Air Plan that describes how the jurisdiction will meet air quality standards, and these plans must be updated every three years. The most recently adopted air quality plan for the SFBAAB is the 2017 Plan. The control strategy of the 2017 Plan includes measures related to stationary sources, transportation, energy, buildings, agriculture, natural and working lands, waste management, water, and super-greenhouse gas (GHG) pollutants (BAAQMD 2017c).
The 2017 Plan focuses on two paramount goals (BAAQMD 2017c):
Protect air quality and health at the regional and local scale by attaining all state and national air quality standards and eliminating disparities among Bay Area communities in cancer health risk from TACs; and
Protect the climate by reducing Bay Area GHG emissions to 40 percent below 1990 levels by 2030, and 80 percent below 1990 levels by 2050
Under BAAQMD’s methodology, a determination of consistency with the 2017 Plan should demonstrate that a project:
Supports the primary goals of the 2017 Plan; Includes applicable control measures from the 2017 Plan; and
Environmental Checklist Air Quality
Initial Study 29
Would not disrupt or hinder implementation of any control measures in the 2017 Plan.
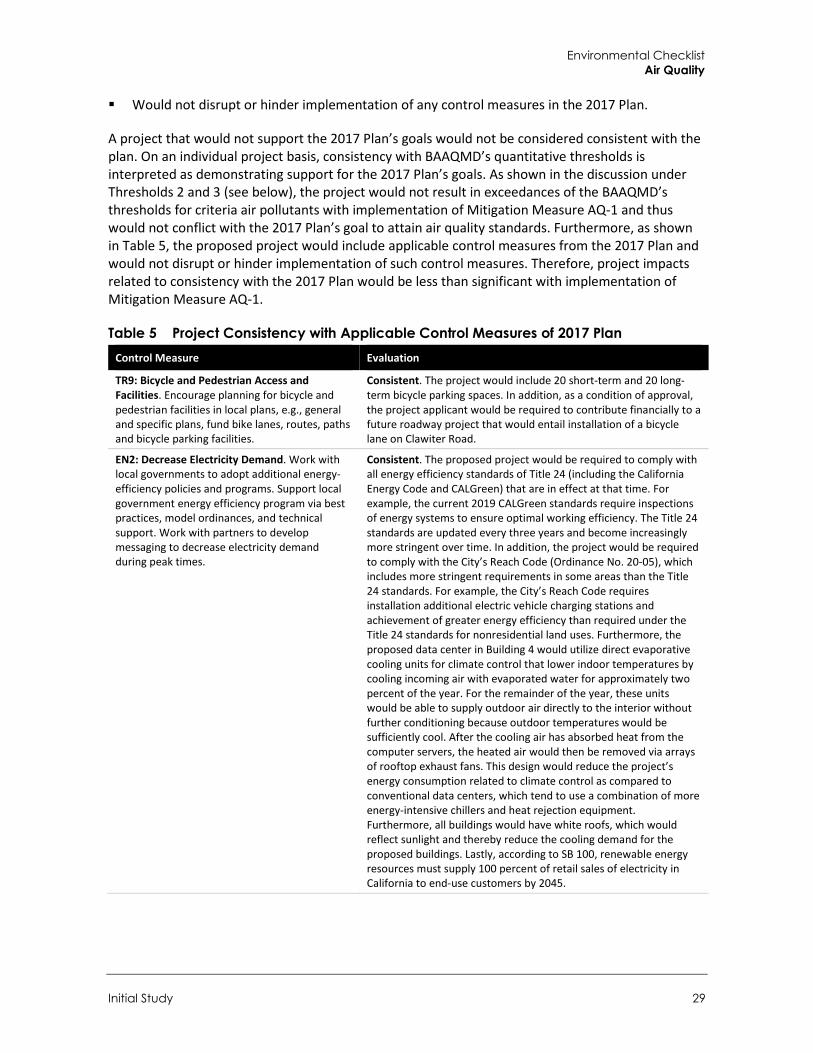
A project that would not support the 2017 Plan’s goals would not be considered consistent with the plan. On an individual project basis, consistency with BAAQMD’s quantitative thresholds is interpreted as demonstrating support for the 2017 Plan’s goals. As shown in the discussion under Thresholds 2 and 3 (see below), the project would not result in exceedances of the BAAQMD’s thresholds for criteria air pollutants with implementation of Mitigation Measure AQ-1 and thus would not conflict with the 2017 Plan’s goal to attain air quality standards. Furthermore, as shown in Table 5, the proposed project would include applicable control measures from the 2017 Plan and would not disrupt or hinder implementation of such control measures. Therefore, project impacts related to consistency with the 2017 Plan would be less than significant with implementation of Mitigation Measure AQ-1.
Table 5 Project Consistency with Applicable Control Measures of 2017 Plan Control Measure Evaluation
TR9: Bicycle and Pedestrian Access and Facilities. Encourage planning for bicycle and pedestrian facilities in local plans, e.g., general and specific plans, fund bike lanes, routes, paths and bicycle parking facilities.
Consistent. The project would include 20 short-term and 20 long-term bicycle parking spaces. In addition, as a condition of approval, the project applicant would be required to contribute financially to a future roadway project that would entail installation of a bicycle lane on Clawiter Road.
EN2: Decrease Electricity Demand. Work with local governments to adopt additional energy-efficiency policies and programs. Support local government energy efficiency program via best practices, model ordinances, and technical support. Work with partners to develop messaging to decrease electricity demand during peak times.
Consistent. The proposed project would be required to comply with all energy efficiency standards of Title 24 (including the California Energy Code and CALGreen) that are in effect at that time. For example, the current 2019 CALGreen standards require inspections of energy systems to ensure optimal working efficiency. The Title 24 standards are updated every three years and become increasingly more stringent over time. In addition, the project would be required to comply with the City’s Reach Code (Ordinance No. 20-05), which includes more stringent requirements in some areas than the Title 24 standards. For example, the City’s Reach Code requires installation additional electric vehicle charging stations and achievement of greater energy efficiency than required under the Title 24 standards for nonresidential land uses. Furthermore, the proposed data center in Building 4 would utilize direct evaporative cooling units for climate control that lower indoor temperatures by cooling incoming air with evaporated water for approximately two percent of the year. For the remainder of the year, these units would be able to supply outdoor air directly to the interior without further conditioning because outdoor temperatures would be sufficiently cool. After the cooling air has absorbed heat from the computer servers, the heated air would then be removed via arrays of rooftop exhaust fans. This design would reduce the project’s energy consumption related to climate control as compared to conventional data centers, which tend to use a combination of more energy-intensive chillers and heat rejection equipment. Furthermore, all buildings would have white roofs, which would reflect sunlight and thereby reduce the cooling demand for the proposed buildings. Lastly, according to SB 100, renewable energy resources must supply 100 percent of retail sales of electricity in California to end-use customers by 2045.
City of Hayward Clawiter Road Industrial Project
30
Control Measure Evaluation
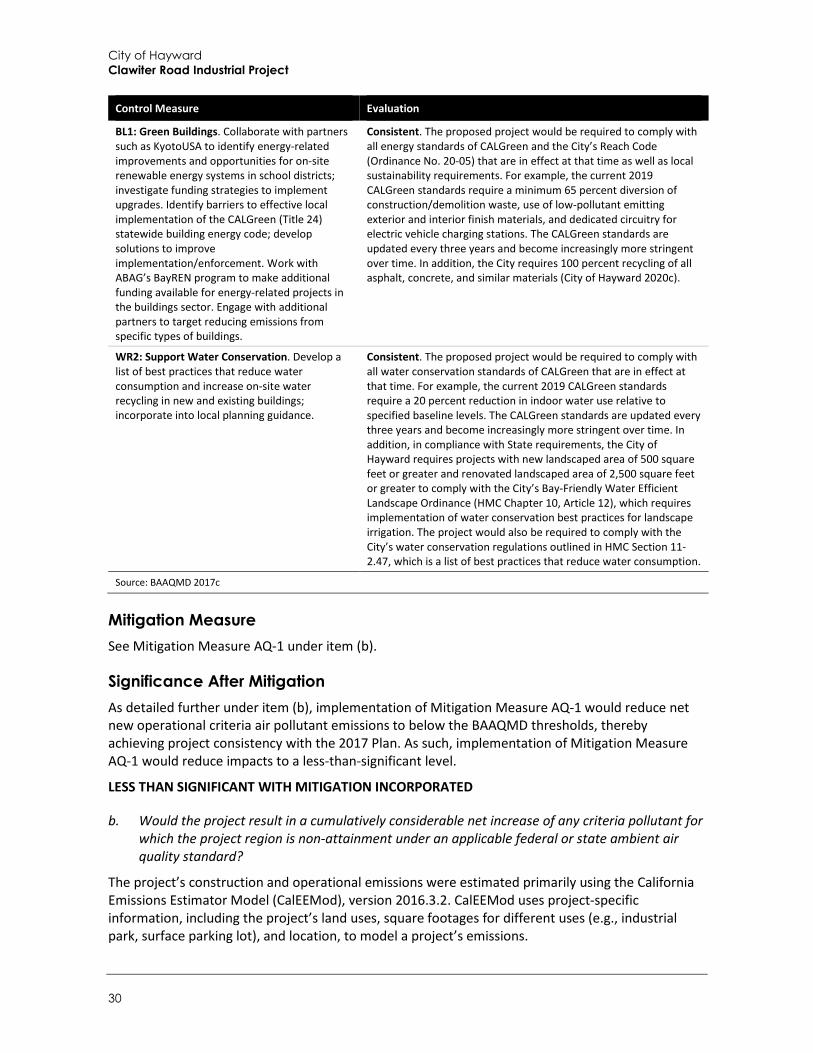
BL1: Green Buildings. Collaborate with partners such as KyotoUSA to identify energy-related improvements and opportunities for on-site renewable energy systems in school districts; investigate funding strategies to implement upgrades. Identify barriers to effective local implementation of the CALGreen (Title 24) statewide building energy code; develop solutions to improve implementation/enforcement. Work with ABAG’s BayREN program to make additional funding available for energy-related projects in the buildings sector. Engage with additional partners to target reducing emissions from specific types of buildings.
Consistent. The proposed project would be required to comply with all energy standards of CALGreen and the City’s Reach Code (Ordinance No. 20-05) that are in effect at that time as well as local sustainability requirements. For example, the current 2019 CALGreen standards require a minimum 65 percent diversion of construction/demolition waste, use of low-pollutant emitting exterior and interior finish materials, and dedicated circuitry for electric vehicle charging stations. The CALGreen standards are updated every three years and become increasingly more stringent over time. In addition, the City requires 100 percent recycling of all asphalt, concrete, and similar materials (City of Hayward 2020c).
WR2: Support Water Conservation. Develop a list of best practices that reduce water consumption and increase on-site water recycling in new and existing buildings; incorporate into local planning guidance.
Consistent. The proposed project would be required to comply with all water conservation standards of CALGreen that are in effect at that time. For example, the current 2019 CALGreen standards require a 20 percent reduction in indoor water use relative to specified baseline levels. The CALGreen standards are updated every three years and become increasingly more stringent over time. In addition, in compliance with State requirements, the City of Hayward requires projects with new landscaped area of 500 square feet or greater and renovated landscaped area of 2,500 square feet or greater to comply with the City’s Bay-Friendly Water Efficient Landscape Ordinance (HMC Chapter 10, Article 12), which requires implementation of water conservation best practices for landscape irrigation. The project would also be required to comply with the City’s water conservation regulations outlined in HMC Section 11-2.47, which is a list of best practices that reduce water consumption.
Source: BAAQMD 2017c
Mitigation Measure See Mitigation Measure AQ-1 under item (b).
Significance After Mitigation As detailed further under item (b), implementation of Mitigation Measure AQ-1 would reduce net new operational criteria air pollutant emissions to below the BAAQMD thresholds, thereby achieving project consistency with the 2017 Plan. As such, implementation of Mitigation Measure AQ-1 would reduce impacts to a less-than-significant level.
LESS THAN SIGNIFICANT WITH MITIGATION INCORPORATED
b. Would the project result in a cumulatively considerable net increase of any criteria pollutant for which the project region is non-attainment under an applicable federal or state ambient air quality standard?
The project’s construction and operational emissions were estimated primarily using the California Emissions Estimator Model (CalEEMod), version 2016.3.2. CalEEMod uses project-specific information, including the project’s land uses, square footages for different uses (e.g., industrial park, surface parking lot), and location, to model a project’s emissions.
Environmental Checklist Air Quality
Initial Study 31
Construction emissions modeled include emissions generated by construction equipment used on-site and emissions generated by vehicle trips off-site associated with construction, such as worker and vendor trips. CalEEMod estimates construction emissions by multiplying the amount of time equipment is in operation by emission factors. Construction of the proposed project was analyzed based on the applicant-provided construction schedule, equipment list, and soil export volume. It is assumed that all construction equipment used would be diesel-powered. This analysis assumes that the project would comply with all applicable regulatory standards. In particular, the project would be required to comply with BAAQMD Regulation 8, Rule 3 (Architectural Coatings) and HMC Section 10-8.32(g) (Grading and Clearing – Performance Standards - Dust Control).
Operational emissions modeled include mobile source emissions (i.e., vehicle emissions), energy emissions, area source emissions, and stationary source emissions. Mobile source emissions are generated by vehicle trips to and from the project site and were estimated using the trip generation rates provided by Kittelson & Associates in the Traffic Study (Appendix H). Emissions attributed to energy use include natural gas consumption for space and water heating. Area source emissions are generated by landscape maintenance equipment, consumer products and architectural coatings. Stationary source emissions include emissions from testing of the anticipated 24 backup generators. Estimated emissions were calculated outside of CalEEMod using emission factors for representative Tier II generators (CAT 3516C [2.5 MW] and C18 [600 kW] generators), conservatively assuming maximum permitted operations of 50 hours per year for each generator or an average of 3.3 total operational hours per day (see Appendix A for representative generator specifications). Operational emissions from existing uses were also modeled in CalEEMod using the trip generation rates provided by Kittelson & Associates in the Traffic Impact Analysis and were subtracted from the project’s emissions to calculate net new operational emissions.
Construction Emissions
Criteria Air Pollutants
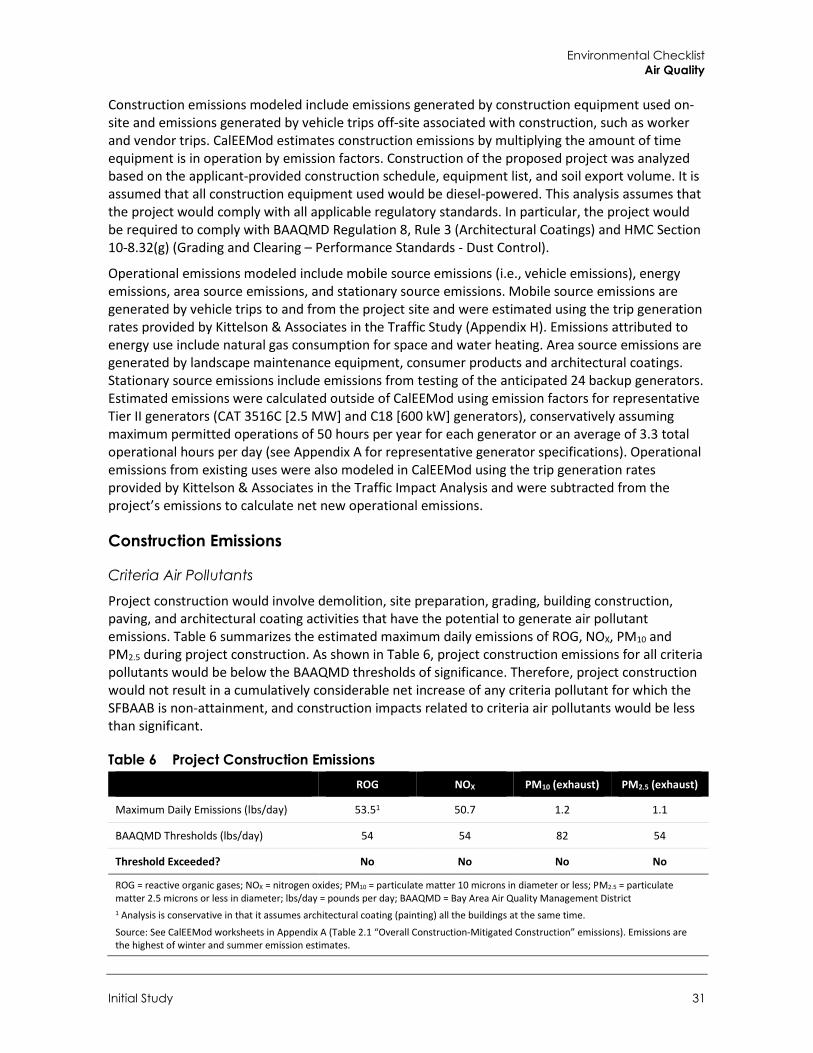
Project construction would involve demolition, site preparation, grading, building construction, paving, and architectural coating activities that have the potential to generate air pollutant emissions. Table 6 summarizes the estimated maximum daily emissions of ROG, NOX, PM10 and PM2.5 during project construction. As shown in Table 6, project construction emissions for all criteria pollutants would be below the BAAQMD thresholds of significance. Therefore, project construction would not result in a cumulatively considerable net increase of any criteria pollutant for which the SFBAAB is non-attainment, and construction impacts related to criteria air pollutants would be less than significant.
Table 6 Project Construction Emissions ROG NOX PM10 (exhaust) PM2.5 (exhaust)
Maximum Daily Emissions (lbs/day) 53.51 50.7 1.2 1.1
BAAQMD Thresholds (lbs/day) 54 54 82 54
Threshold Exceeded? No No No No
ROG = reactive organic gases; NOX = nitrogen oxides; PM10 = particulate matter 10 microns in diameter or less; PM2.5 = particulate matter 2.5 microns or less in diameter; lbs/day = pounds per day; BAAQMD = Bay Area Air Quality Management District 1 Analysis is conservative in that it assumes architectural coating (painting) all the buildings at the same time.
Source: See CalEEMod worksheets in Appendix A (Table 2.1 “Overall Construction-Mitigated Construction” emissions). Emissions are the highest of winter and summer emission estimates.
City of Hayward Clawiter Road Industrial Project
32
Fugitive Dust Site preparation and grading may cause wind-blown dust that could contribute particulate matter into the local atmosphere. The BAAQMD has not established a quantitative threshold for fugitive dust emissions but rather states that projects that incorporate best management practices (BMPs) for fugitive dust control during construction would have a less than significant impact related to fugitive dust emissions. The project would be required to implement dust control measures during grading and clearing activities per HMC Section 10-8.32, which includes requirements to use watering or dust palliative to contain dust and to immediately remove any earth material spilling or accumulating on a public street. Therefore, construction-related fugitive dust emissions would be less than significant.
Operational Emissions Table 7 and Table 8 summarize the project’s estimated net new average daily and annual operational criteria air pollutant emissions, respectively, taking into account emissions generated by existing uses (i.e., the existing vehicle storage area used by an automobile auction company).2 As shown therein, net new average daily and annual emissions would exceed the BAAQMD thresholds for NOX emissions, primarily due to high emissions associated with testing and maintenance of the anticipated 24 backup generators. Emissions would not exceed other average daily or annual thresholds. Because average daily and annual NOX emissions would exceed the thresholds, project operation would potentially result in a cumulatively considerable net increase of NOX emissions, and implementation of Mitigation Measure AQ-1 would be required.
2 Air pollutant emissions associated with the existing use of the project site as a vehicle storage area for an automobile auction company is limited to mobile sources (i.e., vehicle trips to and from the project site). No air pollutant emissions associated with area or energy sources are assumed to be part of the baseline because the existing buildings on-site are currently vacant.
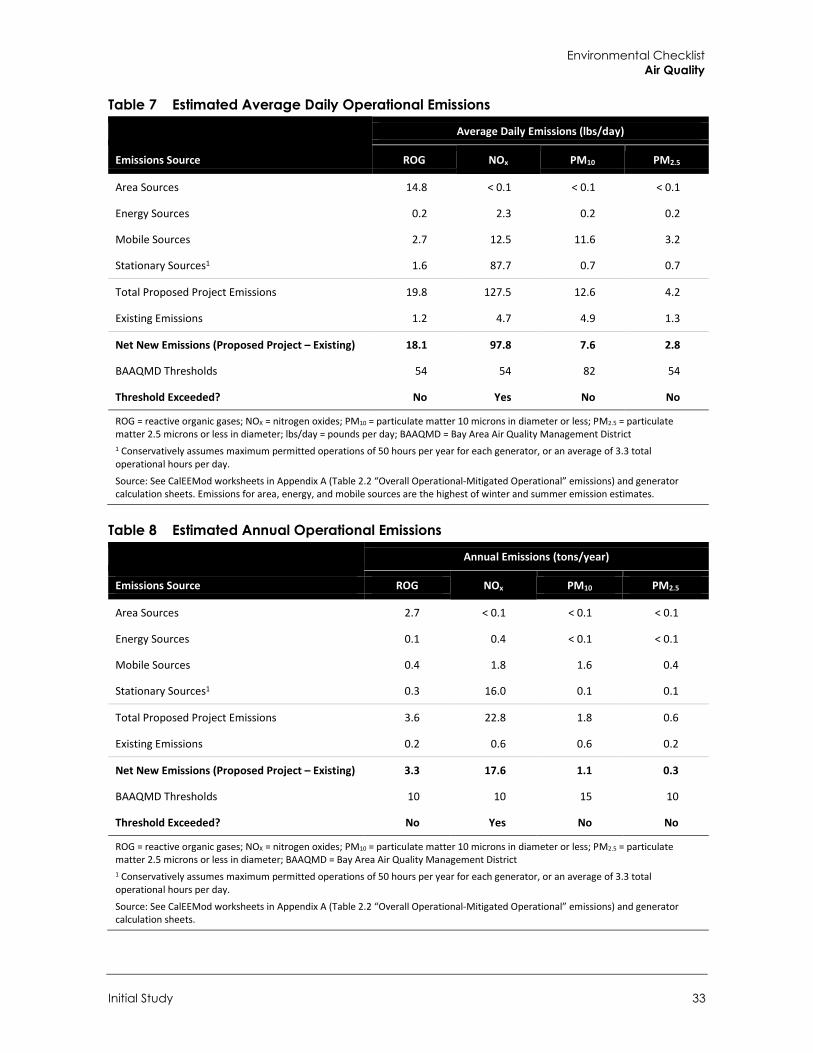
Environmental Checklist Air Quality
Initial Study 33
Table 7 Estimated Average Daily Operational Emissions
Average Daily Emissions (lbs/day)
Emissions Source ROG NOx PM10 PM2.5
Area Sources 14.8 < 0.1 < 0.1 < 0.1
Energy Sources 0.2 2.3 0.2 0.2
Mobile Sources 2.7 12.5 11.6 3.2
Stationary Sources1 1.6 87.7 0.7 0.7
Total Proposed Project Emissions 19.8 127.5 12.6 4.2
Existing Emissions 1.2 4.7 4.9 1.3
Net New Emissions (Proposed Project – Existing) 18.1 97.8 7.6 2.8
BAAQMD Thresholds 54 54 82 54
Threshold Exceeded? No Yes No No
ROG = reactive organic gases; NOX = nitrogen oxides; PM10 = particulate matter 10 microns in diameter or less; PM2.5 = particulate matter 2.5 microns or less in diameter; lbs/day = pounds per day; BAAQMD = Bay Area Air Quality Management District 1 Conservatively assumes maximum permitted operations of 50 hours per year for each generator, or an average of 3.3 total operational hours per day.
Source: See CalEEMod worksheets in Appendix A (Table 2.2 “Overall Operational-Mitigated Operational” emissions) and generator calculation sheets. Emissions for area, energy, and mobile sources are the highest of winter and summer emission estimates.
Table 8 Estimated Annual Operational Emissions
Annual Emissions (tons/year)
Emissions Source ROG NOx PM10 PM2.5
Area Sources 2.7 < 0.1 < 0.1 < 0.1
Energy Sources 0.1 0.4 < 0.1 < 0.1
Mobile Sources 0.4 1.8 1.6 0.4
Stationary Sources1 0.3 16.0 0.1 0.1
Total Proposed Project Emissions 3.6 22.8 1.8 0.6
Existing Emissions 0.2 0.6 0.6 0.2
Net New Emissions (Proposed Project – Existing) 3.3 17.6 1.1 0.3
BAAQMD Thresholds 10 10 15 10
Threshold Exceeded? No Yes No No
ROG = reactive organic gases; NOX = nitrogen oxides; PM10 = particulate matter 10 microns in diameter or less; PM2.5 = particulate matter 2.5 microns or less in diameter; BAAQMD = Bay Area Air Quality Management District 1 Conservatively assumes maximum permitted operations of 50 hours per year for each generator, or an average of 3.3 total operational hours per day.
Source: See CalEEMod worksheets in Appendix A (Table 2.2 “Overall Operational-Mitigated Operational” emissions) and generator calculation sheets.
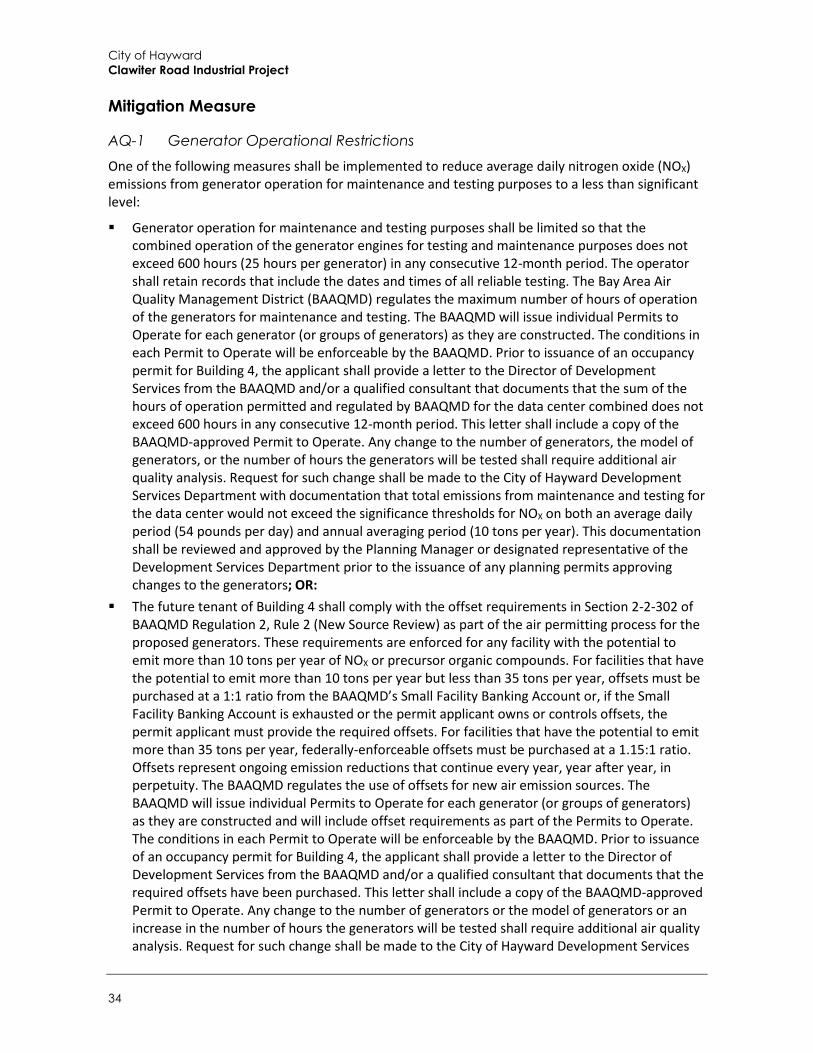
City of Hayward Clawiter Road Industrial Project
34
Mitigation Measure
AQ-1 Generator Operational Restrictions One of the following measures shall be implemented to reduce average daily nitrogen oxide (NOX) emissions from generator operation for maintenance and testing purposes to a less than significant level:
Generator operation for maintenance and testing purposes shall be limited so that the combined operation of the generator engines for testing and maintenance purposes does not exceed 600 hours (25 hours per generator) in any consecutive 12-month period. The operator shall retain records that include the dates and times of all reliable testing. The Bay Area Air Quality Management District (BAAQMD) regulates the maximum number of hours of operation of the generators for maintenance and testing. The BAAQMD will issue individual Permits to Operate for each generator (or groups of generators) as they are constructed. The conditions in each Permit to Operate will be enforceable by the BAAQMD. Prior to issuance of an occupancy permit for Building 4, the applicant shall provide a letter to the Director of Development Services from the BAAQMD and/or a qualified consultant that documents that the sum of the hours of operation permitted and regulated by BAAQMD for the data center combined does not exceed 600 hours in any consecutive 12-month period. This letter shall include a copy of the BAAQMD-approved Permit to Operate. Any change to the number of generators, the model of generators, or the number of hours the generators will be tested shall require additional air quality analysis. Request for such change shall be made to the City of Hayward Development Services Department with documentation that total emissions from maintenance and testing for the data center would not exceed the significance thresholds for NOX on both an average daily period (54 pounds per day) and annual averaging period (10 tons per year). This documentation shall be reviewed and approved by the Planning Manager or designated representative of the Development Services Department prior to the issuance of any planning permits approving changes to the generators; OR:
The future tenant of Building 4 shall comply with the offset requirements in Section 2-2-302 of BAAQMD Regulation 2, Rule 2 (New Source Review) as part of the air permitting process for the proposed generators. These requirements are enforced for any facility with the potential to emit more than 10 tons per year of NOX or precursor organic compounds. For facilities that have the potential to emit more than 10 tons per year but less than 35 tons per year, offsets must be purchased at a 1:1 ratio from the BAAQMD’s Small Facility Banking Account or, if the Small Facility Banking Account is exhausted or the permit applicant owns or controls offsets, the permit applicant must provide the required offsets. For facilities that have the potential to emit more than 35 tons per year, federally-enforceable offsets must be purchased at a 1.15:1 ratio. Offsets represent ongoing emission reductions that continue every year, year after year, in perpetuity. The BAAQMD regulates the use of offsets for new air emission sources. The BAAQMD will issue individual Permits to Operate for each generator (or groups of generators) as they are constructed and will include offset requirements as part of the Permits to Operate. The conditions in each Permit to Operate will be enforceable by the BAAQMD. Prior to issuance of an occupancy permit for Building 4, the applicant shall provide a letter to the Director of Development Services from the BAAQMD and/or a qualified consultant that documents that the required offsets have been purchased. This letter shall include a copy of the BAAQMD-approved Permit to Operate. Any change to the number of generators or the model of generators or an increase in the number of hours the generators will be tested shall require additional air quality analysis. Request for such change shall be made to the City of Hayward Development Services
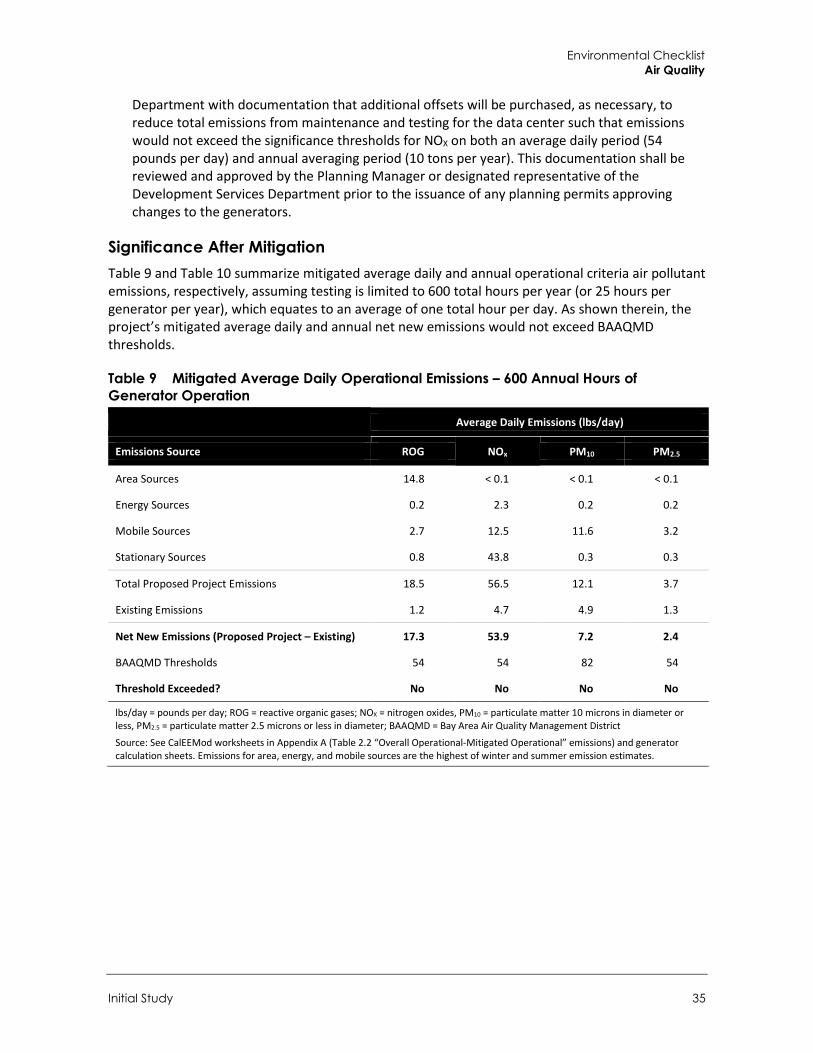
Environmental Checklist Air Quality
Initial Study 35
Department with documentation that additional offsets will be purchased, as necessary, to reduce total emissions from maintenance and testing for the data center such that emissions would not exceed the significance thresholds for NOX on both an average daily period (54 pounds per day) and annual averaging period (10 tons per year). This documentation shall be reviewed and approved by the Planning Manager or designated representative of the Development Services Department prior to the issuance of any planning permits approving changes to the generators.
Significance After Mitigation Table 9 and Table 10 summarize mitigated average daily and annual operational criteria air pollutant emissions, respectively, assuming testing is limited to 600 total hours per year (or 25 hours per generator per year), which equates to an average of one total hour per day. As shown therein, the project’s mitigated average daily and annual net new emissions would not exceed BAAQMD thresholds.
Table 9 Mitigated Average Daily Operational Emissions – 600 Annual Hours of Generator Operation
Average Daily Emissions (lbs/day)
Emissions Source ROG NOx PM10 PM2.5
Area Sources 14.8 < 0.1 < 0.1 < 0.1
Energy Sources 0.2 2.3 0.2 0.2
Mobile Sources 2.7 12.5 11.6 3.2
Stationary Sources 0.8 43.8 0.3 0.3
Total Proposed Project Emissions 18.5 56.5 12.1 3.7
Existing Emissions 1.2 4.7 4.9 1.3
Net New Emissions (Proposed Project – Existing) 17.3 53.9 7.2 2.4
BAAQMD Thresholds 54 54 82 54
Threshold Exceeded? No No No No
lbs/day = pounds per day; ROG = reactive organic gases; NOX = nitrogen oxides, PM10 = particulate matter 10 microns in diameter or less, PM2.5 = particulate matter 2.5 microns or less in diameter; BAAQMD = Bay Area Air Quality Management District
Source: See CalEEMod worksheets in Appendix A (Table 2.2 “Overall Operational-Mitigated Operational” emissions) and generator calculation sheets. Emissions for area, energy, and mobile sources are the highest of winter and summer emission estimates.
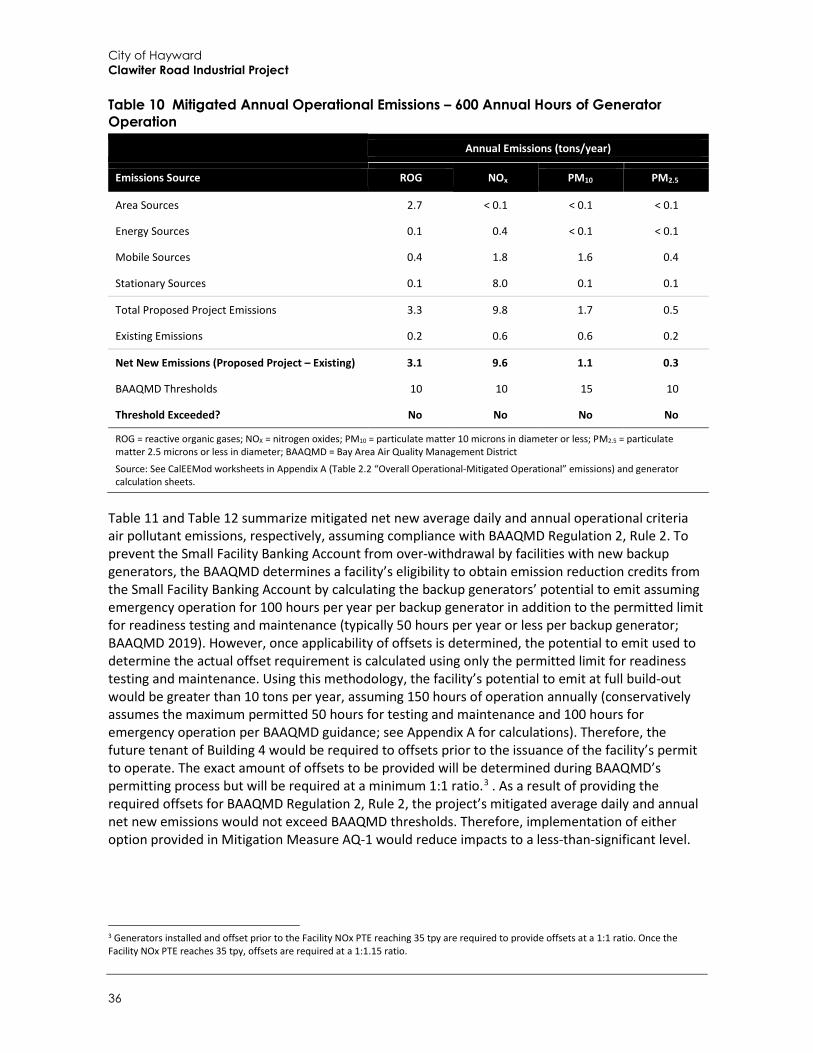
City of Hayward Clawiter Road Industrial Project
36
Table 10 Mitigated Annual Operational Emissions – 600 Annual Hours of Generator Operation
Annual Emissions (tons/year)
Emissions Source ROG NOx PM10 PM2.5
Area Sources 2.7 < 0.1 < 0.1 < 0.1
Energy Sources 0.1 0.4 < 0.1 < 0.1
Mobile Sources 0.4 1.8 1.6 0.4
Stationary Sources 0.1 8.0 0.1 0.1
Total Proposed Project Emissions 3.3 9.8 1.7 0.5
Existing Emissions 0.2 0.6 0.6 0.2
Net New Emissions (Proposed Project – Existing) 3.1 9.6 1.1 0.3
BAAQMD Thresholds 10 10 15 10
Threshold Exceeded? No No No No
ROG = reactive organic gases; NOX = nitrogen oxides; PM10 = particulate matter 10 microns in diameter or less; PM2.5 = particulate matter 2.5 microns or less in diameter; BAAQMD = Bay Area Air Quality Management District
Source: See CalEEMod worksheets in Appendix A (Table 2.2 “Overall Operational-Mitigated Operational” emissions) and generator calculation sheets.
Table 11 and Table 12 summarize mitigated net new average daily and annual operational criteria air pollutant emissions, respectively, assuming compliance with BAAQMD Regulation 2, Rule 2. To prevent the Small Facility Banking Account from over-withdrawal by facilities with new backup generators, the BAAQMD determines a facility’s eligibility to obtain emission reduction credits from the Small Facility Banking Account by calculating the backup generators’ potential to emit assuming emergency operation for 100 hours per year per backup generator in addition to the permitted limit for readiness testing and maintenance (typically 50 hours per year or less per backup generator; BAAQMD 2019). However, once applicability of offsets is determined, the potential to emit used to determine the actual offset requirement is calculated using only the permitted limit for readiness testing and maintenance. Using this methodology, the facility’s potential to emit at full build-out would be greater than 10 tons per year, assuming 150 hours of operation annually (conservatively assumes the maximum permitted 50 hours for testing and maintenance and 100 hours for emergency operation per BAAQMD guidance; see Appendix A for calculations). Therefore, the future tenant of Building 4 would be required to offsets prior to the issuance of the facility’s permit to operate. The exact amount of offsets to be provided will be determined during BAAQMD’s permitting process but will be required at a minimum 1:1 ratio.3 . As a result of providing the required offsets for BAAQMD Regulation 2, Rule 2, the project’s mitigated average daily and annual net new emissions would not exceed BAAQMD thresholds. Therefore, implementation of either option provided in Mitigation Measure AQ-1 would reduce impacts to a less-than-significant level.
3 Generators installed and offset prior to the Facility NOx PTE reaching 35 tpy are required to provide offsets at a 1:1 ratio. Once the Facility NOx PTE reaches 35 tpy, offsets are required at a 1:1.15 ratio.
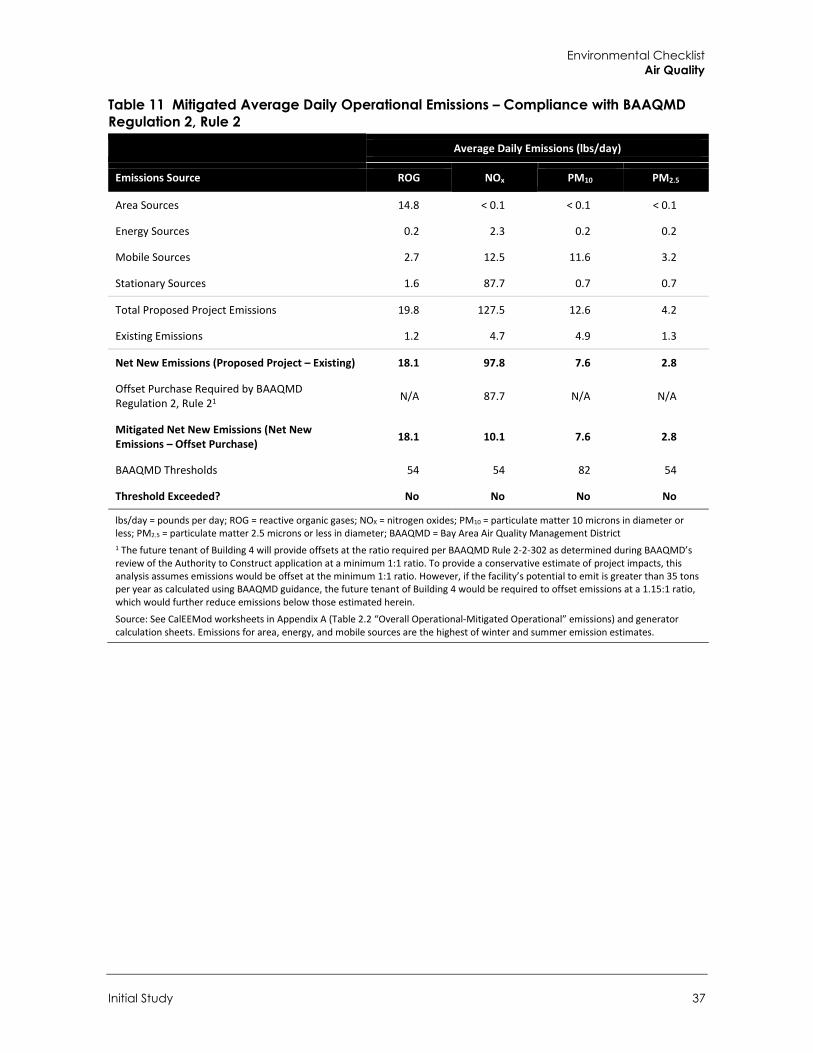
Environmental Checklist Air Quality
Initial Study 37
Table 11 Mitigated Average Daily Operational Emissions – Compliance with BAAQMD Regulation 2, Rule 2
Average Daily Emissions (lbs/day)
Emissions Source ROG NOx PM10 PM2.5
Area Sources 14.8 < 0.1 < 0.1 < 0.1
Energy Sources 0.2 2.3 0.2 0.2
Mobile Sources 2.7 12.5 11.6 3.2
Stationary Sources 1.6 87.7 0.7 0.7
Total Proposed Project Emissions 19.8 127.5 12.6 4.2
Existing Emissions 1.2 4.7 4.9 1.3
Net New Emissions (Proposed Project – Existing) 18.1 97.8 7.6 2.8
Offset Purchase Required by BAAQMD Regulation 2, Rule 21 N/A 87.7 N/A N/A
Mitigated Net New Emissions (Net New Emissions – Offset Purchase) 18.1 10.1 7.6 2.8
BAAQMD Thresholds 54 54 82 54
Threshold Exceeded? No No No No
lbs/day = pounds per day; ROG = reactive organic gases; NOX = nitrogen oxides; PM10 = particulate matter 10 microns in diameter or less; PM2.5 = particulate matter 2.5 microns or less in diameter; BAAQMD = Bay Area Air Quality Management District 1 The future tenant of Building 4 will provide offsets at the ratio required per BAAQMD Rule 2-2-302 as determined during BAAQMD’s review of the Authority to Construct application at a minimum 1:1 ratio. To provide a conservative estimate of project impacts, this analysis assumes emissions would be offset at the minimum 1:1 ratio. However, if the facility’s potential to emit is greater than 35 tons per year as calculated using BAAQMD guidance, the future tenant of Building 4 would be required to offset emissions at a 1.15:1 ratio, which would further reduce emissions below those estimated herein.
Source: See CalEEMod worksheets in Appendix A (Table 2.2 “Overall Operational-Mitigated Operational” emissions) and generator calculation sheets. Emissions for area, energy, and mobile sources are the highest of winter and summer emission estimates.
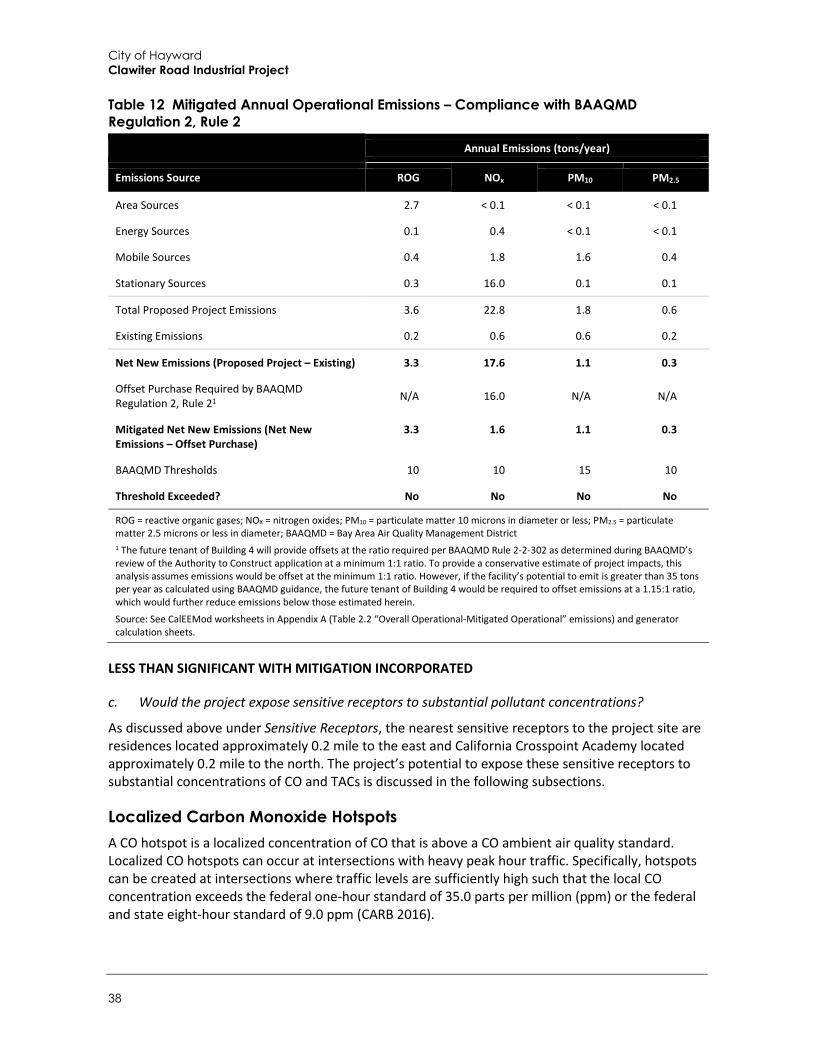
City of Hayward Clawiter Road Industrial Project
38
Table 12 Mitigated Annual Operational Emissions – Compliance with BAAQMD Regulation 2, Rule 2
Annual Emissions (tons/year)
Emissions Source ROG NOx PM10 PM2.5
Area Sources 2.7 < 0.1 < 0.1 < 0.1
Energy Sources 0.1 0.4 < 0.1 < 0.1
Mobile Sources 0.4 1.8 1.6 0.4
Stationary Sources 0.3 16.0 0.1 0.1
Total Proposed Project Emissions 3.6 22.8 1.8 0.6
Existing Emissions 0.2 0.6 0.6 0.2
Net New Emissions (Proposed Project – Existing) 3.3 17.6 1.1 0.3
Offset Purchase Required by BAAQMD Regulation 2, Rule 21 N/A 16.0 N/A N/A
Mitigated Net New Emissions (Net New Emissions – Offset Purchase)
3.3 1.6 1.1 0.3
BAAQMD Thresholds 10 10 15 10
Threshold Exceeded? No No No No
ROG = reactive organic gases; NOX = nitrogen oxides; PM10 = particulate matter 10 microns in diameter or less; PM2.5 = particulate matter 2.5 microns or less in diameter; BAAQMD = Bay Area Air Quality Management District 1 The future tenant of Building 4 will provide offsets at the ratio required per BAAQMD Rule 2-2-302 as determined during BAAQMD’s review of the Authority to Construct application at a minimum 1:1 ratio. To provide a conservative estimate of project impacts, this analysis assumes emissions would be offset at the minimum 1:1 ratio. However, if the facility’s potential to emit is greater than 35 tons per year as calculated using BAAQMD guidance, the future tenant of Building 4 would be required to offset emissions at a 1.15:1 ratio, which would further reduce emissions below those estimated herein.
Source: See CalEEMod worksheets in Appendix A (Table 2.2 “Overall Operational-Mitigated Operational” emissions) and generator calculation sheets.
LESS THAN SIGNIFICANT WITH MITIGATION INCORPORATED
c. Would the project expose sensitive receptors to substantial pollutant concentrations?
As discussed above under Sensitive Receptors, the nearest sensitive receptors to the project site are residences located approximately 0.2 mile to the east and California Crosspoint Academy located approximately 0.2 mile to the north. The project’s potential to expose these sensitive receptors to substantial concentrations of CO and TACs is discussed in the following subsections.
Localized Carbon Monoxide Hotspots A CO hotspot is a localized concentration of CO that is above a CO ambient air quality standard. Localized CO hotspots can occur at intersections with heavy peak hour traffic. Specifically, hotspots can be created at intersections where traffic levels are sufficiently high such that the local CO concentration exceeds the federal one-hour standard of 35.0 parts per million (ppm) or the federal and state eight-hour standard of 9.0 ppm (CARB 2016).
Environmental Checklist Air Quality
Initial Study 39
As stated in the BAAQMD May 2017 CEQA Air Quality Guidelines, the proposed project would result in a less than significant impact related to local CO concentrations if the project is consistent with an applicable CMP; would not increase traffic volumes at affected intersections to more than 44,000 vehicles per hour; and would not increase traffic volumes at affected intersections to more than 24,000 vehicles per hour where vertical and/or horizontal mixing is substantially limited (e.g., tunnel, parking garage, bridge underpass, natural or urban street canyon, below-grade roadway).
The CMP network routes nearest to the project site are Clawiter Road, SR 92, and Industrial Boulevard/Parkway West. The segment of Clawiter Road north of SR 92 to Winton Avenue, which runs immediately west of the project site, currently operates at LOS B/C during PM peak hour; the segment of SR 92 between the Toll Plaza and Interstate 880 that runs immediately south of the project site currently operates at LOS E during the PM peak hour; and the segment of Industrial Boulevard between Clawiter Road and Mission Boulevard, which runs approximately 0.2 mile east of the project site, currently operates at LOS B/C during PM peak hour. The LOS standard for these roadways is LOS E (Alameda County Transportation Commission 2018). A CMP analysis was not conducted as part of the CEQA analysis as Level of Service (LOS) thresholds are not considered CEQA impacts per Senate Bill 743. However, based on the trip generation and distribution show in the CEQA Transportation Analysis report (Kittelson & Associates 2020, Appendix H), the project would generate up to 181 peak hour trips that would travel on Clawiter Road between Winton Avenue and SR 92 with 50 percent of trips (i.e., approximately 91 trips) traveling on the segment of SR 92 between the Toll Plaza and Interstate 880. These additional project-related peak hour traffic volumes are not anticipated to cause LOS to fall below acceptable levels such that the project would conflict with the CMP.
The highest volume intersection that would accommodate project traffic is the Industrial Boulevard and Clawiter Road (east) intersection. Weekday PM peak hour traffic volumes at this intersection under cumulative (2035) plus project conditions would be approximately 2,404 vehicles which is substantially below the 44,000 vehicle-per-hour threshold described above (Figure 12 in Appendix H). Furthermore, none of the study area intersections are located in areas where vertical and/or horizontal mixing is substantially limited. Therefore, the project would not expose sensitive receptors to substantial CO concentrations, and impacts would be less than significant.
Toxic Air Contaminants
Construction Impacts
One of the main sources of TACs in California is diesel engines that emit exhaust containing solid material known as diesel particulate matter (DPM; CARB 2020). Construction-related activities would result in temporary project-generated emissions of DPM exhaust emissions from off-road, heavy-duty diesel equipment for site preparation, grading, building construction, and other construction activities.
Generation of DPM from construction projects typically occurs in a single area for a short period. Construction of the proposed project would occur over approximately 15 months. The dose to which the receptors are exposed is the primary factor used to determine health risk. Dose is a function of the concentration of a substance or substances in the environment and the extent of exposure that person has with the substance. Dose is positively correlated with time, meaning that a longer exposure period would result in a higher exposure level for the Maximally Exposed Individual. The risks estimated for a Maximally Exposed Individual are higher if a fixed exposure occurs over a longer period of time. According to the California Office of Environmental Health

City of Hayward Clawiter Road Industrial Project
40
Hazard Assessment, health risk assessments, which determine the exposure of sensitive receptors to toxic emissions, should be based on a 70-year exposure period; however, such assessments should be limited to the period/duration of activities associated with the project. Thus, the duration of proposed construction activities (i.e., 15 months) is approximately two percent of the total exposure period used for health risk calculation. Current models and methodologies for conducting health-risk assessments are associated with longer-term exposure periods of 9, 30, and 70 years, which do not correlate well with the temporary and highly variable nature of construction activities, resulting in difficulties in producing accurate estimates of health risk (BAAQMD 2017a). Therefore, this analysis qualitatively discusses potential health risks associated with construction-related emissions of TACs, focusing on construction activities most likely to generate substantial TAC emissions and the duration of such activities relative to established, longer-term health risk exposure periods.
Maximum PM10 and PM2.5 emissions would occur during demolition activities, which would last for approximately one month. PM emissions would decrease for the remaining construction period because activities such as building construction and architectural coating would require fewer pieces of construction equipment. While the maximum DPM emissions associated with demolition activities would only occur for a portion of the overall construction period, these activities represent the maximum exposure condition for the total construction period. The duration of demolition activities would represent less than one percent of the total exposure period for a 70-year health risk calculation. Furthermore, there are no sensitive receptors within 1,000 feet of the project site. Therefore, DPM generated by project construction would not create conditions where the probability is greater than 10 in one million of contracting cancer for the Maximally Exposed Individual or to generate ground-level concentrations of non-carcinogenic TACs that exceed a Hazard Index greater than one for the Maximally Exposed Individual. Thus, project construction activities would not expose sensitive receptors to substantial TAC concentrations, and impacts would be less than significant.
Operational Impacts
The proposed data center would require 23 2.5-MW standby generators and one 600-kW standby generator with maximum permitted operations of 50 hours per year for each generator. These standby generators would require air permits from the BAAQMD because they would generate TAC emissions in the form of DPM. Therefore, a health risk assessment was prepared to evaluate whether TAC emissions exposure at the Maximum Exposed Individual Resident (MEIR) would exceed the BAAQMD health risk criteria. The following discussion is based on the results of this health risk assessment, which is included in full as Appendix B.
A Tier 1 health risk assessment (HRA) was completed following the California Office of Environmental Health Hazard Assessment (OEHHA; 2015) guidelines using air dispersion modeling conducted via the U.S. EPA’s AERMOD dispersion model and the California Air Resources Board’s (CARB) Hotspots Analysis and Reporting Program Version (HARP) risk analysis tool, consistent with BAAQMD Regulation 2, Rule 5, with the exception that Tier 2 breathing rates adjusted using the 95th percentile (high end) were utilized to provide a conservative estimate of risk. A Tier 1 analysis is a point estimate analysis using OEHHA-specified exposure parameters and exposure durations that are based on standards and guidelines developed by OEHHA to be protective of human health. The 24 proposed standby diesel generators were modeled as point sources of emissions at their proposed locations adjacent to Building 4 using the manufacturer exhaust system characteristics and the particulate matter exhaust emissions rate for representative Tier 2 generators (CAT 3516C [2.5 MW] and C18 [600 kW] generators). This analysis conservatively assumes maximum permitted
Environmental Checklist Air Quality
Initial Study 41
operations of 50 hours per year for each generator, although the actual maintenance and testing routine is anticipated to only require bimonthly 15-minute operation of each generator (i.e., six hours per year per generator). Version 19121 of the CARB HARP 2.0 was used to calculate the potential risk values associated with the worst case one-hour and average annual toxic emission concentrations at surrounding receptors. The MEIR receptor was determined to be located approximately 1,210 feet east of the project site (see Figure 7). Cancer risk was evaluated for the MEIR using the OEHHA intake rate derived method, the U.S. EPA-recommended lifetime residency period of 70 years and the fraction of time-at-home OEHHA assumptions for only age bins greater than 16 years of age because a school (Impact Academy of Arts and Technology) is located within the one-in-a-million cancer risk isopleth.
The BAAQMD has health risk criteria for cancer risk, non-cancer risk (i.e., chronic and acute), and annual average PM2.5 concentration. Cancer risk is expressed as the maximum number of new cancer cases projected to occur in a population of one million people due to exposure to a cancer-causing substance. Potential acute health risks include severe symptoms that develop rapidly and lead quickly to a health issue due to exposure to a harmful substance, whereas chronic health risks include health crises, such as lung inflammation, immune suppression, and immune sensitization, which develop due to exposure to a harmful substance over a long period of time. The BAAQMD considers compliance with a Qualified Community Risk Reduction Plan to indicate project impacts are less than significant. The City of Hayward’s Community Risk Reduction Plan is encompassed in the Hayward 2040 General Plan; however, measures related to the reduction of communitywide exposure to TAC and PM2.5 emissions are not directly applicable to the proposed project. Therefore, the following quantitative thresholds recommended by the BAAQMD are utilized in this analysis to evaluate project-level impacts to local community risks and hazards associated with TACs and PM2.5 (BAAQMD 2017; see discussion under Air Emission Thresholds).
Table 13 summarizes the project-level health risk results associated with operation of the proposed standby generators at the MEIR receptor located approximately 1,210 feet east of the project site (see Figure 7). As shown in Table 13, the excess cancer risk, chronic health risk, and annual average PM2.5 concentration at the MEIR would not exceed BAAQMD thresholds. Because the excess cancer risk at the MEIR is greater than one in one million, the proposed project would be required to equip all generators with Best Available Control Technology (BACT) pursuant to BAAQMD Regulation 2, Rule 5 Section 2-5-301, which would further reduce cancer risk, chronic hazard, and annual average PM2.5 concentration at the MEIR below the BAAQMD significance thresholds. As a result, the project would also not be inconsistent with SB 1000.
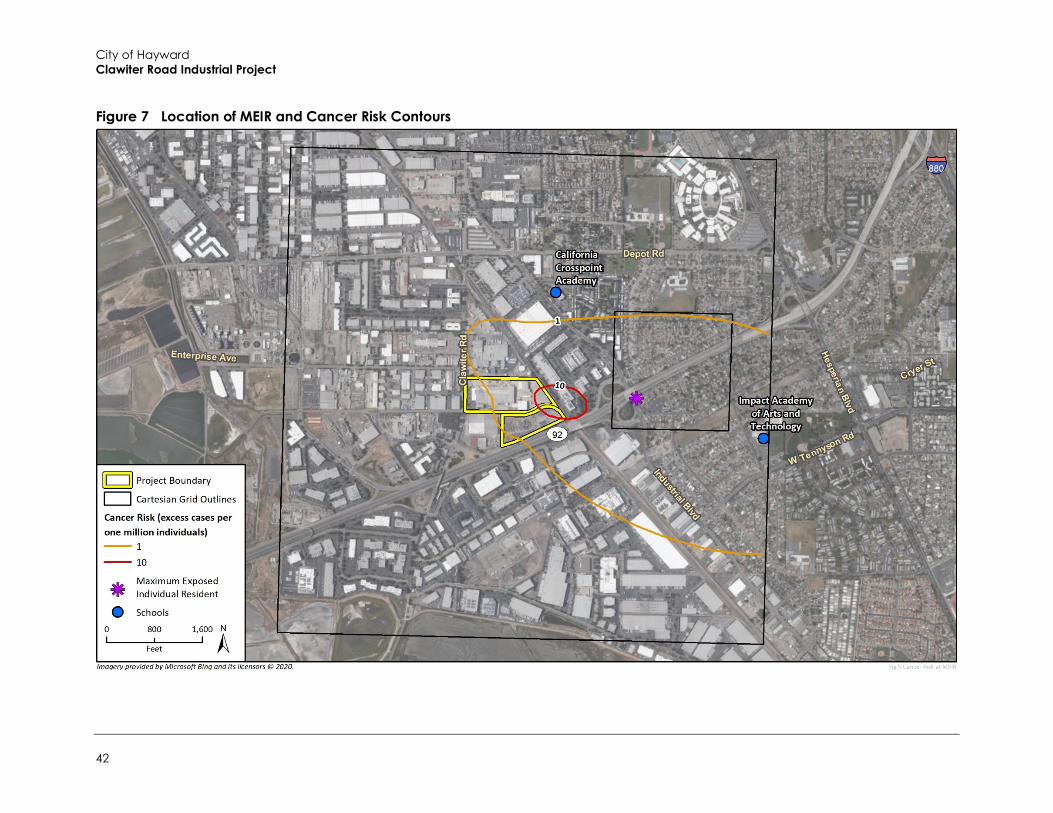
City of Hayward Clawiter Road Industrial Project
42
Figure 7 Location of MEIR and Cancer Risk Contours
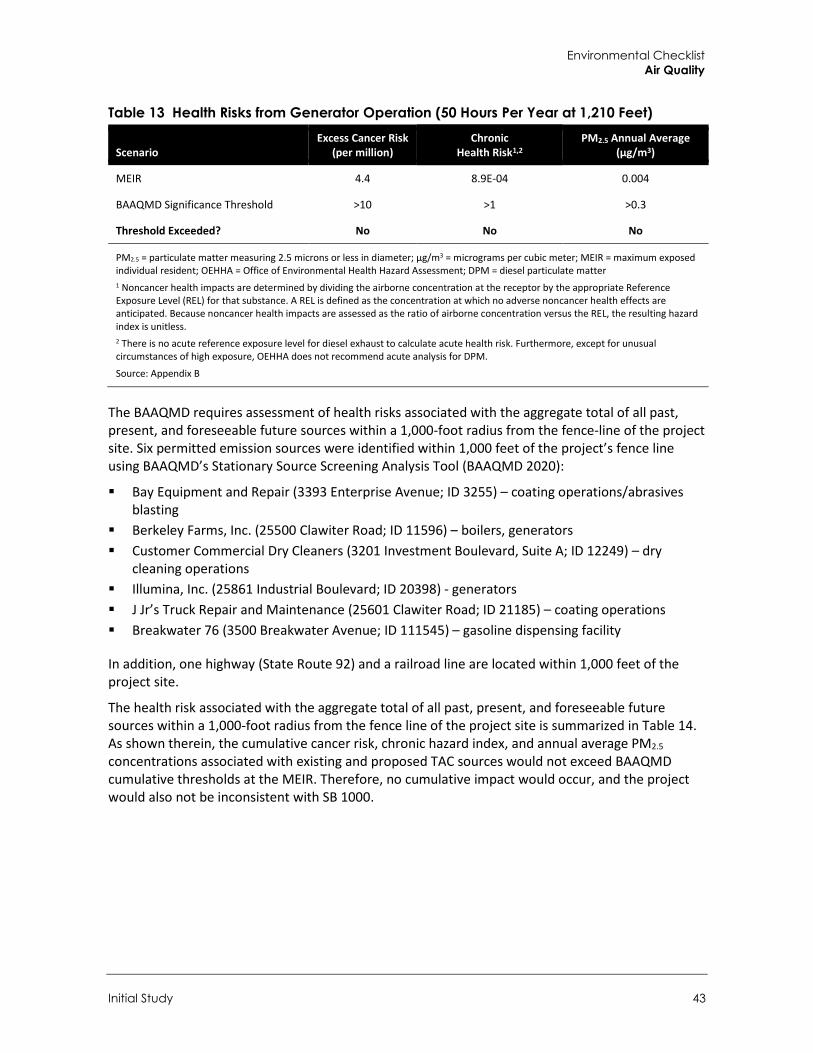
Environmental Checklist Air Quality
Initial Study 43
Table 13 Health Risks from Generator Operation (50 Hours Per Year at 1,210 Feet)
Scenario Excess Cancer Risk
(per million) Chronic
Health Risk1,2 PM2.5 Annual Average
(µg/m3)
MEIR 4.4 8.9E-04 0.004
BAAQMD Significance Threshold >10 >1 >0.3
Threshold Exceeded? No No No
PM2.5 = particulate matter measuring 2.5 microns or less in diameter; µg/m3 = micrograms per cubic meter; MEIR = maximum exposed individual resident; OEHHA = Office of Environmental Health Hazard Assessment; DPM = diesel particulate matter 1 Noncancer health impacts are determined by dividing the airborne concentration at the receptor by the appropriate Reference Exposure Level (REL) for that substance. A REL is defined as the concentration at which no adverse noncancer health effects are anticipated. Because noncancer health impacts are assessed as the ratio of airborne concentration versus the REL, the resulting hazard index is unitless. 2 There is no acute reference exposure level for diesel exhaust to calculate acute health risk. Furthermore, except for unusual circumstances of high exposure, OEHHA does not recommend acute analysis for DPM.
Source: Appendix B
The BAAQMD requires assessment of health risks associated with the aggregate total of all past, present, and foreseeable future sources within a 1,000-foot radius from the fence-line of the project site. Six permitted emission sources were identified within 1,000 feet of the project’s fence line using BAAQMD’s Stationary Source Screening Analysis Tool (BAAQMD 2020):
Bay Equipment and Repair (3393 Enterprise Avenue; ID 3255) – coating operations/abrasives blasting
Berkeley Farms, Inc. (25500 Clawiter Road; ID 11596) – boilers, generators Customer Commercial Dry Cleaners (3201 Investment Boulevard, Suite A; ID 12249) – dry
cleaning operations Illumina, Inc. (25861 Industrial Boulevard; ID 20398) - generators J Jr’s Truck Repair and Maintenance (25601 Clawiter Road; ID 21185) – coating operations Breakwater 76 (3500 Breakwater Avenue; ID 111545) – gasoline dispensing facility
In addition, one highway (State Route 92) and a railroad line are located within 1,000 feet of the project site.
The health risk associated with the aggregate total of all past, present, and foreseeable future sources within a 1,000-foot radius from the fence line of the project site is summarized in Table 14. As shown therein, the cumulative cancer risk, chronic hazard index, and annual average PM2.5 concentrations associated with existing and proposed TAC sources would not exceed BAAQMD cumulative thresholds at the MEIR. Therefore, no cumulative impact would occur, and the project would also not be inconsistent with SB 1000.
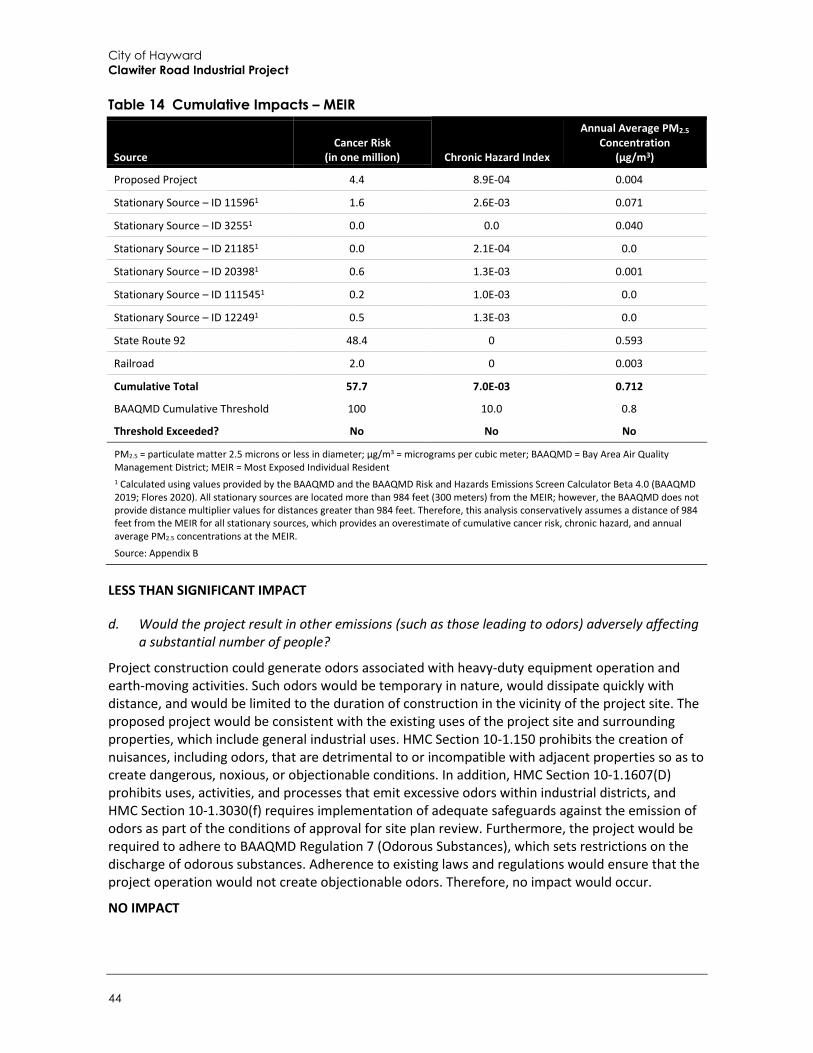
City of Hayward Clawiter Road Industrial Project
44
Table 14 Cumulative Impacts – MEIR
Source Cancer Risk
(in one million) Chronic Hazard Index
Annual Average PM2.5 Concentration
(µg/m3)
Proposed Project 4.4 8.9E-04 0.004
Stationary Source – ID 115961 1.6 2.6E-03 0.071
Stationary Source – ID 32551 0.0 0.0 0.040
Stationary Source – ID 211851 0.0 2.1E-04 0.0
Stationary Source – ID 203981 0.6 1.3E-03 0.001
Stationary Source – ID 1115451 0.2 1.0E-03 0.0
Stationary Source – ID 122491 0.5 1.3E-03 0.0
State Route 92 48.4 0 0.593
Railroad 2.0 0 0.003
Cumulative Total 57.7 7.0E-03 0.712
BAAQMD Cumulative Threshold 100 10.0 0.8
Threshold Exceeded? No No No
PM2.5 = particulate matter 2.5 microns or less in diameter; µg/m3 = micrograms per cubic meter; BAAQMD = Bay Area Air Quality Management District; MEIR = Most Exposed Individual Resident 1 Calculated using values provided by the BAAQMD and the BAAQMD Risk and Hazards Emissions Screen Calculator Beta 4.0 (BAAQMD 2019; Flores 2020). All stationary sources are located more than 984 feet (300 meters) from the MEIR; however, the BAAQMD does not provide distance multiplier values for distances greater than 984 feet. Therefore, this analysis conservatively assumes a distance of 984 feet from the MEIR for all stationary sources, which provides an overestimate of cumulative cancer risk, chronic hazard, and annual average PM2.5 concentrations at the MEIR.
Source: Appendix B
LESS THAN SIGNIFICANT IMPACT
d. Would the project result in other emissions (such as those leading to odors) adversely affecting a substantial number of people?
Project construction could generate odors associated with heavy-duty equipment operation and earth-moving activities. Such odors would be temporary in nature, would dissipate quickly with distance, and would be limited to the duration of construction in the vicinity of the project site. The proposed project would be consistent with the existing uses of the project site and surrounding properties, which include general industrial uses. HMC Section 10-1.150 prohibits the creation of nuisances, including odors, that are detrimental to or incompatible with adjacent properties so as to create dangerous, noxious, or objectionable conditions. In addition, HMC Section 10-1.1607(D) prohibits uses, activities, and processes that emit excessive odors within industrial districts, and HMC Section 10-1.3030(f) requires implementation of adequate safeguards against the emission of odors as part of the conditions of approval for site plan review. Furthermore, the project would be required to adhere to BAAQMD Regulation 7 (Odorous Substances), which sets restrictions on the discharge of odorous substances. Adherence to existing laws and regulations would ensure that the project operation would not create objectionable odors. Therefore, no impact would occur.
NO IMPACT
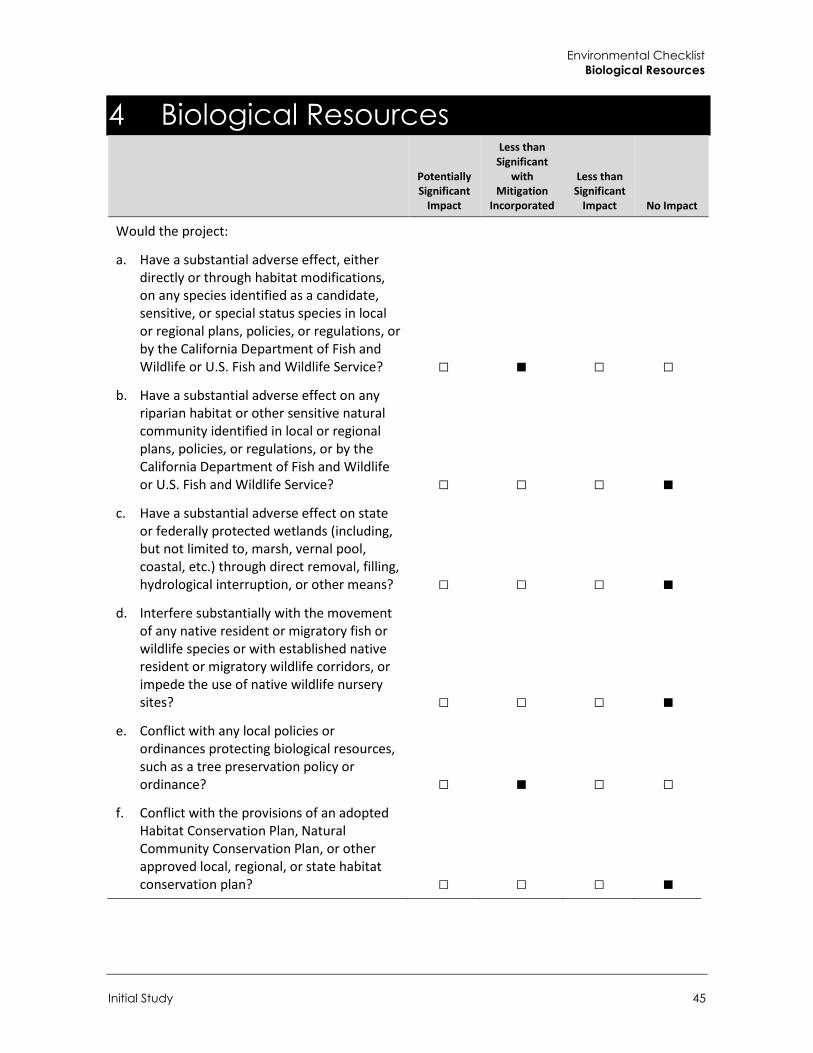
Environmental Checklist Biological Resources
Initial Study 45
4 Biological Resources
Potentially Significant
Impact
Less than Significant
with Mitigation
Incorporated
Less than Significant
Impact No Impact
Would the project:
a. Have a substantial adverse effect, either directly or through habitat modifications, on any species identified as a candidate, sensitive, or special status species in local or regional plans, policies, or regulations, or by the California Department of Fish and Wildlife or U.S. Fish and Wildlife Service? □ ■ □ □
b. Have a substantial adverse effect on any riparian habitat or other sensitive natural community identified in local or regional plans, policies, or regulations, or by the California Department of Fish and Wildlife or U.S. Fish and Wildlife Service? □ □ □ ■
c. Have a substantial adverse effect on state or federally protected wetlands (including, but not limited to, marsh, vernal pool, coastal, etc.) through direct removal, filling, hydrological interruption, or other means? □ □ □ ■
d. Interfere substantially with the movement of any native resident or migratory fish or wildlife species or with established native resident or migratory wildlife corridors, or impede the use of native wildlife nursery sites? □ □ □ ■
e. Conflict with any local policies or ordinances protecting biological resources, such as a tree preservation policy or ordinance? □ ■ □ □
f. Conflict with the provisions of an adopted Habitat Conservation Plan, Natural Community Conservation Plan, or other approved local, regional, or state habitat conservation plan? □ □ □ ■
City of Hayward Clawiter Road Industrial Project
46
Existing Setting The project site is located in an urban business park and industrial area and is surrounded by existing development and major highways. The site is relatively flat and developed with an existing manufacturing facility and vehicle storage yard. Most of the site is paved or covered by existing structures. Vegetation is limited primarily to parking lot and perimeter trees for landscaping.
Impact Analysis
a. Would the project have a substantial adverse effect, either directly or through habitat modifications, on any species identified as a candidate, sensitive, or special status species in local or regional plans, policies, or regulations, or by the California Department of Fish and Wildlife or U.S. Fish and Wildlife Service?
The project site, including off-site improvement area for transmissions lines, has no natural or native vegetation communities that would support special status animal species. However, the project site includes several uninhabited buildings and ancillary structures. These structures may present suitable habitat for pallid bat (Antrozous pallidus) Townsend’s big-eared bat (Corynorhinus townsendii), and western mastiff bat (Eumops perotis californicus). If bat species are present on the project site, construction activities such as building demolition or tree removal could result in impacts to special status bats. Impacts to these species are potentially significant and mitigation is required.
Although vegetation communities observed in the project site are primarily non-native, ornamental, and/or disturbed, the site could be used by numerous species of migratory birds that utilize the ornamental trees and surrounding landscaping as nesting habitat. Ornamental trees along the transmissions line route could also be used by migratory birds. Native bird nests are protected by California Fish & Game Code (CFGC) Section 3503. The nesting season generally extends from February 1st through August 31st in California but can vary based upon annual climatic conditions. Thus, construction activities could also result in the direct take of birds or their nests during vegetation removal, or disturbance-related nest abandonment. Mitigation is required to reduce potential impacts on nesting birds.
Mitigation Measures The following mitigation measure would be required to avoid or reduce the proposed project’s potentially significant impacts to nesting birds and special status wildlife.
BIO-1 Nesting Bird Avoidance and Minimization Efforts If project construction activities occur during the nesting season (between February 1st and August 31st) a qualified biologist shall conduct a pre-construction survey for nesting birds no more than 14 days prior to construction. The survey shall include the entire project site and a 300-foot buffer to account for nesting raptors. If nests are found the qualified biologist shall establish an appropriate species-specific avoidance buffer of sufficient size to prevent disturbance by project activity to the nest (up to 300 feet for raptors, up to 150 feet for all other birds). The qualified biologist shall perform at least two hours of pre-construction monitoring of the nest to characterize "typical" bird behavior.
During construction, active nests identified during the preconstruction survey shall be monitored by the qualified biologist to determine if construction activities are causing any disturbance to the bird
Environmental Checklist Biological Resources
Initial Study 47
and shall increase the buffer if it is determined the birds are showing signs of unusual or distressed behavior associated with project activities. Atypical nesting behaviors that may cause nest abandonment include, but are not limited to, defensive flights, vocalizations directed towards project personnel/activities, standing up from a brooding position, and flying away from the nest. The qualified biologist shall have authority, through the resident engineer, to order the cessation of all project activities if the nesting birds exhibit atypical behavior that may cause nest failure (nest abandonment and loss of eggs and/or young) until a refined appropriate buffer is established. To prevent encroachment, the established buffer(s) should be clearly marked by high visibility material. The established buffer(s) should remain in effect until the young have fledged or the nest has been abandoned as confirmed by the qualified biologist. The monitoring biologist, in consultation with the resident engineer and project manager shall determine the appropriate protection for active nests on a case by case basis using the criteria described above. The qualified biologist shall prepare a nest monitoring report at the time monitoring has been completed. The report will document the methods and results of the monitoring, and the final status of the nest (i.e., successful fledging of the nest, nest depredation, nest failure due to construction activity).
BIO-2 Special-status Bat Species Avoidance and Minimization
Focused surveys to determine the presence/absence of roosting bats shall be conducted prior to the initiation of demolition of buildings and removal of mature trees large enough to contain crevices and hollows that could support bat roosting. If no bats or signs of roosting by bats are observed, no further actions are required. If bats or signs of roosting by bats are observed, a qualified biologist will prepare specific recommendations for either partial dismantling to cause bats to abandon the roost, or humane eviction, both to be conducted during seasonal periods of bat activity, if required. If active maternity roosts are identified, the roost shall not be removed during the breeding season (April 15 to August 31) to the extent practicable. If a structure or tree containing a maternity roost must be removed during the breeding season then measures recommended by the qualified biologist shall be implemented to remove or relocate bats from the roost prior to the onset of demolition activities. Such measures may include removal of roosting site during the time of day the roost is unoccupied or the installation of one-way doors, allowing the bats to leave the roost but not to re-enter.
Significance After Mitigation Implementation of mitigation measures BIO-1 and BIO-2 would ensure protection of nesting birds and special-status bat species that may be on-site during construction activities. These measures would reduce the potentially significant impact to special-status species to a less than significant level.
LESS THAN SIGNIFICANT WITH MITIGATION INCORPORATED
b. Would the project have a substantial adverse effect on any riparian habitat or other sensitive natural community identified in local or regional plans, policies, or regulations, or by the California Department of Fish and Wildlife or U.S. Fish and Wildlife Service?
c. Would the project have a substantial adverse effect on state or federally protected wetlands (including, but not limited to, marsh, vernal pool, coastal, etc.) through direct removal, filling, hydrological interruption, or other means?
The project site is developed with urban uses. No riparian habitat or other sensitive natural community exists on the project site and proposed transmission line route. According to the U.S.
City of Hayward Clawiter Road Industrial Project
48
Fish and Wildfire Service (USFWS) National Wetlands Inventory, there are no wetlands located within or in the vicinity of the project site (USFWS 2019). The nearest wetlands are Estuarian and Marine wetlands located approximately one mile southwest of the project site near the San Francisco Bay. Therefore, the project would have no impacts on riparian habitat or protected wetlands.
NO IMPACT
d. Would the project interfere substantially with the movement of any native resident or migratory fish or wildlife species or with established native resident or migratory wildlife corridors, or impede the use of native wildlife nursery sites?
The project site is developed and primarily has ornamental vegetation. Land use in the vicinity is industrial and commercial with no connectivity to natural habitats and therefore does not support substantial wildlife movement. No impacts to wildlife movement corridors would occur as a result of project activities
NO IMPACT
e. Would the project conflict with any local policies or ordinances protecting biological resources, such as a tree preservation policy or ordinance?
The City’s Tree Preservation Ordinance, included in Hayward Municipal Code (HMC) Chapter 10, Article 15, requires a permit for removal of native trees four inches and greater in trunk diameter and all trees eight inches and greater in trunk diameter. A permit is also required for the removal or cutting of branches over one inch in diameter, or disfigurement of any Protected Tree, among other requirements.
According to the Preliminary Landscape Plan and Tree Protection Plan, there are 116 protected trees on-site (Appendix C). The project would require the removal of 67 of the protected trees and the preservation of 45 protected trees in order to accommodate on-site structures, parking, the transformer yard, and the on-site portion of the transmission lines from the transformer yard to the existing PG&E substation. The project would not require the removal of off-site trees for the off-site portion of the proposed transmission lines. The total estimated value of the 67 trees to be removed is $47,730. Because a number of protected trees proposed for removal are at the request of the City due to their declining health, the estimated value of tree the project would be responsible for replacing is $33,440.
The Landscape Plan for the project includes over 250 new trees. Of the trees that would comply with the HMC requirement for replacement with an equal value tree or trees as those trees planned for removal, the project would provide on-site trees which value approximately $42,450. This would exceed the required mitigation requirement of $33,440.
In addition to the required replacement of the 67 protected trees proposed for removal, the project would need to maintain the 45 protected trees that are proposed to remain. The protected trees retained on the project site have the potential to decline or die during construction or if they are inadequately maintained. The Tree Protection Plan recommends measures to protect these retained protected trees. Therefore, mitigation is required to protect these trees during and after construction to ensure long-term health and sustainability of the preserved protected trees.
Environmental Checklist Biological Resources
Initial Study 49
Mitigation Measures The following mitigation measure would be required to avoid or reduce the proposed project’s potentially significant impacts to protected trees.
BIO-3 Tree Preservation Measures
As outlined in the Tree Protection Plan (Traverso Tree Service, June 2019), the following tree preservation measures are required to protect trees that will be preserved in place as required by HMC Chapter 10, Article 15.
PRE-CONSTRUCTION MEASURES 1. Establish a Tree Protection Zone around each tree to be preserved. For design purposes, the
Tree Protection Zone shall be the dripline or property line for trees. No grading excavation, construction or storage of materials shall occur within the protection zone.
2. Spread a 4” thick layer of arborist wood chips beneath the driplines of the redwoods along the southeast property line, up to the proposed limit of grading.
3. Prior to construction or grading, but after wood chips are spread, the contractor shall install 6’ chain-link fencing to construct a temporary Tree Protection Zone (TPZ) around the redwoods along the southeast property line, as indicated on the tree protection plan.
4. TPZ fencing shall remain in an upright sturdy manner from the start of grading until the completion of construction. Fencing shall not be adjusted or removed without consulting the project arborist.
5. Trees to be preserved may require pruning to provide clearance and/or correct defects in structure. All pruning shall be performed by an ISA Certified Arborist or Certified Tree Worker and shall adhere to the latest edition of the ANSI Z133 and A300 safety standards as well as the ISA Best Management Practices for Tree Pruning with a tree pruning permit from the City. The pruning contractor shall have the C-27/D-49 license specification.
6. All tree work shall comply with the Migratory Bird Treaty Act as well as California Fish and Wildlife Code 3503-3513 to not disturb nesting birds. To the extend feasible tree pruning and removal should be scheduled outside of the breeding season. Breeding bird surveys should be conducted prior to tree work by a qualified biologist. Qualified biologists should be involved in establishing work buffers for active nests if needed.
CONSTRUCTION MEASURES 1. Prior to beginning work, the contractors working in the vicinity of trees for preservation are
required to meet with the Project Arborist at the site to review all work procedure, access routes, storage areas and tree protection measures.
2. Any grading, construction, demolition or other work that is expected to encounter tree roots should be monitored by the Project Arborist. Any necessary root pruning shall be performed by a qualified arborist and not by construction personnel. Roots shall be cleanly pruned with a handsaw or sawzall, immediately covered with wet burlap, and kept moist until backfilled.
3. Should TPZ encroachment be necessary, the contractor shall contact the project arborist for consultation and recommendations.
City of Hayward Clawiter Road Industrial Project
50
4. The contractor shall keep TPZs free of all construction-related materials including but not limited to debris, fill soil, equipment. The only acceptable material is mulch spread out beneath the trees.
5. If damages should occur to any tree during construction, it should be evaluated as soon as possible by the Project Arborist so that appropriate treatments can be applied. If the damages to tree result in removal, removed tree shall be replaced to its appraised value provided by the Project Arborist and approved by City Landscape Architect.
LANDSCAPING MEASURES 1. Tree Protection Zone (TPZ) fencing shall remain in place with the same restrictions until
landscape contractor notifies and meets with project arborist. Fences may not be relocated or removed without permission of the Project Arborist.
2. Proposed irrigation trenching shall be done by hand and shall occur as far from the redwoods along the southeast property line as possible. Permanent drip irrigation shall be provided to all preserved redwoods.
3. Wood chips shall not be removed; processed mulch made of organic chipped wood in dark brown color may be placed on top of the wood chips for aesthetics.
4. Avoid all fill work, grade changes, and trenching within driplines unless it is performed by hand. Pipes shall be threaded under or through large roots without damaging them.
5. Any additional tree pruning needed for clearance during construction must be performed by a qualified arborist and not by construction personnel with a tree pruning permit from City Landscape Architect. Trees shall be irrigated on a schedule to be determined by the Project Arborist. Each irrigation session shall be wet the soil within the Tree Protection Zone to a depth of 30 inch.
Significance After Mitigation Implementation of Mitigation Measure BIO-3 would ensure preservation and maintenance of existing on-site protected trees during and after construction activities. These measures would follow the local tree ordinance and would reduce the potentially significant impact to protected trees to a less than significant level.
LESS THAN SIGNIFICANT WITH MITIGATION INCORPORATED
f. Would the project conflict with the provisions of an adopted Habitat Conservation Plan, Natural Community Conservation Plan, or other approved local, regional, or state habitat conservation plan?
There are no habitat conservation plans, natural community conservation plans, or other similar plans that govern activities on the project site. Therefore, the proposed project would not conflict with a habitat conservation plan.
NO IMPACT
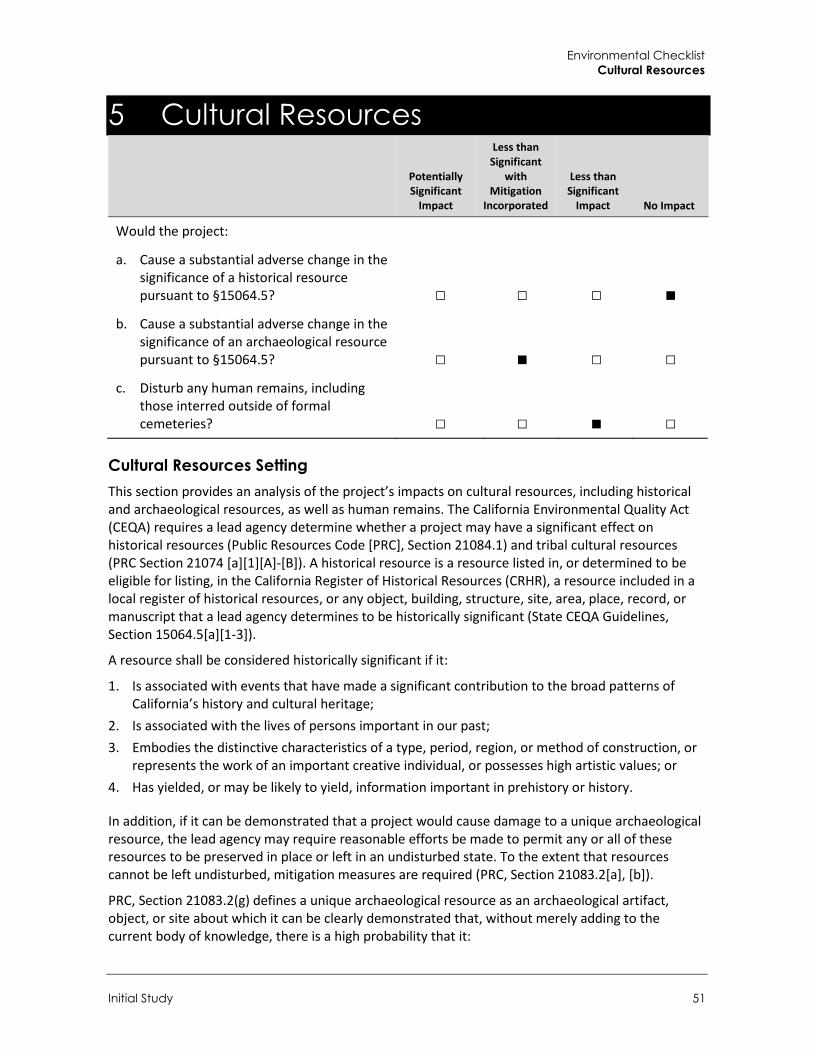
Environmental Checklist Cultural Resources
Initial Study 51
5 Cultural Resources
Potentially Significant
Impact
Less than Significant
with Mitigation
Incorporated
Less than Significant
Impact No Impact
Would the project:
a. Cause a substantial adverse change in the significance of a historical resource pursuant to §15064.5? □ □ □ ■
b. Cause a substantial adverse change in the significance of an archaeological resource pursuant to §15064.5? □ ■ □ □
c. Disturb any human remains, including those interred outside of formal cemeteries? □ □ ■ □
Cultural Resources Setting This section provides an analysis of the project’s impacts on cultural resources, including historical and archaeological resources, as well as human remains. The California Environmental Quality Act (CEQA) requires a lead agency determine whether a project may have a significant effect on historical resources (Public Resources Code [PRC], Section 21084.1) and tribal cultural resources (PRC Section 21074 [a][1][A]-[B]). A historical resource is a resource listed in, or determined to be eligible for listing, in the California Register of Historical Resources (CRHR), a resource included in a local register of historical resources, or any object, building, structure, site, area, place, record, or manuscript that a lead agency determines to be historically significant (State CEQA Guidelines, Section 15064.5[a][1-3]).
A resource shall be considered historically significant if it:
1. Is associated with events that have made a significant contribution to the broad patterns of California’s history and cultural heritage;
2. Is associated with the lives of persons important in our past; 3. Embodies the distinctive characteristics of a type, period, region, or method of construction, or
represents the work of an important creative individual, or possesses high artistic values; or 4. Has yielded, or may be likely to yield, information important in prehistory or history.
In addition, if it can be demonstrated that a project would cause damage to a unique archaeological resource, the lead agency may require reasonable efforts be made to permit any or all of these resources to be preserved in place or left in an undisturbed state. To the extent that resources cannot be left undisturbed, mitigation measures are required (PRC, Section 21083.2[a], [b]).
PRC, Section 21083.2(g) defines a unique archaeological resource as an archaeological artifact, object, or site about which it can be clearly demonstrated that, without merely adding to the current body of knowledge, there is a high probability that it:
City of Hayward Clawiter Road Industrial Project
52
a. Contains information needed to answer important scientific research questions and that there is a demonstrable public interest in that information;
b. Has a special and particular quality such as being the oldest of its type or the best available example of its type; or
c. Is directly associated with a scientifically recognized important prehistoric or historic event or person.
Rincon Consultants prepared a cultural resources study in support of the project in August and September 2020, which includes a cultural resources records search, Native American consultation, a field survey, and historical resources evaluation, and preparation a memorandum to summarize the results (Appendix D). Rincon received search results of the California Historical Resources Information System (CHRIS) at the Northwest Information Center (NWIC) located at Sonoma State University on August 25, 2020. The search was performed to identify previously recorded cultural resources, as well as previously conducted cultural resources studies within the project site and a 0.5-mile radius surrounding it. The CHRIS search included a review of available records at the NWIC, as well as the National Register of Historic Places (NRHP), the CRHR, the Office of Historic Preservation Historic Properties Directory, the California Inventory of Historic Resources, the Archaeological Determinations of Eligibility list, and historic maps.
The NWIC records search identified 29 cultural resources studies conducted within a 0.5-mile radius of the project site, one of which included the project site. The study that includes the project site consists of an archaeological report for the Hayward-San Leandro Transportation Corridor and did not identify cultural resources within the project site. The NWIC records search also identified four previously recorded cultural resources within a 0.5-mile radius of the project site. One, P-01-001783, which intersects the project site, is a linear resource recorded as the Union Pacific Railroad. Although several segments of the resource have been recorded, a review of the documentation provided by NWIC reveals the segment intersecting the project site has not been subject to formal recordation and evaluation. Two segments in Alameda County were recommended eligible for state or federal designation. A segment located in Tracy, California was recorded as the Central Pacific Railroad/Transcontinental Railroad, Niles-Sacramento Line and was recommended eligible for listing in the CRHR under Criterion 1. It was not evaluated for the NRHP. In addition, the Southern Pacific Railroad Dumbarton Cutoff—including as contributing elements the Southern Pacific Dumbarton Bridge and the Southern Pacific Newark Slough Bridge—was recommended eligible for the NRHP under Criteria A, B, and C. The Dumbarton Bridge was recommended individually eligible for listing in the NRHP under Criterion A. Additional segments of the resource were either recommended ineligible for listing in the NRHP and/or CRHR—often due to a loss of integrity—or were recorded without being evaluated.
As a result of the field survey, one property on the project site, the Gillig Brother bus manufacturing facility, was recorded and evaluated for historical resources eligibility on California Department of Parks and Recreation (DPR) 523 series forms. The property is an industrial facility consisting of five large industrial and office buildings and six smaller ancillary buildings. Among these, the Manufacturing Building and a nearby ancillary building, both completed by 1968, are the oldest buildings on the property. The Manufacturing Building is a sprawling, highly altered industrial building. Its irregular plan owes to the successive additions constructed on the north, east, and west elevations between 1968 and 2004. Constructed between 1968 and 1974, the Fabrication and Machining Building is utilitarian industrial building is a prefabricated industrial building. It has also been subject to multiple additions, the last of which was a sizable rear extension built sometime between 1993 and 2002. As detailed further in Appendix D, the study ultimately concluded the

Environmental Checklist Cultural Resources
Initial Study 53
property was ineligible for listing in the NRHP, CRHR, or for local designation due to a lack of architectural or historical significance and integrity.
Impact Analysis
a. Would the project cause a substantial adverse change in the significance of a historical resource pursuant to §15064.5?
The proposed project involves demolition of the four existing on-site structures. One property within the project site was recorded and evaluated through the field survey completed for this project, the former Gillig Brother bus manufacturing facility at 25800 and 25858 Clawiter Road. As discussed in the Cultural Resources Study included in Appendix D, the property is recommended ineligible for federal, state, and local designation as a result of this study and therefore does not qualify as a historical resource under CEQA. The CHRIS records search also confirmed that the Union Pacific Railroad (P-01-001783) intersects the project site. Other segments of this linear resource have been previously evaluated and have been found eligible or ineligible for federal and state designation. However, regardless of any potential historical resources eligibility the segment intersecting the project site may possess, the project would not directly affect the resource. Further, the setting of the rail line has substantially changed since the historic period and the proposed development would be consistent with the resource’s current setting. As such, the project would not cause a substantial adverse change in the significance of a historical resource pursuant to §15064.5
NO IMPACT
b. Would the project cause a substantial adverse change in the significance of an archaeological resource pursuant to §15064.5?
The project site and off-site transmission line route have been disturbed by previous development and no archaeological resources have been recorded within the project site. Rincon Consultants archaeologists reviewed historical aerials and topographic maps from HistoricAerials.com. These images were reviewed to identify potential cultural resource concerns on the project site. Aerial imagery from 1946 to 1966 depicts the project site as undeveloped land next to the Union Pacific Railroad with development emerging by 1968 (NETR Online 2020). Imagery from 1980 to 2002 depict the project site through further development into its current condition. Historic topographic maps from 1899 to 1966 confirm the site’s history of undeveloped land with the Union Pacific Railroad to the east-northeast. The 1969 historic topographic map depicts the project site with emerging development through the 1980 topographic map. The project site has been disturbed by grading and site preparation as well as construction of the buildings and surface parking lots.
Although no archaeological resources are known to exist within the project site, there is always the possibility of unanticipated discoveries during ground disturbance. Impacts to unknown archaeological resources would be potentially significant and mitigation measures would be required.
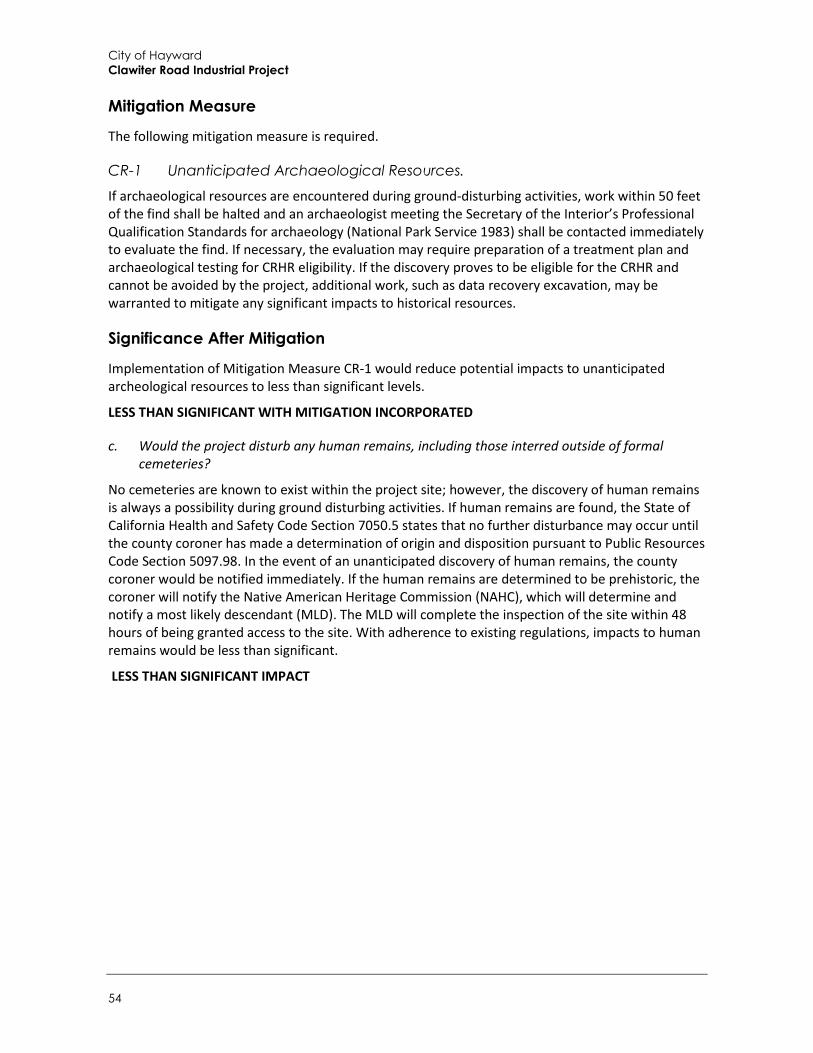
City of Hayward Clawiter Road Industrial Project
54
Mitigation Measure
The following mitigation measure is required.
CR-1 Unanticipated Archaeological Resources. If archaeological resources are encountered during ground-disturbing activities, work within 50 feet of the find shall be halted and an archaeologist meeting the Secretary of the Interior’s Professional Qualification Standards for archaeology (National Park Service 1983) shall be contacted immediately to evaluate the find. If necessary, the evaluation may require preparation of a treatment plan and archaeological testing for CRHR eligibility. If the discovery proves to be eligible for the CRHR and cannot be avoided by the project, additional work, such as data recovery excavation, may be warranted to mitigate any significant impacts to historical resources.
Significance After Mitigation
Implementation of Mitigation Measure CR-1 would reduce potential impacts to unanticipated archeological resources to less than significant levels.
LESS THAN SIGNIFICANT WITH MITIGATION INCORPORATED
c. Would the project disturb any human remains, including those interred outside of formal cemeteries?
No cemeteries are known to exist within the project site; however, the discovery of human remains is always a possibility during ground disturbing activities. If human remains are found, the State of California Health and Safety Code Section 7050.5 states that no further disturbance may occur until the county coroner has made a determination of origin and disposition pursuant to Public Resources Code Section 5097.98. In the event of an unanticipated discovery of human remains, the county coroner would be notified immediately. If the human remains are determined to be prehistoric, the coroner will notify the Native American Heritage Commission (NAHC), which will determine and notify a most likely descendant (MLD). The MLD will complete the inspection of the site within 48 hours of being granted access to the site. With adherence to existing regulations, impacts to human remains would be less than significant.
LESS THAN SIGNIFICANT IMPACT
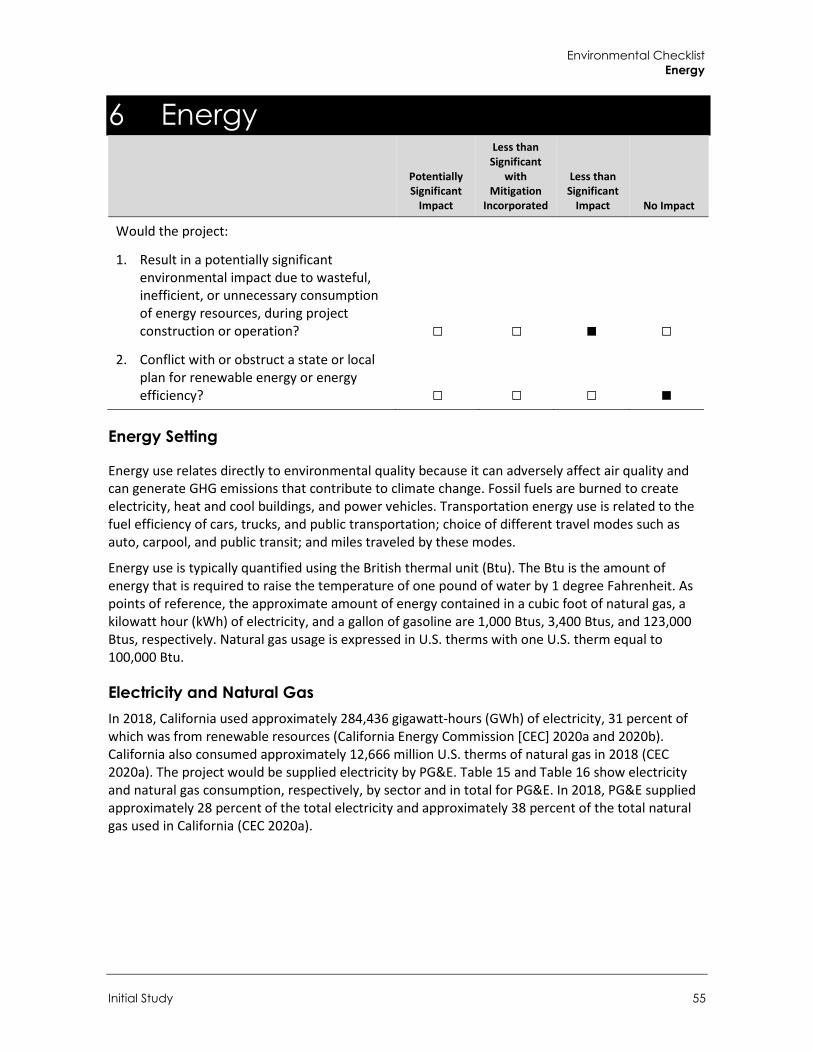
Environmental Checklist Energy
Initial Study 55
6 Energy
Potentially Significant
Impact
Less than Significant
with Mitigation
Incorporated
Less than Significant
Impact No Impact
Would the project:
1. Result in a potentially significant environmental impact due to wasteful, inefficient, or unnecessary consumption of energy resources, during project construction or operation? □ □ ■ □
2. Conflict with or obstruct a state or local plan for renewable energy or energy efficiency? □ □ □ ■
Energy Setting
Energy use relates directly to environmental quality because it can adversely affect air quality and can generate GHG emissions that contribute to climate change. Fossil fuels are burned to create electricity, heat and cool buildings, and power vehicles. Transportation energy use is related to the fuel efficiency of cars, trucks, and public transportation; choice of different travel modes such as auto, carpool, and public transit; and miles traveled by these modes.
Energy use is typically quantified using the British thermal unit (Btu). The Btu is the amount of energy that is required to raise the temperature of one pound of water by 1 degree Fahrenheit. As points of reference, the approximate amount of energy contained in a cubic foot of natural gas, a kilowatt hour (kWh) of electricity, and a gallon of gasoline are 1,000 Btus, 3,400 Btus, and 123,000 Btus, respectively. Natural gas usage is expressed in U.S. therms with one U.S. therm equal to 100,000 Btu.
Electricity and Natural Gas In 2018, California used approximately 284,436 gigawatt-hours (GWh) of electricity, 31 percent of which was from renewable resources (California Energy Commission [CEC] 2020a and 2020b). California also consumed approximately 12,666 million U.S. therms of natural gas in 2018 (CEC 2020a). The project would be supplied electricity by PG&E. Table 15 and Table 16 show electricity and natural gas consumption, respectively, by sector and in total for PG&E. In 2018, PG&E supplied approximately 28 percent of the total electricity and approximately 38 percent of the total natural gas used in California (CEC 2020a).
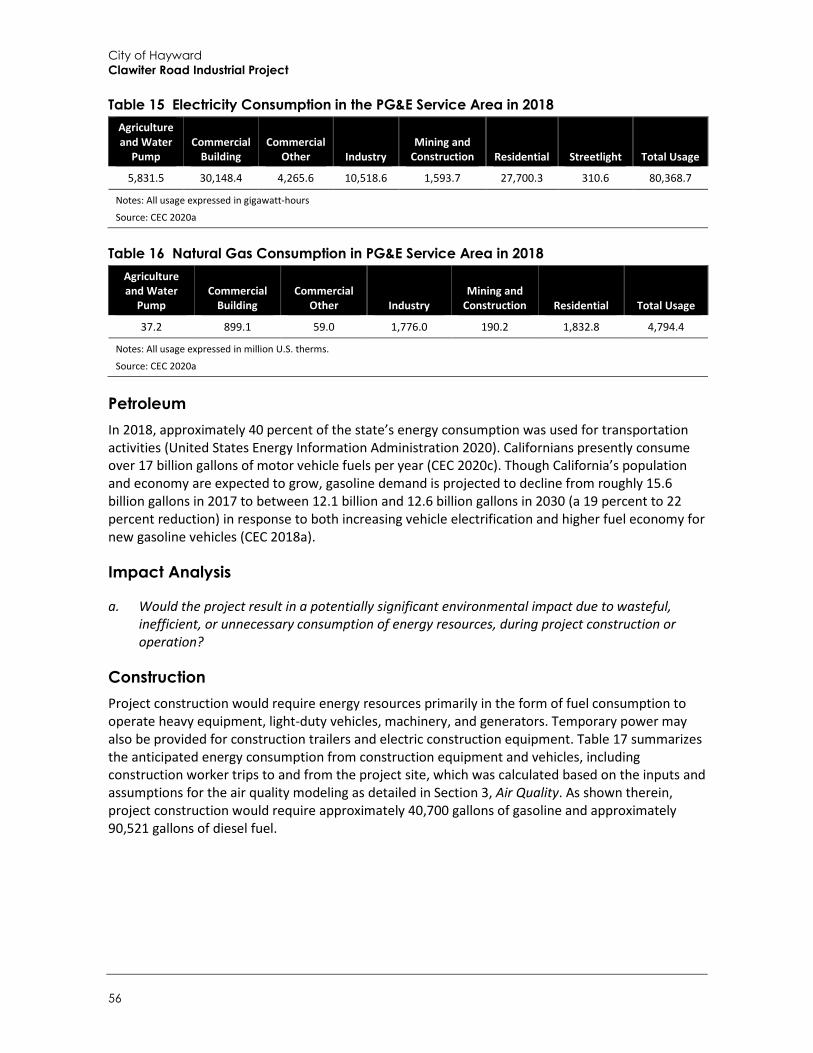
City of Hayward Clawiter Road Industrial Project
56
Table 15 Electricity Consumption in the PG&E Service Area in 2018 Agriculture and Water
Pump Commercial
Building Commercial
Other Industry Mining and
Construction Residential Streetlight Total Usage
5,831.5 30,148.4 4,265.6 10,518.6 1,593.7 27,700.3 310.6 80,368.7
Notes: All usage expressed in gigawatt-hours
Source: CEC 2020a
Table 16 Natural Gas Consumption in PG&E Service Area in 2018 Agriculture and Water
Pump Commercial
Building Commercial
Other Industry Mining and
Construction Residential Total Usage
37.2 899.1 59.0 1,776.0 190.2 1,832.8 4,794.4
Notes: All usage expressed in million U.S. therms.
Source: CEC 2020a
Petroleum In 2018, approximately 40 percent of the state’s energy consumption was used for transportation activities (United States Energy Information Administration 2020). Californians presently consume over 17 billion gallons of motor vehicle fuels per year (CEC 2020c). Though California’s population and economy are expected to grow, gasoline demand is projected to decline from roughly 15.6 billion gallons in 2017 to between 12.1 billion and 12.6 billion gallons in 2030 (a 19 percent to 22 percent reduction) in response to both increasing vehicle electrification and higher fuel economy for new gasoline vehicles (CEC 2018a).
Impact Analysis
a. Would the project result in a potentially significant environmental impact due to wasteful, inefficient, or unnecessary consumption of energy resources, during project construction or operation?
Construction Project construction would require energy resources primarily in the form of fuel consumption to operate heavy equipment, light-duty vehicles, machinery, and generators. Temporary power may also be provided for construction trailers and electric construction equipment. Table 17 summarizes the anticipated energy consumption from construction equipment and vehicles, including construction worker trips to and from the project site, which was calculated based on the inputs and assumptions for the air quality modeling as detailed in Section 3, Air Quality. As shown therein, project construction would require approximately 40,700 gallons of gasoline and approximately 90,521 gallons of diesel fuel.
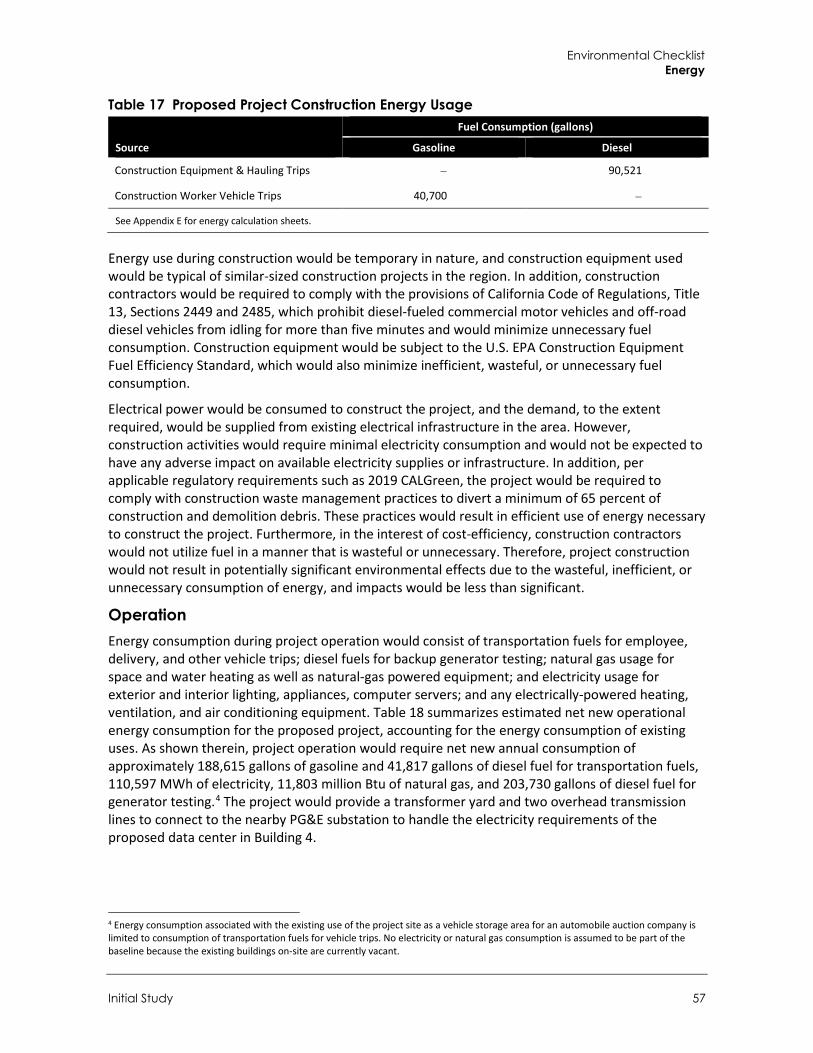
Environmental Checklist Energy
Initial Study 57
Table 17 Proposed Project Construction Energy Usage
Source
Fuel Consumption (gallons)
Gasoline Diesel
Construction Equipment & Hauling Trips − 90,521
Construction Worker Vehicle Trips 40,700 −
See Appendix E for energy calculation sheets.
Energy use during construction would be temporary in nature, and construction equipment used would be typical of similar-sized construction projects in the region. In addition, construction contractors would be required to comply with the provisions of California Code of Regulations, Title 13, Sections 2449 and 2485, which prohibit diesel-fueled commercial motor vehicles and off-road diesel vehicles from idling for more than five minutes and would minimize unnecessary fuel consumption. Construction equipment would be subject to the U.S. EPA Construction Equipment Fuel Efficiency Standard, which would also minimize inefficient, wasteful, or unnecessary fuel consumption.
Electrical power would be consumed to construct the project, and the demand, to the extent required, would be supplied from existing electrical infrastructure in the area. However, construction activities would require minimal electricity consumption and would not be expected to have any adverse impact on available electricity supplies or infrastructure. In addition, per applicable regulatory requirements such as 2019 CALGreen, the project would be required to comply with construction waste management practices to divert a minimum of 65 percent of construction and demolition debris. These practices would result in efficient use of energy necessary to construct the project. Furthermore, in the interest of cost-efficiency, construction contractors would not utilize fuel in a manner that is wasteful or unnecessary. Therefore, project construction would not result in potentially significant environmental effects due to the wasteful, inefficient, or unnecessary consumption of energy, and impacts would be less than significant.
Operation Energy consumption during project operation would consist of transportation fuels for employee, delivery, and other vehicle trips; diesel fuels for backup generator testing; natural gas usage for space and water heating as well as natural-gas powered equipment; and electricity usage for exterior and interior lighting, appliances, computer servers; and any electrically-powered heating, ventilation, and air conditioning equipment. Table 18 summarizes estimated net new operational energy consumption for the proposed project, accounting for the energy consumption of existing uses. As shown therein, project operation would require net new annual consumption of approximately 188,615 gallons of gasoline and 41,817 gallons of diesel fuel for transportation fuels, 110,597 MWh of electricity, 11,803 million Btu of natural gas, and 203,730 gallons of diesel fuel for generator testing.4 The project would provide a transformer yard and two overhead transmission lines to connect to the nearby PG&E substation to handle the electricity requirements of the proposed data center in Building 4.
4 Energy consumption associated with the existing use of the project site as a vehicle storage area for an automobile auction company is limited to consumption of transportation fuels for vehicle trips. No electricity or natural gas consumption is assumed to be part of the baseline because the existing buildings on-site are currently vacant.
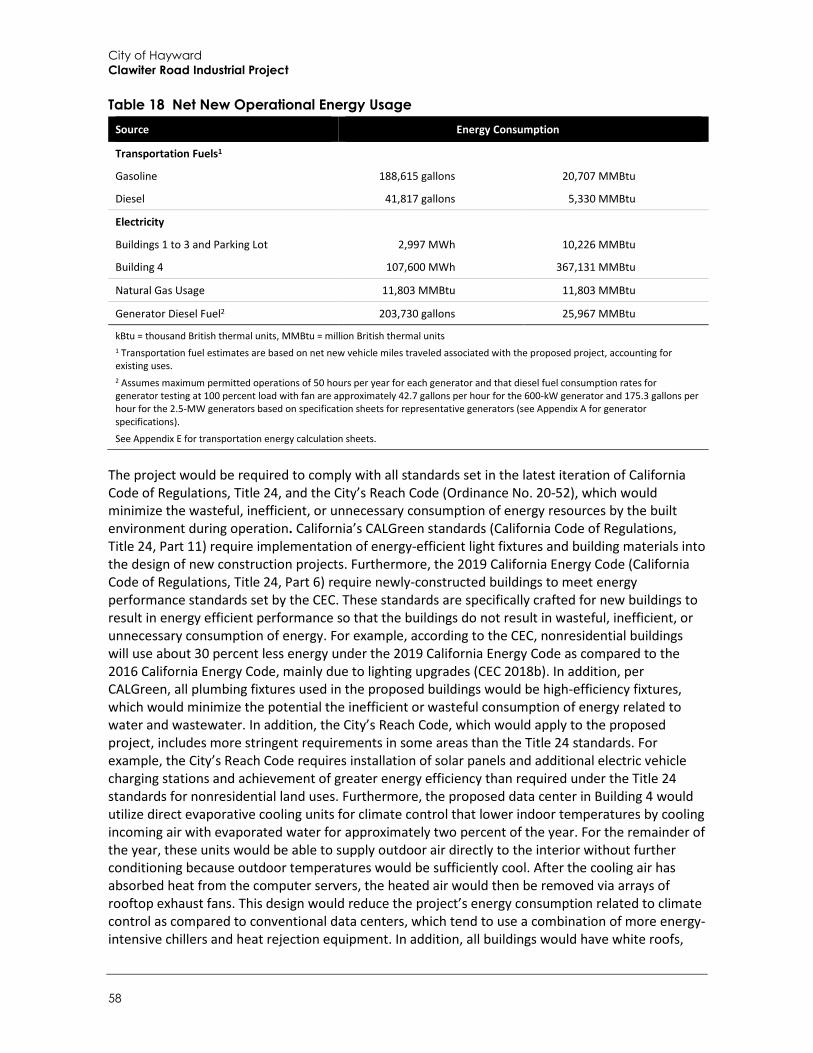
City of Hayward Clawiter Road Industrial Project
58
Table 18 Net New Operational Energy Usage Source Energy Consumption
Transportation Fuels1
Gasoline 188,615 gallons 20,707 MMBtu
Diesel 41,817 gallons 5,330 MMBtu
Electricity
Buildings 1 to 3 and Parking Lot 2,997 MWh 10,226 MMBtu
Building 4 107,600 MWh 367,131 MMBtu
Natural Gas Usage 11,803 MMBtu 11,803 MMBtu
Generator Diesel Fuel2 203,730 gallons 25,967 MMBtu
kBtu = thousand British thermal units, MMBtu = million British thermal units 1 Transportation fuel estimates are based on net new vehicle miles traveled associated with the proposed project, accounting for existing uses. 2 Assumes maximum permitted operations of 50 hours per year for each generator and that diesel fuel consumption rates for generator testing at 100 percent load with fan are approximately 42.7 gallons per hour for the 600-kW generator and 175.3 gallons per hour for the 2.5-MW generators based on specification sheets for representative generators (see Appendix A for generator specifications).
See Appendix E for transportation energy calculation sheets.
The project would be required to comply with all standards set in the latest iteration of California Code of Regulations, Title 24, and the City’s Reach Code (Ordinance No. 20-52), which would minimize the wasteful, inefficient, or unnecessary consumption of energy resources by the built environment during operation. California’s CALGreen standards (California Code of Regulations, Title 24, Part 11) require implementation of energy-efficient light fixtures and building materials into the design of new construction projects. Furthermore, the 2019 California Energy Code (California Code of Regulations, Title 24, Part 6) require newly-constructed buildings to meet energy performance standards set by the CEC. These standards are specifically crafted for new buildings to result in energy efficient performance so that the buildings do not result in wasteful, inefficient, or unnecessary consumption of energy. For example, according to the CEC, nonresidential buildings will use about 30 percent less energy under the 2019 California Energy Code as compared to the 2016 California Energy Code, mainly due to lighting upgrades (CEC 2018b). In addition, per CALGreen, all plumbing fixtures used in the proposed buildings would be high-efficiency fixtures, which would minimize the potential the inefficient or wasteful consumption of energy related to water and wastewater. In addition, the City’s Reach Code, which would apply to the proposed project, includes more stringent requirements in some areas than the Title 24 standards. For example, the City’s Reach Code requires installation of solar panels and additional electric vehicle charging stations and achievement of greater energy efficiency than required under the Title 24 standards for nonresidential land uses. Furthermore, the proposed data center in Building 4 would utilize direct evaporative cooling units for climate control that lower indoor temperatures by cooling incoming air with evaporated water for approximately two percent of the year. For the remainder of the year, these units would be able to supply outdoor air directly to the interior without further conditioning because outdoor temperatures would be sufficiently cool. After the cooling air has absorbed heat from the computer servers, the heated air would then be removed via arrays of rooftop exhaust fans. This design would reduce the project’s energy consumption related to climate control as compared to conventional data centers, which tend to use a combination of more energy-intensive chillers and heat rejection equipment. In addition, all buildings would have white roofs,
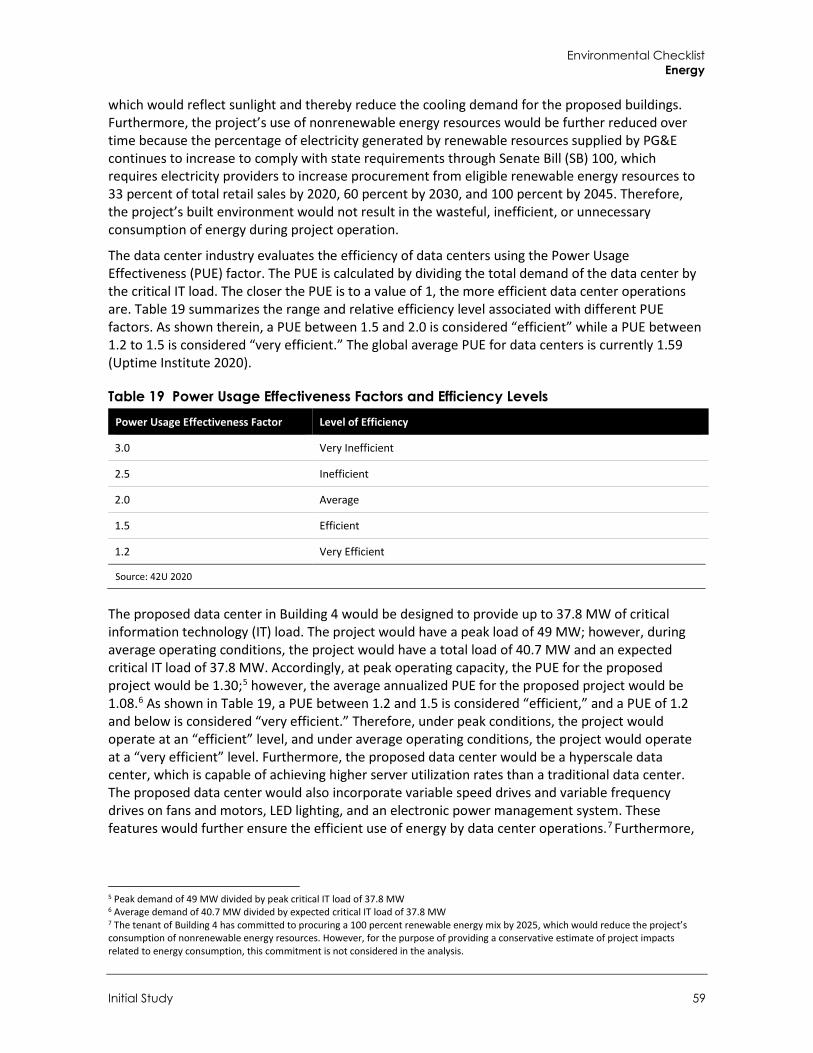
Environmental Checklist Energy
Initial Study 59
which would reflect sunlight and thereby reduce the cooling demand for the proposed buildings. Furthermore, the project’s use of nonrenewable energy resources would be further reduced over time because the percentage of electricity generated by renewable resources supplied by PG&E continues to increase to comply with state requirements through Senate Bill (SB) 100, which requires electricity providers to increase procurement from eligible renewable energy resources to 33 percent of total retail sales by 2020, 60 percent by 2030, and 100 percent by 2045. Therefore, the project’s built environment would not result in the wasteful, inefficient, or unnecessary consumption of energy during project operation.
The data center industry evaluates the efficiency of data centers using the Power Usage Effectiveness (PUE) factor. The PUE is calculated by dividing the total demand of the data center by the critical IT load. The closer the PUE is to a value of 1, the more efficient data center operations are. Table 19 summarizes the range and relative efficiency level associated with different PUE factors. As shown therein, a PUE between 1.5 and 2.0 is considered “efficient” while a PUE between 1.2 to 1.5 is considered “very efficient.” The global average PUE for data centers is currently 1.59 (Uptime Institute 2020).
Table 19 Power Usage Effectiveness Factors and Efficiency Levels Power Usage Effectiveness Factor Level of Efficiency
3.0 Very Inefficient
2.5 Inefficient
2.0 Average
1.5 Efficient
1.2 Very Efficient
Source: 42U 2020
The proposed data center in Building 4 would be designed to provide up to 37.8 MW of critical information technology (IT) load. The project would have a peak load of 49 MW; however, during average operating conditions, the project would have a total load of 40.7 MW and an expected critical IT load of 37.8 MW. Accordingly, at peak operating capacity, the PUE for the proposed project would be 1.30;5 however, the average annualized PUE for the proposed project would be 1.08.6 As shown in Table 19, a PUE between 1.2 and 1.5 is considered “efficient,” and a PUE of 1.2 and below is considered “very efficient.” Therefore, under peak conditions, the project would operate at an “efficient” level, and under average operating conditions, the project would operate at a “very efficient” level. Furthermore, the proposed data center would be a hyperscale data center, which is capable of achieving higher server utilization rates than a traditional data center. The proposed data center would also incorporate variable speed drives and variable frequency drives on fans and motors, LED lighting, and an electronic power management system. These features would further ensure the efficient use of energy by data center operations.7 Furthermore,
5 Peak demand of 49 MW divided by peak critical IT load of 37.8 MW 6 Average demand of 40.7 MW divided by expected critical IT load of 37.8 MW 7 The tenant of Building 4 has committed to procuring a 100 percent renewable energy mix by 2025, which would reduce the project’s consumption of nonrenewable energy resources. However, for the purpose of providing a conservative estimate of project impacts related to energy consumption, this commitment is not considered in the analysis.
City of Hayward Clawiter Road Industrial Project
60
the proposed data center operations would not result in the wasteful, inefficient, or unnecessary consumption of electricity.
The project would include Clean Air/EV spaces in accordance with the requirements of the City’s Reach Code, which would encourage the use of electric vehicles and reduce gasoline fuel consumption by employee vehicle trips. In addition, the project would include 40 bicycle parking spaces that would facilitate employees’ use of alternative transportation. Furthermore, the project would include employee amenity areas, including seating, an area for potential food truck parking, and a fitness system, which would reduce employee vehicle trips to off-site destinations during the work day. In addition, because use of the backup generators would be limited to routine maintenance and extended power outages, deliveries to re-supply diesel fuel stored on-site would be infrequent and only on an as-needed basis. In addition, vehicles driven by future employees of the project would be subject to increasingly stringent federal and state fuel efficiency standards, minimizing the potential for the inefficient consumption of vehicle fuels. Therefore, transportation fuel consumption by employee and delivery vehicle trips would not be wasteful, inefficient, or unnecessary.
Maintenance and emergency use of the backup generators would not result in the wasteful, inefficient, or unnecessary consumption of energy because routine maintenance would only be conducted periodically based on the minimum requirements to ensure reliability and operation would only occur during infrequent extended power outage events.
Overall, project operation would consume electricity, natural gas, and gasoline and diesel fuels. However, because of project design features that would maximize energy efficiency and conservation, overall project operation would not result in the wasteful, inefficient, or unnecessary consumption of energy resources. Therefore, operational energy impacts would be less than significant.
LESS THAN SIGNIFICANT IMPACT
b. Would the project conflict with or obstruct a state or local plan for renewable energy or energy efficiency?
Hayward’s Climate Action Plan (CAP) was adopted by the Hayward City Council on July 28, 2009 and incorporated into the City’s General Plan in 2014 (City of Hayward 2014). The purpose of the CAP is to advance Hayward in becoming a more environmentally and socially sustainable community. Those policies in the CAP specifically pertaining to energy efficiency and renewable energy include NR-4.1 through NR-4.15 relating to energy-efficient design of new development and renewable energy generation. As detailed further in Section 8, Greenhouse Gas Emissions, the proposed project would be consistent with applicable policies from the City’s CAP. In addition, as described under question (a), the project would implement a host of energy efficiency design measures. Therefore, the proposed project would not interfere with the energy-related measures of the CAP and therefore would not conflict with or obstruct a state or local plan for renewable energy or energy efficiency. As such, no impact would occur.
NO IMPACT
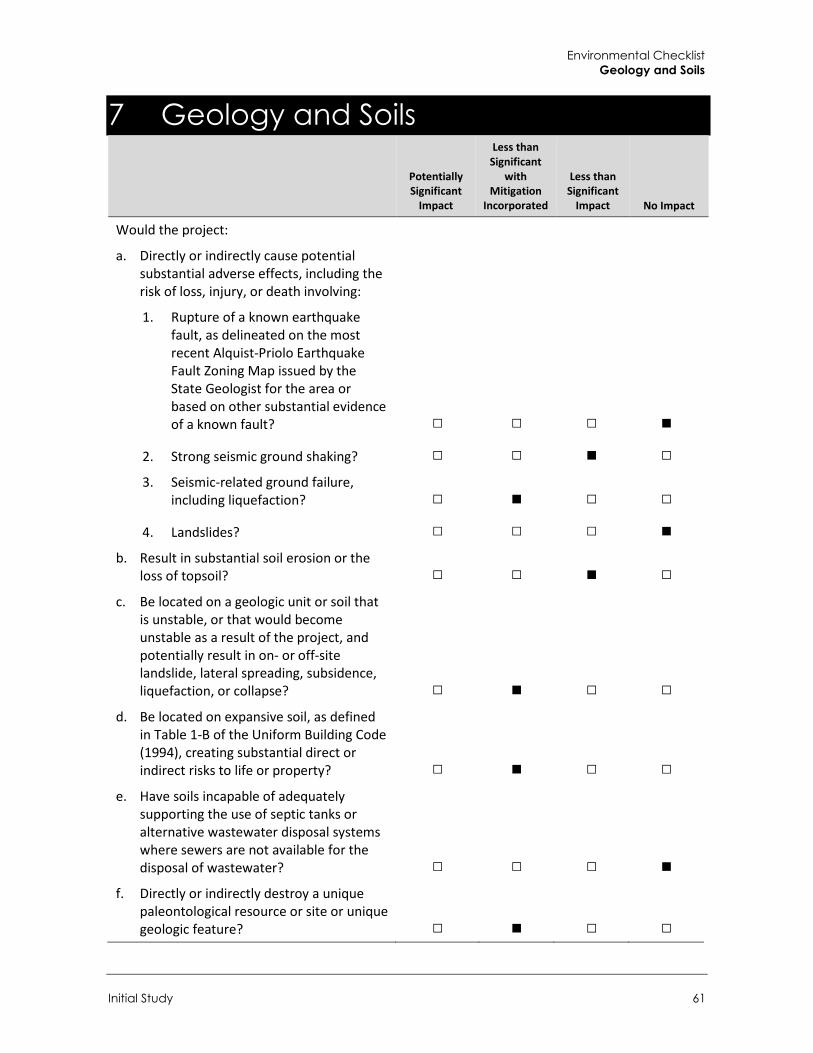
Environmental Checklist Geology and Soils
Initial Study 61
7 Geology and Soils
Potentially Significant
Impact
Less than Significant
with Mitigation
Incorporated
Less than Significant
Impact No Impact
Would the project:
a. Directly or indirectly cause potential substantial adverse effects, including the risk of loss, injury, or death involving: 1. Rupture of a known earthquake
fault, as delineated on the most recent Alquist-Priolo Earthquake Fault Zoning Map issued by the State Geologist for the area or based on other substantial evidence of a known fault? □ □ □ ■
2. Strong seismic ground shaking? □ □ ■ □ 3. Seismic-related ground failure,
including liquefaction? □ ■ □ □
4. Landslides? □ □ □ ■ b. Result in substantial soil erosion or the
loss of topsoil? □ □ ■ □ c. Be located on a geologic unit or soil that
is unstable, or that would become unstable as a result of the project, and potentially result in on- or off-site landslide, lateral spreading, subsidence, liquefaction, or collapse? □ ■ □ □
d. Be located on expansive soil, as defined in Table 1-B of the Uniform Building Code (1994), creating substantial direct or indirect risks to life or property? □ ■ □ □
e. Have soils incapable of adequately supporting the use of septic tanks or alternative wastewater disposal systems where sewers are not available for the disposal of wastewater? □ □ □ ■
f. Directly or indirectly destroy a unique paleontological resource or site or unique geologic feature? □ ■ □ □
City of Hayward Clawiter Road Industrial Project
62
Setting Geotechnical Investigations for the proposed project were prepared by Cornerstone Earth Group in January 2020. One report was prepared for Buildings 1, 2, and 3 and one report was prepared for Building 4. Both reports are included in Appendix F. The purpose of the investigations were to evaluate physical and engineering properties of the subsurface soils, engineering analysis to prepare recommendations for site work and grading, building foundations, flatwork, retaining walls, and pavements. Much of the analysis in this section is based on the information in this report.
Seismic Setting Similar to much of California, the site is located in a seismically active region. The United States Geological Survey (USGS) defines active faults as those that have had surface displacement within the Holocene period (about the last 11,000 years). Surface displacement can be recognized by the existence of cliffs in alluvium, terraces, offset stream courses, fault troughs and saddles, the alignment of depressions, sag ponds, and the existence of steep mountain fronts. Potentially active faults are those that have had surface displacement during the last 1.6 million years, and inactive faults have not had surface displacement within that period. Several faults are within and near the site, including the San Andreas Fault and the Hayward Fault. The Hayward Fault is the closest major fault to the project site and is one of ten major faults that make up the San Andreas Fault Zone. As a result of its location and geologic setting, the City of Hayward is subject to a variety of seismic and geologic hazards, including fault rupture, strong ground shaking, liquefaction, and landslides.
Ground Shaking
Seismically induced ground shaking covers a wide area and is greatly influenced by the distance of the site to the seismic source, soil conditions, and depth to groundwater. The USGS and Associated Bay Area Governments (ABAG) have worked together to map the likely intensity of ground-shaking throughout the Bay Area under various earthquake scenarios. The most intense ground-shaking scenario mapped in the Bay Area assumes a 6.9 magnitude earthquake on the Hayward Fault system. The predicted ground-shaking from such an earthquake would be “very violent” or “violent” throughout the City of Hayward (ABAG 2016).
Liquefaction and Seismically Induced Settlement Liquefaction is defined as the sudden loss of soil strength due to a rapid increase in soil pore water pressure resulting from seismic ground shaking. Liquefaction potential is dependent on such factors as soil type, depth to ground water, degree of seismic shaking, and the relative density of the soil. When liquefaction of the soil occurs, buildings and other objects on the ground surface may tilt or sink, and lightweight buried structures (such as pipelines) may float toward the ground surface. Liquefied soil may be unable to support its own weight or that of structures, which could result in loss of foundation bearing or differential settlement. Liquefaction may also result in cracks in the ground surface followed by the emergence of a sand-water mixture. Figure 9-2 of the 2040 General Plan Background Report shows that the project site is located in an area of liquefaction potential (City of Hayward 2014b).
Landslides
Landslides result when the driving forces that act on a slope (i.e., the weight of the slope material, and the weight of objects placed on it) are greater than the slope’s natural resisting forces (i.e., the shear strength of the slope material). Slope instability may result from natural processes, such as
Environmental Checklist Geology and Soils
Initial Study 63
the erosion of the toe of a slope by a stream, or by ground shaking caused by an earthquake. Slopes can also be modified artificially by grading, or by the addition of water or structures to a slope. Development that occurs on a slope can substantially increase the frequency and extent of potential slope stability hazards.
Areas susceptible to landslides are typically characterized by steep, unstable slopes in weak soil/bedrock units which have a record of previous slope failure. There are numerous factors that affect the stability of the slope, including: slope height and steepness, type of materials, material strength, structural geologic relationships, ground water level, and level of seismic shaking. The project site is located in a generally flat, developed area.
Expansive Soils Expansive soils can change dramatically in volume depending on moisture content. When wet, these soils can expand; conversely, when dry, they can contract or shrink. Sources of moistures that can trigger this shrink-swell phenomenon include seasonal rainfall, landscape irrigation, utility leakage, and/or perched groundwater. Expansive soil can develop wide cracks in the dry season, and changes in soil volume have the potential to damage concrete slabs, foundations, and pavement. Special building/structure design or soil treatment are often needed in areas with expansive soils. The geotechnical investigations identify the presence of expansive soils as a potential hazard at the project site.
Erosion Erosion is the wearing away of the soil mantle by running water, wind or geologic forces. It is a naturally occurring phenomenon and ordinarily is not hazardous. However, excessive erosion can contribute to landslides, siltation of streams, undermining of foundations, and ultimately the loss of structures. Removal of vegetation tends to heighten erosion hazards. The City of Hayward enforces grading and erosion control ordinances to reduce these hazards.
Impact Analysis
a.1. Would the project directly or indirectly cause potential substantial adverse effects, including the risk of loss, injury, or death involving rupture of a known earthquake fault, as delineated on the most recent Alquist-Priolo Earthquake Fault Zoning Map issued by the State Geologist for the area or based on other substantial evidence of a known fault?
According to the California Department of Conservation (DOC) and the Geotechnical Reports, there are no known faults located on or adjacent to the project site (DOC 2020). The nearest known faults are the Hayward and Calaveras faults which are respectively 3.5 miles and 11 miles from the project site, respectively. Therefore, the proposed project would not directly or indirectly cause substantial adverse impacts associated with surface fault rupture. No impact would occur.
NO IMPACT
a.2. Would the project directly or indirectly cause potential substantial adverse effects, including the risk of loss, injury, or death involving strong seismic ground shaking?
The project site is located in an area of relatively high seismic potential. The faults in the area are capable of generating earthquakes that could produce violent to very violent ground shaking at the project site. The U.S. Geological Survey (USGS) Working Group on California Earthquake Probabilities estimates that each region of California will experience a magnitude 6.7 or larger
City of Hayward Clawiter Road Industrial Project
64
earthquake in the next 30 years. Additionally, there is a 63 percent chance of at least one magnitude 6.7 or greater earthquake occurring in the Bay Area region between 2007 and 2036 (Appendix F).
The faults considered capable of generating significant earthquakes near the project site include:
Hayward fault, 3.5 from the site Calaveras fault, 11 miles San Andreas fault, 15 miles Monte Vista-Shannon fault, 15 miles
The effects of earthquake-related ground shaking could include damage to the proposed structures, as well as damage to streets and utilities, and impacts to workers or people on the project site. However, compliance with the current CBC requirements would ensure that the proposed structures and transmissions lines would be able to: (1) resist minor earthquakes without damage; (2) resist moderate earthquakes without structural damage, but with some non-structural damage; and (3) resist major earthquakes without collapse, but with some structural as well as nonstructural damage. By adhering to applicable State and City building code requirements, the direct or indirect impacts from development of the proposed project as they relate to strong seismic ground shaking would be less than significant.
LESS THAN SIGNIFICANT IMPACT
a.3. Would the project directly or indirectly cause potential substantial adverse effects, including the risk of loss, injury, or death involving seismic-related ground failure, including liquefaction?
c. Would the project be located on a geologic unit or soil that is unstable, or that would become unstable as a result of the project, and potentially result in on- or off-site landslide, lateral spreading, subsidence, liquefaction, or collapse?
According to the Geotechnical Investigations, the northern and southern project site is not located on an area susceptible to lateral spreading. However, the northern and southern project site is located within a state-designated liquefaction zone (DOC 2020). The factors known to influence liquefaction potential include grain size, relative density, groundwater conditions, effective confining pressures, and intensity and duration of ground shaking. Loose, saturated, near-surface, cohesionless soils exhibit the highest liquefaction potential, while dense, cohesionless soils and cohesive soils exhibit low to negligible liquefaction potential. The Geotechnical Investigation indicated that there are several layers on the project site which could potentially experience liquefaction-induced settlement ranging from 0.1 to 3.1 inches for Buildings 1 through 3 and 0.46 to 0.66 for Building 4, which could result in differential settlement up 1.5 inches at the southwest portion of building 3 and 0.75 inch for the northwest and eastern portions of Building 3 and Building 1, Building 2, and Building 4 (Appendix F).
In addition, loose unsaturated sandy soils can settle during strong seismic shaking. The project site near Buildings 1 through Building 3 could experience up to 0.7 inches of movement after a strong seismic event and the project site near Building 4 could experience 0.36 inches of movement after a strong seismic event. With the potential for liquefaction and settlement, the Geotechnical Investigation concluded that from a geotechnical viewpoint, the project is feasible provided the considerations included in Mitigation Measure GEO-1 below are addressed in the project design.
Environmental Checklist Geology and Soils
Initial Study 65
Mitigation Measure The following mitigation measure is required:
GEO-1 Geotechnical Considerations The project applicant shall implement the Foundation Recommendations set forth in Section 7 (Foundations) of the Geotechnical Investigations prepared by Cornerstone Earth Group for Buildings 1, 2, 3, and 4 in January 2020. Recommendations include but are not limited to the seismic design criteria (Section 7.2) and shallow foundations (Section 7.3).
In addition, a comprehensive site-specific design-level geotechnical exploration shall be prepared as part of the design process. The exploration may include borings and laboratory soil testing to provide data for preparation of specific recommendations regarding grading, foundation design, corrosion potential, and drainage for the proposed project. The recommendations set forth in the design-level geotechnical exploration shall be implemented.
Significance After Mitigation According to the Geotechnical Investigations, the proposed structures may be supported on shallow foundations provided the specific recommendations in the reports are followed. Therefore, implementation of Mitigation Measure GEO-1 would reduce the liquefaction and unstable geologic soil impacts through foundational design to tolerate total and differential settlement. Impacts from liquefaction or unstable soils would be less than significant with implementation of mitigation.
LESS THAN SIGNIFICANT IMPACT
a.4. Would the project directly or indirectly cause potential substantial adverse effects, including the risk of loss, injury, or death involving landslides?
The project site and surroundings are generally flat and developed. There are no steep slopes located on or near the site or proposed transmission line route. Therefore, there is no potential for landslides at the site. No impact would occur.
NO IMPACT
b. Would the project result in substantial soil erosion or the loss of topsoil?
Construction of the proposed project would require earthwork activities to prepare the site for the construction of the industrial structures. As the proposed project would disturb over one acre of land, the applicant would be required to obtain coverage under the General Permit for Discharges of Storm Water Associated with Construction Activity (Construction General Permit Order 2009-0009-DWQ or 2009-0009-DWQ General Permit) to comply with Clean Water Act (CWA) National Pollutant Discharge Elimination System (NPDES) requirements. Compliance with these requirements would include preparation of a Storm Water Pollution Prevention Plan (SWPPP), which would specify Best Management Practices (BMP) to reduce erosion during construction activities. In accordance with HMC Section 10-3.705, the project applicant is also required to prepare and implement an Erosion and Sediment Control Plan to prevent illicit discharge. Appropriate erosion control and permanent site surface drainage elements per the latest California Building Code would also be implemented, which would reduce soil erosion upon completion and operation of the project. With required implementation of these plans, permits, and BMPs, substantial erosion or the loss of topsoil would not occur at the project site. Impacts would be less than significant.
LESS THAN SIGNIFICANT IMPACT
City of Hayward Clawiter Road Industrial Project
66
d. Would the project be located on expansive soil, as defined in Table 1-B of the Uniform Building Code (1994), creating substantial direct or indirect risks to life or property?
The project site contains moderately expansive soils over its entire area (Appendix F). Expansive soils can undergo significant volume change with changes in moisture content. They shrink and harden when dried and expand and soften when wetted. These soils could impact the proposed structures and development on-site. The Geotechnical Investigation concluded that from a geotechnical viewpoint, the project is feasible provided the recommendations included in Mitigation Measure GEO-1 are addressed in the project design.
Mitigation Measure
GEO-2 Geotechnical Considerations The project applicant shall implement the Grading and Foundation Recommendations set forth in Section 6 (Earthwork) and Section 7 (Foundations) of the Geotechnical Investigations for Buildings 1, 2, 3, and 4 prepared by Cornerstone Earth Group in January 2020.
In addition, a comprehensive site-specific design-level geotechnical exploration shall be prepared as part of the design process. The exploration may include borings and laboratory soil testing to provide data for preparation of specific recommendations regarding grading, foundation design, corrosion potential, and drainage for the proposed project. The recommendations set forth in the design-level geotechnical exploration shall be implemented.
Significance After Mitigation Implementation of Mitigation Measure GEO-2 would reduce expansive soils impacts by requiring slabs-on-grade to have sufficient reinforcement and be supported on a layer of non-expansive fill, footings to extend below the zone of seasonal moisture fluctuation, and limiting moisture changes in the surficial soils by using positive drainage away from buildings as well as limiting landscaping watering. Impacts from expansive soil would be less than significant with implementation of mitigation.
LESS THAN SIGNIFICANT WITH MITIGATION INCORPORATED
e. Would the project have soils incapable of adequately supporting the use of septic tanks or alternative wastewater disposal systems where sewers are not available for the disposal of wastewater?
The proposed project would not include components that would require the use of septic tanks. The proposed project would connect to the City of Hayward municipal sewer system. There would be no impact.
NO IMPACT
f. Would the project directly or indirectly destroy a unique paleontological resource or site or unique geologic feature?
The paleontological sensitivities of the geologic units underlying the project site were evaluated in order to determine if activity conducted under the proposed project could result in significant impacts to paleontological resources. The analysis was based on the results of an online paleontological locality search and review of existing information in the scientific literature concerning known fossils within geologic units mapped within the project site. Fossil collections
Environmental Checklist Geology and Soils
Initial Study 67
records from the Paleobiology Database and University of California Museum of Paleontology (UCMP) online database were reviewed for known fossil localities in Alameda County (Paleobiology Database 2020; UCMP 2020). Based on available information contained within existing scientific literature and the UCMP database, paleontological sensitivities were assigned to the geologic units underlying the project site. The potential for impacts to scientifically important paleontological resources is based on the potential for ground disturbance to directly impact paleontologically sensitive geologic units. The Society of Vertebrate Paleontology (SVP) has developed a system for assessing paleontological sensitivity and describes sedimentary rock units as having high, low, undetermined, or no potential for containing scientifically significant nonrenewable paleontological resources (SVP 2010). This system is based on rock units within which vertebrate or significant invertebrate fossils have been determined by previous studies to be present or likely to be present.
The project site is entirely mapped as Quaternary young (middle to late Holocene) alluvium (Qa), consisting of alluvial gravel, sand, and clay of valley areas, as well as gravel and sand of major stream channels (Dibblee and Minch 2005). Locally, middle to late Holocene alluvial (basin) deposits are generally very fine silty clays and clays deposited near the distal edge of alluvial fans and adjacent to Bay Mud, which may extend partially onto the western or southern edge of the site (Cornerstone Earth Group 2020; Appendix F). Quaternary young (middle to late Holocene) sedimentary deposits, particularly those younger than 5,000 years old, are generally too young to preserve paleontological resources and are determined to have a low paleontological sensitivity according to SVP standards (2010). However, middle to late Holocene deposits may grade downward into early Holocene to late Pleistocene deposits that could preserve fossil remains at moderate or unknown depths. Quaternary old (early Holocene to Pleistocene) alluvial sediments have a well-documented record of abundant and diverse vertebrate fauna throughout California. Localities have produced fossil specimens of mammoth (Mammuthus columbi), horse (Equus), camel (Camelops), and bison (Bison), as well as various birds, rodents, and reptiles (Agenbroad 2003; Jefferson 2010; Paleobiology Database 2020; Savage 1954; UCMP 2020). Therefore, Quaternary old (early Holocene to Pleistocene) alluvial deposits are assigned a high paleontological sensitivity.
Accurately assessing the boundaries between younger and older units within the project site generally requires site-specific geochronological data, some form of radiometric dating, or fossil analysis from nearby sites. Conservative estimates of the depth at which paleontologically sensitive units may occur reduces potential for impacts to paleontological resources. The depths at which these units become old enough to yield fossils is highly variable, but generally does not occur at depths of less than 10 feet.
Project-related ground disturbance would involve cut and fill activities and grading for the proposed building foundations. As discussed above, the project site is in an urbanized area and has been previously developed. Given the nature of the proposed project and existing site conditions, project-related ground disturbance (i.e., excavations) is not likely to extend below the boundary between artificial fill and native (i.e., previously undisturbed) sediments within the project site, and is thus unlikely to impact fossiliferous deposits. Although project implementation is not expected to uncover paleontological resources, a remote possibility for such resources to be uncovered exists, and therefore the potential for impacts that would be potentially significant cannot be excluded. Therefore, impacts are potentially significant and mitigation is required.
City of Hayward Clawiter Road Industrial Project
68
Mitigation Measure
GEO-2 Unanticipated Discovery of Paleontological Resources In the event an unanticipated fossil discovery is made during the course of project development, construction activity should be halted in the immediate vicinity of the fossil, and a qualified professional paleontologist should be notified and retained to evaluate the discovery, determine its significance, and determine if additional mitigation or treatment is warranted. Work in the area of the discovery will resume once the find is properly documented and authorization is given to resume construction work. Any significant paleontological resources found during construction monitoring will be prepared, identified, analyzed, and permanently curated in an approved regional museum repository under the oversight of the qualified paleontologist.
Significance After Mitigation Mitigation Measure GEO- 2 would avoid impacts to paleontological resources in the case of unanticipated fossil discoveries. This measure would apply to all phases of project construction and would reduce the potential for impacts to unanticipated fossils present on site by providing for the recovery, identification, and curation of paleontological resources.
LESS THAN SIGNIFICANT WITH MITIGATION INCORPORATED
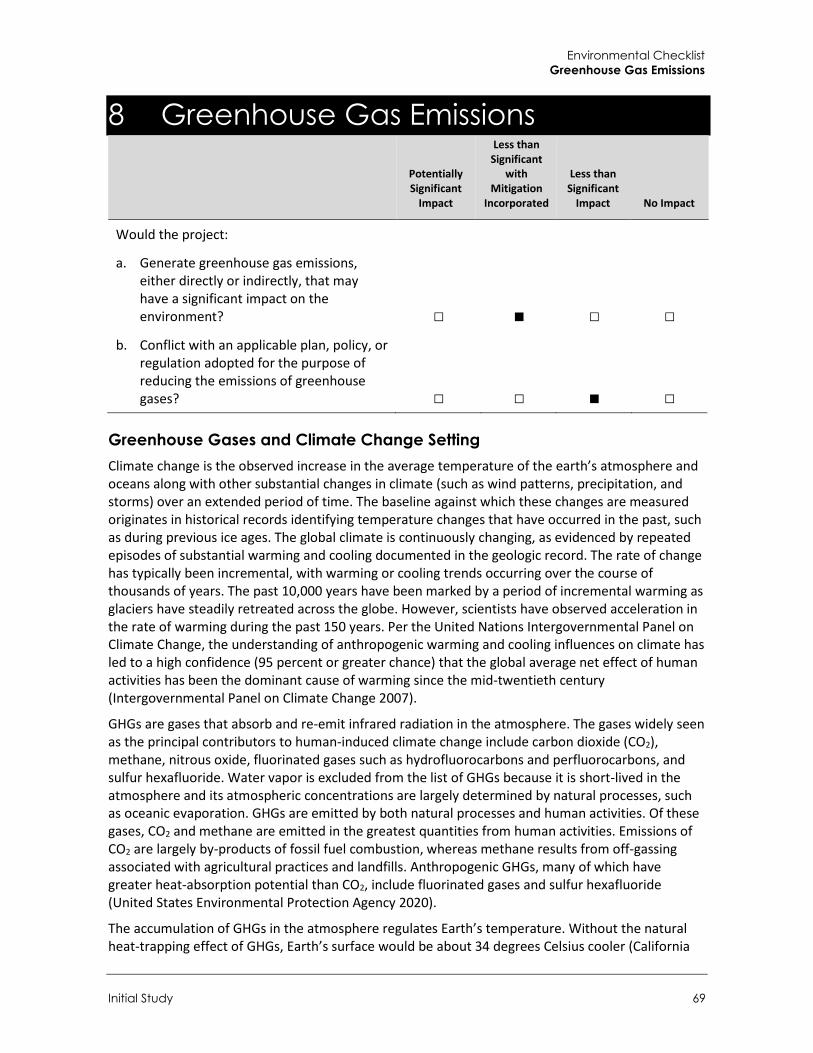
Environmental Checklist Greenhouse Gas Emissions
Initial Study 69
8 Greenhouse Gas Emissions
Potentially Significant
Impact
Less than Significant
with Mitigation
Incorporated
Less than Significant
Impact No Impact
Would the project:
a. Generate greenhouse gas emissions, either directly or indirectly, that may have a significant impact on the environment? □ ■ □ □
b. Conflict with an applicable plan, policy, or regulation adopted for the purpose of reducing the emissions of greenhouse gases? □ □ ■ □
Greenhouse Gases and Climate Change Setting Climate change is the observed increase in the average temperature of the earth’s atmosphere and oceans along with other substantial changes in climate (such as wind patterns, precipitation, and storms) over an extended period of time. The baseline against which these changes are measured originates in historical records identifying temperature changes that have occurred in the past, such as during previous ice ages. The global climate is continuously changing, as evidenced by repeated episodes of substantial warming and cooling documented in the geologic record. The rate of change has typically been incremental, with warming or cooling trends occurring over the course of thousands of years. The past 10,000 years have been marked by a period of incremental warming as glaciers have steadily retreated across the globe. However, scientists have observed acceleration in the rate of warming during the past 150 years. Per the United Nations Intergovernmental Panel on Climate Change, the understanding of anthropogenic warming and cooling influences on climate has led to a high confidence (95 percent or greater chance) that the global average net effect of human activities has been the dominant cause of warming since the mid-twentieth century (Intergovernmental Panel on Climate Change 2007).
GHGs are gases that absorb and re-emit infrared radiation in the atmosphere. The gases widely seen as the principal contributors to human-induced climate change include carbon dioxide (CO2), methane, nitrous oxide, fluorinated gases such as hydrofluorocarbons and perfluorocarbons, and sulfur hexafluoride. Water vapor is excluded from the list of GHGs because it is short-lived in the atmosphere and its atmospheric concentrations are largely determined by natural processes, such as oceanic evaporation. GHGs are emitted by both natural processes and human activities. Of these gases, CO2 and methane are emitted in the greatest quantities from human activities. Emissions of CO2 are largely by-products of fossil fuel combustion, whereas methane results from off-gassing associated with agricultural practices and landfills. Anthropogenic GHGs, many of which have greater heat-absorption potential than CO2, include fluorinated gases and sulfur hexafluoride (United States Environmental Protection Agency 2020).
The accumulation of GHGs in the atmosphere regulates Earth’s temperature. Without the natural heat-trapping effect of GHGs, Earth’s surface would be about 34 degrees Celsius cooler (California
City of Hayward Clawiter Road Industrial Project
70
Environmental Protection Agency 2006). However, emissions from human activities, particularly the consumption of fossil fuels for electricity production and transportation, have elevated the concentration of GHGs in the atmosphere beyond the level of naturally occurring concentrations. Scientific modeling predicts that continued GHG emissions at or above current rates would induce more extreme climate changes during the 21st century than were observed during the 20th century. Some of the potential impacts of climate change in California may include loss of snowpack, sea level rise, more extreme heat days per year, more high ozone days, more large forest fires, and more drought years (State of California 2018). While these potential impacts identify the possible effects of climate change at a statewide level, in general, scientific modeling tools are currently unable to predict what impacts would occur locally.
The City of Hayward completed a baseline 2005 GHG emissions inventory that estimated communitywide emissions of 1,183,279 metric tons (MT) of CO2 equivalents (CO2e) per year. The primary emissions sources were transportation (approximately 62 percent), commercial/industrial energy (approximately 20 percent), and residential energy (approximately 13 percent; City of Hayward 2013). The City has adopted GHG reduction goals of 20 percent below 2005 emission levels by 2020, 30 percent below 2005 emission levels by 2025, and 55 percent below 2005 emission levels by 2030. The City is also striving to achieve carbon neutrality by 2045 (City of Hayward 2020a).
Methodology GHG emissions for project construction and operation were calculated using CalEEMod version 2016.3.2. CalEEMod calculates emissions of CO2, methane, and nitrous oxide associated with construction activities, energy use, area sources, waste generation, and water use and conveyance as well as emissions of CO2 and methane associated with mobile sources. Operational emissions were modeled for the year 2030 to be consistent with the State’s next GHG emission reduction milestone target of achieving 40 percent reduction in 1990 GHG emission levels by 2030. Emissions of all GHGs are converted into their equivalent global warming potential in terms of CO2 (i.e., CO2e).
Electricity emissions are calculated by multiplying the energy use times the carbon intensity of the utility district per kilowatt hour (California Air Pollution Control Officers Association 2017). The project would be served by PG&E; therefore, PG&E’s specific energy intensity factors (i.e., the amount of CO2, methane, and nitrous oxide per kilowatt-hour) are used in the calculations of GHG emissions. The energy intensity factors included in CalEEMod are based on 2009 data by default at which time PG&E had only achieved a 14.1 percent procurement of renewable energy. Per SB 100, the statewide Renewable Portfolio Standard (RPS) Program requires electricity providers to increase procurement from eligible renewable energy sources to 60 percent by 2030. To account for the continuing effects of the RPS, the energy intensity factors included in CalEEMod were reduced based on the percentage of renewables reported by PG&E. PG&E energy intensity factors that include this reduction are shown in Table 20.
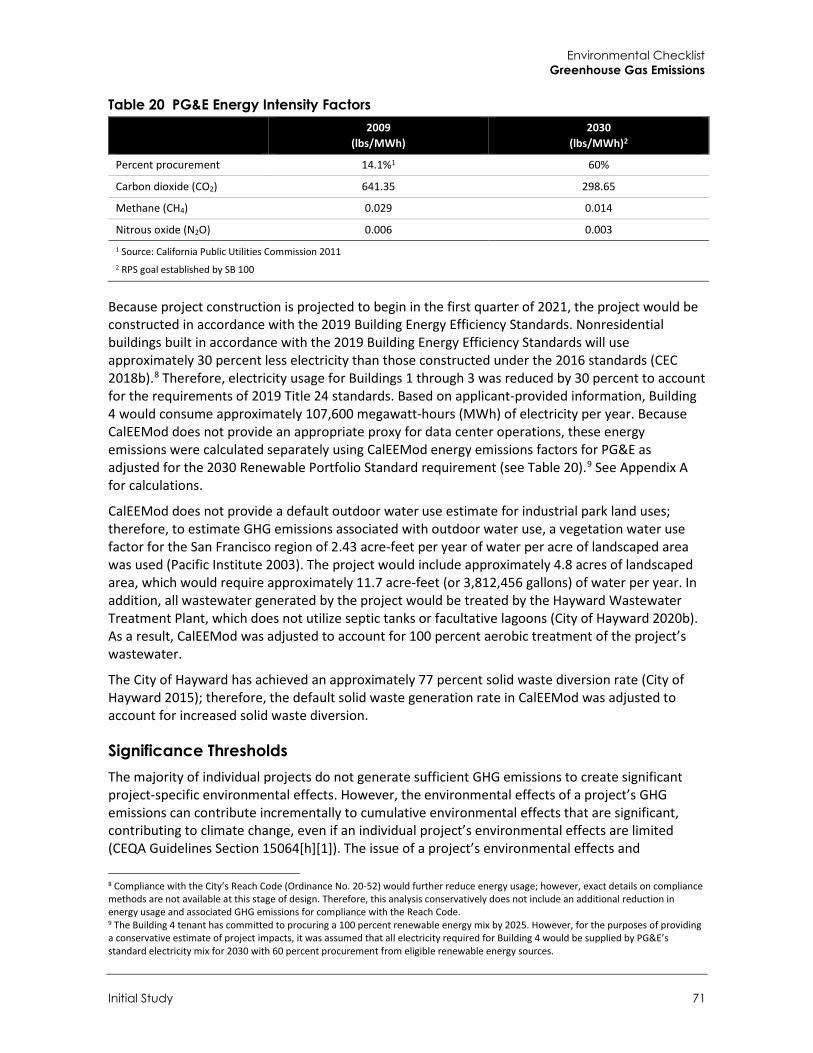
Environmental Checklist Greenhouse Gas Emissions
Initial Study 71
Table 20 PG&E Energy Intensity Factors
2009
(lbs/MWh) 2030
(lbs/MWh)2
Percent procurement 14.1%1 60%
Carbon dioxide (CO2) 641.35 298.65
Methane (CH4) 0.029 0.014
Nitrous oxide (N2O) 0.006 0.003 1 Source: California Public Utilities Commission 2011 2 RPS goal established by SB 100
Because project construction is projected to begin in the first quarter of 2021, the project would be constructed in accordance with the 2019 Building Energy Efficiency Standards. Nonresidential buildings built in accordance with the 2019 Building Energy Efficiency Standards will use approximately 30 percent less electricity than those constructed under the 2016 standards (CEC 2018b).8 Therefore, electricity usage for Buildings 1 through 3 was reduced by 30 percent to account for the requirements of 2019 Title 24 standards. Based on applicant-provided information, Building 4 would consume approximately 107,600 megawatt-hours (MWh) of electricity per year. Because CalEEMod does not provide an appropriate proxy for data center operations, these energy emissions were calculated separately using CalEEMod energy emissions factors for PG&E as adjusted for the 2030 Renewable Portfolio Standard requirement (see Table 20).9 See Appendix A for calculations.
CalEEMod does not provide a default outdoor water use estimate for industrial park land uses; therefore, to estimate GHG emissions associated with outdoor water use, a vegetation water use factor for the San Francisco region of 2.43 acre-feet per year of water per acre of landscaped area was used (Pacific Institute 2003). The project would include approximately 4.8 acres of landscaped area, which would require approximately 11.7 acre-feet (or 3,812,456 gallons) of water per year. In addition, all wastewater generated by the project would be treated by the Hayward Wastewater Treatment Plant, which does not utilize septic tanks or facultative lagoons (City of Hayward 2020b). As a result, CalEEMod was adjusted to account for 100 percent aerobic treatment of the project’s wastewater.
The City of Hayward has achieved an approximately 77 percent solid waste diversion rate (City of Hayward 2015); therefore, the default solid waste generation rate in CalEEMod was adjusted to account for increased solid waste diversion.
Significance Thresholds The majority of individual projects do not generate sufficient GHG emissions to create significant project-specific environmental effects. However, the environmental effects of a project’s GHG emissions can contribute incrementally to cumulative environmental effects that are significant, contributing to climate change, even if an individual project’s environmental effects are limited (CEQA Guidelines Section 15064[h][1]). The issue of a project’s environmental effects and
8 Compliance with the City’s Reach Code (Ordinance No. 20-52) would further reduce energy usage; however, exact details on compliance methods are not available at this stage of design. Therefore, this analysis conservatively does not include an additional reduction in energy usage and associated GHG emissions for compliance with the Reach Code. 9 The Building 4 tenant has committed to procuring a 100 percent renewable energy mix by 2025. However, for the purposes of providing a conservative estimate of project impacts, it was assumed that all electricity required for Building 4 would be supplied by PG&E’s standard electricity mix for 2030 with 60 percent procurement from eligible renewable energy sources.
City of Hayward Clawiter Road Industrial Project
72
contribution towards climate change typically involves an analysis of whether or not a project’s contribution towards climate change is cumulatively considerable. Cumulatively considerable means that the incremental effects of an individual project are significant when viewed in connection with the effects of past projects, other current projects, and probable future projects (CEQA Guidelines Section 15064[h][1]).
According to the CEQA Guidelines, projects can tier from a qualified GHG reduction plan, which allows for project-level evaluation of GHG emissions through a comparison of the project’s consistency with the GHG reduction policies included in a qualified GHG reduction plan. This approach is considered by the Association of Environmental Professionals in their white paper, Beyond Newhall and 2020, to be the most defensible approach presently available under CEQA to determine the significance of a project’s GHG emissions (Association of Environmental Professionals 2016). The City of Hayward has developed a CAP, which has been adopted as a part of the City’s General Plan. However, the CAP does not demonstrate a pathway for the City to achieve the 40 percent reduction target by 2030 required by SB 32. Therefore, the CAP does not qualify as a GHG reduction plan under CEQA Guidelines Section 15183.5 and thus cannot be used for project tiering. In its 2017 CEQA Air Quality Guidelines, the BAAQMD outlines an approach to determine the significance of GHG emissions associated with land use development projects. For residential, commercial, industrial, and public projects, the thresholds of significance for operational-related GHG emissions are as follows:
Compliance with a qualified GHG Reduction Strategy Annual emissions less than 1,100 MT per year of CO2e Per service person emissions of 4.6 MT of CO2e per service person per year (residents +
employees)
As discussed above, the City has not adopted a qualified GHG Reduction Strategy; therefore, it is not appropriate to use the first recommended threshold of significance. The BAAQMD mass emissions threshold of 1,100 MT of CO2e per year was designed to capture 90 percent of all emissions associated with projects in the SFBAAB and require implementation of mitigation so that a considerable reduction in emissions from new projects would be achieved. According to the California Air Pollution Control Officers Association white paper CEQA & Climate Change, a quantitative threshold based on a 90 percent market capture rate is generally consistent with AB 32 (California Air Pollution Control Officers Association 2008). SB 32, codified in 2016, sets a more stringent emission reduction target of 40 percent below the 1990 level by 2030. Because the previously established threshold of 1,100 MT of CO2e was not developed to meet the targets established by SB 32, it is adjusted for the purposes of this analysis to meet the new, more stringent emission reduction target of a 40 percent reduction below the 1990 level by 2030. Because BAAQMD has not adopted a threshold for 2030 yet, this analysis uses a bright-line threshold of 660 MT of CO2e per year (equivalent to a 40 percent reduction of the 1,100 MT of CO2e per year threshold based on the State’s 2030 target). The bright-line threshold is applicable to the proposed project because the City of Hayward does not have a qualified GHG reduction plan and the project is not a residential or mixed-use project for which impacts would be more appropriately evaluated using a service population threshold to reflect per-person emission efficiency.
Environmental Checklist Greenhouse Gas Emissions
Initial Study 73
Impact Analysis
a. Would the project generate GHG emissions, either directly or indirectly, that may have a significant impact on the environment?
Construction Emissions
Project construction would generate temporary GHG emissions primarily due to the operation of construction equipment and truck trips. Site preparation and grading typically generate the greatest amount of emissions due to the use of grading equipment and soil hauling. The BAAQMD has not established a quantitative significance threshold for evaluating construction-related emissions; however, the BAAQMD does recommend quantifying and disclosing construction-related GHG emissions. Therefore, construction-related GHG emissions were quantified for informational purposes. Emissions generated by construction of the proposed project would be approximately 1,265 MT of CO2e, or approximately 42 MT of CO2e per year when amortized over a 30-year period (i.e., the lifetime of the project).
Operational Emissions Table 21 summarizes net new operational GHG emissions associated with the proposed project and shows the net increase in emissions generated by the proposed project as compared to existing uses. As shown therein, net new operational emissions associated with the proposed project would be approximately 16,772 MT of CO2e per year in year 2030, which would exceed the threshold of 660 MT of CO2e per year. Therefore, GHG emissions would be potentially significant. It is noted that the tenant of Building 4 has committed to achieving carbon neutrality by 2040; therefore, GHG emissions from Building 4 along with total project emissions would decrease accordingly after year 2030. However, in accordance with guidance provided by AEP, the project’s GHG emissions are evaluated for consistency with the State’s next milestone target year of 2030.
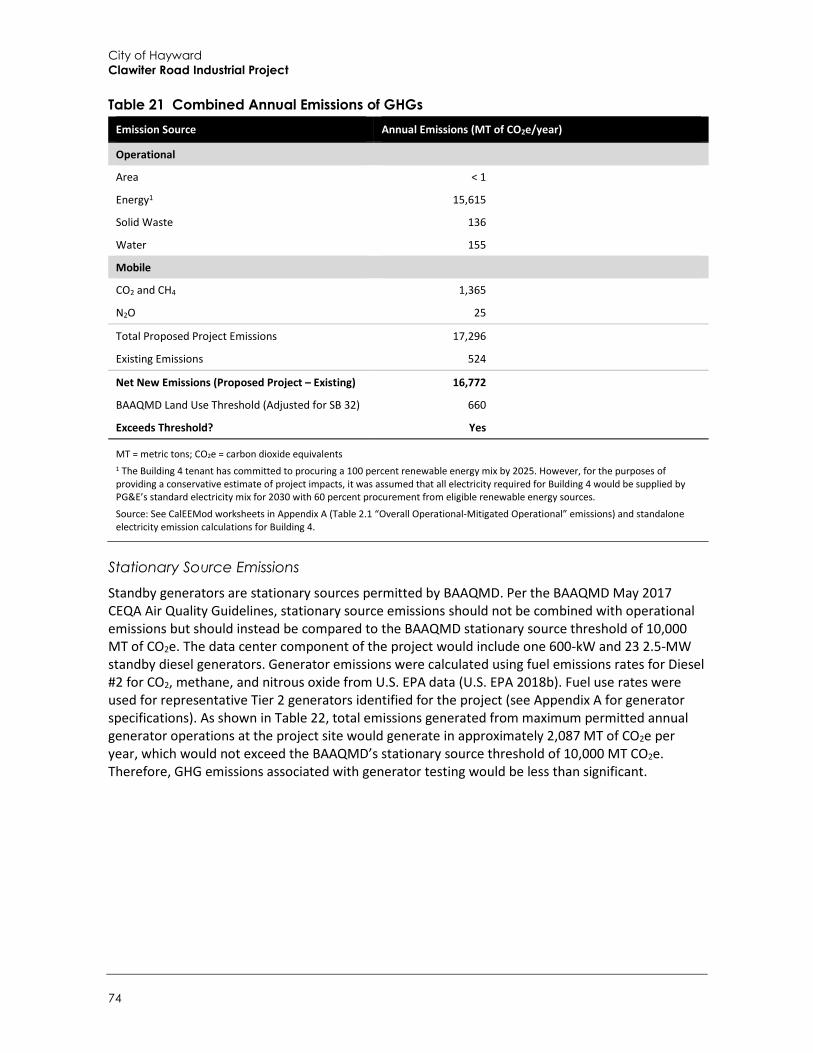
City of Hayward Clawiter Road Industrial Project
74
Table 21 Combined Annual Emissions of GHGs Emission Source Annual Emissions (MT of CO2e/year)
Operational
Area < 1
Energy1 15,615
Solid Waste 136
Water 155
Mobile
CO2 and CH4 1,365
N2O 25
Total Proposed Project Emissions 17,296
Existing Emissions 524
Net New Emissions (Proposed Project – Existing) 16,772
BAAQMD Land Use Threshold (Adjusted for SB 32) 660
Exceeds Threshold? Yes
MT = metric tons; CO2e = carbon dioxide equivalents 1 The Building 4 tenant has committed to procuring a 100 percent renewable energy mix by 2025. However, for the purposes of providing a conservative estimate of project impacts, it was assumed that all electricity required for Building 4 would be supplied by PG&E’s standard electricity mix for 2030 with 60 percent procurement from eligible renewable energy sources.
Source: See CalEEMod worksheets in Appendix A (Table 2.1 “Overall Operational-Mitigated Operational” emissions) and standalone electricity emission calculations for Building 4.
Stationary Source Emissions
Standby generators are stationary sources permitted by BAAQMD. Per the BAAQMD May 2017 CEQA Air Quality Guidelines, stationary source emissions should not be combined with operational emissions but should instead be compared to the BAAQMD stationary source threshold of 10,000 MT of CO2e. The data center component of the project would include one 600-kW and 23 2.5-MW standby diesel generators. Generator emissions were calculated using fuel emissions rates for Diesel #2 for CO2, methane, and nitrous oxide from U.S. EPA data (U.S. EPA 2018b). Fuel use rates were used for representative Tier 2 generators identified for the project (see Appendix A for generator specifications). As shown in Table 22, total emissions generated from maximum permitted annual generator operations at the project site would generate in approximately 2,087 MT of CO2e per year, which would not exceed the BAAQMD’s stationary source threshold of 10,000 MT CO2e. Therefore, GHG emissions associated with generator testing would be less than significant.
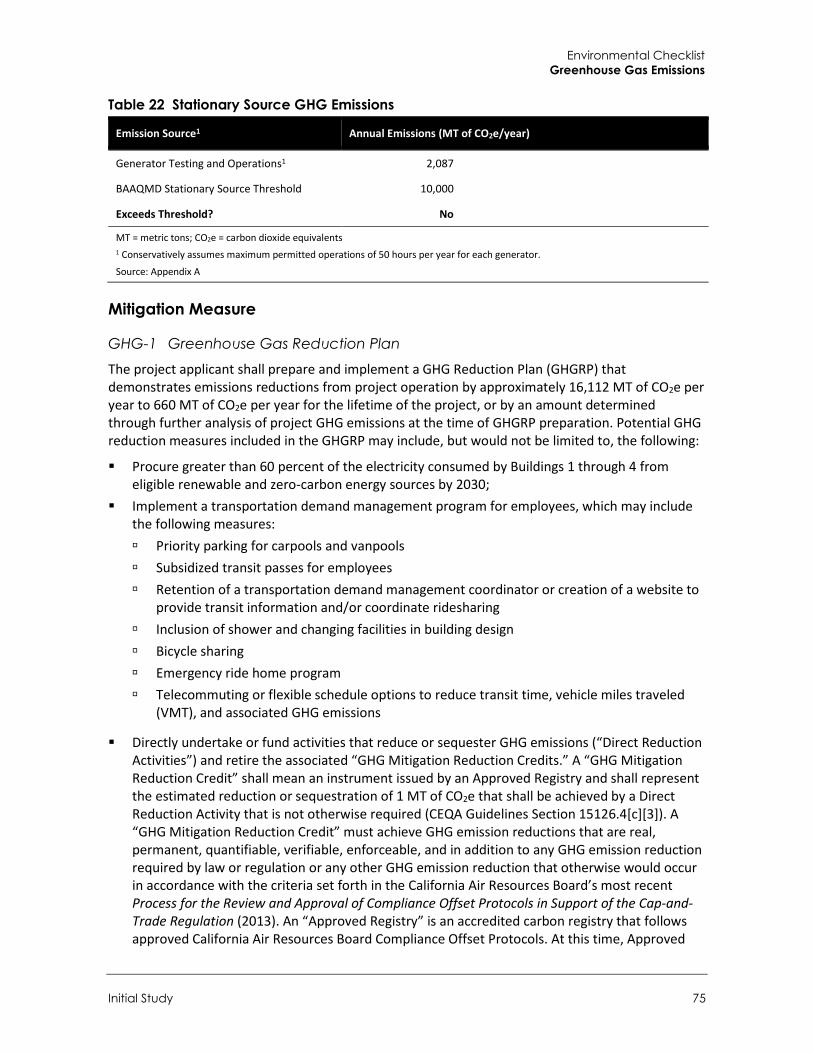
Environmental Checklist Greenhouse Gas Emissions
Initial Study 75
Table 22 Stationary Source GHG Emissions
Emission Source1 Annual Emissions (MT of CO2e/year)
Generator Testing and Operations1 2,087
BAAQMD Stationary Source Threshold 10,000
Exceeds Threshold? No
MT = metric tons; CO2e = carbon dioxide equivalents 1 Conservatively assumes maximum permitted operations of 50 hours per year for each generator.
Source: Appendix A
Mitigation Measure
GHG-1 Greenhouse Gas Reduction Plan The project applicant shall prepare and implement a GHG Reduction Plan (GHGRP) that demonstrates emissions reductions from project operation by approximately 16,112 MT of CO2e per year to 660 MT of CO2e per year for the lifetime of the project, or by an amount determined through further analysis of project GHG emissions at the time of GHGRP preparation. Potential GHG reduction measures included in the GHGRP may include, but would not be limited to, the following:
Procure greater than 60 percent of the electricity consumed by Buildings 1 through 4 from eligible renewable and zero-carbon energy sources by 2030;
Implement a transportation demand management program for employees, which may include the following measures: Priority parking for carpools and vanpools Subsidized transit passes for employees Retention of a transportation demand management coordinator or creation of a website to
provide transit information and/or coordinate ridesharing Inclusion of shower and changing facilities in building design Bicycle sharing Emergency ride home program Telecommuting or flexible schedule options to reduce transit time, vehicle miles traveled
(VMT), and associated GHG emissions
Directly undertake or fund activities that reduce or sequester GHG emissions (“Direct Reduction Activities”) and retire the associated “GHG Mitigation Reduction Credits.” A “GHG Mitigation Reduction Credit” shall mean an instrument issued by an Approved Registry and shall represent the estimated reduction or sequestration of 1 MT of CO2e that shall be achieved by a Direct Reduction Activity that is not otherwise required (CEQA Guidelines Section 15126.4[c][3]). A “GHG Mitigation Reduction Credit” must achieve GHG emission reductions that are real, permanent, quantifiable, verifiable, enforceable, and in addition to any GHG emission reduction required by law or regulation or any other GHG emission reduction that otherwise would occur in accordance with the criteria set forth in the California Air Resources Board’s most recent Process for the Review and Approval of Compliance Offset Protocols in Support of the Cap-and-Trade Regulation (2013). An “Approved Registry” is an accredited carbon registry that follows approved California Air Resources Board Compliance Offset Protocols. At this time, Approved
City of Hayward Clawiter Road Industrial Project
76
Registries include American Carbon Registry, Climate Action Reserve, and Verra (California Air Resources Board 2018). Credits from other sources will not be allowed unless they are shown to be validated by protocols and methods equivalent to or more stringent than the California Air Resources Board standards. In the event that a project or program providing GHG Mitigation Reduction Credits to the project applicant loses its accreditation, the project applicant shall comply with the rules and procedures of retiring GHG Mitigation Reduction Credits specific to the registry involved and shall undertake additional direct investments to recoup the loss.
Obtain and retire “Carbon Offsets.” “Carbon Offset” shall mean an instrument issued by an Approved Registry and shall represent the past reduction or sequestration of 1 MT of CO2e achieved by a Direct Reduction Activity or any other GHG emission reduction project or activity that is not otherwise required (CEQA Guidelines Section 15126.4[c][3]). A “Carbon Offset” must achieve GHG emission reductions that are real, permanent, quantifiable, verifiable, enforceable, and in addition to any GHG emission reduction required by law or regulation or any other GHG emission reduction that otherwise would occur in accordance with the criteria set forth in the California Air Resources Board’s most recent Process for the Review and Approval of Compliance Offset Protocols in Support of the Cap-and-Trade Regulation (2013). If the project applicant chooses to meet some of the GHG reduction requirements by purchasing offsets on an annual and permanent basis, the offsets shall be purchased according to the City’s preference, which is, in order of the City’s preference: (1) within Hayward; (2) within the BAAQMD jurisdictional area; (3) within the State of California; then (4) elsewhere in the United States. In the event that a project or program providing offsets to the project applicant loses its accreditation, the project applicant shall comply with the rules and procedures of retiring offsets specific to the registry involved and shall purchase an equivalent number of credits to recoup the loss. The GHGRP shall be submitted by the project developer and reviewed and approved by the City of Hayward as being in compliance with this measure prior to grading or building permit issuance. Applicable elements of the approved GHGRP shall be reflected on project site plans prior to certificate of occupancy. No more than 50 percent of the project’s total requisite emission reduction over the project’s lifetime may be achieved through direct reduction activities and carbon offsets. Condition compliance shall include monitoring and verifying implementation of measures included in the GHGRP.
Significance After Mitigation To implement Mitigation Measure GHG-1, the project applicant may choose to apply a wide variety of GHG emission reduction measures to reduce project-related emissions to 660 MT of CO2e per year. For example, the following combination of measures would reduce GHG emissions by approximately 16,112 MT of CO2e per year, which would be sufficient to achieve the requisite reduction specified by Mitigation Measure GHG-1:
Supply all on-site electricity for Buildings 1 through 4 from renewable energy sources (approximately 15,161 MT of CO2e per year, equivalent to the project’s estimated electricity demand for Buildings 1 through 4)
Obtain and retire 951 Carbon Offsets (951 MT of CO2e per year, or six percent of the project’s requisite GHG emission reduction)
The above combination of measures is just one example of a combination of measures the project applicant could implement to achieve a reduction of 16,112 MT of CO2e per year. The intent of the above list is to demonstrate that implementation of Mitigation Measure GHG-1 is technically
Environmental Checklist Greenhouse Gas Emissions
Initial Study 77
feasible, and as such, a reduction of project-related GHG emissions to at or below 660 MT of CO2e per year is achievable. Therefore, implementation of Mitigation Measure GHG-1 would reduce project-related emissions below the threshold of significance of 660 MT of CO2e per year. Impacts would be less than significant with mitigation incorporated.
LESS THAN SIGNIFICANT WITH MITIGATION INCORPORATED
b. Would the project conflict with an applicable plan, policy, or regulation adopted for the purpose of reducing the emissions of greenhouse gases?
2017 Scoping Plan
The principal state plan and policy is AB 32, the California Global Warming Solutions Act of 2006, and the follow-up, SB 32. The quantitative goal of AB 32 is to reduce GHG emissions to 1990 levels by 2020 and the goal of SB 32 is to reduce GHG emissions to 40 percent below 1990 levels by 2030. Pursuant to the SB 32 goal, the 2017 Scoping Plan was created to outline goals and measures for the state to achieve the reductions. The 2017 Scoping Plan’s goals include reducing fossil fuel use and energy demand and maximizing recycling and diversion from landfills. The project would be consistent with these goals through project design, which includes complying with the latest Title 24 Green Building Code and Building Efficiency Energy Standards, utilizing direct evaporative cooling units, achieving carbon neutrality for Building 4 by 2040, designating Clean Air/EV spaces in accordance with the requirements of the City’s Reach Code, installing white roofs and 40 bicycle parking spaces, and constructing employee amenity areas such as a fitness system and outdoor seating to reduce off-site vehicle trips. Therefore, impacts would be less than significant.
City of Hayward Climate Action Plan
Hayward’s CAP was adopted by the Hayward City Council on July 28, 2009 and incorporated into the City’s General Plan in 2014 (City of Hayward 2014). The purpose of the CAP is to make Hayward a more environmentally and socially sustainable community. The overall objective of the CAP is to reduce Hayward’s GHG emissions by:
20 percent below 2005 baseline levels by 2020, 62.7 percent below 2005 baseline levels by 2040, and 82.5 percent below 2005 baseline levels by 2050.
In June 2020, these goals were revised to reflect California’s goal of achieving economy-wide carbon neutrality by 2045. The City’s current goals are to reduce GHG emissions by:
30 percent below 2005 levels by 2025, 55 percent below 2005 levels by 2030, and 100 percent below 2005 levels (i.e., carbon neutrality) by 2045.
The CAP includes GHG reduction strategies and actions relating to transportation, land use, energy, solid waste, carbon sequestration, climate change adaptation, and community engagement. The proposed project includes several design features that are consistent with strategies and actions from the City’s CAP. Policy LU-1.8, Green Building and Landscaping Requirements, states the City’s intention to maintain and implement green building and landscaping requirements for private development. Policy NR-4.3, Efficient Construction and Development Practices, calls for the City to encourage construction and building development practices that maximize the use of renewable

City of Hayward Clawiter Road Industrial Project
78
resources and minimize the use of non-renewable resources throughout the life-cycle of a structure. Policy NR-4.11, Green Building Standards, requires that newly constructed buildings meet energy efficiency design and operations standards. Policy NR-2.6, Greenhouse Gas Reduction in New Development, calls for the City to reduce potential GHG emissions by such means as promoting infill development and energy-efficient building design. The proposed project is an infill redevelopment project that would be required to comply with CALGreen and other green building requirements as well as HMC Chapter 10, Article 20 (Bay-Friendly Landscaping Ordinance). Moreover, as described in Section 6, Energy, construction and operation of the project would not involve the wasteful or inefficient use of energy.
Policy M-1.6, Bicycle, Walking, and Transit Amenities, encourages the development of facilities and services to enable bicycling, walking, and transit use, and Policy M-6.2, Encourage Bicycle Use, encourages bicycle use in all neighborhoods. In addition, Policy NR-2.10, Zero-Emission and Low-Emission Vehicle Use, calls for the City to encourage the use of zero-emission vehicles, low-emission vehicles, and bicycles by requiring sufficient and convenient parking facilities. The proposed project would include 20 short-term and 20 long-term bicycle parking spaces as well as Clean Air/EV spaces in accordance with the requirements of the City’s Reach Code, which would facilitate the use of bicycling and electric vehicles as means of transportation for employees.
Policy NR-6.11, Reclaimed Water Usage, states the City’s policy to increase the use of reclaimed water, and Policy NR-6.12, Dual Plumbing Systems, encourages the installation of dual plumbing systems in new buildings to recycle graywater. Building 4 of the proposed project would include a dual plumbing system to allow for a future connection to the City’s purple pipe reclaimed water system. In addition, until reclaimed water is available for use, the evaporative cooling system of Building 4 would be designed to reuse potable water a minimum of three times before discharge to the sewer system.
Policy HQL-8.4, Urban Heat Island Effects, promotes planting shade trees with substantial canopies to shade parking lots and reduce heat island effects. The project would include planting of over 250 trees throughout the project site, including 52 parking lot trees.
PFS-7.12, Construction and Demolition Waste Recycling, requires new development to salvage or recycle asphalt and concrete and all other non-hazardous construction and demolition materials to the maximum extent practicable. In accordance with CALGreen standards, the proposed project would be required to divert at least 65 percent of its construction and demolition waste.
Given the above discussion, the proposed project would support and implement the applicable measures of the City’s CAP, and impacts would be less than significant.
Plan Bay Area 2040 SB 375, signed in August 2008, requires the inclusion of Sustainable Communities Strategies in Regional Transportation Plans to reduce GHG emissions. The Metropolitan Transportation Commission and ABAG adopted a Sustainable Communities Strategy that meets the GHG reduction targets set forth by CARB. Plan Bay Area 2040 is a state-mandated, integrated long-range transportation, land-use, and housing plan that supports a growing economy, provides more housing and transportation choices and reduces transportation-related pollution in the nine-county San Francisco Bay Area (ABAG 2017). Plan Bay Area 2040 builds on earlier efforts to develop an efficient transportation network and grow in a financially and environmentally responsible way and will be updated every four years to reflect new priorities. The goals of Plan Bay Area 2040 related to GHG emissions include (ABAG 2017):
Environmental Checklist Greenhouse Gas Emissions
Initial Study 79
1. Climate Protection. Reduce per capita CO2 emissions. 2. Healthy and Safe Communities. Reduce adverse health impacts. 3. Open Space and Agricultural Preservation. Direct development within urban footprint. 4. Transportation. Increase non-auto mode share.
The proposed project would redevelop an existing industrial site within the urban footprint of Hayward with new industrial land uses. The project would be located in an area with below-average VMT per employee and would include low-VMT supporting features such as Clean Air/EV spaces in accordance with the requirements of the City’s Reach Code, 20 short-term and 20 long-term bicycle parking spaces, fitness facilities, showers, and an on-site food truck space. Furthermore, the project would increase density while decreasing parking to support no net increase in VMT per industrial employee (Appendix H). These features would facilitate the use of non-auto transportation modes and reduce adverse health impacts and CO2 emissions associated with gasoline-powered vehicles. Therefore, the project would be consistent with Plan Bay Area 2040, and impacts would be less than significant.
LESS THAN SIGNIFICANT IMPACT

City of Hayward Clawiter Road Industrial Project
80
This page intentionally left blank.
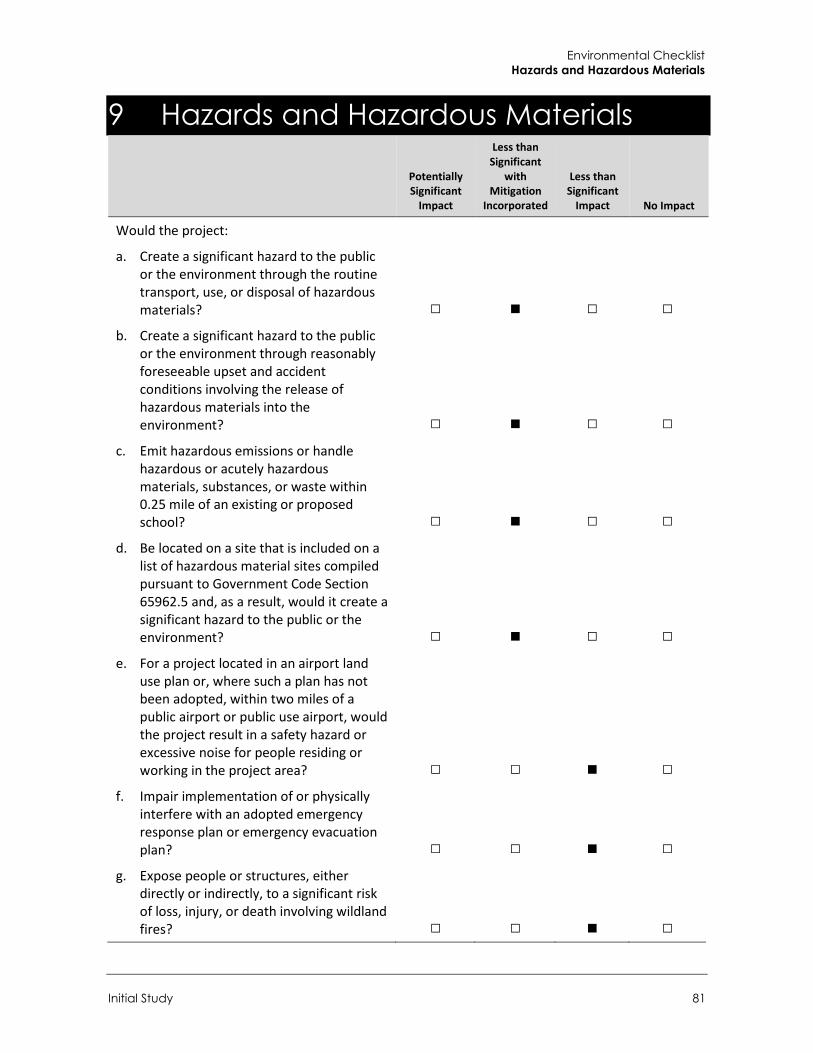
Environmental Checklist Hazards and Hazardous Materials
Initial Study 81
9 Hazards and Hazardous Materials
Potentially Significant
Impact
Less than Significant
with Mitigation
Incorporated
Less than Significant
Impact No Impact
Would the project:
a. Create a significant hazard to the public or the environment through the routine transport, use, or disposal of hazardous materials? □ ■ □ □
b. Create a significant hazard to the public or the environment through reasonably foreseeable upset and accident conditions involving the release of hazardous materials into the environment? □ ■ □ □
c. Emit hazardous emissions or handle hazardous or acutely hazardous materials, substances, or waste within 0.25 mile of an existing or proposed school? □ ■ □ □
d. Be located on a site that is included on a list of hazardous material sites compiled pursuant to Government Code Section 65962.5 and, as a result, would it create a significant hazard to the public or the environment? □ ■ □ □
e. For a project located in an airport land use plan or, where such a plan has not been adopted, within two miles of a public airport or public use airport, would the project result in a safety hazard or excessive noise for people residing or working in the project area? □ □ ■ □
f. Impair implementation of or physically interfere with an adopted emergency response plan or emergency evacuation plan? □ □ ■ □
g. Expose people or structures, either directly or indirectly, to a significant risk of loss, injury, or death involving wildland fires? □ □ ■ □
City of Hayward Clawiter Road Industrial Project
82
Setting The project site was formerly occupied by a Gillig bus manufacturing facility and consists of four industrial buildings on six assessor’s parcels. The former onsite bus manufacturing facility included the use of petroleum products, solvents, adhesives, paint, and other chemicals including 1,1,1-trichloroethane (1,1,1-TCA), acetone, xylene, motor oil, hydraulic oil, oily rags, absorbent, paint and paint-related materials, zinc fume or dust, nickel, chromium, ethylene glycol, chlorodifluoromethane, liquids with small concentrations of halogenated organic compounds, spent non-halogenated solvents, and benzene.
Five environmental documents were reviewed for this hazards and hazardous materials section, as follows:
Phase I ESA, Former Gillig Corp. Facility, 25800 and 25858 Clawiter Road, Hayward, California, Ramboll Environ, September 2017.
Soil Gas Sampling Results for 25800 and 25858 Clawiter Road, Hayward, California (redacted), Stellar Environmental Solutions, June 2018.
Phase I ESA, 25800 and 25858 Clawiter Road, Hayward, California, West Environmental Services & Technology, March 2019.
Hayward Vapor Tables, Tables 1 and 2, Apex Companies, LLC, June 2019. Soil Vapor and Sub-Slab Vapor Investigation Report, 25800 and 25858 Clawiter Road, Hayward,
California, APEX Companies, LLC, August 2019.
In addition, the following documents available on the Regional Water Quality Control Board (RWQCB) Geotracker Website or provided by RMD Environmental Solutions were reviewed:
Phase I ESA, Gillig Corporation, 25800 Clawiter Road, Hayward, California, ERM, February 2008. Underground Storage Tank Removal Report, AEI Consultants, October 10, 2019. Lead Agency Determination for 25800 & 25858 Clawiter Road, Hayward, Alameda County,
RWQCB, October 31, 2019. Data Gap Investigation Workplan, 25800 & 25858 Clawiter Road, Hayward, RMD Environmental
Solutions, November 27, 2019. Data Gap Investigation Workplan Addendum, 25800 & 25858 Clawiter Road, Hayward, RMD
Environmental Solutions, January 10, 2020. Approval of Data Gap Investigation Workplan/Addendum and Requirement for Completion
Report – Clawiter Innovation Site, 25800 & 25858 Clawiter Road, Hayward, Alameda County, RMD Environmental Solutions, January 17, 2020.
Removal of a Double-Walled 12,000-gallon Diesel Underground Storage Tank on August 22, 2019 at Hines Property (Former Gillig Bus Manufacturing Site) located at 25800 Clawiter Road, Hayward CA, Hayward Fire Department, March 20, 2020.
Approval of Data Gap Investigation Completion Report and Requirement for Construction Site Management Plan, Post-Construction Soil Vapor Monitoring Workplan, and Post-Construction Risk Management Plan – Clawiter Innovation, 25800 & 25858 Clawiter Road, Hayward, Alameda County, RWQCB, July 2, 2020.
Response to San Francisco Bay RWQCB’s Approval of Data Gap Investigation Completion Report and Requirement for a Post-Construction Soil Vapor Monitoring Workplan 25800 and 25858 Clawiter Road, Hayward, California, RMD Environmental Solutions, July 23, 2020.
Environmental Checklist Hazards and Hazardous Materials
Initial Study 83
Response to Letter, Withdrawal of Requirement – Clawiter Innovation, 25800 and 25858 Clawiter Road, Hayward, California, RWQCB, August 10, 2020.
Data Gap Investigation Completion Report, 25800 and 25858 Clawiter Road, Hayward, California, RMD Environmental Solutions, March 27, 2020.
Construction Site Management Plan (revised), 25800 and 25858 Clawiter Road, Hayward, California, RMD Environmental Solutions, September 22, 2020.
Approval of Revised Construction Site Management Plan – Clawiter Innovation, 25800 & 25858 Clawiter Road, Hayward, Alameda County, RWQCB, September 25, 2020.
Post-Construction Risk Management Plan (revised), 25800 and 25858 Clawiter Road, Hayward, California, RMD Environmental Solutions, September 25, 2020.
Approval of Revised Post-Construction Risk Management Plan – Clawiter Innovation, 25800 & 25858 Clawiter Road, Hayward, Alameda County, RWQCB, October 5, 2020.
The RWQCB letter dated October 31, 2019, indicates that Clawiter Innovation, LLC applied for agency oversight of a brownfield site and that RWQCB was assigned to be the lead agency for assessment and remediation activities. The Data Gap Investigation Completion Report indicates that chemicals of potential concern (COPCs) in subsurface media are not at levels that warrant active remediation. However, the presence of COPCs in subsurface media warrant administrative controls in the form of a Construction Site Management Plan (SMP) for use during project site grading and redevelopment.
The Construction Site Management Plan provides guidance for managing soil and groundwater during demolition and construction activities and procedures for the handling, management, and disposal of impacted soil and groundwater, if encountered.
The Post-Construction Risk Management Plan (RMP) identifies the requirements for the long-term management of activities at the project site to mitigate potential risks and reduce/minimize exposure to construction workers, occupants, and other project site users associated with residual chemical concentrations detected in soil, soil vapor, and groundwater that do not warrant active remediation. In addition, the Post-Construction RMP indicates that the RMP is expected to be incorporated by reference in a Covenant and Environmental Restriction on Property (Land Use Covenant, or LUC), which will be recorded for the Site in the Official Records of Alameda County, California.
Based on a review of these documents, the following Environmental Concerns were identified at the project location:
Former Onsite Automobile Storage Onsite storage of automobiles occurred at the southern portion of the property (25858 Clawiter Road) since the 1990s. Soil gas at the automobile storage area was investigated in 2018 and 2019 and the following hazardous chemicals were detected: gasoline, benzene, toluene, xylenes, naphthalene, trichloroethene (TCE), cis-1,2-dichloroethene (cis-1,2-DCE), trans-1,2-dichloroethene (trans-1-2-DCE), tetrachloroethene (PCE), and vinyl chloride. Benzene and vinyl chloride were detected above the San Francisco Bay Regional Water Quality Control Board (SFB RWQCB) 2019 Environmental Screening Level (ESLs) of 14 micrograms per cubic meter (µg/m3) and 5.2 µg/m3, respectively.
Per RMD and concurred with by RWQCB, benzene concentrations in soil vapor are heterogeneously distributed and do not pose an unacceptable risk to future receptors. Furthermore, bioattenuation
City of Hayward Clawiter Road Industrial Project
84
of benzene will occur in the presence of oxygen levels measured in the vadose zone (RWQCB, August 10, 2020).
As reported in the Data Gap Report, the vinyl chloride concentration exceeded the ESL in only one soil vapor sample collected at 4.5 feet below ground surface (bgs). Subsequently, five step-out soil vapor samples were collected and vinyl chloride was not detected above laboratory reporting limits. Both benzene and vinyl chloride concentrations greater than the ESL were located on the site periphery or outside the footprint of the proposed buildings (RMD, March 27, 2020). The RWQCB concurred that the extent of benzene and vinyl chloride concentrations above the ESL are limited and not indicative of a significant release area/source zone, with RWQCB approval letters dated July 2, 2020 and August 10, 2020.
Closed UST Known Release Site The project site (25800 Clawiter Road) is a listed as a UST site by the Hayward Fire Department (HFD), that the case is closed with SFB RWQCB concurrence, residual soil, soil vapor, and groundwater impacts remain present onsite at the bus wash canopy, and that closure of the UST case stipulates that should soil and/or groundwater ‘be disturbed during future development and contamination is found, the HFD must be notified and disposal properly managed and a clearance for the proposed future site use obtained from the RWQCB or the Department of Toxic Substances Control (DTSC)’.
Three USTs were formerly present onsite: a 10,000-gallon diesel UST (located west of the water testing canopy/bush wash canopy) and two 1,000-gallon USTs located north of the water testing canopy (formerly utilized to store gasoline, waste oil, waste paint, paint thinner, and/or diesel). Known soil gas impacts at this location include detectable concentrations of 1,1,1-trichloroethane (TCA), benzene, toluene, and vinyl chloride. Benzene was detected above the RWQCB 2019 ESL of 14 µg/m3. Residual soil and groundwater impacts also remain onsite in the vicinity of the former USTs located north of the water testing canopy.
Per RMD and concurred by RWQCB, the extent of benzene concentrations above the ESL are limited and not indicative of a significant release area/source zone (RMD, July 23, 2020 and RWQCB, August 10, 2020).
Based on the results of soil vapor sampling and analysis conducted in 2018 and 2019, the benzene concentrations detected in soil vapor at 5 feet bgs are well below the State Water Resources Control Board – Low Threat UST Closure Policy commercial screening levels, as a former petroleum UST Site with a bioattenuation zone. Downgradient of the former USTs at borings GW-09 and GW-10, TPH and VOC concentrations in groundwater do not exceed ESLs. Therefore, potential migration of COPCs from the former UST area does not pose a potential risk to off-site receptors (RMD, March 27, 2020).
Onsite USTs One 12,000-gallon diesel UST (located east of water testing canopy) is present onsite. Based on the documents reviewed, 12,000-gallon diesel UST was permitted by HFD (Permit number 201904782) for removal in July 2019 and was removed on August 22, 2019. Based on the results of soil sampling and analysis conducted after the UST removal, diesel soil gas impacts from this UST are below the RWQCB 2019 ESLs. A no further action letter related to the UST was issued by the Hayward Fire Department (March 20, 2020).
Environmental Checklist Hazards and Hazardous Materials
Initial Study 85
The reports reviewed indicate that a 1,200-gallon waste paint and thinner UST was noted as being located along the southern edge of 25800 Clawiter Road, however, a ground penetrating radar survey to evaluate the presence of the reported UST was completed and a UST was not identified.
Hazardous Materials Storage and Use Permit The HFD issued a facility closure to Gillig for its hazardous materials storage and use permit in December 2018. This closure document reportedly indicates that “Gillig opted not to conduct subsurface investigation and that a subsurface investigation would be conducted as part of any Site transfer of ownership or redevelopment.” Reportedly, the HFD also indicated that “depending on the findings of a subsurface investigation, Gillig may be liable for cleanup of those materials.”
As required by RWQCB, the 2020 assessment documents provided include RWQCB approved soil gas, soil, and groundwater sampling and analysis results at various locations at the project site.
Outdoor Hazardous Waste Storage Area with Known Release
Empty drums and drums containing hazardous wastes were reportedly stored outdoors near the southeastern corner of 25800 Clawiter Road prior to 1990. This drum storage area, formerly located near the current location of the parts fabrication building, was inspected by HFD in 1988 when they observed over 100 empty and full drums stored onsite. HFD also reportedly observed leaks from the drums, stained concrete and spills on the concrete and on the adjacent unpaved rail spur. In response, the Alameda County Department of Environmental Health (ACDEH) issued a Notice of Violation regarding the drum storage practices and spills. Although the ACDEH reportedly required submittal of a Plan of Correction to correct the drum storage area, this document was not completed.
Soil gas testing was completed in 2019 at the former onsite outside drum storage area (at the current parts fabrication building) and benzene, toluene, ethylbenzene, xylenes, 1,2,4-trimethylbenzene and 1,3,5-trimethylbenzene were detected in soil gas onsite. Benzene was detected at a concentration of 14.4 µg/m3, slightly above the RWQCB 2019 ESL of 14 µg/m3.
Based on the 2019 documents reviewed it appears that hazardous material impacts had not been fully delineated in the former outdoor hazardous materials storage area. However, the 2020 assessment documents include RWQCB approved sampling and analysis results for this location. The RWQCB concurred that the extent of benzene concentrations above the ESL are limited and not indicative of a significant release area/source zone (RWQCB, August 10, 2020).
Seven Paint Spray Booths, Paint Mixing Room and Parts Priming/Painting Structure Seven paint spray booths are present in the former manufacturing building, six booths were located in the northwest corner of the building adjacent to the paint mixing room and one booth was installed at the southeast corner of the building in 1990. A parts priming/painting operation was formerly located in a separate structure to the southeast of the main manufacturing building. Hazardous materials including paints, thinners and solvents, paint filters, and rags were stored and used as part of the paint booth operations.
In 2018, soil gas impacts were identified adjacent to the paint spray booths, paint mixing room, and parts priming/painting structure as follows: benzene, naphthalene, toluene, ethylbenzene, xylenes, and dichloromethane. Benzene was detected at a concentration of 16 µg/m3, slightly above the RWQCB ESL of 14 µg/m3 (RMD, March 27, 2020). Based on the 2019 documents it appears that hazardous material impacts had not been fully delineated in these three areas. However, the 2020
City of Hayward Clawiter Road Industrial Project
86
assessment documents include RWQCB approved sampling and analysis results for these locations. The RWQCB concurred that the extent of benzene concentrations above the ESL are limited and not indicative of a significant release area/source zone (RWQCB, August 10, 2020).
Onsite Current and Former Underground Hoists Six underground hoists (lifts) are or were reportedly present onsite at one time. Two of these onsite hoists (at unknown locations) were reportedly removed and the excavations were filled with concrete. As of 2017, two onsite hoists were present and reportedly still contained hydraulic oil. The location and status of the 5th and 6th underground hoists are unknown.
Based on the 2019 documents, it appears that hazardous material impacts from any of the underground hoists and associated reservoir tanks/piping were not previously assessed. However, the 2020 assessment documents include RWQCB approved sampling and analysis results all six reported current or former hoist locations.
Alignment and Dynamometer Building
The alignment and dynamometer structure, built in the 1990s, included the use of a dynamometer pit and associated oil/water sump. The 2019 documents indicate the dynamometer pit was stained and that information regarding the purpose of the oil/water sump and its discharge locations are not understood. Based on the 2019 documents it appears that hazardous material impacts from the past use of the alignment and dynamometer building/oil water sump have not been assessed. However, the 2020 assessment documents reviewed include RWQCB approved sampling and analysis results at the alignment and dynamometer building and sump.
Former Onsite Outside Steel Storage Onsite outdoor storage of steel occurred on the eastern portion of 25800 Clawiter Road in the 1970s and 1980s; and at 25858 Clawiter Road in the 1980s. The areas of the site utilized for storage were reportedly unpaved.
Based on the 2019 documents it appears that hazardous material impacts from the past use of the project site for steel storage have not been assessed. However, the 2020 assessment documents include RWQCB approved sampling and analysis results at the former steel storage areas.
Fill Material The documents reviewed indicate that fill material from an unknown source was reportedly placed on the eastern portion of 25800 Clawiter Road in the 1960s, prior to development of the bus manufacturing facility.
Based on the 2019 documents it appears that potential hazardous material impacts in the fill material area had not been assessed. However, the 2020 assessment documents include RWQCB approved soil sampling and analysis results across the project site, including the suspected fill material area.
Current Onsite Hazardous Material Storage Structures
In the 1990s, two covered and bermed hazardous materials storage structures were constructed on the eastern portion of 25800 Clawiter Road. Both hazardous material drum storage structures contain staining indicative of hazardous material releases. In 2018 and 2019, soil gas samples were collected outside the storage areas and benzene and toluene were detected.
Environmental Checklist Hazards and Hazardous Materials
Initial Study 87
Based on the 2019 documents it appears that hazardous material impacts from the hazardous materials storage area have not been fully assessed. However, the 2020 assessment documents reviewed include RWQCB approved soil sampling and analysis in the hazardous material storage structures (RMD, March 27, 2020 and RWQCB, August 10, 2020).
Sanitary Sewer Mains Two sanitary sewer mains traverse the project site (25800 Clawiter Road). In 2018 and 2019, soil gas samples were collected along the sewer mains and benzene, toluene, ethylbenzene, xylenes, and tri-chloromethane (chloroform) were detected. Chloroform was detected at a concentration of 35.4 µg/m3, above the RWQCB 2019 ESL of 14 µg/m3. The extent of chloroform concentrations, which can be attributed to potable water (as a result of chlorination of organic matter present in raw water supplies), are limited and not indicative of a significant release (RMD, March 27, 2020 and RWQCB, August 10, 2020). RWQCB did not require any additional sampling along the sanitary sewer.
Onsite and Adjacent Railroad Tracks
A west-east trending Union Pacific Railroad spur rail line is located onsite through the center of the project. In addition, railroad tracks are located along the eastern property boundary, approximately 35 feet to the east of the project site. Based on historical aerial photographs contained in the 2017 Phase I ESA, it does not appear that other railroad spurs were present onsite (Ramboll, 2017). Based on the 2019 and 2020 documents, it appears that typical railroad corridor contaminant impacts have not been assessed along the onsite railroad spur or eastern property boundary
Impacted Building Materials Onsite structures built prior to 1979 may contain asbestos, lead-based paint, and/or other hazardous building materials. The manufacturing building was constructed in 1967; the former fabrication and machining building was constructed in 1967; warehouse B was constructed in 1998; the bus wash facility/water testing canopy was constructed in 1999; the new office building was constructed in 2002; and the former dynamometer building was constructed in 2003.
Above-Ground Storage Tanks Reportedly, eight above ground storage tanks (ASTs) were once present onsite at various locations (Ramboll, 2017). Based on the 2017 Phase I ESA, it appears that one AST was a propane tank and three ASTs were utilized to store waste wash water (one located north of the bus wash canopy/Water Testing Canopy and two located northwest of the former manufacturing building). The following four ASTs were also previously present onsite, yet were removed sometime prior to 2006: one 500-gallon diesel AST located northeast of the former manufacturing building; one 500-gallon diesel AST located north of the bus wash canopy/Water Testing Canopy; one 500-gallon paint AST located west of the former manufacturing building; and one 500-gallon paint thinner AST located northeast of the former manufacturing building.
Underground Sumps/Bus Wash Areas
Two underground sumps remain present onsite. A bus wash structure (Water Testing Canopy) is located on the southern portion of the project site, at 25800 Clawiter Road. The drain for the associated sump (unknown location) is located in the center of the bus wash structure and water in the sump is reportedly pumped to an adjacent holding tank to be reused in the water testing process.
City of Hayward Clawiter Road Industrial Project
88
A second bus wash area and sump are reportedly located in the northwest corner of the former manufacturing building and were used to collect wash water after buses were washed prior to painting. The wash water collected in the sump was reportedly pumped to nearby holding tanks before being processed through an evaporator.
Miscellaneous Areas of Potential Concern Several former onsite uses of concern were noted during this review and did not appear to be assessed for the presence of hazardous materials. These potential concern areas include:
Onsite presence of a subsurface chassis (conveyor) system inside the former bus manufacturing building – oils containing PCBs may have been used during operation of the subsurface conveyor
Onsite presence of an elevator in the New Office Building – oils containing PCBs may have been used during operation of the elevator and/or associated reservoir (Ramboll, 2017)
PFAS/PFOS
In 2019, the California SWRCB sent assessment requirements to property owners of sites that may be potential sources of PFAS. These sites currently include select landfills, airports, wastewater treatment facilities, and chrome plating facilities. According to the SWRCB, “PFAS are a large group of human-made substances that do not occur naturally in the environment and are resistant to heat, water, and oil” (SWRCB 2019).
Our October 15, 2020 review of the California 2019 Statewide PFAS Investigation online Public Map Viewer10 indicates that there are no current chrome plating, airport, or landfill PFAS orders at any facilities located within one-half mile of the project site. The nearest chrome plating PFAS order is located approximately one mile north-northwest of the project site: High Luster Metal Finishing located at 2466 American Ave, Hayward, California.
Landfills – CalRecycle The closest landfills to the project site are the All Cities Landfill located at 4001 West Winton Avenue, Hayward and the Old West Winton Landfill located at the west end of Winton Avenue in Hayward. The landfills are adjacent to each other, located 1.6 miles northwest of the project site, and not expected to impact the project site.
Regulatory Setting
Department of Toxic Substances Control
As a department of CalEPA, DTSC regulates hazardous waste, cleans up existing contamination, and looks for ways to reduce the hazardous waste produced in California. DTSC regulates hazardous waste in California primarily under the authority of Resource Conservation and Recovery Act and the California Health and Safety Code.
DTSC also administers the California Hazardous Waste Control Law (HWCL) to regulate hazardous wastes. While the HWCL is generally more stringent than Resource Conservation and Recovery Act, until the USEPA approves the California program, both state and federal laws apply in California. The HWCL lists 791 chemicals and approximately 300 common materials that may be hazardous; establishes criteria for identifying, packaging, and labeling hazardous wastes; prescribes
10 https://www.waterboards.ca.gov/pfas/
Environmental Checklist Hazards and Hazardous Materials
Initial Study 89
management controls; establishes permit requirements for treatment, storage, disposal, and transportation; and identifies some wastes that cannot be disposed of in landfills.
Government Code Section 65962.5 requires the DTSC, the State Department of Health Services, the SWRCB, and CalRecycle compile and annually update lists of hazardous waste sites and land designated as hazardous waste sites throughout the state. The Secretary for Environmental Protection consolidates the information submitted by these agencies and distributes it to each city and county where sites on the lists are located. Before the lead agency accepts an application for any development project as complete, the applicant must consult these lists to determine if the site at issue is included.
If any soil is excavated from a site containing hazardous materials, it is considered a hazardous waste if it exceeds specific criteria in Title 22 of the CCR. Remediation of hazardous wastes found at a site may be required if excavation of these materials is performed, or if certain other soil disturbing activities would occur. Even if soil or groundwater at a contaminated site does not have the characteristics required to be defined as hazardous waste, remediation of the site may be required by regulatory agencies subject to jurisdictional authority. Cleanup requirements are determined on a case-by-case basis by the agency taking jurisdiction.
Regional Water Quality Control Board
RWQCB regulates discharges and releases to surface and groundwater in the project area. The RWQCB generally oversees cases involving groundwater contamination. In the RWQCB, the County of Alameda Department of Environmental Health handles most leaking underground storage tank cases, so the RWQCB may oversee cases involving other groundwater contaminants; i.e., Spills, Leaks, Incidents, and Clean-up cases. In the case of spills at a project site, the responsible party would notify the County of Alameda, RWQCB, or DTSC and a lead would be determined.
The RWQCB has established guidelines used to evaluate the potential risk associated with chemicals found in soil or groundwater where a release of hazardous materials has occurred called Environmental Screening Levels developed for a variety of purposes including
Hayward Fire Department Hayward Fire Department (HFD) is designated as the City of Hayward’s Certified Unified Program Agency (CUPA), which is overseen by the California Environmental Protection Agency and coordinates the regulation of hazardous materials and hazardous wastes in the City. CUPA ensures the consistent application of statewide standards during administrative, permitting, inspection, and enforcement activities associated with hazardous materials and hazardous wastes. If a business operated at the project site would use and store hazardous materials and generate hazardous wastes, CUPA would require the electronic submittal of chemical and facility information, a Hazardous Materials Business Plan, and hazardous waste generator permits to the California Environmental Reporting System online database. If operations at the project site would include the treatment, storage, and/or disposal of hazardous waste, HFDs Hazardous Materials Office would regulate these activities under a tiered permitting system.
CUPA, through the Hazardous Materials Office, regulates USTs containing hazardous materials, including installation, operation and maintenance, temporary closure, and removal and disposal of USTs. Additionally, CUPA holds the responsibility and authority to implement the Aboveground Petroleum Storage Act, which regulates aboveground petroleum storage tanks through
City of Hayward Clawiter Road Industrial Project
90
administrative requirements, permitting, inspections, and enforcement. Any above- or underground storage tanks present at the project site would be managed by the HFD Hazardous Materials Office.
The Hazardous Materials Office administers the California Accidental Release Prevention (CalARP) Program, which aims to reduce the likelihood and impact of accidental releases of regulated toxic and flammable substances through administrative and operational procedures, and facility inspections. If the facility located on the project site would be regulated under the CalARP Program, the facility would file a written Risk Management Plan with the HFD.
Impact Analysis
a. Would the project create a significant hazard to the public or the environment through the routine transport, use, or disposal of hazardous materials?
b. Would the project create a significant hazard to the public or the environment through reasonably foreseeable upset and accident conditions involving the release of hazardous materials into the environment?
d. Would the project be located on a site that is included on a list of hazardous material sites compiled pursuant to Government Code Section 65962.5 and, as a result, would it create a significant hazard to the public or the environment?
Project Construction Due to previous industrial, railroad, and agricultural uses as described in the Setting section above and the project site’s inclusion on the RWQCB Cleanup Program Site (#01S0815) list, RWQCB LUST Cleanup Site (#01-0701) list, and Hayward City Fire Department UST site (01-003-009601) list, project construction could result in a significant hazard to the public or the environment. Although the project site is not listed specifically as a Cortese site compiled pursuant to Government Code Section 65962.5, it is listed on multiple hazardous materials release site databases.
Since construction and occupancy of the industrial buildings would not disturb soil along the east-west trending railroad spur that crosses the property, railroad ties, railroad ballast, and potentially impacted soil would not be disturbed.
Due to the site’s previous agricultural and industrial uses, RWQCB approved soil gas, soil, and groundwater sampling and analysis was conducted at various locations at the project site and were summarized in the Data Gap Investigation Completion Report, dated March 27, 2020. The RWQCB concurred the investigation findings in two letters dated July 2, 2020 and August 10, 2020.
However, residual soil, soil vapor, and groundwater impacts remain onsite and contaminated soils and groundwater may be encountered onsite during demolition and site grading.
In the event that 1) impacted soil or groundwater is identified during construction activities, or 2) soil export is necessary for completion of the project; project construction would involve the removal of contaminated soil/groundwater during grading or excavation which would result in the transport and disposal of hazardous materials as they are unearthed and removed from the site. Because the release, transport, and disposal of hazardous materials could create a hazard to the public or environment, this impact would be potentially significant and mitigation is required.

Environmental Checklist Hazards and Hazardous Materials
Initial Study 91
Demolition Demolishing the existing structures on-site could result in upset and release of hazardous materials into the environment. Due to its age, the existing buildings, constructed between 1960 and 2003, may contain asbestos, polychlorinated biphenyls (PCB), mercury, and/or lead-based paints (LBP). Because some buildings were constructed before the federal ban on PCBs, it is possible that they are present in light ballasts, additionally waste oils containing PCBs maybe present onsite. Demolition could result in health hazard impacts to workers if not remediated prior to construction activities. However, demolition and construction would be required to comply with Bay Area Air Quality Management District (BAAQMD) Regulation 11, Rule 2, which governs the proper handling and disposal of asbestos containing material for demolition, renovation, and manufacturing activities in the Bay Area. These activities would also need to comply with CalOSHA regulations regarding lead-based materials. The California Code of Regulations, Section 1532.1, requires testing, monitoring, containment, and disposal of lead-based materials such that exposure levels do not exceed CalOSHA standards. DTSC has classified PCBs as a hazardous waste when concentrations exceed 50 parts per million in non-liquids; consequently, the DTSC requires that materials containing those concentrations of PCBs be transported and disposed of as hazardous waste. Any light ballast removed would be evaluated for the presence of PCBs and managed appropriately pursuant to DTSC standards, which would be protective of safety during the construction phase. Compliance with BAAQMD, CalOSHA, and DTSC policies regarding asbestos containing materials (ACM), LBP, and PCBs, would reduce impacts to less than significant levels.
Subsurface Demolition and Grading
Remaining onsite underground sumps, hoists, drains/piping, ASTs, USTs, and other unknown, unidentified features would likely need to be removed as part of grading and construction. These structures may contain residual liquids that would require removal prior to demolition and removal/disposal of these structures would also need to be permitted and removed with agency oversite. Because the release, transport, and disposal of hazardous materials could create a hazard to the public or environment, this impact would be potentially significant and mitigation is required.
Construction
Project construction would require heavy construction equipment, the operation of which could result in a spill or accidental release of hazardous materials, including fuel, engine oil, engine coolant, and lubricants. Project construction would also include temporary transport, storage, and use of potentially hazardous materials including fuels, lubricating fluids, cleaners, solvents, or potentially contaminated groundwater or soils.
As described above, the project site was previously used for agricultural and industrial operations indicating potential for residual chemicals in the soil associated with the previous use. Therefore, ground-disturbing activities could expose construction workers to soil contaminated with agricultural and industrial chemicals above the environmental safety limits.
The transport of hazardous materials would be subject to federal, state, and local regulations, which would minimize risks associated with the transport of hazardous materials. Construction activities that involve hazardous materials would be required to transport such materials along roadways designated for that purpose in the County, thereby limiting risk of upset during transportation.
City of Hayward Clawiter Road Industrial Project
92
Nevertheless, due to existing soil conditions, construction of the project has the potential to expose the public, construction workers and the environment to on-site hazardous materials due to previous industrial, railroad, and agricultural uses as described above in the Setting section above.
Therefore, construction of the project may create a potentially significant hazard to the public or the environment through the routine transport, use, or disposal of hazardous materials; create a potentially significant hazard to the public or the environment through reasonably foreseeable upset and accident conditions involving the release of hazardous materials into the environment; and is located on a site that is included on a list of hazardous material sites compiled pursuant to Government Code Section 65962.5 (or similar). Construction of the project would result in a potentially significant hazard to the public or the environment. Mitigation Measures HAZ-1 through HAZ-4 are required to manage hazardous materials.
Operation As discussed in the Description of the Project, the proposed project involves core and shell construction of four buildings and associated improvements. Future tenants for Buildings 1 through 3 are unknown but are anticipated to include warehouse facilities, manufacturing, and other uses allowed under the IC designation. Building 4 would be occupied by data center uses.
Transport, use, and storage of hazardous materials during operation of the site and the buildings would be conducted pursuant to all applicable local, State, and federal laws, including but not limited to Title 49 of the Code of Federal Regulations implemented by Title 13 of the California Code of Regulations, which describes strict regulations for the safe transportation of hazardous materials, and in cooperation with the County’s Department of Environmental Health. As required by California Health and Safety Code Section 25507, a business shall establish and implement a Hazardous Materials Business Emergency Plan for emergency response to a release or threatened release of a hazardous material. As required, the hazardous materials would be stored in locations according to compatibility and in storage enclosures (i.e., flammable material storage cabinets and biological safety cabinets) or in areas or rooms specially designed, protected, and contained for such storage, in accordance with applicable regulations.
Under the California Hazard Communication Regulation, chemical manufacturers, distributors, or importers must provide Safety Data Sheets (formerly Material Safety Data Sheets) for each hazardous chemical to downstream users to communicate information on these hazards. All businesses of more than ten employees must comply when employees may be exposed to hazardous substances found in the workplace under normal conditions of use as well as in reasonably foreseeable emergency conditions (i.e., a spill or release of a flammable chemical). Businesses are also required to train employees on protocols in the event of a chemical spill or a leak from a sealed container (California Department of Industrial Relations 2012).
Generally, maintenance and upkeep of facilities on-site, including cleaning of workspaces, parking areas, restroom facilities and maintenance of landscaping occasionally require the use of various solvents, cleaners, paints, oils/fuels, and pesticides/herbicides. In addition, potential hazardous materials, such as fuel, paint products, lubricants, solvents, and cleaning products, may be used and/or stored on-site. However, due to the limited quantities of these materials to be used by the project, they are not considered hazardous to the public at large.
The Building #4 tenant is anticipated to require the use of on-site backup generators which would require diesel fuel for operation. The potential transport, use, and storage of large quantities of diesel fuel associated with future on-site generators would be reviewed for consistency with the
Environmental Checklist Hazards and Hazardous Materials
Initial Study 93
City’s Municipal code and other regulations. Further, the potential future transformer yard may also involve the use, transport, and storage of transformer fuel. If the Building 4 tenants or other future tenants would require the use and storage of hazardous materials deemed as exceeding a primary use levels based on type and storage of hazardous materials, then the tenants would be required to be considered under a separate administrative use permit. The administrative use permits would require discretionary approval by the City to ensure all safety requirements are met. As discussed in Section 15, Public Services, the project would also be required to comply with the California Fire Code as adopted by the City of Hayward, which further regulates explosive and hazardous materials use and storage. Therefore, use or Storage of diesel or transformer fuel on-site would be required to be in compliance with all applicable local, State, and federal laws. Compliance with relevant laws and regulations concerning the storage, transport, and use of hazardous materials would minimize the likelihood of hazardous materials releases from the proposed use or storage of diesel fuel, oils, lubricants, and water treatment chemicals on the site by the project would not create a significant hazard to the public or the environment due to foreseeable upset or accident conditions.
Therefore, the proposed project would not emit hazardous emissions or use acutely hazardous materials such that a significant impact would occur. Operational impacts would be less than significant.
Railway Hazards The UPRR tracks adjacent to the project site support both passenger and freight traffic and the tracks that bisect the site support freight traffic. Freight trains may carry hazardous materials, which could be released during an accident. The public health risk posed by an accidental release would depend upon the materials involved, their toxicity, and the wind direction that could carry emissions from the release. The possibility of impact is determined by a combination of the probability of an accident, the probability that the released cargo is hazardous, and the probability that winds are blowing from the spill toward occupied receptor sites.
Of the infrequent daytime freight traffic, only a small percentage would involve transport of hazardous materials, and that transport is regulated by the federal Department of Transportation (DOT) to minimize risks of accidents or spills. In addition, because of the urban context in the site vicinity, trains travel through the area at relatively low speeds, further minimizing the likelihood of accidents.
Further, the California Supreme Court in a December 2015 opinion (BIA v. BAAQMD) confirmed that CEQA is primarily concerned with the impacts of a proposed project on the environment, not the effects of the environment on the proposed project. The proposed project would not involve changes to the tracks or easement. Only the required emergency access would be allowed, and the proposed project would not modify or expand access to the tracks. Therefore, the project would not exacerbate hazards.
Overall, the proposed project would not increase or change the use of the tracks and would not affect train operations. The risk of derailment with or without hazardous material release is extremely low, and the proposed project would not increase potential risks. Impacts would be less than significant.
City of Hayward Clawiter Road Industrial Project
94
Mitigation Measures
HAZ-1 Regulatory Agency UST Involvement – HFD and RWQCB Since the project site at 25800 Clawiter Road is listed as a closed HFD UST site (#01-003-009601) and a closed RWQCB LUST site (#01-0701), the applicant shall notify the Hayward City Fire Department UST and the RWQCB LUST of the following:
Current development plan and any modifications to the development plan Identification of additional underground tank features, if encountered
Additionally, all UST removals and associated assessment work shall be completed under the direction of HFD and/or RWQCB, as determined by HFD and RWQCB. The UST closure and agency approval documents shall be reviewed and approved by the City of Hayward prior to issuance of grading permit.
Upon identification of UST features onsite, HFD and/or RWQCB could require actions such as: development of removal action workplans; obtaining permits for removal of USTs or other underground features; soil excavation and offsite disposal; assessment of soil and/or groundwater beneath the excavation; and/or completion of UST removal reports or case closure documents.
HAZ-2 Regulatory Agency Subsurface Involvement – RWQCB Since the project site at 25800 and 25858 Clawiter Road is listed as an open RWQCB Cleanup site, the RWQCB Cleanup case #01S0815 shall continue to be utilized for agency oversight of assessment and remediation of this project site through completion of building demolition, subsurface demolition, and construction. The applicant shall notify the SFB RWQCB Cleanup project manager of the following:
Current development plan and any modifications to the development plan Former onsite use of seven above ground storage tanks that formerly contained wash water,
diesel fuel, paint, and paint thinner (Ramboll, 2017) Former onsite use of an elevator that may have contained oils containing PCBs (Ramboll, 2017) Former onsite use of a subsurface chassis (conveyor) system that may have utilized oils
containing PCBs (Ramboll, 2017) Former onsite use of two sumps for wash water at the former bus wash facilities: one at the bus
wash facility/Water Testing Canopy and one in the northwest corner of the former manufacturing building (Ramboll, 2017)
Other regulatory UST case listings (HFD and RWQCB) assessment work that will be completed under the direction of other regulatory agencies
All former environmental documents completed for the project site, including 25800 and 25858 Clawiter Road and this Initial Study document
Upon notification of the information above, RWQCB could require actions such as: development of subsurface investigation workplans; completion of soil, soil vapor, and/or groundwater subsurface investigations; installation of soil vapor or groundwater monitoring wells; soil excavation and offsite disposal; completion of human health risk assessments; and/or completion of remediation reports or case closure documents.
Environmental Checklist Hazards and Hazardous Materials
Initial Study 95
If groundwater wells or soil vapor monitoring probes are identified during demolition, subsurface demolition or construction at 25800 and 25858 Clawiter Road, they will be abandoned/destroyed with approval of RWQCB and under permit from the Alameda County Public Works Agency (ACPWA). Demolition activities will be documented in a letter report submitted to RWQCB within 60 days of the completion of abandonment activities. Abandonment of sub-slab vapor points would be completed with RWQCB approval and demolition activities would be documented in a letter report to RWQCB.
The SFB RWQCB closure and agency approval documents shall be submitted and reviewed by the City of Hayward prior to issuance of grading permit.
It should also be noted that the SFB RWQCB may determine that Alameda County Department of Environmental Health (ACDEH) or DTSC may be best suited to perform the lead agency duties for the assessment and/or remediation of this project site. Should the lead agency be transferred to ACDEH or DTSC, this and other mitigation measures will still apply to these agencies.
HAZ-3 Construction Site Management Plan The applicant shall implement the September 22, 2020 (or most recent) RWQCB approved Revised Construction Site Management Plan (Revised SMP) (RMD Environmental Solutions 2020) at the project site to address potential issues that may be encountered during redevelopment activities of the property involving subsurface work. The Construction SMP objectives include:
Communicating information to project site construction workers about environmental conditions,
Presenting measures to mitigate potential risks to the environment, construction workers, and other nearby receptors from potential exposure to hazardous substances that may be associated with unknown conditions or unexpected underground structures, and
Presenting protocols for management of known contaminated soil or groundwater encountered during construction activities.
The Construction SMP identifies the project contacts, responsibilities, and notification requirements, and outlines the procedures for Health and Safety; Soil Management; Contingency Measures for Discovery of Unexpected Underground Structures; Erosion, Dust, and Odor Management; Groundwater Management; Waste Management; Stormwater Management; and Written Records and Reporting. The Construction SMP shall be reviewed and approved by the City of Hayward prior to issuance of grading permit.
HAZ-4 Post-Construction Risk Management Plan
Following construction and during operation of the project site, the August 31, 2020 (or most recent) Post-Construction Risk Management Plan (RMP) approved by the RWQCB shall be implemented (RMD Environmental Solutions 2020). The RMP documents the requirements for the long-term management of activities at the Project site to mitigate potential risks and reduce/minimize exposure to construction workers, occupants, and other site users associated with residual chemical concentrations detected in soil, soil vapor, and groundwater that do not warrant active remediation.
This RMP will be incorporated by reference in a Covenant and Environmental Restriction on Property (Land Use Covenant, or LUC), which will be recorded for the project site in the Official Records of Alameda County, California.
City of Hayward Clawiter Road Industrial Project
96
The RMP will include requirements regarding the following:
1. Land Use Expectation and Limitations – future land use at the project site will be limited to industrial, commercial, and/or office space use
2. Project Site Development and Occupancy Modifications - modifications to the project site or subsurface work will be conducted in accordance with the Construction SMP, and any contaminated soils brought to the surface by grading, excavation, trenching, or backfilling shall be managed by the Property Owner or its designee in accordance with applicable provisions of local, state and federal law
3. Contingency Reporting - if impacted soil or groundwater is encountered during site activities, RWQCB will be notified and upon completion of subgrade work and any offsite removal of soil and groundwater, a report will be prepared by the Environmental Consultant or its designee and submitted to RWQCB
4. Regulatory Access - any persons acting pursuant to RWQCB orders, shall have reasonable access to the project site after giving reasonable notice to the Property Owner or Lessor for the purposes of inspection, surveillance, maintenance, or monitoring.
Specifically, for contingency reporting, the reports will be uploaded to the SWRCB GeoTracker website https://geotracker.waterboards.ca.gov (GeoTracker Global ID T10000013771; and the reports will include the following information
Brief letter documenting RWQCB notification and the scope of work completed; Photographs documenting the project site conditions; and Recommendations for preventative and/or corrective repair needs that are identified to
maintain compliance with the RMP.
Significance After Mitigation Mitigation Measures HAZ-1 through HAZ-4 would reduce potential impacts by involving regulatory agencies, creating a Construction Management Plan approved by the RWQCB, and requiring a post-construction RMP. Implementation of these measures would reduce impacts from on-site hazardous materials to less than significant levels.
LESS THAN SIGNIFICANT WITH MITIGATION INCORPORATED
c. Would the project emit hazardous emissions or handle hazardous or acutely hazardous materials, substances, or waste within 0.25 mile of an existing or proposed school?
The nearest school to the project site is the California Crosspoint Academy, located approximately 0.2 mile to the north. Other nearby schools include Eden Gardens Elementary School, located approximately 0.5 miles northeast of the project site. Operation of the project would not involve the use of hazardous materials which could impact the nearby schools. Limited amounts of diesel fuel would be stored on-site for the backup generators, but the fuel would be stored in compliance with applicable local, State, and federal laws. However, due to existing soil conditions, construction of the project has the potential to expose the nearby school sites to on-site hazardous materials from the previous industrial, railroad, and agricultural uses as described above in the Setting section above. Therefore, mitigation would be required to reduce potential construction impacts to less than significant levels.
Environmental Checklist Hazards and Hazardous Materials
Initial Study 97
Mitigation Measures Mitigation Measures HAZ-1 through HAZ-4.
Significance After Mitigation Mitigation Measures HAZ-1 through HAZ-4 would reduce potential impacts by involving regulatory agencies, creating a Construction Management Plan approved by the RWQCB, and requiring a post-construction RMP. Implementation of these measures would reduce impacts from on-site hazardous materials on nearby schools to less than significant levels.
LESS THAN SIGNIFICANT WITH MITIGATION INCORPORATED
e. For a project located within an airport land use plan or, where such a plan has not been adopted, within two miles of a public airport or public use airport, would the project result in a safety hazard or excessive noise for people residing or working in the project area?
The closest airport is the Hayward Executive Airport, located approximately 2.0 miles north of the project site. In addition, the Oakland International Airport is located approximately 7.0 miles to the northwest. The project site is located within the Airport Influence Area of the Hayward Executive Airport and the Oakland International Airport. However, the project site is located outside all safety zones for both airports (Alameda County Airport Land Use Commission 2010; 2012). Therefore, the proposed industrial park use of the site would be compatible with the nearby airports.
The maximum height of proposed building 4 (106.3 feet) is below the minimum elevation established by Federal Aviation Regulations, Part 77, for required filing with the Federal Aviation Administration for airspace safety review, which is 200 feet above ground level. As discussed in Section 13, Noise, noise impacts from these airports would not be significant. Therefore, impacts would be less than significant.
LESS THAN SIGNIFICANT IMPACT
f. Would the project impair implementation of or physically interfere with an adopted emergency response plan or emergency evacuation plan?
Construction of the proposed project would occur within the boundary of the project site and would not lead to street closures which would interfere with emergency evacuations or response. Further, installation of off-site transmission lines would not require closure of streets south of SR 92. The proposed project does not involve the development of structures that could potentially impair implementation of or physically interfere with an adopted emergency response plan or emergency evacuation plan, including the Hayward Local Hazard Mitigation Plan (City of Hayward 2016b). No streets or property access points would be closed, rerouted, or substantially altered upon implementation and operation of the project. Therefore, there would be no impact.
NO IMPACT

City of Hayward Clawiter Road Industrial Project
98
g. Would the project expose people or structures, either directly or indirectly, to a significant risk of loss, injury, or death involving wildland fires?
As described below in Section 20, Wildfire, the project site is in a developed urban area and is not within or adjacent to a designated very high wildland fire hazard area. Therefore, the project would not expose people or structures to a significant loss, injury or death involving wildland fires. There would be no impact.
NO IMPACT
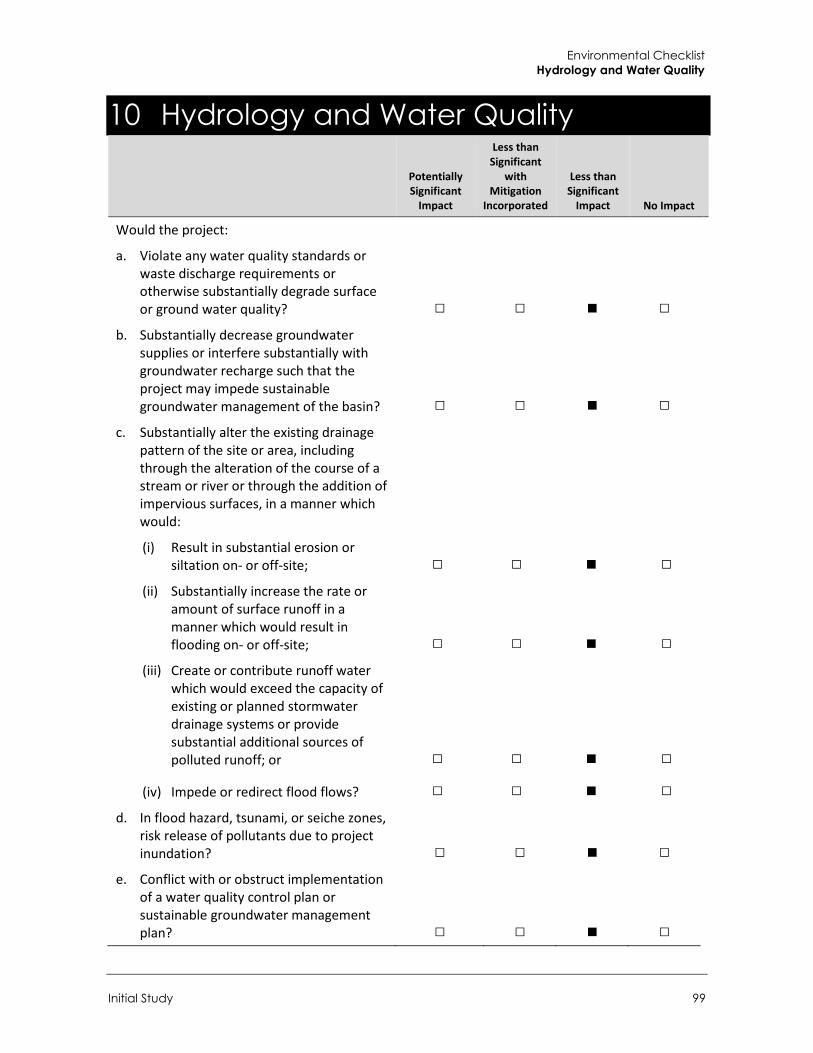
Environmental Checklist Hydrology and Water Quality
Initial Study 99
10 Hydrology and Water Quality
Potentially Significant
Impact
Less than Significant
with Mitigation
Incorporated
Less than Significant
Impact No Impact
Would the project:
a. Violate any water quality standards or waste discharge requirements or otherwise substantially degrade surface or ground water quality? □ □ ■ □
b. Substantially decrease groundwater supplies or interfere substantially with groundwater recharge such that the project may impede sustainable groundwater management of the basin? □ □ ■ □
c. Substantially alter the existing drainage pattern of the site or area, including through the alteration of the course of a stream or river or through the addition of impervious surfaces, in a manner which would: (i) Result in substantial erosion or
siltation on- or off-site; □ □ ■ □ (ii) Substantially increase the rate or
amount of surface runoff in a manner which would result in flooding on- or off-site; □ □ ■ □
(iii) Create or contribute runoff water which would exceed the capacity of existing or planned stormwater drainage systems or provide substantial additional sources of polluted runoff; or □ □ ■ □
(iv) Impede or redirect flood flows? □ □ ■ □ d. In flood hazard, tsunami, or seiche zones,
risk release of pollutants due to project inundation? □ □ ■ □
e. Conflict with or obstruct implementation of a water quality control plan or sustainable groundwater management plan? □ □ ■ □
City of Hayward Clawiter Road Industrial Project
100
Impact Analysis
a. Would the project violate any water quality standards or waste discharge requirements or otherwise substantially degrade surface or ground water quality?
c.(i) Would the project substantially alter the existing drainage pattern of the site or area, including through the alteration of the course of a stream or river or through the addition of impervious surfaces, in a manner which would result in substantial erosion or siltation on- or off-site?
e. Would the project conflict with or obstruct implementation of a water quality control plan or sustainable groundwater management plan?
Construction Project construction would involve demolition of the existing on-site structures, associated facilities, and improvements, ground-disturbing activities, and use of heavy construction equipment. Grading and other construction activities associated with the project would have the potential to impact soil erosion and increase sediment loads in stormwater runoff resulting from exposed or disturbed soil. Additionally, spills, leakage, or improper handling and storage of substances such as oils, fuels, chemicals, metals, and other substances used during various construction phases could be collected in stormwater runoff and impact water quality of receiving water bodies (San Francisco Bay).
As part of Section 402 of the CWA, the U.S. EPA has established regulations under the National Pollution Discharge Elimination System (NPDES) program to control both construction and operation (occupancy) stormwater discharges. For the proposed project, the San Francisco Regional Water Quality Control Board (RWQCB) administers the NPDES permitting program and is responsible for developing permitting requirements. The proposed project would be subject to the San Francisco Bay Region Municipal Regional Stormwater National Pollutant Discharge Elimination System (NPDES) Permit (MRP) – NPDES Permit Order No. R2-2015-0049, and the provisions set forth in Section C.3 New Development and Redevelopment. Under the conditions of the permitting program, the applicant would be required to eliminate or reduce non-stormwater discharges to waters of the nation, develop and implement a Stormwater Pollution Prevention Plan (SWPPP) for construction activities, and perform inspections of the stormwater pollution prevention measures and control practices to ensure conformance with the site SWPPP. Because the proposed project would disturb at least one acre of land, the project must provide stormwater treatment and would be required to obtain coverage under the General Permit for Discharges of Storm Water Associated with Construction Activity (Construction General Permit Order 2009-0009-DWQ or 2009-0009-DWQ General Permit).
In addition, in accordance with HMC Chapter 10, Article 8 (Grading and Clearing), all grading activities must be conducted in a manner that will minimize the potential for erosion from the site. The project applicant would be required to prepare and implement an Erosion and Sediment Control Plan that specifies control techniques that would prevent erosion during and after construction. Therefore, with compliance with construction-related water quality and erosion control requirements, construction of the proposed project would not violate water quality standards, substantially alter the drainage pattern of the area such that substantial erosion or siltation would occur and would not degrade water quality. Impacts during construction would be less than significant.
Environmental Checklist Hydrology and Water Quality
Initial Study 101
Operation The proposed project would increase the total area of impervious surfaces on the project site by approximately 87,500 square feet, which can result in a greater potential to introduce pollutants to receiving waters. Urban runoff can carry a variety of pollutants, including oil and grease, metals, sediment, and pesticide residues from roadways, parking lots, rooftops, and landscaped areas depositing them into adjacent waterways via the storm drain system.
Water quality in stormwater runoff is regulated locally by the Alameda County Clean Water Program, which includes the C.3 provisions set by the San Francisco Bay RWQCB. Provision C.3 of the MRP addresses post-construction stormwater requirements for new development and redevelopment projects that add and/or replace 10,000 square feet or more of impervious area. Because the proposed project would replace in excess of 10,000 square feet of the impervious surface of the project site, it must comply with the C.3 provisions set by the RWQCB. Therefore, the proposed project must meet certain criteria including: 1) incorporate site design, source control, and stormwater treatment measures into the project design; 2) minimize the discharge of pollutants in stormwater runoff and non-stormwater discharge; and 3) minimize increases in runoff flows as compared to pre-development conditions.
In accordance with the C.3 requirements, the project is designed to direct runoff from roofs and sidewalks into vegetated areas and would include 31,065 square-feet of landscaped bioretention areas to treat runoff before entering the stormwater system. By adhering to the provisions of NPDES Section C.3, the SWPPP, and the stormwater control plan, the proposed project would not result in adverse effects on water quality or erosion during construction or operation. Therefore, the proposed project would not conflict with the applicable water quality control plan or result in substantial erosion or siltation off-site. Impacts would be less than significant.
LESS THAN SIGNIFICANT IMPACT
b. Would the project substantially decrease groundwater supplies or interfere substantially with groundwater recharge such that the project may impede sustainable groundwater management of the basin?
As discussed in Section 19, Utilities and Service Systems, the proposed project would receive its water from the City of Hayward. Hayward receives its water from the Hetch Hetchy system, owned and operated by the San Francisco Public Utilities Commission (SFPUC). Hayward does not currently use groundwater to meet the City’s water demand (City of Hayward 2016a). Therefore, the proposed project would not rely on groundwater for its water supply and would not increase groundwater usage such that a net deficit in aquifer volume would occur.
Development of the proposed project does not include installation of new groundwater wells or use of groundwater from existing wells. The southern portion of the project site consists of compacted dirt and other mostly pervious surfaces. The proposed project would increase impervious surfaces by approximately 87,500 square-feet which could impact groundwater recharge in the area. However, the proposed project would include landscaping and bioretention areas to allow some recharge. Overall, the project would not directly extract groundwater such that the project would impede sustainable groundwater management of a groundwater basin. Impacts related to groundwater would be less than significant.
LESS THAN SIGNIFICANT IMPACT
City of Hayward Clawiter Road Industrial Project
102
c.(ii) Would the project substantially alter the existing drainage pattern of the site or area, including through the alteration of the course of a stream or river or through the addition of impervious surfaces, in a manner which would substantially increase the rate or amount of surface runoff in a manner which would result in flooding on- or off-site?
c.(iii) Would the project substantially alter the existing drainage pattern of the site or area, including through the alteration of the course of a stream or river or through the addition of impervious surfaces, in a manner that would create or contribute runoff water which would exceed the capacity of existing or planned stormwater drainage systems or provide substantial additional sources of polluted runoff?
c.(iv) Would the project substantially alter the existing drainage pattern of the site or area, including through the alteration of the course of a stream or river or through the addition of impervious surfaces, in a manner which would impede or redirect flood flows?
The project site is not located in a flood zone, as discussed under Item d below, and does not contain a river or stream which would be altered and result in flooding on- or off-site. The nearest watercourse to the site is Alameda Creek, located approximately two miles southeast. The project would not directly alter the course of a stream or river and would not impede or redirect flood flows. However, the proposed project would increase impervious surfaces by approximately 87,500 square-feet which would increase the volume of runoff compared to existing conditions. As described in the Project Description, the project would include new stormwater collection and conveyance systems designed to mimic the existing conditions of the site. Therefore, overall, the project would not alter the drainage pattern of the site as it would continue existing drainage patterns. Further, the project involves stormwater detention areas as needed to comply with development requirements of the Alameda County Flood Control & Water Conservation District (the District). The District requires that the discharge flow rate of development projects be less than or equal to the pre-development discharge flow rate. Stormwater treatment and detention needs would be met through a combination of bioretention planters, underground storm drain pipes, and stormwater pumps. By controlling the rate of runoff to be equal to or less than pre-development conditions, the project would not increase the rate of runoff such that there would be flooding on- or off-site or such that the capacity of storm drain systems would be exceeded. As described above under the responses to checklist questions (a), c(i), and (e), the project would comply with C.3 requirements and would not create sources of additional polluted runoff. Impacts would be less than significant.
LESS THAN SIGNIFICANT IMPACT
d. In flood hazard, tsunami, or seiche zones, would the project risk release of pollutants due to project inundation?
According to the Federal Emergency Management Agency (FEMA), the project site is located in Flood Zone X, which is considered an area of minimal flood hazard and is outside of FEMA designated flood zones (FEMA 2009). Therefore, the proposed project is not located within a flood zone and impacts concerning flood hazards would be less than significant. According to the City of Hayward General Plan, the bay area, including the project site, does not have a history or significant risk of tsunamis (City of Hayward 2014). The project site is approximately two miles inland from the San Francisco Bay and would not risk release of pollutants due to inundation by seiche. Therefore, impacts would be less than significant.
LESS THAN SIGNIFICANT IMPACT
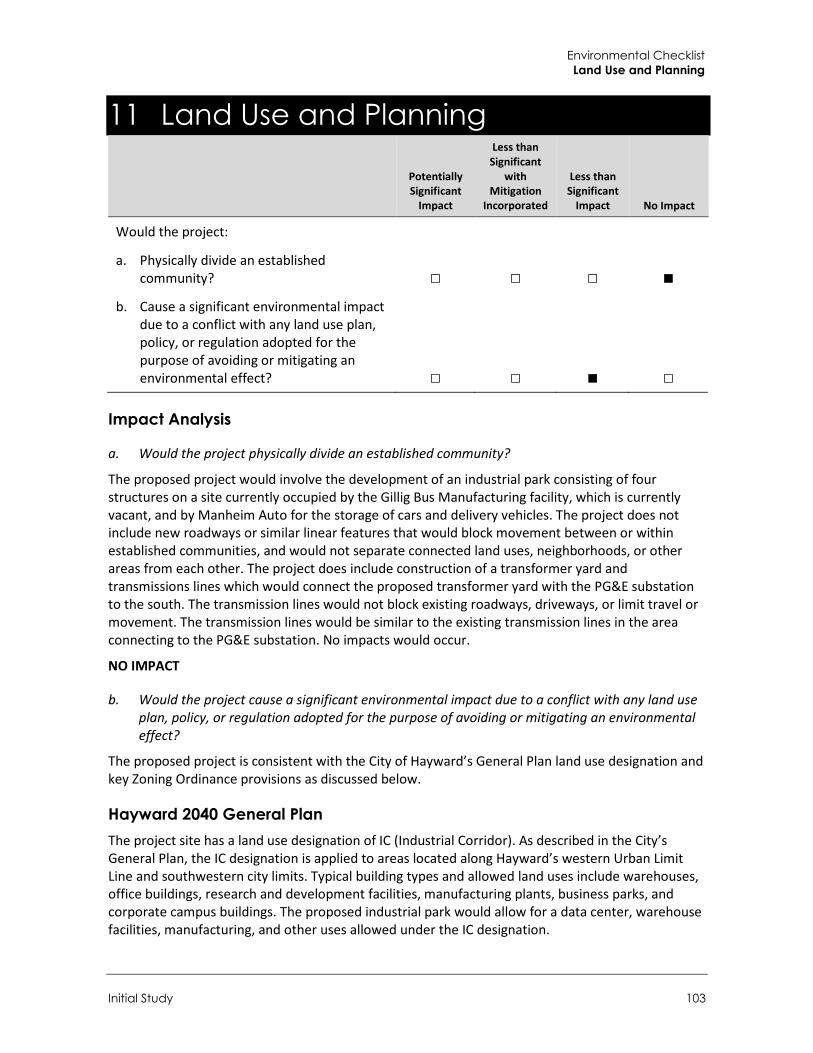
Environmental Checklist Land Use and Planning
Initial Study 103
11 Land Use and Planning
Potentially Significant
Impact
Less than Significant
with Mitigation
Incorporated
Less than Significant
Impact No Impact
Would the project:
a. Physically divide an established community? □ □ □ ■
b. Cause a significant environmental impact due to a conflict with any land use plan, policy, or regulation adopted for the purpose of avoiding or mitigating an environmental effect? □ □ ■ □
Impact Analysis
a. Would the project physically divide an established community?
The proposed project would involve the development of an industrial park consisting of four structures on a site currently occupied by the Gillig Bus Manufacturing facility, which is currently vacant, and by Manheim Auto for the storage of cars and delivery vehicles. The project does not include new roadways or similar linear features that would block movement between or within established communities, and would not separate connected land uses, neighborhoods, or other areas from each other. The project does include construction of a transformer yard and transmissions lines which would connect the proposed transformer yard with the PG&E substation to the south. The transmission lines would not block existing roadways, driveways, or limit travel or movement. The transmission lines would be similar to the existing transmission lines in the area connecting to the PG&E substation. No impacts would occur.
NO IMPACT
b. Would the project cause a significant environmental impact due to a conflict with any land use plan, policy, or regulation adopted for the purpose of avoiding or mitigating an environmental effect?
The proposed project is consistent with the City of Hayward’s General Plan land use designation and key Zoning Ordinance provisions as discussed below.
Hayward 2040 General Plan The project site has a land use designation of IC (Industrial Corridor). As described in the City’s General Plan, the IC designation is applied to areas located along Hayward’s western Urban Limit Line and southwestern city limits. Typical building types and allowed land uses include warehouses, office buildings, research and development facilities, manufacturing plants, business parks, and corporate campus buildings. The proposed industrial park would allow for a data center, warehouse facilities, manufacturing, and other uses allowed under the IC designation.
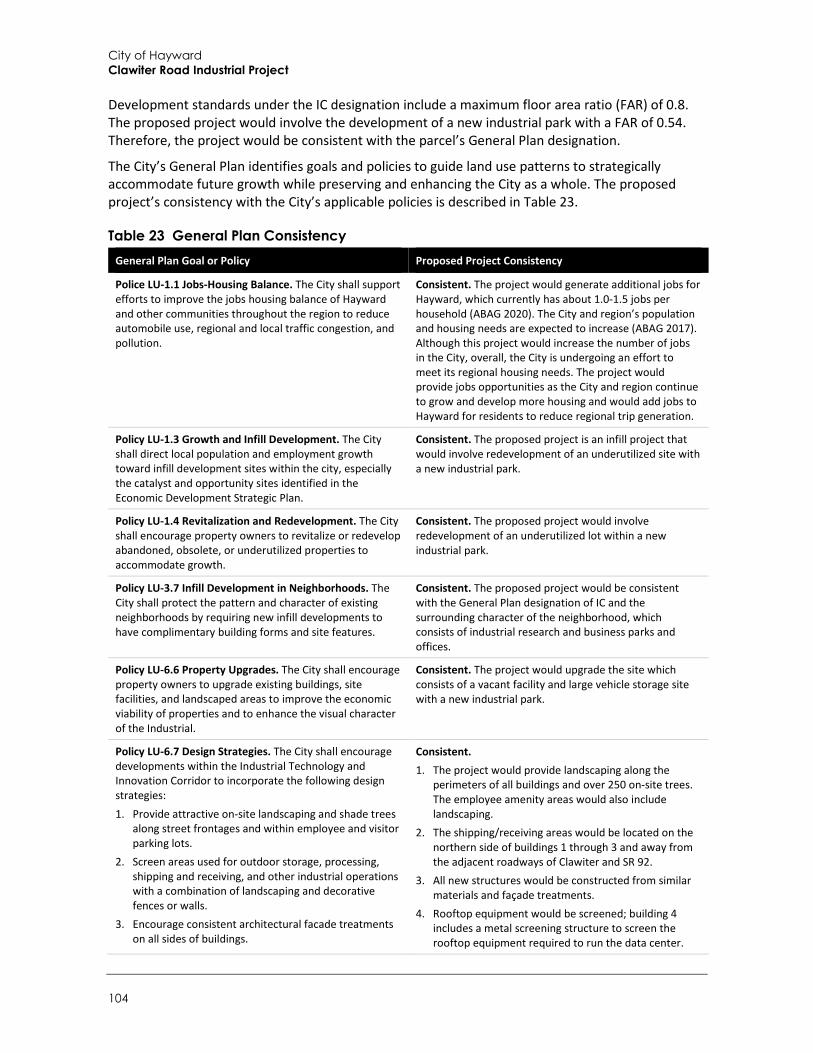
City of Hayward Clawiter Road Industrial Project
104
Development standards under the IC designation include a maximum floor area ratio (FAR) of 0.8. The proposed project would involve the development of a new industrial park with a FAR of 0.54. Therefore, the project would be consistent with the parcel’s General Plan designation.
The City’s General Plan identifies goals and policies to guide land use patterns to strategically accommodate future growth while preserving and enhancing the City as a whole. The proposed project’s consistency with the City’s applicable policies is described in Table 23.
Table 23 General Plan Consistency General Plan Goal or Policy Proposed Project Consistency
Police LU-1.1 Jobs-Housing Balance. The City shall support efforts to improve the jobs housing balance of Hayward and other communities throughout the region to reduce automobile use, regional and local traffic congestion, and pollution.
Consistent. The project would generate additional jobs for Hayward, which currently has about 1.0-1.5 jobs per household (ABAG 2020). The City and region’s population and housing needs are expected to increase (ABAG 2017). Although this project would increase the number of jobs in the City, overall, the City is undergoing an effort to meet its regional housing needs. The project would provide jobs opportunities as the City and region continue to grow and develop more housing and would add jobs to Hayward for residents to reduce regional trip generation.
Policy LU-1.3 Growth and Infill Development. The City shall direct local population and employment growth toward infill development sites within the city, especially the catalyst and opportunity sites identified in the Economic Development Strategic Plan.
Consistent. The proposed project is an infill project that would involve redevelopment of an underutilized site with a new industrial park.
Policy LU-1.4 Revitalization and Redevelopment. The City shall encourage property owners to revitalize or redevelop abandoned, obsolete, or underutilized properties to accommodate growth.
Consistent. The proposed project would involve redevelopment of an underutilized lot within a new industrial park.
Policy LU-3.7 Infill Development in Neighborhoods. The City shall protect the pattern and character of existing neighborhoods by requiring new infill developments to have complimentary building forms and site features.
Consistent. The proposed project would be consistent with the General Plan designation of IC and the surrounding character of the neighborhood, which consists of industrial research and business parks and offices.
Policy LU-6.6 Property Upgrades. The City shall encourage property owners to upgrade existing buildings, site facilities, and landscaped areas to improve the economic viability of properties and to enhance the visual character of the Industrial.
Consistent. The project would upgrade the site which consists of a vacant facility and large vehicle storage site with a new industrial park.
Policy LU-6.7 Design Strategies. The City shall encourage developments within the Industrial Technology and Innovation Corridor to incorporate the following design strategies: 1. Provide attractive on-site landscaping and shade trees
along street frontages and within employee and visitor parking lots.
2. Screen areas used for outdoor storage, processing, shipping and receiving, and other industrial operations with a combination of landscaping and decorative fences or walls.
3. Encourage consistent architectural facade treatments on all sides of buildings.
Consistent. 1. The project would provide landscaping along the
perimeters of all buildings and over 250 on-site trees. The employee amenity areas would also include landscaping.
2. The shipping/receiving areas would be located on the northern side of buildings 1 through 3 and away from the adjacent roadways of Clawiter and SR 92.
3. All new structures would be constructed from similar materials and façade treatments.
4. Rooftop equipment would be screened; building 4 includes a metal screening structure to screen the rooftop equipment required to run the data center.
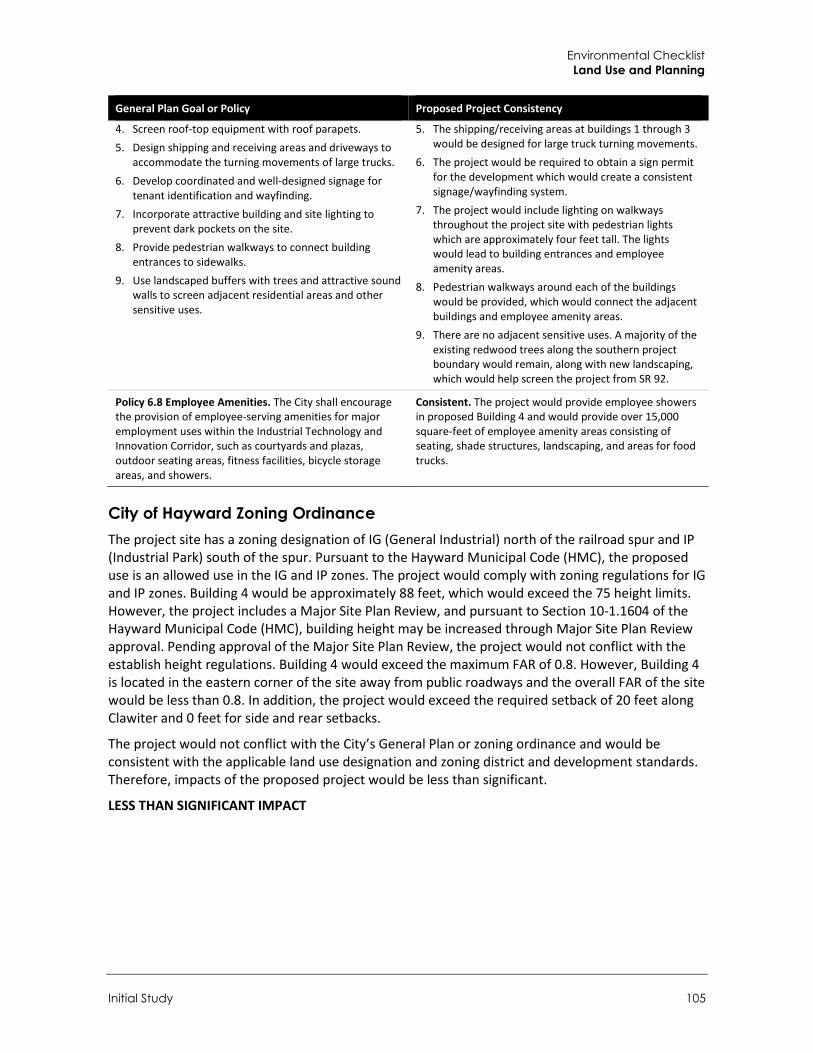
Environmental Checklist Land Use and Planning
Initial Study 105
General Plan Goal or Policy Proposed Project Consistency
4. Screen roof-top equipment with roof parapets. 5. Design shipping and receiving areas and driveways to
accommodate the turning movements of large trucks. 6. Develop coordinated and well-designed signage for
tenant identification and wayfinding. 7. Incorporate attractive building and site lighting to
prevent dark pockets on the site. 8. Provide pedestrian walkways to connect building
entrances to sidewalks. 9. Use landscaped buffers with trees and attractive sound
walls to screen adjacent residential areas and other sensitive uses.
5. The shipping/receiving areas at buildings 1 through 3 would be designed for large truck turning movements.
6. The project would be required to obtain a sign permit for the development which would create a consistent signage/wayfinding system.
7. The project would include lighting on walkways throughout the project site with pedestrian lights which are approximately four feet tall. The lights would lead to building entrances and employee amenity areas.
8. Pedestrian walkways around each of the buildings would be provided, which would connect the adjacent buildings and employee amenity areas.
9. There are no adjacent sensitive uses. A majority of the existing redwood trees along the southern project boundary would remain, along with new landscaping, which would help screen the project from SR 92.
Policy 6.8 Employee Amenities. The City shall encourage the provision of employee-serving amenities for major employment uses within the Industrial Technology and Innovation Corridor, such as courtyards and plazas, outdoor seating areas, fitness facilities, bicycle storage areas, and showers.
Consistent. The project would provide employee showers in proposed Building 4 and would provide over 15,000 square-feet of employee amenity areas consisting of seating, shade structures, landscaping, and areas for food trucks.
City of Hayward Zoning Ordinance The project site has a zoning designation of IG (General Industrial) north of the railroad spur and IP (Industrial Park) south of the spur. Pursuant to the Hayward Municipal Code (HMC), the proposed use is an allowed use in the IG and IP zones. The project would comply with zoning regulations for IG and IP zones. Building 4 would be approximately 88 feet, which would exceed the 75 height limits. However, the project includes a Major Site Plan Review, and pursuant to Section 10-1.1604 of the Hayward Municipal Code (HMC), building height may be increased through Major Site Plan Review approval. Pending approval of the Major Site Plan Review, the project would not conflict with the establish height regulations. Building 4 would exceed the maximum FAR of 0.8. However, Building 4 is located in the eastern corner of the site away from public roadways and the overall FAR of the site would be less than 0.8. In addition, the project would exceed the required setback of 20 feet along Clawiter and 0 feet for side and rear setbacks.
The project would not conflict with the City’s General Plan or zoning ordinance and would be consistent with the applicable land use designation and zoning district and development standards. Therefore, impacts of the proposed project would be less than significant.
LESS THAN SIGNIFICANT IMPACT

City of Hayward Clawiter Road Industrial Project
106
This page intentionally left blank.
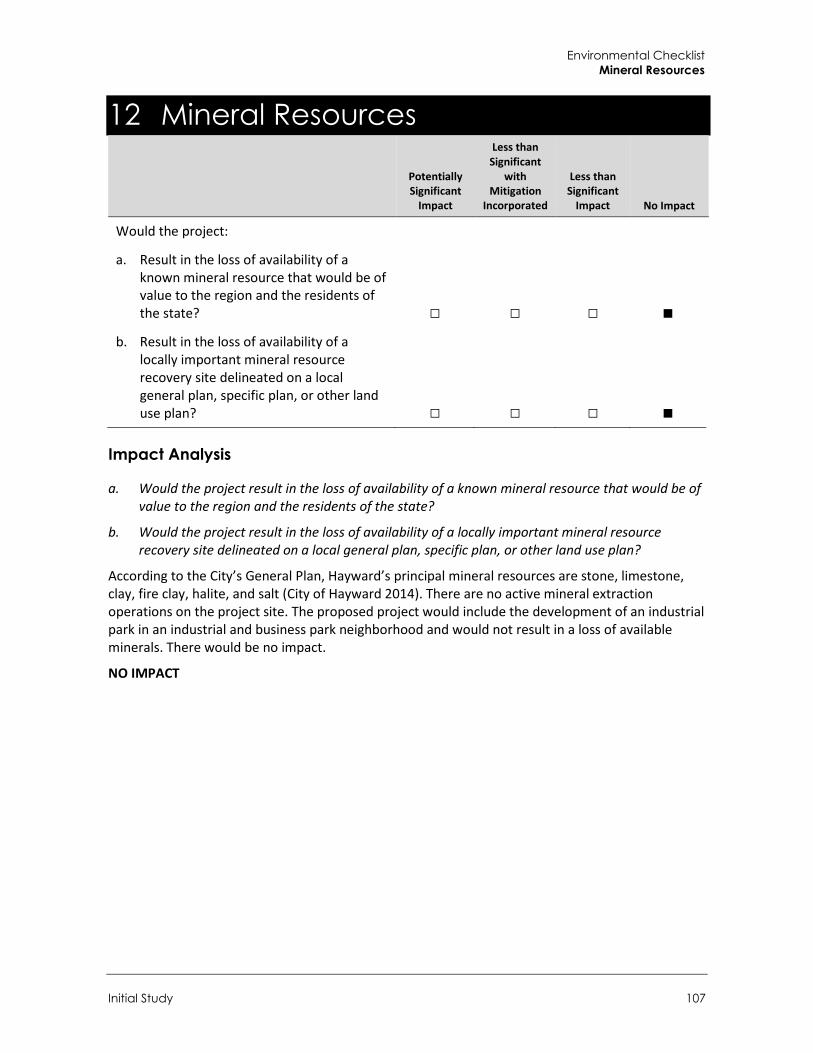
Environmental Checklist Mineral Resources
Initial Study 107
12 Mineral Resources
Potentially Significant
Impact
Less than Significant
with Mitigation
Incorporated
Less than Significant
Impact No Impact
Would the project:
a. Result in the loss of availability of a known mineral resource that would be of value to the region and the residents of the state? □ □ □ ■
b. Result in the loss of availability of a locally important mineral resource recovery site delineated on a local general plan, specific plan, or other land use plan? □ □ □ ■
Impact Analysis
a. Would the project result in the loss of availability of a known mineral resource that would be of value to the region and the residents of the state?
b. Would the project result in the loss of availability of a locally important mineral resource recovery site delineated on a local general plan, specific plan, or other land use plan?
According to the City’s General Plan, Hayward’s principal mineral resources are stone, limestone, clay, fire clay, halite, and salt (City of Hayward 2014). There are no active mineral extraction operations on the project site. The proposed project would include the development of an industrial park in an industrial and business park neighborhood and would not result in a loss of available minerals. There would be no impact.
NO IMPACT

City of Hayward Clawiter Road Industrial Project
108
This page intentionally left blank.
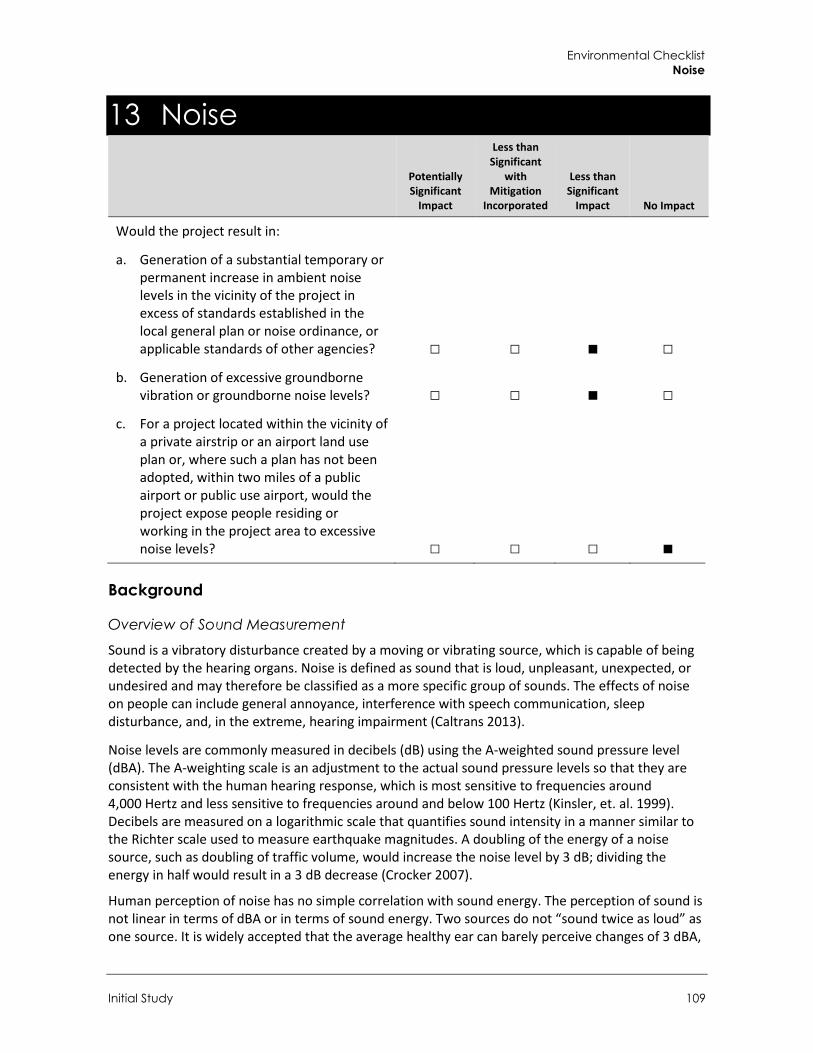
Environmental Checklist Noise
Initial Study 109
13 Noise
Potentially Significant
Impact
Less than Significant
with Mitigation
Incorporated
Less than Significant
Impact No Impact
Would the project result in:
a. Generation of a substantial temporary or permanent increase in ambient noise levels in the vicinity of the project in excess of standards established in the local general plan or noise ordinance, or applicable standards of other agencies? □ □ ■ □
b. Generation of excessive groundborne vibration or groundborne noise levels? □ □ ■ □
c. For a project located within the vicinity of a private airstrip or an airport land use plan or, where such a plan has not been adopted, within two miles of a public airport or public use airport, would the project expose people residing or working in the project area to excessive noise levels? □ □ □ ■
Background
Overview of Sound Measurement Sound is a vibratory disturbance created by a moving or vibrating source, which is capable of being detected by the hearing organs. Noise is defined as sound that is loud, unpleasant, unexpected, or undesired and may therefore be classified as a more specific group of sounds. The effects of noise on people can include general annoyance, interference with speech communication, sleep disturbance, and, in the extreme, hearing impairment (Caltrans 2013).
Noise levels are commonly measured in decibels (dB) using the A-weighted sound pressure level (dBA). The A-weighting scale is an adjustment to the actual sound pressure levels so that they are consistent with the human hearing response, which is most sensitive to frequencies around 4,000 Hertz and less sensitive to frequencies around and below 100 Hertz (Kinsler, et. al. 1999). Decibels are measured on a logarithmic scale that quantifies sound intensity in a manner similar to the Richter scale used to measure earthquake magnitudes. A doubling of the energy of a noise source, such as doubling of traffic volume, would increase the noise level by 3 dB; dividing the energy in half would result in a 3 dB decrease (Crocker 2007).
Human perception of noise has no simple correlation with sound energy. The perception of sound is not linear in terms of dBA or in terms of sound energy. Two sources do not “sound twice as loud” as one source. It is widely accepted that the average healthy ear can barely perceive changes of 3 dBA,
City of Hayward Clawiter Road Industrial Project
110
increase or decrease (i.e., twice the sound energy); that a change of 5 dBA is readily perceptible (eight times the sound energy); and that an increase (or decrease) of 10 dBA sounds twice (half) as loud ([10.5x the sound energy] Crocker 2007).
Sound changes in both level and frequency spectrum as it travels from the source to the receiver. The most obvious change is the decrease in level as the distance from the source increases. The manner by which noise reduces with distance depends on factors such as the type of sources (e.g., point or line, the path the sound will travel, site conditions, and obstructions). Noise levels from a point source typically attenuate, or drop off, at a rate of 6 dBA per doubling of distance (e.g., construction, industrial machinery, ventilation units). Noise from a line source (e.g., roadway, pipeline, railroad) typically attenuates at about 3 dBA per doubling of distance (Caltrans 2013). The propagation of noise is also affected by the intervening ground, known as ground absorption. A hard site, such as a parking lot or smooth body of water, receives no additional ground attenuation and the changes in noise levels with distance (drop-off rate) result from simply the geometric spreading of the source. An additional ground attenuation value of 1.5 dBA per doubling of distance applies to a soft site (e.g., soft dirt, grass, or scattered bushes and trees) (Caltrans 2013). Noise levels may also be reduced by intervening structures; the amount of attenuation provided by this “shielding” depends on the size of the object and the frequencies of the noise levels. Natural terrain features such as hills and dense woods, and man-made features such as buildings and walls, can significantly alter noise levels. Generally, any large structure blocking the line of sight will provide at least a 5-dBA reduction in source noise levels at the receiver (Federal Highway Administration [FHWA] 2017). Structures can substantially reduce exposure to noise as well. The FHWA’s guidelines indicate that modern building construction generally provides an exterior-to-interior noise level reduction of 20 to 35 dBA with closed windows.
The impact of noise is not a function of loudness alone. The time of day when noise occurs, and the duration of the noise are also important factors of project noise impact. Most noise that lasts for more than a few seconds is variable in its intensity. Consequently, a variety of noise descriptors have been developed. One of the most frequently used noise metrics is the equivalent noise level (Leq); it considers both duration and sound power level. Leq is defined as the single steady A-weighted level equivalent to the same amount of energy as that contained in the actual fluctuating levels over time. Typically, Leq is summed over a one-hour period. Lmax is the highest root mean squared (RMS) sound pressure level within the sampling period, and Lmin is the lowest RMS sound pressure level within the measuring period (Crocker 2007).
Noise that occurs at night tends to be more disturbing than that occurring during the day. Community noise is usually measured using Day-Night Average Level (DNL), which is the 24-hour average noise level with a +10 dBA penalty for noise occurring during nighttime (10:00 p.m. to 7:00 a.m.) hours; it is also measured using Community Noise Equivalent Level (CNEL), which is the 24-hour average noise level with a +5 dBA penalty for noise occurring from 7:00 p.m. to 10:00 p.m. and a +10 dBA penalty for noise occurring from 10:00 p.m. to 7:00 a.m. (Caltrans 2013). Noise levels described by DNL and CNEL usually differ by about 1 dBA. The relationship between the peak-hour Leq value and the DNL/CNEL depends on the distribution of traffic during the day, evening, and night. Quiet suburban areas typically have CNEL noise levels in the range of 40 to 50 dBA, while areas near arterial streets are in the 50 to 60-plus CNEL range. Normal conversational levels are in the 60 to 65-dBA Leq range; ambient noise levels greater than 65 dBA Leq can interrupt conversations (Federal Transit Administration [FTA] 2018).
Environmental Checklist Noise
Initial Study 111
Vibration Groundborne vibration of concern in environmental analysis consists of the oscillatory waves that move from a source through the ground to adjacent structures. The number of cycles per second of oscillation makes up the vibration frequency, described in terms of Hz. The frequency of a vibrating object describes how rapidly it oscillates. The normal frequency range of most groundborne vibration that can be felt by the human body starts from a low frequency of less than 1 Hz and goes to a high of about 200 Hz (Crocker 2007).
While people have varying sensitivities to vibrations at different frequencies, in general they are most sensitive to low-frequency vibration. Vibration in buildings, such as from nearby construction activities, may cause windows, items on shelves, and pictures on walls to rattle. Vibration of building components can also take the form of an audible low-frequency rumbling noise, referred to as groundborne noise. Groundborne noise is usually only a problem when the originating vibration spectrum is dominated by frequencies in the upper end of the range (60 to 200 Hz), or when foundations or utilities, such as sewer and water pipes, physically connect the structure and the vibration source (FTA 2018). Although groundborne vibration is sometimes noticeable in outdoor environments, it is almost never annoying to people who are outdoors. The primary concern from vibration is that it can be intrusive and annoying to building occupants and vibration-sensitive land uses.
Vibration energy spreads out as it travels through the ground, causing the vibration level to diminish with distance away from the source. High-frequency vibrations diminish much more rapidly than low frequencies, so low frequencies tend to dominate the spectrum at large distances from the source. Discontinuities in the soil strata can also cause diffractions or channeling effects that affect the propagation of vibration over long distances (Caltrans 2020a). When a building is impacted by vibration, a ground-to-foundation coupling loss will usually reduce the overall vibration level. However, under rare circumstances, the ground-to-foundation coupling may actually amplify the vibration level due to structural resonances of the floors and walls.
Vibration amplitudes are usually expressed in peak particle velocity (PPV) or root mean squared (RMS) vibration velocity. The PPV and RMS velocity are normally described in inches per second (in./sec.). PPV is defined as the maximum instantaneous positive or negative peak of a vibration signal. PPV is often used in monitoring of blasting vibration because it is related to the stresses that are experienced by buildings (Caltrans 2020a).
Vibration limits used in this analysis to determine a potential impact to local land uses from construction activities, such as blasting, pile-driving, vibratory compaction, demolition, drilling, and excavation, are based on information contained in Caltrans’ Transportation and Construction Vibration Guidance Manual and the Federal Transit Administration and the FTA Transit Noise and Vibration Impact Assessment Manual (Caltrans 2020a; FTA 2018). Maximum recommended vibration limits by the American Association of State Highway and Transportation Officials (AASHTO) are identified in Table 24.
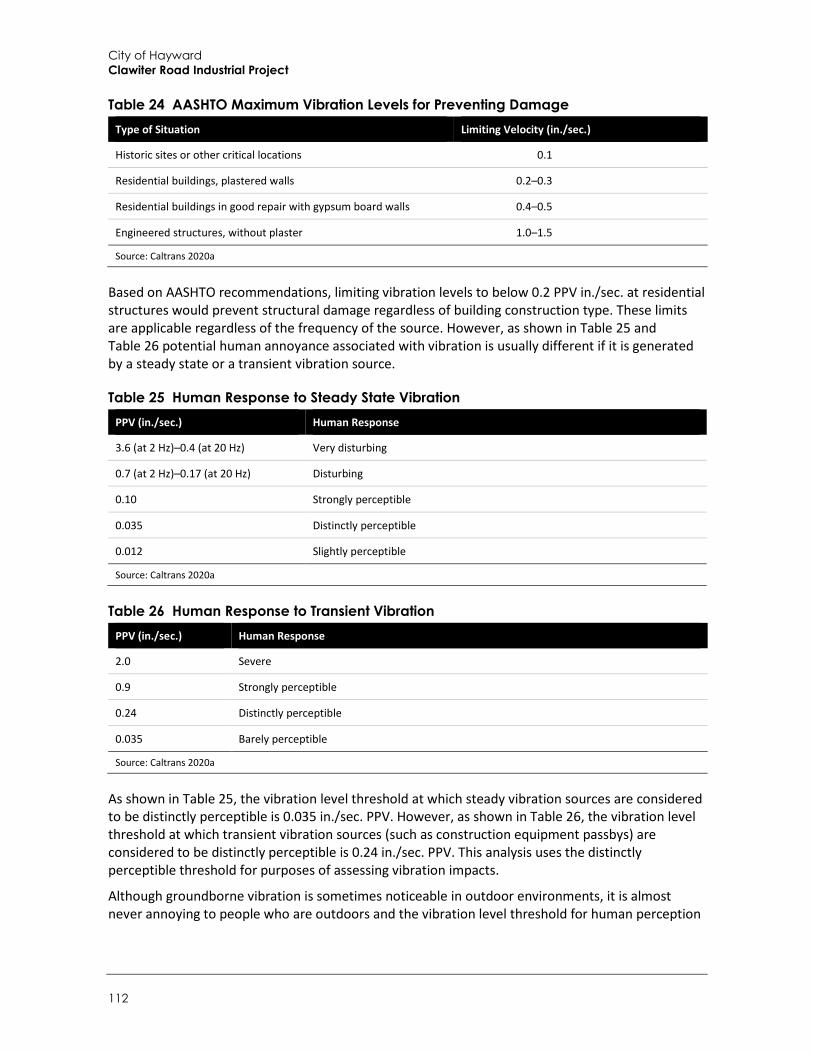
City of Hayward Clawiter Road Industrial Project
112
Table 24 AASHTO Maximum Vibration Levels for Preventing Damage Type of Situation Limiting Velocity (in./sec.)
Historic sites or other critical locations 0.1
Residential buildings, plastered walls 0.2–0.3
Residential buildings in good repair with gypsum board walls 0.4–0.5
Engineered structures, without plaster 1.0–1.5
Source: Caltrans 2020a
Based on AASHTO recommendations, limiting vibration levels to below 0.2 PPV in./sec. at residential structures would prevent structural damage regardless of building construction type. These limits are applicable regardless of the frequency of the source. However, as shown in Table 25 and Table 26 potential human annoyance associated with vibration is usually different if it is generated by a steady state or a transient vibration source.
Table 25 Human Response to Steady State Vibration PPV (in./sec.) Human Response
3.6 (at 2 Hz)–0.4 (at 20 Hz) Very disturbing
0.7 (at 2 Hz)–0.17 (at 20 Hz) Disturbing
0.10 Strongly perceptible
0.035 Distinctly perceptible
0.012 Slightly perceptible
Source: Caltrans 2020a
Table 26 Human Response to Transient Vibration PPV (in./sec.) Human Response
2.0 Severe
0.9 Strongly perceptible
0.24 Distinctly perceptible
0.035 Barely perceptible
Source: Caltrans 2020a
As shown in Table 25, the vibration level threshold at which steady vibration sources are considered to be distinctly perceptible is 0.035 in./sec. PPV. However, as shown in Table 26, the vibration level threshold at which transient vibration sources (such as construction equipment passbys) are considered to be distinctly perceptible is 0.24 in./sec. PPV. This analysis uses the distinctly perceptible threshold for purposes of assessing vibration impacts.
Although groundborne vibration is sometimes noticeable in outdoor environments, it is almost never annoying to people who are outdoors and the vibration level threshold for human perception

Environmental Checklist Noise
Initial Study 113
is assessed at occupied structures (FTA 2018). Therefore, vibration impacts are assessed at the structure of an affected property.
Sensitive Receivers Noise exposure goals for various types of land uses reflect the varying noise sensitivities associated with those uses. The City’s General Plan Hazards Element defines noise sensitive receivers as residences, schools, hospitals, libraries, religious institutions, and convalescent homes (City of Hayward 2014). As the project site is located in an industrial and commercial area, no noise-sensitive receivers are located adjacent to the project site. The nearest noise-sensitive receivers are single- and multi-family residences located approximately 0.2 mile (approximately 1,000 feet) to the east.
Vibration sensitive receivers are similar to noise sensitive receivers, such as residences, and institutional uses, such as schools, churches, and hospitals. However, vibration sensitive receivers also include buildings where vibrations may interfere with vibration-sensitive equipment, affected by levels that may be well below those associated with human annoyance.
Regulatory Framework The goals and policies contained in the Hayward 2040 General Plan Hazards Element focus on minimizing human exposure to excessive noise by evaluating noise exposure risks and incorporating appropriate mitigation measures (City of Hayward 2014). In support of these goals, the General Plan contains a table of exterior noise compatibility standards for various land uses (shown in Table 27) to determine potential noise exposure impacts. The highest level of exterior noise exposure regarded as “normally acceptable” for office buildings is 70 CNEL and for industrial manufacturing is 75 CNEL.
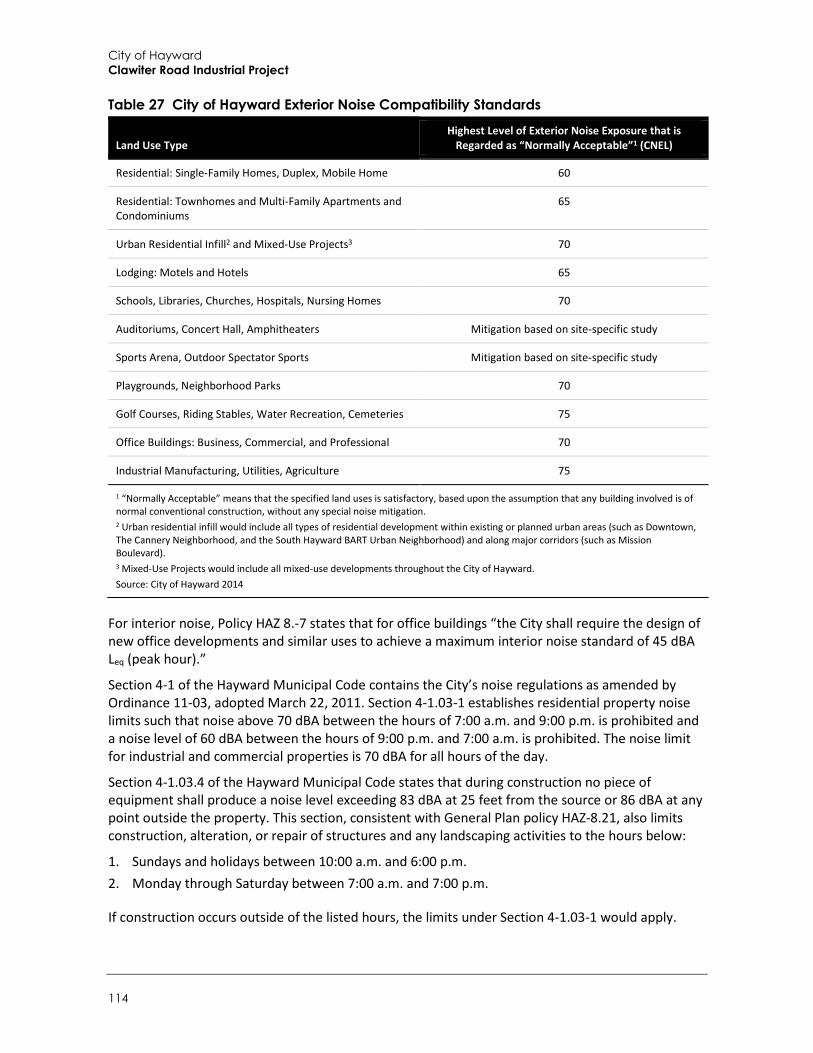
City of Hayward Clawiter Road Industrial Project
114
Table 27 City of Hayward Exterior Noise Compatibility Standards
Land Use Type Highest Level of Exterior Noise Exposure that is
Regarded as “Normally Acceptable”1 (CNEL)
Residential: Single-Family Homes, Duplex, Mobile Home 60
Residential: Townhomes and Multi-Family Apartments and Condominiums
65
Urban Residential Infill2 and Mixed-Use Projects3 70
Lodging: Motels and Hotels 65
Schools, Libraries, Churches, Hospitals, Nursing Homes 70
Auditoriums, Concert Hall, Amphitheaters Mitigation based on site-specific study
Sports Arena, Outdoor Spectator Sports Mitigation based on site-specific study
Playgrounds, Neighborhood Parks 70
Golf Courses, Riding Stables, Water Recreation, Cemeteries 75
Office Buildings: Business, Commercial, and Professional 70
Industrial Manufacturing, Utilities, Agriculture 75
1 “Normally Acceptable” means that the specified land uses is satisfactory, based upon the assumption that any building involved is of normal conventional construction, without any special noise mitigation. 2 Urban residential infill would include all types of residential development within existing or planned urban areas (such as Downtown, The Cannery Neighborhood, and the South Hayward BART Urban Neighborhood) and along major corridors (such as Mission Boulevard). 3 Mixed-Use Projects would include all mixed-use developments throughout the City of Hayward. Source: City of Hayward 2014
For interior noise, Policy HAZ 8.-7 states that for office buildings “the City shall require the design of new office developments and similar uses to achieve a maximum interior noise standard of 45 dBA Leq (peak hour).”
Section 4-1 of the Hayward Municipal Code contains the City’s noise regulations as amended by Ordinance 11-03, adopted March 22, 2011. Section 4-1.03-1 establishes residential property noise limits such that noise above 70 dBA between the hours of 7:00 a.m. and 9:00 p.m. is prohibited and a noise level of 60 dBA between the hours of 9:00 p.m. and 7:00 a.m. is prohibited. The noise limit for industrial and commercial properties is 70 dBA for all hours of the day.
Section 4-1.03.4 of the Hayward Municipal Code states that during construction no piece of equipment shall produce a noise level exceeding 83 dBA at 25 feet from the source or 86 dBA at any point outside the property. This section, consistent with General Plan policy HAZ-8.21, also limits construction, alteration, or repair of structures and any landscaping activities to the hours below:
1. Sundays and holidays between 10:00 a.m. and 6:00 p.m. 2. Monday through Saturday between 7:00 a.m. and 7:00 p.m.
If construction occurs outside of the listed hours, the limits under Section 4-1.03-1 would apply.
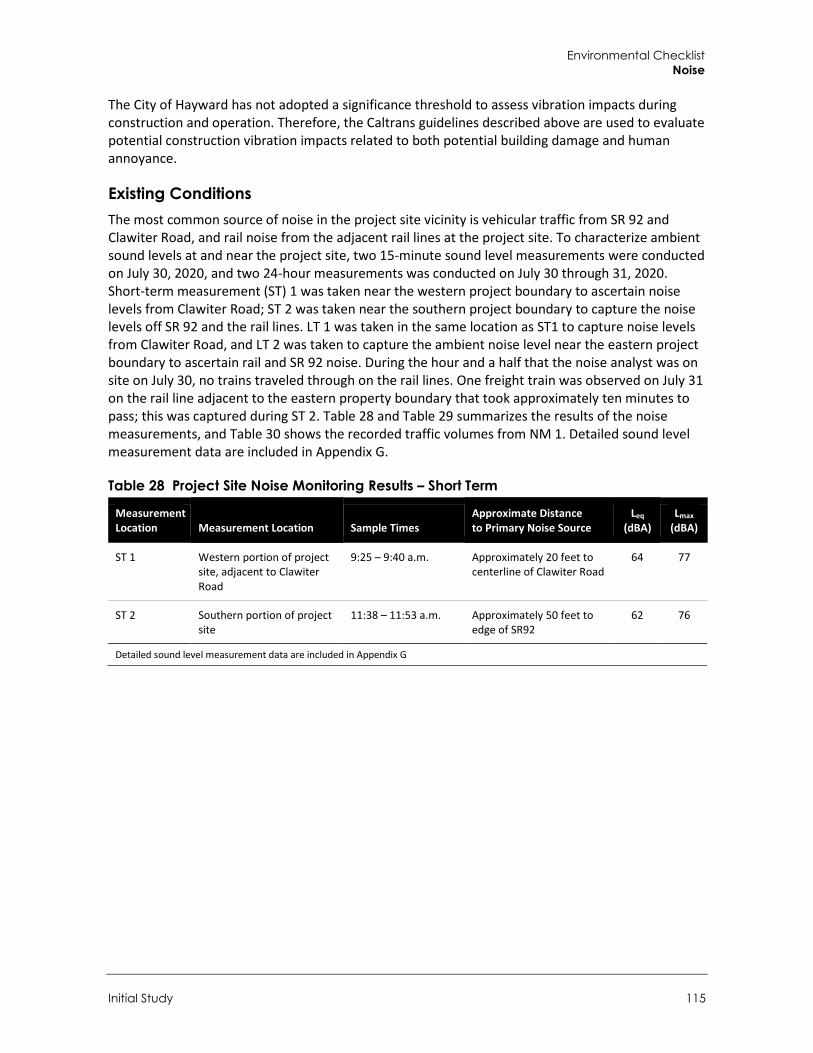
Environmental Checklist Noise
Initial Study 115
The City of Hayward has not adopted a significance threshold to assess vibration impacts during construction and operation. Therefore, the Caltrans guidelines described above are used to evaluate potential construction vibration impacts related to both potential building damage and human annoyance.
Existing Conditions The most common source of noise in the project site vicinity is vehicular traffic from SR 92 and Clawiter Road, and rail noise from the adjacent rail lines at the project site. To characterize ambient sound levels at and near the project site, two 15-minute sound level measurements were conducted on July 30, 2020, and two 24-hour measurements was conducted on July 30 through 31, 2020. Short-term measurement (ST) 1 was taken near the western project boundary to ascertain noise levels from Clawiter Road; ST 2 was taken near the southern project boundary to capture the noise levels off SR 92 and the rail lines. LT 1 was taken in the same location as ST1 to capture noise levels from Clawiter Road, and LT 2 was taken to capture the ambient noise level near the eastern project boundary to ascertain rail and SR 92 noise. During the hour and a half that the noise analyst was on site on July 30, no trains traveled through on the rail lines. One freight train was observed on July 31 on the rail line adjacent to the eastern property boundary that took approximately ten minutes to pass; this was captured during ST 2. Table 28 and Table 29 summarizes the results of the noise measurements, and Table 30 shows the recorded traffic volumes from NM 1. Detailed sound level measurement data are included in Appendix G.
Table 28 Project Site Noise Monitoring Results – Short Term
Measurement Location Measurement Location Sample Times
Approximate Distance to Primary Noise Source
Leq (dBA)
Lmax (dBA)
ST 1 Western portion of project site, adjacent to Clawiter Road
9:25 – 9:40 a.m. Approximately 20 feet to centerline of Clawiter Road
64 77
ST 2 Southern portion of project site
11:38 – 11:53 a.m. Approximately 50 feet to edge of SR92
62 76
Detailed sound level measurement data are included in Appendix G
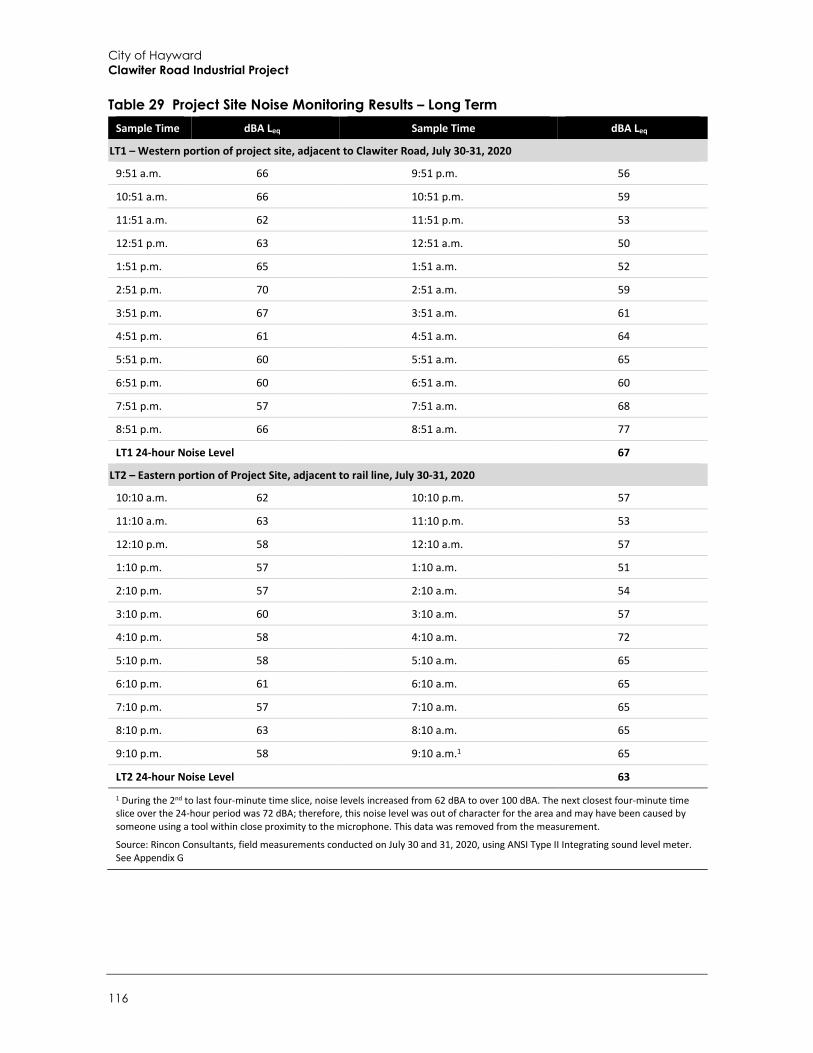
City of Hayward Clawiter Road Industrial Project
116
Table 29 Project Site Noise Monitoring Results – Long Term Sample Time dBA Leq Sample Time dBA Leq
LT1 – Western portion of project site, adjacent to Clawiter Road, July 30-31, 2020
9:51 a.m. 66 9:51 p.m. 56
10:51 a.m. 66 10:51 p.m. 59
11:51 a.m. 62 11:51 p.m. 53
12:51 p.m. 63 12:51 a.m. 50
1:51 p.m. 65 1:51 a.m. 52
2:51 p.m. 70 2:51 a.m. 59
3:51 p.m. 67 3:51 a.m. 61
4:51 p.m. 61 4:51 a.m. 64
5:51 p.m. 60 5:51 a.m. 65
6:51 p.m. 60 6:51 a.m. 60
7:51 p.m. 57 7:51 a.m. 68
8:51 p.m. 66 8:51 a.m. 77
LT1 24-hour Noise Level 67
LT2 – Eastern portion of Project Site, adjacent to rail line, July 30-31, 2020
10:10 a.m. 62 10:10 p.m. 57
11:10 a.m. 63 11:10 p.m. 53
12:10 p.m. 58 12:10 a.m. 57
1:10 p.m. 57 1:10 a.m. 51
2:10 p.m. 57 2:10 a.m. 54
3:10 p.m. 60 3:10 a.m. 57
4:10 p.m. 58 4:10 a.m. 72
5:10 p.m. 58 5:10 a.m. 65
6:10 p.m. 61 6:10 a.m. 65
7:10 p.m. 57 7:10 a.m. 65
8:10 p.m. 63 8:10 a.m. 65
9:10 p.m. 58 9:10 a.m.1 65
LT2 24-hour Noise Level 63
1 During the 2nd to last four-minute time slice, noise levels increased from 62 dBA to over 100 dBA. The next closest four-minute time slice over the 24-hour period was 72 dBA; therefore, this noise level was out of character for the area and may have been caused by someone using a tool within close proximity to the microphone. This data was removed from the measurement.
Source: Rincon Consultants, field measurements conducted on July 30 and 31, 2020, using ANSI Type II Integrating sound level meter. See Appendix G
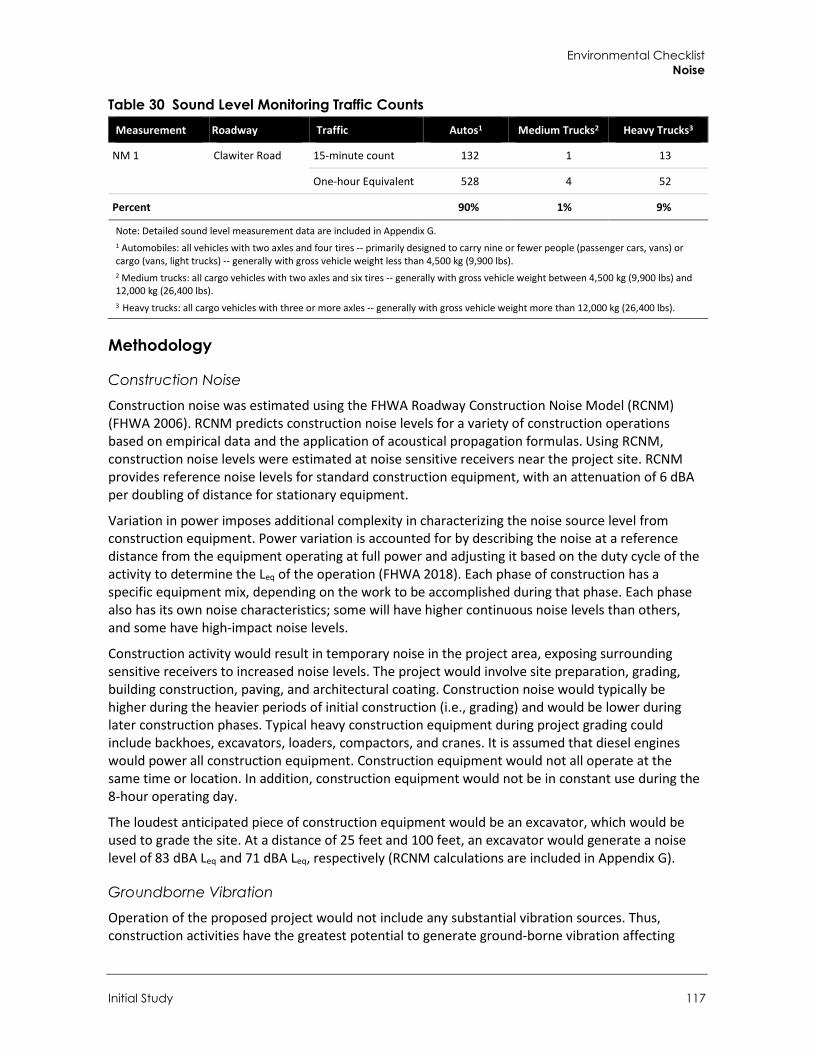
Environmental Checklist Noise
Initial Study 117
Table 30 Sound Level Monitoring Traffic Counts Measurement Roadway Traffic Autos1 Medium Trucks2 Heavy Trucks3
NM 1 Clawiter Road 15-minute count 132 1 13
One-hour Equivalent 528 4 52
Percent 90% 1% 9%
Note: Detailed sound level measurement data are included in Appendix G. 1 Automobiles: all vehicles with two axles and four tires -- primarily designed to carry nine or fewer people (passenger cars, vans) or cargo (vans, light trucks) -- generally with gross vehicle weight less than 4,500 kg (9,900 lbs). 2 Medium trucks: all cargo vehicles with two axles and six tires -- generally with gross vehicle weight between 4,500 kg (9,900 lbs) and 12,000 kg (26,400 lbs). 3 Heavy trucks: all cargo vehicles with three or more axles -- generally with gross vehicle weight more than 12,000 kg (26,400 lbs).
Methodology
Construction Noise Construction noise was estimated using the FHWA Roadway Construction Noise Model (RCNM) (FHWA 2006). RCNM predicts construction noise levels for a variety of construction operations based on empirical data and the application of acoustical propagation formulas. Using RCNM, construction noise levels were estimated at noise sensitive receivers near the project site. RCNM provides reference noise levels for standard construction equipment, with an attenuation of 6 dBA per doubling of distance for stationary equipment.
Variation in power imposes additional complexity in characterizing the noise source level from construction equipment. Power variation is accounted for by describing the noise at a reference distance from the equipment operating at full power and adjusting it based on the duty cycle of the activity to determine the Leq of the operation (FHWA 2018). Each phase of construction has a specific equipment mix, depending on the work to be accomplished during that phase. Each phase also has its own noise characteristics; some will have higher continuous noise levels than others, and some have high-impact noise levels.
Construction activity would result in temporary noise in the project area, exposing surrounding sensitive receivers to increased noise levels. The project would involve site preparation, grading, building construction, paving, and architectural coating. Construction noise would typically be higher during the heavier periods of initial construction (i.e., grading) and would be lower during later construction phases. Typical heavy construction equipment during project grading could include backhoes, excavators, loaders, compactors, and cranes. It is assumed that diesel engines would power all construction equipment. Construction equipment would not all operate at the same time or location. In addition, construction equipment would not be in constant use during the 8-hour operating day.
The loudest anticipated piece of construction equipment would be an excavator, which would be used to grade the site. At a distance of 25 feet and 100 feet, an excavator would generate a noise level of 83 dBA Leq and 71 dBA Leq, respectively (RCNM calculations are included in Appendix G).
Groundborne Vibration Operation of the proposed project would not include any substantial vibration sources. Thus, construction activities have the greatest potential to generate ground-borne vibration affecting

City of Hayward Clawiter Road Industrial Project
118
nearby receivers, especially during grading and excavation of the project site. The greatest vibratory source during construction would be equipment similar to a dozer, such as an excavator. Neither blasting nor pile driving would be required for construction of the proposed project. Construction vibration estimates are based on vibration levels reported by Caltrans and the FTA (Caltrans 2020a, FTA 2018). Table 31 shows typical vibration levels for various pieces of construction equipment used in the assessment of construction vibration (FTA 2018).
Table 31 Vibration Levels Measured during Construction Activities Equipment PPV at 25 ft. (in./sec.)
Large Bulldozer 0.089
Loaded Trucks 0.076
Small Bulldozer 0.003
Source: FTA 2018
Operational Noise Sources Noise sources associated with operation of the proposed project would consist of low speed on-site vehicular noise, landscaping maintenance, general conversations, and mechanical equipment (e.g., heating, ventilation, and air conditioning [HVAC] units, transformers, exhaust fans, and emergency backup generators). Due to the distances and low noise levels associated with general site activities, on-site traffic, and landscape maintenance, these sources are not considered substantial and are not analyzed further.
On site-noise sources were modeled with SoundPLAN. Propagation of modeled stationary noise sources was based on ISO Standard 9613-2, “Attenuation of Sound during Propagation Outdoors, Part 2: General Method of Calculation.” The assessment methodology assumes that all receivers would be downwind of stationary sources. This is a worst-case assumption for total noise impacts since only some receivers would be downwind at any one time. Receivers were placed at five feet above ground elevation. It was also conservatively assumed that all equipment would be fully operational at 100 percent load. Locations of some of the nearby offsite buildings were entered into the model to account for building shielding of noise levels; however, due to the number of offsite buildings between the project and the farthest off-site receivers, not all buildings were captured in the model. Therefore, additional noise attenuation would occur in real world conditions compared to the model due to additional buildings in between the project’s operational noise and receivers.
GENERATORS The project would use 23 2.5-MW generators and 1 600-kW generator on site for backup emergency energy. The generators would not be operated other than for periodic testing and maintenance requirements during normal facility operation. During non-emergency generator operation, only one generator would be in operation at a time. Operation of all generators would only occur during an emergency (power outage) and would therefore be exempt from the City’s Noise Ordinance, per Section 4-1.03.5.
According to the project applicant, the generator enclosure specification requirements for an individual backup generator for the project would require a noise level of 85 dBA when measured 23 feet from enclosure and five feet above grade in a free field environment with generator at full load. This would result in a Sound Power Level of approximately 110 dBA per generator.
Environmental Checklist Noise
Initial Study 119
HEATING AND COOLING EQUIPMENT
Data Center
Conventional data center designs tend to use a combination of chillers and heat rejection equipment like cooling towers to remove heat from the data center spaces. However, the project’s data center design is substantially different from conventional data centers because the main data hall cooling systems inside the building would not use refrigerants, compressors, cooling coils, cooling towers, or chilled water systems; rather, the internal data halls would be cooled by direct evaporative cooling units located inside the building. Accordingly, the only heating and cooling equipment to be found outside the building’s perimeter on the site plans would be the water storage tanks. No pumps or noise generating equipment is associated with the water storage tanks. Therefore, no heating or cooling equipment that generates noise would be located outside of the data center building, and as a result noise levels would be negligible from the data center heating and cooling equipment.
Office Buildings
HVAC units used for cooling and heating the office portion of the buildings would generate noise. HVAC units would not be used for cooling the industrial portion of the buildings. Each project building would contain 5,000 square feet of office space. The unit used in this analysis is a 16.7-ton Carrier 38AUD25 split system condenser (see Appendix G for manufacturer’s specifications). Each building was assumed to contain one HVAC unit based upon one ton of HVAC per 600 sf of building space. The manufacturer’s noise data lists the unit as having a sound power level of 85 dBA. Units were assumed to be located on the rooftops of each building above the office portion. All HVAC units were modeled with the center of the noise source as being three feet above the roof elevation.
DATA CENTER MECHANICAL PENTHOUSE The data center would contain a shielded mechanical penthouse area for fan assemblies. The proposed exhaust fans would have a Sound Powel Level of 86 dBA. Based upon similar data center projects, it was assumed that four fans would be in operation on the rooftop enclosed by the penthouse. See Appendix G for specifications of the equipment.
TRANSFORMER YARD The stationary noise impacts associated with the transformer yard would be a dry type transformer associated with each 230 kV transmission line. For a transformer capable of handling a 230 kV line, a transformer noise level of 58 dBA at one foot was obtained from the National Electrical Manufacturer’s Association Dry Type Transformers for General Applications manual. See Appendix G for specifications and references of the equipment.
Transportation Noise Sources Analysis of impacts of the environment on a project is generally not required for CEQA compliance (Ballona Wetlands Land Trust et al. v. City of Los Angeles). Therefore, noise exposure to new noise-sensitive land uses from transportation noise sources has been analyzed for informational purposes only. The project would be subject to transportation noise levels from vehicles (roadway) and from trains (railway). Transportation noise levels were modeled from these sources simultaneously at the project site; details on each source are described further below.

City of Hayward Clawiter Road Industrial Project
120
ROADWAY Noise levels affecting the proposed project site would be primarily influenced by traffic noise from SR 92. Future noise levels affecting the compatibility of the project site were estimated using the FHWA’s Traffic Noise Model (TNM) traffic noise-reference levels and SoundPLAN. Traffic noise-model inputs to SoundPLAN include the three-dimensional coordinates of the roadways, noise receivers, and topographic features or planned barriers that would affect noise propagation; vehicle volumes and speeds, by type of vehicle; and absorption factors.
SR 92 is an eight-lane highway with a posted speed limit of 65 miles per hour (mph). Clawiter Road is a two-lane roadway with a posted speed limit of 35 mph. The project would develop an industrial park, replacing an existing manufacturing area. Trip generation is based on the project’s traffic analysis, which determined the project would result in an increase of 71 new trips over the existing use during the peak hour (Kittelson & Associates 2020). Traffic volumes for SR 92 and Clawiter Road used in modeling were obtained from Caltrans and the City’s General Plan and are shown in Table 32.
Table 32 Existing and Future Traffic Volumes Traffic Counts (Peak Hour)
Roadway Existing Existing + Project
SR 921 4,600 4,6713
Clawiter Road2 1,478 1,5493
1 Caltrans 2020b (peak hour assumed 10 percent of average daily traffic) 2 City 2014; the City General Plan does not contain roadway volumes for Clawiter Road; the closest road included, Industrial Parkway west of Hesperian Boulevard, was used as a proxy. This segment of Industrial Parkway merges with Clawiter Road approximately 0.6 mile north of the project site. 3 Project would add 71 peak hour trips (Kittelson & Associates 2020)
The CNEL is calculated based on the peak-hour traffic volumes, which are considered representative of the CNEL. To determine the vehicle classification mix for modeling, Caltrans vehicle classification for SR 92 were used (Caltrans 2020b), with a mix of 98 percent automobiles, 1 percent medium trucks, and 1 percent heavy trucks. Exterior transportation noise levels were modeled at the future office and industrial building façades and exterior use areas, with the receivers placed at 5 feet above ground level.
RAILWAY During the on-site noise measurements, for the hour and a half that the noise analyst was on site on July 30, no trains traveled through on the rail lines. One freight train was observed on July 31 on the rail line adjacent to the eastern property boundary that took approximately ten minutes to pass. An analysis of the rail lines indicates that the main rail line that borders the eastern property boundary is a Union Pacific freight line spur from San Leandro to Newark, and the rail line through the site is a minor freight line spur off this line that ends approximately 0.6 mile west of the project site. Freight lines typically have low train volumes, with small freight spurs being used even more sparingly, and schedules are not publicly available. A recent analysis of a Union Pacific freight line similar in use to the San Leandro to Newark line on a Union Pacific Railroad line in El Centro, California, indicated between two and four freight trains would pass on the line per day (Rincon Consultants 2020). As the freight lines near the project site are also run by the Union Pacific Railroad, these assumptions
Environmental Checklist Noise
Initial Study 121
were used for modeling purposes. For peak-hour modeling, it was assumed that one freight train would pass on the spur rail line nearest to the project site and one freight train would run on the main line. Defaults in SoundPLAN for conventional freight trains of three locomotives per train, 32 cars per train, and a car length of 57 feet were used.
Trains would not be expected to travel at full speed by the project site as the railways are located in an urban area in close proximity to several at-grade street crossings. In addition, trains using the freight spur line that runs through the project site would have to navigate a 90-degree rail turn on the project site to join the main freight line. Per the Code of Federal Regulations (CFR) Section 213.9(a), the maximum allowable operating speed for freight trains ranges from 10 to 80 miles per hour, depending on track class (Class 1 through Class 5). According to an Association of American Railroads report, in the first 39 weeks of 2019 the average speed of freight trains in the U.S. was 25.7 miles per hour (Journal of Commerce 2019). Given the aforementioned reasons and for a conservative analysis, a speed of 40 miles per hour was used.
Methodology The following thresholds are based on City noise standards and Appendix G of the CEQA guidelines. Noise impacts would be significant if:
Noise in Excess of Established Standards: The project would result in the generation of a substantial temporary or permanent increase in ambient noise levels in the vicinity of the project in excess of standards established in the local general plan or noise ordinance, or applicable standards of other agencies. Temporary: Construction noise would be significant if:
− Noise levels exceed 86 dBA at any point outside the property; or − Construction noise is generated outside of allowable construction hours as stated in
Section 4-1.03.4 of the Hayward Municipal Code. Permanent: Operational noise would be significant if:
− Per Section 4-1.03-1 of the Hayward Municipal Code, if the project’s stationary noises sources generated noise levels exceed 70 dBA between the hours of 7:00 a.m. and 9:00 p.m. and a noise level of 60 dBA between the hours of 9:00 p.m. and 7:00 a.m. at residential property limits, or 70 dBA for all hours of the day at industrial and commercial property limits; or
− For traffic-related noise, impacts would be significant if project-generated traffic would result in exposure of sensitive receivers to an unacceptable increase in noise levels. For purposes of this analysis, a significant impact would occur if project-related traffic increases the ambient noise environment of noise-sensitive locations by 3 dB or more where the ambient noise level exceeds the City Noise Element land use compatibility standards (i.e., those with-project conditions that fall within the “normally unacceptable” or “clearly unacceptable” land use categories). In addition, a significant impact would also occur if project-related traffic increases the ambient noise environment of noise-sensitive locations by 5 dB or more regardless of the ambient noise level under with-project conditions.
City of Hayward Clawiter Road Industrial Project
122
Vibration: The project would result in the generation of excessive ground-borne vibration or ground-borne noise levels. This would occur if the project would subject vibration-sensitive land uses to construction-
related ground-borne vibration that exceeds the distinctly perceptible vibration annoyance potential criteria for human receivers of 0.24 in./sec. PPV, or the residential structural damage criteria of 0.2 PPV in./sec.
Airport Noise: For a project located in the vicinity of a private airstrip or an airport land use plan or, where such a plan has not been adopted, within two miles of a public airport or public use airport, if the project exposes people residing or working in the project area to excessive noise levels.
Land Use Compatibility: The project’s on-site uses would be subject to noise exceeding City Noise Element land use compatibility standards. This would occur if exterior use areas of the project are subject to noise levels in excess of
70 CNEL, and interior office areas of the project are subject to noise levels in excess of 45 dBA Leq (peak hour).
a. Would the project result in generation of a substantial temporary or permanent increase in ambient noise levels in the vicinity of the project in excess of standards established in the local general plan or noise ordinance, or applicable standards of other agencies?
Construction Over the course of a typical construction day, construction equipment would be located as close as 25 feet to the nearest property lines but would typically be located at an average distance further away due to the nature of construction where equipment is mobile throughout the day. Therefore, it is conservatively assumed that over the course of a typical construction day the construction equipment would operate at an average of 100 feet from the nearest property lines.
As described under Methodology, at distances of 25 feet and 100 feet, an excavator would generate a noise level of 83 dBA Leq and 71 dBA Leq, respectively. Therefore, construction noise levels associated with this equipment would not exceed the City’s construction noise threshold of 86 dBA at any point outside the property. In addition, construction would occur within the allowed hours of the City’s Municipal Code. Given these considerations, construction noise impacts would be less than significant.
Operation The project would introduce sources of operational noise to the site from mechanical equipment such as generators, HVAC units, exhaust fans, and transformers. Assumptions for these sources are discussed under Operational Noise Sources. Noise levels at the nearest properties from each noise source and their combined noise levels are shown in Table 33. Receiver locations and operational noise level contours are shown on Figure 8; on-site operation noise levels would be dominated by a generator unit when one is being tested. As shown in Table 33, noise levels would not exceed the residential, commercial, or industrial noise limits during any time of day. Therefore, operational noise from the project would not exceed limits at off-site noise-sensitive receivers, and impacts would be less than significant.
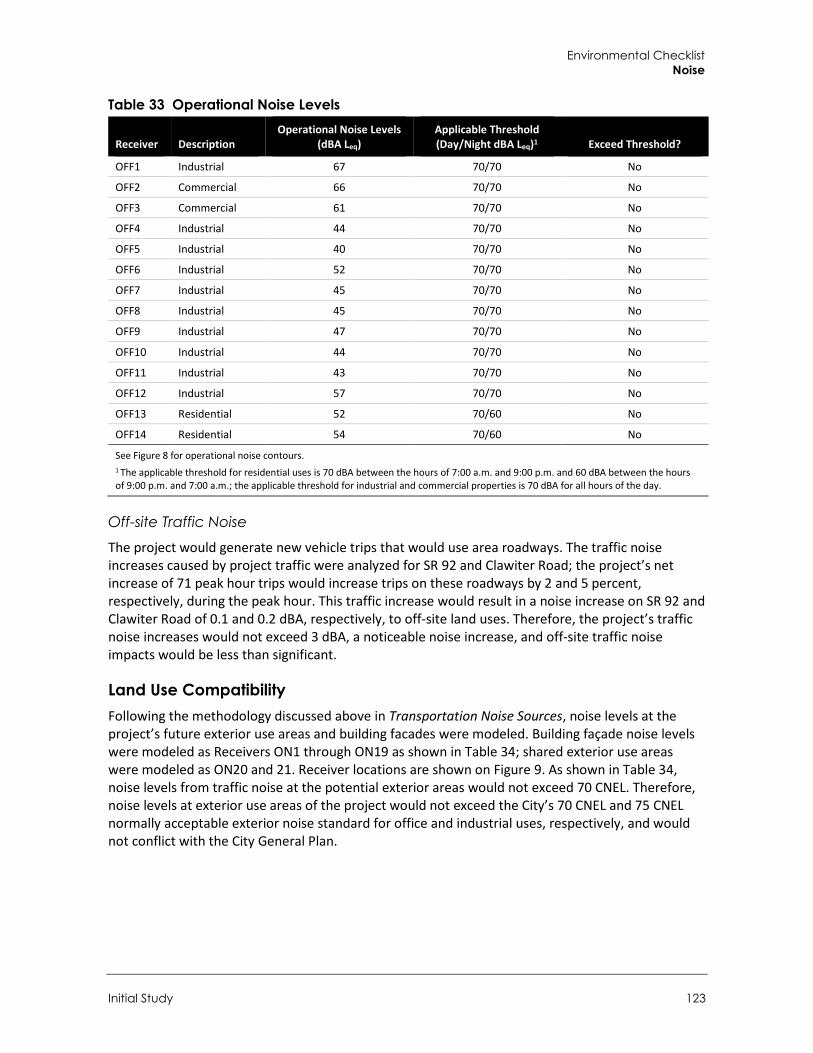
Environmental Checklist Noise
Initial Study 123
Table 33 Operational Noise Levels
Receiver Description Operational Noise Levels
(dBA Leq) Applicable Threshold (Day/Night dBA Leq)1 Exceed Threshold?
OFF1 Industrial 67 70/70 No
OFF2 Commercial 66 70/70 No
OFF3 Commercial 61 70/70 No
OFF4 Industrial 44 70/70 No
OFF5 Industrial 40 70/70 No
OFF6 Industrial 52 70/70 No
OFF7 Industrial 45 70/70 No
OFF8 Industrial 45 70/70 No
OFF9 Industrial 47 70/70 No
OFF10 Industrial 44 70/70 No
OFF11 Industrial 43 70/70 No
OFF12 Industrial 57 70/70 No
OFF13 Residential 52 70/60 No
OFF14 Residential 54 70/60 No
See Figure 8 for operational noise contours. 1 The applicable threshold for residential uses is 70 dBA between the hours of 7:00 a.m. and 9:00 p.m. and 60 dBA between the hours of 9:00 p.m. and 7:00 a.m.; the applicable threshold for industrial and commercial properties is 70 dBA for all hours of the day.
Off-site Traffic Noise The project would generate new vehicle trips that would use area roadways. The traffic noise increases caused by project traffic were analyzed for SR 92 and Clawiter Road; the project’s net increase of 71 peak hour trips would increase trips on these roadways by 2 and 5 percent, respectively, during the peak hour. This traffic increase would result in a noise increase on SR 92 and Clawiter Road of 0.1 and 0.2 dBA, respectively, to off-site land uses. Therefore, the project’s traffic noise increases would not exceed 3 dBA, a noticeable noise increase, and off-site traffic noise impacts would be less than significant.
Land Use Compatibility Following the methodology discussed above in Transportation Noise Sources, noise levels at the project’s future exterior use areas and building facades were modeled. Building façade noise levels were modeled as Receivers ON1 through ON19 as shown in Table 34; shared exterior use areas were modeled as ON20 and 21. Receiver locations are shown on Figure 9. As shown in Table 34, noise levels from traffic noise at the potential exterior areas would not exceed 70 CNEL. Therefore, noise levels at exterior use areas of the project would not exceed the City’s 70 CNEL and 75 CNEL normally acceptable exterior noise standard for office and industrial uses, respectively, and would not conflict with the City General Plan.
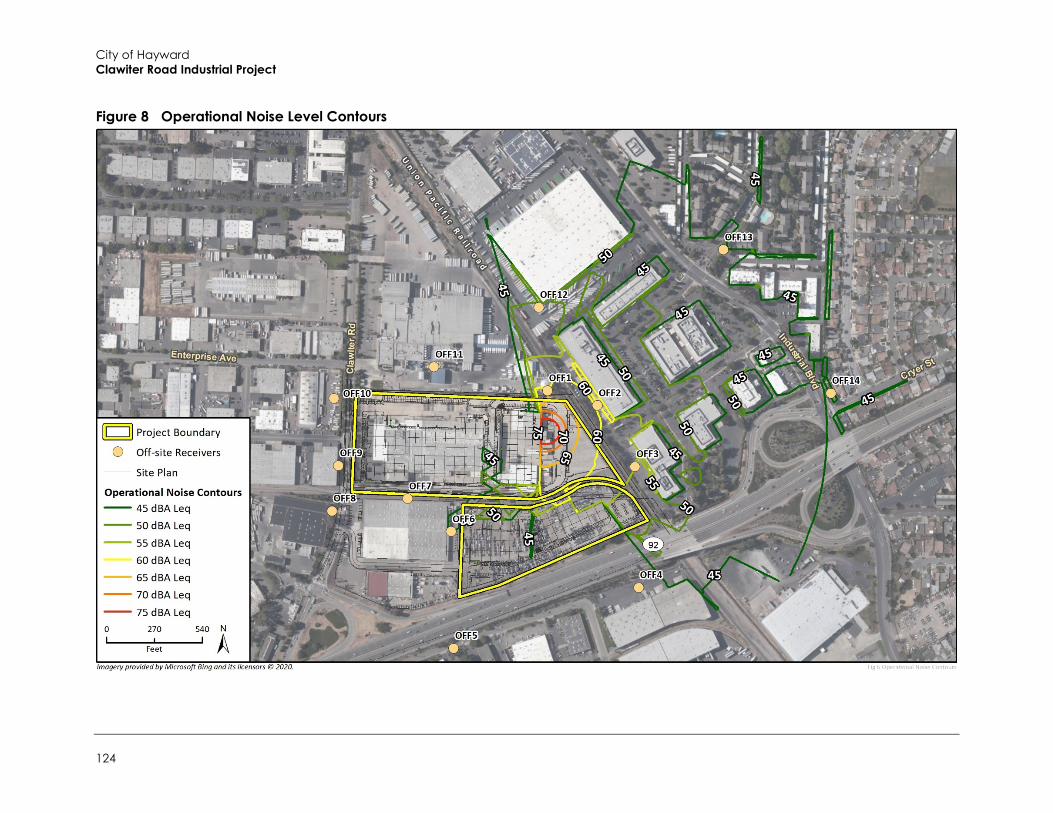
City of Hayward Clawiter Road Industrial Project
124
Figure 8 Operational Noise Level Contours
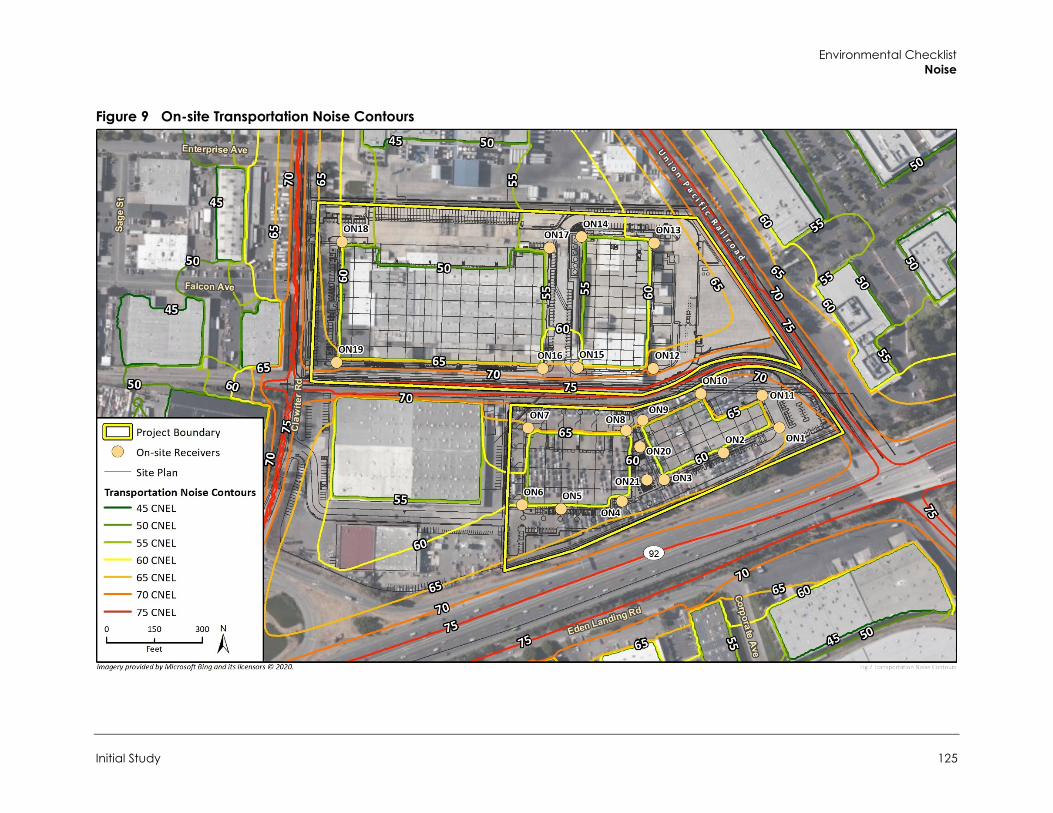
Environmental Checklist Noise
Initial Study 125
Figure 9 On-site Transportation Noise Contours
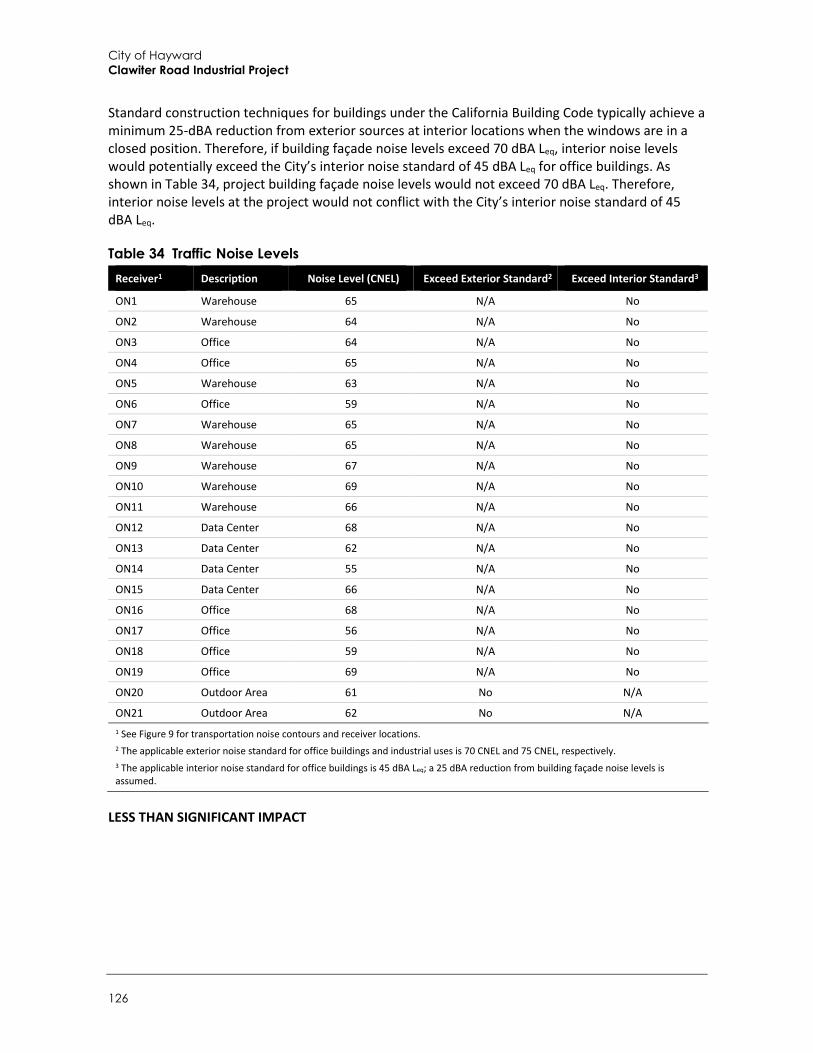
City of Hayward Clawiter Road Industrial Project
126
Standard construction techniques for buildings under the California Building Code typically achieve a minimum 25-dBA reduction from exterior sources at interior locations when the windows are in a closed position. Therefore, if building façade noise levels exceed 70 dBA Leq, interior noise levels would potentially exceed the City’s interior noise standard of 45 dBA Leq for office buildings. As shown in Table 34, project building façade noise levels would not exceed 70 dBA Leq. Therefore, interior noise levels at the project would not conflict with the City’s interior noise standard of 45 dBA Leq.
Table 34 Traffic Noise Levels Receiver1 Description Noise Level (CNEL) Exceed Exterior Standard2 Exceed Interior Standard3
ON1 Warehouse 65 N/A No
ON2 Warehouse 64 N/A No
ON3 Office 64 N/A No
ON4 Office 65 N/A No
ON5 Warehouse 63 N/A No
ON6 Office 59 N/A No
ON7 Warehouse 65 N/A No
ON8 Warehouse 65 N/A No
ON9 Warehouse 67 N/A No
ON10 Warehouse 69 N/A No
ON11 Warehouse 66 N/A No
ON12 Data Center 68 N/A No
ON13 Data Center 62 N/A No
ON14 Data Center 55 N/A No
ON15 Data Center 66 N/A No
ON16 Office 68 N/A No
ON17 Office 56 N/A No
ON18 Office 59 N/A No
ON19 Office 69 N/A No
ON20 Outdoor Area 61 No N/A
ON21 Outdoor Area 62 No N/A 1 See Figure 9 for transportation noise contours and receiver locations. 2 The applicable exterior noise standard for office buildings and industrial uses is 70 CNEL and 75 CNEL, respectively. 3 The applicable interior noise standard for office buildings is 45 dBA Leq; a 25 dBA reduction from building façade noise levels is assumed.
LESS THAN SIGNIFICANT IMPACT
Environmental Checklist Noise
Initial Study 127
b. Would the project result in generation of excessive groundborne vibration or groundborne noise levels?
Construction activities known to generate excessive ground-borne vibration, such as pile driving, would not be conducted by the project. The greatest anticipated source of vibration during general project construction activities would be from equipment similar to a dozer, such as an excavator, which may be used within 100 feet of the nearest structures to the south when accounting for setbacks. A dozer would create approximately 0.089 in/sec PPV at a distance of 25 feet (Caltrans 2020a). This would equal a vibration level of 0.02 in/sec PPV at a distance of 100 feet.11 This would be lower than what is considered a distinctly perceptible impact for humans of 0.24 in/sec PPV, and the structural damage impact of 0.2 in/sec PPV. Therefore, although the equipment may be perceptible to nearby human receptors, temporary impacts associated with the equipment would be less than significant.
Operation of the project would not include substantial vibration sources. Therefore, operational vibration impacts would be less than significant.
LESS THAN SIGNIFICANT IMPACT
c. For a project located within the vicinity of a private airstrip or an airport land use plan or, where such a plan has not been adopted, within two miles of a public airport or public use airport, would the project expose people residing or working in the project area to excessive noise levels?
The closest airport is the Hayward Executive Airport, located approximately 2.0 miles north of the project site. In addition, the Oakland International Airport is located approximately 7.0 miles to the northwest. The noise contours from these airports do not reach the project site (Alameda County Community Development Agency 2012). Therefore, construction workers or users of the project site would not be exposed to substantial aircraft noise, and no impacts would occur.
NO IMPACT
11 PPVEquipment = PPVRef (25/D)n (in/sec), PPVRef = reference PPV at 25 feet, D = distance ,and n = 1.1

City of Hayward Clawiter Road Industrial Project
128
This page intentionally left blank.
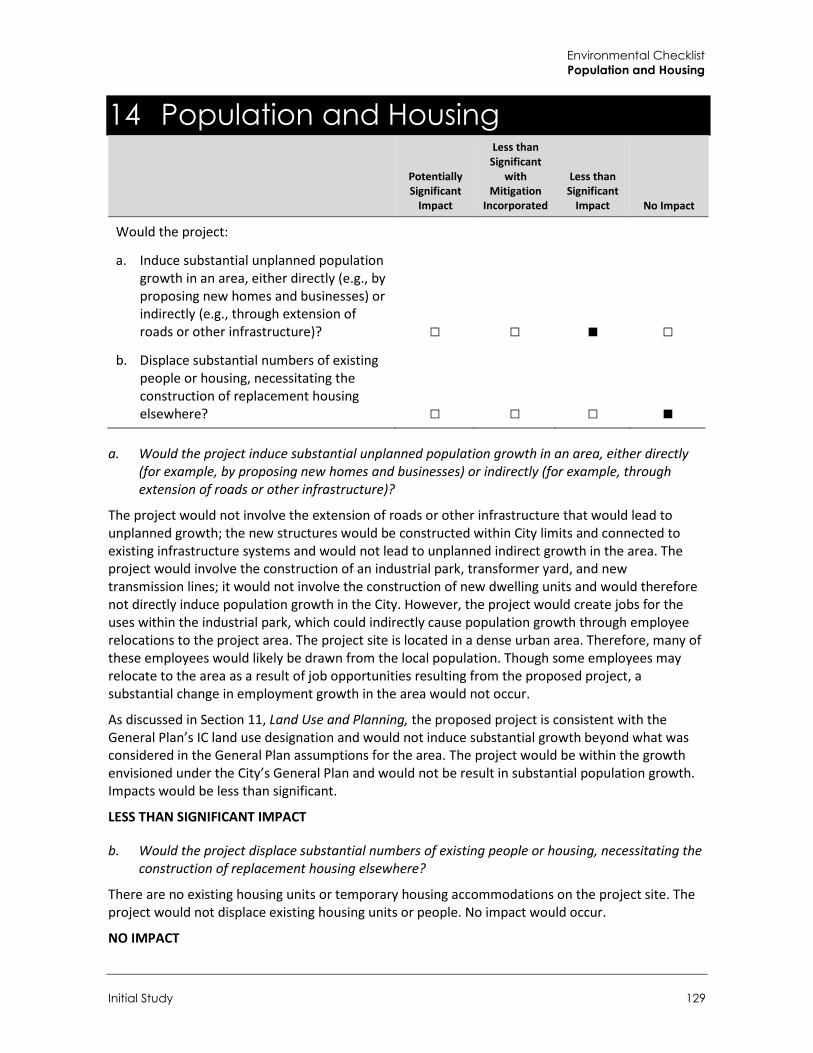
Environmental Checklist Population and Housing
Initial Study 129
14 Population and Housing
Potentially Significant
Impact
Less than Significant
with Mitigation
Incorporated
Less than Significant
Impact No Impact
Would the project:
a. Induce substantial unplanned population growth in an area, either directly (e.g., by proposing new homes and businesses) or indirectly (e.g., through extension of roads or other infrastructure)? □ □ ■ □
b. Displace substantial numbers of existing people or housing, necessitating the construction of replacement housing elsewhere? □ □ □ ■
a. Would the project induce substantial unplanned population growth in an area, either directly (for example, by proposing new homes and businesses) or indirectly (for example, through extension of roads or other infrastructure)?
The project would not involve the extension of roads or other infrastructure that would lead to unplanned growth; the new structures would be constructed within City limits and connected to existing infrastructure systems and would not lead to unplanned indirect growth in the area. The project would involve the construction of an industrial park, transformer yard, and new transmission lines; it would not involve the construction of new dwelling units and would therefore not directly induce population growth in the City. However, the project would create jobs for the uses within the industrial park, which could indirectly cause population growth through employee relocations to the project area. The project site is located in a dense urban area. Therefore, many of these employees would likely be drawn from the local population. Though some employees may relocate to the area as a result of job opportunities resulting from the proposed project, a substantial change in employment growth in the area would not occur.
As discussed in Section 11, Land Use and Planning, the proposed project is consistent with the General Plan’s IC land use designation and would not induce substantial growth beyond what was considered in the General Plan assumptions for the area. The project would be within the growth envisioned under the City’s General Plan and would not be result in substantial population growth. Impacts would be less than significant.
LESS THAN SIGNIFICANT IMPACT
b. Would the project displace substantial numbers of existing people or housing, necessitating the construction of replacement housing elsewhere?
There are no existing housing units or temporary housing accommodations on the project site. The project would not displace existing housing units or people. No impact would occur.
NO IMPACT

City of Hayward Clawiter Road Industrial Project
130
This page intentionally left blank.
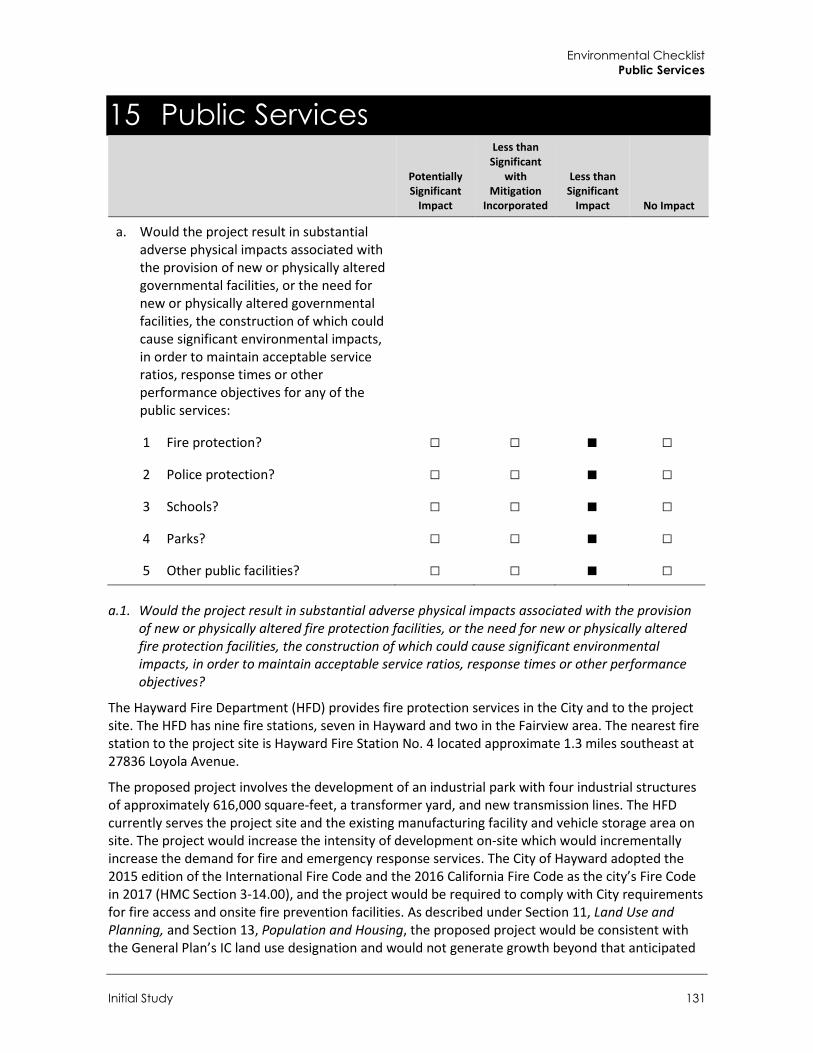
Environmental Checklist Public Services
Initial Study 131
15 Public Services
Potentially Significant
Impact
Less than Significant
with Mitigation
Incorporated
Less than Significant
Impact No Impact
a. Would the project result in substantial adverse physical impacts associated with the provision of new or physically altered governmental facilities, or the need for new or physically altered governmental facilities, the construction of which could cause significant environmental impacts, in order to maintain acceptable service ratios, response times or other performance objectives for any of the public services:
1 Fire protection? □ □ ■ □
2 Police protection? □ □ ■ □
3 Schools? □ □ ■ □
4 Parks? □ □ ■ □
5 Other public facilities? □ □ ■ □
a.1. Would the project result in substantial adverse physical impacts associated with the provision of new or physically altered fire protection facilities, or the need for new or physically altered fire protection facilities, the construction of which could cause significant environmental impacts, in order to maintain acceptable service ratios, response times or other performance objectives?
The Hayward Fire Department (HFD) provides fire protection services in the City and to the project site. The HFD has nine fire stations, seven in Hayward and two in the Fairview area. The nearest fire station to the project site is Hayward Fire Station No. 4 located approximate 1.3 miles southeast at 27836 Loyola Avenue.
The proposed project involves the development of an industrial park with four industrial structures of approximately 616,000 square-feet, a transformer yard, and new transmission lines. The HFD currently serves the project site and the existing manufacturing facility and vehicle storage area on site. The project would increase the intensity of development on-site which would incrementally increase the demand for fire and emergency response services. The City of Hayward adopted the 2015 edition of the International Fire Code and the 2016 California Fire Code as the city’s Fire Code in 2017 (HMC Section 3-14.00), and the project would be required to comply with City requirements for fire access and onsite fire prevention facilities. As described under Section 11, Land Use and Planning, and Section 13, Population and Housing, the proposed project would be consistent with the General Plan’s IC land use designation and would not generate growth beyond that anticipated
City of Hayward Clawiter Road Industrial Project
132
in the General Plan. The project site is located in a developed, industrial area already served by HFD. The development of the proposed industrial park and new transmissions lines would be consistent with surrounding uses and would not place an unanticipated burden on fire protection services or affect response times or service ratios such that new or expanded fire facilities would be needed. Impacts would be less than significant.
LESS THAN SIGNIFICANT IMPACT
a.2. Would the project result in substantial adverse physical impacts associated with the provision of new or physically altered police protection facilities, or the need for new or physically altered police protection facilities, the construction of which could cause significant environmental impacts, in order to maintain acceptable service ratios, response times or other performance objectives?
Law enforcement services in the City and to the project site are provided by the Hayward Police Department (HPD). The project site is located within HPD Beat E, which is a specific geographic area in the southwest portion of the City. The nearest police station to the site is located at 300 West Winton Avenue, 3.4 miles northeast of the project site (approximately six minutes driving time). As discussed under Impact a.1. above, the project involves the development of an industrial park with four industrial structures of approximately 616,000 square-feet, a transformer yard, and new transmission lines. The project site and surrounding area are currently served by HPD. The project would increase the development intensity on-site which would incrementally increase the demand for police services. However, the project site is located within four miles of the City’s police headquarters and was envisioned for future industrial park development in the City’s General Plan. In addition, the entire perimeter of the data center in Proposed Building 4 would be enclosed by an eight-foot high security fence. Gates at the parking lot entrances would allow only permitted personnel in the data center area. Also, a guard shack would be located near the generator yard and transformer yard, which would reduce demand on police services. Therefore, the project would not require the construction or expansion of police protection facilities beyond those already planned under General Plan assumptions (City of Hayward 2013). Impacts would be less than significant.
LESS THAN SIGNIFICANT IMPACT
a.3. Would the project result in substantial adverse physical impacts associated with the provision of new or physically altered schools, or the need for new or physically altered schools, the construction of which could cause significant environmental impacts, in order to maintain acceptable service ratios or other performance objectives?
Schools in Hayward are in the Hayward Unified School District (HUSD), which operates 22 elementary, five middle, and four high schools. As described in Section 13, Population and Housing, although the project could result in indirect population growth through employee relocation, overall, the project would not result in direct population growth or substantial indirect population growth. Therefore, the project would not result in a substantial increase in the number of students attending schools operated by HUSD. In addition, the project would be required to pay HUSD Developer Fees at $0.66 per square foot (HUSD 2020). Pursuant to Senate Bill 50 (Section 65995(h)), payment of mandatory fees to the affected school district would reduce potential school impacts to less than significant level under CEQA. Therefore, the proposed project would have a less than significant impact with respect to schools.
LESS THAN SIGNIFICANT IMPACT
Environmental Checklist Public Services
Initial Study 133
a.4. Would the project result in substantial adverse physical impacts associated with the provision of new or physically altered parks, or the need for new or physically altered parks, the construction of which could cause significant environmental impacts, in order to maintain acceptable service ratios or other performance objectives?
Please see Section 16, Recreation, for an analysis of impacts related to parks and recreation resources. Impacts were found to be less than significant.
LESS THAN SIGNIFICANT IMPACT
a.5. Would the project result in substantial adverse physical impacts associated with the provision of other new or physically altered public facilities, or the need for other new or physically altered public facilities, the construction of which could cause significant environmental impacts, in order to maintain acceptable service ratios, response times or other performance objectives?
As discussed in Section 13, Population and Housing, the proposed project would not result in substantial population growth in Hayward or growth beyond that anticipated in the City’s General Plan. As discussed in Section 10, Hydrology and Water Quality, impacts related to stormwater facilities would be less than significant. As discussed in Section 19, Utilities and Service Systems, impacts related to water and wastewater water facilities would be less than significant. No significant impacts to other public services are anticipated. Impacts would be less than significant.
LESS THAN SIGNIFICANT IMPACT

City of Hayward Clawiter Road Industrial Project
134
This page intentionally left blank.
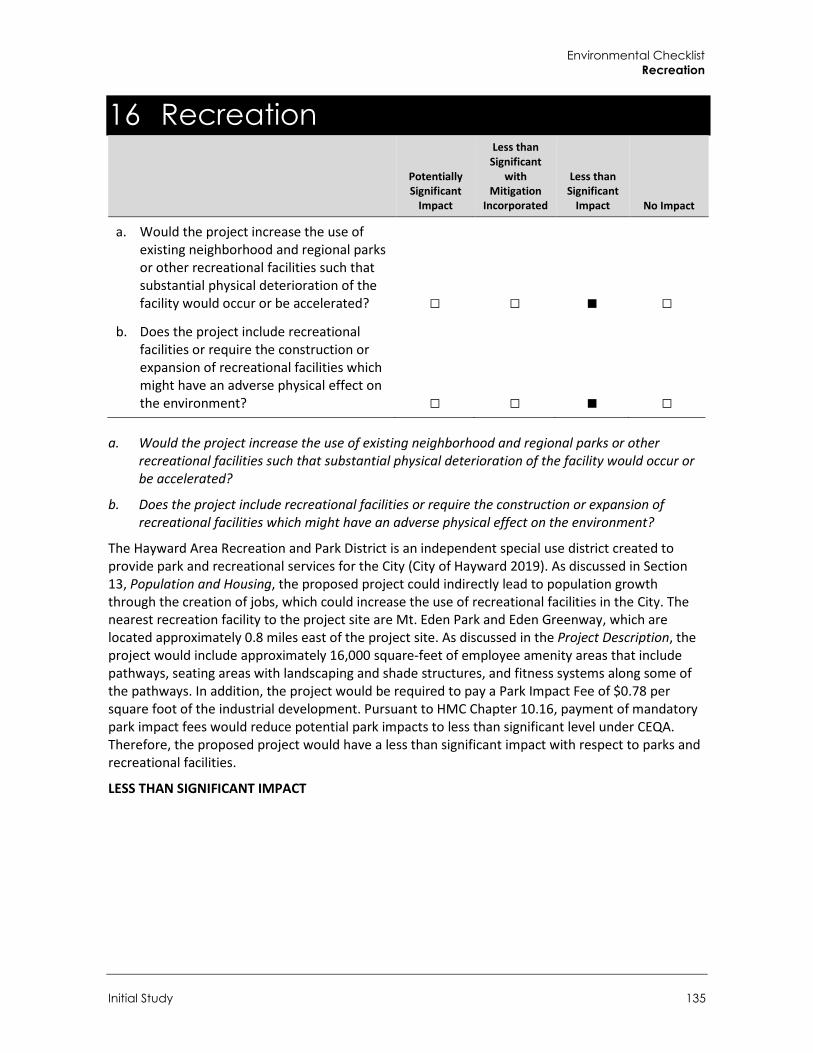
Environmental Checklist Recreation
Initial Study 135
16 Recreation
Potentially Significant
Impact
Less than Significant
with Mitigation
Incorporated
Less than Significant
Impact No Impact
a. Would the project increase the use of existing neighborhood and regional parks or other recreational facilities such that substantial physical deterioration of the facility would occur or be accelerated? □ □ ■ □
b. Does the project include recreational facilities or require the construction or expansion of recreational facilities which might have an adverse physical effect on the environment? □ □ ■ □
a. Would the project increase the use of existing neighborhood and regional parks or other recreational facilities such that substantial physical deterioration of the facility would occur or be accelerated?
b. Does the project include recreational facilities or require the construction or expansion of recreational facilities which might have an adverse physical effect on the environment?
The Hayward Area Recreation and Park District is an independent special use district created to provide park and recreational services for the City (City of Hayward 2019). As discussed in Section 13, Population and Housing, the proposed project could indirectly lead to population growth through the creation of jobs, which could increase the use of recreational facilities in the City. The nearest recreation facility to the project site are Mt. Eden Park and Eden Greenway, which are located approximately 0.8 miles east of the project site. As discussed in the Project Description, the project would include approximately 16,000 square-feet of employee amenity areas that include pathways, seating areas with landscaping and shade structures, and fitness systems along some of the pathways. In addition, the project would be required to pay a Park Impact Fee of $0.78 per square foot of the industrial development. Pursuant to HMC Chapter 10.16, payment of mandatory park impact fees would reduce potential park impacts to less than significant level under CEQA. Therefore, the proposed project would have a less than significant impact with respect to parks and recreational facilities.
LESS THAN SIGNIFICANT IMPACT

City of Hayward Clawiter Road Industrial Project
136
This page intentionally left blank.
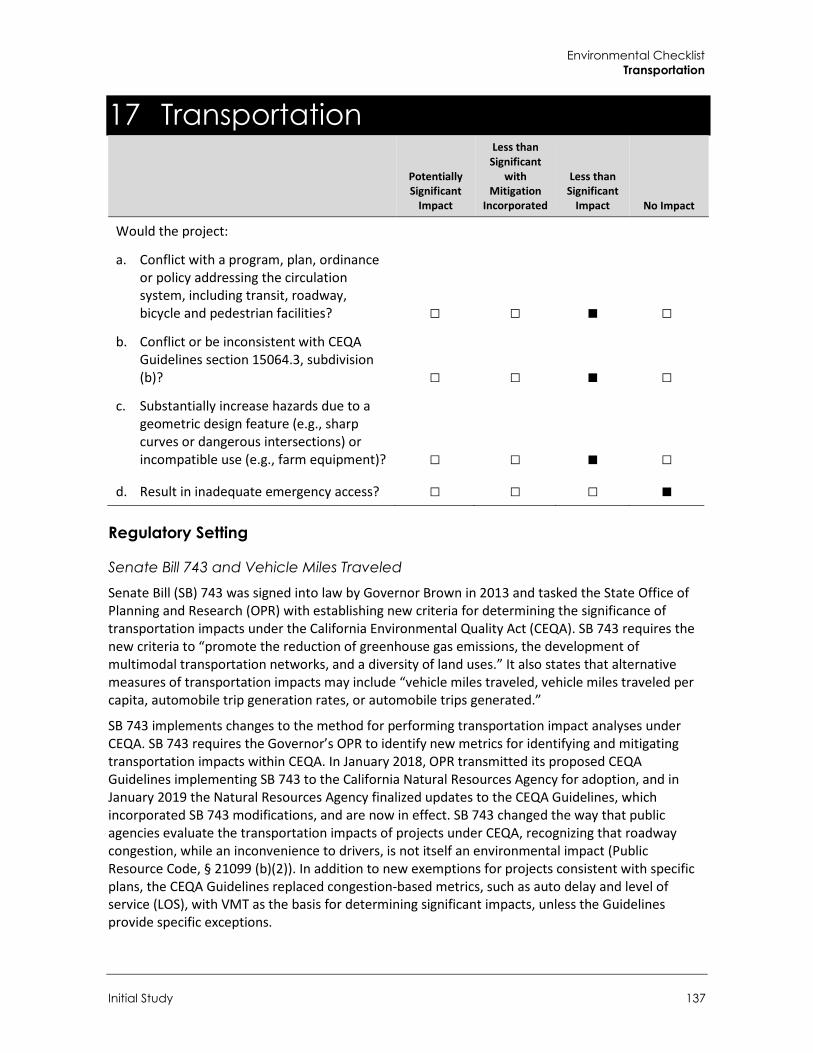
Environmental Checklist Transportation
Initial Study 137
17 Transportation
Potentially Significant
Impact
Less than Significant
with Mitigation
Incorporated
Less than Significant
Impact No Impact
Would the project:
a. Conflict with a program, plan, ordinance or policy addressing the circulation system, including transit, roadway, bicycle and pedestrian facilities? □ □ ■ □
b. Conflict or be inconsistent with CEQA Guidelines section 15064.3, subdivision (b)? □ □ ■ □
c. Substantially increase hazards due to a geometric design feature (e.g., sharp curves or dangerous intersections) or incompatible use (e.g., farm equipment)? □ □ ■ □
d. Result in inadequate emergency access? □ □ □ ■
Regulatory Setting
Senate Bill 743 and Vehicle Miles Traveled Senate Bill (SB) 743 was signed into law by Governor Brown in 2013 and tasked the State Office of Planning and Research (OPR) with establishing new criteria for determining the significance of transportation impacts under the California Environmental Quality Act (CEQA). SB 743 requires the new criteria to “promote the reduction of greenhouse gas emissions, the development of multimodal transportation networks, and a diversity of land uses.” It also states that alternative measures of transportation impacts may include “vehicle miles traveled, vehicle miles traveled per capita, automobile trip generation rates, or automobile trips generated.”
SB 743 implements changes to the method for performing transportation impact analyses under CEQA. SB 743 requires the Governor’s OPR to identify new metrics for identifying and mitigating transportation impacts within CEQA. In January 2018, OPR transmitted its proposed CEQA Guidelines implementing SB 743 to the California Natural Resources Agency for adoption, and in January 2019 the Natural Resources Agency finalized updates to the CEQA Guidelines, which incorporated SB 743 modifications, and are now in effect. SB 743 changed the way that public agencies evaluate the transportation impacts of projects under CEQA, recognizing that roadway congestion, while an inconvenience to drivers, is not itself an environmental impact (Public Resource Code, § 21099 (b)(2)). In addition to new exemptions for projects consistent with specific plans, the CEQA Guidelines replaced congestion-based metrics, such as auto delay and level of service (LOS), with VMT as the basis for determining significant impacts, unless the Guidelines provide specific exceptions.
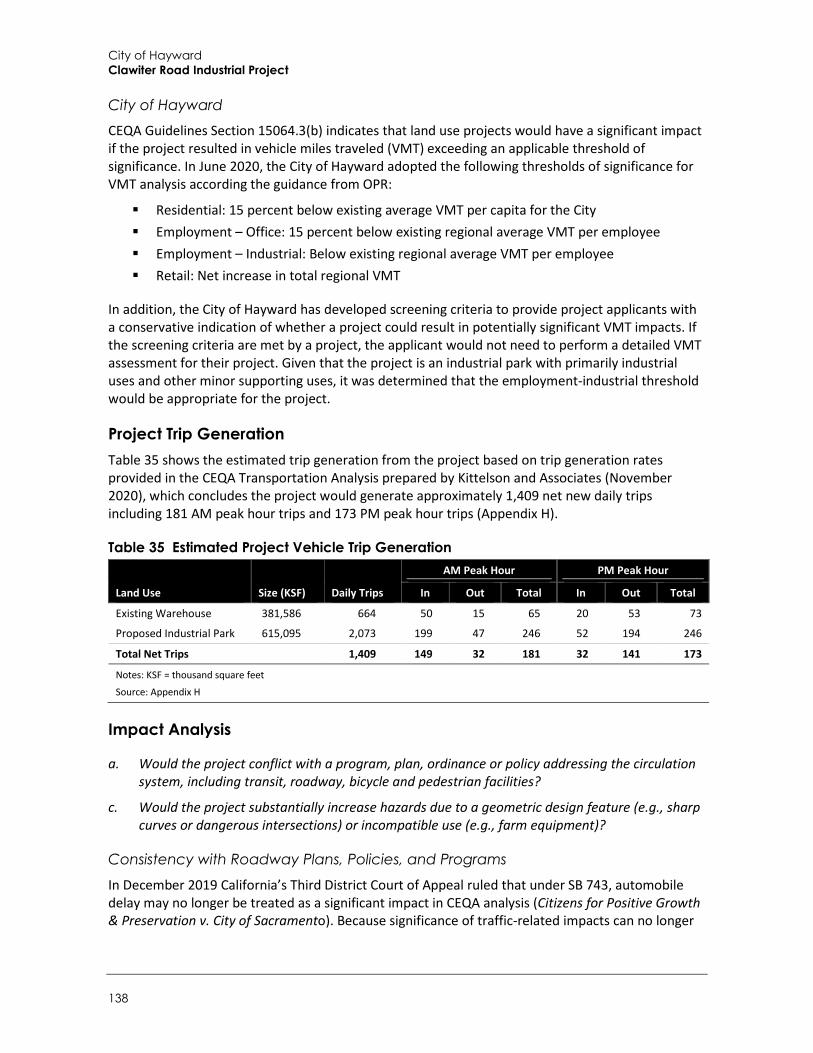
City of Hayward Clawiter Road Industrial Project
138
City of Hayward CEQA Guidelines Section 15064.3(b) indicates that land use projects would have a significant impact if the project resulted in vehicle miles traveled (VMT) exceeding an applicable threshold of significance. In June 2020, the City of Hayward adopted the following thresholds of significance for VMT analysis according the guidance from OPR:
Residential: 15 percent below existing average VMT per capita for the City Employment – Office: 15 percent below existing regional average VMT per employee Employment – Industrial: Below existing regional average VMT per employee Retail: Net increase in total regional VMT
In addition, the City of Hayward has developed screening criteria to provide project applicants with a conservative indication of whether a project could result in potentially significant VMT impacts. If the screening criteria are met by a project, the applicant would not need to perform a detailed VMT assessment for their project. Given that the project is an industrial park with primarily industrial uses and other minor supporting uses, it was determined that the employment-industrial threshold would be appropriate for the project.
Project Trip Generation Table 35 shows the estimated trip generation from the project based on trip generation rates provided in the CEQA Transportation Analysis prepared by Kittelson and Associates (November 2020), which concludes the project would generate approximately 1,409 net new daily trips including 181 AM peak hour trips and 173 PM peak hour trips (Appendix H).
Table 35 Estimated Project Vehicle Trip Generation
Land Use Size (KSF) Daily Trips
AM Peak Hour PM Peak Hour
In Out Total In Out Total
Existing Warehouse 381,586 664 50 15 65 20 53 73
Proposed Industrial Park 615,095 2,073 199 47 246 52 194 246
Total Net Trips 1,409 149 32 181 32 141 173
Notes: KSF = thousand square feet
Source: Appendix H
Impact Analysis
a. Would the project conflict with a program, plan, ordinance or policy addressing the circulation system, including transit, roadway, bicycle and pedestrian facilities?
c. Would the project substantially increase hazards due to a geometric design feature (e.g., sharp curves or dangerous intersections) or incompatible use (e.g., farm equipment)?
Consistency with Roadway Plans, Policies, and Programs
In December 2019 California’s Third District Court of Appeal ruled that under SB 743, automobile delay may no longer be treated as a significant impact in CEQA analysis (Citizens for Positive Growth & Preservation v. City of Sacramento). Because significance of traffic-related impacts can no longer
Environmental Checklist Transportation
Initial Study 139
be based on LOS, impacts related to consistency with roadway programs, plans, ordinance, are policies (such as LOS standards) facilities are not addressed in this analysis.
Consistency with Transit Plans, Policies, and Programs Transit service in the project area is provided by Alameda-Contra Costa Transit District (AC Transit) through Routes 97, 86, and M. According to the CEQA Transportation Analysis (Appendix H), the project would not substantially increase traffic levels at intersections serving local AC Transit buses such as Routes 86, 97, and M. In addition, the project would not degrade local access to bus stops along Clawiter Road, which can be accessed via the local sidewalk network and existing facilities such as ADA curb ramps and crosswalks; there are no active bus stops near the project and no bus stops abut the project driveways. Therefore, implementation of the project would not conflict with plans, programs, and policies regarding transit facilities, or decrease the performance and safety of such facilities.
Consistency with Pedestrian Plans, Policies, and Programs
According to the CEQA Transportation Analysis (Appendix H), the project area features sidewalks and curb ramps that are in good condition. However, sidewalk coverage is limited, especially along Clawiter Road adjacent to the project and the SR-92 ramps. In addition, while some high-visibility ladder crosswalks are provided along Clawiter Road, several standard crosswalks have faded striping.
The pedestrian access point to the north half of the project would be the proposed north driveway along Clawiter Road, and the pedestrian access point to the south half of the project would be the south project driveway along Clawiter Road (the central driveway is not designated as a pedestrian access point). To access the north half of the project, pedestrians could utilize a dedicated pedestrian walkway through the site. Pedestrians accessing the south half of the project would not have a dedicated walkway through the access easement, but rather a path marked with yellow paint for pedestrian access; this access path would be parallel to those used by bicycles, automobiles, and trucks. A dedicated walkway would be available east of the easement. In addition, pedestrian lighting would be provided at multiple locations in both the north and south site areas.
Pedestrians accessing the north half of the project, as well as pedestrians traveling along Clawiter Road, may experience conflicts with vehicles both on-site and at the driveways. Pedestrian-oriented treatments that would be considered as part of design review and conditions of approval include:
Ensure that the north and central driveways on Clawiter Road are designed for pedestrian visibility safety (sidewalks clearly delineated, improved visibility by minimizing bushes and large signs).
Coordinate with the City of Hayward to install warning signage (such as caution signage for exiting vehicles) and continental crosswalks at the north and central driveways.
Pedestrians accessing the south half of the project, as well as pedestrians traveling along Clawiter Road, may experience conflicts with vehicles both on-site and at the driveways. Pedestrians accessing the site could face some limitations due to the lack of a dedicated pedestrian walkway and a lack of sidewalks along Clawiter Road south of the railroad tracks. Pedestrian-oriented treatments that would be considered as part of design review and conditions of approval include:
With the City and existing property owner, explore options such as designing the southern driveway on Clawiter Road for pedestrian visibility safety (e.g. improved visibility by minimizing
City of Hayward Clawiter Road Industrial Project
140
bushes and large signs) and installing warning signage (such as caution signage for exiting vehicles) and continental crosswalks at the southern driveway.
Explore options with the existing property owner to better delineate the pedestrian access path through the access easement with high-visibility paint and signage.
With the City and existing property owner, explore options to install sidewalks along Clawiter Road south of the railroad tracks.
Adherence to conditions of approval to improve pedestrian access would ensure the project would not conflict with plans, programs, and policies regarding pedestrian facilities, or decrease the performance and safety of such facilities. Impacts would be less than significant.
Consistency with Bicycle Plans, Policies, and Programs The existing bicycle facilities in the study area include:
Class III bike route on Clawiter Road
Class II buffered bike lanes on Eden Landing Road south of SR-92
Class III bike route on Depot Road
Class III bike route on Industrial Boulevard
Class III bike route on Winton Avenue west of Clawiter Road and on the north side of Winton Avenue east of Clawiter Road
Class II bike lane on the south side of Winton Avenue east of Clawiter Road
The site plan includes bike racks around all four buildings, consistent with California Green Building Code (CALGreen) requirements for developers to provide bicycle parking for 5 percent of the vehicular parking spaces added on a site. 18 short-term bike racks and 18 long-term bike racks are required, and the project has proposed to provide 22 of each, exceeding the state’s requirements by 22 percent. The project would also include showers. Per conditions of approval, the project would financially contribute to a future roadway project that will install a bike lane on Clawiter Road. The bicyclist access points to the project would consist of the three driveways along Clawiter Road. The bicyclist path through the site (including through the access easement) would be delineated by bicycle “sharrows” stenciled onto driveway pavement, indicating the bike-vehicle shared traffic lane. The bicyclist path of travel would run parallel to the truck path of travel. Alternatively, bicyclists accessing the site’s north half could dismount and use the internal pedestrian path on foot.
Since bicyclist access to, from, and through the project site consists of shared facilities that would include trucks, bicyclist comfort may be affected due to conflicts with automobiles and trucks. Potential treatments should be considered to increase bicyclist safety as part of design review and conditions of approval. Recommended improvements include:
Coordinate with the City of Hayward to install signage (such as bikeway signage and caution signage) for vehicles entering or existing the project driveways.
Ensure the on-site bike sharrows are high-visibility and are accompanied by the appropriate signage.
The City of Hayward is currently updating its Bicycle and Pedestrian Master Plan. At this time, the draft plan proposes replacing the bike route along Clawiter Road with separated bike lanes. Should separated bike lanes be installed, the property owner would be required to coordinate with the City to provide the appropriate signage and transition markings at the project driveways.

Environmental Checklist Transportation
Initial Study 141
Adherence to conditions of approval to improve pedestrian access would ensure that the project would not conflict with plans, programs, and policies regarding bicycle facilities, or decrease the performance and safety of such facilities. Impacts would be less than significant.
Design Hazards or Incompatible Uses Project implementation would occur on existing parcels developed with warehouse and vehicle storage uses. The implementation of the project would not alter or affect existing street and intersection networks or involve an incompatible use. Access and movement through the project site would be designed to support large trucks and vehicles for potential warehouse or distribution facilities. Sufficient turning areas and access opportunities for truck and passenger vehicle access are proposed in accordance with City requirements. No new roadways or alterations to existing roadway design would occur. In addition, the proposed project would be required to comply with the City’s design standards for vehicular access and circulation and the Fire Code. Therefore, the project would not create a significant safety hazard due to a design feature or incompatible use.
LESS THAN SIGNIFICANT IMPACT
b. Would the project conflict or be inconsistent with CEQA Guidelines section 15064.3, subdivision (b)?
As described in the Regulatory Setting section above, the screening criteria for employment-industrial threshold would be appropriate for the project. The City’s screening criterion for projects analyzed under the employment-industrial threshold are:
Located in areas with below average VMT per employee and/or within a half mile of a major transit stop or corridor
Include low VMT-supporting features that will produce low VMT per employee Must include features that are similar to or better than what exists today for density and
parking to support no increase in VMT per industrial employee
As shown in Figure 8 in the City’s VMT Thresholds of Significance Screening Criteria, the proposed project is located in an area with below average VMT for industrial uses (Appendix H). In addition, the project includes the following low-VMT supporting features:
Parking areas that include carpool-designated preferred area as well as electric vehicle charging stations
Incentives for commuting by bicycle with bike racks and storage facilities, fitness facilities, showers, and on-site bike sharrows
On-site food truck space so employees can remain in the area for lunch and food breaks
Finally, the proposed project includes features that are similar to, or better than what exists on the project site currently, related to development intensity and parking to support no increase in VMT per industrial employee. The project site currently has 282,000 square-feet of development, and the project would involve redevelopment of the site with an increase in development intensity to 631,000 square-feet. This increase in square footage would allow more jobs and services to be provided in an existing industrial area instead of resulting in the introduction of new development in undeveloped areas. Also, the site currently has approximately 450 parking spaces, which would decrease to about 320 parking spaces and 45 trailer parking spaces (Appendix H). Because the
City of Hayward Clawiter Road Industrial Project
142
project meets the low-VMT screening criteria for industrial projects, the project would have a less than significant impact on VMT and a detailed analysis is not required.
LESS THAN SIGNIFICANT IMPACT
d. Would the project result in inadequate emergency access?
An existing, active railroad spur divides access to the northern and southern portions of the site, as shown in Figure 4. Access to the northern and southern areas of the site would both be along Clawiter Road, through one ingress/egress easement on the south side of the project and two driveways on the north side. In addition, existing emergency access to the railroad spur would continue to be used for emergency access between the northern and southern project sites. The proposed project would be required to comply with all building, fire, and safety codes and specific development plans would be subject to review and approval by the City’s Public Works Department and HFD. Required review by these departments would ensure the circulation system for the project site would provide adequate emergency access. In addition, the proposed project would not require temporary or permanent closures to roadways. There would be no impact.
NO IMPACT
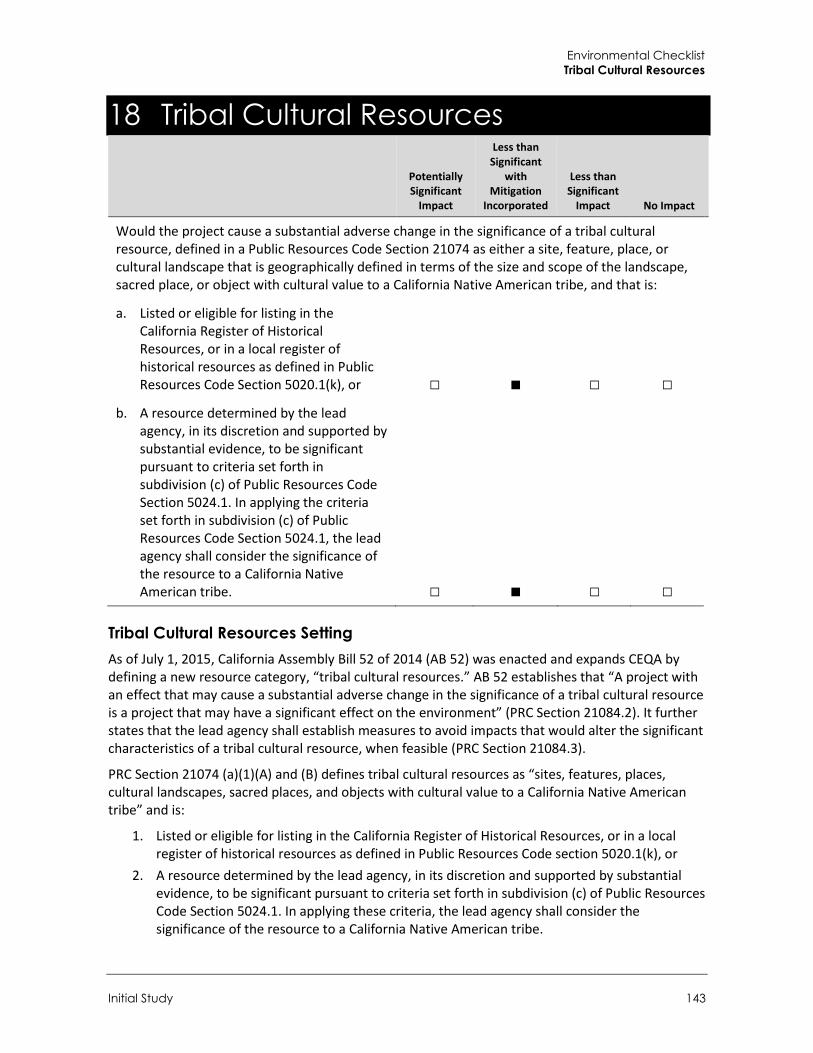
Environmental Checklist Tribal Cultural Resources
Initial Study 143
18 Tribal Cultural Resources
Potentially Significant
Impact
Less than Significant
with Mitigation
Incorporated
Less than Significant
Impact No Impact
Would the project cause a substantial adverse change in the significance of a tribal cultural resource, defined in a Public Resources Code Section 21074 as either a site, feature, place, or cultural landscape that is geographically defined in terms of the size and scope of the landscape, sacred place, or object with cultural value to a California Native American tribe, and that is:
a. Listed or eligible for listing in the California Register of Historical Resources, or in a local register of historical resources as defined in Public Resources Code Section 5020.1(k), or □ ■ □ □
b. A resource determined by the lead agency, in its discretion and supported by substantial evidence, to be significant pursuant to criteria set forth in subdivision (c) of Public Resources Code Section 5024.1. In applying the criteria set forth in subdivision (c) of Public Resources Code Section 5024.1, the lead agency shall consider the significance of the resource to a California Native American tribe. □ ■ □ □
Tribal Cultural Resources Setting As of July 1, 2015, California Assembly Bill 52 of 2014 (AB 52) was enacted and expands CEQA by defining a new resource category, “tribal cultural resources.” AB 52 establishes that “A project with an effect that may cause a substantial adverse change in the significance of a tribal cultural resource is a project that may have a significant effect on the environment” (PRC Section 21084.2). It further states that the lead agency shall establish measures to avoid impacts that would alter the significant characteristics of a tribal cultural resource, when feasible (PRC Section 21084.3).
PRC Section 21074 (a)(1)(A) and (B) defines tribal cultural resources as “sites, features, places, cultural landscapes, sacred places, and objects with cultural value to a California Native American tribe” and is:
1. Listed or eligible for listing in the California Register of Historical Resources, or in a local register of historical resources as defined in Public Resources Code section 5020.1(k), or
2. A resource determined by the lead agency, in its discretion and supported by substantial evidence, to be significant pursuant to criteria set forth in subdivision (c) of Public Resources Code Section 5024.1. In applying these criteria, the lead agency shall consider the significance of the resource to a California Native American tribe.
City of Hayward Clawiter Road Industrial Project
144
AB 52 also establishes a formal consultation process for California tribes regarding those resources. The consultation process must be completed before a CEQA document can be certified. Under AB 52, lead agencies are required to “begin consultation with a California Native American tribe that is traditionally and culturally affiliated with the geographic area of the proposed project.” Native American tribes to be included in the process are those that have requested notice of projects proposed within the jurisdiction of the lead agency.
Impact Analysis
a. Would the project cause a substantial adverse change in the significance of a tribal cultural resource as defined in Public Resources Code Section 21074 that is listed or eligible for listing in the California Register of Historical Resources, or in a local register of historical resources as defined in Public Resources Code Section 5020.1(k)?
b. Would the project cause a substantial adverse change in the significance of a tribal cultural resource as defined in Public Resources Code 21074 that is a resource determined by the lead agency, in its discretion and supported by substantial evidence, to be significant pursuant to criteria set forth in subdivision (c) of Public Resources Code Section 5024.1?
The California Native American Heritage Commission (NAHC) was contacted and a review of the Sacred Lands File (SLF) requested on July 22, 2020. On July 22, 2020, the NAHC sent a response indicating that the SLF search indicated the presence of any known cultural resources in the project site.
On September 15, 2020, the City of Hayward mailed a notification letter on April 3, 2020 to the one local Native American tribe that has requested notification under AB 52: the Ione Band of Miwok Indians (Appendix I). Correspondence is included in Appendix I. Under AB 52, tribes have 30 days from receipt of the letter to respond and request consultation. The tribe did not respond during that window to request formal consultation under AB 52.
Nonetheless, the SLF was returned with positive results; therefore, it is possible that ground disturbance during construction would encounter unknown tribal cultural resources or known cultural resources that may be identified as tribal cultural resources. Thus, the project has the potential to significantly impact tribal cultural resources through ground disturbance and looting or vandalism of encountered resources. Mitigation is required to ensure that unanticipated discoveries of tribal cultural resources are avoided or, where avoidance is infeasible, mitigated to a less than significant level.
Mitigation Measure
TCR-1 Unanticipated Discovery of Tribal Cultural Resources In the event that cultural resources of Native American origin that may be considered tribal cultural resources are identified during construction, all earth disturbing work within 50 feet of the find must be temporarily suspended or redirected until an archaeologist has evaluated the nature and significance of the find and in consultation with the on-site Native American monitor. If the archaeologist and Native American monitor determine that the resource is a tribal cultural resource and thus significant under CEQA, a mitigation plan shall be prepared and implemented in accordance with state guidelines and in consultation with Native American groups. The plan would include avoidance of the resource or, if avoidance of the resource is infeasible, the plan would
Environmental Checklist Tribal Cultural Resources
Initial Study 145
outline the appropriate treatment of the resource in coordination with the appropriate Native American tribal representative(s).
Significance After Mitigation Mitigation Measure TCR-1 would ensure that tribal cultural resources are identified properly and preserved in the event they are uncovered during construction and would reduce impacts regarding disrupting tribal cultural resources to a less than significant level.
LESS THAN SIGNIFICANT WITH MITIGATION INCORPORATED

City of Hayward Clawiter Road Industrial Project
146
This page intentionally left blank.

Environmental Checklist Utilities and Service Systems
Initial Study 147
19 Utilities and Service Systems
Potentially Significant
Impact
Less than Significant
with Mitigation
Incorporated
Less than Significant
Impact No Impact
Would the project:
a. Require or result in the relocation or construction of new or expanded water, wastewater treatment or storm water drainage, electric power, natural gas, or telecommunications facilities, the construction or relocation of which could cause significant environmental effects? □ □ ■ □
b. Have sufficient water supplies available to serve the project and reasonably foreseeable future development during normal, dry and multiple dry years? □ □ ■ □
c. Result in a determination by the wastewater treatment provider which serves or may serve the project that it has adequate capacity to serve the project’s projected demand in addition to the provider’s existing commitments? □ □ ■ □
d. Generate solid waste in excess of State or local standards, or in excess of the capacity of local infrastructure, or otherwise impair the attainment of solid waste reduction goals? □ □ ■ □
e. Comply with federal, state, and local management and reduction statutes and regulations related to solid waste? □ □ ■ □
a. Would the project require or result in the relocation or construction of new or expanded water, wastewater treatment or storm water drainage, electric power, natural gas, or telecommunications facilities, the construction or relocation of which could cause significant environmental effects?
b. Would the project have sufficient water supplies available to serve the project and reasonably foreseeable future development during normal, dry and multiple dry years?
c. Would the project result in a determination by the wastewater treatment provider which serves or may serve the project that it has adequate capacity to serve the project’s projected demand in addition to the provider’s existing commitments?
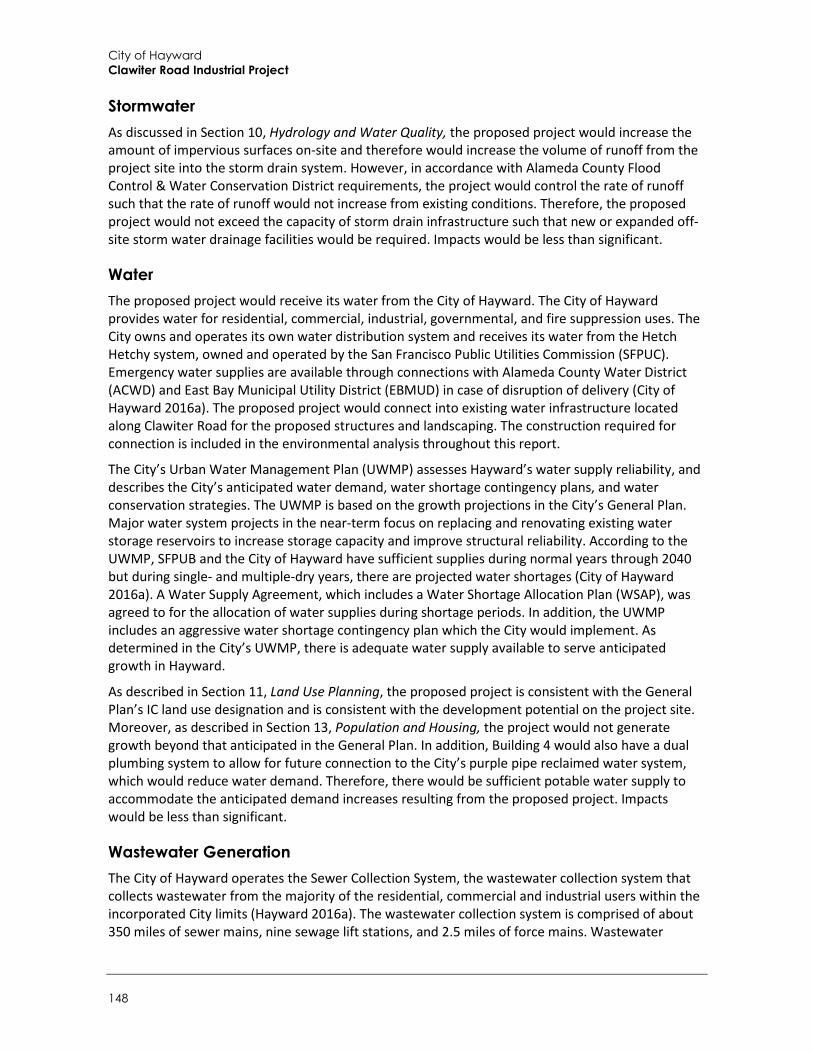
City of Hayward Clawiter Road Industrial Project
148
Stormwater As discussed in Section 10, Hydrology and Water Quality, the proposed project would increase the amount of impervious surfaces on-site and therefore would increase the volume of runoff from the project site into the storm drain system. However, in accordance with Alameda County Flood Control & Water Conservation District requirements, the project would control the rate of runoff such that the rate of runoff would not increase from existing conditions. Therefore, the proposed project would not exceed the capacity of storm drain infrastructure such that new or expanded off-site storm water drainage facilities would be required. Impacts would be less than significant.
Water The proposed project would receive its water from the City of Hayward. The City of Hayward provides water for residential, commercial, industrial, governmental, and fire suppression uses. The City owns and operates its own water distribution system and receives its water from the Hetch Hetchy system, owned and operated by the San Francisco Public Utilities Commission (SFPUC). Emergency water supplies are available through connections with Alameda County Water District (ACWD) and East Bay Municipal Utility District (EBMUD) in case of disruption of delivery (City of Hayward 2016a). The proposed project would connect into existing water infrastructure located along Clawiter Road for the proposed structures and landscaping. The construction required for connection is included in the environmental analysis throughout this report.
The City’s Urban Water Management Plan (UWMP) assesses Hayward’s water supply reliability, and describes the City’s anticipated water demand, water shortage contingency plans, and water conservation strategies. The UWMP is based on the growth projections in the City’s General Plan. Major water system projects in the near-term focus on replacing and renovating existing water storage reservoirs to increase storage capacity and improve structural reliability. According to the UWMP, SFPUB and the City of Hayward have sufficient supplies during normal years through 2040 but during single- and multiple-dry years, there are projected water shortages (City of Hayward 2016a). A Water Supply Agreement, which includes a Water Shortage Allocation Plan (WSAP), was agreed to for the allocation of water supplies during shortage periods. In addition, the UWMP includes an aggressive water shortage contingency plan which the City would implement. As determined in the City’s UWMP, there is adequate water supply available to serve anticipated growth in Hayward.
As described in Section 11, Land Use Planning, the proposed project is consistent with the General Plan’s IC land use designation and is consistent with the development potential on the project site. Moreover, as described in Section 13, Population and Housing, the project would not generate growth beyond that anticipated in the General Plan. In addition, Building 4 would also have a dual plumbing system to allow for future connection to the City’s purple pipe reclaimed water system, which would reduce water demand. Therefore, there would be sufficient potable water supply to accommodate the anticipated demand increases resulting from the proposed project. Impacts would be less than significant.
Wastewater Generation The City of Hayward operates the Sewer Collection System, the wastewater collection system that collects wastewater from the majority of the residential, commercial and industrial users within the incorporated City limits (Hayward 2016a). The wastewater collection system is comprised of about 350 miles of sewer mains, nine sewage lift stations, and 2.5 miles of force mains. Wastewater
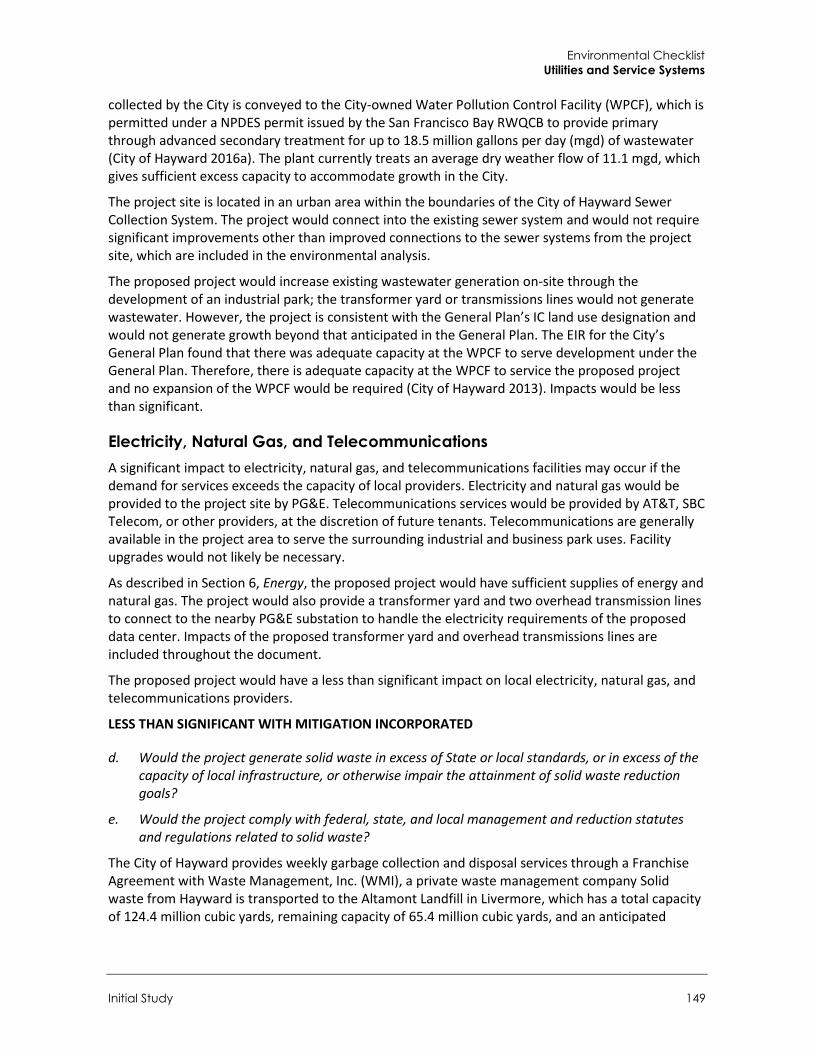
Environmental Checklist Utilities and Service Systems
Initial Study 149
collected by the City is conveyed to the City-owned Water Pollution Control Facility (WPCF), which is permitted under a NPDES permit issued by the San Francisco Bay RWQCB to provide primary through advanced secondary treatment for up to 18.5 million gallons per day (mgd) of wastewater (City of Hayward 2016a). The plant currently treats an average dry weather flow of 11.1 mgd, which gives sufficient excess capacity to accommodate growth in the City.
The project site is located in an urban area within the boundaries of the City of Hayward Sewer Collection System. The project would connect into the existing sewer system and would not require significant improvements other than improved connections to the sewer systems from the project site, which are included in the environmental analysis.
The proposed project would increase existing wastewater generation on-site through the development of an industrial park; the transformer yard or transmissions lines would not generate wastewater. However, the project is consistent with the General Plan’s IC land use designation and would not generate growth beyond that anticipated in the General Plan. The EIR for the City’s General Plan found that there was adequate capacity at the WPCF to serve development under the General Plan. Therefore, there is adequate capacity at the WPCF to service the proposed project and no expansion of the WPCF would be required (City of Hayward 2013). Impacts would be less than significant.
Electricity, Natural Gas, and Telecommunications A significant impact to electricity, natural gas, and telecommunications facilities may occur if the demand for services exceeds the capacity of local providers. Electricity and natural gas would be provided to the project site by PG&E. Telecommunications services would be provided by AT&T, SBC Telecom, or other providers, at the discretion of future tenants. Telecommunications are generally available in the project area to serve the surrounding industrial and business park uses. Facility upgrades would not likely be necessary.
As described in Section 6, Energy, the proposed project would have sufficient supplies of energy and natural gas. The project would also provide a transformer yard and two overhead transmission lines to connect to the nearby PG&E substation to handle the electricity requirements of the proposed data center. Impacts of the proposed transformer yard and overhead transmissions lines are included throughout the document.
The proposed project would have a less than significant impact on local electricity, natural gas, and telecommunications providers.
LESS THAN SIGNIFICANT WITH MITIGATION INCORPORATED
d. Would the project generate solid waste in excess of State or local standards, or in excess of the capacity of local infrastructure, or otherwise impair the attainment of solid waste reduction goals?
e. Would the project comply with federal, state, and local management and reduction statutes and regulations related to solid waste?
The City of Hayward provides weekly garbage collection and disposal services through a Franchise Agreement with Waste Management, Inc. (WMI), a private waste management company Solid waste from Hayward is transported to the Altamont Landfill in Livermore, which has a total capacity of 124.4 million cubic yards, remaining capacity of 65.4 million cubic yards, and an anticipated
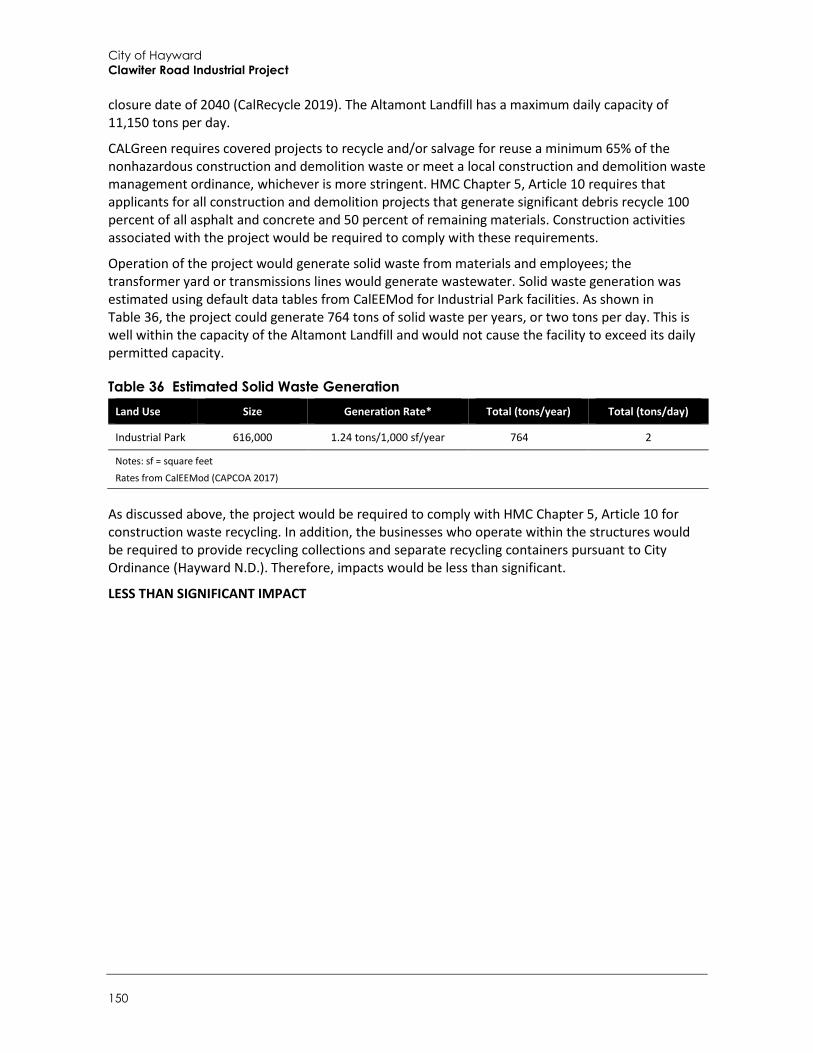
City of Hayward Clawiter Road Industrial Project
150
closure date of 2040 (CalRecycle 2019). The Altamont Landfill has a maximum daily capacity of 11,150 tons per day.
CALGreen requires covered projects to recycle and/or salvage for reuse a minimum 65% of the nonhazardous construction and demolition waste or meet a local construction and demolition waste management ordinance, whichever is more stringent. HMC Chapter 5, Article 10 requires that applicants for all construction and demolition projects that generate significant debris recycle 100 percent of all asphalt and concrete and 50 percent of remaining materials. Construction activities associated with the project would be required to comply with these requirements.
Operation of the project would generate solid waste from materials and employees; the transformer yard or transmissions lines would generate wastewater. Solid waste generation was estimated using default data tables from CalEEMod for Industrial Park facilities. As shown in Table 36, the project could generate 764 tons of solid waste per years, or two tons per day. This is well within the capacity of the Altamont Landfill and would not cause the facility to exceed its daily permitted capacity.
Table 36 Estimated Solid Waste Generation Land Use Size Generation Rate* Total (tons/year) Total (tons/day)
Industrial Park 616,000 1.24 tons/1,000 sf/year 764 2
Notes: sf = square feet
Rates from CalEEMod (CAPCOA 2017)
As discussed above, the project would be required to comply with HMC Chapter 5, Article 10 for construction waste recycling. In addition, the businesses who operate within the structures would be required to provide recycling collections and separate recycling containers pursuant to City Ordinance (Hayward N.D.). Therefore, impacts would be less than significant.
LESS THAN SIGNIFICANT IMPACT
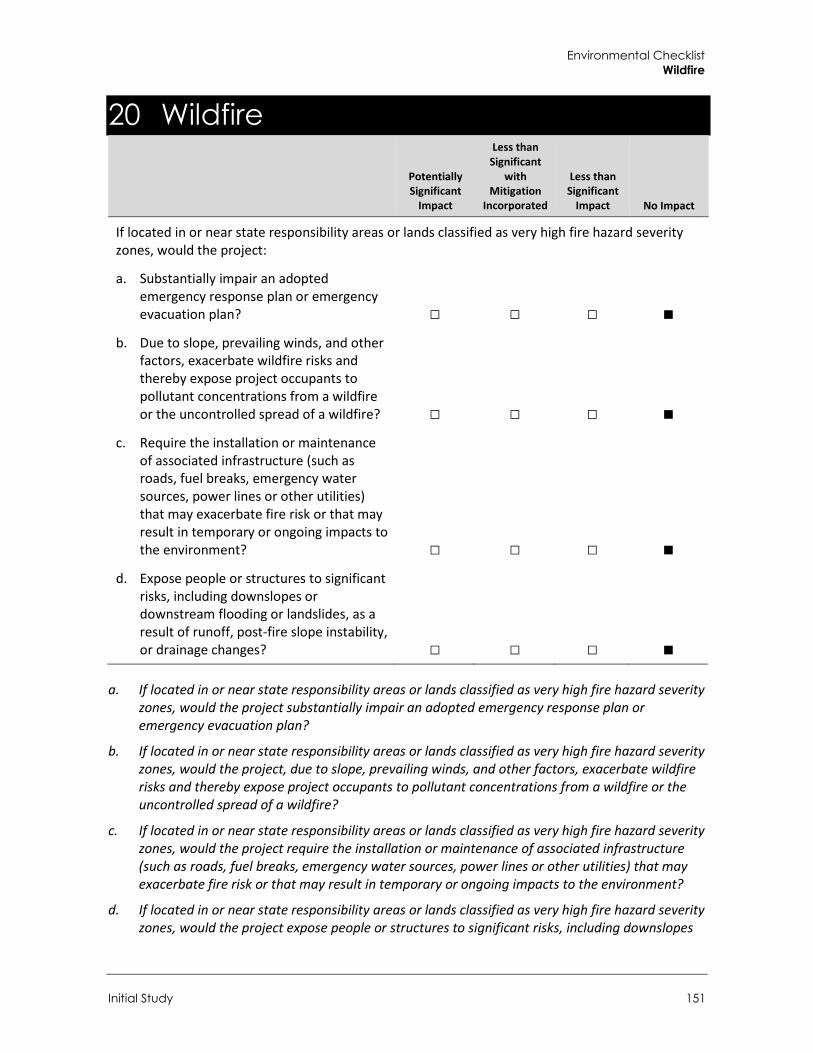
Environmental Checklist Wildfire
Initial Study 151
20 Wildfire
Potentially Significant
Impact
Less than Significant
with Mitigation
Incorporated
Less than Significant
Impact No Impact
If located in or near state responsibility areas or lands classified as very high fire hazard severity zones, would the project:
a. Substantially impair an adopted emergency response plan or emergency evacuation plan? □ □ □ ■
b. Due to slope, prevailing winds, and other factors, exacerbate wildfire risks and thereby expose project occupants to pollutant concentrations from a wildfire or the uncontrolled spread of a wildfire? □ □ □ ■
c. Require the installation or maintenance of associated infrastructure (such as roads, fuel breaks, emergency water sources, power lines or other utilities) that may exacerbate fire risk or that may result in temporary or ongoing impacts to the environment? □ □ □ ■
d. Expose people or structures to significant risks, including downslopes or downstream flooding or landslides, as a result of runoff, post-fire slope instability, or drainage changes? □ □ □ ■
a. If located in or near state responsibility areas or lands classified as very high fire hazard severity zones, would the project substantially impair an adopted emergency response plan or emergency evacuation plan?
b. If located in or near state responsibility areas or lands classified as very high fire hazard severity zones, would the project, due to slope, prevailing winds, and other factors, exacerbate wildfire risks and thereby expose project occupants to pollutant concentrations from a wildfire or the uncontrolled spread of a wildfire?
c. If located in or near state responsibility areas or lands classified as very high fire hazard severity zones, would the project require the installation or maintenance of associated infrastructure (such as roads, fuel breaks, emergency water sources, power lines or other utilities) that may exacerbate fire risk or that may result in temporary or ongoing impacts to the environment?
d. If located in or near state responsibility areas or lands classified as very high fire hazard severity zones, would the project expose people or structures to significant risks, including downslopes

City of Hayward Clawiter Road Industrial Project
152
or downstream flooding or landslides, as a result of runoff, post-fire slope instability, or drainage changes?
The project site is not located within or near a Very High Fire Hazard Severity Zone or state responsibility area. The nearest Very High Fire Hazard Severity Zone is located approximately six miles north of the project site in Castro Valley (CalFire 2007; 2008). Because the site is not within or near a state responsibility area or a Very High Fire Hazard Severity Zone, no impacts related to wildfires would occur.
NO IMPACT
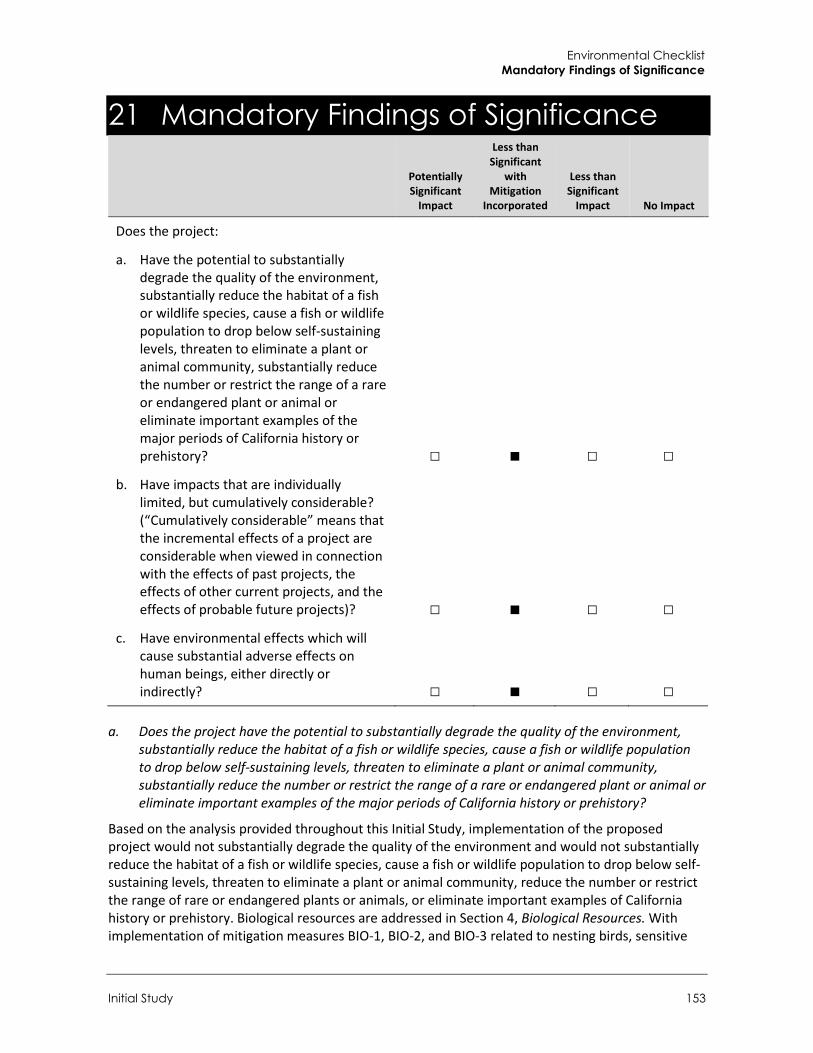
Environmental Checklist Mandatory Findings of Significance
Initial Study 153
21 Mandatory Findings of Significance
Potentially Significant
Impact
Less than Significant
with Mitigation
Incorporated
Less than Significant
Impact No Impact
Does the project:
a. Have the potential to substantially degrade the quality of the environment, substantially reduce the habitat of a fish or wildlife species, cause a fish or wildlife population to drop below self-sustaining levels, threaten to eliminate a plant or animal community, substantially reduce the number or restrict the range of a rare or endangered plant or animal or eliminate important examples of the major periods of California history or prehistory? □ ■ □ □
b. Have impacts that are individually limited, but cumulatively considerable? (“Cumulatively considerable” means that the incremental effects of a project are considerable when viewed in connection with the effects of past projects, the effects of other current projects, and the effects of probable future projects)? □ ■ □ □
c. Have environmental effects which will cause substantial adverse effects on human beings, either directly or indirectly? □ ■ □ □
a. Does the project have the potential to substantially degrade the quality of the environment, substantially reduce the habitat of a fish or wildlife species, cause a fish or wildlife population to drop below self-sustaining levels, threaten to eliminate a plant or animal community, substantially reduce the number or restrict the range of a rare or endangered plant or animal or eliminate important examples of the major periods of California history or prehistory?
Based on the analysis provided throughout this Initial Study, implementation of the proposed project would not substantially degrade the quality of the environment and would not substantially reduce the habitat of a fish or wildlife species, cause a fish or wildlife population to drop below self-sustaining levels, threaten to eliminate a plant or animal community, reduce the number or restrict the range of rare or endangered plants or animals, or eliminate important examples of California history or prehistory. Biological resources are addressed in Section 4, Biological Resources. With implementation of mitigation measures BIO-1, BIO-2, and BIO-3 related to nesting birds, sensitive
City of Hayward Clawiter Road Industrial Project
154
bat species in the existing on-site structure, and the removal of on-site trees, the proposed project would not substantially reduce wildlife habitat or population. Mitigation measures CR-1 and TCR-1 have been designed to reduce potential impacts to unknown archaeological and tribal cultural resources. Based on the ability of the identified mitigation measures to reduce potential impacts to less than significant levels, the proposed project’s impacts would be less than significant with mitigation incorporated.
LESS THAN SIGNIFICANT WITH MITIGATION INCORPORATED
b. Does the project have impacts that are individually limited, but cumulatively considerable? (“Cumulatively considerable” means that the incremental effects of a project are considerable when viewed in connection with the effects of past projects, the effects of other current projects, and the effects of probable future projects)?
Cumulative impacts associated with some of the resource areas are addressed in the individual resource sections above: Air Quality, Greenhouse Gases, Water Supply, and Solid Waste (CEQA Guidelines Section 15064(h)(3)). Air Quality and Greenhouse Gas impacts would be less than significant with generator operational restrictions under Mitigation Measure AQ-1 and a greenhouse gas reduction strategy required under Mitigation Measure GHG-1. Water supply and solid waste impacts would be less than significant. Some of the other resource areas were determined to have no impact in comparison to existing conditions and therefore would not contribute to cumulative impacts, such as Mineral Resources and Agricultural Resources. As such, cumulative impacts in these issue areas would also be less than significant (not cumulatively considerable). The proposed project would incrementally increase traffic compared to existing conditions. However, due to the low volume of traffic generated by the proposed project, the proposed project would not significantly contribute to cumulative impacts to nearby roadways. The project site is located in an area with below average VMT per employee, includes low-VMT supporting features, and has features that would increase density and decrease parking over existing conditions. Therefore, the project would not lead to a significant cumulative increase in VMT. The proposed project involves development of an industrial park and would be consistent with the City’s General Plan designation. The proposed project would not result in a significant contribution to cumulatively considerable impacts, and impacts would be less than significant with mitigation incorporated.
LESS THAN SIGNIFICANT WITH MITIGATION INCORPORATED
c. Does the project have environmental effects which will cause substantial adverse effects on human beings, either directly or indirectly?
Effects to human beings are generally associated with air quality, noise, traffic safety, geology/soils and hazards/hazardous materials. As discussed in this Initial Study, implementation of the proposed project would result in less than significant environmental impacts with respect to these issue areas with mitigation incorporated. Mitigation Measure AQ-1 would reduce health impacts from on-site generators through operational restrictions. The geotechnical recommendations Mitigation Measure GEO-1 and GEO-2 discussed in Section 7, Geology and Soils, would ensure that soils and grounds are stable, and that liquefaction risks are less than significant. Mitigation Measures AQ-1 and GEO-1/GEO-2 would reduce health and safety risks to human beings and would result in less than significant impacts. Mitigation measures HAZ-1 through HAZ-4 would reduce impacts associated with hazardous materials. With mitigation, the proposed project would not cause

Environmental Checklist Mandatory Findings of Significance
Initial Study 155
substantial adverse effects on human beings, either directly or indirectly. Impacts would be less than significant with mitigation.
LESS THAN SIGNIFICANT WITH MITIGATION INCORPORATED

City of Hayward Clawiter Road Industrial Project
156
This page intentionally left blank.
References
Initial Study 157
References
Bibliography 42U. 2020. “What is PUE/DCiE? How to Calculate, What to Measure.”
https://www.42u.com/measurement/pue-dcie.htm (accessed August 2020).
Alameda County Airport Land Use Commission. 2010. Hayward Executive Airport Land Use Compatibility Plan. September 2010
____. 2012. Oakland International Airport Land Use Compatibility Plan. December 15, 2012.
Alameda County Community Development Agency. 2012. Hayward Executive Airport Land Use Compatibility Plan. August. Available at: https://www.acgov.org/cda/planning/generalplans/documents/HWD_ALUCP_082012_FULL.pdf
Alameda County Transportation Commission. 2018. “Congestion Management Program.” https://www.alamedactc.org/planning/congestion-management-program/ (accessed August 2020).
Alameda County Department of Environmental Health website: https://deh.acgov.org/landwater/lop.page. Accessed October 19, 2020.
Association of Bay Area Governments (ABAG).2016. ABAG Resilience Program. Retrieved April 12, 2017, from http://resilience.abag.ca.gov/earthquakes/ (accessed May 2020).
____. 2017. Plan Bay Area 2040 Final Plan. http://planbayarea.org/ (accessed August 2020).
Association of Environmental Professionals (AEP). 2016. Final White Paper Beyond 2020 and Newhall: A Field Guide to New CEQA Greenhouse Gas Thresholds and Climate Action Plan Targets for California. https://califaep.org/docs/AEP-2016_Final_White_Paper.pdf (accessed September 2020).
Bay Area Air Quality Management District (BAAQMD). 2012. Understanding Particulate Matter: Protecting Public Health in the San Francisco Bay Area. November 2012. https://www.baaqmd.gov/~/media/Files/Planning%20and%20Research/Plans/PM%20Planning/ParticulatesMatter_Nov%207.ashx?la=en (accessed September 2020).
____. 2014. “Community Air Risk Evaluation Program.” Last modified: August 20, 2014. https://www.baaqmd.gov/community-health/community-health-protection-program/community-air-risk-evaluation-care-program (accessed August 2020).
____. 2017a. California Environmental Quality Act: Air Quality Guidelines. San Francisco, CA. May 2017. http://www.baaqmd.gov/~/media/files/planning-and-research/ceqa/ceqa_guidelines_may2017-pdf.pdf?la=en (accessed August 2020).
____. 2017b. “Air Quality Standards and Attainment Status.” Last modified January 5, 2017. http://www.baaqmd.gov/about-air-quality/research-and-data/air-quality-standards-and-attainment-status (accessed August 2020).
City of Hayward Clawiter Road Industrial Project
158
____. 2017c. Final 2017 Clean Air Plan. San Francisco, CA. April 19, 2017. http://www.baaqmd.gov/~/media/files/planning-and-research/plans/2017-clean-air-plan/attachment-a_-proposed-final-cap-vol-1-pdf.pdf?la=en
____. 2019. Policy: Calculating Potential to Emit for Emergency Backup Power Generators. June 3, 2019. https://www.baaqmd.gov/~/media/files/engineering/policy_and_procedures/banking-and-offsets/calculating-pte-for-emergency-generators-06032019-pdf.pdf?la=en (accessed November 2020).
California Air Pollution Control Officers Association. 2008. CEQA and Climate Change: Addressing Climate Change through California Environmental Quality Act (CEQA).
____. 2017. California Emissions Estimator Model User Guide. November 2017.
California Air Resources Board (CARB). 2016. “Ambient Air Quality Standards.” Last modified: May 4, 2016. https://ww2.arb.ca.gov/sites/default/files/2020-07/aaqs2.pdf (accessed August 2020).
____. 2020. “Overview: Diesel Exhaust & Health.” https://ww2.arb.ca.gov/resources/overview-diesel-exhaust-and-health (accessed August 2020).
California Department of Conservation (DOC). 2016. Alameda County Important Farmland 2014. ftp://ftp.consrv.ca.gov/pub/dlrp/FMMP/pdf/2014/ala14.pdf. Accessed August 2020.
____. 2020. Data Viewer Seismic Hazards Program: Alquist Priolo Fault Hazard Zones. https://maps.conservation.ca.gov/cgs/DataViewer/index.html. Accessed August 2020.
California Department of Forestry and Fire (CalFire). 2007. Fire Hazard Severity Zones in SRA. https://osfm.fire.ca.gov/media/7271/fhszs_map1.pdf. (accessed September 2020).
____. 2008. Very High Fire Hazard Severity Zones in LRA. https://osfm.fire.ca.gov/media/6638/fhszl_map1.pdf. (accessed September 2020).
California Department of Industrial Relations. 2012. Guide to the California Hazard Communication Regulation. https://www.dir.ca.gov/dosh/dosh_publications/hazcom.pdf. (accessed October 2020).
California Department of Resources Recycling and Recovery (CalRecycle). 2019. SWIS Facility Detail. Altamont Landfill & Resource Recovery (01-AA-0009). https://www2.calrecycle.ca.gov/SolidWaste/SiteActivity/Details/7?siteID=7. (accessed September 2020).
California Department of Transportation (Caltrans). 2013. Technical Noise Supplement to the Traffic Noise Analysis Protocol. (CT-HWANP-RT-13-069.25.2) September. Available at: http://www.dot.ca.gov/hq/env/noise/pub/TeNS_Sept_2013B.pdf
____. 2019. Scenic Highways. Retrieved from: https://dot.ca.gov/programs/design/lap-landscape-architecture-and-community-livability/lap-liv-i-scenic-highways (accessed August 2020)
____. 2020a. Transportation and Construction Vibration Guidance Manual. Available at: https://dot.ca.gov/-/media/dot-media/programs/environmental-analysis/documents/env/tcvgm-apr2020-a11y.pdf
____. 2020b. Traffic Census Program. Available at: https://dot.ca.gov/programs/traffic-operations/census
References
Initial Study 159
California Energy Commission (CEC). 2018a. Revised Transportation Energy Demand Forecast 2018-2030. April 19, 2018.
____. 2018b. “2019 Building Energy and Efficiency Standards Frequently Asked Questions.”
____. 2020a. “California Energy Consumption Database.” http://ecdms.energy.ca.gov/Default.aspx (accessed August 2020).
____. 2020b. “2018 Total System Electric Generation.” https://www.energy.ca.gov/data-reports/energy-almanac/california-electricity-data/2018-total-system-electric-generation (accessed August 2020).
____. 2020c. “California Retail Fuel Outlet Annual Reporting (CE-A15) Results.” https://www.energy.ca.gov/data-reports/energy-almanac/transportation-energy/california-retail-fuel-outlet-annual-reporting (accessed August 2020).
California Environmental Protection Agency. 2006. Climate Action Team Report to Governor Schwarzenegger and the Legislature.
California Office of Environmental Health Hazard Assessment. 2018. “SB 535 Disadvantaged Communities.” Last updated: June 25, 2018. https://oehha.ca.gov/calenviroscreen/sb535 (accessed November 2020).
California Public Utilities Commission (CPUC). 2011. Renewables Portfolio Standard Quarterly Report. 1st Quarter 2011. http://www.cpuc.ca.gov/WorkArea/DownloadAsset.aspx?id=5858 (accessed August 2020).
Dibblee, T.W., and Minch, J.A., 2005, Geologic map of the Hayward quadrangle, Contra Costa and Alameda Counties, California: Dibblee Geological Foundation, Dibblee Foundation Map DF-163, scale 1:24,000.
Federal Emergency Management Agency (FEMA). 2009. FIRM Map #06001C0288G. https://msc.fema.gov/portal/home. (accessed September 2020).
Federal Highway Administration (FHWA). 2006. FHWA Highway Construction Noise Handbook. (FHWAHEP-06-015; DOT-VNTSC-FHWA-06-02). Available at: http://www.fhwa.dot.gov/environment/construction_noise/handbook. Accessed November 2018.
Federal Transit Administration (FTA). 2018. Transit Noise and Vibration Impact Assessment. November. Available at: https://www.transit.dot.gov/sites/fta.dot.gov/files/docs/research-innovation/118131/transit-noise-and-vibration-impact-assessment-manual-fta-report-no-0123_0.pdf
Generator Source. 2020. “Approximate Diesel Fuel Consumption Chart.” https://www.generatorsource.com/Diesel_Fuel_Consumption.aspx (accessed August 2020).
Graymer, R.W. 2000. Geologic map and map database of the Oakland metropolitan area, Alameda, Contra Costa, and San Francisco Counties, California. U.S. Geological Survey, Miscellaneous Field Studies Map MF-2342, scale 1:50,000.
Intergovernmental Panel on Climate Change. 2007. Summary for Policymakers. In: Climate Change 2007: The Physical Science Basis. Contribution of Working Group I to the Fourth Assessment Report of the Intergovernmental Panel on Climate Change.
City of Hayward Clawiter Road Industrial Project
160
Hayward, City of. 2013. Final Environmental Impact Report – City of Hayward 2040 General Plan. SCH #2013082015. May 2014. https://www.hayward-ca.gov/your-government/documents/planning-documents/general-plan (accessed August 2020).
____. 2014. Hayward 2040 General Plan. July 2014. https://www.hayward-ca.gov/sites/default/files/documents/General_Plan_FINAL.pdf (accessed August 2020).
____.2014b. Hayward 2040 General Plan Background Report. https://www.hayward-ca.gov/sites/default/files/documents/HayGPU_PRDBackground_Report_20140131.pdf (accessed October 2020).
____. 2015. “Solid Waste Diversion Rate.” https://www.hayward-ca.gov/content/solid-waste-diversion-rate (accessed August 2020).
____. 2016a. Urban Water Management Plan. https://www.water.ca.gov/LegacyFiles/urbanwatermanagement/2010uwmps/Hayward,%20City%20of/Hayward%202010%20UWMP%20with%20Appendices%20June%202010.pdf. (accessed September 2020).
____. 2016b. Local Hazard Mitigation Plan.
____. 2019. Hayward Area Recreation and Park District – A Brief History. https://www.haywardrec.org/27/About-Us. (accessed September 2020).
____. 2020a. “Climate Action Plan.” https://www.hayward-ca.gov/services/city-services/climate-action (accessed August 2020).
____. 2020b. “Wastewater.” https://www.hayward-ca.gov/your-environment/green-your-community/wastewater (accessed August 2020).
____. 2020c. “Construction and Demolition Debris Disposal.” https://www.hayward-ca.gov/services/city-services/construction-and-demolition-debris-disposal (accessed November 2020).
____. N.D. Business Recycling Mandates. https://www.hayward-ca.gov/sites/default/files/Business%20Recycling%20Mandates.pdf. (accessed October 2020).
Hayward Fire Department website: https://www.hayward-ca.gov/fire-department/office-fire-marshal/hazardous-materials. Accessed October 19, 2020.
Hayward Unified School District (HUSD). 2020. 2020 Developer Fee Justification Study. February 2020.
Helley, E.J., and Graymer, R.W. 1997. Quaternary Geology of Alameda County, and Parts of Contra Costa, Santa Clara, San Mateo, San Francisco, Stanislaus, and San Joaquin Counties, California: A Digital Database. U.S. Geological Survey Open File Report 9797, scale 1:100,000.
Jefferson, G.T. 2010. A catalogue of late Quaternary vertebrates from California. Natural History Museum of Los Angeles County Technical Report 7, p. 5-172.
Journal of Commerce. 2019. Q3 intermodal volumes disappoint again. October 3. Available at: https://www.joc.com/rail-intermodal/intermodal-shipping/q3-intermodal-volumes-disappoint-again_20191003.html
References
Initial Study 161
Malcolm J. Crocker (Editor). 2007. Handbook of Noise and Vibration Control Book, ISBN: 978-0-471-39599-7, Wiley-VCH, October.
National Environmental Title Research (NETR Online). “Historic Aerials: Viewer,” Historic aerial imagery of 25800 Clawiter Road and vicinity. https://www.historicaerials.com/viewer.
Pacific Institute. 2003. Waste Not, Want Not: The Potential for Urban Water Conservation in California. November 2003. https://pacinst.org/publication/waste-not-want-not/ (accessed August 2020).
Paleobiology Database. 2020. Online fossil locality database. Available online: https://www.paleobiodb.org/#/.
Rincon Consultants, Inc. 2020. El Dorado Family Apartments Project Rail Noise Memorandum. March 2
Society of Vertebrate Paleontology. 2010. Standard Procedures for the Assessment and Mitigation of Adverse Impacts to Paleontological Resources. Society of Vertebrate Paleontology Impact Mitigation Guidelines Revision Committee.
State of California. 2018. California’s Fourth Climate Change Assessment Statewide Summary Report. August 27, 2018. http://www.climateassessment.ca.gov/state/ (accessed May 2020).
United States Energy Information Administration. 2020. “California – State Profile and Energy Estimates.” https://www.eia.gov/state/?sid=CA#tabs-2 (accessed August 2020).
United States Environmental Protection Agency (U.S. EPA). 1996. AP-42. https://www.epa.gov/air-emissions-factors-and-quantification/ap-42-compilation-air-emissions-factors (accessed April 2020).
____. 2018a. “Criteria Air Pollutants.” https://www.epa.gov/criteria-air-pollutants (accessed August 2020).
____. 2018b. Emission Factors for Greenhouse Gas Inventories. March 9. https://www.epa.gov/sites/production/files/2018-03/documents/emission-factors_mar_2018_0.pdf (accessed September 2020).
____. 2020. “Inventory of U.S. Greenhouse Gas Emissions and Sinks.” Last modified: April 13, 2020. https://www.epa.gov/ghgemissions/inventory-us-greenhouse-gas-emissions-and-sinks (accessed May 2020).
University of California Museum of Paleontology (UCMP) Online Database. 2020. UCMP specimen search portal, http://ucmpdb.berkeley.edu/.
U.S. Fish and Wildlife Service. 2019. National Wetlands Inventory. fws.gov/wetlands/data/mapper.html. (accessed August 2020).
Uptime Institute. 2020. Uptime Institute global data center survey 2020. July 13, 2020.
https://www.epa.gov/air-emissions-factors-and-quantification/ap-42-compilation-air-emissions-factors
City of Hayward Clawiter Road Industrial Project
162
List of Preparers Rincon Consultants, Inc. prepared this IS-MND under contract to the City of Hayward. Persons involved in data gathering analysis, project management, and quality control are listed below.
RINCON CONSULTANTS, INC. Abe Leider, AICP CEP, Principal in Charge Karly Kaufman, MESM, Project Manager Ryan Russell, Associate Environmental Planner Annaliese Miller, Associate Environmental Planner Bill Vosti, Senior Environmental Planner Steven Treffers, Architectural Historian Hannah Haas, MA, RPA, Archaeologist Jorge Mendieta, Associate Environmental Scientist/Paleontologist Allysen Valencia, GIS Analyst Annette Tran, GIS Analyst