CK-12 Ecology - Erie's Public Schools
685
-
Upload
khangminh22 -
Category
Documents
-
view
0 -
download
0
Transcript of CK-12 Ecology - Erie's Public Schools


CK-12 Ecology
Jean Brainard, Ph.D.Dana Desonie, Ph.D.
CK-12
Say Thanks to the AuthorsClick http://www.ck12.org/saythanks
(No sign in required)

www.ck12.org
To access a customizable version of this book, as well as otherinteractive content, visit www.ck12.org
CK-12 Foundation is a non-profit organization with a mission toreduce the cost of textbook materials for the K-12 market both inthe U.S. and worldwide. Using an open-source, collaborative, andweb-based compilation model, CK-12 pioneers and promotes thecreation and distribution of high-quality, adaptive online textbooksthat can be mixed, modified and printed (i.e., the FlexBook®textbooks).
Copyright © 2019 CK-12 Foundation, www.ck12.org
The names “CK-12” and “CK12” and associated logos and theterms “FlexBook®” and “FlexBook Platform®” (collectively“CK-12 Marks”) are trademarks and service marks of CK-12Foundation and are protected by federal, state, and internationallaws.
Any form of reproduction of this book in any format or medium,in whole or in sections must include the referral attribution linkhttp://www.ck12.org/saythanks (placed in a visible location) inaddition to the following terms.
Except as otherwise noted, all CK-12 Content (including CK-12Curriculum Material) is made available to Users in accordancewith the Creative Commons Attribution-Non-Commercial 3.0Unported (CC BY-NC 3.0) License (http://creativecommons.org/licenses/by-nc/3.0/), as amended and updated by Creative Com-mons from time to time (the “CC License”), which is incorporatedherein by this reference.
Complete terms can be found at http://www.ck12.org/about/terms-of-use.
Printed: June 28, 2019
AUTHORSJean Brainard, Ph.D.Dana Desonie, Ph.D.CK-12
CONTRIBUTORSBarbara Akre, M.A.Jennifer Blanchette, Ph.D.Niamh Gray-Wilson
EDITORDouglas Wilkin, Ph.D.
iii

Contents www.ck12.org
Contents
1 How Science Works 11.1 Scientific Explanations and Interpretations . . . . . . . . . . . . . . . . . . . . . . . . . . . . . 21.2 Scientific Method . . . . . . . . . . . . . . . . . . . . . . . . . . . . . . . . . . . . . . . . . . 61.3 Developing Hypotheses . . . . . . . . . . . . . . . . . . . . . . . . . . . . . . . . . . . . . . . 101.4 Testing Hypotheses . . . . . . . . . . . . . . . . . . . . . . . . . . . . . . . . . . . . . . . . . 131.5 Correlation and Causation . . . . . . . . . . . . . . . . . . . . . . . . . . . . . . . . . . . . . . 171.6 Observations and Experiments . . . . . . . . . . . . . . . . . . . . . . . . . . . . . . . . . . . 201.7 Theories . . . . . . . . . . . . . . . . . . . . . . . . . . . . . . . . . . . . . . . . . . . . . . . 231.8 Evolution, Plate Tectonics, and Climate Change . . . . . . . . . . . . . . . . . . . . . . . . . . 271.9 Scientific Models . . . . . . . . . . . . . . . . . . . . . . . . . . . . . . . . . . . . . . . . . . 311.10 Scientific Community . . . . . . . . . . . . . . . . . . . . . . . . . . . . . . . . . . . . . . . . 341.11 References . . . . . . . . . . . . . . . . . . . . . . . . . . . . . . . . . . . . . . . . . . . . . . 37
2 What is Biology? 382.1 Biology: The Study of Life . . . . . . . . . . . . . . . . . . . . . . . . . . . . . . . . . . . . . 392.2 References . . . . . . . . . . . . . . . . . . . . . . . . . . . . . . . . . . . . . . . . . . . . . . 50
3 The Chemistry of Life 513.1 Atoms and Molecules . . . . . . . . . . . . . . . . . . . . . . . . . . . . . . . . . . . . . . . . 523.2 Chemical Bonds . . . . . . . . . . . . . . . . . . . . . . . . . . . . . . . . . . . . . . . . . . . 563.3 Matter and Organic Compounds . . . . . . . . . . . . . . . . . . . . . . . . . . . . . . . . . . 603.4 Biochemical Reactions . . . . . . . . . . . . . . . . . . . . . . . . . . . . . . . . . . . . . . . 723.5 Water, Acids, and Bases . . . . . . . . . . . . . . . . . . . . . . . . . . . . . . . . . . . . . . . 783.6 References . . . . . . . . . . . . . . . . . . . . . . . . . . . . . . . . . . . . . . . . . . . . . . 85
4 Life: From the First Organism Onward 864.1 Evolution of Simple Cells . . . . . . . . . . . . . . . . . . . . . . . . . . . . . . . . . . . . . . 874.2 Earth Forms and Life Begins . . . . . . . . . . . . . . . . . . . . . . . . . . . . . . . . . . . . 934.3 Principles of Relative Dating . . . . . . . . . . . . . . . . . . . . . . . . . . . . . . . . . . . . 1044.4 Types of Fossilization . . . . . . . . . . . . . . . . . . . . . . . . . . . . . . . . . . . . . . . . 1094.5 Extinction and Radiation of Life . . . . . . . . . . . . . . . . . . . . . . . . . . . . . . . . . . 1134.6 The Evolution of Multicellular Life . . . . . . . . . . . . . . . . . . . . . . . . . . . . . . . . . 1164.7 Human Evolution . . . . . . . . . . . . . . . . . . . . . . . . . . . . . . . . . . . . . . . . . . 1264.8 Classification . . . . . . . . . . . . . . . . . . . . . . . . . . . . . . . . . . . . . . . . . . . . 1294.9 References . . . . . . . . . . . . . . . . . . . . . . . . . . . . . . . . . . . . . . . . . . . . . . 134
5 The Theory of Evolution 1365.1 Adaptation and Evolution of Populations . . . . . . . . . . . . . . . . . . . . . . . . . . . . . . 1375.2 Darwin and the Theory of Evolution . . . . . . . . . . . . . . . . . . . . . . . . . . . . . . . . 1405.3 Evidence for Evolution . . . . . . . . . . . . . . . . . . . . . . . . . . . . . . . . . . . . . . . 1505.4 Microevolution and the Genetics of Populations . . . . . . . . . . . . . . . . . . . . . . . . . . 1585.5 Macroevolution and the Origin of Species . . . . . . . . . . . . . . . . . . . . . . . . . . . . . 166
iv

www.ck12.org Contents
5.6 References . . . . . . . . . . . . . . . . . . . . . . . . . . . . . . . . . . . . . . . . . . . . . . 170
6 The Principles of Ecology 1726.1 The Science of Ecology . . . . . . . . . . . . . . . . . . . . . . . . . . . . . . . . . . . . . . . 1736.2 Distribution of Water on Earth . . . . . . . . . . . . . . . . . . . . . . . . . . . . . . . . . . . 1856.3 States of Water . . . . . . . . . . . . . . . . . . . . . . . . . . . . . . . . . . . . . . . . . . . . 1876.4 The Water Cycle . . . . . . . . . . . . . . . . . . . . . . . . . . . . . . . . . . . . . . . . . . . 1906.5 Importance of the Atmosphere . . . . . . . . . . . . . . . . . . . . . . . . . . . . . . . . . . . 1966.6 Composition of the Atmosphere . . . . . . . . . . . . . . . . . . . . . . . . . . . . . . . . . . 2006.7 Troposphere . . . . . . . . . . . . . . . . . . . . . . . . . . . . . . . . . . . . . . . . . . . . . 2046.8 Stratosphere . . . . . . . . . . . . . . . . . . . . . . . . . . . . . . . . . . . . . . . . . . . . . 2076.9 Recycling Matter . . . . . . . . . . . . . . . . . . . . . . . . . . . . . . . . . . . . . . . . . . 2106.10 Nitrogen Cycle in Ecosystems . . . . . . . . . . . . . . . . . . . . . . . . . . . . . . . . . . . 2166.11 Seasons . . . . . . . . . . . . . . . . . . . . . . . . . . . . . . . . . . . . . . . . . . . . . . . 2206.12 Soil Characteristics . . . . . . . . . . . . . . . . . . . . . . . . . . . . . . . . . . . . . . . . . 2256.13 Soil Formation . . . . . . . . . . . . . . . . . . . . . . . . . . . . . . . . . . . . . . . . . . . . 2306.14 Soil Horizons and Profiles . . . . . . . . . . . . . . . . . . . . . . . . . . . . . . . . . . . . . . 2346.15 Types of Soils . . . . . . . . . . . . . . . . . . . . . . . . . . . . . . . . . . . . . . . . . . . . 2386.16 Latitude, Longitude, and Direction . . . . . . . . . . . . . . . . . . . . . . . . . . . . . . . . . 2436.17 Solar Energy and Latitude . . . . . . . . . . . . . . . . . . . . . . . . . . . . . . . . . . . . . . 2486.18 Greenhouse Effect . . . . . . . . . . . . . . . . . . . . . . . . . . . . . . . . . . . . . . . . . . 2506.19 Importance of the Oceans . . . . . . . . . . . . . . . . . . . . . . . . . . . . . . . . . . . . . . 2546.20 Weather vs. Climate . . . . . . . . . . . . . . . . . . . . . . . . . . . . . . . . . . . . . . . . . 2576.21 Ocean Currents and Climate . . . . . . . . . . . . . . . . . . . . . . . . . . . . . . . . . . . . 2606.22 Effect of Latitude on Climate . . . . . . . . . . . . . . . . . . . . . . . . . . . . . . . . . . . . 2636.23 Effect of Atmospheric Circulation on Climate . . . . . . . . . . . . . . . . . . . . . . . . . . . 2666.24 Effect of Continental Position on Climate . . . . . . . . . . . . . . . . . . . . . . . . . . . . . 2706.25 Effect of Altitude and Mountains on Climate . . . . . . . . . . . . . . . . . . . . . . . . . . . . 2736.26 Biomes . . . . . . . . . . . . . . . . . . . . . . . . . . . . . . . . . . . . . . . . . . . . . . . . 2756.27 Fresh Water Ecosystems . . . . . . . . . . . . . . . . . . . . . . . . . . . . . . . . . . . . . . . 2886.28 Ocean Ecosystems . . . . . . . . . . . . . . . . . . . . . . . . . . . . . . . . . . . . . . . . . . 2936.29 References . . . . . . . . . . . . . . . . . . . . . . . . . . . . . . . . . . . . . . . . . . . . . . 298
7 Communities and Populations 3027.1 Community Interactions . . . . . . . . . . . . . . . . . . . . . . . . . . . . . . . . . . . . . . . 3037.2 Population Size . . . . . . . . . . . . . . . . . . . . . . . . . . . . . . . . . . . . . . . . . . . 3127.3 Characteristics of Populations . . . . . . . . . . . . . . . . . . . . . . . . . . . . . . . . . . . . 3167.4 Human Population Growth . . . . . . . . . . . . . . . . . . . . . . . . . . . . . . . . . . . . . 3247.5 The Biodiversity Crisis . . . . . . . . . . . . . . . . . . . . . . . . . . . . . . . . . . . . . . . 3317.6 Natural Resources and Climate Change . . . . . . . . . . . . . . . . . . . . . . . . . . . . . . . 3417.7 References . . . . . . . . . . . . . . . . . . . . . . . . . . . . . . . . . . . . . . . . . . . . . . 352
8 Earth’s Energy and Resources 3548.1 Energy Resources . . . . . . . . . . . . . . . . . . . . . . . . . . . . . . . . . . . . . . . . . . 3558.2 Obtaining Energy Resources . . . . . . . . . . . . . . . . . . . . . . . . . . . . . . . . . . . . 3598.3 Energy Conservation . . . . . . . . . . . . . . . . . . . . . . . . . . . . . . . . . . . . . . . . 3628.4 Renewable vs. Nonrenewable Energy Resources . . . . . . . . . . . . . . . . . . . . . . . . . . 3668.5 Fossil Fuel Formation . . . . . . . . . . . . . . . . . . . . . . . . . . . . . . . . . . . . . . . . 3708.6 Coal Power . . . . . . . . . . . . . . . . . . . . . . . . . . . . . . . . . . . . . . . . . . . . . 3738.7 Petroleum Power . . . . . . . . . . . . . . . . . . . . . . . . . . . . . . . . . . . . . . . . . . 3788.8 Natural Gas Power . . . . . . . . . . . . . . . . . . . . . . . . . . . . . . . . . . . . . . . . . . 3838.9 Fossil Fuel Reserves . . . . . . . . . . . . . . . . . . . . . . . . . . . . . . . . . . . . . . . . . 387
v

Contents www.ck12.org
8.10 Nuclear Power . . . . . . . . . . . . . . . . . . . . . . . . . . . . . . . . . . . . . . . . . . . . 3908.11 Solar Energy . . . . . . . . . . . . . . . . . . . . . . . . . . . . . . . . . . . . . . . . . . . . . 3958.12 Hydroelectric Power . . . . . . . . . . . . . . . . . . . . . . . . . . . . . . . . . . . . . . . . . 3998.13 Wind Energy . . . . . . . . . . . . . . . . . . . . . . . . . . . . . . . . . . . . . . . . . . . . . 4038.14 Geothermal Energy . . . . . . . . . . . . . . . . . . . . . . . . . . . . . . . . . . . . . . . . . 4078.15 Biomass Energy . . . . . . . . . . . . . . . . . . . . . . . . . . . . . . . . . . . . . . . . . . . 4108.16 Materials Humans Use . . . . . . . . . . . . . . . . . . . . . . . . . . . . . . . . . . . . . . . 4138.17 Finding and Mining Ores . . . . . . . . . . . . . . . . . . . . . . . . . . . . . . . . . . . . . . 4168.18 Availability of Natural Resources . . . . . . . . . . . . . . . . . . . . . . . . . . . . . . . . . . 4218.19 Natural Resource Conservation . . . . . . . . . . . . . . . . . . . . . . . . . . . . . . . . . . . 4258.20 References . . . . . . . . . . . . . . . . . . . . . . . . . . . . . . . . . . . . . . . . . . . . . . 428
9 Human Impacts on Earth’s Environment 4319.1 Growth of Human Populations . . . . . . . . . . . . . . . . . . . . . . . . . . . . . . . . . . . 4329.2 Agriculture and Human Population Growth . . . . . . . . . . . . . . . . . . . . . . . . . . . . 4369.3 Overpopulation and Over-Consumption . . . . . . . . . . . . . . . . . . . . . . . . . . . . . . 4429.4 Sustainable Development . . . . . . . . . . . . . . . . . . . . . . . . . . . . . . . . . . . . . . 4479.5 Soil Erosion . . . . . . . . . . . . . . . . . . . . . . . . . . . . . . . . . . . . . . . . . . . . . 4509.6 Avoiding Soil Loss . . . . . . . . . . . . . . . . . . . . . . . . . . . . . . . . . . . . . . . . . 4569.7 Hazardous Waste . . . . . . . . . . . . . . . . . . . . . . . . . . . . . . . . . . . . . . . . . . 4629.8 Impacts of Hazardous Waste . . . . . . . . . . . . . . . . . . . . . . . . . . . . . . . . . . . . 4649.9 Preventing Hazardous Waste Problems . . . . . . . . . . . . . . . . . . . . . . . . . . . . . . . 4689.10 Environmental Impacts of Mining . . . . . . . . . . . . . . . . . . . . . . . . . . . . . . . . . 4729.11 References . . . . . . . . . . . . . . . . . . . . . . . . . . . . . . . . . . . . . . . . . . . . . . 475
10 Human Impacts on Earth’s Water 47710.1 Uses of Water . . . . . . . . . . . . . . . . . . . . . . . . . . . . . . . . . . . . . . . . . . . . 47810.2 Water Distribution . . . . . . . . . . . . . . . . . . . . . . . . . . . . . . . . . . . . . . . . . . 48410.3 Safety of Water . . . . . . . . . . . . . . . . . . . . . . . . . . . . . . . . . . . . . . . . . . . 48910.4 Water Pollution . . . . . . . . . . . . . . . . . . . . . . . . . . . . . . . . . . . . . . . . . . . 49210.5 Protecting Water From Pollution . . . . . . . . . . . . . . . . . . . . . . . . . . . . . . . . . . 49610.6 Groundwater Depletion . . . . . . . . . . . . . . . . . . . . . . . . . . . . . . . . . . . . . . . 50010.7 Groundwater Pollution . . . . . . . . . . . . . . . . . . . . . . . . . . . . . . . . . . . . . . . 50410.8 Cleaning Up Groundwater . . . . . . . . . . . . . . . . . . . . . . . . . . . . . . . . . . . . . 50710.9 Conserving Water . . . . . . . . . . . . . . . . . . . . . . . . . . . . . . . . . . . . . . . . . . 51110.10 Coastal Pollution . . . . . . . . . . . . . . . . . . . . . . . . . . . . . . . . . . . . . . . . . . 51410.11 Ocean Garbage Patch . . . . . . . . . . . . . . . . . . . . . . . . . . . . . . . . . . . . . . . . 51810.12 Oil Spills . . . . . . . . . . . . . . . . . . . . . . . . . . . . . . . . . . . . . . . . . . . . . . . 52210.13 References . . . . . . . . . . . . . . . . . . . . . . . . . . . . . . . . . . . . . . . . . . . . . . 529
11 Human Impacts on Earth’s Atmosphere 53111.1 Air Quality . . . . . . . . . . . . . . . . . . . . . . . . . . . . . . . . . . . . . . . . . . . . . . 53211.2 Types of Air Pollution . . . . . . . . . . . . . . . . . . . . . . . . . . . . . . . . . . . . . . . . 53611.3 Causes Of Air Pollution . . . . . . . . . . . . . . . . . . . . . . . . . . . . . . . . . . . . . . . 54011.4 Effects of Air Pollution on the Environment . . . . . . . . . . . . . . . . . . . . . . . . . . . . 54411.5 Effects of Air Pollution on Human Health . . . . . . . . . . . . . . . . . . . . . . . . . . . . . 54811.6 Mercury Pollution . . . . . . . . . . . . . . . . . . . . . . . . . . . . . . . . . . . . . . . . . . 55111.7 Acid Rain . . . . . . . . . . . . . . . . . . . . . . . . . . . . . . . . . . . . . . . . . . . . . . 55611.8 Ozone Depletion . . . . . . . . . . . . . . . . . . . . . . . . . . . . . . . . . . . . . . . . . . . 56111.9 Reducing Air Pollution . . . . . . . . . . . . . . . . . . . . . . . . . . . . . . . . . . . . . . . 56611.10 Reducing Ozone Destruction . . . . . . . . . . . . . . . . . . . . . . . . . . . . . . . . . . . . 57111.11 Climate Change in Earth History . . . . . . . . . . . . . . . . . . . . . . . . . . . . . . . . . . 574
vi

www.ck12.org Contents
11.12 Short-Term Climate Change . . . . . . . . . . . . . . . . . . . . . . . . . . . . . . . . . . . . . 57711.13 Long-Term Climate Change . . . . . . . . . . . . . . . . . . . . . . . . . . . . . . . . . . . . . 58111.14 Carbon Cycle and Climate . . . . . . . . . . . . . . . . . . . . . . . . . . . . . . . . . . . . . 58611.15 Global Warming . . . . . . . . . . . . . . . . . . . . . . . . . . . . . . . . . . . . . . . . . . . 59211.16 Impact of Continued Global Warming . . . . . . . . . . . . . . . . . . . . . . . . . . . . . . . 59711.17 Reducing Greenhouse Gas Pollution . . . . . . . . . . . . . . . . . . . . . . . . . . . . . . . . 60211.18 References . . . . . . . . . . . . . . . . . . . . . . . . . . . . . . . . . . . . . . . . . . . . . . 606
12 Biology Glossary 60912.1 A . . . . . . . . . . . . . . . . . . . . . . . . . . . . . . . . . . . . . . . . . . . . . . . . . . . 61012.2 B . . . . . . . . . . . . . . . . . . . . . . . . . . . . . . . . . . . . . . . . . . . . . . . . . . . 61512.3 C . . . . . . . . . . . . . . . . . . . . . . . . . . . . . . . . . . . . . . . . . . . . . . . . . . . 61812.4 D . . . . . . . . . . . . . . . . . . . . . . . . . . . . . . . . . . . . . . . . . . . . . . . . . . . 62412.5 E . . . . . . . . . . . . . . . . . . . . . . . . . . . . . . . . . . . . . . . . . . . . . . . . . . . 62612.6 F . . . . . . . . . . . . . . . . . . . . . . . . . . . . . . . . . . . . . . . . . . . . . . . . . . . 63012.7 G . . . . . . . . . . . . . . . . . . . . . . . . . . . . . . . . . . . . . . . . . . . . . . . . . . . 63212.8 H . . . . . . . . . . . . . . . . . . . . . . . . . . . . . . . . . . . . . . . . . . . . . . . . . . . 63612.9 I . . . . . . . . . . . . . . . . . . . . . . . . . . . . . . . . . . . . . . . . . . . . . . . . . . . 63812.10 J . . . . . . . . . . . . . . . . . . . . . . . . . . . . . . . . . . . . . . . . . . . . . . . . . . . 64012.11 K . . . . . . . . . . . . . . . . . . . . . . . . . . . . . . . . . . . . . . . . . . . . . . . . . . . 64112.12 L . . . . . . . . . . . . . . . . . . . . . . . . . . . . . . . . . . . . . . . . . . . . . . . . . . . 64212.13 M . . . . . . . . . . . . . . . . . . . . . . . . . . . . . . . . . . . . . . . . . . . . . . . . . . 64512.14 N . . . . . . . . . . . . . . . . . . . . . . . . . . . . . . . . . . . . . . . . . . . . . . . . . . . 64912.15 O . . . . . . . . . . . . . . . . . . . . . . . . . . . . . . . . . . . . . . . . . . . . . . . . . . . 65112.16 P . . . . . . . . . . . . . . . . . . . . . . . . . . . . . . . . . . . . . . . . . . . . . . . . . . . 65312.17 R . . . . . . . . . . . . . . . . . . . . . . . . . . . . . . . . . . . . . . . . . . . . . . . . . . . 65912.18 S . . . . . . . . . . . . . . . . . . . . . . . . . . . . . . . . . . . . . . . . . . . . . . . . . . . 66112.19 T . . . . . . . . . . . . . . . . . . . . . . . . . . . . . . . . . . . . . . . . . . . . . . . . . . . 66612.20 U . . . . . . . . . . . . . . . . . . . . . . . . . . . . . . . . . . . . . . . . . . . . . . . . . . . 66812.21 V . . . . . . . . . . . . . . . . . . . . . . . . . . . . . . . . . . . . . . . . . . . . . . . . . . . 66912.22 W . . . . . . . . . . . . . . . . . . . . . . . . . . . . . . . . . . . . . . . . . . . . . . . . . . 67112.23 X . . . . . . . . . . . . . . . . . . . . . . . . . . . . . . . . . . . . . . . . . . . . . . . . . . . 67212.24 Z . . . . . . . . . . . . . . . . . . . . . . . . . . . . . . . . . . . . . . . . . . . . . . . . . . . 67312.25 References . . . . . . . . . . . . . . . . . . . . . . . . . . . . . . . . . . . . . . . . . . . . . . 674
vii

www.ck12.org Chapter 1. How Science Works
CHAPTER 1How Science Works
Chapter Outline1.1 SCIENTIFIC EXPLANATIONS AND INTERPRETATIONS
1.2 SCIENTIFIC METHOD
1.3 DEVELOPING HYPOTHESES
1.4 TESTING HYPOTHESES
1.5 CORRELATION AND CAUSATION
1.6 OBSERVATIONS AND EXPERIMENTS
1.7 THEORIES
1.8 EVOLUTION, PLATE TECTONICS, AND CLIMATE CHANGE
1.9 SCIENTIFIC MODELS
1.10 SCIENTIFIC COMMUNITY
1.11 REFERENCES
1

www.ck12.org
Introduction
Science is a different way of understanding the world
If someone asks you “what is science?” you might say that it’s a bunch of facts and explanations; but that’s only partof the story. Science is a knowledge base and a way of learning about the world.
2

www.ck12.org Chapter 1. How Science Works
1.1 Scientific Explanations and Interpretations
Learning Objectives
• Identify and define facts, explanations, and opinions.
”It used to be, everyone was entitled to their own opinion, but not their own facts. But that’s not the caseanymore." Stephen Colbert, AV Club Interview, January 2006
Can you tell a fact from an opinion? Can you tell when an idea follows logically from a fact? Basing ideas on factsis essential to good science. Science is a set of facts, and it is also a set of explanations that are based on those facts.Science relies on facts to explain the natural world.
3

1.1. Scientific Explanations and Interpretations www.ck12.org
Facts, Observations, Opinions
Scientists usually begin an investigation with facts. A fact is a bit of information that is true. Facts come from datacollected from observations or from experiments that have already been run. Data is factual information that is notsubject to opinion or bias.
What is a fact? Look at the following list and identify if the statement is a fact (from observation or prior experi-ments), an opinion, or a combination.
FIGURE 1.1Can you be sure from the photo that Susan has a cold?
1. Susan has long hair.2. Susan is sneezing and has itchy eyes. She is not well. She has a cold.3. Colds are caused by viruses.4. Echinacea is an herb that prevents colds.5. Jeff Bezos s the smartest man in the United States.6. People born under the astrological sign Leo are fiery, self-assured, and charming.7. Average global temperature has been rising at least since 1960.
An Analysis
The following is an analysis of the statements above:
1. This is a fact made from observation.2. The first part is from observations. The second is a fact drawn from the prior observations. The third is an
opinion, since she might actually have allergies or the flu. Tests could be done to see what is causing herillness.
3. This is a fact. Many, many scientific experiments have shown that colds are caused by viruses.4. While that sounds like a fact, the scientific evidence is mixed. One reputable study published in 2007 showed
a decrease of 58%, but several other studies have shown no beneficial effect.5. Jeff Bezos is the wealthiest man in the United States; that’s a fact. But there’s no evidence that he’s also the
smartest man, and chances are he’s not. This is an opinion.6. This sounds like a fact, but it is not. It is easy to test. Gather together a large number of subjects, each
with a friend. Have the friends fill out a questionnaire describing the subject. Match the traits against theperson’s astrological sign to see if the astrological predictions fit. Are Leos actually more fiery, self assured,and charming? Tests like this have not supported the claims of astrologers, yet astrologers have not modifiedtheir opinions.
7. This is a fact. The Figure 1.2 shows the temperature anomaly since 1880. There’s no doubt that temperaturehas risen overall since 1880 and especially since the late 1970s.
4

www.ck12.org Chapter 1. How Science Works
FIGURE 1.2Global Average Annual Temperatures areRising. This graph shows temperatureanomaly relative to the 1951-1980 aver-age (the average is made to be 0). Thegreen bars show uncertainty.
Summary
• Facts are true. Data, gathered correctly, are facts.• Some statements that appear to be facts are not.• All scientific explanations and interpretations are based on facts.
Review
1. Just because something appears in print doesn’t mean it’s true. Many stories circulate around the internet andappear to be true but are not. Think of something that you think is true, but may not be, and look it up. Here’sone: a tooth placed in Coca-Cola will dissolve overnight.
2. Neuroscientists have shown that people are more likely to believe a statement if they have heard it before,whether it’s true or not. Look in a newspaper or watch television news and find three statements that are notactually true but that the person saying them is hoping will be believed. Is this effective?
3. What is the relationship between observations and facts? What is the relationship between facts and opinions?
Explore More
Use this resource to answer the questions that follow.
MEDIAClick image to the left or use the URL below.URL: https://www.ck12.org/flx/render/embeddedobject/171330
1. What is science?
5

1.1. Scientific Explanations and Interpretations www.ck12.org
2. What is evidence?3. List the steps of the scientific method (procedure).4. What happens if a hypothesis is determined to be wrong?5. Why is peer review important?6. What is a theory?7. Why might a theory be modified? When might it be thrown out?8. Explain the importance of the scientific method.9. How does technology show that scientific method works?
6

www.ck12.org Chapter 1. How Science Works
1.2 Scientific Method
Learning Objectives
• Explain how scientific questions are answered using scientific method.
How many angels can dance on the head of a pin?
This is a question that has been pondered over the centuries. Can it be answered using scientific method? Is it ascientific question?
7

1.2. Scientific Method www.ck12.org
The Goal of Science
The goal of science is to answer questions about the natural world. Scientific questions must be testable. Which ofthese two questions is a good scientific question and which is not?
• What is the age of our planet Earth?• How many angels can dance on the head of a pin?
The first is a good scientific question that can be answered by radiometrically dating rocks among other techniques.The second cannot be answered using data, so it is not a scientific question.
Scientific Method
Scientists use the scientific method to answer questions. The scientific method is a series of steps that help toinvestigate a question.
Often, students learn that the scientific method is a linear process that goes like this:
• Ask a question. The question is based on one or more observations or on data from a previous experiment.• Do some background research.• Create a hypothesis.• Do experiments or make observations to test the hypothesis.• Gather the data.• Formulate a conclusion.
The process doesn’t always go in a straight line. A scientist might ask a question, then do some background researchand discover that the question needed to be asked a different way, or that a different question should be asked.
MEDIAClick image to the left or use the URL below.URL: https://www.ck12.org/flx/render/embeddedobject/168243
Ask A Question
Now, let’s ask a scientific question. Remember that it must be testable.
We learned above that average global temperature has been rising since record keeping began in 1880. We knowthat carbon dioxide is a greenhouse gas. Greenhouse gases trap heat in the atmosphere. This leads us to a question:
Question: Is the amount of carbon dioxide in Earth’s atmosphere changing?
This is a good scientific question because it is testable.
How has carbon dioxide in the atmosphere changed over those 50-plus years (see Figure 1.3)? About how muchhas atmospheric CO2 risen between 1958 and 2011 in parts per million?
8

www.ck12.org Chapter 1. How Science Works
FIGURE 1.3Atmospheric carbon dioxide has been in-creasing at Mauna Loa Observatory inHawaii since 1958. The small ups anddowns of the red line are seasonal vari-ations. The black line is the annual aver-age.
Answer a Question
So we’ve answered the question using data from research that has already been done. If scientists had not beenmonitoring CO2 levels over the years, we’d have had to start these measurements now.
Because this question can be answered with data, it is testable.
MEDIAClick image to the left or use the URL below.URL: https://www.ck12.org/flx/render/embeddedobject/208821
Summary
• Scientists use scientific method to answer questions about the natural world.• First, scientists ask a question that they want to answer.• Background research is essential for better understanding the question and being able to move to the next step.
Review
1. What features does a question need to have to be a good science question?2. Create a list of three questions that are good science questions. Create a list of three questions that are not
science questions.3. Look at the graph of atmospheric CO2 over time in the Figure 1.3. As close as you can determine, how much
has the atmospheric CO2 content risen since 1958? Levels are about 400 ppm now.
9

1.2. Scientific Method www.ck12.org
Explore More
Use this resource to answer the questions that follow.
MEDIAClick image to the left or use the URL below.URL: https://www.ck12.org/flx/render/embeddedobject/146369
1. Why is a scientific question different from any other question?2. What is an inference? What is an observation?3. Describe the two types of observations.4. How does the speaker recommend you do first? Where do you get the dependent and independent variables?5. Give an example of a question using an independent and dependent variable and the topic of tomato plants.6. What is a hypothesis?
10

www.ck12.org Chapter 1. How Science Works
1.3 Developing Hypotheses
Learning Objectives
• Describe the characteristics of a good hypothesis.
What is a hypothesis?
An educated guess? Is that what you learned a hypothesis is? Lots of people have learned that, but it’s not exactlyright. So what is a hypothesis? There are two hypotheses listed below to address a question about carbon dioxide inthe atmosphere. Check out what those hypotheses are and what to do with them next.
Asking a New Question
Before we develop some hypotheses, let’s find a new question that we want to answer. What we just learned thatatmospheric CO2 has been increasing at least since 1958. This leads us to ask this question: Why is atmosphericCO2 increasing?
Possible Answers for the Question
We do some background research to find the possible sources of carbon dioxide into the atmosphere. We discovertwo things:
• Carbon dioxide is released into the atmosphere by volcanoes when they erupt.• Carbon dioxide is released when fossil fuels are burned.
A hypothesis is a reasonable explanation to explain a small range of phenomena. A hypothesis is limited in scope,explaining a single event or a fact. A hypothesis must be testable and falsifiable. We must be able to test it and itmust be possible to show that it is wrong.
11

1.3. Developing Hypotheses www.ck12.org
From these two facts we can create two hypotheses. We will have multiple working hypotheses. We can test eachof these hypotheses.
Hypothesis 1
Atmospheric CO2 has increased over the past five decades, because the amount of CO2 gas released by volcanoeshas increased.
Hypothesis 2
The increase in atmospheric CO2 is due to the increase in the amount of fossil fuels that are being burned.
Usually, testing a hypothesis requires making observations or performing experiments. In this case, we will lookinto the scientific literature to see if we can support or refute either or both of these hypotheses.
MEDIAClick image to the left or use the URL below.URL: https://www.ck12.org/flx/render/embeddedobject/185959
Summary
• A hypothesis is a reasonable explanation to explain a phenomenon.• A scientific hypothesis must be testable and falsifiable.• Often, scientists as individuals or as a group test more than one hypothesis at a time to explain a phenomenon.
This is called multiple working hypotheses.
Review
1. Why is calling a hypothesis "a reasonable explanation” better than “an educated guess”?2. A hypothesis is shown to be wrong. Is the question the scientists are trying to answer a bad question?3. Why would scientists have multiple working hypotheses rather than just dealing with one hypothesis until it
is shown to be right or is thrown out?
Explore More
Use this resource to answer the questions that follow.
12

www.ck12.org Chapter 1. How Science Works
MEDIAClick image to the left or use the URL below.URL: https://www.ck12.org/flx/render/embeddedobject/177920
1. What is the point of a hypothesis?2. What is an independent variable? How many independent variables does an experiment have?3. What is a dependent variable?4. What causes the dependent variable to change?5. In this question - If the temperature of the air decreases what happens to the speed of the bear? - what is the
dependent variable and what is the independent variable?6. What is the answer to the question?7. How do you make a hypothesis?8. What is the hypothesis given involving air temperature and bear speed?9. Is our prediction random?
13

1.4. Testing Hypotheses www.ck12.org
1.4 Testing Hypotheses
Learning Objectives
• Identify and explain the steps required to test a hypothesis.
How can I show that my hypothesis is wrong?
Many young scientists learn that a good scientist tries to disprove her hypothesis. This is the best way to be surethat your hypothesis is getting a rigorous test. Why do you think established scientists tell students this? Why is it agood idea?
Testing Hypothesis 1
How do you test a hypothesis? In this example, we will look into the scientific literature to find data in studies thatwere done using scientific method.
To test Hypothesis 1 from the concept "Development of Hypotheses," we need to see if the amount of CO2 gasreleased by volcanoes over the past several decades has increased.
14

www.ck12.org Chapter 1. How Science Works
There are two ways volcanoes could account for the increase in CO2:
• There has been an increase in volcanic eruptions in that time.• The CO2 content of volcanic gases has increased over time globally.
To test the first hypothesis, we look at the scientific literature. We see that the number of volcanic eruptions is aboutconstant. We also learn from the scientific literature that volcanic gas compositions have not changed over time.Different types of volcanoes have different gas compositions, but overall the gases are the same. Another journalarticle states that major volcanic eruptions for the past 30 years have caused short-term cooling, not warming!
Hypothesis 1 is wrong! Volcanic activity is not able to account for the rise in atmospheric CO2. Remember thatscience is falsifiable. We can discard Hypothesis 1.
Testing Hypothesis 2
Hypothesis 2 states that the increase in atmospheric CO2 is due to the increase in the amount of fossil fuels that arebeing burned. We look into the scientific literature and find this graph in the Figure 1.4.
FIGURE 1.4Global carbon dioxide emissions from fos-sil fuel consumption and cement produc-tion. The black line represents all emis-sion types combined, and colored linesshow emissions from individual fossil fu-els.
Fossil fuels have added an increasing amount of carbon dioxide to the atmosphere since the beginning of theIndustrial Revolution in the mid 19th century. Hypothesis 2 is true!
MEDIAClick image to the left or use the URL below.URL: https://www.ck12.org/flx/render/embeddedobject/185961
15

1.4. Testing Hypotheses www.ck12.org
MEDIAClick image to the left or use the URL below.URL: https://www.ck12.org/flx/render/embeddedobject/185963
Summary
• Science is falsifiable. An incorrect hypothesis is discarded.• Carbon dioxide levels in the atmosphere are increasing due to fossil fuel burning.
Review
1. Think of at least one other hypothesis for why atmospheric carbon dioxide has been rising for the past severaldecades. How would you test that hypothesis?
2. If your hypothesis is shown to be true, does that mean that hypothesis 2, which states that the increase inatmospheric CO2 is due to fossil fuel burning, is wrong?
3. How did having multiple working hypotheses help this investigation along?
Explore More
Use this resource to answer the questions that follow.
MEDIAClick image to the left or use the URL below.URL: https://www.ck12.org/flx/render/embeddedobject/1433
16

www.ck12.org Chapter 1. How Science Works
1. What is the purpose of the scientific method?2. What is your task?3. Create a hypothesis that explains how the machine works.4. What would you like to know to be able to better create a hypothesis?5. What would you need to do to see if your hypothesis right?
17

1.5. Correlation and Causation www.ck12.org
1.5 Correlation and Causation
Learning Objectives
• Distinguish between correlation and causation.
Sugar consumption up. Global temperatures up. Is one causing the other?
Is the rise in sugar consumption in America causing average global temperature to rise? Are rising temperaturescausing people to eat more sugar? Both of these factors are rising but are they related by correlation, causation, orboth?
Correlation
We made a few discoveries in the previous sections:
• Average global temperature has been rising for the past several decades.
18

www.ck12.org Chapter 1. How Science Works
• Atmospheric carbon dioxide levels have been rising for the past several decades.• Carbon dioxide emissions into the atmosphere from fossil fuel burning have been rising for the past several
decades.
We see a correlation. A correlation is the mutual relationship between two or more things. CO2 emissions fromfossil fuel burning, atmospheric CO2 levels, and average global temperatures are all rising. They exhibit positivecorrelation because they are all going in the same direction. If one factor rises while another sinks they havenegative correlation.
Causation
But correlation does not necessarily indicate causation. To explain the difference, let’s look at an example. Sugarconsumption in the United States has also been rising for decades. This is positively correlated with rising averageglobal temperatures.
FIGURE 1.5American consumption of caloric sweet-eners (sugar), 1970-2009.
Is the rise in sugar consumption causing the rise in global temperatures or vice versa? While this isn’t impossible;it’s extremely unlikely. There’s no mechanism for one to increase the other. Here there is correlation, not causation.
Causation refers to the factor that is producing the effect. To establish causation we need to know how one wouldcause the other.
Here is a brief outline of the way an increase in CO2 can increase global temperatures. Climate change science isdealt with extensively in later concepts.
• Greenhouse gases in the atmosphere trap heat. This is natural and good.• CO2 is a greenhouse gas.• The more greenhouse gases there are in the atmosphere, the more heat can be trapped.• The more heat that’s trapped, the warmer average global temperatures are.
Because carbon dioxide is a greenhouse gas, increased atmospheric CO2 causes average global temperatures to rise.We found one cause for rising global temperatures. There are also others.
19

1.5. Correlation and Causation www.ck12.org
MEDIAClick image to the left or use the URL below.URL: https://www.ck12.org/flx/render/embeddedobject/185964
Summary
• Correlation is a comparison of two factors within a population. Correlation does not imply causation.• If one factor is responsible for the change in another factor, there is causation.• Establishing causation requires a mechanism to show how one factor can influence the other.• Burning fossil fuels releases CO2 into the atmosphere. That CO2 traps heat, which causes global temperatures
to rise.
Review
1. Compare and contrast correlation and causation.2. Sugar consumption has been rising in the U.S. for decades. Can you think of something this might be positively
correlated with? Can you think of something this might be negatively correlated with? Do you know if thesethings share causality?
3. Name at least two factors that are changing as a result of the increase in sugar consumption in the U.S. Is thiscorrelation or causation?
20

www.ck12.org Chapter 1. How Science Works
1.6 Observations and Experiments
Learning Objectives
• Explain how observations and experiments are used to answer scientific questions.
How do you test a hypothesis?
When you test a hypothesis, you must make observations or perform experiments. We could test the two hypothesesin the concept "Correlation and Causation" using the scientific literature because scientists who came before uscollected that data using scientific method. If the question was new we would need to do the testing ourselves. Howmight you do the testing yourself?
Testing Hypotheses
If we were doing a scientific investigation we need to gather the information to test the hypotheses ourselves. Wewould do this by making observations or running experiments.
Observations
Observations of Earth’s surface may be made from the land surface or from space. Many important observations aremade by orbiting satellites, which have a bird’s eye view of how the planet is changing (for example, see Figure1.6).
21

1.6. Observations and Experiments www.ck12.org
FIGURE 1.6This satellite image shows how the extentof glaciers in Glacier National Park haschanged in recent years.
Often, observation is used to collect data when it is not possible for practical or ethical reasons to perform experi-ments. Scientists may send devices to make observations for them when it is too dangerous or impractical for themto make the observations directly. They may use microscopes to explore tiny objects or telescopes to learn about theuniverse (see Figure 1.7).
FIGURE 1.7Artist’s concept of the Juno orbiter circlingJupiter. The mission is ongoing.
Experiments
Answering some questions requires experiments. An experiment is a test that may be performed in the field or in alaboratory. An experiment must always done under controlled conditions. The goal of an experiment is to verify orfalsify a hypothesis.
In an experiment, it is important to change only one factor. All other factors must be kept the same.
• Independent variable: The factor that will be manipulated.
22

www.ck12.org Chapter 1. How Science Works
• Dependent variable: The factors that depend on the independent variable.
An experiment must have a control group. The control group is not subjected to the independent variable. Forexample, if you want to test if Vitamin C prevents colds, you must divide your sample group up so that some receiveVitamin C and some do not. Those who do not receive the Vitamin C are the control group.
Experimental Error
Scientists often make many measurements during experiments. As in just about every human endeavor, errorsare unavoidable. In a scientific experiment, this is called experimental error. Systematic errors are part of theexperimental setup, so that the numbers are always skewed in one direction. For example, a scale may alwaysmeasure one-half of an ounce high. Random errors occur because a measurement is not made precisely. Forexample, a stopwatch may be stopped too soon or too late. To correct for this, many measurements are taken andthen averaged. Experiments always have a margin of error associated with them.
In an experiment, if a result is inconsistent with the results from other samples and many tests have been done, it islikely that a mistake was made in that experiment. The inconsistent data point can be thrown out.
MEDIAClick image to the left or use the URL below.URL: https://www.ck12.org/flx/render/embeddedobject/185965
Summary
• Testing a hypothesis requires data. Data can be gathered by observations or by experiments.• Observations can be done simply by looking at and measuring a phenomenon, or by using advanced technol-
ogy.• Experiments must be well-designed. They must be done under controlled conditions and with the manipulation
of only one variable.• Guidelines must be followed when dealing with possible experimental errors.
Review
1. Under what circumstances would a scientist test a hypothesis using observations?2. Under what circumstances would a scientist test a hypothesis using experiments?3. What is a control group in an experiment?4. What is the difference between an independent and a dependent variable in an experiment?5. An experiment is done on 90 people to test their vitamin D levels: 30 are given vitamin D tablets, 30 are told
to spend 15 minutes in the sun each day and 30 are kept inside and not given any supplements. What is thecontrol group? What is the dependent variable? What is the independent variable?
23

1.7. Theories www.ck12.org
1.7 Theories
Learning Objectives
• Define the terms theory and law as they are used in science.
Do you have a theory about this couple?
“My theory on why she doesn’t want to go out with him any more is that he won’t let her see her friends.” Whilethat might be why she doesn’t want to go out with him, the idea is not a theory. In common speech, the word theoryis often misused. It is sometimes misused when referring to scientific ideas as well. What would be a better word touse?
Theory
Scientists seek evidence that supports or refutes a hypothesis. If there is no significant evidence to refute thehypothesis and there is an enormous amount of evidence to support it, the idea is accepted. It may become atheory.
A scientific theory is strongly supported by many different lines of evidence. A theory has no major inconsistencies.A theory must be constantly tested and revised. A theory provides a model of reality that is simpler than thephenomenon itself. Scientists can use a theory to offer reliable explanations and make accurate predictions.
A theory can be revised or thrown out if conflicting data is discovered. However, a longstanding theory that has lotsof evidence to back it up is less likely to be overthrown than a newer theory. But science does not prove anythingbeyond a shadow of a doubt.
24

www.ck12.org Chapter 1. How Science Works
MEDIAClick image to the left or use the URL below.URL: https://www.ck12.org/flx/render/embeddedobject/152
Laws
Many people think that any idea that is completely accepted in science is a law. In science, a law is somethingthat always applies under the same conditions. If you hold something above the ground and let go it will fall. Thisphenomenon is recognized by the law of gravity. A law explains a simpler phenomenon or set of phenomena thandoes a theory. But a theory tells you why something happens and a law only tells you that it happens.
Amazingly, scientific laws may have exceptions. Even the law of gravity does not always hold! If water is in anenclosed space between a hillside and a glacier, the weight of the glacier at the bottom of the hill may force the waterto flow uphill - against gravity! That doesn’t mean that gravity is not a law. A law always applies under the rightcircumstances.
MEDIAClick image to the left or use the URL below.URL: https://www.ck12.org/flx/render/embeddedobject/185967
Summary
• In science, a theory is an explanation of a much more complex phenomenon than a law describes. A theorytells why something happens.
• A theory can be used to predict future events.• A law describes something that always happens under the same set of circumstances, but not why it happens.
But even laws do not always hold.
Review
1. Compare and contrast hypothesis, theory, and law.2. Can a theory become a law or a law become a theory? Can a hypothesis become a law or a theory?3. Which of these, if any, is more important in science: hypothesis, theory, or law?
25

1.7. Theories www.ck12.org
FIGURE 1.8The Leaning Tower of Pisa in Italy onlyappears to defy gravity.
Explore More
Use this resource to answer the questions that follow.
MEDIAClick image to the left or use the URL below.URL: https://www.ck12.org/flx/render/embeddedobject/176763
26

www.ck12.org Chapter 1. How Science Works
1. What does a scientific theory do?2. What does a scientific law describe?3. What is the relationship between theories and laws?4. Why are theories more useful than laws?5. Under what circumstances will a theory become a law?
27

1.8. Evolution, Plate Tectonics, and Climate Change www.ck12.org
1.8 Evolution, Plate Tectonics, and ClimateChange
Learning Objectives
• Describe the three essential theories of Earth science: the theory of evolution, the theory of plate tectonics,and the theory of climate change.
How do you know this isn’t what the world is like?
The natural world wouldn’t make much sense without the theories scientists have developed to explain the thingsthat happen or that we observe. Without science, we might think that the world was on the back of an elephant thatrested on a tortoise (an inquisitive person would then wonder what the tortoise is resting on). With science, we havetheories. Some are essential for earth science.
Three Essential Theories
Scientific theories are sometimes thrown out when the data shows them to be wrong. Before plate tectonics theorywas accepted, people thought that fossil organisms had spread around using land bridges. Although a land bridgeacross the Atlantic seemed a bit far-fetched, there was no better idea. Most scientists were relieved when they couldtoss that theory out.
28

www.ck12.org Chapter 1. How Science Works
But some theories account for so many phenomena and are so broadly supported by so many lines of evidence thatthey are unlikely ever to be disproved. Additional scientific evidence may reveal problems and scientists may needto modify the theories. But there is so much evidence to support them and nothing major to refute them that theyhave become essential to their fields of science.
The Theory of Evolution
Darwin’s theory of evolution has been under attack ever since Darwin proposed it. But nearly all biologists acceptthe theory and recognize that everything they learn about life on Earth supports the theory. Evolution is seen inthe fossil record, in the developmental paths of organisms, in the geographic distribution of organisms, and in thegenetic codes of living organisms. Evolution has a mechanism, called natural selection. People often refer to naturalselection as “the survival of the fittest.” With natural selection, the organism that is best adapted to its environmentwill be most likely to survive and produce offspring, thus spreading its genes to the next generation.
FIGURE 1.9The theory of evolution maintains that modern humans evolved from ape-like ancestors.
The Theory of Plate Tectonics
The theory of plate tectonics is the most important theory in much of earth science. Plate tectonics explains whymuch geological activity happens where it does, why many natural resources are found where they are, and can beused to determine what was happening long ago in Earth’s history. The theory of plate tectonics will be explored indetail in later concepts.
29

1.8. Evolution, Plate Tectonics, and Climate Change www.ck12.org
The Theory That Climate is Changing Due to Human Activities
The theory of climate change is a much newer theory than the previous two. We know that average global tempera-tures are rising. We even know why: Carbon dioxide is released into the atmosphere when fossil fuels are burned.Carbon dioxide is a greenhouse gas. In the atmosphere, greenhouse gases trap heat. This is like putting an extrablanket over Earth. Since more heat is being trapped, global temperature is rising.
There is very little information that contradicts the theory that climate is changing due in large part to humanactivities. Unless some major discrepancy is discovered about how the atmosphere works, the theory is very likelyto stand. So far, the evidence that is being collected supports the idea and global warming can be used to predictfuture events, which are already taking place. This idea will be explored in detail in later concepts.
Summary
• Since scientific ideas must be testable and falsifiable, theories are sometimes tested and shown to be wrong.• Many theories have held up against most tests over many decades. These theories may need to be modified
but they are solid at their core.• Three essential theories for Earth Science are the theory of evolution, the theory of plate tectonics, and the
theory that human activities are altering Earth’s climate.
Review
1. Scientists are reluctant to say that any theory is absolutely true. Why do you think that is?
2. What reasons do people have outside science to think that a theory is incorrect? Are these valid scientificarguments?
3. What are the three essential theories in Earth science as stated here?
Explore More
Use these resource to answer the questions that follow. Note that plate tectonics will be described in great detail incoming concepts.
MEDIAClick image to the left or use the URL below.URL: https://www.ck12.org/flx/render/embeddedobject/1438
1. Briefly explain the theory of evolution.2. Why is the evolution by natural selection called the unifying theory of biology?3. How many experiments have been done that show evolution not to be true?4. Is it likely that scientists will unearth something that will show the theory of evolution to be false?5. How does the process of evolution differ from the theory of evolution?
30

www.ck12.org Chapter 1. How Science Works
MEDIAClick image to the left or use the URL below.URL: https://www.ck12.org/flx/render/embeddedobject/1440
5. Briefly explain the theory of climate change as mentioned here.6. What evidence is there for this theory?7. Most people, including scientists, do not call this a theory. Why not? Do you think it should be called a theory?
Would calling it a theory saddle it with the same air of uncertainty that follows the theory of evolution?
31

1.9. Scientific Models www.ck12.org
1.9 Scientific Models
Learning Objectives
• Explain why scientists use models.• Explain the importance and uses of scientific models.
Why do scientists need models?
What does it mean when the newspaper reports the results of a scientist’s most recent climate modelling? Scientistswork with models when the system they are interested in studying is too complex, too remote, or too difficult to dealwith as a whole. Models are necessary in science, but it must always be remembered that they are models.
Models Are Useful Tools
Scientific models are useful tools in science. Earth’s climate is extremely complex, with many factors that aredependent on one another. Such a system is impossible for scientists to work with as a whole. To deal with suchcomplexity, scientists may create models to represent the system that they are interested in studying.
32

www.ck12.org Chapter 1. How Science Works
Scientists must validate their ideas by testing. A model can be manipulated and adjusted far more easily than a realsystem. Models help scientists understand, analyze, and make predictions about systems that would be impossibleto study as a whole. If a scientist wants to understand how rising CO2 levels will affect climate, it will be easier tomodel a smaller portion of that system. For example, he may model how higher levels of CO2 affect plant growthand the effect that will have on climate.
Models Can Be Used To Make Predictions
How can scientists know if a model designed to predict the future is likely to be accurate, since it may not be possibleto wait long enough to see if the prediction comes true? One way is to run the model using a time in the past as thestarting point see if the model can accurately predict the present. A model that can successfully predict the presentis more likely to be accurate when predicting the future.
Many models are created on computers because only computers can handle and manipulate such enormous amountsof data. For example, climate models are very useful for trying to determine what types of changes we can expect asthe composition of the atmosphere changes. A reasonably accurate climate model would be impossible on anythingother than the most powerful computers.
Models Have Limitations
Since models are simpler than real objects or systems, they have limitations. A model deals with only a portion of asystem. It may not predict the behavior of the real system very accurately. But the more computing power that goesinto the model and the care with which the scientists construct the model can increase the chances that a model willbe accurate.
Types of Models
• Physical models are smaller and simpler representations of the thing being studied. A globe or a map is aphysical model of a portion or all of Earth.
• Conceptual models tie together many ideas to explain a phenomenon or event.• Mathematical models are sets of equations that take into account many factors to represent a phenomenon.
Mathematical models are usually done on computers.
MEDIAClick image to the left or use the URL below.URL: https://www.ck12.org/flx/render/embeddedobject/185978
MEDIAClick image to the left or use the URL below.URL: https://www.ck12.org/flx/render/embeddedobject/185969
33

1.9. Scientific Models www.ck12.org
Summary
• A model is a representation of a more complex system. Models can be manipulated far more easily than thesystem they represent.
• Models can be used to make predictions.• Models may be physical, conceptual, or mathematical.
34

www.ck12.org Chapter 1. How Science Works
1.10 Scientific Community
Learning Objectives
• Explain how the scientific community self-regulates and supports research.
How does science monitor itself?
Computer hackers stole files and emails from the Climate Research Unit’s server. These messages were allegedto show that scientists had a conspiracy to promote the idea of global warming. Government and scientific bodiesinvestigated the charges and found no evidence of a conspiracy. Science is done with a great deal of quality controland nearly all allegations of scientific misconduct are found to be false.
Sharing Results
A hypothesis will not be fully accepted unless it is supported by the work of many scientists. Although a study maytake place in a single laboratory, a scientist must present her work to the community of scientists in her field.
Initially, she may present her data and conclusions at a scientific conference where she will talk with many otherscientists. Later, she will write a paper to be published in a scientific journal. After she submits the paper, severalscientists will review the paper - a process called peer review - to suggest further investigations or changes ininterpretation to make the paper stronger. The scientists will then recommend or deny the paper for publication.Once it is published, other scientists incorporate the results into their own research. If they cannot replicate herresults, her work will be thrown out!
Scientific ideas are advanced after many papers on a topic are published.
35

1.10. Scientific Community www.ck12.org
FIGURE 1.10Participants share their results at a scien-tific conference.
Scientific Integrity
There scientific community controls the quality and type of research that is done by project funding. Most scientificresearch is expensive, so scientists must write a proposal to a funding agency, such as the National Science Foun-dation or the National Aeronautics and Space Administration (NASA), to pay for equipment, supplies, and salaries.Scientific proposals are reviewed by other scientists in the field and are evaluated for funding. In many fields, thefunding rate is low and the money goes only to the most worthy research projects.
The scientific community monitors scientific integrity. During their training, students learn how to conduct goodscientific experiments. They learn not to fake, hide, or selectively report data, and they learn how to fairly evaluatedata and the work of other scientists. Scientists who do not have scientific integrity are strongly condemned by thescientific community.
Nothing is perfect, but considering all the scientific research that is done, there are few incidences of scientificdishonesty. Yet when they do occur, they are often reported with great vehemence by the media. Often this causesthe public to mistrust scientists in ways that are unwarranted.
MEDIAClick image to the left or use the URL below.URL: https://www.ck12.org/flx/render/embeddedobject/185971
MEDIAClick image to the left or use the URL below.URL: https://www.ck12.org/flx/render/embeddedobject/185973
36

www.ck12.org Chapter 1. How Science Works
Summary
• If science is done well, other scientists who replicate the same work will get the same results.• Scientists peer review a scientific paper before it is published to be sure the work was done using the scientific
method.• There are lots of controls in science, including oversight of the projects that get funded.• The checks and balances assure that nearly all scientists operate with a great deal of integrity.
Review
1. How does peer review work keep quality control high in scientific research?2. What happens if a scientist’s results cannot be replicated by other scientists?3. What procedures are present in science to insure scientific integrity?
Summary
Science is different from other types of information because scientists follow rigorous methods to learn about theworld. A scientific idea must be testable and falsifiable. Ideas that are not supported by observations and data arerevised or thrown out. The distinction between science and other ways of understanding the world is importantbecause scientific information has been obtained with much more rigor than ideas that are the result of opinion, gutfeelings, or faith. Scientists use the scientific method to answer questions about the natural world. The scientificmethod is not linear but takes on this basic structure: Ask a question, do background research, propose a hypothesis,test the hypothesis using data from observations and experiments, continue testing the hypothesis if it holds up orfind a new hypothesis if it does not, eventually create a theory. A theory is an explanation of a complicated set ofphenomena that fits virtually all of the available data. The theories of evolution, plate tectonics, and climate changeare crucial to understanding earth science.
37

1.11. References www.ck12.org
1.11 References
1. . . CC BY-NC2. Courtesy of NASA Goddard Institute for Space Studies. http://data.giss.nasa.gov/gistemp/graphs/Fig.A2.gif
. Public Domain3. Image copyright kaarsten, 2014;Courtesy of NASA Goddard Institute for Space Studies. http://www.shutterst
ock.com;http://data.giss.nasa.gov/gistemp/graphs/Fig.A2.gif . Used under license from Shutterstock.com;PublicDomain
4. Courtesy of NASA Goddard Institute for Space Studies. http://data.giss.nasa.gov/gistemp/graphs/Fig.A2.gif. Public Domain
5. Dr. Pieter Tans, NOAA/ESRL (www.esrl.noaa.gov/gmd/ccgg/trends/) and Dr. Ralph Keeling, Scripps Insti-tution of Oceanography (scrippsco2.ucsd.edu/);Image copyright frangipani, 2014. http://www.esrl.noaa.gov/gmd/ccgg/trends/;http://www.shutterstock.com . Public Domain;Used under license from Shutterstock.com
6. Dr. Pieter Tans, NOAA/ESRL (www.esrl.noaa.gov/gmd/ccgg/trends/) and Dr. Ralph Keeling, Scripps Institu-tion of Oceanography (scrippsco2.ucsd.edu/). http://www.esrl.noaa.gov/gmd/ccgg/trends/ . Public Domain
7. . . CC BY-NC8. . . CC BY-NC9. T.A. Boden, G. Marland, and R.J. Andres; courtesy of the Carbon Dioxide Information Analysis Center, Oak
Ridge National Laboratory, U.S. Department of Energy. http://cdiac.ornl.gov/trends/emis/glo.html . PublicDomain
10. . . CC BY-NC11. USDA, Economic Research Service (data); Tim Huth (plot). http://www.ers.usda.gov/Data/FoodConsumption
/FoodAvailSpreadsheets.htm#sweets . Public Domain12. . . CC BY-NC13. Courtesy of Robert Simmon, NASA’s Earth Observatory, using ALI data from the EO-1 team and Global Land
Ice Measurements from Space. http://earthobservatory.nasa.gov/IOTD/view.php?id=43942 . Public Domain14. Courtesy of NASA/JPL. http://commons.wikimedia.org/wiki/File:Juno_Mission_to_Jupiter_%282010_Artis
t%27s_Concept%29.jpg . Public Domain15. . . CC BY-NC16. Sébastien Bertrand. http://www.flickr.com/photos/tiseb/29703429/ . CC BY 2.017. Takumi Tsutaya (Flickr:tsutatsuta). http://www.flickr.com/photos/45757941@N05/6290455979/ . CC BY-
NC18. Takumi Tsutaya (Flickr:tsutatsuta). http://www.flickr.com/photos/45757941@N05/6290455979/ . CC BY
2.019. . . CC BY-NC20. Flickr:ThinkGeoEnergy. http://www.flickr.com/photos/thinkgeoenergy/8073507285/ . CC BY 2.021. Flickr:ThinkGeoEnergy. http://www.flickr.com/photos/thinkgeoenergy/8073507285/ . CC BY 2.0
38

www.ck12.org Chapter 2. What is Biology?
CHAPTER 2 What is Biology?Chapter Outline
2.1 BIOLOGY: THE STUDY OF LIFE
2.2 REFERENCES
Is this picture a colorful work of abstract art, or is it something else? Imagine shrinking down to a tiny size, so smallyou could enter a blood vessel. This illustration shows what you might see rushing toward you. Do you know whatthe red objects are? If you guessed red blood cells, you are right. What about the knobby green objects? Watch outfor these! They are viruses that have invaded the blood. However, this image is not scale, in reality viruses are muchsmaller in relationship to the red blood cells pictured here.
When you read this book, you will take an exciting journey into the realm of blood cells, viruses, and just abouteverything else that is related to life. You will learn how your own body works, what makes living things unique,and what you and viruses have in common. This first chapter explains how scientists learn about the natural worldand introduces you to biology, the science of life.Image copyright K jpargeter, 2014. www.shutterstock.com. Used under license f rom Shutterstock.com.
39

2.1. Biology: The Study of Life www.ck12.org
2.1 Biology: The Study of Life
Lesson Objectives
• List the characteristics of all living things.• State four unifying principles of biology.• Describe how living things interact.• Explain how life on Earth evolves.
Vocabulary
• adaptation• biodiversity• biology• biome• biosphere• cell• cell theory• community• competition• ecosystem• evolution• gene theory• homeostasis• natural selection• organ• organ system• organism• population• reproduction• symbiosis• tissue
Introduction
In this book, you will learn about one particular branch of science, the branch called biology. Biology is the scienceof life. Do you know what life is? Can you define it? Watch http://vimeo.com/15407847 to begin your journey intothe study of life.
40

www.ck12.org Chapter 2. What is Biology?
Characteristics of Life
Look at the duck decoy in Figure 2.1. It looks very similar to a real duck. Of course, real ducks are living things.What about the decoy duck? It looks like a duck, but it is actually made of wood. The decoy duck doesn’t have allthe characteristics of a living thing. What characteristics set the real ducks apart from the decoy duck? What are thecharacteristics of living things?
FIGURE 2.1This duck decoy looks like it’s alive. It even fools real ducks. Why isn’t it aliving thing?
To be classified as a living thing, an object must have all six of the following characteristics:
1. It responds to the environment.2. It grows and develops.3. It produces offspring.4. It maintains homeostasis.5. It has complex chemistry.6. It consists of cells.
Response to the Environment
All living things detect changes in their environment and respond to them. What happens if you step on a rock?Nothing; the rock doesn’t respond because it isn’t alive. But what if you think you are stepping on a rock andactually step on a turtle shell? The turtle is likely to respond by moving—it may even snap at you!
Growth and Development
All living things grow and develop. For example, a plant seed may look like a lifeless pebble, but under the rightconditions it will grow and develop into a plant. Animals also grow and develop. Look at the animals in Figure 2.2.How will the tadpoles change as they grow and develop into adult frogs?
Reproduction
All living things are capable of reproduction. Reproduction is the process by which living things give rise tooffspring. Reproducing may be as simple as a single cell dividing to form two daughter cells. Generally, however,it is much more complicated. Nonetheless, whether a living thing is a huge whale or a microscopic bacterium, it iscapable of reproduction.
41

2.1. Biology: The Study of Life www.ck12.org
FIGURE 2.2Tadpoles go through many changes tobecome adult frogs.
Keeping Things Constant
All living things are able to maintain a more-or-less constant internal environment. They keep things relatively stableon the inside regardless of the conditions around them. The process of maintaining a stable internal environmentis called homeostasis. Human beings, for example, maintain a stable internal body temperature. If you go outsidewhen the air temperature is below freezing, your body doesn’t freeze. Instead, by shivering and other means, itmaintains a stable internal temperature.
Complex Chemistry
All living things—even the simplest life forms—have complex chemistry. Living things consist of large, complexmolecules, and they also undergo many complicated chemical changes to stay alive. Complex chemistry is neededto carry out all the functions of life.
Cells
All forms of life are built of cells. A cell is the basic unit of the structure and function of living things. Living thingsmay appear very different from one another on the outside, but their cells are very similar. Compare the human cellsand onion cells in Figure 2.3. How are they similar? If you click on the animation titled Inside a Cell at the linkbelow, you can look inside a cell and see its internal structures. http://bio-alive.com/animations/cell-biology.htm
Unifying Principles of Biology
Four unifying principles form the basis of biology. Whether biologists are interested in ancient life, the life ofbacteria, or how humans could live on the moon, they base their overall understanding of biology on these fourprinciples:
1. cell theory
42

www.ck12.org Chapter 2. What is Biology?
FIGURE 2.3A representation of human cells (left) and onion cells (right). If you looked at human and onion cells under amicroscope, this is what you might see.
2. gene theory3. homeostasis4. evolution
The Cell Theory
According to the cell theory, all living things are made up of cells, and living cells always come from other livingcells. In fact, each living thing begins life as a single cell. Some living things, such as bacteria, remain single-celled.Other living things, including plants and animals, grow and develop into many cells. Your own body is made up ofan amazing 100 trillion cells! But even you—like all other living things—began life as a single cell. More of thecell theory will be discussed in a later chapter.
The Gene Theory
The gene theory is the idea that the characteristics of living things are controlled by genes, which are passed fromparents to their offspring. Genes are located on larger structures, called chromosomes, that are found inside everycell. Chromosomes, in turn, contain large molecules known as DNA (deoxyribonucleic acid). Molecules of DNA areencoded with instructions that tell cells what to do. To see how this happens, click on the animation titled Journeyinto DNA at the link below. http://www.pbs.org/wgbh/nova/genome/dna.html
Homeostasis
Homeostasis, or keeping things constant, is not just a characteristic of living things. It also applies to nature as awhole. Consider the concentration of oxygen in Earth’s atmosphere. Oxygen makes up 21% of the atmosphere, andthis concentration is fairly constant. What keeps the concentration of oxygen constant? The answer is living things.
43

2.1. Biology: The Study of Life www.ck12.org
Most living things need oxygen to survive, and when they breathe, they remove oxygen from the atmosphere. On theother hand, many living things, including plants, give off oxygen when they make food, and this adds oxygen to theatmosphere. The concentration of oxygen in the atmosphere is maintained mainly by the balance between these twoprocesses. A quick overview of homeostasis can be viewed at http://www.youtube.com/watch?v=DFyt7FJn-UM .
Evolution
Evolution is a change in the characteristics of living things over time. Evolution occurs by a process called naturalselection. In natural selection, some living things produce more offspring than others, so they pass more genes tothe next generation than others do. Over many generations, this can lead to major changes in the characteristics ofliving things. Evolution explains how living things are changing today and how modern living things have descendedfrom ancient life forms that no longer exist on Earth.
As living things evolve, they generally become better suited for their environment. This is because they evolveadaptations. An adaptation is a characteristic that helps a living thing survive and reproduce in a given environment.Look at the mole in Figure 2.4. It has tentacles around its nose that it uses to sense things by touch. The mole livesunderground in the soil where it is always dark. However, by using its touch organ, it can detect even tiny fooditems in the soil in total darkness. The touch organ is an adaptation because it helps the mole survive in its dark,underground environment.
FIGURE 2.4This mole uses its star-shaped nose organ to sense food by touch in thedark. The mole’s very large front claws are also an adaptation for its life inthe soil. Can you explain why?
Interdependence of Living Things
All living things depend on their environment to supply them with what they need, including food, water, and shelter.Their environment consists of physical factors—such as soil, air, and temperature—and also of other organisms. Anorganism is an individual living thing. Many living things interact with other organisms in their environment. Infact, they may need other organisms in order to survive. For example, living things that cannot make their own foodmust eat other organisms for food. Other interactions between living things include symbiosis and competition.
Symbiosis
Symbiosis is a close relationship between organisms of different species in which at least one of the organismsbenefits. The other organism may also benefit, or it may be unaffected or harmed by the relationship. Figure 2.5shows an example of symbiosis. The birds in the picture are able to pick out food from the fur of the deer. The deerwon’t eat the birds. In fact, the deer knowingly lets the birds rest on it. What, if anything, do you think the deer getsout of the relationship?
44

www.ck12.org Chapter 2. What is Biology?
FIGURE 2.5A flock of starlings looks out, before searching for parasites on a red deerstag.
Competition
Competition is a relationship between living things that depend on the same resources. The resources may be food,water, or anything else they both need. Competition occurs whenever they both try to get the same resources in thesame place and at the same time. The two organisms are likely to come into conflict, and the organism with betteradaptations may win out over the other organism.
Levels of Organization
The living world can be organized into different levels. For example, many individual organisms can be organizedinto the following levels:
• Cell: basic unit of all living things• Tissue: group of cells of the same kind• Organ: structure composed of one or more types of tissues• Organ system: group of organs that work together to do a certain job• Organism: individual living thing that may be made up of one or more organ systems
Examples of these levels of organization are shown in Figure 2.6.
FIGURE 2.6An individual mouse is made up of severalorgan systems. The system shown hereis the digestive system, which breaksdown food to a form that cells can use.One of the organs of the digestive systemis the stomach. The stomach, in turn,consists of different types of tissues. Eachtype of tissue is made up of cells of thesame type.
There are also levels of organization above the individual organism. These levels are illustrated in Figure 2.7.
45

2.1. Biology: The Study of Life www.ck12.org
• Organisms of the same species that live in the same area make up a population. For example, all of thegoldfish living in the same area make up a goldfish population.
• All of the populations that live in the same area make up a community. The community that includes thegoldfish population also includes the populations of other fish, coral and other organisms.
• An ecosystem consists of all the living things in a given area, together with the nonliving environment. Thenonliving environment includes water, sunlight, and other physical factors.
• A group of similar ecosystems with the same general type of physical environment is called a biome.• The biosphere is the part of Earth where all life exists, including all the land, water, and air where living
things can be found. The biosphere consists of many different biomes.
FIGURE 2.7This picture shows the levels of organization in nature, from the individual organism to the biosphere.
46

www.ck12.org Chapter 2. What is Biology?
Diversity of Life
Life on Earth is very diverse. The diversity of living things is called biodiversity. A measure of Earth’s biodiversityis the number of different species of organisms that live on Earth. At least 10 million different species live on Earthtoday. They are commonly grouped into six different kingdoms. Examples of organisms within each kingdom areshown in Figure 2.8.
FIGURE 2.8Diversity of life from Archaebacteria toPlants and Animals.
Evolution of Life
The diversity of life on Earth today is the result of evolution. Life began on Earth at least 4 billion years ago, and ithas been evolving ever since. At first, all living things on Earth were simple, single-celled organisms. Much later,the first multicellular organisms evolved, and after that, Earth’s biodiversity greatly increased. Figure 2.9 shows atimeline of the history of life on Earth. You can also find an interactive timeline of the history of life at the linkbelow. http://www.johnkyrk.com/evolution.html
Today, scientists accept the evolution of life on Earth as a fact. There is too much evidence supporting evolution todoubt it. However, that wasn’t always the case. An introduction to evolution and natural selection can be viewed athttp://www.youtube.com/watch?v=GcjgWov7mTM .
MEDIAClick image to the left or use the URL below.URL: https://www.ck12.org/flx/render/embeddedobject/156
47

2.1. Biology: The Study of Life www.ck12.org
FIGURE 2.9This timeline shows the history of life on Earth. In the entire span of the time, humans are a relatively newaddition.
Darwin and the Theory of Evolution
The idea of evolution has been around for centuries. In fact, it goes all the way back to the ancient Greek philosopherAristotle. However, evolution is most often associated with Charles Darwin. Darwin published a book on evolutionin 1869 titled On the Origin of Species. In the book, Darwin stated the theory of evolution by natural selection. Healso presented a great deal of evidence that evolution occurs.
Despite all the evidence Darwin presented, his theory was not well-received at first. Many people found it hardto accept the idea that humans had evolved from an ape-like ancestor, and they saw evolution as a challenge totheir religious beliefs. Look at the cartoon in Figure 2.10. Drawn in 1871, it depicts Darwin himself as an ape.The cartoon reflects how many people felt about Darwin and his theory during his own time. Darwin had actuallyexpected this type of reaction to his theory and had waited a long time before publishing his book for this reason.It was only when another scientist, named Alfred Wallace, developed essentially the same theory of evolution thatDarwin put his book into print.
Although Darwin presented a great deal of evidence for evolution in his book, he was unable to explain how evolution
48

www.ck12.org Chapter 2. What is Biology?
FIGURE 2.10Charles Darwin’s name is linked with the theory of evolution. This cartoonfrom the 1870s makes fun of both Darwin and his theory.
occurs. That’s because he knew nothing about genes. As a result, he didn’t know how characteristics are passedfrom parents to offspring, let alone how they could change over time.
Evolutionary Theory After Darwin
Since Darwin’s time, scientists have gathered even more evidence to support the theory of evolution. Some of theevidence comes from fossils, and some comes from studies that show how similar living things are to one another.By the 1930s, scientists had also learned about genes. As a result, they could finally explain how characteristics oforganisms could pass from one generation to the next and change over time.
Using modern technology, scientists can now directly compare the genes of living species. The more genes dif-ferent species share in common, the more closely related the species are presumed to be. Consider humans andchimpanzees. They share about 98% of their genes. This means that they shared a common ancestor in the not-too-distant past. This is just one of many pieces of evidence that show we are part of the evolution of life on Earth.
Misconceptions About Evolution
Today, evolution is still questioned by some people. Often, people who disagree with the theory of evolution do notreally understand it. For example, some people think that the theory of evolution explains how life on Earth firstbegan. In fact, the theory explains only how life changed after it first appeared. Some people think the theory ofevolution means that humans evolved from modern apes. In fact, humans and modern apes have a common ancestorthat lived several million years ago. These and other misconceptions about evolution contribute to the controversythat still surrounds this fundamental principle of biology.
Lesson Summary
• Living things are distinguished from nonliving things on the basis of six characteristics: response to theenvironment, growth and development, reproduction, homeostasis, complex chemistry, and cells.
• Four underlying principles form the basis of biology. They are cell theory, gene theory, homeostasis, andevolution.
• Many living things interact with one another in some way. The interactions are often necessary for theirsurvival.
49

2.1. Biology: The Study of Life www.ck12.org
• The great diversity of life on Earth today is the result of 4 billion years of evolution. During that time, livingthings evolved from simple, single-celled organisms to complex, multicellular life forms.
Lesson Review Questions
Recall
1. List the six characteristics of all living things.
2. Identify four unifying principles of modern biology.
3. Outline the levels of organization of a complex, multicellular organism such as a mouse, starting with the cell.
4. What is homeostasis? Give an example.
Apply Concepts
5. Describe examples of ways that you depend on other living things.
6. Assume that you found an object that looks like a dead twig. You wonder if it might be a stick insect. How couldyou determine if it is a living thing?
Think Critically
7. Compare and contrast symbiosis and competition.
8. Explain how a population differs from a community.
9. How is gene theory related to the theory of evolution?
Points to Consider
In this lesson, you learned that living things have complex chemistry.
• Do you know which chemicals make up living things?• All living things need energy to carry out the processes of life. Where do you think this energy comes from?
For example, where do you get the energy you need to get through your day?
50

www.ck12.org Chapter 2. What is Biology?
2.2 References
1. . . CC BY-NC2. Peter Shanks (Flickr:BotheredByBees). http://www.flickr.com/photos/botheredbybees/3152335109/ . CC
BY 2.03. Mariana Ruiz Villarreal (User:LadyofHats/Wikimedia Commons). http://commons.wikimedia.org/wiki/Fi
le:Greenfrog_life_stages.svg . Public Domain4. Human cells: Image copyright Sebastian Kaulitzki, 2014; Onion cells: Umberto Salvagnin. Human cells: htt
p://www.shutterstock.com; Onion cells: http://www.flickr.com/photos/kaibara/3839720754 . Human cells:Used under license from Shutterstock.com; Onion cells: CC BY 2.0
5. Flickr:gordonramsaysubmissions. http://www.flickr.com/photos/54397539@N06/5153972000/ . CC BY 2.06. Image copyright godrick, 2014. http://www.shutterstock.com . Used under license from Shutterstock.com7. Mariana Ruiz Villarreal (User:LadyofHats/Wikimedia Commons). http://commons.wikimedia.org/wiki/Fi
le:Organization_levels_mouse.svg . Public Domain8. Christopher Auyeung. CK-12 Foundation . CC BY-NC 3.09. Archaebacteria: NASA; Bacteria: De Wood and Chris Pooley/Agricultural Research Service, USDA; Protist:
Image copyright MichaelTaylor, 2014; Fungus: Tony Hisgett; Plant: Mauro Guanandi; Animal: úlfhams_-víkingur. Archaebacteria: http://commons.wikimedia.org/wiki/File:Halobacteria.jpg; Bacteria: http://commons.wikimedia.org/wiki/File:Campylobacter.jpg; Protist: http://www.shutterstock.com/; Fungus: http://www.flickr.com/photos/hisgett/4086503406/; Plant: http://www.flickr.com/photos/mauroguanandi/2194637211/; Animal: http://www.flickr.com/photos/24710622@N05/3230447306/ . Archaebacteria, Bacteria: Public Do-main; Protist: Used under license from Shutterstock.com; Fungus, Plant, Animal: CC BY 2.0
10. Mariana Ruiz Villarreal (User:LadyofHats/Wikimedia Commons). http://commons.wikimedia.org/wiki/File:Timeline_evolution_of_life.svg . Public Domain
11. . http://commons.wikimedia.org/wiki/File:Editorial_cartoon_depicting_Charles_Darwin_as_an_ape_%281871%29.jpg . Public Domain
51

www.ck12.org
CHAPTER 3 The Chemistry of LifeChapter Outline
3.1 ATOMS AND MOLECULES
3.2 CHEMICAL BONDS
3.3 MATTER AND ORGANIC COMPOUNDS
3.4 BIOCHEMICAL REACTIONS
3.5 WATER, ACIDS, AND BASES
3.6 REFERENCES
What do you see when you look at this picture? Is it just a mass of tangled ribbons? Look closely. It’s actually acomplex pattern of three-dimensional shapes. It represents the structure of a common chemical found inside livingcells. The chemical is a protein called hemoglobin. It is the protein in red blood cells which transports oxygenaround the body.
What are proteins? What other chemicals are found in living things? You will learn the answers to these questionsas you read about the chemistry of life.CK−12 Foundation, created f rom 1hkx.pdb (www.rcsb.org/pdb/explore/explore.do?structureId=1hkx) using UCSF Chimera. CC BY−NC 3.0.
52

www.ck12.org Chapter 3. The Chemistry of Life
3.1 Atoms and Molecules
Learning Objectives
• Describe atoms and isotopes.
What is your brain made of?
Everything you can see, touch, smell, feel, and taste is made of atoms. Atoms are the basic building-block of allmatter (including you and me, and everyone else you’ll ever meet), so if we want to know about what Earth is madeof, then we have to know a few things about these incredibly small objects.
Atoms
Everyday experience should convince you that matter is found in myriad forms, yet all the matter you have everseen is made of atoms, or atoms stuck together in configurations of dizzying complexity. A chemical element is a
53

3.1. Atoms and Molecules www.ck12.org
substance that cannot be made into a simpler form by ordinary chemical means. The smallest unit of a chemicalelement is an atom, and all atoms of a particular element are identical.
Parts of an Atom
There are two parts to an atom (Figure 3.1):
• At the center of an atom is a nucleus made up of two types of particles called protons and neutrons.
– Protons have a positive electrical charge. The number of protons in the nucleus determines what elementthe atom is.
– Neutrons are about the size of protons but have no charge.
• Electrons, much smaller than protons or neutrons, have a negative electrical charge, move at nearly the speedof light, and orbit the nucleus at exact distances, depending on their energy.
FIGURE 3.1Major parts of an atom. What chemicalelement is this? (Hint: 3 protons, 3electrons)
Atomic Mass
Because electrons are minuscule compared with protons and neutrons, the number of protons plus neutrons givesthe atom its atomic mass. All atoms of a given element always have the same number of protons, but may differ inthe number of neutrons found in the nucleus.
54

www.ck12.org Chapter 3. The Chemistry of Life
Isotopes
Atoms with the same number of protons of an element with differing numbers of neutrons are called isotopes. Forexample, carbon always has 6 protons but may have 6, 7, or 8 neutrons. This means there are three isotopes ofcarbon: carbon-12, carbon-13, and carbon-14, however, carbon-12 is by far the most abundant.
Ions
Atoms are stable when they have a full outermost electron energy level. To fill its outermost shell, an atom will give,take, or share electrons. When an atom either gains or loses electrons, this creates an ion. Ions have either a positiveor a negative electrical charge. What is the charge of an ion if the atom loses an electron? An atom with the samenumber of protons and electrons has no overall charge, so if an atom loses the negatively charged electron, it has apositive charge. What is the charge of an ion if the atom gains an electron? If the atom gains an electron, it has anegative charge.
Molecules
In the previous section we said that many atoms are more stable when they have a net charge: they are more stableas ions. When a cation gets close to an anion, they link up because of their different net charges — positive chargesattract negative charges and vice versa. When two or more atoms link up, they create a molecule. A molecule ofwater is made of two atoms of hydrogen (H) and one atom of oxygen (O). The molecular mass is the sum of themasses of all the atoms in the molecule. A collection of molecules is called a compound.
MEDIAClick image to the left or use the URL below.URL: https://www.ck12.org/flx/render/embeddedobject/186008
Summary
• An atom has negatively-charged electrons in orbit around its nucleus, which is composed of positively-chargedprotons and neutrons, which have no charge.
• Isotopes of an element must have a given number of protons but may have variety of numbers of neutrons.• An atom that gains or loses electrons is an ion.
Review
1. If an atom has 8 protons, 8 neutrons, and 8 electrons and then loses an electron, what is it? What is its charge?2. What charge(s) does an ion have, positive, negative, or neutral?3. What is a molecule made of and what is its molecular mass?
55

3.1. Atoms and Molecules www.ck12.org
Explore More
Use the resource below to answer the questions that follow.
MEDIAClick image to the left or use the URL below.URL: https://www.ck12.org/flx/render/embeddedobject/190173
1. What is found at the center of an atom?2. What makes up the nucleus?3. What is the charge on the nucleus?4. What is equal in neutral atoms?5. List the parts of an atom and identify the charge of each.
56

www.ck12.org Chapter 3. The Chemistry of Life
3.2 Chemical Bonds
Learning Objectives
• Explain how different types of chemical bonds form.
How do compounds stick together?
When you think of bonding, you may not think of ions. Like most of us, you probably think of bonding betweenpeople. Like people, molecules bond — and some bonds are stronger than others. It’s hard to break up a mother andbaby, or a molecule made up of one oxygen and two hydrogens!
Chemical Bonding
Ions come together to create a molecule so that electrical charges are balanced; the positive charges balance thenegative charges and the molecule has no electrical charge. To balance electrical charge, an atom may share itselectron with another atom, give it away, or receive an electron from another atom.
The joining of ions to make molecules is called chemical bonding. There are three main types of chemical bondsthat are important in our discussion of minerals and rocks:
• Ionic bond: Electrons are transferred between atoms. An ion will give one or more electrons to another ion.Table salt, sodium chloride (NaCl), is a common example of an ionic compound. Note that sodium is on theleft side of the periodic table and that chlorine is on the right side of the periodic table. In the Figure 3.3, anatom of lithium donates an electron to an atom of fluorine to form an ionic compound. The transfer of theelectron gives the lithium ion a net charge of +1, and the fluorine ion a net charge of -1. These ions bondbecause they experience an attractive force due to the difference in sign of their charges.
57

3.2. Chemical Bonds www.ck12.org
FIGURE 3.2Periodic Table of the Elements.
FIGURE 3.3Lithium (left) and fluorine (right) form anionic compound called lithium fluoride.
• Covalent bond : In a covalent bond, an atom shares one or more electrons with another atom.
In the picture of methane (CH4) below (Figure 3.4), the carbon ion (with a net charge of +4) shares a single electronfrom each of the the four hydrogens. Covalent bonding is prevalent in organic compounds. In fact, your body is heldtogether by electrons shared by carbons and hydrogens! Covalent bonds are also very strong, meaning it takes a lotof energy to break them apart.
• Hydrogen bond: These weak, intermolecular bonds are formed when the positive side of one polar moleculeis attracted to the negative side of another polar molecule.
58

www.ck12.org Chapter 3. The Chemistry of Life
FIGURE 3.4Methane is formed when four hydrogensand one carbon covalently bond.
Water is a classic example of a polar molecule because it has a slightly positive side, and a slightly negative side.In fact, this property is why water is so good at dissolving things. The positive side of the molecule is attracted tonegative ions and the negative side is attracted to positive ions.
FIGURE 3.5Water is a polar molecule. Because the oxygen atom has the electronsmost of the time, the hydrogen side (blue) of the molecule has a slightlypositive charge while the oxygen side (red) has a slightly negative charge.
Summary
• In an ionic bond, an atom gives away one or more electrons to another atom.• In a covalent bond, two atoms share one or more electrons.• A hydrogen bond is a relatively weak bond between two oppositely charged sides of two or more molecules.
Water is a polar molecule.
Review
1. How is a covalent bond different from an ionic bond?2. Why is a hydrogen bond a relatively weak bond?3. Diagram the polarity of a water molecule.
59

3.2. Chemical Bonds www.ck12.org
Explore More
Use this resource to answer the questions that follow.
MEDIAClick image to the left or use the URL below.URL: https://www.ck12.org/flx/render/embeddedobject/624
1. What is ionic bonding?2. How many valence electrons does sodium have? How many valence electrons does chlorine have?3. How does chlorine bond with sodium?4. What is the charge on a sodium ion? What about the chlorine ion?5. When does covalent bonding occur? How does it work?6. How many valence electrons does oxygen have?7. Why do oxygen and hydrogen bond so well?
60

www.ck12.org Chapter 3. The Chemistry of Life
3.3 Matter and Organic Compounds
Lesson Objectives
• Define elements and compounds.• Explain why carbon is essential to life on Earth.• Describe the structure and function of the four major types of organic compounds.
Vocabulary
• amino acid• carbohydrate• chemical bond• chemical reaction• complementary base pair• compound• DNA• double helix• element• lipid• matter• monosaccharide• nucleic acid• nucleotide• organic compound• polynucleotide• polypeptide• polysaccharide• protein• RNA• saturated fatty acid• unsaturated fatty acid
Introduction
If you look at your hand, what do you see? Of course, you see skin, which consists of cells. But what are skin cellsmade of? Like all living cells, they are made of matter. In fact, all things are made of matter. Matter is anythingthat takes up space and has mass. Matter, in turn, is made up of chemical substances. In this lesson you will learnabout the chemical substances that make up living things.
61

3.3. Matter and Organic Compounds www.ck12.org
Chemical Substances
A chemical substance is matter that has a definite composition. It also has the same composition throughout. Achemical substance may be either an element or a compound.
Elements
An element is a pure substance. It cannot be broken down into other types of substances. Each element is made upof just one type of atom. An atom is the smallest particle of an element that still has the properties of that element.
There are almost 120 known elements. As you can see from Figure 3.6, the majority of elements are metals.Examples of metals are iron (Fe) and copper (Cu). Metals are shiny and good conductors of electricity and heat.Nonmetal elements are far fewer in number. They include hydrogen (H) and oxygen (O). They lack the propertiesof metals.
FIGURE 3.6Periodic Table of the Elements. The periodic table of the elements arranges elements in groups based on theirproperties. The element most important to life is carbon (C). Find carbon in the table. What type of element is it,metal or nonmetal?
62

www.ck12.org Chapter 3. The Chemistry of Life
Compounds
A compound is a substance that consists of two or more elements. A compound has a unique composition that isalways the same. The smallest particle of a compound is called a molecule.
Consider water as an example. A molecule of water always contains one atom of oxygen and two atoms of hydrogen.The composition of water is expressed by the chemical formula H2O. A model of a water molecule is shown inFigure 3.7.
FIGURE 3.7Water Molecule. A water molecule always has this composition, one atomof oxygen and two atoms of hydrogen.
What causes the atoms of a water molecule to “stick” together? The answer is chemical bonds. A chemical bondis a force that holds molecules together. Chemical bonds form when substances react with one another. A chemicalreaction is a process that changes some chemical substances into others. A chemical reaction is needed to form acompound. Another chemical reaction is needed to separate the substances in a compound.
The Significance of Carbon
A compound found mainly in living things is known as an organic compound. Organic compounds make upthe cells and other structures of organisms and carry out life processes. Carbon is the main element in organiccompounds, so carbon is essential to life on Earth. Without carbon, life as we know it could not exist.
Why is carbon so basic to life? The reason is carbon’s ability to form stable bonds with many elements, includingitself. This property allows carbon to form a huge variety of very large and complex molecules. In fact, there arenearly 10 million carbon-based compounds in living things! However, the millions of organic compounds can begrouped into just four major types: carbohydrates, lipids, proteins, and nucleic acids. You can compare the fourtypes in Table 3.1. Each type is also described below.
TABLE 3.1: Types of Organic Compounds
Type of Compound Examples Elements Functions MonomerCarbohydrates sugars, starches carbon, hydrogen,
oxygenprovides energy tocells, stores energy,forms body struc-tures
monosaccharide
Lipids fats, oils carbon, hydrogen,oxygen
stores energy, formscell membranes,carries messages
63

3.3. Matter and Organic Compounds www.ck12.org
TABLE 3.1: (continued)
Type of Compound Examples Elements Functions MonomerProteins enzymes, antibodies carbon, hydrogen,
oxygen, nitrogen,sulfur
helps cells keeptheir shape,makes up muscles,speeds up chemicalreactions, carriesmessages andmaterials
amino acid
Nucleic Acids DNA, RNA carbon, hydrogen,oxygen, nitrogen,phosphorus
containsinstructions forproteins, passesinstructions fromparents to offspring,helps make proteins
nucleotide
Carbohydrates, proteins, and nucleic acids are large molecules (macromolecules) built from smaller molecules(monomers) through dehydration reactions. In a dehydration reaction, water is removed as two monomers are joinedtogether.
KQED: Energy From Carbon?
It may look like waste, but to some people it’s green power. Find out how California dairy farms and white tableclothrestaurants are taking their leftover waste and transforming it into clean energy. See From Waste To Watts: BiofuelBonanza at http://www.kqed.org/quest/television/from-waste-to-watts-biofuel-bonanza for further information.
Carbohydrates are the most common type of organic compound. A carbohydrate is an organic compound suchas sugar or starch, and is used to store energy. Like most organic compounds, carbohydrates are built of small,repeating units that form bonds with each other to make a larger molecule. In the case of carbohydrates, the smallrepeating units are called monosaccharides.
Monosaccharides
A monosaccharide is a simple sugar such as fructose or glucose. Fructose is found in fruits, whereas glucosegenerally results from the digestion of other carbohydrates. Glucose is used for energy by the cells of mostorganisms.
Polysaccharides
A polysaccharide is a complex carbohydrate that forms when simple sugars bind together in a chain. Polysaccha-rides may contain just a few simple sugars or thousands of them. Complex carbohydrates have two main functions:storing energy and forming structures of living things. Some examples of complex carbohydrates and their functionsare shown in Table 3.2. Which type of complex carbohydrate does your own body use to store energy?
TABLE 3.2: Complex Carbohydrates
Name Function Example
64

www.ck12.org Chapter 3. The Chemistry of Life
TABLE 3.2: (continued)
Name Function ExampleStarch Used by plants to store energy. A potato stores starch in under-
ground tubers.
Glycogen Used by animals to store energy. A human being stores glycogen inliver cells.
Cellulose Used by plants to form rigid wallsaround cells.
Plants use cellulose for their cellwalls.
Chitin Used by some animals to form anexternal skeleton.
A housefly uses chitin for its ex-oskeleton.
KQED: Biofuels: From Sugar to Energy
For years there’s been buzz - both positive and negative - about generating ethanol fuel from corn. But thanks torecent developments, the Bay Area of California is rapidly becoming a world center for the next generation of greenfuel alternatives. The Joint BioEnergy Institute is developing methods to isolate biofeuls from the sugars in cellulose.
MEDIAClick image to the left or use the URL below.URL: https://www.ck12.org/flx/render/embeddedobject/466
65

3.3. Matter and Organic Compounds www.ck12.org
Lipids
A lipid is an organic compound such as fat or oil. Organisms use lipids to store energy, but lipids have otherimportant roles as well. Lipids consist of repeating units called fatty acids. There are two types of fatty acids:saturated fatty acids and unsaturated fatty acids.
Saturated Fatty Acids
In saturated fatty acids, carbon atoms are bonded to as many hydrogen atoms as possible. This causes the moleculesto form straight chains, as shown in Figure 3.8. The straight chains can be packed together very tightly, allowingthem to store energy in a compact form. This explains why saturated fatty acids are solids at room temperature.Animals use saturated fatty acids to store energy.
FIGURE 3.8Fatty Acids. Saturated fatty acids have straight chains, like the three fatty acids shown on the left. Unsaturatedfatty acids have bent chains, like all the other fatty acids in the figure.
Unsaturated Fatty Acids
In unsaturated fatty acids, there is a double bond between adjacent carbon atoms that results in a bend or kink inthe molecule chain (see Figure 3.8). The bent chains cannot be packed together very tightly, so unsaturated fatty
66

www.ck12.org Chapter 3. The Chemistry of Life
acids are liquids at room temperature. Plants use unsaturated fatty acids to store energy. Some examples are shownin Figure 3.9.
FIGURE 3.9These plant products all contain unsatu-rated fatty acids.
Types of Lipids
Lipids may consist of fatty acids alone, or they may contain other molecules as well. For example, some lipidscontain alcohol or phosphate groups. They include
1. triglycerides: the main form of stored energy in animals2. phospholipids: the major components of cell membranes3. steroids: serve as chemical messengers and have other roles
Proteins
A protein is an organic compound made up of small molecules called amino acids. There are 20 different aminoacids commonly found in the proteins of living things. Small proteins may contain just a few hundred amino acids,whereas large proteins may contain thousands of amino acids.
Protein Structure
When amino acids bind together, they form a long chain called a polypeptide. A protein consists of one or morepolypeptide chains. A protein may have up to four levels of structure. The lowest level, a protein’s primary structure,is its sequence of amino acids. Higher levels of protein structure are described in Figure 3.10. The complexstructures of different proteins give them unique properties, which they need to carry out their various jobs in livingorganisms. You can learn more about protein structure by watching the animation at the link below. http://www.stolaf.edu/people/giannini/flashanimat/proteins/protein%20structure.swf
Functions of Proteins
Proteins play many important roles in living things. Some proteins help cells keep their shape, and some make upmuscle tissues. Many proteins speed up chemical reactions in cells. Other proteins are antibodies, which bind to
67

3.3. Matter and Organic Compounds www.ck12.org
FIGURE 3.10Protein Structure. The structure of aprotein starts with its sequence of aminoacids. What determines the secondarystructure of a protein? What are two typesof secondary protein structure?
foreign substances such as bacteria and target them for destruction. Still other proteins carry messages or materials.For example, human red blood cells contain a protein called hemoglobin, which binds with oxygen. Hemoglobinallows the blood to carry oxygen from the lungs to cells throughout the body. A model of the hemoglobin moleculeis shown in Figure 3.11.
FIGURE 3.11Hemoglobin Molecule. This model represents the protein hemoglobin.The purple part of the molecule contains iron. The iron binds with oxygenmolecules.
A short video describing protein function can be viewed at http://www.youtube.com/watch?v=T500B5yTy58 (4:02).
Nucleic Acids
A nucleic acid is an organic compound, such as DNA or RNA, that is built of small units called nucleotides. Manynucleotides bind together to form a chain called a polynucleotide. The nucleic acid DNA (deoxyribonucleic acid)consists of two polynucleotide chains. The nucleic acid RNA (ribonucleic acid) consists of just one polynucleotidechain.
An overview of DNA can be seen at http://www.youtube.com/watch?v=_-vZ_g7K6P0 (28:05).
68

www.ck12.org Chapter 3. The Chemistry of Life
MEDIAClick image to the left or use the URL below.URL: https://www.ck12.org/flx/render/embeddedobject/199
Structure of Nucleic Acids
Each nucleotide consists of three smaller molecules:
1. sugar2. phosphate group3. nitrogen base
If you look at Figure 3.12, you will see that the sugar of one nucleotide binds to the phosphate group of the nextnucleotide. These two molecules alternate to form the backbone of the nucleotide chain.
The nitrogen bases in a nucleic acid stick out from the backbone. There are four different types of bases: cytosine,adenine, guanine, and either thymine (in DNA) or uracil (in RNA). In DNA, bonds form between bases on the twonucleotide chains and hold the chains together. Each type of base binds with just one other type of base: cytosinealways binds with guanine, and adenine always binds with thymine. These pairs of bases are called complementarybase pairs.
The binding of complementary bases allows DNA molecules to take their well-known shape, called a double helix,which is shown in Figure 3.13. A double helix is like a spiral staircase. The double helix shape forms naturally andis very strong, making the two polynucleotide chains difficult to break apart. The structure of DNA will be furtherdiscussed in the chapter Molecular Genetics: From DNA to Proteins.
An animation of DNA structure can be viewed at http://www.youtube.com/watch?v=qy8dk5iS1f0 .
Roles of Nucleic Acids
DNA is found in genes, and its sequence of bases makes up a code. Between “starts” and “stops,” the code carriesinstructions for the correct sequence of amino acids in a protein (see Figure 3.13). RNA uses the information inDNA to assemble the correct amino acids and help make the protein. The information in DNA is passed from parentcells to daughter cells whenever cells divide. The information in DNA is also passed from parents to offspring whenorganisms reproduce. This is how inherited characteristics are passed from one generation to the next.
Lesson Summary
• Living things consist of matter, which can be an element or a compound. A compound consists of two or moreelements and forms as a result of a chemical reaction.
• Carbon’s unique ability to form chemical bonds allows it to form millions of different large, organic com-pounds. These compounds make up living things and carry out life processes.
69

3.3. Matter and Organic Compounds www.ck12.org
FIGURE 3.12Nucleic Acid. Sugars and phosphategroups form the backbone of a polynu-cleotide chain. Hydrogen bonds betweencomplementary bases hold two polynu-cleotide chains together.
FIGURE 3.13DNA Molecule. Hydrogen bonds betweencomplementary bases help form the dou-ble helix of a DNA molecule. The lettersA, T, G, and C stand for the bases ade-nine, thymine, guanine, and cytosine. Thesequence of these four bases in DNA is acode that carries instructions for makingproteins. Shown is a representation ofhow the double helix folds into a chromo-some.
70

www.ck12.org Chapter 3. The Chemistry of Life
• Carbohydrates are organic compounds such as sugars and starches. They provide energy and form structuressuch as cell walls.
• Lipids are organic compounds such as fats and oils. They store energy and help form cell membranes inaddition to having other functions in organisms.
• Proteins are organic compounds made up of amino acids. They form muscles, speed up chemical reactions,and perform many other cellular functions.
• Nucleic acids are organic compounds that include DNA and RNA. DNA contains genetic instructions forproteins, and RNA helps assemble the proteins.
Lesson Review Questions
Recall
1. What are elements and compounds? Give an example of each.
2. List the four major types of organic compounds.
3. What determines the primary structure of a protein?
4. State two functions of proteins.
5. Identify the three parts of a nucleotide.
Apply Concepts
6. Butter is a fat that is a solid at room temperature. What type of fatty acids does butter contain? How do youknow?
7. Assume that you are trying to identify an unknown organic molecule. It contains only carbon, hydrogen, andoxygen and is found in the cell walls of a newly discovered plant species. What type of organic compound is it?
Think Critically
8. Explain why carbon is essential to all known life on Earth.
9. Compare and contrast the structures and functions of simple sugars and complex carbohydrates.
10. Explain why molecules of saturated and unsaturated fatty acids have different shapes.
Further Reading / Supplemental Links
• James D. Watson, The Double Helix: A Personal Account of the Discovery of DNA. Touchstone, 2001.• The Chemistry of Biology: http://www.infoplease.com/cig/biology/organic-chemistry.html
Points to Consider
Large organic compounds consist of many smaller units that are linked together in chains.
71

3.3. Matter and Organic Compounds www.ck12.org
• How can the smaller units become linked together? What process do you think is involved?• What do you think holds the smaller units together in a chain?
72

www.ck12.org Chapter 3. The Chemistry of Life
3.4 Biochemical Reactions
Lesson Objectives
• Describe what happens in chemical reactions.• State the role of energy in chemical reactions.• Explain the importance of enzymes to living organisms.
Vocabulary
• activation energy• anabolic reaction• biochemical reaction• catabolic reaction• endothermic reaction• enzyme• exothermic reaction• metabolism• product• reactant
Introduction
The element chlorine (Cl) is a greenish poison. Would you eat chlorine? Of course not, but you often eat a compoundcontaining chlorine. In fact, you probably eat this chlorine compound just about every day. Do you know what itis? It’s table salt. Table salt is sodium chloride (NaCl), which forms when chlorine and sodium (Na) combine incertain proportions. How does chlorine, a toxic green chemical, change into harmless white table salt? It happens ina chemical reaction.
What Are Chemical Reactions?
A chemical reaction is a process that changes some chemical substances into others. A substance that starts achemical reaction is called a reactant, and a substance that forms as a result of a chemical reaction is called aproduct. During a chemical reaction, the reactants are used up to create the products.
An example of a chemical reaction is the burning of methane, which is shown in Figure 3.14. In this chemicalreaction, the reactants are methane (CH4) and oxygen (O2), and the products are carbon dioxide (CO2) and water(H2O). A chemical reaction involves the breaking and forming of chemical bonds. When methane burns, bondsbreak in the methane and oxygen molecules, and new bonds form in the molecules of carbon dioxide and water.
73

3.4. Biochemical Reactions www.ck12.org
FIGURE 3.14Methane Burning. When methane burns,it combines with oxygen. What are theproducts of this chemical reaction?
Chemical Equations
A chemical reaction can be represented by a chemical equation. For example, the burning of methane can berepresented by the chemical equation:
CH4 + 2O2→ CO2 + 2H2O
The arrow in a chemical equation separates the reactants from the products and shows the direction in which thereaction proceeds. If the reaction could occur in the opposite direction as well, two arrows pointing in oppositedirections would be used. The number 2 in front of O2 and H2O shows that two oxygen molecules and twowater molecules are involved in the reaction. (With no number in front of a chemical symbol, just one moleculeis involved.)
Conservation of Matter
In a chemical reaction, the quantity of each element does not change; there is the same amount of each element inthe products as there was in the reactants. This is because matter is always conserved. The conservation of matter isreflected in a reaction’s chemical equation. The same number of atoms of each element appears on each side of thearrow. For example, in the chemical equation above, there are four hydrogen atoms on each side of the arrow. Canyou find all four of them on each side of this equation?
Chemical Reactions and Energy
Chemical reactions always involve energy. When methane burns, for example, it releases energy in the form of heatand light. Other chemical reactions absorb energy rather than release it.
74

www.ck12.org Chapter 3. The Chemistry of Life
Exothermic Reactions
A chemical reaction that releases energy (as heat) is called an exothermic reaction. This type of reaction can berepresented by a general chemical equation:
Reactants→ Products + Heat
In addition to methane burning, another example of an exothermic reaction is chlorine combining with sodium toform table salt. This reaction also releases energy.
Endothermic Reactions
A chemical reaction that absorbs energy is called an endothermic reaction. This type of reaction can also berepresented by a general chemical equation:
Reactants + Heat→ Products
Did you ever use a chemical cold pack like the one in Figure 3.15? The pack cools down because of an endothermicreaction. When a tube inside the pack is broken, it releases a chemical that reacts with water inside the pack. Thisreaction absorbs heat energy and quickly cools down the pack.
FIGURE 3.15This pack gets cold due to an endothermic reaction.
Activation Energy
All chemical reactions need energy to get started. Even reactions that release energy need a boost of energy in orderto begin. The energy needed to start a chemical reaction is called activation energy. Activation energy is like thepush a child needs to start going down a playground slide. The push gives the child enough energy to start moving,but once she starts, she keeps moving without being pushed again. Activation energy is illustrated in Figure 3.16.
Why do all chemical reactions need energy to get started? In order for reactions to begin, reactant molecules mustbump into each other, so they must be moving, and movement requires energy. When reactant molecules bumptogether, they may repel each other because of intermolecular forces pushing them apart. Overcoming these forcesso the molecules can come together and react also takes energy.
An overview of activation energy can be viewed at http://www.youtube.com/watch?v=VbIaK6PLrRM (1:16).
75

3.4. Biochemical Reactions www.ck12.org
FIGURE 3.16Activation Energy. Activation energy pro-vides the “push” needed to start a chem-ical reaction. Is the chemical reaction inthis figure an exothermic or endothermicreaction?
Biochemical Reactions and Enzymes
Biochemical reactions are chemical reactions that take place inside the cells of living things. The field of biochem-istry demonstrates that knowledge of chemistry as well as biology is needed to understand fully the life processes oforganisms at the level of the cell. The sum of all the biochemical reactions in an organism is called metabolism. Itincludes both exothermic and endothermic reactions.
Types of Biochemical Reactions
Exothermic reactions in organisms are called catabolic reactions. These reactions break down molecules intosmaller units and release energy. An example of a catabolic reaction is the breakdown of glucose, which releasesenergy that cells need to carry out life processes. Endothermic reactions in organisms are called anabolic reactions.These reactions build up bigger molecules from smaller ones. An example of an anabolic reaction is the joining ofamino acids to form a protein. Which type of reactions—catabolic or anabolic—do you think occur when your bodydigests food?
Enzymes
Most biochemical reactions in organisms need help in order to take place. Why is this the case? For one thing,temperatures are usually too low inside living things for biochemical reactions to occur quickly enough to maintainlife. The concentrations of reactants may also be too low for them to come together and react. Where do thebiochemical reactions get the help they need to proceed? The help comes from enzymes.
76

www.ck12.org Chapter 3. The Chemistry of Life
An enzyme is a protein that speeds up a biochemical reaction. An enzyme works by reducing the amount ofactivation energy needed to start the reaction. The graph in Figure 3.17 shows the activation energy needed forglucose to combine with oxygen. Less activation energy is needed when the correct enzyme is present than when itis not present. You can watch an animation of a biochemical reaction with and without an enzyme at the link below.This animation shows how the enzyme brings reactant molecules together so they can react: http://www.stolaf.edu/people/giannini/flashanimat/enzymes/prox-orien.swf .
An overview of enzymes can be viewed at http://www.youtube.com/watch?v=E90D4BmaVJM (9:43).
FIGURE 3.17Enzyme Action. This graph shows whathappens when glucose combines withoxygen. An enzyme speeds up the re-action by lowering the activation energy.Compare the activation energy neededwith and without the enzyme.
Enzymes are involved in most biochemical reactions, and they do their job extremely well. A typical biochemicalreaction could take several days to occur without an enzyme. With the proper enzyme, the same reaction can occurin just a split second! Without enzymes to speed up biochemical reactions, most organisms could not survive. Theactivities of enzymes depend on the temperature, ionic conditions, and the pH of the surroundings. Some enzymeswork best at acidic pHs, while others work best in neutral environments.
An animation of how enzymes work can be seen at http://www.youtube.com/watch?v=CZD5xsOKres (2:02).
Lesson Summary
• A chemical reaction is a process that changes some chemical substances into others. It involves breaking andforming chemical bonds.
• Some chemical reactions release energy, whereas other chemical reactions absorb energy. All chemicalreactions require activation energy to get started.
• Enzymes are needed to speed up biochemical reactions in organisms. They work by lowering activationenergy.
77

3.4. Biochemical Reactions www.ck12.org
Lesson Review Questions
Recall
1. Identify the roles of reactants and products in chemical reactions.
2. What is the general chemical equation for an endothermic reaction?
3. What are biochemical reactions? What is an example?
4. How do enzymes speed up biochemical reactions?
Apply Concepts
5. What is wrong with the chemical equation below? How could you fix it?
CH4 + O2 → CO2 + 2H2O
6. What type of reaction is represented by the following chemical equation? Explain your answer.
2Na + 2HCl→ 2NaCl + H2 + heat
Think Critically
7. How does a chemical equation show that matter is always conserved in a chemical reaction?
8. Why do all chemical reactions require activation energy?
9. Explain why organisms need enzymes to survive.
Points to Consider
Most chemical reactions in organisms take place in an environment that is mostly water.
• What do you know about water? How would you describe it?• Water behaves differently than most other substances. Do you know why?
78

www.ck12.org Chapter 3. The Chemistry of Life
3.5 Water, Acids, and Bases
Lesson Objectives
• Describe the distribution of Earth’s water.• Identify water’s structure and properties.• Define acids, bases, and pH.• Explain why water is essential for life.
Vocabulary
• acid• base• hydrogen bond• pH• polarity• solution
Introduction
Water, like carbon, has a special role in living things. It is needed by all known forms of life. As you have seen,water is a simple molecule, containing just three atoms. Nonetheless, water’s structure gives it unique properties thathelp explain why it is vital to all living organisms.
Water, Water Everywhere
Water is a common chemical substance on planet Earth. In fact, Earth is sometimes called the “water planet” becausealmost 75% of its surface is covered with water. If you look at Figure 3.18, you will see where Earth’s water is found.The term water generally refers to its liquid state, and water is a liquid over a wide range of temperatures on Earth.However, water also occurs on Earth as a solid (ice) and as a gas (water vapor).
Structure and Properties of Water
No doubt, you are already aware of some of the properties of water. For example, you probably know that water istasteless and odorless. You also probably know that water is transparent, which means that light can pass through it.This is important for organisms that live in the water, because some of them need sunlight to make food.
79

3.5. Water, Acids, and Bases www.ck12.org
FIGURE 3.18Most of the water on Earth consists ofsaltwater in the oceans. What percent ofEarth’s water is fresh water? Where ismost of the fresh water found?
Chemical Structure of Water
To understand some of water’s properties, you need to know more about its chemical structure. As you have seen,each molecule of water consists of one atom of oxygen and two atoms of hydrogen. The oxygen atom in a watermolecule attracts electrons more strongly than the hydrogen atoms do. As a result, the oxygen atom has a slightlynegative charge, and the hydrogen atoms have a slightly positive charge. A difference in electrical charge betweendifferent parts of the same molecule is called polarity. The diagram in Figure 3.19 shows water’s polarity.
Opposites attract when it comes to charged molecules. In the case of water, the positive (hydrogen) end of onewater molecule is attracted to the negative (oxygen) end of a nearby water molecule. Because of this attraction,weak bonds form between adjacent water molecules, as shown in Figure 3.20. The type of bond that forms betweenmolecules is called a hydrogen bond. Bonds between molecules are not as strong as bonds within molecules, but inwater they are strong enough to hold together nearby molecules.
Properties of Water
Hydrogen bonds between water molecules explain some of water’s properties. For example, hydrogen bonds explainwhy water molecules tend to stick together. Did you ever watch water drip from a leaky faucet or from a meltingicicle? If you did, then you know that water always falls in drops rather than as separate molecules. The dew dropsin Figure 3.21 are another example of water molecules sticking together.
Hydrogen bonds cause water to have a relatively high boiling point of 100°C (212°F). Because of its high boilingpoint, most water on Earth is in a liquid state rather than in a gaseous state. Water in its liquid state is needed by allliving things. Hydrogen bonds also cause water to expand when it freezes. This, in turn, causes ice to have a lowerdensity (mass/volume) than liquid water. The lower density of ice means that it floats on water. For example, in coldclimates, ice floats on top of the water in lakes. This allows lake animals such as fish to survive the winter by stayingin the water under the ice.
80

www.ck12.org Chapter 3. The Chemistry of Life
FIGURE 3.19Water Molecule. This diagram shows thepositive and negative parts of a watermolecule. It also depicts how a charge,such as on an ion (Na or Cl, for example)can interact with a water molecule.
FIGURE 3.20Hydrogen Bonding in Water Molecules.Hydrogen bonds form between nearbywater molecules. How do you think thismight affect water’s properties?
81

3.5. Water, Acids, and Bases www.ck12.org
FIGURE 3.21Droplets of Dew. Drops of dew cling to a spider web in this picture. Canyou think of other examples of water forming drops? (Hint: What happenswhen rain falls on a newly waxed car?)
Acids and Bases
Water is the main ingredient of many solutions. A solution is a mixture of two or more substances that has thesame composition throughout. Some solutions are acids and some are bases. To understand acids and bases, youneed to know more about pure water. In pure water (such as distilled water), a tiny fraction of water moleculesnaturally breaks down to form ions. An ion is an electrically charged atom or molecule. The breakdown of water isrepresented by the chemical equation
2 H2O→ H3O+ + OH−
The products of this reaction are a hydronium ion (H3O+) and a hydroxide ion (OH−). The hydroxide ion, which hasa negative charge, forms when a water molecule gives up a positively charged hydrogen ion (H+). The hydroniumion, which has positive charge, forms when another water molecule accepts the hydrogen ion.
Acidity and pH
The concentration of hydronium ions in a solution is known as acidity. In pure water, the concentration of hydroniumions is very low; only about 1 in 10 million water molecules naturally breaks down to form a hydronium ion. As aresult, pure water is essentially neutral. Acidity is measured on a scale called pH, as shown in Figure 3.22. Purewater has a pH of 7, so the point of neutrality on the pH scale is 7.
Acids
If a solution has a higher concentration of hydronium ions than pure water, it has a pH lower than 7. A solutionwith a pH lower than 7 is called an acid. As the hydronium ion concentration increases, the pH value decreases.Therefore, the more acidic a solution is, the lower its pH value is. Did you ever taste vinegar? Like other acids, ittastes sour. Stronger acids can be harmful to organisms. For example, stomach acid would eat through the stomachif it were not lined with a layer of mucus. Strong acids can also damage materials, even hard materials such as glass.
Bases
If a solution has a lower concentration of hydronium ions than pure water, it has a pH higher than 7. A solution witha pH higher than 7 is called a base. Bases, such as baking soda, have a bitter taste. Like strong acids, strong basescan harm organisms and damage materials. For example, lye can burn the skin, and bleach can remove the colorfrom clothing.
82

www.ck12.org Chapter 3. The Chemistry of Life
FIGURE 3.22Acidity and the pH Scale. Water has apH of 7, so this is the point of neutralityon the pH scale. Acids have a pH lessthan 7, and bases have a pH greater than7. The approximate pHs of numeroussubstances is shown.
Acids and Bases in Organisms
Acids and bases are important in living things because most enzymes can do their job only at a certain level ofacidity. Cells secrete acids and bases to maintain the proper pH for enzymes to work. For example, every timeyou digest food, acids and bases are at work in your digestive system. Consider the enzyme pepsin, which helpsbreak down proteins in the stomach. Pepsin needs an acidic environment to do its job, and the stomach secretes astrong acid that allows pepsin to work. However, when stomach contents enter the small intestine, the acid must beneutralized. This is because enzymes in the small intestine need a basic environment in order to work. An organ
83

3.5. Water, Acids, and Bases www.ck12.org
called the pancreas secretes a strong base into the small intestine, and this base neutralizes the acid.
Water and Life
The human body is about 70% water (not counting the water in body fat, which varies from person to person). Thebody needs all this water to function normally. Just why is so much water required by human beings and otherorganisms? Water can dissolve many substances that organisms need, and it is necessary for many biochemicalreactions. The examples below are among the most important biochemical processes that occur in living things, butthey are just two of many ways that water is involved in biochemical reactions.
• Photosynthesis—In this process, cells use the energy in sunlight to change carbon dioxide and water to glucoseand oxygen. The reactions of photosynthesis can be represented by the chemical equation:
6CO2 + 6H2O + Energy→ C6H12O6 + 6O2
• Cellular respiration—In this process, cells break down glucose in the presence of oxygen and release carbondioxide, water, and energy. The reactions of cellular respiration can be represented by the chemical equation:
C6H12O6 + 6O2 → 6CO2 + 6H2O + Energy
Water is involved in many other biochemical reactions. As a result, just about all life processes depend on water.Clearly, life as we know it could not exist without water.
Lesson Summary
• Most of Earth’s water is salt water in the oceans. Less than 3% is freshwater.• Water molecules are polar, so they form hydrogen bonds. This gives water unique properties, such as a
relatively high boiling point.• The extremely low hydronium ion concentration of pure water gives pure water a neutral pH of 7. Acids have
a pH lower than 7, and bases have a pH higher than 7.• Water is involved in most biochemical reactions. Therefore, water is essential to life.
Lesson Review Questions
Recall
1. Where is most of Earth’s water found?
2. What is polarity? Describe the polarity of water.
3. What is the pH of a neutral solution?
4. Describe an example of an acid or a base that is involved in human digestion.
84

www.ck12.org Chapter 3. The Chemistry of Life
Apply Concepts
5. Assume that you test an unknown solution and find that it has a pH of 7.2. What type of solution is it? How doyou know?
6. How could you demonstrate to a child that solid water is less dense than liquid water?
Think Critically
7. Explain how water’s polarity is related to its boiling point.
8. Explain why metabolism in organisms depends on water.
Points to Consider
Most biochemical reactions take place within cells. Cells are the microscopic building blocks of organisms.
• What do you think you would see if you could look inside the cell of an organism? What structures do youthink you might observe?
• What biochemical processes might be occurring?
For Table 3.2, from top to bottom:
• Courtesy of the United States Department of Agriculture. http://commons.wikimedia.org/wiki/File:Potatoes.jpg . Public Domain.
• Image copyright Convit, 2014. http://www.shutterstock.com . Used under license from Shutterstock.com.• Image copyright Jubal Harshaw, 2014. http://www.shutterstock.com . Used under license from Shutter-
stock.com.• Hafiz Issadeen (Flickr:YIM Hafiz). http://www.flickr.com/photos/yimhafiz/2547531809/ . CC BY 2.0.
85

3.6. References www.ck12.org
3.6 References
1. . . CC BY-NC2. Jodi So. CK-12 Foundation . CC BY-NC 3.03. Jodi So. CK-12 Foundation . CC BY-NC 3.04. Ben Mills (User:Benjah-bmm27/Wikimedia Commons). http://commons.wikimedia.org/wiki/File:Water-elp
ot-transparent-3D-balls.png . Public Domain5. User:Cepheus/Wikimedia Commons. http://commons.wikimedia.org/wiki/File:Periodic_table.svg . Public
Domain6. Laura Guerin. CK-12 Foundation;CK-12 . CC BY-NC 3.07. Laura Guerin. CK-12 Foundation . CC BY-NC 3.08. Ben Mills (User:Benjah-bmm27/Wikimedia Commons);Laura Guerin. http://commons.wikimedia.org/wik
i/File:Water-elpot-transparent-3D-balls.png;CK-12;CK-12 Foundation . Public Domain;CC BY-NC 3.09. Christopher Auyeung. CK-12 Foundation . CC BY-NC 3.0
10. Mariana Ruiz Villarreal (LadyofHats) for CK-12 Foundation. CK-12 Foundation . CC BY-NC 3.011. . . CC BY-NC12. . . CC BY-NC13. . . CC BY-NC14. . . CC BY-NC15. Mariana Ruiz Villarreal (LadyofHats) for CK-12 Foundation. CK-12 Foundation . CC BY-NC 3.016. Seeds: Lebensmittelfotos; Olives: Steve Jurvetson; Nuts: Petr Kratochvil. Seeds: http://pixabay.com/en
/barley-grain-cereals-whole-wheat-74247/; Olives: http://www.flickr.com/photos/jurvetson/454873761/; Nuts: http://www.publicdomainpictures.net/view-image.php?image=424&picture=nuts . Seeds: Public Domain;Olives: CC BY 2.0; Nuts: Public Domain
17. Hana Zavadska, based on image from the National Human Genome Research Institute. CK-12 Foundation .CC BY-NC 3.0
18. Image copyright ynse, 2014. http://www.shutterstock.com . Used under license from Shutterstock.com19. Mariana Ruiz Villarreal (LadyofHats) for CK-12. CK-12 Foundation . CC BY-NC 3.020. Mariana Ruiz Villarreal (LadyofHats) for CK-12. CK-12 Foundation . CC BY-NC 3.021. Image copyright Steven Paul Pepper, 2014. http://www.shutterstock.com . Used under license from Shutter-
stock.com22. Julie Magro (Flickr:aMichiganMom). http://www.flickr.com/photos/magro-family/4010361790/ . CC BY
2.023. Hana Zavadska. CK-12 Foundation . CC BY-NC 3.024. Hana Zavadska. CK-12 Foundation . CC BY-NC 3.025. Mariana Ruiz Villarreal (LadyofHats) for the CK-12 Foundation. CK-12 Foundation . CC BY-NC 3.026. Mariana Ruiz Villarreal (LadyofHats) for CK-12 Foundation. CK-12 Foundation . CC BY-NC 3.027. Jodi So. CK-12 Foundation . CC BY-NC 3.028. Flickr:devra. http://www.flickr.com/photos/minicooper93402/6181554829/ . CC BY 2.029. Hana Zavadska and Mariana Ruiz Villarreal (LadyofHats) for CK-12 Foundation. CK-12 Foundation . CC
BY-NC 3.0
86

www.ck12.org Chapter 4. Life: From the First Organism Onward
CHAPTER 4 Life: From the FirstOrganism Onward
Chapter Outline4.1 EVOLUTION OF SIMPLE CELLS
4.2 EARTH FORMS AND LIFE BEGINS
4.3 PRINCIPLES OF RELATIVE DATING
4.4 TYPES OF FOSSILIZATION
4.5 EXTINCTION AND RADIATION OF LIFE
4.6 THE EVOLUTION OF MULTICELLULAR LIFE
4.7 HUMAN EVOLUTION
4.8 CLASSIFICATION
4.9 REFERENCES
What alien planet is represented by this picture? Would it surprise you to learn that the picture represents Earth?After Earth first formed about 4.6 billion years ago, it may well have looked like this. Instead of rivers of water,rivers of molten rock flowed over its surface. Life as we know it could not have survived in such a place. How didthis fiery hot planet become today’s Earth, covered with water and teeming with life? The long and incredible storyof Earth’s history is told in this chapter.Image copyright Dariush M, 2014. www.shutterstock.com. Used under license f rom Shutterstock.com.
87

4.1. Evolution of Simple Cells www.ck12.org
4.1 Evolution of Simple Cells
Learning Objectives
• Identify and describe key developments in the evolution of early life on Earth.
88

www.ck12.org Chapter 4. Life: From the First Organism Onward
Who was the ancestor to us all (and I really mean us ALL)?
If we trace all the evolutionary lineages (humans, sponges, slime molds, etc.) back, at some point there would beone organism that is the ancestor to all of the others. This organism is referred to as LUCA, which stands for the"Last Universal Common Ancestor." LUCA lived 3.5 to 3.8 billion years ago.
Simple Cells Evolve
Simple organic molecules such as proteins and nucleic acids eventually became complex organic substances. Sci-entists think that the organic molecules adhered to clay minerals, which provided the structure needed for thesesubstances to organize. The clays, along with their metal cations, catalyzed the chemical reactions that caused themolecules to form polymers. The first RNA fragments could also have come together on ancient clays.
FIGURE 4.1E. coli (Escherichia coli) is a primitiveprokaryote that may resemble the earliestcells.
For an organic molecule to become a cell, it must be able to separate itself from its environment. To enclose themolecule, a lipid membrane grew around the organic material. Eventually the molecules could synthesize their ownorganic material and replicate themselves. These became the first cells.
Prokaryotes
The earliest cells were prokaryotes (Figure 4.1). Although prokaryotes have a cell membrane, they lack a cellnucleus and other organelles. Without a nucleus, RNA was loose within the cell. Over time the cells became morecomplex.
LUCA was a prokaryote but differed from the first living cells because its genetic code was based on DNA. Theoldest fossils are tiny microbe-like objects that are 3.5 billion years old. Evidence for bacteria, the first single-celledlife forms, goes back 3.5 billion years (Figure 4.2).
89

4.1. Evolution of Simple Cells www.ck12.org
FIGURE 4.2A diagram of a bacterium.
Photosynthesis
The earliest life forms did not have the ability to photosynthesize. Without photosynthesis what did the earliest cellseat? Most likely they absorbed the nutrients that floated around in the organic soup that surrounded them. Afterhundreds of millions of years, these nutrients would have become less abundant.
Sometime around 3 billion years ago (about 1.5 billion years after Earth formed!), photosynthesis began. Photo-synthesis allowed organisms to use sunlight and inorganic molecules, such as carbon dioxide and water, to createchemical energy that they could use for food. To photosynthesize, a cell needs chloroplasts (Figure 4.3).
FIGURE 4.3Chloroplasts are visible in these cellsfound within a moss.
90

www.ck12.org Chapter 4. Life: From the First Organism Onward
Importance of Photosynthesis
In what two ways did photosynthesis make the planet much more favorable for life?
1. Photosynthesis allowed organisms to create food energy so that they did not need to rely on nutrients floatingaround in the environment. Photosynthesizing organisms could also become food for other organisms.
2. A byproduct of photosynthesis is oxygen. When photosynthesis evolved, all of a sudden oxygen was present inlarge amounts in the atmosphere. For organisms used to an anaerobic environment, the gas was toxic, and manyorganisms died out.
MEDIAClick image to the left or use the URL below.URL: https://www.ck12.org/flx/render/embeddedobject/186606
MEDIAClick image to the left or use the URL below.URL: https://www.ck12.org/flx/render/embeddedobject/186610
Cyanobacteria
What were these organisms that completely changed the progression of life on Earth by changing the atmospherefrom anaerobic to aerobic? The oldest known fossils that are from organisms known to photosynthesize are cyanobac-teria. Cyanobacteria were present by 2.8 billion years ago, and some may have been around as far back as 3.5 billionyears.
Cyanobacteria were the dominant life forms in the Archean. Why would such a primitive life-form have beendominant in the Precambrian? Many cyanobacteria lived in reef-like structures known as stromatolites (Figure4.4). Stromatolites continued on into the Cambrian but their numbers declined.
Modern cyanobacteria are also called blue-green algae. These organisms may consist of a single or many cells andthey are found in many different environments (Figure 4.5). Even now cyanobacteria account for 20% to 30% ofphotosynthesis on Earth.
Summary
• A prokaryote has a cell membrane but otherwise organelles are loose within the cell.• Photosynthesis allows organisms to produce food energy with oxygen as a by-product.• Cyanobacteria, which are still around today, were the earliest known photosynthesizing organisms.
91

4.1. Evolution of Simple Cells www.ck12.org
FIGURE 4.4These rocks in Glacier National Park,Montana may contain some of the oldestfossil microbes on Earth.
FIGURE 4.5A large bloom of cyanobacteria is harmfulto this lake.
Review
1. What were the characteristics of LUCA, the last common ancestor of life on Earth? Where did it get itsnutrients?
2. Why was the development of photosynthesis so important to the evolution of life?3. What is the role of modern, primitive photosynthesizing organisms?
Explore More
Use this resource to answer the questions that follow.
92

www.ck12.org Chapter 4. Life: From the First Organism Onward
MEDIAClick image to the left or use the URL below.URL: https://www.ck12.org/flx/render/embeddedobject/178268
1. Why is NASA interested in how life on Earth began?2. Where did the self-assembling molecules that were necessary for life on Earth to begin come from?3. What do these molecules self-assemble into? What portion of a cell do they resemble?4. What was the early Earth like geologically? Where might organic material have come from?5. What do people who support intelligent design people say about early molecules?6. What does the scientist being interviewed say about that idea? How can the scientists test that ATP synthase
is not too complex?
93

4.2. Earth Forms and Life Begins www.ck12.org
4.2 Earth Forms and Life Begins
Lesson Objectives
• Explain how scientists learn about the history of life on Earth.• Describe how and when planet Earth formed.• Outline how the first organic molecules arose.• Describe the characteristics of the first cells.• Explain how eukaryotes are thought to have evolved.
Vocabulary
• absolute dating• extinction• fossil• fossil record• geologic time scale• Last Universal Common Ancestor (LUCA)• molecular clock• relative dating• RNA world hypothesis
Introduction
Earth formed 4.6 billion years ago, and life first appeared about 4 billion years ago. The first life forms were micro-scopic, single-celled organisms. From these simple beginnings, evolution gradually produced the vast complexityand diversity of life today.
The evolution of life on Earth wasn’t always smooth and steady—far from it. Living things had to cope with someastounding changes. Giant meteorites struck Earth’s surface. Continents drifted and shifted. Ice ages buried theplanet in snow and ice for millions of years at a time. At least five times, many, if not most, of Earth’s living thingswent extinct. Extinction occurs when a species completely dies out and no members of the species remain. But lifeon Earth was persistent. Each time, it came back more numerous and diverse than before.
Earth in a Day
It’s hard to grasp the vast amounts of time since Earth formed and life first appeared on its surface. It may help tothink of Earth’s history as a 24-hour day, as shown in Figure 4.6. Humans would have appeared only during the last
94

www.ck12.org Chapter 4. Life: From the First Organism Onward
minute of that day. If we are such newcomers on planet Earth, how do we know about the vast period of time thatwent before us? How have we learned about the distant past?
FIGURE 4.6History of Earth in a Day. In this modelof Earth’s history, the planet formed atmidnight. What time was it when the firstprokaryotes evolved?
Learning About the Past
Much of what we know about the history of life on Earth is based on the fossil record. Detailed knowledge ofmodern organisms also helps us understand how life evolved.
The Fossil Record
Fossils are the preserved remains or traces of organisms that lived in the past. The soft parts of organisms almostalways decompose quickly after death. On occasion, the hard parts—mainly bones, teeth, or shells—remain longenough to mineralize and form fossils. An example of a complete fossil skeleton is shown in Figure 4.7. The fossilrecord is the record of life that unfolded over four billion years and pieced back together through the analysis offossils.
To be preserved as fossils, remains must be covered quickly by sediments or preserved in some other way. Forexample, they may be frozen in glaciers or trapped in tree resin, like the frog in Figure 4.8. Sometimes traces oforganisms—such as footprints or burrows—are preserved (see the fossil footprints in Figure 4.8). The conditionsrequired for fossils to form rarely occur. Therefore, the chance of an organism being preserved as a fossil is verylow. You can watch a video at the following link to see in more detail how fossils form: http://www.youtube.com/watch?v=A5i5Qrp6sJU .
In order for fossils to “tell” us the story of life, they must be dated. Then they can help scientists reconstruct how
95

4.2. Earth Forms and Life Begins www.ck12.org
FIGURE 4.7Extinct Lion Fossil. This fossilized skele-ton represents an extinct lion species. It israre for fossils to be so complete and wellpreserved as this one.
FIGURE 4.8The photo on the left shows an ancientfrog trapped in hardened tree resin, oramber. The photo on the right shows thefossil footprints of a dinosaur.
life changed over time. Fossils can be dated in two different ways: relative dating and absolute dating. Both aredescribed below. You can also learn more about dating methods in the video at this link: http://www.youtube.com/watch?v=jM7vZ-9bBc0 .
• Relative dating determines which of two fossils is older or younger than the other, but not their age in years.Relative dating is based on the positions of fossils in rock layers. Lower layers were laid down earlier, so theyare assumed to contain older fossils. This is illustrated in Figure 4.9.
• Absolute dating determines about how long ago a fossil organism lived. This gives the fossil an approximateage in years. Absolute dating is often based on the amount of carbon-14 or other radioactive element thatremains in a fossil. You can learn more about carbon-14 dating by watching the animation at this link: http://www.absorblearning.com/media/attachment.action?quick=bo&att=832 .
96

www.ck12.org Chapter 4. Life: From the First Organism Onward
FIGURE 4.9Relative Dating Using Rock Layers. Rela-tive dating establishes which of two fossilsis older than the other. It is based on therock layers in which the fossils formed.
Molecular Clocks
Evidence from the fossil record can be combined with data from molecular clocks. A molecular clock uses DNAsequences (or the proteins they encode) to estimate how long it has been since related species diverged from acommon ancestor. Molecular clocks are based on the assumption that mutations accumulate through time at a steadyaverage rate for a given region of DNA. Species that have accumulated greater differences in their DNA sequences
97

4.2. Earth Forms and Life Begins www.ck12.org
are assumed to have diverged from their common ancestor in the more distant past. Molecular clocks based ondifferent regions of DNA may be used together for more accuracy.
Consider the example in Table 4.1. The table shows how similar the DNA of several animal species is to humanDNA. Based on these data, which organism do you think shared the most recent common ancestor with humans?
TABLE 4.1: Comparing DNA: Humans and Other Animals
Organism Similarity with Human DNA (percent)Chimpanzee 98Mouse 85Chicken 60Fruit Fly 44
Geologic Time Scale
Another tool for understanding the history of Earth and its life is the geologic time scale, shown in Figure 4.10. Thegeologic time scale divides Earth’s history into divisions (such as eons, eras, and periods) that are based on majorchanges in geology, climate, and the evolution of life. It organizes Earth’s history and the evolution of life on thebasis of important events instead of time alone. It also allows more focus to be placed on recent events, about whichwe know the most.
How Earth Formed: We Are Made of Stardust!
We’ll start the story of life at the very beginning, when Earth and the rest of the solar system first formed. Thesolar system began as a rotating cloud of stardust. Then, a nearby star exploded and sent a shock wave through thedust cloud, increasing its rate of spin. As a result, most of the mass became concentrated in the middle of the disk,forming the sun. Smaller concentrations of mass rotating around the center formed the planets, including Earth. Youcan watch a video showing how Earth formed at this link: http://www.youtube.com/watch?v=-x8-KMR0nx8 .
At first, Earth was molten and lacked an atmosphere and oceans. Gradually, the planet cooled and formed a solidcrust. As the planet continued to cool, volcanoes released gases, which eventually formed an atmosphere. Theearly atmosphere contained ammonia, methane, water vapor, and carbon dioxide but only a trace of oxygen. Asthe atmosphere became denser, clouds formed and rain fell. Water from rain (and perhaps also from comets andasteroids that stuck Earth) eventually formed the oceans. The ancient atmosphere and oceans represented by thepicture in Figure 4.11 would be toxic to today’s life, but they set the stage for life to begin.
The First Organic Molecules
All living things consist of organic molecules. Therefore, it is likely that organic molecules evolved before cells,perhaps as long as 4 billion years ago. How did these building blocks of life first form?
Scientists think that lightning sparked chemical reactions in Earth’s early atmosphere. They hypothesize that thiscreated a “soup” of organic molecules from inorganic chemicals. In 1953, scientists Stanley Miller and Harold Ureyused their imaginations to test this hypothesis. They created a simulation experiment to see if organic moleculescould arise in this way (see Figure 4.12). They used a mixture of gases to represent Earth’s early atmosphere. Then,they passed sparks through the gases to represent lightning. Within a week, several simple organic molecules had
98

www.ck12.org Chapter 4. Life: From the First Organism Onward
FIGURE 4.10Geologic Time Scale. The geologic time scale divides Earth’s history into units that reflect major changes in Earthand its life forms. During which eon did Earth form? What is the present era?
formed. You can watch a dramatization of Miller and Urey’s experiment at this link: http://www.youtube.com/watch?v=j9ZRHoawyOg .
Recently, the findings of Miller and Urey have come into question due to discrepancies in the composition of the earlyatmosphere, allowing a number of other ideas to surface on the formation of the first organic molecules. One ideastates that the active volcanoes on early Earth gave the necessary materials for life. Despite the simplified account
99

4.2. Earth Forms and Life Begins www.ck12.org
FIGURE 4.11Ancient Earth. This is how ancient Earthmay have looked after its atmosphere andoceans formed.
FIGURE 4.12Miller and Urey’s Experiment. Millerand Urey demonstrated that organicmolecules could form under simulatedconditions on early Earth. What assump-tions were their simulation based upon?
discussed above, the problem of the origin of the first organic compounds remains. Despite tremendous advances inbiochemical analysis, answers to the problem remain. But whatever process did result in the first organic molecules,it was probably a spontaneous process, with elements coming together randomly to form small compounds, andsmall compounds reacting with other elements and other small compounds to make larger compounds. So, whichorganic molecule did come first?
Which Organic Molecule Came First?
Living things need organic molecules to store genetic information and to carry out the chemical work of cells.Modern organisms use DNA to store genetic information and proteins to catalyze chemical reactions. So, did DNA
100

www.ck12.org Chapter 4. Life: From the First Organism Onward
or proteins evolve first? This is like asking whether the chicken or the egg came first. DNA encodes proteins andproteins are needed to make DNA, so each type of organic molecule needs the other for its own existence. Howcould either of these two molecules have evolved before the other? Did some other organic molecule evolve first,instead of DNA or proteins?
RNA World Hypothesis
Some scientists speculate that RNA may have been the first organic molecule to evolve. In fact, they think that earlylife was based solely on RNA and that DNA and proteins evolved later. This is called the RNA world hypothesis.Why RNA? It can encode genetic instructions (like DNA), and some RNAs can carry out chemical reactions (likeproteins). Therefore, it solves the chicken-and-egg problem of which of these two molecules came first. Otherevidence also suggests that RNA may be the most ancient of the organic molecules. You can learn more about theRNA world hypothesis and the evidence for it at this link: http://www.youtube.com/watch?v=sAkgb3yNgqg .
The First Cells
How organic molecules such as RNA developed into cells is not known for certain. Scientists speculate that lipidmembranes grew around the organic molecules. The membranes prevented the molecules from reacting with othermolecules, so they did not form new compounds. In this way, the organic molecules persisted, and the first cells mayhave formed. Figure 4.13 shows a model of the hypothetical first cell.
FIGURE 4.13Hypothetical First Cell. The earliest cellsmay have consisted of little more thanRNA inside a lipid membrane.
LUCA
No doubt there were many early cells of this type. However, scientists think that only one early cell (or group ofcells) eventually gave rise to all subsequent life on Earth. That one cell is called the Last Universal CommonAncestor (LUCA). It probably existed around 3.5 billion years ago. LUCA was one of the earliest prokaryotic cells.It would have lacked a nucleus and other membrane-bound organelles. To learn more about LUCA and universalcommon descent, you can watch the video at the following link: http://www.youtube.com/watch?v=G0UGpcea8Zg.
101

4.2. Earth Forms and Life Begins www.ck12.org
Photosynthesis and Cellular Respiration
The earliest cells were probably heterotrophs. Most likely they got their energy from other molecules in the organic“soup.” However, by about 3 billion years ago, a new way of obtaining energy evolved. This new way wasphotosynthesis. Through photosynthesis, organisms could use sunlight to make food from carbon dioxide and water.These organisms were the first autotrophs. They provided food for themselves and for other organisms that began toconsume them.
After photosynthesis evolved, oxygen started to accumulate in the atmosphere. This has been dubbed the “oxygencatastrophe.” Why? Oxygen was toxic to most early cells because they had evolved in its absence. As a result, manyof them died out. The few that survived evolved a new way to take advantage of the oxygen. This second majorinnovation was cellular respiration. It allowed cells to use oxygen to obtain more energy from organic molecules.
Evolution of Eukaryotes
The first eukaryotic cells probably evolved about 2 billion years ago. This is explained by endosymbiotic theory. Asshown in Figure 4.14, endosymbiosis came about when large cells engulfed small cells. The small cells were notdigested by the large cells. Instead, they lived within the large cells and evolved into cell organelles.
FIGURE 4.14From Independent Cell to Organelle. Theendosymbiotic theory explains how eu-karyotic cells evolved.
The large and small cells formed a symbiotic relationship in which both cells benefited. Some of the small cellswere able to break down the large cell’s wastes for energy. They supplied energy not only to themselves but alsoto the large cell. They became the mitochondria of eukaryotic cells. Other small cells were able to use sunlight tomake food. They shared the food with the large cell. They became the chloroplasts of eukaryotic cells.
With their specialized organelles, eukaryotic cells were powerful and efficient. They would go on to evolve addi-tional major adaptations. These adaptations include sexual reproduction, cell specialization, and multicellularity.Eventually, eukaryotic cells would evolve into the animals, plants, and fungi we know today.
102

www.ck12.org Chapter 4. Life: From the First Organism Onward
Arsenic in Place of Phosphorus - New Biochemicals for Life?
In late 2010, NASA scientists proposed the notion that the elements essential for life - carbon, hydrogen, oxygen,nitrogen, phosphorus, and sulfur - may have additional members. Scientists have trained a bacterium to eat and growon a diet of arsenic, in place of phosphorus. Phosphorus chains form the backbone of DNA, and ATP, with threephosphates, is the principal molecule in which energy is stored in the cell. Arsenic is directly under phosphorus inthe Periodic Table, so the two elements have similar chemical bonding properties. This finding raises the possibilitythat organisms could exist on Earth or elsewhere in the universe using biochemicals not currently known to exist.These results expand the notion of what life could be and where it could be. It could be possible that life on otherplanets may have formed using biochemicals with elements different from the elements used in life on Earth.
In a classic example of the scientific community questioning controversial information, in the immediate six monthsafter the original publication in the scientific journal Nature, the scientific community has raised various technicaland theoretical issues concerning this finding. And as a response, the NASA team dismisses the criticism and standsby their data and interpretations.
See http://www.nytimes.com/2010/12/03/science/03arsenic.html?pagewanted=1&_r=3 and http://science.nasa.gov/science-news/science-at-nasa/2010/02dec_monolake/ for further information on this controversial finding.
Lesson Summary
• Much of what we know about the history of life on Earth is based on the fossil record. Molecular clocks areused to estimate how long it has been since two species diverged from a common ancestor. The geologic timescale is another important tool for understanding the history of life on Earth.
• Earth formed about 4.6 billion years ago. At first, Earth was molten and lacked an atmosphere and oceans.Gradually, the atmosphere formed, followed by the oceans.
• The first organic molecules formed about 4 billion years ago. This may have happened when lightning sparkedchemical reactions in Earth’s early atmosphere. RNA may have been the first organic molecule to form as wellas the basis of early life.
• The first cells consisted of little more than an organic molecule such as RNA inside a lipid membrane. Onecell (or group of cells), called the last universal common ancestor (LUCA), gave rise to all subsequent lifeon Earth. Photosynthesis evolved by 3 billion years ago and released oxygen into the atmosphere. Cellularrespiration evolved after that to make use of the oxygen.
• Eukaryotic cells probably evolved about 2 billion years ago. Their evolution is explained by endosymbiotictheory. Eukaryotic cells would go on to evolve into the diversity of eukaryotes we know today.
Lesson Review Questions
Recall
1. What are fossils?
2. Describe how fossils form.
3. Give an overview of how Earth formed and how its atmosphere and oceans developed.
4. Describe Miller and Urey’s experiment. What did it demonstrate?
5. State the RNA world hypothesis.
103

4.2. Earth Forms and Life Begins www.ck12.org
6. What was LUCA? What were its characteristics?
Apply Concepts
7. Table 4.2 shows DNA sequence comparisons for some hypothetical species. Based on the data, describeevolutionary relationships between Species A and the other four species. Explain your answer.
TABLE 4.2: DNA Similarities
Species DNA Similarity with Species A (%)Species B 42Species C 85Species D 67Species E 91
Think Critically
8. Compare and contrast relative and absolute dating.
9. Why could cellular respiration evolve only after photosynthesis had evolved?
Points to Consider
The earliest organisms lived in the ocean. Even after eukaryotes evolved, it was more than a billion years beforeorganisms lived on land for the first time.
• What special challenges do you think organisms faced when they moved from water to land?• How do you think they met these challenges? What adaptations might they have evolved?
104

www.ck12.org Chapter 4. Life: From the First Organism Onward
4.3 Principles of Relative Dating
Learning Objectives
• Steno’s laws are used to determine the order in which geological events took place.
What are relative ages?
In most families a person’s age fits into his or her generation: Siblings are around the same age as are first cousins.But in some families, multiple marriages, delayed childbearing, extended childbearing or other variations mixes upgenerations so that Aunt Julia may be five years younger than her nephew. In a family like this it’s hard to tell howpeople are related simply by age. With rock units we use certain principles to tell their ages relative to each other.
Relative Age Dating
Early geologists had no way to determine the absolute age of a geological material. If they didn’t see it form, theycouldn’t know if a rock was one hundred years or 100 million years old. What they could do was determine the agesof materials relative to each other. Using sensible principles they could say whether one rock was older than anotherand when a process occurred relative to those rocks.
Steno’s Laws
Remember Nicholas Steno, who determined that fossils represented parts of once-living organisms? Steno alsonoticed that fossil seashells could be found in rocks and mountains far from any ocean. He wanted to explainhow that could occur. Steno proposed that if a rock contained the fossils of marine animals, the rock formed fromsediments that were deposited on the seafloor. These rocks were then uplifted to become mountains.
105

4.3. Principles of Relative Dating www.ck12.org
This scenario led him to develop the principles that are discussed below. They are known as Steno’s laws. Steno’slaws are illustrated in Figure 4.15.
• Original horizontality: Sediments are deposited in fairly flat, horizontal layers. If a sedimentary rock isfound tilted, the layer was tilted after it was formed.
• Lateral continuity: Sediments are deposited in continuous sheets that span the body of water that they aredeposited in. When a valley cuts through sedimentary layers, it is assumed that the rocks on either side of thevalley were originally continuous.
• Superposition: Sedimentary rocks are deposited one on top of another. The youngest layers are found at thetop of the sequence, and the oldest layers are found at the bottom.
FIGURE 4.15(a) Original horizontality. (b) Lateral continuity. (c) Superposition.
More Principles of Relative Dating
Other scientists observed rock layers and formulated other principles.
Geologist William Smith (1769-1839) identified the principle of faunal succession, which recognizes that:
• Some fossil types are never found with certain other fossil types (e.g. human ancestors are never found withdinosaurs) meaning that fossils in a rock layer represent what lived during the period the rock was deposited.
• Older features are replaced by more modern features in fossil organisms as species change through time; e.g.feathered dinosaurs precede birds in the fossil record.
• Fossil species with features that change distinctly and quickly can be used to determine the age of rock layersquite precisely.
106

www.ck12.org Chapter 4. Life: From the First Organism Onward
Scottish geologist, James Hutton (1726-1797) recognized the principle of cross-cutting relationships. This helpsgeologists to determine the older and younger of two rock units (Figure 4.16).
FIGURE 4.16If an igneous dike (B) cuts a series ofmetamorphic rocks (A), which is older andwhich is younger? In this image, A musthave existed first for B to cut across it.
The Grand Canyon
The Grand Canyon provides an excellent illustration of the principles above. The many horizontal layers of sedi-mentary rock illustrate the principle of original horizontality (Figure 4.17).
• The youngest rock layers are at the top and the oldest are at the bottom, which is described by the law ofsuperposition.
• Distinctive rock layers, such as the Kaibab Limestone, are matched across the broad expanse of the canyon.These rock layers were once connected, as stated by the rule of lateral continuity.
• The Colorado River cuts through all the layers of rock to form the canyon. Based on the principle of cross-cutting relationships, the river must be younger than all of the rock layers that it cuts through.
Summary
• Sediments are deposited horizontally with the oldest at the bottom. Any difference in this pattern means thatthe rock units have been altered.
• The principle of faunal succession recognizes that species evolve and these changes can be seen in the rockrecord.
107

4.3. Principles of Relative Dating www.ck12.org
FIGURE 4.17At the Grand Canyon, the CoconinoSandstone appears across canyons. TheCoconino is the distinctive white layer; itis a vast expanse of ancient sand dunes.
• The Grand Canyon exhibits many of the principles of relative dating and is a fantastic location for learningabout the geology of the southwestern U.S.
Review
1. How do Steno’s laws help geologists to decipher the geological history of a region?2. What is the principle of faunal succession?3. Why does just about every geology textbook use the Grand Canyon as the example in the sections on geolog-
ical history?
Explore More
Use this resource (start at 1:23) to answer the questions that follow.
MEDIAClick image to the left or use the URL below.URL: https://www.ck12.org/flx/render/embeddedobject/178309
1. What do you determine when you’re doing relative dating? What are you not determining?2. What is the Law of Superposition? What is the exception?3. What is the Law of Original Horizontality? If rocks are not horizontal what does that mean?4. What is the Law of Cross-Cutting Relationships?5. What is the Law of Inclusions?6. What is an unconformity? What can cause an unconformity?7. What does an angular unconformity look like? What does this indicate?
108

www.ck12.org Chapter 4. Life: From the First Organism Onward
8. What happened during an unconformity and how do we know that?9. How do you know where there is a disconformity?
10. What happened to create an nonconformity? What can you look for to identify a nonconformity?
109

4.4. Types of Fossilization www.ck12.org
4.4 Types of Fossilization
Learning Objectives
• Learn the five processes that create most of the fossils.
Are all fossils so complete and well-preserved?
Very few circumstances lead to fossils that are as beautiful and complete as this baby mammoth that was frozen inice. An animal falling into a crevasse or a tar pit does not undergo the scattering and degradation that an animaldying at the surface does and so fossils from these types of rare sites are often fantastic.
Types of Fossilization
Most fossils are preserved by one of five processes outlined below (Figure 4.18):
Preserved Remains
Most uncommon is the preservation of soft-tissue original material. Insects have been preserved perfectly in amber,which is ancient tree sap. Mammoths and a Neanderthal hunter were frozen in glaciers, allowing scientists the rareopportunity to examine their skin, hair, and organs. Scientists collect DNA from these remains and compare theDNA sequences to those of modern counterparts.
110

www.ck12.org Chapter 4. Life: From the First Organism Onward
FIGURE 4.18Five types of fossils: (a) insect preserved in amber, (b) petrified wood (permineralization), (c) cast and mold of aclam shell, (d) pyritized ammonite, and (e) compression fossil of a fern.
Permineralization
FIGURE 4.19Trilobite.
The most common method of fossilization is permineralization. After a bone, wood fragment, or shell is buriedin sediment, mineral-rich water moves through the sediment. This water deposits minerals into empty spaces and
111

4.4. Types of Fossilization www.ck12.org
produces a fossil. Fossil dinosaur bones, petrified wood, and many marine fossils were formed by permineralization.
Molds and Casts
When the original bone or shell dissolves and leaves behind an empty space in the shape of the material, thedepression is called a mold. The space is later filled with other sediments to form a matching cast within themold that is the shape of the original organism or part. Many mollusks (clams, snails, octopi, and squid) are foundas molds and casts because their shells dissolve easily.
Replacement
The original shell or bone dissolves and is replaced by a different mineral. For example, calcite shells may bereplaced by dolomite, quartz, or pyrite. If a fossil that has been replace by quartz is surrounded by a calcite matrix,mildly acidic water may dissolve the calcite and leave behind an exquisitely preserved quartz fossil.
Compression
Some fossils form when their remains are compressed by high pressure, leaving behind a dark imprint. Compressionis most common for fossils of leaves and ferns, but can occur with other organisms.
MEDIAClick image to the left or use the URL below.URL: https://www.ck12.org/flx/render/embeddedobject/186628
MEDIAClick image to the left or use the URL below.URL: https://www.ck12.org/flx/render/embeddedobject/186630
Science Friday: Tar Noir: Paleoforensics at the La Brea Tar Pits
The La Brea Tar Pits contain a massive collection on animals. But how did all these animals die, and how did theyget there? In this video by Science Friday, researchers explain how these processes occurred and what the La BreaTar Pits tell us about Los Angeles thousands of years ago.
112

www.ck12.org Chapter 4. Life: From the First Organism Onward
MEDIAClick image to the left or use the URL below.URL: https://www.ck12.org/flx/render/embeddedobject/195449
Summary
• Very few fossils preserve soft parts; some insects are preserved in amber and animals may be preserved in ice.• Some fossils are created when minerals replace the organic material.• A fossil may be in the form of a mold, which is the depression left in the shape of the material or a cast, which
is rocky material that filled the mold.
Review
1. Why are there so few fossils of soft parts? What are the exceptions to this?2. If a snail shell is buried in mud and then infused with mineral rich water what type of fossilization has
occurred?3. What types of fossils are most likely to form by compression and why?
Explore More
Use this resource to answer the questions that follow.
MEDIAClick image to the left or use the URL below.URL: https://www.ck12.org/flx/render/embeddedobject/178302
1. What are mold fossils?2. What are cast fossils?3. What are trace fossils?4. What are true form fossils? What are the two main kinds talked about in the video?5. How do insects get preserved by unaltered preservation typically?6. What is permineralization?
113

4.5. Extinction and Radiation of Life www.ck12.org
4.5 Extinction and Radiation of Life
Learning Objectives
• Define extinction and explain why it occurs.• Define adaptive radiation, and explain its relationship to extinction.
Should this pterodactyl be concerned? Should you?
When the dinosaurs were wiped out by an asteroid impact, the mammals were waiting to take over their niches.Could this happen again? Are there other ways species could go extinct and leave open niches for new organisms tofill?
Extinction
Most of the species that have lived have also gone extinct. There are two ways to go extinct: besides the obviousway of dying out completely, a species goes extinct if it evolves into a different species. Extinction is a normal partof Earth’s history.
But sometimes large numbers of species go extinct in a short amount of time. This is a mass extinction. The causesof different mass extinctions are different: collisions with comets or asteroids, massive volcanic eruptions, or rapidlychanging climate are all possible causes of some of these disasters (Figure 4.20).
114

www.ck12.org Chapter 4. Life: From the First Organism Onward
FIGURE 4.20An extinct Tyrannosaurus rex. This fossil resembles a living organism.
Adaptive Radiation
After a mass extinction, many habitats are no longer inhabited by organisms because they have gone extinct. Withnew habitats available, some species will adapt to the new environments. Evolutionary processes act rapidly duringthese times and many new species evolve to fill those available habitats. The process in which many new speciesevolve in a short period of time to fill available niches is called adaptive radiation. At the end of this period of rapidevolution the life forms do not look much like the ones that were around before the mass extinction. For example,after the extinction of the dinosaurs, mammals underwent adaptive radiation and became the dominant life form.
Summary
• Species go extinct when all of the individuals die out or evolve into a different species.• Many species go extinct at roughly the same time during a mass extinction.• New habitats become available and species evolve to fill them so that biodiversity increases during adaptive
radiation.
Review
1. Why is extinction considered a normal part of Earth’s history?2. What are some of the possible causes of mass extinctions?3. Why do many new species evolve after a mass extinction?
Explore More
Use this resource to answer the questions that follow.
115

4.5. Extinction and Radiation of Life www.ck12.org
MEDIAClick image to the left or use the URL below.URL: https://www.ck12.org/flx/render/embeddedobject/178261
1. What does a branch on a phylogenetic tree indicate?2. What two things could have happened when a species disappears?3. What is necessary regarding ability to mate for one species to become two different species?4. What two things might a changing environment force to happen? What do each of these to things do to
biodiversity?5. How did natural selection take place in three-spined stickelbacks at Loberg Lake in Alaska? How is this an
example of speciation?6. Under what conditions does adaptive radiation take place? How are honeycreepers in Hawaii an example?7. How many species that ever existed are now extinct?8. How many mass extinctions have been identified according to the teacher? What is a mass extinction?9. What is the K-T (Cretaceous-Tertiary) boundary?
10. What is found at the K-T boundary? What could that mean?
116

www.ck12.org Chapter 4. Life: From the First Organism Onward
4.6 The Evolution of Multicellular Life
Lesson Objectives
• Describe important events of the late Precambrian.• Give an overview of evolution during the Paleozoic Era.• Explain why the Mesozoic Era is called the age of the dinosaurs.• Outline the main evolutionary events of the Cenozoic Era.
Vocabulary
• Cambrian explosion• Cenozoic Era• mass extinction• Mesozoic Era• Palezoic Era• Permian extinction
Introduction
Nearly 80% of Earth’s history passed before multicellular life evolved. Up until then, all organisms existed as singlecells. Why did multicellular organisms evolve? What led up to this major step in the evolution of life? To put theevolution of multicellularity in context, let’s return to what was happening on planet Earth during this part of itshistory.
Setting the Stage: The Late Precambrian
The late Precambrian is the time from about 2 billion to half a billion years ago. During this long span of time, Earthexperienced many dramatic geologic and climatic changes.
• Continents drifted. They collided to form a gigantic supercontinent and then broke up again and moved apart.Continental drift changed climates worldwide and caused intense volcanic activity. To see an animation ofcontinental drift, go to this link: http://www.ucmp.berkeley.edu/geology/anim1.html .
• Carbon dioxide levels in the atmosphere rose and fell. This was due to volcanic activity and other factors.When the levels were high, they created a greenhouse effect. More heat was trapped on Earth’s surface, andthe climate became warmer. When the levels were low, less heat was trapped and the planet cooled. Severaltimes, cooling was severe enough to plunge Earth into an ice age. One ice age was so cold that snow and icecompletely covered the planet (see Figure 4.21).
117

4.6. The Evolution of Multicellular Life www.ck12.org
FIGURE 4.21Snowball Earth. During the late Precam-brian, Earth grew so cold that it was cov-ered with snow and ice. Earth during thisice age has been called “snowball Earth.”
Life During the Late Precambrian
The dramatic changes of the late Precambrian had a major impact on Earth’s life forms. Living things that could notadapt died out. They were replaced by organisms that evolved new adaptations. These adaptations included sexualreproduction, specialization of cells, and multicellularity.
• Sexual reproduction created much more variety among offspring. This increased the chances that at least someof them would survive when the environment changed. It also increased the speed at which evolution couldoccur.
• Some cells started to live together in colonies. In some colonies, cells started to specialize in doing differentjobs. This made the cells more efficient as a colony than as individual cells.
• By 1 billion years ago, the first multicellular organisms had evolved. They may have developed from coloniesof specialized cells. Their cells were so specialized they could no longer survive independently. However,together they were mighty. They formed an organism that was bigger, more efficient, and able to do muchmore than any single-celled organism ever could.
The Precambrian Extinction
At the close of the Precambrian 544 million years ago, a mass extinction occurred. In a mass extinction, many oreven most species abruptly disappear from Earth. There have been five mass extinctions in Earth’s history. Manyscientists think we are currently going through a sixth mass extinction.
What caused the Precambrian mass extinction? A combination of climatic and geologic events was probablyresponsible. No matter what the cause, the extinction paved the way for a burst of new life during the followingPaleozoic Era.
118

www.ck12.org Chapter 4. Life: From the First Organism Onward
Life During the Paleozoic
The Paleozoic Era is literally the era of “old life.” It lasted from 544 to 245 million years ago and is divided intosix periods. Major events in each period of the Paleozoic Era are described in Figure 4.22. The era began with aspectacular burst of new life. This is called the Cambrian explosion. The era ended with the biggest mass extinctionthe world had ever seen. This is known as the Permian extinction. At the following link, you can watch a videoabout these and other events of the Paleozoic Era: http://www.youtube.com/watch?v=Bf2rrRmconU .
FIGURE 4.22The Paleozoic Era includes the six peri-ods described here.
Paleozoic Era
The Cambrian Period: Following the Precambrian mass extinction, there was an explosion of new kinds oforganisms in the Cambrian Period (544-505 million years ago). Many types of primitive animals called spongesevolved. Small ocean invertebrates called Trilobites became abundant.
119

4.6. The Evolution of Multicellular Life www.ck12.org
FIGURE 4.23Two representatives of more than fiftymodern animal phyla from the Cambrianexplosion are reef-building sponges (left)and early arthropods known as trilobites(right). Both were abundant during theCambrian and later became extinct; how-ever, the phyla they represent persist tothis day.
The Ordovician Period: During the next period, the Ordovician Period (505-440 million years ago), the oceansbecame filled with invertebrates of many types. Also during this period, the first fish evolved and plants colonizedthe land for the first time. But animals still remained in the water.
The Silurian Period: During the Silurian Period (440-410 million years ago), corals appeared in the oceans, andfish continued to evolve. On land, vascular plants appeared (Figure 4.24). With special tissues to circulate waterand other materials, these plants could grow larger than the earlier nonvascular plants.
FIGURE 4.24Cooksonia, a branching vascular plant with sporangia at the tips of eachbranch. Cooksonia fossils measure just centimeters in height and datefrom the Silurian period.
The Devonian Period: During the Devonian Period (410-360 million years ago), the first seed plants evolved(Figure 4.25). Seeds have a protective coat and stored food to help them survive. Seed plants eventually becamethe most common type of land plants. In the oceans, fish with lobe fins evolved. They could breathe air when theyraised their heads above water. Breathing would be necessary for animals to eventually colonize the land.
The Carboniferous Period: Next, during the Carboniferous Period (360-290 million years ago), widespread forestsof huge plants left massive deposits of carbon that eventually turned to coal. The first amphibians evolved to moveout of the water and colonize land, but they had to return to the water to reproduce. Soon after amphibians arose, thefirst reptiles evolved. They were the first animals that could reproduce on dry land.
The Permian Period: During the Permian Period (290-245 million years ago), all the major land masses collidedto form a supercontinent called Pangaea (Figure 4.26). Temperatures were extreme, and the climate was dry. Plants
120

www.ck12.org Chapter 4. Life: From the First Organism Onward
FIGURE 4.25On land, clubmosses, horsetails, andferns joined primitive seed plants andearly trees to form the first forests.
and animals evolved adaptations to dryness, such as waxy leaves or leathery skin to prevent water loss. The PermianPeriod ended with a mass extinction.
FIGURE 4.26The supercontinent Pangaea encom-passed all of today’s continents in a sin-gle land mass. This configuration limitedshallow coastal areas which harbor ma-rine species, and may have contributedto the dramatic event which ended thePermian - the most massive extinctionever recorded.
In the mass extinction that ended the Permian, the majority of species went extinct. Many hypotheses have beenoffered to explain why this mass extinction occurred. These include huge meteorites striking Earth and enormousvolcanoes spewing ashes and gases into the atmosphere. Both could have darkened the skies with dust for manymonths. This, in turn, would have shut down photosynthesis and cooled the planet.
Despite the great loss of life, there was light at the end of the tunnel. The Permian extinction paved the way for
121

4.6. The Evolution of Multicellular Life www.ck12.org
another burst of new life at the start of the following Mesozoic Era. This included the evolution of the dinosaurs.
Mesozoic Era: Age of Dinosaurs
The Mesozoic Era is literally the era of “middle life.” It is also known as the age of dinosaurs. It lasted from 245to 65 million years ago and is divided into the three periods described in Figure 4.27. The Mesozoic began with thesupercontinent Pangaea. Then, during the era, Pangaea broke up and the continents drifted apart. The movement ofcontinents changed climates. It also caused a lot of volcanic activity.
Mass extinctions occurred at the end of the Triassic and Cretaceous Periods. The first extinction paved the way fora dinosaur takeover. In the second extinction, the dinosaurs finally disappeared. At the link below, you can watcha video about these and other exciting events during the age of dinosaurs. http://www.youtube.com/watch?v=watgb11LOHE
The Triassic Period: During the Triassic Period (245-200 million years ago), the first dinosaurs branched off fromthe reptiles and colonized the land, air, and water. Huge seed ferns and conifers dominated the forests, and moderncorals, fish, and insects evolved. The supercontinent Pangaea started to separate into Laurasia (today’s NorthernHemisphere continents) and Gondwanaland (today’s Southern Hemisphere continents). The Triassic Period endedwith a mass extinction.
The Jurassic Period: The next period, the Jurassic Period (200-145 million years ago), began after the massextinction that ended the Triassic Period. This mass extinction allowed dinosaurs to flourish in the Jurassic Period.This was the golden age of dinosaurs. Also during the Jurassic, the earliest birds evolved from reptile ancestors,and all the major groups of mammals evolved, but individual mammals were still small in size. Flowering plantsappeared for the first time, and new insects also evolved to pollinate the flowers. The continents continued to moveapart, and volcanic activity was especially intense.
The Cretaceous Period: During the Cretaceous Period (145-65 million years ago), dinosaurs reached their peak insize and distribution. Tyrannosaurus Rex, weighed at least 7 tons. By the end of the Cretaceous, the continents wereclose to their present locations. Earth’s overall climate was warm; even the poles lacked ice. The period ended withthe dramatic extinction of the dinosaurs.
What happened to the dinosaurs? Why did they go extinct at the end of the Cretaceous Period? Some scientiststhink a comet or asteroid may have collided with Earth, causing skies to darken, photosynthesis to shut down, andclimates to change. A collision was probably at least a contributing factor. Without the dinosaurs, there were manyopportunities for new organisms to exploit in the next era, the Cenozoic. Which living things do you think took overwhere the dinosaurs left off?
What happened to the dinosaurs? Why did they go extinct at the end of the Cretaceous Period? Some scientiststhink a comet or asteroid may have collided with Earth, causing skies to darken, photosynthesis to shut down, andclimates to change. A collision was probably at least a contributing factor. Without the dinosaurs, there were manyopportunities for new organisms to exploit in the next era, the Cenozoic. Which living things do you think took overwhere the dinosaurs left off?
Cenozoic Era: Age of Mammals
The Cenozoic Era literally means the era of “modern life.” It is also called the age of mammals. Mammals tookadvantage of the extinction of the dinosaurs. They flourished and soon became the dominant animals on Earth. Youcan learn more about the evolution of mammals during the Cenozoic at the link below. The Cenozoic began 65million years ago and continues to the present. It may be divided into the two periods described in Figure 4.28. http
122

www.ck12.org Chapter 4. Life: From the First Organism Onward
FIGURE 4.27Mesozoic Era. The Mesozoic Era consists of the three periods described here.
://www.youtube.com/watch?v=H0uTGkCWXwQ
The Tertiary Period: During the Tertiary Period (65-1.8 million years ago), Earth’s climate was generally warmand humid. Mammals evolved to fill virtually all niches vacated by dinosaurs. Many mammals increased in size.Mammals called primates evolved, including human ancestors. Modern rain forests and grasslands appeared, andflowering plants and insects were numerous and widespread.
The Quaternary Period: During the Quaternary Period (1.8 million years ago-present), Earth’s climate cooled,leading to a series of ice ages. Sea levels fell because so much water was frozen in glaciers. This created landbridges between continents, allowing land animals to move to new areas. Some mammals, like the woolly mammothsadapted to the cold by evolving very large size and thick fur. Other animals moved closer to the equator or went
123
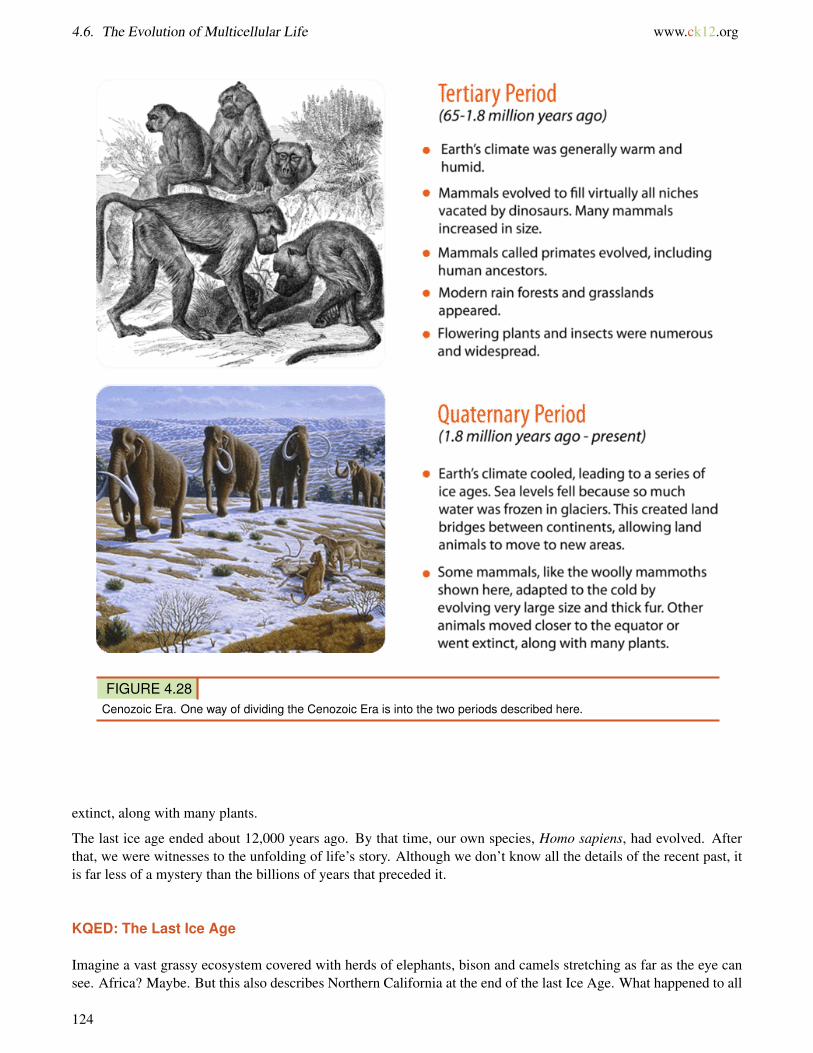
4.6. The Evolution of Multicellular Life www.ck12.org
FIGURE 4.28Cenozoic Era. One way of dividing the Cenozoic Era is into the two periods described here.
extinct, along with many plants.
The last ice age ended about 12,000 years ago. By that time, our own species, Homo sapiens, had evolved. Afterthat, we were witnesses to the unfolding of life’s story. Although we don’t know all the details of the recent past, itis far less of a mystery than the billions of years that preceded it.
KQED: The Last Ice Age
Imagine a vast grassy ecosystem covered with herds of elephants, bison and camels stretching as far as the eye cansee. Africa? Maybe. But this also describes Northern California at the end of the last Ice Age. What happened to all
124

www.ck12.org Chapter 4. Life: From the First Organism Onward
this wildlife? Were they over hunted and killed off? Did global warming destroy their populations? Scientists arenot sure, but this relatively recent loss of life does raise many interesting questions.
MEDIAClick image to the left or use the URL below.URL: https://www.ck12.org/flx/render/embeddedobject/524
Lesson Summary
• During the late Precambrian, continents drifted, carbon dioxide levels fluctuated, and climates changed. Manyorganisms could not survive the changes and died out. Others evolved important new adaptations. Theseinclude sexual reproduction, cell specialization, and multicellularity. The Precambrian ended with a massextinction. It paved the way for the Cambrian explosion.
• The Paleozoic Era began with the Cambrian explosion. It ended with the Permian extinction. During the era,invertebrate animals diversified in the oceans. Plants, amphibians, and reptiles also moved to the land.
• The Mesozoic Era is the age of dinosaurs. They evolved from earlier reptiles to fill niches on land, in thewater, and in the air. Mammals also evolved but were small in size. Flowering plants appeared for the firsttime. Dinosaurs went extinct at the end of the Mesozoic.
• The Cenozoic Era is the age of mammals. They evolved to fill virtually all the niches vacated by dinosaurs.The ice ages of the Quaternary Period of the Cenozoic led to many extinctions. The last ice age ended 12,000years ago. By that time, Homo sapiens had evolved.
Lesson Review Questions
Recall
1. Describe geologic and climatic changes that occurred during the late Precambrian.
2. What is a mass extinction?
3. What is the relationship between the Precambrian extinction and the Cambrian explosion?
4. List several important evolutionary events that occurred during the Paleozoic Era.
5. Describe how the continents shifted during the Mesozoic Era.
6. What explains why mammals were able to flourish during Cenozoic Era?
Apply Concepts
7. Create a timeline of major evolutionary events during the Mesozoic and Cenozoic Eras. Include approximatedates in your timeline.
125

4.6. The Evolution of Multicellular Life www.ck12.org
Think Critically
8. Explain the evolutionary advantages of sexual reproduction and multicellularity.
9. Relate the Permian, Triassic, and Cretaceous extinctions to the evolution and extinction of the dinosaurs.
10. Compare and contrast the Tertiary and Quaternary Periods of the Cenozoic Era.
Points to Consider
The human species evolved during the Cenozoic Era. The scientific name of the human species is Homo sapiens.
• Do you know what this name means? Do you know why species are given scientific names?• What is a species? What determines whether a group of organisms is considered a species?
126

www.ck12.org Chapter 4. Life: From the First Organism Onward
4.7 Human Evolution
Learning Objectives
• Identify and describe key developments in human evolution.
What is a "cave man"?
What if you were to wake up in the Cenozoic, even in the very recent Cenozoic, but with a group of Neanderthals?They were close relatives, but you might find them to be a bit different from your usual friends.
Human Evolution
Humans evolved during the later Cenozoic. New fossil discoveries alter the details of what we know about theevolution of modern humans, but the major evolutionary path is well understood.
127

4.7. Human Evolution www.ck12.org
Primate Ancestors
Humans evolved from primates, and apes and humans have a primate common ancestor. About 7 million years ago,chimpanzees (our closest living relatives) and humans shared their last common ancestor.
Hominids
Animals of the genus Ardipithecus, living roughly 4 to 6 million years ago, had brains roughly the size of a femalechimp. Although they lived in trees, they were bipedal. Standing on two feet allows an organism to see and also touse its hands and arms for hunting. By the time of Australopithecus afarensis, between 3.9 and 2.9 million yearsago, these human ancestors were completely bipedal and their brains were growing rapidly (Figure 4.29).
FIGURE 4.29Australopithecus afarensis is a human ancestor that lived about 3 millionyears ago.
The genus Homo appeared about 2.5 million years ago. Humans developed the first stone tools. Homo erectusevolved in Africa about 1.8 million years ago. Fossils of these animals show a much more human-like body structure,which allowed them to travel long distances to hunt. Cultures begin and evolve.
Homo sapiens, our species, originated about 200,000 years ago in Africa. Evidence of a spiritual life appears about32,000 years ago with stone figurines that probably have religious significance (Figure 4.30).
The ice ages allowed humans to migrate. During the ice ages, water was frozen in glaciers and so land bridges suchas the Bering Strait allowed humans to walk from the old world to the new world.
DNA evidence suggests that the humans who migrated out of Africa interbred with Neanderthal since these peoplecontain some Neanderthal DNA.
128

www.ck12.org Chapter 4. Life: From the First Organism Onward
FIGURE 4.30Stone figurines likely indicate a spirituallife.
MEDIAClick image to the left or use the URL below.URL: https://www.ck12.org/flx/render/embeddedobject/186619
Summary
• Australopithecus afarensis was completely bipedal and had a growing brain.• Homo erectus evolved 1.8 million years ago and left behind signs of an early culture.• Our species is Homo sapiens, which evolved 200,000 years ago in Africa and continues to today.
Review
1. What are the characteristics that make humans human?2. Why did the evolution of bipedalism advance human evolution?3. How did people get from the old world to the new world?
129

4.8. Classification www.ck12.org
4.8 Classification
Lesson Objectives
• Outline the Linnaean classification, and define binomial nomenclature.• Describe phylogenetic classification, and explain how it differs from Linnaean classification.
Vocabulary
• binomial nomenclature• clade• domain• genus• kingdom• Linnaean classification system• phylogenetic tree• phylogeny• species• taxa• taxonomy
Introduction
The evolution of life on Earth over the past 4 billion years has resulted in a huge variety of species. For more than2,000 years, humans have been trying to classify the great diversity of life. The science of classifying organismsis called taxonomy. Classification is an important step in understanding the present diversity and past evolutionaryhistory of life on Earth.
Linnaean Classification
All modern classification systems have their roots in the Linnaean classification system. It was developed bySwedish botanist Carolus Linnaeus in the 1700s. He tried to classify all living things that were known at his time.He grouped together organisms that shared obvious physical traits, such as number of legs or shape of leaves. Forhis contribution, Linnaeus is known as the “father of taxonomy.” You can learn more about Linnaeus and his systemof classification by watching the video at this link: http://teachertube.com/viewVideo.php?video_id=169889 .
The Linnaean system of classification consists of a hierarchy of groupings, called taxa (singular, taxon). Taxa rangefrom the kingdom to the species (see Figure 4.31). The kingdom is the largest and most inclusive grouping. Itconsists of organisms that share just a few basic similarities. Examples are the plant and animal kingdoms. The
130

www.ck12.org Chapter 4. Life: From the First Organism Onward
species is the smallest and most exclusive grouping. It consists of organisms that are similar enough to producefertile offspring together. Closely related species are grouped together in a genus.
FIGURE 4.31Linnaean Classification System: Classifi-cation of the Human Species. This chartshows the taxa of the Linnaean classifica-tion system. Each taxon is a subdivisionof the taxon below it in the chart. Forexample, a species is a subdivision of agenus. The classification of humans isgiven in the chart as an example.
Binomial Nomenclature
Perhaps the single greatest contribution Linnaeus made to science was his method of naming species. This method,called binomial nomenclature, gives each species a unique, two-word Latin name consisting of the genus nameand the species name. An example is Homo sapiens, the two-word Latin name for humans. It literally means “wisehuman.” This is a reference to our big brains.
Why is having two names so important? It is similar to people having a first and a last name. You may know severalpeople with the first name Michael, but adding Michael’s last name usually pins down exactly whom you mean. Inthe same way, having two names uniquely identifies a species.
Revisions in Linnaean Classification
Linnaeus published his classification system in the 1700s. Since then, many new species have been discovered.The biochemistry of organisms has also become known. Eventually, scientists realized that Linnaeus’s system ofclassification needed revision.
A major change to the Linnaean system was the addition of a new taxon called the domain. A domain is a taxonthat is larger and more inclusive than the kingdom. Most biologists agree there are three domains of life on Earth:Bacteria, Archaea, and Eukaryota (see Figure 4.32). Both Bacteria and Archaea consist of single-celled prokaryotes.
131

4.8. Classification www.ck12.org
Eukaryota consists of all eukaryotes, from single-celled protists to humans. This domain includes the Animalia(animals), Plantae (plants), Fungi (fungi), and Protista (protists) kingdoms.
FIGURE 4.32This phylogenetic tree is based on com-parisons of ribosomal RNA base se-quences among living organisms. Thetree divides all organisms into three do-mains: Bacteria, Archaea, and Eukarya.Humans and other animals belong to theEukarya domain. From this tree, organ-isms that make up the domain Eukaryaappear to have shared a more recentcommon ancestor with Archaea than Bac-teria.
Phylogenetic Classification
Linnaeus classified organisms based on obvious physical traits. Basically, organisms were grouped together if theylooked alike. After Darwin published his theory of evolution in the 1800s (discussed in the following chapter),scientists looked for a way to classify organisms that showed phylogeny. Phylogeny is the evolutionary history of agroup of related organisms. It is represented by a phylogenetic tree, like the one in Figure 4.33.
FIGURE 4.33Phylogenetic Tree. This phylogenetic treeshows how three hypothetical species arerelated to each other through commonancestors. Do you see why Species 1 and2 are more closely related to each otherthan either is to Species 3?
One way of classifying organisms that shows phylogeny is by using the clade. A clade is a group of organisms thatincludes an ancestor and all of its descendants. Clades are based on cladistics. This is a method of comparing traitsin related species to determine ancestor-descendant relationships. Clades are represented by cladograms, like theone in Figure 4.34. This cladogram represents the mammal and reptile clades. The reptile clade includes birds. Itshows that birds evolved from reptiles. Linnaeus classified mammals, reptiles, and birds in separate classes. Thismasks their evolutionary relationships.
132

www.ck12.org Chapter 4. Life: From the First Organism Onward
FIGURE 4.34This cladogram classifies mammals, rep-tiles, and birds in clades based on theirevolutionary relationships.
Lesson Summary
• Classification is an important step in understanding life on Earth. All modern classification systems have theirroots in the Linnaean classification system. The Linnaean system is based on similarities in obvious physicaltraits. It consists of a hierarchy of taxa, from the kingdom to the species. Each species is given a uniquetwo-word Latin name. The recently added domain is a larger and more inclusive taxon than the kingdom.
• Phylogeny is the evolutionary history of group of related organisms. It is represented by a phylogenetic treethat shows how species are related to each other through common ancestors. A clade is a group of organismsthat includes an ancestor and all of its descendants. It is a phylogenetic classification, based on evolutionaryrelationships.
Lesson Review Questions
Recall
1. What is taxonomy?
2. Define taxon and give an example.
3. What is binomial nomenclature? Why is it important?
4. What is a domain? What are the three domains of life on Earth?
5. What is cladistics, and what is it used for?
Apply Concepts
6. Create a taxonomy, modeled on the Linnaean classification system, for a set of common objects, such as motorvehicles, tools, or office supplies. Identify the groupings that correspond to the different taxa in the Linnaean system.
7. Dogs and wolves are more closely related to each other than either is to cats. Draw a phylogenetic tree to showthese relationships.
133

4.8. Classification www.ck12.org
Think Critically
8. Compare and contrast a Linnaean taxon, such as the family or genus, with the clade.
9. Explain why reptiles and birds are placed in the same clade.
Points to Consider
This chapter gives you a glimpse of 4 billion years of evolution on Earth. In the next chapter, you will read aboutthe forces that bring about evolution. Natural selection is one of these forces. It generally results in a population orspecies becoming better adapted to its environment over time.
• How does natural selection work? How does it bring about evolutionary change?• What might be the other forces of evolution?
134

www.ck12.org Chapter 4. Life: From the First Organism Onward
4.9 References
1. . . CC BY-NC2. Courtesy of Jesse Allen/NASA’s Earth Observatory. http://earthobservatory.nasa.gov/IOTD/view.php?id=41
385 . Public Domain3. Courtesy of Rocky Mountain Laboratories, NIAID, NIH. http://commons.wikimedia.org/wiki/File:Escherich
iaColi_NIAID.jpg . Public Domain4. Mariana Ruiz Villarreal (User:LadyofHats/Wikimedia Commons). http://commons.wikimedia.org/wiki/Fi
le:Average_prokaryote_cell-_en.svg . Public Domain5. Brandon Zierer. http://www.flickr.com/photos/arwing3/6946034795/ . CC BY 2.06. Courtesy of P. Carrara, National Park Service. http://commons.wikimedia.org/wiki/File:Stromatolites.jpg .
Public Domain7. Courtesy of Jesse Allen/NASA’s Earth Observatory. http://earthobservatory.nasa.gov/IOTD/view.php?id=41
385 . Public Domain8. Mariana Ruiz Villarreal (LadyofHats) for CK-12 Foundation. CK-12 Foundation .9. User:Karora/Wikimedia Commons. http://commons.wikimedia.org/wiki/File:Thylacoleo_skeleton_in_Naraco
orte_Caves.jpg .10. Frog in resin: Image copyright Galyna Andrushko, 2014; Footprint: Edmondo Gnerre. Frog in resin: http:
//www.shutterstock.com; Footprint: http://commons.wikimedia.org/wiki/File:Tuba_City_Dinosaur_Track.jpg. Frog in resin: Used under license from Shutterstock.com; Footprint: CC BY 2.0
11. Mariana Ruiz Villarreal (LadyofHats) for CK-12 Foundation. CK-12 Foundation . CC BY-NC 3.012. Hana Zavadska. CK-12 Foundation . CC BY-NC 3.013. User:BrendelSignature/Wikimedia Commons. http://commons.wikimedia.org/wiki/File:Sunset_Marina.JPG
. CC BY 3.014. User:Carny/He.Wikipedia, modified by CK-12 Foundation. http://commons.wikimedia.org/wiki/File:MUexp
eriment.png . CC BY 2.515. Zachary Wilson. CK-12 Foundation . CC BY-NC 3.016. LadyofHats. CK-12 Foundation . CC-BY-NC-SA 3.017. . . CC BY-NC18. (a) Laura Guerin; (b) User:Woudloper/Wikimedia Commons; (c) Mark A. Wilson (User:Wilson44691/Wikimedia
Commons). (a) CK-12 Foundation; (b) http://commons.wikimedia.org/wiki/File:Principle_of_horizontal_continuity.svg; (c) http://commons.wikimedia.org/wiki/File:IsfjordenSuperposition.jpg . (a) CC BY-NC 3.0; (b)Public Domain; (c) Public Domain
19. Courtesy of US Geological Survey, modified by CK-12 Foundation. http://commons.wikimedia.org/wiki/File:Skagit-gneiss-Cascades.jpg . Public Domain
20. Miles Orchinik;(a) Kyle Simourd; (b) Courtesy of the US Department of the Interior. CK-12 Foundation;(a)http://www.flickr.com/photos/89241789@N00/172766933/; (b) http://commons.wikimedia.org/wiki/File:St
ratigraphy_of_the_Grand_Canyon.png . CC BY-NC 3.0;(a) CC BY 2.0; (b) Public Domain21. . . CC BY-NC22. (a) Adrian Pingstone (User:Apingstone/Wikipedia); (b) Jon Sullivan; (c) Courtesy of US Geological Survey,
modified by User:Adrignola/Wikimedia Commons; (d) Kevin Walsh; (e) User:Woudloper/Wikimedia Com-mons;(a) Mark A Wilson (User:Wilson44691/Wikimedia Commons); (b) Mark A Wilson (User:Wilson44691/WikimediaCommons); (c) Flickr:digital cat. (a) http://commons.wikimedia.org/wiki/File:Amber.insect.800pix.050203.jpg; (b) http://commons.wikimedia.org/wiki/File:PetrifiedWood.jpg; (c) http://commons.wikimedia.org/wiki/File:Cast_and_mold_of_a_clam_shell.jpg; (d) http://www.flickr.com/photos/86624586@N00/3005767958/; (e) http://commons.wikimedia.org/wiki/File:Pecopteris_arborescens.jpg;(a) http://commons.wikimedia.org/wiki/File:WalcottQuarry080509.jpg; (b) http://commons.wikimedia.org/wiki/File:Anomalocaris_Mt._Stephen.
135

4.9. References www.ck12.org
jpg; (c) http://www.flickr.com/photos/14646075@N03/3934445785/ . (a) Public Domain; (b) Public Domain;(c) Public Domain; (d) CC BY 2.0 ; (e) Public Domain;(a) Public Domain; (b) Public Domain; (c) CC BY 2.0
23. Kevin Walsh;(a) Mark A Wilson (User:Wilson44691/Wikimedia Commons); (b) Mark A Wilson (User:Wilson44691/WikimediaCommons); (c) Flickr:digital cat. http://www.flickr.com/photos/86624586@N00/4663012974/;(a) http://commons.wikimedia.org/wiki/File:WalcottQuarry080509.jpg; (b) http://commons.wikimedia.org/wiki/File:Anomalocaris_Mt._Stephen.jpg; (c) http://www.flickr.com/photos/14646075@N03/3934445785/ . CC BY 2.0;(a)Public Domain; (b) Public Domain; (c) CC BY 2.0
24. . . CC BY-NC25. Jeff. http://www.flickr.com/photos/jeffedoe/3754680716/ . CC BY 2.026. Neethis. http://commons.wikimedia.org/wiki/File:Fictional_Snowball_Earth_1_Neethis.jpg . The copyright
holder of this work allows anyone to use it for any purpose including unrestricted redistribution, commercialuse, and modification
27. Mariana Ruiz Villarreal (LadyofHats) for CK-12 Foundation. CK-12 Foundation .28. Left: Stanton F. Fink; Right: User:TheoricienQuantique/Wikimedia Commons. Left: http://commons.wik
imedia.org/wiki/File:Archaeocyatha.jpg; Right: http://commons.wikimedia.org/wiki/File:Asaphiscus_Wheeleri_3.jpg . Left: CC BY 2.5; Right: Public Domain
29. Mariana Ruiz Villarreal (LadyofHats) for CK-12 Foundation. CK-12 Foundation . CC BY-NC 3.030. Eduard Riou. http://commons.wikimedia.org/wiki/File:Devonianscene.jpg . Public Domain31. Laura Guerin. CK-12 Foundation . CC BY-NC 3.032. Dinosaur images from top to bottom: Nobu Tamura; Image copyright Computer Earth, 2014; Charles R.
Knight. Dinosaur images from top to bottom: http://commons.wikimedia.org/wiki/File:Staurikosaurus_BW.jpg; http://www.shutterstock.com; http://commons.wikimedia.org/wiki/File:T._rex_old_posture.jpg . Di-nosaur images from top to bottom: CC BY 3.0; Used under license from Shutterstock.com; Public Domain
33. Top image: Gustav Mützel; Bottom image: Mauricio Antón. Top image: http://commons.wikimedia.org/wiki/File:Gelber_Babuin-drawing.jpg; Bottom image: http://commons.wikimedia.org/wiki/File:Woolly_mammoth_siberian_tundra.jpg . Top image: Public Domain; Bottom image: CC BY 2.5
34. Ernst Haeckel. http://en.wikipedia.org/wiki/File:Age-of-Man-wiki.jpg . CC BY-NC35. Yuri Virovets. http://www.flickr.com/photos/virovets/1668922628/ . CC BY 2.036. Jean-Gilles Berizzi. http://commons.wikimedia.org/wiki/File:Venus_of_Brassempouy.jpg . Public Domain37. Christopher Auyeung (based on image by Peter Halasz). CK-12 Foundation (original image from http://com
mons.wikimedia.org/wiki/File:Biological_classification_L_Pengo_tweaked.svg) . CC BY-NC 3.0 (originalimage in public domain)
38. . http://en.wikipedia.org/wiki/Image:Phylogenetic_tree.svg . Public Domain39. Mariana Ruiz Villarreal (LadyofHats) for CK-12 Foundation. CK-12 Foundation . CC BY-NC 3.040. Mariana Ruiz Villarreal (LadyofHats) for CK-12 Foundation. CK-12 Foundation . CC BY-NC 3.0
136

www.ck12.org Chapter 5. The Theory of Evolution
CHAPTER 5 The Theory of EvolutionChapter Outline
5.1 ADAPTATION AND EVOLUTION OF POPULATIONS
5.2 DARWIN AND THE THEORY OF EVOLUTION
5.3 EVIDENCE FOR EVOLUTION
5.4 MICROEVOLUTION AND THE GENETICS OF POPULATIONS
5.5 MACROEVOLUTION AND THE ORIGIN OF SPECIES
5.6 REFERENCES
The Grand Canyon, shown here, is an American icon and one of the wonders of the natural world. It’s also a recordof the past. Look at the rock layers in the picture. If you were to walk down a trail to the bottom of the canyon,with each step down you would be taking a step back in time. That’s because lower layers of rock represent themore distant past. The rock layers and the fossils they contain show the history of Earth and its organisms over a2-billion-year time span.
Although Charles Darwin never visited the Grand Canyon, he saw rock layers and fossils in other parts of the world.They were one inspiration for his theory of evolution. Darwin’s theory rocked the scientific world. In this chapter,you will read why.Image copyright Daniel Korzeniewski, 2014. www.shutterstock.com. Used under license f rom Shutterstock.com.
137

5.1. Adaptation and Evolution of Populations www.ck12.org
5.1 Adaptation and Evolution of Populations
Learning Objectives
• Define adaptation.• Explain the theory of evolution by natural selection.
Why would an organism match its background? Wouldn’t it be better to stand out?
An organism that blends with its background is more likely to avoid predators. If it survives, it is more likely to haveoffspring. Those offspring are more likely to blend into their backgrounds.
Adaptation
The characteristics of an organism that help it to survive in a given environment are called adaptations. Adaptationsare traits that an organism inherits from its parents. Within a population of organisms are genes coding for a certainnumber of traits. For example, a human population may have genes for eyes that are blue, green, hazel, or brown,but as far as we know, not purple or lime green.
Adaptations develop when certain variations or differences in a population help some members survive better thanothers (Figure 5.1). The variation may already exist within the population, but often the variation comes from amutation, or a random change in an organism’s genes. Some mutations are harmful and the organism dies; in thatcase, the variation will not remain in the population. Many mutations are neutral and remain in the population. If theenvironment changes, the mutation may be beneficial and it may help the organism adapt to the environment. Theorganisms that survive pass this favorable trait on to their offspring.
138

www.ck12.org Chapter 5. The Theory of Evolution
Biological Evolution
Many changes in the genetic makeup of a species may accumulate over time, especially if the environment ischanging. Eventually the descendants will be very different from their ancestors and may become a whole newspecies. Changes in the genetic makeup of a species over time are known as biological evolution.
Natural Selection
The mechanism for evolution is natural selection. Traits become more or less common in a population dependingon whether they are beneficial or harmful. An example of evolution by natural selection can be found in the deermouse, species Peromyscus maniculatus. In Nebraska this mouse is typically brown, but after glaciers carried lightersand over the darker soil in the Sand Hills, predators could more easily spot the dark mice. Natural selection favoredthe light mice, and over time, the population became light colored.
FIGURE 5.1An explanation of how adaptations de-velop.
MEDIAClick image to the left or use the URL below.URL: https://www.ck12.org/flx/render/embeddedobject/186575
139

5.1. Adaptation and Evolution of Populations www.ck12.org
MEDIAClick image to the left or use the URL below.URL: https://www.ck12.org/flx/render/embeddedobject/186577
Summary
• A population has genetic variations, possibly due to mutations. Favorable variations may allow an organismto be better adapted to its environment and survive to reproduce.
• Beneficial traits are favored in a population so that they may become better represented.• Changes in the genetic makeup of a species may result in a new species; this is biological evolution.
Review
1. The Grand Canyon was carved, separating what had once been a single population of squirrel into two separatepopulations. What do you think happened to those populations over time?
2. How does natural selection work?3. How does biological evolution work?4. What will cause evolution to proceed rapidly?
Explore More
Use these resources to answer the questions that follow.
MEDIAClick image to the left or use the URL below.URL: https://www.ck12.org/flx/render/embeddedobject/178257
1. What is an adaptation? What does an adaptation do?2. What adaptation does the rock pocket mouse have for living over desert sand and gravel? What adaptation
does it have for living over lava?3. How could bacteria become resistant to antibiotics.4. As climate warms what may happen to polar bears?5. How does natural selection change the rock pocket mouse population from brown to black?6. How do new species form?7. What are the four factors of natural selection so that a species is better adapted to its environment?8. What is adaptation? What is the mechanism?
140

www.ck12.org Chapter 5. The Theory of Evolution
5.2 Darwin and the Theory of Evolution
Lesson Objectives
• State Darwin’s theory of evolution by natural selection.• Describe observations Darwin made on the voyage of the Beagle.• Identify influences on Darwin’s development of evolutionary theory.• Explain how a species can evolve through natural selection.
Vocabulary
• artificial selection• fitness• Galápagos Islands• inheritance of acquired characteristics
Introduction
The Englishman Charles Darwin is one of the most famous scientists who ever lived. His place in the history ofscience is well deserved. Darwin’s theory of evolution represents a giant leap in human understanding. It explainsand unifies all of biology.
An overview of evolution can be seen at http://www.youtube.com/watch?v=GcjgWov7mTM (17:39).
MEDIAClick image to the left or use the URL below.URL: https://www.ck12.org/flx/render/embeddedobject/156
Darwin’s Theory at a Glance
Darwin’s theory of evolution actually contains two major ideas:
1. One idea is that evolution occurs. In other words, organisms change over time. Life on Earth has changed asdescendants diverged from common ancestors in the past.
141

5.2. Darwin and the Theory of Evolution www.ck12.org
2. The other idea is that evolution occurs by natural selection. Natural selection is the process in which livingthings with beneficial traits produce more offspring than others do. This results in changes in the traits ofliving things over time.
In Darwin’s day, most people believed that all species were created at the same time and remained unchangedthereafter. They also believed that Earth was only 6,000 years old. Therefore, Darwin’s ideas revolutionized biology.How did Darwin come up with these important ideas? It all started when he went on a voyage.
The Voyage of the HMS Beagle
In 1831, when Darwin was just 22 years old, he set sail on a scientific expedition on a ship called the HMS Beagle.He was the naturalist on the voyage. As a naturalist, it was his job to observe and collect specimens of plants,animals, rocks, and fossils wherever the expedition went ashore. The route the ship took and the stops they made areshown in Figure 5.2. You can learn more about Darwin’s voyage at this link: http://www.aboutdarwin.com/voyage/voyage03.html .
FIGURE 5.2Voyage of the Beagle. This map shows the route of Darwin’s 5-year voyage on the HMS Beagle. Each stop alongthe way is labeled. Darwin and the others on board eventually circled the globe.
Darwin was fascinated by nature, so he loved his job on the Beagle. He spent more than 3 years of the 5-yeartrip exploring nature on distant continents and islands. While he was away, a former teacher published Darwin’saccounts of his observations. By the time Darwin finally returned to England, he had become famous as a naturalist.
142

www.ck12.org Chapter 5. The Theory of Evolution
Darwin’s Observations
During the long voyage, Darwin made many observations that helped him form his theory of evolution. For example:
• He visited tropical rainforests and other new habitats where he saw many plants and animals he had never seenbefore (see Figure 5.3). This impressed him with the great diversity of life.
• He experienced an earthquake that lifted the ocean floor 2.7 meters (9 feet) above sea level. He also foundrocks containing fossil sea shells in mountains high above sea level. These observations suggested thatcontinents and oceans had changed dramatically over time and continue to change in dramatic ways.
• He visited rock ledges that had clearly once been beaches that had gradually built up over time. This suggestedthat slow, steady processes also change Earth’s surface.
• He dug up fossils of gigantic extinct mammals, such as the ground sloth (see Figure 5.3). This was hardevidence that organisms looked very different in the past. It suggested that living things—like Earth’s sur-face—change over time.
FIGURE 5.3On his voyage, Darwin saw giant marine iguanas and blue-footed boobies. He also dug up the fossil skeleton ofa giant ground sloth like the one shown here. From left: Giant Marine Iguana, Blue-Footed Boobies, and FossilSkeleton of a Giant Ground Sloth
The Galápagos Islands
Darwin’s most important observations were made on the Galápagos Islands (see map in Figure 5.4). This is agroup of 16 small volcanic islands 966 kilometers (600 miles) off the west coast of South America.
Individual Galápagos islands differ from one another in important ways. Some are rocky and dry. Others have bettersoil and more rainfall. Darwin noticed that the plants and animals on the different islands also differed. For example,the giant tortoises on one island had saddle-shaped shells, while those on another island had dome-shaped shells (seeFigure 5.5). People who lived on the islands could even tell the island a turtle came from by its shell. This startedDarwin thinking about the origin of species. He wondered how each island came to have its own type of tortoise.
The Farallon Islands - "California’s Galapagos"
One of the most productive marine food webs on the planet is located on the Farallon Islands, just 28 miles off theSan Francisco, California coast. These islands host the largest seabird breeding colony in the continental UnitedStates, with over 300,000 breeding seabirds. The Farallon Islands also have a rich diversity of marine life. They are
143

5.2. Darwin and the Theory of Evolution www.ck12.org
FIGURE 5.4Galápagos Islands. This map shows thelocation of the Galápagos Islands thatDarwin visited on his voyage.
FIGURE 5.5Galápagos Tortoises. Galápagos tor-toises have differently shaped shells de-pending on which island they inhabit.Tortoises with saddle-shaped shells canreach up to eat plant leaves above theirhead. Tortoises with dome-shaped shellscannot reach up in this way. These twotypes of tortoises live on islands withdifferent environments and food sources.How might this explain the differences intheir shells?
the spawning grounds for numerous fish and invertebrate species, and at least 36 species of marine mammals havebeen observed in surrounding waters. The islands are known as the Galapagos of California. Why?
MEDIAClick image to the left or use the URL below.URL: https://www.ck12.org/flx/render/embeddedobject/438
144

www.ck12.org Chapter 5. The Theory of Evolution
Influences on Darwin
Science, like evolution, always builds on the past. Darwin didn’t develop his theory completely on his own. He wasinfluenced by the ideas of earlier thinkers.
Earlier Thinkers Who Influenced Darwin
1. Jean Baptiste Lamarck (1744-1829) was an important French naturalist. He was one of the first scientists topropose that species change over time. However, Lamarck was wrong about how species change. His idea ofthe inheritance of acquired characteristics is incorrect. Traits an organism develops during its own life timecannot be passed on to offspring, as Lamarck believed.
2. Charles Lyell (1797-1875) was a well-known English geologist. Darwin took his book, Principles of Geology,with him on the Beagle. In the book, Lyell argued that gradual geological processes have gradually shapedEarth’s surface. From this, Lyell inferred that Earth must be far older than most people believed.
3. Thomas Malthus (1766-1834) was an English economist. He wrote an essay titled On Population. In the essay,Malthus argued that human populations grow faster than the resources they depend on. When populationsbecome too large, famine and disease break out. In the end, this keeps populations in check by killing off theweakest members.
Artificial Selection
These weren’t the only influences on Darwin. He was also aware that humans could breed plants and animals tohave useful traits. By selecting which animals were allowed to reproduce, they could change an organism’s traits.The pigeons in Figure 5.6 are good examples. Darwin called this type of change in organisms artificial selection.He used the word artificial to distinguish it from natural selection.
Wallace’s Theory
Did you ever hear the saying that “great minds think alike?” It certainly applies to Charles Darwin and anotherEnglish naturalist named Alfred Russel Wallace. Wallace lived at about the same time as Darwin. He also traveledto distant places to study nature. Wallace wasn’t as famous as Darwin. However, he developed basically the sametheory of evolution. While working in distant lands, Wallace sent Darwin a paper he had written. In the paper,Wallace explained his evolutionary theory. This served to confirm what Darwin already thought.
Darwin’s Theory of Evolution by Natural Selection
Darwin spent many years thinking about the work of Lamarck, Lyell, and Malthus, what he had seen on his voyage,and artificial selection. What did all this mean? How did it all fit together? It fits together in Darwin’s theory ofevolution by natural selection. It’s easy to see how all of these influences helped shape Darwin’s ideas.
For a discussion of the underlying causes of natural selection and evolution see http://www.youtube.com/watch?v=DuArVnT1i-E (19:51).
145

5.2. Darwin and the Theory of Evolution www.ck12.org
FIGURE 5.6Artificial Selection in Pigeons. Pigeonhobbyists breed pigeons to have certaincharacteristics. Both of the pigeons in thebottom row were bred from the commonrock pigeon.
MEDIAClick image to the left or use the URL below.URL: https://www.ck12.org/flx/render/embeddedobject/169
Evolution of Darwin’s Theory
It took Darwin years to form his theory of evolution by natural selection. His reasoning went like this:
1. Like Lamarck, Darwin assumed that species can change over time. The fossils he found helped convince himof that.
2. From Lyell, Darwin saw that Earth and its life were very old. Thus, there had been enough time for evolutionto produce the great diversity of life Darwin had observed.
3. From Malthus, Darwin knew that populations could grow faster than their resources. This “overproduction ofoffspring” led to a “struggle for existence,” in Darwin’s words.
4. From artificial selection, Darwin knew that some offspring have chance variations that can be inherited. Innature, offspring with certain variations might be more likely to survive the “struggle for existence” andreproduce. If so, they would pass their favorable variations to their offspring.
5. Darwin coined the term fitness to refer to an organism’s relative ability to survive and produce fertile offspring.Nature selects the variations that are most useful. Therefore, he called this type of selection natural selection.
6. Darwin knew artificial selection could change domestic species over time. He inferred that natural selectioncould also change species over time. In fact, he thought that if a species changed enough, it might evolve into
146

www.ck12.org Chapter 5. The Theory of Evolution
a new species.
Wallace’s paper not only confirmed Darwin’s ideas. They pushed him to finish his book, On the Origin of Species.Published in 1859, this book changed science forever. It clearly spelled out Darwin’s theory of evolution by naturalselection and provided convincing arguments and evidence to support it.
Applying Darwin’s Theory
The following example applies Darwin’s theory. It explains how giraffes came to have such long necks (see Figure5.7).
• In the past, giraffes had short necks. But there was chance variation in neck length. Some giraffes had necksa little longer than the average.
• Then, as now, giraffes fed on tree leaves. Perhaps the environment changed, and leaves became scarcer. Therewould be more giraffes than the trees could support. Thus, there would be a “struggle for existence.”
• Giraffes with longer necks had an advantage. They could reach leaves other giraffes could not. Therefore, thelong-necked giraffes were more likely to survive and reproduce. They had greater fitness.
• These giraffes passed the long-neck trait to their offspring. Each generation, the population contained morelong-necked giraffes. Eventually, all giraffes had long necks.
FIGURE 5.7African Giraffes. Giraffes feed on leaveshigh in trees. Their long necks allow themto reach leaves that other ground animalscannot.
As this example shows, chance variations may help a species survive if the environment changes. Variation amongspecies helps ensure that at least one will be able to survive environmental change.
A summary of Darwin’s ideas are presented in the Natural Selection and the Owl Butterfly video: http://www.youtube.com/watch?v=dR_BFmDMRaI (13:29).
MEDIAClick image to the left or use the URL below.URL: https://www.ck12.org/flx/render/embeddedobject/170
147

5.2. Darwin and the Theory of Evolution www.ck12.org
KQED: Chasing Beetles, Finding Darwin
It’s been over 150 years since Charles Darwin published On the Origin of Species. Yet his ideas remain as central toscientific exploration as ever, and has been called the unifying concept of all biology. Is evolution continuing today?Of course it is.
QUEST follows researchers who are still unlocking the mysteries of evolution, including entomologist David Ka-vanaugh of the California Academy of Sciences, who predicted that a new beetle species would be found on theTrinity Alps of Northern California.
It’s rare for a biologist to predict the discovery of a new species - even for someone like Kavanaugh, who hasdiscovered many new species. For his prediction, Kavanaugh drew inspiration from Darwin’s own 1862 prediction.When Darwin observed an orchid from Madagascar with a foot-long nectare, he predicted that a pollinator would befound with a tongue long enough to reach the nectar inside the orchid’s very thin, elongated nectar "pouch," thoughhe had never seen such a bird or insect. Darwin’s prediction was based on his finding that all species are related toeach other and that some of them evolve together, developing similar adaptations. His prediction came true in 1903,when a moth was discovered in Madagascar with a long, thin proboscis, which it uncurls to reach the nectar in theorchid’s nectare. In the process of feeding from the orchid, the moth serves as its pollinator. The moth was given thescientific name Xanthopan morganii praedicta, in honor of Darwin’s prediction.
MEDIAClick image to the left or use the URL below.URL: https://www.ck12.org/flx/render/embeddedobject/435
KQED: The California Academy of Sciences
Founded in 1853 as the first scientific institution in the western United States, the California Academy of Sciences’mission is to explore, explain, and protect the natural world. The California Academy of Sciences has the largestcollection of biological reference materials west of the Mississippi River. Dating back over 100 years, the collectionprovides a treasure trove of biological information for scientists and researchers studying the natural world.
MEDIAClick image to the left or use the URL below.URL: https://www.ck12.org/flx/render/embeddedobject/436
Norman Penny, collections manager of the entomology department of the California Academy of Sciences, givesQUEST viewers a peek at the California Academy of Sciences vast butterfly collection, and discusses the evolution-ary importance of butterflies.
148

www.ck12.org Chapter 5. The Theory of Evolution
MEDIAClick image to the left or use the URL below.URL: https://www.ck12.org/flx/render/embeddedobject/437
Lesson Summary
• Darwin’s theory of evolution by natural selection states that living things with beneficial traits produce moreoffspring than others do. This produces changes in the traits of living things over time.
• During his voyage on the Beagle, Darwin made many observations that helped him develop his theory ofevolution. His most important observations were made on the Galápagos Islands.
• Darwin was influenced by other early thinkers, including Lamarck, Lyell, and Malthus. He was also influencedby his knowledge of artificial selection.
• Wallace’s paper on evolution confirmed Darwin’s ideas. It also pushed him to publish his book, On the Originof Species. The book clearly spells out his theory. It also provides evidence and logic to support it.
Lesson Review Questions
Recall
1. State Darwin’s theory of evolution by natural selection.
2. Describe two observations Darwin made on his voyage on the Beagle that helped him develop his theory ofevolution.
3. What is the inheritance of acquired characteristics? What scientist developed this mistaken idea?
4. What is artificial selection? How does it work?
5. How did Alfred Russel Wallace influence Darwin?
Apply Concepts
6. Apply Darwin’s theory of evolution by natural selection to a specific case. For example, explain how Galápagostortoises could have evolved saddle-shaped shells.
Think Critically
7. Why did Darwin’s observations of Galápagos tortoises cause him to wonder how species originate?
8. Explain how the writings of Charles Lyell and Thomas Malthus helped Darwin develop his theory of evolutionby natural selection.
149

5.2. Darwin and the Theory of Evolution www.ck12.org
Points to Consider
Darwin’s book On the Origin of Species is a major milestone in science. It introduced biology’s most importanttheory. It also provided an excellent example of how to think like a scientist. A scientist uses evidence and logicto understand the natural world. In this lesson, you read about some of the evidence Darwin used. This evidenceincluded fossils and artificial selection.
• What other evidence might be used to show that evolution occurs? What about evidence based on molecules?• Do you think it’s possible to see evolution occurring? How might that happen?
150

www.ck12.org Chapter 5. The Theory of Evolution
5.3 Evidence for Evolution
Lesson Objectives
• Describe how fossils help us understand the past.• Explain how evidence from living species gives clues about evolution.• State how biogeography relates to evolutionary change.
Vocabulary
• adaptive radiation• analogous structure• biogeography• comparative anatomy• comparative embryology• homologous structure• paleontologist• vestigial structure
Introduction
In his book On the Origin of Species, Darwin included a lot of evidence to show that evolution had taken place. Healso made logical arguments to support his theory that evolution occurs by natural selection. Since Darwin’s time,much more evidence has been gathered. The evidence includes a huge number of fossils. It also includes moredetailed knowledge of living things, right down to their DNA.
Fossil Evidence
Fossils are a window into the past. They provide clear evidence that evolution has occurred. Scientists who find andstudy fossils are called paleontologists. How do they use fossils to understand the past? Consider the example ofthe horse, shown in Figure 5.8. The fossil record shows how the horse evolved.
The oldest horse fossils show what the earliest horses were like. They were about the size of a fox, and they had fourlong toes. Other evidence shows they lived in wooded marshlands, where they probably ate soft leaves. Throughtime, the climate became drier, and grasslands slowly replaced the marshes. Later fossils show that horses changedas well.
• They became taller, which would help them see predators while they fed in tall grasses.
151

5.3. Evidence for Evolution www.ck12.org
FIGURE 5.8Evolution of the Horse. The fossil recordreveals how horses evolved.
• They evolved a single large toe that eventually became a hoof. This would help them run swiftly and escapepredators.
• Their molars (back teeth) became longer and covered with cement. This would allow them to grind toughgrasses and grass seeds without wearing out their teeth.
Similar fossil evidence demonstrates the evolution of the whale, moving from the land into the sea. An animation ofthis process can be viewed at http://collections.tepapa.govt.nz/exhibitions/whales/Segment.aspx?irn=161 .
152

www.ck12.org Chapter 5. The Theory of Evolution
Does The Fossil Record Support Evolution? This video can be seen at http://www.youtube.com/watch?v=QWVoXZPOCGk (9:20).
Evidence from Living Species
Just as Darwin did, today’s scientists study living species to learn about evolution. They compare the anatomy,embryos, and DNA of modern organisms to understand how they evolved.
Comparative Anatomy
Comparative anatomy is the study of the similarities and differences in the structures of different species. Similarbody parts may be homologies or analogies. Both provide evidence for evolution.
Homologous structures are structures that are similar in related organisms because they were inherited from acommon ancestor. These structures may or may not have the same function in the descendants. Figure 5.9 showsthe hands of several different mammals. They all have the same basic pattern of bones. They inherited this patternfrom a common ancestor. However, their forelimbs now have different functions.
FIGURE 5.9Hands of Different Mammals. The fore-limbs of all mammals have the same basicbone structure.
Analogous structures are structures that are similar in unrelated organisms. The structures are similar because theyevolved to do the same job, not because they were inherited from a common ancestor. For example, the wings of batsand birds, shown in Figure 5.10, look similar on the outside. They also have the same function. However, wingsevolved independently in the two groups of animals. This is apparent when you compare the pattern of bones insidethe wings.
Comparative Embryology
Comparative embryology is the study of the similarities and differences in the embryos of different species.Similarities in embryos are evidence of common ancestry. All vertebrate embryos, for example, have gill slitsand tails. All of the animals in the figure, except for fish, lose their gill slits by adulthood. Some of them also losetheir tail. In humans, the tail is reduced to the tail bone. Thus, similarities organisms share as embryos may be goneby adulthood. This is why it is valuable to compare organisms in the embryonic stage. See http://www.pbs.org/wgbh/evolution/library/04/2/pdf/l_042_03.pdf for additional information and a nice comparative diagram of human,monkey, pig, chicken and salamander embryos.
153

5.3. Evidence for Evolution www.ck12.org
FIGURE 5.10Wings of Bats and Birds. Wings of batsand birds serve the same function. Lookclosely at the bones inside the wings. Thedifferences show they developed from dif-ferent ancestors.
Vestigial Structures
Structures like the human tail bone are called vestigial structures. Evolution has reduced their size because thestructures are no longer used. The human appendix is another example of a vestigial structure. It is a tiny remnant ofa once-larger organ. In a distant ancestor, it was needed to digest food. It serves no purpose in humans today. Whydo you think structures that are no longer used shrink in size? Why might a full-sized, unused structure reduce anorganism’s fitness?
Comparing DNA
Darwin could compare only the anatomy and embryos of living things. Today, scientists can compare their DNA.Similar DNA sequences are the strongest evidence for evolution from a common ancestor. Look at the cladogram inFigure 5.11. It shows how humans and apes are related based on their DNA sequences.
Evolution and molecules are discussed at http://www.youtube.com/watch?v=nvJFI3ChOUU (3:52).
Using various types of information to understand evolutionary relationships is discussed in the following videos:http://www.youtube.com/watch?v=aZc1t2Os6UU (3:38), http://www.youtube.com/watch?v=6IRz85QNjz0 (6:45),http://www.youtube.com/watch?v=JgyTVT3dqGY (10:51).
Evidence from Biogeography
Biogeography is the study of how and why plants and animals live where they do. It provides more evidence forevolution. Let’s consider the camel family as an example.
154

www.ck12.org Chapter 5. The Theory of Evolution
FIGURE 5.11Cladogram of Humans and Apes. Thiscladogram is based on DNA compar-isons. It shows how humans are related toapes by descent from common ancestors.
Biogeography of Camels: An Example
Today, the camel family includes different types of camels. They are shown in Figure 5.12. All of today’s camelsare descended from the same camel ancestors. These ancestors lived in North America about a million years ago.
FIGURE 5.12Camel Migrations and Present-Day Vari-ation. Members of the camel family nowlive in different parts of the world. Theydiffer from one another in a number oftraits. However, they share basic similari-ties. This is because they all evolved froma common ancestor. What differencesand similarities do you see?
Early North American camels migrated to other places. Some went to East Asia. They crossed a land bridge duringthe last ice age. A few of them made it all the way to Africa. Others went to South America. They crossed the Isthmusof Panama. Once camels reached these different places, they evolved independently. They evolved adaptations that
155

5.3. Evidence for Evolution www.ck12.org
suited them for the particular environment where they lived. Through natural selection, descendants of the originalcamel ancestors evolved the diversity they have today.
Island Biogeography
The biogeography of islands yields some of the best evidence for evolution. Consider the birds called finches thatDarwin studied on the Galápagos Islands (see Figure 5.13). All of the finches probably descended from one birdthat arrived on the islands from South America. Until the first bird arrived, there had never been birds on the islands.The first bird was a seed eater. It evolved into many finch species. Each species was adapted for a different type offood. This is an example of adaptive radiation. This is the process by which a single species evolves into manynew species to fill available niches.
FIGURE 5.13Galápagos finches differ in beak size andshape, depending on the type of food theyeat.
Eyewitness to Evolution
In the 1970s, biologists Peter and Rosemary Grant went to the Galápagos Islands. They wanted to re-study Darwin’sfinches. They spent more than 30 years on the project. Their efforts paid off. They were able to observe evolutionby natural selection actually taking place.
While the Grants were on the Galápagos, a drought occurred. As a result, fewer seeds were available for finches toeat. Birds with smaller beaks could crack open and eat only the smaller seeds. Birds with bigger beaks could crackand eat seeds of all sizes. As a result, many of the small-beaked birds died in the drought. Birds with bigger beakssurvived and reproduced (see Figure 5.14). Within 2 years, the average beak size in the finch population increased.Evolution by natural selection had occurred.
156

www.ck12.org Chapter 5. The Theory of Evolution
FIGURE 5.14Evolution of Beak Size in Galápagos Finches. The top graph shows the beak sizes of the entire finch populationstudied by the Grants in 1976. The bottom graph shows the beak sizes of the survivors in 1978. In just 2 years,beak size increased.
Lesson Summary
• Fossils provide a window into the past. They are evidence for evolution. Scientists who find and study fossilsare called paleontologists.
• Scientists compare the anatomy, embryos, and DNA of living things to understand how they evolved. Evidencefor evolution is provided by homologous structures. These are structures shared by related organisms that wereinherited from a common ancestor. Other evidence is provided by analogous structures. These are structuresthat unrelated organisms share because they evolved to do the same job.
• Biogeography is the study of how and why plants and animals live where they do. It also provides evidencefor evolution. On island chains, such as the Galápagos, one species may evolve into many new species to fill
157

5.3. Evidence for Evolution www.ck12.org
available niches. This is called adaptive radiation.
Lesson Review Questions
Recall
1. How do paleontologists learn about evolution?
2. Describe what fossils reveal about the evolution of the horse.
3. What are vestigial structures? Give an example.
4. Define biogeography.
5. Describe an example of island biogeography that provides evidence of evolution.
Apply Concepts
6. Humans and apes have five fingers they can use to grasp objects. Do you think these are analogous or homologousstructures? Explain.
Think Critically
7. Compare and contrast homologous and analogous structures. What do they reveal about evolution?
8. Why does comparative embryology show similarities between organisms that do not appear to be similar asadults?
Points to Consider
The Grants saw evolution occurring from one generation to the next in a population of finches.
• What factors caused the short-term evolution the Grants witnessed? How did the Grants know that evolutionhad occurred?
• What other factors do you think might cause evolution to occur so quickly within a population?
158

www.ck12.org Chapter 5. The Theory of Evolution
5.4 Microevolution and the Genetics ofPopulations
Lesson Objectives
• Distinguish between microevolution and macroevolution.• Define gene pool, and explain how to calculate allele frequencies.• State the Hardy-Weinberg theorem• Identify the four forces of evolution.
Vocabulary
• allele frequency• directional selection• disruptive selection• gene flow• gene pool• genetic drift• Hardy-Weinberg theorem• macroevolution• microevolution• population genetics• sexual dimorphism• stabilizing selection
Introduction
Darwin knew that heritable variations are needed for evolution to occur. However, he knew nothing about Mendel’slaws of genetics. Mendel’s laws were rediscovered in the early 1900s. Only then could scientists fully understandthe process of evolution.
The Scale of Evolution
We now know that variations of traits are heritable. These variations are determined by different alleles. We alsoknow that evolution is due to a change in alleles over time. How long a time? That depends on the scale of evolution.
• Microevolution occurs over a relatively short period of time within a population or species. The Grantsobserved this level of evolution in Darwin’s finches.
• Macroevolution occurs over geologic time above the level of the species. The fossil record reflects this levelof evolution. It results from microevolution taking place over many generations.
159

5.4. Microevolution and the Genetics of Populations www.ck12.org
Genes in Populations
Individuals do not evolve. Their genes do not change over time. The unit of evolution is the population. A populationconsists of organisms of the same species that live in the same area. In terms of evolution, the population is assumedto be a relatively closed group. This means that most mating takes place within the population. The science thatfocuses on evolution within populations is population genetics. It is a combination of evolutionary theory andMendelian genetics.
Gene Pool
The genetic makeup of an individual is the individual’s genotype. A population consists of many genotypes.Altogether, they make up the population’s gene pool. The gene pool consists of all the genes of all the members ofthe population. For each gene, the gene pool includes all the different alleles for the gene that exist in the population.For a given gene, the population is characterized by the frequency of the different alleles in the gene pool.
Allele Frequencies
Allele frequency is how often an allele occurs in a gene pool relative to the other alleles for that gene. Look at theexample in Table 5.1. The population in the table has 100 members. In a sexually reproducing species, each memberof the population has two copies of each gene. Therefore, the total number of copies of each gene in the gene pool is200. The gene in the example exists in the gene pool in two forms, alleles A and a. Knowing the genotypes of eachpopulation member, we can count the number of alleles of each type in the gene pool. The table shows how this isdone.
TABLE 5.1: Number of Alleles in a Gene Pool
Genotype Number of Individualsin the Population withthat Genotype
Number of Allele A Con-tributed to the GenePool by that Genotype
Number of Allele a Con-tributed to the GenePool by that Genotype
AA 50 50 × 2 = 100 50 × 0 = 0Aa 40 40 × 1 = 40 40 × 1 = 40aa 10 10 × 0 = 0 10 × 2 = 20Totals 100 140 60
Let the letter p stand for the frequency of allele A. Let the letter q stand for the frequency of allele a. We can calculatep and q as follows:
• p = number of A alleles/total number of alleles = 140/200 = 0.7• q = number of a alleles/total number of alleles = 60/200 = 0.3• Notice that p + q = 1.
Evolution occurs in a population when allele frequencies change over time. What causes allele frequencies tochange? That question was answered by Godfrey Hardy and Wilhelm Weinberg in 1908.
160
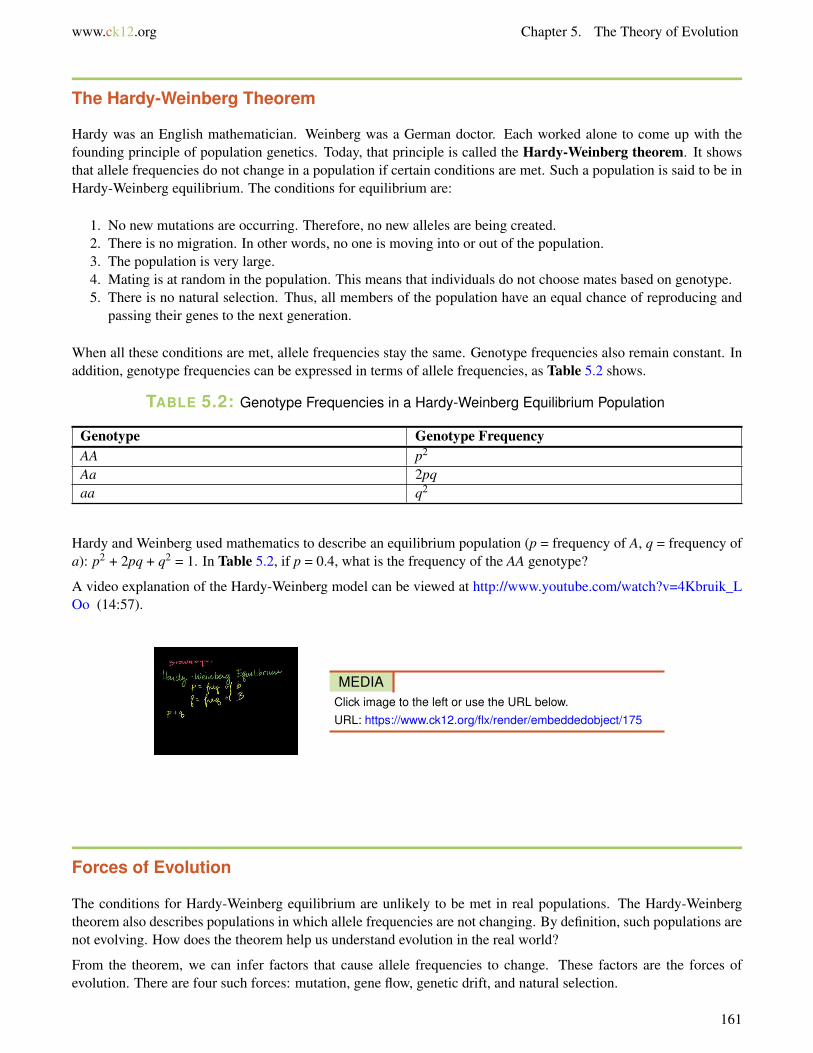
www.ck12.org Chapter 5. The Theory of Evolution
The Hardy-Weinberg Theorem
Hardy was an English mathematician. Weinberg was a German doctor. Each worked alone to come up with thefounding principle of population genetics. Today, that principle is called the Hardy-Weinberg theorem. It showsthat allele frequencies do not change in a population if certain conditions are met. Such a population is said to be inHardy-Weinberg equilibrium. The conditions for equilibrium are:
1. No new mutations are occurring. Therefore, no new alleles are being created.2. There is no migration. In other words, no one is moving into or out of the population.3. The population is very large.4. Mating is at random in the population. This means that individuals do not choose mates based on genotype.5. There is no natural selection. Thus, all members of the population have an equal chance of reproducing and
passing their genes to the next generation.
When all these conditions are met, allele frequencies stay the same. Genotype frequencies also remain constant. Inaddition, genotype frequencies can be expressed in terms of allele frequencies, as Table 5.2 shows.
TABLE 5.2: Genotype Frequencies in a Hardy-Weinberg Equilibrium Population
Genotype Genotype FrequencyAA p2
Aa 2pqaa q2
Hardy and Weinberg used mathematics to describe an equilibrium population (p = frequency of A, q = frequency ofa): p2 + 2pq + q2 = 1. In Table 5.2, if p = 0.4, what is the frequency of the AA genotype?
A video explanation of the Hardy-Weinberg model can be viewed at http://www.youtube.com/watch?v=4Kbruik_LOo (14:57).
MEDIAClick image to the left or use the URL below.URL: https://www.ck12.org/flx/render/embeddedobject/175
Forces of Evolution
The conditions for Hardy-Weinberg equilibrium are unlikely to be met in real populations. The Hardy-Weinbergtheorem also describes populations in which allele frequencies are not changing. By definition, such populations arenot evolving. How does the theorem help us understand evolution in the real world?
From the theorem, we can infer factors that cause allele frequencies to change. These factors are the forces ofevolution. There are four such forces: mutation, gene flow, genetic drift, and natural selection.
161

5.4. Microevolution and the Genetics of Populations www.ck12.org
Mutation
Mutation creates new genetic variation in a gene pool. It is how all new alleles first arise. In sexually reproducingspecies, the mutations that matter for evolution are those that occur in gametes. Only these mutations can be passedto offspring. For any given gene, the chance of a mutation occurring in a given gamete is very low. Thus, mutationsalone do not have much effect on allele frequencies. However, mutations provide the genetic variation needed forother forces of evolution to act.
Gene Flow
Gene flow occurs when individuals move into or out of a population. If the rate of migration is high, this can have asignificant effect on allele frequencies. Both the population they leave and the population they enter may change.
During the Vietnam War in the 1960s and 1970s, many American servicemen had children with Vietnamese women.Most of the servicemen returned to the United States after the war. However, they left copies of their genes behindin their offspring. In this way, they changed the allele frequencies in the Vietnamese gene pool. Was the gene poolof the American population also affected? Why or why not?
Genetic Drift
Genetic drift is a random change in allele frequencies that occurs in a small population. When a small number ofparents produce just a few offspring, allele frequencies in the offspring may differ, by chance, from allele frequenciesin the parents.
This is like tossing a coin. If you toss a coin just a few times, you may, by chance, get more or less than the expected50 percent heads or tails. In a small population, you may also, by chance, get different allele frequencies thanexpected in the next generation. In this way, allele frequencies may drift over time.
There are two special conditions under which genetic drift occurs. They are called bottleneck effect and foundereffect.
1. Bottleneck effect occurs when a population suddenly gets much smaller. This might happen because of anatural disaster such as a forest fire. By chance, allele frequencies of the survivors may be different from thoseof the original population.
2. Founder effect occurs when a few individuals start, or found, a new population. By chance, allele frequenciesof the founders may be different from allele frequencies of the population they left. An example is describedin Figure 5.15.
Natural Selection
Natural selection occurs when there are differences in fitness among members of a population. As a result, someindividuals pass more genes to the next generation. This causes allele frequencies to change. The example of sickle-cell anemia is described in Figure 5.16 and Table 5.3. It shows how natural selection can keep a harmful allele in agene pool. You can also watch a video about natural selection and sickle-cell anemia at this link: http://www.pbs.org/wgbh/evolution/library/01/2/l_012_02.html .
TABLE 5.3: Sickle Cell and Natural Selection
Genotype Phenotype FitnessAA 100% normal hemoglobin Somewhat reduced fitness because
of no resistance to malaria
162

www.ck12.org Chapter 5. The Theory of Evolution
TABLE 5.3: (continued)
Genotype Phenotype FitnessAS Enough normal hemoglobin to pre-
vent sickle-cell anemiaHighest fitness because of resis-tance to malaria
SS 100% abnormal hemoglobin, caus-ing sickle-cell anemia
Greatly reduced fitness because ofsickle-cell anemia
163

5.4. Microevolution and the Genetics of Populations www.ck12.org
FIGURE 5.15Founder Effect in the Amish Population. The Amish population in the U.S. and Canada had a small number offounders. How has this affected the Amish gene pool?
FIGURE 5.16Sickle Cell and Natural Selection.
Here’s how natural selection can keep a harmful allele in a gene pool:
• The allele (S) for sickle-cell anemia is a harmful autosomal recessive. It is caused by a mutation in the normalallele (A) for hemoglobin (a protein on red blood cells).
• Malaria is a deadly tropical disease. It is common in many African populations.• Heterozygotes (AS) with the sickle-cell allele are resistant to malaria. Therefore, they are more likely to
survive and reproduce. This keeps the S allele in the gene pool.
The sickle-cell example shows that fitness depends on phenotypes. It also shows that fitness may depend on theenvironment. What do you think might happen if malaria was eliminated in an African population with a relativelyhigh frequency of the S allele? How might the fitness of the different genotypes change? How might this affect thefrequency of the S allele?
Sickle-cell trait is controlled by a single gene. Natural selection for polygenic traits is more complex, unless you
164

www.ck12.org Chapter 5. The Theory of Evolution
just look at phenotypes. Three ways that natural selection can affect phenotypes are shown in Figure 5.17. You canalso watch an animation comparing the three ways at the link below. http://bcs.whfreeman.com/thelifewire/content/chp23/2301s.swf .
1. Stabilizing selection occurs when phenotypes at both extremes of the phenotypic distribution are selectedagainst. This narrows the range of variation. An example is human birth weight. Babies that are very large orvery small at birth are less likely to survive. This keeps birth weight within a relatively narrow range.
2. Directional selection occurs when one of two extreme phenotypes is selected for. This shifts the distributiontoward that extreme. This is the type of natural selection that the Grants observed in the beak size of Galápagosfinches.
3. Disruptive selection occurs when phenotypes in the middle of the range are selected against. This resultsin two overlapping phenotypes, one at each end of the distribution. An example is sexual dimorphism.This refers to differences between the phenotypes of males and females of the same species. In humans, forexample, males and females have different heights and body shapes.
FIGURE 5.17Natural Selection for a Polygenic Trait. Natural selection may affect the distribution of a polygenic trait. Thesegraphs show three ways this can happen.
For a review of natural selection and genetic drift, and how they relate to evolution, see http://www.cultureunplugged.com/play/2533/Mechanisms-of-Evolution . Mutation, natural selection, genetic drift and gene flow are discussed athttp://www.youtube.com/watch?v=RtIQvkQWTZY (8:45).
Lesson Summary
• Microevolution occurs over a short period of time in a population or species. Macroevolution occurs overgeologic time above the level of the species.
• The population is the unit of evolution. A population’s gene pool consists of all the genes of all the membersof the population. For a given gene, the population is characterized by the frequency of different alleles in thegene pool.
• The Hardy-Weinberg theorem states that, if a population meets certain conditions, it will be in equilibrium. Inan equilibrium population, allele and genotype frequencies do not change over time. The conditions that mustbe met are no mutation, no migration, very large population size, random mating, and no natural selection.
• There are four forces of evolution: mutation, gene flow, genetic drift, and natural selection. Natural selectionfor a polygenic trait changes the distribution of phenotypes. It may have a stabilizing, directional, or disruptiveeffect on the phenotype distribution.
165

5.4. Microevolution and the Genetics of Populations www.ck12.org
Lesson Review Questions
Recall
1. Why are populations, rather than individuals, the units of evolution?
2. What is a gene pool?
3. Describe a Hardy-Weinberg equilibrium population. What conditions must it meet to remain in equilibrium?
4. Identify the four forces of evolution.
5. Why is mutation needed for evolution to occur, even though it usually has little effect on allele frequencies?
6. What is founder effect? Give an example.
7. Identify three types of natural selection for a polygenic trait.
Apply Concepts
8. Assume that a population of 50 individuals has the following numbers of genotypes for a gene with two alleles, Band b: BB = 30, Bb = 10, and bb = 10. Calculate the frequencies of the two alleles in the population’s gene pool.
9. Assume that a population is in Hardy-Weinberg equilibrium for a particular gene with two alleles, A and a. Thefrequency of A is p, and the frequency of a is q. Because these are the only two alleles for this gene, p + q = 1.0. Ifthe frequency of homozygous recessive individuals (aa) is 0.04, what is the value of q? Based on the value of q, findp. Then use the values of p and q to calculate the frequency of the heterozygote genotype (Aa).
Think Critically
10. Compare and contrast microevolution and macroevolution. How are the two related?
11. Explain why genetic drift is most likely to occur in a small population.
Points to Consider
Disruptive selection for a polygenic trait results in two overlapping phenotypes. Theoretically, disruptive selectioncould lead to two new species forming.
• How might this happen? Can you describe how it could occur?• How else might one species diverge into two?
166

www.ck12.org Chapter 5. The Theory of Evolution
5.5 Macroevolution and the Origin of Species
Lesson Objectives
• Describe two ways that new species may originate.• Define coevolution, and give an example.• Distinguish between gradualism and punctuated equilibrium.
Vocabulary
• allopatric speciation• coevolution• gradualism• punctuated equilibrium• speciation• sympatric speciation
Introduction
Macroevolution is evolution over geologic time above the level of the species. One of the main topics in macroevolu-tion is how new species arise. The process by which a new species evolves is called speciation. How does speciationoccur? How does one species evolve into two or more new species?
Origin of Species
To understand how a new species forms, it’s important to review what a species is. A species is a group of organismsthat can breed and produce fertile offspring together in nature. For a new species to arise, some members of a speciesmust become reproductively isolated from the rest of the species. This means they can no longer interbreed withother members of the species. How does this happen? Usually they become geographically isolated first.
Allopatric Speciation
Assume that some members of a species become geographically separated from the rest of the species. If they remainseparated long enough, they may evolve genetic differences. If the differences prevent them from interbreeding withmembers of the original species, they have evolved into a new species. Speciation that occurs in this way is calledallopatric speciation. An example is described in Figure 5.18.
167

5.5. Macroevolution and the Origin of Species www.ck12.org
FIGURE 5.18Allopatric Speciation in the Kaibab Squirrel. The Kaibab squirrel is in the process of becoming a new species.
Sympatric Speciation
Less often, a new species arises without geographic separation. This is called sympatric speciation. The followingexample shows one way this can occur.
1. Hawthorn flies lay eggs in hawthorn trees (see Figure 5.19). The eggs hatch into larvae that feed on hawthornfruits. Both the flies and trees are native to the U.S.
2. Apple trees were introduced to the U.S. and often grow near hawthorn trees. Some hawthorn flies started tolay eggs in nearby apple trees. When the eggs hatched, the larvae fed on apples.
3. Over time, the two fly populations—those that fed on hawthorn trees and those that preferred apple trees—evolvedreproductive isolation. Now they are reproductively isolated because they breed at different times. Theirbreeding season matches the season when the apple or hawthorn fruits mature.
4. Because they rarely interbreed, the two populations of flies are evolving other genetic differences. They appearto be in the process of becoming separate species.
Isolating mechanisms are discussed in the following video http://www.youtube.com/watch?v=-e64TfKeAXU (2:57).
168

www.ck12.org Chapter 5. The Theory of Evolution
FIGURE 5.19Sympatric Speciation in Hawthorn Flies.Hawthorn flies are diverging from onespecies into two. As this example shows,behaviors as well as physical traits mayevolve and lead to speciation.
Coevolution
Evolution occurs in response to a change in the environment. Environmental change often involves other species oforganisms. In fact, species in symbiotic relationships tend to evolve together. This is called coevolution. As onespecies changes, the other species must also change in order to adapt.
Coevolution occurs in flowering plants and the species that pollinate them. The flower and bird in Figure 5.20 are agood example. They have evolved matching structures.
FIGURE 5.20Results of Coevolution in a Flower and Its Pollinator. The very long mouthpart of this hummingbird has coevolved with the tubular flower it pollinates.Only this species of bird can reach the nectar deep in the flower. Whatmight happen to the flower if the bird species went extinct?
Timing of Macroevolution
Is evolution slow and steady? Or does it occur in fits and starts? It may depend on what else is going on, such aschanges in climate and geologic conditions.
• When geologic and climatic conditions are stable, evolution may occur gradually. This is how Darwin thoughtevolution occurred. This model of the timing of evolution is called gradualism.
• When geologic and climatic conditions are changing, evolution may occur more quickly. Thus, long periodsof little change may be interrupted by bursts of rapid change. This model of the timing of evolution is calledpunctuated equilibrium. It is better supported by the fossil record than is gradualism.
169

5.5. Macroevolution and the Origin of Species www.ck12.org
Lesson Summary
• New species arise in the process of speciation. Allopatric speciation occurs when some members of a speciesbecome geographically separated. They then evolve genetic differences. If the differences prevent themfrom interbreeding with the original species, a new species has evolved. Sympatric speciation occurs withoutgeographic separation.
• Coevolution occurs when species evolve together. This often happens in species that have symbiotic relation-ships. Examples include flowering plants and their pollinators.
• Darwin thought that evolution occurs gradually. This model of evolution is called gradualism. The fossilrecord better supports the model of punctuated equilibrium. In this model, long periods of little change areinterrupted by bursts of rapid change.
Lesson Review Questions
Recall
1. Define speciation.
2. Describe how allopatric speciation occurs.
3. What is gradualism? When is it most likely to apply?
4. Describe the timing of evolutionary change according to the punctuated equilibrium model.
Apply Concepts
5. Apply the concepts of fitness and natural selection to explain how the insect and flower pictured in Figure 5.20could have evolved their matching structures.
Think Critically
6. Why is sympatric speciation less likely to occur than allopatric speciation?
Points to Consider
You read in this chapter about adaptive radiation on the Galápagos Islands. A single finch species evolved into manynew species to fill all available niches. For example, the species evolved adaptations for a variety of food sources.
• What is a species’ niche? What do you think it might include besides the food a species eats?• Niche is a term from ecology. What is ecology? How do you think knowledge of ecology might help scientists
understand evolution?
170

www.ck12.org Chapter 5. The Theory of Evolution
5.6 References
1. . . CC BY-NC2. Adrian Pingstone (Wikimedia: Arpingstone);Hana Zavadska. http://okplanttrees.okstate.edu/resources/educat
ional/pdr/section3.html;http://commons.wikimedia.org/wiki/File:Blue_poison_dart_frog_arp.jpg;CK-12 Foundation . CC BY-NC 3.0
3. Hana Zavadska. CK-12 Foundation . CC BY-NC 3.04. Christopher Auyeung. CK-12 Foundation . CC BY-NC 3.05. From left to right: A. Davey; Nicolas de Camaret; Mariana Ruiz Villarreal. From left to right: http://www.flick
r.com/photos/adavey/4114230491/; http://www.flickr.com/photos/ndecam/6214744005/; http://commons.wikimedia.org/wiki/File:Megatherium_americanum_complete.JPG . From left to right: CC BY 2.0; CC BY 2.0;Public Domain
6. User:Geo Swan/Wikimedia Commons. http://commons.wikimedia.org/wiki/File:Orthographic_projection_centred_over_the_Galapagos.png . Public Domain
7. Saddle-shell: Catriona MacCallum; Dome-shell: Nicolas de Camaret. Saddle-shell: http://commons.wikimedia.org/wiki/File:Geochelone_nigra.png; Dome-shell: http://www.flickr.com/photos/ndecam/6215265502/ . Saddle-shell: CC BY 2.5; Dome-shell: CC BY 2.0
8. Common rock pigeon: Image copyright Marketa Mark, 2014; Carrier pigeon: Image copyright guenter-manaus, 2014; Fantail pigeon: Image copyright Ulrike Haberkorn, 2014. http://www.shutterstock.com .Used under licenses from Shutterstock.com
9. William Warby. http://www.flickr.com/photos/wwarby/2405281800/ . CC BY 2.010. Mariana Ruiz Villarreal (LadyofHats) for the CK-12 Foundation. CK-12 Foundation . CC-BY-NC-SA 3.011. Christopher Auyeung. CK-12 Foundation . CC BY-NC 3.012. John Romanes, modified by CK-12 Foundation. http://commons.wikimedia.org/wiki/File:Homology.jpg .
Public Domain13. Human: User:MrKimm/Wikimedia Commons; Chimpanzee: Afrika Force; Gorilla: Roger Luijten; Ba-
boon: Birdseye Maple. Human: http://commons.wikimedia.org/wiki/File:Human-gender-neutral.png; Chimpanzee: http://www.flickr.com/photos/afrikaforce/5187391191; Gorilla: http://www.flickr.com/photos/66555186@N02/6312198231; Baboon: http://www.flickr.com/photos/26198976@N04/4007297452 . Human: Pub-lic Domain; Chimpanzee, Gorilla, Baboon: CC BY 2.0
14. Map by CK-12 Foundation; Camels (left to right): User:Agadez/Wikimedia Commons; Adrian Pingstone(User:Arpingstone/Wikimedia Commons); User:PowersPhotos/Wikipedia; Composite created by CK-12 Foun-dation. Camels (left to right): http://commons.wikimedia.org/wiki/File:Camelus_dromedarius_at_Tierpark_-Berlin_%281%29.JPG; http://commons.wikimedia.org/wiki/File:Bactrian.camel.sideon.arp.jpg; http://commons.wikimedia.org/wiki/File:Guanaco_09.24.jpg . Map: CC BY-NC 3.0; Camels (left to right): CC BY 2.5;Public Domain; Public Domain
15. Christopher Auyeung. CK-12 Foundation . CC BY-NC 3.016. Jodi So. CK-12 Foundation . CC BY-NC 3.017. Horse and Buggy: Derek Jensen; Hands: G Baujat and M Le Merrer; Composite created by CK-12 Foun-
dation. Horse and Buggy: http://commons.wikimedia.org/wiki/File:Shipshewana-indiana-amish-buggy.jpg;Hands: http://commons.wikimedia.org/wiki/File:Polydactyly_ECS.jpg . Horse and Buggy: Public Domain;
Hands: CC BY 2.018. Image copyright Sebastian Kaulitzki, 2014. http://www.shutterstock.com . Used under license from Shutter-
stock.com19. Zachary Wilson. CK-12 Foundation . CC BY-NC 3.020. From left to right: Allyson Mathis/National Park Service; Courtesy of NASA; Sally King/National Park
Service; Composite created by CK-12 Foundation. From left to right: http://www.flickr.com/photos/grand_c
171

5.6. References www.ck12.org
anyon_nps/6171345968/; http://commons.wikimedia.org/wiki/File:Grand_Canyon_autumn_STS61A-48-91.jpg; http://bandelier.areaparks.com/parkinfo.html?pid=1789 . Public Domain
21. Hawthorn berries: Brian Clift; Apples: Jennifer C.; Hawthorn fly: Joseph Berger; Composite created byCK-12 Foundation. Hawthorn berries: http://www.flickr.com/photos/brianac37/6052521522/; Apples: http://www.flickr.com/photos/29638108@N06/7714246618/; Hawthorn fly: http://www.invasive.org/browse/detail.cfm?imgnum=5402798 . Hawthorn berries and apples: CC BY 2.0; Hawthorn fly: CC BY 3.0
22. Charles J. Sharp. http://commons.wikimedia.org/wiki/File:Purple-throated_carib_hummingbird_feeding.jpg. CC BY 3.0
172

www.ck12.org Chapter 6. The Principles of Ecology
CHAPTER 6 The Principles of EcologyChapter Outline
6.1 THE SCIENCE OF ECOLOGY
6.2 DISTRIBUTION OF WATER ON EARTH
6.3 STATES OF WATER
6.4 THE WATER CYCLE
6.5 IMPORTANCE OF THE ATMOSPHERE
6.6 COMPOSITION OF THE ATMOSPHERE
6.7 TROPOSPHERE
6.8 STRATOSPHERE
6.9 RECYCLING MATTER
6.10 NITROGEN CYCLE IN ECOSYSTEMS
6.11 SEASONS
6.12 SOIL CHARACTERISTICS
6.13 SOIL FORMATION
6.14 SOIL HORIZONS AND PROFILES
6.15 TYPES OF SOILS
6.16 LATITUDE, LONGITUDE, AND DIRECTION
6.17 SOLAR ENERGY AND LATITUDE
6.18 GREENHOUSE EFFECT
6.19 IMPORTANCE OF THE OCEANS
6.20 WEATHER VS. CLIMATE
6.21 OCEAN CURRENTS AND CLIMATE
6.22 EFFECT OF LATITUDE ON CLIMATE
6.23 EFFECT OF ATMOSPHERIC CIRCULATION ON CLIMATE
6.24 EFFECT OF CONTINENTAL POSITION ON CLIMATE
6.25 EFFECT OF ALTITUDE AND MOUNTAINS ON CLIMATE
6.26 BIOMES
6.27 FRESH WATER ECOSYSTEMS
6.28 OCEAN ECOSYSTEMS
6.29 REFERENCES
173

www.ck12.org
These brilliant red “feathers” are actually animals called tube worms. They live in an extreme environment on thedeep ocean floor, thousands of meters below the water’s surface. Their world is always very cold and completelydark. Without sunlight, photosynthesis is not possible. So what do organisms eat at these depths? Tube wormsdepend on chemosynthetic microorganisms that live inside them for food. In this and other ways, tube worms haveadapted to the extreme conditions of their environment.
All organisms must adapt to their environment in order to survive. This is true whether they live in water or on land.Most environments are not as extreme as the deep ocean where tube worms live. But they all have conditions thatrequire adaptations. In this chapter, you will read about a wide variety of environments and the organisms that livein them.Courtesy o f Nicolle Rager Fuller, National Science Foundation. www.ns f .gov/news/special_reports/s f s/popup/li f e_vc_tubeworms.htm. Public Domain.
174

www.ck12.org Chapter 6. The Principles of Ecology
6.1 The Science of Ecology
Lesson Objectives
• Distinguish between abiotic and biotic factors.• Define ecosystem and other ecological concepts.• Describe how energy flows through ecosystems.• Explain how food chains and webs model feeding relationships.• Identify trophic levels in a food chain or web.
Vocabulary
• abiotic factor• biomass• biotic factor• carnivore• chemoautotroph• competitive exclusion principle• decomposer• detritivore• detritus• ecology• food chain• food web• habitat• herbivore• niche• omnivore• photoautotroph• saprotroph• scavenger• trophic level
Introduction
Ecology is the study of how living things interact with each other and with their environment. It is a major branch ofbiology, but has areas of overlap with geography, geology, climatology, and other sciences. This lesson introducesfundamental concepts in ecology, beginning with organisms and the environment.
175

6.1. The Science of Ecology www.ck12.org
Organisms and the Environment
Organisms are individual living things. Despite their tremendous diversity, all organisms have the same basic needs:energy and matter. These must be obtained from the environment. Therefore, organisms are not closed systems.They depend on and are influenced by their environment. The environment includes two types of factors: abioticand biotic.
1. Abiotic factors are the nonliving aspects of the environment. They include factors such as sunlight, soil,temperature, and water.
2. Biotic factors are the living aspects of the environment. They consist of other organisms, including membersof the same and different species.
The Ecosystem
An ecosystem is a unit of nature and the focus of study in ecology. It consists of all the biotic and abiotic factors inan area and their interactions. Ecosystems can vary in size. A lake could be considered an ecosystem. So could adead log on a forest floor. Both the lake and log contain a variety of species that interact with each other and withabiotic factors. Another example of an ecosystem is pictured in Figure 6.1.
FIGURE 6.1Desert Ecosystem. What are some ofthe biotic and abiotic factors in this desertecosystem?
When it comes to energy, ecosystems are not closed. They need constant inputs of energy. Most ecosystemsget energy from sunlight. A small minority get energy from chemical compounds. Unlike energy, matter is notconstantly added to ecosystems. Instead, it is recycled. Water and elements such as carbon and nitrogen are usedover and over again.
Niche
One of the most important concepts associated with the ecosystem is the niche. A niche refers to the role of aspecies in its ecosystem. It includes all the ways that the species interacts with the biotic and abiotic factors of the
176

www.ck12.org Chapter 6. The Principles of Ecology
environment. Two important aspects of a species’ niche are the food it eats and how the food is obtained. Look atFigure 6.2. It shows pictures of birds that occupy different niches. Each species eats a different type of food andobtains the food in a different way.
Habitat
Another aspect of a species’ niche is its habitat. The habitat is the physical environment in which a species livesand to which it is adapted. A habitat’s features are determined mainly by abiotic factors such as temperature andrainfall. These factors also influence the traits of the organisms that live there.
Competitive Exclusion Principle
A given habitat may contain many different species, but each species must have a different niche. Two differentspecies cannot occupy the same niche in the same place for very long. This is known as the competitive exclusionprinciple. If two species were to occupy the same niche, what do you think would happen? They would competewith one another for the same food and other resources in the environment. Eventually, one species would be likelyto outcompete and replace the other.
Flow of Energy
Energy enters ecosystems in the form of sunlight or chemical compounds. Some organisms use this energy to makefood. Other organisms get energy by eating the food.
Producers
Producers are organisms that produce food for themselves and other organisms. They use energy and simpleinorganic molecules to make organic compounds. The stability of producers is vital to ecosystems because allorganisms need organic molecules. Producers are also called autotrophs. There are two basic types of autotrophs:photoautotrophs and chemoautotrophs.
1. Photoautotrophs use energy from sunlight to make food by photosynthesis. They include plants, algae, andcertain bacteria (see Figure 6.3).
2. Chemoautotrophs use energy from chemical compounds to make food by chemosynthesis. They includesome bacteria and also archaea. Archaea are microorganisms that resemble bacteria.
Consumers
Consumers are organisms that depend on other organisms for food. They take in organic molecules by essentially“eating” other living things. They include all animals and fungi. (Fungi don’t really “eat”; they absorb nutrientsfrom other organisms.) They also include many bacteria and even a few plants, such as the pitcher plant in Figure6.4. Consumers are also called heterotrophs. Heterotrophs are classified by what they eat:
• Herbivores consume producers such as plants or algae. They are a necessary link between producers andother consumers. Examples include deer, rabbits, and mice.
• Carnivores consume animals. Examples include lions, polar bears, hawks, frogs, salmon, and spiders.Carnivores that are unable to digest plants and must eat only animals are called obligate carnivores. Othercarnivores can digest plants but do not commonly eat them.
177

6.1. The Science of Ecology www.ck12.org
FIGURE 6.2Bird Niches. Each of these species of birds has a beak that suits it for its niche. For example, the long slenderbeak of the nectarivore allows it to sip liquid nectar from flowers. The short sturdy beak of the granivore allows itto crush hard, tough grains.
178

www.ck12.org Chapter 6. The Principles of Ecology
FIGURE 6.3Different types of photoautotrophs are important in different ecosystems.
• Omnivores consume both plants and animals. They include humans, pigs, brown bears, gulls, crows, andsome species of fish.
179

6.1. The Science of Ecology www.ck12.org
FIGURE 6.4Pitcher Plants. Virtually all plants are producers. The pitcher plant is anexception. It consumes insects. It traps them in a sticky substance inits “pitcher.” Then it secretes enzymes that break down the insects andrelease nutrients. Which type of consumer is a pitcher plant?
Decomposers
When organisms die, they leave behind energy and matter in their remains. Decomposers break down the remainsand other wastes and release simple inorganic molecules back to the environment. Producers can then use themolecules to make new organic compounds. The stability of decomposers is essential to every ecosystem. Decom-posers are classified by the type of organic matter they break down:
• Scavengers consume the soft tissues of dead animals. Examples of scavengers include vultures, raccoons, andblowflies.
• Detritivores consume detritus—the dead leaves, animal feces, and other organic debris that collects on thesoil or at the bottom of a body of water. On land, detritivores include earthworms, millipedes, and dung beetles(see Figure 6.5). In water, detritivores include “bottom feeders” such as sea cucumbers and catfish.
• Saprotrophs are the final step in decomposition. They feed on any remaining organic matter that is left afterother decomposers do their work. Saprotrophs include fungi and single-celled protozoa. Fungi are the onlyorganisms that can decompose wood.
FIGURE 6.5Dung Beetle. This dung beetle is rolling aball of feces to its nest to feed its young.
180

www.ck12.org Chapter 6. The Principles of Ecology
KQED: Banana Slugs: The Ultimate Recyclers
One of the most beloved and iconic native species within the old growth redwood forests of California is the PacificBanana Slug. These slimy friends of the forest are the ultimate recyclers. Feeding on fallen leaves, mushrooms oreven dead animals, they play a pivotal role in replenishing the soil. QUEST goes to Henry Cowell Redwoods StatePark near Santa Cruz, California on a hunt to find Ariolomax dolichophallus, a bright yellow slug with a very bigpersonality.
MEDIAClick image to the left or use the URL below.URL: https://www.ck12.org/flx/render/embeddedobject/440
Food Chains and Food Webs
Food chains and food webs are diagrams that represent feeding relationships. They show who eats whom. In thisway, they model how energy and matter move through ecosystems.
Food Chains
A food chain represents a single pathway through which energy and matter flow through an ecosystem. An exampleis shown in Figure 6.6. Food chains are generally simpler than what really happens in nature. Most organismsconsume—and are consumed by—more than one species.
A musical summary of food chains can be heard at http://www.youtube.com/watch?v=TE6wqG4nb3M (2:46).
Food Webs
A food web represents multiple pathways through which energy and matter flow through an ecosystem. It includesmany intersecting food chains. It demonstrates that most organisms eat, and are eaten, by more than one species.Examples are shown in Figures 6.7 and 6.8.
Trophic Levels
The feeding positions in a food chain or web are called trophic levels. The different trophic levels are defined inTable 6.1. Examples are also given in the table. All food chains and webs have at least two or three trophic levels.Generally, there are a maximum of four trophic levels.
181
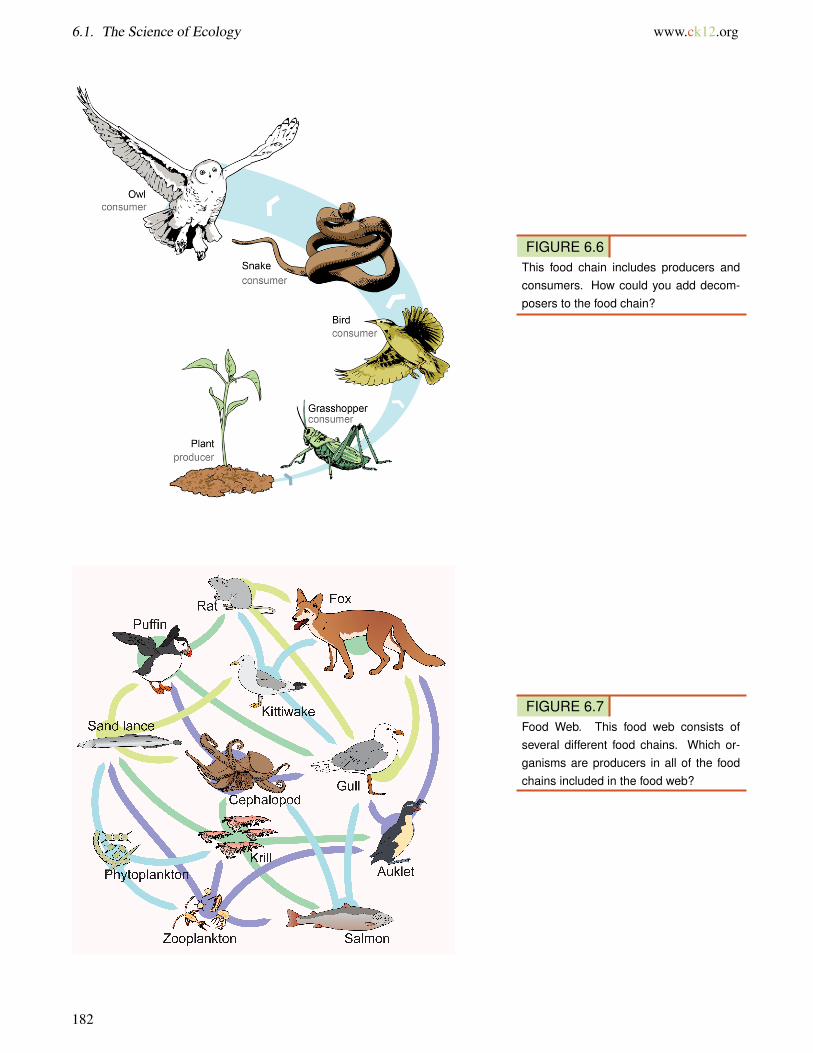
6.1. The Science of Ecology www.ck12.org
FIGURE 6.6This food chain includes producers andconsumers. How could you add decom-posers to the food chain?
FIGURE 6.7Food Web. This food web consists ofseveral different food chains. Which or-ganisms are producers in all of the foodchains included in the food web?
182

www.ck12.org Chapter 6. The Principles of Ecology
FIGURE 6.8Examples of food webs.
183

6.1. The Science of Ecology www.ck12.org
TABLE 6.1: Trophic Levels
Trophic Level Where It Gets Food Example1st Trophic Level: Producer Makes its own food Plants make food2nd Trophic Level: Primary Con-sumer
Consumes producers Mice eat plant seeds
3rd Trophic Level: Secondary Con-sumer
Consumes primary consumers Snakes eat mice
4th Trophic Level: Tertiary Con-sumer
Consumes secondary consumers Hawks eat snakes
Many consumers feed at more than one trophic level. Humans, for example, are primary consumers when they eatplants such as vegetables. They are secondary consumers when they eat cows. They are tertiary consumers whenthey eat salmon.
Trophic Levels and Energy
Energy is passed up a food chain or web from lower to higher trophic levels. However, only about 10 percent of theenergy at one level is available to the next level. This is represented by the pyramid in Figure 6.9. What happens tothe other 90 percent of energy? It is used for metabolic processes or given off to the environment as heat. This lossof energy explains why there are rarely more than four trophic levels in a food chain or web. Sometimes there maybe a fifth trophic level, but usually there’s not enough energy left to support any additional levels.
FIGURE 6.9Ecological Pyramid. This pyramidshows how energy and biomass decreasefrom lower to higher trophic levels. As-sume that producers in this pyramid have1,000,000 kilocalories of energy. Howmuch energy is available to primary con-sumers?
Energy pyramids are discussed at http://www.youtube.com/watch?v=8T2nEMzk6_E (1:44).
184

www.ck12.org Chapter 6. The Principles of Ecology
Trophic Levels and Biomass
With less energy at higher trophic levels, there are usually fewer organisms as well. Organisms tend to be larger insize at higher trophic levels, but their smaller numbers result in less biomass. Biomass is the total mass of organismsat a trophic level. The decrease in biomass from lower to higher levels is also represented by Figure 6.9.
Lesson Summary
• Ecology is the study of how living things interact with each other and with their environment. The environmentincludes abiotic (nonliving) and biotic (living) factors.
• An ecosystem consists of all the biotic and abiotic factors in an area and their interactions. A niche refers tothe role of a species in its ecosystem. A habitat is the physical environment in which a species lives and towhich it is adapted. Two different species cannot occupy the same niche in the same place for very long.
• Ecosystems require constant inputs of energy from sunlight or chemicals. Producers use energy and inorganicmolecules to make food. Consumers take in food by eating producers or other living things. Decomposersbreak down dead organisms and other organic wastes and release inorganic molecules back to the environment.
• Food chains and food webs are diagrams that represent feeding relationships. They model how energy andmatter move through ecosystems.
• The different feeding positions in a food chain or web are called trophic levels. Generally, there are no morethan four trophic levels because energy and biomass decrease from lower to higher levels.
Lesson Review Questions
Recall
1. Define biotic and abiotic factors of the environment. Give an example of each.
2. How do ecologists define the term ecosystem?
3. State the competitive exclusion principle.
4. Identify three different types of consumers. Name an example of each type.
5. Describe the role of decomposers in food webs.
Apply Concepts
6. Draw a terrestrial food chain that includes four trophic levels. Identify the trophic level of each organism in thefood chain.
Think Critically
7. Compare and contrast the ecosystem concepts of niche and habitat.
8. What can you infer about an ecosystem that depends on chemoautotrophs for food?
9. Explain how energy limits the number of trophic levels in a food chain or web.
185

6.1. The Science of Ecology www.ck12.org
Points to Consider
In this lesson, you learned how matter is transferred through food chains and webs. Producers make food frominorganic molecules. Other organisms consume the producers. When organisms die, decomposers break down theirremains and release inorganic molecules that can be used again by producers. In this way, matter is recycled by thebiotic factors in ecosystems.
• Do you think that abiotic factors in ecosystems might also play a role in recycling matter? In what way?• What abiotic factors might be involved in recycling matter? For example, what abiotic factors might be
involved in recycling water?
186

www.ck12.org Chapter 6. The Principles of Ecology
6.2 Distribution of Water on Earth
Learning Objectives
• Describe the distribution of Earth’s water.• Explain why fresh water is a scarce resource.
Water, water everywhere. But how much of it is useful?
Earth is the water planet. From space, Earth is a blue ball, unlike any of the other planets in our solar system. Life,also unique to Earth of the planets in our solar system, depends on this water. While there’s a lot of salt water, asurprisingly small amount of it is fresh water.
Distribution of Water
Earth’s oceans contain 97% of the planet’s water. That leaves just 3% as fresh water, water with low concentrationsof salts (Figure 6.10). Most fresh water is trapped as ice in the vast glaciers and ice sheets of Greenland andAntarctica.
How is the 3% of fresh water divided into different reservoirs? How much of that water is useful for living creatures?How much for people?
A storage location for water such as an ocean, glacier, pond, or even the atmosphere is known as a reservoir. Awater molecule may pass through a reservoir very quickly or may remain for much longer. The amount of time amolecule stays in a reservoir is known as its residence time.
187

6.2. Distribution of Water on Earth www.ck12.org
FIGURE 6.10The distribution of Earth’s water.
MEDIAClick image to the left or use the URL below.URL: https://www.ck12.org/flx/render/embeddedobject/160141
Summary
• Of Earth’s water, 97% is in the oceans.• Of the remaining 3%, much is trapped in ice and glaciers.• A substance is stored in a reservoir and the amount of time it stays in that reservoir is its residence time.
Review
1. If Earth is the water planet, why is water sometimes a scarce resource?2. What are the reservoirs for water?3. In which reservoirs does water have the longest residence times? The shortest?
188

www.ck12.org Chapter 6. The Principles of Ecology
6.3 States of Water
Learning Objectives
• Define polar molecule.• Describe the water molecule.• Identify the three states of water.
H - two - O. Why is something so simple so important?
Water is the most important substance on Earth. Think about all the things you use water for? If your water accesswere restricted what would you miss about it?
The Water Molecule
Water is simply two atoms of hydrogen and one atom of oxygen bonded together (Figure 6.11). The hydrogen ionsare on one side of the oxygen ion, making water a polar molecule. This means that one side, the side with thehydrogen ions, has a slightly positive electrical charge. The other side, the side without the hydrogen ions, has aslightly negative charge.
Despite its simplicity, water has remarkable properties. Water expands when it freezes, has high surface tension(because of the polar nature of the molecules, they tend to stick together), and others. Without water, life might notbe able to exist on Earth and it certainly would not have the tremendous complexity and diversity that we see.
189

6.3. States of Water www.ck12.org
FIGURE 6.11A water molecule. The hydrogen atoms have a slightly positive charge,and the oxygen atom has a slightly negative charge.
Three States of Matter
Water is the only substance on Earth that is present in all three states of matter - as a solid, liquid or gas. (And Earthis the only planet where water is abundantly present in all three states.) Because of the ranges in temperature inspecific locations around the planet, all three phases may be present in a single location or in a region. The threephases are solid (ice or snow), liquid (water), and gas (water vapor). See ice, water, and clouds (Figure 6.12).
FIGURE 6.12(a) Ice floating in the sea. Can you find all three phases of water in this image? (b) Liquid water. (c) Water vaporis invisible, but clouds that form when water vapor condenses are not.
MEDIAClick image to the left or use the URL below.URL: https://www.ck12.org/flx/render/embeddedobject/186380
190

www.ck12.org Chapter 6. The Principles of Ecology
Summary
• Water is a polar molecule with a more positive charge on one side and a more negative charge on the otherside.
• Water is the only substance on Earth that is stable in all three states.• Earth is the only planet in the Solar System that has water in all three states.
Review
1. What is a polar molecule?2. What makes water a polar molecule?3. What are the three states that a substance can have?4. Where in the solar system is water found in all three states?
Explore More
Use this resource (watch up to 5:50) to answer the questions that follow.
MEDIAClick image to the left or use the URL below.URL: https://www.ck12.org/flx/render/embeddedobject/169589
1. What is the only substance that occurs naturally on Earth in all three states of matter?2. Why do scientists look for water in other places in the solar system?3. Describe the bond that keeps the water molecule together.4. What does it mean to say that the water molecule is polar?5. What are hydrogen bonds?6. Why does water form a droplet if it is placed on waxed paper or teflon?7. Why does water experience adhesion rather than cohesion with glass?8. What causes water in a straw to rise higher than the surface level of the water in the beaker the tube is in?9. Why is water such a great solvent?
10. Why doesn’t oil mix with water?
191

6.4. The Water Cycle www.ck12.org
6.4 The Water Cycle
Learning Objectives
• Describe the water cycle and describe the processes that carry water between reservoirs.• Define the processes by which water changes state and explain the role each plays in the water cycle.
Where have these water molecules been?
Because of the unique properties of water, water molecules can cycle through almost anywhere on Earth. The watermolecule found in your glass of water today could have erupted from a volcano early in Earth’s history. In theintervening billions of years, the molecule probably spent time in a glacier or far below the ground. The moleculesurely was high up in the atmosphere and maybe deep in the belly of a dinosaur. Where will that water molecule gonext?
The Water Cycle
The movement of water around Earth’s surface is the hydrological (water) cycle (Figure 6.13). Water inhabitsreservoirs within the cycle, such as ponds, oceans, or the atmosphere. The molecules move between these reservoirsby certain processes, including condensation and precipitation. There are only so many water molecules and thesemolecules cycle around. If climate cools and glaciers and ice caps grow, there is less water for the oceans and sealevel will fall. The reverse can also happen.
The following section looks at the reservoirs and the processes that move water between them.
Solar Energy
The Sun, many millions of kilometers away, provides the energy that drives the water cycle. Our nearest star directlyimpacts the water cycle by supplying the energy needed for evaporation.
192

www.ck12.org Chapter 6. The Principles of Ecology
FIGURE 6.13Because it is a cycle, the water cycle has no beginning and no end.
Oceans
Most of Earth’s water is stored in the oceans, where it can remain for hundreds or thousands of years.
Atmosphere
Water changes from a liquid to a gas by evaporation to become water vapor. The Sun’s energy can evaporate waterfrom the ocean surface or from lakes, streams, or puddles on land. Only the water molecules evaporate; the saltsremain in the ocean or a fresh water reservoir.
The water vapor remains in the atmosphere until it undergoes condensation to become tiny droplets of liquid. Thedroplets gather in clouds, which are blown about the globe by wind. As the water droplets in the clouds collide andgrow, they fall from the sky as precipitation. Precipitation can be rain, sleet, hail, or snow. Sometimes precipitationfalls back into the ocean and sometimes it falls onto the land surface.
193

6.4. The Water Cycle www.ck12.org
Streams and Lakes
When water falls from the sky as rain it may enter streams and rivers that flow downward to oceans and lakes. Waterthat falls as snow may sit on a mountain for several months. Snow may become part of the ice in a glacier, where itmay remain for hundreds or thousands of years. Snow and ice may go directly back into the air by sublimation, theprocess in which a solid changes directly into a gas without first becoming a liquid. Although you probably have notseen water vapor undergoing sublimation from a glacier, you may have seen dry ice sublimate in air.
Snow and ice slowly melt over time to become liquid water, which provides a steady flow of fresh water to streams,rivers, and lakes below. A water droplet falling as rain could also become part of a stream or a lake. At the surface,the water may eventually evaporate and reenter the atmosphere.
Soil
A significant amount of water infiltrates into the ground. Soil moisture is an important reservoir for water (Figure6.14). Water trapped in soil is important for plants to grow.
FIGURE 6.14The moisture content of soil in the UnitedStates varies greatly.
Groundwater
Water may seep through dirt and rock below the soil and then through pores infiltrating the ground to go into Earth’sgroundwater system. Groundwater enters aquifers that may store fresh water for centuries. Alternatively, the watermay come to the surface through springs or find its way back to the oceans.
Biosphere
Plants and animals depend on water to live. They also play a role in the water cycle. Plants take up water from thesoil and release large amounts of water vapor into the air through their leaves (Figure 6.15), a process known astranspiration.
194

www.ck12.org Chapter 6. The Principles of Ecology
FIGURE 6.15Clouds form above the Amazon Rainfor-est even in the dry season because ofmoisture from plant transpiration.
Human Uses
People also depend on water as a natural resource. Not content to get water directly from streams or ponds, humanscreate canals, aqueducts, dams, and wells to collect water and direct it to where they want it (Figure 6.16).
FIGURE 6.16Pont du Gard in France is an ancientaqueduct and bridge that was part of of awell-developed system that supplied wa-ter around the Roman empire.
MEDIAClick image to the left or use the URL below.URL: https://www.ck12.org/flx/render/embeddedobject/186383
195

6.4. The Water Cycle www.ck12.org
Science Friday: Forecasting the Meltdown: The Aerial Snow Observatory
75% of Southern California’s water supply comes from the snowpack in the Sierra Nevada Mountain Range. Thisvideo byScience Friday explains how NASA uses specialized instrumentation in the Airborne Snow Observatory tocarefully measure the water content.
MEDIAClick image to the left or use the URL below.URL: https://www.ck12.org/flx/render/embeddedobject/194571
Summary
• The water cycle describes all of the reservoirs of water and the processes that carry it between them.• Water changes state by evaporation, condensation, and sublimation.• Plants release water through their leaves by transpiration.
Review
1. What is transpiration?2. Describe when and how sublimation occurs.3. What is the role of the major reservoirs in the water cycle?
Explore More
Use this resource to answer the questions that follow.
MEDIAClick image to the left or use the URL below.URL: https://www.ck12.org/flx/render/embeddedobject/178090
1. How often is water added to the Earth system?2. How can the two parts of the water cycle be summarized?3. What are the major reservoirs for water?4. What is precipitation?5. Where does snow melt go?6. As rain falls onto land, what can happen to it?7. How long does water stay in groundwater?
196

www.ck12.org Chapter 6. The Principles of Ecology
8. How does water get back into the atmosphere?9. How do plants engage in transpiration?
Resources
MEDIAClick image to the left or use the URL below.URL: https://www.ck12.org/flx/render/embeddedobject/114889
197

6.5. Importance of the Atmosphere www.ck12.org
6.5 Importance of the Atmosphere
Learning Objectives
• Describe Earth’s atmosphere and explain the important roles it plays in sustaining life on Earth.
If Earth didn’t have an atmosphere, would it always be cold?
This is a question commonly asked by 12-year-old girls being driven to school by their mothers. "Of course," themoms answer, "it would be extremely hot when the Sun is out and bitter cold when it’s dark." Does this conversationsound familiar?
What Is the Atmosphere?
Earth’s atmosphere is a thin blanket of gases and tiny particles — together called air. We are most aware of air whenit moves and creates wind. Earth’s atmosphere, along with the abundant liquid water at Earth’s surface, are the keysto our planet’s unique place in the solar system. Much of what makes Earth exceptional depends on the atmosphere.For example, all living things need some of the gases in air for life support. Without an atmosphere, Earth wouldlikely be just another lifeless rock.
Let’s consider some of the reasons we are lucky to have an atmosphere.
Gases Indispensable for Life on Earth
Without the atmosphere, Earth would look a lot more like the Moon. Atmospheric gases, especially carbon dioxide(CO2) and oxygen (O2), are extremely important for living organisms. How does the atmosphere make life possible?How does life alter the atmosphere?
198

www.ck12.org Chapter 6. The Principles of Ecology
FIGURE 6.17The composition of Earth’s atmosphere.
Photosynthesis
In photosynthesis, plants use CO2 and create O2. Photosynthesis is responsible for nearly all of the oxygen currentlyfound in the atmosphere.
The chemical reaction for photosynthesis is:
6CO2 + 6H2O + solar energy→ C6H12O6 (sugar) + 6O2
Respiration
By creating oxygen and food, plants have made an environment that is favorable for animals. In respiration, animalsuse oxygen to convert sugar into food energy they can use. Plants also go through respiration and consume some ofthe sugars they produce.
The chemical reaction for respiration is:
C6H12O6 + 6O2 → 6CO2 + 6H2O + useable energy
How is respiration similar to and different from photosynthesis? They are approximately the reverse of each other.In photosynthesis, CO2 is converted to O2 and in respiration, O2 is converted to CO2 (Figure 6.18).
Crucial Part of the Water Cycle
As part of the hydrologic cycle, water spends a lot of time in the atmosphere, mostly as water vapor. The atmosphereis an important reservoir for water.
199

6.5. Importance of the Atmosphere www.ck12.org
FIGURE 6.18Chlorophyll indicates the presence ofphotosynthesizing plants as does the veg-etation index.
Ozone Makes Life on Earth Possible
Ozone is a molecule composed of three oxygen atoms, (O3). Ozone in the upper atmosphere absorbs high-energyultraviolet (UV) radiation coming from the Sun. This protects living things on Earth’s surface from the Sun’s mostharmful rays. Without ozone for protection, only the simplest life forms would be able to live on Earth. The highestconcentration of ozone is in the ozone layer in the lower stratosphere.
Keeps Earth’s Temperature Moderate
Along with the oceans, the atmosphere keeps Earth’s temperatures within an acceptable range. Without an atmo-sphere, Earth’s temperatures would be frigid at night and scorching during the day. If the 12-year-old in the scenarioabove asked why, she would find out. Greenhouse gases trap heat in the atmosphere. Important greenhouse gasesinclude carbon dioxide, methane, water vapor, and ozone.
Provides the Substance for Waves to Travel Through
The atmosphere is made of gases that take up space and transmit energy. Sound waves are among the types of energythat travel though the atmosphere. Without an atmosphere, we could not hear a single sound. Earth would be assilent as outer space (explosions in movies about space should be silent). Of course, no insect, bird, or airplanewould be able to fly, because there would be no atmosphere to hold it up.
MEDIAClick image to the left or use the URL below.URL: https://www.ck12.org/flx/render/embeddedobject/186438
200

www.ck12.org Chapter 6. The Principles of Ecology
Summary
• The atmosphere is made of gases that are essential for photosynthesis and respiration, among other lifeactivities.
• The atmosphere is a crucial part of the water cycle. It is an important reservoir for water and the source ofprecipitation.
• The atmosphere moderates Earth’s temperature because greenhouse gases absorb heat.
Review
1. What gases are used and expelled by photosynthesis and respiration?2. Where is the largest concentration of ozone and what value does it have?3. How does the atmosphere keep Earth’s temperature moderate?
Explore More
Use these resources to answer the questions that follow.
MEDIAClick image to the left or use the URL below.URL: https://www.ck12.org/flx/render/embeddedobject/160897
1. What is the composition of the atmosphere?2. What does the atmosphere do?3. How are humans clanging the composition of the atmosphere?4. What is the negative effect of that?5. If Earth didn’t have an atmosphere what would global temperatures be like?6. Why don’t you feel the air pressure of the air above you?
201

6.6. Composition of the Atmosphere www.ck12.org
6.6 Composition of the Atmosphere
Learning Objectives
• Describe the composition of the atmosphere.
Did life evolve to match the atmosphere or is the fit just coincidence?
Life as we know it would not survive if there were no ozone layer to protect it from high energy ultraviolet radiation.Most life needs oxygen to survive. Nitrogen is also needed, albeit in a different form from that found in theatmosphere. Greenhouse gases keep the temperature moderate so that organisms can live around the planet. Lifeevolved to match the conditions that were available and to some extent changed the atmosphere to suit its needs.
Composition of Air
Several properties of the atmosphere change with altitude, but the composition of the natural gases does not. Theproportions of gases in the atmosphere are everywhere the same, with one exception. At about 20 km to 40 km
202

www.ck12.org Chapter 6. The Principles of Ecology
above the surface, there is a greater concentration of ozone molecules than in other portions of the atmosphere. Thisis called the ozone layer.
Nitrogen and Oxygen
Nitrogen and oxygen together make up 99% of the planet’s atmosphere. Nitrogen makes up the bulk of theatmosphere, but is not involved in geological or biological processes in its gaseous form. Nitrogen fixing is describedin the chapter Life on Earth. Oxygen is extremely important because it is needed by animals for respiration. The restof the gases are minor components but sometimes are very important (Figure 6.19).
FIGURE 6.19Nitrogen and oxygen make up 99% of the atmosphere; carbon dioxide isa very important minor component.
Water Vapor
Humidity is the amount of water vapor in the air. Humidity varies from place to place and season to season. Thisfact is obvious if you compare a summer day in Atlanta, Georgia, where humidity is high, with a winter day inPhoenix, Arizona, where humidity is low. When the air is very humid, it feels heavy or sticky. Dry air usually feelsmore comfortable. When humidity is high, water vapor makes up only about 4% of the atmosphere.
Where around the globe is mean atmospheric water vapor higher and where is it lower (Figure 6.20)? Why? Higherhumidity is found around the equatorial regions because air temperatures are higher and warm air can hold moremoisture than cooler air. Of course, humidity is lower near the polar regions because air temperature is lower.
Greenhouse Gases
Remember that greenhouse gases trap heat in the atmosphere. Important natural greenhouse gases include carbondioxide, methane, water vapor, and ozone. CFCs and some other man-made compounds are also greenhouse gases.
203

6.6. Composition of the Atmosphere www.ck12.org
FIGURE 6.20Mean winter atmospheric water vapor in the Northern Hemisphere when temperature and humidity are lower thanthey would be in summer.
Particulates
Some of what is in the atmosphere is not gas. Particles of dust, soil, fecal matter, metals, salt, smoke, ash, and othersolids make up a small percentage of the atmosphere and are called particulates. Particles provide starting points(or nuclei) for water vapor to condense on and form raindrops. Some particles are pollutants.
MEDIAClick image to the left or use the URL below.URL: https://www.ck12.org/flx/render/embeddedobject/186442
Summary
• The major atmospheric gases are nitrogen and oxygen. The atmosphere also contains minor amounts of othergases, including carbon dioxide.
• Greenhouse gases trap heat in the atmosphere and include carbon dioxide, methane, water vapor, and ozone.
204

www.ck12.org Chapter 6. The Principles of Ecology
• Not everything in the atmosphere is gas; particulates are particles that are important as the nucleus of raindropsand snowflakes.
Review
1. What are the two major atmospheric gases and what roles do they play?2. What are the important greenhouse gases?3. What is humidity? If the humidity is 95% does that mean 95% of the air is water vapor?
Explore More
Use this resource to answer the questions that follow.
MEDIAClick image to the left or use the URL below.URL: https://www.ck12.org/flx/render/embeddedobject/160893
1. What do we do with the nitrogen we breathe from the air around us?2. What is the percent of each of the two most abundant gases in the atmosphere?3. What is the most abundant gas in the remaining 1%? What are some of the other gases present?4. Why is carbon dioxide important even though there is so little of it in the atmosphere?5. How does oxygen get into the atmosphere?6. What happens to the oxygen that is taken up in cellular respiration?
205

6.7. Troposphere www.ck12.org
6.7 Troposphere
Learning Objectives
• Describe the characteristics and importance of the troposphere.• Explain temperature inversion and its role in the troposphere.
Why is the troposphere important?
All of the wind, rain, and snow on Earth, as well as all of the air you breathe, is in the troposphere. The troposphereis the lowest and most important layer of the atmosphere. In this photo, a cumulonimbus cloud close to the surfaceover western Africa extends upward through the troposphere but does not pass into the stratosphere.
Temperature Gradient
The temperature of the troposphere is highest near the surface of the Earth and decreases with altitude. On average,the temperature gradient of the troposphere is 6.5oC per 1,000 m (3.6oF per 1,000 ft) of altitude.
Earth’s surface is the source of heat for the troposphere. Rock, soil, and water on Earth absorb the Sun’s light andradiate it back into the atmosphere as heat, so there is more heat near the surface. The temperature is also highernear the surface because gravity pulls in more gases. The greater density of gases causes the temperature to rise.
Notice that in the troposphere warmer air is beneath cooler air. This condition is unstable since warm air is lessdense than cool air. The warm air near the surface rises and cool air higher in the troposphere sinks, so air in thetroposphere does a lot of mixing. This mixing causes the temperature gradient to vary with time and place. Therising and sinking of air in the troposphere means that all of the planet’s weather takes place in the troposphere.
206

www.ck12.org Chapter 6. The Principles of Ecology
Temperature Inversion
Sometimes there is a temperature inversion, in which air temperature in the troposphere increases with altitude andwarm air sits over cold air. Inversions are very stable and may last for several days or even weeks. Inversions form:
• Over land at night or in winter when the ground is cold. The cold ground cools the air that sits above it, makingthis low layer of air denser than the air above it.
• Near the coast, where cold seawater cools the air above it. When that denser air moves inland, it slides beneaththe warmer air over the land.
Since temperature inversions are stable, they often trap pollutants and produce unhealthy air conditions in cities(Figure 6.21).
FIGURE 6.21Smoke makes a temperature inversionvisible. The smoke is trapped in colddense air that lies beneath a cap ofwarmer air.
At the top of the troposphere is a thin layer in which the temperature does not change with height. This means thatthe cooler, denser air of the troposphere is trapped beneath the warmer, less dense air of the stratosphere. Air fromthe troposphere and stratosphere rarely mix.
MEDIAClick image to the left or use the URL below.URL: https://www.ck12.org/flx/render/embeddedobject/186451
Summary
• In the troposphere warm air ordinarily sits below cooler air.• With a temperature inversion, cold air sits below warm air and can’t move.• An inversion starts over land at night or in the winter, or near the coast.
207

6.7. Troposphere www.ck12.org
Review
1. How does an inversion form at a coastal area?2. What is the source of heat in the troposphere?3. Describe the temperature gradient found in the troposphere.
Explore More
Use this resource to answer the questions that follow.
MEDIAClick image to the left or use the URL below.URL: https://www.ck12.org/flx/render/embeddedobject/178110
1. What layer is all of Earth’s surface in?2. What is the thickness of the troposphere relative to the other layers? Where is the troposphere thickest and
where is it thinnest?3. Why does the troposphere contain most of the matter in the atmosphere?4. Where is the warmest part of the troposphere and why?5. What is a temperature inversion?6. What is the environmental lapse rate?7. How do scientists know the true environmental lapse rate in a column of air?
208

www.ck12.org Chapter 6. The Principles of Ecology
6.8 Stratosphere
Learning Objectives
• Describe the stratosphere and the ozone layer within it.• Explain the ozone layer’s importance to life on Earth.
The pilot says, "We are now at our cruising altitude of 30,000 feet." Why do planes fly so high?
That altitude gets them out of the troposphere and into the stratosphere. Although the arc that they must travel isgreater the further from the surface they get, fuel costs are lower because there is less friction due to the lower airdensity. Also, there is little air turbulence, which makes the passengers happier.
Stratosphere
There is little mixing between the stratosphere, the layer above the troposphere, and the troposphere below it. Thetwo layers are quite separate. Sometimes ash and gas from a large volcanic eruption may burst into the stratosphere.Once in the stratosphere, it remains suspended there for many years because there is so little mixing between thetwo layers.
Temperature Gradient
In the stratosphere, temperature increases with altitude. What is the heat source for the stratosphere? The direct heatsource for the stratosphere is the Sun. The ozone layer in the stratosphere absorbs high energy ultraviolet radiation,
209

6.8. Stratosphere www.ck12.org
which breaks the ozone molecule (3-oxygens) apart into an oxygen molecule (2-oxygens) and an oxygen atom (1-oxygen). In the mid-stratosphere there is less UV light and so the oxygen atom and molecule recombine to fromozone. The creation of the ozone molecule releases heat.
Because warmer, less dense air sits over cooler, denser air, air in the stratosphere is stable. As a result, there islittle mixing of air within the layer. There is also little interaction between the troposphere and stratosphere for thisreason.
The Ozone Layer
The ozone layer is found within the stratosphere between 15 to 30 km (9 to 19 miles) altitude. The ozone layerhas a low concentration of ozone; it’s just higher than the concentration elsewhere. The thickness of the ozone layervaries by the season and also by latitude.
Ozone is created in the stratosphere by solar energy. Ultraviolet radiation splits an oxygen molecule into two oxygenatoms. One oxygen atom combines with another oxygen molecule to create an ozone molecule, O3. The ozone isunstable and is later split into an oxygen molecule and an oxygen atom. This is a natural cycle that leaves someozone in the stratosphere.
The ozone layer is extremely important because ozone gas in the stratosphere absorbs most of the Sun’s harmfulultraviolet (UV) radiation. Because of this, the ozone layer protects life on Earth. High-energy UV light penetratescells and damages DNA, leading to cell death (which we know as a bad sunburn). Organisms on Earth are notadapted to heavy UV exposure, which kills or damages them. Without the ozone layer to absorb UVC and UVBradiation, most complex life on Earth would not survive long.
MEDIAClick image to the left or use the URL below.URL: https://www.ck12.org/flx/render/embeddedobject/186456
MEDIAClick image to the left or use the URL below.URL: https://www.ck12.org/flx/render/embeddedobject/186454
Summary
• There is little mixing between the troposphere, where all the turbulence is, and the stratosphere.• Ozone gas protects life on Earth from harmful UV light, which damages cells.• The ozone layer, in the stratosphere, has a higher concentration of ozone than other spots in the atmosphere.
210

www.ck12.org Chapter 6. The Principles of Ecology
Review
1. Why doesn’t air mix between the troposphere and stratosphere?2. Why does one part of the stratosphere earn the name ozone layer?3. What is the natural cycle that creates and destroys ozone molecules?
Explore More
Use this resource (watch up to 5:24) to answer the questions that follow.
MEDIAClick image to the left or use the URL below.URL: https://www.ck12.org/flx/render/embeddedobject/178112
1. What does the figure tell you about what happens to air temperature when you climb a mountain?2. What happens to temperature with altitude in the stratosphere?3. Why does the stratosphere have that temperature gradient?4. What tops the stratosphere?5. What is the most important feature of the stratosphere and why?
211

6.9. Recycling Matter www.ck12.org
6.9 Recycling Matter
Lesson Objectives
• Define biogeochemical cycles.• Describe the water cycle and its processes.• Give an overview of the carbon cycle.• Outline the steps of the nitrogen cycle.
Vocabulary
• aquifer• biogeochemical cycle• carbon cycle• condensation• evaporation• exchange pool• groundwater• nitrogen cycle• nitrogen fixation• precipitation• reservoir• runoff• sublimation• transpiration• water cycle
Introduction
Where does the water come from that is needed by your cells? Or the carbon and nitrogen that is needed to makeyour organic molecules? Unlike energy, matter is not lost as it passes through an ecosystem. Instead, matter isrecycled. This recycling involves specific interactions between the biotic and abiotic factors in an ecosystem.
Biogeochemical Cycles
The chemical elements and water that are needed by organisms continuously recycle in ecosystems. They passthrough biotic and abiotic components of the biosphere. That’s why their cycles are called biogeochemical cycles.For example, a chemical might move from organisms (bio) to the atmosphere or ocean (geo) and back to organismsagain. Elements or water may be held for various periods of time in different parts of a cycle.
212

www.ck12.org Chapter 6. The Principles of Ecology
• Part of a cycle that holds an element or water for a short period of time is called an exchange pool. Forexample, the atmosphere is an exchange pool for water. It usually holds water (in the form of water vapor) forjust a few days.
• Part of a cycle that holds an element or water for a long period of time is called a reservoir. The ocean is areservoir for water. The deep ocean may hold water for thousands of years.
The rest of this lesson describes three biogeochemical cycles: the water cycle, carbon cycle, and nitrogen cycle.
The Water Cycle
Water on Earth is billions of years old. However, individual water molecules keep moving through the water cycle.The water cycle is a global cycle. It takes place on, above, and below Earth’s surface, as shown in Figure 6.22.
FIGURE 6.22Like other biogeochemical cycles, there isno beginning or end to the water cycle. Itjust keeps repeating.
During the water cycle, water occurs in three different states: gas (water vapor), liquid (water), and solid (ice). Manyprocesses are involved as water changes state in the water cycle.
Evaporation, Sublimation, and Transpiration
Water changes to a gas by three different processes:
1. Evaporation occurs when water on the surface changes to water vapor. The sun heats the water and giveswater molecules enough energy to escape into the atmosphere.
2. Sublimation occurs when ice and snow change directly to water vapor. This also happens because of heatfrom the sun.
3. Transpiration occurs when plants release water vapor through leaf pores called stomata (see Figure 6.23).The water is a product of respiration.
213

6.9. Recycling Matter www.ck12.org
FIGURE 6.23Plant leaves have many tiny stomata. They release water vapor into theair.
Condensation and Precipitation
Rising air currents carry water vapor into the atmosphere. As the water vapor rises in the atmosphere, it cools andcondenses. Condensation is the process in which water vapor changes to tiny droplets of liquid water. The waterdroplets may form clouds. If the droplets get big enough, they fall as precipitation—rain, snow, sleet, hail, orfreezing rain. Most precipitation falls into the ocean. Eventually, this water evaporates again and repeats the watercycle. Some frozen precipitation becomes part of ice caps and glaciers. These masses of ice can store frozen waterfor hundreds of years or longer.
Groundwater and Runoff
Precipitation that falls on land may flow over the surface of the ground. This water is called runoff. It may eventuallyflow into a body of water. Some precipitation that falls on land may soak into the ground, becoming groundwater.Groundwater may seep out of the ground at a spring or into a body of water such as the ocean. Some groundwatermay be taken up by plant roots. Some may flow deeper underground to an aquifer. This is an underground layer ofrock that stores water, sometimes for thousands of years.
The water cycle is demonstrated at http://www.youtube.com/watch?v=iohKd5FWZOE (4:00).
The Water Cycle Jump can be viewed at http://www.youtube.com/watch?v=BayExatv8lE (1:31).
KQED: Tracking Raindrops
We all rely on the water cycle, but how does it actually work? Scientists at University of California Berkeley areembarking on a new project to understand how global warming is affecting our fresh water supply. And they’redoing it by tracking individual raindrops in Mendocino and north of Lake Tahoe. See https://www.youtube.com/watch?v=ABGC6SalwJU for more information.
MEDIAClick image to the left or use the URL below.URL: https://www.ck12.org/flx/render/embeddedobject/187092
214

www.ck12.org Chapter 6. The Principles of Ecology
The Carbon Cycle
Flowing water can slowly dissolve carbon in sedimentary rock. Most of this carbon ends up in the ocean. The deepocean can store carbon for thousands of years or more. Sedimentary rock and the ocean are major reservoirs ofstored carbon. Carbon is also stored for varying lengths of time in the atmosphere, in living organisms, and as fossilfuel deposits. These are all parts of the carbon cycle, which is shown in Figure 6.24.
FIGURE 6.24The Carbon Cycle. Carbon moves from one reservoir to another in the carbon cycle. What role do organismsplay in this cycle?
The carbon cycle is discussed in the following video: http://www.youtube.com/watch?v=0Vwa6qtEih8 (1:56).
Carbon cycles quickly between organisms and the atmosphere. Cellular respiration releases carbon into the atmo-sphere as carbon dioxide. Carbon is also released when organisms decompose. Human actions, such as the burningof fossil fuels, also release carbon into the atmosphere. Natural processes, such as volcanic eruptions, release carbonfrom magma into the atmosphere. Warm ocean waters also release carbon, whereas cold ocean water dissolvescarbon from the atmosphere. Photosynthesis (autotrophs) removes carbon dioxide from the atmosphere and uses itto make organic compounds. Carbon cycles far more slowly through geological processes such as sedimentation.Runoff, rivers and streams dissolve carbon in rocks and carry it to the ocean. Sediments from dead organisms mayform fossil fuels or carbon-containing rocks. Carbon may be stored in sedimentary rock for millions of years.
215

6.9. Recycling Matter www.ck12.org
The Nitrogen Cycle
Nitrogen makes up 78 percent of Earth’s atmosphere. It’s also an important part of living things. Nitrogen is foundin proteins, nucleic acids, and chlorophyll. The nitrogen cycle moves nitrogen through the abiotic and biotic partsof ecosystems. Figure 6.25 shows how nitrogen cycles through a terrestrial ecosystem. Nitrogen passes through asimilar cycle in aquatic ecosystems.
FIGURE 6.25Nitrogen Cycle in a Terrestrial Ecosystem.Nitrogen cycles between the atmosphereand living things.
Plants cannot use nitrogen gas from the air to make organic compounds for themselves and other organisms. Thenitrogen gas must be changed to a form called nitrates, which plants can absorb through their roots. The processof changing nitrogen gas to nitrates is called nitrogen fixation. It is carried out by nitrogen-fixing bacteria. Thebacteria live in soil and roots of legumes, such as peas.
When plants and other organisms die, decomposers break down their remains. In the process, they release nitrogenin the form of ammonium ions. Nitrifying bacteria change the ammonium ions into nitrates. Some of the nitratesare used by plants. Some are changed back to nitrogen gas by denitrifying bacteria.
The nitrogen cycle is discussed at http://www.youtube.com/watch?v=pdY4I-EaqJA (5:08).
Lesson Summary
• Chemical elements and water are recycled through biogeochemical cycles. The cycles include both biotic andabiotic parts of ecosystems.
• The water cycle takes place on, above, and below Earth’s surface. In the cycle, water occurs as water vapor,liquid water, and ice. Many processes are involved as water changes state in the cycle. The atmosphere is anexchange pool for water. Ice masses, aquifers, and the deep ocean are water reservoirs.
• In the carbon cycle, carbon passes among sedimentary rocks, fossil fuel deposits, the ocean, the atmosphere,and living things. Carbon cycles quickly between organisms and the atmosphere. It cycles far more slowlythrough geological processes.
216

www.ck12.org Chapter 6. The Principles of Ecology
• The nitrogen cycle moves nitrogen back and forth between the atmosphere and organisms. Bacteria changenitrogen gas from the atmosphere to nitrogen compounds that plants can absorb. Other bacteria changenitrogen compounds back to nitrogen gas, which re-enters the atmosphere.
Lesson Review Questions
Recall
1. What is a biogeochemical cycle? Name an example.
2. Identify and define two processes by which water naturally changes from a solid or liquid to a gas.
3. Define exchange pool and reservoir, and identify an example of each in the water cycle.
4. State three ways that carbon dioxide enters Earth’s atmosphere.
5. List all the ways that a single tree may be involved in the carbon cycle.
Apply Concepts
6. Assume you are a molecule of water. Describe one way you could go through the water cycle, starting as watervapor in the atmosphere.
7. Read the following passage, then apply information from the lesson to explain why the farmer plants peas:
A farmer has three fields in which she grows corn for market. Every year, she plants one of the fields with peas, eventhough she cannot make as much money selling peas as she can selling corn. She rotates the fields she plants withpeas so that each field is planted with peas every 3 years.
Think Critically
8. Compare and contrast biological and geological pathways of the carbon cycle.
9. Explain why bacteria are essential parts of the nitrogen cycle.
Points to Consider
In this lesson, you read how matter is recycled through ecosystems. Ecosystems vary in the amount of matter theycan recycle. For example, rainforests can recycle more matter than deserts.
• Consider the abiotic and biotic factors of a rainforest and desert. How might they be different?• Why do you think a rainforest can recycle more matter than a desert?
https://www.youtube.com/watch?v=ABGC6SalwJU
217

6.10. Nitrogen Cycle in Ecosystems www.ck12.org
6.10 Nitrogen Cycle in Ecosystems
Learning Objectives
• Describe nitrogen’s roles as a nutrient.• Define nitrogen fixation and explain how it occurs.
Lentils, anyone?
Why are legumes important to biological cycles? Nitrogen gas, as found in the atmosphere, is not useful toorganisms. Legumes have bacteria in their root nodules that fix nitrogen. Putting legumes into a crop rotationreduces fertilizer costs and makes the soil and the crops healthier.
Nitrogen as a Nutrient
Nitrogen (N2) is vital for life on Earth as an essential component of organic materials, such as amino acids, chloro-phyll, and nucleic acids such as DNA and RNA (Figure 6.26). Chlorophyll molecules, essential for photosynthesis,contain nitrogen.
Nitrogen Fixing
Although nitrogen is the most abundant gas in the atmosphere, it is not in a form that plants can use. To be useful,nitrogen must be “fixed,” or converted into a more useful form. Although some nitrogen is fixed by lightning or
218

www.ck12.org Chapter 6. The Principles of Ecology
FIGURE 6.26(a) Nucleic acids contain nitrogen (b) Chlorophyll molecules contain nitrogen
blue-green algae, much is modified by bacteria in the soil. These bacteria combine the nitrogen with oxygen orhydrogen to create nitrates or ammonia (Figure 6.27).
FIGURE 6.27The nitrogen cycle.
219

6.10. Nitrogen Cycle in Ecosystems www.ck12.org
Nitrogen-fixing bacteria either live free or in a symbiotic relationship with leguminous plants (peas, beans, peanuts).The symbiotic bacteria use carbohydrates from the plant to produce ammonia that is useful to the plant. Plants usethis fixed nitrogen to build amino acids, nucleic acids (DNA, RNA), and chlorophyll. When these legumes die, thefixed nitrogen they contain fertilizes the soil.
Up the Food Chain
Animals eat plant tissue and create animal tissue. After a plant or animal dies or an animal excretes waste, bacteriaand some fungi in the soil fix the organic nitrogen and return it to the soil as ammonia. Nitrifying bacteria oxidizethe ammonia to nitrites, while other bacteria oxidize the nitrites to nitrates, which can be used by the next generationof plants. In this way, nitrogen does not need to return to a gas. Under conditions when there is no oxygen, somebacteria can reduce nitrates to molecular nitrogen.
MEDIAClick image to the left or use the URL below.URL: https://www.ck12.org/flx/render/embeddedobject/186560
Summary
• Nitrogen is an essential component of many organic molecules.• Nitrogen is fixed when it is changed into a form that organisms can use.• Bacteria and some fungi fix organic nitrogen into ammonia and nitrifying bacteria oxidize it to nitrates.
Review
1. What do soil bacteria do with nitrogen?2. Why are legumes important as nitrogen fixers?3. Why do organisms need nitrogen?
Explore More
Use this resource (watch up to 5:15) to answer the questions that follow.
MEDIAClick image to the left or use the URL below.URL: https://www.ck12.org/flx/render/embeddedobject/176031
220

www.ck12.org Chapter 6. The Principles of Ecology
1. How much nitrogen are animals? How much phosphorous?2. What do animals use nitrogen for?3. Why is nitrogen gas impossible for us to use for the nitrogen we need?4. Which organisms can change the nitrogen into a form that we can use? What is this process called?5. Where do these bacteria live? What do they create?6. What do nitrifying bacteria do?7. What would life on Earth be like without these two types of bacteria?8. What else can break nitrogen apart?9. What do denitrifying bacteria do?
Resources
MEDIAClick image to the left or use the URL below.URL: https://www.ck12.org/flx/render/embeddedobject/178249
221

6.11. Seasons www.ck12.org
6.11 Seasons
Learning Objectives
• Explain why seasons occur.
Do you like the seasons?
Do you live in a place with well-defined seasons? Do you appreciate the change of the seasons, from cold and darkto hot and bright, over the months? In other words, are you happy that Earth’s axis is tilted?
Earth’s Seasons
A common misconception is that the Sun is closer to Earth in the summer and farther away from it during the winter.Instead, the seasons are caused by the 23.5o tilt of Earth’s axis of rotation relative to its plane of orbit around the Sun(Figure 6.28). Solstice refers to the position of the Sun when it is closest to one of the poles. At summer solstice,June 21 or 22, Earth’s axis points toward the Sun and so the Sun is directly overhead at its furthest north point of theyear, the Tropic of Cancer (23.5o N).
During the summer, areas north of the Equator experience longer days and shorter nights. In the Southern Hemi-sphere, the Sun is as far away as it will be and so it is their winter. Locations will have longer nights and shorterdays. The opposite occurs on winter solstice, which begins on December 21. More about seasons can be found inthe Atmospheric Processes chapter.
222

www.ck12.org Chapter 6. The Principles of Ecology
FIGURE 6.28The Earth’s tilt on its axis leads to onehemisphere facing the Sun more than theother hemisphere and gives rise to sea-sons.
Solar Radiation on Earth
Different parts of the Earth receive different amounts of solar radiation. Which part of the planet receives the mostsolar radiation? The Sun’s rays strike the surface most directly at the Equator.
Different areas also receive different amounts of sunlight in different seasons. What causes the seasons? The seasonsare caused by the direction Earth’s axis is pointing relative to the Sun.
The Earth revolves around the Sun once each year and spins on its axis of rotation once each day. This axis ofrotation is tilted 23.5o relative to its plane of orbit around the Sun. The axis of rotation is pointed toward Polaris, theNorth Star. As the Earth orbits the Sun, the tilt of Earth’s axis stays lined up with the North Star.
Northern Hemisphere Summer
The North Pole is tilted towards the Sun and the Sun’s rays strike the Northern Hemisphere more directly in summer(Figure 6.29). At the summer solstice, June 21 or 22, the Sun’s rays hit the Earth most directly along the Tropic ofCancer (23.5oN); that is, the angle of incidence of the Sun’s rays there is zero (the angle of incidence is the deviationin the angle of an incoming ray from straight on). When it is summer solstice in the Northern Hemisphere, it iswinter solstice in the Southern Hemisphere.
Northern Hemisphere Winter
Winter solstice for the Northern Hemisphere happens on December 21 or 22. The tilt of Earth’s axis points awayfrom the Sun (Figure 6.30). Light from the Sun is spread out over a larger area, so that area isn’t heated as much.With fewer daylight hours in winter, there is also less time for the Sun to warm the area. When it is winter in theNorthern Hemisphere, it is summer in the Southern Hemisphere.
223

6.11. Seasons www.ck12.org
FIGURE 6.29Summer solstice in the Northern Hemisphere.
Equinox
Halfway between the two solstices, the Sun’s rays shine most directly at the Equator, called an equinox (Figure6.31). The daylight and nighttime hours are exactly equal on an equinox. The autumnal equinox happens onSeptember 22 or 23 and the vernal, or spring, equinox happens March 21 or 22 in the Northern Hemisphere.
MEDIAClick image to the left or use the URL below.URL: https://www.ck12.org/flx/render/embeddedobject/186093
Summary
• In the Northern Hemisphere, at summer solstice the Sun is closest to the north pole (around June 22) and atwinter solstice, the Sun is closest to the south pole (around December 22). In the Southern Hemisphere, thenames are changed.
224

www.ck12.org Chapter 6. The Principles of Ecology
FIGURE 6.30In Southern Hemisphere summer, the Sun’s rays directly strike the Tropic of Capricorn (23.5oS). Sunlight is spreadacross a large area near the South Pole. No sunlight reaches the North Pole.
• Over the course of a year, the amount of solar energy received by the Equator is greater than the amountreceived elsewhere.
• At equinox the Sun is directly over the Equator; autumnal equinox is around September 22 and spring equinoxis around March 22 in the Northern Hemisphere.
Review
1. At summer solstice in the Northern Hemisphere, what is the date and where is the Sun? What is happening atthe South Pole at that time?
2. Since the Sun is up for months during the summer at the north pole, why is it that the Equator actually getsthe most solar radiation over the course of a year?
3. What are equinoxes and when do they come?
Explore More
Use these resources to answer the questions that follow.
225

6.11. Seasons www.ck12.org
FIGURE 6.31Where sunlight reaches on springequinox, summer solstice, vernalequinox, and winter solstice. The time is9:00 p.m. Universal Time, at Greenwich,England.
MEDIAClick image to the left or use the URL below.URL: https://www.ck12.org/flx/render/embeddedobject/177964
1. What is the tilt of Earth’s axis? How often does Earth go around the Sun?2. What effect does the axial tilt have on solar radiation on Earth?3. When the Northern Hemisphere points toward the sun, what season is it in the Southern Hemisphere?4. Within a hemisphere, what causes the seasons?5. What location on Earth receives roughly the same amount of solar radiation year-round? What location has
the most variability in solar radiation?
226

www.ck12.org Chapter 6. The Principles of Ecology
6.12 Soil Characteristics
Learning Objectives
• Describe the characteristics of soil.
“Land, then, is not merely soil; it is a fountain of energy flowing through a circuit of soils, plants, and animals.”— Aldo Leopold, A Sand County Almanac, 1949
Even though soil is only a very thin layer on Earth’s surface over the solid rocks below, it is the where the atmosphere,hydrosphere, biosphere, and lithosphere meet. We should appreciate soil more.
Characteristics of Soil
Soil is a complex mixture of different materials.
• About half of most soils are inorganic materials, such as the products of weathered rock, including pebbles,sand, silt, and clay particles.
• About half of all soils are organic materials, formed from the partial breakdown and decomposition of plantsand animals. The organic materials are necessary for a soil to be fertile. The organic portion provides thenutrients, such as nitrogen, needed for strong plant growth.
• In between the solid pieces, there are tiny spaces filled with air and water.
Within the soil layer, important reactions between solid rock, liquid water, air, and living things take place.
In some soils, the organic portion could be missing, as in desert sand. Or a soil could be completely organic, such asthe materials that make up peat in a bog or swamp (Figure 6.32).
227

6.12. Soil Characteristics www.ck12.org
FIGURE 6.32Peat is so rich in organic material, it canbe burned for energy.
Soil Texture
The inorganic portion of soil is made of many different size particles, and these different size particles are present indifferent proportions. The combination of these two factors determines some of the properties of the soil.
• A permeable soil allows water to flow through it easily because the spaces between the inorganic particlesare large and well connected. Sandy or silty soils are considered "light" soils because they are permeable,water-draining types of soils.
• Soils that have lots of very small spaces are water-holding soils. For example, when clay is present in a soil,the soil is heavier, holds together more tightly, and holds water.
• When a soil contains a mixture of grain sizes, the soil is called a loam (Figure 6.33).
FIGURE 6.33A loam field.
Classification
When soil scientists want to precisely determine soil type, they measure the percentage of sand, silt, and clay. Theyplot this information on a triangular diagram, with each size particle at one corner (Figure 6.34). The soil type can
228

www.ck12.org Chapter 6. The Principles of Ecology
then be determined from the location on the diagram. At the top, a soil would be clay; at the left corner, it would besand; at the right corner, it would be silt. Soils in the lower middle with less than 50% clay are loams.
FIGURE 6.34Soil types by particle size.
Soil, the Ecosystem
Soil is an ecosystem unto itself. In the spaces of soil, there are thousands or even millions of living organisms. Thoseorganisms could include earthworms, ants, bacteria, or fungi (Figure 6.35).
FIGURE 6.35Earthworms and insects are importantresidents of soils.
229

6.12. Soil Characteristics www.ck12.org
MEDIAClick image to the left or use the URL below.URL: https://www.ck12.org/flx/render/embeddedobject/186344
Summary
• Soil reflects the interactions between the lithosphere, atmosphere, hydrosphere and biosphere.• Permeable soils allow water to flow through.• The proportions of silt, clay, and sand allow scientists to classify soil type.
Review
1. What is the inorganic material that makes up a soil?2. What is the organic material that makes up a soil?3. If a soil has equal amounts of silt, clay, and sand, what type of soil is it?
Explore More
Use this resource to answer the questions that follow.
MEDIAClick image to the left or use the URL below.URL: https://www.ck12.org/flx/render/embeddedobject/178050
1. What is soil? Does it contain organic or inorganic materials?2. Why is soil a habitat?3. What does soil do for water?4. Where does the organic material in soil come from?5. Where does the inorganic material come from?6. What happens as a soil matures?7. Why are mature soils best for plant growth?8. What determines the characteristics that a soil will ultimately have?9. What is the mnemonic device for the layers of soil: OAEBC?
10. What is in the O layer?’11. What makes good topsoil?12. Where is the E zone?13. What does the E stand for? What happens in the E zone?
230

www.ck12.org Chapter 6. The Principles of Ecology
14. What is zone B?15. What is zone C?16. What important feature does particle size determine? What does that mean?17. What makes up the most porous soil type? The middle soil type? The least porous soil type?18. How is soil classified?19. What about clay is important for plants?20. What is 90% of the biological stuff in soil? What is the remaining 10%?21. What happens when a soil is degraded?22. Which soils are most vulnerable to erosion?
231
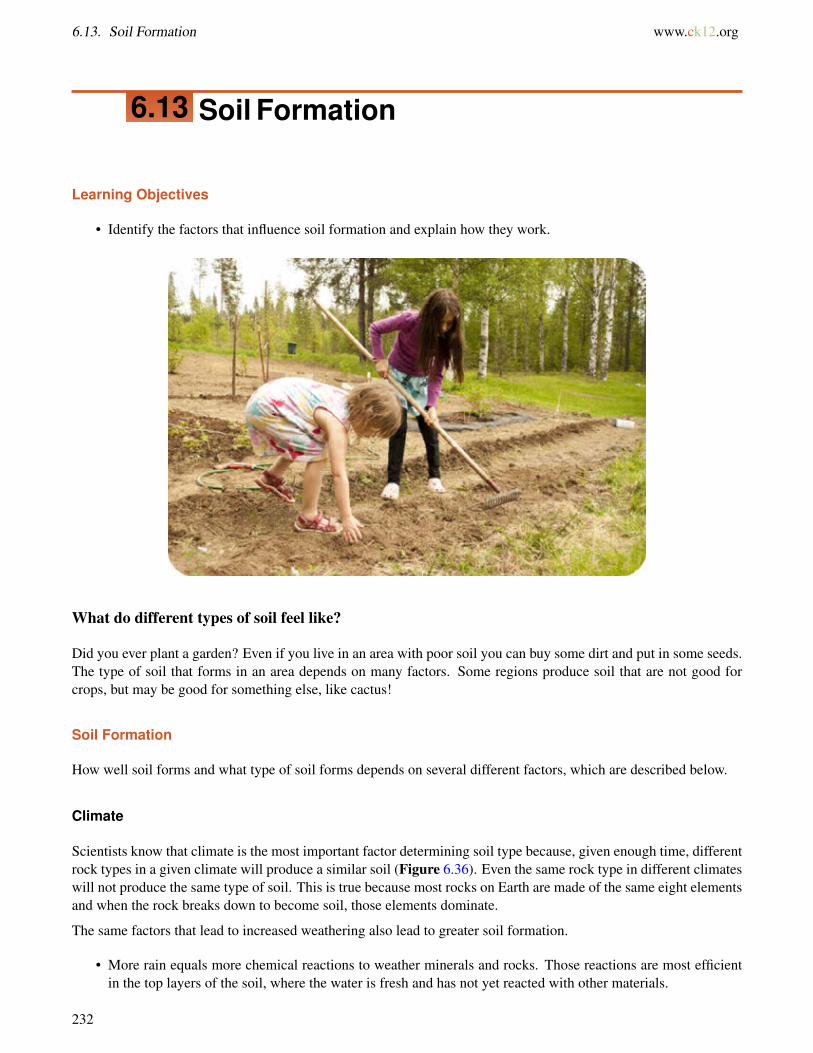
6.13. Soil Formation www.ck12.org
6.13 Soil Formation
Learning Objectives
• Identify the factors that influence soil formation and explain how they work.
What do different types of soil feel like?
Did you ever plant a garden? Even if you live in an area with poor soil you can buy some dirt and put in some seeds.The type of soil that forms in an area depends on many factors. Some regions produce soil that are not good forcrops, but may be good for something else, like cactus!
Soil Formation
How well soil forms and what type of soil forms depends on several different factors, which are described below.
Climate
Scientists know that climate is the most important factor determining soil type because, given enough time, differentrock types in a given climate will produce a similar soil (Figure 6.36). Even the same rock type in different climateswill not produce the same type of soil. This is true because most rocks on Earth are made of the same eight elementsand when the rock breaks down to become soil, those elements dominate.
The same factors that lead to increased weathering also lead to greater soil formation.
• More rain equals more chemical reactions to weather minerals and rocks. Those reactions are most efficientin the top layers of the soil, where the water is fresh and has not yet reacted with other materials.
232

www.ck12.org Chapter 6. The Principles of Ecology
FIGURE 6.36Climate is the most important factor in determining the type of soil that will form in a particular area.
• Increased rainfall increases the amount of rock that is dissolved as well as the amount of material that is carriedaway by moving water. As materials are carried away, new surfaces are exposed, which also increases the rateof weathering.
• Increased temperature increases the rate of chemical reactions, which also increases soil formation.• In warmer regions, plants and bacteria grow faster, which helps to weather material and produce soils. In
tropical regions, where temperature and precipitation are consistently high, thick soils form. Arid regionshave thin soils.
Soil type also influences the type of vegetation that can grow in the region. We can identify climate types by thetypes of plants that grow there.
Rock Type
The original rock is the source of the inorganic portion of the soil. The minerals that are present in the rock determinethe composition of the material that is available to make soil. Soils may form in place or from material that has beenmoved.
• Residual soils form in place. The underlying rock breaks down to form the layers of soil that reside above it.Only about one-third of the soils in the United States are residual.
• Transported soils have been transported in from somewhere else. Sediments can be transported into an areaby glaciers, wind, water, or gravity. Soils form from the loose particles that have been transported to a newlocation and deposited.
233

6.13. Soil Formation www.ck12.org
Slope
The steeper the slope, the less likely material will be able to stay in place to form soil. Material on a steep slope islikely to go downhill. Materials will accumulate and soil will form where land areas are flat or gently undulating.
Time
Soils thicken as the amount of time available for weathering increases. The longer the amount of time that soilremains in a particular area, the greater the degree of alteration.
Biological Activity
The partial decay of plant material and animal remains produces the organic material and nutrients in soil. Insoil, decomposing organisms breakdown the complex organic molecules of plant matter and animal remains to formsimpler inorganic molecules that are soluble in water. Decomposing organisms also create organic acids that increasethe rate of weathering and soil formation. Bacteria in the soil change atmospheric nitrogen into nitrates.
The decayed remains of plant and animal life are called humus, which is an extremely important part of the soil.Humus coats the mineral grains. It binds them together into clumps that then hold the soil together, creating itsstructure. Humus increases the soil’s porosity and water-holding capacity and helps to buffer rapid changes in soilacidity. Humus also helps the soil to hold its nutrients, increasing its fertility. Fertile soils are rich in nitrogen,contain a high percentage of organic materials, and are usually black or dark brown in color. Soils that are nitrogenpoor and low in organic material might be gray or yellow or even red in color. Fertile soils are more easily cultivated.
MEDIAClick image to the left or use the URL below.URL: https://www.ck12.org/flx/render/embeddedobject/186346
Summary
• The factors that affect soil formation are climate, rock type, slope, time, and biological activity. Differencesin these factors will produce different types of soil.
• Soil type determines what can grow in a region.• Humus, the decayed remains of living organisms, is essential for soils to be fertile.
Review
1. How does climate affect soil type? Why is climate the most important factor in developing the characteristicsof a soil?
2. How does time affect soil formation in an arid environment versus in a warm, humid environment?3. What is the role of partially decayed plant and animal remains in a soil?
234

www.ck12.org Chapter 6. The Principles of Ecology
Explore More
Use the resource below to answer the questions that follow.
MEDIAClick image to the left or use the URL below.URL: https://www.ck12.org/flx/render/embeddedobject/1617
1. Which chemical property most contributes to soil formation and what effects does it have?2. Which physical properties most contributes to soil formation and what effect does it have?3. How does relief affect soil formation?4. What do the scientists say is the succession that occurs in soil development?5. How does the slope that has been deglaciated for 50 years differ from the nearby slope that has been glacier
free for thousands of years?6. How does agricultural development affect the timing of soil formation?7. Why do scientists who study soils need a new set of terms to describe soils?
235

6.14. Soil Horizons and Profiles www.ck12.org
6.14 Soil Horizons and Profiles
Learning Objectives
• Define soil horizon and soil profile.• Describe the characteristics of the three major types of soil horizon, and explain the relationship of each to
weathering processes.
What conditions would create so much clay?
Soils are so different. In the desert there’s a very thin layer and then bedrock. The quarry in the photo is of clay.A thick, thick layer of clay is found in this area. The area must be quite moist for so much rock material to haveweathered to clays.
Soil Horizons and Profiles
A residual soil forms over many years, as mechanical and chemical weathering slowly change solid rock into soil.The development of a residual soil may go something like this.
1. The bedrock fractures because of weathering from ice wedging or another physical process.2. Water, oxygen, and carbon dioxide seep into the cracks to cause chemical weathering.3. Plants, such as lichens or grasses, become established and produce biological weathering.4. Weathered material collects until there is soil.5. The soil develops soil horizons, as each layer becomes progressively altered. The greatest degree of weather-
ing is in the top layer. Each successive, lower layer is altered just a little bit less. This is because the first placewhere water and air come in contact with the soil is at the top.
236

www.ck12.org Chapter 6. The Principles of Ecology
A cut in the side of a hillside shows each of the different layers of soil. All together, these are called a soil profile(Figure 6.37).
FIGURE 6.37Soil is an important resource. Each soilhorizon is distinctly visible in this photo-graph.
The simplest soils have three horizons.
Topsoil
Called the A-horizon, the topsoil is usually the darkest layer of the soil because it has the highest proportion oforganic material. The topsoil is the region of most intense biological activity: insects, worms, and other animalsburrow through it and plants stretch their roots down into it. Plant roots help to hold this layer of soil in place.
In the topsoil, minerals may dissolve in the fresh water that moves through it to be carried to lower layers of the soil.Very small particles, such as clay, may also get carried to lower layers as water seeps down into the ground.
Subsoil
The B-horizon or subsoil is where soluble minerals and clays accumulate. This layer is lighter brown and holdsmore water than the topsoil because of the presence of iron and clay minerals. There is less organic material. Figure6.38.
C horizon
The C-horizon is a layer of partially altered bedrock. There is some evidence of weathering in this layer, but piecesof the original rock are seen and can be identified.
Not all climate regions develop soils, and not all regions develop the same horizons. Some areas develop as many asfive or six distinct layers, while others develop only very thin soils or perhaps no soils at all.
237

6.14. Soil Horizons and Profiles www.ck12.org
FIGURE 6.38A soil profile is the complete set of soil layers. Each layer is called ahorizon.
MEDIAClick image to the left or use the URL below.URL: https://www.ck12.org/flx/render/embeddedobject/186348
Summary
• Soil horizons are layers within a soil showing different amounts of alteration.• Soil profiles show the layers of soil, which include topsoil, subsoil and the C horizon.• Topsoil has the highest proportion of organic material and is very important for agriculture.
Review
1. Describe topsoil. Why is loss of topsoil a very large problem when it happens?2. Describe the weathering processes that go into producing soil.3. What is the C horizon?
Explore More
Use this resource to answer the questions that follow.
MEDIAClick image to the left or use the URL below.URL: https://www.ck12.org/flx/render/embeddedobject/178053
238

www.ck12.org Chapter 6. The Principles of Ecology
1. What creates soil horizons?2. What is a soil profile?3. What is the O horizon made of?4. What are the characteristics of the A horizon?5. What are the characteristics of the E horizon?6. What are the characteristics of the B horizon?7. What are the characteristics of the C horizon?
239

6.15. Types of Soils www.ck12.org
6.15 Types of Soils
Learning Objectives
• Describe the characteristics of types of soil and where each is found.
What makes soil good?
Some types of soils are good for growing crops and some are not. When good soils are found in good climates wherewater is available, a variety of crops will grow. If one of these things is missing, the possibilities are much morelimited.
240

www.ck12.org Chapter 6. The Principles of Ecology
Types of Soils
Although soil scientists recognize thousands of types of soil - each with its own specific characteristics and name- let’s consider just three soil types. This will help you to understand some of the basic ideas about how climateproduces a certain type of soil, but there are many exceptions to what we will learn right now (Figure 6.39).
FIGURE 6.39Just some of the thousands of soil types.
Pedalfer
Deciduous trees, the trees that lose their leaves each winter, need at least 65 cm of rain per year. These forestsproduce soils called pedalfers, which are common in many areas of the temperate, eastern part of the United States(Figure 6.40). The word pedalfer comes from some of the elements that are commonly found in the soil. The "Al"in pedalfer is the chemical symbol of the element aluminum, and the "Fe" in pedalfer is the chemical symbol foriron. Pedalfers are usually a very fertile, dark brown or black soil. Not surprisingly, they are rich in aluminum claysand iron oxides. Because a great deal of rainfall is common in this climate, most of the soluble minerals dissolveand are carried away, leaving the less soluble clays and iron oxides behind.
Pedocal
Pedocal soils form in drier, temperate areas where grasslands and brush are the usual types of vegetation (Figure6.41). The climates that form pedocals have less than 65 cm rainfall per year. Compared to pedalfers there is lesschemical weathering and less water to dissolve away soluble minerals, so more soluble minerals are present andfewer clay minerals are produced. It is a drier region with less vegetation, so the soils have lower amounts of organicmaterial and are less fertile.
A pedocal is named for the calcite enriched layer that forms. Water begins to move down through the soil layers, butbefore it gets very far, it begins to evaporate. Soluble minerals, like calcium carbonate, concentrate in a layer thatmarks the lowest place that water was able to reach. This layer is called caliche.
241

6.15. Types of Soils www.ck12.org
FIGURE 6.40A pedalfer is the dark, fertile type of soilthat will form in a forested region.
FIGURE 6.41A lizard on soil typical of an arid region inMexico.
Laterite
In tropical rainforests where it rains literally every day, laterite soils form (Figure 6.42). In these hot, wet, tropicalregions, intense chemical weathering strips the soils of their nutrients. There is practically no humus. All solubleminerals are removed from the soil and all plant nutrients are carried away. All that is left behind are the least solublematerials, like aluminum and iron oxides. These soils are often red in color from the iron oxides. Laterite soils bakeas hard as a brick if they are exposed to the Sun.
MEDIAClick image to the left or use the URL below.URL: https://www.ck12.org/flx/render/embeddedobject/186352
Many climate types have not been mentioned here. Each produces a distinctive soil type that forms in the particular
242

www.ck12.org Chapter 6. The Principles of Ecology
FIGURE 6.42A laterite is the type of thick, nutrient-poorsoil that forms in the rainforest.
circumstances found there. Where there is less weathering, soils are thinner but soluble minerals may be present.Where there is intense weathering, soils may be thick but nutrient-poor. Soil development takes a very long time, itmay take hundreds or even thousands of years for a good fertile topsoil to form. Soil scientists estimate that in thevery best soil-forming conditions, soil forms at a rate of about 1mm/year. In poor conditions, soil formation maytake thousands of years!
Summary
• Pedalfer is the soil common in deciduous forests and is rich in aluminum and iron. Pedalfers are dark brownand fertile.
• Pedocal is the soil common in grasslands where the climate is drier and is rich in calcium.• Laterite forms in tropical rain forests. Chemical weathering strips the soils of their nutrients, so when the
forest is removed the soil is not very fertile.
Review
1. What is pedocal and under what conditions does it form?2. What is pedalfer and under what conditions does it form?3. What is laterite and under what conditions does it form?
Explore More
Use this resource (start at 3:52) to answer the questions that follow.
MEDIAClick image to the left or use the URL below.URL: https://www.ck12.org/flx/render/embeddedobject/178055
243

6.15. Types of Soils www.ck12.org
1. What defines the two different soil types in the United States?2. What are the characteristics of pedalfer? What is this due to?3. What happens in the western half of the U.S. that inhibits soil development?
244

www.ck12.org Chapter 6. The Principles of Ecology
6.16 Latitude, Longitude, and Direction
Learning Objectives
• Identify and define latitude and longitude.• Use latitude and longitude to find a location.
If you found this feature while out in the field, could you find it again?
If you’re going to make observations of Earth systems, you’re going to need to know the location where you are soyou can mark it on a map. If you find a rock formation filled with gold, you’ll want to be able to find the location
245

6.16. Latitude, Longitude, and Direction www.ck12.org
again! You may need to tell someone when your truck gets stuck when you’re in the field so you’ll need a directionto give them.
The photo above is of Old Faithful Geyser in Yellowstone National Park. Let’s explore just a few of the ways wecan pinpoint the location of this famous geological icon.
Location
How would you find Old Faithful? One way is by using latitude and longitude. Any location on Earth’s surface —or on a map — can be described using these coordinates. Latitude and longitude are expressed as degrees that aredivided into 60 minutes. Each minute is divided into 60 seconds.
FIGURE 6.43
Latitude
A look on a reliable website shows us that Old Faithful Geyser is located at N44o27’ 43”. What does this mean?
Latitude tells the distance north or south of the Equator. Latitude lines start at the Equator and circle around theplanet. The North Pole is 90oN, with 90 degree lines in the Northern Hemisphere. Old Faithful is at 44 degrees, 27minutes and 43 seconds north of the Equator. That’s just about exactly half way between the Equator and the NorthPole!
Longitude
The latitude mentioned above does not locate Old Faithful exactly, since a circle could be drawn that latitude north ofthe Equator. To locate Old Faithful we need another point - longitude. At Old Faithful the longitude is W110o49’57”.
Longitude lines are circles that go around the Earth from north to south, like the sections of an orange. Longitude ismeasured perpendicular to the Equator. The Prime Meridian is 0o longitude and passes through Greenwich, England.
246

www.ck12.org Chapter 6. The Principles of Ecology
The International Date Line is the 180o meridian. Old Faithful is in the Western Hemisphere, between the PrimeMeridian in the east and the International Date Line in the west.
Elevation
An accurate location must take into account the third dimension. Elevation is the height above or below sea level.Sea level is the average height of the ocean’s surface or the midpoint between high and low tide. Sea level is thesame all around Earth.
Old Faithful is higher above sea level than most locations at 7,349 ft (2240 m). Of course, the highest point on Earth,Mount Everest, is much higher at 29,029 ft (8848 m).
Global Positioning System
Satellites continually orbit Earth and can be used to indicate location. A global positioning system receiver detectsradio signals from at least four nearby GPS satellites. The receiver measures the time it takes for radio signalsto travel from a satellite and then calculates its distance from the satellite using the speed of radio signals. Bycalculating distances from each of the four satellites the receiver can triangulate to determine its location. You canuse a GPS meter to tell you how to get to Old Faithful.
Direction
Direction is important if you want to go between two places. Directions are expressed as north (N), east (E), south(S), and west (W), with gradations in between. The most common way to describe direction in relation to the Earth’ssurface is with a compass, a device with a floating needle that is actually a small magnet. The compass needle alignsitself with the Earth’s magnetic north pole. Since the magnetic north pole is 11.5 degrees offset from its geographicnorth pole on the axis of rotation, you must correct for this discrepancy.
FIGURE 6.44Map of the Visitor Center at Old Faithful, Yellowstone National Park,Wyoming.
Without using a compass, we can say that to get to Old Faithful, you enter Yellowstone National Park at the SouthEntrance, drive north-northeast to West Thumb, and then drive west-northwest to Old Faithful.
247

6.16. Latitude, Longitude, and Direction www.ck12.org
MEDIAClick image to the left or use the URL below.URL: https://www.ck12.org/flx/render/embeddedobject/185998
Summary
• Latitude is the distance north or south of the Equator and is expressed as a number between 0 and 90 degreesnorth or south.
• Longitude is the distance east or west of the Prime Meridian and is expressed as a number between 0 and 180degrees east or west.
• Elevation is the height above sea level.• Direction is expressed as north, south, east, or west, or some gradation between them.
Review
1. Where would a feature at N44o 27’ 43”and W110o49’57”be located?2. How else might you describe where Old Faithful is?3. Define latitude and longitude.
Explore More
Use this resource to answer the questions that follow.
MEDIAClick image to the left or use the URL below.URL: https://www.ck12.org/flx/render/embeddedobject/1643
1. What are lines of latitude?
2. How far apart are the lines of latitude, in degrees, in miles?
3. What are the latitudes of the Equator, the Tropic of Cancer, and the Tropic of Capricorn? What are thecharacteristics of the regions found between the Tropic of Cancer and Tropic of Capricorn?
4. Where are the Arctic and Antarctic circle? What are the characteristics of the regions that are found poleward ofthese circles?
5. What are lines of longitude?
6. Where do the meridians meet?
7. What is the Prime Meridian? Where is it located?
248

www.ck12.org Chapter 6. The Principles of Ecology
8. How are longitude and latitude measured?
249

6.17. Solar Energy and Latitude www.ck12.org
6.17 Solar Energy and Latitude
Learning Objectives
• Describe the different amounts of solar energy that strike at different latitudes.
This is Antarctica. What season is this?
The Sun is always up, even in the middle of the night. That’s the photo on the left. In the day, the Sun never gets toohigh in the sky. That’s the photo on the right. So, this is summer. In the winter, it’s just dark in Antarctica.
Energy and Latitude
Different parts of Earth’s surface receive different amounts of sunlight (Figure 6.45). The Sun’s rays strike Earth’ssurface most directly at the Equator. This focuses the rays on a small area. Near the poles, the Sun’s rays strike thesurface at a slant. This spreads the rays over a wide area. The more focused the rays are, the more energy an areareceives, and the warmer it is.
FIGURE 6.45The lowest latitudes get the most energyfrom the Sun. The highest latitudes getthe least.
The difference in solar energy received at different latitudes drives atmospheric circulation. Places that get moresolar energy have more heat. Places that get less solar energy have less heat. Warm air rise, and cool air sinks. Theseprinciples mean that air moves around the planet. The heat moves around the globe in certain ways. This determinesthe way the atmosphere moves.
250

www.ck12.org Chapter 6. The Principles of Ecology
Summary
• A lot of the solar energy that reaches Earth hits the Equator.• Much less solar energy gets to the poles.• The difference in the amount of solar energy drives atmospheric circulation.
Review
1. The North Pole receives sunlight 24 hours a day in the summer. Why does it receive less solar radiation thanthe Equator?
2. What part of Earth receives the most solar radiation in a year? Why?3. What makes the atmosphere move the way it does?
251

6.18. Greenhouse Effect www.ck12.org
6.18 Greenhouse Effect
Learning Objectives
• Describe the greenhouse effect.• Explain how human actions contribute to the greenhouse effect.
How does the atmosphere resemble a greenhouse?
To extend the growing season, many farmers use greenhouses. A greenhouse traps heat so that days that might be toocool for a growing plant can be made to be just right. Similar to a greenhouse, greenhouse gases in the atmospherekeep Earth warm.
The Greenhouse Effect
The exception to Earth’s temperature being in balance is caused by greenhouse gases. But first the role of greenhousegases in the atmosphere must be explained.
Greenhouse gases warm the atmosphere by trapping heat. Some of the heat that radiates out from the ground istrapped by greenhouse gases in the troposphere. Like a blanket on a sleeping person, greenhouse gases act asinsulation for the planet. The warming of the atmosphere because of insulation by greenhouse gases is called thegreenhouse effect (Figure 6.46). Greenhouse gases are the component of the atmosphere that moderate Earth’stemperatures.
Greenhouse Gases
Greenhouse gases include CO2, H2O, methane, O3, nitrous oxides (NO and NO2), and chlorofluorocarbons (CFCs).All are a normal part of the atmosphere except CFCs. Table 6.2 shows how each greenhouse gas naturally enters theatmosphere.
TABLE 6.2: Greenhouse Gas Entering the Atmosphere
Greenhouse Gas Where It Comes FromCarbon dioxide Respiration, volcanic eruptions, decomposition of plant
material; burning of fossil fuels
252

www.ck12.org Chapter 6. The Principles of Ecology
TABLE 6.2: (continued)
Greenhouse Gas Where It Comes FromMethane Decomposition of plant material under some condi-
tions, biochemical reactions in stomachsNitrous oxide Produced by bacteriaOzone Atmospheric processesChlorofluorocarbons Not naturally occurring; made by humans
253

6.18. Greenhouse Effect www.ck12.org
FIGURE 6.46The Earth’s heat budget shows theamount of energy coming into and goingout of the Earth’s system and the im-portance of the greenhouse effect. Thenumbers are the amount of energy that isfound in one square meter of that location.
Different greenhouse gases have different abilities to trap heat. For example, one methane molecule traps 23 timesas much heat as one CO2 molecule. One CFC-12 molecule (a type of CFC) traps 10,600 times as much heat as oneCO2. Still, CO2 is a very important greenhouse gas because it is much more abundant in the atmosphere.
Human Activity and Greenhouse Gas Levels
Human activity has significantly raised the levels of many of greenhouse gases in the atmosphere. Methane levelsare about 2 1/2 times higher as a result of human activity. Carbon dioxide has increased more than 35%. CFCs haveonly recently existed.
What do you think happens as atmospheric greenhouse gas levels increase? More greenhouse gases trap moreheat and warm the atmosphere. The increase or decrease of greenhouse gases in the atmosphere affect climate andweather the world over.
MEDIAClick image to the left or use the URL below.URL: https://www.ck12.org/flx/render/embeddedobject/186464
Summary
• Greenhouse gases include CO2, H2O, methane, O3, nitrous oxides (NO and NO2), and chlorofluorocarbons(CFCs).
• Tropospheric greenhouse gases trap heat in the atmosphere; greenhouse gases vary in their heat-trappingabilities.
254

www.ck12.org Chapter 6. The Principles of Ecology
• Levels of greenhouse gases in the atmosphere are increasing due to human activities.
Review
1. If you were trying to keep down global temperature and you had a choice between adding 100 methanemolecules or 1 CFC-12 molecule to the atmosphere, which would you choose and why?
2. What is the greenhouse effect?3. How does Earth’s atmosphere resemble a greenhouse?
Explore More
Use this resource to answer the questions that follow.
MEDIAClick image to the left or use the URL below.URL: https://www.ck12.org/flx/render/embeddedobject/160869
1. What would the temperature of the surface be if the Earth did not have an atmosphere?2. What does it mean to say that Earth is in radiative equilibrium?3. What happens to the radiation emitted by Earth into space?4. What are the most common greenhouse gases?5. How do greenhouse gases react to incoming solar radiation and outgoing heat?6. What do greenhouse gases do with the radiation they absorb? What happens to that?7. What is greenhouse effect?8. What happens to the surface of the Earth when there is an increase in greenhouse gases?
Resources
MEDIAClick image to the left or use the URL below.URL: https://www.ck12.org/flx/render/embeddedobject/178121
255
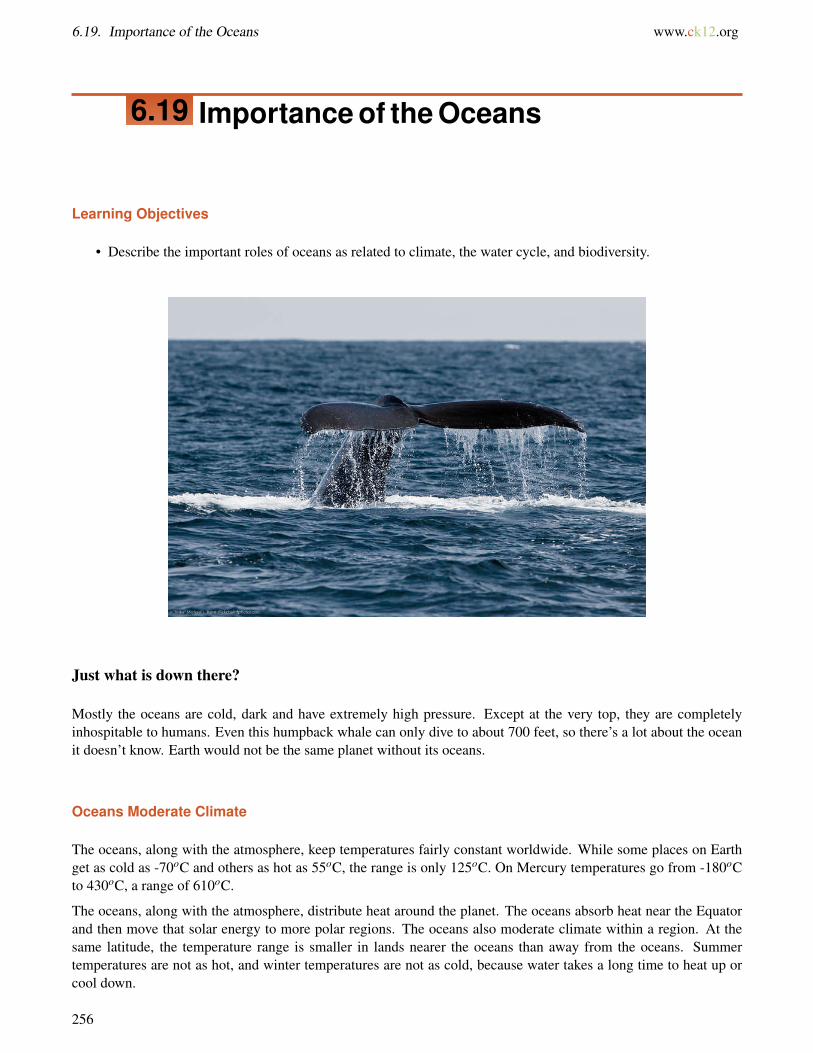
6.19. Importance of the Oceans www.ck12.org
6.19 Importance of the Oceans
Learning Objectives
• Describe the important roles of oceans as related to climate, the water cycle, and biodiversity.
Just what is down there?
Mostly the oceans are cold, dark and have extremely high pressure. Except at the very top, they are completelyinhospitable to humans. Even this humpback whale can only dive to about 700 feet, so there’s a lot about the oceanit doesn’t know. Earth would not be the same planet without its oceans.
Oceans Moderate Climate
The oceans, along with the atmosphere, keep temperatures fairly constant worldwide. While some places on Earthget as cold as -70oC and others as hot as 55oC, the range is only 125oC. On Mercury temperatures go from -180oCto 430oC, a range of 610oC.
The oceans, along with the atmosphere, distribute heat around the planet. The oceans absorb heat near the Equatorand then move that solar energy to more polar regions. The oceans also moderate climate within a region. At thesame latitude, the temperature range is smaller in lands nearer the oceans than away from the oceans. Summertemperatures are not as hot, and winter temperatures are not as cold, because water takes a long time to heat up orcool down.
256

www.ck12.org Chapter 6. The Principles of Ecology
Water Cycle
The oceans are an essential part of Earth’s water cycle. Since they cover so much of the planet, most evaporationcomes from oceans and most precipitation falls on oceans.
Biologically Rich
The oceans are home to an enormous amount of life. That is, they have tremendous biodiversity (Figure 6.47). Tinyocean plants, called phytoplankton, create the base of a food web that supports all sorts of life forms. Marine lifemakes up the majority of all biomass on Earth. (Biomass is the total mass of living organisms in a given area.) Theseorganisms supply us with food and even the oxygen created by marine plants.
FIGURE 6.47Polar bears are well adapted to frigid Arc-tic waters.
MEDIAClick image to the left or use the URL below.URL: https://www.ck12.org/flx/render/embeddedobject/186413
MEDIAClick image to the left or use the URL below.URL: https://www.ck12.org/flx/render/embeddedobject/197350
257

6.19. Importance of the Oceans www.ck12.org
Summary
• Oceans moderate Earth’s temperature by not changing temperature rapidly and by distributing heat around theplanet.
• Oceans are an enormous reservoir for water in the water cycle.• Oceans have tremendous biodiversity and the majority of all biomass on Earth.
Review
1. What organisms form the base of the ocean food web?2. How do the oceans moderate Earth’s temperature?3. What role do oceans play in the water cycle?
258

www.ck12.org Chapter 6. The Principles of Ecology
6.20 Weather vs. Climate
Learning Objectives
• Define weather and climate, and explain the relationship between them.
What’s the weather like?
If someone across country asks you what the weather is like today, you need to consider several factors. Airtemperature, humidity, wind speed, the amount and types of clouds, and precipitation are all part of a thoroughweather report.
What is Weather?
All weather takes place in the atmosphere, virtually all of it in the lower atmosphere. Weather describes what theatmosphere is like at a specific time and place. A location’s weather depends on:
• air temperature• air pressure• fog• humidity• cloud cover• precipitation• wind speed and direction
All of these characteristics are directly related to the amount of energy that is in the system and where that energyis. The ultimate source of this energy is the Sun.
259

6.20. Weather vs. Climate www.ck12.org
Weather is the change we experience from day to day. Weather can change rapidly.
What is Climate?
Although almost anything can happen with the weather, climate is more predictable. The weather on a particularwinter day in San Diego may be colder than on the same day in Lake Tahoe, but, on average, Tahoe’s winter climateis significantly colder than San Diego’s (Figure 6.48).
FIGURE 6.48Winter weather at Lake Tahoe doesn’tmuch resemble winter weather in SanDiego even though they’re both in Califor-nia.
Climate is the long-term average of weather in a particular spot. Good climate is why we choose to vacation inHawaii in February, even though the weather is not guaranteed to be good! A location’s climate can be described byits air temperature, humidity, wind speed and direction, and the type, quantity, and frequency of precipitation.
The climate for a particular place is steady, and changes only very slowly. Climate is determined by many factors,including the angle of the Sun, the likelihood of cloud cover, and the air pressure. All of these factors are related tothe amount of energy that is found in that location over time.
The climate of a region depends on its position relative to many things. These factors are described in the nextsections.
MEDIAClick image to the left or use the URL below.URL: https://www.ck12.org/flx/render/embeddedobject/186470
MEDIAClick image to the left or use the URL below.URL: https://www.ck12.org/flx/render/embeddedobject/186472
260

www.ck12.org Chapter 6. The Principles of Ecology
Summary
• A region’s weather depends on its air temperature, air pressure, humidity, precipitation, wind speed anddirection, and other factors.
• Climate is the long-term average of weather.• Weather can change in minutes, but climate changes very slowly.
Review
1. When you’re in a cold place in December and you’re planning a vacation for February, are you interested ina location’s weather or climate? If it’s a summer day and you want to take a picnic are you concerned withweather or climate?
2. What factors account for a location’s weather?3. If climate is the long-term average of weather, how can climate change?
261

6.21. Ocean Currents and Climate www.ck12.org
6.21 Ocean Currents and Climate
• Explain how ocean currents like the Gulf Stream influence Earth’s climate.
Why is northwestern Europe relatively warm?
The Gulf Stream waters do a lot for Europe. The equatorial warmth this current brings to the North Atlanticmoderates temperatures in northern Europe. In a satellite image of water temperature in the western Atlantic it
262

www.ck12.org Chapter 6. The Principles of Ecology
is easy to pick out the Gulf Stream, which brings warmer waters from the Equator up the coast of eastern NorthAmerica.
Effect on Global Climate
Surface currents play an enormous role in Earth’s climate. Even though the Equator and poles have very differentclimates, these regions would have more extremely different climates if ocean currents did not transfer heat from theequatorial regions to the higher latitudes.
The Gulf Stream is a river of warm water in the Atlantic Ocean, about 160 kilometers wide and about a kilometerdeep. Water that enters the Gulf Stream is heated as it travels along the Equator. The warm water then flows upthe east coast of North America and across the Atlantic Ocean to Europe (see opening image). The energy the GulfStream transfers is enormous: more than 100 times the world’s energy demand.
The Gulf Stream’s warm waters raise temperatures in the North Sea, which raises the air temperatures over landbetween 3 to 6◦C (5 to 11◦F). London, U.K., for example, is at about six degrees further south than Quebec, Canada.However, London’s average January temperature is 3.8◦C (38◦F), while Quebec’s is only -12◦C (10◦F). Because airtraveling over the warm water in the Gulf Stream picks up a lot of water, London gets a lot of rain. In contrast,Quebec is much drier and receives its precipitation as snow.
FIGURE 6.49London, England in winter.
MEDIAClick image to the left or use the URL below.URL: https://www.ck12.org/flx/render/embeddedobject/186428
263

6.21. Ocean Currents and Climate www.ck12.org
FIGURE 6.50Quebec City, Quebec in winter.
Summary
• Water in the Gulf Stream travels along the Equator and is heated as it goes.• The Gulf Stream brings warm water north along the Atlantic coast of the United States and then across the
northern Atlantic to the British Isles.• A tremendous amount of energy is transferred from the equatorial regions to the polar regions by ocean
currents.
Review
1. Explain why England is relatively mild and rainy in winter but central Canada, at the same latitude and duringthe same season, is dry and frigid.
2. Where else do you think ocean currents might moderate global climate?3. What would Earth be like if ocean water did not move?
Explore More
1. What drives ocean and atmospheric circulation? What does the ocean store more of than the atmosphere?2. What are surface ocean currents driven by? What are deeper ocean currents driven by?3. What is the importance of upwelling nutrients in the ocean?4. What causes El Nino and La Nina? What happens during these events?5. How does heat exchange between ocean surface and atmosphere influence climate?6. How do hurricanes form in the oceans? Where does the heat come from to power them?7. What kind of life would be on Earth if there were no oceans?
264

www.ck12.org Chapter 6. The Principles of Ecology
6.22 Effect of Latitude on Climate
Learning Objectives
• Describe how latitude influences a region’s climate, particularly its average temperature.
Where do you want to go on vacation?
If you live in a frigid climate you may want to go to lower latitudes for your mid-winter vacation. If you live inthe desert, you may like to spend part of your summer at higher latitudes. Different climates are found at differentlatitudes.
Latitude
Many factors influence the climate of a region. The most important factor is latitude because different latitudesreceive different amounts of solar radiation.
• The Equator receives the most solar radiation. Days are equally long year-round and the Sun is just aboutdirectly overhead at midday.
• The polar regions receive the least solar radiation. The night lasts six months during the winter. Even insummer, the Sun never rises very high in the sky. Sunlight filters through a thick wedge of atmosphere,making the sunlight much less intense. The high albedo, because of ice and snow, reflects a good portion ofthe Sun’s light.
265
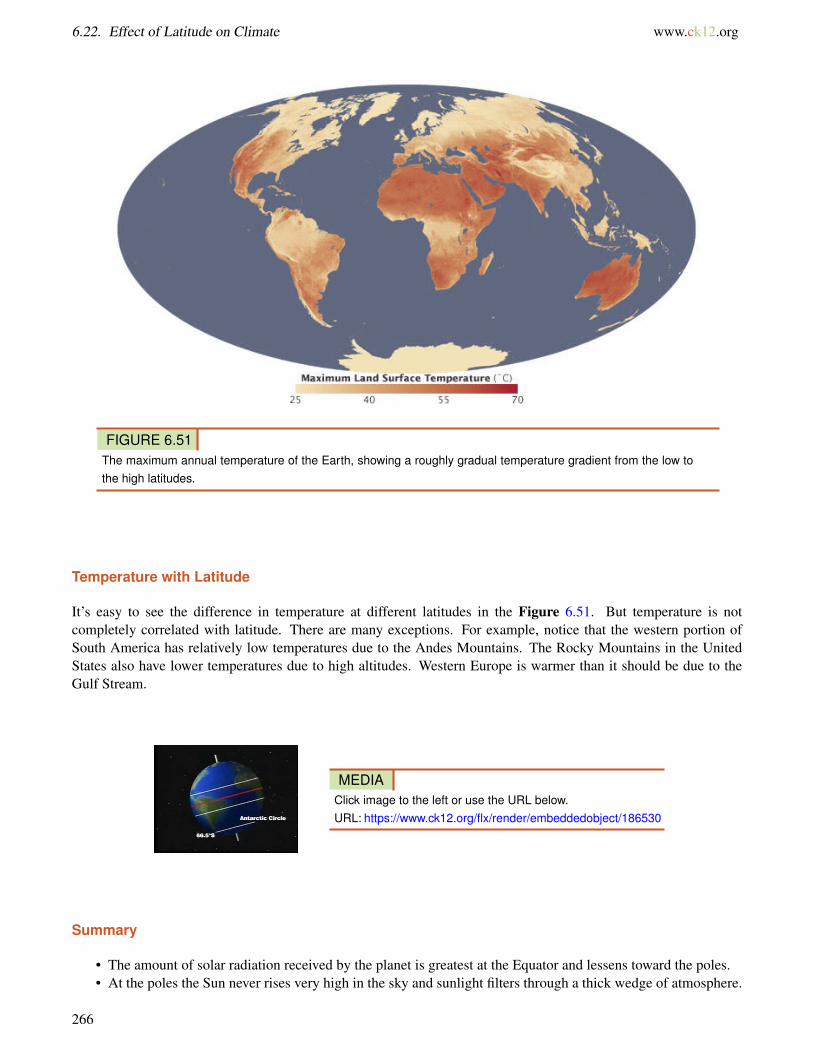
6.22. Effect of Latitude on Climate www.ck12.org
FIGURE 6.51The maximum annual temperature of the Earth, showing a roughly gradual temperature gradient from the low tothe high latitudes.
Temperature with Latitude
It’s easy to see the difference in temperature at different latitudes in the Figure 6.51. But temperature is notcompletely correlated with latitude. There are many exceptions. For example, notice that the western portion ofSouth America has relatively low temperatures due to the Andes Mountains. The Rocky Mountains in the UnitedStates also have lower temperatures due to high altitudes. Western Europe is warmer than it should be due to theGulf Stream.
MEDIAClick image to the left or use the URL below.URL: https://www.ck12.org/flx/render/embeddedobject/186530
Summary
• The amount of solar radiation received by the planet is greatest at the Equator and lessens toward the poles.• At the poles the Sun never rises very high in the sky and sunlight filters through a thick wedge of atmosphere.
266

www.ck12.org Chapter 6. The Principles of Ecology
• Latitude is not the only factor that determines the temperature of a region, as can be seen in the striped mapabove.
Review
1. Why do the poles receive so much less solar radiation than the Equator considering that it’s light for six monthsat the poles?
2. Why is latitude considered the most important factor in determining temperature?3. Look at a map of geological features and look at the temperature map to try to determine why some of the
exceptions exist. What’s the realtively cool blob north of India?
Explore More
Use this resource to answer the questions that follow.
MEDIAClick image to the left or use the URL below.URL: https://www.ck12.org/flx/render/embeddedobject/178231
1. Why does less solar radiation reach the poles?2. What are the mean annual temperatures at the equator? What are they at the south pole?3. How does latitude affect precipitation?4. Where are the regions of rising air?5. Where are the regions of sinking air?6. Why are the Sahara and the deserts of the American Southwest at about the same latitude?7. Why are there lots of forests at 60-degrees latitude? Why is this a stormy region?8. How can the north and south poles be called deserts? Why is there snow there?
267

6.23. Effect of Atmospheric Circulation on Climate www.ck12.org
6.23 Effect of Atmospheric Circulation onClimate
Learning Objectives
• Explain how major climate traits correlate with the positions of the atmospheric circulation cells.
Does it really never rain in California like the song says?
In California, the predominant winds are the westerlies blowing in from the Pacific Ocean, which bring in relativelycool air in summer and relatively warm air in winter. The winds do bring rain, quite a bit in northern California, butin San Diego there are only 10 inches a year on average.
Atmospheric Circulation Cells
The position of a region relative to the circulation cells and wind belts has a great affect on its climate. In an areawhere the air is mostly rising or sinking, there is not much wind.
The ITCZ
The Intertropical Convergence Zone (ITCZ) is the low pressure area near the Equator in the boundary betweenthe two Hadley Cells. The air rises so that it cools and condenses to create clouds and rain (Figure 6.53). Climatealong the ITCZ is therefore warm and wet. Early mariners called this region the doldrums because their ships wereoften unable to sail due to the lack of steady winds.
268

www.ck12.org Chapter 6. The Principles of Ecology
FIGURE 6.52The atmospheric circulation cells andtheir relationships to air movement on theground.
FIGURE 6.53The ITCZ can easily be seen where thunderstorms are lined up north of the Equator.
The ITCZ migrates slightly with the season. Land areas heat more quickly than the oceans. Because there are moreland areas in the Northern Hemisphere, the ITCZ is influenced by the heating effect of the land. In Northern Hemi-sphere summer, it is approximately 5◦ north of the Equator, while in the winter it shifts back and is approximately atthe Equator. As the ITCZ shifts, the major wind belts also shift slightly north in summer and south in winter, whichcauses the wet and dry seasons in this area (Figure 6.54).
269

6.23. Effect of Atmospheric Circulation on Climate www.ck12.org
FIGURE 6.54Seasonal differences in the location of the ITCZ are shown on this map.
MEDIAClick image to the left or use the URL below.URL: https://www.ck12.org/flx/render/embeddedobject/186534
Hadley Cell and Ferrell Cell Boundary
At about 30◦N and 30◦S, the air is fairly warm and dry because much of it came from the Equator, where it lost mostof its moisture at the ITCZ. At this location the air is descending, and sinking air warms and causes evaporation.
Mariners named this region the horse latitudes. Sailing ships were sometimes delayed for so long by the lack ofwind that they would run out of water and food for their livestock. Sailors tossed horses and other animals over theside after they died. Sailors sometimes didn’t make it either.
Ferrell Cell and Polar Cell Boundary
The polar front is around 50◦ to 60◦, where cold air from the poles meets warmer air from the tropics. The meetingof the two different air masses causes the polar jet stream, which is known for its stormy weather. As the Earth orbitsthe Sun, the shift in the angle of incoming sunlight causes the polar jet stream to move. Cities to the south of thepolar jet stream will be under warmer, moister air than cities to its north. Directly beneath the jet stream, the weather
270

www.ck12.org Chapter 6. The Principles of Ecology
is often stormy and there may be thunderstorms and tornadoes.
Prevailing Winds
The prevailing winds are the bases of the Hadley, Ferrell, and polar cells. These winds greatly influence the climateof a region because they bring the weather from the locations they come from. Local winds also influence localclimate. For example, land breezes and sea breezes moderate coastal temperatures.
MEDIAClick image to the left or use the URL below.URL: https://www.ck12.org/flx/render/embeddedobject/186532
Summary
• High and low pressure zones related to the atmospheric circulation cells are important in determining a region’sclimate.
• Prevailing winds influence the climate of a region because they bring in weather from the upwind area.• Boundaries between cells are often known for winds and stormy weather due to the contact of different air
masses.
Review
1. What are prevailing winds and how do they affect climate?2. What is the ITCZ? How does its location affect weather?3. Where is there not much wind?
271

6.24. Effect of Continental Position on Climate www.ck12.org
6.24 Effect of Continental Position on Climate
Learning Objectives
• Define marine and continental climates, and explain how continental position and ocean currents affect cli-mate.
What causes San Francisco’s famous fog?
The California Current travels from the north and brings cold water to the region just offshore. The warm Mediter-ranean climate of coastal California contrasts with the cold water offshore and forms advection fog, which blows offthe shore and up to a few miles inland. Fog under the Golden Gate Bridge is a common sight in the City by the Bay.
Continental Position
When a particular location is near an ocean or large lake, the body of water plays an extremely important role inaffecting the region’s climate.
• A maritime climate is strongly influenced by the nearby sea. Temperatures vary a relatively small amountseasonally and daily. For a location to have a true maritime climate, the winds must most frequently come offthe sea.
• A continental climate is more extreme, with greater temperature differences between day and night andbetween summer and winter.
The ocean’s influence in moderating climate can be seen in the following temperature comparisons. Each of thesecities is located at 37oN latitude, within the westerly winds (Figure 6.55).
The climate of San Francisco is influenced by the cool California current and offshore upwelling. Wichita has amore extreme continental climate. Virginia Beach, though, is near the Atlantic Ocean. Why is the climate there less
272

www.ck12.org Chapter 6. The Principles of Ecology
FIGURE 6.55How does the ocean influence the climate of these three cities?
influenced by the ocean than is the climate in San Francisco? Hint: Think about the direction the winds are goingat that latitude. The weather in San Francisco comes from over the Pacific Ocean while much of the weather inVirginia comes from the continent.
Ocean Currents
The temperature of the water offshore influences the temperature of a coastal location, particularly if the windscome off the sea. The cool waters of the California Current bring cooler temperatures to the California coastalregion. Coastal upwelling also brings cold, deep water up to the ocean surface off of California, which contributes tothe cool coastal temperatures. Further north, in southern Alaska, the upwelling actually raises the temperature of thesurrounding land because the ocean water is much warmer than the land. The important effect of the Gulf Stream onthe climate of northern Europe is described in the chapter Water on Earth.
Summary
• A maritime climate is influenced by a nearby ocean. A continental climate is influenced by nearby land.• The temperature of offshore currents affect nearby land areas.• A maritime climate is less extreme than a continental climate because the ocean moderates temperatures.
273

6.24. Effect of Continental Position on Climate www.ck12.org
Review
1. If upwelling stopped off of California, how would climate be affected?2. From which direction would weather come to a city at 65-degrees north?3. Why is the climate of San Francisco so different from the climate of Virginia Beach when both are near an
ocean?
Resources
MEDIAClick image to the left or use the URL below.URL: https://www.ck12.org/flx/render/embeddedobject/183843
274

www.ck12.org Chapter 6. The Principles of Ecology
6.25 Effect of Altitude and Mountains on Climate
Learning Objectives
• Explain how altitude and mountain ranges affect climate.• Define rainshadow effect.
Altitude and Mountain Ranges
Air pressure and air temperature decrease with altitude. The closer molecules are packed together, the more likelythey are to collide. Collisions between molecules give off heat, which warms the air. At higher altitudes, the air isless dense and air molecules are more spread out and less likely to collide. A location in the mountains has loweraverage temperatures than one at the base of the mountains. In Colorado, for example, Lakewood’s (5,640 feet)average annual temperature is 62oF (17oC), while Climax Lake’s (11,300 feet) is 42oF (5.4oC).
Mountain ranges have two effects on the climate of the surrounding region:
• rainshadow effect, which brings warm, dry climate to the leeward side of a mountain range (Figure 6.56).• separation in the coastal region from the rest of the continent. Since a maritime air mass may have trouble
rising over a mountain range, the coastal area will have a maritime climate but the inland area on the leewardside will have a continental climate.
FIGURE 6.56The Bonneville Salt Flats are part of thevery dry Great Basin of the Sierra Nevadaof California. The region receives littlerainfall.
Five factors that Affect Climate takes a very thorough look at what creates the climate zones. The climate of a regionallows certain plants to grow, creating an ecological biome.
275

6.25. Effect of Altitude and Mountains on Climate www.ck12.org
MEDIAClick image to the left or use the URL below.URL: https://www.ck12.org/flx/render/embeddedobject/1588
Summary
• Collisions between molecules increase temperature: where air is denser, the air temperature is higher.• Rainshadow effect occurs on the leeward side of a mountain range.• Maritime air may become stuck on the windward side of a mountain range and so is unable to bring cooler air
further inland.
Review
1. Why does an increase in altitude cause a change in temperature?2. What is rainshadow effect?3. Besides rainshadow effect, how else do mountains affect weather downwind?
Explore More
Use this resource to answer the questions that follow.
MEDIAClick image to the left or use the URL below.URL: https://www.ck12.org/flx/render/embeddedobject/1589
1. What happens when wind crashes into a mountain range?2. What weather occurs on the windward side of a mountain?3. What is the climate on the windward side of the mountain relative to the leeward side of the mountain?4. What are rain shadow deserts?5. Describe the characteristics seen on the windward side of the Sierra Nevada Mountains.6. Describe the characteristics see on the leeward side of the Sierra Nevada Mountains.
276

www.ck12.org Chapter 6. The Principles of Ecology
6.26 Biomes
Lesson Objectives
• Identify and describe terrestrial biomes.• Give an overview of aquatic biomes.
Vocabulary
• aphotic zone• aquatic biome• climate• dormancy• estuary• freshwater biome• growing season• intertidal zone• marine biome• photic zone• phytoplankton• terrestrial biome• wetland• zooplankton
Introduction
If you look at the two pictures in Figure 6.57, you will see very few similarities. The picture on the left shows adesert in Africa. The picture on the right shows a rainforest in Australia. The desert doesn’t have any visible plants,whereas the rainforest is densely packed with trees. What explains these differences?
FIGURE 6.57Sahara Desert in northern Africa (left).Rainforest in northeastern Australia(right). Two very different biomes arepictured here. Both are found at roughlythe same distance from the equator.
277

6.26. Biomes www.ck12.org
The two pictures in Figure 6.57 represent two different biomes. A biome is a group of similar ecosystems with thesame general abiotic factors and primary producers. Biomes may be terrestrial or aquatic.
Terrestrial Biomes
Terrestrial biomes include all the land areas on Earth where organisms live. The distinguishing features of terrestrialbiomes are determined mainly by climate. Terrestrial biomes include tundras, temperate forests and grasslands,chaparral, temperate and tropical deserts, and tropical forests and grasslands.
Terrestrial Biomes and Climate
Climate is the average weather in an area over a long period of time. Weather refers to the conditions of theatmosphere from day to day. Climate is generally described in terms of temperature and moisture.
Temperature falls from the equator to the poles. Therefore, major temperature zones are based on latitude. Theyinclude tropical, temperate, and arctic zones (see Figure 6.58). However, other factors besides latitude may alsoinfluence temperature. For example, land near the ocean may have cooler summers and warmer winters than landfarther inland. This is because water gains and loses heat more slowly than does land, and the water temperatureinfluences the temperature on the coast. Temperature also falls from lower to higher altitudes. That’s why tropicalzone mountain tops may be capped with snow.
FIGURE 6.58Temperature Zones. Temperature zonesare based on latitude. What temperaturezone do you live in?
In terms of moisture, climates can be classified as arid (dry), semi-arid, humid (wet), or semi-humid. The amount ofmoisture depends on both precipitation and evaporation.
278

www.ck12.org Chapter 6. The Principles of Ecology
Climate and Plant Growth
Plants are the major producers in terrestrial biomes. They have five basic needs: air, warmth, sunlight, water, andnutrients. How well these needs are met in a given location depends on the growing season and soil quality, both ofwhich are determined mainly by climate.
• The growing season is the period of time each year when it is warm and wet enough for plants to grow. Thegrowing season may last all year in a hot, wet climate but just a few months in a cooler or drier climate.
• Plants grow best in soil that contains plenty of nutrients and organic matter. Both are added to soil when plantlitter and dead organisms decompose. Decomposition occurs too slowly in cold climates and too quickly inhot, wet climates for nutrients and organic matter to accumulate. Temperate climates usually have the bestsoil for plant growth.
Climate and Biodiversity
Because climate determines plant growth, it also influences the number and variety of other organisms in a terrestrialbiome. Biodiversity generally increases from the poles to the equator. It is also usually greater in more humidclimates. This is apparent from the desert and rainforest biomes pictured in Figure 6.57.
Climate and Adaptations
Organisms evolve adaptations that help them survive in the climate of the biome where they live. For example, inbiomes with arid climates, plants may have special tissues for storing water (see Figure 6.59). The desert animalspictured in Figure 6.60 also have adaptations for a dry climate.
FIGURE 6.59Aloe Plant and Barrel Cactus. The aloeplant on the left stores water in its large,hollow leaves. The cactus plant on theright stores water in its stout, barrel-shaped stems.
In biomes with cold climates, plants may adapt by becoming dormant during the coldest part of the year. Dormancyis a state in which a plant slows down cellular activities and may shed its leaves. Animals also adapt to coldtemperatures. One way is with insulation in the form of fur and fat. This is how the polar bears in Figure 6.61 staywarm.
279

6.26. Biomes www.ck12.org
FIGURE 6.60Gila Monster and Kangaroo Rat. The Gilamonster’s fat tail is an adaptation to itsdry climate. It serves as a storage depotfor water. The kangaroo rat has very effi-cient kidneys. They produce concentratedurine, thus reducing the amount of waterlost from the body.
FIGURE 6.61Polar Bears. Thick fur and a layer of blub-ber keep polar bears warm in their Arcticecosystem. Why do you think their fur iswhite? Why might it be an adaptation inan Arctic biome?
Survey of Terrestrial Biomes
Terrestrial biomes are classified by climatic factors and types of primary producers. The world map in Figure 6.62shows where 13 major terrestrial biomes are found.
The following figures summarize the basic features of major terrestrial biomes. Think about how its biodiversity andtypes of plants and animals relate to its climate. For example, why do you think there are no amphibians or reptilesin tundra biomes? (Hint: Amphibians and reptiles cannot maintain a constant body temperature. Instead, they haveabout the same temperature as their surroundings.)
280

www.ck12.org Chapter 6. The Principles of Ecology
FIGURE 6.62Worldwide Distribution of Terrestrial Biomes. This map shows the locations of Earth’s major terrestrial biomes.
281

6.26. Biomes www.ck12.org
Aquatic Biomes
Terrestrial organisms are generally limited by temperature and moisture. Therefore, terrestrial biomes are defined interms of these abiotic factors. Most aquatic organisms do not have to deal with extremes of temperature or moisture.Instead, their main limiting factors are the availability of sunlight and the concentration of dissolved oxygen andnutrients in the water. These factors vary from place to place in a body of water and are used to define aquaticbiomes.
Aquatic Biomes and Sunlight
In large bodies of standing water, including the ocean and lakes, the water can be divided into zones based on theamount of sunlight it receives:
1. The photic zone extends to a maximum depth of 200 meters (656 feet) below the surface of the water. This iswhere enough sunlight penetrates for photosynthesis to occur. Algae and other photosynthetic organisms canmake food and support food webs.
2. The aphotic zone is water deeper than 200 meters. This is where too little sunlight penetrates for photo-synthesis to occur. As a result, food must be made by chemosynthesis or else drift down from the waterabove.
These and other aquatic zones in the ocean are identified in Figure 6.63.
Aquatic Biomes and Dissolved Substances
Water in lakes and the ocean also varies in the amount of dissolved oxygen and nutrients it contains:
1. Water near the surface of lakes and the ocean usually has more dissolved oxygen than does deeper water. Thisis because surface water absorbs oxygen from the air above it.
2. Water near shore generally has more dissolved nutrients than water farther from shore. This is because mostnutrients enter the water from land. They are carried by runoff, streams, and rivers that empty into a body ofwater.
3. Water near the bottom of lakes and the ocean may contain more nutrients than water closer to the surface.When aquatic organisms die, they sink to the bottom. Decomposers near the bottom of the water break downthe dead organisms and release their nutrients back into the water.
284

www.ck12.org Chapter 6. The Principles of Ecology
FIGURE 6.63The ocean is divided into many different zones, depending on distance from shore and depth of water.
Aquatic Organisms
Aquatic organisms generally fall into three broad groups: plankton, nekton, and benthos. They vary in how theymove and where they live.
1. Plankton are tiny aquatic organisms that cannot move on their own. They live in the photic zone. Theyinclude phytoplankton and zooplankton. Phytoplankton are bacteria and algae that use sunlight to makefood. Zooplankton are tiny animals that feed on phytoplankton.
2. Nekton are aquatic animals that can move on their own by “swimming” through the water. They may livein the photic or aphotic zone. They feed on plankton or other nekton. Examples of nekton include fish andshrimp.
3. Benthos are aquatic organisms that crawl in sediments at the bottom of a body of water. Many are decom-posers. Benthos include sponges, clams, and anglerfish like the one in Figure 6.64. How has this fish adaptedto a life in the dark?
285

6.26. Biomes www.ck12.org
FIGURE 6.64Anglerfish. This anglerfish lives between 1000 and 4000 meters belowsea level. No sunlight penetrates to this depth. The rod-like structure onits face has a glow-in-the-dark tip. It is covered with microorganisms thatgive off their own light. The fish wiggles the structure like a worm to attractprey. In the darkness, only the rod-like worm is visible.
Marine Biomes
Anglerfish live in the ocean. Aquatic biomes in the ocean are called marine biomes. Organisms that live in marinebiomes must be adapted to the salt in the water. For example, many have organs for excreting excess salt. Two oceanzones are particularly challenging to marine organisms: the intertidal zone and the deep ocean.
The intertidal zone is the narrow strip along the coastline that is covered by water at high tide and exposed to airat low tide (see Figure 6.65). There are plenty of nutrients and sunlight in the intertidal zone. However, the wateris constantly moving in and out, and the temperature keeps changing. These conditions require adaptations in theorganisms that live there, such as the barnacles in Figure 6.66.
FIGURE 6.65These pictures show the intertidal zone ofthe Bay of Fundy, on the Atlantic coastin Maine. Can you identify the intertidalzone from the pictures?
Organisms that live deep in the ocean must be able to withstand extreme water pressure, very cold water, andcomplete darkness. However, even here, thriving communities of living things can be found. Organisms clusteraround hydrothermal vents in the ocean floor. The vents release hot water containing chemicals that would be toxicto most other living things. The producers among them are single-celled chemoautotrophs. They make food usingenergy stored in the chemicals. The tube worms in this chapter’s opening photo depend on these chemoautotrophsfor food.
Monitoring Marine Protected Areas
Is overfishing an important issue? What would happen if fish populations dwindled? Marine Protected Areas areno-fishing zones that have recently been established up and down the California coast, in the hope of allowing fish tobreed, grow large, and replenish state waters. Scientists monitor these areas to determine if this process is working.
286

www.ck12.org Chapter 6. The Principles of Ecology
FIGURE 6.66Barnacles. Barnacles secrete a cement-like substance that anchors them to rocksin the intertidal zone.
MEDIAClick image to the left or use the URL below.URL: https://www.ck12.org/flx/render/embeddedobject/108471
Freshwater Biomes
Freshwater biomes have water that contains little or no salt. They include standing and running freshwater biomes.Standing freshwater biomes include ponds and lakes. Lakes are generally bigger and deeper than ponds. Some ofthe water in lakes is in the aphotic zone where there is too little sunlight for photosynthesis. Plankton and plants(such as the duckweed in Figure 6.67) are the primary producers in standing freshwater biomes.
FIGURE 6.67The pond on the left has a thick mat ofduckweed plants. They cover the surfaceof the water and use sunlight for photo-synthesis. The cattails on the right growalong a stream bed. They have tough,slender leaves that can withstand movingwater.
Running freshwater biomes include streams and rivers. Rivers are usually larger than streams. Streams may startwith runoff or water seeping out of a spring. The water runs downhill and joins other running water to become astream. A stream may flow into a river that empties into a lake or the ocean. Running water is better able to dissolveoxygen and nutrients than standing water. However, the moving water is a challenge to many living things. Algaeand plants (such as the cattails in Figure 6.67) are the primary producers in running water biomes.
287

6.26. Biomes www.ck12.org
Wetlands
A wetland is an area that is saturated with water or covered by water for at least one season of the year. The watermay be freshwater or salt water. Wetlands are extremely important biomes for several reasons:
• They store excess water from floods.• They slow down runoff and help prevent erosion.• They remove excess nutrients from runoff before it empties into rivers or lakes.• They provide a unique habitat that certain communities of plants need to survive.• They provide a safe, lush habitat for many species of animals, so they have high biodiversity.
Lesson Summary
• Terrestrial biomes are determined mainly by climate. Climate influences plant growth, biodiversity, andadaptations of land organisms. Terrestrial biomes include tundras, temperate forests and grasslands, chaparral,temperate and tropical deserts, and tropical forests and grasslands.
• Aquatic biomes are determined mainly by sunlight and concentrations of dissolved oxygen and nutrients inthe water. Aquatic organisms are either plankton, nekton, or benthos. Marine biomes are found in the saltwater of the ocean. Freshwater biomes include standing and running water biomes. Wetlands are extremelyimportant biomes. They may have freshwater or salt water.
Lesson Review Questions
Recall
1. What is climate? How does it differ from weather?
2. What is a rain shadow?
3. How does climate influence plant growth?
4. Identify two types of tundra and where they are found.
5. In which biome are you most likely to find grasses, zebras, and lions?
6. What is the photic zone of the ocean?
Apply Concepts
7. Compare the data for Seattle and Denver in Table 6.3. Seattle is farther north than Denver. Why is Seattlewarmer?
TABLE 6.3: Seattle versus Denver
City, State Latitude (◦N) Altitude (ft abovesea level)
Location (relative toocean)
Average Low Tem-perature in January(◦F)
Seattle, Washington 48 429 Coastal 33
288

www.ck12.org Chapter 6. The Principles of Ecology
TABLE 6.3: (continued)
City, State Latitude (◦N) Altitude (ft abovesea level)
Location (relative toocean)
Average Low Tem-perature in January(◦F)
Denver, Colorado 41 5183 Interior 15
8. If you were to design a well-adapted desert animal, what adaptations would you give it to help it survive in itsdesert biome?
Think Critically
9. Explain the relationship between biodiversity and climate in terrestrial biomes.
10. Compare and contrast plankton, nekton, and benthos.
11. A developer wants to extend a golf course into a wetland. Outline environmental arguments you could makeagainst this plan.
Points to Consider
You read in this lesson that wetlands have high biodiversity.
• In general, what abiotic factors do you think contribute to high biodiversity?• Do you think Earth’s biodiversity is increasing or decreasing? Why?
289

6.27. Fresh Water Ecosystems www.ck12.org
6.27 Fresh Water Ecosystems
Learning Objectives
• Describe the various types of freshwater ecosystems.
Why did people used to rush to fill in swamps?
People didn’t know the value of wetlands. Many are in locations that might be desirable for people to live, likenear a shoreline. Mosquitoes, which no one seems to like, breed there. But wetlands serve a number of valuablepurposes. They are breeding grounds for many organisms and they protect inland areas from storms. Now wetlandsare protected.
Freshwater Ecosystems
Organisms that live in lakes, ponds, streams, springs or wetlands are part of freshwater ecosystems. These ecosys-tems vary by temperature, pressure (in lakes), the amount of light that penetrates and the type of vegetation that livesthere.
Lake Ecosystems
Limnology is the study of bodies of fresh water and the organisms that live there. A lake has zones just like theocean. The ecosystem of a lake is divided into three distinct zones (Figure 6.68):
1. The surface (littoral) zone is the sloped area closest to the edge of the water.
2. The open-water zone (also called the photic or limnetic zone) has abundant sunlight.
290
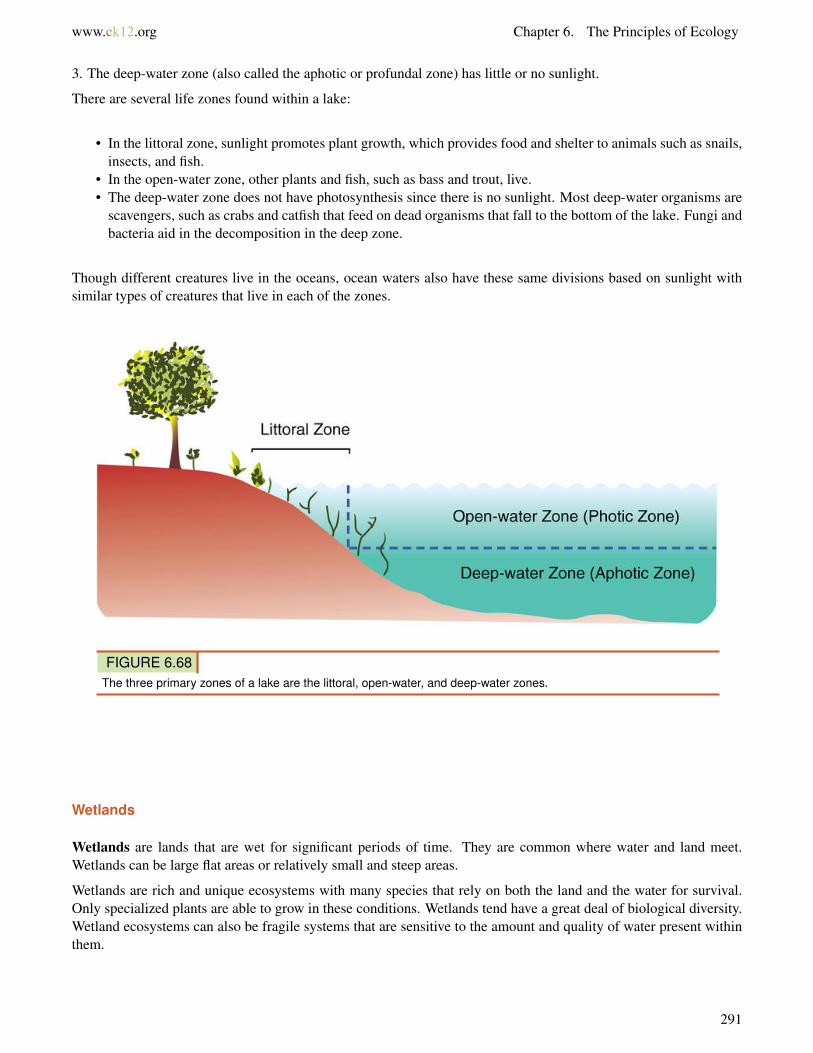
www.ck12.org Chapter 6. The Principles of Ecology
3. The deep-water zone (also called the aphotic or profundal zone) has little or no sunlight.
There are several life zones found within a lake:
• In the littoral zone, sunlight promotes plant growth, which provides food and shelter to animals such as snails,insects, and fish.
• In the open-water zone, other plants and fish, such as bass and trout, live.• The deep-water zone does not have photosynthesis since there is no sunlight. Most deep-water organisms are
scavengers, such as crabs and catfish that feed on dead organisms that fall to the bottom of the lake. Fungi andbacteria aid in the decomposition in the deep zone.
Though different creatures live in the oceans, ocean waters also have these same divisions based on sunlight withsimilar types of creatures that live in each of the zones.
FIGURE 6.68The three primary zones of a lake are the littoral, open-water, and deep-water zones.
Wetlands
Wetlands are lands that are wet for significant periods of time. They are common where water and land meet.Wetlands can be large flat areas or relatively small and steep areas.
Wetlands are rich and unique ecosystems with many species that rely on both the land and the water for survival.Only specialized plants are able to grow in these conditions. Wetlands tend have a great deal of biological diversity.Wetland ecosystems can also be fragile systems that are sensitive to the amount and quality of water present withinthem.
291

6.27. Fresh Water Ecosystems www.ck12.org
MEDIAClick image to the left or use the URL below.URL: https://www.ck12.org/flx/render/embeddedobject/186564
Marshes
Marshes are shallow wetlands around lakes, streams, or the ocean where grasses and reeds are common, but treesare not (Figure 6.69). Frogs, turtles, muskrats, and many varieties of birds are at home in marshes.
FIGURE 6.69A salt marsh on Cape Cod in Mas-sachusetts.
Swamps
A swamp is a wetland with lush trees and vines found in low-lying areas beside slow-moving rivers (Figure 6.70).Like marshes, they are frequently or always inundated with water. Since the water in a swamp moves slowly,oxygen in the water is often scarce. Swamp plants and animals must be adapted for these low-oxygen conditions.Like marshes, swamps can be fresh water, salt water, or a mixture of both.
Ecological Role of Wetlands
As mentioned above, wetlands are home to many different species of organisms. Although they make up only 5%of the area of the United States, wetlands contain more than 30% of the plant types. Many endangered species livein wetlands, so wetlands are protected from human use.
Wetlands also play a key biological role by removing pollutants from water. For example, they can trap and usefertilizer that has washed off a farmer’s field, and therefore they prevent that fertilizer from contaminating anotherbody of water. Since wetlands naturally purify water, preserving wetlands also helps to maintain clean supplies ofwater.
292

www.ck12.org Chapter 6. The Principles of Ecology
FIGURE 6.70A swamp is characterized by trees in stillwater.
Summary
• The conditions that affect lake ecosystems are similar to those that affect marine ecosystems, such as lightpenetration, temperature and water depth.
• Wetlands are lands that are wet for a significant portion of the year.• Wetlands are extremely important as an ecosystem and as a filter for pollutants.
Review
1. Describe how ecological zones in lakes are similar to ecological zones in oceans.2. For many decades, people drained wetlands. Was this a good idea or a bad idea? Why?3. How are marshes different from swamps? How are they the same?
Explore More
Use this resource (watch up to 10:40) to answer the questions that follow.
MEDIAClick image to the left or use the URL below.URL: https://www.ck12.org/flx/render/embeddedobject/178251
1. What are the three main kinds of water biomes?2. What are the two types of freshwater biomes?
293

6.27. Fresh Water Ecosystems www.ck12.org
3. How does the geology of a region affect the ecology of a river?4. What grows in slow-moving rivers that won’t grow in fast rivers?5. Why is there plenty of oxygen in a moving river?6. Why don’t most lakes become saline?7. What are bogs?8. How are swamps and marshes different from bogs? How are marshes different from swamp?9. How do living things last through a winter in a lake if the top of the lake freezes?
10. What happens to the lake when the ice melts in the spring?11. Why is the lake temperature stratified in the summer?12. How much circulation is in the lake in autumn?13. What brings nutrients into a lake?14. What is a young lake with little food called15. Is a lake that has a lot of plants at the top teeming with life?
294

www.ck12.org Chapter 6. The Principles of Ecology
6.28 Ocean Ecosystems
Learning Objectives
• Describe the various types of ocean ecosystems.
Which ecosystem doesn’t depend on photosynthesis?
When scientists first dove in Alvin and witnessed hydrothermal vents, they were not surprised by the eruptions ofhot water. But they never anticipated finding life there. Without sunlight, they knew that photosynthesis could not bethe basis of this community. Eventually they discovered a different way of producing food, chemosynthesis. Manymore hydrothermal vents were discovered and many more types of vent organisms.
The Intertidal
Conditions in the intertidal zone change rapidly as water covers and uncovers the region and waves pound on therocks. A great abundance of life is found in the intertidal zone (Figure 6.71). High energy waves hit the organismsthat live in this zone, so they must be adapted to pounding waves and exposure to air during low tides. Hard shellsprotect from waves and also protect against drying out when the animal is above water. Strong attachments keep theanimals anchored to the rock.
In a tide pool, as in the photo, what organisms are found where and what specific adaptations do they have to thatzone? The mussels on the top left have hard shells for protection and to prevent drying because they are often notcovered by water. The sea anemones in the lower right are more often submerged and have strong attachments butcan close during low tides.
295

6.28. Ocean Ecosystems www.ck12.org
FIGURE 6.71Organisms in a tide pool include sea starsand sea urchins.
Many young organisms get their start in estuaries and so they must be adapted to rapid shifts in salinity.
MEDIAClick image to the left or use the URL below.URL: https://www.ck12.org/flx/render/embeddedobject/186570
Reefs
Corals and other animals deposit calcium carbonate to create rock reefs near the shore. Coral reefs are the “rain-forests of the oceans,” with a tremendous amount of species diversity (Figure 6.72).
Reefs can form interesting shapes in the oceans. Remember that hot spots create volcanoes on the seafloor. If thesevolcanoes rise above sea level to become islands, and if they occur in tropical waters, coral reefs will form on them.Since the volcanoes are cones, the reef forms in a circle around the volcano. As the volcano comes off the hot spot,the crust cools. The volcano subsides and then begins to erode away (Figure 6.73).
Eventually, all that is left is a reef island called an atoll. A lagoon is found inside the reef.
Oceanic Zone
The open ocean is a vast area. Food either washes down from the land or is created by photosynthesizing plankton.Zooplankton and larger animals feed on the phytoplankton and on each other. Larger animals such as whales andgiant groupers may live their entire lives in the open water.
296

www.ck12.org Chapter 6. The Principles of Ecology
FIGURE 6.72Coral reefs are among the most denselyinhabited and diverse areas on the globe.
FIGURE 6.73In this image of Maupiti Island in theSouth Pacific, the remnants of the volcanoare surrounded by the circular reef.
How do fish survive in the deepest ocean? The few species that live in the greatest depths are very specialized(Figure 6.74). Since it’s rare to find a meal, the fish use very little energy; they move very little, breathe slowly,have minimal bone structure and a slow metabolism. These fish are very small. To maximize the chance of getting ameal, some species may have jaws that unhinge to accept a larger fish or backward-folding teeth to keep prey fromescaping.
Hydrothermal Vents
Hydrothermal vents are among the most unusual ecosystems on Earth since they are dependent on chemosyntheticorganisms at the base of the food web. At mid-ocean ridges at hydrothermal vents, bacteria that use chemosynthe-sis for food energy are the base of a unique ecosystem (Figure 6.75). This ecosystem is entirely separate from thephotosynthesis at the surface. Shrimp, clams, fish, and giant tube worms have been found in these extreme places.
A video explaining hydrothermal vents with good footage is seen here:
297

6.28. Ocean Ecosystems www.ck12.org
FIGURE 6.74An 1896 drawing of a deep sea anglerfish with a bioluminescent “lure” to attractprey.
FIGURE 6.75Giant tube worms found at hydrothermalvents get food from the chemosyntheticbacteria that live within them. The bacte-ria provide food; the worms provide shel-ter.
Summary
• In the ocean, phytoplankton photosynthesize as the main food source. They are eaten by zooplankton andother larger animals.
• Organisms that live in the deepest ocean have amazing adaptations to the exceptionally harsh conditions, suchas unhinging jaws, backward-folding teeth, or a bioluminescent lure.
• A hydrothermal vent ecosystem has chemosynthesis as its food source. The ecosystem is independent ofphotosynthesis at the surface.
Review
1. Why is there so much biodiversity in the intertidal zone?2. Why is survival in the deep ocean difficult? What adaptations to organisms have to do this?3. What is the source of energy at a hydrothermal vent system? How much do these communities depend on the
surface?
298

www.ck12.org Chapter 6. The Principles of Ecology
Explore More
Use this resource to answer the questions that follow.
MEDIAClick image to the left or use the URL below.URL: https://www.ck12.org/flx/render/embeddedobject/178253
1. What are a few of the ecological services provided by marine ecosystems?2. What is the economic value of the oceans?3. What are the three major life zones in the oceans?4. What is the coastal zone?5. What is the value or the coastal zone to the marine ecosystems? Why is this true?6. What are two estuaries and why are they rich in life?7. Why is life harsh in the coastal zone?8. What ecological services do estuaries and coastal marshes provide?9. What is the intertidal zone? What do organisms in this zone need to deal with?
10. What ecological services are provided by coral reefs?11. What are the three zones of the open ocean? How are they divided?12. What are the characteristics of the upper zone?13. What are the characteristics of the middle zone?14. What are the characteristics of the bottom zone?15. Why does the ocean have high productivity?16. Where is productivity relatively high? Why?17. Which human activities are causing losses in ocean productivity?
Resources
MEDIAClick image to the left or use the URL below.URL: https://www.ck12.org/flx/render/embeddedobject/178255
299

6.29. References www.ck12.org
6.29 References
1. . . CC BY-NC2. Jon DeJong. http://www.flickr.com/photos/jondejong/6661379095/ . CC BY 2.03. Jodi So. CK-12 Foundation . CC BY-NC 3.04. Tree: User:Haabet/Wikimedia Commons; Grass: User:Polishname/Wikipedia; Diatoms: Gordon T. Tay-
lor/Stony Brook University/National Oceanic and Atmospheric Administration; Seaweed: User:Flyingdream/Wikipedia;Cyanobacteria: Barry H. Rosen/US Geological Survey; Purple bacteria: Janice Carr/Centers for Disease Con-trol and Prevention; Composite created by CK-12 Foundation. Tree: http://commons.wikimedia.org/wiki/File:Raunkiaer.jpg; Grass: http://commons.wikimedia.org/wiki/File:TallWildGrass.jpg; Diatoms: http://commons.wikimedia.org/wiki/File:Diatoms_through_the_microscope.jpg; Seaweed: http://commons.wikimedia.org/wiki/File:Codiumfragile.jpg; Cyanobacteria: http://microbiology.usgs.gov/image_gallery_cyanobacteria_phormidium.html; Purple bacteria: http://phil.cdc.gov/phil/details.asp (ID 9999) . Public Domain
5. Tim Mansfield. http://www.flickr.com/photos/timbomb/406235908/ . CC BY 2.06. Amy. http://www.flickr.com/photos/amylovesyah/3945525048/ . CC BY 2.07. Mariana Ruiz Villarreal (LadyofHats) for CK-12 Foundation. CK-12 Foundation . CC BY-NC 3.08. Mariana Ruiz Villarreal (LadyofHats) for CK-12 Foundation. CK-12 Foundation . CC BY-NC 3.09. Mariana Ruiz Villarreal (LadyofHats) for CK-12 Foundation. CK-12 Foundation . CC BY-NC 3.0
10. Mariana Ruiz Villarreal (LadyofHats) for CK-12 Foundation. CK-12 Foundation . CC BY-NC 3.011. Hana Zavadska, based on data from National Climate Data Center. CK-12 Foundation . CC BY-NC 3.012. Hana Zavadska, based on data from National Climate Data Center. CK-12 Foundation . CC BY-NC 3.013. Image copyright Kristin Smith, 20114;Hana Zavadska. http://www.shutterstock.com;CK-12 Foundation .
Used under license from Shutterstock.com14. User:Booyabazooka/Wikipedia. http://commons.wikimedia.org/wiki/File:Water_molecule.png . Public Do-
main15. (A) Natalie Lucier; (B) Gareth Haywood; (C) Lynn Greyling. (A) http://www.flickr.com/photos/natalieluci
er/3623933920/; (B) http://www.flickr.com/photos/gazhaywood/7101897147/; (C) http://www.publicdomainpictures.net/view-image.php?image=50359&picture=catching-clouds . (A) CC BY 2.0; (B) CC BY 2.0; (C)Public Domain
16. Image copyright Filip Fuxa, 2014. http://www.shutterstock.com . Used under license from Shutterstock.com;(A)CC BY 2.0; (B) CC BY 2.0; (C) Public Domain
17. Courtesy of US Geological Survey. http://commons.wikimedia.org/wiki/File:Water_cycle.png . Public Do-main
18. Courtesy of NASA’s Earth Observatory. http://earthobservatory.nasa.gov/IOTD/view.php?id=3763 . PublicDomain
19. Courtesy of Jeff Schmaltz/NASA’s Earth Observatory. http://earthobservatory.nasa.gov/IOTD/view.php?id=39936 . Public Domain
20. Image copyright Filip Fuxa, 2014. http://www.shutterstock.com . Used under license from Shutterstock.com21. Provided by the SeaWiFS Project, NASA/Goddard Space Flight Center and ORBIMAGE;Courtesy GMAO
Chemical Forecasts and GEOS-CHEM NRT Simulations for ICARTT and Randy Kawa, NASA GSFC;User:Mysid/Wikipedia;Courtesyof MODIS/NASA. http://commons.wikimedia.org/wiki/File:Seawifs_global_biosphere.jpg;http://earthobservatory.nasa.gov/IOTD/view.php?id=5270;https://commons.wikimedia.org/wiki/File:Atmospheric_Layers.svg;http://commons.wikimedia.org/wiki/File:Atmospheric_Water_Vapor_Mean.2005.030.jpg . Public Domain
22. User:Mysid/Wikipedia. http://commons.wikimedia.org/wiki/File:Atmosphere_gas_proportions.svg . PublicDomain
23. Provided by the SeaWiFS Project, NASA/Goddard Space Flight Center and ORBIMAGE. http://commons.wikimedia.org/wiki/File:Seawifs_global_biosphere.jpg . Public Domain
300

www.ck12.org Chapter 6. The Principles of Ecology
24. Courtesy GMAO Chemical Forecasts and GEOS-CHEM NRT Simulations for ICARTT and Randy Kawa,NASA GSFC;User:Mysid/Wikipedia;Provided by the SeaWiFS Project, NASA/Goddard Space Flight Centerand ORBIMAGE;Courtesy of MODIS/NASA. http://earthobservatory.nasa.gov/IOTD/view.php?id=5270;http://commons.wikimedia.org/wiki/File:Atmosphere_gas_proportions.svg;http://commons.wikimedia.org/wiki/File:Seawifs_global_biosphere.jpg;http://commons.wikimedia.org/wiki/File:Atmospheric_Water_Vapor_Mean.2005.030.jpg . CC BY-NC
25. User:Mysid/Wikipedia. http://commons.wikimedia.org/wiki/File:Atmosphere_gas_proportions.svg . PublicDomain
26. Courtesy of MODIS/NASA. http://commons.wikimedia.org/wiki/File:Atmospheric_Water_Vapor_Mean.2005.030.jpg . Public Domain
27. Ed Dunens. http://www.flickr.com/photos/blachswan/12476339224/ . CC BY 2.028. Ed Dunens. http://www.flickr.com/photos/blachswan/12476339224/ . CC BY 2.029. NASA. http://en.wikipedia.org/wiki/File:Future_ozone_layer_concentrations.jpg . CC BY-NC30. Mariana Ruiz Villarreal (LadyofHats) for CK-12 Foundation. CK-12 Foundation . CC BY-NC 3.031. Stomata: User:Photohound/Wikimedia Commons; Leaf: Jon Sullivan/pdphoto.org. Stomata: http://commons.
wikimedia.org/wiki/File:Tomato_leaf_stomate_1-color.jpg; Leaf: http://commons.wikimedia.org/wiki/File:Leaf_1_web.jpg . Public Domain
32. Mariana Ruiz Villarreal (LadyofHats) for CK-12 Foundation. CK-12 Foundation . CC BY-NC 3.033. Mariana Ruiz Villarreal (LadyofHats) for CK-12 Foundation. CK-12 Foundation . CC BY-NC 3.034. Jodi So. CK-12 Foundation . CC BY-NC 3.035. (a) Madeleine Price Ball; (b) User:Slashme/Wikimedia Commons. (a) http://commons.wikimedia.org/wiki/Fi
le:DNA_chemical_structure.svg; (b) http://commons.wikimedia.org/wiki/File:Chlorophyll_c1.svg . PublicDomain
36. Jodi So. CK-12 Foundation . CC BY-NC 3.037. Tom Ruen, Full Sky Observatory;Laura Guerin. http://commons.wikimedia.org/wiki/File:Seasonearth.png;C
K-12 Foundation . Public Domain38. CK-12 Foundation. CK-12 Foundation . CC BY-NC 3.039. Sam McCabe. CK-12 Foundation . CC BY-NC 3.040. Sam McCabe. CK-12 Foundation . CC BY-NC 3.041. Tom Ruen, Full Sky Observatory;Laura Guerin. http://commons.wikimedia.org/wiki/File:Seasonearth.png;C
K-12 Foundation . Public Domain42. S Shepherd (Flickr:schizoform);Courtesy of the National Weather Service. http://commons.wikimedia.org
/wiki/File:Earthworm_dives.jpg;http://www.srh.noaa.gov/jetstream/global/climate_max.htm . Public Domain43. Flickr:Kecko. http://www.flickr.com/photos/kecko/4645512055/ . CC BY 2.044. User:Otto Normalverbraucher/De.Wikipedia. http://commons.wikimedia.org/wiki/File:Lehmgrube.jpg . The
copyright holder of this file allows anyone to use it for any purpose, provided that the copyright holder isproperly attributed
45. Courtesy of the USDA Natural Resources Conservation Service, modified by Sam McCabe (CK-12 Foun-dation). http://www.nrcs.usda.gov/wps/portal/nrcs/detail/soils/edu/kthru6/?cid=nrcs142p2_054311 . PublicDomain
46. S Shepherd (Flickr:schizoform). http://commons.wikimedia.org/wiki/File:Earthworm_dives.jpg . CC BY 2.047. Courtesy of the National Weather Service. http://www.srh.noaa.gov/jetstream/global/climate_max.htm . Pub-
lic Domain48. Courtesy of the National Weather Service;Miguel Tremblay. http://www.srh.noaa.gov/jetstream/global/cli
mate_max.htm;http://commons.wikimedia.org/wiki/File:Pothole.jpg . Public Domain49. . . CC BY-NC50. User:HolgerK/Wikipedia. http://commons.wikimedia.org/wiki/File:Stagnogley.JPG . Public Domain51. Courtesy of US Department of Agriculture. http://commons.wikimedia.org/wiki/File:Soil_profile.png . Pub-
lic Domain52. . . CC BY-NC53. Oregon Department of Transportation. http://www.flickr.com/photos/oregondot/10699533006/ . CC BY 2.0
301

6.29. References www.ck12.org
54. User:Laitche/Wikimedia Commons. http://commons.wikimedia.org/wiki/File:Forest_Osaka_Japan.jpg . Pub-lic Domain
55. Image copyright Tim Pleasant, 2014. http://www.shutterstock.com . Used under license from Shutter-stock.com
56. Image copyright samkin, 2013. http://www.shutterstock.com . Used under license from Shutterstock.com57. . . CC BY-NC58. Courtesy of the National Park Service. http://www.nps.gov/history/history/online_books/brochures/1941/yell/
sec1.htm . Public Domain59. Courtesy of the National Park Service. http://www.nps.gov/features/yell/interactivemap/ofdetail.htm . Public
Domain60. . . CC BY-NC61. Laura Guerin. CK-12 Foundation . CC BY-NC 3.062. Jodi So. CK-12 Foundation . CC BY-NC63. Jodi So;Ridge Tahoe Resort Hotel. CK-12 Foundation;http://www.flickr.com/photos/87154833@N06/79801
56226/ . CC BY-NC 3.0;CC BY 2.064. . . CC BY-NC65. Erica Peterson. http://www.flickr.com/photos/probabilistic/5156632674/ . CC BY 2.066. Ridge Tahoe Resort Hotel. http://www.flickr.com/photos/87154833@N06/7980156226/ . CC BY 2.067. Ridge Tahoe Resort Hotel. http://www.flickr.com/photos/87154833@N06/7980156226/ . CC BY 2.068. . . CC BY-NC69. Mikey;Ridge Tahoe Resort Hotel. http://www.flickr.com/photos/raver_mikey/7178364975;http://www.flick
r.com/photos/87154833@N06/7980156226/ . CC BY 2.070. Flickr:abdallahh;Ridge Tahoe Resort Hotel. http://www.flickr.com/photos/husseinabdallah/5590989843/;htt
p://www.flickr.com/photos/87154833@N06/7980156226/ . CC BY 2.071. . . CC BY-NC72. Courtesy of Jesse Allen and Robert Simmon/NASA, using MODIS data;Ridge Tahoe Resort Hotel. http://earth
observatory.nasa.gov/IOTD/view.php?id=77779;http://www.flickr.com/photos/87154833@N06/7980156226/. Public Domain;CC BY 2.0
73. . . CC BY-NC74. Zachary Wilson. CK-12 Foundation . CC BY-NC 3.075. Courtesy of NASA. http://commons.wikimedia.org/wiki/File:IntertropicalConvergenceZone-EO.jpg . Public
Domain76. User:Mats Halldin/Wikimedia Commons. http://commons.wikimedia.org/wiki/File:ITCZ_january-july.png .
Public Domain77. Laura Guerin. CK-12 Foundation . CC BY-NC 3.078. Laura Guerin. CK-12 Foundation . CC BY-NC 3.079. Flickr:KellyB.. http://www.flickr.com/photos/foreverphoto/139855111/ . CC BY 2.080. Desert: Flickr:wonker; Rainforest: User:Tim35/Wikipedia. Desert: http://www.flickr.com/photos/wonker/
4300437105/; Rainforest: http://commons.wikimedia.org/wiki/File:Rainforrest_between_Kuranda_and_Cairns,_North_East_Queensland.jpg . Desert: CC BY 2.0; Rainforest: Public Domain
81. Laura Guerin, using globe graphic courtesy of the Defense Institute of Security Assistance Management. CK-12 Foundation (globe graphic: http://commons.wikimedia.org/wiki/File:Globe_Atlantic.svg) . CC BY-NC3.0 (globe graphic available in the public domain)
82. Aloe: Rae Allen; Cactus: Amante Darmanin. Aloe: http://www.flickr.com/photos/raeallen/7049539727/; Cactus: http://www.flickr.com/photos/amantedar/5699827213/ . CC BY 2.0
83. Gila monster: David Mark; Kangaroo rat: Courtesy of US Fish and Wildlife. Gila monster: http://pixabay.com/en/reticulate-gila-monster-animal-86618/; Kangaroo rat: http://commons.wikimedia.org/wiki/File:Kangaroo-rat.jpg . Public Domain
84. Courtesy of US Fish and Wildlife Service. http://alaska.fws.gov/aba/budget/index.htm . Public Domain85. CK-12 Foundation. CK-12 Foundation . CC BY-NC 3.086. By Jeremy Noble from St. Paul, United States (The duck Part 2 Uploaded by Fæ) [CC BY 2.0 (http://creativecommons.org/licenses/by/2.0)],
302

www.ck12.org Chapter 6. The Principles of Ecology
via Wikimedia Commons. https://commons.wikimedia.org/wiki/File%3AThe_duck_Part_2_(2508435690).jpg . CC BY-NC
87. By Jeremy Noble from St. Paul, United States (The duck Part 2 Uploaded by Fæ) [CC BY 2.0 (http://creativecommons.org/licenses/by/2.0)],via Wikimedia Commons. https://commons.wikimedia.org/wiki/File%3AThe_duck_Part_2_(2508435690).jpg . CC BY-NC
88. By Jeremy Noble from St. Paul, United States (The duck Part 2 Uploaded by Fæ) [CC BY 2.0 (http://creativecommons.org/licenses/by/2.0)],via Wikimedia Commons. https://commons.wikimedia.org/wiki/File%3AThe_duck_Part_2_(2508435690).jpg . CC BY-NC
89. By Jeremy Noble from St. Paul, United States (The duck Part 2 Uploaded by Fæ) [CC BY 2.0 (http://creativecommons.org/licenses/by/2.0)],via Wikimedia Commons. https://commons.wikimedia.org/wiki/File%3AThe_duck_Part_2_(2508435690).jpg . CC BY-NC
90. By Jeremy Noble from St. Paul, United States (The duck Part 2 Uploaded by Fæ) [CC BY 2.0 (http://creativecommons.org/licenses/by/2.0)],via Wikimedia Commons. https://commons.wikimedia.org/wiki/File%3AThe_duck_Part_2_(2508435690).jpg . CC BY-NC
91. By Jeremy Noble from St. Paul, United States (The duck Part 2 Uploaded by Fæ) [CC BY 2.0 (http://creativecommons.org/licenses/by/2.0)],via Wikimedia Commons. https://commons.wikimedia.org/wiki/File%3AThe_duck_Part_2_(2508435690).jpg . CC BY-NC
92. By Jeremy Noble from St. Paul, United States (The duck Part 2 Uploaded by Fæ) [CC BY 2.0 (http://creativecommons.org/licenses/by/2.0)],via Wikimedia Commons. https://commons.wikimedia.org/wiki/File%3AThe_duck_Part_2_(2508435690).jpg . CC BY-NC
93. By Jeremy Noble from St. Paul, United States (The duck Part 2 Uploaded by Fæ) [CC BY 2.0 (http://creativecommons.org/licenses/by/2.0)],via Wikimedia Commons. https://commons.wikimedia.org/wiki/File%3AThe_duck_Part_2_(2508435690).jpg . CC BY-NC
94. Jodi So. CK-12 Foundation . CC BY-NC 3.095. A Brauer. http://commons.wikimedia.org/wiki/File:Humpback_anglerfish.png . Public Domain96. Dylan Kereluk. Left: http://commons.wikimedia.org/wiki/File:Bay_of_Fundy_-_Tide_Out.jpg; Right: http://
commons.wikimedia.org/wiki/File:Bay_of_Fundy_-_Tide_In.jpg . CC BY 2.097. Mo Riza. http://www.flickr.com/photos/modomatic/2394983702/ . CC BY 2.098. Duckweed: Jonathan Jordan, Cattails: User:JoJan/Wikimedia Commons. Duckweed: http://www.flickr.
com/photos/jjordan64816/7251615240/, Cattails: http://commons.wikimedia.org/wiki/File:Girona_009.JPG. Duckweed: CC BY 2.0, Cattails: CC BY 3.0
99. Mike Love. http://www.flickr.com/photos/mikelove/2526016742/ . CC BY 2.0100. Geoff Ruth. CK-12 Foundation . CC BY-NC 3.0101. Image copyright Zina Seletskaya, 2014. http://www.shutterstock.com . Used under license from Shutter-
stock.com102. Mike Love. http://www.flickr.com/photos/mikelove/2526016742/ . CC BY 2.0103. Courtesy of the National Science Foundation. http://www.nsf.gov/news/overviews/earth-environ/assets/inter
act06.jpg . Public Domain104. Flickr:mountainamoeba. http://www.flickr.com/photos/mountainamoeba/696520153/ . CC BY 2.0105. NOAA’s National Ocean Service. http://www.flickr.com/photos/usoceangov/11177135805/ . CC BY 2.0106. Courtesy of Robert Simmon and NASA’s Earth Observatory. http://earthobservatory.nasa.gov/IOTD/view.p
hp?id=41320 . Public Domain107. G Brown Goode and Tarleton H Bean. http://commons.wikimedia.org/wiki/File:Ceratias_holboelli.jpg .
Public Domain108. Courtesy of the National Science Foundation. http://www.nsf.gov/news/overviews/earth-environ/assets/inter
act06.jpg . Public Domain
303

www.ck12.org
CHAPTER 7 Communities andPopulations
Chapter Outline7.1 COMMUNITY INTERACTIONS
7.2 POPULATION SIZE
7.3 CHARACTERISTICS OF POPULATIONS
7.4 HUMAN POPULATION GROWTH
7.5 THE BIODIVERSITY CRISIS
7.6 NATURAL RESOURCES AND CLIMATE CHANGE
7.7 REFERENCES
If you saw the movie Finding Nemo, then you probably recognize this fish. It’s known as a clownfish, and it’sswimming near the tentacles of an animal called a sea anemone. The sea anemone kills prey by injecting poisonwith its tentacles. For some reason, the anemone doesn’t harm the clownfish, perhaps because the fish has a coatingof mucus that helps disguise it. But why does the clownfish “hang out” with the sea anemone? One reason is for thefood. The clownfish eats the remains of the anemone’s prey after it finishes feeding. Another reason is safety. Theclownfish is safe from predators when it’s near the anemone. Predators are scared away by the anemone’s poisontentacles. In return, the clownfish helps the anemone catch food by attracting prey with its bright colors. Its fecesalso provide nutrients to the anemone.
The clownfish and anemone are just one example of the diverse ways that living things may help each other in nature.You will learn more about species interactions such as this when you read this chapter.Image copyright stockpix4u, 2014. www.shutterstock.com. Used under license f rom Shutterstock.com.
304

www.ck12.org Chapter 7. Communities and Populations
7.1 Community Interactions
Lesson Objectives
• Define community as the term is used in ecology.• Describe predation and its effects on population size and evolution.• Explain why interspecific competition leads to extinction or greater specialization.• Compare and contrast mutualism, commensalism, and parasitism.• Outline primary and secondary succession, and define climax community.
Vocabulary
• climax community• commensalism• ecological succession• host• interspecific competition• intraspecific competition• keystone species• limiting factor• mutualism• parasite• parasitism• pioneer species• predation• predator• prey• primary succession• secondary succession• specialization
Introduction
Biomes as different as deserts and wetlands share something very important. All biomes have populations ofinteracting species. Species also interact in the same basic ways in all biomes. For example, all biomes havesome species that prey on others for food. The focus of study of species interactions is the community.
305

7.1. Community Interactions www.ck12.org
What Is a Community?
A community is the biotic part of an ecosystem. It consists of all the populations of all the species in the same area.It also includes their interactions. Species interactions in communities are important factors in natural selection.They help shape the evolution of the interacting species. There are three major types of community interactions:predation, competition, and symbiosis.
Predation
Predation is a relationship in which members of one species (the predator) consume members of another species(the prey). The lionesses and zebra in Figure 7.1 are classic examples of predators and prey. In addition to thelionesses, there is another predator in this figure. Can you spot it? The other predator is the zebra. Like thelionesses, it consumes prey species, in this case species of grass. However, unlike the lionesses, the zebra does notkill its prey. Predator-prey relationships such as these account for most energy transfers in food chains and foodwebs.
FIGURE 7.1Predators and Their Prey. These li-onesses feed on the carcass of a zebra.
Predation and Population
A predator-prey relationship tends to keep the populations of both species in balance. This is shown by the graph inFigure 7.2. As the prey population increases, there is more food for predators. So, after a slight lag, the predatorpopulation increases as well. As the number of predators increases, more prey are captured. As a result, the preypopulation starts to decrease. What happens to the predator population then?
In the predator-prey example, one factor limits the growth of the other factor. As the prey population decreases, thepredator population begins to decrease as well. The prey population is a limiting factor. A limiting factor limits thegrowth or development of an organism, population, or process.
Keystone Species
Some predator species are known as keystone species. A keystone species is one that plays an especially importantrole in its community. Major changes in the numbers of a keystone species affect the populations of many other
306

www.ck12.org Chapter 7. Communities and Populations
FIGURE 7.2Predator-Prey population Dynamics. Asthe prey population increases, why doesthe predator population also increase?
species in the community. For example, some sea star species are keystone species in coral reef communities. Thesea stars prey on mussels and sea urchins, which have no other natural predators. If sea stars were removed from acoral reef community, mussel and sea urchin populations would have explosive growth. This, in turn, would driveout most other species. In the end, the coral reef community would be destroyed.
Adaptations to Predation
Both predators and prey have adaptations to predation that evolve through natural selection. Predator adaptationshelp them capture prey. Prey adaptations help them avoid predators. A common adaptation in both predator andprey is camouflage. Several examples are shown in Figure 7.3. Camouflage in prey helps them hide from predators.Camouflage in predators helps them sneak up on prey.
FIGURE 7.3Camouflage in Predator and Prey Species. Can you see the crab in the photo on the left? It is camouflaged withthe sand. The preying mantis in the middle photo looks just like the dead leaves in the background. Can you tellwhere one zebra ends and another one begins? This may confuse a predator and give the zebras a chance torun away.
307

7.1. Community Interactions www.ck12.org
Competition
Competition is a relationship between organisms that strive for the same resources in the same place. The resourcesmight be food, water, or space. There are two different types of competition:
1. Intraspecific competition occurs between members of the same species. For example, two male birds of thesame species might compete for mates in the same area. This type of competition is a basic factor in naturalselection. It leads to the evolution of better adaptations within a species.
2. Interspecific competition occurs between members of different species. For example, predators of differentspecies might compete for the same prey.
Interspecific Competition and Extinction
Interspecific competition often leads to extinction. The species that is less well adapted may get fewer of theresources that both species need. As a result, members of that species are less likely to survive, and the speciesmay go extinct.
Interspecific Competition and Specialization
Instead of extinction, interspecific competition may lead to greater specialization. Specialization occurs whencompeting species evolve different adaptations. For example, they may evolve adaptations that allow them to usedifferent food sources. Figure 7.4 describes an example.
FIGURE 7.4Specialization in Anole Lizards. Spe-cialization lets different species of anolelizards live in the same area without com-peting.
308

www.ck12.org Chapter 7. Communities and Populations
Symbiotic Relationships
Symbiosis is a close relationship between two species in which at least one species benefits. For the other species,the relationship may be positive, negative, or neutral. There are three basic types of symbiosis: mutualism, com-mensalism, and parasitism.
Mutualism
Mutualism is a symbiotic relationship in which both species benefit. An example of mutualism involves goby fishand shrimp (see Figure 7.5). The nearly blind shrimp and the fish spend most of their time together. The shrimpmaintains a burrow in the sand in which both the fish and shrimp live. When a predator comes near, the fish touchesthe shrimp with its tail as a warning. Then, both fish and shrimp retreat to the burrow until the predator is gone.From their relationship, the shrimp gets a warning of approaching danger. The fish gets a safe retreat and a place tolay its eggs.
FIGURE 7.5The multicolored shrimp in the front andthe green goby fish behind it have a mu-tualistic relationship.
Commensalism
Commensalism is a symbiotic relationship in which one species benefits while the other species is not affected. Onespecies typically uses the other for a purpose other than food. For example, mites attach themselves to larger flyinginsects to get a “free ride.” Hermit crabs use the shells of dead snails for homes.
Parasitism
Parasitism is a symbiotic relationship in which one species (the parasite) benefits while the other species (the host)is harmed. Many species of animals are parasites, at least during some stage of their life. Most species are also hoststo one or more parasites.
Some parasites live on the surface of their host. Others live inside their host. They may enter the host through abreak in the skin or in food or water. For example, roundworms are parasites of mammals, including humans, cats,
309

7.1. Community Interactions www.ck12.org
and dogs (see Figure 7.6). The worms produce huge numbers of eggs, which are passed in the host’s feces to theenvironment. Other individuals may be infected by swallowing the eggs in contaminated food or water.
FIGURE 7.6Roundworm. A roundworm like this one might eventually fill a dog’sintestine unless it gets medical treatment.
Some parasites kill their host, but most do not. It’s easy to see why. If a parasite kills its host, the parasite is alsolikely to die. Instead, parasites usually cause relatively minor damage to their host.
Ecological Succession
Communities are not usually static. The numbers and types of species that live in them generally change throughtime. This is called ecological succession. Important cases of succession are primary and secondary succession.
Primary Succession
Primary succession occurs in an area that has never before been colonized. Generally, the area is nothing but barerock. This type of environment may come about when
• lava flows from a volcano and hardens into rock.• a glacier retreats and leaves behind bare rock.• a landslide uncovers an area of bare rock.
The first species to colonize a disturbed area such as this are called pioneer species (see Figure 7.7). They changethe environment and pave the way for other species to come into the area. Pioneer species are likely to includebacteria and lichens that can live on bare rock. Along with wind and water, they help weather the rock and form soil.Once soil begins to form, plants can move in. At first, the plants include grasses and other species that can grow inthin, poor soil. As more plants grow and die, organic matter is added to the soil. This improves the soil and helps ithold water. The improved soil allows shrubs and trees to move into the area.
Secondary Succession
Secondary succession occurs in a formerly inhabited area that was disturbed. The disturbance could be a fire, flood,or human action such as farming. This type of succession is faster because the soil is already in place. In this case,the pioneer species are plants such as grasses, birch trees, and fireweed. Organic matter from the pioneer species
310
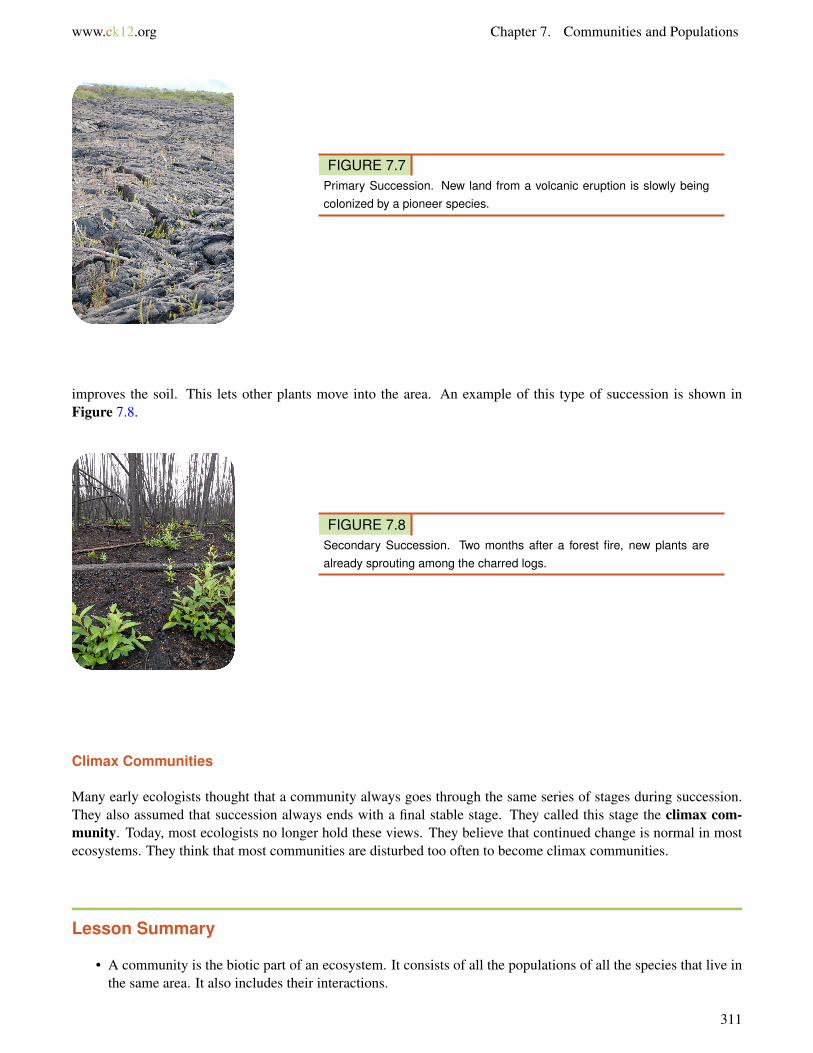
www.ck12.org Chapter 7. Communities and Populations
FIGURE 7.7Primary Succession. New land from a volcanic eruption is slowly beingcolonized by a pioneer species.
improves the soil. This lets other plants move into the area. An example of this type of succession is shown inFigure 7.8.
FIGURE 7.8Secondary Succession. Two months after a forest fire, new plants arealready sprouting among the charred logs.
Climax Communities
Many early ecologists thought that a community always goes through the same series of stages during succession.They also assumed that succession always ends with a final stable stage. They called this stage the climax com-munity. Today, most ecologists no longer hold these views. They believe that continued change is normal in mostecosystems. They think that most communities are disturbed too often to become climax communities.
Lesson Summary
• A community is the biotic part of an ecosystem. It consists of all the populations of all the species that live inthe same area. It also includes their interactions.
311

7.1. Community Interactions www.ck12.org
• Predation is a relationship in which members of one species (the predator) consume members of anotherspecies (the prey). A predator-prey relationship keeps the populations of both species in balance.
• Competition is a relationship between organisms that strive for the same resources in the same place. In-traspecific competition occurs between members of the same species. It improves the species’ adaptations.Interspecific competition occurs between members of different species. It may lead to one species goingextinct or both becoming more specialized.
• Symbiosis is a close relationship between two species in which at least one species benefits. Mutualism is asymbiotic relationship in which both species benefit. Commensalism is a symbiotic relationship in which onespecies benefits while the other species is not affected. Parasitism is a symbiotic relationship in which onespecies (the parasite) benefits while the other species (the host) is harmed.
• Ecological succession is the process in which a community changes through time. Primary succession occursin an area that has never before been colonized. Secondary succession occurs in a formerly inhabited area thatwas disturbed.
Lesson Review Questions
Recall
1. List the three major types of community interactions.
2. Describe the relationship between a predator population and the population of its prey.
3. What is a keystone species? Give an example.
4. Define mutualism and commensalism.
5. What is a climax community?
6. Summarize how ideas about ecological succession and climax communities have changed.
Apply Concepts
7. In 1980, a massive volcanic eruption of Mount St. Helen’s in Washington State covered a large area with lava andash. By 2010, plants were growing in the area, including some small trees. What type of ecological succession hadoccurred? How do you know? Describe how living things colonized the bare rock.
Think Critically
8. Compare and contrast the evolutionary effects of intraspecific and interspecific competition.
9. Explain why most parasites do not kill their host. Why is it in their own best interest to keep their host alive?
Points to Consider
Communities consist of populations of different species. The size and growth of populations in a community areinfluenced by species interactions. For example, predator-prey relationships control the growth of both predator andprey populations.
• How might populations grow without these influences? What other factors do you think might affect popula-tion growth?
312

www.ck12.org Chapter 7. Communities and Populations
• What factors do you think may have affected the growth of the human population?
313

7.2. Population Size www.ck12.org
7.2 Population Size
Learning Objectives
• Describe the factors that regulate population size.
How many penguins are the right number for this beach?
As many as can survive and have healthy offspring! A population will tend to grow as big as it can for the resourcesit needs. Once it is too large, some of its members will die off. This keeps the population size at the right number.
Populations
Biotic and abiotic factors determine the population size of a species in an ecosystem. What are some important bioticfactors? Biotic factors include the amount of food that is available to that species and the number of organisms thatalso use that food source. What are some important abiotic factors? Space, water, and climate all help determine aspecies population.
When does a population grow? A population grows when the number of births is greater than the number of deaths.When does a population shrink? When deaths exceed births.
What causes a population to grow? For a population to grow there must be ample resources and no major problems.What causes a population to shrink? A population can shrink either because of biotic or abiotic limits. An increasein predators, the emergence of a new disease, or the loss of habitat are just three possible problems that will decreasea population. A population may also shrink if it grows too large for the resources required to support it.
314

www.ck12.org Chapter 7. Communities and Populations
Carrying Capacity
When the number of births equals the number of deaths, the population is at its carrying capacity for that habitat.In a population at its carrying capacity, there are as many organisms of that species as the habitat can support. Thecarrying capacity depends on biotic and abiotic factors. If these factors improve, the carrying capacity increases. Ifthe factors become less plentiful, the carrying capacity drops. If resources are being used faster than they are beingreplenished, then the species has exceeded its carrying capacity. If this occurs, the population will then decrease insize.
Limiting Factors
Every stable population has one or more factors that limit its growth. A limiting factor determines the carryingcapacity for a species. A limiting factor can be any biotic or abiotic factor: nutrient, space, and water availability areexamples (Figure 7.9). The size of a population is tied to its limiting factor.
FIGURE 7.9In a desert such as this, what is thelimiting factor on plant populations? Whatwould make the population increase?What would make the population de-crease?
What happens if a limiting factor increases a lot? Is it still a limiting factor? If a limiting factor increases a lot,another factor will most likely become the new limiting factor.
This may be a bit confusing, so let’s look at an example of limiting factors. Say you want to make as many chocolatechip cookies as you can with the ingredients you have on hand. It turns out that you have plenty of flour and otheringredients, but only two eggs. You can make only one batch of cookies, because eggs are the limiting factor. Butthen your neighbor comes over with a dozen eggs. Now you have enough eggs for seven batches of cookies, butonly two pounds of butter. You can make four batches of cookies, with butter as the limiting factor. If you get morebutter, some other ingredient will be limiting.
Species ordinarily produce more offspring than their habitat can support (Figure 7.10). If conditions improve, moreyoung survive and the population grows. If conditions worsen, or if too many young are born, there is competitionbetween individuals. As in any competition, there are some winners and some losers. Those individuals that surviveto fill the available spots in the niche are those that are the most fit for their habitat.
315
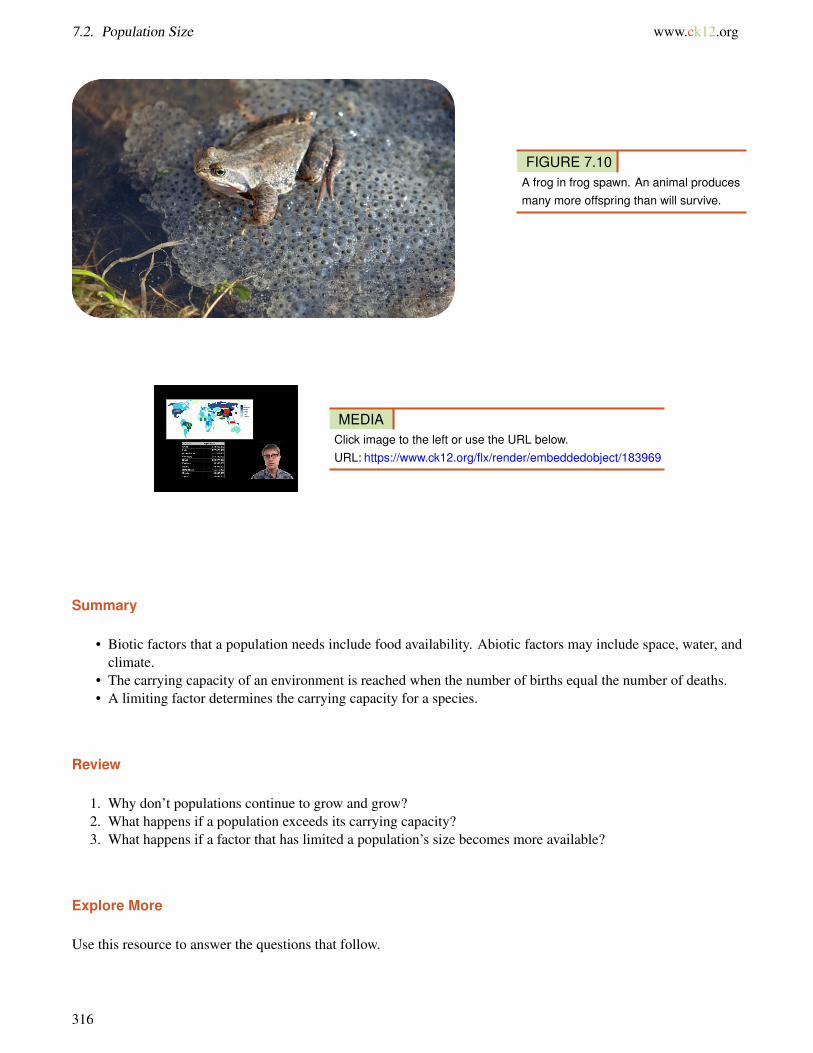
7.2. Population Size www.ck12.org
FIGURE 7.10A frog in frog spawn. An animal producesmany more offspring than will survive.
MEDIAClick image to the left or use the URL below.URL: https://www.ck12.org/flx/render/embeddedobject/183969
Summary
• Biotic factors that a population needs include food availability. Abiotic factors may include space, water, andclimate.
• The carrying capacity of an environment is reached when the number of births equal the number of deaths.• A limiting factor determines the carrying capacity for a species.
Review
1. Why don’t populations continue to grow and grow?2. What happens if a population exceeds its carrying capacity?3. What happens if a factor that has limited a population’s size becomes more available?
Explore More
Use this resource to answer the questions that follow.
316

www.ck12.org Chapter 7. Communities and Populations
MEDIAClick image to the left or use the URL below.URL: https://www.ck12.org/flx/render/embeddedobject/214167
1. Under what circumstances can population growth be exponential?2. What is carrying capacity?3. What does reaching the carrying capacity do to population growth?4. What does carrying capacity depend on?5. What happens if a population exceeds its carrying capacity?6. Is the carrying capacity constant? What changes it?7. What are the two ways to eliminate a pest from your home?8. Give the definition of density dependent factors that are limiting to population growth.9. Give four examples and explain them for density dependent factors.
10. How do natural disasters affect the population size in a region?
317

7.3. Characteristics of Populations www.ck12.org
7.3 Characteristics of Populations
Lesson Objectives
• Define population size, density, and dispersion.• Relate population pyramids and survivorship curves to population structure.• Identify factors that determine population growth rate.• Compare and contrast exponential and logistic growth.
Vocabulary
• age-sex structure• carrying capacity (K)• dispersal• emigration• exponential growth• immigration• K-selected• logistic growth• migration• population density• population distribution• population growth rate (r)• population pyramid• r-selected• survivorship curve
Introduction
Communities are made up of populations of different species. In biology, a population is a group of organisms ofthe same species that live in the same area. The population is the unit of natural selection and evolution. How largea population is and how fast it is growing are often used as measures of its health.
Population Size, Density, and Distribution
Population size is the number of individuals in a population. For example, a population of insects might consist of100 individual insects, or many more. Population size influences the chances of a species surviving or going extinct.Generally, very small populations are at greatest risk of extinction. However, the size of a population may be lessimportant than its density.
318

www.ck12.org Chapter 7. Communities and Populations
Population Density
Population density is the average number of individuals in a population per unit of area or volume. For example, apopulation of 100 insects that live in an area of 100 square meters has a density of 1 insect per square meter. If thesame population lives in an area of only 1 square meter, what is its density? Which population is more crowded?How might crowding affect the health of a population?
Population Distribution
Population density just gives the average number of individuals per unit of area or volume. Often, individuals ina population are not spread out evenly. Instead, they may live in clumps or some other pattern (see Figure 7.11).The pattern may reflect characteristics of the species or its environment. Population distribution describes how theindividuals are distributed, or spread throughout their habitat.
FIGURE 7.11Patterns of Population Distribution. What factors influence the pattern of a population over space?
319

7.3. Characteristics of Populations www.ck12.org
Population Structure
Population growth is the change in the size of the population over time. An important factor in population growth isage-sex structure. This is the number of individuals of each sex and age in the population. The age-sex structureinfluences population growth. This is because younger people are more likely to reproduce, while older people havehigher rates of dying.
Population Pyramids
Age-sex structure is represented by a population pyramid. This is a bar graph, like the one Figure 7.12. In thisexample, the bars become narrower from younger to older ages. Can you explain why?
FIGURE 7.12Population Pyramid. A population pyramid represents the age-sex structure of a population.
Survivorship Curves
Another way to show how deaths affect populations is with survivorship curves. These are graphs that representthe number of individuals still alive at each age. Examples are shown in Figure 7.13.
The three types of curves shown in the figure actually represent different strategies species use to adapt to theirenvironment:
320
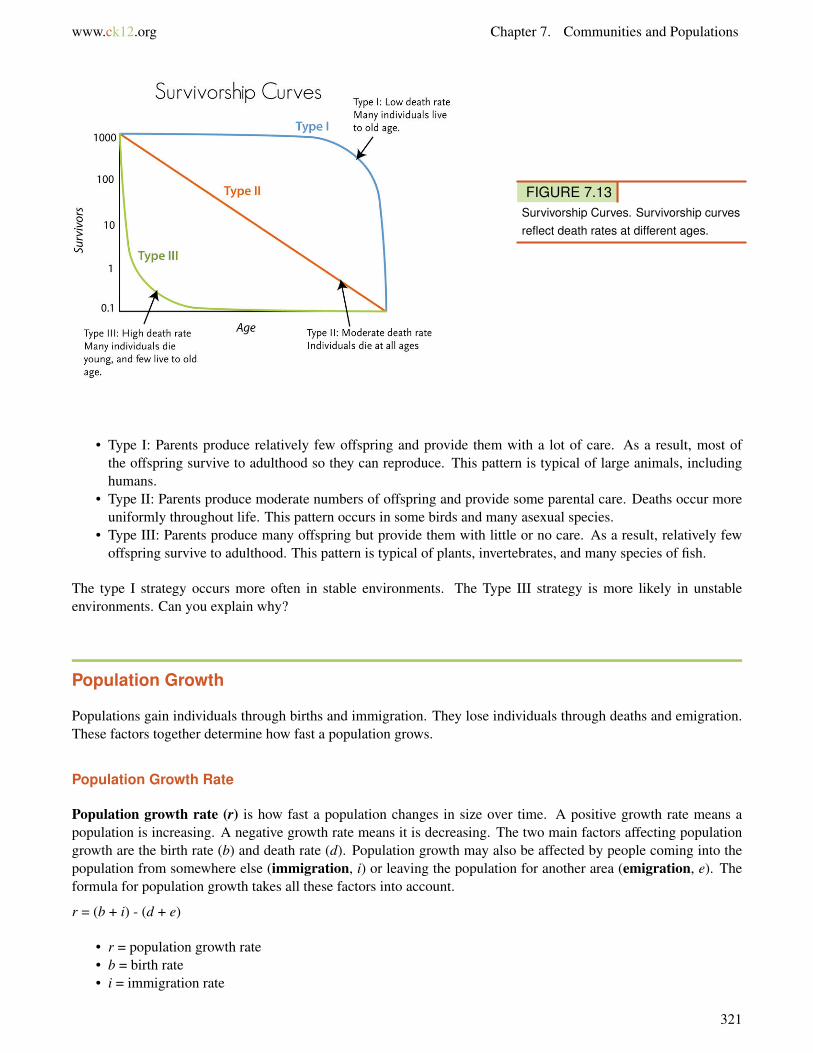
www.ck12.org Chapter 7. Communities and Populations
FIGURE 7.13Survivorship Curves. Survivorship curvesreflect death rates at different ages.
• Type I: Parents produce relatively few offspring and provide them with a lot of care. As a result, most ofthe offspring survive to adulthood so they can reproduce. This pattern is typical of large animals, includinghumans.
• Type II: Parents produce moderate numbers of offspring and provide some parental care. Deaths occur moreuniformly throughout life. This pattern occurs in some birds and many asexual species.
• Type III: Parents produce many offspring but provide them with little or no care. As a result, relatively fewoffspring survive to adulthood. This pattern is typical of plants, invertebrates, and many species of fish.
The type I strategy occurs more often in stable environments. The Type III strategy is more likely in unstableenvironments. Can you explain why?
Population Growth
Populations gain individuals through births and immigration. They lose individuals through deaths and emigration.These factors together determine how fast a population grows.
Population Growth Rate
Population growth rate (r) is how fast a population changes in size over time. A positive growth rate means apopulation is increasing. A negative growth rate means it is decreasing. The two main factors affecting populationgrowth are the birth rate (b) and death rate (d). Population growth may also be affected by people coming into thepopulation from somewhere else (immigration, i) or leaving the population for another area (emigration, e). Theformula for population growth takes all these factors into account.
r = (b + i) - (d + e)
• r = population growth rate• b = birth rate• i = immigration rate
321

7.3. Characteristics of Populations www.ck12.org
• d = death rate• e = emigration rate
Two lectures on demography are available at http://www.youtube.com/watch?v=3diw1Hu3auk (50:36) and http://www.youtube.com/watch?v=Wg3ESbyKbic (49:38).
Dispersal and Migration
Other types of movements may also affect population size and growth. For example, many species have some meansof dispersal. This refers to offspring moving away from their parents. This prevents the offspring from competingwith the parents for resources such as light or water. For example, dandelion seeds have “parachutes.” They allowthe wind to carry the seeds far from the parents (see Figure 7.14).
FIGURE 7.14Dandelion Seeds. These dandelionseeds may disperse far from the parentplant. Why might this be beneficial to bothparents and offspring?
Migration is another type of movement that changes population size. Migration is the regular movement ofindividuals or populations each year during certain seasons. The purpose of migration usually is to find food, mates,or other resources. For example, many Northern Hemisphere birds migrate thousands of miles south each fall. Theygo to areas where the weather is warmer and more resources are available (see Figure 7.15). Then they return northin the spring to nest. Some animals, such as elk, migrate vertically. They go up the sides of mountains in spring assnow melts. They go back down the mountain sides in fall as snow returns.
Patterns of Population Growth
Populations may show different patterns of growth. The growth pattern depends partly on the conditions underwhich a population lives.
Exponential Growth
Under ideal conditions, populations of most species can grow at exponential rates. Curve A in Figure 7.16 representsexponential growth. The population starts out growing slowly. As population size increases, the growth rate alsoincreases. The larger the population becomes, the faster it grows.
322

www.ck12.org Chapter 7. Communities and Populations
FIGURE 7.15Swainson’s hawks migrate from North toSouth America and back again each year.This map shows where individual hawkshave been identified during their migra-tion.
FIGURE 7.16Exponential and Logistic Growth. CurveA shows exponential growth. Curve Bshows logistic growth.
323

7.3. Characteristics of Populations www.ck12.org
Logistic Growth
Most populations do not live under ideal conditions. Therefore, most do not grow exponentially. Certainly, nopopulation can keep growing exponentially for very long. Many factors may limit growth. Often, the factors aredensity dependent. These are factors that kick in when the population becomes too large and crowded. For example,the population may start to run out of food or be poisoned by its own wastes. As a result, population growth slowsand population size levels off. Curve B in Figure 7.16 represents this pattern of growth, which is called logisticgrowth.
At what population size does growth start to slow in the logistic model of growth? That depends on the population’scarrying capacity (see Figure 7.16). The carrying capacity (K) is the largest population size that can be supportedin an area without harming the environment. Population growth hits a ceiling at that size in the logistic growthmodel.
Species can be divided into two basic types when it comes to how their populations grow.
• Species that live in stable environments are likely to be K-selected. Their population growth is controlledby density-dependent factors. Population size is generally at or near the carrying capacity. These species arerepresented by curve B in Figure 7.16.
• Species that live in unstable environments are likely to r-selected. Their potential population growth is rapid.For example, they have large numbers of offspring. However, individuals are likely to die young. Thus,population size is usually well below the carrying capacity. These species are represented by the lower part ofcurve A in Figure 7.16.
Lesson Summary
• Population size is the number of individuals in a population. Population density is the average number ofindividuals per unit of area or volume. The pattern of spacing of individuals in a population may be affectedby characteristics of a species or its environment.
• The age-sex structure of a population is the number of individuals of each sex and age in the population.Age-sex structure influences population growth. It is represented by a population pyramid. The number ofsurvivors at each age is plotted on a survivorship curve.
• Population growth rate is how fast a population changes in size over time. It is determined by rates of birth,death, immigration, and emigration.
• Under ideal conditions, populations can grow exponentially. The growth rate increases as the population getslarger. Most populations do not live under ideal conditions and grow logistically instead. Density-dependentfactors slow population growth as population size nears the carrying capacity.
Lesson Review Questions
Recall
1. What is population density?
2. Define immigration and emigration.
324

www.ck12.org Chapter 7. Communities and Populations
3. What is migration? Give an example.
4. Write the formula for the population growth rate. Identify all the variables.
5. State why dispersal of offspring away from their parents might be beneficial.
6. Describe exponential population growth.
7. What are K-selected and r-selected species?
Apply Concepts
8. A population of 820 insects lives in a 1.2-acre area. They gather nectar from a population of 560 flowering plants.The plants live in a 0.2-acre area. Which population has greater density, the insects or the plants?
9. Assume that a population pyramid has a very broad base. What does that tell you about the population itrepresents?
Think Critically
10. What can you infer about a species that has a random pattern of distribution over space? A uniform pattern?
11. Compare and contrast Type I and Type III survivorship curves.
Points to Consider
Human populations have an interesting history that you will read about in the next lesson. You just read aboutpopulation dispersion and growth. Make some predictions about dispersion and growth in human populations:
• Do you think human populations have a clumped, random, or uniform dispersion?• How fast do human populations grow? What might limit their growth?
325

7.4. Human Population Growth www.ck12.org
7.4 Human Population Growth
Lesson Objectives
• Describe early human population growth.• Outline the stages of the demographic transition.• Explain trends in recent human population growth.• Summarize the human population problem and possible solutions to the problem.
Vocabulary
• demographic transition
Introduction
Humans have been called the most successful “weed species” Earth has ever seen. Like weeds, human populationsare fast growing. They also disperse rapidly. They have colonized habitats from pole to pole. Overall, the humanpopulation has had a pattern of exponential growth, as shown in Figure 7.17. The population increased very slowlyat first. As it increased in size, so did its rate of growth.
FIGURE 7.17Growth of the Human Population. Thisgraph gives an overview of human popu-lation growth since 10,000 BC. It took untilabout 1800 AD for the number of humansto reach 1 billion. It took only a littleover 100 years for the number to reach2 billion. Today, the human populationis rapidly approaching the 7 billion mark!Why do you think the human populationbegan growing so fast?
326

www.ck12.org Chapter 7. Communities and Populations
Early Population Growth
Homo sapiens arose about 200,000 years ago in Africa. Early humans lived in small populations of nomadic huntersand gatherers. They first left Africa about 40,000 years ago. They soon moved throughout Europe, Asia, andAustralia. By 10,000 years ago, they had reached the Americas. During this long period, birth and death rates wereboth fairly high. As a result, population growth was slow.
Humans invented agriculture about 10,000 years ago. This provided a bigger, more dependable food supply. It alsolet them settle down in villages and cities for the first time. The death rate increased because of diseases associatedwith domestic animals and crowded living conditions. The birth rate increased because there was more food andsettled life offered other advantages. The combined effect was continued slow population growth.
Demographic Transition
Major changes in the human population first began during the 1700s in Europe and North America. First death ratesfell, followed somewhat later by birth rates.
Death Rates Fall
Several advances in science and technology led to lower death rates in 18th century Europe and North America:
• New scientific knowledge of the causes of disease led to improved water supplies, sewers, and personalhygiene.
• Better farming techniques and machines increased the food supply.• The Industrial Revolution of the 1800s led to new sources of energy, such as coal and electricity. This increased
the efficiency of the new agricultural machines. It also led to train transport, which improved the distributionof food.
For all these reasons, death rates fell, especially in children. This allowed many more children to survive toadulthood, so birth rates increased. As the gap between birth and death rates widened, the human population grewfaster.
Birth Rates Fall
It wasn’t long before birth rates started to fall as well in Europe and North America. People started having fewerchildren because large families were no longer beneficial for several reasons.
• As child death rates fell and machines did more work, farming families no longer needed to have as manychildren to work in the fields.
• Laws were passed that required children to go to school. Therefore, they could no longer work and contributeto their own support. They became a drain on the family’s income.
Eventually, birth rates fell to match death rates. As a result, population growth slowed to nearly zero.
Stages of the Demographic Transition
These changes in population that occurred in Europe and North America have been called the demographic transi-tion. The transition can be summarized in the following four stages, which are illustrated in Figure 7.18:
327

7.4. Human Population Growth www.ck12.org
• Stage 1—High birth and death rates lead to slow population growth.• Stage 2—The death rate falls but the birth rate remains high, leading to faster population growth.• Stage 3—The birth rate starts to fall, so population growth starts to slow.• Stage 4—The birth rate reaches the same low level as the death rate, so population growth slows to zero.
FIGURE 7.18Stages of the Demographic Transition. Inthe demographic transition, the death ratefalls first. After a lag, the birth rate alsofalls. How do these changes affect therate of population growth over time?
Recent Population Growth
At one time, scientists predicted that all human populations would pass through the same demographic transitionas Europe and North America. Now, they are not so sure. Death rates have fallen throughout the world. Nocountry today remains in Stage 1 of the transition. However, birth rates are still high in many poor countries. Thesepopulations seem to be stuck in Stage 2. An example is the African country of Angola. Its population pyramid for2005 is shown in Figure 7.19. The wide base of the pyramid base reflects the high birth rate of this population.
Many other countries have shifted to Stage 3 of the transition. Birth rates have started to fall. As a result, populationgrowth is slowing. An example is Mexico. Its population pyramid for 1998 is shown in Figure 7.20. It reflects arecent fall in the birth rate.
Most developed nations have entered Stage 4. Sweden is an example (see Figure 7.21). The birth rate has been lowfor many years in Sweden. Therefore, the rate of population growth is near zero.
In some countries, birth rates have fallen even lower than death rates. As result, their population growth ratesare negative. In other words, the populations are shrinking in size. These populations have top-heavy populationpyramids, like the one for Italy shown in Figure 7.22. This is a new stage of the demographic transition, referredto as Stage 5. You might think that a negative growth rate would be a good thing. In fact, it may cause problems.For example, growth-dependent industries decline. Supporting the large aging population is also a burden for theshrinking younger population of workers.
328

www.ck12.org Chapter 7. Communities and Populations
FIGURE 7.19Angola’s population pyramid is typical ofStage 2 of the demographic transition.
FIGURE 7.20Mexico’s 1998 population pyramid is typ-ical of Stage 3 population. How can youtell that the birth rate has started to fall?
FIGURE 7.21Sweden’s 1998 population pyramid showsa population in Stage 4.
329

7.4. Human Population Growth www.ck12.org
FIGURE 7.22This 1998 population pyramid for Italy rep-resents a Stage 5 population.
Future Population Growth
During the month of October 2011, the world’s population surpassed 7 billion people. It took just 12 years for thepopulation to increase by a billion people. At this rate, there may be well over 9 billion people by 2050, and easily10 billion people by 2100. This raises many questions for both people and the planet. These issues are discussed athttp://www.cnn.com/2011/10/17/opinion/sachs-global-population/index.html .
The human population is now growing by more than 200,000 people a day. The human population may well beclose to its carrying capacity. It has already harmed the environment. An even larger human population may causesevere environmental problems. This could lead to outbreaks of disease, starvation, and global conflict. There arethree potential solutions:
1. Use technology to make better use of resources to support more people.2. Change behaviors to reduce human numbers and how much humans consume.3. Distribute resources more fairly among all the world’s people.
Which solution would you choose?
Census Update: What the World Will Look like in 2050
On June 30, 2011, Time.com published Census Update: What the World Will Look like in 2050 at http://www.time.com/time/nation/article/0,8599,2080404,00.html . According to the U.S Census Bureau, in 2050, there will be 9.4billion people:
• India will be the most populous nation, surpassing China sometime around 2025.• The U.S. will remain the third most populous nation, with a population of 423 million (up from 308 million
in 2010).• Declining birth rates Japan and Russia will cause them to fall from their current positions as the 9th and 10th
most populous nations, respectively, to 16th and 17th.• Nigeria will have a population of 402 million, up from 166 million people.• Ethiopia’s population will likely triple, from 91 million to 278 million, making the East African nation one of
the top 10 most populous countries in the world.
So what does all this mean?
330

www.ck12.org Chapter 7. Communities and Populations
• The African continent is expected to experience significant population growth in the coming decades, whichcould compound the already-problematic food-supply issues in some African nations.
• Immigration and differing birth rates among races will change the ethnic composition of the U.S.• Population booms in Africa and India, the decline of Russia and the expected plateau of China will all change
the makeup of the estimated 9.4 billion people who will call Earth home in 2050.
Lesson Summary
• Early humans lived in small populations of nomadic hunters and gatherers. Both birth and death rates werefairly high. As a result, human population growth was very slow. The invention of agriculture increased bothbirth and death rates. The population continued to grow slowly.
• Major changes in the human population first began during the 1700s. This occurred in Europe and NorthAmerica. First, death rates fell while birth rates remained high. This led to rapid population growth. Later,birth rates also fell. As a result, population growth slowed.
• Other countries have completed a similar demographic transition. However, some countries seem stalled atearly stages. They have high birth rates and rapidly growing populations.
• The total human population may have to stop growing eventually. Even if we reduce our use of resources anddistribute them more fairly, at some point the carrying capacity will be reached.
Lesson Review Questions
Recall
1. How did the invention of agriculture affect human birth and death rates? How did it affect human populationgrowth?
2. Outline the four stages of the demographic transition as it occurred in Europe and North America.
3. State two reasons why death rates fell in Europe and North America, starting in the 1700s.
4. Why did birth rates fall in Europe and North America during the demographic transition?
5. Why was a fifth stage added to the demographic transition model? Describe a population at this stage.
Apply Concepts
6. Which stage of the demographic transition is represented by the population pyramid in the Figure 7.23?
7. Assume you will add a line to the graph in Figure 7.18 to represent the population growth rate (r). Describe whatthe line would look like.
Think Critically
8. Evaluate how well the original demographic transition model represents human populations today.
9. What is the human population problem? What are some potential solutions? Which solution do you think is best?Present a logical argument to support your choice.
331

7.4. Human Population Growth www.ck12.org
FIGURE 7.23
Points to Consider
The human population may already be larger than its carrying capacity.
• What evidence might show that there are too many people on Earth today?• How does human overpopulation affect the environment? How does it affect the populations of other species?
332

www.ck12.org Chapter 7. Communities and Populations
7.5 The Biodiversity Crisis
Lesson Objectives
• Define biodiversity.• Identify economic benefits and ecosystem services of biodiversity.• Relate human actions to the sixth mass extinction.
Vocabulary
• exotic species• habitat loss• sixth mass extinction
Introduction
One of the effects of human overpopulation is the loss of other species. The rapidly growing human population hasreduced Earth’s biodiversity.
What Is Biodiversity?
Biodiversity refers to the variety of life and its processes, including the variety of living organisms, the geneticdifferences among them, and the communities and ecosystems in which they occur. Scientists have identified about1.9 million species alive today. They are divided into the six kingdoms of life shown in Figure 7.24. Scientists arestill discovering new species. Thus, they do not know for sure how many species really exist today. Most estimatesrange from 5 to 30 million species.
A discussion of biodiversity is available at http://www.youtube.com/watch?v=vGxJArebKoc (6:12).
Millions of Unseen Species
A study released in August 2011 estimates that Earth has almost 8.8 million animal, plant and fungi species, butwe’ve only discovered less than a quarter of them. So far, only 1.9 million species have been found. Recent newlydiscovered species have been very diverse: a psychedelic frogfish, a lizard the size of a dime and even a blind hairymini-lobster at the bottom of the ocean. There are potential benefits from these undiscovered species, which need tobe found before they disappear from the planet. The study estimates that of the 8.8 million species, about 6.5 millionwould be on land and 2.2 million in the ocean. The research estimates that animals rule with 7.8 million species,followed by fungi with 611,000 and plants with just shy of 300,000 species. See http://news.yahoo.com/wild-world-millions-unseen-species-fill-earth-210051661.html for additional information.
333

7.5. The Biodiversity Crisis www.ck12.org
FIGURE 7.24Known species represent only a fractionof all species that exist on Earth.
334

www.ck12.org Chapter 7. Communities and Populations
Why Is Biodiversity Important?
Human beings benefit in many ways from biodiversity. Biodiversity has direct economic benefits. It also providesservices to entire ecosystems.
Economic Benefits of Biodiversity
The diversity of species provides humans with a wide range of economic benefits:
• Wild plants and animals maintain a valuable pool of genetic variation. This is important because domesticspecies are genetically uniform. This puts them at great risk of dying out due to disease.
• Other organisms provide humans with many different products. Timber, fibers, adhesives, dyes, and rubberare just a few.
• Certain species may warn us of toxins in the environment. When the peregrine falcon nearly went extinct, forexample, it warned us of the dangers of DDT.
• More than half of the most important prescription drugs come from wild species. Only a fraction of specieshave yet been studied for their medical potential.
• Other living things provide inspiration for engineering and technology. For example, the car design in Figure7.25 was based on a fish.
FIGURE 7.25From flowers to fish, biodiversity benefits humans in many ways.
Ecosystem Services of Biodiversity
Biodiversity generally increases the productivity and stability of ecosystems. It helps ensure that at least somespecies will survive environmental change. It also provides many other ecosystem services. For example:
• Plants and algae maintain the atmosphere. During photosynthesis, they add oxygen and remove carbondioxide.
335

7.5. The Biodiversity Crisis www.ck12.org
• Plants help prevent soil erosion. They also improve soil quality when they decompose.• Microorganisms purify water in rivers and lakes. They also return nutrients to the soil.• Bacteria fix nitrogen and make it available to plants. Other bacteria recycle the nitrogen from organic wastes
and remains of dead organisms.• Insects and birds pollinate flowering plants, including crop plants.• Natural predators control insect pests. They reduce the need for expensive pesticides, which may harm people
and other living things.
Human Actions and the Sixth Mass Extinction
Over 99 percent of all species that ever lived on Earth have gone extinct. Five mass extinctions are recorded in thefossil record. They were caused by major geologic and climatic events. Evidence shows that a sixth mass extinctionis occurring now. Unlike previous mass extinctions, the sixth extinction is due to human actions.
Some scientists consider the sixth extinction to have begun with early hominids during the Pleistocene. They areblamed for over-killing big mammals such as mammoths. Since then, human actions have had an ever greater impacton other species. The present rate of extinction is between 100 and 100,000 species per year. In 100 years, we couldlose more than half of Earth’s remaining species.
Causes of Extinction
The single biggest cause of extinction today is habitat loss. Agriculture, forestry, mining, and urbanization havedisturbed or destroyed more than half of Earth’s land area. In the U.S., for example, more than 99 percent of tall-grassprairies have been lost. Other causes of extinction today include:
• Exotic species introduced by humans into new habitats. They may carry disease, prey on native species, anddisrupt food webs. Often, they can out-compete native species because they lack local predators. An exampleis described in Figure 7.26.
• Over-harvesting of fish, trees, and other organisms. This threatens their survival and the survival of speciesthat depend on them.
• Global climate change, largely due to the burning of fossil fuels. This is raising Earth’s air and oceantemperatures. It is also raising sea levels. These changes threaten many species.
• Pollution, which adds chemicals, heat, and noise to the environment beyond its capacity to absorb them. Thiscauses widespread harm to organisms.
• Human overpopulation, which is crowding out other species. It also makes all the other causes of extinctionworse.
Effects of Extinction
The results of a study released in the summer of 2011 have shown that the decline in the numbers of large predatorslike sharks, lions and wolves is disrupting Earth’s ecosystem in all kinds of unusual ways. The study, conducted byscientists from 22 different institutions in six countries, confirmed the sixth mass extinction. The study states thatthis mass extinction differs from previous ones because it is entirely driven by human activity through changes inland use, climate, pollution, hunting, fishing and poaching. The effects of the loss of these large predators can beseen in the oceans and on land.
• Fewer cougars in the western US state of Utah led to an explosion of the deer population. The deer ate morevegetation, which altered the path of local streams and lowered overall biodiversity.
336

www.ck12.org Chapter 7. Communities and Populations
FIGURE 7.26Brown Tree Snake. The brown tree snake is an exotic species that has caused many extinctions on Pacific islandssuch as Guam.
• In Africa, where lions and leopard are being lost to poachers, there is a surge in the numbers of olive baboonswho are transferring intestinal parasites to human who live nearby.
• In the oceans, industrial whaling led a change in the diets of killer whales, who eat more sea lion, seals andotters and dramatically lowered those population counts.
The study concludes that the loss of big predators has likely driven many of the pandemics, population collapses andecosystem shifts the Earth has seen in recent centuries. See http://www.nsf.gov/news/news_summ.jsp?cntn_id=121020 for additional information.
KQED: Disappearing Frogs
Around the world, frogs are declining at an alarming rate due to threats like pollution, disease and climate change.Frogs bridge the gap between water and land habitats, making them the first indicators of ecosystem changes. Meetthe California researchers working to protect frogs across the state and across the world in the video below.
MEDIAClick image to the left or use the URL below.URL: https://www.ck12.org/flx/render/embeddedobject/443
337

7.5. The Biodiversity Crisis www.ck12.org
KQED: Nonnative Species
Scoop a handful of critters out of the San Francisco Bay and you’ll find many organisms from far away shores.Invasive kinds of mussels, fish and more are choking out native species, challenging experts around the state tochange the human behavior that brings them here.
MEDIAClick image to the left or use the URL below.URL: https://www.ck12.org/flx/render/embeddedobject/444
How You Can Help Protect Biodiversity
There are many steps you can take to help protect biodiversity. For example:
• Consume wisely. Reduce your consumption wherever possible. Re-use or recycle rather than throw out andbuy new. When you do buy new, choose products that are energy efficient and durable.
• Avoid plastics. Plastics are made from petroleum and produce toxic waste.• Go organic. Organically grown food is better for your health. It also protects the environment from pesticides
and excessive nutrients in fertilizers.• Save energy. Unplug electronic equipment and turn off lights when not in use. Take mass transit instead of
driving.
See http://www.youtube.com/watch?v=GnK7gNXxb3c for an outstanding 60 Minutes video of the Great Migrationin Kenya, and the issues facing these animals.
Lost Salmon
Why is the salmon population of Northern California so important? Salmon do not only provide food for humans,but also supply necessary nutrients for their ecosystems. Because of a sharp decline in their numbers, in part due tohuman interference, the entire salmon fishing season off California and Oregon was canceled in both 2008 and 2009.The species in the most danger of extinction is the California coho salmon. Explore the important role salmon playin their native ecosystems and methods to increase their numbers through watching the video below.
MEDIAClick image to the left or use the URL below.URL: https://www.ck12.org/flx/render/embeddedobject/445
338

www.ck12.org Chapter 7. Communities and Populations
The Encyclopedia of Life
The Encyclopedia of Life (EOL) is a free, online collaborative encyclopedia intended to document all of the 1.9+million living species known to science. It is compiled from existing scientific databases, and from contributions byexperts and non-experts world-wide. Its goal is to build one infinitely expandable page for each species, includingvideos, sound, images, graphics, and text. As the discovery of new species is expected to continue (the current rate isabout 20,000 new species identified per year), EOL will grow continuously. As taxonomy finds new ways to includespecies identified by molecular techniques, the rate of new species additions will increase - in particular with respectto the microbial world of (eu)bacteria, archaebacteria and viruses. EOL went live on February 26, 2008 with 30,000entries.
The EOL has developed web-based tools and services that provide visitors enhanced capability to use EOL contentfor their own purposes and to contribute to the site and become part of a growing international community interestedin biodiversity.
See http://www.eol.org/ and http://www.youtube.com/watch?v=6NwfGA4cxJQ for additional information.
MEDIAClick image to the left or use the URL below.URL: https://www.ck12.org/flx/render/embeddedobject/418
In addition, Understanding Biodiversity, the CK-12 and EOL biodiversity-themed resource currently under de-velopment, is an expanding library of biodiversity information aimed at the secondary-level biology classroom.Understanding Biodiversity pages will provide information for each species relevant to the high school biologycurriculum: cell biology, genetics, evolution, ecology, and physiology. If you would like to submit a species page toUnderstanding Biodiversity, email a proposal for contributions to [email protected].
Field Guides
http://fieldguides.eol.org/
339

7.5. The Biodiversity Crisis www.ck12.org
Field Guides pull selected content from EOL species pages into a format that is easier to view and use for particularprojects. Rather than sorting through all 1.9 million species pages and all of the Table of Contents information, userswill see information for just the organisms and information they select. Users are able to customize and edit thecontent in their field guide.
You can try creating a field guide for the organisms found in your schoolyard or for the organisms discussed inanother chapter of this resource. See what information is found in EOL and what is missing. Is there anything youcan contribute to EOL, such as an image or class research information?
EOL Podcasts
Lend an ear and discover the wonders of nature—right outside your back door and halfway around the world. EOLaudio broadcasts are aimed at learning about life-from organisms as small as yeast to as big as a bowhead whale.Hear people’s stories about nature and hone your backyard observation skills. Explore the diversity of life—fiveminutes and One Species at a Time. Listen to the podcasts online, or download them and take them with you on yourown exploration of the world around you.
One Species at a Time
The audio series One Species at a Time is a tribute to life on Earth. Each episode is a story, a mystery, a riddle, or anexploration of a different creature pulsing, fluttering, surging, respiring, and galloping on this planet. Biodiversity iscenter stage, from scurrying invasive beetles in Oregon to the threatened cedar trees of Lebanon to Ediacaran faunafrom 580 million years ago. There are associated Extras and a Meet the Scientist section with each podcast. Somehave associated educational materials. Some have associated educational materials. All podcasts are freely availableand can be used in other projects.
The Biodiversity Heritage Library
http://www.biodiversitylibrary.org/
Twelve major natural history museum libraries, botanical libraries, and research institutions have joined to form theBiodiversity Heritage Library. The participating libraries have over two million volumes of biodiversity literaturecollected over 200 years to support the work of scientists, researchers, and students in their home institutions andthroughout the world.
The Biodiversity Heritage Library (BHL) consortium cooperates to digitize and make accessible the biodiversityliterature held in their collections and to make that literature available for open access and responsible use as a partof a global “biodiversity commons.” Because of the BHL’s success in digitizing a significant mass of biodiversityliterature, the scientific documentation of the study of living organisms since the time of Linnaeus has became easilyaccessible.
Anyone can access the BHL website directly or link to it from any EOL species page. When on a species page, scrolldown through the Table of Contents on the left hand side of the page to the "References and More Information" sec-tion and click on "Biodiversity Heritage Library." BHL literature directly related to the species under considerationwill be shown.
The published literature on biological diversity has limited global distribution; much of it is available in only a fewselect libraries in the developed world. These collections are of exceptional value because the domain of systematicbiology depends - more than any other science - upon historic literature. Yet, this wealth of knowledge is availableonly to those few who can gain direct access to significant library collections. Literature about the life that exists indeveloping countries is often not available within their borders. Biologists have long considered that access to the
340

www.ck12.org Chapter 7. Communities and Populations
published literature is one of the chief impediments to the efficiency of research in the field. Among other results,free global access to digitized versions of the literature would make available information about the Earth’s speciesto all parts of the world. Many of the texts digitized by the BHL have until now only been held in a few Europeanor North American libraries. Now, with this resource, scientists and student in the developing world have access tothem, thereby accelerating biodiversity research.
Since 2009, the BHL has expanded globally. The European Commission’s eContentPlus program has recentlyfunded the BHL-Europe project, with 28 institutions, to assemble the European language literature. Additionally, theChinese Academy of Sciences, the Atlas of Living Australia, Brazil, and the Bibliotheca Alexandrina have createdregional BHL sites. These projects will work together to share content, protocols, services, and digital preservationpractices.
Lesson Summary
• Biodiversity refers to the number of species in an ecosystem or the biosphere as a whole.• Biodiversity has direct economic benefits. It also provides services to entire ecosystems.• Evidence shows that a sixth mass extinction is occurring. The single biggest cause is habitat loss caused by
human actions. There are many steps you can take to help protect biodiversity. For example, you can use lessenergy.
• The Encyclopedia of Life is a free, online collaborative encyclopedia intended to document all of the 1.9+million living species known to science.
Lesson Review Questions
Recall
1. What is biodiversity?
2. List three economic benefits of biodiversity.
3. Identify ecosystem services of biodiversity.
4. How is human overpopulation related to the sixth mass extinction?
Apply Concepts
5. Create a poster that conveys simple tips for protecting biodiversity.
6. Why might the brown tree snake or the peregrine falcon serve as “poster species” for causes of the sixth massextinction?
Think Critically
7. Predict what would happen to other organisms in an ecosystem in which all the decomposers went extinct?
8. Describe a hypothetical example showing how rising sea levels due to global warming might cause extinction.
341

7.5. The Biodiversity Crisis www.ck12.org
Points to Consider
All species depend on the environment to provide them with the resources they need. As populations grow, resourcesmay be used up. Just using the resources can create more problems.
• What resources do you depend on?• Does using the resources pollute the environment? Are the resources running out?
342

www.ck12.org Chapter 7. Communities and Populations
7.6 Natural Resources and Climate Change
Lesson Objectives
• Distinguish between renewable and nonrenewable resources.• Describe threats to soil and water resources.• Identify the causes and effects of air pollution.• Explain global climate change.
Vocabulary
• acid rain• air pollution• algal bloom• dead zone• global warming• greenhouse effect• natural resource• nonrenewable resource• ozone hole• renewable resource• soil• sustainable use
Introduction
A natural resource is something supplied by nature that helps support life. When you think of natural resources,you may think of minerals and fossil fuels. However, ecosystems and the services they provide are also naturalresources. Biodiversity is a natural resource as well.
Renewable and Nonrenewable Resources
From the human point of view, natural resources can be classified as renewable or nonrenewable.
Renewable Resources
Renewable resources can be replenished by natural processes as quickly as humans use them. Examples includesunlight and wind. They are in no danger of being used up (see Figure 7.27). Metals and other minerals are
343
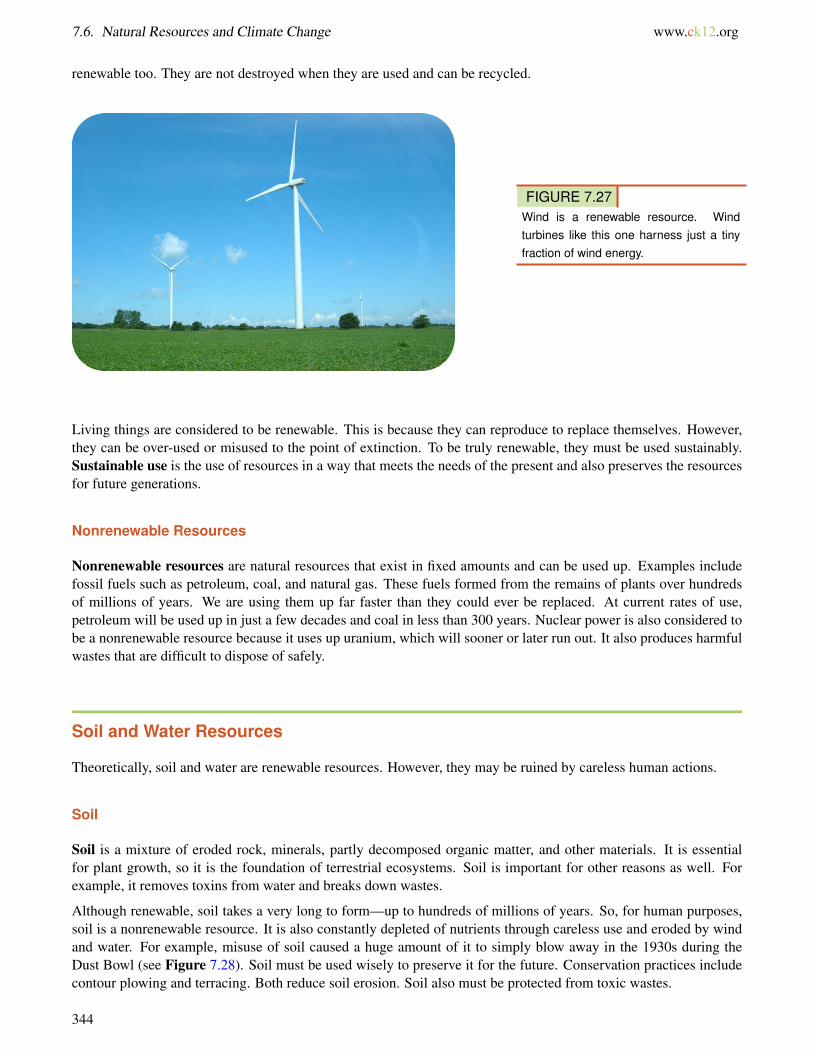
7.6. Natural Resources and Climate Change www.ck12.org
renewable too. They are not destroyed when they are used and can be recycled.
FIGURE 7.27Wind is a renewable resource. Windturbines like this one harness just a tinyfraction of wind energy.
Living things are considered to be renewable. This is because they can reproduce to replace themselves. However,they can be over-used or misused to the point of extinction. To be truly renewable, they must be used sustainably.Sustainable use is the use of resources in a way that meets the needs of the present and also preserves the resourcesfor future generations.
Nonrenewable Resources
Nonrenewable resources are natural resources that exist in fixed amounts and can be used up. Examples includefossil fuels such as petroleum, coal, and natural gas. These fuels formed from the remains of plants over hundredsof millions of years. We are using them up far faster than they could ever be replaced. At current rates of use,petroleum will be used up in just a few decades and coal in less than 300 years. Nuclear power is also considered tobe a nonrenewable resource because it uses up uranium, which will sooner or later run out. It also produces harmfulwastes that are difficult to dispose of safely.
Soil and Water Resources
Theoretically, soil and water are renewable resources. However, they may be ruined by careless human actions.
Soil
Soil is a mixture of eroded rock, minerals, partly decomposed organic matter, and other materials. It is essentialfor plant growth, so it is the foundation of terrestrial ecosystems. Soil is important for other reasons as well. Forexample, it removes toxins from water and breaks down wastes.
Although renewable, soil takes a very long to form—up to hundreds of millions of years. So, for human purposes,soil is a nonrenewable resource. It is also constantly depleted of nutrients through careless use and eroded by windand water. For example, misuse of soil caused a huge amount of it to simply blow away in the 1930s during theDust Bowl (see Figure 7.28). Soil must be used wisely to preserve it for the future. Conservation practices includecontour plowing and terracing. Both reduce soil erosion. Soil also must be protected from toxic wastes.
344

www.ck12.org Chapter 7. Communities and Populations
FIGURE 7.28The Dust Bowl occurred between 1933 and 1939 in Oklahoma and other southwestern U.S. states. Plowing hadexposed prairie soil. Drought turned the soil to dust. Intense dust storms blew away vast quantities of the soil.Much of the soil blew all the way to the Atlantic Ocean.
Water
Water is essential for all life on Earth. For human use, water must be fresh. Of all the water on Earth, only 1 percentis fresh, liquid water. Most of the rest is either salt water in the ocean or ice in glaciers and ice caps.
Although water is constantly recycled through the water cycle, it is in danger. Over-use and pollution of freshwaterthreaten the limited supply that people depend on. Already, more than 1 billion people worldwide do not haveadequate freshwater. With the rapidly growing human population, the water shortage is likely to get worse.
KQED: Are We in Danger of Running Out of Water?
California’s population is growing by 600,000 people a year, but much of the state receives as much annual rainfallas Morocco. With fish populations crashing, global warming, and the demands of the country’s largest agriculturalindustry, the pressures on our water supply are increasing. Are we in danger of running out of water?
MEDIAClick image to the left or use the URL below.URL: https://www.ck12.org/flx/render/embeddedobject/447
Too Much of a Good Thing
Water pollution comes from many sources. One of the biggest sources is runoff. Runoff picks up chemicals suchas fertilizer from agricultural fields, lawns, and golf courses. It carries the chemicals to bodies of water. The added
345

7.6. Natural Resources and Climate Change www.ck12.org
nutrients from fertilizer often cause excessive growth of algae, creating algal blooms (see Figure 7.29). The algaeuse up oxygen in the water so that other aquatic organisms cannot survive. This has occurred over large areas of theocean, creating dead zones, where low oxygen levels have killed all ocean life. A very large dead zone exists in theGulf of Mexico. Measures that can help prevent these problems include cutting down on fertilizer use. Preservingwetlands also helps because wetlands filter runoff.
FIGURE 7.29Algal Bloom. Nutrients from fertilizer in runoff caused this algal bloom.
The Atmosphere
The atmosphere plays an important part in maintaining Earth’s freshwater supply. It is part of the water cycle. Itrefills lakes and rivers with precipitation. The atmosphere also provides organisms with gases needed for life. Itcontains oxygen for cellular respiration and carbon dioxide for photosynthesis.
Air Pollution
Earth’s atmosphere is vast. However, it has been seriously polluted by human activities. Air pollution consistsof chemical substances and particles released into the atmosphere, mainly by human actions. The major cause ofoutdoor air pollution is the burning of fossil fuels. Power plants, motor vehicles, and home furnaces all burn fossilfuels and contribute to the problem (see Table 7.1). Ranching and using chemicals such as fertilizers also cause airpollution. Erosion of soil in farm fields and construction sites adds dust particles to the air as well. Fumes frombuilding materials, furniture, carpets, and paint add toxic chemicals to indoor air.
TABLE 7.1: Pollutant Problems
Pollutant Example/Major Source ProblemSulfur oxides (SOx) Coal-fired power plants Acid RainNitrogen oxides (NOx) Motor vehicle exhaust Acid RainCarbon monoxide (CO) Motor vehicle exhaust PoisoningCarbon dioxide (CO2) All fossil fuel burning Global WarmingParticulate matter (smoke, dust) Wood and coal burning Respiratory disease, Global Dim-
mingMercury Coal-fired power plants, medical
wasteNeurotoxicity
Smog Coal burning Respiratory problems; eye irritationGround-level ozone Motor vehicle exhaust Respiratory problems; eye irritation
346

www.ck12.org Chapter 7. Communities and Populations
In humans, air pollution causes respiratory and cardiovascular problems. In fact, more people die each year from airpollution than automobile accidents. Air pollution also affects ecosystems worldwide by causing acid rain, ozonedepletion, and global warming. Ways to reduce air pollution from fossil fuels include switching to nonpollutingenergy sources (such as solar energy) and using less energy. What are some ways you could use less energy?
Acid Rain
All life relies on a relatively narrow range of pH, or acidity. That’s because protein structure and function is verysensitive to pH. Air pollution can cause precipitation to become acidic. Nitrogen and sulfur oxides—mainly frommotor vehicle exhaust and coal burning—create acids when they combine with water in the air. The acids lower thepH of precipitation, forming acid rain. If acid rain falls on the ground, it may damage soil and soil organisms. If itfalls on plants, it may kill them (see Figure 7.30). If it falls into lakes, it lowers the pH of the water and kills aquaticorganisms.
FIGURE 7.30Effects of Acid Rain. These trees in aEuropean forest were killed by acid rain.
Ozone Depletion
There are two types of ozone. You can think of them as bad ozone and good ozone. Both are affected by air pollution.
• Bad ozone forms near the ground when sunlight reacts with pollutants in the air. Ground-level ozone isharmful to the respiratory systems of humans and other animals.
• Good ozone forms in a thin layer high up in the atmosphere, between 15 and 35 kilometers above Earth’ssurface. This ozone layer shields Earth from most of the sun’s harmful UV radiation. It plays an importantrole in preventing mutations in the DNA of organisms.
Unfortunately, the layer of good ozone is being destroyed by air pollution. The chief culprits are chlorine andbromine gases. They are released in aerosol sprays, coolants, and other products. Loss of ozone has created anozone hole over Antarctica. Ozone depletion results in higher levels of UV radiation reaching Earth. In humans, thisincreases skin cancers and eye cataracts. It also disturbs the nitrogen cycle, kills plankton, and disrupts ocean foodwebs. The total loss of the ozone layer would be devastating to most life. It’s rate of loss has slowed with restrictionson pollutants, but it is still at risk.
347

7.6. Natural Resources and Climate Change www.ck12.org
Global Climate Change
Another major problem caused by air pollution is global climate change. Gases such as carbon dioxide from theburning of fossil fuels increase the natural greenhouse effect. This raises the temperature of Earth’s surface.
What Is the Greenhouse Effect?
The greenhouse effect is a natural feature of Earth’s atmosphere. It occurs when gases in the atmosphere radiate thesun’s heat back down to Earth’s surface (see Figure 7.31). Otherwise, the heat would escape into space. Without thegreenhouse effect, Earth’s surface temperature would be far cooler than it is. In fact, it would be too cold to supportlife as we know it.
FIGURE 7.31The Greenhouse Effect. Without green-house gases, most of the sun’s energywould be radiated from Earth’s surfaceback out to space.
Global Warming
Global warming refers to a recent increase in Earth’s average surface temperature (see Figure 7.32). During thepast century, the temperature has risen by almost 1◦C (about 1.3◦F). That may not seem like much. But considerthat just 10◦C is the difference between an ice-free and an ice-covered Earth.
Most scientists agree that global warming is caused by more carbon dioxide in the atmosphere (see Figure 7.33).This increases the greenhouse effect. There is more carbon dioxide mainly because of the burning of fossil fuels.Destroying forests is another cause. With fewer forests, less carbon dioxide is removed from the atmosphere byphotosynthesis.
Effects of Climate Change
How has global warming affected Earth and its life? Some of its effects include:
348

www.ck12.org Chapter 7. Communities and Populations
FIGURE 7.32The average annual temperature on Earth has been rising for the past 100 years.
FIGURE 7.33This graph shows the recent trend in car-bon dioxide in the atmosphere.
349

7.6. Natural Resources and Climate Change www.ck12.org
• Decline in cold-adapted species such as polar bears.• Melting of glaciers and rising sea levels.• Coastal flooding and shoreline erosion.• Heat-related human health problems.• More droughts and water shortages.• Changing patterns of precipitation.• Increasing severity of storms.• Major crop losses.
These two videos discuss some of the consequences from changes in ecosystems: http://www.youtube.com/watch?v=jHWgWxDWhsA (7:47) and http://www.youtube.com/watch?v=5qblwORXwrg (2:26).
KQED: Climate Watch: California at the Tipping Point
The world’s climate is changing and California is now being affected in both dramatic and subtle ways. In 2008,scientists determined that California’s temperatures increased by more than 2.1◦F during the last century. What’smore, the data showed that human activity has played a significant role in that climate change. "What’s just 2degrees?" you may wonder. But, as the science shows, just 2 degrees is extremely significant.
What does all this temperature change mean? For starters, declining mountain snowpack and prolonged droughtconditions could pose a threat to limited water supplies. Heat waves are projected to be longer, bringing increaseddanger from wildfires and heat-related deaths. Rising sea levels due to temperature shifts jeopardize life in coastalareas, both for human communities and the plants and animals that rely on intertidal and rich wetland ecosystems.Also, more precipitation is expected to fall as rain rather than snow, thereby increasing the risk of floods. And, asheat increases the formation of smog, poor air quality could get even worse.
Climate change may also profoundly affect the economy in California and elsewhere. Shorter ski seasons anddamage to the marine ecosystem mean a reduction in tourism. Water shortages mean issues with the commercial andrecreational fishing industry, and higher temperatures will affect crop growth and quality, weakening the agriculturalindustry, to name just a few of the economic issues associated with climate change.
Get an in-depth look at the science behind climate change in the video below.
MEDIAClick image to the left or use the URL below.URL: https://www.ck12.org/flx/render/embeddedobject/414
KQED: Giant Redwoods and Global Warming
Forest ecologist Steve Sillett is leading a team of scientists as they climb and measure every branch of some of thelast and tallest old growth redwoods in California. Their goal is to learn how these ancient giants have historicallyresponded to climatic shifts and to monitor how they are being impacted today by global warming.
350

www.ck12.org Chapter 7. Communities and Populations
MEDIAClick image to the left or use the URL below.URL: https://www.ck12.org/flx/render/embeddedobject/415
KQED: Acidic Seas
Melting glaciers, rising temperatures and droughts are all impacts of global warming. But how does global warmingactually affect the oceans? The sea, it turns out, absorbs carbon dioxide emissions. The ocean acts like a giantsponge, absorbing carbon dioxide emissions from the air. And as we add more and more carbon dioxide to air byburning fossil fuels, the ocean is absorbing it. On one level, it’s done us a big favor. Scientists say that we would beexperiencing much more extreme climate change were it not for the ocean’s ability to remove the heat-trapping gas.However, these emissions are causing the oceans to become more acidic. Changing pH levels threaten entire marinefood webs, from coral reefs to salmon.
MEDIAClick image to the left or use the URL below.URL: https://www.ck12.org/flx/render/embeddedobject/108466
As carbon dioxide levels increase in the atmosphere, the levels also increase in the oceans. What effects does thishave? Can ocean acidification make it difficult for sea life to produce their hard exoskeletons?
MEDIAClick image to the left or use the URL below.URL: https://www.ck12.org/flx/render/embeddedobject/108467
What Can Be Done?
Efforts to reduce future global warming mainly involve energy use. We need to use less energy, for example, bydriving more fuel-efficient cars. We also need to switch to energy sources that produce less carbon dioxide, such assolar and wind energy. At the same time, we can increase the amount of carbon dioxide that is removed from air.We can stop destroying forests and plant new ones.
KQED: Earth Day
Earth Day Network’s mission is to broaden, diversify and activate the environmental movement worldwide, drivingaction year-round through a combination of education, public policy, and consumer campaigns. See http://www.earthday.org/ for additional information.
351

7.6. Natural Resources and Climate Change www.ck12.org
Each year, April 22 marks the anniversary of what many consider the birth of the modern environmental movementin 1970. The idea came to Earth Day founder Gaylord Nelson, then a U.S. Senator from Wisconsin, after witnessingthe ravages of the 1969 massive oil spill in Santa Barbara, California. On the 22nd of April, 20 million Americanstook to the streets, parks, and auditoriums to demonstrate for a healthy, sustainable environment in massive coast-to-coast rallies. Thousands of colleges and universities organized protests against the deterioration of the environment.Groups that had been fighting against oil spills, polluting factories and power plants, raw sewage, toxic dumps,pesticides, freeways, the loss of wilderness, and the extinction of wildlife suddenly realized they shared commonvalues.
As 1990 approached, a group of environmental leaders organized another big campaign. This time, Earth Day wentglobal, mobilizing 200 million people in 141 countries and lifting environmental issues onto the world stage. EarthDay 1990 gave a huge boost to recycling efforts worldwide and helped pave the way for the 1992 United NationsEarth Summit in Rio de Janeiro.
As the year 2000 approached, 5,000 environmental groups in a record 184 countries reached out to hundreds ofmillions of people. Earth Day 2000 used the Internet to organize activists, but also featured a talking drum chainthat traveled from village to village in Gabon, Africa, and hundreds of thousands of people gathered on the NationalMall in Washington, DC. Earth Day 2000 sent world leaders the loud and clear message that citizens around theworld wanted quick and decisive action on clean energy.
In 2010, the Earth Day Network reestablished Earth Day as a powerful focal point around which people coulddemonstrate their commitment. The Earth Day Network brought 225,000 people to the National Mall for a ClimateRally, amassed 40 million environmental service actions toward its 2012 goal of A Billion Acts of Green, launchedan international, 1-million tree planting initiative with Avatar director James Cameron, and tripled its online baseto over 900,000 members. The fight for a clean environment continues in a climate of increasing urgency, as theravages of climate change become more manifest every day.
See the video below for more information on California’s environmental movement.
MEDIAClick image to the left or use the URL below.URL: https://www.ck12.org/flx/render/embeddedobject/117459
Lesson Summary
• Renewable resources can be replaced by natural processes as quickly as humans use them. Examples includesunlight and wind. Nonrenewable resources exist in fixed amounts. They can be used up. Examples includefossil fuels such as coal.
• Soil and water are renewable resources but may be ruined by careless human actions. Soil can be depleted ofnutrients. It can also be eroded by wind or water. Over-use and pollution of freshwater threaten the limitedsupply that people depend on.
• Air pollution consists of chemical substances and particles released into the air, mainly by human actions.The major cause of outdoor air pollution is the burning of fossil fuels. Indoor air can also be polluted. Airpollution, in turn, causes acid rain, ozone depletion, and global warming.
• Gases such as carbon dioxide from the burning of fossil fuels increase the natural greenhouse effect. This israising the temperature of Earth’s surface, and is called global warming.
352

www.ck12.org Chapter 7. Communities and Populations
Lesson Review Questions
Recall
1. Define natural resource.
2. Distinguish between renewable and nonrenewable resources and give examples.
3. Summarize the environmental effects of burning fossil fuels.
4. How does air pollution contribute to global warming?
Apply Concepts
5. How could you create a three-dimensional model of the greenhouse effect? What processes would you demon-strate with your model? What materials would you use?
6. Apply lesson concepts to explain the relationship between the graphs in Figure 7.32 and Figure 7.33
Think Critically
7. Infer factors that determine whether a natural resource is renewable or nonrenewable.
8. Why would you expect a dead zone to start near the mouth of a river, where the river flows into a body of water?
9. Explain how air pollution is related to acid rain and ozone depletion.
Points to Consider
Microorganisms such as bacteria are important living resources in all ecosystems. They recycle nutrients and othermatter.
• What do you know about microorganisms? Besides bacteria, are there other types of microorganisms?• Are viruses microorganisms? Are they living things?
353

7.7. References www.ck12.org
7.7 References
1. . . CC BY-NC2. Patti Sandoval. http://www.flickr.com/photos/thomson-safaris/8377408989/ . CC BY 2.03. Hana Zavadska. CK-12 Foundation . CC BY-NC 3.04. Crab: Thomas Hubauer; Mantis: Adrian Pingstone; Zebra: Paul Maritz, User:Pharaoh Hound/Wikimedia
Commons, and User:Fir0002/Wikimedia Commons. Crab: http://www.flickr.com/photos/drth80/8754597558/; Mantis: http://en.wikipedia.org/wiki/File:Bristol.zoo.dead.leaf.mantis.arp.jpg; Zebra: http://en.wikipedia.org/wiki/File:Zebra_Botswana_edit02.jpg . Crab: CC BY 2.0; Mantis: Public Domain; Zebra: CC BY 2.5
5. Ground Anole: Flickr:pondhawk; Tree Anole: Jordan Walmsley. Ground Anole: http://www.flickr.com/photos/38686613@N08/4750887836/; Tree Anole: http://www.flickr.com/photos/champofsomething/8658719965/ . CC BY 2.0
6. User:Haplochromis/Wikimedia Commons. http://commons.wikimedia.org/wiki/File:Alpheus_bellulus.JPG .Public Domain
7. Image copyright Carsten Medom Madsen, 2014. http://www.shutterstock.com . Used under license fromShutterstock.com
8. Image copyright E. Glanfield, 2014. http://www.shutterstock.com . Used under license from Shutterstock.com9. Image copyright Pi-Lens, 2014. http://www.shutterstock.com . Used under license from Shutterstock.com
10. Image copyright Birute Vijeikiene, 2014. http://www.shutterstock.com . Used under license from Shutter-stock.com
11. Miles Orchinik. CK-12 Foundation . CC BY-NC 3.012. Image copyright Birute Vijeikiene, 2014. http://www.shutterstock.com . Used under license from Shutter-
stock.com13. CK-12 Foundation. CK-12 Foundation . CC BY-NC 3.014. Hana Zavadska. CK-12 Foundation . CC BY-NC 3.015. Hana Zavadska. CK-12 Foundation . CC BY-NC 3.016. John Liu. http://www.flickr.com/photos/8047705@N02/5572197407/ . CC BY 2.017. Courtesy of US Geological Survey. http://commons.wikimedia.org/wiki/File:Swainson%27s_hawk_migrati
on_route.jpg . Public Domain18. Hana Zavadska. CK-12 Foundation . CC BY-NC 3.019. Hana Zavadska. CK-12 Foundation . CC BY-NC 3.020. User:Charmed88/Wikipedia and User:NikNaks/Wikimedia Commons. http://commons.wikimedia.org/wik
i/File:Stage5.svg . Public Domain21. Hana Zavadska, based on data from US Census Bureau. CK-12 Foundation . CC BY-NC 3.022. US Census Bureau. http://www.census.gov/ipc/www/idb/country.php . Public Domain23. US Census Bureau. http://www.census.gov/ipc/www/idb/country.php . Public Domain24. US Census Bureau. http://www.census.gov/ipc/www/idb/country.php . Public Domain25. US Census Bureau. http://www.census.gov/ipc/www/idb/country.php . Public Domain26. Barbara Akre and Jin Yu, based on data from http://cnx.org/content/m12174/latest/ and http://en.wikipedia.org/wiki/Biodiversity.
CK-12 Foundation . CC BY-NC 3.027. Flower: User:Ulhaspa/Wikimedia Commons; Fish: J Petersen; Car: CK-12 Foundation. Flower: http://c
ommons.wikimedia.org/wiki/File:Rosy_periwinkle.jpg; Fish: http://commons.wikimedia.org/wiki/File:Ostracion_cubicus.JPG . Flower: CC BY 3.0; Fish: CC BY 2.5; Car: CC BY-NC 3.0
28. Snake image courtesy of National Park Service. http://commons.wikimedia.org/wiki/File:Brown_tree_snake_-Boiga_irregularis_2_USGS_Photograph.jpg . Public Domain
29. . . CC BY-NC30. Patrick Finnegan. http://www.flickr.com/photos/vax-o-matic/2621902438/ . CC BY 2.0
354

www.ck12.org Chapter 7. Communities and Populations
31. Left: Courtesy of National Oceanic and Atmospheric Administration; Right: Courtesy of US Departmentof Agriculture. Left: http://commons.wikimedia.org/wiki/File:Dust_Storm_Texas_1935.jpg; Right: http://commons.wikimedia.org/wiki/File:Dust_Bowl_-_Dallas,_South_Dakota_1936.jpg . Public Domain
32. Courtesy of Dr. Jennifer L. Graham, US Geological Survey. http://gallery.usgs.gov/photos/06_30_2010_hLc5FSq11Y_06_30_2010_11#.T767jMV62Sp . Public Domain
33. User:Nipik/Wikimedia Commons. http://commons.wikimedia.org/wiki/File:Acid_rain_woods1.JPG . PublicDomain
34. Courtesy of the US Environmental Protection Agency. http://epa.gov/climatechange/indicators/slideshow.html?placeValuesBeforeTB_=savedValues&TB_iframe=true&height=550&width=800 . Public Domain
35. Courtesy of NASA, modified by Zachary Wilson/CK-12 Foundation. http://commons.wikimedia.org/wiki/File:Temperature_global.gif . Public Domain
36. Steven Lai and Zachary Wilson, based on data from Carbon Dioxide Information Analysis Center (http://cdiac.ornl.gov/ftp/trends/co2/maunaloa.co2).CK-12 Foundation . CC BY-NC 3.0
355

www.ck12.org
CHAPTER 8 Earth’s Energy andResources
Chapter Outline8.1 ENERGY RESOURCES
8.2 OBTAINING ENERGY RESOURCES
8.3 ENERGY CONSERVATION
8.4 RENEWABLE VS. NONRENEWABLE ENERGY RESOURCES
8.5 FOSSIL FUEL FORMATION
8.6 COAL POWER
8.7 PETROLEUM POWER
8.8 NATURAL GAS POWER
8.9 FOSSIL FUEL RESERVES
8.10 NUCLEAR POWER
8.11 SOLAR ENERGY
8.12 HYDROELECTRIC POWER
8.13 WIND ENERGY
8.14 GEOTHERMAL ENERGY
8.15 BIOMASS ENERGY
8.16 MATERIALS HUMANS USE
8.17 FINDING AND MINING ORES
8.18 AVAILABILITY OF NATURAL RESOURCES
8.19 NATURAL RESOURCE CONSERVATION
8.20 REFERENCES
356

www.ck12.org Chapter 8. Earth’s Energy and Resources
Introduction
How important are natural resources to you?
Look around you. Wherever you happen to be and whatever you are doing, you’re using natural resources. Sinceyou’re reading this you’re probably on a screen attached to some sort of computer, which uses metals, plastics thatcome from fossil fuels, and many other materials. The computer is powered by electricity, which may come from anearby coal or nuclear plant or possibly from solar panels on the roof of your house. One thing is certain, modernlife requires lots of natural resources!
357

8.1. Energy Resources www.ck12.org
8.1 Energy Resources
Learning Objectives
• Define energy.• Describe energy’s forms of storage and release.• Explain the law of conservation of energy.
Where does this young basketball player get his energy?
He gets his energy from the Sun. Not directly, of course. He eats food, which used sunlight to grow, or he eatssomething that ate something that used sunlight to grow. When he shoots the ball, some of the energy goes into theball and hopefully the ball goes into the hoop. Two points!
Energy Basics
Energy is the ability to do work or produce change. Every living thing needs energy to perform its daily functionsand even more energy to grow. Plants get energy from the “food” they make by photosynthesis, and animals getenergy directly or indirectly from that food. People also use energy for many things, such as cooking food, keepingice cream cold in the freezer, heating a house, constructing a skyscraper, or lighting their homes. Because billions ofpeople all around the world use energy, there is a huge need for energy resources. Energy conservation is somethingeveryone can do now to help reduce the strain on energy resources.
358

www.ck12.org Chapter 8. Earth’s Energy and Resources
Conservation of Energy
The law of conservation of energy says that energy cannot be created or destroyed. This means that even thoughenergy changes form, the total amount of energy always stays the same. How does energy get converted from onetype to another when you kick a soccer ball? When your body breaks down the food you eat, it stores the energyfrom the food as chemical energy. But some of this stored energy has to be released to make your leg muscles move.The chemical energy is converted to another form of energy called kinetic energy. Kinetic energy is the energy ofanything in motion. Your muscles move your leg, your foot kicks the ball, and the ball gains kinetic energy from thekick. So you can think of the action of kicking the ball as a story of energy changing forms.
Potential energy is energy that is stored. Potential energy has the potential to do work or the potential to be convertedinto other forms of energy. If a ball is sitting on the very edge at the top of the hill, it is not moving, but it has a lotof potential energy.
Fuel
If you read a book beneath a lit lamp, that lamp has energy from electricity. The energy to make the electricity comesfrom fuel. Fuel has energy that it releases. A fuel is any material that can release energy in a chemical change.
What are some examples of fuel, and what are they used for?
1. Food is fuel for your body.2. Sunlight is the energy plants need to make food by photosynthesis.3. Gasoline is fuel for cars.4. Hydrogen is fuel for the Sun.
For a fuel to be useful, its energy must be released in a way that can be controlled. Controlling the release of energymakes it possible for the energy to be used to do work.
Heat
When fuel is used for its energy, it is usually burned, and most of the energy is released as heat (Figure 8.1). Theheat may then be used to do work. Think of a person striking a match to set some small twigs on fire. After thetwigs burn for a while, they get hot enough to make some larger sticks burn. The fire keeps getting hotter, and soonit is hot enough to burn whole logs. Pretty soon the fire is roaring, and a pot of water placed on the fire starts to boil.Some of the liquid water evaporates.
What is the source of energy for boiling and evaporating the water? Although some chemical energy from the matchwas put into starting the fire, the heat to boil and evaporate the water comes from the energy that was stored in thewood. The wood is the fuel for the fire.
MEDIAClick image to the left or use the URL below.URL: https://www.ck12.org/flx/render/embeddedobject/186718
359

8.1. Energy Resources www.ck12.org
FIGURE 8.1A controlled fire.
Summary
• Energy is the ability to do work. Energy cannot be created or destroyed; it can only change form.• Fuel stores energy that can be released during use.• Heat is the motion of atoms due to the use of energy.
Review
1. Give an example of how the law of conservation of energy works.2. Compare and contrast chemical energy, kinetic energy, and potential energy.3. Think about a candle flame and a bathtub full of hot water. Which has the highest temperature and which has
the highest heat? What’s the difference?
Explore More
Use this resource to answer the questions that follow.
MEDIAClick image to the left or use the URL below.URL: https://www.ck12.org/flx/render/embeddedobject/178342
1. How can the energy of a weight at the top of a pulley be transferred into heat in a tub of water? List the typesof energy involved.
2. What is true about energy in a closed system?3. What are the two things that energy can become in a closed system?4. Where is the energy to drive a car stored and what type is it? What type of energy does that become?
360

www.ck12.org Chapter 8. Earth’s Energy and Resources
Resources
MEDIAClick image to the left or use the URL below.URL: https://www.ck12.org/flx/render/embeddedobject/178340
361

8.2. Obtaining Energy Resources www.ck12.org
8.2 Obtaining Energy Resources
Learning Objectives
• Describe how useable energy from an energy source is obtained and measured.
Have you converted to compact fluorescent light bulbs at your house?
Compact fluorescent light bulbs are more efficient than incandescent light bulbs. Look at the chart and try to seehow much more efficient. The answer is that they could be as much as six times more efficient. So why aren’t allpeople using compact fluorescent bulbs all the time? Early ones were large and expensive, and many people don’tlike the color of the light. But they are much more environmentally friendly.
Net Energy
Net energy is the amount of useable energy available from a resource after subtracting the amount of energy neededto make the energy from that resource available. For example, every 5 barrels of oil that are made available for userequire 1 barrel for extracting and refining the petroleum. What is the net energy from this process? About 4 barrels(5 barrels minus 1 barrel).
What happens if the energy needed to extract and refine oil increases? Why might that happen? The energy costof an energy resource increases when the easy deposits of that resource have already been consumed. For example,if all the nearshore petroleum in a region has been extracted, more costly drilling must take place further offshore(Figure 8.2). If the energy cost of obtaining energy increases, the resource will be used even faster.
362

www.ck12.org Chapter 8. Earth’s Energy and Resources
FIGURE 8.2Offshore drilling is taking place in deeper water than before. It takes a lotof energy to build a deep drilling platform and to run it.
Net-Energy Ratio
The net-energy ratio demonstrates the difference between the amount of energy available in a resource and theamount of energy used to get it. If it takes 8 units of energy to make available 10 units of energy, then the net-energyratio is 10/8 or 1.25. What does a net-energy ratio larger than 1 mean? What if the net-energy ratio is less than 1?A net-energy ratio larger than 1 means that there is a net gain in usable energy; a net-energy ratio smaller than onemeans there is an overall energy loss.
Table 8.1 shows the net-energy ratios for some common energy sources.
TABLE 8.1: Net-Energy Ratios for Common Energy Sources
Energy Source Net-energy RatioSolar Energy 5.8Natural Gas 4.9Petroleum 4.5Coal-fired Electricity 2.5-5.1
Notice from the table that solar energy yields much more net energy than other sources. This is because it takes verylittle energy to get usable solar energy. Sunshine is abundant and does not need to be found, extracted, or transportedvery far. The range for coal-fired electricity is because of the differing costs of transporting the coal. What does thissuggest about using coal to generate electricity? The efficiency is greater in areas where the coal is locally minedand does not have to be transported great distances (Figure 8.3).
FIGURE 8.3Obtaining coal for energy takes a lot of energy. The coal must be located,extracted, refined, and transported.
This is not to say that solar energy is less expensive than other types of energy. The cost of energy is dependent onlots of different factors, such as the cost of the equipment needed to harness the energy. If solar power cost less touse, it would be more widespread.
Energy Efficiency
Energy efficiency describes how much useful work is extracted from one unit of energy. Remember that althoughenergy is not created or destroyed, it’s just transferred from one form to another, some energy is nearly always lostin the transfer as heat. By saying that the work must be useful, it is possible to account for the energy that is lostto non-useful work. For example, some energy may not be doing useful work if the equipment is not running well(maybe a piston is moving sideways a bit rather than just up and down).
Higher energy efficiency is desirable because:
363

8.2. Obtaining Energy Resources www.ck12.org
• Less energy is being wasted.• Non-renewable resources will last longer.• The cost is kept lower.
Because so much of the energy we use is from fossil fuels, we need to be especially concerned about using themefficiently. Sometimes our choices affect energy efficiency. For example, transportation by cars and airplanes is lessenergy-efficient than transportation by boats and trains.
Summary
• Net energy is the amount of that is actually useable from an energy resource. Net-energy ratio is the ratio ofthe amount of useable energy from a resource and the amount it takes to make that energy useful.
• Many factors besides net-energy ratio go into determining if a type of energy will be used.• An energy source with high energy efficiency provides a lot of work for the amount of energy used.
Review
1. Compare and contrast net energy, the net-energy ratio, and energy efficiency.2. Since the net-energy ratio for solar energy is higher than other types of energy, why don’t we use solar for
electricity almost exclusively?3. Why would the energy needed to make a type of energy useful increase or decrease? In other words, why
would the net-energy ratio change?
Explore More
Use this resource to answer the questions that follow.
MEDIAClick image to the left or use the URL below.URL: https://www.ck12.org/flx/render/embeddedobject/114939
1. Besides energy, what is lost when energy drips away?2. Why should you replace incandescent bulbs with CFLS?3. Why is it good to plug electronics into a power strip?4. Why should you use a programmable thermostat?5. What is the purpose of insulation?6. Why is an old appliance an energy sink?7. If you did these things, how much money would you save in a decade on average (in Minnesota)?
364

www.ck12.org Chapter 8. Earth’s Energy and Resources
8.3 Energy Conservation
Learning Objectives
• Describe forms of energy conservation.• Explain why energy conservation is important
How much energy can you save?
By turning off the lights, keeping rooms at a reasonable temperature in summer and winter, driving a fuel-efficientcar or taking the bus, and many other things, society can save a lot of energy. By saving energy we reduce thefinancial and environmental costs of collecting that energy, and the pollution and greenhouse gases that come fromusing that energy. In all, it’s a win-win situation!
Energy Conservation
What benefits are there from energy conservation? Conserving energy means that less energy is needed, whichreduces costs, ensures that non-renewable energy sources will last longer, and reduces political and environmentalimpacts.
What are the two ways that energy can be conserved? (1) Use less energy, and (2) use energy more efficiently.
The pie chart (Figure 8.4) shows how energy is used in the United States.
Table 8.2 shows some ways that people can decrease energy use and use energy more efficiently in transportation,residences, industries, and office settings.
365

8.3. Energy Conservation www.ck12.org
FIGURE 8.4Almost one-half of the energy used inthe United States is for transportation andhome use. This means individual choicescan make a big impact on energy conser-vation.
TABLE 8.2: Ways to Use Energy More Efficiently
Where Energy is Used How We Can Use Less Energy How We Can Use Energy More Ef-ficiently
Transportation Ride a bike or walk instead of tak-ing a car.Reduce the number of trips youmake.Use public transportation.
Increase fuel efficiency in cars.Buy and drive smaller cars.Build cars from lighter and strongermaterials.Drive at speeds at or below 90 kilo-meters per hour (55 miles per hour).
Residential Turn off lights when not in a room.Only run appliances when neces-sary.Unplug appliances when not in use.Wear a sweater instead of turningup heat.Use fans instead of turning down airconditioner.Engage in activities that do not in-volve electronics.Rely on sunlight instead of artificiallight.
Replace old appliances with newermore efficient models.Insulate your home.Make sure windows and doors arewell sealed.Use LED bulbs if available, or com-pact fluorescent light bulbs (anddispose of properly!).
Industrial Recycle materials like soda cansand steel.Reduce use of plastic, paper, andmetal materials.
Practice conservation in factories.Reuse materials.Design equipment to be more effi-cient.
366

www.ck12.org Chapter 8. Earth’s Energy and Resources
TABLE 8.2: (continued)
Where Energy is Used How We Can Use Less Energy How We Can Use Energy More Ef-ficiently
Commercial (businesses, shoppingareas, etc.)
Turn off appliances and equipmentwhen not in use.
Use fluorescent lighting.Set thermostats to automaticallyturn off heat or air conditioningwhen buildings are closed.
Using less energy, or using energy more efficiently, will help conserve our energy resources. Since many of theenergy resources we depend upon are non-renewable, we need to make sure that we waste them as little as possible.
MEDIAClick image to the left or use the URL below.URL: https://www.ck12.org/flx/render/embeddedobject/186730
Summary
• Conserving energy is is cleaner and cheaper than finding new energy.• To conserve energy, use less energy and be more efficient about the energy you use.• There are many ways to conserve energy in your own life, such as walking or taking the bus, wearing a sweater
instead of turning up the heat, etc.
Review
1. Why is conservation the best way to stretch our energy resources?2. List some ways that society can conserve energy.3. List some ways that you and the other members of your household can conserve energy.
Explore More
Use this resource to answer the questions that follow.
MEDIAClick image to the left or use the URL below.URL: https://www.ck12.org/flx/render/embeddedobject/1556
367

8.3. Energy Conservation www.ck12.org
1. What will the population be in 2030?2. How much will our energy demands increase by 2030? How much will that elevate global carbon dioxide
emissions if this demand is met by fossil fuels?3. What is the single most important source of future energy?4. What is energy efficiency?5. How can industries optimize their energy efficiency?6. What can be done to make vehicles more efficient?7. How can we make our homes more energy efficient?8. How effective can using energy efficiently be?
368

www.ck12.org Chapter 8. Earth’s Energy and Resources
8.4 Renewable vs. Nonrenewable EnergyResources
Learning Objectives
• Define renewable resource and non-renewable resource.• Compare and contrast renewable and non-renewable resources.• Identify renewable and non-renewable resources.
What is the source of nearly all of Earth’s energy?
The source of nearly all energy on Earth is our star, the Sun. Solar energy feeds almost all life on Earth, is trapped infossil fuels, and is the reason wind blows and water flows. Earth’s other big source of energy is the planet’s internalheat.
Types of Energy Resources
Energy resources are either renewable or non-renewable. Non-renewable resources are used faster than they canbe replaced, so the supply available to society is limited. Renewable resources will not run out because they arereplaced as quickly as they are used (see example in Figure 8.5). Can you think of some renewable and non-renewable energy sources?
369
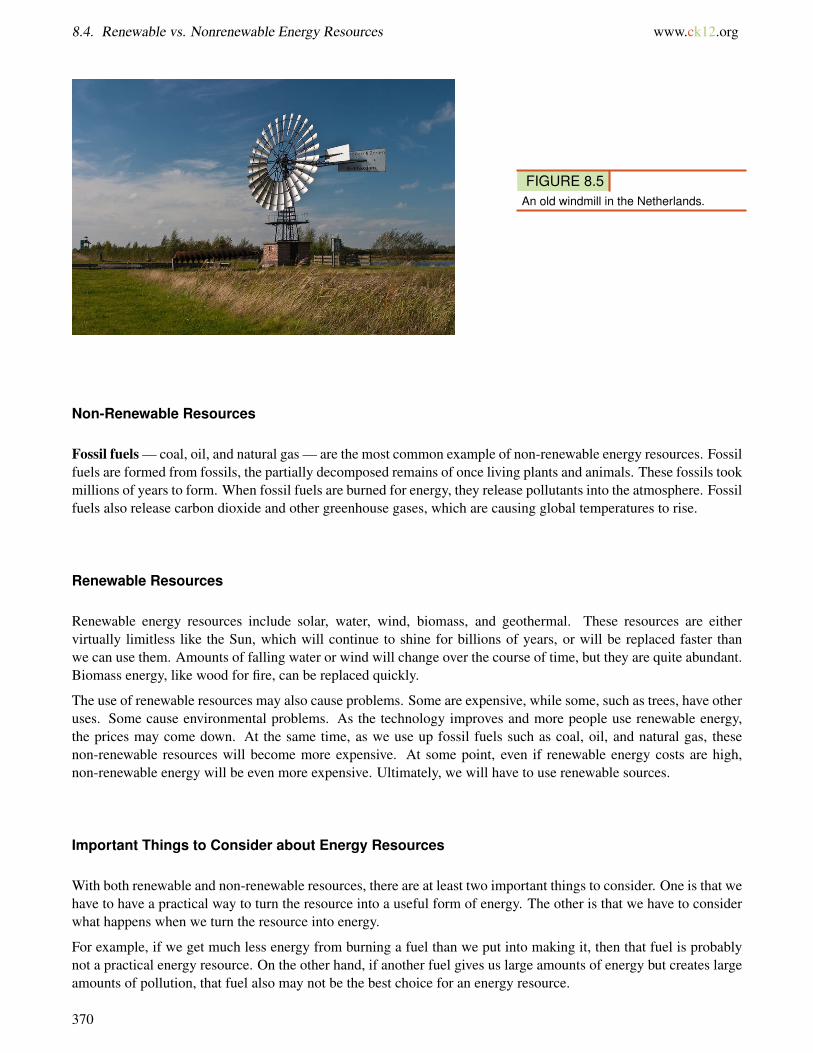
8.4. Renewable vs. Nonrenewable Energy Resources www.ck12.org
FIGURE 8.5An old windmill in the Netherlands.
Non-Renewable Resources
Fossil fuels — coal, oil, and natural gas — are the most common example of non-renewable energy resources. Fossilfuels are formed from fossils, the partially decomposed remains of once living plants and animals. These fossils tookmillions of years to form. When fossil fuels are burned for energy, they release pollutants into the atmosphere. Fossilfuels also release carbon dioxide and other greenhouse gases, which are causing global temperatures to rise.
Renewable Resources
Renewable energy resources include solar, water, wind, biomass, and geothermal. These resources are eithervirtually limitless like the Sun, which will continue to shine for billions of years, or will be replaced faster thanwe can use them. Amounts of falling water or wind will change over the course of time, but they are quite abundant.Biomass energy, like wood for fire, can be replaced quickly.
The use of renewable resources may also cause problems. Some are expensive, while some, such as trees, have otheruses. Some cause environmental problems. As the technology improves and more people use renewable energy,the prices may come down. At the same time, as we use up fossil fuels such as coal, oil, and natural gas, thesenon-renewable resources will become more expensive. At some point, even if renewable energy costs are high,non-renewable energy will be even more expensive. Ultimately, we will have to use renewable sources.
Important Things to Consider about Energy Resources
With both renewable and non-renewable resources, there are at least two important things to consider. One is that wehave to have a practical way to turn the resource into a useful form of energy. The other is that we have to considerwhat happens when we turn the resource into energy.
For example, if we get much less energy from burning a fuel than we put into making it, then that fuel is probablynot a practical energy resource. On the other hand, if another fuel gives us large amounts of energy but creates largeamounts of pollution, that fuel also may not be the best choice for an energy resource.
370

www.ck12.org Chapter 8. Earth’s Energy and Resources
Electrical Grids
No matter what the source, once it is generated electricity has go move from place to place. It does so by an electricalgrid. Many communities have electrical grids that were built decades ago. These grids are inefficient and have highfailure rates.
The electrical grids of the future are likely to be smart grids. Smart grids start with electricity production fromone or more power generation sources. The electricity is streamed through multiple networks out to millions ofconsumers. Smart meters are placed with the consumers. They supply information on the state of the electricalsystem. Operators know within minutes if the power goes out, rather than having to wait for phone calls fromconsumers. Smart meters measure consumption and assist consumers in using power when it is more economical,even turning on or off appliances in homes or workplaces to smooth demand. Smart grids are essential for integratingrenewable energy sources, such as solar and wind, into the network because they have highs and lows in their supply.
Today we rely on electricity more than ever, but the resources that currently supply our power are finite. The raceis on to harness more renewable resources, but getting all that clean energy from production sites to homes andbusinesses is proving to be a major challenge.
MEDIAClick image to the left or use the URL below.URL: https://www.ck12.org/flx/render/embeddedobject/116510
Summary
• Non-renewable resources are used faster than they can be replaced. Once they’re gone, they are, for allpractical purposes, gone. Renewable resources are so abundant or are replaced so rapidly that, for all practicalpurposes, they can’t run out.
• Fossil fuels are the most commonly used non-renewable resources. Renewable resources include solar, wind,hydro, and (possibly) biomass.
• A resource may take so much energy to harness that it doesn’t provide much net energy.
Review
1. What does it mean that a form of energy might take more energy to harness than it provides?2. Are renewable resources always renewable, or can they become non-renewable?3. Why aren’t renewable resources used for everything that we use energy for?
Explore More
Use this resource to answer the questions that follow.
371

8.4. Renewable vs. Nonrenewable Energy Resources www.ck12.org
MEDIAClick image to the left or use the URL below.URL: https://www.ck12.org/flx/render/embeddedobject/178344
1. What is renewable energy?2. Which energy resources are renewable and why?3. Which energy resources are non-renewable and why?
372

www.ck12.org Chapter 8. Earth’s Energy and Resources
8.5 Fossil Fuel Formation
Learning Objectives
• Describe the formation of fossil fuels.
What exactly powers a car?
There was an old ad suggesting that you put a tiger in your tank was referring to the strength and speed of these wildcats. But it might also have been referring to the use of organic material to power an engine. When your tank is fullof gas, it doesn’t have a tiger in it, but it does have ancient plants, plankton, and other formerly living creatures.
Formation of Fossil Fuels
Can you name some fossils? How about dinosaur bones or dinosaur footprints? Animal skeletons, teeth, shells,coprolites (otherwise known as feces), or any other remains or traces from a living creature that becomes rock is afossil.
The same processes that formed these fossils also created some of our most important energy resources, fossil fuels.Coal, oil, and natural gas are fossil fuels. Fossil fuels come from living matter starting about 500 million years ago.Millions of years ago, plants used energy from the Sun to form sugars, carbohydrates, and other energy-rich carboncompounds. As plants and animals died, their remains settled on the ground on land and in swamps, lakes, and seas(Figure 8.6).
373

8.5. Fossil Fuel Formation www.ck12.org
FIGURE 8.6This wetland may look something like anancient coal-forming swamp.
Over time, layer upon layer of these remains accumulated. Eventually, the layers were buried so deeply that theywere crushed by an enormous mass of earth. The weight of this earth pressing down on these plant and animalremains created intense heat and pressure. After millions of years of heat and pressure, the material in these layersturned into chemicals called hydrocarbons (Figure 8.7).
FIGURE 8.7Hydrocarbons are made of carbon and hydrogen atoms. This moleculewith one carbon and four hydrogen atoms is methane.
Hydrocarbons can be solid, liquid, or gaseous. The solid form is what we know as coal. The liquid form is petroleum,or crude oil. Natural gas is the gaseous form.
The solar energy stored in fossil fuels is a rich source of energy. Although fossil fuels provide very high qualityenergy, they are non-renewable.
MEDIAClick image to the left or use the URL below.URL: https://www.ck12.org/flx/render/embeddedobject/186736
374

www.ck12.org Chapter 8. Earth’s Energy and Resources
Summary
• Hydrocarbons are molecules made of one carbon and four hydrogen atoms.• Ancient living organisms are buried quickly and altered by intense heat and pressure to form fossil fuels.• Fossil fuels include solid coal, liquid petroleum, and liquid natural gas.
Review
1. Why are coal, petroleum, and natural gas called fossil fuels?2. How do fossil fuels form?3. What is the actual source of energy in a fossil fuel?
Explore More
Use this resource to answer the questions that follow.
MEDIAClick image to the left or use the URL below.URL: https://www.ck12.org/flx/render/embeddedobject/178346
1. What are fossil fuels made from?2. How long has it taken for these fuels to form?3. What do these fuels contain that we need?4. What are most of the plants that create fossil fuels and where do they live?5. What happens next?6. How does this turn into fossil fuel? What happens to the energy?7. How are different fossil fuels created?8. What makes coal? Oil? Natural gas?9. Why are fossil fuels non-renewable?
10. What is the problem with fossil fuels?
375

8.6. Coal Power www.ck12.org
8.6 Coal Power
Learning Objectives
• Explain how coal forms and is used.• Describe the environmental consequences of burning coal.
What was the foundation of the Industrial Revolution?
The Industrial Revolution was the change in society that resulted from people learning to use fossil fuels. Byharnessing fossil fuels, work could be done more rapidly and more cheaply, allowing people to manufacture goodscheaply and efficiently.
Coal
Coal, a solid fossil fuel formed from the partially decomposed remains of ancient forests, is burned primarily toproduce electricity. Coal use is undergoing enormous growth as the availability of oil and natural gas decreases and
376

www.ck12.org Chapter 8. Earth’s Energy and Resources
cost increases. This increase in coal use is happening particularly in developing nations, such as China, where coalis cheap and plentiful.
Coal is black or brownish-black. The most common form of coal is bituminous, a sedimentary rock that containsimpurities such as sulfur (Figure 8.8). Anthracite coal has been metamorphosed and is nearly all carbon. For thisreason, anthracite coal burns more cleanly than bituminous coal.
FIGURE 8.8Bituminous coal is a sedimentary rock.
Coal Formation
Coal forms from dead plants that settled at the bottom of ancient swamps. Lush coal swamps were common inthe tropics during the Carboniferous period, which took place more than 300 million years ago (Figure 8.9). Theclimate was warmer then.
Mud and other dead plants buried the organic material in the swamp, and burial kept oxygen away. When plantsare buried without oxygen, the organic material can be preserved or fossilized. Sand and clay settling on top ofthe decaying plants squeezed out the water and other substances. Millions of years later, what remains is a carbon-containing rock that we know as coal.
Coal Use
Around the world, coal is the largest source of energy for electricity. The United States is rich in coal (Figure 8.10).California once had a number of small coal mines, but the state no longer produces coal. To turn coal into electricity,the rock is crushed into powder, which is then burned in a furnace that has a boiler. Like other fuels, coal releasesits energy as heat when it burns. Heat from the burning coal boils the water in the boiler to make steam. The steamspins turbines, which turn generators to create electricity. In this way, the energy stored in the coal is converted touseful energy like electricity.
377

8.6. Coal Power www.ck12.org
FIGURE 8.9The location of the continents during the Carboniferous period. Notice that quite a lot of land area is in the regionof the tropics.
Consequences of Coal Use
For coal to be used as an energy source, it must first be mined. Coal mining occurs at the surface or undergroundby methods that are described in the the chapter Materials of Earth’s Crust (Figure 8.11). Mining, especiallyunderground mining, can be dangerous. In April 2010, 29 miners were killed at a West Virginia coal mine when gasthat had accumulated in the mine tunnels exploded and started a fire.
Coal mining exposes minerals and rocks from underground to air and water at the surface. Many of these mineralscontain the element sulfur, which mixes with air and water to make sulfuric acid, a highly corrosive chemical. If thesulfuric acid gets into streams, it can kill fish, plants, and animals that live in or near the water.
MEDIAClick image to the left or use the URL below.URL: https://www.ck12.org/flx/render/embeddedobject/186738
378

www.ck12.org Chapter 8. Earth’s Energy and Resources
FIGURE 8.10United States coal-producing regions in 1996. Orange is highest grade anthracite; red is low volatile bituminous;gray and gray-green is medium to high-volatile bituminous; green is subbituminous; and yellow is the lowest gradelignite.
Summary
• Coal is solid fossil fuels formed primarily from ancient swamp plants, especially during the Carboniferous.• Coal is the source of most electricity.• Coal mining may bring dangerous materials into the air and coal burning is sometimes quite dirty.
Review
1. How does coal form?2. There are swamps today. Why is coal not a renewable resource?3. What are some of the environmental consequences of coal use?
Explore More
Use this resource (watch up to 6:17) to answer the questions that follow.
379

8.6. Coal Power www.ck12.org
FIGURE 8.11The coal used in power plants must be mined. One method to mine coal is by mountaintop removal.
MEDIAClick image to the left or use the URL below.URL: https://www.ck12.org/flx/render/embeddedobject/178348
1. What environment is best for coal formation?2. Although the implication is that coal formed due to the Cretaceous-Tertiary extinction, most coal formed
before that. What do the plants that become coal undergo in the swamp?3. How does this organic material become coal?4. How does brown coal turn into usable bituminous and higher grade coal?5. What is the gas exchange done by plants? What is the gas exchange done by coal burning?6. Ultimately where does the energy in coal come from?
380

www.ck12.org Chapter 8. Earth’s Energy and Resources
8.7 Petroleum Power
Learning Objectives
• Explain how petroleum forms and is used.• Describe the environmental consequences of petroleum use.
What is the connection between ancient organisms and the Indy 500?
Many forms of fun and transportation are made possible by liquid petroleum. Petroleum is the result of ancientplankton or plants dying in a sea.
381

8.7. Petroleum Power www.ck12.org
Oil
Oil is a liquid fossil fuel that is extremely useful because it can be transported easily and can be used in cars andother vehicles. Oil is currently the single largest source of energy in the world.
Oil Formation
Oil from the ground is called crude oil, which is a mixture of many different hydrocarbons. Crude oil is a thick darkbrown or black liquid hydrocarbon. Oil also forms from buried dead organisms, but these are tiny organisms thatlive on the sea surface and then sink to the seafloor when they die. The dead organisms are kept away from oxygenby layers of other dead creatures and sediments. As the layers pile up, heat and pressure increase. Over millions ofyears, the dead organisms turn into liquid oil.
Oil Production
In order to be collected, the oil must be located between a porous rock layer and an impermeable layer (Figure 8.12).Trapped above the porous rock layer and beneath the impermeable layer, the oil will remain between these layersuntil it is extracted from the rock.
FIGURE 8.12Oil (red) is found in the porous rock layer(yellow) and trapped by the impermeablelayer (brown). The folded structure hasallowed the oil to pool so a well can bedrilled into the reservoir.
To separate the different types of hydrocarbons in crude oil for different uses, the crude oil must be refined inrefineries like the one shown in Figure 8.13. Refining is possible because each hydrocarbon in crude oil boils at adifferent temperature. When the oil is boiled in the refinery, separate equipment collects the different compounds.
Oil Use
Most of the compounds that come out of the refining process are fuels, such as gasoline, diesel, and heating oil.Because these fuels are rich sources of energy and can be easily transported, oil provides about 90% of the energyused for transportation around the world. The rest of the compounds from crude oil are used for waxes, plastics,fertilizers, and other products.
Gasoline is in a convenient form for use in cars and other transportation vehicles. In a car engine, the burned gasolinemostly turns into carbon dioxide and water vapor. The fuel releases most of its energy as heat, which causes thegases to expand. This creates enough force to move the pistons inside the engine and to power the car.
382

www.ck12.org Chapter 8. Earth’s Energy and Resources
FIGURE 8.13Refineries like this one separate crude oilinto many useful fuels and other chemi-cals.
MEDIAClick image to the left or use the URL below.URL: https://www.ck12.org/flx/render/embeddedobject/186742
Consequences of Oil Use
The United States does produce oil, but the amount produced is only about one-quarter as much as the nation uses.The United States has only about 1.5% of the world’s proven oil reserves, so most of the oil used by Americans mustbe imported from other nations.
The main oil-producing regions in the United States are the Gulf of Mexico, Texas, Alaska, and California (Figure8.14).
As in every type of mining, mining for oil has environmental consequences. Oil rigs are unsightly (Figure 8.15),and spills are too common (Figure 8.16).
MEDIAClick image to the left or use the URL below.URL: https://www.ck12.org/flx/render/embeddedobject/186740
383

8.7. Petroleum Power www.ck12.org
FIGURE 8.14Offshore well locations in the Gulf of Mex-ico. Note that some wells are located invery deep water.
FIGURE 8.15Drill rigs at the San Ardo Oil Field in Monterey, California.
Summary
• Liquid fossil fuels include petroleum, which is useful for vehicles because it is easily stored and transported.• Petroleum is also extremely important for materials like waxes, plastics, fertilizers, and other products.• Extracting petroleum from the ground and transporting it can be damaging to the environment.
384

www.ck12.org Chapter 8. Earth’s Energy and Resources
FIGURE 8.16A deadly explosion on an oil rig in the Gulfof Mexico in April 2010 led to a massiveoil spill. When this picture was taken inJuly 2010, oil was still spewing into theGulf. The long-term consequences of thespill are being studied and are as yetunknown.
Review
1. Why is it harder to find a substitute for petroleum than it is for coal? Think about what these fuels are usedfor.
2. Why are there more likely to be hazardous consequences for deep oil drilling than for the shallow drillingthat’s been taking place for centuries?
3. How does crude oil form?
Explore More
Use this resource to answer the questions that follow.
MEDIAClick image to the left or use the URL below.URL: https://www.ck12.org/flx/render/embeddedobject/178350
1. What is petroleum?2. What is a barrel of crude oil used for?3. Where do you find petroleum and natural gas?4. How does crude oil form?5. What is needed for us to be able to get oil from a formation?6. How is the oil extracted?7. How is oil refined?
385

8.8. Natural Gas Power www.ck12.org
8.8 Natural Gas Power
Learning Objectives
• Explain how natural gas forms and is used.• Describe the consequences of natural gas extraction.
What caused the recent earthquakes in Ohio and Oklahoma?
The process of extracting natural gas, known as fracking, injects liquid waste into deep wells. Coincidentally,locations where seismic activity is virtually unknown have begun to experience earthquakes. Is fracking related toearthquake activity? Many geologists think the link is undeniable.
Natural Gas
Natural gas, often known simply as gas, is composed mostly of the hydrocarbon methane. The amount of naturalgas being extracted and used in the Untied States is increasing rapidly.
386
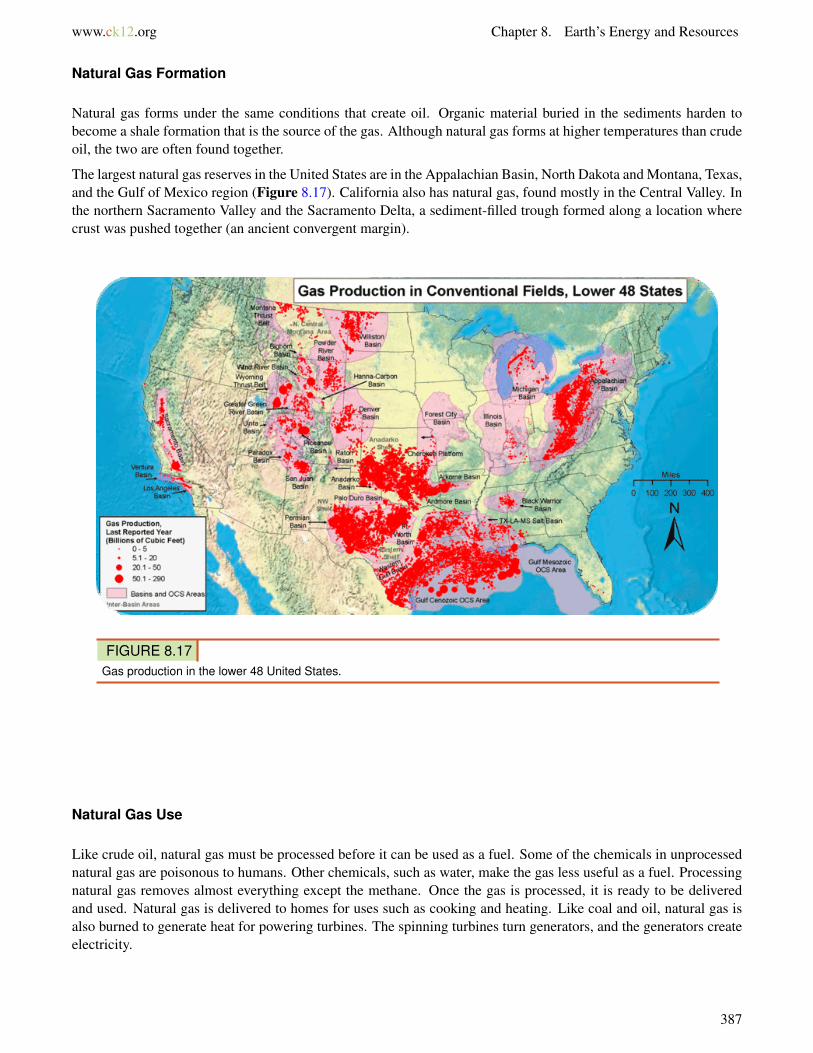
www.ck12.org Chapter 8. Earth’s Energy and Resources
Natural Gas Formation
Natural gas forms under the same conditions that create oil. Organic material buried in the sediments harden tobecome a shale formation that is the source of the gas. Although natural gas forms at higher temperatures than crudeoil, the two are often found together.
The largest natural gas reserves in the United States are in the Appalachian Basin, North Dakota and Montana, Texas,and the Gulf of Mexico region (Figure 8.17). California also has natural gas, found mostly in the Central Valley. Inthe northern Sacramento Valley and the Sacramento Delta, a sediment-filled trough formed along a location wherecrust was pushed together (an ancient convergent margin).
FIGURE 8.17Gas production in the lower 48 United States.
Natural Gas Use
Like crude oil, natural gas must be processed before it can be used as a fuel. Some of the chemicals in unprocessednatural gas are poisonous to humans. Other chemicals, such as water, make the gas less useful as a fuel. Processingnatural gas removes almost everything except the methane. Once the gas is processed, it is ready to be deliveredand used. Natural gas is delivered to homes for uses such as cooking and heating. Like coal and oil, natural gas isalso burned to generate heat for powering turbines. The spinning turbines turn generators, and the generators createelectricity.
387

8.8. Natural Gas Power www.ck12.org
MEDIAClick image to the left or use the URL below.URL: https://www.ck12.org/flx/render/embeddedobject/186746
Consequences of Natural Gas Use
Natural gas burns much cleaner than other fossil fuels, meaning that it causes less air pollution. Natural gas alsoproduces less carbon dioxide than other fossil fuels do for the same amount of energy, so its global warming effectsare less (Figure 8.18).
FIGURE 8.18A natural gas drill rig in Texas.
Unfortunately, drilling for natural gas can be environmentally destructive. One technique used is hydraulic fractur-ing, also called fracking, which increases the rate of recovery of natural gas. Fluids are pumped through a boreholeto create fractures in the reservoir rock that contains the natural gas. Material is added to the fluid to prevent thefractures from closing. The damage comes primarily from chemicals in the fracturing fluids. Chemicals that havebeen found in the fluids may be carcinogens (cancer-causing), radioactive materials, or endocrine disruptors, whichinterrupt hormones in the bodies of humans and animals. The fluids may get into groundwater or may runoff intostreams and other surface waters. As noted above, fracking may cause earthquakes.
MEDIAClick image to the left or use the URL below.URL: https://www.ck12.org/flx/render/embeddedobject/186744
388

www.ck12.org Chapter 8. Earth’s Energy and Resources
Summary
• Natural gas forms with crude oil but at higher temperatures.• Natural gas burns more cleanly than petroleum and produces fewer greenhouse gases.• Hydraulic fracturing, known as fracking, is a relatively new method for extracting natural gas, which may be
linked to groundwater contamination and the generation of small earthquakes in non-seismic regions.
Review
1. You’ll be hearing a lot about fracking in the coming years. What is it and how does it work?2. How is natural gas different from crude oil and how does it form differently?3. Why is natural gas considered more environmentally sound than other fossil fuels?
Explore More
Use this resource to answer the questions that follow.
MEDIAClick image to the left or use the URL below.URL: https://www.ck12.org/flx/render/embeddedobject/178352
1. What does hydraulic fracturing do and how long has it been happening?2. How is a fracking well drilled?3. According to the video, why is groundwater not adversely affected.4. What happens in the shale unit?5. What all is in fracturing fluid?6. What does the fracturing fluid do?7. How long will a fracking well last?8. What are the advantages to fracking?
389
8.9. Fossil Fuel Reserves www.ck12.org
8.9 Fossil Fuel Reserves
Learning Objectives
• Describe the limitations of traditional and alternative fossil fuels.
How much is left?
The answer to that question depends on what we as a society are willing to do to get fossil fuels. How much arewe willing to damage the environment to extract and transport fossil fuels? How much are we willing to raiseatmospheric greenhouse gas levels and further alter climate? The Keystone Pipeline would bring crude oil from tarsands to the U.S., but for the time being, that project is on hold.
Fossil Fuel Reserves
Fossil fuels provide about 85% of the world’s energy at this time. Worldwide fossil fuel usage has increased manytimes over in the past half century (coal - 2.6x, oil - 8x, natural gas - 14x) because of population increases, becauseof increases in the number of cars, televisions, and other fuel-consuming uses in the developed world, and becauseof lifestyle improvements in the developing world.
The amount of fossil fuels that remain untapped is unknown, but can likely be measured in decades for oil andnatural gas and in a few centuries for coal (Figure 8.19).
Alternative Fossil Fuels
As the easy-to-reach fossil fuel sources are depleted, alternative sources of fossil fuels are increasingly beingexploited (Figure 8.20). These include oil shale and tar sands. Oil shale is rock that contains dispersed oil thathas not collected in reservoirs. To extract the oil from the shale requires enormous amounts of hot water. Tar sandsare rocky materials mixed with very thick oil. The tar is too thick to pump and so tar sands are strip-mined. Hotwater and caustic soda are used to separate the oil from the rock.
The environmental consequences of mining these fuels, and of fossil fuel use in general, along with the fact thatthese fuels do not have a limitless supply, are prompting the development of alternative energy sources in someregions.
390

www.ck12.org Chapter 8. Earth’s Energy and Resources
FIGURE 8.19Worldwide oil reserves.
FIGURE 8.20A satellite image of an oil-sands mine inCanada.
MEDIAClick image to the left or use the URL below.URL: https://www.ck12.org/flx/render/embeddedobject/186752
391

8.9. Fossil Fuel Reserves www.ck12.org
MEDIAClick image to the left or use the URL below.URL: https://www.ck12.org/flx/render/embeddedobject/186756
Summary
• Easy to get at fossil fuels are running out, but there are other sources that are harder to get at that are stillavailable.
• Oil shales and tar sands are two of the alternative sources of fossil fuels that are much in the news.• The need for fossil fuels continues to grow as people in the developed work use more and more people in the
developing world want them.
Review
1. What are oil shales and tar sands?2. What do you think goes into calculations that try to determine how much fossil fuel energy is left? Why is
this difficult to calculate?3. Why is the need for fossil fuels increasing?
Explore More
Use this resource to answer the questions that follow.
MEDIAClick image to the left or use the URL below.URL: https://www.ck12.org/flx/render/embeddedobject/178354
1. Why is oil so great?2. How long did it take for nature to make oil? How long did it take us to use the best of it?3. What is peak oil?4. What happened to world crude oil production? What were the consequences of that?5. What does fracking do to this situation?6. What is old and what is new? What is the effect of the new thing?7. What is needed for fracking?8. How does the economy respond to high oil prices?9. What is inevitable? What should we do to prepare?
392

www.ck12.org Chapter 8. Earth’s Energy and Resources
8.10 Nuclear Power
Learning Objectives
• Explain how nuclear energy is harnessed and used, and describe its consequences.
What does an atomic bomb have to do with energy generation?
Splitting atoms releases enormous amounts of energy. To be useful rather than destructive, nuclear power plantsmust be safeguarded, but this attempt is not always successful.
Nuclear Energy
When the nucleus of an atom is split, it releases a huge amount of energy called nuclear energy. For nuclear energyto be used as a power source, scientists and engineers have learned to split nuclei and to control the release of energy(Figure 8.21).
Nuclear Energy Use
Nuclear power plants, such as the one seen in Figure 8.22, use uranium, which is mined, processed, and thenconcentrated into fuel rods. When the uranium atoms in the fuel rods are hit by other extremely tiny particles, theysplit apart. The number of tiny particles allowed to hit the fuel rods needs to be controlled, or they would cause a
393

8.10. Nuclear Power www.ck12.org
FIGURE 8.21When struck by a tiny particle, Uranium-235 breaks apart and releasesenergy.
dangerous explosion. The energy from a nuclear power plant heats water, which creates steam and causes a turbineto spin. The spinning turbine turns a generator, which in turn produces electricity.
FIGURE 8.22Nuclear power plants like this one provideFrance with almost 80% of its electricity.
Many countries around the world use nuclear energy as a source of electricity. In the United States, a little less than20% of electricity comes from nuclear energy.
Consequences of Nuclear Power
Nuclear power is clean. It does not pollute the air. However, the use of nuclear energy does create other environ-mental problems. Uranium must be mined (Figure 8.23). The process of splitting atoms creates radioactive waste,which remains dangerous for thousands or hundreds of thousands of years. As yet, there is no long-term solution forstoring this waste.
The development of nuclear power plants has been on hold for three decades. Accidents at Three Mile Island andChernobyl, Ukraine verified people’s worst fears about the dangers of harnessing nuclear power (Figure 8.24).
394

www.ck12.org Chapter 8. Earth’s Energy and Resources
FIGURE 8.23Uranium mine in Kakadu National Park,Australia.
FIGURE 8.24Damaged building near the site of theChernobyl disaster.
Recently, nuclear power appeared to be making a comeback as society looked for alternatives to fossil fuels. Afterall, nuclear power emits no pollutants, including no greenhouse gases. But the 2011 disaster at the FukushimaDaiichi Nuclear Power Plant in Japan may have resulted in a new fear of nuclear power. The cause of the disasterwas a 9.0 magnitude earthquake and subsequent tsunami, which compromised the plant. Although a total meltdownwas averted, the plant experienced multiple partial meltdowns, core breaches, radiation releases, and cooling failures.The plant is scheduled for a complete cold shutdown before the end of 2011.
Nuclear power is a controversial subject in California and most other places. Nuclear power has no pollutantsincluding carbon emissions, but power plants are not always safe and the long-term disposal of wastes is a problemthat has not yet been solved. The future of nuclear power is murky.
Summary
• Nuclear energy is released when the nucleus of an atom is split.• Nuclear power plants use uranium in fuel rods, which later become nuclear waste. Nuclear waste can be
dangerous for hundreds of thousands of years.
395

8.10. Nuclear Power www.ck12.org
• Periodic accidents involving nuclear power plants seem to slow down the development of nuclear power inmany countries.
Review
1. How is nuclear energy generated?2. Since the waste from nuclear power plants is dangerous for up to hundreds of thousands of years, how do you
think it should be safeguarded?3. Do you think that the nuclear disaster in Japan in 2011 should affect how nations develop or choose not to
develop their nuclear resources? What about nations that are not near a subduction zone?
Explore More
Use this resource to answer the questions that follow.
MEDIAClick image to the left or use the URL below.URL: https://www.ck12.org/flx/render/embeddedobject/178357
1. What is nuclear power?2. What are the two most common nuclear fuels? Where do these materials come from?3. What are some of the pros of getting energy from nuclear power?4. What one major con of getting energy from nuclear power?5. When does contamination occur?6. What are the three examples of nuclear disasters?7. What is another problem with nuclear reactors?8. How does the price of nuclear power compare with other nonrenewable sources? Why?
Resources
MEDIAClick image to the left or use the URL below.URL: https://www.ck12.org/flx/render/embeddedobject/186762
396

www.ck12.org Chapter 8. Earth’s Energy and Resources
MEDIAClick image to the left or use the URL below.URL: https://www.ck12.org/flx/render/embeddedobject/186764
397
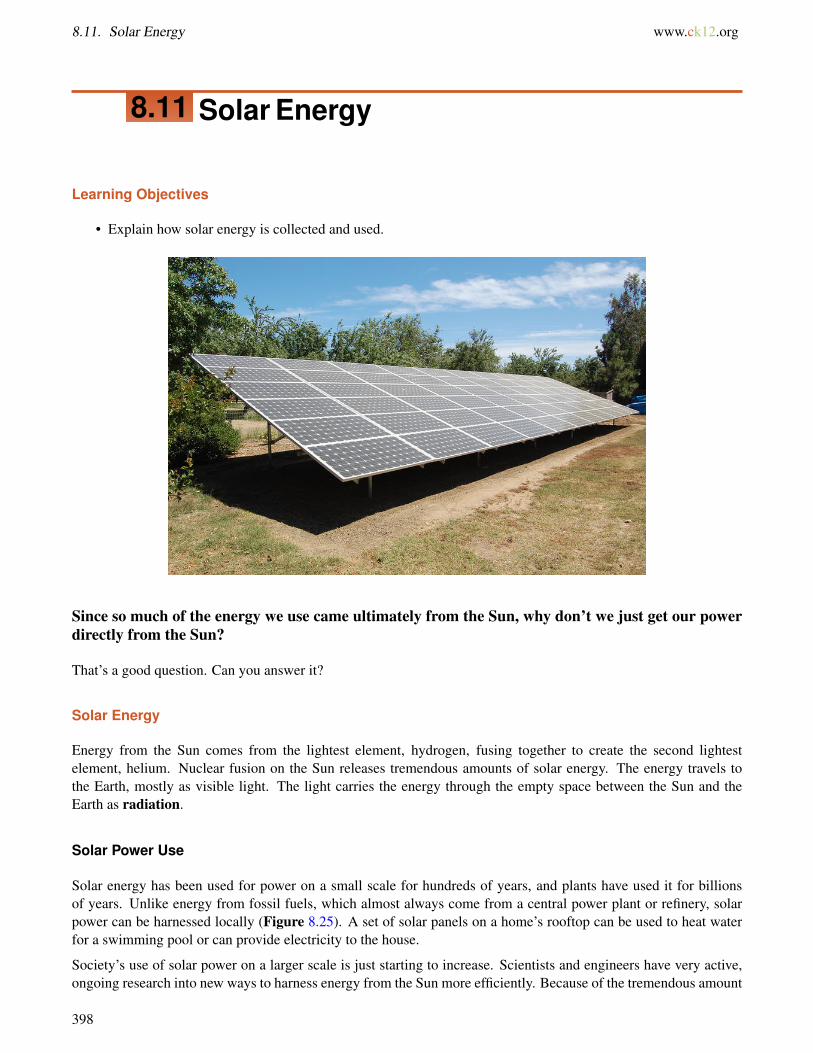
8.11. Solar Energy www.ck12.org
8.11 Solar Energy
Learning Objectives
• Explain how solar energy is collected and used.
Since so much of the energy we use came ultimately from the Sun, why don’t we just get our powerdirectly from the Sun?
That’s a good question. Can you answer it?
Solar Energy
Energy from the Sun comes from the lightest element, hydrogen, fusing together to create the second lightestelement, helium. Nuclear fusion on the Sun releases tremendous amounts of solar energy. The energy travels tothe Earth, mostly as visible light. The light carries the energy through the empty space between the Sun and theEarth as radiation.
Solar Power Use
Solar energy has been used for power on a small scale for hundreds of years, and plants have used it for billionsof years. Unlike energy from fossil fuels, which almost always come from a central power plant or refinery, solarpower can be harnessed locally (Figure 8.25). A set of solar panels on a home’s rooftop can be used to heat waterfor a swimming pool or can provide electricity to the house.
Society’s use of solar power on a larger scale is just starting to increase. Scientists and engineers have very active,ongoing research into new ways to harness energy from the Sun more efficiently. Because of the tremendous amount
398

www.ck12.org Chapter 8. Earth’s Energy and Resources
FIGURE 8.25Solar panels supply power to the Interna-tional Space Station.
of incoming sunlight, solar power is being developed in the United States in southeastern California, Nevada, andArizona.
Solar power plants turn sunlight into electricity using a large group of mirrors to focus sunlight on one place, called areceiver (Figure 8.26). A liquid, such as oil or water, flows through this receiver and is heated to a high temperatureby the focused sunlight. The heated liquid transfers its heat to a nearby object that is at a lower temperature througha process called conduction. The energy conducted by the heated liquid is used to make electricity.
FIGURE 8.26This solar power plant uses mirrors to focus sunlight on the tower in the center. The sunlight heats a liquid insidethe tower to a very high temperature, producing energy to make electricity.
399

8.11. Solar Energy www.ck12.org
Consequences of Solar Power Use
Solar energy has many benefits. It is extremely abundant, widespread, and will never run out. But there are problemswith the widespread use of solar power.
• Sunlight must be present. Solar power is not useful in locations that are often cloudy or dark. However,storage technology is being developed.
• The technology needed for solar power is still expensive. An increase in interested customers will provideincentive for companies to research and develop new technologies and to figure out how to mass-produceexisting technologies (Figure 8.27).
• Solar panels require a lot of space. Fortunately, solar panels can be placed on any rooftop to supply at leastsome of the power required for a home or business.
FIGURE 8.27This experimental car is one example ofthe many uses that engineers have foundfor solar energy.
MEDIAClick image to the left or use the URL below.URL: https://www.ck12.org/flx/render/embeddedobject/186810
MEDIAClick image to the left or use the URL below.URL: https://www.ck12.org/flx/render/embeddedobject/186812
400

www.ck12.org Chapter 8. Earth’s Energy and Resources
Summary
• Solar energy is the result of nuclear fusion in our nearest star.• A liquid is heated and moves that energy by conduction.• Solar power is expensive, but as demand increases technology improves and costs decrease.
Review
1. How is solar power collected on a large scale?2. What are some of the downsides of depending on solar energy?3. What are some of the positive sides of using solar energy?
Explore More
Use this resource to answer the questions that follow.
MEDIAClick image to the left or use the URL below.URL: https://www.ck12.org/flx/render/embeddedobject/178359
1. How effective could solar energy be as a power source?2. How are fossil fuels solar power? How are wind and hydroelectric power sources from the sun?3. What do we use to collect solar energy?4. How do photovoltaic panel work?5. What is one of the advantages of solar power over power that is generated at large plants?6. What is the advantage of using mirrors to concentrate solar energy?7. What is the expensive part of photovoltaics? What is the expensive part of concentrated solar power?8. How do you get the best of both those technologies?9. What could we do to keep solar power working at night? What’s the problem with this?
10. Rather than discounting solar power because it is expensive, what is another way to look at this?
401

8.12. Hydroelectric Power www.ck12.org
8.12 Hydroelectric Power
Learning Objectives
• Explain how energy from falling water is harnessed for hydroelectric power.• Describe the consequences of hydroelectric power use.
Did the idea for the first dam come from beavers?
Beavers have been building dams for a long time, for food, for a home, and for protection from predators. Theyprobably haven’t realized that they can use a dam for hydroelectric power, although are we sure there aren’t littleTVs in those lodges?
Water Power
Water covers 70% of the planet’s surface, and water power (hydroelectric power) is the most widely used form ofrenewable energy in the world. Hydroelectric power from streams provides almost one fifth of the world’s electricity.
Hydroelectric Power
Remember that potential energy is the energy of an object waiting to fall. Water held behind a dam has a lot ofpotential energy.
402

www.ck12.org Chapter 8. Earth’s Energy and Resources
In a hydroelectric plant, a dam across a riverbed holds a stream to create a reservoir. Instead of flowing down itsnormal channel, the water is allowed to flow into a large turbine. As the water moves, it has kinetic energy, whichmakes the turbine spin. The turbine is connected to a generator, which makes electricity (Figure 8.28).
FIGURE 8.28A cross-section of a hydroelectric plant.
Most of the streams in the United States and elsewhere in the developed world that are suitable for hydroelectricpower have already been dammed. In California, about 14.5% of the total electricity comes from hydropower. Thestate’s nearly 400 hydropower plants are mostly located in the eastern mountain ranges, where large streams descenddown a steep grade.
MEDIAClick image to the left or use the URL below.URL: https://www.ck12.org/flx/render/embeddedobject/186817
Consequences of Water Power Use
The major benefit of hydropower is that it generates power without releasing any pollution. Hydropower is also arenewable resource since the stream will keep on flowing. However, there are a limited number of suitable damsites. Hydropower also has environmental problems. When a large dam disrupts a river’s flow, it changes theecosystem upstream. As the land is flooded by rising water, plants and animals are displaced or killed. Manybeautiful landscapes, villages, and archeological sites have been drowned by the water in a reservoir (Figure 8.29).
The dam and turbines also change the downstream environment for fish and other living things. Dams slow therelease of silt so that downstream deltas retreat and seaside cities become dangerously exposed to storms and risingsea levels.
403

8.12. Hydroelectric Power www.ck12.org
FIGURE 8.29Glen Canyon Dam in Arizona createdLake Powell. The dam was controversialbecause it flooded Glen Canyon, a beau-tiful desert canyon.
Ocean Water Power
The energy of waves and tides can be used to produce water power. Tidal power stations may need to close off anarrow bay or estuary. Wave power applications have to be able to withstand coastal storms and the corrosion ofseawater. Because of the many problems with them, tide and wave power plants are not very common.
Although not yet widely used, many believe tidal power has more potential than wind or solar power for meetingalternative energy needs. Quest radio looks at plans for harnessing power from the sea by San Francisco and alongthe northern California coast.
MEDIAClick image to the left or use the URL below.URL: https://www.ck12.org/flx/render/embeddedobject/186815
Summary
• Hydroelectric power is clean and is important in many regions of the world.• Hydropower has downsides like the changes dams make to a river’s ecosystem.• Hydropower utilizes the energy of falling water.
Review
1. How does energy transition from one form to another as water moves from behind a dam to downstream of adam?
2. Describe how hydroelectric energy is harnessed.3. What are some of the downsides of using hydroelectric power?
404

www.ck12.org Chapter 8. Earth’s Energy and Resources
Explore More
Use this resource to answer the questions that follow.
MEDIAClick image to the left or use the URL below.URL: https://www.ck12.org/flx/render/embeddedobject/178361
1. How does a hydropower facility generate electricity?2. How much of the energy in the US is generated by hydropowr?3. What makes hydropower renewable?4. How does an impoundment generate electricity?5. How does a diversion generate electricity?6. What is pumped storage hydropower?7. What is new in hydropower technology?
405

8.13. Wind Energy www.ck12.org
8.13 Wind Energy
Learning Objectives
• Explain how wind energy is harnessed and used, and describe its consequences.
What does "NIMBY" stand for?
Not in my backyard. As much as any type of power source, wind power pits people who are concerned about theenvironment against, well, people who are concerned about the environment. Some people want the benefits of cleanwind power but don’t want the turbines in their vicinity.
Wind Energy
Energy from the Sun also creates wind, which can be used as wind power. The Sun heats different locations on Earthby different amounts. Air that becomes warm rises and then sucks cooler air into that spot. The movement of airfrom one spot to another along the ground creates wind. Since wind is moving, it has kinetic energy.
Wind power is the fastest growing renewable energy source in the world. Windmills are now seen in many locations,either individually or, more commonly, in large fields.
Wind Power Use
Wind is the source of energy for wind power. Wind has been used for power for centuries. For example, windmillswere used to grind grain and pump water. Sailing ships traveled by wind power long before ships were powered by
406

www.ck12.org Chapter 8. Earth’s Energy and Resources
fossil fuels. Wind can be used to generate electricity, as the moving air spins a turbine to create electricity (Figure8.30).
FIGURE 8.30Wind turbines like the ones shown hereturn wind into electricity without creatingpollution.
MEDIAClick image to the left or use the URL below.URL: https://www.ck12.org/flx/render/embeddedobject/186820
Consequences of Wind Power
Wind power has many advantages. It does not burn, so it does not release pollution or carbon dioxide. Also, wind isplentiful in many places. Wind, however, does not blow all of the time, even though power is needed all of the time.Just as with solar power, engineers are working on technologies that can store wind power for later use.
Windmills are expensive and wear out quickly. A lot of windmills are needed to power a region, so nearby residentsmay complain about the loss of a nice view if a wind farm is built. Coastlines typically receive a lot of wind, butwind farms built near beaches may cause unhappiness for local residents and tourists.
The Cape Wind project off of Cape Cod, Massachusetts has been approved but is generating much controversy.Opponents are in favor of green power but not at that location. Proponents say that clean energy is needed and theproject would supply 75% of the electricity needed for Cape Cod and nearby islands (Figure 8.31).
California was an early adopter of wind power. Windmills are found in mountain passes, where the cooler PacificOcean air is sucked through on its way to warmer inland valleys. Large fields of windmills can be seen at AltamontPass in the eastern San Francisco Bay Area, San Gorgonio Pass east of Los Angeles, and Tehachapi Pass at thesouthern end of the San Joaquin Valley.
407

8.13. Wind Energy www.ck12.org
FIGURE 8.31Cape Wind off of Cape Cod in Massachusetts receives a great deal of wind (red color) but is also popular withtourists for its beauty.
Summary
• Wind contains energy, which can move a turbine and generate electricity.• Wind power is clean and does not release greenhouse gases, but some people complain about the spread of
windmills across certain locations.• Wind has been used as a local energy source for centuries and is now being scaled up for use regionally.
Review
1. Describe what causes wind and how wind energy can be harnessed.2. What are some of the downsides of using wind power?3. Why do you think that wind is the fastest growing non-renewable energy source?
408

www.ck12.org Chapter 8. Earth’s Energy and Resources
Explore More
Use this resource to answer the questions that follow.
MEDIAClick image to the left or use the URL below.URL: https://www.ck12.org/flx/render/embeddedobject/178363
1. Think about what you know about local winds. Why would a desert near tall mountains be a good place forwind turbines?
2. How does a wind turbine capture energy?3. Why are turbines high in the sky?4. Are all wind farms on land?
Resources
MEDIAClick image to the left or use the URL below.URL: https://www.ck12.org/flx/render/embeddedobject/186818
409

8.14. Geothermal Energy www.ck12.org
8.14 Geothermal Energy
Learning Objectives
• Explain how geothermal energy is harnessed and used.
How could geothermal energy be used just about anywhere?
Geothermal energy comes from heat deep below the surface of the Earth. That heat may come to the surface naturallyor it may be available through drilling. Nothing must be done to the geothermal energy. It is a resource that can beused without processing.
Geothermal Energy
The heat that is used for geothermal power may come to the surface naturally as hot springs or geysers, like TheGeysers in northern California. Where water does not naturally come to the surface, engineers may pump cool water
410

www.ck12.org Chapter 8. Earth’s Energy and Resources
into the ground. The water is heated by the hot rock and then pumped back to the surface for use. The hot water orsteam from a geothermal well spins a turbine to make electricity.
Geothermal energy is clean and safe. The energy source is renewable since hot rock is found everywhere in theEarth, although in many parts of the world the hot rock is not close enough to the surface for building geothermalpower plants. In some areas, geothermal power is common (Figure 8.32).
FIGURE 8.32A geothermal energy plant in Iceland. Ice-land gets about one fourth of its electricityfrom geothermal sources.
In the United States, California is a leader in producing geothermal energy. The largest geothermal power plant inthe state is in the Geysers Geothermal Resource Area in Napa and Sonoma Counties. The source of heat is thoughtto be a large magma chamber lying beneath the area.
Where Earth’s internal heat gets close to the surface, geothermal power is a clean source of energy. In California,The Geysers supplies energy for many nearby homes and businesses.
MEDIAClick image to the left or use the URL below.URL: https://www.ck12.org/flx/render/embeddedobject/116511
MEDIAClick image to the left or use the URL below.URL: https://www.ck12.org/flx/render/embeddedobject/186823
Summary
• Most geothermal energy being used now is in regions where hot material comes to the surface.
411

8.14. Geothermal Energy www.ck12.org
• Hot rocks are everywhere below Earth’s surface so geothermal energy could be used anywhere with drilling.• Geothermal energy is clean and does not release greenhouse gases.
Review
1. How is geothermal energy harnessed?2. How would it be possible for a geothermal plant to gather energy if the hot material was not located at the
surface?3. Why is geothermal energy becoming more popular?
Explore More
Use this resource to answer the questions that follow.
MEDIAClick image to the left or use the URL below.URL: https://www.ck12.org/flx/render/embeddedobject/178365
1. How does geothermal energy work?2. Where were geothermal plans in the past?3. How does dry steam geothermal work?4. How does a flash steam power plant work?
412

www.ck12.org Chapter 8. Earth’s Energy and Resources
8.15 Biomass Energy
Learning Objectives
• Explain how biomass energy is harnessed and used, and describe its consequences.
Why is algae better than corn for biofuel?
Algae is a better alternative for producing biofuel than traditional crops because crops could be used for other things,like feeding people.
413

8.15. Biomass Energy www.ck12.org
Biomass
Biomass is the material that comes from plants and animals that were recently living. Biomass can be burned directly,such as setting fire to wood. For as long as humans have had fire, people have used biomass for heating and cooking.People can also process biomass to make fuel, called biofuel. Biofuel can be created from crops, such as corn oralgae, and processed for use in a car (Figure 8.33). The advantage to biofuels is that they burn more cleanly thanfossil fuels. As a result, they create less pollution and less carbon dioxide.
FIGURE 8.33Biofuels, such as ethanol, are added togasoline to cut down the amount of fossilfuels that are used.
Organic material, like almond shells, can be made into electricity. Biomass power is a great use of wastes and ismore reliable than other renewable energy sources, but harvesting biomass energy uses energy and biomass plantsproduce pollutants including greenhouse gases.
Cow manure can have a second life as a source of methane gas, which can be converted to electricity. Not only thatfood scraps can also be converted into green energy.
Food that is tossed out produces methane, a potent greenhouse gas. But that methane from leftovers can be harnessedand used as fuel. Sounds like a win-win situation.
Consequences of Biomass Use
In many instances, the amount of energy, fertilizer, and land needed to produce the crops used make biofuels meanthat they often produce very little more energy than they consume. The fertilizers and pesticides used to grow thecrops run off and become damaging pollutants in nearby water bodies or in the oceans.
To generate biomass energy, break down the cell walls of plants to release the sugars and then ferment those sugarsto create fuel. Corn is a very inefficient source; scientists are looking for much better sources of biomass energy.
Algae Biofuels
Research is being done into alternative crops for biofuels. A very promising alternative is algae. Growing algaerequires much less land and energy than crops. Algae can be grown in locations that are not used for other things,like in desert areas where other crops are not often grown. Algae can be fed agricultural and other waste so valuable
414

www.ck12.org Chapter 8. Earth’s Energy and Resources
resources are not used. Much research is being done to bring these alternative fuels to market. Many groups areresearching the use of algae for fuel.
Many people think that the best source of biomass energy for the future is algae. Compared to corn, algae is not afood crop, it can grow in many places, it’s much easier to convert to a usable fuel, and it’s carbon neutral.
Summary
• Biofuels are useful because they are liquid and can go into a gas tank unlike many other types of alternativeenergy.
• Algae is the focus of much research because it is a very promising alternative to traditional crops for biofuels.• Biofuels have been used for as long as people have been burning wood for warmth or to cook their food.
Review
1. What are the advantages of algae over other sources of biofuels?2. Why are some crops, like corn, not necessarily a good source of biofuels?3. How can an energy source produce very little energy more than the energy it takes to produce it?
Explore More
Use this resource to answer the questions that follow.
MEDIAClick image to the left or use the URL below.URL: https://www.ck12.org/flx/render/embeddedobject/178367
1. What is used to create biomass fuels?2. Why do biofuels have an advantage?3. Besides fuel, what can biomass be used to create?4. How can biofuels reduce the amount of petroleum we use without entirely replacing it?5. How are biofuels created?6. How does biochemical refining work?7. How does thermochemical refining work?8. What happens if you add oxygen to the process - thermochemical gasification?9. Why are biofuels favorable?
415

8.16. Materials Humans Use www.ck12.org
8.16 Materials Humans Use
Learning Objectives
• Identify resources commonly consumed by human uses.
What resources are in those electronics?
Everyone may realize that we use resources like trees, copper, water, and gemstones, but how many of us realize thetremendous variety of elements we need to make a single electronic device? A tablet computer with a touch screencontains many common chemical elements and a variety of rare earth elements.
Common Materials We Use From The Earth
People depend on natural resources for just about everything that keeps us fed and sheltered, as well as for the thingsthat keep us entertained. Every person in the United States uses about 20,000 kilograms (40,000 pounds) of mineralsevery year for a wide range of products, such as cell phones, TVs, jewelry, and cars. Table 8.3 shows some commonobjects, the materials they are made from, and whether they are renewable or non-renewable.
TABLE 8.3: Common Objects We Use From the Earth
Common Object Natural Resources Used Are These Resources Renewable orNon-Renewable?
Cars 15 different metals, such as iron,lead, and chromium to make thebody.
Non-renewable
416

www.ck12.org Chapter 8. Earth’s Energy and Resources
TABLE 8.3: (continued)
Common Object Natural Resources Used Are These Resources Renewable orNon-Renewable?
Jewelry Precious metals like gold, silver,and platinum.Gems like diamonds, rubies, emer-alds, turquoise.
Non-renewable
Electronic Appliances (TV’s, com-puters, DVD players, cell phones,etc.)
Many different metals, like copper,mercury, gold.
Non-renewable
Clothing Soil to grow fibers such as cotton.Sunlight for the plants to grow.Animals for fur and leather.
Renewable
Food Soil to grow plants.Wildlife and agricultural animals.
Renewable
Bottled Water Water from streams or springs.Petroleum products to make plasticbottles.
Non-renewable and Renewable
Gasoline Petroleum drilled from wells. Non-renewableHousehold Electricity Coal, natural gas, solar power, wind
power, hydroelectric power.Non-renewable and Renewable
Paper Trees; Sunlight Soil. RenewableHouses Trees for timber.
Rocks and minerals for construc-tion materials, for example, granite,gravel, sand.
Non-renewable and Renewable
MEDIAClick image to the left or use the URL below.URL: https://www.ck12.org/flx/render/embeddedobject/186827
MEDIAClick image to the left or use the URL below.URL: https://www.ck12.org/flx/render/embeddedobject/186829
417

8.16. Materials Humans Use www.ck12.org
Summary
• Many objects, such as a car, contain many types of resources.• Resources may be renewable or non-renewable, and an object may contain some of each.• Rare earth elements and other unusual materials are used in some electronic devices.
Review
1. What resources are important to you that are renewable? Non-renewable?2. What resources do you use that you could use less or not use at all?3. How might one of these resources go from being renewable to non-renewable?
Explore More
Use this resource to answer the questions that follow.
MEDIAClick image to the left or use the URL below.URL: https://www.ck12.org/flx/render/embeddedobject/171334
1. What do we use neodymium for?2. What are rare earth elements used for in general?3. Where do we get our REEs? Why are there signs that this can’t continue?4. Can we develop alternatives?5. What is the problem with the deposit of REEs that is offshore of Japan?6. What is the danger for the future?
418

www.ck12.org Chapter 8. Earth’s Energy and Resources
8.17 Finding and Mining Ores
Learning Objectives
• Describe how ore deposits are located, mined, and refined to become useful materials.
Why is the football team in San Francisco named the 49ers?
Football team names sometimes reflect the history of a region. The San Francisco 49ers are a reference to theCalifornia Gold Rush, when immigrants from around the United States came to what would become The GoldenState to mine placer deposits. What that has to do with football is anyone’s guess!
Ore Deposits
Some minerals are very useful. An ore is a rock that contains minerals with useful elements. Aluminum in bauxiteore (Figure 8.34) is extracted from the ground and refined to be used in aluminum foil and many other products.The cost of creating a product from a mineral depends on how abundant the mineral is and how much the extractionand refining processes cost. Environmental damage from these processes is often not figured into a product’s cost.It is important to use mineral resources wisely.
419

8.17. Finding and Mining Ores www.ck12.org
FIGURE 8.34Aluminum is made from the aluminum-bearing minerals in bauxite.
Finding and Mining Minerals
Geologic processes create and concentrate minerals that are valuable natural resources. Geologists study geologicalformations and then test the physical and chemical properties of soil and rocks to locate possible ores and determinetheir size and concentration.
A mineral deposit will only be mined if it is profitable. A concentration of minerals is only called an ore deposit ifit is profitable to mine. There are many ways to mine ores.
Surface Mining
Surface mining allows extraction of ores that are close to Earth’s surface. Overlying rock is blasted and the rockthat contains the valuable minerals is placed in a truck and taken to a refinery. As pictured in Figure 8.35, surfacemining includes open-pit mining and mountaintop removal. Other methods of surface mining include strip mining,placer mining, and dredging. Strip mining is like open pit mining but with material removed along a strip.
Placers are valuable minerals found in stream gravels. California’s nickname, the Golden State, can be traced backto the discovery of placer deposits of gold in 1848. The gold weathered out of hard metamorphic rock in the westernSierra Nevada, which also contains deposits of copper, lead, zinc, silver, chromite, and other valuable minerals. Thegold traveled down rivers and then settled in gravel deposits. Currently, California has active mines for gold andsilver and for non-metal minerals such as sand and gravel, which are used for construction.
Underground Mining
Underground mining is used to recover ores that are deeper into Earth’s surface. Miners blast and tunnel into rockto gain access to the ores. How underground mining is approached — from above, below, or sideways — dependson the placement of the ore body, its depth, the concentration of ore, and the strength of the surrounding rock.
Underground mining is very expensive and dangerous. Fresh air and lights must also be brought into the tunnels forthe miners, and accidents are far too common.
420

www.ck12.org Chapter 8. Earth’s Energy and Resources
FIGURE 8.35These different forms of surface mining are methods of extracting ores close to Earth’s surface.
FIGURE 8.36Underground mine.
Ore Extraction
The ore’s journey to becoming a useable material is only just beginning when the ore leaves the mine (Figure8.37). Rocks are crushed so that the valuable minerals can be separated from the waste rock. Then the minerals areseparated out of the ore. A few methods for extracting ore are:
• heap leaching: the addition of chemicals, such as cyanide or acid, to remove ore.• flotation: the addition of a compound that attaches to the valuable mineral and floats.• smelting: roasting rock, causing it to segregate into layers so the mineral can be extracted.
421

8.17. Finding and Mining Ores www.ck12.org
FIGURE 8.37Enormous trucks haul rock containing orefrom a mine site to where the rock isprocessed.
To extract the metal from the ore, the rock is melted at a temperature greater than 900oC, which requires a lot ofenergy. Extracting metal from rock is so energy-intensive that if you recycle just 40 aluminum cans, you will savethe energy equivalent of one gallon of gasoline.
FIGURE 8.38A steel mill.
Summary
• An ore deposit must be profitable to mine by definition. If it is no longer profitable, it is no longer an oredeposit.
• Surface mines are created for mineral deposits that are near the surface; underground mines are blasted intorock to get at deeper deposits.
• Ore is extracted from rock by heap leaching, flotation or smelting.
422

www.ck12.org Chapter 8. Earth’s Energy and Resources
Review
1. What sorts of changes can transform a deposit that is an ore into a deposit that is not an ore?2. Why is the production of the metal to create your aluminum soda can energy-intensive?3. How is ore taken from a rock and made into a metal like a copper wire?4. Why should you recycle your aluminum cans?
423

8.18. Availability of Natural Resources www.ck12.org
8.18 Availability of Natural Resources
Learning Objectives
• Explain how factors such as abundance, price, and politics influence the availability and cost of resources.
What is electronic waste?
We obtain resources of developing nations. We also dump waste on these nations. Many of our electronic wastes,which we think are being recycled, end up in developing countries. These are known as electronic waste or e-waste.People pick through the wastes looking for valuable materials that they can sell, but this exposes them to many toxiccompounds that are hazardous to them and the environment.
Resource Availability
Supply
From the table in the concept "Materials Humans Use," you can see that many of the resources we depend on arenon-renewable. Non-renewable resources vary in their availability; some are very abundant and others are rare.Materials, such as gravel or sand, are technically non-renewable, but they are so abundant that running out is noissue. Some resources are truly limited in quantity: when they are gone, they are gone, and something must be foundthat will replace them. There are even resources, such as diamonds and rubies, that are valuable in part because theyare so rare.
424

www.ck12.org Chapter 8. Earth’s Energy and Resources
Price
Besides abundance, a resource’s value is determined by how easy it is to locate and extract. If a resource is difficultto use, it will not be used until the price for that resource becomes so great that it is worth paying for. For example,the oceans are filled with an abundant supply of water, but desalination is costly, so it is used only where water isreally limited (Figure 8.39). As the cost of desalination plants comes down, more will likely be built.
FIGURE 8.39Tampa Bay, Florida, has one of the fewdesalination plants in the United States.
Politics
Politics is also part of determining resource availability and cost. Nations that have a desired resource in abundancewill often export that resource to other countries, while countries that need that resource must import it from oneof the countries that produces it. This situation is a potential source of economic and political trouble.
Of course the greatest example of this is oil. Twelve countries have approximately 80% of all of the world’s oil(Figure 8.40). However, the biggest users of oil, the United States, China, and Japan, are all located outside thisoil-rich region. This leads to a situation in which the availability and price of the oil is determined largely by one setof countries that have their own interests to look out for. The result has sometimes been war, which may have beenattributed to all sorts of reasons, but at the bottom, the reason is oil.
Waste
The topic of overconsumption was touched on in the chapter Life on Earth. Many people in developed countries,such as the United States and most of Europe, use many more natural resources than people in many other countries.We have many luxury and recreational items, and it is often cheaper for us to throw something away than to fix it orjust hang on to it for a while longer. This consumerism leads to greater resource use, but it also leads to more waste.Pollution from discarded materials degrades the land, air, and water (Figure 8.41).
Natural resource use is generally lower in developing countries because people cannot afford many products. Someof these nations export natural resources to the developed world since their deposits may be richer and the cost oflabor lower. Environmental regulations are often more lax, further lowering the cost of resource extraction.
425

8.18. Availability of Natural Resources www.ck12.org
FIGURE 8.40The nations in blue are the 12 biggest producers of oil; they are Algeria, Angola, Ecuador, Iran, Iraq, Kuwait,Libya, Nigeria, Qatar, Saudi Arabia, the United Arab Emirates, and Venezuela.
FIGURE 8.41Pollution from discarded materials de-grades the environment and reduces theavailability of natural resources.
MEDIAClick image to the left or use the URL below.URL: https://www.ck12.org/flx/render/embeddedobject/180339
426

www.ck12.org Chapter 8. Earth’s Energy and Resources
Summary
• The availability of a resource depends on how much of it there is and how hard it is to extract, refine, andtransport to where it is needed.
• Politics plays an important role in resource availability since an unfavorable political situation can make aresource unavailable to a nation.
• Increased resource use generally means more waste; electronic waste from developed nations is a growingproblem in the developing world.
Review
1. Why does electronic waste that is generated in developed nations get dumped in developing nations?2. Why is politics important in the availability of resources?3. Why do some nations consume more goods and generate more waste than others?
Explore More
Use the resource below to answer the questions that follow.
MEDIAClick image to the left or use the URL below.URL: https://www.ck12.org/flx/render/embeddedobject/1564
1. What is e-waste?2. Why are they melting computer circuit boards?3. Why are the workers doing this work?4. What metals are they extracting from these computers?5. What do CRTs contain?6. What do computer batteries contain?7. How can these chemicals harm people? Which people are most at risk and why?8. Why do computers from North America and Europe end up in India for recycling? #Which factors go into
this difference in costs?9. How often do you replace you computer or cell phone?
427

8.19. Natural Resource Conservation www.ck12.org
8.19 Natural Resource Conservation
Learning Objectives
• Describe forms of natural resource conservation.• Explain why natural resource conservation is important.
Can you make a difference?
Yes! You can conserve natural resources every day with every decision you make. Should you recycle that can?Yes! Should you buy a bottle of water or drink from the water fountain? Fountain! Should you walk or ride yourbike to school or ask for a ride? Walk - it’s good exercise too!
Conserving Natural Resources
So that people in developed nations maintain a good lifestyle and people in developing nations have the ability toimprove their lifestyles, natural resources must be conserved and protected (Figure 8.42). People are researchingways to find renewable alternatives to non-renewable resources. Here is a checklist of ways to conserve resources:
428

www.ck12.org Chapter 8. Earth’s Energy and Resources
FIGURE 8.42Recycling can help conserve natural re-sources.
• Buy less stuff (use items as long as you can, and ask yourself if you really need something new).• Reduce excess packaging (drink tap water instead of water from plastic bottles).• Recycle materials such as metal cans, old cell phones, and plastic bottles.• Purchase products made from recycled materials.• Reduce pollution so that resources are maintained.• Prevent soil erosion.• Plant new trees to replace those that are cut down.• Drive cars less, take public transportation, bicycle, or walk.• Conserve energy at home (turn out lights when they are not needed).
MEDIAClick image to the left or use the URL below.URL: https://www.ck12.org/flx/render/embeddedobject/186836
MEDIAClick image to the left or use the URL below.URL: https://www.ck12.org/flx/render/embeddedobject/186834
Summary
• To conserve natural resources it is important to use less resources or even eliminate the use of some resources.
429

8.19. Natural Resource Conservation www.ck12.org
• It is important to watch unintended consumption; e.g. with packaging.• To reduce resource use, work on making some renewable: plant trees or use recycled products.
Review
1. Why should you use renewable resources rather than non-renewable resources when possible?2. Why should you recycle materials when possible?3. Why should you drink tap water or install a filter on your tap for filtered water?
Summary
Natural resources, including energy resources, may be renewable or non-renewable. Non-renewable resources willnot be replaced faster than they can be used up; when they’re gone, they’re gone. Renewable resources can bereplaced as rapidly or more rapidly than they are used, so they can supply human activities forever. Fossil fuelsare very popular non-renewable resources. Cheap, abundant fossil fuels have been responsible for the developmentof modern human society due to their impact in transportation, industrialization and agriculture. Nuclear energy isalso non-renewable because the necessary element uranium is limited. Renewable resources tend to be clean, withless or even no pollution or greenhouse gas emissions, but they come with their own problems. Some are relativelyexpensive, hard to develop, or difficult to find locations for. Increasing demand for renewable resources increasesthe research going into them, so the technologies are improving and becoming less expensive. Still, there are someproblems that may not be resolved except on a case-by-case basis, such as the siting of wind farms. The best andcheapest way to increase resource availability is conservation, which can be done by an individual, a family, anindustry or a society.
430

www.ck12.org Chapter 8. Earth’s Energy and Resources
8.20 References
1. . . CC BY-NC2. User:Awesomoman/Wikimedia Commons. http://commons.wikimedia.org/wiki/File:Fire.JPG . Public Do-
main3. User:Awesomoman/Wikimedia Commons. http://commons.wikimedia.org/wiki/File:Fire.JPG . Public Do-
main4. Image copyright Brad Sauter, 2014. http://www.shutterstock.com . Used under license from Shutterstock.com5. Chad Teer. http://commons.wikimedia.org/wiki/File:Gulf_Offshore_Platform.jpg . CC BY 2.06. Image copyright Brad Sauter, 2014. http://www.shutterstock.com . Used under license from Shutterstock.com7. Hana Zavadska. CK-12 Foundation . CC BY-NC 3.08. Hana Zavadska. CK-12 Foundation . CC BY-NC 3.09. Hans Pama. http://www.flickr.com/photos/hanspama/3944624501/ . CC BY 2.0
10. Hans Pama. http://www.flickr.com/photos/hanspama/3944624501/ . CC BY 2.011. Ben Mills (User:Benjah-bmm27/Wikimedia Commons). http://commons.wikimedia.org/wiki/File:Methane-3
D-balls.png . Public Domain12. Geoff Gallice. http://www.flickr.com/photos/dejeuxx/10631077204/ . CC BY 2.013. Ben Mills (User:Benjah-bmm27/Wikimedia Commons). http://commons.wikimedia.org/wiki/File:Methane-3
D-balls.png . Public Domain14. (a) JW Randolph; (b) Rennett Stowe. (a) http://commons.wikimedia.org/wiki/File:MTR1.jpg; (b) http://
flickr.com/photos/tomsaint/3518071026/;http://news.bbc.co.uk/2/hi/science/nature/322107.stm . (a) PublicDomain; (b) CC BY 2.0
15. Courtesy of the US Geological Survey and the Mineral Information Institute. http://commons.wikimedia.org/wiki/File:Coal_bituminous.jpg . Public Domain
16. User:RoRo/Wikimedia Commons. http://commons.wikimedia.org/wiki/File:The_World_of_the_Carboniferous-Permian_boundary.svg . Public Domain
17. Courtesy of the US Geological Survey. http://commons.wikimedia.org/wiki/File:Us_coal_regions_1996.png. Public Domain
18. (a) JW Randolph; (b) Rennett Stowe. (a) http://commons.wikimedia.org/wiki/File:MTR1.jpg; (b) http://flickr.com/photos/tomsaint/3518071026/ . (a) Public Domain; (b) CC BY 2.0
19. Courtesy of MODIS Rapid Response Team/NASA’s Earth Observatory. http://earthobservatory.nasa.gov/IOTD/view.php?id=44375 . Public Domain
20. User:Oceanh/Wikimedia Commons, modified by CK-12 Foundation. http://commons.wikimedia.org/wiki/File:Structural_Trap_%28Anticlinal%29.svg . CC BY 3.0
21. Walter Siegmund. http://commons.wikimedia.org/wiki/File:Anacortes_Refinery_31904.JPG . CC BY 2.522. Courtesy of the US Energy Information Administration. http://commons.wikimedia.org/wiki/File:US_Gulf_o
f_Mexico_offshore_gas.jpg . Public Domain23. Flickr:Loco Steve. http://flickr.com/photos/locosteve/6132948846/ . CC BY 2.024. Courtesy of MODIS Rapid Response Team/NASA’s Earth Observatory. http://earthobservatory.nasa.gov/IOT
D/view.php?id=44375 . Public Domain25. Roy Luck. http://www.flickr.com/photos/royluck/5556781051/ . CC BY 2.026. Courtesy of the U.S. Energy Information Administration (April 2002). http://www.eia.doe.gov/oil_gas/rpd/c
onventional_gas.jpg . Public Domain27. Roy Luck. http://www.flickr.com/photos/royluck/5556781051/ . CC BY 2.028. Courtesy of NASA’s Earth Observatory. http://earthobservatory.nasa.gov/IOTD/view.php?id=40997 . Public
Domain29. User:HêRø/Wikimedia Commons. http://commons.wikimedia.org/wiki/File:Oil_Reserves_Updated.png . Pub-
431

8.20. References www.ck12.org
lic Domain30. Courtesy of NASA’s Earth Observatory. http://earthobservatory.nasa.gov/IOTD/view.php?id=40997 . Public
Domain31. Image copyright Sergey Kamshylin, 2014. http://www.shutterstock.com . Used under license from Shutter-
stock.com32. User:Fastfission/Wikimedia Commons. http://commons.wikimedia.org/wiki/File:Nuclear_fission.svg . Pub-
lic Domain33. Gretchen Mahan. http://www.flickr.com/photos/30245262@N07/4949091312/ . CC BY 2.034. Alberto Otero García. http://commons.wikimedia.org/wiki/File:Ranger_Uranium_Mine.jpg . CC BY 2.035. Image copyright Sergey Kamshylin, 2014. http://www.shutterstock.com . Used under license from Shutter-
stock.com36. Daniel Borman (Flickr:borman818). http://www.flickr.com/photos/dborman2/3256540903/ . CC BY 2.037. Courtesy of NASA. http://commons.wikimedia.org/wiki/File:Earth_horizon_and_International_Space_Station
_solar_panel_array_%28Expedition_17_crew,_August_2008%29.jpg . Public Domain38. Flickr:afloresm. http://www.flickr.com/photos/afloresm/1448540890/ . CC BY 2.039. Daniel Borman (Flickr:borman818). http://www.flickr.com/photos/dborman2/3256540903/ . CC BY 2.040. Image copyright Manamana, 2014. http://www.shutterstock.com . Used under license from Shutterstock.com41. User:Tomia/Wikimedia Commons. http://commons.wikimedia.org/wiki/File:Hydroelectric_dam.svg . CC
BY 2.542. Image copyright Manamana, 2014. http://www.shutterstock.com . Used under license from Shutterstock.com43. Courtesy of National Renewable Energy Laboratory/US Department of Energy. http://commons.wikimedia
.org/wiki/File:Massachusetts_wind_resource_map_50m_800.jpg . Public Domain44. Andre Engels. http://commons.wikimedia.org/wiki/File:Windmills.jpg . CC BY 2.045. Courtesy of National Renewable Energy Laboratory/US Department of Energy. http://commons.wikimedia
.org/wiki/File:Massachusetts_wind_resource_map_50m_800.jpg . Public Domain46. Gretar Ívarsson. http://commons.wikimedia.org/wiki/File:NesjavellirPowerPlant_edit2.jpg . Public Domain47. Gretar Ívarsson. http://commons.wikimedia.org/wiki/File:NesjavellirPowerPlant_edit2.jpg . Public Domain48. . . CC BY-NC49. Michael Coté. http://www.flickr.com/photos/cote/3130646389/ . CC BY 2.050. . . CC BY-NC51. Třinecké železárny. http://commons.wikimedia.org/wiki/File:VysokePece1.jpg . The copyright holder of this
file allows anyone to use it for any purpose provided that the copyright holder is properly attributed52. Courtesy of US Geological Survey/Mineral Information Institute. http://commons.wikimedia.org/wiki/File:B
auxiteUSGOV.jpg . Public Domain53. (a) Flickr:Loco Steve; (b) Courtesy of Jesse Allen/NASA’s Earth Observatory; (c) Matt Wasson; Composite
created by CK-12 Foundation. (a) http://www.flickr.com/photos/locosteve/4964411958/; (b) http://earthobservatory.nasa.gov/IOTD/view.php?id=41966; (c) http://www.flickr.com/photos/nationalmemorialforthemountains/4535374630/ . (a) CC BY 2.0; (b) Public Domain; (c) CC BY 2.0
54. Flickr:mjtmail (tiggy). http://www.flickr.com/photos/mjtmail/3823526817/ . CC BY 2.055. Peter Craven. http://www.flickr.com/photos/cdeimages/6324887779/ . CC BY 2.056. Třinecké železárny. http://commons.wikimedia.org/wiki/File:VysokePece1.jpg . The copyright holder of this
file allows anyone to use it for any purpose provided that the copyright holder is properly attributed57. Courtesy of the US Environmental Protection Agency. http://commons.wikimedia.org/wiki/File:Autowreck
ers.jpg . Public Domain58. Image copyright Anthony Jay D. Villalon, 2014. http://www.shutterstock.com . Used under license from
Shutterstock.com59. User:Bourgeois/Wikimedia Commons. http://commons.wikimedia.org/wiki/File:OPEC.svg . Public Domain60. Courtesy of the US Environmental Protection Agency. http://commons.wikimedia.org/wiki/File:Autowreck
ers.jpg . Public Domain61. Terence Ong. http://commons.wikimedia.org/wiki/File:NEA_recycling_bins,_Orchard_Road.JPG . CC BY
2.5
432

www.ck12.org Chapter 8. Earth’s Energy and Resources
62. Terence Ong. http://commons.wikimedia.org/wiki/File:NEA_recycling_bins,_Orchard_Road.JPG . CC BY2.5
433

www.ck12.org
CHAPTER 9 Human Impacts on Earth’sEnvironment
Chapter Outline9.1 GROWTH OF HUMAN POPULATIONS
9.2 AGRICULTURE AND HUMAN POPULATION GROWTH
9.3 OVERPOPULATION AND OVER-CONSUMPTION
9.4 SUSTAINABLE DEVELOPMENT
9.5 SOIL EROSION
9.6 AVOIDING SOIL LOSS
9.7 HAZARDOUS WASTE
9.8 IMPACTS OF HAZARDOUS WASTE
9.9 PREVENTING HAZARDOUS WASTE PROBLEMS
9.10 ENVIRONMENTAL IMPACTS OF MINING
9.11 REFERENCES
Introduction
Surely Earth is too big for humans to impact it too much...
Many people think that Earth is so large that human activities couldn’t possibly be making much of an impact onthe planet. But human populations have expanded at a more than exponential rate and it is human ingenuity fromadvances in farming that has kept so many people alive. The map above depicts a quantitative analysis of humaninfluence around the world. Low scores are the least human influence; higher scores are greater impact. Taken intoaccount were population density, land transformation, human access, and power infrastructure. Human access andland transformation alter ecosystems and bring in pollution and invasive species, which decrease biodiversity. Thischapter explores some of the impacts that humans have had on Earth’s systems.
434

www.ck12.org Chapter 9. Human Impacts on Earth’s Environment
9.1 Growth of Human Populations
Learning Objectives
• Describe the rate of current human population growth.
What will stop population growth?
It took all of human history until 1802 for the human population to reach its first billion. It took just 12 years for itto acquire its most recent billion. Although the growth rate is predicted to slow later this century, there’s no end topopulation growth in sight. Yet, the population can’t continue to grow forever. How will it stop?
Human Population Numbers
Human population growth over the past 10,000 years has been tremendous (Figure 9.1). The entire human popula-tion was estimated to be
• 5 million in 8000 B.C.• 300 million in A.D. 1• 1 billion in 1802• 3 billion in 1961• 7 billion in 2011
As the human population continues to grow, different factors limit population in different parts of the world. Whatmight be a limiting factor for human population in a particular location? Space, clean air, clean water, and food tofeed everyone are limiting in some locations.
435

9.1. Growth of Human Populations www.ck12.org
FIGURE 9.1Human population from 10,000BC through 2000 AD, showing theexponential increase in human populationthat has occurred in the last few centuries.
The Rate of Growth
Not only has the population increased, but the rate of population growth has increased (Figure 9.2). The populationwas estimated to reach 7 billion in 2012, but it did so in 2011, just 12 years after reaching 6 billion.
FIGURE 9.2The amount of time between the addition of each one billion people to the planet’s population, includingspeculation about the future.
Although population continues to grow rapidly, the rate that the growth rate is increasing has declined. Still, a recentestimate by the United Nations estimates that 10.1 billion people will be sharing this planet by the end of the century.
436

www.ck12.org Chapter 9. Human Impacts on Earth’s Environment
The total added will be about 3 billion people, which is more than were even in existence as recently as 1960.
MEDIAClick image to the left or use the URL below.URL: https://www.ck12.org/flx/render/embeddedobject/186839
Summary
• The human population is growing more than exponentially.• The human population is increasing, the rate of human population growth is increasing, but the rate at which
the rate of growth is increasing has declined.• The United Nations estimates a population of 10.1 billion by the end of the century yet that is much less than
the number we would expect if 1 billion people were being added every 12 years.
Review
1. What does it mean that the human population growth rate is increasing?2. What does it mean that the rate that the growth rate is increasing has declined?3. What factors may someday limit human population growth?
Explore More
Use this resource to answer the questions that follow.
MEDIAClick image to the left or use the URL below.URL: https://www.ck12.org/flx/render/embeddedobject/171323
1. What is exponential growth in a population?2. What happened in 1650?3. What was the population in 1650? 1850? 1930? 1975? What is the population now?4. What has the human population of the planet done in the past 80 years?5. What does R versus K selection theory compare? What does that have to do with reproduction?6. Which organisms tend to be R and which K? What population size do K organisms tend to have?7. Why are humans considered to be K animals?
437

9.1. Growth of Human Populations www.ck12.org
8. How have humans managed to go 350 years with a population growth curve that looks more like an R animal?Describe the reasons.
9. What is the estimated carrying capacity of humans on Earth?10. How do ecologists now try to determine what the carrying capacity is? Why is this not the same for everyone
on Earth?11. What happens as we take up more space and resources?12. What does it mean that the rate of human population growth peaked in 1962? Is population still growing?13. Why is the rate of population growth decreasing and how can we make the rate decrease further?
438

www.ck12.org Chapter 9. Human Impacts on Earth’s Environment
9.2 Agriculture and Human Population Growth
Learning Objectives
• Explain how advances in agriculture have led to leaps in population numbers.
What’s your vision of a chicken farm?
In many nations, farming today is industrial, growing the maximum amount of food for the minimum price, oftenwithout much thought as to the long-term social or environmental consequences. These industrial food productionplants are a long way from the farms of the past.
Advances in Agriculture and Population
Every major advance in agriculture has allowed global population to increase. Early farmers could settle down to asteady food supply. Irrigation, the ability to clear large swaths of land for farming efficiently, and the developmentof farm machines powered by fossil fuels allowed people to grow more food and transport it to where it was needed.
Hunters and Gatherers
What is Earth’s carrying capacity for humans? Are humans now exceeding Earth’s carrying capacity for our species?Many anthropologists say that the carrying capacity of humans on the planet without agriculture is about 10 million(Figure 9.3). This population was reached about 10,000 years ago. At the time, people lived together in small bandsof hunters and gatherers. Typically men hunted and fished; women gathered nuts and vegetables.
439

9.2. Agriculture and Human Population Growth www.ck12.org
FIGURE 9.3In a hunter-gatherer society, people reliedon the resources they could find wherethey lived.
Obviously, human populations have blown past this hypothetical carrying capacity. By using our brains, our erectposture, and our hands, we have been able to manipulate our environment in ways that no other species has everdone. What have been the important developments that have allowed population to grow?
Farming
About 10,000 years ago, we developed the ability to grow our own food. Farming increased the yield of foodplants and allowed people to have food available year round. Animals were domesticated to provide meat. Withagriculture, people could settle down, so that they no longer needed to carry all their possessions (Figure 9.4). Theycould develop better farming practices and store food for when it was difficult to grow. Agriculture allowed peopleto settle in towns and cities.
When advanced farming practices allowed farmers to grow more food than they needed for their families (Figure9.5), some people were then able to do other types of work, such as crafts or shop keeping.
The Industrial Revolution
The next major stage in the growth of the human population was the Industrial Revolution, which started in thelate 1700s (Figure 9.6). This major historical event marks when products were first mass-produced and when fossilfuels were first widely used for power.
The Green Revolution
The Green Revolution has allowed the addition of billions of people to the population in the past few decades. TheGreen Revolution has improved agricultural productivity by:
• Improving crops by selecting for traits that promote productivity; recently, genetically engineered crops havebeen introduced.
440

www.ck12.org Chapter 9. Human Impacts on Earth’s Environment
FIGURE 9.4More advanced farming practices alloweda single farmer to grow food for manymore people.
FIGURE 9.5Farming has increasingly depended onmachines. Such advanced farming prac-tices allow one farmer to feed many morepeople than in the past.
• Increasing the use of artificial fertilizers and chemical pesticides. About 23 times more fertilizer and 50 timesmore pesticides are used around the world than were used just 50 years ago (Figure 9.7).
• Agricultural machinery: plowing, tilling, fertilizing, picking, and transporting are all done by machines. About17% of the energy used each year in the United States is for agriculture.
• Increasing access to water. Many farming regions depend on groundwater, which is not a renewable resource.Some regions will eventually run out of this water source. Currently about 70% of the world’s fresh water isused for agriculture.
The Green Revolution has increased the productivity of farms immensely. A century ago, a single farmer producedenough food for 2.5 people, but now a farmer can feed more than 130 people. The Green Revolution is credited forfeeding 1 billion people that would not otherwise have been able to live.
441

9.2. Agriculture and Human Population Growth www.ck12.org
FIGURE 9.6Early in the Industrial Revolution, largenumbers of people who had been freedfrom food production were available towork in factories.
FIGURE 9.7Rows of a single crop and heavy ma-chinery are normal sights for modern dayfarms.
The Future
The flip side to this is that for the population to continue to grow, more advances in agriculture and an ever increasingsupply of water will be needed. We’ve increased the carrying capacity for humans by our genius: growing crops,trading for needed materials, and designing ways to exploit resources that are difficult to get at, such as groundwater.And most of these resources are limited.
The question is, even though we have increased the carrying capacity of the planet, have we now exceeded it (Figure9.8)? Are humans on Earth experiencing overpopulation?
There is not yet an answer to that question, but there are many different opinions. In the eighteenth century, ThomasMalthus predicted that human population would continue to grow until we had exhausted our resources. At thatpoint, humans would become victims of famine, disease, or war. This has not happened, at least not yet. Somescientists think that the carrying capacity of the planet is about 1 billion people, not the 7 billion people we havetoday. The limiting factors have changed as our intelligence has allowed us to expand our population. Can wecontinue to do this indefinitely into the future?
442

www.ck12.org Chapter 9. Human Impacts on Earth’s Environment
FIGURE 9.8Manhattan is one of the most heavily pop-ulated regions in the world.
Summary
• Hunters and gatherers lived off the land, with no agriculture, and reached a total population of no more thanaround 10 million.
• Farming allowed people to settle down and allowed populations to grow.• The Green Revolution and the Industrial Revolution are heavily dependent on fossil fuels.
Review
1. Link major advances in agriculture and industry with changes in the human population.2. What is carrying capacity? Has the human population exceeded Earth’s carrying capacity for humans? If so,
how could this have happened?3. What is the Green Revolution? How has it affected human population?4. What do you think of Thomas Malthus’ prediction? Have we proven Malthus wrong or have we just not gotten
to that point yet?
Explore More
Use this resource to answer the questions that follow.
MEDIAClick image to the left or use the URL below.URL: https://www.ck12.org/flx/render/embeddedobject/1554
443

9.2. Agriculture and Human Population Growth www.ck12.org
1. Who was Thomas Malthus?2. What did Malthus think would happen as population increased?3. What did Malthus think would limit population?4. What is the Malthusian limit?5. What is happening to population growth in some developed countries today?6. Malthus didn’t account for what in his theory?7. What country is close to the Malthusian limit today?
444

www.ck12.org Chapter 9. Human Impacts on Earth’s Environment
9.3 Overpopulation and Over-Consumption
Learning Objectives
• Describe the consequences of the Green Revolution on Earth’s systems.• Define over-consumption and explain its impact on Earth’s systems.
How many people could live in this house?
The amount of space and resources used by each resident of this house far exceeds the average for a single humanresident of planet Earth and even more for a single person in a poor country in sub-Saharan Africa.
Consequences of the Green Revolution
The Green Revolution has brought enormous impacts to the planet.
Land Loss
Natural landscapes have been altered to create farmland and cities. Already, half of the ice-free lands have beenconverted to human uses. Estimates are that by 2030, that number will be more than 70%. Forests and otherlandscapes have been cleared for farming or urban areas. Rivers have been dammed and the water is transported bycanals for irrigation and domestic uses. Ecologically sensitive areas have been altered: wetlands are now drainedand coastlines are developed.
445

9.3. Overpopulation and Over-Consumption www.ck12.org
Pollution
Modern agricultural practices produce a lot of pollution (Figure 9.9). Some pesticides are toxic. Dead zones growas fertilizers drain off farmland and introduce nutrients into lakes and coastal areas. Farm machines and vehiclesused to transport crops produce air pollutants. Pollutants enter the air, water, or are spilled onto the land. Moreover,many types of pollution easily move between air, water, and land. As a result, no location or organism — not evenpolar bears in the remote Arctic — is free from pollution.
FIGURE 9.9Pesticides are hazardous in large quanti-ties and some are toxic in small quantities.
Consequences for Other Resources
The increased numbers of people have other impacts on the planet. Humans do not just need food. They also needclean water, secure shelter, and a safe place for their wastes. These needs are met to different degrees in differentnations and among different socioeconomic classes of people. For example, about 1.2 billion of the world’s peopledo not have enough clean water for drinking and washing each day (Figure 9.10).
446
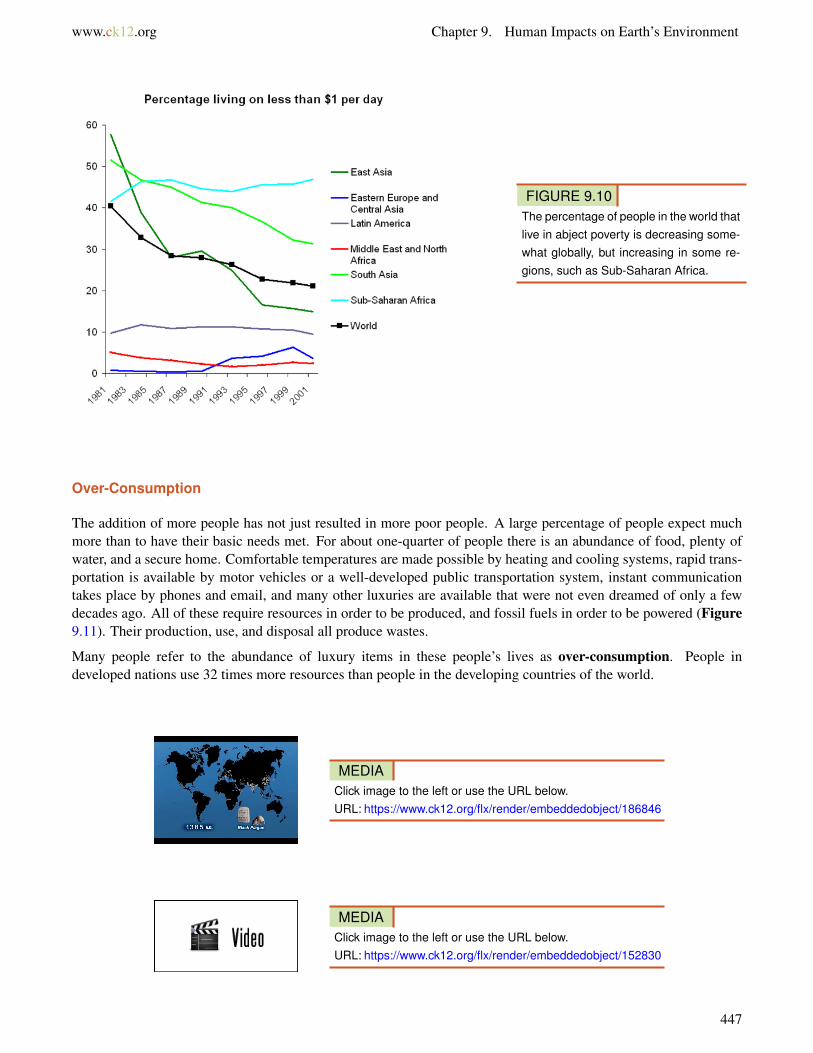
www.ck12.org Chapter 9. Human Impacts on Earth’s Environment
FIGURE 9.10The percentage of people in the world thatlive in abject poverty is decreasing some-what globally, but increasing in some re-gions, such as Sub-Saharan Africa.
Over-Consumption
The addition of more people has not just resulted in more poor people. A large percentage of people expect muchmore than to have their basic needs met. For about one-quarter of people there is an abundance of food, plenty ofwater, and a secure home. Comfortable temperatures are made possible by heating and cooling systems, rapid trans-portation is available by motor vehicles or a well-developed public transportation system, instant communicationtakes place by phones and email, and many other luxuries are available that were not even dreamed of only a fewdecades ago. All of these require resources in order to be produced, and fossil fuels in order to be powered (Figure9.11). Their production, use, and disposal all produce wastes.
Many people refer to the abundance of luxury items in these people’s lives as over-consumption. People indeveloped nations use 32 times more resources than people in the developing countries of the world.
MEDIAClick image to the left or use the URL below.URL: https://www.ck12.org/flx/render/embeddedobject/186846
MEDIAClick image to the left or use the URL below.URL: https://www.ck12.org/flx/render/embeddedobject/152830
447

9.3. Overpopulation and Over-Consumption www.ck12.org
FIGURE 9.11Since CO2 is a waste product from fossil fuel burning, CO2 emissions tell which countries are using the mostfossil fuels, which means that the population has a high standard of living.
Summary
• The Green Revolution has allowed more people to be fed and the human population to increase. The conse-quences are land loss, pollution, and a tremendous use of fossil fuels.
• By keeping more people alive, the Green Revolution has put a strain on other needed resources like water andmaterials.
• Overpopulation is a big problem, but over-consumption is also depleting Earth’s resources as some people inthe world use far more materials than others.
Review
1. Why has so much natural land been converted to human uses? What happens to the ecosystems that areaffected?
2. What causes pollution and why is it so widespread?3. What do you use in your daily life that would be inconceivable for a poor teenager in sub-Saharan Africa?
What about contrasting yourself with a poor teen living in an urban ghetto in the U.S.?
Explore More
Use these resources to answer the questions that follow.
448

www.ck12.org Chapter 9. Human Impacts on Earth’s Environment
MEDIAClick image to the left or use the URL below.URL: https://www.ck12.org/flx/render/embeddedobject/171326
1. What is the bank the announcer is referring to?2. What are the two factors that our impact on this bank depend on?3. Earth is now home to 7 billion people yet there is the statement that if everyone lived like an average European
Earth could only support 2 billion in the long term, so what does that mean about the present?4. What are ecosystem services? What are some examples?5. What is overconsumpulation?6. What does the speaker say will happen if we don’t get population down to 2 billion?7. What are the two options?8. What will happen if population continue to grow or doesn’t shrink?
449

9.4. Sustainable Development www.ck12.org
9.4 Sustainable Development
Learning Objectives
• Define sustainable development.• Describe forms of sustainable development and explain how they conserve energy and natural resources.
Is there another way?
Visibility in Beijing is sometimes so bad that the airport must be closed due to smog. In their rush to develop, manynations are making the same mistakes that the developed nations have already made. Can everyone find a moresustainable path?
Sustainable Development
FIGURE 9.12Can society change and get on a sustain-able path?
A topic generating a great deal of discussion these days is sustainable development. The goals of sustainabledevelopment are to:
450

www.ck12.org Chapter 9. Human Impacts on Earth’s Environment
• help people out of poverty.• protect the environment.• use resources no faster than the rate at which they are regenerated.
One of the most important steps to achieving a more sustainable future is to reduce human population growth. Thishas been happening in recent years. Studies have shown that the birth rate decreases as women become educated,because educated women tend to have fewer, and healthier, children.
Science can be an important part of sustainable development. When scientists understand how Earth’s naturalsystems work, they can recognize how people are impacting them. Scientists can work to develop technologiesthat can be used to solve problems wisely. An example of a practice that can aid sustainable development is fishfarming, as long as it is done in environmentally sound ways. Engineers can develop cleaner energy sources toreduce pollution and greenhouse gas emissions.
Citizens can change their behavior to reduce the impact they have on the planet by demanding products that areproduced sustainably. When forests are logged, new trees should be planted. Mining should be done so that thelandscape is not destroyed. People can consume less and think more about the impacts of what they do consume.
And what of the waste products of society? Will producing all that we need to keep the population growing result ina planet so polluted that the quality of life will be greatly diminished? Will warming temperatures cause problemsfor human populations? The only answer to all of these questions is, time will tell.
MEDIAClick image to the left or use the URL below.URL: https://www.ck12.org/flx/render/embeddedobject/186848
Summary
• Sustainable development tries to bring people up to certain minimum living conditions without doing furtherdamage to the environment.
• To develop sustainably, the human population must stabilize.• Resources must be developed and used consciously and in environmentally sound ways.
Review
1. Why does the status of women help decrease population growth?2. What is sustainable development? Do you think that it can be achieved in your lifetime?3. How can environmental protections be enacted and people be helped out of poverty at the same time? Are
those goals conflicting?
Explore More
Use this resource (watch to 10:38) to answer the questions that follow.
451

9.4. Sustainable Development www.ck12.org
MEDIAClick image to the left or use the URL below.URL: https://www.ck12.org/flx/render/embeddedobject/178372
1. What is sustainable development?2. What are some of the conflicts?3. Can sustainable development be done?4. What are the challenges?5. What is human impact on the environment the product of? In which direction are those factors going (growing
or shrinking)?6. What will happen as resources become more limited?7. What is the effect of bio-fuels on food prices?8. What is the effect of affluence on pollution?9. How is sustainable development an ethical issue?
10. At what level can this be addressed? What possible instruments are there to do this?11. What is the problem with obtaining political leadership?12. Why are we further from achieving sustainable development now htan we were 20 years ago?
Resources
MEDIAClick image to the left or use the URL below.URL: https://www.ck12.org/flx/render/embeddedobject/186850
452

www.ck12.org Chapter 9. Human Impacts on Earth’s Environment
9.5 Soil Erosion
Learning Objectives
• Explain how human activities cause soil erosion.
What would cause such a tremendous dust storm?
Farmers were forced off their lands during the Dust Bowl in the 1930s when the rains stopped and the topsoil blewoff these former grasslands. A wind storm blew huge amounts of soil into the air in Texas on April 14, 1935. Thisscene was repeated throughout the central United States.
Causes of Soil Erosion
The agents of soil erosion are the same as the agents of all types of erosion: water, wind, ice, or gravity. Runningwater is the leading cause of soil erosion, because water is abundant and has a lot of power. Wind is also a leadingcause of soil erosion because wind can pick up soil and blow it far away.
Activities that remove vegetation, disturb the ground, or allow the ground to dry are activities that increase erosion.What are some human activities that increase the likelihood that soil will be eroded?
Farming
Agriculture is probably the most significant activity that accelerates soil erosion because of the amount of land thatis farmed and how much farming practices disturb the ground (Figure 9.13). Farmers remove native vegetation andthen plow the land to plant new seeds. Because most crops grow only in spring and summer, the land lies fallowduring the winter. Of course, winter is also the stormy season in many locations, so wind and rain are available to
453

9.5. Soil Erosion www.ck12.org
wash soil away. Tractor tires make deep grooves, which are natural pathways for water. Fine soil is blown away bywind.
The soil that is most likely to erode is the nutrient-rich topsoil, which degrades the farmland.
FIGURE 9.13(a) The bare areas of farmland are especially vulnerable to erosion. (b) Slash-and-burn agriculture leaves landopen for soil erosion and is one of the leading causes of soil erosion in the world.
Grazing
Grazing animals (Figure 9.14) wander over large areas of pasture or natural grasslands eating grasses and shrubs.Grazers expose soil by removing the plant cover for an area. They also churn up the ground with their hooves. If toomany animals graze the same land area, the animals’ hooves pull plants out by their roots. A land is overgrazed iftoo many animals are living there.
Logging and Mining
Logging removes trees that protect the ground from soil erosion. The tree roots hold the soil together and the treecanopy protects the soil from hard falling rain. Logging results in the loss of leaf litter, or dead leaves, bark, andbranches on the forest floor. Leaf litter plays an important role in protecting forest soils from erosion (Figure 9.15).
Much of the world’s original forests have been logged. Many of the tropical forests that remain are currently thesite of logging because North America and Europe have already harvested many of their trees (Figure 9.16). Soilseroded from logged forests clog rivers and lakes, fill estuaries, and bury coral reefs.
Surface mining disturbs the land (Figure 9.17) and leaves the soil vulnerable to erosion.
454

www.ck12.org Chapter 9. Human Impacts on Earth’s Environment
FIGURE 9.14Grazing animals can cause erosion if theyare allowed to overgraze and remove toomuch or all of the vegetation in a pasture.
FIGURE 9.15Logging exposes large areas of land toerosion.
Construction
Constructing buildings and roads churns up the ground and exposes soil to erosion. In some locations, nativelandscapes, such as forest and grassland, are cleared, exposing the surface to erosion (in some locations the landthat will be built on is farmland). Near construction sites, dirt, picked up by the wind, is often in the air. Completedconstruction can also contribute to erosion (Figure 9.18).
Recreational Activities
Recreational activities may accelerate soil erosion. Off-road vehicles disturb the landscape and the area eventuallydevelops bare spots where no plants can grow. In some delicate habitats, even hikers’ boots can disturb the ground,so it’s important to stay on the trail (Figure 9.19).
Soil erosion is as natural as any other type of erosion, but human activities have greatly accelerated soil erosion. In
455

9.5. Soil Erosion www.ck12.org
FIGURE 9.16Deforested swatches in Brazil show up asgray amid the bright red tropical rainfor-est.
FIGURE 9.17(a) Disturbed land at a coal mine pit in Germany. (b) This coal mine in West Virginia covers more than 10,000acres (15.6 square miles). Some of the exposed ground is being reclaimed by planting trees.
some locations soil erosion may occur about 10 times faster than its natural rate. Since Europeans settled in NorthAmerica, about one-third of the topsoil in the area that is now the United States has eroded away.
456

www.ck12.org Chapter 9. Human Impacts on Earth’s Environment
FIGURE 9.18Urban areas and parking lots result in lesswater entering the ground. Water runsoff the parking lot onto nearby lands andspeeds up erosion in those areas.
FIGURE 9.19(a) ATV’S churn up the soil, accelerating erosion. (b) Hiking trails may become eroded.
MEDIAClick image to the left or use the URL below.URL: https://www.ck12.org/flx/render/embeddedobject/186852
457

9.5. Soil Erosion www.ck12.org
MEDIAClick image to the left or use the URL below.URL: https://www.ck12.org/flx/render/embeddedobject/186854
Summary
• Although soil erosion is a natural process, human activities have greatly accelerated it.• The agents of soil erosion are the same as of other types of erosion: water, ice, wind, and gravity.• Soil erosion is more likely where the ground has been disturbed by agriculture, grazing animals, logging,
mining, construction, and recreational activities.
Review
1. What is soil erosion? Why did soil erosion accelerate so greatly during the Dust Bowl?2. How do human activities accelerate soil erosion? Since soil erosion is a natural process, is this bad?3. What is the consequence of the acceleration of soil erosion?
458

www.ck12.org Chapter 9. Human Impacts on Earth’s Environment
9.6 Avoiding Soil Loss
Learning Objectives
• Describe steps that can be taken to minimize soil loss.
How does the terracing shown in this photo prevent soil erosion?
Terracing keeps the soil from moving very far downhill since it will only get as far as the next terrace downhill.Water will also be slowed by the terraces and so will be less able to carry tremendous amounts of soil downhill.Terracing is a great way to preserve soil when farming is being done on hillsides.
Soil Erosion
Bad farming practices and a return to normal rainfall levels after an unusually wet period led to the Dust Bowl. Insome regions more than 75% of the topsoil blew away. This is the most extreme example of soil erosion the UnitedStates has ever seen.
Still, in many areas of the world, the rate of soil erosion is many times greater than the rate at which it is forming.Drought, insect plagues, or outbreaks of disease are natural cycles of events that can negatively impact ecosystemsand the soil, but there are also many ways in which humans neglect or abuse this important resource. Soils can alsobe contaminated if too much salt accumulates in the soil or where pollutants sink into the ground.
One harmful practice is removing the vegetation that helps to hold soil in place. Sometimes just walking or ridingyour bike over the same place will kill the grass that normally grows there. Land is also deliberately cleared ordeforested for wood. The loose soils then may be carried away by wind or running water.
459

9.6. Avoiding Soil Loss www.ck12.org
FIGURE 9.20A farmer and his sons walk through a duststorm in Cimarron County, Oklahoma in1936.
MEDIAClick image to the left or use the URL below.URL: https://www.ck12.org/flx/render/embeddedobject/186856
Soil Conservation
Soil is only a renewable resource if it is carefully managed. There are many practices that can protect and preservesoil resources.
Organic Material
Adding organic material to the soil in the form of plant or animal waste, such as compost or manure, increases thefertility of the soil and improves its ability to hold on to water and nutrients (Figure 9.21). Inorganic fertilizer canalso temporarily increase the fertility of a soil and may be less expensive or time consuming, but it does not providethe same long-term improvements as organic materials.
Preventing Soil Erosion
Soil is a natural resource that is vitally important for sustaining natural habitats and for growing food. Although soilis a renewable resource, it is renewed slowly, taking hundreds or thousands of years for a good fertile soil to develop.
460

www.ck12.org Chapter 9. Human Impacts on Earth’s Environment
FIGURE 9.21Organic material can be added to soil tohelp increase its fertility.
Most of the best land for farming is already being cultivated. With human populations continuing to grow, it isextremely important to protect our soil resources. Agricultural practices such as rotating crops, alternating the typesof crops planted in each row, and planting nutrient-rich cover crops all help to keep soil more fertile as it is usedseason after season. Planting trees as windbreaks, plowing along contours of the field, or building terraces intosteeper slopes will all help to hold soil in place (Figure 9.22). No-till or low-tillage farming helps to keep soil inplace by disturbing the ground as little as possible when planting.
FIGURE 9.22Steep slopes can be terraced to makelevel planting areas and decrease surfacewater runoff and erosion.
The rate of topsoil loss in the United States and other developed countries has decreased recently as better farmingpractices have been adopted. Unfortunately, in developing nations, soil is often not protected.
Table 9.1 shows some steps that we can take to prevent erosion. Some are things that can be done by farmers ordevelopers. Others are things that individual homeowners or community members can implement locally.
TABLE 9.1: Erosion
Source of Erosion Strategies for Prevention
461

9.6. Avoiding Soil Loss www.ck12.org
TABLE 9.1: (continued)
Source of Erosion Strategies for PreventionAgriculture
• Leave leaf litter on the ground in the winter.• Grow cover crops, special crops grown in the
winter to cover the soil.• Plant tall trees around fields to buffer the effects
of wind.• Drive tractors as little as possible.• Use drip irrigation that puts small amounts of
water in the ground frequently.• Avoid watering crops with sprinklers that make
big water drops on the ground.• Keep fields as flat as possible to avoid soil erod-
ing down hill.
Grazing Animals
• Move animals throughout the year, so they don’tconsume all the vegetation in one spot.
• Keep animals away from stream banks, wherehills are especially prone to erosion.
Logging and Mining
• Reduce the amount of land that is logged andmined.
• Reduce the number of roads that are built toaccess logging areas.
• Avoid logging and mining on steep lands.• Cut only small areas at one time and quickly
replant logged areas with new seedlings.
Development
• Reduce the amount of land area that is developedinto urban areas, parking lots, etc.
• Keep as much “green space” in cities as possible,such as parks or strips where plants can grow.
• Invest in and use new technologies for parkinglots that make them permeable to water in orderto reduce runoff of water.
Recreational Activities
• Avoid using off-road vehicles on hilly lands.• Stay on designated trails.
462

www.ck12.org Chapter 9. Human Impacts on Earth’s Environment
TABLE 9.1: (continued)
Source of Erosion Strategies for PreventionBuilding Construction
• Avoid building on steep hills.• Grade surrounding land to distribute water rather
than collecting it in one place.• Where water collects, drain to creeks and rivers.• Landscape with plants that minimize erosion.
MEDIAClick image to the left or use the URL below.URL: https://www.ck12.org/flx/render/embeddedobject/186858
Summary
• Soil is a renewable resource, but sometimes it is lost faster than it can be replaced.• Soil resources must be preserved because there are many more people on Earth who need to eat and a great
deal of topsoil has already been lost in many regions.• There are many techniques available for preventing soil loss in agriculture, grazing, logging, mining, and
recreation.• Soil conservation is extremely important. Some helpful practices include adding organic material, terracing,
and no-till farming.
Review
1. Why is it so important for strategies that prevent soil erosion to be understood and used?2. Which agricultural techniques are better that preserving soils?3. How do recreational activities exacerbate soil erosion and how can this be lessened?4. Why does the addition of organic material to soil help with its conservation?5. What are a few agricultural practices that make conserving soil a priority?
Explore More
Use this resource (watch up to 7:25) to answer the questions that follow.
463

9.6. Avoiding Soil Loss www.ck12.org
MEDIAClick image to the left or use the URL below.URL: https://www.ck12.org/flx/render/embeddedobject/178374
1. What is soil erosion?2. What increases soil erosion?3. What are the negative effects of soil erosion?4. What caused the Dust Bowl?5. Is soil a renewable or nonrenewable resource on US cropland? Is that changing?6. What did the 1985 Food Security Act do to protect sol?7. What is conservation tillage?8. What can be done on steep slopes to reduce erosion and why?9. What is contour farming?
10. What is strip cropping?11. What is alley-cropping or agroforestry?12. How should water be added?13. What is desertification?14. How can desertification be slowed?
464

www.ck12.org Chapter 9. Human Impacts on Earth’s Environment
9.7 Hazardous Waste
Learning Objectives
• Define hazardous waste.• Explain how hazardous wastes negatively affect humans and the environment.
Are these hazardous wastes safely stored?
Hazardous wastes must be stored, used and disposed of properly. Some wastes are extremely corrosive and can getthrough steel drums over time. How can we be sure that hazardous wastes are actually stored safely for the timenecessary?
What Is Hazardous Waste?
Hazardous waste is any waste material that is dangerous to human health or that degrades the environment. Haz-ardous waste includes substances that are:
1. Toxic: causes serious harm or death, or is poisonous.2. Chemically active: causes dangerous or unwanted chemical reactions, such as explosions.3. Corrosive: destroys other things by chemical reactions.4. Flammable: easily catches fire and may send dangerous smoke into the air.
All sorts of materials are hazardous wastes and there are many sources. Many people have substances that couldbecome hazardous wastes in their homes. Several cleaning and gardening chemicals are hazardous if not usedproperly. These include chemicals like drain cleaners and pesticides that are toxic to humans and many other
465

9.7. Hazardous Waste www.ck12.org
creatures. While these chemicals are fine if they are stored and used properly, if they are used or disposed ofimproperly, they may become hazardous wastes. Others sources of hazardous waste are shown in Table 9.2.
TABLE 9.2: Hazardous Waste
Type of Hazardous Waste Example Why it is HazardousChemicals from the automobile in-dustry
Gasoline, used motor oil, batteryacid, brake fluid
Toxic to humans and other organ-isms; often chemically active; oftenflammable.
Batteries Car batteries, household batteries Contain toxic chemicals; are oftencorrosive.
Medical wastes Surgical gloves, wastes contami-nated with body fluids such asblood, x-ray equipment
Toxic to humans and other organ-isms; may be chemically active.
Paints Paints, paint thinners, paint strip-pers, wood stains
Toxic; flammable.
Dry cleaning chemicals Many various chemicals Toxic; many cause cancer in hu-mans.
Agricultural chemicals Pesticides, herbicides, fertilizers Toxic to humans; can harm otherorganism; pollute soils and water.
MEDIAClick image to the left or use the URL below.URL: https://www.ck12.org/flx/render/embeddedobject/186860
Summary
• Hazardous waste is material that is toxic, chemically active, corrosive, or flammable.• Hazardous wastes are damaging to the environment or human health.• Hazardous materials are found in a variety of settings, including industry, agriculture, and people’s homes.
Review
1. If pesticides are toxic, why do we spray them on food crops?2. Why are some medical wastes hazardous?3. What is hazardous waste? Is it always clear whether something is hazardous or not?
466

www.ck12.org Chapter 9. Human Impacts on Earth’s Environment
9.8 Impacts of Hazardous Waste
Learning Objectives
• Describe the impacts of hazardous waste on humans and the environment.• Trace how these impacts led to the Superfund Act.
What role do citizens play in protecting their environment?
Sometimes it’s up to the residents in an area to recognize the effects of hazardous waste and to get the governmentto find the responsible party and initiate cleanup. Here, a resident of Love Canal protests the hazardous waste
467

9.8. Impacts of Hazardous Waste www.ck12.org
contamination in her neighborhood.
Love Canal
The story of Love Canal, New York, begins in the 1950s, when a local chemical company placed hazardous wastesin 55-gallon steel drums and buried them. Love Canal was an abandoned waterway near Niagara Falls and wasthought to be a safe site for hazardous waste disposal because the ground was fairly impermeable (Figure 9.23).After burial, the company covered the containers with soil and sold the land to the local school system for $1. Thecompany warned the school district that the site had been used for toxic waste disposal.
FIGURE 9.23Steel drums were used to contain 21,000tons of hazardous chemicals at LoveCanal.
Soon a school, a playground, and 100 homes were built on the site. The impermeable ground was breached whensewer systems were dug into the rock layer. Over time, the steel drums rusted and the chemicals were released intothe ground. In the 1960s people began to notice bad odors. Children developed burns after playing in the soil, andthey were often sick. In 1977 a swamp created by heavy rains was found to contain 82 toxic chemicals, including11 suspected cancer-causing chemicals.
A Love Canal resident, Lois Gibbs, organized a group of citizens called the Love Canal Homeowners Associationto try to find out what was causing the problems (See opening image). When they discovered that toxic chemicalswere buried beneath their homes and school, they demanded that the government take action to clean up the area andremove the chemicals.
Superfund Act
In 1978, people were relocated to safe areas. The problem of Love Canal was instrumental in the passage of the theSuperfund Act in 1980. This law requires companies to be responsible for hazardous chemicals that they put intothe environment and to pay to clean up polluted sites, which can often cost hundreds of millions of dollars. LoveCanal became a Superfund site in 1983 and as a result, several measures were taken to secure the toxic wastes. Theland was capped so that water could not reach the waste, debris was cleaned from the nearby area, and contaminatedsoils were removed.
468

www.ck12.org Chapter 9. Human Impacts on Earth’s Environment
Impacts of Hazardous Waste
The pollution at Love Canal was not initially visible, but it became visible. The health effects from the waste werealso not initially visible, but they became clearly visible. The effects of the contamination that were seen in humanhealth included sickness in children and a higher than normal number of miscarriages in pregnant women. Toxicchemicals may cause cancer and birth defects. Why do you think children and fetuses are more susceptible? Becauseyoung organisms grow more rapidly, they take in more of the toxic chemicals and are more affected.
Cancer Clusters
Sometimes the chemicals are not so easily seen as they were at Love Canal. But the impacts can be seen statistically.For example, contaminated drinking water may cause an increase in some types of cancer in a community.
Why is one person with cancer not enough to suspect contamination by toxic waste? One is not a statistically validnumber. A certain number of people get cancer all the time. To identify contamination, a number of cancers abovethe normal rate, called a cancer cluster, must be discovered. A case that was made into a book and movie called ACivil Action involved the community of Woburn, Massachusetts. Groundwater contamination was initially suspectedbecause of an increase in childhood leukemia and other illnesses. As a result of concern by parents, the well waterwas analyzed and shown to have high levels of TCE (trichloroethylene).
Toxic Metals
Lead and mercury are two chemicals that are especially toxic to humans. Lead was once a common ingredientin gasoline and paint, but it was shown to damage human brains and nervous systems. Since young children aregrowing rapidly, lead is especially harmful in children under the age of six (Figure 9.24). In the 1970s and 1980s,the United States government passed laws completely banning lead in gasoline and paint. Homes built before the1970s may contain lead paint. Paint so old is likely to be peeling and poses a great threat to human health. About200 children die every year from lead poisoning.
FIGURE 9.24(a) Leaded gasoline. (b) Leaded paint.
469

9.8. Impacts of Hazardous Waste www.ck12.org
Mercury is a pollutant that can easily spread around the world. Sources of mercury include volcanic eruptions, coalburning, and wastes such as batteries, electronic switches, and electronic appliances such as television sets. Likelead, mercury damages the brain and impairs nervous system function. More about the hazards of mercury pollutioncan be found later in this concept.
Summary
• The Superfund Act of 1980 requires that companies safely dispose of hazardous chemicals they generate andclean up sites they pollute.
• The effects of hazardous wastes on human populations include miscarriages, birth defects, brain damage, andcancer, particularly in children.
• An individual may develop a disease, like cancer, but when the number of cases of the disease exceeds whatis found in other areas, it is cause for concern.
Review
1. If waste is to remain hazardous for a long period of time, how can society protect itself from problems asoccurred at Love Canal?
2. What is the Superfund Act and how did Love Canal lead to it?3. What is a cancer cluster? What should be done if one is found?
Resources
MEDIAClick image to the left or use the URL below.URL: https://www.ck12.org/flx/render/embeddedobject/169944
470

www.ck12.org Chapter 9. Human Impacts on Earth’s Environment
9.9 Preventing Hazardous Waste Problems
Learning Objectives
• Explain how to prevent pollution by hazardous wastes.
What should be done about hazardous waste sites?
Cleaning up toxic wastes has incredible costs in time and money. Laws now protect lands from contamination,but many sites were damaged before those laws were passed. No other organization is big enough, so it is thegovernment’s job to clean up a toxic site if the company that caused the damage no longer exists or cannot affordcleanup.
Preventing Hazardous Waste Pollution
Nations that have more industry produce more hazardous waste. Currently, the United States is the world’s largestproducer of hazardous wastes, but China, which produces so many products for the developed world, may soon takeover the number-one spot.
Countries with more industry produce more hazardous wastes than those with little industry. Problems with haz-ardous wastes and their disposal became obvious sooner in the developed world than in the developing world. As aresult, many developed nations, including the United States, have laws to help control hazardous waste disposal andto clean toxic sites.
As mentioned in the "Impacts of Hazardous Waste" concept, the Superfund Act requires companies to clean upcontaminated sites that are designated as Superfund sites (Figure 9.25). If a responsible party cannot be identified,
471

9.9. Preventing Hazardous Waste Problems www.ck12.org
because the company has gone out of business or its culpability cannot be proven, the federal government pays forthe cleanup out of a trust fund with money put aside by the petroleum and chemical industries. As a result of theSuperfund Act, companies today are more careful about how they deal with hazardous substances.
FIGURE 9.25Superfund sites are located all over the nation and many are waiting to be cleaned up.
The Resource Conservation and Recovery Act of 1976 requires that companies keep track of any hazardous materialsthey produce. These materials must be disposed of using government guidelines and records must be kept to showthe government that the wastes were disposed of safely. Workers must be protected from the hazardous materials.
To some extent, individuals can control the production and disposal of hazardous wastes. We can choose to usematerials that are not hazardous, such as using vinegar as a cleanser. At home, people can control the amount ofpesticides that they use (or they can use organic methods of pest control). It is also necessary to dispose of hazardousmaterials properly by not pouring them over the land, down the drain or toilet, or into a sewer or trashcan.
472

www.ck12.org Chapter 9. Human Impacts on Earth’s Environment
MEDIAClick image to the left or use the URL below.URL: https://www.ck12.org/flx/render/embeddedobject/186861
MEDIAClick image to the left or use the URL below.URL: https://www.ck12.org/flx/render/embeddedobject/186863
Summary
• Government regulations, like the Superfund Act, hold companies accountable for the hazardous materials theyproduce.
• Developed nations have seen the consequences of hazardous waste and are more likely to have protections inplace than developing countries.
• People can lessen the hazardous waste problem by using materials that are not hazardous or by disposing ofwastes properly.
Review
1. How do the Superfund Act and other government regulations prevent lands from being contaminated?2. What can you do to prevent or lessen the generation of hazardous wastes?3. Why does the United States have so many Superfund sites compared with other nations?
Explore More
Use this resource to answer the questions that follow.
MEDIAClick image to the left or use the URL below.URL: https://www.ck12.org/flx/render/embeddedobject/178376
1. Why can’t hazardous wastes be thrown in the trash?2. What does proper disposal of hazardous waste prevent?
473

9.9. Preventing Hazardous Waste Problems www.ck12.org
3. Although this video is made for a specific location, how can you use the information to dispose of hazardouswaste in your own region?
4. What typical household wastes are hazardous?5. What should you do with the hazardous wastes?6. What should you do with leftover pharmaceuticals?7. How does the hazardous waste facility in Contra Costa County meet the motto reduce, reuse, recycle?8. How can you find a hazardous waste facility in your area? Does your facility take all toxic waste items? How
about pharmaceuticals?
474

www.ck12.org Chapter 9. Human Impacts on Earth’s Environment
9.10 Environmental Impacts of Mining
Learning Objectives
• Describe the environmental costs of mining.
How much does your mp3 player really cost?
Many of the things we want come partly from minerals. But making minerals useful often causes environmentaldamage.
Mining and the Environment
Although mining provides people with many needed resources, the environmental costs can be high. Surface miningclears the landscape of trees and soil, and nearby streams and lakes are inundated with sediment. Pollutants from themined rock, such as heavy metals, enter the sediment and water system. Acids flow from some mine sites, changingthe composition of nearby waterways (Figure 9.26).
U.S. law has changed in recent decades so that a mine region must be restored to its natural state, a process calledreclamation. This is not true of older mines. Pits may be refilled or reshaped and vegetation planted. Pits may beallowed to fill with water and become lakes or may be turned into landfills. Underground mines may be sealed offor left open as homes for bats.
MEDIAClick image to the left or use the URL below.URL: https://www.ck12.org/flx/render/embeddedobject/186866
475

9.10. Environmental Impacts of Mining www.ck12.org
FIGURE 9.26Acid drainage from a surface coal mine in Missouri.
Summary
• Surface mining clears the land, completely destroying the ecosystems that were found there.• Mining releases pollutants, which affect the immediate area and may travel downstream or downwind to cause
problems elsewhere.• Reclamation occurs when people attempt to return the mined land to its original state.
Review
1. What damage may be caused by mining?2. Why is sediment considered a problem in mined areas?3. If lands altered by mining in recent decades must be reclaimed, what happens to lands that were mined prior
to that law?
Explore More
Use this resource to answer the questions that follow.
MEDIAClick image to the left or use the URL below.URL: https://www.ck12.org/flx/render/embeddedobject/178378
1. How was coal traditional mined in West Virginia?2. What is mountaintop removal mining?3. What is the first step after the site has been identified?
476

www.ck12.org Chapter 9. Human Impacts on Earth’s Environment
4. What role do geologists play?5. How does the rock get broken?6. What is done with the broken rock?7. What is the ratio of coal to rock removed?8. What is the advantage of mountaintop removal for miners?9. What is the environmental cost?
Summary
Human population grew by 1 billion in the past 12 years to reach 7 billion. In 1960, the human population wasonly 3 billion. The population growth of every species on Earth is limited by some limiting factor so that withineach ecosystem the carrying capacity for each species is set. Human ingenuity due to our brains and our hands, hasallowed us to blow past any previously held idea of what Earth’s carrying capacity for humans is. The developmentof and advances in agriculture over for the past 10,000 years have been the largest factors. How long can humanpopulation continue to grow? No one knows, and no one knows what the planet’s ultimate carrying capacity forhumans will be. The enormous number of people, and the tremendous consumption of the percentage of the world’spopulation that does more than just meet its basic needs, has put a strain on Earth’s resources and generated atremendous amount of waste. Land is used for farming and other activities and also for the disposal of hazardouswastes. Water is used for drinking, bathing, agricultural and industrial uses, which may deplete supplies and pollutewater sources. Much of what has fueled development in agriculture and industry has been the availability ofcheap fossil fuels, which pollute the air and emit carbon dioxide into the atmosphere. Carbon dioxide is one ofthe greenhouse gases that trap heat and moderate Earth’s temperature. As the levels of carbon dioxide and othergreenhouse gases in the atmosphere rise, they can trap more heat, which causes global temperatures to warm. Theeffects of global warming are already being seen as ice melts and sea level rises, species are forced to move uphillor higher in latitude seeking a suitable habitat, the oceans become ore acidic, and many other consequences.
477
9.11. References www.ck12.org
9.11 References
1. Hana Zavadska. CK-12 Foundation . CC BY-NC 3.02. Hana Zavadska. CK-12 Foundation . CC BY-NC 3.03. Hana Zavadska. CK-12 Foundation . CC BY-NC 3.04. Hana Zavadska. CK-12 Foundation . CC BY-NC 3.05. User:(WT-shared) Rangliker/Wts.Wikivoyage. http://commons.wikimedia.org/wiki/File:Manhattan,_view_f
rom_Empire_State_Building.jpg . Public Domain6. Image copyright Pichugin Dmitry, 2014. http://www.shutterstock.com . Used under license from Shutter-
stock.com7. Flickr:AnanthBS. https://commons.wikimedia.org/wiki/File:India_Farming.jpg . CC BY 2.08. Courtesy of the US Department of Agriculture. http://commons.wikimedia.org/wiki/File:Combine-harvestin
g-corn.jpg . Public Domain9. Herman Heyenbrock. http://commons.wikimedia.org/wiki/File:1890heyenbrock.jpg . Public Domain
10. User:NightThree/Wikipedia. http://commons.wikimedia.org/wiki/File:Tractors_in_Potato_Field.jpg . CCBY 2.0
11. User:(WT-shared) Rangliker/Wts.Wikivoyage. http://commons.wikimedia.org/wiki/File:Manhattan,_view_from_Empire_State_Building.jpg . Public Domain
12. Richard Olson and Holly Gibbs, ORNL/ESD. http://cdiac.esd.ornl.gov/ndps/ndp058a.html . Public Domain13. Courtesy of Charles O’Rear/US Department of Agriculture. http://commons.wikimedia.org/wiki/File:Cropd
uster_spraying_pesticides.jpg . Public Domain14. User:Ultramarine/Wikipedia. http://commons.wikimedia.org/wiki/File:Percentage_living_on_less_than_%2
41_per_day_1981-2001.png . Public Domain15. Richard Olson and Holly Gibbs, ORNL/ESD. http://cdiac.esd.ornl.gov/ndps/ndp058a.html . Public Domain16. Image copyright Andy Dean Photography, 2014. http://www.shutterstock.com . Used under license form
Shutterstock.com17. Image copyright Andy Dean Photography, 2014. http://www.shutterstock.com . Used under license form
Shutterstock.com18. (a) Jim Simonson; (b) Image copyright Neil Bradfield, 2014. (a) http://www.flickr.com/photos/rocketjim54
/262623806/; (b) http://www.shutterstock.com . (a) CC BY 2.0; (b) Used under license from Shutterstock.com19. (a) Courtesy of Lynn Betts, US Department of Agriculture; (b) Image copyright Frank Fennema, 2014. (a)
http://commons.wikimedia.org/wiki/File:TerracesBuffers.JPG; (b) http://www.shutterstock.com . (a) PublicDomain; (b) Used under license from Shutterstock.com
20. Courtesy of the National Resources Conservation Service. http://commons.wikimedia.org/wiki/File:Sheep_and_goats.jpg . Public Domain
21. Lucas Corrigan. http://www.flickr.com/photos/lucas_a_corrigan/8057281048/ . CC BY 2.022. Courtesy of NASA/GSFC/METI/ERSDAC/JAROS and US/Japan ASTER Science Team. http://earthobservat
ory.nasa.gov/IOTD/view.php?id=1141 . Public Domain23. (a) Alice Wiegand (User:Lyzzy/Wikimedia Commons); (b) Courtesy of Robert Simmon and NASA. (a) http
://commons.wikimedia.org/wiki/File:Braunkohletagebau-Garzweiler_2006.jpg; (b) http://earthobservatory.nasa.gov/IOTD/view.php?id=43000 . (a) CC BY 2.5; (b) Public Domain
24. User:Ingolfson/Wikimedia Commons. http://commons.wikimedia.org/wiki/File:Industrial_Wasteland_As_Parking_Lots.jpg . Public Domain
25. (a) Jim Simonson; (b) Image copyright Neil Bradfield, 2014. (a) http://www.flickr.com/photos/rocketjim54/262623806/; (b) http://www.shutterstock.com . (a) CC BY 2.0; (b) Used under license from Shutterstock.com
26. User:Bcasterline/Wikipedia. http://commons.wikimedia.org/wiki/File:Intikawan_Amantani.jpg . Public Do-main
478

www.ck12.org Chapter 9. Human Impacts on Earth’s Environment
27. Courtesy of Arthur Rothstein/Farm Security Administration. http://commons.wikimedia.org/wiki/File:Farmer_walking_in_dust_storm_Cimarron_County_Oklahoma2.jpg . Public Domain
28. Joi Ito. http://www.flickr.com/photos/joi/423508812/ . CC BY 2.029. User:Bcasterline/Wikipedia. http://commons.wikimedia.org/wiki/File:Intikawan_Amantani.jpg . Public Do-
main30. . . CC BY-NC31. (a) Taber Andrew Bain; (b) Image copyright Mike Red, 2014. (a) http://www.flickr.com/photos/andrewbain/
548574614/; (b) http://www.shutterstock.com . (a) CC BY 2.0; (b) Used under license from Shutterstock.com32. Courtesy of the US Environmental Protection Agency. http://www.epa.gov/superfund/30years/timeline/# .
Public Domain33. (a) Taber Andrew Bain; (b) Image copyright Mike Red, 2014. (a) http://www.flickr.com/photos/andrewbain/
548574614/; (b) http://www.shutterstock.com . (a) CC BY 2.0; (b) Used under license from Shutterstock.com34. Courtesy of the EPA. http://www.epa.gov/superfund/sites/phonefax/products.htm . Public Domain35. Courtesy of the EPA. http://www.epa.gov/superfund/sites/phonefax/products.htm . Public Domain36. Courtesy of D. Hardesty/USGS Columbia Environmental Research Center. http://commons.wikimedia.org
/wiki/File:Iron_hydroxide_precipitate_in_stream.jpg . Public Domain37. Courtesy of D. Hardesty/USGS Columbia Environmental Research Center. http://commons.wikimedia.org
/wiki/File:Iron_hydroxide_precipitate_in_stream.jpg . Public Domain
479

www.ck12.org
CHAPTER 10 Human Impacts on Earth’sWater
Chapter Outline10.1 USES OF WATER
10.2 WATER DISTRIBUTION
10.3 SAFETY OF WATER
10.4 WATER POLLUTION
10.5 PROTECTING WATER FROM POLLUTION
10.6 GROUNDWATER DEPLETION
10.7 GROUNDWATER POLLUTION
10.8 CLEANING UP GROUNDWATER
10.9 CONSERVING WATER
10.10 COASTAL POLLUTION
10.11 OCEAN GARBAGE PATCH
10.12 OIL SPILLS
10.13 REFERENCES
480

www.ck12.org Chapter 10. Human Impacts on Earth’s Water
10.1 Uses of Water
Learning Objectives
• Describe how humans use water in a variety of ways.
What do you use water for?
Drinking, of course. Bathing, naturally. But what else? Growing food, producing goods, recreation, maintaininghealthy ecosystems: all require lots and lots of water.
Water Consumption
Humans use six times as much water today as they did 100 years ago. People living in developed countries use a fargreater proportion of the world’s water than people in less developed countries. What do people use all of that waterfor?
Human Uses of Water
Besides drinking and washing, people need water for agriculture, industry, household uses, and recreation (Figure10.1). Recreational use and environmental use average 1% each.
Water use can be consumptive or non-consumptive, depending on whether the water is lost to the ecosystem.
• Non-consumptive water use includes water that can be recycled and reused. For example, the water that goesdown the drain and enters the sewer system is purified and then redistributed for reuse. By recycling water,the overall water consumption is reduced.
• Consumptive water use takes the water out of the ecosystem. Can you name some examples of consumptivewater use?
481

10.1. Uses of Water www.ck12.org
FIGURE 10.1Water used for home, industrial, andagricultural purposes in different regions.Globally more than two-thirds of water isfor agriculture.
Agriculture
Some of the world’s farmers still farm without irrigation by choosing crops that match the amount of rain that fallsin their area. But some years are wet and others are dry. For farmers to avoid years in which they produce little orno food, many of the world’s crops are produced using irrigation.
Wasteful Methods
Three popular irrigation methods are:
• Overhead sprinklers.• Trench irrigation: canals carry water from a water source to the fields.• Flood irrigation: fields are flooded with water.
All of these methods waste water. Between 15% and 36% percent of the water never reaches the crops because itevaporates or leaves the fields as runoff. Water that runs off a field often takes valuable soil with it.
Non-wasteful Methods
A much more efficient way to water crops is drip irrigation (Figure 10.2). With drip irrigation, pipes and tubesdeliver small amounts of water directly to the soil at the roots of each plant or tree. The water is not sprayed into theair or over the ground, so nearly all of it goes directly into the soil and plant roots.
Why Not Change?
Why do farmers use wasteful irrigation methods when water-efficient methods are available? Many farmers andfarming corporations have not switched to more efficient irrigation methods for two reasons:
1. Drip irrigation and other more efficient irrigation methods are more expensive than sprinklers, trenches, andflooding.
482

www.ck12.org Chapter 10. Human Impacts on Earth’s Water
FIGURE 10.2Drip irrigation delivers water to the baseof each plant so little is lost to evaporationand runoff.
2. In the United States and some other countries, the government pays for much of the cost of the water that is usedfor agriculture. Because farmers do not pay the full cost of their water use, they do not have any financial incentiveto use less water.
What ideas can you come up with to encourage farmers to use more efficient irrigation systems?
Aquaculture
Aquaculture is a different type of agriculture. Aquaculture is farming to raise fish, shellfish, algae, or aquatic plants(Figure 10.3). As the supplies of fish from lakes, rivers, and the oceans dwindle, people are getting more fish fromaquaculture. Raising fish increases our food resources and is especially valuable where protein sources are limited.Farmed fish are becoming increasingly common in grocery stores all over the world.
FIGURE 10.3Workers at a fish farm harvest fish they will sell to stores.
Growing fish in a large scale requires that the fish stocks are healthy and protected from predators. The speciesraised must be hearty, inexpensive to feed, and able to reproduce in captivity. Wastes must be flushed out to keepanimals healthy. Raising shellfish at farms can also be successful.
483

10.1. Uses of Water www.ck12.org
Aquaculture Problems
For some species, aquaculture is very successful and environmental harm is minimal. But for other species, aqua-culture can cause problems. Natural landscapes, such as mangroves, which are rich ecosystems and also protectcoastlines from storm damage, may be lost to fish farms (Figure 10.4). For fish farmers, keeping costs down maybe a problem since coastal land may be expensive and labor costs may be high. Large predatory fish at the 4th or 5thtrophic level must eat a lot, so feeding large numbers of these fish is expensive and environmentally costly. Farmedfish are genetically different from wild stocks, and if they escape into the wild they may cause problems for nativefish. Because the organisms live so close together, parasites are common and may also escape into the wild.
FIGURE 10.4Shrimp farms on the coast of Ecuadorare shown as blue rectangles. Mangroveforests, salt flats, and salt marshes havebeen converted to shrimp farms.
Industrial Water Use
Industrial water use accounts for an estimated 15% of worldwide water use, with a much greater percentage indeveloped nations. Industrial uses of water include power plants that use water to cool their equipment and oilrefineries that use water for chemical processes. Manufacturing is also water intensive.
Household Use
Think about all the ways you use water in a day. You need to count the water you drink, cook with, bathe in, gardenwith, let run down the drain, or flush down the toilet. In developed countries, people use a lot of water, while in lessdeveloped countries people use much less. Globally, household or personal water use is estimated to account for15% of world-wide water use.
Some household water uses are non-consumptive, because water is recaptured in sewer systems, treated, and returnedto surface water supplies for reuse. Many things can be done to lower water consumption at home.
• Convert lawns and gardens to drip-irrigation systems.• Install low-flow shower heads and low-flow toilets.
In what other ways can you use less water at home?
484

www.ck12.org Chapter 10. Human Impacts on Earth’s Water
Recreational Use
People love water for swimming, fishing, boating, river rafting, and other activates. Even activities such as golf,where there may not be any standing water, require plenty of water to make the grass on the course green. Despiteits value, the amount of water that most recreational activities use is low: less than 1% of all the water we use.
Many recreational water uses are non-consumptive including swimming, fishing, and boating. Golf courses are thebiggest recreational water consumer since they require large amounts for irrigation, especially because many coursesare located in warm, sunny, desert regions where water is scarce and evaporation is high.
Environmental Use
Environmental use of water includes creating wildlife habitat. Lakes are built to create places for fish and waterbirds (Figure 10.5). Most environmental uses are non-consumptive and account for an even smaller percentage ofwater use than recreational uses. A shortage of this water is a leading cause of global biodiversity loss.
FIGURE 10.5Wetlands and other environments dependon clean water to survive.
MEDIAClick image to the left or use the URL below.URL: https://www.ck12.org/flx/render/embeddedobject/186869
Summary
• Consumptive water use takes water out of the ecosystem; non-consumptive water use includes water that canbe recycled and reused.
• People can use less water by having efficient systems for water use and by reusing and recycling water wherepossible.
485

10.1. Uses of Water www.ck12.org
• Some water must remain in the environment for recreational use for humans and to support ecosystems.
Review
1. Why do people in developed countries use so much more water than they used to?2. Why don’t localities and people use water in the most efficient way, rather than sometimes in wasteful ways?3. What is aquaculture and why is it going to be increasingly important in the future?
Explore More
Use these resources to answer the questions that follow.
MEDIAClick image to the left or use the URL below.URL: https://www.ck12.org/flx/render/embeddedobject/178380
1. Since so little water is drinkable, what could be done to make undrinkable water drinkable?2. How much of the world’s population doesn’t have safe water?3. Do people around the world die from water-related diseases?4. How much water does the average person in North America use per day?5. How much water does the average person in Europe use per day? What percentage of North America’s use is
that roughly?6. How much water does the average person in Mozambique and other developing countries use per day? About
what percentage of North America’s water use is that roughly?7. What happens to water availability as population grows?
486

www.ck12.org Chapter 10. Human Impacts on Earth’s Water
10.2 Water Distribution
Learning Objectives
• Describe how water is distributed across the globe.• Explain the causes and consequences of water scarcity.
Will water cause the next war?
Wars have been fought over oil, but many people predict that the next war will be fought over water. Certainly, wateris becoming scarcer.
Water Distribution
Water is unevenly distributed around the world. Large portions of the world, such as much of northern Africa, receivevery little water relative to their population (Figure 10.6). The map shows the number of months in which there islittle rainfall in each region. In developed nations, water is stored, but in underdeveloped nations, water storage maybe minimal.
Over time, as population grows, rainfall totals will change, resulting in less water per person in some regions. In2025, many nations, even developed nations, are projected to have less water per person than now
Water Shortages
Water scarcity is a problem now and will become an even larger problem in the future as water sources are reducedor polluted and population grows. In 1995, about 40% of the world’s population faced water scarcity. Scientists
487

10.2. Water Distribution www.ck12.org
FIGURE 10.6Some regions have very little rainfall per month.
estimate that by the year 2025, nearly half of the world’s people won’t have enough water to meet their daily needs.Nearly one-quarter of the world’s people will have less than 500 m3 of water to use in an entire year. That amount isless water in a year than some people in the United States use in one day.
Droughts
Droughts occur when a region experiences unusually low precipitation for months or years (Figure 10.7). Periodsof drought may create or worsen water shortages.
Human activities can contribute to the frequency and duration of droughts. For example, deforestation keeps treesfrom returning water to the atmosphere by transpiration; part of the water cycle becomes broken. Because it isdifficult to predict when droughts will happen, it is difficult for countries to predict how serious water shortages willbe each year.
Effect of Changing Climate
Global warming will change patterns of rainfall and water distribution. As the Earth warms, regions that currentlyreceive an adequate supply of rain may shift. Regions that rely on snowmelt may find that there is less snow andthe melt comes earlier and faster in the spring, causing the water to run off and not be available through the drysummers. A change in temperature and precipitation would completely change the types of plants and animals thatcan live successfully in that region.
488

www.ck12.org Chapter 10. Human Impacts on Earth’s Water
FIGURE 10.7Extended periods with lower than normal rainfall cause droughts.
Water Scarcity
Water scarcity can have dire consequences for the people, the economy, and the environment. Without adequatewater, crops and livestock dwindle and people go hungry. Industry, construction, and economic development ishalted, causing a nation to sink further into poverty. The risk of regional conflicts over scarce water resources rises.People die from diseases, thirst, or even in war over scarce resources.
California’s population is growing by hundreds of thousands of people a year, but much of the state receives asmuch annual rainfall as Morocco. With fish populations crashing, global warming, and the demands of the country’slargest agricultural industry, the pressures on our water supply are increasing.
MEDIAClick image to the left or use the URL below.URL: https://www.ck12.org/flx/render/embeddedobject/178381
MEDIAClick image to the left or use the URL below.URL: https://www.ck12.org/flx/render/embeddedobject/186871
489

10.2. Water Distribution www.ck12.org
Conflicts Over Water
As water supplies become scarce, conflicts will arise between the individuals or nations that have enough clean waterand those that do not (Figure 10.8). Some of today’s greatest tensions are happening in places where water is scarce.Water disputes may add to tensions between countries where differing national interests and withdrawal rights havebeen in conflict. Just as with energy resources today, wars may erupt over water.
FIGURE 10.8Many regions already experience water scarcity. This map shows the number of months in which the amount ofwater that is used exceeds the availability of water that can be used sustainably. This is projected to get worse asdemand increases.
Water disputes are happening along 260 different river systems that cross national boundaries. Some of these disputesare potentially very serious. International water laws, such as the Helsinki Rules, help interpret water rights amongcountries.
Science Friday: Forecasting the Meltdown: The Aerial Snow Observatory
75% of Southern California’s water supply comes from the snowpack in the Sierra Nevada Mountain Range.This video by Science Friday explains how NASA uses the Airborne Snow Observatory that uses specializedinstrumentation to carefully measure the water content.
MEDIAClick image to the left or use the URL below.URL: https://www.ck12.org/flx/render/embeddedobject/194571
490

www.ck12.org Chapter 10. Human Impacts on Earth’s Water
Summary
• A lot of the problem with water is that it is not evenly distributed across the planet.• Many of the world’s people live with water scarcity, and that percentage will increase as populations increase
and climate changes.• Some people predict that, just as wars are fought over energy now, future wars will be fought over water.
Review
1. How will changing climate affect the availability and distribution of water?2. How do human activities affect the occurrence of droughts?3. How do so many people live with so little water?
Explore More
Use these resources to answer the questions that follow.
MEDIAClick image to the left or use the URL below.URL: https://www.ck12.org/flx/render/embeddedobject/178383
1. What does the water footprint of a product refer to?2. What is the water footprint of developed nations, like the United States and southern Europe, per capita
compared with developing nations? How about compared with the global average?3. What is the water footprint of the United Kingdom and other northern European countries compared with the
global average? How about with the developing nations?4. What is used as the water footprint cap? Is that sustainable?5. Besides living within the water footprint cap, what should governments do?6. How can the issue of water equity be addressed?
491

10.3. Safety of Water www.ck12.org
10.3 Safety of Water
Learning Objectives
• Describe the causes and consequences of unsafe water.
What do you see in this photo?
The Ganges River is sacred to the people of India. It is also a major source of water for drinking and bathing formillions of people. An estimated 400 million people are affected by pollution in the Ganges. What can be done toprotect a water body that has so much pressure placed on it?
Scarcity of Safe Drinking Water
The water that comes out of our faucets is safe because it has gone through a series of treatment and purificationprocesses to remove contaminants. Those of us who are fortunate enough to always be able to get clean water froma tap in our home may have trouble imagining life in a country that cannot afford the technology to treat and purifywater.
Pollution
Many people in the world have no choice but to drink from the same polluted river where sewage is dumped. One-fifth of all people in the world, more than 1.1 billion people, do not have access to safe water for drinking, personal
492

www.ck12.org Chapter 10. Human Impacts on Earth’s Water
cleanliness, and domestic use. Unsafe drinking water carries many pathogens, or disease-causing biological agentssuch as infectious bacteria and parasites. Toxic chemicals and radiological hazards in water can also cause diseases.
Waterborne Disease
Waterborne disease caused by unsafe drinking water is the leading cause of death for children under the age of fivein many nations and a cause of death and illness for many adults. About 88% of all diseases are caused by drinkingunsafe water (Figure 10.9). Throughout the world, more than 14,000 people die every day from waterborne diseases,such as cholera, and many of the world’s hospital beds are occupied by patients suffering from a waterborne disease.
FIGURE 10.9Dracunculiasis, commonly known asGuinea Worm, is contracted when a per-son drinks the guinea worm larvae.
Guinea worm is a serious problem in parts of Africa that is being eradicated. Learn what is being done to decreasethe number of people suffering from this parasite at the video below.
MEDIAClick image to the left or use the URL below.URL: https://www.ck12.org/flx/render/embeddedobject/114938
Summary
• More than 1 billion people do not have access to water that is safe for drinking and washing.• Waterborne diseases cause death and illness to people in many parts of the world.• Government programs and international aid help to provide safe drinking water for some people.
493

10.3. Safety of Water www.ck12.org
Review
1. Would you go thirsty or would you drink from a water source that was visibly polluted?2. Why do nations fail to provide safe drinking water for their people?3. Why do waterborne diseases rarely strike in the developed world?
Explore More
Use this resource to answer the questions that follow.
MEDIAClick image to the left or use the URL below.URL: https://www.ck12.org/flx/render/embeddedobject/178391
1. How many children are killed by waterborne diseases every year?2. What did one school in rural Kenya do to tackle its water problem?3. What problems did the school have before the tank was built?4. What has happened since the construction of the tank?5. What burden do the students no longer have?6. What is the source of water in the tank?
Resources
MEDIAClick image to the left or use the URL below.URL: https://www.ck12.org/flx/render/embeddedobject/186872
494

www.ck12.org Chapter 10. Human Impacts on Earth’s Water
10.4 Water Pollution
Learning Objectives
• Describe the sources of water pollution.
Is polluted water like this only seen in developing nations?
There is certainly polluted water in developed nations, but that water is cleaned and purified before it is put in tapsand sent to people’s homes. Pollutants come from a variety of sources. Freshwater and ocean pollution are seriousglobal problems that affect the availability of safe drinking water, human health, and the environment. Waterbornediseases from water pollution kill millions of people in underdeveloped countries every year.
Sources of Water Pollution
Water pollution contributes to water shortages by making some water sources unavailable for use. In underdevelopedcountries, raw sewage is dumped into the same water that people drink and bathe in. Even in developed countries,water pollution affects human and environmental health.
Water pollution includes any contaminant that gets into lakes, streams, and oceans. The most widespread source ofwater contamination in developing countries is raw sewage. In developed countries, the three main sources of waterpollution are described below.
495

10.4. Water Pollution www.ck12.org
Municipal Pollution
Wastewater from cities and towns contains many different contaminants from many different homes, businesses, andindustries (Figure 10.10). Contaminants come from:
• Sewage disposal (some sewage is inadequately treated or untreated).• Storm drains.• Septic tanks (sewage from homes).• Boats that dump sewage.• Yard runoff (fertilizer and herbicide waste).
FIGURE 10.10Municipal and agricultural pollution.
Large numbers of sewage spills into San Francisco Bay are forcing cities, water agencies and the public to take acloser look at wastewater and its impacts on the health of the bay. QUEST investigates the causes of the spills andwhat’s being done to prevent them.
MEDIAClick image to the left or use the URL below.URL: https://www.ck12.org/flx/render/embeddedobject/116516
Industrial Pollution
Factories and hospitals spew pollutants into the air and waterways (Figure 10.11). Some of the most hazardousindustrial pollutants include:
• Radioactive substances from nuclear power plants and medical and scientific sources.• Heavy metals, organic toxins, oils, and solids in industrial waste.• Chemicals, such as sulfur, from burning fossil fuels.• Oil and other petroleum products from supertanker spills and offshore drilling accidents.• Heated water from industrial processes, such as power stations.
496

www.ck12.org Chapter 10. Human Impacts on Earth’s Water
FIGURE 10.11Industrial Waste Water: Polluted watercoming from a factory in Mexico. Thedifferent colors of foam indicate variouschemicals in the water and industrial pol-lution.
Agricultural Pollution
Runoff from crops, livestock, and poultry farming carries contaminants such as fertilizers, pesticides, and animalwaste into nearby waterways (Figure 10.12). Soil and silt also run off farms. Animal wastes may carry harmfuldiseases, particularly in the developing world.
FIGURE 10.12The high density of animals in a factoryfarm means that runoff from the area isfull of pollutants.
Fertilizers that run off of lawns and farm fields are extremely harmful to the environment. Nutrients, such as nitrates,in the fertilizer promote algae growth in the water they flow into. With the excess nutrients, lakes, rivers, and baysbecome clogged with algae and aquatic plants. Eventually these organisms die and decompose. Decompositionuses up all the dissolved oxygen in the water. Without oxygen, large numbers of plants, fish, and bottom-dwellinganimals die.
497

10.4. Water Pollution www.ck12.org
Summary
• Municipal pollution comes from sewage, storm drains, septic tanks, boats, and runoff from yards.• Industrial pollution, from factories and hospitals, includes radioactive substances; heavy metals and other
pollutants in industrial waste; by-products of fossil fuel burning; oil and other petroleum products; and heatfrom factories and power plants.
• Agricultural pollutants include wastes from animals, pesticides, herbicides, fertilizers, and soil.
Review
1. How can fertilizers, which help things grow, be pollutants?2. Why is raw sewage a major pollutant in some countries but not in developed countries?3. How could heat be a pollutant? What damage could it cause?
Explore More
Use this resource to answer the questions that follow.
MEDIAClick image to the left or use the URL below.URL: https://www.ck12.org/flx/render/embeddedobject/160889
1. What is an example of point source pollution?2. What is our biggest threat to clean water, at least in Indiana?3. What are the common pollutants carried in non-source pollution?4. Why does non-point source pollution have the greatest impact on water quality?5. How does non-point source pollution end up in our water sources?6. What are some of the common causes of non-point source pollution?
Resources
MEDIAClick image to the left or use the URL below.URL: https://www.ck12.org/flx/render/embeddedobject/164831
498

www.ck12.org Chapter 10. Human Impacts on Earth’s Water
10.5 Protecting Water From Pollution
Learning Objectives
• Explain how to reduce water pollution and clean up polluted water.
How do municipalities clean water?
We take clean water for granted because we have advanced wastewater treatment facilities that remove impuritieswith settling containers, filters, chemicals, and biological agents.
Reducing Water Pollution
Water pollution can be reduced in two ways:
• Keep the water from becoming polluted.• Clean water that is already polluted.
Clean Water Act
Keeping water from becoming polluted often requires laws to be sure that people and companies behave responsibly.In the United States, the Clean Water Act gives the Environmental Protection Agency (EPA) the authority to setstandards for water quality for industry, agriculture, and domestic uses. The law gives the EPA the authority toreduce the discharge of pollution into waterways, finance wastewater treatment plants, and manage runoff. Since itspassage in 1972, more wastewater treatment plants have been constructed and the release of industrial waste into thewater supply is better controlled.
499

10.5. Protecting Water From Pollution www.ck12.org
The United Nations and other international groups are working to improve global water quality standards by pro-viding the technology for treating water. These organizations also educate people in how to protect and improve thequality of the water they use (Figure 10.13).
FIGURE 10.13Scientists control water pollution by sam-pling the water and studying the pollutantsthat are in the water.
MEDIAClick image to the left or use the URL below.URL: https://www.ck12.org/flx/render/embeddedobject/186876
Water Treatment
The goal of water treatment is to make water suitable for such uses as drinking, medicine, agriculture, and industrialprocesses.
People living in developed countries suffer from few waterborne diseases and illness, because they have extensivewater treatment systems to collect, treat, and redeliver clean water. Many underdeveloped nations have few or nowater treatment facilities.
Wastewater contains hundreds of contaminants, such as suspended solids, oxygen-demanding materials, dissolvedinorganic compounds, and harmful bacteria. In a wastewater treatment plant, multiple processes must be used toproduce usable water:
• Sewage treatment removes contaminants, such as solids and particles, from sewage.• Water purification produces drinking water by removing bacteria, algae, viruses, fungi, unpleasant elements
such as iron and sulfur, and man-made chemical pollutants.
The treatment method used depends on the kind of wastewater being treated and the desired end result. Wastewateris treated using a series of steps, each of which produces water with fewer contaminants.
500

www.ck12.org Chapter 10. Human Impacts on Earth’s Water
What Can You Do?
What can individuals do to protect water quality?
• Find approved recycling or disposal facilities for motor oil and household chemicals.• Use lawn, garden, and farm chemicals sparingly and wisely.• Repair automobile or boat engine leaks immediately.• Keep litter, pet waste, leaves, and grass clippings out of street gutters and storm drains.
MEDIAClick image to the left or use the URL below.URL: https://www.ck12.org/flx/render/embeddedobject/186878
Science Friday: Poop and Paddle: An Eco-Friendly Floating Toilet
How do wetlands filter water? In this video by Science Friday, inventor Adam Katzman describes how his toilet-boatconverts human waste into cattails and clean water.
MEDIAClick image to the left or use the URL below.URL: https://www.ck12.org/flx/render/embeddedobject/194516
Summary
• Keeping water from becoming polluted is easier, less expensive, and safer than cleaning it once it is polluted.• Since the passage of the Clean Water Act, many wastewater treatment plants have been constructed and
utilized.• There are multiple levels of water treatment: some water is cleaned enough for use on lawns, while other
water is cleaned enough to be safe for drinking.
Review
1. What is the purpose of the Clean Water Act?2. How is wastewater treated?3. What can the members of your household do to protect water quality?
501

10.5. Protecting Water From Pollution www.ck12.org
Explore More
Use this resource to answer the questions that follow.
MEDIAClick image to the left or use the URL below.URL: https://www.ck12.org/flx/render/embeddedobject/164824
1. What has the Clean Water Act been doing for the past four decades?2. What has changed in the past 15 years?3. What is keeping water clean about, according to the EPA Administrator?4. Who depends on clean water?5. Who had input into the new rules governing the Clean Water Act?6. Does the proposal protect waters that were previously unprotected? What does it do?
502

www.ck12.org Chapter 10. Human Impacts on Earth’s Water
10.6 Groundwater Depletion
Learning Objectives
• Explain the causes and consequences of groundwater depletion.
Is it good to make the desert bloom?
Many sunny, arid regions are good for growing crops as long as water can be added. Some of the increase inproductivity is due to farming in regions that are technically too dry. Groundwater can be used to make the desertbloom, but at what cost? And for how long? Eventually the wells will run dry.
Groundwater Overuse
Some aquifers are overused; people pump out more water than is replaced. As the water is pumped out, the watertable slowly falls, requiring wells to be dug deeper, which takes more money and energy. Wells may go completelydry if they are not deep enough to reach into the lowered water table.
Other problems may stem from groundwater overuse. Subsidence and saltwater intrusion are two of them.
Ogallala Aquifer
The Ogallala Aquifer supplies about one-third of the irrigation water in the United States. The Ogallala Aquifer iswidely used by people for municipal and agricultural needs. (Figure 10.15). The aquifer is found from 30 to 100meters deep over an area of about 440,000 square kilometers!
The water in the aquifer is mostly from the last ice age. About eight times more water is taken from the OgallalaAquifer each year than is replenished. Much of the water is used for irrigation (Figure 10.16).
503

10.6. Groundwater Depletion www.ck12.org
FIGURE 10.14Intense drought has reduced groundwater levels in the southern U.S., particularly in Texas and New Mexico.
MEDIAClick image to the left or use the URL below.URL: https://www.ck12.org/flx/render/embeddedobject/186880
Subsidence
Lowering the water table may cause the ground surface to sink. Subsidence may occur beneath houses and otherstructures (Figure 10.17).
Salt Water Intrusion
When coastal aquifers are overused, salt water from the ocean may enter the aquifer, contaminating the aquifer andmaking it less useful for drinking and irrigation. Salt water incursion is a problem in developed coastal regions, suchas on Hawaii.
504

www.ck12.org Chapter 10. Human Impacts on Earth’s Water
FIGURE 10.15The Ogallala Aquifer is found beneatheight states and is heavily used.
FIGURE 10.16Farms in Kansas use central pivot irrigation, which is more efficient sincewater falls directly on the crops instead of being shot in the air. Thesefields are between 800 and 1600 meters (0.5 and 1 mile) in diameter.
Summary
• When water is pumped from an aquifer, the water table declines and wells must be drilled deeper.• The Ogallala Aquifer was filled in the ice age but is being used to irrigate the farms of the Midwestern U.S. at
a rate far greater than it is being replenished.
505

10.6. Groundwater Depletion www.ck12.org
FIGURE 10.17The San Joaquin Valley of California is one of the world’s major agriculturalareas. So much groundwater has been pumped that the land hassubsided many tens of feet.
• Ground subsidence and saltwater intrusion are two possible consequences of groundwater overuse.
Review
1. What are some of the problems that come from overuse of groundwater?2. How does salt water enter an aquifer?3. In a location where the ground has subsided due to the extraction of groundwater from an aquifer, what do
you think would happen if people tried to pump water back into the aquifer?
Explore More
Use this resource to answer the questions that follow.
MEDIAClick image to the left or use the URL below.URL: https://www.ck12.org/flx/render/embeddedobject/1549
1. How has irrigation changed farming?2. What is leading to people’s demands for additional water?3. What do scientists need to see to better plan for future water use?4. What is the GRACE satellite doing?5. How does GRACE find groundwater aquifers?6. How people know the aquifers are being depleted?7. What is happening in India? what will happen if the water continues to decline?8. What is the future of water?
506

www.ck12.org Chapter 10. Human Impacts on Earth’s Water
10.7 Groundwater Pollution
Learning Objectives
• Describe how pollutants enter groundwater.
How could the water in this well be polluted?
Such an idyllic scene. The water from the well must taste as fresh as the springtime air. Of course, the water maybe contaminated. Industrial waste from a factory down the road, or any number of other things, could have pollutedthe aquifer.
How Pollutants Enter Groundwater
Groundwater pollutants are the same as surface water pollutants: municipal, agricultural, and industrial. Ground-water is more susceptible to some sources of pollution. For example, irrigation water infiltrates into the ground,bringing with it the pesticides, fertilizers, and herbicides that were sprayed on the fields. Water that seeps throughlandfills also carries toxins into the ground. Toxic substances and things like gasoline are kept in undergroundstorage tanks; more than 100,000 of the tanks are currently leaking and many more may develop leaks.
Filtered Water
Groundwater is a bit safer from pollution than surface water from some types of pollution because some pollutantsare filtered out by the rock and soil that water travels through as it travels through the ground or once it is in theaquifer. But rock and soil can’t get out everything, depending on the type of rock and soil and on the types of
507

10.7. Groundwater Pollution www.ck12.org
FIGURE 10.18Tanks may break and leak whatever tox-ins they contain into the ground.
pollutants. As it is, about 25% of the usable groundwater and 45% of the municipal groundwater supplies in theUnited States are polluted.
Pollutant Plume
When the pollutant enters the aquifer, contamination spreads in the water outward from the source and travels inthe direction that the water is moving. This pollutant plume may travel very slowly, only a few inches a day, butover time can contaminate a large portion of the aquifer. Many wells that are currently in use are contaminated. InFlorida, for example, more than 90% of wells have detectible contaminants and thousands have been closed.
Further Reading
Cleaning Up Groundwater
Summary
• Groundwater is susceptible to pollutants that infiltrate into the ground from underground storage tanks oragricultural fields.
• Rock and soil filters some pollutants as water travels down to and through an aquifer.• A plume containing pollutants travels outward from the source and through the aquifer in the direction the
water is moving.
Review
1. Is groundwater always cleaner than surface water?2. Is water that is advertised as spring water necessarily free of contaminants? Why or why not?3. How does groundwater move into and through an aquifer?
Explore More
Use this resource to answer the questions that follow.
508

www.ck12.org Chapter 10. Human Impacts on Earth’s Water
MEDIAClick image to the left or use the URL below.URL: https://www.ck12.org/flx/render/embeddedobject/1543
1. What chemicals get into drinking water?2. How does water get into the groundwater aquifer?3. How does rock dissolve?4. How does karst aquifers groundwater get contaminated?5. What are the three types of contaminants?6. What happens to these contaminates when it rains above a karst aquifer?7. What do sediments increase pollution in an aquifer?
509

10.8. Cleaning Up Groundwater www.ck12.org
10.8 Cleaning Up Groundwater
Learning Objectives
• Describe how to clean up groundwater and explain why it is difficult and expensive.
510

www.ck12.org Chapter 10. Human Impacts on Earth’s Water
Would you drink this water?
This water is obviously dirty, but some of the worst contaminants that can be in water are actually invisible. Thosecontaminants, especially when they are in groundwater, are extremely difficult to remove.
Cleaning Groundwater
Preventing groundwater contamination is much easier and cheaper than cleaning it. To clean groundwater, the water,as well as the rock and soil through which it travels, must be cleansed. Thoroughly cleaning an aquifer would requirecleansing each pore within the soil or rock unit. For this reason, cleaning polluted groundwater is very costly, takesyears, and is sometimes not technically feasible. If the toxic materials can be removed from the aquifer, disposingof them is another challenge.
Stages of Groundwater Cleaning
Elimination of the Pollution Source
If the source is an underground tank, the tank will be pumped dry and then dug out from the ground. If the source isa factory that is releasing toxic chemicals that are ending up in the groundwater, the factory may be required to stopthe discharge.
Monitoring the Extent of the Pollutant
Hydrologists must determine how far, in what direction, and how rapidly the plume is moving. They must determinethe concentration of the contaminant to determine how much it is being diluted. The scientists will use existing wellsand may drill test wells to check for concentrations and monitor the movement of the plume.
FIGURE 10.19Test wells are drilled to monitor groundwater pollution.
Modeling the Contaminant Plume
Using the well data, the hydrologist uses a computer program with information on the permeability of the aquiferand the direction and rate of groundwater flow, then models the plume to predict the dispersal of the contaminantthrough the aquifer. Drilling test wells to monitor pollution is expensive.
511

10.8. Cleaning Up Groundwater www.ck12.org
Remediation
First, an underground barrier is constructed to isolate the contaminated groundwater from the rest of the aquifer.Next, the contaminated groundwater may be treated in place.
Bioremediation is relatively inexpensive. Bioengineered microorganisms are injected into the contaminant plumeand allowed to consume the pollutant. Air may be pumped into the polluted region to encourage the growth andreproduction of the microbes. With chemical remediation, a chemical is pumped into the aquifer so the contaminantis destroyed. Acids or bases can neutralize contaminants or cause pollutants to precipitate from the water.
The most difficult and expensive option is for reclamation teams to pump the water to the surface, cleanse it usingchemical or biological methods, then re-inject it into the aquifer. The contaminated portions of the aquifer must bedug up and the pollutant destroyed by incinerating or chemically processing the soil, which is then returned to theground. This technique is often prohibitively expensive and is done only in extreme cases.
MEDIAClick image to the left or use the URL below.URL: https://www.ck12.org/flx/render/embeddedobject/186882
Summary
• There are four stages needed to clean groundwater: remove the pollutant source, monitor the pollutant, modelthe contaminant plume, and perform remediation.
• By testing the water in many wells for a contaminant, scientists can model the contaminant plume in an aquifer.• Cleaning groundwater in an aquifer usually requires bioremediation, the use of microorganisms that are
bioengineered to consume a pollutant, or chemical remediation, which causes neutralizing chemical reactions.
Review
1. Why does cleaning groundwater in an aquifer also require cleaning the soil or rock that the water travelsthrough?
2. Describe how bioremediation works. Why is this a good way to clean an aquifer without removing the water?3. How do scientists monitor and model a contaminant plume?
Explore More
Use this resource (watch up to 3:03) to answer the questions that follow.
512

www.ck12.org Chapter 10. Human Impacts on Earth’s Water
MEDIAClick image to the left or use the URL below.URL: https://www.ck12.org/flx/render/embeddedobject/178423
1. What is the goal of project 6 at UC Berkeley?2. For this project: What does oxidation refer to? What is in situ?3. What is in situ chemical oxidation (ISCO)?4. How does ISCO work?5. What is the speaker using for an oxidant? What must be done to this chemical before it can be used for this
purpose?6. What makes this work difficult to accomplish?
513

10.9. Conserving Water www.ck12.org
10.9 Conserving Water
Learning Objectives
• Describe ways to conserve water.
Is there a way to conserve our water supply?
You can help to use less water by conserving in your own home. One way is to install a low-flow shower head toreduce the amount water used during showers.
How Society Can Conserve Water
Water consumption per person has been going down for the past few decades. There are many ways that waterconservation can be encouraged. Charging more for water gives a financial incentive for careful water use. Wateruse may be restricted by time of day, season, or activity. Good behavior can be encouraged; for example, people canbe given an incentive to replace grass with desert plants in arid regions.
How You Can Conserve Water
As human population growth continues, water conservation will become increasingly important globally, especiallyin developed countries where people use an enormous amount of water. What are some of the ways you can conservewater in and around your home?
• Avoid polluting water so that less is needed.• Convert to more efficient irrigation methods on farms and in gardens.• Reduce household demand by installing water-saving devices such as low-flow shower heads and toilets.• Reduce personal demand by turning off the tap when water is not being used and taking shorter showers.• Engage in water-saving practices: for instance, water lawns less and sweep rather than hose down sidewalks.
514

www.ck12.org Chapter 10. Human Impacts on Earth’s Water
FIGURE 10.20This colorful adobe house in Tucson,Arizona is surrounded by native cactus,which needs little water to thrive.
At Earth Summit 2002, many governments approved a Plan of Action to address the scarcity of water and safedrinking water in developing countries. One goal of this plan was to cut in half the number of people without accessto safe drinking water by 2015. Although this is a very important goal, it will not be met. Goals like these are mademore difficult as population continues to grow.
MEDIAClick image to the left or use the URL below.URL: https://www.ck12.org/flx/render/embeddedobject/186886
Summary
• Society can reduce water consumption by making policies that encourage or require conservation.• People can reduce water consumption by taking shorter showers, installing water-saving devices, and many
other methods.• Financial incentives can work to encourage people to conserve water and other resources.
Review
1. Why does your choice of garden plants affect the water consumption of your household?2. How does water pollution reduce the amount of water that is available for people to use?3. Why is providing clean water to all people so difficult? Why is it so important?
Explore More
Use this resource to answer the questions that follow.
515

10.9. Conserving Water www.ck12.org
MEDIAClick image to the left or use the URL below.URL: https://www.ck12.org/flx/render/embeddedobject/1526
1. What percentage of water is used in the bathroom?2. How do low-flow toilets conserve water?3. What does an aerator do?4. List additional tips for saving water that don’t cost anything.5. How much water does a professional car war wash use?6. Why shouldn’t you use the garden hose to wash a car?
516

www.ck12.org Chapter 10. Human Impacts on Earth’s Water
10.10 Coastal Pollution
Learning Objectives
• Explain the relationship between coastal pollution and marine dead zones.
Fertilizer makes things grow. How could it cause a dead zone?
Fertilizer from farms and yards carried from the Mississippi River into the Gulf of Mexico creates an enormous deadzone, where algae use up all the oxygen and nothing else can live. The largest, in 2002, was about 22,000 squarekilometers (8,400 mi2).
Ocean Pollution
Most ocean pollution comes as runoff from land and originates as agricultural, industrial, and municipal wastes(Figure 10.21). The remaining 20% of water pollution enters the ocean directly from oil spills and people dumpingwastes directly into the water. Ships at sea empty their wastes directly into the ocean, for example.
517

10.10. Coastal Pollution www.ck12.org
FIGURE 10.21In some areas of the world, ocean pollution is all too obvious.
Coastal pollution can make coastal water unsafe for humans and wildlife. After rainfall, there can be enough runoffpollution that beaches must be closed to prevent the spread of disease from pollutants. A surprising number ofbeaches are closed because of possible health hazards each year.
A large proportion of the fish we rely on for food live in the coastal wetlands or lay their eggs there. Coastalrunoff from farm waste often carries water-borne organisms that cause lesions that kill fish. Humans who come incontact with polluted waters and affected fish can also experience harmful symptoms. More than one-third of theshellfish-growing waters of the United States are adversely affected by coastal pollution.
Dead Zones
Fertilizers that run off of lawns and farm fields are extremely harmful to the environment. Nutrients, such as nitrates,in the fertilizer promote algae growth in the water they flow into. With the excess nutrients, lakes, rivers, and baysbecome clogged with algae and aquatic plants. Eventually these organisms die and decompose. Decompositionuses up all the dissolved oxygen in the water. Without oxygen, large numbers of plants, fish, and bottom-dwellinganimals die.
Every year dead zones appear in lakes and nearshore waters. A dead zone is an area of hundreds of kilometers ofocean without fish or plant life.
The Mississippi is not the only river that carries the nutrients necessary to cause a dead zone. Rivers that drainregions where human population density is high and where crops are grown create dead zones all over the world(Figure 10.22).
Summary
• Most ocean pollution comes from land and much congregates in the coastal regions.• Excess fertilizer travels in rivers to the sea and causes algae to bloom. These algae die and decomposition uses
up the oxygen in an area, causing a dead zone.• The dead zone in the Gulf of Mexico from Mississippi River runoff is getting larger each year.
Review
1. What are the consequences of coastal pollution?
518

www.ck12.org Chapter 10. Human Impacts on Earth’s Water
FIGURE 10.22Dead zones off the coasts. Red dots show the location and size of the dead zone; black circles show the locationbut the size is unknown. Darker blue regions of the oceans indicate that organic particulates are high and maylead to a dead zone.
2. What are the sources of coastal pollution?3. What sequence of events causes a dead zone?
Explore More
Use these resources to answer the questions that follow.
MEDIAClick image to the left or use the URL below.URL: https://www.ck12.org/flx/render/embeddedobject/1520
1. Why does the US Coast Guard do vehicle patrols?2. Why are storm drains under US Coast Guard jurisdiction?3. What is the purpose of the pollution fines?
519

10.10. Coastal Pollution www.ck12.org
MEDIAClick image to the left or use the URL below.URL: https://www.ck12.org/flx/render/embeddedobject/1521
1. What typically makes a beach unfit for swimming?2. What percent of samples violated public health standards for the year this video was made?3. What is the danger of swimming in contaminated water?4. What is the danger of digging in the sand?
520

www.ck12.org Chapter 10. Human Impacts on Earth’s Water
10.11 Ocean Garbage Patch
Learning Objectives
• Explain how trash ends up as ocean debris.• Trace the path of trash to the ocean garbage patch.
How could these balloons kill a sea turtle?
Balloons flying off into the sky symbolize freedom and happiness. Eventually those balloons pop and the plasticfalls to the surface. Much of this plastic will end up in the sea where it may be accidentally ingested by a marineorganism — with dire results.
Marine Trash
Trash from land may end up as trash in the ocean, sometimes extremely far from land. Some of it will eventuallywash ashore, possibly far from where it originated (Figure 10.23).
Sources of Trash
Although people had once thought that the trash found everywhere at sea was from ships, it turns out that 80% isfrom land. Some of that is from runoff, some is blown from nearshore landfills, and some is dumped directly intothe sea.
521

10.11. Ocean Garbage Patch www.ck12.org
FIGURE 10.23Trash has washed up on this beach.
The 20% that comes from ships at sea includes trash thrown overboard by large cruise ships and many other vessels.It also includes lines and nets from fishing vessels. Ghost nets, nets abandoned by fishermen intentionally or not,float the seas and entangle animals so that they cannot escape. Containers sometimes go overboard in storms. Somenoteworthy events, like a container of rubber ducks that entered the sea in 1992, are used to better understand oceancurrents. The ducks went everywhere!
Makeup of Trash
About 80% of the trash that ends up in the oceans is plastic. This is because a large amount of the trash producedsince World War II is plastic. Also many types of plastic do not biodegrade, so they simply accumulate. While manytypes of plastic photodegrade — that is, they break up in sunlight — this process only works when the plastics aredry. Plastic trash in the water does break down into smaller pieces, eventually becoming molecule-sized polymers.Other trash in the oceans includes chemical sludge and materials that do biodegrade, like wood.
Toxic chemicals
Some plastics contain toxic chemicals, such as bisphenol A. Plastics can also absorb organic pollutants that may befloating in the water, such as the pesticide DDT (which is banned in the U.S. but not in other nations) and someendocrine disruptors.
Effect on Organisms
Marine birds, such as albatross, or animals like sea turtles, live most of their lives at sea and just come ashore tomate. These organisms can’t break down the plastic and they may eventually die (Figure 10.24). Boats may beaffected. Plastic waste is estimated to kill 100,000 sea turtles and marine mammals annually, but exact numbers areunknown.
Plastic shopping bags are extremely abundant in the oceans. If an organism accidentally ingests one, it may clogdigestion and cause starvation by stopping food from moving through or making the animal not feel hungry.
522

www.ck12.org Chapter 10. Human Impacts on Earth’s Water
FIGURE 10.24This albatross likely died from the plasticit had ingested.
The Great Pacific Garbage Patch
Trash from the lands all around the North Pacific is caught up in currents. The currents bring the trash into the centerof the North Pacific Gyre. Scientists estimate that it takes about six years for trash to move from west coast of NorthAmerica to the center of the gyre. The concentration of trash increases toward the center of the gyre.
While recognizable pieces of garbage are visible, much of the trash is tiny plastic polymers that are invisible butcan be detected in water samples. The particles are at or just below the surface within the gyre. Plastic confetti-likepieces are visible beneath the surface at the gyre’s center.
FIGURE 10.25Plastic bags in the ocean can be mis-taken for food by an unsuspecting marinepredator.
The size of the garbage patch is unknown, since it can’t be seen from above. Some people estimate that it’s twicethe size of continental U.S, with a mass of 100 million tons.
523

10.11. Ocean Garbage Patch www.ck12.org
Effect on Organisms
In some areas, plastics have seven times the concentration of zooplankton. This means that filter feeders are ingestinga lot of plastics. This may kill the organisms or the plastics may remain in their bodies. They are then eaten by largerorganisms that store the plastics and may eventually die. Fish may eat organisms that have eaten plastic and then beeaten by people. This also exposes humans to toxic chemicals that the fish may have ingested with the plastic.
There are similar patches of trash in the gyres of the North Atlantic and Indian oceans. The Southern Hemispherehas less trash buildup because less of the region is continent.
Summary
• Trash from land (80%) or human activities at sea (20%) ends up in the oceans; about 80% of this trash isplastic.
• Plastic trash does not usually biodegrade in the ocean but just forms tiny polymers that resemble plankton.• Plastic pieces of trash and plastic molecules can kill marine organisms by becoming lodged in their digestive
systems or by trapping them so they can’t swim.
Review
1. How can plastic kill marine organisms?2. Since plastic doesn’t biodegrade in the oceans, what does the future hold? What can be done to make the
future better?3. Some people say that the Great Pacific Garbage Patch is a hoax. What can scientists do to show people that it
is real?
524

www.ck12.org Chapter 10. Human Impacts on Earth’s Water
10.12 Oil Spills
Learning Objectives
• Describe the damage that occurs from oil spills.
Will this oil spill victim live?
After every oil spill, photos are released of marine organisms covered with oil. Sometimes people are trying toclean them. Seabirds are especially vulnerable; they dive into a slick because the surface looks like calmer water.Oil-coated birds cannot regulate their body temperatures and will die. After cleanup, some birds will live and somewill not.
Oil Spills
Large oil spills, like the Exxon Valdez in Alaska in 1989, get a lot of attention, as they should. Besides these largespills, though, much more oil enters the oceans from small leaks that are only a problem locally. In this concept,we’ll take a look at a large recent oil spill in the Gulf of Mexico.
525

10.12. Oil Spills www.ck12.org
The Gulf of Mexico Oil Spill
New drilling techniques have allowed oil companies to drill in deeper waters than ever before. This allows usto access oil deposits that were never before accessible, but only with great technological difficulty. The risksfrom deepwater drilling and the consequences when something goes wrong are greater than those associated withshallower wells.
Explosion
Working on oil platforms is dangerous. Workers are exposed to harsh ocean conditions and gas explosions. Thedanger was never more obvious than on April 20, 2010, when 11 workers were killed and 17 injured in an explosionon a deepwater oil rig in the Gulf of Mexico (Figure 10.26). The drilling rig, operated by BP, was 77 km (48 miles)offshore and the depth to the well was more than 5,000 feet.
FIGURE 10.26The U.S. Coast Guard tries to put out thefire and search for missing workers afterthe explosion on the Deepwater Horizondrilling rig. Eleven workers were killed.
Spill
Two days after the explosion, the drill rig sank. The 5,000-foot pipe that connected the wellhead to the drillingplatform bent. Oil was free to gush into the Gulf of Mexico from nearly a mile deep (Figure 10.27). Initial effortsto cap or contain the spill at or near its source all failed to stop the vast oil spill. It was not until July 15, nearly threemonths after the accident, that the well was successfully capped.
Estimating the flow of oil into the Gulf from the well was extremely difficult because the leak was so far below thesurface. The U.S. government estimates that about 4.9 million barrels entered the Gulf at a rate of 35,000 to 60,000barrels a day. The largest previous oil spill in the United States was of 300,000 barrels by the Exxon Valdez in 1989in Prince William Sound, Alaska.
Cleanup
Once the oil is in the water, there are three types of methods for dealing with it:
526

www.ck12.org Chapter 10. Human Impacts on Earth’s Water
FIGURE 10.27(a) On May 17, 2010, oil had been leaking into the Gulf for nearly one month. On that date government estimatesput the maximum total oil leak at 1,600,000 barrels, according to the New York Times. (b) The BP oil spill on June19, 2010. The government estimates for total oil leaked by this date was 3,200,000 barrels.
1. Removal: Oil is corralled and then burned; natural gas is flared off (Figure 10.28). Machines that can separateoil from the water are placed aboard ships stationed in the area. These ships cleaned tens of thousands of barrels ofcontaminated seawater each day.
FIGURE 10.28Burning the oil can reduce the amount inthe water.
2. Containment: Floating containment booms are placed on the surface offshore of the most sensitive coastal areasin an attempt to attempt to trap the oil. But the seas must be calm for the booms to be effective, and so were not veryuseful in the Gulf (Figure 10.29). Sand berms have been constructed off of the Louisiana coast to keep the oil from
527

10.12. Oil Spills www.ck12.org
reaching shore.
FIGURE 10.29A containment boom holds back oil, but itis only effective in calm water.
3. Dispersal: Oil disperses naturally over time because it mixes with the water. However, such large amounts ofoil will take decades to disperse. To speed the process up, BP has sprayed unprecedented amounts of chemicaldispersants on the spill. That action did not receive support from the scientific community since no one knows therisks to people and the environment from such a large amount of these harmful chemicals. Some workers may havebecome ill from exposure to the chemicals.
Plugging the Well
BP drilled two relief wells into the original well. When the relief wells entered the original borehole, specializedliquids were pumped into the original well to stop the flow. Operation of the relief wells began in August 2010. Theoriginal well was declared effectively dead on September 19, 2010.
Impact
The economic and environmental impact of this spill will be felt for many years. Many people rely on the Gulf fortheir livelihoods or for recreation. Commercial fishing, tourism, and oil-related jobs are the economic engines ofthe region. Fearing contamination, NOAA imposed a fishing ban on approximately one-third of the Gulf (Figure10.30). Tourism is down in the region as beach goers find other ways to spend their time. Real estate prices alongthe Gulf have declined precipitously.
The toll on wildlife is felt throughout the Gulf. Plankton, which form the base of the food chain, are killed by the oil,leaving other organisms without food. Islands and marshlands around the Gulf have many species that are alreadyat risk, including four endangered species of sea turtles. With such low numbers, rebuilding their populations afterthe spill will be difficult.
The Gulf of Mexico is one of only two places in the world where bluefin tuna spawn and they are also alreadyendangered. Marine mammals in the Gulf may come up into the slick as they come to the surface to breathe.
Eight national parks and seashores are found along the Gulf shores. Other locations may be ecologically sensitivehabitats such as mangroves or marshlands.
528

www.ck12.org Chapter 10. Human Impacts on Earth’s Water
FIGURE 10.30This was the extent of the banned area onJune 21, 2010.
Long-Term Effects
There is still oil on beaches and in sediment on the seafloor in the region. Chemicals from the oil dispersants arestill in the water. In October 2011 a report was issued that showed that whales and dolphins are dying in the Gulf attwice their normal rate. The long-term effects will be with us for a long time.
MEDIAClick image to the left or use the URL below.URL: https://www.ck12.org/flx/render/embeddedobject/186890
Summary
• As oil becomes scarcer, there are economic incentives to drill in deeper water, but this is a technologicallydifficult undertaking.
• There are still chemicals in the water that cause damage to wildlife.• Massive amounts of oil that have been spilled into a water body can be removed, contained, or dispersed.
These actions are difficult and may have negative consequences.• Birds or beaches coated with oil are the most visible evidence of a spill, but there are many consequences that
we can’t see, like oil on the seabed or chemical dispersants in the water.
529

10.12. Oil Spills www.ck12.org
Review
1. What precautions should be made to be sure that there is little chance of negative consequences from an oilspill?
2. How do chemical dispersants work? Should they always be used?3. What are the long-term effects of a major oil spill?
Explore More
Use the resource below to answer the questions that follow.
MEDIAClick image to the left or use the URL below.URL: https://www.ck12.org/flx/render/embeddedobject/178425
1. What were the causes of the Exxon Valdez disaster?2. What were the oil industry’s response plans?3. What was the industry’s response actually?4. What were chemical dispersants used for?5. What were the concerns brought about by the use of chemical dispersants?6. How much of the oil was recovered?7. Who was assigned responsibility for the spill? What was lost?8. When plan for the Alaska pipeline was drawn up, how was the environment to be protected? What was the
mistake made by the state?9. What happened when the state passed its own safety law?
10. How did the passage of ships change from when the oil first was passing through the area to when the ExxonValdez spill happened?
11. What was supposed to be done during the time the ship was going through the channel, who was supposed todo it, and what was actually happening?
12. What was the long-term damage?13. What are the safeties now in place?14. What does it mean that the offense got ahead of the defense in the Gulf of Mexico?15. How had cleanup changed in two decades?16. Have we really learned the lessons of Exxon Valdez and Gulf of Mexico spills?
Resources
530

www.ck12.org Chapter 10. Human Impacts on Earth’s Water
MEDIAClick image to the left or use the URL below.URL: https://www.ck12.org/flx/render/embeddedobject/186892
531

10.13. References www.ck12.org
10.13 References
1. Hana Zavadska, based on data from National Climate Data Center;Wikimedia Commons and Google Earth;Courtesyof the US Army Corps of Engineers. Powerpoint;http://commons.wikimedia.org/wiki/File:Atchafalaya_Basin.jpg . CC BY-NC 3.0;Public Domain
2. Joy Sheng, based on data from the Food and Agriculture Organization of the United Nations, 2012;WikimediaCommons and Google Earth. CK-12 Foundation;Powerpoint . CC BY-NC 3.0
3. Courtesy of the Agricultural Research Service/US Department of Agriculture. http://www.ars.usda.gov/main/docs.htm?docid=2999&page=6 . Public Domain
4. Courtesy of Ken Hammond, US Department of Agriculture. http://commons.wikimedia.org/wiki/File:Delta_Pride_Catfish_farm_harvest.jpg;CK-12 . Public Domain
5. Courtesy of Jesse Allen, NASA’s Earth Observatory. http://earthobservatory.nasa.gov/IOTD/view.php?id=6918 . Public Domain
6. Courtesy of the US Army Corps of Engineers. http://commons.wikimedia.org/wiki/File:Atchafalaya_Basin.jpg . Public Domain
7. AY Hoekstra, MM Mekonnen, et al.. http://www.plosone.org/article/info%3Adoi%2F10.1371%2Fjournal.pone.0032688 . CC BY 2.5
8. PR Hunter, AM MacDonald, RC Carter. http://www.plosmedicine.org/article/info%3Adoi%2F10.1371%2Fjournal.pmed.1000361 . CC BY 2.5
9. Tomas Castelazo. http://commons.wikimedia.org/wiki/File:Drought.jpg . CC BY 3.010. AY Hoekstra, MM Mekonnen, et al.. http://www.plosone.org/article/info%3Adoi%2F10.1371%2Fjournal.po
ne.0032688 . CC BY 2.511. Courtesy of the Centers for Disease Control and Prevention. http://commons.wikimedia.org/wiki/File:Dracu
nculiasis2_DPDx.jpg . Public Domain12. Courtesy of the Centers for Disease Control and Prevention. http://commons.wikimedia.org/wiki/File:Dracu
nculiasis2_DPDx.jpg . Public Domain13. Image copyright mosista, 2014;Courtesy of NOAA. http://www.shutterstock.com;http://commons.wikimedia
.org/wiki/File:Turtle_entangled_in_marine_debris_(ghost_net).jpg . Used under license from Shutterstock.com14. Courtesy of the US Environmental Protection Agency. http://commons.wikimedia.org/wiki/File:Water_pol
lution.jpg . Public Domain15. Calexico New River Committee. http://commons.wikimedia.org/wiki/File:Nrborderborderentrythreecolorsmay
05-1-.JPG . Public Domain16. Image copyright mosista, 2014. http://www.shutterstock.com . Used under license from Shutterstock.com17. 176th Wing, Alaska Air National Guard. http://www.flickr.com/photos/176wg/5703987129/ . CC BY 2.018. 176th Wing, Alaska Air National Guard. http://www.flickr.com/photos/176wg/5703987129/ . CC BY 2.019. Courtesy of the US Geological Survey. http://commons.wikimedia.org/wiki/File:Gwsanjoaquin.jpg . Public
Domain20. Courtesy of Chris Poulsen, National Drought Mitigation Center at the University of Nebraska-Lincoln, NASA
Goddard Space Flight Center, and the GRACE science team. http://earthobservatory.nasa.gov/IOTD/view.php?id=76575 . Public Domain
21. Courtesy of the US Geological Survey. http://ne.water.usgs.gov/ogw/hpwlms/physsett.html . Public Domain22. Courtesy of NASA/GSFC/METI/ERSDAC/JAROS and US/Japan ASTER Science Team. http://earthobservat
ory.nasa.gov/IOTD/view.php?id=5772 . Public Domain23. Courtesy of the US Geological Survey. http://commons.wikimedia.org/wiki/File:Gwsanjoaquin.jpg . Public
Domain24. Image copyright Vasily Smirnov, 2014. http://www.shutterstock.com . Used under license from Shutter-
stock.com
532

www.ck12.org Chapter 10. Human Impacts on Earth’s Water
25. Image copyright Vasily Smirnov, 2014. http://www.shutterstock.com . Used under license from Shutter-stock.com
26. Image copyright Zbynek Burival, 2014. http://www.shutterstock.com . Used under license from Shutter-stock.com
27. Image copyright Zbynek Burival, 2014. http://www.shutterstock.com . Used under license from Shutter-stock.com
28. Image copyright Kellie Diane Stewart, 2014. http://www.shutterstock.com . Used under license from Shut-terstock.com
29. Image copyright Kellie Diane Stewart, 2014. http://www.shutterstock.com . Used under license from Shut-terstock.com
30. Courtesy of Robert Simmon and Jesse Allen, NASA’s Earth Observatory. http://earthobservatory.nasa.gov/IOTD/view.php?id=44677 . Public Domain;CC BY-NC 3.0
31. Stephen Codrington. http://commons.wikimedia.org/wiki/File:Obvious_water_pollution.jpeg . CC BY 2.5;CCBY-NC 3.0
32. Courtesy of Robert Simmon and Jesse Allen, NASA’s Earth Observatory. http://earthobservatory.nasa.gov/IOTD/view.php?id=44677 . Public Domain;CC BY-NC 3.0
33. Image copyright Rich Carey, 2014. http://www.shutterstock.com . Used under license from Shutterstock.com;CCBY-NC 3.0
34. Flickr:epSos .de. http://www.flickr.com/photos/epsos/5444678656/ . CC BY 2.035. Courtesy of Duncan Wright/US Fish and Wildlife Services. http://commons.wikimedia.org/wiki/File:Albat
ross_chick_plastic.jpg . Public Domain36. Image copyright Rich Carey, 2014. http://www.shutterstock.com . Used under license from Shutterstock.com37. Courtesy of the US National Oceanic and Atmospheric Administration. http://commons.wikimedia.org/wik
i/File:Deepwater_Horizon_oil_spill_fishing_closure_map_2010-06-21.png . Public Domain;CC BY-NC 3.038. Courtesy of the US Coast Guard. http://commons.wikimedia.org/wiki/File:Deepwater_Horizon_offshore_dr
illing_unit_on_fire_2010.jpg . Public Domain;CC BY-NC 3.039. (a) Courtesy of Jeff Schmaltz, MODIS Rapid Respond Team, and NASA; (b) Courtesy of MODIS Rapid
Response Team and NASA. (a) http://earthobservatory.nasa.gov/IOTD/view.php?id=44006; (b) http://earthobservatory.nasa.gov/IOTD/view.php?id=44375 . Public Domain;CC BY-NC 3.0
40. Courtesy of John Kepsimelis, US Coast Guard. http://commons.wikimedia.org/wiki/File:Controlled_burn_of_oil_on_May_19th.JPG . Public Domain;CC BY-NC 3.0
41. Courtesy of the Minerals Management Service. http://commons.wikimedia.org/wiki/File:Oil_Spill_Containment_Boom.jpg . Public Domain;CC BY-NC 3.0
42. Courtesy of the US National Oceanic and Atmospheric Administration. http://commons.wikimedia.org/wiki/File:Deepwater_Horizon_oil_spill_fishing_closure_map_2010-06-21.png . Public Domain;CC BY-NC 3.0
533

www.ck12.org
CHAPTER 11 Human Impacts on Earth’sAtmosphere
Chapter Outline11.1 AIR QUALITY
11.2 TYPES OF AIR POLLUTION
11.3 CAUSES OF AIR POLLUTION
11.4 EFFECTS OF AIR POLLUTION ON THE ENVIRONMENT
11.5 EFFECTS OF AIR POLLUTION ON HUMAN HEALTH
11.6 MERCURY POLLUTION
11.7 ACID RAIN
11.8 OZONE DEPLETION
11.9 REDUCING AIR POLLUTION
11.10 REDUCING OZONE DESTRUCTION
11.11 CLIMATE CHANGE IN EARTH HISTORY
11.12 SHORT-TERM CLIMATE CHANGE
11.13 LONG-TERM CLIMATE CHANGE
11.14 CARBON CYCLE AND CLIMATE
11.15 GLOBAL WARMING
11.16 IMPACT OF CONTINUED GLOBAL WARMING
11.17 REDUCING GREENHOUSE GAS POLLUTION
11.18 REFERENCES
534

www.ck12.org Chapter 11. Human Impacts on Earth’s Atmosphere
11.1 Air Quality
Learning Objectives
• Explain how air pollution affects air quality.
What is this in the air?
People have euphemisms for smog; sometimes it’s fog, sometimes it’s haze. It’s hard to know sometimes whetherthe air is full of something natural, like water vapor, or something man-made, like ozone. But in cities like this theair is often being marred by air pollution.
Air Quality
Pollutants include materials that are naturally occurring but are added to the atmosphere so that they are there inlarger quantities than normal. Pollutants may also be human-made compounds that have never before been found inthe atmosphere. Pollutants dirty the air, change natural processes in the atmosphere, and harm living things.
Problems with Air Quality
Air pollution started to be a problem when early people burned wood for heat and cooking fires in enclosed spacessuch as caves and small tents or houses. But the problems became more widespread as fossil fuels such as coalbegan to be burned during the Industrial Revolution.
535

11.1. Air Quality www.ck12.org
Smog
Air pollution started to be a problem when early people burned wood for heat and cooking fires in enclosed spacessuch as caves and small tents or houses. But the problems became more widespread as fossil fuels such as coalbegan to be burned during the Industrial Revolution (Figure 11.1).
FIGURE 11.1The 2012 Olympic Games in Londonopening ceremony contained a reen-actment of the Industrial Revolution -complete with pollution streaming fromsmokestacks.
Photochemical Smog
Photochemical smog, a different type of air pollution, first became a problem in Southern California after WorldWar II. The abundance of cars and sunshine provided the perfect setting for a chemical reaction between some ofthe molecules in auto exhaust or oil refinery emissions and sunshine (Figure 11.2). Photochemical smog consists ofmore than 100 compounds, most importantly ozone.
FIGURE 11.2Smog over Los Angeles as viewed fromthe Hollywood Hills.
536

www.ck12.org Chapter 11. Human Impacts on Earth’s Atmosphere
The Clean Air Act
Terrible air pollution events in Pennsylvania and London, in which many people died, plus the recognition of thehazards of photochemical smog, led to the passage of the Clean Air Act in 1970 in the United States. The act nowregulates 189 pollutants. The six most important pollutants regulated by the Act are ozone, particulate matter, sulfurdioxide, nitrogen dioxide, carbon monoxide, and the heavy metal lead. Other important regulated pollutants includebenzene, perchloroethylene, methylene chloride, dioxin, asbestos, toluene, and metals such as cadmium, mercury,chromium, and lead compounds.
What is the result of the Clean Air Act? In short, the air in the United States is much cleaner. Visibility is betterand people are no longer incapacitated by industrial smog. However, despite the Act, industry, power plants, andvehicles put 160 million tons of pollutants into the air each year. Some of this smog is invisible and some contributesto the orange or blue haze that affects many cities.
Regional Air Quality
Air quality in a region is not just affected by the amount of pollutants released into the atmosphere in that location butby other geographical and atmospheric factors. Winds can move pollutants into or out of a region and a mountainrange can trap pollutants on its leeward side. Inversions commonly trap pollutants within a cool air mass. If theinversion lasts long enough, pollution can reach dangerous levels.
Pollutants remain over a region until they are transported out of the area by wind, diluted by air blown in fromanother region, transformed into other compounds, or carried to the ground when mixed with rain or snow.
Table 11.1 lists the smoggiest cities in 2018. Fairbanks, Alaska is a surprise at #1. That ranking is due to particulatesfrom people burning wood for warmth in winter. Fairbanks has very little ozone pollution because it has very fewcarts and it is not very warm.
Seven of the 10 of the smoggiest cities are in California. Why do you think California cities are among those withthe worst air pollution? The state has the right conditions for collecting pollutants including mountain ranges thattrap smoggy air, arid and sometimes windless conditions, agriculture, industry, and lots and lots of cars.
TABLE 11.1: Smoggiest U.S. Cities, 2018
Rank City, State1 Fairbanks, Alaska2 Visalia-Porterville, California3 Bakersfield-Delano, California4 Los Angeles-Long Beach, California5 Fresno-Madera, California6 Modesto-Merced, California7 El Centro, California8 (tie) Pittsburgh-New Castle-Weirton, Pennsylvania-Ohio-
West Virginia8 (tie) Lancaster, Pennsylvania10 (tie) San Jose-San Francisco-Oakland, California10 (tie) Cleveland-Akron-Canton, Ohio
Summary
• Air is polluted by natural compounds in unnatural quantities or by unnatural compounds.• Some pollutants enter the air directly and others are created by chemical reactions, such as those that are part
537

11.1. Air Quality www.ck12.org
of photochemical smog.• Regions that are chronically polluted experience the release of a lot of pollutants into the air. The effects of
pollution may also be amplified by geographical and atmospheric factors.
Review
1. How does photochemical smog differ from other types of air pollution?2. What does the Clean Air Act regulate? what are the most important pollutants it regulates?3. Why do parts of California have such bad air pollution?
1: Fairbanks, Alaska
538

www.ck12.org Chapter 11. Human Impacts on Earth’s Atmosphere
11.2 Types of Air Pollution
Learning Objectives
• Distinguish between primary and secondary pollutants and identify examples of each.
Why is there a lid over that smog?
The gray smog pictured above is stuck between two layers of air. The bottom layer is more dense than the top layer,so there is no mixing between the two layers. In winter, an inversion traps all of the pollutants that are emitted intothe air over a region.
Types of Air Pollution
The two types of air pollutants are primary pollutants, which enter the atmosphere directly, and secondary pollutants,which form from a chemical reaction.
Primary Pollutants
Some primary pollutants are natural, such as volcanic ash. Dust is natural but exacerbated by human activities; forexample, when the ground is torn up for agriculture or development. Most primary pollutants are the result of humanactivities, the direct emissions from vehicles and smokestacks. Primary pollutants include:
• Carbon oxides include carbon monoxide (CO) and carbon dioxide (CO2) (Figure 11.3). Both are colorless,odorless gases. CO is toxic to both plants and animals. CO and CO2 are both greenhouse gases.
• Nitrogen oxides are produced when nitrogen and oxygen from the atmosphere come together at high temper-atures. This occurs in hot exhaust gas from vehicles, power plants, or factories. Nitrogen oxide (NO) andnitrogen dioxide (NO2) are greenhouse gases. Nitrogen oxides contribute to acid rain.
• Sulfur oxides include sulfur dioxide (SO2) and sulfur trioxide (SO3). These form when sulfur from burningcoal reaches the air. Sulfur oxides are components of acid rain.
• Particulates are solid particles, such as ash, dust, and fecal matter (Figure 11.4). They are commonly formedfrom combustion of fossil fuels, and can produce smog. Particulates can contribute to asthma, heart disease,and some types of cancers.
539

11.2. Types of Air Pollution www.ck12.org
FIGURE 11.3High CO2 levels are found in major metropolitan areas and along the major interstate highways.
FIGURE 11.4Particulates from a brush fire give the skya strange glow in Arizona.
540

www.ck12.org Chapter 11. Human Impacts on Earth’s Atmosphere
• Lead was once widely used in automobile fuels, paint, and pipes. This heavy metal can cause brain damageor blood poisoning.
• Volatile organic compounds (VOCs) are mostly hydrocarbons. Important VOCs include methane (a naturallyoccurring greenhouse gas that is increasing because of human activities), chlorofluorocarbons (human-madecompounds that are being phased out because of their effect on the ozone layer), and dioxin (a byproduct ofchemical production that serves no useful purpose, but is harmful to humans and other organisms).
Secondary Pollutants
Any city can have photochemical smog, but it is most common in sunny, dry locations. A rise in the numberof vehicles in cities worldwide has increased photochemical smog. Nitrogen oxides, ozone, and several othercompounds are some of the components of this type of air pollution.
Photochemical smog forms when car exhaust is exposed to sunlight. Nitrogen oxide is created by gas combustionin cars and then into the air (Figure 11.5). In the presence of sunshine, the NO2 splits and releases an oxygen ion(O). The O then combines with an oxygen molecule (O2) to form ozone (O3). This reaction can also go in reverse:Nitric oxide (NO) removes an oxygen atom from ozone to make it O2. The direction the reaction goes depends onhow much NO2 and NO there is. If NO2 is three times more abundant than NO, ozone will be produced. If nitricoxide levels are high, ozone will not be created.
FIGURE 11.5The brown color of the air behind theGolden Gate Bridge is typical of Californiacities, because of nitrogen oxides.
Ozone is one of the major secondary pollutants. It is created by a chemical reaction that takes place in exhaust andin the presence of sunlight. The gas is acrid-smelling and whitish. Warm, dry cities surrounded by mountains, suchas Los Angeles, Phoenix, and Denver, are especially prone to photochemical smog. Photochemical smog peaks atmidday on the hottest days of summer. Ozone is also a greenhouse gas.
Summary
• There are many types of primary pollutants, including carbon oxides, nitrogen oxides, sulfur oxides, particu-lates, lead, and volatile organic compounds.
• Secondary pollutants form from chemical reactions that occur when pollution is exposed to sunlight.• Ozone is a secondary pollutant that is also a greenhouse gas.
541

11.2. Types of Air Pollution www.ck12.org
Review
1. How are primary and secondary pollutants different?2. Explain how nitrogen oxide pollutants form.3. What is ozone and how does it form as part of photochemical smog?
Explore More
Use this resource to answer the questions that follow.
MEDIAClick image to the left or use the URL below.URL: https://www.ck12.org/flx/render/embeddedobject/164841
1. Does pollution stay over the city where it originates?2. What causes vehicle pollution? What can you do to reduce it?3. What accounts for the majority of all air pollution? Is that source increasing or decreasing overall?4. What else causes air pollution?5. What is a major source of pollution in rural areas and why?6. What are the sources of particulate matter?7. What is particulate matter?8. What colors the air on a smoggy day?9. Why are particulates dangerous?
10. Why are very small particulates dangerous? Why are they more dangerous than larger particles?11. What is making a difference?
Resources
MEDIAClick image to the left or use the URL below.URL: https://www.ck12.org/flx/render/embeddedobject/186895
542

www.ck12.org Chapter 11. Human Impacts on Earth’s Atmosphere
11.3 Causes Of Air Pollution
Learning Objectives
• Describe the sources of air pollution.
Why don’t we see emissions like this too often any more?
This photo of a power plant was taken before emission control equipment was added. Emissions are down sincelaws have been enacted to protect the air.
Causes of Air Pollution
Most air pollutants come from burning fossil fuels or plant material. Some are the result of evaporation from human-made materials. Nearly half (49%) of air pollution comes from transportation, 28% from factories and power plants,and the remaining pollution from a variety of other sources.
Fossil Fuels
Fossil fuels are burned in most motor vehicles and power plants. These non-renewable resources are the powerfor nearly all manufacturing and other industries. Pure coal and petroleum can burn cleanly and emit only carbondioxide and water, but most of the time these fossil fuels do not burn completely and the incomplete chemical
543

11.3. Causes Of Air Pollution www.ck12.org
reactions produce pollutants. Few sources of these fossil fuels are pure, so other pollutants are usually released.These pollutants include carbon monoxide, nitrogen dioxide, sulfur dioxide, and hydrocarbons.
In large car-dependent cities such as Los Angeles and Mexico City, 80% to 85% of air pollution is from motorvehicles (Figure 11.6). Ozone, carbon monoxide, and nitrous oxides come from vehicle exhaust.
FIGURE 11.6Auto exhaust like this means that the fuelsis not burning efficiently.
A few pollutants come primarily from power plants or industrial plants that burn coal or oil. Sulfur dioxide (SO2) isa major component of industrial air pollution that is released whenever coal and petroleum are burned. SO2 mixeswith H2O in the air to produce sulfuric acid (H2SO4).
Mercury is released when coal and some types of wastes are burned. Mercury is emitted as a gas, but as it cools, itbecomes a droplet. Mercury droplets eventually fall to the ground. If they fall into sediments, bacteria convert themto the most dangerous form of mercury: methyl mercury. Highly toxic, methyl mercury is one of the metal’s organicforms.
Biomass Burning
Fossil fuels are ancient plants and animals that have been converted into usable hydrocarbons. Burning plantand animal material directly also produces pollutants. Biomass is the total amount of living material found inan environment. The biomass of a rainforest is the amount of living material found in that rainforest.
The primary way biomass is burned is for slash-and-burn agriculture (Figure 11.7). The rainforest is slashed downand then the waste is burned to clear the land for farming. Biomass from other biomes, such as the savannah, is alsoburned to clear farmland. The pollutants are much the same as from burning fossil fuels: CO2, carbon monoxide,methane, particulates, nitrous oxide, hydrocarbons, and organic and elemental carbon. Burning forests increasesgreenhouse gases in the atmosphere by releasing the CO2 stored in the biomass and also by removing the forest sothat it cannot store CO2 in the future. As with all forms of air pollution, the smoke from biomass burning oftenspreads far and pollutants can plague neighboring states or countries.
Particulates result when anything is burned. About 40% of the particulates that enter the atmosphere above theUnited States are from industry and about 17% are from vehicles. Particulates also occur naturally from volcaniceruptions or windblown dust. Like other pollutants, they travel all around the world on atmospheric currents.
544

www.ck12.org Chapter 11. Human Impacts on Earth’s Atmosphere
FIGURE 11.7A forest that has been slash-and-burnedto make new farmland.
Evaporation
Volatile organic compounds (VOCs) enter the atmosphere by evaporation. VOCs evaporate from human-madesubstances, such as paint thinners, dry cleaning solvents, petroleum, wood preservatives, and other liquids. Naturallyoccurring VOCs evaporate off of pine and citrus trees. The atmosphere contains tens of thousands of different VOCs,nearly 100 of which are monitored. The most common is methane, a greenhouse gas (Figure 11.8). Methane occursnaturally, but human agriculture is increasing the amount of methane in the atmosphere.
FIGURE 11.8Methane forms when organic material decomposes in an oxygen-poor environment. In the top image, surfacemethane production is shown. Stratospheric methane concentrations in the bottom image show that methane iscarried up into the stratosphere by the upward flow of air in the tropics.
Summary
• Most fossil fuels are dirty and release pollutants such as carbon monoxide, nitrogen dioxide, sulfur dioxide,and hydrocarbons.
545

11.3. Causes Of Air Pollution www.ck12.org
• Burning plants and other biomass releases pollutants including carbon monoxide, methane, particulates,nitrous oxide, hydrocarbons, and organic and elemental carbon.
• Volatile organic compounds evaporate into the air and become pollutants.
Review
1. What is slash-and-burn agriculture and what pollutants does it release?2. What are volatile organic compounds and why are they pollutants?3. Name a compound that occurs in the atmosphere naturally but is a pollutant in excess amounts due to human
activities.
546

www.ck12.org Chapter 11. Human Impacts on Earth’s Atmosphere
11.4 Effects of Air Pollution on the Environment
Learning Objectives
• Explain how air pollution damages the environment.
Did you ever see a sky without contrails?
In the three days after the terrorists attacks on September 11, 2001, jet airplanes did not fly over the United States.Without the gases from jet contrails blocking sunlight, air temperature increased 1◦C (1.8◦F) across the UnitedStates. This is just one of the effects air pollution has on the environment.
Smog Effects on the Environment
All air pollutants cause some damage to living creatures and the environment. Different types of pollutants causedifferent types of harm.
Particulates
Particulates reduce visibility. In the western United States, people can now ordinarily see only about 100 to 150kilometers (60 to 90 miles), which is one-half to two-thirds the natural (pre-pollution) range on a clear day. In theEast, people can only see about 40 to 60 kilometers (25-35 miles), about one-fifth the distance they could see withoutany air pollution (Figure 11.9).
547

11.4. Effects of Air Pollution on the Environment www.ck12.org
FIGURE 11.9Smog in New York City.
Particulates reduce the amount of sunshine that reaches the ground, which may reduce photosynthesis. Sinceparticulates form the nucleus for raindrops, snowflakes, or other forms of precipitation, precipitation may increasewhen particulates are high. An increase in particles in the air seems to increase the number of raindrops, but oftendecreases their size.
By reducing sunshine, particulates can also alter air temperature as mentioned above. Imagine how much all of thesources of particulates combine to reduce temperatures. What affect might this have on global warming?
Ozone
Ozone damages some plants. Since ozone effects accumulate, plants that live a long time show the most damage.Some species of trees appear to be the most susceptible. If a forest contains ozone-sensitive trees, they may die outand be replaced by species that are not as easily harmed. This can change an entire ecosystem, because animals andplants may not be able to survive without the habitats created by the native trees.
Some crop plants show ozone damage (Figure 11.10). When exposed to ozone, spinach leaves become spotted.Soybeans and other crops have reduced productivity. In developing nations, where getting every last bit of foodenergy out of the agricultural system is critical, any loss is keenly felt.
Oxides
Oxide air pollutants also damage the environment. NO2 is a toxic, orange-brown colored gas that gives air adistinctive orange color and an unpleasant odor. Nitrogen and sulfur-oxides in the atmosphere create acids thatfall as acid rain.
Lichen get a lot of their nutrients from the air so they may be good indicators of changes in the atmosphere such asincreased nitrogen. In Yosemite National Park, this could change the ecosystem of the region and lead to fires andother problems.
548

www.ck12.org Chapter 11. Human Impacts on Earth’s Atmosphere
FIGURE 11.10The spots on this leaf are caused byozone damage.
MEDIAClick image to the left or use the URL below.URL: https://www.ck12.org/flx/render/embeddedobject/186903
Summary
• An increase in particulates may reduce photosynthesis, increase precipitation, and reduce temperatures.• Ozone may damage native plants and some crop plants by slowing growth or damaging leaves.• Nitrogen and sulfur-oxides are pollutants. They also create acids in the atmosphere that fall as acid rain.
Review
1. What is the effect of an increase in particulates on the environment?2. What is the effect of ozone on native and crop plants?3. What happened to air temperature when jet airplanes could not fly over the United States for three days? Why?
If smog were reduced, what effect might that have on temperature?
Resources
549

11.4. Effects of Air Pollution on the Environment www.ck12.org
MEDIAClick image to the left or use the URL below.URL: https://www.ck12.org/flx/render/embeddedobject/186905
550

www.ck12.org Chapter 11. Human Impacts on Earth’s Atmosphere
11.5 Effects of Air Pollution on Human Health
Learning Objectives
• Describe the affects of air pollution on are on the rise.
How is breathing on a smoggy day like breathing trash?
On a smoggy day, you’re breathing garbage. No different from tossing trash out of a car window with no intentionof picking it up, we spew trash into the air as we drive, as we heat our homes, and as we manufacture goods. Wouldwe tolerate all this trash if it were in our houses laying on the ground?
Smog Effects on Human Health
Human health suffers in locations with high levels of air pollution.
Pollutants and Their Effects
Different pollutants have different health effects:
• Lead is the most common toxic material and is responsible for lead poisoning.• Carbon monoxide can kill people in poorly ventilated spaces, such as tunnels.• Nitrogen and sulfur-oxides cause lung disease and increased rates of asthma, emphysema, and viral infections
such as the flu.• Ozone damages the human respiratory system, causing lung disease. High ozone levels are also associated
with increased heart disease and cancer.
551

11.5. Effects of Air Pollution on Human Health www.ck12.org
• Particulates enter the lungs and cause heart or lung disease. When particulate levels are high, asthma attacksare more common. By some estimates, 30,000 deaths a year in the United States are caused by fine particlepollution.
Human Illnesses from Air Pollution
Many but not all cases of asthma can be linked to air pollution. During the 1996 Olympic Games, Atlanta, Georgia,closed off their downtown to private vehicles. This action decreased ozone levels by 28%. At the same time, therewere 40% fewer hospital visits for asthma. Can scientists conclude without a shadow of a doubt that the reductionin ozone caused the reduction in hospital visits? What could they do to make that determination?
Lung cancer among people who have never smoked is around 15% and is increasing. One study showed that the riskof being afflicted with lung cancer increases directly with a person’s exposure to air pollution (Figure 11.11). Thestudy concluded that no level of air pollution should be considered safe. Exposure to smog also increased the risk ofdying from any cause, including heart disease.
FIGURE 11.11A lung tumor is highlighted in this illustra-tion.
One study found that in the United States, children develop asthma at more than twice the rate of two decades agoand at four times the rate of children in Canada. Adults also suffer from air pollution-related illnesses that includelung disease, heart disease, lung cancer, and weakened immune systems. The asthma rate worldwide is rising 20%to 50% every decade.
552

www.ck12.org Chapter 11. Human Impacts on Earth’s Atmosphere
Science Friday: Pedaling Through Pollution
Peddling is often a popular activity, with some obvious dangers such as cars. However, air pollution is anotherdanger that is often harder to measure. In this video by Science Friday, researchers Steven Chillrud and Darby Jackdescribe how their experiment aims to measure the amount of air pollution exposure experienced by a cyclist.
MEDIAClick image to the left or use the URL below.URL: https://www.ck12.org/flx/render/embeddedobject/195450
Summary
• Pollutants emitted into the air cause lung and other diseases in humans.• Asthma, lung cancer, and other lung diseases are linked to air pollution.• Disease rates for air pollutant related diseases are rising.
Review
1. Lung cancer is on the rise in people who’ve never smoked. To what might you attribute this fact?2. What experiments have been done, deliberately or inadvertently, to test the effects of air pollution on asthma?3. How might the increase in asthma be related to air pollution?
Explore More
Use this resource to answer the questions that follow.
MEDIAClick image to the left or use the URL below.URL: https://www.ck12.org/flx/render/embeddedobject/1516
1. What is the your body’s first line of defense against air pollutants?2. What happens when people breath in air pollutants?3. Besides lung problems, what other types of problems can air pollutants cause?4. Which populations are most effected by air pollution?5. Why is air population especially dangerous for infants and toddlers?6. When does pollution affect everybody?7. What else does poor air affect negatively?8. How much does poor air cost Washington state each year?
553

11.6. Mercury Pollution www.ck12.org
11.6 Mercury Pollution
Learning Objectives
• Explain the health hazards posed by mercury pollution.
How much fish should you eat?
On the one hand, you hear fish is good for you. On the other, you hear that you’re not supposed to eat too much ofsome types of fish, like tuna. How can something that’s supposed to be good for you be harmful to your health?
Mercury Pollution
Mercury is released into the atmosphere when coal is burned (Figure 11.12). But breathing the mercury is notharmful. In the atmosphere, the mercury forms small droplets that are deposited in water or sediments.
Bioaccumulation
Do you know why you are supposed to eat large predatory fish like tuna infrequently? It is because of the bioaccu-mulation of mercury in those species.
Some pollutants remain in an organism throughout its life, a phenomenon called bioaccumulation. In this process, anorganism accumulates the entire amount of a toxic compound that it consumes over its lifetime. Not all substancesbioaccumulate. Can you name one that does not? Aspirin does not bioaccumulate; if it did, a person would quicklyaccumulate a toxic amount in her body. Compounds that bioaccumulate are usually stored in the organism’s fat.
554

www.ck12.org Chapter 11. Human Impacts on Earth’s Atmosphere
FIGURE 11.12Historic increases of mercury in the atmo-sphere: blue is volcanic eruptions; brown,purple, and pink are human-caused. Thered region shows the effect of industrial-ization on atmospheric mercury.
In the sediments, bacteria convert the droplets to the hazardous compound methyl mercury. Bacteria and planktonstore all of the mercury from all of the seawater they ingest (Figure 11.13). A small fish that eats bacteria andplankton accumulates all of the mercury from all of the tiny creatures it eats over its lifetime. A big fish accumulatesall of the mercury from all of the small fish it eats over its lifetime. For a tuna at the top of the food chain, that’s alot of mercury.
So tuna pose a health hazard to anything that eats them because their bodies are so high in mercury. This is whythe government recommends limits on the amount of tuna that people eat. Limiting intake of large predatory fish isespecially important for children and pregnant women. If the mercury just stayed in a person’s fat, it would not beharmful, but that fat is used when a woman is pregnant or nursing a baby. A person will also get the mercury intoher system when she (or he) burns the fat while losing weight.
555

11.6. Mercury Pollution www.ck12.org
FIGURE 11.13Methyl mercury bioaccumulates up thefood chain.
Mad As a Hatter
Methyl mercury poisoning can cause nervous system or brain damage, especially in infants and children. Childrenmay experience brain damage or developmental delays. The phrase “mad as a hatter” was common when LewisCarroll wrote his Alice in Wonderland stories. It was based on symptoms suffered by hatters who were exposed tomercury and experienced mercury poisoning while using the metal to make hats (Figure 11.14). Like mercury, othermetals and VOCS can bioaccumulate, causing harm to animals and people high on the food chain.
Mercury, a potent neurotoxin, has been flowing into the San Francisco Bay since the Gold Rush Era. It has settled inthe bay’s mud and made its way up the food chain, endangering wildlife and making many fish unsafe to eat. Nowa multi-billion-dollar plan aims to clean it up.
MEDIAClick image to the left or use the URL below.URL: https://www.ck12.org/flx/render/embeddedobject/116514
556

www.ck12.org Chapter 11. Human Impacts on Earth’s Atmosphere
FIGURE 11.14The Mad Hatter.
Summary
• Burning coal releases mercury into the atmosphere. It falls into sediments and is converted into methylmercury by bacteria.
• Creatures ingest the methyl mercury and store it. Then, larger creatures eat them and store all of that methylmercury, on up the food chain.
• Mercury poisoning causes nervous system damage.
Review
1. What is bioaccumulation?2. How does mercury change from something benign to something harmful?3. Why should you restrict your intake of tuna and other large predatory fish but continue to eat or even increase
your consumption of small fish that are low on the food chain, like anchovies?
Explore More
Use this resource to answer the questions that follow.
557

11.6. Mercury Pollution www.ck12.org
MEDIAClick image to the left or use the URL below.URL: https://www.ck12.org/flx/render/embeddedobject/1537
1. What is a natural source of mercury in the air?2. What the are the human-made sources of mercury?3. Where does mercury come from relative to the location of Acadia National Park?4. Why is Acadia National Park concerned about mercury?5. How is mercury an example of biomagnification?6. What are the toxic effects of mercury?7. Where does mercury enter the park ecosystem from?8. How much mercury is deposited relative to the amount scientists think existed before industrialization?9. Explain what people can do to reduce mercury in the environment.
558

www.ck12.org Chapter 11. Human Impacts on Earth’s Atmosphere
11.7 Acid Rain
Learning Objectives
• Describe the causes and consequences of acid rain.
What made the pits in this gargoyle?
This gargoyle, on Notre Dame Cathedral in Paris, has pits and rounded edges, which are the results of acid rain.Acid rain damages statues and architecture in developed nations.
Acid Rain
Acid rain is caused by sulfur and nitrogen oxides emanating from power plants or metal refineries. The smokestackshave been built tall so that pollutants don’t sit over cities (Figure 11.15).
As they move, these pollutants combine with water vapor to form sulfuric and nitric acids. The acid droplets formacid fog, rain, snow, or they may be deposited dry. Most typical is acid rain (Figure 11.16).
pH and Acid Rain
Acid rain water is more acidic than normal rain water. Acidity is measured on the pH scale. Lower numbers aremore acidic and higher numbers are less acidic (also called more alkaline) (Figure 11.17). Natural rain is somewhat
559

11.7. Acid Rain www.ck12.org
FIGURE 11.15Tall smokestacks allow the emissions torise high into the atmosphere and travelup to 1,000 km (600 miles) downwind.
FIGURE 11.16Pollutants are deposited dry or in precipi-tation.
acidic, with a pH of 5.6; acid rain must have a pH of less than 5.0. A small change in pH represents a large changein acidity: rain with a pH of 4.6 is 10 times more acidic than normal rain (with a pH of 5.6). Rain with a pH of 3.6is 100 times more acidic.
Regions with a lot of coal-burning power plants have the most acidic rain. The acidity of average rainwater in thenortheastern United States has fallen to between 4.0 and 4.6. Acid fog has even lower pH with an average of around3.4. One fog in Southern California in 1986 had a pH of 1.7, equal to toilet-bowl cleaner.
In arid climates, such as in Southern California, acids deposit on the ground dry. Acid precipitation ends up on theland surface and in water bodies. Some forest soils in the northeast are five to ten times more acidic than they weretwo or three decades ago. Acid droplets move down through acidic soils to lower the pH of streams and lakes evenmore. Acids strip soil of metals and nutrients, which collect in streams and lakes. As a result, stripped soils may nolonger provide the nutrients that native plants need.
560

www.ck12.org Chapter 11. Human Impacts on Earth’s Atmosphere
FIGURE 11.17A pH scale goes from 1 to 14; numbersare shown with the pH of some commonsubstances. A value of 7 is neutral. Thestrongest acids are at the low end of thescale and the strongest bases are at thehigh end.
Effects of Acid Rain
Acid rain takes a toll on ecosystems (Figure 11.18). Plants that are exposed to acids become weak and are morelikely to be damaged by bad weather, insect pests, or disease. Snails die in acid soils, so songbirds do not have asmuch food to eat. Young birds and mammals do not build bones as well and may not be as strong. Eggshells mayalso be weak and break more easily.
As lakes become acidic, organisms die off. No fish can live if the pH drops below 4.5. Organic material cannotdecay, and mosses take over the lake. Wildlife that depend on the lake for drinking water suffer population declines.
Crops are damaged by acid rain. This is most noticeable in poor nations where people can’t afford to fix the problemswith fertilizers or other technology.
561

11.7. Acid Rain www.ck12.org
FIGURE 11.18Acid rain has killed trees in this forest inthe Czech Republic.
Acid rain damages cultural monuments like buildings and statues. These include the U.S. Capitol and many buildingsin Europe, such as Westminster Abbey.
Carbonate rocks neutralize acids and so some regions do not suffer the effects of acid rain nearly as much. Limestonein the midwestern United States protects the area. One reason that the northeastern United States is so vulnerable toacid rain damage is that the rocks are not carbonates.
Because pollutants can travel so far, much of the acid rain that falls hurts states or nations other than ones where thepollutants were released. All the rain that falls in Sweden is acidic and fish in lakes all over the country are dying. Thepollutants come from the United Kingdom and Western Europe, which are now working to decrease their emissions.Canada also suffers from acid rain that originates in the United States, a problem that is also improving. SoutheastAsia is experiencing more acid rain between nations as the region industrializes.
MEDIAClick image to the left or use the URL below.URL: https://www.ck12.org/flx/render/embeddedobject/186909
MEDIAClick image to the left or use the URL below.URL: https://www.ck12.org/flx/render/embeddedobject/186911
562

www.ck12.org Chapter 11. Human Impacts on Earth’s Atmosphere
Summary
• Nitrogen and sulfur compounds emitted high into the atmosphere create acids that later fall as acid rain.• Acidity is measured on a pH scale. Rain that is 5.0 or less on that scale is considered acid rain.• Acid rain weakens plants and animals and damages cultural treasures.
Review
1. Why do acids travel so far before they fall as acid rain?2. Where does the acid that comes out of the atmosphere go?3. What damage does acid rain do to organisms and cultural structures?4. One problem with acid rain is that the pollutants that cause it may be emitted far upwind from where it falls
in a different country. How can nations deal with this problem?
563

11.8. Ozone Depletion www.ck12.org
11.8 Ozone Depletion
Learning Objectives
• Explain how a hole in the ozone layer forms, and describe the effects that follow.
Why can’t the children in Punta Arenas go outside in the spring?
Children in Punta Arenas, Chile, the world’s most southern city, look forward to spring as much as anyone who livesthrough a frigid, dark winter. But unlike the children pictured above, some years, the children in Punta Arenas areinstructed not to go outside because the ozone hole has moved north and the UV radiation is too high.
Ozone Depletion
At this point you might be asking yourself, “Is ozone bad or is ozone good?” There is no simple answer to thatquestion: It depends on where the ozone is located (Figure 11.19).
• In the troposphere, ozone is a pollutant.• In the ozone layer in the stratosphere, ozone screens out high energy ultraviolet radiation and makes Earth
habitable.
How Ozone is Destroyed
Human-made chemicals are breaking ozone molecules in the ozone layer. Chlorofluorocarbons (CFCs) are themost common, but there are others, including halons, methyl bromide, carbon tetrachloride, and methyl chloroform.
564

www.ck12.org Chapter 11. Human Impacts on Earth’s Atmosphere
FIGURE 11.19(1) Solar energy breaks apart oxygenmolecules into two oxygen atoms. (2)Ozone forms when oxygen atoms bondtogether as O3. UV rays break apartthe ozone molecules into one oxygenmolecule (O2) and one oxygen atom (O).These processes convert UV radiationinto heat, which is how the Sun heatsthe stratosphere. (3) Under natural cir-cumstances, the amount of ozone cre-ated equals the amount destroyed. WhenO3 interacts with chlorine or some othergases the O3 breaks down into O2 and Oand so the ozone layer loses its ability tofilter out UV.
CFCs were once widely used because they are cheap, nontoxic, nonflammable, and non-reactive. They were used asspray-can propellants, refrigerants, and in many other products.
Once they are released into the air, CFCs float up to the stratosphere. Air currents move them toward the poles. Inthe winter, they freeze onto nitric acid molecules in polar stratospheric clouds (PSC) (Figure 11.20). In the spring,the Sun’s warmth starts the air moving, and ultraviolet light breaks the CFCs apart. The chlorine atom floats awayand attaches to one of the oxygen atoms on an ozone molecule. The chlorine pulls the oxygen atom away, leavingbehind an O2 molecule, which provides no UV protection. The chlorine then releases the oxygen atom and moveson to destroy another ozone molecule. One CFC molecule can destroy as many as 100,000 ozone molecules.
FIGURE 11.20PSCs form only where the stratosphereis coldest, and are most common aboveAntarctica in the wintertime. PSCs areneeded for stratospheric ozone to be de-stroyed.
565

11.8. Ozone Depletion www.ck12.org
The Ozone Hole
Ozone destruction creates the ozone hole where the layer is dangerously thin (Figure 11.21). As air circulates overAntarctica in the spring, the ozone hole expands northward over the southern continents, including Australia, NewZealand, southern South America, and southern Africa. UV levels may rise as much as 20% beneath the ozone hole.The hole was first measured in 1981 when it was 2 million square km (900,000 square miles). The 2006 hole wasthe largest ever observed at 28 million square km (11.4 million square miles). The size of the ozone hole each yeardepends on many factors, including whether conditions are right for the formation of PSCs.
FIGURE 11.21The September 2006 ozone hole, thelargest observed (through 2013). Blueand purple colors show particularly lowlevels of ozone.
Ozone Loss in the North
Ozone loss also occurs over the North Polar Region, but it is not enough for scientists to call it a hole. Why doyou think there is less ozone loss over the North Pole area? The region of low ozone levels is small because theatmosphere is not as cold and PSCs do not form as readily. Still, springtime ozone levels are relatively low. Thislow moves south over some of the world’s most populated areas in Europe, North America, and Asia. At 40oN, thelatitude of New York City, UV-B has increased about 4% per decade since 1978. At 55oN, the approximate latitudeof Moscow and Copenhagen, the increase has been 6.8% per decade since 1978.
MEDIAClick image to the left or use the URL below.URL: https://www.ck12.org/flx/render/embeddedobject/1550
566

www.ck12.org Chapter 11. Human Impacts on Earth’s Atmosphere
Effects of Ozone Loss
Ozone losses on human health and environment include:
• Increases in sunburns, cataracts (clouding of the lens of the eye), and skin cancers. A loss of ozone of only1% is estimated to increase skin cancer cases by 5% to 6%.
• Decreases in the human immune system’s ability to fight off infectious diseases.• Reduction in crop yields because many plants are sensitive to ultraviolet light.• Decreases in phytoplankton productivity. A decrease of 6% to 12% has been measured around Antarctica,
which may be at least partly related to the ozone hole. The effects of excess UV on other organisms is notknown.
• Whales in the Gulf of California have been found to have sunburned cells in their lowest skin layers, indicatingvery severe sunburns. The problem is greatest with light colored species or species that spend more time nearthe sea surface.
When the problem with ozone depletion was recognized, world leaders took action. CFCs were banned in spraycans in some nations in 1978. The greatest production of CFCs was in 1986, but it has declined since then. This willbe discussed more in the next concept.
Summary
• CFCs float up into the stratosphere where they break apart. The chlorine pulls an oxygen ion off of an ozonemolecule and destroys it.
• The ozone hole is where there is less ozone than normal at that altitude. It forms in the spring.• Ozone loss increases the amount of high-energy ultraviolet radiation that can strike Earth, causing ecological
and health problems.
Review
1. How do CFCs destroy ozone?2. What is the ozone hole and where is it found? Is there an equivalent hole in the Northern Hemisphere?3. What are some of the consequences of ozone loss that have been identified?
Explore More
Use this resource to answer the questions that follow.
MEDIAClick image to the left or use the URL below.URL: https://www.ck12.org/flx/render/embeddedobject/153478
567

11.8. Ozone Depletion www.ck12.org
1. What does ozone in the stratosphere do?2. What is the ozone molecule? How does it form?3. How does stratospheric ozone absorb ultraviolet radiation?4. What is one of the major properties of the ozone molecule? What does it react with?5. What happens when a chlorine atom comes intersects an ozone molecule?6. What happens when the chlorine monoxide collides with a free oxygen atom.What happens next to the
chlorine?7. What has altered the balance between ozone creation and ozone loss in the stratosphere?8. Why are CFCs damaging?9. What happens to CFCs in the stratosphere? What happens next?
10. Where did scientists first discover the ozone depletion in the atmosphere? What is this called?11. What is the good news?
Resources
MEDIAClick image to the left or use the URL below.URL: https://www.ck12.org/flx/render/embeddedobject/169904
568

www.ck12.org Chapter 11. Human Impacts on Earth’s Atmosphere
11.9 Reducing Air Pollution
Learning Objectives
• Describe ways to reduce air pollution.
What does a catalytic converter do anyway?
In the days before catalytic converters, cars spewed lots of smoke. Laws governing emissions have helped to cleanup the air.
The Clean Air Act
The Clean Air Act of 1970 and the amendments since then have done a great job in requiring people to clean upthe air over the United States. Emissions of the six major pollutants regulated by the Clean Air Act — carbonmonoxide, lead, nitrous oxides, ozone, sulfur dioxide, and particulates — have decreased by more than 50%. Cars,power plants, and factories individually release less pollution than they did in the mid-20th century. But there aremany more cars, power plants, and factories. Many pollutants are still being released and some substances havebeen found to be pollutants that were not known to be pollutants in the past. There is still much work to be done tocontinue to clean up the air.
Reducing Air Pollution from Vehicles
Reducing air pollution from vehicles can be done in a number of ways.
569

11.9. Reducing Air Pollution www.ck12.org
• Breaking down pollutants before they are released into the atmosphere. Motor vehicles emit less pollutionthan they once did because of catalytic converters (Figure 11.22). Catalytic converters contain a catalystthat speeds up chemical reactions and breaks down nitrous oxides, carbon monoxide, and VOCs. Catalyticconverters only work when they are hot, so a lot of exhaust escapes as the car is warming up.
FIGURE 11.22Catalytic converters are placed on mod-ern cars in the United States.
• Making a vehicle more fuel efficient. Lighter, more streamlined vehicles need less energy. Hybrid vehicleshave an electric motor and a rechargeable battery. The energy that would be lost during braking is funneledinto charging the battery, which then can power the car. The internal combustion engine only takes over whenpower in the battery has run out. Hybrids can reduce auto emissions by 90% or more, but many models do notmaximize the possible fuel efficiency of the vehicle.
A plug-in hybrid is plugged into an electricity source when it is not in use, perhaps in a garage, to make sure that thebattery is charged. Plug-in hybrids run for a longer time on electricity and so are less polluting than regular hybrids.Plug-in hybrids began to become available in 2010.
• Developing new technologies that do not use fossil fuels. Fueling a car with something other than a liquidorganic-based fuel is difficult. A fuel cell converts chemical energy into electrical energy. Hydrogen fuelcells harness the energy released when hydrogen and oxygen come together to create water (Figure 11.23).Fuel cells are extremely efficient and they produce no pollutants. But developing fuel-cell technology has hadmany problems and no one knows when or if they will become practical.
Reducing Industrial Air Pollution
Pollutants are removed from the exhaust streams of power plants and industrial plants before they enter the atmo-sphere. Particulates can be filtered out, and sulfur and nitric oxides can be broken down by catalysts. Removingthese oxides reduces the pollutants that cause acid rain.
570

www.ck12.org Chapter 11. Human Impacts on Earth’s Atmosphere
FIGURE 11.23A hydrogen fuel-cell car looks like agasoline-powered car.
Particles are relatively easy to remove from emissions by using motion or electricity to separate particles from thegases. Scrubbers remove particles and waste gases from exhaust using liquids or neutralizing materials (Figure11.24). Gases, such as nitrogen oxides, can be broken down at very high temperatures.
Gasification
Gasification is a developing technology. In gasification, coal (rarely is another organic material used) is heated toextremely high temperatures to create syngas, which is then filtered. The energy goes on to drive a generator. Syngasreleases about 80% less pollution than regular coal plants, and greenhouse gases are also lower. Clean coal plants donot need scrubbers or other pollution control devices. Although the technology is ready, clean coal plants are moreexpensive to construct and operate. Also, heating the coal to high enough temperatures uses a great deal of energy,so the technology is not energy efficient. In addition, large amounts of the greenhouse gas CO2 are still released withclean coal technology. Nonetheless, a few of these plants are operating in the United States and around the world.
Ways You Can Reduce Air Pollution
How can air pollution be reduced? Using less fossil fuel is one way to lessen pollution. Some examples of ways toconserve fossil fuels are:
• Riding a bike or walking instead of driving.• Taking a bus or carpooling.• Buying a car that has greater fuel efficiency.• Turning off lights and appliances when they are not in use.• Using energy efficient light bulbs and appliances.• Buying fewer things that are manufactured using fossil fuels.
All these actions reduce the amount of energy that power plants need to produce.
MEDIAClick image to the left or use the URL below.URL: https://www.ck12.org/flx/render/embeddedobject/186915
571

11.9. Reducing Air Pollution www.ck12.org
FIGURE 11.24Scrubbers remove particles and wastegases from exhaust.
Developing alternative energy sources is important. What are some of the problems facing wider adoption ofalternative energy sources?
• The technologies for several sources of alternative energy, including solar and wind, are still being developed.• Solar and wind are still expensive relative to using fossil fuels. The technology needs to advance so that the
price falls.• Some areas get low amounts of sunlight and are not suited for solar. Others do not have much wind. It is
important that regions develop what best suits them. While the desert Southwest will need to develop solar,the Great Plains can use wind energy as its energy source. Perhaps some locations will rely on nuclear powerplants, although current nuclear power plants have major problems with safety and waste disposal.
Sometimes technological approaches are what is needed.
572

www.ck12.org Chapter 11. Human Impacts on Earth’s Atmosphere
MEDIAClick image to the left or use the URL below.URL: https://www.ck12.org/flx/render/embeddedobject/164837
Summary
• Catalytic converters break down some pollutants, but only when they are hot.• Hybrid vehicles use the energy that is usually wasted as a car slows to charge a battery that then powers the
car.• Different types of clean energy can be developed for different locations, such as solar for the desert southwest
and wind for coastal regions.
Review
1. How do fuel cells work, what are their advantages, and why are they not used in every vehicle?2. What is gasification technology and what role could it play in reducing air pollution?3. What can you do to reduce the amount of air pollution you produce?
573

11.10. Reducing Ozone Destruction www.ck12.org
11.10 Reducing Ozone Destruction
Learning Objectives
• Describe efforts to reduce ozone destruction.
What would have happened if CFCs had not been phased out?
Had CFCs not been phased out, by 2050 there would have been 10 times more skin cancer cases than in 1980.The result would have been about 20 million more cases of skin cancer in the United States and 130 million casesglobally.
Reducing Ozone Destruction
One success story in reducing pollutants that harm the atmosphere concerns ozone-destroying chemicals. In 1973,scientists calculated that CFCs could reach the stratosphere and break apart. This would release chlorine atoms,which would then destroy ozone. Based only on their calculations, the United States and most Scandinaviancountries banned CFCs in spray cans in 1978.
More confirmation that CFCs break down ozone was needed before more was done to reduce production of ozone-destroying chemicals. In 1985, members of the British Antarctic Survey reported that a 50% reduction in the ozonelayer had been found over Antarctica in the previous three springs.
574

www.ck12.org Chapter 11. Human Impacts on Earth’s Atmosphere
The Montreal Protocol
Two years after the British Antarctic Survey report, the "Montreal Protocol on Substances that Deplete the OzoneLayer" was ratified by nations all over the world.
The Montreal Protocol controls the production and consumption of 96 chemicals that damage the ozone layer(Figure 11.25). Hazardous substances are phased out first by developed nations and one decade later by developingnations. More hazardous substances are phased out more quickly. CFCs have been mostly phased out since 1995,although were used in developing nations until 2010. Some of the less hazardous substances will not be phased outuntil 2030. The Protocol also requires that wealthier nations donate money to develop technologies that will replacethese chemicals.
FIGURE 11.25Ozone levels over North America decreased between 1974 and 2009. Models of the future predict what ozonelevels would have been if CFCs were not being phased out. Warmer colors indicate more ozone.
Since CFCs take many years to reach the stratosphere and can survive there a long time before they break down, theozone hole will probably continue to grow for some time before it begins to shrink. The ozone layer will reach thesame levels it had before 1980 around 2068 and 1950 levels in one or two centuries.
Summary
• Calculations of ozone destruction prompted governments to ban some CFCs in 1978.• The Montreal Protocol protects the ozone layer by regulating the production and consumption of ozone-
destroying chemicals.• Ozone levels continue to decrease, but the ozone hole will eventually begin to get smaller.
Review
1. How did mathematical calculations and observations of depletion of ozone over Antarctica prompt society toact to protect the ozone layer?
575

11.10. Reducing Ozone Destruction www.ck12.org
2. What is the Montreal Protocol?3. Why doesn’t the ozone hole repair itself now that CFCs are banned?
Explore More
Use this resource (watch up to 11:00) to answer the questions that follow:
MEDIAClick image to the left or use the URL below.URL: https://www.ck12.org/flx/render/embeddedobject/164305
1. What was the value of the ozone data collected by the British Antarctic Survey since the 1950s? What didJonathan Shanklin do with this data?
2. What did Shanklin discover with this data?3. What did the first pictures of the ozone layer look like from satellites?4. Why is the fact that CFCs are non-reactive dangerous?5. Why was the chemical destruction of ozone over Antarctica?6. Why was the Montreal Protocol a landmark agreement?7. What happened to ozone depleting substances by the mid-1990s?8. What has happened to ozone depleting substances in the atmosphere since then?9. What is the status of ozone depletion in the ozone layer? Has the hole healed?
10. What would have happened without the Montreal Protocol and there was no regulation of chlorine?11. What would have happened with a much reduced ozone layer?12. When will the ozone hole heal?13. What is the relationship between ozone depleting substances and climate change?14. What is the problem with hydrochlorofluorocarbons?
576

www.ck12.org Chapter 11. Human Impacts on Earth’s Atmosphere
11.11 Climate Change in Earth History
Learning Objectives
• Explain how Earth’s climate has changed in the past.
How important is climate in the history of life?
Dinosaurs lived a long time, geologically speaking, in part because the weather was favorable to them. Giantmammals lived during the ice ages because conditions were favorable. Earth’s climate has been warmer and colderin Earth history, but mostly it’s been warmer.
Climate Change in Earth History
Climate has changed throughout Earth history. Much of the time Earth’s climate was hotter and more humid than itis today, but climate has also been colder, as when glaciers covered much more of the planet. The most recent iceages were in the Pleistocene Epoch, between 1.8 million and 10,000 years ago (Figure 11.26). Glaciers advancedand retreated in cycles, known as glacial and interglacial periods. With so much of the world’s water bound intothe ice, sea level was about 125 meters (395 feet) lower than it is today. Many scientists think that we are now in awarm, interglacial period that has lasted about 10,000 years.
For the past 1500 years, climate has been relatively mild and stable when compared with much of Earth’s history.Why has climate stability been beneficial for human civilization? Stability has allowed the expansion of agricultureand the development of towns and cities.
Fairly small temperature changes can have major effects on global climate. The average global temperature duringglacial periods was only about 5.5oC (10oF) less than Earth’s current average temperature. Temperatures during theinterglacial periods were about 1.1oC (2.0oF) higher than today (Figure 11.27).
577

11.11. Climate Change in Earth History www.ck12.org
FIGURE 11.26The maximum extent of Northern Hemi-sphere glaciers during the Pleistoceneepoch.
Since the end of the Pleistocene, the global average temperature has risen about 4oC (7oF). Glaciers are retreatingand sea level is rising. While climate is getting steadily warmer, there have been a few more extreme warm and cooltimes in the last 10,000 years. Changes in climate have had effects on human civilization.
• The Medieval Warm Period from 900 to 1300 A.D. allowed Vikings to colonize Greenland and Great Britainto grow wine grapes.
• The Little Ice Age, from the 14th to 19th centuries, the Vikings were forced out of Greenland and humans hadto plant crops further south.
578

www.ck12.org Chapter 11. Human Impacts on Earth’s Atmosphere
FIGURE 11.27The graph is a compilation of 5 recon-structions (the green line is the meanof the five records) of mean temperaturechanges. This illustrates the high tem-peratures of the Medieval Warm Period,the lows of the Little Ice Age, and thevery high (and climbing) temperature ofthis decade.
MEDIAClick image to the left or use the URL below.URL: https://www.ck12.org/flx/render/embeddedobject/186917
Summary
• Earth’s climate has been warmer and colder, but mostly warmer, through Earth history.• For the past 2,000 years, when human society has really blossomed, climate has been relatively stable.• An increase in glaciers lowers sea level and a decrease in glaciers raises sea level.
Review
1. How has climate changed in the past 1,100 years?2. What were the temperatures of the glacial and interglacial periods of the Pleistocene ice ages?3. Why is the fact that climate has changed a lot during Earth history important to a discussion of climate change
today?
579

11.12. Short-Term Climate Change www.ck12.org
11.12 Short-Term Climate Change
Learning Objectives
• Describe common short-term climate variations.
Why is El Niño important to a discussion on climate change?
In 1973 a severe El Niño shut off upwelling off of South America, resulting in the collapse of the anchovetta fishery.Without small fish to eat, larger marine organisms died off. Since then, severe El Niño events have become morefrequent.
El Niño Southern Oscillation
Short-term changes in climate are common and they have many causes (Figure 11.28). The largest and mostimportant of these is the oscillation between El Niño and La Niña conditions. This cycle is called the ENSO (ElNiño Southern Oscillation). The ENSO drives changes in climate that are felt around the world about every two toseven years.
Normal Conditions
In a normal year, the trade winds blow across the Pacific Ocean near the Equator from east to west (toward Asia).A low pressure cell rises above the western equatorial Pacific. Warm water in the western Pacific Ocean raises sealevels by half a meter. Along the western coast of South America, the Peru Current carries cold water northward,and then westward along the Equator with the trade winds. Upwelling brings cold, nutrient-rich waters from thedeep sea.
580

www.ck12.org Chapter 11. Human Impacts on Earth’s Atmosphere
FIGURE 11.28Under normal conditions, low pressureand warm water (shown in red) build upin the western Pacific Ocean. Noticethat continents are shown in brown in theimage. North and South America are onthe right in this image.
El Niño
In an El Niño year, when water temperature reaches around 28oC (82oF), the trade winds weaken or reverse directionand blow east (toward South America) (Figure 11.29). Warm water is dragged back across the Pacific Ocean andpiles up off the west coast of South America. With warm, low-density water at the surface, upwelling stops. Withoutupwelling, nutrients are scarce and plankton populations decline. Since plankton form the base of the food web, fishcannot find food, and fish numbers decrease as well. All the animals that eat fish, including birds and humans, areaffected by the decline in fish.
FIGURE 11.29In El Niño conditions, the trade windsweaken or reverse directions. Warm wa-ter moves eastward across the PacificOcean and piles up against South Amer-ica.
By altering atmospheric and oceanic circulation, El Niño events change global climate patterns.
• Some regions receive more than average rainfall, including the west coast of North and South America, thesouthern United States, and Western Europe.
• Drought occurs in other parts of South America, the western Pacific, southern and northern Africa, andsouthern Europe.
581

11.12. Short-Term Climate Change www.ck12.org
An El Niño cycle lasts one to two years. Often, normal circulation patterns resume. Sometimes circulation patternsbounce back quickly and extremely (Figure 11.30). This is a La Niña.
La Niña
In a La Niña year, as in a normal year, trade winds moves from east to west and warm water piles up in the westernPacific Ocean. Ocean temperatures along coastal South America are colder than normal (instead of warmer, as in ElNiño). Cold water reaches farther into the western Pacific than normal.
FIGURE 11.30A La Niña year is like a normal year butthe circulation patterns are more extreme.
Other important oscillations are smaller and have a local, rather than global, effect. The North Atlantic Oscillationmostly alters climate in Europe. The Mediterranean also goes through cycles, varying between being dry at sometimes and warm and wet at others.
MEDIAClick image to the left or use the URL below.URL: https://www.ck12.org/flx/render/embeddedobject/186919
Summary
• El Niño and La Niña are two examples of short-term climate changes lasting one to a few years.• In an El Niño, the trade winds reverse direction, as do the equatorial surface currents, causing warm water to
pool off of South America and stop upwelling.• A La Niña is like normal conditions only more so.
582

www.ck12.org Chapter 11. Human Impacts on Earth’s Atmosphere
Review
1. Describe what happens with wind and current directions during an El Niño event.2. Why does an El Niño cause a collapse of the food chain off of South America?3. How does a La Niña event compare with an El Niño event?
Explore More
Use this resource to answer the questions that follow.
MEDIAClick image to the left or use the URL below.URL: https://www.ck12.org/flx/render/embeddedobject/178434
1. What are El Niño and La Niña characterized by?2. What is the temperature situation like in the equatorial Pacific during a La Niña?3. What is the temperature situation like in the equatorial Pacific during a El Niño?4. What happens when upwelling is shut off offshore of South America?5. What happens to the United States during an El Niño?6. What happens to the United States during an La Niña
583

11.13. Long-Term Climate Change www.ck12.org
11.13 Long-Term Climate Change
Learning Objectives
• Explain mechanisms that can change climate over the long term.
Why do the blue, green and red lines go in the same direction at the same time?
This is a complicated graph, but extremely interesting. The data are from the 3600 meter-long Vostok ice core, whichgave climate scientists an unprecedented look into the history of Earth’s climate. The red line is temperature. Youcan see that carbon dioxide and methane are correlated with temperature. When these greenhouse gases are high,temperature is high. This holds true for the 440,000 years revealed in the core.
Causes of Long-Term Climate Change
Many processes can cause climate to change. These include changes:
• In the amount of energy the Sun produces over years.• In the positions of the continents over millions of years.• In the tilt of Earth’s axis and orbit over thousands of years.• That are sudden and dramatic because of random catastrophic events, such as a large asteroid impact.• In greenhouse gases in the atmosphere, caused naturally or by human activities.
584

www.ck12.org Chapter 11. Human Impacts on Earth’s Atmosphere
Solar Variation
The amount of energy the Sun radiates is variable. Sunspots are magnetic storms on the Sun’s surface that increaseand decrease over an 11-year cycle (Figure 11.31). When the number of sunspots is high, solar radiation is alsorelatively high. But the entire variation in solar radiation is tiny relative to the total amount of solar radiation thatthere is, and there is no known 11-year cycle in climate variability. The Little Ice Age corresponded to a time whenthere were no sunspots on the Sun.
FIGURE 11.31Sunspots on the face of the Sun.
Plate Tectonics
Plate tectonic movements can alter climate. Over millions of years as seas open and close, ocean currents maydistribute heat differently. For example, when all the continents are joined into one supercontinent (such as Pangaea),nearly all locations experience a continental climate. When the continents separate, heat is more evenly distributed.
Plate tectonic movements may help start an ice age. When continents are located near the poles, ice can accumulate,which may increase albedo and lower global temperature. Low enough temperatures may start a global ice age.
Plate motions trigger volcanic eruptions, which release dust and CO2 into the atmosphere. Ordinary eruptions, evenlarge ones, have only a short-term effect on weather (Figure 11.32). Massive eruptions of the fluid lavas that createlava plateaus release much more gas and dust, and can change climate for many years. This type of eruption isexceedingly rare; none has occurred since humans have lived on Earth.
Milankovitch Cycles
The most extreme climate of recent Earth history was the Pleistocene. Scientists attribute a series of ice ages tovariation in the Earth’s position relative to the Sun, known as Milankovitch cycles.
585

11.13. Long-Term Climate Change www.ck12.org
FIGURE 11.32An eruption like Sarychev Volcano (KurilIslands, northeast of Japan) in 2009would have very little impact on weather.
The Earth goes through regular variations in its position relative to the Sun:
1. The shape of the Earth’s orbit changes slightly as it goes around the Sun. The orbit varies from more circularto more elliptical in a cycle lasting between 90,000 and 100,000 years. When the orbit is more elliptical, there is agreater difference in solar radiation between winter and summer.
2. The planet wobbles on its axis of rotation. At one extreme of this 27,000 year cycle, the Northern Hemispherepoints toward the Sun when the Earth is closest to the Sun. Summers are much warmer and winters are much colderthan now. At the opposite extreme, the Northern Hemisphere points toward the Sun when it is farthest from the Sun.This results in chilly summers and warmer winters.
3. The planet’s tilt on its axis varies between 22.1o and 24.5o. Seasons are caused by the tilt of Earth’s axis of rotation,which is at a 23.5o angle now. When the tilt angle is smaller, summers and winters differ less in temperature. Thiscycle lasts 41,000 years.
When these three variations are charted out, a climate pattern of about 100,000 years emerges. Ice ages correspondclosely with Milankovitch cycles. Since glaciers can form only over land, ice ages only occur when landmassescover the polar regions. Therefore, Milankovitch cycles are also connected to plate tectonics.
Changes in Atmospheric Greenhouse Gas Levels
Since greenhouse gases trap the heat that radiates off the planet’s surfaces, what would happen to global temperaturesif atmospheric greenhouse gas levels decreased? What if greenhouse gases increased? A decrease in greenhouse gaslevels decreases global temperature and an increase raises global temperature.
Greenhouse gas levels have varied throughout Earth history. For example, CO2 has been present at concentrationsless than 200 parts per million (ppm) and more than 5,000 ppm. But for at least 650,000 years, CO2 has never risenabove 300 ppm, during either glacial or interglacial periods (Figure 11.33).
Natural processes add and remove CO2 from the atmosphere.
• Processes that add CO2:
– volcanic eruptions– decay or burning of organic matter.
• Processes that remove CO2:
586

www.ck12.org Chapter 11. Human Impacts on Earth’s Atmosphere
FIGURE 11.33CO2 levels during glacial (blue) and inter-glacial (yellow) periods. Are CO2 levelsrelatively high or relatively low during in-terglacial periods? Current carbon diox-ide levels are at around 400 ppm, thehighest level for the last 650,000 years.BP means years before present.
– absorption by plant and animal tissue.
When plants are turned into fossil fuels, the CO2 in their tissue is stored with them. So CO2 is removed from theatmosphere. What does this do to Earth’s average temperature?
What happens to atmospheric CO2 when the fossil fuels are burned? What happens to global temperatures?
Summary
• The positions of continents, the sizes of oceans and the amount of volcanic activity that takes place are allways that plate tectonics processes can affect climate.
• Milankovitch cycles affect the way Earth relates to the Sun due to the shape of the planet’s orbit, its axial tilt,and its wobble.
• Atmospheric greenhouse gas levels correlate with average global temperatures.
Review
1. How do Milankovitch cycles affect global temperatures?2. How do plate tectonics processes affect global climate?3. How are atmospheric greenhouse gas levels correlated with global temperatures?4. What are carbon dioxide levels now? How often in the past 650,000 years have they been that high?
Explore More
Use these resources to answer the questions that follow.
587

11.13. Long-Term Climate Change www.ck12.org
MEDIAClick image to the left or use the URL below.URL: https://www.ck12.org/flx/render/embeddedobject/1534
1. What do Milankovitch cycles initiate?2. How often do Milankovitch cycles produce a warm period lately?3. What is the Holecene?4. When should we enter another ice age?5. What is happening to climate now?
588

www.ck12.org Chapter 11. Human Impacts on Earth’s Atmosphere
11.14 Carbon Cycle and Climate
Learning Objectives
• Explain the carbon cycle.
What is a diamond?
Carbon takes all sorts of forms as an element and as a compound. A diamond is just carbon, pure carbon. A diamondis good for cutting things, but it’s not good for breathing or building proteins out of, yet other forms of carbon are.Carbon is essential for life on Earth and, as carbon dioxide, it is an important atmospheric gas.
The Carbon Cycle
Carbon is a very important element to living things. As the second most common element in the human body,we know that human life without carbon would not be possible. Protein, carbohydrates, and fats are all part ofthe body and all contain carbon. When your body breaks down food to produce energy, you break down protein,carbohydrates, and fat, and you breathe out carbon dioxide.
589

11.14. Carbon Cycle and Climate www.ck12.org
Carbon occurs in many forms on Earth. The element moves through organisms and then returns to the environment.When all this happens in balance, the ecosystem remains in balance too.
Short Term Cycling of Carbon
The short term cycling of carbon begins with carbon dioxide (CO2) in the atmosphere.
Photosynthesis
Through photosynthesis, the inorganic carbon in carbon dioxide plus water and energy from sunlight is transformedinto organic carbon (food) with oxygen given off as a waste product. The chemical equation for photosynthesis is:
Respiration
Plants and animals engage in the reverse of photosynthesis, which is respiration. In respiration, animals use oxygento convert the organic carbon in sugar into food energy they can use. Plants also go through respiration and consumesome of the sugars they produce.
The chemical reaction for respiration is:
C6H12O6 + 6 O2→ 6 CO2 + 6 H2O + useable energy
Photosynthesis and respiration are a gas exchange process. In photosynthesis, CO2 is converted to O2; in respiration,O2 is converted to CO2.
Remember that plants do not create energy. They change the energy from sunlight into chemical energy that plantsand animals can use as food (Figure 11.34).
FIGURE 11.34The carbon cycle shows where a carbonatom might be found. The black num-bers indicate how much carbon is storedin various reservoirs, in billions of tons("GtC" stands for gigatons of carbon).The purple numbers indicate how muchcarbon moves between reservoirs eachyear. The sediments, as defined in thisdiagram, do not include the ~70 millionGtC of carbonate rock and kerogen.
590

www.ck12.org Chapter 11. Human Impacts on Earth’s Atmosphere
Long-Term Carbon Cycling
Carbon Sinks and Carbon Sources
Places in the ecosystem that store carbon are reservoirs. Places that supply and remove carbon are carbon sourcesand carbon sinks, respectively. If more carbon is provided than stored, the place is a carbon source. If more carbondioxide is absorbed than is emitted, the reservoir is a carbon sink. What are some examples of carbon sources andsinks?
• Carbon sinks are reservoirs where carbon is stored. Healthy living forests and the oceans act as carbon sinks.• Carbon sources are reservoirs from which carbon can enter the environment. The mantle is a source of carbon
from volcanic gases.
A reservoir can change from a sink to a source and vice versa. A forest is a sink, but when the forest burns it becomesa source.
The amount of time that carbon stays, on average, in a reservoir is the residence time of carbon in that reservoir.
Atmospheric Carbon Dioxide
Remember that the amount of CO2 in the atmosphere is very low. This means that a small increase or decrease inthe atmospheric CO2 can have a large effect.
By measuring the composition of air bubbles trapped in glacial ice, scientists can learn the amount of atmosphericCO2 at times in the past. Of particular interest is the time just before the Industrial Revolution, when society beganto use fossil fuels. That value is thought to be the natural content of CO2 for this time period; that number was 280parts per million (ppm).
By 1958, when scientists began to directly measure CO2 content from the atmosphere at Mauna Loa volcano in thePacific Ocean, the amount was 316 ppm (Figure below ). In 2018, the atmospheric CO2 content crossed over to 410ppm.
FIGURE 11.35The amount of CO2 in the atmospherehas been measured at Mauna Loa Obser-vatory since 1958. The blue line showsyearly averaged CO2. The red line showsseasonal variations in CO2.
591

11.14. Carbon Cycle and Climate www.ck12.org
This is an increase in atmospheric CO2 of 40% since the before the Industrial Revolution. About 65% of that increasehas occurred since the first CO2 measurements were made on Mauna Loa Volcano, Hawaii, in 1958.
Human Actions Impact the Carbon Cycle
Humans have changed the natural balance of the carbon cycle because we use coal, oil, and natural gas to supplyour energy demands. Fossil fuels are a sink for CO2 when they form, but they are a source for CO2 when they areburned.
The equation for combustion of propane, which is a simple hydrocarbon looks like this:
The equation shows that when propane burns, it uses oxygen and produces carbon dioxide and water. So when acar burns a tank of gas, the amount of CO2 in the atmosphere increases just a little. Added over millions of tanks ofgas and coal burned for electricity in power plants and all of the other sources of CO2, the result is the increase inatmospheric CO2 seen in the Figure 11.35.
The second largest source of atmospheric CO2 is deforestation (Figure 11.36). Trees naturally absorb CO2 whilethey are alive. Trees that are cut down lose their ability to absorb CO2. If the tree is burned or decomposes, itbecomes a source of CO2. A forest can go from being a carbon sink to being a carbon source.
FIGURE 11.36This forest in Mexico has been cut downand burned to clear forested land for agri-culture.
Why the Carbon Cycle is Important
Why is such a small amount of carbon dioxide in the atmosphere even important? Carbon dioxide is a greenhousegas. Greenhouse gases trap heat energy that would otherwise radiate out into space, which warms Earth. Thesegases were discussed in the chapter Atmospheric Processes.
Summary
• Carbon is essential for life as part of proteins, carbohydrates, and fats.
592

www.ck12.org Chapter 11. Human Impacts on Earth’s Atmosphere
• The amount of carbon dioxide in the atmosphere is extremely low, but it is extremely important since carbondioxide is a greenhouse gas, which helps to keep Earth’s climate moderate.
• The amount of carbon dioxide in the atmosphere is rising, a fact that has been documented on Mauna Loavolcano since 1958.
Review
1. What does it mean to say that photosynthesis and respiration are gas exchange processes?2. How do scientists learn about carbon levels in the past?3. How do human activities affect the carbon cycle?
Explore More
Use this resource to answer the questions that follow.
MEDIAClick image to the left or use the URL below.URL: https://www.ck12.org/flx/render/embeddedobject/178440
1. What do greenhouse gases do?2. Where did most of the carbon dioxide that was present in the early atmosphere go?3. What did the early plants add to the atmosphere and why was that important? What else did they create?4. What do organisms do with the organic carbon?5. What are the two major things that carbon does?6. What is the 30 second version of the carbon cycle?7. What does carbon fixation do with carbon dioxide?8. How do organisms use the carbohydrates produced by carbon fixing reactions?9. What is cellular respiration the reverse of?
10. After the organisms metabolize carbohydrates, how is the carbon released back into the environment?11. What happens when carbon dioxide mixes with water and what does it cause?12. What happens to the carbonate ions in the marine environment?13. What happens when shell building organisms die? What happens if those organisms are buried deeply?14. How much carbon is wrapped up in fossil fuels compared to the total amount of carbon?15. Where does the carbon dioxide go that is released from fossil fuels? Where does the excess carbon dioxide
go?
Resources
593

11.14. Carbon Cycle and Climate www.ck12.org
MEDIAClick image to the left or use the URL below.URL: https://www.ck12.org/flx/render/embeddedobject/178435
MEDIAClick image to the left or use the URL below.URL: https://www.ck12.org/flx/render/embeddedobject/178438
594

www.ck12.org Chapter 11. Human Impacts on Earth’s Atmosphere
11.15 Global Warming
Learning Objectives
• Describe the consequences of global warming.
Do polar bears belong in garbage dumps?
Changes due to warmer temperatures are becoming more visible. The Arctic is covered with ice less of the year, sopolar bears can’t hunt and are raiding garbage dumps for food. Extreme weather events are becoming more commonas weather becomes stranger. Sea level is rising, which is a problem during storms.
Global Warming
With more greenhouse gases trapping heat, average annual global temperatures are rising. This is known as globalwarming.
Increasing Temperatures
While temperatures have risen since the end of the Pleistocene, 10,000 years ago, this rate of increase has been morerapid in the past century, and has risen even faster since 1990. The 10 warmest years in the 134-year record haveall occurred in the 21st century. The warmest year on record was 2016, with 2015 and 2014 being the second andthird warmest (through 2016) (Figure below ). People who are younger than 30, have never experienced a month inwhich Earth’s average surface temperature was below average for that month during the 20th century. The last timeglobal temperatures were below that average was in February 1985. (Figure below ).
595

11.15. Global Warming www.ck12.org
FIGURE 11.37Recent temperature increases show howmuch temperature has risen since theIndustrial Revolution began.
Annual variations aside, the average global temperature increased about 01.0◦C (1.8◦F) between 1880 and 2015,according to the Goddard Institute for Space Studies, NASA. This number doesn’t seem very large. Why is itimportant?
Greenhouse Gas Emissions
The United States has long been the largest emitter of greenhouse gases, with about 20% of total emissions in 2004.As a result of China’s rapid economic growth, its emissions surpassed those of the United States in 2008. However,it’s also important to keep in mind that the United States has only about one-fifth the population of China. What’sthe significance of this? The average United States citizen produces far more greenhouse gas emissions than theaverage Chinese person.
Changes Due to Warming Temperatures
The following images show changes in the Earth and organisms as a result of global warming: Figure 11.38, Figure11.39, Figure 11.40.
FIGURE 11.38(a) Breakup of the Larsen Ice Shelf inAntarctica in 2002 was related to climatewarming in the region. (b) The BoulderGlacier has melted back tremendouslysince 1985. Other mountain glaciersaround the world are also melting.
The timing of events for species is changing. Mating and migrations take place earlier in the spring months. Speciesthat can are moving their ranges uphill. Some regions that were already marginal for agriculture are no longer arable
596

www.ck12.org Chapter 11. Human Impacts on Earth’s Atmosphere
FIGURE 11.39Permafrost is melting and its extent de-creasing. There are now fewer summerlakes in Siberia.
FIGURE 11.40(a) Melting ice caps add water to theoceans, so sea level is rising. Rememberthat water slightly expands as it warms— this expansion is also causing sealevel to rise. (b) Weather is becomingmore variable with more severe stormsand droughts. Snow blanketed the west-ern United States in December 2009.(c) As surface seas warm, phytoplanktonproductivity has decreased. (d) Coralreefs are dying worldwide; corals thatare stressed by high temperatures turnwhite. (e) Pine beetle infestations havekilled trees in western North America Theinsects have expanded their ranges intoareas that were once too cold.
because they have become too warm or dry.
What are the two major effects being seen in this animation? Glaciers are melting and vegetation zones are movinguphill. If fossil fuel use exploded in the 1950s, why do these changes begin early in the animation? Does this meanthat the climate change we are seeing is caused by natural processes and not by fossil fuel use?
Warming temperatures are bringing changes to much of the planet, including California. Sea level is rising, snowpack is changing, and the ecology of the state is responding to these changes.
597

11.15. Global Warming www.ck12.org
MEDIAClick image to the left or use the URL below.URL: https://www.ck12.org/flx/render/embeddedobject/414
Summary
• Greenhouse gases trap heat in the atmosphere; burning fossil fuels and other human activities release green-house gases into the atmosphere; greenhouse gas levels in the atmosphere are increasing; and global tempera-tures are increasing.
• Average global temperature has been rising since the end of the ice ages but the rate of its rise has increasedin recent decades.
• Changes due to increasing temperatures are seen around the globe but are most dramatic in the polar regions.
Review
1. The first point in the summary above is a set of facts. Does it logically follow that human activities are causingglobal temperatures to rise? Is there a different explanation that fits with the facts?
2. Why is average global temperature the most important value when talking about climate change?3. What are some of the effects of climate change that are already being seen?
Explore More
Use the resource below to answer the questions that follow.
MEDIAClick image to the left or use the URL below.URL: https://www.ck12.org/flx/render/embeddedobject/1542
1. How much has the global temperature risen in the last century?2. What is the major human activity that contributes to global warming and why?3. What is the greenhouse effect?4. Is average global temperature rising? What is your evidence?5. Which greenhouse gases are at their highest levels in history? When was the last time they were as high?6. What do researchers predict will happen?7. What can we do now to slow the rise in temperatures?
598

www.ck12.org Chapter 11. Human Impacts on Earth’s Atmosphere
Resources
MEDIAClick image to the left or use the URL below.URL: https://www.ck12.org/flx/render/embeddedobject/169911
599
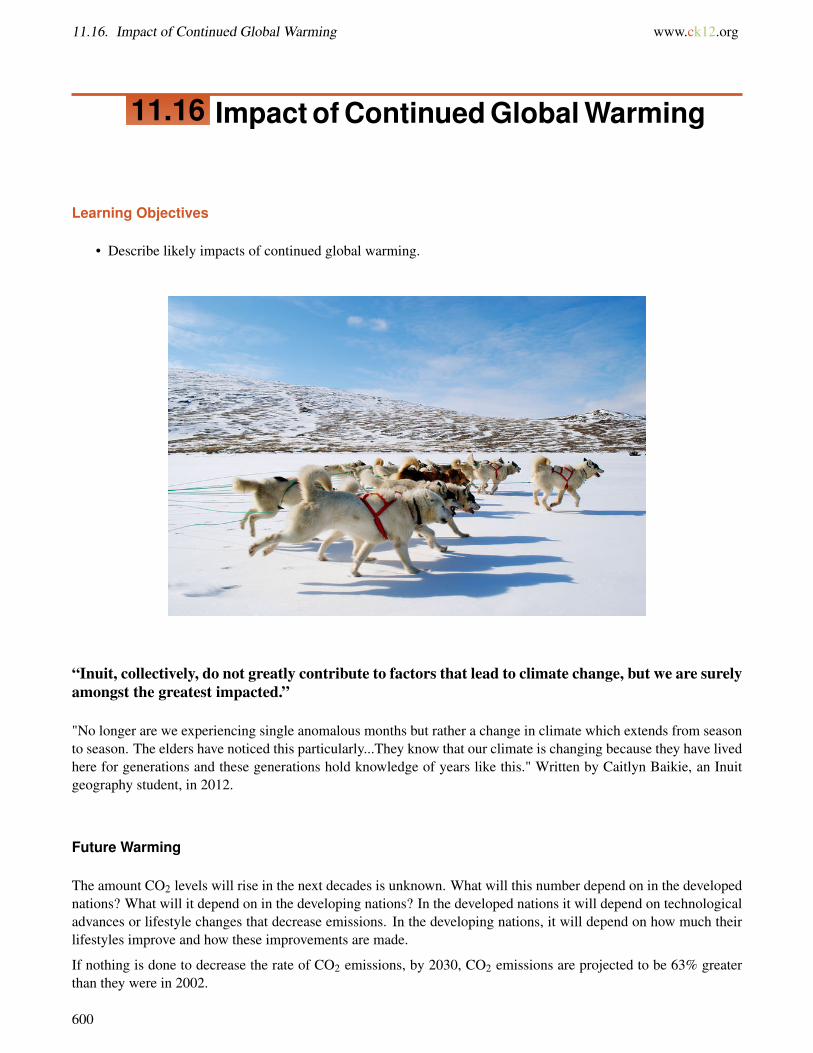
11.16. Impact of Continued Global Warming www.ck12.org
11.16 Impact of Continued Global Warming
Learning Objectives
• Describe likely impacts of continued global warming.
“Inuit, collectively, do not greatly contribute to factors that lead to climate change, but we are surelyamongst the greatest impacted.”
"No longer are we experiencing single anomalous months but rather a change in climate which extends from seasonto season. The elders have noticed this particularly...They know that our climate is changing because they have livedhere for generations and these generations hold knowledge of years like this." Written by Caitlyn Baikie, an Inuitgeography student, in 2012.
Future Warming
The amount CO2 levels will rise in the next decades is unknown. What will this number depend on in the developednations? What will it depend on in the developing nations? In the developed nations it will depend on technologicaladvances or lifestyle changes that decrease emissions. In the developing nations, it will depend on how much theirlifestyles improve and how these improvements are made.
If nothing is done to decrease the rate of CO2 emissions, by 2030, CO2 emissions are projected to be 63% greaterthan they were in 2002.
600

www.ck12.org Chapter 11. Human Impacts on Earth’s Atmosphere
FIGURE 11.41Global CO2 emissions are rising rapidly.The industrial revolution began about1850 and industrialization has been ac-celerating.
Temperature Scenarios
Computer models are used to predict the effects of greenhouse gas increases on climate for the planet as a wholeand also for specific regions. If nothing is done to control greenhouse gas emissions and they continue to increase atcurrent rates, the surface temperature of the Earth can be expected to increase between 0.5oC and 2.0oC (0.9oF and3.6oF) by 2050 and between 2o and 4.5oC (3.5o and 8oF) by 2100, with CO2 levels over 800 parts per million (ppm).On the other hand, if severe limits on CO2 emissions begin soon, temperatures could rise less than 1.1oC (2oF) by2100.
MEDIAClick image to the left or use the URL below.URL: https://www.ck12.org/flx/render/embeddedobject/1436
Whatever the temperature increase, it will not be uniform around the globe. A rise of 2.8oC (5oF) would result in0.6o to 1.2oC (1o to 2oF) at the Equator, but up to 6.7oC (12oF) at the poles. So far, global warming has affected theNorth Pole more than the South Pole, but temperatures are still increasing at Antarctica (Figure 11.42).
Global Changes
As greenhouse gases increase, changes will be more extreme. Oceans will become more acidic, making it moredifficult for creatures with carbonate shells to grow, and that includes coral reefs. A study monitoring ocean acidityin the Pacific Northwest found ocean acidity increasing ten times faster than expected and 10% to 20% of shellfish(mussels) being replaced by acid-tolerant algae.
601

11.16. Impact of Continued Global Warming www.ck12.org
FIGURE 11.42Temperature changes over Antarctica.
Plant and animal species seeking cooler temperatures will need to move poleward 100 to 150 km (60 to 90 miles)or upward 150 m (500 feet) for each 1.0oC (8oF) rise in global temperature. There will be a tremendous loss ofbiodiversity because forest species can’t migrate that rapidly. Biologists have already documented the extinction ofhigh-altitude species that have nowhere higher to go.
Decreased snow packs, shrinking glaciers, and the earlier arrival of spring will all lessen the amount of wateravailable in some regions of the world, including the western United States and much of Asia. Ice will continueto melt and sea level is predicted to rise 18 to 97 cm (7 to 38 inches) by 2100 (Figure 11.43). An increase this largewill gradually flood coastal regions, where about one-third of the world’s population lives, forcing billions of peopleto move inland.
Weather will become more extreme, with more frequent and more intense heat waves and droughts. Some modelerspredict that the midwestern United States will become too dry to support agriculture and that Canada will becomethe new breadbasket. In all, about 10% to 50% of current cropland worldwide may become unusable if CO2 doubles.
Although scientists do not all agree, hurricanes are likely to become more severe and possibly more frequent.Tropical and subtropical insects will expand their ranges, resulting in the spread of tropical diseases such as malaria,encephalitis, yellow fever, and dengue fever.
You may notice that the numerical predictions above contain wide ranges. Sea level, for example, is expected to risesomewhere between 18 and 97 cm — quite a wide range. What is the reason for this uncertainty? It is partly becausescientists cannot predict exactly how the Earth will respond to increased levels of greenhouses gases. How quicklygreenhouse gases continue to build up in the atmosphere depends in part on the choices we make.
An important question people ask is this: Are the increases in global temperature natural? In other words, cannatural variations in temperature account for the increase in temperature that we see? The answer is no. Changes inthe Sun’s irradiance, El Niño and La Niña cycles, natural changes in greenhouse gas, and other atmospheric gasescannot account for the increase in temperature that has already happened in the past decades.
Along with the rest of the world’s oceans, San Francisco Bay is rising. Changes are happening slowly in the coastal
602

www.ck12.org Chapter 11. Human Impacts on Earth’s Atmosphere
FIGURE 11.43Sea ice thickness around the North Polehas been decreasing in recent decadesand will continue to decrease in the com-ing decades.
arena of the San Francisco Bay Area and even the most optimistic estimates about how high and how quickly thisrise will occur indicate potentially huge problems for the region.
MEDIAClick image to the left or use the URL below.URL: https://www.ck12.org/flx/render/embeddedobject/116515
Summary
• An increase in greenhouse gases will increase the changes that are already being seen including in oceanacidity.
• A decrease in snow pack will cause a shortage of water in a lot of regions that depend on a summer melt tosupply water in the dry months.
• Temperature changes are not uniform around the globe. The largest changes are being seen in the polarregions.
Review
1. What factors does a computer model that predicts environmental changes due to increases in atmosphericgreenhouse gases need to take into account?
2. Why does a small change in average global temperature have a large effect on the planet?3. Why do you think that scientists do not have a firm understanding of how Earth will respond to increases in
global temperature in the future?
603

11.16. Impact of Continued Global Warming www.ck12.org
Explore More
Use this resource to answer the questions that follow.
MEDIAClick image to the left or use the URL below.URL: https://www.ck12.org/flx/render/embeddedobject/169946
1. What have the world’s top scientists concluded? What are the main causes?2. What has happened over the past 250 years and why?3. What changes are happening to the atmosphere?4. What is causing sea level to rise? What will happen to small island nations?5. What happens to biodiversity?6. What could happen to food supplies?7. Who is the most vulnerable to climate changes?8. What will happen to coastal areas?9. What must we do to change this future?
10. What must each of us do? Governments?11. What should be reflected in the costs of fossil fuels?
Resources
MEDIAClick image to the left or use the URL below.URL: https://www.ck12.org/flx/render/embeddedobject/169922
604

www.ck12.org Chapter 11. Human Impacts on Earth’s Atmosphere
11.17 Reducing Greenhouse Gas Pollution
Learning Objectives
• Describe how greenhouse gas pollution can be reduced.
“The chance of averting catastrophic climate change is slipping through our hands with every passing yearthat nations fail to agree on a rescue plan for the planet.” — Greenpeace International director Kumi Naidoo, atthe Durban, South Africa Climate Change Conference in 2011.
Reducing Greenhouse Gases
Climate scientists agree that climate change is a global problem that must be attacked by a unified world with asingle goal. All nations must come together to reduce greenhouse gas emissions. However, getting nations to agreeon anything has proven to be difficult. A few ideas have been proposed and in some nations are being enacted.
International Agreements
The first attempt to cap greenhouse gas emissions was the Kyoto Protocol, which climate scientists agree did not doenough in terms of cutting emissions or in getting nations to participate. The Kyoto Protocol set up a cap-and-tradesystem. Cap-and-trade provides a monetary incentive for nations to develop technologies that will reduce emissionsand to conserve energy. Some states and cities within the United States have begun their own cap-and-trade systems.
The United Nations Climate Change Conference meets in a different location annually. Although recommendationsare made each year, the group has not gotten the nations to sign on to a binding agreement. By doing nothing weare doing something - continuing to raise greenhouse gas levels and failing to prepare for the coming environmentalchanges.
605

11.17. Reducing Greenhouse Gas Pollution www.ck12.org
Carbon Tax
The easiest and quickest way is to reduce greenhouse gas emissions is to increase energy efficiency. One effectiveway to encourage efficiency is financial. A carbon tax can be placed on CO2 emissions to encourage conservation.The tax would be placed on gasoline, carbon dioxide emitted by factories, and home energy bills so people orbusinesses that emit more carbon would pay more money. This would encourage conservation since when peoplepurchase a new car, for example, they would be more likely to purchase an energy-efficient model. The money fromthe carbon tax would be used for research into alternative energy sources. All plans for a carbon tax allow a taxcredit for people who cannot afford to pay more for energy so that they do not suffer unfairly.
New technologies can be developed, such as renewable sources that were discussed in the chapter Natural Resources.Biofuels can replace gasoline in vehicles, but they must be developed sensibly (Figure 11.44). So far much of thebiofuel is produced from crops such as corn. But when food crops are used for fuel, the price of food goes up.Modern agriculture is also extremely reliant on fossil fuels for pesticides, fertilizers, and the work of farming. Thismeans that not much energy is gained from using a biofuel over using the fossil fuels directly. More promising cropsfor biofuels are now being researched. Surprisingly, algae is being investigated as a source of fuel! The algae can begrown in areas that are not useful for agriculture, and it also contains much more usable oil than crops such as corn.
FIGURE 11.44A bus that runs on soybean oil shows thepotential of biofuels.
Carbon Capture and Sequestration
If climate change becomes bad enough, people can attempt to remove greenhouse gases from the atmosphere afterthey are emitted. Carbon sequestration occurs naturally when carbon dioxide is removed from the atmosphere bytrees in a forest. One way to remove carbon would be to plant more trees, but unfortunately, more forest land iscurrently being lost than gained.
Carbon can also be artificially sequestered. For example, carbon can be captured from the emissions from gasifica-tion plants and then stored underground in salt layers or coal seams. While some small sequestration projects are indevelopment, large-scale sequestration has not yet been attempted.
This type of carbon capture and sequestration comes under the heading of geoengineering. There are many otherfascinating ideas in geoengineering that people have proposed that are worth looking at. One wild example is toshadow the planet with large orbiting objects. A large mirror in orbit could reflect about 2% of incoming solarradiation back into space. These sorts of solutions would be expensive in cost and energy.
606
www.ck12.org Chapter 11. Human Impacts on Earth’s Atmosphere
Just as individuals can diminish other types of air pollution, people can fight global warming by conserving energy.Also, people can become involved in local, regional, and national efforts to make sound choices on energy policy.
MEDIAClick image to the left or use the URL below.URL: https://www.ck12.org/flx/render/embeddedobject/186927
Summary
• A cap-and-trade system gives nations a cap on the greenhouse gas emissions they’re allowed and allows themto trade allowances with other nations so that they can meet their cap.
• A carbon tax taxes carbon emissions to encourage conservation.• Carbon capture and sequestration is a geoengineering solution for removing excess carbon dioxide from the
atmosphere.
Review
1. Why would a carbon tax be effective at reducing greenhouse gas emissions?2. How does a carbon tax not penalize people who can’t afford to pay more for fuel and other items?3. What are the advantages and disadvantages of using geoengineering solutions to reduce climate change rather
than things like cap-and-trade or a carbon tax?
Explore More
Use this resource (watch from 2:12 to 4:25) to answer the questions that follow.
MEDIAClick image to the left or use the URL below.URL: https://www.ck12.org/flx/render/embeddedobject/178443
1. What are the four strategies that California will use together to meet their greenhouse gas reduction target?2. What does cap and trade do?3. What does the cap in cap-and-trade refer to?4. How will California meet its cap?5. What does the trade in cap-and-trade refer to? What is the incentive to reduce emissions?
607

11.17. Reducing Greenhouse Gas Pollution www.ck12.org
6. Why is cap-and-trade a good system?7. Has this system worked in another environmental area?
608

www.ck12.org Chapter 11. Human Impacts on Earth’s Atmosphere
11.18 References
1. Clinton Steeds. http://www.flickr.com/photos/cwsteeds/56538836/ . CC BY 2.02. Shimelle Laine. http://www.flickr.com/photos/56728994@N00/7656532570/ . CC BY 2.03. Clinton Steeds. http://www.flickr.com/photos/cwsteeds/56538836/ . CC BY 2.04. Image copyright Mattia Terrando, 2014. http://www.shutterstock.com . Used under license from Shutter-
stock.com5. Courtesy of Jesse Allen and Robert Simmon, NASA. http://earthobservatory.nasa.gov/IOTD/view.php?id=89
03 . Public Domain6. Miles Orchinik. CK-12 Foundation . CC BY-NC 3.07. Image copyright Mattia Terrando, 2014. http://www.shutterstock.com . Used under license from Shutter-
stock.com8. Courtesy GMAO Chemical Forecasts and GEOS-CHEM NRT Simulations for ICARTT and Randy Kawa,
NASA GSFC. http://earthobservatory.nasa.gov/IOTD/view.php?id=5270 . Public Domain9. Image copyright Olegusk, 2014;http://www.shutterstock.com. http://www.shutterstock.com . Used under
license from Shutterstock.com10. Jami Dwyer. http://commons.wikimedia.org/wiki/File:Lacanja_burn.JPG . Public Domain11. Courtesy GMAO Chemical Forecasts and GEOS-CHEM NRT Simulations for ICARTT and Randy Kawa,
NASA GSFC. http://earthobservatory.nasa.gov/IOTD/view.php?id=5270 . Public Domain12. Courtesy of Pat Temple, US Forest Service. http://commons.wikimedia.org/wiki/File:Alder_showing_ozo
ne_discolouration.jpg . Public Domain13. Courtesy of Edwin P Ewin, Jr/Centers for Disease and Control Prevention. http://commons.wikimedia.org
/wiki/File:SmogNY.jpg . Public Domain14. Courtesy of Pat Temple, US Forest Service. http://commons.wikimedia.org/wiki/File:Alder_showing_ozo
ne_discolouration.jpg . Public Domain15. Image copyright Sebastian Kaulitzki, 2014. http://www.shutterstock.com . Used under license from Shutter-
stock.com16. Image copyright Sebastian Kaulitzki, 2014. http://www.shutterstock.com . Used under license from Shutter-
stock.com17. John Tenniel;Bretwood Higman, Ground Truth Trekking. http://commons.wikimedia.org/wiki/File:MadlHatte
rByTenniel.svg;http://www.groundtruthtrekking.org/Graphics/MercuryFoodChain.html . Public Domain;CCBY 3.0
18. Courtesy of US Geological Survey. http://commons.wikimedia.org/wiki/File:Mercury_fremont_ice_core.png. Public Domain
19. Bretwood Higman, Ground Truth Trekking. http://www.groundtruthtrekking.org/Graphics/MercuryFoodChain.html . CC BY 3.0
20. John Tenniel. http://commons.wikimedia.org/wiki/File:MadlHatterByTenniel.svg . Public Domain21. User:Npik/Wikimedia Commons. http://commons.wikimedia.org/wiki/File:Acid_rain_woods1.JPG . Public
Domain22. User:Adilettante/Wikipedia. http://commons.wikimedia.org/wiki/File:SSPX0347.jpg . Public Domain23. Courtesy of the US Environmental Protection Agency. http://commons.wikimedia.org/wiki/File:Origins.gif .
Public Domain24. Hana Zavadska and Mariana Ruiz Villarreal (LadyofHats) for CK-12 Foundation. CK-12 Foundation . CC
BY-NC 3.025. User:Npik/Wikimedia Commons. http://commons.wikimedia.org/wiki/File:Acid_rain_woods1.JPG . Public
Domain26. NASA;Courtesy of NASA. http://en.wikipedia.org/wiki/File:Future_ozone_layer_concentrations.jpg;http://c
609

11.18. References www.ck12.org
ommons.wikimedia.org/wiki/File:NASA_and_NOAA_Announce_Ozone_Hole_is_a_Double_Record_Breaker.png . Public Domain
27. Courtesy of NASA;NASA. http://commons.wikimedia.org/wiki/File:Ozone_cycle.svg;http://en.wikipedia.org/wiki/File:Future_ozone_layer_concentrations.jpg;http://commons.wikimedia.org/wiki/File:NASA_and_NOAA_-Announce_Ozone_Hole_is_a_Double_Record_Breaker.png . Public Domain
28. Courtesy of Paul Newman, NASA’s Goddard Space Flight Center. http://earthobservatory.nasa.gov/IOTD/view.php?id=3146 . Public Domain
29. Courtesy of NASA;NASA. http://commons.wikimedia.org/wiki/File:NASA_and_NOAA_Announce_Ozone_-Hole_is_a_Double_Record_Breaker.png . Public Domain
30. Courtesy of US Environmental Protection Agency. http://commons.wikimedia.org/wiki/File:Bafflespray.jpg. Public Domain
31. User:Ahanix1989/Wikimedia Commons. http://commons.wikimedia.org/wiki/File:DodgeCatCon.jpg . Pub-lic Domain
32. User:Bbqjunkie/Wikipedia. http://commons.wikimedia.org/wiki/File:FCX_Clarity.jpg . CC BY 3.033. Courtesy of US Environmental Protection Agency. http://commons.wikimedia.org/wiki/File:Bafflespray.jpg
. Public Domain34. Courtesy of the Goddard Space Flight Center Scientific Visualization Studio and NASA. http://earthobservat
ory.nasa.gov/IOTD/view.php?id=38685 . Public Domain35. Courtesy of the Goddard Space Flight Center Scientific Visualization Studio and NASA. http://earthobservat
ory.nasa.gov/IOTD/view.php?id=38685 . Public Domain36. U Büntgen, C Raible, et al.. http://www.plosone.org/article/info%3Adoi%2F10.1371%2Fjournal.pone.00251
33 . CC BY 2.537. Courtesy of US Geological Survey. http://commons.wikimedia.org/wiki/File:Pleistocene_north_ice_map.jpg
. Public Domain38. U Büntgen, C Raible, et al.. http://www.plosone.org/article/info%3Adoi%2F10.1371%2Fjournal.pone.00251
33 . CC BY 2.539. Courtesy of US National Oceanic and Atmospheric Administration. http://commons.wikimedia.org/wiki/Fi
le:Enso_lanina.png . Public Domain40. Courtesy of US National Oceanic and Atmospheric Administration. http://commons.wikimedia.org/wiki/Fi
le:Enso_normal.png . Public Domain41. Courtesy of US National Oceanic and Atmospheric Administration. http://commons.wikimedia.org/wiki/Fi
le:Enso_elnino.png . Public Domain42. Courtesy of US National Oceanic and Atmospheric Administration. http://commons.wikimedia.org/wiki/Fi
le:Enso_lanina.png . Public Domain43. Tom Ruen. http://commons.wikimedia.org/wiki/File:Atmospheric_CO2_with_glaciers_cycles.gif . Public
Domain44. Courtesy of NOAA. http://www.noaanews.noaa.gov/stories2008/20080104_sunspot.html . Public Domain45. Courtesy of Expedition 20 crew/NASA. http://earthobservatory.nasa.gov/IOTD/view.php?id=38985 . Public
Domain46. Tom Ruen. http://commons.wikimedia.org/wiki/File:Atmospheric_CO2_with_glaciers_cycles.gif . Public
Domain47. Jami Dwyer. http://commons.wikimedia.org/wiki/File:Lacanja_burn.JPG . Public Domain;CC BY-NC 3.048. . . CC BY-NC49. User:FischX/Wikimedia Commons, based on diagram from NASA;Jami Dwyer. http://commons.wikimedia
.org/wiki/File:Carbon_cycle-cute_diagram.svg;http://commons.wikimedia.org/wiki/File:Lacanja_burn.JPG .Public Domain;CC BY-NC 3.0
50. Courtesy of NOAA Earth System Research Laboratory. https://www.esrl.noaa.gov/gmd/webdata/ccgg/trends/co2_data_mlo.png . Public Domain;CC BY-NC 3.0
51. . . CC BY-NC 3.052. Jami Dwyer. http://commons.wikimedia.org/wiki/File:Lacanja_burn.JPG . Public Domain;CC BY-NC 3.053. (a) Courtesy of US EPA; (b) Courtesy of Jesse Allen/MODIS Rapid Response Team and NASA’s Earth Obser-
610

www.ck12.org Chapter 11. Human Impacts on Earth’s Atmosphere
vatory; (c) Courtesy of Jesse Allen and NASA’s Earth Observatory; (d) Courtesy of the US National Oceanicand Atmospheric Administration; (e) User:RadRafe/Wikimedia Commons. (a) http://commons.wikimedia.org/wiki/File:Trends_in_global_average_absolute_sea_level,_1870-2008_%28US_EPA%29.png; (b) http://earthobservatory.nasa.gov/IOTD/view.php?id=41554; (c) http://earthobservatory.nasa.gov/IOTD/view.php?id=7187;
(d) http://commons.wikimedia.org/wiki/File:Coral-reef-bioerosion.jpg; (e) http://commons.wikimedia.org/wiki/File:Dead_pines.jpg . Public Domain
54. Courtesy of NASA. http://data.giss.nasa.gov/gistemp/graphs_v3/ . Public Domain55. (a) Courtesy of Ted Scambos, National Snow and Ice Data Center, NASA’s Earth Observatory; (b) User:Peltoms/Wikipedia.
(a) http://earthobservatory.nasa.gov/IOTD/view.php?id=2288 (b) http://commons.wikimedia.org/wiki/File:Bouldert.jpg . (a) Public Domain; (b) The copyright holder of this work allows anyone to use it for any purposeincluding unrestricted redistribution, commercial use, and modification
56. Courtesy of Jesse Allen, NASA’s Earth Observatory. http://earthobservatory.nasa.gov/IOTD/view.php?id=5713 . Public Domain
57. (a) Courtesy of US EPA; (b) Courtesy of Jesse Allen/MODIS Rapid Response Team and NASA’s Earth Obser-vatory; (c) Courtesy of Jesse Allen and NASA’s Earth Observatory; (d) Courtesy of the US National Oceanicand Atmospheric Administration; (e) User:RadRafe/Wikimedia Commons. (a) http://commons.wikimedia.org/wiki/File:Trends_in_global_average_absolute_sea_level,_1870-2008_%28US_EPA%29.png; (b) http://earthobservatory.nasa.gov/IOTD/view.php?id=41554; (c) http://earthobservatory.nasa.gov/IOTD/view.php?id=7187;
(d) http://commons.wikimedia.org/wiki/File:Coral-reef-bioerosion.jpg; (e) http://commons.wikimedia.org/wiki/File:Dead_pines.jpg . Public Domain
58. Courtesy of the National Oceanic and Atmospheric Administration. http://commons.wikimedia.org/wiki/File:Arctic_Ice_Thickness.png . Public Domain
59. Courtesy of the National Energy Technology Laboratory/DOE, using data from CDIAC. http://www.netl.doe.gov/research/coal/carbon-capture/drivers . Public Domain
60. Courtesy of Robert Simmon, NASA. http://earthobservatory.nasa.gov/IOTD/view.php?id=8239 . Public Do-main
61. Courtesy of the National Oceanic and Atmospheric Administration. http://commons.wikimedia.org/wiki/File:Arctic_Ice_Thickness.png . Public Domain
62. Courtesy of US Department of Energy. http://commons.wikimedia.org/wiki/File:Soybeanbus.jpg . PublicDomain
63. Courtesy of US Department of Energy. http://commons.wikimedia.org/wiki/File:Soybeanbus.jpg . PublicDomain
611

www.ck12.org
CHAPTER 12 Biology GlossaryChapter Outline
12.1 A
12.2 B
12.3 C
12.4 D
12.5 E
12.6 F
12.7 G
12.8 H
12.9 I
12.10 J
12.11 K
12.12 L
12.13 M
12.14 N
12.15 O
12.16 P
12.17 R
12.18 S
12.19 T
12.20 U
12.21 V
12.22 W
12.23 X
12.24 Z
12.25 REFERENCES
612

www.ck12.org Chapter 12. Biology Glossary
12.1 A
abiotic factornonliving aspect of the environment such as sunlight and soil
absolute datingcarbon-14 or other method of dating fossils that gives an approximate age in years
absorptionprocess in which substances such as nutrients pass into the blood stream
acidsolution with a pH lower than 7
acid rainlow-pH precipitation that forms with air pollution combines with water
acquired immunodeficiency syndrome (AIDS)disorder characterized by frequent opportunistic infections that eventually develops in people who are infectedwith human immunodeficiency virus (HIV)
action potentialreversal of electrical charge across the membrane of a resting neuron that travels down the axon of the neuronas a nerve impulse
activation energyenergy needed to start a chemical reaction
active immunityability to resist a pathogen that results when an immune response to the pathogen produces memory cells
active transportmovement of substances across a plasma membrane that requires energy
adaptationcharacteristic that helps living things survive and reproduce in a given environment
adaptive radiationprocess by which a single species evolves into many new species to fill available niches
adolescenceperiod of transition between the beginning of puberty and adulthood during which significant physical, mental,emotional, and social changes occur
613

12.1. A www.ck12.org
adolescent growth spurtperiod of rapid growth that occurs during puberty
adrenal glandspair of endocrine glands located above the kidneys that secrete hormones such as cortisol and adrenaline
aerobic respirationtype of cellular respiration that requires oxygen
age-sex structurenumber of individuals of each sex and age in a population
aggressionbehavior that is intended to cause harm or pain
air pollutionchemical substances and particles released into the air mainly by human actions such as burning fossil fuels
Air Quality Index (AQI)assessment of the levels of pollutants in the outdoor air that is based on their human health effects
alcoholic fermentationtype of anaerobic respiration that includes glycolysis followed by the conversion of pyruvic acid to ethanoland carbon dioxide and the formation of NAD+
algae (singular, alga)plant-like protists such as diatoms and seaweeds
algal bloomexcessive growth of algae in bodies of water because of high levels of nutrients, usually from fertilizer inrunoff
alleleone of two or more different versions of the same gene
allele frequencyhow often an allele occurs in a gene pool relative to the other alleles for that gene
allergenany antigen that causes an allergy
allergydisease in which the immune system makes an inflammatory response to a harmless antigen
allopatric speciationevolution of a new species that occurs when some members of an original species become geographicallyseparated from the rest of the species
614

www.ck12.org Chapter 12. Biology Glossary
alternation of generationschange back and forth from one generation to the next between haploid gametophyte and diploid sporophytestages in the life cycle of plants
alveoli (singular, alveolus)tiny sacs at the ends of bronchioles in the lungs where pulmonary gas exchange takes place
amoeboidtype of protozoa, such as Amoeba, that moves with pseudopods
amino acidsmall molecule that is a building block of proteins
amnioteanimal that produces eggs with internal membranes that allow gases but not water to pass through so theembryo can breathe without drying out (reptile, bird, or mammal)
amniotic sacenclosed membrane containing fluid that surrounds and protects a fetus
amphibianectothermic, tetrapod vertebrate that may live on land but must return to water in order to reproduce
anabolic reactionendothermic reaction in organisms
anaerobic respirationtype of cellular respiration that does not require oxygen
analogous structurestructure that is similar in unrelated organisms because it evolved to do the same job, not because it wasinherited from a common ancestor
anaphasethird phase of mitosis during which sister chromatids separate and move to opposite poles of the cell
angiospermtype of seed plant that produces seeds in the ovary of a flower
animalheterotrophic, multicellular eukaryote with cells that lack cell walls; member of the animal kingdom
animal behaviorany way that animals interact with each other or the environment
Annelidainvertebrate phylum of segmented worms such as earthworms
615

12.1. A www.ck12.org
antheridia (singular, antheridium)male reproductive organs of the gametophyte generation of plants that produce motile sperm
antibiotic drugdrug that kills bacteria and cures bacterial infections and diseases
antibiotic resistanceability to withstand antibiotic drugs that has evolved in some bacteria
antibodylarge, Y-shaped proteins produced by B cells that recognize and bind to antigens in a humoral immune response
antigenmolecule that the immune system identifies as foreign and responds to by forming antibodies
aphotic zonearea in aquatic biomes deeper than 200 meters
aquatic biomewater-based biomes, defined by the availability of sunlight and the concentration of dissolved oxygen andnutrients in the water
aquiferunderground layer of rock that stores water
arborealof or pertaining to trees, as in arboreal, or tree-living, mammal
Archaeaone of two prokaryote domains that includes organisms that live in extreme environments
archegonia (singular, archegonium)female reproductive organs of the gametophyte generation of plants that produce eggs
arterytype of blood vessel that carries blood away from the heart toward the lungs or body
arthropodinvertebrate in the phylum Arthropoda, characterized by a segmented body, hard exoskeleton, and jointedappendages
artificial selectionprocess in which organisms evolve traits useful to humans because people select which individuals are allowedto reproduce and pass on their genes to successive generations
asexual reproductionreproduction that involves a single parent and results in offspring that are all genetically identical to the parent
616

www.ck12.org Chapter 12. Biology Glossary
asthmarespiratory system disease in which air passages of the lungs periodically become too narrow, making breath-ing difficult
atherosclerosiscondition in which plaque builds up inside arteries
athlete’s footinfection of the skin between the toes by the fungus Trichophyton
ATP (adenosine triphosphate)energy-carrying molecule that cells use to power their metabolic processes
autoimmune diseasetype of disease, such as type 1 diabetes, in which the immune system attacks the body’s cells as though theywere pathogens
autonomic nervous system (ANS)division of the peripheral nervous system that controls involuntary activities not under conscious control suchas heart rate and digestion
autosomechromosomes 1–22 in humans that contain genes for characteristics unrelated to sex
autotrophorganism that makes its own food
axonlong extension of the cell body of a neuron that transmits nerve impulses to other cells
617

12.2. B www.ck12.org
12.2 B
Bacteriadomain of prokaryotes, some of which cause human diseases
barktissue that provides a rough, woody external covering on the stems of trees
basesolution with a pH higher than 7
B celltype of lymphocyte that fights infections by forming antibodies
bilateral symmetrysymmetry of a body plan in which there are distinct head and tail ends, so the body can be divided into twoidentical right and left halves
bilefluid produced by the liver and stored in the gall bladder that is secreted into the small intestine to help digestlipids and neutralize acid from the stomach
binary fissiontype of cell division that occurs in prokaryotic cells in which a parent cells divides into two identical daughtercells
binomial nomenclaturemethod of naming species with two names, consisting of the genus name and species name
biochemical reactionchemical reaction that occurs inside the cells of living things
biodiversitythe variety of life and its processes; including the variety of living organisms, the genetic differences amongthem, and the communities and ecosystems in which they occur
biofilmcolony of prokaryotes that is stuck to a surface such as a rock or a host’s tissue
biogeochemical cycleinterconnected pathways through which water or a chemical element such as carbon is continuously recycledthrough the biotic and abiotic components of the biosphere
biogeographystudy of how and why plants and animals live where they do
618

www.ck12.org Chapter 12. Biology Glossary
biologyscience of life, study of life
biomasstotal mass of organisms at a trophic level
biomegroup of similar ecosystems with the same general type of physical environment
biospherepart of Earth where all life exists, including land, water, and air
biotechnologyuse of technology to change the genetic makeup of living things in order to produce useful products
bioterrorismintentional release or spread of agents of disease
biotic factorliving aspects of the environment, including organisms of the same and different species
birdbipedal, endothermic, tetrapod vertebrate that lays amniotic eggs and has wings and feathers
bladderhollow, sac-like organ that stores urine until it is excreted from the body
blastocystfluid-filled ball of cells that develops a few days after fertilization in humans
bloodfluid connective tissue that circulates throughout the body through blood vessels
blood pressureforce exerted by circulating blood on the walls of blood vessels
blood typegenetic characteristic associated with the presence or absence of antigens on the surface of red blood cells
body mass index (BMI)estimate of the fat content of the body calculated by dividing a person’s weight (in kilograms) by the squareof the person’s height (in meters)
bonehard tissue in most vertebrates that consists of a collagen matrix, or framework, filled in with minerals such acalcium
bone marrowsoft connective tissue in spongy bone that produces blood cells
619

12.2. B www.ck12.org
bone matrixrigid framework of bone that consists of tough protein fibers and mineral crystals
braincentral nervous system organ inside the skull that is the control center of the nervous system
brain stemlowest part of the brain that connects the brain with the spinal cord and controls unconscious functions suchas heart rate and breathing
bryophytetype of plant that lacks vascular tissues, such as a liverwort, hornwort, or moss
buddingtype of asexual reproduction in yeasts in which an offspring cell pinches off from the parent cell
620

www.ck12.org Chapter 12. Biology Glossary
12.3 C
Calvin cyclesecond stage of photosynthesis in which carbon atoms from carbon dioxide are combined, using the energy inATP and NADPH, to make glucose
Cambrian explosionspectacular burst of new life that occurred at the start of the Paleozoic Era
cancerdisease that occurs when the cell cycle is no longer regulated and cells divide out of control
candidiasisinfection of the mouth or of the vagina in females that is caused by the yeast Candida
capillarysmallest type of blood vessel that connects very small arteries and veins
capsidprotein coat that surrounds the DNA or RNA of a virus particle
carbohydrateorganic compound such as sugar or starch
carbon cycleinterconnected pathways through which carbon is recycled through the biotic and abiotic components of thebiosphere
carcinogenanything that can cause cancer
cardiac muscleinvoluntary, striated muscle found only in the walls of the heart
cardiovascular disease (CVD)any disease that affects the heart or blood vessels
carnivoreconsumer that eats animals
carrying capacity (K)largest population size that can be supported in an area without harming the environment
cartilagedense connective tissue that provides a smooth surface for the movement of bones at joints
621

12.3. C www.ck12.org
catabolic reactionexothermic reaction in organisms
cellbasic unit of structure and function of living things
cell bodycentral part of a neuron that contains the nucleus and other cell organelles
cell cyclerepeating series of events that a cell goes through during its life, including growth, DNA, synthesis, and celldivision
cell divisionprocess in which a parent cell divides to form two daughter cells
cell-mediated immune responsetype of immune response in which T cells destroy cells that are infected with viruses
cell theorytheory that all living things are made up of cells, all life functions occur within cells, and all cells come fromalready existing cells
cellular respirationprocess in which cells break down glucose and make ATP for energy
cell wallrigid layer that surrounds the plasma membrane of a plant cell and helps support and protect the cell
Cenozoic Eraage of mammals that lasted from 65 million years ago to the present
central dogma of molecule biologydoctrine that genetic instructions in DNA are copied by RNA, which carries them to a ribosome where theyare used to synthesize a protein (DNA→ RNA→ protein)
central nervous system (CNS)one of two main divisions of the nervous system that includes the brain and spinal cord
central vacuolelarge saclike organelle in plant cells that stores substances such as water and helps keep plant tissues rigid
centromereregion of sister chromatids where they are joined together
cephalizationconcentration of nerve tissue in one end of an animal, forming a head region
622

www.ck12.org Chapter 12. Biology Glossary
cerebellumpart of the brain below the cerebrum that coordinates body movements
cerebrumlargest part of the brain that controls conscious functions such as reasoning and sight
Chargaff’s rulesobservations by Erwin Chargaff that concentrations of the four nucleotide bases differ among species; and that,within a species, the concentrations of adenine and thymine are always about the same and the concentrationsof cytosine and guanine are always about the same
chemical bondforce that holds molecules together
chemical digestionchemical breakdown of large, complex food molecules into smaller, simpler nutrient molecules that can beabsorbed by the blood
chemical reactionprocess that changes some chemical substances into others
chemoautotrophproducer that uses energy from chemical compounds to make food by chemosynthesis
chemosynthesisprocess of using the energy in chemical compounds to make food
chitintough carbohydrate that makes up the cell walls of fungi and the exoskeletons of insects and other arthropods
chlamydiasexually transmitted bacterial infection that is the most common STI in the United States
chlorophyllgreen pigment in a chloroplast that absorbs sunlight in the light reactions of photosynthesis
chloroplastorganelle in the cells of plants and algae where photosynthesis takes place
chordatesconsists of all animals with a notochord, dorsal hollow nerve cord, post-anal tail, and pharyngeal slits duringat least some stage of their life
chromatidone of two identical copies of a chromosome that are joined together at a centromere before a cell divides
chromatingrainy material that DNA forms when it is not coiled into chromosomes
623

12.3. C www.ck12.org
chromosomal alterationmutation that changes chromosome structure
chromosomecoiled structure made of DNA and proteins containing sister chromatids that is the form in which the geneticmaterial of a cell goes through cell division
cilia (singular, cilium)short, hairlike projections, similar to flagella, that allow some cells to move
ciliatetype of protozoa, such as Paramecium, that moves with cilia
circadian rhythmregular change in biology or behavior that occurs in a 24-hour cycle
circulatory systemorgan system consisting of the heart, blood vessels, and blood that transports materials around the body
cladegroup of related organisms that includes an ancestor and all of its descendants
climateaverage weather in an area over a long period of time
climax communityfinal stable stage of ecological succession that may be reached in an undisturbed community
cloacabody cavity with a single opening in amphibians, reptiles, and monotreme mammals that collects and excreteswastes from the digestive and excretory systems and gametes from the reproductive system
Cnidariainvertebrate phylum that includes animals such as jellyfish and corals that are characterized by radial symme-try, tissues, and a stinger called a nematocyst
codominancerelationship between two alleles for the same gene in which both alleles are expressed equally in the phenotypeof the heterozygote
codongroup of three nitrogen bases in nucleic acids that makes up a code “word” of the genetic code and stands foran amino acid, start, or stop
coelomfluid-filled body cavity
coevolutionprocess in which two interacting species evolve together, with each species influencing the other’s evolution
624

www.ck12.org Chapter 12. Biology Glossary
commensalismsymbiotic relationship in which one species benefits while the other species is not affected
communityall of the populations of different species that live in the same area
compact bonedense outer layer of bone that is very hard and strong
comparative anatomystudy of the similarities and differences in the structures of different species
comparative embryologystudy of the similarities and differences in the embryos of different species
competitionrelationship between living things that depend on the same resources in the same place and at the same time
competitive exclusion principleprinciple of ecology stating that two different species cannot occupy the same niche in the same place for verylong
complementary base pairpair of nucleotide bases that bond together—either adenine and thymine (or uracil) or cytosine and guanine
complete digestive systemdigestive system consisting of a digestive tract and two body openings (mouth and anus)
compoundsubstance with a unique, fixed composition that consists of two or more elements
condensationprocess in which water vapor changes to tiny droplets of liquid water
conestructure consisting of scales that bear naked seeds in the type of seed plants called gymnosperms
connective tissuetissue made up of cells that form the body’s structure, such as bone and cartilage
consumerorganism that consumes other organisms for food
cooperationtype of animal behavior in which social animals live and work together for the good of the group
courtshipanimal behavior that is intended to attract a mate
625

12.3. C www.ck12.org
craniumpart of a vertebrate endoskeleton that encloses and protects the brain; also called the skull
cropsac-like structure in the digestive system of birds that stores and moistens food before it is digested
crossing-overexchange of genetic material between homologous chromosomes when they are closely paired during meiosisI
cuticlewaxy, waterproof substance produced by epidermal cells of leaves, shoots, and other above-ground parts ofplants to prevent damage and loss of water by evaporation
cyanobacteriaGram-positive blue-green photosynthetic bacteria of the type that added oxygen to Earth’s early atmosphereand evolved into chloroplasts of eukaryotic cells
cytokinesissplitting of the cytoplasm to form daughter cells when a cell divides
cytoplasmall of the material inside the plasma membrane of a cell (excluding organelles)
cytoskeletonstructure of filaments and tubules in the cytoplasm that provides a cell with an internal framework
626

www.ck12.org Chapter 12. Biology Glossary
12.4 D
dead zonearea in the ocean or other body of water where low oxygen levels from excessive growth of algae have killedall aquatic organisms
deciduous planttype of plant that seasonally loses its leaves to reduce water loss during the cold or dry season each year andgrows new leaves later in the year
decomposerorganism that breaks down the remains of dead organisms and other organic wastes
demographic transitionchanges in population that occurred in Europe and North America beginning in the 18th century, in whichdeath rates fell and population growth rates increased, followed by birth rates falling and population growthrates decreasing
dendriteextension of the cell body of a neuron that receives nerve impulses from other neurons
dependent variablevariable in a scientific experiment that is affected by another variable, called the independent variable
deposit feederanimal that obtains organic matter for nutrition by eating soil or the sediments at the bottom of a body of water
dermal tissuetype of plant tissue that covers the outside of a plant in a single layer of cells called the epidermis
dermislower layer of the skin that is made of tough connective tissue and contains blood vessels, nerve endings, hairfollicles, and glands
detritivoredecomposer that consumes detritus
detritussubstance composed of dead leaves, other plant remains, and animal feces that collects on the soil or at thebottom of a body of water
dialysismedical procedure in which blood is filtered through a machine in patients with kidney failure
627

12.4. D www.ck12.org
diaphragmlarge, sheet-like muscle below the lungs that allows breathing to occur when it contracts and relaxes
differentiationprocess by which unspecialized cells become specialized into one of many different types of cells, such asneurons or epithelial cells
diffusiontype of passive transport that does not require the help of transport proteins
digestionprocess of breaking down food into nutrients that can be absorbed by the blood
digestive systemorgan system that breaks down food, absorbs nutrients, and eliminates any remaining waste
diploidhaving two of each type of chromosome
directional selectiontype of natural selection for a polygenic trait in which one of two extreme phenotypes is selected for, resultingin a shift of the phenotypic distribution toward that extreme
dispersalmovement of offspring away from their parents
disruptive selectiontype of natural selection for a polygenic trait in which phenotypes in the middle of the phenotypic distributionare selected against, resulting in two overlapping phenotypes, one at each end of the distribution
DNA (deoxyribonucleic acid)double-stranded nucleic acid that makes up genes and chromosomes
DNA replicationprocess of copying of DNA prior to cell division
domaintaxon in the revised Linnaean system that is larger and more inclusive than the kingdom
dominant alleleallele that masks the presence of another allele for the same gene when they occur together in a heterozygote
dormancystate in which a plant slows down cellular activity and may shed its leaves
double helixdouble spiral shape of the DNA molecule
drug abuseuse of a drug without the advice of a medical professional and for reasons not originally intended
drug addictionsituation in which a drug user is unable to stop using a drug
628

www.ck12.org Chapter 12. Biology Glossary
12.5 E
eating disordermental illness in which people feel compelled to eat in a way that causes physical, mental, and emotionalhealth problems
echinodermsinvertebrates such as sea stars and sand dollars that are characterized by a spiny endoskeleton, radial symmetryas adults, and a water vascular system
ecological successionchanges through time in the numbers and types of species that make up the community of an ecosystem
ecologybranch of biology that is the study of how living things interact with each other and with their environment
ecosystemall the living things in a given area together with the physical factors of the nonliving environment
ectodermouter embryonic cell layer in animals
ectothermyregulation of body temperature from the outside through behavioral changes such as basking in the sun
eggfemale gamete
ejaculationmuscle contractions that propel sperm from the epididymes and out through the urethra in males
electron transport chainseries of electron-transport molecules that pass high-energy electrons from molecule to molecule and capturetheir energy
elementpure substance that cannot be broken down into other types of substances
eliminationprocess in which waste passes out of the body
embryostage of growth and development that occurs from implantation through the eighth week after fertilization inhumans
629

12.5. E www.ck12.org
emigrationmovement of individuals out of a population
emphysemalung disease, usually caused by smoking, in which walls of alveoli break down, so less gas can be exchangedin the lungs
endocrine systemhuman body system of glands that release hormones into the blood
endocytosistype of vesicle transport that moves substances into a cell
endoderminner embryonic cell layer in animals
endoplasmic reticulum (ER)organelle in eukaryotic cells that helps make and transport proteins
endoskeletoninternal skeleton that provides support and protection
endospermstored food inside a plant seed
endosporespores that form inside prokaryotic cells when they are under stress, enclosing the DNA and helping it surviveconditions that may kill the cell
endosymbiotic theorytheory that eukaryotic organelles such as mitochondria evolved from ancient, free-living prokaryotes thatinvaded primitive eukaryotic cells
endothermic reactionchemical reaction that absorbs energy
endothermyregulation of body temperature from the inside through metabolic or other physical changes
energyability to do work
enzymeprotein that speeds up biochemical reactions
epidermisouter layer of skin that consists mainly of epithelial cells and lacks nerve endings and blood vessels
630

www.ck12.org Chapter 12. Biology Glossary
epididymis (plural, epididymes)one of two male reproductive organs where sperm mature and are stored until they leave the body
epiphyteplant that is adapted to grow on other plants and obtain moisture from the air
epistasissituation in which one gene affects the expression of another gene
epithelial tissuetissue made up of cells that line inner and outer body surfaces, such as skin
esophaguslong, narrow digestive organ that passes food from the pharynx to the stomach
estrogenfemale sex hormone secreted by the ovaries
estuarya partly enclosed coastal body of water with one or more rivers or streams flowing into it, and with a freeconnection to the ocean
ethologybranch of biology that studies animal behavior
eukaryoteorganism that has cells containing a nucleus and other organelles
eukaryotic cellcell that contains a nucleus and other organelles
evaporationprocess in which liquid water changes to water vapor
evergreen planttype of plant that keeps its leaves and stays green year-round
evidenceany type of data that may be used to test a hypothesis
evolutionchange in the characteristics of living things over time; the change in species over time
exchange poolpart of a biogeochemical cycle that holds an element or water for a short period of time
excretionprocess of removing wastes and excess water from the body
631
12.5. E www.ck12.org
excretory systemorgan system that removes wastes and excess water from the body and includes the kidneys, large intestine,liver, skin, and lungs
exocytosistype of vesicle transport that moves substances out of a cell
exoskeletonnon-bony skeleton that forms on the outside of the body of some invertebrates and provides protection andsupport
exothermic reactionchemical reaction that releases energy
exotic speciesspecies that is introduced (usually by human actions) into a new habitat where it may lack local predators andout-compete native species
experimentspecial type of scientific investigation that is performed under controlled conditions
exponential growthpattern of population growth in which a population starts out growing slowly but grows faster and faster aspopulation size increases
extinctionsituation in which a species completely dies out and no members of the species remain
extremophileany type of Archaea that lives in an extreme environment, such as a very salty, hot, or acidic environment
632

www.ck12.org Chapter 12. Biology Glossary
12.6 F
facilitated diffusiondiffusion with the help of transport proteins
Fallopian tubeone of two female reproductive organs that carry eggs from the ovary to the uterus and provide the site wherefertilization usually takes place
fecessolid waste that remains after food is digested and is eliminated from the body through the anus
fermentationtype of anaerobic respiration that includes glycolysis followed by the conversion of pyruvic acid to one ormore other compounds and the formation of NAD+
fertilizationunion of two gametes that produces a diploid zygote
fetusdeveloping human organism between weeks 8 and 38 after fertilization
fibrous rootthreadlike root that makes up part of the fibrous root system of some plants
filter feederanimal that obtains organic matter for nutrition by filtering particles out of water
fishectothermic, aquatic vertebrate with a streamlined body and gills for absorbing oxygen from water
fitnessrelative ability of an organism to survive and produce fertile offspring
flagella (singular, flagellum)long, thin protein extensions of the plasma membrane in most prokaryotic cells that help the cells move
flagellatetype of protozoa, such as Giardia, that moves with flagella
flowerstructure in angiosperms consisting of male and female reproductive structures that attracts animal pollinators
follicle-stimulating hormone (FSH)pituitary gland hormone that stimulates the ovaries to secrete estrogen and follicles in the ovaries to mature
633

12.6. F www.ck12.org
foodorganic molecules such as glucose that organisms use for chemical energy
food chaindiagram that represents a single pathway through which energy and matter flow through an ecosystem
food webdiagram that represents multiple intersecting pathways through which energy and matter flow through anecosystem
fossilpreserved remains or traces of organisms that lived in the past
fossil recordthe record of life as told by the study and analysis of fossils
frameshift mutationdeletion or insertion of one or more nucleotides that changes the reading frame of the genetic material
freshwater biomeaquatic biome such as a pond, lake, stream, or river in which the water contains little or no salt
fruitstructure in many flowering plants that develops from the ovary and contains seeds
fungi (singular, fungus)kingdom in the domain Eukarya that includes molds, mushrooms, and yeasts
634

www.ck12.org Chapter 12. Biology Glossary
12.7 G
Galápagos Islandsgroup of 16 small volcanic islands in the Pacific Ocean 966 kilometers (600 miles) off the west coast of SouthAmerica, where Darwin made some of his most important observations during his voyage on the HMS Beagle
gall bladdersac-like organ that stores bile from the liver and secretes it into the duodenum of the small intestine
gametereproductive cell produced during meiosis that has the haploid number of chromosomes
gametogenesisdevelopment of haploid cells into gametes such as sperm and egg
gametophytehaploid generation in the life cycle of a plant that results from asexual reproduction with spores and thatproduces gametes for sexual reproduction
gastrointestinal (GI) tractorgans of the digestive system through which food passes during digestion, including the mouth, esophagus,stomach, and small and large intestines
geneunit of DNA on a chromosome that is encoded with the instructions for a single protein
gene cloningprocess of isolating and making copies of a gene
gene expressionuse of a gene to make a protein
gene flowchange in allele frequencies that occurs when individuals move into or out of a population
gene poolall the genes of all the members of a population
generalistorganism that can consume many different types of food
gene theorytheory that the characteristics of living things are controlled by genes that are passed from parents to offspring
635

12.7. G www.ck12.org
gene therapyway to cure genetic disorders by inserting normal genes into cells with mutant genes
genetic codeuniversal code of three-base codons that encodes the genetic instructions for the amino acid sequence ofproteins
genetic disorderdisease caused by a mutation in one or a few genes
genetic drifta random change in allele frequencies that occurs in a small population
genetic engineeringusing biotechnology to change the genetic makeup of an organism
geneticsthe science of heredity
genetic traitcharacteristic that is encoded in DNA
genetic transfermethod of increasing genetic variation in prokaryotes that involves cells “grabbing” stray pieces of DNA fromtheir environment or exchanging DNA directly with other cells
genital herpessexually transmitted infection caused by a herpes virus that is characterized by periodic outbreaks of blisterson the genitals
genital wartssmall, rough growths on the genitals caused by a sexually transmitted infection with human papillomavirus(HPV)
genotypealleles an individual inherits at a particular genetic locus
genustaxon above the species in the Linnaean classification system; group of closely related species
geologic time scaletime line of Earth based on major events in geology, climate, and the evolution of life
germinationearly growth and development of a plant embryo in a seed
germline mutationmutation that occur in gametes
636
www.ck12.org Chapter 12. Biology Glossary
giardiasisdisease caused by Giardia protozoa that spreads through contaminated food or water
gillsorgans in aquatic organisms composed of thin filaments that absorb oxygen from water
gizzardfood-grinding organ in the digestive system of birds and some other animals that may contain swallowedstones
global warmingrecent rise in Earth’s average surface temperature generally attributed to an increased greenhouse effect
glucosesimple carbohydrate with the chemical formula C6H12O6 that is the nearly universal food for life
glycolysisfirst stage of cellular respiration in which glucose is split, in the absence of oxygen, to form two molecules ofpyruvate (pyruvic acid) and two (net) molecules of ATP
Golgi apparatusorganelle in eukaryotic cells that processes proteins and prepares them for use both inside and outside the cell
gonadsglands that secrete sex hormones and produce gametes; testes in males and ovaries in females
gonorrheacommon sexually transmitted infection that is caused by bacteria
gradualismmodel of the timing of evolution in which evolutionary change occurs at a slow and steady pace
Gram-negative bacteriatype of bacteria that stain red with Gram stain and have a thin cell wall with an outer membrane
Gram-positive bacteriatype of bacteria that stain purple with Gram stain and have a thick cell wall without an outer membrane
granawithin the chloroplast, consists of sac-like membranes, known as thylakoid membranes
greenhouse effectnatural feature of Earth’s atmosphere that occurs when gases in the atmosphere radiate the sun’s heat backdown to Earth’s surface, making Earth’s temperature far warmer than it otherwise would be
ground tissuetype of plant tissue making up most of the interior of the roots and stems of plants that carries out basicmetabolic functions and provides support and storage
637

12.7. G www.ck12.org
groundwaterwater that exists in the ground either in the soil or in rock layers below the surface
growing seasonperiod of time each year when it is warm enough and wet enough for plants to grow
gymnospermtype of seed plant that produces bare seeds in cones
638

www.ck12.org Chapter 12. Biology Glossary
12.8 H
habitatphysical environment in which a species lives and to which it has become adapted
habitat lossdestruction or disruption of Earth’s natural habitats, most often due to human actions such as agriculture,forestry, mining, and urbanization
hair folliclestructure in the dermis of skin where a hair originates
haploidhaving only one chromosome of each type
Hardy-Weinberg theoremfounding principle of population genetics that proves allele and genotype frequencies do not change in apopulation that meets the conditions of no mutation, no migration, large population size, random mating, andno natural selection
heartmuscular organ in the chest that that pumps blood through blood vessels when it contracts
heart attackblockage of blood flow to heart muscle tissues that may result in the death of cardiac muscle fibers
hepatitis Binflammation of the liver caused by infection with hepatitis B virus, which is often transmitted through sexualcontact
herbivoreconsumer that eats producers such as plants or algae
heterotrophorganism that gets food by consuming other organisms
heterozygoteorganism that inherits two different alleles for a given gene
homeobox genegene that codes of regulatory proteins that control gene expression during development
homeostasisprocess of maintaining a stable environment inside a cell or an entire organism
639

12.8. H www.ck12.org
homologous chromosomespair of chromosomes that have the same size and shape and contain the same genes
homologous structurestructure that is similar in related organisms because it was inherited from a common ancestor
homozygoteorganism that inherits two alleles of the same type for a given gene
hostspecies that is harmed in a parasitic relationship
human genomeall of the DNA of the human species
Human Genome Projectinternational science project that sequenced all 3 billion base pairs of the human genome
human immunodeficiency virus (HIV)virus transmitted through body fluids that infects and destroys helper T cells and eventually causes acquiredimmunodeficiency syndrome (AIDS)
human papilloma virus (HPV)sexually transmitted virus that causes genital warts and cervical cancer
humoral immune responsetype of immune response in which B cells produce antibodies against antigens in blood and lymph
hybridoffspring that results from a cross between two different types of parents
hydrogen bondtype of chemical bond that forms between molecules: found between water molecules
hydrostatic skeletontype of internal support in an animal body that results from the pressure of fluid within the body cavity knownas the coelom
hypertensionhigh blood pressure
hyphae (singular, hypha)thread-like filaments that make up the body of a fungus and consist of one or more cells surrounded by atubular cell wall
hypothalamuspart of the brain that secretes hormones
hypothesispossible answer to a scientific question; must be falsifiable
640

www.ck12.org Chapter 12. Biology Glossary
12.9 I
immigrationmovement of individuals into a population
immune responsespecific defense against a particular pathogen
immune systembody system that consists of skin, mucous, membranes, and other tissues and organs that defends the bodyfrom pathogens and cancer
immunityability to resist a pathogen due to memory lymphocytes or antibodies to the antigens the pathogen carries
immunizationdeliberate exposure of a person to a pathogen in order to provoke an immune response and the formation ofmemory cells specific to that pathogen
immunodeficiencyinability of the immune system to fight off pathogens that a normal immune system would be able to resist
implantationprocess in which a blastocyst embeds in the endometrium lining the uterus
incomplete digestive systemdigestive system that consists of a digestive cavity and a single opening that serves as both mouth and anus
incomplete dominancerelationship between the alleles for a gene in which one allele is only partly dominant to the other allele so anintermediate phenotype results
incubationperiod of bird reproduction when one or both parents sit on, or brood, the eggs in order to keep them warmuntil they hatch
independent assortmentindependent segregation of chromosomes to gametes during meiosis
independent variablevariable in a scientific experiment that is manipulated by the researcher to investigate its effect on anothervariable called the dependent variable
infancyfirst year of life after birth in humans
641

12.9. I www.ck12.org
inflammatory responsenonspecific response the body first makes to tissue damage or infection
inheritance of acquired characteristicsmistaken idea of Jean Baptiste Lamarck that evolution occurs through the inheritance of traits that an organismdevelops in its own life time
innate behaviorbehavior closely controlled by genes that occurs naturally, without learning or practice, in all members of aspecies whenever they are exposed to a certain stimulus; also called instinctive behavior
instinctability of an animal to perform a behavior the first time it is exposed to the proper stimulus
integumentary systemhuman body system that includes the skin, nails, and hair
interneurontype of neuron that carries nerve impulses back and forth between sensory and motor neurons
interphasestage of the eukaryotic cell cycle when the cell grows, synthesizes DNA, and prepares to divide
interspecific competitionrelationship between organisms of different species that strive for the same resources in the same place
intertidal zonein marine biomes, the narrow strip along the coastline that is covered by water at high tide and exposed to airat low tide
intraspecific competitionrelationship between organisms of the same species that strive for the same resources in the same place
invertebrateanimal that lacks a vertebral column, or backbone
642

www.ck12.org Chapter 12. Biology Glossary
12.10 J
jointplace where two or more bones of the skeleton meet
643

12.11. K www.ck12.org
12.11 K
kelpmulticellular seaweed that may grow as large as a tree and occurs in forests found throughout the ocean intemperate and arctic climates
keratintough, fibrous protein in skin, nails, and hair
keystone speciesspecies that plays an especially important role in its community so that major changes in its numbers affectthe populations of many other species in the community
kidneymain organ of the excretory system that filters blood and forms urine
kidney failureloss of the ability of nephrons of the kidney to function fully
kingdomlargest and most inclusive taxon in the original Linnaean classification system
Krebs cyclesecond stage of aerobic respiration in which two pyruvate (pyruvic acid) molecules from the first stage reactto form ATP, NADH, and FADH2
K-selectedspecies in which population growth is controlled by density-dependent factors and population size is generallyat or near carrying capacity
644

www.ck12.org Chapter 12. Biology Glossary
12.12 L
lactationproduction of milk for an offspring by mammary glands, which occurs in all female mammals after givingbirth or laying eggs
lactic acid fermentationtype of anaerobic respiration that includes glycolysis followed by the conversion of pyruvic acid to lactic acidand the formation of NAD+
lanceletsmembers of the subphylum Cephalochordata
large intestineorgan of the digestive system that removes water from food waste and forms feces
larva (plural, larvae)juvenile stage that occurs in the life cycle of many invertebrates, fish, and amphibians and that differs in formand function from the adult stage
larynxorgan of the respiratory system between the pharynx and trachea that is also called the voice box because itallows the production of vocal sounds
last universal common ancestor (LUCA)hypothetical early cell (or group of cells) that gave rise to all subsequent life on Earth
latencyperiod of dormancy of a virus inside a living body that may last for many years
law of independent assortmentMendel’s second law stating that factors controlling different characteristics are inherited independently ofeach other
law of segregationMendel’s first law stating that the two factors controlling a characteristics separate and go to different gametes
learningchange in behavior that occurs as a result of experience
leukocytewhite blood cell produced by bone marrow to fight infections
lichenan organism that results from a mutualistic relationship between a fungus and a cyanobacterium or green alga
645

12.12. L www.ck12.org
life cycleseries of stages a sexually reproducing organism goes through from one generation to the next
ligamentband of fibrous connective tissue that holds bones together
light reactionsfirst stage of photosynthesis in which light energy from the sun is captured and changed into chemical energythat is stored in ATP and NADPH
lignintough, hydrophobic carbohydrate molecule that stiffens and waterproofs vascular tissues of plants
linkage mapmap that shows the positions of genes on a chromosome based on the frequency of crossing-over between thegenes
linked genesgenes that are located on the same chromosome
Linnaean classification systemsystem of classifying organisms based on observable physical traits; consists of a hierarchy of taxa, fro thekingdom to the species
lipidorganic compound such as fat or oil
liverorgan of digestion and excretion that secretes bile for lipid digestion and breaks down excess amino acids andtoxins in the blood
locusposition of a gene on a chromosome
logistic growthpattern of population growth in which growth slows and population size levels off as the population approachesthe carrying capacity
lungorgan of the respiratory system in which gas exchange takes place between the blood and the atmosphere
luteinizing hormone (LH)pituitary gland hormone that stimulates the testes to secrete testosterone and the ovaries to secrete estrogen
lymphfluid that leaks out of capillaries into spaces between cells and circulates in the vessels of the lymphatic system
lymphatic systemsystem of the body consisting of organs, vessels, nodes, and lymph that produces lymphocytes and filterspathogens from body fluids
646

www.ck12.org Chapter 12. Biology Glossary
lymph nodesmall structures located on lymphatic vessels where pathogens are filtered from lymph and destroyed bylymphocytes
lymphocytetype of leukocyte that is a key cell in the immune response to a specific pathogen
647

12.13. M www.ck12.org
12.13 M
macroevolutionevolutionary change that occurs over geologic time above the level of the species
macronutrientnutrient such as carbohydrates, proteins, lipids, or water that is needed by the body in relatively large amounts
malariadisease caused by Plasmodium protozoa and transmitted by mosquitoes in tropical and subtropical regions ofthe world
mammalendothermic, tetrapod vertebrate that lays amniotic eggs and has mammary glands (in females) and hair or fur
mammary glandgland in female mammals that produces milk for offspring
mantlelayer of tissue that lies between the shell and body of a mollusk and forms a cavity, called the mantle cavity,that pumps water for filter feeding
marine biomeaquatic biome in the salt water of the ocean
marsupialtherian mammal in which the embryo is born at an early, immature stage and completes its developmentoutside the mother’s body in a pouch on her belly
mass extinctionextinction event in which many if not most species abruptly disappear from Earth
matteranything that takes up space and has mass
mechanical digestionphysical breakdown of chunks of food into smaller pieces by organs of the digestive system
medusa (plural, medusae)basic body plan in cnidarians such as jellyfish that is bell-shaped and typically motile
meiosistype of cell division in which the number of chromosomes is reduced by half and four haploid cells result
648

www.ck12.org Chapter 12. Biology Glossary
melaninbrown pigment produced by melanocytes in the skin that gives skin most of its color and prevents UV lightfrom penetrating the skin
memory celllymphocyte (B or T cell) that retains a “memory” of a specific pathogen after an infection is over and thusprovides immunity to the pathogen
menarchebeginning of menstruation; first monthly period in females
menopauseperiod during which menstrual cycles slow down and eventually stop in middle adulthood
menstrual cyclemonthly cycle of processes and events in the ovaries and uterus of a sexually mature human female
menstruationprocess in which the endometrium of the uterus is shed from the body during the first several days of themenstrual cycle; also called monthly period
meristemtype of plant tissue consisting of undifferentiated cells that can continue to divide and differentiate and fromwhich plants grow in length or width
mesodermembryonic cell layer in many animals that is located between the endoderm (inner cell layer) and ectoderm(outer cell layer)
mesophyllspecialized tissue inside plant leaves where photosynthesis takes place
Mesozoic Eraage of dinosaurs that lasted from 245–65 million years ago
messenger RNA (mRNA)type of RNA that copies genetic instructions from DNA in the nucleus and carries them to the cytoplasm
metabolismsum of all the biochemical reactions in an organism
metamorphosisprocess in which a larva undergoes a major transformation to change into the adult form, which occurs inamphibians, arthropods, and other invertebrates
metaphasesecond phase of mitosis during which chromosomes line up at the equator of the cell
649

12.13. M www.ck12.org
microevolutionevolutionary change that occurs over a relatively short period of time within a population or species
micronutrientnutrient such as a vitamin or mineral that is needed by the body in relatively small amounts
migrationregular movement of individuals or populations each year during certain seasons, usually to find food, mates,or other resources
mineralchemical element such as calcium or potassium that is needed in relatively small amounts for proper bodyfunctioning
mitochondria (singular, mitochondrion)organelle in eukaryotic cells that makes energy available to the cell in the form of ATP molecules
mitosisprocess in which the nucleus of a eukaryotic cell divides
modelrepresentation of part of the real world
molecular clockusing DNA (or proteins) to measure how long it has been since related species diverged from a commonancestor
Molluscaphylum of invertebrates that are generally characterized by a hard outer shell, a mantle, and a feeding organcalled a radula
moltingprocess in which an animal sheds and replaces the outer covering of the body, such as the exoskeleton inarthropods
monosaccharidesimple sugar such as glucose that is a building block of carbohydrates
monotremetype of mammal that reproduces by laying eggs
motilitythe ability to move
motor neurontype of neuron that carries nerve impulses from the central nervous system to muscles and glands
mucous membraneepithelial tissue that lines inner body surfaces and body openings and produces mucus
650

www.ck12.org Chapter 12. Biology Glossary
mucusslimy substance produced by mucous membranes that traps pathogens, particles, and debris
multiple allele traittrait controlled by one gene with more than two alleles
muscle fiberlong, thin muscle cell that has the ability to contract, or shorten
muscle tissuetissue made up of cells that can contract; includes smooth, skeletal, and cardiac muscle tissue
muscular systemhuman body system that includes all the muscles of the body
mutagenenvironmental factors that causes mutations
mutationchange in the sequence of bases in DNA or RNA
mutualismtype of symbiotic relationship in which both species benefit
myceliumbody of a fungus that consists of a mass of threadlike filaments called hyphae
mycorrhizamutualistic relationship between a plant and a fungus that grows in or on its roots
myelin sheathlipid layer around the axon of a neuron that allows nerve impulses to travel more rapidly down the axon
MyPlatevisual guideline for balanced eating, replacing MyPyramid in 2011
MyPyramidvisual dietary guideline that shows the relative amounts of foods in different food groups that should be eateneach day
651

12.14. N www.ck12.org
12.14 N
natural resourcesomething supplied by nature that helps support life
natural selectionevolutionary process in which some living things produce more offspring than others so the characteristics oforganisms change over time
nature-nurture debatedebate over the extent to which genes (nature) or experiences in a given environment (nurture) control traitssuch as animal behaviors
nectarsweet, sugary liquid produced by the flowers of many angiosperms to attract animal pollinators
Nematodaphylum of invertebrates called roundworms, which have a pseudocoelom and complete digestive system
neocortexlayer of nerve cells covering the cerebrum of the mammalian brain that plays an important role in manycomplex brain functions
nephronstructural and functional unit of the kidney that filters blood and forms urine
nerveone of many cable-like bundles of axons that make up the peripheral nervous system
nerve impulseelectrical signal transmitted by the nervous system
nervous systemhuman body system that carries electrical messages throughout the body
nervous tissuetissue made up of neurons, or nerve cells, that carry electrical messages
neuronnerve cell; structural and functional unit of the nervous system
neurotransmitterchemical that carries a nerve impulse from one nerve to another at a synapse
652

www.ck12.org Chapter 12. Biology Glossary
nicherole of a species in its ecosystem that includes all the ways the species interacts with the biotic and abioticfactors of the ecosystem
nitrogen cycleinterconnected pathways through which nitrogen is recycled through the biotic and abiotic components of thebiosphere
nitrogen fixationprocess of changing nitrogen gas to nitrates that is carried out by nitrogen-fixing bacteria in the soil or in theroots of legumes
nondisjunctionfailure of replicated chromosomes to separate during meiosis II, resulting in some gametes with a missingchromosome and some with an extra chromosome
nonrenewable resourcenatural resource that exists in a fixed amount and can be used up
notochordstiff support rod that runs from one end of the body to the other in animals called chordates
nucleic acidorganic compound such as DNA or RNA
nucleotidesmall molecule containing a sugar, phosphate group, and base that is a building block of nucleic acids
nucleus (plural, nuclei)organelle inside eukaryotic cells that contains most of the cell’s DNA and acts as the control center of the cell
nutrientsubstance the body needs for energy, building materials, or control of body processes
653

12.15. O www.ck12.org
12.15 O
obesitycondition in which the body mass index is 30.0 kg/m2 or greater
observationanything that is detected with the senses
omnivoreconsumer that eats both plants and animals
oogenesisprocess of producing eggs in the ovary
open circulatory systemtype of circulatory system in which blood flows not only through blood vessels but also through a body cavity
operatora region of an operon where regulatory proteins bind
operonregion of prokaryotic DNA that consists of a promoter, an operator, and one or more genes that encode proteinsneeded for a specific function
organstructure composed of more than one type of tissue that performs a particular function
organellestructure within the cytoplasm of a cell that is enclosed within a membrane and performs a specific job
organic compoundcompound found in living things that contains mainly carbon
organisman individual living thing
organ systemgroup of organs that work together to do a certain job
osmosisdiffusion of water molecules across a membrane
ossificationprocess in which mineral deposits replace cartilage and change it into bone
654
www.ck12.org Chapter 12. Biology Glossary
osteoblasttype of bone cell that makes new bone cells and secretes collagen
osteoclasttype of bone cell that dissolves minerals in bone and releases them back into the blood
osteocytetype of bone cell that regulates mineral homeostasis by directing the uptake of minerals from the blood andthe release of minerals back into the blood as needed
ovaryone of two female reproductive organs that produces eggs and secretes estrogen
oviparytype of reproduction in which an embryo develops within an egg outside the mother’s body
ovoviviparytype of reproduction in which an embryo develops inside an egg within the mother’s body but in which themother provides no nourishment to the developing embryo in the egg
ovulationrelease of a secondary oocyte from the uterus about half way through the menstrual cycle
ozone holehole in the ozone layer high in the atmosphere over Antarctica caused by air pollution destroying ozone
655

12.16. P www.ck12.org
12.16 P
paleontologistscientist who finds and studies fossils to learn about evolution and understand the past
Paleozoic Eraage of “old life” from 544–245 million years ago that began with the Cambrian explosion and ended with thePermian extinction
pancreasgland near the stomach that secretes insulin and glucagon to regulate blood glucose and enzymes to help digestfood
parasitespecies that benefits in a parasitic relationship
parasitismsymbiotic relationship in which one species benefits while the other species is harmed
parathyroid glandsa pair of small glands in the neck that secretes hormones that regulate blood calcium
passive immunitytype of immunity to a particular pathogen that results when antibodies are transferred to a person who hasnever been exposed to the pathogen
passive transportmovement of substances across a plasma membrane that does not require energy
pathogendisease-causing agent such as a bacterium, virus, fungus, or protozoan
pedigreechart showing how a trait is passed from generation to generation within a family
penismale reproductive organ containing the urethra, through which sperm and urine pass out of the body
periosteumtough, fibrous membrane that covers the outer surface of bone
peripheral nervous system (PNS)one of two major divisions of the nervous system that consists of all the nervous tissue that lies outside thecentral nervous system
656

www.ck12.org Chapter 12. Biology Glossary
peristalsisrapid, involuntary, wave-like contraction of muscles that pushes food through the GI tract and urine throughthe ureters
Permian extinctionextinction at the end of the Paleozoic Period that was the biggest mass extinction the world had ever seen untilthen
petalouter parts of flowers that are usually brightly colored to attract animal pollinators
pHscale that is used to measure acidity
phagocytosisprocess in which leukocytes engulf and break down pathogens and debris
pharmacogenomicsfield that is tailoring medical treatments to fit our genetic profiles
pharynxlong, tubular organ that connects the mouth and nasal cavity with the larynx through which air and food pass
phenotypecharacteristics of an organism that depend on how the organism’s genotype is expressed
phloemtype of vascular tissue in a plant that transports food from photosynthetic cells to other parts of the plant
phospholipid bilayerdouble layer of phospholipid molecules that makes up a plasma membrane
photic zonearea in an aquatic biome that extends to a maximum depth of 200 meters
photoautotrophproducer that uses energy from sunlight to make food by photosynthesis
photosynthesisprocess of using the energy in sunlight to make food (glucose)
photosystemgroup of molecules, including chlorophyll, in the thylakoid membrane of a chloroplast that captures lightenergy
phylogenetic treediagram that shows how species are related to each other through common ancestors
657

12.16. P www.ck12.org
phylogenyevolutionary history of a group of related organisms
phytoplanktonbacteria and algae that use sunlight to make food
pineal glandgland of the endocrine system that secretes the hormone melatonin that regulates sleep-wake cycles
pioneer speciestype of species that first colonizes a disturbed area
pistilfemale reproductive structure of a flower that consists of a stigma, style, and ovary
pituitary glandmaster gland of the endocrine system that secretes many hormones, the majority of which regulate otherendocrine glands
placentatemporary organ that consists of a large mass of maternal and fetal blood vessels through the mother’s andfetus’s blood exchange substances
placental mammaltherian mammal in which a placenta develops during pregnancy to sustain the fetus while it develops insidethe mother’s uterus
plantmulticellular eukaryote with chloroplasts, cell walls made of cellulose, and specialized reproductive organs
plasmagolden-yellow fluid part of blood that contains many dissolved substances and blood cells
plasma membranethin coat of lipids (phospholipids) that surrounds and encloses a cell
plasmidsmall, circular piece of DNA in a prokaryotic cell
plateletcell fragment in blood that helps blood clot
Platyhelminthesinvertebrate phylum of flatworms that are characterized by a flat body because they lack a coelom or pseudo-coelom
pleiotropysituation in which a single gene affects more than one trait
658

www.ck12.org Chapter 12. Biology Glossary
pneumoniadisease in which the alveoli of the lungs become inflamed and filled with fluid as a result of infection or injury
point mutationchange in a single nucleotide base in the genetic material
polaritydifference in electrical charge between different parts of the same molecule
pollentiny grains that bear the male gametes of seed plants and transfer sperm to female reproductive structures
pollinationfertilization in plants in which pollen is transferred to female gametes in an ovary
polygenic characteristiccharacteristic, or trait, controlled by more than one gene, each of which may have two or more alleles
polymerase chain reaction (PCR)biotechnology process that makes many copies of a gene or other DNA segment
polynucleotidechain of nucleotides that alone or with another such chain makes up a nucleic acid
polypbasic body plan in cnidarians such as jellyfish that is tubular in shape and typically sessile
polypeptidechain of amino acids that alone or with other such chains makes up a protein
polysaccharidechain of monosaccharides that makes up a complex carbohydrate such as starch
populationall the organisms of the same species that live in the same area
population densityaverage number of individuals in a population per unit of area or volume
population distributiondescribes how the individuals are distributed, or spread throughout their habitat
population geneticsscience focusing on evolution within populations that is the area of overlap between evolutionary theory andMendelian genetics
population growth rate (r)how fast a population changes in size over time
659

12.16. P www.ck12.org
population pyramidbar graph that represents the age-structure of a population
Poriferainvertebrate phylum of sponges, which have a non-bony endoskeleton and are sessile as adults
precipitationwater that falls from clouds in the atmosphere to Earth’s in the form of rain, snow, sleet, hail, or freezing rain
predationrelationship in which members of one species consume members of another species
predatorspecies that consumes another in a predator-prey relationship
predictionstatement that tells what will happen under certain conditions
pregnancycarrying of one or more offspring from fertilization until birth
preyspecies that is consumed by another in a predator-prey relationship
primary successionchange in the numbers and types of species that live in a community that occurs in an area that has neverbefore been colonized
probabilitythe likelihood, or chance, than a certain event will occur
producerorganism that produces food for itself and other organisms
productsubstance that forms as the result of a chemical reaction
prokaryotesingle-celled organism that lacks a nucleus
prokaryotic cellcell without a nucleus that is found in single-celled organisms
promoterregion of a gene where a RNA polymerase binds to initiate transcription of the gene
prophasefirst phase of mitosis during which chromatin condense into chromosomes, the nuclear envelope breaks down,centrioles separate, and a spindle begins to form
660

www.ck12.org Chapter 12. Biology Glossary
proteinorganic compound made up of amino acids
protein synthesisprocess in which cells make proteins that includes transcription of DNA and translation of mRNA
protistkingdom in the domain Eukarya that includes all eukaryotes except plants, animals, and fungi
protozoa (singular, protozoan)animal-like protists such as Amoeba and Paramecium
pseudocoelompartial, fluid-filled cavity inside the body of some invertebrates
pseudopodtemporary, foot-like extension of the cytoplasm that some cells use for movement or feeding
psychoactive drugdrug that affects the central nervous system, generally by influencing the transmission of never impulses inthe brain
pubertyperiod during which humans become sexually mature
pulmonary circulationpart of the circulatory system that carries blood between the heart and lungs
punctuated equilibriummodel of the timing of evolution in which long periods of little evolutionary change are interrupted by burstsof rapid evolutionary change
Punnett squarechart for determining the expected percentages of different genotypes in the offspring of two parents
pupalife cycle stage of many insects that occurs between the larval and adult stages and during which the insect isimmobile, may be encased within a cocoon, and changes into the adult form
661

12.17. R www.ck12.org
12.17 R
radial symmetrysymmetry of a body plan in which there is a distinct top and bottom but not distinct head and tail ends, so thebody can be divided into two halves like a pie
reactantstarting material in a chemical reaction
recessive alleleallele that is masked by the presence of another allele for the same gene when they occur together in aheterozygote
recombinant DNADNA that results when DNA from two organisms is combined
red blood celltype of cell in blood that contains hemoglobin and carries oxygen
reflexrapid motor response to a sensory stimulus in which nerve impulses travel in an arc that includes the spinalcord but not the brain
regenerationregrowing of tissues, organs, or limbs that have been lost or damaged
regulatory elementregion of DNA where a regulatory protein binds
regulatory proteinprotein that regulates gene expression
relative datingmethod of dating fossils by their location in rock layers; determines which fossils are older or younger but nottheir age in years
renewable resourcenatural resource that can be replenished by natural processes as quickly as humans use it
reproductionprocess by which living things give rise to offspring
reproductive systemsystem of organs that produces gametes and secretes sex hormones
662

www.ck12.org Chapter 12. Biology Glossary
reptileectothermic, tetrapod vertebrate that lays amniotic eggs; includes crocodiles, lizards, snakes, and turtles
reservoirpart of a biogeochemical cycle that holds an element or water for a long period of time
respirationexchange of gases between the body and the outside air
respiratory systemorgan system that brings oxygen into the body and releases carbon dioxide into the atmosphere
resting potentialdifference in electrical charge across the plasma membrane of a neuron that is not actively transmitting a nerveimpulse
rhizoidhair-like structure in a nonvascular plant that absorbs water and minerals and anchors the plant to a surface
ribosomal RNAtype of RNA that helps form ribosomes and assemble proteins
ribosomeorganelle inside all cells where proteins are made
ringwormskin infection caused by the fungus Trichophyton that causes a characteristic ring-shaped rash
RNA (ribonucleic acid)single-stranded nucleic acid that helps make proteins
RNA world hypothesishypothesis that RNA was the first organic molecule to evolve and that early life was based on RNA, ratherthan DNA or protein
root hairtiny hairlike structure that extends from an epidermal cell of a plant root and increases the surface area forabsorption
root systemall the roots of a plant, including primary roots and secondary roots
r-selectedspecies in which population growth is rapid but death rates are high so population size is generally below thecarrying capacity
runoffprecipitation that falls on land and flows over the surface of the ground
663

12.18. S www.ck12.org
12.18 S
saprotrophdecomposer such as a fungus or protozoan that feeds on any remaining organic matter that is left after otherdecomposers do their work
saturated fatty acidmolecule in lipids in which carbon atoms are bonded to as many hydrogen atoms as possible
sauropsidtype of early amniote that evolved during the Carboniferous Period and eventually gave rise to dinosaurs,reptiles, and birds
scavengerdecomposer that consumers the soft tissues of dead animals
sciencedistinctive way of gaining knowledge about the natural world that tries to answer questions with evidence andlogic
scientific investigationplan for asking questions and testing possible answers
scientific lawstatement describing what always happens under certain conditions in nature
scientific methodthe process of a scientific investigation
scientific theorybroad explanation that is widely accepted as true because it is supported by a great deal of evidence
sebaceous glandgland in the dermis of skin that produces sebum, an oily substance that waterproofs the skin and hair
secondary successionchange in the numbers and types of species that live in a community that occurs in an area that was previouslycolonized but has been disturbed
seedstructure produced by a seed plant that contains an embryo and food supply enclosed within a tough coat
seed coattough covering of a seed that protects the embryo and keeps it from drying out until conditions are favorablefor germination
664

www.ck12.org Chapter 12. Biology Glossary
segmentationdivision of an animal body into multiple segments
semenfluid containing sperm and gland secretions that nourish sperm and carry them through the urethra and out ofthe body
sensory neurontype of neuron that carries nerve impulses from tissue and organs to the spinal cord and brain
sensory receptorspecialized nerve cell that responds to a particular type of stimulus such as light or chemicals
sepalpart of a flower that helps protect it while it is still in bud
sessileof or relating to an animal that is unable to move from place to place
sex chromosomeX or Y chromosome (in humans)
sex hormonechemical messenger that controls sexual development and reproduction
sex-linked genegene located on a sex chromosome
sex-linked traittraits controlled by a gene located on a sex chromosome
sexual dimorphismdifferences between the phenotypes of males and females of the same species
sexually transmitted infection (STI)infection caused by a pathogen that spreads mainly through sexual contact; also known as sexually transmitteddisease (STD)
sexual reproductiontype of reproduction that involves the fertilization of gametes produced by two parents and produces geneti-cally variable offspring
sixth mass extinctioncurrent mass extinction caused primarily by habitat loss due to human actions
skeletal musclevoluntary, striated muscle that is attached to bones of the skeleton and helps the body move
665

12.18. S www.ck12.org
skeletal systemhuman body system that consists of all the bones of the body as well as cartilage and ligaments
sliding filament theorytheory that explains muscle contraction by the sliding of myosin filaments over actin filaments within musclefibers
slime moldfungus-like protist commonly found on rotting logs and other decaying organic matter
small intestinelong, narrow, tube-like organ of the digestive system where most chemical digestion of food and virtually allabsorption of nutrients take place
smooth muscleinvoluntary, nonstriated muscle that is found in the walls of internal organs such as the stomach
social animalanimal that lives in a society
societyclose-knit group of animals of the same species that live and work together
sodium-potassium pumptype of active transport in which sodium ions are pumped out of the cell and potassium ions are pumped intothe cell with the help of a carrier protein and energy from ATP
soilmixture of eroded rock, minerals, organic matter, and other materials that is essential for plant growth andforms the foundation of terrestrial ecosystems
solutionmixture that has the same composition throughout
somatic mutationmutation that occurs in cells of the body other than gametes
somatic nervous system (SNS)division of the peripheral nervous system that controls voluntary, conscious activities and reflexes
spawningdepositing large numbers of gametes in the same place and at the same time by fish or amphibians
specializationevolution of different adaptations in competing species, which allows them to live in the same area withoutcompeting
speciationprocess by which a new species evolves
666

www.ck12.org Chapter 12. Biology Glossary
speciesgroup of organisms that are similar enough to mate together and produce fertile offspring
spermmale gamete
spermatogenesisprocess of producing sperm in the testes
spermatophytetype of plant that reproduces by producing seeds
spinal cordthin, tubular bundle of nervous tissue that extends from the brainstem down the back to the pelvis and connectsthe brain with the peripheral nervous system
spongy bonelight, porous inner layer of bone that contains bone marrow
sporangium (plural, sporangia)structure on a plant of the sporophyte generation that produces spores for asexual reproduction
sporophytediploid generation in the life cycle of a plant that results from sexual reproduction with gametes and thatproduces spores for asexual reproduction
sporozoa (singular, sporozoan)type of protozoa that cannot move as adults
stabilizing selectiontype of natural selection for a polygenic trait in which phenotypes at both extremes of the phenotypic distri-bution are selected against, resulting in a narrowing of the range of phenotypic variation
stamenmale reproductive structure of a flower that consists of a stalk-like filament and a pollen-producing anther
stimulussomething that triggers a behavior
stomachsac-like organ of the digestive system between the esophagus and small intestine in which both mechanicaland chemical digestion take place
stomata (singular, stoma)tiny pore in the epidermis of a plant leaf that controls transpiration and gas exchange with the air
stromaspace outside the thylakoid membranes of a chloroplast where the Calvin cycle of photosynthesis takes place
667

12.18. S www.ck12.org
sublimationprocess in which ice and snow change directly to water vapor
survivorship curvegraph that represents the individuals still alive at each age in a population
sustainable useuse of resources in a way that meets the needs of the present and also preserves the resources for the use offuture generations
sweat glandgland in the dermis of skin that produces the salty fluid called sweat, which excretes wastes and helps cool thebody
swim bladderballoon-like internal organ in most fish that can be used to move up or down through the water column bychanging the amount of gas it contains
symbiosisclose relationship between organisms of different species in which at least one of the organisms benefits fromthe relationship
sympatric speciationevolution of a new species that occurs when without geographic separation first occurring between membersof an original species
synapseplace where an axon terminal meets another cell
synapsidtype of early amniote that evolved during the Carboniferous Period and eventually gave rise to mammals
synthetic biologyfield of biology involved in engineering new functions from living systems
syphilissexually transmitted infection caused by bacteria that may eventually be fatal if untreated
systemic circulationpart of the circulatory system that carries blood between the heart and body
668

www.ck12.org Chapter 12. Biology Glossary
12.19 T
taprootsingle, thick primary root that characterizes the root system of some plants
target celltype of cell on which a particular hormone has an effect because it has receptor molecules for the hormone
TATA boxregulatory element that is part of the promoter of most eukaryotic genes
taxaa grouping of organisms in a classification system such as the Linnaean system; for example, species or genus
taxonomyscience of classifying organisms
T celltype of lymphocyte involved in cell-mediated immunity in which cells infected with viruses are destroyed
telophaselast stage of mitosis during which chromosomes uncoil to form chromatin, the spindle breaks down, and newnuclear membranes form
tendontough connective tissue that attaches skeletal muscle to bones of the skeleton
terrestrial biomea biome of or pertaining to land, as in terrestrial ecosystem
testis (plural, testes)one of two male reproductive organs that produces sperm and secretes testosterone
testosteronemale sex hormone secreted by the testes
tetrapodvertebrate with four legs (amphibian, reptile, bird, or mammal)
therapsidtype of extinct organism that lived during the Permian Period and gave rise to mammals
therian mammalviviparous mammal that may be either a marsupial or placental mammal
669

12.19. T www.ck12.org
thylakoid membranemembrane in a chloroplast where the light reactions of photosynthesis occur
thyroid glandlarge endocrine gland in the neck that secretes hormones that control the rate of cellular metabolism throughoutthe body
tissuegroup of cells of the same kind that perform a particular function in an organism
trachealong, tubular organ of the respiratory system, also called the wind pipe, that carries air between the larynx andlungs
tracheophytetype of plant that has vascular tissues, such as a seed plant or flowering plant
transcriptionprocess in which genetic instructions in DNA are copied to form a complementary strand of mRNA
transfer RNA (tRNA)type of RNA that brings amino acids to ribosomes where they are joined together to form proteins
transgenic cropcrop that has been genetically modified with new genes that code for traits useful to humans
translationprocess in which genetic instructions in mRNA are “read” to synthesize a protein
transpirationprocess in which plants give off water vapor from photosynthesis through tiny pores, called stomata, in theirleaves
transport proteinprotein in a plasma membrane that helps other substances cross the membrane
trichomoniasiscommon sexually transmitted infection that is caused by protozoa
trilobiteoldest known arthropod, which is now extinct and known only from numerous fossils
trophic levelfeeding position in a food chain or food web, such as producer, primary consumer, or secondary consumer
tropismturning by an organism or part of an organism toward or away from an environmental stimulus
tumorabnormal mass of cells that may be cancerous
tunicatesmembers of the subphylum Urochordata are tunicates (also called sea squirts)
670

www.ck12.org Chapter 12. Biology Glossary
12.20 U
unsaturated fatty acidmolecule in lipids in which some carbon atoms are bonded to other groups of atoms rather than to hydrogenatoms
uretermuscular, tube-like organ of the urinary system that moves urine by peristalsis from a kidney to the bladder
urethramuscular, tube-like organ of the urinary system that carries urine out of the body from the bladder; in males,it also carries sperm out of the body
urinary systemorgan system that includes the kidneys and is responsible for filtering waste products and excess water fromthe blood and excreting them from the body
urinationprocess in which urine leaves the body through a sphincter at the end of the urethra
urineliquid waste product of the body that is formed by the kidneys and excreted by the other organs of the urinarysystem
uterus (plural, uteri)female reproductive organ in therian mammals where an embryo or fetus grows and develops until birth
671

12.21. V www.ck12.org
12.21 V
vaccinesubstance containing modified pathogens that does not cause disease but provokes an immune response andresults in immunity to the pathogen
vacuolelarge saclike organelle that stores and transports materials inside a cell
vaginafemale reproductive organ that receives sperm during sexual intercourse and provides a passageway for a babyto leave the mother’s body during birth
vascular tissuetype of tissue in plants that transports fluids through the plant; includes xylem and phloem
vectororganism such as an insect that spreads pathogens from host to host
vegetative reproductionasexual reproduction in plants using nonreproductive tissues such as leaves, stems, or roots
veintype of blood vessel that carries blood toward the heart from the lungs or body
ventilationprocess of carrying air from the atmosphere into the lungs
vertebrae (singular, vertebra)repeating bony units that make up the vertebral column of vertebrates
vertebral columnbony support structure that runs down the back of a vertebrate animal; also called a backbone
vertebrateanimal with a vertebral column, or backbone
vesiclesmall saclike organelle that stores and transports materials inside a cell
vesicle transporttype of active transport in which substances are carried across the cell membrane by vesicles
672

www.ck12.org Chapter 12. Biology Glossary
vestigial structurestructure such as the human tailbone or appendix that evolution has reduced in size because it is no longerused
villi (singular, villus)microscopic, finger-like projections in the mucous membrane lining the small intestine that form a largesurface area for the absorption of nutrients
virionindividual virus particle that consists of nucleic acid within a protein capsid
virustiny, nonliving particle that contains DNA but lacks other characteristics of living cells
vitaminorganic compound needed in small amounts for proper body functioning
viviparytype of reproduction in which an embryo develops within, and is nourished by, the mother’s body
vulvaexternal female reproductive structures, including the labia and vaginal opening
673

12.22. W www.ck12.org
12.22 W
water cycleinterconnected pathways through which water is recycled through the biotic and abiotic components of thebiosphere
water moldfungus-like protist commonly found in moist soil and surface water
weedplant that is growing where people do not want it
wetlandarea that is saturated with water or covered by water for at least one season of the year
white blood celltype of cell in blood that defends the body against invading microorganisms or other threats in blood orextracellular fluid
674

www.ck12.org Chapter 12. Biology Glossary
12.23 X
xerophyteplant that is adapted to a very dry environment
X-linked genegene located on the X chromosome
X-linked traittrait controlled by a gene located on the X chromosome
xylemtype of vascular tissue in a plant that transports water and dissolved nutrients from roots to stems and leaves
675

12.24. Z www.ck12.org
12.24 Z
zooplanktontiny animals that feed on phytoplankton
zygosporediploid spore in fungi that is produced by the fusion of two haploid parent cells
zygotediploid cell that forms when two haploid gametes unite during fertilization
676