


CK 12 PreCalculus Concepts
704
-
Upload
khangminh22 -
Category
Documents
-
view
0 -
download
0
Transcript of CK 12 PreCalculus Concepts

CK-12 PreCalculus Concepts
Mark Spong
Say Thanks to the AuthorsClick http://www.ck12.org/saythanks
(No sign in required)

www.ck12.org
To access a customizable version of this book, as well as otherinteractive content, visit www.ck12.org
CK-12 Foundation is a non-profit organization with a mission toreduce the cost of textbook materials for the K-12 market bothin the U.S. and worldwide. Using an open-content, web-basedcollaborative model termed the FlexBook®, CK-12 intends topioneer the generation and distribution of high-quality educationalcontent that will serve both as core text as well as provide anadaptive environment for learning, powered through the FlexBookPlatform®.
Copyright © 2013 CK-12 Foundation, www.ck12.org
The names “CK-12” and “CK12” and associated logos and theterms “FlexBook®” and “FlexBook Platform®” (collectively“CK-12 Marks”) are trademarks and service marks of CK-12Foundation and are protected by federal, state, and internationallaws.
Any form of reproduction of this book in any format or medium,in whole or in sections must include the referral attribution linkhttp://www.ck12.org/saythanks (placed in a visible location) inaddition to the following terms.
Except as otherwise noted, all CK-12 Content (including CK-12Curriculum Material) is made available to Users in accordancewith the Creative Commons Attribution-Non-Commercial 3.0Unported (CC BY-NC 3.0) License (http://creativecommons.org/licenses/by-nc/3.0/), as amended and updated by Creative Com-mons from time to time (the “CC License”), which is incorporatedherein by this reference.
Complete terms can be found at http://www.ck12.org/terms.
Printed: October 3, 2013
AUTHORMark Spong
EDITORKaitlyn Spong
iii

Contents www.ck12.org
Contents
1 Functions and Graphs 11.1 Function Families . . . . . . . . . . . . . . . . . . . . . . . . . . . . . . . . . . . . . . . . . . 21.2 Graphical Transformations . . . . . . . . . . . . . . . . . . . . . . . . . . . . . . . . . . . . . 91.3 Point Notation and Function Notation . . . . . . . . . . . . . . . . . . . . . . . . . . . . . . . 151.4 Domain and Range . . . . . . . . . . . . . . . . . . . . . . . . . . . . . . . . . . . . . . . . . 201.5 Maximums and Minimums . . . . . . . . . . . . . . . . . . . . . . . . . . . . . . . . . . . . . 271.6 Symmetry . . . . . . . . . . . . . . . . . . . . . . . . . . . . . . . . . . . . . . . . . . . . . . 341.7 Increasing and Decreasing . . . . . . . . . . . . . . . . . . . . . . . . . . . . . . . . . . . . . 381.8 Zeroes and Intercepts of Functions . . . . . . . . . . . . . . . . . . . . . . . . . . . . . . . . . 441.9 Asymptotes and End Behavior . . . . . . . . . . . . . . . . . . . . . . . . . . . . . . . . . . . 491.10 Continuity and Discontinuity . . . . . . . . . . . . . . . . . . . . . . . . . . . . . . . . . . . . 561.11 Function Composition . . . . . . . . . . . . . . . . . . . . . . . . . . . . . . . . . . . . . . . . 631.12 Inverses of Functions . . . . . . . . . . . . . . . . . . . . . . . . . . . . . . . . . . . . . . . . 691.13 References . . . . . . . . . . . . . . . . . . . . . . . . . . . . . . . . . . . . . . . . . . . . . . 75
2 Polynomials and Rational Functions 782.1 Factoring Review . . . . . . . . . . . . . . . . . . . . . . . . . . . . . . . . . . . . . . . . . . 792.2 Advanced Factoring . . . . . . . . . . . . . . . . . . . . . . . . . . . . . . . . . . . . . . . . . 842.3 Polynomial Expansion and Pascal’s Triangle . . . . . . . . . . . . . . . . . . . . . . . . . . . . 892.4 Rational Expressions . . . . . . . . . . . . . . . . . . . . . . . . . . . . . . . . . . . . . . . . 942.5 Polynomial Long Division and Synthetic Division . . . . . . . . . . . . . . . . . . . . . . . . . 1002.6 Solving Rational Equations . . . . . . . . . . . . . . . . . . . . . . . . . . . . . . . . . . . . . 1042.7 Holes in Rational Functions . . . . . . . . . . . . . . . . . . . . . . . . . . . . . . . . . . . . . 1092.8 Zeroes of Rational Functions . . . . . . . . . . . . . . . . . . . . . . . . . . . . . . . . . . . . 1162.9 Vertical Asymptotes . . . . . . . . . . . . . . . . . . . . . . . . . . . . . . . . . . . . . . . . . 1192.10 Horizontal Asymptotes . . . . . . . . . . . . . . . . . . . . . . . . . . . . . . . . . . . . . . . 1242.11 Oblique Asymptotes . . . . . . . . . . . . . . . . . . . . . . . . . . . . . . . . . . . . . . . . . 1302.12 Sign Test for Rational Function Graphs . . . . . . . . . . . . . . . . . . . . . . . . . . . . . . . 1352.13 Graphs of Rational Functions by Hand . . . . . . . . . . . . . . . . . . . . . . . . . . . . . . . 1412.14 References . . . . . . . . . . . . . . . . . . . . . . . . . . . . . . . . . . . . . . . . . . . . . . 147
3 Logs and Exponents 1483.1 Exponential Functions . . . . . . . . . . . . . . . . . . . . . . . . . . . . . . . . . . . . . . . . 1493.2 Properties of Exponents . . . . . . . . . . . . . . . . . . . . . . . . . . . . . . . . . . . . . . . 1533.3 Scientific Notation . . . . . . . . . . . . . . . . . . . . . . . . . . . . . . . . . . . . . . . . . . 1573.4 Properties of Logs . . . . . . . . . . . . . . . . . . . . . . . . . . . . . . . . . . . . . . . . . . 1603.5 Change of Base . . . . . . . . . . . . . . . . . . . . . . . . . . . . . . . . . . . . . . . . . . . 1643.6 Exponential Equations . . . . . . . . . . . . . . . . . . . . . . . . . . . . . . . . . . . . . . . . 1673.7 Logistic Functions . . . . . . . . . . . . . . . . . . . . . . . . . . . . . . . . . . . . . . . . . . 1723.8 References . . . . . . . . . . . . . . . . . . . . . . . . . . . . . . . . . . . . . . . . . . . . . . 178
4 Basic Triangle Trigonometry 179
iv

www.ck12.org Contents
4.1 Angles in Radians and Degrees . . . . . . . . . . . . . . . . . . . . . . . . . . . . . . . . . . . 1804.2 Circular Motion and Dimensional Analysis . . . . . . . . . . . . . . . . . . . . . . . . . . . . . 1834.3 Special Right Triangles . . . . . . . . . . . . . . . . . . . . . . . . . . . . . . . . . . . . . . . 1874.4 Right Triangle Trigonometry . . . . . . . . . . . . . . . . . . . . . . . . . . . . . . . . . . . . 1944.5 Law of Cosines . . . . . . . . . . . . . . . . . . . . . . . . . . . . . . . . . . . . . . . . . . . 2004.6 Law of Sines . . . . . . . . . . . . . . . . . . . . . . . . . . . . . . . . . . . . . . . . . . . . . 2064.7 Area of a Triangle . . . . . . . . . . . . . . . . . . . . . . . . . . . . . . . . . . . . . . . . . . 2114.8 Applications of Basic Triangle Trigonometry . . . . . . . . . . . . . . . . . . . . . . . . . . . . 2154.9 References . . . . . . . . . . . . . . . . . . . . . . . . . . . . . . . . . . . . . . . . . . . . . . 222
5 Trigonometric Functions 2235.1 The Unit Circle . . . . . . . . . . . . . . . . . . . . . . . . . . . . . . . . . . . . . . . . . . . 2245.2 The Sinusoidal Function Family . . . . . . . . . . . . . . . . . . . . . . . . . . . . . . . . . . 2315.3 Amplitude of Sinusoidal Functions . . . . . . . . . . . . . . . . . . . . . . . . . . . . . . . . . 2375.4 Vertical Shift of Sinusoidal Functions . . . . . . . . . . . . . . . . . . . . . . . . . . . . . . . . 2445.5 Frequency and Period of Sinusoidal Functions . . . . . . . . . . . . . . . . . . . . . . . . . . . 2515.6 Phase Shift of Sinusoidal Functions . . . . . . . . . . . . . . . . . . . . . . . . . . . . . . . . . 2595.7 Graphs of Other Trigonometric Functions . . . . . . . . . . . . . . . . . . . . . . . . . . . . . 2655.8 Graphs of Inverse Trigonometric Functions . . . . . . . . . . . . . . . . . . . . . . . . . . . . . 2725.9 References . . . . . . . . . . . . . . . . . . . . . . . . . . . . . . . . . . . . . . . . . . . . . . 280
6 Analytic Trigonometry 2826.1 Basic Trigonometric Identities . . . . . . . . . . . . . . . . . . . . . . . . . . . . . . . . . . . 2836.2 Sum and Difference Identities . . . . . . . . . . . . . . . . . . . . . . . . . . . . . . . . . . . . 2886.3 Pythagorean Identities - PreCalculus . . . . . . . . . . . . . . . . . . . . . . . . . . . . . . . . 2936.4 Double, Half, and Power Reducing Identities . . . . . . . . . . . . . . . . . . . . . . . . . . . . 2976.5 Trigonometric Equations . . . . . . . . . . . . . . . . . . . . . . . . . . . . . . . . . . . . . . 3016.6 References . . . . . . . . . . . . . . . . . . . . . . . . . . . . . . . . . . . . . . . . . . . . . . 307
7 Vectors 3087.1 Basic Properties of Vectors . . . . . . . . . . . . . . . . . . . . . . . . . . . . . . . . . . . . . 3097.2 Operations with Vectors . . . . . . . . . . . . . . . . . . . . . . . . . . . . . . . . . . . . . . . 3167.3 Resolution of Vectors into Components . . . . . . . . . . . . . . . . . . . . . . . . . . . . . . . 3227.4 Dot Product and Angle Between Two Vectors . . . . . . . . . . . . . . . . . . . . . . . . . . . 3277.5 Vector Projection . . . . . . . . . . . . . . . . . . . . . . . . . . . . . . . . . . . . . . . . . . 3327.6 References . . . . . . . . . . . . . . . . . . . . . . . . . . . . . . . . . . . . . . . . . . . . . . 338
8 Systems and Matrices 3398.1 Systems of Two Equations and Two Unknowns . . . . . . . . . . . . . . . . . . . . . . . . . . 3408.2 Systems of Three Equations and Three Unknowns . . . . . . . . . . . . . . . . . . . . . . . . . 3468.3 Matrices to Represent Data . . . . . . . . . . . . . . . . . . . . . . . . . . . . . . . . . . . . . 3558.4 Matrix Algebra . . . . . . . . . . . . . . . . . . . . . . . . . . . . . . . . . . . . . . . . . . . 3618.5 Row Operations and Row Echelon Forms . . . . . . . . . . . . . . . . . . . . . . . . . . . . . 3688.6 Augmented Matrices . . . . . . . . . . . . . . . . . . . . . . . . . . . . . . . . . . . . . . . . 3738.7 Determinant of Matrices . . . . . . . . . . . . . . . . . . . . . . . . . . . . . . . . . . . . . . . 3798.8 Cramer’s Rule . . . . . . . . . . . . . . . . . . . . . . . . . . . . . . . . . . . . . . . . . . . . 3848.9 Inverse Matrices . . . . . . . . . . . . . . . . . . . . . . . . . . . . . . . . . . . . . . . . . . . 3928.10 Partial Fractions . . . . . . . . . . . . . . . . . . . . . . . . . . . . . . . . . . . . . . . . . . . 3988.11 References . . . . . . . . . . . . . . . . . . . . . . . . . . . . . . . . . . . . . . . . . . . . . . 404
9 Conics 4059.1 General Form of a Conic . . . . . . . . . . . . . . . . . . . . . . . . . . . . . . . . . . . . . . 406
v
Contents www.ck12.org
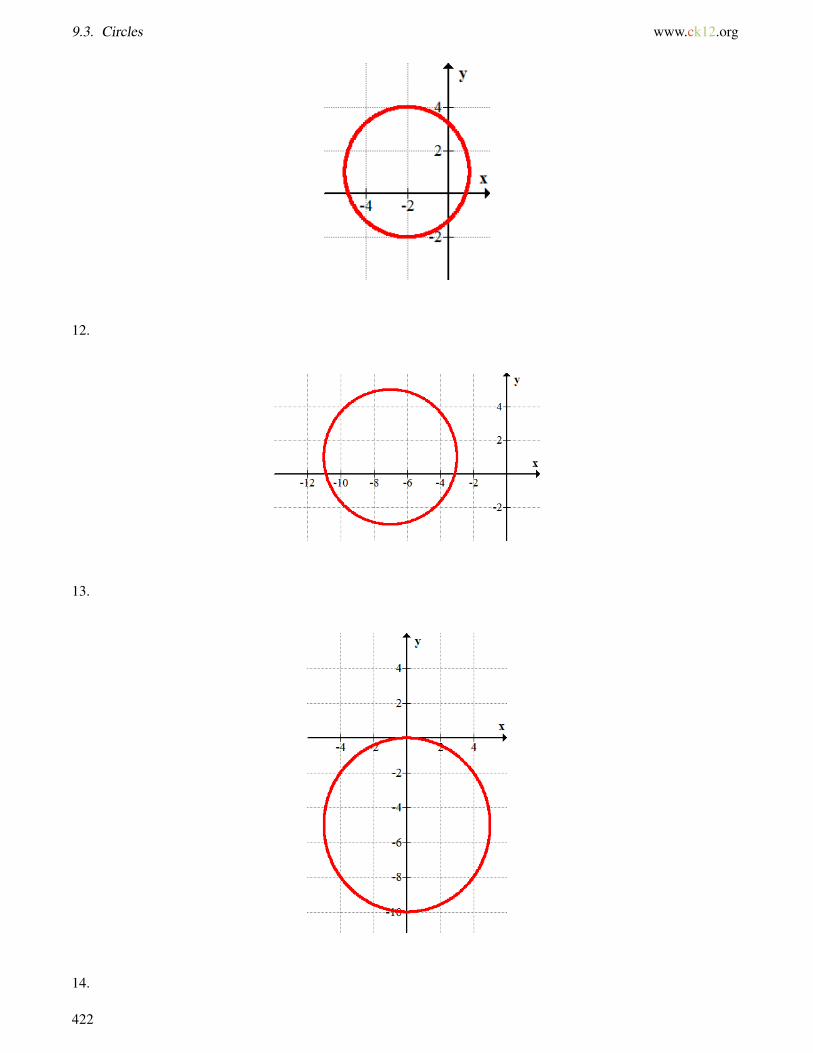
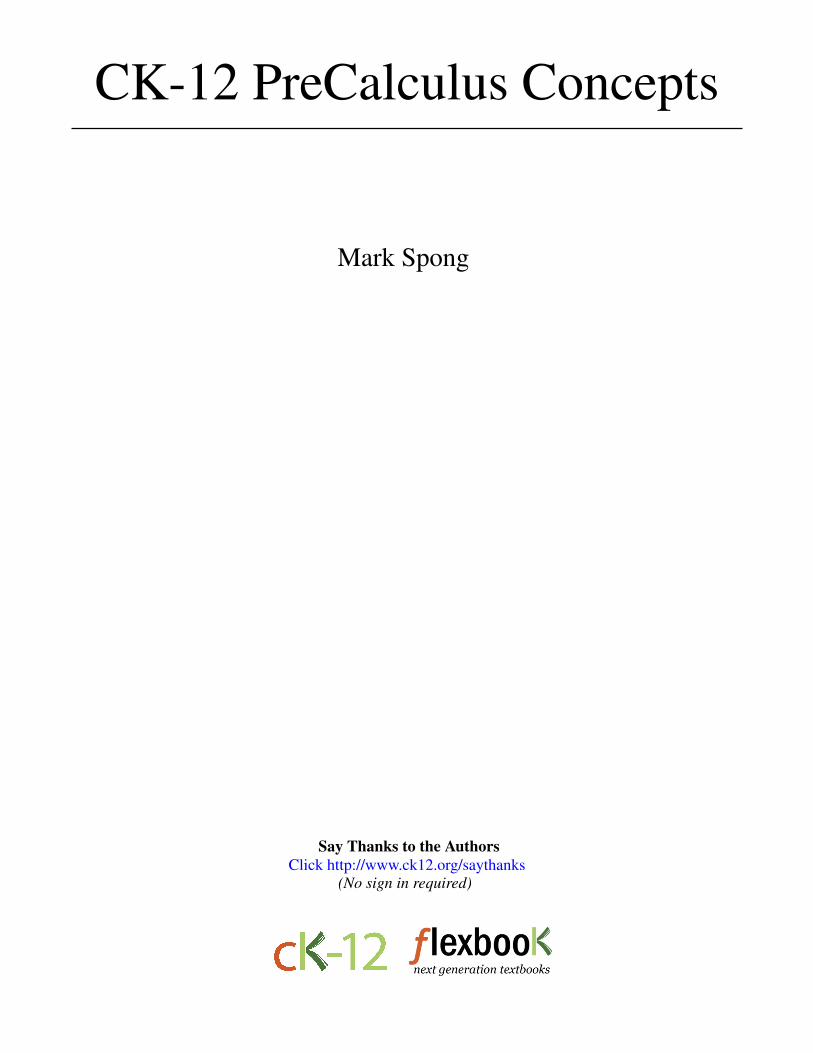
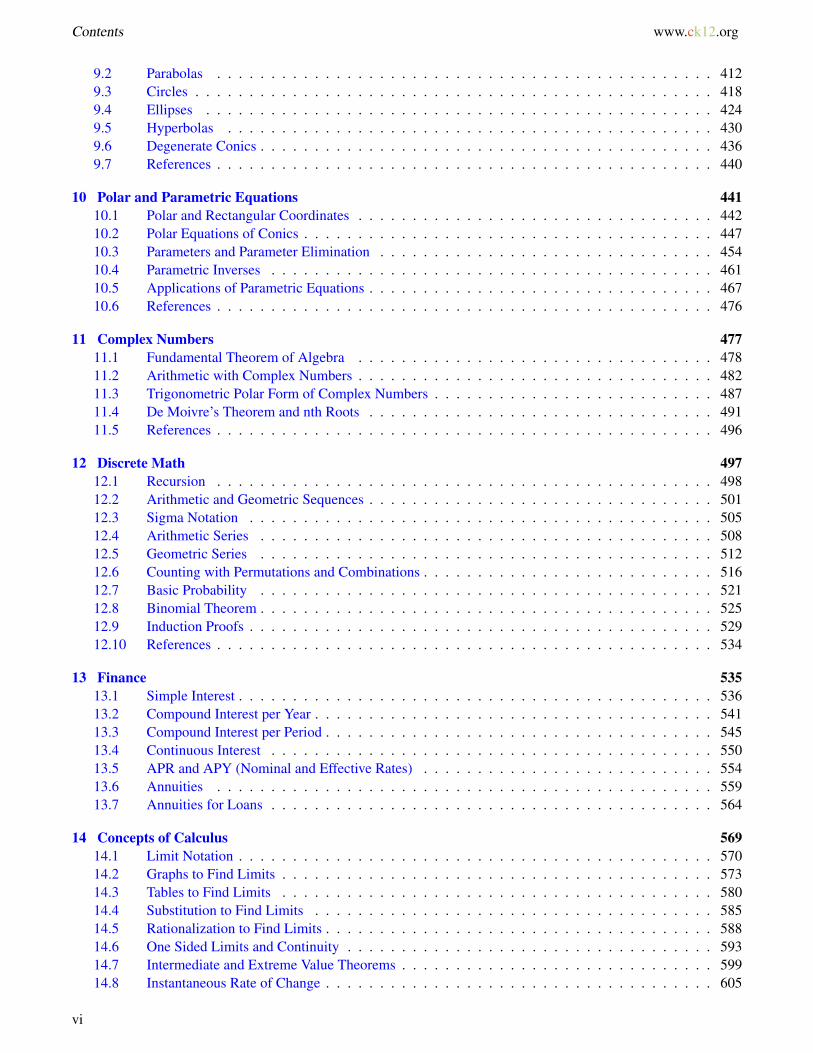
9.2 Parabolas . . . . . . . . . . . . . . . . . . . . . . . . . . . . . . . . . . . . . . . . . . . . . . 4129.3 Circles . . . . . . . . . . . . . . . . . . . . . . . . . . . . . . . . . . . . . . . . . . . . . . . . 4189.4 Ellipses . . . . . . . . . . . . . . . . . . . . . . . . . . . . . . . . . . . . . . . . . . . . . . . 4249.5 Hyperbolas . . . . . . . . . . . . . . . . . . . . . . . . . . . . . . . . . . . . . . . . . . . . . 4309.6 Degenerate Conics . . . . . . . . . . . . . . . . . . . . . . . . . . . . . . . . . . . . . . . . . . 4369.7 References . . . . . . . . . . . . . . . . . . . . . . . . . . . . . . . . . . . . . . . . . . . . . . 440
10 Polar and Parametric Equations 44110.1 Polar and Rectangular Coordinates . . . . . . . . . . . . . . . . . . . . . . . . . . . . . . . . . 44210.2 Polar Equations of Conics . . . . . . . . . . . . . . . . . . . . . . . . . . . . . . . . . . . . . . 44710.3 Parameters and Parameter Elimination . . . . . . . . . . . . . . . . . . . . . . . . . . . . . . . 45410.4 Parametric Inverses . . . . . . . . . . . . . . . . . . . . . . . . . . . . . . . . . . . . . . . . . 46110.5 Applications of Parametric Equations . . . . . . . . . . . . . . . . . . . . . . . . . . . . . . . . 46710.6 References . . . . . . . . . . . . . . . . . . . . . . . . . . . . . . . . . . . . . . . . . . . . . . 476
11 Complex Numbers 47711.1 Fundamental Theorem of Algebra . . . . . . . . . . . . . . . . . . . . . . . . . . . . . . . . . 47811.2 Arithmetic with Complex Numbers . . . . . . . . . . . . . . . . . . . . . . . . . . . . . . . . . 48211.3 Trigonometric Polar Form of Complex Numbers . . . . . . . . . . . . . . . . . . . . . . . . . . 48711.4 De Moivre’s Theorem and nth Roots . . . . . . . . . . . . . . . . . . . . . . . . . . . . . . . . 49111.5 References . . . . . . . . . . . . . . . . . . . . . . . . . . . . . . . . . . . . . . . . . . . . . . 496
12 Discrete Math 49712.1 Recursion . . . . . . . . . . . . . . . . . . . . . . . . . . . . . . . . . . . . . . . . . . . . . . 49812.2 Arithmetic and Geometric Sequences . . . . . . . . . . . . . . . . . . . . . . . . . . . . . . . . 50112.3 Sigma Notation . . . . . . . . . . . . . . . . . . . . . . . . . . . . . . . . . . . . . . . . . . . 50512.4 Arithmetic Series . . . . . . . . . . . . . . . . . . . . . . . . . . . . . . . . . . . . . . . . . . 50812.5 Geometric Series . . . . . . . . . . . . . . . . . . . . . . . . . . . . . . . . . . . . . . . . . . 51212.6 Counting with Permutations and Combinations . . . . . . . . . . . . . . . . . . . . . . . . . . . 51612.7 Basic Probability . . . . . . . . . . . . . . . . . . . . . . . . . . . . . . . . . . . . . . . . . . 52112.8 Binomial Theorem . . . . . . . . . . . . . . . . . . . . . . . . . . . . . . . . . . . . . . . . . . 52512.9 Induction Proofs . . . . . . . . . . . . . . . . . . . . . . . . . . . . . . . . . . . . . . . . . . . 52912.10 References . . . . . . . . . . . . . . . . . . . . . . . . . . . . . . . . . . . . . . . . . . . . . . 534
13 Finance 53513.1 Simple Interest . . . . . . . . . . . . . . . . . . . . . . . . . . . . . . . . . . . . . . . . . . . . 53613.2 Compound Interest per Year . . . . . . . . . . . . . . . . . . . . . . . . . . . . . . . . . . . . . 54113.3 Compound Interest per Period . . . . . . . . . . . . . . . . . . . . . . . . . . . . . . . . . . . . 54513.4 Continuous Interest . . . . . . . . . . . . . . . . . . . . . . . . . . . . . . . . . . . . . . . . . 55013.5 APR and APY (Nominal and Effective Rates) . . . . . . . . . . . . . . . . . . . . . . . . . . . 55413.6 Annuities . . . . . . . . . . . . . . . . . . . . . . . . . . . . . . . . . . . . . . . . . . . . . . 55913.7 Annuities for Loans . . . . . . . . . . . . . . . . . . . . . . . . . . . . . . . . . . . . . . . . . 564
14 Concepts of Calculus 56914.1 Limit Notation . . . . . . . . . . . . . . . . . . . . . . . . . . . . . . . . . . . . . . . . . . . . 57014.2 Graphs to Find Limits . . . . . . . . . . . . . . . . . . . . . . . . . . . . . . . . . . . . . . . . 57314.3 Tables to Find Limits . . . . . . . . . . . . . . . . . . . . . . . . . . . . . . . . . . . . . . . . 58014.4 Substitution to Find Limits . . . . . . . . . . . . . . . . . . . . . . . . . . . . . . . . . . . . . 58514.5 Rationalization to Find Limits . . . . . . . . . . . . . . . . . . . . . . . . . . . . . . . . . . . . 58814.6 One Sided Limits and Continuity . . . . . . . . . . . . . . . . . . . . . . . . . . . . . . . . . . 59314.7 Intermediate and Extreme Value Theorems . . . . . . . . . . . . . . . . . . . . . . . . . . . . . 59914.8 Instantaneous Rate of Change . . . . . . . . . . . . . . . . . . . . . . . . . . . . . . . . . . . . 605
vi
www.ck12.org Contents
14.9 Area Under a Curve . . . . . . . . . . . . . . . . . . . . . . . . . . . . . . . . . . . . . . . . . 61114.10 References . . . . . . . . . . . . . . . . . . . . . . . . . . . . . . . . . . . . . . . . . . . . . . 620
15 Concepts of Statistics 62115.1 Mean, Median and Mode . . . . . . . . . . . . . . . . . . . . . . . . . . . . . . . . . . . . . . 62215.2 Expected Value and Payoffs . . . . . . . . . . . . . . . . . . . . . . . . . . . . . . . . . . . . . 62615.3 Five Number Summary . . . . . . . . . . . . . . . . . . . . . . . . . . . . . . . . . . . . . . . 63115.4 Graphic Displays of Data . . . . . . . . . . . . . . . . . . . . . . . . . . . . . . . . . . . . . . 63415.5 Variance . . . . . . . . . . . . . . . . . . . . . . . . . . . . . . . . . . . . . . . . . . . . . . . 64315.6 The Normal Curve . . . . . . . . . . . . . . . . . . . . . . . . . . . . . . . . . . . . . . . . . . 64915.7 Linear Correlation . . . . . . . . . . . . . . . . . . . . . . . . . . . . . . . . . . . . . . . . . . 65415.8 Modeling with Regression . . . . . . . . . . . . . . . . . . . . . . . . . . . . . . . . . . . . . . 66215.9 References . . . . . . . . . . . . . . . . . . . . . . . . . . . . . . . . . . . . . . . . . . . . . . 670
16 Logic and Set Theory 67116.1 And and Or Statements . . . . . . . . . . . . . . . . . . . . . . . . . . . . . . . . . . . . . . . 67216.2 If-Then Statements . . . . . . . . . . . . . . . . . . . . . . . . . . . . . . . . . . . . . . . . . 67716.3 Negative Statements . . . . . . . . . . . . . . . . . . . . . . . . . . . . . . . . . . . . . . . . . 68416.4 Inverse, Converse, and Contrapositive . . . . . . . . . . . . . . . . . . . . . . . . . . . . . . . 69216.5 References . . . . . . . . . . . . . . . . . . . . . . . . . . . . . . . . . . . . . . . . . . . . . . 697
vii

www.ck12.org Chapter 1. Functions and Graphs
CHAPTER 1 Functions and GraphsChapter Outline
1.1 FUNCTION FAMILIES
1.2 GRAPHICAL TRANSFORMATIONS
1.3 POINT NOTATION AND FUNCTION NOTATION
1.4 DOMAIN AND RANGE
1.5 MAXIMUMS AND MINIMUMS
1.6 SYMMETRY
1.7 INCREASING AND DECREASING
1.8 ZEROES AND INTERCEPTS OF FUNCTIONS
1.9 ASYMPTOTES AND END BEHAVIOR
1.10 CONTINUITY AND DISCONTINUITY
1.11 FUNCTION COMPOSITION
1.12 INVERSES OF FUNCTIONS
1.13 REFERENCES
Here you will review and extend concepts about functions and graphing. You will learn how to transform basicfunctions and write these transformations using the correct notation. You will learn to describe a function in terms ofits domain, range, extrema, symmetry, intercepts, asymptotes, and continuity. Finally, you will learn about functioncomposition and inverses of functions.
1

1.1. Function Families www.ck12.org
1.1 Function Families
Here you will learn to identify primary function families by their equations and graphs. This will set the stage foranalyzing all types of functions.
Functions come in all different shapes. A few are very closely related and others are very different, but oftenconfused. For example, what is the difference betweenx2 and2x? They both have anx and a 2 and they both equal 4whenx = 2, but one eventually becomes much bigger than the other.
Watch This
MEDIAClick image to the left for more content.
http://www.youtube.com/watch?v=3a7UbMJpeIM Khan Academy: Graphing a Quadratic Function
MEDIAClick image to the left for more content.
http://www.youtube.com/watch?v=Mi6OJ4TAufY Khan Academy: Graphing Radical Functions
MEDIAClick image to the left for more content.
http://www.youtube.com/watch?v=9SOSfRNCQZQ Khan Academy: Graphing Exponential Functions
MEDIAClick image to the left for more content.
2

www.ck12.org Chapter 1. Functions and Graphs
http://www.youtube.com/watch?v=outcfkh69U0 Khan Academy: Graphs of Square Root Functions
Guidance
If mathematicians are cooks, then families of functions are their ingredients. Each family of functions has its ownflavor and personality. Before you learn to combine functions to create an infinite number of potential models, youneed to get a clear idea of the name of each function family and how it acts.
The Identity Function: f (x) = x
The identity function is the simplest function and all straight lines are transformations of the identity function family.
The Squaring Function: f (x) = x2
The squaring function is commonly called a parabola and is useful for modeling the motion of falling objects. Allparabolas are transformations of this squaring function.
The Cubing Function: f (x) = x3
3

1.1. Function Families www.ck12.org
The cubing function has a different kind of symmetry than the squaring function. Since volume is measured in cubicunits, many physics applications use the cubic function.
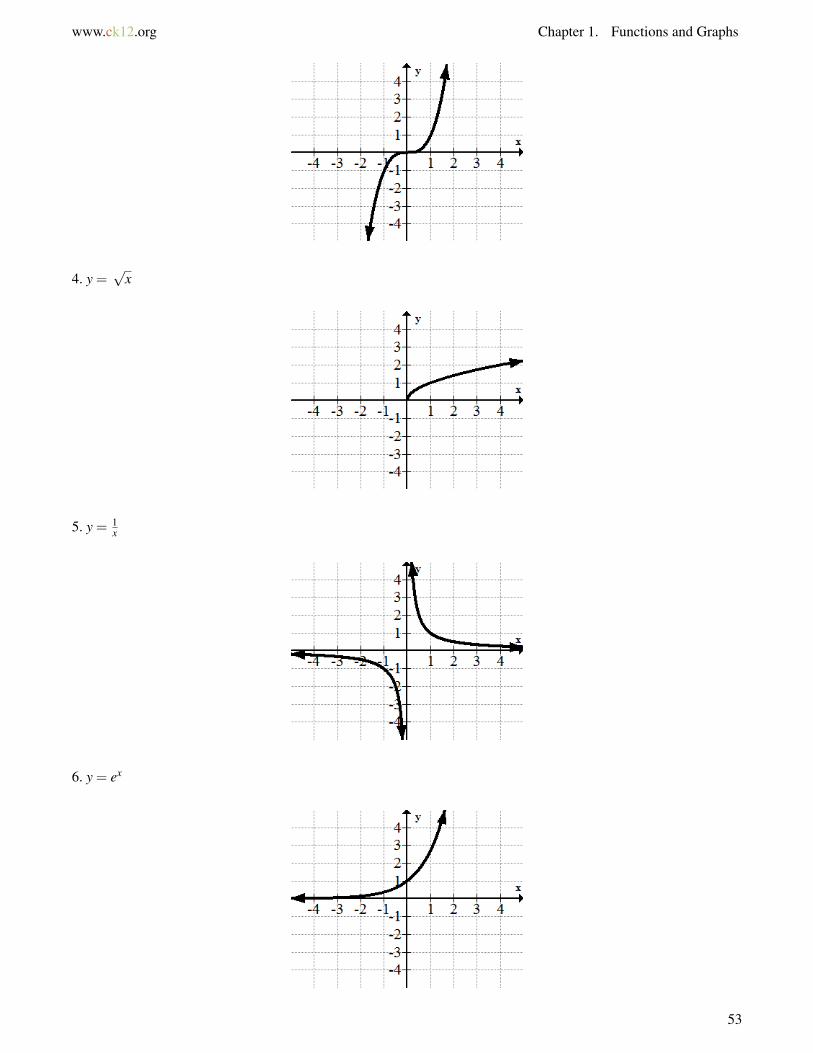
The Square Root Function: f (x) =√
x = x12
The square root function is not defined over all real numbers. It introduces the possibility of complex numbers andis also closely related to the squaring function.
The Reciprocal Function: f (x) = x−1 = 1x
The reciprocal function is also known as a hyperbola and a rational function. It has two parts that are disconnectedand is not defined at zero. Simple electric circuits are modeled with the reciprocal function.
So far all the functions can be grouped together into an even larger function family called the power function family.
The Power Function Family: f (x) = cxa
The power function family has two parameters. The parameter c is a vertical scale factor. The parameter a controlseverything about the shape. The reason why all the functions so far are subsets of the larger power function familyis because they only differ in their value of a. The power function family also shows you that there are an infinitenumber of other functions like quartics ( f (x) = x4) and quintics ( f (x) = x5) that don’t really need a whole categoryof their own. The power function family can be extended to create polynomials and rational functions.
The Exponential Function Family: f (x) = ex
4

www.ck12.org Chapter 1. Functions and Graphs
The exponential function family is one of the first functions you see where x is not the base of the exponent. Thisfunction eventually grows much faster than any power function. f (x) = 2x is a very common exponential functionas well. Many applications like biology and finance require the use of exponential growth.
The Logarithm Function: f (x) = lnx
The log function is closely related to the exponential function family. Many people confuse the graph of the logfunction with the square root function. Careful analysis will show several important differences. The log function isthe basis for the Richter Scale which is how earthquakes are measured.
The Periodic Function Family: f (x) = sinx
The sine graph is one of many periodic functions. Periodic refers to the fact that the sine wave repeats a cycle everyperiod of time. Periodic functions are extremely important for modeling tides and other real world phenomena.
The Absolute Value Function: f (x) = |x|
5

1.1. Function Families www.ck12.org
The absolute value function is one of the few basic functions that is not totally smooth.
The Logistic Function: f (x) = 11+e−x
The logistic function is a combination of the exponential function and the reciprocal function. This curve isvery powerful because it models population growths where the maximum population is limited by environmentalresources.
Example A
Compare and contrast the graphs of the two functions: f (x) = lnx and h(x) =√
x
Solution:
Similarities: Both functions increase without bound as x gets larger. Both functions are not defined for negativenumbers.
Differences: The log function approaches negative infinity as x approaches 0. The square root function, on the otherhand, just ends at the point (0, 0).
Example B
Describe the symmetry among the function families discussed in this concept. Consider both reflection symmetryand rotation symmetry.
Solution:
Some function families have reflective symmetry with themselves:
y = x,y = x2,y = 1x ,y = |x|
Some function families are rotationally symmetric:
y = x,y = x3,y = 1x ,y = sinx,y = 1
1+e−x
Some pairs of function families are full or partial reflections of other function families:
y = x2,y =√
x
y = ex,y = lnx
6
www.ck12.org Chapter 1. Functions and Graphs
Example C
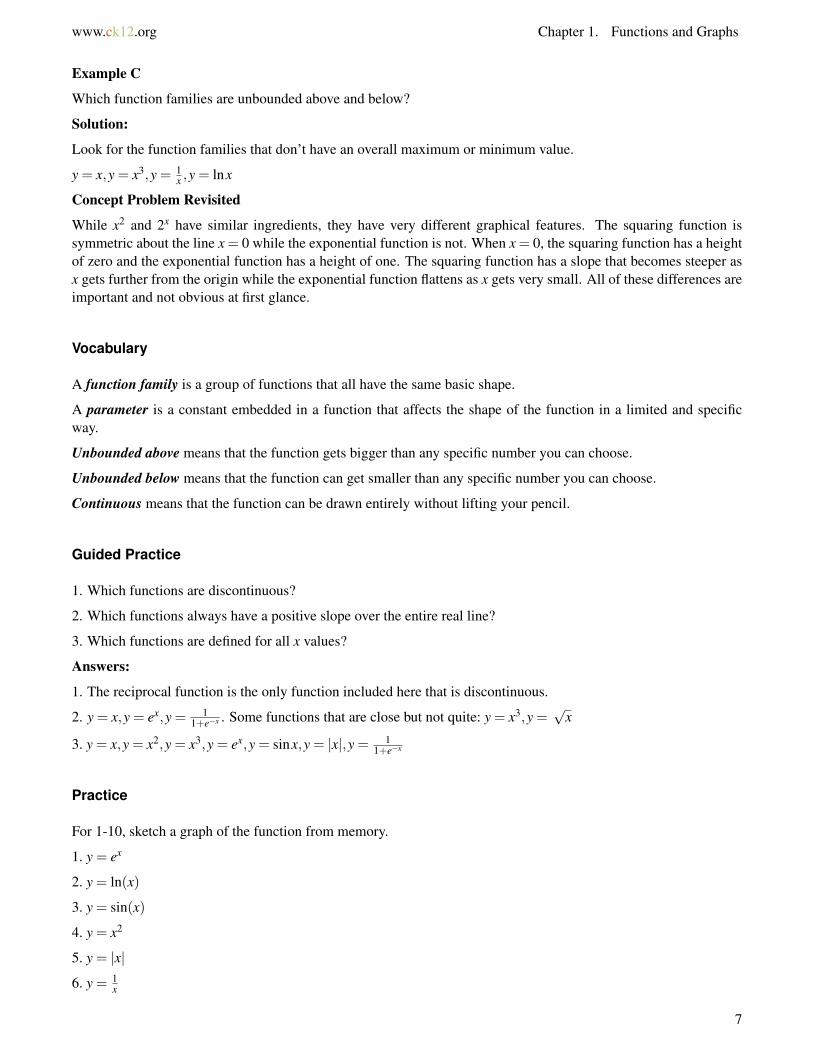
Which function families are unbounded above and below?
Solution:
Look for the function families that don’t have an overall maximum or minimum value.
y = x,y = x3,y = 1x ,y = lnx
Concept Problem Revisited
While x2 and 2x have similar ingredients, they have very different graphical features. The squaring function issymmetric about the line x = 0 while the exponential function is not. When x = 0, the squaring function has a heightof zero and the exponential function has a height of one. The squaring function has a slope that becomes steeper asx gets further from the origin while the exponential function flattens as x gets very small. All of these differences areimportant and not obvious at first glance.
Vocabulary
A function family is a group of functions that all have the same basic shape.
A parameter is a constant embedded in a function that affects the shape of the function in a limited and specificway.
Unbounded above means that the function gets bigger than any specific number you can choose.
Unbounded below means that the function can get smaller than any specific number you can choose.
Continuous means that the function can be drawn entirely without lifting your pencil.
Guided Practice
1. Which functions are discontinuous?
2. Which functions always have a positive slope over the entire real line?
3. Which functions are defined for all x values?
Answers:
1. The reciprocal function is the only function included here that is discontinuous.
2. y = x,y = ex,y = 11+e−x . Some functions that are close but not quite: y = x3,y =
√x
3. y = x,y = x2,y = x3,y = ex,y = sinx,y = |x|,y = 11+e−x
Practice
For 1-10, sketch a graph of the function from memory.
1. y = ex
2. y = ln(x)
3. y = sin(x)
4. y = x2
5. y = |x|
6. y = 1x
7

1.1. Function Families www.ck12.org
7. y = 11+e−x
8. y =√
x
9. y = x3
10. y = x
11. Which function is not defined at 0? Why?
12. Which functions are bounded below but not above?
13. What are the differences between y = x2 and y = x3?
14. What is a similarity between y = ex and y = ln(x)?
15. Explain why y =√
x is not defined for all values of x.
8

www.ck12.org Chapter 1. Functions and Graphs
1.2 Graphical Transformations
Here you will learn how a graph changes when you change its equation by adding, subtracting, and multiplying byconstants.
The basic functions are powerful, but they are extremely limited until you can change them to match any givensituation. Transformation means that you can change theequation of a basic function by adding, subtracting, and/ormultiplying by constants and thus cause a corresponding change in thegraph. What are the effects of the followingtransformations?
1) f (x)→ f (x+3)
2) h(x)→ h(x)−5
3) g(x)→−g(2x)
4) j(x)→ j(− x
2
)Watch This
MEDIAClick image to the left for more content.
http://www.youtube.com/watch?v=CESXLJaq6Mk James Sousa: Function Transformations: Horizontal and Verti-cal Translations
MEDIAClick image to the left for more content.
http://www.youtube.com/watch?v=2S9LUinJ8-w James Sousa: Function Transformations: Horizontal and VerticalStretch and Compression
Guidance
A function is a rule that takes any input x and gives a specific output. When you use letters like f , g, h, or j to describethe rule, this is called function notation. In order to interpret what effect the algebraic change in the equation willhave on the graph, it is important to be able to read those changes in general function notation and then apply themto specific cases.
9

1.2. Graphical Transformations www.ck12.org
When transforming a function, you can transform the argument (the part inside the parentheses with the x), or thefunction itself. There are two ways to linearly transform the argument. You can multiply the x by a constant and/oradd a constant to the x as shown below:
f (x)→ f (bx+ c)
The function itself can also be linearly transformed in the same ways:
f (x)→ a f (x)+d
Each of the letters a,b,c, and d corresponds to a very specific change. Some of these changes are straightforward,while others may be the opposite of what you might expect.
• a is a vertical stretch. If a is negative, there is also a reflection across the x axis.• d is a vertical shift. If d is positive, then the shift is up. If d is negative, then the shift is down.
When transforming the argument of the function things are much trickier.
• 1b is a horizontal stretch. If b is negative, there is also a reflection across the y axis.
• c is a horizontal shift. If c is positive, then the shift is to the left. If c is negative, then the shift is to the right.Note that this is the opposite of what most people think at first.
The trickiest part with transforming the argument of a function is the order in which you carry out the transforma-tions. See Example A.
Example A
Describe the following transformation in words and show an example with a picture: f (x)→ f (3x−6)
Solution: Often it makes sense to apply the transformation to a specific function that is known and then describe thetransformation that you see.
Clearly the graph is narrower and to the right, but in order to be specific you must look closer. First, note thatthe transformation is entirely within the argument of the function. This affects only the horizontal values. Thismeans while the graph seems like it was stretched vertically, you must keep your perspective focused on a horizontalcompression.
10
www.ck12.org Chapter 1. Functions and Graphs
Look carefully at the vertex of the parabola. It has moved to the right two units. This is because first the entire graphwas shifted entirely to the right 6 units. Then the function was horizontally compressed by a factor of 3 which meansthe point (6, 0) became (2, 0) and the x value of every other point was also compressed by a factor of 3 towards theline x = 0. This method is counter-intuitive because it requires reading the transformations backwards (the oppositeof the way the order of operations tells you to).
Alternatively, the argument can be factored and each component of the transformation will present itself. This timethe stretch occurs from the center of the transformed graph, not the origin. This method is ultimately the preferredmethod.
f (3(x−2))
Either way, this is a horizontal compression by a factor of 3 and a horizontal shift to the right by 2 units.
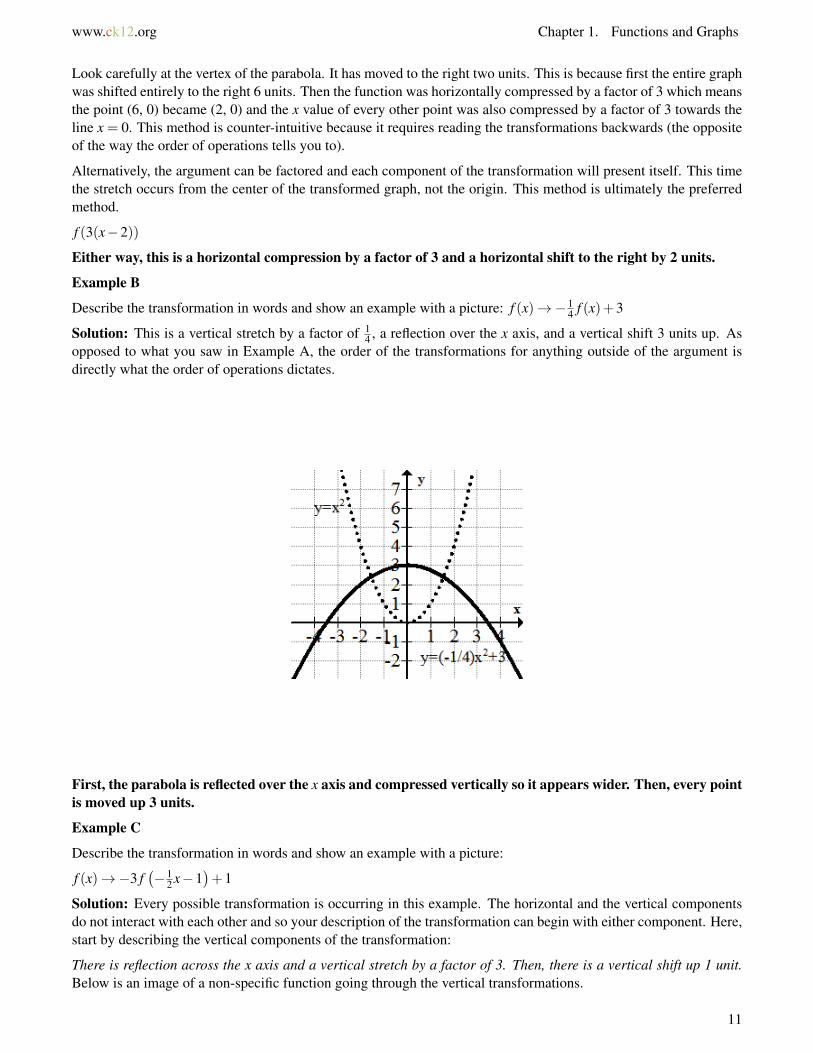
Example B
Describe the transformation in words and show an example with a picture: f (x)→−14 f (x)+3
Solution: This is a vertical stretch by a factor of 14 , a reflection over the x axis, and a vertical shift 3 units up. As
opposed to what you saw in Example A, the order of the transformations for anything outside of the argument isdirectly what the order of operations dictates.
First, the parabola is reflected over the x axis and compressed vertically so it appears wider. Then, every pointis moved up 3 units.
Example C
Describe the transformation in words and show an example with a picture:
f (x)→−3 f(−1
2 x−1)+1
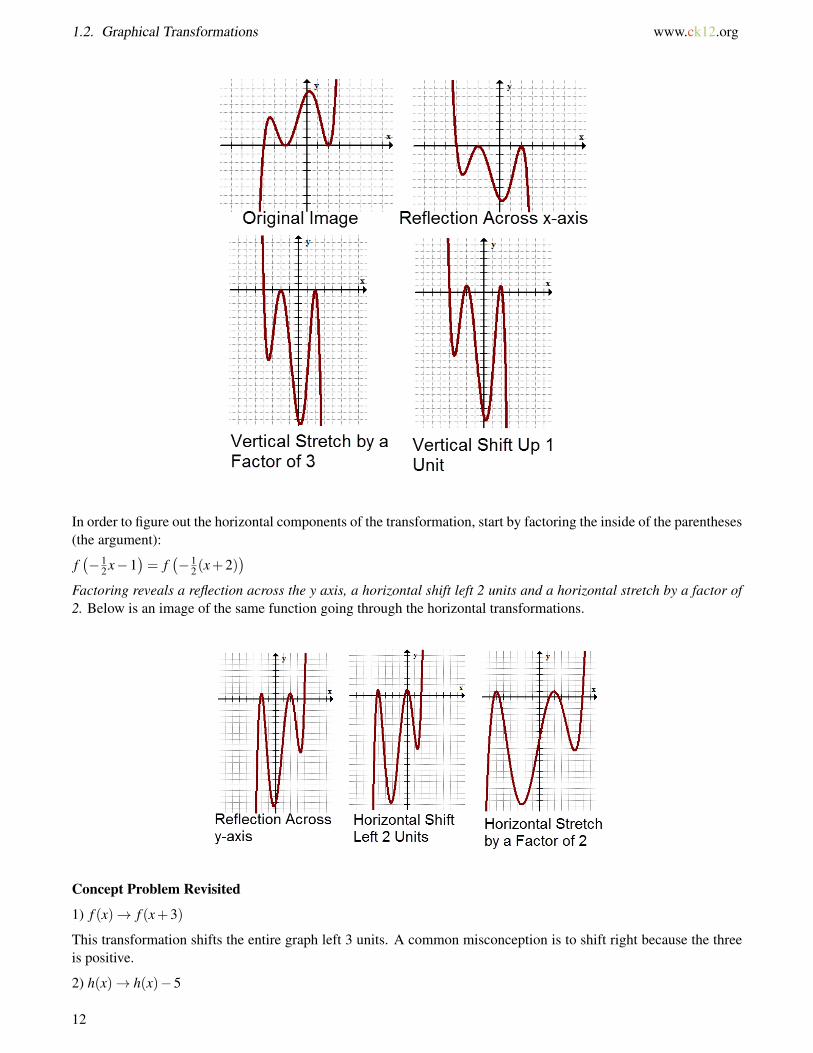
Solution: Every possible transformation is occurring in this example. The horizontal and the vertical componentsdo not interact with each other and so your description of the transformation can begin with either component. Here,start by describing the vertical components of the transformation:
There is reflection across the x axis and a vertical stretch by a factor of 3. Then, there is a vertical shift up 1 unit.Below is an image of a non-specific function going through the vertical transformations.
11
1.2. Graphical Transformations www.ck12.org
In order to figure out the horizontal components of the transformation, start by factoring the inside of the parentheses(the argument):
f(−1
2 x−1)= f
(−1
2(x+2))
Factoring reveals a reflection across the y axis, a horizontal shift left 2 units and a horizontal stretch by a factor of2. Below is an image of the same function going through the horizontal transformations.
Concept Problem Revisited
1) f (x)→ f (x+3)
This transformation shifts the entire graph left 3 units. A common misconception is to shift right because the threeis positive.
2) h(x)→ h(x)−5
12
www.ck12.org Chapter 1. Functions and Graphs
This transformation shifts the entire graph down 5 units.
3) g(x)→−g(2x)
This transformation is a vertical reflection across the x axis and a horizontal compression by a factor of 2.
4) j(x) = j(− x
2
)This transformation is a horizontal reflection across the y axis and a horizontal stretch by a factor of 2. A commonmisconception is to see the 1
2 and believe that the x values will be half as big which is a horizontal compression. How-ever, the x values need to be twice as big to counteract this factor of 1
2 .
Vocabulary
Horizontal comes from the word horizon and means flat.
Vertical means up and down.
Shift is a rigid transformation that means the shape keeps the exact shape.
Stretch is a scaled transformation.
Guided Practice
1. Describe the following transformation in words: g(x)→ 2g(−x)
2. Describe the transformation that would change h(x) in the following ways:
• Vertical compression by a factor of 3.• Vertical shift down 4 units.• Horizontal shift right 5 units.
3. Describe the transformation that would change f (x) in the following ways:
• Horizontal stretch by a factor of 4 and a horizontal shift 3 units to the right.• Vertical reflection across the x axis and a shift down 2 units.
Answers:
1. Vertical stretch by a factor of 2 and a reflection across the y axis.
2. 13 h(x−5)−4
3.− f(1
4(x−3))−2 or − f
(14 x− 3
4
)−2
Practice
Describe the following transformations in words.
1. g(x)→−g(−x)
2. f (x)→− f (x+3)
3. h(x)→ h(x+1)−2
4. j(x)→ j(−x+3)
5. k(x)→−k(2x)
6. f (x)→ 4 f(1
2 x+1)
13

1.2. Graphical Transformations www.ck12.org
7. g(x)→−3g(x−2)−2
8. h(x)→ 5h(x+1)
9. Describe the transformation that would change h(x) in the following ways:
• Vertical stretch by a factor of 2• Vertical shift up 3 units.• Horizontal shift right 2 units.
10. Describe the transformation that would change f (x) in the following ways:
• Vertical reflection across the x axis.• Vertical shift down 1 unit.• Horizontal shift left 2 units.
11. Describe the transformation that would change g(x) in the following ways:
• Vertical compression by a factor of 4.• Reflection across the y axis.
12. Describe the transformation that would change j(x) in the following ways:
• Horizontal compression by a factor of 3.• Vertical shift up 3 units.• Horizontal shift right 2 units.
13. Describe the transformation that would change k(x) in the following ways:
• Horizontal stretch by a factor of 4.• Vertical shift up 3 units.• Horizontal shift left 1 unit.
14. Describe the transformation that would change h(x) in the following ways:
• Vertical compression by a factor of 2.• Horizontal shift right 3 units.• Reflection across the y axis.
15. Describe the transformation that would change f (x) in the following ways:
• Vertical stretch by a factor of 5.• Reflection across the x axis.
14

www.ck12.org Chapter 1. Functions and Graphs
1.3 Point Notation and Function Notation
Here you will learn about the notation conventions involved with transformations.
When performing multiple transformations, it is very easy to make a small error. This is especially true when youtry to do every step mentally. Point notation is a useful tool for concentrating your efforts on a single point and helpsyou to avoid making small mistakes.
What would f (3x)+7 look like in point notation and why is it useful?
Watch This
MEDIAClick image to the left for more content.
http://www.youtube.com/watch?v=An29CALYjAA James Sousa: Function Transformations: A Summary
Guidance
A transformation can be written in function notation and in point notation. Function notation is very common andpractical because it allows you to graph any function using the same basic thought process it takes to graph a parabolain vertex form.
Another way to graph a function is to transform each point one at a time. This method works well when a tableof x,y values is available or easily identified from the graph.
Essentially, it takes each coordinate (x,y) and assigns a new coordinate based on the transformation.
(x,y)→ (new x,new y)
The new y coordinate is straightforward and is directly from what takes place outside f (x) because f (x) is justanother way to write y. For example, f (x)→ 2 f (x)−1 would have a new y coordinate of 2y−1.
The new x coordinate is trickier. It comes from undoing the operations that affect x.
For example, f (x)→ f (2x−1) would have a new x coordinate of x+12 .
Example A
Convert the following transformation into function notation and point notation. Then, apply the transformation tothe three points in the table. Transformation: Horizontal shift right three units, vertical shift up 4 units.
TABLE 1.1:
x y
1 3
15
1.3. Point Notation and Function Notation www.ck12.org
TABLE 1.1: (continued)
2 5
8 -11
Solution:
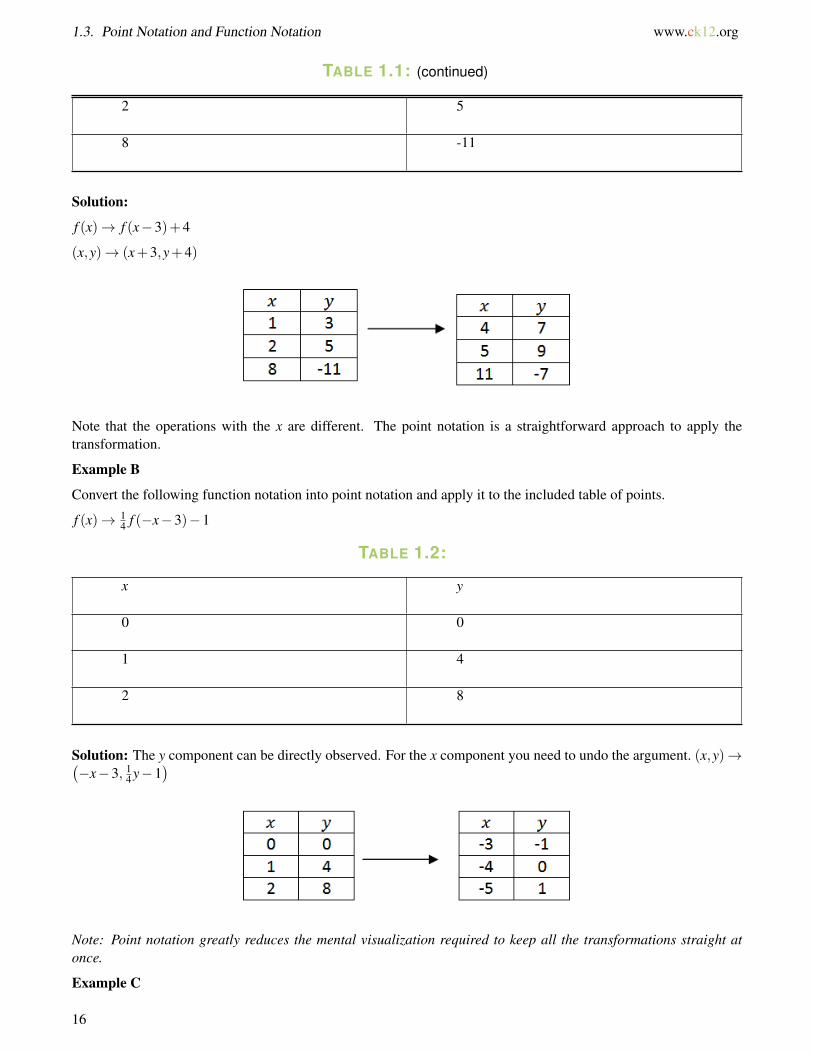
f (x)→ f (x−3)+4
(x,y)→ (x+3,y+4)
Note that the operations with the x are different. The point notation is a straightforward approach to apply thetransformation.
Example B
Convert the following function notation into point notation and apply it to the included table of points.
f (x)→ 14 f (−x−3)−1
TABLE 1.2:
x y
0 0
1 4
2 8
Solution: The y component can be directly observed. For the x component you need to undo the argument. (x,y)→(−x−3, 1
4 y−1)
Note: Point notation greatly reduces the mental visualization required to keep all the transformations straight atonce.
Example C
16

www.ck12.org Chapter 1. Functions and Graphs
Convert the following point notation to words and to function notation and then apply the transformation to theincluded table of points.
(x+3,y−1)→ (2x+6,−y)
TABLE 1.3:
x y
10 8
12 7
14 6
Solution: This problem is different because it seems like there is a transformation happening to the original leftpoint. This is an added layer of challenge because the transformation of interest is just the difference between thetwo points. Notice that the x coordinate has simply doubled and the y coordinate has gotten bigger by one and turnednegative. This problem can be rewritten as:
(x,y)→ (2x,−(y+1)) = (2x,−y−1)
f (x)→− f( x
2
)−1
Concept Problem Revisited
The function f (3x)+7 would be written in point notation as (x,y)→( x
3 ,y+7). This is useful because it becomes
obvious that the x values are all divided by three and the y values all increase by 7.
Vocabulary
Notation is a mathematical convention that helps others read your work. It is supposed to be designed to help aidyour thinking, but when misunderstood can cause great confusion.
Guided Practice
1. Convert the following function notation into words and then point notation. Finally, apply the transformation tothree example points.
f (x)→−2 f (x−1)+4
2. Convert the following function in point notation to words and then function notation.
(x,y)→ (3x+1,−y+7)
3. Convert the following function in function notation to words and then point notation.
17

1.3. Point Notation and Function Notation www.ck12.org
f (x)→−12 f (x−1)+3
Answers:
1. f (x)→−2 f (x−1)+4
Vertical reflection across the x axis. Vertical stretch by a factor of 2. Vertical shift 4 units. Horizontal shift right oneunit.
(x,y)→ (x+1,−2y+4)
2. (x,y)→ (3x+1,−y+7)
Horizontal stretch by a factor of 3 and then a horizontal shift right one unit.
Vertical reflection over the x axis and then a vertical shift 7 units up.
f (x)→− f(1
3 x− 13
)+7
3. f (x)→−12 f (x−1)+3
Vertical reflection across the x axis, stretch by a factor of 12 and shift up 3. Horizontal shift right 1 unit.
(x,y)→(x+1,−1
2 y+3)
Practice
Convert the following function notation into words and then point notation. Finally, apply the transformation tothree example points.
TABLE 1.4:
x y
0 5
1 6
2 7
1. f (x)→−12 f (x+1)
2. g(x)→ 2g(3x)+2
3. h(x)→−h(x−4)−3
4. j(x)→ 3 j(2x−4)+1
5. k(x)→−k(x−3)
Convert the following functions in point notation to function notation.
18

www.ck12.org Chapter 1. Functions and Graphs
6. (x,y)→(1
2 x+3,y−4)
7. (x,y)→ (2x+4,−y+1)
8. (x,y)→ (4x,3y−5)
9. (2x,y)→ (4x,−y+1)
10. (x+1,y−2)→ (3x+3,−y+3)
Convert the following functions in function notation to point notation.
11. f (x)→ 3 f (x−2)+1
12. g(x)→−4g(x−1)+3
13. h(x)→ 12 h(2x+2)−5
14. j(x)→ 5 j(1
2 x−2)−1
15. k(x)→ 14 k(2x−4)
19

1.4. Domain and Range www.ck12.org
1.4 Domain and Range
Here you will refine your understanding of domain and range from Algebra 2 by exploring tables, basic functionsand irregular graphs.
Analyze means to examine methodically and in detail. One way to analyze functions is by looking at possible inputs(domain) and possible outputs (range). Which of the basic functions have limited domains and why?
Watch This
MEDIAClick image to the left for more content.
http://www.youtube.com/watch?v=FtJRstFMdhA James Sousa: Determining Domain and Range
Guidance
Domain is the possible inputs to a function. Many functions allow any kind of numbers to be inputted. This includesnumbers that are positive, negative, zero, fractions or decimals. The squaring function y = x2 is an example that hasa domain of all possible real numbers. Three functions have very specific restrictions:
1) The square root function: y =√
x
Domain restriction: x≥ 0
This is because the square root of a negative number is not a real number. This restriction can be observed in thegraph because the curve ends at the point (0, 0) and is not defined anywhere where x is negative.
2) The logarithmic function: y = lnx
Domain restriction: x > 0
The log function is only defined on numbers that are strictly bigger than zero. This is because the logarithmicfunction is a different way of writing exponents. One property of exponents is that any positive number raised to any
20

www.ck12.org Chapter 1. Functions and Graphs
power will never produce a negative number or zero. The restriction can be observed in the graph by the way the logfunction approaches the vertical line x = 0 and shoots down to infinity.
3) The reciprocal function: y = 1x
Domain Restriction: x 6= 0
The reciprocal function is restricted because you cannot divide numbers by zero. Any x values that make thedenominator of a function zero are outside of the domain. This restriction can be observed in the graph by the waythe reciprocal function never touches the vertical line x = 0.
Range is the possible outputs of a function. Just about any function can produce any output through the use oftransformations and so determining the range of a function is significantly less procedural than determining thedomain. Use what you know about the shape of each function and their equations to decide which y values arepossible to produce and which y values are impossible to produce.
Example A
Domain and range are described in interval notation. Convert the following descriptions of numbers into intervalnotation.
a. All numbers.b. All negative numbers not including 0.c. All positive numbers including 0.d. Every number between 1 and 4 including 1 and 4.e. Every number between 5 and 6 not including 5 or 6.f. The numbers 1 through 2 including 1 but not including 2 and the numbers 10 through 25 including both 10
and 25.
Solution: Parentheses, ( ), mean non-inclusive. Brackets, [], mean inclusive.
a. (−∞,∞) Note: Parentheses are always used with infinity.
21
1.4. Domain and Range www.ck12.org
b. (−∞,0)c. [0,∞)d. [1, 4]e. (5, 6)f. [1,2)∪ [10,25]
Note: The ∪ symbol means Union and refers to the fact that if some number x is in this union, then it is either inthe first group or it is in the second group. This symbol is associated with the OR statement. While it is true thatthe Union symbol seems to bring one group and another group together, the symbol for AND is ∩ which meansintersection. Intersection is different from union because intersection means all numbers that are in both the firstgroup and second group at the same time.
Example B
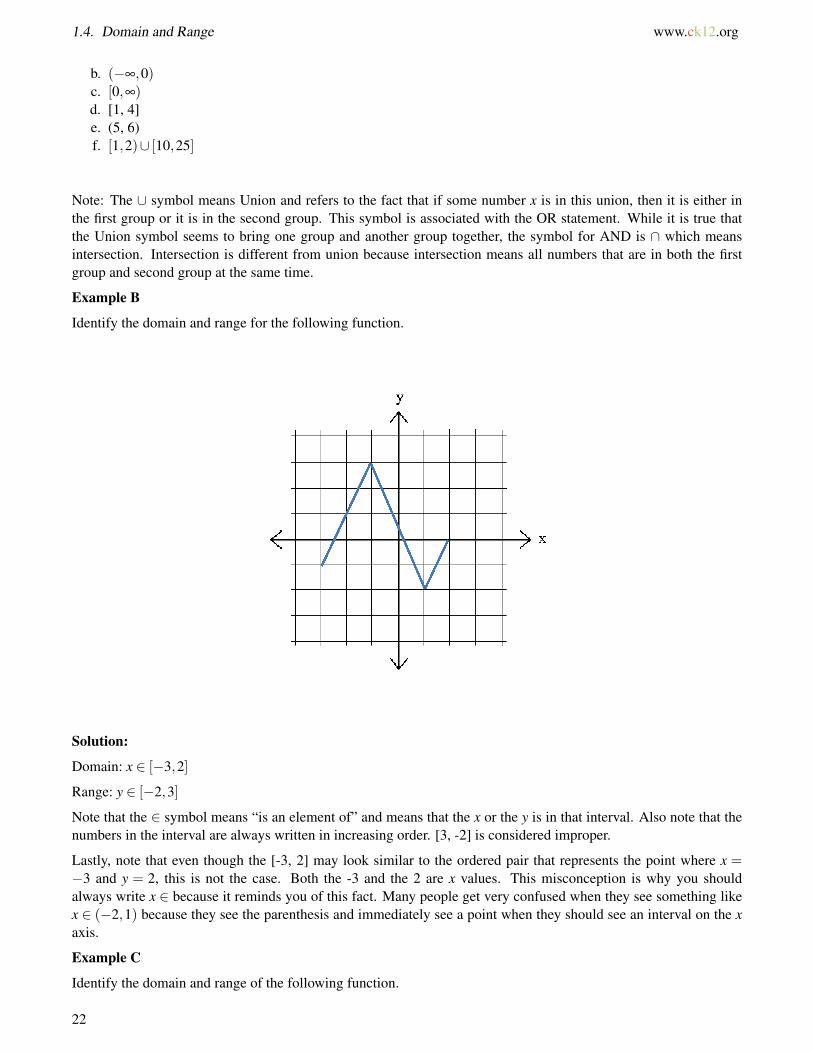
Identify the domain and range for the following function.
Solution:
Domain: x ∈ [−3,2]
Range: y ∈ [−2,3]
Note that the ∈ symbol means “is an element of” and means that the x or the y is in that interval. Also note that thenumbers in the interval are always written in increasing order. [3, -2] is considered improper.
Lastly, note that even though the [-3, 2] may look similar to the ordered pair that represents the point where x =−3 and y = 2, this is not the case. Both the -3 and the 2 are x values. This misconception is why you shouldalways write x ∈ because it reminds you of this fact. Many people get very confused when they see something likex ∈ (−2,1) because they see the parenthesis and immediately see a point when they should see an interval on the xaxis.
Example C
Identify the domain and range of the following function.
22

www.ck12.org Chapter 1. Functions and Graphs
Solution:
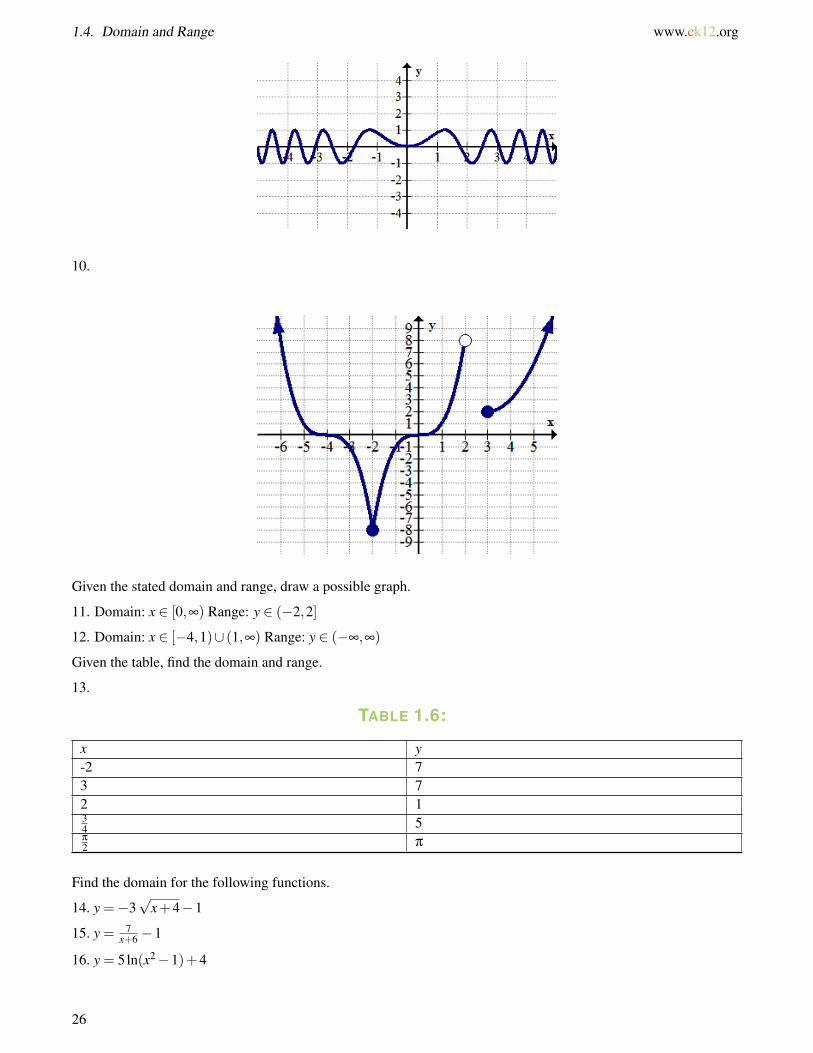
Domain: x ∈ [−3,−1)∪ [0,3)
Range: y ∈ [−2,∞)
Note that the function seems to approach the vertical line x =−1 without actually reaching it. Also note the emptyhole at the point (3, 1) which is why the domain excludes the x value of 3.
Concept Problem Revisited
The three functions that have limited domains are the square root function, the log function and the reciprocalfunction. The square root function has a restricted domain because you cannot take square roots of negative numbersand produce real numbers. The log function is restricted because the log function is not defined to operate on non-positive numbers. The reciprocal function is restricted because numbers that are divided by zero are not defined.
Vocabulary
Domain is the possible x values or inputs of a function.
Range is the possible y values or outputs of a function.
Interval notation is a tool for describing groups of numbers in the domain and range. Intervals are either open orclosed or both.
Open intervals use parentheses, (), and refer to intervals that do not include the end points. They are always usedwith infinity.
Closed intervals use brackets, [], and refer to intervals that do include the end points.
Curly brackets, {}, are used when the domain or range are distinct numbers and not an interval of values.
∈ is a symbol that stands for “is an element of” and tells you what kind of values an interval describes.
∪ is a symbol that stands for Union and is used to connect two groups together. It is associated with the logical termOR.
23

1.4. Domain and Range www.ck12.org
Guided Practice
1. Identify the domain and range of the following function written in a table:
TABLE 1.5:
x y0 51 62 712 6π
π
2
2. Identify the domain of the following three transformed functions.
a. y = 10√
2− x−3
b. y = 3xx2+7x+12
c. y =−4ln(3x−9)+11
3. What is the domain and range of the sine wave?
Answers:
1. The specific equation of the function may be hidden, but from the table you can determine the domain and rangedirectly from the x and y values. It may be tempting to guess that other values could potentially work in the table,especially if the pattern is obvious, but this is not the kind of question that asks what the function could be. Insteadthis question just asks what is the stated domain and range.
Domain: x ∈ {0,1,2, 12 ,π}
Range: y ∈ {5,6,7, π
2}
Note that the two 6’s that appear in the table do not need to be written twice in the range.
2. Each of the functions requires knowledge of one of the three domain restrictions.
a. y = 10√
2− x−3
The argument of the function must be greater than or equal to 0.
2− x≥ 0
−x≥−2
x≤ 2
Domain: x ∈ (−∞,2]
b. y = 3xx2+7x+12
The denominator cannot be equal to 0. First find what values of x would make it equal to zero and then you canexclude those values.
x2 +7x+12 = 0
(x+4)(x+3) = 0
x =−4,−3
24
www.ck12.org Chapter 1. Functions and Graphs
Domain: x ∈ (−∞,−4)∪ (−4,−3)∪ (−3,∞)
c. y =−4ln(3x−9)+11
The argument must be strictly greater than 0.
3x−9 > 0
3x > 9
x > 3
Domain: x ∈ (3,∞)
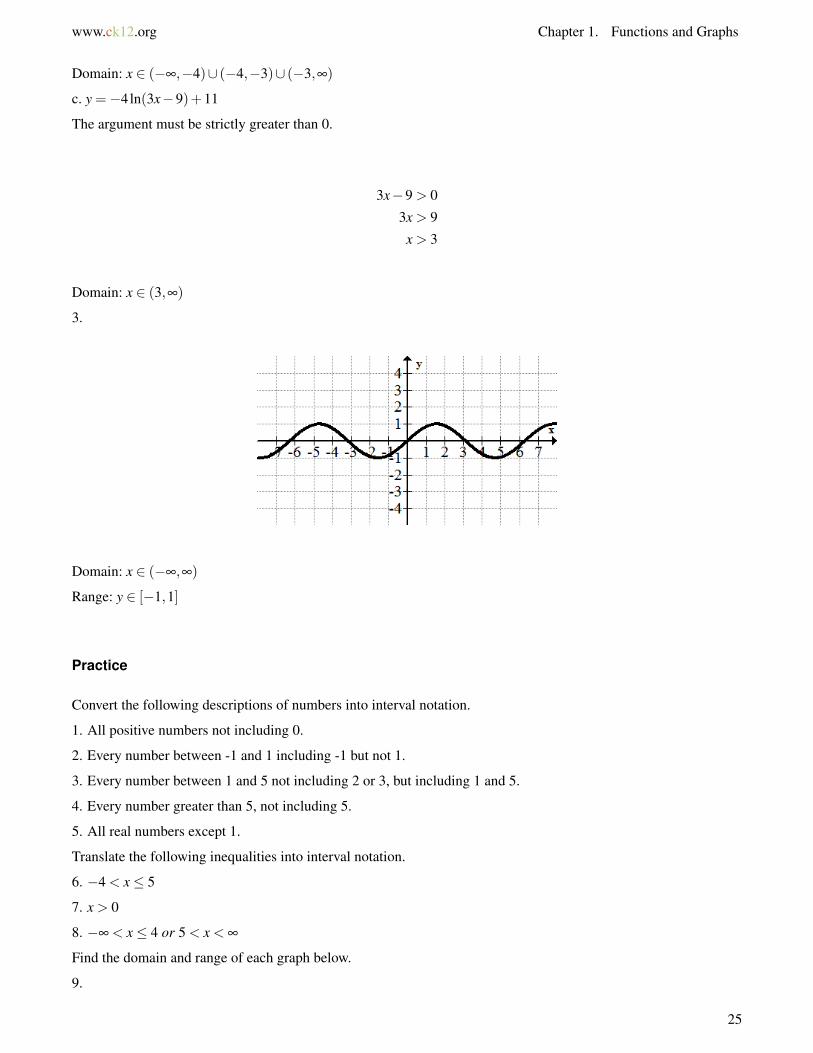
3.
Domain: x ∈ (−∞,∞)
Range: y ∈ [−1,1]
Practice
Convert the following descriptions of numbers into interval notation.
1. All positive numbers not including 0.
2. Every number between -1 and 1 including -1 but not 1.
3. Every number between 1 and 5 not including 2 or 3, but including 1 and 5.
4. Every number greater than 5, not including 5.
5. All real numbers except 1.
Translate the following inequalities into interval notation.
6. −4 < x≤ 5
7. x > 0
8. −∞ < x≤ 4 or 5 < x < ∞
Find the domain and range of each graph below.
9.
25
1.4. Domain and Range www.ck12.org
10.
Given the stated domain and range, draw a possible graph.
11. Domain: x ∈ [0,∞) Range: y ∈ (−2,2]
12. Domain: x ∈ [−4,1)∪ (1,∞) Range: y ∈ (−∞,∞)
Given the table, find the domain and range.
13.
TABLE 1.6:
x y-2 73 72 134 5π
2 π
Find the domain for the following functions.
14. y =−3√
x+4−1
15. y = 7x+6 −1
16. y = 5ln(x2−1)+4
26

www.ck12.org Chapter 1. Functions and Graphs
1.5 Maximums and Minimums
Here you will learn to identify the maximums and minimums in various graphs and be able to differentiate betweenglobal and relative extreme values.
When riding a roller coaster there is always one point that is the absolute highest off the ground. There are usuallymany other places that reach fairly high, just not as high as the first. How do you identify and distinguish betweenthese different peaks in a precise way?
Watch This
MEDIAClick image to the left for more content.
http://www.youtube.com/watch?v=votVWz-wKeI
Guidance
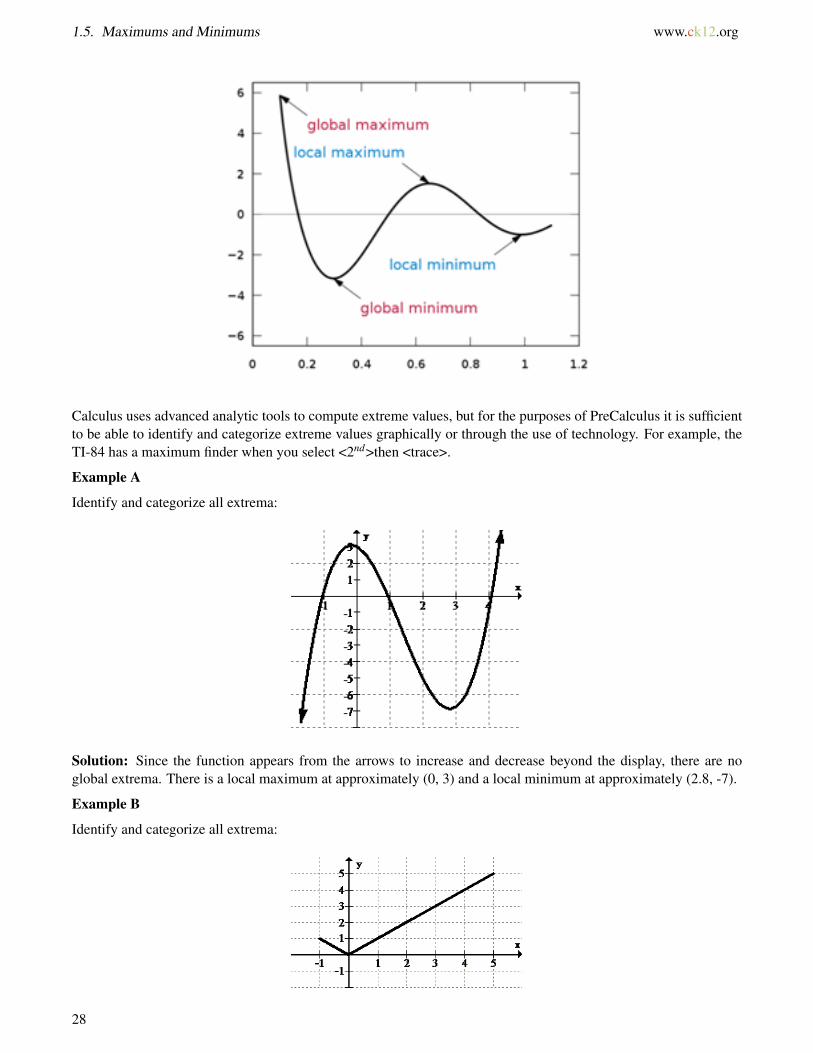
A global maximum refers to the point with the largest y value possible on a function. A global minimum refers to thepoint with the smallest y value possible. Together these two values are referred to as global extrema. There can onlybe one global maximum and only one global minimum. Global refers to entire space where the function is defined.Global extrema are also called absolute extrema.
In addition to global maximums and global minimums, there are also local extrema or relative maximums andrelative minimums. The word relative is used because in relation to some neighborhood, these values stand out asbeing the highest or the lowest.
27
1.5. Maximums and Minimums www.ck12.org
Calculus uses advanced analytic tools to compute extreme values, but for the purposes of PreCalculus it is sufficientto be able to identify and categorize extreme values graphically or through the use of technology. For example, theTI-84 has a maximum finder when you select <2nd>then <trace>.
Example A
Identify and categorize all extrema:
Solution: Since the function appears from the arrows to increase and decrease beyond the display, there are noglobal extrema. There is a local maximum at approximately (0, 3) and a local minimum at approximately (2.8, -7).
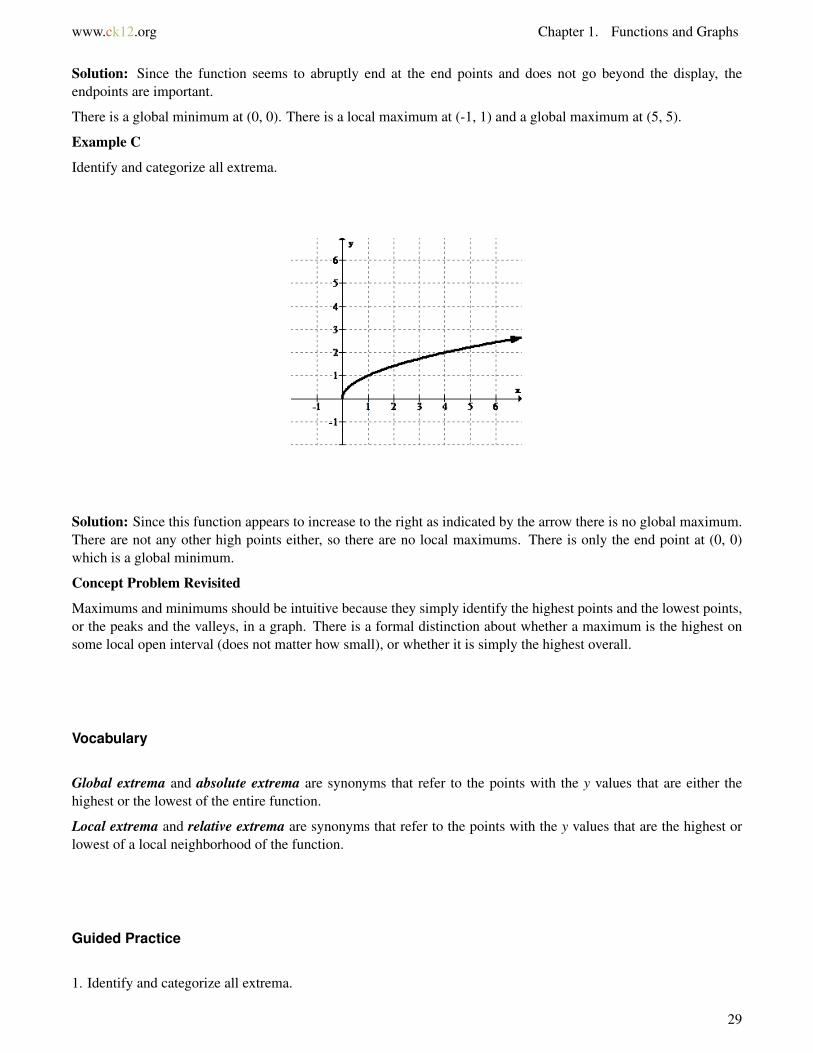
Example B
Identify and categorize all extrema:
28
www.ck12.org Chapter 1. Functions and Graphs
Solution: Since the function seems to abruptly end at the end points and does not go beyond the display, theendpoints are important.
There is a global minimum at (0, 0). There is a local maximum at (-1, 1) and a global maximum at (5, 5).
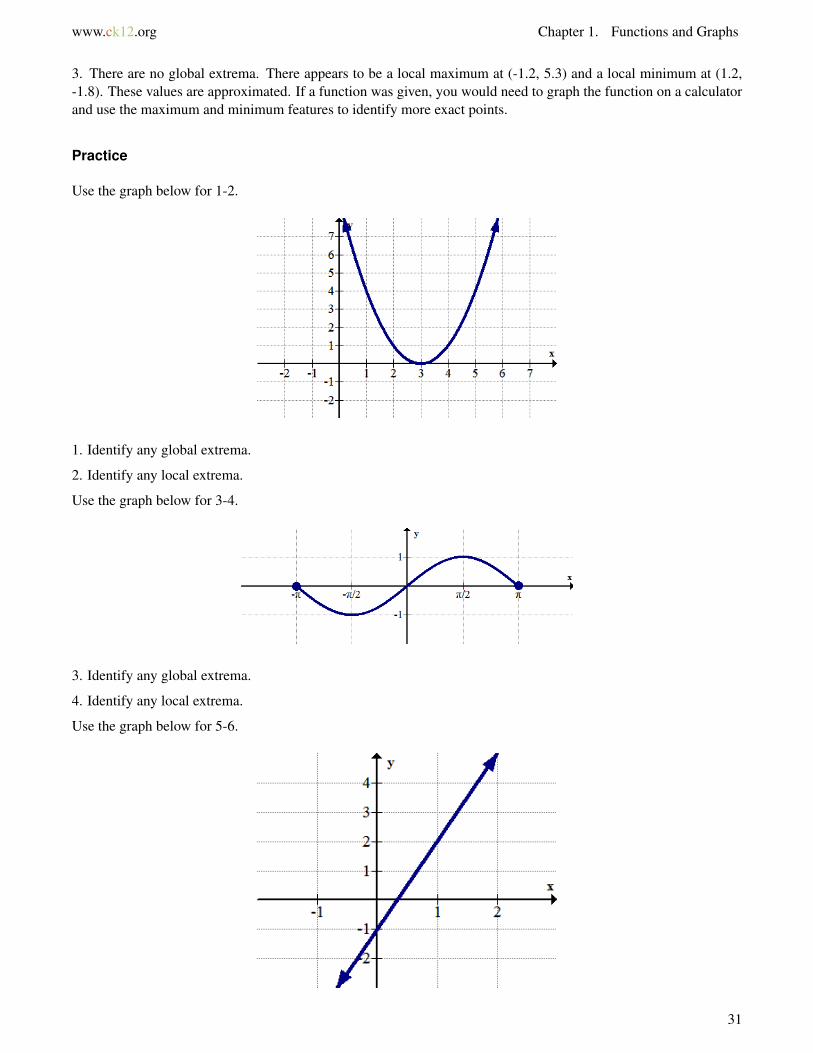
Example C
Identify and categorize all extrema.
Solution: Since this function appears to increase to the right as indicated by the arrow there is no global maximum.There are not any other high points either, so there are no local maximums. There is only the end point at (0, 0)which is a global minimum.
Concept Problem Revisited
Maximums and minimums should be intuitive because they simply identify the highest points and the lowest points,or the peaks and the valleys, in a graph. There is a formal distinction about whether a maximum is the highest onsome local open interval (does not matter how small), or whether it is simply the highest overall.
Vocabulary
Global extrema and absolute extrema are synonyms that refer to the points with the y values that are either thehighest or the lowest of the entire function.
Local extrema and relative extrema are synonyms that refer to the points with the y values that are the highest orlowest of a local neighborhood of the function.
Guided Practice
1. Identify and categorize all extrema.
29

1.5. Maximums and Minimums www.ck12.org
2. Identify and categorize the extrema.
3. Identify and categorize the extrema.
Answers:
1. There are no global or local maximums or minimums. The function flattens, but does not actually reach a peak ora valley.
2. There are no global extrema. There appears to be a local maximum at (0, 0) and a local minimum at (1, -1).
30
www.ck12.org Chapter 1. Functions and Graphs
3. There are no global extrema. There appears to be a local maximum at (-1.2, 5.3) and a local minimum at (1.2,-1.8). These values are approximated. If a function was given, you would need to graph the function on a calculatorand use the maximum and minimum features to identify more exact points.
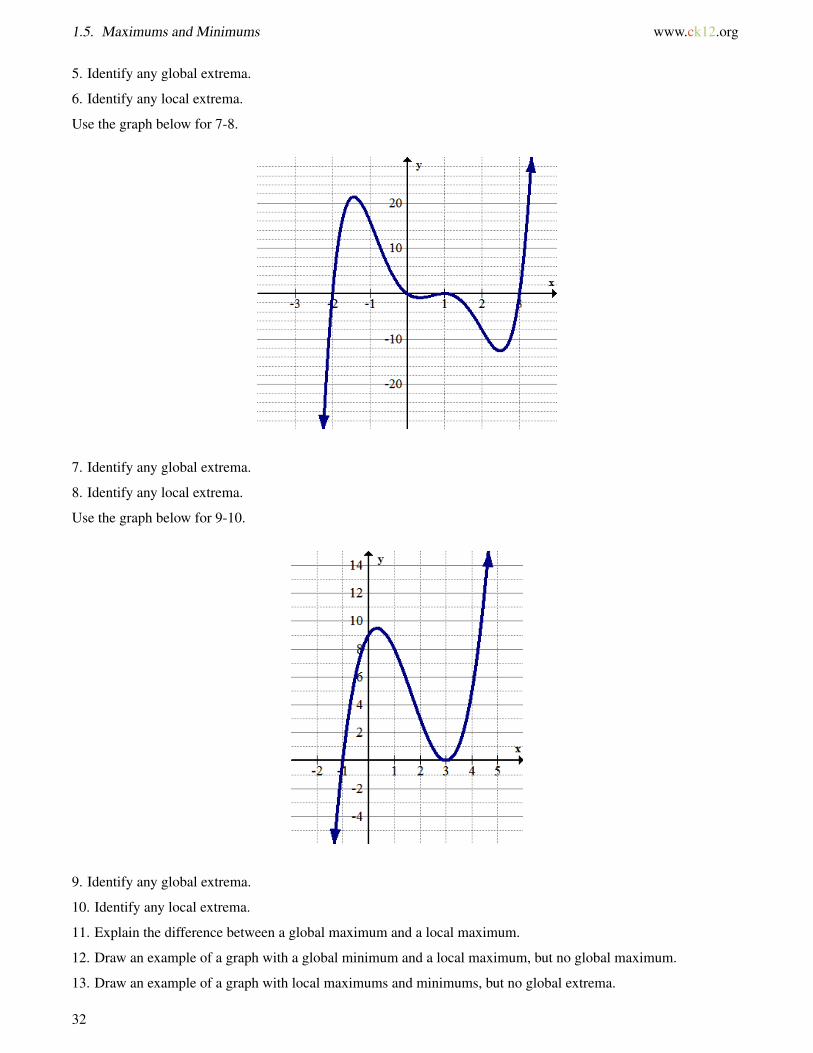
Practice
Use the graph below for 1-2.
1. Identify any global extrema.
2. Identify any local extrema.
Use the graph below for 3-4.
3. Identify any global extrema.
4. Identify any local extrema.
Use the graph below for 5-6.
31
1.5. Maximums and Minimums www.ck12.org
5. Identify any global extrema.
6. Identify any local extrema.
Use the graph below for 7-8.
7. Identify any global extrema.
8. Identify any local extrema.
Use the graph below for 9-10.
9. Identify any global extrema.
10. Identify any local extrema.
11. Explain the difference between a global maximum and a local maximum.
12. Draw an example of a graph with a global minimum and a local maximum, but no global maximum.
13. Draw an example of a graph with local maximums and minimums, but no global extrema.
32

www.ck12.org Chapter 1. Functions and Graphs
14. Use your graphing calculator to identify and categorize the extrema of:
f (x) = 12 x4 +2x3−6.5x2−20x+24.
15. Use your graphing calculator to identify and categorize the extrema of:
g(x) =−x4 +2x3 +4x2−2x−3.
33
1.6. Symmetry www.ck12.org
1.6 Symmetry
Here you will review rotation and reflection symmetry as well as explore how algebra accomplishes both.
Some functions, like the sine function, the absolute value function and the squaring function, have reflectionsymmetry across the linex = 0. Other functions like the cubing function and the reciprocal function have rotationalsymmetry about the origin.
Why is the first group categorized as even functions while the second group is categorized as odd functions?
Watch This
MEDIAClick image to the left for more content.
http://www.youtube.com/watch?v=8VgmBe3ulb8 Khan Academy: Recognizing Odd and Even Functions
Guidance
Functions symmetrical across the line x = 0 (the y axis) are called even. Even functions have the property that whena negative value is substituted for x, it produces the same value as when the positive value is substituted for the x.
f (−x) = f (x)
Functions that have rotational symmetry about the origin are called odd functions. When a negative x value issubstituted into the function, it produces a negative version of the function evaluated at a positive value.
f (−x) =− f (x)
This property becomes increasingly important in problems and proofs of Calculus and beyond, but for now it issufficient to identify functions that are even, odd or neither and show why.
Example A
Show that f (x) = 3x4−5x2 +1 is even.
Solution:
f (−x) = 3(−x)4−5(−x)2 +1
= 3x4−5x2 +1
= f (x)
The property that both positive and negative numbers raised to an even power are always positive is the reason whythe term even is used. It does not matter that the coefficients are even or odd, just the exponents.
34

www.ck12.org Chapter 1. Functions and Graphs
Example B
Show that f (x) = 4x3− x is odd.
Solution:
f (−x) = 4(−x)3− x
=−4x3 + x
=−(4x3 + x)
=− f (x)
Just like even functions are named, odd functions are named because negative signs don’t disappear and can alwaysbe factored out of odd functions.
Example C
Identify whether the function is even, odd or neither and explain why.
f (x) = 4x3−|x|
Solution:
f (−x) = 4(−x)3− x
=−4x3− x
This does not seem to match either f (x) = 4x3−|x| or − f (x) =−4x3 + |x|. Therefore, this function is neither evennor odd.
Note that this function is a difference of an odd function and an even function. This should be a clue that the resultingfunction is neither even nor odd.
Concept Problem Revisited
Even and odd functions describe different types of symmetry, but both derive their name from the properties ofexponents. A negative number raised to an even number will always be positive. A negative number raised to an oddnumber will always be negative.
Vocabulary
An even function means f (−x) = f (x). Even functions have reflection symmetry across the line x = 0.
An odd function means f (−x) =− f (x). Odd functions have rotation symmetry about the origin.
Guided Practice
1. Which of the basic functions are even, which are odd and which are neither?
2. Suppose h(x) is an even function and g(x) is an odd function. f (x) = h(x)+g(x). Is f (x) even or odd?
3. Determine whether the following function is even, odd, or neither.
f (x) = x(x2−1)(x4 +1)
35

1.6. Symmetry www.ck12.org
Answers:
1. Even Functions: The squaring function, the absolute value function.
Odd Functions: The identity function, the cubing function, the reciprocal function, the sine function.
Neither: The square root function, the exponential function and the log function. The logistic function is also neitherbecause it is rotationally symmetric about the point
(0, 1
2
)as opposed to the origin.
2. If h(x) is even then h(−x) = h(x). If g(x) is odd then g(−x) =−g(x).
Therefore: f (−x) = h(−x)+g(−x) = h(x)−g(x)
This does not match f (x) = h(x)+g(x) nor does it match − f (x) =−h(x)−g(x).
This is a proof that shows the sum of an even function and an odd function will never itself be even or odd.
3.
f (x) = x(x2−1)(x4 +1)
f (−x) = (−x)((−x)2−1)((−x)4 +1)
=−x(x2−1)(x4 +1)
=− f (x)
The function is odd.
Practice
Determine whether the following functions are even, odd, or neither.
1. f (x) =−4x2 +1
2. g(x) = 5x3−3x
3. h(x) = 2x2− x
4. j(x) = (x−4)(x−3)3
5. k(x) = x(x2−1)2
6. f (x) = 2x3−5x2−2x+1
7. g(x) = 2x2−4x+2
8. h(x) =−5x4 + x2 +2
9. Suppose h(x) is even and g(x) is odd. Show that f (x) = h(x)−g(x) is neither even nor odd.
10. Suppose h(x) is even and g(x) is odd. Show that f (x) = h(x)g(x) is odd.
11. Suppose h(x) is even and g(x) is odd. Show that f (x) = h(x) ·g(x) is odd.
36

www.ck12.org Chapter 1. Functions and Graphs
12. Is the sum of two even functions always an even function? Explain.
13. Is the sum of two odd functions always an odd function? Explain.
14. Why are some functions neither even nor odd?
15. If you know that a function is even or odd, what does that tell you about the symmetry of the function?
37
1.7. Increasing and Decreasing www.ck12.org
1.7 Increasing and Decreasing
Here you will apply interval notation to identify when functions are increasing and decreasing.
It is important to be able to distinguish between when functions are increasing and when they are decreasing. Inbusiness this could mean the difference between making money and losing money. In physics it could mean thedifference between speeding up and slowing down.
How do you decide when a function is increasing or decreasing?
Watch This
MEDIAClick image to the left for more content.
http://www.youtube.com/watch?v=78b4HOMVcKM James Sousa: Determine Where a Function is Increasing orDecreasing
Guidance
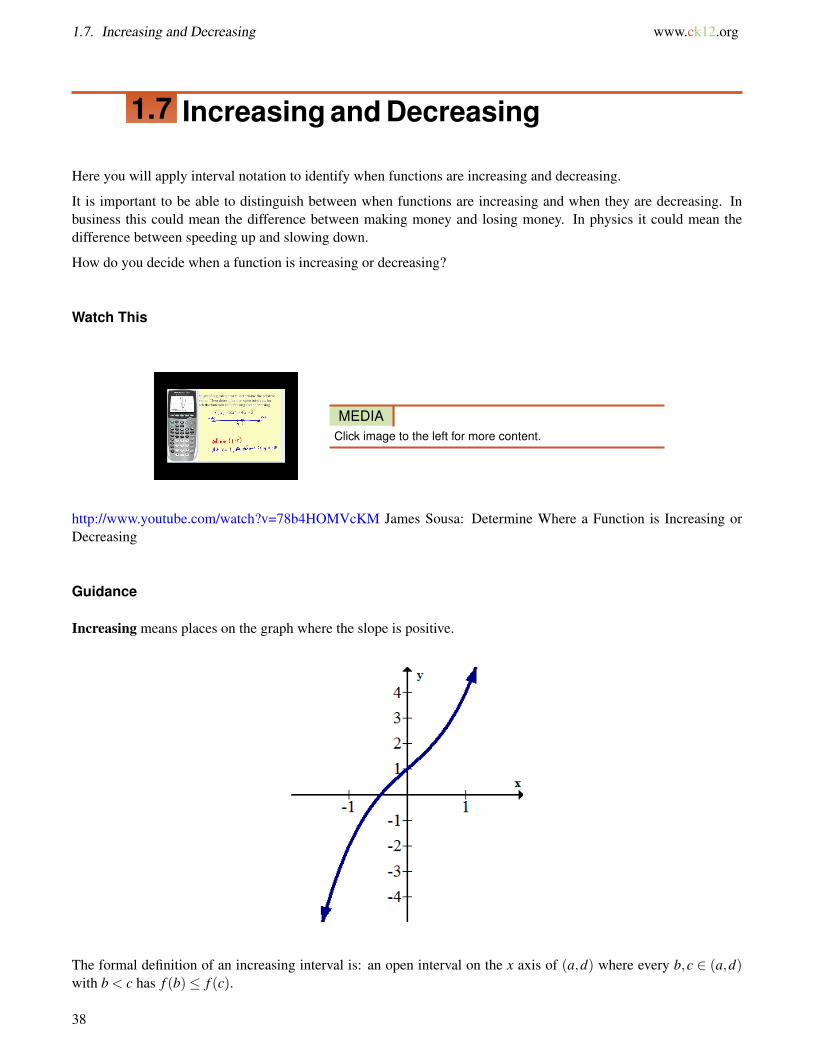
Increasing means places on the graph where the slope is positive.
The formal definition of an increasing interval is: an open interval on the x axis of (a,d) where every b,c ∈ (a,d)with b < c has f (b)≤ f (c).
38
www.ck12.org Chapter 1. Functions and Graphs
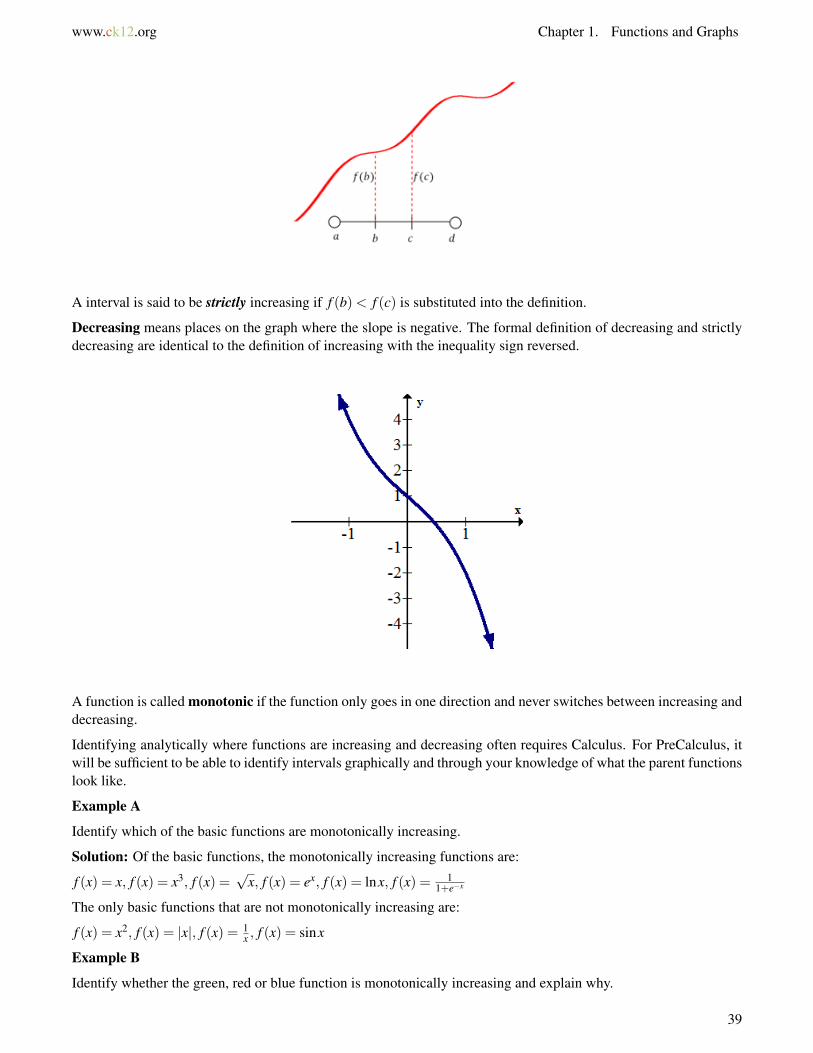
A interval is said to be strictly increasing if f (b)< f (c) is substituted into the definition.
Decreasing means places on the graph where the slope is negative. The formal definition of decreasing and strictlydecreasing are identical to the definition of increasing with the inequality sign reversed.
A function is called monotonic if the function only goes in one direction and never switches between increasing anddecreasing.
Identifying analytically where functions are increasing and decreasing often requires Calculus. For PreCalculus, itwill be sufficient to be able to identify intervals graphically and through your knowledge of what the parent functionslook like.
Example A
Identify which of the basic functions are monotonically increasing.
Solution: Of the basic functions, the monotonically increasing functions are:
f (x) = x, f (x) = x3, f (x) =√
x, f (x) = ex, f (x) = lnx, f (x) = 11+e−x
The only basic functions that are not monotonically increasing are:
f (x) = x2, f (x) = |x|, f (x) = 1x , f (x) = sinx
Example B
Identify whether the green, red or blue function is monotonically increasing and explain why.
39
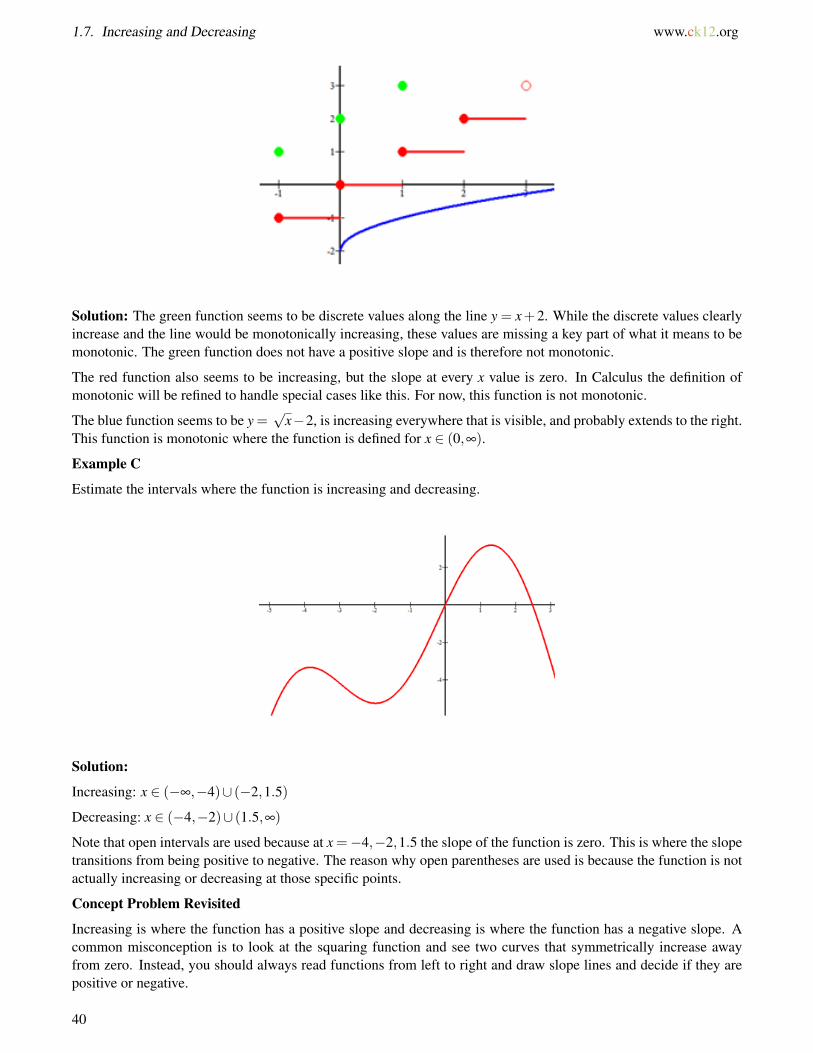
1.7. Increasing and Decreasing www.ck12.org
Solution: The green function seems to be discrete values along the line y = x+2. While the discrete values clearlyincrease and the line would be monotonically increasing, these values are missing a key part of what it means to bemonotonic. The green function does not have a positive slope and is therefore not monotonic.
The red function also seems to be increasing, but the slope at every x value is zero. In Calculus the definition ofmonotonic will be refined to handle special cases like this. For now, this function is not monotonic.
The blue function seems to be y =√
x−2, is increasing everywhere that is visible, and probably extends to the right.This function is monotonic where the function is defined for x ∈ (0,∞).
Example C
Estimate the intervals where the function is increasing and decreasing.
Solution:
Increasing: x ∈ (−∞,−4)∪ (−2,1.5)
Decreasing: x ∈ (−4,−2)∪ (1.5,∞)
Note that open intervals are used because at x =−4,−2,1.5 the slope of the function is zero. This is where the slopetransitions from being positive to negative. The reason why open parentheses are used is because the function is notactually increasing or decreasing at those specific points.
Concept Problem Revisited
Increasing is where the function has a positive slope and decreasing is where the function has a negative slope. Acommon misconception is to look at the squaring function and see two curves that symmetrically increase awayfrom zero. Instead, you should always read functions from left to right and draw slope lines and decide if they arepositive or negative.
40

www.ck12.org Chapter 1. Functions and Graphs
Vocabulary
Increasing over an interval means to have a positive slope over that interval.
Decreasing over an interval means to have a negative slope over that interval.
Monotonic means that the function doesn’t switch between increasing and decreasing at any point.
Strictly is an adjective that alters increasing and decreasing to exclude any flatness.
Guided Practice
1. Estimate where the following function is increasing and decreasing.
2. Estimate where the following function is increasing and decreasing.
3. A continuous function has a global maximum at the point (3, 2), a global minimum at (5, -12) and has no relativeextrema or other places with a slope of zero. What are the increasing and decreasing intervals for this function?
Answers:
1. Increasing: x ∈ (−∞,−1.5)∪ (1.5,∞). Decreasing: x ∈ (−1.5,1.5)
2. Increasing x ∈ (−∞,−4)∪ (−4,−2.7)∪ (−1,2)∪ (2,∞). Decreasing x ∈ (−2.7,−1)
3. Increasing x ∈ (−∞,3)∪ (5,∞). Decreasing x ∈ (3,5)
Notice that the y coordinates are not used in the intervals. A common mistake is to want to use the y coordinates.
Practice
Use the graph below for 1-2.
41
1.7. Increasing and Decreasing www.ck12.org
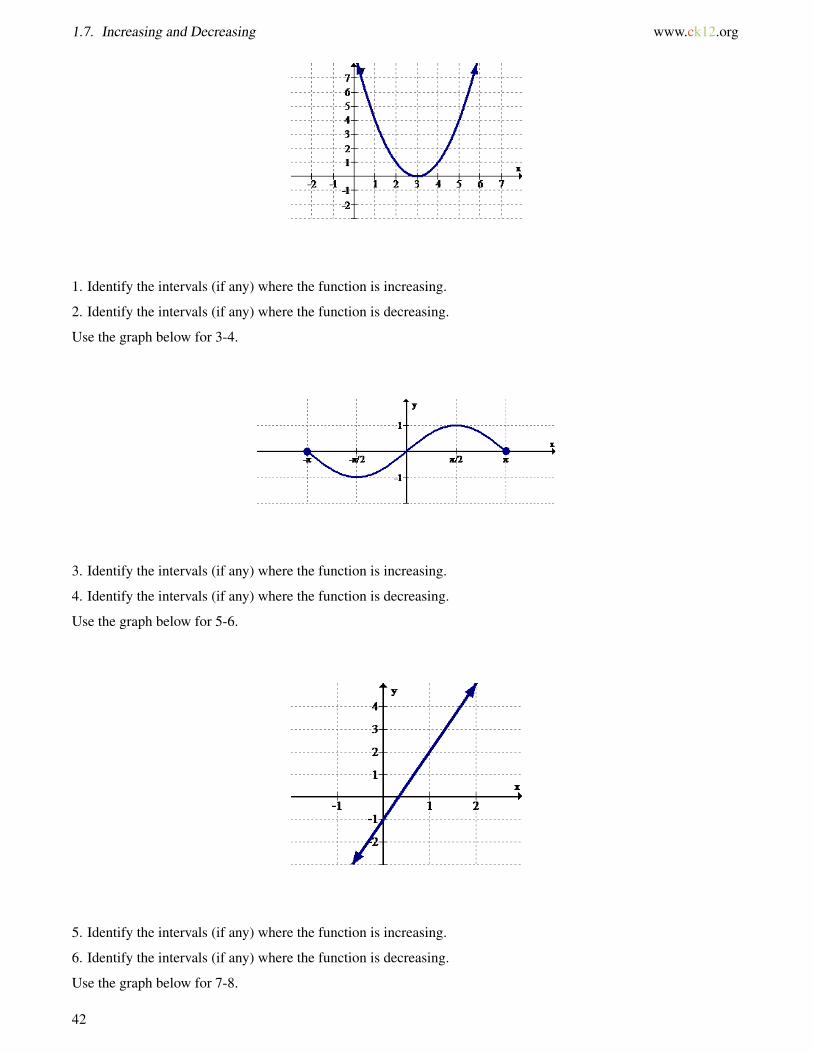
1. Identify the intervals (if any) where the function is increasing.
2. Identify the intervals (if any) where the function is decreasing.
Use the graph below for 3-4.
3. Identify the intervals (if any) where the function is increasing.
4. Identify the intervals (if any) where the function is decreasing.
Use the graph below for 5-6.
5. Identify the intervals (if any) where the function is increasing.
6. Identify the intervals (if any) where the function is decreasing.
Use the graph below for 7-8.
42
www.ck12.org Chapter 1. Functions and Graphs
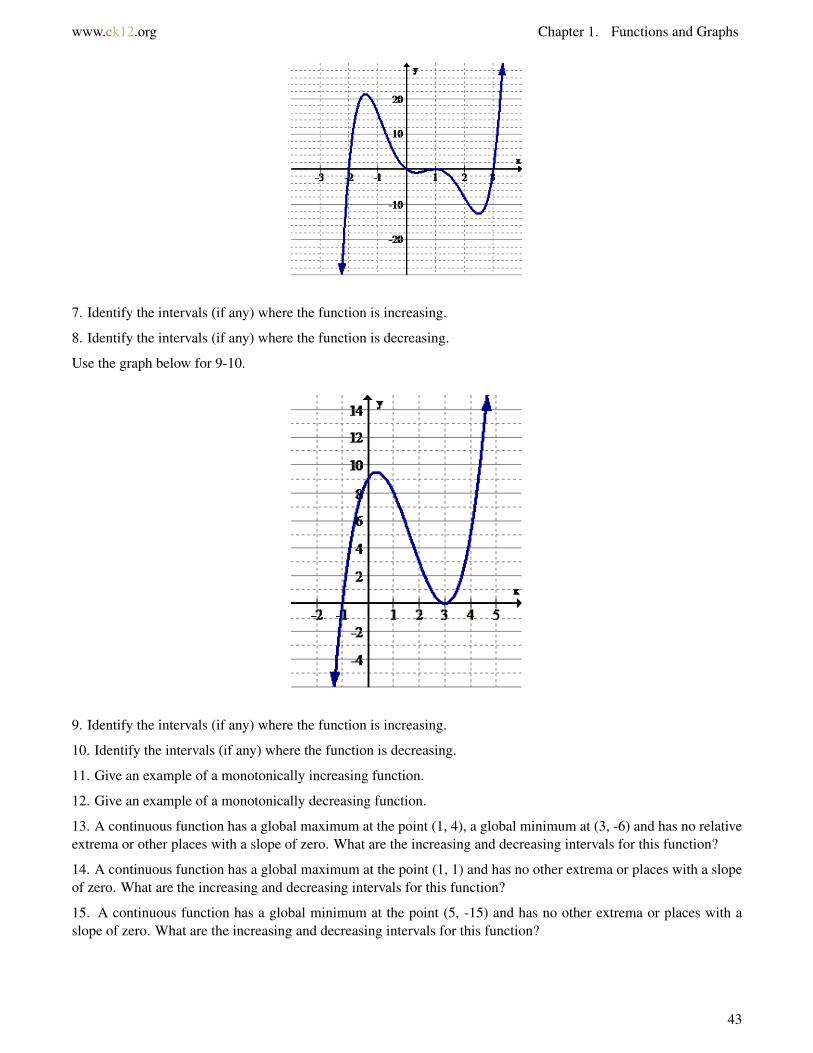
7. Identify the intervals (if any) where the function is increasing.
8. Identify the intervals (if any) where the function is decreasing.
Use the graph below for 9-10.
9. Identify the intervals (if any) where the function is increasing.
10. Identify the intervals (if any) where the function is decreasing.
11. Give an example of a monotonically increasing function.
12. Give an example of a monotonically decreasing function.
13. A continuous function has a global maximum at the point (1, 4), a global minimum at (3, -6) and has no relativeextrema or other places with a slope of zero. What are the increasing and decreasing intervals for this function?
14. A continuous function has a global maximum at the point (1, 1) and has no other extrema or places with a slopeof zero. What are the increasing and decreasing intervals for this function?
15. A continuous function has a global minimum at the point (5, -15) and has no other extrema or places with aslope of zero. What are the increasing and decreasing intervals for this function?
43
1.8. Zeroes and Intercepts of Functions www.ck12.org
1.8 Zeroes and Intercepts of Functions
Here you will learn about x and y intercepts. You will learn to approximate them graphically and solve for themexactly using algebra.
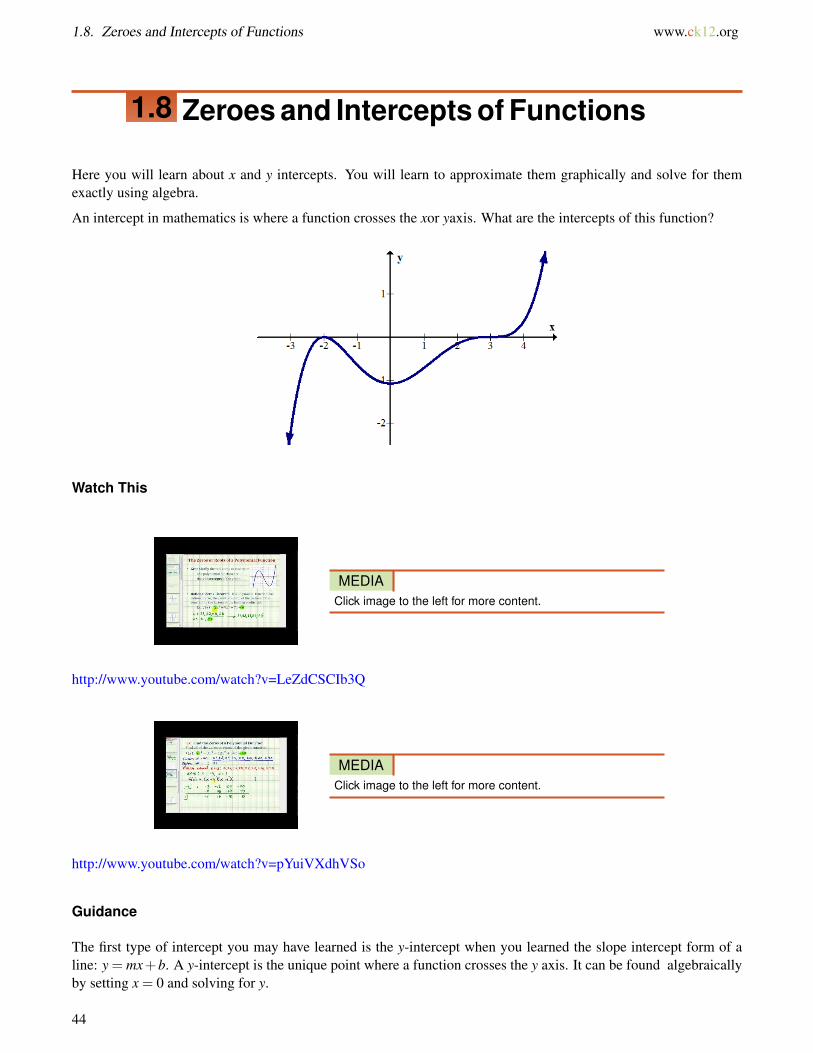
An intercept in mathematics is where a function crosses the xor yaxis. What are the intercepts of this function?
Watch This
MEDIAClick image to the left for more content.
http://www.youtube.com/watch?v=LeZdCSCIb3Q
MEDIAClick image to the left for more content.
http://www.youtube.com/watch?v=pYuiVXdhVSo
Guidance
The first type of intercept you may have learned is the y-intercept when you learned the slope intercept form of aline: y = mx+b. A y-intercept is the unique point where a function crosses the y axis. It can be found algebraicallyby setting x = 0 and solving for y.
44
www.ck12.org Chapter 1. Functions and Graphs
x-intercepts are where functions cross the x axis and where the height of the function is zero. They are also calledroots, solutions and zeroes of a function. They are found algebraically by setting y = 0 and solving for x.
Example A
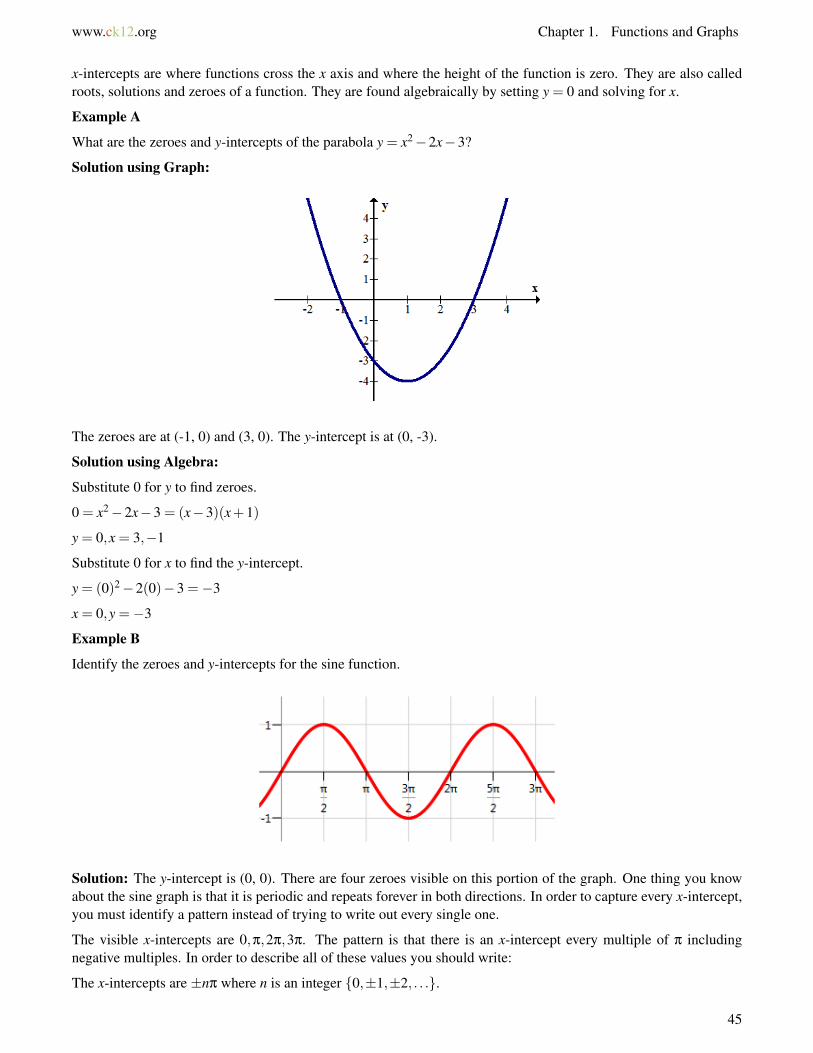
What are the zeroes and y-intercepts of the parabola y = x2−2x−3?
Solution using Graph:
The zeroes are at (-1, 0) and (3, 0). The y-intercept is at (0, -3).
Solution using Algebra:
Substitute 0 for y to find zeroes.
0 = x2−2x−3 = (x−3)(x+1)
y = 0,x = 3,−1
Substitute 0 for x to find the y-intercept.
y = (0)2−2(0)−3 =−3
x = 0,y =−3
Example B
Identify the zeroes and y-intercepts for the sine function.
Solution: The y-intercept is (0, 0). There are four zeroes visible on this portion of the graph. One thing you knowabout the sine graph is that it is periodic and repeats forever in both directions. In order to capture every x-intercept,you must identify a pattern instead of trying to write out every single one.
The visible x-intercepts are 0,π,2π,3π. The pattern is that there is an x-intercept every multiple of π includingnegative multiples. In order to describe all of these values you should write:
The x-intercepts are ±nπ where n is an integer {0,±1,±2, . . .}.
45

1.8. Zeroes and Intercepts of Functions www.ck12.org
Example C
Identify the intercepts and zeroes of the function: f (x) = 1100(x−3)3(x+2)2.
Solution:
To find the y-intercept, substitute 0 for x:
y = 1100(0−3)3(0+2)2 = 1
100(−27)(4) =−108100 =−1.08
To find the x-intercepts, substitute 0 for y:
0 = 1100(x−3)3(x+2)2
x = 3,−2
Thus the y-intercept is (0, -1.08) and the x-intercepts are (3, 0) and (-2, 0).
Concept Problem Revisited
Graphically the function has zeroes at -2 and 3 with a y intercept at about -1.1. The algebraic solution is demonstratedin Example C.
Vocabulary
Zeroes, roots, solutions and x-intercepts are synonyms for the points where a function crosses the x axis.
A y-intercept is the point where a function crosses the y axis.
Note that in order for a function to pass the vertical line test, it must only have one y-intercept, but it may havemultiple x-intercepts.
Guided Practice
1. Determine the zeroes and y-intercept of the following function using algebra: f (x) = (x+3)2(x−2)
2. Determine the roots and y-intercept of the following function using algebra or a graph:
f (x) = x4 +3x3−7x2−15x+18
3. Determine the intercepts of the following function graphically.
46

www.ck12.org Chapter 1. Functions and Graphs
Answers:
1. The y-intercept is (0, -18). The zeroes (x-intercepts) are (-3, 0) and (2, 0).
2. The y-intercept is (0, 18). The roots (x-intercepts) are (2, 0), (1, 0) and (-3, 0).
3. The y-intercept is approximately (0, -1). The x-intercepts are approximately (-2.3, 0), (-0.4, 0) and (0.7, 0). Whenfinding values graphically, answers are always approximate. Exact answers need to be found analytically.
Practice
1. Determine the zeroes and y-intercept of the following function using algebra:
f (x) = (x+1)3(x−4)
2. Determine the roots and y-intercept of the following function using algebra or a graph:
g(x) = x4−2x3−7x2 +20x−12
3. Determine the intercepts of the following function graphically:
Find the intercepts for each of the following functions.
4. y = x2
5. y = x3
6. y = ln(x)
7. y = 1x
8. y = ex
9. y =√
x
47

1.8. Zeroes and Intercepts of Functions www.ck12.org
10. Are there any functions without a y-intercept? Explain.
11. Are there any functions without an x-intercept? Explain.
12. Explain why it makes sense that an x-intercept of a function is also called a “zero” of the function.
Determine the intercepts of the following functions using algebra or a graph.
13. h(x) = x3−6x2 +3x+10
14. j(x) = x2−6x−7
15. k(x) = 4x4−20x3−3x2 +14x+5
48

www.ck12.org Chapter 1. Functions and Graphs
1.9 Asymptotes and End Behavior
Here you will get a conceptual and graphical understanding of what is meant by asymptotes and end behavior. Thiswill lay the groundwork for future concepts.
Most functions continue beyond the viewing window in our calculator or computer. People often draw an arrow nextto a dotted line to indicate the pattern specifically. How can you recognize these asymptotes?
Watch This
MEDIAClick image to the left for more content.
http://www.youtube.com/watch?v=y78Dpr9LLN0 James Sousa: Summary of End Behavior or Long Run Behaviorof Polynomial Functions
Guidance
A vertical asymptote is a vertical line such as x = 1 that indicates where a function is not defined and yet getsinfinitely close to.
A horizontal asymptote is a horizontal line such as y = 4 that indicates where a function flattens out as x gets verylarge or very small. A function may touch or pass through a horizontal asymptote.
The reciprocal function has two asymptotes, one vertical and one horizontal. Most computers and calculators do notdraw the asymptotes and so they must be inserted by hand as dotted lines.
The reason why asymptotes are important is because when your perspective is zoomed way out, the asymptotesessentially become the graph.
49
1.9. Asymptotes and End Behavior www.ck12.org
Example A
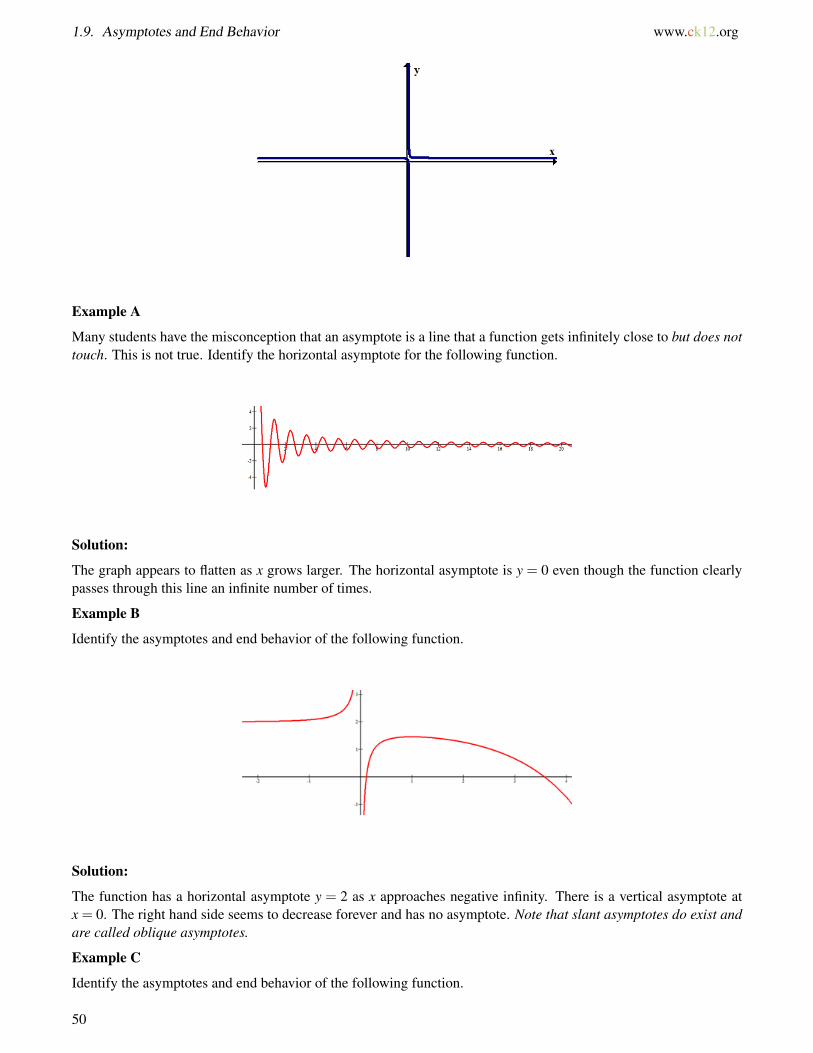
Many students have the misconception that an asymptote is a line that a function gets infinitely close to but does nottouch. This is not true. Identify the horizontal asymptote for the following function.
Solution:
The graph appears to flatten as x grows larger. The horizontal asymptote is y = 0 even though the function clearlypasses through this line an infinite number of times.
Example B
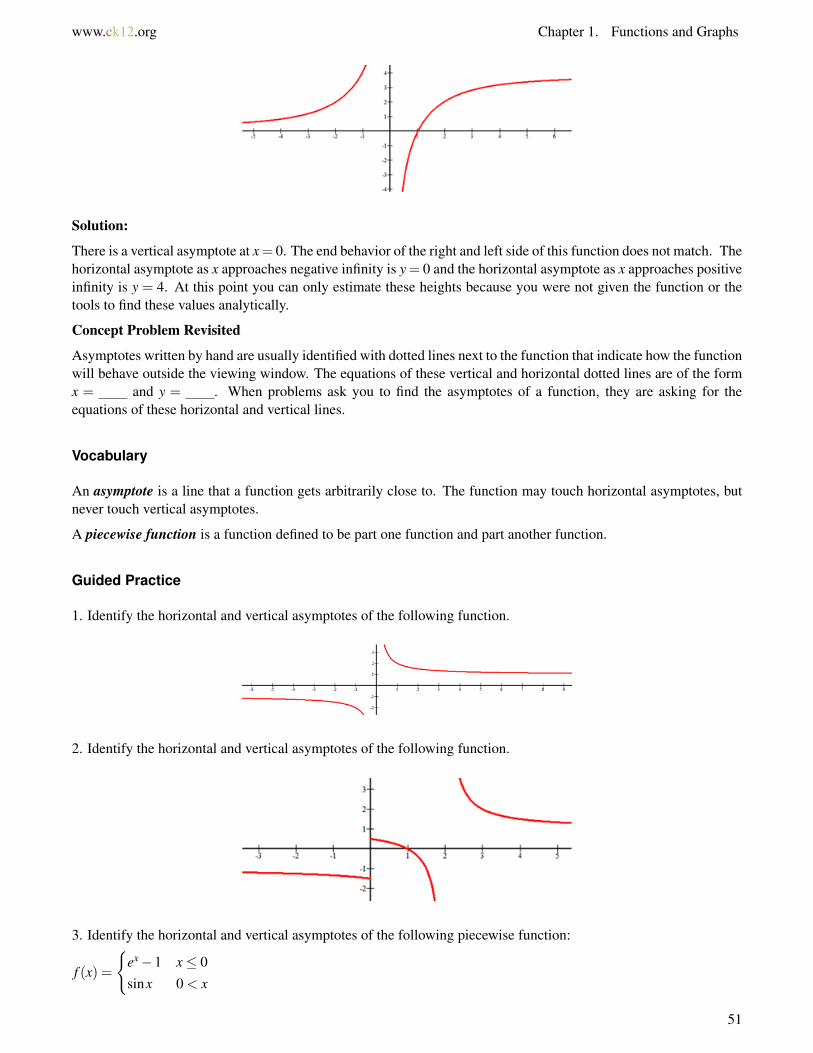
Identify the asymptotes and end behavior of the following function.
Solution:
The function has a horizontal asymptote y = 2 as x approaches negative infinity. There is a vertical asymptote atx = 0. The right hand side seems to decrease forever and has no asymptote. Note that slant asymptotes do exist andare called oblique asymptotes.
Example C
Identify the asymptotes and end behavior of the following function.
50
www.ck12.org Chapter 1. Functions and Graphs
Solution:
There is a vertical asymptote at x= 0. The end behavior of the right and left side of this function does not match. Thehorizontal asymptote as x approaches negative infinity is y = 0 and the horizontal asymptote as x approaches positiveinfinity is y = 4. At this point you can only estimate these heights because you were not given the function or thetools to find these values analytically.
Concept Problem Revisited
Asymptotes written by hand are usually identified with dotted lines next to the function that indicate how the functionwill behave outside the viewing window. The equations of these vertical and horizontal dotted lines are of the formx = and y = . When problems ask you to find the asymptotes of a function, they are asking for theequations of these horizontal and vertical lines.
Vocabulary
An asymptote is a line that a function gets arbitrarily close to. The function may touch horizontal asymptotes, butnever touch vertical asymptotes.
A piecewise function is a function defined to be part one function and part another function.
Guided Practice
1. Identify the horizontal and vertical asymptotes of the following function.
2. Identify the horizontal and vertical asymptotes of the following function.
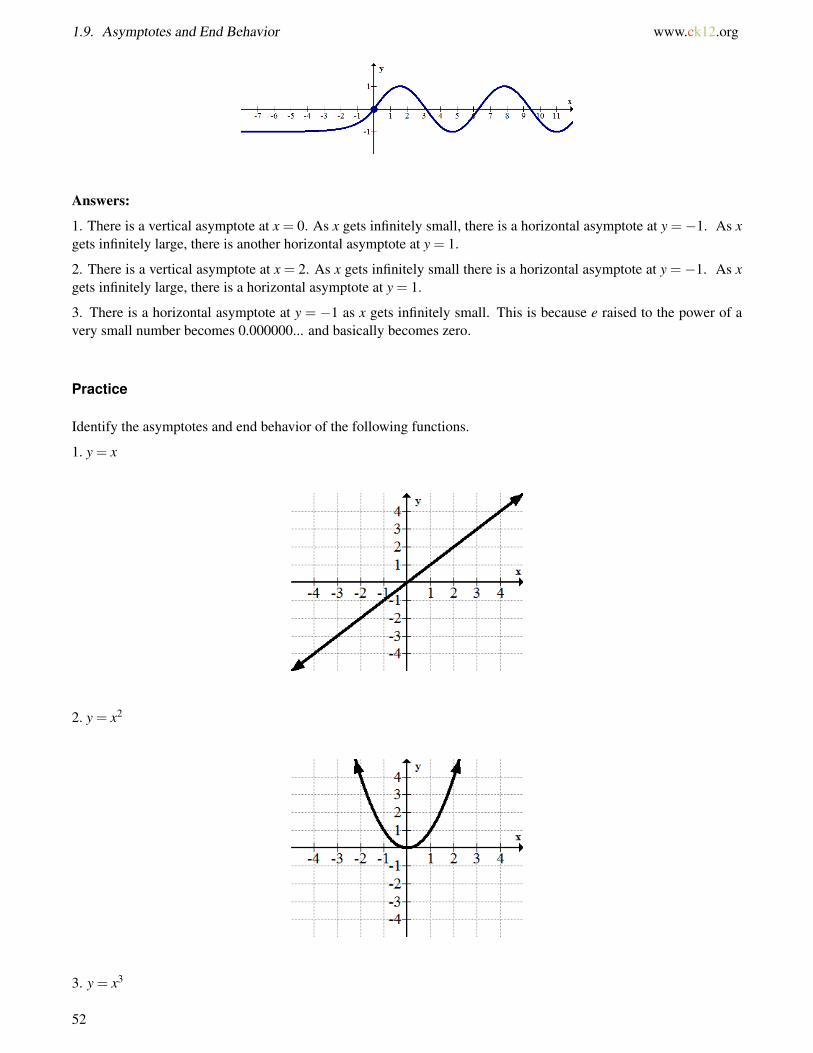
3. Identify the horizontal and vertical asymptotes of the following piecewise function:
f (x) =
{ex−1 x≤ 0sinx 0 < x
51
1.9. Asymptotes and End Behavior www.ck12.org
Answers:
1. There is a vertical asymptote at x = 0. As x gets infinitely small, there is a horizontal asymptote at y =−1. As xgets infinitely large, there is another horizontal asymptote at y = 1.
2. There is a vertical asymptote at x = 2. As x gets infinitely small there is a horizontal asymptote at y =−1. As xgets infinitely large, there is a horizontal asymptote at y = 1.
3. There is a horizontal asymptote at y = −1 as x gets infinitely small. This is because e raised to the power of avery small number becomes 0.000000... and basically becomes zero.
Practice
Identify the asymptotes and end behavior of the following functions.
1. y = x
2. y = x2
3. y = x3
52

1.9. Asymptotes and End Behavior www.ck12.org
7. y = ln(x)
8. y = 11+e−x
9.
10.
11.
54
www.ck12.org Chapter 1. Functions and Graphs
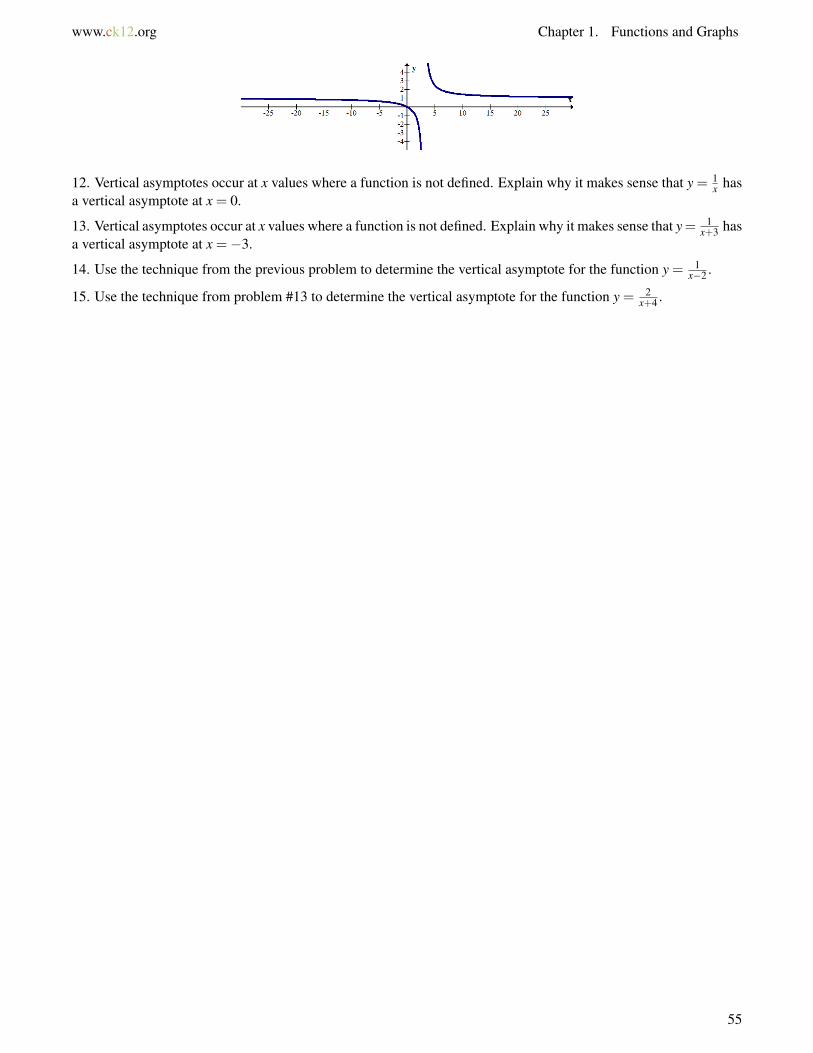
12. Vertical asymptotes occur at x values where a function is not defined. Explain why it makes sense that y = 1x has
a vertical asymptote at x = 0.
13. Vertical asymptotes occur at x values where a function is not defined. Explain why it makes sense that y= 1x+3 has
a vertical asymptote at x =−3.
14. Use the technique from the previous problem to determine the vertical asymptote for the function y = 1x−2 .
15. Use the technique from problem #13 to determine the vertical asymptote for the function y = 2x+4 .
55
1.10. Continuity and Discontinuity www.ck12.org
1.10 Continuity and Discontinuity
Here you will learn the formal definition of continuity, the three types of discontinuities and more about piecewisefunctions.
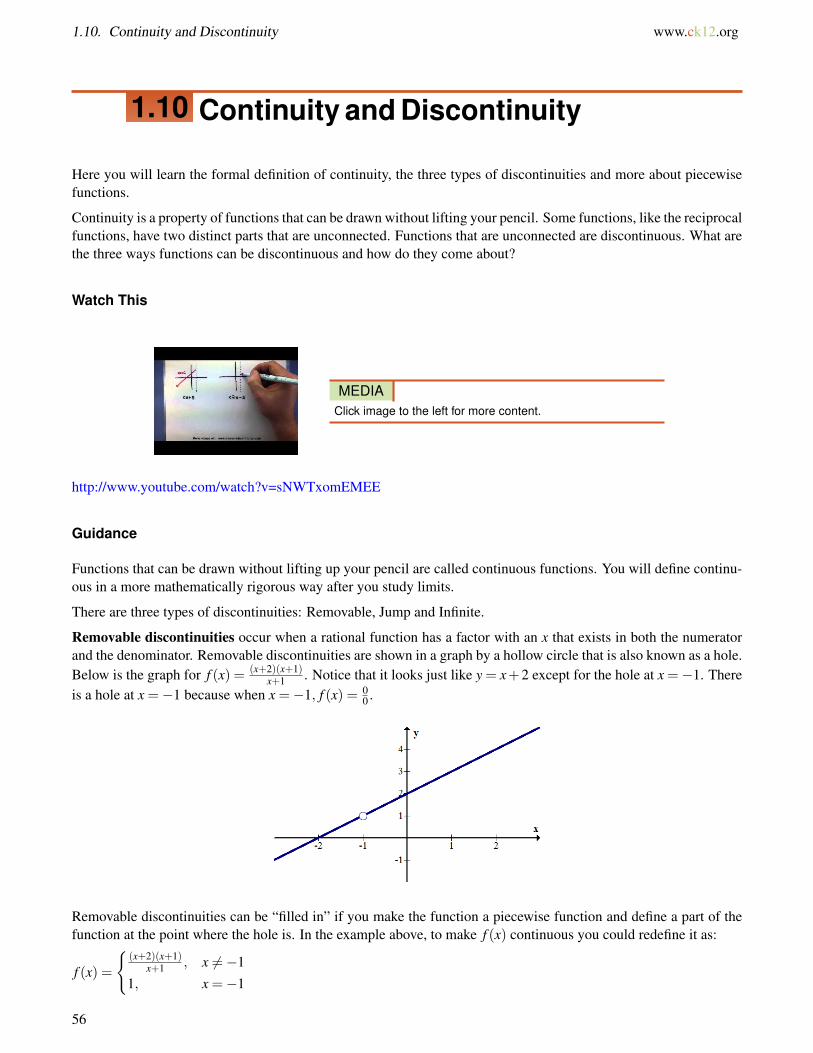
Continuity is a property of functions that can be drawn without lifting your pencil. Some functions, like the reciprocalfunctions, have two distinct parts that are unconnected. Functions that are unconnected are discontinuous. What arethe three ways functions can be discontinuous and how do they come about?
Watch This
MEDIAClick image to the left for more content.
http://www.youtube.com/watch?v=sNWTxomEMEE
Guidance
Functions that can be drawn without lifting up your pencil are called continuous functions. You will define continu-ous in a more mathematically rigorous way after you study limits.
There are three types of discontinuities: Removable, Jump and Infinite.
Removable discontinuities occur when a rational function has a factor with an x that exists in both the numeratorand the denominator. Removable discontinuities are shown in a graph by a hollow circle that is also known as a hole.Below is the graph for f (x) = (x+2)(x+1)
x+1 . Notice that it looks just like y = x+2 except for the hole at x =−1. Thereis a hole at x =−1 because when x =−1, f (x) = 0
0 .
Removable discontinuities can be “filled in” if you make the function a piecewise function and define a part of thefunction at the point where the hole is. In the example above, to make f (x) continuous you could redefine it as:
f (x) =
{(x+2)(x+1)
x+1 , x 6=−11, x =−1
56

www.ck12.org Chapter 1. Functions and Graphs
Jump discontinuities occur when a function has two ends that don’t meet even if the hole is filled in. In order tosatisfy the vertical line test and make sure the graph is truly that of a function, only one of the end points may befilled. Below is an example of a function with a jump discontinuity.
Infinite discontinuities occur when a function has a vertical asymptote on one or both sides. This is shown in thegraph of the function below at x = 1.
Example A
Identify the discontinuity of the function algebraically and then graph the function.
f (x) = (x−2)(x+2)(x−1)(x−1)
Solution: Since the factor x−1 is in both the numerator and the denominator, there is a removable discontinuity atx = 1.
When graphing the function, you should cancel the removable factor, graph like usual and then insert a hole in theappropriate spot at the end.
Example B
Identify the discontinuity of the piecewise function graphically.
57

1.10. Continuity and Discontinuity www.ck12.org
f (x) =
x2−4 x < 1−1 x = 1−1
2 x+1 x > 1
Solution: There is a jump discontinuity at x = 1. The piecewise function describes a function in three parts; aparabola on the left, a single point in the middle and a line on the right.
Example C
Identify the discontinuity of the function below.
Solution: Since there is a vertical asymptote at x = 1, this is an infinite discontinuity.
Concept Problem Revisited
There are three ways that functions can be discontinuous. When a rational function has a vertical asymptote as aresult of the denominator being equal to zero at some point, it will have an infinite discontinuity at that point. Whenthe numerator and denominator of a rational function have one or more of the same factors, there will be removablediscontinuities corresponding to each of these factors. Finally, when the different parts of a piecewise function don’t“match”, there will be a jump discontinuity.
Vocabulary
Removable discontinuities are also known as holes. They occur when factors can be algebraically canceled fromrational functions.
Jump discontinuities occur most often with piecewise functions when the pieces don’t match up.
Infinite discontinuities occur when a factor in the denominator of the function is zero.
Guided Practice
1. Describe the continuity or discontinuity of the function f (x) = sin(1
x
).
58

www.ck12.org Chapter 1. Functions and Graphs
2. Describe the discontinuities of the function below.
3. Describe the discontinuities of the function below.
Answers:
1. The function seems to oscillate infinitely as x approaches zero. One thing that the graph fails to show is that 0 isclearly not in the domain. The graph does not shoot to infinity, nor does it have a simple hole or jump discontinuity.Calculus and Real Analysis are required to state more precisely what is going on.
2. There is a jump discontinuity at x =−1 and an infinite discontinuity at x = 2.
3. There are jump discontinuities at x = −2 and x = 4. There is a removable discontinuity at x = 2. There is aninfinite discontinuity at x = 0.
Practice
Describe any discontinuities in the functions below:
1. y = x
59
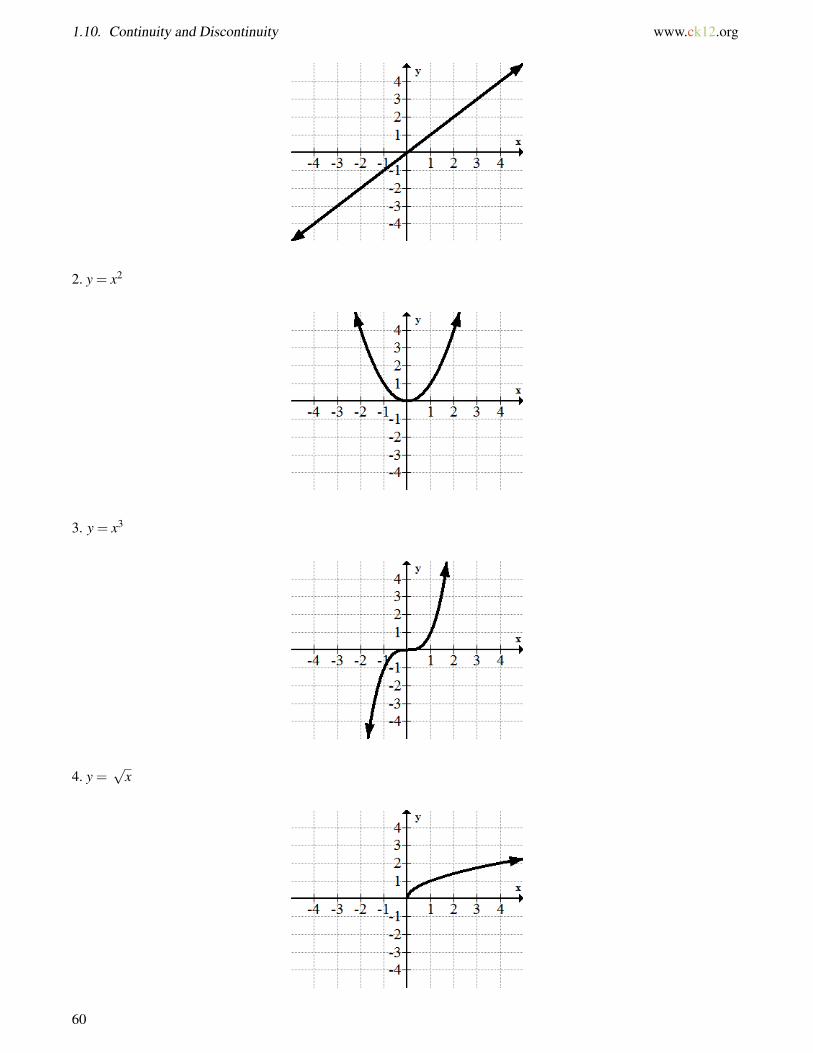
1.10. Continuity and Discontinuity www.ck12.org
2. y = x2
3. y = x3
4. y =√
x
60
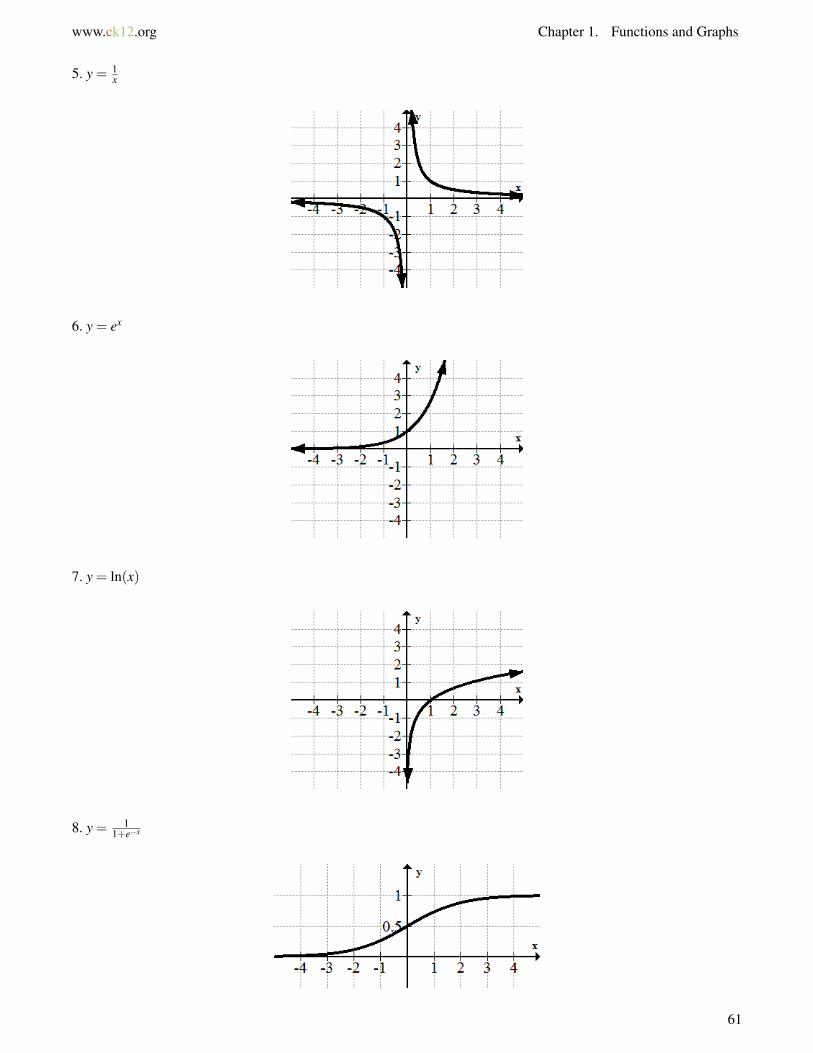
www.ck12.org Chapter 1. Functions and Graphs
5. y = 1x
6. y = ex
7. y = ln(x)
8. y = 11+e−x
61

1.10. Continuity and Discontinuity www.ck12.org
9.
10.
11.
12. f (x) has a jump discontinuity at x = 3, a removable discontinuity at x = 5, and another jump discontinuity atx = 6. Draw a picture of a graph that could be f (x).
13. g(x) has a jump discontinuity at x = −2, an infinite discontinuity at x = 1, and another jump discontinuity atx = 3. Draw a picture of a graph that could be g(x).
14. h(x) has a removable discontinuity at x = −4, a jump discontinuity at x = 1, and another jump discontinuity atx = 7. Draw a picture of a graph that could be h(x).
15. j(x) has an infinite discontinuity at x = 0, a removable discontinuity at x = 1, and a jump discontinuity at x = 4.Draw a picture of a graph that could be j(x).
62
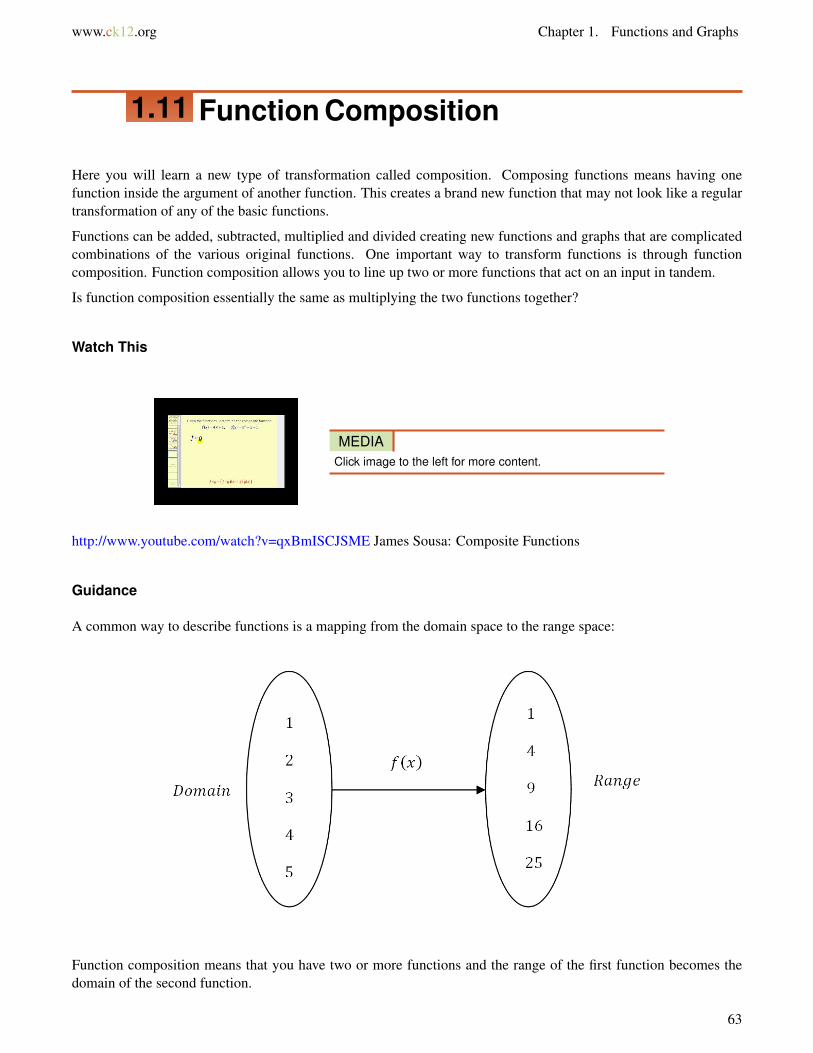
www.ck12.org Chapter 1. Functions and Graphs
1.11 Function Composition
Here you will learn a new type of transformation called composition. Composing functions means having onefunction inside the argument of another function. This creates a brand new function that may not look like a regulartransformation of any of the basic functions.
Functions can be added, subtracted, multiplied and divided creating new functions and graphs that are complicatedcombinations of the various original functions. One important way to transform functions is through functioncomposition. Function composition allows you to line up two or more functions that act on an input in tandem.
Is function composition essentially the same as multiplying the two functions together?
Watch This
MEDIAClick image to the left for more content.
http://www.youtube.com/watch?v=qxBmISCJSME James Sousa: Composite Functions
Guidance
A common way to describe functions is a mapping from the domain space to the range space:
Function composition means that you have two or more functions and the range of the first function becomes thedomain of the second function.
63
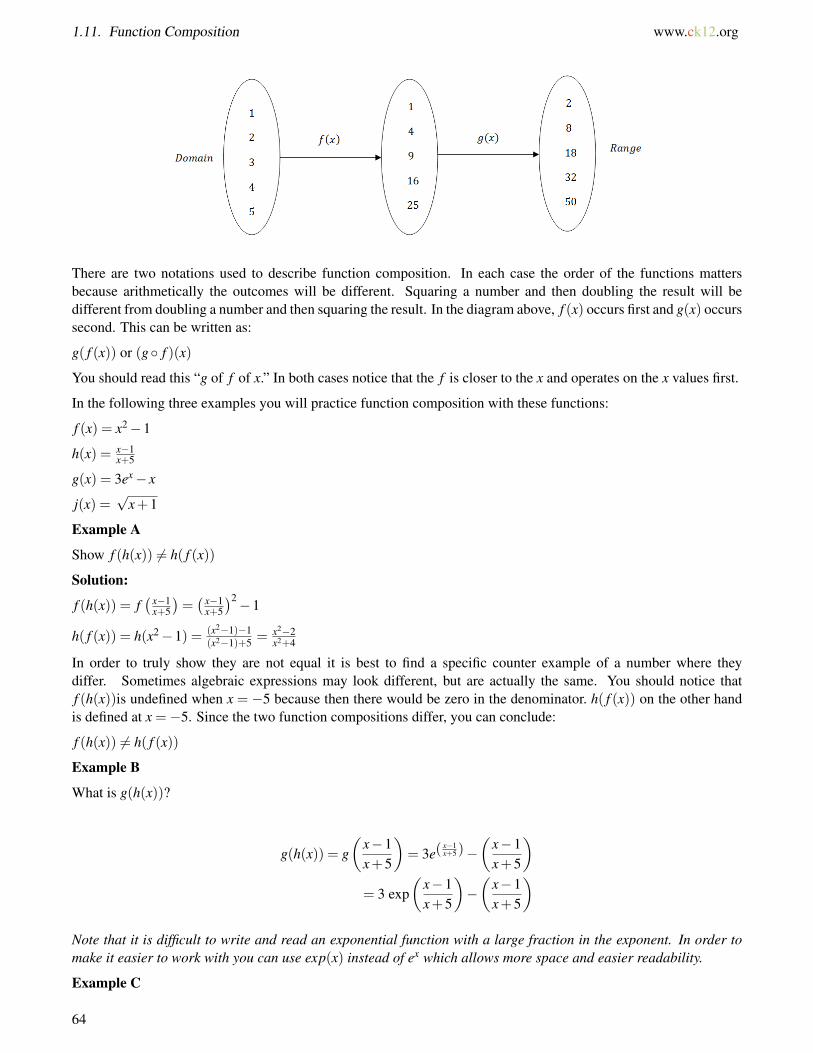
1.11. Function Composition www.ck12.org
There are two notations used to describe function composition. In each case the order of the functions mattersbecause arithmetically the outcomes will be different. Squaring a number and then doubling the result will bedifferent from doubling a number and then squaring the result. In the diagram above, f (x) occurs first and g(x) occurssecond. This can be written as:
g( f (x)) or (g◦ f )(x)
You should read this “g of f of x.” In both cases notice that the f is closer to the x and operates on the x values first.
In the following three examples you will practice function composition with these functions:
f (x) = x2−1
h(x) = x−1x+5
g(x) = 3ex− x
j(x) =√
x+1
Example A
Show f (h(x)) 6= h( f (x))
Solution:
f (h(x)) = f( x−1
x+5
)=( x−1
x+5
)2−1
h( f (x)) = h(x2−1) = (x2−1)−1(x2−1)+5 = x2−2
x2+4
In order to truly show they are not equal it is best to find a specific counter example of a number where theydiffer. Sometimes algebraic expressions may look different, but are actually the same. You should notice thatf (h(x))is undefined when x = −5 because then there would be zero in the denominator. h( f (x)) on the other handis defined at x =−5. Since the two function compositions differ, you can conclude:
f (h(x)) 6= h( f (x))
Example B
What is g(h(x))?
g(h(x)) = g(
x−1x+5
)= 3e(
x−1x+5)−
(x−1x+5
)= 3 exp
(x−1x+5
)−(
x−1x+5
)Note that it is difficult to write and read an exponential function with a large fraction in the exponent. In order tomake it easier to work with you can use exp(x) instead of ex which allows more space and easier readability.
Example C
64
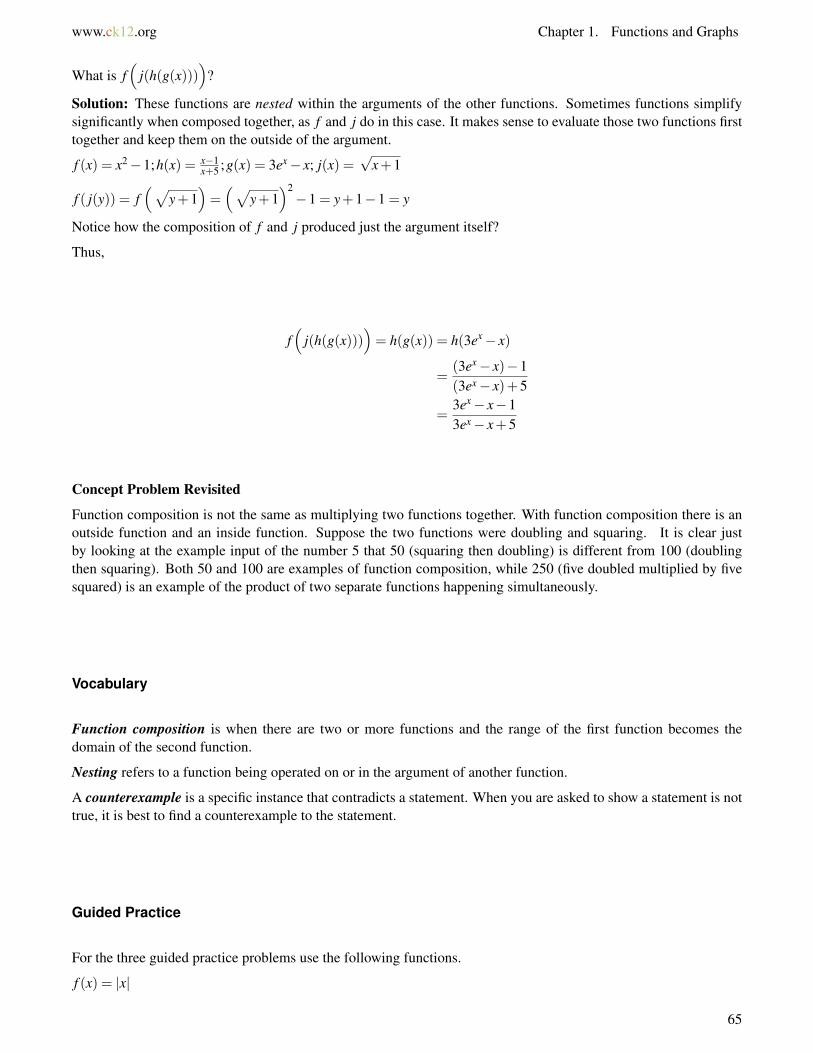
www.ck12.org Chapter 1. Functions and Graphs
What is f(
j(h(g(x))))
?
Solution: These functions are nested within the arguments of the other functions. Sometimes functions simplifysignificantly when composed together, as f and j do in this case. It makes sense to evaluate those two functions firsttogether and keep them on the outside of the argument.
f (x) = x2−1;h(x) = x−1x+5 ;g(x) = 3ex− x; j(x) =
√x+1
f ( j(y)) = f(√
y+1)=(√
y+1)2−1 = y+1−1 = y
Notice how the composition of f and j produced just the argument itself?
Thus,
f(
j(h(g(x))))= h(g(x)) = h(3ex− x)
=(3ex− x)−1(3ex− x)+5
=3ex− x−13ex− x+5
Concept Problem Revisited
Function composition is not the same as multiplying two functions together. With function composition there is anoutside function and an inside function. Suppose the two functions were doubling and squaring. It is clear justby looking at the example input of the number 5 that 50 (squaring then doubling) is different from 100 (doublingthen squaring). Both 50 and 100 are examples of function composition, while 250 (five doubled multiplied by fivesquared) is an example of the product of two separate functions happening simultaneously.
Vocabulary
Function composition is when there are two or more functions and the range of the first function becomes thedomain of the second function.
Nesting refers to a function being operated on or in the argument of another function.
A counterexample is a specific instance that contradicts a statement. When you are asked to show a statement is nottrue, it is best to find a counterexample to the statement.
Guided Practice
For the three guided practice problems use the following functions.
f (x) = |x|
65
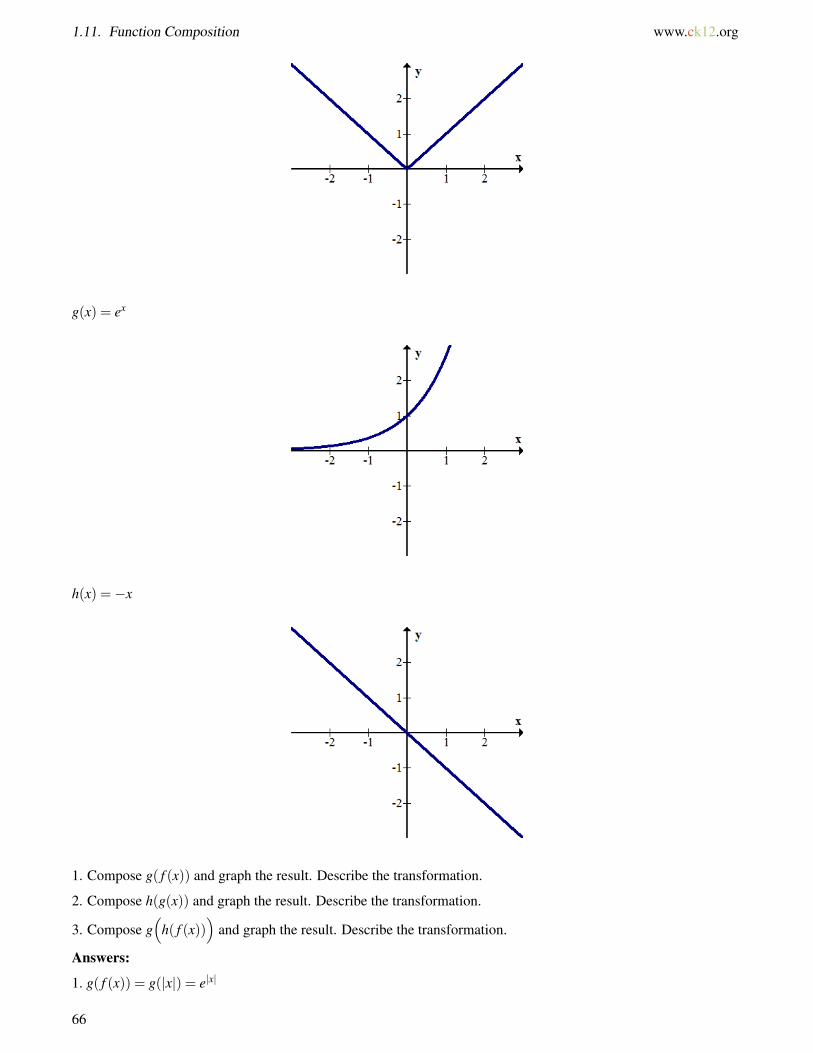
1.11. Function Composition www.ck12.org
g(x) = ex
h(x) =−x
1. Compose g( f (x)) and graph the result. Describe the transformation.
2. Compose h(g(x)) and graph the result. Describe the transformation.
3. Compose g(
h( f (x)))
and graph the result. Describe the transformation.
Answers:
1. g( f (x)) = g(|x|) = e|x|
66
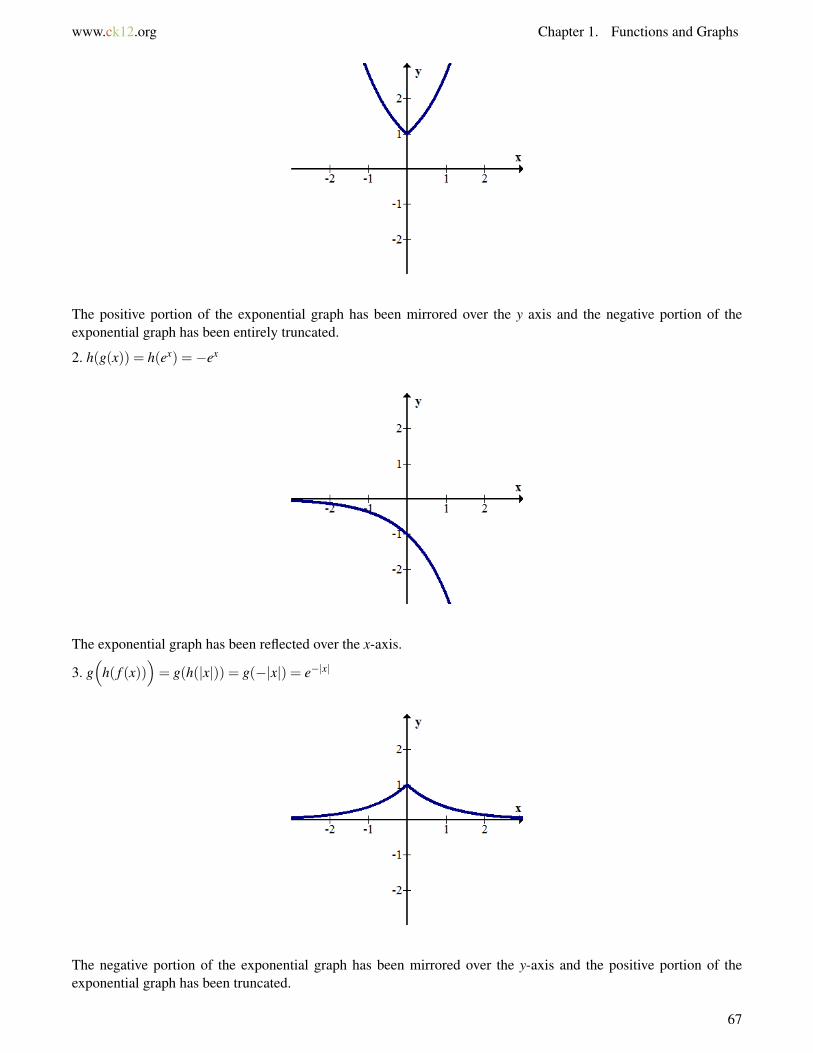
www.ck12.org Chapter 1. Functions and Graphs
The positive portion of the exponential graph has been mirrored over the y axis and the negative portion of theexponential graph has been entirely truncated.
2. h(g(x)) = h(ex) =−ex
The exponential graph has been reflected over the x-axis.
3. g(
h( f (x)))= g(h(|x|)) = g(−|x|) = e−|x|
The negative portion of the exponential graph has been mirrored over the y-axis and the positive portion of theexponential graph has been truncated.
67
1.11. Function Composition www.ck12.org
Practice
For questions 1-9, use the following three functions: f (x) = |x|,h(x) =−x,g(x) = (x−2)2−3.
1. Graph f (x),h(x) and g(x).
2. Find f (g(x)) algebraically.
3. Graph f (g(x)) and describe the transformation.
4. Find g( f (x)) algebraically.
5. Graph g( f (x)) and describe the transformation.
6. Find h(g(x)) algebraically.
7. Graph h(g(x)) and describe the transformation.
8. Find g(h(x)) algebraically.
9. Graph g(h(x)) and describe the transformation.
For 10-16, use the following three functions: j(x) = x2,k(x) = |x|,m(x) =√
x.
10. Graph j(x),k(x) and m(x).
11. Find j(k(x)) algebraically.
12. Graph j(k(x)) and describe the transformation.
13. Find k(m(x)) algebraically.
14. Graph k(m(x)) and describe the transformation.
15. Find m(k(x)) algebraically.
16. Graph m(k(x)) and describe the transformation.
68
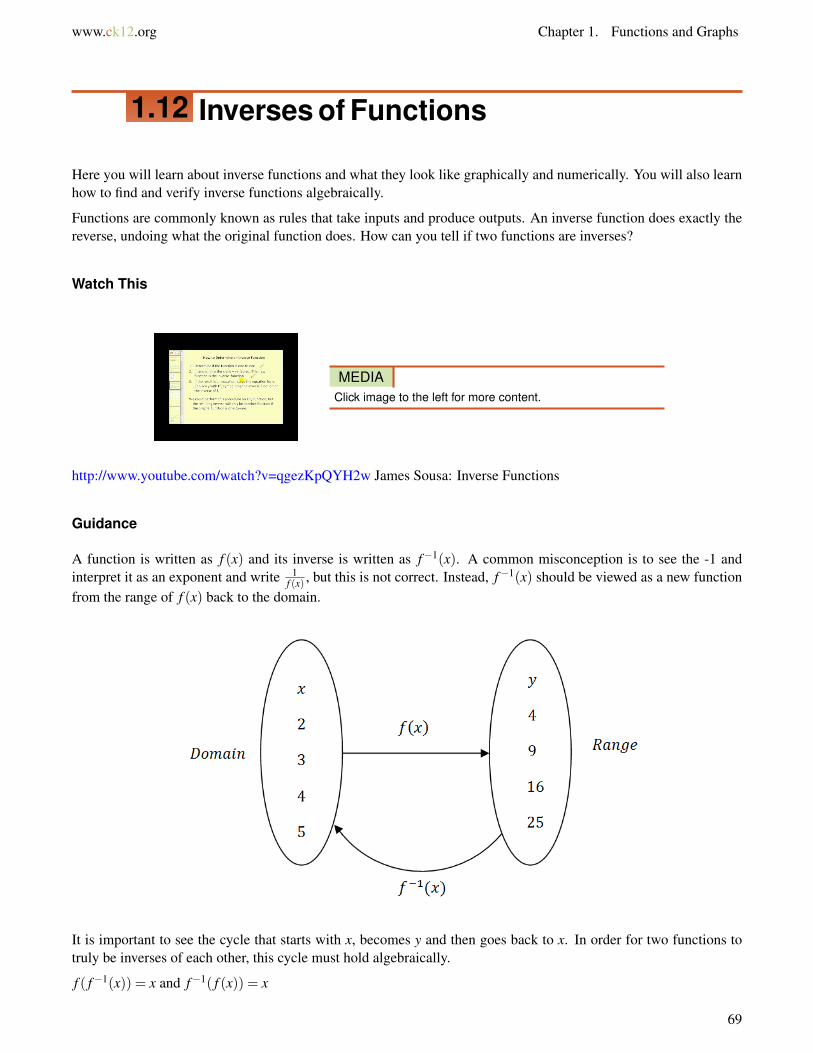
www.ck12.org Chapter 1. Functions and Graphs
1.12 Inverses of Functions
Here you will learn about inverse functions and what they look like graphically and numerically. You will also learnhow to find and verify inverse functions algebraically.
Functions are commonly known as rules that take inputs and produce outputs. An inverse function does exactly thereverse, undoing what the original function does. How can you tell if two functions are inverses?
Watch This
MEDIAClick image to the left for more content.
http://www.youtube.com/watch?v=qgezKpQYH2w James Sousa: Inverse Functions
Guidance
A function is written as f (x) and its inverse is written as f−1(x). A common misconception is to see the -1 andinterpret it as an exponent and write 1
f (x) , but this is not correct. Instead, f−1(x) should be viewed as a new functionfrom the range of f (x) back to the domain.
It is important to see the cycle that starts with x, becomes y and then goes back to x. In order for two functions totruly be inverses of each other, this cycle must hold algebraically.
f ( f−1(x)) = x and f−1( f (x)) = x
69

1.12. Inverses of Functions www.ck12.org
When given a function there are two steps to take to find its inverse. In the original function, first switch thevariables x and y. Next, solve the function for y. This will give you the inverse function. After finding the inverse, itis important to check both directions of compositions to make sure that together the function and its inverse producethe value x. In other words, verify that f ( f−1(x)) = x and f−1( f (x)) = x.
Graphically, inverses are reflections across the line y = x. Below you see inverses y = ex and y = lnx. Notice howthe (x,y) coordinates in one graph become (y,x) coordinates in the other graph.
In order to decide whether an inverse function is also actually a function you can use the vertical line test on theinverse function like usual. You can also use the horizontal line test on the original function. The horizontal line testis exactly like the vertical line test except the lines simply travel horizontally.
Example A
Find the inverse, then verify the inverse algebraically. f (x) = y = (x+1)2 +4
Solution: To find the inverse, switch x and y then solve for y.
x = (y+1)2 +4
x−4 = (y+1)2
±√
x−4 = y+1
−1±√
x−4 = y = f−1(x)
To verify algebraically, you must show x = f ( f−1(x)) = f−1( f (x)):
f ( f−1(x)) = f(−1±
√x−4
)= ((−1±
√x−4 )+1)2 +4
=(±√
x−4)2
+4
= x−4+4 = x
70
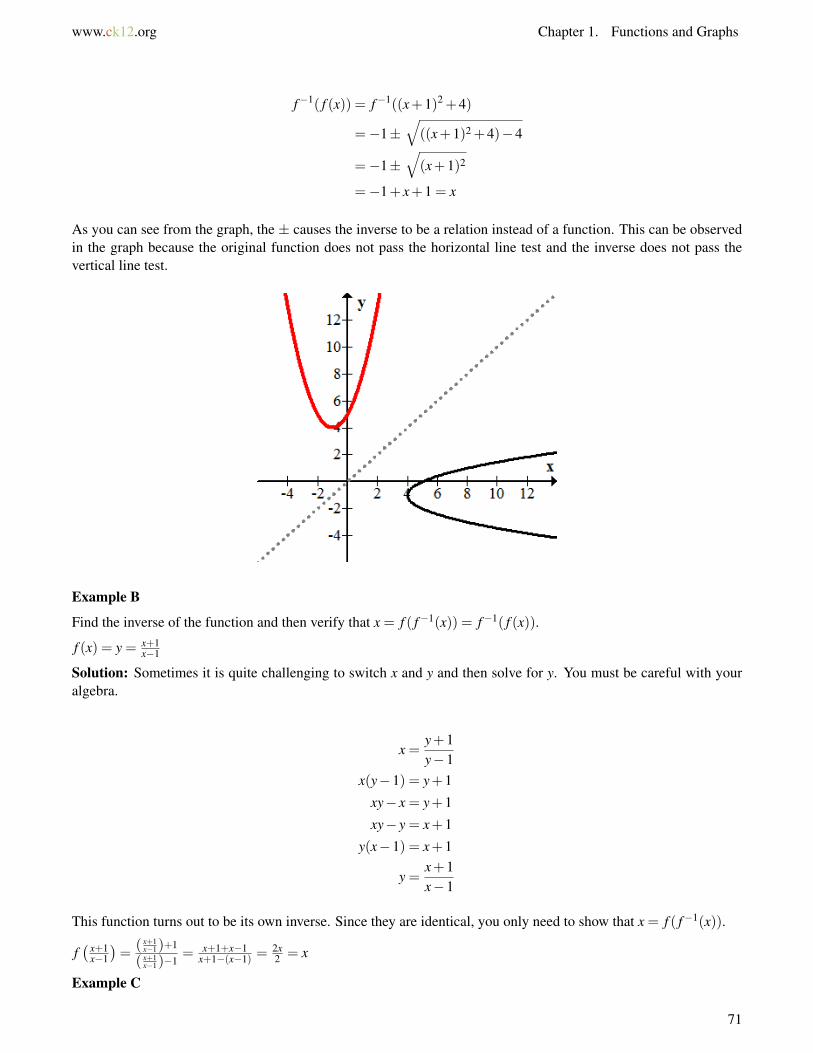
www.ck12.org Chapter 1. Functions and Graphs
f−1( f (x)) = f−1((x+1)2 +4)
=−1±√((x+1)2 +4)−4
=−1±√(x+1)2
=−1+ x+1 = x
As you can see from the graph, the ± causes the inverse to be a relation instead of a function. This can be observedin the graph because the original function does not pass the horizontal line test and the inverse does not pass thevertical line test.
Example B
Find the inverse of the function and then verify that x = f ( f−1(x)) = f−1( f (x)).
f (x) = y = x+1x−1
Solution: Sometimes it is quite challenging to switch x and y and then solve for y. You must be careful with youralgebra.
x =y+1y−1
x(y−1) = y+1
xy− x = y+1
xy− y = x+1
y(x−1) = x+1
y =x+1x−1
This function turns out to be its own inverse. Since they are identical, you only need to show that x = f ( f−1(x)).
f( x+1
x−1
)=
( x+1x−1)+1
( x+1x−1)−1
= x+1+x−1x+1−(x−1) =
2x2 = x
Example C
71
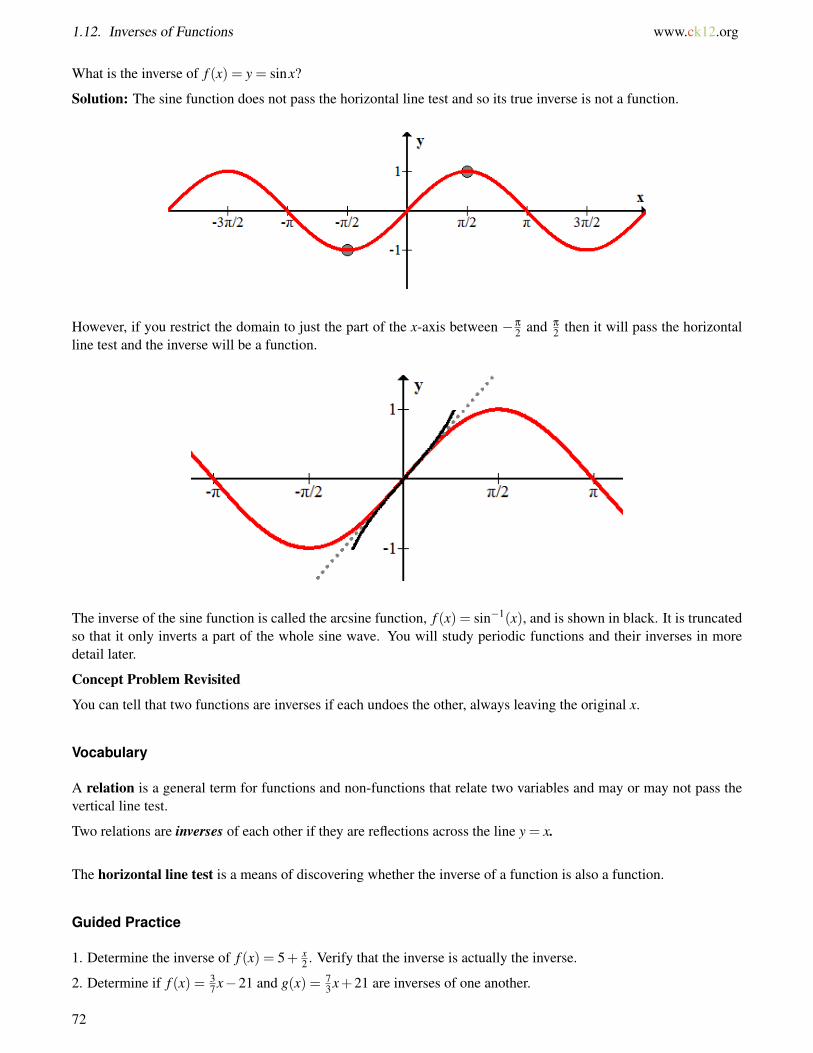
1.12. Inverses of Functions www.ck12.org
What is the inverse of f (x) = y = sinx?
Solution: The sine function does not pass the horizontal line test and so its true inverse is not a function.
However, if you restrict the domain to just the part of the x-axis between −π
2 and π
2 then it will pass the horizontalline test and the inverse will be a function.
The inverse of the sine function is called the arcsine function, f (x) = sin−1(x), and is shown in black. It is truncatedso that it only inverts a part of the whole sine wave. You will study periodic functions and their inverses in moredetail later.
Concept Problem Revisited
You can tell that two functions are inverses if each undoes the other, always leaving the original x.
Vocabulary
A relation is a general term for functions and non-functions that relate two variables and may or may not pass thevertical line test.
Two relations are inverses of each other if they are reflections across the line y = x.
The horizontal line test is a means of discovering whether the inverse of a function is also a function.
Guided Practice
1. Determine the inverse of f (x) = 5+ x2 . Verify that the inverse is actually the inverse.
2. Determine if f (x) = 37 x−21 and g(x) = 7
3 x+21 are inverses of one another.
72
www.ck12.org Chapter 1. Functions and Graphs
3. Determine the inverse of f (x) = xx+4 .
Answers:
1. To find the inverse,
y = 5+x2
x = 5+y2
x−5 =y2
2(x−5) = y = f−1(x)
Verification:
2(5+ x
2 −5)= 2
( x2
)= x
5+ 2(x−5)2 = 5+ x−5 = x
They are truly inverses of each other.
2. Even though f (x) = 37 x− 21 and g(x) = 7
3 x+ 21 have some inverted pieces, they are not inverses of each other.In order to show this, you must show that the composition does not simplify to x. 3
7
(73 x+21
)−21 = x+9−21 =
x−12 6= x
3. To find the inverse, switch x and y.
f (x) = y =x
x+4
x =y
y+4x(y+4) = y
xy+4x = y
xy− y =−4x
y(x−1) =−4x
f−1(x) = y =− 4xx−1
Practice
Consider f (x) = x3.
1. Sketch f (x) and f−1(x).
2. Find f−1(x) algebraically. It is actually a function?
3. Verify algebraically that f (x) and f−1(x) are inverses.
Consider g(x) =√
x.
4. Sketch g(x) and g−1(x).
5. Find g−1(x) algebraically. It is actually a function?
6. Verify algebraically that g(x) and g−1(x) are inverses.
Consider h(x) = |x|.
73

1.12. Inverses of Functions www.ck12.org
7. Sketch h(x) and h−1(x).
8. Find h−1(x) algebraically. It is actually a function?
9. Verify graphically that h(x) and h−1(x) are inverses.
Consider j(x) = 2x−5.
10. Sketch j(x) and j−1(x).
11. Find j−1(x) algebraically. It is actually a function?
12. Verify algebraically that j(x) and j−1(x) are inverses.
13. Use the horizontal line test to determine whether or not the inverse of f (x) = x3−2x2 +1 is also a function.
14. Are g(x) = ln(x+1) and h(x) = ex−1 inverses? Explain.
15. If you were given a table of values for a function, how could you create a table of values for the inverse of thefunction?
Key features of functions were explored through the use of ten basic function families. Transforming functions andfinding inverses of functions were also considered.
74
www.ck12.org Chapter 1. Functions and Graphs
1.13 References
1. CK-12 Foundation. . CCSA2. CK-12 Foundation. . CCSA3. CK-12 Foundation. . CCSA4. CK-12 Foundation. . CCSA5. CK-12 Foundation. . CCSA6. CK-12 Foundation. . CCSA7. CK-12 Foundation. . CCSA8. CK-12 Foundation. . CCSA9. CK-12 Foundation. . CCSA
10. CK-12 Foundation. . CCSA11. CK-12 Foundation. . CCSA12. CK-12 Foundation. . CCSA13. CK-12 Foundation. . CCSA14. CK-12 Foundation. . CCSA15. CK-12 Foundation. . CCSA16. CK-12 Foundation. . CCSA17. CK-12 Foundation. . CCSA18. CK-12 Foundation. . CCSA19. CK-12 Foundation. . CCSA20. CK-12 Foundation. . CCSA21. CK-12 Foundation. . CCSA22. CK-12 Foundation. . CCSA23. CK-12 Foundation. . CCSA24. CK-12 Foundation. . CCSA25. CK-12 Foundation. . CCSA26. CK-12 Foundation. . CCSA27. CK-12 Foundation. . CCSA28. CK-12 Foundation. . CCSA29. CK-12 Foundation. . CCSA30. CK-12 Foundation. . CCSA31. CK-12 Foundation. . CCSA32. CK-12 Foundation. . CCSA33. CK-12 Foundation. . CCSA34. CK-12 Foundation. . CCSA35. CK-12 Foundation. . CCSA36. CK-12 Foundation. . CCSA37. CK-12 Foundation. . CCSA38. CK-12 Foundation. . CCSA39. CK-12 Foundation. . CCSA40. CK-12 Foundation. . CCSA41. CK-12 Foundation. . CCSA42. CK-12 Foundation. . CCSA43. CK-12 Foundation. . CCSA44. CK-12 Foundation. . CCSA45. CK-12 Foundation. . CCSA
75
1.13. References www.ck12.org
46. CK-12 Foundation. . CCSA47. CK-12 Foundation. . CCSA48. CK-12 Foundation. . CCSA49. CK-12 Foundation. . CCSA50. CK-12 Foundation. . CCSA51. CK-12 Foundation. . CCSA52. CK-12 Foundation. . CCSA53. CK-12 Foundation. . CCSA54. CK-12 Foundation. . CCSA55. CK-12 Foundation. . CCSA56. CK-12 Foundation. . CCSA57. CK-12 Foundation. . CCSA58. CK-12 Foundation. . CCSA59. CK-12 Foundation. . CCSA60. CK-12 Foundation. . CCSA61. CK-12 Foundation. . CCSA62. CK-12 Foundation. . CCSA63. CK-12 Foundation. . CCSA64. CK-12 Foundation. . CCSA65. CK-12 Foundation. . CCSA66. CK-12 Foundation. . CCSA67. CK-12 Foundation. . CCSA68. CK-12 Foundation. . CCSA69. CK-12 Foundation. . CCSA70. CK-12 Foundation. . CCSA71. CK-12 Foundation. . CCSA72. CK-12 Foundation. . CCSA73. CK-12 Foundation. . CCSA74. CK-12 Foundation. . CCSA75. CK-12 Foundation. . CCSA76. CK-12 Foundation. . CCSA77. CK-12 Foundation. . CCSA78. CK-12 Foundation. . CCSA79. CK-12 Foundation. . CCSA80. CK-12 Foundation. . CCSA81. CK-12 Foundation. . CCSA82. CK-12 Foundation. . CCSA83. CK-12 Foundation. . CCSA84. CK-12 Foundation. . CCSA85. CK-12 Foundation. . CCSA86. CK-12 Foundation. . CCSA87. CK-12 Foundation. . CCSA88. CK-12 Foundation. . CCSA89. CK-12 Foundation. . CCSA90. CK-12 Foundation. . CCSA91. CK-12 Foundation. . CCSA92. CK-12 Foundation. . CCSA93. CK-12 Foundation. . CCSA94. CK-12 Foundation. . CCSA95. CK-12 Foundation. . CCSA96. CK-12 Foundation. . CCSA
76
www.ck12.org Chapter 1. Functions and Graphs
97. CK-12 Foundation. .98. CK-12 Foundation. . CCSA99. CK-12 Foundation. . CCSA
100. CK-12 Foundation. . CCSA101. CK-12 Foundation. . CCSA102. CK-12 Foundation. . CCSA103. CK-12 Foundation. . CCSA104. CK-12 Foundation. . CCSA105. CK-12 Foundation. . CCSA106. CK-12 Foundation. . CCSA107. CK-12 Foundation. . CCSA108. CK-12 Foundation. . CCSA109. CK-12 Foundation. . CCSA110. CK-12 Foundation. . CCSA
77

www.ck12.org
CHAPTER 2 Polynomials and RationalFunctions
Chapter Outline2.1 FACTORING REVIEW
2.2 ADVANCED FACTORING
2.3 POLYNOMIAL EXPANSION AND PASCAL’S TRIANGLE
2.4 RATIONAL EXPRESSIONS
2.5 POLYNOMIAL LONG DIVISION AND SYNTHETIC DIVISION
2.6 SOLVING RATIONAL EQUATIONS
2.7 HOLES IN RATIONAL FUNCTIONS
2.8 ZEROES OF RATIONAL FUNCTIONS
2.9 VERTICAL ASYMPTOTES
2.10 HORIZONTAL ASYMPTOTES
2.11 OBLIQUE ASYMPTOTES
2.12 SIGN TEST FOR RATIONAL FUNCTION GRAPHS
2.13 GRAPHS OF RATIONAL FUNCTIONS BY HAND
2.14 REFERENCES
Here you will deepen you knowledge about polynomials from your work in algebra. You will review factoring andlearn more advanced factoring techniques. You will learn how to divide polynomials and how polynomials andrational expressions are related. You will then focus on rational functions and learn about their unique featuresincluding three different types of asymptotes. Finally, you will put it all together and learn how to graph rationalfunctions by hand.
78
www.ck12.org Chapter 2. Polynomials and Rational Functions
2.1 Factoring Review
Here you will review factoring techniques from Algebra 1 and 2 in preparation for more advanced factoring tech-niques. The review will include factoring out a greatest common factor, factoring into binomials and the differenceof squares.
To factor means to write an expression as a product instead of a sum. Factoring is particularly useful when solvingequations set equal to zero because then logically at least one factor must be equal to zero. In PreCalculus, youshould be able to factor even when there is no obvious greatest common factor or the difference is not between twoperfect squares.
How do you use the difference of perfect squares factoring technique on polynomials that don’t contain perfectsquares and why would this be useful?
Watch This
MEDIAClick image to the left for more content.
http://www.youtube.com/watch?v=EDebmfT5Nsk James Sousa: Factoring: Greatest Common Factor
MEDIAClick image to the left for more content.
http://www.youtube.com/watch?v=0yBDsZvfT0g James Sousa: Factoring: Difference of Squares
MEDIAClick image to the left for more content.
http://www.youtube.com/watch?v=cWapvAWXdoY James Sousa: Factoring: Basic Trinomials with a=1
79
2.1. Factoring Review www.ck12.org
Guidance
A polynomial is a sum of a finite number of terms. Each term consists of a constant that multiplies a variable. Thevariable may only be raised to a non-negative exponent. The letters a,b,c . . . in the following general polynomialexpression stand for regular numbers like 0,5,−1
4 ,√
2 and the x represents the variable.
axn +bxn−1 + . . .+ f x2 +gx+h
You have already learned many properties of polynomials. For example, you know the commutative property whichstates that terms of a polynomial can be rearranged to create an equivalent polynomial. When two polynomialsare added, subtracted or multiplied the result is always a polynomial. This means polynomials are closed underaddition, and is one of the properties that makes the factoring of polynomials possible. Polynomials are not closedunder division because dividing two polynomials could result in a variable in the denominator, which is a rationalexpression (not a polynomial).
There are three methods for factoring that are essential to master. The first method you should always try is tofactor out the greatest common factor (GCF) of the expression (see Example A). The second method you shouldimplement after factoring out a GCF is to see if you can factor the expression into the product of two binomials (seeExample B). This type of factoring is usually recognizable as a trinomial where x2 has a coefficient of 1. The thirdtype of basic factoring is the difference of squares. It is recognizable as one square monomial being subtracted fromanother square monomial.
The rigor of the following factoring examples and exercises is greater than an introductory level factoring lesson butthe techniques are the same.
Example A
Use the GCF technique to factor the following expression. Check that the factored expression matches the original.
−12 x4 + 7
2 x2−6
Solution: Many students just learning factoring may conclude that the three terms share no factors besides one. How-ever, the name GCF is deceiving because this expression has an infinite number of equivalent expressions many ofwhich are more useful. In order to find these alternative expressions you must strategically factor numbers that areneither the greatest factor nor common to all three terms. In this case, −1
2 is an excellent choice.
−12 x4 + 7
2 x2−6 =−12(x
4−7x2 +12)
In order to check to see that this is an equivalent expression, you need to distribute the −12 . When you distribute, the
first coefficient matches because it just gets multiplied by 1, the second term becomes 72 and the third term becomes
-6.
Example B
Factor the expression from Example A into the product of two binomials and a constant.
−12(x
4−7x2 +12)
Solution: Many students familiar with basic factoring may be initially stuck on a problem like this. However, youshould recognize that beneath the 4th degree and the −1
2 the problem boils down to being able to factor u2− 7u+12 which is just (u−3)(u−4).
Start by rewriting the problem: −12(x
4−7x2 +12)
Then choose a temporary substitution: Let u = x2.
Then substitute and factor away. Remember to substitute back at the end.
80
www.ck12.org Chapter 2. Polynomials and Rational Functions
−12(u2−7u+12) =−1
2(u−3)(u−4)
=−12(x2−3)(x2−4)
This type of temporary substitution that enables you to see the underlying structure of an expression is very commonin calculus.
Example C
Factor the resulting expression from Example B into four linear factors and a constant.
−12(x
2−3)(x2−4)
Solution: Many students may recognize that x2− 4 immediately factors by the difference of squares method to be(x−2)(x+2). This problem asks for more because sometimes the difference of squares method can be applied toexpressions like x2−3 where each term is not a perfect square. The number 3 actually is a square.
3 =(√
3)2
So the expression may be factored to be:
−12
(x−√
3)(
x+√
3)(x−2)(x+2)
Concept Problem Revisited
One reason why it might be useful to completely factor an expression like −12(x
4−7x2 +12) into linear factors is ifyou wanted to find the roots of the function f (x) =−1
2(x4−7x2 +12). The roots are x =±
√3,±2.
You should recognize that x2− 3 can still be thought of as the difference of perfect squares because the number 3
can be expressed as(√
3)2
. Rewriting the number 3 to fit a factoring pattern that you already know is an exampleof using the basic factoring techniques at a PreCalculus level.
Vocabulary
A polynomial is a mathematical expression that is often represented as a sum of terms or a product of factors.
To factor means to rewrite a polynomial expression given as a sum of terms into a product of factors.
Linear factors are expressions of the form ax+b where a and b are real numbers.
Guided Practice
1. Factor the following expression into strictly linear factors if possible. If not possible, explain why.x5
3 −11x3
3 +6x
2. Factor the following expression into strictly linear factors if possible. If not possible, explain why.
−27 x4 + 74
63 x2− 863
3. Factor the following expression into strictly linear factors if possible. If not possible, explain why.
x4 + x2−72
Answers:
1. x5
3 −11x3
3 +6x
81
2.1. Factoring Review www.ck12.org
=13
x(x4−11x2 +18)
=13
x(x2−2)(x2−9)
=13
x(x+√
2)(x−√
2)(x+3)(x−3)
2. −27 x4 + 74
63 x2− 863 . Let u = x2.
=−27
u2 +7463
u− 863
=−27
(u2− 37
9u+
49
)
Factoring through fractions like this can be extremely tricky. You must recognize that −19 and -4 sum to −37
9 andmultiply to 4
9 .
=−27
(u− 1
9
)(u−4)
=−27
(x2− 1
9
)(x2−4)
=−27
(x− 1
3
)(x+
13
)(x−2)(x+2)
3. x4 + x2−72
= (x2−8)(x2 +9)
Notice that (x2− 8) can be written as the difference of perfect squares because 8 =(√
8)2
=(
2√
2)2
. On the
other hand, x2 +9 cannot be written as the difference between squares because the x2 and the 9 are being added notsubtracted. This polynomial cannot be factored into strictly linear factors.
= (x−2√
2)(x+2√
2)(x2 +9)
Practice
Factor each polynomial into strictly linear factors if possible. If not possible, explain why not.
1. x2 +5x+62. x4 +5x2 +63. x4−164. 2x2−205. 3x2 +9x+66. x4
2 −5x2 + 92
7. 2x4
3 −34x2
3 + 323
8. x2− 14
9. x4− 37x2
4 + 94
10. 34 x4− 87
4 x2 +75
82

www.ck12.org Chapter 2. Polynomials and Rational Functions
11. 12 x4− 29
2 x2 +5012. x4
2 −5x2
9 + 118
13. x4− 1336 x2 + 1
3614. How does the degree of a polynomial relate to the number of linear factors?15. If a polynomial does not have strictly linear factors, what does this imply about the type of roots that the
polynomial has?
83

2.2. Advanced Factoring www.ck12.org
2.2 Advanced Factoring
Here you will be exposed to a variety of factoring techniques for special situations. Additionally, you will seealternatives to trial and error for factoring.
The difference of perfect squares can be generalized as a factoring technique. By extension, any differencebetween terms that are raised to an even power likea6− b6 can be factored using the difference of perfect squarestechnique. This is because even powers can always be written as perfect squares:a6−b6 = (a3)2− (b3)2.
What about the sum or difference of terms with matching odd powers? How can those be factored?
Watch This
MEDIAClick image to the left for more content.
http://www.youtube.com/watch?v=55wm2c1xkp0 James Sousa: Factoring: Trinomials using Trial and Error andGrouping
Guidance
Factoring a trinomial of the form ax2 + bx+ c is much more difficult when a 6= 1. In Examples A and B, youwill see how the following expression can be factored using educated guessing and checking and the quadraticformula. Additionally, you will see an algorithm (a step by step procedure) for factoring these types of polynomialswithout guessing. The proof of the algorithm is beyond the scope of this book, but is a reliable technique for gettinga handle on tricky factoring questions of the form:
6x2−13x−28
When you compare the computational difficulty of the three methods, you will see that the algorithm described inExample A is the most efficient.
A second type of advanced factoring technique is factoring by grouping. Suppose you start with an expressionalready in factored form:
(4x+ y)(3x+ z) = 12x2 +4xz+3xy+ yz
Usually when you multiply the factored form of a polynomial, two terms can be combined because they are liketerms. In this case, there are no like terms that can be combined. In Example C, you will see how to factor bygrouping.
The last method of advanced factoring is the sum or difference of terms with matching odd powers. The pattern is:
a3 +b3 = (a+b)(a2−ab+b2)
a3−b3 = (a−b)(a2 +ab+b2)
This method is shown in the guided practice and the pattern is fully explored in the exercises.
84
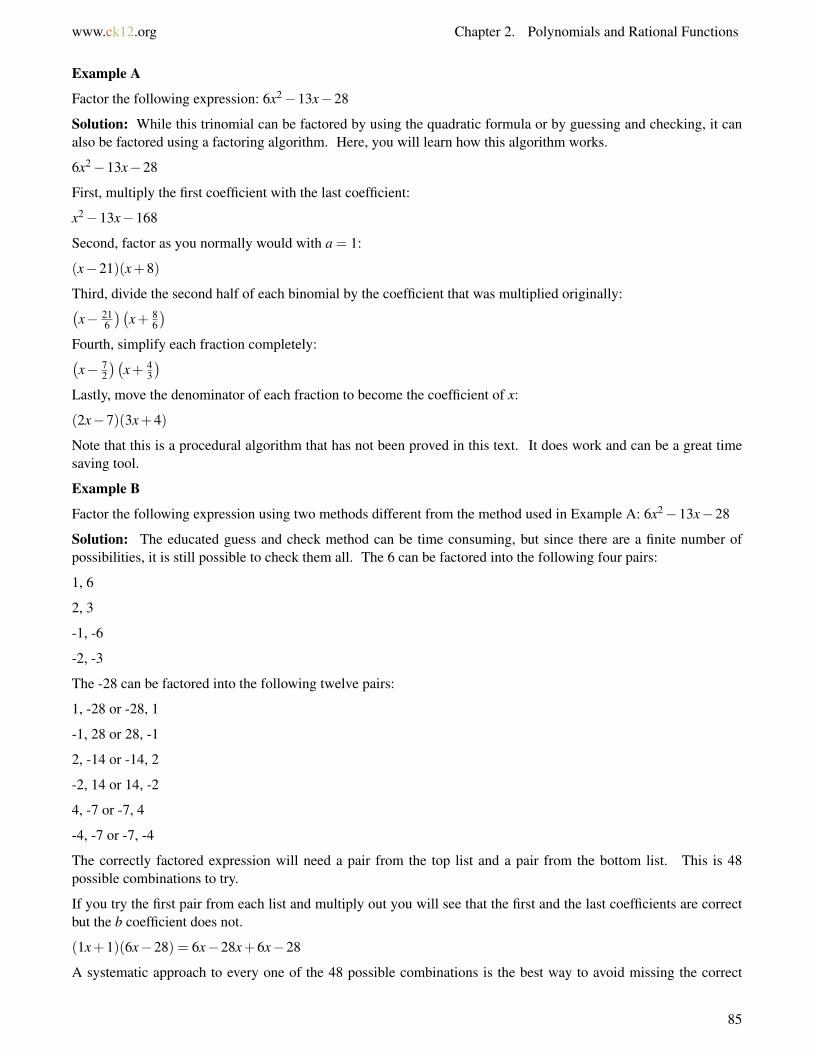
www.ck12.org Chapter 2. Polynomials and Rational Functions
Example A
Factor the following expression: 6x2−13x−28
Solution: While this trinomial can be factored by using the quadratic formula or by guessing and checking, it canalso be factored using a factoring algorithm. Here, you will learn how this algorithm works.
6x2−13x−28
First, multiply the first coefficient with the last coefficient:
x2−13x−168
Second, factor as you normally would with a = 1:
(x−21)(x+8)
Third, divide the second half of each binomial by the coefficient that was multiplied originally:(x− 21
6
)(x+ 8
6
)Fourth, simplify each fraction completely:(x− 7
2
)(x+ 4
3
)Lastly, move the denominator of each fraction to become the coefficient of x:
(2x−7)(3x+4)
Note that this is a procedural algorithm that has not been proved in this text. It does work and can be a great timesaving tool.
Example B
Factor the following expression using two methods different from the method used in Example A: 6x2−13x−28
Solution: The educated guess and check method can be time consuming, but since there are a finite number ofpossibilities, it is still possible to check them all. The 6 can be factored into the following four pairs:
1, 6
2, 3
-1, -6
-2, -3
The -28 can be factored into the following twelve pairs:
1, -28 or -28, 1
-1, 28 or 28, -1
2, -14 or -14, 2
-2, 14 or 14, -2
4, -7 or -7, 4
-4, -7 or -7, -4
The correctly factored expression will need a pair from the top list and a pair from the bottom list. This is 48possible combinations to try.
If you try the first pair from each list and multiply out you will see that the first and the last coefficients are correctbut the b coefficient does not.
(1x+1)(6x−28) = 6x−28x+6x−28
A systematic approach to every one of the 48 possible combinations is the best way to avoid missing the correct
85
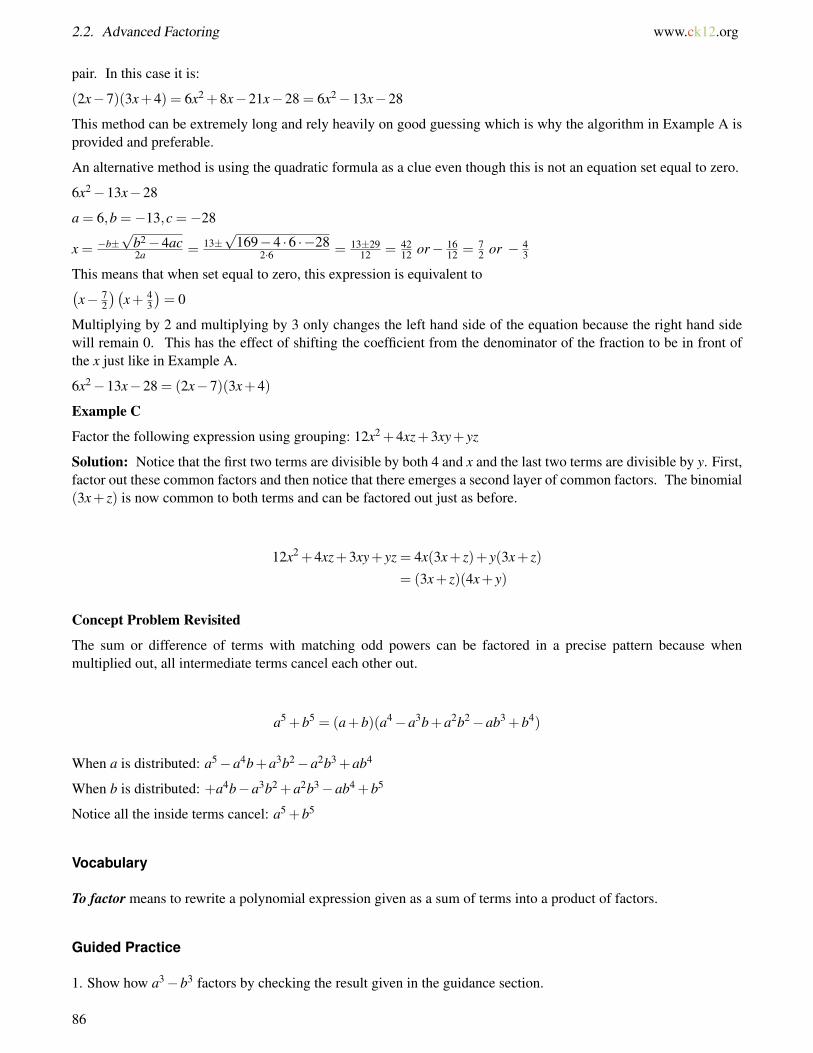
2.2. Advanced Factoring www.ck12.org
pair. In this case it is:
(2x−7)(3x+4) = 6x2 +8x−21x−28 = 6x2−13x−28
This method can be extremely long and rely heavily on good guessing which is why the algorithm in Example A isprovided and preferable.
An alternative method is using the quadratic formula as a clue even though this is not an equation set equal to zero.
6x2−13x−28
a = 6,b =−13,c =−28
x = −b±√
b2−4ac2a = 13±
√169−4 ·6 ·−28
2·6 = 13±2912 = 42
12 or− 1612 = 7
2 or − 43
This means that when set equal to zero, this expression is equivalent to(x− 7
2
)(x+ 4
3
)= 0
Multiplying by 2 and multiplying by 3 only changes the left hand side of the equation because the right hand sidewill remain 0. This has the effect of shifting the coefficient from the denominator of the fraction to be in front ofthe x just like in Example A.
6x2−13x−28 = (2x−7)(3x+4)
Example C
Factor the following expression using grouping: 12x2 +4xz+3xy+ yz
Solution: Notice that the first two terms are divisible by both 4 and x and the last two terms are divisible by y. First,factor out these common factors and then notice that there emerges a second layer of common factors. The binomial(3x+ z) is now common to both terms and can be factored out just as before.
12x2 +4xz+3xy+ yz = 4x(3x+ z)+ y(3x+ z)
= (3x+ z)(4x+ y)
Concept Problem Revisited
The sum or difference of terms with matching odd powers can be factored in a precise pattern because whenmultiplied out, all intermediate terms cancel each other out.
a5 +b5 = (a+b)(a4−a3b+a2b2−ab3 +b4)
When a is distributed: a5−a4b+a3b2−a2b3 +ab4
When b is distributed: +a4b−a3b2 +a2b3−ab4 +b5
Notice all the inside terms cancel: a5 +b5
Vocabulary
To factor means to rewrite a polynomial expression given as a sum of terms into a product of factors.
Guided Practice
1. Show how a3−b3 factors by checking the result given in the guidance section.
86
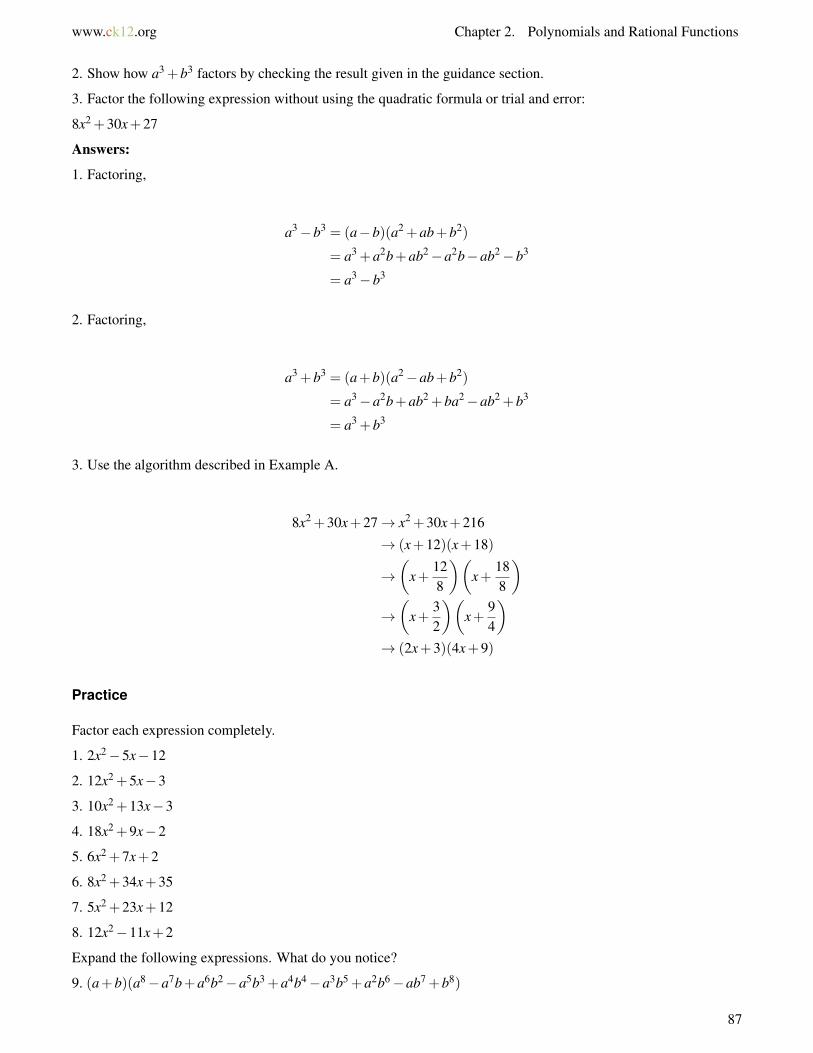
www.ck12.org Chapter 2. Polynomials and Rational Functions
2. Show how a3 +b3 factors by checking the result given in the guidance section.
3. Factor the following expression without using the quadratic formula or trial and error:
8x2 +30x+27
Answers:
1. Factoring,
a3−b3 = (a−b)(a2 +ab+b2)
= a3 +a2b+ab2−a2b−ab2−b3
= a3−b3
2. Factoring,
a3 +b3 = (a+b)(a2−ab+b2)
= a3−a2b+ab2 +ba2−ab2 +b3
= a3 +b3
3. Use the algorithm described in Example A.
8x2 +30x+27→ x2 +30x+216
→ (x+12)(x+18)
→(
x+128
)(x+
188
)→(
x+32
)(x+
94
)→ (2x+3)(4x+9)
Practice
Factor each expression completely.
1. 2x2−5x−12
2. 12x2 +5x−3
3. 10x2 +13x−3
4. 18x2 +9x−2
5. 6x2 +7x+2
6. 8x2 +34x+35
7. 5x2 +23x+12
8. 12x2−11x+2
Expand the following expressions. What do you notice?
9. (a+b)(a8−a7b+a6b2−a5b3 +a4b4−a3b5 +a2b6−ab7 +b8)
87
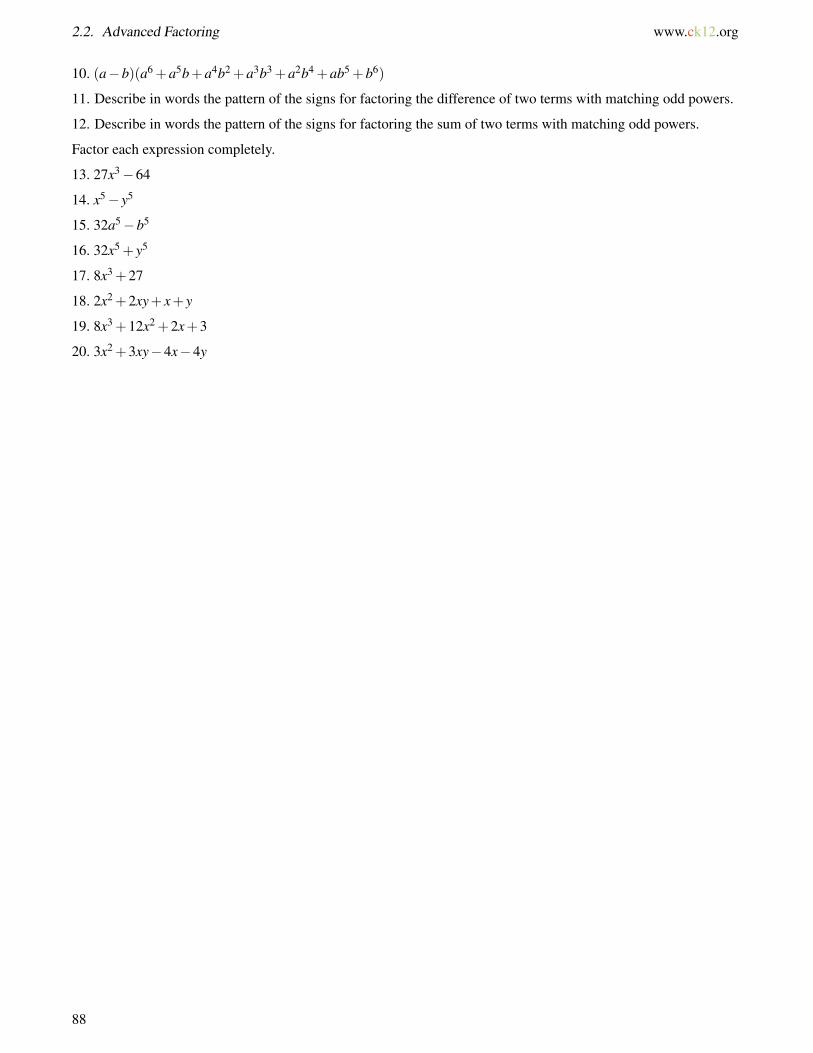
2.2. Advanced Factoring www.ck12.org
10. (a−b)(a6 +a5b+a4b2 +a3b3 +a2b4 +ab5 +b6)
11. Describe in words the pattern of the signs for factoring the difference of two terms with matching odd powers.
12. Describe in words the pattern of the signs for factoring the sum of two terms with matching odd powers.
Factor each expression completely.
13. 27x3−64
14. x5− y5
15. 32a5−b5
16. 32x5 + y5
17. 8x3 +27
18. 2x2 +2xy+ x+ y
19. 8x3 +12x2 +2x+3
20. 3x2 +3xy−4x−4y
88

www.ck12.org Chapter 2. Polynomials and Rational Functions
2.3 Polynomial Expansion and Pascal’s Trian-gle
Here you will explore patterns with binomial and polynomial expansion and find out how to get coefficients usingPascal’s Triangle.
The expression(2x+3)5 would take a while to multiply out. Is there a pattern you can use?
Watch This
MEDIAClick image to the left for more content.
http://www.youtube.com/watch?v=NLQmQGA4a3M James Sousa: The Binomial Theorem Using Pascal’s Triangle
Guidance
Pascal was a French mathematician in the 17th century, but the triangle now named Pascal’s Triangle was studiedlong before Pascal used it. The pattern was used around the 10th century in Persia, India and China as well as manyother places.
The primary purpose for using this triangle is to introduce how to expand binomials.
89

2.3. Polynomial Expansion and Pascal’s Triangle www.ck12.org
(x+ y)0 = 1
(x+ y)1 = x+ y
(x+ y)2 = x2 +2y+ y2
(x+ y)3 = x3 +3x2y+3xy2 + y3
Notice that the coefficients for the x and y terms on the right hand side line up exactly with the numbers from Pascal’striangle. This means that given (x+y)n for any power n you can write out the expansion using the coefficients fromthe triangle. When you study how to count with combinations then you will be able to calculate the value of anycoefficient without writing out the whole triangle.
There are many patterns in the triangle. Here are just a few.
1. Notice the way each number is created by summing the two numbers above on the left and right hand side.2. As you go further down the triangle the values in a row approach a bell curve. This is closely related to the
normal distribution in statistics.3. For any row that has a second term that is prime, all the numbers besides 1 in that row are divisible by that
prime number.4. In the game Plinko where an object is dropped through a triangular array of pegs, the probability (which
corresponds proportionally to the values in the triangle) of landing towards the center is greater than landingtowards the edge. This is because every number in the triangle indicates the number of ways a falling objectcan get to that space through the preceding numbers.
90
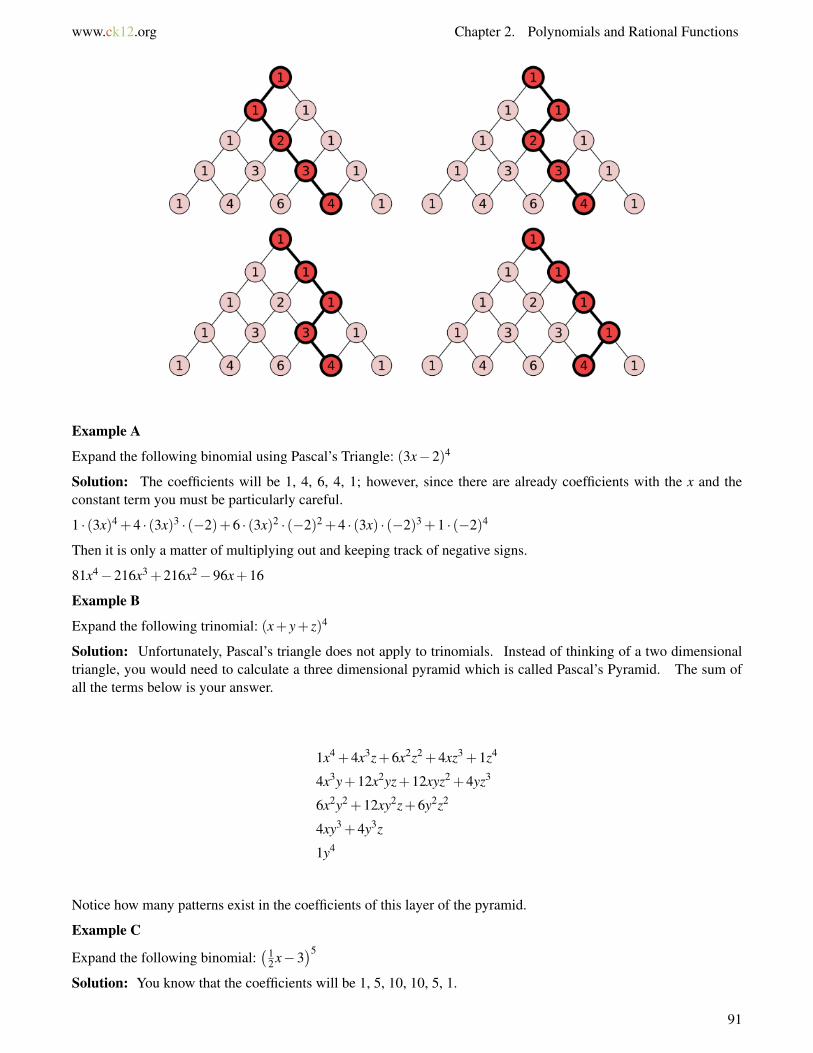
www.ck12.org Chapter 2. Polynomials and Rational Functions
Example A
Expand the following binomial using Pascal’s Triangle: (3x−2)4
Solution: The coefficients will be 1, 4, 6, 4, 1; however, since there are already coefficients with the x and theconstant term you must be particularly careful.
1 · (3x)4 +4 · (3x)3 · (−2)+6 · (3x)2 · (−2)2 +4 · (3x) · (−2)3 +1 · (−2)4
Then it is only a matter of multiplying out and keeping track of negative signs.
81x4−216x3 +216x2−96x+16
Example B
Expand the following trinomial: (x+ y+ z)4
Solution: Unfortunately, Pascal’s triangle does not apply to trinomials. Instead of thinking of a two dimensionaltriangle, you would need to calculate a three dimensional pyramid which is called Pascal’s Pyramid. The sum ofall the terms below is your answer.
1x4 +4x3z+6x2z2 +4xz3 +1z4
4x3y+12x2yz+12xyz2 +4yz3
6x2y2 +12xy2z+6y2z2
4xy3 +4y3z
1y4
Notice how many patterns exist in the coefficients of this layer of the pyramid.
Example C
Expand the following binomial:(1
2 x−3)5
Solution: You know that the coefficients will be 1, 5, 10, 10, 5, 1.
91
2.3. Polynomial Expansion and Pascal’s Triangle www.ck12.org
1(
12
x)5
+5(
12
x)4
(−3)+10(
12
x)3
(−3)2 +10(
12
x)2
(−3)3 +5(
12
x)(−3)4 +1 · (−3)5
=x5
32− 15x4
16+
90x3
8− 270x2
4+
405x2−243
Remember to simplify fractions.
=x5
32− 15x4
16+
45x3
4− 135x2
2+
405x2−243
Concept Problem Revisited
Pascal’s triangle allows you to identify that the coefficients of (2x+ 3)5 will be 1, 5, 10, 10, 5, 1 like in ExampleC. By carefully substituting, the expansion will be:
1 · (2x)5 +5 · (2x)4 ·3+10 · (2x)3 ·32 +10 · (2x2) ·33 +5(2x)1 ·34 +35
Simplifying is a matter of arithmetic, but most of the work is done thanks to the patterns of Pascal’s Triangle.
Vocabulary
A binomial expansion is a polynomial that can be factored as the power of a binomial.
Pascal’s Triangle is a triangular array of numbers that describes the coefficients in a binomial expansion.
Guided Practice
1. Factor the following polynomial by recognizing the coefficients.
x4 +4x3 +6x2 +4x+1
2. Factor the following polynomial by recognizing the coefficients.
8x3−12x2 +6x−1
3. Expand the following binomial using Pascal’s Triangle.
(A−B)6
Answers:
1. (x+1)4
2. Notice that the first term of the binomial must be 2x, the last term must be -1 and the power must be 3. Now allthat remains is to check.
(2x−1)3 = (2x)3 +3(2x)2 · (−1)+3(2x)1(−1)2 +(−1)3 = 8x3−12x2 +6x−1
3. (A−B)6 = A6−6A5B+15A4B2−20A3B3 +15A2B4−6AB5 +B6
92
www.ck12.org Chapter 2. Polynomials and Rational Functions
Practice
Factor the following polynomials by recognizing the coefficients.
1. x2 +2xy+ y2
2. x3 +3x2 +3x+1
3. x5 +5x4 +10x3 +10x2 +5x+1
4. 27x3−27x2 +9x−1
5. x3 +12x2 +48x+64
Expand the following binomials using Pascal’s Triangle.
6. (2x−3)3
7. (3x+4)4
8. (x− y)7
9. (a+b)10
10. (2x+5)5
11. (4x−1)4
12. (5x+2)3
13. (x+ y)6
14. (3x+2y)3
15. (5x−2y)4
93

2.4. Rational Expressions www.ck12.org
2.4 Rational Expressions
Here you will add, subtract, multiply and divide rational expressions in order to help you solve and graph rationalexpressions in the future.
A rational expression is a ratio just like a fraction. Instead of a ratio between numbers, a rational expression is aratio between two expressions. One driving question to ask is:
Are the rules for simplifying and operating on rational expressions are the same as the rules for simplifying andoperating on fractions?
Watch This
MEDIAClick image to the left for more content.
http://www.youtube.com/watch?v=TxbWaDUrYls James Sousa: Simplifying Rational Expressions
MEDIAClick image to the left for more content.
http://www.youtube.com/watch?v=5mcwdhoRSOc James Sousa: Multiplying and Dividing Rational Expressions
MEDIAClick image to the left for more content.
http://www.youtube.com/watch?v=mJ6qOMno4-g James Sousa: Adding and Subtracting Rational Expressions
Guidance
A rational expression is a ratio of two polynomial expressions. When simplifying or operating on rational expres-sions, it is vital that each polynomial be fully factored. Once all expressions are factored, identical factors in the
94

www.ck12.org Chapter 2. Polynomials and Rational Functions
numerator and denominator may be canceled. The reason they can be “canceled” is that any expression divided byitself is equal to 1. An identical expression in the numerator and denominator is just an expression being divided byitself, and so equals 1.
• To multiply rational expressions, you should write the product of all the numerator factors over the product ofall the denominator factors and then cancel identical factors.
• To divide rational expressions, you should rewrite the division problem as a multiplication problem. Multiplythe first rational expression by the reciprocal of the second rational expression. Follow the steps above formultiplying.
To add or subtract rational expressions, it is essential to first find a common denominator. While any commondenominator will work, using the least common denominator is a means of keeping the number of additionalfactors under control. Look at each rational expression you are working with and identify your desired commondenominator. Multiply each expression by an appropriate clever form of 1 and then you should have your commondenominator.
In both multiplication and division problems answers are most commonly left entirely factored to demonstrateeverything has been reduced appropriately. In addition and subtraction problems the numerator must be multi-plied, combined and then re-factored. Example B shows you how to finish an addition and subtraction problemappropriately.
Example A
Simplify the following rational expression.
x2 +7x+12x2 +4x+3
· x2 +9x+82x2−128
÷ x+4x−8
· 141
Solution: First factor everything. Second, turn division into multiplication (only one term). Third, cancelappropriately which will leave the answer.
=(x+3)(x+4)(x+3)(x+1)
· (x+8)(x+1)2(x+8)(x−8)
· (x−8)(x+4)
· 141
=(((((
(((x+3)(x+4)
((((((((x+3)(x+1)
· ((((((
((x+8)(x+1)2((((
((((x+8)(x−8)·����(x−8)���
�(x+4)· 14
1
=142
= 7
In this example, the strike through is shown. You should use this technique to match up factors in the numeratorand the denominator when simplifying.
Example B
Combine the following rational expressions.
x2−9x4−81
− 4xx2 +9
÷ x−32
Solution:
95

2.4. Rational Expressions www.ck12.org
((((((((x+3)(x−3)
(x2 +9)((((((((x+3)(x−3)
− 4x(x2 +9)
· 2(x−3)
=1
(x2 +9)− 8x
(x2 +9)(x−3)
=(x−3)
(x2 +9)(x−3)− 8x
(x2 +9)(x−3)
=(−7x−3)
(x2 +9)(x−3)
The numerator cannot factor at this point, so in this example there is not a factor that cancels at the end. Rememberthat the sum of perfect squares does not factor.
Example C
Combine the following rational expressions.
1x2 +5x+6
− 1x2−4
+(x−7)(x+5)+5
(x+2)(x−2)(x+3)(x−4)
Solution: First factor everything and decide on a common denominator. While the numerators do not really needto be factored, it is sometimes helpful in simplifying individual expressions before combining them. Note that thenumerator of the expression on the right hand seems factored but it really is not. Since the 5 is not connected tothe rest of the numerator through multiplication, that part of the expression needs to be multiplied out and like termsneed to be combined.
=1
(x+2)(x+3)− 1
(x+2)(x−2)+
x2−2x−35+5(x+2)(x−2)(x+3)(x−4)
=1
(x+2)(x+3)− 1
(x+2)(x−2)+
x2−2x−30(x+2)(x−2)(x+3)(x−4)
Note that the right expression has 4 factors in the denominator while each of the left expressions have two that matchand two that are missing from those four factors. This tells you what you need to multiply each expression by inorder to have the denominators match up.
=(x−2)(x−4)
(x+2)(x−2)(x+3)(x−4)− (x+3)(x−4)
(x+2)(x−2)(x+3)(x−4)+
x2−2x−30(x+2)(x−2)(x+3)(x−4)
Now since the rational expressions have a common denominator, the numerators may be multiplied out and com-bined. Sometimes instead of rewriting an expression repeatedly in mathematics you can use an abbreviation. Inthis case, you can replace the denominator with the letter D and then replace it at the end.
=(x−2)(x−4)− (x+3)(x−4)+ x2−2x−30
D
=x2−6x+8− [x2− x−12]+ x2−2x−30
D
Notice how it is extremely important to use brackets to indicate that the subtraction applies to all the terms of themiddle expression not just x2. This is one of the most common mistakes.
96
www.ck12.org Chapter 2. Polynomials and Rational Functions
=x2−6x+8− x2 + x+12+ x2−2x−30
D
=x2−8x−10
D
After the numerator has been entirely simplified try to factor the remaining expression and see if anything cancelswith the denominator which you now need to replace.
=��
��(x+2)(x−5)��
��(x+2)(x−2)(x+3)(x−4)
=(x−5)
(x−2)(x+3)(x−4)
Concept Problem Revisited
Rational expressions are an extension of fractions and the operations of simplifying, adding, subtracting, multiplyingand dividing work in exactly the same way.
Vocabulary
A rational expression is a ratio of two polynomial expressions.
Guided Practice
1. Simplify the following expression.1
x+1−1
x+21
x−2+1
x+1
2. Subtract the following rational expressions.x−2x+3 −
x3−3x2+8x−242(x+2)(x2−9)
3. Simplify the following expression which has an infinite number of fractions nested within other fractions.−1
2+ −12+ −1
2+ −12+ −1
2+ −12+...
Answers:
1. The expression itself does not look like a rational expression, but it can be rewritten so it is more recogniz-able. Also working with fractions within fractions is an important skill.
97

2.4. Rational Expressions www.ck12.org
=
(1
x+1− 1
x+2
)÷(
1x−2
+1
x+1
)=
[(x+2)
(x+1)(x+2)− (x+1)
(x+1)(x+2)
]÷[
(x+1)(x+1)(x−2)
− (x−2)(x+1)(x−2)
]=
[1
(x+1)(x+2)
]÷[
3(x+1)(x−2)
]=
1(x+1)(x+2)
· (x+1)(x−2)3
=(x−2)3(x+2)
2. Being able to factor effectively is of paramount importance.
=x−2x+3
− x3−3x2 +8x−242(x+2)(x2−9)
=(x−2)(x+3)
− x2(x−3)+8(x−3)2(x+2)(x2−9)
=(x−2)(x+3)
− (x−3)(x2 +8)2(x+2)(x+3)(x−3)
Before subtracting, simplify where possible so you don’t contribute to unnecessarily complicated denominators.
=(x−2)(x+3)
− x2 +82(x+2)(x+3)
The left expression lacks 2(x+2), so multiply both its numerator and denominator by 2(x+2).
=2(x+2)(x−2)2(x+2)(x+3)
− (x2 +8)2(x+2)(x+3)
=2(x2−4)− x2−8
2(x+2)(x+3)
=x2−16
2(x+2)(x+3)
3. It would be an exercise in futility to attempt to try to compute this expression directly. Instead, notice that therepeating nature of the expression lends itself to an extremely nice substitution.
Let −12+ −1
2+ −12+ −1
2+ −12+ −1
2+...
= x
Notice that the red portion of the fraction is exactly the same as the rest of the fraction and so x may be substitutedthere and solved.
98
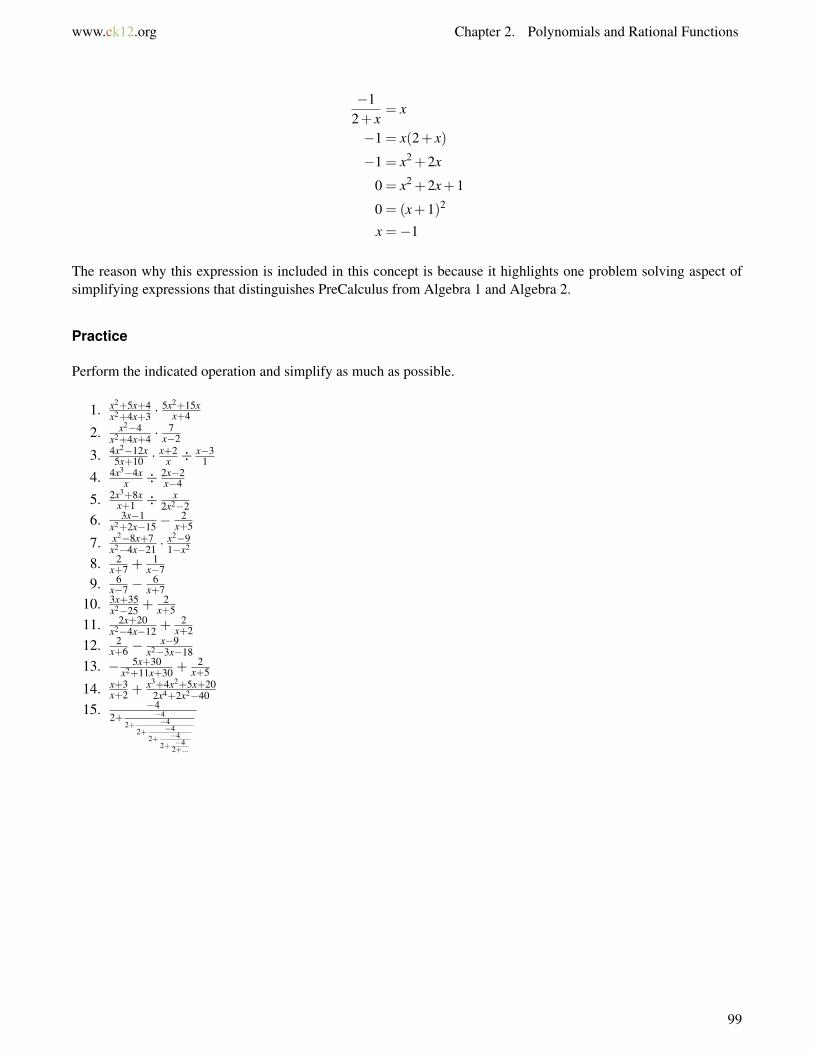
www.ck12.org Chapter 2. Polynomials and Rational Functions
−12+ x
= x
−1 = x(2+ x)
−1 = x2 +2x
0 = x2 +2x+1
0 = (x+1)2
x =−1
The reason why this expression is included in this concept is because it highlights one problem solving aspect ofsimplifying expressions that distinguishes PreCalculus from Algebra 1 and Algebra 2.
Practice
Perform the indicated operation and simplify as much as possible.
1. x2+5x+4x2+4x+3 ·
5x2+15xx+4
2. x2−4x2+4x+4 ·
7x−2
3. 4x2−12x5x+10 ·
x+2x ÷
x−31
4. 4x3−4xx ÷ 2x−2
x−4
5. 2x3+8xx+1 ÷
x2x2−2
6. 3x−1x2+2x−15 −
2x+5
7. x2−8x+7x2−4x−21 ·
x2−91−x2
8. 2x+7 +
1x−7
9. 6x−7 −
6x+7
10. 3x+35x2−25 +
2x+5
11. 2x+20x2−4x−12 +
2x+2
12. 2x+6 −
x−9x2−3x−18
13. − 5x+30x2+11x+30 +
2x+5
14. x+3x+2 +
x3+4x2+5x+202x4+2x2−40
15. −42+ −4
2+ −42+ −4
2+ −42+ −4
2+...
99
2.5. Polynomial Long Division and Synthetic Division www.ck12.org
2.5 Polynomial Long Division and SyntheticDivision
Here you will learn how to perform long division with polynomials. You will see how synthetic division abbreviatesthis process. In addition to mastering this procedure, you will see the how the remainder root theorem and therational root theorem operate.
While you may be experienced in factoring, there will always be polynomials that do not readily factor using basicor advanced techniques. How can you identify the roots of these polynomials?
Watch This
MEDIAClick image to the left for more content.
http://www.youtube.com/watch?v=brpNxPAkv1c James Sousa: Dividing Polynomials-Long Division
MEDIAClick image to the left for more content.
http://www.youtube.com/watch?v=5dBAdzl2Mns James Sousa: Dividing Polynomials-Synthetic Division
Guidance
There are numerous theorems that point out relationships between polynomials and their factors. For examplethere is a theorem that a polynomial of degree n must have exactly n solutions/factors that may or may not be realnumbers. The Rational Root Theorem and the Remainder Theorem are two theorems that are particularly usefulstarting places when manipulating polynomials.
• The Rational Root Theorem states that in a polynomial, every rational solution can be written as a reducedfraction
(x = p
q
), where p is an integer factor of the constant term and q is an integer factor of the leading
coefficient. Example A shows how all the possible rational solutions can be listed using the Rational RootTheorem.
• The Remainder Theorem states that the remainder of a polynomial f (x) divided by a linear divisor (x− a)is equal to f (a). The Remainder Theorem is only useful after you have performed polynomial long divisionbecause you are usually never given the divisor and the remainder to start. The main purpose of the RemainderTheorem in this setting is a means of double checking your application of polynomial long division. ExampleB shows how the Remainder Theorem is used.
100

www.ck12.org Chapter 2. Polynomials and Rational Functions
Polynomial long division is identical to regular long division. Synthetic division is a condensed version of regularlong division where only the coefficients are kept track of. In Example B polynomial long division is used and inExample C synthetic long division is used.
Example A
Identify all possible rational solutions of the following polynomial using the Rational Root Theorem.
12x18−91x17 + x16 + · · ·+2x2−14x+5 = 0
Solution: The integer factors of 12 are and 1, 2, 3, 4, 6 and 12. The integer factors of 5 are 1, 5. Since pairs offactors could both be negative, remember to include ±.
± pq = 1
1 ,15 ,
21 ,
25 ,
31 ,
35 ,
41 ,
45 ,
61 ,
65 ,
121 ,
125
While narrowing the possible solutions down to 24 possible rational answers may not seem like a big improvement,it surely is. This is especially true considering there are only a handful of integer solutions. If this question requiredyou to find a solution, then the Rational Root Theorem would give you a great starting place.
Example B
Use Polynomial Long Division to divide:x3+2x2−5x+7
x−3
Solution: First note that it is clear that 3 is not a root of the polynomial because of the Rational Root Theorem andso there will definitely be a remainder. Start a polynomial long division question by writing the problem like a longdivision problem with regular numbers:
x−3)x3 +2x2−5x+7
Just like with regular numbers ask yourself “how many times does x go into x3?” which in this case is x2.
x2
x−3)x3+2x2−5x+7
Now multiply the x2 by x−3 and copy below. Remember to subtract the entire quantity.
x2
x−3)x3+2x2−5x+7
−(x3−3x2)
Combine the rows, bring down the next number and repeat.
x2+5x+10
x−3)x3+2x2−5x+7
−(x3−3x2)
5x2−5x
−(5x2−15x)
10x+7
−(10x−30)
37
The number 37 is the remainder. There are two things to think about at this point. First, interpret in an equation:x3+2x2−5x+7
x−3 = (x2 +5x+10)+ 37x−3
101
2.5. Polynomial Long Division and Synthetic Division www.ck12.org
Second, check your result with the Remainder Theorem which states that the original function evaluated at 3 mustbe 37. Notice the notation indicating to substitute 3 in for x.
(x3 +2x2−5x+7)|x=3= 33 +2 ·32−5 ·3+7 = 27+18−15+7 = 37
Example C
Use Synthetic Division to divide the same rational expression as the previous example.
Solution: Synthetic division is mostly used when the leading coefficients of the numerator and denominator areequal to 1 and the divisor is a first degree binomial.x3+2x2−5x+7
x−3
Instead of continually writing and rewriting the x symbols, synthetic division relies on an ordered spacing.
+3)1 2 −5 7
Notice how only the coefficients for the denominator are used and the divisor includes a positive three rather thana negative three. The first coefficient is brought down and then multiplied by the three to produce the value whichgoes beneath the 2.
+3)1 2 −5 7
↓ 3
1
Next the new column is added. 2+ 3 = 5, which goes beneath the 2nd column. Now, multiply 5 ·+3 = 15, whichgoes underneath the -5 in the 3rd column. And the process repeats. . .
+3)1 2 −5 7
↓ 3 15 30
1 5 10 37
The last number, 37, is the remainder. The three other numbers represent the quadratic that is identical to thesolution to Example B.
1x2 +5x+10
Concept Problem Revisited
Identifying roots of polynomials by hand can be tricky business. The best way to identify roots is to use the rationalroot theorem to quickly identify likely candidates for solutions and then use synthetic or polynomial long divisionto quickly and effectively test them to see if their remainders are truly zero.
Vocabulary
Polynomial long division is a procedure with rules identical to regular long division. The only difference is thedividend and divisor are polynomials.
Synthetic division is an abbreviated version of polynomial long division where only coefficients are used.
Guided Practice
1. Divide the following polynomials.
102

www.ck12.org Chapter 2. Polynomials and Rational Functions
x3+2x2−4x+8x−2
2. Completely factor the following polynomial.
x4 +6x3 +3x2−26x−24
3. Divide the following polynomials.3x5−2x2+10x−5
x−1
Answers:
1. x3+2x2−4x+8x−2 = x2 +4x+4+ 16
x−2
2. Notice that possible roots are ±1,2,3,4,6,8,24. Of these 14 possibilities, four will yield a remainder ofzero. When you find one, repeat the process.
x4 +6x3 +3x2−26x−24
= (x+1)(x3 +5x2−2x−4)
= (x+1)(x−2)(x2 +7x+12)
= (x+1)(x−2)(x+3)(x+4)
3. 3x5−2x2+10x−5x−1 = 3x4 +3x3 +3x2 + x+11+ 6
x−1
Practice
Identify all possible rational solutions of the following polynomials using the Rational Root Theorem.
1. 15x14−12x13 + x12 + · · ·+2x2−5x+5 = 0
2. 18x11 +42x10 + x9 + · · ·+ x2−3x+7 = 0
3. 12x16 +11x15 +3x14 + · · ·+6x2−2x+11 = 0
4. 14x7−7x6 + x5 + · · ·+ x2 +6x+3 = 0
5. 9x9−10x8 +3x7 + · · ·+4x2−2x+2 = 0
Completely factor the following polynomials.
6. 2x4− x3−21x2−26x−8
7. x4 +7x3 +5x2−31x−30
8. x4 +3x3−8x2−12x+16
9. 4x4 +19x3−48x2−117x−54
10. 2x4 +17x3−8x2−173x+210
Divide the following polynomials.
11. x4+7x3+5x2−31x−30x+4
12. x4+7x3+5x2−31x−30x+2
13. x4+3x3−8x2−12x+16x+3
14. 2x4−x3−21x2−26x−8x3−x2−10x−8
15. x4+8x3+3x2−32x−28x3+10x2+23x+14
103
2.6. Solving Rational Equations www.ck12.org
2.6 Solving Rational Equations
Here you will extend your knowledge of linear and quadratic equations to rational equations in general. You willgain insight as to what extraneous solutions are and how to identify them.
The techniques for solving rational equations are extensions of techniques you already know. Recall that whenthere are fractions in an equation you can multiply through by the denominator to clear the fraction. The sametechnique helps turn rational expressions into polynomials that you already know how to solve. When you multiplyby a constant there is no problem, but when you multiply through by a value that varies and could possibly be zerointeresting things happen.
Since every equation is trivially true when both sides are multiplied by zero, how do you account for this whensolving rational equations?
Watch This
MEDIAClick image to the left for more content.
http://www.youtube.com/watch?v=MMORnvhR4wA James Sousa: Solving Rational Equations
Guidance
The first step in solving rational equations is to transform the equation into a polynomial equation. This isaccomplished by clearing the fraction which means multiplying the entire equation by the common denominatorof all the rational expressions. Then you should solve using what you already know. The last thing to check onceyou have the solutions is that they do not make the denominators of any part of the equation equal to zero whensubstituted back into the original equation. If so, that solution is called extraneous and is a “fake” solution that wasintroduced when both sides of the equation were multiplied by a number that happened to be zero.
Example A
Solve the following rational equation.
x− 5x+3 = 12
Solution: Multiply all parts of the equation by (x+3), the common denominator.
104

www.ck12.org Chapter 2. Polynomials and Rational Functions
x(x+3)−5 = 12(x+3)
x2 +3x−5−12x−36 = 0
x2−9x−41 = 0
x =−(−9)±
√(−9)2−4 ·1 · (−41)
2 ·1
x =9±7
√5
2
The only potential extraneous solution would have been -3, so both answers are possible.
Example B
Solve the following rational equation3x
x+4 −1
x+2 =− 2x2+6x+8
Solution: Multiply each part of the equation by the common denominator of x2 +6x+8 = (x+2)(x+4).
(x+2)(x+4)[
3xx+4
− 1x+2
]=
[−2
(x+2)(x+4)
](x+2)(x+4)
3x(x+2)− (x+4) =−2
3x2 +6x− x−2 = 0
3x2 +5x−2 = 0
(3x−1)(x+2) = 0
x =13,−2
Note that -2 is an extraneous solution. The only actual solution is x = 13 .
Example C
Solve the following rational equation for y.
x = 2+ 12+ 1
y+1
Solution: This question can be done multiple ways. You can use the clearing fractions technique twice.
(2+
1y+1
)x =
[2+
12+ 1
y+1
](2+
1y+1
)2x+
xy+1
= 2(
2+1
y+1
)+1
2x+x
y+1= 4+
2y+1
+1
(y+1)[
2x+x
y+1
]=
[5+
2y+1
](y+1)
2x(y+1)+ x = 5(y+1)+2
2xy+2x+ x = 5y+5+2
Now just get the y variable to one side of the equation and everything else to the other side.
105
2.6. Solving Rational Equations www.ck12.org
2xy−5y =−3x+7
y(2x−5) =−3x+7
y =−3x+72x−5
Concept Problem Revisited
In order to deal with extra solutions introduced when both sides of an equation are multiplied by a variable, youmust check each solution to see if it makes the denominator of any fraction in the original equation zero. If it does,it is called an extraneous solution.
Vocabulary
An extraneous solution is a “fake” solution to a rational equation that is introduced when both sides of an equationare multiplied through by zero.
A rational equation is an equation with at least one rational expression.
A rational expression is a ratio of two polynomial expressions.
Guided Practice
1. Solve the following rational equation.3x
x−5 +4 = x
2. In electrical circuits, resistance can be solved for using rational expressions. This is an electric circuit diagramwith three resistors. The first resistor R1 is run in series to the other two resistors R2 and R3 which are run inparallel. If the total resistance R is 100 ohms and R1 and R3 are each 22 ohms, what is the resistance of R2?
The equation of value is:
R = R1 +R2R3
R2 +R3
106
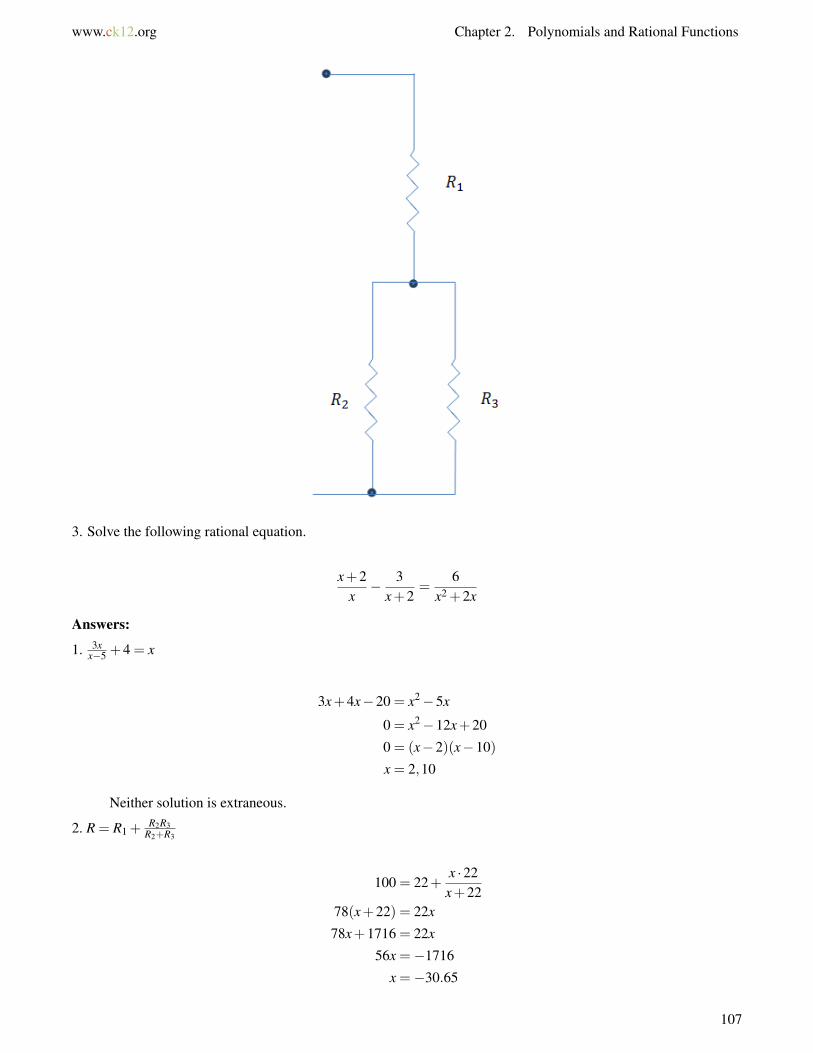
www.ck12.org Chapter 2. Polynomials and Rational Functions
3. Solve the following rational equation.
x+2x− 3
x+2=
6x2 +2x
Answers:
1. 3xx−5 +4 = x
3x+4x−20 = x2−5x
0 = x2−12x+20
0 = (x−2)(x−10)
x = 2,10
Neither solution is extraneous.
2. R = R1 +R2R3
R2+R3
100 = 22+x ·22x+22
78(x+22) = 22x
78x+1716 = 22x
56x =−1716
x =−30.65
107
2.6. Solving Rational Equations www.ck12.org
A follow up question would be to ask whether or not ohms can be negative which is beyond the scope of thistext.
3. x+2x −
3x+2 = 6
x2+2x
(x+2)(x+2)−3x = 6
x2 +4x+4−3x−6 = 0
x2 + x−2 = 0
(x+2)(x−1) = 0
x =−2,1
Note that -2 is an extraneous solution.
Practice
Solve the following rational equations. Identify any extraneous solutions.
1. 2x−4x = 16
x2. 4
x+1 −x
x+1 = 23. 5
x+3 +2
x−3 = 14. 3
x−4 −5
x+4 = 65. x
x+1 −6
x+2 = 46. x
x−4 −4
x−4 = 87. 4x
x−2 +3 = 18. −2x
x+1 +6 =−x9. 1
x+2 +1 =−2x10. −6x−3
x+1 −3 =−4x11. x+3
x −3
x+3 = 6x2+3x
12. x−4x −
2x−4 = 8
x2−4x13. x+6
x −2
x+6 = 12x2+6x
14. x+5x −
3x+5 = 15
x2+5x15. Explain what it means for a solution to be extraneous.
108
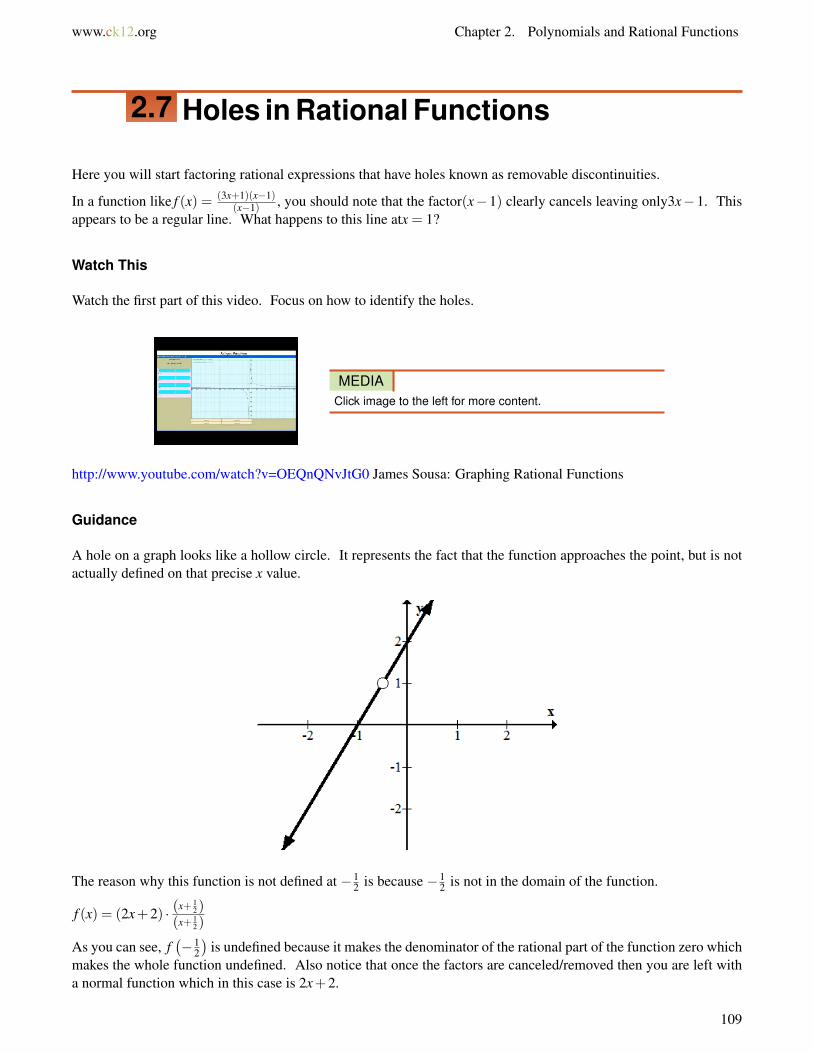
www.ck12.org Chapter 2. Polynomials and Rational Functions
2.7 Holes in Rational Functions
Here you will start factoring rational expressions that have holes known as removable discontinuities.
In a function like f (x) = (3x+1)(x−1)(x−1) , you should note that the factor(x−1) clearly cancels leaving only3x−1. This
appears to be a regular line. What happens to this line atx = 1?
Watch This
Watch the first part of this video. Focus on how to identify the holes.
MEDIAClick image to the left for more content.
http://www.youtube.com/watch?v=OEQnQNvJtG0 James Sousa: Graphing Rational Functions
Guidance
A hole on a graph looks like a hollow circle. It represents the fact that the function approaches the point, but is notactually defined on that precise x value.
The reason why this function is not defined at −12 is because −1
2 is not in the domain of the function.
f (x) = (2x+2) · (x+ 12)
(x+ 12)
As you can see, f(−1
2
)is undefined because it makes the denominator of the rational part of the function zero which
makes the whole function undefined. Also notice that once the factors are canceled/removed then you are left witha normal function which in this case is 2x+2.
109
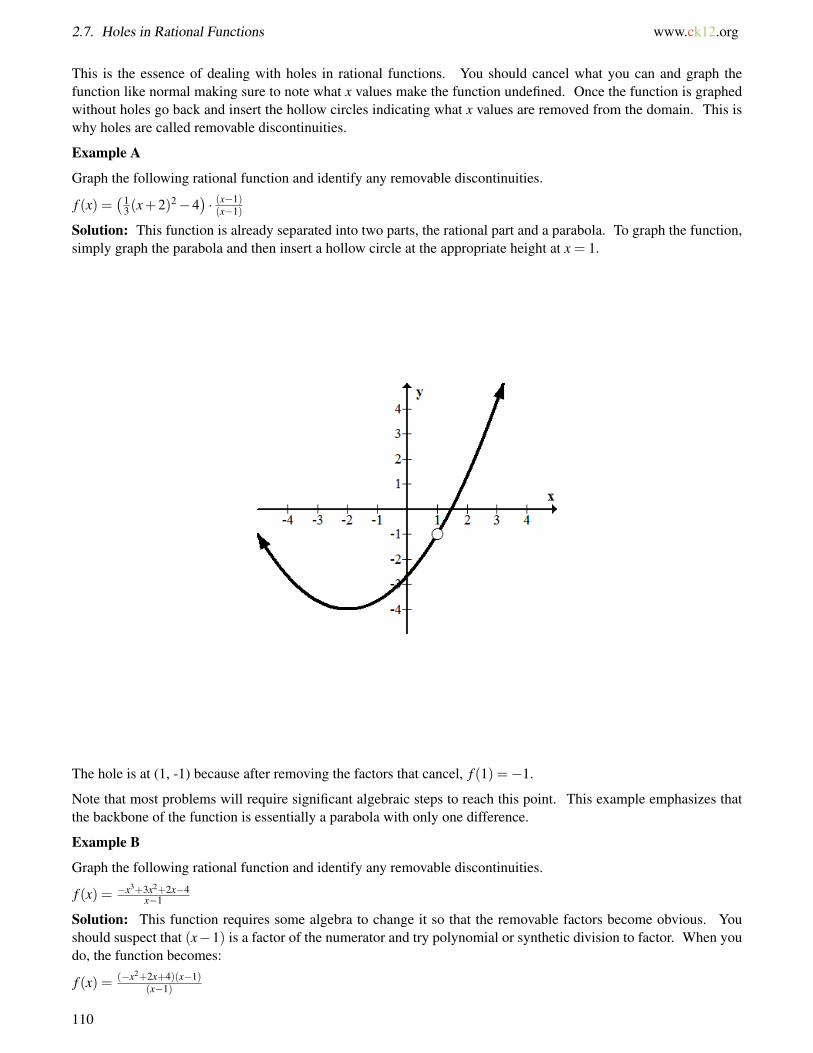
2.7. Holes in Rational Functions www.ck12.org
This is the essence of dealing with holes in rational functions. You should cancel what you can and graph thefunction like normal making sure to note what x values make the function undefined. Once the function is graphedwithout holes go back and insert the hollow circles indicating what x values are removed from the domain. This iswhy holes are called removable discontinuities.
Example A
Graph the following rational function and identify any removable discontinuities.
f (x) =(1
3(x+2)2−4)· (x−1)(x−1)
Solution: This function is already separated into two parts, the rational part and a parabola. To graph the function,simply graph the parabola and then insert a hollow circle at the appropriate height at x = 1.
The hole is at (1, -1) because after removing the factors that cancel, f (1) =−1.
Note that most problems will require significant algebraic steps to reach this point. This example emphasizes thatthe backbone of the function is essentially a parabola with only one difference.
Example B
Graph the following rational function and identify any removable discontinuities.
f (x) = −x3+3x2+2x−4x−1
Solution: This function requires some algebra to change it so that the removable factors become obvious. Youshould suspect that (x−1) is a factor of the numerator and try polynomial or synthetic division to factor. When youdo, the function becomes:
f (x) = (−x2+2x+4)(x−1)(x−1)
110
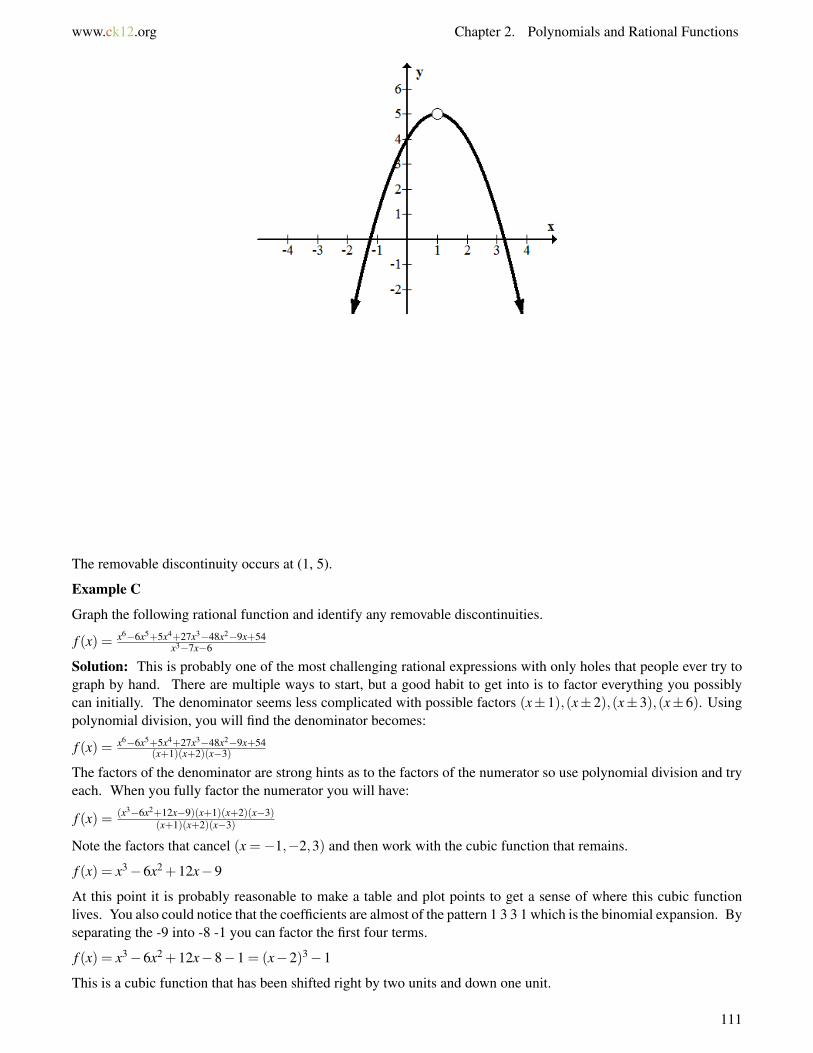
www.ck12.org Chapter 2. Polynomials and Rational Functions
The removable discontinuity occurs at (1, 5).
Example C
Graph the following rational function and identify any removable discontinuities.
f (x) = x6−6x5+5x4+27x3−48x2−9x+54x3−7x−6
Solution: This is probably one of the most challenging rational expressions with only holes that people ever try tograph by hand. There are multiple ways to start, but a good habit to get into is to factor everything you possiblycan initially. The denominator seems less complicated with possible factors (x±1),(x±2),(x±3),(x±6). Usingpolynomial division, you will find the denominator becomes:
f (x) = x6−6x5+5x4+27x3−48x2−9x+54(x+1)(x+2)(x−3)
The factors of the denominator are strong hints as to the factors of the numerator so use polynomial division and tryeach. When you fully factor the numerator you will have:
f (x) = (x3−6x2+12x−9)(x+1)(x+2)(x−3)(x+1)(x+2)(x−3)
Note the factors that cancel (x =−1,−2,3) and then work with the cubic function that remains.
f (x) = x3−6x2 +12x−9
At this point it is probably reasonable to make a table and plot points to get a sense of where this cubic functionlives. You also could notice that the coefficients are almost of the pattern 1 3 3 1 which is the binomial expansion. Byseparating the -9 into -8 -1 you can factor the first four terms.
f (x) = x3−6x2 +12x−8−1 = (x−2)3−1
This is a cubic function that has been shifted right by two units and down one unit.
111
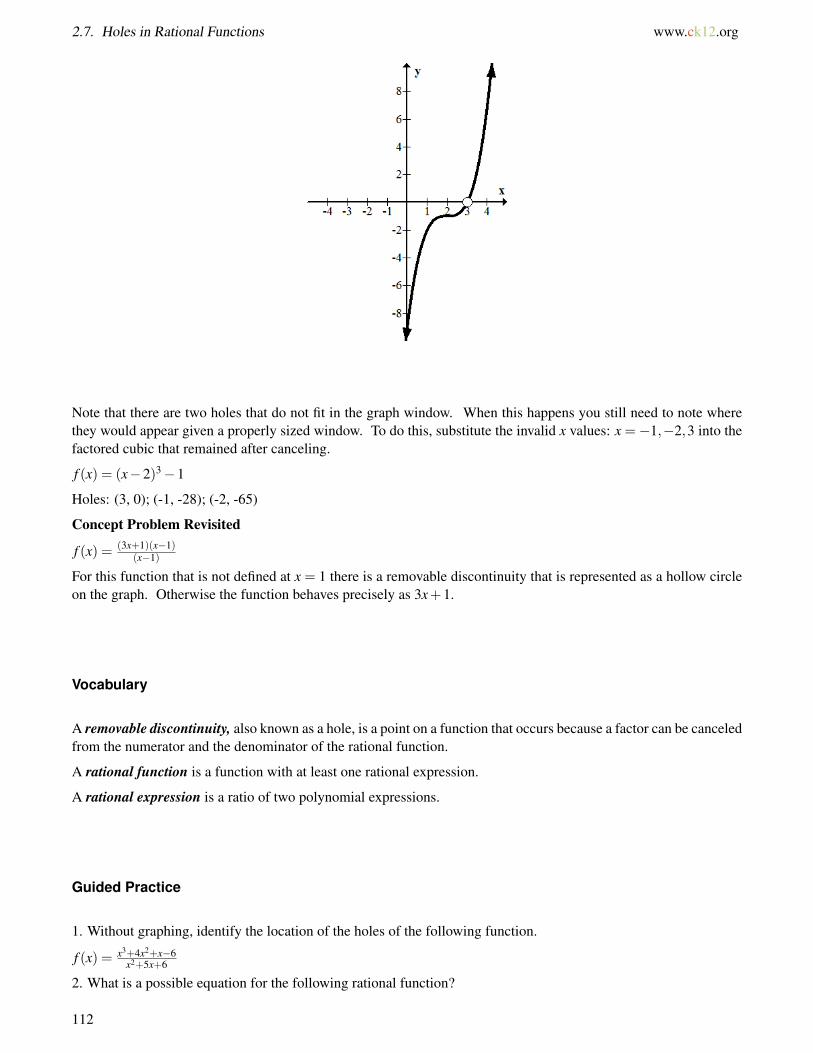
2.7. Holes in Rational Functions www.ck12.org
Note that there are two holes that do not fit in the graph window. When this happens you still need to note wherethey would appear given a properly sized window. To do this, substitute the invalid x values: x =−1,−2,3 into thefactored cubic that remained after canceling.
f (x) = (x−2)3−1
Holes: (3, 0); (-1, -28); (-2, -65)
Concept Problem Revisited
f (x) = (3x+1)(x−1)(x−1)
For this function that is not defined at x = 1 there is a removable discontinuity that is represented as a hollow circleon the graph. Otherwise the function behaves precisely as 3x+1.
Vocabulary
A removable discontinuity, also known as a hole, is a point on a function that occurs because a factor can be canceledfrom the numerator and the denominator of the rational function.
A rational function is a function with at least one rational expression.
A rational expression is a ratio of two polynomial expressions.
Guided Practice
1. Without graphing, identify the location of the holes of the following function.
f (x) = x3+4x2+x−6x2+5x+6
2. What is a possible equation for the following rational function?
112
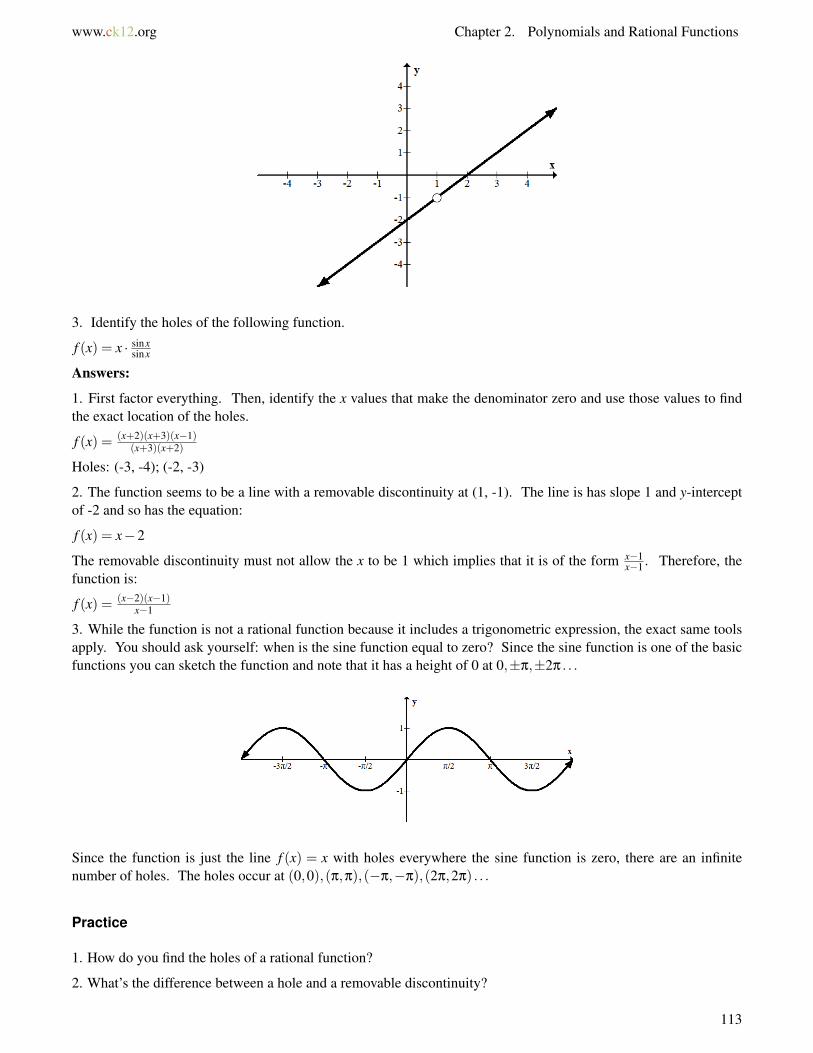
www.ck12.org Chapter 2. Polynomials and Rational Functions
3. Identify the holes of the following function.
f (x) = x · sinxsinx
Answers:
1. First factor everything. Then, identify the x values that make the denominator zero and use those values to findthe exact location of the holes.
f (x) = (x+2)(x+3)(x−1)(x+3)(x+2)
Holes: (-3, -4); (-2, -3)
2. The function seems to be a line with a removable discontinuity at (1, -1). The line is has slope 1 and y-interceptof -2 and so has the equation:
f (x) = x−2
The removable discontinuity must not allow the x to be 1 which implies that it is of the form x−1x−1 . Therefore, the
function is:
f (x) = (x−2)(x−1)x−1
3. While the function is not a rational function because it includes a trigonometric expression, the exact same toolsapply. You should ask yourself: when is the sine function equal to zero? Since the sine function is one of the basicfunctions you can sketch the function and note that it has a height of 0 at 0,±π,±2π . . .
Since the function is just the line f (x) = x with holes everywhere the sine function is zero, there are an infinitenumber of holes. The holes occur at (0,0),(π,π),(−π,−π),(2π,2π) . . .
Practice
1. How do you find the holes of a rational function?
2. What’s the difference between a hole and a removable discontinuity?
113
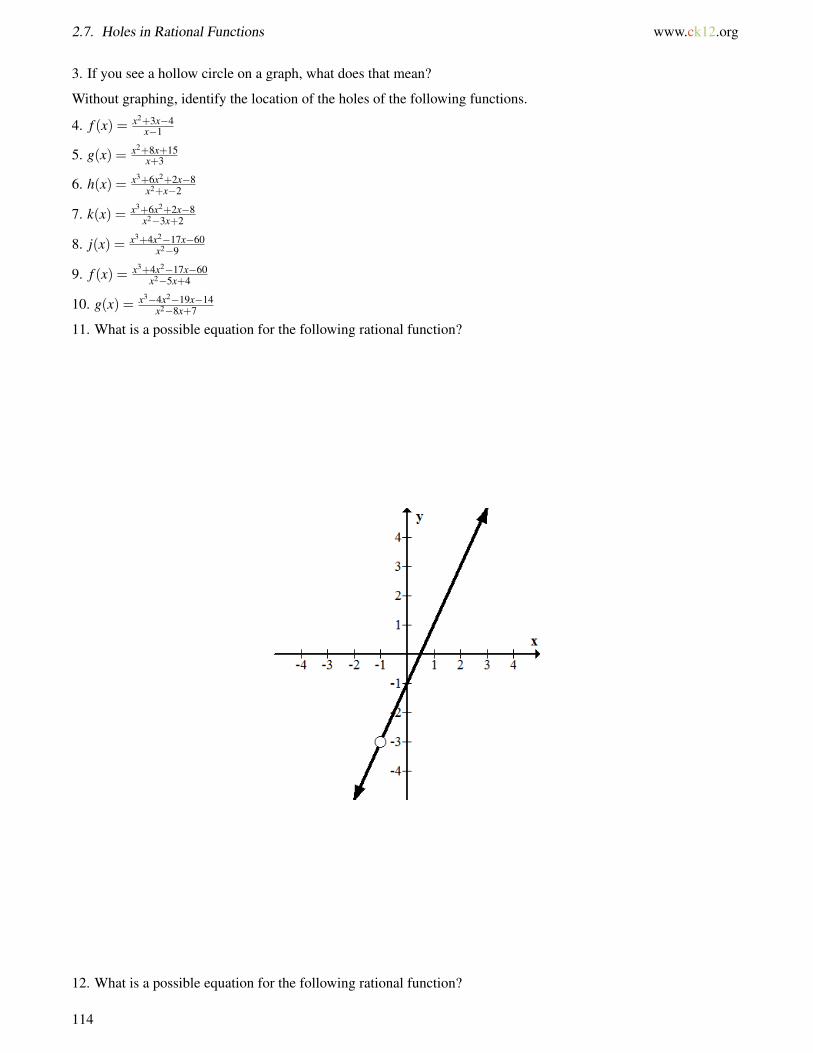
2.7. Holes in Rational Functions www.ck12.org
3. If you see a hollow circle on a graph, what does that mean?
Without graphing, identify the location of the holes of the following functions.
4. f (x) = x2+3x−4x−1
5. g(x) = x2+8x+15x+3
6. h(x) = x3+6x2+2x−8x2+x−2
7. k(x) = x3+6x2+2x−8x2−3x+2
8. j(x) = x3+4x2−17x−60x2−9
9. f (x) = x3+4x2−17x−60x2−5x+4
10. g(x) = x3−4x2−19x−14x2−8x+7
11. What is a possible equation for the following rational function?
12. What is a possible equation for the following rational function?
114

www.ck12.org Chapter 2. Polynomials and Rational Functions
Sketch the following rational functions.
13. f (x) = x3+4x2−17x−60x2−x−12
14. g(x) = x3+4x2−17x−60x2+8x+15
15. h(x) = x3−4x2−19x−14x2−6x−7
115
2.8. Zeroes of Rational Functions www.ck12.org
2.8 Zeroes of Rational Functions
Here you will revisit how to find zeroes of functions by focusing on rational expressions and what to do in specialcases where the zeroes and holes seem to overlap.
The zeroes of a function are the collection of xvalues where the height of the function is zero. How do you findthese values for a rational function and what happens if the zero turns out to be a hole?
Watch This
Focus on the portion of this video discussing holes and x-intercepts.
MEDIAClick image to the left for more content.
http://www.youtube.com/watch?v=UnVZs2EaEjI James Sousa: Find the Intercepts, Asymptotes, and Hole of aRational Function
Guidance
Zeroes are also known as x-intercepts, solutions or roots of functions. They are the x values where the height of thefunction is zero. For rational functions, you need to set the numerator of the function equal to zero and solve for thepossible x values. If a hole occurs on the x value, then it is not considered a zero because the function is not trulydefined at that point.
Example A
Identify the zeroes and holes of the following rational function.
f (x) = (x−1)(x+3)(x+3)x+3
Solution: Notice how one of the x+3 factors seems to cancel and indicate a removable discontinuity. Even thoughthere are two x+3 factors, the only zero occurs at x = 1 and the hole occurs at (-3, 0).
116

www.ck12.org Chapter 2. Polynomials and Rational Functions
Example B
Identify the zeroes, holes and y intercepts of the following rational function without graphing.
f (x) = x(x−2)(x−1)(x+1)(x+1)(x+2)(x−1)(x+1)
Solution: The holes occur at x =−1,1. To get the exact points, these values must be substituted into the functionwith the factors canceled.
f (x) = x(x−2)(x+1)(x+2)
f (−1) = 0, f (1) =−6
The holes are (-1, 0); (1, 6). The zeroes occur at x = 0,2,−2. The zero that is supposed to occur at x = −1 hasalready been demonstrated to be a hole instead.
Example C
Create a function with holes at x = 1,2,3 and zeroes at x = 0,4.
Solution: There are an infinite number of possible functions that fit this description because the function can bemultiplied by any constant. One possible function could be:
f (x) = (x−1)(x−2)(x−3)x(x−4)x(x−4)
Concept Problem Revisited
To find the zeroes of a rational function, set the numerator equal to zero and solve for the x values. When a hole anda zero occur at the same point, the hole wins and there is no zero at that point.
Vocabulary
A zero is where a function crosses the x-axis. It is also known as a root, solution or x-intercept.
A rational function is a function with at least one rational expression.
A rational expression is a ratio of two polynomial expressions.
Guided Practice
1. Create a function with holes instead of zeroes.
2. Identify the y intercepts, holes, and zeroes of the following rational function.
117
2.8. Zeroes of Rational Functions www.ck12.org
f (x) = 6x3−7x2−x+2x−1
3. Identify the zeroes and holes of the following rational function.
f (x) = 2(x+1)(x+1)(x+1)2(x+1)
Answers:
1. There are an infinite number of functions that meet the requirements. An illustrative example would be:
f (x) = (x−1)(x+1) · (x−1)(x+1)(x−1)(x+1)
The two x values that are holes are identical to the two x values that would be zeroes. Therefore, this function hasno zeroes because holes exist in their place.
2. After noticing that a possible hole occurs at x = 1 and using polynomial long division on the numerator youshould get:
f (x) = (6x2− x−2) · x−1x−1
A hole occurs at x = 1 which turns out to be the point (1, 3) because 6 ·12−1−2 = 3.
The y-intercept always occurs where x = 0 which turns out to be the point (0, -2) because f (0) =−2.
To find the x-intercepts you need to factor the remaining part of the function:
(2x+1)(3x−2)
Thus the zeroes (x-intercepts) are x =−12 ,
23 .
3. The hole occurs at x = −1 which turns out to be a double zero. The hole still wins so the point (-1, 0) is ahole. There are no zeroes. The constant 2 in front of the numerator and the denominator serves to illustrate the factthat constant scalars do not impact the x values of either the zeroes or holes of a function.
Practice
Identify the intercepts and holes of each of the following rational functions.
1. f (x) = x3+x2−10x+8x−2
2. g(x) = 6x3−17x2−5x+6x−3
3. h(x) = (x+2)(1−x)x−1
4. j(x) = (x−4)(x+2)(x+2)x+2
5. k(x) = x(x−3)(x−4)(x+4)(x+4)(x+2)(x−3)(x+4)
6. f (x) = x(x+1)(x+1)(x−1)(x−1)(x+1)
7. g(x) = x3−x2−x+1x2−1
8. h(x) = 4−x2
x−29. Create a function with holes at x = 3,5,9 and zeroes at x = 1,2.
10. Create a function with holes at x =−1,4 and zeroes at x = 1.11. Create a function with holes at x = 0,5 and zeroes at x = 2,3.12. Create a function with holes at x =−3,5 and zeroes at x = 4.13. Create a function with holes at x =−2,6 and zeroes at x = 0,3.14. Create a function with holes at x = 1,5 and zeroes at x = 0,6.15. Create a function with holes at x = 2,7 and zeroes at x = 3.
118
www.ck12.org Chapter 2. Polynomials and Rational Functions
2.9 Vertical Asymptotes
Here you will learn to recognize when vertical asymptotes occur and what makes them different from removablediscontinuities.
The basic rational function f (x) = 1x is a hyperbola with a vertical asymptote atx = 0. More complicated rational
functions may have multiple vertical asymptotes. These asymptotes are very important characteristics of the functionjust like holes. Both holes and vertical asymptotes occur at xvalues that make the denominator of the functionzero. A driving question is: what makes vertical asymptotes different from holes?
Watch This
Watch the following video, focusing on the parts about vertical asymptotes.
MEDIAClick image to the left for more content.
http://www.youtube.com/watch?v=wBZxVxiJS9I James Sousa: Determining Horizontal and Vertical Asymptotesof Rational Functions
Guidance
Vertical asymptotes occur when a factor of the denominator of a rational expression does not cancel with a factorfrom the numerator. When you have a factor that does not cancel, instead of making a hole at that x value, thereexists a vertical asymptote. The vertical asymptote is represented by a dotted vertical line. Most calculators will notidentify vertical asymptotes and some will incorrectly draw a steep line as part of a function where the asymptoteactually exists.
Your job is to be able to identify vertical asymptotes from a function and describe each asymptote using the equationof a vertical line.
Example A
Identify the holes and the equations of the vertical asymptotes for the following rational function.
f (x) = (2x−3)(x+1)(x−2)(x+2)(x+1)
Solution: The factor that cancels represents the removable discontinuity. There is a hole at (-1, 15). The verticalasymptote occurs at x =−2 because the factor x+2 does not cancel.
Example B
Identify the domain of the following function and then identify the holes and vertical asymptotes.
f (x) = (3x−4)(1−x)(x2+4)(3x−2)(x−1)
Solution: The domain of the function written in interval notation is:(−∞, 2
3
)∪(2
3 ,1)∪ (1,∞)
119
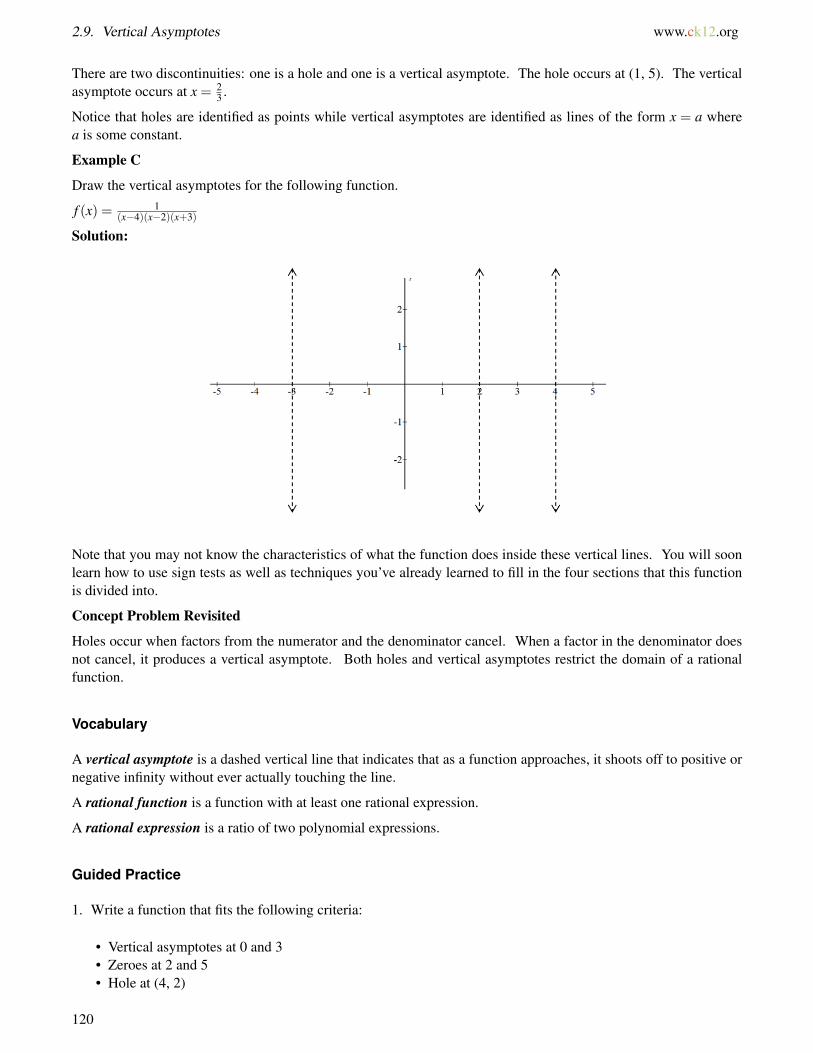
2.9. Vertical Asymptotes www.ck12.org
There are two discontinuities: one is a hole and one is a vertical asymptote. The hole occurs at (1, 5). The verticalasymptote occurs at x = 2
3 .
Notice that holes are identified as points while vertical asymptotes are identified as lines of the form x = a wherea is some constant.
Example C
Draw the vertical asymptotes for the following function.
f (x) = 1(x−4)(x−2)(x+3)
Solution:
Note that you may not know the characteristics of what the function does inside these vertical lines. You will soonlearn how to use sign tests as well as techniques you’ve already learned to fill in the four sections that this functionis divided into.
Concept Problem Revisited
Holes occur when factors from the numerator and the denominator cancel. When a factor in the denominator doesnot cancel, it produces a vertical asymptote. Both holes and vertical asymptotes restrict the domain of a rationalfunction.
Vocabulary
A vertical asymptote is a dashed vertical line that indicates that as a function approaches, it shoots off to positive ornegative infinity without ever actually touching the line.
A rational function is a function with at least one rational expression.
A rational expression is a ratio of two polynomial expressions.
Guided Practice
1. Write a function that fits the following criteria:
• Vertical asymptotes at 0 and 3• Zeroes at 2 and 5• Hole at (4, 2)
120
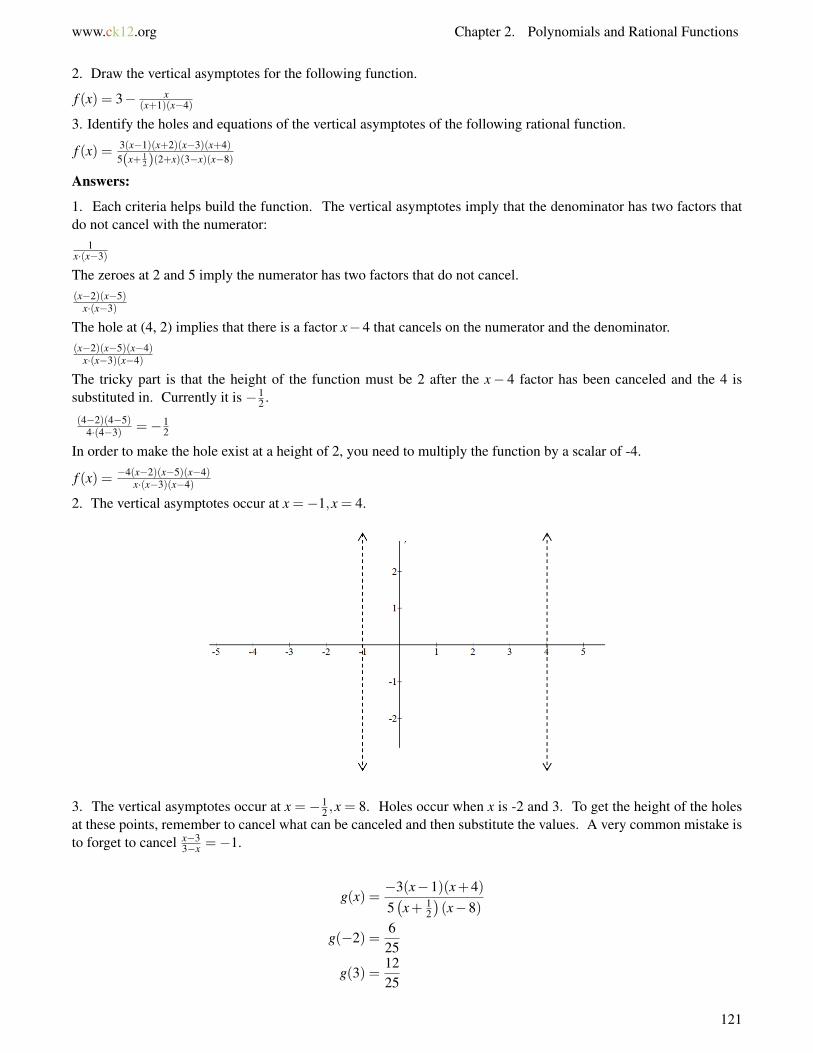
www.ck12.org Chapter 2. Polynomials and Rational Functions
2. Draw the vertical asymptotes for the following function.
f (x) = 3− x(x+1)(x−4)
3. Identify the holes and equations of the vertical asymptotes of the following rational function.
f (x) = 3(x−1)(x+2)(x−3)(x+4)5(x+ 1
2)(2+x)(3−x)(x−8)
Answers:
1. Each criteria helps build the function. The vertical asymptotes imply that the denominator has two factors thatdo not cancel with the numerator:
1x·(x−3)
The zeroes at 2 and 5 imply the numerator has two factors that do not cancel.(x−2)(x−5)
x·(x−3)
The hole at (4, 2) implies that there is a factor x−4 that cancels on the numerator and the denominator.(x−2)(x−5)(x−4)
x·(x−3)(x−4)
The tricky part is that the height of the function must be 2 after the x− 4 factor has been canceled and the 4 issubstituted in. Currently it is −1
2 .(4−2)(4−5)
4·(4−3) =−12
In order to make the hole exist at a height of 2, you need to multiply the function by a scalar of -4.
f (x) = −4(x−2)(x−5)(x−4)x·(x−3)(x−4)
2. The vertical asymptotes occur at x =−1,x = 4.
3. The vertical asymptotes occur at x =−12 ,x = 8. Holes occur when x is -2 and 3. To get the height of the holes
at these points, remember to cancel what can be canceled and then substitute the values. A very common mistake isto forget to cancel x−3
3−x =−1.
g(x) =−3(x−1)(x+4)5(x+ 1
2
)(x−8)
g(−2) =625
g(3) =1225
121
2.9. Vertical Asymptotes www.ck12.org
The holes are at(−2, 6
25
),(3, 12
25
).
Practice
1. Write a function that fits the following criteria:
• Vertical asymptotes at 1 and 4• Zeroes at 3 and 5• Hole at (6, 3)
2. Write a function that fits the following criteria:
• Vertical asymptotes at -2 and 2• Zeroes at 1 and 5• Hole at (3, -4)
3. Write a function that fits the following criteria:
• Vertical asymptotes at 0 and 3• Zeroes at 1 and 2• Hole at (8, 21)
4. Write a function that fits the following criteria:
• Vertical asymptotes at 2 and 6• Zero at 5• Hole at (4, 1)
5. Write a function that fits the following criteria:
• Vertical asymptote at 4• Zeroes at 0 and 3• Hole at (5, 10)
Give the equations of the vertical asymptotes for the following functions.
6. f (x) = (2−x)(x−2)(x−4)
7. g(x) = −x(x+1)(x−3)
8. h(x) = 6− x+2(x+1)(x−5)
9. j(x) = 10x−3 −
x(x+2)(x−3)
10. k(x) = 2− (4−x)(x+3)(x−4)
Identify the holes and equations of the vertical asymptotes of the following rational functions.
11. f (x) = 3(x−1)(x+1)(x−4)(x+4)4(x+4)(2+x)(4−x)(x+1)
12. g(x) = x(x−3)(x−8)(x−3)(x+4)7(x+1)(1+x)(3−x)(x−8)
State the domain of the following rational functions.
13. h(x) = x(x+1)(x−3)(x+4)x(3−x)(x−1)
122

www.ck12.org Chapter 2. Polynomials and Rational Functions
14. j(x) = x2+3x−4x2−6x−16
15. k(x) = 2x−10x3+4x2+3x
123
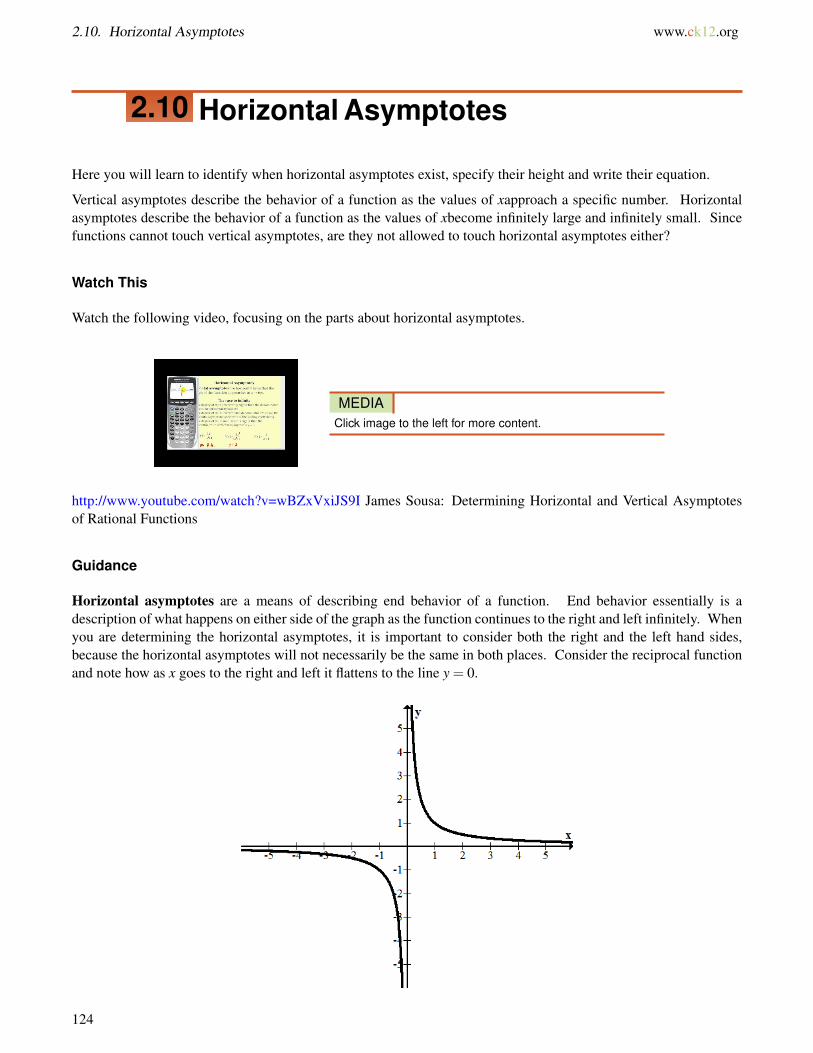
2.10. Horizontal Asymptotes www.ck12.org
2.10 Horizontal Asymptotes
Here you will learn to identify when horizontal asymptotes exist, specify their height and write their equation.
Vertical asymptotes describe the behavior of a function as the values of xapproach a specific number. Horizontalasymptotes describe the behavior of a function as the values of xbecome infinitely large and infinitely small. Sincefunctions cannot touch vertical asymptotes, are they not allowed to touch horizontal asymptotes either?
Watch This
Watch the following video, focusing on the parts about horizontal asymptotes.
MEDIAClick image to the left for more content.
http://www.youtube.com/watch?v=wBZxVxiJS9I James Sousa: Determining Horizontal and Vertical Asymptotesof Rational Functions
Guidance
Horizontal asymptotes are a means of describing end behavior of a function. End behavior essentially is adescription of what happens on either side of the graph as the function continues to the right and left infinitely. Whenyou are determining the horizontal asymptotes, it is important to consider both the right and the left hand sides,because the horizontal asymptotes will not necessarily be the same in both places. Consider the reciprocal functionand note how as x goes to the right and left it flattens to the line y = 0.
124
www.ck12.org Chapter 2. Polynomials and Rational Functions
Sometimes functions flatten out and other times functions increase or decrease without bound. There are basicallythree cases.
Case 1: The first case is the function flattens out to 0 as x gets infinitely large or infinitely small. This happens whenthe degree of the numerator is less than the degree of the denominator. The degree is determined by the greatestexponent of x.
f (x) =2x8 +3x2 +100
x9−12
One way to reason through why this makes sense is because when x is a ridiculously large number then most partsof the function hardly make any impact. The 100 for example is nothing in comparison and neither is the 3x2. Thetwo important terms to compare are x8 and x9. The 2 isn’t even important now because if x is even just a millionthan the x9 will be a million times bigger than the x8 and the 2 hardly matters again. Essentially, when x gets bigenough, this function acts like 1
x which has a horizontal asymptote of 0.
Case 2: The degree of the numerator is equal to the degree of the denominator. In this case, the horizontal asymptoteis equal to the ratio of the leading coefficients.
f (x) =6x4−3x3 +12x2−93x4 +144x−0.001
Notice how the degree of both the numerator and the denominator is 4. This means that the horizontal asymptote isy = 6
3 = 2. One way to reason through why this makes sense is because when x gets to be a very large number all thesmaller powers will not really make much of an impact. The biggest contributors are only the biggest powers. Thenthe value of the numerator will be about twice that of the denominator. As x gets even bigger, then the function willget even closer to 2.
Case 3: The degree of the numerator is greater than the degree of the denominator. In this case there does not exista horizontal asymptote and you must determine if the function increases or decreases without bound in both the leftand right directions.
Example A
Identify the horizontal asymptotes of the following 3 functions:
a. f (x) =4x3 +993x4−99
b. h(x) =234x45−45x234 +100
x235
c. g(x) =x3 +3x6
x3−6x6
Solution:
a. y = 0 because the degree of the numerator is 3 and the degree of the denominator is 4, so the denominator getsbigger eventually and the fraction approaches 0.
b. y = 0 because the degree of the numerator is 234 which is smaller than the degree of the denominator (235).c. y =−1
2 because the degree of both the numerator and the denominator is 6 so the horizontal asymptote is theratio of the leading coefficients. Note that leading refers to the coefficients of the greatest powers of x notthe coefficients that happen to be written out front. Convention usually tells you to write the powers of x indescending order.
125

2.10. Horizontal Asymptotes www.ck12.org
Example B
Identify the vertical and horizontal asymptotes of the following rational function.
f (x) =(x−2)(4x+3)(x−4)(x−1)(4x+3)(x−6)
Solution: There is factor that cancels that is neither a horizontal or vertical asymptote. The vertical asymptotesoccur at x = 1 and x = 6. To obtain the horizontal asymptote you could methodically multiply out each binomial,however since most of those terms do not matter, it is more efficient to first determine the relative powers of thenumerator and the denominator. In this case they both happen to be 3. Next determine the coefficient of the cubicterms only. The numerator will have 4x3 and the denominator will have 4x3 and so the horizontal asymptote willoccur at y = 4
4 = 1.
Example C
Describe the right hand end behavior of the following function.
Solution: Notice how quickly this dampening wave function settles down. There seems to be an obvious horizontalaxis on the right at y = 1
Concept Problem Revisited
As in Example C, functions may touch and pass through horizontal asymptotes without limit. This is a differencebetween vertical and horizontal asymptotes. In calculus, there are rigorous proofs to show that functions like theone in Example C do become arbitrarily close to the asymptote.
Vocabulary
A horizontal asymptote is a flat dotted line that indicates where a function goes as x get infinitely large or infinitelysmall.
End behavior is a term that asks you to describe the horizontal asymptotes.
A vertical asymptote is a dashed vertical line that indicates that as a function approaches, it shoots off to positive ornegative infinity without ever actually touching the line.
A rational function is a function with at least one rational expression.
A rational expression is a ratio of two polynomial expressions.
126

www.ck12.org Chapter 2. Polynomials and Rational Functions
Guided Practice
1. Identify the horizontal asymptotes of the following function.
f (x) =(x−3)(x+2)|(x−5)|·(x−1)
2. Identify the vertical and horizontal asymptotes and the holes of the following function.
f (x) =(x4−9)(x−1)(x2 +3)(x−3)
3. Identify the horizontal asymptotes if they exist for the following 3 functions.
a. f (x) =3x6−72xx6 +999
b. h(x) =ax4 +bx3 + cx2 +dx+ e
f x4 +gx3 +hx2
c. g(x) =f (x)h(x)
Answers:
1. First notice the absolute value surrounding one of the terms in the denominator. The degrees of both the numeratorand the denominator will be 2 which means that the horizontal asymptote will occur at a number. As x gets infinitelylarge, the function is approximately:
f (x) =x2
x2
So the horizontal asymptote is y =−1 as x gets infinitely large.
On the other hand, as x gets infinitely small the function is approximately:
f (x) =x2
−x2
So the horizontal asymptote is y =−1 as x gets infinitely small.
In this case, you cannot blindly use the leading coefficient rule because the absolute value changes the sign.
2. The numerator of the function factors to be:
f (x) =(x2 +3)(x2−3)(x−1)
(x2 +3)(x−3)=
(x2−3)(x−1)x−3
Note that a factor does cancel and also notice that this factor is never equal to zero. Not all factors that cancelindicate a hole. A horizontal asymptote does not exist because the degree of the numerator is greater than the degreeof the denominator. The vertical asymptote is at x = 3.
3.
127
2.10. Horizontal Asymptotes www.ck12.org
a. The degrees of the numerator and the denominator are equal so the horizontal asymptote is y = 3.b. The degrees of the numerator and the denominators are equal again so the horizontal asymptote is y = a
f .c. As x gets infinitely large,
g(x) =f (x)h(x)
=3x6−72xx6+999
ax4+bx3+cx2+dx+ef x4+gx3+hx2
≈ 3af=
3 fa
When you study calculus, you will learn the rigorous techniques that enable you to feel more confident about resultslike this.
Practice
Identify the horizontal asymptotes, if they exist, for the following functions.
1. f (x) =5x4−2xx4 +32
2. g(x) =3x4−2x6
−x4 +2
3. h(x) =3x4−5x8x3 +3x4
4. j(x) =2x3−15x−x4 +3
5. k(x) =2x5−3x
5x2 +3x4 +2x−7x5
6. f (x) =ax14 +bx23 + cx12 +dx+ e
f x24 +gx23 +hx21
7. g(x) =(x−1)(x+4)|(x−2)|·(x−1)
8. Write a function that fits the following criteria:
• Vertical asymptotes at x = 1 and x = 4• Zeroes at 3 and 5• Hole when x = 6• Horizontal asymptote at y = 2
3
9. Write a function that fits the following criteria:
• Vertical asymptotes at x =−2 and x = 2• Zeroes at 1 and 5• Hole when x = 3• Horizontal asymptote at y = 1
10. Write a function that fits the following criteria:
• Vertical asymptotes at x = 0 and x = 3• Zeroes at 1 and 2• Hole when x = 8• Horizontal asymptote at y = 2
11. Write a function that fits the following criteria:
• Vertical asymptotes at 2 and 6• Zero at 5• Hole when x = 4
128
www.ck12.org Chapter 2. Polynomials and Rational Functions
• Horizontal asymptote at y = 0
12. Write a function that fits the following criteria:
• Vertical asymptote at 4• Zeroes at 0 and 3• Hole at when x = 5• No horizontal asymptotes
Identify the vertical and horizontal asymptotes of the following rational functions.
13. f (x) =(x−5)(2x+1)(x−3)(x−3)(4x+5)(x−6)
14. g(x) =x(x−1)(x+3)(x−5)
3x(x−1)(4x+3)
15. h(x) =(x−2)(x+3)(x−6)(x−4)(x+3)2(x+2)
129
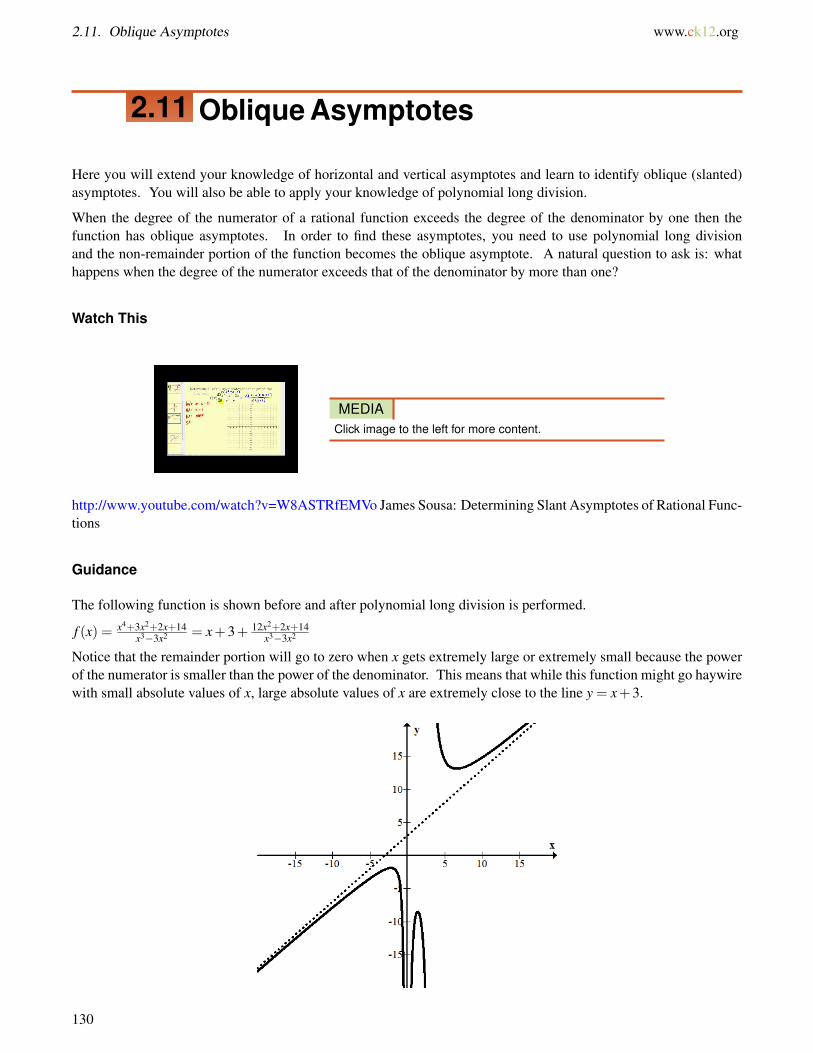
2.11. Oblique Asymptotes www.ck12.org
2.11 Oblique Asymptotes
Here you will extend your knowledge of horizontal and vertical asymptotes and learn to identify oblique (slanted)asymptotes. You will also be able to apply your knowledge of polynomial long division.
When the degree of the numerator of a rational function exceeds the degree of the denominator by one then thefunction has oblique asymptotes. In order to find these asymptotes, you need to use polynomial long divisionand the non-remainder portion of the function becomes the oblique asymptote. A natural question to ask is: whathappens when the degree of the numerator exceeds that of the denominator by more than one?
Watch This
MEDIAClick image to the left for more content.
http://www.youtube.com/watch?v=W8ASTRfEMVo James Sousa: Determining Slant Asymptotes of Rational Func-tions
Guidance
The following function is shown before and after polynomial long division is performed.
f (x) = x4+3x2+2x+14x3−3x2 = x+3+ 12x2+2x+14
x3−3x2
Notice that the remainder portion will go to zero when x gets extremely large or extremely small because the powerof the numerator is smaller than the power of the denominator. This means that while this function might go haywirewith small absolute values of x, large absolute values of x are extremely close to the line y = x+3.
130

www.ck12.org Chapter 2. Polynomials and Rational Functions
Oblique asymptotes are these slanted asymptotes that show exactly how a function increases or decreases withoutbound.
Example A
Identify the oblique asymptotes of the following rational function.
f (x) = x3−x−33x2+3x−4 = x−3+ 12x−45
(x−1)(x+4)
Solution: Since this function has been rewritten after long division has been performed, the oblique asymptote isthe line that remains:
y = x−3
Example B
Identify the vertical and oblique asymptotes of the following rational function.
f (x) = x3−x2−x−1(x−3)(x+4)
Solution: After using polynomial long division and rewriting the function with a remainder and non-remainderportion it looks like this:
f (x) = x−2+ 13x−25x2+x−12 = x−2+ 13x−25
(x−3)(x+4)
The oblique asymptote is y = x−2. The vertical asymptotes are at x = 3 and x =−4 which are easier to observe inlast form of the function because they clearly don’t cancel to become holes.
Example C
Identify the oblique asymptotes of the following rational function.
f (x) = (x2−4)(x+3)10(x−1)
Solution: The degree of the numerator is 3 so the slant asymptote will not be a line. However when the graph isobserved, there is still a clear pattern as to how this function increases without bound as x approaches very large andvery small numbers.
f (x) = 110(x
2 +4x)− 1210(x−1)
As you can see, this looks like a parabola with a remainder. This rational function has a parabola backbone. Thisis not technically an oblique asymptote because it is not a line.
Concept Problem Revisited
When the numerator exceeds the denominator by more than one, the function develops a backbone as in Example Cthat can be shaped like any polynomial. Oblique asymptotes are always lines.
Vocabulary
Oblique asymptotes are asymptotes that occur at a slant. They are always lines.
131
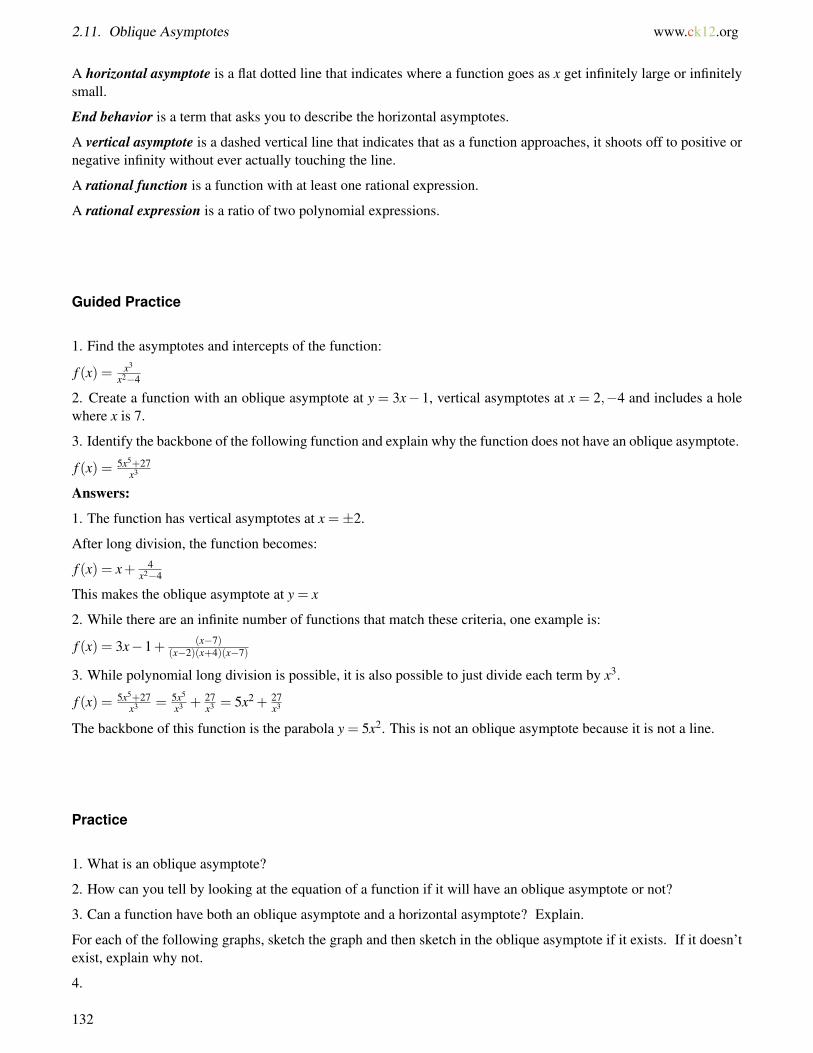
2.11. Oblique Asymptotes www.ck12.org
A horizontal asymptote is a flat dotted line that indicates where a function goes as x get infinitely large or infinitelysmall.
End behavior is a term that asks you to describe the horizontal asymptotes.
A vertical asymptote is a dashed vertical line that indicates that as a function approaches, it shoots off to positive ornegative infinity without ever actually touching the line.
A rational function is a function with at least one rational expression.
A rational expression is a ratio of two polynomial expressions.
Guided Practice
1. Find the asymptotes and intercepts of the function:
f (x) = x3
x2−4
2. Create a function with an oblique asymptote at y = 3x− 1, vertical asymptotes at x = 2,−4 and includes a holewhere x is 7.
3. Identify the backbone of the following function and explain why the function does not have an oblique asymptote.
f (x) = 5x5+27x3
Answers:
1. The function has vertical asymptotes at x =±2.
After long division, the function becomes:
f (x) = x+ 4x2−4
This makes the oblique asymptote at y = x
2. While there are an infinite number of functions that match these criteria, one example is:
f (x) = 3x−1+ (x−7)(x−2)(x+4)(x−7)
3. While polynomial long division is possible, it is also possible to just divide each term by x3.
f (x) = 5x5+27x3 = 5x5
x3 + 27x3 = 5x2 + 27
x3
The backbone of this function is the parabola y = 5x2. This is not an oblique asymptote because it is not a line.
Practice
1. What is an oblique asymptote?
2. How can you tell by looking at the equation of a function if it will have an oblique asymptote or not?
3. Can a function have both an oblique asymptote and a horizontal asymptote? Explain.
For each of the following graphs, sketch the graph and then sketch in the oblique asymptote if it exists. If it doesn’texist, explain why not.
4.
132
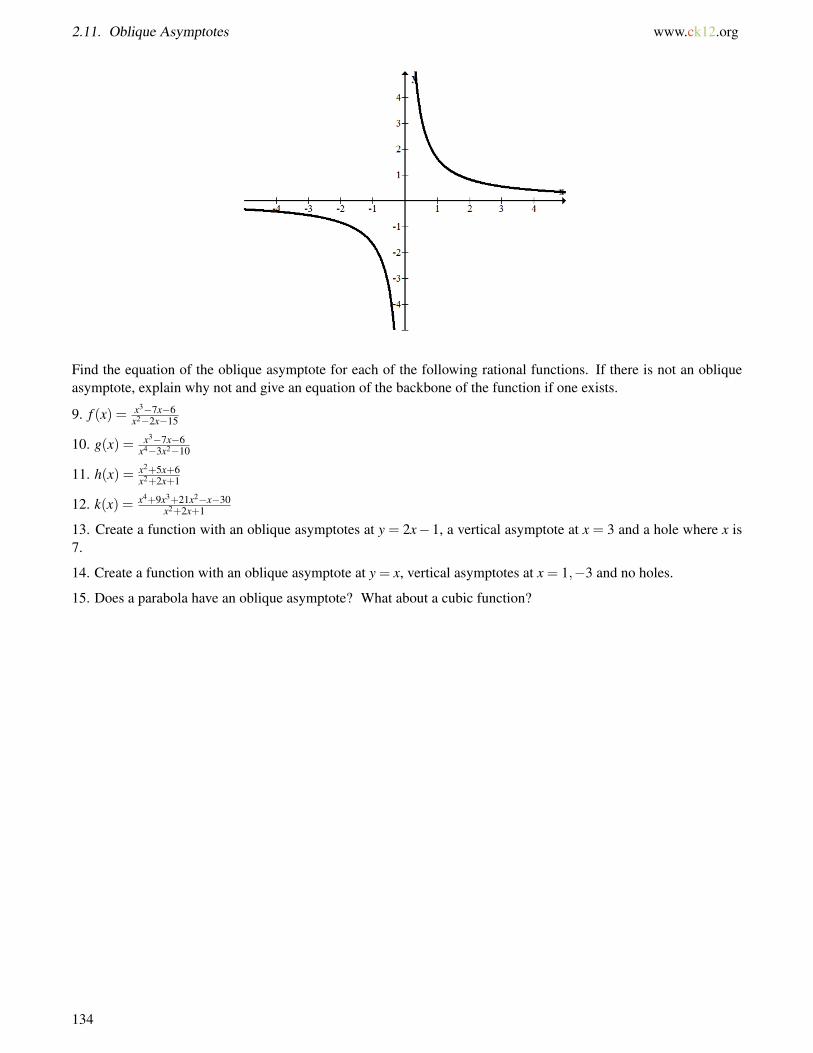
2.11. Oblique Asymptotes www.ck12.org
Find the equation of the oblique asymptote for each of the following rational functions. If there is not an obliqueasymptote, explain why not and give an equation of the backbone of the function if one exists.
9. f (x) = x3−7x−6x2−2x−15
10. g(x) = x3−7x−6x4−3x2−10
11. h(x) = x2+5x+6x2+2x+1
12. k(x) = x4+9x3+21x2−x−30x2+2x+1
13. Create a function with an oblique asymptotes at y = 2x−1, a vertical asymptote at x = 3 and a hole where x is7.
14. Create a function with an oblique asymptote at y = x, vertical asymptotes at x = 1,−3 and no holes.
15. Does a parabola have an oblique asymptote? What about a cubic function?
134

www.ck12.org Chapter 2. Polynomials and Rational Functions
2.12 Sign Test for Rational Function Graphs
Here you will learn to predict the nature of a rational function near the asymptotes.
The asymptotes of a rational function provide a very rigid structure in which the function must live. Once theasymptotes are known you must use the sign testing procedure to see if the function becomes increasingly positiveor increasingly negative near the asymptotes. A driving question then becomes how close does near need to be inorder for the sign test to work?
Watch This
MEDIAClick image to the left for more content.
http://www.youtube.com/watch?v=OEQnQNvJtG0 James Sousa: Graphing Rational Functions
Guidance
Consider mentally substituting the number 2.99999 into the following rational expression.
f (x) =(x−1)(x+3)(x−5)(x+10)
(x+2)(x−4)(x−3)
Without doing any of the arithmetic, simply note the sign of each term:
f (x) =(+) · (+) · (−) · (+)
(+) · (−) · (−)
The only term where the value is close to zero is (x−3) but careful subtraction still indicates a negative sign. Theproduct of all of these signs is negative. This is strong evidence that this function approaches negative infinity asx approaches 3 from the left.
Next consider mentally substituting 3.00001 and going through the same process.
f (x) =(+) · (+) · (−) · (+)
(+) · (−) · (+)
The product of all of these signs is positive which means that from the right this function approaches positive infinityinstead.
135
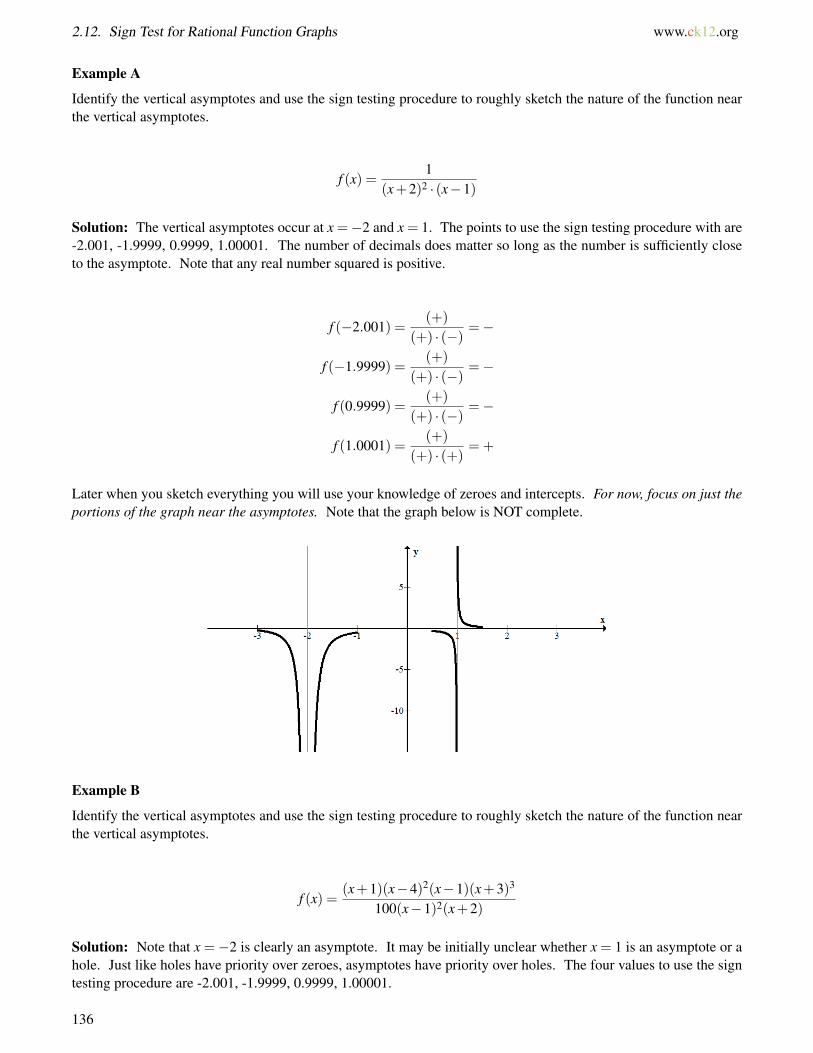
2.12. Sign Test for Rational Function Graphs www.ck12.org
Example A
Identify the vertical asymptotes and use the sign testing procedure to roughly sketch the nature of the function nearthe vertical asymptotes.
f (x) =1
(x+2)2 · (x−1)
Solution: The vertical asymptotes occur at x =−2 and x = 1. The points to use the sign testing procedure with are-2.001, -1.9999, 0.9999, 1.00001. The number of decimals does matter so long as the number is sufficiently closeto the asymptote. Note that any real number squared is positive.
f (−2.001) =(+)
(+) · (−)=−
f (−1.9999) =(+)
(+) · (−)=−
f (0.9999) =(+)
(+) · (−)=−
f (1.0001) =(+)
(+) · (+)= +
Later when you sketch everything you will use your knowledge of zeroes and intercepts. For now, focus on just theportions of the graph near the asymptotes. Note that the graph below is NOT complete.
Example B
Identify the vertical asymptotes and use the sign testing procedure to roughly sketch the nature of the function nearthe vertical asymptotes.
f (x) =(x+1)(x−4)2(x−1)(x+3)3
100(x−1)2(x+2)
Solution: Note that x =−2 is clearly an asymptote. It may be initially unclear whether x = 1 is an asymptote or ahole. Just like holes have priority over zeroes, asymptotes have priority over holes. The four values to use the signtesting procedure are -2.001, -1.9999, 0.9999, 1.00001.
136
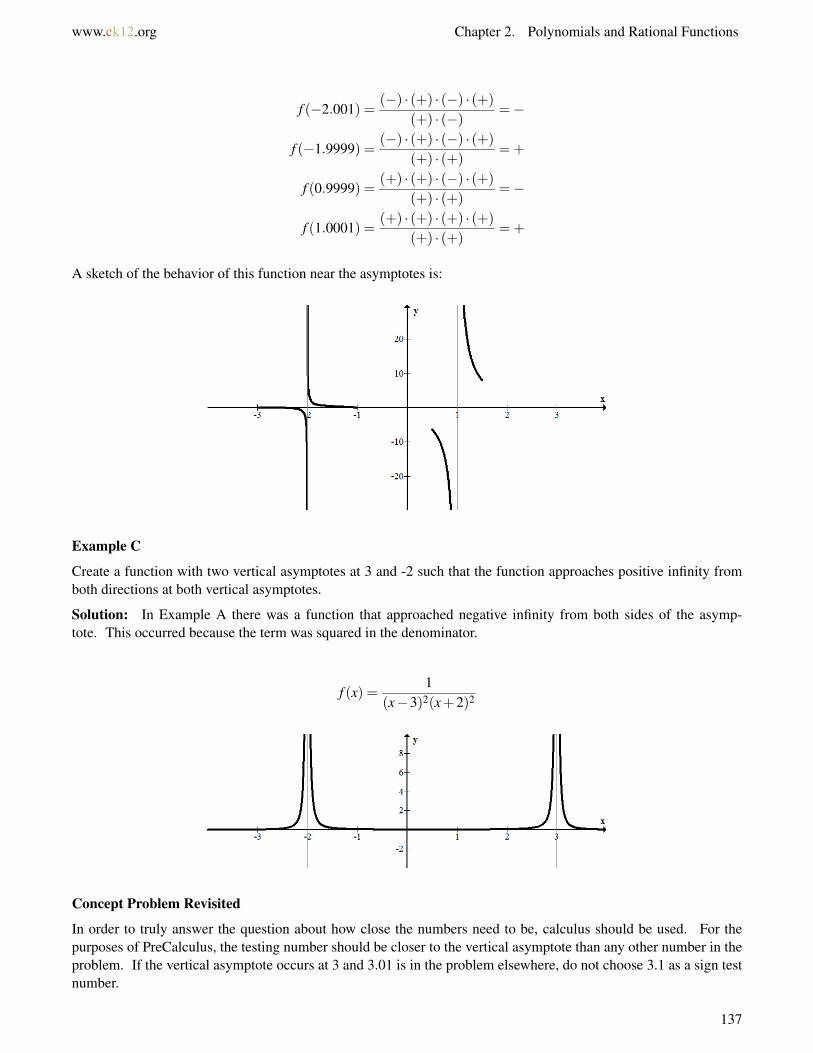
www.ck12.org Chapter 2. Polynomials and Rational Functions
f (−2.001) =(−) · (+) · (−) · (+)
(+) · (−)=−
f (−1.9999) =(−) · (+) · (−) · (+)
(+) · (+)= +
f (0.9999) =(+) · (+) · (−) · (+)
(+) · (+)=−
f (1.0001) =(+) · (+) · (+) · (+)
(+) · (+)= +
A sketch of the behavior of this function near the asymptotes is:
Example C
Create a function with two vertical asymptotes at 3 and -2 such that the function approaches positive infinity fromboth directions at both vertical asymptotes.
Solution: In Example A there was a function that approached negative infinity from both sides of the asymp-tote. This occurred because the term was squared in the denominator.
f (x) =1
(x−3)2(x+2)2
Concept Problem Revisited
In order to truly answer the question about how close the numbers need to be, calculus should be used. For thepurposes of PreCalculus, the testing number should be closer to the vertical asymptote than any other number in theproblem. If the vertical asymptote occurs at 3 and 3.01 is in the problem elsewhere, do not choose 3.1 as a sign testnumber.
137
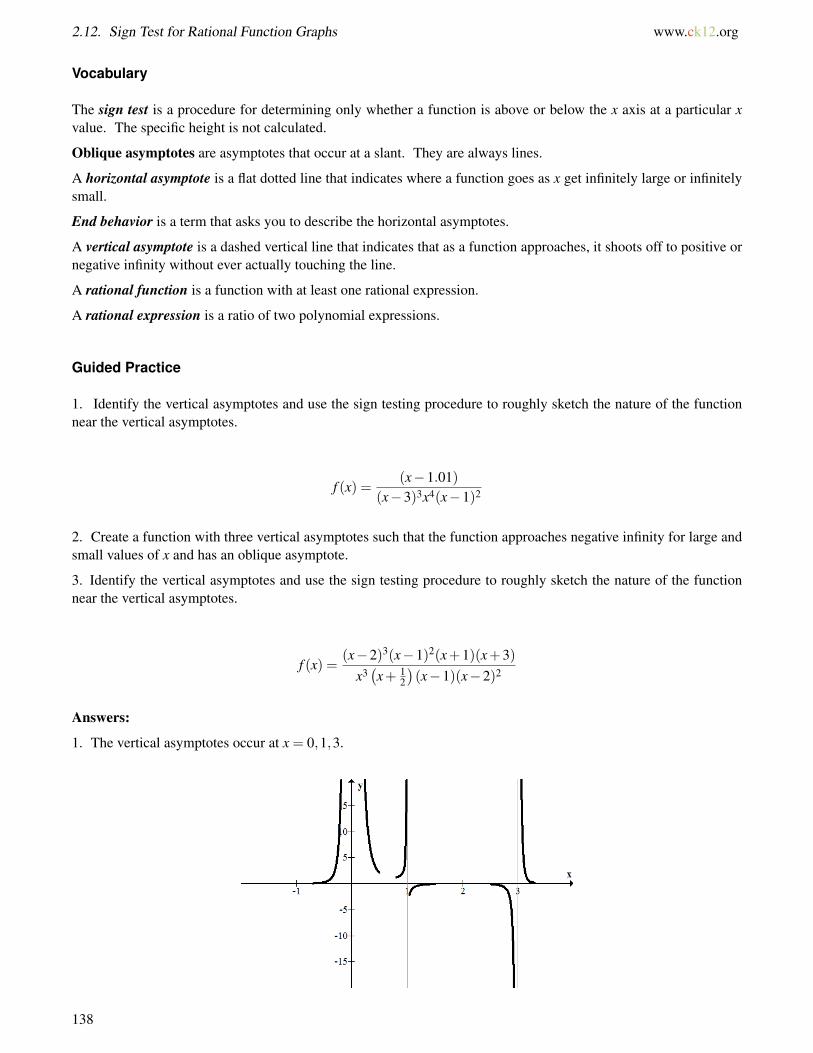
2.12. Sign Test for Rational Function Graphs www.ck12.org
Vocabulary
The sign test is a procedure for determining only whether a function is above or below the x axis at a particular xvalue. The specific height is not calculated.
Oblique asymptotes are asymptotes that occur at a slant. They are always lines.
A horizontal asymptote is a flat dotted line that indicates where a function goes as x get infinitely large or infinitelysmall.
End behavior is a term that asks you to describe the horizontal asymptotes.
A vertical asymptote is a dashed vertical line that indicates that as a function approaches, it shoots off to positive ornegative infinity without ever actually touching the line.
A rational function is a function with at least one rational expression.
A rational expression is a ratio of two polynomial expressions.
Guided Practice
1. Identify the vertical asymptotes and use the sign testing procedure to roughly sketch the nature of the functionnear the vertical asymptotes.
f (x) =(x−1.01)
(x−3)3x4(x−1)2
2. Create a function with three vertical asymptotes such that the function approaches negative infinity for large andsmall values of x and has an oblique asymptote.
3. Identify the vertical asymptotes and use the sign testing procedure to roughly sketch the nature of the functionnear the vertical asymptotes.
f (x) =(x−2)3(x−1)2(x+1)(x+3)
x3(x+ 1
2
)(x−1)(x−2)2
Answers:
1. The vertical asymptotes occur at x = 0,1,3.
138
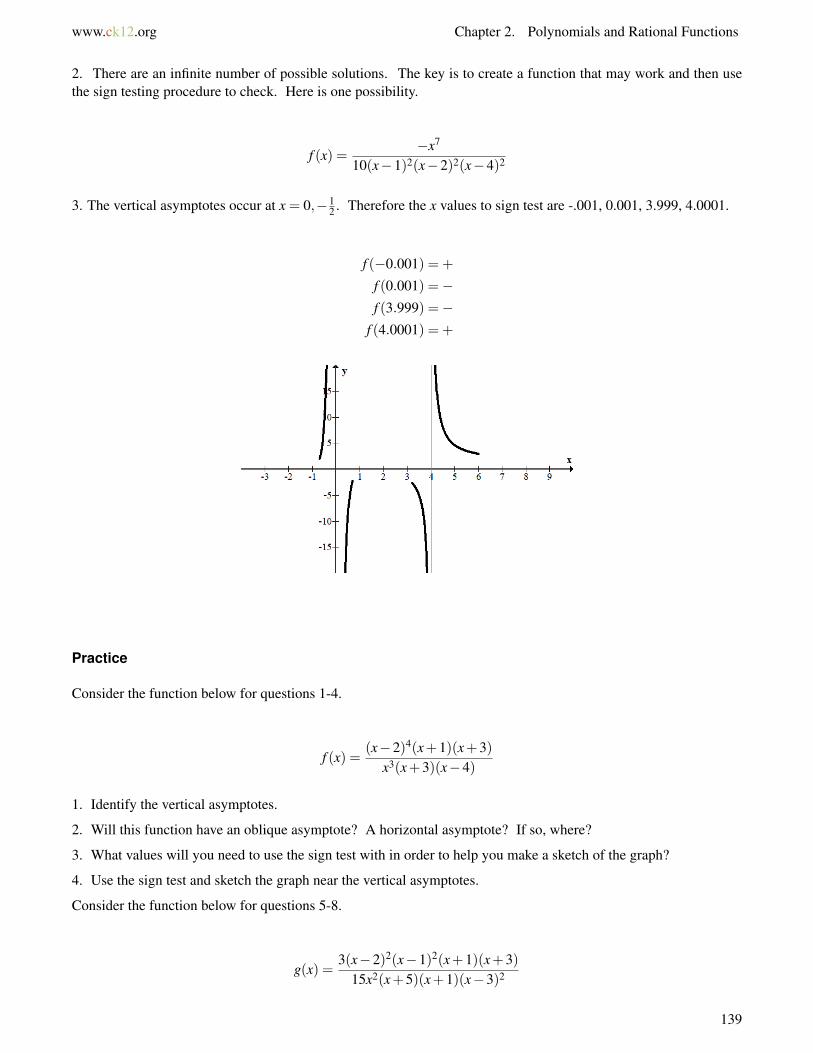
www.ck12.org Chapter 2. Polynomials and Rational Functions
2. There are an infinite number of possible solutions. The key is to create a function that may work and then usethe sign testing procedure to check. Here is one possibility.
f (x) =−x7
10(x−1)2(x−2)2(x−4)2
3. The vertical asymptotes occur at x = 0,−12 . Therefore the x values to sign test are -.001, 0.001, 3.999, 4.0001.
f (−0.001) = +
f (0.001) =−f (3.999) =−
f (4.0001) = +
Practice
Consider the function below for questions 1-4.
f (x) =(x−2)4(x+1)(x+3)
x3(x+3)(x−4)
1. Identify the vertical asymptotes.
2. Will this function have an oblique asymptote? A horizontal asymptote? If so, where?
3. What values will you need to use the sign test with in order to help you make a sketch of the graph?
4. Use the sign test and sketch the graph near the vertical asymptotes.
Consider the function below for questions 5-8.
g(x) =3(x−2)2(x−1)2(x+1)(x+3)
15x2(x+5)(x+1)(x−3)2
139
2.12. Sign Test for Rational Function Graphs www.ck12.org
5. Identify the vertical asymptotes.
6. Will this function have an oblique asymptote? A horizontal asymptote? If so, where?
7. What values will you need to use the sign test with in order to help you make a sketch of the graph?
8. Use the sign test and sketch the graph near the vertical asymptote(s).
Consider the function below for questions 9-12.
h(x) =9x4−102x3 +349x2−340x+100
x3−9x2 +24x−16
9. Identify the vertical asymptotes.
10. Will this function have an oblique asymptote? A horizontal asymptote? If so, where?
11. What values will you need to use the sign test with in order to help you make a sketch of the graph?
12. Use the sign test and sketch the graph near the vertical asymptotes.
Consider the function below for questions 13-16.
k(x) =2x3−5x2−11x−43x3 +11x2 +5x−3
13. Identify the vertical asymptotes.
14. Will this function have an oblique asymptote? A horizontal asymptote? If so, where?
15. What values will you need to use the sign test with in order to help you make a sketch of the graph?
16. Use the sign test and sketch the graph near the vertical asymptotes.
140
www.ck12.org Chapter 2. Polynomials and Rational Functions
2.13 Graphs of Rational Functions by Hand
Here you will use your knowledge of zeroes, intercepts, holes and asymptotes to sketch rational functions by hand.
Sketching rational functions by hand is a mental workout because it combines so many different specific skills toproduce a single coherent image. It will require you to closely examine the equation of the function in a varietyof different ways in order to find clues as to the shape of the overall function. Since computers can graph thesecomplicated functions much more accurately than people can, why is sketching by hand important?
Watch This
MEDIAClick image to the left for more content.
http://www.youtube.com/watch?v=vMVYaFptvkk&feature=youtu.be James Sousa: Ex. Match Equations of Ratio-nal Functions to Graphs
Guidance
While there is no strict procedure for graphing rational functions by hand there is a flow of clues to look for in thefunction. In general, it will make sense to identify different pieces of information in this order and record them ona sketch.
STEPS FOR GRAPHING BY HAND
1. Examine the denominator of the rational function to determine the domain of the function. Distinguishbetween holes which are factors that can be canceled and vertical asymptotes that cannot. Plot the verticalasymptotes.
2. Identify the end behavior of the function by comparing the degrees of the numerator and denominator anddetermine if there exists a horizontal or oblique asymptote. Plot the horizontal or oblique asymptotes.
3. Identify the holes of the function and plot them.4. Identify the zeroes and intercepts of the function and plot them.5. Use the sign test to determine the behavior of the function near the vertical asymptotes.6. Connect everything as best you can.
Example A
Completely plot the following rational function.
f (x) =4x3−2x2 +3x−18(x−1)2(x+2)
141
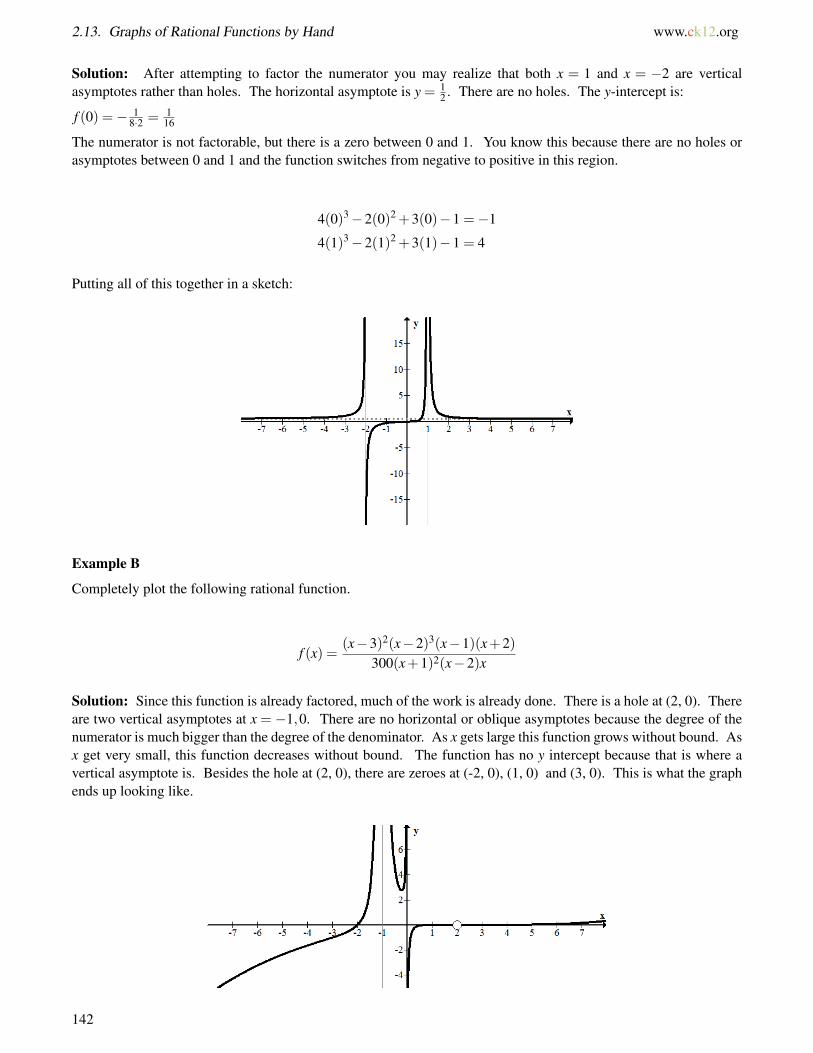
2.13. Graphs of Rational Functions by Hand www.ck12.org
Solution: After attempting to factor the numerator you may realize that both x = 1 and x = −2 are verticalasymptotes rather than holes. The horizontal asymptote is y = 1
2 . There are no holes. The y-intercept is:
f (0) =− 18·2 = 1
16
The numerator is not factorable, but there is a zero between 0 and 1. You know this because there are no holes orasymptotes between 0 and 1 and the function switches from negative to positive in this region.
4(0)3−2(0)2 +3(0)−1 =−1
4(1)3−2(1)2 +3(1)−1 = 4
Putting all of this together in a sketch:
Example B
Completely plot the following rational function.
f (x) =(x−3)2(x−2)3(x−1)(x+2)
300(x+1)2(x−2)x
Solution: Since this function is already factored, much of the work is already done. There is a hole at (2, 0). Thereare two vertical asymptotes at x = −1,0. There are no horizontal or oblique asymptotes because the degree of thenumerator is much bigger than the degree of the denominator. As x gets large this function grows without bound. Asx get very small, this function decreases without bound. The function has no y intercept because that is where avertical asymptote is. Besides the hole at (2, 0), there are zeroes at (-2, 0), (1, 0) and (3, 0). This is what the graphends up looking like.
142

www.ck12.org Chapter 2. Polynomials and Rational Functions
Notice on the right portion of the graph the curve seems to stay on the x-axis. In fact it does go slightly above andbelow x-axis, crossing through it at (1, 0), (2, 0) and (3, 0) before starting to increase.
Example C
Estimate a function that would have the following graphical characteristics:
Solution: First think about the vertical asymptotes and how they affect the equation of the function. Then considerzeroes and holes, and the way the graph looks at these places. Finally, use the y-intercept to refine your equation.
• The function has two vertical asymptotes at x =−2,1 so the denominator must have the factors (x+2)(x−1).• There is one zero at x =−1, so the numerator must have a factor of (x+1).• There are two holes that appear to override zeroes which means the numerator and denominator must have the
factors (x+3) and (x−4).• Because the graph goes from above the x-axis to below the x-axis at x = −3, the degree of the exponent of
the (x+3) factor must be ultimately odd.• Because the graph stays above the x-axis before and after x = 4, the degree of the (x− 4) factor must be
ultimately even.
A good estimate for the function is:
f (x) =(x+1)(x+3)4(x−4)3
(x+2)(x−1)(x+3)(x−4)
This function has all the basic characteristics, however it isn’t scaled properly. When x = 0 this function has ay-intercept of -216 when it should be about -2. Thus you must divide by 108 so that the y intercept matches. Hereis a better estimate for the function:
f (x) =(x+1)(x+3)4(x−4)3
108(x+2)(x−1)(x+3)(x−4)
Concept Problem Revisited
Computers can graph rational functions more accurately than people. However, computers may not be able toexplain why a function behaves in certain ways. By being a detective and looking for clues in the equation of afunction, you are applying high level analytical skills and powers of deduction. These analytical skills are vastlymore important and transferrable than the specific techniques involved with rational functions.
143
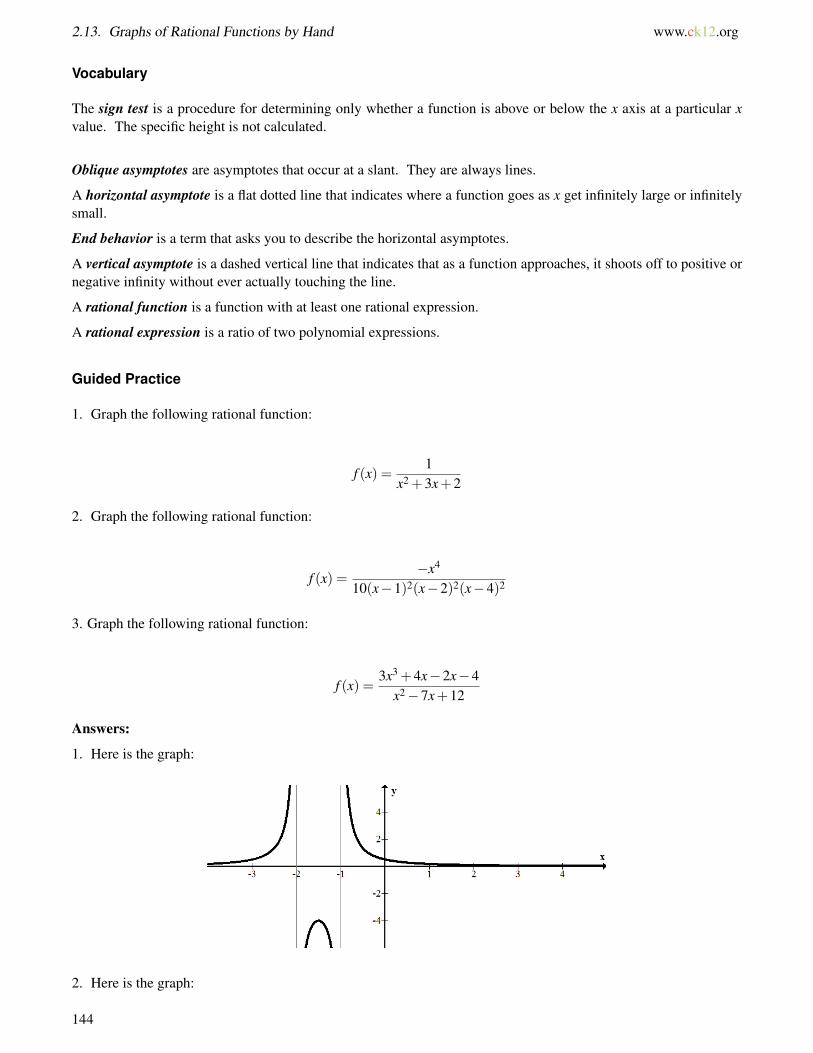
2.13. Graphs of Rational Functions by Hand www.ck12.org
Vocabulary
The sign test is a procedure for determining only whether a function is above or below the x axis at a particular xvalue. The specific height is not calculated.
Oblique asymptotes are asymptotes that occur at a slant. They are always lines.
A horizontal asymptote is a flat dotted line that indicates where a function goes as x get infinitely large or infinitelysmall.
End behavior is a term that asks you to describe the horizontal asymptotes.
A vertical asymptote is a dashed vertical line that indicates that as a function approaches, it shoots off to positive ornegative infinity without ever actually touching the line.
A rational function is a function with at least one rational expression.
A rational expression is a ratio of two polynomial expressions.
Guided Practice
1. Graph the following rational function:
f (x) =1
x2 +3x+2
2. Graph the following rational function:
f (x) =−x4
10(x−1)2(x−2)2(x−4)2
3. Graph the following rational function:
f (x) =3x3 +4x−2x−4
x2−7x+12
Answers:
1. Here is the graph:
2. Here is the graph:
144
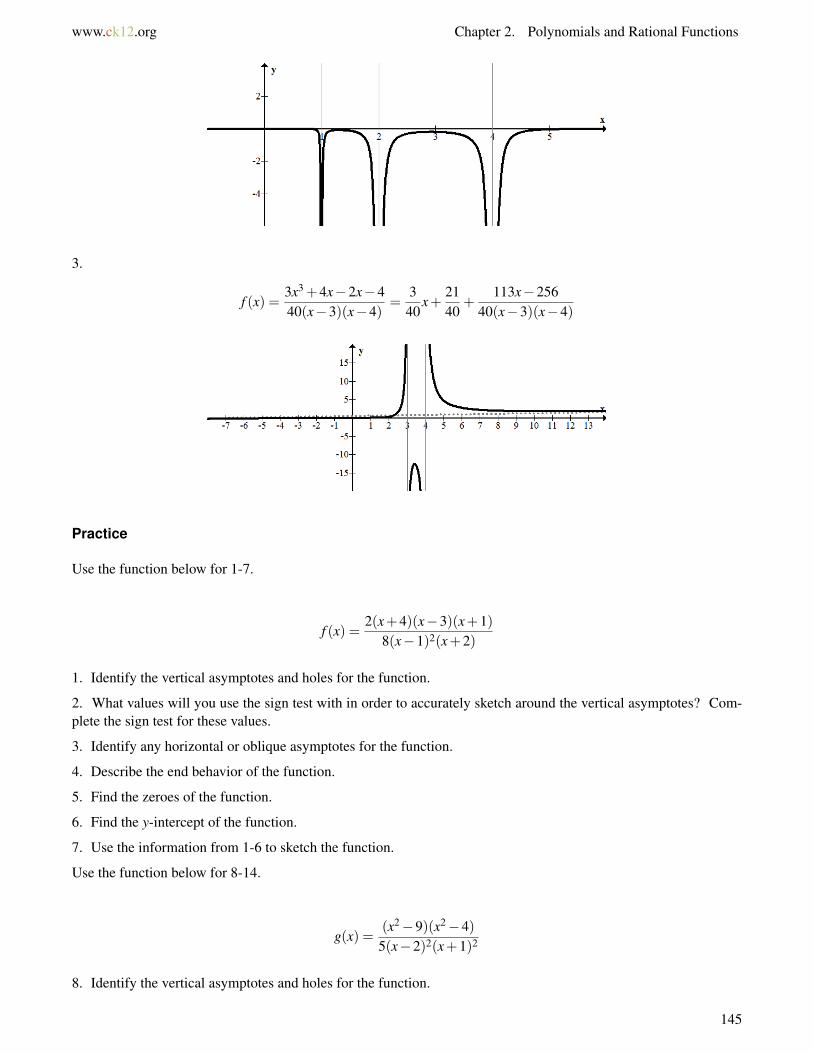
www.ck12.org Chapter 2. Polynomials and Rational Functions
3.
f (x) =3x3 +4x−2x−440(x−3)(x−4)
=340
x+2140
+113x−256
40(x−3)(x−4)
Practice
Use the function below for 1-7.
f (x) =2(x+4)(x−3)(x+1)
8(x−1)2(x+2)
1. Identify the vertical asymptotes and holes for the function.
2. What values will you use the sign test with in order to accurately sketch around the vertical asymptotes? Com-plete the sign test for these values.
3. Identify any horizontal or oblique asymptotes for the function.
4. Describe the end behavior of the function.
5. Find the zeroes of the function.
6. Find the y-intercept of the function.
7. Use the information from 1-6 to sketch the function.
Use the function below for 8-14.
g(x) =(x2−9)(x2−4)
5(x−2)2(x+1)2
8. Identify the vertical asymptotes and holes for the function.
145
2.13. Graphs of Rational Functions by Hand www.ck12.org
9. What values will you use the sign test with in order to accurately sketch around the vertical asymptotes? Com-plete the sign test for these values.
10. Identify any horizontal or oblique asymptotes for the function.
11. Describe the end behavior of the function.
12. Find the zeroes of the function.
13. Find the y-intercept of the function.
14. Use the information from 8-13 to sketch the function.
15. Graph the function below by hand.
h(x) =x3 +5x2 +2x−8
x2−3x−10
Polynomials and rational functions were explored. Special features of rational functions such as holes and asymp-totes were introduced. Graphing rational functions by hand, which utilized work from many concepts, concludedthe chapter.
146

www.ck12.org Chapter 2. Polynomials and Rational Functions
2.14 References
1. CK-12 Foundation. . CCSA2. CK-12 Foundation. . CCSA3. CK-12 Foundation. . CCSA4. CK-12 Foundation. . CCSA5. CK-12 Foundation. . CCSA6. CK-12 Foundation. . CCSA7. CK-12 Foundation. . CCSA8. CK-12 Foundation. . CCSA9. CK-12 Foundation. . CCSA
10. CK-12 Foundation. . CCSA11. CK-12 Foundation. . CCSA12. CK-12 Foundation. . CCSA13. CK-12 Foundation. . CCSA14. CK-12 Foundation. . CCSA15. CK-12 Foundation. . CCSA16. CK-12 Foundation. . CCSA17. CK-12 Foundation. . CCSA18. CK-12 Foundation. . CCSA19. CK-12 Foundation. . CCSA20. CK-12 Foundation. . CCSA21. CK-12 Foundation. . CCSA22. CK-12 Foundation. . CCSA23. CK-12 Foundation. . CCSA24. CK-12 Foundation. . CCSA25. CK-12 Foundation. . CCSA26. CK-12 Foundation. . CCSA27. CK-12 Foundation. . CCSA28. CK-12 Foundation. . CCSA29. CK-12 Foundation. . CCSA30. CK-12 Foundation. . CCSA31. CK-12 Foundation. . CCSA32. CK-12 Foundation. . CCSA33. CK-12 Foundation. . CCSA34. CK-12 Foundation. . CCSA35. CK-12 Foundation. . CCSA
147

www.ck12.org
CHAPTER 3 Logs and ExponentsChapter Outline
3.1 EXPONENTIAL FUNCTIONS
3.2 PROPERTIES OF EXPONENTS
3.3 SCIENTIFIC NOTATION
3.4 PROPERTIES OF LOGS
3.5 CHANGE OF BASE
3.6 EXPONENTIAL EQUATIONS
3.7 LOGISTIC FUNCTIONS
3.8 REFERENCES
Exponential growth has been called one of the most powerful forces in the universe. You may already know thebasic rules of exponents. Here you will explore their relationship with logarithms and their application to differenttypes of growth and decay.
148
www.ck12.org Chapter 3. Logs and Exponents
3.1 Exponential Functions
Here you will explore exponential functions as a way to model a special kind of growth or decay and you will learnmore about the number e.
Exponential growth is one of the most powerful forces in nature. A famous legend states that the inventor of chesswas asked to state his own reward from the king. The man asked for a single grain of rice for the first square of thechessboard, two grains of rice for the second square and four grains of rice for the third. He asked for the entire 64squares to be filled in this way and that would be his reward. Did the man ask for too little, or too much?
Watch This
MEDIAClick image to the left for more content.
http://www.youtube.com/watch?v=7fpazNs1ZRE James Sousa: Graph Exponential Functions
Guidance
Exponential functions take the form f (x) = a ·bx where a and b are constants. a is the starting amount when x = 0.b tells the story about the growth. If the growth is doubling then b is 2. If the growth is halving (which would bedecay), then b is 1
2 . If the growth is increasing by 6% then b is 1.06.
Exponential growth is everywhere. Money grows exponentially in banks. Populations of people, bacteria andanimals grow exponentially when their food and space aren’t limited.
Radioactive isotopes like Carbon 14 have something called a half-life that indicates how long it takes for half of themolecules present to decay into other more stable molecules. It takes about 5,730 years for this process to occurwhich is how scientists can date artifacts of ancient humans.
Example A
A mummified animal is found preserved on the slopes of an ice covered mountain. After testing, you see that exactlyone fourth of the carbon-14 has yet to decay. How long ago was this animal alive?
Solution: Since this problem does not give specific amounts of carbon, it can be inferred that the time will notdepend on the specific amounts. One technique that makes the problem easier to work with could be to create anexample scenario that fits the one fourth ratio. Suppose 60 units were present when the animal was alive at timezero. This means that 15 units must be present today.
15 = a ·(
12
)x
60 = a ·(
12
)0
149
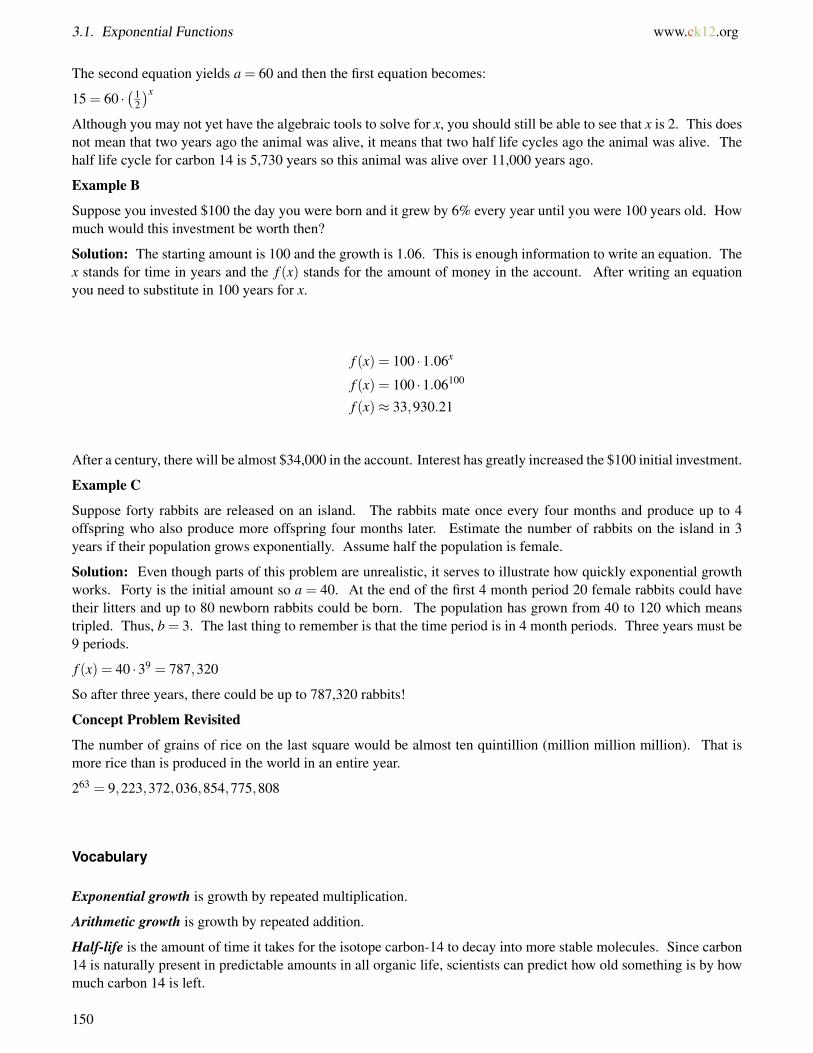
3.1. Exponential Functions www.ck12.org
The second equation yields a = 60 and then the first equation becomes:
15 = 60 ·(1
2
)x
Although you may not yet have the algebraic tools to solve for x, you should still be able to see that x is 2. This doesnot mean that two years ago the animal was alive, it means that two half life cycles ago the animal was alive. Thehalf life cycle for carbon 14 is 5,730 years so this animal was alive over 11,000 years ago.
Example B
Suppose you invested $100 the day you were born and it grew by 6% every year until you were 100 years old. Howmuch would this investment be worth then?
Solution: The starting amount is 100 and the growth is 1.06. This is enough information to write an equation. Thex stands for time in years and the f (x) stands for the amount of money in the account. After writing an equationyou need to substitute in 100 years for x.
f (x) = 100 ·1.06x
f (x) = 100 ·1.06100
f (x)≈ 33,930.21
After a century, there will be almost $34,000 in the account. Interest has greatly increased the $100 initial investment.
Example C
Suppose forty rabbits are released on an island. The rabbits mate once every four months and produce up to 4offspring who also produce more offspring four months later. Estimate the number of rabbits on the island in 3years if their population grows exponentially. Assume half the population is female.
Solution: Even though parts of this problem are unrealistic, it serves to illustrate how quickly exponential growthworks. Forty is the initial amount so a = 40. At the end of the first 4 month period 20 female rabbits could havetheir litters and up to 80 newborn rabbits could be born. The population has grown from 40 to 120 which meanstripled. Thus, b = 3. The last thing to remember is that the time period is in 4 month periods. Three years must be9 periods.
f (x) = 40 ·39 = 787,320
So after three years, there could be up to 787,320 rabbits!
Concept Problem Revisited
The number of grains of rice on the last square would be almost ten quintillion (million million million). That ismore rice than is produced in the world in an entire year.
263 = 9,223,372,036,854,775,808
Vocabulary
Exponential growth is growth by repeated multiplication.
Arithmetic growth is growth by repeated addition.
Half-life is the amount of time it takes for the isotope carbon-14 to decay into more stable molecules. Since carbon14 is naturally present in predictable amounts in all organic life, scientists can predict how old something is by howmuch carbon 14 is left.
150
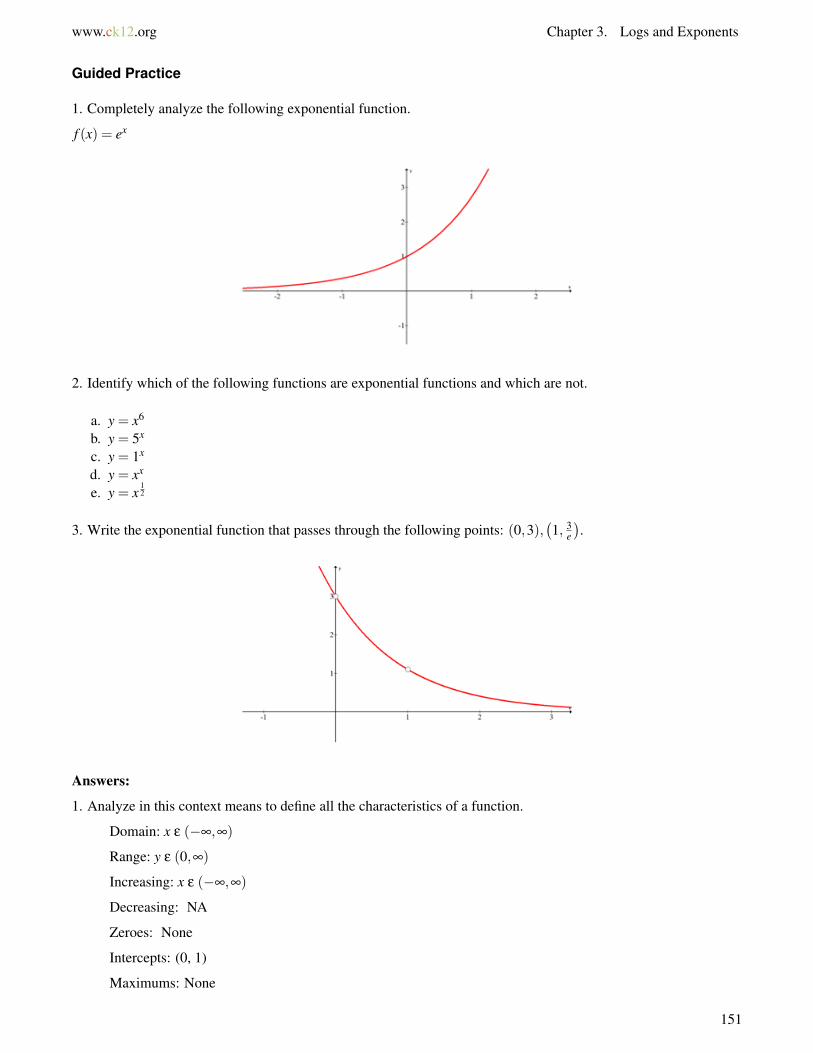
www.ck12.org Chapter 3. Logs and Exponents
Guided Practice
1. Completely analyze the following exponential function.
f (x) = ex
2. Identify which of the following functions are exponential functions and which are not.
a. y = x6
b. y = 5x
c. y = 1x
d. y = xx
e. y = x12
3. Write the exponential function that passes through the following points: (0,3),(1, 3
e
).
Answers:
1. Analyze in this context means to define all the characteristics of a function.
Domain: x ε (−∞,∞)
Range: y ε (0,∞)
Increasing: x ε (−∞,∞)
Decreasing: NA
Zeroes: None
Intercepts: (0, 1)
Maximums: None
151
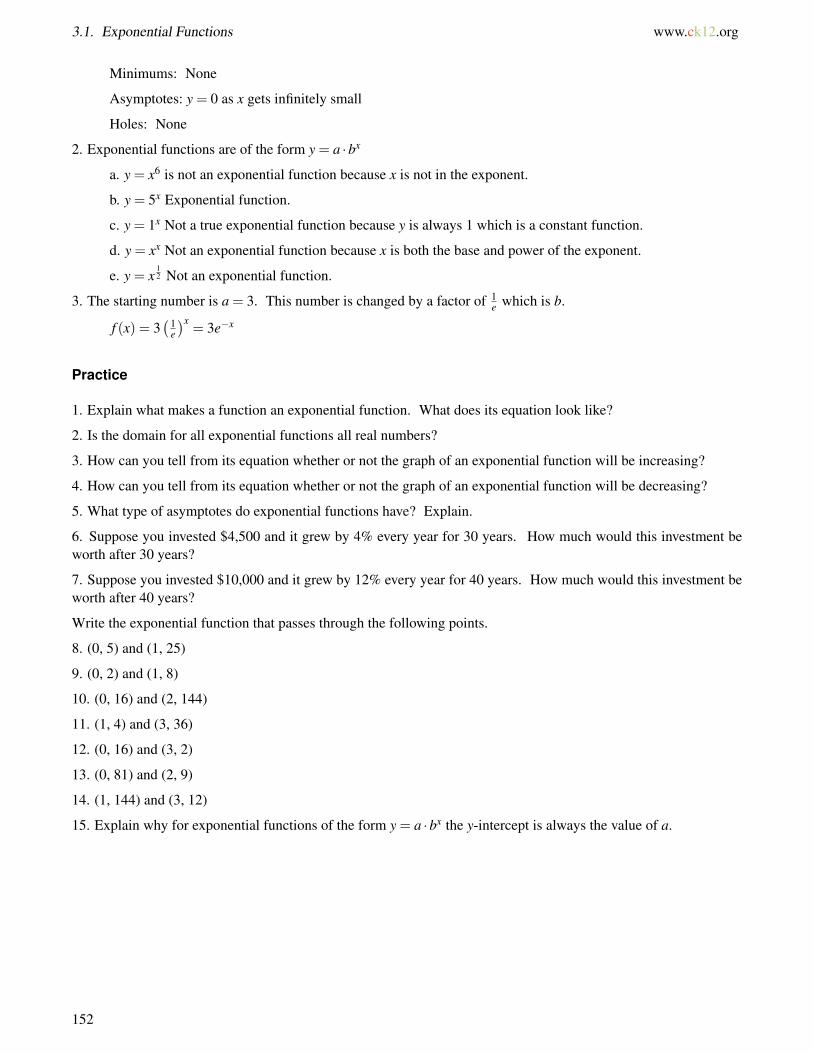
3.1. Exponential Functions www.ck12.org
Minimums: None
Asymptotes: y = 0 as x gets infinitely small
Holes: None
2. Exponential functions are of the form y = a ·bx
a. y = x6 is not an exponential function because x is not in the exponent.
b. y = 5x Exponential function.
c. y = 1x Not a true exponential function because y is always 1 which is a constant function.
d. y = xx Not an exponential function because x is both the base and power of the exponent.
e. y = x12 Not an exponential function.
3. The starting number is a = 3. This number is changed by a factor of 1e which is b.
f (x) = 3(1
e
)x= 3e−x
Practice
1. Explain what makes a function an exponential function. What does its equation look like?
2. Is the domain for all exponential functions all real numbers?
3. How can you tell from its equation whether or not the graph of an exponential function will be increasing?
4. How can you tell from its equation whether or not the graph of an exponential function will be decreasing?
5. What type of asymptotes do exponential functions have? Explain.
6. Suppose you invested $4,500 and it grew by 4% every year for 30 years. How much would this investment beworth after 30 years?
7. Suppose you invested $10,000 and it grew by 12% every year for 40 years. How much would this investment beworth after 40 years?
Write the exponential function that passes through the following points.
8. (0, 5) and (1, 25)
9. (0, 2) and (1, 8)
10. (0, 16) and (2, 144)
11. (1, 4) and (3, 36)
12. (0, 16) and (3, 2)
13. (0, 81) and (2, 9)
14. (1, 144) and (3, 12)
15. Explain why for exponential functions of the form y = a ·bx the y-intercept is always the value of a.
152

www.ck12.org Chapter 3. Logs and Exponents
3.2 Properties of Exponents
Here you will learn how exponents interact in a variety of algebraic situations including addition, subtraction,multiplication and exponentiation.
It is important to quickly and effectively manipulate algebraic expressions involving exponents. One simplificationthat comes up often is that expressions and numbers raised to the 0 power are always equal to 1. Why is this trueand is it always true?
Watch This
MEDIAClick image to the left for more content.
http://www.youtube.com/watch?v=0GAMbuPJGOY James Sousa: Properties of Exponents
Guidance
Consider the following exponential expressions with the same base and what happens through the algebraic opera-tions. You should feel comfortable with all of these types of manipulations.
by,bx
Addition and subtraction: bx±by = bx±by
Only in the special case when x = y can the terms be combined. This is a basic property of combining like terms.
Multiplication: bx ·by = bx+y
When the bases are the same then exponents can be added.
Division: bx
by = bx−y
The division rule is an extension of the multiplication rule with the possibility of a negative in the exponent.
Negative exponent: b−x = 1bx
A negative exponent means reciprocal.
Fractional exponent: (b)1x =
x√b
Square roots are what most people think of when they think of roots, but roots can be taken with any real numberusing fractional exponents.
Powers of Powers: (bx)y = bx·y
Example A
Simplify the following expression until all exponents are positive.
153

3.2. Properties of Exponents www.ck12.org
(a−2b3)−3
ab2c0
Solution:
(a−2b3)−3
ab2c0 =a6b−9
ab2 ·1=
a5
b11
Example B
Simplify the following expression until all exponents are positive.
(2x)5 · 42
2−3 ·a3b2c4
a2b−4c0
Solution:
(2x)5 · 42
2−3 =25x524
2−3 =29x5
2−3 = 212x5
Example C
Simplify the following expression until all exponents are positive.
(a−3b2c4)−1
(a2b−4c0)3
Solution:
(a−3b2c4)−1
(a2b−4c0)3 =a3b−2c−4
a6b−12 =b10
a3c4
Concept Problem Revisited
Consider the following pattern and decide what the next term in the sequence should be:
16, 8, 4, 2, ___
It makes sense that the next term is 1 because each successive term is half that of the previous term. These numberscorrespond to powers of 2.
24,23,22,21,
In this case you could decide that the next term must be 20. This is a useful technique for remembering what happenswhen a number is raised to the 0 power.
One question that extends this idea is what is the value of 00? People have argued about this for centuries. Eulerargued that it should be 1 and many other mathematicians like Cauchy and Möbius argued as well. If you searchtoday you will still find people discussing what makes sense.
In practice, it is convenient for mathematicians to rely on 00 = 1.
154
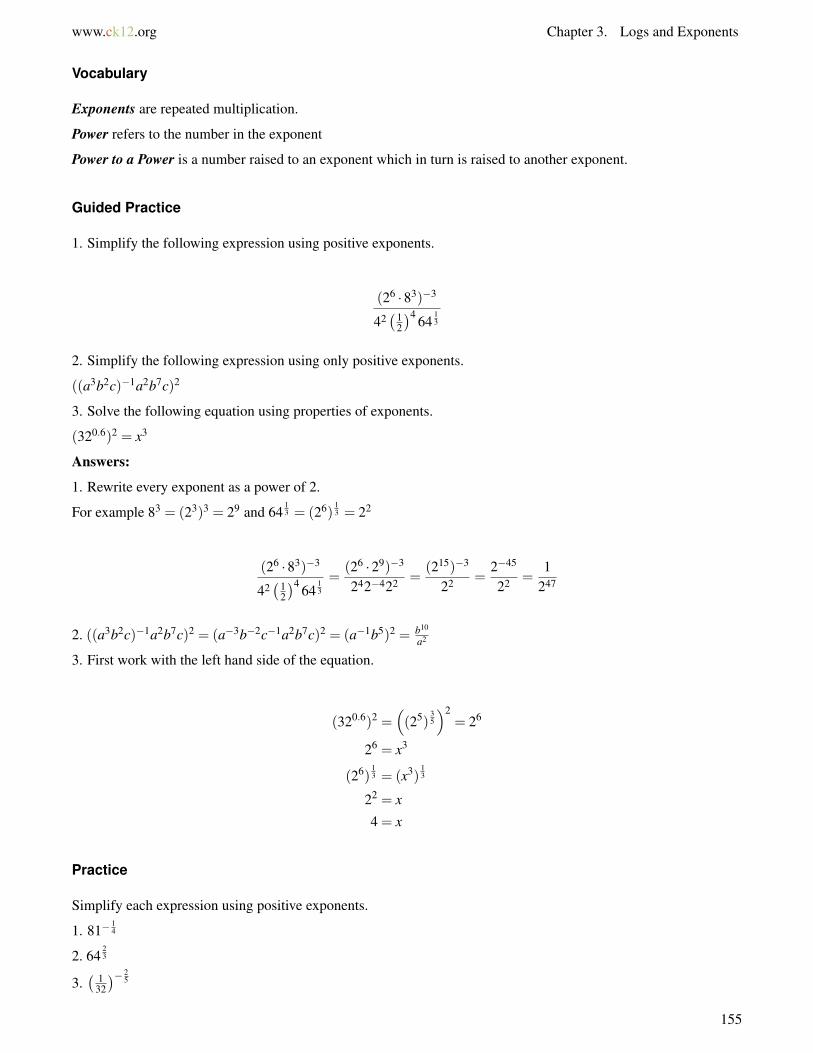
www.ck12.org Chapter 3. Logs and Exponents
Vocabulary
Exponents are repeated multiplication.
Power refers to the number in the exponent
Power to a Power is a number raised to an exponent which in turn is raised to another exponent.
Guided Practice
1. Simplify the following expression using positive exponents.
(26 ·83)−3
42(1
2
)4 6413
2. Simplify the following expression using only positive exponents.
((a3b2c)−1a2b7c)2
3. Solve the following equation using properties of exponents.
(320.6)2 = x3
Answers:
1. Rewrite every exponent as a power of 2.
For example 83 = (23)3 = 29 and 6413 = (26)
13 = 22
(26 ·83)−3
42(1
2
)4 6413
=(26 ·29)−3
242−422 =(215)−3
22 =2−45
22 =1
247
2. ((a3b2c)−1a2b7c)2 = (a−3b−2c−1a2b7c)2 = (a−1b5)2 = b10
a2
3. First work with the left hand side of the equation.
(320.6)2 =((25)
35
)2= 26
26 = x3
(26)13 = (x3)
13
22 = x
4 = x
Practice
Simplify each expression using positive exponents.
1. 81−14
2. 6423
3.( 1
32
)− 25
155
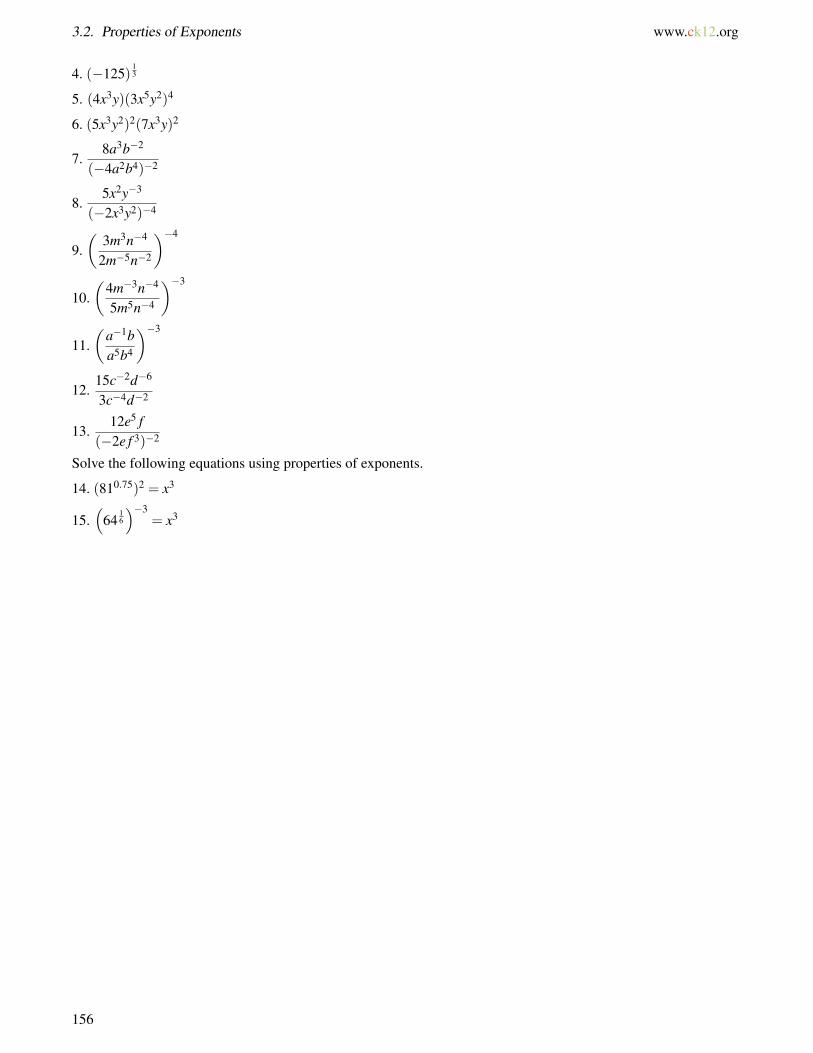
3.2. Properties of Exponents www.ck12.org
4. (−125)13
5. (4x3y)(3x5y2)4
6. (5x3y2)2(7x3y)2
7.8a3b−2
(−4a2b4)−2
8.5x2y−3
(−2x3y2)−4
9.(
3m3n−4
2m−5n−2
)−4
10.(
4m−3n−4
5m5n−4
)−3
11.(
a−1ba5b4
)−3
12.15c−2d−6
3c−4d−2
13.12e5 f
(−2e f 3)−2
Solve the following equations using properties of exponents.
14. (810.75)2 = x3
15.(
6416
)−3= x3
156

www.ck12.org Chapter 3. Logs and Exponents
3.3 Scientific Notation
Here you will review how to write very large and very small numbers in scientific notation and how to use scientificnotation in arithmetic operations.
In science, measurements are often extremely small or extremely large. It is inefficient to write the many zeroesin very small numbers like 0.00000000000000523. Usually, the order of magnitude and the first few digits of thenumber are what people are interested in. How should you represent these extreme numbers?
Watch This
MEDIAClick image to the left for more content.
http://www.youtube.com/watch?v=hY-ecKyZ244 James Sousa: Scientific Notation
Guidance
Scientific notation is a means of representing very large and very small numbers in a more efficient way. The generalform of scientific notation is a ·10b
The a is a number between 1 and 10 and most often includes a decimal. The integer b is called the order ofmagnitude and is a measure of the general size of the number. If b is negative then the number is small and if b ispositive then the number is large.
1,240,000 = 1.24 ·106
0.0000354 = 3.54 ·10−5
Note that when switching to and from scientific notation the sign of b indicates which direction and how many placesto move the decimal point.
Multiplying and dividing numbers that are in scientific notation is just an exercise in exponent rules:
(a ·10x) · (b ·10y) = a ·b ·10x+y
(a ·10x)÷ (b ·10y) =ab·10x−y
Addition and subtraction require the numbers to have identical order of magnitudes.
1.2 ·106−5.5 ·105 = 12 ·105−5.5 ·105 = 6.5 ·105
Example A
157
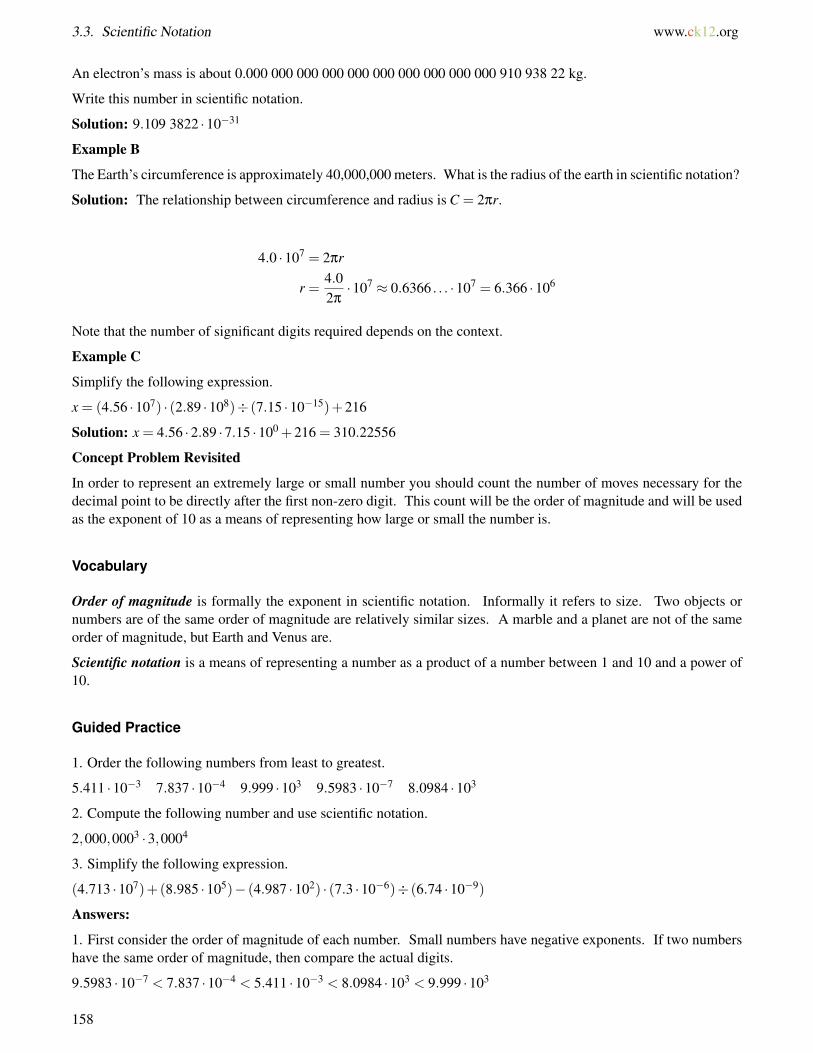
3.3. Scientific Notation www.ck12.org
An electron’s mass is about 0.000 000 000 000 000 000 000 000 000 000 910 938 22 kg.
Write this number in scientific notation.
Solution: 9.109 3822 ·10−31
Example B
The Earth’s circumference is approximately 40,000,000 meters. What is the radius of the earth in scientific notation?
Solution: The relationship between circumference and radius is C = 2πr.
4.0 ·107 = 2πr
r =4.02π·107 ≈ 0.6366 . . . ·107 = 6.366 ·106
Note that the number of significant digits required depends on the context.
Example C
Simplify the following expression.
x = (4.56 ·107) · (2.89 ·108)÷ (7.15 ·10−15)+216
Solution: x = 4.56 ·2.89 ·7.15 ·100 +216 = 310.22556
Concept Problem Revisited
In order to represent an extremely large or small number you should count the number of moves necessary for thedecimal point to be directly after the first non-zero digit. This count will be the order of magnitude and will be usedas the exponent of 10 as a means of representing how large or small the number is.
Vocabulary
Order of magnitude is formally the exponent in scientific notation. Informally it refers to size. Two objects ornumbers are of the same order of magnitude are relatively similar sizes. A marble and a planet are not of the sameorder of magnitude, but Earth and Venus are.
Scientific notation is a means of representing a number as a product of a number between 1 and 10 and a power of10.
Guided Practice
1. Order the following numbers from least to greatest.
5.411 ·10−3 7.837 ·10−4 9.999 ·103 9.5983 ·10−7 8.0984 ·103
2. Compute the following number and use scientific notation.
2,000,0003 ·3,0004
3. Simplify the following expression.
(4.713 ·107)+(8.985 ·105)− (4.987 ·102) · (7.3 ·10−6)÷ (6.74 ·10−9)
Answers:
1. First consider the order of magnitude of each number. Small numbers have negative exponents. If two numbershave the same order of magnitude, then compare the actual digits.
9.5983 ·10−7 < 7.837 ·10−4 < 5.411 ·10−3 < 8.0984 ·103 < 9.999 ·103
158

www.ck12.org Chapter 3. Logs and Exponents
2. First convert each number to scientific notation individually, then process the exponent and multiplication.
2,000,0003 ·3,0004 = (2 ·106)3 · (3 ·103)4
= 8 ·1018 ·81 ·1012
= 648 ·1030
= 6.48 ·1032
3. Resolve in order of standard order of operations
(4.713 ·107)+(8.985 ·105)− (4.987 ·102) · (7.3 ·10−6)÷ (6.74 ·10−9)
= (4.713 ·107)+(8.985 ·105)− (5.40135 ·105)
= (471.3 ·105)+(8.985 ·105)− (5.40135 ·105)
= 474.8836499 ·105
= 4.748836499 ·107
Practice
Write the following numbers in scientific notation.
1. 152,780
2. 0.00003256
3. 56, 320
4. 0.0821
5. 1, 000, 000, 000, 000, 000, 000, 000
6. 7.32
7. If the federal budget is $1.5 trillion, how much does it cost each individual, on average, if there are 300,000,000people?
8. The Library of Congress has about 60,000,000 items. How could you express this number in scientific notation?
9. The sun develops 5×10²³ horsepower per second. How much horsepower is developed in a day? In a year with365 days?
10. A light-year is about 5,869,713,600 miles. A spacecraft travels 8.23× 10⁴ miles per hour. How long will ittake the spacecraft to travel a light–year?
11. Compute the following number and use scientific notation: 324,000 ·30,0003.
12. Compute the following number and use scientific notation: 14,300 ·20,2002.
Simplify the following expressions.
13. (3.29 ·104)− (3.295 ·105)+(1.25 ·102) · (3.97 ·1015) · (5.8 ·10−6)
14. (1.95 ·102)+(6.798 ·106)+(2.896 ·103) · (5.6 ·10−3)÷ (2.89 ·104)
15. (2.158 ·107) · (1.679 ·106)− (9.98 ·104) · (3.4 ·10−2)
159
3.4. Properties of Logs www.ck12.org
3.4 Properties of Logs
Here you will be introduced to logarithmic expressions and will learn how they can be combined using properties ofarithmetic.
Log functions are inverses of exponential functions. This means the domain of one is the range of the other. This isextremely helpful when solving an equation and the unknown is in an exponent. Before solving equations, you mustbe able to simplify expressions containing logs. The rules of exponents are applied, but in non-obvious ways. Inorder to get a conceptual handle on the properties of logs, it may be helpful to continually ask, what does a logexpression represent? For example, what doeslog10 1,000 represent?
Watch This
MEDIAClick image to the left for more content.
http://www.youtube.com/watch?v=SxF44olWTyk James Sousa: Properties of Logarithms
Guidance
Exponential and logarithmic expressions have the same 3 components. They are each written in a different way sothat a different variable is isolated. The following two equations are equivalent to one another.
bx = a↔ logb a = x
The exponential equation is read “b to the power x is a.” The logarithmic equation is read “log base b of a is x”.
The two most common bases for logs are 10 and e. At the PreCalculus level log by itself implies log base 10 andln implies base e. ln is called the natural log. One important restriction for all log functions is that they must havestrictly positive numbers in their arguments. So, if you press log -2 or log 0 on your calculator, it will give an error.
There are four basic properties of logs that correlate to properties of exponents.
Addition/Multiplication:
logb x+ logb y = logb(x · y)
bw+z = bw ·bz
Subtraction/Division:
logb x− logb y = logb
(xy
)bw−z = bw
bz
Exponentiation:
logb(xn) = n · logb x
160
www.ck12.org Chapter 3. Logs and Exponents
(bw)n = bw·n
There are a few standard results that should be memorized and should serve as baseline reference tools.
• logb 1 = 0• logb b = 1• logb(b
x) = x• blogb x = x
Example A
Simplify the following expressions:
a. log4 64b. log 1
232
c. log3 35
d. log2 128
Solution:
a. log4 64 = log4 43 = 3 · log4 4 = 3 ·1 = 3b.
log 12
32 = x can be rewritten as(
12
)x
= 32.
2−x = 32
x =−5
c. log3 35 = 5 · log3 3 = 5d. log2 128 = log2 27 = 7
Example B
Write the expression as a logarithm of a single argument.
log2 12+ log4 6− log2 24
Solution: Note that the center expression is of a different base. First change it to base 2 by switching back toexponential form.
log4 6 = x↔ 4x = 6
22x = 6↔ log2 6 = 2x
x =12
log2 6 = log2 612
Thus the expression with the same base is:
log2 12+ log2 612 − log2 24 = log2
(12 ·√
624
)
= log2
( √6
2
)
161

3.4. Properties of Logs www.ck12.org
Example C
Simplify the following expression: 2 log12 144−4.
Solution: 2log12 144−4 =−8 · log12 122 =−16 · log12 12 =−16
Concept Problem Revisited
A log expression represents an exponent. The expression log10 1,000 represents the number 3. The reason tokeep this in mind is that it can solidify the properties of logs. For example, adding exponents implies bases aremultiplied. Thus adding logs means the bases of the exponents are multiplied.
Vocabulary
A logarithm is a way of rewriting exponential equations to isolate the exponent.
Guided Practice
1. Prove the following log identity:
loga b = 1logb a
2. Rewrite the following expression under a single log.
lne− ln4x+2(elnx · ln5)
3. True or false:
(log3 4x) · (log3 5y) = log3(4x+5y)
Answers:
1. Start by letting the left side of the equation be equal to x. Then, rewrite in exponential form, manipulate, andrewrite back in logarithmic form until you get the expression from the left side of the equation.
loga b = x
bx = a
b = a1x
logb a =1x
x =1
logb a
Therefore, 1logb a = loga b because both expressions are equal to x.
2. lne− ln4x+2(elnx · ln5)
= ln( e
4x
)+2x · ln5
= ln( e
4x
)+ ln(52x)
= ln(
e ·52x
4x
)3. Note, it may be very tempting to make errors in this practice problem.
162

www.ck12.org Chapter 3. Logs and Exponents
False. It is true that the log of a product is the sum of logs. It is not true that the product of logs is the log of a sum.
Practice
Decide whether each of the following statements are true or false. Explain.
1. logxlogy = log
(xy
)2. (logx)n = n logx
3. logx+ logy = logxy
Rewrite each of the following expressions under a single log and simplify.
4. log4x+ log(2x+4)
5. 5 logx+ logx
6. 4 log2 x+ 12 log2 9− log2 y
7. 6 log3 z2 + 14 log3 y8−2log3 z4y
Expand the expression as much as possible.
8. log4
(2x3
5
)9. ln
(4xy2
15
)10. log
(x2(yz)3
3
)Translate from exponential form to logarithmic form.
11. 2x+1 +4 = 14
Translate from logarithmic form to exponential form.
12. log2(x−1) = 12
Prove the following properties of logarithms.
13. logbn x = 1n logb x
14. logbn xn = logb x
15. log 1b
1x = logb x
163
3.5. Change of Base www.ck12.org
3.5 Change of Base
Here you will extend your knowledge of log properties to a simple way to change the base of a logarithm.
While it is possible to change bases by always going back to exponential form, it is more efficient to find out howto change the base of logarithms in general. Since there are only basee and base 10 logarithms on a calculator, howwould you evaluate an expression likelog3 12?
Watch This
MEDIAClick image to the left for more content.
http://www.youtube.com/watch?v=9kKg19s5b78 James Sousa: Logarithms Change of Base Formula
Guidance
The change of base property states:
logb a =logx alogx b
You can derive this formula by converting logb a to exponential form and then taking the log base x of bothsides. This is shown below.
logb a = y
→ by = a
→ logx by = logx a
→ y logx b = logx a
→ y =logx alogx b
Therefore, logb a =logx alogx b .
Example A
Evaluate log3 4 by changing the base and using your calculator.
Solution:
log3 4 =log10 4log10 3 = ln4
ln3 ≈ 1.262
Example B
Prove the following log identity.
164

www.ck12.org Chapter 3. Logs and Exponents
loga b = 1logb a
Solution:
loga b =logx blogx a = 1
logx alogx b
= 1logb a
Example C
Simplify to an exact result: (log4 5) · (log3 4) · (log5 81) · (log5 25)
Solution:log5log4 ·
log4log3 ·
log34
log5 ·log52
log5 = log5log4 ·
log4log3 ·
4·log3log5 ·
2·log5log5 4 ·2 = 8
Concept Problem Revisited
In order to evaluate an expression like log3 12 you have two options on your calculator:ln12ln3 = log12
log3 ≈ 2.26
Vocabulary
Change of base refers to the formula that allows you to rewrite a logarithm with a new base that you choose. Com-mon bases to use are 10 and e.
Guided Practice
1. Simplify the following expression: (log2013 7+ log2013 9− log2013 11) log2013
2. Evaluate: log2 48− log4 36
3. Given log3 5≈ 1.465 find log25 27 without using a log button on the calculator.
Answers:
1.[
log7log2013 +
log9log2013 −
log11log2013
]· log2013 = log7+ log9− log11 = log
(7·911
)2. log2 48− log4 36
=log48log2
− log36log22
=log48log2
− log62
log22
=log48log2
− 2 · log62 · log2
=log48− log6
log2
=log(48
6
)log2
=log8log2
=log23
log2
=3 · log2
log2= 3
165
3.5. Change of Base www.ck12.org
3. log25 27 = log33
log52 =32 ·
1( log5
log3)= 3
2 ·1
log3 5 ≈32 ·
11.465 = 1.0239
Practice
Evaluate each expression by changing the base and using your calculator.
1. log6 15
2. log9 12
3. log5 25
Evaluate each expression.
4. log8(log4(log3 81))
5. log2 3 · log3 4 · log6 16 · log4 6
6. log125 · log9 4 · log4 81 · log5 10
7. log5(5log5 125)
8. log(log6(log2 64))
9. 10log100 9
10. (log4 x)(logx 16)
11. log49 495
12. 3 log24 248
13. 4log2 3
Prove the following properties of logarithms.
14. (loga b)(logb c) = loga c
15. (loga b)(logb c)(logc d) = loga d
166
www.ck12.org Chapter 3. Logs and Exponents
3.6 Exponential Equations
Here you will apply the new algebraic techniques associated with logs to solve equations.
When you were first learning equations, you learned the rule that whatever you do to one side of an equation, youmust also do to the other side so that the equation stays in balance. The basic techniques of adding, subtracting,multiplying and dividing both sides of an equation worked to solve almost all equations up until now. Withlogarithms, you have more tools to isolate a variable. Consider the following equation and ask yourself: whyisx = 3? Logically it makes sense that if the bases match, then the exponents must match as well, but how can it beshown?
1.798982x = 1.798986
Watch This
MEDIAClick image to the left for more content.
http://www.youtube.com/watch?v=5R5mKpLsfYg James Sousa: Solving Exponential Equations II
Guidance
A common technique for solving equations with unknown variables in exponents is to take the log of the desiredbase of both sides of the equation. Then, you can use properties of logs to simplify and solve the equation. See theexamples below.
Example A
Solve the following equation for t. Note: This type of equation is common in financial mathematics. This examplerepresents the unknown amount of time it will take you to save $9,000 in a savings account if you save $300 at theend of each year in an account that earns 6% annual compound interest.
9,000 = 300 · (1.06)t−10.06
Solution:
167
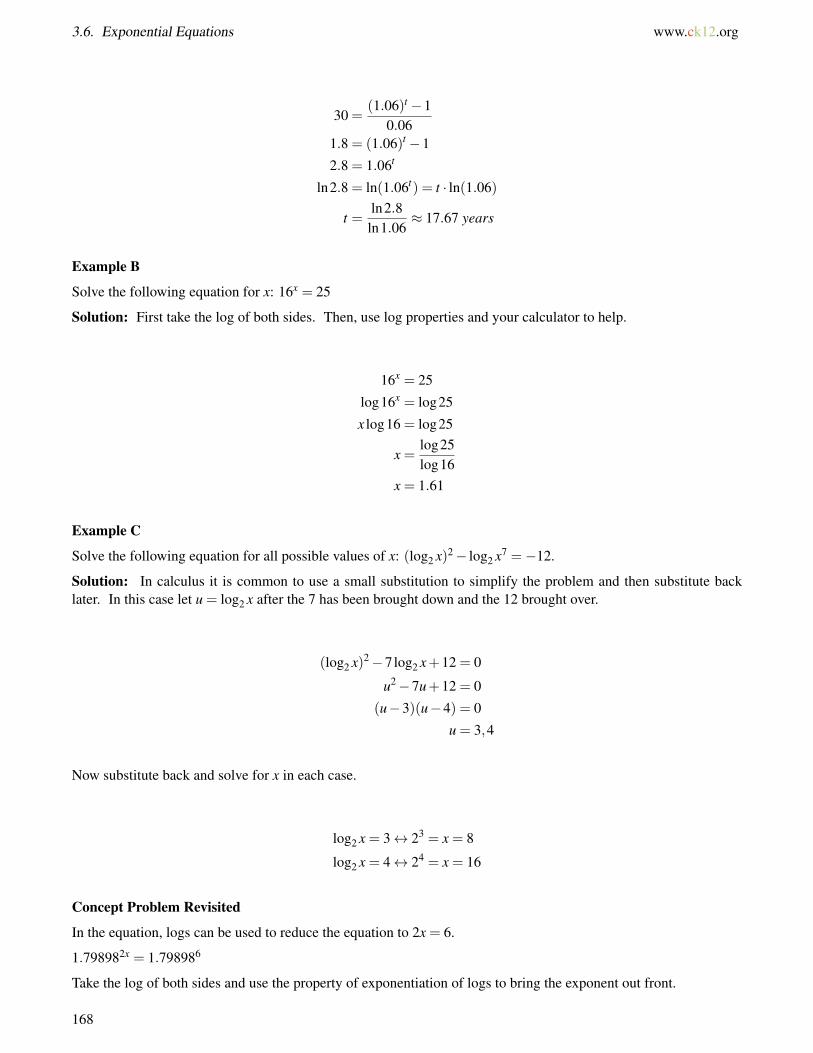
3.6. Exponential Equations www.ck12.org
30 =(1.06)t −1
0.061.8 = (1.06)t −1
2.8 = 1.06t
ln2.8 = ln(1.06t) = t · ln(1.06)
t =ln2.8ln1.06
≈ 17.67 years
Example B
Solve the following equation for x: 16x = 25
Solution: First take the log of both sides. Then, use log properties and your calculator to help.
16x = 25
log16x = log25
x log16 = log25
x =log25log16
x = 1.61
Example C
Solve the following equation for all possible values of x: (log2 x)2− log2 x7 =−12.
Solution: In calculus it is common to use a small substitution to simplify the problem and then substitute backlater. In this case let u = log2 x after the 7 has been brought down and the 12 brought over.
(log2 x)2−7log2 x+12 = 0
u2−7u+12 = 0
(u−3)(u−4) = 0
u = 3,4
Now substitute back and solve for x in each case.
log2 x = 3↔ 23 = x = 8
log2 x = 4↔ 24 = x = 16
Concept Problem Revisited
In the equation, logs can be used to reduce the equation to 2x = 6.
1.798982x = 1.798986
Take the log of both sides and use the property of exponentiation of logs to bring the exponent out front.
168
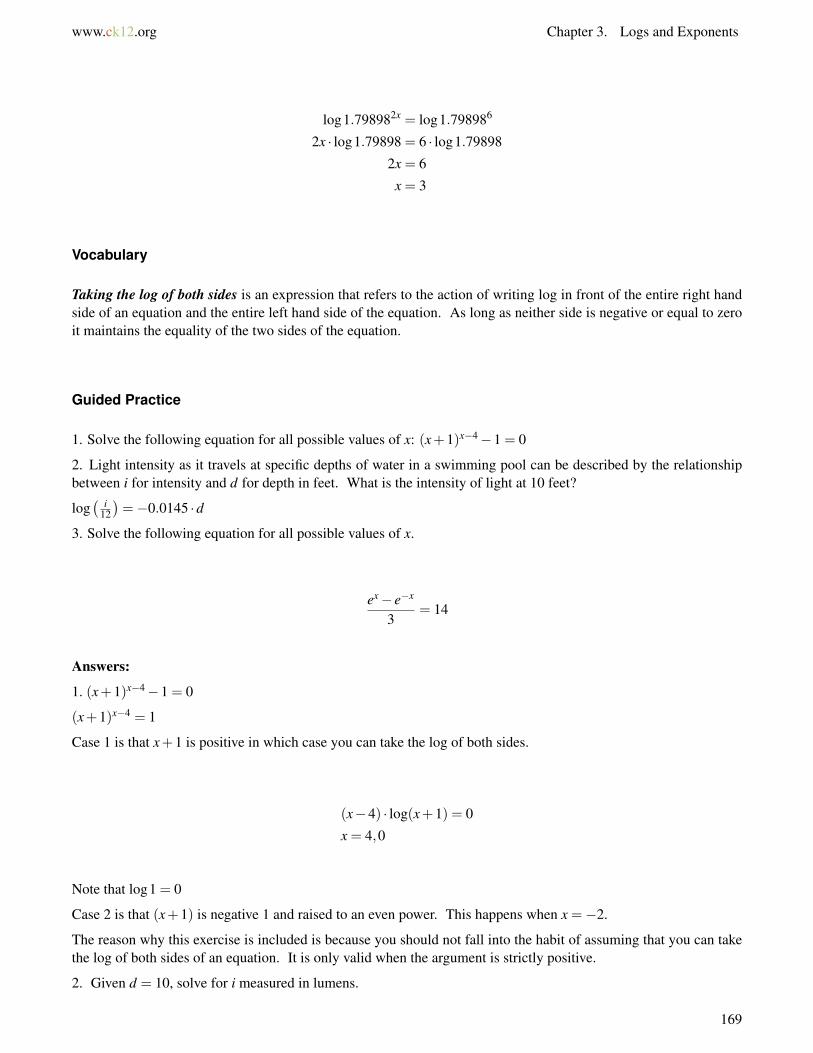
www.ck12.org Chapter 3. Logs and Exponents
log1.798982x = log1.798986
2x · log1.79898 = 6 · log1.79898
2x = 6
x = 3
Vocabulary
Taking the log of both sides is an expression that refers to the action of writing log in front of the entire right handside of an equation and the entire left hand side of the equation. As long as neither side is negative or equal to zeroit maintains the equality of the two sides of the equation.
Guided Practice
1. Solve the following equation for all possible values of x: (x+1)x−4−1 = 0
2. Light intensity as it travels at specific depths of water in a swimming pool can be described by the relationshipbetween i for intensity and d for depth in feet. What is the intensity of light at 10 feet?
log( i
12
)=−0.0145 ·d
3. Solve the following equation for all possible values of x.
ex− e−x
3= 14
Answers:
1. (x+1)x−4−1 = 0
(x+1)x−4 = 1
Case 1 is that x+1 is positive in which case you can take the log of both sides.
(x−4) · log(x+1) = 0
x = 4,0
Note that log1 = 0
Case 2 is that (x+1) is negative 1 and raised to an even power. This happens when x =−2.
The reason why this exercise is included is because you should not fall into the habit of assuming that you can takethe log of both sides of an equation. It is only valid when the argument is strictly positive.
2. Given d = 10, solve for i measured in lumens.
169
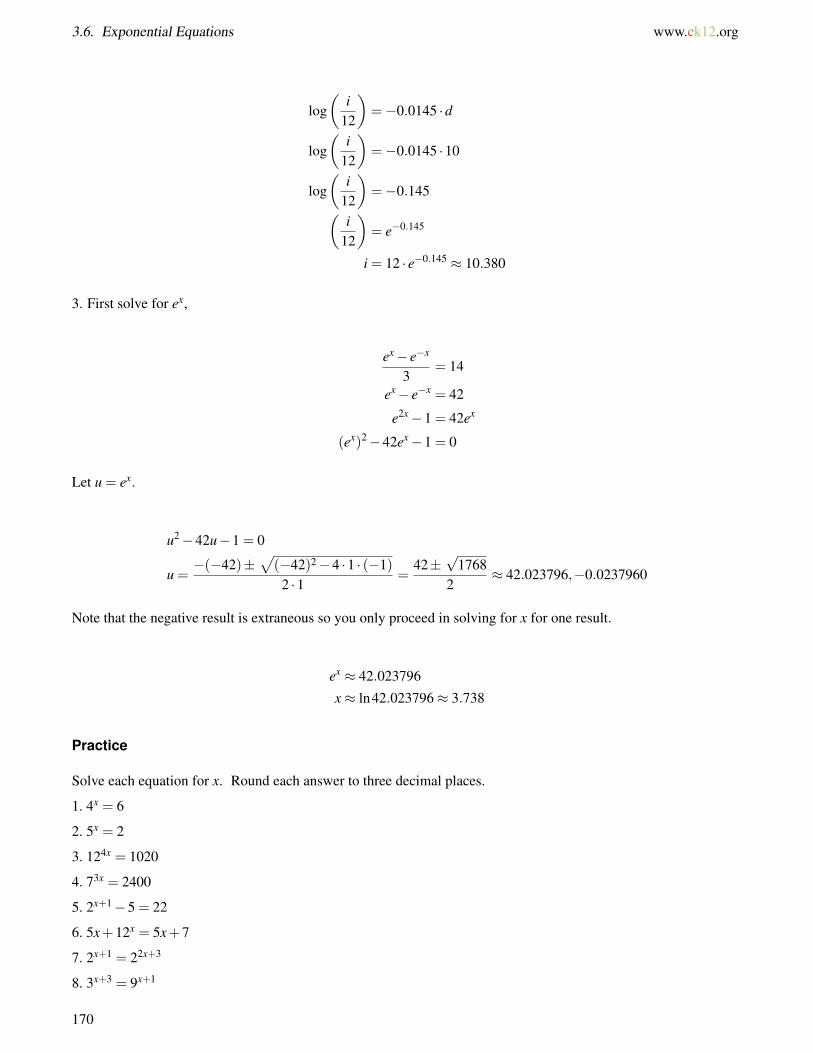
3.6. Exponential Equations www.ck12.org
log(
i12
)=−0.0145 ·d
log(
i12
)=−0.0145 ·10
log(
i12
)=−0.145(
i12
)= e−0.145
i = 12 · e−0.145 ≈ 10.380
3. First solve for ex,
ex− e−x
3= 14
ex− e−x = 42
e2x−1 = 42ex
(ex)2−42ex−1 = 0
Let u = ex.
u2−42u−1 = 0
u =−(−42)±
√(−42)2−4 ·1 · (−1)
2 ·1=
42±√
17682
≈ 42.023796,−0.0237960
Note that the negative result is extraneous so you only proceed in solving for x for one result.
ex ≈ 42.023796
x≈ ln42.023796≈ 3.738
Practice
Solve each equation for x. Round each answer to three decimal places.
1. 4x = 6
2. 5x = 2
3. 124x = 1020
4. 73x = 2400
5. 2x+1−5 = 22
6. 5x+12x = 5x+7
7. 2x+1 = 22x+3
8. 3x+3 = 9x+1
170
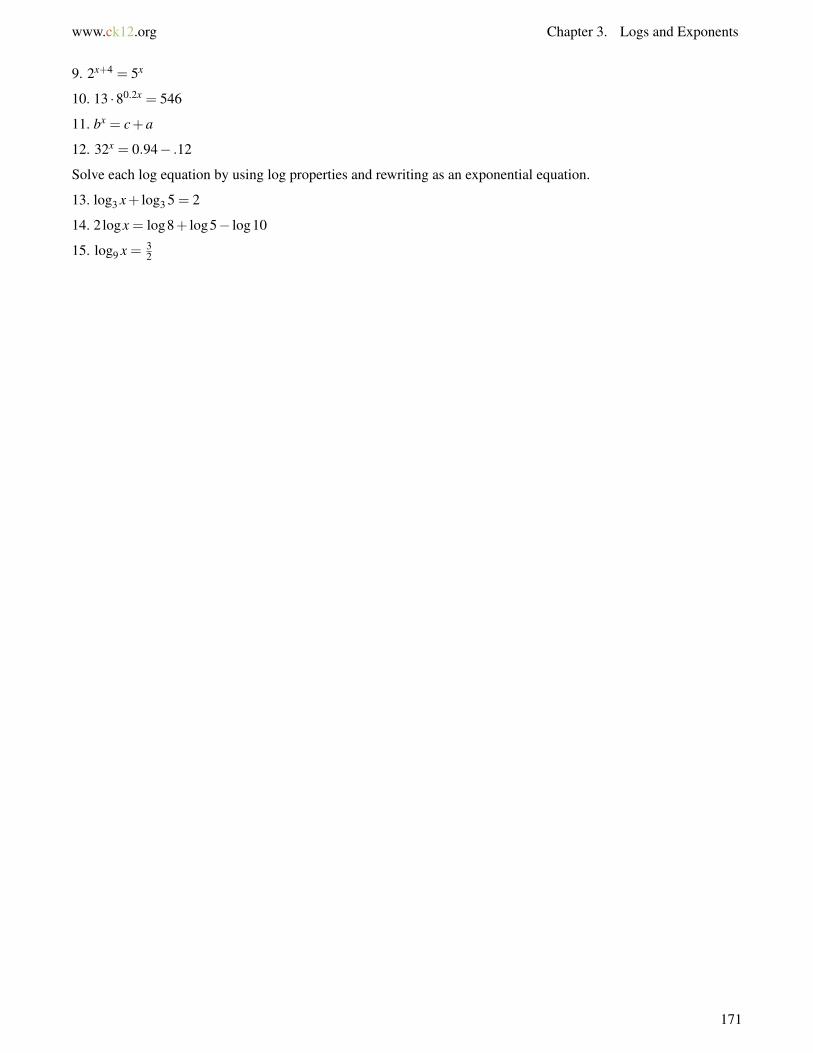
www.ck12.org Chapter 3. Logs and Exponents
9. 2x+4 = 5x
10. 13 ·80.2x = 546
11. bx = c+a
12. 32x = 0.94− .12
Solve each log equation by using log properties and rewriting as an exponential equation.
13. log3 x+ log3 5 = 2
14. 2 logx = log8+ log5− log10
15. log9 x = 32
171
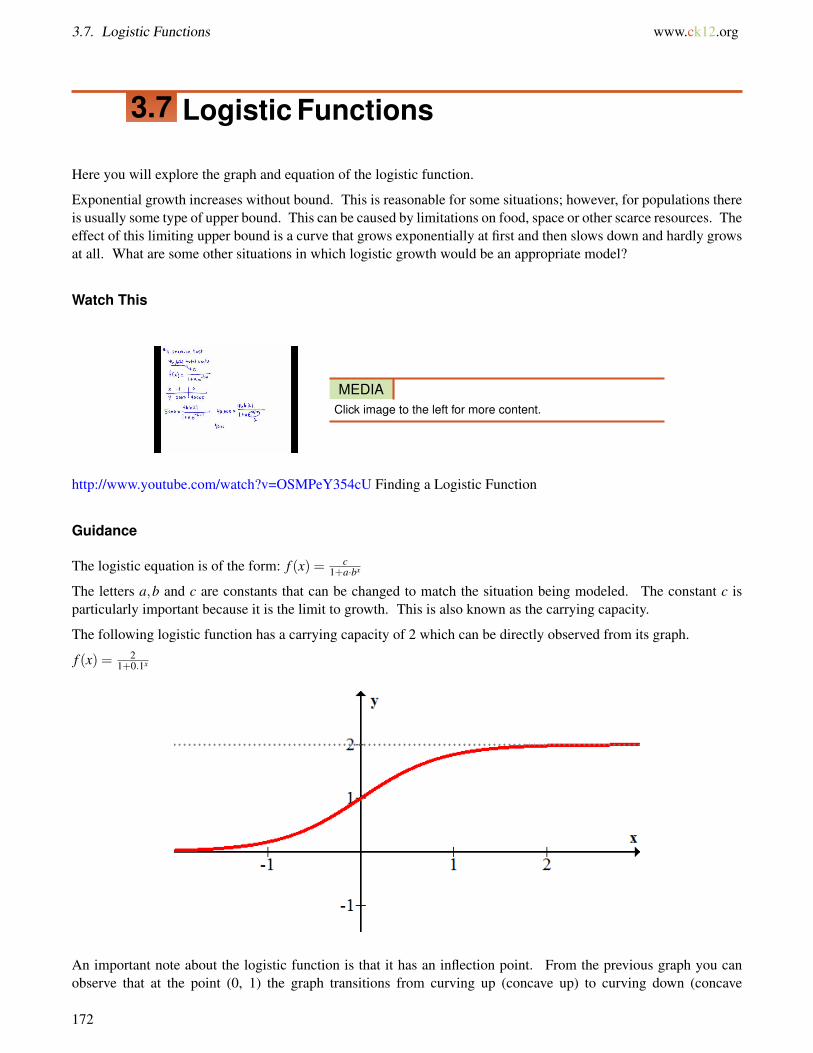
3.7. Logistic Functions www.ck12.org
3.7 Logistic Functions
Here you will explore the graph and equation of the logistic function.
Exponential growth increases without bound. This is reasonable for some situations; however, for populations thereis usually some type of upper bound. This can be caused by limitations on food, space or other scarce resources. Theeffect of this limiting upper bound is a curve that grows exponentially at first and then slows down and hardly growsat all. What are some other situations in which logistic growth would be an appropriate model?
Watch This
MEDIAClick image to the left for more content.
http://www.youtube.com/watch?v=OSMPeY354cU Finding a Logistic Function
Guidance
The logistic equation is of the form: f (x) = c1+a·bx
The letters a,b and c are constants that can be changed to match the situation being modeled. The constant c isparticularly important because it is the limit to growth. This is also known as the carrying capacity.
The following logistic function has a carrying capacity of 2 which can be directly observed from its graph.
f (x) = 21+0.1x
An important note about the logistic function is that it has an inflection point. From the previous graph you canobserve that at the point (0, 1) the graph transitions from curving up (concave up) to curving down (concave
172

www.ck12.org Chapter 3. Logs and Exponents
down). This change in curvature will be studied more in calculus, but for now it is important to know that theinflection point occurs halfway between the carrying capacity and the x axis.
Example A
A rumor is spreading at a school that has a total student population of 1200. Four people know the rumor when itstarts and three days later three hundred people know the rumor. About how many people at the school know therumor by the fourth day?
Solution: In a limited population, the count of people who know a rumor is an example of a situation that can bemodeled using the logistic function. The population is 1200 so this will be the carrying capacity.
Identifying information: c = 1200;(0,4);(3,300). First, use the point (0, 4) so solve for a.
12001+a ·b0 = 4
a = 299
Next, use the point (3, 300) to solve for b.
12001+299 ·b3 = 300
4 = 1+299 b3
3299
= b3
0.21568≈ b
The modeling equation at x = 4:
f (x) = 12001+299·0.21568x → f (4)≈ 729 people
A similar growth pattern will exist with any kind of infectious disease that spreads quickly and can only infect aperson or animal once.
Example B
Long Island has roughly 8 million people. A hundred years ago, it had 2 million people. Suppose that the resourcesand infrastructure of the island could only support 20 million people. When will the population reach ten millioninhabitants?
Solution: Identify known points and the carrying capacity. (0, 8,000,000) and (-100, 2,000,000). c= 20,000,000. Usethe first point to solve for a.
8,000,000 =20,000,000
1+a ·b0
1+a =20,000,0008,000,000
= 2.5
a = 1.5
Now use the other point to solve for b.
173

3.7. Logistic Functions www.ck12.org
2,000,000 =20,000,000
1+1.5 ·b−100
1+1.5 ·b−100 = 10
b−100 =9
1.5= 6
b≈ 0.98224
The question asks for the x value when f (x) = 10,000,000.
10,000,000 =20,000,000
1+1.5 · (0.98224)x
1+1.5 · (0.98224)x = 2
(0.98224)x =23
x · ln(0.98224) = ln(
23
)x =
ln(2
3
)ln(0.98224)
≈ 22.629
This means that according to your assumption and the two population data points you used, the predicted time fromnow that the population of Long Island will reach 10 million inhabitants is about 22.6 years.
Example C
A special kind of algae is grown in giant clear plastic tanks and can be harvested to make biofuel. The algae are givenplenty of food, water and sunlight to grow rapidly and the only limiting resource is space in the tank. The algae areharvested when 95% of the tank is full leaving the tank 5% full of algae to reproduce and refill the tank. Currentlythe time between harvests is twenty days and the payoff is 90% harvest. Would you recommend a more optimalharvest schedule?
Solution: Identify known quantities and model the growth of the algae.
Known quantities: (0,0.05);(20,0.95);c = 1 or 100%
0.05 =1
1+a ·b0
a = 19
0.95 =1
1+19 ·b20
1+19 ·b20 =1
0.95
b20 =
( 10.95 −1
)19
b≈ 0.74495
The model for the algae growth is:
f (x) = 11+19·(0.74495)x
The question asks about optimal harvest schedule. Currently the harvest is 90% per 20 day or a unit rate of 4.5% perday. If you shorten the time between harvests where the algae are growing the most efficiently, then potentially this
174
www.ck12.org Chapter 3. Logs and Exponents
unit rate might be higher. Suppose you leave 15% of the algae in the tank and harvest when it reaches 85%. Howmuch time will that take to yield 70%?
0.15 =1
1+19 · (0.74495)x
x1 ≈ 4.10897
0.85 =1
1+19 · (0.74495)x
x2 ≈ 15.8914
It takes about 12 days for the batches to yield 70% harvest which is a unit rate of about 6% per day. This is asignificant increase in efficiency. A harvest schedule that maximizes the time where the logistic curve is steepestcreates the fastest overall algae growth.
Concept Problem Revisited
The logistic model is appropriate whenever the total count has an upper limit and the initial growth is exponen-tial. Examples are the spread of rumors and disease in a limited population and the growth of bacteria or humanpopulation when resources are limited.
Vocabulary
Carrying capacity is the maximum sustainable population that the environmental factors will support. In otherwords, it is the population limit.
Guided Practice
1. Given the following logistic model, predict the x value that will produce a height of 14 and then predict the heightwhen x is 4.
f (x) = 201+4·(0.9)x
2. Determine the logistic model given c = 12 and the points (0, 9) and (1, 11).
3. Determine the logistic model given c = 7 and the points (0, 2) and (3, 5).
Answers:
1. The first part involves solving for x with a known height.
14 =20
1+4 · (0.9)x
1+4 · (0.9)x =2014
(0.9)x =
(2014 −1
)4
x = log0.9
((2014 −1
)4
)=
ln(( 20
14−1)4
)ln0.9
≈ 21.1995
The second part requires a substitution for x = 4.
175

3.7. Logistic Functions www.ck12.org
f (x) = 201+4·(0.9)4 = 5.51815
2. The two points give two equations, and the logistic model has two variables.
9 =12
1+a ·b0
1+a =129
a =13
11 =12
1+(1
3
)·b1
1+(
13
)·b =
1211
b = 0.27
Thus the approximate model is:
f (x) = 121+( 1
3)·(0.27273)x
3. The two points give two equations, and the logistic model has two variables.
2 =7
1+aa = 1.5
5 =7
1+(1.5) ·b3
b3 = 0.4
b≈ 0.7368
Thus the approximate model is:
f (x) = 71+(1.5)·(0.7368)x
Practice
For 1-5, determine the logistic model given the carrying capacity and two points.
1. c = 12;(0,5);(1,7)
2. c = 200;(0,150);(5,180)
3. c = 1500;(0,150);(10,1000)
4. c = 1000000;(0,100000);(−40,20000)
5. c = 30000000;(−60,10000);(0,8000000)
For 6-8, use the logistic function f (x) = 321+3e−x .
6. What is the carrying capacity of the function?
7. What is the y-intercept of the function?
8. Use your answers to 6 and 7 along with at least two points on the graph to make a sketch of the function.
176

www.ck12.org Chapter 3. Logs and Exponents
For 9-11, use the logistic function g(x) = 251+4·0.2x .
9. What is the carrying capacity of the function?
10. What is the y-intercept of the function?
11. Use your answers to 9 and 10 along with at least two points on the graph to make a sketch of the function.
For 12-14, use the logistic function h(x) = 41+2·0.68x .
12. What is the carrying capacity of the function?
13. What is the y-intercept of the function?
14. Use your answers to 12 and 13 along with at least two points on the graph to make a sketch of the function.
15. Give an example of a logistic function that is decreasing (models decay). In general, how can you tell from theequation if the logistic function is increasing or decreasing?
Exponential functions demonstrate applications of geometric growth and decay in the real world. After practicingwith the rules and procedures to gain fluency with exponents and scientific notation, you transferred your knowledgeto logarithms and their properties. Lastly, you explored how a new type of function, the logistic function, improveson exponential growth models for real world application.
177

3.8. References www.ck12.org
3.8 References
1. CK-12 Foundation. . CCSA2. CK-12 Foundation. . CCSA3. CK-12 Foundation. . CCSA
178
www.ck12.org Chapter 4. Basic Triangle Trigonometry
CHAPTER 4 Basic Triangle TrigonometryChapter Outline
4.1 ANGLES IN RADIANS AND DEGREES
4.2 CIRCULAR MOTION AND DIMENSIONAL ANALYSIS
4.3 SPECIAL RIGHT TRIANGLES
4.4 RIGHT TRIANGLE TRIGONOMETRY
4.5 LAW OF COSINES
4.6 LAW OF SINES
4.7 AREA OF A TRIANGLE
4.8 APPLICATIONS OF BASIC TRIANGLE TRIGONOMETRY
4.9 REFERENCES
Trigonometry is the study of triangles and the relationships between their sides, angles and areas. Using what youknow from Geometry like the Pythagorean theorem and the formula for the area of a triangle, you will be able toderive more powerful formulas and learn to apply them appropriately in different situations.
179
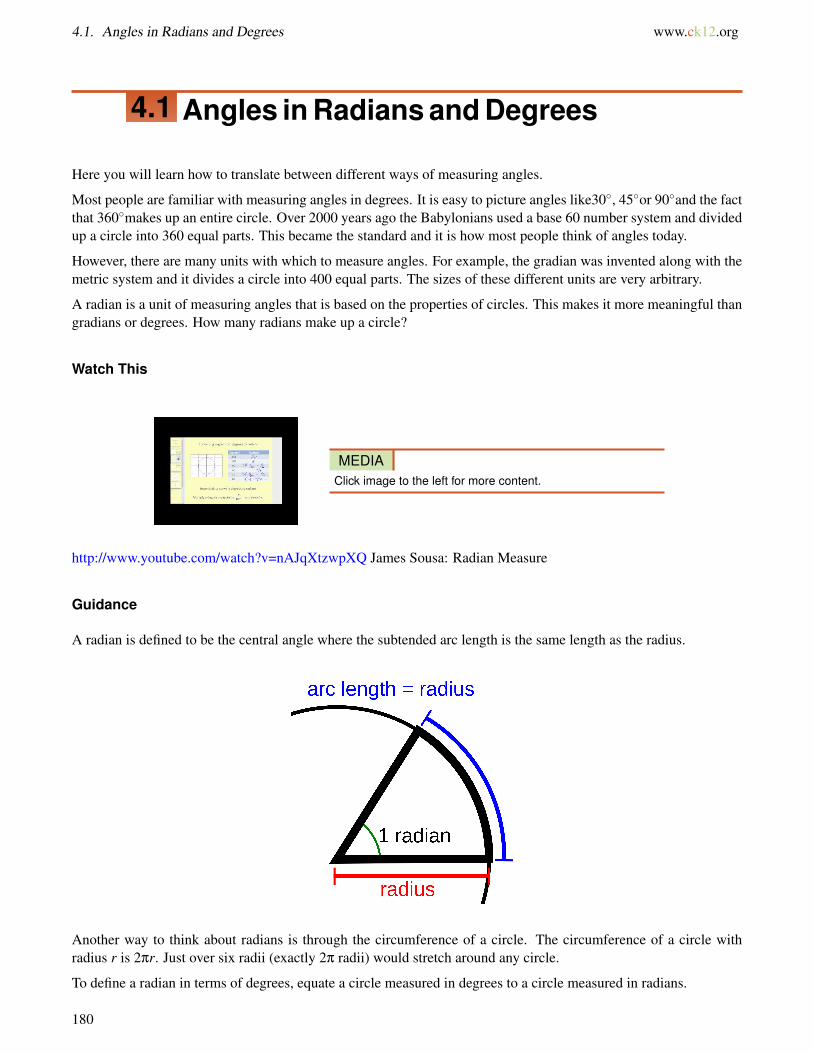
4.1. Angles in Radians and Degrees www.ck12.org
4.1 Angles in Radians and Degrees
Here you will learn how to translate between different ways of measuring angles.
Most people are familiar with measuring angles in degrees. It is easy to picture angles like30◦, 45◦or 90◦and the factthat 360◦makes up an entire circle. Over 2000 years ago the Babylonians used a base 60 number system and dividedup a circle into 360 equal parts. This became the standard and it is how most people think of angles today.
However, there are many units with which to measure angles. For example, the gradian was invented along with themetric system and it divides a circle into 400 equal parts. The sizes of these different units are very arbitrary.
A radian is a unit of measuring angles that is based on the properties of circles. This makes it more meaningful thangradians or degrees. How many radians make up a circle?
Watch This
MEDIAClick image to the left for more content.
http://www.youtube.com/watch?v=nAJqXtzwpXQ James Sousa: Radian Measure
Guidance
A radian is defined to be the central angle where the subtended arc length is the same length as the radius.
Another way to think about radians is through the circumference of a circle. The circumference of a circle withradius r is 2πr. Just over six radii (exactly 2π radii) would stretch around any circle.
To define a radian in terms of degrees, equate a circle measured in degrees to a circle measured in radians.
180
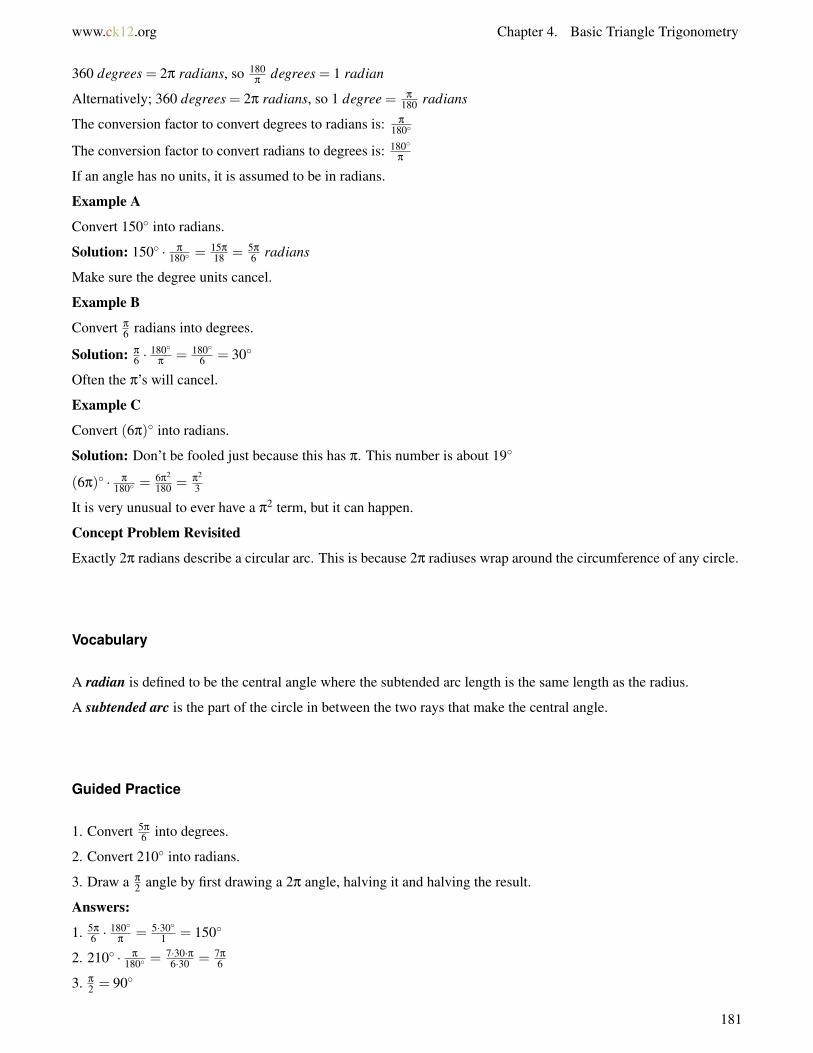
www.ck12.org Chapter 4. Basic Triangle Trigonometry
360 degrees = 2π radians, so 180π
degrees = 1 radian
Alternatively; 360 degrees = 2π radians, so 1 degree = π
180 radians
The conversion factor to convert degrees to radians is: π
180◦
The conversion factor to convert radians to degrees is: 180◦π
If an angle has no units, it is assumed to be in radians.
Example A
Convert 150◦ into radians.
Solution: 150◦ · π
180◦ =15π
18 = 5π
6 radians
Make sure the degree units cancel.
Example B
Convert π
6 radians into degrees.
Solution: π
6 ·180◦
π= 180◦
6 = 30◦
Often the π’s will cancel.
Example C
Convert (6π)◦ into radians.
Solution: Don’t be fooled just because this has π. This number is about 19◦
(6π)◦ · π
180◦ =6π2
180 = π2
3
It is very unusual to ever have a π2 term, but it can happen.
Concept Problem Revisited
Exactly 2π radians describe a circular arc. This is because 2π radiuses wrap around the circumference of any circle.
Vocabulary
A radian is defined to be the central angle where the subtended arc length is the same length as the radius.
A subtended arc is the part of the circle in between the two rays that make the central angle.
Guided Practice
1. Convert 5π
6 into degrees.
2. Convert 210◦ into radians.
3. Draw a π
2 angle by first drawing a 2π angle, halving it and halving the result.
Answers:
1. 5π
6 ·180◦
π= 5·30◦
1 = 150◦
2. 210◦ · π
180◦ =7·30·π6·30 = 7π
6
3. π
2 = 90◦
181

4.1. Angles in Radians and Degrees www.ck12.org
Practice
Find the radian measure of each angle.
1. 120◦
2. 300◦
3. 90◦
4. 330◦
5. 270◦
6. 45◦
7. (5π)◦
Find the degree measure of each angle.
8. 7π
6
9. 5π
4
10. 3π
2
11. 5π
3
12. π
13. π
6
14. 3
15. Explain why if you are given an angle in degrees and you multiply it by π
180 you will get the same angle inradians.
182

www.ck12.org Chapter 4. Basic Triangle Trigonometry
4.2 Circular Motion and Dimensional Analysis
Here you’ll review converting between linear and angular speeds using radians and circumference.
Converting between units is essential for mathematics and science in general. Radians are very powerful becausethey provide a link between linear and angular speed. One radian is an angle that always corresponds to an arc lengthof one radius. This will allow you to convert the rate at which you pedal a bike to the actual speed you can travel.
1 revolution = 2πr
The gear near the pedals on a bike has a radius of 5 inches and spins once every second. It is connected by a chainto a second gear that has a 3 inch radius. If the second wheel is connected to a tire with a 17 inch radius, how fast isthe bike moving in miles per hour?
Watch This
MEDIAClick image to the left for more content.
http://www.youtube.com/watch?v=sn8Y7qpYLCY&list=PL67FBCE6482808280 James Sousa: American and Met-ric Conversions
Guidance
Dimensional analysis just means converting from one unit to another. Sometimes it must be done in several stepsin which case it is best to write the original amount on the left and then multiply it by all the different requiredconversions. To convert 3 miles to inches you write:3 mile
1 · 5280 f eet1 mile ·
12 inches1 f oot = 3·5280·12 inches
1 = 190080 inches
Notice how miles and feet/foot cancel leaving the desired unit of inches. Also notice each conversion factor is thesame distance on the numerator and denominator, just written with different units.
Circular motion refers to the fact that on a spinning wheel points close to the center of the wheel actually travelvery slowly and points near the edge of the wheel actually travel much quicker. While the two points have the sameangular speed, their linear speed is very different.
Example A
Suppose Summit High School has a circular track with two lanes for running. The interior lane is 30 meters fromthe center of the circle and the lane towards the exterior is 32 meters from the center of the circle. If two people run4 laps together, how much further does the person on the outside go?
Solution: Calculate the distance each person ran separately using 1 lap to be 1 circumference and find the difference.
183
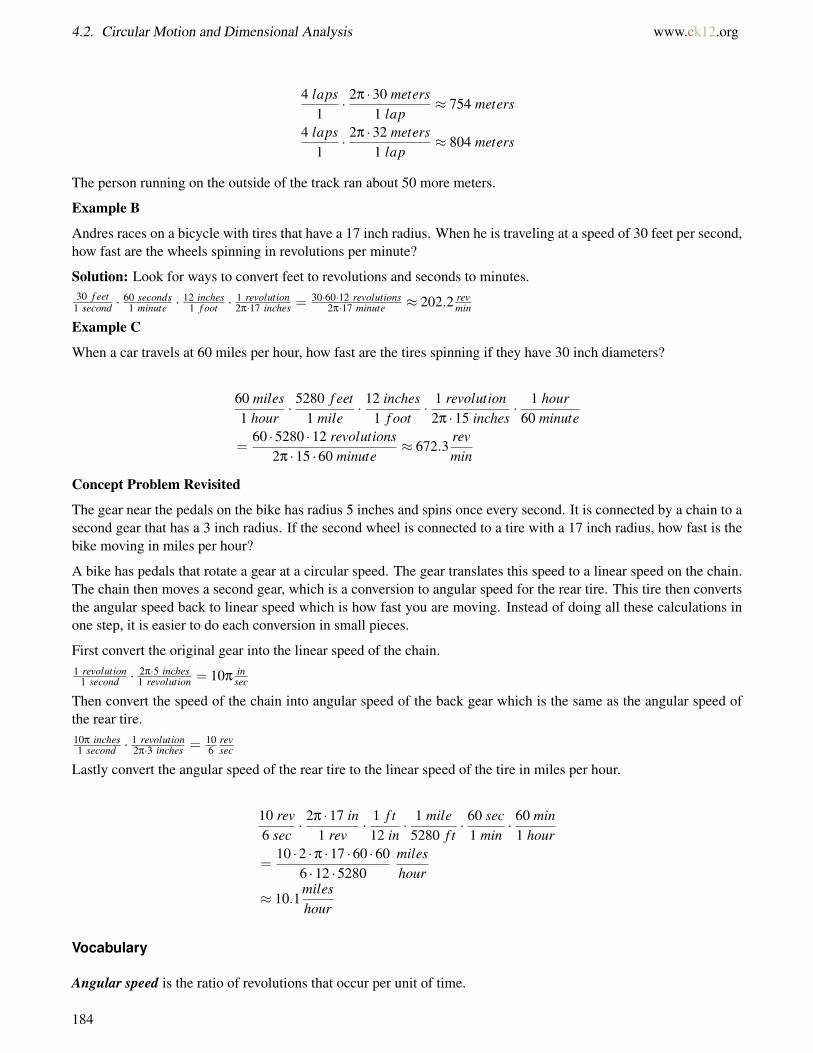
4.2. Circular Motion and Dimensional Analysis www.ck12.org
4 laps1· 2π ·30 meters
1 lap≈ 754 meters
4 laps1· 2π ·32 meters
1 lap≈ 804 meters
The person running on the outside of the track ran about 50 more meters.
Example B
Andres races on a bicycle with tires that have a 17 inch radius. When he is traveling at a speed of 30 feet per second,how fast are the wheels spinning in revolutions per minute?
Solution: Look for ways to convert feet to revolutions and seconds to minutes.30 f eet
1 second ·60 seconds1 minute ·
12 inches1 f oot ·
1 revolution2π·17 inches =
30·60·12 revolutions2π·17 minute ≈ 202.2 rev
min
Example C
When a car travels at 60 miles per hour, how fast are the tires spinning if they have 30 inch diameters?
60 miles1 hour
· 5280 f eet1 mile
· 12 inches1 f oot
· 1 revolution2π ·15 inches
· 1 hour60 minute
=60 ·5280 ·12 revolutions
2π ·15 ·60 minute≈ 672.3
revmin
Concept Problem Revisited
The gear near the pedals on the bike has radius 5 inches and spins once every second. It is connected by a chain to asecond gear that has a 3 inch radius. If the second wheel is connected to a tire with a 17 inch radius, how fast is thebike moving in miles per hour?
A bike has pedals that rotate a gear at a circular speed. The gear translates this speed to a linear speed on the chain.The chain then moves a second gear, which is a conversion to angular speed for the rear tire. This tire then convertsthe angular speed back to linear speed which is how fast you are moving. Instead of doing all these calculations inone step, it is easier to do each conversion in small pieces.
First convert the original gear into the linear speed of the chain.1 revolution
1 second ·2π·5 inches1 revolution = 10π
insec
Then convert the speed of the chain into angular speed of the back gear which is the same as the angular speed ofthe rear tire.10π inches1 second ·
1 revolution2π·3 inches = 10
6revsec
Lastly convert the angular speed of the rear tire to the linear speed of the tire in miles per hour.
10 rev6 sec
· 2π ·17 in1 rev
· 1 f t12 in
· 1 mile5280 f t
· 60 sec1 min
· 60 min1 hour
=10 ·2 ·π ·17 ·60 ·60
6 ·12 ·5280mileshour
≈ 10.1mileshour
Vocabulary
Angular speed is the ratio of revolutions that occur per unit of time.
184
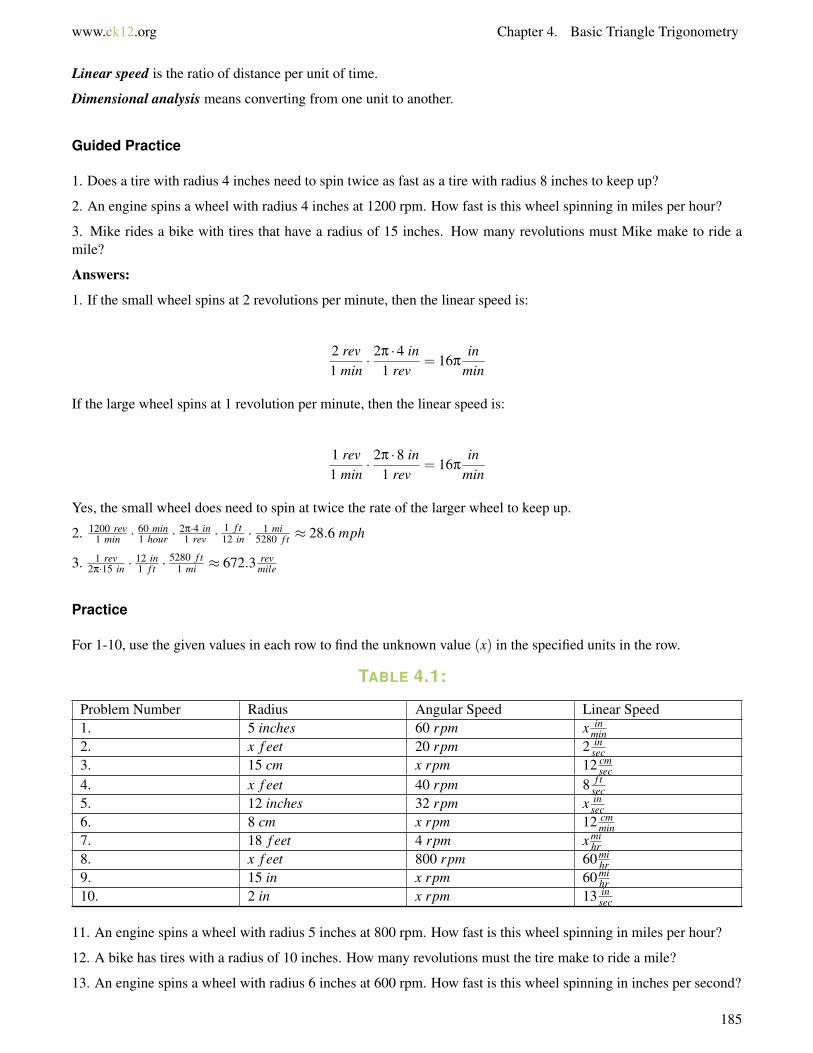
www.ck12.org Chapter 4. Basic Triangle Trigonometry
Linear speed is the ratio of distance per unit of time.
Dimensional analysis means converting from one unit to another.
Guided Practice
1. Does a tire with radius 4 inches need to spin twice as fast as a tire with radius 8 inches to keep up?
2. An engine spins a wheel with radius 4 inches at 1200 rpm. How fast is this wheel spinning in miles per hour?
3. Mike rides a bike with tires that have a radius of 15 inches. How many revolutions must Mike make to ride amile?
Answers:
1. If the small wheel spins at 2 revolutions per minute, then the linear speed is:
2 rev1 min
· 2π ·4 in1 rev
= 16πin
min
If the large wheel spins at 1 revolution per minute, then the linear speed is:
1 rev1 min
· 2π ·8 in1 rev
= 16πin
min
Yes, the small wheel does need to spin at twice the rate of the larger wheel to keep up.
2. 1200 rev1 min ·
60 min1 hour ·
2π·4 in1 rev ·
1 f t12 in ·
1 mi5280 f t ≈ 28.6 mph
3. 1 rev2π·15 in ·
12 in1 f t ·
5280 f t1 mi ≈ 672.3 rev
mile
Practice
For 1-10, use the given values in each row to find the unknown value (x) in the specified units in the row.
TABLE 4.1:
Problem Number Radius Angular Speed Linear Speed1. 5 inches 60 rpm x in
min2. x f eet 20 rpm 2 in
sec3. 15 cm x rpm 12 cm
sec4. x f eet 40 rpm 8 f t
sec5. 12 inches 32 rpm x in
sec6. 8 cm x rpm 12 cm
min7. 18 f eet 4 rpm x mi
hr8. x f eet 800 rpm 60 mi
hr9. 15 in x rpm 60 mi
hr10. 2 in x rpm 13 in
sec
11. An engine spins a wheel with radius 5 inches at 800 rpm. How fast is this wheel spinning in miles per hour?
12. A bike has tires with a radius of 10 inches. How many revolutions must the tire make to ride a mile?
13. An engine spins a wheel with radius 6 inches at 600 rpm. How fast is this wheel spinning in inches per second?
185

4.2. Circular Motion and Dimensional Analysis www.ck12.org
14. Bob has a car with tires that have a 15 inch radius. When he is traveling at a speed of 30 miles per hour, howfast are the wheels spinning in revolutions per minute?
15. A circular track has two lanes. The interior lane is 25 feet from the center of the circle and the lane towards theexterior is 30 feet from the center of the circle. If you jog 6 laps, how much further will you jog in the exterior laneas opposed to the interior lane?
186

www.ck12.org Chapter 4. Basic Triangle Trigonometry
4.3 Special Right Triangles
Here you will review properties of 30-60-90 and 45-45-90 right triangles.
The Pythagorean Theorem is great for finding the third side of a right triangle when you already know two othersides. There are some triangles like 30-60-90 and 45-45-90 triangles that are so common that it is useful to know theside ratios without doing the Pythagorean Theorem each time. Using these patterns also allows you to totally solvefor the missing sides of these special triangles when you only know one side length.
Given a 45-45-90 right triangle with sides 6 inches, 6 inches and x inches, what is the value of x?
Watch This
MEDIAClick image to the left for more content.
http://www.youtube.com/watch?v=681WWiNxMIQ Khan Academy: Intro to 30 60 90 Triangles Geometry
MEDIAClick image to the left for more content.
http://www.youtube.com/watch?v=tSHitjFIjd8 Khan Academy: 45 45 90 Triangles
Guidance
A 30-60-90 right triangle has side ratios x,x√
3,2x.
187
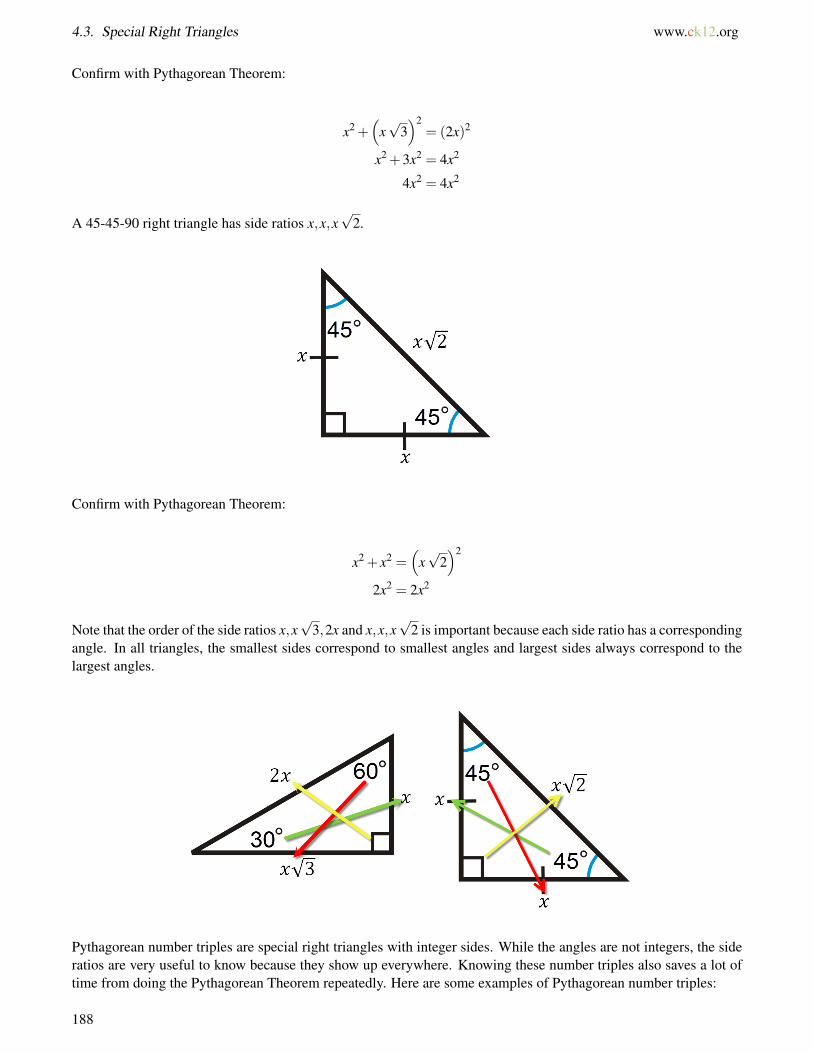
4.3. Special Right Triangles www.ck12.org
Confirm with Pythagorean Theorem:
x2 +(
x√
3)2
= (2x)2
x2 +3x2 = 4x2
4x2 = 4x2
A 45-45-90 right triangle has side ratios x,x,x√
2.
Confirm with Pythagorean Theorem:
x2 + x2 =(
x√
2)2
2x2 = 2x2
Note that the order of the side ratios x,x√
3,2x and x,x,x√
2 is important because each side ratio has a correspondingangle. In all triangles, the smallest sides correspond to smallest angles and largest sides always correspond to thelargest angles.
Pythagorean number triples are special right triangles with integer sides. While the angles are not integers, the sideratios are very useful to know because they show up everywhere. Knowing these number triples also saves a lot oftime from doing the Pythagorean Theorem repeatedly. Here are some examples of Pythagorean number triples:
188

www.ck12.org Chapter 4. Basic Triangle Trigonometry
• 3, 4, 5• 5, 12, 13• 7, 24, 25• 8, 15, 17• 9, 40, 41
More Pythagorean number triples can be found by scaling any other Pythagorean number triple. For example:
3,4,5→ 6,8,10 (scaled by a factor of 2)
Even more Pythagorean number triples can be found by taking any odd integer like 11, squaring it to get 121, halvingthe result to get 60.5. The original number 11 and the two numbers that are 0.5 above and below (60 and 61) willalways be a Pythagorean number triple.
112 +602 = 612
Example A
A right triangle has two sides that are 3 inches. What is the length of the third side?
Solution: Since it is a right triangle and it has two sides of equal length then it must be a 45-45-90 right triangle. Thethird side is 3
√2 inches.
Example B
A 30-60-90 right triangle has hypotenuse of length 10. What are the lengths of the other two sides?
Solution: The hypotenuse is the side opposite 90. Sometimes it is helpful to draw a picture or make a table.
TABLE 4.2:
30 60 90
x x√
3 2x
10
From the table you can write very small subsequent equations to solve for the missing sides.
10 = 2x
x = 5
x√
3 = 5√
3
Example C
A 30-60-90 right triangle has a side length of 18 inches corresponding to 60 degrees. What are the lengths of theother two sides?
Solution: Make a table with the side ratios and the information given, then write equations and solve for the missingside lengths.
TABLE 4.3:
30 60 90
189
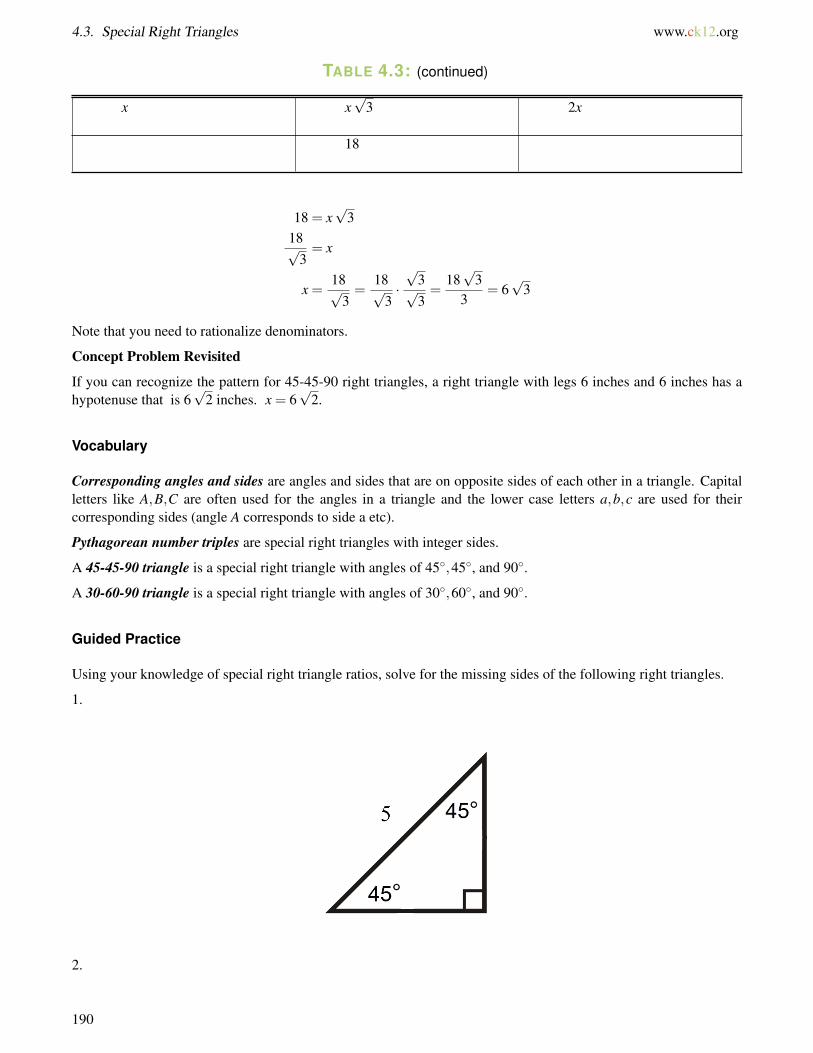
4.3. Special Right Triangles www.ck12.org
TABLE 4.3: (continued)
x x√
3 2x
18
18 = x√
318√
3= x
x =18√
3=
18√3·√
3√3=
18√
33
= 6√
3
Note that you need to rationalize denominators.
Concept Problem Revisited
If you can recognize the pattern for 45-45-90 right triangles, a right triangle with legs 6 inches and 6 inches has ahypotenuse that is 6
√2 inches. x = 6
√2.
Vocabulary
Corresponding angles and sides are angles and sides that are on opposite sides of each other in a triangle. Capitalletters like A,B,C are often used for the angles in a triangle and the lower case letters a,b,c are used for theircorresponding sides (angle A corresponds to side a etc).
Pythagorean number triples are special right triangles with integer sides.
A 45-45-90 triangle is a special right triangle with angles of 45◦,45◦, and 90◦.
A 30-60-90 triangle is a special right triangle with angles of 30◦,60◦, and 90◦.
Guided Practice
Using your knowledge of special right triangle ratios, solve for the missing sides of the following right triangles.
1.
2.
190
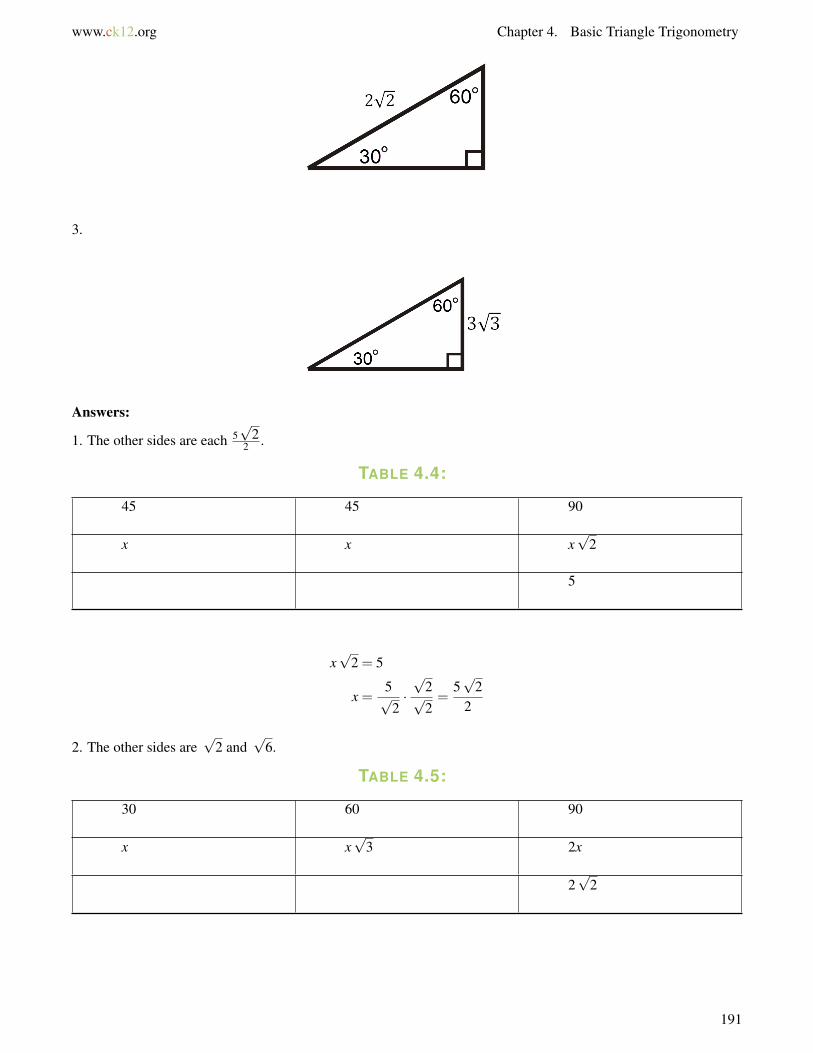
www.ck12.org Chapter 4. Basic Triangle Trigonometry
3.
Answers:
1. The other sides are each 5√
22 .
TABLE 4.4:
45 45 90
x x x√
2
5
x√
2 = 5
x =5√2·√
2√2=
5√
22
2. The other sides are√
2 and√
6.
TABLE 4.5:
30 60 90
x x√
3 2x
2√
2
191

4.3. Special Right Triangles www.ck12.org
2x = 2√
2
x =√
2
x√
3 =√
2 ·√
3 =√
6
3. The other sides are 9 and 6√
3.
TABLE 4.6:
30 60 90
x x√
3 2x
3√
3
x = 3√
3
2x = 6√
3
x√
3 = 3√
3 ·√
3 = 9
Practice
For 1-4, find the missing sides of the 45-45-90 triangle based on the information given in each row.
TABLE 4.7:
Problem Number Side Opposite 45◦ Side Opposite 45◦ Side Opposite 90◦
1. 32. 7.23. 164. 5
√2
For 5-8, find the missing sides of the 30-60-90 triangle based on the information given in each row.
TABLE 4.8:
Problem Number Side Opposite 30◦ Side Opposite 60◦ Side Opposite 90◦
5. 3√
26. 47. 158. 12
√3
Use the picture below for 9-11.
192
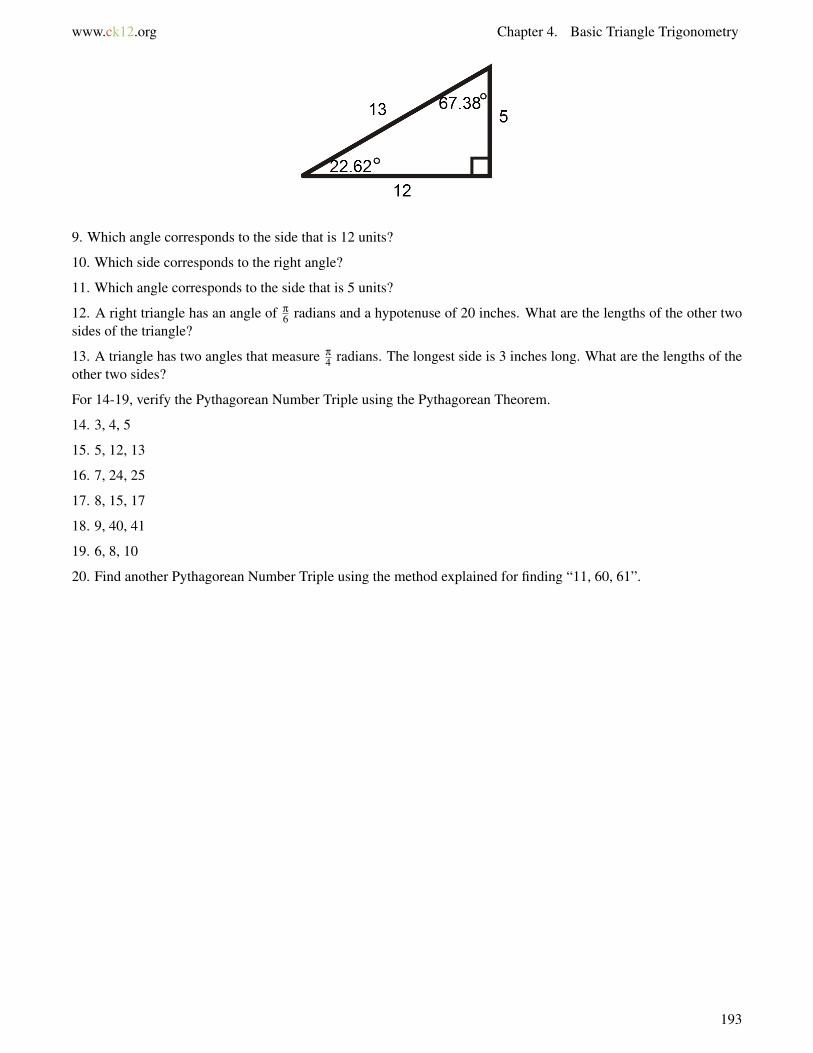
www.ck12.org Chapter 4. Basic Triangle Trigonometry
9. Which angle corresponds to the side that is 12 units?
10. Which side corresponds to the right angle?
11. Which angle corresponds to the side that is 5 units?
12. A right triangle has an angle of π
6 radians and a hypotenuse of 20 inches. What are the lengths of the other twosides of the triangle?
13. A triangle has two angles that measure π
4 radians. The longest side is 3 inches long. What are the lengths of theother two sides?
For 14-19, verify the Pythagorean Number Triple using the Pythagorean Theorem.
14. 3, 4, 5
15. 5, 12, 13
16. 7, 24, 25
17. 8, 15, 17
18. 9, 40, 41
19. 6, 8, 10
20. Find another Pythagorean Number Triple using the method explained for finding “11, 60, 61”.
193
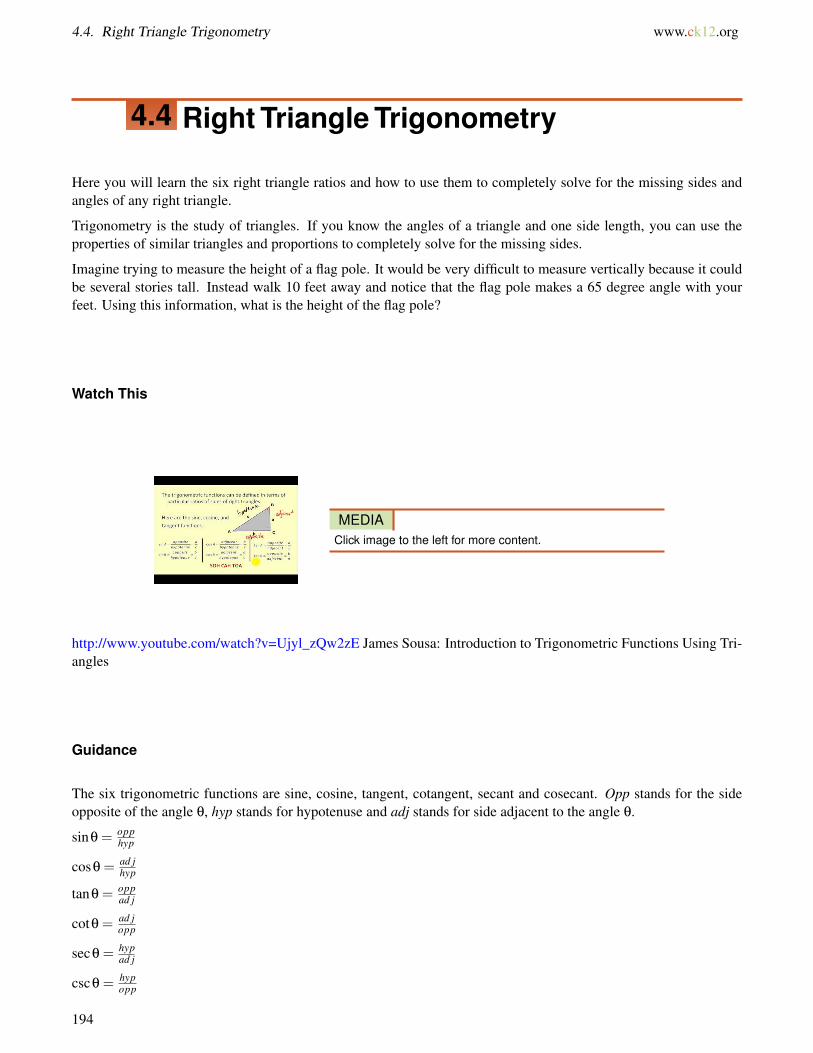
4.4. Right Triangle Trigonometry www.ck12.org
4.4 Right Triangle Trigonometry
Here you will learn the six right triangle ratios and how to use them to completely solve for the missing sides andangles of any right triangle.
Trigonometry is the study of triangles. If you know the angles of a triangle and one side length, you can use theproperties of similar triangles and proportions to completely solve for the missing sides.
Imagine trying to measure the height of a flag pole. It would be very difficult to measure vertically because it couldbe several stories tall. Instead walk 10 feet away and notice that the flag pole makes a 65 degree angle with yourfeet. Using this information, what is the height of the flag pole?
Watch This
MEDIAClick image to the left for more content.
http://www.youtube.com/watch?v=Ujyl_zQw2zE James Sousa: Introduction to Trigonometric Functions Using Tri-angles
Guidance
The six trigonometric functions are sine, cosine, tangent, cotangent, secant and cosecant. Opp stands for the sideopposite of the angle θ, hyp stands for hypotenuse and adj stands for side adjacent to the angle θ.
sinθ = opphyp
cosθ = ad jhyp
tanθ = oppad j
cotθ = ad jopp
secθ = hypad j
cscθ = hypopp
194
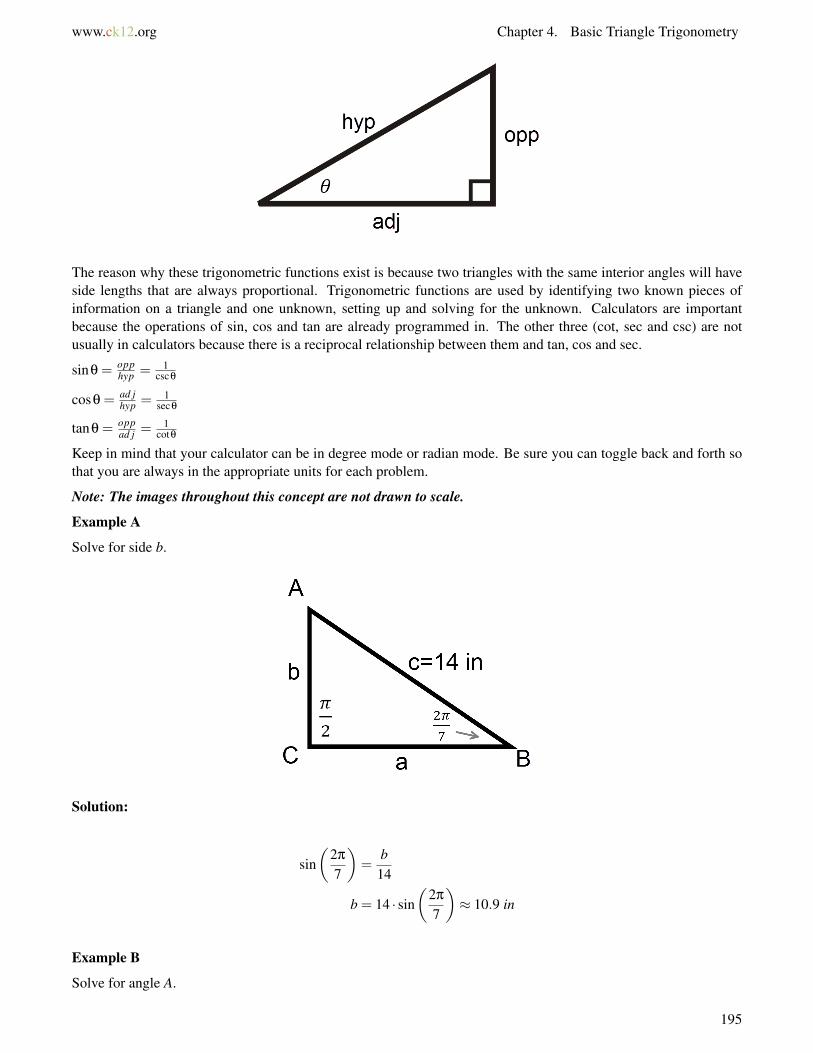
www.ck12.org Chapter 4. Basic Triangle Trigonometry
The reason why these trigonometric functions exist is because two triangles with the same interior angles will haveside lengths that are always proportional. Trigonometric functions are used by identifying two known pieces ofinformation on a triangle and one unknown, setting up and solving for the unknown. Calculators are importantbecause the operations of sin, cos and tan are already programmed in. The other three (cot, sec and csc) are notusually in calculators because there is a reciprocal relationship between them and tan, cos and sec.
sinθ = opphyp = 1
cscθ
cosθ = ad jhyp = 1
secθ
tanθ = oppad j =
1cotθ
Keep in mind that your calculator can be in degree mode or radian mode. Be sure you can toggle back and forth sothat you are always in the appropriate units for each problem.
Note: The images throughout this concept are not drawn to scale.
Example A
Solve for side b.
Solution:
sin(
2π
7
)=
b14
b = 14 · sin(
2π
7
)≈ 10.9 in
Example B
Solve for angle A.
195
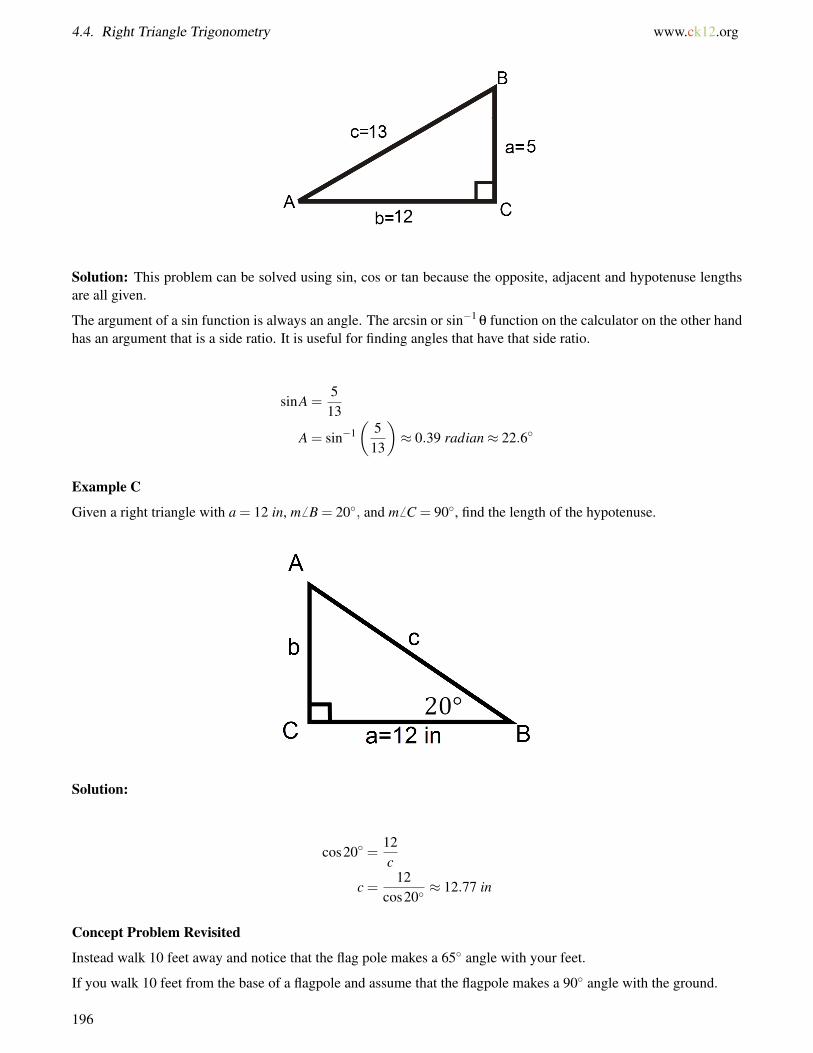
4.4. Right Triangle Trigonometry www.ck12.org
Solution: This problem can be solved using sin, cos or tan because the opposite, adjacent and hypotenuse lengthsare all given.
The argument of a sin function is always an angle. The arcsin or sin−1θ function on the calculator on the other hand
has an argument that is a side ratio. It is useful for finding angles that have that side ratio.
sinA =513
A = sin−1(
513
)≈ 0.39 radian≈ 22.6◦
Example C
Given a right triangle with a = 12 in, m6 B = 20◦, and m6 C = 90◦, find the length of the hypotenuse.
Solution:
cos20◦ =12c
c =12
cos20◦≈ 12.77 in
Concept Problem Revisited
Instead walk 10 feet away and notice that the flag pole makes a 65◦ angle with your feet.
If you walk 10 feet from the base of a flagpole and assume that the flagpole makes a 90◦ angle with the ground.
196

www.ck12.org Chapter 4. Basic Triangle Trigonometry
tan65◦ =x
10x = 10tan65◦ ≈ 30.8 f t
Vocabulary
The six trigonometric ratios are universal proportions that are always true of similar triangles (triangles withcongruent corresponding angles).
θ (theta) is a Greek letter and is just a letter used in math to stand for an unknown angle.
Guided Practice
1. Given4ABC where B is a right angle, m6 C = 18◦, and c = 12. What is a?
2. Given4XY Z where Z is a right angle, m 6 X = 1 radian, and x = 3. What is z?
3. Given4MNO where O is a right angle, m = 12, and n = 14. What is the measure of angle M?
Answers:
1. Drawing out this triangle, it looks like:
tan18◦ =12a
a =12
tan18◦≈ 36.9
197

4.4. Right Triangle Trigonometry www.ck12.org
2. Drawing out the triangle, it looks like:
sin1 =3z
z =3
sin1≈ 3.6
3. Drawing out the triangle, it looks like:
tanM =1214
M = tan−1(
1214
)≈ 0.7 radian≈ 40.6◦
Practice
For 1-15, information about the sides and/or angles of right triangle ABC is given. Completely solve the triangle(find all missing sides and angles) to 1 decimal place.
TABLE 4.9:
ProblemNumber
A B C a b c
198

www.ck12.org Chapter 4. Basic Triangle Trigonometry
TABLE 4.9: (continued)
1. 90◦ 4 72. 90◦ 37◦ 183. 90◦ 15◦ 324. 90◦ 6 115. 90◦ 12◦ 196. 90◦ 17 107. 90◦ 10◦ 28. 4◦ 90◦ 0.39. π
2 radian 1 radian 1510. π
2 radian 12 1511. π
2 radian 9 1412. π
4 radian π
4 radian 513. π
2 radian 26 1314. π
2 radian 19 1615. π
2 radian 10 10√
2
199
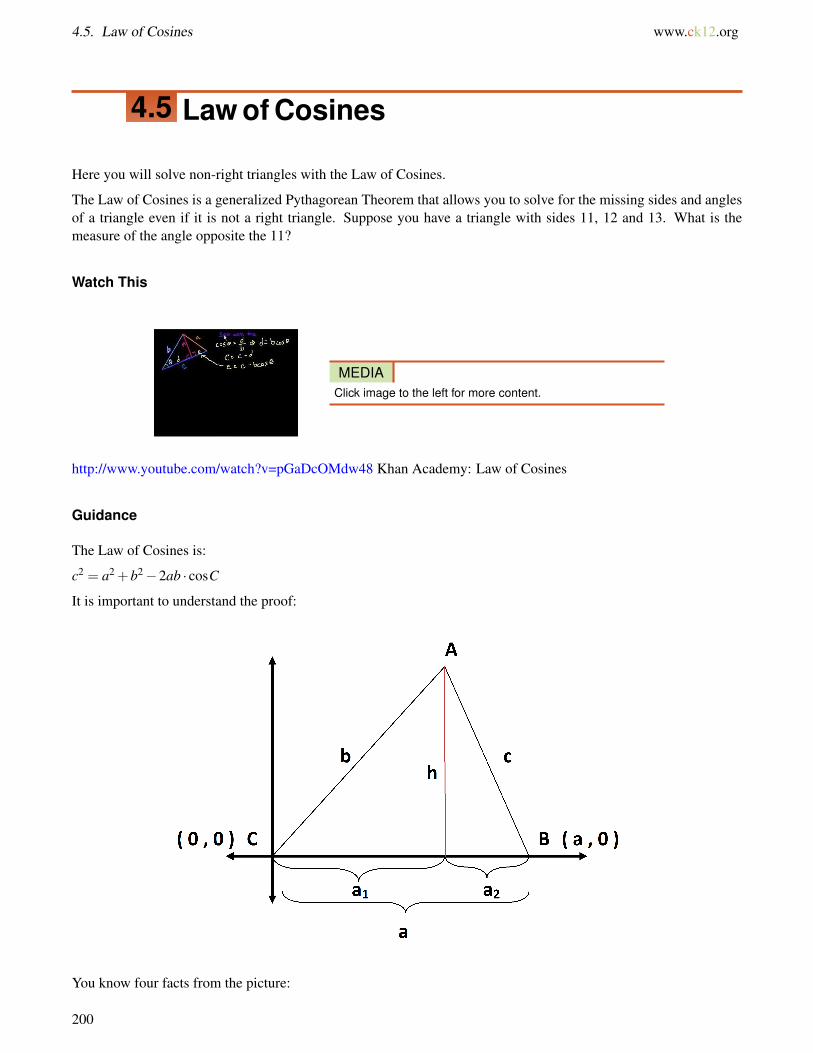
4.5. Law of Cosines www.ck12.org
4.5 Law of Cosines
Here you will solve non-right triangles with the Law of Cosines.
The Law of Cosines is a generalized Pythagorean Theorem that allows you to solve for the missing sides and anglesof a triangle even if it is not a right triangle. Suppose you have a triangle with sides 11, 12 and 13. What is themeasure of the angle opposite the 11?
Watch This
MEDIAClick image to the left for more content.
http://www.youtube.com/watch?v=pGaDcOMdw48 Khan Academy: Law of Cosines
Guidance
The Law of Cosines is:
c2 = a2 +b2−2ab · cosC
It is important to understand the proof:
You know four facts from the picture:
200
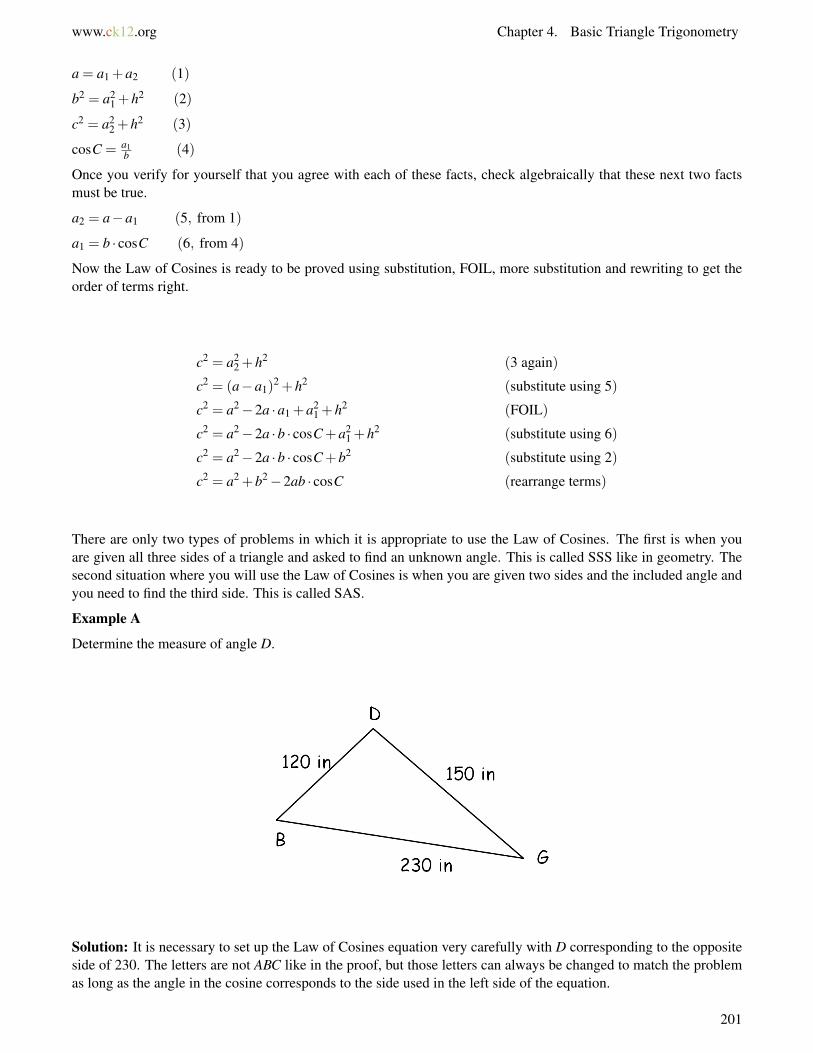
www.ck12.org Chapter 4. Basic Triangle Trigonometry
a = a1 +a2 (1)
b2 = a21 +h2 (2)
c2 = a22 +h2 (3)
cosC = a1b (4)
Once you verify for yourself that you agree with each of these facts, check algebraically that these next two factsmust be true.
a2 = a−a1 (5, from 1)
a1 = b · cosC (6, from 4)
Now the Law of Cosines is ready to be proved using substitution, FOIL, more substitution and rewriting to get theorder of terms right.
c2 = a22 +h2 (3 again)
c2 = (a−a1)2 +h2 (substitute using 5)
c2 = a2−2a ·a1 +a21 +h2 (FOIL)
c2 = a2−2a ·b · cosC+a21 +h2 (substitute using 6)
c2 = a2−2a ·b · cosC+b2 (substitute using 2)
c2 = a2 +b2−2ab · cosC (rearrange terms)
There are only two types of problems in which it is appropriate to use the Law of Cosines. The first is when youare given all three sides of a triangle and asked to find an unknown angle. This is called SSS like in geometry. Thesecond situation where you will use the Law of Cosines is when you are given two sides and the included angle andyou need to find the third side. This is called SAS.
Example A
Determine the measure of angle D.
Solution: It is necessary to set up the Law of Cosines equation very carefully with D corresponding to the oppositeside of 230. The letters are not ABC like in the proof, but those letters can always be changed to match the problemas long as the angle in the cosine corresponds to the side used in the left side of the equation.
201

4.5. Law of Cosines www.ck12.org
c2 = a2 +b2−2ab · cosC
2302 = 1202 +1502−2 ·120 ·150 · cosD
2302−1202−1502 =−2 ·120 ·150 · cosD
2302−1202−1502
−2 ·120 ·150= cosD
D = cos−1(
2302−1202−1502
−2 ·120 ·150
)≈ 116.4◦ ≈ 2.03 radians
Example B
Determine the length of side p.
Solution:
c2 = a2 +b2−2ab · cosC
p2 = 2122 +3882−2 ·212 ·388 · cos82◦
p2 ≈ 194192.02 . . .
p≈ 440.7
Example C
Determine the degree measure of angle N.
202

www.ck12.org Chapter 4. Basic Triangle Trigonometry
Solution: This problem must be done in two parts. First apply the Law of Cosines to determine the length of sidem. This is a SAS situation like Example B. Once you have all three sides you will be in the SSS situation like inExample A and can apply the Law of Cosines again to find the unknown angle N.
c2 = a2 +b2−2ab · cosC
m2 = 382 +402−2 ·38 ·40 · cos93◦
m2 ≈ 3203.1 . . .
m≈ 56.59 . . .
Now that you have all three sides you can apply the Law of Cosines again to find the unknown angle N. Rememberto match angle N with the corresponding side length of 38 inches. It is also best to store m into your calculator anduse the unrounded number in your future calculations.
c2 = a2 +b2−2ab · cosC
382 = 402 +(56.59 . . .)2−2 ·40 · (56.59 . . .) · cosN
382−402− (56.59 . . .)2 =−2 ·40 · (56.59 . . .) · cosN
382−402− (56.59 . . .)2
−2 ·40 · (56.59 . . .)= cosN
N = cos−1(
382−402− (56.59 . . .)2
−2 ·40 · (56.59 . . .)
)≈ 42.1◦
Concept Problem Revisited
A triangle that has sides 11, 12 and 13 is not going to be a right triangle. In order to solve for the missing angle youneed to use the Law of Cosines because this is a SSS situation.
c2 = a2 +b2−2ab · cosC
112 = 122 +(13)2−2 ·12 ·13 · cosC
C = cos−1(
112−122−132
−2 ·12 ·13
)≈ 52.02 . . .◦
Vocabulary
The Law of Cosines is a generalized Pythagorean Theorem that allows you to solve for the missing sides and anglesof a triangle even if it is not a right triangle.
SSS refers to Side, Side, Side and refers to a property of congruent triangles in geometry. In this case it refers to thefact that all three sides are known in the problem.
SAS refers to Side, Angle, Side and refers to a property of congruent triangles in geometry. In this case it refers tothe fact that the known quantities of a triangle are two sides and the included angle.
Included angle is the angle between two sides.
203

4.5. Law of Cosines www.ck12.org
Guided Practice
1. Determine the length of side r.
2. Determine the measure of angle T in degrees.
3. Determine the measure of angle S in radians.
Answers:
1. r2 = 362 +422−2 ·36 ·42 · cos63
r = 41.07 . . .
2. 362 = (41.07 . . .)2 +422−2 · (41.07 . . .) ·42 · cosT
T ≈ 51.34 . . .◦
3. You could repeat the process from the previous question, or use the knowledge that the three angles in a triangleadd up to 180.
63+51.34 . . .+S = 180
S≈ 65.65◦ · π
180◦≈ 1.145 . . .radians
Practice
For all problems, find angles in degrees rounded to one decimal place.
In ∆ABC,a = 12,b = 15, and c = 20.
1. Find the measure of angle A.
2. Find the measure of angle B.
3. Find the measure of angle C.
4. Find the measure of angle C in a different way.
In ∆DEF,d = 20,e = 10, and f = 16.
5. Find the measure of angle D.
6. Find the measure of angle E.
7. Find the measure of angle F .
In ∆GHI,g = 19, 6 H = 55◦, and i = 12.
204
www.ck12.org Chapter 4. Basic Triangle Trigonometry
8. Find the length of h.
9. Find the measure of angle G.
10. Find the measure of angle I.
11. Explain why the Law of Cosines is connected to the Pythagorean Theorem.
12. What are the two types of problems where you might use the Law of Cosines?
Determine whether or not each triangle is possible.
13. a = 5,b = 6,c = 15
14. a = 1,b = 5,c = 4
15. a = 5,b = 6,c = 10
205
4.6. Law of Sines www.ck12.org
4.6 Law of Sines
Here you will further explore solving non-right triangles in cases where a corresponding side and angle are givenusing the Law of Sines.
When given a right triangle, you can use basic trigonometry to solve for missing information. When given SSS orSAS, you can use the Law of Cosines to solve for the missing information. But what happens when you are giventwo sides of a triangle and an angle that is not included? There are many ways to show two triangles are congruent,but SSA is not one of them. Why not?
Watch This
http://www.youtube.com/watch?v=APNkWrD-U1k Khan Academy: Proof: Law of Sines
MEDIAClick image to the left for more content.
http://www.youtube.com/watch?v=dxYVBbSXYkA James Sousa: The Law of Sines: The Basics
MEDIAClick image to the left for more content.
Guidance
When given two sides and an angle that is not included between the two sides, you can use the Law of Sines. TheLaw of Sines states that in every triangle the ratio of each side to the sine of its corresponding angle is always thesame. Essentially, it clarifies the general concept that opposite the largest angle is always the longest side.
asinA = b
sinB = csinC
Here is a proof of the Law of Sines:
206
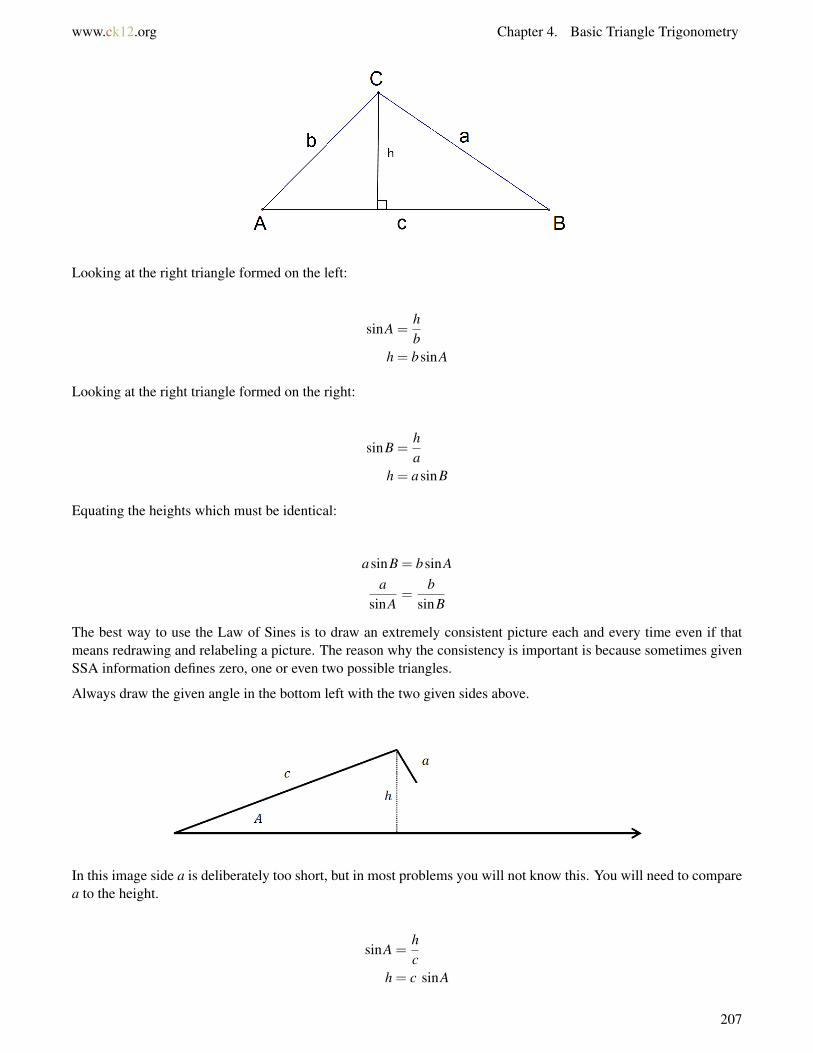
www.ck12.org Chapter 4. Basic Triangle Trigonometry
Looking at the right triangle formed on the left:
sinA =hb
h = bsinA
Looking at the right triangle formed on the right:
sinB =ha
h = asinB
Equating the heights which must be identical:
asinB = bsinAa
sinA=
bsinB
The best way to use the Law of Sines is to draw an extremely consistent picture each and every time even if thatmeans redrawing and relabeling a picture. The reason why the consistency is important is because sometimes givenSSA information defines zero, one or even two possible triangles.
Always draw the given angle in the bottom left with the two given sides above.
In this image side a is deliberately too short, but in most problems you will not know this. You will need to comparea to the height.
sinA =hc
h = c sinA
207
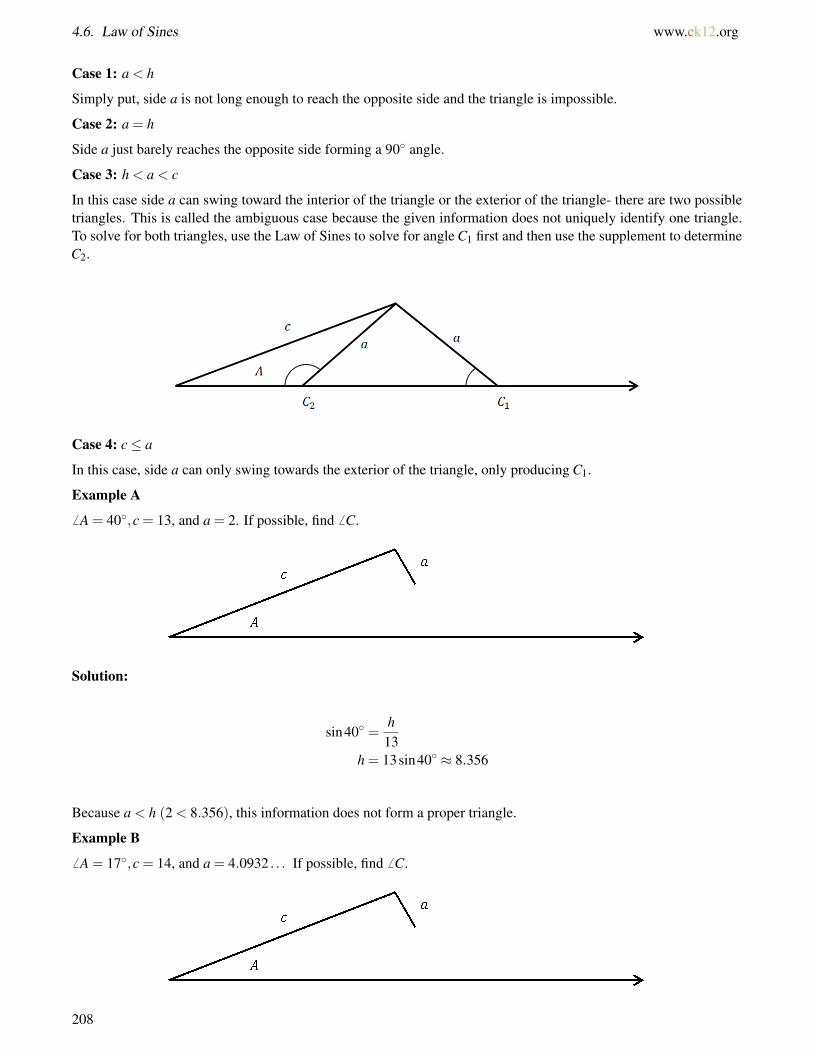
4.6. Law of Sines www.ck12.org
Case 1: a < h
Simply put, side a is not long enough to reach the opposite side and the triangle is impossible.
Case 2: a = h
Side a just barely reaches the opposite side forming a 90◦ angle.
Case 3: h < a < c
In this case side a can swing toward the interior of the triangle or the exterior of the triangle- there are two possibletriangles. This is called the ambiguous case because the given information does not uniquely identify one triangle.To solve for both triangles, use the Law of Sines to solve for angle C1 first and then use the supplement to determineC2.
Case 4: c≤ a
In this case, side a can only swing towards the exterior of the triangle, only producing C1.
Example A6 A = 40◦,c = 13, and a = 2. If possible, find 6 C.
Solution:
sin40◦ =h13
h = 13sin40◦ ≈ 8.356
Because a < h (2 < 8.356), this information does not form a proper triangle.
Example B6 A = 17◦,c = 14, and a = 4.0932 . . . If possible, find 6 C.
208

www.ck12.org Chapter 4. Basic Triangle Trigonometry
Solution:
sin17◦ =h
14h = 14 sin17◦ ≈ 4.0932 . . .
Since a = h, this information forms exactly one triangle and angle C must be 90◦.
Example C6 A = 22◦,c = 11 and a = 9. If possible, find 6 C.
Solution:
sin22◦ =h11
h = 11 sin22◦ ≈ 4.12 . . .
Since h < a < c, there must be two possible angles for angle C.
Apply the Law of Sines:
9sin22◦
=11
sinC1
9sinC1 = 11sin22◦
sinC1 =11sin22◦
9
C1 = sin−1(
11sin22◦
9
)≈ 27.24 . . .◦
C2 = 180−C1 = 152.75 . . .◦
Concept Problem Revisited
SSA is not a method from Geometry that shows two triangles are congruent because it does not always define aunique triangle.
Vocabulary
Ambiguous means that the given information may not uniquely identify one triangle.
209
4.6. Law of Sines www.ck12.org
Guided Practice
1. Given ∆ABC where A = 10◦,b = 10,a = 11, find 6 B.
2. Given ∆ABC where A = 12◦,B = 50◦,a = 14 find b.
3. Given ∆ABC where A = 70◦,b = 8,a = 3, find 6 B if possible.
Answers:
1. 10sinB = 11
sin10◦
B = sin−1 (10sin10◦11
)≈ 9.08 . . .◦
2. 14sin12◦ =
bsin50◦
b = 14sin50◦sin12◦ ≈ 51.58 . . .
3. sin70◦ = h8
h = 8sin70◦ ≈ 7.51 . . .
Because a < h, this triangle is impossible.
Practice
For 1-3, draw a picture of the triangle and state how many triangles could be formed with the given values.
1. A = 30◦,a = 13,b = 15
2. A = 22◦,a = 21,b = 12
3. A = 42◦,a = 36,b = 37
For 4-7, find all possible measures of 6 B (if any exist) for each of the following triangle values.
4. A = 86◦,a = 15,b = 11
5. A = 30◦,a = 24,b = 43
6. A = 48◦,a = 34,b = 39
7. A = 80◦,a = 22,b = 20
For 8-12, find the length of b for each of the following triangle values.
8. A = 94◦,a = 31,B = 34◦
9. A = 112◦,a = 12,B = 15◦
10. A = 78◦,a = 20,B = 16◦
11. A = 54◦,a = 15,B = 112◦
12. A = 39◦,a = 9,B = 98◦
13. In ∆ABC,b = 10 and 6 A = 39◦. What’s a possible value for a that would produce two triangles?
14. In ∆ABC,b = 10 and 6 A = 39◦. What’s a possible value for a that would produce no triangles?
15. In ∆ABC,b = 10 and 6 A = 39◦. What’s a possible value for a that would produce one triangle?
210
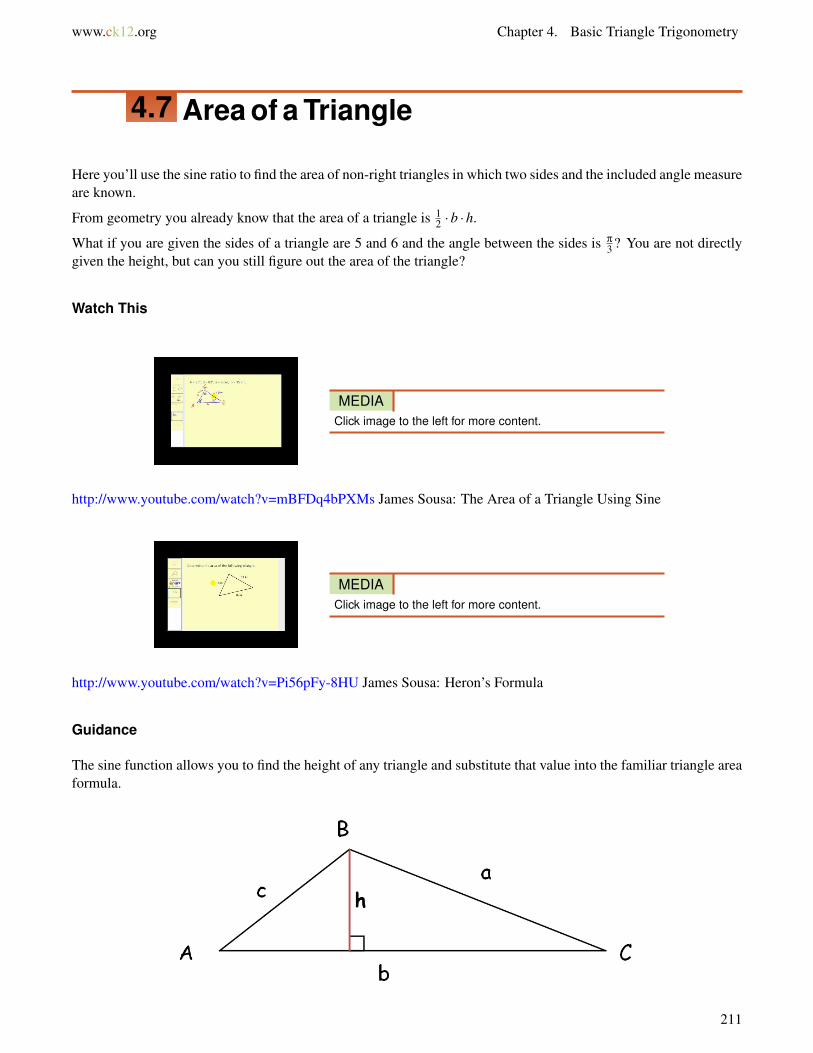
www.ck12.org Chapter 4. Basic Triangle Trigonometry
4.7 Area of a Triangle
Here you’ll use the sine ratio to find the area of non-right triangles in which two sides and the included angle measureare known.
From geometry you already know that the area of a triangle is 12 ·b ·h.
What if you are given the sides of a triangle are 5 and 6 and the angle between the sides is π
3 ? You are not directlygiven the height, but can you still figure out the area of the triangle?
Watch This
MEDIAClick image to the left for more content.
http://www.youtube.com/watch?v=mBFDq4bPXMs James Sousa: The Area of a Triangle Using Sine
MEDIAClick image to the left for more content.
http://www.youtube.com/watch?v=Pi56pFy-8HU James Sousa: Heron’s Formula
Guidance
The sine function allows you to find the height of any triangle and substitute that value into the familiar triangle areaformula.
211
4.7. Area of a Triangle www.ck12.org
Using the sine function, you can isolate h for height:
sinC =ha
asinC = h
Substituting into the area formula:
Area =12
b ·h
Area =12
b ·a · sinC
Area =12·a ·b · sinC
Example A
Given ∆ABC with A = 22◦,b = 6,c = 7. What is the area?
Solution: The letters don’t have to match exactly because the triangle or the formula can just be relabeled. Theimportant part is that neither given side corresponds to the given angle.
Area =12
bcsinA
Area =12·6 ·7 · sin22◦ ≈ 7.86 . . .units2
Example B
Given ∆XY Z has area 28 square inches, what is the angle included between side length 8 and 9?
Solution:
Area =12·a ·b · sinC
28 =12·8 ·9 · sinC
sinC =28 ·28 ·9
C = sin−1(
28 ·28 ·9
)≈ 51.05 . . .◦
Example C
Given triangle ABC with A = 12◦,b = 4 and Area = 1.7 un2, what is the length of side c?
Solution:
Area =12· c ·b · sinA
1.7 =12· c ·4 · sin12◦
c =1.7 ·2
4 · sin12◦≈ 4.08 . . .
212
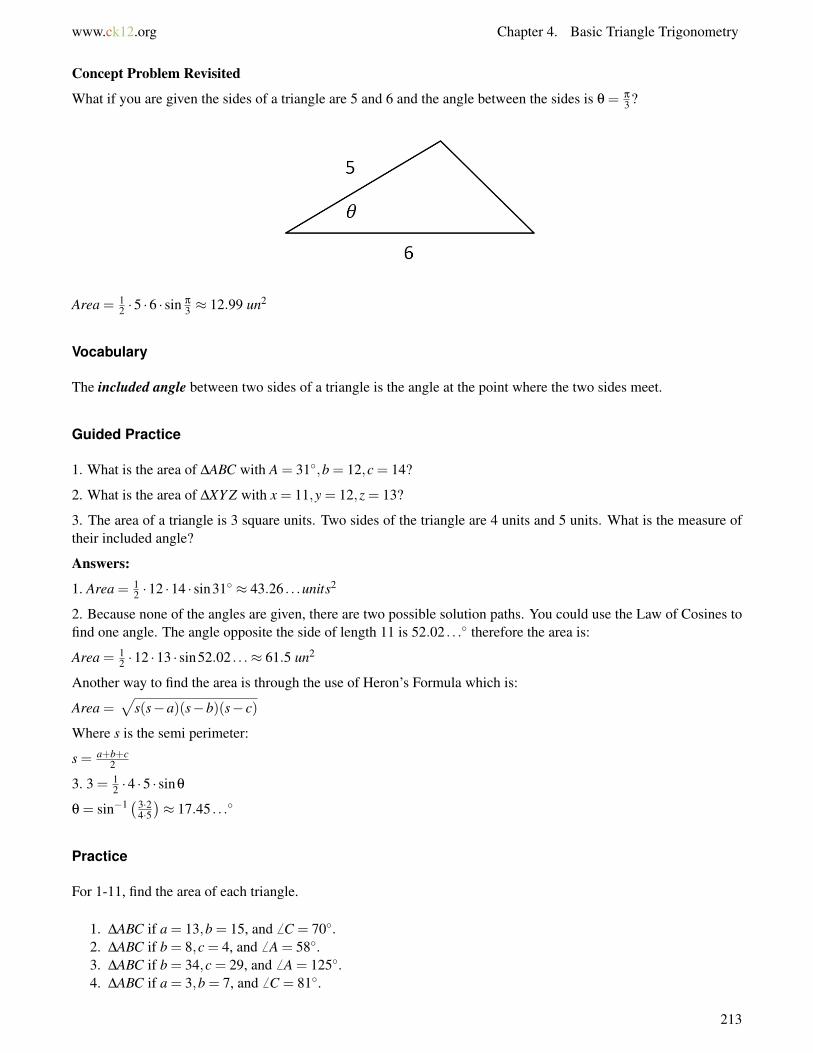
www.ck12.org Chapter 4. Basic Triangle Trigonometry
Concept Problem Revisited
What if you are given the sides of a triangle are 5 and 6 and the angle between the sides is θ = π
3 ?
Area = 12 ·5 ·6 · sin π
3 ≈ 12.99 un2
Vocabulary
The included angle between two sides of a triangle is the angle at the point where the two sides meet.
Guided Practice
1. What is the area of ∆ABC with A = 31◦,b = 12,c = 14?
2. What is the area of ∆XY Z with x = 11,y = 12,z = 13?
3. The area of a triangle is 3 square units. Two sides of the triangle are 4 units and 5 units. What is the measure oftheir included angle?
Answers:
1. Area = 12 ·12 ·14 · sin31◦ ≈ 43.26 . . .units2
2. Because none of the angles are given, there are two possible solution paths. You could use the Law of Cosines tofind one angle. The angle opposite the side of length 11 is 52.02 . . .◦ therefore the area is:
Area = 12 ·12 ·13 · sin52.02 . . .≈ 61.5 un2
Another way to find the area is through the use of Heron’s Formula which is:
Area =√
s(s−a)(s−b)(s− c)
Where s is the semi perimeter:
s = a+b+c2
3. 3 = 12 ·4 ·5 · sinθ
θ = sin−1 (3·24·5)≈ 17.45 . . .◦
Practice
For 1-11, find the area of each triangle.
1. ∆ABC if a = 13,b = 15, and 6 C = 70◦.2. ∆ABC if b = 8,c = 4, and 6 A = 58◦.3. ∆ABC if b = 34,c = 29, and 6 A = 125◦.4. ∆ABC if a = 3,b = 7, and 6 C = 81◦.
213
4.7. Area of a Triangle www.ck12.org
5. ∆ABC if a = 4.8,c = 3.7, and 6 B = 54◦.6. ∆ABC if a = 12,b = 5, and 6 C = 22◦.7. ∆ABC if a = 3,b = 10, and 6 C = 65◦.8. ∆ABC if a = 5,b = 9, and 6 C = 11◦.9. ∆ABC if a = 5,b = 7, and c = 8.
10. ∆ABC if a = 7,b = 8, and c = 14.11. ∆ABC if a = 12,b = 14, and c = 13.12. The area of a triangle is 12 square units. Two sides of the triangle are 8 units and 4 units. What is the measure
of their included angle?13. The area of a triangle is 23 square units. Two sides of the triangle are 14 units and 5 units. What is the measure
of their included angle?14. Given ∆DEF has area 32 square inches, what is the angle included between side length 9 and 10?15. Given ∆GHI has area 15 square inches, what is the angle included between side length 7 and 11?
214
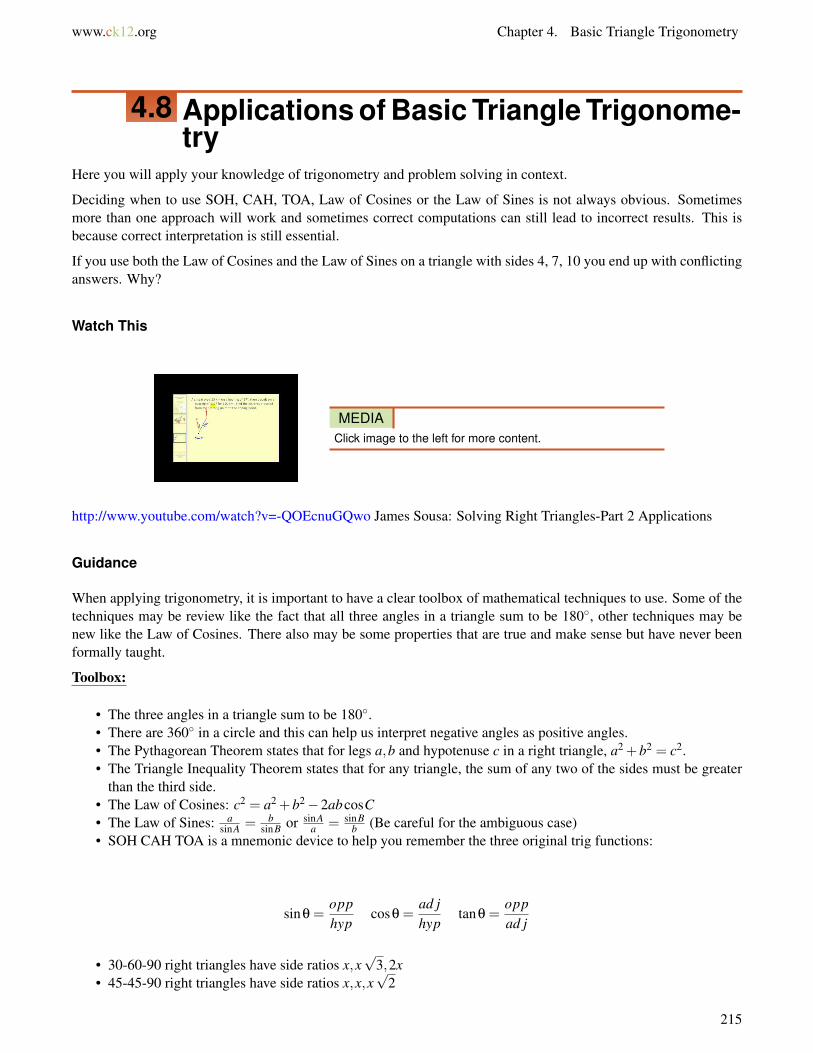
www.ck12.org Chapter 4. Basic Triangle Trigonometry
4.8 Applications of Basic Triangle Trigonome-try
Here you will apply your knowledge of trigonometry and problem solving in context.
Deciding when to use SOH, CAH, TOA, Law of Cosines or the Law of Sines is not always obvious. Sometimesmore than one approach will work and sometimes correct computations can still lead to incorrect results. This isbecause correct interpretation is still essential.
If you use both the Law of Cosines and the Law of Sines on a triangle with sides 4, 7, 10 you end up with conflictinganswers. Why?
Watch This
MEDIAClick image to the left for more content.
http://www.youtube.com/watch?v=-QOEcnuGQwo James Sousa: Solving Right Triangles-Part 2 Applications
Guidance
When applying trigonometry, it is important to have a clear toolbox of mathematical techniques to use. Some of thetechniques may be review like the fact that all three angles in a triangle sum to be 180◦, other techniques may benew like the Law of Cosines. There also may be some properties that are true and make sense but have never beenformally taught.
Toolbox:
• The three angles in a triangle sum to be 180◦.• There are 360◦ in a circle and this can help us interpret negative angles as positive angles.• The Pythagorean Theorem states that for legs a,b and hypotenuse c in a right triangle, a2 +b2 = c2.• The Triangle Inequality Theorem states that for any triangle, the sum of any two of the sides must be greater
than the third side.• The Law of Cosines: c2 = a2 +b2−2abcosC• The Law of Sines: a
sinA = bsinB or sinA
a = sinBb (Be careful for the ambiguous case)
• SOH CAH TOA is a mnemonic device to help you remember the three original trig functions:
sinθ =opphyp
cosθ =ad jhyp
tanθ =oppad j
• 30-60-90 right triangles have side ratios x,x√
3,2x• 45-45-90 right triangles have side ratios x,x,x
√2
215
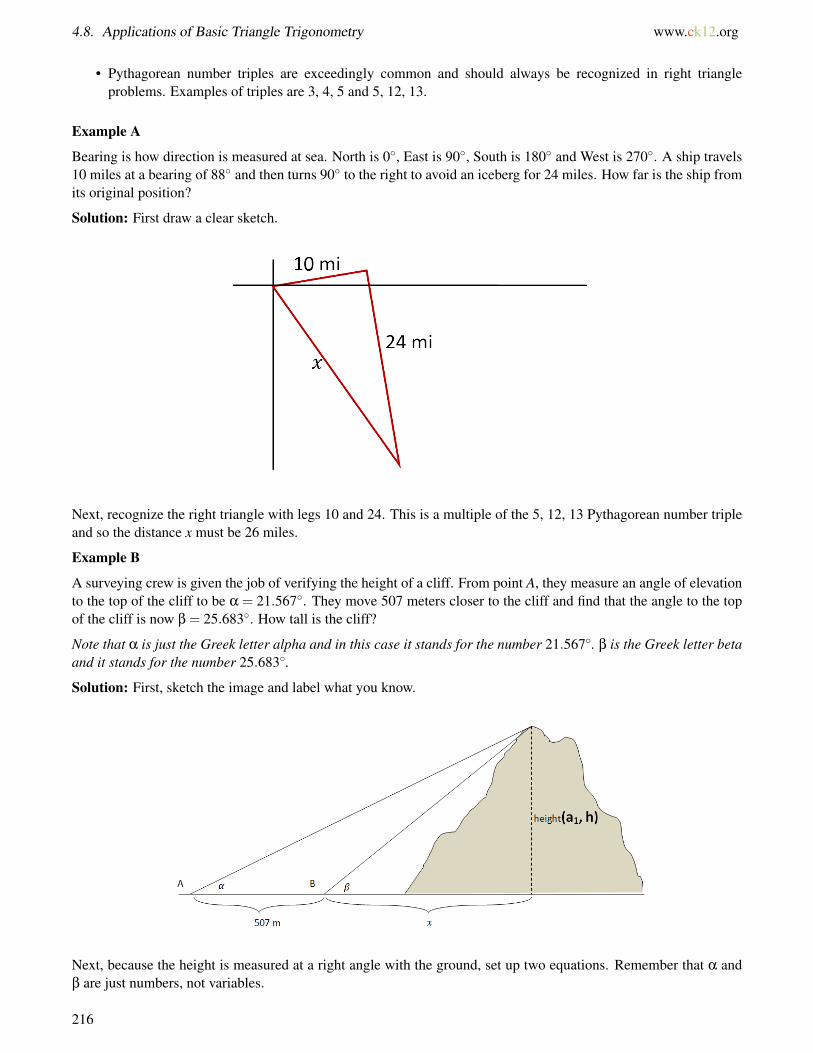
4.8. Applications of Basic Triangle Trigonometry www.ck12.org
• Pythagorean number triples are exceedingly common and should always be recognized in right triangleproblems. Examples of triples are 3, 4, 5 and 5, 12, 13.
Example A
Bearing is how direction is measured at sea. North is 0◦, East is 90◦, South is 180◦ and West is 270◦. A ship travels10 miles at a bearing of 88◦ and then turns 90◦ to the right to avoid an iceberg for 24 miles. How far is the ship fromits original position?
Solution: First draw a clear sketch.
Next, recognize the right triangle with legs 10 and 24. This is a multiple of the 5, 12, 13 Pythagorean number tripleand so the distance x must be 26 miles.
Example B
A surveying crew is given the job of verifying the height of a cliff. From point A, they measure an angle of elevationto the top of the cliff to be α = 21.567◦. They move 507 meters closer to the cliff and find that the angle to the topof the cliff is now β = 25.683◦. How tall is the cliff?
Note that α is just the Greek letter alpha and in this case it stands for the number 21.567◦. β is the Greek letter betaand it stands for the number 25.683◦.
Solution: First, sketch the image and label what you know.
Next, because the height is measured at a right angle with the ground, set up two equations. Remember that α andβ are just numbers, not variables.
216

www.ck12.org Chapter 4. Basic Triangle Trigonometry
tanα =h
507+ x
tanβ =hx
Both of these equations can be solved for h and then set equal to each other to find x.
h = tanα(507+ x) = x tanβ
507tanα+ x tanα = x tanβ
507tanα = x tanβ− x tanα
507tanα = x(tanβ− tanα)
x =507tanα
tanβ− tanα=
507tan21.567◦
tan25.683◦− tan21.567◦≈ 228.7 meters
Since the problem asked for the height, you need to substitute x back and solve for h.
h = x tanβ = 228.7tan25.683◦ ≈ 109.99 meters
Example C
Given a triangle with SSS or SAS you know to use the Law of Cosines. In triangles where there are correspondingangles and sides like AAS or SSA it makes sense to use the Law of Sines. What about ASA?
Given ∆ABC with A = π
4 radians,C = π
6 radians and b = 10 in what is a?
Solution: First, draw a picture.
The sum of the angles in a triangle is 180◦. Since this problem is in radians you either need to convert this rule toradians, or convert the picture to degrees.
A =π
4· 180◦
π= 45◦
C =π
6· 180◦
π= 30◦
The missing angle must be 6 B = 105◦. Now you can use the Law of Sines to solve for a.
sin105◦
10=
sin45◦
a
a =10sin45◦
sin105◦≈ 7.32 in
217
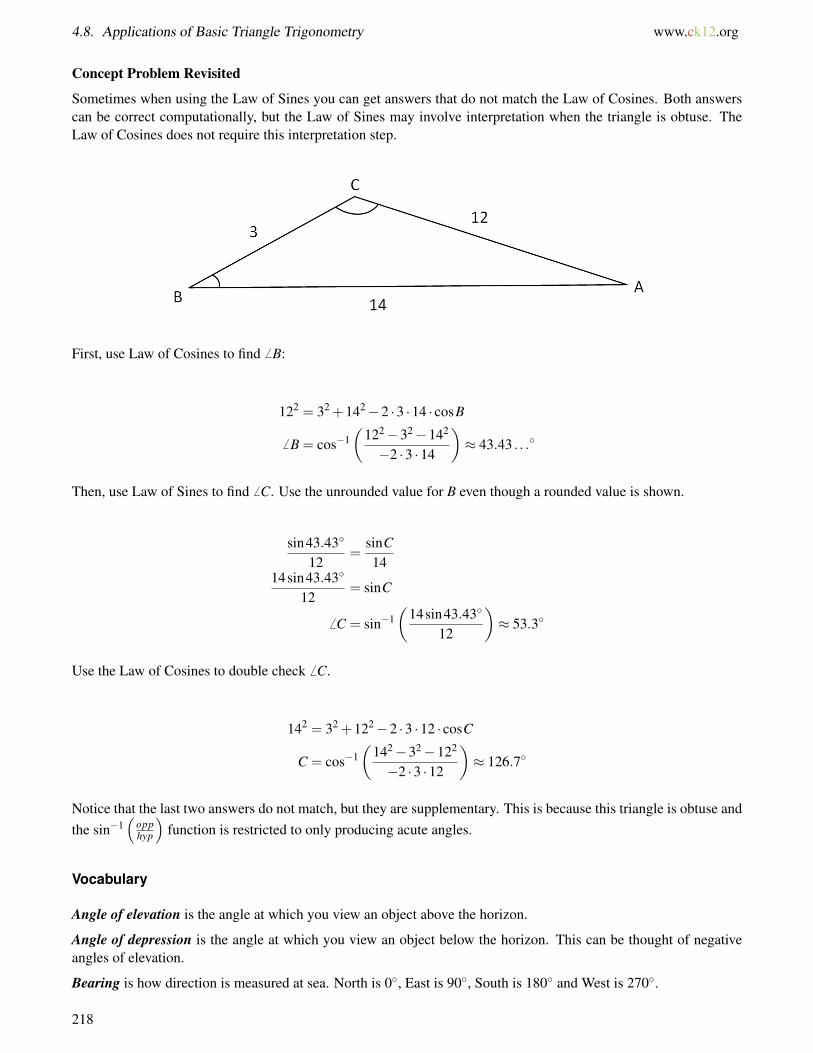
4.8. Applications of Basic Triangle Trigonometry www.ck12.org
Concept Problem Revisited
Sometimes when using the Law of Sines you can get answers that do not match the Law of Cosines. Both answerscan be correct computationally, but the Law of Sines may involve interpretation when the triangle is obtuse. TheLaw of Cosines does not require this interpretation step.
First, use Law of Cosines to find 6 B:
122 = 32 +142−2 ·3 ·14 · cosB
6 B = cos−1(
122−32−142
−2 ·3 ·14
)≈ 43.43 . . .◦
Then, use Law of Sines to find 6 C. Use the unrounded value for B even though a rounded value is shown.
sin43.43◦
12=
sinC14
14sin43.43◦
12= sinC
6 C = sin−1(
14sin43.43◦
12
)≈ 53.3◦
Use the Law of Cosines to double check 6 C.
142 = 32 +122−2 ·3 ·12 · cosC
C = cos−1(
142−32−122
−2 ·3 ·12
)≈ 126.7◦
Notice that the last two answers do not match, but they are supplementary. This is because this triangle is obtuse andthe sin−1
(opphyp
)function is restricted to only producing acute angles.
Vocabulary
Angle of elevation is the angle at which you view an object above the horizon.
Angle of depression is the angle at which you view an object below the horizon. This can be thought of negativeangles of elevation.
Bearing is how direction is measured at sea. North is 0◦, East is 90◦, South is 180◦ and West is 270◦.
218

www.ck12.org Chapter 4. Basic Triangle Trigonometry
Greek letters alpha and beta (α,β) are often used as placeholders for known angles. Unknown angles are oftenreferred to as θ (theta).
ASA refers to the situation from geometry when there are two known angles in a triangle and one known side that isbetween the known angles.
Guided Practice
1. The angle of depression of a boat in the distance from the top of a lighthouse is π
10 . The lighthouse is 200 feet tall.Find the distance from the base of the lighthouse to the boat.
2. From the third story of a building (50 feet) David observes a car moving towards the building driving on thestreets below. If the angle of depression of the car changes from 21◦ to 45◦ while he watches, how far did the cartravel?
3. If a boat travels 4 miles SW and then 2 miles NNW, how far away is it from its starting point?
Answers:
1. When you draw a picture, you see that the given angle π
10 is not directly inside the triangle between the lighthouse,the boat and the base of the lighthouse. It is complementary to the angle you need.
π
10+θ =
π
2
θ =2π
5
Now that you have the angle, use tangent to solve for x.
tan2π
5=
x200
x = 200tan2π
5≈ 615.5 . . . f t
Alternatively, you could have noticed that π
10 is alternate interior angles with the angle of elevation of the lighthousefrom the boat’s perspective. This would yield the same distance for x.
2. Draw a very careful picture:
219
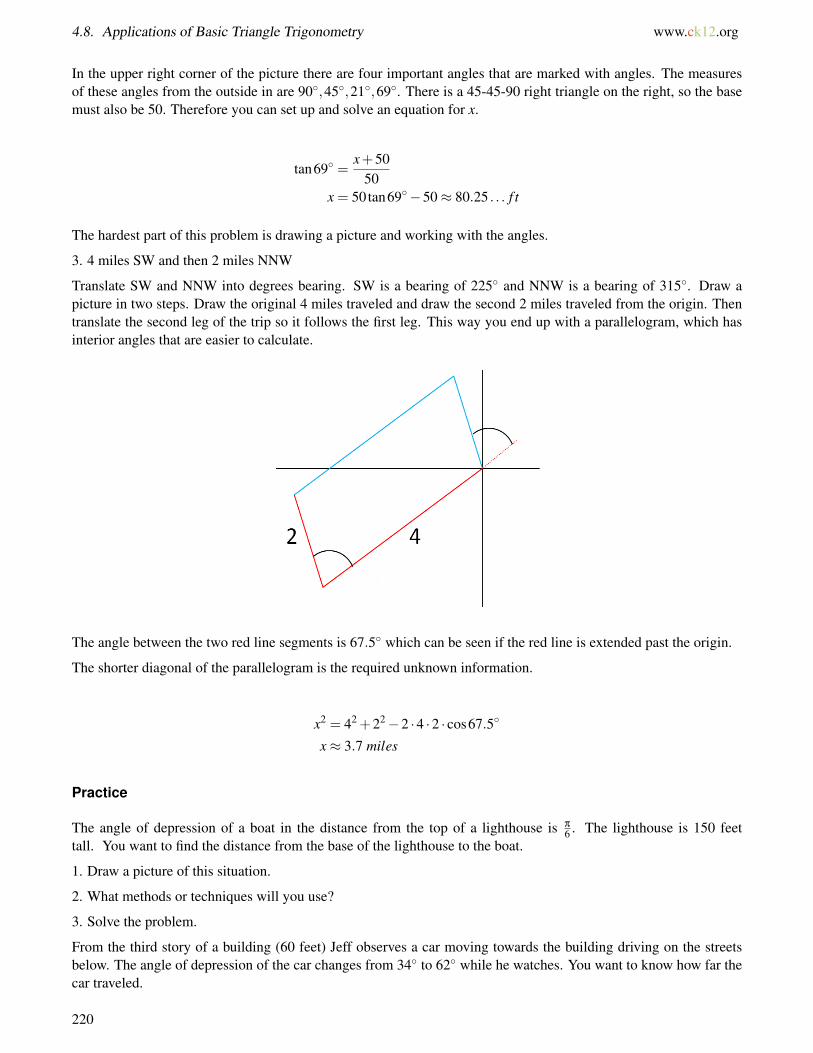
4.8. Applications of Basic Triangle Trigonometry www.ck12.org
In the upper right corner of the picture there are four important angles that are marked with angles. The measuresof these angles from the outside in are 90◦,45◦,21◦,69◦. There is a 45-45-90 right triangle on the right, so the basemust also be 50. Therefore you can set up and solve an equation for x.
tan69◦ =x+50
50x = 50tan69◦−50≈ 80.25 . . . f t
The hardest part of this problem is drawing a picture and working with the angles.
3. 4 miles SW and then 2 miles NNW
Translate SW and NNW into degrees bearing. SW is a bearing of 225◦ and NNW is a bearing of 315◦. Draw apicture in two steps. Draw the original 4 miles traveled and draw the second 2 miles traveled from the origin. Thentranslate the second leg of the trip so it follows the first leg. This way you end up with a parallelogram, which hasinterior angles that are easier to calculate.
The angle between the two red line segments is 67.5◦ which can be seen if the red line is extended past the origin.
The shorter diagonal of the parallelogram is the required unknown information.
x2 = 42 +22−2 ·4 ·2 · cos67.5◦
x≈ 3.7 miles
Practice
The angle of depression of a boat in the distance from the top of a lighthouse is π
6 . The lighthouse is 150 feettall. You want to find the distance from the base of the lighthouse to the boat.
1. Draw a picture of this situation.
2. What methods or techniques will you use?
3. Solve the problem.
From the third story of a building (60 feet) Jeff observes a car moving towards the building driving on the streetsbelow. The angle of depression of the car changes from 34◦ to 62◦ while he watches. You want to know how far thecar traveled.
220
www.ck12.org Chapter 4. Basic Triangle Trigonometry
4. Draw a picture of this situation.
5. What methods or techniques will you use?
6. Solve the problem.
A boat travels 6 miles NW and then 2 miles SW. You want to know how far away the boat is from its starting point.
7. Draw a picture of this situation.
8. What methods or techniques will you use?
9. Solve the problem.
You want to figure out the height of a building. From point A, you measure an angle of elevation to the top of thebuilding to be α = 10◦. You move 50 feet closer to the building to point B and find that the angle to the top of thebuilding is now β = 60◦.
10. Draw a picture of this situation.
11. What methods or techniques will you use?
12. Solve the problem.
13. Given ∆ABC with A = 40◦,C = 65◦ and b = 8 in, what is a?
14. Given ∆ABC with A = π
3 radians,C = π
8 radians and b = 12 in what is a?
15. Given ∆ABC with A = π
6 radians,C = π
4 radians and b = 20 in what is a?
The relationship between the sides and angles of all kinds of triangles were explored though the use of the six basictrigonometric functions.
221

4.9. References www.ck12.org
4.9 References
1. CK-12 Foundation. . CCSA2. CK-12 Foundation. . CCSA3. CK-12 Foundation. . CCSA4. CK-12 Foundation. . CCSA5. CK-12 Foundation. . CCSA6. . . CC BY-NC-SA7. CK-12 Foundation. . CCSA8. CK-12 Foundation. . CCSA9. CK-12 Foundation. . CCSA
10. CK-12 Foundation. . CCSA11. CK-12 Foundation. . CCSA12. CK-12 Foundation. . CCSA13. CK-12 Foundation. . CCSA14. CK-12 Foundation. . CCSA15. CK-12 Foundation. . CCSA16. CK-12 Foundation. . CCSA17. CK-12 Foundation. . CCSA18. CK-12 Foundation. . CCSA19. CK-12 Foundation. . CCSA20. CK-12 Foundation. . CCSA21. CK-12 Foundation. . CCSA22. CK-12 Foundation. . CCSA23. CK-12 Foundation. . CCSA24. CK-12 Foundation. . CCSA25. CK-12 Foundation. . CCSA26. CK-12 Foundation. . CCSA27. CK-12 Foundation. . CCSA28. CK-12 Foundation. . CCSA29. CK-12 Foundation. . CCSA30. CK-12 Foundation. . CCSA31. CK-12 Foundation. . CCSA32. CK-12 Foundation. . CCSA33. CK-12 Foundation. . CCSA34. CK-12 Foundation. . CCSA35. CK-12 Foundation. . CCSA36. CK-12 Foundation. . CCSA
222
www.ck12.org Chapter 5. Trigonometric Functions
CHAPTER 5 Trigonometric FunctionsChapter Outline
5.1 THE UNIT CIRCLE
5.2 THE SINUSOIDAL FUNCTION FAMILY
5.3 AMPLITUDE OF SINUSOIDAL FUNCTIONS
5.4 VERTICAL SHIFT OF SINUSOIDAL FUNCTIONS
5.5 FREQUENCY AND PERIOD OF SINUSOIDAL FUNCTIONS
5.6 PHASE SHIFT OF SINUSOIDAL FUNCTIONS
5.7 GRAPHS OF OTHER TRIGONOMETRIC FUNCTIONS
5.8 GRAPHS OF INVERSE TRIGONOMETRIC FUNCTIONS
5.9 REFERENCES
Trigonometry is the study of the relationship between the angles and sides of triangles. Here you will extend thisidea to functions that have a cyclical and repeating nature. Tides, the height of a person on a Ferris wheel andseasonal temperature can all be modeled through the use of sine and cosine functions. You will apply the basic rulesof transformations to create equations and graphs that fit data.
223
5.1. The Unit Circle www.ck12.org
5.1 The Unit Circle
Here you will use your knowledge of basic triangle trigonometry to identify key points and angles around a circle ofradius one centered at the origin.
Theunit circle is a circle of radius one, centered at the origin, that summarizes all the 30-60-90 and 45-45-90 trianglerelationships that exist. When memorized, it is extremely useful for evaluating expressions likecos(135◦) orsin
(−5π
3
). It
also helps to produce the parent graphs of sine and cosine.
How can you use the unit circle to evaluate cos(135◦) and sin(−5π
3
)?
Watch This
MEDIAClick image to the left for more content.
http://www.youtube.com/watch?v=i56P6xzsB5Y James Sousa: Determine Trigonometric Function Values Usingthe Unit Circle
Guidance
You already know how to translate between degrees and radians and the triangle ratios for 30-60-90 and 45-45-90 right triangles. In order to be ready to completely fill in and memorize a unit circle, two triangles need to beworked out. Start by finding the side lengths of a 30-60-90 triangle and a 45-45-90 triangle each with hypotenuseequal to 1.
TABLE 5.1:
30◦ 60◦ 90◦
x x√
3 2x12
√3
2 1
TABLE 5.2:
45◦ 45◦ 90◦
x x x√
2√2
2
√2
2 1
This is enough information to fill out the important points in the first quadrant of the unit circle. The values of thex and y coordinates for each of the key points are shown below. Remember that the x and y coordinates come fromthe lengths of the legs of the special right triangles, as shown specifically for the 30◦ angle. Always remember to
224

www.ck12.org Chapter 5. Trigonometric Functions
measure the angle from the positive portion of the x-axis.
Knowing the first quadrant well is the key to knowing the entire unit circle. Every other point on the unit circle canbe found using logic and this quadrant.
Example A
Use your knowledge of the first quadrant of the unit circle to identify the angles and important points of the secondquadrant.
Solution: The heights are mirrored and equal which correspond to the y values. The x values are all negative.
225
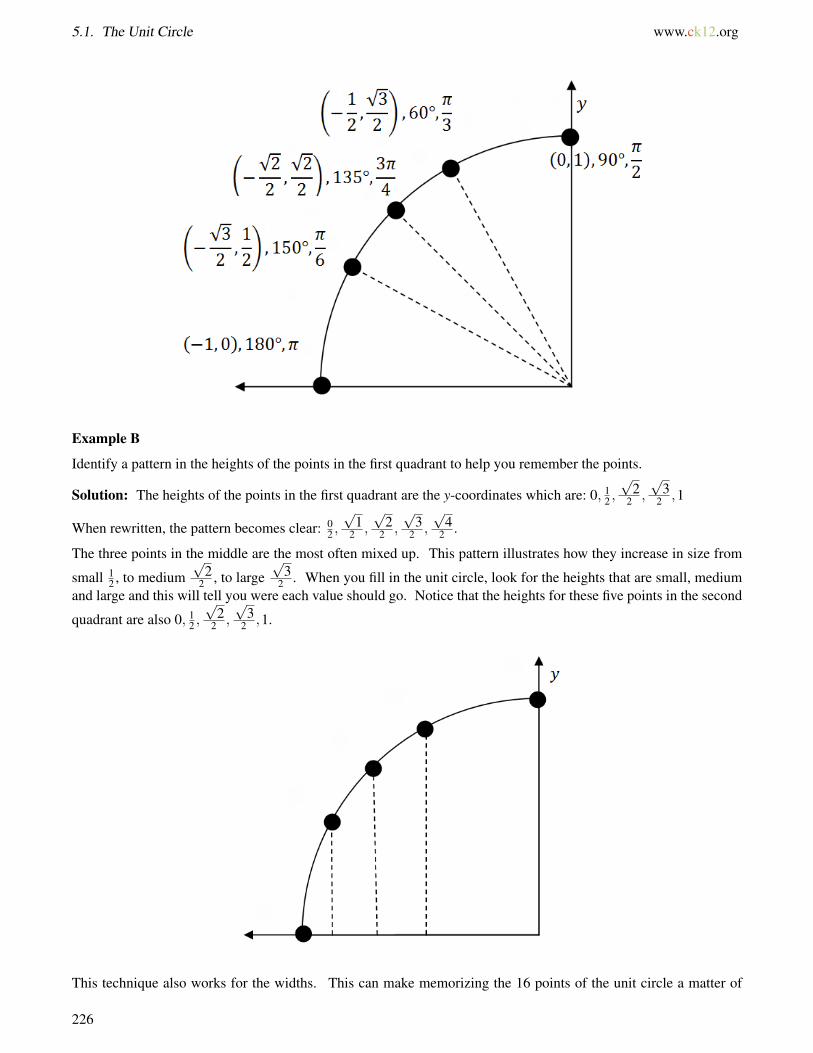
5.1. The Unit Circle www.ck12.org
Example B
Identify a pattern in the heights of the points in the first quadrant to help you remember the points.
Solution: The heights of the points in the first quadrant are the y-coordinates which are: 0, 12 ,
√2
2 ,
√3
2 ,1
When rewritten, the pattern becomes clear: 02 ,
√1
2 ,
√2
2 ,
√3
2 ,
√4
2 .
The three points in the middle are the most often mixed up. This pattern illustrates how they increase in size from
small 12 , to medium
√2
2 , to large√
32 . When you fill in the unit circle, look for the heights that are small, medium
and large and this will tell you were each value should go. Notice that the heights for these five points in the second
quadrant are also 0, 12 ,
√2
2 ,
√3
2 ,1.
This technique also works for the widths. This can make memorizing the 16 points of the unit circle a matter of
226

www.ck12.org Chapter 5. Trigonometric Functions
logic and the pattern: 02 ,
√1
2 ,
√2
2 ,
√3
2 ,
√4
2 .
Example C
Evaluate cos60◦ using the unit circle and right triangle trigonometry. What is the connection between the xcoordinate of the point and the cosine of the angle?
Solution: The point on the unit circle for 60◦ is(
12 ,
√3
2
)and the point is one unit from the origin. This can be
represented as a 30-60-90 triangle.
Since cosine is adjacent over hypotenuse, cosine turns out to be exactly the x coordinate 12 .
Concept Problem Revisited
The x value of a point along the unit circle corresponds to the cosine of the angle. The y value of a point correspondsto the sine of the angle. When the angles and points are memorized, simply recall the x or y coordinate.
When evaluating cos(135◦) your thought process should be something like this:
You know 135◦ goes with the point(−√
22 ,
√2
2
)and cosine is the x portion. So, cos(135◦) =−
√2
2 .
When evaluating sin(−5π
3
)your thought process should be something like this:
You know −5π
3 goes with the point(
12 ,−√
32
)and sine is the y portion. So, sin
(−5π
3
)=−
√3
2 .
Vocabulary
Coterminal Angles are sets of angles such as −10◦,350◦,710◦ that start at the positive x-axis and end at the sameterminal side. Since coterminal angles end at identical points along the unit circle, trigonometric expressionsinvolving coterminal angles are equivalent: sin−10◦ = sin350◦ = sin710◦.
227
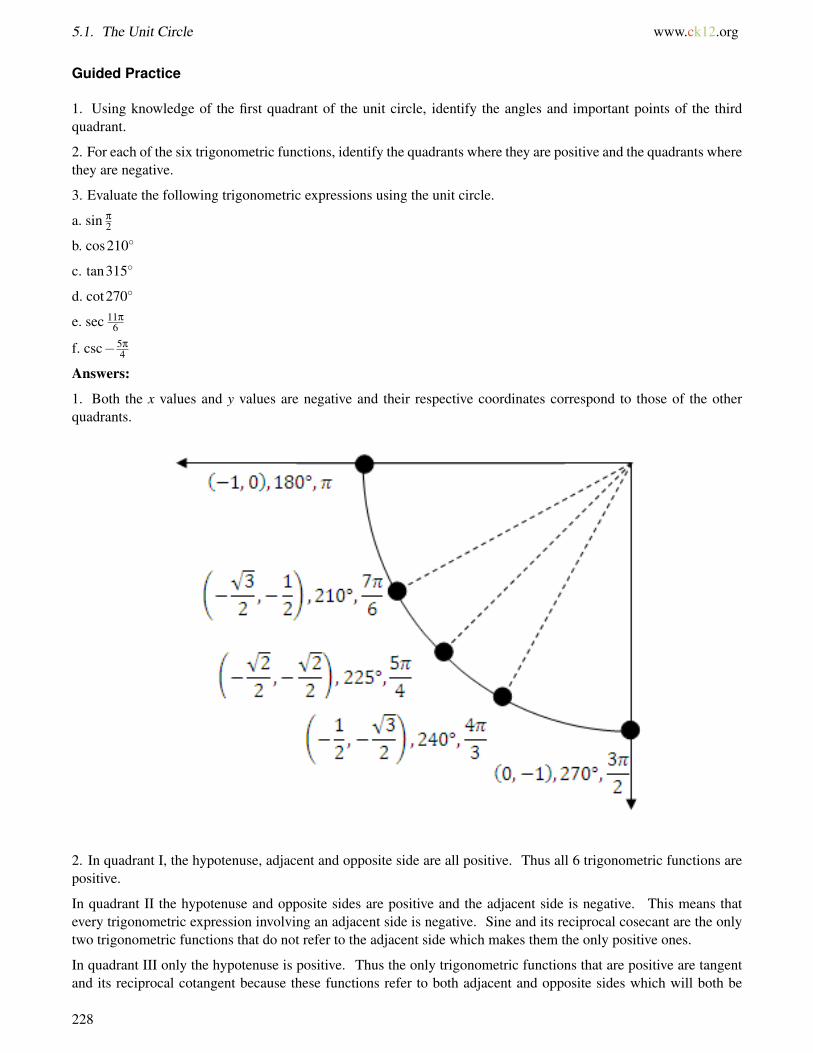
5.1. The Unit Circle www.ck12.org
Guided Practice
1. Using knowledge of the first quadrant of the unit circle, identify the angles and important points of the thirdquadrant.
2. For each of the six trigonometric functions, identify the quadrants where they are positive and the quadrants wherethey are negative.
3. Evaluate the following trigonometric expressions using the unit circle.
a. sin π
2
b. cos210◦
c. tan315◦
d. cot270◦
e. sec 11π
6
f. csc−5π
4
Answers:
1. Both the x values and y values are negative and their respective coordinates correspond to those of the otherquadrants.
2. In quadrant I, the hypotenuse, adjacent and opposite side are all positive. Thus all 6 trigonometric functions arepositive.
In quadrant II the hypotenuse and opposite sides are positive and the adjacent side is negative. This means thatevery trigonometric expression involving an adjacent side is negative. Sine and its reciprocal cosecant are the onlytwo trigonometric functions that do not refer to the adjacent side which makes them the only positive ones.
In quadrant III only the hypotenuse is positive. Thus the only trigonometric functions that are positive are tangentand its reciprocal cotangent because these functions refer to both adjacent and opposite sides which will both be
228
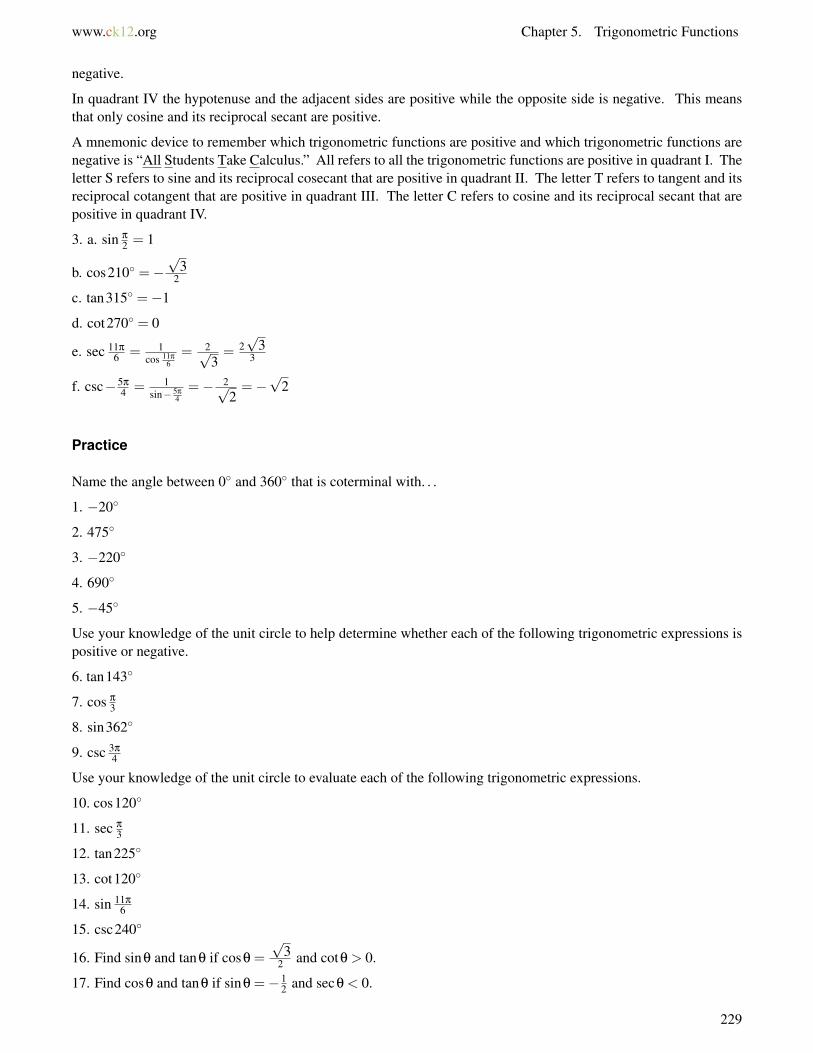
www.ck12.org Chapter 5. Trigonometric Functions
negative.
In quadrant IV the hypotenuse and the adjacent sides are positive while the opposite side is negative. This meansthat only cosine and its reciprocal secant are positive.
A mnemonic device to remember which trigonometric functions are positive and which trigonometric functions arenegative is “All Students Take Calculus.” All refers to all the trigonometric functions are positive in quadrant I. Theletter S refers to sine and its reciprocal cosecant that are positive in quadrant II. The letter T refers to tangent and itsreciprocal cotangent that are positive in quadrant III. The letter C refers to cosine and its reciprocal secant that arepositive in quadrant IV.
3. a. sin π
2 = 1
b. cos210◦ =−√
32
c. tan315◦ =−1
d. cot270◦ = 0
e. sec 11π
6 = 1cos 11π
6= 2√
3= 2√
33
f. csc−5π
4 = 1sin− 5π
4=− 2√
2=−√
2
Practice
Name the angle between 0◦ and 360◦ that is coterminal with. . .
1. −20◦
2. 475◦
3. −220◦
4. 690◦
5. −45◦
Use your knowledge of the unit circle to help determine whether each of the following trigonometric expressions ispositive or negative.
6. tan143◦
7. cos π
3
8. sin362◦
9. csc 3π
4
Use your knowledge of the unit circle to evaluate each of the following trigonometric expressions.
10. cos120◦
11. sec π
3
12. tan225◦
13. cot120◦
14. sin 11π
6
15. csc240◦
16. Find sinθ and tanθ if cosθ =
√3
2 and cotθ > 0.
17. Find cosθ and tanθ if sinθ =−12 and secθ < 0.
229

5.1. The Unit Circle www.ck12.org
18. Draw the complete unit circle (all four quadrants) and label the important points.
230

www.ck12.org Chapter 5. Trigonometric Functions
5.2 The Sinusoidal Function Family
Here you will see how the graphs of sine and cosine come from the unit circle.
The cosine function is the xcoordinates of the unit circle and the sine function is the ycoordinates. Since the unitcircle has radius one and is centered at the origin, both sine and cosine oscillate between positive and negative one.
What happens when the circle is not centered at the origin and does not have a radius of 1?
Watch This
MEDIAClick image to the left for more content.
http://www.youtube.com/watch?v=nXx2PsgMjYA James Sousa: Graphing the Sine and Cosine Functions
MEDIAClick image to the left for more content.
http://www.youtube.com/watch?v=QNQAkUUHNxo James Sousa: Animation: Graphing the Sine Function Usingthe Unit Circle
MEDIAClick image to the left for more content.
http://www.youtube.com/watch?v=tcjZOGaeoeo James Sousa: Animation: Graphing the Cosine Function Using theUnit Circle
Guidance
Consider a Ferris wheel that spins evenly with a radius of 1 unit. It starts at (1, 0) or an angle of 0 radians and spinscounterclockwise at a rate of one cycle per 2π minutes (so you can use time is equal to radians).
231

5.2. The Sinusoidal Function Family www.ck12.org
The 16 points around the circle are chosen because they correspond to the key points of the unit circle. Their heights(y-values) and widths (x-values) are already known and can be filled in.
First consider the height at each of the points as you travel around half of the circle from the starting location. Keeptrack of your work in a table.
TABLE 5.3:
Angle (radians) Height (units)0 0π
612
π
4
√2
2 ≈ 0.707π
3
√3
2 ≈ 0.866π
2 12π
3
√3
2 ≈ 0.8663π
4
√2
2 ≈ 0.7075π
612
π 0
Notice the symmetry of the height around π
2 and see the rest of the table in the examples. Once the table is finished,you can plot these points on a regular coordinate plane where the x axis is the angle and the y axis is the height. Thisis the first part of the graph of the sine function.
232

www.ck12.org Chapter 5. Trigonometric Functions
You will see a complete cycle of the sine function in Example A. In Example B, you will see how the x-coordinatesproduce the plot of the cosine curve.
Example A
Finish the table for heights of the points in quadrants III and IV and draw an entire cycle (known as a period) of thesine function.
Solution:
TABLE 5.4:
Angle (radians) Height (units)π 07π
6 −12
5π
4 −√
22 ≈−0.707
4π
3 −√
32 ≈−0.866
3π
2 -15π
3 −√
32 ≈−0.866
7π
4 −√
22 ≈−0.707
11π
6 −12
2π 0
233
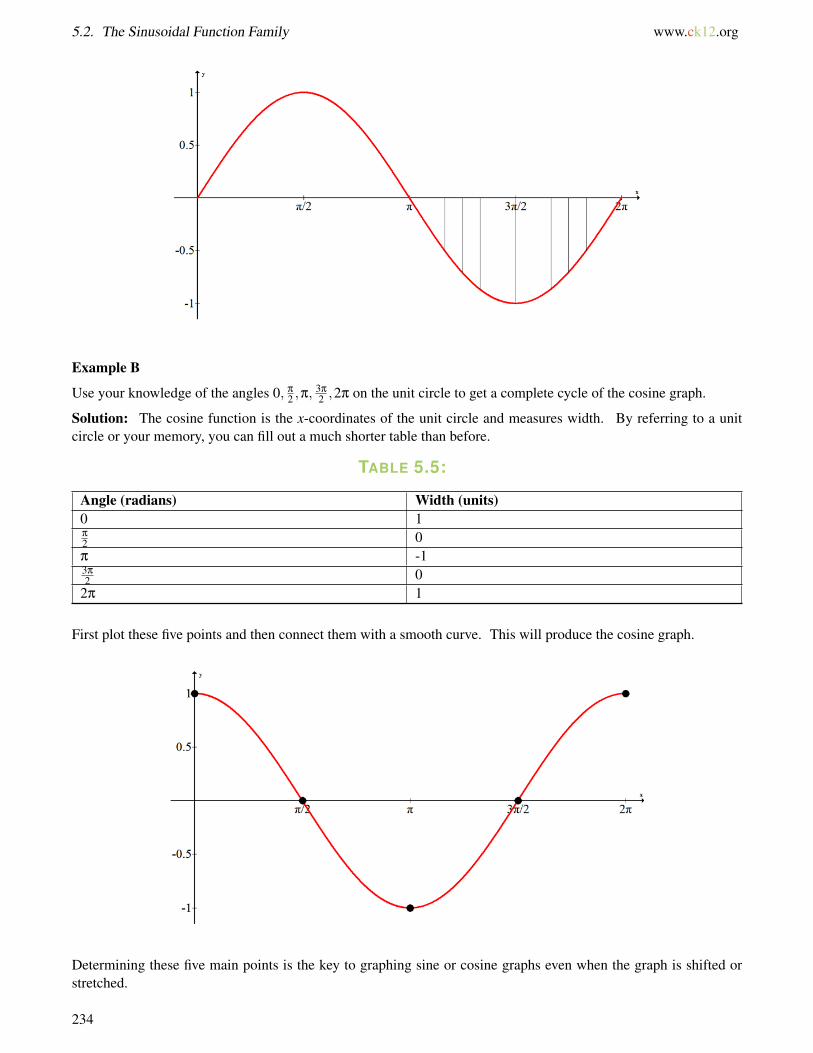
5.2. The Sinusoidal Function Family www.ck12.org
Example B
Use your knowledge of the angles 0, π
2 ,π,3π
2 ,2π on the unit circle to get a complete cycle of the cosine graph.
Solution: The cosine function is the x-coordinates of the unit circle and measures width. By referring to a unitcircle or your memory, you can fill out a much shorter table than before.
TABLE 5.5:
Angle (radians) Width (units)0 1π
2 0π -13π
2 02π 1
First plot these five points and then connect them with a smooth curve. This will produce the cosine graph.
Determining these five main points is the key to graphing sine or cosine graphs even when the graph is shifted orstretched.
234
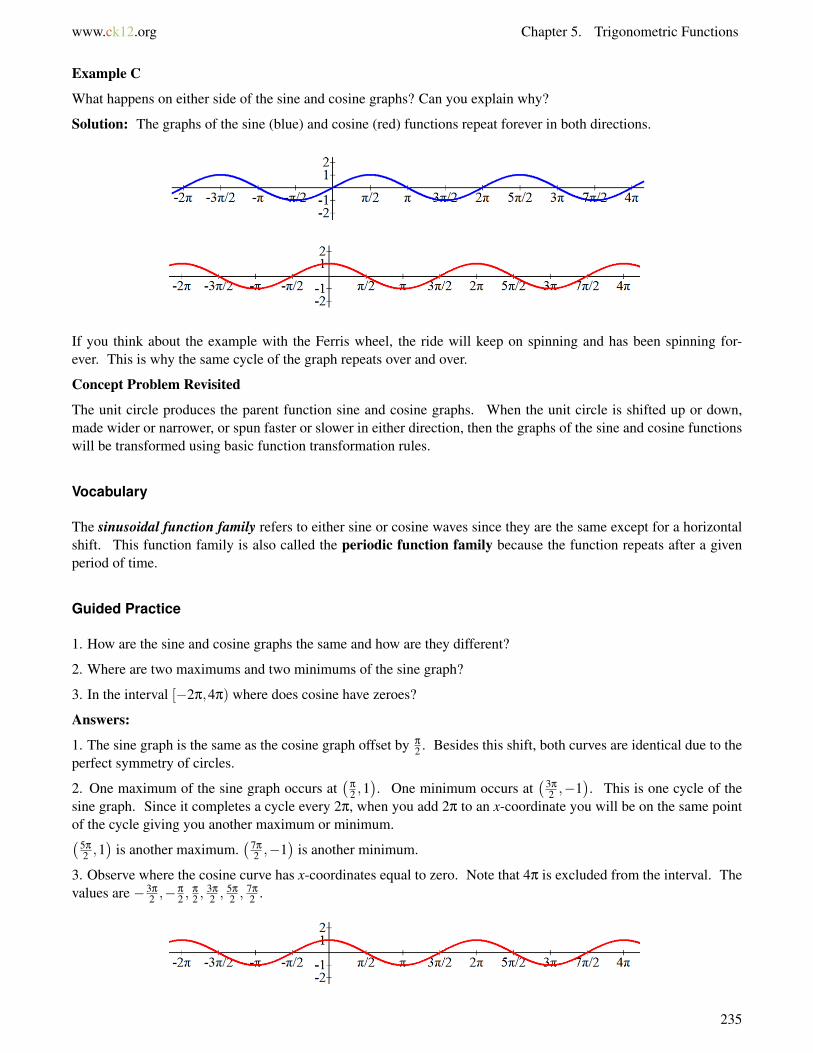
www.ck12.org Chapter 5. Trigonometric Functions
Example C
What happens on either side of the sine and cosine graphs? Can you explain why?
Solution: The graphs of the sine (blue) and cosine (red) functions repeat forever in both directions.
If you think about the example with the Ferris wheel, the ride will keep on spinning and has been spinning for-ever. This is why the same cycle of the graph repeats over and over.
Concept Problem Revisited
The unit circle produces the parent function sine and cosine graphs. When the unit circle is shifted up or down,made wider or narrower, or spun faster or slower in either direction, then the graphs of the sine and cosine functionswill be transformed using basic function transformation rules.
Vocabulary
The sinusoidal function family refers to either sine or cosine waves since they are the same except for a horizontalshift. This function family is also called the periodic function family because the function repeats after a givenperiod of time.
Guided Practice
1. How are the sine and cosine graphs the same and how are they different?
2. Where are two maximums and two minimums of the sine graph?
3. In the interval [−2π,4π) where does cosine have zeroes?
Answers:
1. The sine graph is the same as the cosine graph offset by π
2 . Besides this shift, both curves are identical due to theperfect symmetry of circles.
2. One maximum of the sine graph occurs at(
π
2 ,1). One minimum occurs at
(3π
2 ,−1). This is one cycle of the
sine graph. Since it completes a cycle every 2π, when you add 2π to an x-coordinate you will be on the same pointof the cycle giving you another maximum or minimum.(5π
2 ,1)
is another maximum.(7π
2 ,−1)
is another minimum.
3. Observe where the cosine curve has x-coordinates equal to zero. Note that 4π is excluded from the interval. Thevalues are −3π
2 ,−π
2 ,π
2 ,3π
2 , 5π
2 , 7π
2 .
235
5.2. The Sinusoidal Function Family www.ck12.org
Practice
1. Sketch p(x) = sinx from memory.
2. Sketch j(x) = cosx from memory.
3. Where do the maximums of the cosine graph occur?
4. Where do the minimums of the cosine graph occur?
5. Find all the zeroes of the sine function on the interval[−π, 5π
2
].
6. Find all the zeroes of the cosine function on the interval(−π
2 ,7π
2
].
7. Preview: Using your knowledge of function transformations and the cosine graph, predict what the graph off (x) = 2cosx will look like.
8. Preview: Using your knowledge of function transformations and the cosine graph, predict what the graph g(x) =cosx+2 of will look like.
9. Preview: Using your knowledge of function transformations and the cosine graph, predict what the graph ofh(x) = cos(x−π) will look like.
10. Preview: Using your knowledge of function transformations and the cosine graph, predict what the graph ofk(x) =−cosx will look like.
236
www.ck12.org Chapter 5. Trigonometric Functions
5.3 Amplitude of Sinusoidal Functions
Here you will see how changing the radius of a circle affects the graph of the sine function through a vertical stretch.
The amplitude of the sine and cosine functions is the distance between the sinusoidal axis and the maximum orminimum value of the function. In relation to sound waves, amplitude is a measure of how loud something is.
What is the most common mistake made when graphing the amplitude of a sine wave?
Watch This
Watch the portion of this video discussing amplitude:
MEDIAClick image to the left for more content.
http://www.youtube.com/watch?v=qJ-oUV7xL3w James Sousa: Amplitude and Period of Sine and Cosine
Guidance
The general form a sinusoidal function is:
f (x) =±a · sin(b(x+ c))+d
The cosine function can just as easily be substituted and for many problems it will be easier to use a cosineequation. Since both the sine and cosine waves are identical except for a horizontal shift, it all depends on whereyou see the wave starting.
The coefficient a is the amplitude (which fortunately also starts with the letter a). When there is no number present,then the amplitude is 1. The best way to define amplitude is through a picture. Below is the graph of the functionf (x) = 3 · sinx, which has an amplitude of 3.
237

5.3. Amplitude of Sinusoidal Functions www.ck12.org
Notice that the amplitude is 3, not 6. This corresponds to the absolute value of the maximum and minimum valuesof the function. If the function had been f (x) =−3 ·sinx, then the whole graph would be reflected across the x axis.
Also notice that the x axis on the graph above is unlabeled. This is to show that amplitude is a vertical distance. Thesinusoidal axis is the neutral horizontal line that lies between the crests and the troughs (or peaks and valleys ifyou prefer). For this function, the sinusoidal axis was just the x axis, but if the whole graph were shifted up, thesinusoidal axis would no longer be the x axis. Instead, it would still be the horizontal line directly between the crestsand troughs.
Example A
Graph the following function by first plotting main points: f (x) =−2 · cosx.
Solution: The amplitude is 2, which means the maximum values will be at 2 and the minimum values will be at-2. Normally with a basic cosine curve the points corresponding to 0, π
2 ,π,3π
2 ,2π fall above, on or below the line inthe following sequence: above, on, below, on, above. The negative sign switches above with below. The wholegraph is reflected across the x-axis.
Example B
Write a cosine equation for each of the following functions.
238
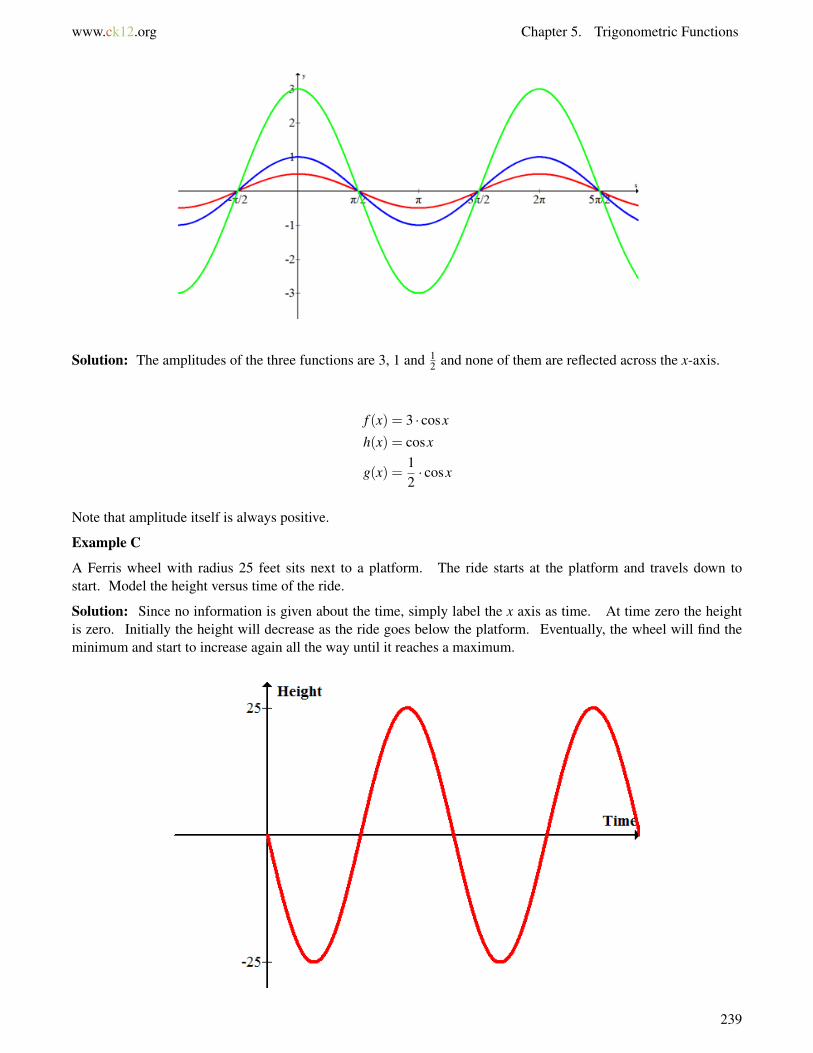
www.ck12.org Chapter 5. Trigonometric Functions
Solution: The amplitudes of the three functions are 3, 1 and 12 and none of them are reflected across the x-axis.
f (x) = 3 · cosx
h(x) = cosx
g(x) =12· cosx
Note that amplitude itself is always positive.
Example C
A Ferris wheel with radius 25 feet sits next to a platform. The ride starts at the platform and travels down tostart. Model the height versus time of the ride.
Solution: Since no information is given about the time, simply label the x axis as time. At time zero the heightis zero. Initially the height will decrease as the ride goes below the platform. Eventually, the wheel will find theminimum and start to increase again all the way until it reaches a maximum.
239
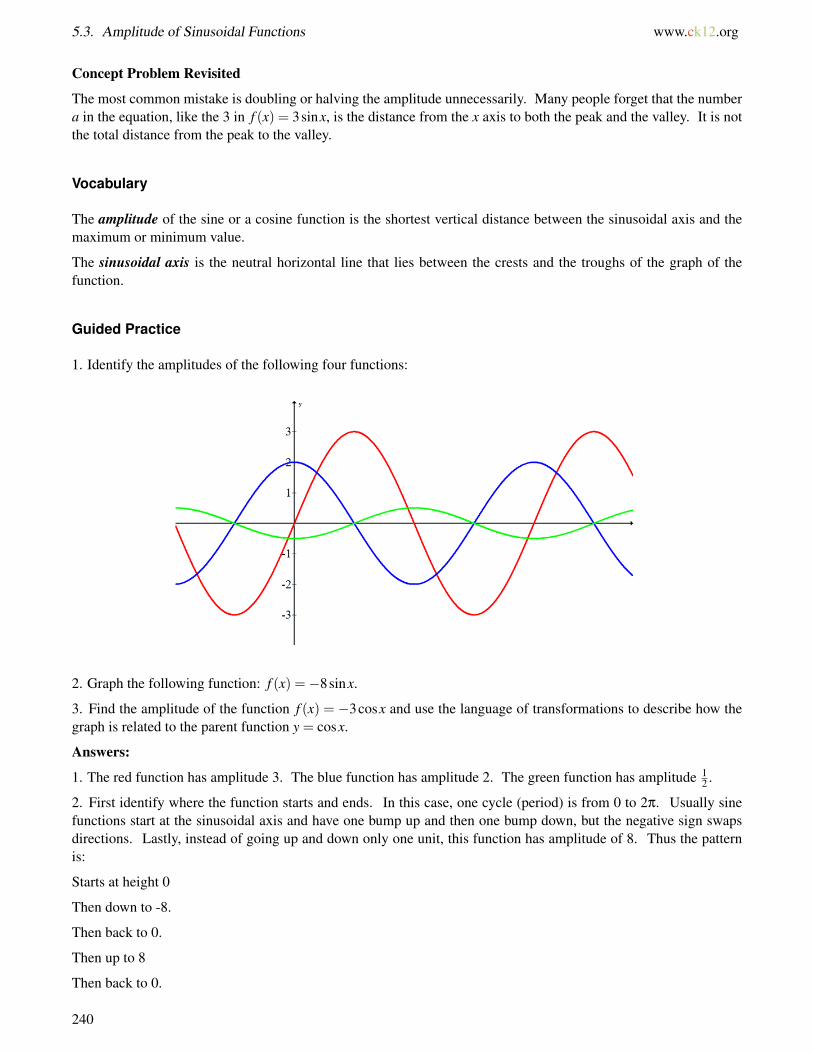
5.3. Amplitude of Sinusoidal Functions www.ck12.org
Concept Problem Revisited
The most common mistake is doubling or halving the amplitude unnecessarily. Many people forget that the numbera in the equation, like the 3 in f (x) = 3sinx, is the distance from the x axis to both the peak and the valley. It is notthe total distance from the peak to the valley.
Vocabulary
The amplitude of the sine or a cosine function is the shortest vertical distance between the sinusoidal axis and themaximum or minimum value.
The sinusoidal axis is the neutral horizontal line that lies between the crests and the troughs of the graph of thefunction.
Guided Practice
1. Identify the amplitudes of the following four functions:
2. Graph the following function: f (x) =−8sinx.
3. Find the amplitude of the function f (x) = −3cosx and use the language of transformations to describe how thegraph is related to the parent function y = cosx.
Answers:
1. The red function has amplitude 3. The blue function has amplitude 2. The green function has amplitude 12 .
2. First identify where the function starts and ends. In this case, one cycle (period) is from 0 to 2π. Usually sinefunctions start at the sinusoidal axis and have one bump up and then one bump down, but the negative sign swapsdirections. Lastly, instead of going up and down only one unit, this function has amplitude of 8. Thus the patternis:
Starts at height 0
Then down to -8.
Then back to 0.
Then up to 8
Then back to 0.
240
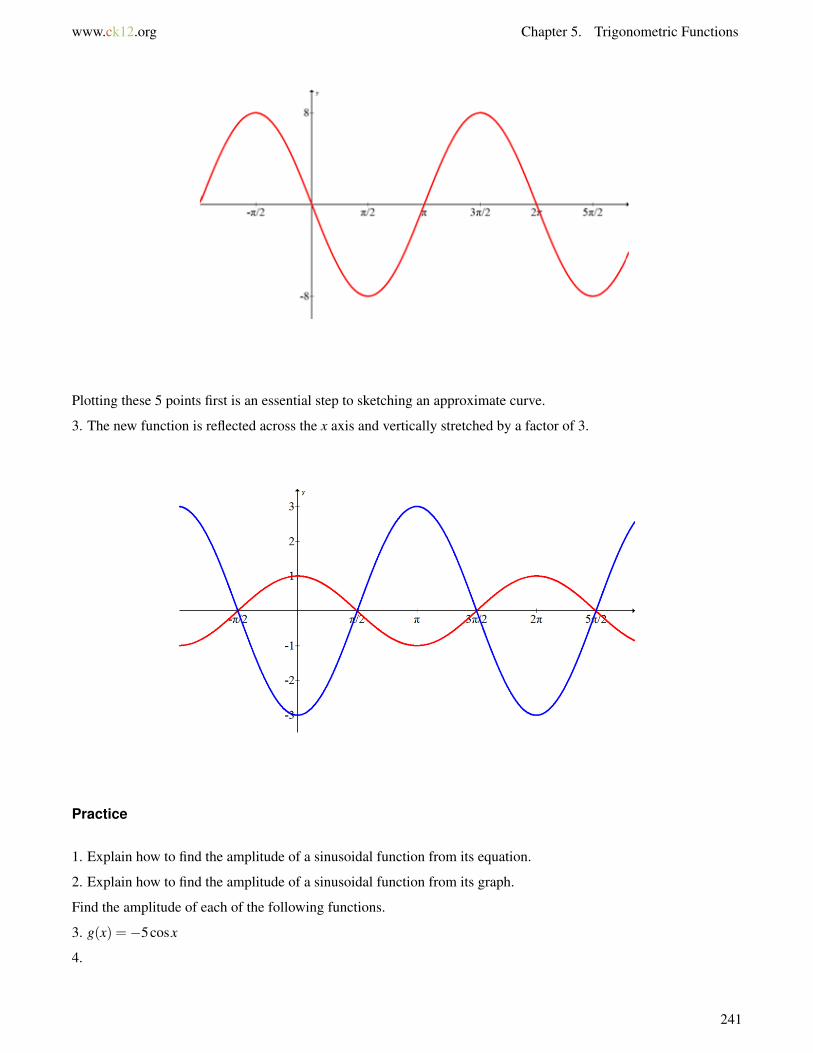
www.ck12.org Chapter 5. Trigonometric Functions
Plotting these 5 points first is an essential step to sketching an approximate curve.
3. The new function is reflected across the x axis and vertically stretched by a factor of 3.
Practice
1. Explain how to find the amplitude of a sinusoidal function from its equation.
2. Explain how to find the amplitude of a sinusoidal function from its graph.
Find the amplitude of each of the following functions.
3. g(x) =−5cosx
4.
241
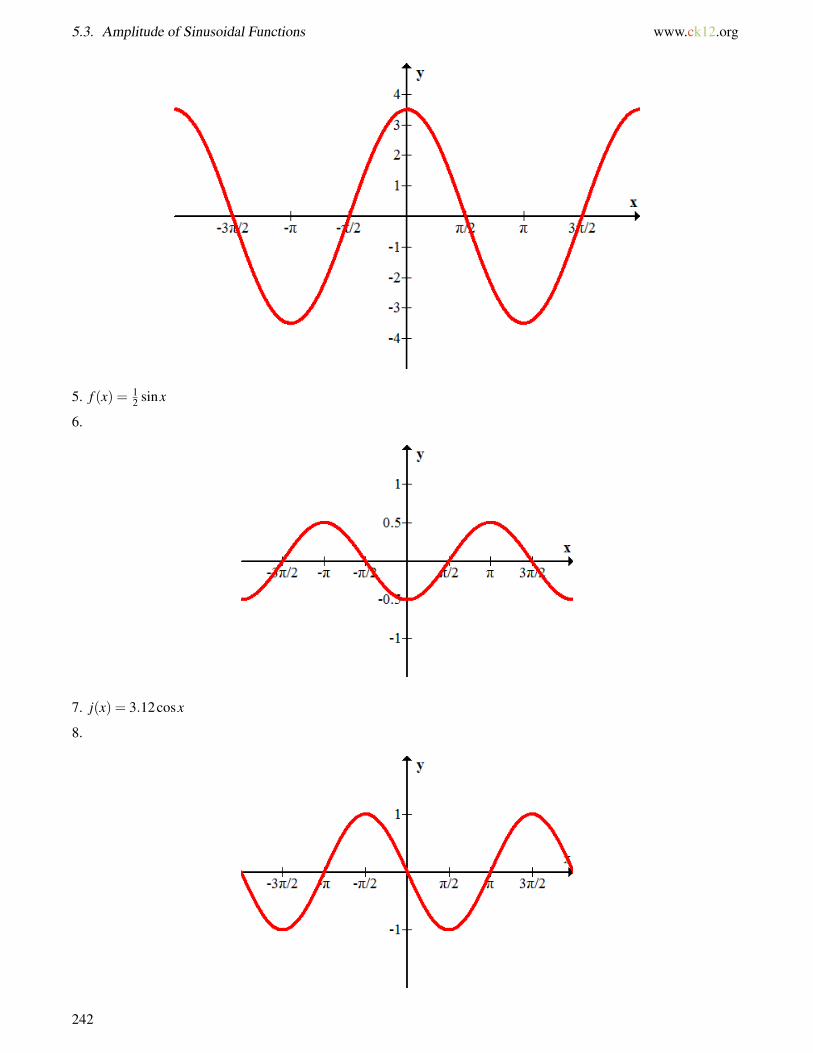
5.3. Amplitude of Sinusoidal Functions www.ck12.org
5. f (x) = 12 sinx
6.
7. j(x) = 3.12cosx
8.
242

www.ck12.org Chapter 5. Trigonometric Functions
Sketch each of the following functions.
9. f (x) = 3sinx
10. g(x) =−4cosx
11. h(x) = πsinx
12. k(x) =−1.2cosx
13. p(x) = 23 cosx
14. m(x) =−12 sinx
15. Preview: r(x) = 3sinx+2
243
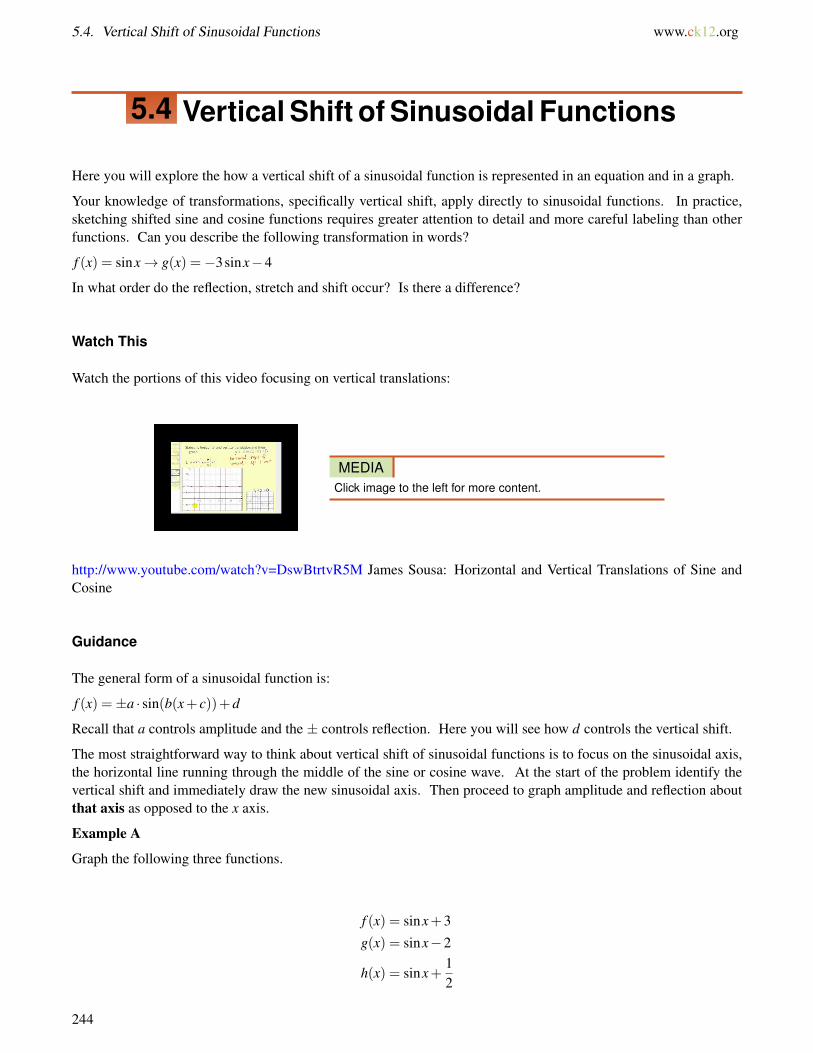
5.4. Vertical Shift of Sinusoidal Functions www.ck12.org
5.4 Vertical Shift of Sinusoidal Functions
Here you will explore the how a vertical shift of a sinusoidal function is represented in an equation and in a graph.
Your knowledge of transformations, specifically vertical shift, apply directly to sinusoidal functions. In practice,sketching shifted sine and cosine functions requires greater attention to detail and more careful labeling than otherfunctions. Can you describe the following transformation in words?
f (x) = sinx→ g(x) =−3sinx−4
In what order do the reflection, stretch and shift occur? Is there a difference?
Watch This
Watch the portions of this video focusing on vertical translations:
MEDIAClick image to the left for more content.
http://www.youtube.com/watch?v=DswBtrtvR5M James Sousa: Horizontal and Vertical Translations of Sine andCosine
Guidance
The general form of a sinusoidal function is:
f (x) =±a · sin(b(x+ c))+d
Recall that a controls amplitude and the ± controls reflection. Here you will see how d controls the vertical shift.
The most straightforward way to think about vertical shift of sinusoidal functions is to focus on the sinusoidal axis,the horizontal line running through the middle of the sine or cosine wave. At the start of the problem identify thevertical shift and immediately draw the new sinusoidal axis. Then proceed to graph amplitude and reflection aboutthat axis as opposed to the x axis.
Example A
Graph the following three functions.
f (x) = sinx+3
g(x) = sinx−2
h(x) = sinx+12
244
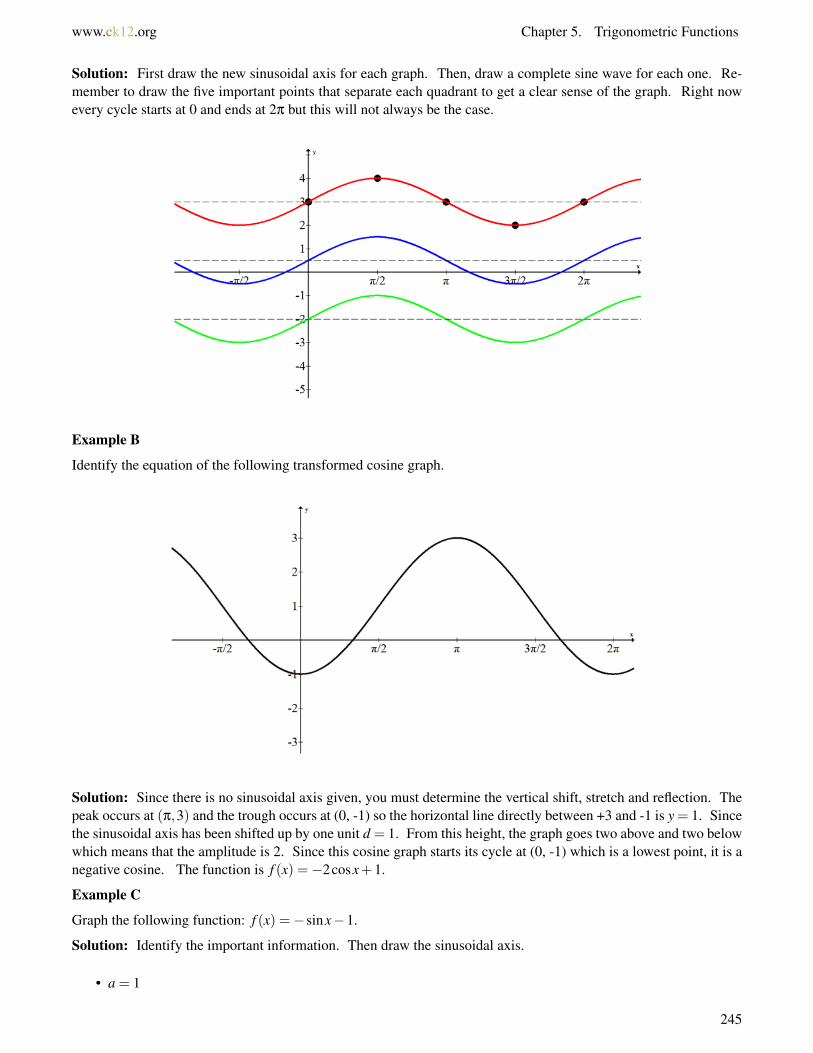
www.ck12.org Chapter 5. Trigonometric Functions
Solution: First draw the new sinusoidal axis for each graph. Then, draw a complete sine wave for each one. Re-member to draw the five important points that separate each quadrant to get a clear sense of the graph. Right nowevery cycle starts at 0 and ends at 2π but this will not always be the case.
Example B
Identify the equation of the following transformed cosine graph.
Solution: Since there is no sinusoidal axis given, you must determine the vertical shift, stretch and reflection. Thepeak occurs at (π,3) and the trough occurs at (0, -1) so the horizontal line directly between +3 and -1 is y = 1. Sincethe sinusoidal axis has been shifted up by one unit d = 1. From this height, the graph goes two above and two belowwhich means that the amplitude is 2. Since this cosine graph starts its cycle at (0, -1) which is a lowest point, it is anegative cosine. The function is f (x) =−2cosx+1.
Example C
Graph the following function: f (x) =−sinx−1.
Solution: Identify the important information. Then draw the sinusoidal axis.
• a = 1
245
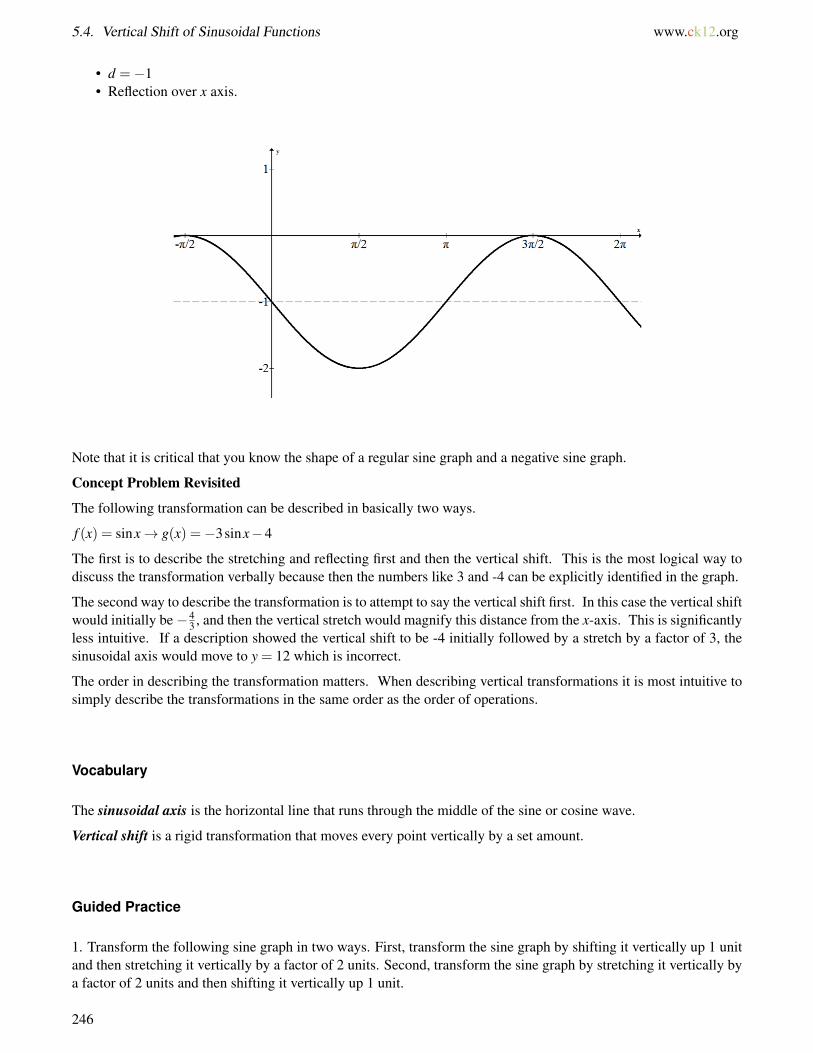
5.4. Vertical Shift of Sinusoidal Functions www.ck12.org
• d =−1• Reflection over x axis.
Note that it is critical that you know the shape of a regular sine graph and a negative sine graph.
Concept Problem Revisited
The following transformation can be described in basically two ways.
f (x) = sinx→ g(x) =−3sinx−4
The first is to describe the stretching and reflecting first and then the vertical shift. This is the most logical way todiscuss the transformation verbally because then the numbers like 3 and -4 can be explicitly identified in the graph.
The second way to describe the transformation is to attempt to say the vertical shift first. In this case the vertical shiftwould initially be−4
3 , and then the vertical stretch would magnify this distance from the x-axis. This is significantlyless intuitive. If a description showed the vertical shift to be -4 initially followed by a stretch by a factor of 3, thesinusoidal axis would move to y = 12 which is incorrect.
The order in describing the transformation matters. When describing vertical transformations it is most intuitive tosimply describe the transformations in the same order as the order of operations.
Vocabulary
The sinusoidal axis is the horizontal line that runs through the middle of the sine or cosine wave.
Vertical shift is a rigid transformation that moves every point vertically by a set amount.
Guided Practice
1. Transform the following sine graph in two ways. First, transform the sine graph by shifting it vertically up 1 unitand then stretching it vertically by a factor of 2 units. Second, transform the sine graph by stretching it vertically bya factor of 2 units and then shifting it vertically up 1 unit.
246
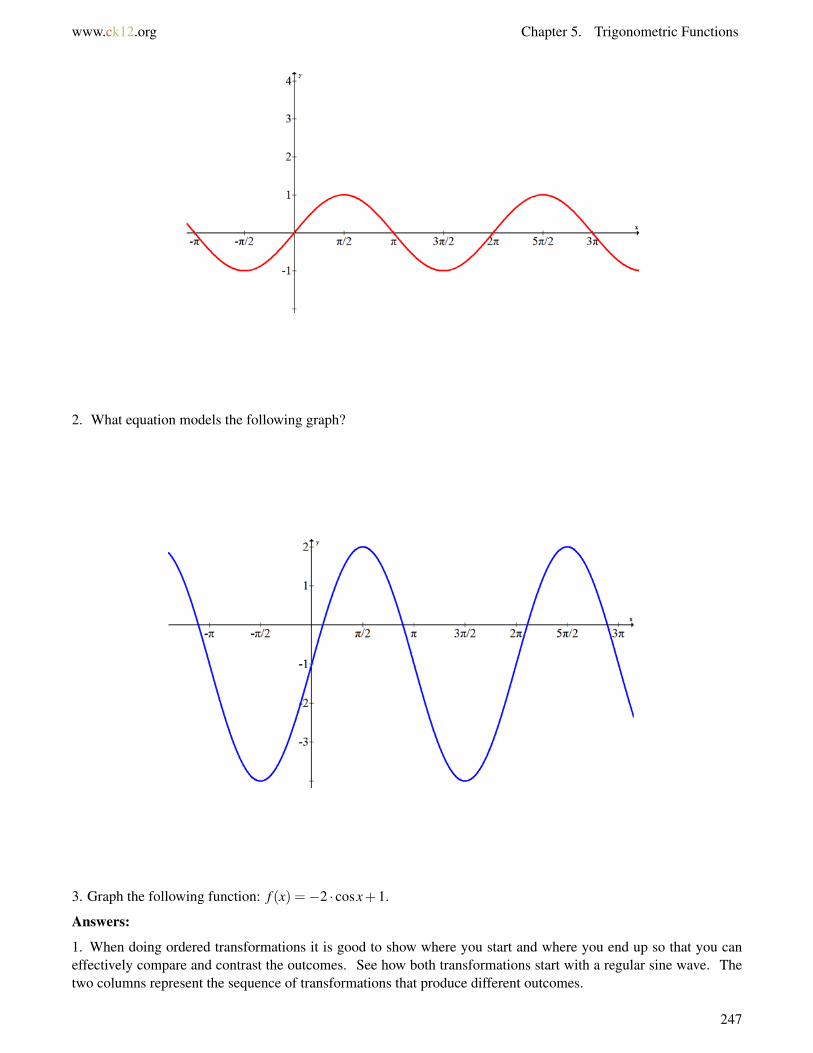
www.ck12.org Chapter 5. Trigonometric Functions
2. What equation models the following graph?
3. Graph the following function: f (x) =−2 · cosx+1.
Answers:
1. When doing ordered transformations it is good to show where you start and where you end up so that you caneffectively compare and contrast the outcomes. See how both transformations start with a regular sine wave. Thetwo columns represent the sequence of transformations that produce different outcomes.
247
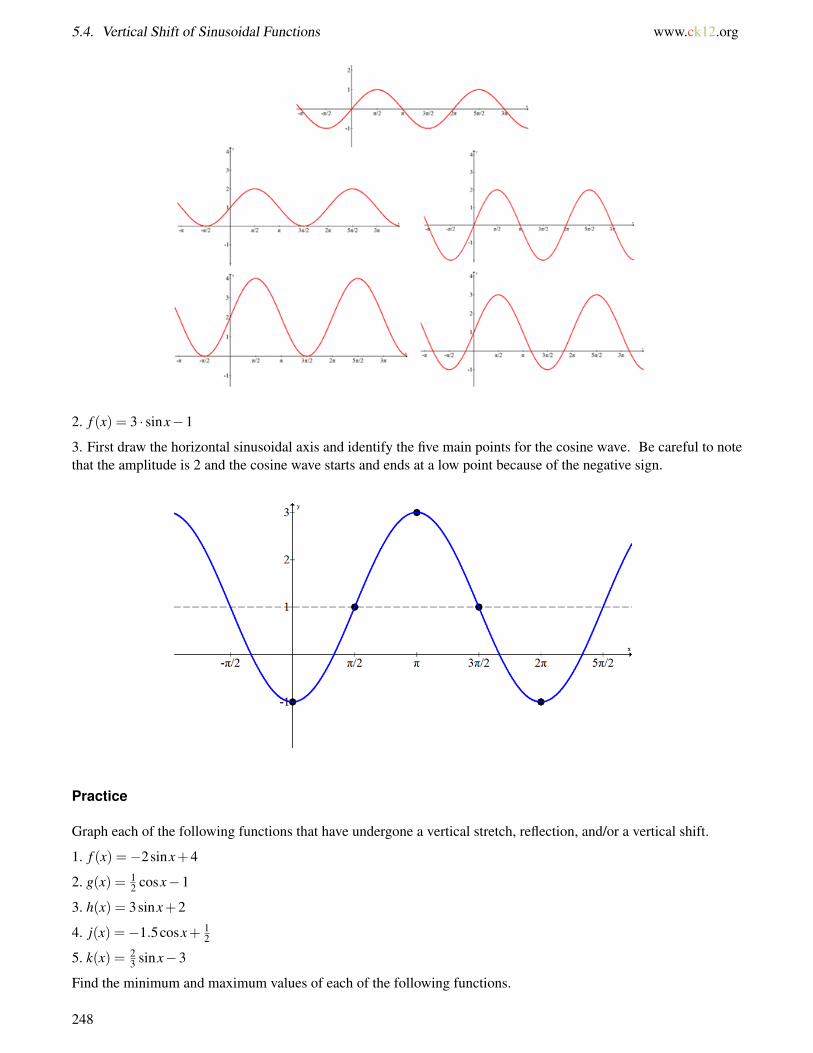
5.4. Vertical Shift of Sinusoidal Functions www.ck12.org
2. f (x) = 3 · sinx−1
3. First draw the horizontal sinusoidal axis and identify the five main points for the cosine wave. Be careful to notethat the amplitude is 2 and the cosine wave starts and ends at a low point because of the negative sign.
Practice
Graph each of the following functions that have undergone a vertical stretch, reflection, and/or a vertical shift.
1. f (x) =−2sinx+4
2. g(x) = 12 cosx−1
3. h(x) = 3sinx+2
4. j(x) =−1.5cosx+ 12
5. k(x) = 23 sinx−3
Find the minimum and maximum values of each of the following functions.
248

www.ck12.org Chapter 5. Trigonometric Functions
6. f (x) =−3sinx+1
7. g(x) = 2cosx−4
8. h(x) = 12 sinx+1
9. j(x) =−cosx+5
10. k(x) = sin(x)−1
Give the equation of each function graphed below.
11.
12,
13.
249

www.ck12.org Chapter 5. Trigonometric Functions
5.5 Frequency and Period of Sinusoidal Func-tions
Here you will apply your knowledge of horizontal stretching transformations to sine and cosine functions.
The transformation rules about horizontal stretching and shrinking directly apply to sine and cosine graphs. If a sinegraph is horizontally stretched by a factor of 1
2 that is the same as a horizontal compression by a factor of 2.
How does the equation change when a sine or cosine graph is stretched by a factor of 3?
Watch This
MEDIAClick image to the left for more content.
http://www.youtube.com/watch?v=qJ-oUV7xL3w James Sousa: Amplitude and Period of Sine and Cosine
Guidance
The general equation for a sinusoidal function is:
f (x) =±a · sin(b(x+ c))+d
The ± controls the reflection across the x-axis. The coefficient a controls the amplitude. The constant d controlsthe vertical shift. Here you will see that the coefficient b controls the horizontal stretch.
Horizontal stretch is measured for sinusoidal functions as their periods. This is why this function family is alsocalled the periodic function family. The period of a sinusoid is the length of a complete cycle. For basic sine andcosine functions, the period is 2π. This length can be measured in multiple ways. In word problems and in othertricky circumstances, it may be most useful to measure from peak to peak.
251
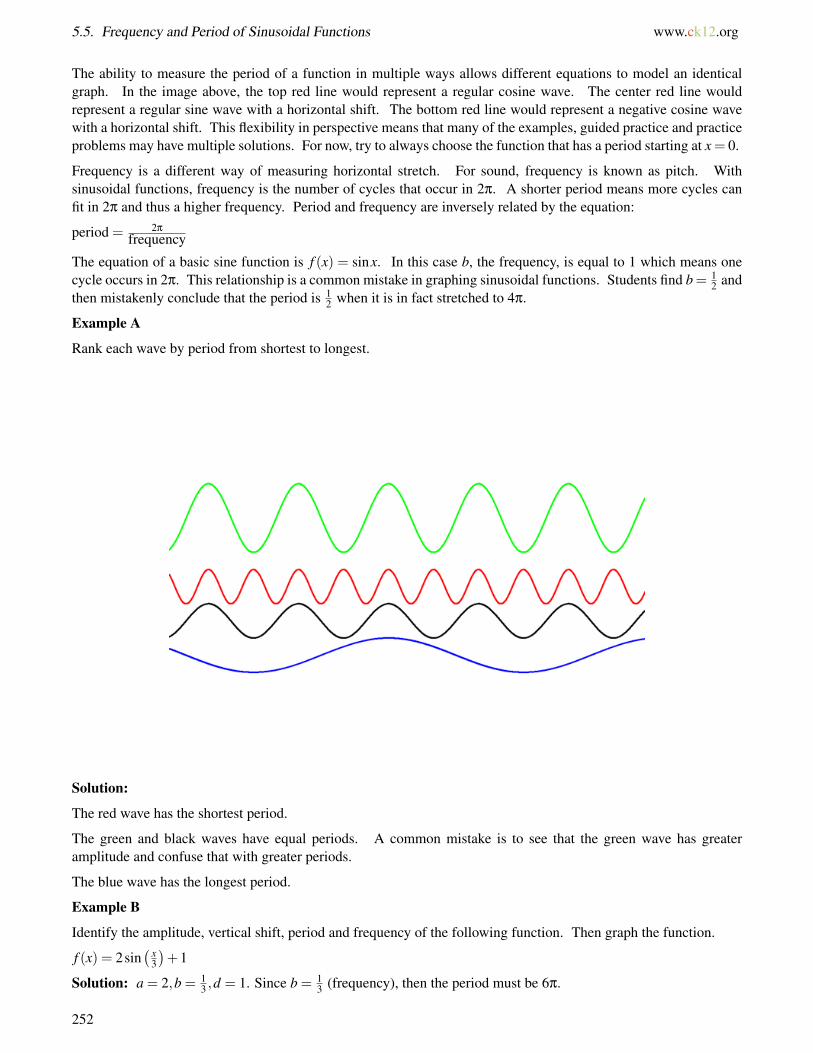
5.5. Frequency and Period of Sinusoidal Functions www.ck12.org
The ability to measure the period of a function in multiple ways allows different equations to model an identicalgraph. In the image above, the top red line would represent a regular cosine wave. The center red line wouldrepresent a regular sine wave with a horizontal shift. The bottom red line would represent a negative cosine wavewith a horizontal shift. This flexibility in perspective means that many of the examples, guided practice and practiceproblems may have multiple solutions. For now, try to always choose the function that has a period starting at x = 0.
Frequency is a different way of measuring horizontal stretch. For sound, frequency is known as pitch. Withsinusoidal functions, frequency is the number of cycles that occur in 2π. A shorter period means more cycles canfit in 2π and thus a higher frequency. Period and frequency are inversely related by the equation:
period = 2π
frequency
The equation of a basic sine function is f (x) = sinx. In this case b, the frequency, is equal to 1 which means onecycle occurs in 2π. This relationship is a common mistake in graphing sinusoidal functions. Students find b= 1
2 andthen mistakenly conclude that the period is 1
2 when it is in fact stretched to 4π.
Example A
Rank each wave by period from shortest to longest.
Solution:
The red wave has the shortest period.
The green and black waves have equal periods. A common mistake is to see that the green wave has greateramplitude and confuse that with greater periods.
The blue wave has the longest period.
Example B
Identify the amplitude, vertical shift, period and frequency of the following function. Then graph the function.
f (x) = 2sin( x
3
)+1
Solution: a = 2,b = 13 ,d = 1. Since b = 1
3 (frequency), then the period must be 6π.
252
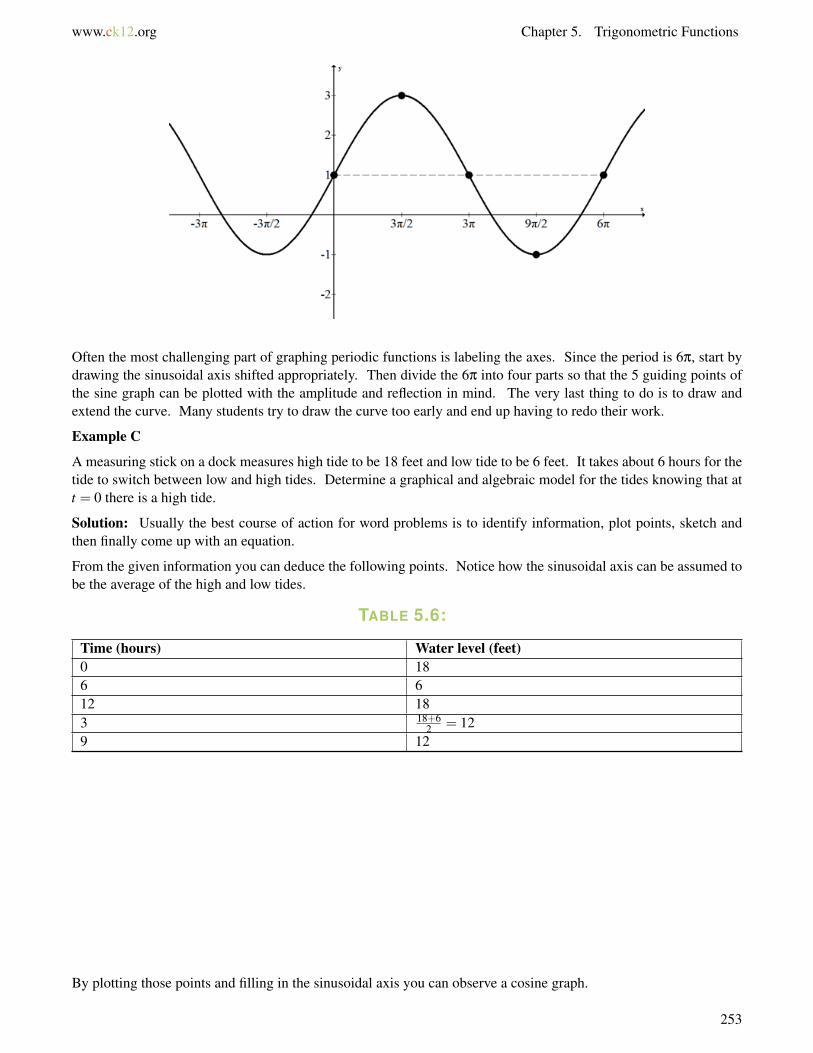
www.ck12.org Chapter 5. Trigonometric Functions
Often the most challenging part of graphing periodic functions is labeling the axes. Since the period is 6π, start bydrawing the sinusoidal axis shifted appropriately. Then divide the 6π into four parts so that the 5 guiding points ofthe sine graph can be plotted with the amplitude and reflection in mind. The very last thing to do is to draw andextend the curve. Many students try to draw the curve too early and end up having to redo their work.
Example C
A measuring stick on a dock measures high tide to be 18 feet and low tide to be 6 feet. It takes about 6 hours for thetide to switch between low and high tides. Determine a graphical and algebraic model for the tides knowing that att = 0 there is a high tide.
Solution: Usually the best course of action for word problems is to identify information, plot points, sketch andthen finally come up with an equation.
From the given information you can deduce the following points. Notice how the sinusoidal axis can be assumed tobe the average of the high and low tides.
TABLE 5.6:
Time (hours) Water level (feet)0 186 612 183 18+6
2 = 129 12
By plotting those points and filling in the sinusoidal axis you can observe a cosine graph.
253
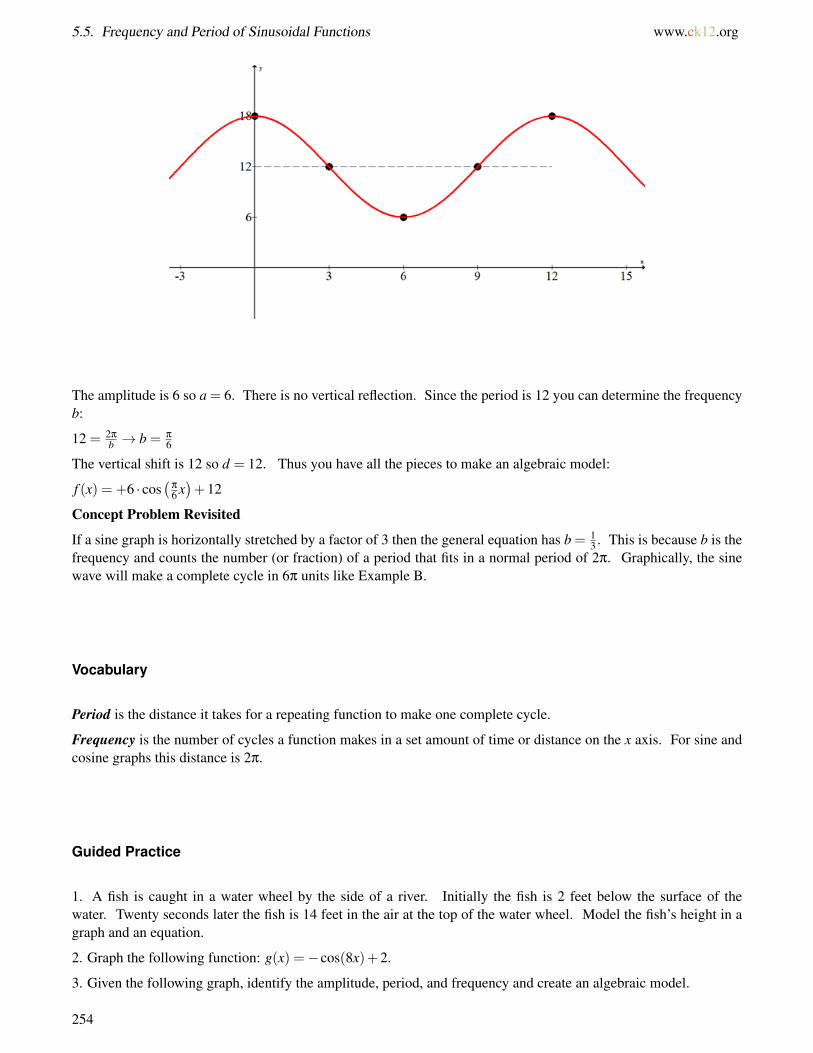
5.5. Frequency and Period of Sinusoidal Functions www.ck12.org
The amplitude is 6 so a = 6. There is no vertical reflection. Since the period is 12 you can determine the frequencyb:
12 = 2π
b → b = π
6
The vertical shift is 12 so d = 12. Thus you have all the pieces to make an algebraic model:
f (x) = +6 · cos(
π
6 x)+12
Concept Problem Revisited
If a sine graph is horizontally stretched by a factor of 3 then the general equation has b = 13 . This is because b is the
frequency and counts the number (or fraction) of a period that fits in a normal period of 2π. Graphically, the sinewave will make a complete cycle in 6π units like Example B.
Vocabulary
Period is the distance it takes for a repeating function to make one complete cycle.
Frequency is the number of cycles a function makes in a set amount of time or distance on the x axis. For sine andcosine graphs this distance is 2π.
Guided Practice
1. A fish is caught in a water wheel by the side of a river. Initially the fish is 2 feet below the surface of thewater. Twenty seconds later the fish is 14 feet in the air at the top of the water wheel. Model the fish’s height in agraph and an equation.
2. Graph the following function: g(x) =−cos(8x)+2.
3. Given the following graph, identify the amplitude, period, and frequency and create an algebraic model.
254
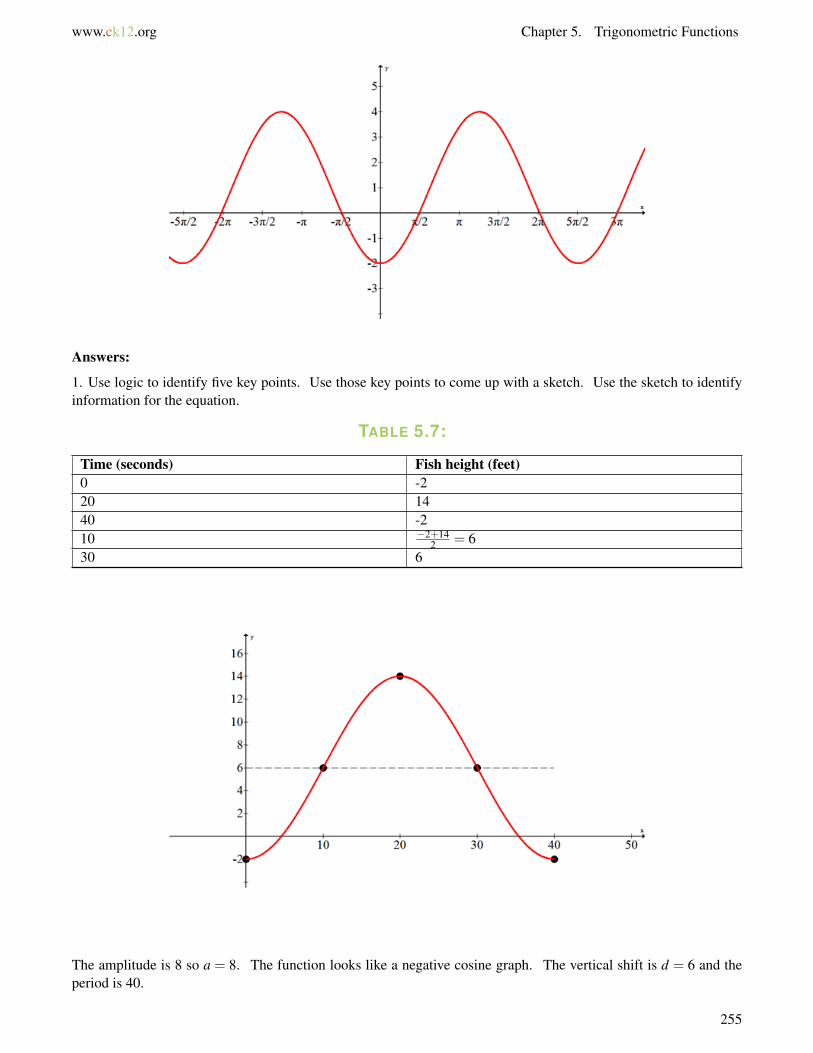
www.ck12.org Chapter 5. Trigonometric Functions
Answers:
1. Use logic to identify five key points. Use those key points to come up with a sketch. Use the sketch to identifyinformation for the equation.
TABLE 5.7:
Time (seconds) Fish height (feet)0 -220 1440 -210 −2+14
2 = 630 6
The amplitude is 8 so a = 8. The function looks like a negative cosine graph. The vertical shift is d = 6 and theperiod is 40.
255
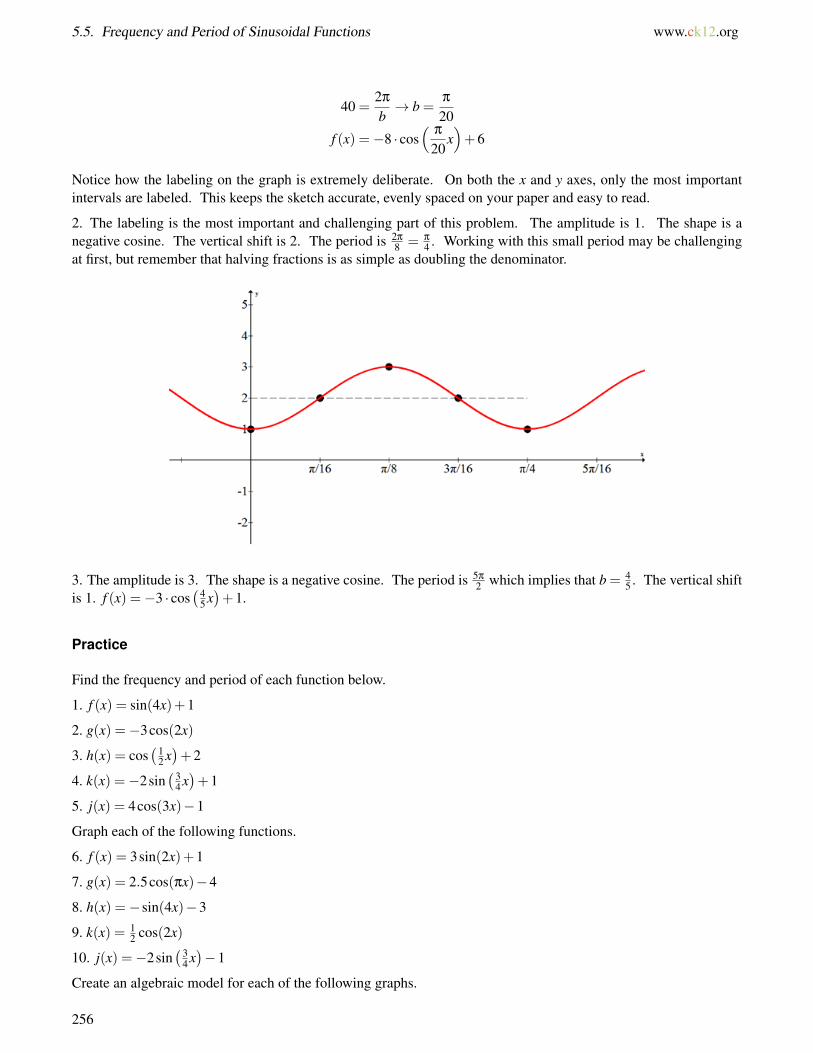
5.5. Frequency and Period of Sinusoidal Functions www.ck12.org
40 =2π
b→ b =
π
20
f (x) =−8 · cos(
π
20x)+6
Notice how the labeling on the graph is extremely deliberate. On both the x and y axes, only the most importantintervals are labeled. This keeps the sketch accurate, evenly spaced on your paper and easy to read.
2. The labeling is the most important and challenging part of this problem. The amplitude is 1. The shape is anegative cosine. The vertical shift is 2. The period is 2π
8 = π
4 . Working with this small period may be challengingat first, but remember that halving fractions is as simple as doubling the denominator.
3. The amplitude is 3. The shape is a negative cosine. The period is 5π
2 which implies that b = 45 . The vertical shift
is 1. f (x) =−3 · cos(4
5 x)+1.
Practice
Find the frequency and period of each function below.
1. f (x) = sin(4x)+1
2. g(x) =−3cos(2x)
3. h(x) = cos(1
2 x)+2
4. k(x) =−2sin(3
4 x)+1
5. j(x) = 4cos(3x)−1
Graph each of the following functions.
6. f (x) = 3sin(2x)+1
7. g(x) = 2.5cos(πx)−4
8. h(x) =−sin(4x)−3
9. k(x) = 12 cos(2x)
10. j(x) =−2sin(3
4 x)−1
Create an algebraic model for each of the following graphs.
256

5.5. Frequency and Period of Sinusoidal Functions www.ck12.org
14. At time 0 it is high tide and the water at a certain location is 10 feet high. At low tide 6 hours later, the water is2 feet high. Given that tides can be modeled by sinusoidal functions, find a graph that models this scenario.
15. Find the equation that models the scenario in the previous problem.
258
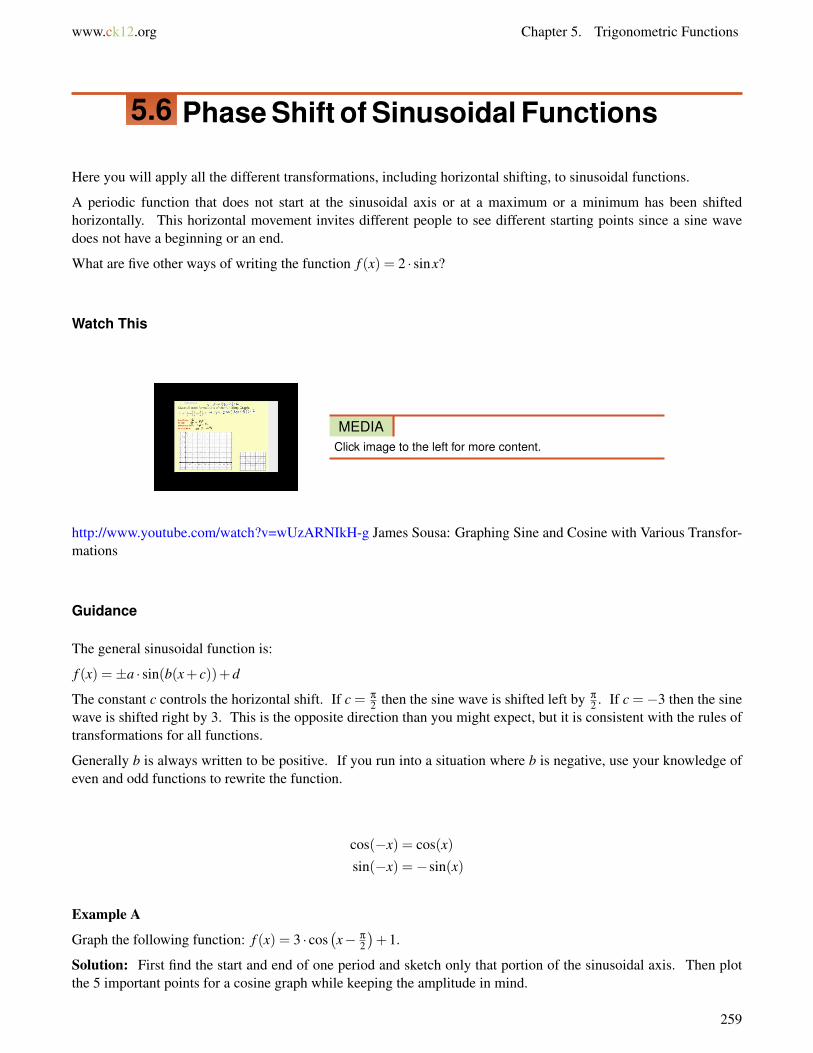
www.ck12.org Chapter 5. Trigonometric Functions
5.6 Phase Shift of Sinusoidal Functions
Here you will apply all the different transformations, including horizontal shifting, to sinusoidal functions.
A periodic function that does not start at the sinusoidal axis or at a maximum or a minimum has been shiftedhorizontally. This horizontal movement invites different people to see different starting points since a sine wavedoes not have a beginning or an end.
What are five other ways of writing the function f (x) = 2 · sinx?
Watch This
MEDIAClick image to the left for more content.
http://www.youtube.com/watch?v=wUzARNIkH-g James Sousa: Graphing Sine and Cosine with Various Transfor-mations
Guidance
The general sinusoidal function is:
f (x) =±a · sin(b(x+ c))+d
The constant c controls the horizontal shift. If c = π
2 then the sine wave is shifted left by π
2 . If c =−3 then the sinewave is shifted right by 3. This is the opposite direction than you might expect, but it is consistent with the rules oftransformations for all functions.
Generally b is always written to be positive. If you run into a situation where b is negative, use your knowledge ofeven and odd functions to rewrite the function.
cos(−x) = cos(x)
sin(−x) =−sin(x)
Example A
Graph the following function: f (x) = 3 · cos(x− π
2
)+1.
Solution: First find the start and end of one period and sketch only that portion of the sinusoidal axis. Then plotthe 5 important points for a cosine graph while keeping the amplitude in mind.
259
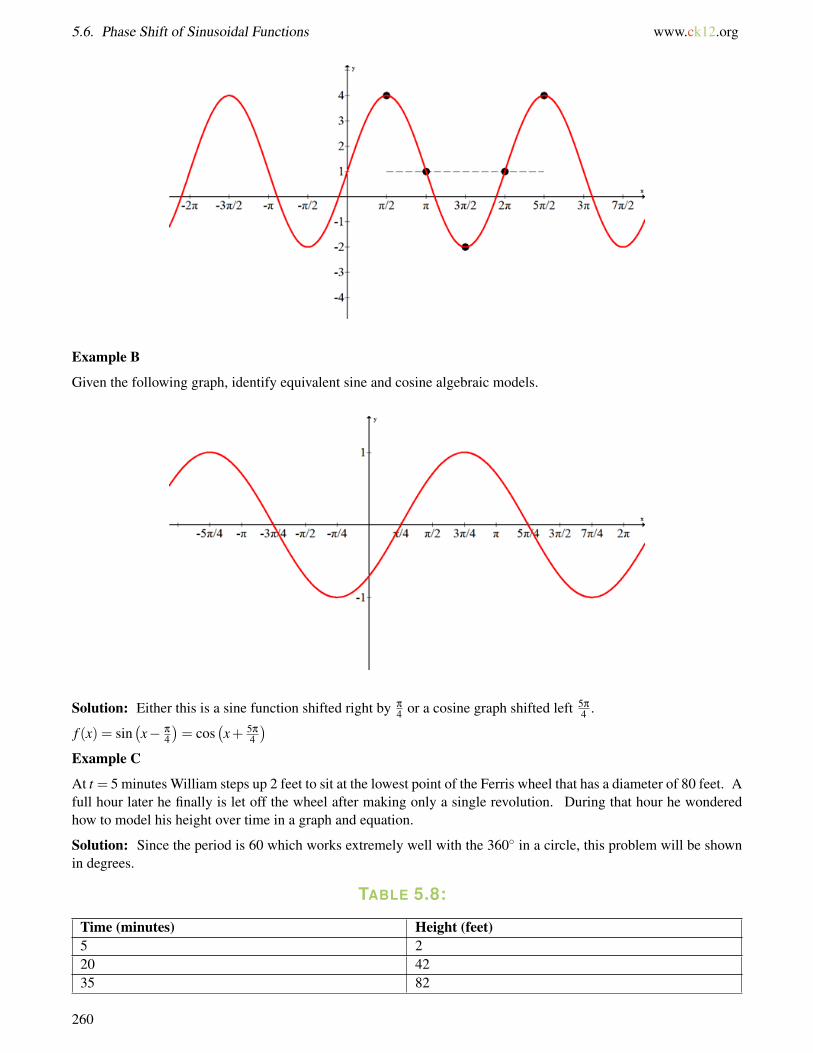
5.6. Phase Shift of Sinusoidal Functions www.ck12.org
Example B
Given the following graph, identify equivalent sine and cosine algebraic models.
Solution: Either this is a sine function shifted right by π
4 or a cosine graph shifted left 5π
4 .
f (x) = sin(x− π
4
)= cos
(x+ 5π
4
)Example C
At t = 5 minutes William steps up 2 feet to sit at the lowest point of the Ferris wheel that has a diameter of 80 feet. Afull hour later he finally is let off the wheel after making only a single revolution. During that hour he wonderedhow to model his height over time in a graph and equation.
Solution: Since the period is 60 which works extremely well with the 360◦ in a circle, this problem will be shownin degrees.
TABLE 5.8:
Time (minutes) Height (feet)5 220 4235 82
260
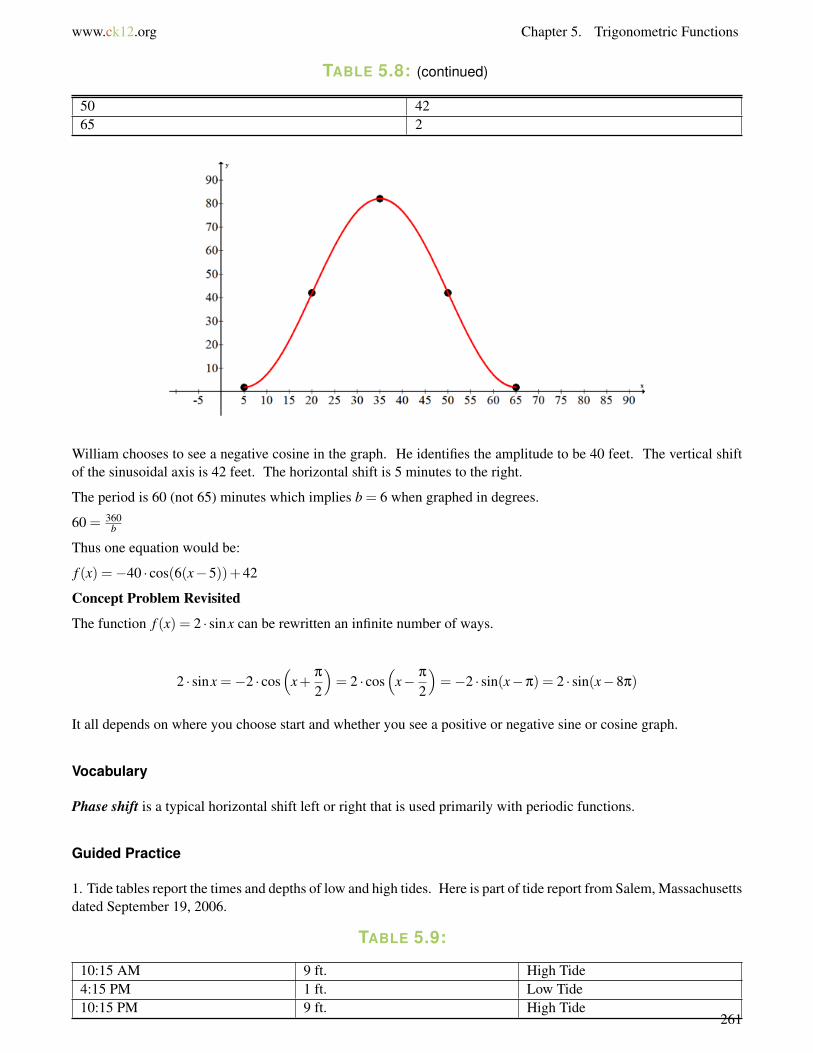
www.ck12.org Chapter 5. Trigonometric Functions
TABLE 5.8: (continued)
50 4265 2
William chooses to see a negative cosine in the graph. He identifies the amplitude to be 40 feet. The vertical shiftof the sinusoidal axis is 42 feet. The horizontal shift is 5 minutes to the right.
The period is 60 (not 65) minutes which implies b = 6 when graphed in degrees.
60 = 360b
Thus one equation would be:
f (x) =−40 · cos(6(x−5))+42
Concept Problem Revisited
The function f (x) = 2 · sinx can be rewritten an infinite number of ways.
2 · sinx =−2 · cos(
x+π
2
)= 2 · cos
(x− π
2
)=−2 · sin(x−π) = 2 · sin(x−8π)
It all depends on where you choose start and whether you see a positive or negative sine or cosine graph.
Vocabulary
Phase shift is a typical horizontal shift left or right that is used primarily with periodic functions.
Guided Practice
1. Tide tables report the times and depths of low and high tides. Here is part of tide report from Salem, Massachusettsdated September 19, 2006.
TABLE 5.9:
10:15 AM 9 ft. High Tide4:15 PM 1 ft. Low Tide10:15 PM 9 ft. High Tide
261

5.6. Phase Shift of Sinusoidal Functions www.ck12.org
Find an equation that predicts the height based on the time. Choose when t = 0 carefully.
2. Use the equation from Guided Practice #1 to predict the height of the tide at 6:05 AM.
3. Use the equation from Guided Practice #1 to find out when the tide will be at exactly 8 ft on September 19th.
Answers:
1. There are two logical places to set t = 0. The first is at midnight the night before and the second is at 10:15AM. The first option illustrates a phase shift that is the focus of this concept, but the second option produces asimpler equation. Set t = 0 to be at midnight and choose units to be in minutes.
TABLE 5.10:
Time (hours : minutes) Time (minutes) Tide (feet)10:15 615 916:15 975 122:15 1335 9
615+9752 = 795 5
1335+9752 = 1155 5
These numbers seem to indicate a positive cosine curve. The amplitude is four and the vertical shift is 5. Thehorizontal shift is 615 and the period is 720.
720 = 2π
b → b = π
360
Thus one equation is:
f (x) = 4 · cos(
π
360(x−615))+5
2. The height at 6:05 AM or 365 minutes is: f (365)≈ 2.7057 feet.
3. This problem is slightly different from question 2 because instead of giving x and using the equation to find the y,this problem gives the y and asks you to find the x. Later you will learn how to solve this algebraically, but for nowuse the power of the intersect button on your calculator to intersect the function with the line y = 8. Remember tofind all the x values between 0 and 1440 to account for the entire 24 hours.
There are four times within the 24 hours when the height is exactly 8 feet. You can convert these times to hours andminutes if you prefer.
t ≈ 532.18 (8:52), 697.82 (11:34), 1252.18 (20 : 52), 1417.82 (23:38)
262
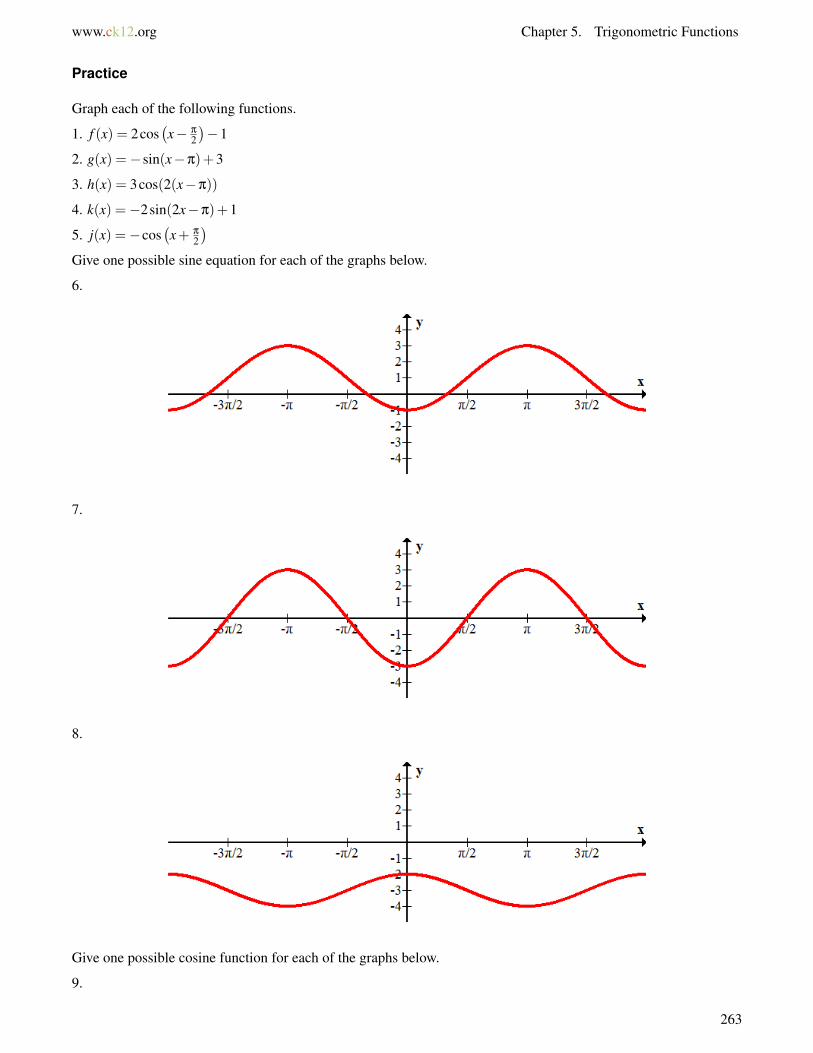
www.ck12.org Chapter 5. Trigonometric Functions
Practice
Graph each of the following functions.
1. f (x) = 2cos(x− π
2
)−1
2. g(x) =−sin(x−π)+3
3. h(x) = 3cos(2(x−π))
4. k(x) =−2sin(2x−π)+1
5. j(x) =−cos(x+ π
2
)Give one possible sine equation for each of the graphs below.
6.
7.
8.
Give one possible cosine function for each of the graphs below.
9.
263
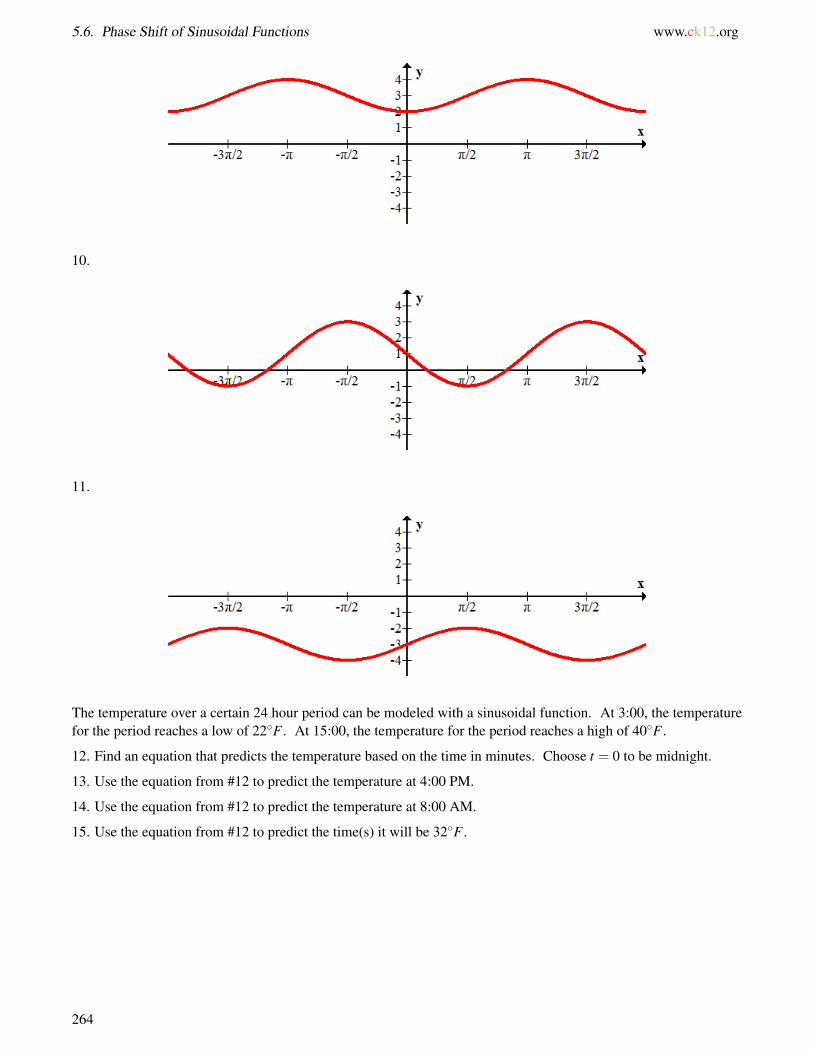
5.6. Phase Shift of Sinusoidal Functions www.ck12.org
10.
11.
The temperature over a certain 24 hour period can be modeled with a sinusoidal function. At 3:00, the temperaturefor the period reaches a low of 22◦F . At 15:00, the temperature for the period reaches a high of 40◦F .
12. Find an equation that predicts the temperature based on the time in minutes. Choose t = 0 to be midnight.
13. Use the equation from #12 to predict the temperature at 4:00 PM.
14. Use the equation from #12 to predict the temperature at 8:00 AM.
15. Use the equation from #12 to predict the time(s) it will be 32◦F .
264
www.ck12.org Chapter 5. Trigonometric Functions
5.7 Graphs of Other Trigonometric Functions
Here you will extend what you know about rational functions and sine and cosine functions to produce graphs ofthe four other trigonometric functions: tangent, secant, cosecant, and cotangent. You will also see how the fourcoefficients of a general sinusoidal function affect the new functions in similar ways.
If you already know the relationship between the equation and graph of sine and cosine functions then the other fourfunctions can be found by identifying zeroes, asymptotes and key points. Are the four new functions transformationsof the sine and cosine functions?
Watch This
MEDIAClick image to the left for more content.
http://www.youtube.com/watch?v=5kOgBAVnrCI James Sousa: Graphing the Cosecant and Secant Functions
MEDIAClick image to the left for more content.
http://www.youtube.com/watch?v=6pc95eHUJhY James Sousa: Graphing the Tangent Function
MEDIAClick image to the left for more content.
http://www.youtube.com/watch?v=5_65h_i8Yxg James Sousa: Graphing the Cotangent Function
Guidance
Since secant is the inverse of cosine the graphs are very closely related.
265
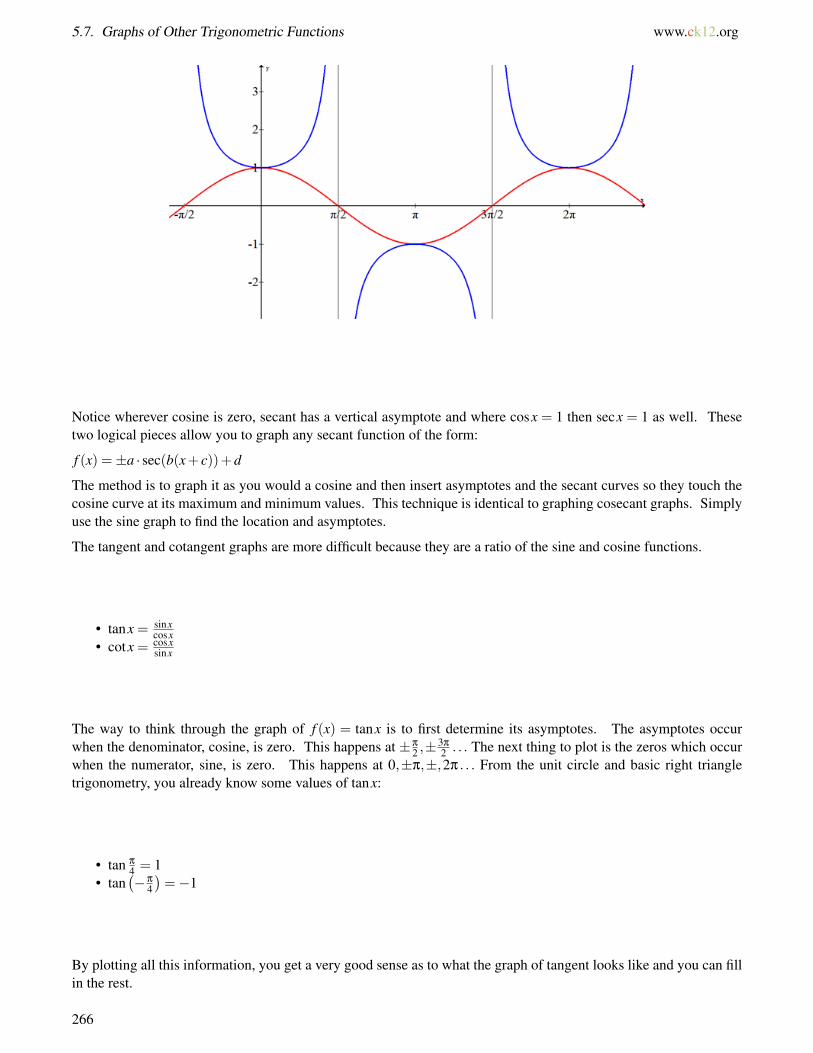
5.7. Graphs of Other Trigonometric Functions www.ck12.org
Notice wherever cosine is zero, secant has a vertical asymptote and where cosx = 1 then secx = 1 as well. Thesetwo logical pieces allow you to graph any secant function of the form:
f (x) =±a · sec(b(x+ c))+d
The method is to graph it as you would a cosine and then insert asymptotes and the secant curves so they touch thecosine curve at its maximum and minimum values. This technique is identical to graphing cosecant graphs. Simplyuse the sine graph to find the location and asymptotes.
The tangent and cotangent graphs are more difficult because they are a ratio of the sine and cosine functions.
• tanx = sinxcosx
• cotx = cosxsinx
The way to think through the graph of f (x) = tanx is to first determine its asymptotes. The asymptotes occurwhen the denominator, cosine, is zero. This happens at ±π
2 ,±3π
2 . . . The next thing to plot is the zeros which occurwhen the numerator, sine, is zero. This happens at 0,±π,±,2π . . . From the unit circle and basic right triangletrigonometry, you already know some values of tanx:
• tan π
4 = 1• tan
(−π
4
)=−1
By plotting all this information, you get a very good sense as to what the graph of tangent looks like and you can fillin the rest.
266

www.ck12.org Chapter 5. Trigonometric Functions
Notice that the period of tangent is π not 2π, because it has a shorter cycle.
The graph of cotangent can be found using identical logic as tangent. It is shown in Example A.
Example A
Graph f (x) = cotx
Solution: You know cotx = 1tanx . This means that the graph of cotangent will have zeros wherever tangent has
asymptotes and asymptotes wherever tangent has zeroes. You also know that where tangent is 1, cotangent is also1.
Example B
Graph the function f (x) =−2 · csc(π(x−1))+1.
Solution: Graph the function as if it were a sine function. Then insert asymptotes wherever the sine functioncrosses the sinusoidal axis. Lastly add in the cosecant curves.
The amplitude is 2. The shape is negative sine. The function is shifted up one unit and to the right one unit.
267
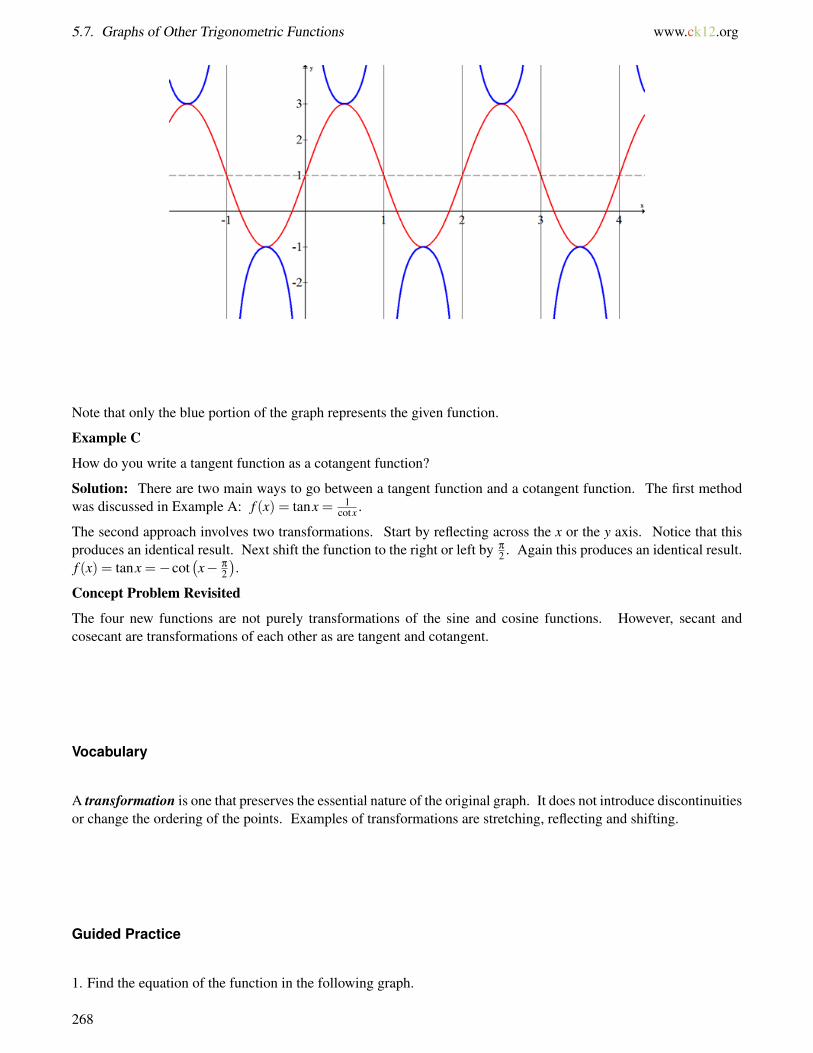
5.7. Graphs of Other Trigonometric Functions www.ck12.org
Note that only the blue portion of the graph represents the given function.
Example C
How do you write a tangent function as a cotangent function?
Solution: There are two main ways to go between a tangent function and a cotangent function. The first methodwas discussed in Example A: f (x) = tanx = 1
cotx .
The second approach involves two transformations. Start by reflecting across the x or the y axis. Notice that thisproduces an identical result. Next shift the function to the right or left by π
2 . Again this produces an identical result.f (x) = tanx =−cot
(x− π
2
).
Concept Problem Revisited
The four new functions are not purely transformations of the sine and cosine functions. However, secant andcosecant are transformations of each other as are tangent and cotangent.
Vocabulary
A transformation is one that preserves the essential nature of the original graph. It does not introduce discontinuitiesor change the ordering of the points. Examples of transformations are stretching, reflecting and shifting.
Guided Practice
1. Find the equation of the function in the following graph.
268

www.ck12.org Chapter 5. Trigonometric Functions
2. Graph the function f (x) =−5 · sec(
π
3 (x−2))−4.
3. Where are the asymptotes for tangent and why do they occur?
Answers:
1. If you connect the relative maximums and minimums of the function, it produces a shifted cosine curve that iseasier to work with.
The amplitude is 3. The vertical shift is 2 down. The period is 4 which implies that b = π
2 . The shape ispositive cosine and if you choose to start at x = 0 there is no phase shift.
f (x) = 3 · csc(
π
2 x)−2
2. First graph the function as if it were a cosine. The vertical shift is -4. The horizontal shift is to the right 2. Thisgives a starting point for the period. Since b = π
3 the period must be 6.
269
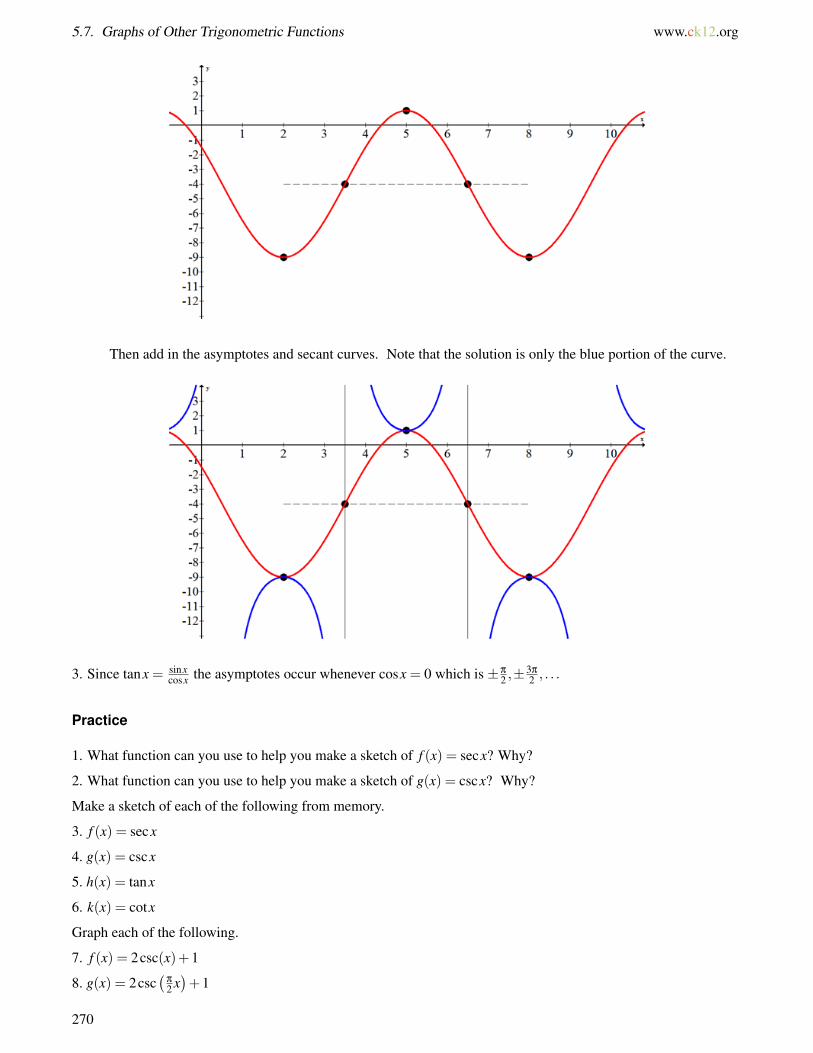
5.7. Graphs of Other Trigonometric Functions www.ck12.org
Then add in the asymptotes and secant curves. Note that the solution is only the blue portion of the curve.
3. Since tanx = sinxcosx the asymptotes occur whenever cosx = 0 which is ±π
2 ,±3π
2 , . . .
Practice
1. What function can you use to help you make a sketch of f (x) = secx? Why?
2. What function can you use to help you make a sketch of g(x) = cscx? Why?
Make a sketch of each of the following from memory.
3. f (x) = secx
4. g(x) = cscx
5. h(x) = tanx
6. k(x) = cotx
Graph each of the following.
7. f (x) = 2csc(x)+1
8. g(x) = 2csc(
π
2 x)+1
270

www.ck12.org Chapter 5. Trigonometric Functions
9. h(x) = 2csc(
π
2 (x−3))+1
10. j(x) = cot(
π
2 x)+3
11. k(x) =−sec(
π
3 (x+1))−4
12. m(x) =− tan(x)+1
13. p(x) =−2tan(x− π
2
)+1
14. Find two ways to write secx in terms of other trigonometric functions.
15. Find two ways to write cscx in terms of other trigonometric functions.
271
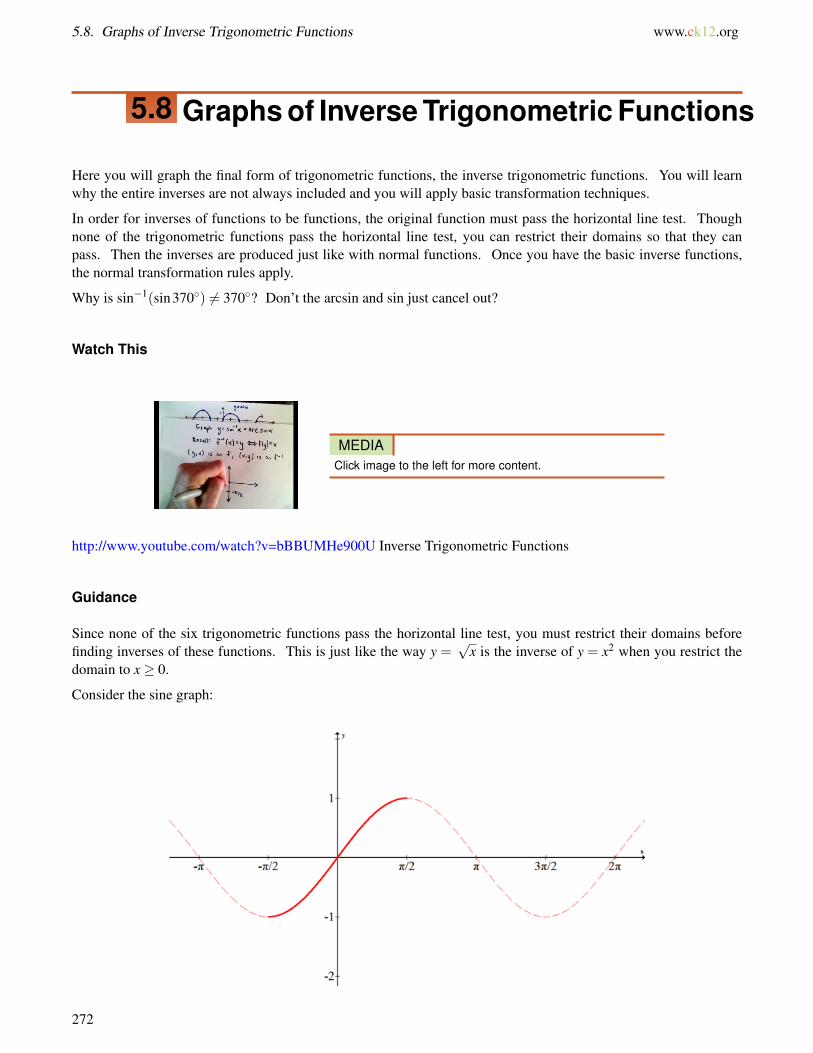
5.8. Graphs of Inverse Trigonometric Functions www.ck12.org
5.8 Graphs of Inverse Trigonometric Functions
Here you will graph the final form of trigonometric functions, the inverse trigonometric functions. You will learnwhy the entire inverses are not always included and you will apply basic transformation techniques.
In order for inverses of functions to be functions, the original function must pass the horizontal line test. Thoughnone of the trigonometric functions pass the horizontal line test, you can restrict their domains so that they canpass. Then the inverses are produced just like with normal functions. Once you have the basic inverse functions,the normal transformation rules apply.
Why is sin−1(sin370◦) 6= 370◦? Don’t the arcsin and sin just cancel out?
Watch This
MEDIAClick image to the left for more content.
http://www.youtube.com/watch?v=bBBUMHe900U Inverse Trigonometric Functions
Guidance
Since none of the six trigonometric functions pass the horizontal line test, you must restrict their domains beforefinding inverses of these functions. This is just like the way y =
√x is the inverse of y = x2 when you restrict the
domain to x≥ 0.
Consider the sine graph:
272
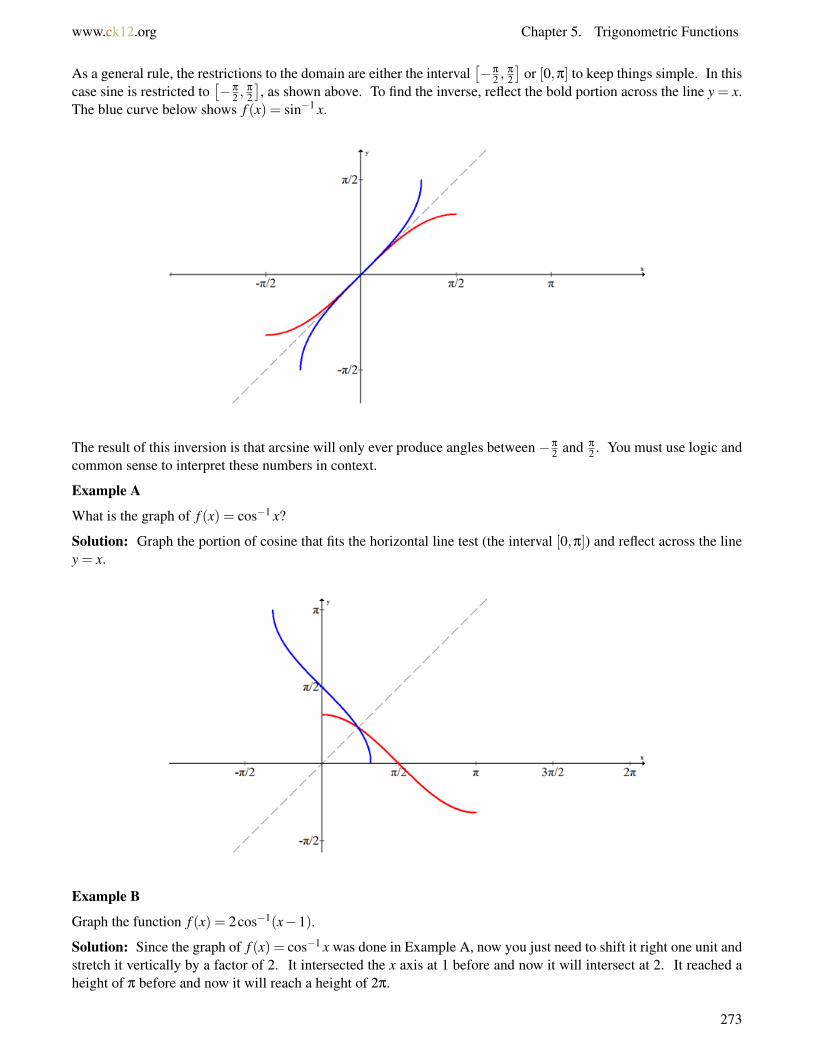
www.ck12.org Chapter 5. Trigonometric Functions
As a general rule, the restrictions to the domain are either the interval[−π
2 ,π
2
]or [0,π] to keep things simple. In this
case sine is restricted to[−π
2 ,π
2
], as shown above. To find the inverse, reflect the bold portion across the line y = x.
The blue curve below shows f (x) = sin−1 x.
The result of this inversion is that arcsine will only ever produce angles between −π
2 and π
2 . You must use logic andcommon sense to interpret these numbers in context.
Example A
What is the graph of f (x) = cos−1 x?
Solution: Graph the portion of cosine that fits the horizontal line test (the interval [0,π]) and reflect across the liney = x.
Example B
Graph the function f (x) = 2cos−1(x−1).
Solution: Since the graph of f (x) = cos−1 x was done in Example A, now you just need to shift it right one unit andstretch it vertically by a factor of 2. It intersected the x axis at 1 before and now it will intersect at 2. It reached aheight of π before and now it will reach a height of 2π.
273

5.8. Graphs of Inverse Trigonometric Functions www.ck12.org
Example C
Evaluate the following expression with and without a calculator using right triangles and your knowledge of inversetrigonometric functions.
cot(csc−1
(−13
5
))Solution: When using a calculator it can be extremely confusing trying to tell the difference between sin−1 x and(sinx)−1. In order to be able to effectively calculate this out it is best to write the expression explicitly only in termsof functions that your calculator does have.
The hardest part of this question is seeing the csc as a function (which produces an angle) on a ratio of a hypotenuseof 13 and an opposite side of -5. The sine of the inverse ratio must produce the same angle, so you can substitute it.
• csc−1(−13
5
)= sin−1 (− 5
13
)• cot(θ) = 1
tanθ
cot(csc−1
(−13
5
))= 1
tan(sin−1(− 513))
=−125
Not using a calculator is usually significantly easier. Start with your knowledge that csc−1(−13
5
)describes an
angle in the fourth or the second quadrant because those are the two quadrants where cosecant is negative. Sincecsc−1 θ has range −π
2 ,π
2 , it only produces angles in quadrant I or quadrant IV (see Guided Practice 2). This trianglemust then be in the fourth quadrant. All you need to do is draw the triangle and identify the cotangent ratio.
Cotangent is adjacent over opposite.
274
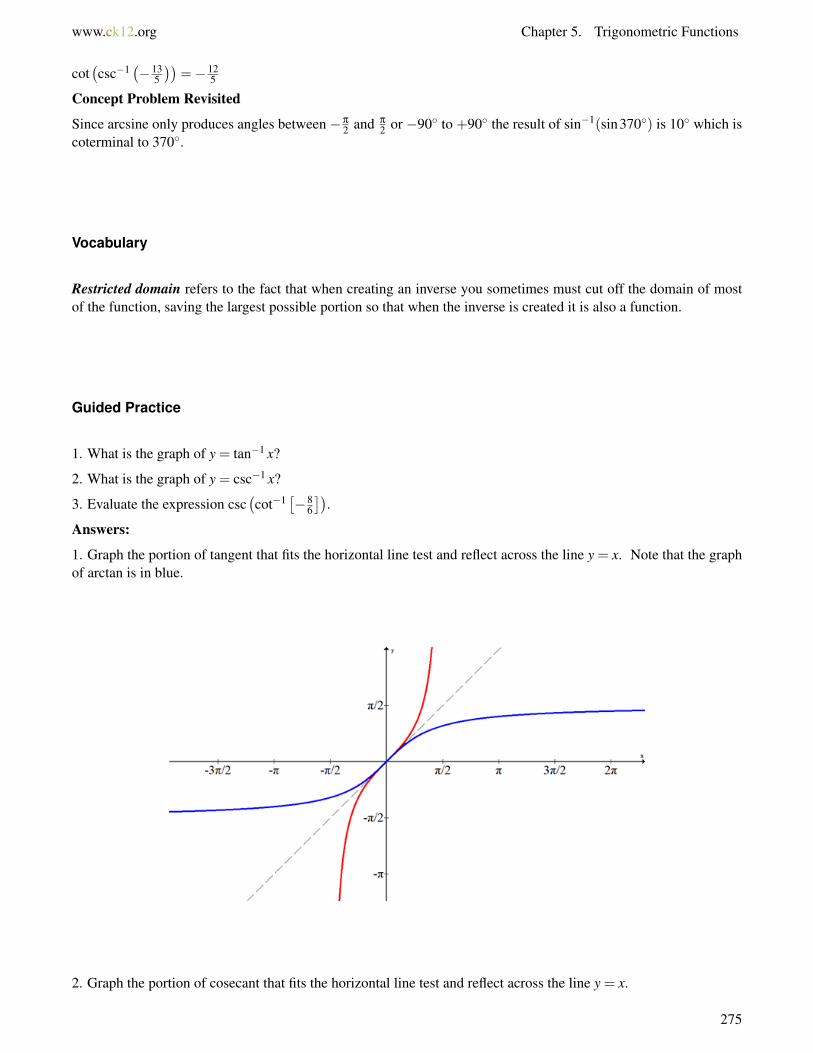
www.ck12.org Chapter 5. Trigonometric Functions
cot(csc−1
(−13
5
))=−12
5
Concept Problem Revisited
Since arcsine only produces angles between −π
2 and π
2 or −90◦ to +90◦ the result of sin−1(sin370◦) is 10◦ which iscoterminal to 370◦.
Vocabulary
Restricted domain refers to the fact that when creating an inverse you sometimes must cut off the domain of mostof the function, saving the largest possible portion so that when the inverse is created it is also a function.
Guided Practice
1. What is the graph of y = tan−1 x?
2. What is the graph of y = csc−1 x?
3. Evaluate the expression csc(cot−1
[−8
6
]).
Answers:
1. Graph the portion of tangent that fits the horizontal line test and reflect across the line y = x. Note that the graphof arctan is in blue.
2. Graph the portion of cosecant that fits the horizontal line test and reflect across the line y = x.
275

5.8. Graphs of Inverse Trigonometric Functions www.ck12.org
Note that f (x) = csc−1 x is in blue. Also note that the word “arc-co-secant” is too cumbersome to use because ofthe train of prefixes.
3.
csc(
cot−1[−8
6
])=
1sin(cot−1
[−8
6
])=
1sin(tan−1
(−6
8
))=−10
6
=−53
Practice
1. Graph f (x) = cot−1 x.
2. Graph g(x) = sec−1 x.
276
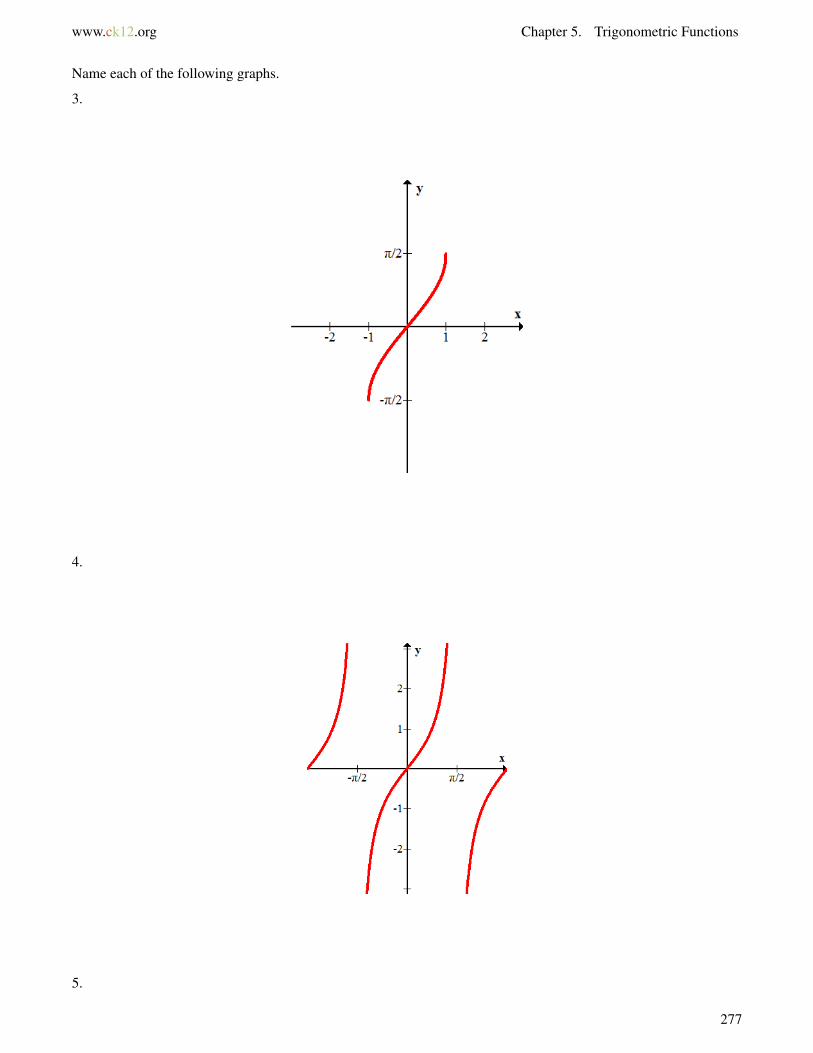
www.ck12.org Chapter 5. Trigonometric Functions
Name each of the following graphs.
3.
4.
5.
277

www.ck12.org Chapter 5. Trigonometric Functions
Graph each of the following functions using your knowledge of function transformations.
8. h(x) = 3sin−1(x+1)
9. k(x) = 2sin−1(x)+ π
2
10. m(x) =−cos−1(x−2)
11. j(x) = cot−1(x)+π
12. p(x) =−2tan−1(x−1)
13. q(x) = csc−1(x−2)
14. r(x) =−sec−1(x)+4
15. t(x) = csc−1(x+1)− 3π
2
16. v(x) = 2sec−1(x+2)+ π
2
17. w(x) =−cot−1(x)− π
2
Evaluate each expression.
18. sec(tan−1
[34
])19. cot
(csc−1
[1312
])20. csc
(tan−1
[43
])The height of a point on a circle as it spins over time creates a sine wave. You learned that there are many ways tochange this function and each depends on manipulating the circle where the wave comes from. The circle can beshifted up or down, made larger or smaller, spun faster or slower or even started at different places. Each of thesechanges produces a transformation in the graph.
279

5.9. References www.ck12.org
5.9 References
1. . . CC BY-NC-SA2. CK-12 Foundation. . CCSA3. CK-12 Foundation. . CCSA4. CK-12 Foundation. . CCSA5. CK-12 Foundation. . CCSA6. CK-12 Foundation. . CCSA7. CK-12 Foundation. . CCSA8. CK-12 Foundation. . CCSA9. CK-12 Foundation. . CCSA
10. CK-12 Foundation. . CCSA11. CK-12 Foundation. . CCSA12. CK-12 Foundation. . CCSA13. CK-12 Foundation. . CCSA14. CK-12 Foundation. . CCSA15. CK-12 Foundation. . CCSA16. CK-12 Foundation. . CCSA17. CK-12 Foundation. . CCSA18. CK-12 Foundation. . CCSA19. CK-12 Foundation. . CCSA20. CK-12 Foundation. . CCSA21. CK-12 Foundation. . CCSA22. CK-12 Foundation. . CCSA23. CK-12 Foundation. . CCSA24. CK-12 Foundation. . CCSA25. CK-12 Foundation. . CCSA26. CK-12 Foundation. . CCSA27. CK-12 Foundation. . CCSA28. CK-12 Foundation. . CCSA29. CK-12 Foundation. . CCSA30. CK-12 Foundation. . CCSA31. CK-12 Foundation. . CCSA32. CK-12 Foundation. . CCSA33. CK-12 Foundation. . CCSA34. CK-12 Foundation. . CCSA35. CK-12 Foundation. . CCSA36. CK-12 Foundation. . CCSA37. CK-12 Foundation. . CCSA38. CK-12 Foundation. . CCSA39. CK-12 Foundation. . CCSA40. CK-12 Foundation. . CCSA41. CK-12 Foundation. . CCSA42. CK-12 Foundation. . CCSA43. CK-12 Foundation. . CCSA44. CK-12 Foundation. . CCSA45. CK-12 Foundation. . CCSA
280
www.ck12.org Chapter 5. Trigonometric Functions
46. CK-12 Foundation. . CCSA47. CK-12 Foundation. . CCSA48. CK-12 Foundation. . CCSA49. CK-12 Foundation. . CCSA50. CK-12 Foundation. . CCSA51. CK-12 Foundation. . CCSA52. CK-12 Foundation. . CCSA53. CK-12 Foundation. . CCSA54. CK-12 Foundation. . CCSA55. CK-12 Foundation. . CCSA56. CK-12 Foundation. . CCSA57. CK-12 Foundation. . CCSA58. CK-12 Foundation. . CCSA59. CK-12 Foundation. . CCSA60. CK-12 Foundation. . CCSA61. CK-12 Foundation. . CCSA62. CK-12 Foundation. . CCSA63. CK-12 Foundation. . CCSA64. CK-12 Foundation. . CCSA65. CK-12 Foundation. . CCSA66. CK-12 Foundation. . CCSA67. CK-12 Foundation. . CCSA68. CK-12 Foundation. . CCSA69. CK-12 Foundation. . CCSA70. CK-12 Foundation. . CCSA71. CK-12 Foundation. . CCSA72. CK-12 Foundation. . CCSA73. CK-12 Foundation. . CCSA74. CK-12 Foundation. . CCSA
281
www.ck12.org
CHAPTER 6 Analytic TrigonometryChapter Outline
6.1 BASIC TRIGONOMETRIC IDENTITIES
6.2 SUM AND DIFFERENCE IDENTITIES
6.3 PYTHAGOREAN IDENTITIES - PRECALCULUS
6.4 DOUBLE, HALF, AND POWER REDUCING IDENTITIES
6.5 TRIGONOMETRIC EQUATIONS
6.6 REFERENCES
Here you will focus on the algebraic manipulations of trigonometric functions. You will learn the trigonometricidentities, which are a list of equivalent trigonometric statements. These will serve as a toolbox that, together withalgebra, will help you to combine, reduce, and simplify trigonometric expressions.
282
www.ck12.org Chapter 6. Analytic Trigonometry
6.1 Basic Trigonometric Identities
Here you will simplify trigonometric expressions using the reciprocal, quotient, odd-even and cofunction identi-ties. You will also apply these simplification techniques in trigonometric proofs.
The basic trigonometric identities are ones that can be logically deduced from the definitions and graphs of the sixtrigonometric functions. Previously, some of these identities have been used in a casual way, but now they will beformalized and added to the toolbox of trigonometric identities.
How can you use the trigonometric identities to simplify the following expression?[sin( π
2−θ)sin(−θ)
]−1
Watch This
MEDIAClick image to the left for more content.
http://youtu.be/_gkuml–4_Q James Sousa: Cofunction Identities
MEDIAClick image to the left for more content.
http://www.youtube.com/watch?v=YbU8Sq0quWE James Sousa: Even and Odd Trigonometric Identities
Guidance
The reciprocal identities refer to the connections between the trigonometric functions like sine and cosecant. Sine isopposite over hypotenuse and cosecant is hypotenuse over opposite. This logic produces the following six identities.
• sinθ = 1cscθ
• cosθ = 1secθ
• tanθ = 1cotθ
• cotθ = 1tanθ
• secθ = 1cosθ
• cscθ = 1sinθ
283
6.1. Basic Trigonometric Identities www.ck12.org
The quotient identities follow from the definition of sine, cosine and tangent.
• tanθ = sinθ
cosθ
• cotθ = cosθ
sinθ
The odd-even identities follow from the fact that only cosine and its reciprocal secant are even and the rest of thetrigonometric functions are odd.
• sin(−θ) =−sinθ
• cos(−θ) = cosθ
• tan(−θ) =− tanθ
• cot(−θ) =−cotθ
• sec(−θ) = secθ
• csc(−θ) =−cscθ
The cofunction identities make the connection between trigonometric functions and their “co” counterparts like sineand cosine. Graphically, all of the cofunctions are reflections and horizontal shifts of each other.
• cos(
π
2 −θ)= sinθ
• sin(
π
2 −θ)= cosθ
• tan(
π
2 −θ)= cotθ
• cot(
π
2 −θ)= tanθ
• sec(
π
2 −θ)= cscθ
• csc(
π
2 −θ)= secθ
Example A
If sinθ = 0.87, find cos(θ− π
2
).
Solution: While it is possible to use a calculator to find θ, using identities works very well too.
First you should factor out the negative from the argument. Next you should note that cosine is even and apply theodd-even identity to discard the negative in the argument. Lastly recognize the cofunction identity.
cos(θ− π
2
)= cos
(−(
π
2 −θ))
= cos(
π
2 −θ)= sinθ = 0.87
Example B
Use identities to simplify the following expression: tanxcotx+ sinxcotx(secx)2
secx .
Solution: Start by rewriting the expression and replacing one or two terms that you see will cancel. In this case,replace the cotx = 1
tanx and cancel the secant term.
= tanx · 1tanx + sinxcotxsecx
Cancel the tangents to make a one and then use the quotient and reciprocal identities to rewrite the right part of theexpression in terms of just sines and cosines. Lastly you should cancel and simplify.
= 1+ sinx · cosxsinx
· 1cosx
= 1+1
= 2
Example C
Use identities to prove the following: cot(−β)cot(
π
2 −β)
sin(−β) = cos(β− π
2
).
284

www.ck12.org Chapter 6. Analytic Trigonometry
Solution: When doing trigonometric proofs, it is vital that you start on one side and only work with that side untilyou derive what is on the other side. Sometimes it may be helpful to work from both sides and find where the twosides meet, but this work is not considered a proof. You will have to rewrite your steps so they follow from onlyone side. In this case, work with the left side and keep rewriting it until you have cos
(β− π
2
).
cot(−β)cot(
π
2−β
)sin(−β) =−cotβ tanβ ·−sinβ
=−1 ·−sinβ
= sinβ
= cos(
π
2−β
)= cos
(−(
β− π
2
))= cos
(β− π
2
)Concept Problem Revisited
The following trigonometric expression can be simplified to be equivalent to negative tangent.
[sin(
π
2 −θ)
sin(−θ)
]−1
=sin(−θ)
sin(
π
2 −θ)
=−sinθ
cosθ
=− tanθ
Vocabulary
An identity is a mathematical sentence involving the symbol “=” that is always true for variables within the domainsof the expressions on either side. In the concept problem, the equivalent expressions are meaningless if thedenominator of the rational expression ends up as zero. This is why identities only work within a valid domain.
Cofunctions are functions that are identical except for a reflection and horizontal shift. Examples are sine andcosine, tangent and cotangent, secant and cosecant.
A proof is a derivation where two sides of an expression are shown to be equivalent through a sequence of logicalsteps.
Guided Practice
1. Prove the quotient identity for tangent using the definition of sine, cosine and tangent.
2. If cos(θ− π
2
)= 0.68 then determine csc(−θ).
3. Prove the following trigonometric identity by working with only one side.
cosxsinx tanxcotxsecxcscx = 1
Answers:
1. When tangent, sine and cosine are replaced with the shorthand for side ratios the equivalence becomes a matterof algebra.
285

6.1. Basic Trigonometric Identities www.ck12.org
tanθ =oppad j
=
(opphyp
)(
ad jhyp
)=
sinθ
cosθ
2. As Example C and Example A show, cos(θ− π
2
)= cos
(π
2 −θ).
0.68 = cos(
θ− π
2
)= cos
(π
2−θ
)= sin(θ)
Then, csc(−θ) =−cscθ
=− 1sinθ
=−(0.68)−1
3.
cosxsinx tanxcotxsecxcscx = cosxsinx tanx · 1tanx
· 1cosx
· 1sinx
= 1
Practice
1. Prove the quotient identity for cotangent using sine and cosine.
2. Explain why cos(
π
2 −θ)= sinθ using graphs and transformations.
3. Explain why secθ = 1cosθ
.
4. Prove that tanθ · cotθ = 1.
5. Prove that sinθ · cscθ = 1.
6. Prove that sinθ · secθ = tanθ.
7. Prove that cosθ · cscθ = cotθ.
8. If sinθ = 0.81, what is sin(−θ)?
9. If cosθ = 0.5, what is cos(−θ)?
10. If cosθ = 0.25, what is sec(−θ)?
11. If cscθ = 0.7, what is sin(−θ)?
12. How can you tell from a graph if a function is even or odd?
13. Prove tanx·secxcscx · cotx = tanx.
286

www.ck12.org Chapter 6. Analytic Trigonometry
14. Prove sin2 x·secxtanx · cscx = 1.
15. Prove cosx · tanx = sinx.
287

6.2. Sum and Difference Identities www.ck12.org
6.2 Sum and Difference Identities
Here you will add six identities to your toolbox: the sum and difference identities for sine, cosine and tangent. Youwill use these identities along with previous identities for proofs and simplifying expressions.
With your knowledge of special angles like the sine and cosine of30◦ and45◦, you can find the sine and cosine of15◦,the difference of45◦ and30◦, and75◦, the sum of45◦ and30◦. Using what you know about the unit circle and the sumand difference identities, how do you determinesin15◦ andsin75◦?
Watch This
MEDIAClick image to the left for more content.
http://www.youtube.com/watch?v=H-0jQTzfkWQ James Sousa: Sum and Difference Identities for Cosine
MEDIAClick image to the left for more content.
http://www.youtube.com/watch?v=hiNDDQyee2E James Sousa: Sum and Difference Identities for Sine
MEDIAClick image to the left for more content.
http://www.youtube.com/watch?v=OQP78bwYcWw James Sousa: Sum and Difference Identities for Tangent
Guidance
There are some intuitive but incorrect formulas for sums and differences with respect to trigonometric functions. Theform below does not work for any trigonometric function and is one of the most common incorrect guesses as tothe sum and difference identity.
288
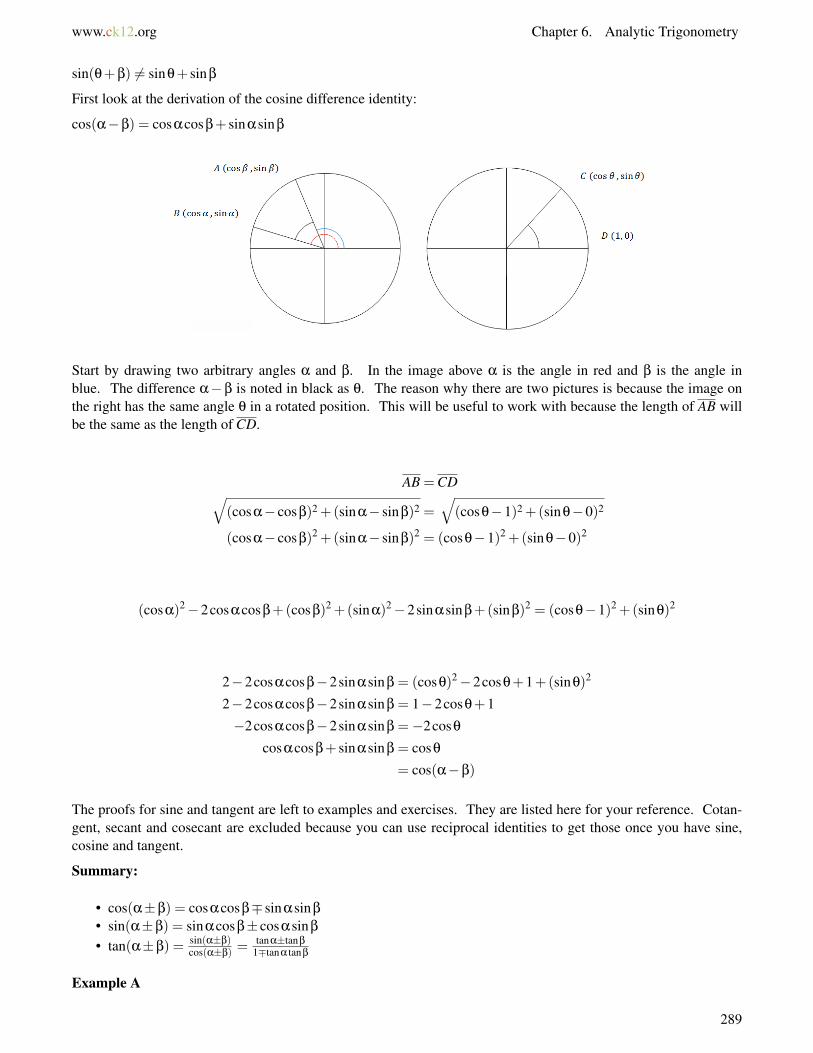
www.ck12.org Chapter 6. Analytic Trigonometry
sin(θ+β) 6= sinθ+ sinβ
First look at the derivation of the cosine difference identity:
cos(α−β) = cosαcosβ+ sinαsinβ
Start by drawing two arbitrary angles α and β. In the image above α is the angle in red and β is the angle inblue. The difference α−β is noted in black as θ. The reason why there are two pictures is because the image onthe right has the same angle θ in a rotated position. This will be useful to work with because the length of AB willbe the same as the length of CD.
AB =CD√(cosα− cosβ)2 +(sinα− sinβ)2 =
√(cosθ−1)2 +(sinθ−0)2
(cosα− cosβ)2 +(sinα− sinβ)2 = (cosθ−1)2 +(sinθ−0)2
(cosα)2−2cosαcosβ+(cosβ)2 +(sinα)2−2sinαsinβ+(sinβ)2 = (cosθ−1)2 +(sinθ)2
2−2cosαcosβ−2sinαsinβ = (cosθ)2−2cosθ+1+(sinθ)2
2−2cosαcosβ−2sinαsinβ = 1−2cosθ+1
−2cosαcosβ−2sinαsinβ =−2cosθ
cosαcosβ+ sinαsinβ = cosθ
= cos(α−β)
The proofs for sine and tangent are left to examples and exercises. They are listed here for your reference. Cotan-gent, secant and cosecant are excluded because you can use reciprocal identities to get those once you have sine,cosine and tangent.
Summary:
• cos(α±β) = cosαcosβ∓ sinαsinβ
• sin(α±β) = sinαcosβ± cosαsinβ
• tan(α±β) = sin(α±β)cos(α±β) =
tanα±tanβ
1∓tanα tanβ
Example A
289

6.2. Sum and Difference Identities www.ck12.org
Prove the cosine of a sum identity.
Solution: Start with the cosine of a difference and make a substitution. Then use the odd-even identity.
cosαcosβ+ sinαsinβ = cos(α−β)
Let γ =−β
cosαcos(−γ)+ sinαsin(−γ) = cos(α+ γ)
cosαcosγ− sinαsinγ = cos(α+ γ)
Example B
Find the exact value of tan15◦ without using a calculator.
Solution: tan15◦ = tan(45◦−30◦) = tan45◦−tan30◦1+tan45◦ tan30◦ =
1−√
33
1+1·√
33
= 3−√
33+√
3
A final solution will not have a radical in the denominator. In this case multiplying through by the conjugate of thedenominator will eliminate the radical. This technique is very common in PreCalculus and Calculus.
=(3−
√3) · (3−
√3)
(3+√
3) · (3−√
3)
=(3−
√3)2
9−3
=(3−
√3)2
6
Example C
Evaluate the expression exactly without using a calculator.
cos50◦ cos5◦+ sin50◦ sin5◦
Solution: Once you know the general form of the sum and difference identities then you will recognize this ascosine of a difference.
cos50◦ cos5◦+ sin50◦ sin5◦ = cos(50◦−5◦) = cos45◦ =√
22
Concept Problem Revisited
In order to evaluate sin15◦ and sin75◦ exactly without a calculator, you need to use the sine of a difference and sineof a sum.
sin(45◦−30◦) = sin45◦ cos30◦− cos45◦ sin30◦ =
√2
2·√
32−√
22· 1
2=
√6−√
24
sin(45◦+30◦) = sin45◦ cos30◦+ cos45◦ sin30◦ =
√2
2·√
32
+
√2
2· 1
2=
√6+√
24
Vocabulary
The Greek letters used in this concept refer to unknown angles. They are α-alpha, β- beta, θ- theta, γ- gamma.
The symbol ± is short hand for “plus or minus.” The symbol ∓ is shorthand for “minus or plus.” The order isimportant because for cosine of a sum, the negative sign is used on the other side of the identity. This is the oppositeof sine of a sum, where a positive sign is used on the other side of the identity.
290

www.ck12.org Chapter 6. Analytic Trigonometry
Guided Practice
1. Prove the sine of a difference identity.
2. Use a sum or difference identity to find an exact value of cot(5π
12
).
3. Prove the following identity:sin(x−y)sin(x+y) =
tanx−tanytanx+tany
Answers:
1. Start with the cofunction identity and then distribute and work out the cosine of a sum and cofunction identities.
sin(α−β) = cos(
π
2− (α−β)
)= cos
((π
2−α
)+β
)= cos
(π
2−α
)cosβ− sin
(π
2−α
)sinβ
= sinαcosβ− cosαsinβ
2.Start with the definition of cotangent as the inverse of tangent.
cot(
5π
12
)=
1tan(5π
12
)=
1tan(9π
12 −4π
12
)=
1tan(135◦−60◦)
=1+ tan135◦ tan60◦
tan135◦− tan60◦
=1+(−1) ·
√3
(−1)−√
3
=(1−
√3)
(−1−√
3)
=(1−
√3)2
(−1+√
3) · (1−√
3)
=(1−
√3)2
−(1−3)
=(1−
√3)2
2
3. Here are the steps:
291
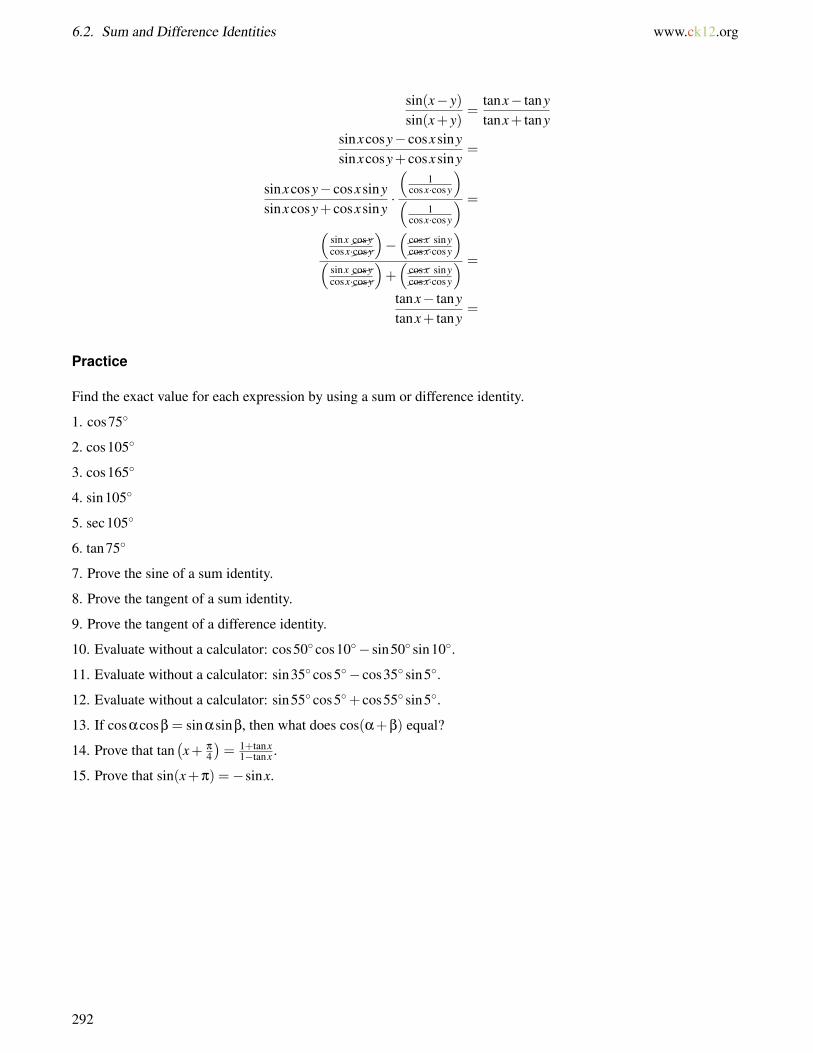
6.2. Sum and Difference Identities www.ck12.org
sin(x− y)sin(x+ y)
=tanx− tanytanx+ tany
sinxcosy− cosxsinysinxcosy+ cosxsiny
=
sinxcosy− cosxsinysinxcosy+ cosxsiny
·
(1
cosx·cosy
)(
1cosx·cosy
) =
(sinx��cosycosx·��cosy
)−(��cosx siny��cosx·cosy
)(
sinx��cosycosx·��cosy
)+(��cosx siny��cosx·cosy
) =
tanx− tanytanx+ tany
=
Practice
Find the exact value for each expression by using a sum or difference identity.
1. cos75◦
2. cos105◦
3. cos165◦
4. sin105◦
5. sec105◦
6. tan75◦
7. Prove the sine of a sum identity.
8. Prove the tangent of a sum identity.
9. Prove the tangent of a difference identity.
10. Evaluate without a calculator: cos50◦ cos10◦− sin50◦ sin10◦.
11. Evaluate without a calculator: sin35◦ cos5◦− cos35◦ sin5◦.
12. Evaluate without a calculator: sin55◦ cos5◦+ cos55◦ sin5◦.
13. If cosαcosβ = sinαsinβ, then what does cos(α+β) equal?
14. Prove that tan(x+ π
4
)= 1+tanx
1−tanx .
15. Prove that sin(x+π) =−sinx.
292
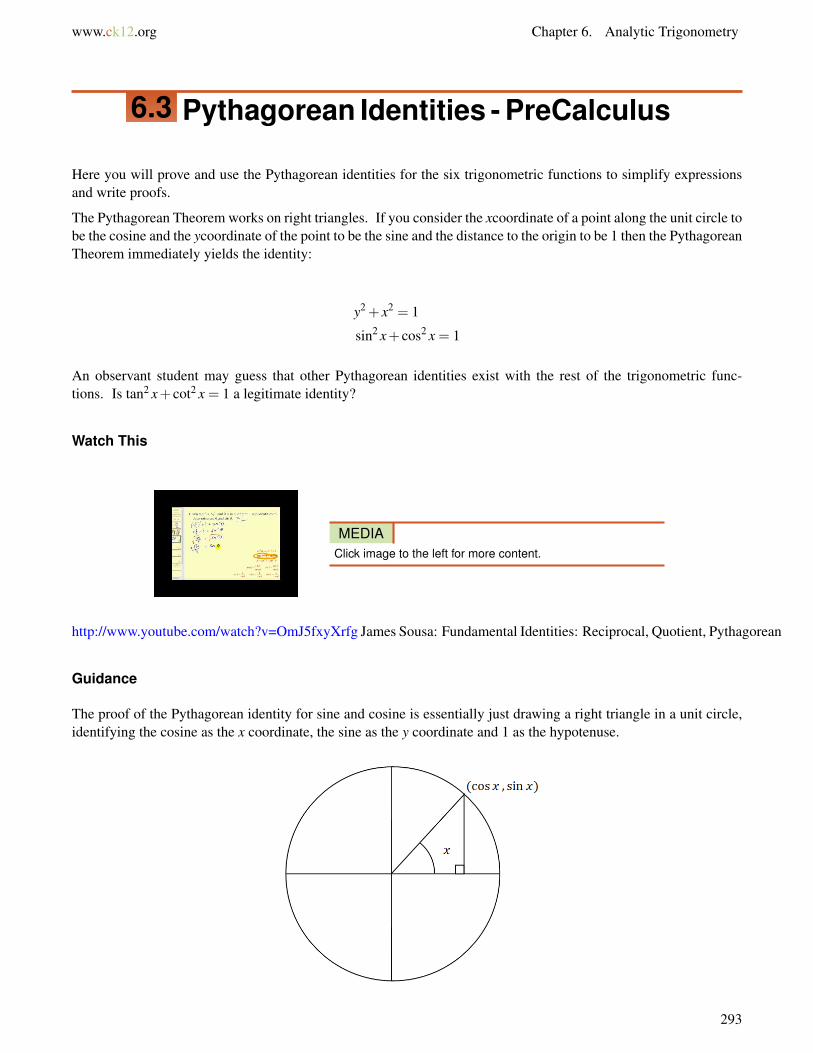
www.ck12.org Chapter 6. Analytic Trigonometry
6.3 Pythagorean Identities - PreCalculus
Here you will prove and use the Pythagorean identities for the six trigonometric functions to simplify expressionsand write proofs.
The Pythagorean Theorem works on right triangles. If you consider the xcoordinate of a point along the unit circle tobe the cosine and the ycoordinate of the point to be the sine and the distance to the origin to be 1 then the PythagoreanTheorem immediately yields the identity:
y2 + x2 = 1
sin2 x+ cos2 x = 1
An observant student may guess that other Pythagorean identities exist with the rest of the trigonometric func-tions. Is tan2 x+ cot2 x = 1 a legitimate identity?
Watch This
MEDIAClick image to the left for more content.
http://www.youtube.com/watch?v=OmJ5fxyXrfg James Sousa: Fundamental Identities: Reciprocal, Quotient, Pythagorean
Guidance
The proof of the Pythagorean identity for sine and cosine is essentially just drawing a right triangle in a unit circle,identifying the cosine as the x coordinate, the sine as the y coordinate and 1 as the hypotenuse.
293

6.3. Pythagorean Identities - PreCalculus www.ck12.org
cos2 x+ sin2 x = 1
Most people rewrite the order of the sine and cosine so that the sine comes first.
sin2 x+ cos2 x = 1
The two other Pythagorean identities are:
• 1+ cot2 x = csc2 x• tan2 x+1 = sec2 x
To derive these two Pythagorean identities, divide the original Pythagorean identity by sin2 x and cos2 x respectively.
Example A
Derive the following Pythagorean identity: 1+ cot2 x = csc2 x.
Solution: First start with the original Pythagorean identity and then divide through by sin2 x and simplify.
sin2 xsin2 x
+cos2 xsin2 x
=1
sin2 x1+ cot2 x = csc2 x
Example B
Simplify the following expression: sinx(cscx−sinx)1−sinx .
Solution:
sinx(cscx− sinx)1− sinx
=sinx · cscx− sin2 x
1− sinx
=1− sin2 x1− sinx
=(1− sinx)(1+ sinx)
1− sinx= 1+ sinx
Note that factoring the Pythagorean identity is one of the most powerful applications. This is very common and isa technique that you should feel comfortable using.
Example C
Prove the following trigonometric identity: (sec2 x+ csc2 x)− (tan2 x+ cot2 x) = 2.
Solution: Group the terms and apply a different form of the second two Pythagorean identities which are 1+cot2 x=csc2 x and tan2 x+1 = sec2 x.
(sec2 x+ csc2 x)− (tan2 x+ cot2 x) = sec2 x− tan2 x+ csc2 x− cot2 x
= 1+1
= 2
Concept Problem Revisited
294
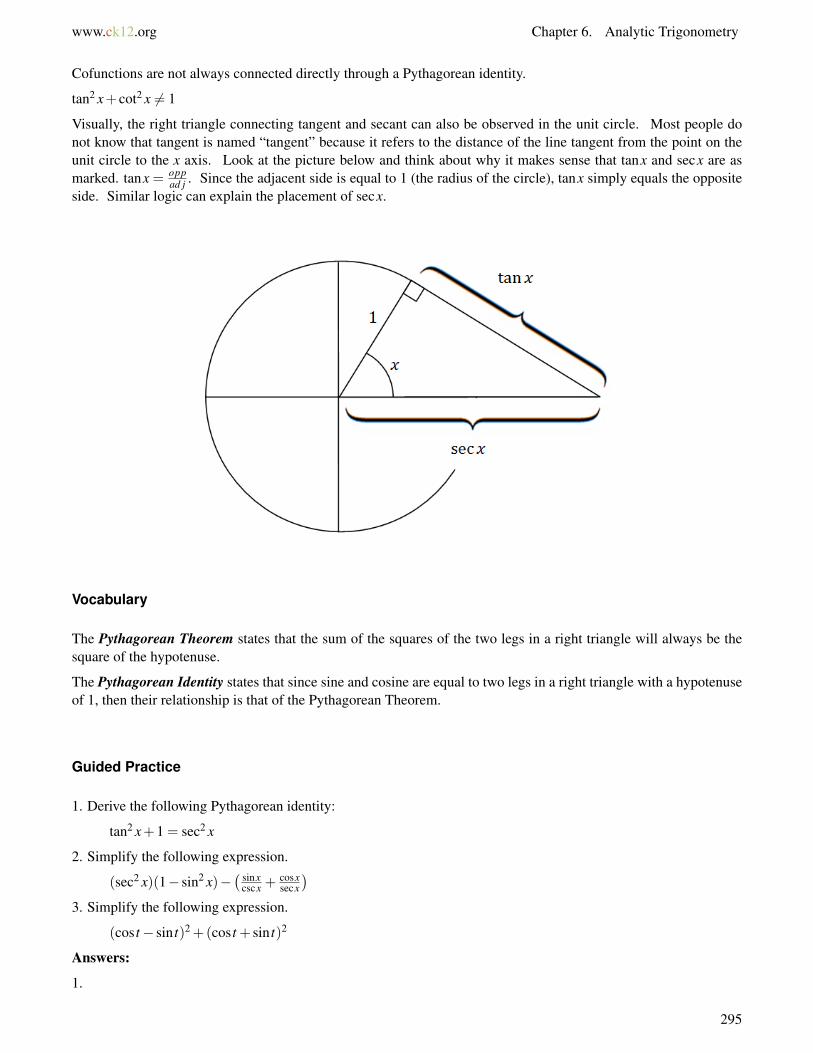
www.ck12.org Chapter 6. Analytic Trigonometry
Cofunctions are not always connected directly through a Pythagorean identity.
tan2 x+ cot2 x 6= 1
Visually, the right triangle connecting tangent and secant can also be observed in the unit circle. Most people donot know that tangent is named “tangent” because it refers to the distance of the line tangent from the point on theunit circle to the x axis. Look at the picture below and think about why it makes sense that tanx and secx are asmarked. tanx = opp
ad j . Since the adjacent side is equal to 1 (the radius of the circle), tanx simply equals the oppositeside. Similar logic can explain the placement of secx.
Vocabulary
The Pythagorean Theorem states that the sum of the squares of the two legs in a right triangle will always be thesquare of the hypotenuse.
The Pythagorean Identity states that since sine and cosine are equal to two legs in a right triangle with a hypotenuseof 1, then their relationship is that of the Pythagorean Theorem.
Guided Practice
1. Derive the following Pythagorean identity:
tan2 x+1 = sec2 x
2. Simplify the following expression.
(sec2 x)(1− sin2 x)−( sinx
cscx +cosxsecx
)3. Simplify the following expression.
(cos t− sin t)2 +(cos t + sin t)2
Answers:
1.
295

6.3. Pythagorean Identities - PreCalculus www.ck12.org
sin2 xcos2 x
+cos2 xcos2 x
=1
cos2 xtan2 x+1 = sec2 x
2.
(sec2 x)(1− sin2 x)−(
sinxcscx
+cosxsecx
)= sec2 x · cos2 x− (sin2 x+ cos2 x)
= 1−1
= 0
3. Note that initially, the expression is not the same as the Pythagorean identity.
(cos t− sin t)2 +(cos t + sin t)2
= cos2 t−2cos t sin t + sin2 t + cos2 t +2cos t sin t + sin2 t
= 1−2cos t sin t +1+2cos t sin t
= 2
Practice
Prove each of the following:
1. (1− cos2 x)(1+ cot2 x) = 1
2. cosx(1− sin2 x) = cos3 x
3. sin2 x = (1− cosx)(1+ cosx)
4. sinx = sin2 x+cos2 xcscx
5. sin4 x− cos4 x = sin2 x− cos2 x
6. sin2 xcos3 x = (sin2 x− sin4 x)(cosx)
Simplify each expression as much as possible.
7. tan3 xcsc3 x
8. csc2 x−1sec2 x
9. 1−sin2 x1+sinx
10.√
1− cos2 x
11. sin2 x−sin4 xcos2 x
12. (1+ tan2 x)(sec2 x)
13. sin2 x+tan2 x+cos2 xsecx
14. 1+tan2 xcsc2 x
15. 1−sin2 xcosx
296
www.ck12.org Chapter 6. Analytic Trigonometry
6.4 Double, Half, and Power Reducing Identi-ties
Here you will prove and use the double, half, and power reducing identities.
These identities are significantly more involved and less intuitive than previous identities. By practicing and workingwith these advanced identities, your toolbox and fluency substituting and proving on your own will increase. Eachidentity in this concept is named aptly. Double angles work on findingsin80◦ if you already knowsin40◦. Halfangles allow you to find sin15◦if you already knowsin30◦. Power reducing identities allow you to findsin2 15◦ ifyou know the sine and cosine of30◦.
What is sin2 15◦?
Watch This
MEDIAClick image to the left for more content.
http://www.youtube.com/watch?v=-zhCYiHcVIE James Sousa: Double Angle Identities
MEDIAClick image to the left for more content.
http://www.youtube.com/watch?v=Rp61qiglwfg James Sousa: Half Angle Identities
Guidance
The double angle identities are proved by applying the sum and difference identities. They are left as practiceproblems. These are the double angle identities.
• sin2x = 2sinxcosx• cos2x = cos2 x− sin2 x• tan2x = 2tanx
1−tan2 x
The power reducing identities allow you to write a trigonometric function that is squared in terms of smallerpowers. The proofs are left as guided practice and practice problems.
• sin2 x = 1−cos2x2
297
6.4. Double, Half, and Power Reducing Identities www.ck12.org
• cos2 x = 1+cos2x2
• tan2 x = 1−cos2x1+cos2x
The half angle identities are a rewritten version of the power reducing identities. The proofs are left as practiceproblems.
• sin x2 =±
√1− cosx
2
• cos x2 =±
√1+ cosx
2
• tan x2 =±
√1− cosx1+ cosx
Example A
Rewrite sin4 x as an expression without powers greater than one.
Solution: While sinx · sinx · sinx · sinx does technically solve this question, try to get the terms to sum together notmultiply together.
sin4 x = (sin2 x)2
=
(1− cos2x
2
)2
=1−2cos2x+ cos2 2x
4
=14
(1−2cos2x+
1+ cos4x2
)Example B
Write the following expression with only sinx and cosx : sin2x+ cos3x.
Solution:
sin2x+ cos3x = 2sinxcosx+ cos(2x+ x)
= 2sinxcosx+ cos2xcosx− sin2xsinx
= 2sinxcosx+(cos2 x− sin2 x)cosx− (2sinxcosx)sinx
= 2sinxcosx+ cos3 x− sin2 xcosx−2sin2 xcosx
= 2sinxcosx+ cos3 x−3sin2 xcosx
Example C
Use half angles to find an exact value of tan22.5◦ without using a calculator.
Solution: tan x2 =±
√1− cosx1+ cosx
tan22.5◦ = tan 45◦2 =±
√1− cos45◦
1+ cos45◦=±
√√√√1−√
22
1+√
22
=±
√√√√ 22 −
√2
222 +
√2
2
=±
√2−√
22+√
2
Sometimes you may be requested to get all the radicals out of the denominator.
298
www.ck12.org Chapter 6. Analytic Trigonometry
Concept Problem Revisited
In order to fully identify sin2 15◦ you need to use the power reducing formula.
sin2 x =1− cos2x
2
sin2 15◦ =1− cos30◦
2=
12−√
34
Vocabulary
An identity is a statement proved to be true once so that it can be used as a substitution in future simplifications andproofs.
Guided Practice
1. Prove the power reducing identity for sine.
sin2 x = 1−cos2x2
2. Simplify the following identity: sin4 x− cos4 x.
3. What is the period of the following function?
f (x) = sin2x · cosx+ cos2x · sinx
Answers:
1. Start with the double angle identity for cosine.
cos2x = cos2 x− sin2 x
cos2x = (1− sin2 x)− sin2 x
cos2x = 1−2sin2 x
This expression is an equivalent expression to the double angle identity and is often considered an alternate form.
2sin2 x = 1− cos2x
sin2 x =1− cos2x
2
2. Here are the steps:
sin4 x− cos4 x = (sin2 x− cos2 x)(sin2 x+ cos2 x)
=−(cos2 x− sin2 x)
=−cos2x
3. f (x) = sin2x · cosx+ cos2x · sinx so f (x) = sin(2x+ x) = sin3x. Since b = 3 this implies the period is 2π
3 .
299
6.4. Double, Half, and Power Reducing Identities www.ck12.org
Practice
Prove the following identities.
1. sin2x = 2sinxcosx
2. cos2x = cos2 x− sin2 x
3. tan2x = 2tanx1−tan2 x
4. cos2 x = 1+cos2x2
5. tan2 x = 1−cos2x1+cos2x
6. sin x2 =±
√1− cosx
2
7. cos x2 =±
√1+ cosx
2
8. tan x2 =±
√1− cosx1+ cosx
9. csc2x = 12 cscxsecx
10. cot2x = cot2 x−12cotx
Find the value of each expression using half angle identities.
11. tan15◦
12. tan22.5◦
13. sec22.5◦
14. Show that tan x2 = 1−cosx
sinx .
15. Show that tan x2 = sinx
1+cosx .
300

www.ck12.org Chapter 6. Analytic Trigonometry
6.5 Trigonometric Equations
Here you will solve equations that contain trigonometric functions. You will also learn to identify when an equationis an identity and when it is has no solutions.
Solving a trigonometric equation is just like solving a regular equation. You will use factoring and other algebraictechniques to get the variable on one side. The biggest difference with trigonometric equations is the opportunityfor there to be an infinite number of solutions that must be described with a pattern. The equationcosx = 1 has manysolutions including 0 and2π. How would you describe all of them?
Watch This
MEDIAClick image to the left for more content.
http://www.youtube.com/watch?v=26EWKD2Xha4 James Sousa: Solve Trigonometric Equations I
MEDIAClick image to the left for more content.
http://www.youtube.com/watch?v=ABKO3ta_Azw James Sousa: Solve Trigonometric Equations II
MEDIAClick image to the left for more content.
http://www.youtube.com/watch?v=7thuFLqC7z0 James Sousa: Solve Trigonometric Equations III
Guidance
The identities you have learned are helpful in solving trigonometric equations. The goal of solving an equationhasn’t changed. Do whatever it takes to get the variable alone on one side of the equation. Factoring, especiallywith the Pythagorean identity, is critical.
301
6.5. Trigonometric Equations www.ck12.org
When solving trigonometric equations, try to give exact (non-rounded) answers. If you are working with a calculator,
keep in mind that while some newer calculators can provide exact answers like√
32 , most calculators will produce
a decimal of 0.866... If you see a decimal like 0.866..., try squaring it. The result might be a nice fraction like34 . Then you can logically conclude that the original decimal must be the square root of 3
4 or√
32 .
When solving, if the two sides of the equation are always equal, then the equation is an identity. If the two sides ofan equation are never equal, as with sinx = 3, then the equation has no solution.
Example A
Solve the following equation algebraically and confirm graphically on the interval [−2π,2π].
cos2x = sinx
Solution:
cos2x = sinx
1−2sin2 x = sinx
0 = 2sin2 x+ sinx−1
0 = (2sinx−1)(sinx+1)
Solving the first part set equal to zero within the interval yields:
0 = 2sinx−112= sinx
x =π
6,5π
6,−11π
6,−7π
6
Solving the second part set equal to zero yields:
0 = sinx+1
−1 = sinx
x =−π
2,3π
2
These are the six solutions that will appear as intersections of the two graphs f (x) = cos2x and g(x) = sinx.
302
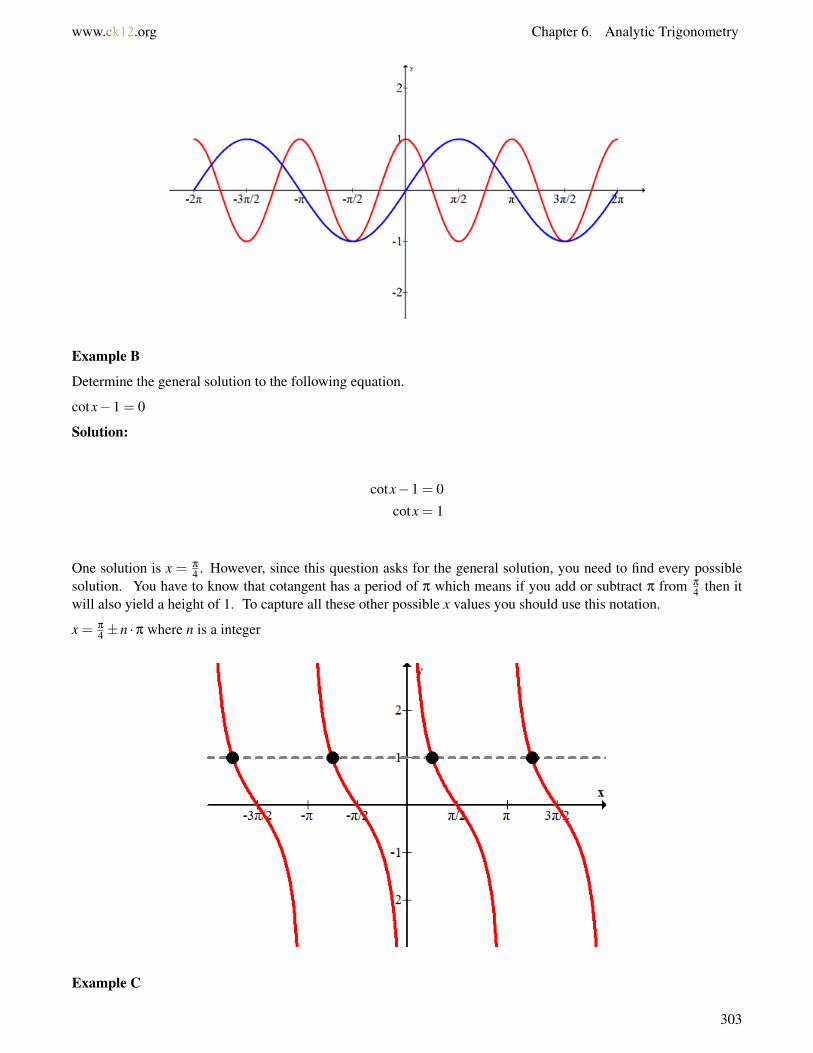
www.ck12.org Chapter 6. Analytic Trigonometry
Example B
Determine the general solution to the following equation.
cotx−1 = 0
Solution:
cotx−1 = 0
cotx = 1
One solution is x = π
4 . However, since this question asks for the general solution, you need to find every possiblesolution. You have to know that cotangent has a period of π which means if you add or subtract π from π
4 then itwill also yield a height of 1. To capture all these other possible x values you should use this notation.
x = π
4 ±n ·π where n is a integer
Example C
303
6.5. Trigonometric Equations www.ck12.org
Solve the following equation.
4cos2 x−1 = 3−4sin2 x
Solution:
4cos2 x−1 = 3−4sin2 x
4cos2 x+4sin2 x = 3+1
4(cos2 x+ sin2 x) = 4
4 = 4
This equation is always true which means the right side is always equal to the left side. This is an identity.
Concept Problem Revisited
The equation cosx = 1 has many solutions. When you type cos−1 1 on your calculator, it will yield only one solutionwhich is 0. In order to describe all the solutions you must use logic and the graph to figure out that cosine also has aheight of 1 at −2π,2π,−4π,4π . . . Luckily all these values are sequences in a clear pattern so you can describe themall in general with the following notation:
x = 0±n ·2π where n is an integer, or x =±n ·2π where n is an integer
Vocabulary
The terms “general solution,” “completely solve”, and “solve exactly” mean you must find solutions to an equationwithout the use of a calculator. In addition, trigonometric equations may have an infinite number of solutions thatrepeat in a certain pattern because they are periodic functions. When you see these directions remember to find allthe solutions by using notation like in Example B.
Guided Practice
1. Solve the following equation on the interval (2π,4π).
2sinx+1 = 0
2. Solve the following equation exactly.
2cos2 x+3cosx−2 = 0
3. Create an equation that has the solutions:π
4 ±n ·2π where n is an integer
Answers:
1. First, solve for the solutions within one period and then use logic to find the solutions in the correct interval.
2sinx+1 = 0
sinx =−12
x =7π
6,11π
6
You must add 2π to each of these solutions to get solutions that are in the interval.
304

www.ck12.org Chapter 6. Analytic Trigonometry
x = 19π
6 , 23π
6
2. Start by factoring:
2cos2 x+3cosx−2 = 0
(2cosx−1)(cosx+2) = 0
Note that cosx 6=−2 which means only one equation needs to be solved for solutions.
2cosx−1 = 0
cosx =12
x =π
3,−π
3
These are the solutions within the interval −π to π. Since this represents one full period of cosine, the rest of thesolutions are just multiples of 2π added and subtracted to these two values.
x =±π
3 ±n ·2π where n is an integer
3. There are an infinite number of possible equations that will work. When you see the π
4 you should think either of
where tangent is equal to one or where sine/cosine is equal to√
22 . The problem with both of these initial guesses
is that tangent repeats every π not every 2π, and sine/cosine have a second place where they reach a height of 1. Anoption that works is:
tan x2 = 1
This equation works because the period of tan x2 is 2π.
Practice
Solve each equation on the interval [0,2π).
1. 3cos2 x2 = 3
2. 4sin2 x = 8sin2 x2
Find approximate solutions to each equation on the interval [0,2π).
3. 3cos2 x+10cosx+2 = 0
4. sin2 x+3sinx = 5
5. tan2 x+ tanx = 3
6. cot2 x+5tanx+14 = 0
7. sin2 x+ cos2 x = 1
Solve each equation on the interval [0,360◦).
8. 2sin(x− π
2
)= 1
9. 4cos(x−π) = 4
Solve each equation on the interval [2π,4π).
10. cos2 x+2cosx+1 = 0
305
6.5. Trigonometric Equations www.ck12.org
11. 3sinx = 2cos2 x
12. tanxsin2 x = tanx
13. sin2 x+1 = 2sinx
14. sec2 x = 4
15. sin2 x−4 = cos2 x− cos2x−4
The various trigonometric identities were introduced, proved and added to your toolbox. You learned what proofslook like in trigonometry and used the identities to derive the identities themselves. You solved trigonometricequations and bridged the connection between analytic trigonometry, which is very algebraic, with graphical repre-sentations.
306

www.ck12.org Chapter 6. Analytic Trigonometry
6.6 References
1. CK-12 Foundation. . CCSA2. CK-12 Foundation. . CCSA3. CK-12 Foundation. . CCSA4. CK-12 Foundation. . CCSA5. CK-12 Foundation. . CCSA
307
www.ck12.org
CHAPTER 7 VectorsChapter Outline
7.1 BASIC PROPERTIES OF VECTORS
7.2 OPERATIONS WITH VECTORS
7.3 RESOLUTION OF VECTORS INTO COMPONENTS
7.4 DOT PRODUCT AND ANGLE BETWEEN TWO VECTORS
7.5 VECTOR PROJECTION
7.6 REFERENCES
Graphically, vectors are arrows in the coordinate plane. They have length and direction. Algebraically, they allow awhole new way to think about points, lines, angles. Most importantly, they provide an opportunity for you to applyyour knowledge of trigonometry in context.
308

www.ck12.org Chapter 7. Vectors
7.1 Basic Properties of Vectors
Here you will find out what a vector is algebraically and graphically.
An airplane being pushed off course by wind and a swimmer’s movement across a moving river are both examplesof vectors in action. Points in the coordinate plane describe location. Vectors, on the other hand, have no locationand indicate only direction and magnitude. Vectors can describe the strength of forces like gravity or speed anddirection of a ship at sea. Vectors are extremely useful in modeling complex situations in the real world.
What are other differences between vectors and points?
Watch This
MEDIAClick image to the left for more content.
http://www.youtube.com/watch?v=IKzR0Odurm0 James Sousa: Introduction to Vectors
Guidance
A two dimensional vector is represented graphically as an arrow with a tail and a head. The head is the arrow and isalso called the terminal point. When finding the vector between two points start with the terminal point and subtractthe initial point (the tail).
The two defining characteristics of a vector are its magnitude and its direction. The magnitude is shown graphicallyby the length of the arrow and the direction is indicated by the angle that the arrow is pointing. Notice how thefollowing vector is shown multiple times on the same coordinate plane. This emphasizes that the location on thecoordinate plane does not matter and is not unique. Each representation of the vector has identical direction andmagnitude.
309

7.1. Basic Properties of Vectors www.ck12.org
One way to define a vector is as a line segment with a direction. Vectors are said to be equal if they have the samemagnitude and the same direction. The absolute value of a vector is the same as the length of the line segment orthe magnitude of the vector. Magnitude can be found by using the Pythagorean Theorem or the distance formula.
There are a few different ways to write a vector v.
v,−→v ,⇀v , or v with a ∼ underneath
When you write about vectors algebraically there are a few ways to describe a specific vector. First, you coulddescribe its angle and magnitude as r,θ. Second, you could describe it as an ordered pair: < x,y >. Notice thatwhen discussing vectors you should use the brackets <> instead of parentheses because it helps avoid confusionbetween a vector and a point. Vectors can be multidimensional.
Example A
A ship is traveling NNW at 17 knots (nautical mph). Describe this ship’s movement in a vector.
Solution: NNW is halfway between NW and N. When describing ships at sea, it is best to use bearing which has0◦ as due North and 270◦ as due West. This makes NW equal to 315◦ and NNW equal to 337.5◦.
310
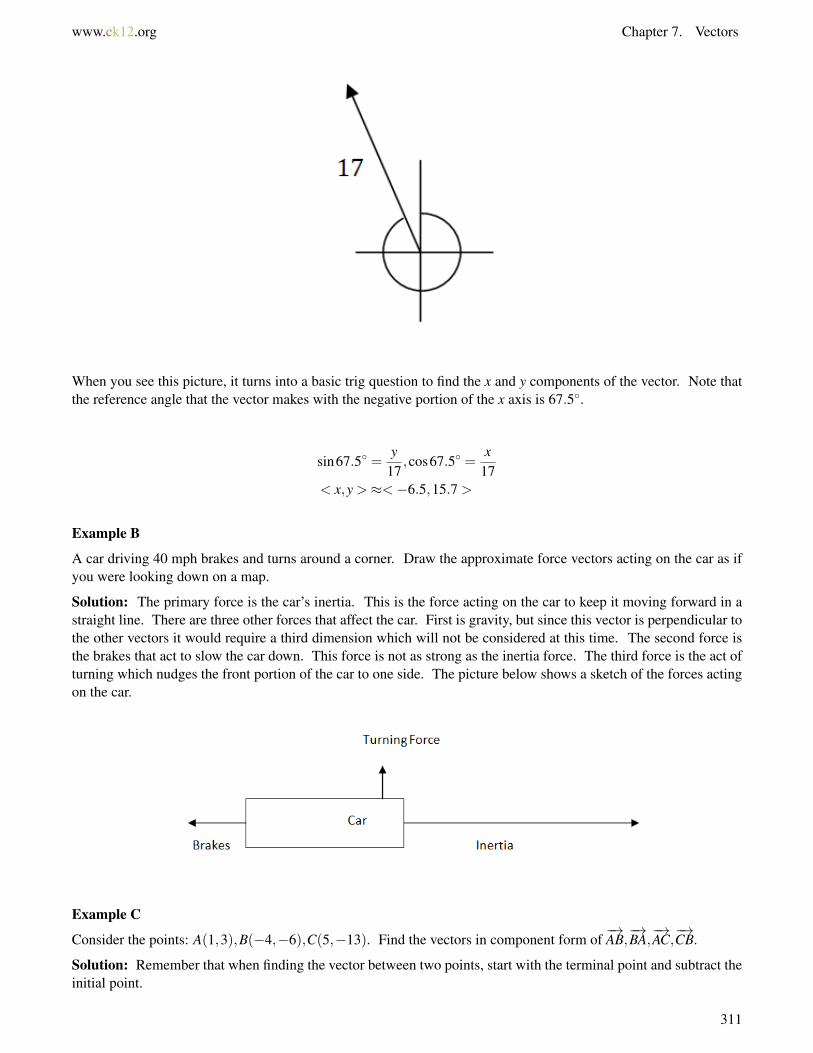
www.ck12.org Chapter 7. Vectors
When you see this picture, it turns into a basic trig question to find the x and y components of the vector. Note thatthe reference angle that the vector makes with the negative portion of the x axis is 67.5◦.
sin67.5◦ =y
17,cos67.5◦ =
x17
< x,y >≈<−6.5,15.7 >
Example B
A car driving 40 mph brakes and turns around a corner. Draw the approximate force vectors acting on the car as ifyou were looking down on a map.
Solution: The primary force is the car’s inertia. This is the force acting on the car to keep it moving forward in astraight line. There are three other forces that affect the car. First is gravity, but since this vector is perpendicular tothe other vectors it would require a third dimension which will not be considered at this time. The second force isthe brakes that act to slow the car down. This force is not as strong as the inertia force. The third force is the act ofturning which nudges the front portion of the car to one side. The picture below shows a sketch of the forces actingon the car.
Example C
Consider the points: A(1,3),B(−4,−6),C(5,−13). Find the vectors in component form of−→AB,−→BA,−→AC,−→CB.
Solution: Remember that when finding the vector between two points, start with the terminal point and subtract theinitial point.
311
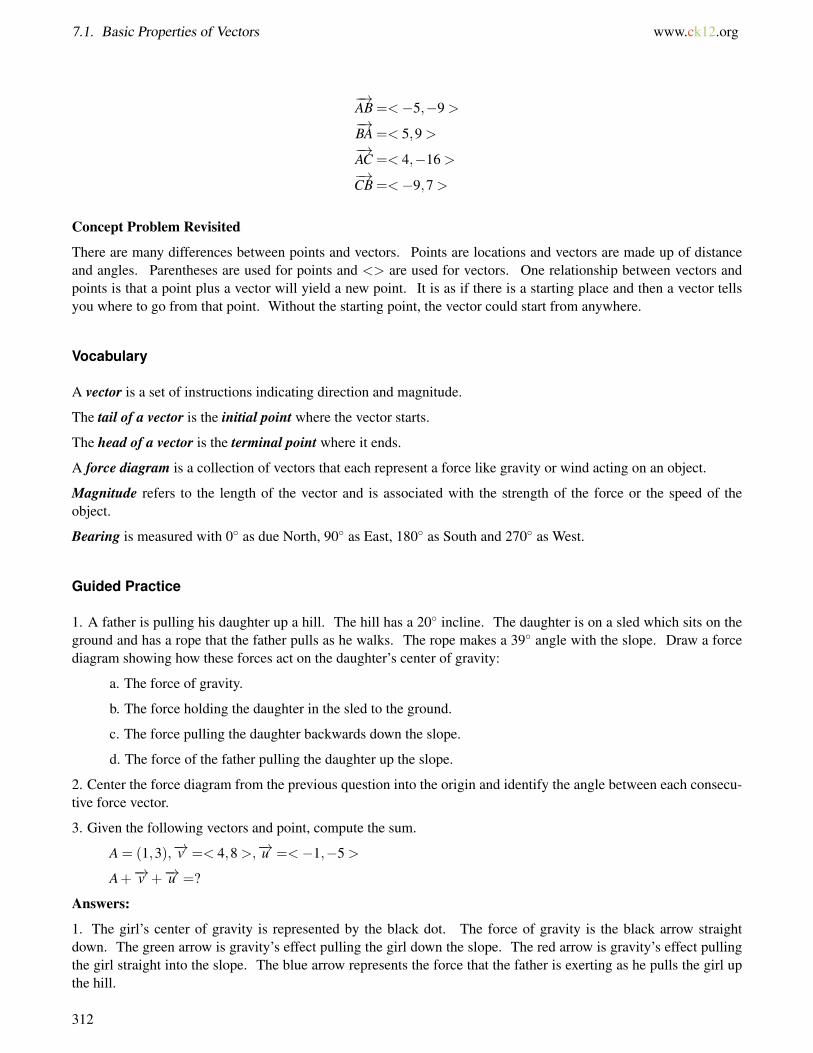
7.1. Basic Properties of Vectors www.ck12.org
−→AB =<−5,−9 >−→BA =< 5,9 >−→AC =< 4,−16 >−→CB =<−9,7 >
Concept Problem Revisited
There are many differences between points and vectors. Points are locations and vectors are made up of distanceand angles. Parentheses are used for points and <> are used for vectors. One relationship between vectors andpoints is that a point plus a vector will yield a new point. It is as if there is a starting place and then a vector tellsyou where to go from that point. Without the starting point, the vector could start from anywhere.
Vocabulary
A vector is a set of instructions indicating direction and magnitude.
The tail of a vector is the initial point where the vector starts.
The head of a vector is the terminal point where it ends.
A force diagram is a collection of vectors that each represent a force like gravity or wind acting on an object.
Magnitude refers to the length of the vector and is associated with the strength of the force or the speed of theobject.
Bearing is measured with 0◦ as due North, 90◦ as East, 180◦ as South and 270◦ as West.
Guided Practice
1. A father is pulling his daughter up a hill. The hill has a 20◦ incline. The daughter is on a sled which sits on theground and has a rope that the father pulls as he walks. The rope makes a 39◦ angle with the slope. Draw a forcediagram showing how these forces act on the daughter’s center of gravity:
a. The force of gravity.
b. The force holding the daughter in the sled to the ground.
c. The force pulling the daughter backwards down the slope.
d. The force of the father pulling the daughter up the slope.
2. Center the force diagram from the previous question into the origin and identify the angle between each consecu-tive force vector.
3. Given the following vectors and point, compute the sum.
A = (1,3),−→v =< 4,8 >,−→u =<−1,−5 >
A+−→v +−→u =?
Answers:
1. The girl’s center of gravity is represented by the black dot. The force of gravity is the black arrow straightdown. The green arrow is gravity’s effect pulling the girl down the slope. The red arrow is gravity’s effect pullingthe girl straight into the slope. The blue arrow represents the force that the father is exerting as he pulls the girl upthe hill.
312
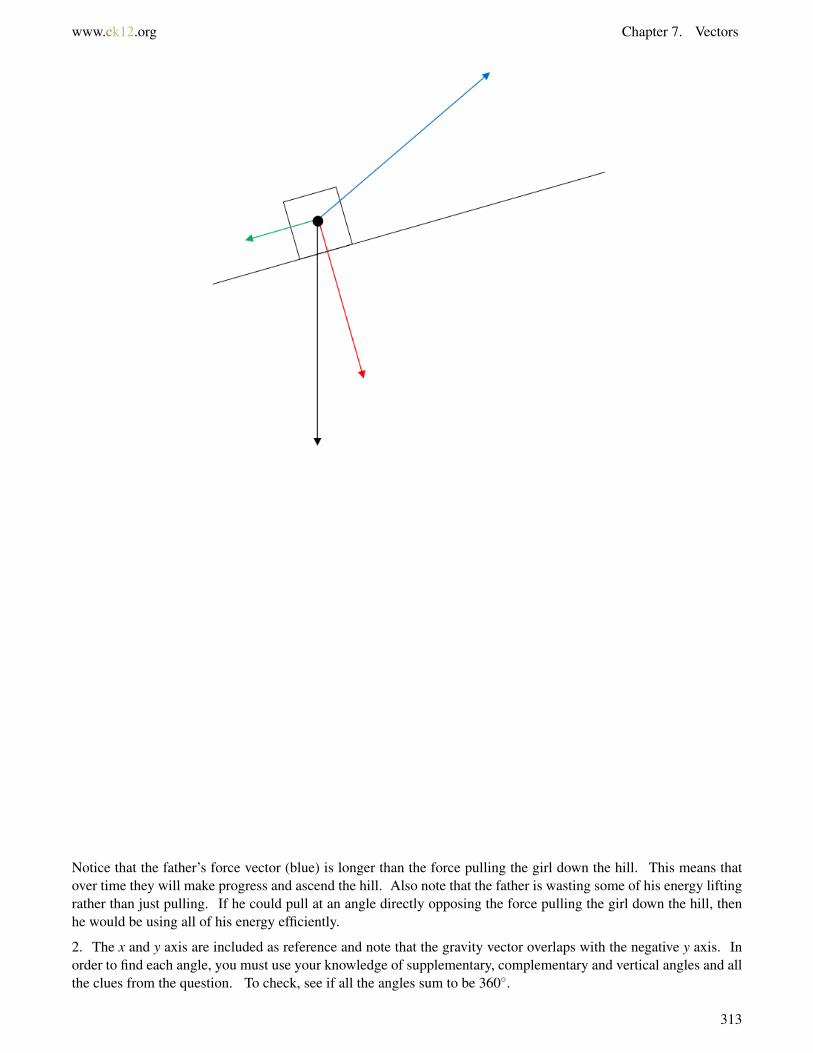
www.ck12.org Chapter 7. Vectors
Notice that the father’s force vector (blue) is longer than the force pulling the girl down the hill. This means thatover time they will make progress and ascend the hill. Also note that the father is wasting some of his energy liftingrather than just pulling. If he could pull at an angle directly opposing the force pulling the girl down the hill, thenhe would be using all of his energy efficiently.
2. The x and y axis are included as reference and note that the gravity vector overlaps with the negative y axis. Inorder to find each angle, you must use your knowledge of supplementary, complementary and vertical angles and allthe clues from the question. To check, see if all the angles sum to be 360◦.
313
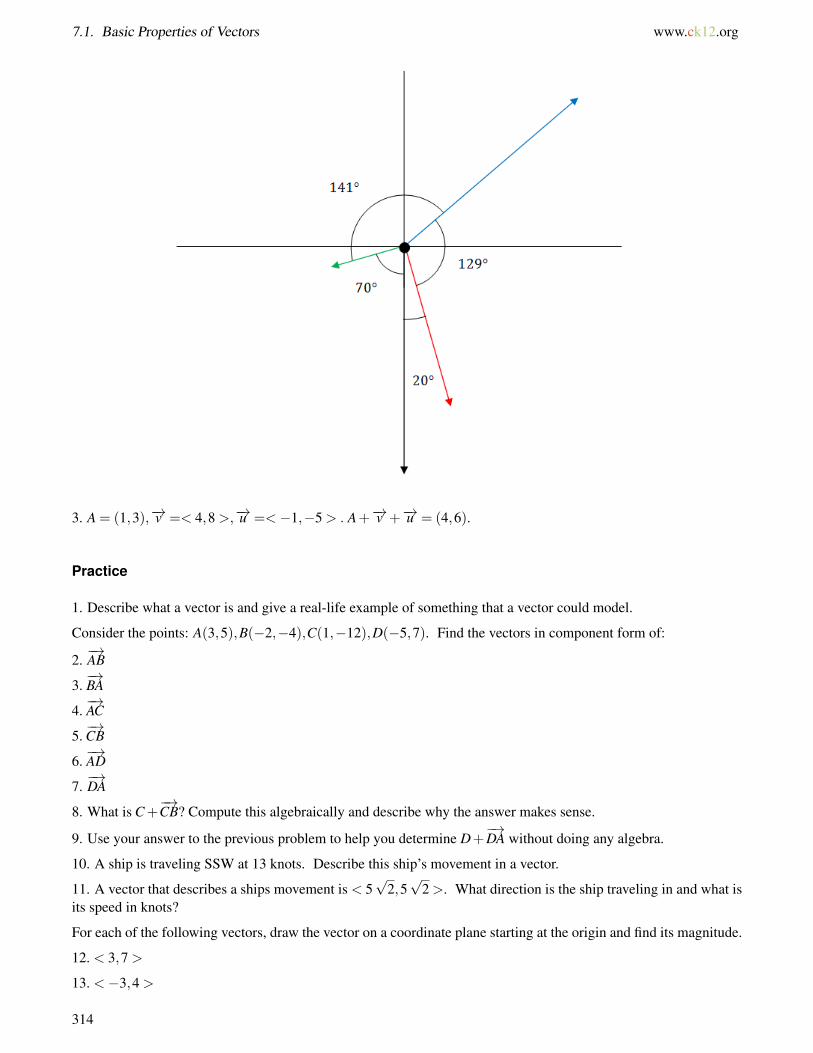
7.1. Basic Properties of Vectors www.ck12.org
3. A = (1,3),−→v =< 4,8 >,−→u =<−1,−5 > . A+−→v +−→u = (4,6).
Practice
1. Describe what a vector is and give a real-life example of something that a vector could model.
Consider the points: A(3,5),B(−2,−4),C(1,−12),D(−5,7). Find the vectors in component form of:
2.−→AB
3.−→BA
4.−→AC
5.−→CB
6.−→AD
7.−→DA
8. What is C+−→CB? Compute this algebraically and describe why the answer makes sense.
9. Use your answer to the previous problem to help you determine D+−→DA without doing any algebra.
10. A ship is traveling SSW at 13 knots. Describe this ship’s movement in a vector.
11. A vector that describes a ships movement is < 5√
2,5√
2 >. What direction is the ship traveling in and what isits speed in knots?
For each of the following vectors, draw the vector on a coordinate plane starting at the origin and find its magnitude.
12. < 3,7 >
13. <−3,4 >
314

7.2. Operations with Vectors www.ck12.org
7.2 Operations with Vectors
Here you will add and subtract vectors with vectors and vectors with points.
When two or more forces are acting on the same object, they combine to create a new force. A bird flying due southat 10 miles an hour in a headwind of 2 miles an hour only makes headway at a rate of 8 miles per hour. These forcesdirectly oppose each other. In real life, most forces are not parallel. What will happen when the headwind has aslight crosswind as well, blowing NE at 2 miles per hour. How far does the bird get in one hour?
Watch This
MEDIAClick image to the left for more content.
http://www.youtube.com/watch?v=EYIxFJXoUvA James Sousa: Vector Operations
Guidance
When adding vectors, place the tail of one vector at the head of the other. This is called the tail-to-head rule. Thevector that is formed by joining the tail of the first vector with the head of the second is called the resultant vector.
Vector subtraction reverses the direction of the second vector. −→a −−→b =−→a +(−
−→b ):
316
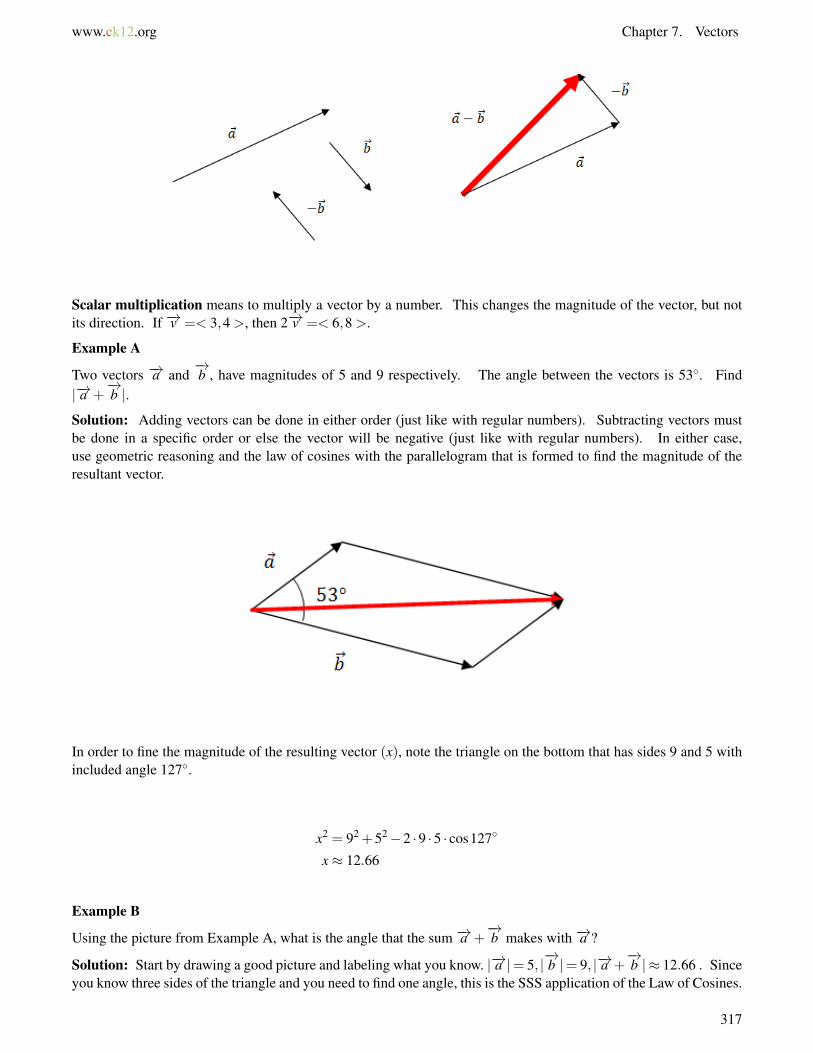
www.ck12.org Chapter 7. Vectors
Scalar multiplication means to multiply a vector by a number. This changes the magnitude of the vector, but notits direction. If −→v =< 3,4 >, then 2−→v =< 6,8 >.
Example A
Two vectors −→a and−→b , have magnitudes of 5 and 9 respectively. The angle between the vectors is 53◦. Find
|−→a +−→b |.
Solution: Adding vectors can be done in either order (just like with regular numbers). Subtracting vectors mustbe done in a specific order or else the vector will be negative (just like with regular numbers). In either case,use geometric reasoning and the law of cosines with the parallelogram that is formed to find the magnitude of theresultant vector.
In order to fine the magnitude of the resulting vector (x), note the triangle on the bottom that has sides 9 and 5 withincluded angle 127◦.
x2 = 92 +52−2 ·9 ·5 · cos127◦
x≈ 12.66
Example B
Using the picture from Example A, what is the angle that the sum −→a +−→b makes with −→a ?
Solution: Start by drawing a good picture and labeling what you know. |−→a |= 5, |−→b |= 9, |−→a +
−→b | ≈ 12.66 . Since
you know three sides of the triangle and you need to find one angle, this is the SSS application of the Law of Cosines.
317

7.2. Operations with Vectors www.ck12.org
92 = 12.662 +52−2 ·12.66 ·5 · cosθ
θ = 34.6◦
Example C
Elaine started a dog walking business. She walks two dogs at a time named Elvis and Ruby. They each pull her indifferent directions at a 45◦ angle with different forces. Elvis pulls at a force of 25 N and Ruby pulls at a force of49 N. How hard does Elaine need to pull so that she can stay balanced? Note: N stands for Newtons which is thestandard unit of force.
Solution: Even though the two vectors are centered at Elaine, the forces are added which means that you need touse the tail-to-head rule to add the vectors together. Finding the angle between each component vector requireslogical use of supplement angles.
318

www.ck12.org Chapter 7. Vectors
x2 = 492 +252−2 ·49 ·25 · cos135◦
x≈ 68.98 N
In order for Elaine to stay balanced, she will need to counteract this force with an equivalent force of her own in theexact opposite direction.
Concept Problem Revisited
A bird flying due south at 10 miles an hour with a cross headwind of 2 mph heading NE would have a force diagramthat looks like this:
The angle between the bird’s vector and the wind vector is 45◦ which means this is a perfect situation for the Law ofCosines. Let x = the red vector.
x2 = 102 +22−2 ·10 ·2 · cos45◦
x≈ 8.7
The bird is blown slightly off track and travels only about 8.7 miles in one hour.
Vocabulary
A resultant vector is the vector that is produced when two or more vectors are summed or subtracted. It is also whatis produced when a single vector is scaled by a constant.
Scaling a vector means that the components are each multiplied by a common scale factor. For example: 4· <3,2 >=< 12,8 >
Guided Practice
1. Find the magnitude of |~a−~b| from Example A.
2. Consider vector −→v =< 2,5 > and vector −→u =< −1,9 >. Determine the component form of the following:3−→v −2−→u .
319
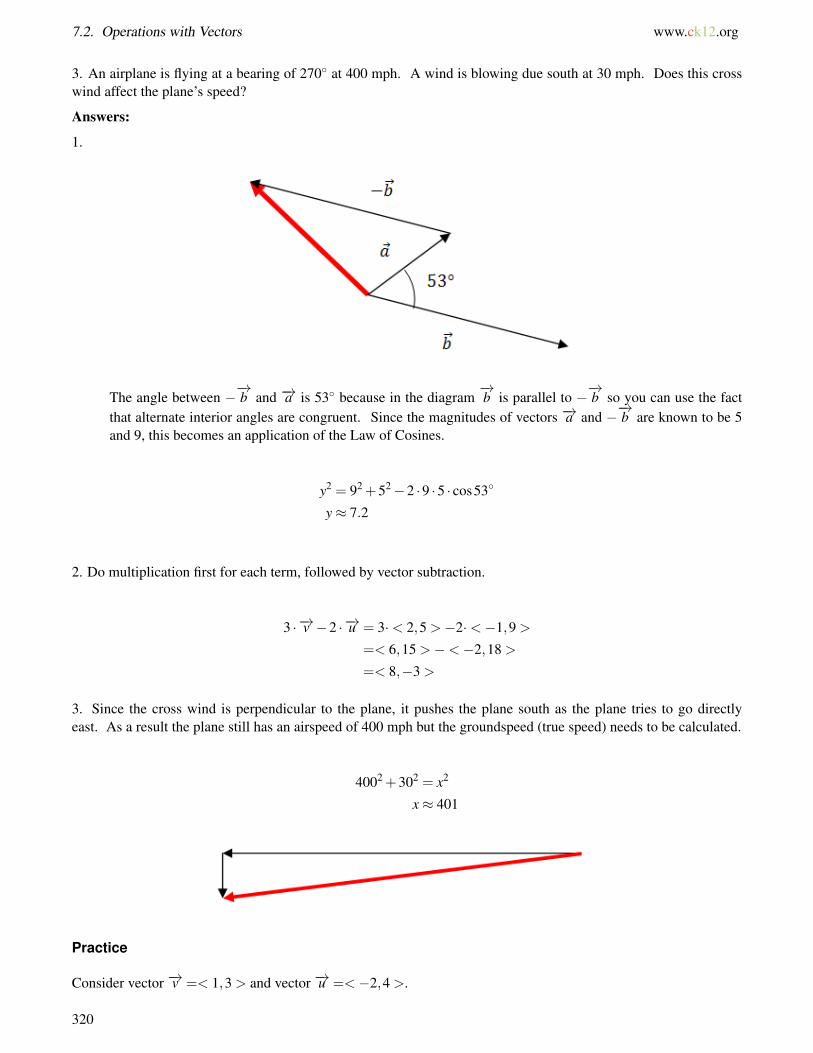
7.2. Operations with Vectors www.ck12.org
3. An airplane is flying at a bearing of 270◦ at 400 mph. A wind is blowing due south at 30 mph. Does this crosswind affect the plane’s speed?
Answers:
1.
The angle between −−→b and −→a is 53◦ because in the diagram
−→b is parallel to −
−→b so you can use the fact
that alternate interior angles are congruent. Since the magnitudes of vectors −→a and −−→b are known to be 5
and 9, this becomes an application of the Law of Cosines.
y2 = 92 +52−2 ·9 ·5 · cos53◦
y≈ 7.2
2. Do multiplication first for each term, followed by vector subtraction.
3 ·−→v −2 ·−→u = 3·< 2,5 >−2·<−1,9 >
=< 6,15 >−<−2,18 >
=< 8,−3 >
3. Since the cross wind is perpendicular to the plane, it pushes the plane south as the plane tries to go directlyeast. As a result the plane still has an airspeed of 400 mph but the groundspeed (true speed) needs to be calculated.
4002 +302 = x2
x≈ 401
Practice
Consider vector −→v =< 1,3 > and vector −→u =<−2,4 >.
320
www.ck12.org Chapter 7. Vectors
1. Determine the component form of 5−→v −2−→u .2. Determine the component form of −2−→v +4−→u .3. Determine the component form of 6−→v +−→u .4. Determine the component form of 3−→v −6−→u .5. Find the magnitude of the resultant vector from #1.6. Find the magnitude of the resultant vector from #2.7. Find the magnitude of the resultant vector from #3.8. Find the magnitude of the resultant vector from #4.9. The vector < 3,4 > starts at the origin. What is the direction of the vector?
10. The vector <−1,2 > starts at the origin. What is the direction of the vector?11. The vector < 3,−4 > starts at the origin. What is the direction of the vector?12. A bird flies due south at 8 miles an hour with a cross headwind blowing due east at 15 miles per hour. How
far does the bird get in one hour?13. What direction is the bird in the previous problem actually moving?14. A football is thrown at 50 miles per hour due north. There is a wind blowing due east at 8 miles per hour. What
is the actual speed of the football?15. What direction is the football in the previous problem actually moving?
321

7.3. Resolution of Vectors into Components www.ck12.org
7.3 Resolution of Vectors into Components
Here you will find unit vectors and you will convert vectors into linear combinations of standard unit vectors andcomponent vectors.
Sometimes working with horizontal and vertical components of a vector can be significantly easier than workingwith just an angle and a magnitude. This is especially true when combining several forces together.
Consider four siblings fighting over a candy in a four way tug of war. Lanie pulls with 8 lb of force at an angleof 41◦. Connie pulls with 10 lb of force at an angle of 100◦. Cynthia pulls with 12 lb of force at an angle of200◦. How much force and in what direction does poor little Terry have to pull the candy so it doesn’t move?
Watch This
MEDIAClick image to the left for more content.
http://www.youtube.com/watch?v=Ect0fBnBlLc James Sousa: The Unit Vector
MEDIAClick image to the left for more content.
http://youtu.be/WZ3xzVHT0mc James Sousa: Find the Component Form of a Vector Given Magnitude and Direc-tion
Guidance
A unit vector is a vector of length one. Sometimes you might wish to scale a vector you already have so that it hasa length of one. If the length was five, you would scale the vector by a factor of 1
5 so that the resulting vector has
magnitude of 1. Another way of saying this is that a unit vector in the direction of vector→v is
−→v|−→v | .
322

www.ck12.org Chapter 7. Vectors
There are two standard unit vectors that make up all other vectors in the coordinate plane. They are−→i which is
the vector < 1,0 > and−→j which is the vector < 0,1 >. These two unit vectors are perpendicular to each other. A
linear combination of−→i and
−→j will allow you to uniquely describe any other vector in the coordinate plane. For
instance the vector < 5,3 > is the same as 5−→i +3
−→j .
Often vectors are initially described as an angle and a magnitude rather than in component form. Working with vec-tors written as an angle and magnitude requires extremely precise geometric reasoning and excellent pictures. Oneadvantage of rewriting the vectors in component form is that much of this work is simplified.
Example A
A plane has a bearing of 60◦ and is going 350 mph. Find the component form of the velocity of the airplane.
Solution: A bearing of 60◦ is the same as a 30◦ on the unit circle which corresponds to the point(√
32 , 1
2
). When
written as a vector <√
32 , 1
2 > is a unit vector because it has magnitude 1. Now you just need to scale by a factorof 350 and you get your answer of < 175
√3,175 >.
Example B
Consider the plane flying in Example A. If there is wind blowing with the bearing of 300◦ at 45 mph, what is thecomponent form of the total velocity of the airplane?
Solution: A bearing of 300◦ is the same as 150◦ on the unit circle which corresponds to the point(−√
32 , 1
2
). You
can now write and then scale the wind vector.
45·<−√
32 , 1
2 >=<−45√
32 , 45
2 >
Since both the wind vector and the velocity vector of the airplane are written in component form, you can simplysum them to find the component vector of the total velocity of the airplane.
< 175√
3,175 >+<−45√
32 , 45
2 >=< 305√
32 , 395
2 >
Example C
Consider the plane and wind in Example A and Example B. Find the actual ground speed and direction of the plane(as a bearing).
Solution: Since you already know the component vector of the total velocity of the airplane, you should rememberthat these components represent an x distance and a y distance and the question asks for the hypotenuse.
323

7.3. Resolution of Vectors into Components www.ck12.org
(305√
32
)2
+
(395
2
)2
= c2
329.8≈ c
The airplane is traveling at about 329.8 mph.
Since you know the x and y components, you can use tangent to find the angle. Then convert this angle into bearing.
tanθ =
(3952
)(305√
32
)θ≈ 36.8◦
An angle of 36.8◦ on the unit circle is equivalent to a bearing of 53.2◦.
Note that you can do the entire problem in bearing by just switching sine and cosine, but it is best to truly understandwhat you are doing every step of the way and this will probably involve always going back to the unit circle.
Concept Problem Revisited
Consider four siblings fighting over a candy in a four way tug of war. Lanie pulls with 8 lb of force at an angleof 41◦. Connie pulls with 10 lb of force at an angle of 100◦. Cynthia pulls with 12 lb of force at an angle of200◦. How much force and in what direction does poor little Terry have to pull the candy so it doesn’t move?
To add the three vectors together would require several iterations of the Law of Cosines. Instead, write each vectorin component form and set equal to a zero vector indicating that the candy does not move.
324
www.ck12.org Chapter 7. Vectors
−→L +−−→CON +
−−→CY N +
−→T =< 0,0 >
< 8 · cos41◦,8 · sin41◦ >+< 10 · cos100◦,10 · sin100◦ >
+< 12 · cos200◦,12 · sin200◦ >+−→T =< 0,0 >
Use a calculator to add all the x components and bring them to the far side and the y components and then subtractfrom the far side to get:
−→T ≈< 6.98,−10.99 >
Turning this component vector into an angle and magnitude yields how hard and in what direction he would have topull. Terry will have to pull with about 13 lb of force at an angle of 302.4◦.
Vocabulary
A unit vector is a vector of magnitude one.
Component form means in the form < x,y >. To translate from magnitude r and direction θ, use the relationship< r · cosθ,r · sinθ >=< x,y >.
The standard unit vectors are−→i which is the vector < 1,0 > and
−→j which is the vector < 0,1 >.
A linear combination of vectors −→u and −→v means a multiple of one plus a multiple of the other.
Guided Practice
−→v =< 2,−5 >,−→u =<−3,2 >,−→t =<−4,−3 >,−→r =< 5,y >
B = (4,−5),P = (−3,8)
1. Solve for y in vector −→r to make −→r perpendicular to −→t .
2. Find the unit vectors in the same direction as −→u and −→t .
3. Find the point 10 units away from B in the direction of P.
Answers:
1. −→t has slope 34 which means that −→r must have slope −4
3 . A vector’s slope is found by putting the y componentover the x component just like with rise
run .
y5=−4
3
y =−203
2. To find a unit vector, divide each vector by its magnitude.−→u|−→u | =< −3√
13, 2√
13>,−→t|−→t |
=< −45 , −3
5 >
325
7.3. Resolution of Vectors into Components www.ck12.org
3. The vector−→BP is <−7,13 >. First take the unit vector and then scale it so it has a magnitude of 10.
BP|BP|
=<−7√218
,13√218
>
10 · BP|BP|
=<−70√
218,
130√218
>
You end up with a vector that is ten units long in the right direction. The question asked for a point from B whichmeans you need to add this vector to point B.
(4,−5)+< −70√218
, 130√218
>≈ (−0.74,3.8)
Practice
−→v =< 1,−3 >,−→u =< 2,5 >,−→t =< 9,−1 >,−→r =< 2,y >
A = (−3,2),B = (5,−2)
1. Solve for y in vector −→r to make −→r perpendicular to −→t .
2. Find the unit vector in the same direction as −→u .
3. Find the unit vector in the same direction as −→t .
4. Find the unit vector in the same direction as −→v .
5. Find the unit vector in the same direction as −→r .
6. Find the point exactly 3 units away from A in the direction of B.
7. Find the point exactly 6 units away from B in the direction of A.
8. Find the point exactly 5 units away from A in the direction of B.
9. Jack and Jill went up a hill to fetch a pail of water. When they got to the top of the hill, they were very thirsty sothey each pulled on the bucket. Jill pulled at 30◦ with 20 lbs of force. Jack pulled at 45◦ with 28 lbs of force. Whatis the resulting vector for the bucket?
10. A plane is flying on a bearing of 60◦ at 400 mph. Find the component form of the velocity of the plane. Whatdoes the component form tell you?
11. A baseball is thrown at a 70◦ angle with the horizontal with an initial speed of 30 mph. Find the componentform of the initial velocity.
12. A plane is flying on a bearing of 200◦ at 450 mph. Find the component form of the velocity of the plane.
13. A plane is flying on a bearing of 260◦ at 430 mph. At the same time, there is a wind blowing at a bearingof 30◦ at 60 mph. What is the component form of the velocity of the plane?
14. Use the information from the previous problem to find the actual ground speed and direction of the plane.
15. Wind is blowing at a magnitude of 40 mph with an angle of 25◦ with respect to the east. What is the velocity ofthe wind blowing to the north? What is the velocity of the wind blowing to the east?
326
www.ck12.org Chapter 7. Vectors
7.4 Dot Product and Angle Between Two Vec-tors
Here you will compute the dot product between two vectors and interpret its meaning.
While two vectors cannot be strictly multiplied like numbers can, there are two different ways to find the productbetween two vectors. The cross product between two vectors results in a new vector perpendicular to the other twovectors. You can study more about the cross product between two vectors when you take Linear Algebra. Thesecond type of product is the dot product between two vectors which results in a regular number. This numberrepresentshow much of one vector goes in the direction of the other. In one sense, it indicates how much the twovectors agree with each other. This concept will focus on the dot product between two vectors.
What is the dot product between <−1,1 > and < 4,4 >? What does the result mean?
Watch This
Watch the portion of this video focusing on the dot product:
MEDIAClick image to the left for more content.
http://www.youtube.com/watch?v=EYIxFJXoUvA James Sousa: Vector Operations
Guidance
The dot product is defined as:
u · v =< u1,u2 > ·< v1,v2 >= u1v1 +u2v2
This procedure states that you multiply the corresponding values and then sum the resulting products. It can workwith vectors that are more than two dimensions in the same way.
Before trying this procedure with specific numbers, look at the following pairs of vectors and relative estimates oftheir dot product.
327
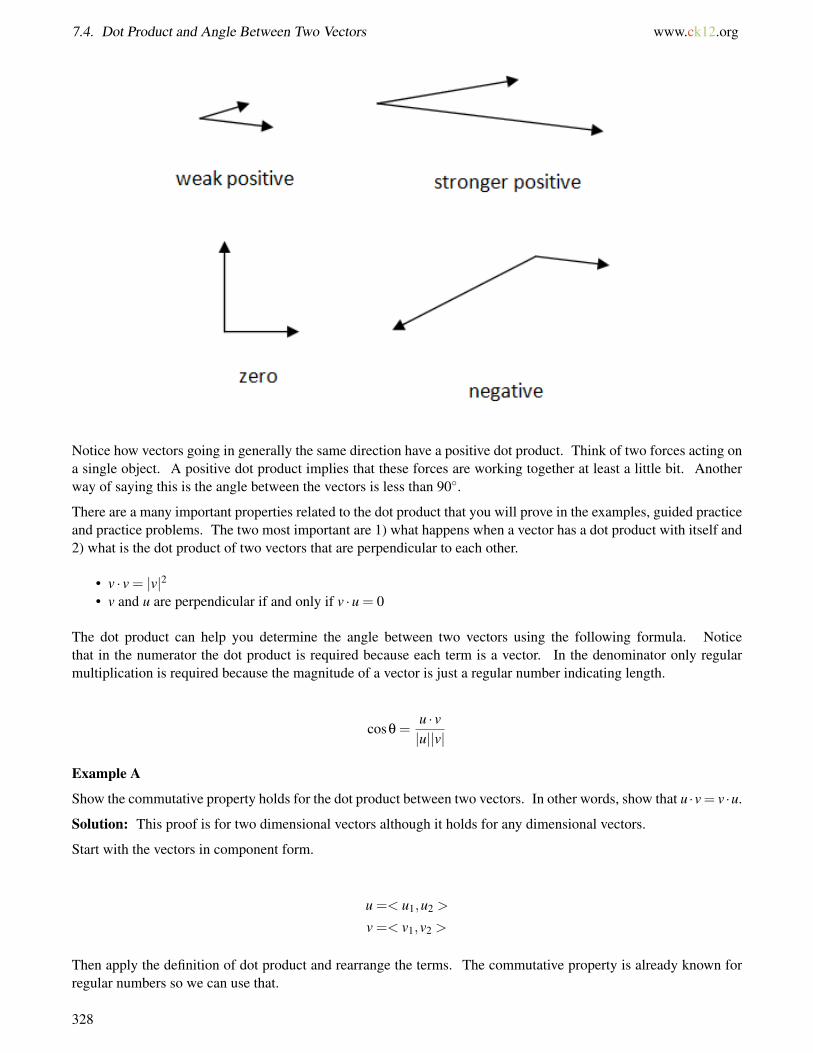
7.4. Dot Product and Angle Between Two Vectors www.ck12.org
Notice how vectors going in generally the same direction have a positive dot product. Think of two forces acting ona single object. A positive dot product implies that these forces are working together at least a little bit. Anotherway of saying this is the angle between the vectors is less than 90◦.
There are a many important properties related to the dot product that you will prove in the examples, guided practiceand practice problems. The two most important are 1) what happens when a vector has a dot product with itself and2) what is the dot product of two vectors that are perpendicular to each other.
• v · v = |v|2• v and u are perpendicular if and only if v ·u = 0
The dot product can help you determine the angle between two vectors using the following formula. Noticethat in the numerator the dot product is required because each term is a vector. In the denominator only regularmultiplication is required because the magnitude of a vector is just a regular number indicating length.
cosθ =u · v|u||v|
Example A
Show the commutative property holds for the dot product between two vectors. In other words, show that u ·v= v ·u.
Solution: This proof is for two dimensional vectors although it holds for any dimensional vectors.
Start with the vectors in component form.
u =< u1,u2 >
v =< v1,v2 >
Then apply the definition of dot product and rearrange the terms. The commutative property is already known forregular numbers so we can use that.
328
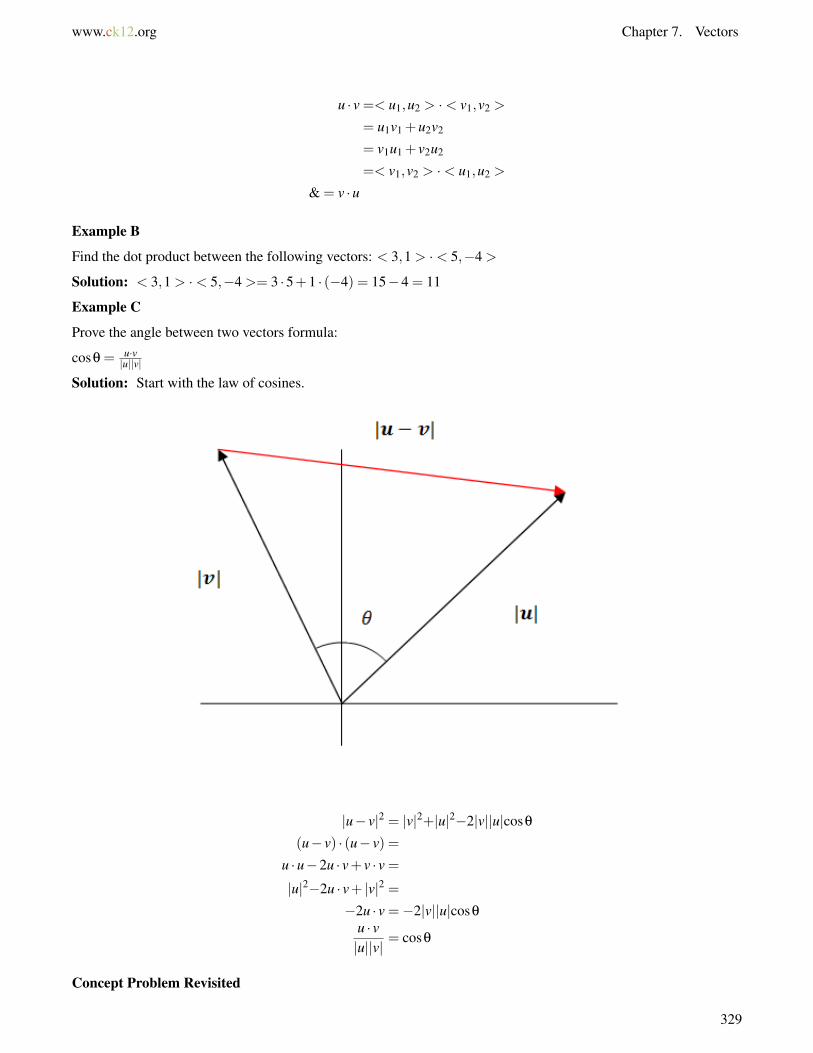
www.ck12.org Chapter 7. Vectors
u · v =< u1,u2 > ·< v1,v2 >
= u1v1 +u2v2
= v1u1 + v2u2
=< v1,v2 > ·< u1,u2 >
& = v ·u
Example B
Find the dot product between the following vectors: < 3,1 > ·< 5,−4 >
Solution: < 3,1 > ·< 5,−4 >= 3 ·5+1 · (−4) = 15−4 = 11
Example C
Prove the angle between two vectors formula:
cosθ = u·v|u||v|
Solution: Start with the law of cosines.
|u− v|2 = |v|2+|u|2−2|v||u|cosθ
(u− v) · (u− v) =
u ·u−2u · v+ v · v =|u|2−2u · v+ |v|2 =
−2u · v =−2|v||u|cosθ
u · v|u||v|
= cosθ
Concept Problem Revisited
329

7.4. Dot Product and Angle Between Two Vectors www.ck12.org
The dot product between the two vectors <−1,1 > and < 4,4 > can be computed as:
(−1)(4)+1(4) =−4+4 = 0
The result of zero makes sense because these two vectors are perpendicular to each other.
Vocabulary
The dot product is also known as inner product and scalar product. It is one of two kinds of products takenbetween vectors. It produces a number that can be interpreted to tell how much one vector goes in the direction ofthe other.
Guided Practice
1. Show the distributive property holds under the dot product.
u · (v+w) = uv+uw
2. Find the dot product between the following vectors.
(4i−2 j) · (3i−8 j)
3. What is the angle between v =< 3,5 > and u =< 2,8 >?
Answers:
1. This proof will work with two dimensional vectors although the property does hold in general.
u =< u1,u2 >,v =< v1,v2 >,w =< w1,w2 >
u · (v+w) = u · (< v1,v2 >+< w1,w2 >)
= u·< v1 +w1,v2 +w2 >
=< u1,u2 > ·< v1 +w1,v2 +w2 >
= u1(v1 +w1)+u2(v2 +w2)
= u1v1 +u1w1 +u2v2 +u2w2
= u1v1 +u2v2 +u1w1 +u2w2
= u · v+ v ·w
2. The standard unit vectors can be written as component vectors.
< 4,−2 > ·< 3,−8 >= 12+(−2)(−8) = 12+16 = 28
3. Use the angle between two vectors formula.
v =< 3,5 > and u =< 2,8 >
330
www.ck12.org Chapter 7. Vectors
u · v|u||v|
= cosθ
< 3,5 > ·< 2,8 >√34 ·√
68= cosθ
6+35√34 ·√
68= cosθ
cos−1(
41√34 ·√
68
)= θ
31.49≈ θ
Practice
Find the dot product for each of the following pairs of vectors.
1. < 2,6 > ·<−3,5 >
2. < 5,−1 > ·< 4,4 >
3. <−3,−4 > ·< 2,2 >
4. < 3,1 > ·< 6,3 >
5. <−1,4 > ·< 2,9 >
Find the angle between each pair of vectors below.
6. < 2,6 > ·<−3,5 >
7. < 5,−1 > ·< 4,4 >
8. <−3,−4 > ·< 2,2 >
9. < 3,1 > ·< 6,3 >
10. <−1,4 > ·< 2,9 >
11. What is v · v?
12. How can you use the dot product to find the magnitude of a vector?
13. What is 0 · v?
14. Show that (cu) · v = u · (cv) where c is a constant.
15. Show that < 2,3 > is perpendicular to < 1.5,−1 >.
331
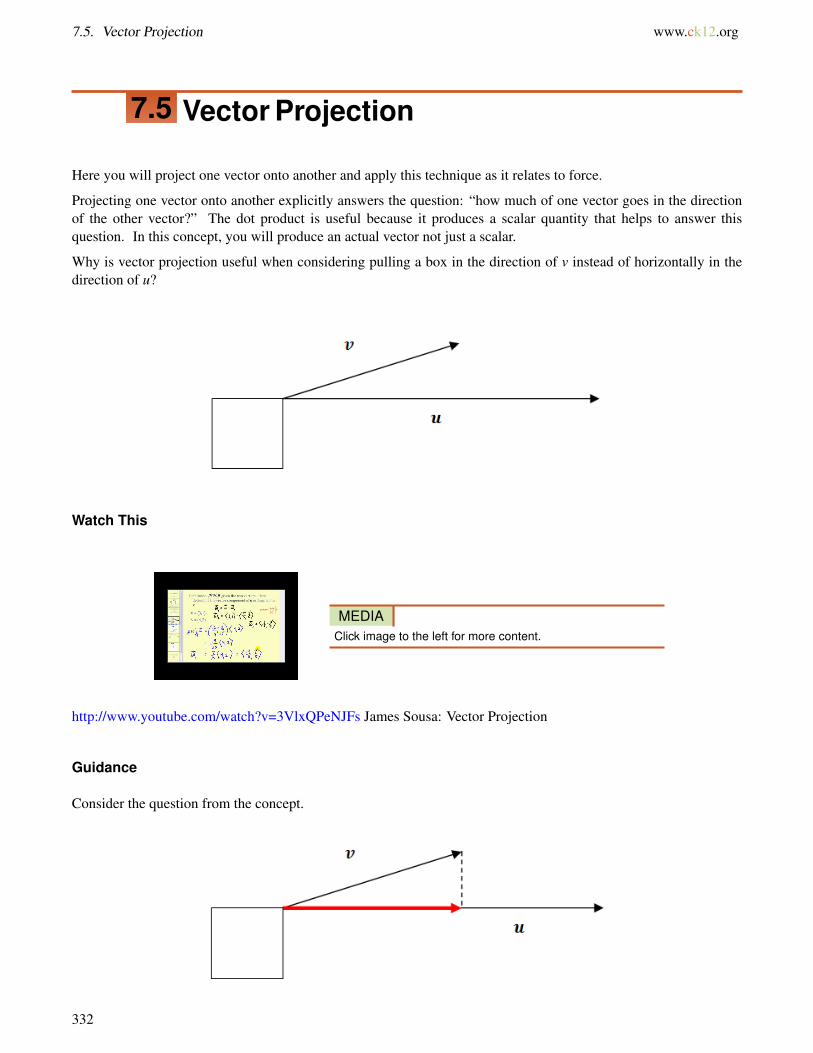
7.5. Vector Projection www.ck12.org
7.5 Vector Projection
Here you will project one vector onto another and apply this technique as it relates to force.
Projecting one vector onto another explicitly answers the question: “how much of one vector goes in the directionof the other vector?” The dot product is useful because it produces a scalar quantity that helps to answer thisquestion. In this concept, you will produce an actual vector not just a scalar.
Why is vector projection useful when considering pulling a box in the direction of v instead of horizontally in thedirection of u?
Watch This
MEDIAClick image to the left for more content.
http://www.youtube.com/watch?v=3VlxQPeNJFs James Sousa: Vector Projection
Guidance
Consider the question from the concept.
332

www.ck12.org Chapter 7. Vectors
The definition of vector projection for the indicated red vector is the called pro juv. When you read pro juv youshould say “the vector projection of v onto u.” This implies that the new vector is going in the direction of u. Con-ceptually, this means that if someone was pulling the box at an angle and strength of vector v then some of theirenergy would be wasted pulling the box up and some of the energy would actually contribute to pulling the boxhorizontally.
The definition of scalar projection is simply the length of the vector projection. When the scalar projection ispositive it means that the angle between the two vectors is less than 90◦. When the scalar projection is negative itmeans that the two vectors are heading in opposite directions.
The vector projection formula can be written two ways. The version on the left is most simplified, but the versionon the right makes the most sense conceptually. The proof is demonstrated in Example A.
pro juv =(
v·u|u|2
)u =
(v·u|u|
)u|u|
Example A
Prove the vector projection formula.
Solution: Given two vectors u,v, what is pro juv?
First note that the projected vector in red will go in the direction of u. This means that it will be a product of theunit vector u
|u| and the length of the red vector (the scalar projection). In order to find the scalar projection, note theright triangle, the unknown angle θ between the two vectors and the cosine ratio.
cosθ = scalar pro jection|v|
Recall that cosθ = u·v|u||v| . Now just substitute and simplify to find the length of the scalar projection.
cosθ =scalar pro jection
|v|u · v|u||v|
=scalar pro jection
|v|u · v|u|
= scalar pro jection
Now you have the length of the vector projection and the direction you want it to go:
pro juv =(
u·v|u|
)u|u|
Example B
Find the scalar projection of vector v =< 3,4 > onto vector u =< 5,−12 >.
Solution: As noted in Example A, the scalar projection is the magnitude of the vector projection. This was shownto be
(u·v|u|
)where u is the vector being projected onto.
u·v|u| =
<5,−12>·<3,4>13 = 15−48
13 =−3313
333

7.5. Vector Projection www.ck12.org
Example C
Find the vector projection of vector v =< 3,4 > onto vector u =< 5,−12 >
Solution: Since the scalar projection has already been found in Example B, you should multiply the scalar by the“onto” unit vector.
−3313 < 5
13 ,−1213 >=<−165
169 ,396169 >
Concept Problem Revisited
Vector projection is useful in physics applications involving force and work.
When the box is pulled by vector v some of the force is wasted pulling up against gravity. In real life this may beuseful because of friction, but for now this energy is inefficiently wasted in the horizontal movement of the box.
Vocabulary
The vector projection is the vector produced when one vector is resolved into two component vectors, one that isparallel to the second vector and one that is perpendicular to the second vector. The parallel vector is the vectorprojection.
The scalar projection is the length of the vector projection. When the scalar projection is negative it means that thetwo vectors are heading in opposite directions and the angle between the vectors is greater than 90◦.
Guided Practice
1. Sketch vectors < 1,3 > and < 5,2 >. What is the vector projection of < 1,3 > onto < 5,2 >? Sketch theprojection.
2. Sketch the vector < −2,−2 > and < 4,−2 >. Explain using a sketch why a negative scalar projection of<−2,−2 > onto < 4,−2 > makes sense.
3. A father is pulling his daughter up a hill. The hill has a 20◦ incline. The daughter is on a sled that sits on theground and has a rope that the father pulls with a force of 100 lb as he walks. The rope makes a 39◦ angle with theslope. What is the effective force that the father exerts moving his daughter and the sled up the hill?
Answers:
1.
334
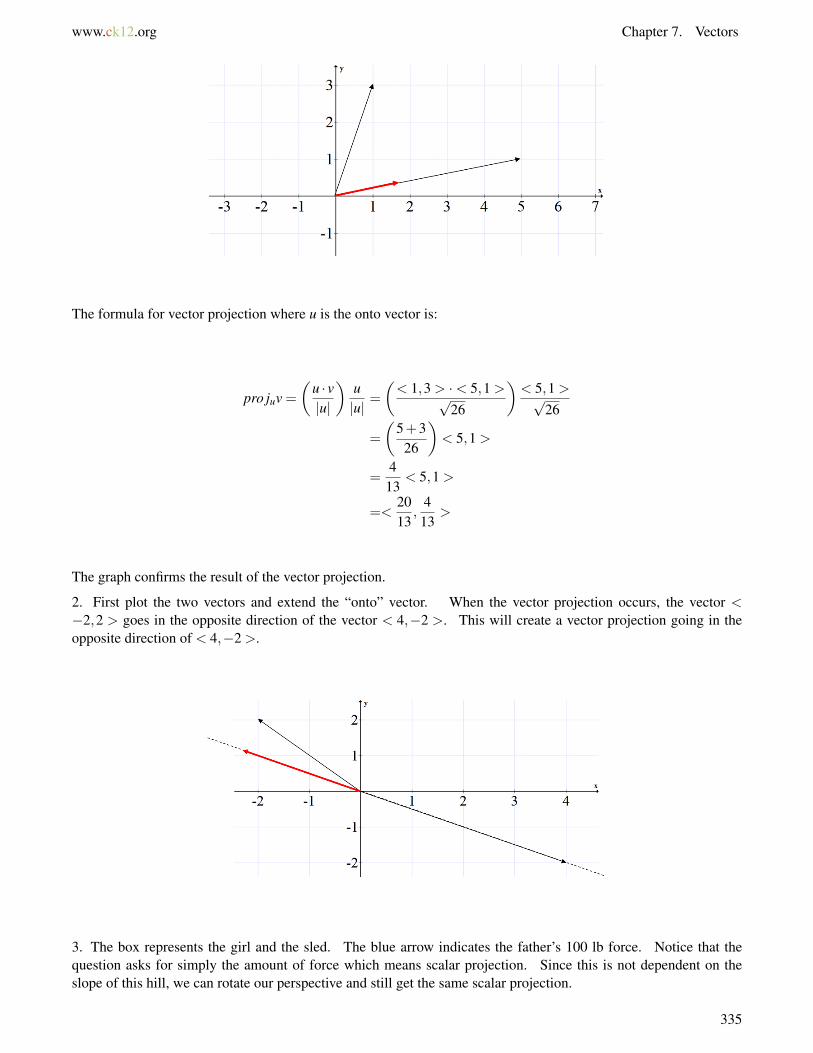
www.ck12.org Chapter 7. Vectors
The formula for vector projection where u is the onto vector is:
pro juv =(
u · v|u|
)u|u|
=
(< 1,3 > ·< 5,1 >√
26
)< 5,1 >√
26
=
(5+3
26
)< 5,1 >
=413
< 5,1 >
=<2013
,413
>
The graph confirms the result of the vector projection.
2. First plot the two vectors and extend the “onto” vector. When the vector projection occurs, the vector <−2,2 > goes in the opposite direction of the vector < 4,−2 >. This will create a vector projection going in theopposite direction of < 4,−2 >.
3. The box represents the girl and the sled. The blue arrow indicates the father’s 100 lb force. Notice that thequestion asks for simply the amount of force which means scalar projection. Since this is not dependent on theslope of this hill, we can rotate our perspective and still get the same scalar projection.
335

7.5. Vector Projection www.ck12.org
The components of the father’s force vector is 100 < cos39◦,sin39◦ > and the “onto” vector is any vector horizon-tally to the right. Since we are only looking for the length of the horizontal component and you already have theangle between the two vectors, the scalar projection is:
100 · cos39◦ ≈ 77.1 lb
Practice
1. Sketch vectors < 2,4 > and < 2,1 >.
2. What is the vector projection of < 2,4 > onto < 2,1 >? Sketch the projection.
3. Sketch vectors <−2,1 > and <−1,3 >.
4. What is the vector projection of <−1,3 > onto <−2,1 >? Sketch the projection.
5. Sketch vectors < 6,2 > and < 8,1 >.
6. What is the vector projection of < 6,2 > onto < 8,1 >? Sketch the projection.
7. Sketch vectors < 1,7 > and < 6,3 >.
8. What is the vector projection of < 1,7 > onto < 6,3 >? Sketch the projection.
9. A box is on the side of a hill inclined at 30◦. The weight of the box is 40 pounds. What is the magnitude of theforce required to keep the box from sliding down the hill?
10. Sarah is on a sled on the side of a hill inclined at 60◦. The weight of Sarah and the sled is 125 pounds. What isthe magnitude of the force required for Sam to keep Sarah from sliding down the hill.
11. A 1780 pound car is parked on a street that makes an angle of 15◦ with the horizontal. Find the magnitude ofthe force required to keep the car from rolling down the hill.
12. A 1900 pound car is parked on a street that makes an angle of 10◦ with the horizontal. Find the magnitude ofthe force required to keep the car from rolling down the hill.
13. A 30 pound force that makes an angle of 32◦ with an inclined plane is pulling a box up the plane. The inclinedplane makes a 20◦ angle with the horizontal. What is the magnitude of the effective force pulling the box up theplane?
336

www.ck12.org Chapter 7. Vectors
14. A 22 pound force that makes an angle of 12◦ with an inclined plane is pulling a box up the plane. The inclinedplane makes a 25◦ angle with the horizontal. What is the magnitude of the effective force pulling the box up theplane?
15. Anne pulls a wagon on a horizontal surface with a force of 50 pounds. The handle of the wagon makes an angleof 30◦ with the ground. What is the magnitude of the effective force pulling the wagon?
You learned that you can add and subtract vectors just like you can numbers. You saw that vectors also have otheralgebraic properties and essentially create an entirely new algebraic structure. There are two ways the product ofvectors can be taken and you studied one way called the dot product. Lastly, you learned to calculate how much ofone vector goes into the direction of another vector.
337
7.6. References www.ck12.org
7.6 References
1. CK-12 Foundation. . CCSA2. CK-12 Foundation. . CCSA3. CK-12 Foundation. . CCSA4. CK-12 Foundation. . CCSA5. CK-12 Foundation. . CCSA6. CK-12 Foundation. . CCSA7. CK-12 Foundation. . CCSA8. CK-12 Foundation. . CCSA9. CK-12 Foundation. . CCSA
10. CK-12 Foundation. . CCSA11. CK-12 Foundation. . CCSA12. CK-12 Foundation. . CCSA13. CK-12 Foundation. . CCSA14. CK-12 Foundation. . CCSA15. CK-12 Foundation. . CCSA16. CK-12 Foundation. . CCSA17. CK-12 Foundation. . CCSA18. CK-12 Foundation. . CCSA19. CK-12 Foundation. . CCSA20. CK-12 Foundation. . CCSA21. CK-12 Foundation. . CCSA22. CK-12 Foundation. . CCSA23. CK-12 Foundation. . CCSA24. CK-12 Foundation. . CCSA25. CK-12 Foundation. . CCSA26. CK-12 Foundation. . CCSA27. CK-12 Foundation. . CCSA
338
www.ck12.org Chapter 8. Systems and Matrices
CHAPTER 8 Systems and MatricesChapter Outline
8.1 SYSTEMS OF TWO EQUATIONS AND TWO UNKNOWNS
8.2 SYSTEMS OF THREE EQUATIONS AND THREE UNKNOWNS
8.3 MATRICES TO REPRESENT DATA
8.4 MATRIX ALGEBRA
8.5 ROW OPERATIONS AND ROW ECHELON FORMS
8.6 AUGMENTED MATRICES
8.7 DETERMINANT OF MATRICES
8.8 CRAMER’S RULE
8.9 INVERSE MATRICES
8.10 PARTIAL FRACTIONS
8.11 REFERENCES
You have solved systems of equations in Algebra 1 and Algebra 2 using methods such as substitution and elimina-tion. These ideas can be extended and improved upon using matrices, which are an array of numbers.
339
8.1. Systems of Two Equations and Two Unknowns www.ck12.org
8.1 Systems of Two Equations and Two Un-knowns
Here you will review how to solve a system of two equations and two unknowns using the elimination method.
The cost of two cell phone plans can be written as a system of equations based on the number of minutes used andthe base monthly rate. As a consumer, it would be useful to know when the two plans cost the same and when isone plan cheaper.
Plan A costs $40 per month plus $0.10 for each minute of talk time.
Plan B costs $25 per month plus $0.50 for each minute of talk time.
Plan B has a lower starting cost, but since it costs more per minute, it may not be the right plan for someone wholikes to spend a lot of time on the phone. When do the two plans cost the same amount?
Watch This
MEDIAClick image to the left for more content.
http://www.youtube.com/watch?v=ova8GSmPV4o James Sousa: Solving Systems of Equations by Elimination
Guidance
There are many ways to solve a system that you have learned in the past including substitution and graphicalintersection. Here you will focus on solving using elimination because the knowledge and skills used will transferdirectly into using matrices.
When solving a system, the first thing to do is to count the number of variables that are missing and the number ofequations. The number of variables needs to be the same or fewer than the number of equations. Two equationsand two variables can be solved, but one equation with two variables cannot.
Get into the habit of always writing systems in standard form: Ax+By =C. This will help variables line up, avoid+/- errors and lay the groundwork for using matrices. Once two equations with two variables are in standard form,decide which variable you want to eliminate, scale each equation as necessary by multiplying through by constantsand then add the equations together. This procedure should reduce both the number of equations and the number ofvariables leaving one equation and one variable. Solve and substitute to determine the value of the second variable.
Example A
Solve the following system of equations: 5x+12y = 72 and 3x−2y = 18.
Solution: Here is a system of two equations and two variables in standard form. Notice that there is an x columnand a y column on the left hand side and a constant column on the right hand side when you rewrite the equations asshown. Also notice that if you add the system as written no variable will be eliminated.
Equation 1: 5x+12y = 72
340
www.ck12.org Chapter 8. Systems and Matrices
Equation 2: 3x−2y = 18
Strategically choose to eliminate y by scaling the second equation by 6 so that the coefficient of y will match at 12and -12.
5x+12y = 72
18x−12y = 108
Add the two equations:
23x = 180
x =18023
The value for x could be substituted into either of the original equations and the result could be solved for y; however,since the value is a fraction it will be easier to repeat the elimination process in order to solve for x. This time youwill take the first two equations and eliminate x by making the coefficients of x to be 15 and -15. Scale the firstequation by a factor of 3 and scale the second equation by a factor of -5.
Equation 1: 15x+36y = 216
Equation 2: −15x+10y =−90
Adding the two equations:
0x+46y = 126
y =12646
=6323
The point(180
23 ,6323
)is where these two lines intersect.
Example B
Solve the following system of equations:
6x−7y = 8
15x−14y = 21
Solution: Scaling the first equation by -2 will allow the y term to be eliminated when the equations are summed.
−12x+14y =−16
15x−14y = 21
The sum is:
3x = 5
x =53
341

8.1. Systems of Two Equations and Two Unknowns www.ck12.org
You can substitute x into the first equation to solve for y.
6 · 53−7y = 8
10−7y = 8
−7y =−2
y =27
The point(5
3 ,27
)is where these two lines intersect.
Example C
Solve the following system of equations:
5 · 1x+2 · 1
y= 11
1x+
1y= 4
Solution: The strategy of elimination still applies. You can eliminate the 1y term if the second equation is scaled by
a factor of -2.
5 · 1x+2 · 1
y= 11
−2 · 1x−2 · 1
y=−8
Add the equations together and solve for x.
−3 · 1x+0 · 1
y= 3
−3 · 1x= 3
1x=−1
x =−1
Substitute into the second equation and solve for y.
1−1
+1y= 4
−1+1y= 4
1y= 5
y =15
342
www.ck12.org Chapter 8. Systems and Matrices
The point(−1, 1
5
)is the point of intersection between these two curves.
Concept Problem Revisited
Plan A costs $40 per month plus $0.10 for each minute of talk time.
Plan B costs $25 per month plus $0.50 for each minute of talk time.
If you want to find out when the two plans cost the same, you can represent each plan with an equation and solve thesystem of equations. Let y represent cost and x represent number of minutes.
y = 0.10x+40
y = 0.50x+25
First you put these equations in standard form.
x−10y =−400
x−2y =−50
Then you scale the second equation by -1 and add the equations together and solve for y.
−8y =−350
y = 43.75
To solve for x, you can scale the second equation by -5, add the equations together and solve for x.
−4x =−150
x = 37.5
The equivalent costs of plan A and plan B will occur at 37.5 minutes of talk time with a cost of $43.75.
Vocabulary
A system of equations is two or more equations.
Standard form for the equation of a line is Ax+By =C.
To scale an equation means to multiply every term by a constant.
Guided Practice
1. Solve the following system using elimination:
20x+6y =−32
18x−14y = 10
343
8.1. Systems of Two Equations and Two Unknowns www.ck12.org
2. Solve the following system using elimination:
5x− y = 22
−2x+7y = 19
3. Solve the following system using elimination:
11 · 1x−5 · 1
y=−38
9 · 1x+2 · 1
y=−25
Answers:
1. Start by scaling both of the equations by 12 . Then notice that you have 3y and −7y. Rescale the first equation by
7 and the second equation by 3 to make the coefficients of y at 21 and -21. There are a number of possible ways toeliminate y.
70x+21y =−112
27x−21y = 15
Add, solve for x =−1, substitute and solve for y.
Final Answer: (-1, -2)
2. Start by scaling the first equation by 7 and notice that the y coefficient will immediately be eliminated when theequations are summed.
35x−7y = 154
−2x+7y = 19
Add, solve for x = 17333 . Instead of substituting, practice eliminating x by scaling the first equation by 2 and the
second equation by 5.
10x−2y = 44
−10x+35y = 95
Add, solve for y.
Final Answer:(173
33 ,13933
)3. To eliminate 1
y , scale the first equation by 2 and the second equation by 5.
To eliminate 1x , scale the first equation by -9 and the second equation by 11.
Final Answer:(−1
3 ,1)
344

www.ck12.org Chapter 8. Systems and Matrices
Practice
Solve each system of equations using the elimination method.
1. x+ y =−4;−x+2y = 13
2. 32 x− 1
2 y = 12 ;−4x+2y = 4
3. 6x+15y = 1;2x− y = 19
4. x− 2y3 = −2
3 ;5x−2y = 10
5. −9x−24y =−243; 12 x+ y = 21
2
6. 5x+ 283 y = 176
3 ;y+ x = 10
7. 2x−3y = 50;7x+8y =−10
8. 2x+3y = 1;2y =−3x+14
9. 2x+ 35 y = 3; 3
2 x− y =−5
10. 5x = 9−2y;3y = 2x−3
11. How do you know if a system of equations has no solution?
12. If a system of equations has no solution, what does this imply about the relationship of the curves on the graph?
13. Give an example of a system of two equations with two unknowns with an infinite number of solutions. Explainhow you know the system has an infinite number of solutions.
14. Solve:
12 · 1x−18 · 1
y= 4
8 · 1x+9 · 1
y= 5
15. Solve:
14 · 1x−5 · 1
y=−3
7 · 1x+2 · 1
y= 3
345

8.2. Systems of Three Equations and Three Unknowns www.ck12.org
8.2 Systems of Three Equations and Three Un-knowns
Here you will extend your knolwedge of systems of equations to three equations and three unknowns.
Later, you will learn about matrices and how to row reduce which will allow you to solve systems of equations ina new way. In order to set you up so that using matrices is logical and helpful, it is important to first solve a fewsystems of three equations using a very specific type of variable elimination.
When solving systems, what are you allowed to do to each equation?
Watch This
MEDIAClick image to the left for more content.
http://youtu.be/3RbVSvvRyeI James Sousa: Ex 1: System of Three Equations with Three Unknowns Using Elimi-nation
Guidance
A system of three equations with three unknowns represents three planes in three dimensional space. When solvingthe system, you are figuring out how the planes intersect. It is possible that the three planes could intersect in apoint:
It is also possible for two or more planes to be parallel or each pair of planes to intersect in a line. In either of thesecases the three planes do not intersect at a single point and the system is said to have no solution. If the three planesintersect at a line or a plane, there are an infinite number of solutions.
346
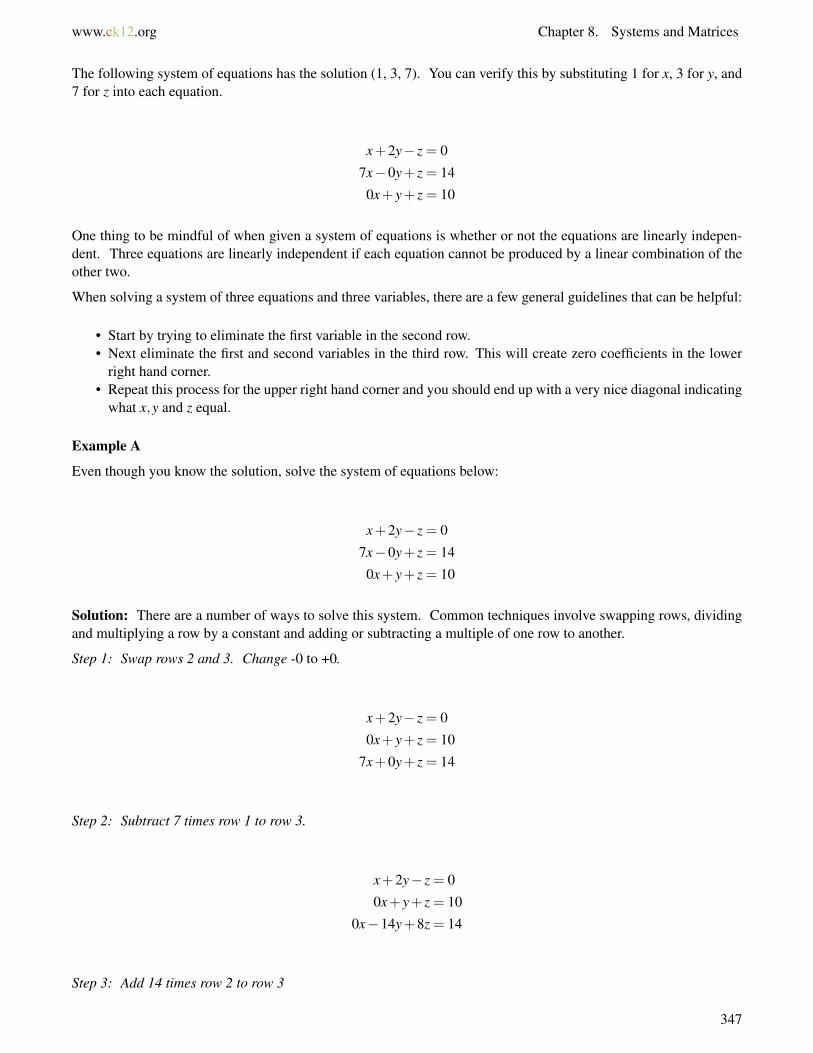
www.ck12.org Chapter 8. Systems and Matrices
The following system of equations has the solution (1, 3, 7). You can verify this by substituting 1 for x, 3 for y, and7 for z into each equation.
x+2y− z = 0
7x−0y+ z = 14
0x+ y+ z = 10
One thing to be mindful of when given a system of equations is whether or not the equations are linearly indepen-dent. Three equations are linearly independent if each equation cannot be produced by a linear combination of theother two.
When solving a system of three equations and three variables, there are a few general guidelines that can be helpful:
• Start by trying to eliminate the first variable in the second row.• Next eliminate the first and second variables in the third row. This will create zero coefficients in the lower
right hand corner.• Repeat this process for the upper right hand corner and you should end up with a very nice diagonal indicating
what x,y and z equal.
Example A
Even though you know the solution, solve the system of equations below:
x+2y− z = 0
7x−0y+ z = 14
0x+ y+ z = 10
Solution: There are a number of ways to solve this system. Common techniques involve swapping rows, dividingand multiplying a row by a constant and adding or subtracting a multiple of one row to another.
Step 1: Swap rows 2 and 3. Change -0 to +0.
x+2y− z = 0
0x+ y+ z = 10
7x+0y+ z = 14
Step 2: Subtract 7 times row 1 to row 3.
x+2y− z = 0
0x+ y+ z = 10
0x−14y+8z = 14
Step 3: Add 14 times row 2 to row 3
347
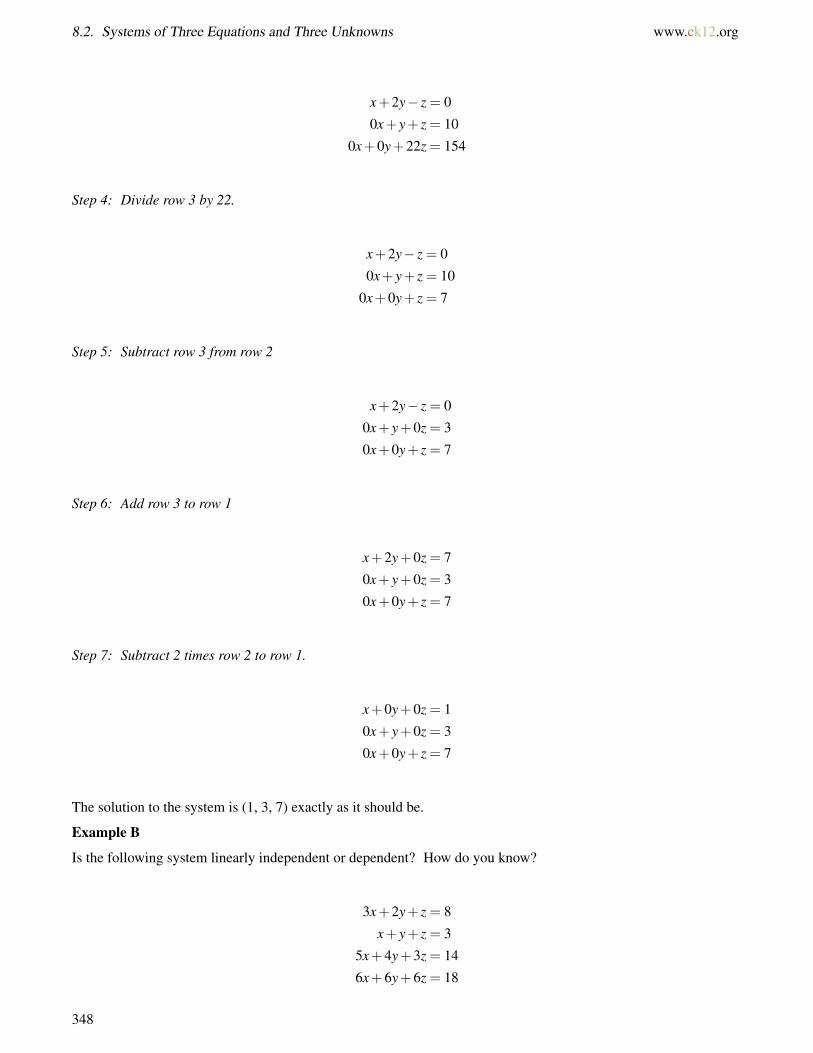
8.2. Systems of Three Equations and Three Unknowns www.ck12.org
x+2y− z = 0
0x+ y+ z = 10
0x+0y+22z = 154
Step 4: Divide row 3 by 22.
x+2y− z = 0
0x+ y+ z = 10
0x+0y+ z = 7
Step 5: Subtract row 3 from row 2
x+2y− z = 0
0x+ y+0z = 3
0x+0y+ z = 7
Step 6: Add row 3 to row 1
x+2y+0z = 7
0x+ y+0z = 3
0x+0y+ z = 7
Step 7: Subtract 2 times row 2 to row 1.
x+0y+0z = 1
0x+ y+0z = 3
0x+0y+ z = 7
The solution to the system is (1, 3, 7) exactly as it should be.
Example B
Is the following system linearly independent or dependent? How do you know?
3x+2y+ z = 8
x+ y+ z = 3
5x+4y+3z = 14
6x+6y+6z = 18
348
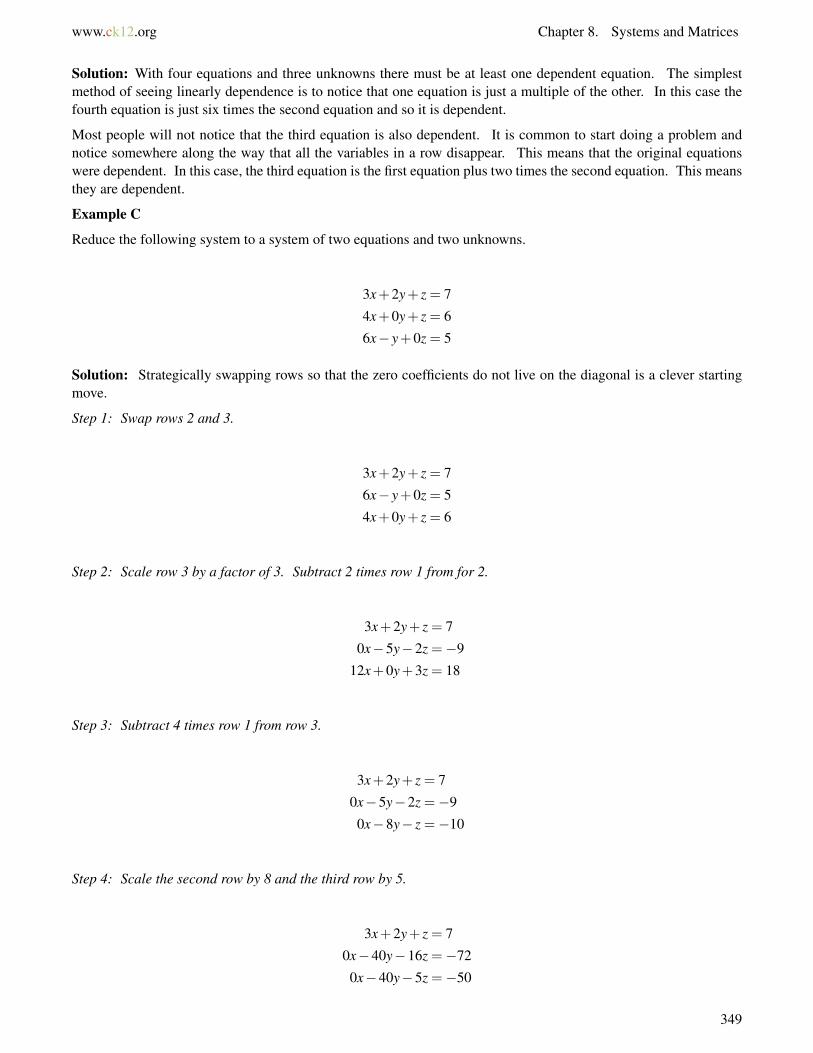
www.ck12.org Chapter 8. Systems and Matrices
Solution: With four equations and three unknowns there must be at least one dependent equation. The simplestmethod of seeing linearly dependence is to notice that one equation is just a multiple of the other. In this case thefourth equation is just six times the second equation and so it is dependent.
Most people will not notice that the third equation is also dependent. It is common to start doing a problem andnotice somewhere along the way that all the variables in a row disappear. This means that the original equationswere dependent. In this case, the third equation is the first equation plus two times the second equation. This meansthey are dependent.
Example C
Reduce the following system to a system of two equations and two unknowns.
3x+2y+ z = 7
4x+0y+ z = 6
6x− y+0z = 5
Solution: Strategically swapping rows so that the zero coefficients do not live on the diagonal is a clever startingmove.
Step 1: Swap rows 2 and 3.
3x+2y+ z = 7
6x− y+0z = 5
4x+0y+ z = 6
Step 2: Scale row 3 by a factor of 3. Subtract 2 times row 1 from for 2.
3x+2y+ z = 7
0x−5y−2z =−9
12x+0y+3z = 18
Step 3: Subtract 4 times row 1 from row 3.
3x+2y+ z = 7
0x−5y−2z =−9
0x−8y− z =−10
Step 4: Scale the second row by 8 and the third row by 5.
3x+2y+ z = 7
0x−40y−16z =−72
0x−40y−5z =−50
349
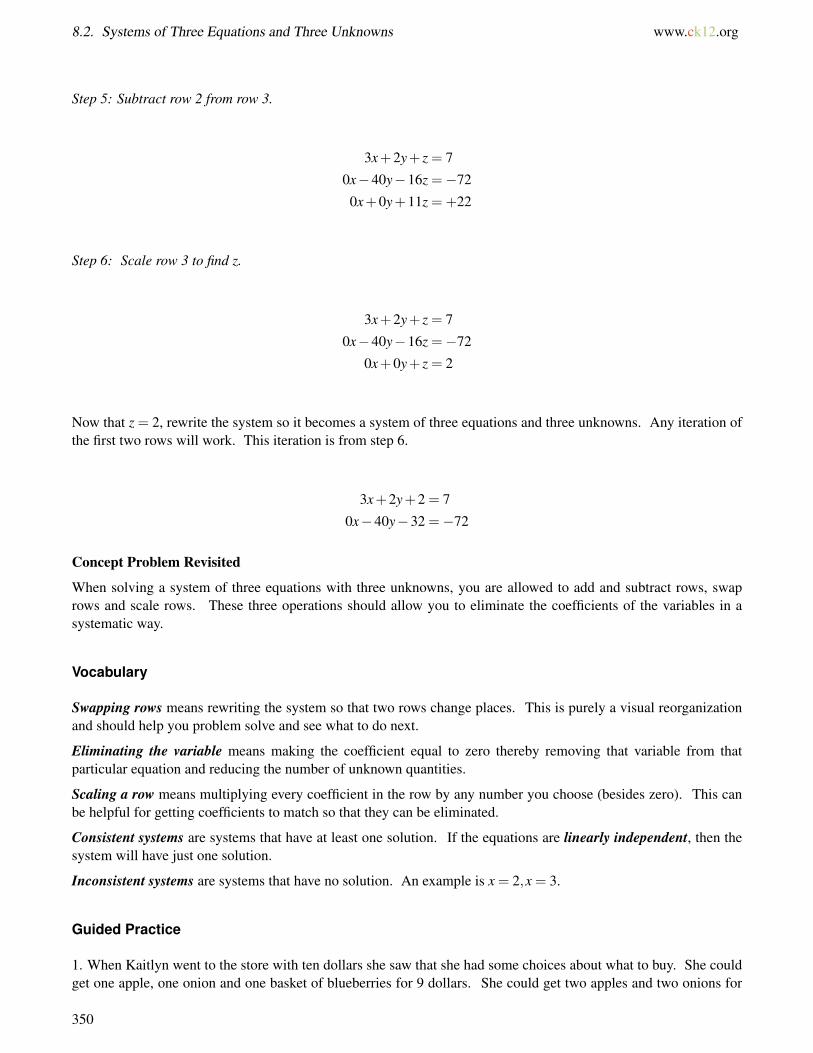
8.2. Systems of Three Equations and Three Unknowns www.ck12.org
Step 5: Subtract row 2 from row 3.
3x+2y+ z = 7
0x−40y−16z =−72
0x+0y+11z =+22
Step 6: Scale row 3 to find z.
3x+2y+ z = 7
0x−40y−16z =−72
0x+0y+ z = 2
Now that z = 2, rewrite the system so it becomes a system of three equations and three unknowns. Any iteration ofthe first two rows will work. This iteration is from step 6.
3x+2y+2 = 7
0x−40y−32 =−72
Concept Problem Revisited
When solving a system of three equations with three unknowns, you are allowed to add and subtract rows, swaprows and scale rows. These three operations should allow you to eliminate the coefficients of the variables in asystematic way.
Vocabulary
Swapping rows means rewriting the system so that two rows change places. This is purely a visual reorganizationand should help you problem solve and see what to do next.
Eliminating the variable means making the coefficient equal to zero thereby removing that variable from thatparticular equation and reducing the number of unknown quantities.
Scaling a row means multiplying every coefficient in the row by any number you choose (besides zero). This canbe helpful for getting coefficients to match so that they can be eliminated.
Consistent systems are systems that have at least one solution. If the equations are linearly independent, then thesystem will have just one solution.
Inconsistent systems are systems that have no solution. An example is x = 2,x = 3.
Guided Practice
1. When Kaitlyn went to the store with ten dollars she saw that she had some choices about what to buy. She couldget one apple, one onion and one basket of blueberries for 9 dollars. She could get two apples and two onions for
350
www.ck12.org Chapter 8. Systems and Matrices
10 dollars. She could also get two onions and one basket of blueberries for 10 dollars. Write a system of equationswith variables a,o and b representing each of the three things she can buy.
2. Solve the system described in # 1.
3. Show that the following system is dependent.
x+ y+ z = 9
x+2y+3z = 22
2x+3y+4z = 31
Answers:
1. Here is the system of equations:
a+o+b = 9
2a+2o = 10
2o+b = 10
2. Rewrite the system using x,y and z so that o and 0 do not get mixed up. Include coefficients of 0 so that eachcolumn represents one variable.
Step 1: Rewrite
1x+1y+1z = 9
2x+2y+0z = 10
0x+2y+1z = 10
Step 2: Subtract 2 times row 1 from row 2.
1x+1y+1z = 9
0x+0y−2z =−8
0x+2y+1z = 10
Step 3: Swap row 2 and row 3. Then scale row 3.
1x+1y+1z = 9
0x+2y+1z = 10
0x+0y+ z = 4
At this point you can see from the third equation that z = 4. From the second equation, 2y+ 4 = 10, so y = 3.Finally you can see from the first equation that x+ 3+ 4 = 9 so x = 2. Apples cost 2 dollars each, onions cost 3dollars each and blueberries cost 4 dollars each.
351

8.2. Systems of Three Equations and Three Unknowns www.ck12.org
3. You could notice that the third equation is simply the sum of the other two. What happens when you do notnotice and try to solve the system as if it were independent?
Step 1: Rewrite the system.
x+ y+ z = 9
x+2y+3z = 22
2x+3y+4z = 31
Step 2: Subtract 2 times row 1 from row 3.
x+ y+ z = 9
x+2y+3z = 22
0x+1y+2z = 13
Step 3: Subtract row 1 from row 2.
x+ y+ z = 9
0x+1y+2z = 13
0x+1y+2z = 13
At this point when you subtract row 2 from row 3, all the coefficients in row 3 disappear. This means that you willend up with the following system of only two equations and three unknowns. Since the unknowns outnumber theequations, the system does not have a solution of one point.
x+ y+ z = 9
0x+1y+2z = 13
Practice
1. An equation with three variables represents a plane in space. Describe all the ways that three planes couldinteract in space.
2. What does it mean for equations to be linearly dependent?
3. How can you tell that a system is linearly dependent?
4. If you have linearly independent equations with four unknowns, how many of these equations would you need inorder to get one solution?
5. Solve the following system of equations:
3x−4y+ z =−17
6x+ y−3z = 4
−x− y+5z = 16
352
www.ck12.org Chapter 8. Systems and Matrices
6. Show that the following system is dependent:
2x−2y+ z = 5
6x+ y−3z = 2
4x+3y−4z =−3
7. Solve the following system of equations:
4x+ y+ z = 15
−2x+3y+4z = 38
−x− y+3z = 16
8. Solve the following system of equations:
3x−2y+3z = 6
x+3y−3z =−14
−x+ y+5z = 22
9. Solve the following system of equations:
3x− y+ z =−10
6x−2y+2z =−20
−x− y+4z = 12
10. Solve the following system of equations:
x−3y+6z =−30
4x+2y−3z = 18
−8x−3y+2z =−22
11. Solve the following system of equations.
x+2y+2z+w = 5
2x+ y+2z−0w = 5
3x+3y+3z+2w = 12
x+0y+ z+w = 1
A parabola goes through (3, -9.5), (6, -32), and (-4, 8).
12. Write a system of equations that you could use to solve to find the equation of the parabola. Hint: Use thegeneral equation Ax2 +Bx+C = y.
353

8.2. Systems of Three Equations and Three Unknowns www.ck12.org
13. Solve the system of equations from #12.
A parabola goes through (-2, 3), (2, 19), and (1, 6).
14. Write a system of equations that you could use to solve to find the equation of the parabola. Hint: Use thegeneral equation Ax2 +Bx+C = y.
15. Solve the system of equations from #14.
354
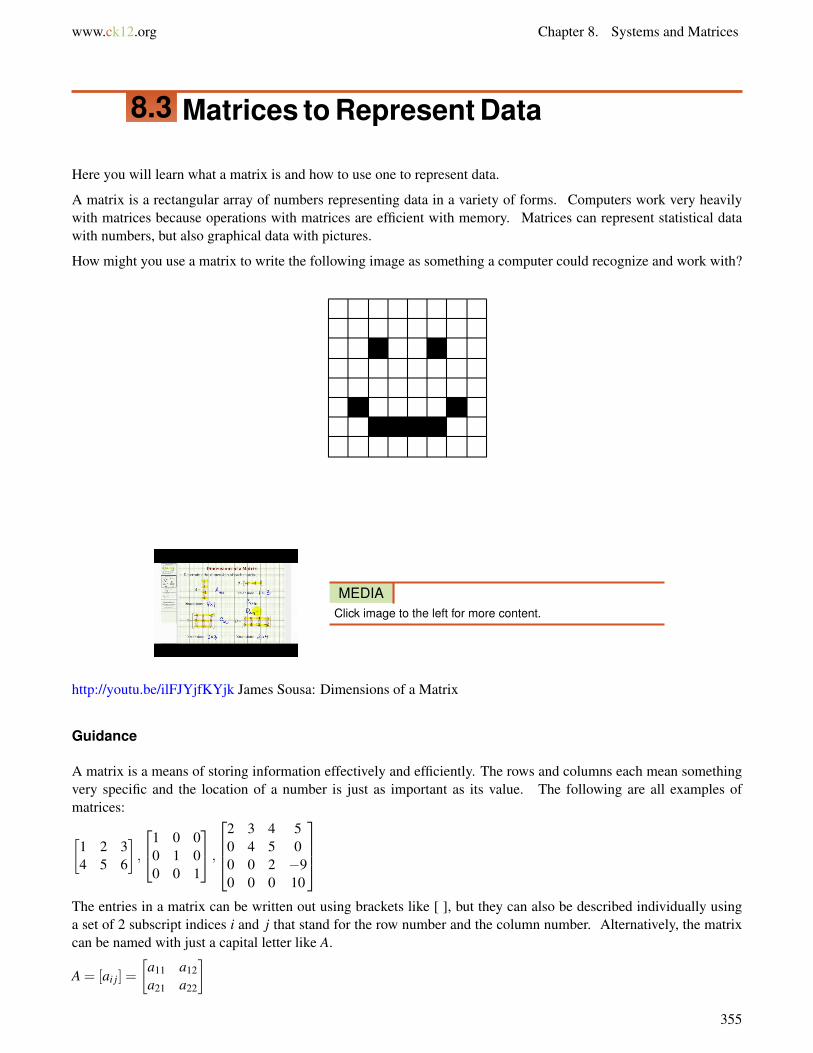
www.ck12.org Chapter 8. Systems and Matrices
8.3 Matrices to Represent Data
Here you will learn what a matrix is and how to use one to represent data.
A matrix is a rectangular array of numbers representing data in a variety of forms. Computers work very heavilywith matrices because operations with matrices are efficient with memory. Matrices can represent statistical datawith numbers, but also graphical data with pictures.
How might you use a matrix to write the following image as something a computer could recognize and work with?
MEDIAClick image to the left for more content.
http://youtu.be/ilFJYjfKYjk James Sousa: Dimensions of a Matrix
Guidance
A matrix is a means of storing information effectively and efficiently. The rows and columns each mean somethingvery specific and the location of a number is just as important as its value. The following are all examples ofmatrices:
[1 2 34 5 6
],
1 0 00 1 00 0 1
,
2 3 4 50 4 5 00 0 2 −90 0 0 10
The entries in a matrix can be written out using brackets like [ ], but they can also be described individually usinga set of 2 subscript indices i and j that stand for the row number and the column number. Alternatively, the matrixcan be named with just a capital letter like A.
A = [ai j] =
[a11 a12a21 a22
]355
8.3. Matrices to Represent Data www.ck12.org
Square matrices have the same number of rows as columns. The order of a matrix describes the number of rowsand the number of columns in the matrix. The following matrix is said to have order 2×3 because it has two rowsand three columns. A 1×1 matrix is just a regular number.[
1 2 34 5 6
]The identity matrix of order n×n has zeros everywhere except along the main diagonal where it has ones. Just likethe number 1 has an important property with numbers, the identity matrix of any order has special properties as well.
[1],[
1 00 1
],
1 0 00 1 00 0 1
When you turn the rows of a matrix into the columns of a new matrix, the two matrices are transpositions of oneanother. The superscript T stands for transpose. Sometimes using the transpose of a matrix is more useful thanusing the matrix itself.
A =
[1 2 34 5 6
]
AT =
1 42 53 6
A triangular matrix is not a matrix in the shape of a triangle. Rather, a lower triangular matrix is a square matrixwhere every entry below the diagonal is zero. An upper triangular matrix is a square matrix where every entry abovethe diagonal is zero. The following is a lower triangular matrix. When you work with solving matrices, look fortriangular matrices because they are much easier to solve.
2 3 4 50 4 5 00 0 2 −90 0 0 10
A diagonal matrix is both upper and lower triangular which means all the entries except those along the diagonal arezero. The identity matrix is a special case of a diagonal matrix.
Example A
Organize the driving distances between Sacramento (A), Dallas (B), Albany (C) and Las Vegas (D) in a matrix.
Solution:
A B C D
ABCD
0 1727 2847 560
1727 0 1648 12192847 1648 0 2552560 1219 2552 0
Note that this matrix is symmetric across the main diagonal. Symmetric matrices are important, just like triangularmatrices.
Example B
Kate runs three bakeries and each bakery sells bagels and muffins. The rows represent the bakeries and the columnsrepresent bagels (left) and muffins (right) sold. Answer the following questions about Kate’s sales.
356

www.ck12.org Chapter 8. Systems and Matrices
K =
144 192115 12727 34
a. What does 127 represent?b. How many muffins did Kate sell in total?c. How many bagels did Kate sell in her first location?d. Which location is doing poorly?
Solution:
a. 127 represents the number of muffins that Kate sold in her second location. You know this because it is in themuffin column and the second row.
b. The total muffins sold is equal to the sum of the right hand column. 192+127+34 = 353c. Kate sold 144 bagels at her first location.d. The third location is doing much worse than the other two locations.
Example C
Identify the order of the following matrices
A =[1 3 4 7
], B =
[21 45 134 1 5
], C =
25 235562 5624 413
454 331 141
Solution: A is 1× 4, B is 2× 3, C is 5× 2. Note that 4× 1,3× 2,2× 5 are not the same orders and would beincorrect.
Concept Problem Revisited
By writing every hollow square as a 0 and a blank square as a 1 a computer could read the picture:
When you use computers to manipulate images, the computer just manipulates the numbers. In this case, if youswap zeros and ones, you get the negative image.
357
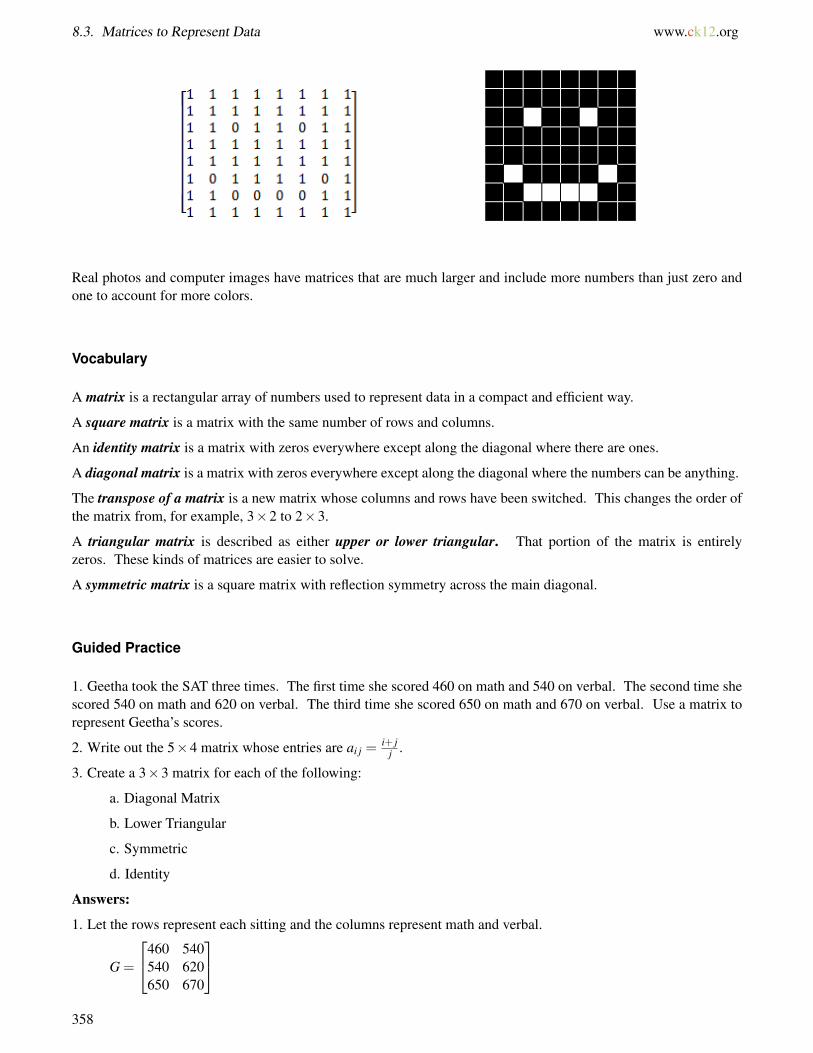
8.3. Matrices to Represent Data www.ck12.org
Real photos and computer images have matrices that are much larger and include more numbers than just zero andone to account for more colors.
Vocabulary
A matrix is a rectangular array of numbers used to represent data in a compact and efficient way.
A square matrix is a matrix with the same number of rows and columns.
An identity matrix is a matrix with zeros everywhere except along the diagonal where there are ones.
A diagonal matrix is a matrix with zeros everywhere except along the diagonal where the numbers can be anything.
The transpose of a matrix is a new matrix whose columns and rows have been switched. This changes the order ofthe matrix from, for example, 3×2 to 2×3.
A triangular matrix is described as either upper or lower triangular. That portion of the matrix is entirelyzeros. These kinds of matrices are easier to solve.
A symmetric matrix is a square matrix with reflection symmetry across the main diagonal.
Guided Practice
1. Geetha took the SAT three times. The first time she scored 460 on math and 540 on verbal. The second time shescored 540 on math and 620 on verbal. The third time she scored 650 on math and 670 on verbal. Use a matrix torepresent Geetha’s scores.
2. Write out the 5×4 matrix whose entries are ai j =i+ j
j .
3. Create a 3×3 matrix for each of the following:
a. Diagonal Matrix
b. Lower Triangular
c. Symmetric
d. Identity
Answers:
1. Let the rows represent each sitting and the columns represent math and verbal.
G =
460 540540 620650 670
358
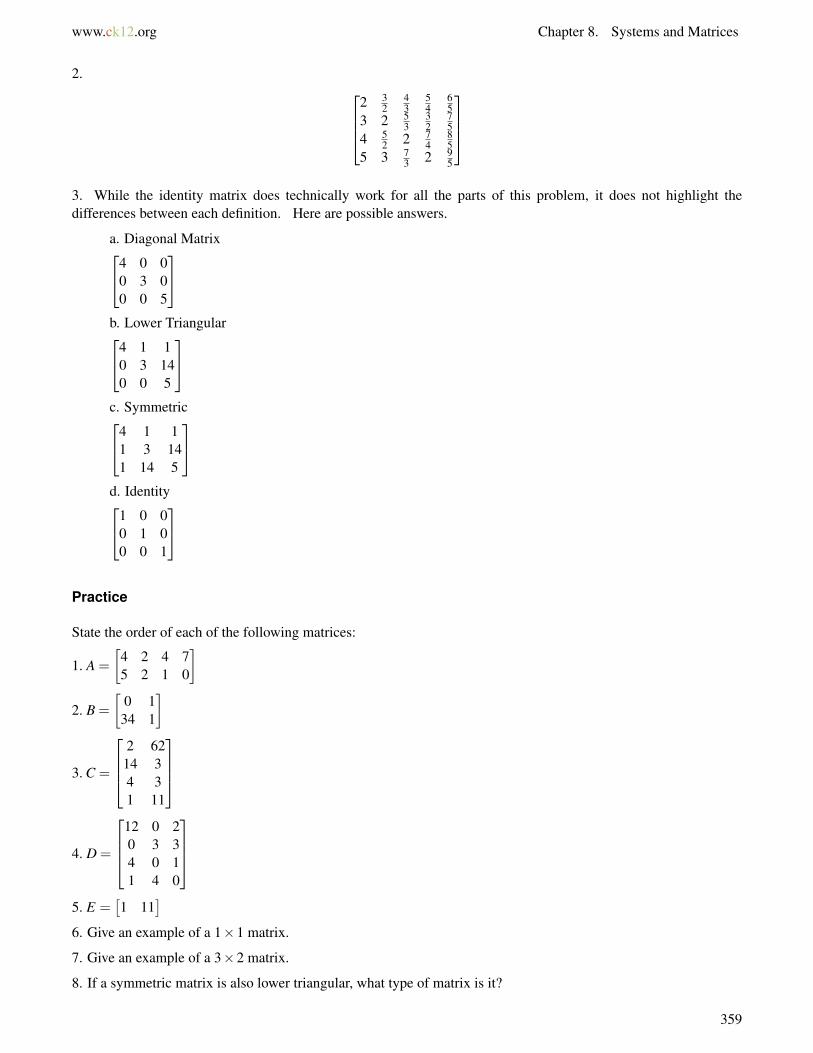
www.ck12.org Chapter 8. Systems and Matrices
2. 2 3
243
54
65
3 2 53
32
75
4 52 2 7
485
5 3 73 2 9
5
3. While the identity matrix does technically work for all the parts of this problem, it does not highlight thedifferences between each definition. Here are possible answers.
a. Diagonal Matrix4 0 00 3 00 0 5
b. Lower Triangular4 1 1
0 3 140 0 5
c. Symmetric4 1 1
1 3 141 14 5
d. Identity1 0 0
0 1 00 0 1
Practice
State the order of each of the following matrices:
1. A =
[4 2 4 75 2 1 0
]2. B =
[0 134 1
]
3. C =
2 6214 34 31 11
4. D =
12 0 20 3 34 0 11 4 0
5. E =
[1 11
]6. Give an example of a 1×1 matrix.
7. Give an example of a 3×2 matrix.
8. If a symmetric matrix is also lower triangular, what type of matrix is it?
359
8.3. Matrices to Represent Data www.ck12.org
9. Write out the 2×3 matrix whose entries are ai j = i− j.
Morgan worked for three weeks during the summer earning money on Mondays, Tuesdays, Wednesdays, Thursdays,and Fridays. The following matrix represents his earnings.
24 22 3225 28 3030 28 3210 15 1935 32 30
10. What do the rows and columns represent?
11. How much money did Morgan make in the first week?
12. How much money did Morgan make on Tuesdays?
13. What day of the week was most profitable?
14. What day of the week was least profitable?
15. Is the following a matrix? Explain.dogs 0cats 3
sheep 0ducks 4
360
www.ck12.org Chapter 8. Systems and Matrices
8.4 Matrix Algebra
Here you will add, subtract and multiply matrices. As a result you will discover the algebraic properties of matrices.
Algebra refers to your ability to manipulate variables and unknowns based on rules and properties. Matrix algebrais extremely similar to the algebra you already know for numbers with a few important differences. What are thesedifferences?
Watch This
MEDIAClick image to the left for more content.
http://www.youtube.com/watch?v=iNty4CSFIpU James Sousa: Matrix Addition, Subtraction, and Scalar Multipli-cation
MEDIAClick image to the left for more content.
http://www.youtube.com/watch?v=6Hmzu-WKCjc James Sousa: Matrix Multiplication
MEDIAClick image to the left for more content.
http://www.youtube.com/watch?v=C7Dc414qmlk James Sousa: Matrix Multiplication on the Calculator
Guidance
Two matrices of the same order can be added by summing the entries in the corresponding positions.[1 2 34 5 6
]+
[6 5 43 2 1
]=
[7 7 77 7 7
]361

8.4. Matrix Algebra www.ck12.org
Two matrices of the same order can be subtracted by subtracting the entries in the corresponding positions.[10 9 87 6 5
]−[
2 2 22 2 2
]=
[8 7 65 4 3
]You can find the product of matrix A and matrix B if the number of columns in matrix A matches the number of rowsin matrix B. Another way to remember this is when you write the orders of matrix A and matrix B next to each otherthey must be connected by the same number. The resulting matrix has the number of rows from the first matrix andthe number of columns from the second matrix.
(2×3) · (3×5) = (2×5)
To compute the first entry of the resulting 2×5 matrix you should match the first row from the first matrix and thefirst column of the second matrix. The arithmetic operation to combine these numbers is identical to taking the dotproduct between two vectors.
• The entry in the first row first column of the new matrix is computed as 1 ·0+4 ·2+3 ·1 = 11.• The entry in the second row first column of the new matrix is computed as 5 ·0+6 ·2+9 ·1 = 21.• The rest of the entries of this product are left to Example A.
Properties of Matrix Algebra
• Commutatively holds for matrix addition. This means that when matrices A and B can be added (when theyhave matching orders), then: A+B = B+A
• Commutatively does not hold in general for matrix multiplication.• Associativity holds for both multiplication and addition. (AB)C = A(BC),(A+B)+C = A+(B+C)• Distribution over addition and subtraction holds. A(B±C) = AB±AC
Example A
Complete the entries of the matrix multiplication introduced in the guidance section.[1 4 35 6 9
]·
0 1 3 1 02 0 0 2 11 1 3 0 1
Solution: Two of the arithmetic operations are shown.
C =
[11 4 12 9 721 14 42 17 15
]c12 = 1 ·1+4 ·0+3 ·1 = 4
c22 = 5 ·1+6 ·0+9 ·1 = 14
Example B
Show the commutative property does not hold by demonstrating AB 6= BA
362

www.ck12.org Chapter 8. Systems and Matrices
A =
0 −1 81 2 04 3 12
, B =
1 5 12 2 14 3 0
Solution:
AB =
30 22 −15 9 358 62 7
BA =
9 12 206 5 283 2 32
Example C
Compute the following matrix arithmetic: 10 · (2A−3C) ·B.
A =
[1 24 5
],B =
[0 1 24 3 2
],C =
[12 01 3
]Solution: When a matrix is multiplied by a scalar (such as with 2A), multiply each entry in the matrix by the scalar.
2A =
[2 48 10
]−3C =
[−36 0−3 −9
]2A−3C =
[−34 4
5 1
]
Since the associative property holds, you can either distribute the ten or multiply by matrix B next.
(2A−3C) ·B =
[16 −22 −604 8 12
]10 · (2A−3C) ·B =
[160 −220 −60040 80 120
]
Concept Problem Revisited
The main difference between matrix algebra and regular algebra with numbers is that matrices do not have thecommutative property for multiplication. There are other complexities that matrices have, but many of them stemfrom the fact that for most matrices AB 6= BA.
Vocabulary
Matrix operations are addition, subtraction and multiplication. Division involves a multiplicative inverse that is notdiscussed at this point.
363

8.4. Matrix Algebra www.ck12.org
Guided Practice
1. Show that a 3×3 identity matrix works as the multiplicative identity.
2. Use your calculator to input and compute the following matrix operations.
A =
54 65 12235 322 167413 512 123
, B =
163 212 46691 221 18442 55 42
AT ·B ·A−100A
3. Matrix multiplication can be used as a transformation in the coordinate system. Consider the triangle withcoordinates (0, 0) (1, 2) and (1, 0) the following matrix:[
cos90◦ sin90◦
−sin90 cos90
]
What does the new picture look like?
Answers:
1. A 3×3 matrix multiplied by the identity should yield the original matrix.
a b cd e fg h i
·1 0 0
0 1 00 0 1
=
a b cd e fg h i
a11 = a ·1+b ·0+ c ·0 = a
a12 = a ·0+b ·1+ c ·0 = b...
2. Most graphing calculators like the TI-84 can do operations on matrices. Find where you can enter matrices andenter the two matrices.
364
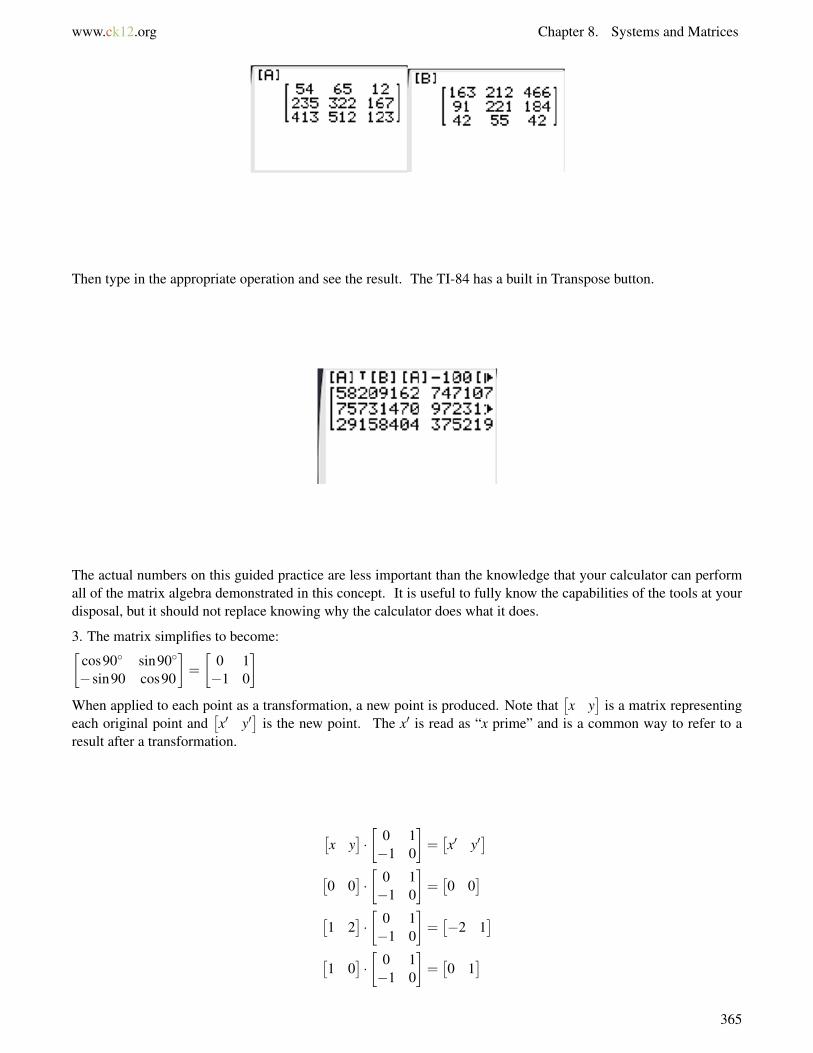
www.ck12.org Chapter 8. Systems and Matrices
Then type in the appropriate operation and see the result. The TI-84 has a built in Transpose button.
The actual numbers on this guided practice are less important than the knowledge that your calculator can performall of the matrix algebra demonstrated in this concept. It is useful to fully know the capabilities of the tools at yourdisposal, but it should not replace knowing why the calculator does what it does.
3. The matrix simplifies to become:[cos90◦ sin90◦
−sin90 cos90
]=
[0 1−1 0
]When applied to each point as a transformation, a new point is produced. Note that
[x y
]is a matrix representing
each original point and[x′ y′
]is the new point. The x′ is read as “x prime” and is a common way to refer to a
result after a transformation.
[x y
]·[
0 1−1 0
]=[x′ y′
][0 0
]·[
0 1−1 0
]=[0 0
][1 2
]·[
0 1−1 0
]=[−2 1
][1 0
]·[
0 1−1 0
]=[0 1
]365
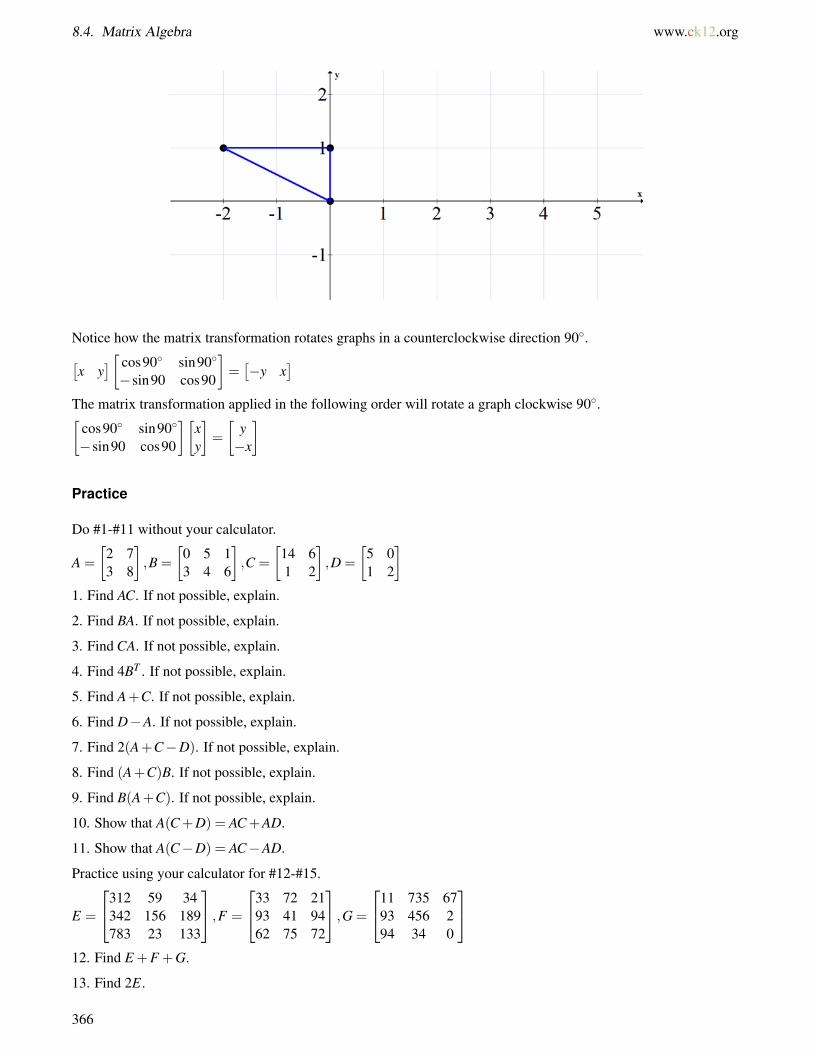
8.4. Matrix Algebra www.ck12.org
Notice how the matrix transformation rotates graphs in a counterclockwise direction 90◦.[x y
][ cos90◦ sin90◦
−sin90 cos90
]=[−y x
]The matrix transformation applied in the following order will rotate a graph clockwise 90◦.[
cos90◦ sin90◦
−sin90 cos90
][xy
]=
[y−x
]
Practice
Do #1-#11 without your calculator.
A =
[2 73 8
],B =
[0 5 13 4 6
],C =
[14 61 2
],D =
[5 01 2
]1. Find AC. If not possible, explain.
2. Find BA. If not possible, explain.
3. Find CA. If not possible, explain.
4. Find 4BT . If not possible, explain.
5. Find A+C. If not possible, explain.
6. Find D−A. If not possible, explain.
7. Find 2(A+C−D). If not possible, explain.
8. Find (A+C)B. If not possible, explain.
9. Find B(A+C). If not possible, explain.
10. Show that A(C+D) = AC+AD.
11. Show that A(C−D) = AC−AD.
Practice using your calculator for #12-#15.
E =
312 59 34342 156 189783 23 133
,F =
33 72 2193 41 9462 75 72
,G =
11 735 6793 456 294 34 0
12. Find E +F +G.
13. Find 2E.
366

www.ck12.org Chapter 8. Systems and Matrices
14. Find 4F .
15. Find (E +F)G.
367
8.5. Row Operations and Row Echelon Forms www.ck12.org
8.5 Row Operations and Row Echelon Forms
Here you will manipulate matrices using row operations into row echelon form and reduced row echelon form.
Applying row operations to reduce a matrix is a procedural skill that takes lots of writing, rewriting and carefularithmetic. The payoff for being able to transform a matrix into a simplified form will become clear later. For now,what does the simplified form mean for a matrix?
Watch This
MEDIAClick image to the left for more content.
http://www.youtube.com/watch?v=LsnOlNjWWug James Sousa: Introduction to Augmented Matrices
Guidance
There are only three operations that are permitted to act on matrices. They are the exact same operations that arepermitted when solving a system of equations.
1. Add a multiple of one row to another row.2. Scale a row by multiplying through by a non-zero constant.3. Swap two rows.
Using these three operations, your job is to simplify matrices into row echelon form. Row echelon form must meetthree requirements.
1. The leading coefficient of each row must be a one.
2. All entries in a column below a leading one must be zero.
3. All rows that just contain zeros are at the bottom of the matrix.
Here are some examples of matrices in row echelon form:
[1 140 1
],
[1 2 30 1 4
],
1 2 3 5 60 0 1 4 70 0 0 1 −20 0 0 0 0
Reduced row echelon form also has one extra stipulation compared with row echelon form.
4. Every leading coefficient of 1 must be the only non-zero element in that column.
Here are some examples of matrices in reduced row echelon form:
368
www.ck12.org Chapter 8. Systems and Matrices
[1 00 1
],
[1 0 30 1 4
],
1 2 0 0 60 0 1 0 70 0 0 1 −20 0 0 0 0
Putting a matrix into reduced row echelon form is a result of performing Gauss-Jordan elimination. The processillustrated in this concept is named after those mathematicians.
Example A
Put the following matrix into reduced row echelon form.[3 72 5
]Solution: In each step of the solution, only one of the three row operations will be used. Specific shorthand willbe introduced.[
3 72 5
]→
→ ·3 →
[3 76 15
]→
→ −2 · I →
[3 70 1
]Note that the ·3 in between the first two matrices indicates that the second row is scaled by a factor of 3. The−2 · I between the next two matrices indicates that the second row has two times the first row subtracted fromit. The I is a roman numeral referring to the row number.[
3 70 1
]→ −7II →
→
[3 00 1
]→ ·13 →→
[1 00 1
]Row reducing a 2×2 matrix to become the identity matrix is an exercise that illustrates the fact that the rows werelinearly independent.
Example B
Put the following matrix into reduced row echelon form.2 4 00 3 11 2 4
Solution:2 4 0
0 3 11 2 4
→→
→ − I2 →
2 4 00 3 10 0 4
→→
→ ÷4 →
2 4 00 3 10 0 1
→ ÷2 →→ ÷3 →
→
1 2 00 1 1
30 0 1
Note that in the preceding step, two operations were used. This is acceptable when the operations do not interfereor interact with each other.1 2 0
0 1 13
0 0 1
→→ − III
3 →→
1 2 00 1 00 0 1
→ −2II →→→
1 0 00 1 00 0 1
Again, row reducing a 3×3 matrix to become the identity matrix is just an exercise that illustrates the fact that therows were linearly independent.
Example C
In a single 3×3 matrix, describe the general approach of Gauss-Jordan elimination. In other words, which locationswould you try to focus on first?
Solution: One approach is to try to get a one in the A position. Then get a zero in position B and position C bymultiplying by a multiple of row 1. Then try to get a zero in position D.
369
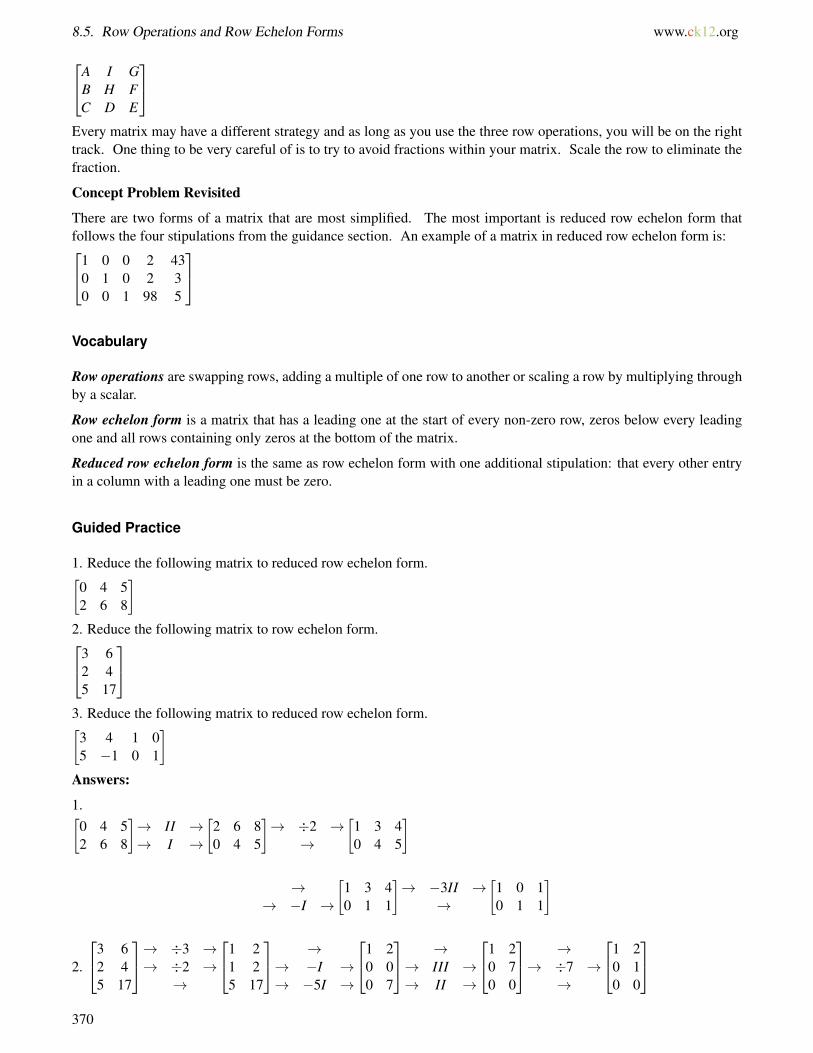
8.5. Row Operations and Row Echelon Forms www.ck12.org
A I GB H FC D E
Every matrix may have a different strategy and as long as you use the three row operations, you will be on the righttrack. One thing to be very careful of is to try to avoid fractions within your matrix. Scale the row to eliminate thefraction.
Concept Problem Revisited
There are two forms of a matrix that are most simplified. The most important is reduced row echelon form thatfollows the four stipulations from the guidance section. An example of a matrix in reduced row echelon form is:1 0 0 2 43
0 1 0 2 30 0 1 98 5
Vocabulary
Row operations are swapping rows, adding a multiple of one row to another or scaling a row by multiplying throughby a scalar.
Row echelon form is a matrix that has a leading one at the start of every non-zero row, zeros below every leadingone and all rows containing only zeros at the bottom of the matrix.
Reduced row echelon form is the same as row echelon form with one additional stipulation: that every other entryin a column with a leading one must be zero.
Guided Practice
1. Reduce the following matrix to reduced row echelon form.[0 4 52 6 8
]2. Reduce the following matrix to row echelon form.3 6
2 45 17
3. Reduce the following matrix to reduced row echelon form.[
3 4 1 05 −1 0 1
]Answers:
1.[0 4 52 6 8
]→ II →→ I →
[2 6 80 4 5
]→ ÷2 →
→
[1 3 40 4 5
]
→→ −I →
[1 3 40 1 1
]→ −3II →
→
[1 0 10 1 1
]
2.
3 62 45 17
→ ÷3 →→ ÷2 →
→
1 21 25 17
→→ −I →→ −5I →
1 20 00 7
→→ III →→ II →
1 20 70 0
→→ ÷7 →
→
1 20 10 0
370
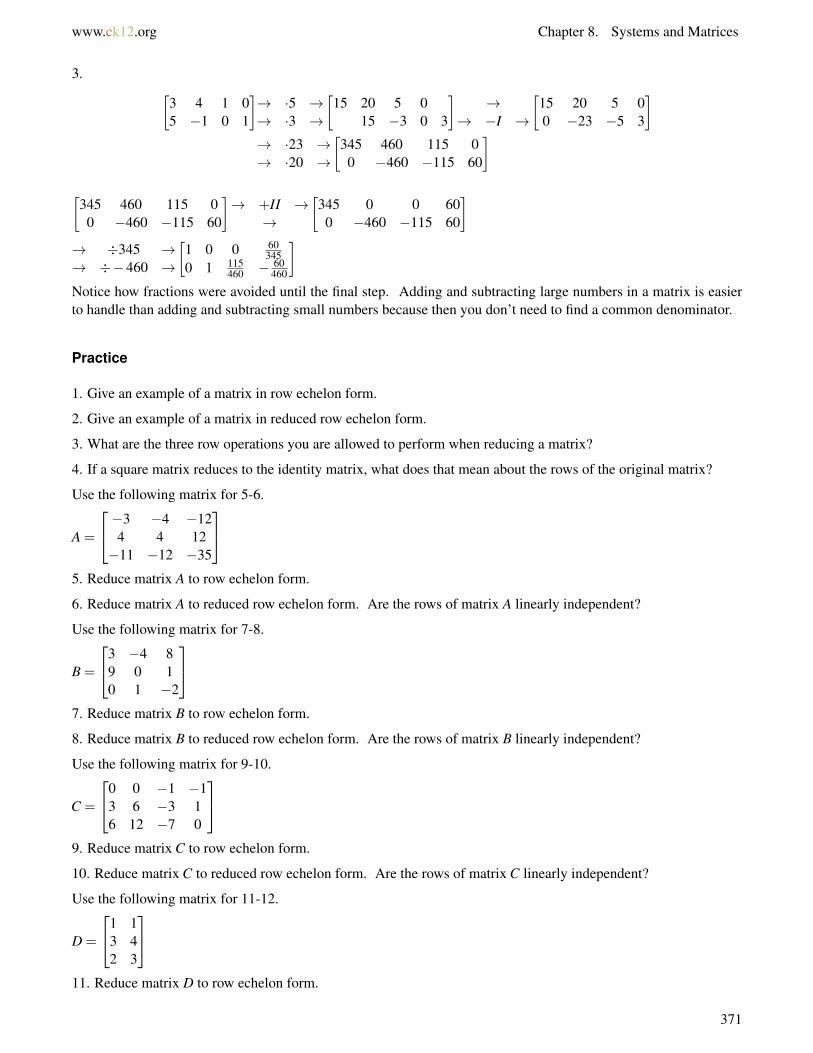
www.ck12.org Chapter 8. Systems and Matrices
3. [3 4 1 05 −1 0 1
]→ ·5 →→ ·3 →
[15 20 5 0
15 −3 0 3
]→
→ −I →
[15 20 5 00 −23 −5 3
]→ ·23 →→ ·20 →
[345 460 115 0
0 −460 −115 60
][
345 460 115 00 −460 −115 60
]→ +II →
→
[345 0 0 600 −460 −115 60
]→ ÷345 →→ ÷−460 →
[1 0 0 60
3450 1 115
460 − 60460
]Notice how fractions were avoided until the final step. Adding and subtracting large numbers in a matrix is easierto handle than adding and subtracting small numbers because then you don’t need to find a common denominator.
Practice
1. Give an example of a matrix in row echelon form.
2. Give an example of a matrix in reduced row echelon form.
3. What are the three row operations you are allowed to perform when reducing a matrix?
4. If a square matrix reduces to the identity matrix, what does that mean about the rows of the original matrix?
Use the following matrix for 5-6.
A =
−3 −4 −124 4 12−11 −12 −35
5. Reduce matrix A to row echelon form.
6. Reduce matrix A to reduced row echelon form. Are the rows of matrix A linearly independent?
Use the following matrix for 7-8.
B =
3 −4 89 0 10 1 −2
7. Reduce matrix B to row echelon form.
8. Reduce matrix B to reduced row echelon form. Are the rows of matrix B linearly independent?
Use the following matrix for 9-10.
C =
0 0 −1 −13 6 −3 16 12 −7 0
9. Reduce matrix C to row echelon form.
10. Reduce matrix C to reduced row echelon form. Are the rows of matrix C linearly independent?
Use the following matrix for 11-12.
D =
1 13 42 3
11. Reduce matrix D to row echelon form.
371
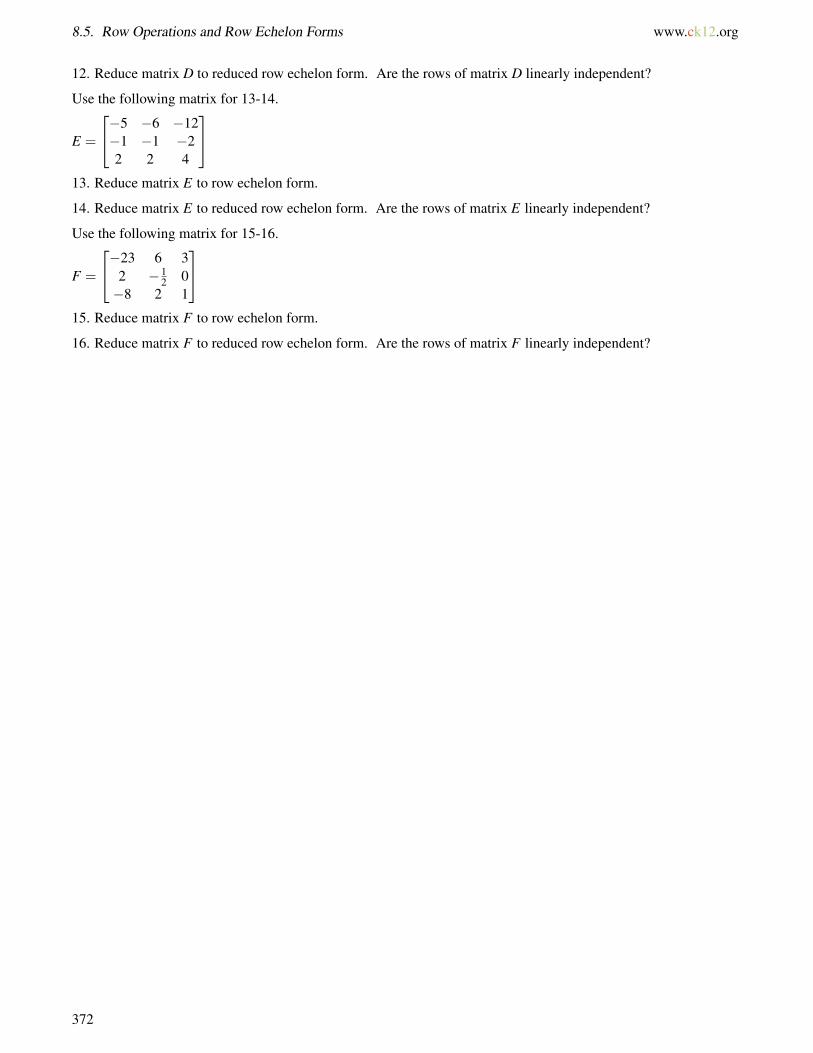
8.5. Row Operations and Row Echelon Forms www.ck12.org
12. Reduce matrix D to reduced row echelon form. Are the rows of matrix D linearly independent?
Use the following matrix for 13-14.
E =
−5 −6 −12−1 −1 −22 2 4
13. Reduce matrix E to row echelon form.
14. Reduce matrix E to reduced row echelon form. Are the rows of matrix E linearly independent?
Use the following matrix for 15-16.
F =
−23 6 32 −1
2 0−8 2 1
15. Reduce matrix F to row echelon form.
16. Reduce matrix F to reduced row echelon form. Are the rows of matrix F linearly independent?
372
www.ck12.org Chapter 8. Systems and Matrices
8.6 Augmented Matrices
Here you will solve systems of equations using augmented matrices.
The reason why the rules for row reducing matrices are the same as the rules for eliminating coefficients whensolving a system of equations is because you are essentially doing the same thing in each case. When you writeand rewrite the equation every time you end up writing down lots of extra information. Matrices take care of thisinformation by embedding it in the location of each entry. How would you use matrices to write the followingsystem of equations?
Watch This
MEDIAClick image to the left for more content.
http://www.youtube.com/watch?v=BWBckWPjfpw James Sousa: Augmented Matrices: Row Echelon Form
Guidance
In order to represent a system as a matrix equation, first write all the equations in standard form so that the coefficientsof the variables line up in columns. Then copy down just the coefficients in a matrix array. Next copy the variablesin a variable matrix and the constants into a constant matrix.
x+ y+ z = 9
x+2y+3z = 22
2x+3y+4z = 31
1 1 11 2 32 3 4
·x
yz
=
92231
The reason why this works is because of the way matrix multiplication is defined.1 1 1
1 2 32 3 4
·x
yz
=
1x+1y+1z1x+2y+3z2z+3y+4z
=
92231
Notice how putting brackets around the two matrices on the right does very little to hide the fact that this is just aregular system of 3 equations and 3 variables.
373
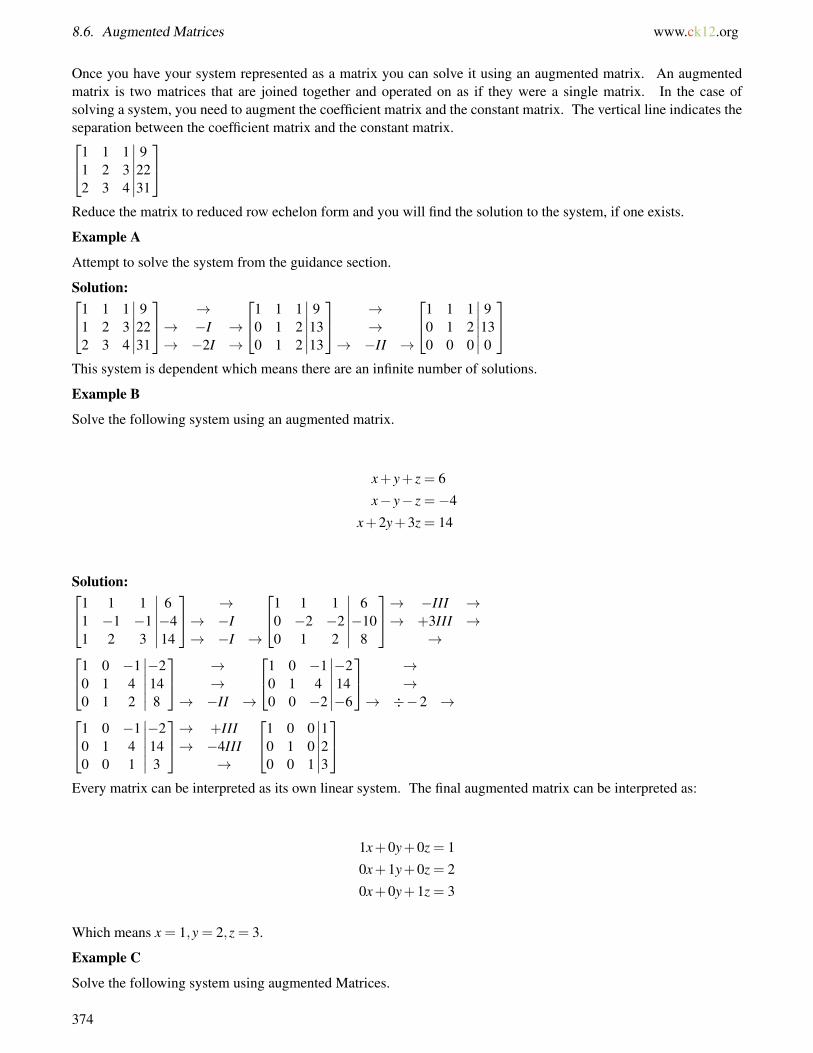
8.6. Augmented Matrices www.ck12.org
Once you have your system represented as a matrix you can solve it using an augmented matrix. An augmentedmatrix is two matrices that are joined together and operated on as if they were a single matrix. In the case ofsolving a system, you need to augment the coefficient matrix and the constant matrix. The vertical line indicates theseparation between the coefficient matrix and the constant matrix.1 1 1
1 2 32 3 4
∣∣∣∣∣∣92231
Reduce the matrix to reduced row echelon form and you will find the solution to the system, if one exists.
Example A
Attempt to solve the system from the guidance section.
Solution:1 1 11 2 32 3 4
∣∣∣∣∣∣92231
→→ −I →→ −2I →
1 1 10 1 20 1 2
∣∣∣∣∣∣9
1313
→→
→ −II →
1 1 10 1 20 0 0
∣∣∣∣∣∣9130
This system is dependent which means there are an infinite number of solutions.
Example B
Solve the following system using an augmented matrix.
x+ y+ z = 6
x− y− z =−4
x+2y+3z = 14
Solution:1 1 11 −1 −11 2 3
∣∣∣∣∣∣6−414
→→ −I→ −I →
1 1 10 −2 −20 1 2
∣∣∣∣∣∣6−10
8
→ −III →→ +3III →
→1 0 −10 1 40 1 2
∣∣∣∣∣∣−2148
→→
→ −II →
1 0 −10 1 40 0 −2
∣∣∣∣∣∣−214−6
→→
→ ÷−2 →1 0 −10 1 40 0 1
∣∣∣∣∣∣−2143
→ +III→ −4III
→
1 0 00 1 00 0 1
∣∣∣∣∣∣123
Every matrix can be interpreted as its own linear system. The final augmented matrix can be interpreted as:
1x+0y+0z = 1
0x+1y+0z = 2
0x+0y+1z = 3
Which means x = 1,y = 2,z = 3.
Example C
Solve the following system using augmented Matrices.
374
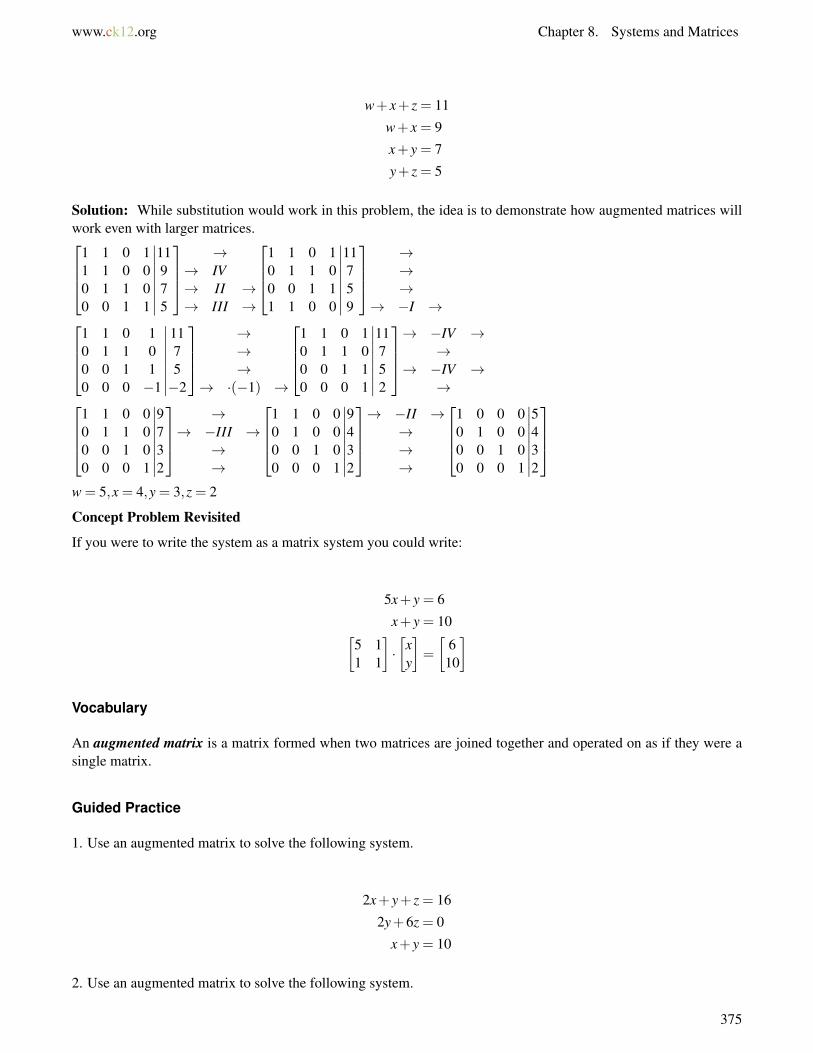
www.ck12.org Chapter 8. Systems and Matrices
w+ x+ z = 11
w+ x = 9
x+ y = 7
y+ z = 5
Solution: While substitution would work in this problem, the idea is to demonstrate how augmented matrices willwork even with larger matrices.
1 1 0 11 1 0 00 1 1 00 0 1 1
∣∣∣∣∣∣∣∣11975
→
→ IV→ II →→ III →
1 1 0 10 1 1 00 0 1 11 1 0 0
∣∣∣∣∣∣∣∣11759
→→→
→ −I →1 1 0 10 1 1 00 0 1 10 0 0 −1
∣∣∣∣∣∣∣∣1175−2
→→→
→ ·(−1) →
1 1 0 10 1 1 00 0 1 10 0 0 1
∣∣∣∣∣∣∣∣11752
→ −IV →
→→ −IV →
→1 1 0 00 1 1 00 0 1 00 0 0 1
∣∣∣∣∣∣∣∣9732
→
→ −III →→→
1 1 0 00 1 0 00 0 1 00 0 0 1
∣∣∣∣∣∣∣∣9432
→ −II →
→→→
1 0 0 00 1 0 00 0 1 00 0 0 1
∣∣∣∣∣∣∣∣5432
w = 5,x = 4,y = 3,z = 2
Concept Problem Revisited
If you were to write the system as a matrix system you could write:
5x+ y = 6
x+ y = 10[5 11 1
]·[
xy
]=
[6
10
]
Vocabulary
An augmented matrix is a matrix formed when two matrices are joined together and operated on as if they were asingle matrix.
Guided Practice
1. Use an augmented matrix to solve the following system.
2x+ y+ z = 16
2y+6z = 0
x+ y = 10
2. Use an augmented matrix to solve the following system.
375

8.6. Augmented Matrices www.ck12.org
3x+ y =−15
x+2y = 15
3. Use an augmented matrix to solve the following system.
−a+b− c = 0
2a−2b−3c = 25
3a−4b+3c = 2
Answers:
1. The row reduction steps are not shown. Only the initial and final augmented matrices are shown.2 1 10 2 61 1 0
∣∣∣∣∣∣16010
→1 0 0
0 1 00 0 1
∣∣∣∣∣∣73−1
2.[
3 11 2
∣∣∣∣−1515
]→[
1 00 1
∣∣∣∣−912
]
3.
−1 1 −12 −2 −33 −4 3
∣∣∣∣∣∣0
252
→1 0 0
0 1 00 0 1
∣∣∣∣∣∣3−2−5
Practice
Solve the following systems of equations using augmented matrices. If one solution does not exist, explain why not.
1.
4x−2y =−20
x−3y =−15
2.
3x+5y = 33
−x−2y =−13
3.
x+4y = 11
3x+12y = 33
4.
376
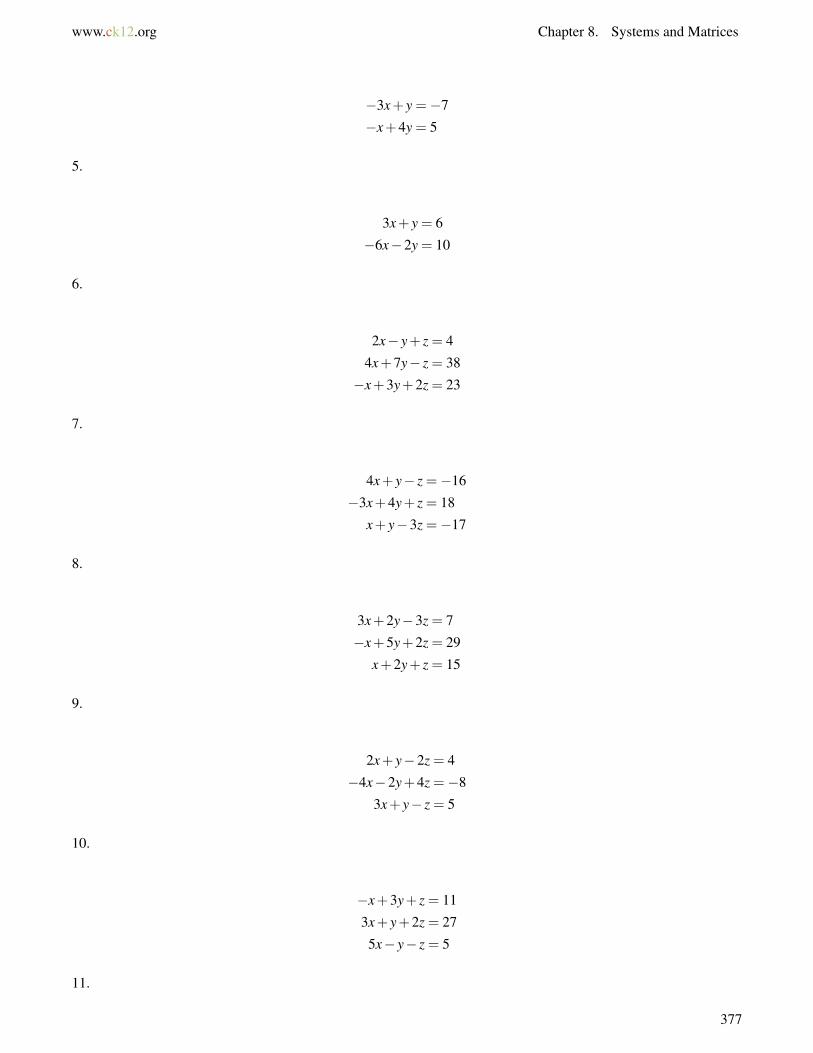
www.ck12.org Chapter 8. Systems and Matrices
−3x+ y =−7
−x+4y = 5
5.
3x+ y = 6
−6x−2y = 10
6.
2x− y+ z = 4
4x+7y− z = 38
−x+3y+2z = 23
7.
4x+ y− z =−16
−3x+4y+ z = 18
x+ y−3z =−17
8.
3x+2y−3z = 7
−x+5y+2z = 29
x+2y+ z = 15
9.
2x+ y−2z = 4
−4x−2y+4z =−8
3x+ y− z = 5
10.
−x+3y+ z = 11
3x+ y+2z = 27
5x− y− z = 5
11.
377

8.6. Augmented Matrices www.ck12.org
3x+2y+4z = 21
−2x+3y+ z =−11
x+2y−3z =−3
12.
−x+2y−6z = 4
8x+5y+3z =−8
2x−4y+12z = 5
13.
3x+5y+8z = 37
−6x+3y+ z = 42
x+3y−2z = 5
14.
4x+ y−6z =−38
2x+7y+8z = 108
−3x+2y−3z =−15
15.
6x+3y−2z =−22
−4x−2y+4z = 28
3x+3y+2z = 7
378

www.ck12.org Chapter 8. Systems and Matrices
8.7 Determinant of Matrices
Here you will find the determinants of 2×2 and higher order matrices.
Adeterminant is a number computed from the entries in a square matrix. It has many properties and interpretationsthat you will explore in linear algebra. This concept is focused on the procedure of calculating determinants. Onceyou know how to calculate the determinant of a2× 2 matrix, then you will be able to calculate the determinant ofa3×3matrix. Once you know how to calculate the determinant of a3×3 matrix you can calculate the determinantof a4×4 and so on.
A logical question about determinants is where does the procedure come from? Why are determinants defined inthe way that they are?
Watch This
MEDIAClick image to the left for more content.
http://www.youtube.com/watch?v=OI07C1HsOuc James Sousa: Determinants
Guidance
The determinant of a matrix A is written as |A|. For a 2×2 matrix A, the value is calculated as:
A =
[a bc d
]det A = |A|=
∣∣∣∣a bc d
∣∣∣∣= ad−bc
Notice how the diagonals are multiplied and then subtracted.
The determinant of a 3×3 matrix is more involved.
B =
a b cd e fg h i
Usually you will start by looking at the top row, although any row or column will work. Then use the checkerboardpattern for signs (shown below) and create smaller 2×2 matrices.+ − +− + −+ − +
379
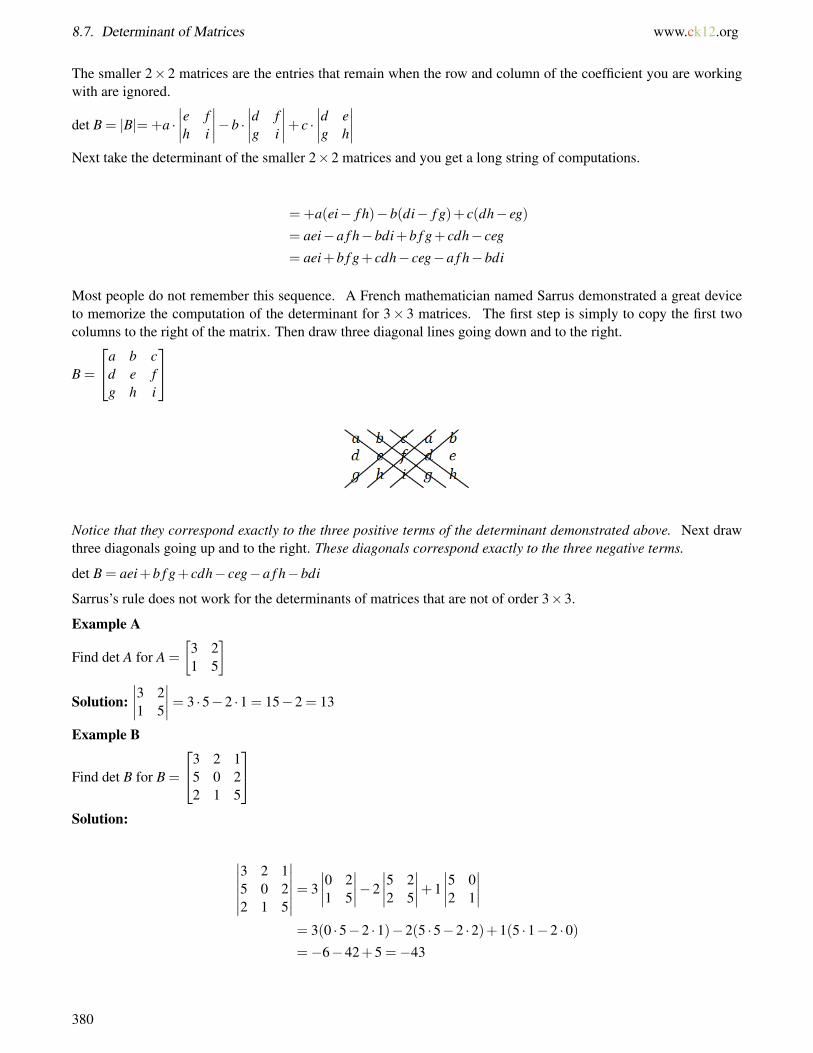
8.7. Determinant of Matrices www.ck12.org
The smaller 2×2 matrices are the entries that remain when the row and column of the coefficient you are workingwith are ignored.
det B = |B|=+a ·∣∣∣∣e fh i
∣∣∣∣−b ·∣∣∣∣d fg i
∣∣∣∣+ c ·∣∣∣∣d eg h
∣∣∣∣Next take the determinant of the smaller 2×2 matrices and you get a long string of computations.
=+a(ei− f h)−b(di− f g)+ c(dh− eg)
= aei−a f h−bdi+b f g+ cdh− ceg
= aei+b f g+ cdh− ceg−a f h−bdi
Most people do not remember this sequence. A French mathematician named Sarrus demonstrated a great deviceto memorize the computation of the determinant for 3× 3 matrices. The first step is simply to copy the first twocolumns to the right of the matrix. Then draw three diagonal lines going down and to the right.
B =
a b cd e fg h i
Notice that they correspond exactly to the three positive terms of the determinant demonstrated above. Next drawthree diagonals going up and to the right. These diagonals correspond exactly to the three negative terms.
det B = aei+b f g+ cdh− ceg−a f h−bdi
Sarrus’s rule does not work for the determinants of matrices that are not of order 3×3.
Example A
Find det A for A =
[3 21 5
]Solution:
∣∣∣∣3 21 5
∣∣∣∣= 3 ·5−2 ·1 = 15−2 = 13
Example B
Find det B for B =
3 2 15 0 22 1 5
Solution:
∣∣∣∣∣∣3 2 15 0 22 1 5
∣∣∣∣∣∣= 3∣∣∣∣0 21 5
∣∣∣∣−2∣∣∣∣5 22 5
∣∣∣∣+1∣∣∣∣5 02 1
∣∣∣∣= 3(0 ·5−2 ·1)−2(5 ·5−2 ·2)+1(5 ·1−2 ·0)=−6−42+5 =−43
380
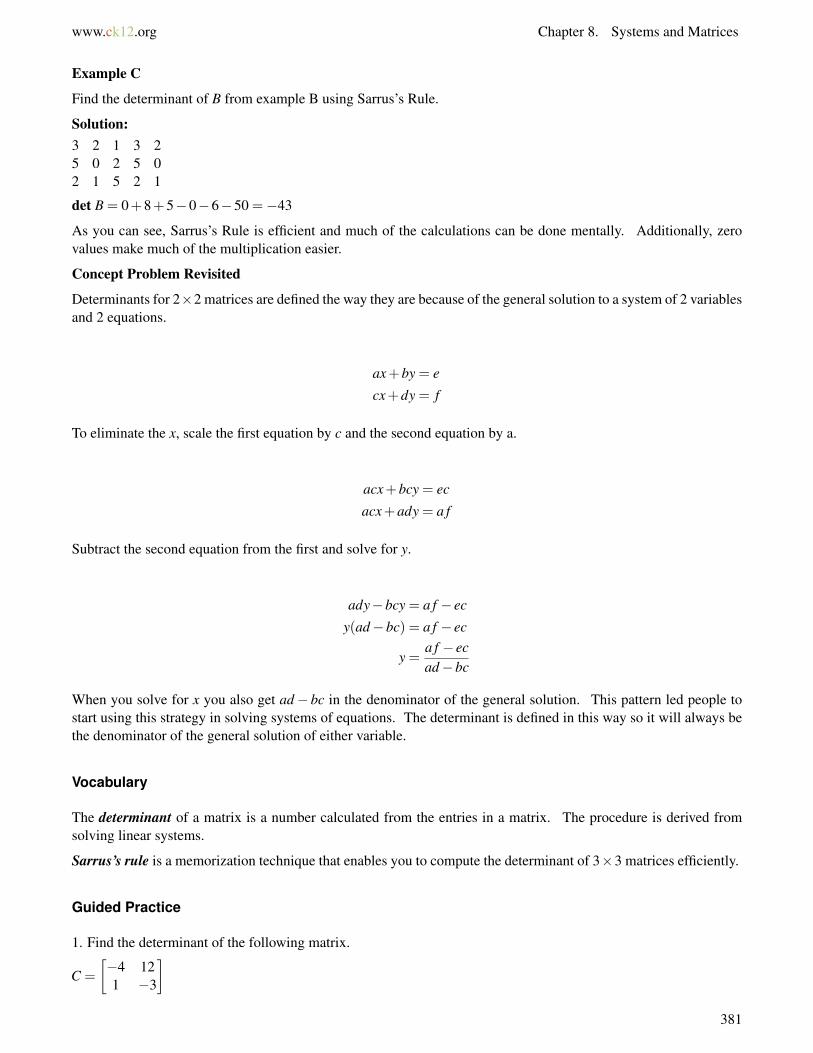
www.ck12.org Chapter 8. Systems and Matrices
Example C
Find the determinant of B from example B using Sarrus’s Rule.
Solution:3 2 1 3 25 0 2 5 02 1 5 2 1
det B = 0+8+5−0−6−50 =−43
As you can see, Sarrus’s Rule is efficient and much of the calculations can be done mentally. Additionally, zerovalues make much of the multiplication easier.
Concept Problem Revisited
Determinants for 2×2 matrices are defined the way they are because of the general solution to a system of 2 variablesand 2 equations.
ax+by = e
cx+dy = f
To eliminate the x, scale the first equation by c and the second equation by a.
acx+bcy = ec
acx+ady = a f
Subtract the second equation from the first and solve for y.
ady−bcy = a f − ec
y(ad−bc) = a f − ec
y =a f − ecad−bc
When you solve for x you also get ad− bc in the denominator of the general solution. This pattern led people tostart using this strategy in solving systems of equations. The determinant is defined in this way so it will always bethe denominator of the general solution of either variable.
Vocabulary
The determinant of a matrix is a number calculated from the entries in a matrix. The procedure is derived fromsolving linear systems.
Sarrus’s rule is a memorization technique that enables you to compute the determinant of 3×3 matrices efficiently.
Guided Practice
1. Find the determinant of the following matrix.
C =
[−4 121 −3
]381

8.7. Determinant of Matrices www.ck12.org
2. Find the determinant of the following matrix.
D =
4 8 30 1 7
12 5 13
3. Find the determinant of the following 4×4 matrix by carefully choosing the row or column to work with.
E =
4 5 0 2−1 −3 0 34 8 1 5−3 2 0 9
Answers:
1. det C =
∣∣∣∣−4 121 −3
∣∣∣∣= 12−12 = 0
2. det D =
∣∣∣∣∣∣4 8 30 1 712 5 13
∣∣∣∣∣∣= 4 ·13+8 ·7 ·12+0−36−5 ·7 ·4−0 = 548
3. Notice that the third column is made up with zeros and a one. Choose this column to make up the coefficientsbecause then instead of having to evaluate the determinant of four individual 3× 3 matrices, you only need to doone.
∣∣∣∣∣∣∣∣4 5 0 2−1 −3 0 34 8 1 5−3 2 0 9
∣∣∣∣∣∣∣∣= 0 ·
∣∣∣∣∣∣−1 −3 34 8 5−3 2 9
∣∣∣∣∣∣−0 ·
∣∣∣∣∣∣4 5 24 8 5−3 2 9
∣∣∣∣∣∣+1 ·
∣∣∣∣∣∣4 5 2−1 −3 3−3 2 9
∣∣∣∣∣∣−0 ·
∣∣∣∣∣∣4 5 2−1 −3 34 8 5
∣∣∣∣∣∣=
∣∣∣∣∣∣4 5 2−1 −3 3−3 2 9
∣∣∣∣∣∣= 4 · (−3) ·9+5 ·3 · (−3)+2 · (−1) ·2−18−24− (−45)
=−154
Practice
Find the determinants of each of the following matrices.
1.[
4 52 3
]2.[−3 62 5
]3.[−1 22 0
]4.[
1 00 1
]5.[
6 52 −2
]6.[
1 26 3
]382
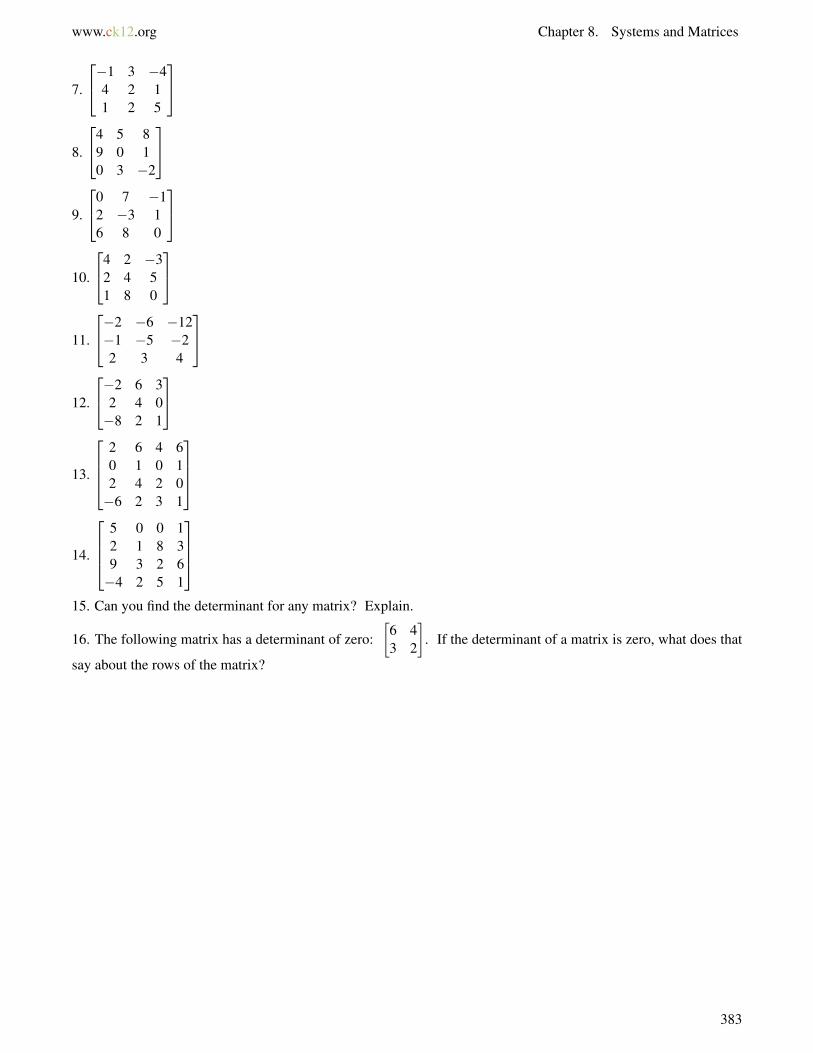
www.ck12.org Chapter 8. Systems and Matrices
7.
−1 3 −44 2 11 2 5
8.
4 5 89 0 10 3 −2
9.
0 7 −12 −3 16 8 0
10.
4 2 −32 4 51 8 0
11.
−2 −6 −12−1 −5 −22 3 4
12.
−2 6 32 4 0−8 2 1
13.
2 6 4 60 1 0 12 4 2 0−6 2 3 1
14.
5 0 0 12 1 8 39 3 2 6−4 2 5 1
15. Can you find the determinant for any matrix? Explain.
16. The following matrix has a determinant of zero:[
6 43 2
]. If the determinant of a matrix is zero, what does that
say about the rows of the matrix?
383

8.8. Cramer’s Rule www.ck12.org
8.8 Cramer’s Rule
Here you will solve systems of equations using Cramer’s Rule.
A system of equations can be represented and solved in general using matrices and determinants. This method canbe significantly more efficient than eliminating variables in equations. What does it mean for a solution method tobe more efficient? Is Cramer’s Rule the most efficient means of solving a system of equations?
Watch This
MEDIAClick image to the left for more content.
http://www.youtube.com/watch?v=ItxF3IjC_uw James Sousa: Cramer’s Rule
Guidance
The determinant is defined in a seemingly arbitrary way; however, when you look at the general solution for a2×2 matrix, the reasoning why it is defined this way is apparent.
ax+by = e
cx+dy = f
When you solve the system above for y and x, you get the following:
y =a f − cead−bc
x =b f −dead−bc
Note that the system can be represented by the matrix and the solutions can be written as ratios of two determi-nants. The determinant in the denominator is of the coefficient matrix. The numerator of the x solution is thedeterminant of the new matrix whose columns are made up of the y coefficients and the solution coefficients. Thenumerator of the y solution is the determinant of the new matrix made up of the x coefficients and the solutioncoefficients.
384

www.ck12.org Chapter 8. Systems and Matrices
[a bc d
][xy
]=
[ef
]
x =
∣∣∣∣e bf d
∣∣∣∣∣∣∣∣a bc d
∣∣∣∣y =
∣∣∣∣a ec f
∣∣∣∣∣∣∣∣a bc d
∣∣∣∣This is a fantastic improvement over solving systems using substitution or elimination. Cramer’s Rule also workswith larger order matrices. For a system of 3 variables and 3 equations the reasoning is identical.
ax+by+ cz = j
dx+ ey+ f z = k
gx+hy+ iz = l
The system can be represented as a matrix.a b cd e fg h i
·x
yz
=
jkl
The three solutions can be represented as a ratio of determinants.
x =
∣∣∣∣∣∣j b ck e fl h i
∣∣∣∣∣∣∣∣∣∣∣∣a b cd e fg h i
∣∣∣∣∣∣
y =
∣∣∣∣∣∣a j cd k fg l i
∣∣∣∣∣∣∣∣∣∣∣∣a b cd e fg h i
∣∣∣∣∣∣
z =
∣∣∣∣∣∣a b jd e kg h l
∣∣∣∣∣∣∣∣∣∣∣∣a b cd e fg h i
∣∣∣∣∣∣Remember that evaluating the determinants of 3×3 matrices using Sarrus’s rule is very efficient.
385
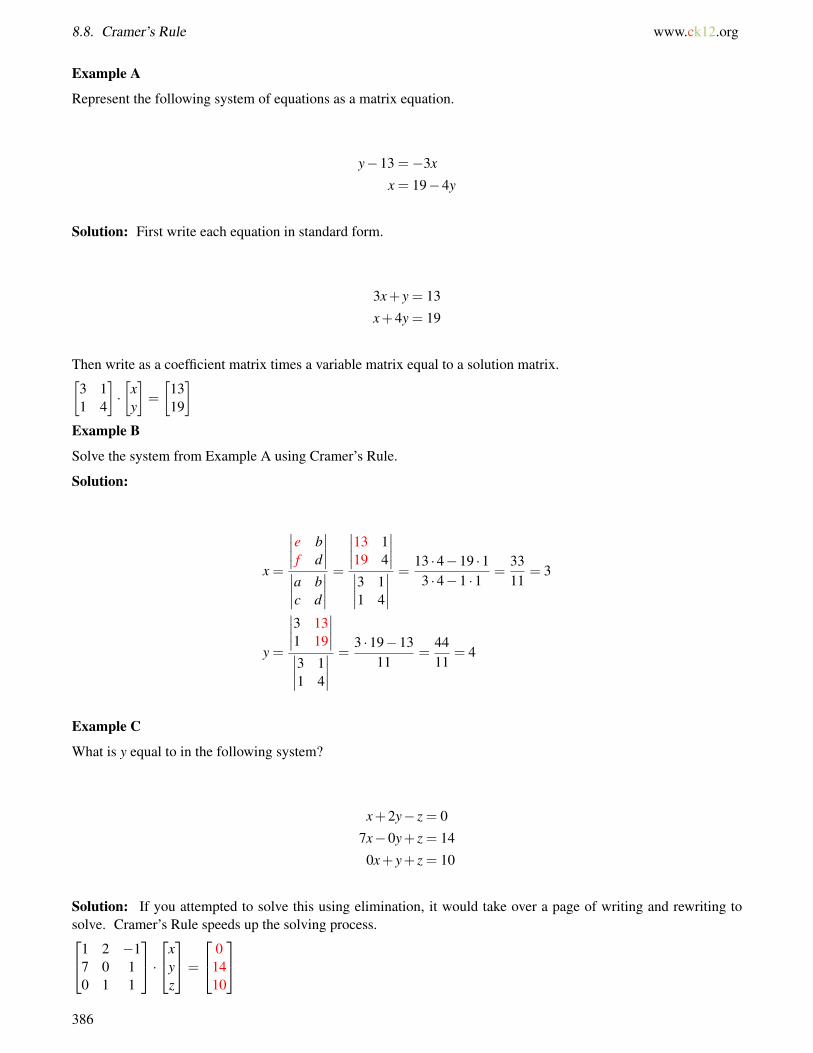
8.8. Cramer’s Rule www.ck12.org
Example A
Represent the following system of equations as a matrix equation.
y−13 =−3x
x = 19−4y
Solution: First write each equation in standard form.
3x+ y = 13
x+4y = 19
Then write as a coefficient matrix times a variable matrix equal to a solution matrix.[3 11 4
]·[
xy
]=
[1319
]Example B
Solve the system from Example A using Cramer’s Rule.
Solution:
x =
∣∣∣∣e bf d
∣∣∣∣∣∣∣∣a bc d
∣∣∣∣ =∣∣∣∣13 119 4
∣∣∣∣∣∣∣∣3 11 4
∣∣∣∣ =13 ·4−19 ·13 ·4−1 ·1
=3311
= 3
y =
∣∣∣∣3 131 19
∣∣∣∣∣∣∣∣3 11 4
∣∣∣∣ =3 ·19−13
11=
4411
= 4
Example C
What is y equal to in the following system?
x+2y− z = 0
7x−0y+ z = 14
0x+ y+ z = 10
Solution: If you attempted to solve this using elimination, it would take over a page of writing and rewriting tosolve. Cramer’s Rule speeds up the solving process.1 2 −1
7 0 10 1 1
·x
yz
=
01410
386
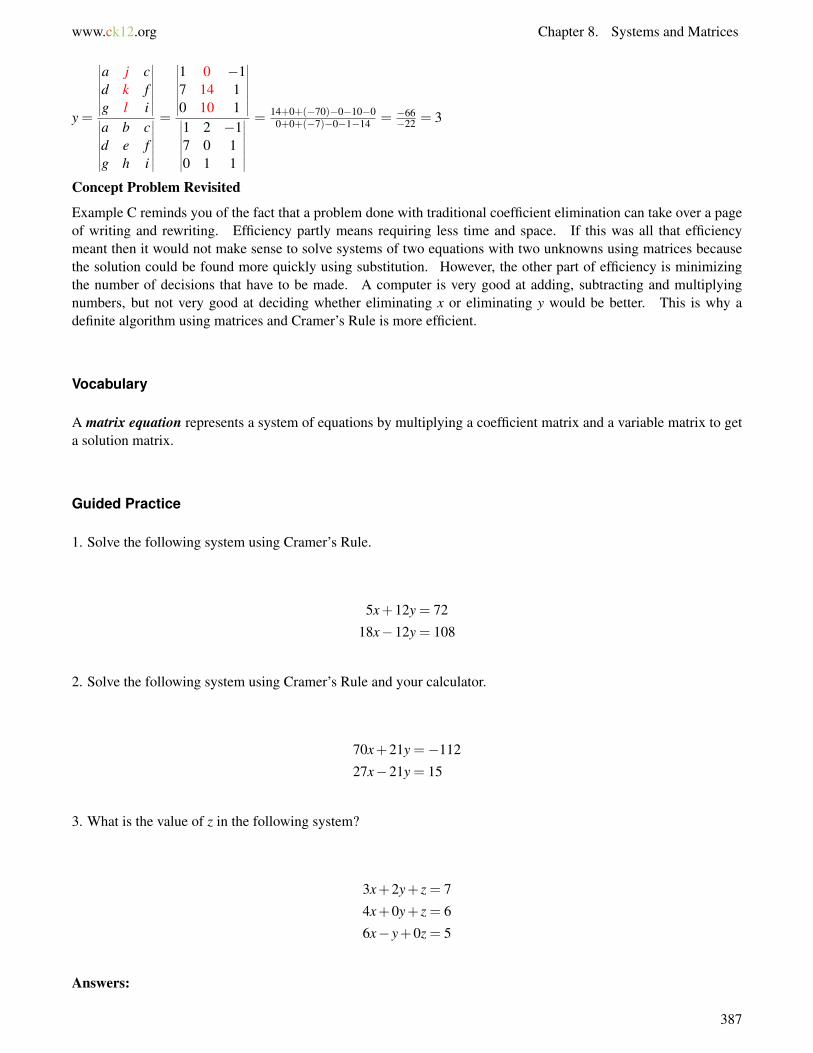
www.ck12.org Chapter 8. Systems and Matrices
y =
∣∣∣∣∣∣∣∣a j cd k fg l i
∣∣∣∣∣∣∣∣∣∣∣∣∣∣∣∣a b cd e fg h i
∣∣∣∣∣∣∣∣=
∣∣∣∣∣∣∣∣1 0 −17 14 10 10 1
∣∣∣∣∣∣∣∣∣∣∣∣∣∣∣∣1 2 −17 0 10 1 1
∣∣∣∣∣∣∣∣= 14+0+(−70)−0−10−0
0+0+(−7)−0−1−14 = −66−22 = 3
Concept Problem Revisited
Example C reminds you of the fact that a problem done with traditional coefficient elimination can take over a pageof writing and rewriting. Efficiency partly means requiring less time and space. If this was all that efficiencymeant then it would not make sense to solve systems of two equations with two unknowns using matrices becausethe solution could be found more quickly using substitution. However, the other part of efficiency is minimizingthe number of decisions that have to be made. A computer is very good at adding, subtracting and multiplyingnumbers, but not very good at deciding whether eliminating x or eliminating y would be better. This is why adefinite algorithm using matrices and Cramer’s Rule is more efficient.
Vocabulary
A matrix equation represents a system of equations by multiplying a coefficient matrix and a variable matrix to geta solution matrix.
Guided Practice
1. Solve the following system using Cramer’s Rule.
5x+12y = 72
18x−12y = 108
2. Solve the following system using Cramer’s Rule and your calculator.
70x+21y =−112
27x−21y = 15
3. What is the value of z in the following system?
3x+2y+ z = 7
4x+0y+ z = 6
6x− y+0z = 5
Answers:
387

8.8. Cramer’s Rule www.ck12.org
1.
x =
∣∣∣∣ 72 12108 −12
∣∣∣∣∣∣∣∣ 5 1218 −12
∣∣∣∣ =72 · (−12)−12 ·1085 · (−12)−12 ·18
=−2160
276=
18023
y =
∣∣∣∣ 5 7218 108
∣∣∣∣∣∣∣∣ 5 1218 −12
∣∣∣∣ =5 ·108−72 ·18
276=−756276
=−6323
2. Input the following three matrices into your calculator. Matrix A has columns that are the constants and the ycoefficients. Matrix B has columns that are x coefficients and the constants. Matrix C is just the coefficient matrix.
A =
[−112 21
15 −21
]B =
[70 −11227 15
]C =
[70 2127 −21
]
Then compute x = det Adet C
and y = det Bdet C
The solution is x =−1,y =−2
3.
3x+2y+ z = 7
4x+0y+ z = 6
6x− y+0z = 5
z =
∣∣∣∣∣∣3 2 74 0 66 −1 5
∣∣∣∣∣∣∣∣∣∣∣∣3 2 14 0 16 −1 0
∣∣∣∣∣∣=
0+2 ·6 ·6+7 ·4 · (−1)−0− (−1) ·6 ·3−5 ·4 ·20+2 ·1 ·6+1 ·4 · (−1)−0− (−1) ·1 ·3−0
=2211
= 2
Practice
Solve the following systems of equations using Cramer’s Rule. If one solution does not exist, explain.
388

www.ck12.org Chapter 8. Systems and Matrices
1.
4x−2y =−20
x−3y =−15
2.
3x+5y = 33
−x−2y =−13
3.
x+4y = 11
3x+12y = 33
4.
−3x+ y =−7
−x+4y = 5
5.
3x+ y = 6
−6x−2y = 10
6. Use Cramer’s Rule to solve for x in the following system:
2x− y+ z = 4
4x+7y− z = 38
−x+3y+2z = 23
7. Use Cramer’s Rule to solve for y in the following system:
4x+ y− z =−16
−3x+4y+ z = 18
x+ y−3z =−17
8. Use Cramer’s Rule to solve for z in the following system:
389

8.8. Cramer’s Rule www.ck12.org
3x+2y−3z = 7
−x+5y+2z = 29
x+2y+ z = 15
9. Use Cramer’s Rule to solve for x in the following system:
2x+ y−2z =−5
−4x−2y+3z = 2
3x+ y− z = 3
10. Use Cramer’s Rule to solve for y in the following system:
−x+3y+ z = 11
3x+ y+2z = 27
5x− y− z = 5
11. Use Cramer’s Rule to solve for z in the following system:
3x+2y+4z = 21
−2x+3y+ z =−11
x+2y−3z =−3
Solve the following systems of equations using Cramer’s Rule. Practice using your calculator to help with at leastone problem. If one solution does not exist, explain.
12.
−x+2y−6z = 4
8x+5y+3z =−8
2x−4y+12z = 5
13.
3x+5y+8z = 37
−6x+3y+ z = 42
x+3y−2z = 5
14.
4x+ y−6z =−38
2x+7y+8z = 108
−3x+2y−3z =−15
390
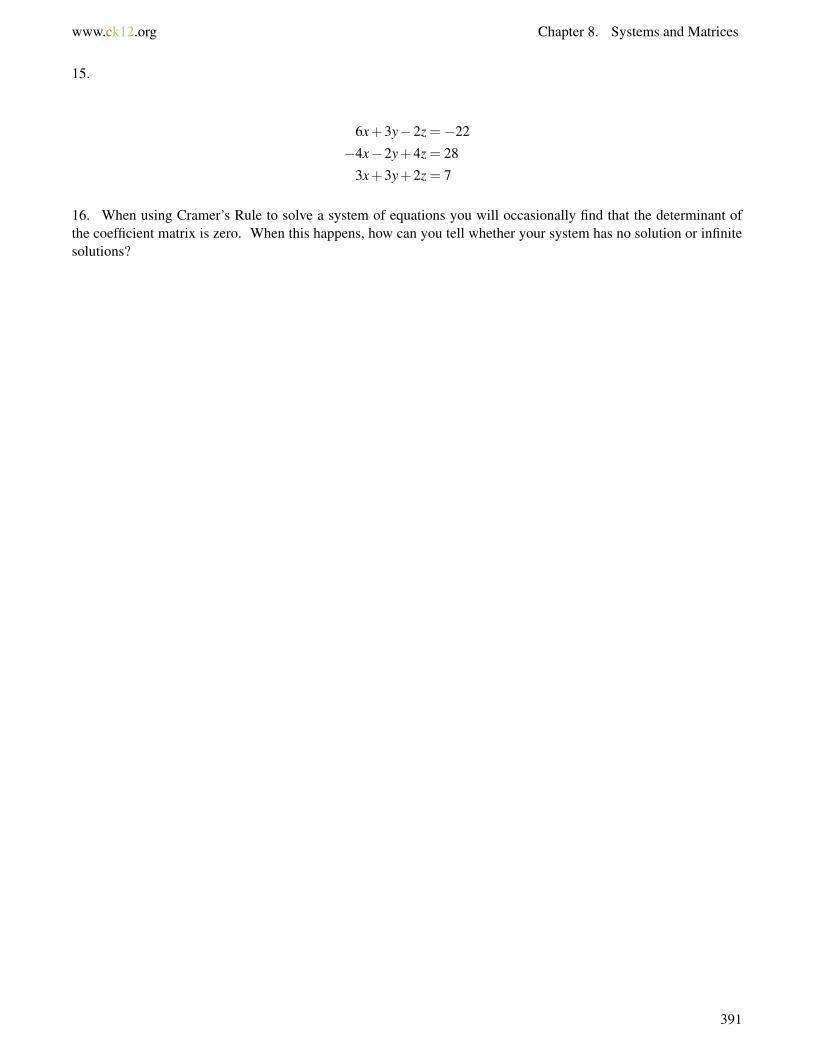
www.ck12.org Chapter 8. Systems and Matrices
15.
6x+3y−2z =−22
−4x−2y+4z = 28
3x+3y+2z = 7
16. When using Cramer’s Rule to solve a system of equations you will occasionally find that the determinant ofthe coefficient matrix is zero. When this happens, how can you tell whether your system has no solution or infinitesolutions?
391
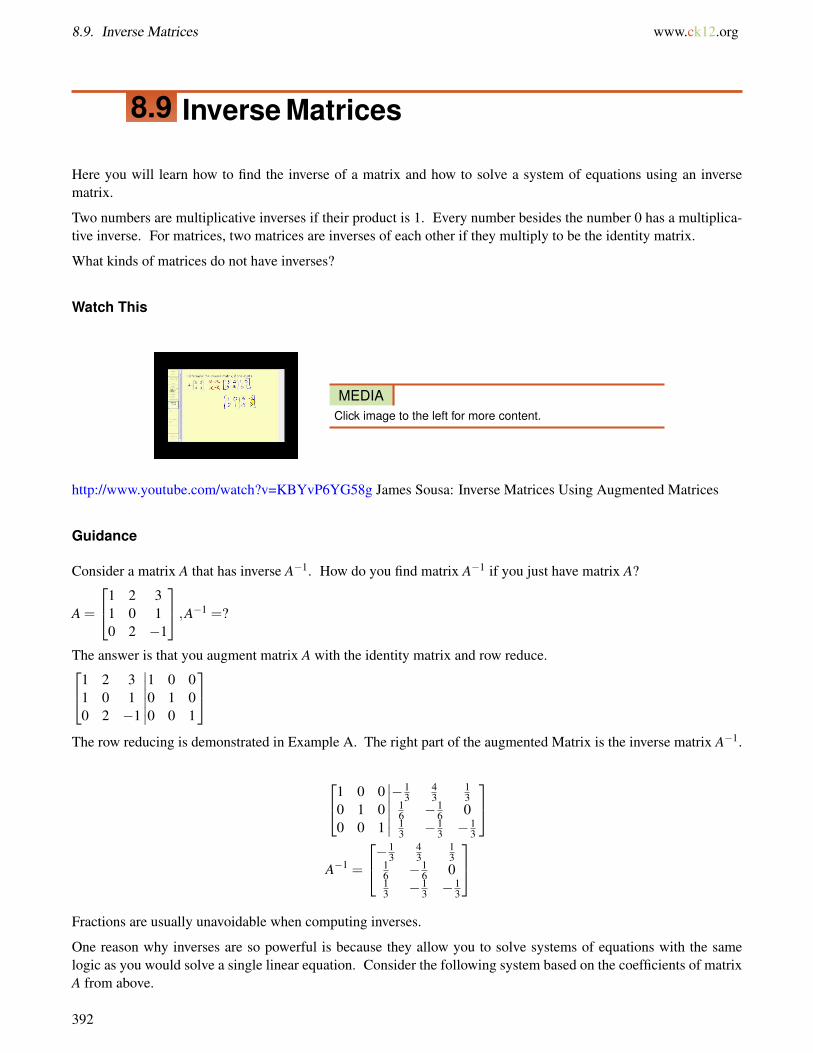
8.9. Inverse Matrices www.ck12.org
8.9 Inverse Matrices
Here you will learn how to find the inverse of a matrix and how to solve a system of equations using an inversematrix.
Two numbers are multiplicative inverses if their product is 1. Every number besides the number 0 has a multiplica-tive inverse. For matrices, two matrices are inverses of each other if they multiply to be the identity matrix.
What kinds of matrices do not have inverses?
Watch This
MEDIAClick image to the left for more content.
http://www.youtube.com/watch?v=KBYvP6YG58g James Sousa: Inverse Matrices Using Augmented Matrices
Guidance
Consider a matrix A that has inverse A−1. How do you find matrix A−1 if you just have matrix A?
A =
1 2 31 0 10 2 −1
,A−1 =?
The answer is that you augment matrix A with the identity matrix and row reduce.1 2 31 0 10 2 −1
∣∣∣∣∣∣1 0 00 1 00 0 1
The row reducing is demonstrated in Example A. The right part of the augmented Matrix is the inverse matrix A−1.
1 0 00 1 00 0 1
∣∣∣∣∣∣−1
343
13
16 −1
6 013 −1
3 −13
A−1 =
−13
43
13
16 −1
6 013 −1
3 −13
Fractions are usually unavoidable when computing inverses.
One reason why inverses are so powerful is because they allow you to solve systems of equations with the samelogic as you would solve a single linear equation. Consider the following system based on the coefficients of matrixA from above.
392
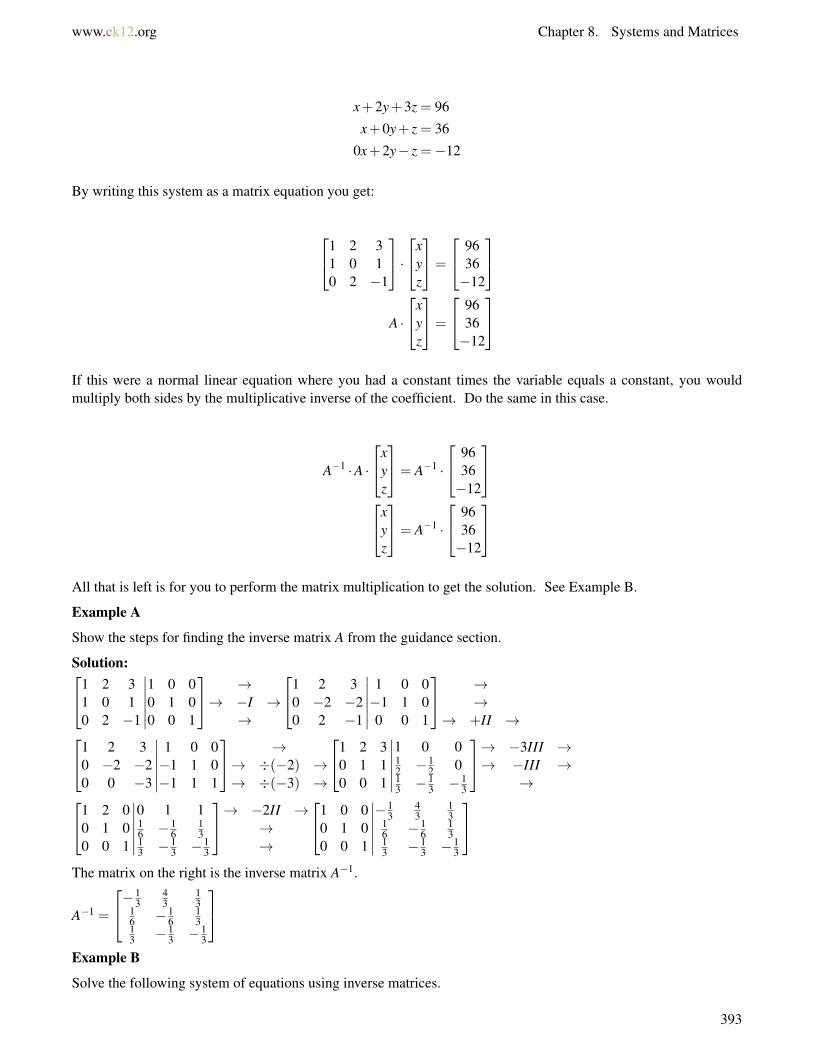
www.ck12.org Chapter 8. Systems and Matrices
x+2y+3z = 96
x+0y+ z = 36
0x+2y− z =−12
By writing this system as a matrix equation you get:
1 2 31 0 10 2 −1
·x
yz
=
9636−12
A ·
xyz
=
9636−12
If this were a normal linear equation where you had a constant times the variable equals a constant, you wouldmultiply both sides by the multiplicative inverse of the coefficient. Do the same in this case.
A−1 ·A ·
xyz
= A−1 ·
9636−12
x
yz
= A−1 ·
9636−12
All that is left is for you to perform the matrix multiplication to get the solution. See Example B.
Example A
Show the steps for finding the inverse matrix A from the guidance section.
Solution:1 2 31 0 10 2 −1
∣∣∣∣∣∣1 0 00 1 00 0 1
→→ −I →→
1 2 30 −2 −20 2 −1
∣∣∣∣∣∣1 0 0−1 1 00 0 1
→→
→ +II →1 2 30 −2 −20 0 −3
∣∣∣∣∣∣1 0 0−1 1 0−1 1 1
→→ ÷(−2) →→ ÷(−3) →
1 2 30 1 10 0 1
∣∣∣∣∣∣1 0 012 −1
2 013 −1
3 −13
→ −3III →→ −III →
→1 2 00 1 00 0 1
∣∣∣∣∣∣0 1 116 −1
613
13 −1
3 −13
→ −2II →→→
1 0 00 1 00 0 1
∣∣∣∣∣∣−1
343
13
16 −1
613
13 −1
3 −13
The matrix on the right is the inverse matrix A−1.
A−1 =
−13
43
13
16 −1
613
13 −1
3 −13
Example B
Solve the following system of equations using inverse matrices.
393
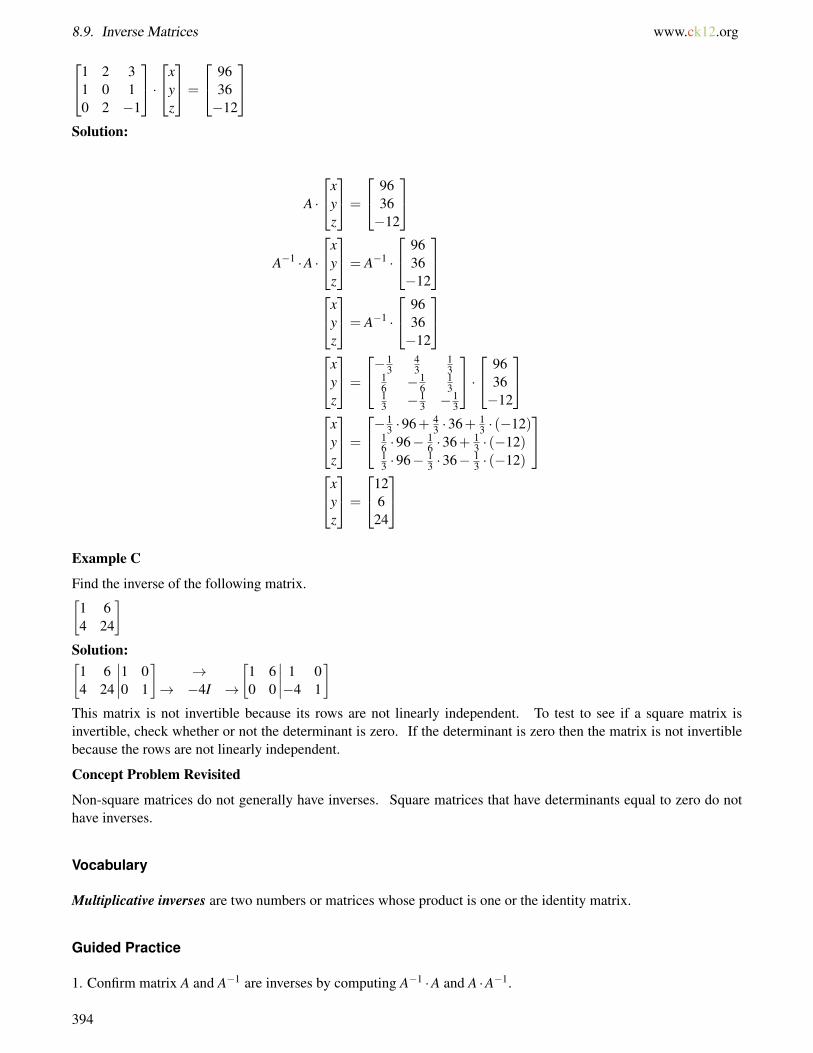
8.9. Inverse Matrices www.ck12.org
1 2 31 0 10 2 −1
·x
yz
=
9636−12
Solution:
A ·
xyz
=
9636−12
A−1 ·A ·
xyz
= A−1 ·
9636−12
x
yz
= A−1 ·
9636−12
x
yz
=
−13
43
13
16 −1
613
13 −1
3 −13
· 96
36−12
x
yz
=
−13 ·96+ 4
3 ·36+ 13 · (−12)
16 ·96− 1
6 ·36+ 13 · (−12)
13 ·96− 1
3 ·36− 13 · (−12)
x
yz
=
12624
Example C
Find the inverse of the following matrix.[1 64 24
]Solution:[
1 64 24
∣∣∣∣1 00 1
]→
→ −4I →
[1 60 0
∣∣∣∣ 1 0−4 1
]This matrix is not invertible because its rows are not linearly independent. To test to see if a square matrix isinvertible, check whether or not the determinant is zero. If the determinant is zero then the matrix is not invertiblebecause the rows are not linearly independent.
Concept Problem Revisited
Non-square matrices do not generally have inverses. Square matrices that have determinants equal to zero do nothave inverses.
Vocabulary
Multiplicative inverses are two numbers or matrices whose product is one or the identity matrix.
Guided Practice
1. Confirm matrix A and A−1 are inverses by computing A−1 ·A and A ·A−1.
394
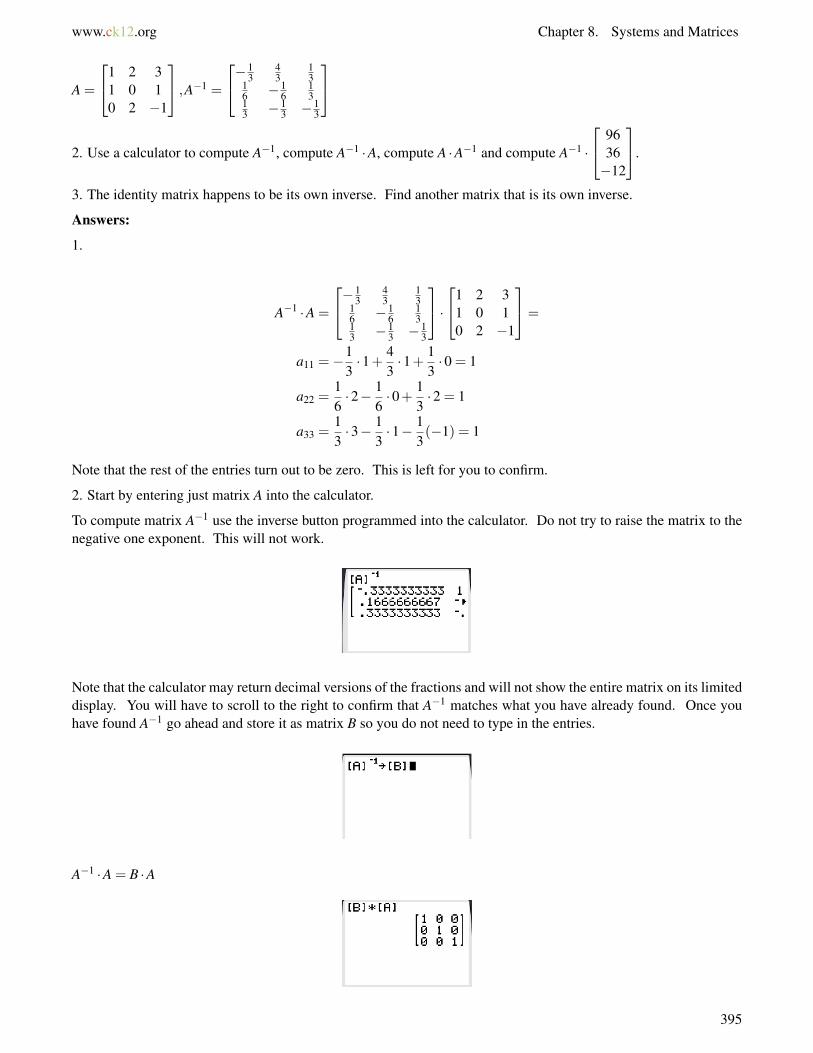
www.ck12.org Chapter 8. Systems and Matrices
A =
1 2 31 0 10 2 −1
,A−1 =
−13
43
13
16 −1
613
13 −1
3 −13
2. Use a calculator to compute A−1, compute A−1 ·A, compute A ·A−1 and compute A−1 ·
9636−12
.
3. The identity matrix happens to be its own inverse. Find another matrix that is its own inverse.
Answers:
1.
A−1 ·A =
−13
43
13
16 −1
613
13 −1
3 −13
·1 2 3
1 0 10 2 −1
=
a11 =−13·1+ 4
3·1+ 1
3·0 = 1
a22 =16·2− 1
6·0+ 1
3·2 = 1
a33 =13·3− 1
3·1− 1
3(−1) = 1
Note that the rest of the entries turn out to be zero. This is left for you to confirm.
2. Start by entering just matrix A into the calculator.
To compute matrix A−1 use the inverse button programmed into the calculator. Do not try to raise the matrix to thenegative one exponent. This will not work.
Note that the calculator may return decimal versions of the fractions and will not show the entire matrix on its limiteddisplay. You will have to scroll to the right to confirm that A−1 matches what you have already found. Once youhave found A−1 go ahead and store it as matrix B so you do not need to type in the entries.
A−1 ·A = B ·A
395
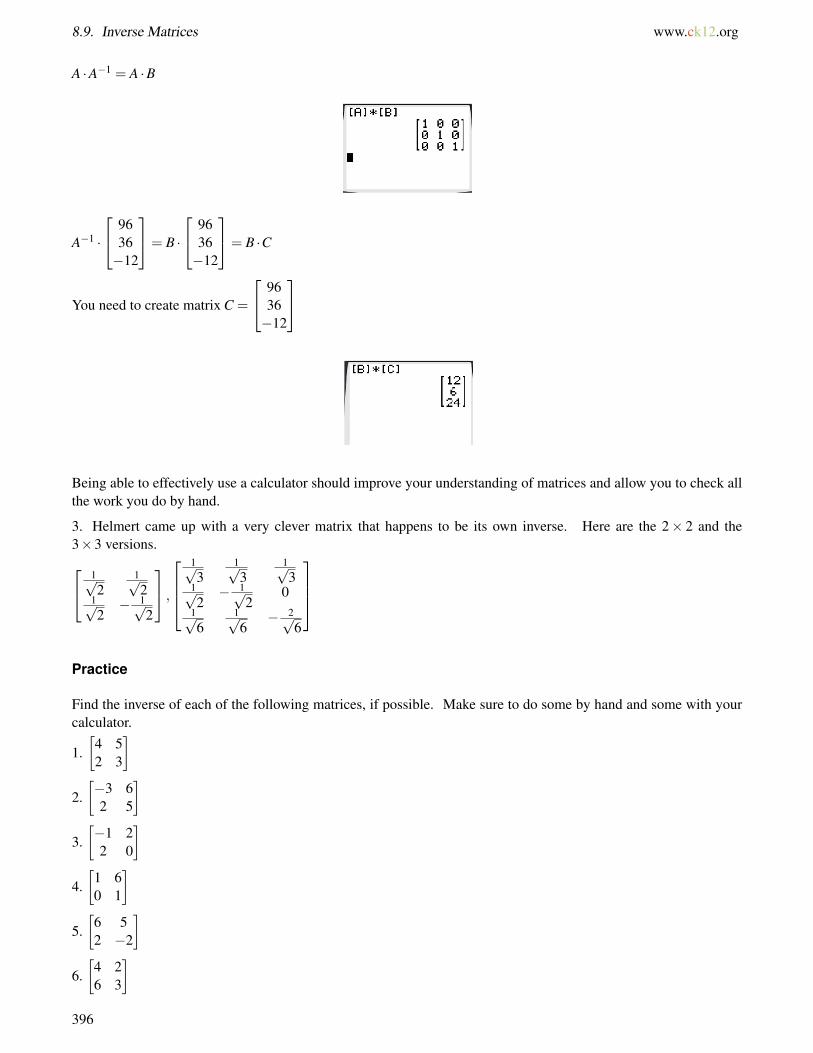
8.9. Inverse Matrices www.ck12.org
A ·A−1 = A ·B
A−1 ·
9636−12
= B ·
9636−12
= B ·C
You need to create matrix C =
9636−12
Being able to effectively use a calculator should improve your understanding of matrices and allow you to check allthe work you do by hand.
3. Helmert came up with a very clever matrix that happens to be its own inverse. Here are the 2× 2 and the3×3 versions. 1√
21√2
1√2− 1√
2
,
1√3
1√3
1√3
1√2− 1√
20
1√6
1√6− 2√
6
Practice
Find the inverse of each of the following matrices, if possible. Make sure to do some by hand and some with yourcalculator.
1.[
4 52 3
]2.[−3 62 5
]3.[−1 22 0
]4.[
1 60 1
]5.[
6 52 −2
]6.[
4 26 3
]396

www.ck12.org Chapter 8. Systems and Matrices
7.
−1 3 −44 2 11 2 5
8.
4 5 89 0 10 3 −2
9.
0 7 −12 −3 16 8 0
10.
4 2 −32 4 51 8 0
11.
−2 −6 −12−1 −5 −22 3 4
12.
−2 6 32 4 0−8 2 1
13. Show that Helmert’s 2×2 matrix is its own inverse:
1√2
1√2
1√2− 1√
2
14. Show that Helmert’s 3×3 matrix is its own inverse:
1√3
1√3
1√3
1√2− 1√
20
1√6
1√6− 2√
6
.
15. Non-square matrices sometimes have left inverses, where A−1 ·A = I, or right inverses, where A ·A−1 = I. Whycan’t non-square matrices have “regular” inverses?
397
8.10. Partial Fractions www.ck12.org
8.10 Partial Fractions
Here you will apply what you know about systems and matrices to decompose rational expressions into the sum ofseveral partial fractions.
When given a rational expression like 4x−9x2−3x it is very helpful in calculus to be able to write it as the sum of two
simpler fractions like 3x +
1x−3 . The challenging part is trying to get from the initial rational expression to the simpler
fractions.
You may know how to add fractions and go from two or more separate fractions to a single fraction, but how do yougo the other way around?
Watch This
MEDIAClick image to the left for more content.
http://www.youtube.com/watch?v=S-XKGBesRzk Khan Academy: Partial Fraction Expansion 1
Guidance
Partial fraction decomposition is a procedure that reverses adding fractions with unlike denominators. The mostchallenging part is coming up with the denominators of each individual partial fraction. See if you can spot thepattern.
6x−1x2(x−1)(x2+2) =
Ax +
Bx2 +
Cx−1 +
Dx+Ex2+2
In this example each individual factor must be represented. Linear factors that are raised to a power greater thanone must have each successive power included as a separate denominator. Quadratic terms that do not factor to belinear terms are included with a numerator that is a linear function of x.
Example A
Use partial fractions to decompose the following rational expression.7x2+x+6
x3+3x
Solution: First factor the denominator and identify the denominators of the partial fractions.7x2+x+6x(x2+3) = A
x +Bx+Cx2+3
When the fractions are eliminated by multiplying through by the LCD the equation becomes:
7x2 + x+6 = A(x2 +3)+ x(Bx+C)
7x2 + x+6 = Ax2 +3A+Bx2 +Cx
398
www.ck12.org Chapter 8. Systems and Matrices
Notice the squared term, linear term and constant term form a system of three equations with three variables.
A+B = 7
C = 1
3A = 6
In this case it is easy to see that A = 2,B = 5,C = 1. Often, the resulting system of equations is more complex andwould benefit from your knowledge of solving systems using matrices.7x2+x+6x(x2+3) = 2
x +5x+1x2+3
Example B
Decompose the following rational expression.5x4−3x3−x2+4x−1
(x−1)3x2
Solution: First identify the denominators of the partial fractions.
5x4−3x3− x2 +4x−1(x−1)3x2 =
Ax−1
+B
(x−1)2 +C
(x−1)3 +Dx+
Ex2
When the entire fraction is multiplied through by (x−1)3x2 the equation results to:
5x4−3x3− x2 +4x−1
= A(x−1)2x2 +B(x−1)x2 +Cx2 +D(x−1)3x+E(x−1)3
Multiplication of each term can be done separately to be extra careful.
Ax4−2Ax3 +Ax2
Bx3−Bx2
Cx2
Dx4−3Dx3 +3Dx2−Dx
Ex3−3Ex2 +3Ex−E
Group terms with the same power of x and set equal to the corresponding term.
5x4 = Ax4 +Dx4
−3x3 =−2Ax3 +Bx3−3D3 +Ex3
−x2 = Ax2−Bx2 +Cx2 +3Dx2−3Ex2
4x =−Dx+3Ex
−1 =−E
From these 5 equations, every x can be divided out. Assume that x 6= 0 because if it were, then the original expressionwould be undefined.
399
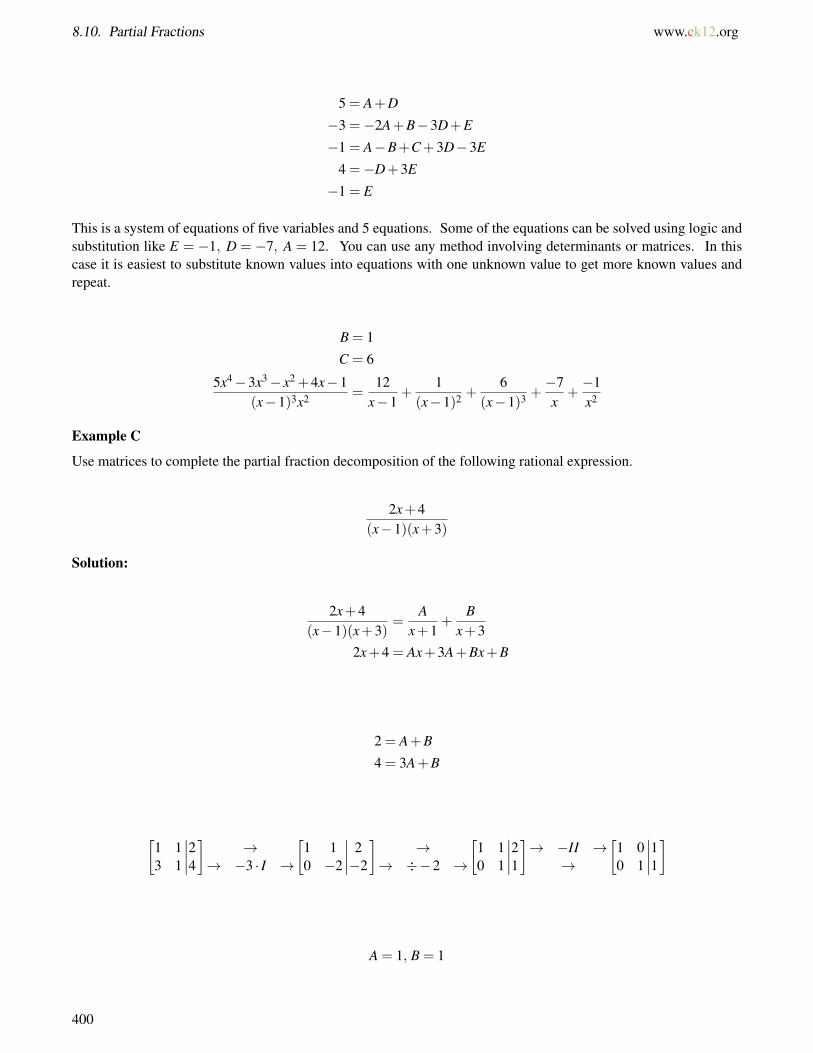
8.10. Partial Fractions www.ck12.org
5 = A+D
−3 =−2A+B−3D+E
−1 = A−B+C+3D−3E
4 =−D+3E
−1 = E
This is a system of equations of five variables and 5 equations. Some of the equations can be solved using logic andsubstitution like E = −1, D = −7, A = 12. You can use any method involving determinants or matrices. In thiscase it is easiest to substitute known values into equations with one unknown value to get more known values andrepeat.
B = 1
C = 6
5x4−3x3− x2 +4x−1(x−1)3x2 =
12x−1
+1
(x−1)2 +6
(x−1)3 +−7x
+−1x2
Example C
Use matrices to complete the partial fraction decomposition of the following rational expression.
2x+4(x−1)(x+3)
Solution:
2x+4(x−1)(x+3)
=A
x+1+
Bx+3
2x+4 = Ax+3A+Bx+B
2 = A+B
4 = 3A+B
[1 13 1
∣∣∣∣24]
→→ −3 · I →
[1 10 −2
∣∣∣∣ 2−2
]→
→ ÷−2 →
[1 10 1
∣∣∣∣21]→ −II →
→
[1 00 1
∣∣∣∣11]
A = 1, B = 1
400
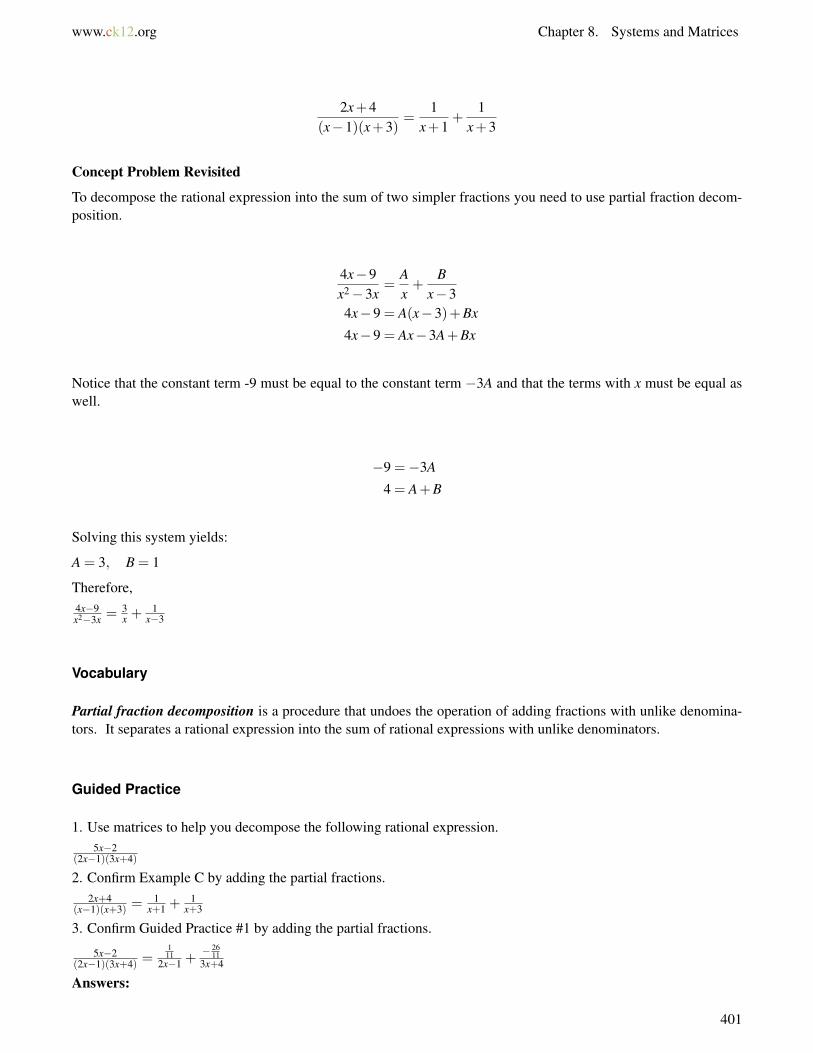
www.ck12.org Chapter 8. Systems and Matrices
2x+4(x−1)(x+3)
=1
x+1+
1x+3
Concept Problem Revisited
To decompose the rational expression into the sum of two simpler fractions you need to use partial fraction decom-position.
4x−9x2−3x
=Ax+
Bx−3
4x−9 = A(x−3)+Bx
4x−9 = Ax−3A+Bx
Notice that the constant term -9 must be equal to the constant term −3A and that the terms with x must be equal aswell.
−9 =−3A
4 = A+B
Solving this system yields:
A = 3, B = 1
Therefore,4x−9x2−3x =
3x +
1x−3
Vocabulary
Partial fraction decomposition is a procedure that undoes the operation of adding fractions with unlike denomina-tors. It separates a rational expression into the sum of rational expressions with unlike denominators.
Guided Practice
1. Use matrices to help you decompose the following rational expression.5x−2
(2x−1)(3x+4)
2. Confirm Example C by adding the partial fractions.2x+4
(x−1)(x+3) =1
x+1 +1
x+3
3. Confirm Guided Practice #1 by adding the partial fractions.
5x−2(2x−1)(3x+4) =
111
2x−1 +− 26
113x+4
Answers:
401
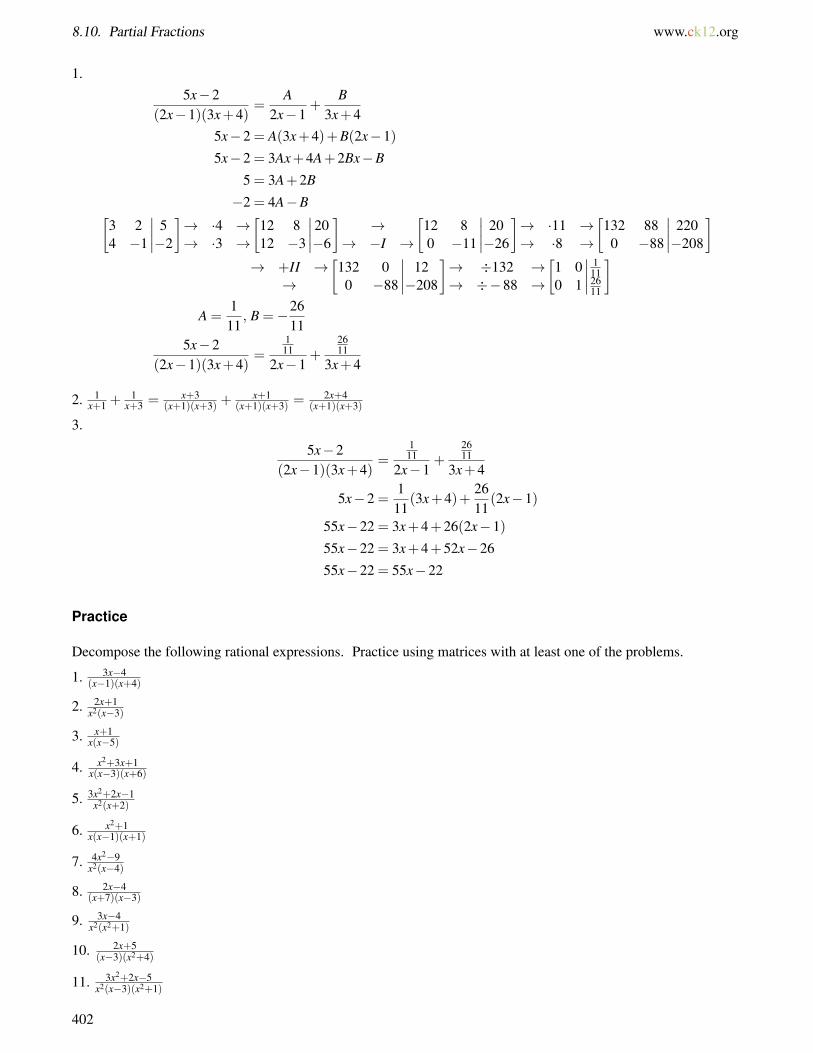
8.10. Partial Fractions www.ck12.org
1.5x−2
(2x−1)(3x+4)=
A2x−1
+B
3x+45x−2 = A(3x+4)+B(2x−1)
5x−2 = 3Ax+4A+2Bx−B
5 = 3A+2B
−2 = 4A−B[3 24 −1
∣∣∣∣ 5−2
]→ ·4 →→ ·3 →
[12 812 −3
∣∣∣∣20−6
]→
→ −I →
[12 80 −11
∣∣∣∣ 20−26
]→ ·11 →→ ·8 →
[132 880 −88
∣∣∣∣ 220−208
]→ +II →
→
[132 0
0 −88
∣∣∣∣ 12−208
]→ ÷132 →→ ÷−88 →
[1 00 1
∣∣∣∣ 1112611
]A =
111
, B =−2611
5x−2(2x−1)(3x+4)
=111
2x−1+
2611
3x+4
2. 1x+1 +
1x+3 = x+3
(x+1)(x+3) +x+1
(x+1)(x+3) =2x+4
(x+1)(x+3)
3.
5x−2(2x−1)(3x+4)
=111
2x−1+
2611
3x+4
5x−2 =111
(3x+4)+2611
(2x−1)
55x−22 = 3x+4+26(2x−1)
55x−22 = 3x+4+52x−26
55x−22 = 55x−22
Practice
Decompose the following rational expressions. Practice using matrices with at least one of the problems.
1. 3x−4(x−1)(x+4)
2. 2x+1x2(x−3)
3. x+1x(x−5)
4. x2+3x+1x(x−3)(x+6)
5. 3x2+2x−1x2(x+2)
6. x2+1x(x−1)(x+1)
7. 4x2−9x2(x−4)
8. 2x−4(x+7)(x−3)
9. 3x−4x2(x2+1)
10. 2x+5(x−3)(x2+4)
11. 3x2+2x−5x2(x−3)(x2+1)
402

www.ck12.org Chapter 8. Systems and Matrices
12. Confirm your answer to #1 by adding the partial fractions.
13. Confirm your answer to #3 by adding the partial fractions.
14. Confirm your answer to #6 by adding the partial fractions.
15. Confirm your answer to #9 by adding the partial fractions.
A system of equations is a collection of two or more equations with multiple unknown variables. You learnedthat solving a system means solving for these variables. Graphically this means finding where the lines, curves orplanes intersect. You learned that a matrix is a rectangular array of numbers that corresponds to the coefficients ina system. Using a matrix to represent the system is incredibly powerful because it makes it easier to solve for thevariables. In this chapter on systems and matrices, you reviewed techniques for solving systems in two and threedimensions, learned the basic idea of matrices, exercised different properties of matrices and finally used matricesto solve systems.
403

8.11. References www.ck12.org
8.11 References
1. CK-12 Foundation. . CCSA2. CK-12 Foundation. . CCSA3. CK-12 Foundation. . CCSA4. CK-12 Foundation. . CCSA5. CK-12 Foundation. . CCSA6. CK-12 Foundation. . CCSA7. CK-12 Foundation. . CCSA8. CK-12 Foundation. . CCSA9. CK-12 Foundation. . CCSA
10. CK-12 Foundation. . CCSA11. CK-12 Foundation. . CCSA12. CK-12 Foundation. . CCSA13. CK-12 Foundation. . CCSA14. CK-12 Foundation. . CCSA15. CK-12 Foundation. . CCSA16. CK-12 Foundation. . CCSA
404

www.ck12.org Chapter 9. Conics
CHAPTER 9 ConicsChapter Outline
9.1 GENERAL FORM OF A CONIC
9.2 PARABOLAS
9.3 CIRCLES
9.4 ELLIPSES
9.5 HYPERBOLAS
9.6 DEGENERATE CONICS
9.7 REFERENCES
Conics are an application of analytic geometry. Here you will get a chance to work with shapes like circles that youhave worked with before. You will also get to see the equations and definitions that turn circles into curved ellipsesand the rest of the conic sections.
405

9.1. General Form of a Conic www.ck12.org
9.1 General Form of a Conic
Here you will see how each conic section is the intersection of a plane and a cone, review completing the square andstart working with the general equation of a conic.
Conics are a family of graphs that include parabolas, circles, ellipses and hyperbolas. All of these graphs come fromthe same general equation and by looking and manipulating a specific equation you can learn to tell which conic itis and how it can be graphed.
What is the one essential skill that enables you to manipulate the equation of a conic in order to sketch its graph?
Watch This
MEDIAClick image to the left for more content.
http://www.youtube.com/watch?v=iJOcn9C9y4w James Sousa: Introduction to Conic Sections
Guidance
The word conic comes from the word cone which is where the shapes of parabolas, circles, ellipses and hyperbolasoriginate. Consider two cones that open up in opposite directions and a plane that intersects it horizontally. A flatintersection would produce a perfect circle.
To produce an ellipse, tilt the plane so that the circle becomes elongated and oval shaped. Notice that the angle thatthe plane is tilted is still less steep than the slope of the side of the cone.
406
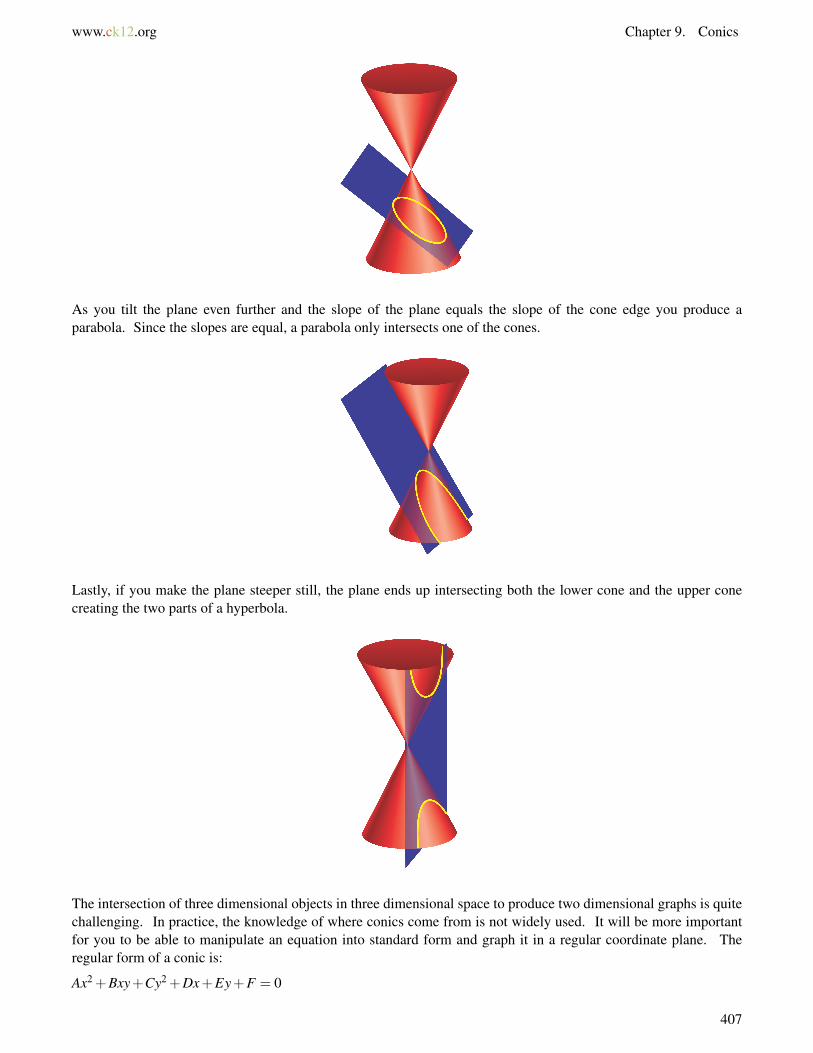
www.ck12.org Chapter 9. Conics
As you tilt the plane even further and the slope of the plane equals the slope of the cone edge you produce aparabola. Since the slopes are equal, a parabola only intersects one of the cones.
Lastly, if you make the plane steeper still, the plane ends up intersecting both the lower cone and the upper conecreating the two parts of a hyperbola.
The intersection of three dimensional objects in three dimensional space to produce two dimensional graphs is quitechallenging. In practice, the knowledge of where conics come from is not widely used. It will be more importantfor you to be able to manipulate an equation into standard form and graph it in a regular coordinate plane. Theregular form of a conic is:
Ax2 +Bxy+Cy2 +Dx+Ey+F = 0
407

9.1. General Form of a Conic www.ck12.org
Before you start manipulating the general form of a conic equation you should be able to recognize whether it is acircle, ellipse, parabola or hyperbola. In standard form, the two coefficients to examine are A and C.
• For circles, the coefficients of x2 and y2 are the same sign and the same value: A =C• For ellipses, the coefficients of x2 and y2 are the same sign and different values: A,C > 0, A 6=C• For hyperbolas, the coefficients of x2 and y2 are opposite signs: C < 0 < A or A < 0 <C• For parabolas, either the coefficient of x2 or y2 must be zero: A = 0 or C = 0
Each specific type of conic has its own graphing form, but in all cases the technique of completing the square isessential. The examples review completing the square and recognizing conics.
Example A
Complete the square in the expression x2 +6x. Demonstrate graphically what completing the square represents.
Solution: Algebraically, completing the square just requires you to divide the coefficient of x by 2 and square theresult. In this case
(62
)2= 32 = 9. Since you cannot add nine to an expression without changing its value, you must
simultaneously add nine and subtract nine so the net change will be zero.
x2 +6x+9−9
Now you can factor by recognizing a perfect square.
(x+3)2−9
Graphically the original expression x2 +6x can be represented by the area of a rectangle with sides x and (x+6).
The term “complete the square” has visual meaning as well algebraic meaning. The rectangle can be rearranged tobe more square-like so that instead of small rectangle of area 6x at the bottom, there is a rectangle of area 3x on two
408
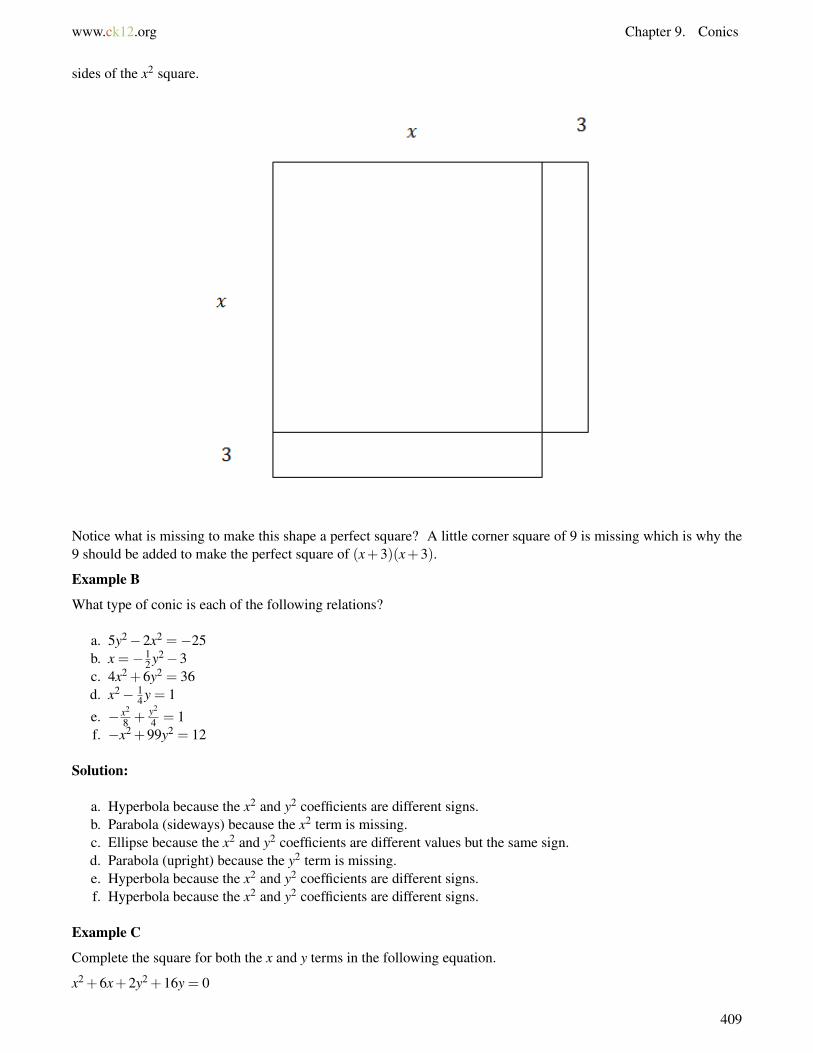
www.ck12.org Chapter 9. Conics
sides of the x2 square.
Notice what is missing to make this shape a perfect square? A little corner square of 9 is missing which is why the9 should be added to make the perfect square of (x+3)(x+3).
Example B
What type of conic is each of the following relations?
a. 5y2−2x2 =−25b. x =−1
2 y2−3c. 4x2 +6y2 = 36d. x2− 1
4 y = 1
e. − x2
8 + y2
4 = 1f. −x2 +99y2 = 12
Solution:
a. Hyperbola because the x2 and y2 coefficients are different signs.b. Parabola (sideways) because the x2 term is missing.c. Ellipse because the x2 and y2 coefficients are different values but the same sign.d. Parabola (upright) because the y2 term is missing.e. Hyperbola because the x2 and y2 coefficients are different signs.f. Hyperbola because the x2 and y2 coefficients are different signs.
Example C
Complete the square for both the x and y terms in the following equation.
x2 +6x+2y2 +16y = 0
409
9.1. General Form of a Conic www.ck12.org
Solution: First write out the equation with space so that there is room for the terms to be added to both sides. Sincethis is an equation, it is appropriate to add the values to both sides instead of adding and subtracting the same valuesimultaneously. As you rewrite with spaces, factor out any coefficient of the x2 or y2 terms since your algorithm forcompleting the square only works when this coefficient is one.
x2 +6x+ +2(y2 +8y+ ) = 0
Next complete the square by adding a nine and what looks like a 16 on the left (it is actually a 32 since it is insidethe parentheses).
x2 +6x+9+2(y2 +8y+16) = 9+32
Factor.
(x+3)2 +2(y+4)2 = 41
Concept Problem Revisited
The one essential skill that you need for conics is completing the square. If you can do problems like Example Cthen you will be able to graph every type of conic.
Vocabulary
Completing the square is a procedure that enables you to combine squared and linear terms of the same variableinto a perfect square of a binomial.
Conics are a family of graphs (not functions) that come from the same general equation. This family is theintersection of a two sided cone and a plane in three dimensional space.
Guided Practice
1. Identify the type of conic in each of the following relations.
a. 3x2 = 3y2 +18b. y = 4(x−3)2 +2c. x2 + y2 = 4d. y2 +2y+ x2−6x = 12e. x2
6 + y2
12 = 1f. x2− y2 +4 = 0
2. Complete the square in the following expression.
6y2−36y+4
3. Complete the square for both x and y in the following equation.
−3x2−24x+4y2−32y = 8
Answers:
1. a. The relation is a hyperbola because when you move the 3y2 to the left hand side of the equation, it becomesnegative and then the coefficients of x2 and y2 have opposite signs.
b. Parabola
c. Circle
d. Circle
e. Ellipse
410
www.ck12.org Chapter 9. Conics
f. Hyperbola
2.
6y2−36y+4
6(y2−6y+ )+4
6(y2−6y+9)+4−54
6(y−3)2−50
3.
−3x2−24x+4y2−32y = 8
−3(x2 +8x+ )+4(y2−8y+ ) = 8
−3(x2 +8x+16)+4(y2−8y+16) = 8−48+64
−3(x+4)2 +4(y−4)2 = 24
Practice
Identify the type of conic in each of the following relations.
1. 3x2 +4y2 = 12
2. x2 + y2 = 9
3. x2
4 + y2
9 = 1
4. y2 + x = 11
5. x2 +2x− y2 +6y = 15
6. x2 = y−1
Complete the square for x and/or y in each of the following expressions.
7. x2 +4x
8. y2−8y
9. 3x2 +6x+4
10. 3y2 +9y+15
11. 2x2−12x+1
Complete the square for x and/or y in each of the following equations.
12. 4x2−16x+ y2 +2y =−1
13. 9x2−54x+ y2−2y =−81
14. 3x2−6x−4y2 = 9
15. y = x2 +4x+1
411

9.2. Parabolas www.ck12.org
9.2 Parabolas
Here you will define a parabola in terms of its directrix and focus, graph parabolas vertically and horizontally, anduse a new graphing form of the parabola equation.
When working with parabolas in the past you probably used vertex form and analyzed the graph by finding its rootsand intercepts. There is another way of defining a parabola that turns out to be more useful in the real world. Oneof the many uses of parabolic shapes in the real world is satellite dishes. In these shapes it is vital to know wherethe receptor point should be placed so that it can absorb all the signals being reflected from the dish.
Where should the receptor be located on a satellite dish that is four feet wide and nine inches deep?
Watch This
MEDIAClick image to the left for more content.
http://www.youtube.com/watch?v=k7wSPisQQYs James Sousa: Conic Sections: The Parabola part 1 of 2
MEDIAClick image to the left for more content.
http://www.youtube.com/watch?v=CKepZr52G6Y James Sousa: Conic Sections: The Parabola part 2 of 2
Guidance
The definition of a parabola is the collection of points equidistant from a point called the focus and a line called thedirectrix.
412

www.ck12.org Chapter 9. Conics
Notice how the three points P1,P2,P3 are each connected by a blue line to the focus point F and the directrix line L.
FP1 = P1Q1
FP2 = P2Q2
FP3 = P3Q3
There are two graphing equations for parabolas that will be used in this concept. The only difference is one equationgraphs parabolas opening vertically and one equation graphs parabolas opening horizontally. You can recognizethe parabolas opening vertically because they have an x2 term. Likewise, parabolas opening horizontally have ay2 term. The general equation for a parabola opening vertically is (x−h)2 =±4p(y− k). The general equation fora parabola opening horizontally is (y− k)2 =±4p(x−h).
Note that the vertex is still (h,k). The parabola opens upwards or to the right if the 4p is positive. The parabolaopens down or to the left if the 4p is negative. The focus is just a point that is distance p away from the vertex. Thedirectrix is just a line that is distance p away from the vertex in the opposite direction. You can sketch how wide theparabola is by noting the focal width is |4p|.
Once you put the parabola into this graphing form you can sketch the parabola by plotting the vertex, identifying pand plotting the focus and directrix and lastly determining the focal width and sketching the curve.
413

9.2. Parabolas www.ck12.org
Example A
Identify the following conic, put it into graphing form and identify its vertex, focal length (p), focus, directrix andfocal width.
2x2 +16x+ y = 0
Solution: This is a parabola because the y2 coefficient is zero.
x2 +8x =−12
y
x2 +8x+16 =−12
y+16
(x+4)2 =−12(y−32)
(x+4)2 =−4 · 18(y−32)
The vertex is (-4, 32). The focal length is p = 18 . This parabola opens down which means that the focus is at(
−4,32− 18
)and the directrix is horizontal at y = 32+ 1
8 . The focal width is 12 .
Example B
Sketch the following parabola and identify the important pieces of information.
(y+1)2 = 4 · 12 · (x+3)
Solution:
The vertex is at (-3, -1). The parabola is sideways because there is a y2 term. The parabola opens to the rightbecause the 4p is positive. The focal length is p = 1
2 which means the focus is 12 to the right of the vertex at (-2.5,
-1) and the directrix is 12 to the left of the vertex at x = −3.5. The focal width is 2 which is why the width of the
parabola stretches from (-2.5, 0) to (-2.5, -2).
Example C
What is the equation of a parabola that has a focus at (4, 3) and a directrix of y =−1?
Solution: It would probably be useful to graph the information that you have in order to reason about where thevertex is.
414
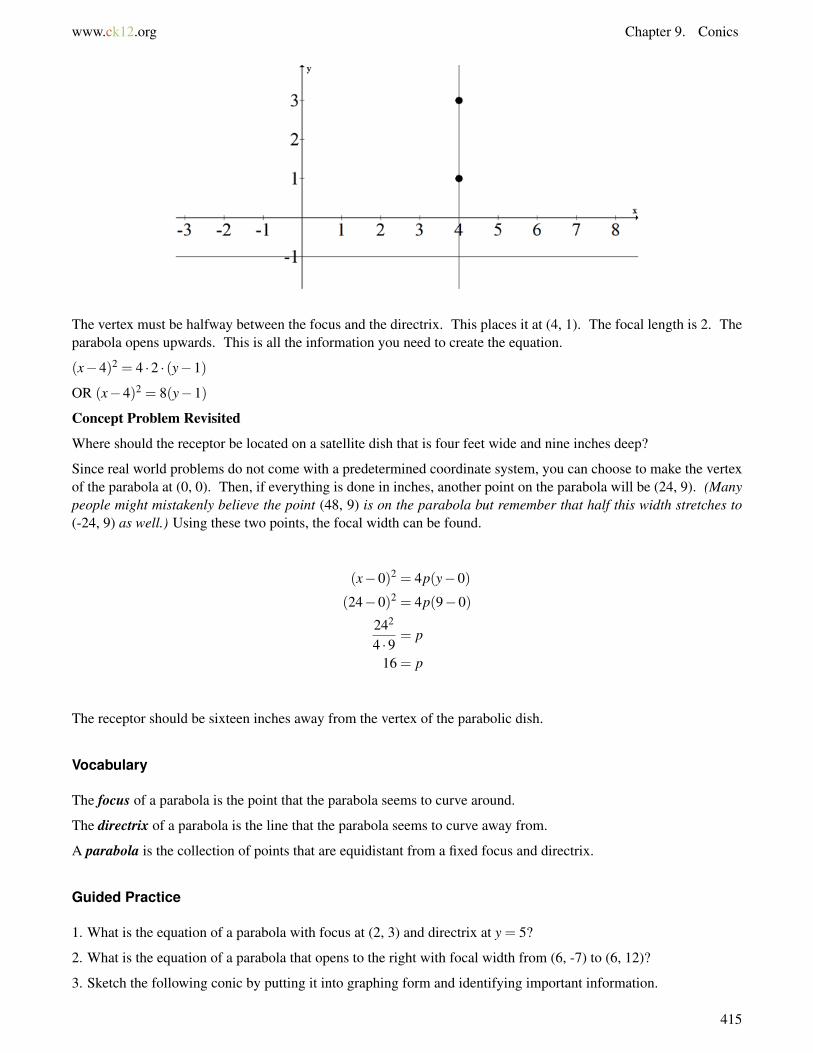
www.ck12.org Chapter 9. Conics
The vertex must be halfway between the focus and the directrix. This places it at (4, 1). The focal length is 2. Theparabola opens upwards. This is all the information you need to create the equation.
(x−4)2 = 4 ·2 · (y−1)
OR (x−4)2 = 8(y−1)
Concept Problem Revisited
Where should the receptor be located on a satellite dish that is four feet wide and nine inches deep?
Since real world problems do not come with a predetermined coordinate system, you can choose to make the vertexof the parabola at (0, 0). Then, if everything is done in inches, another point on the parabola will be (24, 9). (Manypeople might mistakenly believe the point (48, 9) is on the parabola but remember that half this width stretches to(-24, 9) as well.) Using these two points, the focal width can be found.
(x−0)2 = 4p(y−0)
(24−0)2 = 4p(9−0)
242
4 ·9= p
16 = p
The receptor should be sixteen inches away from the vertex of the parabolic dish.
Vocabulary
The focus of a parabola is the point that the parabola seems to curve around.
The directrix of a parabola is the line that the parabola seems to curve away from.
A parabola is the collection of points that are equidistant from a fixed focus and directrix.
Guided Practice
1. What is the equation of a parabola with focus at (2, 3) and directrix at y = 5?
2. What is the equation of a parabola that opens to the right with focal width from (6, -7) to (6, 12)?
3. Sketch the following conic by putting it into graphing form and identifying important information.
415

9.2. Parabolas www.ck12.org
y2−4y+12x−32 = 0
Answers:
1. The vertex must lie directly between the focus and the directrix, so it must be at (2, 4). The focal length istherefore equal to 1. The parabola opens downwards.
(x−2)2 =−4 ·1 · (y−4)
2. The focus is in the middle of the focal width. The focus is(6, 5
2
). The focal width is 19 which is four times the
focal length so the focal length must be 194 . The vertex must be a focal length to the left of the focus, so the vertex
is at(6− 19
4 ,52
). This is enough information to write the equation of the parabola.(
y− 52
)2= 4 · 19
4 ·(x−6+ 19
4
)3. y2−4y+12x−32 = 0
y2−4y =−12x+32
y2−4y+4 =−12x+32+4
(y−2)2 =−12(x−3)
(y−2)2 =−4 ·3 · (x−3)
The vertex is at (3, 2). The focus is at (0, 2). The directrix is at x = 6.
Practice
1. What is the equation of a parabola with focus at (1, 4) and directrix at y =−2?
2. What is the equation of a parabola that opens to the left with focal width from (-2, 5) to (-2, -7)?
3. What is the equation of a parabola that opens to the right with vertex at (5, 4) and focal width of 12?
4. What is the equation of a parabola with vertex at (1, 8) and directrix at y = 12?
5. What is the equation of a parabola with focus at (-2, 4) and directrix at x = 4?
6. What is the equation of a parabola that opens downward with a focal width from (-4, 9) to (16, 9)?
7. What is the equation of a parabola that opens upward with vertex at (1, 11) and focal width of 4?
Sketch the following parabolas by putting them into graphing form and identifying important information.
416

www.ck12.org Chapter 9. Conics
8. y2 +2y−8x+33 = 0
9. x2−8x+20y+36 = 0
10. x2 +6x−12y−15 = 0
11. y2−12y+8x+4 = 0
12. x2 +6x−4y+21 = 0
13. y2 +14y−2x+59 = 0
14. x2 +12x− 83 y+ 92
3 = 0
15. x2 +2x− 45 y+1 = 0
417
9.3. Circles www.ck12.org
9.3 Circles
Here you will formalize the definition of a circle, translate a conic from standard form into graphing form, and graphcircles.
A circle is the collection of points that are the same distance from a single point. What is the connection betweenthe Pythagorean Theorem and a circle?
Watch This
MEDIAClick image to the left for more content.
http://www.youtube.com/watch?v=g1xa7PvYV3I Conic Sections: The Circle
Guidance
A circle is the collection of points that are equidistant from a single point. This single point is called the center ofthe circle. A circle does not have a focus or a directrix, instead it simply has a center. Circles can be recognizedimmediately from the general equation of a conic when the coefficients of x2 and y2 are the same sign and the samevalue. Circles are not functions because they do not pass the vertical line test. The distance from the center of acircle to the edge of the circle is called the radius of the circle. The distance from one end of the circle through thecenter to the other end of the circle is called the diameter. The diameter is equal to twice the radius.
The graphing form of a circle is:
(x−h)2 +(y− k)2 = r2
The center of the circle is at (h,k) and the radius of the circle is r. Note that this looks remarkably like thePythagorean Theorem.
Example A
Graph the following circle.
(x−1)2 +(y+2)2 = 9
Solution: Plot the center and the four points that are exactly 3 units from the center.
418

www.ck12.org Chapter 9. Conics
Example B
Turn the following equation into graphing form for a circle. Identify the center and the radius.
36x2 +36y2−24x+36y−275 = 0
Solution: Complete the square and then divide by the coefficient of x2 and y2
36x2−24x+36y2 +36y = 275
36(
x2− 23
x+)+36(y2 + y+ ) = 275
36(
x2− 23
x+19
)+36
(y2 + y+
14
)= 275+4+9
36(
x− 13
)2
+36(
y+12
)2
= 288(x− 1
3
)2
+
(y+
12
)2
= 8
The center is(1
3 ,−12
). The radius is
√8 = 2
√2.
Example C
Write the equation of the following circle.
419
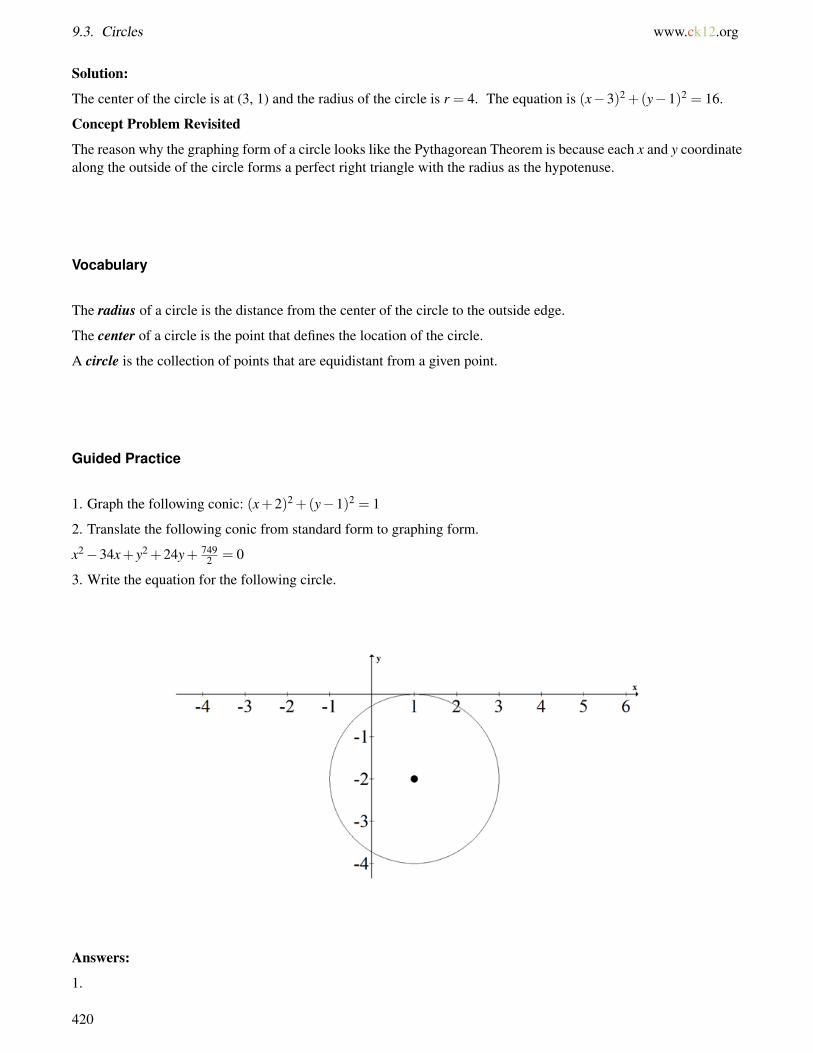
9.3. Circles www.ck12.org
Solution:
The center of the circle is at (3, 1) and the radius of the circle is r = 4. The equation is (x−3)2 +(y−1)2 = 16.
Concept Problem Revisited
The reason why the graphing form of a circle looks like the Pythagorean Theorem is because each x and y coordinatealong the outside of the circle forms a perfect right triangle with the radius as the hypotenuse.
Vocabulary
The radius of a circle is the distance from the center of the circle to the outside edge.
The center of a circle is the point that defines the location of the circle.
A circle is the collection of points that are equidistant from a given point.
Guided Practice
1. Graph the following conic: (x+2)2 +(y−1)2 = 1
2. Translate the following conic from standard form to graphing form.
x2−34x+ y2 +24y+ 7492 = 0
3. Write the equation for the following circle.
Answers:
1.
420

www.ck12.org Chapter 9. Conics
2.
x2−34x+ y2 +24y+7492
= 0
x2−34x+ y2 +24y =−7492
x2−34x+289+ y2 +24y+144 =−7492
+289+144
(x−17)2 +(y+12)2 =1172
3.
(x−1)2 +(y+2)2 = 4
Practice
Graph the following conics:
1. (x+4)2 +(y−3)2 = 1
2. (x−7)2 +(y+1)2 = 4
3. (y+2)2 +(x−1)2 = 9
4. x2 +(y−5)2 = 8
5. (x−2)2 + y2 = 16
Translate the following conics from standard form to graphing form.
6. x2−4x+ y2 +10y+18 = 0
7. x2 +2x+ y2−8y+1 = 0
8. x2−6x+ y2−4y+12 = 0
9. x2 +2x+ y2 +14y+25 = 0
10. x2−2x+ y2−2y = 0
Write the equations for the following circles.
11.
421

9.4. Ellipses www.ck12.org
9.4 Ellipses
Here you will translate ellipse equations from standard conic form to graphing form, graph ellipses and identify thedifferent axes. You will also identify eccentricity and solve word problems involving ellipses.
An ellipse is commonly known as an oval. Ellipses are just as common as parabolas in the real world with their ownuses. Rooms that have elliptical shaped ceilings are called whisper rooms because if you stand at one focus pointand whisper, someone standing at the other focus point will be able to hear you.
Ellipses look similar to circles, but there are a few key differences between these shapes. Ellipses have both anx-radius and a y-radius while circles have only one radius. Another difference between circles and ellipses is that anellipse is defined as the collection of points that are a set distance from two focus points while circles are defined asthe collection of points that are a set distance from one center point. A third difference between ellipses and circlesis that not all ellipses are similar to each other while all circles are similar to each other. Some ellipses are narrowand some are almost circular. How do you measure how strangely shaped an ellipse is?
Watch This
MEDIAClick image to the left for more content.
http://www.youtube.com/watch?v=LVumLCx3fQo James Sousa: Conic Sections: The Ellipse part 1
MEDIAClick image to the left for more content.
http://www.youtube.com/watch?v=oZB69DY0q9A James Sousa: Conic Sections: The Ellipse part 2
Guidance
An ellipse has two foci. For every point on the ellipse, the sum of the distances to each foci is constant. This is whatdefines an ellipse. Another way of thinking about the definition of an ellipse is to allocate a set amount of string andfix the two ends of the string so that there is some slack between them. Then use a pencil to pull the string taughtand trace the curve all the way around both fixed points. You will trace an ellipse and the fixed end points of thestring will be the foci. Foci is the plural form of focus. In the picture below, (h,k) is the center of the ellipse andthe other two marked points are the foci.
424
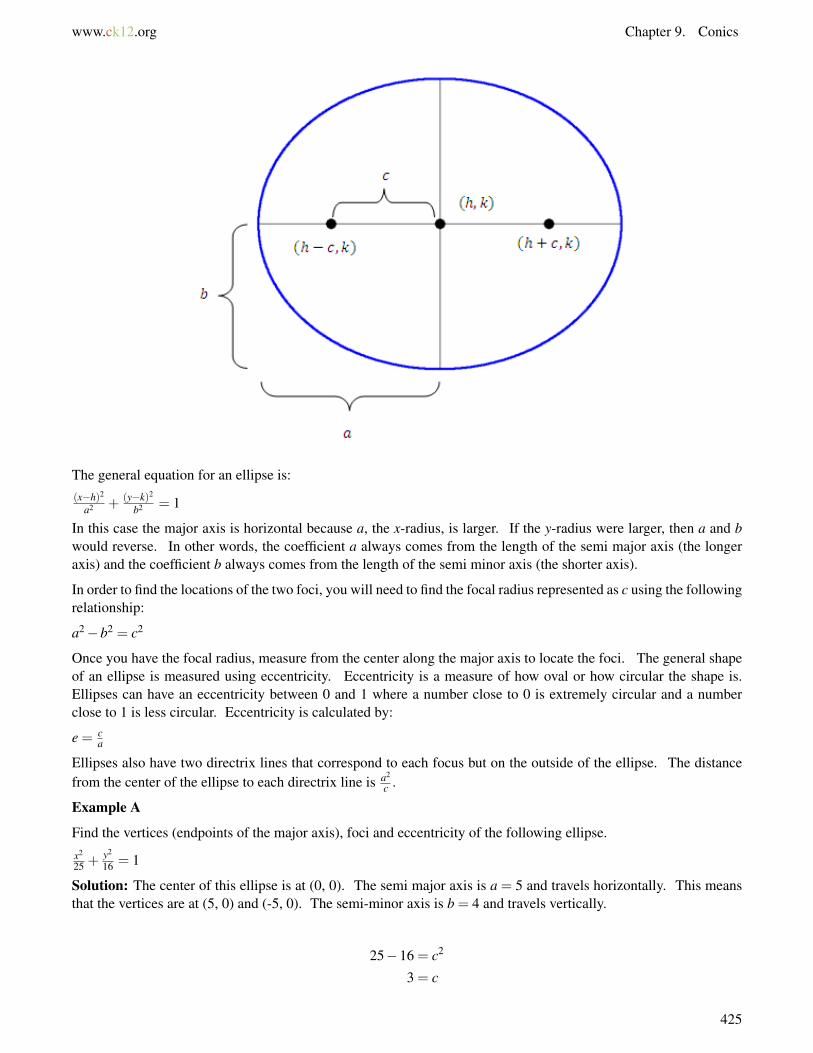
www.ck12.org Chapter 9. Conics
The general equation for an ellipse is:(x−h)2
a2 + (y−k)2
b2 = 1
In this case the major axis is horizontal because a, the x-radius, is larger. If the y-radius were larger, then a and bwould reverse. In other words, the coefficient a always comes from the length of the semi major axis (the longeraxis) and the coefficient b always comes from the length of the semi minor axis (the shorter axis).
In order to find the locations of the two foci, you will need to find the focal radius represented as c using the followingrelationship:
a2−b2 = c2
Once you have the focal radius, measure from the center along the major axis to locate the foci. The general shapeof an ellipse is measured using eccentricity. Eccentricity is a measure of how oval or how circular the shape is.Ellipses can have an eccentricity between 0 and 1 where a number close to 0 is extremely circular and a numberclose to 1 is less circular. Eccentricity is calculated by:
e = ca
Ellipses also have two directrix lines that correspond to each focus but on the outside of the ellipse. The distancefrom the center of the ellipse to each directrix line is a2
c .
Example A
Find the vertices (endpoints of the major axis), foci and eccentricity of the following ellipse.x2
25 +y2
16 = 1
Solution: The center of this ellipse is at (0, 0). The semi major axis is a = 5 and travels horizontally. This meansthat the vertices are at (5, 0) and (-5, 0). The semi-minor axis is b = 4 and travels vertically.
25−16 = c2
3 = c
425
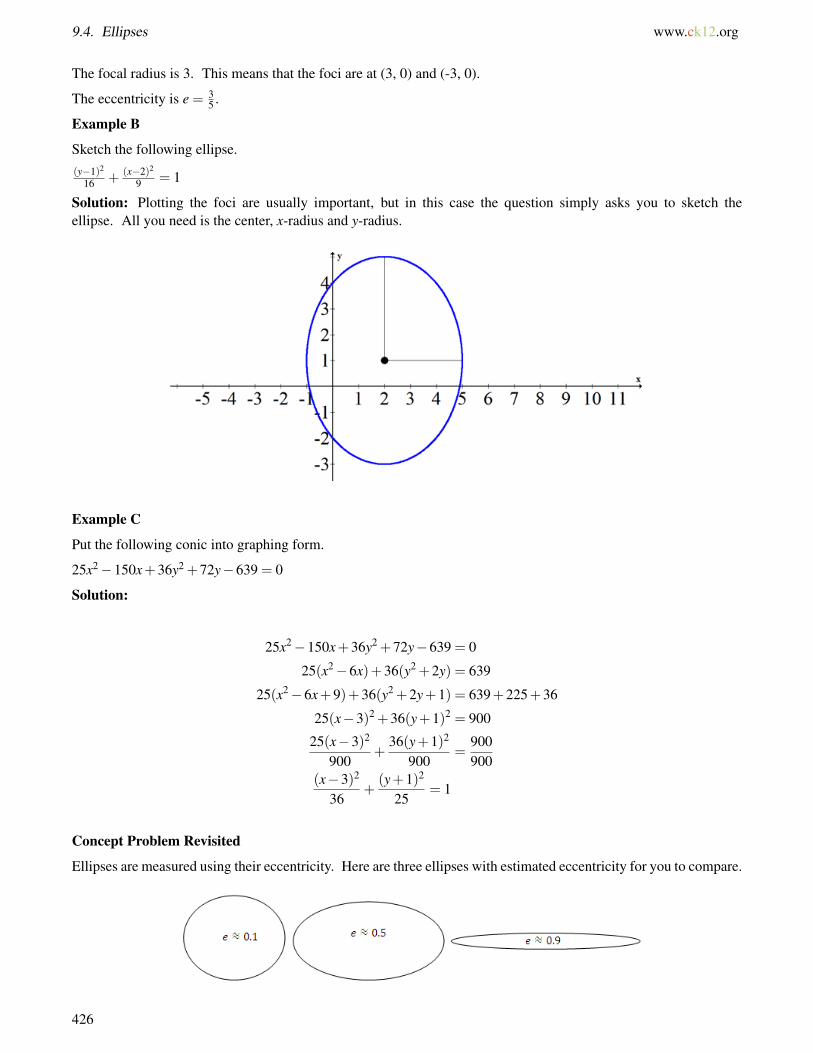
9.4. Ellipses www.ck12.org
The focal radius is 3. This means that the foci are at (3, 0) and (-3, 0).
The eccentricity is e = 35 .
Example B
Sketch the following ellipse.(y−1)2
16 + (x−2)2
9 = 1
Solution: Plotting the foci are usually important, but in this case the question simply asks you to sketch theellipse. All you need is the center, x-radius and y-radius.
Example C
Put the following conic into graphing form.
25x2−150x+36y2 +72y−639 = 0
Solution:
25x2−150x+36y2 +72y−639 = 0
25(x2−6x)+36(y2 +2y) = 639
25(x2−6x+9)+36(y2 +2y+1) = 639+225+36
25(x−3)2 +36(y+1)2 = 900
25(x−3)2
900+
36(y+1)2
900=
900900
(x−3)2
36+
(y+1)2
25= 1
Concept Problem Revisited
Ellipses are measured using their eccentricity. Here are three ellipses with estimated eccentricity for you to compare.
426

www.ck12.org Chapter 9. Conics
Eccentricity is the ratio of the focal radius to the semi major axis: e = ca .
Vocabulary
The semi-major axis is the distance from the center of the ellipse to the furthest point on the ellipse. The letter arepresents the length of the semi-major axis.
The major axis is the longest distance from end to end of an ellipse. This distance is twice that of the semi-majoraxis.
The semi-minor axis is the distance from the center to the edge of the ellipse on the axis that is perpendicular to thesemi-major axis. The letter b represents the length of the semi-minor axis.
An ellipse is the collection of points whose sum of distances from two foci is constant.
The foci in an ellipse are the two points that the ellipse curves around.
Eccentricity is a measure of how oval or how circular the shape is. It is the ratio of the focal radius to the semimajor axis: e = c
a .
Guided Practice
1. Find the vertices (endpoints of the major axis), foci and eccentricity of the following ellipse.(x−2)2
4 + (y+1)2
16 = 1
2. Sketch the following ellipse.
(x−3)2 + (y−1)2
9 = 1
3. Put the following conic into graphing form.
9x2−9x+4y2 +12y+ 94 =−8
Answers:
1. The center of the ellipse is at (2, -1). The major axis is vertical which means the semi major axis is a = 4. Thevertices are (2, 3) and (2, -5).
162−42 = c2
4√
15 =√
240 = c
Thus the foci are (2,−1+4√
15) and (2,−1−4√
15)
2.
427
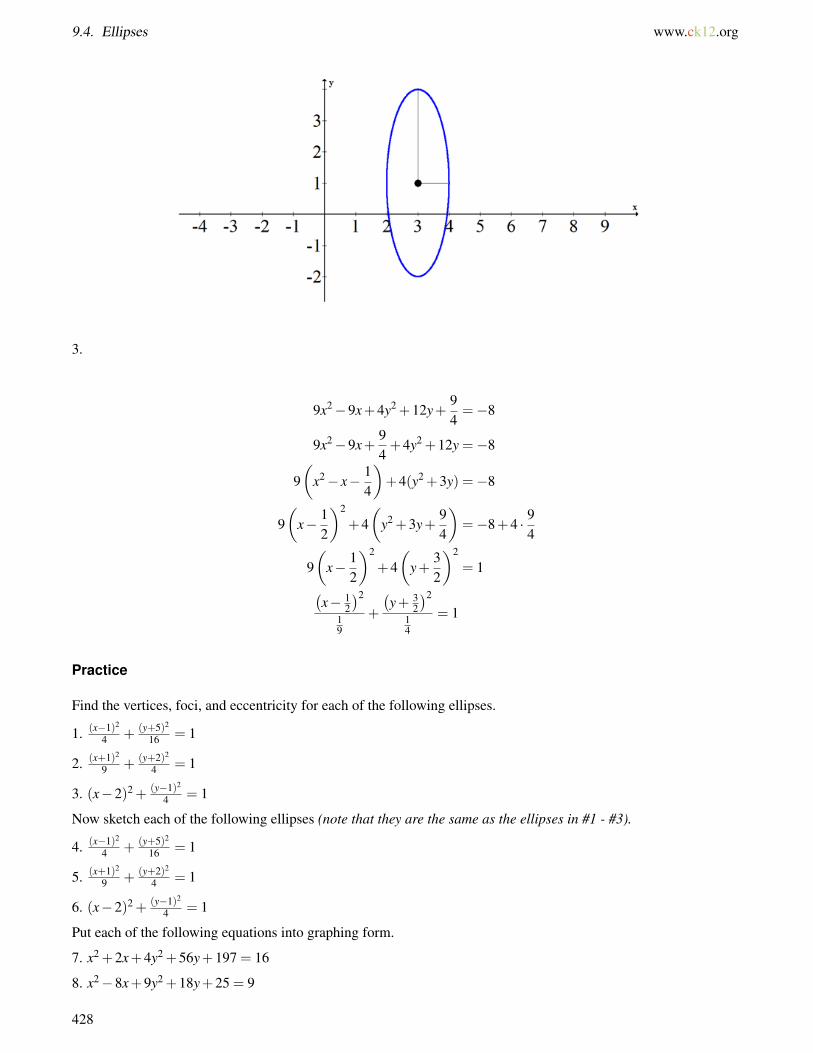
9.4. Ellipses www.ck12.org
3.
9x2−9x+4y2 +12y+94=−8
9x2−9x+94+4y2 +12y =−8
9(
x2− x− 14
)+4(y2 +3y) =−8
9(
x− 12
)2
+4(
y2 +3y+94
)=−8+4 · 9
4
9(
x− 12
)2
+4(
y+32
)2
= 1(x− 1
2
)2
19
+
(y+ 3
2
)2
14
= 1
Practice
Find the vertices, foci, and eccentricity for each of the following ellipses.
1. (x−1)2
4 + (y+5)2
16 = 1
2. (x+1)2
9 + (y+2)2
4 = 1
3. (x−2)2 + (y−1)2
4 = 1
Now sketch each of the following ellipses (note that they are the same as the ellipses in #1 - #3).
4. (x−1)2
4 + (y+5)2
16 = 1
5. (x+1)2
9 + (y+2)2
4 = 1
6. (x−2)2 + (y−1)2
4 = 1
Put each of the following equations into graphing form.
7. x2 +2x+4y2 +56y+197 = 16
8. x2−8x+9y2 +18y+25 = 9
428

www.ck12.org Chapter 9. Conics
9. 9x2−36x+4y2 +16y+52 = 36
Find the equation for each ellipse based on the description.
10. An ellipse with vertices (4, -2) and (4, 8) and minor axis of length 6.
11. An ellipse with minor axis from (4, -1) to (4, 3) and major axis of length 12.
12. An ellipse with minor axis from (-2, 1) to (-2, 7) and one focus at (2, 4).
13. An ellipse with one vertex at (6, -15), and foci at (6, 10) and (6, -14).
A bridge over a roadway is to be built with its bottom the shape of a semi-ellipse 100 feet wide and 25 feet high atthe center. The roadway is to be 70 feet wide.
14. Find one possible equation of the ellipse that models the bottom of the bridge.
15. What is the clearance between the roadway and the overpass at the edge of the roadway?
429
9.5. Hyperbolas www.ck12.org
9.5 Hyperbolas
Here you will translate conic equations into graphing form and graph hyperbolas. You will also learn how tomeasure the eccentricity of a hyperbola and solve word problems.
Hyperbolas are relations that have asymptotes. When graphing rational functions you often produce a hyperbola. Inthis concept, hyperbolas will not be oriented in the same way as with rational functions, but the basic shape of ahyperbola will still be there.
Hyperbolas can be oriented so that they open side to side or up and down. One of the most common mistakes thatyou can make is to forget which way a given hyperbola should open. What are some strategies to help?
Watch This
MEDIAClick image to the left for more content.
http://www.youtube.com/watch?v=i6vM82SNAUk James Sousa: Conic Sections: The Hyperbola part 1
MEDIAClick image to the left for more content.
http://www.youtube.com/watch?v=6Xahrwp6LkI James Sousa: Conic Sections: The Hyperbola part 2
Guidance
A hyperbola has two foci. For every point on the hyperbola, the difference of the distances to each foci is con-stant. This is what defines a hyperbola. The graphing form of a hyperbola that opens side to side is:(x−h)2
a2 − (y−k)2
b2 = 1
A hyperbola that opens up and down is:(y−k)2
a2 − (x−h)2
b2 = 1
Notice that for hyperbolas, a goes with the positive term and b goes with the negative term. It does not matterwhich constant is larger.
430
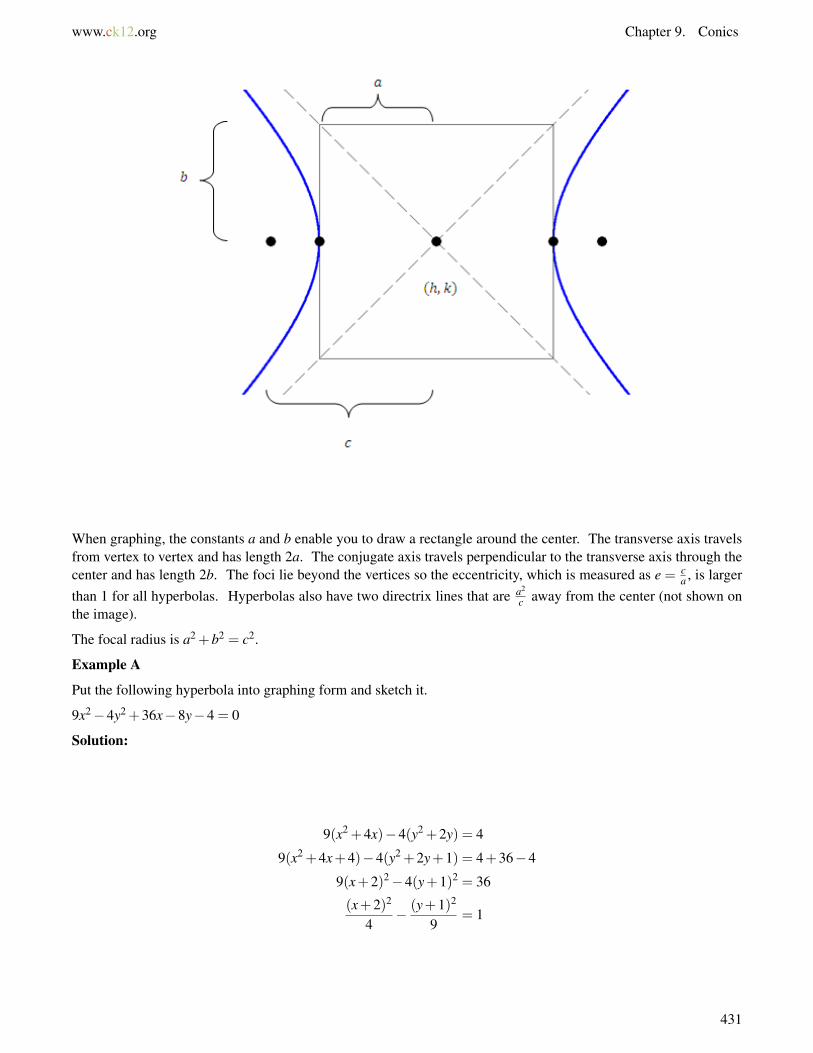
www.ck12.org Chapter 9. Conics
When graphing, the constants a and b enable you to draw a rectangle around the center. The transverse axis travelsfrom vertex to vertex and has length 2a. The conjugate axis travels perpendicular to the transverse axis through thecenter and has length 2b. The foci lie beyond the vertices so the eccentricity, which is measured as e = c
a , is largerthan 1 for all hyperbolas. Hyperbolas also have two directrix lines that are a2
c away from the center (not shown onthe image).
The focal radius is a2 +b2 = c2.
Example A
Put the following hyperbola into graphing form and sketch it.
9x2−4y2 +36x−8y−4 = 0
Solution:
9(x2 +4x)−4(y2 +2y) = 4
9(x2 +4x+4)−4(y2 +2y+1) = 4+36−4
9(x+2)2−4(y+1)2 = 36
(x+2)2
4− (y+1)2
9= 1
431

9.5. Hyperbolas www.ck12.org
Example B
Find the equation of the hyperbola with foci at (-3, 5) and (9, 5) and asymptotes with slopes of ±43 .
Solution: The center is between the foci at (3, 5). The focal radius is c = 6. The slope of the asymptotes is alwaysthe rise over run inside the box. In this case since the hyperbola is horizontal and a is in the x direction the slope isba . This makes a system of equations.
ba=±4
3a2 +b2 = 62
When you solve, you get a =√
13, b = 43
√13.
(x−3)2
13 − (y−5)2
169 ·13
= 1
Example C
Find the equation of the conic that has a focus point at (1, 2), a directrix at x = 5, and an eccentricity equal to 32 . Use
the property that the distance from a point on the hyperbola to the focus is equal to the eccentricity times the distancefrom that same point to the directrix:
PF = ePD
Solution: This relationship bridges the gap between ellipses which have eccentricity less than one and hyperbolaswhich have eccentricity greater than one. When eccentricity is equal to one, the shape is a parabola.√
(x−1)2 +(y−2)2 = 32
√(x−5)2
Square both sides and rearrange terms so that it is becomes a hyperbola in graphing form.
432

www.ck12.org Chapter 9. Conics
x2−2x+1+(y−2)2 =94(x2−10x+25)
x2−2x+1− 94
x2 +904
x− 2254
+(y−2)2 = 0
−54
x2 +924
x+(y−2)2 =2214
−5x2 +92x+4(y−2)2 = 221
−5(
x2− 925
x)+4(y−2)2 = 221
−5(
x2− 925
x+922
102
)+4(y−2)2 = 221− 2116
5
−5(
x− 9210
)2
+4(y−2)2 =−10115(
x− 9210
)2
− (y−2)2 =1011100(
x− 9210
)2(1011100
) − (y−2)2(1011100
) = 1
Concept Problem Revisited
The best strategy to remember which direction the hyperbola opens is often the simplest. Consider the hyperbolax2−y2 = 1. This hyperbola opens side to side because x can clearly never be equal to zero. This is a basic case thatshows that when the negative is with the y value then the hyperbola opens up side to side.
Vocabulary
Eccentricity is the ratio between the length of the focal radius and the length of the semi transverse axis. Forhyperbolas, the eccentricity is greater than one.
A hyperbola is the collection of points that share a constant difference between the distances between two focuspoints.
Guided Practice
1. Completely identify the components of the following conic.
9x2−16y2−18x+96y+9 = 0
2. Given the following graph, estimate the equation of the conic.
433
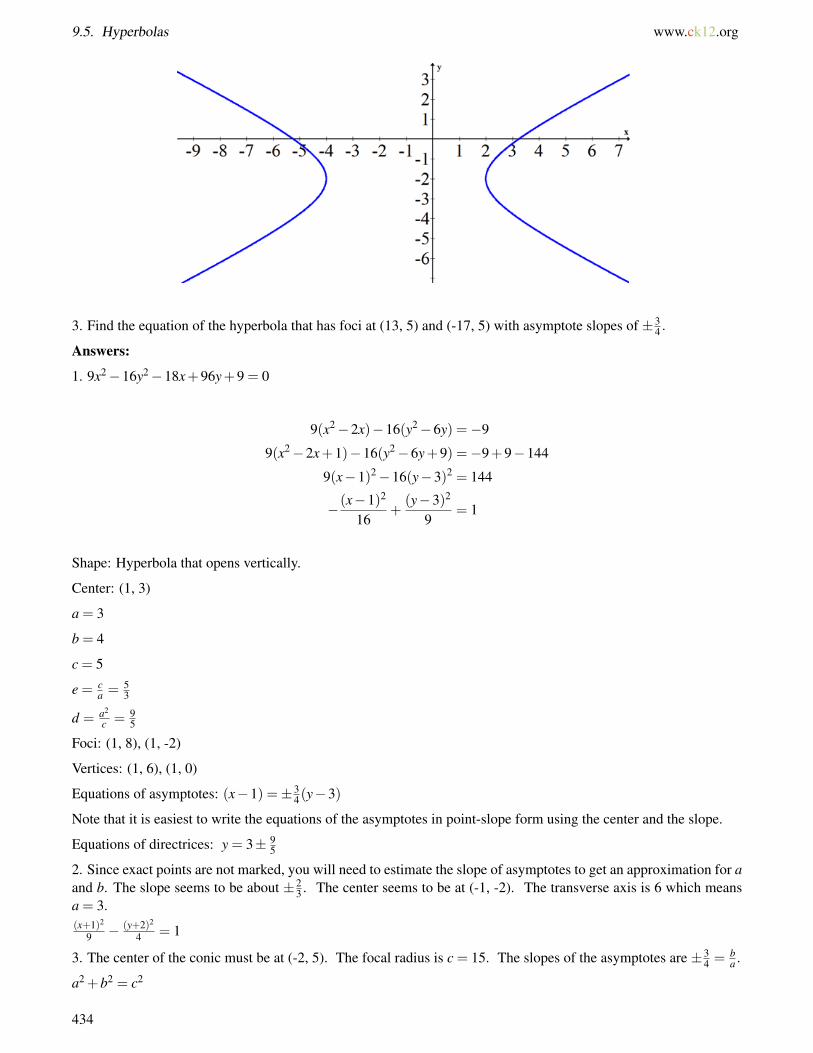
9.5. Hyperbolas www.ck12.org
3. Find the equation of the hyperbola that has foci at (13, 5) and (-17, 5) with asymptote slopes of ±34 .
Answers:
1. 9x2−16y2−18x+96y+9 = 0
9(x2−2x)−16(y2−6y) =−9
9(x2−2x+1)−16(y2−6y+9) =−9+9−144
9(x−1)2−16(y−3)2 = 144
−(x−1)2
16+
(y−3)2
9= 1
Shape: Hyperbola that opens vertically.
Center: (1, 3)
a = 3
b = 4
c = 5
e = ca = 5
3
d = a2
c = 95
Foci: (1, 8), (1, -2)
Vertices: (1, 6), (1, 0)
Equations of asymptotes: (x−1) =±34(y−3)
Note that it is easiest to write the equations of the asymptotes in point-slope form using the center and the slope.
Equations of directrices: y = 3± 95
2. Since exact points are not marked, you will need to estimate the slope of asymptotes to get an approximation for aand b. The slope seems to be about ±2
3 . The center seems to be at (-1, -2). The transverse axis is 6 which meansa = 3.(x+1)2
9 − (y+2)2
4 = 1
3. The center of the conic must be at (-2, 5). The focal radius is c = 15. The slopes of the asymptotes are ±34 = b
a .
a2 +b2 = c2
434

www.ck12.org Chapter 9. Conics
Since 3, 4, 5 is a well known Pythagorean number triple it should be clear to you that a = 12,b = 9.(x+2)2
122 − (y−5)2
92 = 1
Practice
Use the following equation for #1 - #5: x2 +2x−4y2−24y−51 = 0
1. Put the hyperbola into graphing form. Explain how you know it is a hyperbola.
2. Identify whether the hyperbola opens side to side or up and down.
3. Find the location of the vertices.
4. Find the equations of the asymptotes.
5. Sketch the hyperbola.
Use the following equation for #6 - #10: −9x2−36x+16y2−32y−164 = 0
6. Put the hyperbola into graphing form. Explain how you know it is a hyperbola.
7. Identify whether the hyperbola opens side to side or up and down.
8. Find the location of the vertices.
9. Find the equations of the asymptotes.
10. Sketch the hyperbola.
Use the following equation for #11 - #15: x2−6x−9y2−54y−81 = 0
11. Put the hyperbola into graphing form. Explain how you know it is a hyperbola.
12. Identify whether the hyperbola opens side to side or up and down.
13. Find the location of the vertices.
14. Find the equations of the asymptotes.
15. Sketch the hyperbola.
435
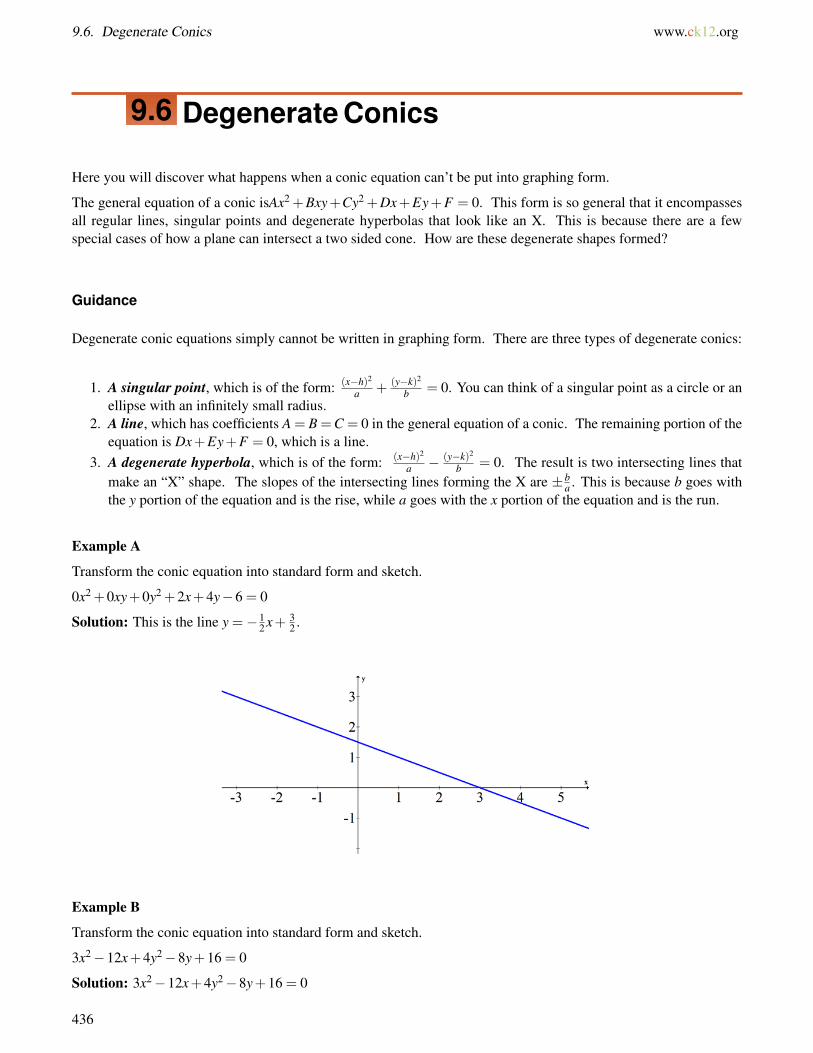
9.6. Degenerate Conics www.ck12.org
9.6 Degenerate Conics
Here you will discover what happens when a conic equation can’t be put into graphing form.
The general equation of a conic isAx2 +Bxy+Cy2 +Dx+Ey+F = 0. This form is so general that it encompassesall regular lines, singular points and degenerate hyperbolas that look like an X. This is because there are a fewspecial cases of how a plane can intersect a two sided cone. How are these degenerate shapes formed?
Guidance
Degenerate conic equations simply cannot be written in graphing form. There are three types of degenerate conics:
1. A singular point, which is of the form: (x−h)2
a + (y−k)2
b = 0. You can think of a singular point as a circle or anellipse with an infinitely small radius.
2. A line, which has coefficients A = B =C = 0 in the general equation of a conic. The remaining portion of theequation is Dx+Ey+F = 0, which is a line.
3. A degenerate hyperbola, which is of the form: (x−h)2
a − (y−k)2
b = 0. The result is two intersecting lines thatmake an “X” shape. The slopes of the intersecting lines forming the X are ±b
a . This is because b goes withthe y portion of the equation and is the rise, while a goes with the x portion of the equation and is the run.
Example A
Transform the conic equation into standard form and sketch.
0x2 +0xy+0y2 +2x+4y−6 = 0
Solution: This is the line y =−12 x+ 3
2 .
Example B
Transform the conic equation into standard form and sketch.
3x2−12x+4y2−8y+16 = 0
Solution: 3x2−12x+4y2−8y+16 = 0
436
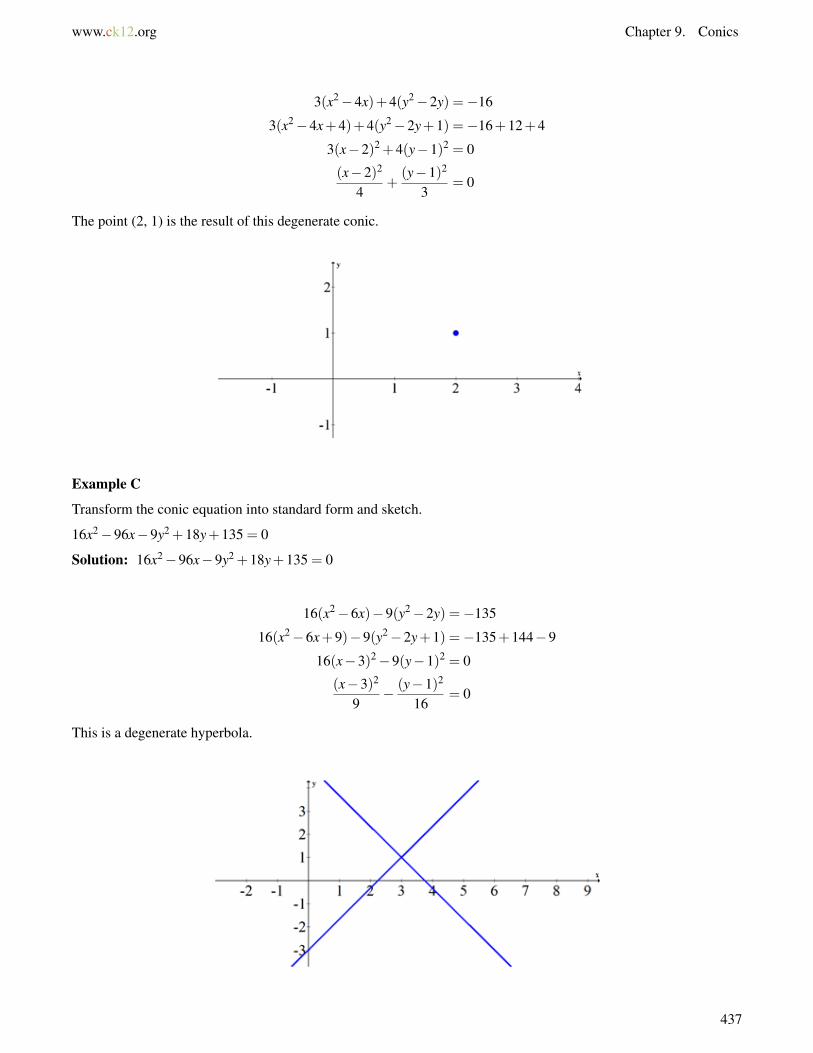
www.ck12.org Chapter 9. Conics
3(x2−4x)+4(y2−2y) =−16
3(x2−4x+4)+4(y2−2y+1) =−16+12+4
3(x−2)2 +4(y−1)2 = 0
(x−2)2
4+
(y−1)2
3= 0
The point (2, 1) is the result of this degenerate conic.
Example C
Transform the conic equation into standard form and sketch.
16x2−96x−9y2 +18y+135 = 0
Solution: 16x2−96x−9y2 +18y+135 = 0
16(x2−6x)−9(y2−2y) =−135
16(x2−6x+9)−9(y2−2y+1) =−135+144−9
16(x−3)2−9(y−1)2 = 0
(x−3)2
9− (y−1)2
16= 0
This is a degenerate hyperbola.
437

9.6. Degenerate Conics www.ck12.org
Concept Problem Revisited
When you intersect a plane with a two sided cone where the two cones touch, the intersection is a single point. Whenyou intersect a plane with a two sided cone so that the plane touches the edge of one cone, passes through the centralpoint and continues touching the edge of the other conic, this produces a line. When you intersect a plane with a twosided cone so that the plane passes vertically through the central point of the two cones, it produces a degeneratehyperbola.
Vocabulary
A degenerate conic is a conic that does not have the usual properties of a conic. Since some of the coefficients ofthe general equation are zero, the basic shape of the conic is merely a point, a line or a pair of lines. The connotationof the word degenerate means that the new graph is less complex than the rest of conics.
Guided Practice
1. Create a conic that describes just the point (4, 7).
2. Transform the conic equation into standard form and sketch.
−4x2 +8x+ y2 +4y = 0
3. Can you tell just by looking at a conic in general form if it is a degenerate conic?
Answers:
1. (x−4)2 +(y−7)2 = 0
2.
−4x2 +8x+ y2 +4y = 0
−4(x2−2x)+(y2 +4y) = 0
−4(x2−2x+1)+(y2 +4y+4) =−4+4
−4(x−1)2 +(y+2)2 = 0
(x−1)2
1− (y+2)2
4= 0
3. In general you cannot tell if a conic is degenerate from the general form of the equation. You can tell thatthe degenerate conic is a line if there are no x2 or y2 terms, but other than that you must always try to put the conicequation into graphing form and see whether it equals zero because that is the best way to identify degenerate conics.
438
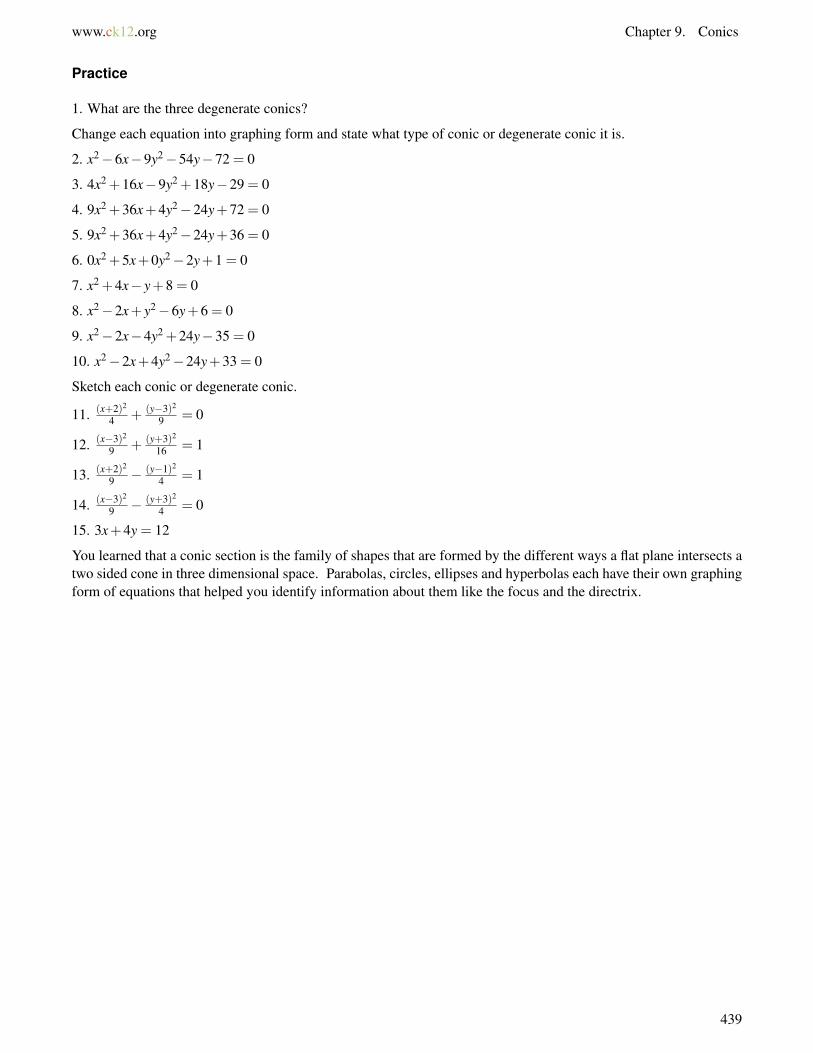
www.ck12.org Chapter 9. Conics
Practice
1. What are the three degenerate conics?
Change each equation into graphing form and state what type of conic or degenerate conic it is.
2. x2−6x−9y2−54y−72 = 0
3. 4x2 +16x−9y2 +18y−29 = 0
4. 9x2 +36x+4y2−24y+72 = 0
5. 9x2 +36x+4y2−24y+36 = 0
6. 0x2 +5x+0y2−2y+1 = 0
7. x2 +4x− y+8 = 0
8. x2−2x+ y2−6y+6 = 0
9. x2−2x−4y2 +24y−35 = 0
10. x2−2x+4y2−24y+33 = 0
Sketch each conic or degenerate conic.
11. (x+2)2
4 + (y−3)2
9 = 0
12. (x−3)2
9 + (y+3)2
16 = 1
13. (x+2)2
9 − (y−1)2
4 = 1
14. (x−3)2
9 − (y+3)2
4 = 0
15. 3x+4y = 12
You learned that a conic section is the family of shapes that are formed by the different ways a flat plane intersects atwo sided cone in three dimensional space. Parabolas, circles, ellipses and hyperbolas each have their own graphingform of equations that helped you identify information about them like the focus and the directrix.
439
9.7. References www.ck12.org
9.7 References
1. CK-12 Foundation. . CCSA2. CK-12 Foundation. . CCSA3. CK-12 Foundation. . CCSA4. CK-12 Foundation. . CCSA5. CK-12 Foundation. . CCSA6. CK-12 Foundation. . CCSA7. CK-12 Foundation. . CCSA8. CK-12 Foundation. . CCSA9. CK-12 Foundation. . CCSA
10. CK-12 Foundation. . CCSA11. CK-12 Foundation. . CCSA12. CK-12 Foundation. . CCSA13. CK-12 Foundation. . CCSA14. CK-12 Foundation. . CCSA15. CK-12 Foundation. . CCSA16. CK-12 Foundation. . CCSA17. CK-12 Foundation. . CCSA18. CK-12 Foundation. . CCSA19. CK-12 Foundation. . CCSA20. CK-12 Foundation. . CCSA21. CK-12 Foundation. . CCSA22. CK-12 Foundation. . CCSA23. CK-12 Foundation. . CCSA24. CK-12 Foundation. . CCSA25. CK-12 Foundation. . CCSA26. CK-12 Foundation. . CCSA27. CK-12 Foundation. . CCSA28. CK-12 Foundation. . CCSA29. CK-12 Foundation. . CCSA30. CK-12 Foundation. . CCSA31. CK-12 Foundation. . CCSA32. CK-12 Foundation. . CCSA
440
www.ck12.org Chapter 10. Polar and Parametric Equations
CHAPTER 10 Polar and ParametricEquations
Chapter Outline10.1 POLAR AND RECTANGULAR COORDINATES
10.2 POLAR EQUATIONS OF CONICS
10.3 PARAMETERS AND PARAMETER ELIMINATION
10.4 PARAMETRIC INVERSES
10.5 APPLICATIONS OF PARAMETRIC EQUATIONS
10.6 REFERENCES
The Cartesian coordinate system with (x,y) coordinates is great for representing some functions and relations, butis very limiting in some ways. The polar coordinate system allows you to easily graph spirals and other shapes thatare not functions. Parametric equations allow you to have both x and y depend on a third variable t. Here you willexplore both polar and parametric equations.
441
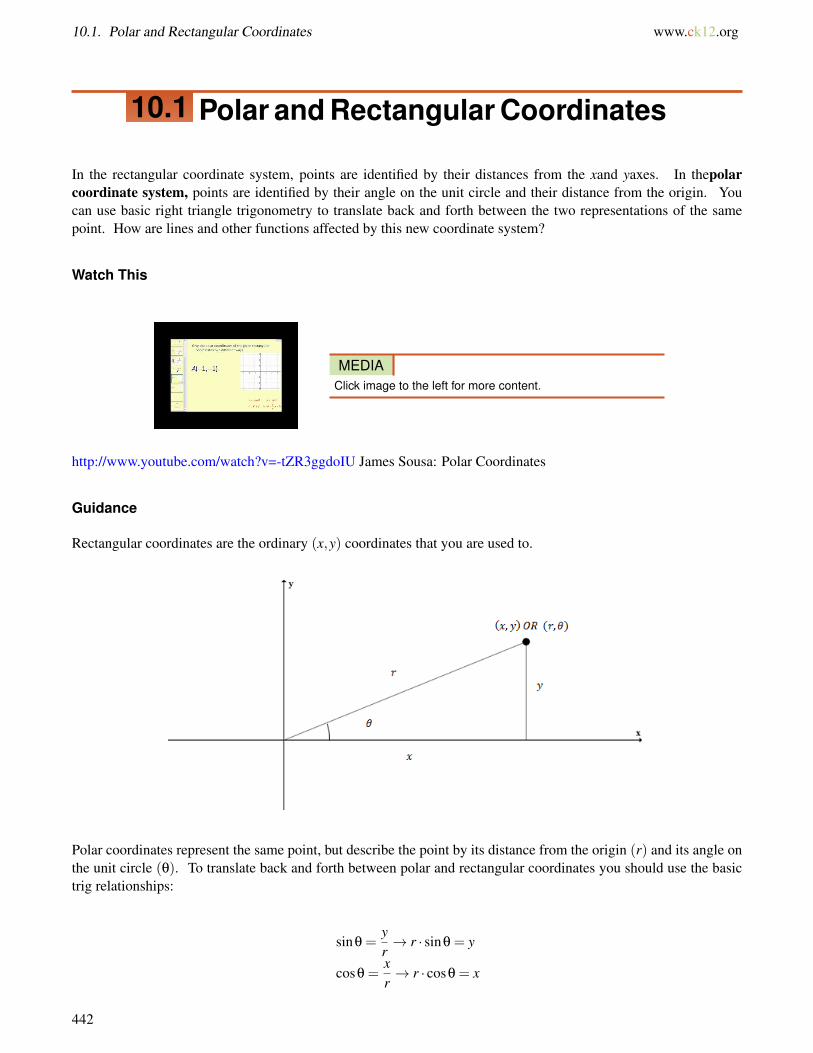
10.1. Polar and Rectangular Coordinates www.ck12.org
10.1 Polar and Rectangular Coordinates
In the rectangular coordinate system, points are identified by their distances from the xand yaxes. In thepolarcoordinate system, points are identified by their angle on the unit circle and their distance from the origin. Youcan use basic right triangle trigonometry to translate back and forth between the two representations of the samepoint. How are lines and other functions affected by this new coordinate system?
Watch This
MEDIAClick image to the left for more content.
http://www.youtube.com/watch?v=-tZR3ggdoIU James Sousa: Polar Coordinates
Guidance
Rectangular coordinates are the ordinary (x,y) coordinates that you are used to.
Polar coordinates represent the same point, but describe the point by its distance from the origin (r) and its angle onthe unit circle (θ). To translate back and forth between polar and rectangular coordinates you should use the basictrig relationships:
sinθ =yr→ r · sinθ = y
cosθ =xr→ r · cosθ = x
442
www.ck12.org Chapter 10. Polar and Parametric Equations
You can also express the relationship between x,y and r using the Pythagorean Theorem.
x2 + y2 = r2
Note that coordinates in polar form are not unique. This is because there are an infinite number of coterminal anglesthat point towards any given (x,y) coordinate.
Once you can translate back and forth between points, use the same substitutions to change equations too. A polarequation is written with the radius as a function of the angle. This means an equation in polar form should be writtenin the form r = .
Example A
Convert the point (3, 4) to polar coordinates in three different ways.
Solution: tanθ = 43
θ = tan−1(
43
)≈ 53.1◦
r2 = 32 +42
r = 5
Three equivalent polar coordinates for the point (3, 4) are:
(5,53.1◦), (5,413.1◦), (−5,233.1◦)
Notice how the third coordinate points in the opposite direction and has a seemingly negative radius. This means goin the opposite direction of the angle.
Example B
Write the equation of the line in polar form: y =−x+1.
Solution: Make substitutions for y and x. Then, solve for r.
r · sinθ =−r · cosθ+1
r · sinθ+ r · cosθ = 1
r(sinθ+ cosθ) = 1
r =1
sinθ+ cosθ
Example C
Express the following equation using rectangular coordinates: r = 81+2cosθ
.
Solution: Use the fact that r =±√
x2 + y2 and r cosθ = x.
r+2r · cosθ = 8
±√
x2 + y2 +2x = 8
±√
x2 + y2 = 8−2x
x2 + y2 = 64−32x+4x2
−3x2 +32x+ y2−64 = 0
443
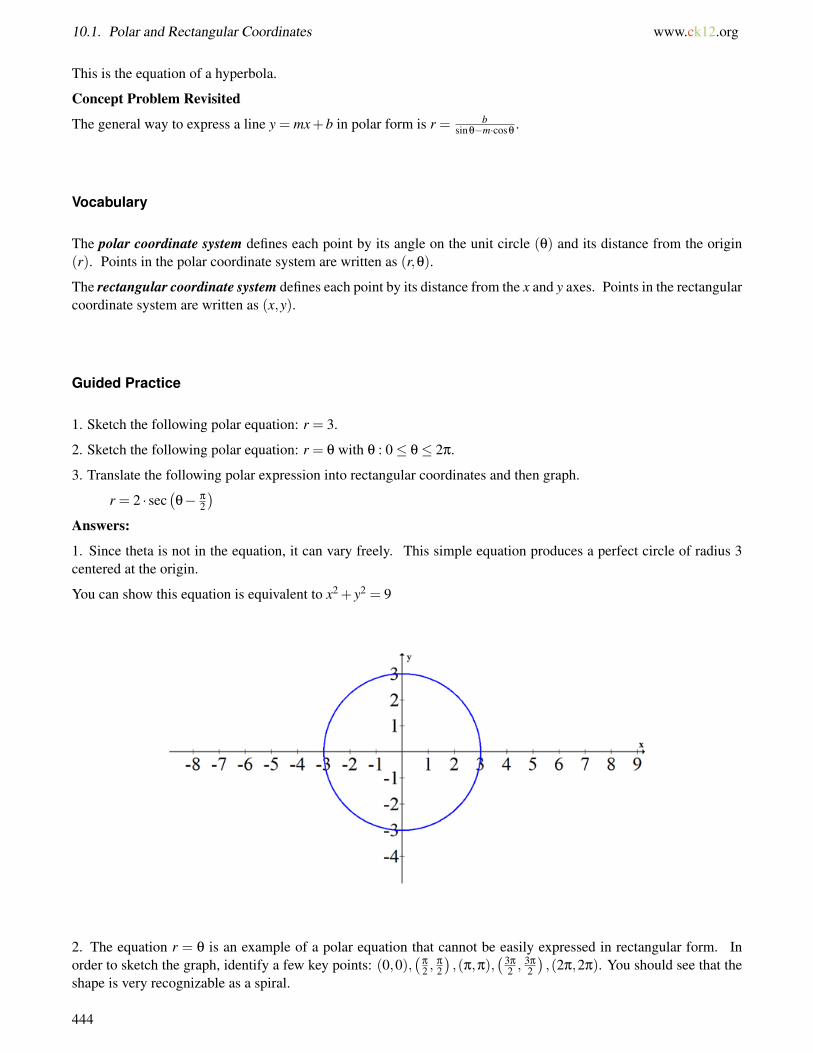
10.1. Polar and Rectangular Coordinates www.ck12.org
This is the equation of a hyperbola.
Concept Problem Revisited
The general way to express a line y = mx+b in polar form is r = bsinθ−m·cosθ
.
Vocabulary
The polar coordinate system defines each point by its angle on the unit circle (θ) and its distance from the origin(r). Points in the polar coordinate system are written as (r,θ).
The rectangular coordinate system defines each point by its distance from the x and y axes. Points in the rectangularcoordinate system are written as (x,y).
Guided Practice
1. Sketch the following polar equation: r = 3.
2. Sketch the following polar equation: r = θ with θ : 0≤ θ≤ 2π.
3. Translate the following polar expression into rectangular coordinates and then graph.
r = 2 · sec(θ− π
2
)Answers:
1. Since theta is not in the equation, it can vary freely. This simple equation produces a perfect circle of radius 3centered at the origin.
You can show this equation is equivalent to x2 + y2 = 9
2. The equation r = θ is an example of a polar equation that cannot be easily expressed in rectangular form. Inorder to sketch the graph, identify a few key points: (0,0),
(π
2 ,π
2
),(π,π),
(3π
2 , 3π
2
),(2π,2π). You should see that the
shape is very recognizable as a spiral.
444
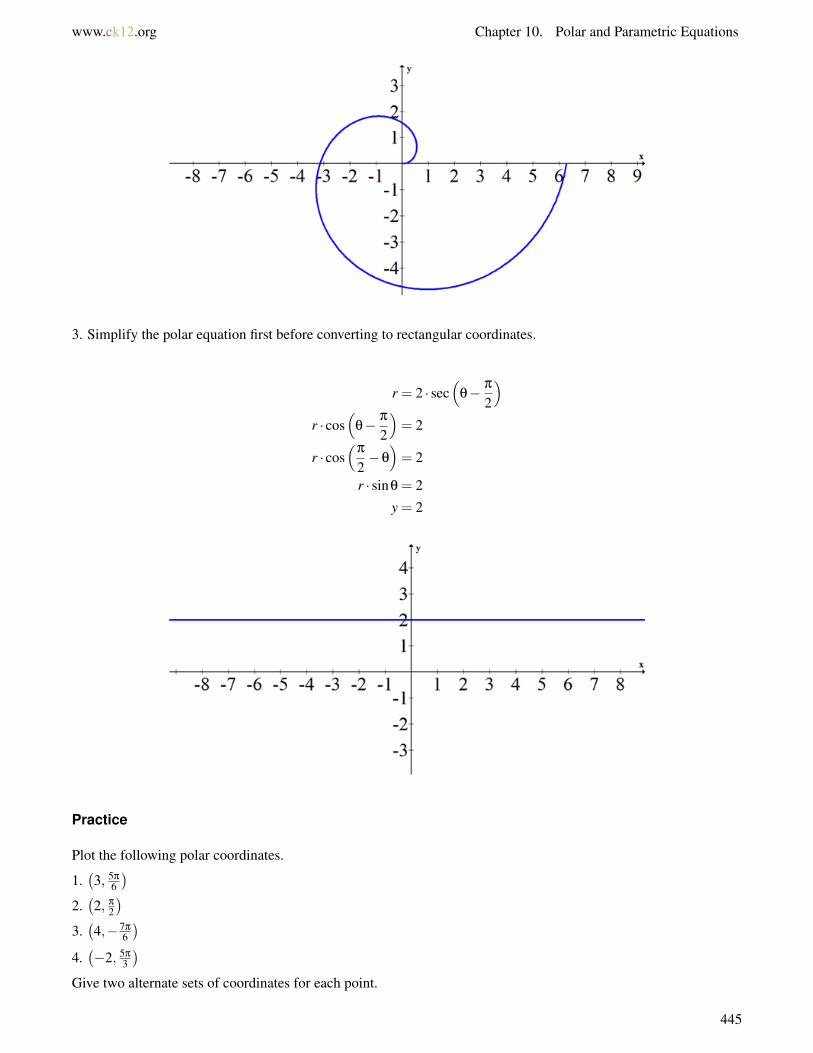
www.ck12.org Chapter 10. Polar and Parametric Equations
3. Simplify the polar equation first before converting to rectangular coordinates.
r = 2 · sec(
θ− π
2
)r · cos
(θ− π
2
)= 2
r · cos(
π
2−θ
)= 2
r · sinθ = 2
y = 2
Practice
Plot the following polar coordinates.
1.(3, 5π
6
)2.(2, π
2
)3.(4,−7π
6
)4.(−2, 5π
3
)Give two alternate sets of coordinates for each point.
445
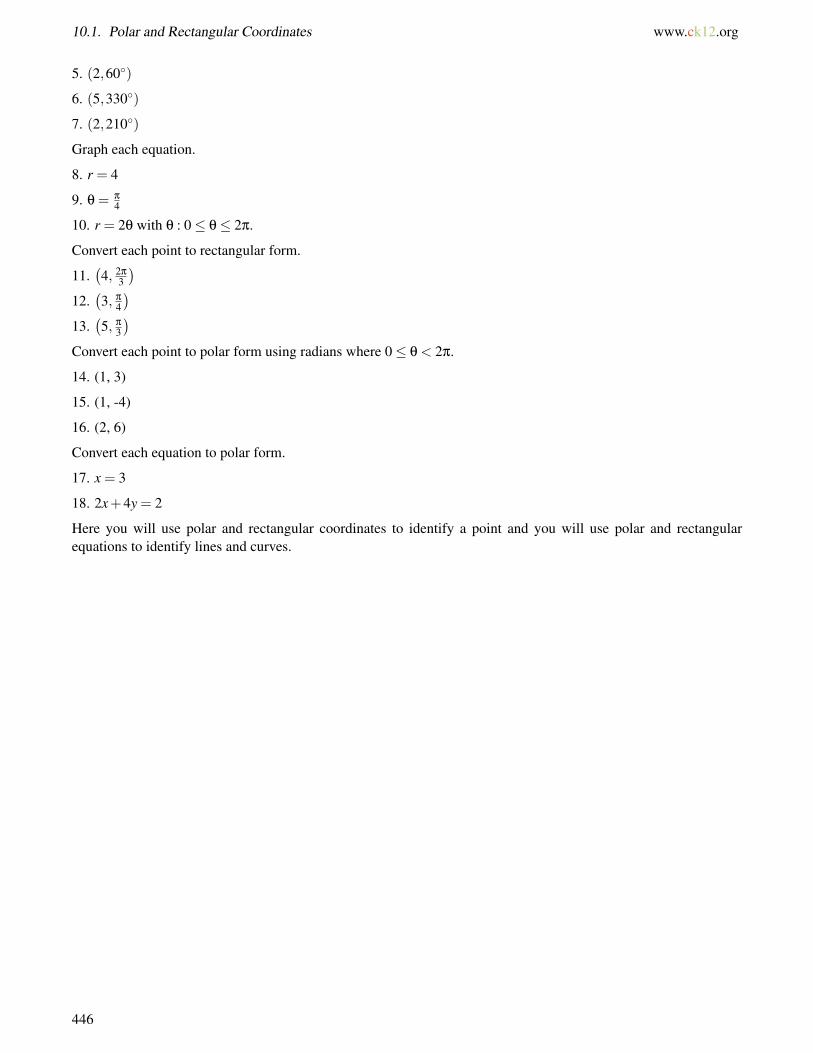
10.1. Polar and Rectangular Coordinates www.ck12.org
5. (2,60◦)
6. (5,330◦)
7. (2,210◦)
Graph each equation.
8. r = 4
9. θ = π
4
10. r = 2θ with θ : 0≤ θ≤ 2π.
Convert each point to rectangular form.
11.(4, 2π
3
)12.(3, π
4
)13.(5, π
3
)Convert each point to polar form using radians where 0≤ θ < 2π.
14. (1, 3)
15. (1, -4)
16. (2, 6)
Convert each equation to polar form.
17. x = 3
18. 2x+4y = 2
Here you will use polar and rectangular coordinates to identify a point and you will use polar and rectangularequations to identify lines and curves.
446

www.ck12.org Chapter 10. Polar and Parametric Equations
10.2 Polar Equations of Conics
Here you will find equations and graphs for various conics, including those whose major axis is at a slant.
Polar coordinates allow you to extend your knowledge of conics in a new context. Calculators are an excellent toolfor graphing polar conics. What settings do you need to know in order to properly use your calculator?
Watch This
MEDIAClick image to the left for more content.
http://youtu.be/ZFNSMfWvVNY James Sousa: Find the Rectangular and Polar Equation of a Circle from a Graph
MEDIAClick image to the left for more content.
http://youtu.be/XkZAtV8jNb4 James Sousa: Find the Polar Equation for a Parabola
Guidance
Polar equations refer to the radius r as a function of the angle θ. There are a few typical polar equations you shouldbe able to recognize and graph directly from their polar form.
The following polar function is a circle of radius a2 passing through the origin with a center at angle β.
r = a · cos(θ−β)
447
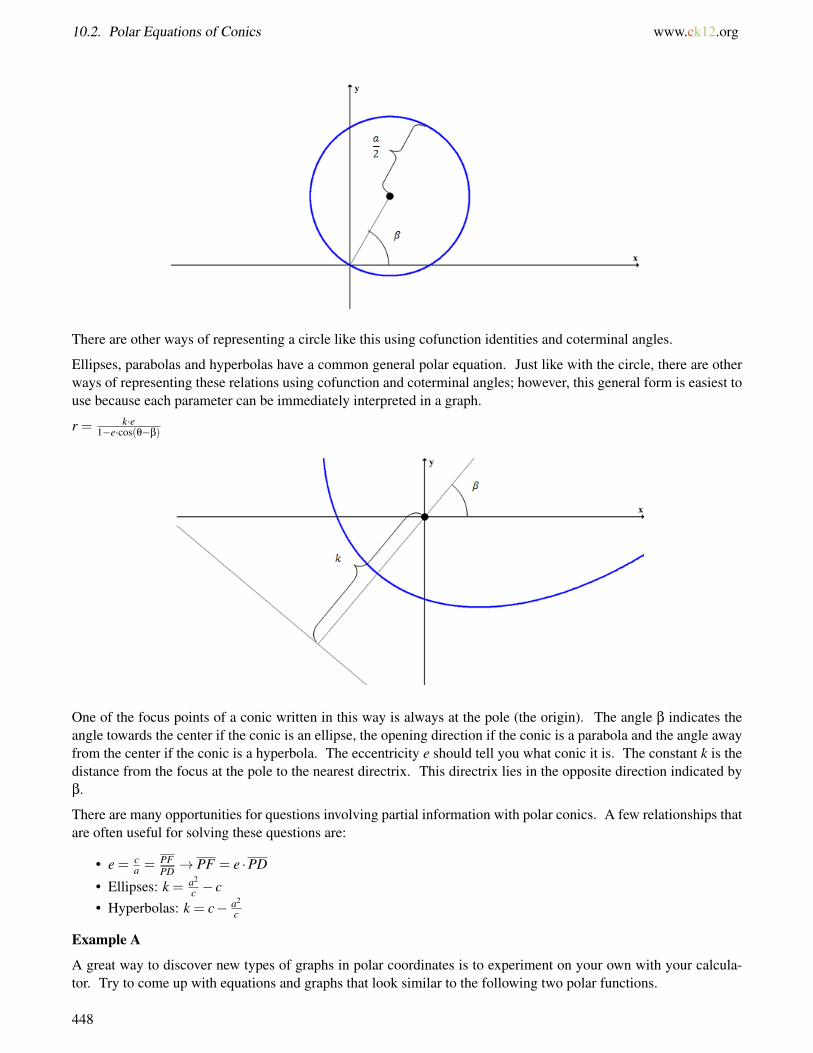
10.2. Polar Equations of Conics www.ck12.org
There are other ways of representing a circle like this using cofunction identities and coterminal angles.
Ellipses, parabolas and hyperbolas have a common general polar equation. Just like with the circle, there are otherways of representing these relations using cofunction and coterminal angles; however, this general form is easiest touse because each parameter can be immediately interpreted in a graph.
r = k·e1−e·cos(θ−β)
One of the focus points of a conic written in this way is always at the pole (the origin). The angle β indicates theangle towards the center if the conic is an ellipse, the opening direction if the conic is a parabola and the angle awayfrom the center if the conic is a hyperbola. The eccentricity e should tell you what conic it is. The constant k is thedistance from the focus at the pole to the nearest directrix. This directrix lies in the opposite direction indicated byβ.
There are many opportunities for questions involving partial information with polar conics. A few relationships thatare often useful for solving these questions are:
• e = ca = PF
PD → PF = e ·PD
• Ellipses: k = a2
c − c• Hyperbolas: k = c− a2
c
Example A
A great way to discover new types of graphs in polar coordinates is to experiment on your own with your calcula-tor. Try to come up with equations and graphs that look similar to the following two polar functions.
448

www.ck12.org Chapter 10. Polar and Parametric Equations
Solution: The circle in blue has a center at 90◦ and has a diameter of 2. Its equation is r = 2cos(θ−90◦).
The red ellipse appears to have center at (2, 0) with a = 4 and c = 2. This means the eccentricity is e = 12 . In order
to write the equation in polar form you still need to find k.
k = a2
c − c = 42
2 −2 = 8−2 = 6
Thus the equation for the ellipse is:
r = 6· 121− 1
2 ·cos(θ)
Example B
Identify the center, foci, vertices and equations of the directrix lines for the following conic:
r = 204−5·cos(θ− 3π
4 )
Solution: First the polar equation needs to be in graphing form. This means that the denominator needs to look like1− e · cos(θ−β).
r =20
4−5 · cos(θ− 3π
4
) · 1414
=5
1− 54 · cos
(θ− 3π
4
) = 4 · 54
1− 54 · cos
(θ− 3π
4
)e =
54, k = 4, β =
3π
4= 135◦
Using this information and the relationships you were reminded of in the guidance, you can set up a system andsolve for a and c.
449
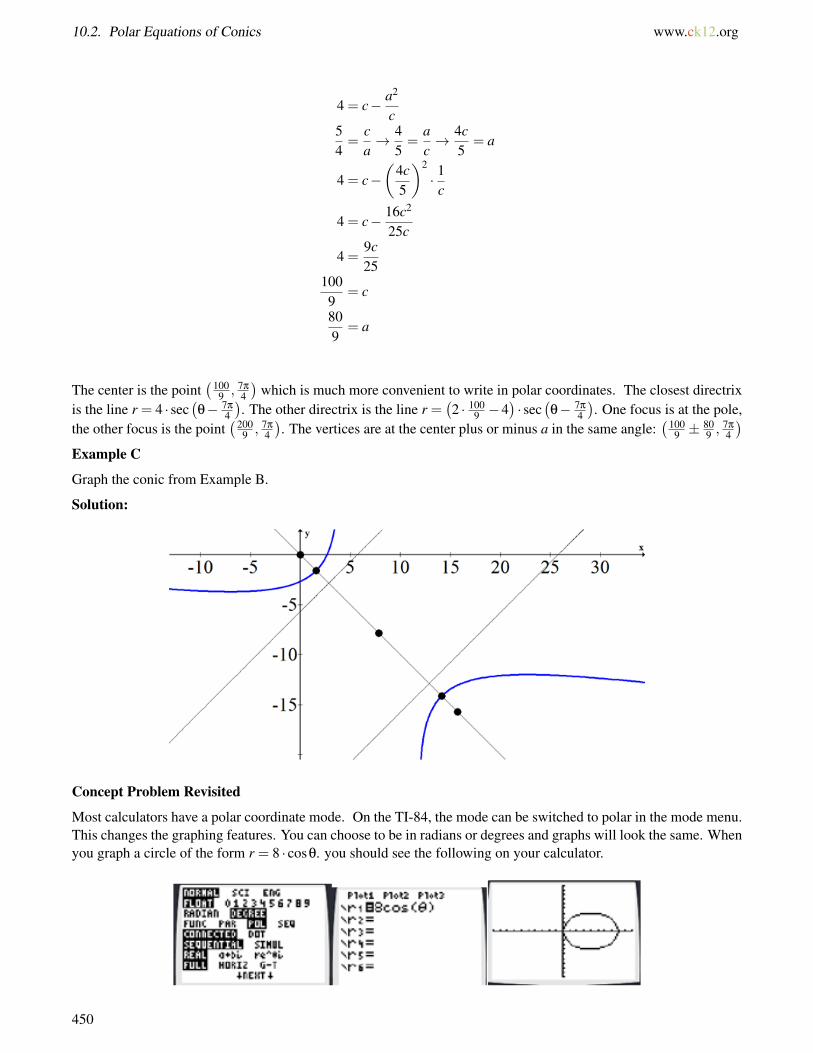
10.2. Polar Equations of Conics www.ck12.org
4 = c− a2
c54=
ca→ 4
5=
ac→ 4c
5= a
4 = c−(
4c5
)2
· 1c
4 = c− 16c2
25c
4 =9c25
1009
= c
809
= a
The center is the point(100
9 , 7π
4
)which is much more convenient to write in polar coordinates. The closest directrix
is the line r = 4 · sec(θ− 7π
4
). The other directrix is the line r =
(2 · 100
9 −4)· sec
(θ− 7π
4
). One focus is at the pole,
the other focus is the point(200
9 , 7π
4
). The vertices are at the center plus or minus a in the same angle:
(1009 ±
809 ,
7π
4
)Example C
Graph the conic from Example B.
Solution:
Concept Problem Revisited
Most calculators have a polar coordinate mode. On the TI-84, the mode can be switched to polar in the mode menu.This changes the graphing features. You can choose to be in radians or degrees and graphs will look the same. Whenyou graph a circle of the form r = 8 · cosθ. you should see the following on your calculator.
450
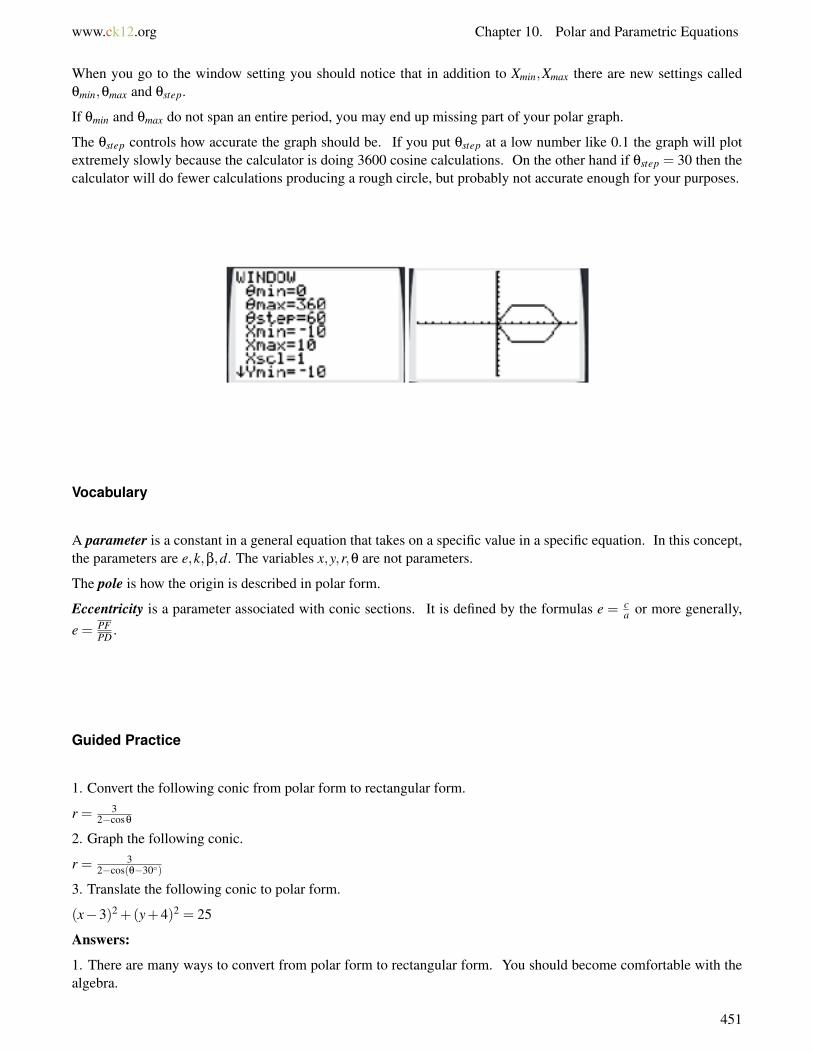
www.ck12.org Chapter 10. Polar and Parametric Equations
When you go to the window setting you should notice that in addition to Xmin,Xmax there are new settings calledθmin,θmax and θstep.
If θmin and θmax do not span an entire period, you may end up missing part of your polar graph.
The θstep controls how accurate the graph should be. If you put θstep at a low number like 0.1 the graph will plotextremely slowly because the calculator is doing 3600 cosine calculations. On the other hand if θstep = 30 then thecalculator will do fewer calculations producing a rough circle, but probably not accurate enough for your purposes.
Vocabulary
A parameter is a constant in a general equation that takes on a specific value in a specific equation. In this concept,the parameters are e,k,β,d. The variables x,y,r,θ are not parameters.
The pole is how the origin is described in polar form.
Eccentricity is a parameter associated with conic sections. It is defined by the formulas e = ca or more generally,
e = PFPD .
Guided Practice
1. Convert the following conic from polar form to rectangular form.
r = 32−cosθ
2. Graph the following conic.
r = 32−cos(θ−30◦)
3. Translate the following conic to polar form.
(x−3)2 +(y+4)2 = 25
Answers:
1. There are many ways to convert from polar form to rectangular form. You should become comfortable with thealgebra.
451

10.2. Polar Equations of Conics www.ck12.org
r =3
2− cosθ
r(2− cosθ) = 3
2r− r · cosθ = 3
2r = 3+ r · cosθ = 3+ y
4r2 = 9+6y+ y2
4(x2 + y2) = 9+6y+ y2
4x2 +4y2 = 9+6y+ y2
4x2 +3y3 +6y = 9
4x2 +3(y2 +2y+1) = 9+3
4x2 +3(y+1)2 = 12
x2
3+
(y+1)2
4= 1
2. Convert to the standard conic form.
r =3
2− cos(θ−30◦)
r =3
2− cos(θ−30◦)·
1212
=32
1− 12 · cos(θ−30◦)
=3 · 1
2
1− 12 · cos(θ−30◦)
k = 3, e =12, β = 30◦
3. Expand the original equation and then translate to polar coordinates:
452
www.ck12.org Chapter 10. Polar and Parametric Equations
(x−3)2 +(y+4)2 = 25
x2−6x+9+ y2 +8y+16 = 25
r2−6x+8y = 0
r2−6r · cosθ+8r · sinθ = 0
r−6cosθ+8sinθ = 0
r = 6cosθ−8sinθ
Practice
Convert the following conics from polar form to rectangular form. Then, identify the conic.
1. r = 53−cosθ
2. r = 42−cosθ
3. r = 22−cosθ
4. r = 32−4cosθ
5. r = 5cos(θ)
Graph the following conics.
6. r = 54−2cos(θ−90◦)
7. r = 53−7cos(θ−60◦)
8. r = 33−3cos(θ−30◦)
9. r = 12−cos(θ−60◦)
10. r = 36−3cos(θ−45◦)
Translate the following conics to polar form.
11. (x−1)2
4 + y2
3 = 1
12. (x−5)2 +(y+12)2 = 169
13. x2 +(y+1)2 = 1
14. (x−1)2 + y2 = 1
15. −3x2−4x+ y2−1 = 0
453

10.3. Parameters and Parameter Elimination www.ck12.org
10.3 Parameters and Parameter Elimination
Here you will represent equations and graphs in a new way with parametric equations.
In a parametric equation, the variables xand yare not dependent on one another. Instead, both variables are dependenton a third variable,t. Usually twill stand for time. A real world example of the relationship between x,yand tis theheight, weight and age of a baby.
Both the height and the weight of a baby depend on time, but there is also clearly a positive relationship between justthe height and weight of the baby. By focusing on the relationship between the height and the weight and lettingtime hide in the background, you create a parametric relationship between the three variables.
What other types of real world situations are modeled with parametric equations?
Watch This
MEDIAClick image to the left for more content.
http://www.youtube.com/watch?v=Fz6p4aC9e2Q James Sousa: Introduction to Parametric Equations
MEDIAClick image to the left for more content.
http://www.youtube.com/watch?v=tW6N7DFTvrM James Sousa: Converting Parametric Equation to RectangularForm
MEDIAClick image to the left for more content.
http://youtu.be/zs0Nw0tb4y8 James Sousa: Parametric Equations for an Ellipse in Cartesian Form
454

www.ck12.org Chapter 10. Polar and Parametric Equations
Guidance
In your graphing calculator there is a parametric mode. Once you put your calculator into parametric mode, on thegraphing screen you will no longer see y = , instead, you will see:
Notice how for plot one, the calculator is asking for two equations based on variable T :
x1T = f (t)
y1T = g(t)
In order to transform a parametric equation into a normal one, you need to do a process called “eliminating theparameter.” To do this, you must solve the x = f (t) equation for t = f−1(x) and substitute this value of t into the yequation. This will produce a normal function of y based on x.
There are two major benefits of graphing in parametric form. First, it is straightforward to graph a portion of aregular function using the Tmin,Tmax and Tstep in the window setting. Second, parametric form enables you to graphprojectiles in motion and see the effects of time.
Example A
Eliminate the parameter in the following equations.
x = 6t−2
y = 5t2−6t
Solution: x = 6t−2 So x+26 = t. Now, substitute this value for t into the second equation:
y = 5( x+2
6
)2−6( x+2
6
)Example B
For the given parametric equation, graph over each interval of t.
x = t2−4
y = 2t
a. −2≤ t ≤ 0b. 0≤ t ≤ 5c. −3≤ t ≤ 2
Solution:
a. A good place to start is to find the coordinates where t indicates the graph will start and end. For−2≤ t ≤ 0, t =−2 and t = 0 indicate that the points (0, -4) and (-4, 0) are the endpoints of the graph.
455

10.3. Parameters and Parameter Elimination www.ck12.org
b. 0≤ t ≤ 5
c. −3≤ t ≤ 2
Example C
Eliminate the parameter and graph the following parametric curve.
x = 3 · sin t
456
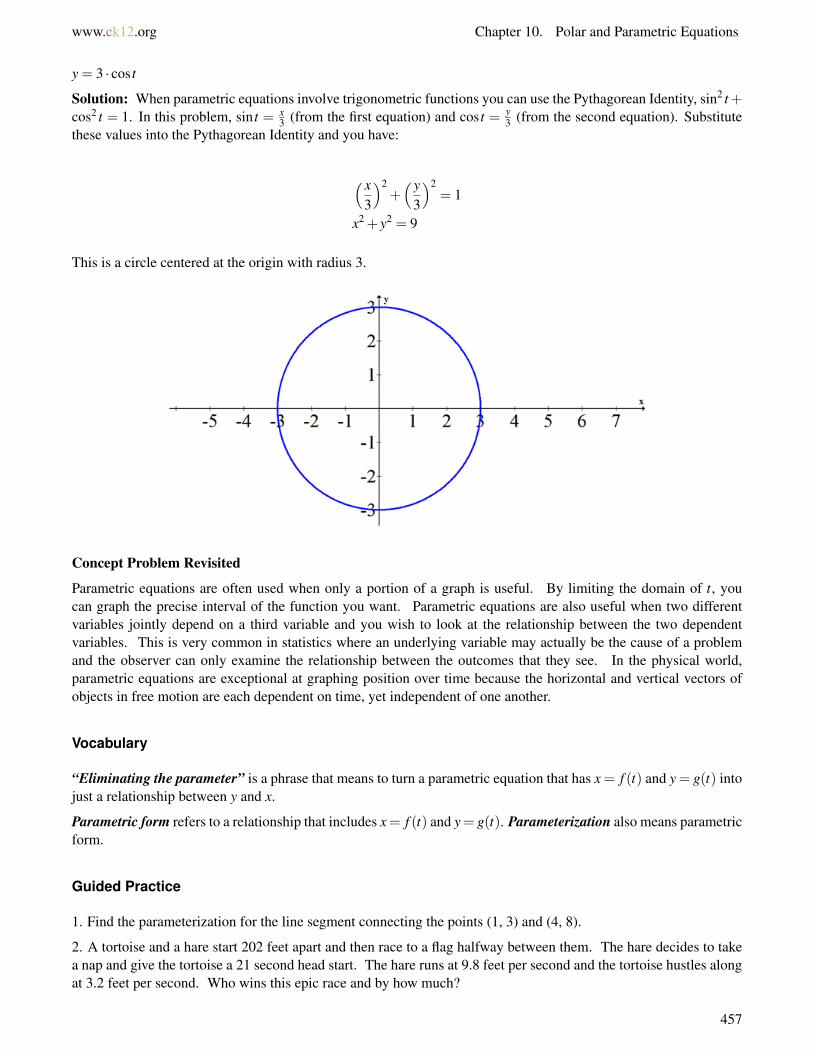
www.ck12.org Chapter 10. Polar and Parametric Equations
y = 3 · cos t
Solution: When parametric equations involve trigonometric functions you can use the Pythagorean Identity, sin2 t+cos2 t = 1. In this problem, sin t = x
3 (from the first equation) and cos t = y3 (from the second equation). Substitute
these values into the Pythagorean Identity and you have:
( x3
)2+( y
3
)2= 1
x2 + y2 = 9
This is a circle centered at the origin with radius 3.
Concept Problem Revisited
Parametric equations are often used when only a portion of a graph is useful. By limiting the domain of t, youcan graph the precise interval of the function you want. Parametric equations are also useful when two differentvariables jointly depend on a third variable and you wish to look at the relationship between the two dependentvariables. This is very common in statistics where an underlying variable may actually be the cause of a problemand the observer can only examine the relationship between the outcomes that they see. In the physical world,parametric equations are exceptional at graphing position over time because the horizontal and vertical vectors ofobjects in free motion are each dependent on time, yet independent of one another.
Vocabulary
“Eliminating the parameter” is a phrase that means to turn a parametric equation that has x = f (t) and y = g(t) intojust a relationship between y and x.
Parametric form refers to a relationship that includes x= f (t) and y= g(t). Parameterization also means parametricform.
Guided Practice
1. Find the parameterization for the line segment connecting the points (1, 3) and (4, 8).
2. A tortoise and a hare start 202 feet apart and then race to a flag halfway between them. The hare decides to takea nap and give the tortoise a 21 second head start. The hare runs at 9.8 feet per second and the tortoise hustles alongat 3.2 feet per second. Who wins this epic race and by how much?
457

10.3. Parameters and Parameter Elimination www.ck12.org
3. Use your calculator to model the race in #2.
Answers:
1. Use the fact that a point plus a vector yields another point. A vector between these points is < 4−1,8−3 >=<3,5 >
Thus the point (1, 3) plus t times the vector < 3,5 > will produce the point (4, 8) when t = 1 and the point (1, 3)when t = 0.
(x,y) = (1,3)+ t·< 3,5 >, for 0≤ t ≤ 1
You than then break up this vector equation into parametric form.
x = 1+3t
y = 3+5t
0≤ t ≤ 1
2. First draw a picture and then represent each character with a set of parametric equations.
The tortoise’s position is (-101, 0) at t = 0 and (-97.8, 0) at t = 1. You can deduce that the equation modeling thetortoise’s position is:
x1 =−101+3.2 · ty1 = 0
The hare’s position is (101, 0) at t = 21 and (91.2, 0) at t = 22. Note that it does not make sense to make equationsmodeling the hare’s position before 21 seconds have elapsed because the Hare is napping and not moving. You canset up an equation to solve for the hare’s theoretical starting position had he been running the whole time.
x2 = b−9.8t
101 = b−9.8 ·21
305.8 = b
The hare’s position equation after t = 21 can be modeled by:
x2 = 305.8−9.8 · ty2 = 0
The tortoise crosses x = 0 when t ≈ 31.5. The hare crosses x = 0 when t ≈ 31.2. The hare wins by about 1.15 feet.
3. There are many settings you should know for parametric equations that bring questions like this to life. TheTI-84 has features that allow you to see the race happen.
First, set the mode to simultaneous graphing. This will show both the tortoise and hare’s position at the same time.
458
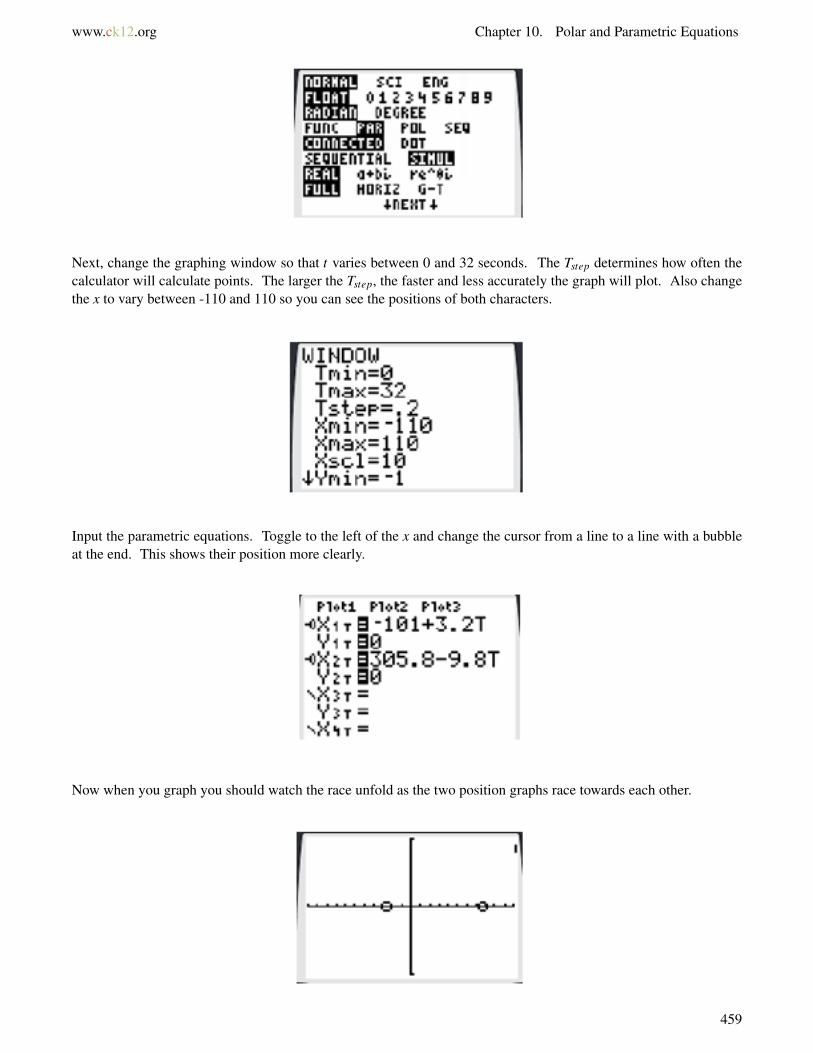
www.ck12.org Chapter 10. Polar and Parametric Equations
Next, change the graphing window so that t varies between 0 and 32 seconds. The Tstep determines how often thecalculator will calculate points. The larger the Tstep, the faster and less accurately the graph will plot. Also changethe x to vary between -110 and 110 so you can see the positions of both characters.
Input the parametric equations. Toggle to the left of the x and change the cursor from a line to a line with a bubbleat the end. This shows their position more clearly.
Now when you graph you should watch the race unfold as the two position graphs race towards each other.
459

10.3. Parameters and Parameter Elimination www.ck12.org
Practice
Eliminate the parameter in the following sets of parametric equations.
1. x = 3t−1; y = 4t2−2t
2. x = 3t2 +6t; y = 2t−1
3. x = t +2; y = t2 +4t +4
4. x = t−5; y = t3 +1
5. x = t +4; y = t2−5
For the parametric equation x = t,y = t2 +1, graph over each interval of t.
6. −2≤ t ≤−1
7. −1≤ t ≤ 0
8. −1≤ t ≤ 1
9. −2≤ t ≤ 2
10. −5≤ t ≤ 5
11. Eliminate the parameter and graph the following parametric curve: x = sin t, y =−4+3cos t.
12. Eliminate the parameter and graph the following parametric curve: x = 1+2cos t, y = 1+2sin t.
13. Using the previous problem as a model, find a parameterization for the circle with center (2, 4) and radius 3.
14. Find the parameterization for the line segment connecting the points (2, 7) and (1, 4).
15. Find a parameterization for the ellipse x2
4 + y2
25 = 1. Use the fact that cos2 t + sin2 t = 1. Check your answer withyour calculator.
16. Find a parameterization for the ellipse (x−4)2
9 + (y+1)2
36 = 1. Check your answer with your calculator.
460

www.ck12.org Chapter 10. Polar and Parametric Equations
10.4 Parametric Inverses
Here you will use your knowledge of both inverses and parametric equations to solve problems.
You have learned that a graph and its inverse are reflections of each other across the liney = x. You have also learnedthat in order to find an inverse algebraically, you can switch thex and y variables and solve for y. Parametric equationsactually make finding inverses easier because both the x and y variables are based on a third variable t. All you needto do to find the inverse of a set of parametric equations and switch the functions for x and y.
Is the inverse of a function always a function?
Watch This
MEDIAClick image to the left for more content.
http://www.youtube.com/watch?v=4Y14XhPD7Os James Sousa: Graphing Parametric Equations in the TI84
Guidance
To find the inverse of a parametric equation you must switch the function of x with the function of y. This will switchall the points from (x,y) to (y,x) and also has the effect of visually reflecting the graph over the line y = x.
Example A
Find and graph the inverse of the parametric function on the domain −2 < t < 2.
x = 2t
y = t2−4
Solution: Switch the x and y functions and graph.
x = t2−4
y = 2t
The original function is shown in blue and the inverse is shown in red.
461
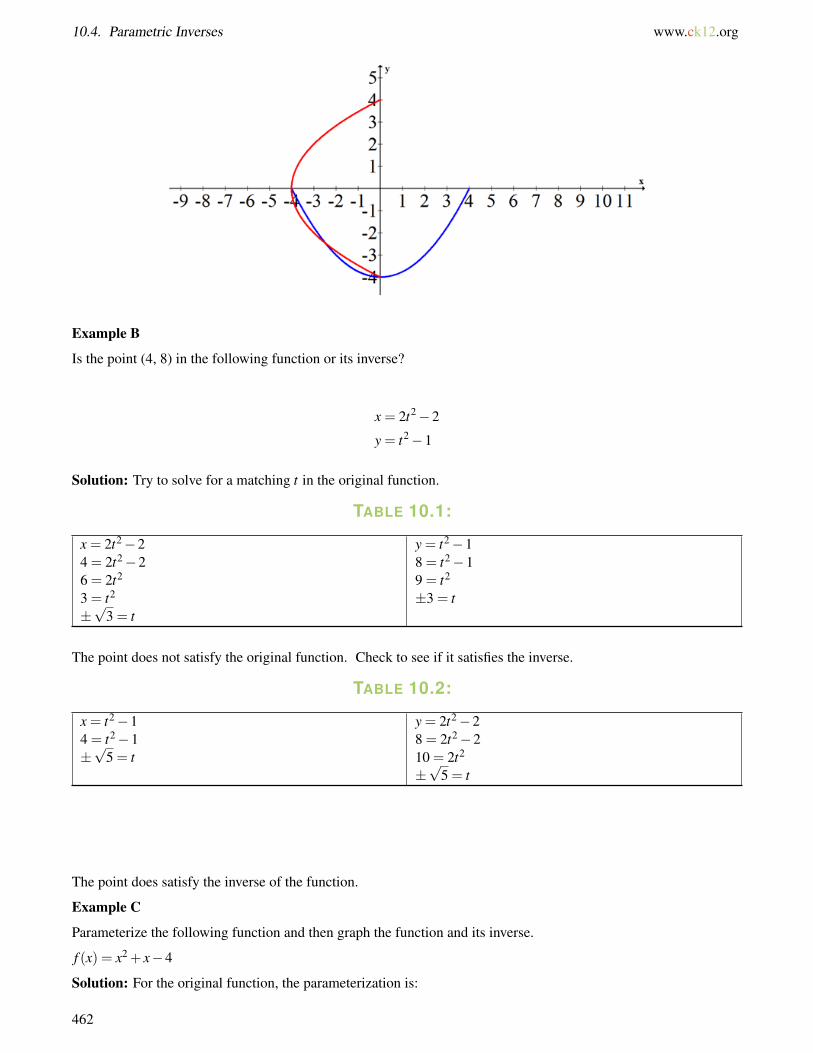
10.4. Parametric Inverses www.ck12.org
Example B
Is the point (4, 8) in the following function or its inverse?
x = 2t2−2
y = t2−1
Solution: Try to solve for a matching t in the original function.
TABLE 10.1:
x = 2t2−24 = 2t2−26 = 2t2
3 = t2
±√
3 = t
y = t2−18 = t2−19 = t2
±3 = t
The point does not satisfy the original function. Check to see if it satisfies the inverse.
TABLE 10.2:
x = t2−14 = t2−1±√
5 = t
y = 2t2−28 = 2t2−210 = 2t2
±√
5 = t
The point does satisfy the inverse of the function.
Example C
Parameterize the following function and then graph the function and its inverse.
f (x) = x2 + x−4
Solution: For the original function, the parameterization is:
462
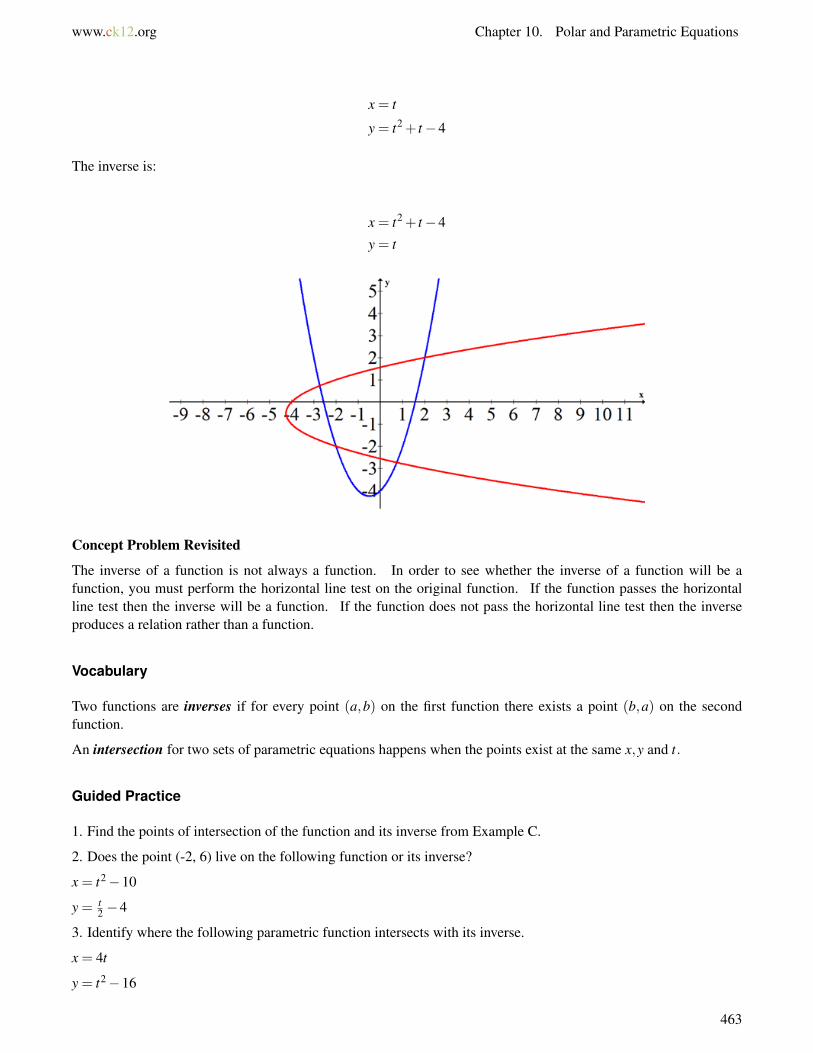
www.ck12.org Chapter 10. Polar and Parametric Equations
x = t
y = t2 + t−4
The inverse is:
x = t2 + t−4
y = t
Concept Problem Revisited
The inverse of a function is not always a function. In order to see whether the inverse of a function will be afunction, you must perform the horizontal line test on the original function. If the function passes the horizontalline test then the inverse will be a function. If the function does not pass the horizontal line test then the inverseproduces a relation rather than a function.
Vocabulary
Two functions are inverses if for every point (a,b) on the first function there exists a point (b,a) on the secondfunction.
An intersection for two sets of parametric equations happens when the points exist at the same x,y and t.
Guided Practice
1. Find the points of intersection of the function and its inverse from Example C.
2. Does the point (-2, 6) live on the following function or its inverse?
x = t2−10
y = t2 −4
3. Identify where the following parametric function intersects with its inverse.
x = 4t
y = t2−16
463
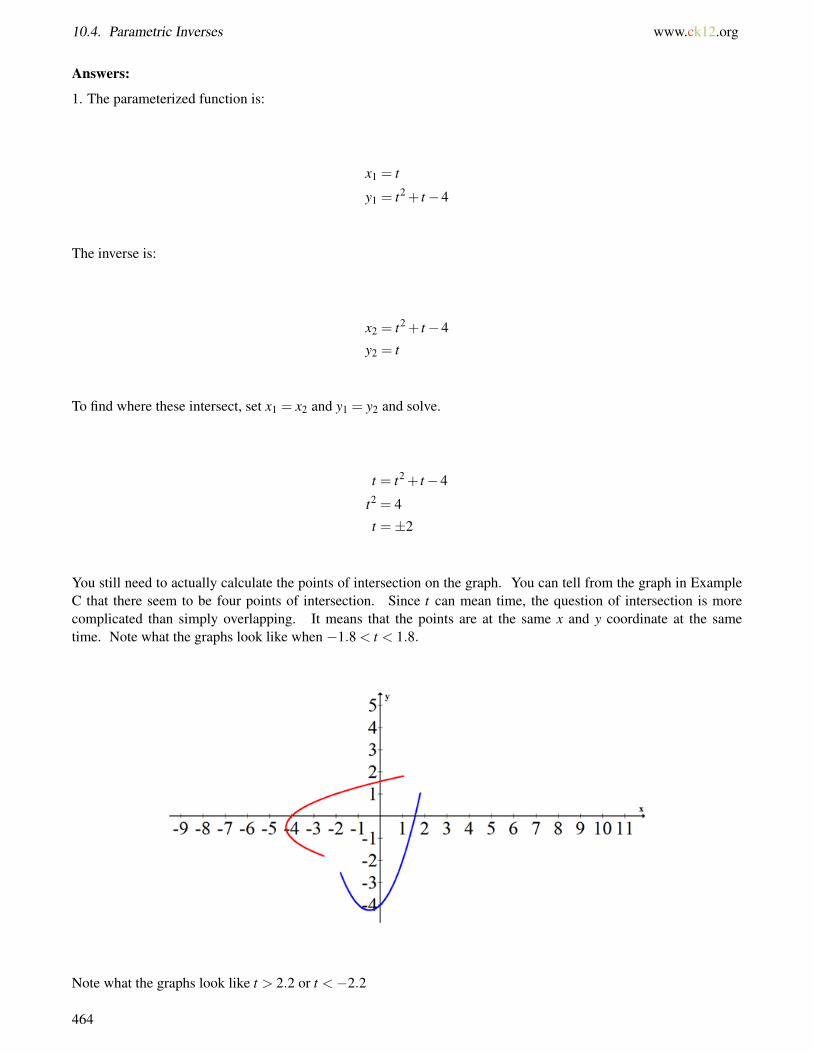
10.4. Parametric Inverses www.ck12.org
Answers:
1. The parameterized function is:
x1 = t
y1 = t2 + t−4
The inverse is:
x2 = t2 + t−4
y2 = t
To find where these intersect, set x1 = x2 and y1 = y2 and solve.
t = t2 + t−4
t2 = 4
t =±2
You still need to actually calculate the points of intersection on the graph. You can tell from the graph in ExampleC that there seem to be four points of intersection. Since t can mean time, the question of intersection is morecomplicated than simply overlapping. It means that the points are at the same x and y coordinate at the sametime. Note what the graphs look like when −1.8 < t < 1.8.
Note what the graphs look like t > 2.2 or t <−2.2
464
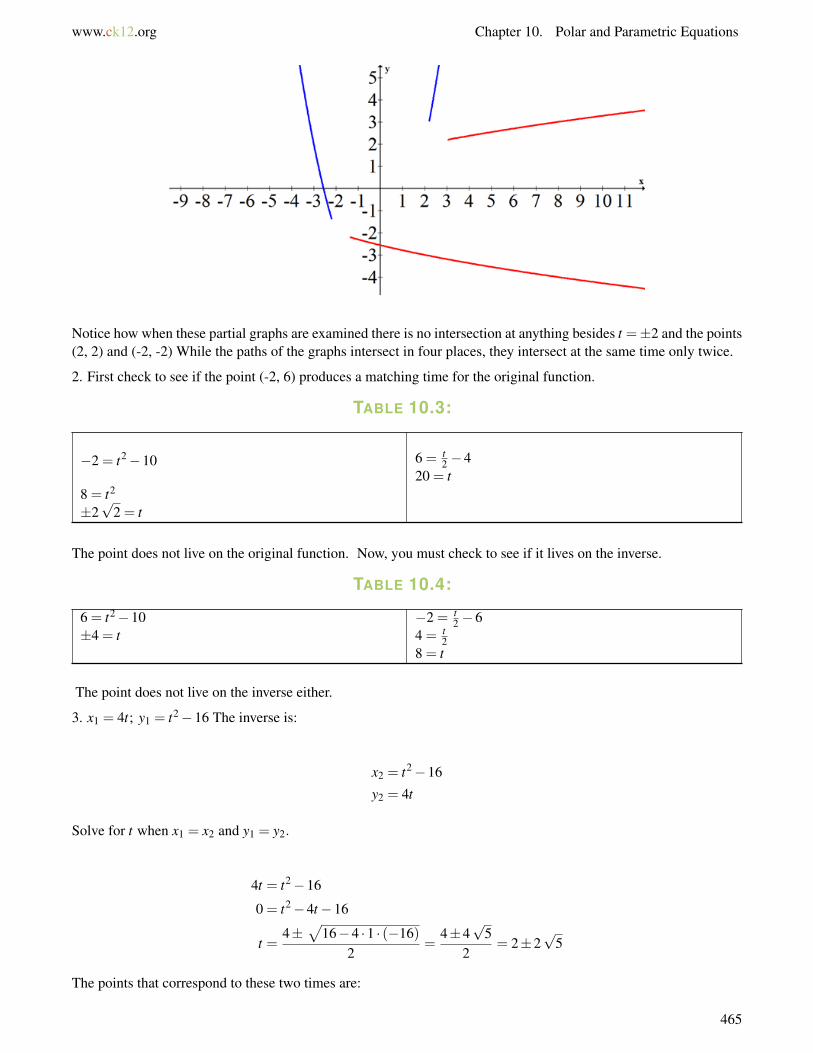
www.ck12.org Chapter 10. Polar and Parametric Equations
Notice how when these partial graphs are examined there is no intersection at anything besides t =±2 and the points(2, 2) and (-2, -2) While the paths of the graphs intersect in four places, they intersect at the same time only twice.
2. First check to see if the point (-2, 6) produces a matching time for the original function.
TABLE 10.3:
−2 = t2−10
8 = t2
±2√
2 = t
6 = t2 −4
20 = t
The point does not live on the original function. Now, you must check to see if it lives on the inverse.
TABLE 10.4:
6 = t2−10±4 = t
−2 = t2 −6
4 = t2
8 = t
The point does not live on the inverse either.
3. x1 = 4t; y1 = t2−16 The inverse is:
x2 = t2−16
y2 = 4t
Solve for t when x1 = x2 and y1 = y2.
4t = t2−16
0 = t2−4t−16
t =4±
√16−4 ·1 · (−16)
2=
4±4√
52
= 2±2√
5
The points that correspond to these two times are:
465
10.4. Parametric Inverses www.ck12.org
x = 4(2+2√
5), y = (2+2√
5)2−16
x = 4(2−2√
5), y = (2−2√
5)2−16
Practice
Use the function x = t−4; y = t2 +2 for #1 - #3.
1. Find the inverse of the function.
2. Does the point (-2, 6) live on the function or its inverse?
3. Does the point (0, 1) live on the function or its inverse?
Use the relation x = t2; y = 4− t for #4 - #6.
4. Find the inverse of the relation.
5. Does the point (4, 0) live on the relation or its inverse?
6. Does the point (0, 4) live on the relation or its inverse?
Use the function x = 2t +1; y = t2−3 for #7 - #9.
7. Find the inverse of the function.
8. Does the point (1, 5) live on the function or its inverse?
9. Does the point (9, 13) live on the function or its inverse?
Use the function x = 3t +14; y = t2−2t for #10 - #11.
10. Find the inverse of the function.
11. Identify where the parametric function intersects with its inverse.
Use the relation x = t2; y = 4t−4 for #12 - #13.
12. Find the inverse of the relation.
13. Identify where the relation intersects with its inverse.
14. Parameterize f (x) = x2 + x−6 and then graph the function and its inverse.
15. Parameterize f (x) = x2 +3x+2 and then graph the function and its inverse.
466
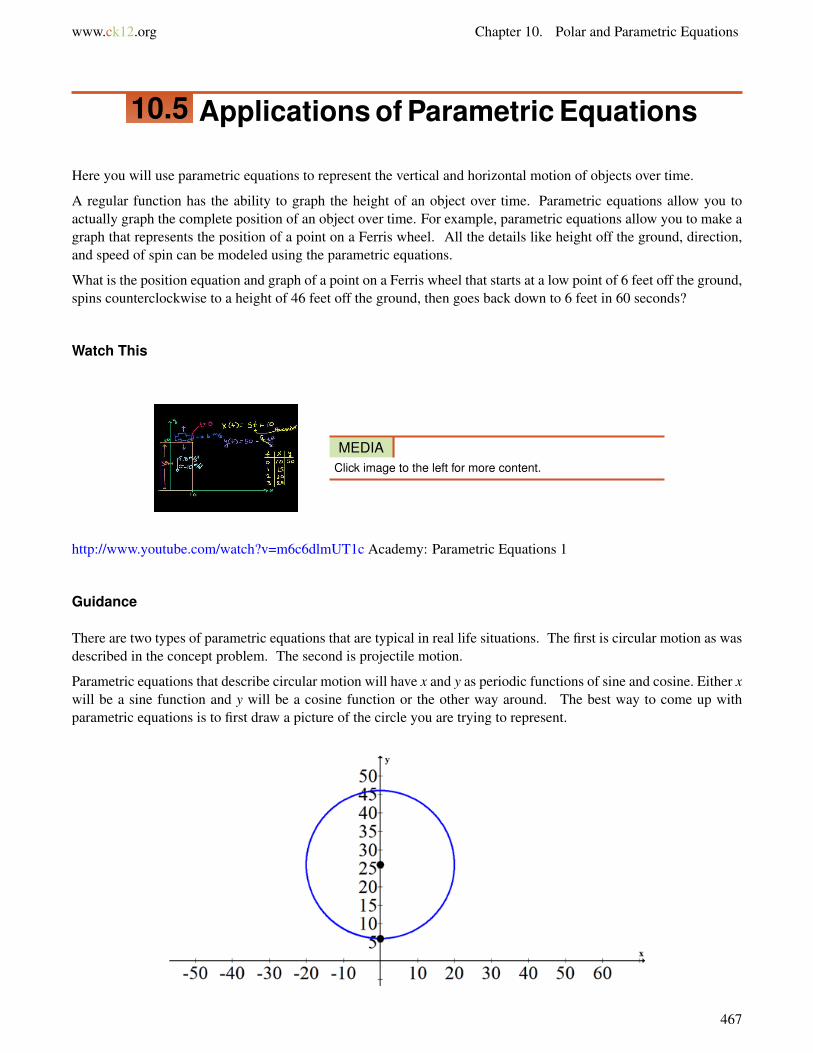
www.ck12.org Chapter 10. Polar and Parametric Equations
10.5 Applications of Parametric Equations
Here you will use parametric equations to represent the vertical and horizontal motion of objects over time.
A regular function has the ability to graph the height of an object over time. Parametric equations allow you toactually graph the complete position of an object over time. For example, parametric equations allow you to make agraph that represents the position of a point on a Ferris wheel. All the details like height off the ground, direction,and speed of spin can be modeled using the parametric equations.
What is the position equation and graph of a point on a Ferris wheel that starts at a low point of 6 feet off the ground,spins counterclockwise to a height of 46 feet off the ground, then goes back down to 6 feet in 60 seconds?
Watch This
MEDIAClick image to the left for more content.
http://www.youtube.com/watch?v=m6c6dlmUT1c Academy: Parametric Equations 1
Guidance
There are two types of parametric equations that are typical in real life situations. The first is circular motion as wasdescribed in the concept problem. The second is projectile motion.
Parametric equations that describe circular motion will have x and y as periodic functions of sine and cosine. Either xwill be a sine function and y will be a cosine function or the other way around. The best way to come up withparametric equations is to first draw a picture of the circle you are trying to represent.
467
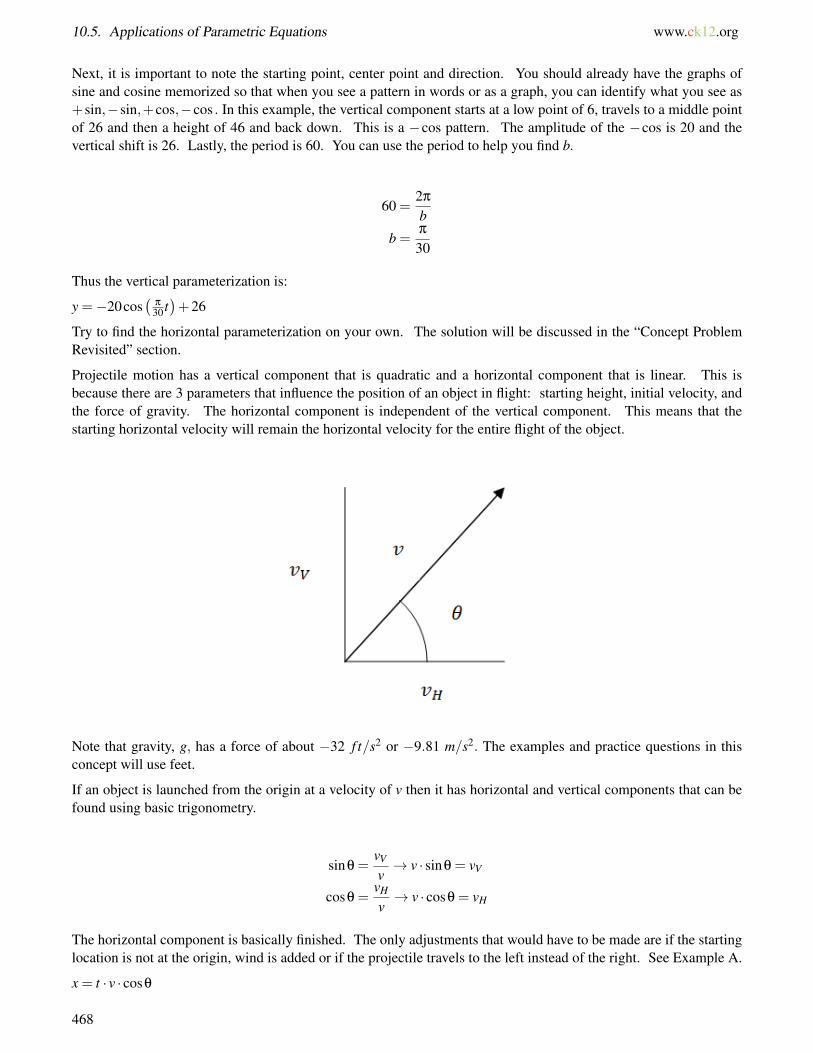
10.5. Applications of Parametric Equations www.ck12.org
Next, it is important to note the starting point, center point and direction. You should already have the graphs ofsine and cosine memorized so that when you see a pattern in words or as a graph, you can identify what you see as+sin,−sin,+cos,−cos . In this example, the vertical component starts at a low point of 6, travels to a middle pointof 26 and then a height of 46 and back down. This is a −cos pattern. The amplitude of the −cos is 20 and thevertical shift is 26. Lastly, the period is 60. You can use the period to help you find b.
60 =2π
b
b =π
30
Thus the vertical parameterization is:
y =−20cos(
π
30 t)+26
Try to find the horizontal parameterization on your own. The solution will be discussed in the “Concept ProblemRevisited” section.
Projectile motion has a vertical component that is quadratic and a horizontal component that is linear. This isbecause there are 3 parameters that influence the position of an object in flight: starting height, initial velocity, andthe force of gravity. The horizontal component is independent of the vertical component. This means that thestarting horizontal velocity will remain the horizontal velocity for the entire flight of the object.
Note that gravity, g, has a force of about −32 f t/s2 or −9.81 m/s2. The examples and practice questions in thisconcept will use feet.
If an object is launched from the origin at a velocity of v then it has horizontal and vertical components that can befound using basic trigonometry.
sinθ =vV
v→ v · sinθ = vV
cosθ =vH
v→ v · cosθ = vH
The horizontal component is basically finished. The only adjustments that would have to be made are if the startinglocation is not at the origin, wind is added or if the projectile travels to the left instead of the right. See Example A.
x = t · v · cosθ
468
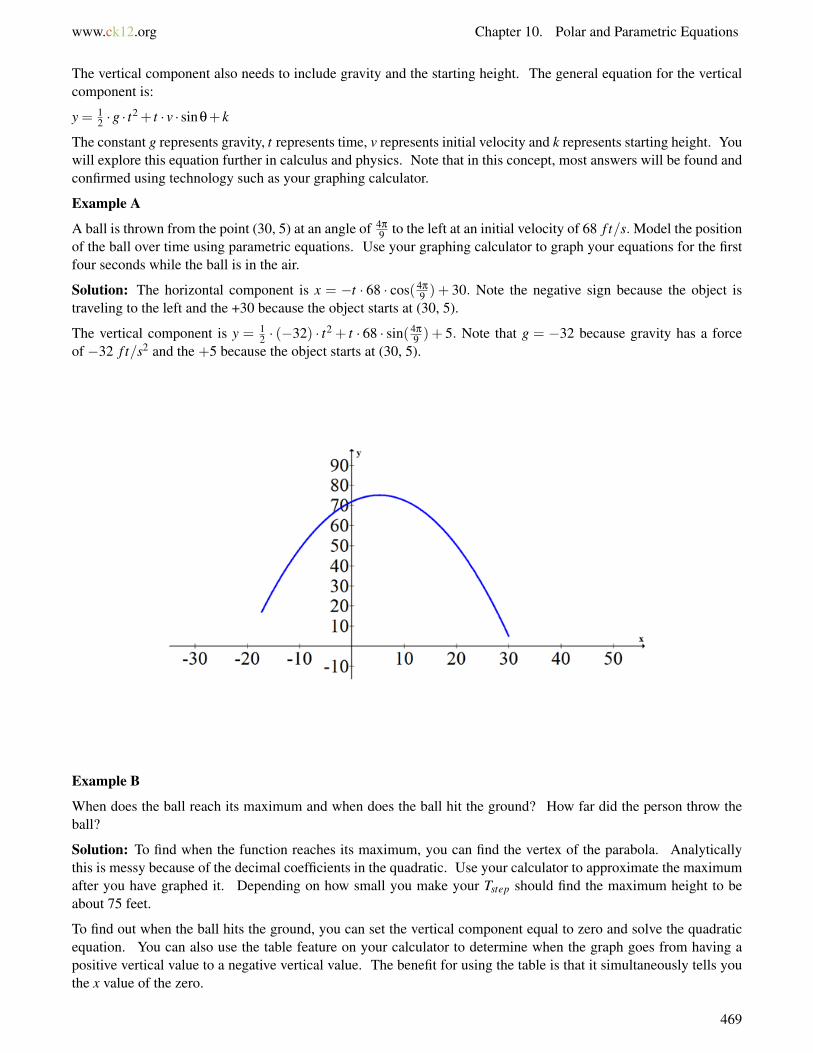
www.ck12.org Chapter 10. Polar and Parametric Equations
The vertical component also needs to include gravity and the starting height. The general equation for the verticalcomponent is:
y = 12 ·g · t
2 + t · v · sinθ+ k
The constant g represents gravity, t represents time, v represents initial velocity and k represents starting height. Youwill explore this equation further in calculus and physics. Note that in this concept, most answers will be found andconfirmed using technology such as your graphing calculator.
Example A
A ball is thrown from the point (30, 5) at an angle of 4π
9 to the left at an initial velocity of 68 f t/s. Model the positionof the ball over time using parametric equations. Use your graphing calculator to graph your equations for the firstfour seconds while the ball is in the air.
Solution: The horizontal component is x = −t · 68 · cos(4π
9 ) + 30. Note the negative sign because the object istraveling to the left and the +30 because the object starts at (30, 5).
The vertical component is y = 12 · (−32) · t2 + t · 68 · sin(4π
9 ) + 5. Note that g = −32 because gravity has a forceof −32 f t/s2 and the +5 because the object starts at (30, 5).
Example B
When does the ball reach its maximum and when does the ball hit the ground? How far did the person throw theball?
Solution: To find when the function reaches its maximum, you can find the vertex of the parabola. Analyticallythis is messy because of the decimal coefficients in the quadratic. Use your calculator to approximate the maximumafter you have graphed it. Depending on how small you make your Tstep should find the maximum height to beabout 75 feet.
To find out when the ball hits the ground, you can set the vertical component equal to zero and solve the quadraticequation. You can also use the table feature on your calculator to determine when the graph goes from having apositive vertical value to a negative vertical value. The benefit for using the table is that it simultaneously tells youthe x value of the zero.
469
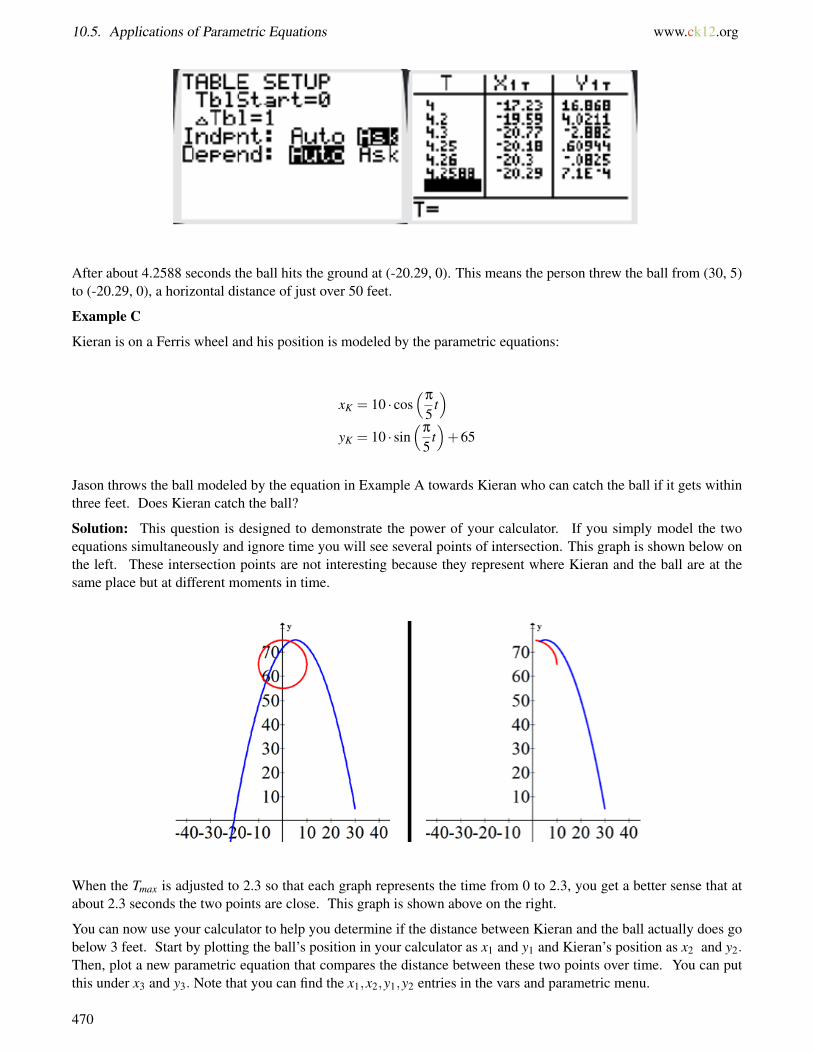
10.5. Applications of Parametric Equations www.ck12.org
After about 4.2588 seconds the ball hits the ground at (-20.29, 0). This means the person threw the ball from (30, 5)to (-20.29, 0), a horizontal distance of just over 50 feet.
Example C
Kieran is on a Ferris wheel and his position is modeled by the parametric equations:
xK = 10 · cos(
π
5t)
yK = 10 · sin(
π
5t)+65
Jason throws the ball modeled by the equation in Example A towards Kieran who can catch the ball if it gets withinthree feet. Does Kieran catch the ball?
Solution: This question is designed to demonstrate the power of your calculator. If you simply model the twoequations simultaneously and ignore time you will see several points of intersection. This graph is shown below onthe left. These intersection points are not interesting because they represent where Kieran and the ball are at thesame place but at different moments in time.
When the Tmax is adjusted to 2.3 so that each graph represents the time from 0 to 2.3, you get a better sense that atabout 2.3 seconds the two points are close. This graph is shown above on the right.
You can now use your calculator to help you determine if the distance between Kieran and the ball actually does gobelow 3 feet. Start by plotting the ball’s position in your calculator as x1 and y1 and Kieran’s position as x2 and y2.Then, plot a new parametric equation that compares the distance between these two points over time. You can putthis under x3 and y3. Note that you can find the x1,x2,y1,y2 entries in the vars and parametric menu.
470
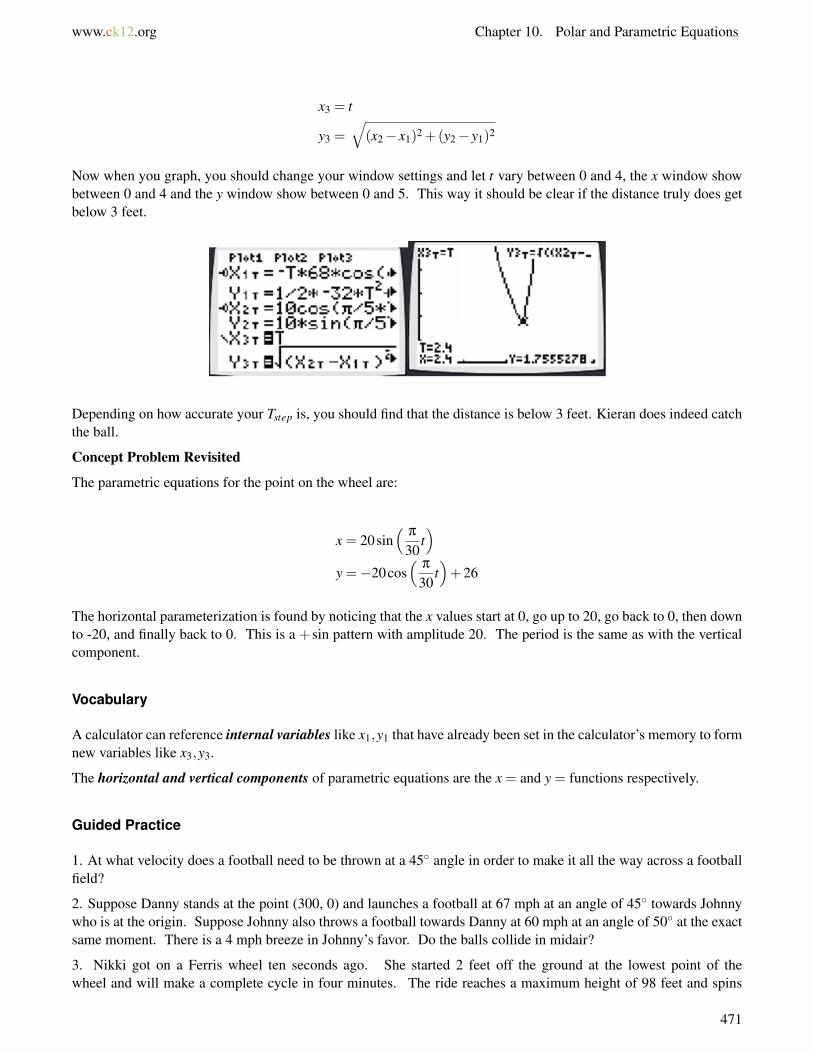
www.ck12.org Chapter 10. Polar and Parametric Equations
x3 = t
y3 =√(x2− x1)2 +(y2− y1)2
Now when you graph, you should change your window settings and let t vary between 0 and 4, the x window showbetween 0 and 4 and the y window show between 0 and 5. This way it should be clear if the distance truly does getbelow 3 feet.
Depending on how accurate your Tstep is, you should find that the distance is below 3 feet. Kieran does indeed catchthe ball.
Concept Problem Revisited
The parametric equations for the point on the wheel are:
x = 20sin(
π
30t)
y =−20cos(
π
30t)+26
The horizontal parameterization is found by noticing that the x values start at 0, go up to 20, go back to 0, then downto -20, and finally back to 0. This is a +sin pattern with amplitude 20. The period is the same as with the verticalcomponent.
Vocabulary
A calculator can reference internal variables like x1,y1 that have already been set in the calculator’s memory to formnew variables like x3,y3.
The horizontal and vertical components of parametric equations are the x = and y = functions respectively.
Guided Practice
1. At what velocity does a football need to be thrown at a 45◦ angle in order to make it all the way across a footballfield?
2. Suppose Danny stands at the point (300, 0) and launches a football at 67 mph at an angle of 45◦ towards Johnnywho is at the origin. Suppose Johnny also throws a football towards Danny at 60 mph at an angle of 50◦ at the exactsame moment. There is a 4 mph breeze in Johnny’s favor. Do the balls collide in midair?
3. Nikki got on a Ferris wheel ten seconds ago. She started 2 feet off the ground at the lowest point of thewheel and will make a complete cycle in four minutes. The ride reaches a maximum height of 98 feet and spins
471

10.5. Applications of Parametric Equations www.ck12.org
clockwise. Write parametric equations that model Nikki’s position over time. Where will Nikki be three minutesfrom now?
Answers:
1. A football field is 100 yards or 300 feet. The parametric equations for a football thrown from (300, 0) back to theorigin at speed v are:
x =−t · v · cos(
π
4
)+300
y =12· (−32) · t2 + t · v · sin
(π
4
)Substituting the point (0, 0) in for (x,y) produces a system of two equations with two variables v, t.
0 =−t · v · cos(
π
4
)+300
0 =12· (−32) · t2 + t · v · sin
(π
4
)You can solve this system many different ways.
t = 5√
32 ≈ 4.3 seconds,v = 40
√6≈ 97.98 f t/s
In order for someone to throw a football at a 45◦ angle all the way across a football field, they would need to throwat about 98 f t/s which is about 66.8 mph.98 f eet
1 sec ·3600 sec1 hour ·
1 mile5280 f eet ≈
66.8 miles1 hour
2. Calculate the velocity of each person and of the wind in feet per second:
67 miles1 hour
· 1 hour3600 sec
· 5280 f eet1 mile
≈ 98.27 f t/sec
60 miles1 hour
· 1 hour3600 sec
· 5280 f eet1 mile
= 88 f t/sec
4 miles1 hour
· 1 hour3600 sec
· 5280 f eet1 mile
≈ 5.87 f t/sec
The location of Danny’s ball can be described with the following parametric equations (in radians). Note that thewind simply adds a linear term.
x1 =−t ·98.27 · cos(
π
4
)+300+5.87t
y1 =12· (−32) · t2 + t ·98.27 · sin
(π
4
)The location of Johnny’s ball can be described with the following parametric equations.
x2 = t ·88 · cos(
5π
18
)+5.87t
y2 =12· (−32) · t2 + t ·88 · sin
(5π
18
)
472
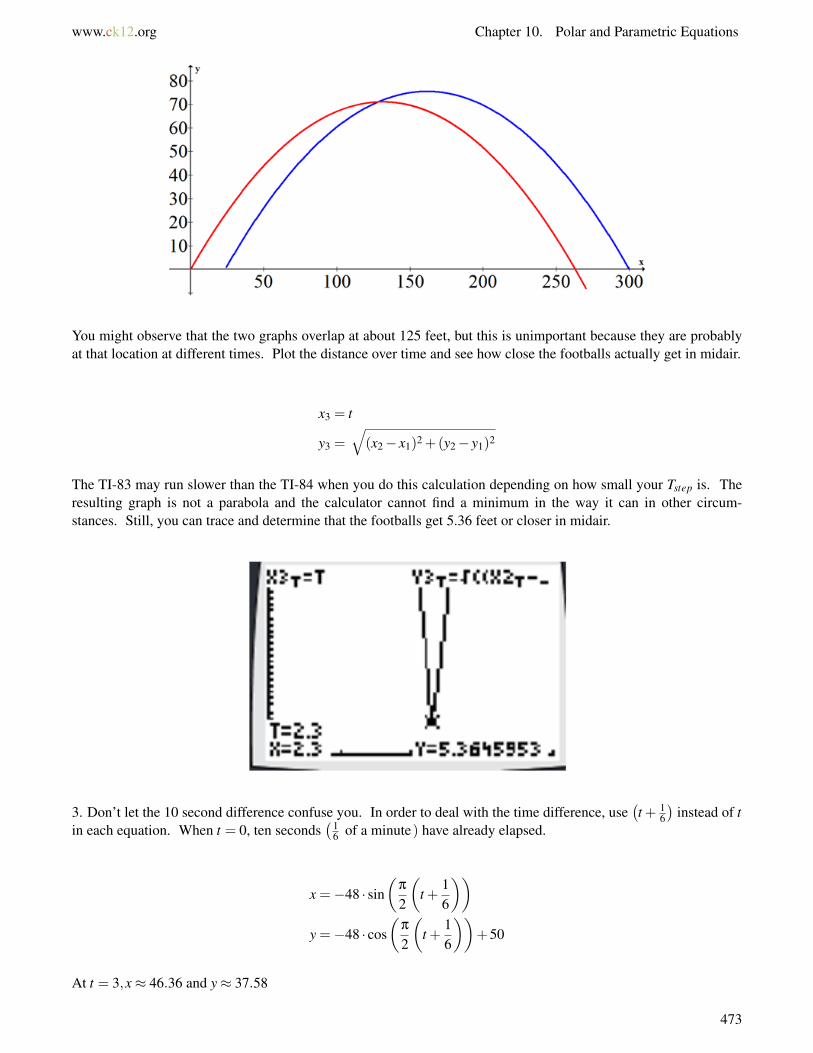
www.ck12.org Chapter 10. Polar and Parametric Equations
You might observe that the two graphs overlap at about 125 feet, but this is unimportant because they are probablyat that location at different times. Plot the distance over time and see how close the footballs actually get in midair.
x3 = t
y3 =√(x2− x1)2 +(y2− y1)2
The TI-83 may run slower than the TI-84 when you do this calculation depending on how small your Tstep is. Theresulting graph is not a parabola and the calculator cannot find a minimum in the way it can in other circum-stances. Still, you can trace and determine that the footballs get 5.36 feet or closer in midair.
3. Don’t let the 10 second difference confuse you. In order to deal with the time difference, use(t + 1
6
)instead of t
in each equation. When t = 0, ten seconds(1
6 of a minute) have already elapsed.
x =−48 · sin(
π
2
(t +
16
))y =−48 · cos
(π
2
(t +
16
))+50
At t = 3,x≈ 46.36 and y≈ 37.58
473
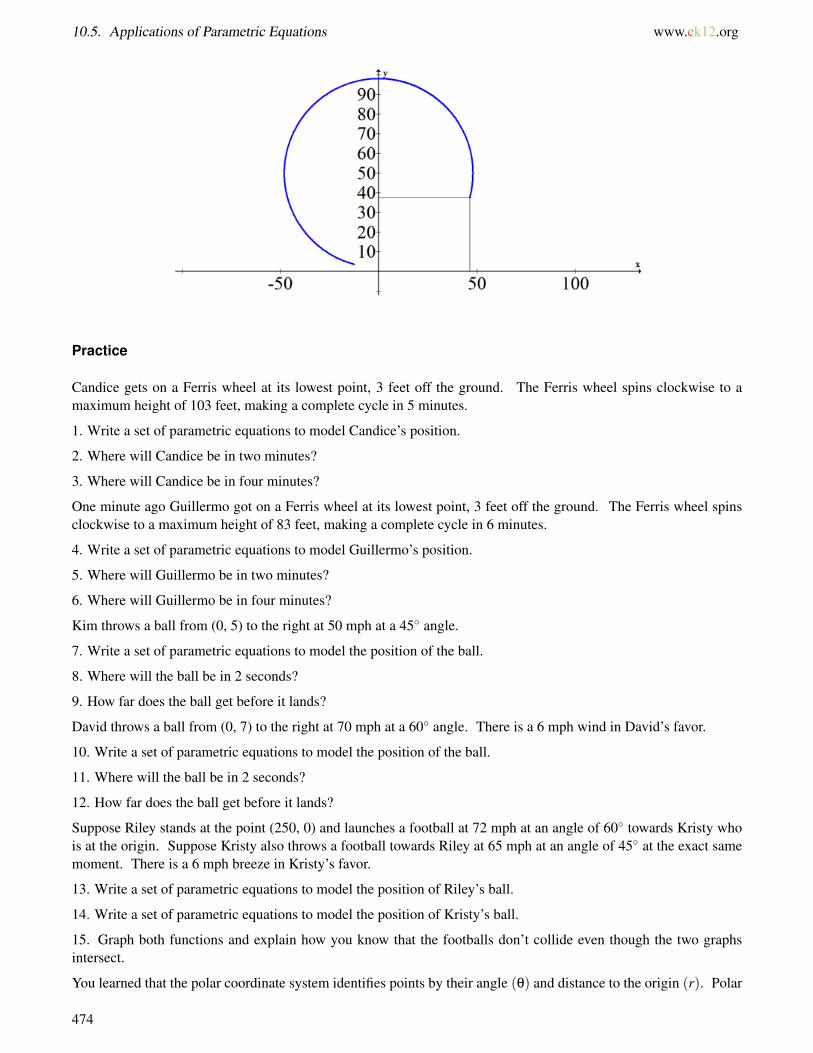
10.5. Applications of Parametric Equations www.ck12.org
Practice
Candice gets on a Ferris wheel at its lowest point, 3 feet off the ground. The Ferris wheel spins clockwise to amaximum height of 103 feet, making a complete cycle in 5 minutes.
1. Write a set of parametric equations to model Candice’s position.
2. Where will Candice be in two minutes?
3. Where will Candice be in four minutes?
One minute ago Guillermo got on a Ferris wheel at its lowest point, 3 feet off the ground. The Ferris wheel spinsclockwise to a maximum height of 83 feet, making a complete cycle in 6 minutes.
4. Write a set of parametric equations to model Guillermo’s position.
5. Where will Guillermo be in two minutes?
6. Where will Guillermo be in four minutes?
Kim throws a ball from (0, 5) to the right at 50 mph at a 45◦ angle.
7. Write a set of parametric equations to model the position of the ball.
8. Where will the ball be in 2 seconds?
9. How far does the ball get before it lands?
David throws a ball from (0, 7) to the right at 70 mph at a 60◦ angle. There is a 6 mph wind in David’s favor.
10. Write a set of parametric equations to model the position of the ball.
11. Where will the ball be in 2 seconds?
12. How far does the ball get before it lands?
Suppose Riley stands at the point (250, 0) and launches a football at 72 mph at an angle of 60◦ towards Kristy whois at the origin. Suppose Kristy also throws a football towards Riley at 65 mph at an angle of 45◦ at the exact samemoment. There is a 6 mph breeze in Kristy’s favor.
13. Write a set of parametric equations to model the position of Riley’s ball.
14. Write a set of parametric equations to model the position of Kristy’s ball.
15. Graph both functions and explain how you know that the footballs don’t collide even though the two graphsintersect.
You learned that the polar coordinate system identifies points by their angle (θ) and distance to the origin (r). Polar
474

www.ck12.org Chapter 10. Polar and Parametric Equations
equations allow you to more easily represent circles and spirals with equations. Parametric equations are a set oftwo functions, each dependent on the same third variable. You saw that parametric equations are especially usefulwhen working with an object in flight where its vertical and horizontal components don’t theoretically interact.
475
10.6. References www.ck12.org
10.6 References
1. CK-12 Foundation. . CCSA2. CK-12 Foundation. . CCSA3. CK-12 Foundation. . CCSA4. CK-12 Foundation. . CCSA5. CK-12 Foundation. . CCSA6. CK-12 Foundation. . CCSA7. CK-12 Foundation. . CCSA8. CK-12 Foundation. . CCSA9. CK-12 Foundation. . CCSA
10. CK-12 Foundation. . CCSA11. CK-12 Foundation. . CCSA12. CK-12 Foundation. . CCSA13. CK-12 Foundation. . CCSA14. CK-12 Foundation. . CCSA15. CK-12 Foundation. . CCSA16. CK-12 Foundation. . CCSA17. CK-12 Foundation. . CCSA18. CK-12 Foundation. . CCSA19. CK-12 Foundation. . CCSA20. CK-12 Foundation. . CCSA21. CK-12 Foundation. . CCSA22. CK-12 Foundation. . CCSA23. CK-12 Foundation. . CCSA24. CK-12 Foundation. . CCSA25. CK-12 Foundation. . CCSA26. CK-12 Foundation. . CCSA27. CK-12 Foundation. . CCSA28. CK-12 Foundation. . CCSA29. CK-12 Foundation. . CCSA30. CK-12 Foundation. . CCSA31. CK-12 Foundation. . CCSA32. CK-12 Foundation. . CCSA33. CK-12 Foundation. . CCSA34. CK-12 Foundation. . CCSA
476

www.ck12.org Chapter 11. Complex Numbers
CHAPTER 11 Complex NumbersChapter Outline
11.1 FUNDAMENTAL THEOREM OF ALGEBRA
11.2 ARITHMETIC WITH COMPLEX NUMBERS
11.3 TRIGONOMETRIC POLAR FORM OF COMPLEX NUMBERS
11.4 DE MOIVRE’S THEOREM AND NTH ROOTS
11.5 REFERENCES
Complex numbers are based on the fact that√−1 is defined to be the imaginary number i, and that normal algebraic
and graphical calculations are still valid even with imaginary numbers. In order to understand the reasoning behindi, you will look at how the Fundamental Theorem of Algebra requires the number of roots of a polynomial to matchthe degree of the polynomial. You will then discover how the complex number system interacts with the real numbersystem.
477
11.1. Fundamental Theorem of Algebra www.ck12.org
11.1 Fundamental Theorem of Algebra
Here you will state the connection between zeroes of a polynomial and the Fundamental Theorem of Algebra andstart to use complex numbers.
You have learned that a quadratic has at most two real zeroes and a cubic has at most three real zeros. You mayhave noticed that the number of real zeros is always less than or equal to the degree of the polynomial. By lookingat a graph you can see when a parabola crosses thex axis 0, 1 or 2 times, but what does this have to do with complexnumbers?
Watch This
MEDIAClick image to the left for more content.
http://www.youtube.com/watch?v=NeTRNpBI17I James Sousa: Complex Numbers
Guidance
A real number is any rational or irrational number. When a real number is squared, it will always produce a non-negative value. Complex numbers include real numbers and another type of number called imaginary numbers.Unlike real numbers, imaginary numbers produce a negative value when squared. The square root of negative oneis defined to be the imaginary number i.
i =√−1 and i2 =−1
Complex numbers are written with a real component and an imaginary component. All complex numbers can bewritten in the form a+bi. When the imaginary component is zero, the number is simply a real number. This meansthat real numbers are a subset of complex numbers.
The Fundamental Theorem of Algebra states that an nth degree polynomial with real or complex coefficients has,with multiplicity, exactly n complex roots. This means a cubic will have exactly 3 roots, some of which may becomplex.
Multiplicity refers to when a root counts more than once. For example, in the following function the only rootoccurs at x = 3.
f (x) = (x−3)2
The Fundamental Theorem of Algebra states that this 2nd degree polynomial must have exactly 2 roots with multi-plicity. This means that the root x = 3 has multiplicity 2. One way to determine the multiplicity is to simply lookat the degree of each of the factors in the factorized polynomial.
g(x) = (x−1)(x−3)4(x+2)
This function has 6 roots. The first two roots x = 1 and x = −2 have multiplicities of 1 because the power of eachof their binomial factors is 1. The third root x = 3 has a multiplicity of 4 because the power of its binomial factor is
478

www.ck12.org Chapter 11. Complex Numbers
4. Keep in mind that all polynomials can be written in factorized form like the above polynomial, due to a theoremcalled the Linear Factorization Theorem.
Example A
Identify the zeroes of the following complex polynomial.
f (x) = x2 +9
Solution: Set y = 0 and solve for x. This will give you the two zeros.
0 = x2 +9
−9 = x2
±3i = x
Thus the linear factorization of the function is:
f (x) = (x−3i)(x+3i)
Example B
Examine the following graph and make conclusions about the number and type of zeros of this 7th degree polynomial.
Solution: A 7th degree polynomial has 7 roots. Three real roots are visible. The root at x = −2 has multiplicity 2and the root at x = 2 has multiplicity 1. The other four roots appear to be imaginary and the clues are the relativemaximums and minimums that do not cross the x axis.
Example C
Identify the polynomial that has the following five roots. x = 0,2,3,±√
5i
Solution: Write the function in factorized form.
f (x) = (x−0)(x−2)(x−3)(x−√
5i)(x+√
5i)
When you multiply through, it will be helpful to do the complex conjugates first. The complex conjugates are (x−√5i)(x+
√5i).
f (x) = x(x2−5x+6)(x2−5 · (−1))
f (x) = (x3−5x2 +6x)(x2 +5)
f (x) = x5−5x4 +6x3 +5x3−25x2 +30x
f (x) = x5−5x4 +11x3−25x2 +30x
479
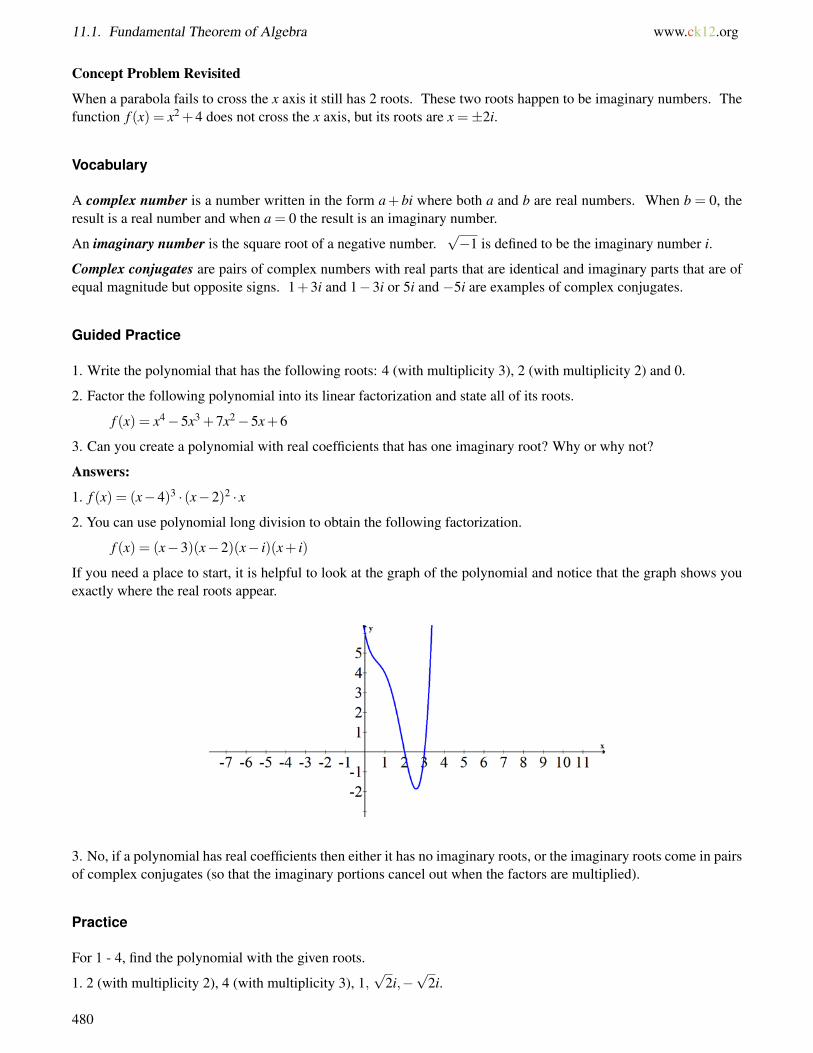
11.1. Fundamental Theorem of Algebra www.ck12.org
Concept Problem Revisited
When a parabola fails to cross the x axis it still has 2 roots. These two roots happen to be imaginary numbers. Thefunction f (x) = x2 +4 does not cross the x axis, but its roots are x =±2i.
Vocabulary
A complex number is a number written in the form a+bi where both a and b are real numbers. When b = 0, theresult is a real number and when a = 0 the result is an imaginary number.
An imaginary number is the square root of a negative number.√−1 is defined to be the imaginary number i.
Complex conjugates are pairs of complex numbers with real parts that are identical and imaginary parts that are ofequal magnitude but opposite signs. 1+3i and 1−3i or 5i and −5i are examples of complex conjugates.
Guided Practice
1. Write the polynomial that has the following roots: 4 (with multiplicity 3), 2 (with multiplicity 2) and 0.
2. Factor the following polynomial into its linear factorization and state all of its roots.
f (x) = x4−5x3 +7x2−5x+6
3. Can you create a polynomial with real coefficients that has one imaginary root? Why or why not?
Answers:
1. f (x) = (x−4)3 · (x−2)2 · x
2. You can use polynomial long division to obtain the following factorization.
f (x) = (x−3)(x−2)(x− i)(x+ i)
If you need a place to start, it is helpful to look at the graph of the polynomial and notice that the graph shows youexactly where the real roots appear.
3. No, if a polynomial has real coefficients then either it has no imaginary roots, or the imaginary roots come in pairsof complex conjugates (so that the imaginary portions cancel out when the factors are multiplied).
Practice
For 1 - 4, find the polynomial with the given roots.
1. 2 (with multiplicity 2), 4 (with multiplicity 3), 1,√
2i,−√
2i.
480
www.ck12.org Chapter 11. Complex Numbers
2. 1, -3 (with multiplicity 3), −1,√
3i,−√
3i
3. 5 (with multiplicity 2), -1 (with multiplicity 2), 2i,−2i
4. i,−i,√
2i,−√
2i
For each polynomial, factor into its linear factorization and state all of its roots.
5. f (x) = x5 +4x4−2x3−14x2−3x−18
6. g(x) = x4−1
7. h(x) = x6−12x5 +61x4−204x3 +532x2−864x+576
8. j(x) = x7−11x6 +49x5−123x4 +219x3−297x2 +243x−81
9. k(x) = x5 +3x4−11x3−15x2 +46x−24
10. m(x) = x6−12x4 +23x2 +36
11. n(x) = x6−3x5−10x4−32x3−81x2−85x−30
12. p(x) = x6 +4x5 +7x4 +12x3−16x2−112x−112
13. How can you tell the number of roots that a polynomial has from its equation?
14. Explain the meaning of the term “multiplicity”.
15. A polynomial with real coefficients has one root that is√
3i. What other root(s) must the polynomial have?
481
11.2. Arithmetic with Complex Numbers www.ck12.org
11.2 Arithmetic with Complex Numbers
Here you will add, subtract, multiply and divide complex numbers. You will also find the absolute value of complexnumbers and plot complex numbers in the complex plane.
The idea of a complex number can be hard to comprehend, especially when you start thinking about absolute value.In the past you may have thought of the absolute value of a number as just the number itself or its positive version.How should you think about the absolute value of a complex number?
Watch This
MEDIAClick image to the left for more content.
http://www.youtube.com/watch?v=htiloYIILqs James Sousa: Complex Number Operations
Guidance
Complex numbers follow all the same rules as real numbers for the operations of adding, subtracting, multiplyingand dividing. There are a few important ideas to remember when working with complex numbers:
1. When simplifying, you must remember to combine imaginary parts with imaginary parts and real parts with realparts. For example, 4+5i+2−3i = 6+2i.
2. If you end up with a complex number in the denominator of a fraction, eliminate it by multiplying both thenumerator and denominator by the complex conjugate of the denominator.
3. The powers of i are:
• i =√−1
• i2 =−1• i3 =−
√−1 =−i
• i4 = 1• i5 = i• . . . and the pattern repeats
The complex plane is set up in the same way as the regular x,y plane, except that real numbers are countedhorizontally and complex numbers are counted vertically. The following is the number 4+3i plotted in the complexnumber plane. Notice how the point is four units over and three units up.
482
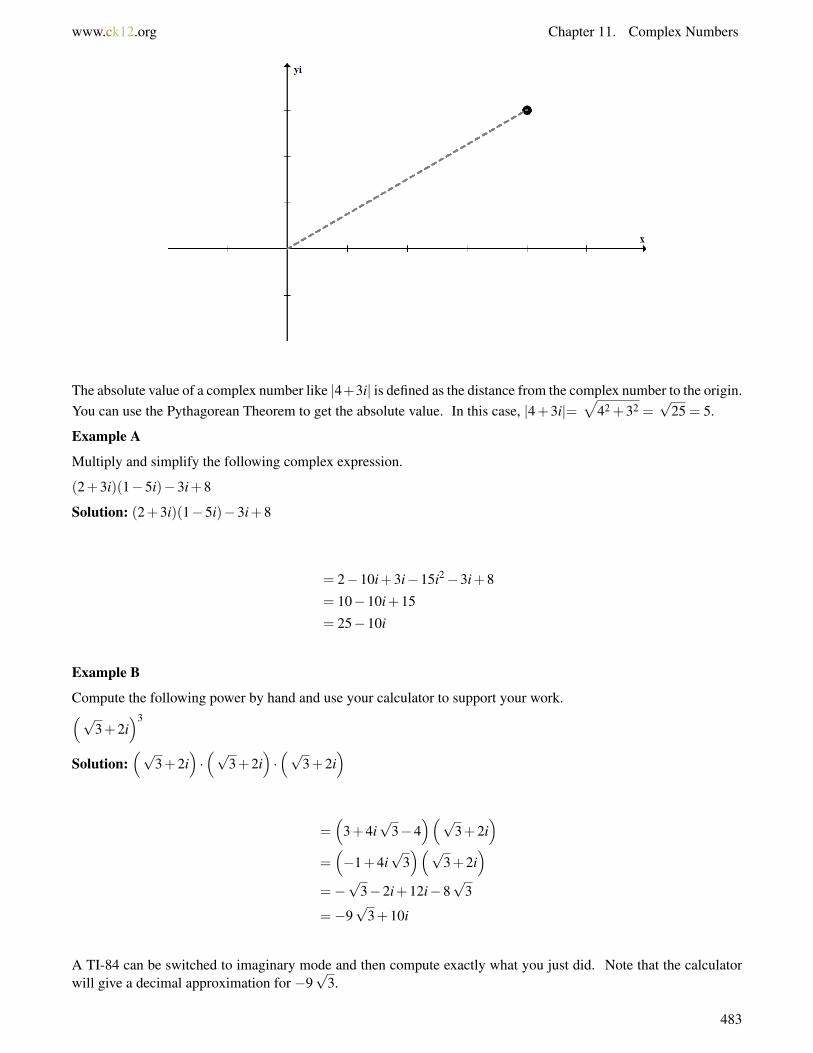
www.ck12.org Chapter 11. Complex Numbers
The absolute value of a complex number like |4+3i| is defined as the distance from the complex number to the origin.You can use the Pythagorean Theorem to get the absolute value. In this case, |4+3i|=
√42 +32 =
√25 = 5.
Example A
Multiply and simplify the following complex expression.
(2+3i)(1−5i)−3i+8
Solution: (2+3i)(1−5i)−3i+8
= 2−10i+3i−15i2−3i+8
= 10−10i+15
= 25−10i
Example B
Compute the following power by hand and use your calculator to support your work.(√3+2i
)3
Solution:(√
3+2i)·(√
3+2i)·(√
3+2i)
=(
3+4i√
3−4)(√
3+2i)
=(−1+4i
√3)(√
3+2i)
=−√
3−2i+12i−8√
3
=−9√
3+10i
A TI-84 can be switched to imaginary mode and then compute exactly what you just did. Note that the calculatorwill give a decimal approximation for −9
√3.
483
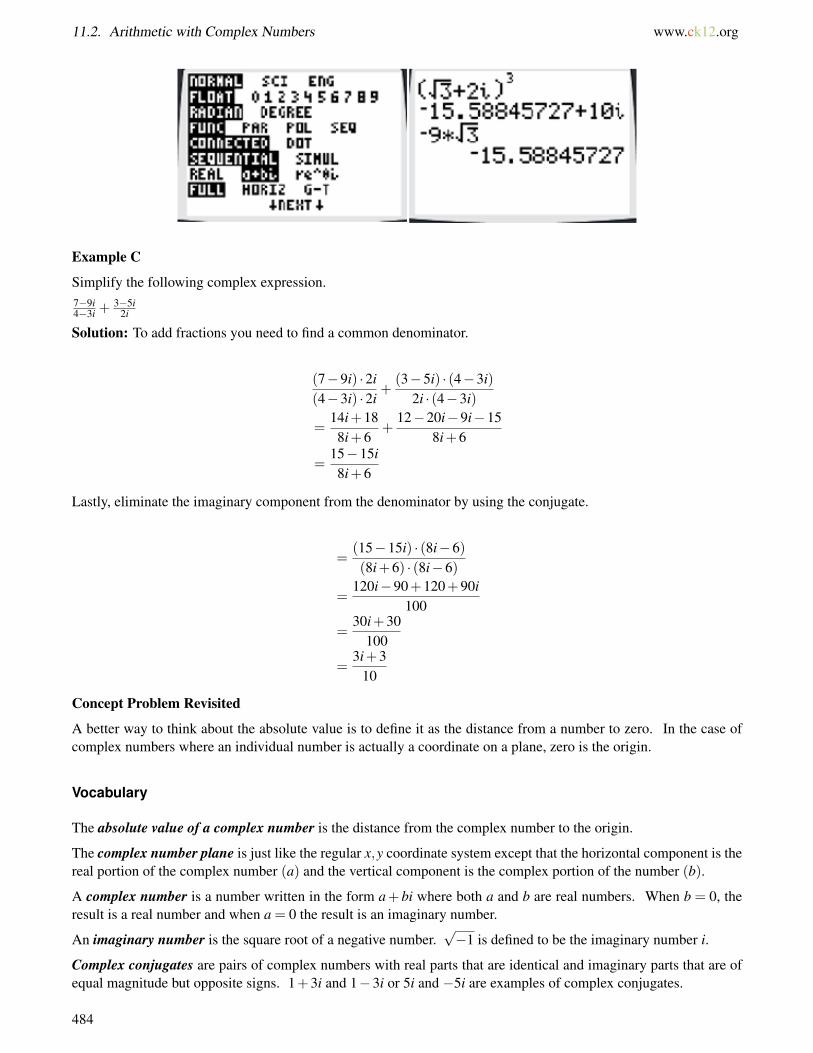
11.2. Arithmetic with Complex Numbers www.ck12.org
Example C
Simplify the following complex expression.7−9i4−3i +
3−5i2i
Solution: To add fractions you need to find a common denominator.
(7−9i) ·2i(4−3i) ·2i
+(3−5i) · (4−3i)
2i · (4−3i)
=14i+188i+6
+12−20i−9i−15
8i+6
=15−15i8i+6
Lastly, eliminate the imaginary component from the denominator by using the conjugate.
=(15−15i) · (8i−6)(8i+6) · (8i−6)
=120i−90+120+90i
100
=30i+30
100
=3i+3
10
Concept Problem Revisited
A better way to think about the absolute value is to define it as the distance from a number to zero. In the case ofcomplex numbers where an individual number is actually a coordinate on a plane, zero is the origin.
Vocabulary
The absolute value of a complex number is the distance from the complex number to the origin.
The complex number plane is just like the regular x,y coordinate system except that the horizontal component is thereal portion of the complex number (a) and the vertical component is the complex portion of the number (b).
A complex number is a number written in the form a+bi where both a and b are real numbers. When b = 0, theresult is a real number and when a = 0 the result is an imaginary number.
An imaginary number is the square root of a negative number.√−1 is defined to be the imaginary number i.
Complex conjugates are pairs of complex numbers with real parts that are identical and imaginary parts that are ofequal magnitude but opposite signs. 1+3i and 1−3i or 5i and −5i are examples of complex conjugates.
484
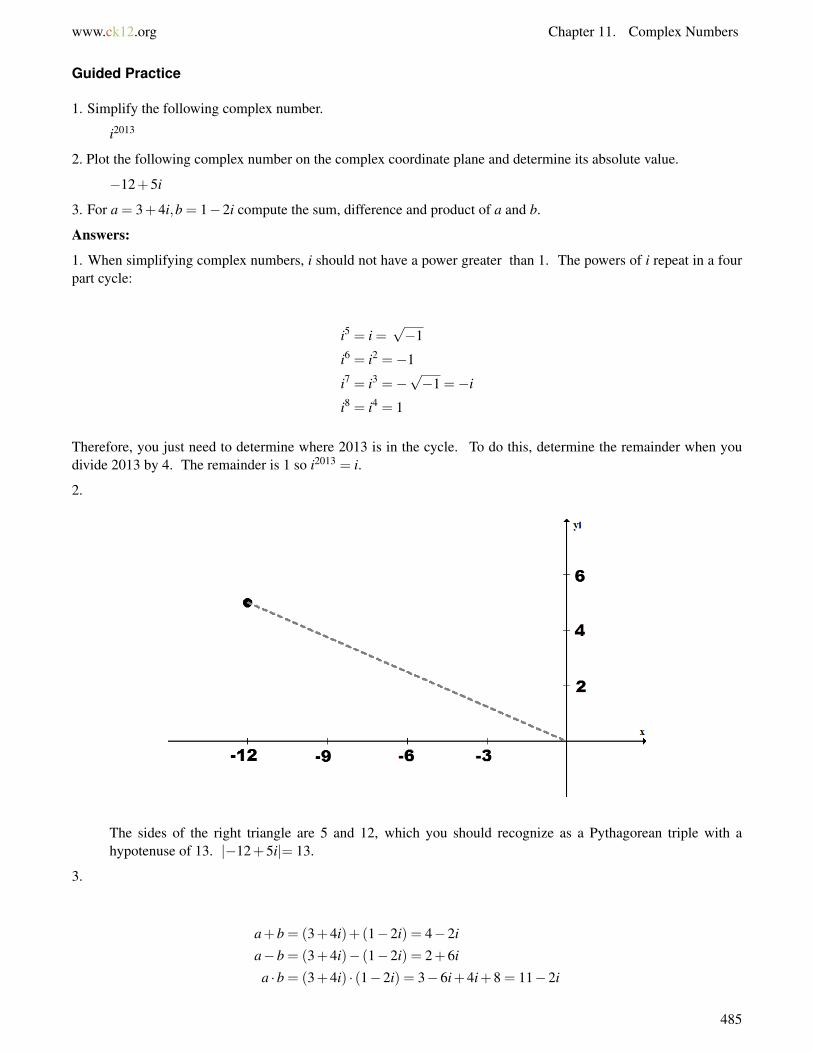
www.ck12.org Chapter 11. Complex Numbers
Guided Practice
1. Simplify the following complex number.
i2013
2. Plot the following complex number on the complex coordinate plane and determine its absolute value.
−12+5i
3. For a = 3+4i,b = 1−2i compute the sum, difference and product of a and b.
Answers:
1. When simplifying complex numbers, i should not have a power greater than 1. The powers of i repeat in a fourpart cycle:
i5 = i =√−1
i6 = i2 =−1
i7 = i3 =−√−1 =−i
i8 = i4 = 1
Therefore, you just need to determine where 2013 is in the cycle. To do this, determine the remainder when youdivide 2013 by 4. The remainder is 1 so i2013 = i.
2.
The sides of the right triangle are 5 and 12, which you should recognize as a Pythagorean triple with ahypotenuse of 13. |−12+5i|= 13.
3.
a+b = (3+4i)+(1−2i) = 4−2i
a−b = (3+4i)− (1−2i) = 2+6i
a ·b = (3+4i) · (1−2i) = 3−6i+4i+8 = 11−2i
485
11.2. Arithmetic with Complex Numbers www.ck12.org
Practice
Simplify the following complex numbers.
1. i252
2. i312
3. i411
4. i2345
For each of the following, plot the complex number on the complex coordinate plane and determine its absolutevalue.
5. 6−8i
6. 2+ i
7. 4−2i
8. −5i+1
Let c = 2+7i and d = 3−5i.
9. What is c+d ?
10. What is c−d ?
11. What is c ·d ?
12. What is 2c−4d ?
13. What is 2c ·4d ?
14. What is cd ?
15. What is c2−d2 ?
486

www.ck12.org Chapter 11. Complex Numbers
11.3 Trigonometric Polar Form of ComplexNumbers
Here you will use basic right triangle trigonometry to represent complex points in the polar plane. You will also usethe trigonometric form of complex numbers to multiply and divide complex numbers.
You already know how to represent complex numbers in the complex plane using rectangular coordinates and youalready know how to multiply and divide complex numbers. Representing these points and performing theseoperations using trigonometric polar form will make your computations more efficient.
What are the two ways to multiply the following complex numbers?(1+√
3i)(√
2−√
2i)
Watch This
MEDIAClick image to the left for more content.
http://www.youtube.com/watch?v=Zha7ZF8aVhU James Sousa: Trigonometric Form of Complex Numbers
Guidance
Any point represented in the complex plane as a+ bi can be represented in polar form just like any point in therectangular coordinate system. You will use the distance from the point to the origin as r and the angle that the pointmakes as θ.
As you can see, the point a+bi can also be represented as r ·cosθ+ i · r · sinθ. The trigonometric polar form can beabbreviated by factoring out the r and noting the first letters:
487
11.3. Trigonometric Polar Form of Complex Numbers www.ck12.org
r(cosθ+ i · sinθ)→ r · cis θ
The abbreviation r · cis θ is read as “r kiss theta.” It allows you to represent a point as a radius and an angle. Onegreat benefit of this form is that it makes multiplying and dividing complex numbers extremely easy. For example:
Let: z1 = r1 · cis θ1,z2 = r2 · cis θ2 with r2 6= 0.
Then:
z1 · z2 = r1 · r2 · cis (θ1 +θ2)
z1÷ z2 =r1
r2· cis(θ1−θ2)
For basic problems, the amount of work required to compute products and quotients for complex numbers given ineither form is roughly equivalent. For more challenging questions, trigonometric polar form becomes significantlyadvantageous.
Example A
Convert the following complex number from rectangular form to trigonometric polar form.
1−√
3i
Solution: The radius is the absolute value of the number.
r2 = 12 +(−√
3)2→ r = 2
The angle can be found with basic trig and the knowledge that the opposite side is always the imaginary componentand the adjacent side is always the real component.
tanθ =−√
31 → θ = 60◦
Thus the trigonometric form is 2 cis 60◦.
Example B
Convert the following complex number from trigonometric polar form to rectangular form.
4 cis(3π
4
)Solution: 4 cis
(3π
4
)= 4
(cos(3π
4
)+ i · sin
(3π
4
))= 4
(−√
22 +
√2
2 i)=−2
√2+2
√2i
Example C
Divide the following complex numbers.4 cis 32◦
2 cis 2◦
Solution: 4 cis 32◦
2 cis 2◦= 4
2 cis (32◦−2◦) = 2 cis (30◦)
Concept Problem Revisited
In rectangular coordinates:(1+√
3i)(√
2−√
2i)=√
2−√
2i+√
6i+√
6
In trigonometric polar coordinates, 1+√
3i = 2 cis 60◦ and√
2−√
2i = 2 cis−45◦. Therefore:(1+√
3i)(√
2−√
2i)= 2 cis 60◦ ·2 cis−45◦ = 4 cis 105◦
488
www.ck12.org Chapter 11. Complex Numbers
Vocabulary
Trigonometric polar form of a complex number describes the location of a point on the complex plane using theangle and the radius of the point.
The abbreviation r · cis θ stands for r · (cosθ+ i · sinθ) and is how trigonometric polar form is typically observed.
Guided Practice
1. Translate the following complex number from trigonometric polar form to rectangular form.
5 cis 270◦
2. Translate the following complex number from rectangular form into trigonometric polar form.
8
3. Multiply the following complex numbers in trigonometric polar form.
4 cis 34◦ ·5 cis 16◦ · 12 cis 100◦
Answers:
1. 5 cis 270◦ = 5(cos270◦+ i · sin270◦) = 5(0− i) =−5i
2. 8 = 8 cis 0◦
3.
4 cis 34◦ ·5 cis 16◦ · 12
cis 100◦
= 4 ·5 · 12· cis (34◦+16◦+100◦) = 10 cis 150
Note how much easier it is to do products and quotients in trigonometric polar form.
Practice
Translate the following complex numbers from trigonometric polar form to rectangular form.
1. 5 cis 270◦
2. 2 cis 30◦
3. −4 cis π
4
4. 6 cis π
3
5. 2 cis 5π
2
Translate the following complex numbers from rectangular form into trigonometric polar form.
6. 2− i
7. 5+12i
8. 6i+8
9. i
Complete the following calculations and simplify.
10. 2 cis 22◦ · 15 cis 15◦ ·3 cis 95◦
11. 9 cis 98◦÷3 cis 12◦
489

11.3. Trigonometric Polar Form of Complex Numbers www.ck12.org
12. 15 cis π
4 ·2 cis π
6
13. −2 cis 2π
3 ÷15 cis 7π
6
Let z1 = r1 · cis θ1 and z2 = r2 · cis θ2 with r2 6= 0.
14. Use the trigonometric sum and difference identities to prove that z1 · z2 = r1 · r2 · cis (θ1 +θ2).
15. Use the trigonometric sum and difference identities to prove that z1÷ z2 =r1r2· cis (θ1−θ2).
490
www.ck12.org Chapter 11. Complex Numbers
11.4 De Moivre’s Theorem and nth Roots
Here you will learn about De Moivre’s Theorem, which will help you to raise complex numbers to powers and findroots of complex numbers.
You know how to multiply two complex numbers together and you’ve seen the advantages of using trigonometricpolar form, especially when multiplying more than two complex numbers at the same time. Because raising anumber to a whole number power is repeated multiplication, you also know how to raise a complex number to awhole number power.
What is a geometric interpretation of squaring a complex number?
Watch This
MEDIAClick image to the left for more content.
http://www.youtube.com/watch?v=Sf9gEzcVZkU James Sousa: De Moivre’s Theorem: Powers of Complex Num-bers in Trig Form
Guidance
Recall that if z1 = r1 · cis θ1 and z2 = r2 · cis θ2 with r2 6= 0, then z1 · z2 = r1 · r2 · cis (θ1 +θ2).
If z1 = z2 = z = r cis θ then you can determine z2 and z3:
z2 = r · r · cis (θ+θ) = r2 cis (2 ·θ)z3 = r3 cis (3 ·θ)
De Moivre’s Theorem simply generalizes this pattern to the power of any positive integer.
zn = rn · cis (n ·θ)
In addition to raising a complex number to a power, you can also take square roots, cube roots and nth roots ofcomplex numbers. Suppose you have complex number z = r cis θ and you want to take the nth root of z. In otherwords, you want to find a number v = s · cis β such that vn = z. Do some substitution and manipulation:
vn = z
(s · cis β)n = r · cis θ
sn · cis (n ·β) = r · cis θ
491
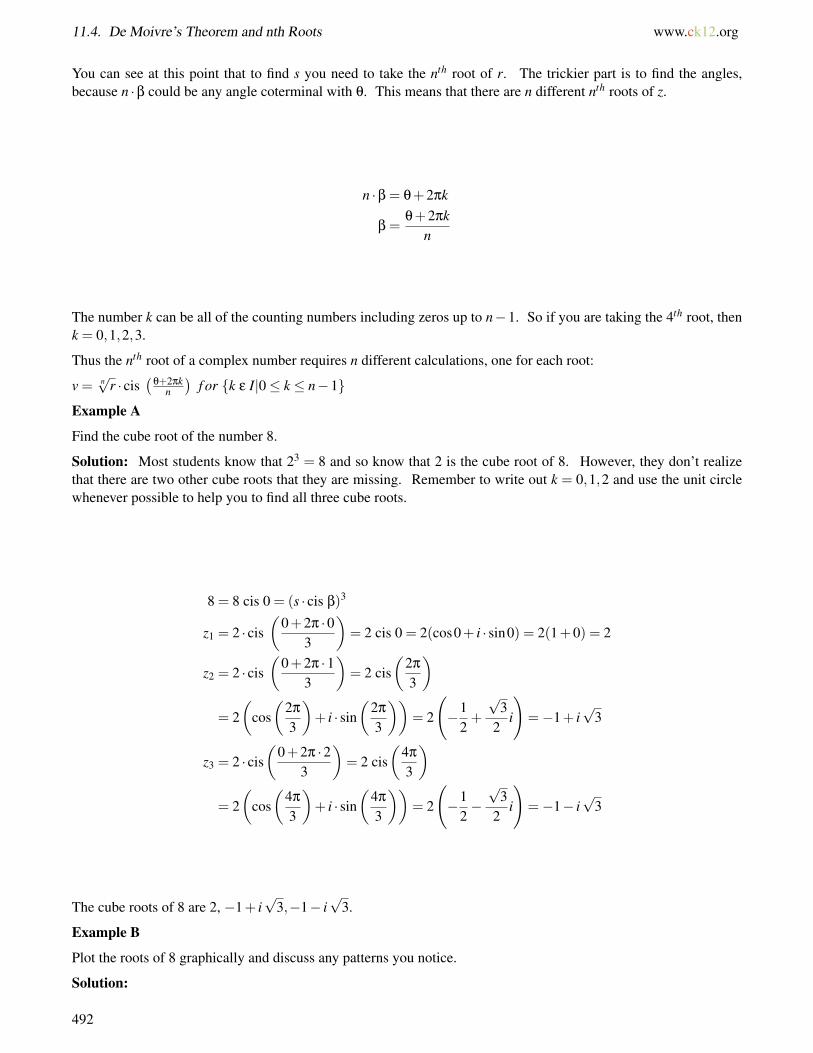
11.4. De Moivre’s Theorem and nth Roots www.ck12.org
You can see at this point that to find s you need to take the nth root of r. The trickier part is to find the angles,because n ·β could be any angle coterminal with θ. This means that there are n different nth roots of z.
n ·β = θ+2πk
β =θ+2πk
n
The number k can be all of the counting numbers including zeros up to n−1. So if you are taking the 4th root, thenk = 0,1,2,3.
Thus the nth root of a complex number requires n different calculations, one for each root:
v = n√r · cis(
θ+2πkn
)f or {k ε I|0≤ k ≤ n−1}
Example A
Find the cube root of the number 8.
Solution: Most students know that 23 = 8 and so know that 2 is the cube root of 8. However, they don’t realizethat there are two other cube roots that they are missing. Remember to write out k = 0,1,2 and use the unit circlewhenever possible to help you to find all three cube roots.
8 = 8 cis 0 = (s · cis β)3
z1 = 2 · cis(
0+2π ·03
)= 2 cis 0 = 2(cos0+ i · sin0) = 2(1+0) = 2
z2 = 2 · cis(
0+2π ·13
)= 2 cis
(2π
3
)= 2
(cos(
2π
3
)+ i · sin
(2π
3
))= 2
(−1
2+
√3
2i
)=−1+ i
√3
z3 = 2 · cis(
0+2π ·23
)= 2 cis
(4π
3
)= 2
(cos(
4π
3
)+ i · sin
(4π
3
))= 2
(−1
2−√
32
i
)=−1− i
√3
The cube roots of 8 are 2, −1+ i√
3,−1− i√
3.
Example B
Plot the roots of 8 graphically and discuss any patterns you notice.
Solution:
492
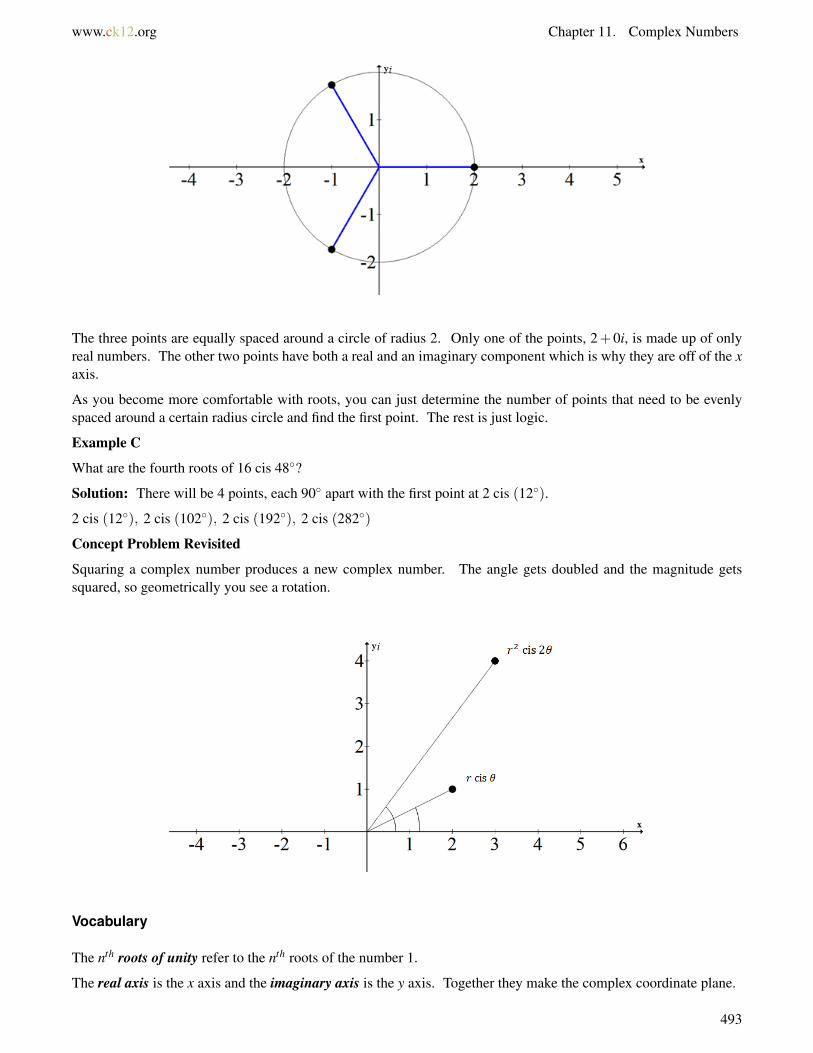
www.ck12.org Chapter 11. Complex Numbers
The three points are equally spaced around a circle of radius 2. Only one of the points, 2+0i, is made up of onlyreal numbers. The other two points have both a real and an imaginary component which is why they are off of the xaxis.
As you become more comfortable with roots, you can just determine the number of points that need to be evenlyspaced around a certain radius circle and find the first point. The rest is just logic.
Example C
What are the fourth roots of 16 cis 48◦?
Solution: There will be 4 points, each 90◦ apart with the first point at 2 cis (12◦).
2 cis (12◦), 2 cis (102◦), 2 cis (192◦), 2 cis (282◦)
Concept Problem Revisited
Squaring a complex number produces a new complex number. The angle gets doubled and the magnitude getssquared, so geometrically you see a rotation.
Vocabulary
The nth roots of unity refer to the nth roots of the number 1.
The real axis is the x axis and the imaginary axis is the y axis. Together they make the complex coordinate plane.
493
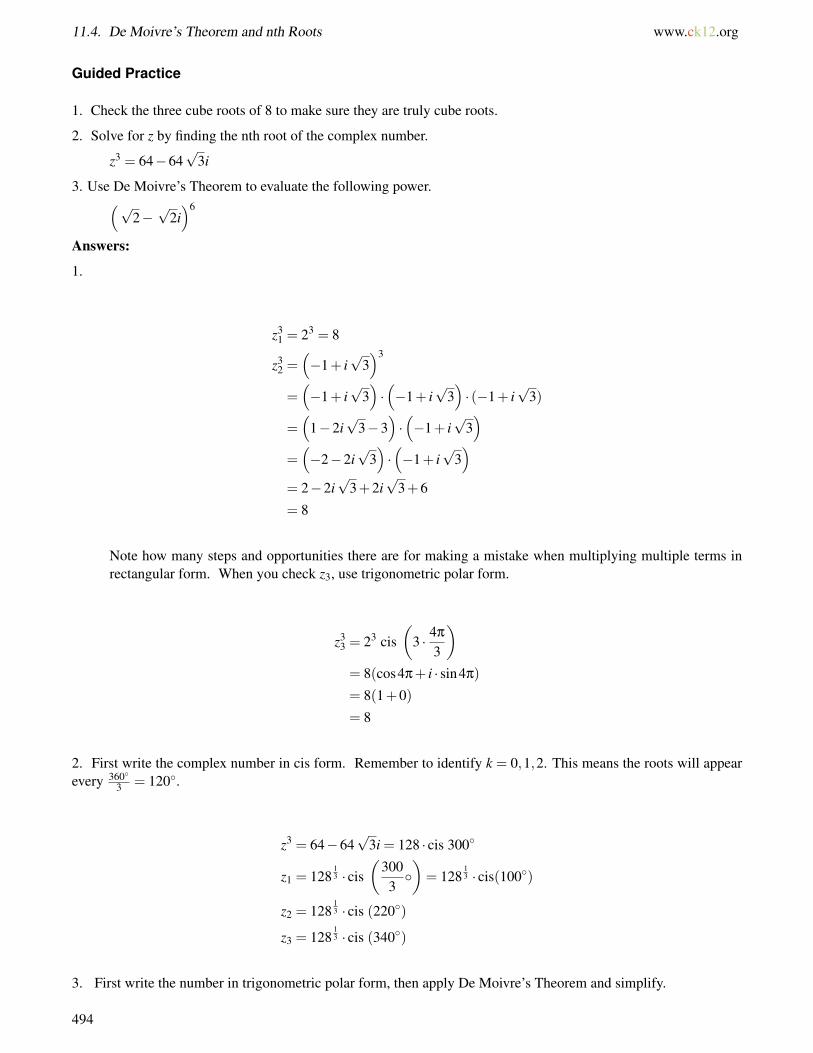
11.4. De Moivre’s Theorem and nth Roots www.ck12.org
Guided Practice
1. Check the three cube roots of 8 to make sure they are truly cube roots.
2. Solve for z by finding the nth root of the complex number.
z3 = 64−64√
3i
3. Use De Moivre’s Theorem to evaluate the following power.(√2−√
2i)6
Answers:
1.
z31 = 23 = 8
z32 =
(−1+ i
√3)3
=(−1+ i
√3)·(−1+ i
√3)· (−1+ i
√3)
=(
1−2i√
3−3)·(−1+ i
√3)
=(−2−2i
√3)·(−1+ i
√3)
= 2−2i√
3+2i√
3+6
= 8
Note how many steps and opportunities there are for making a mistake when multiplying multiple terms inrectangular form. When you check z3, use trigonometric polar form.
z33 = 23 cis
(3 · 4π
3
)= 8(cos4π+ i · sin4π)
= 8(1+0)
= 8
2. First write the complex number in cis form. Remember to identify k = 0,1,2. This means the roots will appearevery 360◦
3 = 120◦.
z3 = 64−64√
3i = 128 · cis 300◦
z1 = 12813 · cis
(3003◦)= 128
13 · cis(100◦)
z2 = 12813 · cis (220◦)
z3 = 12813 · cis (340◦)
3. First write the number in trigonometric polar form, then apply De Moivre’s Theorem and simplify.
494

www.ck12.org Chapter 11. Complex Numbers
(√2−√
2i)6
= (2 cis 315◦)6
= 26 · cis (6 ·315◦)
= 64 · cis (1890◦)
= 64 · cis (1890◦)
= 64 · cis (90◦)
= 64(cos90◦+ i · sin90◦)
= 64(0+ i)
= 64i
Practice
Use De Moivre’s Theorem to evaluate each expression. Write your answers in rectangular form.
1. (1+ i)5
2.(
1−√
3i)3
3. (1+2i)6
4.(√
3− i)5
5.(
12 +
i√
32
)4
6. Find the cube roots of 3+4i.
7. Find the 5th roots of 32i.
8. Find the 5th roots of 1+√
5i.
9. Find the 6th roots of - 64 and plot them on the complex plane.
10. Use your answers to #9 to help you solve x6 +64 = 0.
For each equation: a) state the number of roots, b) calculate the roots, and c) represent the roots graphically.
11. x3 = 1
12. x8 = 1
13. x12 = 1
14. x4 = 16
15. x3 = 27
You learned the motivation for complex numbers by studying the Fundamental Theorem of Algebra. Then youlearned how complex numbers are used in common operations. You learned different ways of representing complexnumbers. Finally, you took powers of roots of complex numbers using De Moivre’s Theorem.
495

11.5. References www.ck12.org
11.5 References
1. CK-12 Foundation. . CCSA2. CK-12 Foundation. . CCSA3. CK-12 Foundation. . CCSA4. CK-12 Foundation. . CCSA5. CK-12 Foundation. . CCSA6. CK-12 Foundation. . CCSA7. CK-12 Foundation. . CCSA8. CK-12 Foundation. . CCSA
496

www.ck12.org Chapter 12. Discrete Math
CHAPTER 12 Discrete MathChapter Outline
12.1 RECURSION
12.2 ARITHMETIC AND GEOMETRIC SEQUENCES
12.3 SIGMA NOTATION
12.4 ARITHMETIC SERIES
12.5 GEOMETRIC SERIES
12.6 COUNTING WITH PERMUTATIONS AND COMBINATIONS
12.7 BASIC PROBABILITY
12.8 BINOMIAL THEOREM
12.9 INDUCTION PROOFS
12.10 REFERENCES
Discrete math is all about patterns, sequences, summing numbers, counting and probability. Many of these topicsyou will revisit in classes after Calculus. The goal here is to familiarize you with the important notation and thehabits of thinking that accompany a mature way of looking at problems.
497
12.1. Recursion www.ck12.org
12.1 Recursion
Here you will define patterns recursively and use recursion to solve problems.
When you look at a pattern, there are many ways to describe it. You can describe patterns explicitly by stating howeach term akis obtained from the term numberk. You can also describe patterns recursively by stating how eachnew term akis obtained from the previous termak−1. Recursion defines an entire sequence based on the first termand the pattern between consecutive terms. The Fibonacci sequence is a famous recursive sequence, but how is itrepresented using recursion?
0,1,1,3,5,8,13,21,34, . . .
Watch This
MEDIAClick image to the left for more content.
http://youtu.be/RjsyEWDEQe0 James Sousa: Finding Terms in a Sequence Given the Recursive Formula
Guidance
When most people see a pattern they see how consecutive terms are related to one another. You might describepatterns with phrases like the ones below:
TABLE 12.1:
Pattern Recursive Description3,6,12,24, . . . “Each term is twice as big as the previous term”3,6,9,12, . . . “Each term is three more than the previous term”
Each phrase is a sign of recursive thinking that defines each term as a function of the previous term.
ak = f (ak−1)
In some cases, a recursive formula can be a function of the previous two or three terms. Keep in mind that thedownside of a recursively defined sequence is that it is impossible to immediately know the 100th term withoutknowing the 99th term.
Example A
For the Fibonacci sequence, determine the first eleven terms and the sum of these terms.
Solution: 0+1+1+2+3+5+8+13+21+34+55 = 143
498

www.ck12.org Chapter 12. Discrete Math
Example B
Write a recursive definition that fits the following sequence.
3,7,11,15,18, . . .
Solution: In order to write a recursive definition for a sequence you must define the pattern and state the firstterm. With this information, others would be able to replicate your sequence without having seen it for themselves.
a1 = 3
ak = ak−1 +4
Example C
What are the first nine terms of the sequence defined by:
a1 = 1
ak =1k +1?
Solution: 1,2, 32 ,
53 ,
83 ,
138 ,
2113 ,
3421 ,
5534
Concept Problem Revisited
The Fibonacci sequence is represented by the recursive definition:
a1 = 0
a2 = 1
ak = ak−2 +ak−1
Vocabulary
A recursively defined pattern or sequence is a sequence with terms that are defined based on the prior term(s) in thesequence.
An explicit pattern or sequence is a sequence with terms that are defined based on the term number.
Guided Practice
1. The Lucas sequence is like the Fibonacci sequence except that the starting numbers are 2 and 1 instead of 1 and0. What are the first ten terms of the Lucas sequence?
2. Zeckendorf’s Theorem states that every positive integer can be represented uniquely as a sum of nonconsecutiveFibonacci numbers. What is the Zeckendorf representation of the number 50 and the number 100?
3. Consider the following pattern generating rule:
If the last number is odd, multiply it by 3 and add 1.
If the last number is even, divide the number by 2.
Repeat.
Try a few different starting numbers and see if you can state what you think always happens.
Answers:
1. 2,1,3,4,7,11,18,29,47,76
2. 50 = 34+13+3; 100 = 89+8+3
3. You can choose any starting positive integer you like. Here are the sequences that start with 7 and 15.
499
12.1. Recursion www.ck12.org
7,22,11,34,17,52,26,13,40,20,10,5,16,8,4,2,1,4,2,1 . . .
15,46,23,70,35,106,53,160,80,40,20,10,5,16,8,4,2,1,4,2,1 . . .
You could make the conjecture that any starting number will eventually lead to the repeating sequence 4, 2, 1.
This problem is called the Collatz Conjecture and is an unproven statement in mathematics. People have usedcomputers to try all the numbers up to 5× 260 and many mathematicians believe it to be true, but since all naturalnumbers are infinite in number, this test does not constitute a proof.
Practice
Write a recursive definition for each of the following sequences.
1. 3,7,11,15,19, . . .
2. 3,9,27,81, . . .
3. 3,6,9,12,15, . . .
4. 3,6,12,24,48, . . .
5. 1,4,16,64, . . .
6. Find the first 6 terms of the following sequence:
b1 = 2
b2 = 8
bk = 6bk−1−4bk−2
7. Find the first 6 terms of the following sequence:
c1 = 4
c2 = 18
ck = 2ck−1 +5ck−2
Suppose the Fibonacci sequence started with 2 and 5.
8. List the first 10 terms of the new sequence.
9. Find the sum of the first 10 terms of the new sequence.
Write a recursive definition for each of the following sequences. These are trickier!
10. 1,4,13,40, . . .
11. 1,5,17,53, . . .
12. 2,11,56,281, . . .
13. 2,3,6,18,108, . . .
14. 4,6,11,18,30, . . .
15. 7,13,40,106,292, . . .
500
www.ck12.org Chapter 12. Discrete Math
12.2 Arithmetic and Geometric Sequences
Here you will identify different types of sequences and use sequences to make predictions.
A sequence is a list of numbers with a common pattern. The common pattern in an arithmetic sequence is thatthe same number is added or subtracted to each number to produce the next number. The common pattern in ageometric sequence is that the same number is multiplied or divided to each number to produce the next number.
Are all sequences arithmetic or geometric?
Watch This
MEDIAClick image to the left for more content.
http://www.youtube.com/watch?v=jExpsJTu9o8 James Sousa: Arithmetic Sequences
MEDIAClick image to the left for more content.
http://www.youtube.com/watch?v=XHyeLKZYb2w James Sousa: Geometric Sequences
Guidance
A sequence is just a list of numbers separated by commas. A sequence can be finite or infinite. If the sequence isinfinite, the first few terms are followed by an ellipsis (. . .) indicating that the pattern continues forever.
An infinite sequence: 1,2,3,4,5, . . .
A finite sequence: 2,4,6,8
In general, you describe a sequence with subscripts that are used to index the terms. The kth term in the sequence isak.
a1,a2,a3,a4, . . . ,ak, . . .
Arithmetic sequences are defined by an initial value a1 and a common difference d.
501

12.2. Arithmetic and Geometric Sequences www.ck12.org
a1 = a1
a2 = a1 +d
a3 = a1 +2d
a4 = a1 +3d...
an = a1 +(n−1)d
Geometric sequences are defined by an initial value a1 and a common ratio r.
a1 = a1
a2 = a1 · ra3 = a1 · r2
a4 = a1 · r3
...
an = a1 · rn−1
If a sequence does not have a common ratio or a common difference, it is neither an arithmetic or a geometricsequence. You should still try to figure out the pattern and come up with a formula that describes it.
Example A
For each of the following three sequences, determine if it is arithmetic, geometric or neither.
a. 0.135,0.189,0.243,0.297, . . .b. 2
9 ,16 ,
18 , . . .
c. 0.54,1.08,3.24, . . .
Solution:
a. The sequence is arithmetic because the common difference is 0.054.b. The sequence is geometric because the common ratio is 3
4 .c. The sequence is not arithmetic because the differences between consecutive terms are 0.54 and 2.16 which are
not common. The sequence is not geometric because the ratios between consecutive terms are 2 and 3 whichare not common.
Example B
For the following sequence, determine the common ratio or difference, the next three terms, and the 2013th term.23 ,
53 ,
83 ,
113 , . . .
Solution: The sequence is arithmetic because the difference is exactly 1 between consecutive terms. The next threeterms are 14
3 ,173 ,
203 . An equation for this sequence would is:
an =23 +(n−1) ·1
Therefore, the 2013th term requires 2012 times the common difference added to the first term.
a2013 =23 +2012 ·1 = 2
3 +6036
3 = 60383
502
www.ck12.org Chapter 12. Discrete Math
Example C
For the following sequence, determine the common ratio or difference and the next three terms.23 ,
49 ,
627 ,
881 ,
10243 , . . .
Solution: This sequence is neither arithmetic nor geometric. The differences between the first few terms are−2
9 ,−29 ,−
1081 ,−
14243 . While there was a common difference at first, this difference did not hold through the se-
quence. Always check the sequence in multiple places to make sure that the common difference holds upthroughout.
The sequence is also not geometric because the ratios between the first few terms are 23 ,
12 ,
49 . These ratios are not
common.
Even though you cannot get a common ratio or a common difference, it is still possible to produce the next threeterms in the sequence by noticing the numerator is an arithmetic sequence with starting term of 2 and a commondifference of 2. The denominators are a geometric sequence with an initial term of 3 and a common ratio of 3. Thenext three terms are:1236 ,
1437 ,
1638
Concept Problem Revisited
Example C shows that some patterns that use elements from both arithmetic and geometric series are neitherarithmetic nor geometric. Two famous sequences that are neither arithmetic nor geometric are the Fibonaccisequence and the sequence of prime numbers.
Fibonacci Sequence: 1,1,2,3,5,8,13,21,34, . . .
Prime Numbers: 2,3,5,7,11,13,17,19,23, . . .
Vocabulary
A sequence is a list of numbers separated by commas.
The common pattern in an arithmetic sequence is that the same number is added or subtracted to each number toproduce the next number. This is called the common difference.
The common pattern in a geometric sequence is that the same number is multiplied or divided to each number toproduce the next number. This is called the common ratio.
Guided Practice
1. What is the tenth term in the following sequence?
−12,6,−3, 32 , . . .
2. What is the tenth term in the following sequence?
−1, 23 ,
73 ,4,
173 , . . .
3. Find an equation that defines the ak term for the following sequence.
0,3,8,15,24,35, . . .
Answers:
1. The sequence is geometric and the common ratio is −12 . The equation is an =−12 ·
(−1
2
)n−1. The tenth term is:
−12 ·(−1
2
)9= 3
128
2. The pattern might not be immediately recognizable, but try ignoring the 13 in each number to see the pattern a
503

12.2. Arithmetic and Geometric Sequences www.ck12.org
different way.
−3,2,7,12,17, . . .
You should see the common difference of 5. This means the common difference from the original sequence is53 . The equation is an =−1+(n−1)
(53
). The 10th term is:
−1+9 ·(5
3
)=−1+3 ·5 =−1+15 = 14
3. The sequence is not arithmetic nor geometric. It will help to find the pattern by examining the common differencesand then the common differences of the common differences. This numerical process is connected to ideas incalculus.
0, 3, 8, 15, 24, 35
3, 5, 7, 9, 11
2, 2, 2, 2
Notice when you examine the common difference of the common differences the pattern becomes increasinglyclear. Since it took two layers to find a constant function, this pattern is quadratic and very similar to the perfectsquares.
1,4,9,16,25,36, . . .
The ak term can be described as ak = k2−1
Practice
Use the sequence 1,5,9,13, . . . for questions 1-3.
1. Find the next three terms in the sequence.
2. Find an equation that defines the ak term of the sequence.
3. Find the 150th term of the sequence.
Use the sequence 12,4, 43 ,
49 , . . . for questions 4-6.
4. Find the next three terms in the sequence.
5. Find an equation that defines the ak term of the sequence.
6. Find the 17th term of the sequence.
Use the sequence 10,−2, 25 ,−
225 , . . . for questions 7-9.
7. Find the next three terms in the sequence.
8. Find an equation that defines the ak term of the sequence.
9. Find the 12th term of the sequence.
Use the sequence 72 ,
92 ,
112 ,
132 , . . . for questions 10-12.
10. Find the next three terms in the sequence.
11. Find an equation that defines the ak term of the sequence.
12. Find the 314th term of the sequence.
13. Find an equation that defines the ak term for the sequence 4,11,30,67, . . .
14. Explain the connections between arithmetic sequences and linear functions.
15. Explain the connections between geometric sequences and exponential functions.
504
www.ck12.org Chapter 12. Discrete Math
12.3 Sigma Notation
Here you will learn how to represent the sum of sequences of numbers using sigma notation.
Writing the sum of long lists of numbers that have a specific pattern is not very efficient. Summation notation allowsyou to use the pattern and the number of terms to represent the same sum in a much more concise way. How canyou use sigma notation to represent the following sum?
1+4+9+16+25+ · · ·+144
Watch This
MEDIAClick image to the left for more content.
http://www.youtube.com/watch?v=0L0rU17hHuM&feature=youtu.be James Sousa: Find a Sum Written in Summa-tion/Sigma Notation
Guidance
A series is a sum of a sequence. The Greek capital letter sigma is used for summation notation because it stands forthe letter S as in sum.
Consider the following general sequence and note that the subscript for each term is an index telling you the termnumber.
a1,a2,a3,a4,a5
When you write the sum of this sequence in a series, it can be represented as a sum of each individual term orabbreviated using a capital sigma.
a1 +a2 +a3 +a4 +a5 =5∑
i=1ai
The three parts of sigma notation that you need to be able to read are the argument, the lower index and the upperindex. The argument, ai, tells you what terms are added together. The lower index, i = 1, tells you where to start andthe upper index, 5, tells you where to end. You should practice reading and understanding sigma notation because itis used heavily in Calculus.
Example A
Write out all the terms of the series.8∑
k=42k
Solution:8∑
k=42k = 2 ·4+2 ·5+2 ·6+2 ·7+2 ·8
505
12.3. Sigma Notation www.ck12.org
Example B
Write the sum in sigma notation: 2+3+4+5+6+7+8+9+10
Solution:
2+3+4+5+6+7+8+9+10 =10∑
i=2i
Example C
Write the sum in sigma notation.112 +
122 +
132 +
142 +
152 +
162 +
172
Solution:
112 +
122 +
132 +
142 +
152 +
162 +
172 =
7∑
i=1
1i2
Concept Problem Revisited
The hardest part when first using sigma representation is determining how each pattern generalizes to the kth term.Once you know the kth term, you know the argument of the sigma. For the sequence creating the series below,ak = k2. Therefore, the argument of the sigma is i2.
1+4+9+16+25+ · · ·+144 = 12 +22 +32 +42 + · · ·122 =12∑
i=1i2
Vocabulary
Sigma notation is also known as summation notation and is a way to represent a sum of numbers. It is especiallyuseful when the numbers have a specific pattern or would take too long to write out without abbreviation.
Guided Practice
1. Write out all the terms of the sigma notation and then calculate the sum.4∑
k=03k−1
2. Represent the following infinite series in summation notation.12 +
14 +
18 +
116 + · · ·
3. Is there a way to represent an infinite product? How would you represent the following product?
1 · sin(360
3
)· sin
(3604
)· sin
(3605
)· sin
(3606
)· sin
(3607
)· . . .
Answers:
1.
4
∑k=0
3k−1 = (3 ·0−1)+(3 ·1−1)+(3 ·2−1)+(3 ·3−1)+(3 ·4−1)
=−1+2+5+8+11
2. There are an infinite number of terms in the series so using an infinity symbol in the upper limit of the sigma isappropriate.
12 +
14 +
18 +
116 + · · ·=
121 +
122 +
123 +
124 + · · ·=
∞
∑i=1
12i
506
www.ck12.org Chapter 12. Discrete Math
3. Just like summation uses a capital Greek letter for S, product uses a capital Greek letter for P which is the capitalform of π.
1 · sin(360
2·3)· sin
(3602·4)· sin
(3602·5)· sin
(3602·6)· sin
(3602·7)· . . .=
∞
∏i=3
sin(360
2·i)
This infinite product is the result of starting with a circle of radius 1 and inscribing a regular triangle inside the circle.Then you inscribe a circle inside the triangle and a square inside the new circle. The shapes alternate being inscribedwithin each other as they are nested inwards: circle, triangle, circle, square, circle, pentagon, ... The question thatthis calculation starts to answer is whether this process reduces to a number or to zero.
Practice
For 1-5, write out all the terms of the sigma notation and then calculate the sum.
1.5∑
k=12k−3
2.8∑
k=02k
3.4∑
i=12 ·3i
4.10∑
i=14i−1
5.4∑
i=02 ·(1
3
)i
Represent the following series in summation notation with a lower index of 0.
6. 1+4+7+10+13+16+19+22
7. 3+5+7+9+11
8. 8+7+6+5+4+3+2+1
9. 5+6+7+8
10. 3+6+12+24+48+ · · ·
11. 10+5+ 52 +
54
12. 4−8+16−32+64 · · ·
13. 2+4+6+8+ · · ·
14. 13 +
19 +
127 +
181 + · · ·
15. 23 +
29 +
227 +
281 + · · ·
507
12.4. Arithmetic Series www.ck12.org
12.4 Arithmetic Series
Here you will learn to compute finite arithmetic series more efficiently than just adding the terms together one at atime.
While it is possible to add arithmetic series one term at a time, it is not feasible or efficient when there are a largenumber of terms. What is a clever way to add up all the whole numbers between 1 and 100?
Watch This
MEDIAClick image to the left for more content.
http://www.youtube.com/watch?v=Dj1JZIdIwwo James Sousa: Arithmetic Series
Guidance
The key to adding up a finite arithmetic series is to pair up the first term with the last term, the second term with thesecond to last term and so on. The sum of each pair will be equal. Consider a generic series:
n∑
i=1ai = a1 +a2 +a3 + · · ·an
When you pair the first and the last terms and note that an = a1 +(n−1)k the sum is:
a1 +an = a1 +a1 +(n−1)k = 2a1 +(n−1)k
When you pair up the second and the second to last terms you get the same sum:
a2 +an−1 = (a1 + k)+(a1 +(n−2)k) = 2a1 +(n−1)k
The next logical question to ask is: how many pairs are there? If there are n terms total then there are exactly n2 pairs.
If n happens to be even then every term will have a partner and n2 will be a whole number. If n happens to be odd
then every term but the middle one will have a partner and n2 will include a 1
2 pair that represents the middle termwith no partner. Here is the general formula for arithmetic series:
n∑
i=1ai =
n2(2a1 +(n−1)k) where k is the common difference for the terms in the series.
Example A
Add up the numbers between one and ten (inclusive) in two ways.
Solution: One way to add up lists of numbers is to pair them up for easier mental arithmetic.
508

www.ck12.org Chapter 12. Discrete Math
1+2+3+4+5+6+7+8+9+10 = 3+7+11+15+19
= 10+26+19
= 36+19
= 55
Another way is to note that 1+10 = 2+9 = 3+8 = 4+7 = 5+6 = 11. There are 5 pairs of 11 which total 55.
Example B
Evaluate the following sum.5∑
k=05k−2
Solution: The first term is -2, the last term is 23 and there are 6 terms making 3 pairs. A common mistake is toforget to count the 0 index.
5∑
k=05k−2 = 6
2 · (−2+23) = 3 ·21 = 63
Example C
Try to evaluate the sum of the following geometric series using the same technique as you would for an arithmeticseries.18 +
12 +2+8+32
Solution:
The real sum is: 3418
When you try to use the technique used for arithmetic sequences you get: 3(1
8 +32)= 771
8
It is important to know that geometric series have their own method for summing. The method learned in this conceptonly works for arithmetic series.
Concept Problem Revisited
Gauss was a mathematician who lived hundreds of years ago and there is an anecdote told about him when he was ayoung boy in school. When misbehaving, his teacher asked him to add up all the numbers between 1 and 100 andhe stated 5050 within a few seconds.
You should notice that 1+100 = 2+99 = · · ·= 101 and that there are exactly 50 pairs that sum to be 101. 50 ·101 =5050.
Vocabulary
An arithmetic series is a sum of numbers whose consecutive terms form an arithmetic sequence.
Guided Practice
1. Sum the first 15 terms of the following arithmetic sequence.
−1, 23 ,
73 ,4,
173 . . .
2. Sum the first 100 terms of the following arithmetic sequence.
−7,−4,−1,2,5,8, . . .
509

12.4. Arithmetic Series www.ck12.org
3. Evaluate the following sum.500∑
i=02i−312
Answers:
1. The initial term is -1 and the common difference is 53 .
n
∑i=1
ai =n2(2a1 +(n−1)k)
=152
(2(−1)+(15−1)
53
)=
152
(−2+14 · 5
3
)= 160
2. The initial term is -7 and the common difference is 3.
n
∑i=1
ai =n2(2a1 +(n−1)k)
=100
2(2(−7)+(100−1)3)
= 14150
3. The initial term is -312 and the common difference is 2.
500
∑i=0
2i−312 =5012
(2(−312)+(501−1)2)
= 94188
Practice
1. Sum the first 24 terms of the sequence 1,5,9,13, . . .
2. Sum the first 102 terms of the sequence 7,9,11,13, . . .
3. Sum the first 85 terms of the sequence −3,−1,1,3, . . .
4. Sum the first 97 terms of the sequence 13 ,
23 ,1,
43 , . . .
5. Sum the first 56 terms of the sequence −23 ,
13 ,
43 , . . .
6. Sum the first 91 terms of the sequence −8,−4,0,4, . . .
Evaluate the following sums.
7.300∑
i=03i+18
8.215∑
i=05i+1
510
www.ck12.org Chapter 12. Discrete Math
9.100∑
i=0i−15
10.85∑
i=0−13i+1
11.212∑
i=0−2i+6
12.54∑
i=06i−9
13.167∑
i=0−5i+3
14.341∑
i=06i+102
15.452∑
i=0−7i− 5
2
511
12.5. Geometric Series www.ck12.org
12.5 Geometric Series
Here you will sum infinite and finite geometric series and categorize geometric series as convergent or divergent.
An advanced factoring technique allows you to rewrite the sum of a finite geometric series in a compact formula. Aninfinite geometric series is more difficult because sometimes it sums to be a number and sometimes the sum keepson growing to infinity. When does an infinite geometric series sum to be just a number and when does it sum to beinfinity?
Watch This
MEDIAClick image to the left for more content.
http://www.youtube.com/watch?v=mYg5gKlJjHc James Sousa: Geometric Series
MEDIAClick image to the left for more content.
http://www.youtube.com/watch?v=RLZXFhvdlV8 James Sousa: Infinite Geometric Series
Guidance
Recall the advanced factoring technique for the difference of two squares and, more generally, two terms of anypower (5 in this case).
a2−b2 = (a−b)(a+b)
a5−b5 = (a−b)(a4 +a3b+a2b2 +ab3 +b4)
an−bn = (a−b)(an−1 + · · ·+bn−1)
If the first term is one then a = 1. If you replace b with the letter r, you end up with:
1− rn = (1− r)(1+ r+ r2 + · · ·rn−1)
You can divide both sides by (1− r) because r 6= 1.
1+ r+ r2 + · · ·rn−1 = 1−rn
1−r
512
www.ck12.org Chapter 12. Discrete Math
The left side of this equation is a geometric series with starting term 1 and common ratio of r. Note that even thoughthe ending exponent of r is n−1, there are a total of n terms on the left. To make the starting term not one, just scaleboth sides of the equation by the first term you want, a1.
a1 +a1r+a1r2 + · · ·a1rn−1 = a1(1−rn
1−r
)This is the sum of a finite geometric series.
To sum an infinite geometric series, you should start by looking carefully at the previous formula for a finitegeometric series. As the number of terms get infinitely large (n→ ∞) one of two things will happen.
a1(1−rn
1−r
)Option 1: The term rn will go to infinity or negative infinity. This will happen when |r| ≥ 1. When this happens, thesum of the infinite geometric series does not go to a specific number and the series is said to be divergent.
Option 2: The term rn will go to zero. This will happen when |r| < 1. When this happens, the sum of the infinitegeometric series goes to a certain number and the series is said to be convergent.
One way to think about these options is think about what happens when you take 0.9100 and 1.1100.
0.9100 ≈ 0.00002656
1.1100 ≈ 13780
As you can see, even numbers close to one either get very small quickly or very large quickly.
The formula for calculating the sum of an infinite geometric series that converges is:∞
∑i=1
a1 · ri−1 = a1( 1
1−r
)Notice how this formula is the same as the finite version but with rn = 0, just as you reasoned.
Example A
Compute the sum of the following infinite geometric series.
0.2+0.02+0.002+0.0002+ · · ·
Solution: You can tell just by looking at the sum that the infinite sum will be the repeating decimal 0.2. You mayrecognize this as the fraction 2
9 , but if you don’t, this is how you turn a repeating decimal into a fraction.
Let x = 0.2
Then 10x = 2.2
Subtract the two equations and solve for x.
10x− x = 2.2−0.2
9x = 2
x =29
Example B
Why does an infinite series with r = 1 diverge?
Solution: If r = 1 this means that the common ratio between the terms in the sequence is 1. This means that eachnumber in the sequence is the same. When you add up an infinite number of any finite numbers (even fractionsclose to zero) you will always get infinity or negative infinity. The only exception is 0. This case is trivial because ageometric series with an initial value of 0 is simply the following series, which clearly sums to 0:
513
12.5. Geometric Series www.ck12.org
0+0+0+0+ · · ·
Example C
What is the sum of the first 8 terms in the following geometric series?
4+2+1+ 12 + · · ·
Solution: The first term is 4 and the common ratio is 12 .
SUM = a1(1−rn
1−r
)= 4
(1−( 1
2)8
1− 12
)= 4
( 25525612
)= 255
32
Concept Problem Revisited
An infinite geometric series converges if and only if |r|< 1. Infinite arithmetic series never converge.
Vocabulary
To converge means the sum approaches a specific number.
To diverge means the sum does not converge, and so usually goes to positive or negative infinity. It could also meanthat the series oscillates infinitely.
A partial sum of an infinite sum is the sum of all the terms up to a certain point. Considering partial sums can beuseful when analyzing infinite sums.
Guided Practice
1. Compute the sum from Example A using the infinite summation formula and confirm that the sum truly doesconverge.
2. Does the following geometric series converge or diverge? Does the sum go to positive or negative infinity?
−2+2−2+2−2+ · · ·
3. You put $100 in a bank account at the end of every year for 10 years. The account earns 6% interest. How muchdo you have total at the end of 10 years?
Answers:
1. The first term of the sequence is a1 = 0.2. The common ratio is 0.1. Since |0.1|< 1, the series does converge.
0.2( 1
1−0.1
)= 0.2
0.9 = 29
2. The initial term is -2 and the common ratio is -1. Since the |−1| ≥ 1, the series is said to diverge. Even thoughthe series diverges, it does not approach negative or positive infinity. When you look at the partial sums (the sumsup to certain points) they alternate between two values:
−2,0,−2,0, . . .
This pattern does not go to a specific number. Just like a sine or cosine wave, it does not have a limit as it approachesinfinity.
3. The first deposit gains 9 years of interest: 100 ·1.069
The second deposit gains 8 years of interest: 100 · 1.068. This pattern continues, creating a geometric series. Thelast term receives no interest at all.
100 ·1.069 +100 ·1.068 + · · ·100 ·1.06+100
Note that normally geometric series are written in the opposite order so you can identify the starting term and thecommon ratio more easily.
514

www.ck12.org Chapter 12. Discrete Math
a1 = 100,r = 1.06
The sum of the 10 years of deposits is:
a1(1−rn
1−r
)= 100
(1−1.0610
1−1.06
)≈ $1318.08
Practice
Find the sum of the first 15 terms for each geometric sequence below.
1. 5,10,20, . . .
2. 2,8,32, . . .
3. 5, 52 ,
54 , . . .
4. 12,4, 43 , . . .
5. 13 ,1,3, . . .
For each infinite geometric series, identify whether the series is convergent or divergent. If convergent, find thenumber where the sum converges.
6. 5+10+20+ · · ·
7. 2+8+32+ · · ·
8. 5+ 52 +
54 + · · ·
9. 12+4+ 43 + · · ·
10. 13 +1+3+ · · ·
11. 6+2+ 23 + · · ·
12. You put $5000 in a bank account at the end of every year for 30 years. The account earns 2% interest. Howmuch do you have total at the end of 30 years?
13. You put $300 in a bank account at the end of every year for 15 years. The account earns 4% interest. How muchdo you have total at the end of 10 years?
14. You put $10,000 in a bank account at the end of every year for 12 years. The account earns 3.5% interest. Howmuch do you have total at the end of 12 years?
15. Why don’t infinite arithmetic series converge?
515
12.6. Counting with Permutations and Combinations www.ck12.org
12.6 Counting with Permutations and Combina-tions
Here you will review counting using decision charts, permutations and combinations.
Sometimes it makes sense to count the number of ways for an event to occur by looking at each possible outcome.However, when there are a large number of outcomes this method quickly becomes inefficient. If someone askedyou how many possible regular license plates there are for the state of California, it would not be feasible to counteach and every one. Instead, you would need to use the fact that on the typical California license plate there are fournumbers and three letters. Using this information, about how many license plates could there be?
Watch This
MEDIAClick image to the left for more content.
http://www.youtube.com/watch?v=qJ7AYDmHVRE James Sousa: The Counting Principle
MEDIAClick image to the left for more content.
http://www.youtube.com/watch?v=JyRKTesp6fQ James Sousa: Permutations
MEDIAClick image to the left for more content.
http://www.youtube.com/watch?v=SGn1913lOYM James Sousa: Combinations
Guidance
Consider choice A with three options (A1,A2,A3) and choice B with two options (B1,B2). If you had to choose anoption from A and then an option from B, the overall total number of options would be 3 · 2 = 6. The options areA1B1,A1B2,A2B1,A2B2,A3B1,A3B2.
516
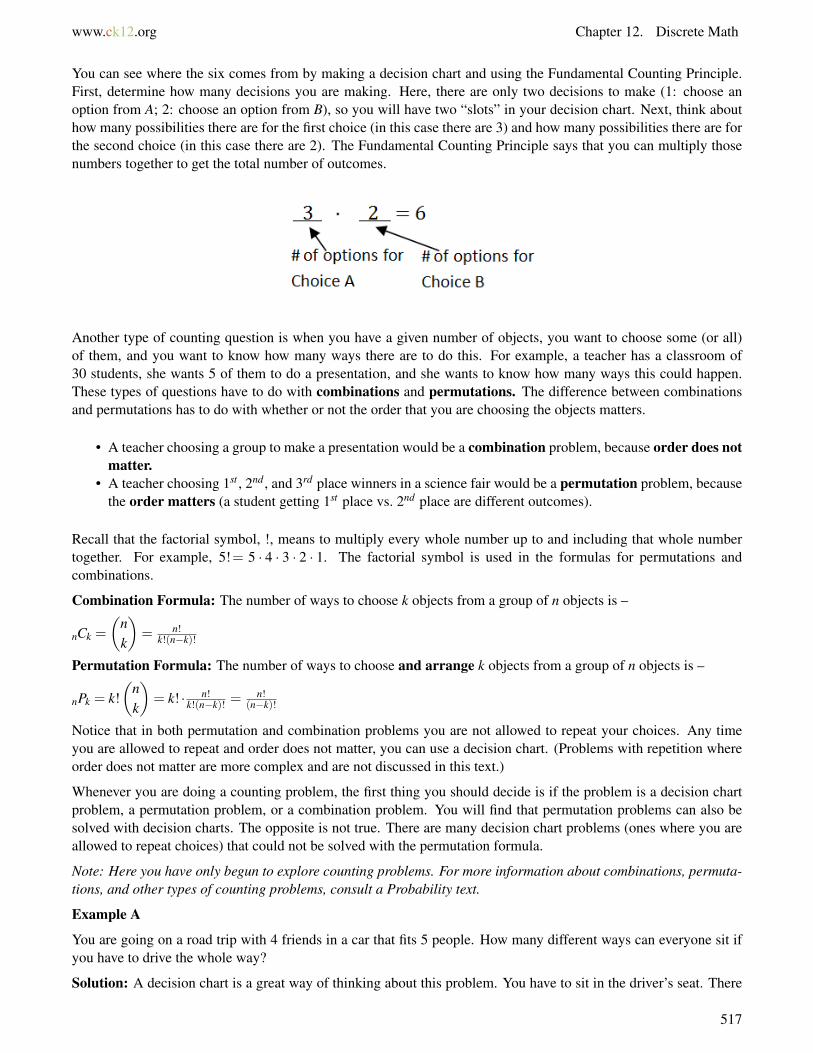
www.ck12.org Chapter 12. Discrete Math
You can see where the six comes from by making a decision chart and using the Fundamental Counting Principle.First, determine how many decisions you are making. Here, there are only two decisions to make (1: choose anoption from A; 2: choose an option from B), so you will have two “slots” in your decision chart. Next, think abouthow many possibilities there are for the first choice (in this case there are 3) and how many possibilities there are forthe second choice (in this case there are 2). The Fundamental Counting Principle says that you can multiply thosenumbers together to get the total number of outcomes.
Another type of counting question is when you have a given number of objects, you want to choose some (or all)of them, and you want to know how many ways there are to do this. For example, a teacher has a classroom of30 students, she wants 5 of them to do a presentation, and she wants to know how many ways this could happen.These types of questions have to do with combinations and permutations. The difference between combinationsand permutations has to do with whether or not the order that you are choosing the objects matters.
• A teacher choosing a group to make a presentation would be a combination problem, because order does notmatter.
• A teacher choosing 1st , 2nd , and 3rd place winners in a science fair would be a permutation problem, becausethe order matters (a student getting 1st place vs. 2nd place are different outcomes).
Recall that the factorial symbol, !, means to multiply every whole number up to and including that whole numbertogether. For example, 5!= 5 · 4 · 3 · 2 · 1. The factorial symbol is used in the formulas for permutations andcombinations.
Combination Formula: The number of ways to choose k objects from a group of n objects is –
nCk =
(nk
)= n!
k!(n−k)!
Permutation Formula: The number of ways to choose and arrange k objects from a group of n objects is –
nPk = k!(
nk
)= k! · n!
k!(n−k)! =n!
(n−k)!
Notice that in both permutation and combination problems you are not allowed to repeat your choices. Any timeyou are allowed to repeat and order does not matter, you can use a decision chart. (Problems with repetition whereorder does not matter are more complex and are not discussed in this text.)
Whenever you are doing a counting problem, the first thing you should decide is if the problem is a decision chartproblem, a permutation problem, or a combination problem. You will find that permutation problems can also besolved with decision charts. The opposite is not true. There are many decision chart problems (ones where you areallowed to repeat choices) that could not be solved with the permutation formula.
Note: Here you have only begun to explore counting problems. For more information about combinations, permuta-tions, and other types of counting problems, consult a Probability text.
Example A
You are going on a road trip with 4 friends in a car that fits 5 people. How many different ways can everyone sit ifyou have to drive the whole way?
Solution: A decision chart is a great way of thinking about this problem. You have to sit in the driver’s seat. There
517
12.6. Counting with Permutations and Combinations www.ck12.org
are four options for the first passenger seat. Once that person is seated there are three options for the next passengerseat. This goes on until there is one person left with one seat.
1 ·4 ·3 ·2 ·1 = 24
Example B
How many different ways can the gold, silver and bronze medals be awarded in an Olympic event with 12 athletescompeting?
Solution: Since the order does matter with the three medals, this is a permutation problem. You will start with 12athletes and then choose and arrange 3 different winners.
12P3 =12!
(12−3)! =12!9! = 12·11·10·9·...
9·... = 12 ·11 ·10 = 1320
Note that you could also use a decision chart to decide how many possibilities are there for gold (12) how manypossibilities are there for silver (11 since one already has gold) and how many possibilities are there for bronze (10).You can use a decision chart for any permutation problem.
12 ·11 ·10 = 1320
Example C
You are deciding which awards you are going to display in your room. You have 8 awards, but you only have roomto display 4 awards. Right now you are not worrying about how to arrange the awards so the order does not matter.In how many ways could you choose the 4 awards to display?
Solution: Since order does not matter, this is a combination problem. You start with 8 awards and then choose 4.
8C4 =
(84
)= 8!
4!(8−4)! =8·7·6·54·3·2·1 = 7 ·2 ·5 = 70
Note that if you try to use a decision chart with this question, you will need to do an extra step of reasoning. Thereare 8 options I could choose first, then 7 left, then 6 and lastly 5.
8 ·7 ·6 ·5 = 1680
This number is so big because it takes into account order, which you don’t care about. It is the same result youwould get if you used the permutation formula instead of the combination formula. To get the right answer, youneed to divide this number by the number of ways 4 objects can be arranged, which is 4!= 24. This has to do withthe connection between the combination formula and the permutation formula.
Concept Problem Revisited
A license plate that has 3 letters and 4 numbers can be represented by a decision chart with seven spaces. You canuse a decision chart because order definitely does matter with license plates. The first spot is a number, the next threespots are letters and the last three spots are numbers. Note that when choosing a license plate, repetition is allowed.
10 ·26 ·26 ·26 ·10 ·10 ·10 = 263 ·104 = 175,760,000
This number is only approximate because in reality there are certain letter and number combinations that are notallowed, some license plates have extra symbols, and some commercial and government license plates have morenumbers, fewer letters or blank spaces.
Vocabulary
A combination is the number of ways of choosing k objects from a total of n objects (order does not matter).
A permutation is the number of ways of choosing and arranging k objects from a total of n objects (order doesmatter)
518
www.ck12.org Chapter 12. Discrete Math
A decision chart is a sequence of numbers that multiply together where each number represents the number ofpossible options for that slot.
Guided Practice
1. There are 20 hockey players on a pro NHL team, two of which are goalies. In how many different ways can 5skaters and 1 goalie be on the ice at the same time?
2. In how many different ways could you score a 70% on a 10 question test where each question is weighted equallyand is either right or wrong?
3. How many different 4 digit ATM passwords are there? Assume you can repeat digits.
Answers:
1. The question asks for how many on the ice, implying that order does not matter. This is combination problemwith two combinations. You need to choose 1 goalie out of a possible of 2 and choose 5 skaters out of a possible 18.(
21
)(185
)= 2 · 18!
5!·13! = 17136
2. The order of the questions you got right does not matter, so this is a combination problem.(107
)= 10!
7!3! = 120
3. Order does matter. There are 10 digits and repetition is allowed. You can use a decision chart for each of the fouroptions.
10 ·10 ·10 ·10 = 10,000
Practice
Simplify each of the following expressions so that they do not have a factorial symbol.
1. 7!3!
2. 110!105!5!
3. 52!49!
4. In how many ways can you choose 3 objects from a set of 9 objects?
5. In how many ways can you choose and arrange 4 objects from a set of 15 objects?
First, state whether each problem is a permutation/decision chart problem or a combination problem. Then, solve.
6. Suppose you need to choose a new combination for your combination lock. You have to choose 3 numbers, eachdifferent and between 0 and 40. How many combinations are there?
7. You just won a contest where you can choose 2 friends to go with you to a concert. You have five friends who areavailable and want to go. In how many ways can you choose the friends?
8. You want to construct a 3 digit number from the digits 4, 6, 8, 9. How many possible numbers are there?
9. There are 12 workshops at a conference and Sam has to choose 3 to attend. In how many ways can he choose the3 to attend?
10. 9 girls and 5 boys are finalists in a contest. In how many ways can 1st , 2nd , and 3rd place winners be chosen?
11. For the special at a restaurant you can choose 3 different items from the 10 item menu. How many differentcombinations of meals could you get?
519
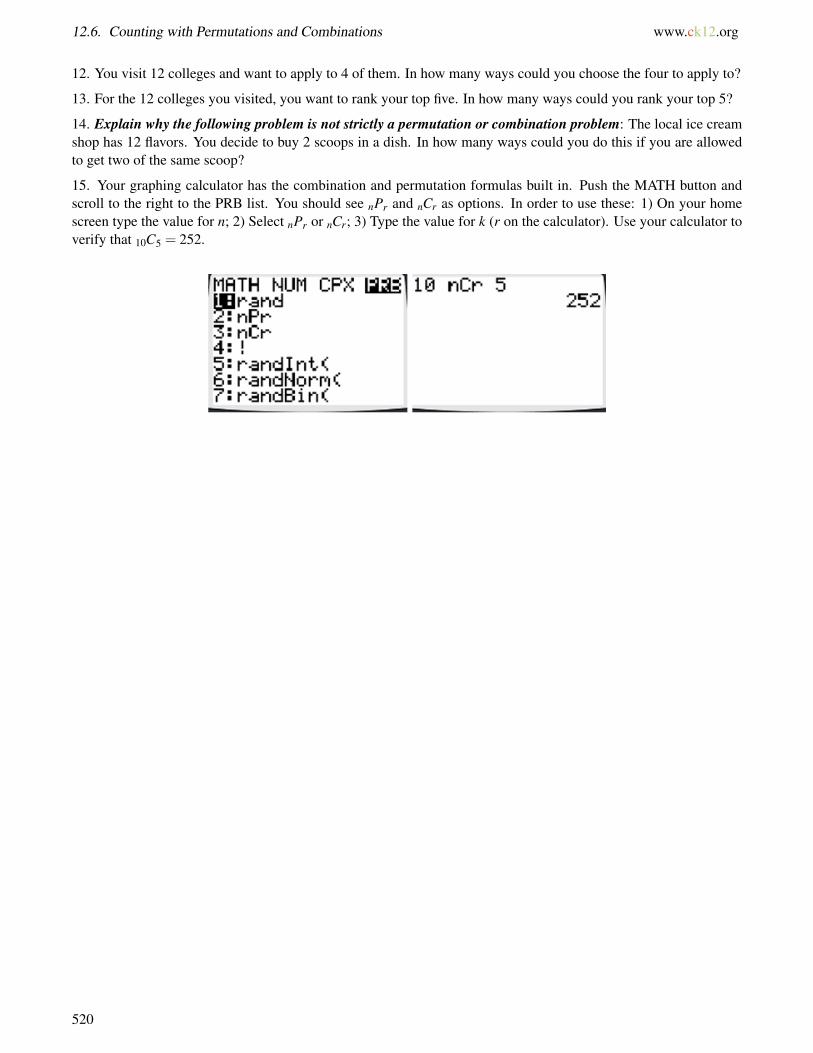
12.6. Counting with Permutations and Combinations www.ck12.org
12. You visit 12 colleges and want to apply to 4 of them. In how many ways could you choose the four to apply to?
13. For the 12 colleges you visited, you want to rank your top five. In how many ways could you rank your top 5?
14. Explain why the following problem is not strictly a permutation or combination problem: The local ice creamshop has 12 flavors. You decide to buy 2 scoops in a dish. In how many ways could you do this if you are allowedto get two of the same scoop?
15. Your graphing calculator has the combination and permutation formulas built in. Push the MATH button andscroll to the right to the PRB list. You should see nPr and nCr as options. In order to use these: 1) On your homescreen type the value for n; 2) Select nPr or nCr; 3) Type the value for k (r on the calculator). Use your calculator toverify that 10C5 = 252.
520
www.ck12.org Chapter 12. Discrete Math
12.7 Basic Probability
Here you will calculate the probability of simple and compound events.
Most are familiar with how flipping a coin or rolling dice works and yet probability remains one of the mostcounterintuitive branches of mathematics for many people. The idea that flipping a coin and getting 10 heads ina row is just as unlikely as getting the following sequence of heads and tails is hard to comprehend.
HHT HT T T HT H
Assume a plane crashes on average once every 100 days (extremely inaccurate). Given a plane crashed today, whatday in the next 100 days is the plane most likely to crash next?
Watch This
MEDIAClick image to the left for more content.
http://www.youtube.com/watch?v=YWt_u5l_jHs James Sousa: Introduction to Probability
MEDIAClick image to the left for more content.
http://www.youtube.com/watch?v=IZAMLgS5x6w James Sousa: Determining Probability
Guidance
Probability is the chance of an event occurring. Simple probability is defined as the number of outcomes youare looking for (also called successes) divided by the total number of outcomes. The notation P(E) is read “theprobability of event E”.
P(E) = successespossible outcomes
Probabilities can be represented with fractions, decimals, or percents. Since the number of possible outcomes is inthe denominator, the probability is always between zero and one. A probability of 0 means the event will definitelynot happen, while a probability of 1 means the event will definitely happen.
0≤ P(E)≤ 1
The probability of something not happening is called the complement and is found by subtracting the probabilityfrom one.
521
12.7. Basic Probability www.ck12.org
P(EC) = 1−P(E)
You will often be looking at probabilities of two or more independent experiments. Experiments are independentwhen the outcome of one experiment has no effect on the outcome of the other experiment. If there are twoexperiments, one with outcome A and the other with outcome B, then the probability of A and B is:
P(A and B) = P(A) ·P(B)
The probability of A or B is:
P(A or B) = P(A)+P(B)−P(A and B)
Example A
If you are dealt one card from a 52 card deck, what is the probability that you are dealt a heart? What is theprobability that you are dealt a 3? What is the probability that you are dealt the three of hearts?
Solution: There are 13 hearts in a deck of 52 cards. P(heart) = 1352 = 1
4
There are 4 threes in the deck of 52. P(three) = 452 = 1
13
There is only one three of hearts. P(three and heart) = 152
Example B
Dean and his friend Randy like to play a special poker game with their friends. Dean goes home a winner 60% ofthe time and Randy goes home a winner 75% of the time.
a. What is the probability that they both win in the same night?b. What is the probability that Randy wins and Dean loses?c. What is the probability that they both lose?
Solution: First represent the information with probability symbols.
Let D be the event that Dean wins. Let R be the event that Randy wins. The complement of each probability is whenDean or Randy loses instead.
P(D) = 0.60, P(DC) = 0.40
P(R) = 0.75, P(RC) = 0.25
a. P(D and R) = P(D) ·P(R) = 0.60 ·0.75 = 0.45b. P(R and DC) = P(R) ·P(DC) = 0.75 ·0.40 = 0.30c. P(DC and RC) = P(DC) ·P(RC) = 0.40 ·0.25 = 0.10
Example C
If a plane crashes on average once every hundred days, what is the probability that the plane will crash in the next100 days?
Solution: The naïve and incorrect approach would be to interpret the question as “what is the sum of the probabilitiesfor each of the days?” Since there are 100 days and each day has a probability of 0.01 for a plane crash, then by thislogic, there is a 100% chance that a plane crashes. This isn’t true because if on average the plane crashes once everyhundred days, some stretches of 100 days there will be more crashes and some stretches there will be no crashes.The 100% solution does not hold.
In order to solve this question, you need to rephrase the question and ask a slightly different one that will help as anintermediate step. What is the probability that a plane does not crash in the next 100 days?
In order for this to happen it must not crash on day 1 and not crash on day 2 and not crash on day 3 etc.
The probability of the plane not crashing on any day is P(no crash) = 1−P(crash) = 1−0.01 = 0.99.
The product of each of these probabilities for the 100 days is:
522
www.ck12.org Chapter 12. Discrete Math
0.99100 ≈ 0.366
Therefore, the probability that a plane does not crash in the next 100 days is about 36.6%. To answer the originalquestion, the probability that a plane does crash in the next 100 days is 1−0.366 = 0.634 or about 63.4%.
Concept Problem Revisited
Whether or not a plane crashes today does not matter. The probability that a plane crashes tomorrow is p= 0.01. Theprobability that it crashes any day in the next 100 days is equally p = 0.01. The key part of the question is the word“next”.
The probability that a plane does not crash on the first day and does crash on the second day is a compoundprobability, which means you multiply the probability of each event.
P(Day 1 no crash AND Day 2 crash) = 0.99 ·0.01 = 0.0099
Notice that this probability is slightly smaller than 0.01. Each successive day has a slightly smaller probability ofbeing the next day that a plane crashes. Therefore, the day with the highest probability of a plane crashing next istomorrow.
Vocabulary
The probability of an event is the number of outcomes you are looking for (called successes) divided by the totalnumber of outcomes.
The complement of an event is the event not happening.
Independent events are events where the occurrence of the first event does not impact the probability of the secondevent.
Guided Practice
1. Jack is a basketball player with a free throw average of 0.77. What is the probability that in a game where he has8 shots that he makes all 8? What is the probability that he only makes 1?
2. If it has a 20% chance of raining on Tuesday, your phone has 30% chance of running out of batteries, and there isa 10% chance that you forget your wallet, what is the probability that you are in the rain without money or a phone?
3. Consider the previous question with the rain, wallet and phone. What is the probability that at least one of thethree events does occur?
Answers:
1. Let J represent the event that Jack makes the free throw shot and JC represent the event that Jack misses the shot.
P(J) = 0.77, P(JC) = 0.23
The probability that Jack makes all 8 shots is the same as Jack making one shot and making the second shot andmaking the third shot etc.
P(J)8 = 0.778 ≈ 12.36%
There are 8 ways that Jack could make 1 shot and miss the rest. The probability of each of these cases occurring is:
P(JC)7 ·P(J) = 0.237 ·0.77
Therefore, the overall probability of Jack making 1 shot and missing the rest is:
0.237 ·0.77 ·8 = 0.0002097 = 0.02097%
2. While a pessimist may believe that all the improbable negative events will occur at the same time, the actualprobability of this happening is less than one percent:
523
12.7. Basic Probability www.ck12.org
0.20 ·0.30 ·0.1 = 0.006 = 0.6%
3. The naïve approach would be to simply add the three probabilities together. This is incorrect. The better way toapproach the problem is to ask the question: what is the probability that none of the events occur?
0.8 ·0.7 ·0.9 = 0.504
The probability that at least one occurs is the complement of none occurring.
1−0.504 = 0.496 = 49.6%
Practice
A card is chosen from a standard deck.
1. What’s the probability that the card is a queen?
2. What’s the probability that the card is a queen or a spade?
You toss a nickel, a penny, and a dime.
3. List all the possible outcomes (the elements in the sample space).
4. What is the probability that the nickel comes up heads?
5. What is the probability that none of the coins comes up heads?
6. What is the probability that at least one of the coins comes up heads?
A bag contains 7 red marbles, 9 blue marbles, and 10 green marbles. You reach in the bag and choose 4 marbles,one after the other, without replacement.
7. What is the probability that all 4 marbles are red?
8. What is the probability that you get a red marble, then a blue marble, then 2 green marbles?
You take a 40 question multiple choice test and believe that for each question you have a 55% chance of getting itright.
9. What is the probability that you get all the questions right?
10. What is the probability that you get all of the questions wrong?
A player rolls a pair of standard dice. Find each probability.
11. P(sum is even)
12. P(sum is 7)
13. P(sum is at least 3)
14. You want to construct a 3 digit number at random from the digits 4, 6, 8, 9 without repeating digits. What is theprobability that you construct the number 684?
15. In poker, a straight is 5 cards in a row (ex. 3, 4, 5, 6, 7), NOT all the same suit (if they are all the same suit itis considered a straight flush or a royal flush). A straight can start or end with an Ace. What’s the probability of astraight? For an even bigger challenge, see if you can calculate the probabilities for all of the poker hands.
524
www.ck12.org Chapter 12. Discrete Math
12.8 Binomial Theorem
Here you will apply the Binomial Theorem to expand binomials that are raised to a power. In order to do this youwill use your knowledge of sigma notation and combinations.
The Binomial Theorem tells you how to expand a binomial such as (2x−3)5 without having to compute the repeateddistribution. What is the expanded version of(2x−3)5?
Watch This
MEDIAClick image to the left for more content.
http://www.youtube.com/watch?v=YxysKtqpbVI James Sousa: The Binomial Theorem Using Combinations
MEDIAClick image to the left for more content.
http://www.youtube.com/watch?v=NLQmQGA4a3M James Sousa: The Binominal Theorem Using Pascal’s Trian-gle
Guidance
The Binomial Theorem states:
(a+b)n =n∑
i=0
(ni
)aibn−i
Writing out a few terms of the summation symbol helps you to understand how this theorem works:
(a+b)n =(n
0
)an +
(n1
)an−1b1 +
(n2
)an−2b2 + · · ·+
(nn
)bn
Going from one term to the next in the expansion, you should notice that the exponents of a decrease while theexponents of b increase. You should also notice that the coefficients of each term are combinations. Recall that
(n0
)is
the number of ways to choose 0 objects from a set of n objects.
Another way to think about the coefficients in the Binomial Theorem is that they are the numbers from Pascal’sTriangle. Look at the expansions of (a+b)n below and notice how the coefficients of the terms are the numbers inPascal’s Triangle.
525
12.8. Binomial Theorem www.ck12.org
Be extremely careful when working with binomials of the form (a− b)n. You need to remember to capture thenegative with the second term as you write out the expansion: (a−b)n = (a+(−b))n.
Example A
Expand the following binomial using the Binomial Theorem.
(m−n)6
Solution:
(m−n)6 =(6
0
)m6 +
(61
)m5(−n)1 +
(62
)m4(−n)2 +
(63
)m3(−n)3
+(6
4
)m2(−n)4 +
(65
)m1(−n)5 +
(66
)(−n)6
= 1m6−6m5n+15m4n2−20m3n3 +15m2n4−6m1n5 +1n6
Example B
What is the coefficient of the term x7y9 in the expansion of the binomial (x+ y)16?
Solution: The Binomial Theorem allows you to calculate just the coefficient you need.(169
)= 16!
9!7! =16·15·14·13·12·11·10
7·6·5·4·3·2·1 = 11,440
Example C
What is the coefficient of x6 in the expansion of (4−3x)7?
Solution: For this problem you should calculate the whole term, since the 3 and the 4 in (3− 4x) will impact thecoefficient of x6 as well.
(76
)41(−3x)6 = 7 ·4 ·729x6 = 20,412x6. The coefficient is 20,412.
Concept Problem Revisited
The expanded version of (2x−3)5 is:
(2x−3)5 =(5
0
)(2x)5 +
(51
)(2x)4(−3)1 +
(52
)(2x)3(−3)2
+(5
3
)(2x)2(−3)3 +
(54
)(2x)1(−3)4 +
(55
)(−3)6
= (2x)5 +5(2x)4(−3)1 +10(2x)3(−3)2
+10(2x)2(−3)3 +5(2x)1(−3)4 +(−3)5
= 32x5−240x4 +720x3−1080x2 +810x−243
526

www.ck12.org Chapter 12. Discrete Math
Vocabulary
The Binomial Theorem is a theorem that states how to expand binomials that are raised to a power using combina-tions. The Binomial Theorem is:
(a+b)n =n∑
i=0
(ni
)aibn−i
Guided Practice
1. What is the coefficient of x3 in the expansion of (x−4)5?
2. Compute the following summation.4∑
i=0
(4i
)3. Collapse the following polynomial using the Binomial Theorem.
32x5−80x4 +80x3−40x2 +10x−1
Answers:
1.(5
2
)·13(−4)2 = 160
2. This is asking for(4
0
)+(4
1
)+ · · ·+
(44
), which are the sum of all the coefficients of (a+b)4.
1+4+6+4+1 = 16
3. Since the last term is -1 and the power on the first term is a 5 you can conclude that the second half of the binomialis (?−1)5. The first term is positive and (2x)5 = 32x5, so the first term in the binomial must be 2x. The binomial is(2x−1)5.
Practice
Expand each of the following binomials using the Binomial Theorem.
1. (x− y)4
2. (x−3y)5
3. (2x+4y)7
4. What is the coefficient of x4 in (x−2)7?
5. What is the coefficient of x3y5 in (x+ y)8?
6. What is the coefficient of x5 in (2x−5)6?
7. What is the coefficient of y2 in (4y−5)4?
8. What is the coefficient of x2y6 in (2x+ y)8?
9. What is the coefficient of x3y4 in (5x+2y)7?
Compute the following summations.
10.9∑
i=0
(9i
)11.
12∑
i=0
(12i
)12.
8∑
i=0
(8i
)527

12.8. Binomial Theorem www.ck12.org
Collapse the following polynomials using the Binomial Theorem.
13. 243x5−405x4 +270x3−90x2 = 15x−1
14. x7−7x6y+21x5y2−35x4y3 +35x3y4−21x2y5 +7xy6− y7
15. 128x7−448x6y+672x5y2−560x4y3 +280x3y4−84x2y5 +14xy6− y7
528
www.ck12.org Chapter 12. Discrete Math
12.9 Induction Proofs
Here you will learn how to prove statements about numbers using induction.
Induction is one of many methods for proving mathematical statements about numbers. The basic idea is that youprove a statement is true for a small number like 1. This is called the base case. Then, you show that if the statementis true for some random numberk, then it must also be true fork+1.
An induction proof is like dominoes set up in a line, where the base case starts the falling cascade of truth. Once youhave shown that in general if the statement is true for k then it must also be true for k+ 1, it means that once youshow the statement is true for 1, then it must also be true for 2, and then it must also be true for 3, and then it mustalso be true for 4 and so on.
What happens when you forget the base case?
Watch This
MEDIAClick image to the left for more content.
http://www.youtube.com/watch?v=QHkG0d5kZvE James Sousa: Mathematical Induction
Guidance
Induction is a method of proof usually used to prove statements about positive whole numbers (the natural numbers).Induction has three steps:
1. The base case is where the statement is shown to be true for a specific number. Usually this is a small numberlike 1.
2. The inductive hypothesis is where the statement is assumed to be true for k.3. The inductive step/proof is where you show that then the statement must be true for k+1.
These three logical pieces will show that the statement is true for every number greater than the base case.
Suppose you wanted to use induction to prove: n≥ 1,2+22 +23 + · · ·+2n = 2n−1−2.
Start with the Base Case. Show that the statement works when n = 1:
21 = 2 and 21+1−2 = 4−2 = 2. Therefore, 21 = 21+1−2. (Both sides are equal to 2)
Next, state your Inductive Hypothesis. Assume that the statement works for some random number k:
2+22 + · · ·+2k = 2k+1−2 (You are assuming that this is a true statement)
Next, you will want to use algebra to manipulate the previous statement to prove that the statement is also true fork+1. So, you will be trying to show that 2+22 + · · ·+2k+1 = 2k+1+1−2. Start with the inductive hypothesis andmultiply both sides of the equation by 2. Then, do some algebra to get the equation looking like you want.
529
12.9. Induction Proofs www.ck12.org
Inductive Hypothesis (starting equation): 2+22 + · · ·2k = 2k+1−2
Multiply by 2: 2(2+22 + · · ·+2k) = 2(2k+1−2)
Rewrite: 22 +23 + · · ·+2k+1 = 2k+1+1−4
Add 2 to both sides: 2+22 +23 + · · ·+2k+1 = 2k+1+1−4+2
Simplify: 2+22 + · · ·+2k+1 = 2k+1+1−2
This is exactly what you were trying to prove! So, first you showed that the statement worked for n = 1. Then,you showed that the if the statement works for one number than it must work for the next number. This means, thestatement must be true for all numbers greater than or equal to 1.
The idea of induction can be hard to understand at first and it definitely takes practice. One thing that makes inductiontricky is that there is not a clear procedure for the “proof” part. With practice, you will start to see some commonalgebra techniques for manipulating equations to prove what you are trying to prove.
Example A
There is something wrong with this proof. Can you explain what the mistake is?
For n≥ 1 : 12 +22 +32 + · · ·+n2 = n(n+1)(2n+1)6
Base Case: 1 = 12 = 1(1+1)(2·1+1)6 = 1·2·3
6 = 66 = 1
Inductive Hypothesis: Assume the following statement is true:
12 +22 +32 + · · ·+ k2 = k(k+1)(2k+1)6
Proof: You want to show the statement is true for k+1.
“Since the statement is assumed true for k, which is any number, then it must be true for k+1. You can just substitutek+1 in.”
12 +22 +32 + · · ·+(k+1)2 = (k+1)((k+1)+1)(2(k+1)+1)6
Solution: This is the most common fallacy when doing induction proofs. The fact that the statement is assumed tobe true for k does not immediately imply that it is true for k+ 1 and you cannot just substitute in k+ 1 to producewhat you are trying to show. his is equivalent to assuming true for all numbers and then concluding true for allnumbers which is circular and illogical.
Example B
Write the base case, inductive hypothesis and what you are trying to show for the following statement. Do notactually prove it.
13 +23 +33 + · · ·+n3 = n2(n+1)2
4
Solution:
Base Case: 13 = 12(1+1)2
4 (Both sides are equal to 1)
Inductive Hypothesis: Assume the following statement is true:
13 +23 +33 + · · ·+ k3 = k2(k+1)2
4
Next, you would want to prove that the following is true:
13 +23 +33 + · · ·+ k3 +(k+1)3 = (k+1)2((k+1)+1)2
4
Example C
Prove the following statement: For n≥ 1,13 +23 +33 + · · ·n3 = (1+2+3+ · · ·n)2.
Solution:
530
www.ck12.org Chapter 12. Discrete Math
Base Case(s): Two base cases are shown however only one is actually necessary.
13 = 12
13 +23 = 1+8 = 9 = 32 = (1+2)2
Inductive Hypothesis: Assume the statement is true for some number k . In other words, assume the following istrue:
13 +23 +33 + · · ·k3 = (1+2+3+ · · ·k)2
Proof: You want to show the statement is true for k+1. It is a good idea to restate what your goal is at this point.Your goal is to show that:
13 +23 +33 + · · ·k3 +(k+1)3 = (1+2+3+ · · ·k+(k+1))2
You need to start with the assumed case and do algebraic manipulations until you have created what you are tryingto show (the equation above):
13 +23 +33 + · · ·k3 = (1+2+3+ · · ·k)2
From the work you have done with arithmetic series you should notice:
1+2+3+4+ · · ·+ k = k2(2+(k−1)) = k(k+1)
2
Substitute into the right side of the equation and add (k+1)3 to both sides:
13 +23 +33 + · · ·k3 +(k+1)3 =(
k(k+1)2
)2+(k+1)3
When you combine the right hand side algebraically you get the result of another arithmetic series.
13 +23 +33 + · · ·k3 +(k+1)3 =((k+1)(k+2)
2
)2= (1+2+3+ · · ·k+(k+1))2
∴
The symbol ∴ is one of many indicators like QED that follow a proof to tell the reader that the proof is complete.
Concept Problem Revisited
If you forget the base case in an induction proof, then you haven’t really proved anything. You can get silly resultslike this “proof” of the statement: “1 = 3”
Base Case: Missing
Inductive Hypothesis: k = k+1 where k is a counting number.
Proof: Start with the assumption step and add one to both sides.
k = k+1
k+1 = k+2
Thus by transitivity of equality:
k = k+1 = k+2
k = k+2
Since k is a counting number, k could equal 1. Therefore:
1 = 3
531

12.9. Induction Proofs www.ck12.org
Vocabulary
The base case is the anchor step. It is the first domino to fall, creating a cascade and thus proving the statement truefor every number greater than the base case.
The inductive hypothesis is the step where you assume the statement is true for k.
The inductive step is the proof. It is when you show the statement is true for k + 1 using only the inductivehypothesis and algebra.
Guided Practice
1. Write the base case, inductive hypothesis, and what you are trying to show for the following statement. Do notactually prove it.
For n≥ 1, n3 +2n is divisible by 3 for any positive integer n
2. Complete the proof for the previous problem.
3. Prove the following statement using induction:
For n≥ 1, 1+2+3+4+ · · ·+n = n(n+1)2
Answers:
1. Base Case: 13 +2 ·1 = 3 which is divisible by 3.
Inductive Step: Assume the following is true for k:
k3 +2k divisible by 3.
Next, you will want to show the following is true for k+1:
(k+1)3 +2(k+1) is divisible by 3.
2. The goal is to show that (k+1)3 +2(k+1) is divisible by 3 if you already know k3 +2k is divisible by 3. Expand(k+1)3 +2(k+1) to see what you get:
(k+1)3 +2(k+1) = k3 +3k2 +3k+1+2k+2
= (k3 +2k)+3(k2 + k+1)
k3 +2k is divisible by 3 by assumption (the inductive step) and 3(k2 +k+1) is clearly a multiple of 3 so is divisibleby 3. The sum of two numbers that are divisible by is also divisible by 3.
∴
3. Base Case: 1 = 1(1+1)2 = 1 · 2
2 = 1
Inductive Hypothesis: 1+2+3+4+ · · ·+ k = k(k+1)2
Proof: Start with what you know and work to showing it true for k+1.
Inductive Hypothesis: 1+2+3+4+ · · ·+ k = k(k+1)2
Add k+1 to both sides: 1+2+3+4+ · · ·+ k+(k+1) = k(k+1)2 +(k+1)
Find a common denominator for the right side: 1+2+3+4+ · · ·+ k+(k+1) = k2+k2 + 2k+2
2
Simplify the right side: 1+2+3+4+ · · ·+ k+(k+1) = k2+3k+22
Factor the numerator of the right side: 1+2+3+4+ · · ·+ k+(k+1) = (k+1)(k+2)2
532
www.ck12.org Chapter 12. Discrete Math
Rewrite the right side: 1+2+3+4+ · · ·+ k+(k+1) = (k+1)((k+1)+1)2
∴
Practice
For each of the following statements: a) show the base case is true; b) state the inductive hypothesis; c) state whatyou are trying to prove in the inductive step/proof. Do not prove yet.
1. For n≥ 5, 4n < 2n.
2. For n≥ 1, 8n−3n is divisible by 5.
3. For n≥ 1, 7n−1 is divisible by 6.
4. For n≥ 2, n2 ≥ 2n.
5. For n≥ 1, 4n +5 is divisible by 3.
6. For n≥ 1, 02 +12 + · · ·+n2 = n(n+1)(2n+1)6
Now, prove each of the following statements. Use your answers to problems 1-6 to help you get started.
7. For n≥ 5, 4n < 2n.
8. For n≥ 1, 8n−3n is divisible by 5.
9. For n≥ 1, 7n−1 is divisible by 6.
10. For n≥ 2, n2 ≥ 2n.
11. For n≥ 1, 4n +5 is divisible by 3.
12. For n≥ 1, 02 +12 + · · ·+n2 = n(n+1)(2n+1)6
13. You should believe that the following statement is clearly false. What happens when you try to prove it true byinduction?
For n≥ 2, n2 < n
14. Explain why the base case is necessary for proving by induction.
15. The principles of inductive proof can be used for other proofs besides proofs about numbers. Can you prove thefollowing statement from geometry using induction?
The sum of the interior angles of any n−gon is 180(n−2) for n≥ 3.
You learned that recursion, how most people intuitively see patterns, is where each term in a sequence is definedby the term that came before. You saw that terms in a pattern can also be represented as a function of their termnumber. You learned about two special types of patterns called arithmetic sequences and geometric sequences thathave a wide variety of applications in the real world. You saw that series are when terms in a sequence are addedtogether. A strong understanding of patterns helped you to count efficiently, which in turn allowed you to computeboth basic and compound probabilities. Finally, you learned that induction is a method of proof that allows you toprove your own mathematical statements.
533

12.10. References www.ck12.org
12.10 References
1. CK-12 Foundation. . CCSA2. CK-12 Foundation. . CCSA3. CK-12 Foundation. . CCSA
534

www.ck12.org Chapter 13. Finance
CHAPTER 13 FinanceChapter Outline
13.1 SIMPLE INTEREST
13.2 COMPOUND INTEREST PER YEAR
13.3 COMPOUND INTEREST PER PERIOD
13.4 CONTINUOUS INTEREST
13.5 APR AND APY (NOMINAL AND EFFECTIVE RATES)
13.6 ANNUITIES
13.7 ANNUITIES FOR LOANS
Here you will review concepts of exponential growth and geometric series with a focus on the relationship betweentime and money.
535

13.1. Simple Interest www.ck12.org
13.1 Simple Interest
Here you’ll learn to calculate the effect of time on the balance of a savings account growing by simple interest.
The basic concept of interest is that a dollar today is worth more than a dollar next year. If a person deposits $100into a bank account today at 6% simple interest, then in one year the bank owes the person that $100 plus a fewdollars more. If the person decides to leave it in the account and keep earning the interest, then after two yearsthe bank would owe the person even more money. How much interest will the person earn each year? How muchmoney will the person have after two years?
Watch This
MEDIAClick image to the left for more content.
http://www.khanacademy.org/math/precalculus/v/introduction-to-interest
Guidance
Simple interest is defined as interest that only accumulates on the initial money deposited in the account. This initialmoney is called the principal. Another type of interest is compound interest where the interest also compounds onitself. In the real world, most companies do not use simple interest because it is considered too simple. You willpractice with it here because it introduces the concept of the time value of money and that a dollar today is worthslightly more than a dollar in one year.
The formula for simple interest has 4 variables and all the problems and examples will give 3 and your job will beto find the unknown quantity using rules of Algebra.
FV means future value and it stands for the amount in the account at some future time t.
PV means present value and it stands for the amount in the account at time 0.
t means time (usually years) that has elapsed between the present value and the future value. The value of t indicateshow long the money has been accumulating interest.
i means the simple interest rate. If the interest rate is 6%, in the formula you will use the decimal version of0.06. Here is the formula that shows the relationship between FV and PV .
FV = PV (1+ t · i)
Example A
Linda invested $1,000 for her child’s college education. She saved it for 18 years at a bank which offered 5% simpleinterest. How much did she have at the end of 18 years?
Solution: First identify known and unknown quantities.
536

www.ck12.org Chapter 13. Finance
PV = $1,000
t = 18 years
i = 0.05
FV = unknown so you will use x
Then substitute the values into the formula and solve to find the future value.
FV = PV (1+ t · i)x = 1,000(1+18 ·0.05)
x = 1,000(1+0.90)
x = 1,000(1.9)
x = 1,900
Linda initially had $1,000, but 18 years later with the effect of 5% simple interest, that money grew to $1,900.
Example B
Tory put $200 into a bank account that earns 8% simple interest. How much interest does Tory earn each year andhow much does she have at the end of 4 years?
Solution: First you will focus on the first year and identify known and unknown quantities.
PV = $200
t = 1 year
i = 0.08
FV = unknown so we will use x
Second, you will substitute the values into the formula and solve to find the future value.
FV = PV (1+ t · i)FV = 200(1+1 ·0.08)
FV = 200 ·1.08
FV = 216
The third thing you need to do is interpret and organize the information. Tory had $200 to start with and then at theend of one year she had $216. The additional $16 is interest she has earned that year. Since the account is simpleinterest, she will keep earning $16 dollars every year because her principal remains at $200. The $16 of interestearned that first year just sits there earning no interest of its own for the following three years.
TABLE 13.1:
Year Principal at Beginning ofYear
Interest Earned that Year Total Interest Earned
1 200 200× .08 = 16 162 200 16 323 200 16 484 200 16 64
537

13.1. Simple Interest www.ck12.org
At the end of 4 years, Tory will have $264 on her account. $64 will be interest. She earned $16 in interest eachyear.
Example C
Amy has $5000 to save and she wants to buy a car for $10,000. For how many years will she need to save if sheearns 10% simple interest? On the other hand, what will the simple interest rate need to be if she wants to saveenough money in 15 years?
Solution: Notice that there are two separate problems. Let’s start with the first problem and identify known andunknown quantities.
PV = 5,000
FV = 10,000
i = 0.10
t =?
Now substitute and solve for t.
FV = PV (1+ t · i)10,000 = 5,000(1+ t ·0.10)
2 = 1+ t ·0.10
1 = t ·0.10
t =1
0.10= 10 years
Now let’s focus on the second problem and go through the process of identifying known and unknown quantities,substituting and solving.
PV = 5,000; FV = 10,000; i =? ; t = 15 years
FV = PV (1+ t · i)10,000 = 5,000(1+15 · i)
2 = 1+15i
1 = 15i
i =115≈ 0.06667 = 6.667%
To answer the first question, Amy would need to save for 10 years getting a simple interest rate of 10%. For thesecond question, she would need to save for 15 years at a simple interest rate of about 6.667%.
Concept Problem Revisited
The person who deposits $100 today at 6% simple interest will have $106 in one year and $112 in two years.
FV = PV (1+ t · i) = 100(1+1 ·0.06) = 100 ·1.06 = 106
FV = PV (1+ t · i) = 100(1+2 ·0.06) = 100 ·1.12 = 112
538
www.ck12.org Chapter 13. Finance
Vocabulary
Principal is the amount initially deposited into the account. Notice the spelling is principal, not principle.
Interest is the conversion of time into money.
Guided Practice
1. How much will a person have at the end of 5 years if they invest $400 at 6% simple interest?
2. How long will it take $3,000 to grow to $4,000 at 4% simple interest?
3. What starting balance grows to $5,000 in 5 years with 10% simple interest?
Answers:
1. PV = 400, t = 5, i = 0.06, FV =?
FV = PV (1+ t · i)= 400(1+5 ·0.06)
= 400 ·1.30
= $520
2. PV = 3,000, t =? , i = 0.04, FV = 4,000
4,000 = 3,000(1+ t ·0.04)43= 1+0.04t
13= 0.04t
t =1
3 ·0.04≈ 8.333 years
3. PV =? , FV = 5,000, t = 5, i = 0.10
FV = PV (1+ t · i)5,000 = PV (1+5 ·0.10)
PV =5,0001+ .50
≈ $3,333.33
Practice
1. How much will a person have at the end of 8 years if they invest $3,000 at 4.5% simple interest?
2. How much will a person have at the end of 6 years if they invest $2,000 at 3.75% simple interest?
3. How much will a person have at the end of 12 years if they invest $1,500 at 7% simple interest?
4. How much interest will a person earn if they invest $10,000 for 10 years at 5% simple interest?
539
13.1. Simple Interest www.ck12.org
5. How much interest will a person earn if they invest $2,300 for 49 years at 3% simple interest?
6. How long will it take $2,000 to grow to $5,000 at 3% simple interest?
7. What starting balance grows to $12,000 in 8 years with 10% simple interest?
8. Suppose you have $3,000 and want to have $35,000 in 25 years. What simple interest rate will you need?
9. How long will it take $1,000 to grow to $4,000 at 8% simple interest?
10. What starting balance grows to $9,500 in 4 years with 6.5% simple interest?
11. Suppose you have $1,500 and want to have $8,000 in 15 years. What simple interest rate will you need?
12. Suppose you have $800 and want to have $6,000 in 45 years. What simple interest rate will you need?
13. What starting balance grows to $2,500 in 2 years with 1.5% simple interest?
14. Suppose you invest $4,000 which earns 5% simple interest for the first 12 years and then 8% simple interest forthe next 8 years. How much money will you have after 20 years?
15. Suppose you invest $10,000 which earns 2% simple interest for the first 8 years and then 5% simple interest forthe next 7 years. How much money will you have after 15 years?
Principal is the amount initially deposited into the account. Notice the spelling is principal, not principle.
Interest is the conversion of time into money.
540
www.ck12.org Chapter 13. Finance
13.2 Compound Interest per Year
Here you’ll explore how to compute an investment’s growth given time and a compound interest rate.
If a person invests $100 in a bank with 6% simple interest, they earn $6 in the first year and $6 again in the secondyear totaling $112. If this was really how interest operated with most banks, then someone clever may think towithdraw the $106 after the first year and immediately reinvest it. That way they earn 6% on $106. At the end ofthe second year, the clever person would have earned $6 like normal, plus an extra .36 cents totaling $112.36. Thirtysix cents may seem like not very much, but how much more would a person earn if they saved their $100 for 50years at 6% compound interest rather than at just 6% simple interest?
Watch This
MEDIAClick image to the left for more content.
http://www.khanacademy.org/finance-economics/core-finance/v/introduction-to-compound-interest
Guidance
Compound interest allows interest to grow on interest. As with simple interest, PV is defined as present value, FV isdefined as future value, i is the interest rate, and t is time. The formulas for simple and compound interest looksimilar, so be careful when reading problems in determining whether the interest rate is simple or compound. Thefollowing table shows the amount of money in an account earning compound interest over time:
TABLE 13.2:
Year Amount Ending in Account1 FV = PV (1+ i)2 FV = PV (1+ i)2
3 FV = PV (1+ i)3
4 FV = PV (1+ i)4
. . .t FV = PV (1+ i)t
An account with a present value of PV that earns compound interest at i percent annually for t years has a futurevalue of FV shown below:
FV = PV (1+ i)t
Example A
541
13.2. Compound Interest per Year www.ck12.org
Compute the amount ending in an account for years 1, 2, 3 and 4 for an initial deposit of $100 at 3% compoundinterest.
Solution: PV = 100, i = 0.03, t = 1,2,3 and 4, FV =?
TABLE 13.3:
Year Amount ending in Account1 FV = 100(1+0.03) = 103.002 FV = 100(1+0.03)2 = 106.093 FV = 100(1+0.03)3 ≈ 109.274 FV = 100(1+0.03)4 ≈ 112.55
Calculator shortcut: When doing repeated calculations that are just 1.03 times the result of the previous calculation,use the <ANS>button to create an entry that looks like <Ans*1.03>. Then, pressing enter repeatedly will rerun theprevious entry producing the values on the right.
Example B
How much will Kyle have in a savings account if he saves $3,000 at 4% compound interest for 10 years?
Solution:
PV = 3,000, i = 0.04, t = 10 years, FV =?
FV = PV (1+ i)t
FV = 3000(1+0.04)10 ≈ $4,440.73
Example C
How long will it take money to double if it is in an account earning 8% compound interest?
Estimation Solution: The rule of 72 is an informal means of estimating how long it takes money to double. Itis useful because it is a calculation that can be done mentally that can yield surprisingly accurate results. This canbe very helpful when doing complex problems to check and see if answers are reasonable. The rule simply states72i ≈ t where i is written as an integer (i.e. 8% would just be 8).
In this case 728 = 9≈ t, so it will take about 9 years.
Exact Solution: Since there is no initial value you are just looking for some amount to double. You can chooseany amount for the present value and double it to get the future value even though specific numbers are not stated inthe problem. Here you should choose 100 for PV and 200 for FV .
PV = 100, FV = 200, i = 0.08, t =?
FV = PV (1+ i)t
200 = 100(1+0.08)t
2 = 1.08t
ln2 = ln1.08t
ln2 = t · ln1.08
t =ln2
ln1.08= 9.00646
542

www.ck12.org Chapter 13. Finance
It will take just over 9 years for money (any amount) to double at 8%. This is extraordinarily close to your estimationand demonstrates how powerful the Rule of 72 can be in estimation.
Concept Problem Revisited
Earlier you were introduced to a concept problem contrasting $100 for 50 years at 6% compound interest versus 6%simple. Now you can calculate how much more powerful compound interest is.
PV = 100, t = 50, i = 6%, FV =?
Simple interest:
FV = PV (1+ t · i) = 100(1+50 ·0.06) = 400
Compound interest:
FV = PV (1+ i)t = 100(1+0.06)50 ≈ 1,842.02
It is remarkable that simple interest grows the balance of the account to $400 while compound interest grows it toabout $1,842.02. The additional money comes from interest growing on interest repeatedly.
Vocabulary
Compound interest is interest that grows not only on principal, but also on previous interest earned.
The Rule of 72 states that the approximate amount of time that it will take an account earning simple interest todouble is t ≈ 72
i , where i is written as an integer.
Guided Practice
1. How much will Phyllis have after 40 years if she invests $20,000 in a savings account that earns 1% compoundinterest?
2. How long will it take money to double at 6% compound interest? Estimate using the rule of 72 and also find theexact answer.
3. What compound interest rate is needed to grow $100 to $120 in three years?
Answers:
1. t = 40, PV = 20,000, i = 0.01
FV = PV (1+ i)t
= 20,000(1+0.01)40
= $29,777.27
2. Estimate: 726 = 12≈ years it will take to double
PV = 100, FV = 200, i = 0.06, t =?
200 = 100(1+0.06)t
2 = (1.06)t
ln2 = ln1.06t = t ln1.06
t =ln2
ln1.06≈ 11.89 years
543
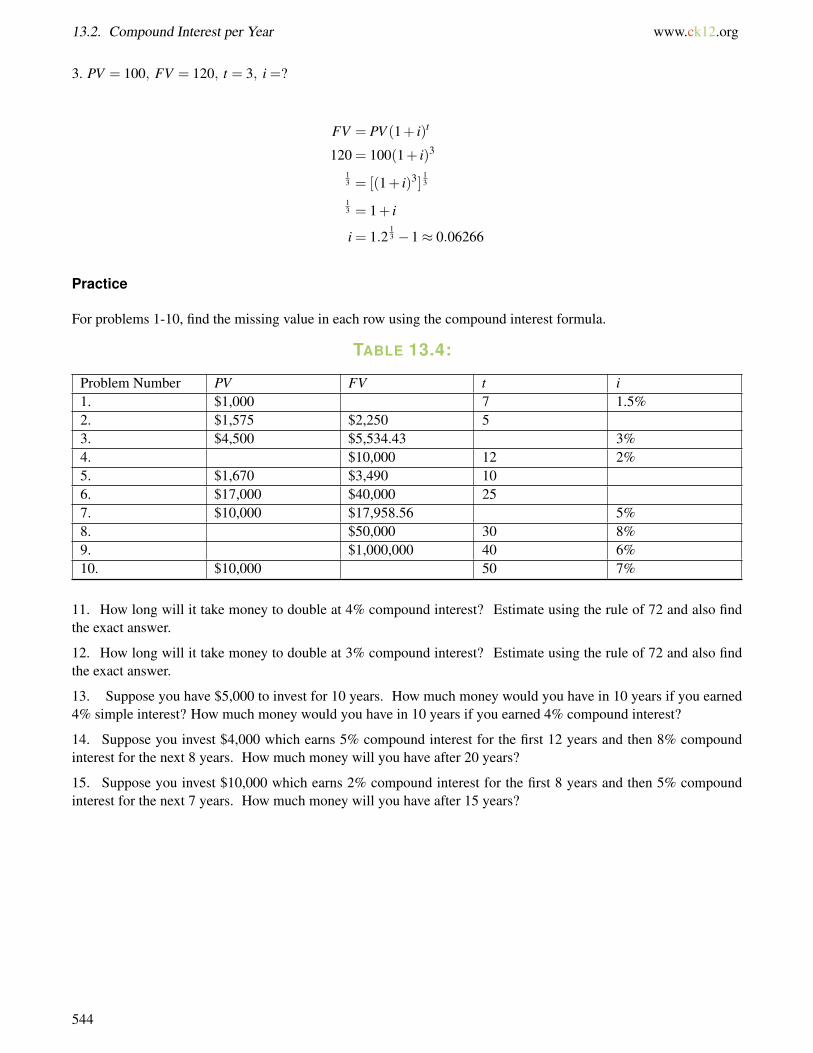
13.2. Compound Interest per Year www.ck12.org
3. PV = 100, FV = 120, t = 3, i =?
FV = PV (1+ i)t
120 = 100(1+ i)3
13 = [(1+ i)3]
13
13 = 1+ i
i = 1.213 −1≈ 0.06266
Practice
For problems 1-10, find the missing value in each row using the compound interest formula.
TABLE 13.4:
Problem Number PV FV t i1. $1,000 7 1.5%2. $1,575 $2,250 53. $4,500 $5,534.43 3%4. $10,000 12 2%5. $1,670 $3,490 106. $17,000 $40,000 257. $10,000 $17,958.56 5%8. $50,000 30 8%9. $1,000,000 40 6%10. $10,000 50 7%
11. How long will it take money to double at 4% compound interest? Estimate using the rule of 72 and also findthe exact answer.
12. How long will it take money to double at 3% compound interest? Estimate using the rule of 72 and also findthe exact answer.
13. Suppose you have $5,000 to invest for 10 years. How much money would you have in 10 years if you earned4% simple interest? How much money would you have in 10 years if you earned 4% compound interest?
14. Suppose you invest $4,000 which earns 5% compound interest for the first 12 years and then 8% compoundinterest for the next 8 years. How much money will you have after 20 years?
15. Suppose you invest $10,000 which earns 2% compound interest for the first 8 years and then 5% compoundinterest for the next 7 years. How much money will you have after 15 years?
544
www.ck12.org Chapter 13. Finance
13.3 Compound Interest per Period
Here you’ll learn to compute future values with interest that accumulates semi-annually, monthly, daily, etc.
Clever Carol went to her bank which was offering 12% interest on its savings account. She asked very nicely ifinstead of having 12% at the end of the year, if she could have 6% after the first 6 months and then another 6% atthe end of the year. Carol and the bank talked it over and they realized that while the account would still seem like itwas getting 12%, Carol would actually be earning a higher percentage. How much more will Carol earn this way?
Watch This
MEDIAClick image to the left for more content.
http://www.khanacademy.org/math/precalculus/v/introduction-to-compound-interest-and-e
Guidance
Consider a bank that compounds and adds interest to accounts k times per year. If the original percent offered is12% then in one year that interest can be compounded:
• Once, with 12% at the end of the year (k = 1)• Twice (semi-annually), with 6% after the first 6 months and 6% after the last six months (k = 2)• Four times (quarterly), with 3% at the end of each 3 months (k = 4)• Twelve times (monthly), with 1% at the end of each month (k = 12)
The intervals could even be days, hours or minutes. When intervals become small so does the amount of interestearned in that period, but since the intervals are small there are more of them. This effect means that there is a muchgreater opportunity for interest to compound.
The formula for interest compounding k times per year for t years at a nominal interest rate i with present value PVand future value FV is:
FV = PV(1+ i
k
)kt
Note: Just like simple interest and compound interest use the symbol i to represent interest but they compound invery different ways, so does a nominal rate. As you will see in the examples, a nominal rate of 12% may actuallyyield more than 12%.
Example A
How much will Felix have in 4 years if he invests $300 in a bank that offers 12% compounded monthly?
Solution: FV =? , PV = 300, t = 4, k = 12, i = 0.12
FV = PV(1+ i
k
)kt= 300
(1+ 0.12
12
)12·4 ≈ 483.67
545
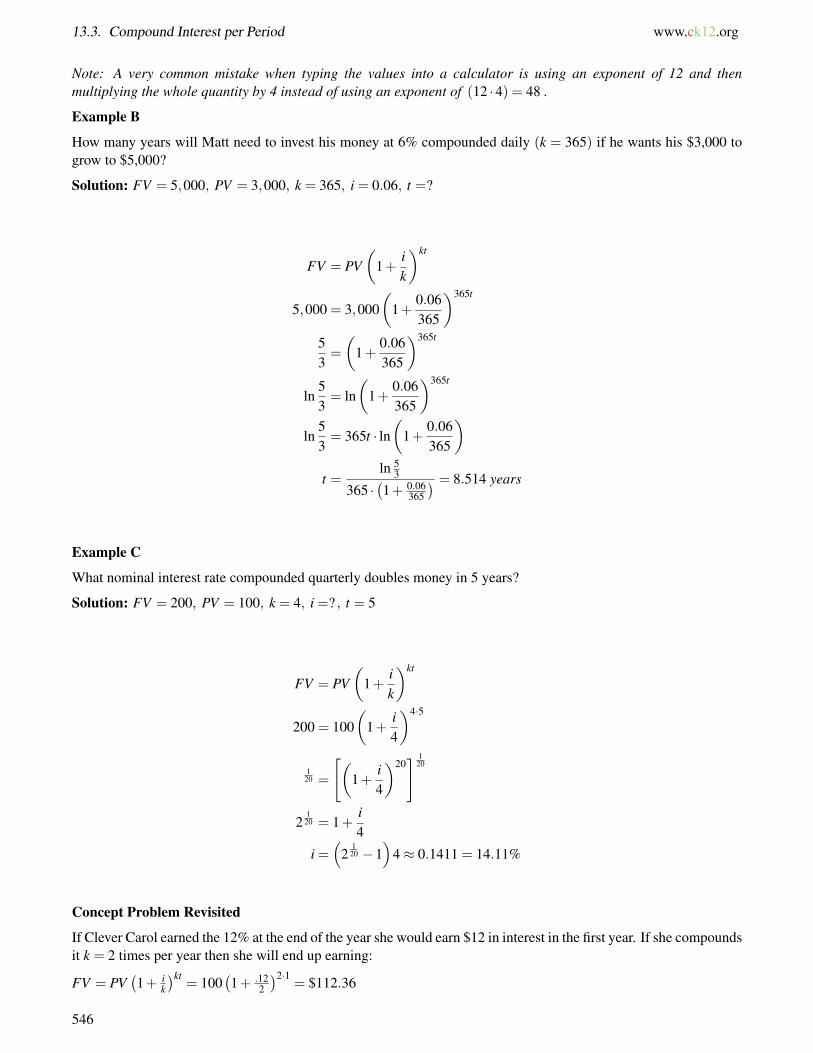
13.3. Compound Interest per Period www.ck12.org
Note: A very common mistake when typing the values into a calculator is using an exponent of 12 and thenmultiplying the whole quantity by 4 instead of using an exponent of (12 ·4) = 48 .
Example B
How many years will Matt need to invest his money at 6% compounded daily (k = 365) if he wants his $3,000 togrow to $5,000?
Solution: FV = 5,000, PV = 3,000, k = 365, i = 0.06, t =?
FV = PV(
1+ik
)kt
5,000 = 3,000(
1+0.06365
)365t
53=
(1+
0.06365
)365t
ln53= ln
(1+
0.06365
)365t
ln53= 365t · ln
(1+
0.06365
)t =
ln 53
365 ·(1+ 0.06
365
) = 8.514 years
Example C
What nominal interest rate compounded quarterly doubles money in 5 years?
Solution: FV = 200, PV = 100, k = 4, i =? , t = 5
FV = PV(
1+ik
)kt
200 = 100(
1+i4
)4·5
120 =
[(1+
i4
)20] 1
20
2120 = 1+
i4
i =(
21
20 −1)
4≈ 0.1411 = 14.11%
Concept Problem Revisited
If Clever Carol earned the 12% at the end of the year she would earn $12 in interest in the first year. If she compoundsit k = 2 times per year then she will end up earning:
FV = PV(1+ i
k
)kt= 100
(1+ .12
2
)2·1= $112.36
546
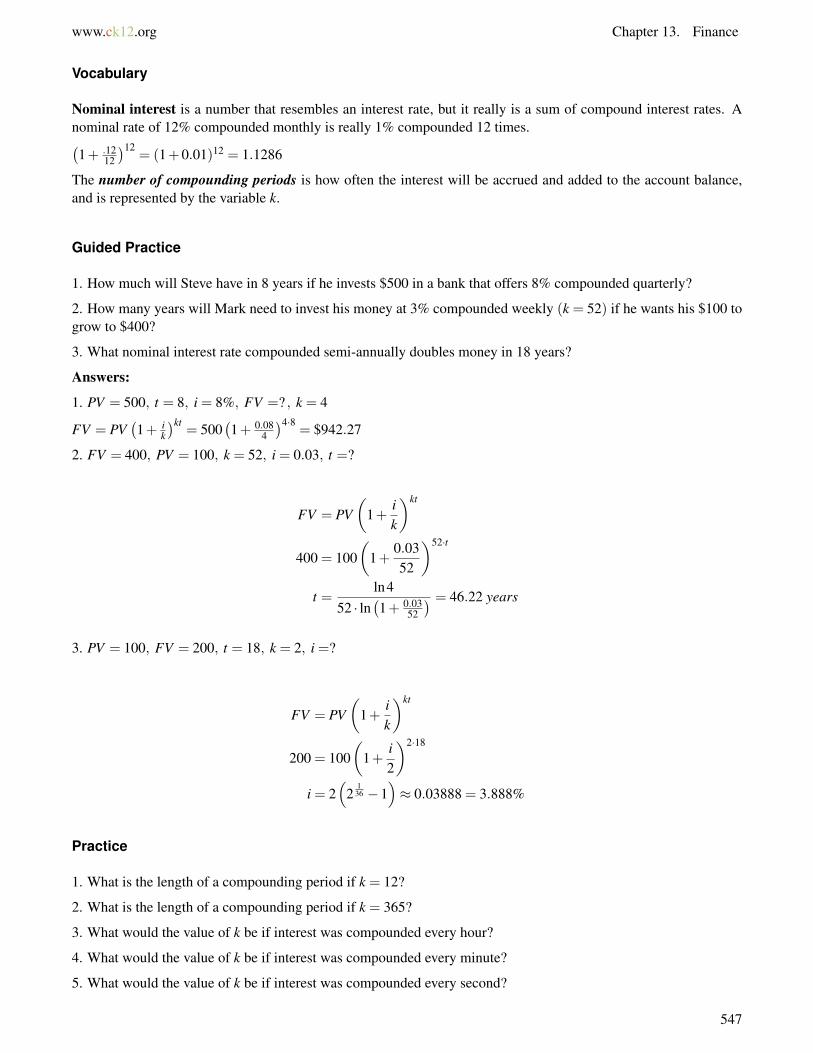
www.ck12.org Chapter 13. Finance
Vocabulary
Nominal interest is a number that resembles an interest rate, but it really is a sum of compound interest rates. Anominal rate of 12% compounded monthly is really 1% compounded 12 times.(1+ .12
12
)12= (1+0.01)12 = 1.1286
The number of compounding periods is how often the interest will be accrued and added to the account balance,and is represented by the variable k.
Guided Practice
1. How much will Steve have in 8 years if he invests $500 in a bank that offers 8% compounded quarterly?
2. How many years will Mark need to invest his money at 3% compounded weekly (k = 52) if he wants his $100 togrow to $400?
3. What nominal interest rate compounded semi-annually doubles money in 18 years?
Answers:
1. PV = 500, t = 8, i = 8%, FV =? , k = 4
FV = PV(1+ i
k
)kt= 500
(1+ 0.08
4
)4·8= $942.27
2. FV = 400, PV = 100, k = 52, i = 0.03, t =?
FV = PV(
1+ik
)kt
400 = 100(
1+0.0352
)52·t
t =ln4
52 · ln(1+ 0.03
52
) = 46.22 years
3. PV = 100, FV = 200, t = 18, k = 2, i =?
FV = PV(
1+ik
)kt
200 = 100(
1+i2
)2·18
i = 2(
2136 −1
)≈ 0.03888 = 3.888%
Practice
1. What is the length of a compounding period if k = 12?
2. What is the length of a compounding period if k = 365?
3. What would the value of k be if interest was compounded every hour?
4. What would the value of k be if interest was compounded every minute?
5. What would the value of k be if interest was compounded every second?
547

13.3. Compound Interest per Period www.ck12.org
For problems 6-15, find the missing value in each row using the compound interest formula.
548

www.ck12.org Chapter 13. Finance
TABLE 13.5:
Problem Num-ber
PV FV t i k
6. $1,000 7 1.5% 127. $1,575 $2,250 5 28. $4,000 $5,375.67 3% 19. $10,000 12 2% 36510. $10,000 50 7% 5211. $1,670 $3,490 10 412. $17,000 $40,000 25 1213. $12,000 3 5% 36514. $50,000 30 8% 415. $1,000,000 40 6% 2
549
13.4. Continuous Interest www.ck12.org
13.4 Continuous Interest
Here you’ll learn to use the force of interest to compute future values when interest is being compounded continu-ously.
Clever Carol realized that she makes more money when she convinces the bank to give her 12% in two chunks of 6%than only one time at 12%. Carol knew she could convince them to give her 1% at the end of each month for a totalof 12% which would be even more than the two chunks of 6%. As Carol makes the intervals smaller and smaller,does she earn more and more money from the bank? Does this extra amount ever stop or does it keep growingforever?
Watch This
MEDIAClick image to the left for more content.
http://www.khanacademy.org/math/precalculus/v/compound-interest-and-e–part-2
MEDIAClick image to the left for more content.
http://www.khanacademy.org/math/precalculus/v/compound-interest-and-e–part--3
MEDIAClick image to the left for more content.
http://www.khanacademy.org/math/precalculus/v/compound-interest-and-e–part-4
MEDIAClick image to the left for more content.
[Fileref: http://www.youtube.com/watch?v=zMeYrkLAqi4
550

www.ck12.org Chapter 13. Finance
Guidance
Calculus deals with adding up an infinite number of infinitely small amounts. A result of calculus that is used infinance is the number e as k the number of compounding periods, approaches infinity.
e≈(1+ 1
k
)k ≈ 2.71828 . . . as k approaches infinity
This means that even when there are an infinite number of infinitely small compounding periods, there will be a limiton the interest earned in a year. The term for infinitely small compounding periods is continuous compounding.
The formula for finding the future value of a present value invested at a continuously compounding interest rate r for t yearsis:
FV = PV · ert
Example A
What is the future value of $360 invested for 6 years at a continuously compounding rate of 5%?
Solution: FV =? , PV = 360, r = 0.05, t = 6
FV = PV · ert = 360e0.05·6 = 360e0.30 ≈ 485.95
Example B
What is the continuously compounding rate that will grow $100 into $250 in just 2 years?
Solution: PV = 100, FV = 250, r =? , t = 2
FV = PV · ert
250 = 100 · er2
2.5 = er2
ln2 = 2r
r =ln22≈ 0.3466 = 34.66%
Example C
What amount invested at 7% continuously compounding yields $1,500 after 8 years?
Solution: PV =? FV = 1,500, t = 8, r = 0.07
FV = PV · ert
1,500 = PV · e0.07·8
PV =1,500e0.07·8 ≈ $856.81
Concept Problem Revisited
Clever Carol could calculate the returns on each of the possible compounding periods for one year.
For once per year, k = 1:
FV = PV (1+ i)t = 100(1+0.12)1 = 112
For twice per year, k = 2:
551
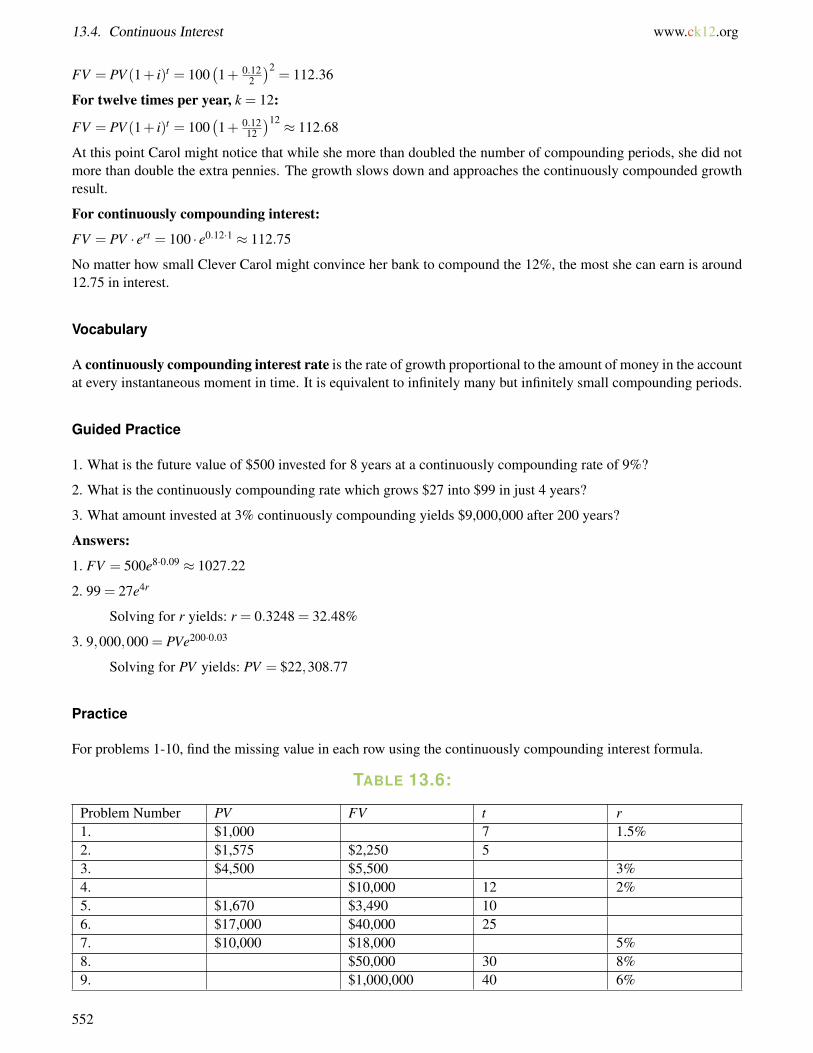
13.4. Continuous Interest www.ck12.org
FV = PV (1+ i)t = 100(1+ 0.12
2
)2= 112.36
For twelve times per year, k = 12:
FV = PV (1+ i)t = 100(1+ 0.12
12
)12 ≈ 112.68
At this point Carol might notice that while she more than doubled the number of compounding periods, she did notmore than double the extra pennies. The growth slows down and approaches the continuously compounded growthresult.
For continuously compounding interest:
FV = PV · ert = 100 · e0.12·1 ≈ 112.75
No matter how small Clever Carol might convince her bank to compound the 12%, the most she can earn is around12.75 in interest.
Vocabulary
A continuously compounding interest rate is the rate of growth proportional to the amount of money in the accountat every instantaneous moment in time. It is equivalent to infinitely many but infinitely small compounding periods.
Guided Practice
1. What is the future value of $500 invested for 8 years at a continuously compounding rate of 9%?
2. What is the continuously compounding rate which grows $27 into $99 in just 4 years?
3. What amount invested at 3% continuously compounding yields $9,000,000 after 200 years?
Answers:
1. FV = 500e8·0.09 ≈ 1027.22
2. 99 = 27e4r
Solving for r yields: r = 0.3248 = 32.48%
3. 9,000,000 = PVe200·0.03
Solving for PV yields: PV = $22,308.77
Practice
For problems 1-10, find the missing value in each row using the continuously compounding interest formula.
TABLE 13.6:
Problem Number PV FV t r1. $1,000 7 1.5%2. $1,575 $2,250 53. $4,500 $5,500 3%4. $10,000 12 2%5. $1,670 $3,490 106. $17,000 $40,000 257. $10,000 $18,000 5%8. $50,000 30 8%9. $1,000,000 40 6%
552

www.ck12.org Chapter 13. Finance
TABLE 13.6: (continued)
10. $10,000 50 7%
11. How long will it take money to double at 4% continuously compounding interest?
12. How long will it take money to double at 3% continuously compounding interest?
13. Suppose you have $6,000 to invest for 12 years. How much money would you have in 10 years if you earned3% simple interest? How much money would you have in 10 years if you earned 3% continuously compoundinginterest?
14. Suppose you invest $2,000 which earns 5% continuously compounding interest for the first 12 years and then8% continuously compounding interest for the next 8 years. How much money will you have after 20 years?
15. Suppose you invest $7,000 which earns 1.5% continuously compounding interest for the first 8 years and then6% continuously compounding interest for the next 7 years. How much money will you have after 15 years?
553

13.5. APR and APY (Nominal and Effective Rates) www.ck12.org
13.5 APR and APY (Nominal and EffectiveRates)
Here you’ll learn how to compare rates for loans and savings accounts to find more favorable deals.
In looking at an advertisement for a car you might see 2.5% APR financing on a $20,000 car. What does APR mean?What rate are they really charging you for the loan? Different banks may offer 8.1% annually, 8% compoundedmonthly or 7.9% compounded continuously. How much would you really be making if you put $100 in each bank?Which bank has the best deal?
Watch This
MEDIAClick image to the left for more content.
http://www.khanacademy.org/finance-economics/core-finance/v/annual-percentage-rate–apr--and-effective-apr
Guidance
A nominal rate is an interest rate in name only. Banks, car dealerships and all companies will often advertise theinterest rate that is most appealing to consumers who don’t know the difference between APR and APY. In placeslike loans where the interest rate is working against you, they advertise a nominal rate that is lower than the effectiverate. On the other hand, banks want to advertise the highest rates possible on their savings accounts so that peoplebelieve they are earning more interest.
In order to calculate what you are truly being charged, or how much money an account is truly making, it is necessaryto use what you have learned about compounding interest and continuous interest. Then, you can make an informeddecision about what is best.
APR stands for Annual Percentage Rate. It is a nominal rate and must be compounded according to the terms. Theterms are usually monthly, so k = 12.
APY stands for Annual Percentage Yield. It is a true rate that states exactly how much money will be earned asinterest.
Example A
If a credit card advertises 19.9% APR (annual rate compounded monthly) and you left $1000 unpaid, how muchwould you owe in a year?
Solution: First recognize that 19.9% APR is a nominal rate compounded monthly.
FV =? PV = 1000, i = .199, k = 12, t = 1
FV = 1000(
1+0.199
12
)12
≈ $1,218.19
554

www.ck12.org Chapter 13. Finance
Notice that $1,218.19 is an increase of about 21.82% on the original $1,000. Many consumers expect to pay only$199 in interest because they misunderstood the term APR. The effective interest on this account is about 21.82%,which is more than advertised.
Another interesting note is that just like there are rounding conventions in this math text (4 significant digits or dollarsand cents), there are legal conventions for rounding interest rate decimals. Many companies include an additional0.0049% because it rounds down for advertising purposes, but adds additional cost when it is time to pay up. Forthe purposes of these example problems and exercises, ignore this addition.
Example B
Three banks offer three slightly different savings accounts. Calculate the Annual Percentage Yield for each bankand choose which bank would be best to invest in.
Bank A offers 7.1% annual interest.
Bank B offers 7.0% annual interest compounded monthly.
Bank C offers 6.98% annual interest compounded continuously.
Solution: Since no initial amount is given, choose a PV that is easy to work with like $1 or $100 and test just oneyear so t = 1. Once you have the future value for 1 year, you can look at the percentage increase from the presentvalue to determine the APY.
TABLE 13.7:
Bank A Bank B Bank C
FV = PV (1+ i)t
FV = 100(1+0.071)
FV = $107.1
APY = 7.1%
FV = PV(
1+ik
)kt
FV = 100(
1+0.0712
)12
FV ≈ 107.229
APY ≈ 7.2290%
FV = PV · ert
FV = 100e.0698
FV ≈ 107.2294
APY = 7.2294%
Bank A compounded only once per year so the APY was exactly the starting interest rate. However, for both BankB and Bank C, the APY was higher than the original interest rates. While the APY’s are very close, Bank C offers aslightly more favorable interest rate to an investor.
Example C
The APY for two banks are the same. What nominal interest rate would a monthly compounding bank need to offerto match another bank offering 4% compounding continuously?
Solution: Solve for APY for the bank where all information is given, the continuously compounding bank.
FV = PV · ert = 100 · e0.04 ≈ 104.08
The APY is about 4.08%. Now you will set up an equation where you use the 104.08 you just calculated, but withthe other banks interest rate.
555
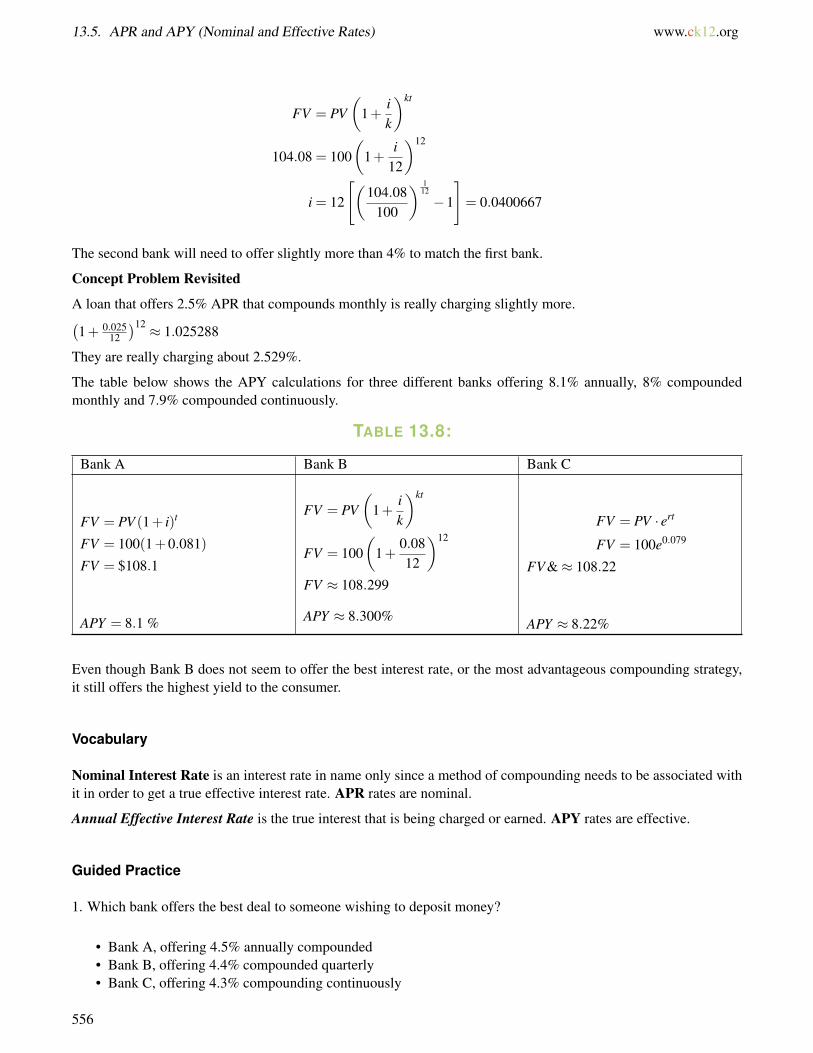
13.5. APR and APY (Nominal and Effective Rates) www.ck12.org
FV = PV(
1+ik
)kt
104.08 = 100(
1+i
12
)12
i = 12
[(104.08
100
) 112
−1
]= 0.0400667
The second bank will need to offer slightly more than 4% to match the first bank.
Concept Problem Revisited
A loan that offers 2.5% APR that compounds monthly is really charging slightly more.(1+ 0.025
12
)12 ≈ 1.025288
They are really charging about 2.529%.
The table below shows the APY calculations for three different banks offering 8.1% annually, 8% compoundedmonthly and 7.9% compounded continuously.
TABLE 13.8:
Bank A Bank B Bank C
FV = PV (1+ i)t
FV = 100(1+0.081)
FV = $108.1
APY = 8.1 %
FV = PV(
1+ik
)kt
FV = 100(
1+0.0812
)12
FV ≈ 108.299
APY ≈ 8.300%
FV = PV · ert
FV = 100e0.079
FV &≈ 108.22
APY ≈ 8.22%
Even though Bank B does not seem to offer the best interest rate, or the most advantageous compounding strategy,it still offers the highest yield to the consumer.
Vocabulary
Nominal Interest Rate is an interest rate in name only since a method of compounding needs to be associated withit in order to get a true effective interest rate. APR rates are nominal.
Annual Effective Interest Rate is the true interest that is being charged or earned. APY rates are effective.
Guided Practice
1. Which bank offers the best deal to someone wishing to deposit money?
• Bank A, offering 4.5% annually compounded• Bank B, offering 4.4% compounded quarterly• Bank C, offering 4.3% compounding continuously
556
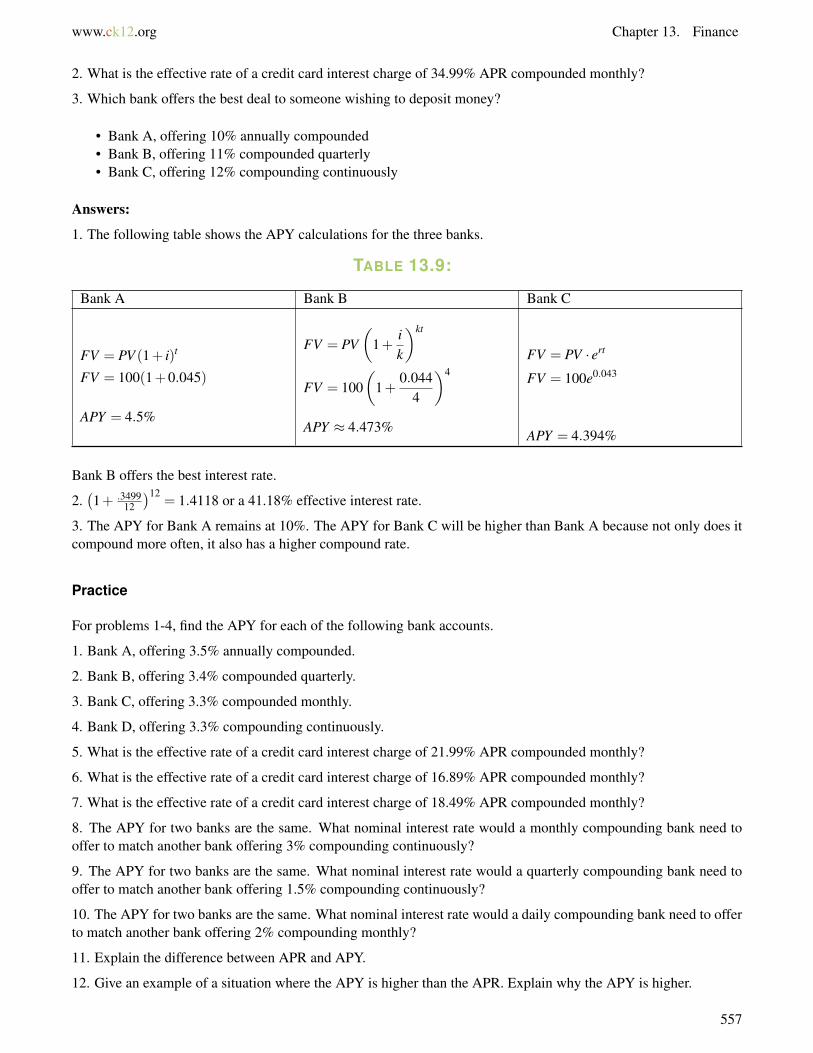
www.ck12.org Chapter 13. Finance
2. What is the effective rate of a credit card interest charge of 34.99% APR compounded monthly?
3. Which bank offers the best deal to someone wishing to deposit money?
• Bank A, offering 10% annually compounded• Bank B, offering 11% compounded quarterly• Bank C, offering 12% compounding continuously
Answers:
1. The following table shows the APY calculations for the three banks.
TABLE 13.9:
Bank A Bank B Bank C
FV = PV (1+ i)t
FV = 100(1+0.045)
APY = 4.5%
FV = PV(
1+ik
)kt
FV = 100(
1+0.044
4
)4
APY ≈ 4.473%
FV = PV · ert
FV = 100e0.043
APY = 4.394%
Bank B offers the best interest rate.
2.(1+ .3499
12
)12= 1.4118 or a 41.18% effective interest rate.
3. The APY for Bank A remains at 10%. The APY for Bank C will be higher than Bank A because not only does itcompound more often, it also has a higher compound rate.
Practice
For problems 1-4, find the APY for each of the following bank accounts.
1. Bank A, offering 3.5% annually compounded.
2. Bank B, offering 3.4% compounded quarterly.
3. Bank C, offering 3.3% compounded monthly.
4. Bank D, offering 3.3% compounding continuously.
5. What is the effective rate of a credit card interest charge of 21.99% APR compounded monthly?
6. What is the effective rate of a credit card interest charge of 16.89% APR compounded monthly?
7. What is the effective rate of a credit card interest charge of 18.49% APR compounded monthly?
8. The APY for two banks are the same. What nominal interest rate would a monthly compounding bank need tooffer to match another bank offering 3% compounding continuously?
9. The APY for two banks are the same. What nominal interest rate would a quarterly compounding bank need tooffer to match another bank offering 1.5% compounding continuously?
10. The APY for two banks are the same. What nominal interest rate would a daily compounding bank need to offerto match another bank offering 2% compounding monthly?
11. Explain the difference between APR and APY.
12. Give an example of a situation where the APY is higher than the APR. Explain why the APY is higher.
557

13.5. APR and APY (Nominal and Effective Rates) www.ck12.org
13. Give an example of a situation where the APY is the same as the APR. Explain why the APY is the same.
14. Give an example of a situation where you would be looking for the highest possible APY.
15. Give an example of a situation where you would be looking for the lowest possible APY.
558
www.ck12.org Chapter 13. Finance
13.6 Annuities
Here you’ll learn how to compute future values of periodic payments.
Sally knows she can earn a nominal rate of 6% convertible monthly in a retirement account, and she decides she canafford to save $1,500 from her paycheck every month. How can you use geometric series to simplify the calculationof finding the future value of all these payments? How much money will Sally have saved in 30 years?
Watch This
MEDIAClick image to the left for more content.
http://www.youtube.com/watch?v=pP4STpYxYe8
MEDIAClick image to the left for more content.
http://www.youtube.com/watch?v=DWFezRwYp0I
Guidance
An annuity is a series of equal payments that occur periodically. The word annuity comes from annual which meansyearly. You will start by working with payments that occur once at the end of each year and then delve deeper topayments that occur monthly or any period.
Assume an investor saves R dollars at the end of each year for t years in an account that earns i interest per period.
• The first payment R will be in the bank account for t−1 years and grow to be: R(1+ i)t−1
• The second payment R will be in the bank account for t−2 years and grow to be: R(1+ i)t−2
• This pattern continues until the last payment of R that is deposited in the account right at t years, so it doesn’tearn any interest at all.
The account balance at this point in the future (Future Value, FV ) is the sum of each individual FV of all thepayments:
FV = R+R(1+ i)1 +R(1+ i)2 + · · ·+R(1+ i)t−2 +R(1+ i)t−1
559
13.6. Annuities www.ck12.org
Recall that a geometric series with initial value a and common ratio r with n terms has sum:
a+ar+ar2 + · · ·+arn−1 = a · 1−rn
1−r
So, a geometric series with starting value R and common ratio (1+ i) has sum:
FV = R · 1− (1+ i)n
1− (1+ i)
= R · 1− (1+ i)n
−i
= R · (1+ i)n−1i
This formula describes the relationship between FV (the account balance in the future), R (the annual payment), n(the number of years) and i (the interest per year).
It is extraordinarily flexible and will work even when payments occur monthly instead of yearly by rethinking what,R, i and n mean. The resulting Future Value will still be correct. If R is monthly payments, then i is the interest rateper month and n is the number of months.
Example A
What will the future value of his IRA (special type of savings account) be if Lenny saves $5,000 a year at the end ofeach year for 35 years at an interest rate of 4%?
Solution: R = 5,000, i = 0.04, n = 35, FV =?
FV = R · (1+ i)n−1i
FV = 5,000 · (1+0.04)35−10.04
FV = $368,281.12
Example B
How long does Mariah need to save if she wants to retire with a million dollars and saves $10,000 a year at 5%interest?
Solution: FV = 1,000,000, R = 10,000, i = 0.05, n =?
FV = R · (1+ i)n−1i
1,000,000 = 10,000 · (1+0.05)n−10.05
100 =(1+0.05)n−1
0.055 = (1+0.05)n−1
6 = (1+0.05)n
n =ln 6
ln 1.05≈ 36.7 years
560
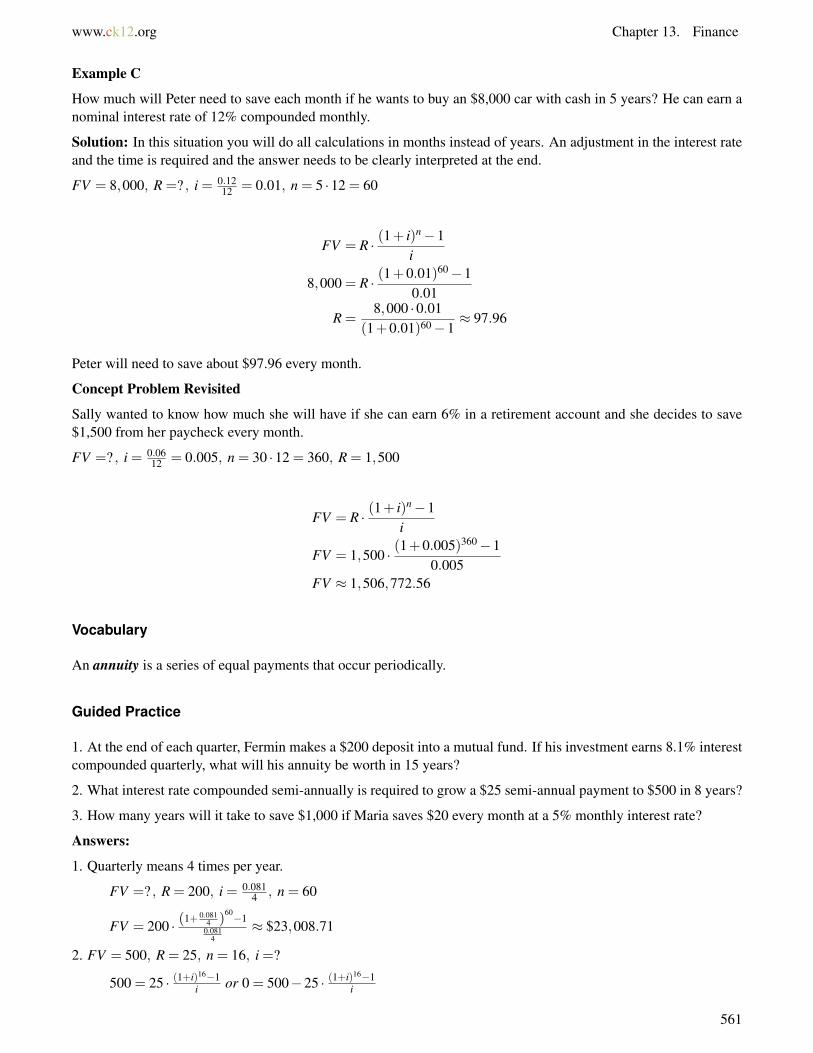
www.ck12.org Chapter 13. Finance
Example C
How much will Peter need to save each month if he wants to buy an $8,000 car with cash in 5 years? He can earn anominal interest rate of 12% compounded monthly.
Solution: In this situation you will do all calculations in months instead of years. An adjustment in the interest rateand the time is required and the answer needs to be clearly interpreted at the end.
FV = 8,000, R =? , i = 0.1212 = 0.01, n = 5 ·12 = 60
FV = R · (1+ i)n−1i
8,000 = R · (1+0.01)60−10.01
R =8,000 ·0.01
(1+0.01)60−1≈ 97.96
Peter will need to save about $97.96 every month.
Concept Problem Revisited
Sally wanted to know how much she will have if she can earn 6% in a retirement account and she decides to save$1,500 from her paycheck every month.
FV =? , i = 0.0612 = 0.005, n = 30 ·12 = 360, R = 1,500
FV = R · (1+ i)n−1i
FV = 1,500 · (1+0.005)360−10.005
FV ≈ 1,506,772.56
Vocabulary
An annuity is a series of equal payments that occur periodically.
Guided Practice
1. At the end of each quarter, Fermin makes a $200 deposit into a mutual fund. If his investment earns 8.1% interestcompounded quarterly, what will his annuity be worth in 15 years?
2. What interest rate compounded semi-annually is required to grow a $25 semi-annual payment to $500 in 8 years?
3. How many years will it take to save $1,000 if Maria saves $20 every month at a 5% monthly interest rate?
Answers:
1. Quarterly means 4 times per year.
FV =? , R = 200, i = 0.0814 , n = 60
FV = 200 · (1+ 0.0814 )
60−10.081
4≈ $23,008.71
2. FV = 500, R = 25, n = 16, i =?
500 = 25 · (1+i)16−1i or 0 = 500−25 · (1+i)16−1
i
561

13.6. Annuities www.ck12.org
At this point it is not easy to solve using regular algebra. Systematic guess and check will work. This is anopportunity to use the solver function on the TI-83/84 calculator. Go to <MATH>, scroll down to find the<Solver>option and press <ENTER>. Enter the equation with x instead of i enter a guess where it says “X =”,and let the calculator approximate the solution by pressing <ALPHA>then <ENTER>. You should get theanswer:
i≈ 0.029009
Remember that the calculation is in semi-annual time periods, so the yearly nominal interest rate is 2 ·0.029009≈ 0.05802 = 5.802%
3. FV = 1,000, R = 20, i = 0.05, n =?. Note that the calculation will be done in months. At the end you willconvert your answer to years.
FV = R · (1+ i)n−1i
1000 = 20 · (1+0.05)n−10.05
2.5 = (1+0.05)n−1
3.5 = (1.05)n
n =ln 3.5ln 1.05
≈ 25.68 months
It will take about 2.140 years.
Practice
1. At the end of each month, Rose makes a $400 deposit into a mutual fund. If her investment earns 6.1% interestcompounded monthly, what will her annuity be worth in 30 years?
2. What interest rate compounded quarterly is required to grow a $40 quarterly payment to $1000 in 5 years?
3. How many years will it take to save $10,000 if Sal saves $50 every month at a 2% monthly interest rate?
4. How much will Bob need to save each month if he wants to buy a $33,000 car with cash in 5 years? He can earna nominal interest rate of 12% compounded monthly.
5. What will the future value of his IRA be if Cal saves $5,000 a year at the end of each year for 35 years at aninterest rate of 8%?
6. How long does Kathy need to save if she wants to retire with four million dollars and saves $10,000 a year at 8%interest?
7. What interest rate compounded monthly is required to grow a $416 monthly payment to $80,000 in 10 years?
8. Every six months, Shanice makes a $1000 deposit into a mutual fund. If her investment earns 5% interestcompounded semi-annually, what will her annuity be worth in 25 years?
9. How much will Jen need to save each month if she wants to put $60,000 down on a house in 5 years? She canearn a nominal interest rate of 8% compounded monthly.
10. How long does Adrian need to save if she wants to retire with three million dollars and saves $5,000 a year at10% interest?
11. What will the future value of her IRA be if Vanessa saves $3,000 a year at the end of each year for 40 years atan interest rate of 6.7%?
12. At the end of each quarter, Justin makes a $1,500 deposit into a mutual fund. If his investment earns 4.5%
562

www.ck12.org Chapter 13. Finance
interest compounded quarterly, what will her annuity be worth in 35 years?
13. What will the future value of his IRA be if Ted saves $3,500 a year at the end of each year for 25 years at aninterest rate of 5.8%?
14. What interest rate compounded monthly is required to grow a $300 monthly payment to $1,000,000 in 35 years?
15. How much will Katie need to save each month if she wants to put $55,000 down in cash on a house in 2 years?She can earn a nominal interest rate of 6% compounded monthly.
563
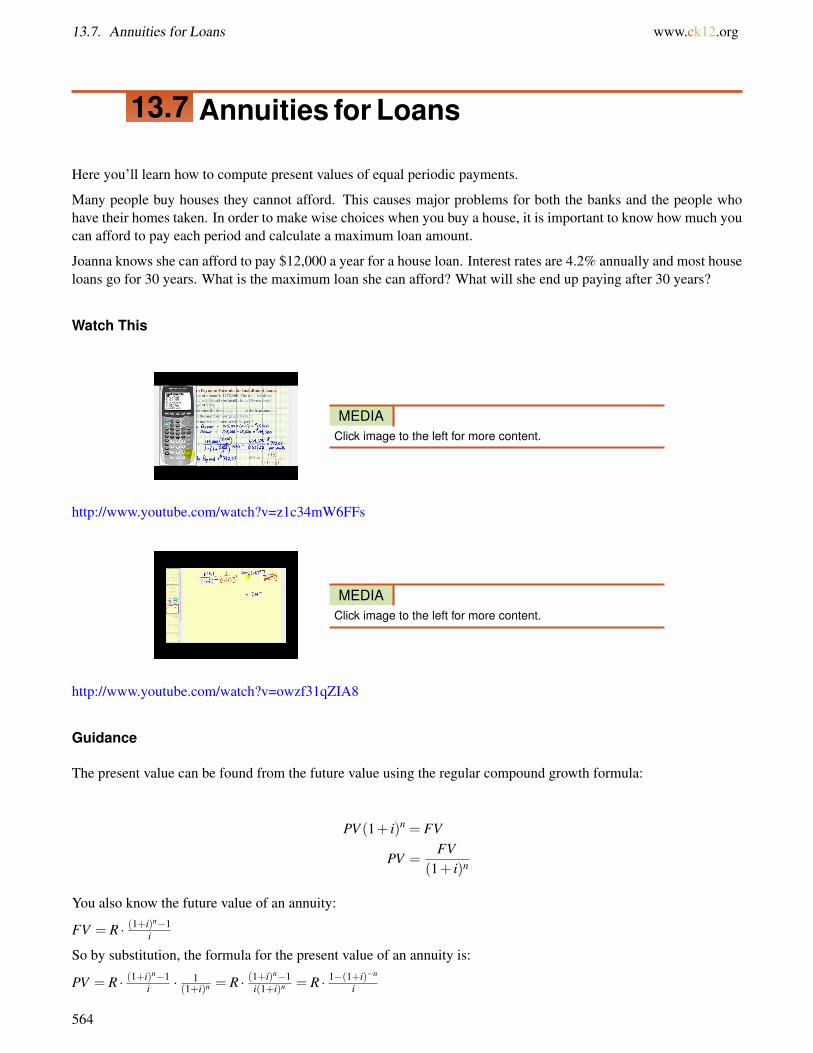
13.7. Annuities for Loans www.ck12.org
13.7 Annuities for Loans
Here you’ll learn how to compute present values of equal periodic payments.
Many people buy houses they cannot afford. This causes major problems for both the banks and the people whohave their homes taken. In order to make wise choices when you buy a house, it is important to know how much youcan afford to pay each period and calculate a maximum loan amount.
Joanna knows she can afford to pay $12,000 a year for a house loan. Interest rates are 4.2% annually and most houseloans go for 30 years. What is the maximum loan she can afford? What will she end up paying after 30 years?
Watch This
MEDIAClick image to the left for more content.
http://www.youtube.com/watch?v=z1c34mW6FFs
MEDIAClick image to the left for more content.
http://www.youtube.com/watch?v=owzf31qZIA8
Guidance
The present value can be found from the future value using the regular compound growth formula:
PV (1+ i)n = FV
PV =FV
(1+ i)n
You also know the future value of an annuity:
FV = R · (1+i)n−1i
So by substitution, the formula for the present value of an annuity is:
PV = R · (1+i)n−1i · 1
(1+i)n = R · (1+i)n−1i(1+i)n = R · 1−(1+i)−n
i
564

www.ck12.org Chapter 13. Finance
The present value of a series of equal payments R with interest rate i per period for n periods is:
PV = R · 1−(1+i)−n
i
Example A
What is the monthly payment of a $1,000,000 house loan over 30 years with a nominal interest rate of 6% convertiblemonthly?
Solution: PV = $1,000,000, R =? , i = 0.005, n = 360
PV = R · 1− (1+ i)−n
i
1,000,000 = R · 1− (1+0.005)−360
0.005
R =1,000,000 ·0.005
1− (1+0.005)−360 ≈ 5995.51
It is remarkable that in order to pay off a $1,000,000 loan you will have to pay $5,995.51 a month, every month, forthirty years. After 30 years, you will have made 360 payments of $5995.51, and therefore will have paid the bankmore than $2.1 million, more than twice the original loan amount. It is no wonder that people can get into troubletaking on more debt than they can afford.
Example B
How long will it take to pay off a $20,000 car loan with a 6% annual interest rate convertible monthly if you pay itoff in monthly installments of $500? What about if you tried to pay it off in monthly installments of $100?
Solution: PV = $20,000, R = $500, i = 0.0612 = 0.005, n =?
PV = R · 1− (1+ i)−n
i
20,000 = 500 · 1− (1+0.005)−n
0.0050.2 = 1− (1+0.005)−n
(1+0.005)−n = 0.8
n =− ln0.8ln1.005
≈ 44.74 months
For the $100 case, if you try to set up an equation and solve, there will be an error. This is because the interest on$20,000 is exactly $100 and so every month the payment will go to only paying off the interest. If someone tries topay off less than $100, then the debt will grow.
Example C
It saves money to pay off debt faster in order to save money on interest. As shown in Example A, interest can morethan double the cost of a 30 year mortgage. This example shows how much money can be saved by paying off morethan the minimum.
Suppose a $300,000 loan has 6% interest convertible monthly with monthly payments over 30 years. What are themonthly payments? How much time and money would be saved if the monthly payments were larger by a fractionof 13
12 ? This is like making 13 payments a year instead of just 12. First you will calculate the monthly payments if12 payments a year are made.
565

13.7. Annuities for Loans www.ck12.org
PV = R · 1− (1+ i)−n
i
300,000 = R · 1− (1+0.005)−360
0.005R = $1,798.65
After 30 years, you will have paid $647,514.57, more than twice the original loan amount.
If instead the monthly payment was 1312 ·1798.65 = 1948.54, you would pay off the loan faster. In order to find out
how much faster, you will make your unknown.
PV = R · 1− (1+ i)−n
i
300,000 = 1948.54 · 1− (1+0.005)−n
0.0050.7698 = 1− (1+0.005)−n
(1+0.005)−n = 0.23019
n =− ln0.23019ln1.005
≈ 294.5 months
294.5 months is about 24.5 years. Paying fractionally more each month saved more than 5 years of payments.
294.5 months ·$1,948.54 = $573,847.99
The loan ends up costing $573,847.99, which saves you more than $73,000 over the total cost if you had paid over30 years.
Concept Problem Revisited
Joanna knows she can afford to pay $12,000 a year to pay for a house loan. Interest rates are 4.2% annually andmost house loans go for 30 years. What is the maximum loan she can afford? What does she end up paying after 30years? You can use the present value formula to calculate the maximum loan:
PV = 12,000 · 1−(1+0.042)−30
0.042 ≈ $202,556.98
For 30 years she will pay $12,000 a year. At the end of the 30 years she will have paid $12,000 · 30 = $360,000total
Vocabulary
A loan is money borrowed that has to be paid back with interest.
A mortgage is a specific loan for a house.
Guided Practice
1. Mackenzie obtains a 15 year student loan for $160,000 with 6.8% interest. What will her yearly payments be?
2. How long will it take Francisco to pay off a $16,000 credit card bill with 19.9% APR if he pays $800 per month?Note: APR in this case means nominal rate convertible monthly.
3. What will the monthly payments be on a credit card debt of $8,000 with 34.99% APR if it is paid off over 3 years?
Answers:
566
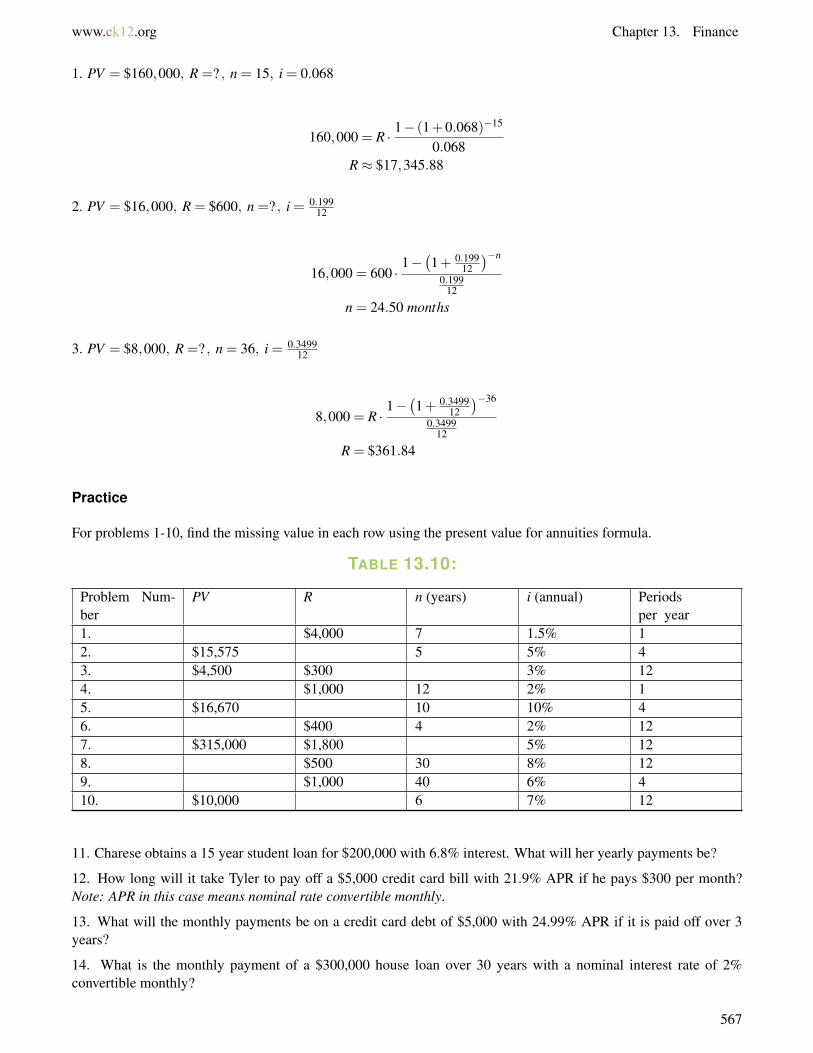
www.ck12.org Chapter 13. Finance
1. PV = $160,000, R =? , n = 15, i = 0.068
160,000 = R · 1− (1+0.068)−15
0.068R≈ $17,345.88
2. PV = $16,000, R = $600, n =? , i = 0.19912
16,000 = 600 ·1−(1+ 0.199
12
)−n
0.19912
n = 24.50 months
3. PV = $8,000, R =? , n = 36, i = 0.349912
8,000 = R ·1−(1+ 0.3499
12
)−36
0.349912
R = $361.84
Practice
For problems 1-10, find the missing value in each row using the present value for annuities formula.
TABLE 13.10:
Problem Num-ber
PV R n (years) i (annual) Periodsper year
1. $4,000 7 1.5% 12. $15,575 5 5% 43. $4,500 $300 3% 124. $1,000 12 2% 15. $16,670 10 10% 46. $400 4 2% 127. $315,000 $1,800 5% 128. $500 30 8% 129. $1,000 40 6% 410. $10,000 6 7% 12
11. Charese obtains a 15 year student loan for $200,000 with 6.8% interest. What will her yearly payments be?
12. How long will it take Tyler to pay off a $5,000 credit card bill with 21.9% APR if he pays $300 per month?Note: APR in this case means nominal rate convertible monthly.
13. What will the monthly payments be on a credit card debt of $5,000 with 24.99% APR if it is paid off over 3years?
14. What is the monthly payment of a $300,000 house loan over 30 years with a nominal interest rate of 2%convertible monthly?
567

13.7. Annuities for Loans www.ck12.org
15. What is the monthly payment of a $270,000 house loan over 30 years with a nominal interest rate of 3%convertible monthly?
The effects of interest on lump sum deposits and periodic deposits were explored. The key idea was that a dollartoday is worth more than a dollar in a year.
568
www.ck12.org Chapter 14. Concepts of Calculus
CHAPTER 14 Concepts of CalculusChapter Outline
14.1 LIMIT NOTATION
14.2 GRAPHS TO FIND LIMITS
14.3 TABLES TO FIND LIMITS
14.4 SUBSTITUTION TO FIND LIMITS
14.5 RATIONALIZATION TO FIND LIMITS
14.6 ONE SIDED LIMITS AND CONTINUITY
14.7 INTERMEDIATE AND EXTREME VALUE THEOREMS
14.8 INSTANTANEOUS RATE OF CHANGE
14.9 AREA UNDER A CURVE
14.10 REFERENCES
Newton and Leibniz invented Calculus a few hundred years ago to account for subtle paradoxes in their representa-tions of the physical world. What happens when you add an infinite number of infinitely small numbers together?What happens when you multiply an infinitely small number by another infinitely small number? Calculus is asystem of tools and a way of thinking about infinity that helps to make sense of these perceived paradoxes.
569
14.1. Limit Notation www.ck12.org
14.1 Limit Notation
Here you will write and read limit notation and use limit notation to describe the behavior of a function at a pointand at infinity.
When learning about the end behavior of a rational function you described the function as either having a horizontalasymptote at zero or another number, or going to infinity. Limit notation is a way of describing this end behaviormathematically.
You already know that as x gets extremely large then the function f (x) = 8x4+4x3+3x2−103x4+6x2+9x goes to 8
3 because thegreatest powers are equal and 8
3 is the ratio of the leading coefficients. How is this statement represented using limitnotation?
Watch This
MEDIAClick image to the left for more content.
http://www.youtube.com/watch?v=ahZ8LLtgu_w James Sousa: Introduction to Limits
Guidance
Limit notation is a way of stating an idea that is a little more subtle than simply saying x = 5 or y = 3.
limx→a f (x) = b
“The limit of f of x as x approaches a is b”
The letter a can be any number or infinity. The function f (x) is any function of x. The letter b can be any number. Ifthe function goes to infinity, then instead of writing “= ∞” you should write that the limit does not exist or “ DNE”.This is because infinity is not a number. If a function goes to infinity then it has no limit.
While a function may never actually reach a height of b it will get arbitrarily close to b. One way to think aboutthe concept of a limit is to use a physical example. Stand some distance from a wall and then take a big step toget halfway to the wall. Take another step to go halfway to the wall again. If you keep taking steps that take youhalfway to the wall then two things will happen. First, you will get extremely close to the wall but never actuallyreach the wall regardless of how many steps you take. Second, an observer who wishes to describe your situationwould notice that the wall acts as a limit to how far you can go.
Example A
Translate the following statement into limit notation.
The limit of y = 4x2 as x approaches 2 is 16.
Solution: limx→2 4x2 = 16
Example B
570
www.ck12.org Chapter 14. Concepts of Calculus
Translate the following mathematical statement into words.
limn→∞
n∑
i=1
(12
)i= 1
Solution: The limit of the sum of 12 +
14 +
18 + · · · as the number of terms approaches infinity is 1.
Example C
Use limit notation to represent the following mathematical statement.13 +
19 +
127 + · · ·=
12
Solution:
limn→∞
n∑
i=1
(13
)i= 1
2
Concept Problem Revisited
The limit of 8x4+4x3+3x2−103x4+6x2+9x as x approaches infinity is 8
3 . This can be written using limit notation as:
limx→∞
(8x4+4x3+3x2−10
3x4+6x2+9x
)= 8
3
Vocabulary
Limit notation is a way of expressing the fact that the function gets arbitrarily close to a value. In calculus or analysisyou may define a limit in terms of the Greek letter epsilon ε and delta δ.
Guided Practice
1. Describe the end behavior of the following rational function at infinity and negative infinity using limits.
f (x) = −5x3+4x2−1010x3+3x2+98
2. Translate the following limit expression into words.
limh→0
(f (x+h)− f (x)
h
)= x
3. What do you notice about the limit expression in # 2?
Answers:
1. Since the function has equal powers of x in the numerator and in the denominator, the end behavior is −12 as
x goes to both positive and negative infinity.
limx→∞
(−5x3+4x2−1010x3+3x2+98
)= lim
x→−∞
(−5x3+4x2−1010x3+3x2+98
)=−1
2
2. The limit of the ratio of the difference between f of quantity x plus h and f of x and h as h approaches 0 is x.
3. You should notice that h→ 0 does not mean h = 0 because if it did then you could not have a 0 in the denominator.You should also note that in the numerator, f (x+h) and f (x) are going to be super close together as h approacheszero. Calculus will enable you to deal with problems that seem to look like 0
0 and ∞
∞.
Practice
Describe the end behavior of the following rational functions at infinity and negative infinity using limits.
1. f (x) = 2x4+4x2−15x4+3x+9
2. g(x) = 8x3+4x2−12x3+4x+7
571
14.1. Limit Notation www.ck12.org
3. f (x) = x2+2x3−35x3+x+4
4. f (x) = 4x+4x2−52x2+3x+3
5. f (x) = 3x2+4x3+46x3+3x2+6
Translate the following statements into limit notation.
6. The limit of y = 2x2 +1 as x approaches 3 is 19.
7. The limit of y = ex as x approaches negative infinity is 0.
8. The limit of y = 1x as x approaches infinity is 0.
Use limit notation to represent the following mathematical statements.
9. 14 +
116 +
164 + · · ·=
13
10. The series 1+ 12 +
13 +
14 + · · · diverges.
11. 1+ 12 +
14 +
18 + · · ·= 2
12. 910 +
9100 +
91000 + · · ·= 1
Translate the following mathematical statements into words.
13. limx→05x2−4x+1 =−4
14. limx→1x3−1x−1 = 3
15. If limx→a f (x) = b, is it possible that f (a) = b? Explain.
572
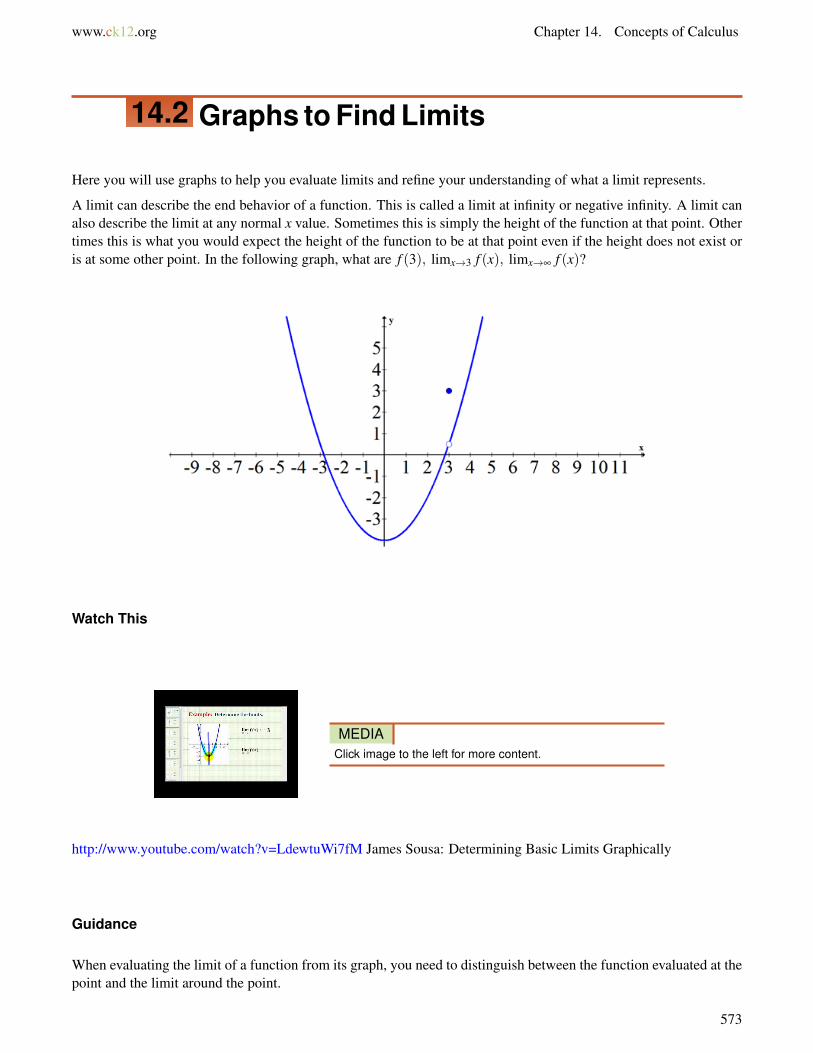
www.ck12.org Chapter 14. Concepts of Calculus
14.2 Graphs to Find Limits
Here you will use graphs to help you evaluate limits and refine your understanding of what a limit represents.
A limit can describe the end behavior of a function. This is called a limit at infinity or negative infinity. A limit canalso describe the limit at any normal x value. Sometimes this is simply the height of the function at that point. Othertimes this is what you would expect the height of the function to be at that point even if the height does not exist oris at some other point. In the following graph, what are f (3), limx→3 f (x), limx→∞ f (x)?
Watch This
MEDIAClick image to the left for more content.
http://www.youtube.com/watch?v=LdewtuWi7fM James Sousa: Determining Basic Limits Graphically
Guidance
When evaluating the limit of a function from its graph, you need to distinguish between the function evaluated at thepoint and the limit around the point.
573

14.2. Graphs to Find Limits www.ck12.org
Functions like the one above with discontinuities, asymptotes and holes require you to have a very solid understand-ing of how to evaluate and interpret limits.
At x = a, the function is undefined because there is a vertical asymptote. You would write:
f (a) = DNE, limx→a f (x) = DNE
At x = b, the function is defined because the filled in circle represents that it is the height of the function. Thisappears to be at about 1. However, since the two sides do not agree, the limit does not exist here either.
f (b) = 1, limx→b f (x) = DNE
At x = 0, the function has a discontinuity in the form of a hole. It is as if the point (0,−2.4) has been lifted upand placed at (0,1). You can evaluate both the function and the limit at this point, however these quantities will notmatch. When you evaluate the function you have to give the actual height of the function, which is 1 in this case.When you evaluate the limit, you have to give what the height of the function is supposed to be based solely on theneighborhood around 0. Since the function appears to reach a height of -2.4 from both the left and the right, the limitdoes exist.
f (0) = 1, limx→0 f (x) =−2.4
At x = c, the limit does not exist because the left and right hand neighborhoods do not agree on a height. On theother hand, the filled in circle represents that the function is defined at x = c to be -3.
f (c) =−3, limx→c
f (x) = DNE
At x→ ∞ you may only discuss the limit of the function since it is not appropriate to evaluate a function at infinity(you cannot find f (∞)). Since the function appears to increase without bound, the limit does not exist.
limx→∞
f (x) = DNE
At x→−∞ the graph appears to flatten as it moves to the left. There is a horizontal asymptote at y = 0 that thisfunction approaches as x→−∞.
limx→−∞
f (x) = 0
When evaluating limits graphically, your main goal is to determine whether the limit exists. The limit only existswhen the left and right sides of the functions meet at a specific height. Whatever the function is doing at that pointdoes not matter for the sake of limits. The function could be defined at that point, could be undefined at that point,or the point could be defined at some other height. Regardless of what is happening at that point, when you evaluatelimits graphically, you only look at the neighborhood to the left and right of the function at the point.
Example A
574

www.ck12.org Chapter 14. Concepts of Calculus
Evaluate the following expressions using the graph of the function f (x).
a. limx→−∞ f (x)b. limx→−1 f (x)c. limx→0 f (x)d. limx→1 f (x)e. limx→3 f (x)f. f (−1)g. f (2)h. f (1)i. f (3)
Solution:
a. limx→−∞ f (x) = 0b. limx→−1 f (x) = DNEc. limx→0 f (x) =−2d. limx→1 f (x) = 0e. limx→3 f (x) = DNE (This is because only one side exists and a regular limit requires both left and right sides
to agree)f. f (−1) = 0g. f (0) =−2h. f (1) = 2i. f (3) = 0
Example B
Sketch a graph that has a limit at x = 2, but that limit does not match the height of the function.
Solution: While there are an infinite number of graphs that fit this criteria, you should make sure your graph has aremovable discontinuity at x = 2.
575
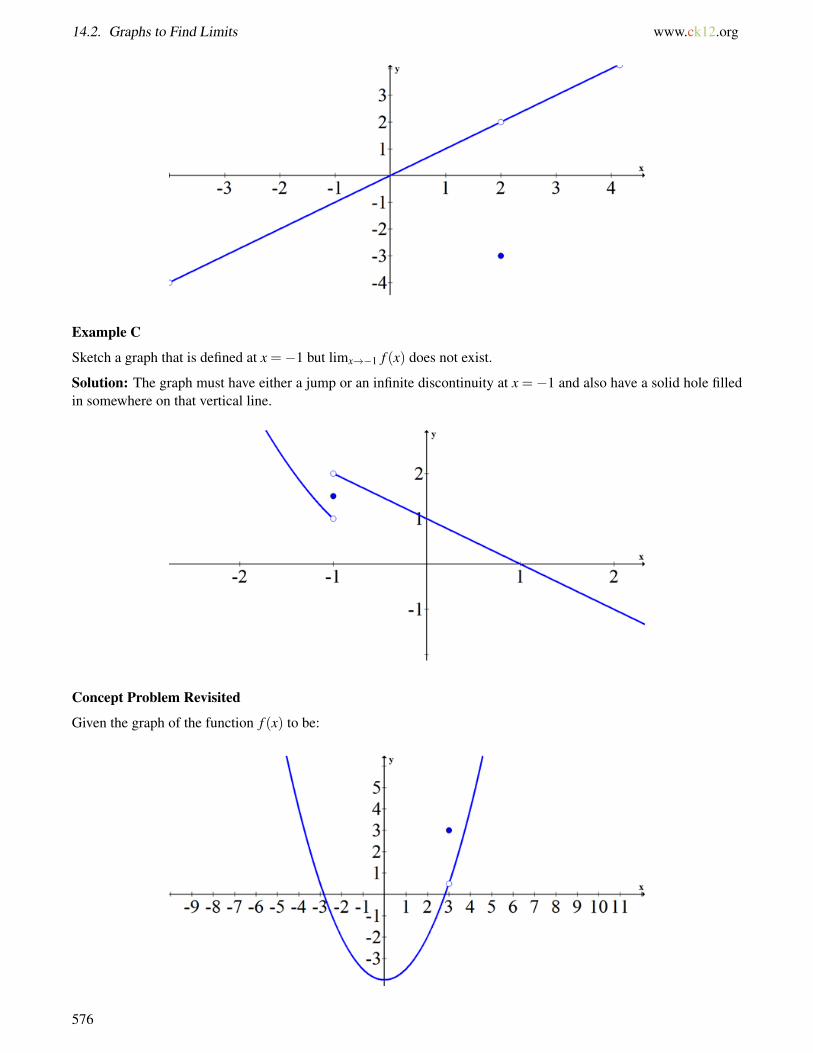
14.2. Graphs to Find Limits www.ck12.org
Example C
Sketch a graph that is defined at x =−1 but limx→−1 f (x) does not exist.
Solution: The graph must have either a jump or an infinite discontinuity at x =−1 and also have a solid hole filledin somewhere on that vertical line.
Concept Problem Revisited
Given the graph of the function f (x) to be:
576
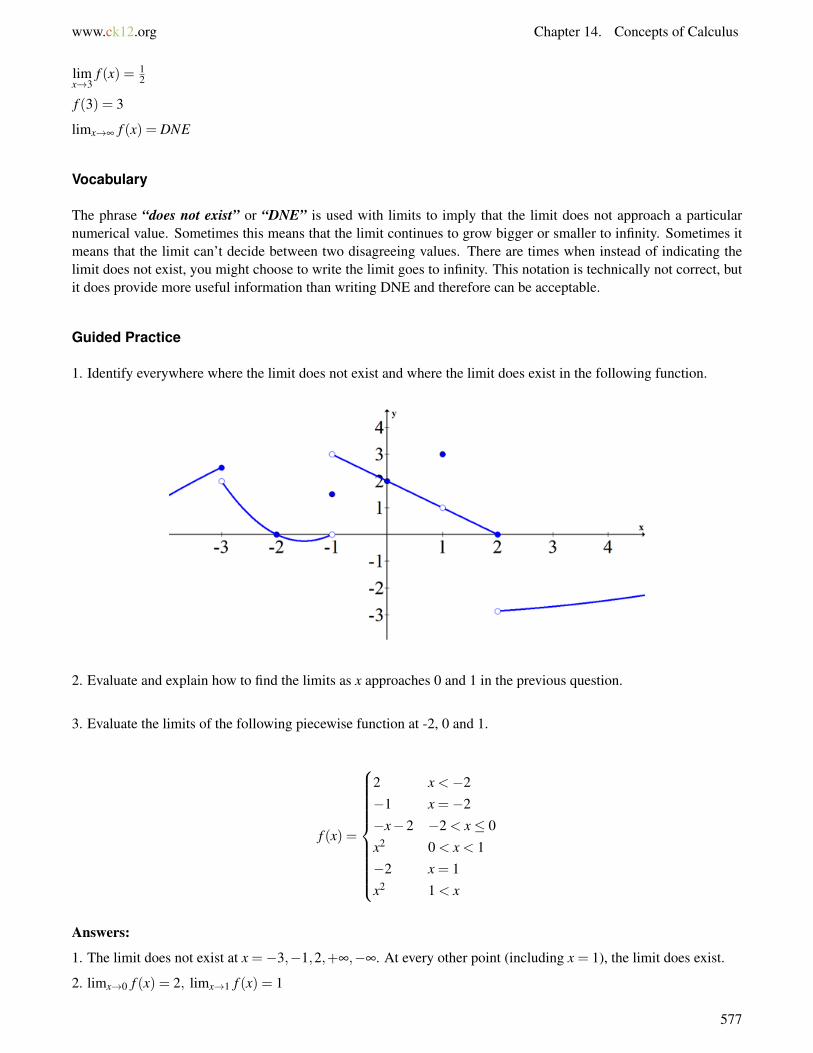
www.ck12.org Chapter 14. Concepts of Calculus
limx→3
f (x) = 12
f (3) = 3
limx→∞ f (x) = DNE
Vocabulary
The phrase “does not exist” or “DNE” is used with limits to imply that the limit does not approach a particularnumerical value. Sometimes this means that the limit continues to grow bigger or smaller to infinity. Sometimes itmeans that the limit can’t decide between two disagreeing values. There are times when instead of indicating thelimit does not exist, you might choose to write the limit goes to infinity. This notation is technically not correct, butit does provide more useful information than writing DNE and therefore can be acceptable.
Guided Practice
1. Identify everywhere where the limit does not exist and where the limit does exist in the following function.
2. Evaluate and explain how to find the limits as x approaches 0 and 1 in the previous question.
3. Evaluate the limits of the following piecewise function at -2, 0 and 1.
f (x) =
2 x <−2−1 x =−2−x−2 −2 < x≤ 0x2 0 < x < 1−2 x = 1x2 1 < x
Answers:
1. The limit does not exist at x =−3,−1,2,+∞,−∞. At every other point (including x = 1), the limit does exist.
2. limx→0 f (x) = 2, limx→1 f (x) = 1
577
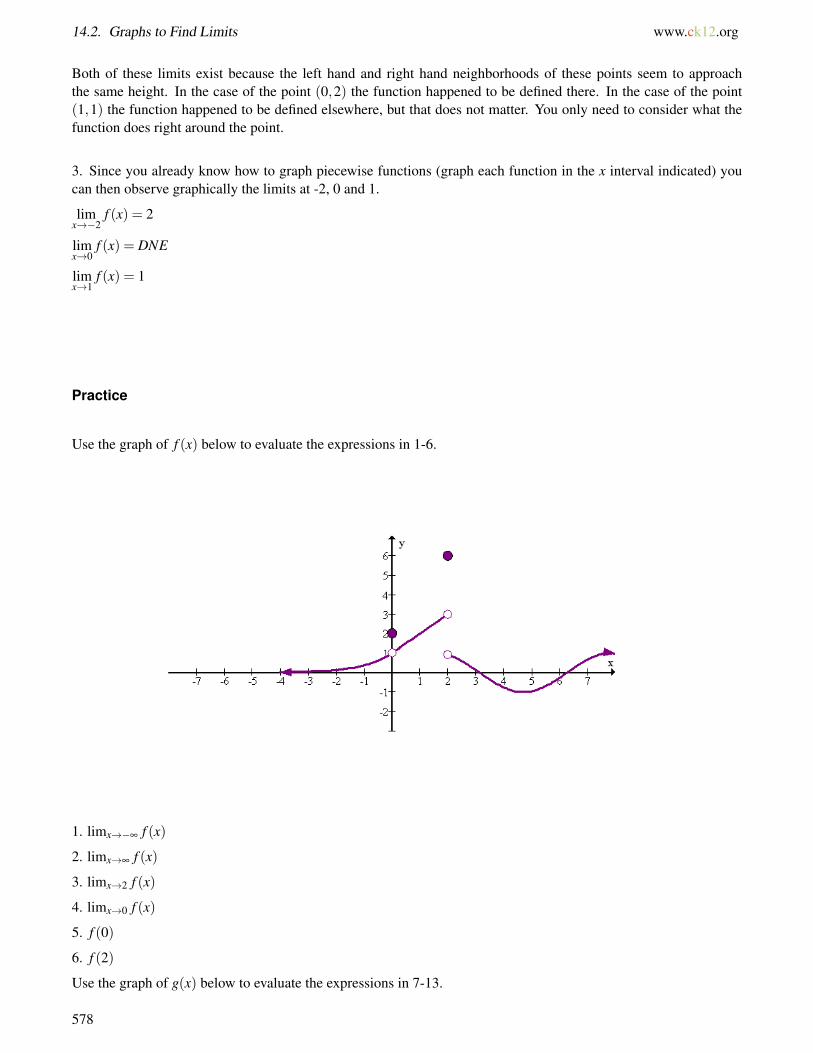
14.2. Graphs to Find Limits www.ck12.org
Both of these limits exist because the left hand and right hand neighborhoods of these points seem to approachthe same height. In the case of the point (0,2) the function happened to be defined there. In the case of the point(1,1) the function happened to be defined elsewhere, but that does not matter. You only need to consider what thefunction does right around the point.
3. Since you already know how to graph piecewise functions (graph each function in the x interval indicated) youcan then observe graphically the limits at -2, 0 and 1.
limx→−2
f (x) = 2
limx→0
f (x) = DNE
limx→1
f (x) = 1
Practice
Use the graph of f (x) below to evaluate the expressions in 1-6.
1. limx→−∞ f (x)
2. limx→∞ f (x)
3. limx→2 f (x)
4. limx→0 f (x)
5. f (0)
6. f (2)
Use the graph of g(x) below to evaluate the expressions in 7-13.
578
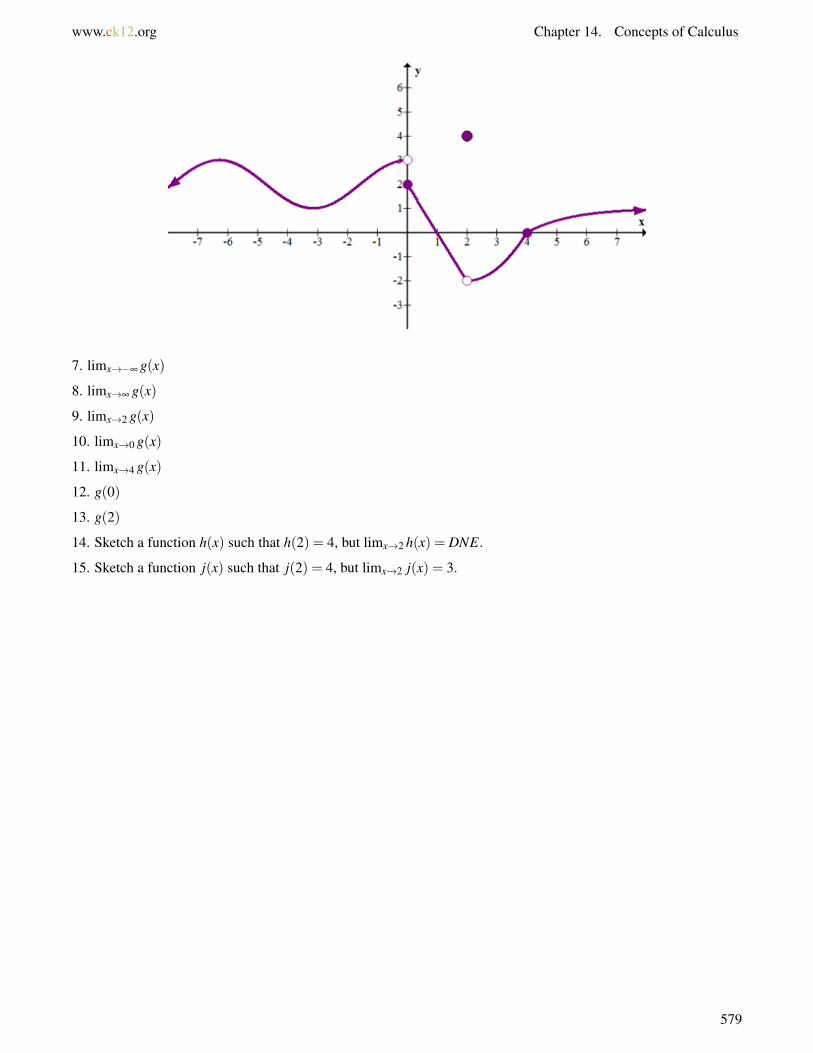
www.ck12.org Chapter 14. Concepts of Calculus
7. limx→−∞ g(x)
8. limx→∞ g(x)
9. limx→2 g(x)
10. limx→0 g(x)
11. limx→4 g(x)
12. g(0)
13. g(2)
14. Sketch a function h(x) such that h(2) = 4, but limx→2 h(x) = DNE.
15. Sketch a function j(x) such that j(2) = 4, but limx→2 j(x) = 3.
579
14.3. Tables to Find Limits www.ck12.org
14.3 Tables to Find Limits
Here you will estimate limits using tables.
Calculators such as the TI-84 have a table view that allows you to make extremely educated guesses as to what thelimit of a function will be at a specific point, even if the function is not actually defined at that point.
How could you use a table to calculate the following limit?
limx→−1x2+3x+2
x+1
Watch This
MEDIAClick image to the left for more content.
http://www.youtube.com/watch?v=l7Tcay720vw James Sousa: Determine a Limit Numerically
Guidance
If you were given the following information organized in a table, how would you fill in the center column?
TABLE 14.1:
3.9 3.99 3.999 4.001 4.01 4.112.25 12.01 12.00001 11.99999 11.99 11.75
It would be logical to see the symmetry and notice how the top row approaches the number 4 from the left and theright. It would also be logical to notice how the bottom row approaches the number 12 from the left and the right.This would lead you to the conclusion that the limit of the function represented by this table is 12 as the top rowapproaches 4. It would not matter if the value at 4 was undefined or defined to be another number like 17, the patterntells you that the limit at 4 is 12.
Using tables to help evaluate limits requires this type of logic. To use a table on your calculator to evaluate a limit:
1. Enter the function on the y = screen2. Go to table set up and highlight “ask” for the independent variable3. Go to the table and enter values close to the number that x approaches
580
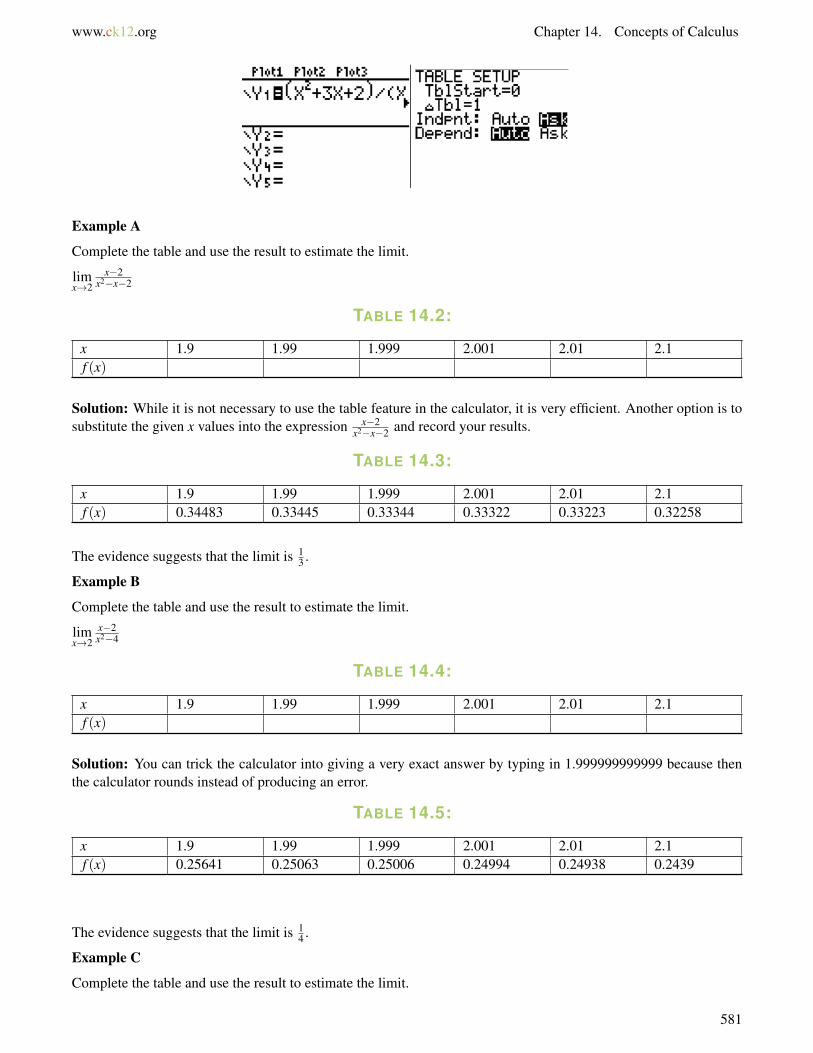
www.ck12.org Chapter 14. Concepts of Calculus
Example A
Complete the table and use the result to estimate the limit.
limx→2
x−2x2−x−2
TABLE 14.2:
x 1.9 1.99 1.999 2.001 2.01 2.1f (x)
Solution: While it is not necessary to use the table feature in the calculator, it is very efficient. Another option is tosubstitute the given x values into the expression x−2
x2−x−2 and record your results.
TABLE 14.3:
x 1.9 1.99 1.999 2.001 2.01 2.1f (x) 0.34483 0.33445 0.33344 0.33322 0.33223 0.32258
The evidence suggests that the limit is 13 .
Example B
Complete the table and use the result to estimate the limit.
limx→2
x−2x2−4
TABLE 14.4:
x 1.9 1.99 1.999 2.001 2.01 2.1f (x)
Solution: You can trick the calculator into giving a very exact answer by typing in 1.999999999999 because thenthe calculator rounds instead of producing an error.
TABLE 14.5:
x 1.9 1.99 1.999 2.001 2.01 2.1f (x) 0.25641 0.25063 0.25006 0.24994 0.24938 0.2439
The evidence suggests that the limit is 14 .
Example C
Complete the table and use the result to estimate the limit.
581

14.3. Tables to Find Limits www.ck12.org
limx→0
√x+3−
√3
x
TABLE 14.6:
x -0.1 -0.01 -0.001 0.001 0.01 0.1f (x)
Solution:
TABLE 14.7:
x -0.1 -0.01 -0.001 0.001 0.01 0.1f (x) 0.29112 0.28892 0.2887 0.28865 0.28843 0.28631
The evidence suggests that the limit is a number between 0.2887 and 0.28865. When you learn to find the limitanalytically, you will know that the exact limit is 1
2 ·312 ≈ 0.2886751346.
Concept Problem Revisited
When you enter values close to -1 in the table you get y values that are increasingly close to the number 1. Thisimplies that the limit as x approaches -1 is 1. Notice that when you evaluate the function at -1, the calculator producesan error. This should lead you to the conclusion that while the function is not defined at x =−1 , the limit does exist.
Vocabulary
Numerically is a term used to describe one of several different representations in mathematics. It refers to tableswhere the actual numbers are visible.
Guided Practice
1. Graph the following function and the use a table to verify the limit as x approaches 1.
f (x) = x3−1x−1 ,x 6= 1
2. Estimate the limit numerically.
limx→2x2−3x+2
x−2
3. Estimate the limit numerically.
limx→0[ 4
x+2 ]−2x
Answers:
1. limx→1 f (x) = 3. This is because when you factor the numerator and cancel common factors, the function becomesa quadratic with a hole at the point (1,3).
582
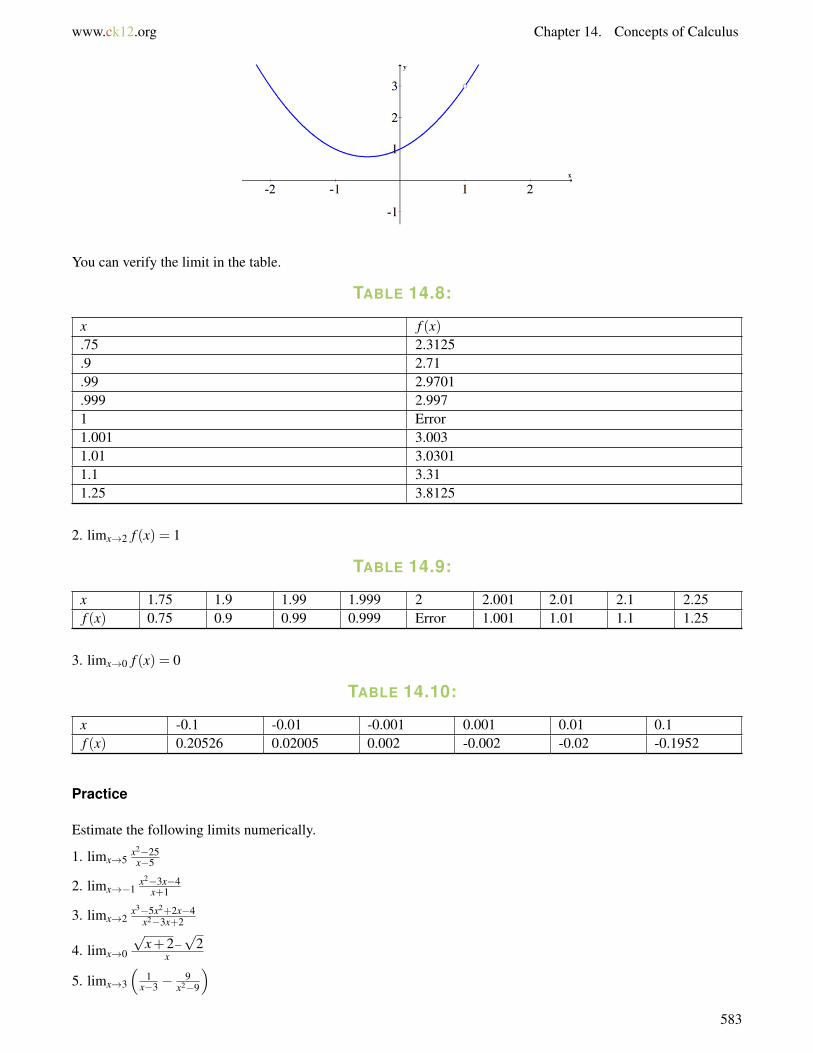
www.ck12.org Chapter 14. Concepts of Calculus
You can verify the limit in the table.
TABLE 14.8:
x f (x).75 2.3125.9 2.71.99 2.9701.999 2.9971 Error1.001 3.0031.01 3.03011.1 3.311.25 3.8125
2. limx→2 f (x) = 1
TABLE 14.9:
x 1.75 1.9 1.99 1.999 2 2.001 2.01 2.1 2.25f (x) 0.75 0.9 0.99 0.999 Error 1.001 1.01 1.1 1.25
3. limx→0 f (x) = 0
TABLE 14.10:
x -0.1 -0.01 -0.001 0.001 0.01 0.1f (x) 0.20526 0.02005 0.002 -0.002 -0.02 -0.1952
Practice
Estimate the following limits numerically.
1. limx→5x2−25x−5
2. limx→−1x2−3x−4
x+1
3. limx→2x3−5x2+2x−4
x2−3x+2
4. limx→0
√x+2−
√2
x
5. limx→3
(1
x−3 −9
x2−9
)583
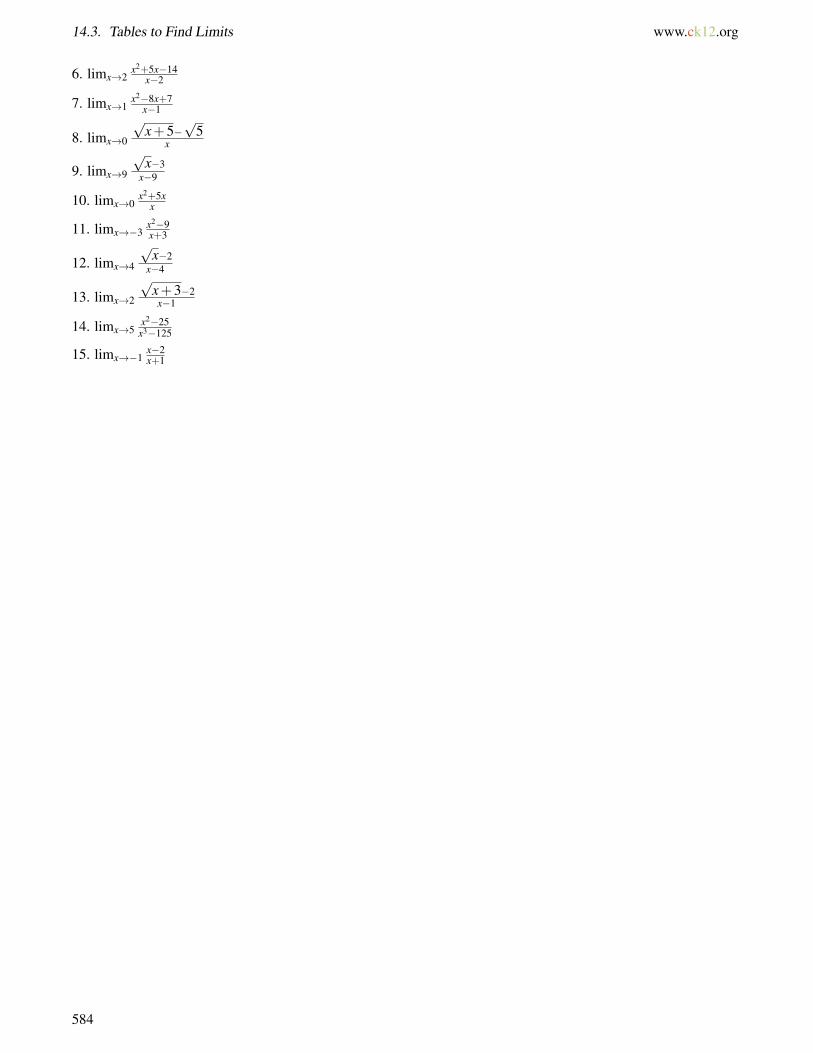
14.3. Tables to Find Limits www.ck12.org
6. limx→2x2+5x−14
x−2
7. limx→1x2−8x+7
x−1
8. limx→0
√x+5−
√5
x
9. limx→9
√x−3
x−9
10. limx→0x2+5x
x
11. limx→−3x2−9x+3
12. limx→4
√x−2
x−4
13. limx→2
√x+3−2x−1
14. limx→5x2−25x3−125
15. limx→−1x−2x+1
584
www.ck12.org Chapter 14. Concepts of Calculus
14.4 Substitution to Find Limits
Here you will start to find limits analytically using substitution.
Finding limits for the vast majority of points for a given function is as simple as substituting the number that xapproaches into the function. Since this turns evaluating limits into an algebra-level substitution, most questionsinvolving limits focus on the cases where substituting does not work. How can you decide if substitution is anappropriate analytical tool for finding a limit?
Watch This
MEDIAClick image to the left for more content.
http://www.youtube.com/watch?v=VLiMfJHZIpk James Sousa: Determine a Limit Analytically
Guidance
Finding a limit analytically means finding the limit using algebraic means. In order to evaluate many limits, you cansubstitute the value that x approaches into the function and evaluate the result. This works perfectly when there areno holes or asymptotes at that particular x value. You can be confident this method works as long as you don’t endup dividing by zero when you substitute.
If the function f (x) has no holes or asymptote at x = a then: limx→a f (x) = f (a)
Occasionally there will be a hole at x = a. The limit in this case is the height of the function if the hole did not exist.In other words, if the function is a rational expression with factors that can be canceled, cancel the term algebraicallyand then substitute into the resulting expression. If no factors can be canceled, it could be that the limit does notexist at that point due to asymptotes.
Example A
Which of the following limits can you determine using direct substitution? Find that limit.
limx→2x2−4x−2 , limx→3
x2−4x−2
Solution: The limit on the right can be evaluated using direct substitution because the hole exists at x = 2 not x = 3.
limx→3x2−4x−2 = 32−4
3−2 = 9−41 = 5
Example B
Evaluate the following limit by canceling first and then using substitution.
limx→2
x2−4x−2
Solution:
585
14.4. Substitution to Find Limits www.ck12.org
limx→2
x2−4x−2
= limx→2
(x−2)(x+2)(x−2)
= limx→2
(x+2)
= 2+2
= 4
Example C
Evaluate the following limit analytically: limx→4x2−x−12
x−4
Solution:
limx→4
x2− x−12x−4
= limx→4
(x−4)(x+3)(x−4)
= limx→4
(x+3)
= 4+3
= 7
Concept Problem Revisited
In order to decide whether substitution is an appropriate first step you can always just try it. You’ll know it won’twork if you end up trying to evaluate an expression with a denominator equal to zero. If this happens, go back andtry to factor and cancel, and then try substituting again.
Vocabulary
Substitution is a method of determining limits where the value that x is approaching is substituted into the functionand the result is evaluated. This is one way to evaluate a limit analytically.
Guided Practice
1. Evaluate the following limit analytically.
limx→3
x2−9x−3
2. Evaluate the following limit analytically.
limt→4
√t +32
3. Evaluate the following limit analytically.
limy→4
3|y−1|y+4
Answers:
1. limx→3x2−9x−3 = limx→3
(x−3)(x+3)(t−3) = limx→3(x+3) = 6
2. limt→4√
t +32 =√
4+32 =√
36 = 6
3. limy→43|y−1|
y+4 = 3|4−1|4+4 = 3·3
8 = 98
586
www.ck12.org Chapter 14. Concepts of Calculus
Practice
Evaluate the following limits analytically.
1. limx→5x2−25x−5
2. limx→−1x2−3x−4
x+1
3. limx→5√
5x−12
4. limx→0x3+3x2−x
5x
5. limx→13x|x−4|
x+1
6. limx→2x2+5x−14
x−2
7. limx→1x2−8x+7
x−1
8. limx→05x−12x2+3
9. limx→1 4x2−2x+5
10. limx→0x2+5x
x
11. limx→−3x2−9x+3
12. limx→05x+1
x
13. limx→15x+1
x
14. limx→5x2−25x3−125
15. limx→−1x−2x+1
587
14.5. Rationalization to Find Limits www.ck12.org
14.5 Rationalization to Find Limits
Here you will evaluate limits analytically using rationalization.
Some limits cannot be evaluated directly by substitution and no factors immediately cancel. In these situations thereis another algebraic technique to try called rationalization. With rationalization, you make the numerator and thedenominator of an expression rational by using the properties of conjugate pairs.
How do you evaluate the following limit using rationalization?
limx→16
√x−4
x−16
Watch This
MEDIAClick image to the left for more content.
http://youtu.be/ouWAhqeAaik James Sousa: Find a Limit Requiring Rationalizing
Guidance
The properties of conjugates are used in a variety of places in PreCalculus.
Conjugates can be used to simplify expressions with a radical in the denominator:
5
1+√
3= 5(
1+√
3) ·
(1−√
3)
(1−√
3) = 5−5
√3
1−3 = 5−5√
3−2
Conjugates can be used to simplify complex numbers with i in the denominator:4
2+3i =4
(2+3i) ·(2−3i)(2−3i) =
8−12i4+9 = 8−12i
13
Here, they can be used to transform an expression in a limit problem that does not immediately factor to one thatdoes immediately factor.
limx→16
(√x−4
)(x−16) ·
(√x+4
)(√
x+4) = lim
x→16
(x−16)
(x−16)(√
x+4)
Now you can cancel the common factors in the numerator and denominator and use substitution to finish evaluatingthe limit.
The rationalizing technique works because when you algebraically manipulate the expression in the limit to anequivalent expression, the resulting limit will be the same. Sometimes you must do a variety of different algebraicmanipulations in order avoid a zero in the denominator when using the substitution method.
Example A
Evaluate the following limit: limx→3x2−9√x−√
3.
588
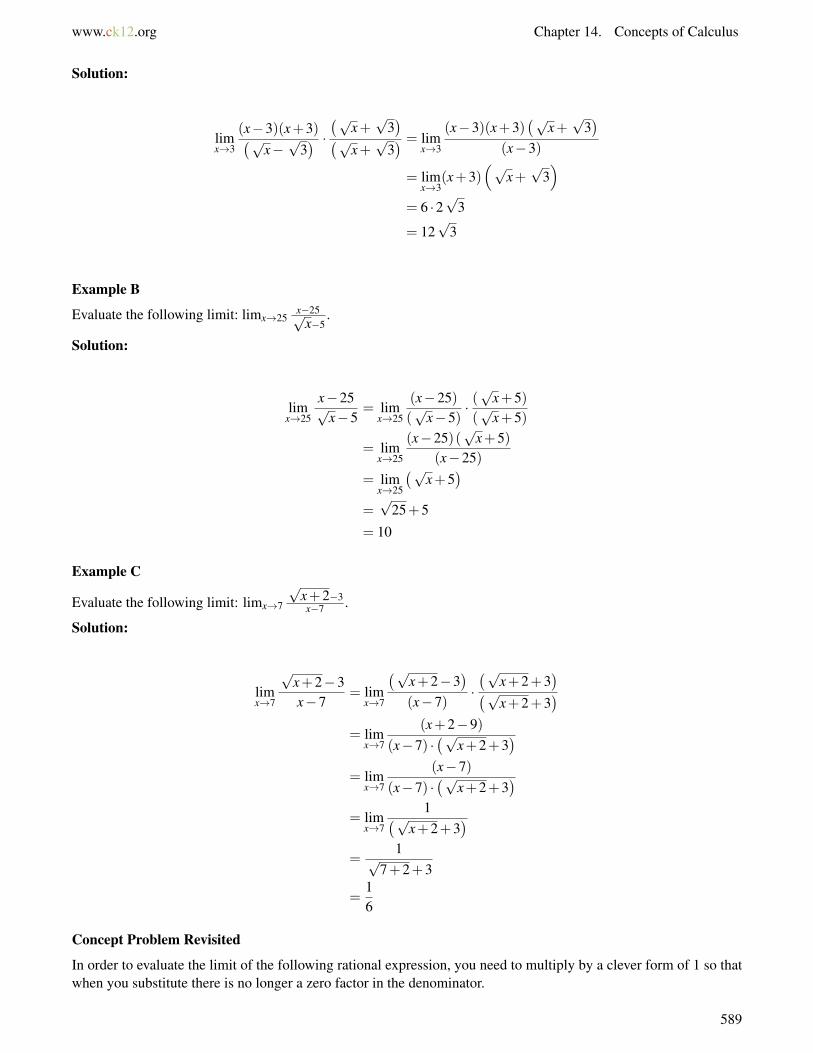
www.ck12.org Chapter 14. Concepts of Calculus
Solution:
limx→3
(x−3)(x+3)(√x−√
3) · (√x+
√3)(√
x+√
3) = lim
x→3
(x−3)(x+3)(√
x+√
3)
(x−3)
= limx→3
(x+3)(√
x+√
3)
= 6 ·2√
3
= 12√
3
Example B
Evaluate the following limit: limx→25x−25√
x−5.
Solution:
limx→25
x−25√x−5
= limx→25
(x−25)(√
x−5)· (√
x+5)(√
x+5)
= limx→25
(x−25)(√
x+5)(x−25)
= limx→25
(√x+5
)=√
25+5
= 10
Example C
Evaluate the following limit: limx→7
√x+2−3x−7 .
Solution:
limx→7
√x+2−3x−7
= limx→7
(√x+2−3
)(x−7)
·(√
x+2+3)(√
x+2+3)
= limx→7
(x+2−9)(x−7) ·
(√x+2+3
)= lim
x→7
(x−7)(x−7) ·
(√x+2+3
)= lim
x→7
1(√x+2+3
)=
1√7+2+3
=16
Concept Problem Revisited
In order to evaluate the limit of the following rational expression, you need to multiply by a clever form of 1 so thatwhen you substitute there is no longer a zero factor in the denominator.
589

14.5. Rationalization to Find Limits www.ck12.org
limx→16
√x−4
x−16= lim
x→16
(√
x−4)(x−16)
· (√
x+4)(√
x+4)
= limx→16
(x−16)(x−16)(
√x+4)
= limx→16
(√x+4
)= 4+4
= 8
Vocabulary
Rationalization generally means to multiply a rational function by a clever form of one in order to eliminate radicalsymbols or imaginary numbers in the denominator. Rationalization is also a technique used to evaluate limits inorder to avoid having a zero in the denominator when you substitute.
Guided Practice
1. Evaluate the following limit: limx→0(2+x)−1−2−1
x .
2. Evaluate the following limit: limx→−3
√x2−5−2
x+3 .
3. Evaluate the following limit: limx→0
(3
x√
9− x− 1
x
).
Answers:
1.
limx→0
(2+ x)−1−2−1
x= lim
x→0
1x+2 −
12
x· (x+2) ·2(x+2) ·2
= limx→0
2− (x+2)2x(x+2)
= limx→0
−x2x(x+2)
= limx→0
−12(x+2)
=− 12(0+2)
=−14
2.
590
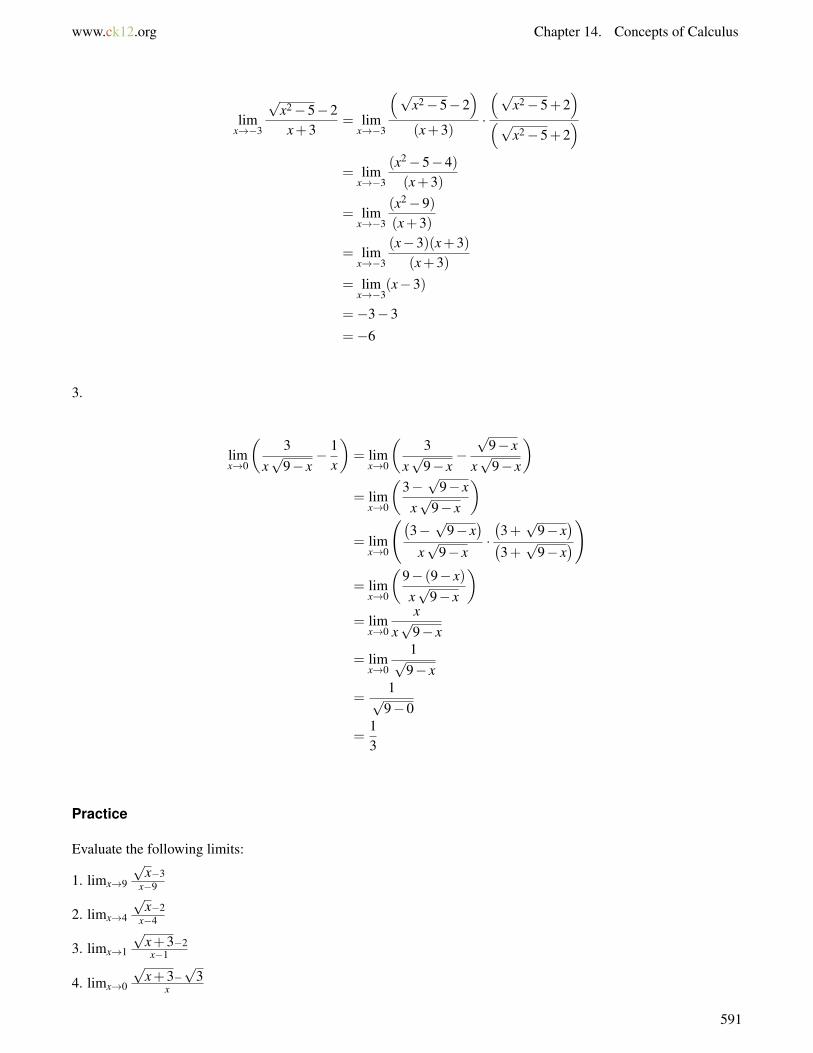
www.ck12.org Chapter 14. Concepts of Calculus
limx→−3
√x2−5−2x+3
= limx→−3
(√x2−5−2
)(x+3)
·
(√x2−5+2
)(√
x2−5+2)
= limx→−3
(x2−5−4)(x+3)
= limx→−3
(x2−9)(x+3)
= limx→−3
(x−3)(x+3)(x+3)
= limx→−3
(x−3)
=−3−3
=−6
3.
limx→0
(3
x√
9− x− 1
x
)= lim
x→0
(3
x√
9− x−√
9− xx√
9− x
)= lim
x→0
(3−√
9− xx√
9− x
)= lim
x→0
((3−√
9− x)
x√
9− x·(3+√
9− x)(
3+√
9− x))
= limx→0
(9− (9− x)x√
9− x
)= lim
x→0
xx√
9− x
= limx→0
1√9− x
=1√
9−0
=13
Practice
Evaluate the following limits:
1. limx→9
√x−3
x−9
2. limx→4
√x−2
x−4
3. limx→1
√x+3−2x−1
4. limx→0
√x+3−
√3
x
591
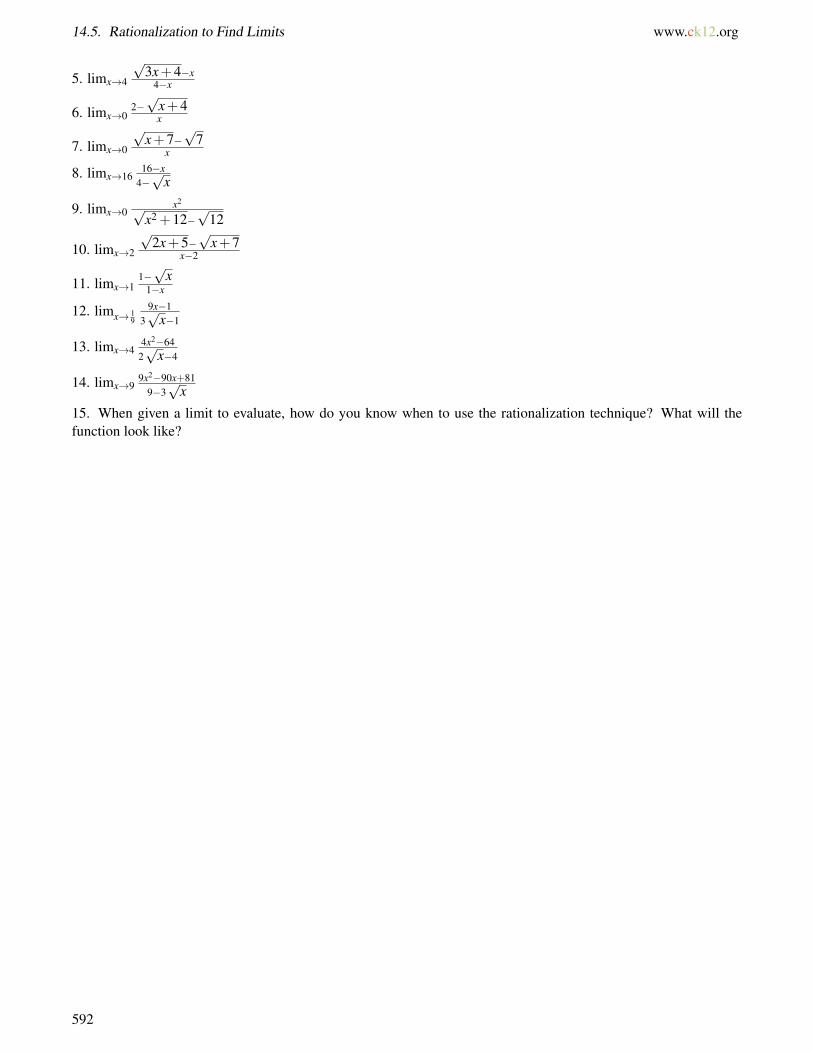
14.5. Rationalization to Find Limits www.ck12.org
5. limx→4
√3x+4−x
4−x
6. limx→02−√
x+4x
7. limx→0
√x+7−
√7
x
8. limx→1616−x
4−√
x
9. limx→0x2√
x2 +12−√
12
10. limx→2
√2x+5−
√x+7
x−2
11. limx→11−√
x1−x
12. limx→ 19
9x−13√
x−1
13. limx→44x2−64
2√
x−4
14. limx→99x2−90x+81
9−3√
x
15. When given a limit to evaluate, how do you know when to use the rationalization technique? What will thefunction look like?
592
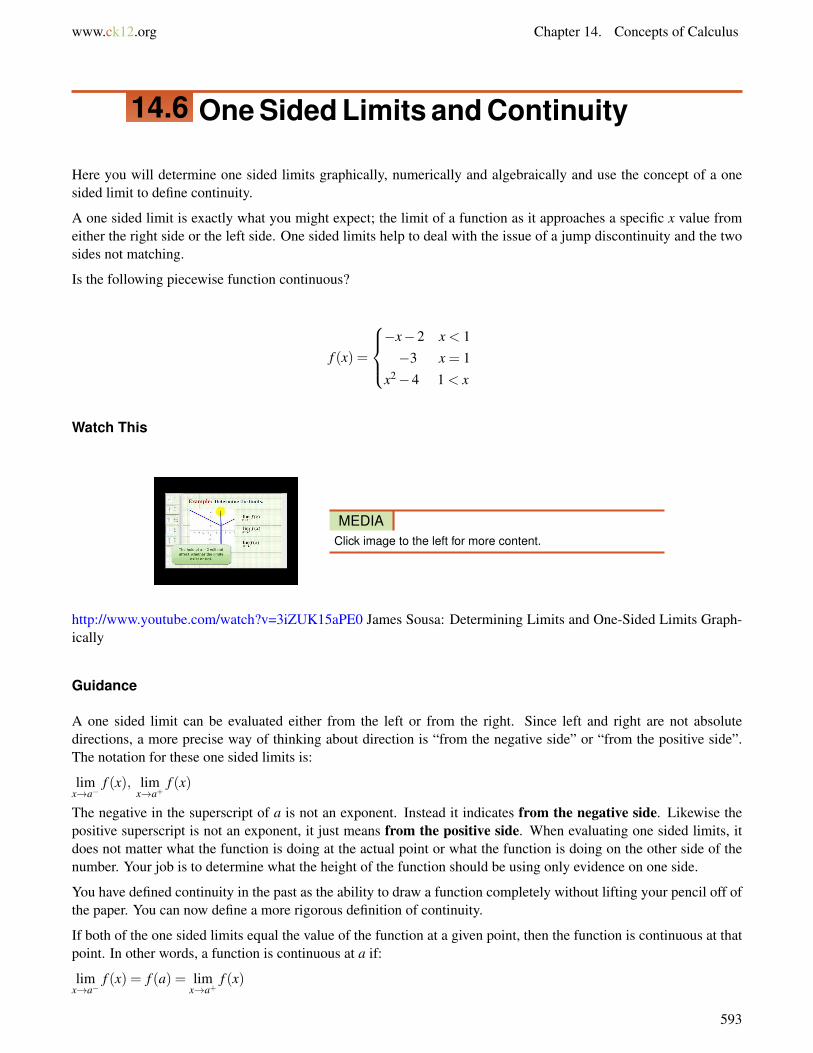
www.ck12.org Chapter 14. Concepts of Calculus
14.6 One Sided Limits and Continuity
Here you will determine one sided limits graphically, numerically and algebraically and use the concept of a onesided limit to define continuity.
A one sided limit is exactly what you might expect; the limit of a function as it approaches a specific x value fromeither the right side or the left side. One sided limits help to deal with the issue of a jump discontinuity and the twosides not matching.
Is the following piecewise function continuous?
f (x) =
−x−2 x < 1−3 x = 1
x2−4 1 < x
Watch This
MEDIAClick image to the left for more content.
http://www.youtube.com/watch?v=3iZUK15aPE0 James Sousa: Determining Limits and One-Sided Limits Graph-ically
Guidance
A one sided limit can be evaluated either from the left or from the right. Since left and right are not absolutedirections, a more precise way of thinking about direction is “from the negative side” or “from the positive side”.The notation for these one sided limits is:
limx→a−
f (x), limx→a+
f (x)
The negative in the superscript of a is not an exponent. Instead it indicates from the negative side. Likewise thepositive superscript is not an exponent, it just means from the positive side. When evaluating one sided limits, itdoes not matter what the function is doing at the actual point or what the function is doing on the other side of thenumber. Your job is to determine what the height of the function should be using only evidence on one side.
You have defined continuity in the past as the ability to draw a function completely without lifting your pencil off ofthe paper. You can now define a more rigorous definition of continuity.
If both of the one sided limits equal the value of the function at a given point, then the function is continuous at thatpoint. In other words, a function is continuous at a if:
limx→a−
f (x) = f (a) = limx→a+
f (x)
593
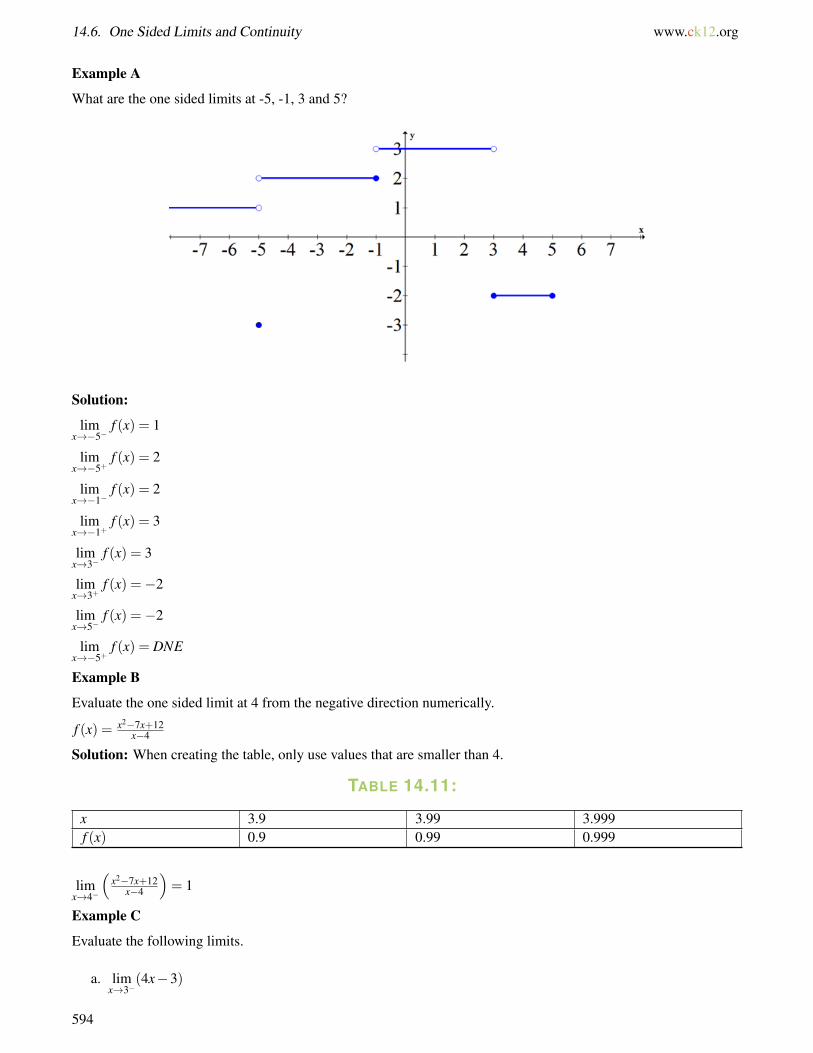
14.6. One Sided Limits and Continuity www.ck12.org
Example A
What are the one sided limits at -5, -1, 3 and 5?
Solution:
limx→−5−
f (x) = 1
limx→−5+
f (x) = 2
limx→−1−
f (x) = 2
limx→−1+
f (x) = 3
limx→3−
f (x) = 3
limx→3+
f (x) =−2
limx→5−
f (x) =−2
limx→−5+
f (x) = DNE
Example B
Evaluate the one sided limit at 4 from the negative direction numerically.
f (x) = x2−7x+12x−4
Solution: When creating the table, only use values that are smaller than 4.
TABLE 14.11:
x 3.9 3.99 3.999f (x) 0.9 0.99 0.999
limx→4−
(x2−7x+12
x−4
)= 1
Example C
Evaluate the following limits.
a. limx→3−
(4x−3)
594
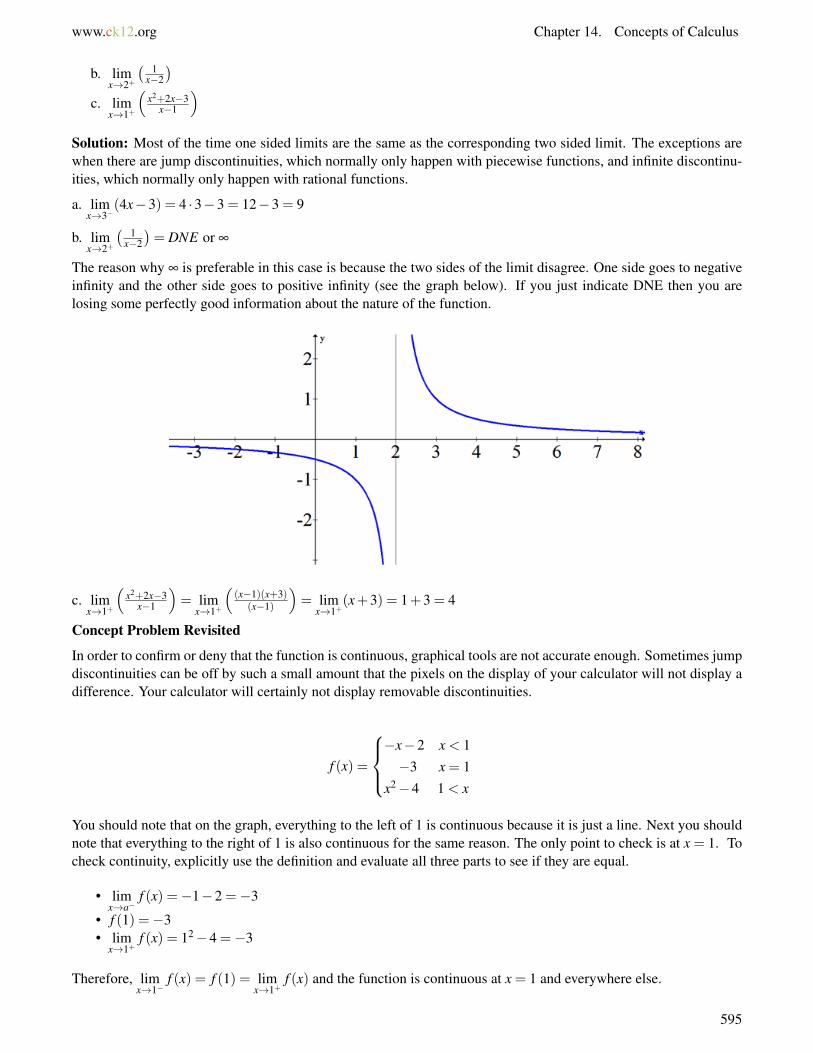
www.ck12.org Chapter 14. Concepts of Calculus
b. limx→2+
( 1x−2
)c. lim
x→1+
(x2+2x−3
x−1
)Solution: Most of the time one sided limits are the same as the corresponding two sided limit. The exceptions arewhen there are jump discontinuities, which normally only happen with piecewise functions, and infinite discontinu-ities, which normally only happen with rational functions.
a. limx→3−
(4x−3) = 4 ·3−3 = 12−3 = 9
b. limx→2+
( 1x−2
)= DNE or ∞
The reason why ∞ is preferable in this case is because the two sides of the limit disagree. One side goes to negativeinfinity and the other side goes to positive infinity (see the graph below). If you just indicate DNE then you arelosing some perfectly good information about the nature of the function.
c. limx→1+
(x2+2x−3
x−1
)= lim
x→1+
((x−1)(x+3)
(x−1)
)= lim
x→1+(x+3) = 1+3 = 4
Concept Problem Revisited
In order to confirm or deny that the function is continuous, graphical tools are not accurate enough. Sometimes jumpdiscontinuities can be off by such a small amount that the pixels on the display of your calculator will not display adifference. Your calculator will certainly not display removable discontinuities.
f (x) =
−x−2 x < 1−3 x = 1
x2−4 1 < x
You should note that on the graph, everything to the left of 1 is continuous because it is just a line. Next you shouldnote that everything to the right of 1 is also continuous for the same reason. The only point to check is at x = 1. Tocheck continuity, explicitly use the definition and evaluate all three parts to see if they are equal.
• limx→a−
f (x) =−1−2 =−3
• f (1) =−3• lim
x→1+f (x) = 12−4 =−3
Therefore, limx→1−
f (x) = f (1) = limx→1+
f (x) and the function is continuous at x = 1 and everywhere else.
595
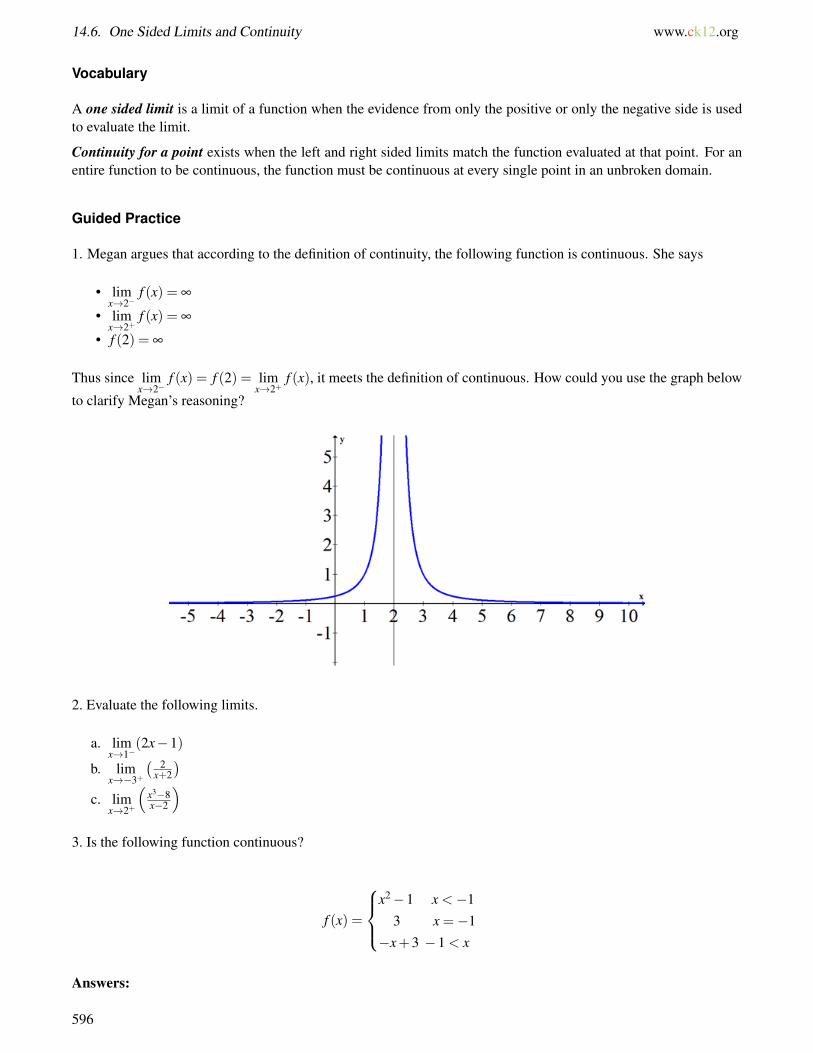
14.6. One Sided Limits and Continuity www.ck12.org
Vocabulary
A one sided limit is a limit of a function when the evidence from only the positive or only the negative side is usedto evaluate the limit.
Continuity for a point exists when the left and right sided limits match the function evaluated at that point. For anentire function to be continuous, the function must be continuous at every single point in an unbroken domain.
Guided Practice
1. Megan argues that according to the definition of continuity, the following function is continuous. She says
• limx→2−
f (x) = ∞
• limx→2+
f (x) = ∞
• f (2) = ∞
Thus since limx→2−
f (x) = f (2) = limx→2+
f (x), it meets the definition of continuous. How could you use the graph below
to clarify Megan’s reasoning?
2. Evaluate the following limits.
a. limx→1−
(2x−1)
b. limx→−3+
( 2x+2
)c. lim
x→2+
(x3−8x−2
)3. Is the following function continuous?
f (x) =
x2−1 x <−1
3 x =−1−x+3 −1 < x
Answers:
596
www.ck12.org Chapter 14. Concepts of Calculus
1. Megan is being extremely liberal with the idea of “= ∞” because what she really means for the two limits is“DNE”. For the function evaluated at 2 the correct response is “undefined”. Two things that do not exist cannot beequal to one another.
2.
a. limx→1−
(2x−1) = 2 ·1−1 = 2−1 = 1
b. limx→−3+
( 2x+2
)= 2−3+2 = 2
−1 =−2
c. limx→2+
(x3−8x−2
)= lim
x→2+
((x−2)(x2+2x+4)
(x−2)
)= lim
x→2+(x2 +2x+4) = 22 +2 ·2+4 = 12
3. Use the definition of continuity.
• limx→1−
f (x) = (−1)2−1 = 1−1 = 0
• f (−1) = 3• lim
x→−1+f (x) =−1+3 = 2
limx→a−
f (x) 6= f (a) 6= limx→a+
f (x) so this function is discontinuous at x =−1. It is continuous everywhere else.
Practice
Evaluate the following limits.
1. limx→6−
(3x2−4)
2. limx→0−
3x−1x
3. limx→0+
3x−1x
4. limx→0+
x|x|
5. limx→0−
x|x|
6. limx→0+
√x√
1+√
x−1
Consider
f (x) =
2x2−1 x < 1
1 x = 1−x+2 1 < x
7. What is limx→1−
f (x)?
8. What is limx→1+
f (x)?
9. Is f (x) continuous at x = 1?
Consider
g(x) =
4x2 +2x−1 x <−2
8 x =−2−3x+5 −2 < x
597

14.6. One Sided Limits and Continuity www.ck12.org
10. What is limx→−2−
g(x)?
11. What is limx→−2+
g(x)?
12. Is g(x) continuous at x =−2?
Consider h(x) shown in the graph below.
13. What is limx→0−
h(x)?
14. What is limx→0+
h(x)?
15. Is h(x) continuous at x = 0?
598
www.ck12.org Chapter 14. Concepts of Calculus
14.7 Intermediate and Extreme Value Theorems
Here you will use continuity to explore the intermediate and extreme value theorems.
While the idea of continuity may seem somewhat basic, when a function is continuous over a closed interval likex ∈ [1,4], you can actually draw some major conclusions. The conclusions may be obvious when you understandthe statements and look at a graph, but they are powerful nonetheless.
What can you conclude using the Intermediate Value Theorem and the Extreme Value Theorem about a function thatis continuous over the closed interval x ∈ [1,4]?
Watch This
MEDIAClick image to the left for more content.
http://www.youtube.com/watch?v=6AFT1wnId9U Intermediate Value Theorem
Guidance
The Intermediate Value Theorem states that if a function is continuous on a closed interval and u is a value betweenf (a) and f (b) then there exists a c ∈ [a,b] such that f (c) = u.
599
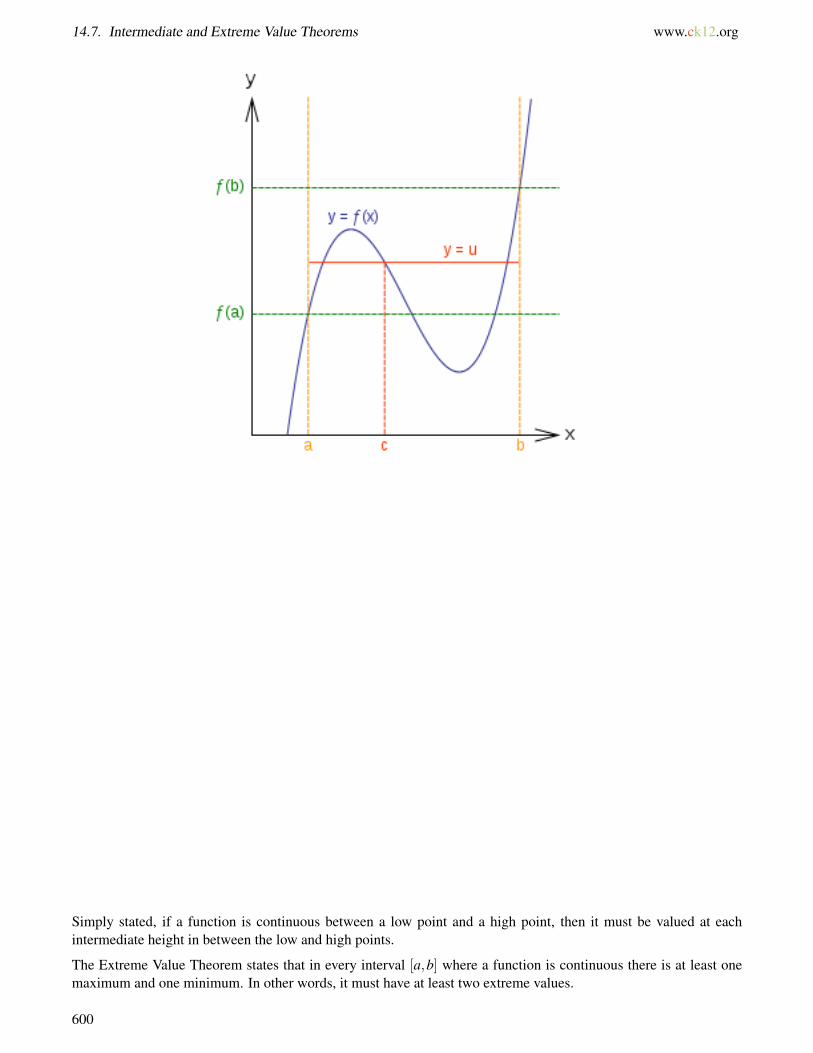
14.7. Intermediate and Extreme Value Theorems www.ck12.org
Simply stated, if a function is continuous between a low point and a high point, then it must be valued at eachintermediate height in between the low and high points.
The Extreme Value Theorem states that in every interval [a,b] where a function is continuous there is at least onemaximum and one minimum. In other words, it must have at least two extreme values.
600

www.ck12.org Chapter 14. Concepts of Calculus
Example A
Show that the converse of the Intermediate Value Theorem is false.
Solution: The converse of the Intermediate Value Theorem is: If there exists a value c ∈ [a,b] such that f (c) = u forevery u between f (a) and f (b) then the function is continuous.
In order to show the statement is false, all you need is one counterexample where every intermediate value is hit andthe function is discontinuous.
This function is discontinuous on the interval [0,10] but every intermediate value between the first height at (0,0) andthe height of the last point (10,5) is hit.
601
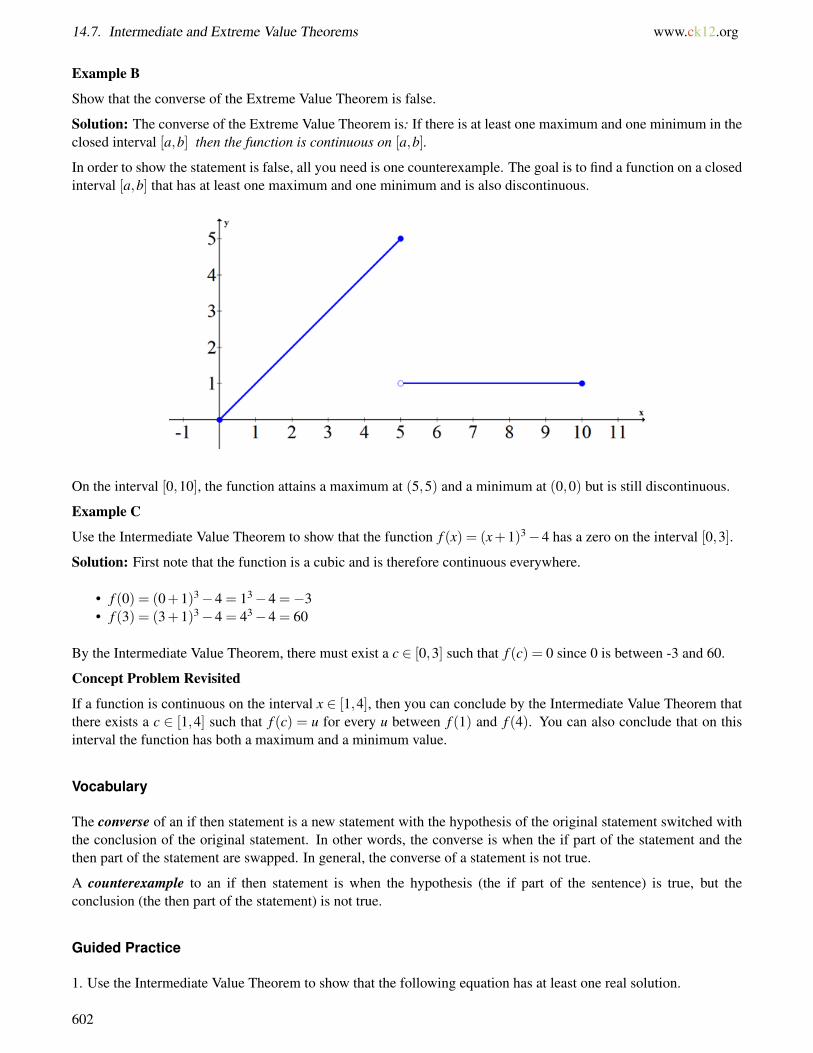
14.7. Intermediate and Extreme Value Theorems www.ck12.org
Example B
Show that the converse of the Extreme Value Theorem is false.
Solution: The converse of the Extreme Value Theorem is: If there is at least one maximum and one minimum in theclosed interval [a,b] then the function is continuous on [a,b].
In order to show the statement is false, all you need is one counterexample. The goal is to find a function on a closedinterval [a,b] that has at least one maximum and one minimum and is also discontinuous.
On the interval [0,10], the function attains a maximum at (5,5) and a minimum at (0,0) but is still discontinuous.
Example C
Use the Intermediate Value Theorem to show that the function f (x) = (x+1)3−4 has a zero on the interval [0,3].
Solution: First note that the function is a cubic and is therefore continuous everywhere.
• f (0) = (0+1)3−4 = 13−4 =−3• f (3) = (3+1)3−4 = 43−4 = 60
By the Intermediate Value Theorem, there must exist a c ∈ [0,3] such that f (c) = 0 since 0 is between -3 and 60.
Concept Problem Revisited
If a function is continuous on the interval x ∈ [1,4], then you can conclude by the Intermediate Value Theorem thatthere exists a c ∈ [1,4] such that f (c) = u for every u between f (1) and f (4). You can also conclude that on thisinterval the function has both a maximum and a minimum value.
Vocabulary
The converse of an if then statement is a new statement with the hypothesis of the original statement switched withthe conclusion of the original statement. In other words, the converse is when the if part of the statement and thethen part of the statement are swapped. In general, the converse of a statement is not true.
A counterexample to an if then statement is when the hypothesis (the if part of the sentence) is true, but theconclusion (the then part of the statement) is not true.
Guided Practice
1. Use the Intermediate Value Theorem to show that the following equation has at least one real solution.
602
www.ck12.org Chapter 14. Concepts of Calculus
x8 = 2x
2. Show that there is at least one solution to the following equation.
sinx = x+2
3. When are you not allowed to use the Intermediate Value Theorem?
Answers:
1. First rewrite the equation: x8−2x = 0
Then describe it as a continuous function: f (x) = x8−2x
This function is continuous because it is the difference of two continuous functions.
• f (0) = 08−20 = 0−1 =−1• f (2) = 28−22 = 256−4 = 252
By the Intermediate Value Theorem, there must exist a c such that f (c) = 0 because −1 < 0 < 252. The number cis one solution to the initial equation.
2. Write the equation as a continuous function: f (x) = sinx− x−2
The function is continuous because it is the sum and difference of continuous functions.
• f (0) = sin0−0−2 =−2• f (−π) = sin(−π)+π−2 = 0+π−2 > 0
By the Intermediate Value Theorem, there must exist a c such that f (c) = 0 because −2 < 0 < π−2. The number cis one solution to the initial equation.
3. The Intermediate Value Theorem should not be applied when the function is not continuous over the interval.
Practice
Use the Intermediate Value Theorem to show that each equation has at least one real solution.
1. cosx =−x
2. ln(x) = e−x +1
3. 2x3−5x2 = 10x−5
4. x3 +1 = x
5. x2 = cosx
6. x5 = 2x3 +2
7. 3x2 +4x−11 = 0
8. 5x4 = 6x2 +1
9. 7x3−18x2−4x+1 = 0
10. Show that f (x) = 2x−32x−5 has a real root on the interval [1,2].
11. Show that f (x) = 3x+12x+4 has a real root on the interval [−1,0].
12. True or false: A function has a maximum and a minimum in the closed interval [a,b]; therefore, the function iscontinuous.
13. True or false: A function is continuous over the interval [a,b]; therefore, the function has a maximum and aminimum in the closed interval.
603

14.7. Intermediate and Extreme Value Theorems www.ck12.org
14. True or false: If a function is continuous over the interval [a,b], then it is possible for the function to have morethan one relative maximum in the interval [a,b].
15. What do the Intermediate Value and Extreme Value Theorems have to do with continuity?
604
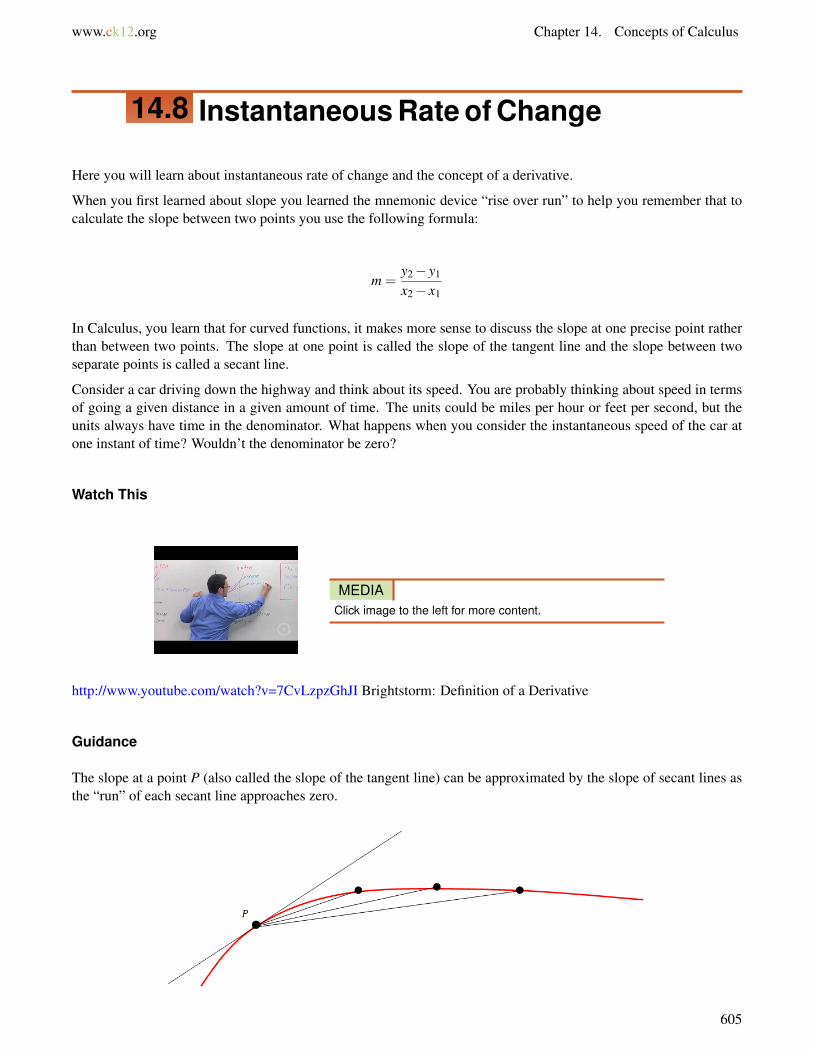
www.ck12.org Chapter 14. Concepts of Calculus
14.8 Instantaneous Rate of Change
Here you will learn about instantaneous rate of change and the concept of a derivative.
When you first learned about slope you learned the mnemonic device “rise over run” to help you remember that tocalculate the slope between two points you use the following formula:
m =y2− y1
x2− x1
In Calculus, you learn that for curved functions, it makes more sense to discuss the slope at one precise point ratherthan between two points. The slope at one point is called the slope of the tangent line and the slope between twoseparate points is called a secant line.
Consider a car driving down the highway and think about its speed. You are probably thinking about speed in termsof going a given distance in a given amount of time. The units could be miles per hour or feet per second, but theunits always have time in the denominator. What happens when you consider the instantaneous speed of the car atone instant of time? Wouldn’t the denominator be zero?
Watch This
MEDIAClick image to the left for more content.
http://www.youtube.com/watch?v=7CvLzpzGhJI Brightstorm: Definition of a Derivative
Guidance
The slope at a point P (also called the slope of the tangent line) can be approximated by the slope of secant lines asthe “run” of each secant line approaches zero.
605

14.8. Instantaneous Rate of Change www.ck12.org
Because you are interested in the slope as the “run” approaches zero, this is a limit question. One of the main reasonsthat you study limits in calculus is so that you can determine the slope of a curve at a point (the slope of a tangentline).
Example A
Estimate the slope of the following function at -3, -2, -1, 0, 1, 2, 3. Organize the slopes in a table.
Solution: By mentally drawing a tangent line at the following x values you can estimate the following slopes.
TABLE 14.12:
x slope-3 0-2 0-1 -10 -11 22 03 0
If you graph these points you will produce a graph of what’s known as the derivative of the original function.
Example B
Estimate the slope of the function f (x) =√
x at the point (1,1) by calculating 4 successively close secant lines.
606

www.ck12.org Chapter 14. Concepts of Calculus
Solution: Calculate the slope between (1,1) and 4 other points on the curve:
• The slope of the line between(
5,√
5)
and (1,1) is: m1 =
√5−1
5−1 ≈ 0.309
• The slope of the line between (4, 2) and (1,1) is: m2 =2−14−1 ≈ 0.333
• The slope of the line between(
3,√
3)
and (1,1) is: m3 =
√3−1
3−1 ≈ 0.366
• The slope of the line between(
2,√
2)
and (1,1) is: m4 =
√2−1
2−1 ≈ 0.414
If you had to guess what the slope was at the point (1,1) what would you guess the slope to be?
Example C
Evaluate the following limit and explain its connection with Example B.
limx→1
(√x−1
x−1
)Solution: Notice that the pattern in the previous problem is leading up to
√1−1
1−1 . Unfortunately, this cannot becomputed directly because there is a zero in the denominator. Luckily, you know how to evaluate using limits.
m = limx→1
((√
x−1)(x−1)
· (√
x+1)(√
x+1)
)= lim
x→1
((x−1)
(x−1)(√
x+1)
)= lim
x→1
(1
(√
x+1)
)=
1√1+1
=12
= 0.5
The slope of the function f (x) =√
x at the point (1,1) is exactly m = 12 .
Concept Problem Revisited
If you write the ratio of distance to time and use limit notation to allow time to go to zero you do seem to get a zeroin the denominator.
limtime→0
(distancetime
)The great thing about limits is that you have learned techniques for finding a limit even when the denominator goes tozero. Instantaneous speed for a car essentially means the number that the speedometer reads at that precise momentin time. You are no longer restricted to finding slope from two separate points.
Vocabulary
A tangent line to a function at a given point is the straight line that just touches the curve at that point. The slope ofthe tangent line is the same as the slope of the function at that point.
A secant line is a line that passes through two distinct points on a function.
A derivative is a function of the slopes of the original function.
607

14.8. Instantaneous Rate of Change www.ck12.org
Guided Practice
1. Sketch a complete cycle of a sine graph. Estimate the slopes at 0, π
2 ,π,3π
2 ,2π.
2. Logan travels by bike at 20 mph for 3 hours. Then she gets in a car and drives 60 mph for 2 hours. Sketch boththe distance vs. time graph and the rate vs. time graph.
3. Approximate the slope of y = x3 at (1,1) by using secant lines from the left. Will the actual slope be greater orless than the estimates?
Answers:
1.
TABLE 14.13:
x Slope0 1π
2 0π -13π
2 02π 1
You should notice that these are the exact values of cosine evaluated at those points.
2. Distance vs. Time:
608

www.ck12.org Chapter 14. Concepts of Calculus
Rate vs. Time: (this is the graph of the derivative of the original function shown above)
3.
• The slope of the line between (0.7,0.73) and (1,1) is: m1 =0.73−10.7−1 ≈ 2.19
• The slope of the line between (0.8,0.83) and (1,1) is: m2 =0.83−10.8−1 ≈ 2.44
• The slope of the line between (0.9,0.93) and (1,1) is: m3 =0.93−10.9−1 ≈ 2.71
• The slope of the line between (0.95,0.953) and (1,1) is: m1 =0.953−10.95−1 ≈ 2.8525
• The slope of the line between (0.975,0.9753) and (1,1) is: m1 =0.9753−10.975−1 ≈ 2.925625
The slope at (1,1) will be slightly greater than the estimates because of the way the slope curves. The slope at (1,1)appears to be about 3.
Practice
1. Approximate the slope of y = x2 at (1,1) by using secant lines from the left. Will the actual slope be greater orless than the estimates?
2. Evaluate the following limit and explain how it confirms your answer to #1.
limx→1
(x2−1x−1
)609

14.8. Instantaneous Rate of Change www.ck12.org
3. Approximate the slope of y = 3x2 +1 at (1,4) by using secant lines from the left. Will the actual slope be greateror less than the estimates?
4. Evaluate the following limit and explain how it confirms your answer to #3.
limx→1
(3x2+1−4
x−1
)5. Approximate the slope of y = x3−2 at (1,−1) by using secant lines from the left. Will the actual slope be greateror less than the estimates?
6. Evaluate the following limit and explain how it confirms your answer to #5.
limx→1
(x3−2−(−1)
x−1
)7. Approximate the slope of y = 2x3−1 at (1,1) by using secant lines from the left. Will the actual slope be greateror less than the estimates?
8. What limit could you evaluate to confirm your answer to #7?
9. Sketch a complete cycle of a cosine graph. Estimate the slopes at 0, π
2 ,π,3π
2 ,2π.
10. How do the slopes found in the previous question relate to the sine function? What function do you think is thederivative of the cosine function?
11. Sketch the line y = 2x+1. What is the slope at each point on this line? What is the derivative of this function?
12. Logan travels by bike at 30 mph for 2 hours. Then she gets in a car and drives 65 mph for 3 hours. Sketch boththe distance vs. time graph and the rate vs. time graph.
13. Explain what a tangent line is and how it relates to derivatives.
14. Why is finding the slope of a tangent line for a point on a function the same as the instantaneous rate of changeat that point?
15. What do limits have to do with finding the slopes of tangent lines?
610
www.ck12.org Chapter 14. Concepts of Calculus
14.9 Area Under a Curve
Here you will estimate the area under a curve and interpret its meaning in context.
Calculating the area under a straight line can be done with geometry. Calculating the area under a curved linerequires calculus. Often the area under a curve can be interpreted as the accumulated amount of whatever thefunction is modeling. Suppose a car’s speed in meters per second can be modeled by a quadratic for the first 8seconds of acceleration:
s(t) = t2
How far has the car traveled in 8 seconds?
Watch This
MEDIAClick image to the left for more content.
http://www.youtube.com/watch?v=Z_OHgubPJKA James Sousa: Interpret the Meaning of Area Under a Function
MEDIAClick image to the left for more content.
http://www.youtube.com/watch?v=BvwyTXeuLS0 James Sousa: Approximate the Area Under a Curve with 4 RightSided Rectangles
Guidance
The area under a curve can be approximated with rectangles equally spaced under a curve as shown below. Forconsistency, you can choose whether the boxes should hit the curve on the left hand corner, the right hand corner,the maximum value, or the minimum value. The more boxes you use the narrower the boxes will be and thus, themore accurate your approximation of the area will be.
611
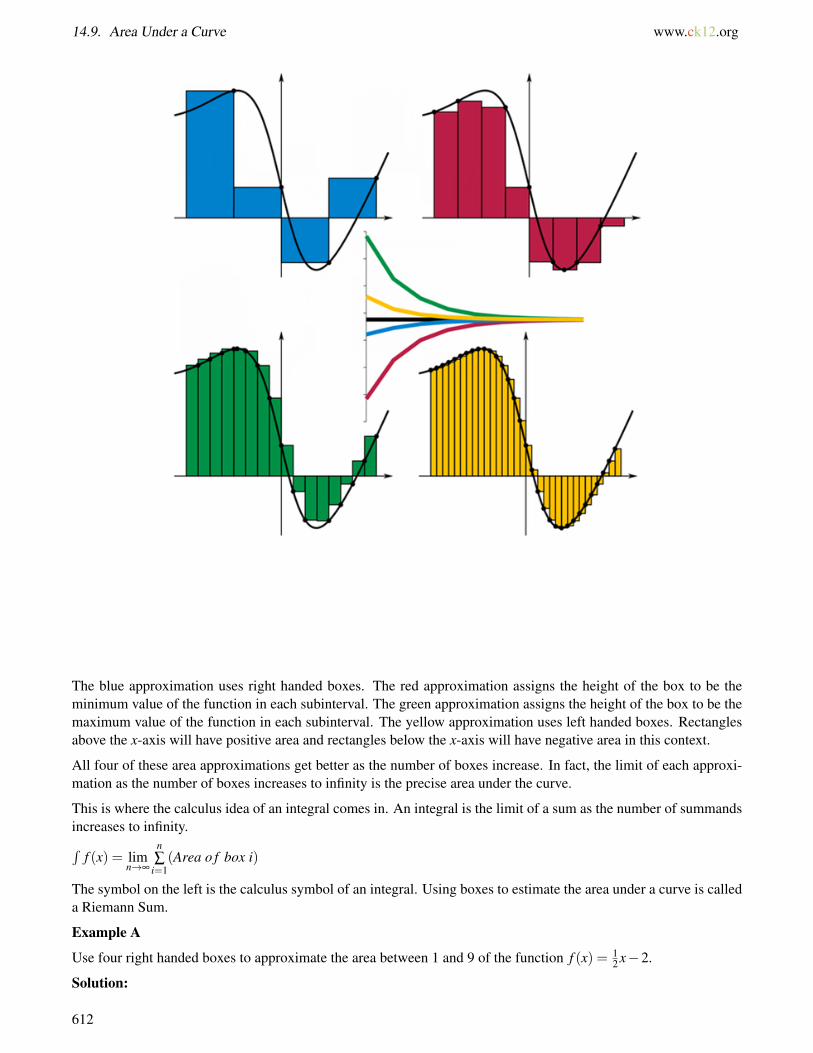
14.9. Area Under a Curve www.ck12.org
The blue approximation uses right handed boxes. The red approximation assigns the height of the box to be theminimum value of the function in each subinterval. The green approximation assigns the height of the box to be themaximum value of the function in each subinterval. The yellow approximation uses left handed boxes. Rectanglesabove the x-axis will have positive area and rectangles below the x-axis will have negative area in this context.
All four of these area approximations get better as the number of boxes increase. In fact, the limit of each approxi-mation as the number of boxes increases to infinity is the precise area under the curve.
This is where the calculus idea of an integral comes in. An integral is the limit of a sum as the number of summandsincreases to infinity.∫
f (x) = limn→∞
n∑
i=1(Area o f box i)
The symbol on the left is the calculus symbol of an integral. Using boxes to estimate the area under a curve is calleda Riemann Sum.
Example A
Use four right handed boxes to approximate the area between 1 and 9 of the function f (x) = 12 x−2.
Solution:
612
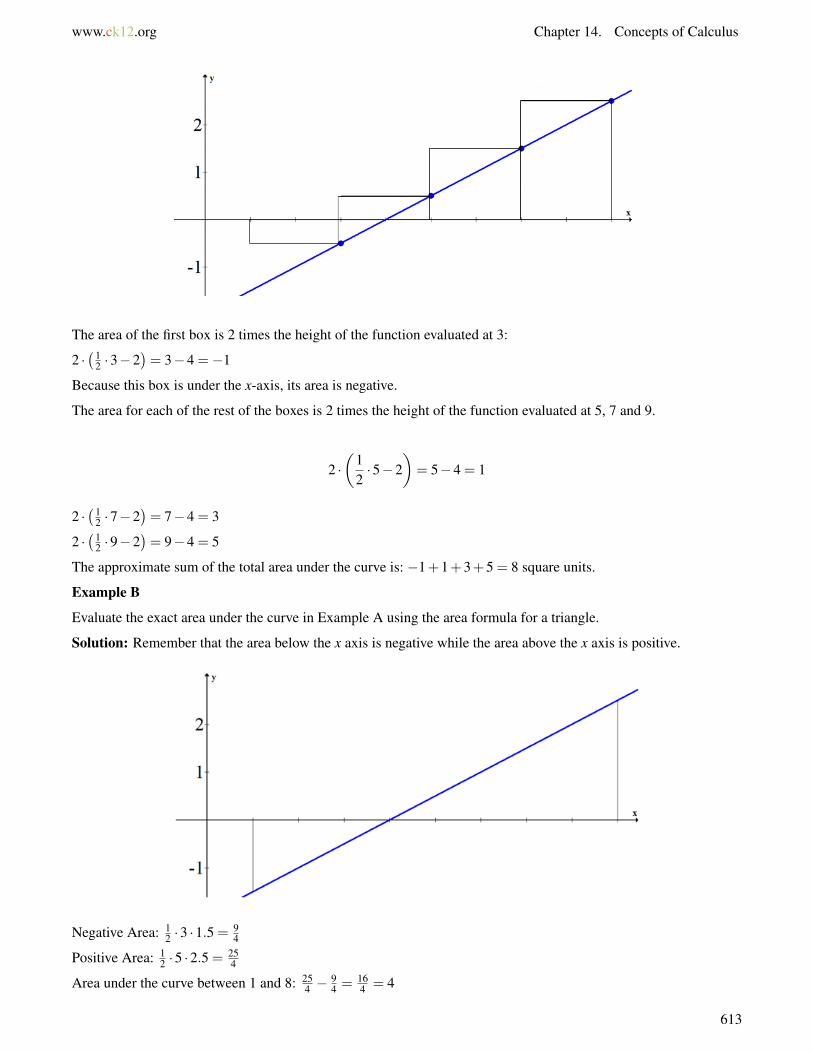
www.ck12.org Chapter 14. Concepts of Calculus
The area of the first box is 2 times the height of the function evaluated at 3:
2 ·(1
2 ·3−2)= 3−4 =−1
Because this box is under the x-axis, its area is negative.
The area for each of the rest of the boxes is 2 times the height of the function evaluated at 5, 7 and 9.
2 ·(
12·5−2
)= 5−4 = 1
2 ·(1
2 ·7−2)= 7−4 = 3
2 ·(1
2 ·9−2)= 9−4 = 5
The approximate sum of the total area under the curve is: −1+1+3+5 = 8 square units.
Example B
Evaluate the exact area under the curve in Example A using the area formula for a triangle.
Solution: Remember that the area below the x axis is negative while the area above the x axis is positive.
Negative Area: 12 ·3 ·1.5 = 9
4
Positive Area: 12 ·5 ·2.5 = 25
4
Area under the curve between 1 and 8: 254 −
94 = 16
4 = 4
613
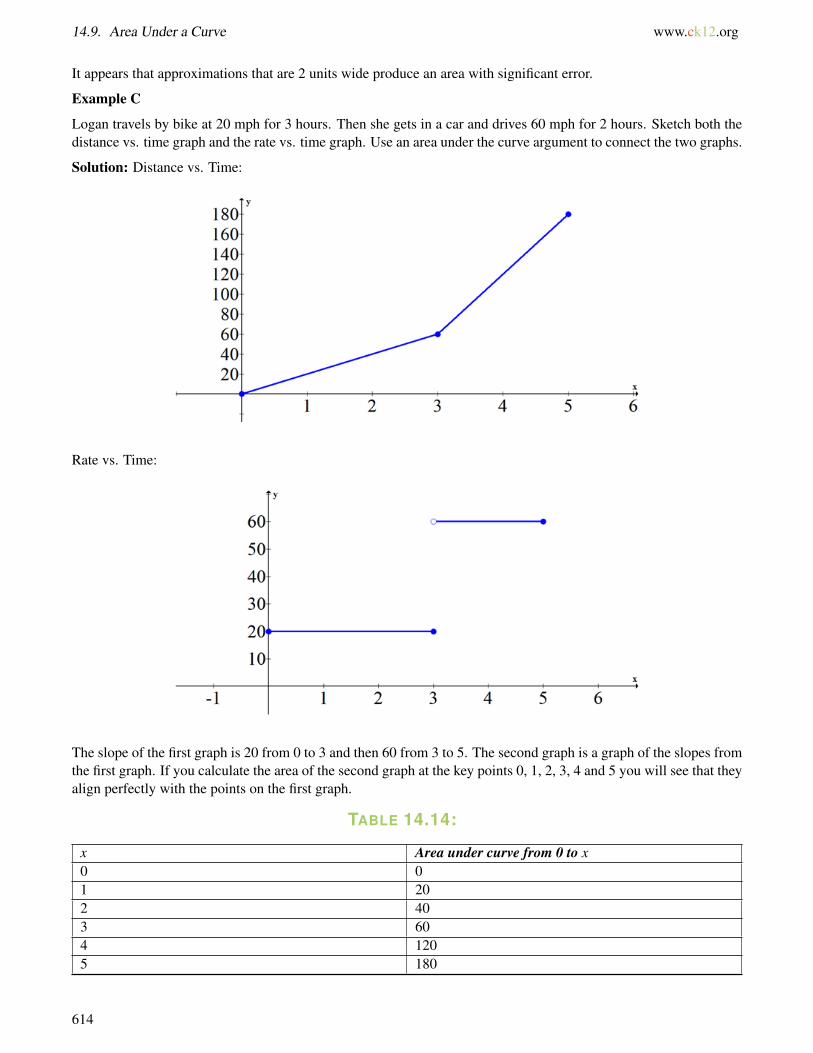
14.9. Area Under a Curve www.ck12.org
It appears that approximations that are 2 units wide produce an area with significant error.
Example C
Logan travels by bike at 20 mph for 3 hours. Then she gets in a car and drives 60 mph for 2 hours. Sketch both thedistance vs. time graph and the rate vs. time graph. Use an area under the curve argument to connect the two graphs.
Solution: Distance vs. Time:
Rate vs. Time:
The slope of the first graph is 20 from 0 to 3 and then 60 from 3 to 5. The second graph is a graph of the slopes fromthe first graph. If you calculate the area of the second graph at the key points 0, 1, 2, 3, 4 and 5 you will see that theyalign perfectly with the points on the first graph.
TABLE 14.14:
x Area under curve from 0 to x0 01 202 403 604 1205 180
614

www.ck12.org Chapter 14. Concepts of Calculus
Concept Problem Revisited
You can use the area under the curve to find the total distance traveled in the first 8 seconds. Since the quadratic is acurve you must choose the number of subintervals you want to use and whether you want right or left handed boxesfor estimating. Suppose you choose 8 left handed boxes of width one.
TABLE 14.15:
x 0 1 2 3 4 5 6 7Area ofbox to theright
1·0 1·1 1·4 1·9 1·16 1·25 1·36 1·49
The approximate sum is 1+ 4+ 9+ 16+ 25+ 36+ 49 = 140. This means that the car traveled approximately 140meters in the first 8 seconds.
Vocabulary
Subintervals are created when an interval is broken into smaller equally sized intervals.
An integral is the limit of a sum as the number of summands increases to infinity.
Using boxes to estimate the area under a curve is called a Riemann Sum.
A summand is one of many pieces being summed together.
Guided Practice
1. Approximate the area under the curve using eight subintervals and right endpoints.
f (x) = 3x2−1, −1≤ x≤ 7
2. Approximate the area under the curve using eight subintervals and left endpoints.
f (x) = 4x +3, 2≤ x≤ 6
3. Approximate the area under the curve using twenty subintervals and left endpoints.
f (x) = xx, 1≤ x≤ 3
Answers:
615
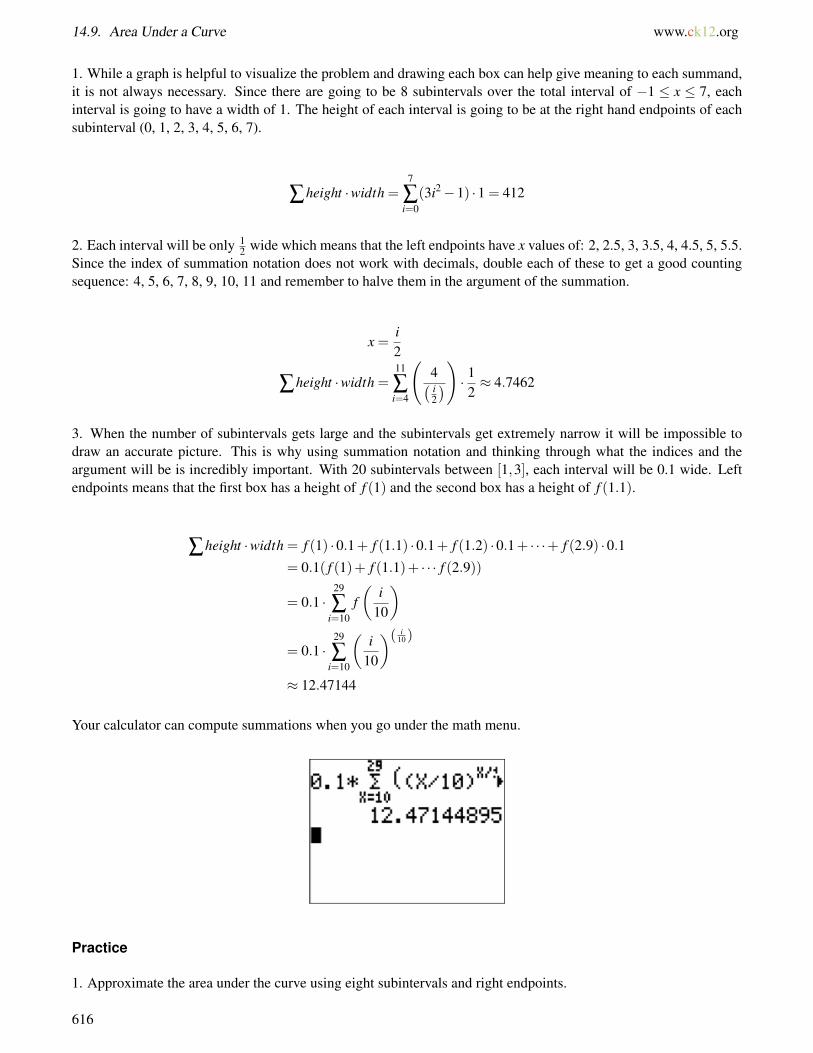
14.9. Area Under a Curve www.ck12.org
1. While a graph is helpful to visualize the problem and drawing each box can help give meaning to each summand,it is not always necessary. Since there are going to be 8 subintervals over the total interval of −1 ≤ x ≤ 7, eachinterval is going to have a width of 1. The height of each interval is going to be at the right hand endpoints of eachsubinterval (0, 1, 2, 3, 4, 5, 6, 7).
∑height ·width =7
∑i=0
(3i2−1) ·1 = 412
2. Each interval will be only 12 wide which means that the left endpoints have x values of: 2, 2.5, 3, 3.5, 4, 4.5, 5, 5.5.
Since the index of summation notation does not work with decimals, double each of these to get a good countingsequence: 4, 5, 6, 7, 8, 9, 10, 11 and remember to halve them in the argument of the summation.
x =i2
∑height ·width =11
∑i=4
(4( i2
)) · 12≈ 4.7462
3. When the number of subintervals gets large and the subintervals get extremely narrow it will be impossible todraw an accurate picture. This is why using summation notation and thinking through what the indices and theargument will be is incredibly important. With 20 subintervals between [1,3], each interval will be 0.1 wide. Leftendpoints means that the first box has a height of f (1) and the second box has a height of f (1.1).
∑height ·width = f (1) ·0.1+ f (1.1) ·0.1+ f (1.2) ·0.1+ · · ·+ f (2.9) ·0.1= 0.1( f (1)+ f (1.1)+ · · · f (2.9))
= 0.1 ·29
∑i=10
f(
i10
)
= 0.1 ·29
∑i=10
(i
10
)( i10)
≈ 12.47144
Your calculator can compute summations when you go under the math menu.
Practice
1. Approximate the area under the curve using eight subintervals and right endpoints.
616

www.ck12.org Chapter 14. Concepts of Calculus
f (x) = x2− x+1, 0≤ x≤ 8
2. Approximate the area under the curve using eight subintervals and left endpoints.
f (x) = x2−2x+1, −4≤ x≤ 4
3. Approximate the area under the curve using twenty subintervals and left endpoints.
f (x) =√
x+3, 0≤ x≤ 4
4. Approximate the area under the curve using 100 subintervals and left endpoints. Compare to your answer from#3.
f (x) =√
x+3, 0≤ x≤ 4
5. Approximate the area under the curve using eight subintervals and left endpoints.
f (x) = cos(x), 0≤ x≤ 4
6. Approximate the area under the curve using twenty subintervals and left endpoints.
f (x) = cos(x), 0≤ x≤ 4
7. Approximate the area under the curve using 100 subintervals and left endpoints.
f (x) = cos(x), 0≤ x≤ 4
The following graph shows the rate (in miles per hour) vs. time (in hours) for a car.
8. Describe what is happening with the car.
9. How far did the car travel in 5 hours?
The following graph shows the rate (in feet per second) vs. time (in seconds) for a car.
617
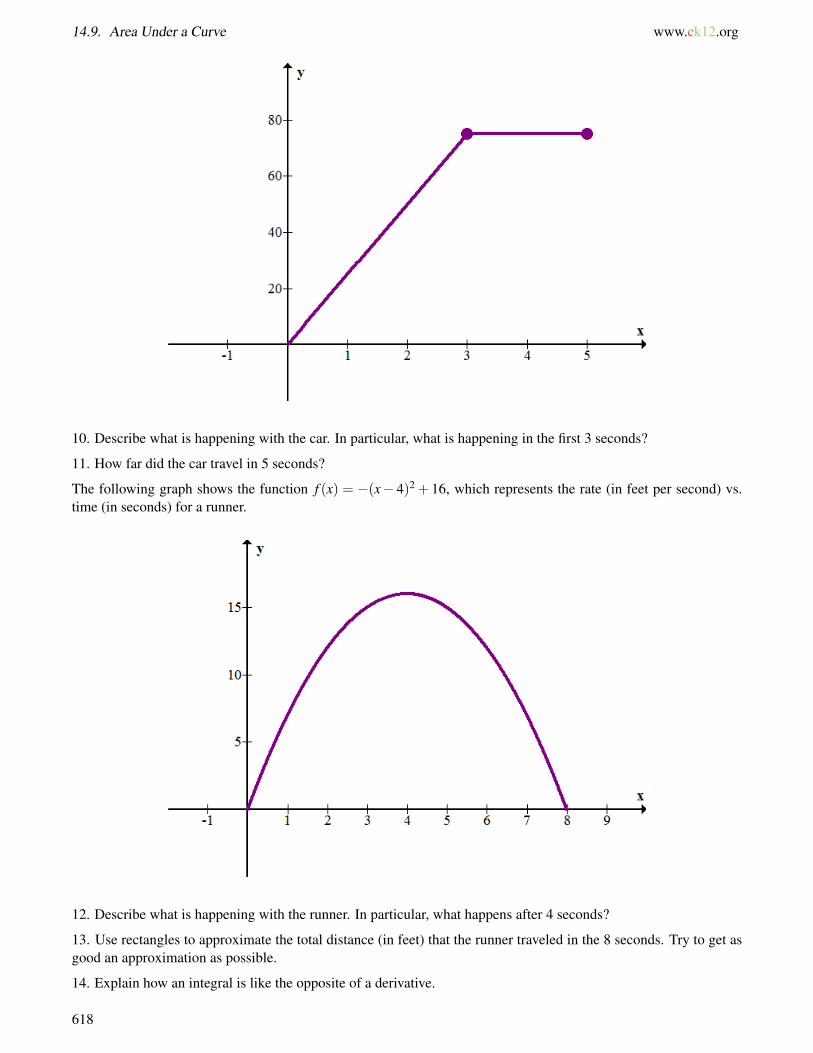
14.9. Area Under a Curve www.ck12.org
10. Describe what is happening with the car. In particular, what is happening in the first 3 seconds?
11. How far did the car travel in 5 seconds?
The following graph shows the function f (x) = −(x− 4)2 + 16, which represents the rate (in feet per second) vs.time (in seconds) for a runner.
12. Describe what is happening with the runner. In particular, what happens after 4 seconds?
13. Use rectangles to approximate the total distance (in feet) that the runner traveled in the 8 seconds. Try to get asgood an approximation as possible.
14. Explain how an integral is like the opposite of a derivative.
618

www.ck12.org Chapter 14. Concepts of Calculus
15. How do integrals relate to sums?
You learned that limits enable you to work infinitely close to a point without caring what happens at the point itself.Using this subtle approach, you began to answer two of the biggest questions in Calculus. 1) What is the slope ofthe tangent line at a point on a curve? 2) What is the area under a curve?
619
14.10. References www.ck12.org
14.10 References
1. CK-12 Foundation. . CCSA2. CK-12 Foundation. . CCSA3. CK-12 Foundation. . CCSA4. CK-12 Foundation. . CCSA5. CK-12 Foundation. . CCSA6. CK-12 Foundation. . CCSA7. CK-12 Foundation. . CCSA8. CK-12 Foundation. . CCSA9. CK-12 Foundation. . CCSA
10. CK-12 Foundation. . CCSA11. CK-12 Foundation. . CCSA12. CK-12 Foundation. . CCSA13. CK-12 Foundation. . CCSA14. CK-12 Foundation. . CCSA15. CK-12 Foundation. . CCSA16. CK-12 Foundation. . CCSA17. CK-12 Foundation. . CCSA18. CK-12 Foundation. . CCSA19. CK-12 Foundation. . CCSA20. CK-12 Foundation. . CCSA21. CK-12 Foundation. . CCSA22. CK-12 Foundation. . CCSA23. CK-12 Foundation. . CCSA24. . . CC BY-NC-SA25. CK-12 Foundation. . CCSA26. CK-12 Foundation. . CCSA27. . . CC BY-NC-SA28. CK-12 Foundation. . CCSA29. CK-12 Foundation. . CCSA30. CK-12 Foundation. . CCSA31. CK-12 Foundation. . CCSA32. CK-12 Foundation. . CCSA33. CK-12 Foundation. . CCSA34. CK-12 Foundation. . CCSA35. CK-12 Foundation. . CCSA36. CK-12 Foundation. . CCSA37. CK-12 Foundation. . CCSA
620
www.ck12.org Chapter 15. Concepts of Statistics
CHAPTER 15 Concepts of StatisticsChapter Outline
15.1 MEAN, MEDIAN AND MODE
15.2 EXPECTED VALUE AND PAYOFFS
15.3 FIVE NUMBER SUMMARY
15.4 GRAPHIC DISPLAYS OF DATA
15.5 VARIANCE
15.6 THE NORMAL CURVE
15.7 LINEAR CORRELATION
15.8 MODELING WITH REGRESSION
15.9 REFERENCES
Statistics is hugely important for understanding, describing and predicting the world around you. Descriptivestatistics is using summaries to present information that you have found to a reader. Summaries can be graphsor small groups of numbers that are easier to understand than long lists of numbers. Inferential statistics is usingdata to make predictions. Both inferential statistics and descriptive statistics help you understand the world aroundyou and communicate it effectively.
621
15.1. Mean, Median and Mode www.ck12.org
15.1 Mean, Median and Mode
Here you will calculate three measures of the center of univariate data and decide which measure is best based oncontext.
The three measures of central tendency are mean, median, and mode. When would it make sense to use one of thesemeasures and not the others?
Watch This
MEDIAClick image to the left for more content.
http://www.youtube.com/watch?v=h8EYEJ32oQ8 Khan Academy: Statistics Intro: Mean, Median, and Mode
Guidance
With descriptive statistics, your goal is to describe the data that you find in a sample or is given in a problem.Because it would not make sense to present your findings as long lists of numbers, you summarize important aspectsof the data. One important aspect of the data is the measure of central tendency, which is a measure of the “middle”value of a set of data. There are three ways to measure central tendency:
1. Use the mean, which is the arithmetic average of the data.2. Use the median, which is the number exactly in the middle of the data. When the data has an odd number of
counts, the median is the middle number after the data has been ordered. When the data has an even numberof counts, the median is the arithmetic average of the two most central numbers.
3. Use the mode, which is the most often occurring number in the data. If there are two or more numbers thatoccur equally frequently, then the data is said to be bimodal or multimodal.
Calculating the mean, median and mode is straightforward. What is challenging is determining when to use eachmeasure and knowing how to interpret the data using the relationships between the three measures.
Example A
Five people were called on a phone survey to respond to some political opinion questions. Two people were fromthe zip code 94061, one person was from the zip code 94305 and two people were from 94062.
Which measure of central tendency makes the most sense to use if you want to state where the average person wasfrom?
Solution: None of the measures of central tendency make sense to apply to this situation. Zip codes are categoricaldata rather than quantitative data even though they happen to be numbers. Other examples of categorical data arehair color or gender. You could argue that mode is applicable in a broad sense, but in general remember that mean,median, and mode can only be applied to quantitative data.
622

www.ck12.org Chapter 15. Concepts of Statistics
Example B
Compute the mean, median and mode for the following numbers.
3, 5, 1, 6, 8, 4, 5, 2, 7, 8, 4, 2, 1, 3, 4, 6, 7, 9, 4, 3, 2
Solution:
Mean: The sum of all these numbers is 94 and there are 21 numbers total so the mean is 9421 ≈ 4.4762.
Median: When you order the numbers from least to greatest you get:
1, 1, 2, 2, 2, 3, 3, 3, 4, 4, 4, 4, 5, 5, 6, 6, 7, 7, 8, 8, 9
The 11th number has ten numbers to the right and ten numbers to the left so it is the median. The median is thenumber 4.
Mode: the most frequently occurring number is the number 4.
Note: it is common practice to round to 4 decimals in AP Statistics.
Example C
You write a computer code to produce a random number between 0 and 10 with equal probability. Unfortunately,you suspect your code doesn’t work perfectly because in your first few attempts at running the code, it produces thefollowing numbers:
1, 9, 1, 1, 9, 2, 9, 1, 9, 9, 9, 2, 2
How would you argue using mean, median, or mode that this code is probably not producing a random numberbetween 0 and 10 with equal probability?
Solution: This question is very similar to questions you will see when you study statistical inference.
First you would note that the mean of the data is 4.9231. If the data was truly random then the mean would probablybe right around the number 5 which it is. This is not strong evidence to suggest that the random number generatingcode is broken.
Next you would note that the median of the data is 2. This should make you suspect that something is wrong. Youwould expect that the median is of random numbers between 0 and 10 to be somewhere around 5.
Lastly, you would note that the mode of the data is 9. By itself this is not strong data to suggest anything. Everysample will have to have at least one mode. What should make you suspicious, however, is the fact that only twoother numbers were produced and were almost as frequent as the number 9. You would expect a greater variety ofnumbers to be produced.
Concept Problem Revisited
In order to decide which measure of central tendency to use, it is a good idea to calculate and interpret all three ofthe numbers.
For example, if someone asked you how many people can sit in the typical car, it would make more sense to usemode than to use mean. With mode, you could find out that a five person car is the most frequent car driven anddetermine that the answer to the question is 5. If you calculate the mean for the number of seats in all cars, you willend up with a decimal like 5.4, which makes less sense in this context.
On the other hand, if you were finding the central heights of NBA players, using mean might make a lot more sensethan mode.
Vocabulary
The mean is the arithmetic average of the data.
The median is the number in the middle of a data set. When the data has an odd number of counts, the median is
623
15.1. Mean, Median and Mode www.ck12.org
the middle number after the data has been ordered. When the data has an even number of counts, the median is theaverage of the two most central numbers.
The mode is the most often occurring number in the data. If there are two or more numbers which occur equallyfrequently, then the data is said to be bimodal or multimodal.
With descriptive statistics, your goal is to describe the data that you find in a sample or is given in a problem.
With inference statistics, your goal is use the data in a sample to draw conclusions about a larger population.
Guided Practice
1. Ross is with his friends and they want to play basketball. They decide to choose teams based on the number ofcousins everyone has. One team will be the team with fewer cousins and the other team will be the team with morecousins. Should they use the mean, median or mode to compute the cutoff number that will separate the two teams?
2. Compute the mean, median, and mode for the following numbers.
1, 4, 5, 7, 6, 8, 0, 3, 2, 2, 3, 4, 6, 5, 7, 8, 9, 0, 6, 5, 3, 1, 2, 4, 5, 6, 7, 8, 8, 8, 4, 3, 2
3. The cost of fresh blueberries at different times of the year are:
$2.50, $2.99, $3.20, $3.99, $4.99
If you bought blueberries regularly what would you typically pay?
Answers:
1. Ross and his friends should use the median number of cousins as the cutoff number because this will allow eachteam to have the same number of players. If there are an odd number of people playing, then the extra person willjust join either team or switch in later.
2. The mean is 4.6061. The median is 5. The mode is 8.
3. The word “typically” is used instead of average to allow you to make your own choice as to whether mean,median, or mode would make the most sense. In this case, mean does make the most sense. The average cost is$3.53.
Practice
You surveyed the students in your English class to find out how many siblings each student had. Here are yourresults:
0, 0, 0, 0, 0, 1, 1, 1, 1, 1, 1, 1, 1, 1, 1, 1, 1, 1, 1, 2, 2, 2, 2, 10, 12
1. Find the mean, median, and mode of this data.
2. Why does it make sense that the mean number of siblings is greater than the median number of siblings?
3. Which measure of central tendency do you think is best for describing the typical number of siblings?
4. So far in math you have taken 10 quizzes this semester. The mean of the scores is 88.5. What is the sum of thescores?
5. Find x if 5, 9, 11, 12, 13, 14, 16, and x have a mean of 12.
6. Meera drove an average of 22 miles a day last week. How many miles did she drive last week?
7. Find x if 2, 6, 9, 8, 4, 5, 8, 1, 4, and x have a median of 5.
Calculate the mean, median, and mode for each set of numbers:
8. 11, 15, 19, 12, 21, 34, 15, 28, 24, 15, 27, 19, 20, 13, 15
624
www.ck12.org Chapter 15. Concepts of Statistics
9. 3, 5, 7, 5, 5, 17, 8, 9, 11, 5, 3, 7
10. -3, 0, 5, 8, 12, 4, 2, 1, 6
Calculate the mean and median for each set of numbers:
11. 12, 88, 89, 90
12. 16, 17, 19, 20, 20, 98
13. For which of the previous two questions was the median less than the mean? What in the set of numbers causedthis?
14. For which of the previous two questions was the median greater than the mean? What in the set of numberscaused this?
15. In each of the sets of numbers for problems 11 and 12, there is one number that could be considered an outlier.Which numbers do you think are the outliers and why? What would happen to the mean and median if you removedthe outliers?
625

15.2. Expected Value and Payoffs www.ck12.org
15.2 Expected Value and Payoffs
Here you will apply what you know about mean and averages to weighted averages and expected value.
When playing a game of chance there are three basic elements. There is the cost to play the game (usually), theprobability of winning the game, and the amount you receive if you win. If games of chance with these threeelements are played repeatedly, you can use probability and averages to calculate how much you can expect to winor lose in the long run.
Consider a dice game that pays you triple your bet if you roll a six and double your bet if you roll a five. If you rollanything else you lose your bet. What is your expected return on a one dollar wager?
Watch This
MEDIAClick image to the left for more content.
http://www.youtube.com/watch?v=j__Kredt7vY Khan Academy: Expected Value
Guidance
A weighted average is like a regular average except the data is often given to you in summary form.
Data in Raw Form:
1, 3, 5, 3, 2, 1, 2, 5, 6, 4, 5, 2, 6, 1, 4, 3, 6, 1, 2, 4, 6, 1, 3, 1, 3, 5, 6
Data in Summary Form:
TABLE 15.1:
Number Occurrence Count1 62 43 54 35 46 5Total Occurrences: 27
Notice that the summary data indicates, for example, how many times a 1 was rolled (6 times). To calculate the totalnumber of occurrences of data:
• In raw form: count how many data points you have
626

www.ck12.org Chapter 15. Concepts of Statistics
• In summary form: find the sum the occurrence column
To calculate the average:
• In raw form: find the sum of the data points and divide by the total number of occurrences.• In summary form: find the sum of the data points by finding the sum of the product of each number and its
occurrence:
1 ·6+2 ·4+3 ·5+4 ·3+5 ·4+6 ·5 = 91
Then, divide that sum by the total number of occurrences. In a sense, you are assigning a weight to each ofthe six numbers based on their frequency in your 27 trials.
The same logic of finding the average of data given in summary form applies when doing theoretical expected valuefor a game or a weighted average. Consider a game of chance with 4 prizes ($1, $2, $3, and $4) where each outcomehas a specific probability of happening, shown in the table below:
TABLE 15.2:
Number Probability$1 50%$2 20%$3 20%$4 10%
Note that the probabilities must add up to 100%! In order to calculate the expected value of this game, weight theoutcomes by their assigned probabilities.
$1 ·0.50+$2 ·0.20+$3 ·0.30+$4 ·0.10 = $2.20
This means that if you were to play this game many times, your average amount of winnings should be $2.20. Notethat there will be no game that you actually get $2.20, because that was none of the options. Expected value is ameasure of what you should expect to get per game in the long run.
The payoff of a game is the expected value of the game minus the cost. If you expect to win about $2.20 on averageif you play a game repeatedly and it costs only $2 to play, then the expected payoff is $0.20 per game.
In general, to find the expected value for a game or other scenario, find the sum of all possible outcomes, eachmultiplied by the probability of its occurrence.
Example A
A teacher has five categories of grades that each make up a specific percentage of the final grade. Calculate Owen’sgrade.
TABLE 15.3:
Category Weight Owen’s gradeQuizzes and Tests 30% 78%Homework 25% 100%Final 20% 74%Projects 20% 90%Participation 5% 100%
627

15.2. Expected Value and Payoffs www.ck12.org
Solution: Using the concept of weighted average, weight each of Owen’s grades by the weight of the category.
0.78 ·0.3+1 ·0.25+0.74 ·0.20+0.90 ·0.20+1 ·0.05 = 0.862
Owen gets an 86.2%.
Example B
Courtney plays a game where she flips a coin. If the coin comes up heads she wins $2. If the coin comes up tails sheloses $3. What is Courtney’s expected payoff each game?
Solution: The probability of getting heads is 50% and the probability of getting tails is 50%. Using the concept ofweighted averages, you should weight winning 2 dollars and losing 3 dollars by 50% each. In this case there is noinitial cost to the game.
2 ·0.50−3 ·0.50 =−0.50
This means that while sometimes she might win and sometimes she might lose, on average she is expected to loseabout 50 cents per game.
Example C
Paul is deciding whether or not to pay the parking meter when he is going to the movies. He knows that a parkingticket costs $30 and he estimates that there is a 40% chance that the traffic police spot his car and write him a ticket.If he chooses to pay the meter it will cost 4 dollars and he will have a 0% chance of getting a ticket.
Is it cheaper to pay the meter or risk the fine?
Solution: Since there are two possible scenarios, calculate the expected cost in each case.
Paying the meter : $4 ·100% = $4
Risking the f ine : $0 ·60%+$30 ·40% = $12
Risking the fine has an expected cost three times that of paying the meter.
Concept Problem Revisited
In a game that pays you triple your bet if you roll a six and double your bet if you roll a five, the expected return ona one dollar wager is:
$0 · 23 +$2 · 1
6 +$3 · 16 = 5
6
If you spend $1 to play the game and you play the game multiple times, you can expect a return of 56 of one dollar
or about 83 cents on average.
Vocabulary
A weighted average is an average that multiplies each component by a factor representing its frequency or probabil-ity.
The expected value is the return or cost you can expect on average, given many trials.
The payoff of a game is the expected value of the game minus the cost.
Guided Practice
1. What is the payoff of a slot machine that costs a dollar to play and pays out $5 with probability 4%, $10 withprobability of 2%, and $30 with probability 0.5%?
2. What is the expected value of an experiment with the following outcomes and corresponding probabilities?
628
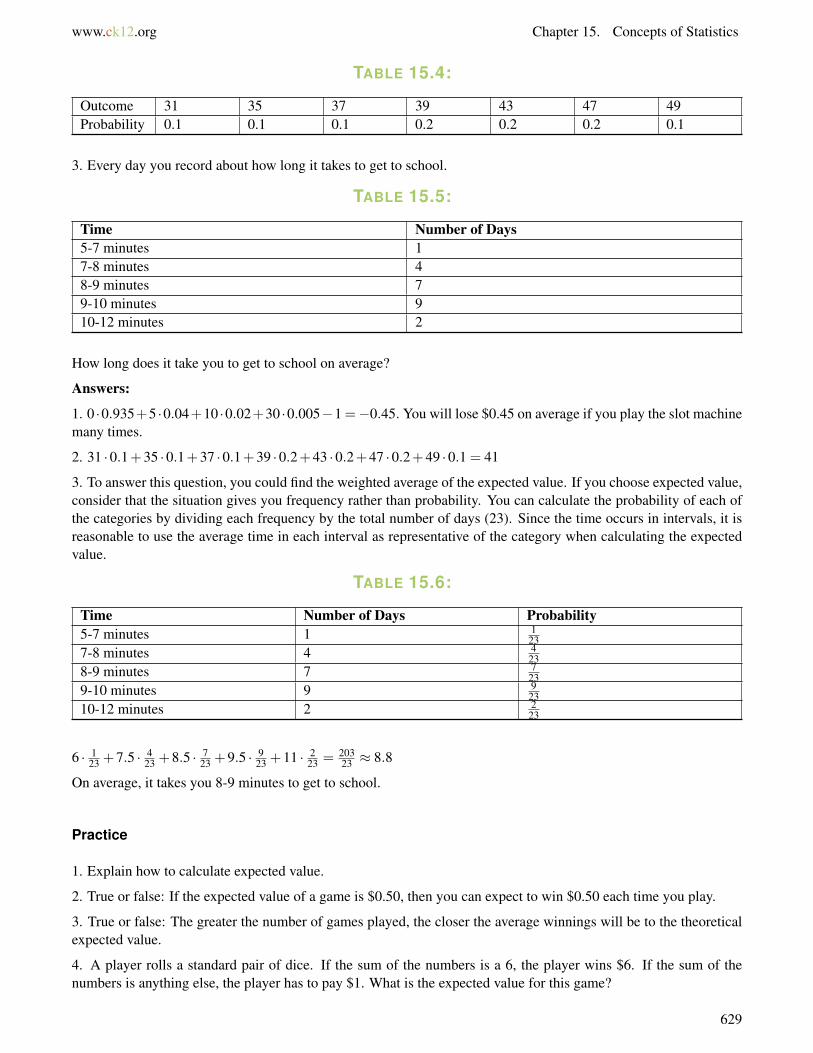
www.ck12.org Chapter 15. Concepts of Statistics
TABLE 15.4:
Outcome 31 35 37 39 43 47 49Probability 0.1 0.1 0.1 0.2 0.2 0.2 0.1
3. Every day you record about how long it takes to get to school.
TABLE 15.5:
Time Number of Days5-7 minutes 17-8 minutes 48-9 minutes 79-10 minutes 910-12 minutes 2
How long does it take you to get to school on average?
Answers:
1. 0 ·0.935+5 ·0.04+10 ·0.02+30 ·0.005−1 =−0.45. You will lose $0.45 on average if you play the slot machinemany times.
2. 31 ·0.1+35 ·0.1+37 ·0.1+39 ·0.2+43 ·0.2+47 ·0.2+49 ·0.1 = 41
3. To answer this question, you could find the weighted average of the expected value. If you choose expected value,consider that the situation gives you frequency rather than probability. You can calculate the probability of each ofthe categories by dividing each frequency by the total number of days (23). Since the time occurs in intervals, it isreasonable to use the average time in each interval as representative of the category when calculating the expectedvalue.
TABLE 15.6:
Time Number of Days Probability5-7 minutes 1 1
237-8 minutes 4 4
238-9 minutes 7 7
239-10 minutes 9 9
2310-12 minutes 2 2
23
6 · 123 +7.5 · 4
23 +8.5 · 723 +9.5 · 9
23 +11 · 223 = 203
23 ≈ 8.8
On average, it takes you 8-9 minutes to get to school.
Practice
1. Explain how to calculate expected value.
2. True or false: If the expected value of a game is $0.50, then you can expect to win $0.50 each time you play.
3. True or false: The greater the number of games played, the closer the average winnings will be to the theoreticalexpected value.
4. A player rolls a standard pair of dice. If the sum of the numbers is a 6, the player wins $6. If the sum of thenumbers is anything else, the player has to pay $1. What is the expected value for this game?
629
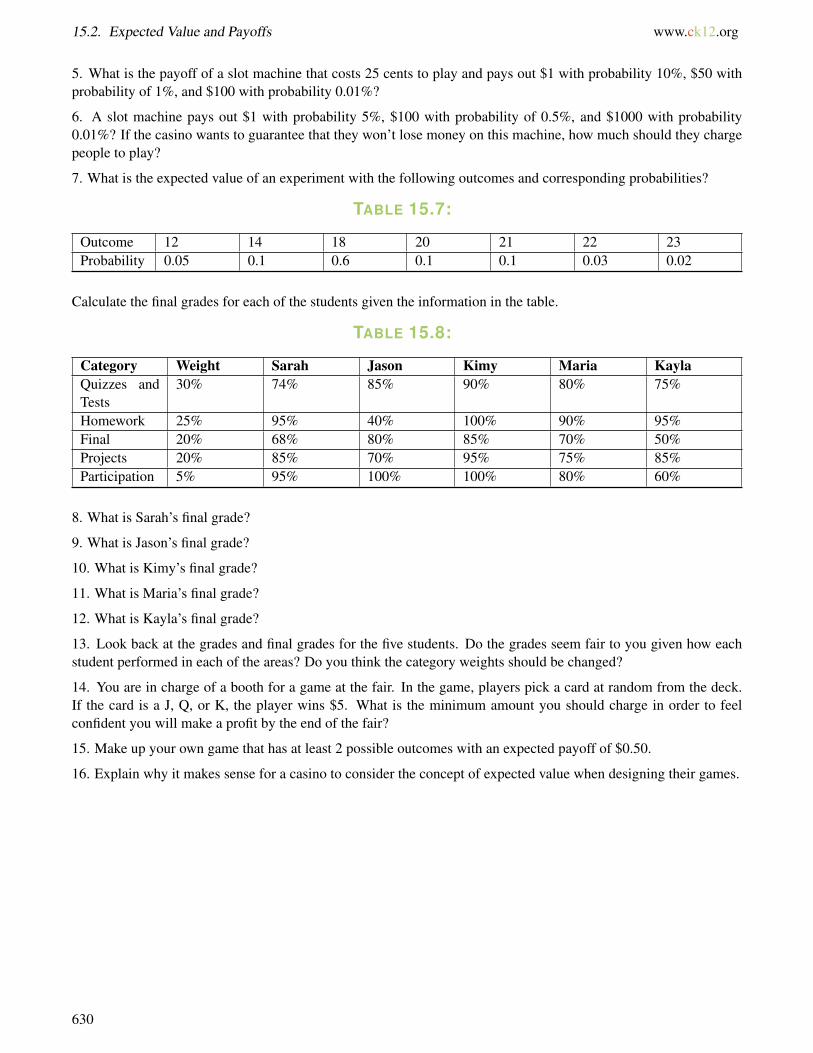
15.2. Expected Value and Payoffs www.ck12.org
5. What is the payoff of a slot machine that costs 25 cents to play and pays out $1 with probability 10%, $50 withprobability of 1%, and $100 with probability 0.01%?
6. A slot machine pays out $1 with probability 5%, $100 with probability of 0.5%, and $1000 with probability0.01%? If the casino wants to guarantee that they won’t lose money on this machine, how much should they chargepeople to play?
7. What is the expected value of an experiment with the following outcomes and corresponding probabilities?
TABLE 15.7:
Outcome 12 14 18 20 21 22 23Probability 0.05 0.1 0.6 0.1 0.1 0.03 0.02
Calculate the final grades for each of the students given the information in the table.
TABLE 15.8:
Category Weight Sarah Jason Kimy Maria KaylaQuizzes andTests
30% 74% 85% 90% 80% 75%
Homework 25% 95% 40% 100% 90% 95%Final 20% 68% 80% 85% 70% 50%Projects 20% 85% 70% 95% 75% 85%Participation 5% 95% 100% 100% 80% 60%
8. What is Sarah’s final grade?
9. What is Jason’s final grade?
10. What is Kimy’s final grade?
11. What is Maria’s final grade?
12. What is Kayla’s final grade?
13. Look back at the grades and final grades for the five students. Do the grades seem fair to you given how eachstudent performed in each of the areas? Do you think the category weights should be changed?
14. You are in charge of a booth for a game at the fair. In the game, players pick a card at random from the deck.If the card is a J, Q, or K, the player wins $5. What is the minimum amount you should charge in order to feelconfident you will make a profit by the end of the fair?
15. Make up your own game that has at least 2 possible outcomes with an expected payoff of $0.50.
16. Explain why it makes sense for a casino to consider the concept of expected value when designing their games.
630

www.ck12.org Chapter 15. Concepts of Statistics
15.3 Five Number Summary
Here you will calculate quartiles and produce five number summaries for data sets.
When given a long list of numbers, it is useful to summarize the data. One way to summarize the data is to give thelowest number, the highest number and the middle number. In addition to these three numbers it is also useful togive the median of the lower half of the data and the median of the upper half of the data. These five numbers give avery concise summary of the data.
What is the five number summary of the following data?
0, 0, 1, 2, 63, 61, 27, 13
Watch This
MEDIAClick image to the left for more content.
http://www.youtube.com/watch?v=XDS5TgZ4CJA The 5 Number Summary
Guidance
Suppose you have ordered data with m observations. The rank of each observation is shown by its index.
y1 ≤ y2 ≤ y3 ≤ ·· · ≤ ym
In data sets that are large enough, you can divide the numbers into four parts called quartiles. The quartiles of interestare the first quartile, Q1, the second quartile, Q2, and the third quartile Q3. The second quartile, Q2, is defined tobe the median of the data. The first quartile, Q1, is defined to be the median of the lower half of the data. The thirdquartile, Q3, is similarly defined to be the median of the upper half of the data.
These three numbers in addition to the minimum and maximum values are the five number summary. Note that thereare variations of the five number summary that you can study in a statistics course.
Example A
Compute the five number summary for the following data.
2, 7, 17, 19, 25, 26, 26, 32
Solution: There are 8 observations total.
• Lowest value (minimum) : 2• Q1 : 7+17
2 = 12 (Note that this is the median of the first half of the data - 2, 7, 17, 19)• Q2 : 19+25
2 = 22 (Note that this is the median of the full set of data)• Q3 : 26 (Note that this is the median of the second half of the data - 25, 26, 26, 32)• Upper value (maximum) : 32
631

15.3. Five Number Summary www.ck12.org
Example B
Compute the five number summary for the following data:
4, 8, 11, 11, 12, 14, 16, 20, 21, 25
Solution: There are 10 observations total.
• Lowest value (minimum) : 4• Q1 : 11 (Note that this is the median of the first half of the data - 4, 8, 11, 11, 12)• Q2 : 12+14
2 = 13 (Note that this is the median of the full set of data)• Q3 : 20 (Note that this is the median of the second half of the data - 14, 16, 20, 21, 25)• Upper value (maximum) : 25
Example C
Compute the five number summary for the following data:
3, 7, 10, 14, 19, 19, 23, 27, 29
Solution: There are 9 observations total. To calculate Q1 and Q3, you should include the median in both the lowerhalf and upper half calculations.
• Lowest value (minimum) : 3• Q1 : 10 (this is the median of 3, 7, 10, 14, 19)• Q2 : 19• Q3 : 23 (this is the median of 19, 19, 23, 27, 29)• Upper value (maximum) : 29
Concept Problem Revisited
To compute the five number summary, it helps to order the data.
0, 0, 1, 2, 13, 27, 61, 63
• Since there are 8 observations, the median is the average of the 4th and 5th observations: 2+132 = 7.5
• The lowest observation is 0.• The highest observation is 63.• The middle of the lower half is 0+1
2 = 0.5• The middle of the upper half is 27+61
2 = 44
The five number summary is 0, 0.5, 7.5, 44, 63
Vocabulary
The rank of an observation is the number of observations that are less than or equal to the value of that observation.
Data is divided into four parts by the first quartile (Q1), second quartile (Q2) and third quartile (Q3). Thesecond quartile is also known as the median.
Guided Practice
1. Create a set of data that meets the following five number summary:
{2, 5, 9, 18, 20}
2. Compute the five number summary for the following data:
632
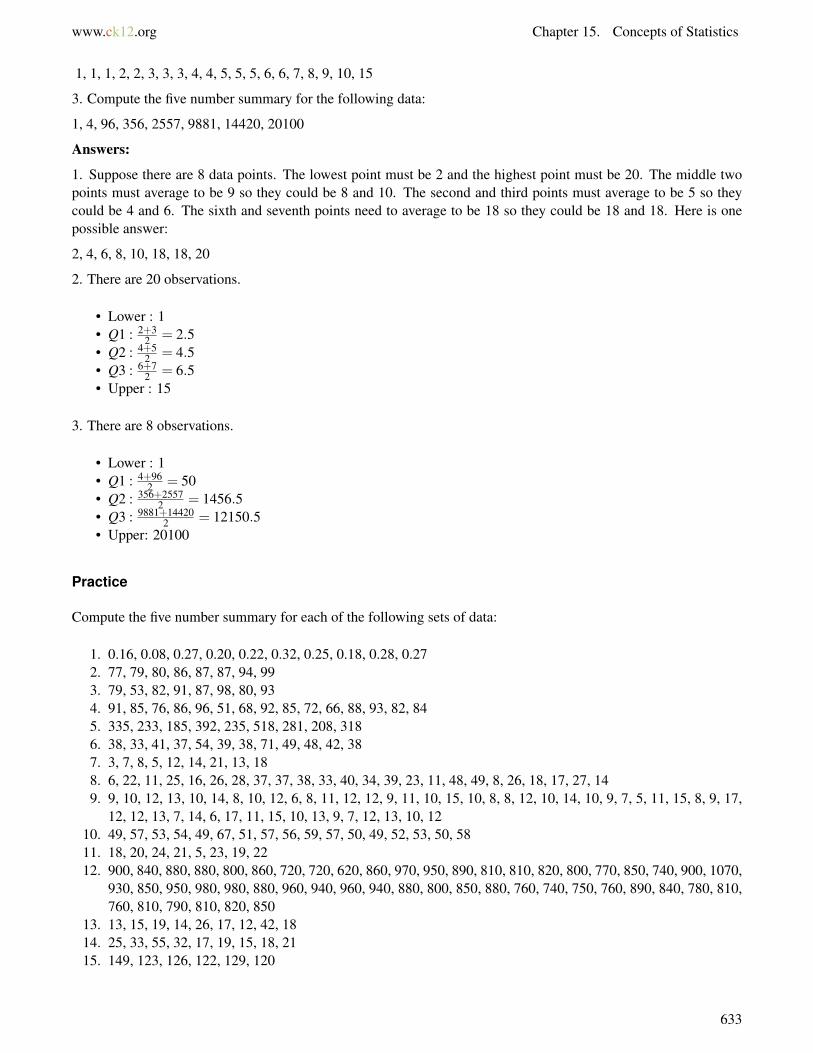
www.ck12.org Chapter 15. Concepts of Statistics
1, 1, 1, 2, 2, 3, 3, 3, 4, 4, 5, 5, 5, 6, 6, 7, 8, 9, 10, 15
3. Compute the five number summary for the following data:
1, 4, 96, 356, 2557, 9881, 14420, 20100
Answers:
1. Suppose there are 8 data points. The lowest point must be 2 and the highest point must be 20. The middle twopoints must average to be 9 so they could be 8 and 10. The second and third points must average to be 5 so theycould be 4 and 6. The sixth and seventh points need to average to be 18 so they could be 18 and 18. Here is onepossible answer:
2, 4, 6, 8, 10, 18, 18, 20
2. There are 20 observations.
• Lower : 1• Q1 : 2+3
2 = 2.5• Q2 : 4+5
2 = 4.5• Q3 : 6+7
2 = 6.5• Upper : 15
3. There are 8 observations.
• Lower : 1• Q1 : 4+96
2 = 50• Q2 : 356+2557
2 = 1456.5• Q3 : 9881+14420
2 = 12150.5• Upper: 20100
Practice
Compute the five number summary for each of the following sets of data:
1. 0.16, 0.08, 0.27, 0.20, 0.22, 0.32, 0.25, 0.18, 0.28, 0.272. 77, 79, 80, 86, 87, 87, 94, 993. 79, 53, 82, 91, 87, 98, 80, 934. 91, 85, 76, 86, 96, 51, 68, 92, 85, 72, 66, 88, 93, 82, 845. 335, 233, 185, 392, 235, 518, 281, 208, 3186. 38, 33, 41, 37, 54, 39, 38, 71, 49, 48, 42, 387. 3, 7, 8, 5, 12, 14, 21, 13, 188. 6, 22, 11, 25, 16, 26, 28, 37, 37, 38, 33, 40, 34, 39, 23, 11, 48, 49, 8, 26, 18, 17, 27, 149. 9, 10, 12, 13, 10, 14, 8, 10, 12, 6, 8, 11, 12, 12, 9, 11, 10, 15, 10, 8, 8, 12, 10, 14, 10, 9, 7, 5, 11, 15, 8, 9, 17,
12, 12, 13, 7, 14, 6, 17, 11, 15, 10, 13, 9, 7, 12, 13, 10, 1210. 49, 57, 53, 54, 49, 67, 51, 57, 56, 59, 57, 50, 49, 52, 53, 50, 5811. 18, 20, 24, 21, 5, 23, 19, 2212. 900, 840, 880, 880, 800, 860, 720, 720, 620, 860, 970, 950, 890, 810, 810, 820, 800, 770, 850, 740, 900, 1070,
930, 850, 950, 980, 980, 880, 960, 940, 960, 940, 880, 800, 850, 880, 760, 740, 750, 760, 890, 840, 780, 810,760, 810, 790, 810, 820, 850
13. 13, 15, 19, 14, 26, 17, 12, 42, 1814. 25, 33, 55, 32, 17, 19, 15, 18, 2115. 149, 123, 126, 122, 129, 120
633

15.4. Graphic Displays of Data www.ck12.org
15.4 Graphic Displays of Data
Here you will display data using bar charts, histograms, pie charts and boxplots.
Two common types of graphic displays are bar charts and histograms. Both bar charts and histograms use vertical orhorizontal bars to represent the number of data points in each category or interval. The main difference graphicallyis that in a bar chart there are spaces between the bars and in a histogram there are not spaces between the bars. Whydoes this subtle difference exist and what does it imply about graphic displays in general?
Watch This
MEDIAClick image to the left for more content.
http://www.youtube.com/watch?v=kiQ6MUQZHSs Khan Academy: Reading Bar Graphs
MEDIAClick image to the left for more content.
http://www.youtube.com/watch?v=4JqH55rLGKY Khan Academy: Reading Pie Graphs
MEDIAClick image to the left for more content.
http://www.youtube.com/watch?v=b2C9I8HuCe4 Khan Academy: Reading Box-and-Whisker Plots
MEDIAClick image to the left for more content.
634

www.ck12.org Chapter 15. Concepts of Statistics
http://www.youtube.com/watch?v=4eLJGG2Ad30 Khan Academy: Histogram
Guidance
It is often easier for people to interpret relative sizes of data when that data is displayed graphically. There are a fewcommon ways of displaying data graphically that you should be familiar with.
1) A pie chart shows the relative proportions of data in different categories. Pie charts are excellent ways ofdisplaying categorical data with easily separable groups. The following pie chart shows six categories labeledA−F . The size of each pie slice is determined by the central angle. Since there are 360◦ in a circle, the size of thecentral angle θA of category A can be found by:θA360 = data points in category A
Total number o f data points
2) A bar chart displays frequencies of categories of data. The bar chart below has 5 categories, and shows theTV channel preferences for 53 adults. The horizontal axis could have also been labeled News, Sports, Local News,Comedy, Action Movies. The reason why the bars are separated by spaces is to emphasize the fact that they arecategories and not continuous numbers. For example, just because you split your time between channel 8 andchannel 44 does not mean on average you watch channel 26. Categories can be numbers so you need to be verycareful.
635
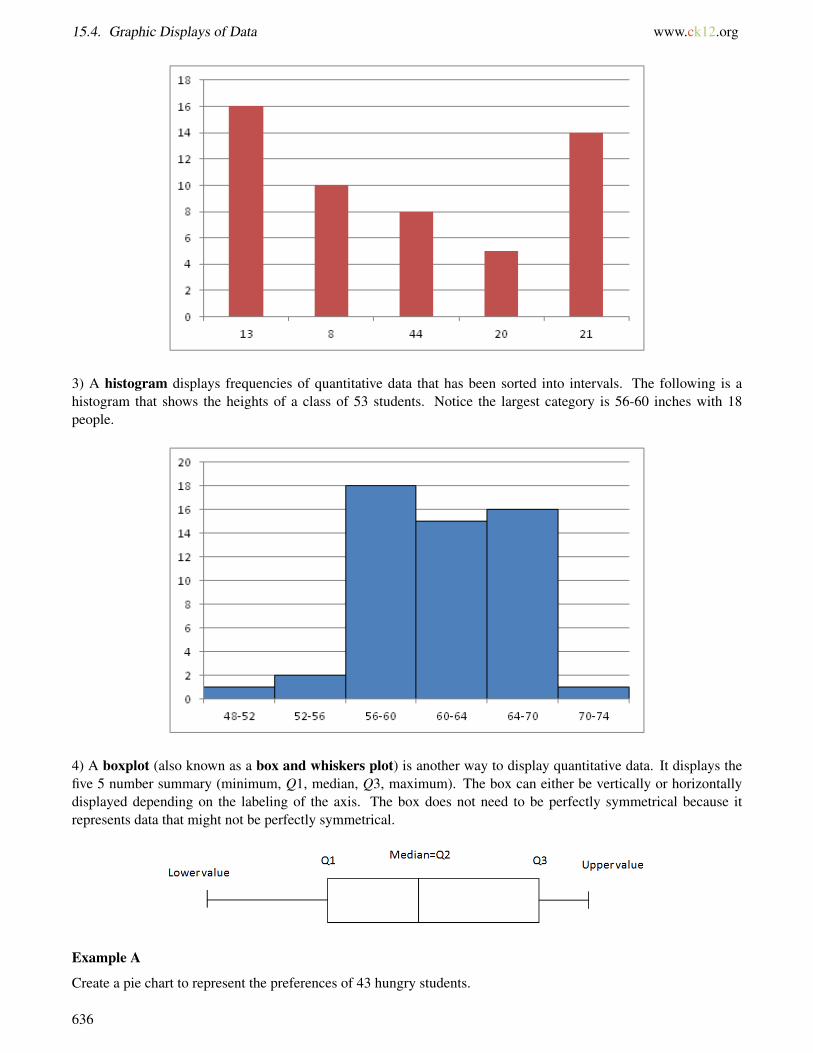
15.4. Graphic Displays of Data www.ck12.org
3) A histogram displays frequencies of quantitative data that has been sorted into intervals. The following is ahistogram that shows the heights of a class of 53 students. Notice the largest category is 56-60 inches with 18people.
4) A boxplot (also known as a box and whiskers plot) is another way to display quantitative data. It displays thefive 5 number summary (minimum, Q1, median, Q3, maximum). The box can either be vertically or horizontallydisplayed depending on the labeling of the axis. The box does not need to be perfectly symmetrical because itrepresents data that might not be perfectly symmetrical.
Example A
Create a pie chart to represent the preferences of 43 hungry students.
636
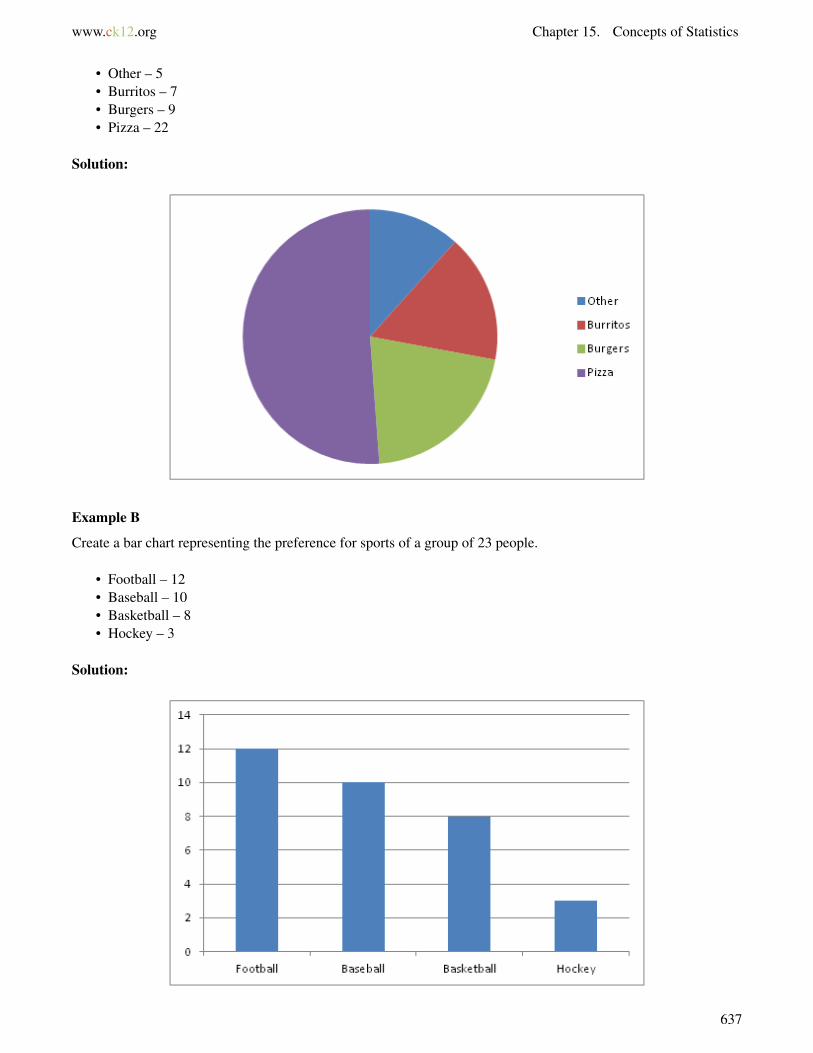
www.ck12.org Chapter 15. Concepts of Statistics
• Other – 5• Burritos – 7• Burgers – 9• Pizza – 22
Solution:
Example B
Create a bar chart representing the preference for sports of a group of 23 people.
• Football – 12• Baseball – 10• Basketball – 8• Hockey – 3
Solution:
637

15.4. Graphic Displays of Data www.ck12.org
Example C
Create a histogram for the income distribution of 200 million people.
• Below $50,000 is 100 million people• Between $50,000 and $100,000 is 50 million people• Between $100,000 and $150,000 is 40 million people• Above $150,000 is 10 million people
Solution:
Concept Problem Revisited
The reason for the space in bar charts but no space in histograms is bar charts graph categorical variables whilehistograms graph quantitative variables. It would be extremely improper to forget the space with bar charts becauseyou would run the risk of implying a spectrum from one side of the chart to the other. Note that in the bar chart whereTV stations where shown, the station numbers were not listed horizontally in order by size. This was to emphasizethe fact that the stations were categories.
Vocabulary
A categorical variable is a variable that can take on one of a limited number of values. Examples of categoricalvariables are tv stations, the state someone lives in, and eye color.
A quantitative variable is a variable that takes on numerical values that represent a measureable quantity. Examplesof quantitative variables are the height of students or the population of a city.
A bar chart is a graphic display of categorical variables that uses bar to represent the frequency of the count in eachcategory.
A histogram is a graphic display of quantitative variables that uses bars to represent the frequency of the count ofthe data in each interval.
A pie chart is a graphic display of categorical data where the relative size of each pie slice corresponds to thefrequency of each category.
A boxplot is a graphic display of quantitative data that demonstrates the five number summary.
638
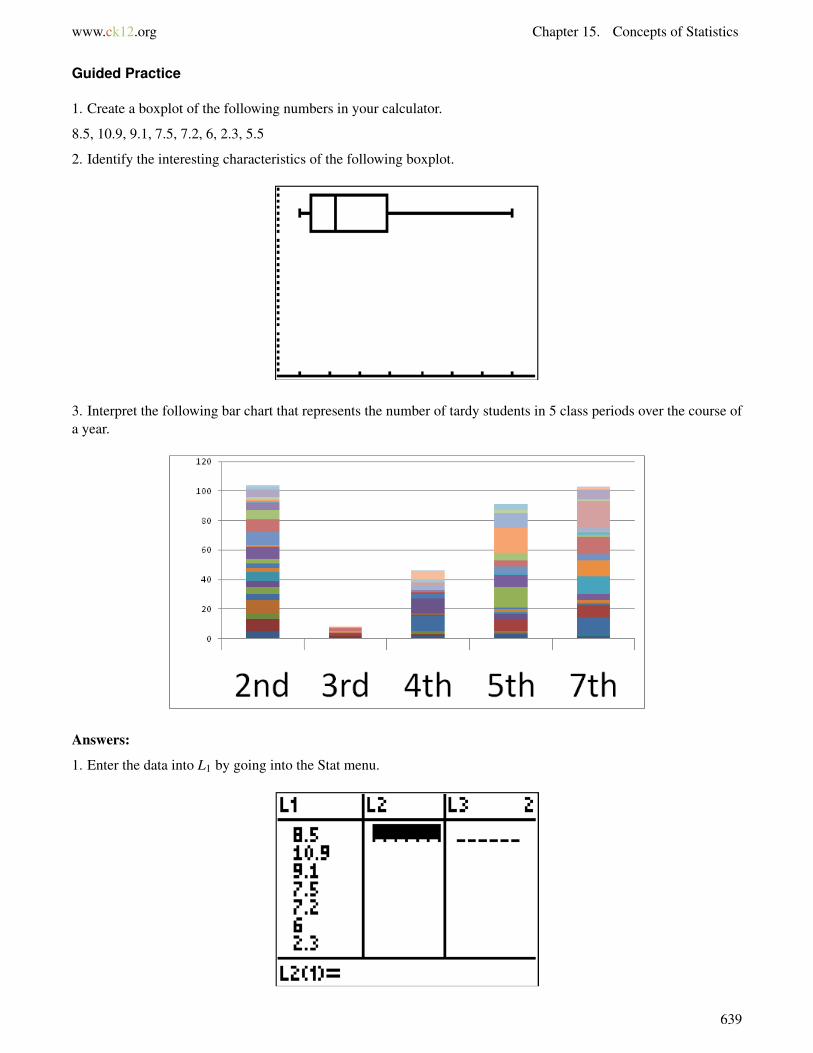
www.ck12.org Chapter 15. Concepts of Statistics
Guided Practice
1. Create a boxplot of the following numbers in your calculator.
8.5, 10.9, 9.1, 7.5, 7.2, 6, 2.3, 5.5
2. Identify the interesting characteristics of the following boxplot.
3. Interpret the following bar chart that represents the number of tardy students in 5 class periods over the course ofa year.
Answers:
1. Enter the data into L1 by going into the Stat menu.
639

15.4. Graphic Displays of Data www.ck12.org
Then turn the statplot on and choose boxplot.
Use Zoomstat to automatically center the window on the boxplot.
2. The lower bound, Q1 and Q2 all seem to be relatively close together. Q3 seems to be stretched a little to the rightand the upper bound is significantly stretched to the right.
3. The bar chart has 5 categories representing each of the five periods. Within each category there are bands ofdifferent colors. Each band represents the number of times an individual student was tardy. For periods 5 andperiods 7 there seem to be fewer students who were tardy more often. In period 2 there seems to be more studentstardy a handful of times each.
Practice
1. What types of graphs show categorical data?
2. What types of graphs show quantitative data?
A math class of 30 students had the following grades:
TABLE 15.9:
Grade Number of Students with GradeA 10B 10C 5D 3F 2
640

www.ck12.org Chapter 15. Concepts of Statistics
3. Create a bar chart for this data.
4. Create a pie chart for this data.
5. Which graph do you think makes a better visual representation of the data?
A set of 20 exam scores is 67, 94, 88, 76, 85, 93, 55, 87, 80, 81, 80, 61, 90, 84, 75, 93, 75, 68, 100, 98
6. Create a histogram for this data. Use your best judgment to decide what the intervals should be.
7. Find the five number summary for this data.
8. Use the five number summary to create a boxplot for this data.
9. Describe the data shown in the boxplot below.
10. Describe the data shown in the histogram below.
A math class of 30 students has the following eye colors:
TABLE 15.10:
Grade Number of Students with GradeBrown 20Blue 5Green 3Other 2
11. Create a bar chart for this data.
12. Create a pie chart for this data.
641

15.4. Graphic Displays of Data www.ck12.org
13. Which graph do you think makes a better visual representation of the data?
14. Suppose you have data that shows the breakdown of registered republicans by state. What types of graphs couldyou use to display this data?
15. From which types of graphs could you obtain information about the spread of the data? Note that spread is ameasure of how spread out all of the data is.
642
www.ck12.org Chapter 15. Concepts of Statistics
15.5 Variance
Here you will calculate population variance, sample variance and standard deviation from univariate data.
Two groups of students that each have an average test score of 75 might have a score distribution that looksremarkably different. One class might be made up entirely of grades between 72 and 78 while the other class mayhave half the group around 50, with the other half getting near 100. Variance is a way of measuring the variationin a set of data. What is the mean and variance for the following sample test scores taken from a larger studentpopulation?
75, 73, 78, 90, 60, 51, 87, 79, 80, 77
Watch This
MEDIAClick image to the left for more content.
http://www.youtube.com/watch?v=6JFzI1DDyyk Khan Academy: Statistics: Variance of a Population
Guidance
The thought process of a person trying to describe the spread of some data for the first time must have been somethinglike this.
Well, the average is 75. What if I try to just add up how different each number is from 75?
As the person calculates the numbers, they realize pretty quickly that this sum will be zero, essentially by definition.This is because the numbers that occur below 75 precisely cancel out with the numbers above 75.
Since I cannot add the differences directly, why don’t I just sum the absolute value of the differences?
This is a legitimate method for describing the spread of data. It is called absolute deviation and is simply the sum ofthe absolute values of each of the differences.
If I take the average absolute difference, I will be able to judge on average how far away each data point is from themean. A larger difference means more spread out.
If you take the average of the absolute deviation, you get the mean absolute deviation. The mean absolute variationis a legitimate, but limited, way of describing the spread of data. Eventually, a person trying to describe the spreadof data for the first time might consider a method called population variance.
What if instead of using absolute value to solve the issue, I square each difference and then add them together? Ofcourse I’d have to divide by the number of data points to get the average difference squared
643
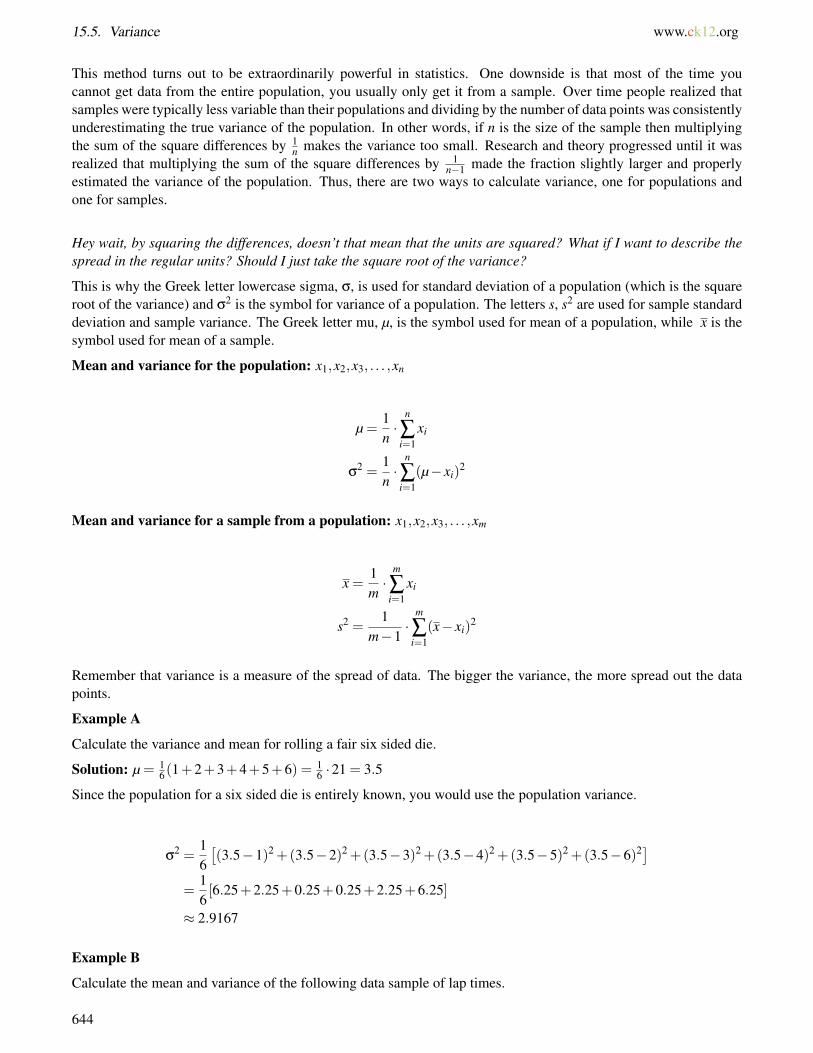
15.5. Variance www.ck12.org
This method turns out to be extraordinarily powerful in statistics. One downside is that most of the time youcannot get data from the entire population, you usually only get it from a sample. Over time people realized thatsamples were typically less variable than their populations and dividing by the number of data points was consistentlyunderestimating the true variance of the population. In other words, if n is the size of the sample then multiplyingthe sum of the square differences by 1
n makes the variance too small. Research and theory progressed until it wasrealized that multiplying the sum of the square differences by 1
n−1 made the fraction slightly larger and properlyestimated the variance of the population. Thus, there are two ways to calculate variance, one for populations andone for samples.
Hey wait, by squaring the differences, doesn’t that mean that the units are squared? What if I want to describe thespread in the regular units? Should I just take the square root of the variance?
This is why the Greek letter lowercase sigma, σ, is used for standard deviation of a population (which is the squareroot of the variance) and σ2 is the symbol for variance of a population. The letters s, s2 are used for sample standarddeviation and sample variance. The Greek letter mu, µ, is the symbol used for mean of a population, while x is thesymbol used for mean of a sample.
Mean and variance for the population: x1,x2,x3, . . . ,xn
µ =1n·
n
∑i=1
xi
σ2 =
1n·
n
∑i=1
(µ− xi)2
Mean and variance for a sample from a population: x1,x2,x3, . . . ,xm
x =1m·
m
∑i=1
xi
s2 =1
m−1·
m
∑i=1
(x− xi)2
Remember that variance is a measure of the spread of data. The bigger the variance, the more spread out the datapoints.
Example A
Calculate the variance and mean for rolling a fair six sided die.
Solution: µ = 16(1+2+3+4+5+6) = 1
6 ·21 = 3.5
Since the population for a six sided die is entirely known, you would use the population variance.
σ2 =
16[(3.5−1)2 +(3.5−2)2 +(3.5−3)2 +(3.5−4)2 +(3.5−5)2 +(3.5−6)2]
=16[6.25+2.25+0.25+0.25+2.25+6.25]
≈ 2.9167
Example B
Calculate the mean and variance of the following data sample of lap times.
644
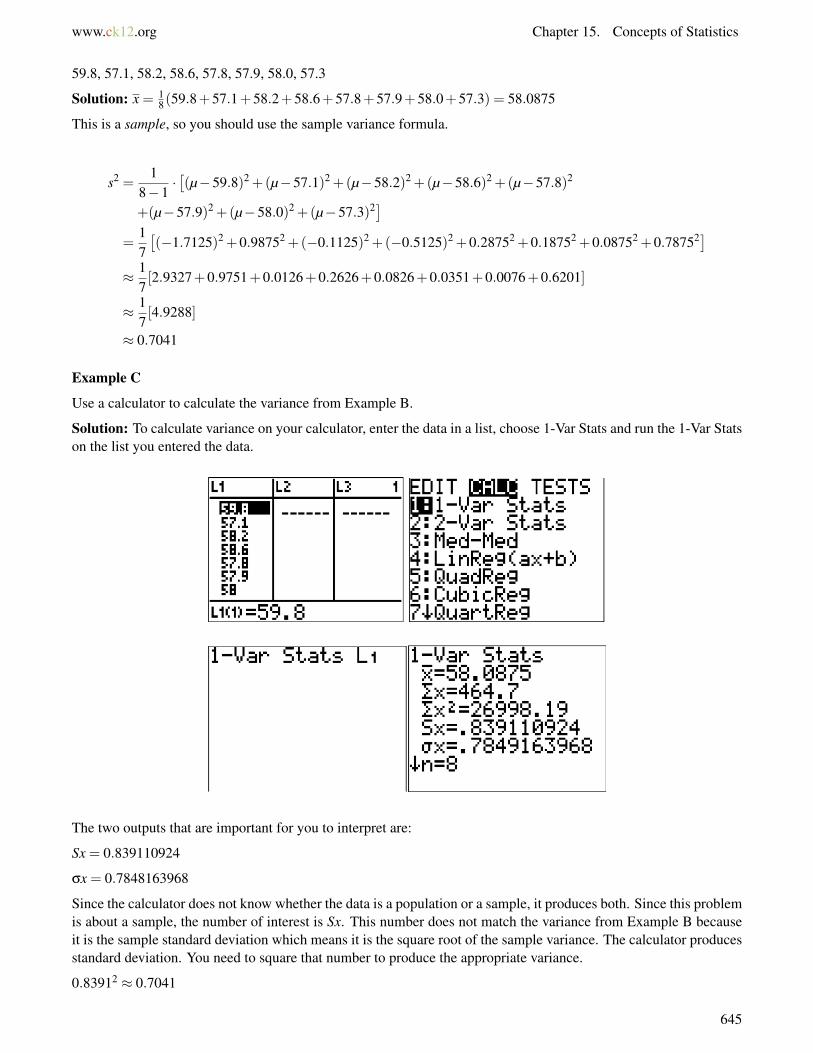
www.ck12.org Chapter 15. Concepts of Statistics
59.8, 57.1, 58.2, 58.6, 57.8, 57.9, 58.0, 57.3
Solution: x = 18(59.8+57.1+58.2+58.6+57.8+57.9+58.0+57.3) = 58.0875
This is a sample, so you should use the sample variance formula.
s2 =1
8−1·[(µ−59.8)2 +(µ−57.1)2 +(µ−58.2)2 +(µ−58.6)2 +(µ−57.8)2
+(µ−57.9)2 +(µ−58.0)2 +(µ−57.3)2]=
17[(−1.7125)2 +0.98752 +(−0.1125)2 +(−0.5125)2 +0.28752 +0.18752 +0.08752 +0.78752]
≈ 17[2.9327+0.9751+0.0126+0.2626+0.0826+0.0351+0.0076+0.6201]
≈ 17[4.9288]
≈ 0.7041
Example C
Use a calculator to calculate the variance from Example B.
Solution: To calculate variance on your calculator, enter the data in a list, choose 1-Var Stats and run the 1-Var Statson the list you entered the data.
The two outputs that are important for you to interpret are:
Sx = 0.839110924
σx = 0.7848163968
Since the calculator does not know whether the data is a population or a sample, it produces both. Since this problemis about a sample, the number of interest is Sx. This number does not match the variance from Example B becauseit is the sample standard deviation which means it is the square root of the sample variance. The calculator producesstandard deviation. You need to square that number to produce the appropriate variance.
0.83912 ≈ 0.7041
645

15.5. Variance www.ck12.org
Concept Problem Revisited
The mean of the test scores is 75. The variance is calculated by taking the difference of each number from the mean,squaring and summing these differences.
02 +22 +32 +152 +152 +242 +122 +42 +52 +22 = 1228
Since this data is a sample, you divide the sum by one fewer than the number of terms.122810−1 ≈ 136.4444
If you knew the variances for two samples, each from a different class, you could quickly determine which class hadtest scores that were more spread out.
Vocabulary
Variance is a measure of how spread out the data is.
The square root of the variance is the standard deviation.
Both the variance and the standard deviation can be calculated from a sample or from the whole population. Theformulas are slightly different in each case so it is important to know whether your data is just a sample or is fromthe whole population.
The absolute deviation is the sum total of how different each number is from the mean.
The mean absolute deviation is an alternate measure of how spread out the data is. While this method might seemmore intuitive, in statistics it has been found to be too limited and is not commonly used.
Guided Practice
1. Calculate the standard deviation for the following 6 numbers by hand. Assume the numbers are a population.
2, 4, 6, 8, 12, 19
2. Use a spreadsheet to organize your calculations for computing the variance of the following numbers. Assumethese numbers are a true population.
14, 15, 7, 15, 2, 0, 6, 5, 12, 3
Answers:
1.
µ =16(2+4+6+8+12+17) = 8
σ2 =
16((8−2)2 +(8−4)2 +(8−6)2 +0+(8−12)2 +(8−17)2)
=16(62 +42 +22 +42 +92)
=16(36+16+4+16+81)
=16(153)
= 25.5
σ≈ 5.0498
646

www.ck12.org Chapter 15. Concepts of Statistics
2. After entering the data in a column, you can use the power of the embedded programming of the spreadsheet tomake a second column of just the average.
• The average command is: “= average(A2:A11)”
You can subtract one cell from another cell to find the difference. You can then square the difference to find thedifference squared. You can then sum these values using the sum command.
• The sum command is: “= sum(D2:D11)”
Finally, just divide the sum by the number of observations (which is 10) to get the variance.
Practice
1. What are the similarities and differences between standard deviation and variance?
2. Data Set A has a mean of 30 and a standard deviation of 10. Data Set B also has a mean of 30, but a standarddeviation of 2. What does this mean about Data Set A compared to Data Set B?
Calculate the variance of each set of data by hand.
3. Sample: 1, 4, 7, 10, 3, 6, 12, 5, 8, 16, 21, 3, 1, 5
4. Population: 23, 27, 19, 24, 20, 22, 31, 30, 28
5. Sample: 64, 62, 60, 58, 54, 60, 61, 63, 47, 100, 29, 59
Calculate the variance of each set of data using your calculator. Compare your answers to your answers to 3-5.
6. Sample: 1, 4, 7, 10, 3, 6, 12, 5, 8, 16, 21, 3, 1, 5
7. Population: 23, 27, 19, 24, 20, 22, 31, 30, 28
8. Sample: 64, 62, 60, 58, 54, 60, 61, 63, 47, 100, 29, 59
9. If σ2 = 16, what is the population standard deviation?
10. Which data set has the largest standard deviation?
a. 10 10 10 10 10b. 0 0 10 10 10
647

15.5. Variance www.ck12.org
c. 0 9 10 11 20d. 20 20 20 20 20
11. What will a large variance look like on a histogram? What will a small variance look like on a histogram?
12. You find some data organized in a bar graph. Could you calculate the variance of this data? Explain.
13. A sample set of 20 exam scores is 67, 94, 88, 76, 85, 93, 55, 87, 80, 81, 80, 61, 90, 84, 75, 93, 75, 68, 100, 98.Calculate the mean, variance, and standard deviation for this data.
14. All of Mike’s bowling scores are: 1, 1, 2, 10, 12, 1, 9, 6, 7, 8, 4, 3, 4, 1, 4, 1, 6, 7, 11, 5. Calculate the mean,variance, and standard deviation for this data.
15. Why can’t you always calculate the population variance and standard deviation? Why do you sometimes haveto calculate the sample variance and standard deviation?
648
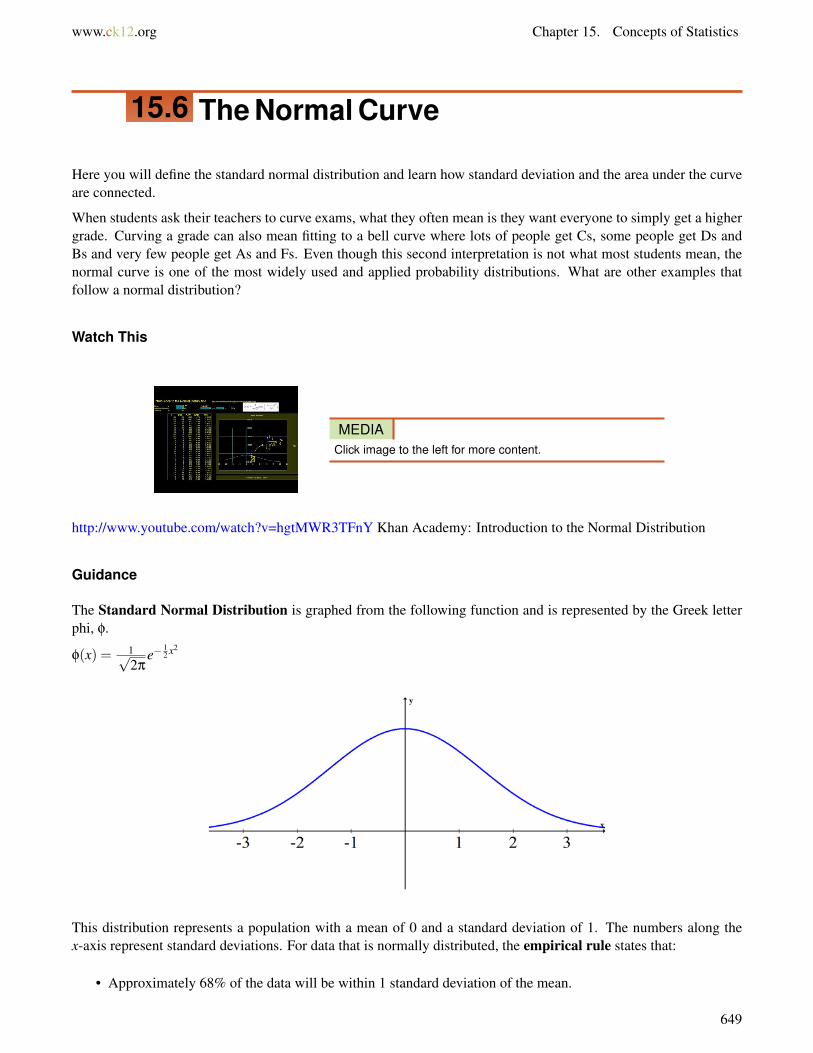
www.ck12.org Chapter 15. Concepts of Statistics
15.6 The Normal Curve
Here you will define the standard normal distribution and learn how standard deviation and the area under the curveare connected.
When students ask their teachers to curve exams, what they often mean is they want everyone to simply get a highergrade. Curving a grade can also mean fitting to a bell curve where lots of people get Cs, some people get Ds andBs and very few people get As and Fs. Even though this second interpretation is not what most students mean, thenormal curve is one of the most widely used and applied probability distributions. What are other examples thatfollow a normal distribution?
Watch This
MEDIAClick image to the left for more content.
http://www.youtube.com/watch?v=hgtMWR3TFnY Khan Academy: Introduction to the Normal Distribution
Guidance
The Standard Normal Distribution is graphed from the following function and is represented by the Greek letterphi, φ.
φ(x) = 1√2π
e−12 x2
This distribution represents a population with a mean of 0 and a standard deviation of 1. The numbers along thex-axis represent standard deviations. For data that is normally distributed, the empirical rule states that:
• Approximately 68% of the data will be within 1 standard deviation of the mean.
649

15.6. The Normal Curve www.ck12.org
• Approximately 95% of the data will be within 2 standard deviations of the mean.• Approximately 99.7% of the data will be within 3 standard deviations of the mean.
Some other important points about the normal distribution:
• The total area between the normal curve and the x axis is 1 and this area represents all possible probabilities.• If data is distributed normally, you can use the normal distribution to determine the percentage of the data
between any two values by calculating the area under the curve between those two values. When you takecalculus, you will learn how to calculate this area analytically, but for now you can use the normalcdf functionon your calculator.
• Many histograms approximate a normal curve, but a true normal curve is infinitely smooth.
Example A
The amount of rain each year in Connecticut follows a normal distribution. What is the probability of getting onestandard deviation below the normal amount of rain?
Solution: You are looking for the area of the shaded portion of the normal distribution shown below. By theempirical rule, you know that approximately 34% of the data is in between -1 and 0. Also, 50% of the data is above0. Therefore, approximately 84% of the data is unshaded. Therefore, 100%−84% = 16% of the data is shaded. Theapproximate probability is 16%.
To get the exact probability, use the normal cdf function on your calculator to calculate the exact area under thecurve. Go to [DISTR] (which is [2nd ] [VARS]) and choose normalcdf. This is the normal cumulative distributionfunction and calculates the area under the curve between two x-values. The syntax (how you will type it in) fornormal cdf is:
normalcdf(lower, upper, mean, standard deviation)
The lower bound for this shaded region is technically −∞, but the TI-84 cannot handle that so use -1E99. -1E99 is−1×1099, an extremely small number, and will give identical results that are correct to many decimal places. Theupper bound is -1. For a standard normal distribution with a mean of zero and a standard deviation of 1 you don’tneed to type anything else in, but since you will be working with normal distributions with means and standarddeviations that are different, it will make sense to get used to using the whole syntax.
normalcdf(-1E99, -1, 0, 1)
650

www.ck12.org Chapter 15. Concepts of Statistics
The exact answer is closer to 15.87%.
Example B
On your first college exam, you score an 82. After the exam the professor tells the class that the mean was a 62 andthe standard deviation was 10. What percentage of the class did better than you?
Solution: An 82 is 20 away from the mean so is 2 standard deviations from the mean. Therefore, this question isasking for the percentage of students that are above +2 standard deviations above the mean.
In future statistics courses you will learn how to create the equation for this distribution and then transform itto standard normal. For now, you can use the fact that your score was exactly 2 standard deviations above themean. Or, you can calculate the probability using the actual numbers.
• normalcdf(2, 1E99, 0, 1) = 0.022750 or 2.750%• normalcdf(82, 1E99, 62, 10) = 0.022750 or 2.750%
2.75% of the class did better than you on the exam. Even though you seemed to score a B-, the professor wouldprobably note that you were near the top of the class and adjust grades accordingly.
Example C
The quality control technician of a widget making factory observes that widgets that are three standard deviationstoo large or three standard deviations too small from the precise widget size are unusable. What is the probability ofproducing a usable widget?
Solution: This question is essentially asking for the area between -3 standard deviations and positive 3 standarddeviations. The empirical rule says this should be 99.7%. Use the normalcdf function to find the exact value.
651
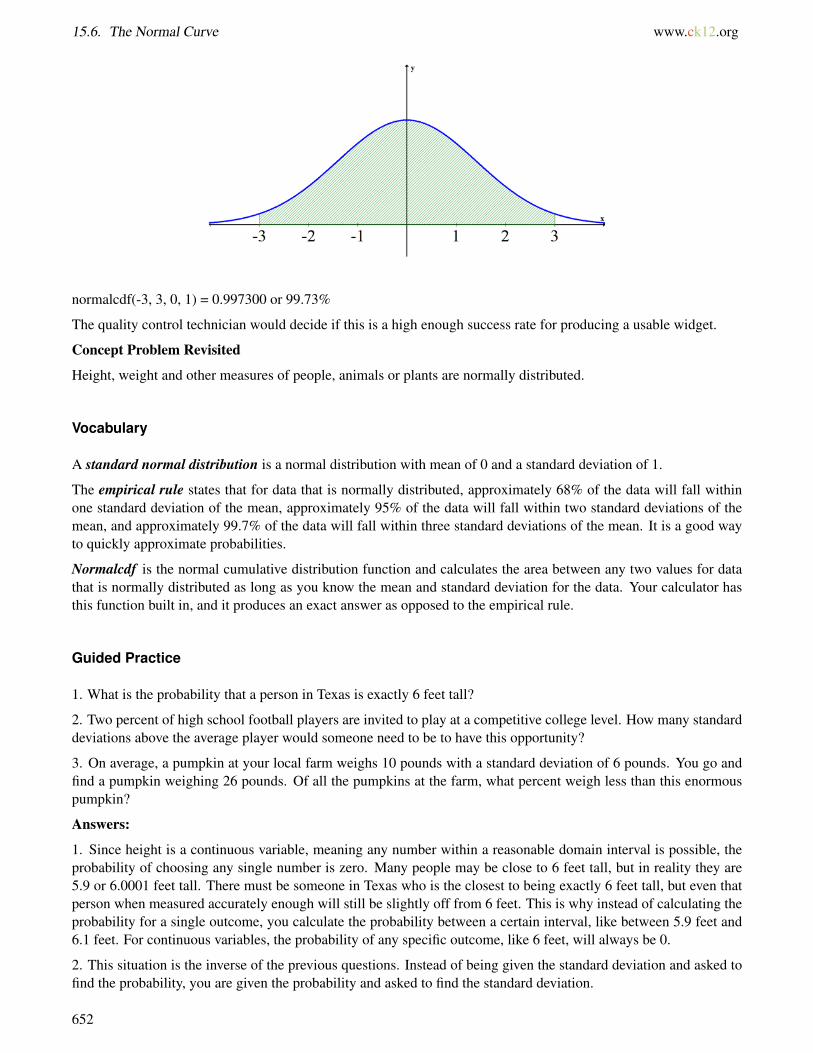
15.6. The Normal Curve www.ck12.org
normalcdf(-3, 3, 0, 1) = 0.997300 or 99.73%
The quality control technician would decide if this is a high enough success rate for producing a usable widget.
Concept Problem Revisited
Height, weight and other measures of people, animals or plants are normally distributed.
Vocabulary
A standard normal distribution is a normal distribution with mean of 0 and a standard deviation of 1.
The empirical rule states that for data that is normally distributed, approximately 68% of the data will fall withinone standard deviation of the mean, approximately 95% of the data will fall within two standard deviations of themean, and approximately 99.7% of the data will fall within three standard deviations of the mean. It is a good wayto quickly approximate probabilities.
Normalcdf is the normal cumulative distribution function and calculates the area between any two values for datathat is normally distributed as long as you know the mean and standard deviation for the data. Your calculator hasthis function built in, and it produces an exact answer as opposed to the empirical rule.
Guided Practice
1. What is the probability that a person in Texas is exactly 6 feet tall?
2. Two percent of high school football players are invited to play at a competitive college level. How many standarddeviations above the average player would someone need to be to have this opportunity?
3. On average, a pumpkin at your local farm weighs 10 pounds with a standard deviation of 6 pounds. You go andfind a pumpkin weighing 26 pounds. Of all the pumpkins at the farm, what percent weigh less than this enormouspumpkin?
Answers:
1. Since height is a continuous variable, meaning any number within a reasonable domain interval is possible, theprobability of choosing any single number is zero. Many people may be close to 6 feet tall, but in reality they are5.9 or 6.0001 feet tall. There must be someone in Texas who is the closest to being exactly 6 feet tall, but even thatperson when measured accurately enough will still be slightly off from 6 feet. This is why instead of calculating theprobability for a single outcome, you calculate the probability between a certain interval, like between 5.9 feet and6.1 feet. For continuous variables, the probability of any specific outcome, like 6 feet, will always be 0.
2. This situation is the inverse of the previous questions. Instead of being given the standard deviation and asked tofind the probability, you are given the probability and asked to find the standard deviation.
652

www.ck12.org Chapter 15. Concepts of Statistics
There is a second programmed feature in the distribution menu that performs this calculation. You are looking forhow many standard deviations above the mean will include 98% of the data.
invNorm(0.98) = 2.0537
A person would have to be greater than about 2 standard deviations above the mean to be in the top 2 percent.
3. Normalcdf(-1E99, 26, 10, 6) = 0.9961 or 99.61%
The vast majority of the pumpkins weigh less than the 26 pound pumpkin you found.
Practice
Consider the standard normal distribution for the following questions.
1. What is the mean?
2. What is the standard deviation?
3. What is the percentage of the data below 1?
4. What is the percentage of the data below -1?
5. What is the percentage of the data above 2?
6. What is the percentage of the data between -2 and 2?
7. What is the percentage of the data between -0.5 and 1.7?
8. What is the probability of a value of 2?
Assume that the mean weight of 1 year old girls in the USA is normally distributed, with a mean of about 9.5kilograms and a standard deviation of approximately 1.1 kilograms.
9. What percent of 1 year old girls weigh between 8 and 12 kilograms?
10. What percent of girls weigh above 12 kilograms?
11. Girls in the bottom 5% by weight need their weight monitored every 2 months. How many standard deviationsbelow the mean would a girl need to be to have their weight monitored?
Suppose that adult women’s heights are normally distributed with a mean of 65 inches and a standard deviation of 2inches.
12. What percent of adult women have heights between 60 inches and 65 inches?
13. Use the empirical rule to describe the range of heights for women within one standard deviation of the mean.
14. What is the probability that a randomly selected adult woman is more than 64 inches tall?
15. What percent of adult women are either less than 60 inches or greater than 72 inches tall?
653

15.7. Linear Correlation www.ck12.org
15.7 Linear Correlation
Here you will begin to work with bivariate data as you learn about linear correlation, correlation coefficients, andregression.
Statistics is largely concerned with how a change in one variable relates to changes in a second variable. Bivariatedata is two lists of data that are paired up. Is there any relationship between the following data? If there is, does itmean that doctors cause cancer?
TABLE 15.11:
NumberofDoctors
27 30 36 60 81 90 156 221 347
CancerRate
0.02 0.07 0.16 0.20 0.43 0.87 1.21 2.80 3.91
Watch This
MEDIAClick image to the left for more content.
http://www.youtube.com/watch?v=ROpbdO-gRUo Khan Academy: Correlation vs. Causality
Guidance
A scatterplot creates an (x,y) point from each data pair. When making a scatterplot, you can try to assign theindependent variable to x and the dependent variable to y; however, it will often not be obvious which variable is thedependent variable, so you will just have to pick one.
Once you plot the data and zoom appropriately you will see the points scattered about. Sometimes there will bea clear linear relationship and sometimes it will appear random. The correlation coefficient, r, is a number thatquantifies two aspects of the relationship between the data:
• The correlation coefficient is either negative, zero or positive. This tells you whether the data is negativelycorrelated, uncorrelated or positively correlated.
• The correlation coefficient is a number between −1 ≤ r ≤ 1 indicating the strength of correlation. If r = 1or r =−1 then the data is perfectly linear. Note that a perfectly linear relationship includes lines with slopesother than 1.
Consider the examples below to see what different correlation coefficients will look like in data:
654
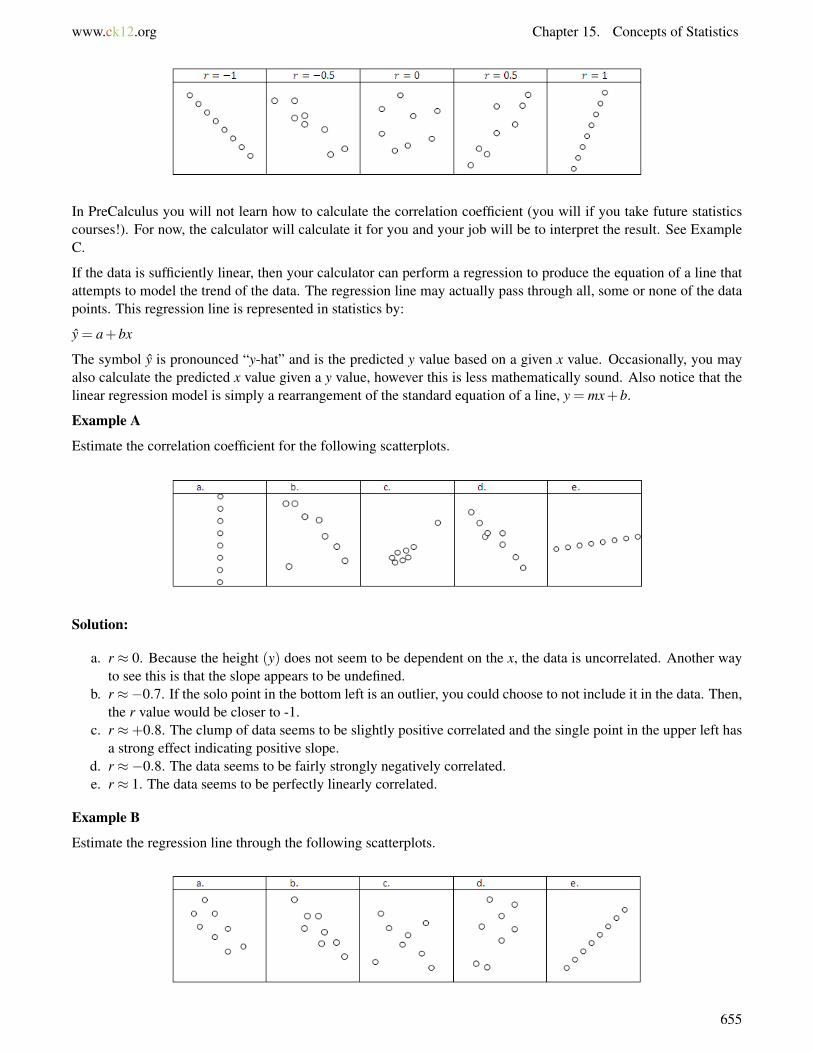
www.ck12.org Chapter 15. Concepts of Statistics
In PreCalculus you will not learn how to calculate the correlation coefficient (you will if you take future statisticscourses!). For now, the calculator will calculate it for you and your job will be to interpret the result. See ExampleC.
If the data is sufficiently linear, then your calculator can perform a regression to produce the equation of a line thatattempts to model the trend of the data. The regression line may actually pass through all, some or none of the datapoints. This regression line is represented in statistics by:
y = a+bx
The symbol y is pronounced “y-hat” and is the predicted y value based on a given x value. Occasionally, you mayalso calculate the predicted x value given a y value, however this is less mathematically sound. Also notice that thelinear regression model is simply a rearrangement of the standard equation of a line, y = mx+b.
Example A
Estimate the correlation coefficient for the following scatterplots.
Solution:
a. r ≈ 0. Because the height (y) does not seem to be dependent on the x, the data is uncorrelated. Another wayto see this is that the slope appears to be undefined.
b. r≈−0.7. If the solo point in the bottom left is an outlier, you could choose to not include it in the data. Then,the r value would be closer to -1.
c. r ≈+0.8. The clump of data seems to be slightly positive correlated and the single point in the upper left hasa strong effect indicating positive slope.
d. r ≈−0.8. The data seems to be fairly strongly negatively correlated.e. r ≈ 1. The data seems to be perfectly linearly correlated.
Example B
Estimate the regression line through the following scatterplots.
655
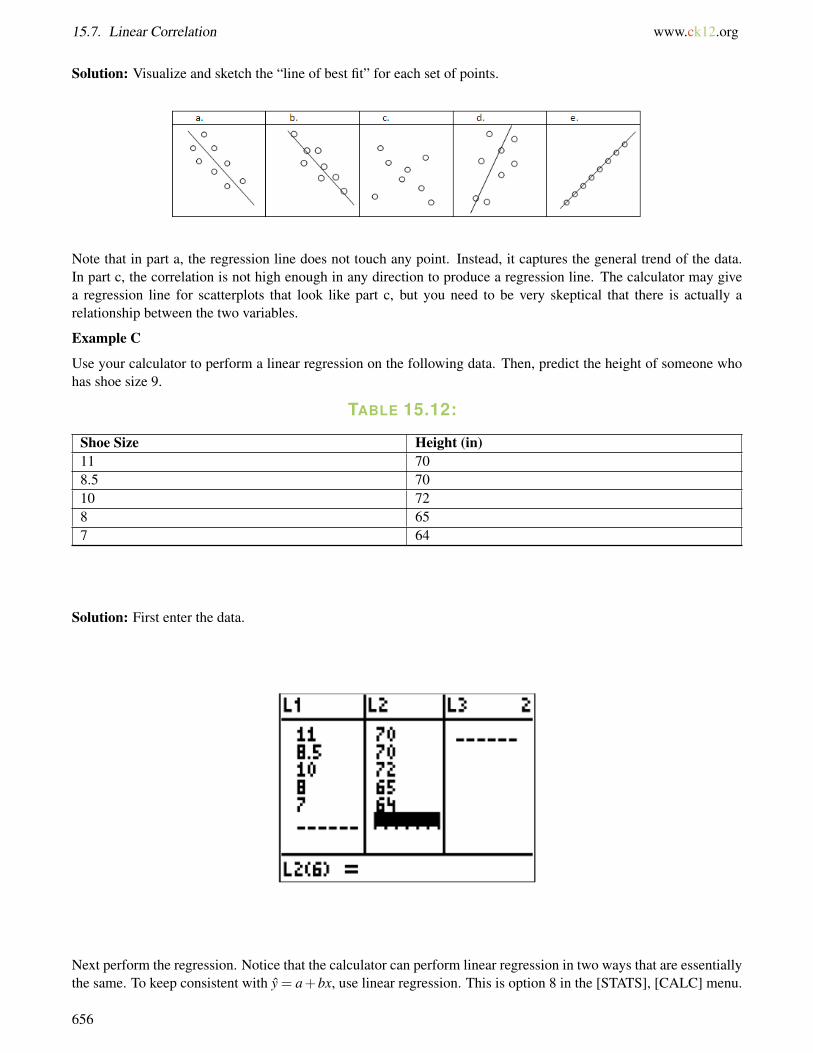
15.7. Linear Correlation www.ck12.org
Solution: Visualize and sketch the “line of best fit” for each set of points.
Note that in part a, the regression line does not touch any point. Instead, it captures the general trend of the data.In part c, the correlation is not high enough in any direction to produce a regression line. The calculator may givea regression line for scatterplots that look like part c, but you need to be very skeptical that there is actually arelationship between the two variables.
Example C
Use your calculator to perform a linear regression on the following data. Then, predict the height of someone whohas shoe size 9.
TABLE 15.12:
Shoe Size Height (in)11 708.5 7010 728 657 64
Solution: First enter the data.
Next perform the regression. Notice that the calculator can perform linear regression in two ways that are essentiallythe same. To keep consistent with y = a+bx, use linear regression. This is option 8 in the [STATS], [CALC] menu.
656
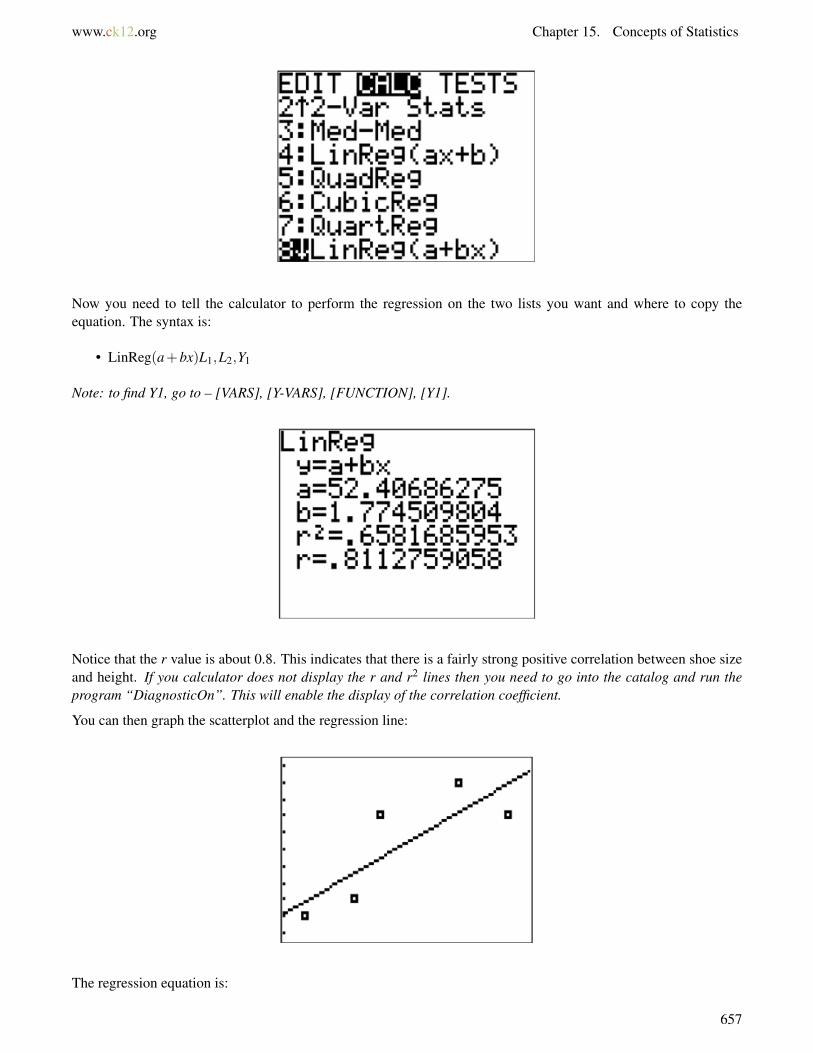
www.ck12.org Chapter 15. Concepts of Statistics
Now you need to tell the calculator to perform the regression on the two lists you want and where to copy theequation. The syntax is:
• LinReg(a+bx)L1,L2,Y1
Note: to find Y1, go to – [VARS], [Y-VARS], [FUNCTION], [Y1].
Notice that the r value is about 0.8. This indicates that there is a fairly strong positive correlation between shoe sizeand height. If you calculator does not display the r and r2 lines then you need to go into the catalog and run theprogram “DiagnosticOn”. This will enable the display of the correlation coefficient.
You can then graph the scatterplot and the regression line:
The regression equation is:
657
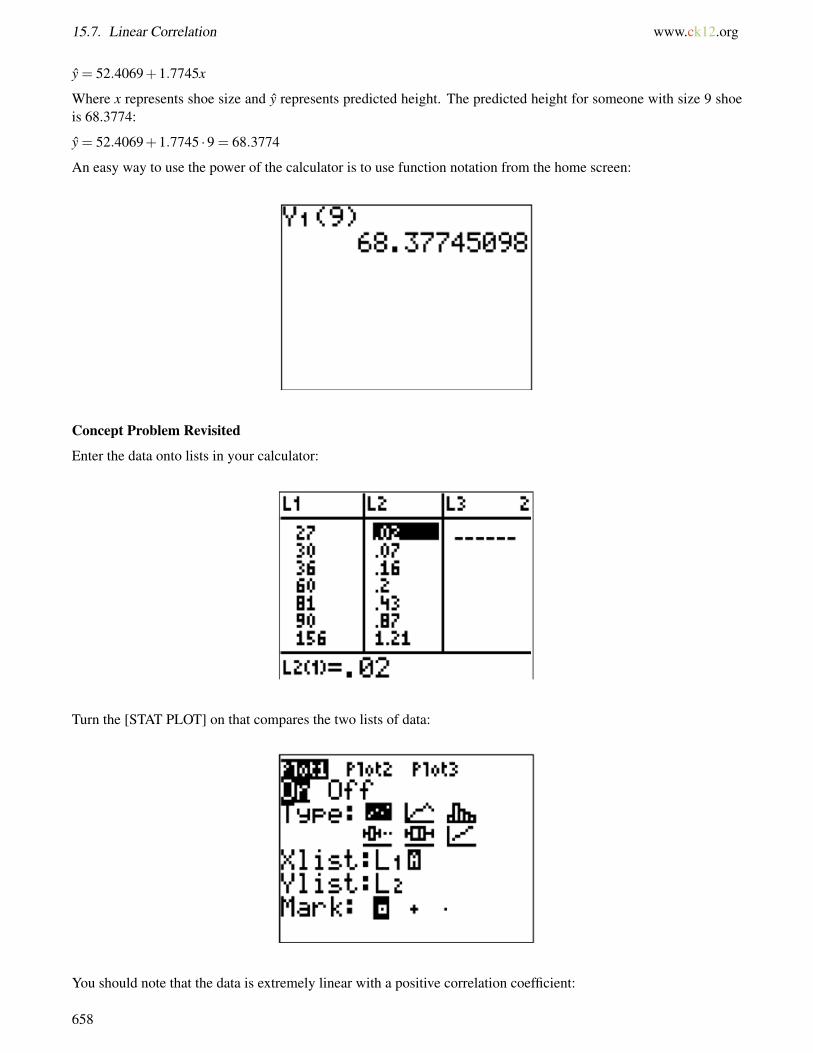
15.7. Linear Correlation www.ck12.org
y = 52.4069+1.7745x
Where x represents shoe size and y represents predicted height. The predicted height for someone with size 9 shoeis 68.3774:
y = 52.4069+1.7745 ·9 = 68.3774
An easy way to use the power of the calculator is to use function notation from the home screen:
Concept Problem Revisited
Enter the data onto lists in your calculator:
Turn the [STAT PLOT] on that compares the two lists of data:
You should note that the data is extremely linear with a positive correlation coefficient:
658
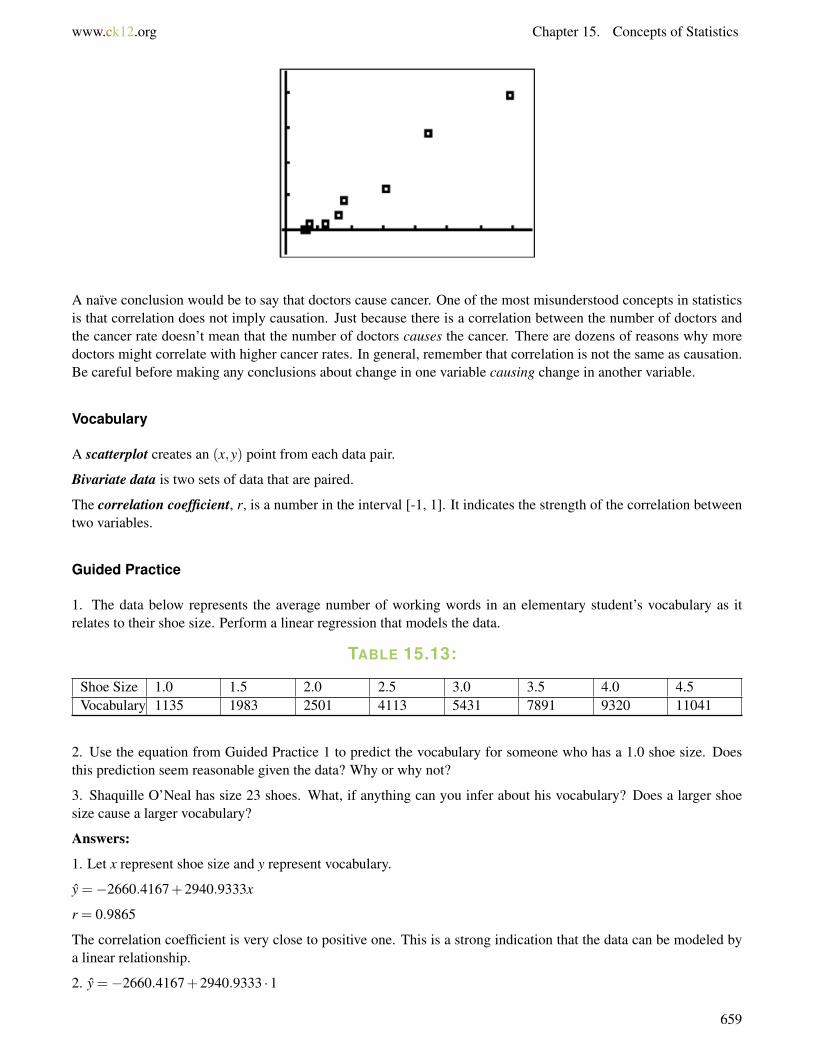
www.ck12.org Chapter 15. Concepts of Statistics
A naïve conclusion would be to say that doctors cause cancer. One of the most misunderstood concepts in statisticsis that correlation does not imply causation. Just because there is a correlation between the number of doctors andthe cancer rate doesn’t mean that the number of doctors causes the cancer. There are dozens of reasons why moredoctors might correlate with higher cancer rates. In general, remember that correlation is not the same as causation.Be careful before making any conclusions about change in one variable causing change in another variable.
Vocabulary
A scatterplot creates an (x,y) point from each data pair.
Bivariate data is two sets of data that are paired.
The correlation coefficient, r, is a number in the interval [-1, 1]. It indicates the strength of the correlation betweentwo variables.
Guided Practice
1. The data below represents the average number of working words in an elementary student’s vocabulary as itrelates to their shoe size. Perform a linear regression that models the data.
TABLE 15.13:
Shoe Size 1.0 1.5 2.0 2.5 3.0 3.5 4.0 4.5Vocabulary 1135 1983 2501 4113 5431 7891 9320 11041
2. Use the equation from Guided Practice 1 to predict the vocabulary for someone who has a 1.0 shoe size. Doesthis prediction seem reasonable given the data? Why or why not?
3. Shaquille O’Neal has size 23 shoes. What, if anything can you infer about his vocabulary? Does a larger shoesize cause a larger vocabulary?
Answers:
1. Let x represent shoe size and y represent vocabulary.
y =−2660.4167+2940.9333x
r = 0.9865
The correlation coefficient is very close to positive one. This is a strong indication that the data can be modeled bya linear relationship.
2. y =−2660.4167+2940.9333 ·1
659
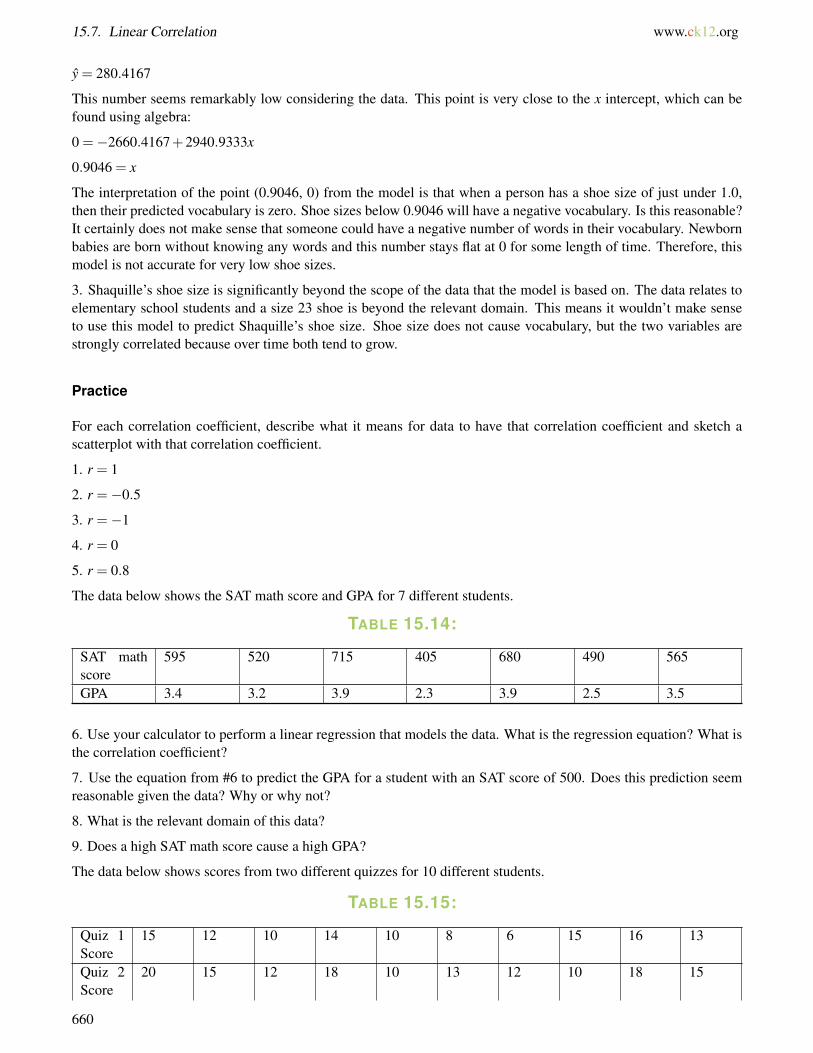
15.7. Linear Correlation www.ck12.org
y = 280.4167
This number seems remarkably low considering the data. This point is very close to the x intercept, which can befound using algebra:
0 =−2660.4167+2940.9333x
0.9046 = x
The interpretation of the point (0.9046, 0) from the model is that when a person has a shoe size of just under 1.0,then their predicted vocabulary is zero. Shoe sizes below 0.9046 will have a negative vocabulary. Is this reasonable?It certainly does not make sense that someone could have a negative number of words in their vocabulary. Newbornbabies are born without knowing any words and this number stays flat at 0 for some length of time. Therefore, thismodel is not accurate for very low shoe sizes.
3. Shaquille’s shoe size is significantly beyond the scope of the data that the model is based on. The data relates toelementary school students and a size 23 shoe is beyond the relevant domain. This means it wouldn’t make senseto use this model to predict Shaquille’s shoe size. Shoe size does not cause vocabulary, but the two variables arestrongly correlated because over time both tend to grow.
Practice
For each correlation coefficient, describe what it means for data to have that correlation coefficient and sketch ascatterplot with that correlation coefficient.
1. r = 1
2. r =−0.5
3. r =−1
4. r = 0
5. r = 0.8
The data below shows the SAT math score and GPA for 7 different students.
TABLE 15.14:
SAT mathscore
595 520 715 405 680 490 565
GPA 3.4 3.2 3.9 2.3 3.9 2.5 3.5
6. Use your calculator to perform a linear regression that models the data. What is the regression equation? What isthe correlation coefficient?
7. Use the equation from #6 to predict the GPA for a student with an SAT score of 500. Does this prediction seemreasonable given the data? Why or why not?
8. What is the relevant domain of this data?
9. Does a high SAT math score cause a high GPA?
The data below shows scores from two different quizzes for 10 different students.
TABLE 15.15:
Quiz 1Score
15 12 10 14 10 8 6 15 16 13
Quiz 2Score
20 15 12 18 10 13 12 10 18 15
660
www.ck12.org Chapter 15. Concepts of Statistics
TABLE 15.15: (continued)
10. Use your calculator to perform a linear regression that models the data. What is the regression equation? Whatis the correlation coefficient?
11. Use the equation from #10 to predict the Quiz 2 score for a student with a Quiz 1 score of 19. Does this predictionseem reasonable given the data? Why or why not?
12. What conclusions can you make about this data?
13. Explain in your own words the difference between causation and correlation.
14. Explain in your own words what the correlation coefficient measures.
15. Explain why a larger sample size will cause a more accurate correlation coefficient.
661
15.8. Modeling with Regression www.ck12.org
15.8 Modeling with Regression
Here you will use regression on a variety of different types of data to make reasonable predictions.
Linear correlation is the simplest type of relationship between two variables. Your calculator has the power to use avariety of different function families to find other relationships and create many different types of models. How doyou choose which function family is best for a given situation?
Watch This
MEDIAClick image to the left for more content.
http://www.youtube.com/watch?v=CxEFOozrMSE Khan Academy: Linear, Quadratic, and Exponential Models
Guidance
Once you understand how to do linear regression with your calculator, you already know the technical mechanics toperform other regressions in the [STAT] [CALC] menu. The most common regressions correspond to the functionfamilies.
• QuadReg - Quadratic function family• CubicReg - Cubic function family• QuarticReg - Quartic function family or 4th degree polynomial• LnReg - Natural Log function family• ExpReg - Exponential function family• PwrReg - Power function family• Logistic - Logistic function family• SinReg - Sinusoidal function family.
When you perform these types of regressions, it will be incredibly important for you to interpret and explain partsof the graph. Here are some points to keep in mind:
1. The y-intercept may have a particular meaning that may or may not be reasonable.2. When you use your model to make predictions it is important for you to remember the relevant domain of
your model. If your data is about elementary school students then it might extend to middle and high schoolstudents, but it might not.
3. The calculator may produce a correlation coefficient for each of these non-linear regressions, but you should bevery careful. Technically, the correlation coefficient is only supposed to be calculated with linear regression,so the calculator is doing some fancy linearization to produce it. You can learn more about this process infuture statistics courses.
662

www.ck12.org Chapter 15. Concepts of Statistics
In general, at this point you should use your best judgment when choosing a function family to model a given set ofdata and deciding how good a fit the model is based on context.
Example A
Given the following data about SAT scores and number of hours slept the night before, use an appropriate functionfamily to produce a reasonable model. Defend your choice of function families.
TABLE 15.16:
# Hours Slept SAT Score8.5 184010.9 15109.1 19007.5 20707.2 15506.0 17202.3 8405.5 1230
Solution: Let x be the number of hours slept and y be the SAT score.
After plotting the points, you should choose a function family to use as a model. In this case, it would be appropriateto try a quadratic relationship.
A quadratic model makes sense because there seems to be a peak in the model and in the data around 8.5 hours ofsleep. It makes sense that someone who does not get enough sleep will do worse and someone who gets too muchsleep might also do worse.
Example B
Using the model from Example A, answer the following questions.
a. What is the perfect amount of sleep to get before the SATs?b. Calculate the score you are predicted to get if you get 5 hours of sleep.c. What is the relevant domain of the model?d. The average SAT score is about 1500. According to the model, what amount of sleep predicts this score? Does
this number represent the average number of hours that people sleep before the SATs?e. Compare the actual and predicted score for someone with 6 hours of sleep.
Solution:
663
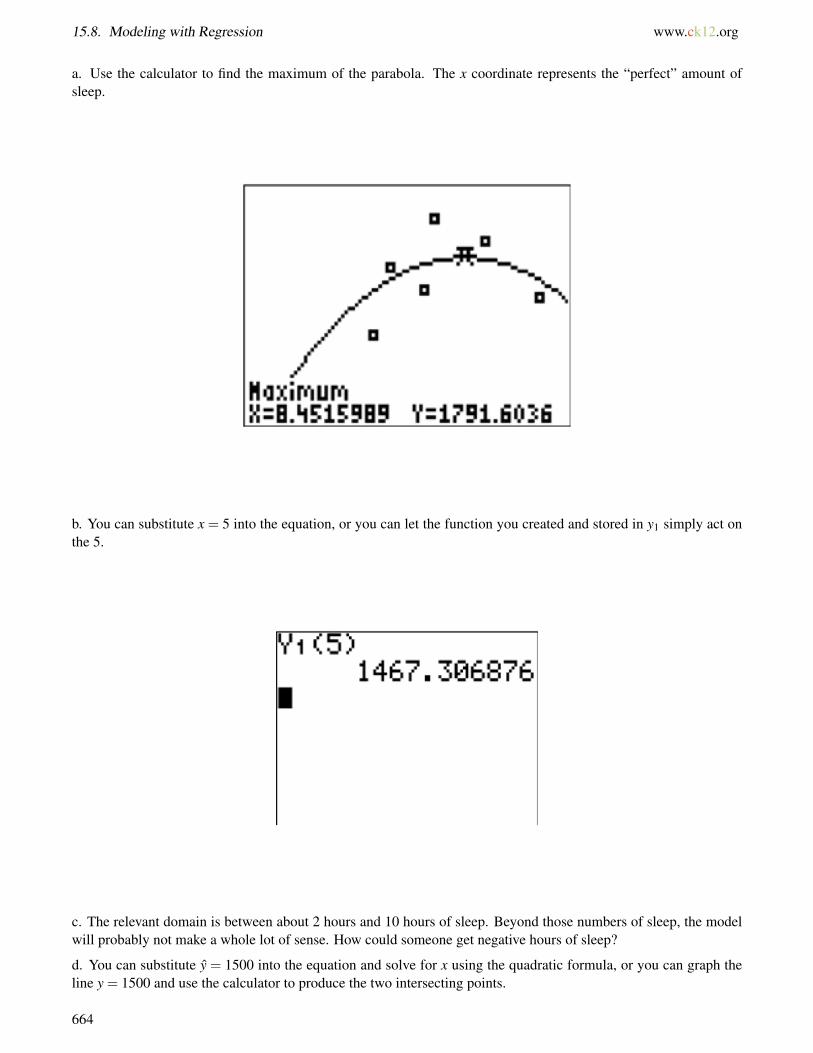
15.8. Modeling with Regression www.ck12.org
a. Use the calculator to find the maximum of the parabola. The x coordinate represents the “perfect” amount ofsleep.
b. You can substitute x = 5 into the equation, or you can let the function you created and stored in y1 simply act onthe 5.
c. The relevant domain is between about 2 hours and 10 hours of sleep. Beyond those numbers of sleep, the modelwill probably not make a whole lot of sense. How could someone get negative hours of sleep?
d. You can substitute y = 1500 into the equation and solve for x using the quadratic formula, or you can graph theline y = 1500 and use the calculator to produce the two intersecting points.
664

www.ck12.org Chapter 15. Concepts of Statistics
5.1786 hours and 11.7246 hours are the number hours of sleep that predict a score of 1500.
When using the model in this direction, the results do not make as much sense and you need to be extremely carefulabout what you say.
e. The actual score for someone who got 6 hours of sleep can be found in the original data to be 1720. The modelpredicts 1627.9970. The difference between the model and what actually happened is 1720−1627.9970 = 92.0030
Example C
Use your knowledge of function families to predict the best model for each of the following scatterplots.
Solution:
Concept Problem Revisited
For some data sets it is possible to use a polynomial or other complicated shape to exactly intersect every data point.The downside is that the model will miss the overall relationship. Consider the following data and modeling a linearrelationship or cubic relationship.
665
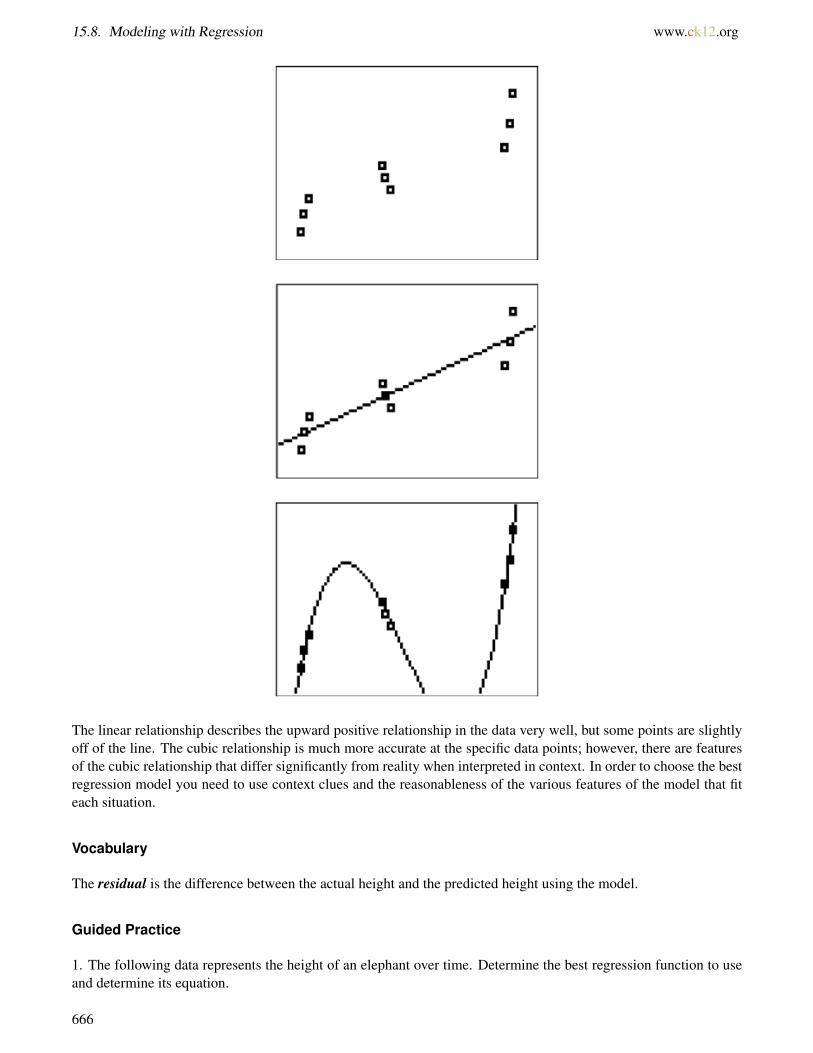
15.8. Modeling with Regression www.ck12.org
The linear relationship describes the upward positive relationship in the data very well, but some points are slightlyoff of the line. The cubic relationship is much more accurate at the specific data points; however, there are featuresof the cubic relationship that differ significantly from reality when interpreted in context. In order to choose the bestregression model you need to use context clues and the reasonableness of the various features of the model that fiteach situation.
Vocabulary
The residual is the difference between the actual height and the predicted height using the model.
Guided Practice
1. The following data represents the height of an elephant over time. Determine the best regression function to useand determine its equation.
666

www.ck12.org Chapter 15. Concepts of Statistics
TABLE 15.17:
Age(Years) Height (ft)0 22 2.84 48 7.512 1016 10.420 10.45
2. The following data represents the speed that Ben can kick a soccer ball at different ages. Determine the bestregression function to use and determine its equation.
TABLE 15.18:
Age(Years) Speed (mph)4 1510 3220 6530 7050 4560 35
3. What are two weaknesses and two strengths of the model used to predict Ben’s kicking speed from GuidedPractice 2?
Answers:
1. Logistic is the best function family because it levels off over time indicating that the elephant ceases to grow onceit matures.
y = 10.76011+5.4526·e−0.3199x
2. The best regression to use is a quadratic relationship because when Ben is little he cannot kick the ball very fastand when he is old he also cannot kick the ball very fast. Ben can kick the ball the fastest when he is an adultbetween the ages of 20 and 40.
y =−0.05981x2 +4.0679x+0.6191
3. One strength is that a quadratic model correctly describes the peak of kicking speed occurring in the middle ofBen’s life. A linear regression might forecast Ben’s kicking speed increasing forever and a logistic regression mightforecast Ben’s kicking speed always staying fast despite his old age. A second strength of the model could be the
667
15.8. Modeling with Regression www.ck12.org
y-intercept of 0.6191. Even though this number is not really in the relevant domain, it implies that as a newbornbaby Ben could kick the ball very slowly which is arguably true.
One weakness of the model is that it predicts that Ben will kick the ball at 0 miles per hour at age 68.1660. Thisimplies that Ben will not be able to kick the ball at all which isn’t necessarily true.
A second weakness of the model is that it predicts negative speed at either age extreme which doesn’t make sense.A better model would be flat at 0 when Ben is born and also at the end of Ben’s life when he is no longer able tokick the ball.
Practice
The table below shows the average height of an American female by age.
TABLE 15.19:
Age (Years) Height (inches)2 348 5011 5715 6323 6435 64
1. Determine two different equations that model the height over time using two different function families.
2. Which function is a better fit for this data? Why?
3. Use both equations to predict the y-intercepts. What does the y-intercept represent in each case? Are yourpredictions reasonable for this part of the graph?
4. Use your “better fit” equation to predict the height of a 70 year-old woman. Is your prediction reasonable for thispart of the graph? Why or why not? What do you really need your model to do for the domain [16,100]?
Alice is in Wonderland and drinks a potion that approximately halves her height for each sip she takes, as shown inthe table below.
TABLE 15.20:
# of sips Height (inches)0 601 292 163 84 4.1
5. Do an exponential regression to determine an appropriate model. What is the equation?
6. Explain why exponential regression is a good choice in this case.
7. How many sips did she take if she is 2 inches tall?
8. How tall will she be if she has 6 sips?
A rumor is spreading around your 400 person school. The following table shows the number of people who knowthe rumor each day.
668
www.ck12.org Chapter 15. Concepts of Statistics
TABLE 15.21:
Day # of people who know the rumor1 22 83 295 1616 3727 3788 391
9. Use logistic regression to determine an equation that models the number of people who know the rumor overtime.
10. Why is the logistic model appropriate in this case?
11. Use your regression equation to predict the time when only one person knew the rumor. Does this make sense?
The data table below represents how the tide changes the depth of the ocean water at a beach. At a certain place inthe water, a scientist measures the depth of the water for ten consecutive hours.
TABLE 15.22:
Hours Depth of Ocean Water (ft)0 91 11.22 12.43 12.94 12.55 116 8.97 78 5.59 4.910 5.4
12. Choose the function family that is the best model for this situation and determine the regression equation.
13. Use your regression equation to predict the depth of the water at 10 hours. What is the difference between theactual depth from the data and the predicted depth from your equation (residual)?
14. Do a cubic regression on the calculator. What is the cubic regression equation? Is this a better or worse modelthan the model you originally chose?
15. Why might statisticians do modeling with regression for their data?
You started by working with univariate data and learned how to display it graphically and summarize it numeri-cally. You learned how to calculate mean, median, mode and variance, and when to use each. You also exploredbivariate data and used the regression capabilities of your calculator to create mathematical models for real worldphenomenon.
669
15.9. References www.ck12.org
15.9 References
1. CK-12 Foundation. . CCSA2. CK-12 Foundation. . CCSA3. CK-12 Foundation. . CCSA4. CK-12 Foundation. . CCSA5. CK-12 Foundation. . CCSA6. CK-12 Foundation. . CCSA7. CK-12 Foundation. . CCSA8. CK-12 Foundation. . CCSA9. CK-12 Foundation. . CCSA
10. CK-12 Foundation. . CCSA11. CK-12 Foundation. . CCSA12. CK-12 Foundation. . CCSA13. CK-12 Foundation. . CCSA14. CK-12 Foundation. . CCSA15. CK-12 Foundation. . CCSA16. CK-12 Foundation. . CCSA17. CK-12 Foundation. . CCSA18. CK-12 Foundation. . CCSA19. CK-12 Foundation. . CCSA20. CK-12 Foundation. . CCSA21. CK-12 Foundation. . CCSA22. CK-12 Foundation. . CCSA23. CK-12 Foundation. . CCSA24. CK-12 Foundation. . CCSA25. CK-12 Foundation. . CCSA26. CK-12 Foundation. . CCSA27. CK-12 Foundation. . CCSA28. CK-12 Foundation. . CCSA29. CK-12 Foundation. . CCSA30. CK-12 Foundation. . CCSA31. CK-12 Foundation. . CCSA32. CK-12 Foundation. . CCSA33. CK-12 Foundation. . CCSA34. CK-12 Foundation. . CCSA35. CK-12 Foundation. . CCSA36. CK-12 Foundation. . CCSA37. CK-12 Foundation. . CCSA38. CK-12 Foundation. . CCSA39. CK-12 Foundation. . CCSA40. CK-12 Foundation. . CCSA41. CK-12 Foundation. . CCSA42. CK-12 Foundation. . CCSA43. CK-12 Foundation. . CCSA
670
www.ck12.org Chapter 16. Logic and Set Theory
CHAPTER 16 Logic and Set TheoryChapter Outline
16.1 AND AND OR STATEMENTS
16.2 IF-THEN STATEMENTS
16.3 NEGATIVE STATEMENTS
16.4 INVERSE, CONVERSE, AND CONTRAPOSITIVE
16.5 REFERENCES
Mathematics involves intricate notation, numbers, graphs and theorems, but at its core is logical reasoning. Mostexplanations, proofs, solutions and arguments involve step by step conclusions that follow from previous state-ments. Inherent to this structure is reasoning about when and how the truth of a conclusion follows from previousstatements. Most students take this reasoning for granted, but to make mathematics truly objective it makes senseto study the nature of logic so that you can be sure that your reasoning truly is airtight. Here you will explore thebasics of logic and set theory.
671
16.1. And and Or Statements www.ck12.org
16.1 And and Or Statements
Here you will use the words “and” and “or” as logical connectives in complex statements. You will also use settheory and logical notation to diagram logical statements.
The words “and” and “or” are common in everyday language. In mathematics, there are some subtle differences thatyou need to watch out for, especially considering the word “or”.
It will rain or it will snow.
When is this statement true and when is it false?
Watch This
Watch the portion of this video focusing on truth tables of conjunction and disjunction:
MEDIAClick image to the left for more content.
http://www.youtube.com/watch?v=_5Z_0824RHw James Sousa: Truth Tables for Compound Statements
Guidance
An atomic statement is a declarative statement without logical connectives that has a truth value. Here are twodeclarative statements:
• P = It is snowing.• Q = I am cold.
The truth value of a statement is whether the statement is true or false. As a mathematician, your job is to determinewhen a logical statement is true and when it is false. If you don’t have enough information to determine whether theoriginal statements are true or false, you can build a truth table to organize all the possible cases.
Consider the atomic statement P joined with the atomic statement Q. The following sentence can be written usingthe symbol “∨” for the logical connective “or”.
It is snowing or I am cold.
P∨Q
This statement is a little strange because it seems to imply that it is always the case that one or both of those atomicstatements is happening. Your common sense may dictate that this statement isn’t true because of course there aretimes when it is sunny and you are warm. It’s important to remember that not all statements are true! Your job is to
672
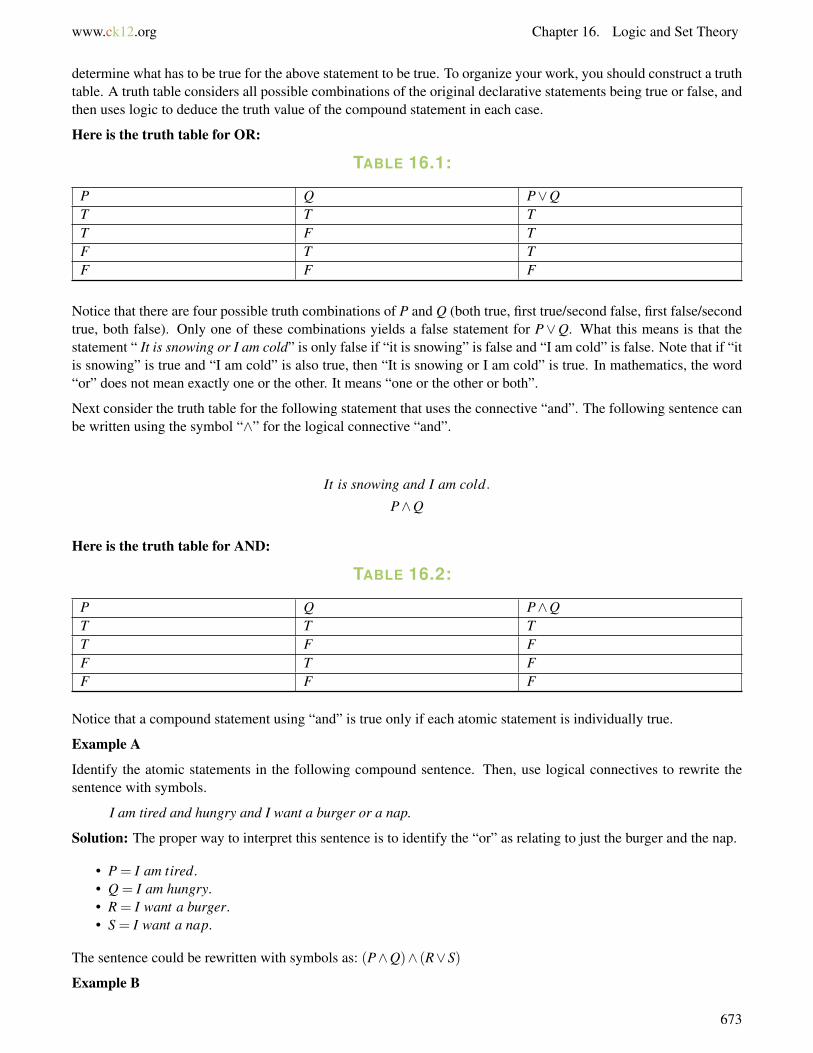
www.ck12.org Chapter 16. Logic and Set Theory
determine what has to be true for the above statement to be true. To organize your work, you should construct a truthtable. A truth table considers all possible combinations of the original declarative statements being true or false, andthen uses logic to deduce the truth value of the compound statement in each case.
Here is the truth table for OR:
TABLE 16.1:
P Q P∨QT T TT F TF T TF F F
Notice that there are four possible truth combinations of P and Q (both true, first true/second false, first false/secondtrue, both false). Only one of these combinations yields a false statement for P∨Q. What this means is that thestatement “ It is snowing or I am cold” is only false if “it is snowing” is false and “I am cold” is false. Note that if “itis snowing” is true and “I am cold” is also true, then “It is snowing or I am cold” is true. In mathematics, the word“or” does not mean exactly one or the other. It means “one or the other or both”.
Next consider the truth table for the following statement that uses the connective “and”. The following sentence canbe written using the symbol “∧” for the logical connective “and”.
It is snowing and I am cold.
P∧Q
Here is the truth table for AND:
TABLE 16.2:
P Q P∧QT T TT F FF T FF F F
Notice that a compound statement using “and” is true only if each atomic statement is individually true.
Example A
Identify the atomic statements in the following compound sentence. Then, use logical connectives to rewrite thesentence with symbols.
I am tired and hungry and I want a burger or a nap.
Solution: The proper way to interpret this sentence is to identify the “or” as relating to just the burger and the nap.
• P = I am tired.• Q = I am hungry.• R = I want a burger.• S = I want a nap.
The sentence could be rewritten with symbols as: (P∧Q)∧ (R∨S)
Example B
673
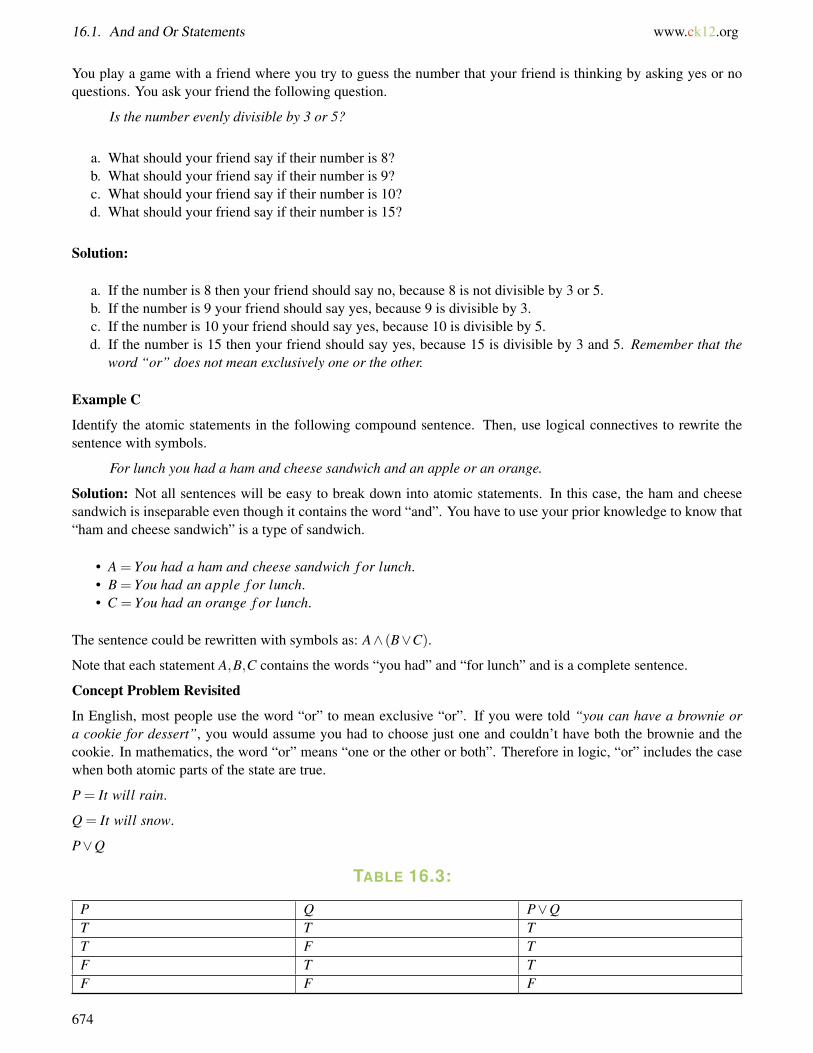
16.1. And and Or Statements www.ck12.org
You play a game with a friend where you try to guess the number that your friend is thinking by asking yes or noquestions. You ask your friend the following question.
Is the number evenly divisible by 3 or 5?
a. What should your friend say if their number is 8?b. What should your friend say if their number is 9?c. What should your friend say if their number is 10?d. What should your friend say if their number is 15?
Solution:
a. If the number is 8 then your friend should say no, because 8 is not divisible by 3 or 5.b. If the number is 9 your friend should say yes, because 9 is divisible by 3.c. If the number is 10 your friend should say yes, because 10 is divisible by 5.d. If the number is 15 then your friend should say yes, because 15 is divisible by 3 and 5. Remember that the
word “or” does not mean exclusively one or the other.
Example C
Identify the atomic statements in the following compound sentence. Then, use logical connectives to rewrite thesentence with symbols.
For lunch you had a ham and cheese sandwich and an apple or an orange.
Solution: Not all sentences will be easy to break down into atomic statements. In this case, the ham and cheesesandwich is inseparable even though it contains the word “and”. You have to use your prior knowledge to know that“ham and cheese sandwich” is a type of sandwich.
• A = You had a ham and cheese sandwich f or lunch.• B = You had an apple f or lunch.• C = You had an orange f or lunch.
The sentence could be rewritten with symbols as: A∧ (B∨C).
Note that each statement A,B,C contains the words “you had” and “for lunch” and is a complete sentence.
Concept Problem Revisited
In English, most people use the word “or” to mean exclusive “or”. If you were told “you can have a brownie ora cookie for dessert”, you would assume you had to choose just one and couldn’t have both the brownie and thecookie. In mathematics, the word “or” means “one or the other or both”. Therefore in logic, “or” includes the casewhen both atomic parts of the state are true.
P = It will rain.
Q = It will snow.
P∨Q
TABLE 16.3:
P Q P∨QT T TT F TF T TF F F
674
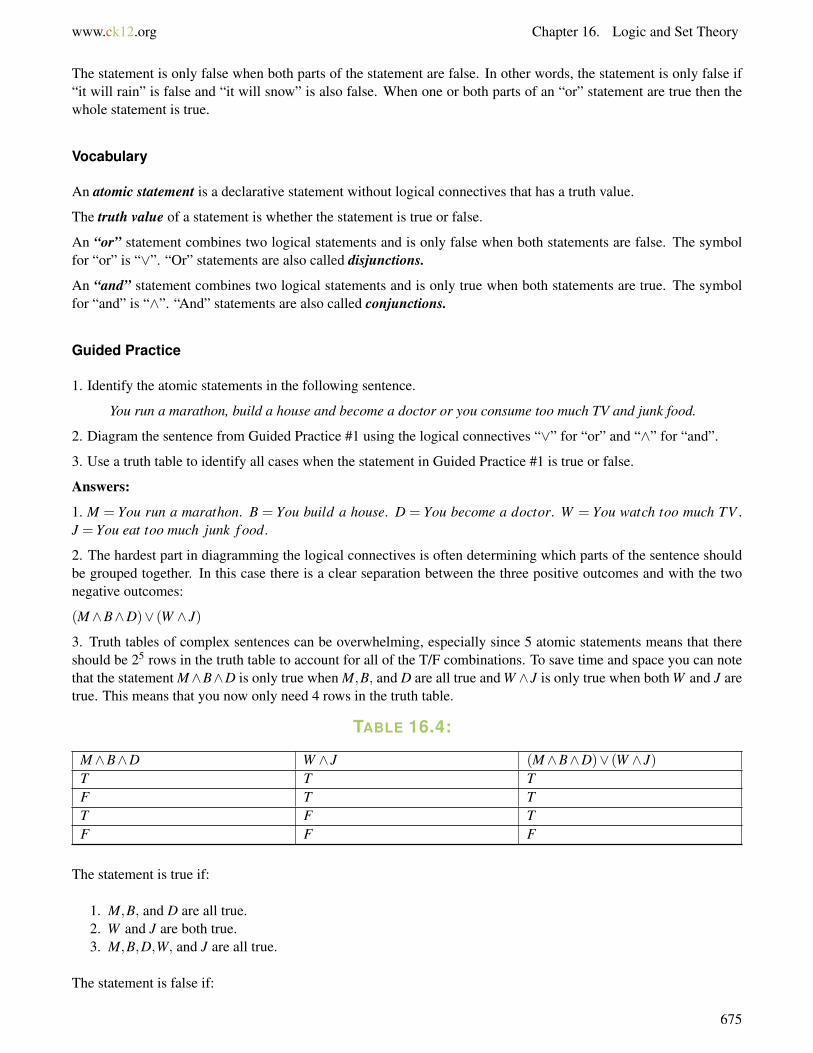
www.ck12.org Chapter 16. Logic and Set Theory
The statement is only false when both parts of the statement are false. In other words, the statement is only false if“it will rain” is false and “it will snow” is also false. When one or both parts of an “or” statement are true then thewhole statement is true.
Vocabulary
An atomic statement is a declarative statement without logical connectives that has a truth value.
The truth value of a statement is whether the statement is true or false.
An “or” statement combines two logical statements and is only false when both statements are false. The symbolfor “or” is “∨”. “Or” statements are also called disjunctions.
An “and” statement combines two logical statements and is only true when both statements are true. The symbolfor “and” is “∧”. “And” statements are also called conjunctions.
Guided Practice
1. Identify the atomic statements in the following sentence.
You run a marathon, build a house and become a doctor or you consume too much TV and junk food.
2. Diagram the sentence from Guided Practice #1 using the logical connectives “∨” for “or” and “∧” for “and”.
3. Use a truth table to identify all cases when the statement in Guided Practice #1 is true or false.
Answers:
1. M = You run a marathon. B = You build a house. D = You become a doctor. W = You watch too much TV .J = You eat too much junk f ood.
2. The hardest part in diagramming the logical connectives is often determining which parts of the sentence shouldbe grouped together. In this case there is a clear separation between the three positive outcomes and with the twonegative outcomes:
(M∧B∧D)∨ (W ∧ J)
3. Truth tables of complex sentences can be overwhelming, especially since 5 atomic statements means that thereshould be 25 rows in the truth table to account for all of the T/F combinations. To save time and space you can notethat the statement M∧B∧D is only true when M,B, and D are all true and W ∧J is only true when both W and J aretrue. This means that you now only need 4 rows in the truth table.
TABLE 16.4:
M∧B∧D W ∧ J (M∧B∧D)∨ (W ∧ J)T T TF T TT F TF F F
The statement is true if:
1. M,B, and D are all true.2. W and J are both true.3. M,B,D,W, and J are all true.
The statement is false if:
675

16.1. And and Or Statements www.ck12.org
1. Not all of M,B, and D are true and not both of W and J are true.
Practice
I go to school and do my work or stay home and play games.
1. Identify the atomic statements in the above compound sentence.
2. Use logical connectives to rewrite the sentence with symbols.
I have macaroni and cheese or steak and green beans or potatoes.
3. Identify the atomic statements in the above compound sentence.
4. Use logical connectives to rewrite the sentence with symbols.
I wear flip flops and either shorts and a t-shirt or a dress.
5. Identify the atomic statements in the above compound sentence.
6. Use logical connectives to rewrite the sentence with symbols.
It is dark outside and I light a candle.
7. Identify the atomic statements in the above compound sentence.
8. Use logical connectives to rewrite the sentence with symbols.
We will go to the beach and have a picnic or go to the movies and eat popcorn.
9. Identify the atomic statements in the above compound sentence.
10. Use logical connectives to rewrite the sentence with symbols.
Make a truth table for each of the following statements.
11. (P∧Q)∨R
12. P∧ (Q∨R)
13. (P∨Q)∨R
14. P∨ (Q∨R)
15. How does the placement of parentheses affect the truth values of compound statements?
676
www.ck12.org Chapter 16. Logic and Set Theory
16.2 If-Then Statements
Here you will learn to identify different parts of if-then statements and determine when an if-then statement is trueor false. You will also use traditional set theory graphical representations.
If-then statements are very common outside formal mathematics. In many cases, your familiarity with these types ofstatements will help you to interpret their meaning and truth value. In other cases, the truth value of some statementsmay be unclear without a formal understanding of logic. Consider the following two statements:
• If it rains today then you will stay at home and read a book.• You stayed at home and read a book.
Did it or did it not rain?
Watch This
MEDIAClick image to the left for more content.
http://www.youtube.com/watch?v=oEr27P1bX9o James Sousa: If-Then Statements and Converses
Guidance
A mathematical set is just a group of things. The group can include anything: letters, numbers, objects or monkeys.Set theory focuses on the relationships between sets as they overlap or are completely within each other. For thepurposes of if-then statements, set theory provides a perfect framework in which to reason.
Consider set P and set Q that are just collections of things represented by circles. If something is not in the set, thenit is not in the circle.
677

16.2. If-Then Statements www.ck12.org
In this case set P is a subset of set Q since it is entirely included within set Q. Mathematically we write the statement“P is a subset of Q” as:
P⊆ Q
This can be translated to an if-then statement, and simplified using symbols:
If it is an element in P, then it is an element in Q.
If P, then Q.
P→ Q
If-then statements are examples of conditional statements. Sometimes conditional statements are written withoutan “if” or a “then”, but can be rewritten. The “if” part of the statement (represented by P above) is called thehypothesis, antecedent or protasis. The “then” part of the statement (represented by Q above) is called theconclusion, consequent or apodosis.
In order to precisely define the truth value of a conditional statement, we need to consider the four differentcombinations of the truth value for P and Q in relation to the diagram
1. If P is true, then Q is true. This statement is true because if an object is inside circle P, then it is definitely
678
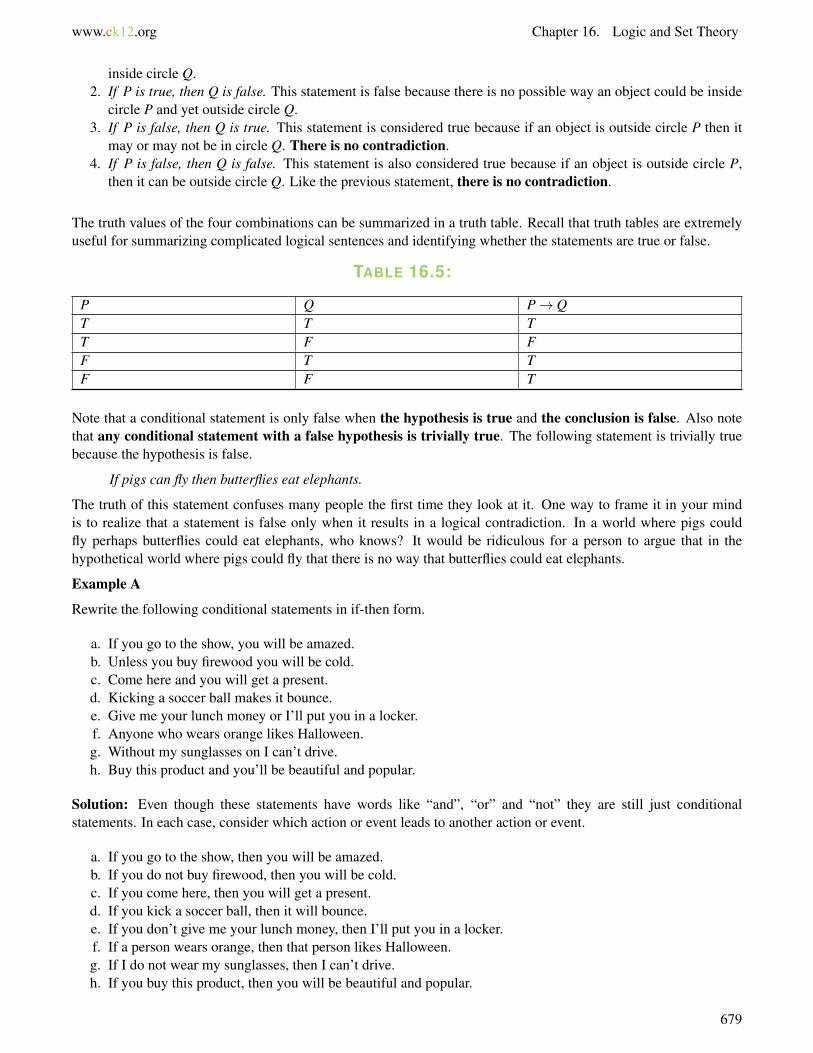
www.ck12.org Chapter 16. Logic and Set Theory
inside circle Q.2. If P is true, then Q is false. This statement is false because there is no possible way an object could be inside
circle P and yet outside circle Q.3. If P is false, then Q is true. This statement is considered true because if an object is outside circle P then it
may or may not be in circle Q. There is no contradiction.4. If P is false, then Q is false. This statement is also considered true because if an object is outside circle P,
then it can be outside circle Q. Like the previous statement, there is no contradiction.
The truth values of the four combinations can be summarized in a truth table. Recall that truth tables are extremelyuseful for summarizing complicated logical sentences and identifying whether the statements are true or false.
TABLE 16.5:
P Q P→ QT T TT F FF T TF F T
Note that a conditional statement is only false when the hypothesis is true and the conclusion is false. Also notethat any conditional statement with a false hypothesis is trivially true. The following statement is trivially truebecause the hypothesis is false.
If pigs can fly then butterflies eat elephants.
The truth of this statement confuses many people the first time they look at it. One way to frame it in your mindis to realize that a statement is false only when it results in a logical contradiction. In a world where pigs couldfly perhaps butterflies could eat elephants, who knows? It would be ridiculous for a person to argue that in thehypothetical world where pigs could fly that there is no way that butterflies could eat elephants.
Example A
Rewrite the following conditional statements in if-then form.
a. If you go to the show, you will be amazed.b. Unless you buy firewood you will be cold.c. Come here and you will get a present.d. Kicking a soccer ball makes it bounce.e. Give me your lunch money or I’ll put you in a locker.f. Anyone who wears orange likes Halloween.g. Without my sunglasses on I can’t drive.h. Buy this product and you’ll be beautiful and popular.
Solution: Even though these statements have words like “and”, “or” and “not” they are still just conditionalstatements. In each case, consider which action or event leads to another action or event.
a. If you go to the show, then you will be amazed.b. If you do not buy firewood, then you will be cold.c. If you come here, then you will get a present.d. If you kick a soccer ball, then it will bounce.e. If you don’t give me your lunch money, then I’ll put you in a locker.f. If a person wears orange, then that person likes Halloween.g. If I do not wear my sunglasses, then I can’t drive.h. If you buy this product, then you will be beautiful and popular.
679
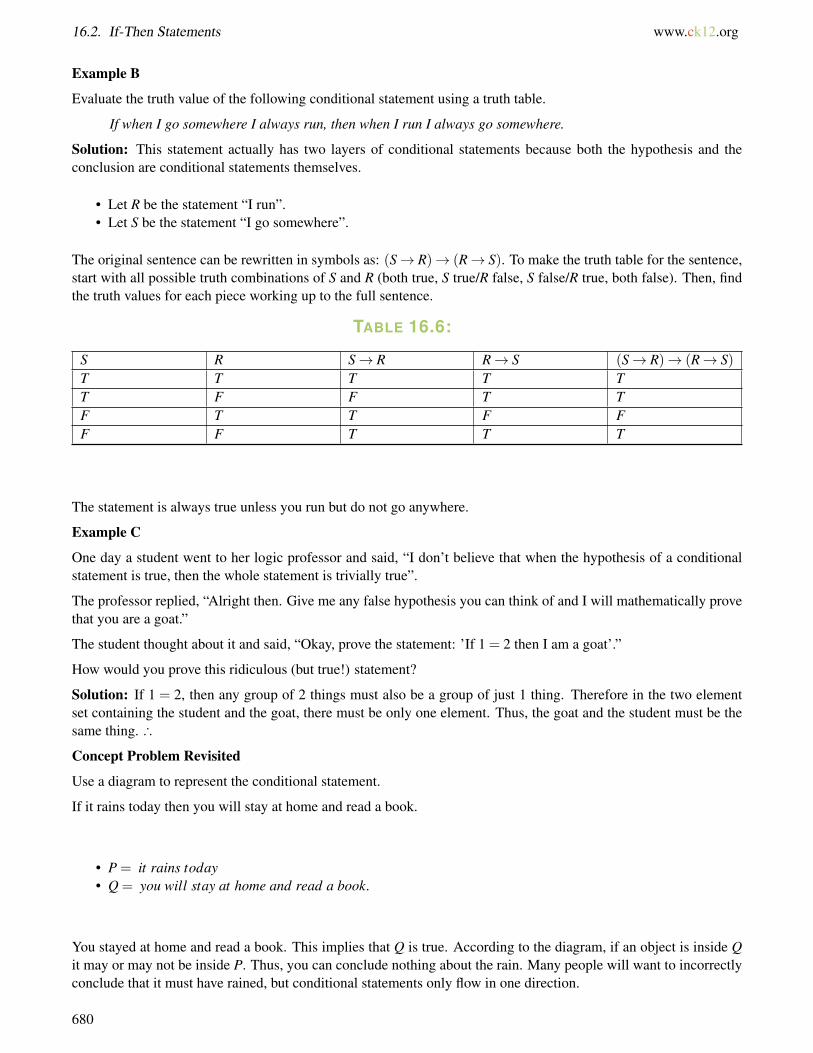
16.2. If-Then Statements www.ck12.org
Example B
Evaluate the truth value of the following conditional statement using a truth table.
If when I go somewhere I always run, then when I run I always go somewhere.
Solution: This statement actually has two layers of conditional statements because both the hypothesis and theconclusion are conditional statements themselves.
• Let R be the statement “I run”.• Let S be the statement “I go somewhere”.
The original sentence can be rewritten in symbols as: (S→ R)→ (R→ S). To make the truth table for the sentence,start with all possible truth combinations of S and R (both true, S true/R false, S false/R true, both false). Then, findthe truth values for each piece working up to the full sentence.
TABLE 16.6:
S R S→ R R→ S (S→ R)→ (R→ S)T T T T TT F F T TF T T F FF F T T T
The statement is always true unless you run but do not go anywhere.
Example C
One day a student went to her logic professor and said, “I don’t believe that when the hypothesis of a conditionalstatement is true, then the whole statement is trivially true”.
The professor replied, “Alright then. Give me any false hypothesis you can think of and I will mathematically provethat you are a goat.”
The student thought about it and said, “Okay, prove the statement: ’If 1 = 2 then I am a goat’.”
How would you prove this ridiculous (but true!) statement?
Solution: If 1 = 2, then any group of 2 things must also be a group of just 1 thing. Therefore in the two elementset containing the student and the goat, there must be only one element. Thus, the goat and the student must be thesame thing. ∴
Concept Problem Revisited
Use a diagram to represent the conditional statement.
If it rains today then you will stay at home and read a book.
• P = it rains today• Q = you will stay at home and read a book.
You stayed at home and read a book. This implies that Q is true. According to the diagram, if an object is inside Qit may or may not be inside P. Thus, you can conclude nothing about the rain. Many people will want to incorrectlyconclude that it must have rained, but conditional statements only flow in one direction.
680
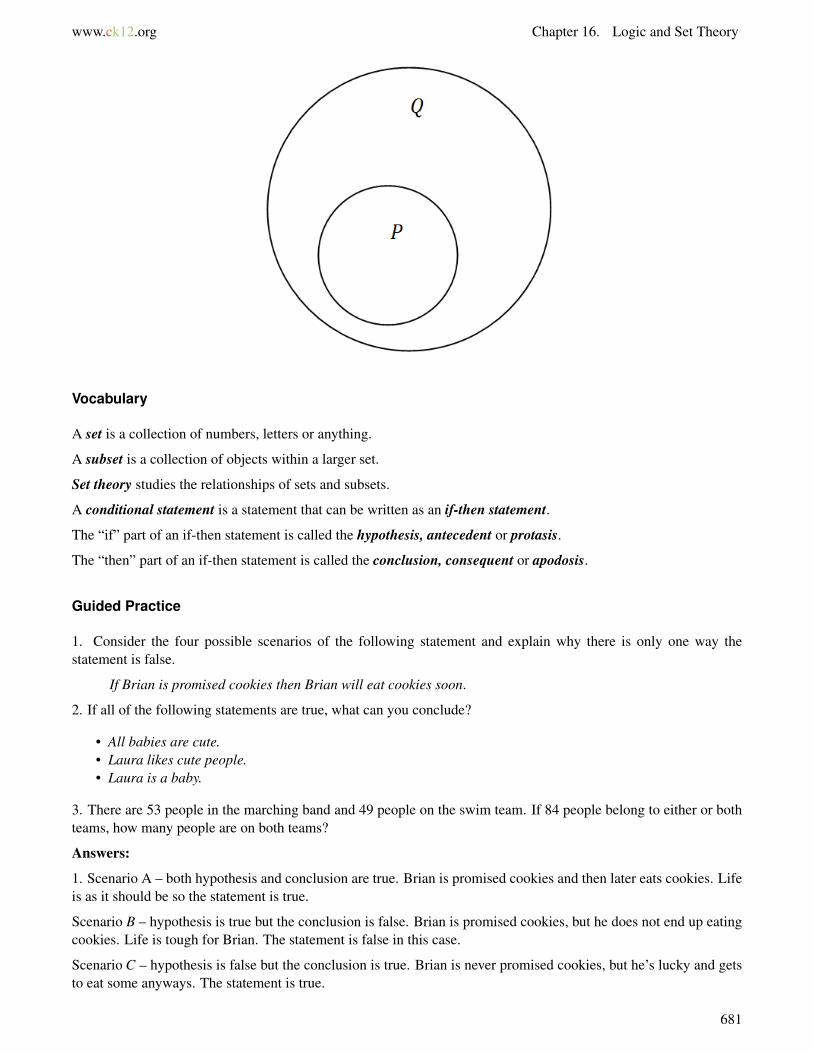
www.ck12.org Chapter 16. Logic and Set Theory
Vocabulary
A set is a collection of numbers, letters or anything.
A subset is a collection of objects within a larger set.
Set theory studies the relationships of sets and subsets.
A conditional statement is a statement that can be written as an if-then statement.
The “if” part of an if-then statement is called the hypothesis, antecedent or protasis.
The “then” part of an if-then statement is called the conclusion, consequent or apodosis.
Guided Practice
1. Consider the four possible scenarios of the following statement and explain why there is only one way thestatement is false.
If Brian is promised cookies then Brian will eat cookies soon.
2. If all of the following statements are true, what can you conclude?
• All babies are cute.• Laura likes cute people.• Laura is a baby.
3. There are 53 people in the marching band and 49 people on the swim team. If 84 people belong to either or bothteams, how many people are on both teams?
Answers:
1. Scenario A – both hypothesis and conclusion are true. Brian is promised cookies and then later eats cookies. Lifeis as it should be so the statement is true.
Scenario B – hypothesis is true but the conclusion is false. Brian is promised cookies, but he does not end up eatingcookies. Life is tough for Brian. The statement is false in this case.
Scenario C – hypothesis is false but the conclusion is true. Brian is never promised cookies, but he’s lucky and getsto eat some anyways. The statement is true.
681
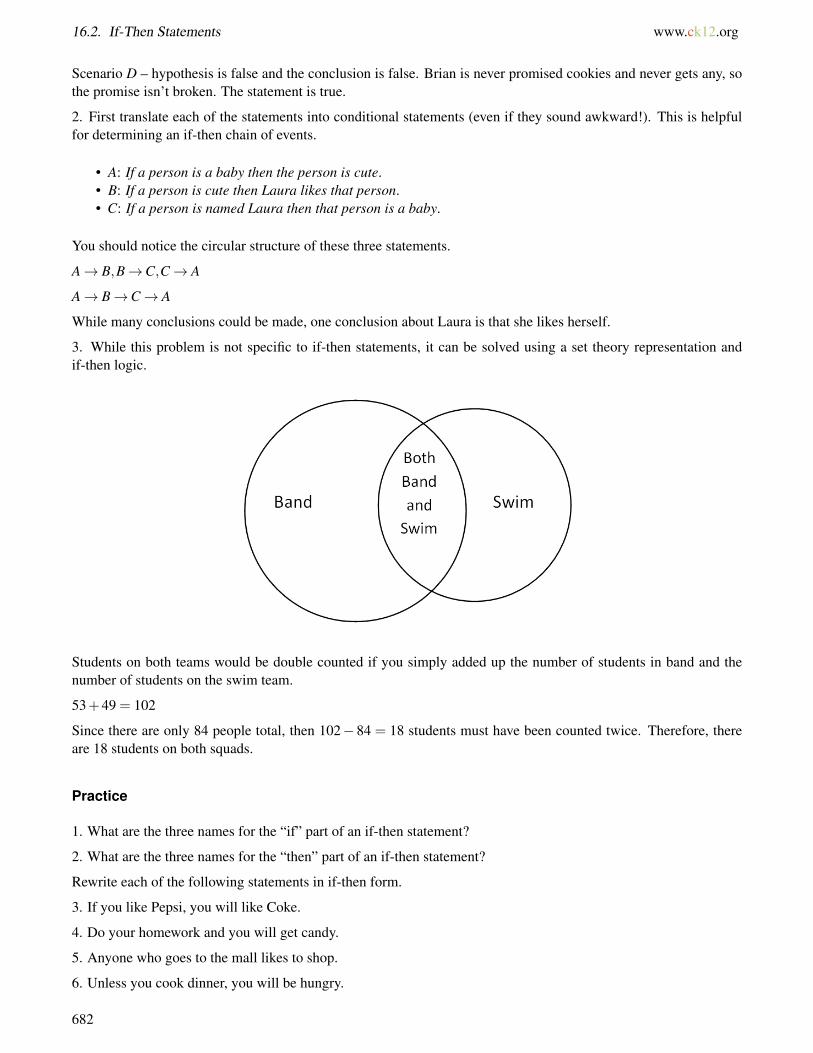
16.2. If-Then Statements www.ck12.org
Scenario D – hypothesis is false and the conclusion is false. Brian is never promised cookies and never gets any, sothe promise isn’t broken. The statement is true.
2. First translate each of the statements into conditional statements (even if they sound awkward!). This is helpfulfor determining an if-then chain of events.
• A: If a person is a baby then the person is cute.• B: If a person is cute then Laura likes that person.• C: If a person is named Laura then that person is a baby.
You should notice the circular structure of these three statements.
A→ B,B→C,C→ A
A→ B→C→ A
While many conclusions could be made, one conclusion about Laura is that she likes herself.
3. While this problem is not specific to if-then statements, it can be solved using a set theory representation andif-then logic.
Students on both teams would be double counted if you simply added up the number of students in band and thenumber of students on the swim team.
53+49 = 102
Since there are only 84 people total, then 102− 84 = 18 students must have been counted twice. Therefore, thereare 18 students on both squads.
Practice
1. What are the three names for the “if” part of an if-then statement?
2. What are the three names for the “then” part of an if-then statement?
Rewrite each of the following statements in if-then form.
3. If you like Pepsi, you will like Coke.
4. Do your homework and you will get candy.
5. Anyone who goes to the mall likes to shop.
6. Unless you cook dinner, you will be hungry.
682
www.ck12.org Chapter 16. Logic and Set Theory
7. Join this program and you will lose weight.
8. Shoveling snow makes your back sore.
9. Without knowing how to drive, you will not get your license.
10. Be nice to your sister or you will be punished.
11. When is the following statement false? If you are a kid, then you like pizza.
12. If all of the following statements are true, what can you conclude?
• All kids like pizza.• Sam is 8 years old.• 8 year olds are kids.
13. There are 15 people in the math club and 27 people in the debate club. If 33 people belong to either or bothclubs, how many people are just in the debate club?
14. There are 32 people on the bus in the morning and 40 people on the bus in the afternoon. If 20 people only ridethe bus in the afternoon, how many people only ride the bus in the morning?
15. There are 24 people in your math class and 27 people in your English class. If 7 people are in your English classbut not your math class, how many people are in your math class but not your English class?
683
16.3. Negative Statements www.ck12.org
16.3 Negative Statements
Here you will negate statements and use graphical representations and set theory to explore the implications ofnegative statements. You will also learn about De Morgan’s Law.
In everyday speech, negative statements are often ambiguous or unclear. Mathematically, you need a precise way tonegate statements so that you can accurately determine whether statements are true or false. When is the negation ofthe following sentence true?
If I am not cold then it is not snowing.
Watch This
MEDIAClick image to the left for more content.
http://www.youtube.com/watch?v=hfz1gAoNd1w James Sousa: Showing Statements are Equivalent
Guidance
While in everyday language the opposite of “dog” might be “cat”, in mathematics the opposite of “dog” is “not adog”. Using the word “not” is the basic way to negate an atomic sentence. An atomic sentence is a logical statementwithout logical connectives that has a truth value.
• Original sentence (D): That thing is a dog.• Negation of sentence (∼ D): That thing is not a dog.
The box below represents the universe of all things. This universe can be separated into things that are dogs andthings that are not dogs.
684

www.ck12.org Chapter 16. Logic and Set Theory
To negate complex statements that involve logical connectives like or, and, or if-then, you should start by constructinga truth table and noting that negation completely switches the truth value.
The negation of a conditional statement is only true when the original if-then statement is false.
TABLE 16.7:
P Q P→ Q ∼ (P→ Q)
T T T FT F F TF T T FF F T F
The negation of a conjunction is only false when the original two statements are both true.
TABLE 16.8:
P Q P∧Q ∼ (P∧Q)
T T T FT F F TF T F TF F F T
The negation of a disjunction is only true when both of the original statements are false.
TABLE 16.9:
P Q P∨Q ∼ (P∨Q)
T T T FT F T FF T T FF F F T
As mathematical sentences become more complex with additional connectives, truth tables and set theory circles aregood ways to interpret when the statements are true and when the statements are false.
685

16.3. Negative Statements www.ck12.org
Example A
Use set theory circles to interpret the negation of a disjunction and explain how the negation of a disjunction can bewritten in a different way.
Solution: The shaded portion in the box represents the area that is within P or within Q. Recall that in mathematicallogic, this is written as P∨Q. In set theory this area is represented similarly as P∪Q where the symbol ∪ stands forunion. While the notation is slightly different, the reasoning about the relationships and implications is identical.
When you negate the statement, you completely switch what is shaded.
A different way to think about this shaded region is that it is the region that is not in P and also not in Q. Thismeans that ∼ (P∨Q) is equivalent to ∼ P∧ ∼ Q.
686
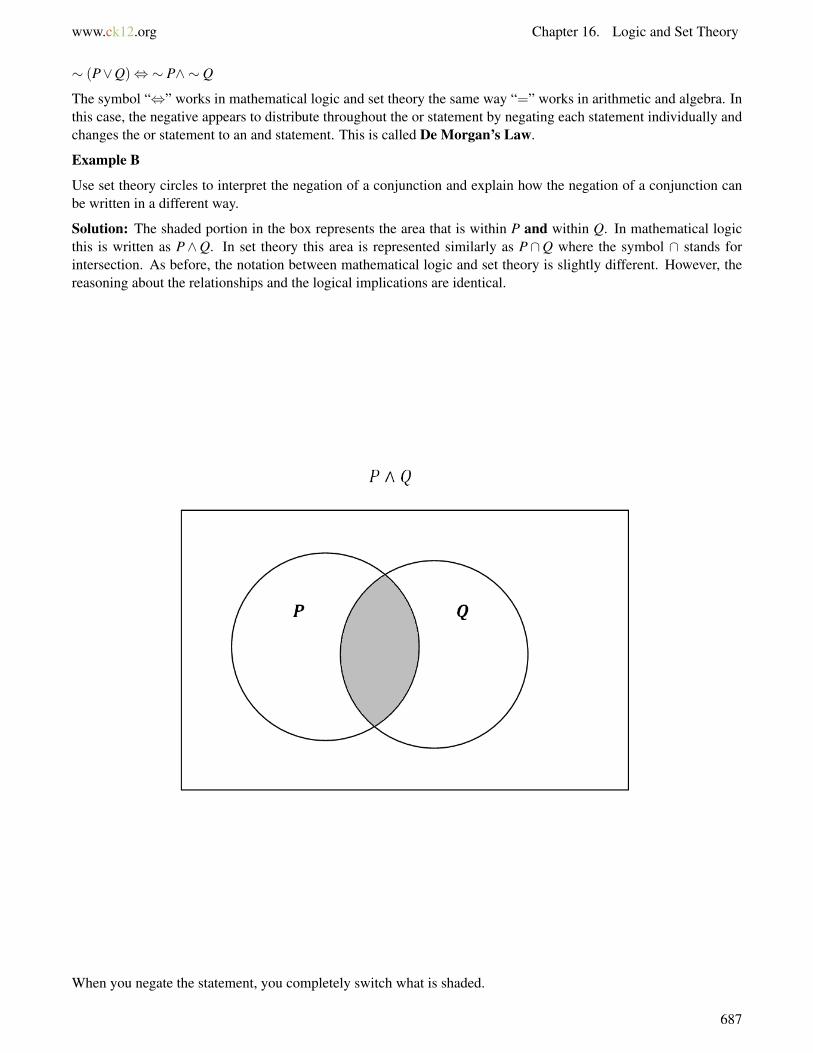
www.ck12.org Chapter 16. Logic and Set Theory
∼ (P∨Q)⇔∼ P∧ ∼ Q
The symbol “⇔” works in mathematical logic and set theory the same way “=” works in arithmetic and algebra. Inthis case, the negative appears to distribute throughout the or statement by negating each statement individually andchanges the or statement to an and statement. This is called De Morgan’s Law.
Example B
Use set theory circles to interpret the negation of a conjunction and explain how the negation of a conjunction canbe written in a different way.
Solution: The shaded portion in the box represents the area that is within P and within Q. In mathematical logicthis is written as P∧Q. In set theory this area is represented similarly as P∩Q where the symbol ∩ stands forintersection. As before, the notation between mathematical logic and set theory is slightly different. However, thereasoning about the relationships and the logical implications are identical.
When you negate the statement, you completely switch what is shaded.
687
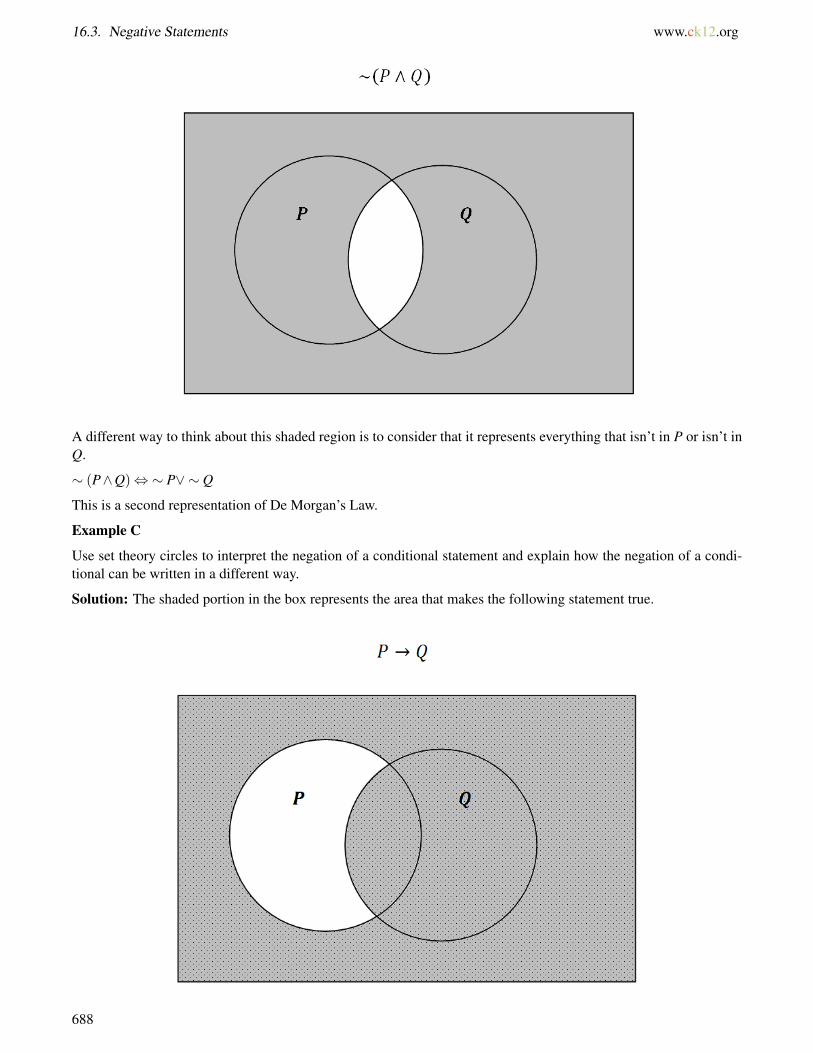
16.3. Negative Statements www.ck12.org
A different way to think about this shaded region is to consider that it represents everything that isn’t in P or isn’t inQ.
∼ (P∧Q)⇔∼ P∨ ∼ Q
This is a second representation of De Morgan’s Law.
Example C
Use set theory circles to interpret the negation of a conditional statement and explain how the negation of a condi-tional can be written in a different way.
Solution: The shaded portion in the box represents the area that makes the following statement true.
688

www.ck12.org Chapter 16. Logic and Set Theory
Notice that there are four different regions in the Venn Diagram which correspond to the four different rows of theconditional truth table. The only space that does not make the statement true is when P is true (inside circle P) and Qis false (outside circle Q).
TABLE 16.10:
P Q P→ QT T TT F FF T TF F T
To negate this statement, you switch the values in the truth table and switch the shaded region in the Venn Diagram.
A different way to think about this shaded region is to see it as the space that is in P but not in Q.
∼ (P→ Q)⇔ P∧ ∼ Q
Concept Problem Revisited
The statement already has several negative parts, so it is incorrect to simply switch one or both of the negations.
If I am not cold, then it is not snowing.
• P = I am cold.• Q = It is snowing.
TABLE 16.11:
P Q ∼ P ∼ Q ∼ P→∼ Q ∼ (∼ P→∼ Q)
T T F F T FT F F T T FF T T F F TF F T T T F
689
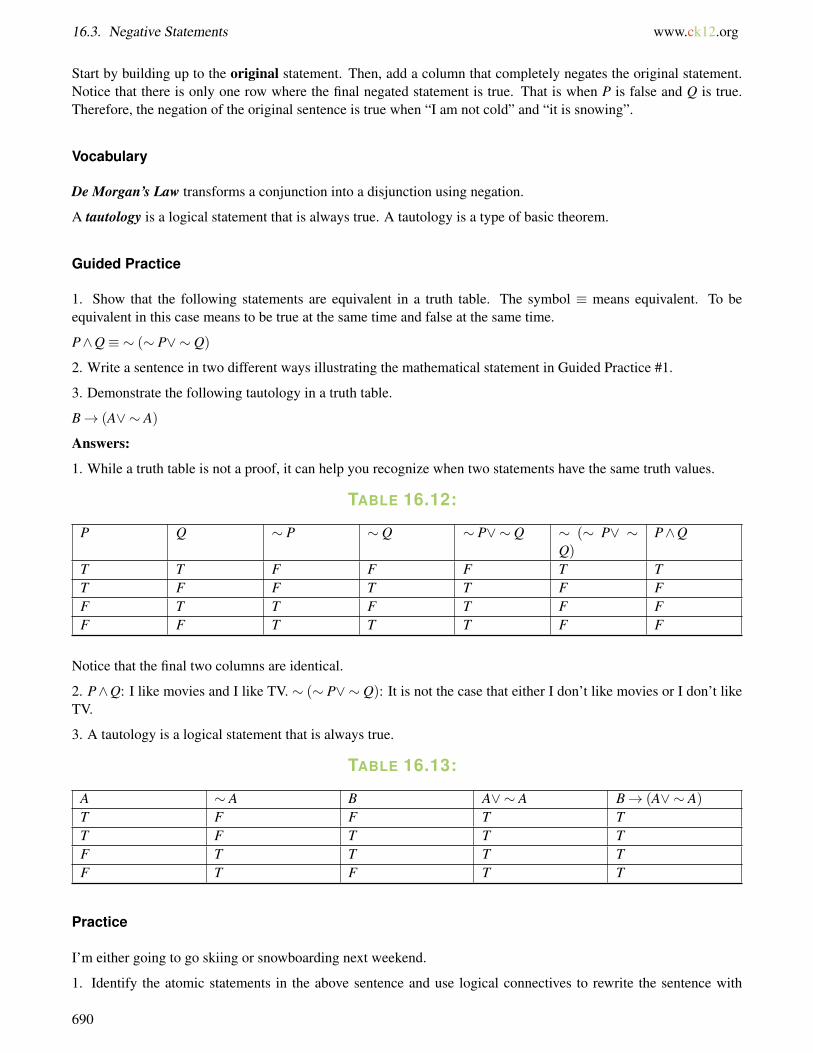
16.3. Negative Statements www.ck12.org
Start by building up to the original statement. Then, add a column that completely negates the original statement.Notice that there is only one row where the final negated statement is true. That is when P is false and Q is true.Therefore, the negation of the original sentence is true when “I am not cold” and “it is snowing”.
Vocabulary
De Morgan’s Law transforms a conjunction into a disjunction using negation.
A tautology is a logical statement that is always true. A tautology is a type of basic theorem.
Guided Practice
1. Show that the following statements are equivalent in a truth table. The symbol ≡ means equivalent. To beequivalent in this case means to be true at the same time and false at the same time.
P∧Q≡ ∼ (∼ P∨ ∼ Q)
2. Write a sentence in two different ways illustrating the mathematical statement in Guided Practice #1.
3. Demonstrate the following tautology in a truth table.
B→ (A∨ ∼ A)
Answers:
1. While a truth table is not a proof, it can help you recognize when two statements have the same truth values.
TABLE 16.12:
P Q ∼ P ∼ Q ∼ P∨ ∼ Q ∼ (∼ P∨ ∼Q)
P∧Q
T T F F F T TT F F T T F FF T T F T F FF F T T T F F
Notice that the final two columns are identical.
2. P∧Q: I like movies and I like TV. ∼ (∼ P∨ ∼ Q): It is not the case that either I don’t like movies or I don’t likeTV.
3. A tautology is a logical statement that is always true.
TABLE 16.13:
A ∼ A B A∨ ∼ A B→ (A∨ ∼ A)T F F T TT F T T TF T T T TF T F T T
Practice
I’m either going to go skiing or snowboarding next weekend.
1. Identify the atomic statements in the above sentence and use logical connectives to rewrite the sentence with
690
www.ck12.org Chapter 16. Logic and Set Theory
symbols.
2. Write the negation of the sentence with symbols and write the negation of the sentence in words in a natural way.
Mike and John both ate lunch with me.
3. Identify the atomic statements in the above sentence and use logical connectives to rewrite the sentence withsymbols.
4. Write the negation of the sentence with symbols and write the negation of the sentence in words in a natural way.
Neither my brother nor my sister wants to play with me.
5. Identify the atomic statements in the above sentence and use logical connectives to rewrite the sentence withsymbols.
6. Write the negation of the sentence with symbols and write the negation of the sentence in words in a natural way.
Write negations for the following statements.
7. All dogs go to heaven.
8. My teacher is seldom wrong.
9. Everyone likes pizza.
Make truth tables for each of the following.
10. (P∧Q)∨ ∼ Q
11. P∧ (Q∨ ∼ Q)
12. (P∨Q)∨ ∼ R
13. (∼ P∧ ∼ Q)∨ ∼ R
14. What is the simplest statement that is equivalent to #11: P∧ (Q∨ ∼ Q)?
15. Use De Morgan’s Law to find a statement equivalent to the following statement: ∼ (Q∨ ∼ Q)
16. Use De Morgan’s Law to find a statement equivalent to the following statement: ∼ (P∨Q)∨ ∼ R
691
16.4. Inverse, Converse, and Contrapositive www.ck12.org
16.4 Inverse, Converse, and Contrapositive
Here you will examine the implications of the inverse, converse and contrapositive statements as they relate to aconditional statement.
The typical conditional statement isP→ Q. The inverse, converse and contrapositive are each related to the condi-tional statement but are not always identical. Which type of statement is always equivalent to the original?
Watch This
MEDIAClick image to the left for more content.
http://www.youtube.com/watch?v=IHd8jiUF3Lk James Sousa: The Converse, Contrapositive, and Inverse of anIf-Then Statement
Guidance
Consider a conditional statement P→ Q where:
• P = It is raining.• Q = T he driveway is wet.
Original Conditional: P→ Q = If it is raining, then the driveway is wet.
TABLE 16.14:
P Q P→ QT T TT F FF T TF F T
The inverse of a conditional negates both the hypothesis and the conclusion.
Inverse: ∼ P→∼ Q = If it is not raining, then the driveway is not wet.
TABLE 16.15:
P Q ∼ P ∼ Q ∼ P→∼ QT T F F TT F F T T
692
www.ck12.org Chapter 16. Logic and Set Theory
TABLE 16.15: (continued)
F T T F FF F T T T
Notice that the truth values of the inverse are not identical to the truth values of the original conditional. The absenceof rain does not guarantee a dry driveway. Some children could have had a water balloon party in the summer. Justbecause a statement is true does not mean that its inverse will be true!
The converse of a conditional statement switches the order of the hypothesis and the conclusion.
Converse: Q→ P = If the driveway is wet, then it is raining.
TABLE 16.16:
P Q Q→ PT T TT F TF T FF F T
Notice that the truth values of the converse are also not identical to the truth values of the original conditional.If children playing with water balloons made the driveway wet then it isn’t necessarily raining. Just because astatement is true does not mean that its converse will be true!
The contrapositive of a conditional statement switches the hypothesis with the conclusion and negates both parts.
Contrapositive: ∼ Q→∼ P = If the driveway is not wet, then it is not raining.
TABLE 16.17:
P Q ∼ P ∼ Q ∼ Q→∼ PT T F F TT F F T FF T T F TF F T T T
The contrapositive of a conditional statement is functionally equivalent to the original conditional. This is becauseyou can logically conclude that a dry driveway means no rain. This means that if a statement is a true then itscontrapositive will also be true.
Example A
Assume the statement “everyone with blonde hair is smart” is true. Use the contrapositive to write another statementthat is related and also true.
Solution: The statement “everyone with blonde hair is smart” can be rewritten as “if a person has blonde hair thenthe person is smart”. The contrapositive is “if a person is not smart, then the person does not have blonde hair”. Thisstatement must be true if the original statement is true.
Example B
Write the inverse, converse and contrapositive of the following conditional statement.
If you buy our product, then you are attractive.
Solution: Note that advertisers regularly imply certain results about their products that may or may not be true. Ifyou listen carefully you will notice that ironclad conditional statements are always avoided so they are not technically
693
16.4. Inverse, Converse, and Contrapositive www.ck12.org
false advertising. At the same time, advertisers prey on the fact that many people mistakenly believe that the inverseand converse are equivalent to the original conditional.
• Inverse: If you do not buy our product, then you are not attractive.• Converse: If you are attractive, then you will buy our product.• Contrapositive: If you are not attractive, then you will not buy our product.
Example C
Assume each of the following is true. Do you end up doing your homework?
• If it is raining then you will be tired.• If you are tired you will nap.• If you do not do your homework then you will take a nap.• If you nap or it rains then you will not do your homework.• If you do not do your homework then it will rain.• Either it will rain, you will take a nap or you will not be tired.
Solution: Start by identifying the individual statements for each conditional.
• R = It is raining.• T = You will be tired.• H = You will do your homework.• N = You will take a nap.
Now, rewrite each sentence using mathematical symbols.
• Statement 1: R→ T• Statement 2: T → N• Statement 3: ∼ H→ N• Statement 4: (N∨R)→∼ H• Statement 5: ∼ H→ R• Statement 6: R∨N∨T
Next, create a train of conditional statements until you reach either “H” or “∼ H”. From statement 6 you know thateither R,N, or T must be true. Consider three cases, one for R being true, one for N being true, and one for T beingtrue.
• Assume R : R→ N∨R→∼ H• Assume N : N→ N∨R→∼ H• Assume T : T → N→ N∨R→∼ H
In all cases you do not end up doing your homework.
Concept Problem Revisited
The only transformation of a conditional statement that is equivalent to the original statement is the contrapositive.Being comfortable with the contrapositive is absolutely essential for logical reasoning about puzzles and riddles.
Vocabulary
A premise is a starting statement that you use to make logical conclusions.
694
www.ck12.org Chapter 16. Logic and Set Theory
The inverse of a conditional statement negates both the hypothesis and the conclusion.
The converse of a conditional statement switches the order of the hypothesis and the conclusion.
The contrapositive of a conditional statement switches the hypothesis with the conclusion and negates both parts.
Guided Practice
1. State the inverse, converse, and contrapositive of the following statement.
If a relation passes the vertical line test, then it is a function.
2. You and two logical friends stand in a line so that you cannot see anyone, the friend behind you can see you andthe friend in the back can see both people. The three of you are shown three black hats and two white hats. The hatsare mixed up and placed on you and your friends’ heads in such a way that nobody knows or can see their own hat.The three of you are told when you know the color of your hat to shout out. Nobody says anything for a long time,but eventually you figure out what color hat you must have even though you cannot see it.
What color hat do you have and how do you know?
3. In a land where some people always lie and some people always tell the truth, you are approached by 2 peoplewho both call the other a liar. You want to know if you are on the right path, so if you can only ask one of them onequestion what should you ask?
Answers:
1. Inverse: If a relation does not pass the vertical line test, then the relation is not a function.
Converse: If a relation is a function, then the relation passes the vertical line test.
Contrapositive: If a relation is not a function, then the relation does not pass the vertical line test.
2. The way to solve this puzzle is to consider what each person sees starting with the person in the back and thenconsider what would make them sure and what would make them unsure.
The friend in the back does not shout out. This means that he does not see two white hats because otherwise hewould know that he has a black hat.
Fact #1: You and the friend behind you have either BB, BW or WB.
The friend in the middle does not shout out. This person also has figured out Fact #1. This means that if they see awhite hat they know they must have a black hat. Since they don’t shout out, they must not see a white hat
Fact #2: You cannot have a white hat.
Conclusion: Your hat is black because that is the only scenario where nobody else is sure about their own hat color.
In this question, both Fact #1 and Fact #2 require contrapositive thinking.
3. This type of question is extremely common in riddles. The trick is to use the fact that a double negative is apositive and a double positive is also a positive. Anything else is negative.
You should ask person A if person B would tell you that you are on the right path.
There will be 4 scenarios that you can organize in a table. Each scenario needs to be carefully thought through. Forexample, the upper right hand response is yes because if you are on the wrong path the person telling the truth wouldtell you that no, you are not on the right path. The liar would respond oppositely telling you yes.
TABLE 16.18:
Right path Wrong PathA is liar No YesA tells truth No Yes
695
16.4. Inverse, Converse, and Contrapositive www.ck12.org
You can be sure you are on the right path if the response is no and you can be sure you are on the wrong path if theresponse is yes.
Practice
Assume each statement is true. Use the contrapositive to write another statement that is related and also true.
1. All unripe fruit is bad.
2. All bears like honey.
3. No desserts are healthy.
4. Music by Taylor Swift is good.
5. Everyone who is overweight is unhealthy.
Write the inverse, converse, and contrapositive for each of the following statements.
6. Puppies like to play.
7. If I don’t like something, then I won’t buy it.
8. Everyone at the party is popular.
9.You like music if you go to a concert.
10. All apples have cores.
I. My pants are the only things I have that are made of jean material.II. All the clothes you gave me are the right size.
III. None of my pants are the right size.
11. Write each of the above statements and its contrapositive symbolically.
12. Determine the final conclusion about “the clothes from you” by stringing the statements/contrapositives together.
I. Nobody who is experienced is unsuccessful.II. Mike is always confused.
III. No successful person is always confused.
13. Write each of the above statements and its contrapositive symbolically.
14. Determine the final conclusion about “Mike” by stringing the statements/contrapositives together.
I. All the plates that got shipped are cracked.II. None of the plates from your mother got shipped.
III. Plates that didn’t get shipped should not go in the trash.
15. Write each of the above statements and its contrapositive symbolically.
16. Can you determine whether or not the “plates from your mother” should go in the trash?
You learned that declarative statements can be joined with other declarative statements using the words not, and, or,if and then. You saw that the relationship between all but the simplest statements requires investigation in a preciseway. You formalized the definitions of the words “or” and “not”. You practiced logical reasoning through puzzles,proofs and riddles. The focus was on metamathematical logic, the how and the why of thinking mathematically.
696

www.ck12.org Chapter 16. Logic and Set Theory
16.5 References
1. CK-12 Foundation. . CCSA2. CK-12 Foundation. . CCSA3. CK-12 Foundation. . CCSA4. CK-12 Foundation. . CCSA5. . . CC BY-NC-SA6. . . CC BY-NC-SA7. . . CC BY-NC-SA8. . . CC BY-NC-SA9. . . CC BY-NC-SA
10. . . CC BY-NC-SA11. . . CC BY-NC-SA
697