City of Yellowknife Strategic Waste Management Plan
397
City of Yellowknife Strategic Waste Management Plan Final Report - April 2018
-
Upload
khangminh22 -
Category
Documents
-
view
2 -
download
0
Transcript of City of Yellowknife Strategic Waste Management Plan

City of Yellowknife
Strategic Waste Management Plan
Final Report - April 2018
sonnevera international corp. Box 23 Bluffton, Alberta T0C 0M0 T: (403) 843-6563 [email protected]

Strategic Waste Management Plan (SWMP) – Final Report The City of Yellowknife
i
Executive Summary
The 2018 Strategic Waste Management Plan builds on the waste reduction goals of the Corporate and Community Energy Plan and previous waste composition studies, composting projects and waste management plans to provide environmentally responsible waste management solutions that are cost-effective and address concerns and expectations of the public and stakeholders.
The plan incorporates additional programs including:
• Community elements such as government leadership, social marketing, branding, zero waste public events and improvements to public spaces recycling.
• Enhancements to the backyard composting campaign, depot recycling system, curbside garbage system (user pay) and enhanced multi-family recycling.
• Industrial, commercial and institutional initiatives such as waste diversion assistance, business recognition, food waste diversion, enhanced recycling and construction / demolition waste diversion.
• Incentives and regulatory mechanisms including additional differential tipping fees and disposal bans.
The plan will be implemented on a foundation of public consultation and program pilots to encourage high levels of support, engagement, and ultimately success.
Program elements are outlined in the following table:

sonnevera international corp.
ii
Option Type Option
Education / Promotion Overall Approaches
Government leadership
• Review and update internal procurement policy to encourage reduction, reuse and recycled content.
• Develop a consistent comprehensive waste diversion program for all City and public buildings and operations.
Community engagement
• Develop a community engagement plan to promote waste reduction and diversion initiatives and leverage existing environmental networks.
Community-based social marketing
• Continue to build internal capacity in community-based social marketing and integrate these approaches into all program designs and implementation.
• Expand marketing efforts for existing programming to improve participation and address specific behaviour issues.
Branding
• Continue using the City of Yellowknife waste branding to ensure a consistent program look and messaging throughout City waste reduction initiatives.
• Initiate a cooperative design process between The City and the contractor for recycling infrastructure to improve consistency in bin design, colours and signage.
Social Media
• Investigate SmartPhone apps that can help to remind residents of waste management services and diversion opportunities.
• Enhance The City’s website to provide more information related to The City’s waste reduction and waste management services, and incorporating more interactive features.
Public spaces recycling
• Pilot new and improved signage at existing public recycling bins, including assessment of participation and contamination levels, as well as an advertising campaign.
• If the pilot is successful, all litter bins in public spaces should be replaced, over time, with multi-stream bins and supported by ongoing promotional activities.
Zero waste public events
• Promote the Yellowknife Sustainable Event Checklist to event organizers.
• Require event organizers to prepare a waste management action plan including waste reduction and diversion elements as part of special events permits.
• Continue to, and expand the program of, providing highly visible garbage and recycling containers to public events that are consistent (colours, signage) with other public space and municipal recycling initiatives.

Strategic Waste Management Plan (SWMP) – Final Report The City of Yellowknife
iii
Option Type Option
Residential Waste Reduction / Diversion
Backyard Composting
• Continue to promote, and expand, the backyard composting awareness campaign.
Curbside Organics
• Consider expanding the collection program to encompass MF and additional residences outside the current service area.
• Deliver ongoing CBSM campaign to encourage Green Cart use and limit contamination.
Expanded recycling sorting categories – Blue Bin Stations
• Require residents to sort materials into additional plastics and paper categories to improve marketability of recyclables.
User-pay/volume limitations
• In the future offer a voluntary smaller waste container option that is associated with a lower fee.
Enhanced multi-family diversion programming
• Work with the recycling contractor to develop a targeted multi-family social marketing program.
• As a launch to the campaign, provide in-suite recycling containers.
Expanded residential organics collection – multi-family
• Work with the waste collection/hauling contractor for the duration of the multi-family organics collection pilot at the Northview complexes.
• Work with the waste collection/hauling contractor to develop a social marketing program specific to multi-family residents.
• As a launch to the campaign, provide in-suite containers for recyclables and a kitchen catcher for organics (one for every unit in every building)
• Due to the scale and potential capital costs associated with a multi-family organics program, a year-long pilot project is recommended. The pilot would allow The City to test organics collection with the multi-family sector and determine the desired program methodology – either by City service through a contractor, or by amending the Solid Waste Management Bylaw (4376).
Industrial, Commercial and Institutional Waste Reduction
Waste diversion assistance
• Provide technical and information assistance to businesses and institutions that want to implement waste diversion programs.
ICI recognition
• Enhance the recognition program for businesses achieving high standards in waste diversion.
ICI food waste diversion
• Expand the pilot ICI food waste collection program, including promotion and education materials and training of staff at participating businesses, to identify specific opportunities and barriers to success.
• Incorporating results from the pilot, introduce a community-wide promotion of ICI food waste collection service options.
• Support ICI locations that want to implement on-site composting.

sonnevera international corp.
iv
Enhanced ICI recycling collection
• Work with the hauling contractor to design and implement alternate collection options for businesses in areas that present challenges to effective participation in diversion programs.
• Consider providing municipal buildings with recycling services as an add-on to the multi-family recycling program
Expanded C&D diversion opportunities
• Expand the wood recycling program to include all clean (uncoated) wood waste.
• Separate clean drywall loads for diversion in the composting program.
• Assess the potential benefits of adding more aggregate diversion opportunities at the SWF.
• Encourage all scalehouse operators/staff to encourage contractors to drop-off reusable items at the ReStore whenever possible.
• Collaborate with the ReStore to encourage more donations, visitors and ultimately move material more quickly.
Infrastructure and Operating Enhancements
Infrastructure and Operating Enhancements
Weigh Scale
• Purchase a second scale so all vehicles can be weighed in and out at the SWF.
• If purchasing a second scale is cost prohibitive, over a period of one month, all self-haul loads should be weighed in and out and an average determined for use in the future.
• OR
• Implement a scale traffic control system, where vehicles drive over the scale both inbound and outbound.
• Complete a landfill traffic monitoring study to review the options for better reporting of load weights.
Composting Site
• Staff should develop a template form that can be used to document routine inspections of the composting facility.
• Staff should correct the reference to pathogen time and temperature requirements on page 24 of the Operations and Maintenance Manual to make it consistent with the information provided on page 30.
• Staff should take advantage of the ability of spreadsheets (or other software) to electronically track process data and develop trend charts.
• A more complete discussion of the protocols for leachate sampling should be included in the Operations and Maintenance Manual.
• Increasing the amount of coarse amendment in the composting piles
• Equipe front-end loader used at the site with an over-sized bucket
• Repair/complete electric safety fence to prevent potential safety issues resulting from human-bear interactions.
• Install knotted ropes or rope nets/ladders around edges of leachate pond.
Salvage Area
• Develop a separate area where material can be donated and picked up without entering heavy traffic areas of the SWF or go across the scale.

Strategic Waste Management Plan (SWMP) – Final Report The City of Yellowknife
v
Option Type Option
Regulatory Options Differential tipping fees
• Create a financial incentive for diverting recyclable and compostable materials through a system of differential tipping fees at the Solid Waste Facility.
Disposal bans
• Consider implementation of disposal bans for waste materials that have an existing collection and processing infrastructure in place.
Residential mandatory recycling / source separation
• If promotion and education and financial incentives such as pay-as-you-throw garbage collection do not provide the desired level of residential program performance, implement curbside collection bans for all organics and recyclables that are part of both programs.
ICI mandatory recycling / source separation
• Once adequate alternatives exist for ICI organics and recyclables, if ICI diversion expectations are not met, require all businesses to participate in diversion programs.
Solid waste management bylaw
• Update the bylaw regularly with new diversion program implementation.
Residuals Management
Disposal Operations
• Confirm any operational requirements imposed by Transport Canada
Landfill Analysis
• Conduct annual airspace monitoring
• Develop a Design and Operations Plan for the SWF
Landfill Financials
• Disaggregate financial tracking for different portions of the SWF
• Update the economic analysis for the balefill facility
WtE Technologies
• Calculate the potential landfill cost savings if waste disposed is reduced by 75%.
• Consider a detailed, site specific study into the cost of transporting heat from a WtE facility located at the solid waste facility and feeding this heat into a new and/or existing district energy system.
Monitoring and Reporting
• Implement a comprehensive reporting system that provides the level of material breakdown to evaluate performance in different sectors.
• Conduct on-site and load audits to assess breakout of waste from various sectors.
• Develop an analysis and reporting tool based on Geoware scale data.
• Incorporate environmental benefits calculations into the reporting system.

sonnevera international corp.
vi
Table of Contents
Executive Summary ........................................................................................................................................ i Table of Contents .......................................................................................................................................... vi Table of Figures ........................................................................................................................................... vii Table of Tables ............................................................................................................................................. ix 1 Introduction .............................................................................................................................................. 1
1.1 Council Vision ................................................................................................................................... 1 1.2 Plan Objectives ................................................................................................................................. 1
2 Background .............................................................................................................................................. 2 2.1 Waste Management Plan, Waste Composition Study History, and Centralized Composting
Project Reports ................................................................................................................................. 2 2.1.1 2001 Waste Management Plan .................................................................................................. 2 2.1.2 2007 Solid Waste Composition Study and Waste Reduction Recommendations..................... 2 2.1.3 2008 Initial Feasibility Study and 2012 Centralized Composting Pilot Project Final Report ..... 3
2.2 Corporate and Community Energy Plan ........................................................................................... 3 2.3 Methodology ..................................................................................................................................... 4
3 Existing Waste Management System and Waste Characterization ........................................................ 6 3.1 Disposal, Diversion and Waste Generation ...................................................................................... 8 3.2 Waste Composition ......................................................................................................................... 13
3.2.1 Waste Sampling Process ......................................................................................................... 13 3.2.2 Results...................................................................................................................................... 14
3.3 Environmental Benefits of Diversion ............................................................................................... 18 3.4 Stakeholder Input / Public Consultation .......................................................................................... 19
3.4.1 Online Business (ICI) Waste Management Survey Highlights ................................................ 19 3.4.2 Feedback from the One-on-One Stakeholder Engagement at the Multiplex ........................... 19 3.4.3 Summary of the Community Discussion at the Northern United Place Auditorium ................. 21
4 Diversion Potential ................................................................................................................................. 23 5 Waste Management Strategy ................................................................................................................ 24
5.1 Waste Reduction, Diversion and Residuals Management Elements ............................................. 24 5.1.1 Education / Promotion Overall Approaches ............................................................................. 25 5.1.2 Residential Waste Reduction / Diversion ................................................................................. 41 5.1.3 Industrial, Commercial & Institutional (ICI) Waste Reduction / Diversion ................................ 50 5.1.4 Infrastructure and Operating Enhancements ........................................................................... 62 5.1.5 Regulatory Options................................................................................................................... 72 5.1.6 Residuals Management ........................................................................................................... 80 5.1.7 Monitoring and Reporting ......................................................................................................... 89
6 Diversion Targets................................................................................................................................... 91 7 Recycling Markets ................................................................................................................................. 92 8 Tipping Fee Rate Structure ................................................................................................................... 94 9 Summary of Recommendations ............................................................................................................ 96 10 Prioritization ......................................................................................................................................... 100
10.1 Ranking of Program Elements ...................................................................................................... 100 11 Implementation Schedule .................................................................................................................... 102 12 Estimated Diversion ............................................................................................................................. 105 APPENDICES
Appendix A – Waste Audit Results Appendix B – ICI Business Survey Results
Strategic Waste Management Plan (SWMP) – Final Report The City of Yellowknife
vii
Appendix C – Stakeholder Engagement Results Appendix D – Best Practices Appendix E – Composting Appendix F – Salvage Area Stories Appendix G – Landfill and Finances Appendix H – WtE Technologies Appendix I – Canadian Tipping Fees
References
Table of Figures
Figure 1: Solid Waste Management Fund Revenue................................................................................... 8 Figure 2: Historic Yellowknife Waste Disposal (kg/capita) with Canadian Average................................... 8 Figure 3: Waste Disposed by Sector .......................................................................................................... 9 Figure 4: ICI Waste Disposed by Customer Type ...................................................................................... 9 Figure 5: Residential Waste Disposed by Customer Type ....................................................................... 10 Figure 6: Yellowknife Diversion ................................................................................................................ 10 Figure 7: Recycling Diversion by Sector ................................................................................................... 11 Figure 8: Organics Diversion by Sector .................................................................................................... 11 Figure 9: Historical Recycling Weights ..................................................................................................... 12 Figure 10: Recycling Tonnages 2017 ....................................................................................................... 12 Figure 11: Audit Team & Audit Area ......................................................................................................... 14 Figure 12: Digital Scale and Audit Log Sheet ........................................................................................... 14 Figure 13: Waste Sorted by Material Type ............................................................................................... 14 Figure 14: Landfill Staff Moving Sample ................................................................................................... 14 Figure 15: Curbside Garbage Composition (by weight) ........................................................................... 15 Figure 16: Multi-Family/Small ICI Garbage Composition (by weight) ...................................................... 16 Figure 17: Large ICI Garbage Composition (by weight) ........................................................................... 16 Figure 18: Self-Haul Garbage Composition (by weight) ........................................................................... 17 Figure 19: Construction and Demolition Garbage Composition (by weight) ............................................ 18 Figure 20: Multi-plex Engagement ............................................................................................................ 20 Figure 21: City of Toronto Workstation Waste Containers ....................................................................... 26 Figure 22: City of Markham Employee Workstation Kit ............................................................................ 26 Figure 23: Centralized Waste Station in City of Markham ....................................................................... 26 Figure 24: Yellowknife Farmers Market Facebook Promotion of Bringing Reusable Containers ............ 27 Figure 25: McMahon Frame Lake Pumpkin Lane .................................................................................... 27 Figure 26: Pumpkin Lane Composting ..................................................................................................... 27 Figure 27: Screenshot from Strathcona GIS Bin Monitoring System ....................................................... 30 Figure 28: Inspection Questions ............................................................................................................... 31 Figure 29: Curbside Audit GIS System on Tablet..................................................................................... 31 Figure 30: Gold Star for Strathcona County Residents Using Their Carts Correctly ............................... 31 Figure 31: Tags/Stickers used in Strathcona County's Curbside Audit Program ..................................... 31 Figure 32: City of Yellowknife logo ........................................................................................................... 32 Figure 33: City of Yellowknife Facebook Banner with Crest .................................................................... 32 Figure 34: Effective signage combining clear words with photos ............................................................. 33 Figure 35: Blue Bin Station Signage Tin Cans and Glass ........................................................................ 33

sonnevera international corp.
viii
Figure 36: Blue Bin Station Signage Cardboard....................................................................................... 33 Figure 37: Public Spaces Waste and Recycling Containers .................................................................... 33 Figure 38: SeeClickFix Overflowing Garbage Example ........................................................................... 34 Figure 39: Medicine Hat my-waste App .................................................................................................... 35 Figure 40: Yellowknife paired public waste and recycling bins ................................................................ 36 Figure 41: Stand-alone garbage public waste bin .................................................................................... 36 Figure 42: City compost bins at the Farmers Market................................................................................ 36 Figure 43: Markham Silver Box Public Space Recycling Container ......................................................... 37 Figure 44: Markham Park Recycling Container ........................................................................................ 37 Figure 45: Langley Public Spaces Pilot Project Receptacles ................................................................... 37 Figure 46: Transitioning Calgary Parks bins to consistent coloured and signed bins .............................. 38 Figure 47: Yellowknife Portable Multi-Stream Units (Source: City of Yellowknife) .................................. 39 Figure 48: Recycling Station at Carnival San Francisco .......................................................................... 39 Figure 49: San Francisco Event Collection Containers ............................................................................ 39 Figure 50: Single family kitchen catcher and promotional items (brochure and compostable bag)......... 42 Figure 51: City of Yellowknife Green Cart 120 Litres ............................................................................... 42 Figure 52: Downtown Organics Bin .......................................................................................................... 42 Figure 53: Residential Recycling Guide.................................................................................................... 43 Figure 54: Plastics Historic Market Prices ................................................................................................ 44 Figure 55: Variable subscription garbage carts ........................................................................................ 45 Figure 56: Markham Apartment Recycling Guide..................................................................................... 47 Figure 57: Markham Blue Bag .................................................................................................................. 47 Figure 58: bluplanet Organics Diversion Starter Kit Educational Flyer – Calgary .................................... 48 Figure 59: Yellowknife Business Categories ............................................................................................ 50 Figure 60: General Business Service Category Business Examples ....................................................... 51 Figure 61: Trade and Industry Category Businesses ............................................................................... 52 Figure 62: Retail Category Businesses .................................................................................................... 53 Figure 63: Portland Recycle at Work Central Collection Box .................................................................. 54 Figure 64: Portland Recycle at Work Desk-side Box .............................................................................. 54 Figure 65: Portland Container Recycling Poster ..................................................................................... 54 Figure 66: Portland Mixed Paper Recycling Poster ................................................................................. 54 Figure 67: Calgary Businesses and Organizations Recycling Guide ....................................................... 55 Figure 68: Calgary Businesses and Organizations Organics Diversion Guide ........................................ 55 Figure 69: Harford County Business Recycling & Waste Reduction 2016 Award Winners Promotion ... 56 Figure 70: Seattle Commercial Collection Compostable Items Flyer ....................................................... 57 Figure 71: Construction and Demolition Waste Disposed at the SWF ..................................................... 60 Figure 72: Asphalt Piles for Diversion....................................................................................................... 60 Figure 73: Drywall in Construction & Demolition Load ............................................................................. 60 Figure 74: ReStore .................................................................................................................................... 61 Figure 75: Composting Feedstock ............................................................................................................ 64 Figure 76: Compost Piles for Curing......................................................................................................... 64 Figure 77 : ASP System at Stickland Farms (Penhold, AB) ..................................................................... 67 Figure 78: Aerated Composting Bunkers in Olds, Alberta built from pre-cast concrete blocks ............... 67 Figure 79: Aerated Composting Bunkers in Moscow, Idaho, with Wood Frame Roof Structure ............. 68 Figure 80: PTO Mixer used at City of Whitehorse composting facility ..................................................... 68 Figure 81: Enclosed Waste Receiving Bunker ......................................................................................... 69 Figure 82: Aggregate bunker with RollCov-R roof system ....................................................................... 69 Figure 83: Salvage Area at SWF .............................................................................................................. 71
Strategic Waste Management Plan (SWMP) – Final Report The City of Yellowknife
ix
Figure 84: Original Foothills Salvage Centre Building .............................................................................. 72 Figure 85: Foothills Salvage Items for Sale .............................................................................................. 72 Figure 86: Summary of Per Capita Disposal in Yellowknife from 2014 to 2017 ...................................... 80 Figure 87: Summary of Annual and Cumulative Materials Disposed
at the Yellowknife Solid Waste Facility ................................................................................... 81 Figure 88: Summary of the 2016 Solid Waste Management Budget ....................................................... 85 Figure 89: Baled Cardboard Stored Outside at the SWF ......................................................................... 92 Figure 90: Baled Mixed Plastics Stored Outside at the SWF ................................................................... 92 Figure 91: Baled Shredded Paper Stored Outside at the SWF ................................................................ 92 Figure 92: 2016 Shipped Recyclables (Tonnes) ...................................................................................... 93 Figure 93: Ranking of Program Elements ..............................................................................................101 Figure 94: Estimated Diversion – Implementation of Strategy ...............................................................106
Table of Tables
Table 1: Corporate and Community Energy Plan Community Action Items and GHG Reduction Targets for Waste .................................................................................... 3
Table 2: The Energy Plan Tasks and Timelines for the Waste Sector ....................................................... 4 Table 3 Number of Samples Audited by Source ...................................................................................... 13 Table 4: Estimated City of Yellowknife Single Family Residential Diversion Potential ............................ 23 Table 5: Estimated City of Yellowknife Commercial Diversion Potential .................................................. 23 Table 6: Waste Management Strategy Elements ..................................................................................... 24 Table 7: City of Markham Department Changes in Zero Waste Facility .................................................. 25 Table 8: Burnaby Variable Garbage Cart Program .................................................................................. 46 Table 9: Austin Variable Rate Garbage Cart Program ............................................................................. 46 Table 10: Estimated Quantities of Organic Waste by Diversion target (tonnes) ...................................... 66 Table 11: Order Magnitude of Cost Estimates for Facility Improvements ................................................ 70 Table 12: Cowichan Valley Regional District 2017 Tipping Fee Schedule .............................................. 73 Table 13: Commercial Waste SWF Tipping Fees .................................................................................... 78 Table 14: Residential Waste SWF Tipping Fees ...................................................................................... 78 Table 15: Single Family Solid Waste Levy ............................................................................................... 78 Table 16: Contractor Waste SWF Tipping Fees ....................................................................................... 79 Table 17: Summary of Waste Disposal at the SWF from 2014 to 2017 (as reported by the City) ........... 80 Table 18: Landfill Airspace Consumption ................................................................................................. 84 Table 19: Closure Capital Cost Estimate .................................................................................................. 86 Table 20: Proposed Waste Target ............................................................................................................ 91 Table 21: Canadian Tipping Fees (2017) ................................................................................................. 94 Table 22: Implementation Plan ...............................................................................................................102 Table 23: Estimated Diversion ................................................................................................................105
Strategic Waste Management Plan (SWMP) – Final Report The City of Yellowknife
1
1 Introduction
In August 2017, sonnevera international corp. (sonnevera) was contracted by The City of Yellowknife to complete a Solid Waste Composition Study and Strategic Waste Management Plan (SWMP) that will direct the City’s solid waste and recycling initiatives for the next 5 to 30 years.
This resulting SWMP provides environmentally responsible waste management solutions that are cost-effective and address concerns and expectations of the public and stakeholders.
1.1 Council Vision
Council approved the Community Waste Management Strategic Plan in 2001 which contained the goal of 40 percent diversion within the next 10 years. This goal was not met, and has subsequently been replaced by targets within the Community Energy Plan, which are outlined in Section 2.2.
1.2 Plan Objectives
The SWMP’s objective is to provide city decisions-makers with a high-level assessment of the current state of waste generation in Yellowknife and provide direction on the future design of reduction and diversion plans that will extend the life of the City landfill.
The options selected for inclusion in the SWMP have been selected with the following objectives in mind:
• Encourage and support waste minimization behaviours;
• Recognize that convenience and accessibility are critical to maintaining community support;
• Create measurable environmental benefits, such as decreasing the annual per capita disposal rate;
• Support sustainable waste management on a regional level; and
• Optimize diversion potential and cost to derive the best value.

sonnevera international corp.
2
2 Background
The City of Yellowknife is the capital city of the Northwest Territories, situated on the northern shore of Great Slave Lake. It has the largest population of any city or town in the Northwest Territories with approximately 21,000 residents. The City has seen a very slight increase in population since 2011.
The City operates a successful waste management service that includes collection of recycling, organics and garbage, and owns and operates their own solid waste facility. With the growth of the city, as well as public expectations for progressive environmental programs and services, The City strives to have its solid waste programs and services meet community expectations. It is with this in mind that The City recently completed its four-year plan to provide single family residential Green Cart service to the entire city. In conjunction with Green Cart roll-out, The City successfully expanded, and continues to expand, its Centralized Composting Project at the Solid Waste Facility; making high quality compost right onsite.
2.1 Waste Management Plan, Waste Composition Study History, and Centralized Composting Project Reports
The City of Yellowknife prepared its first Waste Management Plan in 2001 and a Waste Composition Study was completed in 2007 by Gartner Lee. These plans have been the basis for the programs and services that are in place today. This section provides a brief overview of the previous Plans and reports on their implementation status.
2.1.1 2001 Waste Management Plan
EBA Engineering completed a waste management plan and consultation sessions in 2001, recommending The City of Yellowknife adapt a zero waste goal. Additional recommendations included banning cardboard from disposal by the Industrial, Commercial, and Institutional (ICI) sector and commencement of a composting pilot program.
2.1.2 2007 Solid Waste Composition Study and Waste Reduction Recommendations
2007 was the first year The City of Yellowknife commissioned a waste composition study. The study findings presented results for three waste streams: Single Family, Large Commercial and Multi-Family / Small Commercial. The three largest components of the waste generating sectors were reported as follows:
Single Family
• 21% paper products, 40% organic waste, 16% plastic
Large Commercial
• 50% paper products, 25% organic waste, 13% plastic
Multi-Family/Small Commercial
• 38% paper products, 22% organic waste, 11% plastic
Due to the large amount of organics, as well as paper and plastic recyclables found in the waste stream, the two main recommendations from the report were to:
1. Enhance programs for marketable recyclables
2. Develop a program to manage organic waste, specifically food waste
These audit results are compared to the 2017 study later in this report in the Waste Composition Results section on page 14.

Strategic Waste Management Plan (SWMP) – Final Report The City of Yellowknife
3
2.1.3 2008 Initial Feasibility Study and 2012 Centralized Composting Pilot Project Final Report
Between 2009 and 2012 the City of Yellowknife carried out a Centralized Composting Pilot Project (CCPP) to determine the feasibility of expanding composting in the city. The design of the CCPP was based upon recommendations in the Study of Options for a Centralized Composting Pilot Project in the City of Yellowknife written by Ecology North, in collaboration with the City, in 2008.
Food and yard waste was collected mainly from the industrial, commercial, and institutional (ICI) sector for the pilot project. Approximately 20 businesses and institutions participated in the CCPP, including restaurants, grocery stores, the correctional facility, schools and the hospital. In 2011, two multi-family buildings were added to the program. Additional Yellowknifers interested in the pilot program were also able to participate by dropping off their organic materials in a designated bin at the Solid Waste Facility (SWF). Efforts were made to enable people organizing public events to include centralized composting as part of their event.
Between September 2009 and December 2011, 615 tonnes of organic feedstocks and carbon amendments were processed at the composting facility. Compost windrows were turned one to two times per week with a loader and watered using a pump and fire hose to ensure active composting during the summer months at a minimum.
Due to the success of the pilot program, recommended actions to expand the CCPP included constructing a larger composting facility, expanding ICI and multi-family sector organics collection, and planning a program for residential curbside organics collection.
2.2 Corporate and Community Energy Plan
Waste management is one of the sectors identified in the Corporate and Community Energy Plan (the Energy Plan) and has been assigned GHG reduction targets, as shown in Table 1.
Table 1: Corporate and Community Energy Plan Community Action Items and GHG Reduction Targets for Waste
Overall, the Energy Plan states the possibility of reducing GHG emissions by 9,185 tonnes (17% of targeted reductions) in the waste sector, if tied to a strong waste management plan. As a part of the waste management plan, it calls for waste diversion targets that align with the overarching GHG targets. Also, it points directly to the need to make amendments to the solid waste bylaw, such as enacting disposal bans on cardboard and organics. The timelines associated with these tasks were identified in the following table in the Energy Plan.

sonnevera international corp.
4
Table 2: The Energy Plan Tasks and Timelines for the Waste Sector
2.3 Methodology
During the development of this SWMP, several tasks were completed to define the recommendations for Yellowknife’s future waste management system. Those tasks included:
• Gathering and reviewing existing historical reports and data on solid waste management in Yellowknife
• Site visit to the Solid Waste Facility (SWF)
• Participating in (truck ride-alongs) residential organics, commercial front-end-load, and commercial roll-off collection services (Kavanaugh Waste Removal Services)
• Interviews with key stakeholders
• Waste composition study at the SWF
• One-on-one public consultation with a Waste Strategy display at the Multiplex during the Halloween Skate
• An on-line survey for businesses
• Community stakeholder consultation at Northern United Place Auditorium
• Consultation meetings with a variety of stakeholders including:
– Yellowknives Dene First Nation (N’dilo and Detah)
– Government of the Northwest Territories, Environment and Natural Resources
– Ecology North
– Yellowknife Farmers’ Market
– Northview Apartment REIT
– Food Rescue Yellowknife
– Dream property management company
– Habitat for Humanity ReStore
– Kavanaugh Waste Removal Services (Kavanaugh)
• Compiling and assessing best management practices for application to Yellowknife
• Preparing a comparative assessment of waste management programs in other similar and nearby municipalities
• Review of The City’s waste management budget

Strategic Waste Management Plan (SWMP) – Final Report The City of Yellowknife
5
The stakeholder consultations were conducted on an individual and group basis to determine potential barriers, opportunities and customer needs. The waste stream analyses and waste composition study provided insight into trends specific to Yellowknife and allowed diversion potential to be estimated. A review of best practices in communities with similar characteristics to Yellowknife identified potential approaches that could be implemented in Yellowknife, including economic incentives, regulatory mechanisms and voluntary measures.
The recommended options presented in this document were selected based on a thorough understanding of the current system, preferences identified during stakeholder consultation and their success in comparable jurisdictions. The selection of options also considered The City’s Energy Plan and previous diversion program plans.
sonnevera international corp.
6
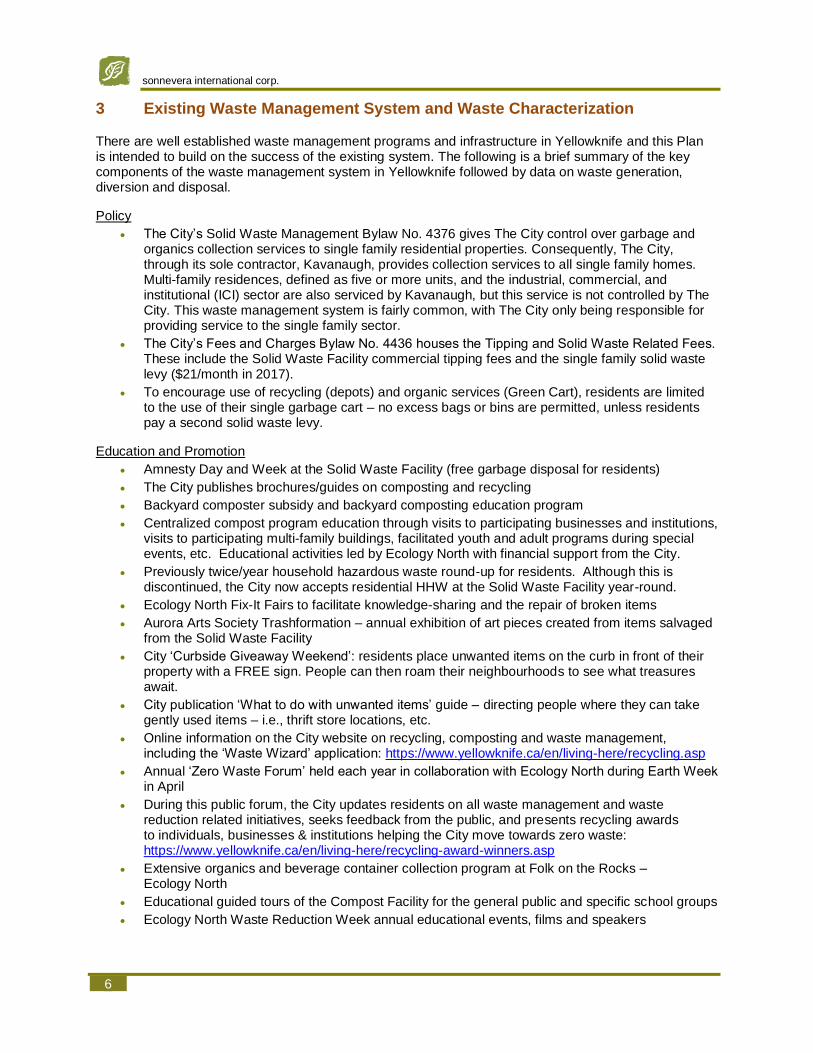
3 Existing Waste Management System and Waste Characterization
There are well established waste management programs and infrastructure in Yellowknife and this Plan is intended to build on the success of the existing system. The following is a brief summary of the key components of the waste management system in Yellowknife followed by data on waste generation, diversion and disposal.
Policy
• The City’s Solid Waste Management Bylaw No. 4376 gives The City control over garbage and organics collection services to single family residential properties. Consequently, The City, through its sole contractor, Kavanaugh, provides collection services to all single family homes. Multi-family residences, defined as five or more units, and the industrial, commercial, and institutional (ICI) sector are also serviced by Kavanaugh, but this service is not controlled by The City. This waste management system is fairly common, with The City only being responsible for providing service to the single family sector.
• The City’s Fees and Charges Bylaw No. 4436 houses the Tipping and Solid Waste Related Fees. These include the Solid Waste Facility commercial tipping fees and the single family solid waste levy ($21/month in 2017).
• To encourage use of recycling (depots) and organic services (Green Cart), residents are limited to the use of their single garbage cart – no excess bags or bins are permitted, unless residents pay a second solid waste levy.
Education and Promotion
• Amnesty Day and Week at the Solid Waste Facility (free garbage disposal for residents)
• The City publishes brochures/guides on composting and recycling
• Backyard composter subsidy and backyard composting education program
• Centralized compost program education through visits to participating businesses and institutions, visits to participating multi-family buildings, facilitated youth and adult programs during special events, etc. Educational activities led by Ecology North with financial support from the City.
• Previously twice/year household hazardous waste round-up for residents. Although this is discontinued, the City now accepts residential HHW at the Solid Waste Facility year-round.
• Ecology North Fix-It Fairs to facilitate knowledge-sharing and the repair of broken items
• Aurora Arts Society Trashformation – annual exhibition of art pieces created from items salvaged from the Solid Waste Facility
• City ‘Curbside Giveaway Weekend’: residents place unwanted items on the curb in front of their property with a FREE sign. People can then roam their neighbourhoods to see what treasures await.
• City publication ‘What to do with unwanted items’ guide – directing people where they can take gently used items – i.e., thrift store locations, etc.
• Online information on the City website on recycling, composting and waste management, including the ‘Waste Wizard’ application: https://www.yellowknife.ca/en/living-here/recycling.asp
• Annual ‘Zero Waste Forum’ held each year in collaboration with Ecology North during Earth Week in April
• During this public forum, the City updates residents on all waste management and waste reduction related initiatives, seeks feedback from the public, and presents recycling awards to individuals, businesses & institutions helping the City move towards zero waste: https://www.yellowknife.ca/en/living-here/recycling-award-winners.asp
• Extensive organics and beverage container collection program at Folk on the Rocks – Ecology North
• Educational guided tours of the Compost Facility for the general public and specific school groups
• Ecology North Waste Reduction Week annual educational events, films and speakers
Strategic Waste Management Plan (SWMP) – Final Report The City of Yellowknife
7
Reduction and Reuse Programs
• Salvage area at the Solid Waste Facility
• The Habitat for Humanity ReStore
• Food Rescue Yellowknife program
• Various thrift stores in Yellowknife
• Paint exchange area at the Solid Waste Facility
• Large item pick-up at specific times of the year
Recycling
• Blue Bin Stations are located around town for residents to drop off their separated recyclables
• Blue Bin Station at the landfill for businesses to use
• Materials collected through the Blue Bin Stations are baled at the SWF and shipped to Edmonton (Cascades) for further processing
• Yellowknife’s Solid Waste Facility provides a broad range of additional recycling / diversion opportunities, including scrap metal, appliances, asphalt,electronics, yard waste, batteries, propane tanks, tires, pallets and household hazardous waste (HHW)
• Kavanaugh provides cardboard recycling to some businesses with the material also being baled at the SWF and shipped for processing. Some large commercial businesses manage their recyclables internally, baling materials (e.g., cardboard) on-site and shipping them back to central warehouses (A known example of a businesses includes Canadian Tire)
• There is a private company, Precision, that takes scrap metal, from The City and residents directly, for recycling
Composting
• City-wide Green Cart program for food and yard waste rolled out in 2017
• The City composts organics from the Green Cart program at the SWF (Centralized Compost Program). The operation of the composting process is provided through contract with Ecology North
• Additional yard waste drop-off is available at the SWF
• There is one public organics collection bin located downtown that is available for residents to use
• Centralized Compost Program looks forward to supporting multi-family residents to join in the near future
• Local penitentiary has a composting program
Garbage Collection
• Residential garbage collection (Black Cart) is provided by The City to all single family residences. The collection is provided through contract with Kavanugh
• Businesses and institutions receive garbage collection directly from Kavanaugh
• Construction and demolition projects must hire their own waste removal service or haul it themselves to the landfill
Disposal
• The Yellowknife SWF is owned and operated by The City
• All municipal solid waste is baled before being landfilled. The baler was purchased in 2008, replacing the previous one that was over 15 years old
• The landfill is a Class II landfill and began accepting waste in 1974. Based on current calculations for this project, the balefill facility area has an estimated 10 years of airpsace remaining at the current disposal rate.
• There is only one scale at the SWF and customers do not typically “weight out” as long as they are registered customers and have tare weights recorded. Self haul loads are assigned an assumed weight (147 kg)
• The SWF is unique in the fact it has a designated salvage area where residents can take materials

sonnevera international corp.
8
Household Hazardous Waste (HHW)
• A HHW, including motor oil, collection area has been set up at the SWF where HHW is collected for a minimum $10 load charge from residents. Materials collected at the depot are recycled or properly disposed of.
Financing
• The financing of solid waste services in Yellowknife is based primarily on user fees for the type of service rendered (collection or disposal). These fees are labelled as the “Garbage Levy Fee” for single family residences and “Tipping Fees” at the landfill. These revenue streams are shown in Figure 1.
Figure 1: Solid Waste Management Fund Revenue
3.1 Disposal, Diversion and Waste Generation
In 2017, 24,289 tonnes of waste from the City of Yellowknife were landfilled at the Solid Waste Facility. This translates to a disposal rate for the City of Yellowknife in 2017 of over 1100 kg per capita, which is more than 400 kg above the Canadian average of 701 kg per capita (Stats Can 2014), as shown in Figure 2.
Figure 2: Historic Yellowknife Waste Disposal (kg/capita) with Canadian Average
0
200
400
600
800
1000
1200
1400
2011 2012 2013 2014 2015 2016 2017
Dis
po
sal (
kg/c
ap
ita
)
Strategic Waste Management Plan (SWMP) – Final Report The City of Yellowknife
9
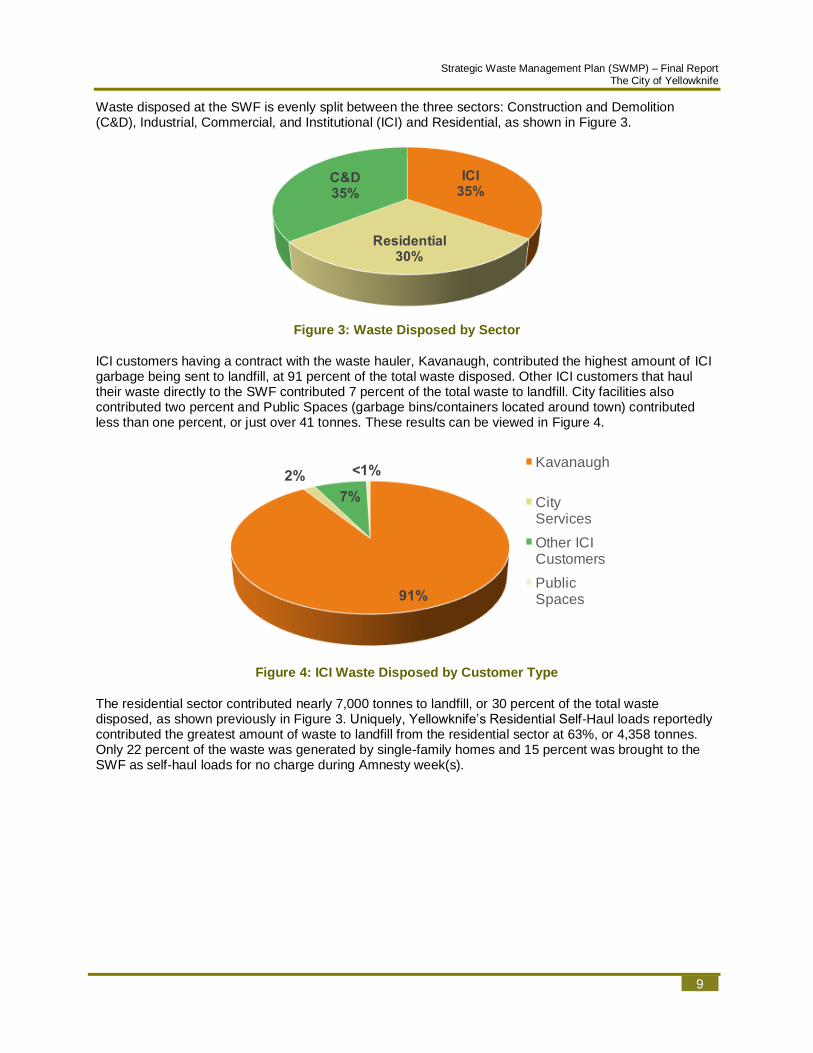
Waste disposed at the SWF is evenly split between the three sectors: Construction and Demolition (C&D), Industrial, Commercial, and Institutional (ICI) and Residential, as shown in Figure 3.
Figure 3: Waste Disposed by Sector
ICI customers having a contract with the waste hauler, Kavanaugh, contributed the highest amount of ICI garbage being sent to landfill, at 91 percent of the total waste disposed. Other ICI customers that haul their waste directly to the SWF contributed 7 percent of the total waste to landfill. City facilities also contributed two percent and Public Spaces (garbage bins/containers located around town) contributed less than one percent, or just over 41 tonnes. These results can be viewed in Figure 4.
Figure 4: ICI Waste Disposed by Customer Type
The residential sector contributed nearly 7,000 tonnes to landfill, or 30 percent of the total waste disposed, as shown previously in Figure 3. Uniquely, Yellowknife’s Residential Self-Haul loads reportedly contributed the greatest amount of waste to landfill from the residential sector at 63%, or 4,358 tonnes. Only 22 percent of the waste was generated by single-family homes and 15 percent was brought to the SWF as self-haul loads for no charge during Amnesty week(s).
ICI35%
Residential30%
C&D35%
91%
2%
7%
<1%Kavanaugh
City Services
Other ICI Customers
Public Spaces

sonnevera international corp.
10
Figure 5: Residential Waste Disposed by Customer Type
The unusually high amount of waste disposed by self-haul loads in Yellowknife may be because of inaccurate weights recorded at the weigh scale. Most self-haul loads are not weighed in and out, and instead are assigned an average 147 kg on entry. This is an extremely high average load for self-haul vehicles, and is likely causing an inflated cumulative weight in the data. Recommendations to mitigate or prevent this issue in the future include installing an additional scale to allow for weighing in and out, or determining a more accurate average weight to assign to self-haul loads by weighing customers in and out for a month’s time. These recommendations are discussed further in the Infrastructure and Operating Enhancements section.
The City of Yellowknife diverted a total of 3,549 tonnes in 2017 through recycling and composting from the residential and ICI sectors. Material diverted includes recyclables from the residential Blue Bin Stations, organic material from the residential and ICI sectors for composting, and recycling from the ICI sector (mainly consisting of cardboard). With the current diversion of these materials, this equates to a rate of about 13% as shown in in Figure 6.
Figure 6: Yellowknife Diversion
With Yellowknife diverting 3,549 tonnes in 2017, that equates to about 170 kg/capita diverted. This is slightly above the Territorial average of 151 kg/capita and about 80 kg under the national average of 253 kg/capita. (Stats Can 2014)
Yellowknife’s ICI sector contributed the most amount of material for recycling in 2017, at 60 percent of the total materials recycled including cardboard, boxboard, paper, plastic, newspaper and mixed recyclables. The residential sector contributed about 40 percent of the overall recycling materials brought to the SWF as shown in Figure 7. However, it is noteworthy that some of the 40 percent is also from the ICI sector, however the amount cannot be determined. That is because the recycling tonnage collected from the
63%
22%
15% Residential Self-Haul
Kavanaugh, Black Cart (SF)
Amnesty Week
Total Waste
Landfilled87%
Total Waste
Diverted13%

Strategic Waste Management Plan (SWMP) – Final Report The City of Yellowknife
11
Blue Bin Stations across the city (residential recycling) is coded in Geoware with the same account code as some ICI recycling dumpster loads. For example, businesses that have the same Geoware recycling account coding as the residential Blue Bin Station material are Avens Manor (seniors independent living), Sissons School, and Mildred Hall.
Figure 7: Recycling Diversion by Sector
562 tonnes of organics were diverted through the Centralized Composting Program in 2017, plus an additional 267 tonnes of tree branches. Most of this material is from the residential Green Cart program. However, the Green Cart program did not expand to all city single family homes until Fall of 2017. Therefore, this organics diversion amount is expected to increase significantly in 2018 with the Green Cart expansion and going forward with the addition of multi-family and ICI organics collection programs in the city.
Differing from recycling diversion, organics diversion mostly occurs in the residential sector. 72 percent of organics diversion is a direct result of the newly implemented Green Cart Program. The ICI sector contributes only 28 percent of the organic material as shown in Figure 8.
Figure 8: Organics Diversion by Sector
The amount of material diverted in Yellowknife has shown a downward trend from 2013 to 2016. In 2017 diversion increased significantly to over 3,500 tonnes. This is due to the completion of the city-wide Green Cart roll-out in the Fall of 2017, which is also expected to cause a continued increasing trend in 2018. 2012 had particularily low recycling tonnages due to a low amount of scrap metal being collected that year. These historical recycling tonnages can be viewed in Figure 9.
ICI60%
Residential40%
ICI28%
Residential72%

sonnevera international corp.
12
Figure 9: Historical Recycling Weights
Similar to most cities in Canada, a very large portion of the recycling stream is cardboard (1,133 tonnes in 2017). This is especially true when commercial recycling is factored into the data. Additionally, Yellowknife has a large amount of scrap metal diversion (1,161 tonnes in 2017), having their own processor located on the boundary of the city. Hence, as shown in Figure 10, cardboard and scrap metal make up the largest amount of recyclable material diverted in Yellowknife.
Figure 10: Recycling Tonnages 2017
0
500
1000
1500
2000
2500
3000
3500
4000
2011 2012 2013 2014 2015 2016 2017
To
nn
es
Year
0
200
400
600
800
1000
1200
To
nn
es
Strategic Waste Management Plan (SWMP) – Final Report The City of Yellowknife
13
3.2 Waste Composition
The scope of the study involved a physical composition audit of samples selected from inbound solid waste (garbage) loads received over a one-week sampling period at the City of Yellowknife SWF. Sources of waste targeted for the audit included: residential (curbside), multi-family, industrial, commercial, and institutional (ICI), construction and demolition (C&D) and self-haul. In addition, a sample of organic waste from the Green Cart program was audited to observe contamination levels. The waste composition audit study period took place from October 2nd through October 6th, 2017.
For a full report on the waste composition event see Appendix A.
3.2.1 Waste Sampling Process
The general audit approach and methodology was based on generally accepted audit approaches and guidelines (e.g., CCME Recommended Waste Characterization Methodology).
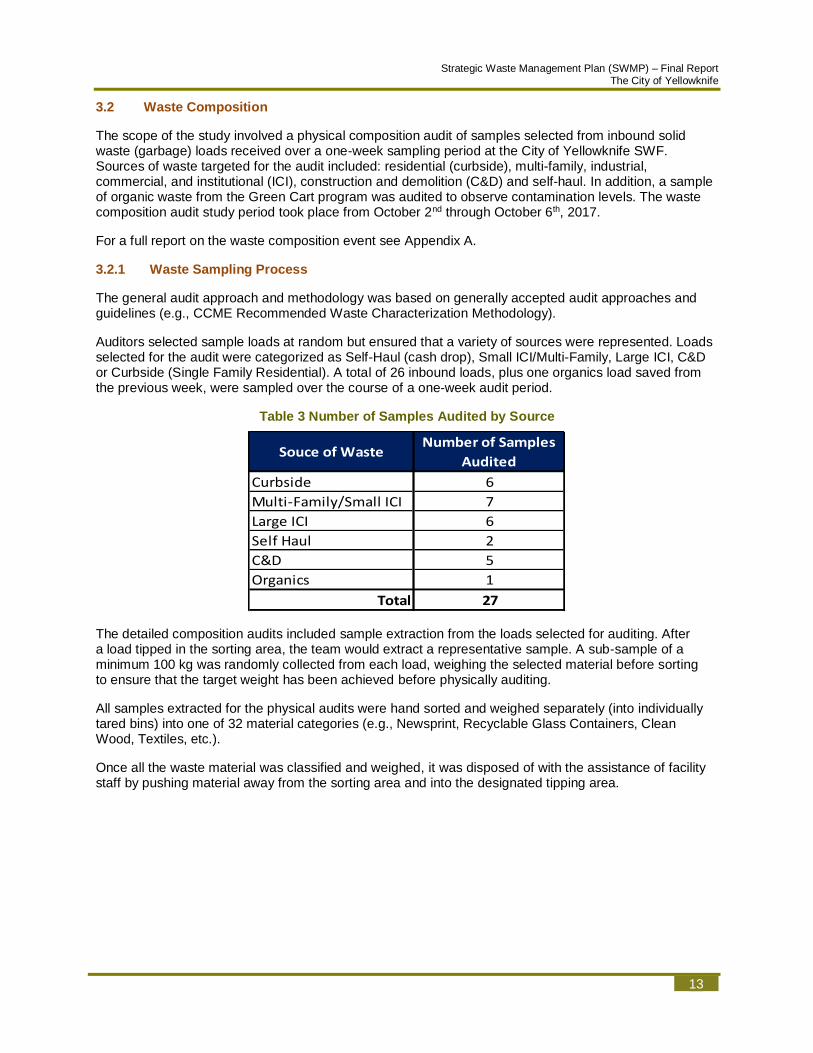
Auditors selected sample loads at random but ensured that a variety of sources were represented. Loads selected for the audit were categorized as Self-Haul (cash drop), Small ICI/Multi-Family, Large ICI, C&D or Curbside (Single Family Residential). A total of 26 inbound loads, plus one organics load saved from the previous week, were sampled over the course of a one-week audit period.
Table 3 Number of Samples Audited by Source
The detailed composition audits included sample extraction from the loads selected for auditing. After a load tipped in the sorting area, the team would extract a representative sample. A sub-sample of a minimum 100 kg was randomly collected from each load, weighing the selected material before sorting to ensure that the target weight has been achieved before physically auditing.
All samples extracted for the physical audits were hand sorted and weighed separately (into individually tared bins) into one of 32 material categories (e.g., Newsprint, Recyclable Glass Containers, Clean Wood, Textiles, etc.).
Once all the waste material was classified and weighed, it was disposed of with the assistance of facility staff by pushing material away from the sorting area and into the designated tipping area.
Souce of WasteNumber of Samples
Audited
Curbside 6
Multi-Family/Small ICI 7
Large ICI 6
Self Haul 2
C&D 5
Organics 1
Total 27

sonnevera international corp.
14
Figure 11: Audit Team & Audit Area
Figure 12: Digital Scale and Audit Log Sheet
Figure 13: Waste Sorted by Material Type
Figure 14: Landfill Staff Moving Sample
3.2.2 Results
3.2.2.1 Single Family Garbage
Figure 15 illustrates the composition, by weight, of the six curbside (residential) garbage samples audited. Recyclable materials accounted for 19% of the stream, with recyclable paper representing 10%, recyclable plastics five percent, recyclable metal containers two percent, and recyclable glass containers two percent. Organics contributed 38% of the stream, with food waste being the primary component (29%), followed by food soiled paper (6%), and yard waste (4%). The primary components of the other materials were diapers & sanitary waste (14%), non-recyclable plastic bags & film (6%, e.g., garbage bags, chip bags, laminated pouches, etc.), other waste (6%, e.g., vacuum contents, wax, composite materials), and textiles (6%).

Strategic Waste Management Plan (SWMP) – Final Report The City of Yellowknife
15
Figure 15: Curbside Garbage Composition (by weight)
Comparing these single-family results to the original 2007 waste audit, the amount of organic material has stayed relatively consistent at 40 percent (previously, in 2007, it was 38 percent). However, the amount of recyclable material in the garbage has decreased since 2007 by over 15 percent. It is important to note that it is difficult to provide detailed comparisons of the results of the two audits, as differences in factors such as methodology are unknown. Ensuring waste audits are conducted with equivalent methodologies can help provide comparisons going forward.
3.2.2.2 Multi-Family & Small ICI
Figure 16 illustrates the composition, by weight, of the seven multi-family residential/small ICI garbage samples audited. It should be noted samples collected from overhead trucks were classified as multi-family/small ICI (e.g., restaurants, schools, hotels, offices, retail shops), as these loads typically contain mixed waste from several properties collected on a route. Recyclable materials accounted for 21% of the stream, with recyclable paper representing 14%, recyclable plastics four percent, recyclable metal containers two percent, and recyclable glass containers one percent. Organics contributed 37% of the stream, with food waste being the primary component (24%), followed by yard waste (7%), and food soiled paper (6%). The primary components of the other materials were diapers & sanitary waste (9%), textiles (6%), miscellaneous rigid plastic (4%), and other waste (4%, e.g., vacuum contents, cigarette butts, filters, etc.). Also noteworthy within the multi-family/small ICI garbage was deposit beverage containers at two percent.
Total Recyclable
Material19%
Total Deposit Material
1%
Total Organic Material
38%
Total Other Material
42%
Residential
sonnevera international corp.
16
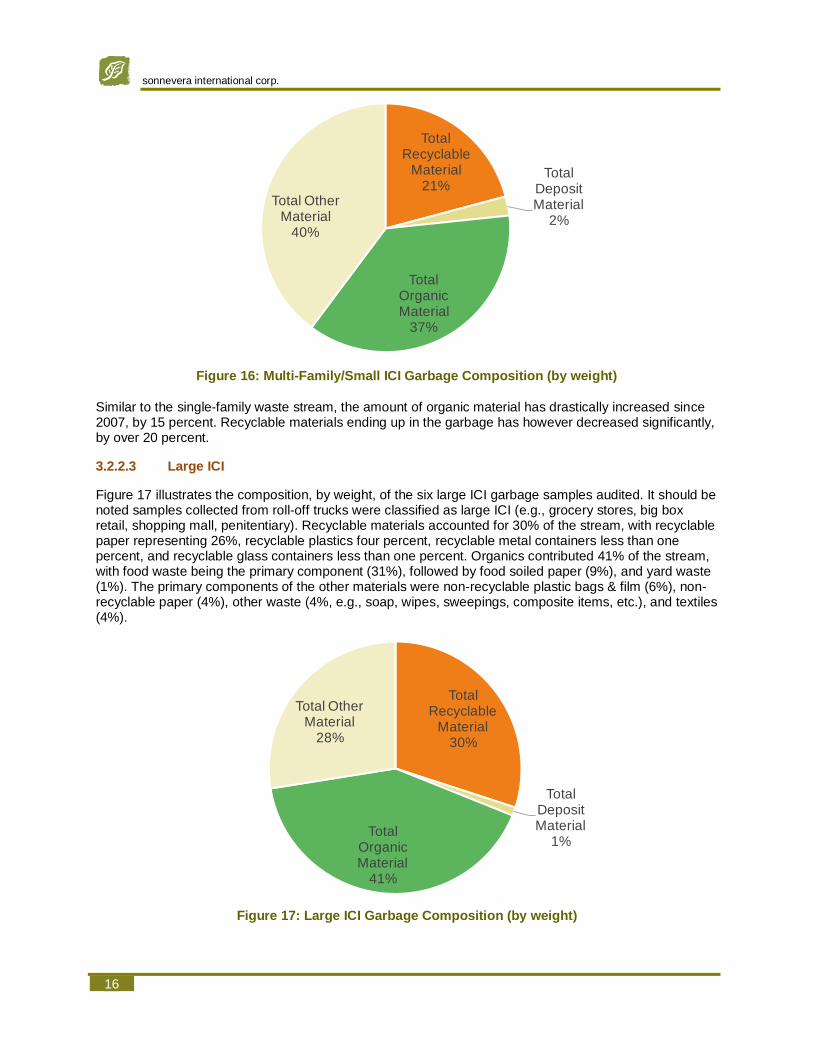
Figure 16: Multi-Family/Small ICI Garbage Composition (by weight)
Similar to the single-family waste stream, the amount of organic material has drastically increased since 2007, by 15 percent. Recyclable materials ending up in the garbage has however decreased significantly, by over 20 percent.
3.2.2.3 Large ICI
Figure 17 illustrates the composition, by weight, of the six large ICI garbage samples audited. It should be noted samples collected from roll-off trucks were classified as large ICI (e.g., grocery stores, big box retail, shopping mall, penitentiary). Recyclable materials accounted for 30% of the stream, with recyclable paper representing 26%, recyclable plastics four percent, recyclable metal containers less than one percent, and recyclable glass containers less than one percent. Organics contributed 41% of the stream, with food waste being the primary component (31%), followed by food soiled paper (9%), and yard waste (1%). The primary components of the other materials were non-recyclable plastic bags & film (6%), non-recyclable paper (4%), other waste (4%, e.g., soap, wipes, sweepings, composite items, etc.), and textiles (4%).
Figure 17: Large ICI Garbage Composition (by weight)
Total Recyclable
Material21%
Total Deposit Material
2%
Total Organic Material
37%
Total Other Material
40%
Multi Family
Total Recyclable
Material30%
Total Deposit Material
1%Total
Organic Material
41%
Total Other Material
28%
Large Businesses

Strategic Waste Management Plan (SWMP) – Final Report The City of Yellowknife
17
The large ICI sector experienced an increase in organic material ending up in the garbage compared to 2007 audit results – 16 percent. The amount of recyclable material in the garbage has since been cut approximately in half, but still has the highest percentage of all the sectors audited.
3.2.2.4 Self-Haul
Figure 18 illustrates the composition, by weight, of the two self-haul garbage samples audited. It should be noted that self-haul samples were pulled from roll-off bins, which contained a mix of garbage from many small self-hauled loads dropped off at the SWF. Recyclable materials accounted for 13% of the stream, with recyclable paper representing most of it at 11%. Organics contributed nine percent of the stream, with food waste being the primary component (8%). The primary components of the other materials were rubble/soil (26%), treated wood (13%, e.g., painted, stained or pressure treated), and other renovation waste (10%).
Figure 18: Self-Haul Garbage Composition (by weight)
3.2.2.5 Construction and Demolition (C&D)
Figure 19 illustrates the weighted composition of the five C&D garbage samples audited. It should be noted that due to the bulky nature of C&D loads, they were visually audited by volume, then converted to weights using volume/density conversion factors. Mixed renovation materials (e.g., mostly drywall, insulation, flooring, etc.) were the largest component of the C&D loads at 44%, followed closely by clean wood (e.g., dimensional lumber, pallets) at 43%. Treated wood (stained/painted, pressure treated, engineered) contributed nine percent of the C&D waste, while other miscellaneous materials comprised the remaining four percent (some scrap metal, plastic film, plastic pipes, etc.). It should be noted that due to the significant variability in C&D related activities (e.g., new construction, demolition, renovation, etc.) there can be significant variability between composition of C&D waste loads. For example, one of the loads received during the audit period was >95% clean drywall scraps, while other loads had none.
Total Recyclable
Material13%
Total Organic Material
9%
Total Other Material
78%
Self haul to landfill

sonnevera international corp.
18
Figure 19: Construction and Demolition Garbage Composition (by weight)
3.2.2.6 Organics
In addition to the garbage stream audit, the team looked at a sample of source separated organics that had been set aside by landfill staff the prior week. Contamination in the sample was found to be low, with non-compostable materials comprising less than one percent by weight. Food and yard waste were the largest components, 59% and 28% respectively, with paper and wood making up the remainder. It should be noted that the composition of this one sample may not be representative of the City’s organics stream overall.
3.3 Environmental Benefits of Diversion
The environmental benefits associated with diversion of recyclables in Yellowknife include greenhouse gas emission offsets of just over 6400 tonnes of CO2 equivalent, based on Environment Canada GHG offset factors for recycling. Organics diversion represents an additional 165 tonnes of CO2 equivalent.
Using the USEPA’s Greenhouse Gas Equivalencies Calculator, this is the equivalent of the emissions from 1400 passenger vehicles for one year, or 15,000 barrels of oil, 87 tanker trucks of gasoline, the electricity use of almost 1000 homes for a year, or the carbon sequestered by more than 170,000 tree seedlings over 10 years. These equivalencies are useful in communicating program benefits to the public.
Recycling GHG offsets are generally not factored into municipal GHG inventories, since the offsets occur in a remote location, and cannot be attributed directly to municipal activities (The City is only responsible for collection of materials, not recycling). However, waste management is one of the sectors identified in the Corporate and Community Energy Plan (the Energy Plan) and has been assigned GHG reduction targets, as previously mentioned. It is assumed these benefits are based on landfill diversion and associated methane emission reductions, but it would be appropriate to mention the global offsets associated with recycling activities, and flag their relative magnitude, even though they are not directly part of the municipal inventory.
Clean Wood43%
Treated Wood
9%
Renovation Waste44%
Other4%
Construction / Demolition

Strategic Waste Management Plan (SWMP) – Final Report The City of Yellowknife
19
3.4 Stakeholder Input / Public Consultation
In developing the SWMP, opinions about the current solid waste system and ideas for the future were sought from stakeholders. Meetings were held with City staff and organizations like the Yellowknives Dene First Nation (N’dilo and Detah), Government of the Northwest Territories, Environment and Natural Resources, Ecology North, Yellowknife Farmers’ Market, Northview Apartment REIT, Food Rescue Yellowknife, Dream property management company, Habitat for Humanity ReStore, and Kavanaugh Waste Removal Services. Businesses and institutions were interviewed in person and additional input was gathered though an online survey.
This section summarizes the stakeholder input. This input aided in the assessment and selection of options for Yellowknife’s future waste management system.
3.4.1 Online Business (ICI) Waste Management Survey Highlights
An online survey was conducted for Yellowknife businesses to determine their current waste management practices and perceived barriers to diversion (recycling and organics). A total of 33 businesses completed the survey in October with half of those businesses being a Professional Service. Other business categories included Retail, Food Service, Manufacturing, Hospitality, Multi-family, Construction, Trucking and several others. Over 65 percent of the businesses surveyed had 10 or less employees. For a detailed analysis of the survey, see Appendix B.
Although there are some businesses leading waste diversion in Yellowknife, there are a significant number of businesses that are keen on participating and are looking for additional diversion options. Very few businesses reported any reuse activities and those that did were mainly related to construction.
The majority of businesses surveyed did not have specific waste management policies or goals, although more than half of the businesses did state they had undergone changes to their business in order to try to reduce waste. Most businesses also reported they think it is important to reduce waste in Yellowknife.
The biggest barrier to recycling for businesses was reported to be time and labour. Accessibility was also identified as a larger issue for some businesses. Similarly, the biggest barriers to organics diversion were also accessibility and time and labour.
Businesses presented a wide range of actions or programs they felt had the most impact on waste diversion. Several reported recycling or composting, while other actions included transitioning to compostable foodware, having a furnace that runs off used oil, donating beverage containers and trying to repair things as much as possible.
3.4.2 Feedback from the One-on-One Stakeholder Engagement at the Multiplex
Yellowknife residents attending the Halloween Skate at the Multiplex on October 25th, 2017 were approached on an individual, or small group basis, and were asked to contribute ideas on “how Yellowknife can reduce waste”. Residents placed ideas on sticky notes that were placed on a large board for others to view. Participants were also asked to place green dots beside the ideas they supported.

sonnevera international corp.
20
Figure 20: Multi-plex Engagement
The concepts that were provided by Yellowknifers were summarized and grouped into the following categories.
1. Reduction – residents thought there needs to be more of a focus on reducing waste within
the city.
2. Promotion – residents expressed the need for The City to highlight its program successes more.
3. Incentives – residents desire financial incentives to encourage recycling and diversion.
4. Donation and Reuse – some residents believed there were options available for increased
donation of food and reuse opportunities of certain materials.
5. Organics – many residents expressed the need for an organics diversion program for multi-
family complexes.
6. Legislation/Policies – some residents suggested having more legislation in place to require
diversion practices.
7. Litter – some residents suggested a focus on litter prevention and clean-up through community
programs.
8. Recycling – residents often wanted easier access to and more options for recycling.
9. Education and Information – residents highlighted the importance and need for The City to
educate residents on recycling best practices.
For a full review of the stakeholder results, see Appendix C.

Strategic Waste Management Plan (SWMP) – Final Report The City of Yellowknife
21
3.4.3 Summary of the Community Discussion at the Northern United Place Auditorium
Over 25 people attended the Community Discussion on Waste, held at the Northern United Place Auditorium, in Yellowknife on the evening of October 26th, 2017. A presentation on the background of Yellowknife’s waste management system, including recent 2017 waste composition results, was given to the participants, followed by an interactive discussion on potential future strategy components. The facilitated discussion generated informative comments on the current system, as well as gained valuable insight into stakeholders’ opinions on the applicability of future waste management initiatives in Yellowknife. For a full review of the comments and feedback from the presentation, see Appendix C.
3.4.3.1 Targets
Few attendees were aware of the diversion targets for organics and cardboard, as mentioned in the Corporate and Community Energy Plan. Attendees highlighted the need for the City to be accountable to its targets and report back and publish results from measurement towards targets.
3.4.3.2 Current Diversion System
The group thought the current residential waste management system was convenient for those that have access to a vehicle but is lacking organics diversion opportunities for multi-family complexes. Attendees also thought not all Yellowknife residents are aware of the diversion options and there is a need for more education on why certain diversion programs have been implemented.
Attendees did not think the current diversion programs were effective and referenced the current diversion rate of 12 percent as proof. It was also noted that the current system does not provide options for recycling or organics diversion to businesses. The discussion brought attention to the lack of diversion programs focused on the ICI sector.
3.4.3.3 Recycling Program
Cardboard was highlighted as both an area for opportunity for increased diversion by residents and businesses and an area where some businesses are doing an excellent job. Attendees noted there are a few businesses in Yellowknife that have good cardboard recycling programs. Many of those being large corporations that ship cardboard back to central locations for recycling.
Transparency by the City and knowledge of where recyclable materials are ending up was also mentioned by the group. One attendee noted there must be flexibility in the program due to the continuous changes in recycling markets. They also asked if there were more opportunities to do some of the recycling locally.
3.4.3.4 Organics
The big take-away for organics was that the group wanted a similar program to the Green Cart available to businesses and multi-family complexes.
3.4.3.5 Construction and Demolition
The group commented on the opportunities to recycle or reuse construction and demolition material. They thought materials such as asphalt and wood could easily be reused and that there needed to be targets for construction and demolition recycling in Yellowknife. There was also strong support for policies and incentives that would encourage recycling of the material.
sonnevera international corp.
22
3.4.3.6 Reuse
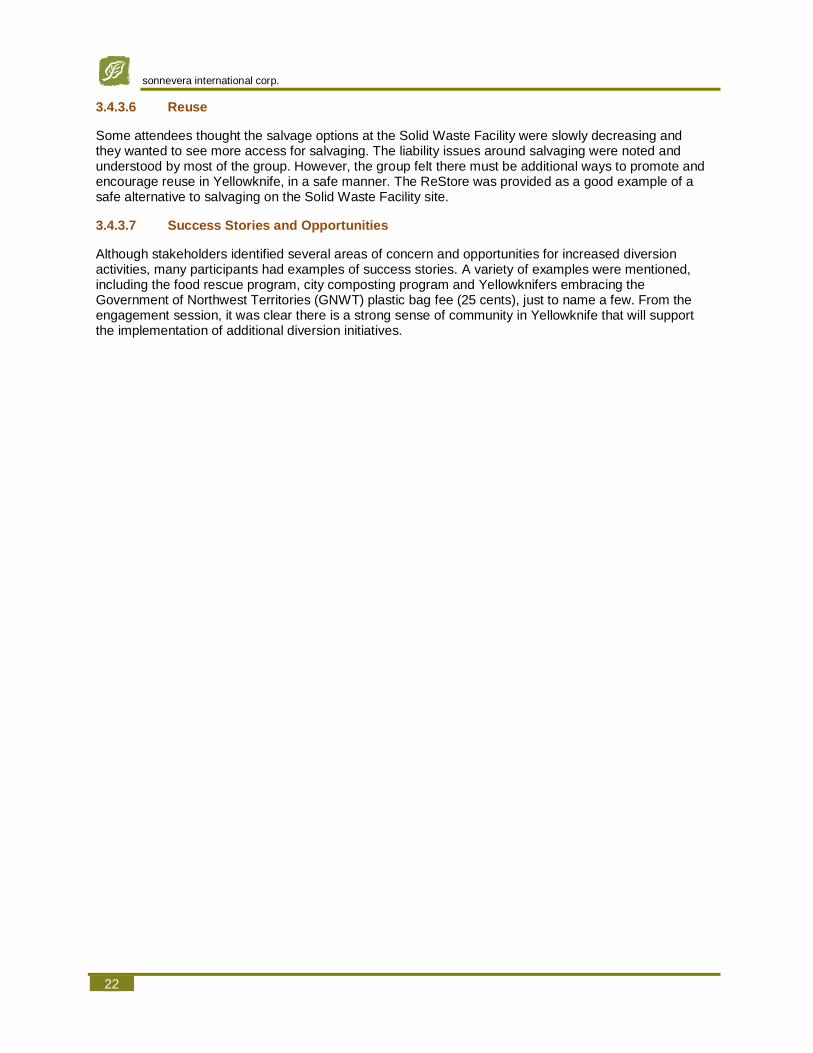
Some attendees thought the salvage options at the Solid Waste Facility were slowly decreasing and they wanted to see more access for salvaging. The liability issues around salvaging were noted and understood by most of the group. However, the group felt there must be additional ways to promote and encourage reuse in Yellowknife, in a safe manner. The ReStore was provided as a good example of a safe alternative to salvaging on the Solid Waste Facility site.
3.4.3.7 Success Stories and Opportunities
Although stakeholders identified several areas of concern and opportunities for increased diversion activities, many participants had examples of success stories. A variety of examples were mentioned, including the food rescue program, city composting program and Yellowknifers embracing the Government of Northwest Territories (GNWT) plastic bag fee (25 cents), just to name a few. From the engagement session, it was clear there is a strong sense of community in Yellowknife that will support the implementation of additional diversion initiatives.

Strategic Waste Management Plan (SWMP) – Final Report The City of Yellowknife
23
4 Diversion Potential
Both the current diversion and additional potential diversion are reported in Table 4 and Table 5 for the single family residential and ICI sector, respectively. Additional diversion potential was calculated using the waste composition results for each sector. The percentage of material in the waste stream according to the audit results was used to calculate a total amount of that material being landfilled based on 2017 disposal rates. It was then assumed an efficient diversion program could capture up to 80% of the total material.
Table 4: Estimated City of Yellowknife Single Family Residential Diversion Potential
2017 Waste
Composition of Waste Stream
Current Diversion 2017
(tonnes)
Additional Diversion Potential
(tonnes/year)*
Recyclables (Blue Bin Stations)
19% 600 1,050
Organic Waste (mainly food)
38% 400 2,100
Total 57% 1,000 3,150
*Assumed 80 percent capture rate
Table 4 also clearly shows that the highest potential diversion within the residential sector lies with organics.
Table 5: Estimated City of Yellowknife Commercial Diversion Potential
2017 Waste Composition Percentage of Waste Stream
Current Diversion (tonnes)
Additional Diversion Potential
(tonnes/year)*
Cardboard 17% 820 1,100
Other Recyclables
13% 110 840
Organic Waste (mainly food)
41% 160 2,660
Total 71% 1,090 4,600
*Assumed 80 percent capture rate
It should also be noted that food waste is concentrated in certain portions of the ICI sector, specifically restaurants and grocery stores. Therefore, diversion of this material can be approached through a targeted program directed at these businesses.
With aggressive waste reduction and recycling programs, over 50% diversion in the ICI sector should be readily achievable. Yellowknife has a distinct advantage in that it has one main commercial hauler, Kavanaugh, and therefore has greater influence over potential diversion initiatives in this sector.

sonnevera international corp.
24
5 Waste Management Strategy
5.1 Waste Reduction, Diversion and Residuals Management Elements
The following strategy elements, outlined in Table 6, for enhanced programs and increased diversion have been identified for The City of Yellowknife, based on needs and opportunities identified, research into best practices, and initial feedback from stakeholders. Detailed information has been compiled on these initiatives that may be considered by The City for future program development and is outlined in Appendix D. In particular, case study examples of programming options have been developed to provide guidance on planning and implementation of potential options.
Table 6: Waste Management Strategy Elements
Option Type Option
Education / Promotion Overall Approaches
Government leadership
Community engagement
Community-based social marketing
Branding
Social Media
Public spaces recycling
Zero waste public events
Residential Waste Reduction/ Diversion
Backyard composting
Depot Recycling Systems
Curbside recycling
User-pay / volume limitations
Enhanced multi-family programming
Industrial, Commercial and Institutional Waste Reduction
Waste diversion assistance
ICI recognition
Enhanced ICI food waste diversion
Enhanced ICI recycling collection
Expanded C&D diversion opportunities
Infrastructure and Operating Enhancements
Composting site
Salvage area
Regulatory Options Differential tipping fees
Disposal bans
Residential mandatory recycling / source separation
ICI mandatory recycling / source separation
Residuals Management Site development
Airspace consumption
Operational considerations
Monitoring and Reporting Diversion Tool Calculator

Strategic Waste Management Plan (SWMP) – Final Report The City of Yellowknife
25
The diversion potential associated with each potential option is highly variable, depending on a number of factors, including effectiveness of the communications / education campaign used to promote the program. For example, focused community-based social marketing has the potential to improve the performance of diversion programs markedly.
A description of each option and the resources required follows.
5.1.1 Education / Promotion Overall Approaches
5.1.1.1 Government Leadership
It is very important for The City to lead by example by establishing progressive waste reduction policies and programs. Providing waste minimization leadership shows commitment to Yellowknife’s citizens, and acts as a model for local businesses and institutions. This type of initiative is also very likely to be supported by Yellowknife residents and businesses, as evidenced in the results of the ICI online survey with over 70 percent of respondents reporting it is very important for Yellowknife to reduce waste.
A leadership role would include green procurement policies that support waste minimization and aggressive waste minimization programs in all municipal operations. The City of Markham is a good example of a waste diversion leader; they have implemented the following initiatives within their municipal operations:
Table 7: City of Markham Department Changes in Zero Waste Facility
Town Department
Oversees Changes
Asset Management
Garbage collection
• Removed all garbage containers from staff work stations and offices (went from 500 containers to 45)
• Provided a small blue box at each desk
• Staff was instructed to empty as needed into larger centralized recycling container
• Introduced centralized organics containers
• Internal material bans from garbage
Purchasing Food services
• Zero Waste Food and Catering Services and Events Policy
• Local Food Plus Procurement Practices
Strategic Services
Special events
• Zero Waste Food and Catering Services and Events Policy
Other leadership examples include The City of Toronto’s “No Waste” program, that helped the City’s major corporate buildings divert 1,300 metric tonnes of recyclables and organics in 2016. This resulted in an overall waste diversion rate for the City of Toronto’s larger corporate office buildings of 90%. At The City of Seattle, Washington, The Seattle Sustainable Purchasing Policy acknowledges that City Purchasing and City Departments are to promote and encourage strategies including consumption reduction, due to the societal and community costs, such as landfill waste handling, toxin exposures, resource depletion and greenhouse gas emissions to:
• Reduce City consumption
• Purchase of remanufactured, recycled or reusable products
• Minimize packaging
• Reduce entry toxin chemicals into the City consumption stream
• Purchase products that are durable, long lasting, reusable, recyclable or otherwise decrease waste
• Participate in manufacturer or vendor take-back programs and/or in the King County “Take Back” program
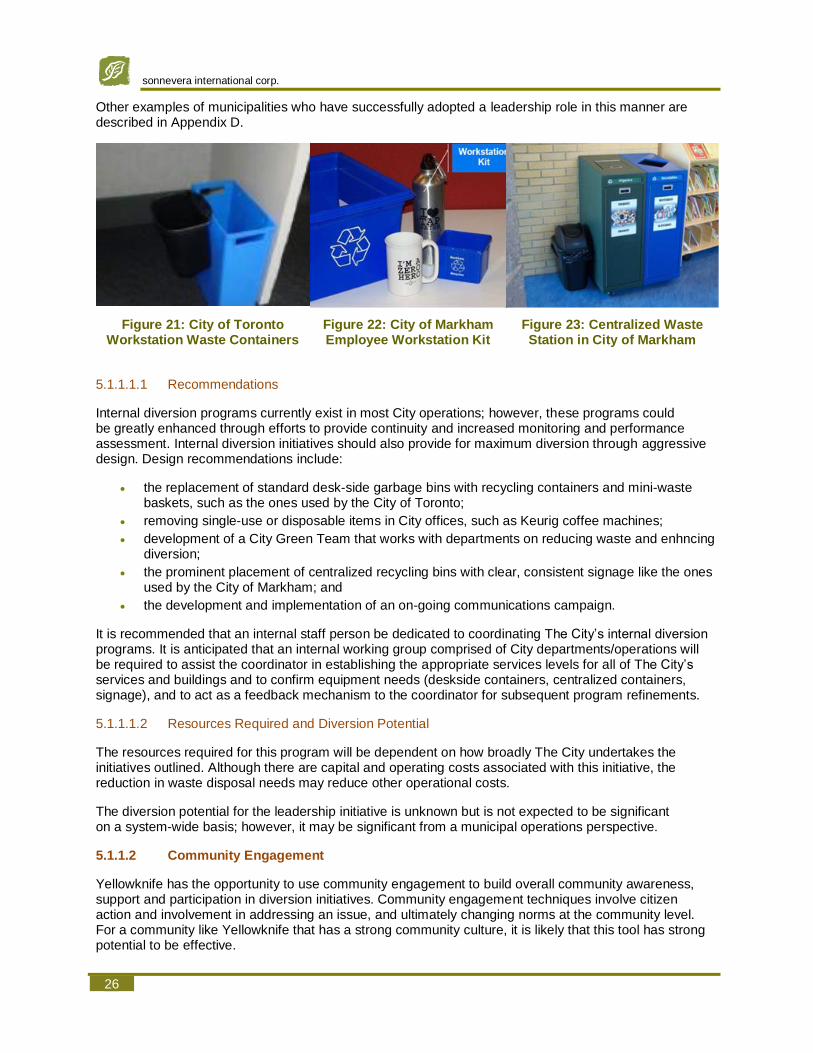
sonnevera international corp.
26
Other examples of municipalities who have successfully adopted a leadership role in this manner are described in Appendix D.
Figure 21: City of Toronto Workstation Waste Containers
Figure 22: City of Markham Employee Workstation Kit
Figure 23: Centralized Waste Station in City of Markham
5.1.1.1.1 Recommendations
Internal diversion programs currently exist in most City operations; however, these programs could be greatly enhanced through efforts to provide continuity and increased monitoring and performance assessment. Internal diversion initiatives should also provide for maximum diversion through aggressive design. Design recommendations include:
• the replacement of standard desk-side garbage bins with recycling containers and mini-wastebaskets, such as the ones used by the City of Toronto;
• removing single-use or disposable items in City offices, such as Keurig coffee machines;
• development of a City Green Team that works with departments on reducing waste and enhncingdiversion;
• the prominent placement of centralized recycling bins with clear, consistent signage like the onesused by the City of Markham; and
• the development and implementation of an on-going communications campaign.
It is recommended that an internal staff person be dedicated to coordinating The City’s internal diversion programs. It is anticipated that an internal working group comprised of City departments/operations will be required to assist the coordinator in establishing the appropriate services levels for all of The City’s services and buildings and to confirm equipment needs (deskside containers, centralized containers, signage), and to act as a feedback mechanism to the coordinator for subsequent program refinements.
5.1.1.1.2 Resources Required and Diversion Potential
The resources required for this program will be dependent on how broadly The City undertakes the initiatives outlined. Although there are capital and operating costs associated with this initiative, the reduction in waste disposal needs may reduce other operational costs.
The diversion potential for the leadership initiative is unknown but is not expected to be significant on a system-wide basis; however, it may be significant from a municipal operations perspective.
5.1.1.2 Community Engagement
Yellowknife has the opportunity to use community engagement to build overall community awareness, support and participation in diversion initiatives. Community engagement techniques involve citizen action and involvement in addressing an issue, and ultimately changing norms at the community level. For a community like Yellowknife that has a strong community culture, it is likely that this tool has strong potential to be effective.
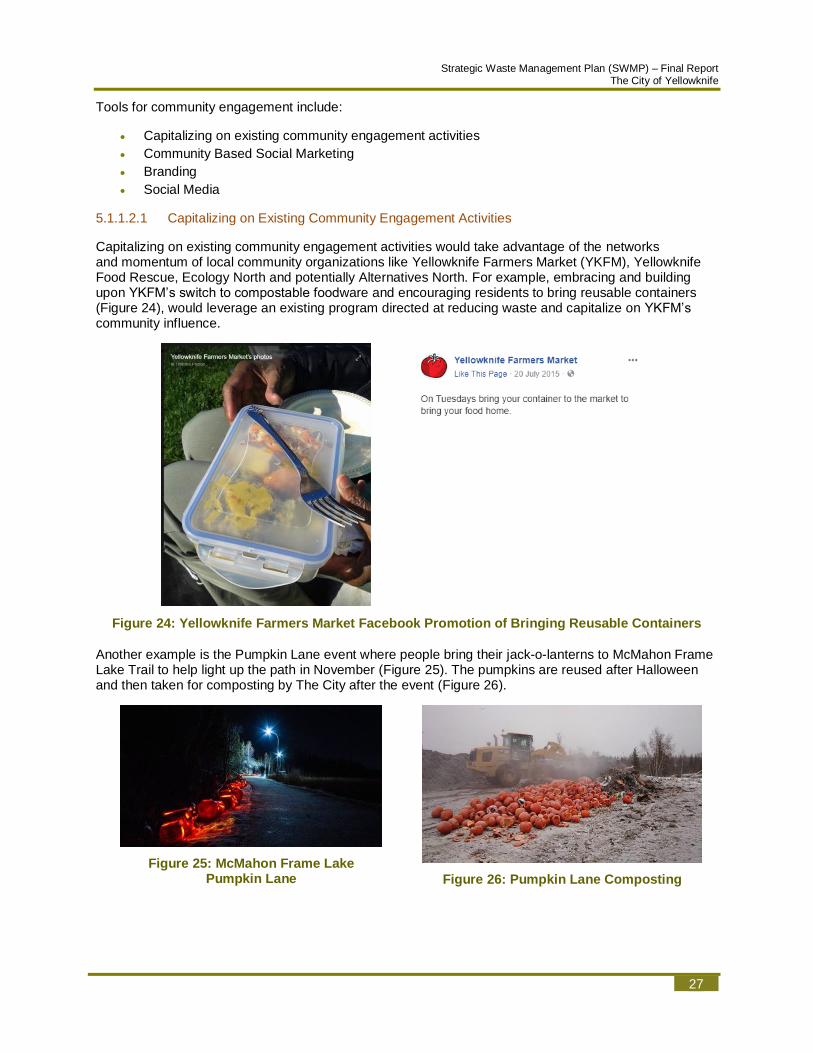
Strategic Waste Management Plan (SWMP) – Final Report The City of Yellowknife
27
Tools for community engagement include:
• Capitalizing on existing community engagement activities
• Community Based Social Marketing
• Branding
• Social Media
5.1.1.2.1 Capitalizing on Existing Community Engagement Activities
Capitalizing on existing community engagement activities would take advantage of the networks and momentum of local community organizations like Yellowknife Farmers Market (YKFM), Yellowknife Food Rescue, Ecology North and potentially Alternatives North. For example, embracing and building upon YKFM’s switch to compostable foodware and encouraging residents to bring reusable containers (Figure 24), would leverage an existing program directed at reducing waste and capitalize on YKFM’s community influence.
Figure 24: Yellowknife Farmers Market Facebook Promotion of Bringing Reusable Containers
Another example is the Pumpkin Lane event where people bring their jack-o-lanterns to McMahon Frame Lake Trail to help light up the path in November (Figure 25). The pumpkins are reused after Halloween and then taken for composting by The City after the event (Figure 26).
Figure 25: McMahon Frame Lake Pumpkin Lane
Figure 26: Pumpkin Lane Composting
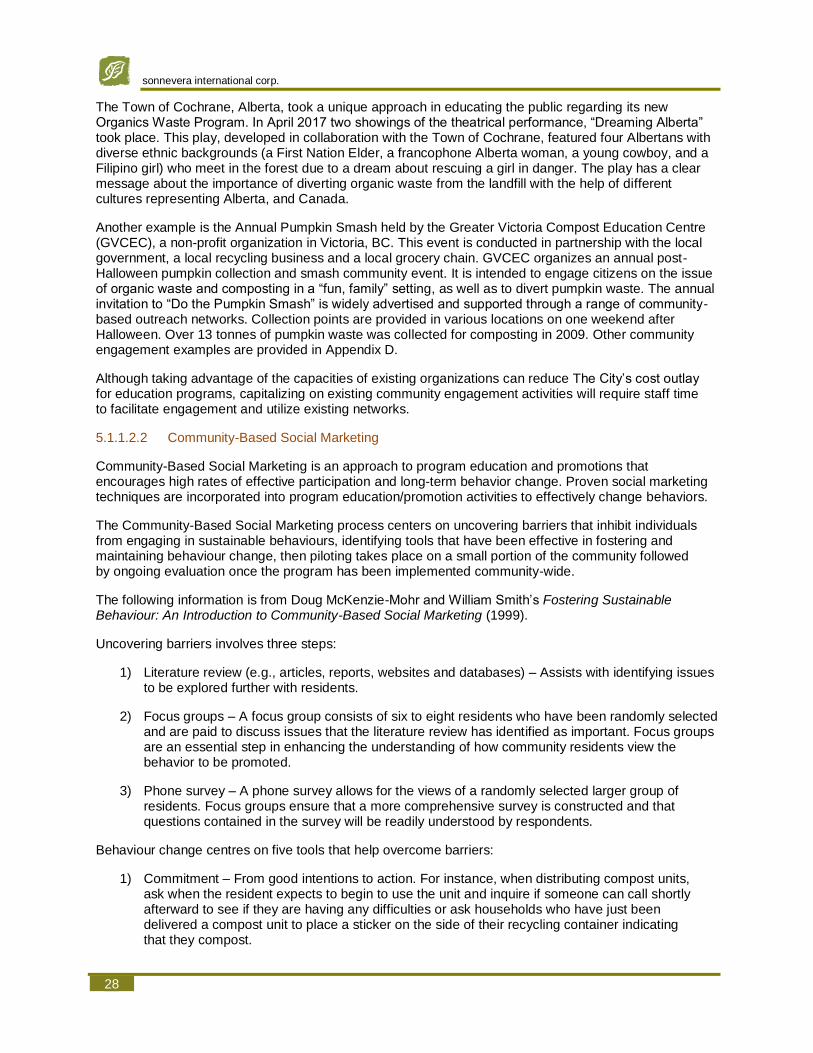
sonnevera international corp.
28
The Town of Cochrane, Alberta, took a unique approach in educating the public regarding its new Organics Waste Program. In April 2017 two showings of the theatrical performance, “Dreaming Alberta” took place. This play, developed in collaboration with the Town of Cochrane, featured four Albertans with diverse ethnic backgrounds (a First Nation Elder, a francophone Alberta woman, a young cowboy, and a Filipino girl) who meet in the forest due to a dream about rescuing a girl in danger. The play has a clear message about the importance of diverting organic waste from the landfill with the help of different cultures representing Alberta, and Canada.
Another example is the Annual Pumpkin Smash held by the Greater Victoria Compost Education Centre (GVCEC), a non-profit organization in Victoria, BC. This event is conducted in partnership with the local government, a local recycling business and a local grocery chain. GVCEC organizes an annual post-Halloween pumpkin collection and smash community event. It is intended to engage citizens on the issue of organic waste and composting in a “fun, family” setting, as well as to divert pumpkin waste. The annual invitation to “Do the Pumpkin Smash” is widely advertised and supported through a range of community-based outreach networks. Collection points are provided in various locations on one weekend after Halloween. Over 13 tonnes of pumpkin waste was collected for composting in 2009. Other community engagement examples are provided in Appendix D.
Although taking advantage of the capacities of existing organizations can reduce The City’s cost outlay for education programs, capitalizing on existing community engagement activities will require staff time to facilitate engagement and utilize existing networks.
5.1.1.2.2 Community-Based Social Marketing
Community-Based Social Marketing is an approach to program education and promotions that encourages high rates of effective participation and long-term behavior change. Proven social marketing techniques are incorporated into program education/promotion activities to effectively change behaviors.
The Community-Based Social Marketing process centers on uncovering barriers that inhibit individuals from engaging in sustainable behaviours, identifying tools that have been effective in fostering and maintaining behaviour change, then piloting takes place on a small portion of the community followed by ongoing evaluation once the program has been implemented community-wide.
The following information is from Doug McKenzie-Mohr and William Smith’s Fostering Sustainable Behaviour: An Introduction to Community-Based Social Marketing (1999).
Uncovering barriers involves three steps:
1) Literature review (e.g., articles, reports, websites and databases) – Assists with identifying issues to be explored further with residents.
2) Focus groups – A focus group consists of six to eight residents who have been randomly selected and are paid to discuss issues that the literature review has identified as important. Focus groups are an essential step in enhancing the understanding of how community residents view the behavior to be promoted.
3) Phone survey – A phone survey allows for the views of a randomly selected larger group of residents. Focus groups ensure that a more comprehensive survey is constructed and that questions contained in the survey will be readily understood by respondents.
Behaviour change centres on five tools that help overcome barriers:
1) Commitment – From good intentions to action. For instance, when distributing compost units, ask when the resident expects to begin to use the unit and inquire if someone can call shortly afterward to see if they are having any difficulties or ask households who have just been delivered a compost unit to place a sticker on the side of their recycling container indicating that they compost.
Strategic Waste Management Plan (SWMP) – Final Report The City of Yellowknife
29
2) Prompts – Remembering to act sustainably. For example, distribute grocery list pads that remind shoppers every time they look at their grocery list to shop for products that have recycled content, are recyclable or have less packaging. One can also place signs at the entrances to supermarkets reminding shoppers to bring their reusable shopping bags into the store and/or distribute car window stickers with the purchase of reusable shopping bags; the stickers can be placed on the window next to the car lock to remind people to bring their reusable bags into the store.
3) Norms – Building community support. For instance, affix a decal to the recycling container indicating that "We Compost" or affix a decal to the recycling container indicating that the household buys recycled products.
4) Communication – Creating effective messages. Several techniques can be used and are not limited to the following:
– Ensure that the message is vivid, personal and concrete
– Have the message delivered by an individual or organization who is credible with the audience
– Make communications easy for residents to remember what to do and how and when to do it
– When possible, use personal contact to deliver the message
– Provide feedback to both the individual and community levels about the impact of sustainable behaviours
5) Incentives – Enhancing motivation to act. For instance, invoke user fees to increase motivation to recycle, compost and source reduce or attach a sizable deposit on household hazardous waste to provide the motivation necessary for individuals to take leftover products to a depot for proper disposal.
The above tools are powerful but they can be ineffective if significant external barriers exist. If the behavior is inconvenient, unpleasant, costly or time-consuming, no matter how well internal barriers are addressed the community-based social marketing strategy will be unsuccessful. Removing or minimizing external barriers is imperative. Examples include:
• It is too inconvenient to obtain a compost unit.
Solution: Deliver compost units door-to-door. When compost units are delivered for free, as they were in a pilot project in the City of Waterloo, Ontario, participation rates can rival those for recycling programs. In that pilot project, a door hanger was distributed to 300 homes informing residents that they had been selected to receive a free composting unit. Of the 300 homes that were contacted, 253 (or 84%) agreed to accept compost units. In a follow-up survey, 77% of these households were found to be using their compost units.
• It is difficult to identify products that are recyclable or have recycled content.
Solution: Provide prompts that make their identification easier.
• The inconvenience of taking household hazardous waste to a depot results in little of this waste being diverted from the landfill.
Solution: Provide semi-annual hazardous waste home collection dates. Pass a municipal bylaw which mandates that hazardous materials must carry a sticker indicating that the product is a hazardous waste and when the collection dates are in that area.
Once barriers are identified and prioritized, and behaviour change tools are selected that match the barriers, the next stage is program design. At this time, a pilot project can be established. When the pilot is effectively changing behaviour, a community-wide program can be implemented.

sonnevera international corp.
30
To increase curbside diversion participation, Strathcona County, Alberta, developed a mapping system (based on GIS) in 2015 for their bin inspectors (summer students) to track and record inspections/audits done at single-family homes, all on a handheld tablet (Figure 27 through Figure 29). Inspectors note levels of contamination, cart spacing, bin fullness and whether or not the cart needs repairs in the system. Inspectors turn bins around, and tag them, if they are contaminated so they are not collected by the hauling contractor that day. This past year inspectors returned for second and third inspections with homes that had been refused collection. Upon the second audit, almost 50 percent of them had made the correction and improvements. The second half were provided more education through information on direct communication. After the third inspection, only about 10 percent still wouldn’t change their behaviours and correct their actions. The program also has gold star stickers (Figure 30) to reinforce correct behavior and other tags (Figure 31) to notify residents why their bins were not collected. Strathcona County reports the curbside audits improved program efficiency and effectiveness, increase diversion and allow for data measurement.
Figure 27: Screenshot from Strathcona GIS Bin Monitoring System

Strategic Waste Management Plan (SWMP) – Final Report The City of Yellowknife
31
Figure 28: Inspection Questions
Figure 29: Curbside Audit GIS System on Tablet
Figure 30: Gold Star for Strathcona County Residents Using Their Carts Correctly
Figure 31: Tags/Stickers used in Strathcona County's Curbside Audit Program
For other community-based social marketing examples see Appendix D.
The effectiveness of individual programming options is highly dependent upon identifying successful social marketing techniques. However, the diversion results from the program option itself, rather than from social marketing. This technique should be included as part of the overall design of any program that requires behaviour change.
Incorporation of this approach will require staff to have expertise in the principles of community-based social marketing, and therefore, staff training in community-based social marketing methods is required. The resulting increased effectiveness of programs is anticipated to more than compensate for this investment.
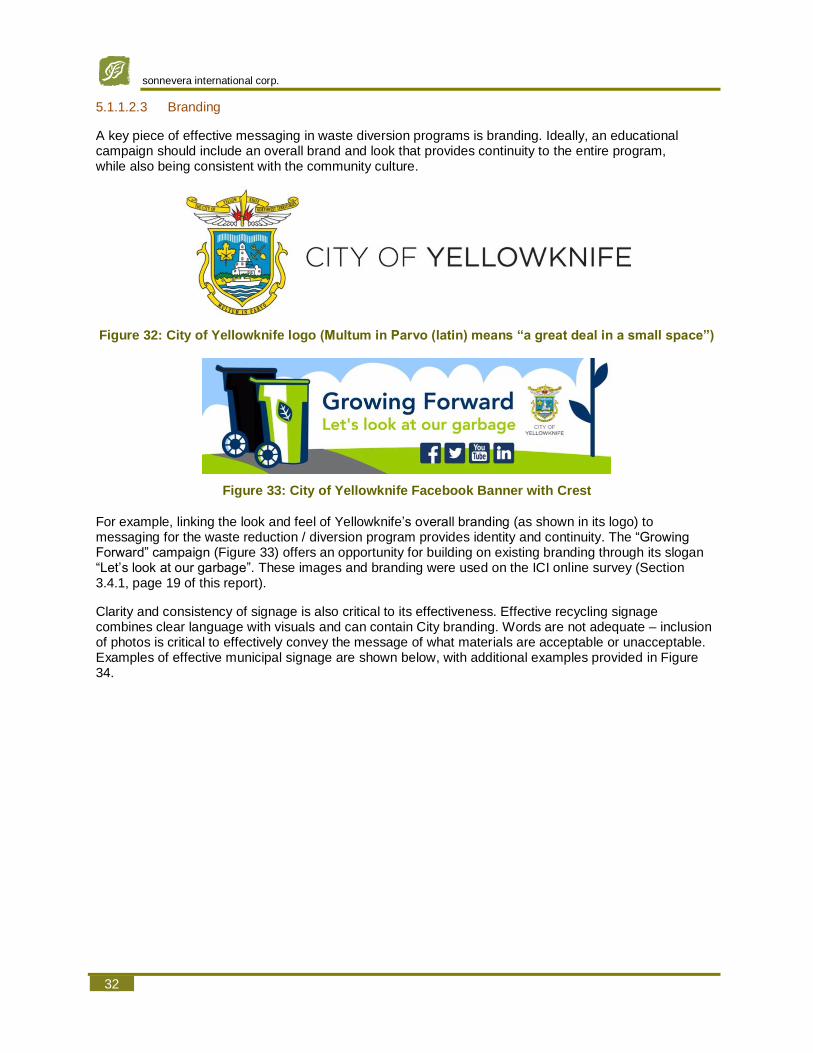
sonnevera international corp.
32
5.1.1.2.3 Branding
A key piece of effective messaging in waste diversion programs is branding. Ideally, an educational campaign should include an overall brand and look that provides continuity to the entire program, while also being consistent with the community culture.
Figure 32: City of Yellowknife logo (Multum in Parvo (latin) means “a great deal in a small space”)
Figure 33: City of Yellowknife Facebook Banner with Crest
For example, linking the look and feel of Yellowknife’s overall branding (as shown in its logo) to messaging for the waste reduction / diversion program provides identity and continuity. The “Growing Forward” campaign (Figure 33) offers an opportunity for building on existing branding through its slogan “Let’s look at our garbage”. These images and branding were used on the ICI online survey (Section 3.4.1, page 19 of this report).
Clarity and consistency of signage is also critical to its effectiveness. Effective recycling signage combines clear language with visuals and can contain City branding. Words are not adequate – inclusion of photos is critical to effectively convey the message of what materials are acceptable or unacceptable. Examples of effective municipal signage are shown below, with additional examples provided in Figure 34.
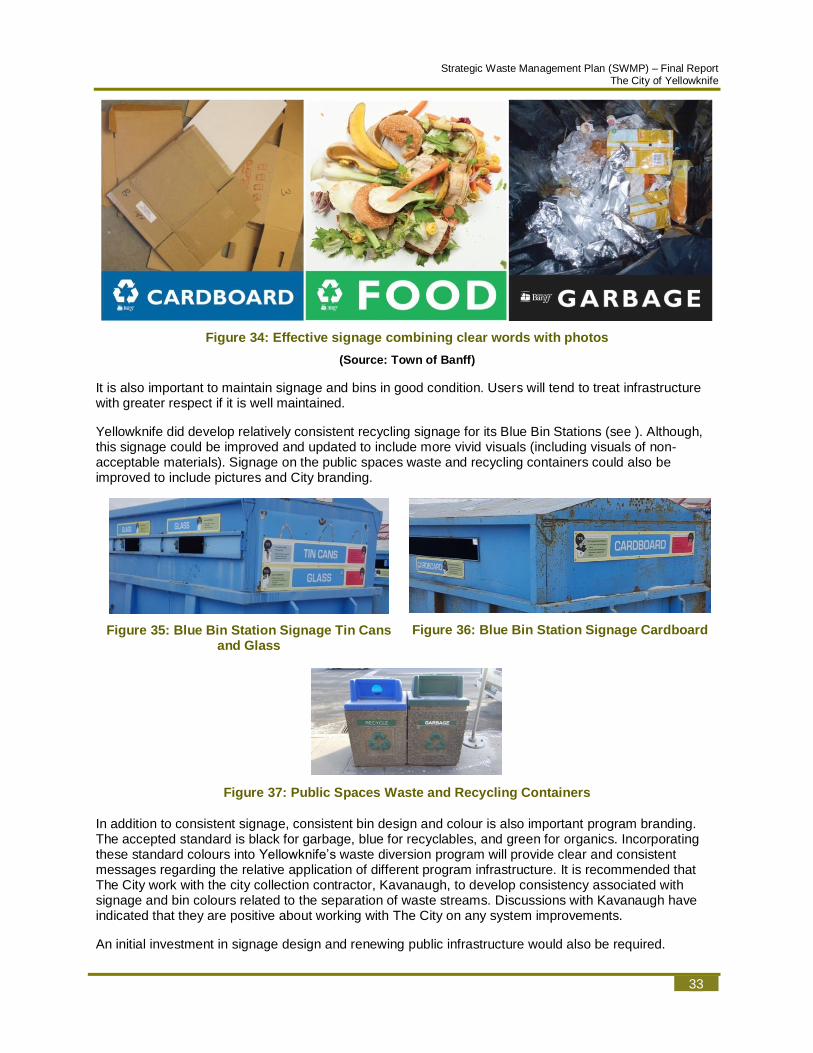
Strategic Waste Management Plan (SWMP) – Final Report The City of Yellowknife
33
Figure 34: Effective signage combining clear words with photos
(Source: Town of Banff)
It is also important to maintain signage and bins in good condition. Users will tend to treat infrastructure with greater respect if it is well maintained.
Yellowknife did develop relatively consistent recycling signage for its Blue Bin Stations (see ). Although, this signage could be improved and updated to include more vivid visuals (including visuals of non-acceptable materials). Signage on the public spaces waste and recycling containers could also be improved to include pictures and City branding.
Figure 35: Blue Bin Station Signage Tin Cans and Glass
Figure 36: Blue Bin Station Signage Cardboard
Figure 37: Public Spaces Waste and Recycling Containers
In addition to consistent signage, consistent bin design and colour is also important program branding. The accepted standard is black for garbage, blue for recyclables, and green for organics. Incorporating these standard colours into Yellowknife’s waste diversion program will provide clear and consistent messages regarding the relative application of different program infrastructure. It is recommended that The City work with the city collection contractor, Kavanaugh, to develop consistency associated with signage and bin colours related to the separation of waste streams. Discussions with Kavanaugh have indicated that they are positive about working with The City on any system improvements.
An initial investment in signage design and renewing public infrastructure would also be required.
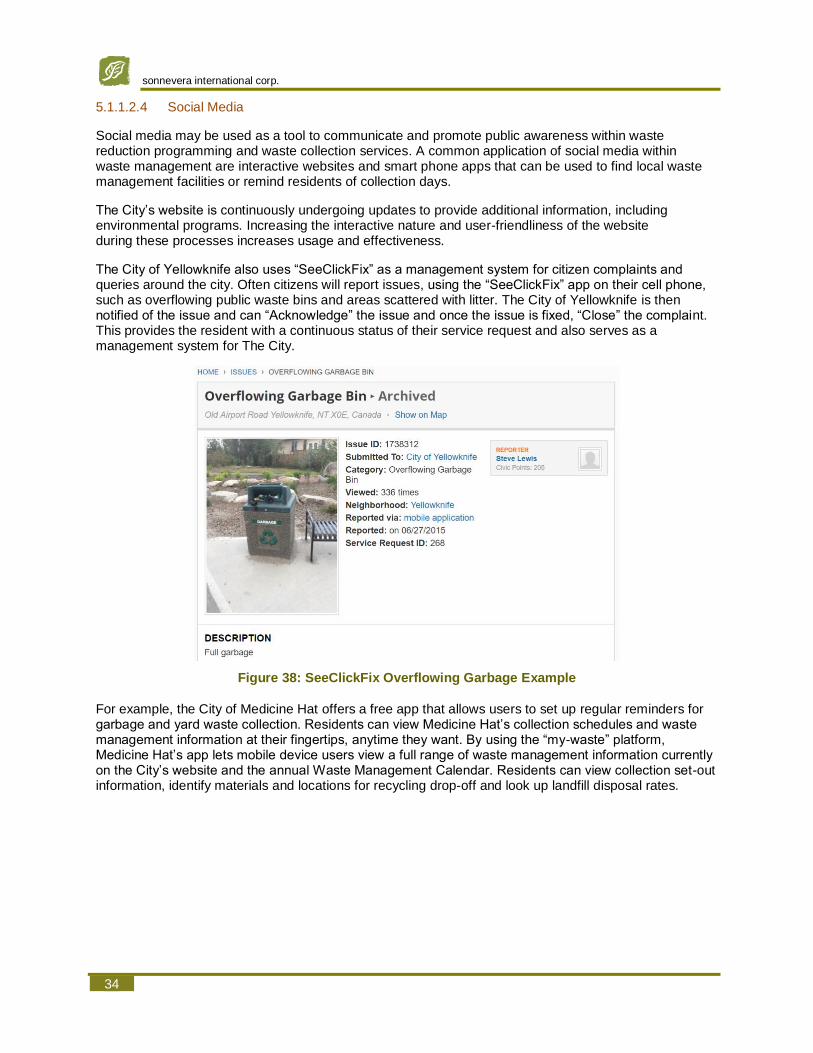
sonnevera international corp.
34
5.1.1.2.4 Social Media
Social media may be used as a tool to communicate and promote public awareness within waste reduction programming and waste collection services. A common application of social media within waste management are interactive websites and smart phone apps that can be used to find local waste management facilities or remind residents of collection days.
The City’s website is continuously undergoing updates to provide additional information, including environmental programs. Increasing the interactive nature and user-friendliness of the website during these processes increases usage and effectiveness.
The City of Yellowknife also uses “SeeClickFix” as a management system for citizen complaints and queries around the city. Often citizens will report issues, using the “SeeClickFix” app on their cell phone, such as overflowing public waste bins and areas scattered with litter. The City of Yellowknife is then notified of the issue and can “Acknowledge” the issue and once the issue is fixed, “Close” the complaint. This provides the resident with a continuous status of their service request and also serves as a management system for The City.
Figure 38: SeeClickFix Overflowing Garbage Example
For example, the City of Medicine Hat offers a free app that allows users to set up regular reminders for garbage and yard waste collection. Residents can view Medicine Hat’s collection schedules and waste management information at their fingertips, anytime they want. By using the “my-waste” platform, Medicine Hat’s app lets mobile device users view a full range of waste management information currently on the City’s website and the annual Waste Management Calendar. Residents can view collection set-out information, identify materials and locations for recycling drop-off and look up landfill disposal rates.
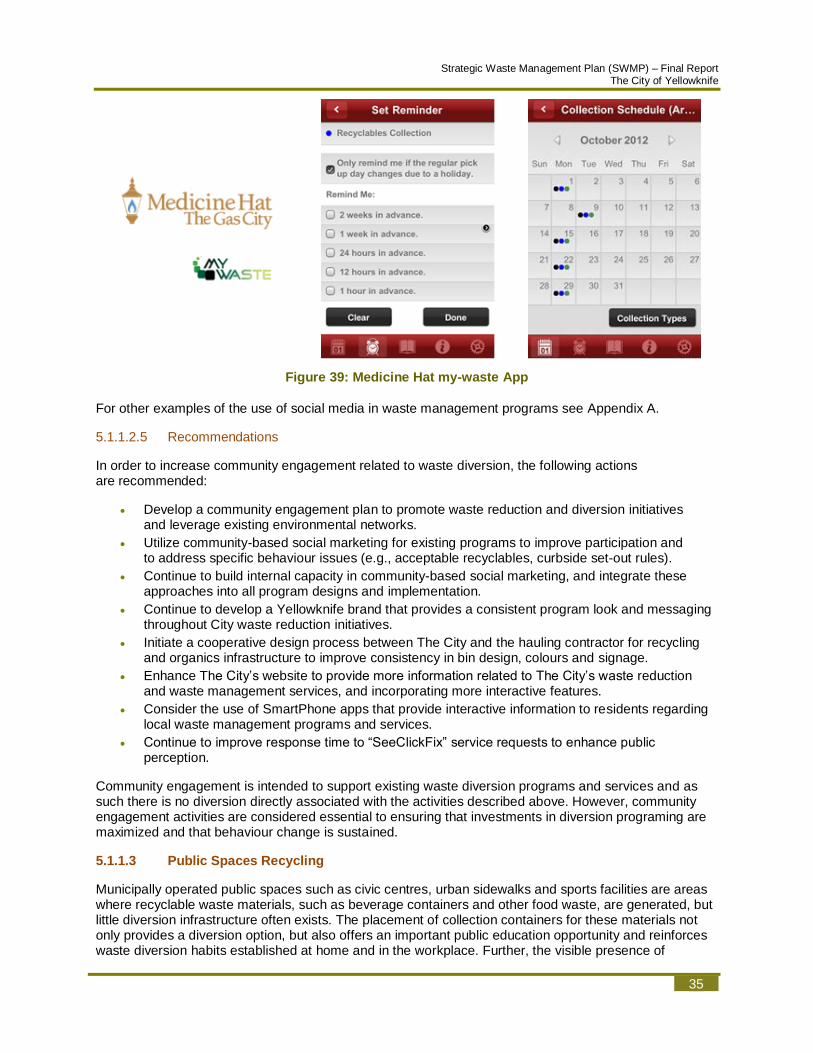
Strategic Waste Management Plan (SWMP) – Final Report The City of Yellowknife
35
Figure 39: Medicine Hat my-waste App
For other examples of the use of social media in waste management programs see Appendix A.
5.1.1.2.5 Recommendations
In order to increase community engagement related to waste diversion, the following actions are recommended:
• Develop a community engagement plan to promote waste reduction and diversion initiatives and leverage existing environmental networks.
• Utilize community-based social marketing for existing programs to improve participation and to address specific behaviour issues (e.g., acceptable recyclables, curbside set-out rules).
• Continue to build internal capacity in community-based social marketing, and integrate these approaches into all program designs and implementation.
• Continue to develop a Yellowknife brand that provides a consistent program look and messaging throughout City waste reduction initiatives.
• Initiate a cooperative design process between The City and the hauling contractor for recycling and organics infrastructure to improve consistency in bin design, colours and signage.
• Enhance The City’s website to provide more information related to The City’s waste reduction and waste management services, and incorporating more interactive features.
• Consider the use of SmartPhone apps that provide interactive information to residents regarding local waste management programs and services.
• Continue to improve response time to “SeeClickFix” service requests to enhance public perception.
Community engagement is intended to support existing waste diversion programs and services and as such there is no diversion directly associated with the activities described above. However, community engagement activities are considered essential to ensuring that investments in diversion programing are maximized and that behaviour change is sustained.
5.1.1.3 Public Spaces Recycling
Municipally operated public spaces such as civic centres, urban sidewalks and sports facilities are areas where recyclable waste materials, such as beverage containers and other food waste, are generated, but little diversion infrastructure often exists. The placement of collection containers for these materials not only provides a diversion option, but also offers an important public education opportunity and reinforces waste diversion habits established at home and in the workplace. Further, the visible presence of

sonnevera international corp.
36
diversion containers in public spaces can make an important contribution to the impression of the city as an environmentally-conscious community.
The City of Yellowknife currently has 47 garbage and 30 recycling containers located in the downtown core that are emptied twice per day in the summer months and once a day in the winter months by the City Parks & Recreation Department. There are an additional 149 garbage containers located around the city, on walking trails and at city points of interest, that are emptied once per day in the summer and one to two times per week in the winter. In the busier summer months in 2017 (May to September), over 24 tonnes of garbage was collected. Parks & Recreation also has a dumpster at the waterfront beside Rotary Park and provides containers and collection for occasional events such as Folk on the Rocks, Frits, Ward Air Plane and the Farmers’ Market.
Inspections of a handful of bins in Yellowknife showed very poor recycling participation, with most filled with general garbage. Stand-alone garbage containers were also often full of recycling materials, mainly paper and beverage containers.
Figure 40: Yellowknife paired public waste and recycling bins
Figure 41: Stand-alone garbage public waste bin
Figure 42: City compost bins at the Farmers Market
(Source: YK Farmers’ Market website)

Strategic Waste Management Plan (SWMP) – Final Report The City of Yellowknife
37
The City of Markham has sought to have recycling broadly available in public spaces, including on urban sidewalks, in parks and at community mail boxes, as shown in the photographs below.
Figure 43: Markham Silver Box Public Space Recycling Container
Figure 44: Markham Park Recycling Container
The Township of Langley, BC launched a new Public Spaces Waste Management Strategy, and tested new receptacles throughout the Walnut Grove Community from April to September 2017.
Figure 45: Langley Public Spaces Pilot Project Receptacles
It was determined through staff field tests that the bin system used in this pilot project is the preferred option based on successful sorting by the public, ease of operations, aesthetics and customization options (Township of Langley, 2017). It is anticipated that the new receptacles will be discussed with local business associations and an onsite survey will take place with the public to determine the success of the pilot.
The City of Calgary, AB implemented a “Waste in Public Spaces” program to ensure The City was compliant with the new mandatory recycling and organics diversion bylaw. The project involved retrofitting and installing hundreds of bins in parks, at bus stops, light rail transit stops, and in municipal buildings. There was a big focus on “pairing” recycling and waste bins and having consistency in colours of receptacle containers, as well as City of Calgary branded signage.
For additional public spaces recycling examples, see Appendix D.
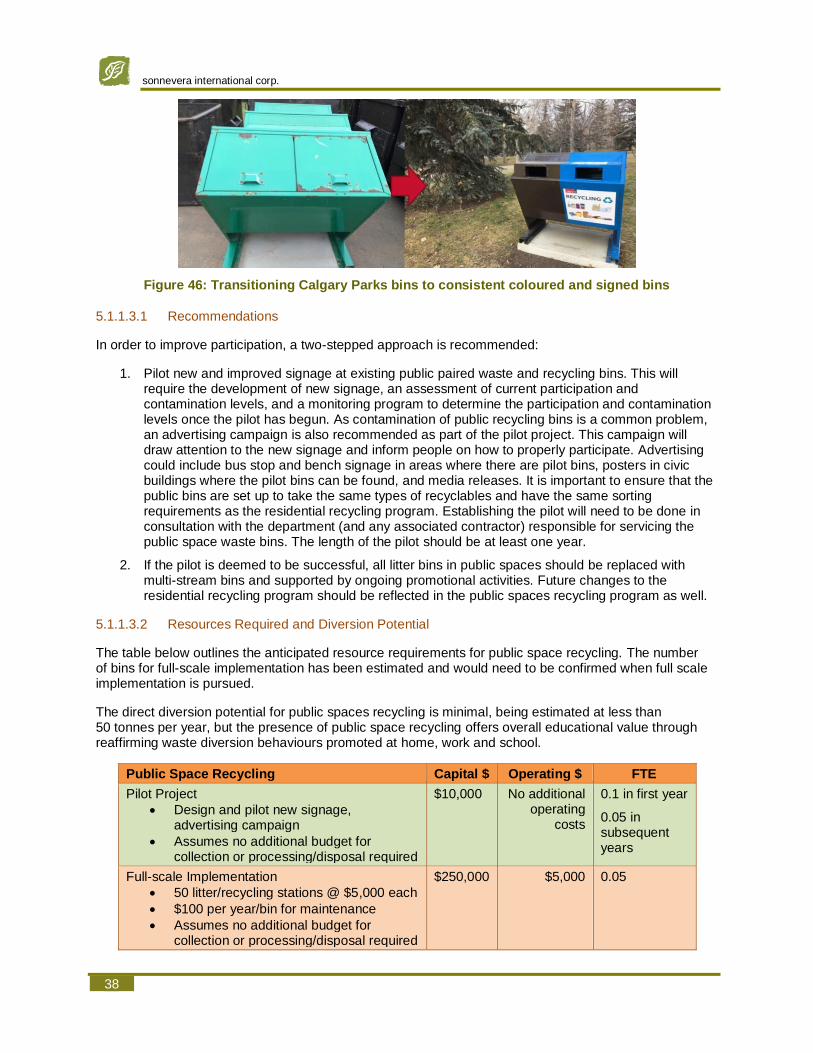
sonnevera international corp.
38
Figure 46: Transitioning Calgary Parks bins to consistent coloured and signed bins
5.1.1.3.1 Recommendations
In order to improve participation, a two-stepped approach is recommended:
1. Pilot new and improved signage at existing public paired waste and recycling bins. This will require the development of new signage, an assessment of current participation and contamination levels, and a monitoring program to determine the participation and contamination levels once the pilot has begun. As contamination of public recycling bins is a common problem, an advertising campaign is also recommended as part of the pilot project. This campaign will draw attention to the new signage and inform people on how to properly participate. Advertising could include bus stop and bench signage in areas where there are pilot bins, posters in civic buildings where the pilot bins can be found, and media releases. It is important to ensure that the public bins are set up to take the same types of recyclables and have the same sorting requirements as the residential recycling program. Establishing the pilot will need to be done in consultation with the department (and any associated contractor) responsible for servicing the public space waste bins. The length of the pilot should be at least one year.
2. If the pilot is deemed to be successful, all litter bins in public spaces should be replaced with multi-stream bins and supported by ongoing promotional activities. Future changes to the residential recycling program should be reflected in the public spaces recycling program as well.
5.1.1.3.2 Resources Required and Diversion Potential
The table below outlines the anticipated resource requirements for public space recycling. The number of bins for full-scale implementation has been estimated and would need to be confirmed when full scale implementation is pursued.
The direct diversion potential for public spaces recycling is minimal, being estimated at less than 50 tonnes per year, but the presence of public space recycling offers overall educational value through reaffirming waste diversion behaviours promoted at home, work and school.
Public Space Recycling Capital $ Operating $ FTE
Pilot Project
• Design and pilot new signage, advertising campaign
• Assumes no additional budget for collection or processing/disposal required
$10,000 No additional operating
costs
0.1 in first year
0.05 in subsequent years
Full-scale Implementation
• 50 litter/recycling stations @ $5,000 each
• $100 per year/bin for maintenance
• Assumes no additional budget for collection or processing/disposal required
$250,000 $5,000 0.05
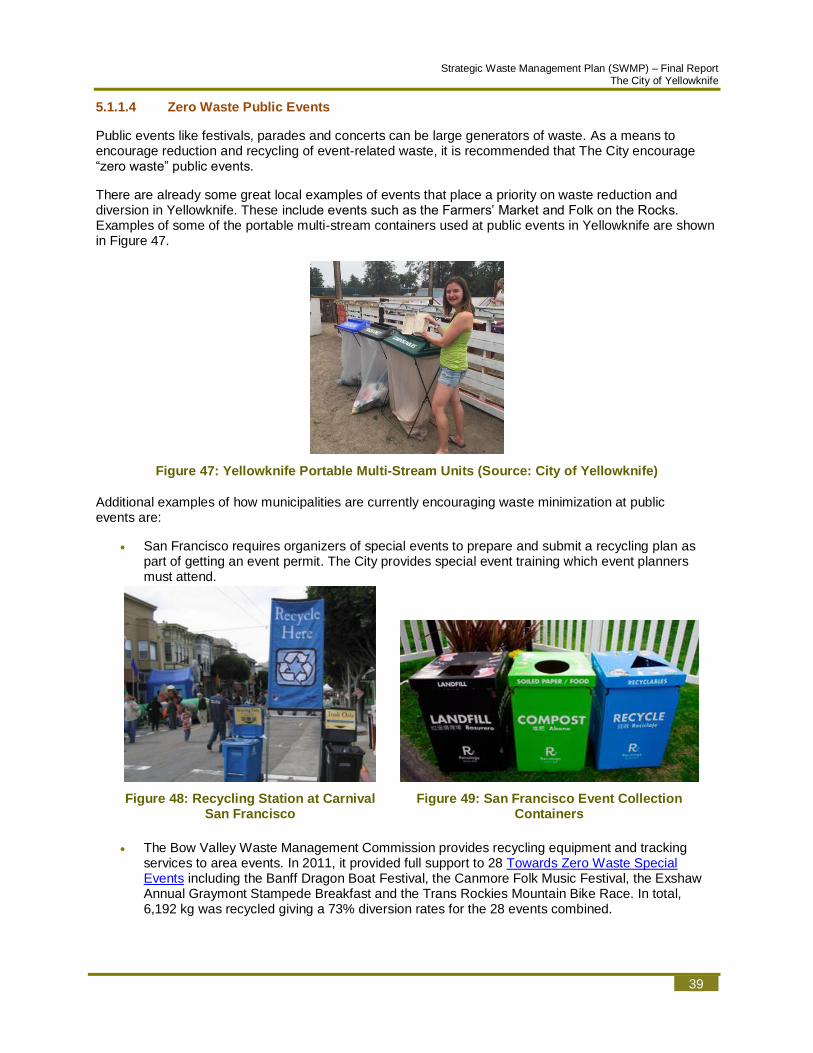
Strategic Waste Management Plan (SWMP) – Final Report The City of Yellowknife
39
5.1.1.4 Zero Waste Public Events
Public events like festivals, parades and concerts can be large generators of waste. As a means to encourage reduction and recycling of event-related waste, it is recommended that The City encourage “zero waste” public events.
There are already some great local examples of events that place a priority on waste reduction and diversion in Yellowknife. These include events such as the Farmers’ Market and Folk on the Rocks. Examples of some of the portable multi-stream containers used at public events in Yellowknife are shown in Figure 47.
Figure 47: Yellowknife Portable Multi-Stream Units (Source: City of Yellowknife)
Additional examples of how municipalities are currently encouraging waste minimization at public events are:
• San Francisco requires organizers of special events to prepare and submit a recycling plan as part of getting an event permit. The City provides special event training which event planners must attend.
Figure 48: Recycling Station at Carnival San Francisco
Figure 49: San Francisco Event Collection Containers
• The Bow Valley Waste Management Commission provides recycling equipment and tracking services to area events. In 2011, it provided full support to 28 Towards Zero Waste Special Events including the Banff Dragon Boat Festival, the Canmore Folk Music Festival, the Exshaw Annual Graymont Stampede Breakfast and the Trans Rockies Mountain Bike Race. In total, 6,192 kg was recycled giving a 73% diversion rates for the 28 events combined.

sonnevera international corp.
40
• The City of San Jose, California offers an Eco-Station Loan program for local events to enable access to recycling and composting collection. Eco-Stations come with corresponding color-coded signs, lids and bags.
Other examples of how municipalities are encouraging zero waste special events are provided in Appendix D.
5.1.1.4.1 Recommendations
The following actions are recommended to encourage “zero waste” public events in Yellowknife:
• Promote the Yellowknife Sustainable Event Checklist to event organizers. This guide was designed by Ecology North to help event coordinators plan key activities reducing the environmental impact of the event such as waste reduction and diversion, energy consumption, transportation and provision of NWT water.
• Require event organizers to prepare a waste management action plan including waste reduction and diversion elements as part of special events permits, using the Sustainable Event Checklist as a tool.
• Provide well-signed, colour-coded containers for recyclables, compostables and garbage to events. The City currently provides dumpsters (all three streams) and some curbside bins to community events on request.
• City-hosted events could be promoted as zero waste events and act as a testing ground for containers, signage and other zero waste initiatives.
5.1.1.4.2 Resources Required and Diversion Potential
The table below outlines the anticipated resource requirements for encouraging zero waste public events.
Staff time would be required to prepare guidelines and permitting requirements, and monitor compliance, as well as to coordinate the use of the recycle trailer and event collection containers.
Experience in other jurisdictions indicates that zero waste events can achieve high diversion rates. It is unknown what the diversion potential is relative to the total amount of waste disposed in Yellowknife, since special event waste is not tracked separately.
Zero Waste Events Capital $ Operating $ FTE
Mandatory waste management action plans 0 0 0.05
Collection Containers for Events
• 15 sets of 3 containers
• Signage
• Recycling, composting and disposal of materials in containers are assumed to be the responsibility of the event organizer
$4,500
$300
$0
Included in above

Strategic Waste Management Plan (SWMP) – Final Report The City of Yellowknife
41
5.1.2 Residential Waste Reduction / Diversion
5.1.2.1 Backyard Composting
Over one-third of residential waste is organic waste, according to the waste audit completed in the Fall of 2017 (see Appendix A). As an on-site management option, backyard composting results in direct cost savings to the municipality through decreased amounts of material requiring collection, either as waste or organics for centralized composting. Therefore, promotion of on-site management methods is a positive action, from both an environmental, as well as budgetary aspect.
Encouraging backyard composting has been recognized as one of the most cost-effective means of reducing waste and hence many municipalities have implemented backyard composting programs. The City of Yellowknife encourages backyard composting and even offers backyard composters for purchase at the SWF for $35 each. There is an entire webpage devoted to educating residents on how to backyard compost with a handout, detailed information of different types of backyard composting set-ups and a poster available online.
Promotion of backyard composting through initiatives like subsidized composter sales can increase this practice by residents.
For examples of successful backyard composting programs, see Appendix D.
5.1.2.1.1 Recommendations
The City’s current backyard composting program is innovative and has the potential to encourage long-term behaviour change in favour of waste reduction. The composters are offered at a reasonable cost and the online information is easily accessible and informative. Composters should continued to be offered and promoted at City events and through other forms of communication. With the newly implemented Green Cart program, it is recommended there be a reminder campaign to residents that backyard composting is still an accepted, and encouraged, practice. The campaign can also be directed at small businesses looking for their own, low cost composting option.
5.1.2.1.2 Resources Required and Diversion Potential
For the purposes of budgeting, it is noted the current backyard composting program is well established with the availability of educational materials and composters. Therefore, it is assumed backyard composting is becoming a normative behaviour in Yellowknife.
The diversion potential for each backyard composter in Yellowknife is estimated to be 125 kg per home per year; however, this estimate can be refined based on the results of the current program.
Backyard Composting Capital $ Operating $ FTE
Composting YK
• Assumes that program and information material development is already complete
$5,000/year 0.05
5.1.2.2 Curbside Organics
Single family homes in Yellowknife currently receive every-other-week organic and garbage collection service by the contracted hauler, Kavanaugh. The program permits all organic material, including compostable bags and containers. Residents were given a “starter kit” (Figure 50) in addition to the 120 litre Green Cart (Figure 51). Nearly 403 tonnes of organic waste was collected through the single-family collection program in 2017. With the program having garbage collection every-other-week, it is a great step towards encouraging diversion and is likely a large reason for the success of the Green Cart program. Organic material can also be dropped off at the SWF where it is composted on-site. There is also one dumpster style bin located downtown for residents to use (Figure 52).
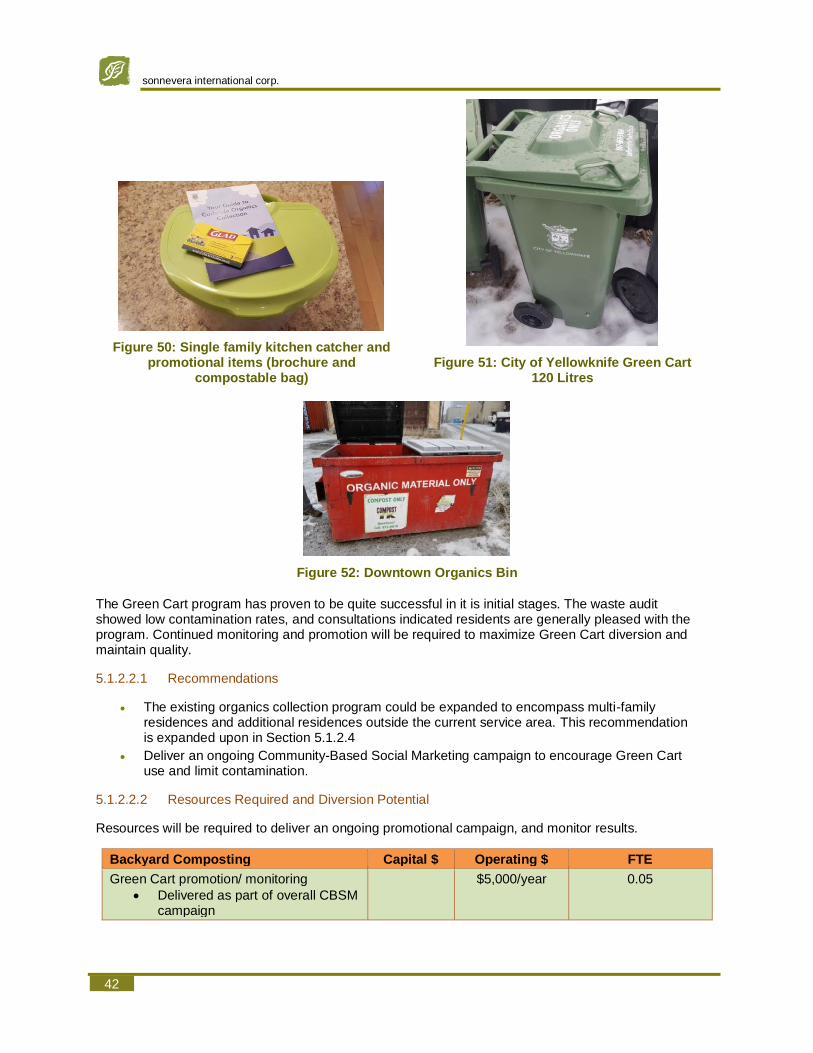
sonnevera international corp.
42
Figure 50: Single family kitchen catcher and promotional items (brochure and
compostable bag)
Figure 51: City of Yellowknife Green Cart 120 Litres
Figure 52: Downtown Organics Bin
The Green Cart program has proven to be quite successful in it is initial stages. The waste audit showed low contamination rates, and consultations indicated residents are generally pleased with the program. Continued monitoring and promotion will be required to maximize Green Cart diversion and maintain quality.
5.1.2.2.1 Recommendations
• The existing organics collection program could be expanded to encompass multi-family residences and additional residences outside the current service area. This recommendation is expanded upon in Section 5.1.2.4
• Deliver an ongoing Community-Based Social Marketing campaign to encourage Green Cart use and limit contamination.
5.1.2.2.2 Resources Required and Diversion Potential
Resources will be required to deliver an ongoing promotional campaign, and monitor results.
Backyard Composting Capital $ Operating $ FTE
Green Cart promotion/ monitoring
• Delivered as part of overall CBSM campaign
$5,000/year
0.05
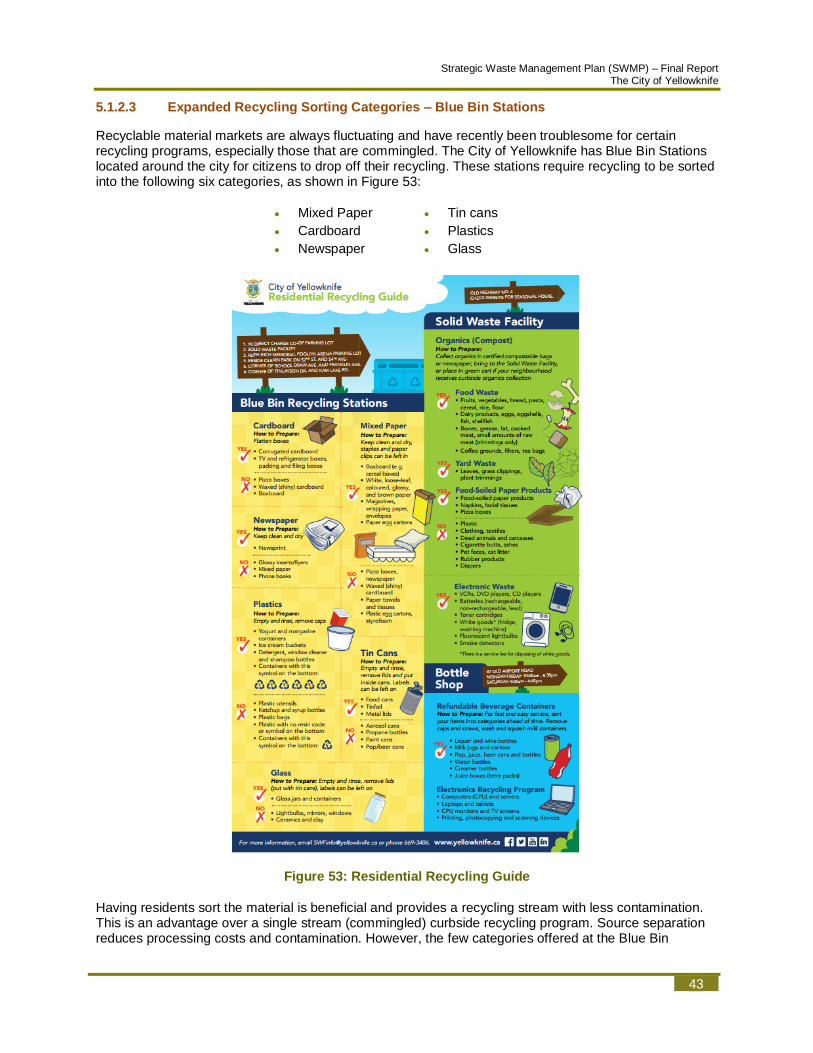
Strategic Waste Management Plan (SWMP) – Final Report The City of Yellowknife
43
5.1.2.3 Expanded Recycling Sorting Categories – Blue Bin Stations
Recyclable material markets are always fluctuating and have recently been troublesome for certain recycling programs, especially those that are commingled. The City of Yellowknife has Blue Bin Stations located around the city for citizens to drop off their recycling. These stations require recycling to be sorted into the following six categories, as shown in Figure 53:
• Mixed Paper
• Cardboard
• Newspaper
• Tin cans
• Plastics
• Glass
Figure 53: Residential Recycling Guide
Having residents sort the material is beneficial and provides a recycling stream with less contamination. This is an advantage over a single stream (commingled) curbside recycling program. Source separation reduces processing costs and contamination. However, the few categories offered at the Blue Bin

sonnevera international corp.
44
Stations limit the marketability of certain materials, such as plastics and paper. Increasing the degree to which residents have to sort materials can also increase immunity to market fluctuations. For example, having paper materials separated into “office paper”, “newspaper”, “magazines” and finally “mixed paper”, ensures a more consistent, higher quality product that is more likely to be accepted for recycling. Similarly, having a separate sorted High Density Polypropylene (HDPE) #2 plastic stream will assist in material salability. Further separation of coloured and clear HDPE #2 plastic is the most desirable as it maximizes revenue (Wolski, 2017). Evidence for the increased marketability of the separated HDPE streams (natural - NHDPE and coloured - CHDPE) is visible on the graph in Figure 54.
Figure 54: Plastics Historic Market Prices
(Source: More Recycling)
The Town of Cochrane has an Eco-Centre that requires residents to sort plastics (HDPE, film and mixed plastic) and paper (newspaper, cardboard and mixed paper) into more detailed categories to ensure market stability for its recyclable materials. For other examples of depot based systems see Appendix D.
5.1.2.3.1 Recommendation
• Adding additional recycling categories at the Blue Bin Stations will increase the marketability of the materials. It is recommended the following sorting categories be utilized:
Paper:
• Office paper
• Newspaper
• Magazines
• Mixed paper
Plastics:
• HDPE (#2) coloured
• HDPE (#2) clear/natural
• Mixed plastics
Having additional separated clean material streams can reduce the financial risk associated with fluctuating recycling markets. Since Yellowknifers already are required to prepare their materials for recycling, adding extra categories for them to sort into will require minimal behavioural change.
• At this time, with the volatile market situation for recyclables, and significant opportunities for diversion through organics diversion, and from the ICI sector, curbside recycling is not

Strategic Waste Management Plan (SWMP) – Final Report The City of Yellowknife
45
recommended. Instead, enhancement of Blue Bin Station recycling and promotion through Community-Based Social Marketing Tools are recommended.
5.1.2.3.2 Resources Required and Diversion Potential
Expanded Recycling Sorting Categories Capital $
Operating $
FTE
Additional storage capacity
• Bunkers, barriers
$5,000
Promotion and Education
• Updates to residential recycling guide
• Printing and distribution of guides
• New signage for Blue Bin Stations
$10,000
5.1.2.4 User-Pay / Volume Limitations
The City of Yellowknife requires all household garbage to fit into the Black Cart (240 litres) which is collected every-other-week (alternating week to the Green Cart). Having this volume limit encourages reduction and use of the Green Cart for organic material.
If further reduction of garbage and encouragement of the diversion options (Green Cart and the Blue Bin Stations) is deemed important, implementing a variable cart size program for garbage is a good next step. Such a system can be set up on a subscription basis, where a choice of cart sizes (see Figure 55) is chosen by the householder, with corresponding variable rates. The calculation of the variable rates must be done very carefully to provide the desired incentive for waste diversion, while still covering fixed costs associated with collection, which comprise the majority of the system costs.
Figure 55: Variable subscription garbage carts
User-pay systems can also be implemented on a weight or number of collection/tips basis. Having a cart system with RFID tags allows the municipality to charge households based on number of collections/tips in a certain time period (usually a month). Residents could also be charged on a weight basis if collection trucks are equipped with scales. Yellowknife single-family household carts are already equipped with RFID tags, it would just be a requirement of equipping the collection fleet with a system capable of reading and tracking RFID codes.
In April 2017, the City of Burnaby introduced every other week residential garbage collection. To promote greater waste reduction and to create incentives, this program offers residents the flexibility to choose which size garbage container meets their needs best. A pricing structure based on the size of the carts selected is found below.

sonnevera international corp.
46
Table 8: Burnaby Variable Garbage Cart Program
Garbage Container Size and Collection Costs
Toter Container Size (Litres) Disposal Fee
Small 120 $25
Default 180 $75
Medium 240 $205
Large 360 $385
Austin, Texas has a variable rate garbage cart system available to residents so they can select the cart size which fits their needs best. Garbage carts sizes and monthly rates are listed below.
Table 9: Austin Variable Rate Garbage Cart Program
Garbage Cart Size 2017 Monthly Fee
24 gallon $17.90
32 gallon $19.15
64 gallon $24.30
96 gallon $42.85
If a larger garbage cart is desired, there is a $15 one-time cart exchange fee. If the garbage cart is downsized to a smaller cart, there is no charge.
Extra garbage bags that do not fit in the garbage cart with lid closed can be placed next to the garbage cart and tagged with an Extra Garbage Sticker which can be purchased at grocery stores for $4 + tax. Extra bags without a sticker will be charged a per-bag fee of $9.60 + tax.
Other examples of programs incorporating user-pay programs can be found in Appendix D.
5.1.2.4.1 Recommendations
• With every-other-week garbage collection already providing a default waste volume limit, it is recommended that further volume limits be provided through a voluntary adoption of a smaller waste bin that is associated with a lower fee. This will provide incentive and reward to those residents who generate significantly lower amounts of waste.
5.1.2.4.2 Resources Required and Diversion Estimates
Variable Carts Capital $
Operating $
FTE
Purchase of smaller carts (on demand)
$25,000
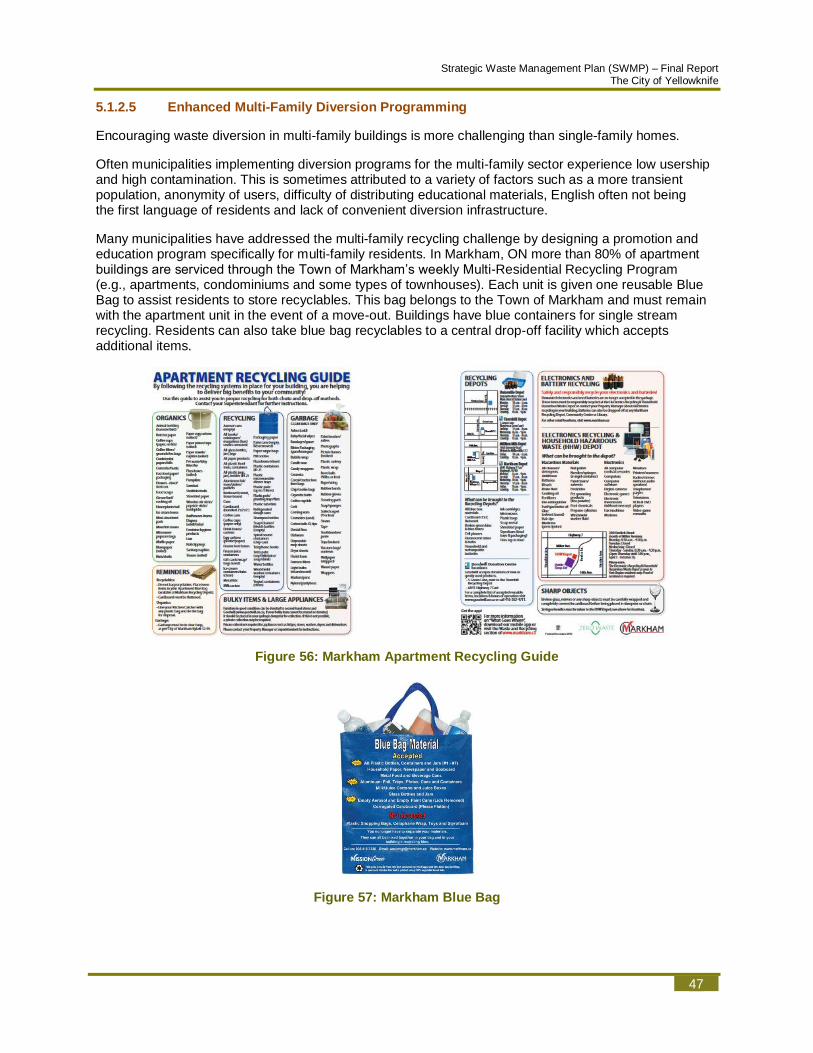
Strategic Waste Management Plan (SWMP) – Final Report The City of Yellowknife
47
5.1.2.5 Enhanced Multi-Family Diversion Programming
Encouraging waste diversion in multi-family buildings is more challenging than single-family homes.
Often municipalities implementing diversion programs for the multi-family sector experience low usership and high contamination. This is sometimes attributed to a variety of factors such as a more transient population, anonymity of users, difficulty of distributing educational materials, English often not being the first language of residents and lack of convenient diversion infrastructure.
Many municipalities have addressed the multi-family recycling challenge by designing a promotion and education program specifically for multi-family residents. In Markham, ON more than 80% of apartment buildings are serviced through the Town of Markham’s weekly Multi-Residential Recycling Program (e.g., apartments, condominiums and some types of townhouses). Each unit is given one reusable Blue Bag to assist residents to store recyclables. This bag belongs to the Town of Markham and must remain with the apartment unit in the event of a move-out. Buildings have blue containers for single stream recycling. Residents can also take blue bag recyclables to a central drop-off facility which accepts additional items.
Figure 56: Markham Apartment Recycling Guide
Figure 57: Markham Blue Bag
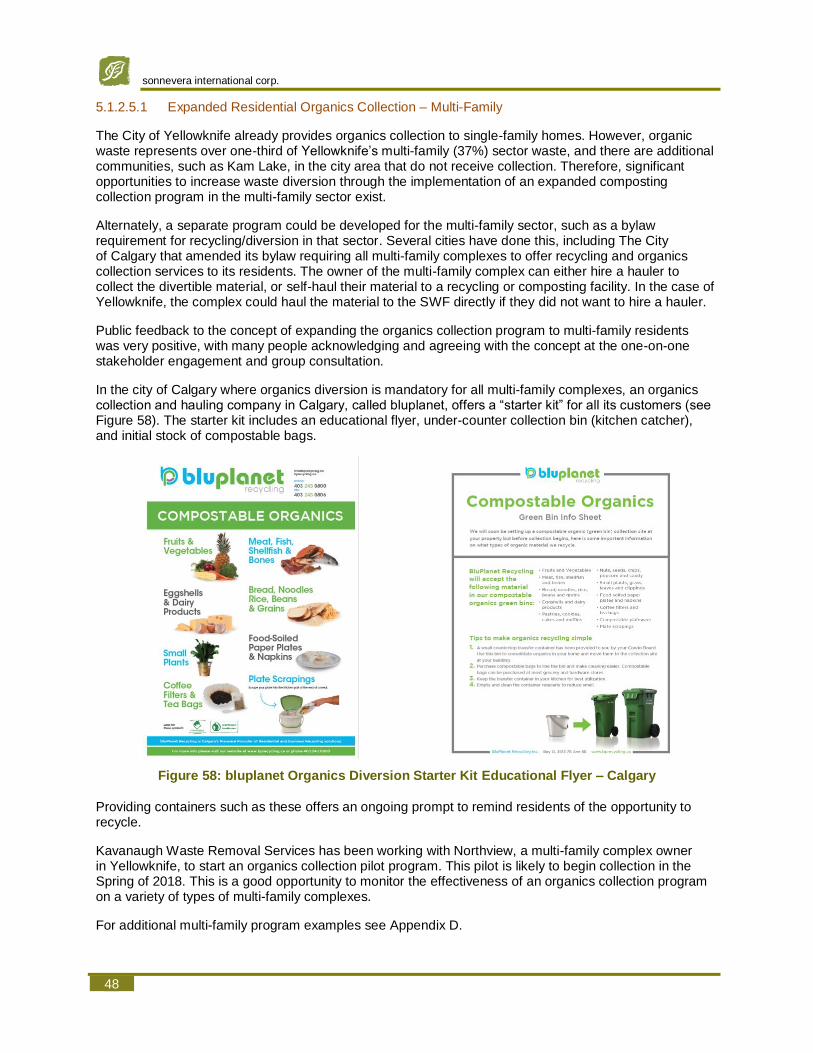
sonnevera international corp.
48
5.1.2.5.1 Expanded Residential Organics Collection – Multi-Family
The City of Yellowknife already provides organics collection to single-family homes. However, organic waste represents over one-third of Yellowknife’s multi-family (37%) sector waste, and there are additional communities, such as Kam Lake, in the city area that do not receive collection. Therefore, significant opportunities to increase waste diversion through the implementation of an expanded composting collection program in the multi-family sector exist.
Alternately, a separate program could be developed for the multi-family sector, such as a bylaw requirement for recycling/diversion in that sector. Several cities have done this, including The City of Calgary that amended its bylaw requiring all multi-family complexes to offer recycling and organics collection services to its residents. The owner of the multi-family complex can either hire a hauler to collect the divertible material, or self-haul their material to a recycling or composting facility. In the case of Yellowknife, the complex could haul the material to the SWF directly if they did not want to hire a hauler.
Public feedback to the concept of expanding the organics collection program to multi-family residents was very positive, with many people acknowledging and agreeing with the concept at the one-on-one stakeholder engagement and group consultation.
In the city of Calgary where organics diversion is mandatory for all multi-family complexes, an organics collection and hauling company in Calgary, called bluplanet, offers a “starter kit” for all its customers (see Figure 58). The starter kit includes an educational flyer, under-counter collection bin (kitchen catcher), and initial stock of compostable bags.
Figure 58: bluplanet Organics Diversion Starter Kit Educational Flyer – Calgary
Providing containers such as these offers an ongoing prompt to remind residents of the opportunity to recycle.
Kavanaugh Waste Removal Services has been working with Northview, a multi-family complex owner in Yellowknife, to start an organics collection pilot program. This pilot is likely to begin collection in the Spring of 2018. This is a good opportunity to monitor the effectiveness of an organics collection program on a variety of types of multi-family complexes.
For additional multi-family program examples see Appendix D.
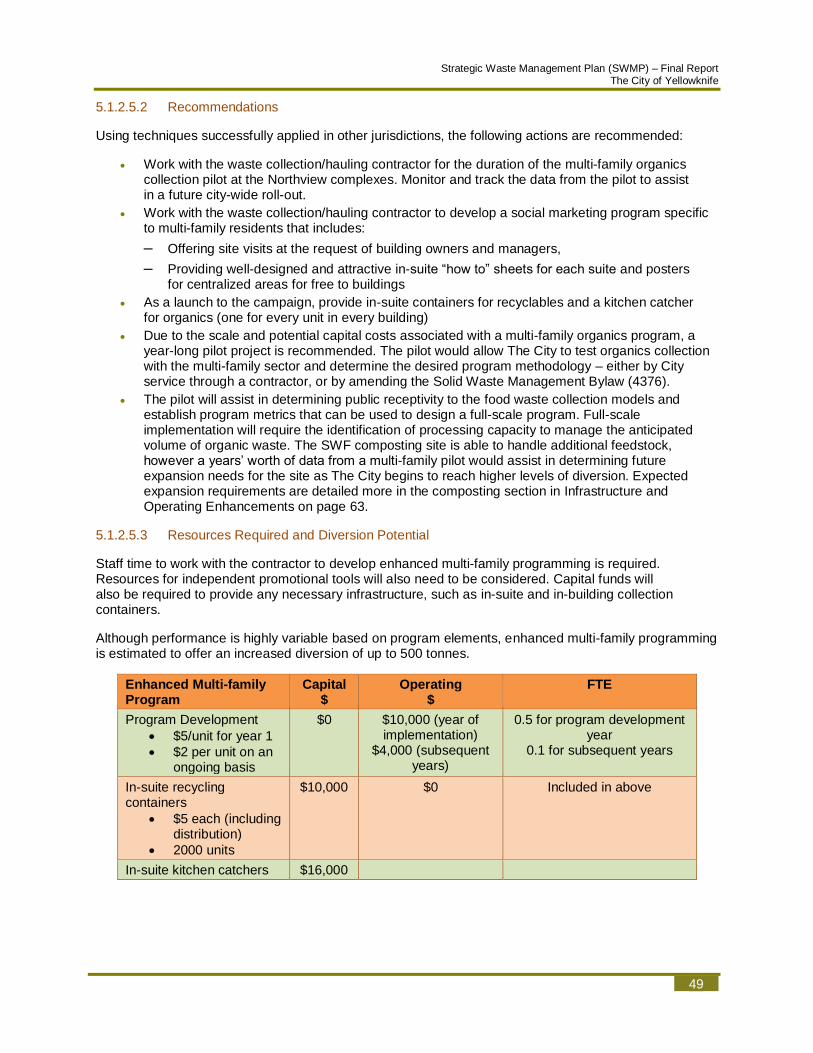
Strategic Waste Management Plan (SWMP) – Final Report The City of Yellowknife
49
5.1.2.5.2 Recommendations
Using techniques successfully applied in other jurisdictions, the following actions are recommended:
• Work with the waste collection/hauling contractor for the duration of the multi-family organics collection pilot at the Northview complexes. Monitor and track the data from the pilot to assist in a future city-wide roll-out.
• Work with the waste collection/hauling contractor to develop a social marketing program specific to multi-family residents that includes:
– Offering site visits at the request of building owners and managers,
– Providing well-designed and attractive in-suite “how to” sheets for each suite and posters for centralized areas for free to buildings
• As a launch to the campaign, provide in-suite containers for recyclables and a kitchen catcher for organics (one for every unit in every building)
• Due to the scale and potential capital costs associated with a multi-family organics program, a year-long pilot project is recommended. The pilot would allow The City to test organics collection with the multi-family sector and determine the desired program methodology – either by City service through a contractor, or by amending the Solid Waste Management Bylaw (4376).
• The pilot will assist in determining public receptivity to the food waste collection models and establish program metrics that can be used to design a full-scale program. Full-scale implementation will require the identification of processing capacity to manage the anticipated volume of organic waste. The SWF composting site is able to handle additional feedstock, however a years’ worth of data from a multi-family pilot would assist in determining future expansion needs for the site as The City begins to reach higher levels of diversion. Expected expansion requirements are detailed more in the composting section in Infrastructure and Operating Enhancements on page 63.
5.1.2.5.3 Resources Required and Diversion Potential
Staff time to work with the contractor to develop enhanced multi-family programming is required. Resources for independent promotional tools will also need to be considered. Capital funds will also be required to provide any necessary infrastructure, such as in-suite and in-building collection containers.
Although performance is highly variable based on program elements, enhanced multi-family programming is estimated to offer an increased diversion of up to 500 tonnes.
Enhanced Multi-family Program
Capital $
Operating $
FTE
Program Development
• $5/unit for year 1
• $2 per unit on an ongoing basis
$0 $10,000 (year of implementation)
$4,000 (subsequent years)
0.5 for program development year
0.1 for subsequent years
In-suite recycling containers
• $5 each (including distribution)
• 2000 units
$10,000 $0 Included in above
In-suite kitchen catchers $16,000

sonnevera international corp.
50
5.1.3 Industrial, Commercial & Institutional (ICI) Waste Reduction / Diversion
The ICI sector in Yellowknife is varied and is composed of over 1800 businesses. Of all the businesses, the most common type of business is General Business Services (over 35% of all businesses in Yellowknife fall into this category). Over 18 percent of Yellowknife businesses fall under the Trade and Industry grouping and over 15 percent are classified as Retail. See Figure 59 for a breakdown of business categories. A full business list is available on The City of Yellowknife Virtual City Hall webpage.
Figure 59: Yellowknife Business Categories
Agriculture & Animal
Services0.99%
Entertainment Services
0.71%
General Business
Services35.44%
Hospitality, Food &
Beverage9.27%
Personal Services
8.34%
Professional Services
6.64%
Recycling0.05%
Retail, Sales, Rentals &
Services15.47%
Trade & Industry
18.16%Transportation
4.94%

Strategic Waste Management Plan (SWMP) – Final Report The City of Yellowknife
51
Examples of the types of businesses included under the General Business Services category are shown in Figure 60.
Figure 60: General Business Service Category Business Examples
Bookkeepers4% Business Services
5%
Charitable Services (Church, Shelter,
Centre, Etc)2%
Communication Services
7%
Consultants30%
Financial Services4%Holding Companies
3%
Janitorial Services9%
Media Services (Film, Audio, Print)
4%
Online Business Services
1%
Property Management
& Services18%
Real Estate3%
Rental & Storage Services
7%
Security Services -Alarms & Guards
2% Writers, Editors & Publishers
1%
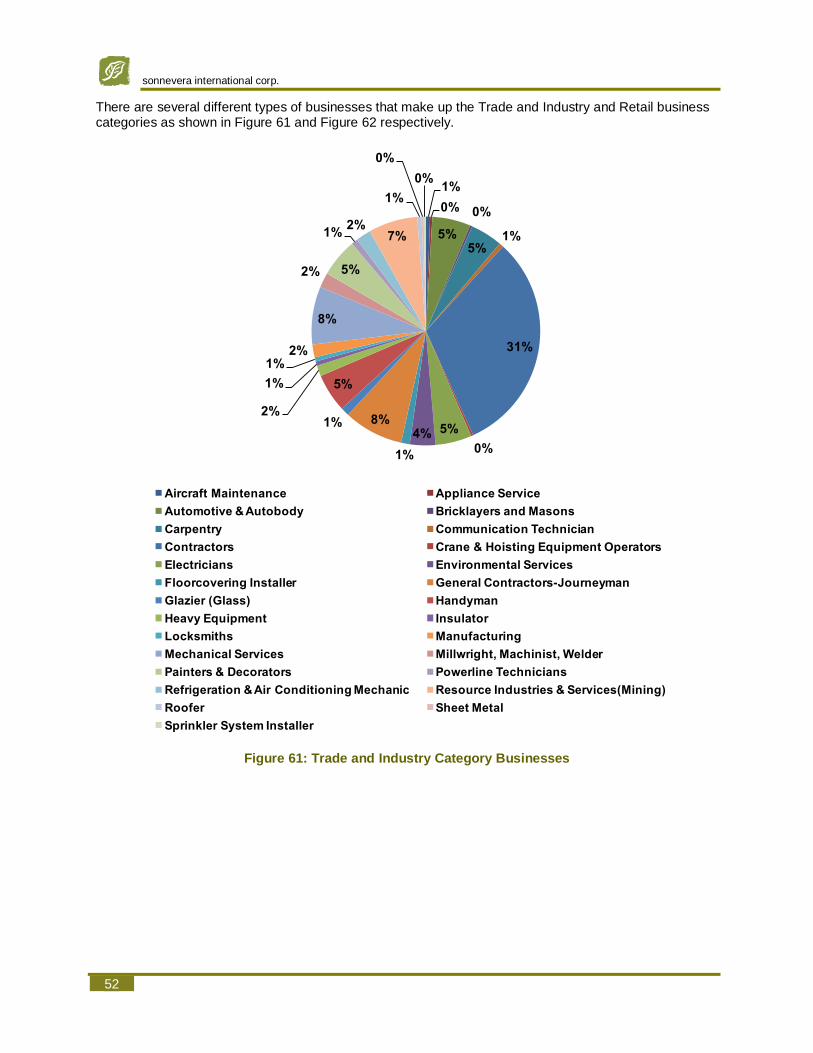
sonnevera international corp.
52
There are several different types of businesses that make up the Trade and Industry and Retail business categories as shown in Figure 61 and Figure 62 respectively.
Figure 61: Trade and Industry Category Businesses
1%
0%
5%
0%
5%1%
31%
0%
5%4%
1%
8%1%
5%
2%
1%
1%2%
8%
2% 5%
1%2%
7%
1%
0%
0%Aircraft Maintenance Appliance Service
Automotive & Autobody Bricklayers and Masons
Carpentry Communication Technician
Contractors Crane & Hoisting Equipment Operators
Electricians Environmental Services
Floorcovering Installer General Contractors-Journeyman
Glazier (Glass) Handyman
Heavy Equipment Insulator
Locksmiths Manufacturing
Mechanical Services Millwright, Machinist, Welder
Painters & Decorators Powerline Technicians
Refrigeration & Air Conditioning Mechanic Resource Industries & Services(Mining)
Roofer Sheet Metal
Sprinkler System Installer
1%
0%
5%
0%
5%1%
31%
0%
5%4%
1%
8%1%
5%
2%
1%
1%2%
8%
2% 5%
1%2%
7%
1%
0%
0%Aircraft Maintenance Appliance Service
Automotive & Autobody Bricklayers and Masons
Carpentry Communication Technician
Contractors Crane & Hoisting Equipment Operators
Electricians Environmental Services
Floorcovering Installer General Contractors-Journeyman
Glazier (Glass) Handyman
Heavy Equipment Insulator
Locksmiths Manufacturing
Mechanical Services Millwright, Machinist, Welder
Painters & Decorators Powerline Technicians
Refrigeration & Air Conditioning Mechanic Resource Industries & Services(Mining)
Roofer Sheet Metal
Sprinkler System Installer

Strategic Waste Management Plan (SWMP) – Final Report The City of Yellowknife
53
Figure 62: Retail Category Businesses
5.1.3.1 Waste Diversion Assistance
An estimated 35% of the waste landfilled in Yellowknife is reported to be from the ICI sector. Consequently, this sector represents a very significant opportunity for waste diversion.
The provision of a technical advisor to help organizations implement waste reduction programs would significantly enhance waste diversion in the ICI sector and would also serve to raise the profile of waste reduction among commercial operators. This program could be implemented in partnership with the existing private service provider, who can play a very important role in encouraging diversion in the commercial sector. This concept received very strong support during the Community Discussion event and on the ICI Online Survey.
An excellent example of a technical assistance program is Metro Portland’s (Oregon) ‘Recycle at Work’ that provides free customized reduction, reuse and recycling assistance to businesses. On-site waste audits, recycling boxes, ready-to-print posters, factsheets and videos are available to interested businesses.
7%
6% 2%
4% 2%
3%0%
15%
1%
0%
2%
6%5%
9%3%
7%
5%
18%
0% 3%Apparel Automotive
Building Convenience Stores (tobacco)
Electrical Retail Grocery
Plumbing Retail Arts and Crafts
Coin/Card Operated Vending Machines ( ATM's etc) Firearms & Ammunition
Furniture or Appliances General Mixed Retail /Department Stores
Home & Garden Industrial
Jewelers Photography
Safety & Medical Speciality
Sporting & Leisure Tailors, Sewing & Drycleaning
7%
6% 2%
4% 2%
3%0%
15%
1%
0%
2%
6%5%
9%3%
7%
5%
18%
0% 3%Apparel Automotive
Building Convenience Stores (tobacco)
Electrical Retail Grocery
Plumbing Retail Arts and Crafts
Coin/Card Operated Vending Machines ( ATM's etc) Firearms & Ammunition
Furniture or Appliances General Mixed Retail /Department Stores
Home & Garden Industrial
Jewelers Photography
Safety & Medical Speciality
Sporting & Leisure Tailors, Sewing & Drycleaning
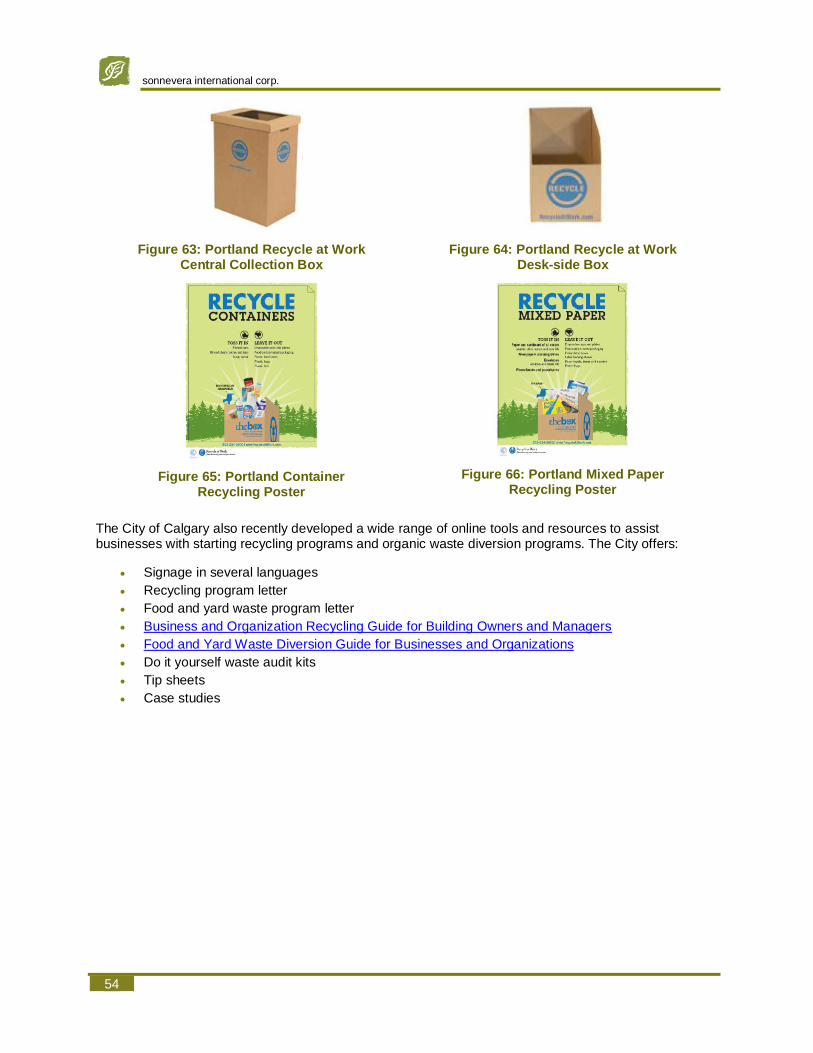
sonnevera international corp.
54
Figure 63: Portland Recycle at Work Central Collection Box
Figure 64: Portland Recycle at Work Desk-side Box
Figure 65: Portland Container Recycling Poster
Figure 66: Portland Mixed Paper Recycling Poster
The City of Calgary also recently developed a wide range of online tools and resources to assist businesses with starting recycling programs and organic waste diversion programs. The City offers:
• Signage in several languages
• Recycling program letter
• Food and yard waste program letter
• Business and Organization Recycling Guide for Building Owners and Managers
• Food and Yard Waste Diversion Guide for Businesses and Organizations
• Do it yourself waste audit kits
• Tip sheets
• Case studies
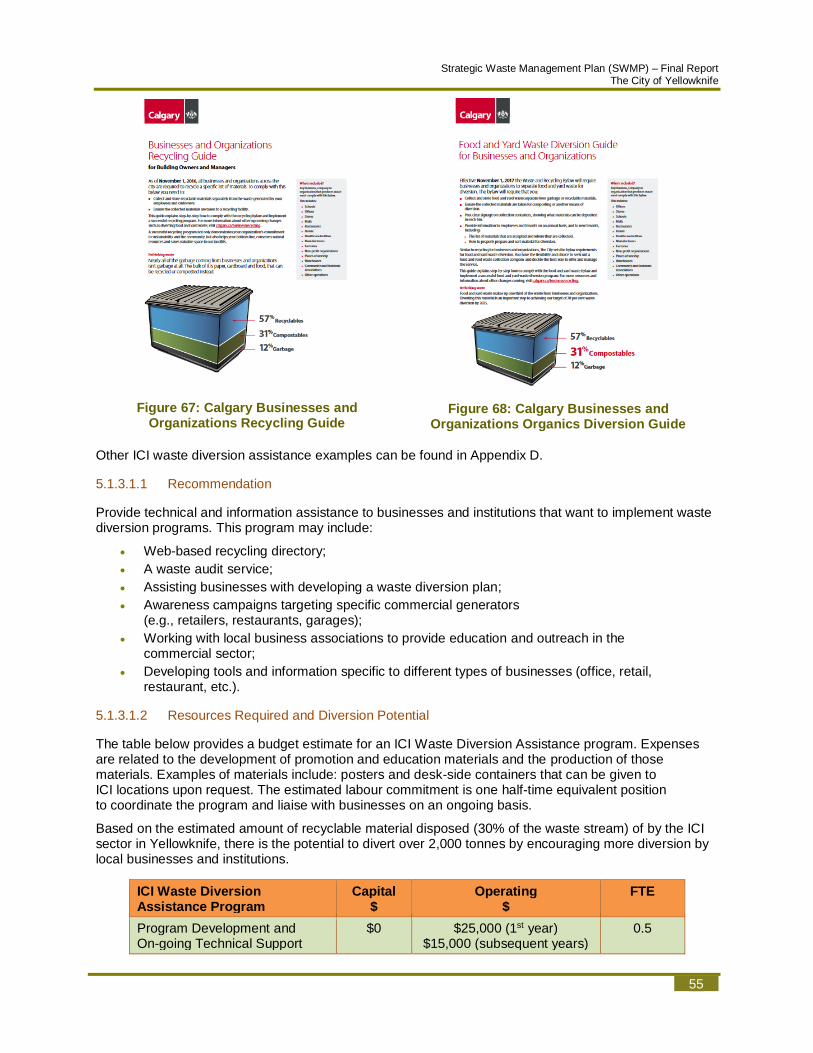
Strategic Waste Management Plan (SWMP) – Final Report The City of Yellowknife
55
Figure 67: Calgary Businesses and Organizations Recycling Guide
Figure 68: Calgary Businesses and Organizations Organics Diversion Guide
Other ICI waste diversion assistance examples can be found in Appendix D.
5.1.3.1.1 Recommendation
Provide technical and information assistance to businesses and institutions that want to implement waste diversion programs. This program may include:
• Web-based recycling directory;
• A waste audit service;
• Assisting businesses with developing a waste diversion plan;
• Awareness campaigns targeting specific commercial generators (e.g., retailers, restaurants, garages);
• Working with local business associations to provide education and outreach in the commercial sector;
• Developing tools and information specific to different types of businesses (office, retail, restaurant, etc.).
5.1.3.1.2 Resources Required and Diversion Potential
The table below provides a budget estimate for an ICI Waste Diversion Assistance program. Expenses are related to the development of promotion and education materials and the production of those materials. Examples of materials include: posters and desk-side containers that can be given to ICI locations upon request. The estimated labour commitment is one half-time equivalent position to coordinate the program and liaise with businesses on an ongoing basis.
Based on the estimated amount of recyclable material disposed (30% of the waste stream) of by the ICI sector in Yellowknife, there is the potential to divert over 2,000 tonnes by encouraging more diversion by local businesses and institutions.
ICI Waste Diversion Assistance Program
Capital $
Operating $
FTE
Program Development and On-going Technical Support
$0 $25,000 (1st year) $15,000 (subsequent years)
0.5

sonnevera international corp.
56
5.1.3.2 ICI Recognition
Public acknowledgement of businesses and institutions that achieve significant waste reduction goals serves to encourage similar programs within other organizations, while also reinforcing the positive behaviours associated with these accomplishments and helping to raise the public profile of participating businesses. The City of Yellowknife is already leading the way with its own yearly Recycling Awards. Each year, businesses and individuals that champion zero waste are acknowledged by the City mayor and receive a plaque. 2017’s Yellowknife winners were:
• Wek'èezhii Land and Water Board
• The Yellowknife Farmers' Market
• Les Rocher
• Dream Office Management (NWT) Inc
• The Fat Fox Café
As another example of a recognition program, Harford County, in Maryland, USA, acknowledges business waste reduction and recycling programs through the Business Recycling and Waste Reduction Awards. Applications are due by the end of March each year. Once reviewed, award winners will receive a plaque for display at a public awards ceremony and be recognized on the Harford County website, in local media and social media.
Figure 69: Harford County Business Recycling & Waste Reduction 2016 Award Winners Promotion
All award applicants become Partners in Recycling and receive a sticker to display at the business and listings on the County website and social media.
Additional ICI waste diversion promotion program examples are in Appendix D.
5.1.3.2.1 Recommendation
The City should continue its yearly Recycling Awards winners and focus on additional promotion of the winners through social media and window display stickers. Slight improvements to the Recycling Awards could be done in conjunction with the ICI Waste Diversion Assistance program. Involving the Chamber of Commerce through education and marketing of the awards program is another potential route to improve nomination numbers and business interest.
5.1.3.2.2 Resources Required and Diversion Potential
Staff resources for the increased marketing of the Recycling Awards program are incorporated into the ICI Waste Diversion Assistance program. Direct expenses associated with the program upgrades are expected to be minimal and are associated with the production of window decals and program marketing.

Strategic Waste Management Plan (SWMP) – Final Report The City of Yellowknife
57
This program provides support to the ICI waste diversion assistance program and disposal bans, and therefore no diversion is attributed to it.
5.1.3.3 ICI Food Waste Diversion
The City of Yellowknife SWF accepts organic material from a small amount of ICI customers. However, organic waste represents well over one-third (41%) of Yellowknife’s ICI sector. Therefore, significant opportunities to increase waste diversion through the implementation of a composting collection program in the ICI sector exists.
Seattle is an example of an approach to the collection of food waste that could be applicable to Yellowknife. Since January 2015, The City of Seattle requires businesses not to place food scraps, compostable paper and yard waste in their garbage through the Seattle Municipal Code Section 21.36.082. The City offers a food scrap collection service and saves money for businesses that generate significant amounts of food waste, such as restaurants, grocery stores, bakeries, hotels, schools and flower shops. Seattle has contracted a waste hauler to provide compost collection containers and collection service. The program is part of Seattle’s larger Resource Venture Program which provides free technical assistance, training and advice on how to collect food waste and compost within a business location. The program also encourages businesses to donate packaged food and food that has not been served to customers to be donated to a local food bank.
The City provides the Food and Compostables Flyer in a variety of languages to businesses and organizations including: English, Amharic, Cambodian, Chinese, Hindi, Japanese, Korean, Lao/Laotian, Oromo, Russian, Somali, Spanish, Tagalog, Thai, Tigrigna, and Vietnamese.
Figure 70: Seattle Commercial Collection Compostable Items Flyer
The City of Calgary recently introduced mandatory food and yard waste diversion in for all businesses. All businesses are responsible for diverting organic material by having collection containers on-site and ensuring the material gets composted. To assist businesses in developing tailor made programs, The City of Calgary provided an array of online education and resources for businesses, and haulers. Some of these resources include composting brochures, printable signs and staff education templates. The City also offered one-on-one meetings with businesses, site visits and waste audit assistance.
Other ICI food waste collection examples can be found in Appendix D.

sonnevera international corp.
58
5.1.3.3.1 Recommendations
The opportunities for diversion of food waste, particularly from restaurants and grocery stores, include the Seattle model of providing the collection service, or alternatively, The City could promote food waste collection directly through a private hauler or by self-haul to the SWF.
It is recommended that commercial food waste diversion be revisited through a pilot to identify specific opportunities and barriers to success that can be incorporated into a full program design. The pilot project will include the development of promotion and education materials and include the training of staff at participating businesses to ensure effective participation.
The results of the pilot project would assist in determining the role that The City would play in a full-scale program. The private sector has indicated a desire to move forward with diversion, which provides an opportunity for The City to act more as a facilitator for a full-scale program, rather than being the service provider. Depending on the results of the pilot, bylaw amendments can be considered to require businesses to divert organic material. The amendments can take many different shapes, including only requiring certain businesses, such as those that generate large amounts of organic waste, or businesses of certain sizes to divert. Additionally, the bylaw can stipulate if the business has to hire a hauler to collect and haul organics, or if the business can self-haul material.
It is also recommended that The City provide support to ICI locations that want to implement on-site composting. This can be done through the ICI waste diversion assistance program.
5.1.3.3.2 Resources Required and Diversion Potential
Introducing a pilot to demonstrate viability of commercial organics diversion will require additional staff resources. The estimated cost to undertake the pilot and provide support to a full-scale program is provided in the following table. This budget assumes that the private collection companies move forward on commercial organics collection, allowing City resources to be minimized. However, it is anticipated that The City will provide on-going support through the previously outlined Waste Diversion Assistance role and undertaking social marketing and other related promotion and education activities targeting ICI waste generators.
Assuming that effective promotion, education and regulatory measures (e.g., disposal bans) are put in place to support the implementation of ICI food waste collection, the estimated diversion potential for this program is about 2,000 tonnes.
ICI Food Waste Diversion Capital
$ Operating
$ FTE
Pilot Project
• 10 participating businesses
• Collection bins (wheeled totes). Average of 4 bins required per site
• Tipping fees (@$33/t)
• Promotion and education materials
$3,500 $20,000 Included in ICI waste diversion assistance staffing requirements
Full Scale Implementation
• Promotion and education
$5,000 As above
Strategic Waste Management Plan (SWMP) – Final Report The City of Yellowknife
59
5.1.3.4 Enhanced ICI Recycling Collection
A private recycling collection service is currently available to Yellowknife’s commercial sector, with the most common material collected being cardboard. As with organics, by working with private service providers, The City can play largely a facilitation role in enhancing commercial recycling.
However, specific sectors of the commercial sector, such as the downtown business area, have specific barriers that present challenges to effective participation in diversion programs. The development of targeted programs for these areas that may not have ready access to recycling infrastructure would serve to increase diversion. For example, encouraging sharing of bins in locations with limited space, and encouraging small businesses to use Blue Bin Stations for material like paper would be approaches to encourage business recycling.
For examples of alternate commercial recycling services, see Appendix D.
5.1.3.4.1 Recommendations
In order to address specific barriers to waste diversion in the commercial sector, The City should work with the contracted hauler and key stakeholders (like the Downtown Business Association) to design and implement alternate collection options in areas that present challenges to effective participation in diversion programs. Consideration should be given to adding applicable municipal buildings (like the Town Hall, City Garages, Ruth Inch Memorial Pool, Public Library, Fieldhouse and Multi-plex) to the existing recycling program.
5.1.3.4.2 Resources Required and Diversion Potential
City resources to develop enhanced commercial recycling collection will be minimal as the collection services is intended to be provided (and invoiced) by private sector collection companies. However, facilitating the improvements to the collection system will require some staff time for working with the collection companies and local businesses in identifying and implementing alternative collection systems. A small dedicated budget for promotion and education has been included in the budget.
It is difficult to estimate the diversion potential specific to this recommendation as the diversion results will depend on the collection systems implemented and the presence of support mechanisms like the waste diversion assistance program and disposal bans. Therefore, the estimated diversion potential allocated to ICI Waste Diversion Assistance is assumed to include any potential diversion associated with enhanced collection services.
Enhanced ICI Recycling Collection Capital
$ Operating
$ FTE
Promotion and education $2,500 (for first 2 years)
Include in ICI waste diversion assistance staffing requirements
5.1.3.5 Expanded C&D Diversion Opportunities
Currently there is a lack of local diversion opportunities for C&D materials in the Yellowknife area. This is likely the main barrier to builders and developers participating in diversion.
One of the largest components of C&D waste is wood, as shown in the photos below. Expanding the current wood recycling program (mainly pallets) to include clean wood waste such as lumber off-cuts could significantly increase the diversion of C&D waste, and this material is required as an amendment within the composting program. Aggregates, including old concrete, also offer an additional diversion opportunity, and The City has had discussions with contractors interested in this material.
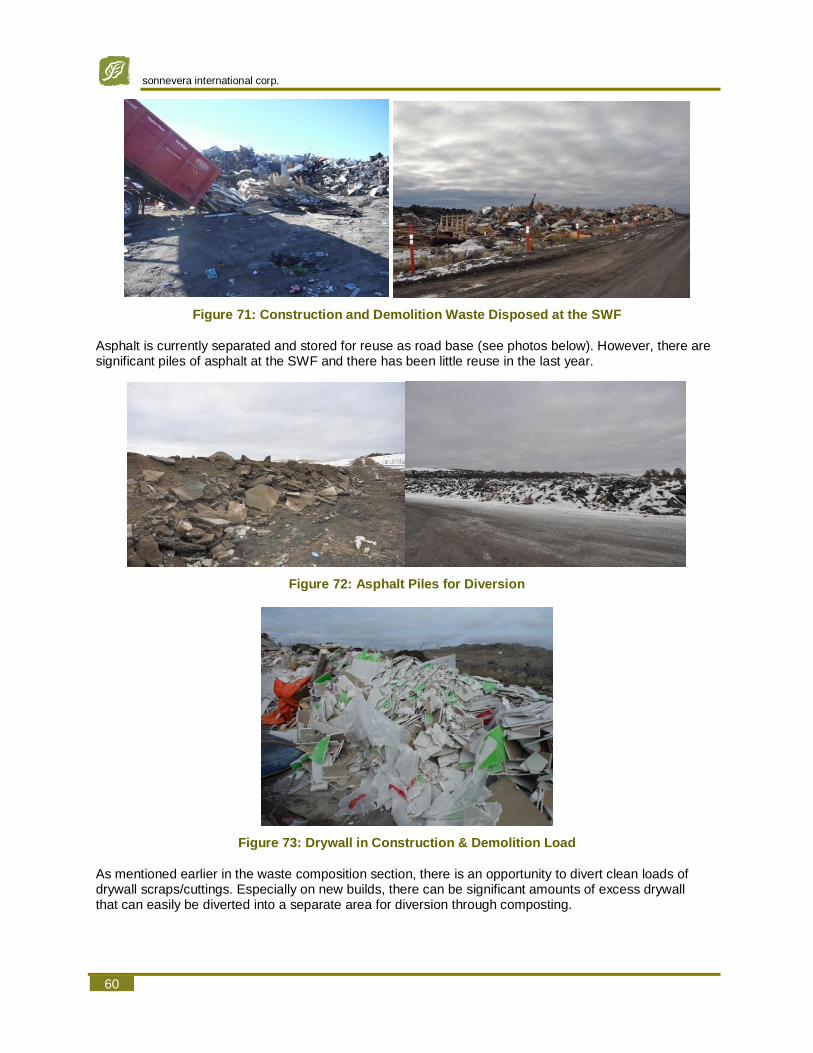
sonnevera international corp.
60
Figure 71: Construction and Demolition Waste Disposed at the SWF
Asphalt is currently separated and stored for reuse as road base (see photos below). However, there are significant piles of asphalt at the SWF and there has been little reuse in the last year.
Figure 72: Asphalt Piles for Diversion
Figure 73: Drywall in Construction & Demolition Load
As mentioned earlier in the waste composition section, there is an opportunity to divert clean loads of drywall scraps/cuttings. Especially on new builds, there can be significant amounts of excess drywall that can easily be diverted into a separate area for diversion through composting.

Strategic Waste Management Plan (SWMP) – Final Report The City of Yellowknife
61
5.1.3.5.1 Habitat for Humanity ReStore
Adjacent to the SWF there is a privately managed Habitat for Humanity ReStore that sells used or unwanted construction and demolition materials. The store contains anything from new nails, doors, furniture, home accessories, to functioning appliances. These items are sold at a price lower than normal retail price. The store is owned and operated by a local Habitat for Humanity affiliate and proceeds are used to build homes in the local community, about one home every two years. Four to five volunteers assist at the store, which is open four days per week. All buildings and shelters used to house the items for sale have been donated to Habitat for Humanity. There is a small workshop space and there is a desire from the local owner to host repair cafes on a regular basis in the near future. The land the ReStore is on is leased from The City of Yellowknife for a very low cost. This is a great reuse opportunity that benefits the community and helps reduce the need for landfilling.
Figure 74: ReStore
With the ReStore only being open four days a week, it is limiting for contractors that want to deliver items to the store for reuse. Often the store is not open when contractors have material to drop off, so the material goes straight to the SWF for disposal. Additionally, there does not seem to be significant encouragement from the City SWF scalehouse to use the ReStore, when available, for dropping off items that might be reusable.
Members of the public have indicated the ReStore has many great items for sale, however comments were received regarding prices being high. This feedback may suggest that lower prices may encourage more use of the store and ultimately more diversion.
5.1.3.5.2 Recommendations
There are four recommendations associated with improving the diversion of C&D waste:
• Expand the wood recycling program to include all clean (uncoated) wood waste. This recommendation may require an expansion or reconfiguration of the existing wood waste recycling area. Additionally, this program would require support through promotion and education activities, variable tipping fees (lower fees on source-separated clean wood waste) or disposal bans.
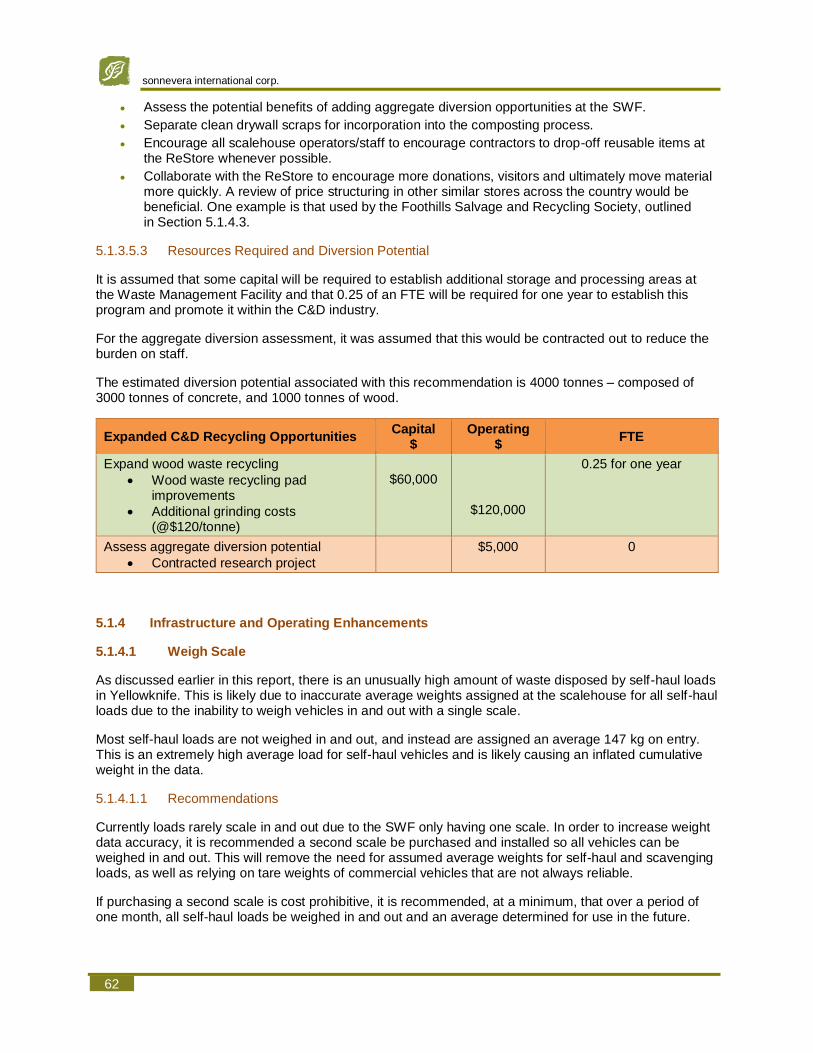
sonnevera international corp.
62
• Assess the potential benefits of adding aggregate diversion opportunities at the SWF.
• Separate clean drywall scraps for incorporation into the composting process.
• Encourage all scalehouse operators/staff to encourage contractors to drop-off reusable items at the ReStore whenever possible.
• Collaborate with the ReStore to encourage more donations, visitors and ultimately move material more quickly. A review of price structuring in other similar stores across the country would be beneficial. One example is that used by the Foothills Salvage and Recycling Society, outlined in Section 5.1.4.3.
5.1.3.5.3 Resources Required and Diversion Potential
It is assumed that some capital will be required to establish additional storage and processing areas at the Waste Management Facility and that 0.25 of an FTE will be required for one year to establish this program and promote it within the C&D industry.
For the aggregate diversion assessment, it was assumed that this would be contracted out to reduce the burden on staff.
The estimated diversion potential associated with this recommendation is 4000 tonnes – composed of 3000 tonnes of concrete, and 1000 tonnes of wood.
Expanded C&D Recycling Opportunities Capital
$ Operating
$ FTE
Expand wood waste recycling
• Wood waste recycling pad improvements
• Additional grinding costs (@$120/tonne)
$60,000
$120,000
0.25 for one year
Assess aggregate diversion potential
• Contracted research project
$5,000 0
5.1.4 Infrastructure and Operating Enhancements
5.1.4.1 Weigh Scale
As discussed earlier in this report, there is an unusually high amount of waste disposed by self-haul loads in Yellowknife. This is likely due to inaccurate average weights assigned at the scalehouse for all self-haul loads due to the inability to weigh vehicles in and out with a single scale.
Most self-haul loads are not weighed in and out, and instead are assigned an average 147 kg on entry. This is an extremely high average load for self-haul vehicles and is likely causing an inflated cumulative weight in the data.
5.1.4.1.1 Recommendations
Currently loads rarely scale in and out due to the SWF only having one scale. In order to increase weight data accuracy, it is recommended a second scale be purchased and installed so all vehicles can be weighed in and out. This will remove the need for assumed average weights for self-haul and scavenging loads, as well as relying on tare weights of commercial vehicles that are not always reliable.
If purchasing a second scale is cost prohibitive, it is recommended, at a minimum, that over a period of one month, all self-haul loads be weighed in and out and an average determined for use in the future.

Strategic Waste Management Plan (SWMP) – Final Report The City of Yellowknife
63
Another option is to implement a scale traffic control system, where vehicles drive over the scale both inbound and outbound. This would require a staging area for vehicles to wait prior to accessing the scale. Then they would be directed by a traffic officer or light system to drive onto the scale. This would require significantly less capital investment than a second scale, but would need additional staffing and would take additional time for system users.
It is suggested to do a landfill traffic monitoring study to review the options for better reporting of load weights, and determine the most efficient approach. If a second scale is added, the site will need to be reengineered to provide required access and operational efficiency and safety.
5.1.4.1.2 Resources Required and Diversion Potential
Installing a second scale will require groundwork and potentially additional related infrastructure like an expanded scalehouse. A used scale would be an option to reduce required capital expenditures. Used scales can be sourced for as low as ~$15,000, where a new 90-foot scale is $45,000.
Weigh Scale Capital
$ Operating
$ FTE
Purchase additional weigh scale
• Scale and ground work / installation
$105,000 $10,000 N/A
Procedure of weighing all self-haul vehicles in and out for one month
$2500
Scale control system for two-way traffic $10,000 0.5
5.1.4.2 Composting Program
5.1.4.2.1 Existing Facility Assessment
A desktop review of the composting program was undertaken, focusing on a review of operating procedures and selected operating records. Ecology North personnel were also interviewed about the composting program and site operations, and Project Team members undertook a brief site inspection in October of 2017. Figure 75 and Figure 76 show pictures from the site visit.
For a full review of the composting program and recommendations for long term composting facility improvements see Appendix E.

sonnevera international corp.
64
Figure 75: Composting Feedstock
Figure 76: Compost Piles for Curing
The facility uses a low-tech windrow composting method to process the roughly 500 to 600 tonnes of food waste and yard waste delivered to the site. The facility receives organic waste on a year-round basis, but active composting activities are more intensive during the period between May and September. Given the relatively small quantities of feedstocks currently being collected and processed, and the remote location of the site relative to neighbours, a low-tech approach has been a good solution to date. To offset the increased odour and nuisance risks that could result from the low-tech composting method, a higher amount of site and process monitoring/management has been invested in the program.
While the higher level of site and process management is a sound technical decision, it does result in increased labour and higher costs: direct operating costs in 2016 were reported to be in the order of $91,000 to handle roughly 400 tonnes of material. The unit processing costs for the program appear high (i.e., in the order of $225/tonne) when compared to food waste composting programs in the 2,500 to 5,000 tonne per year range. Given the low feedstock quantities, this is not surprising.
A cursory review of the design of the composting facility itself was undertaken as part of this assessment and it was found to align with best practices and the normal standard of care taken by compost site designers. It was also observed that the facility has ample capacity to accommodate future growth in the diversion/collection program and has suitable environmental protection and surface water controls.
Based on the review of the Operations and Maintenance Manual and discussions with Ecology North personnel, is appears that best management practices are being followed with respect to site operations. Although there is room for minor improvements, the operations procedures are thorough and well documented. The amount and nature of the operations records kept is more detailed than would normally be expected at a site of this size, but that should not be interpreted as a negative comment.
The Project Team also discussed the finished product testing and use practices with Ecology North staff. The sampling and testing procedures being followed are consistent with normal industry practices and an experienced third-party laboratory is being used to complete the required analyses. It appears that product marketing is a collaborative effort between The City and Ecology North, but there are no defined marketing roles and responsibilities.
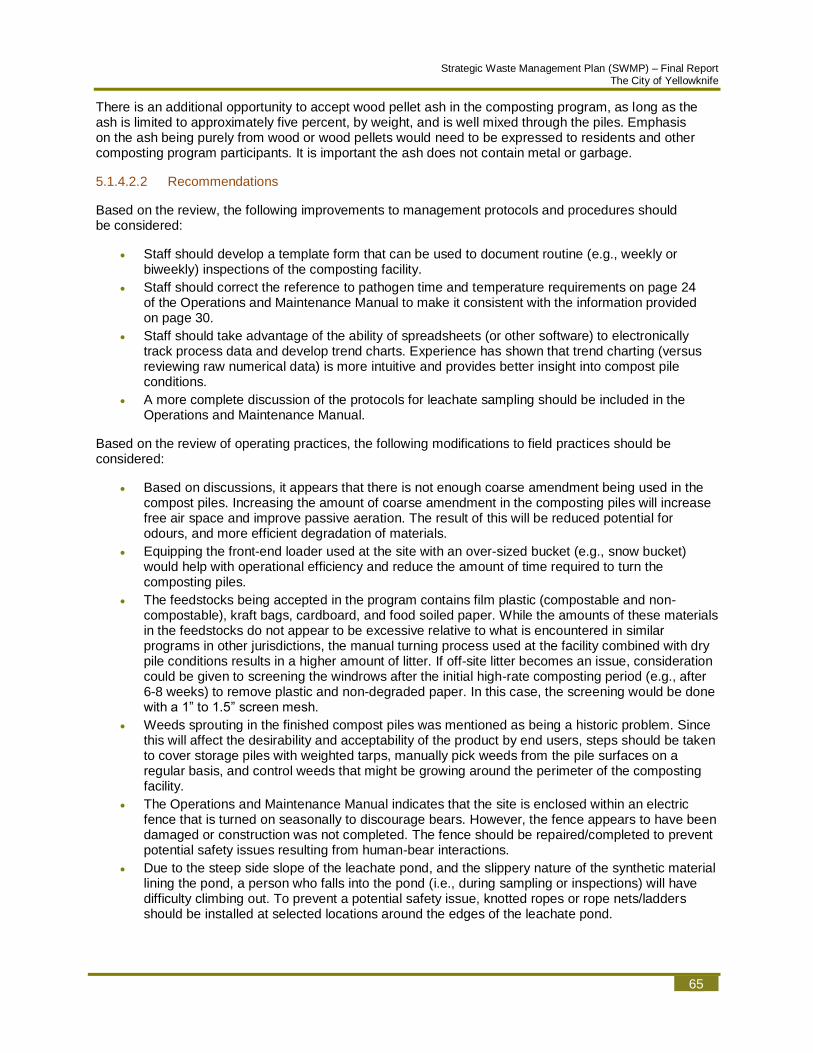
Strategic Waste Management Plan (SWMP) – Final Report The City of Yellowknife
65
There is an additional opportunity to accept wood pellet ash in the composting program, as long as the ash is limited to approximately five percent, by weight, and is well mixed through the piles. Emphasis on the ash being purely from wood or wood pellets would need to be expressed to residents and other composting program participants. It is important the ash does not contain metal or garbage.
5.1.4.2.2 Recommendations
Based on the review, the following improvements to management protocols and procedures should be considered:
• Staff should develop a template form that can be used to document routine (e.g., weekly or biweekly) inspections of the composting facility.
• Staff should correct the reference to pathogen time and temperature requirements on page 24 of the Operations and Maintenance Manual to make it consistent with the information provided on page 30.
• Staff should take advantage of the ability of spreadsheets (or other software) to electronically track process data and develop trend charts. Experience has shown that trend charting (versus reviewing raw numerical data) is more intuitive and provides better insight into compost pile conditions.
• A more complete discussion of the protocols for leachate sampling should be included in the Operations and Maintenance Manual.
Based on the review of operating practices, the following modifications to field practices should be considered:
• Based on discussions, it appears that there is not enough coarse amendment being used in the compost piles. Increasing the amount of coarse amendment in the composting piles will increase free air space and improve passive aeration. The result of this will be reduced potential for odours, and more efficient degradation of materials.
• Equipping the front-end loader used at the site with an over-sized bucket (e.g., snow bucket) would help with operational efficiency and reduce the amount of time required to turn the composting piles.
• The feedstocks being accepted in the program contains film plastic (compostable and non-compostable), kraft bags, cardboard, and food soiled paper. While the amounts of these materials in the feedstocks do not appear to be excessive relative to what is encountered in similar programs in other jurisdictions, the manual turning process used at the facility combined with dry pile conditions results in a higher amount of litter. If off-site litter becomes an issue, consideration could be given to screening the windrows after the initial high-rate composting period (e.g., after 6-8 weeks) to remove plastic and non-degraded paper. In this case, the screening would be done with a 1” to 1.5” screen mesh.
• Weeds sprouting in the finished compost piles was mentioned as being a historic problem. Since this will affect the desirability and acceptability of the product by end users, steps should be taken to cover storage piles with weighted tarps, manually pick weeds from the pile surfaces on a regular basis, and control weeds that might be growing around the perimeter of the composting facility.
• The Operations and Maintenance Manual indicates that the site is enclosed within an electric fence that is turned on seasonally to discourage bears. However, the fence appears to have been damaged or construction was not completed. The fence should be repaired/completed to prevent potential safety issues resulting from human-bear interactions.
• Due to the steep side slope of the leachate pond, and the slippery nature of the synthetic material lining the pond, a person who falls into the pond (i.e., during sampling or inspections) will have difficulty climbing out. To prevent a potential safety issue, knotted ropes or rope nets/ladders should be installed at selected locations around the edges of the leachate pond.

sonnevera international corp.
66
It was also noted by the Project Team that on more than one occasion, staff from Ecology North have attended compost operator training courses offered through the Compost Council of Canada. It is expected that personnel involved with management of the composting program would benefit from visiting other composting operations and talking with other site managers and operators. Tours of other small and mid-sized facilities that process food waste would expose staff to see other methods of processing and see management techniques in practice (as opposed to the classroom setting during the training courses).
5.1.4.2.3 Long Term Composting Facility Improvements
Currently the composting program is diverting in the order of 600 tonnes per year of food waste, food soiled paper, and yard waste. However, it has been estimated that there is as much as 5,855 tonnes of these materials available in the solid waste stream.
As previously outlined, the scope of this study included identifying capital improvements to the facility that would be required to handle the feedstocks resulting from expansion of the composting program and increased diversion. Three specific scenarios were reviewed: 40% diversion, 60% diversion, and 80% diversion. The annual quantities of material corresponding to each scenario are summarized in the following table.
Table 10: Estimated Quantities of Organic Waste by Diversion target (tonnes)
Material 40%
Diversion 60%
Diversion 80%
Diversion
Yard Waste 2,100 3,150 4,200
Food and Soiled Paper 240 360 480
Total 2,340 3,510 4,680
In order to estimate costs, a conceptual design of the composting facility required to support the 40% diversion scenario was developed (i.e., the “base” facility). This facility was intentionally based on a modular design. This allowed the costs for the facilities needed to support the 60% and 80% diversion scenarios to be quickly pro-rated from the base facility design and costs.
In practical terms, a modular design would allow Yellowknife to construct new facility infrastructure in stages as participation in the program increases and the program is expanded to include new generators.
5.1.4.2.3.1 Preliminary Process Design and Mass Balance
In order to size equipment and processing infrastructure, a preliminary mix design and weekly mass and volume balance for the composting facility associated with the 40% diversion scenario was prepared by the Project Team.
The mix design was prepared based on assumptions regarding the weekly quantities of feedstocks that would be delivered to the facility and this assumed feedstock characteristics. The assumptions were based on data from existing food waste composting programs in Alberta and BC, and prior assessment and design work completed by the Project Team for other clients.
In Yellowknife’s case, a bulking agent would need to be added to the feedstocks prior to composting to adjust the moisture content and carbon to nitrogen ratio to optimal ranges. The bulking agent is also required to provide structure and increase free air space within the compost pile, which allows for the movement of air. Typically, wood chips made from tree branches and trunks, other coarse yard debris, forestry industry residuals, or dimension wood waste are used as amendment sources at composting facilities. For this assessment, it was assumed that ground dimension lumber diverted from the landfill, and coarse material removed from the compost during the final screening step would be used as bulking agents.

Strategic Waste Management Plan (SWMP) – Final Report The City of Yellowknife
67
5.1.4.2.3.2 Description of Facility Components
A summary of the major system components associated with the recommended composting facility are provided in the following sections. Since the facility is modular in nature, these components would be the same for all three diversion scenarios.
5.1.4.2.3.3 Active Composting System
Due to the increased risk of bird attraction, odours and other nuisance conditions, continued use of the low-tech windrow composting approach is not recommended. The Project Team instead recommends that Yellowknife move to an aerated composting system. Migrating to an aerated system would also provide more certainty in terms of pathogen reduction relative to the existing windrow composting system, and would reduce labour and equipment requirements during the initial weeks of the composting process.
There are a range of aerated in-vessel composting systems available that could be implemented in Yellowknife to handle the feedstock quantities resulting from the three diversion scenarios. Vendors for such systems include Green Mountain Technologies, Engineered Compost Systems, DTEnvironmental, and Hot Rot. These pre-engineered systems are fully-enclosed and have automated aeration systems, which would help to prevent odour and nuisance conditions, speed up the composting process, contain litter, and reduce bird attraction.
Although there are several technical benefits to a in-vessel system, it is expected that the costs associated with these types of systems and the associated infrastructure would be prohibitive.
Therefore, it is recommended that the City implement an aerated static pile (ASP) system with above-grade aeration pipes to handle the increased feedstock quantities. Such systems have low capital costs, but would provide a comparable level of process control and nuisance reduction as the previously mentioned in-vessel systems. An ASP with an above-grade aeration system could also be constructed at the existing site without having to modify or disturb the existing compost pad and environmental liner.
An example of an appropriate ASP system would be the system installed at Stickland Farms in Penhold, Alberta. This facility uses single-phase electric fans, timers, and above-ground PVC and HDPE aeration piping, all of which is relatively inexpensive and readily available.
Due to Yellowknife’s colder climate, and to optimize the use of the existing composting pad, an extended pile configuration is recommended instead of the discrete composting piles used at the Penhold site. In an extended pile system, compost piles are built directly on the shoulder of, and in direct contact with, adjacent compost piles. An extended pile configuration will reduce the amount of exposed surface area, which will in turn reduce the amount of heat lost from the piles during colder months of the year. A residence time of six weeks in the ASP system is also recommended due to the colder climate in Yellowknife.
Figure 77 : ASP System at Stickland Farms (Penhold, AB)
Figure 78: Aerated Composting Bunkers in Olds, Alberta built from pre-cast
concrete blocks

sonnevera international corp.
68
One possible issue with the implementation of an aerated composting system at the Yellowknife facility is the cost of extending electrical infrastructure to the composting pad. However, there is ample experience with using both generators and solar panels to power smaller aerated static pile and bunker composting systems. It is recommended that a business case analysis of capital and operating costs of solar power versus running the system from a generator or the power grid be explored as part of detailed design process.
Construction of partially enclosed bunkers around the ASP composting system, similar to the facilities constructed at Olds College in Alberta, or by Latah Sanitation in Moscow, Idaho, could be considered as a future upgrade to the composting facility. The use of a bunker structure would provide a further level of protection from climate interferences. The bunker design used in Olds College (i.e., based on using pre-cast concrete blocks) could be constructed without disturbing or modifying the existing composting pad.
5.1.4.2.3.4 Mixing System
The amount of agitation and mixing that occurs in the proposed ASP composting system is significantly reduced relative to the current windrow system. Therefore, thorough mixing of feedstocks and amendments prior to their placement in the ASP system is needed to optimize the composting process and prevent nuisance conditions. While an acceptable level of mixing can be achieved with a front-end loader, it is generally much more effective and efficient to use a mixing system.
PTO (power take-off) and electrically driven vertical auger mixers, which are available from such vendors as Supreme International, Jaylor and Patz, have become very popular in the composting industry over the past ten years. Vertical mixers are more popular than the horizontal mixers that have historically been used at mid and large-scale sites. Vertical mixers also tend to be available in a smaller size range, such as the stationary mixing units manufactured by Penta and Vertablend.
As part of the facility upgrade, a small PTO (i.e., tractor-driven) vertical auger mixer is recommended. The mixer would be similar to the units used at the Stickland Farms compost site in Penhold, and the City of Whitehorse composting facility.
5.1.4.2.3.5 Curing and Screen Product Storage
Once the material has been stabilized in the ASP composting system, it will need to be further cured prior to being used as a soil amendment. However, the material will still be very biologically active and will have the potential to generate odours if not properly managed. It is therefore proposed that the material be cured for three to four months using the windrow method that is currently employed at the Yellowknife facility. Since the material will have gone through the pathogen reduction process in the ASP system, the turning frequency of the curing windrows can be based solely on pile temperatures and the need to re-
Figure 79: Aerated Composting Bunkers in Moscow, Idaho, with Wood Frame
Roof Structure
Figure 80: PTO Mixer used at City of Whitehorse composting facility
(source: transform compost systems)

Strategic Waste Management Plan (SWMP) – Final Report The City of Yellowknife
69
establish porosity. It is expected at the start of the curing stage, weekly or biweekly turning would be needed, but this would taper off to turning every three to four weeks as the curing stage progresses.
After a period of three to four months, material in curing windrows could be screened to removed contaminants and recover bulking agents. The screened material would be consolidated into larger stockpiles and allowed to continue curing until it meets the desired level of maturity. To maximize the use of the existing compost pad, it is proposed that the stockpiles be built to a height of approximately 7.6 m (25 feet) using a stacking conveyor.
5.1.4.2.3.6 Food Waste Receiving Area
An enclosed feedstock receiving area has been incorporated into the base design of the composting facility. An enclosure is needed to control litter, but more importantly it is required to help make the food waste inaccessible to birds, and thus reduce the potential that birds to be attracted to the composting site. Given that the composting facility is situated approximately 2 km from the airport, managing bird attraction must be considered in any facility expansion plan.
By itself, enclosing the receiving area will not completely mitigate attraction of birds. Best operational practices will also be required, including prompt mixing and processing of feedstocks, use of wood chip or compost “biocover” layers over the active composting piles, and a high level of housekeeping in the receiving and mixing areas.
A fully enclosed metal or fabric-style building with a concrete slab floor in which feedstocks could be received would be ideal, but may be cost prohibitive at the outset of the program. The following, lower cost alternatives could be considered as alternative solutions:
• Precast concrete block bunker with retractable fabric cover system (e.g., RollCov-R system).
• Constructing a pole-barn style roof structure with fine netting instead of solid walls.
Interim solutions that could be considered include:
• Adding a wood or metal frame and trusses to the existing receiving bunker so that a fine plastic netting can be suspended overtop and on the sides of the bunker.
• Surrounding the receiving area on three sides with standard 6 m high landfill litter fences, and suspending fine plastic netting overtop of the enclosed area.
For the purposes of estimating costs for this project, it was assumed that a RollCov-R type retractable structure would be installed over the existing receiving bunker. The existing precast blocks would be supplemented with new blocks to construct a 15 foot wide by 20 foot long by 5 foot high bunker. This structure can be constructed on the existing compost pad without the need for foundations, and minimal site preparation work.
Figure 81: Enclosed Waste Receiving Bunker
Figure 82: Aggregate bunker with RollCov-R roof system (source: Chameleon Innovations)
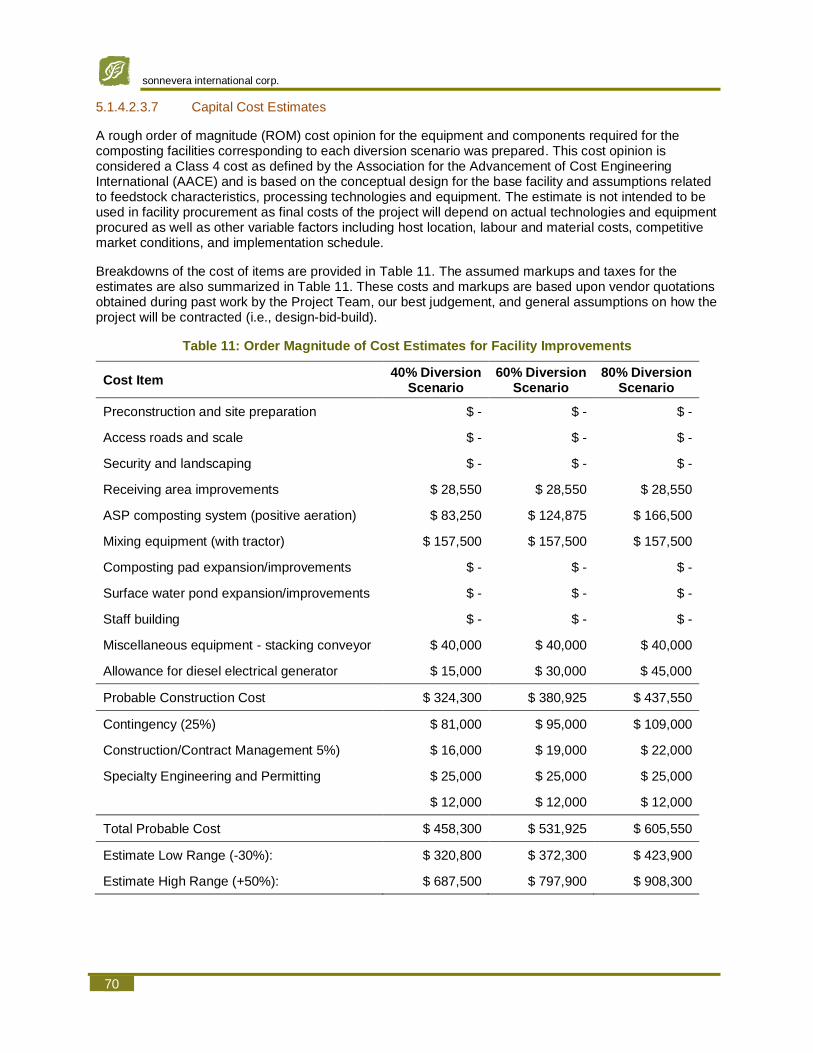
sonnevera international corp.
70
5.1.4.2.3.7 Capital Cost Estimates
A rough order of magnitude (ROM) cost opinion for the equipment and components required for the composting facilities corresponding to each diversion scenario was prepared. This cost opinion is considered a Class 4 cost as defined by the Association for the Advancement of Cost Engineering International (AACE) and is based on the conceptual design for the base facility and assumptions related to feedstock characteristics, processing technologies and equipment. The estimate is not intended to be used in facility procurement as final costs of the project will depend on actual technologies and equipment procured as well as other variable factors including host location, labour and material costs, competitive market conditions, and implementation schedule.
Breakdowns of the cost of items are provided in Table 11. The assumed markups and taxes for the estimates are also summarized in Table 11. These costs and markups are based upon vendor quotations obtained during past work by the Project Team, our best judgement, and general assumptions on how the project will be contracted (i.e., design-bid-build).
Table 11: Order Magnitude of Cost Estimates for Facility Improvements
Cost Item 40% Diversion
Scenario 60% Diversion
Scenario 80% Diversion
Scenario
Preconstruction and site preparation $ - $ - $ -
Access roads and scale $ - $ - $ -
Security and landscaping $ - $ - $ -
Receiving area improvements $ 28,550 $ 28,550 $ 28,550
ASP composting system (positive aeration) $ 83,250 $ 124,875 $ 166,500
Mixing equipment (with tractor) $ 157,500 $ 157,500 $ 157,500
Composting pad expansion/improvements $ - $ - $ -
Surface water pond expansion/improvements $ - $ - $ -
Staff building $ - $ - $ -
Miscellaneous equipment - stacking conveyor $ 40,000 $ 40,000 $ 40,000
Allowance for diesel electrical generator $ 15,000 $ 30,000 $ 45,000
Probable Construction Cost $ 324,300 $ 380,925 $ 437,550
Contingency (25%) $ 81,000 $ 95,000 $ 109,000
Construction/Contract Management 5%) $ 16,000 $ 19,000 $ 22,000
Specialty Engineering and Permitting $ 25,000 $ 25,000 $ 25,000
$ 12,000 $ 12,000 $ 12,000
Total Probable Cost $ 458,300 $ 531,925 $ 605,550
Estimate Low Range (-30%): $ 320,800 $ 372,300 $ 423,900
Estimate High Range (+50%): $ 687,500 $ 797,900 $ 908,300

Strategic Waste Management Plan (SWMP) – Final Report The City of Yellowknife
71
5.1.4.3 Salvage Area
The Yellowknife SWF is very unique in the fact it continues to permit salvaging at the SWF. Previously salvaging was permitted across the entire site. However, due to safety and traffic concerns, there is now a designated salvage area located near the Blue Bin Stations and away from the tipping face of the landfill. People are allowed to drop off materials at this location and also take any items from this area. SWF staff routinely push the materials into a pile as shown in Figure 83 and landfill the remaining materials. In 2017 there were over 8,800 vehicles accessing the salvage area. Salvaging continues to be somewhat of a culture in Yellowknife, with many editorials and news stories focusing on the community and artistry that results from the permission of salvaging at Yellowknife’s SWF. An example of these stories can be found in Appendix F.
Figure 83: Salvage Area at SWF
The Foothills Regional Landfill & Resource Recovery Centre (Foothills Regional LRRC) is a good example of a landfill site that has promoted salvaging in a safe way, while also reducing traffic on their landfill site. The Foothills Regional LRRC leases a small piece of land adjacent to the landfill scalehouse area to a not for profit society called the Foothills Salvage & Recycling Society. The partnering Foothills Regional LRRC strongly encourages its users to consider the Society for reusable items and has resulted in significantly reduced traffic and lineups at the scalehouse.
The society has evolved since 2010 and now has a variety of buildings housing all the donations and materials brought in from the community. The Society sells the materials at very reasonable prices and/or donates items to the Family Resource Centre in the nearby town of Okotoks. For larger items there is a pricing system that helps ensure items sell quickly and are not left on the shelves. Items are marked with three prices that are reduced as time goes on – the first price is the cost needed to buy that item the first week it is put out. The second price is the price it costs to buy the item the second week it is in the store,
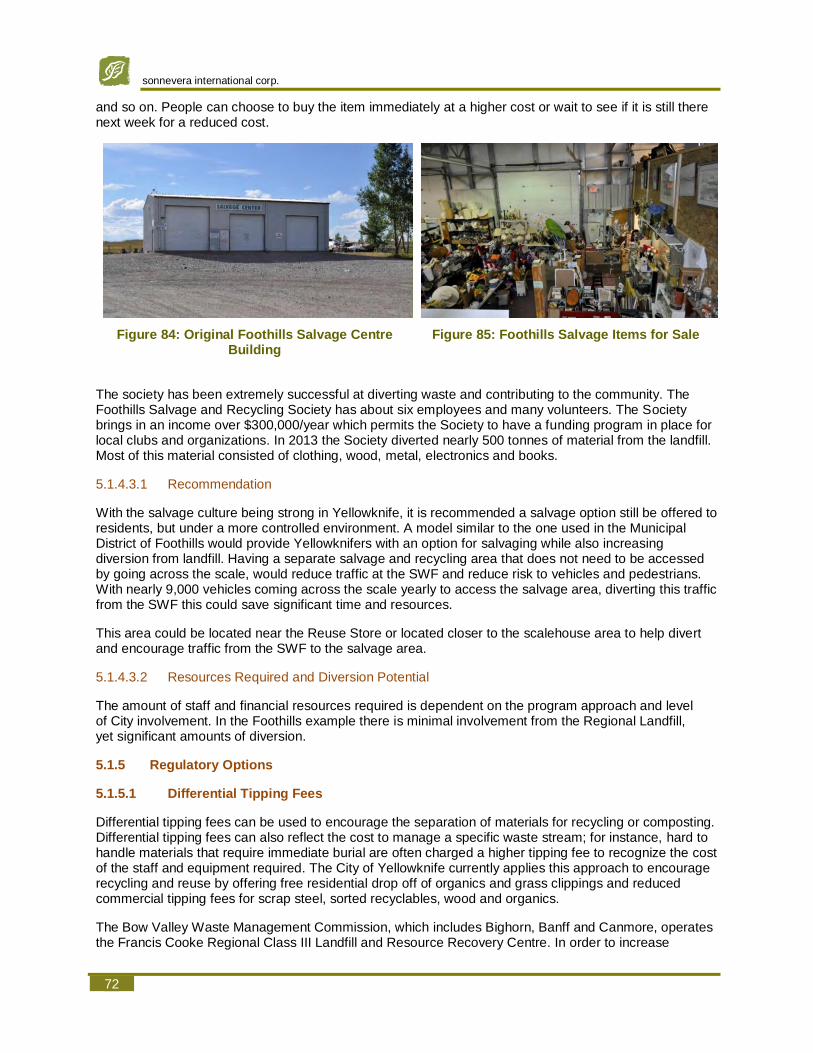
sonnevera international corp.
72
and so on. People can choose to buy the item immediately at a higher cost or wait to see if it is still there next week for a reduced cost.
Figure 84: Original Foothills Salvage Centre Building
Figure 85: Foothills Salvage Items for Sale
The society has been extremely successful at diverting waste and contributing to the community. The Foothills Salvage and Recycling Society has about six employees and many volunteers. The Society brings in an income over $300,000/year which permits the Society to have a funding program in place for local clubs and organizations. In 2013 the Society diverted nearly 500 tonnes of material from the landfill. Most of this material consisted of clothing, wood, metal, electronics and books.
5.1.4.3.1 Recommendation
With the salvage culture being strong in Yellowknife, it is recommended a salvage option still be offered to residents, but under a more controlled environment. A model similar to the one used in the Municipal District of Foothills would provide Yellowknifers with an option for salvaging while also increasing diversion from landfill. Having a separate salvage and recycling area that does not need to be accessed by going across the scale, would reduce traffic at the SWF and reduce risk to vehicles and pedestrians. With nearly 9,000 vehicles coming across the scale yearly to access the salvage area, diverting this traffic from the SWF this could save significant time and resources.
This area could be located near the Reuse Store or located closer to the scalehouse area to help divert and encourage traffic from the SWF to the salvage area.
5.1.4.3.2 Resources Required and Diversion Potential
The amount of staff and financial resources required is dependent on the program approach and level of City involvement. In the Foothills example there is minimal involvement from the Regional Landfill, yet significant amounts of diversion.
5.1.5 Regulatory Options
5.1.5.1 Differential Tipping Fees
Differential tipping fees can be used to encourage the separation of materials for recycling or composting. Differential tipping fees can also reflect the cost to manage a specific waste stream; for instance, hard to handle materials that require immediate burial are often charged a higher tipping fee to recognize the cost of the staff and equipment required. The City of Yellowknife currently applies this approach to encourage recycling and reuse by offering free residential drop off of organics and grass clippings and reduced commercial tipping fees for scrap steel, sorted recyclables, wood and organics.
The Bow Valley Waste Management Commission, which includes Bighorn, Banff and Canmore, operates the Francis Cooke Regional Class III Landfill and Resource Recovery Centre. In order to increase
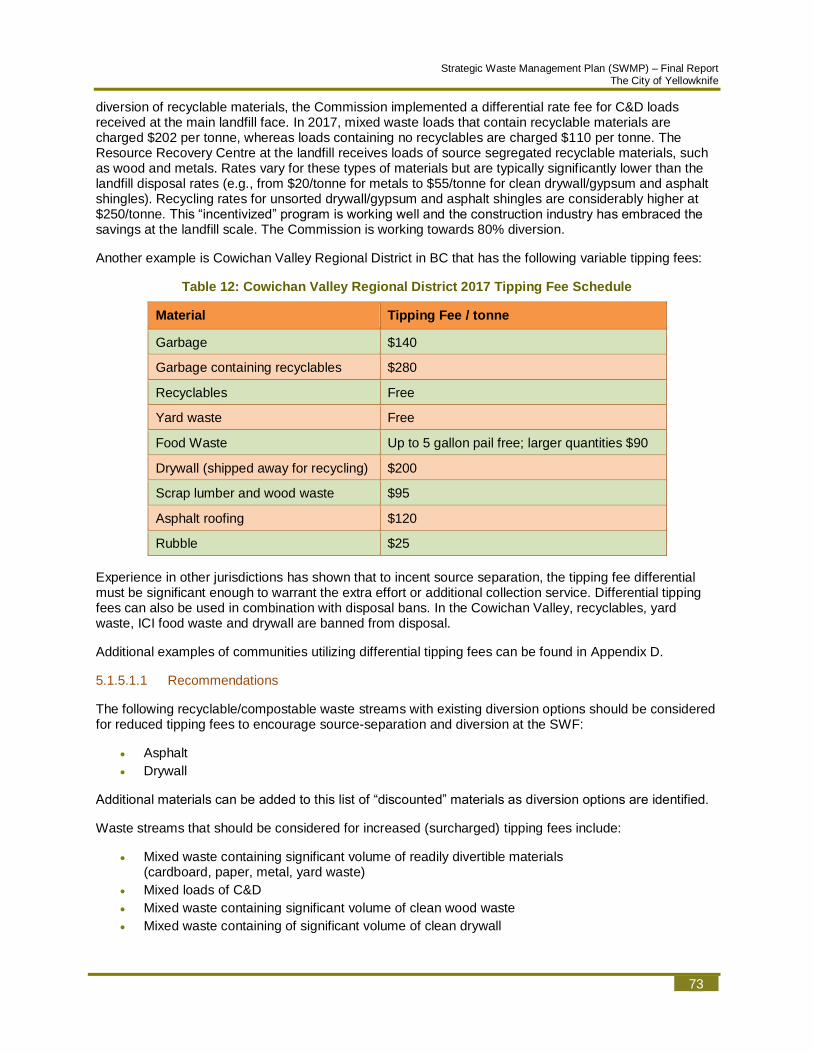
Strategic Waste Management Plan (SWMP) – Final Report The City of Yellowknife
73
diversion of recyclable materials, the Commission implemented a differential rate fee for C&D loads received at the main landfill face. In 2017, mixed waste loads that contain recyclable materials are charged $202 per tonne, whereas loads containing no recyclables are charged $110 per tonne. The Resource Recovery Centre at the landfill receives loads of source segregated recyclable materials, such as wood and metals. Rates vary for these types of materials but are typically significantly lower than the landfill disposal rates (e.g., from $20/tonne for metals to $55/tonne for clean drywall/gypsum and asphalt shingles). Recycling rates for unsorted drywall/gypsum and asphalt shingles are considerably higher at $250/tonne. This “incentivized” program is working well and the construction industry has embraced the savings at the landfill scale. The Commission is working towards 80% diversion.
Another example is Cowichan Valley Regional District in BC that has the following variable tipping fees:
Table 12: Cowichan Valley Regional District 2017 Tipping Fee Schedule
Material Tipping Fee / tonne
Garbage $140
Garbage containing recyclables $280
Recyclables Free
Yard waste Free
Food Waste Up to 5 gallon pail free; larger quantities $90
Drywall (shipped away for recycling) $200
Scrap lumber and wood waste $95
Asphalt roofing $120
Rubble $25
Experience in other jurisdictions has shown that to incent source separation, the tipping fee differential must be significant enough to warrant the extra effort or additional collection service. Differential tipping fees can also be used in combination with disposal bans. In the Cowichan Valley, recyclables, yard waste, ICI food waste and drywall are banned from disposal.
Additional examples of communities utilizing differential tipping fees can be found in Appendix D.
5.1.5.1.1 Recommendations
The following recyclable/compostable waste streams with existing diversion options should be considered for reduced tipping fees to encourage source-separation and diversion at the SWF:
• Asphalt
• Drywall
Additional materials can be added to this list of “discounted” materials as diversion options are identified.
Waste streams that should be considered for increased (surcharged) tipping fees include:
• Mixed waste containing significant volume of readily divertible materials (cardboard, paper, metal, yard waste)
• Mixed loads of C&D
• Mixed waste containing significant volume of clean wood waste
• Mixed waste containing of significant volume of clean drywall

sonnevera international corp.
74
The setting of differential tipping fees should be considered in tandem with annual budgeting with an aim to ensure that WMF operating costs can be adequately funded through tipping fee revenue.
5.1.5.1.2 Resources Required and Diversion Potential
Staff time will be required on an annual basis to establish differential tipping fees that ensure that SWF costs are covered, but incent diversion. A budget of $10,000 has been allocated for the first year to hire a consultant to assist in developing the initial fee structure and to provide funding for associated promotional activities.
The scale house software would need to be modified to incorporate differential tipping fees and some training of scale house staff would be required. No budget has been allocated to this activity.
As economic instruments like differential tipping fees typically have a significant effect on the practices of ICI and CD waste generators and haulers, it is estimated that 1,000 tonnes can be diverted, depending on the amount of differential and associated promotion.
Differential Tipping Fees Capital
$ Operating
$ FTE
Establishing and Promoting Initial Fee Structure $10,000 0.1 for one year
Annual review of fee structure $0 0 (included in regular budgeting process)
5.1.5.2 Disposal Bans
With disposal bans, specified materials are prohibited from being disposed as garbage. This regulatory approach is enforced at the disposal facility. This is a common policy approach to encourage recycling by businesses and the construction/demolition industry without having to engage in the cost of providing a collection program. Bans are only put in place when recycling infrastructure is available.
For example, Regional District of Nanaimo in BC implemented a disposal ban on ICI organic waste in 2005 that affected roughly 800 businesses and institutions. The bylaw, which is enforced at their landfill and transfer station, bans all food and yard waste. If a load of waste arriving at their disposal facilities contains an evident volume of organic waste, it is subject to a doubling of the tipping fee on the whole load. An estimated 6,000 tonnes of commercial organics is diverted annually through this program. The Regional District has also banned gypsum (drywall), wood waste, recyclable cardboard, paper, metal, household plastic containers, and tires from disposal.
Commonly banned materials include: cardboard, paper, metal, yard waste and products/packaging covered by a provincial or territorial stewardship program.
Additional examples of communities that have implemented disposal bans can be found in Appendix D.
5.1.5.2.1 Recommendation
Because disposal bans are an effective and low-cost policy mechanism to drive diversion, implementation of disposal bans is recommended for waste materials that have an existing collection and processing infrastructure in place, once voluntary approaches have been fully implemented.
Disposal bans (enforced at the waste management facility) could be considered for cardboard and other recyclable paper fibres, metal, organic waste, wood, concrete, asphalt, drywall (clean), and materials covered under a territorial stewardship program (i.e., beverage containers, tires, and electronics).
Once an ICI organics collection program has been piloted and deemed successful, a disposal ban on all organic waste could also be considered. Similarly, a disposal ban on clean wood waste could be considered as a mechanism to support expanded wood waste recycling activities at the SWF.
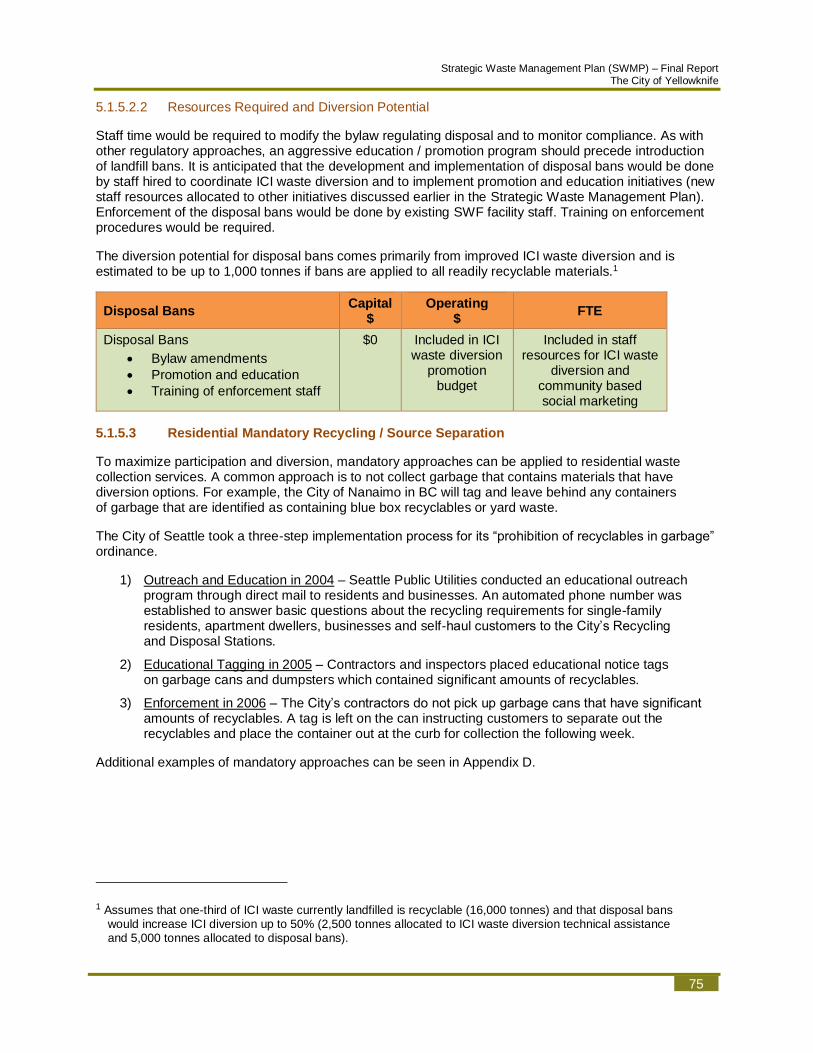
Strategic Waste Management Plan (SWMP) – Final Report The City of Yellowknife
75
5.1.5.2.2 Resources Required and Diversion Potential
Staff time would be required to modify the bylaw regulating disposal and to monitor compliance. As with other regulatory approaches, an aggressive education / promotion program should precede introduction of landfill bans. It is anticipated that the development and implementation of disposal bans would be done by staff hired to coordinate ICI waste diversion and to implement promotion and education initiatives (new staff resources allocated to other initiatives discussed earlier in the Strategic Waste Management Plan). Enforcement of the disposal bans would be done by existing SWF facility staff. Training on enforcement procedures would be required.
The diversion potential for disposal bans comes primarily from improved ICI waste diversion and is estimated to be up to 1,000 tonnes if bans are applied to all readily recyclable materials.1
Disposal Bans Capital
$ Operating
$ FTE
Disposal Bans
• Bylaw amendments
• Promotion and education
• Training of enforcement staff
$0 Included in ICI waste diversion
promotion budget
Included in staff resources for ICI waste
diversion and community based social marketing
5.1.5.3 Residential Mandatory Recycling / Source Separation
To maximize participation and diversion, mandatory approaches can be applied to residential waste collection services. A common approach is to not collect garbage that contains materials that have diversion options. For example, the City of Nanaimo in BC will tag and leave behind any containers of garbage that are identified as containing blue box recyclables or yard waste.
The City of Seattle took a three-step implementation process for its “prohibition of recyclables in garbage” ordinance.
1) Outreach and Education in 2004 – Seattle Public Utilities conducted an educational outreach program through direct mail to residents and businesses. An automated phone number was established to answer basic questions about the recycling requirements for single-family residents, apartment dwellers, businesses and self-haul customers to the City’s Recycling and Disposal Stations.
2) Educational Tagging in 2005 – Contractors and inspectors placed educational notice tags on garbage cans and dumpsters which contained significant amounts of recyclables.
3) Enforcement in 2006 – The City’s contractors do not pick up garbage cans that have significant amounts of recyclables. A tag is left on the can instructing customers to separate out the recyclables and place the container out at the curb for collection the following week.
Additional examples of mandatory approaches can be seen in Appendix D.
1 Assumes that one-third of ICI waste currently landfilled is recyclable (16,000 tonnes) and that disposal bans would increase ICI diversion up to 50% (2,500 tonnes allocated to ICI waste diversion technical assistance and 5,000 tonnes allocated to disposal bans).
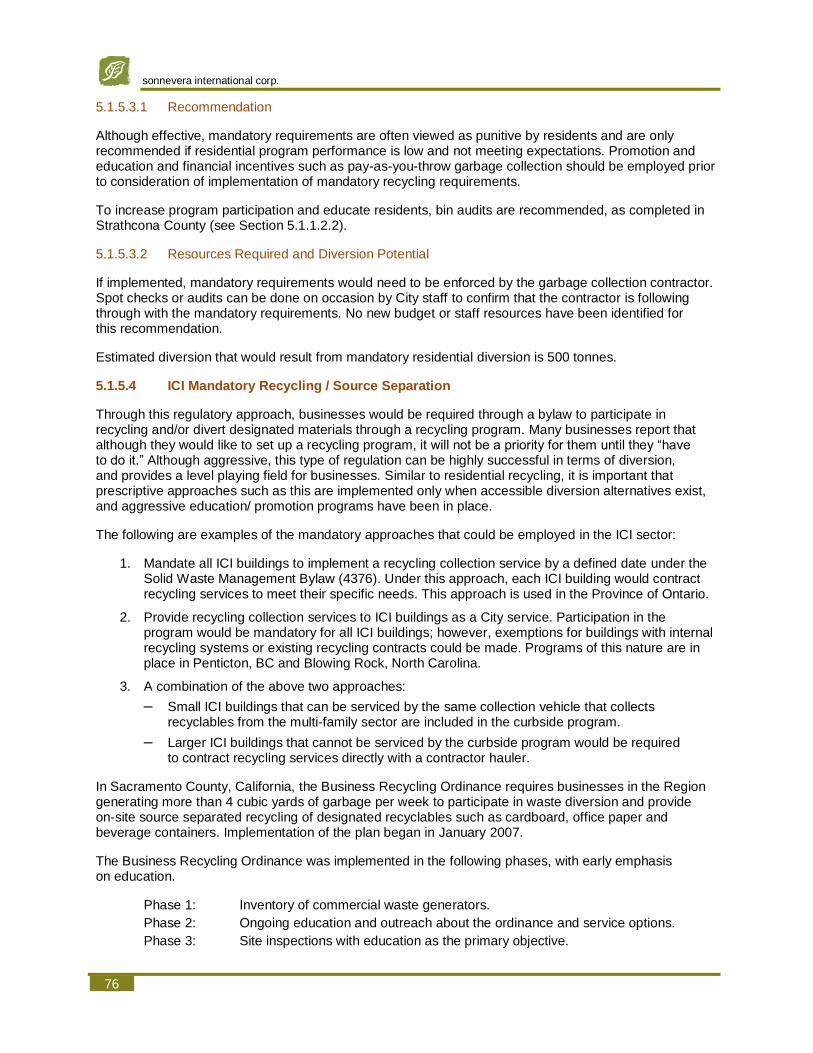
sonnevera international corp.
76
5.1.5.3.1 Recommendation
Although effective, mandatory requirements are often viewed as punitive by residents and are only recommended if residential program performance is low and not meeting expectations. Promotion and education and financial incentives such as pay-as-you-throw garbage collection should be employed prior to consideration of implementation of mandatory recycling requirements.
To increase program participation and educate residents, bin audits are recommended, as completed in Strathcona County (see Section 5.1.1.2.2).
5.1.5.3.2 Resources Required and Diversion Potential
If implemented, mandatory requirements would need to be enforced by the garbage collection contractor. Spot checks or audits can be done on occasion by City staff to confirm that the contractor is following through with the mandatory requirements. No new budget or staff resources have been identified for this recommendation.
Estimated diversion that would result from mandatory residential diversion is 500 tonnes.
5.1.5.4 ICI Mandatory Recycling / Source Separation
Through this regulatory approach, businesses would be required through a bylaw to participate in recycling and/or divert designated materials through a recycling program. Many businesses report that although they would like to set up a recycling program, it will not be a priority for them until they “have to do it.” Although aggressive, this type of regulation can be highly successful in terms of diversion, and provides a level playing field for businesses. Similar to residential recycling, it is important that prescriptive approaches such as this are implemented only when accessible diversion alternatives exist, and aggressive education/ promotion programs have been in place.
The following are examples of the mandatory approaches that could be employed in the ICI sector:
1. Mandate all ICI buildings to implement a recycling collection service by a defined date under the Solid Waste Management Bylaw (4376). Under this approach, each ICI building would contract recycling services to meet their specific needs. This approach is used in the Province of Ontario.
2. Provide recycling collection services to ICI buildings as a City service. Participation in the program would be mandatory for all ICI buildings; however, exemptions for buildings with internal recycling systems or existing recycling contracts could be made. Programs of this nature are in place in Penticton, BC and Blowing Rock, North Carolina.
3. A combination of the above two approaches:
– Small ICI buildings that can be serviced by the same collection vehicle that collects recyclables from the multi-family sector are included in the curbside program.
– Larger ICI buildings that cannot be serviced by the curbside program would be required to contract recycling services directly with a contractor hauler.
In Sacramento County, California, the Business Recycling Ordinance requires businesses in the Region generating more than 4 cubic yards of garbage per week to participate in waste diversion and provide on-site source separated recycling of designated recyclables such as cardboard, office paper and beverage containers. Implementation of the plan began in January 2007.
The Business Recycling Ordinance was implemented in the following phases, with early emphasis on education.
Phase 1: Inventory of commercial waste generators.
Phase 2: Ongoing education and outreach about the ordinance and service options.
Phase 3: Site inspections with education as the primary objective.
Strategic Waste Management Plan (SWMP) – Final Report The City of Yellowknife
77
The County’s environmental department conducts site inspections to educate the business community about what is required to comply with the program and to provide information about the options available to establish recycling programs.
Additional ICI mandatory recycling and source separation approaches can be found in Appendix D.
5.1.5.4.1 Recommendation
Like disposal bans, regulatory approaches can be highly effective at establishing diversion programs in the ICI sector. Although effective, mandatory requirements can be viewed as punitive and are only recommended after intensive promotions if ICI diversion performance is low and not meeting expectations. The effectiveness of an ICI-targeted promotion and education program, combined with technical support, plus the influence of disposal bans on ICI generators, should be reviewed in advance of implementing mandatory recycling requirements.
5.1.5.4.2 Resources Required and Diversion Potential
The amount of staff and financial resources required is dependent on the approach to mandatory recycling selected and therefore has not been estimated for inclusion in the Strategic Waste Management Plan. However, it is assumed that most of the preparation and execution of a mandatory approach would be undertaken by a staff person dedicated to ICI waste diversion (identified previously to support the ICI waste diversion recommendations).
A mandatory approach to ICI waste diversion would be intended to maximize diversion potential and therefore an additional estimated 1,000 tonnes of diversion is allocated to this approach.
5.1.5.5 City of Yellowknife Solid Waste Management Bylaw (No. 4376)
The Solid Waste Management Bylaw (the bylaw) was created in 2005 and is a consolidated bylaw of the previous Garbage and Solid Waste Levy Bylaws. This consolidation was an efficient and practical step. The bylaw also references the Fees and Charges Bylaw No. 4436 which is where the Tipping and Solid Waste Related Fees for Commercial and Residential waste are hosted, as well as the Single Family Solid Waste Levy.

sonnevera international corp.
78
Table 13: Commercial Waste SWF Tipping Fees
Table 14: Residential Waste SWF Tipping Fees
Table 15: Single Family Solid Waste Levy
With the bylaw being created in 2005, from two different bylaws, there are some opportunities for increased efficiencies and corrections with an updated version. For instance, there are definitions not

Strategic Waste Management Plan (SWMP) – Final Report The City of Yellowknife
79
used in the bylaw content, such as “compactor” and there are terms used in the bylaw that are not relevant at this time including “Garbage Receptacle Limits” and “Tag Fees”. These limits were in place when residents could use their own garbage containers and had to purchase tags for excess garbage bags; before Green Cart was implemented. Currently there is no mention of food waste in the bylaw, other than businesses must have garbage collection at least once every two weeks if they have food waste. Thus, there is an opportunity to add in language around food waste diversion options, and/or requirements. Additional clauses regarding recyclables can be added to encourage and/or require increased diversion.
The Fees and Charges Bylaw also has a unique Solid Waste Contractor Rate that appears to apply to the solid waste contractor delivering waste to the solid waste facility that has originated from multi-family unit and commercial premises in the City. The fees for the contractor are specified as $14 less than the commercial tipping fee for waste, and are the same for Sorted Recyclables and Organics.
Table 16: Contractor Waste SWF Tipping Fees
However, these fees are not currently utilized, and therefore should be removed from the bylaw.
It is also noteworthy the current bylaw has important and relevant sections on salvaging and how people are doing so at their own risk and that salvaging is only permitted in the designated salvaging area. Also, the voluntary penalties in Section C are quite strong and have valuable penalty options if needed. These are a good basis for creating future penalties associated with mandatory recycling and organics diversion if deemed required.
For future recycling programs for the multi-family and ICI sector, it is important to realize the current bylaw identifies a multi-family complex as a unit with 5 or more premises in one common structure. This can be a critical element to consider when determining which homes get City residential service versus requiring the building to find their own recycling service through a contractor. Often multi-family complexes will try to get the same service as a residential home and expect The City to provide the service. Having clear definitions of a multi-family complex reduces the risk associated with different service options in the case where the program is different for different sectors. With regards to ICI, businesses are not permitted to use the Blue Bin Stations around the city – they are only permitted to use the recycling stations at the SWF. This is a consideration if making recycling mandatory for the ICI sector. It is essential the ICI sector feels they have fair access to recycling options yet are providing adequate funding for a program if it is being implemented by The City.
The bylaw will need to be regularly updated to coincide with the implementation of new diversion programming. This helps ensure enforcement is possible and increases program effectiveness.

sonnevera international corp.
80
5.1.6 Residuals Management
The Yellowknife SWF has multiple areas for material storage, processing, and disposal. The facility has been operating since 1974 when it opened as a dump with uncontrolled burning and has developed to a modified landfill (1990), then to a balefill (1993). The City has invested in several upgrades and expansions over the facility’s four decades of operation. The facility is now home to a centralized compost facility, C&D waste disposal area, recyclable material storage, baling facility, landfill cell (balefill area), residential drop-off transfer station, and weigh scales.
The City measures the tonnage of materials entering the SWF each year. The total waste disposed at the facility is shown in Table 17. Of the material disposed at the facility, between 5,300 tonnes and 8,300 tonnes was construction and demolition (C&D) material that is disposed in a different section of the facility without baling.
Table 17: Summary of Waste Disposal at the SWF from 2014 to 2017 (as reported by the City)
Description 2014 2015 2016 2017
Total Waste Disposed (tonnes) 19,514.82 27,515.49 19,338.56 24,288.70
C&D Disposed (tonnes) 5,325.46 7,380.96 5,988.53 8,282.10
Total MSW Balefilled (tonnes) 14,189.36 20,134.53 13,350.03 16,006.60
Most material entering the facility for disposal is municipal solid waste (MSW) which is baled and placed in an engineered cell.
For a full review of Yellowknife’s landfill and finances, see Appendix G.
5.1.6.1 Solid Waste Disposal Projections
Data available from the City of Yellowknife indicates that between 19,000 tonnes and 28,000 tonnes of waste per year was disposed at the Yellowknife SWF from 2014 to 2017. Based on NWT Bureau of Statistics (BOS) population estimates for the Yellowknife region, the average disposal rate was 1.143 tonnes/capita of which an average 390 kg/capita was C&D material and 753 kg/capita was MSW which is typically baled and placed for disposal.
Figure 86: Summary of Per Capita Disposal in Yellowknife from 2014 to 2017
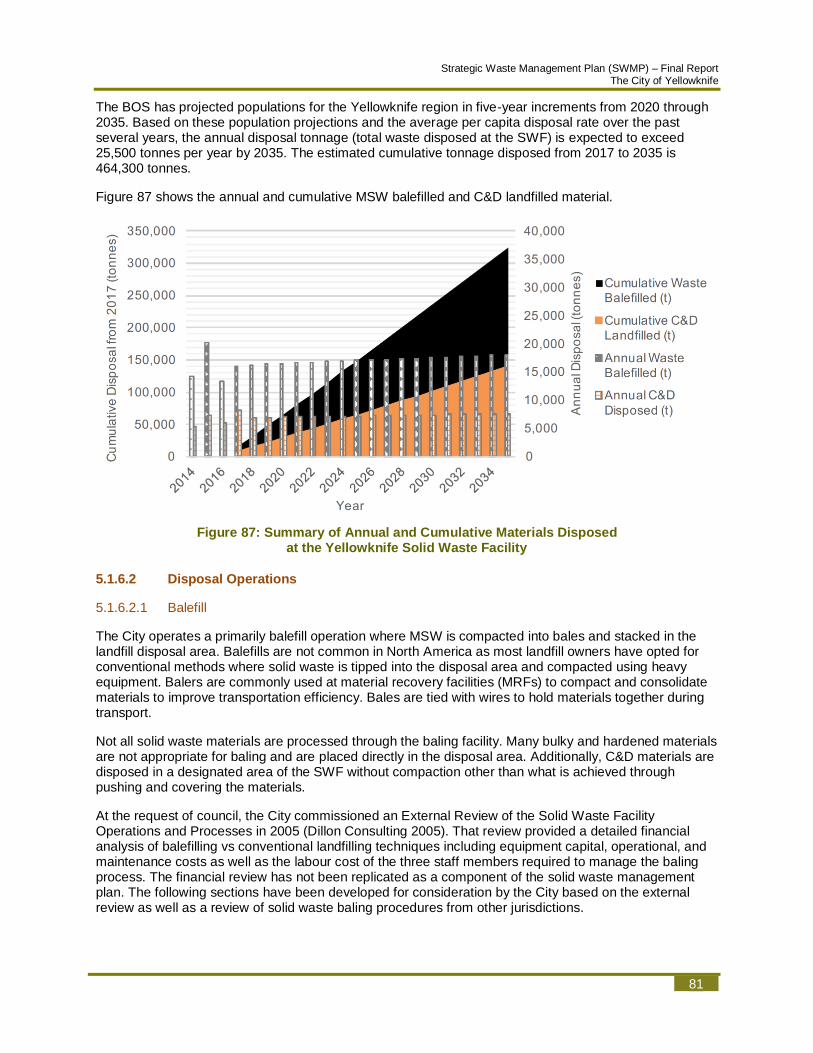
Strategic Waste Management Plan (SWMP) – Final Report The City of Yellowknife
81
The BOS has projected populations for the Yellowknife region in five-year increments from 2020 through 2035. Based on these population projections and the average per capita disposal rate over the past several years, the annual disposal tonnage (total waste disposed at the SWF) is expected to exceed 25,500 tonnes per year by 2035. The estimated cumulative tonnage disposed from 2017 to 2035 is 464,300 tonnes.
Figure 87 shows the annual and cumulative MSW balefilled and C&D landfilled material.
Figure 87: Summary of Annual and Cumulative Materials Disposed at the Yellowknife Solid Waste Facility
5.1.6.2 Disposal Operations
5.1.6.2.1 Balefill
The City operates a primarily balefill operation where MSW is compacted into bales and stacked in the landfill disposal area. Balefills are not common in North America as most landfill owners have opted for conventional methods where solid waste is tipped into the disposal area and compacted using heavy equipment. Balers are commonly used at material recovery facilities (MRFs) to compact and consolidate materials to improve transportation efficiency. Bales are tied with wires to hold materials together during transport.
Not all solid waste materials are processed through the baling facility. Many bulky and hardened materials are not appropriate for baling and are placed directly in the disposal area. Additionally, C&D materials are disposed in a designated area of the SWF without compaction other than what is achieved through pushing and covering the materials.
At the request of council, the City commissioned an External Review of the Solid Waste Facility Operations and Processes in 2005 (Dillon Consulting 2005). That review provided a detailed financial analysis of balefilling vs conventional landfilling techniques including equipment capital, operational, and maintenance costs as well as the labour cost of the three staff members required to manage the baling process. The financial review has not been replicated as a component of the solid waste management plan. The following sections have been developed for consideration by the City based on the external review as well as a review of solid waste baling procedures from other jurisdictions.

sonnevera international corp.
82
5.1.6.2.2 Advantages of Balefill Operations
Several advantages to balefill operations have been identified by municipalities managing disposal facilities:
• Baling reduces wind-blown waste. In some regions (e.g., Southern Alberta) high wind speeds historically forced closures of the landfill tipping face due to safety, environmental and aesthetic concerns associated with blowing litter. The City of Lethbridge, Alberta, which receives the second most windy days of any city in Canada, maintains a baler to ensure that waste disposal can occur throughout the year.
• Baling reduces bird attraction. Operators have found that the tightly packed bales of waste are less attractive to birds than conventional landfills. Transport Canada’s bird hazard risk assessment typically requires a minimum 8 km buffer for commercial airports and landfills containing food wastes. Transport Canada has historically applied a more practical 3 km setback in the North. The Yellowknife SWF is slightly more than 3 km from the airport. It is not clear whether baling MSW is an operational requirement from Transport Canada.
• Baling reduces cover material required. A lack of wind-blown waste reduces the need for daily cover material, reducing the cost and volume of soil required in the landfill.
• Baling increases waste density. Baling is sometimes used by facilities as an alternative to in-place compaction within the landfill cell. Baling waste increases density of landfills compared to open dump sites with no in-place compaction and small facilities which do not use steel-wheeled landfill compactors. Waste baling is also used by some transfer facilities to decrease long-haul trucking costs by maximizing density of loads shipped over long distances.
• Baling may offer cost advantages. Fuel for landfill compaction equipment is a significant cost to municipalities. Fuel costs are reduced for balefill operations as equipment is smaller and more efficient. The 2006 External Review of Solid Waste Facility Operations and Processes (Dillon) indicated cost savings of baling over conventional landfilling methods over a 20 year period.
5.1.6.2.3 Disadvantages of Balefill Operations
While there are advantages to balefill operations, there are also several disadvantages have been identified by municipalities managing disposal facilities:
• Not all material is suitable for baling. Some MSW and most C&D material is not baled in Yellowknife. While C&D material is disposed separately, the bulky and hardened MSW material that is disposed in the balefill area is disposed loose, decreasing the overall density of waste.
• Baling may not outperform density of in-place compaction. The density of waste bales is dependent on the baler’s configuration and the characteristics of the waste. Larger, more expensive balers produce larger and denser bales. It is expected that bales produced in Yellowknife have a high density but an estimated 20% of MSW is placed loose. The apparent density estimated by Dillon (2006) is 0.60 tonnes/m3, lower than the 0.75 tonnes/m3 typically expected in a modern landfill.
• Baling MSW requires significant maintenance and downtime affects operations. While recyclable materials are relatively uniform and dry, MSW composition and moisture content may vary widely between loads. Regular preventative maintenance as well as mechanical servicing is required to prevent significant downtime. When downtime occurs, MSW must be stored until equipment can be repaired.
• Baling MSW may produce significant leachate. Many facilities have had issues managing the amount of liquid produced by the baling process. Precipitation and waste composition significantly affect the leachate produced by baling MSW. Leachate management systems are typically required at the baling facility to control environmental impact.

Strategic Waste Management Plan (SWMP) – Final Report The City of Yellowknife
83
5.1.6.2.4 Recommendations
It is unclear in previous design documents whether baling MSW is a direct requirement from Transport Canada based on its Bird Hazard Risk Assessment criteria. Therefore, The City should engage Transport Canada and the local airport operator in discussions to determine whether operational changes to the disposal process at the SWF are acceptable and request a written record of the airport operator’s hazard assessment for the SWF. This will serve to clarify and record any operational constraints due to proximity to the airport so there is more complete and accurate information for future decisions.
There is potential that this would support a recommendation to switch to compacting instead of baling. The decision would be subject to a determination of achieved apparent density of the balefill as well as the cost and availability of soil for daily cover. Apparent density would be calculated based on tonnage disposed and airspace consumption over a given period. Preferably this would be facilitated through two drone surveys one year apart, but could be done over 6 or 8 months (spring to summer/winter) capturing the summer peak season.
5.1.6.3 Landfill Analysis
The Preliminary Design Report prepared by Dillon Consulting estimated that the “New Solid Waste Facility” would have sufficient capacity to provide the estimated 535,800 m3 required for solid waste and cover material over 20 years (through 2026). The report (Dillon 2006) notes that an approximate 375,000 m3 of airspace could be generated by sustaining existing quarrying operation for 7.5 years, increasing the total landfill capacity to 40 years.
The landfill analysis has been limited to the balefill disposal area of the SWF (identified as Cell A and Cell B in facility plans). Although C&D material is also deposited at the site, it is primarily managed separately from the MSW that is suitable for baling and has therefore not been considered in the airspace analysis.
5.1.6.3.1 Landfill Airspace
A preliminary landfill airspace analysis was conducted based on the topographical information made available from the City. The GIS data of the most recent flight survey and the limit of waste identified in the Solid Waste Facility Landfill Cell B Record Drawings (Dillon 2017) allowed the calculation of approximate airspace remaining in the balefill area (Cell A and Cell B). Final cover contours were not provided for analysis, therefore Tetra Tech developed conceptual level final contours to form the basis of landfill airspace calculations. Based on final cover contours of 3H:1V, there is an estimated 284,800 m3
of airspace remaining in the balefill area.
5.1.6.3.2 Landfill Lifespan
The landfill lifespan was calculated based on a status quo scenario. In this scenario, no additional diversion programs were considered resulting in a constant per capita MSW disposal rate of 753 kg/capita/year. Typically landfill lifespan is calculated based on measured apparent density at the subject site but this site-specific information was not available for the Yellowknife SWF. Based on the New Solid Waste Facility – Preliminary Design Report (Dillon 2006) the expected apparent density (density of waste in the landfill including cover materials) of the balefill facility is 0.60 tonnes/cu. m.2 Table 18 shows that the balefill facility has an estimated 10 years of airspace remaining at the current disposal rate.
2 Apparent density calculated in the preliminary design report assumed 80% of the material would be baled with a density of
0.75t/m3, 20% of waste would be placed loose with a density of 0.5t/m3, and 15% cover material would be used.
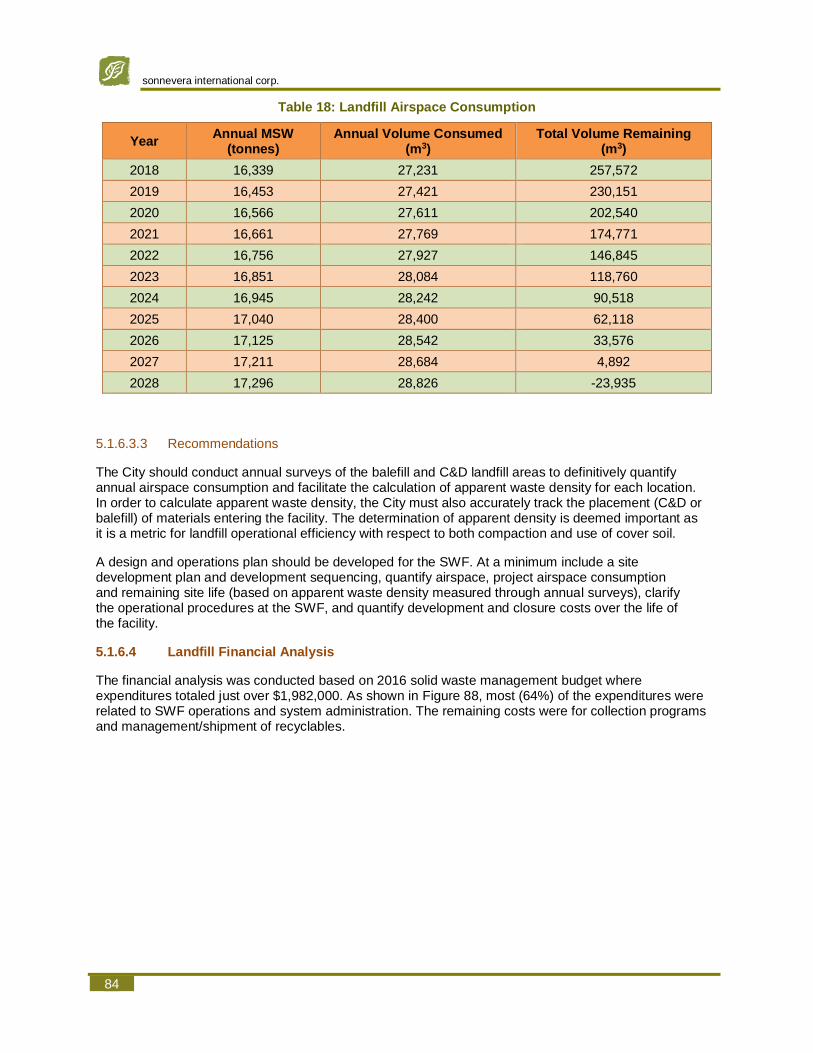
sonnevera international corp.
84
Table 18: Landfill Airspace Consumption
Year Annual MSW
(tonnes) Annual Volume Consumed
(m3) Total Volume Remaining
(m3)
2018 16,339 27,231 257,572
2019 16,453 27,421 230,151
2020 16,566 27,611 202,540
2021 16,661 27,769 174,771
2022 16,756 27,927 146,845
2023 16,851 28,084 118,760
2024 16,945 28,242 90,518
2025 17,040 28,400 62,118
2026 17,125 28,542 33,576
2027 17,211 28,684 4,892
2028 17,296 28,826 -23,935
5.1.6.3.3 Recommendations
The City should conduct annual surveys of the balefill and C&D landfill areas to definitively quantify annual airspace consumption and facilitate the calculation of apparent waste density for each location. In order to calculate apparent waste density, the City must also accurately track the placement (C&D or balefill) of materials entering the facility. The determination of apparent density is deemed important as it is a metric for landfill operational efficiency with respect to both compaction and use of cover soil.
A design and operations plan should be developed for the SWF. At a minimum include a site development plan and development sequencing, quantify airspace, project airspace consumption and remaining site life (based on apparent waste density measured through annual surveys), clarify the operational procedures at the SWF, and quantify development and closure costs over the life of the facility.
5.1.6.4 Landfill Financial Analysis
The financial analysis was conducted based on 2016 solid waste management budget where expenditures totaled just over $1,982,000. As shown in Figure 88, most (64%) of the expenditures were related to SWF operations and system administration. The remaining costs were for collection programs and management/shipment of recyclables.

Strategic Waste Management Plan (SWMP) – Final Report The City of Yellowknife
85
Figure 88: Summary of the 2016 Solid Waste Management Budget
5.1.6.4.1 Operational Costs
The cost to operate the SWF totals almost $1,270,000 per year, 70% of which is allocated to salaries and benefits of employees. Based on the total waste disposed at the SWF in 2016 the cost to manage the facility is approximately $66/tonne. This cost of operation does not include the capital cost to construct the facility or the long-term financial and environmental liability of the site.
5.1.6.4.2 Closure and Post Closure Costs
In addition to ongoing operational costs, the future costs for closure and post-closure care are crucial in assessing landfill finances.
The capital cost for closure was calculated based on the waste footprint for the balefill area (Cell A and Cell B) using conceptual closure contours developed by Tetra Tech, and unit costs developed by Dillon (2016) to estimate the probably closure and post-closure costs. The estimated future cost to close the balefill area is approximately $3.6 million as shown in Table 19.
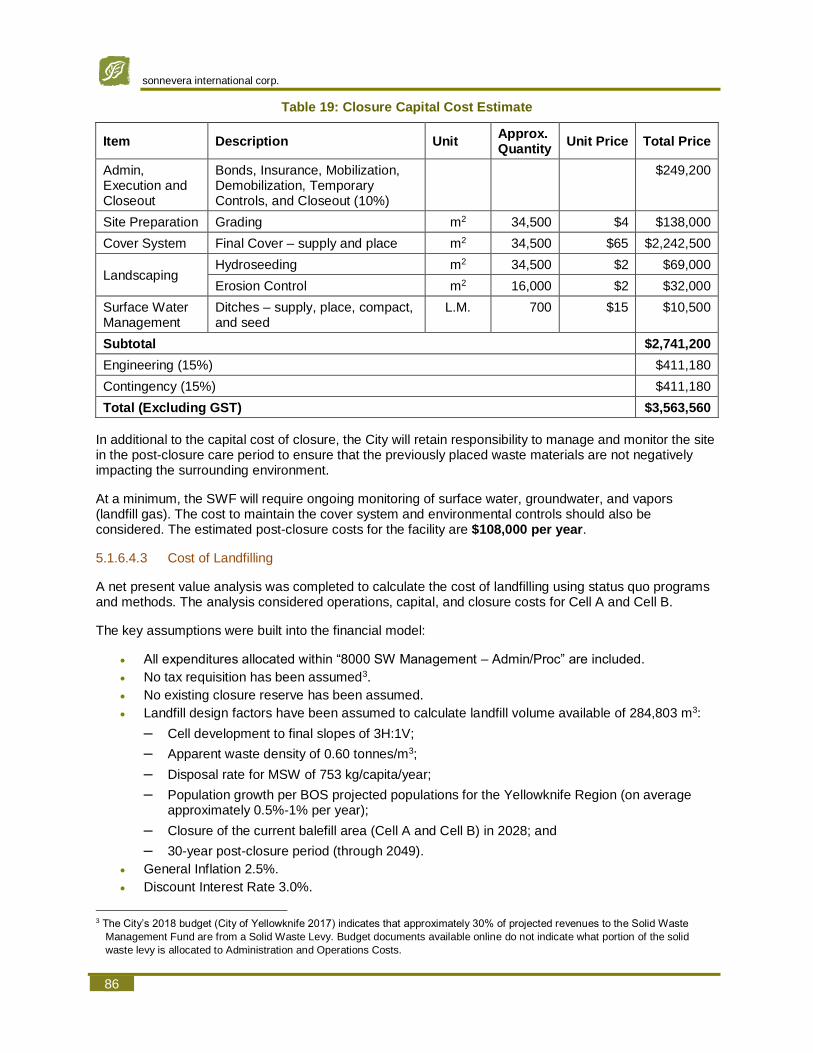
sonnevera international corp.
86
Table 19: Closure Capital Cost Estimate
Item Description Unit Approx. Quantity
Unit Price Total Price
Admin, Execution and Closeout
Bonds, Insurance, Mobilization, Demobilization, Temporary Controls, and Closeout (10%)
$249,200
Site Preparation Grading m2 34,500 $4 $138,000
Cover System Final Cover – supply and place m2 34,500 $65 $2,242,500
Landscaping Hydroseeding m2 34,500 $2 $69,000
Erosion Control m2 16,000 $2 $32,000
Surface Water Management
Ditches – supply, place, compact, and seed
L.M. 700 $15 $10,500
Subtotal $2,741,200
Engineering (15%) $411,180
Contingency (15%) $411,180
Total (Excluding GST) $3,563,560
In additional to the capital cost of closure, the City will retain responsibility to manage and monitor the site in the post-closure care period to ensure that the previously placed waste materials are not negatively impacting the surrounding environment.
At a minimum, the SWF will require ongoing monitoring of surface water, groundwater, and vapors (landfill gas). The cost to maintain the cover system and environmental controls should also be considered. The estimated post-closure costs for the facility are $108,000 per year.
5.1.6.4.3 Cost of Landfilling
A net present value analysis was completed to calculate the cost of landfilling using status quo programs and methods. The analysis considered operations, capital, and closure costs for Cell A and Cell B.
The key assumptions were built into the financial model:
• All expenditures allocated within “8000 SW Management – Admin/Proc” are included.
• No tax requisition has been assumed3.
• No existing closure reserve has been assumed.
• Landfill design factors have been assumed to calculate landfill volume available of 284,803 m3:
– Cell development to final slopes of 3H:1V;
– Apparent waste density of 0.60 tonnes/m3;
– Disposal rate for MSW of 753 kg/capita/year;
– Population growth per BOS projected populations for the Yellowknife Region (on average approximately 0.5%-1% per year);
– Closure of the current balefill area (Cell A and Cell B) in 2028; and
– 30-year post-closure period (through 2049).
• General Inflation 2.5%.
• Discount Interest Rate 3.0%.
3 The City’s 2018 budget (City of Yellowknife 2017) indicates that approximately 30% of projected revenues to the Solid Waste
Management Fund are from a Solid Waste Levy. Budget documents available online do not indicate what portion of the solid
waste levy is allocated to Administration and Operations Costs.

Strategic Waste Management Plan (SWMP) – Final Report The City of Yellowknife
87
Based on the analysis the cost of landfilling is:
• $200/tonne
• $120/m3
Current commercial tipping fees at the SWF are $121/tonne. Higher tipping rates are charged for materials from outside of City boundaries and for special waste. Various volume-based tipping fees are charged for residential loads and a portion of material is disposed for free on Amnesty Days throughout the year. Assuming that $121/tonne is the average tipping fee charged for all material disposed at the SWF, the net present value of the balefill area is -$13,145,000. This analysis indicates that the current tipping fee structure may be undervaluing airspace.
Additional refinement of operating costs related solely to the balefill area (rather than the full SWF) would provide a more accurate analysis of the cost of airspace. A more detailed analysis of revenue generated through the SWF’s current tipping fee schedule coupled with analysis of the solid waste reserve funds would be required to assess the financial viability of the existing system.
5.1.6.4.4 Recommendations
It is recommended The City disaggregate financial tracking for different portions of the SWF. Costs to manage these operations should be split from the operations of other portions of the facility to allow financial analysis of balefill/landfill operations. A greater level of specificity in costs and revenues associated with distinct operations at the SWF would allow more accurate and useful cost-benefit analysis for operational changes in each area.
Additionally, the economic analysis for the balefill facility should be updated. The baseline economic analysis presented in this document should be updated based on the facility planning, performance, and financial information collected through the steps outlined above. An updated economic analysis could review the implications to site life and the fundamental economics associated with potential diversion programs.
5.1.6.5 Waste-to-Energy Technologies for the SWF
For an extensive review of appropriate waste-to-energy (WtE) technologies for Yellowknife, see Appendix H.
5.1.6.5.1 Available Feedstock
In 2016 approximately 4,800 tonnes of C&D waste was diverted from landfill. There is a significant component of the existing C&D waste stream that is suitable as feedstock for a WtE facility. The waste composition study conducted by AET during Fall 2017 showed that approximately 50% of the C&D waste is clean (untreated) wood waste and 10% is treated wood. We assumed that 60% of the C&D waste can be regarded as a feedstock. In total approximately 15,000 tonnes of feedstock is available for a WtE facility in 2016. This is likely to increase to 30,000 tonnes per year by 2035 based on waste projections for landfilled waste and C&D waste. The total feedstock quantity identified will be used as a basis for determining an appropriate size of technology. These disposal figures for Yellowknife are after diversion (recycling and composting).
Recycling and composting are generally considered environmentally superior to energy recovery (according to the waste hierarchy). For the WtE study, it has been assumed that collected paper, fibres, plastics and organics will continue to be recycled and composted and not used in the combustion process.
The heating value of the feedstock could range from 11 to 13 GJ/tonne. New waste diversion initiatives in Yellowknife will influence the heating value. The reduction of organic waste (e.g., food waste) will increase the heating value of the feedstock, although this can be partially offset by increased diversion

sonnevera international corp.
88
of plastic and paper/cardboard packaging. It has been conservatively estimated by Morrison Hershfield that the lower heating value of waste, as received, will be 11 GJ/tonne.
In summary, the feedstock available for WtE is approximately 15,000 tonnes per year, growing to about 30,000 tonnes per year by 2035.
5.1.6.5.2 WtE Background Information
WtE generally has electricity or heat or both as a product for the generation of revenue. In 2017 the City paid approximately 23 cents per kWh for electricity, which, with adjustment riders is approximately 28 cents per kWh. The average heating oil cost in 2017 was $0.82/L, which equates to approximately $21 per GJ.
In Yellowknife there are 20 boilers sized at more than 20 kW for a total capacity of about 12 MW. It is generally not feasible to convert fossil fuel or biomass boilers to using MSW as fuel, but it may be possible to replace some of the boilers and use heat generated by a WtE facility. The WtE plant must be close enough to the users of the heat to make such use technically and financially feasible.
The City is currently installing a district biomass heating system for five City buildings, and heat from WtE could theoretically be used to help offset other fuels. A feasibility study would be required to calculate the benefits of cost savings versus the cost of installing heat piping and heat exchangers from the potential WtE site at the solid waste facility.
A study completed in 2013 revealed that biomass and paper products represented approximately 8,000 tonnes of the City’s waste produced. Combustion tests revealed that waste paper contains similar amounts of energy to wood, but that this type of fuel would be challenging to burn efficiently without specialized boilers. For the purpose of this study, it has been assumed that paper would continue to be recycled. However, if WtE is found to be financially feasible, the potential to include paper into the feedstock could be considered in the future and a technology specified that could handle the paper along with other mixed MSW.
5.1.6.5.3 Technology Review
The most feasible WtE technology is controlled air two –stage combustion. It can be designed for the generation of electricity, for the recovery of heat, or for a combination of both. The preferred WtE technology would not change, even if the quantity of waste were to double, or if other materials were added, such as paper.
Gasification is not feasible at the current state of technology due to the small size of the application in Yellowknife and the lack of reference gasification facilities and gasification technology suppliers in North America.
Converting existing boilers to burn some form of waste is technically not feasible, however, tie-in to existing systems is technically possible through a district energy network.
5.1.6.5.4 Landfill Avoidance and Space Savings
WtE would not replace a landfill, it would only reduce the amount of waste going to a landfill. There will still be a need for a landfill for the ash coming from a WtE plant, for the growth in waste that the WtE plant cannot handle (since the WtE capacity is constant), and for periods of scheduled and unscheduled downtime of the WtE facility. Waste reduction to landfill in the best case would be 75% by weight and 90% by volume.
The cost of WtE, after revenues from the sale of electricity could be in the same range as current landfill costs. However, WtE is not a replacement for the landfill, although some reduction in landfill operational costs can be expected.

Strategic Waste Management Plan (SWMP) – Final Report The City of Yellowknife
89
WtE could provide a reliable and local source of electricity. The cost to generate this electricity would be higher than what it is now, since some landfill costs will still accrue.
WtE has the potential to tie into a district energy network and provide an additional source of heat. The feasibility of this can only be determined with a site specific study, since there are too many unknowns and variables to provide definitive costs.
5.1.6.5.5 Recommendations
It is recommended to calculate the potential landfill cost savings if the waste disposed is reduced by 75%. This information can then be used to determine the actual total waste management costs if WtE is implemented, either for electricity or for heat.
It is further recommended to consider a detailed, site specific study into the cost of transporting heat from a WtE facility located at the solid waste facility and feeding this heat into a new and/or existing district energy system.
5.1.6.6 Gasification of Used Vegetable Oil
The majority of vegetable oil generated in and around Yellowknife is due to mining activity. There is additional used oil vegetable oil generated by the many restaurants in town. The vegetable oil is shipped to a transfer station at the SWF which is operated by KBL Environmental. The material is then shipped to Northern Albert Food Processing. Depending on the grade of oil, the material is used for animal/pet feed, bio-diesel or in cosmetics. Often the grade of oil can be affected by generators mixing grease trap oil with fryer oil. Fryer oil is a much higher grade of material, yet it is difficult to maintain streams of the fryer oil without having grease trap contamination.
In March 2011, Ecology North submitted a report on the “Feasibility of Biodiesel Production and Direct Use of Used Vegetable Oil for Heating in the City of Yellowknife” to the Canadian Northern Economic Development Agency and the GNWT – Environment and Natural Resources. Through a survey of Yellowknife restaurants, the report determined there to be approximately 84,000 litres of used vegetable oil being produced annually in the city. It was found that converting used vegetable oil into biodiesel is not economical, nor practical with the current infrastructure in Yellowknife. However, using used vegetable oil directly as a source of energy for boilers was determined to be more economical than converting to biodiesel.
As a system already exists to divert used vegetable oil to recycling, it seems practical and efficient to continue this practice unless a local business chooses to establish a local conversion facility.
5.1.7 Monitoring and Reporting
Monitoring program results is dependent upon accurate and comprehensive information. Therefore, a system of ongoing measurement of waste diversion and disposal is an important element of the waste management program going forward. Although data is recorded at the SWF through Geoware, there is limited information regarding the relative breakdown of certain portions of the waste stream, such as multi-family residential waste, largely due to loads containing mixed waste from multiple sectors. There are also some scalehouse processes that could be improved to further the quality and accuracy of data. For example, empty vehicles coming across the scalehouse to visit the Salvage Area are inputted into the Geoware system as a 147 kg load Inbound. This is the same amount as a residential customer bringing in a minimum load. However, likely the salvager will be removing material from the site and does not contribute waste material to the overall landfilled amount. Another example is that Leaves and Grass from residential customers are not recorded in Geoware.
With the extremely large amount of material being brought in by residential self-haul loads (over 4,300 tonnes), it would be beneficial to know what the composition of the majority of those loads are. More detailed composition categories for residential self-haul loads would add more comprehensive data
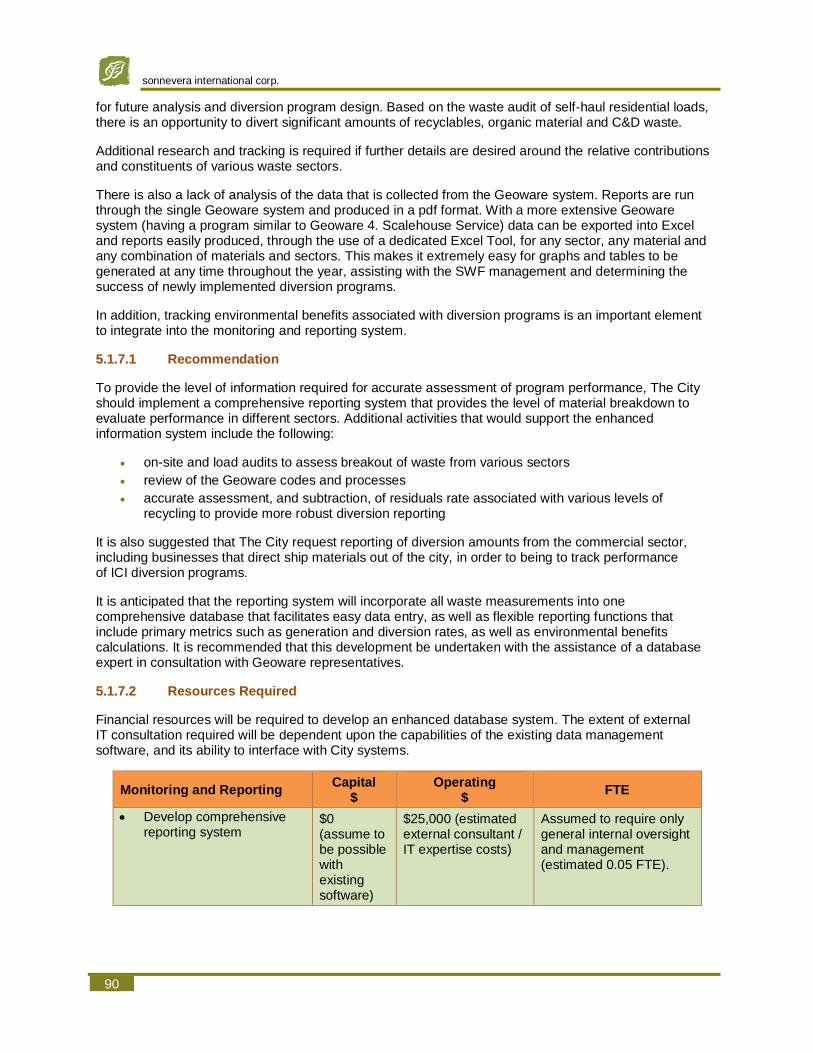
sonnevera international corp.
90
for future analysis and diversion program design. Based on the waste audit of self-haul residential loads, there is an opportunity to divert significant amounts of recyclables, organic material and C&D waste.
Additional research and tracking is required if further details are desired around the relative contributions and constituents of various waste sectors.
There is also a lack of analysis of the data that is collected from the Geoware system. Reports are run through the single Geoware system and produced in a pdf format. With a more extensive Geoware system (having a program similar to Geoware 4. Scalehouse Service) data can be exported into Excel and reports easily produced, through the use of a dedicated Excel Tool, for any sector, any material and any combination of materials and sectors. This makes it extremely easy for graphs and tables to be generated at any time throughout the year, assisting with the SWF management and determining the success of newly implemented diversion programs.
In addition, tracking environmental benefits associated with diversion programs is an important element to integrate into the monitoring and reporting system.
5.1.7.1 Recommendation
To provide the level of information required for accurate assessment of program performance, The City should implement a comprehensive reporting system that provides the level of material breakdown to evaluate performance in different sectors. Additional activities that would support the enhanced information system include the following:
• on-site and load audits to assess breakout of waste from various sectors
• review of the Geoware codes and processes
• accurate assessment, and subtraction, of residuals rate associated with various levels of recycling to provide more robust diversion reporting
It is also suggested that The City request reporting of diversion amounts from the commercial sector, including businesses that direct ship materials out of the city, in order to being to track performance of ICI diversion programs.
It is anticipated that the reporting system will incorporate all waste measurements into one comprehensive database that facilitates easy data entry, as well as flexible reporting functions that include primary metrics such as generation and diversion rates, as well as environmental benefits calculations. It is recommended that this development be undertaken with the assistance of a database expert in consultation with Geoware representatives.
5.1.7.2 Resources Required
Financial resources will be required to develop an enhanced database system. The extent of external IT consultation required will be dependent upon the capabilities of the existing data management software, and its ability to interface with City systems.
Monitoring and Reporting Capital
$ Operating
$ FTE
• Develop comprehensive reporting system
$0 (assume to be possible with existing software)
$25,000 (estimated external consultant / IT expertise costs)
Assumed to require only general internal oversight and management (estimated 0.05 FTE).
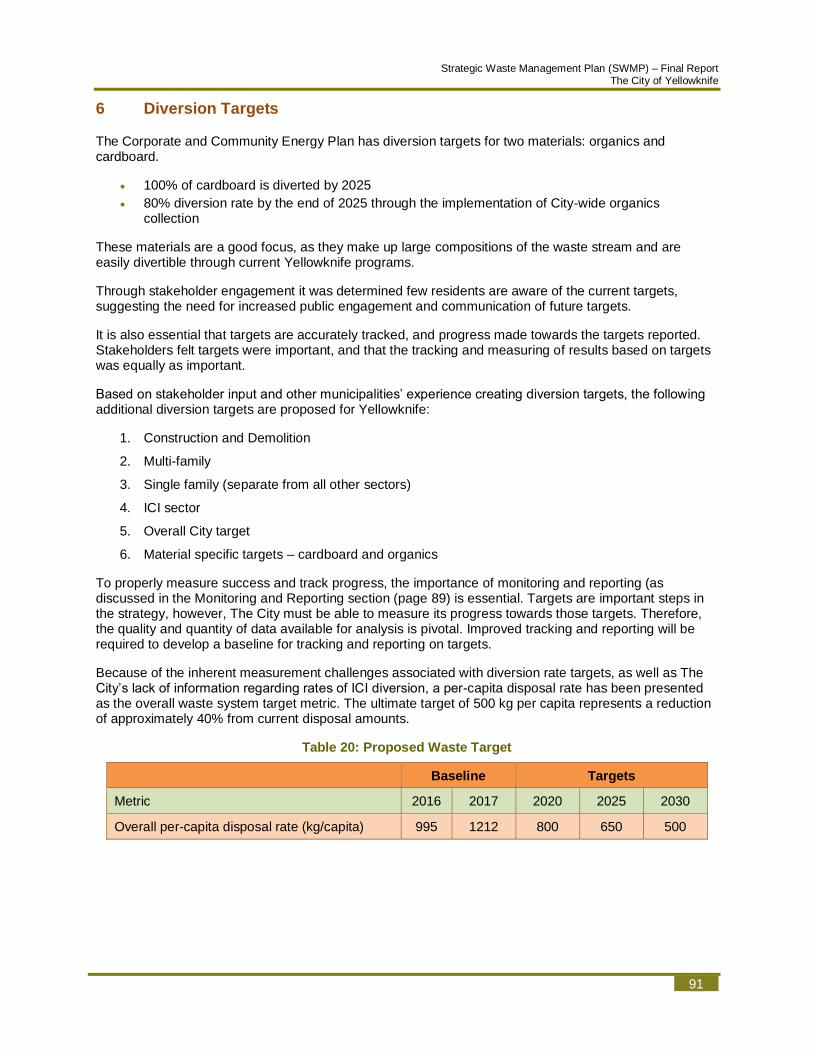
Strategic Waste Management Plan (SWMP) – Final Report The City of Yellowknife
91
6 Diversion Targets
The Corporate and Community Energy Plan has diversion targets for two materials: organics and cardboard.
• 100% of cardboard is diverted by 2025
• 80% diversion rate by the end of 2025 through the implementation of City-wide organics collection
These materials are a good focus, as they make up large compositions of the waste stream and are easily divertible through current Yellowknife programs.
Through stakeholder engagement it was determined few residents are aware of the current targets, suggesting the need for increased public engagement and communication of future targets.
It is also essential that targets are accurately tracked, and progress made towards the targets reported. Stakeholders felt targets were important, and that the tracking and measuring of results based on targets was equally as important.
Based on stakeholder input and other municipalities’ experience creating diversion targets, the following additional diversion targets are proposed for Yellowknife:
1. Construction and Demolition
2. Multi-family
3. Single family (separate from all other sectors)
4. ICI sector
5. Overall City target
6. Material specific targets – cardboard and organics
To properly measure success and track progress, the importance of monitoring and reporting (as discussed in the Monitoring and Reporting section (page 89) is essential. Targets are important steps in the strategy, however, The City must be able to measure its progress towards those targets. Therefore, the quality and quantity of data available for analysis is pivotal. Improved tracking and reporting will be required to develop a baseline for tracking and reporting on targets.
Because of the inherent measurement challenges associated with diversion rate targets, as well as The City’s lack of information regarding rates of ICI diversion, a per-capita disposal rate has been presented as the overall waste system target metric. The ultimate target of 500 kg per capita represents a reduction of approximately 40% from current disposal amounts.
Table 20: Proposed Waste Target
Baseline Targets
Metric 2016 2017 2020 2025 2030
Overall per-capita disposal rate (kg/capita) 995 1212 800 650 500

sonnevera international corp.
92
7 Recycling Markets
Currently, all recycling (except metal) is shipped to Cascades in Edmonton, Alberta for further processing and marketing. Recyclable material is often stored at the SWF for several months at a time before being shipped south. 54 foot trailers are left on-site to be filled with baled material. Only full trailers are shipped south to reduce program costs.
Figure 89: Baled Cardboard Stored Outside at the SWF
Figure 90: Baled Mixed Plastics Stored Outside at the SWF
Figure 91: Baled Shredded Paper Stored Outside at the SWF
Due to the recyclable material being stored for months at a time, amount of material shipped from the SWF to Edmonton varies throughout the year. Cardboard is the largest category of material shipped for recycling, followed by Office and Mixed Paper. There is also some Other Mixed Fibre and a small amount of Mixed Plastics shipped to Cascades as well. The total amount of recyclables shipped to Cascades in 2016 is shown in Figure 92.

Strategic Waste Management Plan (SWMP) – Final Report The City of Yellowknife
93
Figure 92: 2016 Shipped Recyclables (Tonnes)
It is noteworthy to mention that Cascades provides diversion reports to The City containing the total amount of material shipped and recycled. In all cases, the reports indicated that 100 percent of the material shipped for recycling is recycled. This is highly unlikely, as there is likely to be some residual material based on contamination that needs to be disposed. Further investigation into the amounts shipped versus recycled would valuable. This would allow The City to report a more accurate diversion rate in future years.
Scrap metal is processed locally. For example, household metal is baled at the SWF and collected and processed by Precision North, a local scrap metal processor. Annually, the SWF makes about four to five household metal bales.
As recycling markets are volatile and depressed at the moment, securing stable market agreements should be the priority. If The City is happy with current service levels, negotiating a long-term agreement with Cascades should be a consideration to provide stability. Average income received for material in 2017 was $50/tonne, however prices are currently zero or below, and may continue to drop based on the Chinese market restrictions.
If other options are desired to be pursued, the most accessible alternatives are:
• GFL – Edmonton, Alberta GFL operates a large MRF in west Edmonton that is capable of handling all grades of recyclables, including single stream. Discussions indicate that they would be willing to accept Yellowknife’s material for a processing fee of $85/tonne.
• SUEZ – Edmonton, Alberta SUEZ operates the MRF at the Edmonton Waste Management Centre. They may accept outside material, based on assessed quality. Price would need to be negotiated.
Consideration could also be given to shipping material directly to Vancouver markets, although they would still go through Edmonton, so any increase in revenue may not warrant the change, as transportation would be significantly increased.
Cardboard752.07 Tonnes
Office & Mixed Paper
287.64 Tonnes
Other Mixed Fibre
64.99 Tonnes
Mixed Plastics
0.54 Tonnes
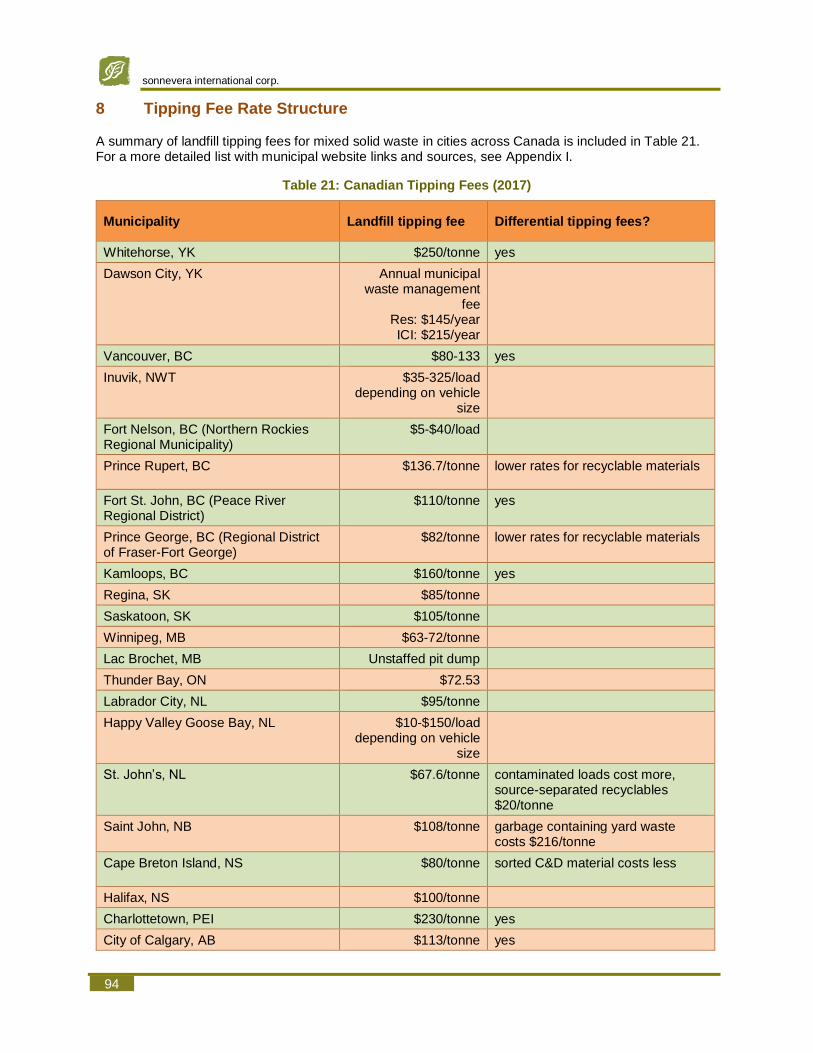
sonnevera international corp.
94
8 Tipping Fee Rate Structure
A summary of landfill tipping fees for mixed solid waste in cities across Canada is included in Table 21. For a more detailed list with municipal website links and sources, see Appendix I.
Table 21: Canadian Tipping Fees (2017)
Municipality Landfill tipping fee Differential tipping fees?
Whitehorse, YK $250/tonne yes
Dawson City, YK Annual municipal waste management
fee Res: $145/year ICI: $215/year
Vancouver, BC $80-133 yes
Inuvik, NWT $35-325/load depending on vehicle
size
Fort Nelson, BC (Northern Rockies Regional Municipality)
$5-$40/load
Prince Rupert, BC $136.7/tonne lower rates for recyclable materials
Fort St. John, BC (Peace River Regional District)
$110/tonne yes
Prince George, BC (Regional District of Fraser-Fort George)
$82/tonne lower rates for recyclable materials
Kamloops, BC $160/tonne yes
Regina, SK $85/tonne
Saskatoon, SK $105/tonne
Winnipeg, MB $63-72/tonne
Lac Brochet, MB Unstaffed pit dump
Thunder Bay, ON $72.53
Labrador City, NL $95/tonne
Happy Valley Goose Bay, NL $10-$150/load depending on vehicle
size
St. John’s, NL $67.6/tonne contaminated loads cost more, source-separated recyclables $20/tonne
Saint John, NB $108/tonne garbage containing yard waste costs $216/tonne
Cape Breton Island, NS $80/tonne sorted C&D material costs less
Halifax, NS $100/tonne
Charlottetown, PEI $230/tonne yes
City of Calgary, AB $113/tonne yes

Strategic Waste Management Plan (SWMP) – Final Report The City of Yellowknife
95
Municipality Landfill tipping fee Differential tipping fees?
Beaver Municipal Solutions Regional Landfill, Ryley, AB
Mackenzie Regional Waste Management Commission, High Level, AB
$68/tonne no
The cost of landfilling calculated as part of this report is $200/tonne. This is considerably higher than current tipping fees, raising the issue that costs are not being covered, and suggesting an increase would be warranted. This combined with the recommendation that differential tipping fees be used to encourage diversion suggests that a process be undertaken to establish a schedule of tipping fees that evolve to provide sustainable funding, while encouraging diversion.
The process is recommended to include:
1. Public consultation with both residential and ICI stakeholders
2. Proven differentials that drive diversion practices
3. Development of a financial model that incorporates full landfill costs, and links diversion to associated per-tonne increases
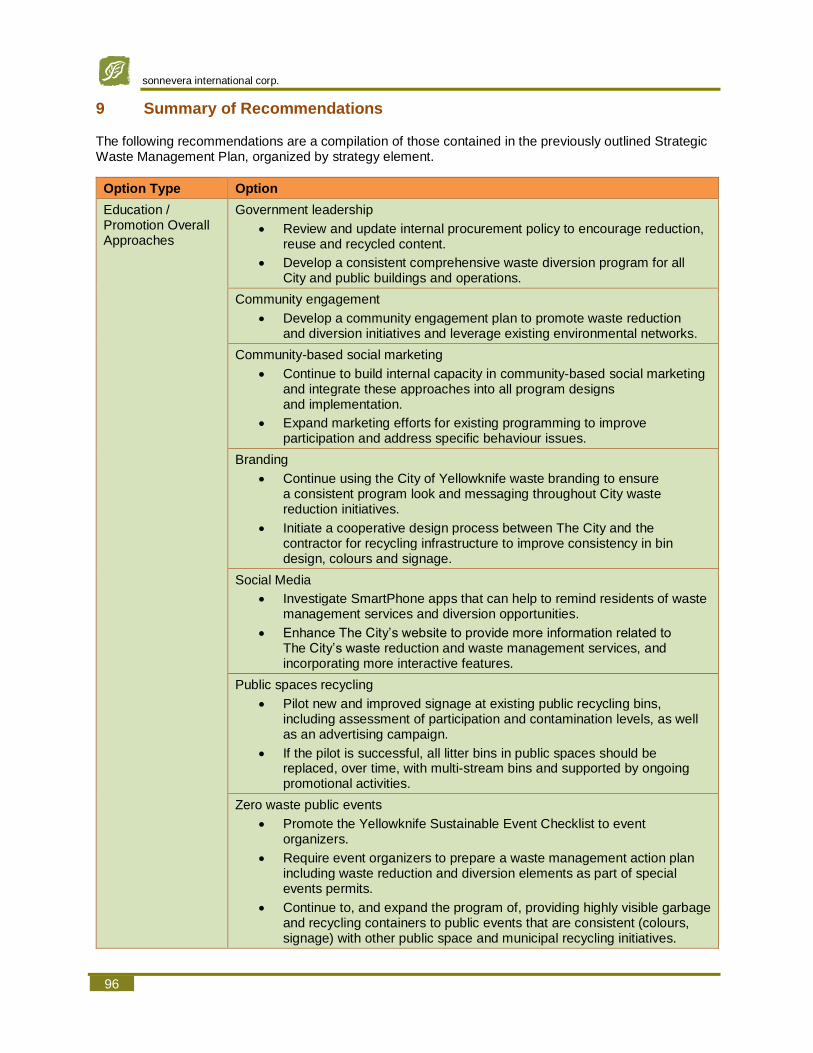
sonnevera international corp.
96
9 Summary of Recommendations
The following recommendations are a compilation of those contained in the previously outlined Strategic Waste Management Plan, organized by strategy element.
Option Type Option
Education / Promotion Overall Approaches
Government leadership
• Review and update internal procurement policy to encourage reduction, reuse and recycled content.
• Develop a consistent comprehensive waste diversion program for all City and public buildings and operations.
Community engagement
• Develop a community engagement plan to promote waste reduction and diversion initiatives and leverage existing environmental networks.
Community-based social marketing
• Continue to build internal capacity in community-based social marketing and integrate these approaches into all program designs and implementation.
• Expand marketing efforts for existing programming to improve participation and address specific behaviour issues.
Branding
• Continue using the City of Yellowknife waste branding to ensure a consistent program look and messaging throughout City waste reduction initiatives.
• Initiate a cooperative design process between The City and the contractor for recycling infrastructure to improve consistency in bin design, colours and signage.
Social Media
• Investigate SmartPhone apps that can help to remind residents of waste management services and diversion opportunities.
• Enhance The City’s website to provide more information related to The City’s waste reduction and waste management services, and incorporating more interactive features.
Public spaces recycling
• Pilot new and improved signage at existing public recycling bins, including assessment of participation and contamination levels, as well as an advertising campaign.
• If the pilot is successful, all litter bins in public spaces should be replaced, over time, with multi-stream bins and supported by ongoing promotional activities.
Zero waste public events
• Promote the Yellowknife Sustainable Event Checklist to event organizers.
• Require event organizers to prepare a waste management action plan including waste reduction and diversion elements as part of special events permits.
• Continue to, and expand the program of, providing highly visible garbage and recycling containers to public events that are consistent (colours, signage) with other public space and municipal recycling initiatives.
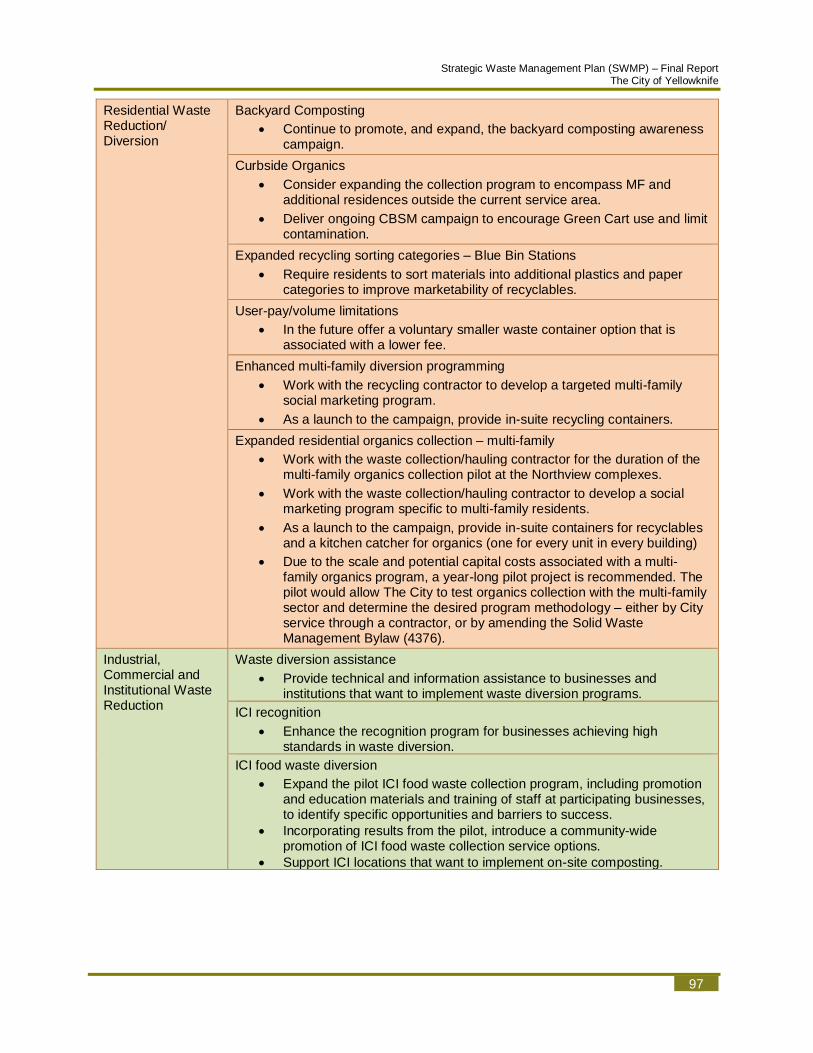
Strategic Waste Management Plan (SWMP) – Final Report The City of Yellowknife
97
Residential Waste Reduction/ Diversion
Backyard Composting
• Continue to promote, and expand, the backyard composting awareness campaign.
Curbside Organics
• Consider expanding the collection program to encompass MF and additional residences outside the current service area.
• Deliver ongoing CBSM campaign to encourage Green Cart use and limit contamination.
Expanded recycling sorting categories – Blue Bin Stations
• Require residents to sort materials into additional plastics and paper categories to improve marketability of recyclables.
User-pay/volume limitations
• In the future offer a voluntary smaller waste container option that is associated with a lower fee.
Enhanced multi-family diversion programming
• Work with the recycling contractor to develop a targeted multi-family social marketing program.
• As a launch to the campaign, provide in-suite recycling containers.
Expanded residential organics collection – multi-family
• Work with the waste collection/hauling contractor for the duration of the multi-family organics collection pilot at the Northview complexes.
• Work with the waste collection/hauling contractor to develop a social marketing program specific to multi-family residents.
• As a launch to the campaign, provide in-suite containers for recyclables and a kitchen catcher for organics (one for every unit in every building)
• Due to the scale and potential capital costs associated with a multi-family organics program, a year-long pilot project is recommended. The pilot would allow The City to test organics collection with the multi-family sector and determine the desired program methodology – either by City service through a contractor, or by amending the Solid Waste Management Bylaw (4376).
Industrial, Commercial and Institutional Waste Reduction
Waste diversion assistance
• Provide technical and information assistance to businesses and institutions that want to implement waste diversion programs.
ICI recognition
• Enhance the recognition program for businesses achieving high standards in waste diversion.
ICI food waste diversion
• Expand the pilot ICI food waste collection program, including promotion and education materials and training of staff at participating businesses, to identify specific opportunities and barriers to success.
• Incorporating results from the pilot, introduce a community-wide promotion of ICI food waste collection service options.
• Support ICI locations that want to implement on-site composting.
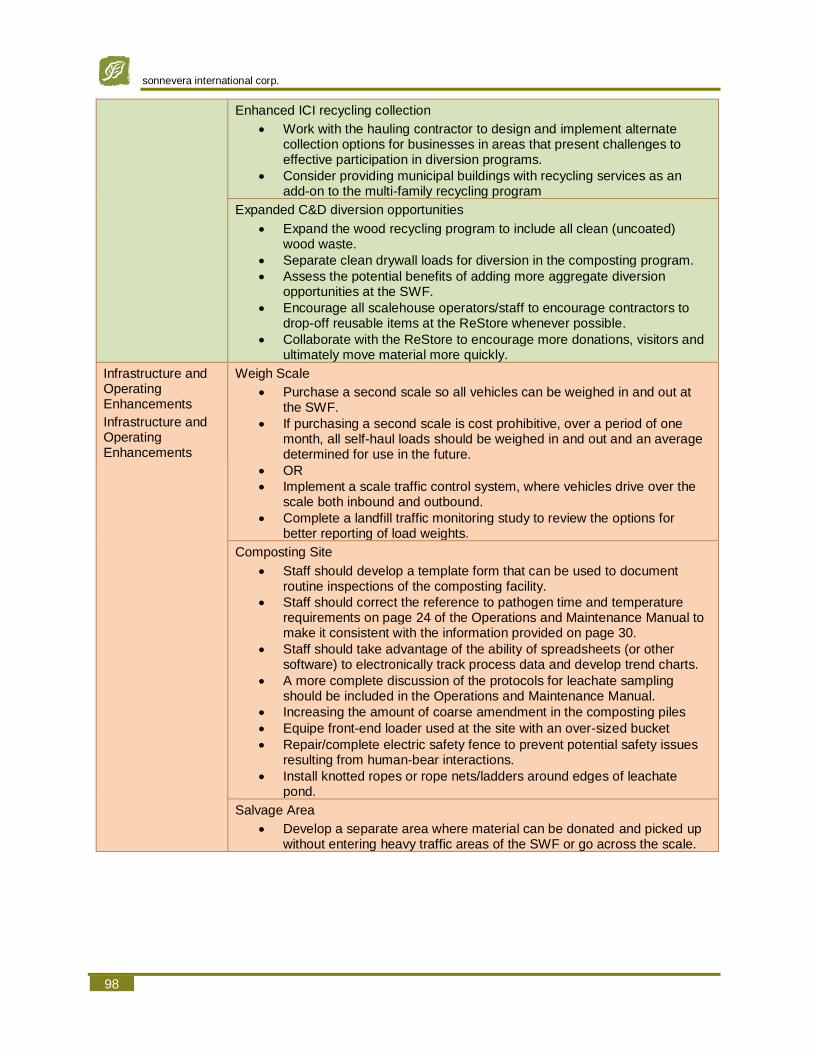
sonnevera international corp.
98
Enhanced ICI recycling collection
• Work with the hauling contractor to design and implement alternate collection options for businesses in areas that present challenges to effective participation in diversion programs.
• Consider providing municipal buildings with recycling services as an add-on to the multi-family recycling program
Expanded C&D diversion opportunities
• Expand the wood recycling program to include all clean (uncoated) wood waste.
• Separate clean drywall loads for diversion in the composting program.
• Assess the potential benefits of adding more aggregate diversion opportunities at the SWF.
• Encourage all scalehouse operators/staff to encourage contractors to drop-off reusable items at the ReStore whenever possible.
• Collaborate with the ReStore to encourage more donations, visitors and ultimately move material more quickly.
Infrastructure and Operating Enhancements
Infrastructure and Operating Enhancements
Weigh Scale
• Purchase a second scale so all vehicles can be weighed in and out at the SWF.
• If purchasing a second scale is cost prohibitive, over a period of one month, all self-haul loads should be weighed in and out and an average determined for use in the future.
• OR
• Implement a scale traffic control system, where vehicles drive over the scale both inbound and outbound.
• Complete a landfill traffic monitoring study to review the options for better reporting of load weights.
Composting Site
• Staff should develop a template form that can be used to document routine inspections of the composting facility.
• Staff should correct the reference to pathogen time and temperature requirements on page 24 of the Operations and Maintenance Manual to make it consistent with the information provided on page 30.
• Staff should take advantage of the ability of spreadsheets (or other software) to electronically track process data and develop trend charts.
• A more complete discussion of the protocols for leachate sampling should be included in the Operations and Maintenance Manual.
• Increasing the amount of coarse amendment in the composting piles
• Equipe front-end loader used at the site with an over-sized bucket
• Repair/complete electric safety fence to prevent potential safety issues resulting from human-bear interactions.
• Install knotted ropes or rope nets/ladders around edges of leachate pond.
Salvage Area
• Develop a separate area where material can be donated and picked up without entering heavy traffic areas of the SWF or go across the scale.
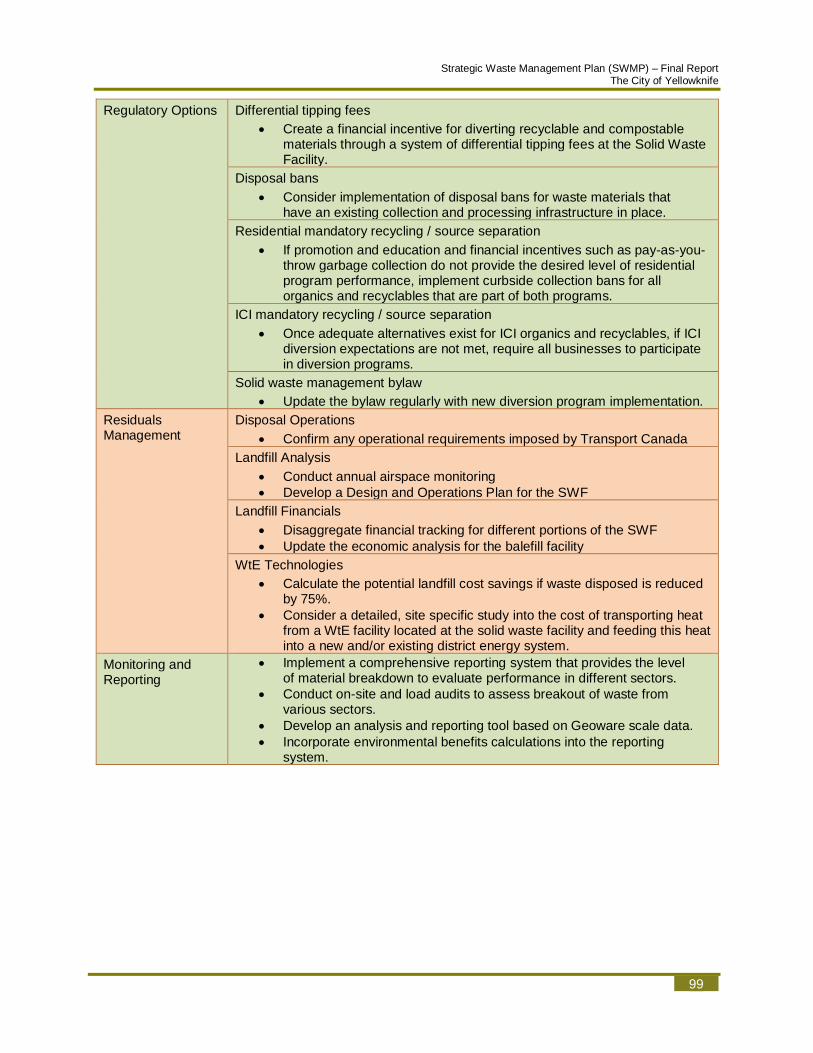
Strategic Waste Management Plan (SWMP) – Final Report The City of Yellowknife
99
Regulatory Options Differential tipping fees
• Create a financial incentive for diverting recyclable and compostable materials through a system of differential tipping fees at the Solid Waste Facility.
Disposal bans
• Consider implementation of disposal bans for waste materials that have an existing collection and processing infrastructure in place.
Residential mandatory recycling / source separation
• If promotion and education and financial incentives such as pay-as-you-throw garbage collection do not provide the desired level of residential program performance, implement curbside collection bans for all organics and recyclables that are part of both programs.
ICI mandatory recycling / source separation
• Once adequate alternatives exist for ICI organics and recyclables, if ICI diversion expectations are not met, require all businesses to participate in diversion programs.
Solid waste management bylaw
• Update the bylaw regularly with new diversion program implementation.
Residuals Management
Disposal Operations
• Confirm any operational requirements imposed by Transport Canada
Landfill Analysis
• Conduct annual airspace monitoring
• Develop a Design and Operations Plan for the SWF
Landfill Financials
• Disaggregate financial tracking for different portions of the SWF
• Update the economic analysis for the balefill facility
WtE Technologies
• Calculate the potential landfill cost savings if waste disposed is reduced by 75%.
• Consider a detailed, site specific study into the cost of transporting heat from a WtE facility located at the solid waste facility and feeding this heat into a new and/or existing district energy system.
Monitoring and Reporting
• Implement a comprehensive reporting system that provides the level of material breakdown to evaluate performance in different sectors.
• Conduct on-site and load audits to assess breakout of waste from various sectors.
• Develop an analysis and reporting tool based on Geoware scale data.
• Incorporate environmental benefits calculations into the reporting system.
sonnevera international corp.
100
10 Prioritization
10.1 Ranking of Program Elements
Figure 93 shows a graphical representation of the relative ranking of program elements within the Waste Management Strategy, using diversion and cost as primary indicators, supported by ease of implementation of various options. Although all program elements are recommended, this provides a foundation for decisions that will need to be made if budget does not allow for full implementation of all components. It is important to note that some elements, such as Community-Based Social Marketing and Government Leadership, are considered to be fundamental to the successful implementation of the strategy as a whole.
As can be seen in Figure 93, the options that offer the greatest diversion at the lowest cost are located in the top left quadrant. Some of these elements (mandatory recycling, disposal bans) are anticipated to encounter public resistance, and therefore have been recommended only as alternatives implemented after more readily accepted options have been fully implemented and failed to reach diversion goals. However, there are options in this high-performing quadrant that are predicted to be relatively easy to implement, including Waste Diversion Assistance and Differential Tipping Fees. Therefore, these options are recommended for early adoption in the strategy.
Also evident in the figure is the observation that a significant number of options are located in the quadrant representing low-cost, but low-diversion options. Many of these elements are also predicted to be relatively easy to implement. Therefore, despite their lower diversion potential, these options are worth implementing because of their likelihood of community support, as well as the supportive role they can play within the overall strategy. At the same time, options with low diversion, but higher cost may be considered for a delayed implementation in the event that budget limitations prevent full implementation of all components.

Strategic Waste Management Plan (SWMP) – Final Report The City of Yellowknife
101
Promotion and Education Residential Waste Reduction ICI Waste Reduction Regulatory Options
Bubble size represents relative ease of implementation (large bubbles are likely to be easy to implement with little community resistance)
Figure 93: Ranking of Program Elements
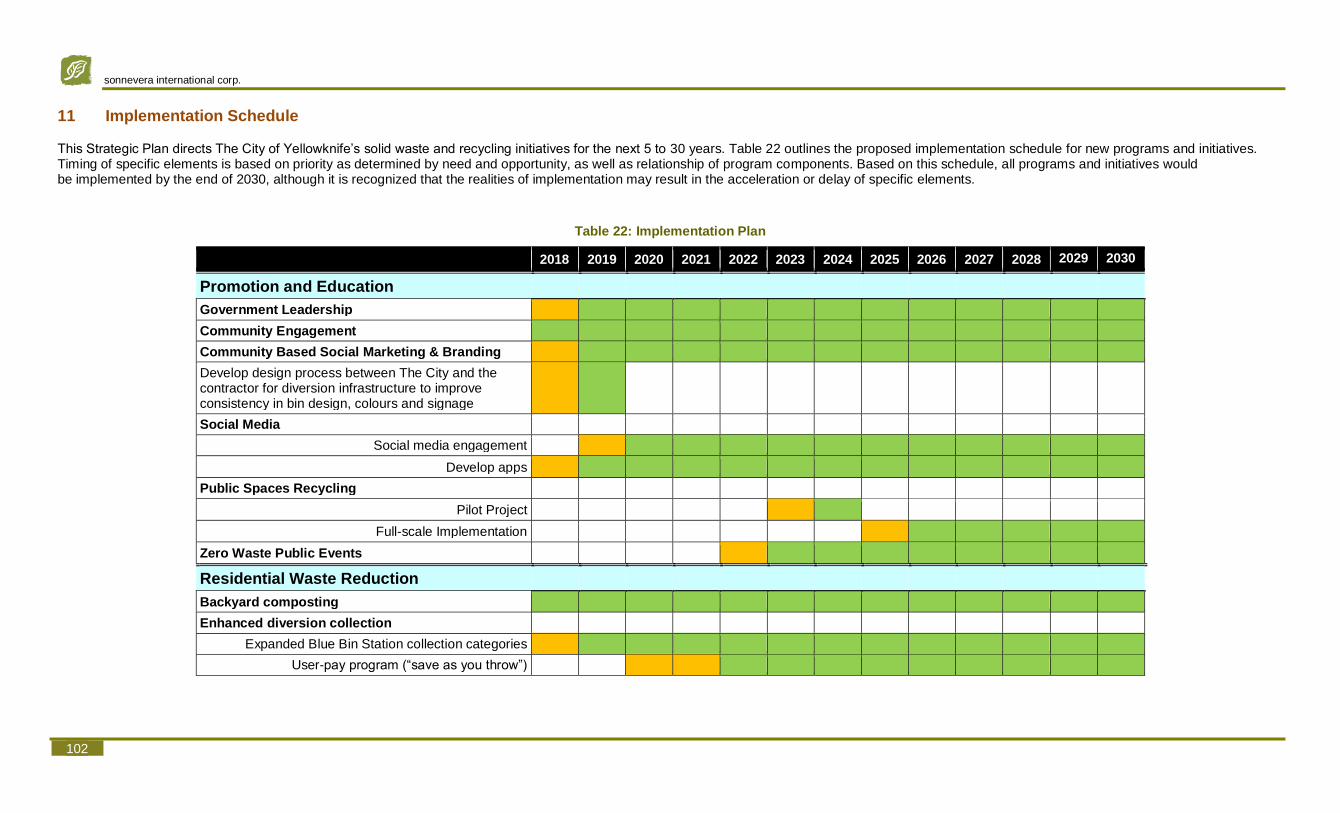
sonnevera international corp.
102
11 Implementation Schedule
This Strategic Plan directs The City of Yellowknife’s solid waste and recycling initiatives for the next 5 to 30 years. Table 22 outlines the proposed implementation schedule for new programs and initiatives. Timing of specific elements is based on priority as determined by need and opportunity, as well as relationship of program components. Based on this schedule, all programs and initiatives would be implemented by the end of 2030, although it is recognized that the realities of implementation may result in the acceleration or delay of specific elements.
Table 22: Implementation Plan
2018 2019 2020 2021 2022 2023 2024 2025 2026 2027 2028 2029 2030
Promotion and Education
Government Leadership
Community Engagement
Community Based Social Marketing & Branding
Develop design process between The City and the contractor for diversion infrastructure to improve consistency in bin design, colours and signage
Social Media
Social media engagement
Develop apps
Public Spaces Recycling
Pilot Project
Full-scale Implementation
Zero Waste Public Events
Residential Waste Reduction
Backyard composting
Enhanced diversion collection
Expanded Blue Bin Station collection categories
User-pay program (“save as you throw”)
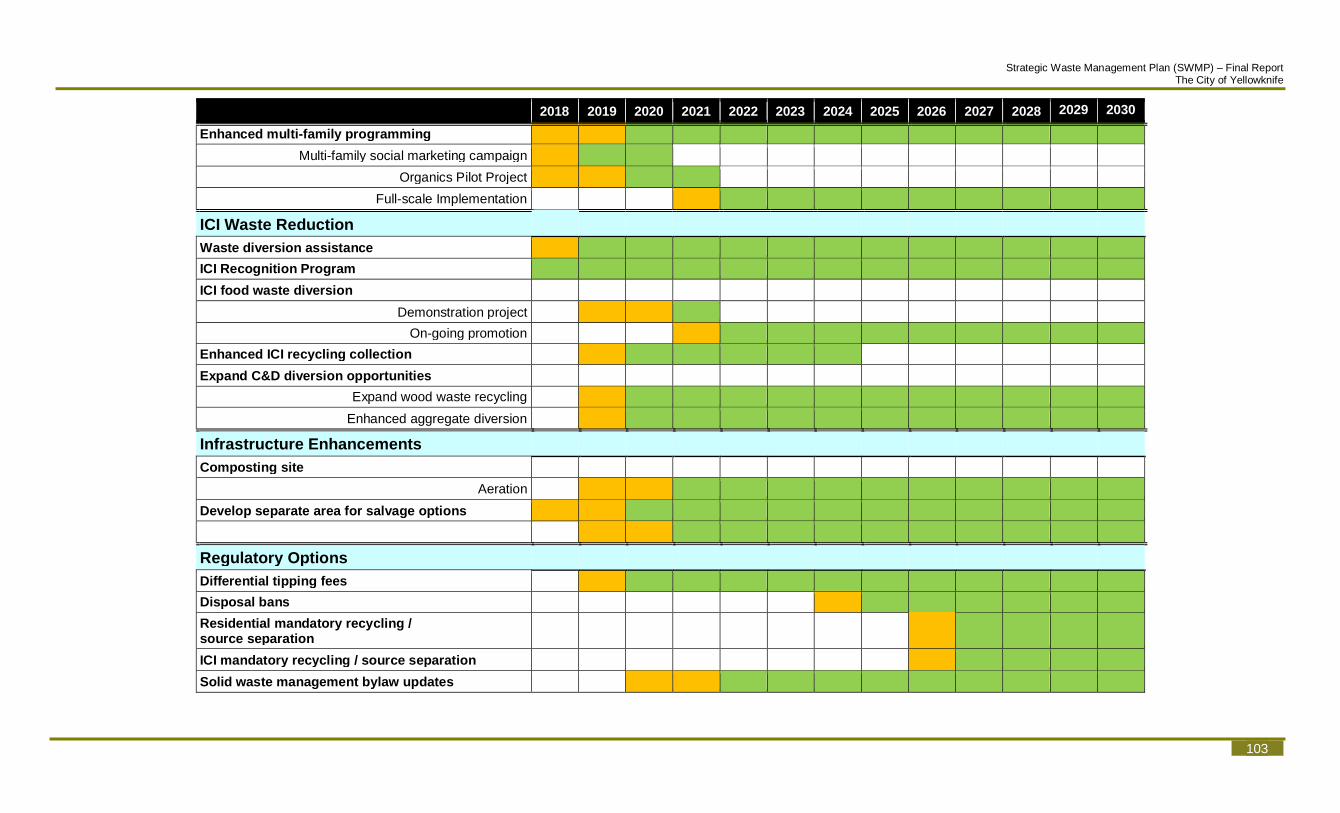
Strategic Waste Management Plan (SWMP) – Final Report The City of Yellowknife
103
2018 2019 2020 2021 2022 2023 2024 2025 2026 2027 2028 2029 2030
Enhanced multi-family programming
Multi-family social marketing campaign
Organics Pilot Project
Full-scale Implementation
ICI Waste Reduction
Waste diversion assistance
ICI Recognition Program
ICI food waste diversion
Demonstration project
On-going promotion
Enhanced ICI recycling collection
Expand C&D diversion opportunities
Expand wood waste recycling
Enhanced aggregate diversion
Infrastructure Enhancements
Composting site
Aeration
Develop separate area for salvage options
Regulatory Options
Differential tipping fees
Disposal bans
Residential mandatory recycling / source separation
ICI mandatory recycling / source separation
Solid waste management bylaw updates

sonnevera international corp.
104
2018 2019 2020 2021 2022 2023 2024 2025 2026 2027 2028 2029 2030
Residuals Management
Annual topographical plan; airspace consumption analysis
Design and operations plan
Economic analysis for balefill facility
Monitoring and Reporting
Develop comprehensive reporting system
research and design
implementation and operation
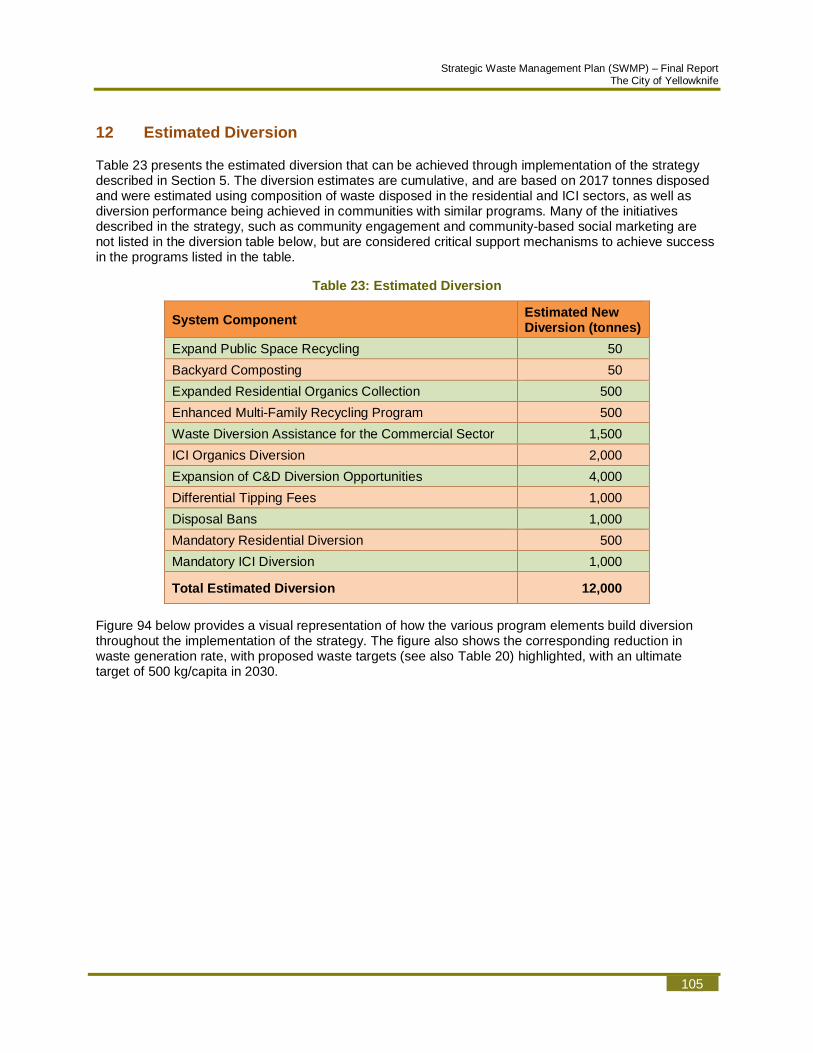
Strategic Waste Management Plan (SWMP) – Final Report The City of Yellowknife
105
12 Estimated Diversion
Table 23 presents the estimated diversion that can be achieved through implementation of the strategy described in Section 5. The diversion estimates are cumulative, and are based on 2017 tonnes disposed and were estimated using composition of waste disposed in the residential and ICI sectors, as well as diversion performance being achieved in communities with similar programs. Many of the initiatives described in the strategy, such as community engagement and community-based social marketing are not listed in the diversion table below, but are considered critical support mechanisms to achieve success in the programs listed in the table.
Table 23: Estimated Diversion
System Component Estimated New Diversion (tonnes)
Expand Public Space Recycling 50
Backyard Composting 50
Expanded Residential Organics Collection 500
Enhanced Multi-Family Recycling Program 500
Waste Diversion Assistance for the Commercial Sector 1,500
ICI Organics Diversion 2,000
Expansion of C&D Diversion Opportunities 4,000
Differential Tipping Fees 1,000
Disposal Bans 1,000
Mandatory Residential Diversion 500
Mandatory ICI Diversion 1,000
Total Estimated Diversion 12,000
Figure 94 below provides a visual representation of how the various program elements build diversion throughout the implementation of the strategy. The figure also shows the corresponding reduction in waste generation rate, with proposed waste targets (see also Table 20) highlighted, with an ultimate target of 500 kg/capita in 2030.

sonnevera international corp.
106
Figure 94: Estimated Diversion – Implementation of Strategy
Waste Generation Target (kg/capita)
500
440
540
640
740
840
940
-
2,000
4,000
6,000
8,000
10,000
12,000
14,000
16,000
2017 2018 2019 2020 2021 2022 2023 2024 2025 2026 2027 2028
kg /
capi
ta
tonn
es
Estimated Diversion - Implementation of SWMPMandatory ICI Diversion
Mandatory Residential DiversionDisposal Bans
Differential Tipping Fees
Expansion of C&D Diversion OpportunitiesICI Organics Diversion
ICI Waste Diversion AssistanceEnhanced Multi-Family Recycling ProgramExpanded Residential OrganicsBackyard Composting
Public Space Recycling
ICI Organics
ICI Recycling
Residential Organics
Residential Recycling
Waste Generation Target (kg/capita)
Strategic Waste Management Plan (SWMP) – Appendix The City of Yellowknife
A-1
APPENDICES
Appendix A – Waste Audit Results
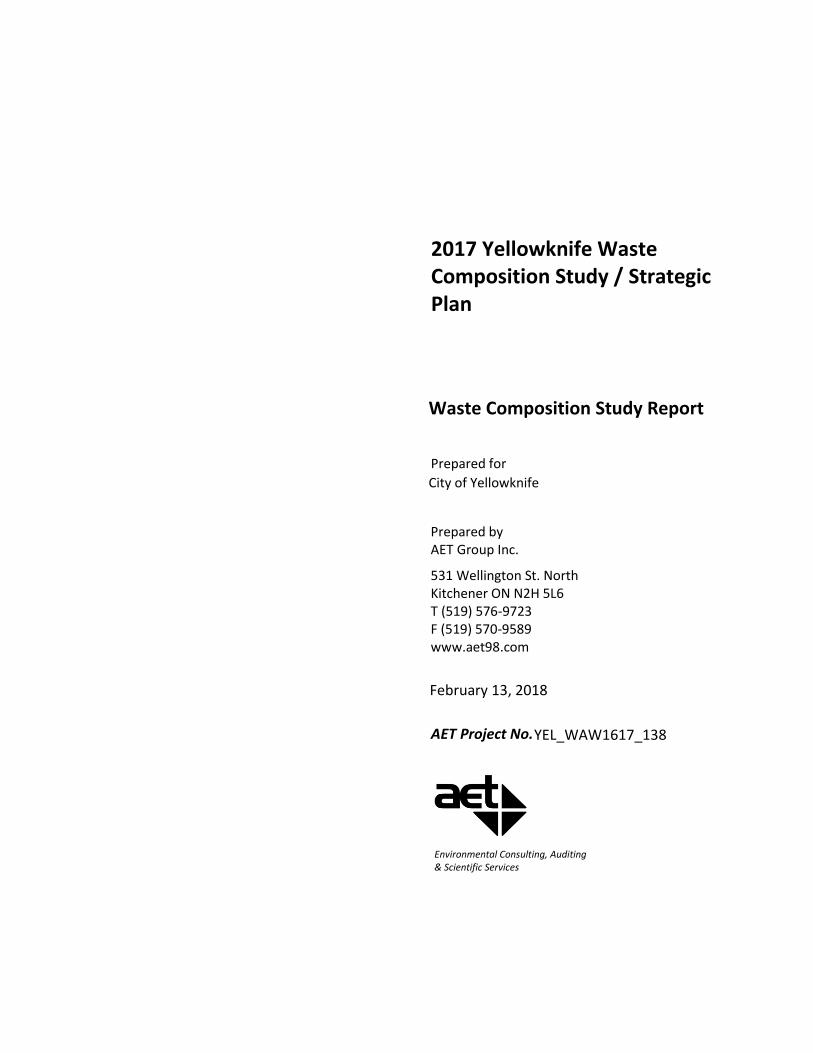
Prepared for
Prepared by AET Group Inc.
531 Wellington St. North Kitchener ON N2H 5L6 T (519) 576-9723 F (519) 570-9589 www.aet98.com
AET Project No.
2017 Yellowknife Waste Composition Study / Strategic Plan
Waste Composition Study Report
City of Yellowknife
February 13, 2018
YEL_WAW1617_138
Environmental Consulting, Auditing & Scientific Services

TABLE OF CONTENTS
1.0 INTRODUCTION ........................................................................................................ 1 1.1 Background .................................................................................................................... 1 1.2 Audit Scope .................................................................................................................... 1
2.0 APPROACH AND METHODOLOGY .............................................................................. 1 2.1 Waste Sampling Process ................................................................................................ 1 2.2 Assumptions, Limitations & Calculations ....................................................................... 4 2.3 Considerations for Future Audits ................................................................................... 5
3.0 RESULTS AND DISCUSSION ........................................................................................ 6 3.1 Waste Composition by Source ....................................................................................... 6
3.1.1 Curbside Garbage ...................................................................................................... 6 3.1.2 Multi-Family & Small Industrial/Commercial/Institutional (ICI) ................................ 7 3.1.3 Large Industrial/Commercial/Institutional (ICI) ......................................................... 8 3.1.4 Self Haul ..................................................................................................................... 9 3.1.5 Construction and Demolition (C&D) ........................................................................ 10 3.1.6 Organics ................................................................................................................... 11
3.2 Overall (Combined) Waste Composition ..................................................................... 11 3.2.1 Construction/Demolition Annual Estimates ............................................................ 13
APPENDICES
Appendix A: Detailed Waste Audit Results Appendix B: Waste Audit Category Descriptions Appendix C: Visual Auditing Density Conversion Factors
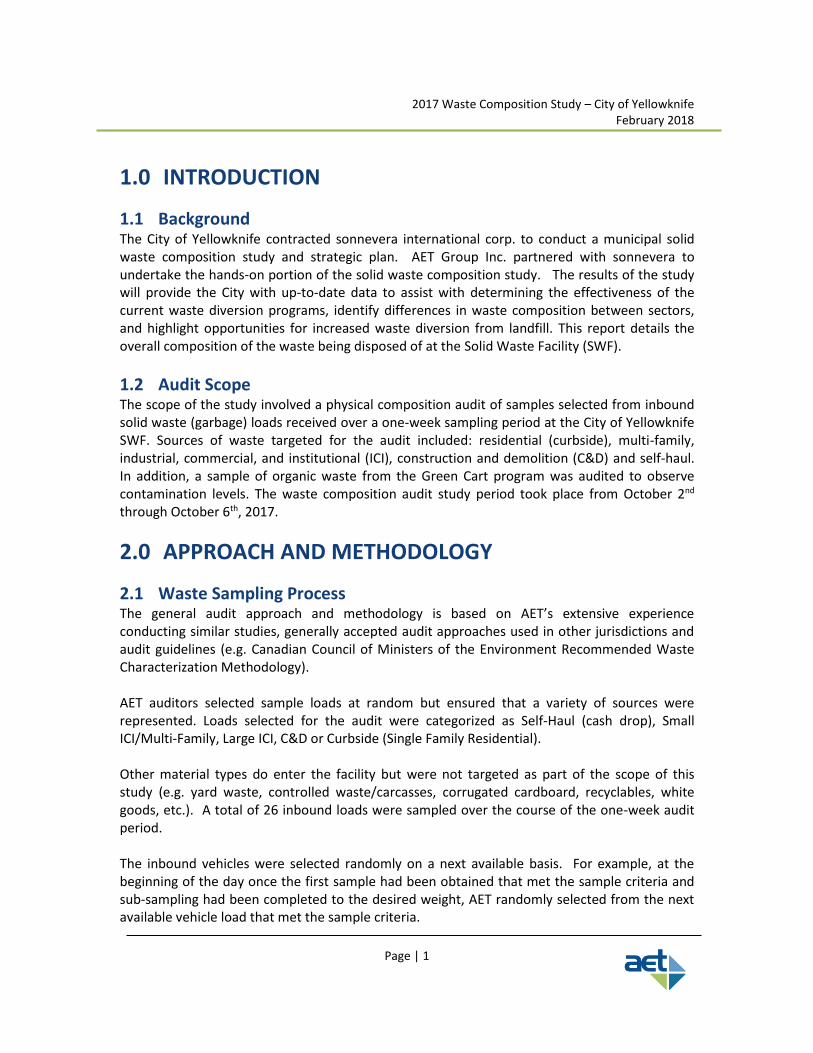
2017 Waste Composition Study – City of Yellowknife February 2018
Page | 1
1.0 INTRODUCTION
1.1 Background The City of Yellowknife contracted sonnevera international corp. to conduct a municipal solid waste composition study and strategic plan. AET Group Inc. partnered with sonnevera to undertake the hands-on portion of the solid waste composition study. The results of the study will provide the City with up-to-date data to assist with determining the effectiveness of the current waste diversion programs, identify differences in waste composition between sectors, and highlight opportunities for increased waste diversion from landfill. This report details the overall composition of the waste being disposed of at the Solid Waste Facility (SWF).
1.2 Audit Scope The scope of the study involved a physical composition audit of samples selected from inbound solid waste (garbage) loads received over a one-week sampling period at the City of Yellowknife SWF. Sources of waste targeted for the audit included: residential (curbside), multi-family, industrial, commercial, and institutional (ICI), construction and demolition (C&D) and self-haul. In addition, a sample of organic waste from the Green Cart program was audited to observe contamination levels. The waste composition audit study period took place from October 2nd through October 6th, 2017.
2.0 APPROACH AND METHODOLOGY
2.1 Waste Sampling Process The general audit approach and methodology is based on AET’s extensive experience conducting similar studies, generally accepted audit approaches used in other jurisdictions and audit guidelines (e.g. Canadian Council of Ministers of the Environment Recommended Waste Characterization Methodology). AET auditors selected sample loads at random but ensured that a variety of sources were represented. Loads selected for the audit were categorized as Self-Haul (cash drop), Small ICI/Multi-Family, Large ICI, C&D or Curbside (Single Family Residential). Other material types do enter the facility but were not targeted as part of the scope of this study (e.g. yard waste, controlled waste/carcasses, corrugated cardboard, recyclables, white goods, etc.). A total of 26 inbound loads were sampled over the course of the one-week audit period. The inbound vehicles were selected randomly on a next available basis. For example, at the beginning of the day once the first sample had been obtained that met the sample criteria and sub-sampling had been completed to the desired weight, AET randomly selected from the next available vehicle load that met the sample criteria.
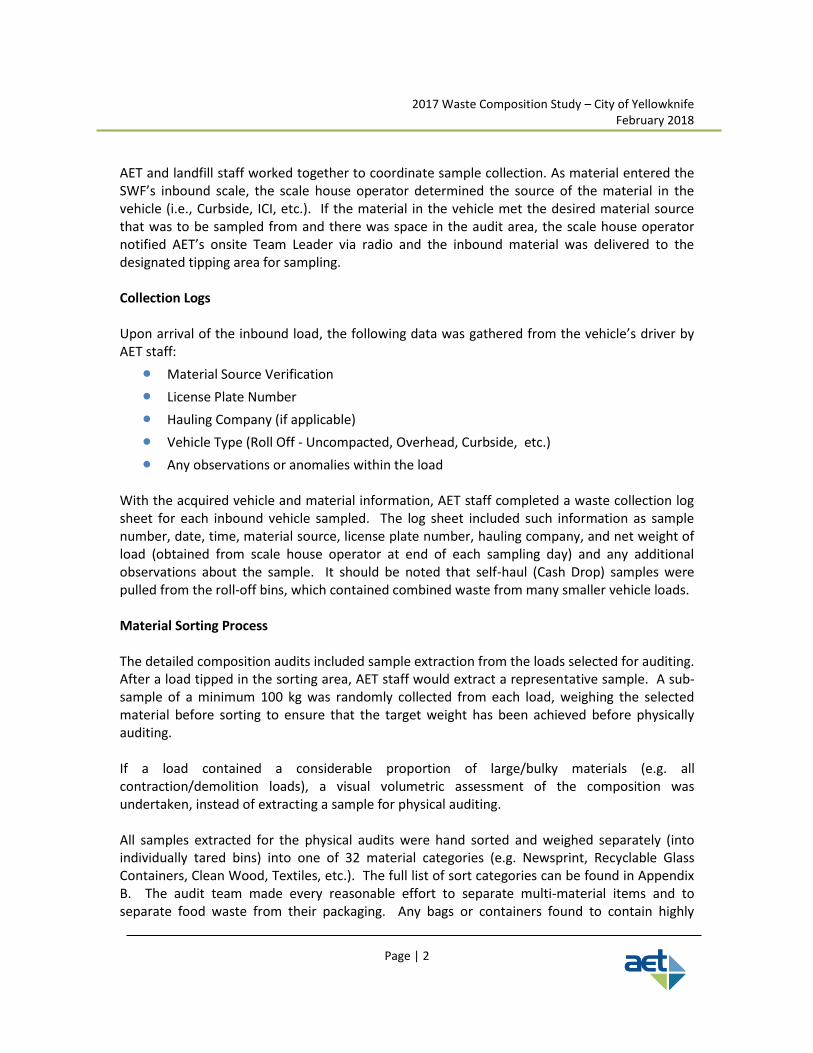
2017 Waste Composition Study – City of Yellowknife February 2018
Page | 2
AET and landfill staff worked together to coordinate sample collection. As material entered the SWF’s inbound scale, the scale house operator determined the source of the material in the vehicle (i.e., Curbside, ICI, etc.). If the material in the vehicle met the desired material source that was to be sampled from and there was space in the audit area, the scale house operator notified AET’s onsite Team Leader via radio and the inbound material was delivered to the designated tipping area for sampling. Collection Logs Upon arrival of the inbound load, the following data was gathered from the vehicle’s driver by AET staff:
• Material Source Verification
• License Plate Number
• Hauling Company (if applicable)
• Vehicle Type (Roll Off - Uncompacted, Overhead, Curbside, etc.)
• Any observations or anomalies within the load
With the acquired vehicle and material information, AET staff completed a waste collection log sheet for each inbound vehicle sampled. The log sheet included such information as sample number, date, time, material source, license plate number, hauling company, and net weight of load (obtained from scale house operator at end of each sampling day) and any additional observations about the sample. It should be noted that self-haul (Cash Drop) samples were pulled from the roll-off bins, which contained combined waste from many smaller vehicle loads. Material Sorting Process The detailed composition audits included sample extraction from the loads selected for auditing. After a load tipped in the sorting area, AET staff would extract a representative sample. A sub-sample of a minimum 100 kg was randomly collected from each load, weighing the selected material before sorting to ensure that the target weight has been achieved before physically auditing. If a load contained a considerable proportion of large/bulky materials (e.g. all contraction/demolition loads), a visual volumetric assessment of the composition was undertaken, instead of extracting a sample for physical auditing. All samples extracted for the physical audits were hand sorted and weighed separately (into individually tared bins) into one of 32 material categories (e.g. Newsprint, Recyclable Glass Containers, Clean Wood, Textiles, etc.). The full list of sort categories can be found in Appendix B. The audit team made every reasonable effort to separate multi-material items and to separate food waste from their packaging. Any bags or containers found to contain highly
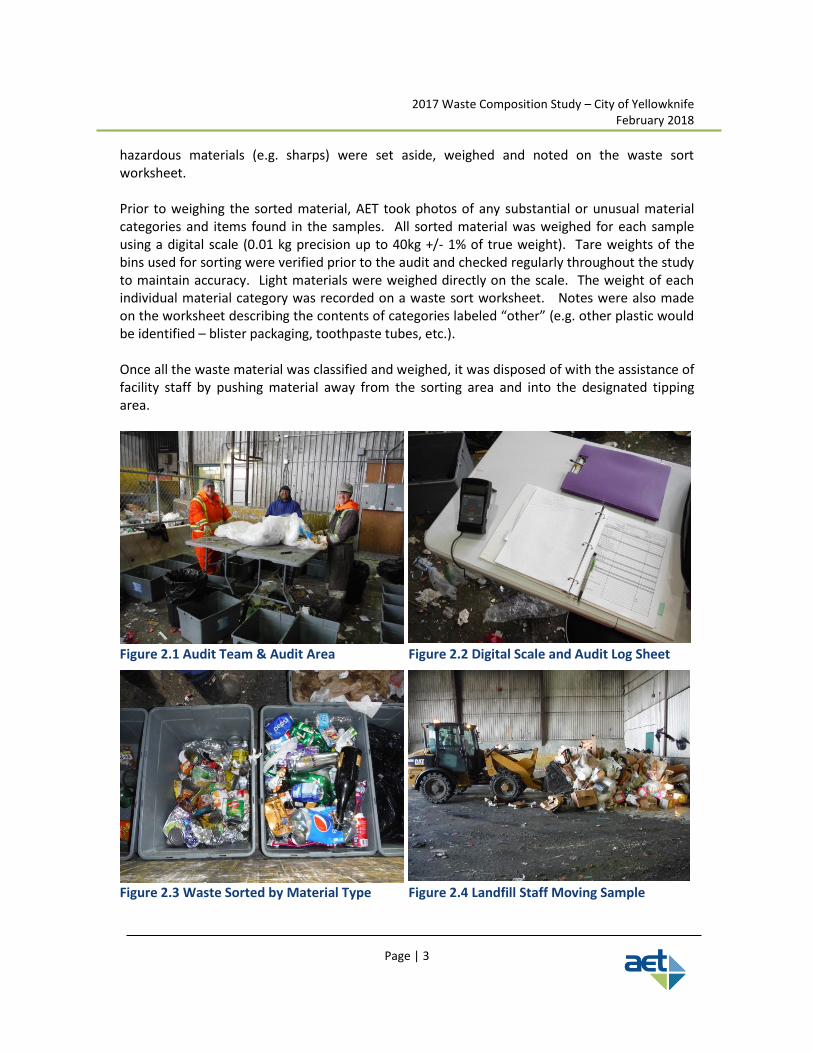
2017 Waste Composition Study – City of Yellowknife February 2018
Page | 3
hazardous materials (e.g. sharps) were set aside, weighed and noted on the waste sort worksheet. Prior to weighing the sorted material, AET took photos of any substantial or unusual material categories and items found in the samples. All sorted material was weighed for each sample using a digital scale (0.01 kg precision up to 40kg +/- 1% of true weight). Tare weights of the bins used for sorting were verified prior to the audit and checked regularly throughout the study to maintain accuracy. Light materials were weighed directly on the scale. The weight of each individual material category was recorded on a waste sort worksheet. Notes were also made on the worksheet describing the contents of categories labeled “other” (e.g. other plastic would be identified – blister packaging, toothpaste tubes, etc.). Once all the waste material was classified and weighed, it was disposed of with the assistance of facility staff by pushing material away from the sorting area and into the designated tipping area.
Figure 2.1 Audit Team & Audit Area Figure 2.2 Digital Scale and Audit Log Sheet
Figure 2.3 Waste Sorted by Material Type Figure 2.4 Landfill Staff Moving Sample
2017 Waste Composition Study – City of Yellowknife February 2018
Page | 4
Visual/Volumetric Waste Auditing Methodology The sampling and sorting methodology described above is best suited for waste from sources such as Residential Curbside and most mixed ICI sources. However, loads which contain more bulky waste (e.g. construction & demolition waste) are better characterized using a visual volumetric auditing approach. For loads warranting a visual volumetric approach, the auditor completed a walk around of the entire material pile. During this time, a visual volumetric assessment of the material composition was completed. As inbound loads were visually audited, the percentage of materials by volume was recorded (e.g. 5% corrugated cardboard, 40% clean wood, etc.). The estimated volumes were later converted into weights based on truck size and fullness, up to date standard material bulk density conversion factors, and the net weight of the load. Conversion factors utilized for the analysis of the visual auditing data can be found in Appendix C.
2.2 Assumptions, Limitations & Calculations
• The audit was conducted over a one-week period in the fall of 2017, therefore, represents conditions and characteristics of waste received at the facility during that period of time (i.e. a “snapshot” in time). The composition of waste can change over time (e.g. seasonality).
• The self haul (cash drop) samples audited were aggregate samples taken from the site roll-off bins, which contained waste from many vehicles. Therefore, the waste composition cannot be attributed on a source by source basis for these samples (e.g. small business vs. residential, etc.).
• The actual weights of self-hauled waste are not currently tracked within the City’s landfill scale records, therefore, no annual extrapolation estimates for this source of waste is possible.
• For the purposes of annual extrapolation estimates, it is assumed that the tonnages of waste received at the landfill from the various other waste sources during the month of September (most recent complete monthly scalehouse data set available at time of audit) are consistent throughout the year.
• Factors such as compaction, wetness and size of materials can affect the volume density of various materials, which may not always be reflected in the visual audit results, due to the use of standard volume density conversion factors.
2017 Waste Composition Study – City of Yellowknife February 2018
Page | 5
2.3 Considerations for Future Audits It is recommended that the City undertakes waste composition studies at regular intervals over time. Even without implementing any significant program changes, waste characteristics are continually changing (i.e. the “evolving tonne”). For example, changing consumer behaviours (e.g.online shopping, digital media vs. print), changing packaging materials (e.g. laminated stand-up pouches vs. rigid plastic containers), and lightweighting of packaging materials (e.g. one PET water bottle today weighs significantly less than one from several years ago), just to name a few. Should budgets permit, consideration should be given to conducting audits at various times throughout a year in order to capture seasonal variability. Seasonal fluctuations could be influenced by factors such as: kids being in school vs. at home in the summer, tourism, holidays, availability of fresh produce, construction activities, etc. Should conducting seasonal audits not be deemed feasible, future audits should be conducted at the same time of year, in order to remove the seasonal variability factor when comparing results over time. The frequency of future audits recommended would be dependent on the intended use of the data. Generally, an audit would be warranted before and after any significant program change. Such audits could be narrower in scope to focus on the area of change (e.g. just residential waste, or just construction waste). The fall 2017 audit was a holistic audit, representing a high level view of waste disposed of at the landfill from all sources.
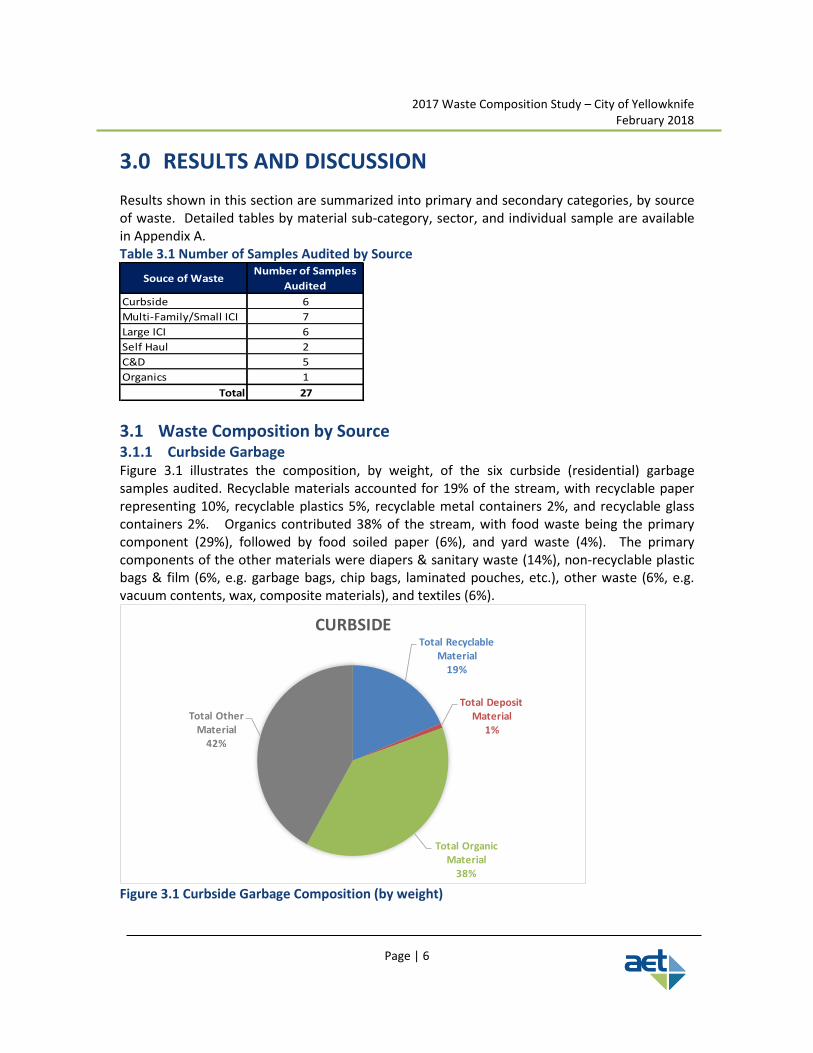
2017 Waste Composition Study – City of Yellowknife February 2018
Page | 6
3.0 RESULTS AND DISCUSSION
Results shown in this section are summarized into primary and secondary categories, by source of waste. Detailed tables by material sub-category, sector, and individual sample are available in Appendix A. Table 3.1 Number of Samples Audited by Source
3.1 Waste Composition by Source 3.1.1 Curbside Garbage Figure 3.1 illustrates the composition, by weight, of the six curbside (residential) garbage samples audited. Recyclable materials accounted for 19% of the stream, with recyclable paper representing 10%, recyclable plastics 5%, recyclable metal containers 2%, and recyclable glass containers 2%. Organics contributed 38% of the stream, with food waste being the primary component (29%), followed by food soiled paper (6%), and yard waste (4%). The primary components of the other materials were diapers & sanitary waste (14%), non-recyclable plastic bags & film (6%, e.g. garbage bags, chip bags, laminated pouches, etc.), other waste (6%, e.g. vacuum contents, wax, composite materials), and textiles (6%).
Figure 3.1 Curbside Garbage Composition (by weight)
Souce of WasteNumber of Samples
Audited
Curbside 6
Multi-Family/Small ICI 7
Large ICI 6
Self Haul 2
C&D 5
Organics 1
Total 27
Total Recyclable Material
19%
Total Deposit Material
1%
Total Organic Material
38%
Total Other Material
42%
CURBSIDE

2017 Waste Composition Study – City of Yellowknife February 2018
Page | 7
3.1.2 Multi-Family & Small Industrial/Commercial/Institutional (ICI) Figure 3.2 illustrates the composition, by weight, of the seven multi-family residential/small ICI garbage samples audited. It should be noted samples collected from overhead trucks were classified as multi-family/small ICI (e.g. restaurants, schools, hotels, offices, retail shops), as these loads typically contain mixed waste from several properties collected on a route. Recyclable materials accounted for 21% of the stream, with recyclable paper representing 14%, recyclable plastics 4%, recyclable metal containers 2%, and recyclable glass containers 1%. Organics contributed 37% of the stream, with food waste being the primary component (24%), followed by yard waste (7%), and food soiled paper (6%). The primary components of the other materials were diapers & sanitary waste (9%), textiles (6%), miscellaneous rigid plastic (4%), and other waste (4%, e.g. vacuum contents, cigarette butts, filters, etc.). Also noteworthy within the multi-family/small ICI garbage was deposit beverage containers at 2%.
Figure 3.2 Multi-Family/Small ICI Garbage Composition (by weight)
Total Recyclable Material
21%
Total Deposit Material
2%
Total Organic Material
37%
Total Other Material
40%
MULTI FAMILY/SMALL ICI

2017 Waste Composition Study – City of Yellowknife February 2018
Page | 8
3.1.3 Large Industrial/Commercial/Institutional (ICI) Figure 3.3 illustrates the composition, by weight, of the six large ICI garbage samples audited. It should be noted samples collected from roll-off trucks were classified as large ICI (e.g. grocery stores, big box retail, shopping mall, penitentiary). Recyclable materials accounted for 30% of the stream, with recyclable paper representing 26%, recyclable plastics 4%, recyclable metal containers <1%, and recyclable glass containers <1%. Organics contributed 41% of the stream, with food waste being the primary component (31%), followed by food soiled paper (9%), and yard waste (1%). The primary components of the other materials were non-recyclable plastic bags & film (6%), non-recyclable paper (4%), other waste (4%, e.g. soap, wipes, sweepings, composite items, etc.), and textiles (4%).
Figure 3.3 Large ICI Garbage Composition (by weight)
Total Recyclable Material
30%
Total Deposit Material
1%
Total Organic Material
41%
Total Other Material
28%
LARGE ICI
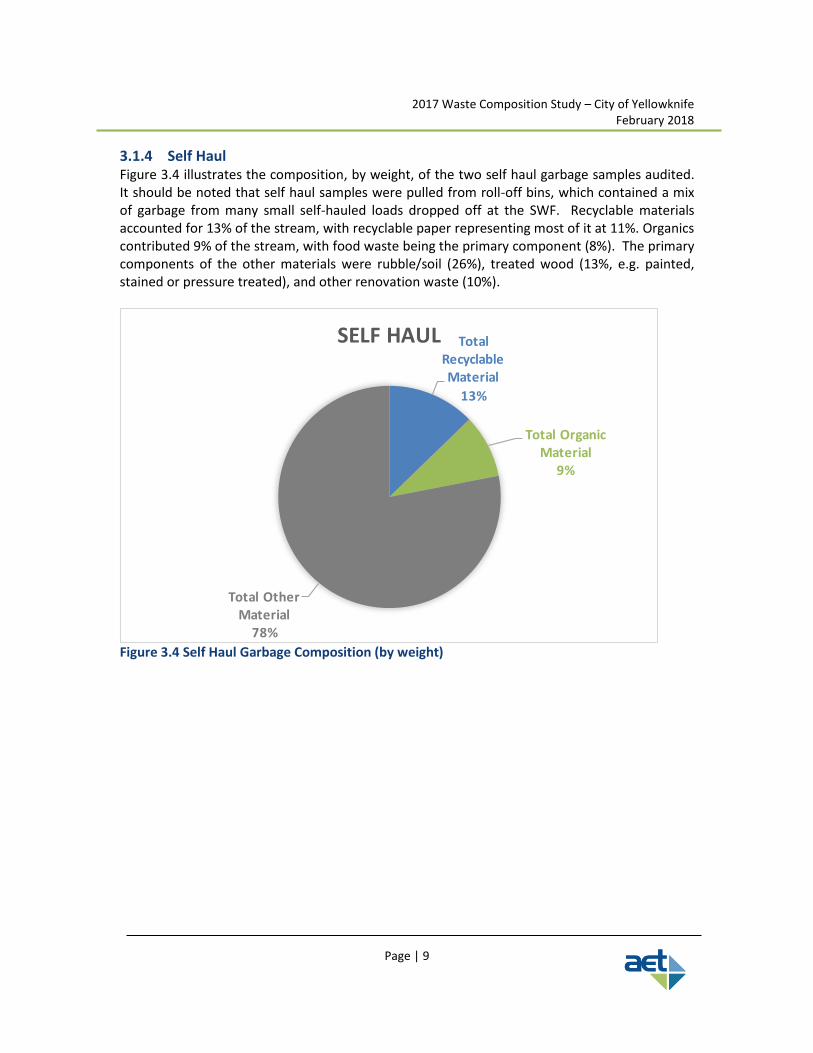
2017 Waste Composition Study – City of Yellowknife February 2018
Page | 9
3.1.4 Self Haul Figure 3.4 illustrates the composition, by weight, of the two self haul garbage samples audited. It should be noted that self haul samples were pulled from roll-off bins, which contained a mix of garbage from many small self-hauled loads dropped off at the SWF. Recyclable materials accounted for 13% of the stream, with recyclable paper representing most of it at 11%. Organics contributed 9% of the stream, with food waste being the primary component (8%). The primary components of the other materials were rubble/soil (26%), treated wood (13%, e.g. painted, stained or pressure treated), and other renovation waste (10%).
Figure 3.4 Self Haul Garbage Composition (by weight)
Total Recyclable Material
13%
Total Organic Material
9%
Total Other Material
78%
SELF HAUL
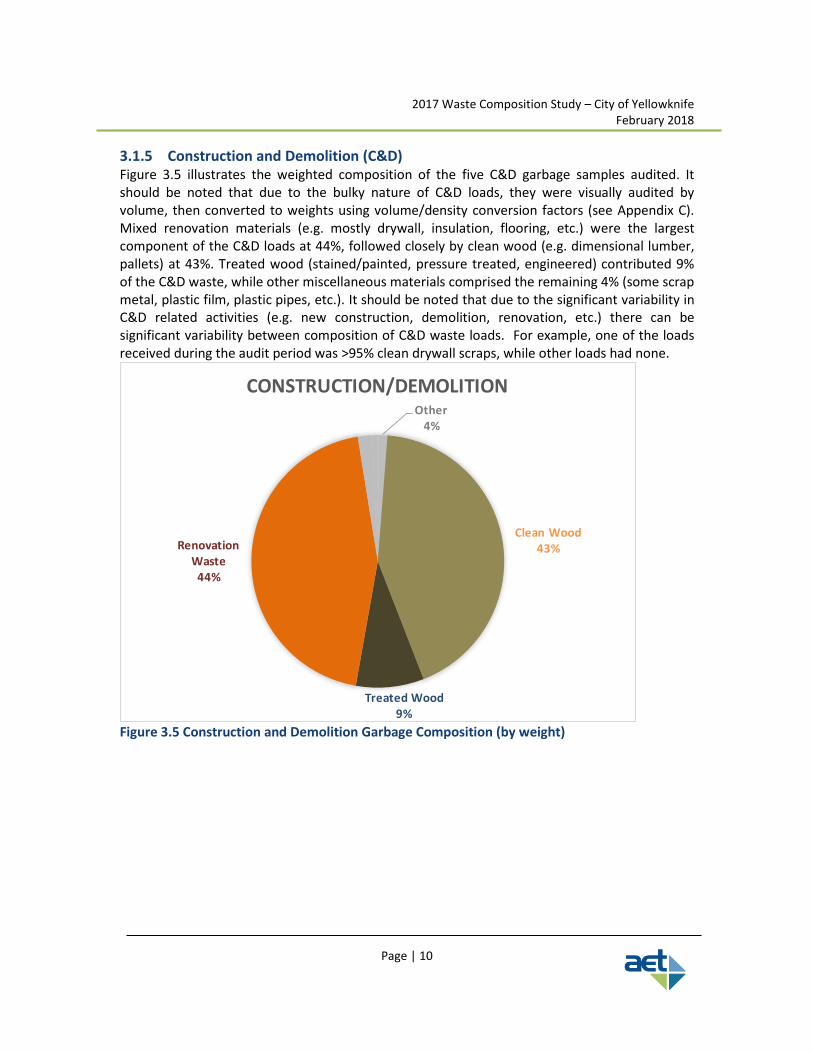
2017 Waste Composition Study – City of Yellowknife February 2018
Page | 10
3.1.5 Construction and Demolition (C&D) Figure 3.5 illustrates the weighted composition of the five C&D garbage samples audited. It should be noted that due to the bulky nature of C&D loads, they were visually audited by volume, then converted to weights using volume/density conversion factors (see Appendix C). Mixed renovation materials (e.g. mostly drywall, insulation, flooring, etc.) were the largest component of the C&D loads at 44%, followed closely by clean wood (e.g. dimensional lumber, pallets) at 43%. Treated wood (stained/painted, pressure treated, engineered) contributed 9% of the C&D waste, while other miscellaneous materials comprised the remaining 4% (some scrap metal, plastic film, plastic pipes, etc.). It should be noted that due to the significant variability in C&D related activities (e.g. new construction, demolition, renovation, etc.) there can be significant variability between composition of C&D waste loads. For example, one of the loads received during the audit period was >95% clean drywall scraps, while other loads had none.
Figure 3.5 Construction and Demolition Garbage Composition (by weight)
Other4%
Clean Wood43%
Treated Wood9%
Renovation Waste
44%
CONSTRUCTION/DEMOLITION
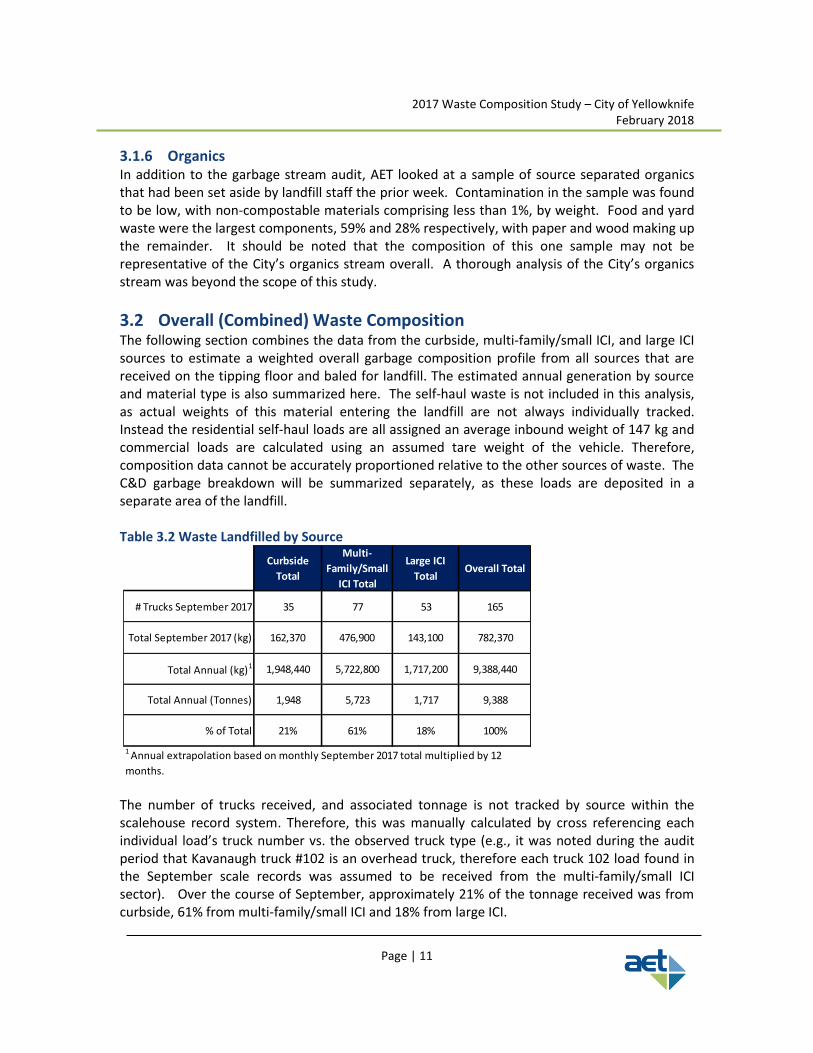
2017 Waste Composition Study – City of Yellowknife February 2018
Page | 11
3.1.6 Organics In addition to the garbage stream audit, AET looked at a sample of source separated organics that had been set aside by landfill staff the prior week. Contamination in the sample was found to be low, with non-compostable materials comprising less than 1%, by weight. Food and yard waste were the largest components, 59% and 28% respectively, with paper and wood making up the remainder. It should be noted that the composition of this one sample may not be representative of the City’s organics stream overall. A thorough analysis of the City’s organics stream was beyond the scope of this study.
3.2 Overall (Combined) Waste Composition The following section combines the data from the curbside, multi-family/small ICI, and large ICI sources to estimate a weighted overall garbage composition profile from all sources that are received on the tipping floor and baled for landfill. The estimated annual generation by source and material type is also summarized here. The self-haul waste is not included in this analysis, as actual weights of this material entering the landfill are not always individually tracked. Instead the residential self-haul loads are all assigned an average inbound weight of 147 kg and commercial loads are calculated using an assumed tare weight of the vehicle. Therefore, composition data cannot be accurately proportioned relative to the other sources of waste. The C&D garbage breakdown will be summarized separately, as these loads are deposited in a separate area of the landfill. Table 3.2 Waste Landfilled by Source
The number of trucks received, and associated tonnage is not tracked by source within the scalehouse record system. Therefore, this was manually calculated by cross referencing each individual load’s truck number vs. the observed truck type (e.g., it was noted during the audit period that Kavanaugh truck #102 is an overhead truck, therefore each truck 102 load found in the September scale records was assumed to be received from the multi-family/small ICI sector). Over the course of September, approximately 21% of the tonnage received was from curbside, 61% from multi-family/small ICI and 18% from large ICI.
Overall Total
# Trucks September 2017 35 77 53 165
Total September 2017 (kg) 162,370 476,900 143,100 782,370
Total Annual (kg)1 1,948,440 5,722,800 1,717,200 9,388,440
Total Annual (Tonnes) 1,948 5,723 1,717 9,388
% of Total 21% 61% 18% 100%
1 Annual extrapolation based on monthly September 2017 total multiplied by 12
months.
Curbside
Total
Multi-
Family/Small
ICI Total
Large ICI
Total
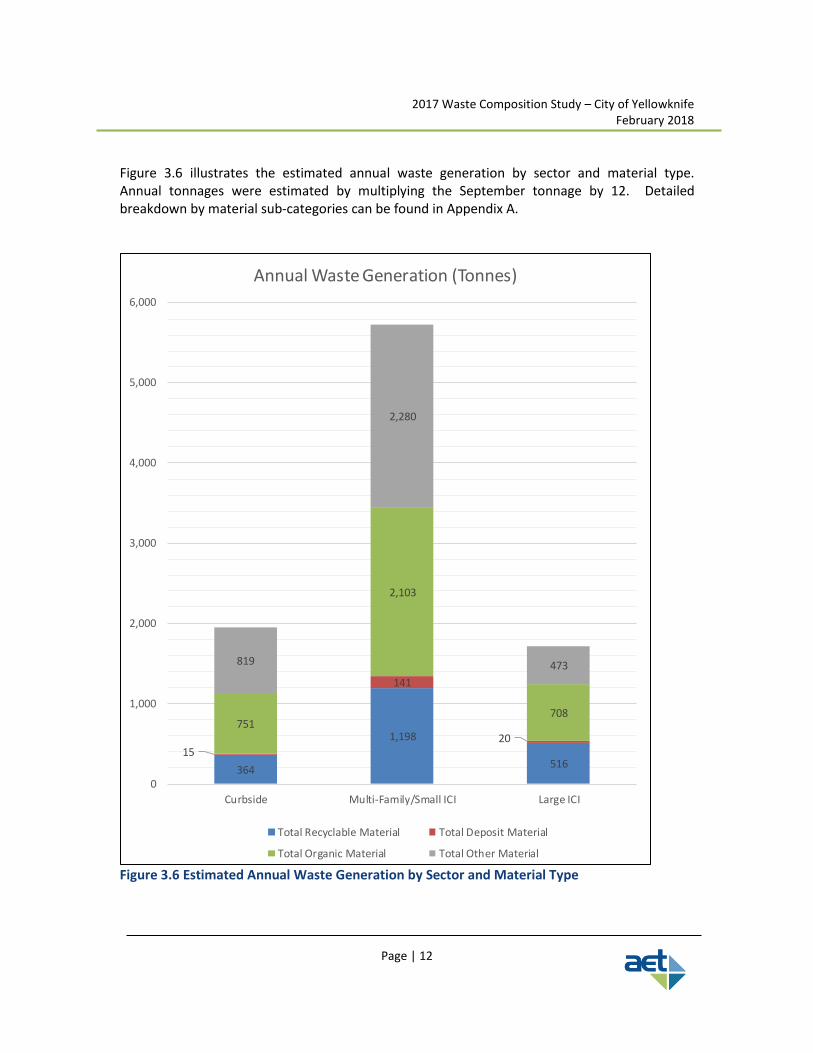
2017 Waste Composition Study – City of Yellowknife February 2018
Page | 12
Figure 3.6 illustrates the estimated annual waste generation by sector and material type. Annual tonnages were estimated by multiplying the September tonnage by 12. Detailed breakdown by material sub-categories can be found in Appendix A.
Figure 3.6 Estimated Annual Waste Generation by Sector and Material Type
364
1,198
51615
141
20751
2,103
708
819
2,280
473
0
1,000
2,000
3,000
4,000
5,000
6,000
Curbside Multi-Family/Small ICI Large ICI
Annual Waste Generation (Tonnes)
Total Recyclable Material Total Deposit Material
Total Organic Material Total Other Material

2017 Waste Composition Study – City of Yellowknife February 2018
Page | 13
Figure 3.7 brings together the data from the curbside, multi-family, and large ICI sectors to illustrate the estimated overall combined annual waste generation by material type.
Figure 3.7 Estimated Combined (Curbside, MF/Small ICI, Large ICI) Annual Waste Generation by Material Type (Tonnes)
3.2.1 Construction/Demolition Annual Estimates C&D waste is tracked as a separate line item within the landfill scalehouse records and tipped in a separate area of the landfill. C&D waste is also more susceptible to seasonal fluctuations. Since C&D waste is tracked separately throughout the year, the annual estimations for this sector were made against the total reported 2016 C&D tonnages (4,762 tonnes); as opposed to simply multiplying the monthly September tonnage by 12, as had to be done for the other sources of waste. Figure 3.8 illustrates the estimated annual C&D waste generation by material type.
Total Recyclable Material
2,078
22%
Total Deposit Material
1762%
Total Organic Material
3,563
38%
Total Other Material
3,572
38%

2017 Waste Composition Study – City of Yellowknife February 2018
Page | 14
Figure 3.8 Estimated C&D Annual Waste Generation by Material Type Report Prepared By:
Ben Dunbar, BES, Dip. EMA, EP (Waste) Manager of Waste Operations
Other179
Clean Wood2,042
Treated Wood414
Renovation Waste 2,127
CONSTRUCTION/DEMOLITION (TONNES/YR)
Disclaimer AET Group Inc. makes no warranty and assumes no liability for the information contained in this report outlining the waste audit study results. These results reflect measurements made over the one-week study period as described in the methodology. As such, waste generation measurements should be considered snapshots and may not reflect accurately conditions across the City of Yellowknife over time. These reported generation and composition results more accurately reflect the quantity of each material generated over the study period and have been extrapolated to calculate annual rates based on scale records.
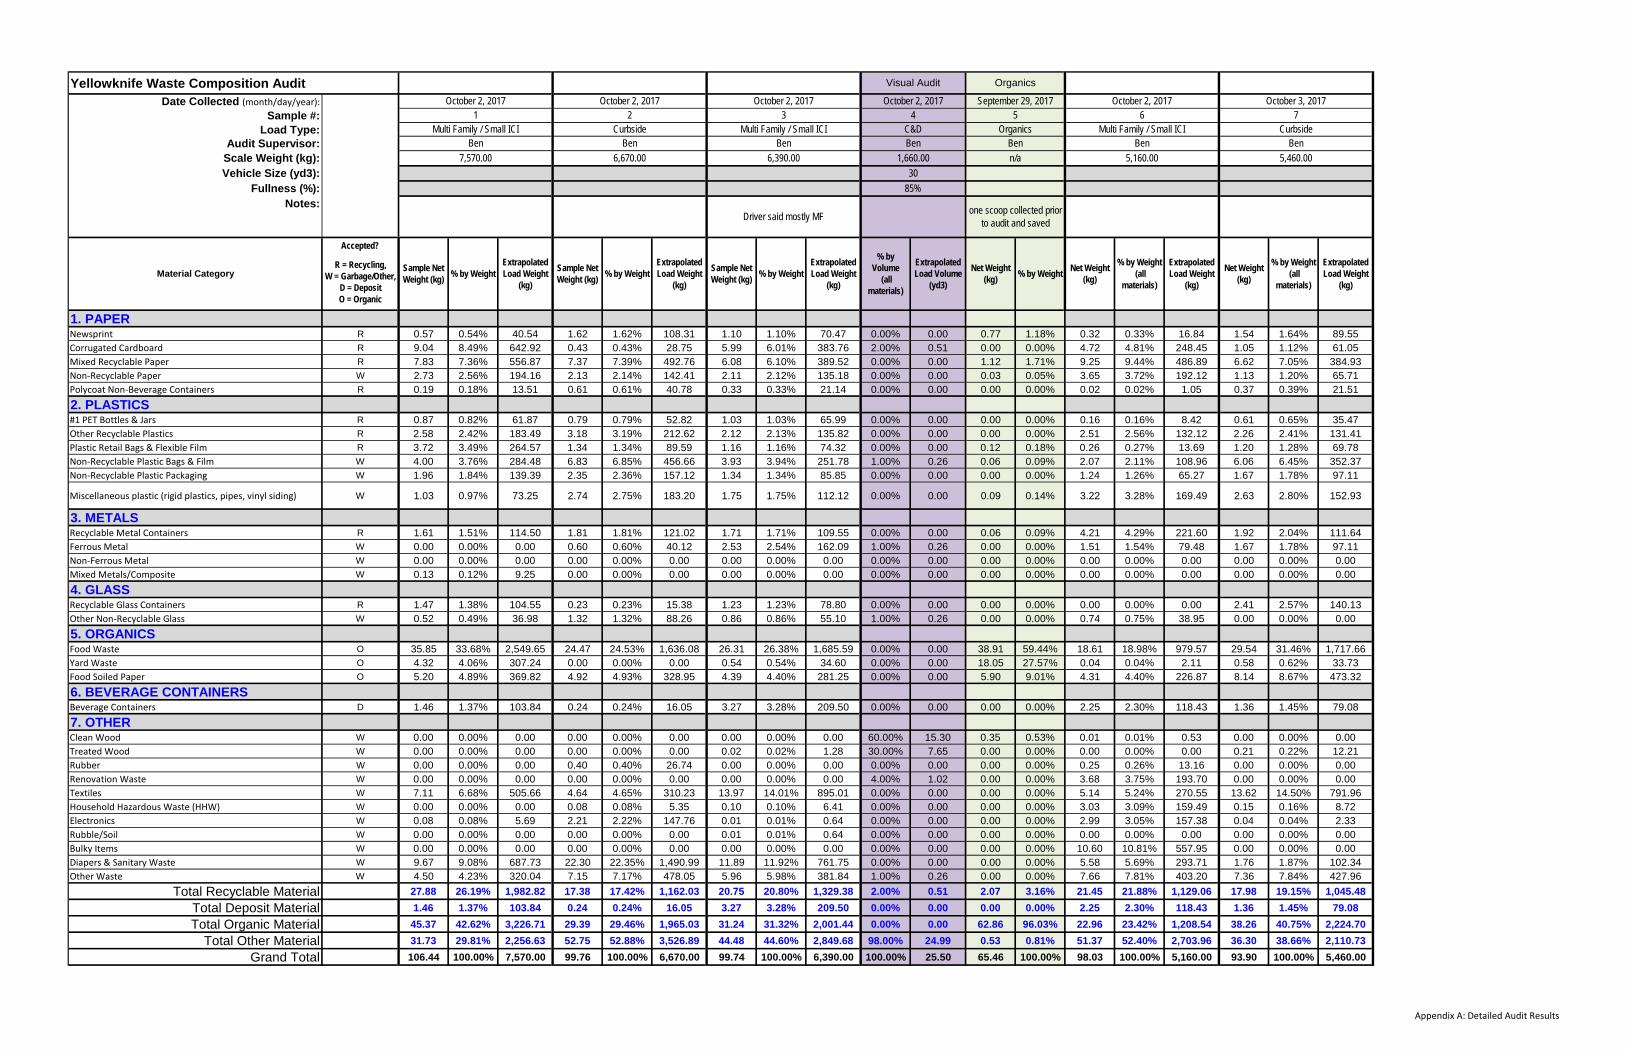
Yellowknife Waste Composition Audit
Sample #:
Load Type:
Scale Weight (kg):
Vehicle Size (yd3):
Fullness (%):
Accepted?
R = Recycling,W = Garbage/Other,
D = DepositO = Organic
1. PAPERNewsprint R 0.57 0.54% 40.54 1.62 1.62% 108.31 1.10 1.10% 70.47 0.00% 0.00 0.77 1.18% 0.32 0.33% 16.84 1.54 1.64% 89.55
Corrugated Cardboard R 9.04 8.49% 642.92 0.43 0.43% 28.75 5.99 6.01% 383.76 2.00% 0.51 0.00 0.00% 4.72 4.81% 248.45 1.05 1.12% 61.05
Mixed Recyclable Paper R 7.83 7.36% 556.87 7.37 7.39% 492.76 6.08 6.10% 389.52 0.00% 0.00 1.12 1.71% 9.25 9.44% 486.89 6.62 7.05% 384.93
Non‐Recyclable Paper W 2.73 2.56% 194.16 2.13 2.14% 142.41 2.11 2.12% 135.18 0.00% 0.00 0.03 0.05% 3.65 3.72% 192.12 1.13 1.20% 65.71
Polycoat Non‐Beverage Containers R 0.19 0.18% 13.51 0.61 0.61% 40.78 0.33 0.33% 21.14 0.00% 0.00 0.00 0.00% 0.02 0.02% 1.05 0.37 0.39% 21.51
2. PLASTICS#1 PET Bottles & Jars R 0.87 0.82% 61.87 0.79 0.79% 52.82 1.03 1.03% 65.99 0.00% 0.00 0.00 0.00% 0.16 0.16% 8.42 0.61 0.65% 35.47
Other Recyclable Plastics R 2.58 2.42% 183.49 3.18 3.19% 212.62 2.12 2.13% 135.82 0.00% 0.00 0.00 0.00% 2.51 2.56% 132.12 2.26 2.41% 131.41
Plastic Retail Bags & Flexible Film R 3.72 3.49% 264.57 1.34 1.34% 89.59 1.16 1.16% 74.32 0.00% 0.00 0.12 0.18% 0.26 0.27% 13.69 1.20 1.28% 69.78
Non‐Recyclable Plastic Bags & Film W 4.00 3.76% 284.48 6.83 6.85% 456.66 3.93 3.94% 251.78 1.00% 0.26 0.06 0.09% 2.07 2.11% 108.96 6.06 6.45% 352.37
Non‐Recyclable Plastic Packaging W 1.96 1.84% 139.39 2.35 2.36% 157.12 1.34 1.34% 85.85 0.00% 0.00 0.00 0.00% 1.24 1.26% 65.27 1.67 1.78% 97.11
Miscellaneous plastic (rigid plastics, pipes, vinyl siding) W 1.03 0.97% 73.25 2.74 2.75% 183.20 1.75 1.75% 112.12 0.00% 0.00 0.09 0.14% 3.22 3.28% 169.49 2.63 2.80% 152.93
3. METALSRecyclable Metal Containers R 1.61 1.51% 114.50 1.81 1.81% 121.02 1.71 1.71% 109.55 0.00% 0.00 0.06 0.09% 4.21 4.29% 221.60 1.92 2.04% 111.64
Ferrous Metal W 0.00 0.00% 0.00 0.60 0.60% 40.12 2.53 2.54% 162.09 1.00% 0.26 0.00 0.00% 1.51 1.54% 79.48 1.67 1.78% 97.11
Non‐Ferrous Metal W 0.00 0.00% 0.00 0.00 0.00% 0.00 0.00 0.00% 0.00 0.00% 0.00 0.00 0.00% 0.00 0.00% 0.00 0.00 0.00% 0.00
Mixed Metals/Composite W 0.13 0.12% 9.25 0.00 0.00% 0.00 0.00 0.00% 0.00 0.00% 0.00 0.00 0.00% 0.00 0.00% 0.00 0.00 0.00% 0.00
4. GLASSRecyclable Glass Containers R 1.47 1.38% 104.55 0.23 0.23% 15.38 1.23 1.23% 78.80 0.00% 0.00 0.00 0.00% 0.00 0.00% 0.00 2.41 2.57% 140.13
Other Non‐Recyclable Glass W 0.52 0.49% 36.98 1.32 1.32% 88.26 0.86 0.86% 55.10 1.00% 0.26 0.00 0.00% 0.74 0.75% 38.95 0.00 0.00% 0.00
5. ORGANICSFood Waste O 35.85 33.68% 2,549.65 24.47 24.53% 1,636.08 26.31 26.38% 1,685.59 0.00% 0.00 38.91 59.44% 18.61 18.98% 979.57 29.54 31.46% 1,717.66
Yard Waste O 4.32 4.06% 307.24 0.00 0.00% 0.00 0.54 0.54% 34.60 0.00% 0.00 18.05 27.57% 0.04 0.04% 2.11 0.58 0.62% 33.73
Food Soiled Paper O 5.20 4.89% 369.82 4.92 4.93% 328.95 4.39 4.40% 281.25 0.00% 0.00 5.90 9.01% 4.31 4.40% 226.87 8.14 8.67% 473.32
6. BEVERAGE CONTAINERSBeverage Containers D 1.46 1.37% 103.84 0.24 0.24% 16.05 3.27 3.28% 209.50 0.00% 0.00 0.00 0.00% 2.25 2.30% 118.43 1.36 1.45% 79.08
7. OTHERClean Wood W 0.00 0.00% 0.00 0.00 0.00% 0.00 0.00 0.00% 0.00 60.00% 15.30 0.35 0.53% 0.01 0.01% 0.53 0.00 0.00% 0.00
Treated Wood W 0.00 0.00% 0.00 0.00 0.00% 0.00 0.02 0.02% 1.28 30.00% 7.65 0.00 0.00% 0.00 0.00% 0.00 0.21 0.22% 12.21
Rubber W 0.00 0.00% 0.00 0.40 0.40% 26.74 0.00 0.00% 0.00 0.00% 0.00 0.00 0.00% 0.25 0.26% 13.16 0.00 0.00% 0.00
Renovation Waste W 0.00 0.00% 0.00 0.00 0.00% 0.00 0.00 0.00% 0.00 4.00% 1.02 0.00 0.00% 3.68 3.75% 193.70 0.00 0.00% 0.00
Textiles W 7.11 6.68% 505.66 4.64 4.65% 310.23 13.97 14.01% 895.01 0.00% 0.00 0.00 0.00% 5.14 5.24% 270.55 13.62 14.50% 791.96
Household Hazardous Waste (HHW) W 0.00 0.00% 0.00 0.08 0.08% 5.35 0.10 0.10% 6.41 0.00% 0.00 0.00 0.00% 3.03 3.09% 159.49 0.15 0.16% 8.72
Electronics W 0.08 0.08% 5.69 2.21 2.22% 147.76 0.01 0.01% 0.64 0.00% 0.00 0.00 0.00% 2.99 3.05% 157.38 0.04 0.04% 2.33
Rubble/Soil W 0.00 0.00% 0.00 0.00 0.00% 0.00 0.01 0.01% 0.64 0.00% 0.00 0.00 0.00% 0.00 0.00% 0.00 0.00 0.00% 0.00
Bulky Items W 0.00 0.00% 0.00 0.00 0.00% 0.00 0.00 0.00% 0.00 0.00% 0.00 0.00 0.00% 10.60 10.81% 557.95 0.00 0.00% 0.00
Diapers & Sanitary Waste W 9.67 9.08% 687.73 22.30 22.35% 1,490.99 11.89 11.92% 761.75 0.00% 0.00 0.00 0.00% 5.58 5.69% 293.71 1.76 1.87% 102.34
Other Waste W 4.50 4.23% 320.04 7.15 7.17% 478.05 5.96 5.98% 381.84 1.00% 0.26 0.00 0.00% 7.66 7.81% 403.20 7.36 7.84% 427.96
Total Recyclable Material 27.88 26.19% 1,982.82 17.38 17.42% 1,162.03 20.75 20.80% 1,329.38 2.00% 0.51 2.07 3.16% 21.45 21.88% 1,129.06 17.98 19.15% 1,045.48
Total Deposit Material 1.46 1.37% 103.84 0.24 0.24% 16.05 3.27 3.28% 209.50 0.00% 0.00 0.00 0.00% 2.25 2.30% 118.43 1.36 1.45% 79.08
Total Organic Material 45.37 42.62% 3,226.71 29.39 29.46% 1,965.03 31.24 31.32% 2,001.44 0.00% 0.00 62.86 96.03% 22.96 23.42% 1,208.54 38.26 40.75% 2,224.70
Total Other Material 31.73 29.81% 2,256.63 52.75 52.88% 3,526.89 44.48 44.60% 2,849.68 98.00% 24.99 0.53 0.81% 51.37 52.40% 2,703.96 36.30 38.66% 2,110.73
Grand Total 106.44 100.00% 7,570.00 99.76 100.00% 6,670.00 99.74 100.00% 6,390.00 100.00% 25.50 65.46 100.00% 98.03 100.00% 5,160.00 93.90 100.00% 5,460.00
Net Weight (kg)
% by Weight (all
materials)
Net Weight (kg)
% by Weight (all
materials)
5,460.00
Extrapolated Load Weight
(kg)
October 2, 2017
one scoop collected prior to audit and saved
Net Weight (kg)
% by Weight
Visual Audit
October 2, 20174
Ben
% by Volume
(all materials)
C&D Organics
1,660.00 n/a
30
85%
Extrapolated Load Volume
(yd3)
Date Collected (month/day/year):
Audit Supervisor:
Organics
September 29, 20175
Ben
October 2, 20171
Multi Family / Small ICIBen
Notes:
Material CategorySample Net Weight (kg)
% by WeightSample Net Weight (kg)
% by Weight
Sample Net Weight (kg)
% by WeightExtrapolated Load Weight
(kg)
7,570.00
Extrapolated Load Weight
(kg)
October 2, 20172
CurbsideBen
6,670.00
Extrapolated Load Weight
(kg)
October 2, 20173
Multi Family / Small ICIBen
6,390.00
Driver said mostly MF
6Multi Family / Small ICI
Ben
5,160.00
Extrapolated Load Weight
(kg)
October 3, 20177
CurbsideBen
Appendix A: Detailed Audit Results

Yellowknife Waste Composition Audit
Sample #:
Load Type:
Scale Weight (kg):
Vehicle Size (yd3):
Fullness (%):
Accepted?
R = Recycling,W = Garbage/Other,
D = DepositO = Organic
1. PAPERNewsprint R
Corrugated Cardboard R
Mixed Recyclable Paper R
Non‐Recyclable Paper W
Polycoat Non‐Beverage Containers R
2. PLASTICS#1 PET Bottles & Jars R
Other Recyclable Plastics R
Plastic Retail Bags & Flexible Film R
Non‐Recyclable Plastic Bags & Film W
Non‐Recyclable Plastic Packaging W
Miscellaneous plastic (rigid plastics, pipes, vinyl siding) W
3. METALSRecyclable Metal Containers R
Ferrous Metal W
Non‐Ferrous Metal W
Mixed Metals/Composite W
4. GLASSRecyclable Glass Containers R
Other Non‐Recyclable Glass W
5. ORGANICSFood Waste O
Yard Waste O
Food Soiled Paper O
6. BEVERAGE CONTAINERSBeverage Containers D
7. OTHERClean Wood W
Treated Wood W
Rubber W
Renovation Waste W
Textiles W
Household Hazardous Waste (HHW) W
Electronics W
Rubble/Soil W
Bulky Items W
Diapers & Sanitary Waste W
Other Waste W
Total Recyclable Material
Total Deposit Material
Total Organic Material
Total Other Material
Grand Total
Date Collected (month/day/year):
Audit Supervisor:
Notes:
Material Category
0.00% 0.00 0.41 0.41% 10.79 0.17 0.18% 6.14 0.77 0.76% 65.76 0.10 0.10% 2.34 1.46 1.43% 84.94 0.00% 0.00
2.00% 0.48 1.21 1.22% 31.86 11.49 12.27% 414.83 4.37 4.33% 373.23 6.57 6.36% 153.97 2.21 2.17% 128.57 0.00% 0.00
0.00% 0.00 4.46 4.48% 117.43 8.37 8.94% 302.19 3.47 3.44% 296.37 3.50 3.39% 82.03 5.13 5.04% 298.44 0.00% 0.00
0.00% 0.00 1.76 1.77% 46.34 3.47 3.71% 125.28 1.22 1.21% 104.20 9.98 9.66% 233.89 0.80 0.79% 46.54 0.00% 0.00
0.00% 0.00 0.18 0.18% 4.74 0.04 0.04% 1.44 0.25 0.25% 21.35 0.00 0.00% 0.00 0.13 0.13% 7.56 0.00% 0.00
0.00% 0.00 0.62 0.62% 16.32 0.23 0.25% 8.30 0.34 0.34% 29.04 0.00 0.00% 0.00 0.63 0.62% 36.65 0.00% 0.00
0.00% 0.00 2.49 2.50% 65.56 3.69 3.94% 133.22 1.53 1.52% 130.67 1.22 1.18% 28.59 3.01 2.96% 175.11 0.00% 0.00
0.00% 0.00 1.09 1.10% 28.70 0.67 0.72% 24.19 0.96 0.95% 81.99 1.06 1.03% 24.84 1.31 1.29% 76.21 0.00% 0.00
1.00% 0.24 4.00 4.02% 105.32 6.34 6.77% 228.90 2.30 2.28% 196.44 6.16 5.97% 144.37 6.91 6.79% 402.00 1.00% 0.30
1.00% 0.24 1.32 1.33% 34.75 1.66 1.77% 59.93 0.84 0.83% 71.74 0.87 0.84% 20.39 1.72 1.69% 100.06 0.00% 0.00
1.00% 0.24 1.03 1.04% 27.12 1.00 1.07% 36.10 13.34 13.23% 1,139.35 0.89 0.86% 20.86 7.29 7.16% 424.10 1.00% 0.30
0.00% 0.00 0.73 0.73% 19.22 0.24 0.26% 8.66 0.71 0.70% 60.64 0.68 0.66% 15.94 1.61 1.58% 93.66 0.00% 0.00
3.00% 0.72 0.18 0.18% 4.74 1.93 2.06% 69.68 12.32 12.22% 1,052.23 0.02 0.02% 0.47 2.19 2.15% 127.41 0.00% 0.00
0.00% 0.00 0.05 0.05% 1.32 0.05 0.05% 1.81 0.00 0.00% 0.00 0.00 0.00% 0.00 0.00 0.00% 0.00 0.00% 0.00
0.00% 0.00 0.00 0.00% 0.00 0.00 0.00% 0.00 0.00 0.00% 0.00 0.00 0.00% 0.00 0.00 0.00% 0.00 0.00% 0.00
0.00% 0.00 1.33 1.34% 35.02 0.11 0.12% 3.97 0.63 0.62% 53.81 0.27 0.26% 6.33 2.31 2.27% 134.39 0.00% 0.00
0.00% 0.00 4.55 4.57% 119.80 0.00 0.00% 0.00 0.44 0.44% 37.58 0.30 0.29% 7.03 0.04 0.04% 2.33 0.00% 0.00
0.00% 0.00 48.54 48.78% 1,278.01 22.58 24.12% 815.21 10.51 10.43% 897.64 63.82 61.81% 1,495.68 19.30 18.97% 1,122.80 0.00% 0.00
0.00% 0.00 0.79 0.79% 20.80 0.37 0.40% 13.36 24.76 24.56% 2,114.71 0.00 0.00% 0.00 8.48 8.33% 493.33 0.00% 0.00
0.00% 0.00 4.17 4.19% 109.79 14.40 15.38% 519.89 8.58 8.51% 732.80 2.64 2.56% 61.87 4.64 4.56% 269.94 0.00% 0.00
0.00% 0.00 1.41 1.42% 37.12 1.04 1.11% 37.55 2.47 2.45% 210.96 2.64 2.56% 61.87 0.77 0.76% 44.80 0.00% 0.00
80.00% 19.20 0.20 0.20% 5.27 0.07 0.07% 2.53 0.00 0.00% 0.00 0.00 0.00% 0.00 0.00 0.00% 0.00 1.00% 0.30
10.00% 2.40 0.00 0.00% 0.00 0.00 0.00% 0.00 0.00 0.00% 0.00 1.26 1.22% 29.53 0.00 0.00% 0.00 0.00% 0.00
0.00% 0.00 0.00 0.00% 0.00 0.09 0.10% 3.25 0.00 0.00% 0.00 0.00 0.00% 0.00 0.07 0.07% 4.07 0.00% 0.00
1.00% 0.24 1.68 1.69% 44.23 0.00 0.00% 0.00 0.00 0.00% 0.00 0.00 0.00% 0.00 0.00 0.00% 0.00 97.00% 29.10
0.00% 0.00 2.04 2.05% 53.71 2.36 2.52% 85.20 3.69 3.66% 315.16 0.40 0.39% 9.37 6.28 6.17% 365.35 0.00% 0.00
0.00% 0.00 0.08 0.08% 2.11 0.22 0.23% 7.94 0.00 0.00% 0.00 0.00 0.00% 0.00 0.84 0.83% 48.87 0.00% 0.00
0.00% 0.00 6.88 6.91% 181.14 0.02 0.02% 0.72 0.00 0.00% 0.00 0.00 0.00% 0.00 0.63 0.62% 36.65 0.00% 0.00
0.00% 0.00 0.00 0.00% 0.00 0.00 0.00% 0.00 0.07 0.07% 5.98 0.00 0.00% 0.00 0.00 0.00% 0.00 0.00% 0.00
0.00% 0.00 0.00 0.00% 0.00 0.00 0.00% 0.00 0.00 0.00% 0.00 0.00 0.00% 0.00 0.00 0.00% 0.00 0.00% 0.00
0.00% 0.00 6.97 7.00% 183.51 0.01 0.01% 0.36 5.40 5.36% 461.20 0.00 0.00% 0.00 14.92 14.66% 867.99 0.00% 0.00
1.00% 0.24 1.34 1.35% 35.28 13.00 13.89% 469.34 1.84 1.83% 157.15 0.88 0.85% 20.62 9.08 8.92% 528.24 0.00% 0.00
2.00% 0.48 12.52 12.58% 329.64 25.01 26.71% 902.95 13.03 12.93% 1,112.87 13.40 12.98% 314.04 17.80 17.49% 1,035.53 0% 0.00
0.00% 0.00 1.41 1.42% 37.12 1.04 1.11% 37.55 2.47 2.45% 210.96 2.64 2.56% 61.87 0.77 0.76% 44.80 0% 0.00
0.00% 0.00 53.50 53.76% 1,408.60 37.35 39.90% 1,348.46 43.85 43.50% 3,745.15 66.46 64.36% 1,557.56 32.42 31.86% 1,886.07 0% 0.00
98.00% 23.52 32.08 32.24% 844.63 30.22 32.28% 1,091.04 41.46 41.13% 3,541.02 20.76 20.10% 486.53 50.77 49.89% 2,953.60 100% 30.00
100.00% 24.00 99.51 100.00% 2,620.00 93.62 100.00% 3,380.00 100.81 100.00% 8,610.00 103.26 100.00% 2,420.00 101.76 100.00% 5,920.00 100% 30.00
Visual Audit
October 4, 201714
Ben
% by Volume
(all materials)
Extrapolated Load
Volume (yd3)
C&D
5,590.00
30
100%
Net Weight (kg)
% by Weight (all
materials)
Net Weight (kg)
% by Weight (all
materials)
Extrapolated Load Weight
(kg)
October 4, 201712
Large ICIBen
2,420.00
Independent Grocery Store
Net Weight (kg)
% by Weight (all
materials)
Net Weight (kg)
% by Weight (all
materials)
Extrapolated Load Weight
(kg)
October 4, 201710
Large ICIBen
3,380.00
Lots of OCC
Net Weight (kg)
% by Weight (all
materials)
Visual Audit
October 3, 20178
Ben
% by Volume
(all materials)
Extrapolated Load
Volume (yd3)
C&D
1,250.00
30
80%
Extrapolated Load Weight
(kg)
October 4, 201711
Multi Family / Small ICIBen
8,610.00
Extrapolated Load Weight
(kg)
October 3, 20179
CurbsideBen
2,620.00
Extrapolated Load Weight
(kg)
October 4, 201713
CurbsideBen
5,920.00
Appendix A: Detailed Audit Results

Yellowknife Waste Composition Audit
Sample #:
Load Type:
Scale Weight (kg):
Vehicle Size (yd3):
Fullness (%):
Accepted?
R = Recycling,W = Garbage/Other,
D = DepositO = Organic
1. PAPERNewsprint R
Corrugated Cardboard R
Mixed Recyclable Paper R
Non‐Recyclable Paper W
Polycoat Non‐Beverage Containers R
2. PLASTICS#1 PET Bottles & Jars R
Other Recyclable Plastics R
Plastic Retail Bags & Flexible Film R
Non‐Recyclable Plastic Bags & Film W
Non‐Recyclable Plastic Packaging W
Miscellaneous plastic (rigid plastics, pipes, vinyl siding) W
3. METALSRecyclable Metal Containers R
Ferrous Metal W
Non‐Ferrous Metal W
Mixed Metals/Composite W
4. GLASSRecyclable Glass Containers R
Other Non‐Recyclable Glass W
5. ORGANICSFood Waste O
Yard Waste O
Food Soiled Paper O
6. BEVERAGE CONTAINERSBeverage Containers D
7. OTHERClean Wood W
Treated Wood W
Rubber W
Renovation Waste W
Textiles W
Household Hazardous Waste (HHW) W
Electronics W
Rubble/Soil W
Bulky Items W
Diapers & Sanitary Waste W
Other Waste W
Total Recyclable Material
Total Deposit Material
Total Organic Material
Total Other Material
Grand Total
Date Collected (month/day/year):
Audit Supervisor:
Notes:
Material Category
0.89 0.83% 32.65 0.72 0.70% 21.93 1.86 1.67% 19.42 0.28 0.27% 3.40 7.14 7.16% 201.97 1.15 1.16% 61.30
5.50 5.15% 201.78 1.29 1.25% 39.29 4.15 3.74% 43.33 3.06 3.00% 37.19 11.00 11.03% 311.16 0.29 0.29% 15.46
8.90 8.33% 326.51 6.43 6.24% 195.85 5.38 4.84% 56.17 4.70 4.61% 57.12 11.54 11.58% 326.44 9.24 9.29% 492.53
1.29 1.21% 47.33 1.01 0.98% 30.76 0.96 0.86% 10.02 2.59 2.54% 31.48 6.37 6.39% 180.19 1.34 1.35% 71.43
0.10 0.09% 3.67 0.00 0.00% 0.00 0.00 0.00% 0.00 0.08 0.08% 0.97 0.20 0.20% 5.66 0.40 0.40% 21.32
0.35 0.33% 12.84 0.16 0.16% 4.87 0.02 0.02% 0.21 0.20 0.20% 2.43 0.16 0.16% 4.53 1.74 1.75% 92.75
1.75 1.64% 64.20 1.56 1.51% 47.52 0.18 0.16% 1.88 0.95 0.93% 11.55 1.59 1.59% 44.98 3.97 3.99% 211.62
1.35 1.26% 49.53 1.25 1.21% 38.07 9.12 8.21% 95.22 0.49 0.48% 5.96 1.51 1.51% 42.71 1.68 1.69% 89.55
4.79 4.48% 175.73 9.17 8.90% 279.31 5.03 4.53% 52.52 2.18 2.14% 26.49 6.54 6.56% 185.00 6.07 6.10% 323.55
1.75 1.64% 64.20 3.07 2.98% 93.51 1.87 1.68% 19.52 0.82 0.80% 9.97 1.05 1.05% 29.70 1.67 1.68% 89.02
3.35 3.14% 122.90 4.42 4.29% 134.63 6.42 5.78% 67.03 1.01 0.99% 12.27 1.80 1.81% 50.92 1.75 1.76% 93.28
1.74 1.63% 63.84 0.66 0.64% 20.10 0.00 0.00% 0.00 0.93 0.91% 11.30 0.26 0.26% 7.35 3.08 3.10% 164.18
3.44 3.22% 126.20 0.01 0.01% 0.30 1.41 1.27% 14.72 3.47 3.40% 42.17 0.39 0.39% 11.03 1.12 1.13% 59.70
0.00 0.00% 0.00 0.00 0.00% 0.00 0.00 0.00% 0.00 0.75 0.74% 9.11 0.00 0.00% 0.00 0.00 0.00% 0.00
0.00 0.00% 0.00 0.00 0.00% 0.00 0.00 0.00% 0.00 0.00 0.00% 0.00 0.00 0.00% 0.00 0.00 0.00% 0.00
2.04 1.91% 74.84 0.00 0.00% 0.00 0.00 0.00% 0.00 0.62 0.61% 7.54 0.12 0.12% 3.39 2.45 2.46% 130.59
1.00 0.94% 36.69 0.00 0.00% 0.00 6.36 5.72% 66.41 0.06 0.06% 0.73 0.16 0.16% 4.53 1.91 1.92% 101.81
31.44 29.42% 1,153.44 30.50 29.59% 928.99 2.21 1.99% 23.07 19.95 19.55% 242.46 36.92 37.03% 1,044.38 33.84 34.03% 1,803.80
2.47 2.31% 90.62 0.00 0.00% 0.00 0.00 0.00% 0.00 0.00 0.00% 0.00 3.28 3.29% 92.78 0.28 0.28% 14.93
5.94 5.56% 217.92 20.42 19.81% 621.97 3.41 3.07% 35.60 2.51 2.46% 30.50 5.48 5.50% 155.02 8.52 8.57% 454.15
6.82 6.38% 250.20 1.86 1.80% 56.65 0.42 0.38% 4.39 0.47 0.46% 5.71 0.84 0.84% 23.76 0.42 0.42% 22.39
0.00 0.00% 0.00 0.00 0.00% 0.00 4.76 4.28% 49.70 0.00 0.00% 0.00 0.00 0.00% 0.00 0.00 0.00% 0.00
4.17 3.90% 152.98 0.00 0.00% 0.00 54.16 48.75% 565.49 31.63 31.00% 384.41 0.00 0.00% 0.00 0.00 0.00% 0.00
0.03 0.03% 1.10 1.41 1.37% 42.95 0.00 0.00% 0.00 0.02 0.02% 0.24 0.00 0.00% 0.00 0.06 0.06% 3.20
0.00 0.00% 0.00 0.00 0.00% 0.00 0.00 0.00% 0.00 3.90 3.82% 47.40 0.00 0.00% 0.00 0.00 0.00% 0.00
1.27 1.19% 46.59 15.98 15.50% 486.73 1.34 1.21% 13.99 1.68 1.65% 20.42 0.15 0.15% 4.24 3.75 3.77% 199.89
0.03 0.03% 1.10 0.00 0.00% 0.00 0.09 0.08% 0.94 1.68 1.65% 20.42 0.00 0.00% 0.00 0.22 0.22% 11.73
0.74 0.69% 27.15 0.00 0.00% 0.00 0.19 0.17% 1.98 14.95 14.65% 181.69 0.98 0.98% 27.72 0.00 0.00% 0.00
0.00 0.00% 0.00 0.00 0.00% 0.00 0.00 0.00% 0.00 0.00 0.00% 0.00 0.00 0.00% 0.00 0.00 0.00% 0.00
0.00 0.00% 0.00 0.00 0.00% 0.00 0.00 0.00% 0.00 0.00 0.00% 0.00 0.00 0.00% 0.00 0.00 0.00% 0.00
12.89 12.06% 472.89 0.00 0.00% 0.00 1.14 1.03% 11.90 0.64 0.63% 7.78 0.36 0.36% 10.18 11.34 11.41% 604.47
2.81 2.63% 103.09 3.17 3.07% 96.55 0.62 0.56% 6.47 2.41 2.36% 29.29 1.85 1.86% 52.33 3.14 3.16% 167.37
22.62 21.17% 829.86 12.07 11.71% 367.64 20.71 18.64% 216.23 11.31 11.08% 137.45 33.52 33.62% 948.20 24.00 24.14% 1,279.29
6.82 6.38% 250.20 1.86 1.80% 56.65 0.42 0.38% 4.39 0.47 0.46% 5.71 0.84 0.84% 23.76 0.42 0.42% 22.39
39.85 37.30% 1,461.97 50.92 49.39% 1,550.96 5.62 5.06% 58.68 22.46 22.01% 272.96 45.68 45.82% 1,292.18 42.64 42.88% 2,272.88
37.56 35.15% 1,377.96 38.24 37.09% 1,164.75 84.35 75.92% 880.70 67.79 66.44% 823.87 19.65 19.71% 555.85 32.37 32.56% 1,725.45
106.85 100.00% 3,920.00 103.09 100.00% 3,140.00 111.10 100.00% 1,160.00 102.03 100.00% 1,240.00 99.69 100.00% 2,820.00 99.43 100.00% 5,300.00
Net Weight (kg)
% by Weight (all
materials)
Net Weight (kg)
% by Weight (all
materials)
2,820.00
Center Square Mall
Net Weight (kg)
% by Weight (all
materials)
October 5, 201720
CurbsideBen
5,300.00
Extrapolated Load Weight
(kg)
Net Weight (kg)
% by Weight (all
materials)
Net Weight (kg)
% by Weight (all
materials)
Extrapolated Load Weight
(kg)
October 5, 201716
Large ICIBen
3,140.00
Local Jail
Net Weight (kg)
% by Weight (all
materials)
Extrapolated Load Weight
(kg)
October 4, 201715
Multi Family / Small ICIBen
3,920.00
Extrapolated Load Weight
(kg)
October 5, 201717
Large ICIBen
1,160.00
Extrapolated Load Weight
(kg)
Extrapolated Load Weight
(kg)
October 5, 201718
Multi Family / Small ICIBen
1,240.00
mostly ICI
October 5, 201719
Large ICIBen
Appendix A: Detailed Audit Results
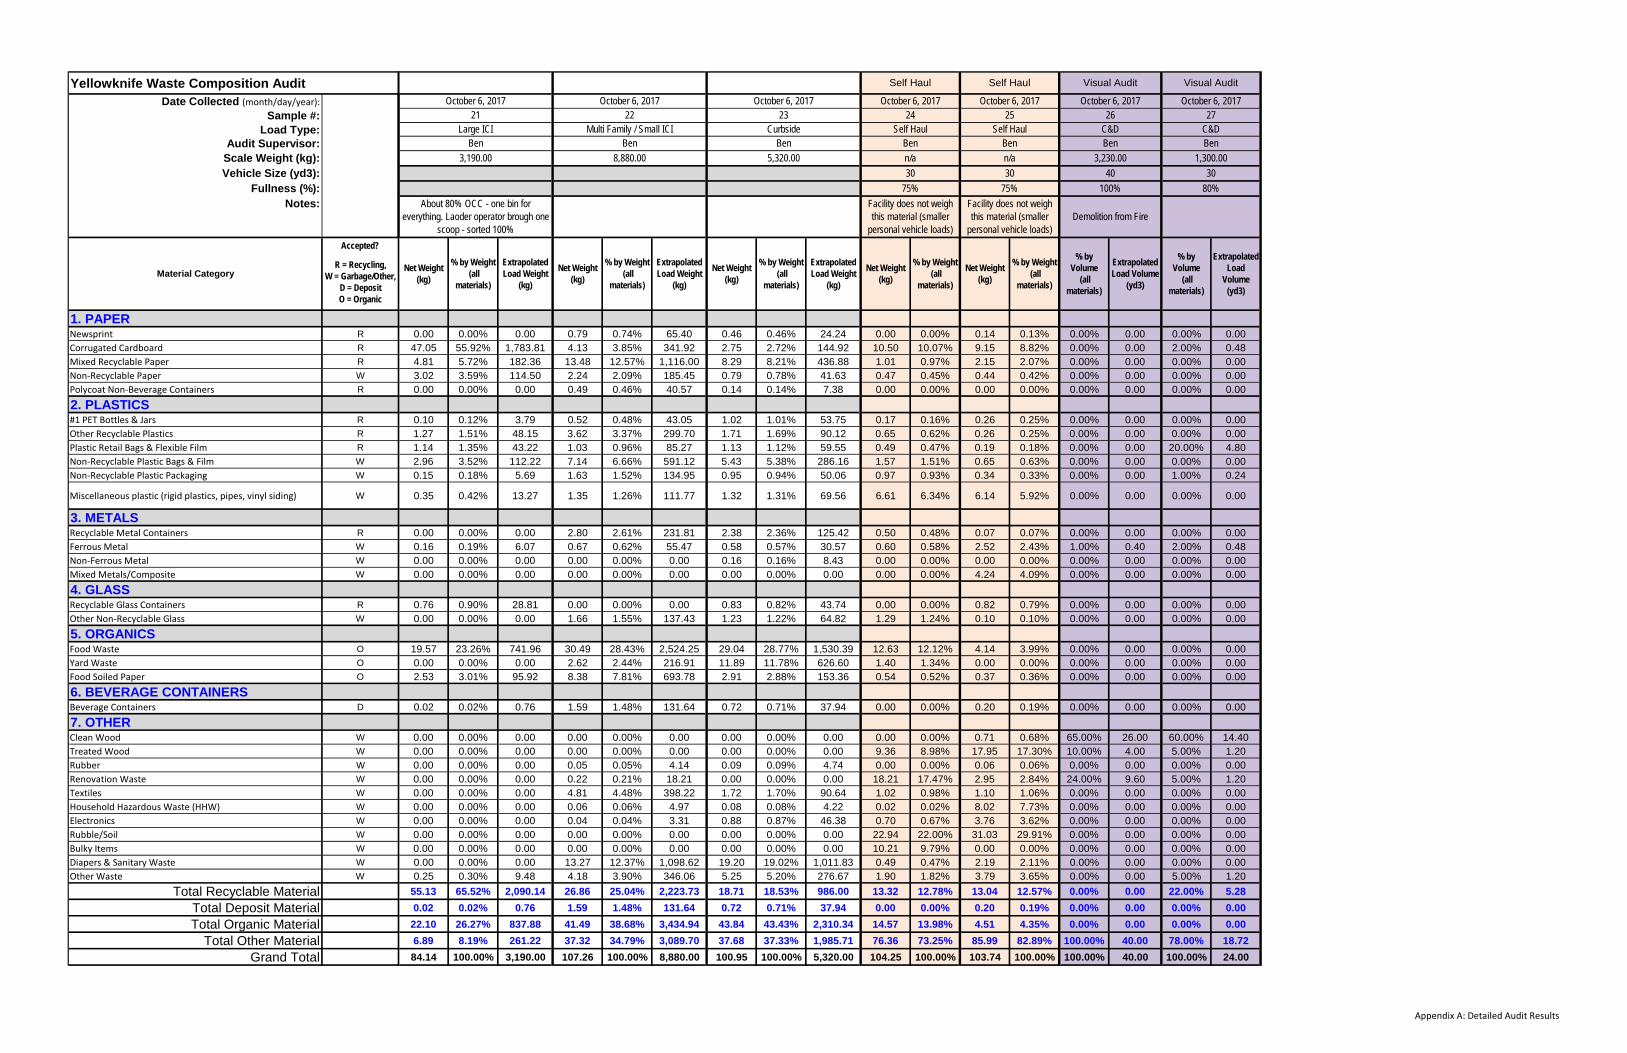
Yellowknife Waste Composition Audit
Sample #:
Load Type:
Scale Weight (kg):
Vehicle Size (yd3):
Fullness (%):
Accepted?
R = Recycling,W = Garbage/Other,
D = DepositO = Organic
1. PAPERNewsprint R
Corrugated Cardboard R
Mixed Recyclable Paper R
Non‐Recyclable Paper W
Polycoat Non‐Beverage Containers R
2. PLASTICS#1 PET Bottles & Jars R
Other Recyclable Plastics R
Plastic Retail Bags & Flexible Film R
Non‐Recyclable Plastic Bags & Film W
Non‐Recyclable Plastic Packaging W
Miscellaneous plastic (rigid plastics, pipes, vinyl siding) W
3. METALSRecyclable Metal Containers R
Ferrous Metal W
Non‐Ferrous Metal W
Mixed Metals/Composite W
4. GLASSRecyclable Glass Containers R
Other Non‐Recyclable Glass W
5. ORGANICSFood Waste O
Yard Waste O
Food Soiled Paper O
6. BEVERAGE CONTAINERSBeverage Containers D
7. OTHERClean Wood W
Treated Wood W
Rubber W
Renovation Waste W
Textiles W
Household Hazardous Waste (HHW) W
Electronics W
Rubble/Soil W
Bulky Items W
Diapers & Sanitary Waste W
Other Waste W
Total Recyclable Material
Total Deposit Material
Total Organic Material
Total Other Material
Grand Total
Date Collected (month/day/year):
Audit Supervisor:
Notes:
Material Category
0.00 0.00% 0.00 0.79 0.74% 65.40 0.46 0.46% 24.24 0.00 0.00% 0.14 0.13% 0.00% 0.00 0.00% 0.00
47.05 55.92% 1,783.81 4.13 3.85% 341.92 2.75 2.72% 144.92 10.50 10.07% 9.15 8.82% 0.00% 0.00 2.00% 0.48
4.81 5.72% 182.36 13.48 12.57% 1,116.00 8.29 8.21% 436.88 1.01 0.97% 2.15 2.07% 0.00% 0.00 0.00% 0.00
3.02 3.59% 114.50 2.24 2.09% 185.45 0.79 0.78% 41.63 0.47 0.45% 0.44 0.42% 0.00% 0.00 0.00% 0.00
0.00 0.00% 0.00 0.49 0.46% 40.57 0.14 0.14% 7.38 0.00 0.00% 0.00 0.00% 0.00% 0.00 0.00% 0.00
0.10 0.12% 3.79 0.52 0.48% 43.05 1.02 1.01% 53.75 0.17 0.16% 0.26 0.25% 0.00% 0.00 0.00% 0.00
1.27 1.51% 48.15 3.62 3.37% 299.70 1.71 1.69% 90.12 0.65 0.62% 0.26 0.25% 0.00% 0.00 0.00% 0.00
1.14 1.35% 43.22 1.03 0.96% 85.27 1.13 1.12% 59.55 0.49 0.47% 0.19 0.18% 0.00% 0.00 20.00% 4.80
2.96 3.52% 112.22 7.14 6.66% 591.12 5.43 5.38% 286.16 1.57 1.51% 0.65 0.63% 0.00% 0.00 0.00% 0.00
0.15 0.18% 5.69 1.63 1.52% 134.95 0.95 0.94% 50.06 0.97 0.93% 0.34 0.33% 0.00% 0.00 1.00% 0.24
0.35 0.42% 13.27 1.35 1.26% 111.77 1.32 1.31% 69.56 6.61 6.34% 6.14 5.92% 0.00% 0.00 0.00% 0.00
0.00 0.00% 0.00 2.80 2.61% 231.81 2.38 2.36% 125.42 0.50 0.48% 0.07 0.07% 0.00% 0.00 0.00% 0.00
0.16 0.19% 6.07 0.67 0.62% 55.47 0.58 0.57% 30.57 0.60 0.58% 2.52 2.43% 1.00% 0.40 2.00% 0.48
0.00 0.00% 0.00 0.00 0.00% 0.00 0.16 0.16% 8.43 0.00 0.00% 0.00 0.00% 0.00% 0.00 0.00% 0.00
0.00 0.00% 0.00 0.00 0.00% 0.00 0.00 0.00% 0.00 0.00 0.00% 4.24 4.09% 0.00% 0.00 0.00% 0.00
0.76 0.90% 28.81 0.00 0.00% 0.00 0.83 0.82% 43.74 0.00 0.00% 0.82 0.79% 0.00% 0.00 0.00% 0.00
0.00 0.00% 0.00 1.66 1.55% 137.43 1.23 1.22% 64.82 1.29 1.24% 0.10 0.10% 0.00% 0.00 0.00% 0.00
19.57 23.26% 741.96 30.49 28.43% 2,524.25 29.04 28.77% 1,530.39 12.63 12.12% 4.14 3.99% 0.00% 0.00 0.00% 0.00
0.00 0.00% 0.00 2.62 2.44% 216.91 11.89 11.78% 626.60 1.40 1.34% 0.00 0.00% 0.00% 0.00 0.00% 0.00
2.53 3.01% 95.92 8.38 7.81% 693.78 2.91 2.88% 153.36 0.54 0.52% 0.37 0.36% 0.00% 0.00 0.00% 0.00
0.02 0.02% 0.76 1.59 1.48% 131.64 0.72 0.71% 37.94 0.00 0.00% 0.20 0.19% 0.00% 0.00 0.00% 0.00
0.00 0.00% 0.00 0.00 0.00% 0.00 0.00 0.00% 0.00 0.00 0.00% 0.71 0.68% 65.00% 26.00 60.00% 14.40
0.00 0.00% 0.00 0.00 0.00% 0.00 0.00 0.00% 0.00 9.36 8.98% 17.95 17.30% 10.00% 4.00 5.00% 1.20
0.00 0.00% 0.00 0.05 0.05% 4.14 0.09 0.09% 4.74 0.00 0.00% 0.06 0.06% 0.00% 0.00 0.00% 0.00
0.00 0.00% 0.00 0.22 0.21% 18.21 0.00 0.00% 0.00 18.21 17.47% 2.95 2.84% 24.00% 9.60 5.00% 1.20
0.00 0.00% 0.00 4.81 4.48% 398.22 1.72 1.70% 90.64 1.02 0.98% 1.10 1.06% 0.00% 0.00 0.00% 0.00
0.00 0.00% 0.00 0.06 0.06% 4.97 0.08 0.08% 4.22 0.02 0.02% 8.02 7.73% 0.00% 0.00 0.00% 0.00
0.00 0.00% 0.00 0.04 0.04% 3.31 0.88 0.87% 46.38 0.70 0.67% 3.76 3.62% 0.00% 0.00 0.00% 0.00
0.00 0.00% 0.00 0.00 0.00% 0.00 0.00 0.00% 0.00 22.94 22.00% 31.03 29.91% 0.00% 0.00 0.00% 0.00
0.00 0.00% 0.00 0.00 0.00% 0.00 0.00 0.00% 0.00 10.21 9.79% 0.00 0.00% 0.00% 0.00 0.00% 0.00
0.00 0.00% 0.00 13.27 12.37% 1,098.62 19.20 19.02% 1,011.83 0.49 0.47% 2.19 2.11% 0.00% 0.00 0.00% 0.00
0.25 0.30% 9.48 4.18 3.90% 346.06 5.25 5.20% 276.67 1.90 1.82% 3.79 3.65% 0.00% 0.00 5.00% 1.20
55.13 65.52% 2,090.14 26.86 25.04% 2,223.73 18.71 18.53% 986.00 13.32 12.78% 13.04 12.57% 0.00% 0.00 22.00% 5.28
0.02 0.02% 0.76 1.59 1.48% 131.64 0.72 0.71% 37.94 0.00 0.00% 0.20 0.19% 0.00% 0.00 0.00% 0.00
22.10 26.27% 837.88 41.49 38.68% 3,434.94 43.84 43.43% 2,310.34 14.57 13.98% 4.51 4.35% 0.00% 0.00 0.00% 0.00
6.89 8.19% 261.22 37.32 34.79% 3,089.70 37.68 37.33% 1,985.71 76.36 73.25% 85.99 82.89% 100.00% 40.00 78.00% 18.72
84.14 100.00% 3,190.00 107.26 100.00% 8,880.00 100.95 100.00% 5,320.00 104.25 100.00% 103.74 100.00% 100.00% 40.00 100.00% 24.00
Visual Audit
October 6, 201727
Ben
% by Volume
(all materials)
Extrapolated Load
Volume (yd3)
Visual Audit
October 6, 201726
Ben
Demolition from Fire
% by Volume
(all materials)
Extrapolated Load Volume
(yd3)
C&D C&D
3,230.00 1,300.00
40
100%
30
80%
Self Haul
Net Weight (kg)
% by Weight (all
materials)
Self Haul
Net Weight (kg)
% by Weight (all
materials)
October 6, 201724
Self HaulBen
n/a
Facility does not weigh this material (smaller
personal vehicle loads)
75%
30 30
75%
October 6, 201725
Self HaulBen
n/a
Facility does not weigh this material (smaller
personal vehicle loads)
Net Weight (kg)
% by Weight (all
materials)
Net Weight (kg)
% by Weight (all
materials)
October 6, 201723
CurbsideBen
5,320.00
Net Weight (kg)
% by Weight (all
materials)
Extrapolated Load Weight
(kg)
Extrapolated Load Weight
(kg)
Extrapolated Load Weight
(kg)
October 6, 201721
Large ICIBen
3,190.00
About 80% OCC - one bin for everything. Laoder operator brough one
scoop - sorted 100%
October 6, 201722
Multi Family / Small ICIBen
8,880.00
Appendix A: Detailed Audit Results

Yellowknife Waste Composition Audit
Sample #:
Load Type:
Scale Weight (kg):
Vehicle Size (yd3):
Fullness (%):
Accepted?
R = Recycling,W = Garbage/Other,
D = DepositO = Organic
1. PAPERNewsprint R
Corrugated Cardboard R
Mixed Recyclable Paper R
Non‐Recyclable Paper W
Polycoat Non‐Beverage Containers R
2. PLASTICS#1 PET Bottles & Jars R
Other Recyclable Plastics R
Plastic Retail Bags & Flexible Film R
Non‐Recyclable Plastic Bags & Film W
Non‐Recyclable Plastic Packaging W
Miscellaneous plastic (rigid plastics, pipes, vinyl siding) W
3. METALSRecyclable Metal Containers R
Ferrous Metal W
Non‐Ferrous Metal W
Mixed Metals/Composite W
4. GLASSRecyclable Glass Containers R
Other Non‐Recyclable Glass W
5. ORGANICSFood Waste O
Yard Waste O
Food Soiled Paper O
6. BEVERAGE CONTAINERSBeverage Containers D
7. OTHERClean Wood W
Treated Wood W
Rubber W
Renovation Waste W
Textiles W
Household Hazardous Waste (HHW) W
Electronics W
Rubble/Soil W
Bulky Items W
Diapers & Sanitary Waste W
Other Waste W
Total Recyclable Material
Total Deposit Material
Total Organic Material
Total Other Material
Grand Total
Date Collected (month/day/year):
Audit Supervisor:
Notes:
Material Category
Note: Visual Volumetric
6 7 6 2 5 1
6 samples 7 samples 6 samples 2 samples 5 samples 1 sample
379 1% 295 1% 252 2% 0 0% 0 0% 0.00 0% 0.00 0.77 1.2%
411 1% 2,229 5% 2,746 17% 20 9% 1 1% 70.83 0% 16.12 0.00 0.0%
2,223 7% 3,229 8% 1,145 7% 3 2% 0 0% 0.00 0% 0.00 1.12 1.7%
414 1% 890 2% 695 4% 1 0% 0 0% 0.00 0% 0.00 0.03 0.0%
103 0% 102 0% 7 0% 0 0% 0 0% 0.00 0% 0.00 0.00 0.0%
288 1% 224 1% 22 0% 0 0% 0 0% 0.00 0% 0.00 0.00 0.0%
886 3% 958 2% 304 2% 1 0% 0 0% 0.00 0% 0.00 0.00 0.0%
413 1% 575 1% 268 2% 1 0% 5 3% 76.36 0% 17.38 0.12 0.2%
1,926 6% 1,635 4% 1,002 6% 2 1% 1 1% 12.65 0% 2.88 0.06 0.1%
528 2% 571 1% 229 1% 1 1% 0 0% 8.16 0% 1.86 0.00 0.0%
950 3% 1,741 4% 323 2% 13 6% 1 0% 9.92 0% 2.26 0.09 0.1%
635 2% 813 2% 52 0% 1 0% 0 0% 0.00 0% 0.00 0.06 0.1%
360 1% 1,518 4% 102 1% 3 2% 2 1% 189.72 1% 43.19 0.00 0.0%
10 0% 9 0% 2 0% 0 0% 0 0% 0.00 0% 0.00 0.00 0.0%
0 0% 9 0% 0 0% 4 2% 0 0% 0.00 0% 0.00 0.00 0.0%
499 2% 320 1% 43 0% 1 0% 0 0% 0.00 0% 0.00 0.00 0.0%
377 1% 343 1% 78 0% 1 1% 0 0% 34.68 0% 7.89 0.00 0.0%
9,089 29% 10,033 24% 5,049 31% 17 8% 0 0% 0.00 0% 0.00 38.91 59.4%
1,189 4% 2,766 7% 106 1% 1 1% 0 0% 0.00 0% 0.00 18.05 27.6%
1,790 6% 2,553 6% 1,490 9% 1 0% 0 0% 0.00 0% 0.00 5.90 9.0%
237 1% 1,030 2% 185 1% 0 0% 0 0% 0.00 0% 0.00 0.00 0.0%
5 0% 1 0% 52 0% 1 0% 75 52% 8,969.15 43% 2,041.81 0.35 0.5%
12 0% 539 1% 595 4% 27 13% 15 11% 1,818.88 9% 414.06 0.00 0.0%
39 0% 19 0% 46 0% 0 0% 0 0% 0.00 0% 0.00 0.00 0.0%
44 0% 259 1% 0 0% 21 10% 41 29% 9,343.32 45% 2,126.99 0.00 0.0%
1,812 6% 2,452 6% 600 4% 2 1% 0 0% 0.00 0% 0.00 0.00 0.0%
81 0% 192 0% 9 0% 8 4% 0 0% 0.00 0% 0.00 0.00 0.0%
414 1% 376 1% 30 0% 4 2% 0 0% 0.00 0% 0.00 0.00 0.0%
0 0% 7 0% 0 0% 54 26% 0 0% 0.00 0% 0.00 0.00 0.0%
0 0% 558 1% 0 0% 10 5% 0 0% 0.00 0% 0.00 0.00 0.0%
4,261 14% 3,784 9% 22 0% 3 1% 0 0% 0.00 0% 0.00 0.00 0.0%
1,914 6% 1,741 4% 655 4% 6 3% 2 1% 384.77 2% 87.59 0.00 0.0%
5,838 19% 8,745 21% 4,839 30% 26 13% 6 4% 147.19 1% 33.51 2.07 3.2%
237 1% 1,030 2% 185 1% 0 0% 0 0% 0.00 0% 0.00 0.00 0.0%
12,068 39% 15,352 37% 6,646 41% 19 9% 0 0% 0.00 0% 0.00 62.86 96.0%
13,147 42% 16,643 40% 4,440 28% 162 78% 137 96% 20,771.23 99% 4,728.54 0.53 0.8%
31,290 100% 41,770 100% 16,110 100% 208 100% 144 100% 20,918.42 100% 4,762.05 65.46 100.0%
Total all Loads (kg)
% by Weight (all Loads)
Curbside Total
Total all Samples (yd3)
% by Volume (all
Samples)
Organics
Total all Samples (kg)
% by Weight (all Samples)
Multi‐Family/Small ICI
Total
Total all Loads (kg)
% by Weight (all Loads)
Large ICI Total
Total all Loads (kg)
% by Weight (all Loads)
Self Haul Total
Total all Samples (kg)
% by Weight (all Samples)
Composition by Weight (kg)
Composition by Weight (%)
Annual Composition by
Weight (Tonnes/yr)
C&D Total
Appendix A: Detailed Audit Results

ANNUAL EXTRAPOLATION
Material Category Accepted?
R = Recycling,W =
Garbage/Other, D = DepositO = Organic
1. PAPERNewsprint R 1.21% 23.61 0.71% 40.43 1.56% 26.84 0.97% 90.88
Corrugated Cardboard R 1.31% 25.57 5.34% 305.42 17.05% 292.74 6.64% 623.74
Mixed Recyclable Paper R 7.10% 138.43 7.73% 442.44 7.11% 122.05 7.49% 702.91
Non‐Recyclable Paper W 1.32% 25.78 2.13% 121.92 4.31% 74.04 2.36% 221.75
Polycoat Non‐Beverage Containers R 0.33% 6.43 0.24% 14.01 0.04% 0.76 0.23% 21.20
2. PLASTICS#1 PET Bottles & Jars R 0.92% 17.92 0.54% 30.64 0.13% 2.31 0.54% 50.87
Other Recyclable Plastics R 2.83% 55.20 2.29% 131.19 1.89% 32.44 2.33% 218.83
Plastic Retail Bags & Flexible Film R 1.32% 25.74 1.38% 78.82 1.67% 28.59 1.42% 133.16
Non‐Recyclable Plastic Bags & Film W 6.16% 119.94 3.91% 224.01 6.22% 106.84 4.80% 450.78
Non‐Recyclable Plastic Packaging W 1.69% 32.89 1.37% 78.28 1.42% 24.38 1.44% 135.55
Miscellaneous plastic (rigid plastics,
pipes, vinyl siding)W 3.04% 59.17 4.17% 238.55 2.00% 34.41 3.54% 332.13
3. METALSRecyclable Metal Containers R 2.03% 39.55 1.95% 111.42 0.32% 5.55 1.67% 156.52
Ferrous Metal W 1.15% 22.39 3.63% 207.93 0.63% 10.90 2.57% 241.22
Non‐Ferrous Metal W 0.03% 0.61 0.02% 1.25 0.01% 0.19 0.02% 2.05
Mixed Metals/Composite W 0.00% 0.00 0.02% 1.27 0.00% 0.00 0.01% 1.27
4. GLASSRecyclable Glass Containers R 1.60% 31.09 0.76% 43.78 0.26% 4.53 0.85% 79.40
Other Non‐Recyclable Glass W 1.20% 23.48 0.82% 47.06 0.48% 8.31 0.84% 78.84
5. ORGANICSFood Waste O 29.05% 565.96 24.02% 1,374.54 31.34% 538.22 26.40% 2,478.72
Yard Waste O 3.80% 74.06 6.62% 378.99 0.66% 11.31 4.95% 464.36
Food Soiled Paper O 5.72% 111.43 6.11% 349.77 9.25% 158.85 6.60% 620.06
6. BEVERAGE
CONTAINERSBeverage Containers D 0.76% 14.78 2.47% 141.16 1.15% 19.72 1.87% 175.65
7. OTHERClean Wood W 0.02% 0.33 0.00% 0.07 0.32% 5.57 0.06% 5.97
Treated Wood W 0.04% 0.76 1.29% 73.80 3.69% 63.42 1.47% 137.99
Rubber W 0.12% 2.41 0.04% 2.55 0.29% 4.92 0.11% 9.89
Renovation Waste W 0.14% 2.75 0.62% 35.53 0.00% 0.00 0.41% 38.28
Textiles W 5.79% 112.82 5.87% 335.89 3.72% 63.91 5.46% 512.62
Household Hazardous Waste (HHW) W 0.26% 5.04 0.46% 26.36 0.06% 0.95 0.34% 32.35
Electronics W 1.32% 25.80 0.90% 51.50 0.19% 3.24 0.86% 80.54
Rubble/Soil W 0.00% 0.00 0.02% 0.91 0.00% 0.00 0.01% 0.91
Bulky Items W 0.00% 0.00 1.34% 76.44 0.00% 0.00 0.81% 76.44
Diapers & Sanitary Waste W 13.62% 265.34 9.06% 518.39 0.14% 2.39 8.37% 786.13
Other Waste W 6.12% 119.16 4.17% 238.48 4.06% 69.80 4.55% 427.44
Total Recyclable Material R 18.66% 363.53 20.94% 1,198.15 30.04% 515.82 22.13% 2,077.51
Total Deposit Material D 0.76% 14.78 2.47% 141.16 1.15% 19.72 1.87% 175.65
Total Organic Material O 38.57% 751.46 36.75% 2,103.30 41.25% 708.38 37.95% 3,563.14
Total Other Material W 42.02% 818.67 39.84% 2,280.19 27.56% 473.28 38.05% 3,572.14
Grand Total 100.00% 1,948.44 100.00% 5,722.80 100.00% 1,717.20 100.00% 9,388.44
Overall
% by WeightTotal Weight
(MT/yr)
Curbside Multi‐Family/Small ICI Large ICI
% by WeightTotal Weight
(MT/yr)% by Weight
Total Weight (MT/yr)
% by WeightTotal Weight
(MT/yr)
Appendix A: Detailed Audit Results

Sample # Date License Plate or
Truck #
Time Source/Load Type Vehicle Type Weight (kg) Notes
1 2‐Oct‐17 119 9:00 AM Multifamily, Small ICI Front End (Overhead) 7570 Kavanaugh2 2‐Oct‐17 117 9:30 AM Curbside Curbside 6670 Kavanaugh3 2‐Oct‐17 119 11:40 AM Multifamily, Small ICI Front End (Overhead) 6390 Kavanaugh4 2‐Oct‐17 118 12:45 PM C & D Roll‐Off 1660 Kavanagh5 29‐Sep‐17 n/a n/a Organics Curbside n/a 1 scoop kept aside over weekend for audit. Kavanaugh6 2‐Oct‐17 102 3:00 PM Multifamily, Small ICI Front End (Overhead) 5160 Kavanaugh7 3‐Oct‐17 117 10:35 AM Curbside Curbside 5460 Kavanaugh8 3‐Oct‐17 118 11:20 AM C & D Roll‐Off 1250 Kavanaugh9 3‐Oct‐17 117 1:08 PM Curbside Curbside 2620 Kavanaugh10 4‐Oct‐17 118 7:35 AM Large ICI Roll‐Off 3380 Independent (Downtown). Kavanaugh11 4‐Oct‐17 102 7:50 AM Multifamily, Small ICI Front End (Overhead) 8610 Kavanaugh12 4‐Oct‐17 118 8:45 AM Large ICI Roll‐Off 2420 Independent grocery (uptown). Kavanaugh13 4‐Oct‐17 117 9:50 AM Curbside Curbside 5920 Kavanaugh14 4‐Oct‐17 118 11:35 AM C&D Roll‐Off 5590 Kavanaugh15 4‐Oct‐17 119 12:30 PM Multifamily, Small ICI Front End (Overhead) 3920 Kavanaugh16 5‐Oct‐17 118 7:52 AM Large ICI Compacted Roll‐Off 3140 From the Jail17 5‐Oct‐17 118 8:56 AM Large ICI Compacted Roll‐Off 1160 From Canadian Tire18 5‐Oct‐17 119 10:55 AM Multifamily, Small ICI Front End (Overhead) 1240 Kavanaugh19 5‐Oct‐17 118 11:10 AM Large ICI Roll‐Off 2820 Center Square Mall20 5‐Oct‐17 117 12:00 PM Curbside Curbside 5300 Kavanaugh21 6‐Oct‐17 118 7:45 AM Large ICI Compacted Roll‐Off 3190 Extra foods22 6‐Oct‐17 102 8:00 AM Multifamily, Small ICI Front End (Overhead) 8880 Kavanaugh23 6‐Oct‐17 117 9:33 AM Curbside Curbside 5320 Kavanaugh24 6‐Oct‐17 n/a 10:40 AM Self‐Haul Roll‐Off n/a 30 yard bin, 75% fullness25 6‐Oct‐17 n/a 1:30 PM Self‐Haul Roll‐Off n/a 30 yard bin, 75% fullness26 6‐Oct‐17 118 1:55 PM C&D Roll‐Off 3230 40 yard bin, 100% fullness27 6‐Oct‐17 118 2:40 PM C&D Roll‐Off 1300 30 yard bin, 80% fullness
Appendix A: Detailed Audit Results

Materials Category Description
1. PAPER
1 Newsprint All daily and weekly newspapers. This includes flyers and inserts.
2 Corrugated Cardboard Corrugated Cardboard
3 Mixed Recyclable PaperMixed fine paper, Kraft paper, boxboard, molded pulp, magazines & catalogues, telephone books,
non‐foil gift wrap, clean unsoiled paper plates.
4 Non‐Recyclable PaperLaminated paper packaging, composite paper/plastic materials, foil wrapping paper, paper cups
5 Polycoat Non‐Beverage ContainersNon‐beverage recyclable polycoat containers ‐ gable top, aseptic, spiral wound containers
2. PLASTIC
6 #1 PET Bottles & Jars #1 PET bottles and jars.
7 Other Recyclable Plastics
Recyclable plastics including #1 PET thermoform, #2 HDPE bottles, jars and jugs, widemouth
containers, #5 PP tubs and lids, rigid plastics (#4) yogurt tubs, sour cream containers, clamshell
containers.
8 Plastic Retail Bags & Flexible Film Shopping bags, Carryout bags, Milk Bags, bread bags. Etc.
9 Non‐Recyclable Plastic Bags & Film Laminated film, garbage bags and ziplok bags.
10 Non‐Recyclable Plastic Packaging #6 PS plastics, Bulky styrofoam, mesh bags, toothpaste tubes, etc.
11 Miscellaneous plastic (rigid plastics, pipes, vinyl siding)Durable plastic products including large rigid plastics, piping, siding, VHS tapes, DVD's, CD's, plastic
cutlery, etc.
3. METAL
12 Recyclable Metal Containers Steel and aluminum food, aluminum foil
13 Ferrous MetalFerrous metals that contain iron. This includes steel, stainless steel, cast iron, wrought iron.
14 Non‐Ferrous Metal Non‐ferrous metals including aluminum, copper, brass, nickel, tin, lead and zinc.
15 Mixed Metals/Composite Mixed metals (i.e., plumbing, electrical, flashing, siding, furniture)
4. GLASS
16 Recyclable Glass Containers Glass jars and bottles
17 Other Non‐Recyclable Glass Other glass materials including dishware, decor, lightbulbs, etc. Includes ceramics.
5. ORGANICS
18 Food Waste
Fruits & vegetables, dairy products, eggs & egg shells, fish & shellfish, Bones, greast, fat & cooked
meat, Small amounts of raw meat (trimmings only), Bread, pasta, cereal, rice & flour, coffee
grounds, filters & tea bags
19 Yard Waste Leaves & grass clippings, plant twimmings
20 Food Soiled Paper Pizza boxes, napkins & facial tissues, wax coated cardboard
6. BEVERAGE CONTAINERS
21 Beverage ContainersGable top containers, aseptic containers, plastic bottles, steel and aluminum cans, empty ready‐to‐
serve beverage containers including water, juice, milk and liquid milk products, soft drinks, energy
drinks, and alcohol beverage containers. Need to get clarification on drink pouches.
7. OTHER
22 Clean Wood Clean, non‐treated wood.
23 Treated WoodTreated wood included pressure treated, painted wood, composite wood materials (particle board,
MDF, laminate flooring, etc.)
24 Rubber Miscellaneous rubber.
25 Renovation Waste Drywall, insulation, shingles, tile, brick, concrete, other.
26 Textiles
27 Household Hazardous Waste (HHW) Paint, solvents, lubricants, oil, CFL lightbulbs, batteries, etc.
28 ElectronicsComputers, computer accessories, TV's, fax machines, cell phones, rechargeable batteries, video
and audio devices.
29 Rubble/Soil
30 Bulky Items Large items including furniture and appliances.
31 Diapers & Sanitary Waste Pet waste/animal waste went with this in the 2007 audit.
32 Other WasteSmall appliances including coffee makers, irons, kettles, blenders, meat pads, wax, furnace filters,
fines, etc.
Appendix B: Audit Categories

Material Categories kg/yd3tonnes/yrd
3 Conversion Factor Source
1. PAPER
Newsprint 202 0.20
California Integrated Waste Management Board, data from
CalRecovery report (w/Tellus) of 1991, Information from other
government sources includes OR & VA Departments of Environmental
Quality, NJ Department of Environmental Protection, HI
documentation as well as US Navy facility guidance documents and
the United States Environmental Protection Agency, National
Recycling Coalition, data from 1998
Corrugated Cardboard 48 0.05Volume to weight conversion factors U.S EPA office of resource
conservation and recovery 2016
Mixed Recyclable Paper 165 0.17DLC Waste Composition Study of the Ecowaste and Vancouver
Landfills, 2005, Gartner Lee
Non‐Recyclable Paper 165 0.17DLC Waste Composition Study of the Ecowaste and Vancouver
Landfills, 2005, Gartner Lee
Polycoat Non‐Beverage Containers 23 0.02Volume to weight conversion factors U.S EPA office of resource
conservation and recovery 2016
2. PLASTICS
#1 PET Bottles & Jars 18 0.02Volume to weight conversion factors U.S EPA office of resource
conservation and recovery 2016
Other Recyclable Plastics 18 0.02Volume to weight conversion factors U.S EPA office of resource
conservation and recovery 2016
Plastic Retail Bags & Flexible Film 16 0.02Volume to weight conversion factors U.S EPA office of resource
conservation and recovery 2016
Non‐Recyclable Plastic Bags & Film 16 0.02Volume to weight conversion factors U.S EPA office of resource
conservation and recovery 2016
Non‐Recyclable Plastic Packaging 17 0.02 National Recycling Coalition, data from 1998
Miscellaneous plastic (rigid plastics, pipes, vinyl siding) 18 0.02Volume to weight conversion factors U.S EPA office of resource
conservation and recovery 2016
3. METALS
Recyclable Metal Containers 68 0.07
California Integrated Waste Management Board, data from
CalRecovery report (w/Tellus) of 1991, Information from other
government sources includes OR & VA Departments of Environmental
Quality, NJ Department of Environmental Protection, HI
documentation as well as US Navy facility guidance documents and
the United States Environmental Protection Agency, National
Recycling Coalition, data from 1998
Ferrous Metal 102 0.10Volume to weight conversion factors U.S EPA office of resource
conservation and recovery 2016
Non‐Ferrous Metal 102 0.10Volume to weight conversion factors U.S EPA office of resource
conservation and recovery 2016
Mixed Metals/Composite 153 0.15DLC Waste Composition Study of the Ecowaste and Vancouver
Landfills, 2005, Gartner Lee
4. GLASS
Recyclable Glass Containers 136 0.14 Metro Vancouver DLC Waste Composition Study, 2014, AET Group Inc.
Other Non‐Recyclable Glass 136 0.14 Metro Vancouver DLC Waste Composition Study, 2014, AET Group Inc.
5. ORGANICS
Food Waste 210 0.21Volume to weight conversion factors U.S EPA office of resource
conservation and recovery 2016
Yard Waste 114 0.11Volume to weight conversion factors U.S EPA office of resource
conservation and recovery 2016
Food Soiled Paper 227 0.23DLC Waste Composition Study of the Ecowaste and Vancouver
Landfills, 2005, Gartner Lee
6. BEVERAGE CONTAINERS
Beverage Containers 18 0.02Volume to weight conversion factors U.S EPA office of resource
conservation and recovery 2016
7. OTHER
Clean Wood 119 0.12Environmental Protection Authority of Victoria, Business and Industry
Waste Materials Density Data, 2017
Treated Wood 119 0.12Environmental Protection Authority of Victoria, Business and Industry
Waste Materials Density Data, 2017
Rubber 454 0.45 Metro Vancouver DLC Waste Composition Study, 2014, AET Group Inc.
Renovation Waste 227 0.23DLC Waste Composition Study of the Ecowaste and Vancouver
Landfills, 2005, Gartner Lee
Textiles 68 0.07Volume to weight conversion factors U.S EPA office of resource
conservation and recovery 2016
Household Hazardous Waste (HHW) 227 0.23DLC Waste Composition Study of the Ecowaste and Vancouver
Landfills, 2005, Gartner Lee
Electronics 156 0.16Volume to weight conversion factors U.S EPA office of resource
conservation and recovery 2016
Rubble/Soil 454 0.45 Metro Vancouver DLC Waste Composition Study, 2014, AET Group Inc.
Bulky Items 182 0.18 Metro Vancouver DLC Waste Composition Study, 2014, AET Group Inc.
Diapers & Sanitary Waste 136 0.14Volume to weight conversion factors U.S EPA office of resource
conservation and recovery 2016
Other Waste 227 0.23DLC Waste Composition Study of the Ecowaste and Vancouver
Landfills, 2005, Gartner Lee
Appendix C: Volume Density Conversion References
Strategic Waste Management Plan (SWMP) – Appendix The City of Yellowknife
B-1
Appendix B – ICI Business Survey Results
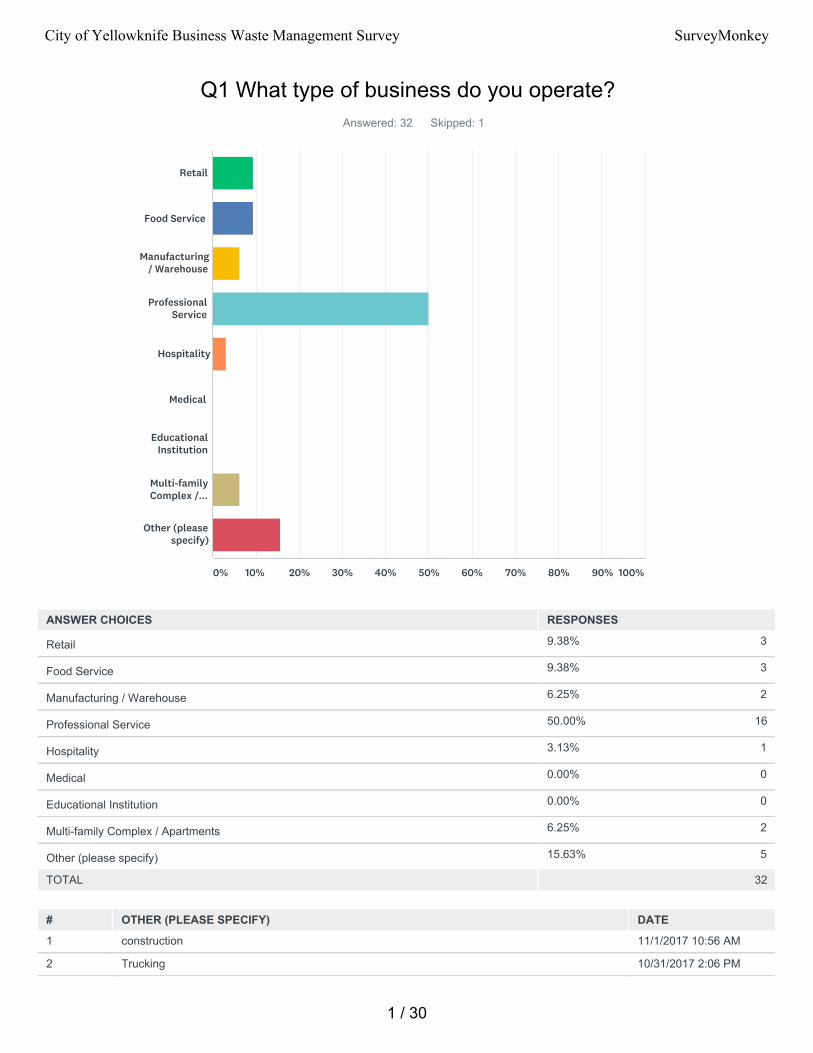
9.38% 3
9.38% 3
6.25% 2
50.00% 16
3.13% 1
0.00% 0
0.00% 0
6.25% 2
15.63% 5
Q1 What type of business do you operate?Answered: 32 Skipped: 1
TOTAL 32
# OTHER (PLEASE SPECIFY) DATE
1 construction 11/1/2017 10:56 AM
2 Trucking 10/31/2017 2:06 PM
Retail
Food Service
Manufacturing/ Warehouse
ProfessionalService
Hospitality
Medical
EducationalInstitution
Multi-familyComplex /...
Other (pleasespecify)
0% 10% 20% 30% 40% 50% 60% 70% 80% 90% 100%
ANSWER CHOICES RESPONSES
Retail
Food Service
Manufacturing / Warehouse
Professional Service
Hospitality
Medical
Educational Institution
Multi-family Complex / Apartments
Other (please specify)
1 / 30
City of Yellowknife Business Waste Management Survey SurveyMonkey
3 Construction 10/31/2017 4:07 AM
4 Yellowknife Farmers Market 10/25/2017 8:05 PM
5 Waste Hauling Services 10/23/2017 12:44 PM
2 / 30
City of Yellowknife Business Waste Management Survey SurveyMonkey
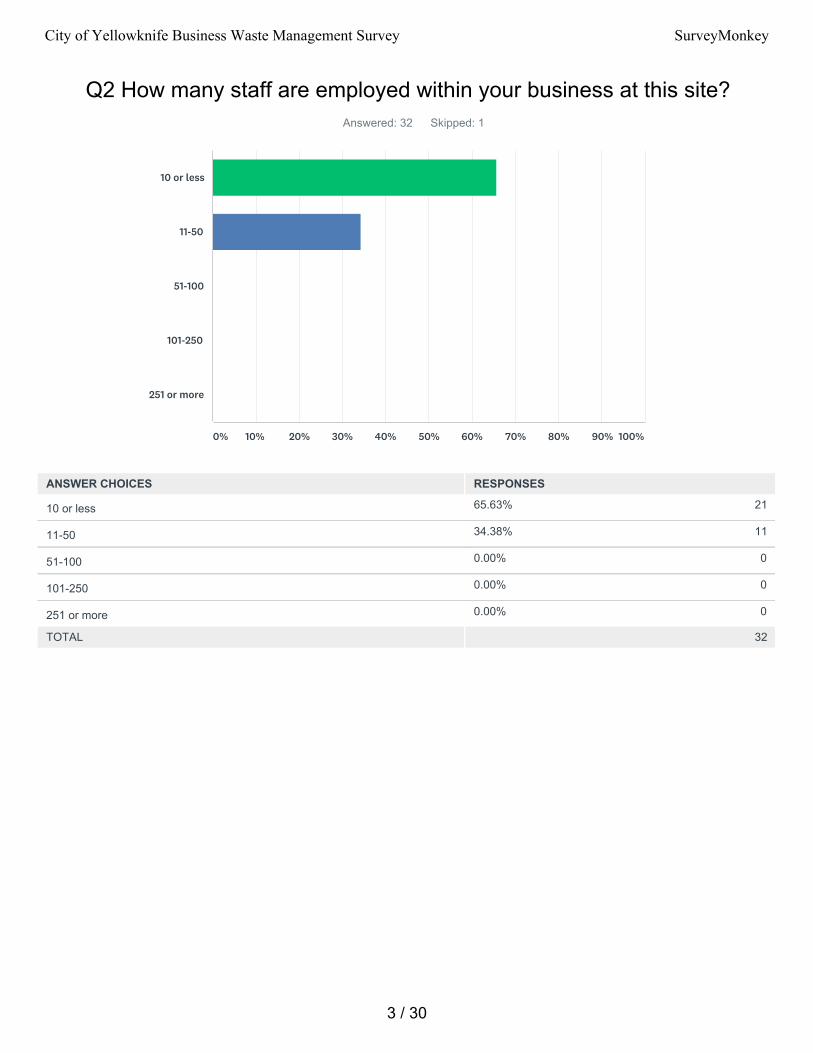
65.63% 21
34.38% 11
0.00% 0
0.00% 0
0.00% 0
Q2 How many staff are employed within your business at this site?Answered: 32 Skipped: 1
TOTAL 32
10 or less
11-50
51-100
101-250
251 or more
0% 10% 20% 30% 40% 50% 60% 70% 80% 90% 100%
ANSWER CHOICES RESPONSES
10 or less
11-50
51-100
101-250
251 or more
3 / 30
City of Yellowknife Business Waste Management Survey SurveyMonkey

Q3 Type of Waste Material Generated and Current Handling MethodsAnswered: 32 Skipped: 1
Cardboard
Paper
Metal
BeverageContainers
Glass
4 / 30
City of Yellowknife Business Waste Management Survey SurveyMonkey

Motor Oil
TonerCartridges
Plasticcontainers
Plastic wrap
Food
5 / 30
City of Yellowknife Business Waste Management Survey SurveyMonkey

CookingOil/Grease
Tires
Concrete
Wood
Drywall
6 / 30
City of Yellowknife Business Waste Management Survey SurveyMonkey

0.00%0
9.68%3
83.87%26
6.45%2
31
6.45%2
19.35%6
70.97%22
3.23%1
31
33.33%10
30.00%9
36.67%11
0.00%0
30
3.23%1
3.23%1
90.32%28
3.23%1
31
19.35%6
25.81%8
51.61%16
3.23%1
31
66.67%20
0.00%0
23.33%7
10.00%3
30
16.67%5
23.33%7
56.67%17
3.33%1
30
12.90%4
25.81%8
61.29%19
0.00%0
31
12.90%4
67.74%21
19.35%6
0.00%0
31
9.68%3
48.39%15
41.94%13
0.00%0
31
67.86%19
14.29%4
17.86%5
0.00%0
28
Don't have Put in garbage Recycle / Compost
Reuse (either within your operation or give away)
AsphaltShingles
Other (specify)
0% 10% 20% 30% 40% 50% 60% 70% 80% 90% 100%
DON'THAVE
PUT INGARBAGE
RECYCLE /COMPOST
REUSE (EITHER WITHIN YOUR OPERATION ORGIVE AWAY)
TOTAL
Cardboard
Paper
Metal
BeverageContainers
Glass
Motor Oil
Toner Cartridges
Plasticcontainers
Plastic wrap
Food
CookingOil/Grease
7 / 30
City of Yellowknife Business Waste Management Survey SurveyMonkey
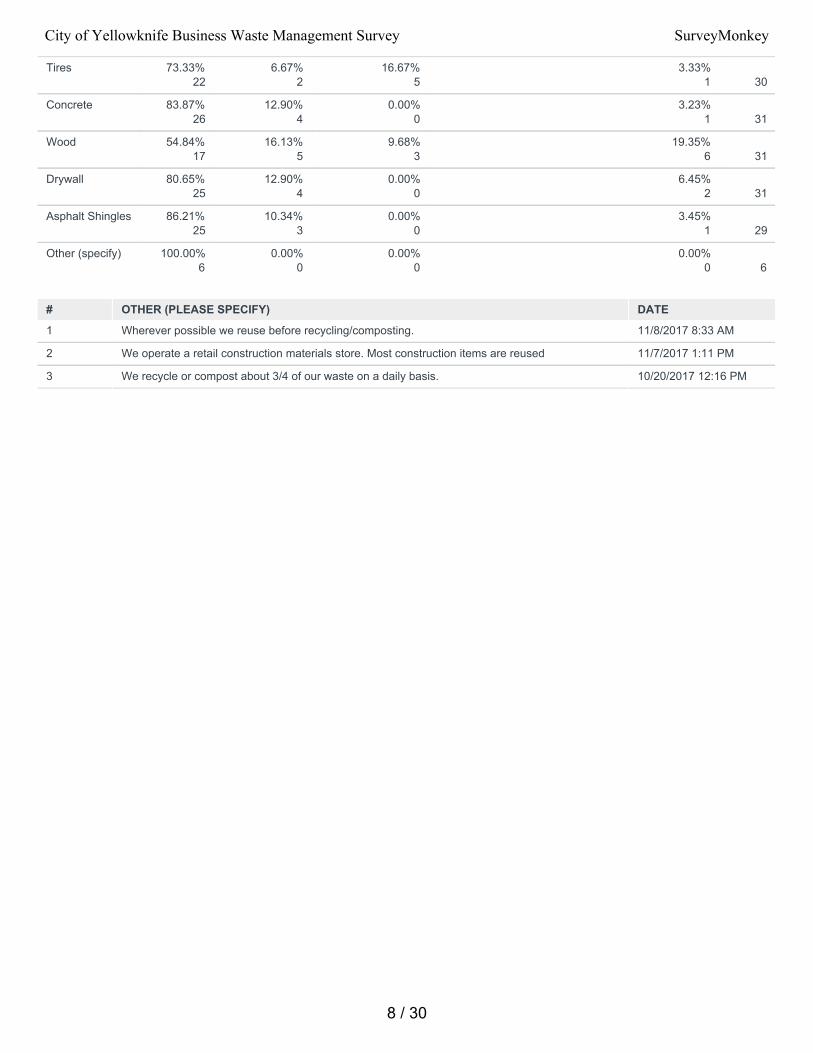
73.33%22
6.67%2
16.67%5
3.33%1
30
83.87%26
12.90%4
0.00%0
3.23%1
31
54.84%17
16.13%5
9.68%3
19.35%6
31
80.65%25
12.90%4
0.00%0
6.45%2
31
86.21%25
10.34%3
0.00%0
3.45%1
29
100.00%6
0.00%0
0.00%0
0.00%0
6
# OTHER (PLEASE SPECIFY) DATE
1 Wherever possible we reuse before recycling/composting. 11/8/2017 8:33 AM
2 We operate a retail construction materials store. Most construction items are reused 11/7/2017 1:11 PM
3 We recycle or compost about 3/4 of our waste on a daily basis. 10/20/2017 12:16 PM
Tires
Concrete
Wood
Drywall
Asphalt Shingles
Other (specify)
8 / 30
City of Yellowknife Business Waste Management Survey SurveyMonkey
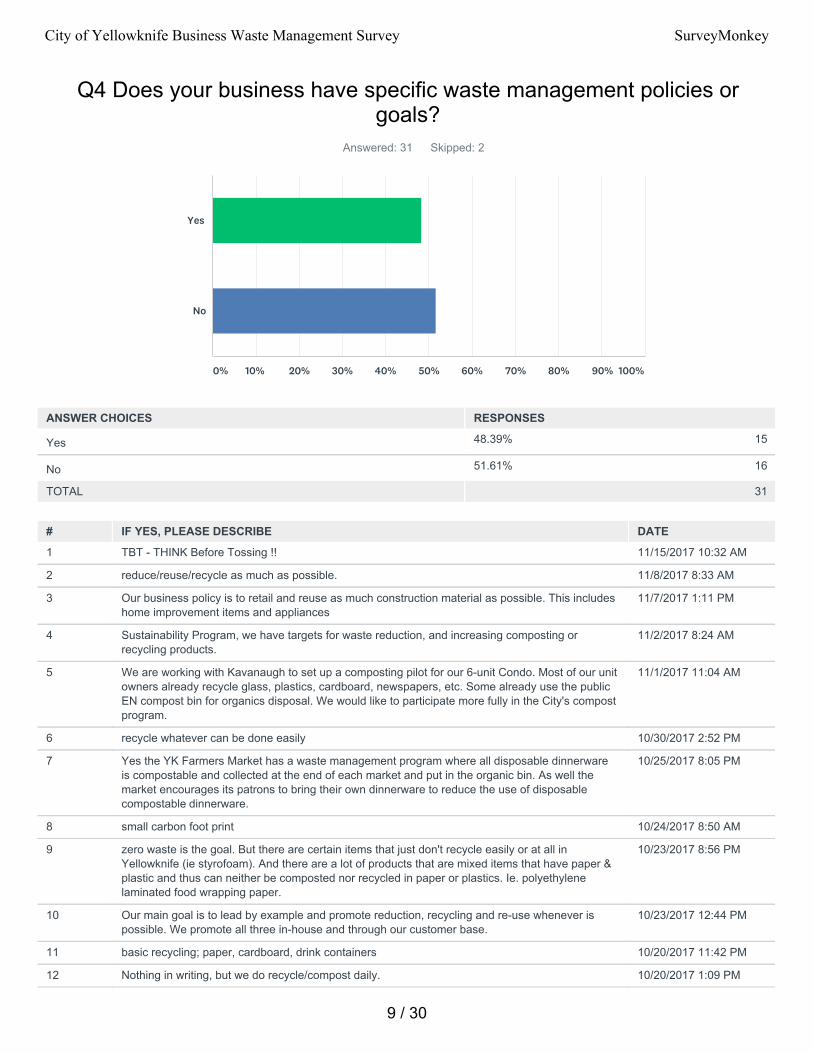
48.39% 15
51.61% 16
Q4 Does your business have specific waste management policies orgoals?
Answered: 31 Skipped: 2
TOTAL 31
# IF YES, PLEASE DESCRIBE DATE
1 TBT - THINK Before Tossing !! 11/15/2017 10:32 AM
2 reduce/reuse/recycle as much as possible. 11/8/2017 8:33 AM
3 Our business policy is to retail and reuse as much construction material as possible. This includeshome improvement items and appliances
11/7/2017 1:11 PM
4 Sustainability Program, we have targets for waste reduction, and increasing composting orrecycling products.
11/2/2017 8:24 AM
5 We are working with Kavanaugh to set up a composting pilot for our 6-unit Condo. Most of our unitowners already recycle glass, plastics, cardboard, newspapers, etc. Some already use the publicEN compost bin for organics disposal. We would like to participate more fully in the City's compostprogram.
11/1/2017 11:04 AM
6 recycle whatever can be done easily 10/30/2017 2:52 PM
7 Yes the YK Farmers Market has a waste management program where all disposable dinnerwareis compostable and collected at the end of each market and put in the organic bin. As well themarket encourages its patrons to bring their own dinnerware to reduce the use of disposablecompostable dinnerware.
10/25/2017 8:05 PM
8 small carbon foot print 10/24/2017 8:50 AM
9 zero waste is the goal. But there are certain items that just don't recycle easily or at all inYellowknife (ie styrofoam). And there are a lot of products that are mixed items that have paper &plastic and thus can neither be composted nor recycled in paper or plastics. Ie. polyethylenelaminated food wrapping paper.
10/23/2017 8:56 PM
10 Our main goal is to lead by example and promote reduction, recycling and re-use whenever ispossible. We promote all three in-house and through our customer base.
10/23/2017 12:44 PM
11 basic recycling; paper, cardboard, drink containers 10/20/2017 11:42 PM
12 Nothing in writing, but we do recycle/compost daily. 10/20/2017 1:09 PM
Yes
No
0% 10% 20% 30% 40% 50% 60% 70% 80% 90% 100%
ANSWER CHOICES RESPONSES
Yes
No
9 / 30
City of Yellowknife Business Waste Management Survey SurveyMonkey

13 We manufacture antennas for the Northern HF radio market. We provide 100% Northern Laborand have very little waste from our manufacturing. Further, we actually re-build antennas we havepreviously manufactured.
10/20/2017 12:57 PM
14 Policy, nothing in writing. In practice we recycle/ compost daily. 10/20/2017 12:16 PM
15 annually reduce waste by 1% 10/20/2017 10:15 AM
16 Pay for recycling pickup, use residential compost pickup 10/19/2017 11:53 PM
10 / 30
City of Yellowknife Business Waste Management Survey SurveyMonkey
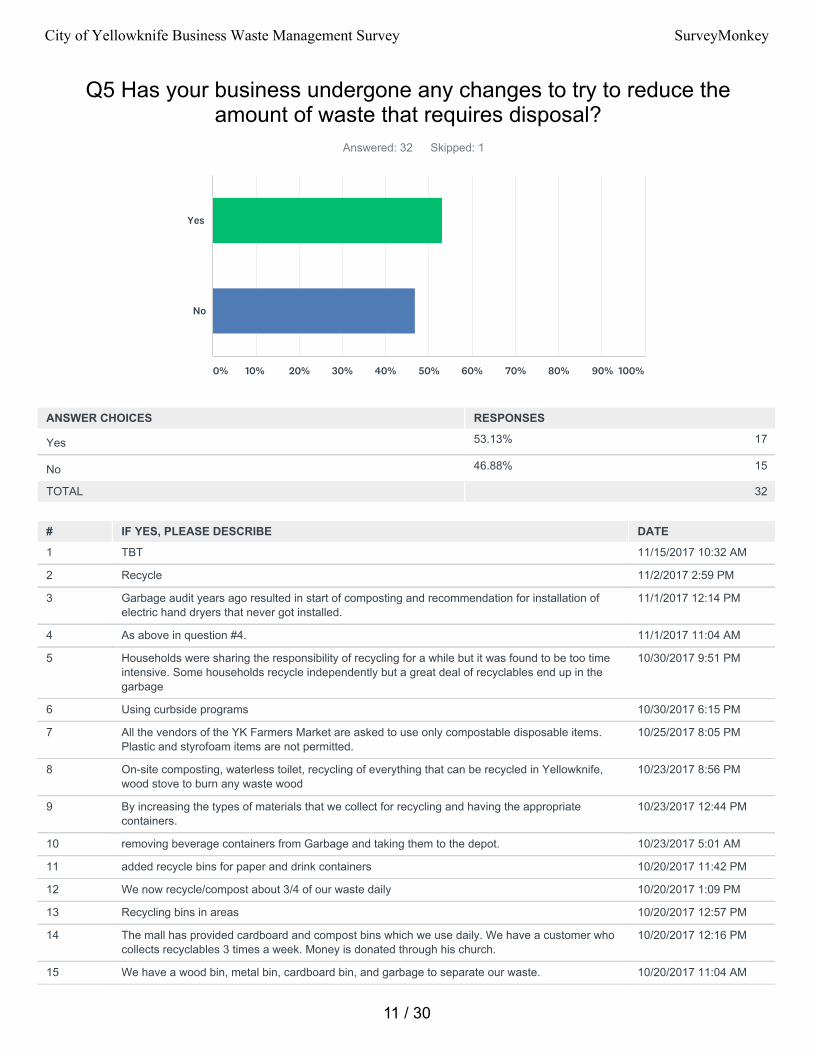
53.13% 17
46.88% 15
Q5 Has your business undergone any changes to try to reduce theamount of waste that requires disposal?
Answered: 32 Skipped: 1
TOTAL 32
# IF YES, PLEASE DESCRIBE DATE
1 TBT 11/15/2017 10:32 AM
2 Recycle 11/2/2017 2:59 PM
3 Garbage audit years ago resulted in start of composting and recommendation for installation ofelectric hand dryers that never got installed.
11/1/2017 12:14 PM
4 As above in question #4. 11/1/2017 11:04 AM
5 Households were sharing the responsibility of recycling for a while but it was found to be too timeintensive. Some households recycle independently but a great deal of recyclables end up in thegarbage
10/30/2017 9:51 PM
6 Using curbside programs 10/30/2017 6:15 PM
7 All the vendors of the YK Farmers Market are asked to use only compostable disposable items.Plastic and styrofoam items are not permitted.
10/25/2017 8:05 PM
8 On-site composting, waterless toilet, recycling of everything that can be recycled in Yellowknife,wood stove to burn any waste wood
10/23/2017 8:56 PM
9 By increasing the types of materials that we collect for recycling and having the appropriatecontainers.
10/23/2017 12:44 PM
10 removing beverage containers from Garbage and taking them to the depot. 10/23/2017 5:01 AM
11 added recycle bins for paper and drink containers 10/20/2017 11:42 PM
12 We now recycle/compost about 3/4 of our waste daily 10/20/2017 1:09 PM
13 Recycling bins in areas 10/20/2017 12:57 PM
14 The mall has provided cardboard and compost bins which we use daily. We have a customer whocollects recyclables 3 times a week. Money is donated through his church.
10/20/2017 12:16 PM
15 We have a wood bin, metal bin, cardboard bin, and garbage to separate our waste. 10/20/2017 11:04 AM
Yes
No
0% 10% 20% 30% 40% 50% 60% 70% 80% 90% 100%
ANSWER CHOICES RESPONSES
Yes
No
11 / 30
City of Yellowknife Business Waste Management Survey SurveyMonkey

16 compost, cardboard recylcing 10/20/2017 10:15 AM
12 / 30
City of Yellowknife Business Waste Management Survey SurveyMonkey
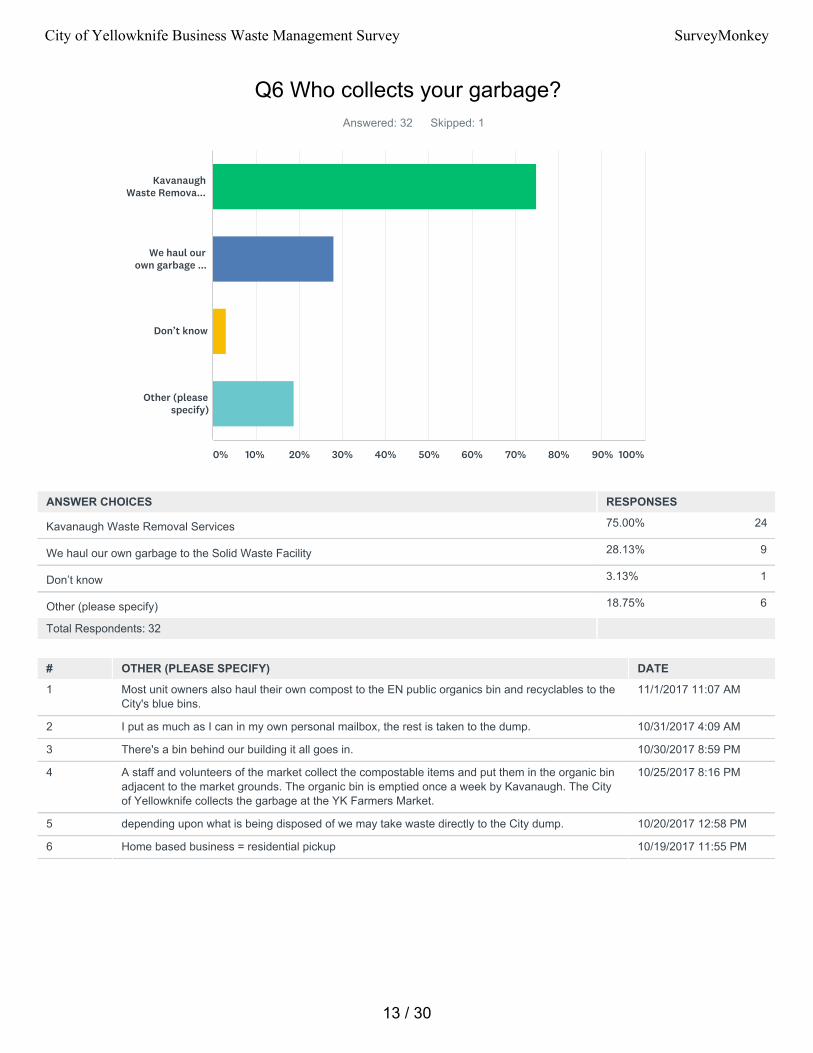
75.00% 24
28.13% 9
3.13% 1
18.75% 6
Q6 Who collects your garbage?Answered: 32 Skipped: 1
Total Respondents: 32
# OTHER (PLEASE SPECIFY) DATE
1 Most unit owners also haul their own compost to the EN public organics bin and recyclables to theCity's blue bins.
11/1/2017 11:07 AM
2 I put as much as I can in my own personal mailbox, the rest is taken to the dump. 10/31/2017 4:09 AM
3 There's a bin behind our building it all goes in. 10/30/2017 8:59 PM
4 A staff and volunteers of the market collect the compostable items and put them in the organic binadjacent to the market grounds. The organic bin is emptied once a week by Kavanaugh. The Cityof Yellowknife collects the garbage at the YK Farmers Market.
10/25/2017 8:16 PM
5 depending upon what is being disposed of we may take waste directly to the City dump. 10/20/2017 12:58 PM
6 Home based business = residential pickup 10/19/2017 11:55 PM
KavanaughWaste Remova...
We haul ourown garbage ...
Don’t know
Other (pleasespecify)
0% 10% 20% 30% 40% 50% 60% 70% 80% 90% 100%
ANSWER CHOICES RESPONSES
Kavanaugh Waste Removal Services
We haul our own garbage to the Solid Waste Facility
Don’t know
Other (please specify)
13 / 30
City of Yellowknife Business Waste Management Survey SurveyMonkey

9.38% 3
9.38% 3
6.25% 2
62.50% 20
0.00% 0
0.00% 0
25.00% 8
Q7 Who collects your recycling?Answered: 32 Skipped: 1
Total Respondents: 32
# OTHER (PLEASE SPECIFY) DATE
1 Homes for Humanity also often advertise for sale 11/15/2017 10:34 AM
2 Abe Miller 11/2/2017 8:25 AM
3 Abe Miller collects our returnables 11/1/2017 12:15 PM
4 some households haul it independently 10/30/2017 9:52 PM
5 The market does not generate recycling containers. When people bring recyclables and dispose ofthem at the market they are collected by the City of Yellowknife.
10/25/2017 8:16 PM
6 we have different customers who pick up compost and recyclable drink containers. 10/20/2017 1:12 PM
7 Customer 10/20/2017 12:17 PM
8 Our cleaner disposes of our recyclables. We return cartridges to Xerox. 10/20/2017 10:58 AM
KavanaughWaste Remova...
Go GreenRecycling
DocumentSecurity...
We haul itourselves to...
We don’trecycle
Don’t know
Other (pleasespecify)
0% 10% 20% 30% 40% 50% 60% 70% 80% 90% 100%
ANSWER CHOICES RESPONSES
Kavanaugh Waste Removal Services
Go Green Recycling
Document Security Services (for shredded paper)
We haul it ourselves to the recycling depot
We don’t recycle
Don’t know
Other (please specify)
14 / 30
City of Yellowknife Business Waste Management Survey SurveyMonkey
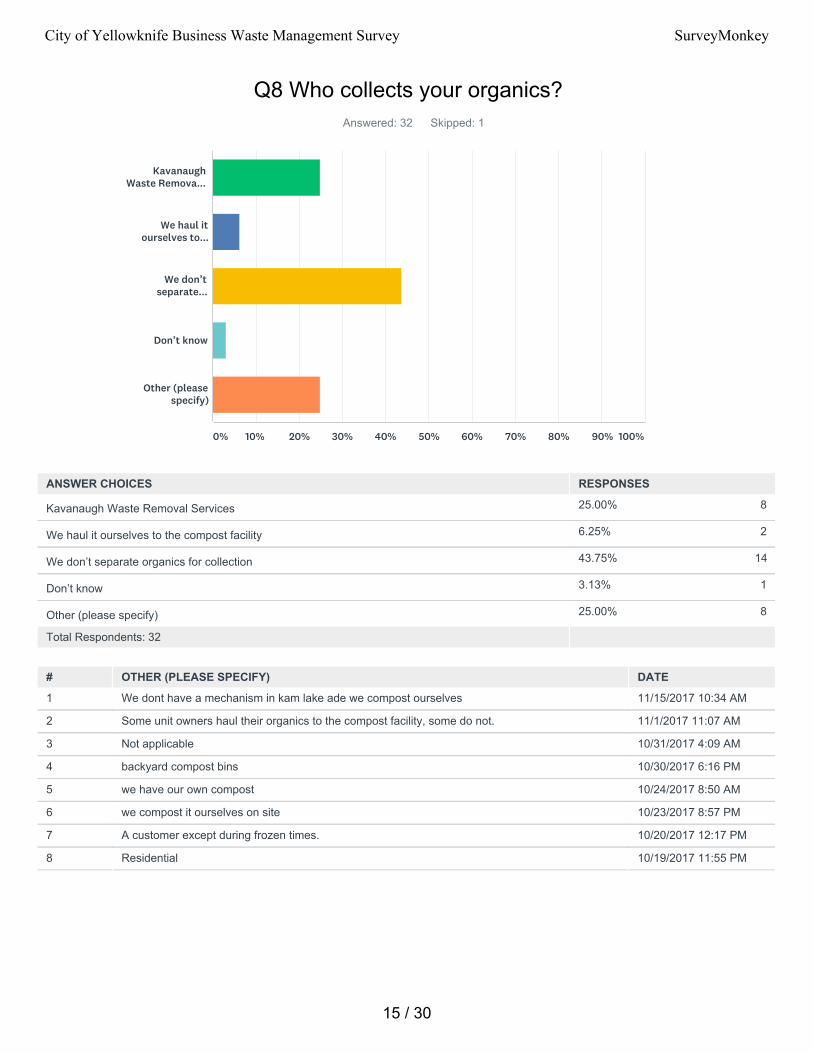
25.00% 8
6.25% 2
43.75% 14
3.13% 1
25.00% 8
Q8 Who collects your organics?Answered: 32 Skipped: 1
Total Respondents: 32
# OTHER (PLEASE SPECIFY) DATE
1 We dont have a mechanism in kam lake ade we compost ourselves 11/15/2017 10:34 AM
2 Some unit owners haul their organics to the compost facility, some do not. 11/1/2017 11:07 AM
3 Not applicable 10/31/2017 4:09 AM
4 backyard compost bins 10/30/2017 6:16 PM
5 we have our own compost 10/24/2017 8:50 AM
6 we compost it ourselves on site 10/23/2017 8:57 PM
7 A customer except during frozen times. 10/20/2017 12:17 PM
8 Residential 10/19/2017 11:55 PM
KavanaughWaste Remova...
We haul itourselves to...
We don’tseparate...
Don’t know
Other (pleasespecify)
0% 10% 20% 30% 40% 50% 60% 70% 80% 90% 100%
ANSWER CHOICES RESPONSES
Kavanaugh Waste Removal Services
We haul it ourselves to the compost facility
We don’t separate organics for collection
Don’t know
Other (please specify)
15 / 30
City of Yellowknife Business Waste Management Survey SurveyMonkey
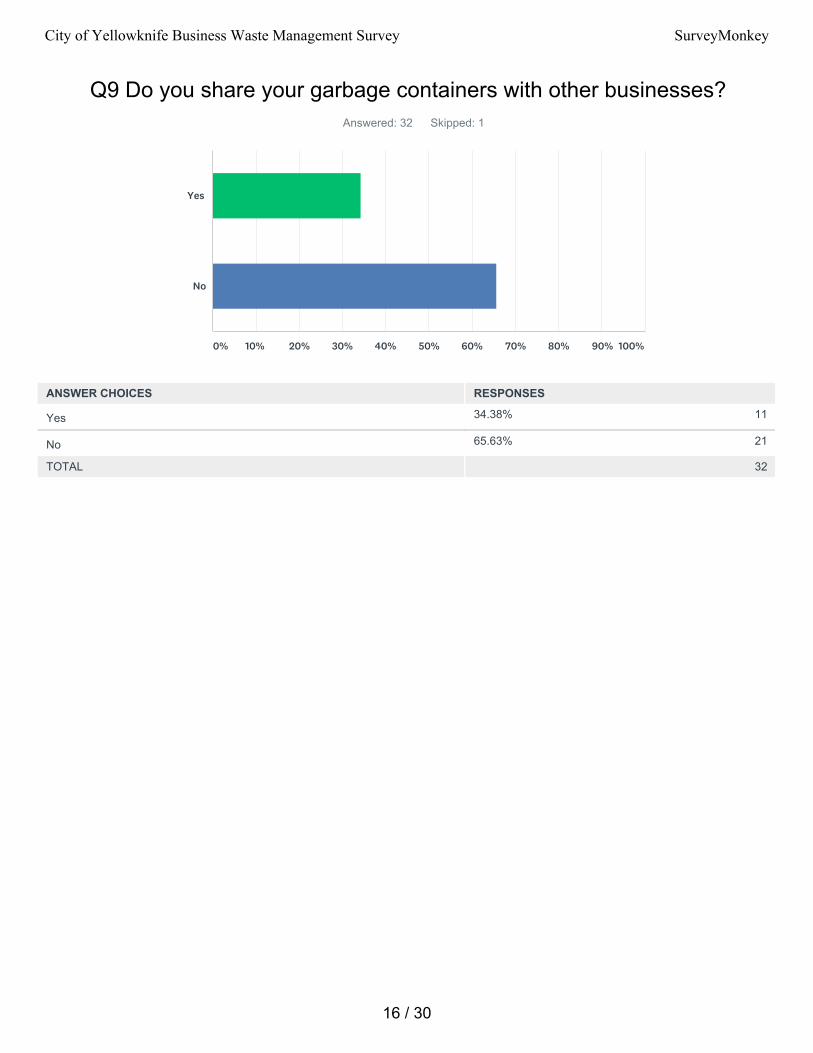
34.38% 11
65.63% 21
Q9 Do you share your garbage containers with other businesses?Answered: 32 Skipped: 1
TOTAL 32
Yes
No
0% 10% 20% 30% 40% 50% 60% 70% 80% 90% 100%
ANSWER CHOICES RESPONSES
Yes
No
16 / 30
City of Yellowknife Business Waste Management Survey SurveyMonkey

18.75% 6
81.25% 26
Q10 Do you share your recycling containers with other businesses?Answered: 32 Skipped: 1
TOTAL 32
Yes
No
0% 10% 20% 30% 40% 50% 60% 70% 80% 90% 100%
ANSWER CHOICES RESPONSES
Yes
No
17 / 30
City of Yellowknife Business Waste Management Survey SurveyMonkey

16.67% 5
83.33% 25
Q11 Do you share your organics containers with other businesses?Answered: 30 Skipped: 3
TOTAL 30
Yes
No
0% 10% 20% 30% 40% 50% 60% 70% 80% 90% 100%
ANSWER CHOICES RESPONSES
Yes
No
18 / 30
City of Yellowknife Business Waste Management Survey SurveyMonkey

18.75% 6
81.25% 26
Q12 As a business, are you a tenant in a building where garbage,recycling, and/or organics services are provided by the landlord?
Answered: 32 Skipped: 1
TOTAL 32
Yes
No
0% 10% 20% 30% 40% 50% 60% 70% 80% 90% 100%
ANSWER CHOICES RESPONSES
Yes
No
19 / 30
City of Yellowknife Business Waste Management Survey SurveyMonkey
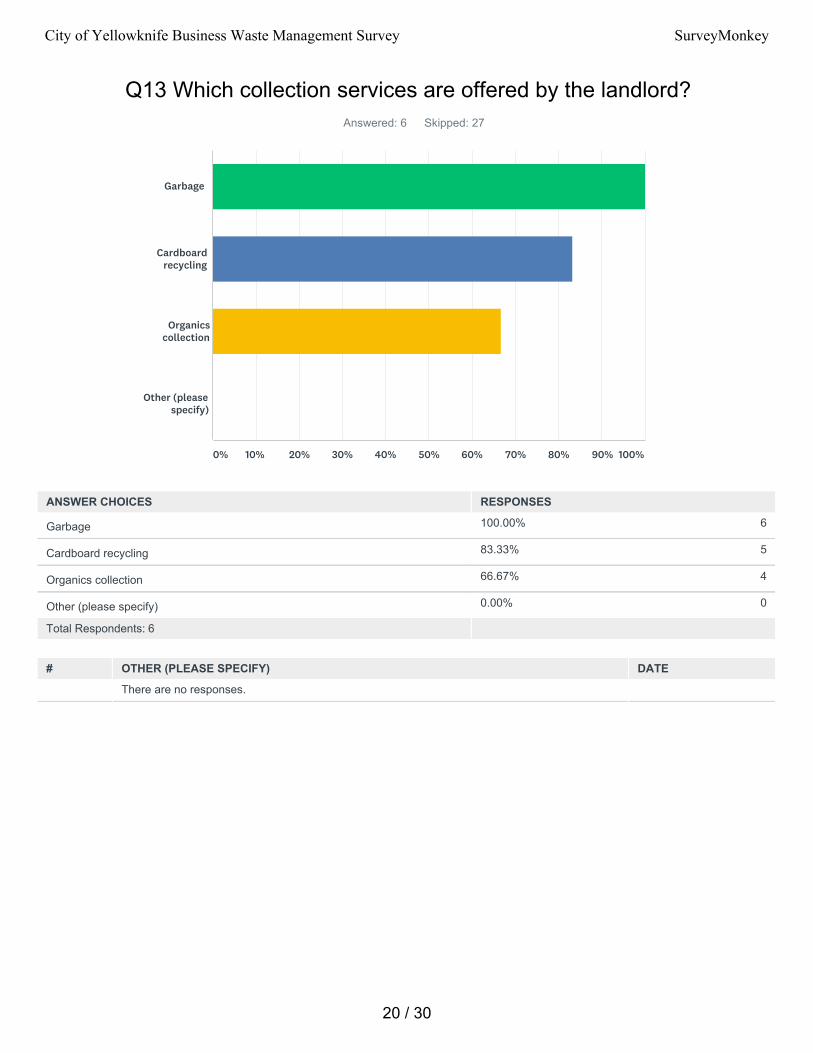
100.00% 6
83.33% 5
66.67% 4
0.00% 0
Q13 Which collection services are offered by the landlord?Answered: 6 Skipped: 27
Total Respondents: 6
# OTHER (PLEASE SPECIFY) DATE
There are no responses.
Garbage
Cardboardrecycling
Organicscollection
Other (pleasespecify)
0% 10% 20% 30% 40% 50% 60% 70% 80% 90% 100%
ANSWER CHOICES RESPONSES
Garbage
Cardboard recycling
Organics collection
Other (please specify)
20 / 30
City of Yellowknife Business Waste Management Survey SurveyMonkey

Q14 On a scale of 1-5, please indicate how significant the followingissues are as a barrier to recycling at your business (with 1 being “not at
all significant” and 5 being “very significant”)Answered: 30 Skipped: 3
Access torecycling bins
Space
Time / Labour
Owners /management /...
21 / 30
City of Yellowknife Business Waste Management Survey SurveyMonkey
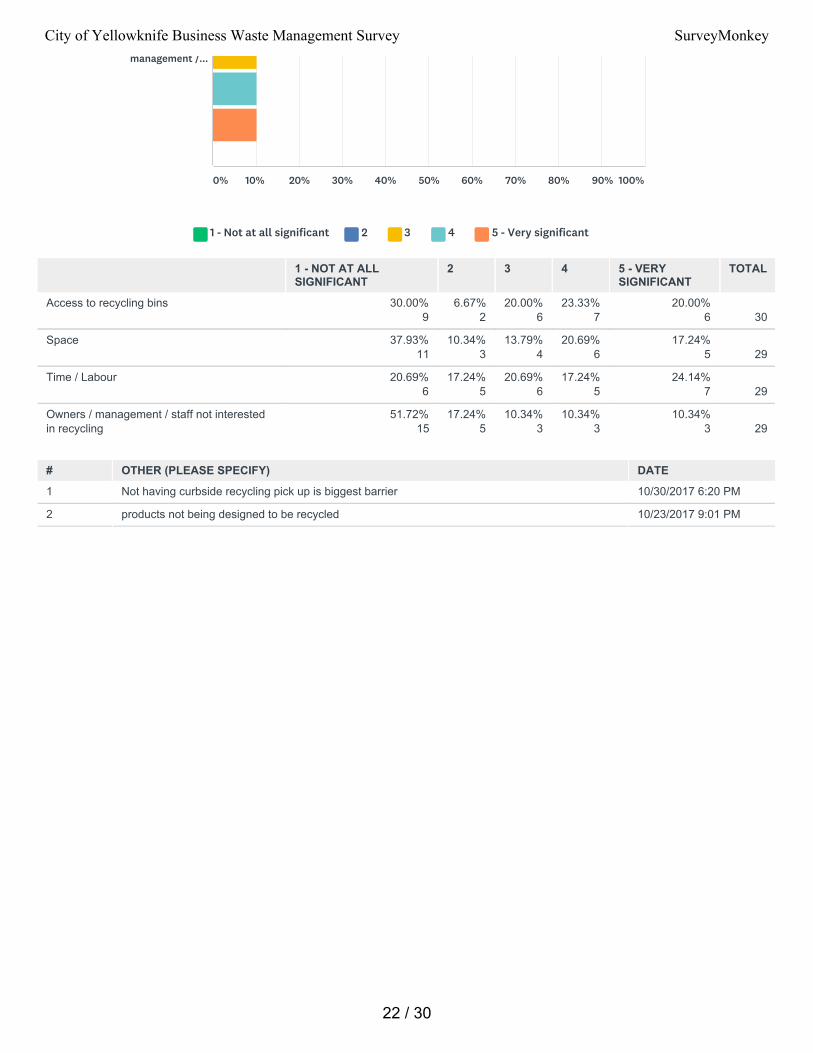
30.00%9
6.67%2
20.00%6
23.33%7
20.00%6
30
37.93%11
10.34%3
13.79%4
20.69%6
17.24%5
29
20.69%6
17.24%5
20.69%6
17.24%5
24.14%7
29
51.72%15
17.24%5
10.34%3
10.34%3
10.34%3
29
# OTHER (PLEASE SPECIFY) DATE
1 Not having curbside recycling pick up is biggest barrier 10/30/2017 6:20 PM
2 products not being designed to be recycled 10/23/2017 9:01 PM
1 - Not at all significant 2 3 4 5 - Very significant
management /...
0% 10% 20% 30% 40% 50% 60% 70% 80% 90% 100%
1 - NOT AT ALLSIGNIFICANT
2 3 4 5 - VERYSIGNIFICANT
TOTAL
Access to recycling bins
Space
Time / Labour
Owners / management / staff not interestedin recycling
22 / 30
City of Yellowknife Business Waste Management Survey SurveyMonkey
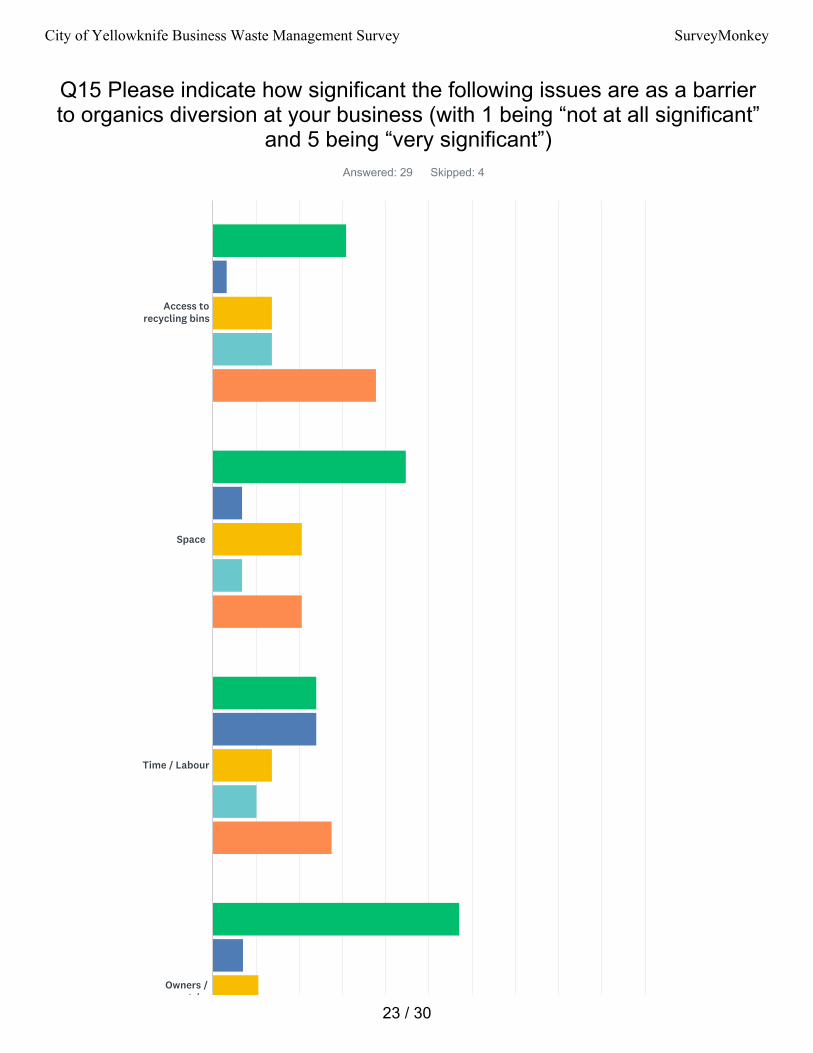
Q15 Please indicate how significant the following issues are as a barrierto organics diversion at your business (with 1 being “not at all significant”
and 5 being “very significant”)Answered: 29 Skipped: 4
Access torecycling bins
Space
Time / Labour
Owners /management /...
23 / 30
City of Yellowknife Business Waste Management Survey SurveyMonkey
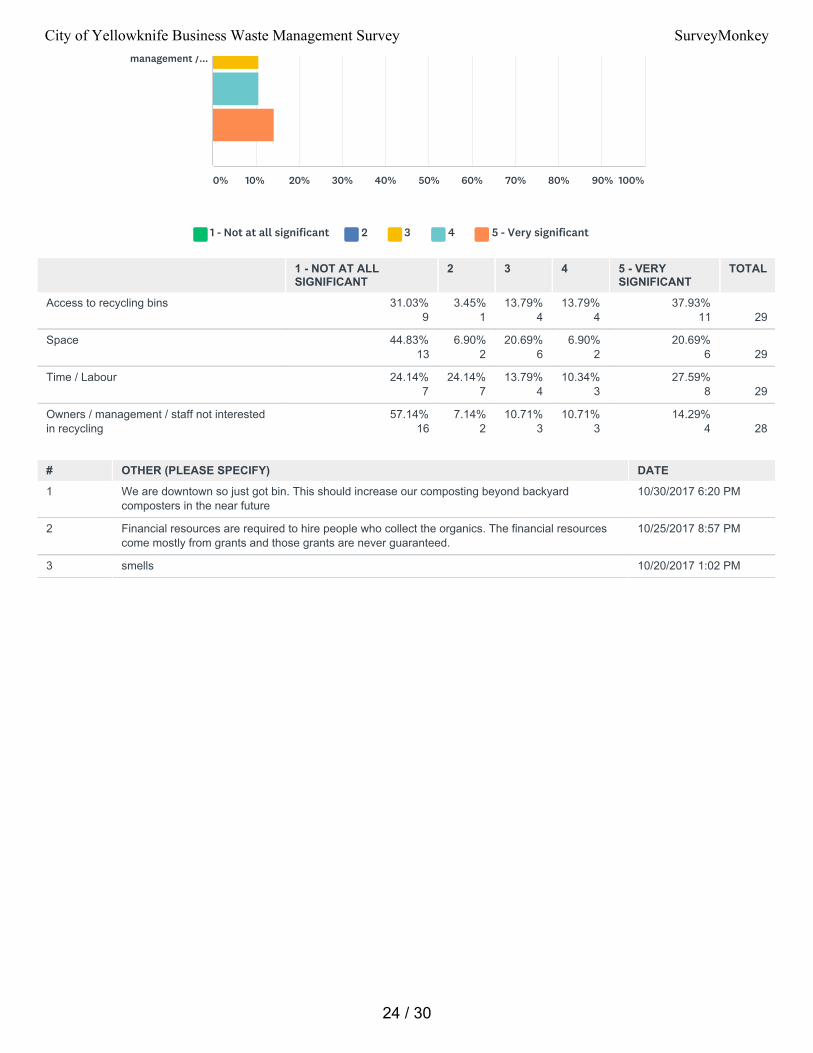
31.03%9
3.45%1
13.79%4
13.79%4
37.93%11
29
44.83%13
6.90%2
20.69%6
6.90%2
20.69%6
29
24.14%7
24.14%7
13.79%4
10.34%3
27.59%8
29
57.14%16
7.14%2
10.71%3
10.71%3
14.29%4
28
# OTHER (PLEASE SPECIFY) DATE
1 We are downtown so just got bin. This should increase our composting beyond backyardcomposters in the near future
10/30/2017 6:20 PM
2 Financial resources are required to hire people who collect the organics. The financial resourcescome mostly from grants and those grants are never guaranteed.
10/25/2017 8:57 PM
3 smells 10/20/2017 1:02 PM
1 - Not at all significant 2 3 4 5 - Very significant
management /...
0% 10% 20% 30% 40% 50% 60% 70% 80% 90% 100%
1 - NOT AT ALLSIGNIFICANT
2 3 4 5 - VERYSIGNIFICANT
TOTAL
Access to recycling bins
Space
Time / Labour
Owners / management / staff not interestedin recycling
24 / 30
City of Yellowknife Business Waste Management Survey SurveyMonkey
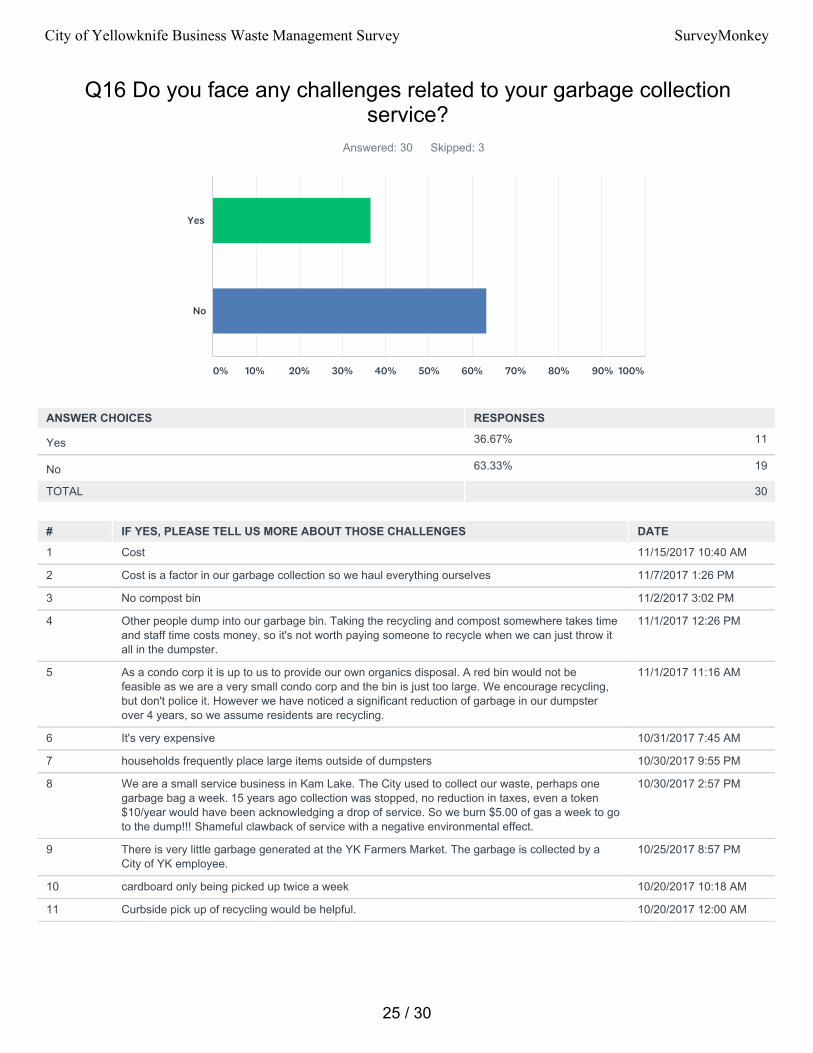
36.67% 11
63.33% 19
Q16 Do you face any challenges related to your garbage collectionservice?
Answered: 30 Skipped: 3
TOTAL 30
# IF YES, PLEASE TELL US MORE ABOUT THOSE CHALLENGES DATE
1 Cost 11/15/2017 10:40 AM
2 Cost is a factor in our garbage collection so we haul everything ourselves 11/7/2017 1:26 PM
3 No compost bin 11/2/2017 3:02 PM
4 Other people dump into our garbage bin. Taking the recycling and compost somewhere takes timeand staff time costs money, so it's not worth paying someone to recycle when we can just throw itall in the dumpster.
11/1/2017 12:26 PM
5 As a condo corp it is up to us to provide our own organics disposal. A red bin would not befeasible as we are a very small condo corp and the bin is just too large. We encourage recycling,but don't police it. However we have noticed a significant reduction of garbage in our dumpsterover 4 years, so we assume residents are recycling.
11/1/2017 11:16 AM
6 It's very expensive 10/31/2017 7:45 AM
7 households frequently place large items outside of dumpsters 10/30/2017 9:55 PM
8 We are a small service business in Kam Lake. The City used to collect our waste, perhaps onegarbage bag a week. 15 years ago collection was stopped, no reduction in taxes, even a token$10/year would have been acknowledging a drop of service. So we burn $5.00 of gas a week to goto the dump!!! Shameful clawback of service with a negative environmental effect.
10/30/2017 2:57 PM
9 There is very little garbage generated at the YK Farmers Market. The garbage is collected by aCity of YK employee.
10/25/2017 8:57 PM
10 cardboard only being picked up twice a week 10/20/2017 10:18 AM
11 Curbside pick up of recycling would be helpful. 10/20/2017 12:00 AM
Yes
No
0% 10% 20% 30% 40% 50% 60% 70% 80% 90% 100%
ANSWER CHOICES RESPONSES
Yes
No
25 / 30
City of Yellowknife Business Waste Management Survey SurveyMonkey
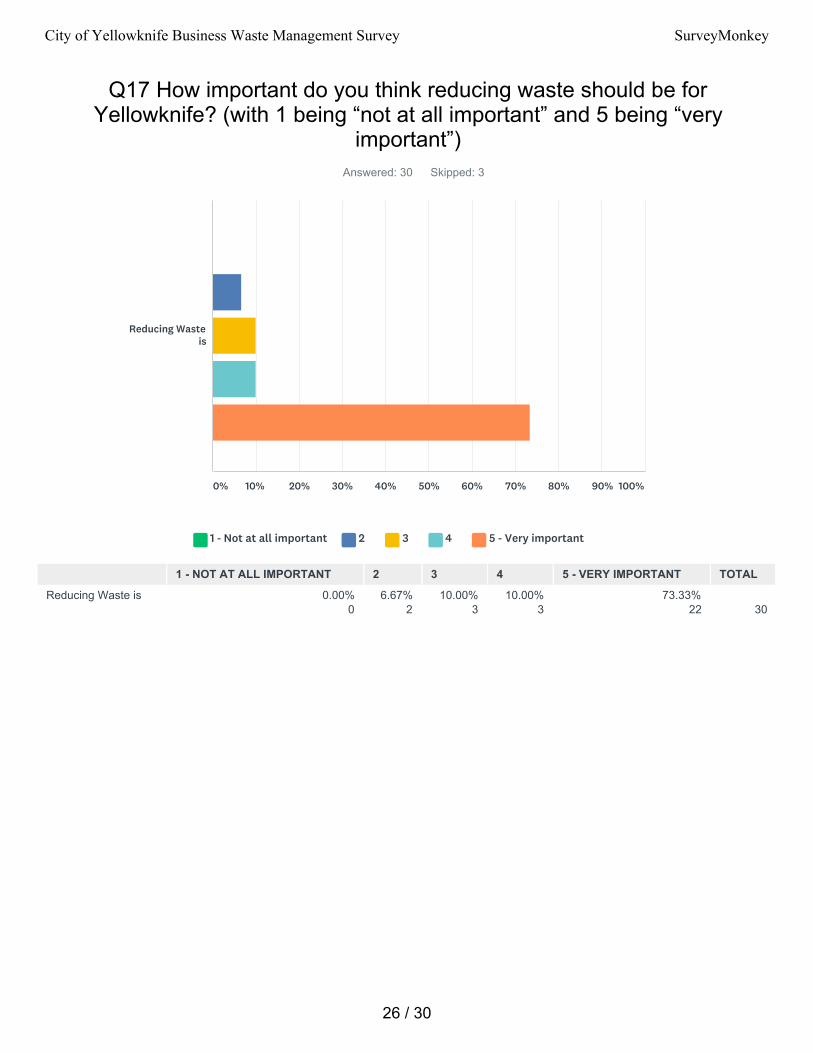
Q17 How important do you think reducing waste should be forYellowknife? (with 1 being “not at all important” and 5 being “very
important”)Answered: 30 Skipped: 3
0.00%0
6.67%2
10.00%3
10.00%3
73.33%22
30
1 - Not at all important 2 3 4 5 - Very important
Reducing Wasteis
0% 10% 20% 30% 40% 50% 60% 70% 80% 90% 100%
1 - NOT AT ALL IMPORTANT 2 3 4 5 - VERY IMPORTANT TOTAL
Reducing Waste is
26 / 30
City of Yellowknife Business Waste Management Survey SurveyMonkey

Q18 What action or program does your business participate in that hasthe most impact on waste diversion?
Answered: 21 Skipped: 12
# RESPONSES DATE
1 Recycling/composting 11/8/2017 8:35 AM
2 Our business model promotes the reuse of home improvement items and construction materials bymaintaining a retail outlet for the public to buy items and discounted prices. We aim to removethese items from waste stream and extend usable life span.
11/7/2017 1:26 PM
3 Recycling 11/2/2017 3:02 PM
4 N/A 11/2/2017 8:28 AM
5 Composting. 11/1/2017 12:26 PM
6 Recycling 11/1/2017 11:16 AM
7 We have a used oil furnace, that uses all our waste, along with significant waste from othercompanies
10/31/2017 2:11 PM
8 composting 10/30/2017 9:55 PM
9 Go Green picking up our recycling and sorting for us 10/30/2017 6:20 PM
10 We burn all paper products in the woodstove we use foe seasonal space heating. 10/30/2017 2:57 PM
11 The use of compostable dinnerware allows the market to divert 85 to 93% of its waste from thelandfill to the compost pile. By asking the patrons to bring their containers there were 305disposable containers not used in 2016.
10/25/2017 8:57 PM
12 compostible containers & composting 10/24/2017 8:53 AM
13 composting 10/23/2017 9:01 PM
14 By providing waste hauling services 10/23/2017 12:49 PM
15 recycling of Paper and Beverage containers 10/23/2017 5:06 AM
16 electronics recycling 10/20/2017 11:46 PM
17 Composting, recycling and donating recyclable beverage containers has reduced our waste byabout 75% since we started in 2010.
10/20/2017 1:24 PM
18 rebuilding or repairing vs replacing 10/20/2017 1:02 PM
19 Paper recycling 10/20/2017 10:59 AM
20 recycling 10/20/2017 10:56 AM
21 cardboard recylcing 10/20/2017 10:18 AM
27 / 30
City of Yellowknife Business Waste Management Survey SurveyMonkey

Q19 What additional business waste diversion options would you like tosee offered in Yellowknife?
Answered: 19 Skipped: 14
# RESPONSES DATE
1 Oil and drums from small business - big problem for small business and I think a very problem within and out side city
11/15/2017 10:40 AM
2 Recycling/composting collection the same as garbage collection. 11/8/2017 8:35 AM
3 Curbside pick up for residential re-cycling. Mandatory cardboard separation for residential andbusiness users
11/7/2017 1:26 PM
4 Compost for business 11/2/2017 3:02 PM
5 Compost programs are becoming more accessible and that's fantastic 11/2/2017 8:28 AM
6 Pickup for recyclables, blue bag programs where others sort recyclables into categories from asingle place, disincentives to put recyclables and compost into the garbage, pickup for compost.
11/1/2017 12:26 PM
7 Waste oil, asphalt, construction materials, more Re-store materials 11/1/2017 11:16 AM
8 Recycling collection in condominium buildings. Banning organics in landfills. Banning cardboard inlandfills.
11/1/2017 10:59 AM
9 picking up unsorted recyclables 10/30/2017 9:55 PM
10 Curbside recycling for sure! Also, an easier way to dispose of dog poop besides having to drive allthe way out to the dump to dispose of.
10/30/2017 6:20 PM
11 Policies and legislations banning the use of plastic, styrofoam in public events, canteens of publicfacilities, take out restaurants etc... Waste management at all public events and YK facilities.Organic bins adjacent to the garbage and recycle bins.
10/25/2017 8:57 PM
12 restaurant left overs to hungry people 10/24/2017 8:53 AM
13 N/A 10/23/2017 12:49 PM
14 Batteries, electronics, ink cartridges 10/20/2017 2:50 PM
15 can used cooking oils be recycled? 10/20/2017 1:24 PM
16 Recyling pickup 10/20/2017 10:59 AM
17 Compost bins for businesses and offices 10/20/2017 10:56 AM
18 tin cans 10/20/2017 10:18 AM
19 Biogas production for heat instead of composting 10/20/2017 12:00 AM
28 / 30
City of Yellowknife Business Waste Management Survey SurveyMonkey
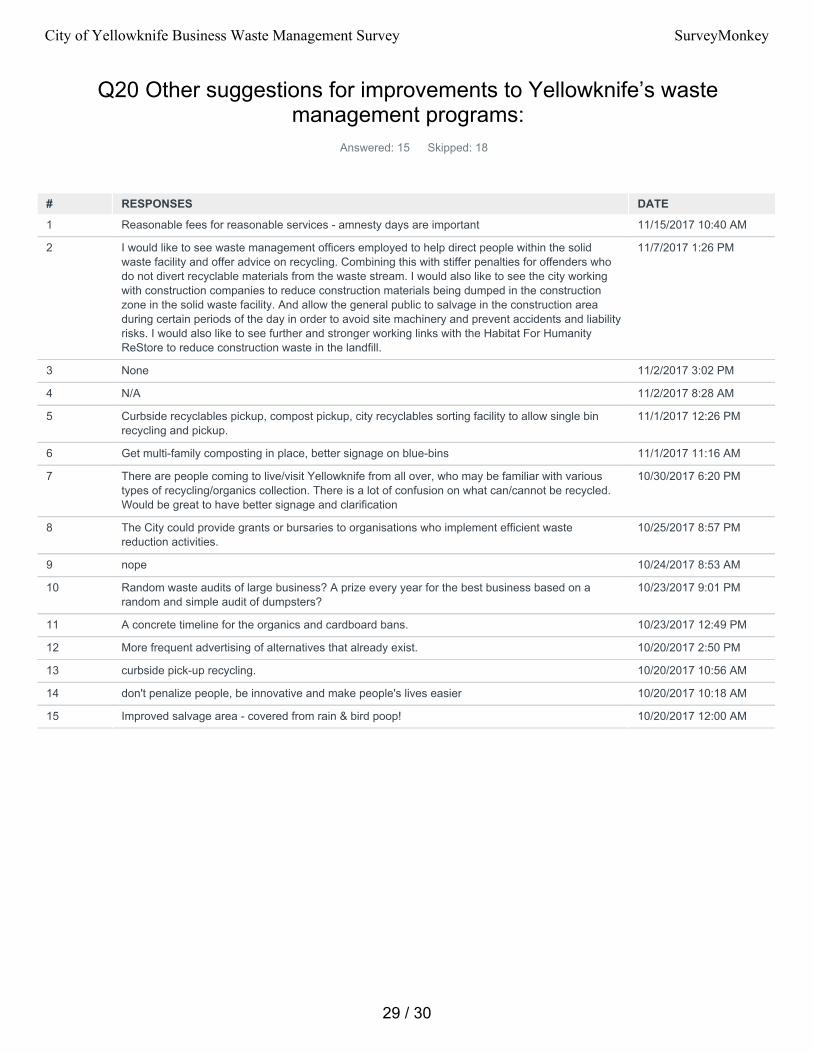
Q20 Other suggestions for improvements to Yellowknife’s wastemanagement programs:
Answered: 15 Skipped: 18
# RESPONSES DATE
1 Reasonable fees for reasonable services - amnesty days are important 11/15/2017 10:40 AM
2 I would like to see waste management officers employed to help direct people within the solidwaste facility and offer advice on recycling. Combining this with stiffer penalties for offenders whodo not divert recyclable materials from the waste stream. I would also like to see the city workingwith construction companies to reduce construction materials being dumped in the constructionzone in the solid waste facility. And allow the general public to salvage in the construction areaduring certain periods of the day in order to avoid site machinery and prevent accidents and liabilityrisks. I would also like to see further and stronger working links with the Habitat For HumanityReStore to reduce construction waste in the landfill.
11/7/2017 1:26 PM
3 None 11/2/2017 3:02 PM
4 N/A 11/2/2017 8:28 AM
5 Curbside recyclables pickup, compost pickup, city recyclables sorting facility to allow single binrecycling and pickup.
11/1/2017 12:26 PM
6 Get multi-family composting in place, better signage on blue-bins 11/1/2017 11:16 AM
7 There are people coming to live/visit Yellowknife from all over, who may be familiar with varioustypes of recycling/organics collection. There is a lot of confusion on what can/cannot be recycled.Would be great to have better signage and clarification
10/30/2017 6:20 PM
8 The City could provide grants or bursaries to organisations who implement efficient wastereduction activities.
10/25/2017 8:57 PM
9 nope 10/24/2017 8:53 AM
10 Random waste audits of large business? A prize every year for the best business based on arandom and simple audit of dumpsters?
10/23/2017 9:01 PM
11 A concrete timeline for the organics and cardboard bans. 10/23/2017 12:49 PM
12 More frequent advertising of alternatives that already exist. 10/20/2017 2:50 PM
13 curbside pick-up recycling. 10/20/2017 10:56 AM
14 don't penalize people, be innovative and make people's lives easier 10/20/2017 10:18 AM
15 Improved salvage area - covered from rain & bird poop! 10/20/2017 12:00 AM
29 / 30
City of Yellowknife Business Waste Management Survey SurveyMonkey

Q21 Any other final comments?Answered: 12 Skipped: 21
# RESPONSES DATE
1 Proactive with solutions and education are far better than bylaws and fines - people want toparticipate and we need to find ways to bring them on board
11/15/2017 10:40 AM
2 Packaging waste should all be recyclable 11/7/2017 1:26 PM
3 None 11/2/2017 3:02 PM
4 Keep up the good work! 11/2/2017 8:28 AM
5 The city's decision to make garbage pickup for businesses and multi-unit residential buildings aprivate business instead of the city taking care of this for the whole city creates a disincentive forapartment dwellers to compost or recycle, and keeps a large segment of the garbage creators fromaccessing the city's programs (green bins, etc). Curbside recycling pickup is needed, a solution forplastic bag recycling would be very good. It is a challenge to recycle in Yellowknife. Constructionwaste is a huge problem, and penalties are required to keep contractors from dumping perfectlygood and/or recyclable materials into a giant pit. They waste and don't recycle because it ischeaper to waste. Getting things in good condition to the re-store costs contractors money. Theywill only do it if they are penalized enough for not doing it that it starts to make economic sense.
11/1/2017 12:26 PM
6 It would be good to know how the City is meeting its goals/targets. 11/1/2017 11:16 AM
7 Overall I believe the city is going in the right direction. Impressed that a small city in the north isworking so hard to reduce waste. Keep up the good work!
10/30/2017 6:20 PM
8 Thank you Yellowknife for aiming at Zero waste! We could become a national example for wastemanagement!
10/25/2017 8:57 PM
9 a lot of larger companies have cardboard recycling bins but most of their cardboard still ends up intheir regular dumpsters. Enforcement?
10/23/2017 9:01 PM
10 Excellent work on the City's part for taking action on waste management and introducing newprograms.
10/23/2017 12:49 PM
11 We have been very successful to date, keep it up! 10/20/2017 2:50 PM
12 It has been very easy for us to reduce our waste by reusing, recycling or donating our beveragecontainers. The big blue bins at various locations around town make it easy to deal with recycling.
10/20/2017 1:24 PM
30 / 30
City of Yellowknife Business Waste Management Survey SurveyMonkey

Strategic Waste Management Plan (SWMP) – Appendix The City of Yellowknife
C-1
Appendix C – Stakeholder Engagement Results
Online Business (ICI) Waste Management Survey
An online survey was conducted for Yellowknife businesses to determine their current waste management practices and perceived barriers to diversion (recycling and organics). A total of 33 businesses completed the survey in October with half of those businesses being a Professional Service. Other business categories included Retail, Food Service, Manufacturing, Hospitality, Multi-family, Construction, Trucking and several others. Over 65 percent of the businesses surveyed had 10 or less employees.
Although there are some businesses leading waste diversion in Yellowknife, there are a significant number of businesses that are throwing recyclables in the garbage. For example, of the businesses surveyed, nearly 10 percent of them still put cardboard in the garbage, 19 percent throw out their paper waste, and 30 percent dispose of metal. Very few businesses reported any reuse activities and those that did were mainly related to construction.
More than half of the businesses surveyed did not have specific waste management policies or goals, although more than half of the businesses did state they had undergone changes to their business in order to try and reduce waste. Examples of this were waste composition studies, the implementation of hand dryers, transition to compostable foodware, and adding recycling containers.
Most businesses (75%) surveyed have their waste collected by Kavanaugh, while most of them who recycle, haul their own recyclables to the Blue Bin Station at the SWF (63%). Over 34 percent of respondents also reported sharing garbage containers with other businesses, while only 19% reported sharing recycling containers.
Businesses that reported being in a building where the landlord is responsible for the waste management services (6), all of them had garbage services, over 80 percent had cardboard recycling and over 65 percent had organics collection. It is noteworthy the sample size for this question was very small and it would not be advisable to extrapolate these results for all businesses renting space in the city.
The biggest barrier to recycling for businesses was reported to be time and labour. Accessibility was also identified as larger issue for some businesses. Similarly, the biggest barriers to organics diversion were also accessibility and time and labour.
Over a third of respondents reported having some issues with their garbage collection service. Comments from the businesses ranged from having their service removed (small business in Kam Lake), other people placing items in their garbage bins, cost, and lack of diversion options being available.
On a scale from 1 to 5, all survey respondents rated “how important do you think reducing waste should be for Yellowknife?” with a 2 or higher, with over 70 percent of respondents selecting a 5 for very important.
Businesses presented a wide range of actions or programs they felt had the most impact on waste diversion. Several reported recycling or composting, while other actions included, burning paper waste in their woodstove for seasonal space heating, transitioning to compostable foodware, having a furnace that runs off used oil, donating beverage containers and trying to repair things as much as possible.
A variety of additional desirable diversion options were listed by the businesses:
• Expanded diversion options for oil and oil drums, especially for small businesses
• Mandatory cardboard recycling
• Curbside pick-up for residential re-cycling
• Compost diversion for businesses
• Recycling for multi-family buildings
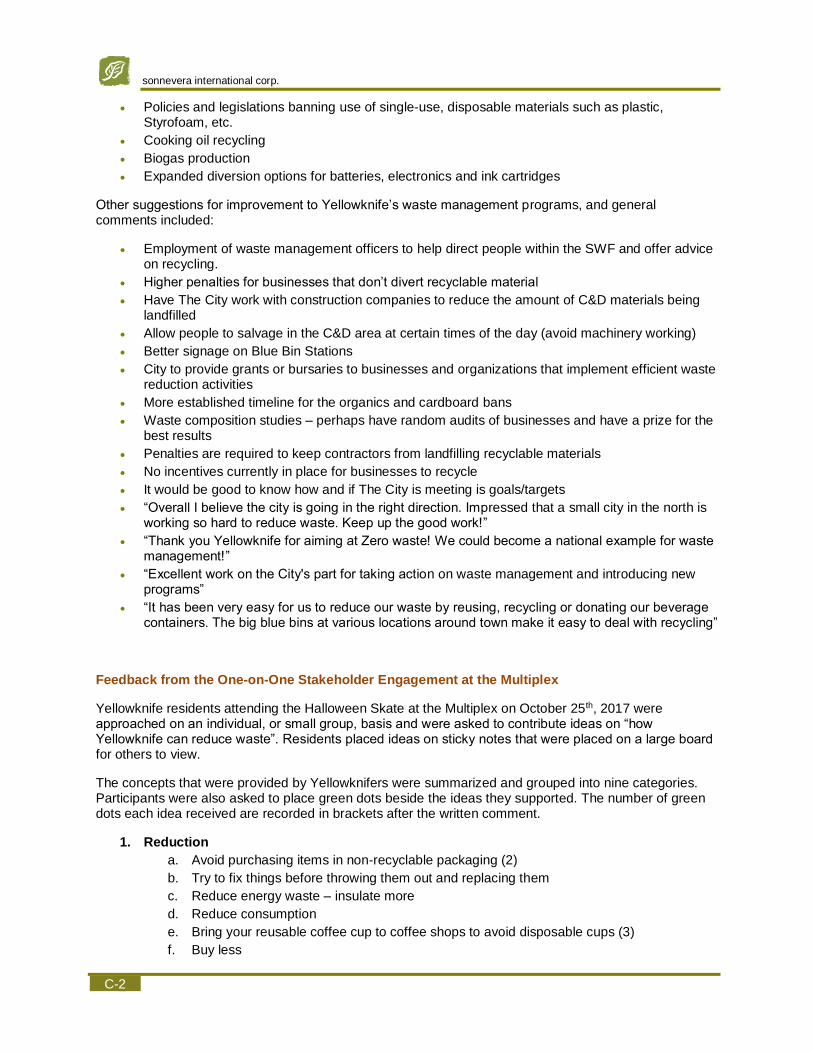
sonnevera international corp.
C-2
• Policies and legislations banning use of single-use, disposable materials such as plastic, Styrofoam, etc.
• Cooking oil recycling
• Biogas production
• Expanded diversion options for batteries, electronics and ink cartridges
Other suggestions for improvement to Yellowknife’s waste management programs, and general comments included:
• Employment of waste management officers to help direct people within the SWF and offer advice on recycling.
• Higher penalties for businesses that don’t divert recyclable material
• Have The City work with construction companies to reduce the amount of C&D materials being landfilled
• Allow people to salvage in the C&D area at certain times of the day (avoid machinery working)
• Better signage on Blue Bin Stations
• City to provide grants or bursaries to businesses and organizations that implement efficient waste reduction activities
• More established timeline for the organics and cardboard bans
• Waste composition studies – perhaps have random audits of businesses and have a prize for the best results
• Penalties are required to keep contractors from landfilling recyclable materials
• No incentives currently in place for businesses to recycle
• It would be good to know how and if The City is meeting is goals/targets
• “Overall I believe the city is going in the right direction. Impressed that a small city in the north is working so hard to reduce waste. Keep up the good work!”
• “Thank you Yellowknife for aiming at Zero waste! We could become a national example for waste management!”
• “Excellent work on the City's part for taking action on waste management and introducing new programs”
• “It has been very easy for us to reduce our waste by reusing, recycling or donating our beverage containers. The big blue bins at various locations around town make it easy to deal with recycling”
Feedback from the One-on-One Stakeholder Engagement at the Multiplex
Yellowknife residents attending the Halloween Skate at the Multiplex on October 25th, 2017 were approached on an individual, or small group, basis and were asked to contribute ideas on “how Yellowknife can reduce waste”. Residents placed ideas on sticky notes that were placed on a large board for others to view.
The concepts that were provided by Yellowknifers were summarized and grouped into nine categories. Participants were also asked to place green dots beside the ideas they supported. The number of green dots each idea received are recorded in brackets after the written comment.
1. Reduction
a. Avoid purchasing items in non-recyclable packaging (2)
b. Try to fix things before throwing them out and replacing them
c. Reduce energy waste – insulate more
d. Reduce consumption
e. Bring your reusable coffee cup to coffee shops to avoid disposable cups (3)
f. Buy less
Strategic Waste Management Plan (SWMP) – Appendix The City of Yellowknife
C-3
2. Promotion
a. Want more access to finished compost
b. Value and support the “free dump day” (1)
c. Interested in purchasing compost but don’t know where it is available (1)
3. Incentives
a. Need more financial incentives to encourage recycling and diversion (an example of this already in place is the plastic bag fee)
b. Support positive incentives, not just negative in the form of fees and/or regulations
4. Donation and Reuse
a. Donate extra food (2)
b. Reuse more materials (2)
5. Organics
a. Would like organics bins for condos (1)
b. Want to see organics/green bins for apartments
c. I live in an apartment and would use a Green Bin if I had access to one (I don’t have one now) (1)
d. I live in a townhouse and don’t currently have a Green Bin. I would use a Green Bin for food scraps if it was easy
e. Bigger kitchen catcher option for larger families for compost.
6. Legislation/Policies
a. Need more legislation
b. Condo corporation should be mandated to provide Green Carts and recycling bins
7. Litter
a. Start a community clean-up (litter collection) program
8. Recycling
a. Encourage cardboard recycling (1)
b. Curbside recycling and willing to pay higher fees for the service (2)
c. The City is encouraging correct recycling habits, yet the City is not actually recycling the material
d. More recycling – we lived in Nova Scotia before and had more access to recycling and composting
e. Curbside recycling service (5)
9. Education and Information
a. Want information on best environmental containers to purchase. For example, is plastic better to purchase than aluminum? (1)
b. Public information on where and how material is being recycled (2)
c. Clear information sheets to residents on what goes into the Green Cart
d. Awareness and education on which materials are recyclable
Additional comments on Yellowknife’s overall program were also provided:
“The Green Bins are awesome!” (1)
“Only one Black Cart collection every two weeks isn’t enough for a big family. Maybe change Black Cart to every week and Green Cart to every other week.”
- This family said they have a day home and have too many diapers to fit into the Black Cart once every two weeks.
“If people think their black cart is too small, they likely are not using the Green Cart”

sonnevera international corp.
C-4
“We like the compost program and use our Green Bin”
“We like the composting program and were very happy to see the delivery of Green Carts”
“Every other week garbage collection is more than sufficient, even when we have four children in diapers!”
“I love the recycling system in Yellowknife! It’s better than in my hometown in Newfoundland. I compost all my organics and use the recycling system fully. It’s fantastic!”
Summary of the Community Discussion at the Northern United Place Auditorium
Over 25 people attended the Community Discussion on Waste, held at the Northern United Place Auditorium, in Yellowknife on the evening of October 26th, 2017. A presentation on the background of Yellowknife’s waste management system, including recent 2017 waste composition results, was given to the participants, followed by an interactive discussion on potential future strategy components. The facilitated discussion generated informative comments on the current system, as well as gained valuable insight into stakeholders’ opinions on the applicability of future waste management initiatives in Yellowknife. The following comments and feedback were recorded throughout the evening.
TARGETS
Few attendees were aware of the diversion targets for organics and cardboard, as mentioned in the Corporate and Community Energy Plan.
It was suggested that targets need to be tracked and progress made towards the targets reported. The group overall felt targets were important, but that the City needed to be able to track and measure the results and success towards the targets.
For additional targets the group suggested the following:
• Aggregate target (Construction & Demolition diversion)
• The need for interim targets
• Targets for the multi-family sector
• Different and appropriate targets for the residential sector, versus the overall community of Yellowknife
– Also corporate targets – City needs to lead by example
• Target the diversion of specific materials, such as coffee cups and vegetable oil
• Have targets across all sectors and consistency with those targets (to ensure all sectors are being focused on and diversion programs for everyone, not just single family)
Attendees highlighted that need for the City to be accountable to its targets and report back and publish results from measurement towards targets.
CURRENT DIVERSION SYSTEM
The group thought the current waste management system was convenient for residents that have access to a vehicle. The group seemed divided on the accessibility of the Blue Bin Stations because many of them had vehicles and were easily able to access the several Stations around town. However, others that lived downtown or had no vehicle, found the Stations inconvenient. It was also noted Seniors may have difficulty accessing the Stations, but also Carts were noted to be not much more convenient for them.
For organics it was noted that the one bin/dumpster downtown had no signage and is located down a darker back alley. Safety concerns and lack of convenience were noted for this bin. People also said it was difficult to access finished compost from the Solid Waste Facility.

Strategic Waste Management Plan (SWMP) – Appendix The City of Yellowknife
C-5
Attendees also had questions on how the greenhouse gas assessment plays into the argument of curbside recycling collection versus the Blue Bin Stations. Lack of enforcement was also noted and some attendees claimed materials are not ending up in the correct recycling streams at the Stations.
EFFECTIVENESS
Attendees did not think the current diversion programs were effective and referenced the current diversion rate of 12 percent as proof. It was also noted that the current system does not provide options for recycling or organics diversion to businesses. The discussion brought attention to the lack of diversion programs focused on the ICI sector.
Attendees also thought not all Yellowknife residents are aware of the diversion options and there is a need for more education on why certain diversion programs have been implemented.
CARDBOARD
Barriers to Cardboard Recycling
• Bulky material; difficult for residents to haul material to Blue Bin Stations
• Businesses don’t want to make program changes
• Staff turnover; lack of awareness from business staff about recycling
• Lack of planning permit requirements
• Lack of space for businesses
• Lack of mandate by the City; level playing field for all sectors and across all businesses
– One attendee noted the opportunity for regulations to make all businesses recycle cardboard. Perhaps even for residents too.
• Lack of curbside recycling
– Many attendees were willing to pay higher fees for curbside collection service
– One attendee spoke out and said “I am not willing to pay a higher fee for curbside collection because I already recycle 99 percent of my stuff. So why should I have to pay for a program for everyone else to use?”
– Some attendees questioned the practicality of curbside recycling – are the extra resources and costs associated with the program worth it?
– One attendee noted there are likely opportunities for cost savings with curbside recycling service when it is combined with Black and Green Cart collection. She thought that using the same hauler to collect all three streams could reduce costs and potentially have the option to strategically bill residents for garbage and not diversion
Attendees did also note there are a few businesses in Yellowknife that are doing a good job recycling cardboard. Many of those being large corporations that ship cardboard back to central locations for recycling. There is also a small business in town, “The Recycling Guy”, that provides recycling pick-up from about 30 homes and takes the material to the Blue Bin Stations.
Transparency by the City and knowledge of where recyclable materials are ending up was also mentioned by the group. One attendee noted there must be flexibility in the program due to the continuous changes in recycling markets. They also asked if there were more opportunities to do some of the recycling locally.
ORGANICS
The big take away for organics was that the group wanted a similar program, to the Green Cart, available to businesses and multi-family complexes.
sonnevera international corp.
C-6
Barriers to Organics Collection and Composting
• Cost of the program and bin
• Food that is packaged can’t be composted
– Although one attendee noted an opportunity for the use of technology to help solve this issue
• Cost of compostable liners/bags
• Flies and bugs
• “Yuck Factor” – one attendee was not sure this can be prevented
• Lack of communication about the program
CONSTRUCTION AND DEMOLITION
The group continuously commented on the opportunities to recycle or reuse construction and demolition material. They thought materials such as asphalt and wood could easily be reused and that there needed to be targets for construction and demolition recycling in Yellowknife. There was also strong support for policies and incentives that would encourage recycling of the material.
REUSE
Some attendees thought the salvage options at the Solid Waste Facility were slowly decreasing and they wanted to see more access for salvaging. The liability issues around salvaging were noted and understood by most of the group. However, the group felt there must be additional ways to promote and encourage reuse in Yellowknife, in a safe manner. The ReStore was provided as a good example of a safe alternative to salvaging on the Solid Waste Facility site.
BIGGEST WASTE MANAGEMENT ISSUE YELLOWKNIFE IS FACING
• Attendees expressed concern over the landfill and how valuable resources are being landfilled instead of utilised
• Discrepancies between diversion targets and programs across the sectors
• Food waste
• Lack of budget and resources to implement the needed diversion programs
• Lack of a clear strategic direction/plan
SUCCESS STORIES IN YELLOWKNIFE
• Food rescue program
• City composting program
• Businesses and government changing their ways
• Citizens embracing the plastic bag fee
• Businesses shipping cardboard back to central locations for recycling
• Beverage container deposit-refund program
• There has been great success with the diversion programs that have been implemented (plastic bags, beverage containers, composting) – it can be done and programs can be very successful!

Strategic Waste Management Plan (SWMP) – Appendix The City of Yellowknife
D-1
Appendix D – Best Practices
Best Practices Table of Contents
Best Practices: Education / Promotion Overall Approaches ..................................................................... D2 Government Leadership ........................................................................................................................ D2 Community Engagement ....................................................................................................................... D9 Community-Based Social Marketing .................................................................................................... D19 Branding .............................................................................................................................................. D36 Social Media ........................................................................................................................................ D45 Public Spaces Recycling ..................................................................................................................... D49 Zero Waste Public Events ................................................................................................................... D57
Best Practices: Residential Waste Reduction / Diversion ....................................................................... D66 Backyard Composting .......................................................................................................................... D66 Depot Recycling Systems (Expanded Drop-off Facilities) ................................................................... D72 User Pay / Volume Limitations ............................................................................................................. D86 Enhanced Multi-family Programming ................................................................................................. D103
Best Practices: Industrial, Commercial and Institutional Waste Reduction ........................................... D122 Waste Diversion Assistance .............................................................................................................. D122 ICI Recognition .................................................................................................................................. D131 Enhanced ICI Food Waste Diversion ................................................................................................. D141 Enhanced ICI Recycling Collection .................................................................................................... D147
Best Practices: Regulatory Options ....................................................................................................... D150 Differential Tipping Fees .................................................................................................................... D150 Disposal Bans .................................................................................................................................... D154 Residential Mandatory Recycling / Source Separation ...................................................................... D158 ICI Mandatory Recycling / Source Separation ................................................................................... D162
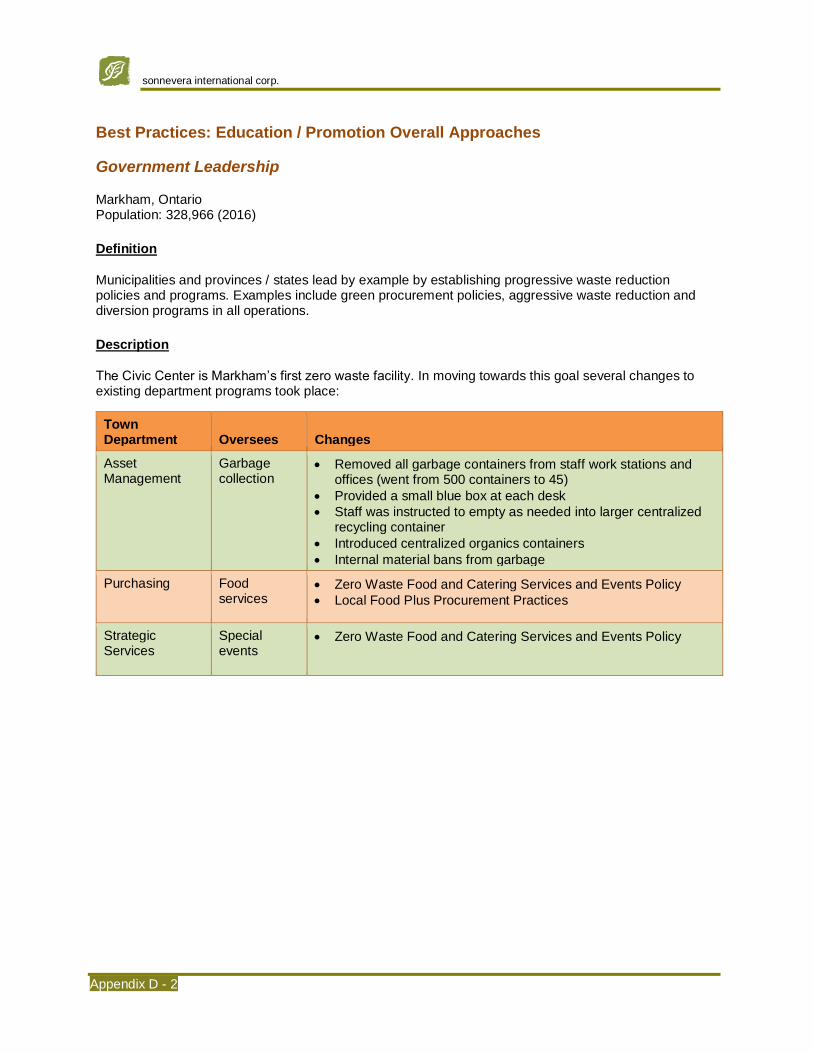
sonnevera international corp.
Appendix D - 2
Best Practices: Education / Promotion Overall Approaches
Government Leadership
Markham, Ontario Population: 328,966 (2016)
Definition
Municipalities and provinces / states lead by example by establishing progressive waste reduction policies and programs. Examples include green procurement policies, aggressive waste reduction and diversion programs in all operations.
Description
The Civic Center is Markham’s first zero waste facility. In moving towards this goal several changes to existing department programs took place:
Town Department Oversees Changes
Asset Management
Garbage collection
• Removed all garbage containers from staff work stations and offices (went from 500 containers to 45)
• Provided a small blue box at each desk
• Staff was instructed to empty as needed into larger centralized recycling container
• Introduced centralized organics containers
• Internal material bans from garbage
Purchasing Food services
• Zero Waste Food and Catering Services and Events Policy
• Local Food Plus Procurement Practices
Strategic Services
Special events
• Zero Waste Food and Catering Services and Events Policy
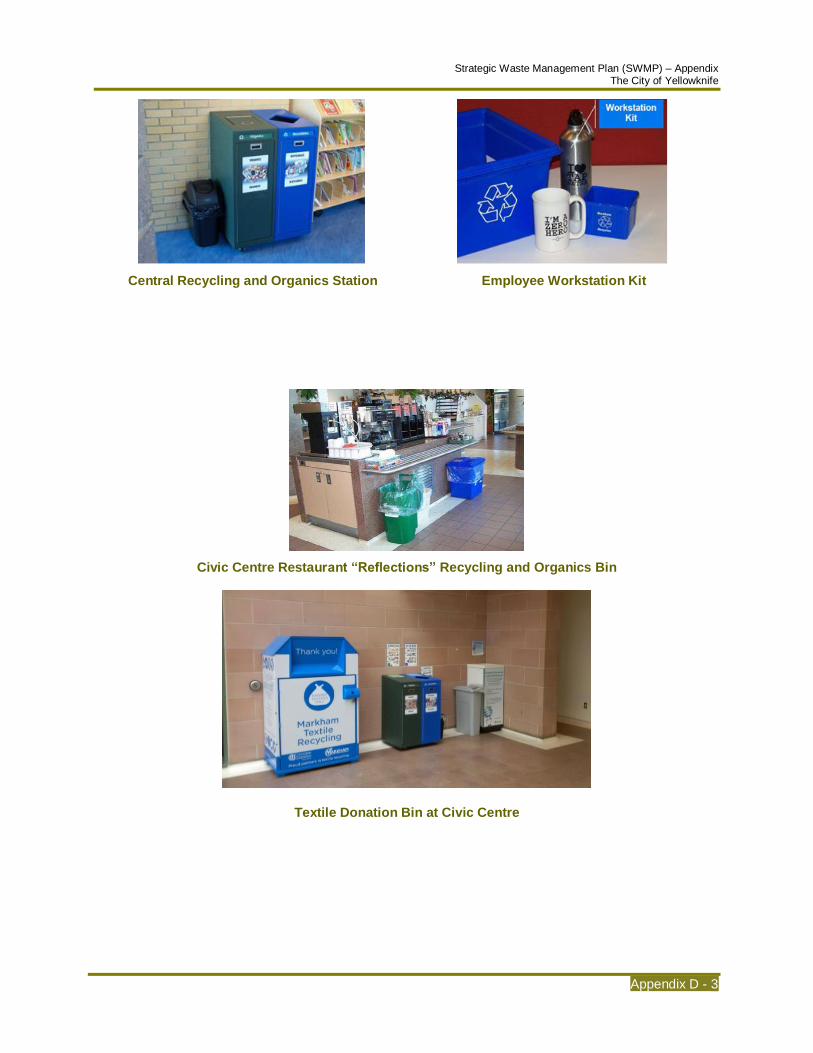
Strategic Waste Management Plan (SWMP) – Appendix The City of Yellowknife
Appendix D - 3
Central Recycling and Organics Station
Employee Workstation Kit
Civic Centre Restaurant “Reflections” Recycling and Organics Bin
Textile Donation Bin at Civic Centre

sonnevera international corp.
Appendix D - 4
Internal Bans
Internal bans from Civic Centre garbage are used for the following materials:
• Batteries
• Blue box recyclables
• Computers
• Construction materials
• Coroplast signs
• Corrugated cardboard
• Garbage from home or other facilities
• Grass
• Ink cartridges
• Leaf and yard material
• Metal items
• Office paper
• Organic material
• Paint cans
• Plastic pails
• Pop cans
• Propane tanks
• Wood
• Wooden skids
Zero Waste Food and Catering Services and Events Policy
Effective July 1, 2008, all food services operations and Town-run events in the Civic Centre have to conform to Markham’s Zero Waste Food and Catering Service Policy.
Example Policy statements include:
• Suppliers shall recycle and/or compost all materials possible.
• Suppliers shall purchase coffee in reusable, recyclable or compostable containers or packaging only.
• Condiments such as tea bags, sugar, milk, cream, mustard, ketchup, jam in single serve non-recyclable packets are prohibited.
• Polystyrene (foam) plastic products for food or beverages is prohibited. Reusable china dinnerware and stainless steel service ware is preferred.
• Paper products such as coffee cups and plates shall contain post-consumer fibre and be recyclable or compostable. Biodegradable paper cups made of corn and 100% recycled unbleached compostable napkins are preferred.
• Zero Waste and recycling instructions shall be visible in the food preparation and service areas. Educational materials approved by the Town will be visible and available.
• Suppliers are encouraged to offer price incentives for the use of reusable mugs or cups.
• Suppliers are encouraged to donate surplus food to local shelters and food banks.
Effective January 1, 2009, all food services operations in Town-owned or leased facilities and Town-run events are required to conform to this Policy.
All food services for Town-sponsored events are prohibited from using polystyrene food serving products, effective January 1, 2009.
Zero Waste Staff Functions With Refreshments Policy
The Town also has specified performance standards, similar to above policy, that must be met for staff functions including meetings, parties and celebrations.
Example Policy statements include:
• Polystyrene (foam) plastic products for food or beverages is prohibited.
• Condiments such as tea bags, sugar, milk, cream, mustard, ketchup, jam in single serve non-recyclable packets are prohibited. Napkin dispensers are preferred over piles of loose napkins.
• Drinking water in pitchers is preferred over serve plastic bottles.
• Using cellophane to wrap prepared food is to be avoided.

Strategic Waste Management Plan (SWMP) – Appendix The City of Yellowknife
Appendix D - 5
Local Food Plus Procurement Practices
In a related program, effective June 2008, Markham was the first municipality in Canada to adopt Local Food Plus (LFP) procurement practices for its municipal food services. This initiative assists supporting Ontario’s farm economy, addresses climate change, reduces greenhouse gases and pesticide use, and promotes environmentally responsible purchasing.
LFP certification requires farmers to adhere to strict guidelines representing significant progress in the transition to sustainable development practices. With the assistance of LFP, Markham will ensure a minimum of 10 percent of its material and produce comes from LFP certified Ontario farmers, with future increases of five percent each year.
Zero Waste Zero Waste Office Supplies Policy
The Town of Markham is developing a policy that covers paper reuse and documents. For instance, any consultant that wishes to submit a proposal to the Town of Markham must do so on 80% – 100% recycled content paper. Additionally, the proposal must not contain any plastic sheets or cerlox binding.
Green Procurement
The Town of Markham has a draft green procurement policy. Presently the Town purchases Fair Trade coffee and recycled content paper products (toilet paper, paper towels and photocopy paper) even though the green procurement policy is not official the spirit of the policy is in place.
Reduction Potential and Quantitative Results
Medium – high reduction potential for City-generated waste. Depends on types of programs/policies implemented.
Since implementing the City Hall (500 employees) recycling and composting programs, waste has decreased from one 14 yard bin being collected twice a week to nine locked 65 gallon toters being collected every six weeks. When the City plastic bag recycling program starts it is anticipated that two 65 gallon toters will be collected every six weeks.
Lessons Learned
• Councilors and senior staff did not like ‘change’, they had a tremendous sense of entitlement of the level of service that they should receive at work. They fought ‘change’ on every level. Ensure that significant education (e.g., cost savings, stewardship) is available prior, during and after ‘change’.
• Start with the area you have most control over.
• Develop relationship with key departments. Action from several Departments may be required to move forward with zero waste (e.g., Asset Management, Purchasing and Strategic Services) and zero waste may not be considered a top priority by each Department.
• Educate public about your achievements.
Communities with Similar Program
Brandon, MB (Pop: 48,859 in 2016) – Effective January 1, 2012 the sale and provision of single-use bottled water has been eliminated at all City owned and operated facilities. Reusable water bottles are available at these facilities for purchase along with water filling stations.
Burlington, VT (Pop: 42,417 in 2010) – The City of Burlington Mayor Bob Kiss declared ‘be straw free’ as a best practice in May 2011. This proclamation is to offer-first as a best practice. Anyone who wants a

sonnevera international corp.
Appendix D - 6
straw can have one, but restaurants are asked to offer straws to patrons rather than placing one in every drink.
Colorado (Pop: 5,029,196 in 2010) – The Governor of the State of Colorado proclaimed July 11, 2013 to be Straw Free Day in the State of Colorado.
London, ON (Pop: 383,822 in 2016) – In 2008 the City of London banned selling bottled water at city-owned sites.
Santa Monica, CA (Pop: 89,736 in 2010) – Polystyrene ban (all polystyrene including expanded polystyrene and clear styrene) adopted January 9, 2007. For all City facilities and operations, city managed concessions, and city sponsored and permitted events the ban was effective February 9, 2007.

Strategic Waste Management Plan (SWMP) – Appendix The City of Yellowknife
Appendix D - 7
For all food service providers it was effective February 9, 2008. Requires that all plastic takeout food packaging be recyclable.
Seattle, WA (Pop: 608,660 in 2010) - The Seattle Sustainable Purchasing Policy acknowledges that City Purchasing and City Departments are to promote and encourage strategies including consumption reduction, due to the societal and community costs, such as landfill waste handling, toxin exposures, resource depletion and greenhouse gas emissions to:
• Reduce City consumption
• Purchase of remanufactured, recycled or reusable products
• Minimize packaging
• Reduce entry toxin chemicals into the City consumption stream
• Purchase products that are durable, long lasting, reusable, recyclable or otherwise decrease waste
• Participate in manufacturer or vendor take-back programs and/or in the King County “Take Back” program
On February 16, 2005 Executive Order 01-05 directed City departments to prevent paper waste through:
• Reducing paper waste by 10 percent in 2005
• Improving recycling rates
• Purchasing 100 per cent recycled paper as the City standard for printing and copying
• Making duplex (two-sided) printing and copying standard procedure for all jobs
• Adopting available technology that creates paper efficiencies
• Applying paper waste prevention measures to procurement, consultant contracts and contracts for printing, copying and related services from outside vendors
• Assigning a Paper Waste Prevention Coordinator at a management level to support implementation of this Executive Order
Spruce Grove, AB (Pop: 34,066 in 2016) – The City of Spruce Grove is committed to sustainable development and supports environmentally positive initiatives. In order to promote environmental leadership and responsibility the City always considers environmentally superior product choices in procurement decisions.
The Spruce Grove Purchasing Policy, adopted May 24, 2005, states that “the goods and services necessary for the provision of municipal services are obtained in an effective, expedient, and environmentally friendly manner and at the best overall value” (City of Spruce Grove, 2005).
Toronto, ON (Pop: 2,731,571 in 2016) – In December 2008, City Council approved a bottled waste ban to take effect in January 2012. This ban affects most of Toronto’s parks and park facilities by prohibiting the sale and distribution of bottled water in all Civic Centres, City facilities and Parks.
Facilities Management operates the City’s Civic Centres and many other City buildings throughout Toronto. With nearly 7,500 staff from 22 divisions, Facility Management created a recycling program called “No Waste”. This program requires staff to empty their own desk-side garbage and recycling bins into colour-coded bins. A green bin organics program is also available in all corporate buildings. In 2016, the City of Toronto’s “No Waste” program helped the City’s major corporate buildings divert 1,303 metric tonnes of recyclables and organics. This resulted in an overall waste diversion rate for the City of Toronto’s larger corporate office buildings of 90%.
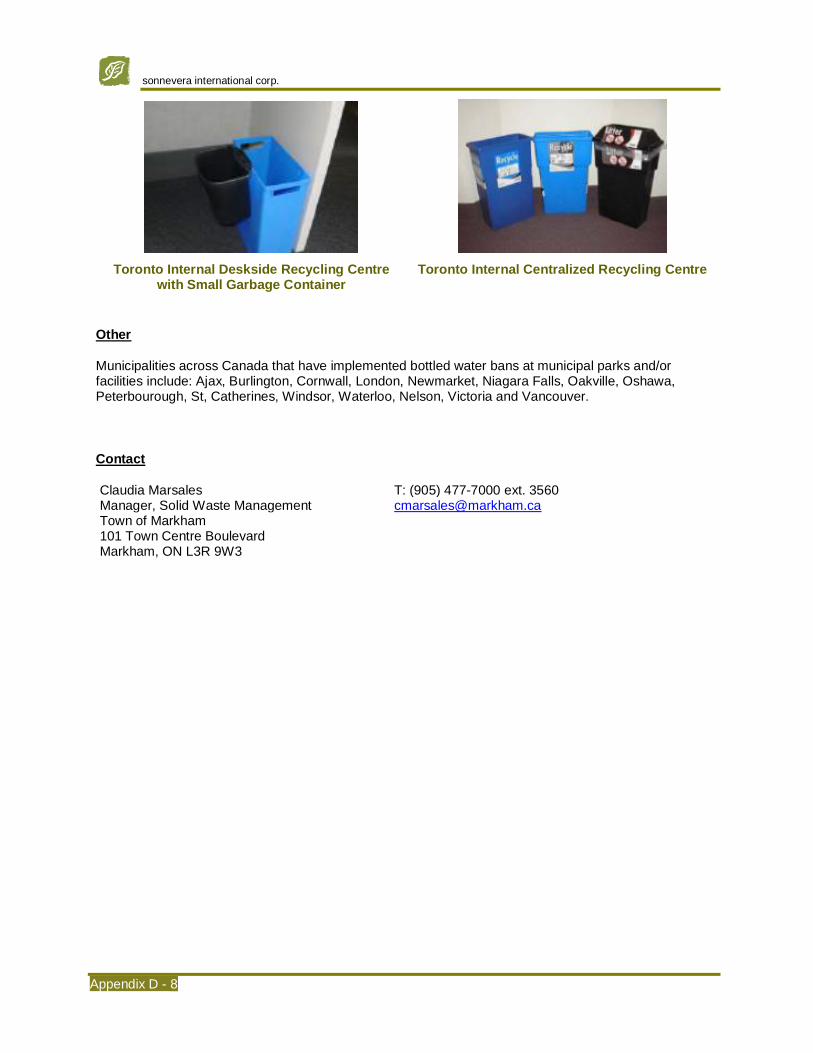
sonnevera international corp.
Appendix D - 8
Toronto Internal Deskside Recycling Centre with Small Garbage Container
Toronto Internal Centralized Recycling Centre
Other
Municipalities across Canada that have implemented bottled water bans at municipal parks and/or facilities include: Ajax, Burlington, Cornwall, London, Newmarket, Niagara Falls, Oakville, Oshawa, Peterbourough, St, Catherines, Windsor, Waterloo, Nelson, Victoria and Vancouver.
Contact
Claudia Marsales Manager, Solid Waste Management Town of Markham 101 Town Centre Boulevard Markham, ON L3R 9W3
T: (905) 477-7000 ext. 3560 [email protected]

Strategic Waste Management Plan (SWMP) – Appendix The City of Yellowknife
Appendix D - 9
Community Engagement
Herefordshire and Worcestershire Councils, United Kingdom Population: 180,100 (Herefordshire in 2015); 578,600 (Worcestershire in 2015)
Definition
A process in which relationships are built for the purpose of applying a collective vision for community benefits. This can be achieved at the government or grassroots level.
Community engagement can be used in conjunction with specific community-based social marketing campaigns to build overall community awareness, support and participation in diversion initiatives.
Description
The goals of the Love Food Hate Waste campaign were to raise awareness of the need to reduce food waste, reduce the level of food waste being sent to landfill and help residents to save money. The specific objectives of the Love Food Hate Waste campaign were to increase the percentage of people committed to reducing food waste by 10% over a six-month period from October 2008 to April 2009; and as a result divert more than 2,000 tonnes of food waste from landfill. The campaign was a mix of advertising, community engagement, and public relations. Key elements included: pre- and post- campaign surveys; 30 “roadshows” (meeting local groups and having booth at local events and in public places); trial door-to-door engagement with eight “food champions” visiting 22,000 households; billboards; bus, press and radio ads; press liaison and editorials; 20,000 leaflets, plus posters.
Love Food Hate Waste Roadshow Booth Love Food Hate Waste Roadshow Booth Campaign Workers
A Waste and Resources Action Programme case study of the Love Food Hate Waste campaign is available online.
Reduction Potential and Quantitative Results
Low to moderate.

sonnevera international corp.
Appendix D - 10
Percent of “Committed Food Waste Reducers” increased from 13% to 23% in five months, achieving the first campaign goal. As a result, it was estimated that the campaign reduced food waste generation by 2,340 tonnes by April 2009, achieving the second campaign goal.
Campaign costs were 30% lower than the cost of disposal, estimated on a per tonne basis.
Lessons Learned
• Direct one-on-one engagement to assist people with decreasing food waste is a positive and effective method for local level communication while door to door engagement is considered to be less efficient for directly engaging citizens regarding food waste habits due to complex issues associated with food culture and behavior.
• For future roll out of the Love Food Hate Waste campaign, the plan will collaborate with local groups with similar goals as well as expanding the Master Composter leadership and outreach program.
Communities with Similar Programs
Albany, Astoria, Bend, Coos Bay, Medford and Pendleton, OR – Non-profit agency Energy Trust of Oregon operates a refrigerator incentive and take-back program aimed at encouraging residents to switch to more energy efficient models. The program had successful results in the capital city of Portland but was less effective in outlying regions due to lack of awareness and skepticism. Between 2009 and 2011, Energy Trust initiated a community engagement program to increase participation in six communities, with a particular focus on direct outreach and community-specific media campaigning. A “Fridge Recycling Challenge” was launched in each community with the objective of identifying the “oldest” fridge still in use; the winner would receive a new energy efficient model. Print, radio and web advertising was used, as well as social media; media outreach resulted in extensive coverage. The result was a “triple digit” increase in the number of refrigerators picked up in each city, compared to prior years.
In 2012, the Energy Trust of Oregon provides a free pickup and gives residents $40 as an incentive to recycle fridges or freezers.
Burnaby, BC (Pop: 232,755 in 2016) – In order to ensure that all Burnaby residents are engaged with multi-family recycling, the City produced Recycling Guides in six languages: English, Arabic, Chinese, Italian, Korean and Punjabi.
Burnaby Multi-Family Recycling Brochure in Chinese
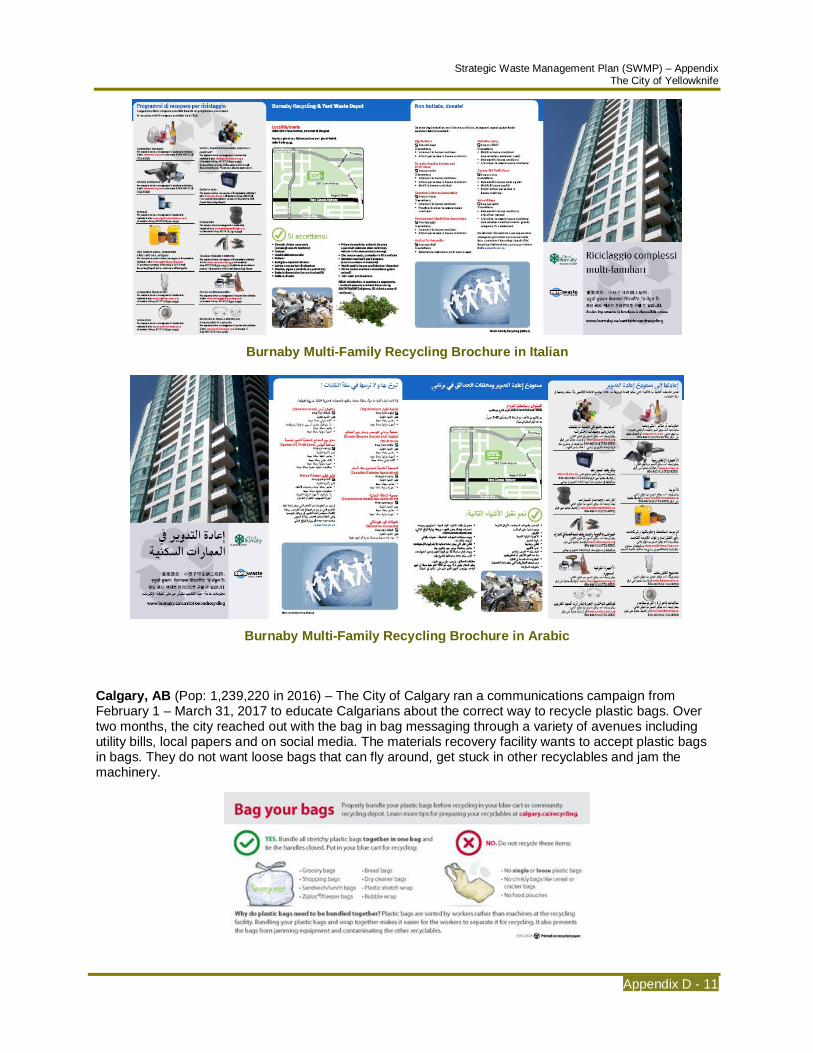
Strategic Waste Management Plan (SWMP) – Appendix The City of Yellowknife
Appendix D - 11
Burnaby Multi-Family Recycling Brochure in Italian
Burnaby Multi-Family Recycling Brochure in Arabic
Calgary, AB (Pop: 1,239,220 in 2016) – The City of Calgary ran a communications campaign from February 1 – March 31, 2017 to educate Calgarians about the correct way to recycle plastic bags. Over two months, the city reached out with the bag in bag messaging through a variety of avenues including utility bills, local papers and on social media. The materials recovery facility wants to accept plastic bags in bags. They do not want loose bags that can fly around, get stuck in other recyclables and jam the machinery.
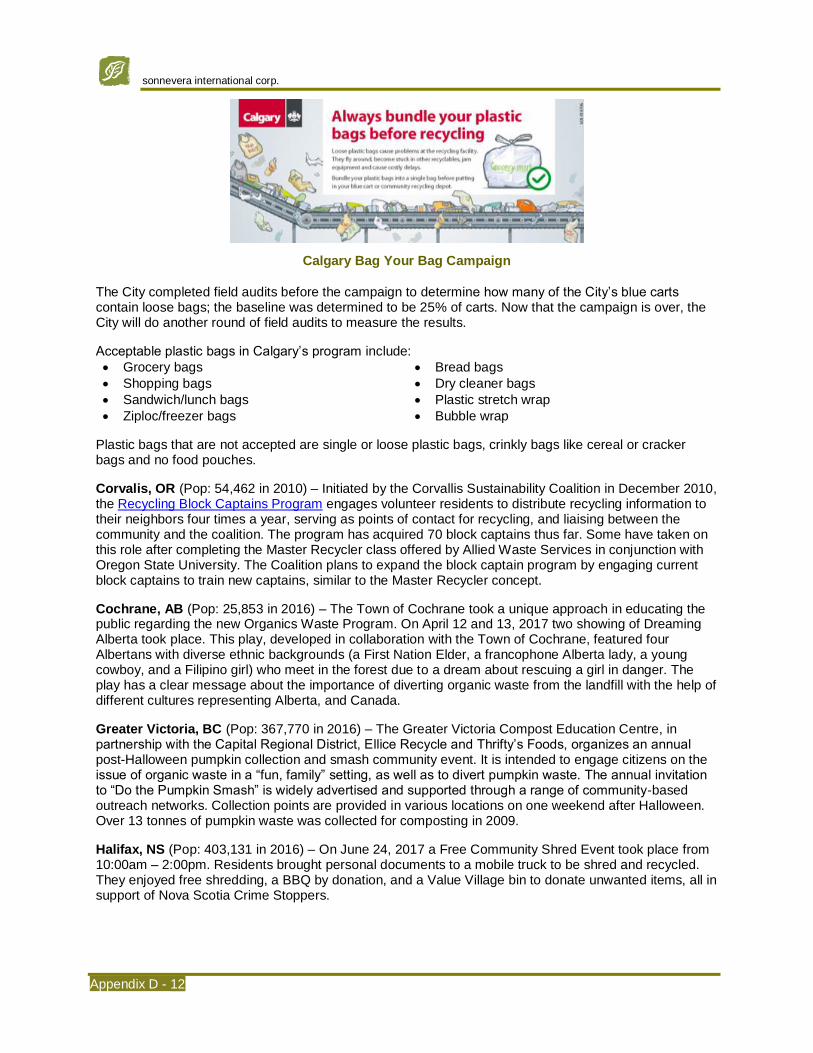
sonnevera international corp.
Appendix D - 12
Calgary Bag Your Bag Campaign
The City completed field audits before the campaign to determine how many of the City’s blue carts contain loose bags; the baseline was determined to be 25% of carts. Now that the campaign is over, the City will do another round of field audits to measure the results.
Acceptable plastic bags in Calgary’s program include:
• Grocery bags
• Shopping bags
• Sandwich/lunch bags
• Ziploc/freezer bags
• Bread bags
• Dry cleaner bags
• Plastic stretch wrap
• Bubble wrap
Plastic bags that are not accepted are single or loose plastic bags, crinkly bags like cereal or cracker bags and no food pouches.
Corvalis, OR (Pop: 54,462 in 2010) – Initiated by the Corvallis Sustainability Coalition in December 2010, the Recycling Block Captains Program engages volunteer residents to distribute recycling information to their neighbors four times a year, serving as points of contact for recycling, and liaising between the community and the coalition. The program has acquired 70 block captains thus far. Some have taken on this role after completing the Master Recycler class offered by Allied Waste Services in conjunction with Oregon State University. The Coalition plans to expand the block captain program by engaging current block captains to train new captains, similar to the Master Recycler concept.
Cochrane, AB (Pop: 25,853 in 2016) – The Town of Cochrane took a unique approach in educating the public regarding the new Organics Waste Program. On April 12 and 13, 2017 two showing of Dreaming Alberta took place. This play, developed in collaboration with the Town of Cochrane, featured four Albertans with diverse ethnic backgrounds (a First Nation Elder, a francophone Alberta lady, a young cowboy, and a Filipino girl) who meet in the forest due to a dream about rescuing a girl in danger. The play has a clear message about the importance of diverting organic waste from the landfill with the help of different cultures representing Alberta, and Canada.
Greater Victoria, BC (Pop: 367,770 in 2016) – The Greater Victoria Compost Education Centre, in partnership with the Capital Regional District, Ellice Recycle and Thrifty’s Foods, organizes an annual post-Halloween pumpkin collection and smash community event. It is intended to engage citizens on the issue of organic waste in a “fun, family” setting, as well as to divert pumpkin waste. The annual invitation to “Do the Pumpkin Smash” is widely advertised and supported through a range of community-based outreach networks. Collection points are provided in various locations on one weekend after Halloween. Over 13 tonnes of pumpkin waste was collected for composting in 2009.
Halifax, NS (Pop: 403,131 in 2016) – On June 24, 2017 a Free Community Shred Event took place from 10:00am – 2:00pm. Residents brought personal documents to a mobile truck to be shred and recycled. They enjoyed free shredding, a BBQ by donation, and a Value Village bin to donate unwanted items, all in support of Nova Scotia Crime Stoppers.

Strategic Waste Management Plan (SWMP) – Appendix The City of Yellowknife
Appendix D - 13
London Borough of Waltham Forest, UK (Pop: 271,200 in 2015) – The objective of this 2007 outreach initiative was to engage black, Asian and minority ethnic communities in the borough of Waltham Forest in order to increase their involvement and participation in recycling. The primary approach was to meet with approximately 40 community and faith-based organizations in the area in order to start a conversation about recycling. It was found that these groups rely on informal networking, conversations and peer support for their public service information rather than on formal communications channels such as print materials and electronic media. Therefore, the Borough should prioritize informal networks, face-to-face discussions and person-to-person linkages for the purposes of ongoing engagement with these communities.
Mecklenburg County, NC (Pop: 918,628 in 2010) – The County is committed to providing faith-based organizations with the opportunity to Wipe Out Waste. Faith-based campaigns build awareness about the importance of recycling and provide educational materials to encourage members to make a positive difference in maintaining a sustainable environment with positive messaging and learning the do’s and don’ts of recycling. There are two campaigns to select from, “Recycling is Heavenly” or “Heaven Holds a Special Place For Those Who Recycle”. Posters, fliers and program inserts are available and can be customized with organization logos.
Mecklenburg County Faith-Based Campaign
Metro Vancouver, BC (Pop: 2,463,431 in 2016) – To assist with public education regarding the January 1, 2015, Metro Vancouver developed a two minute video, Organics Waste Explainer, to introduce the food waste recycling rules. This video is available in English, French, Japanese, Mandarin, Punjabi, Tagalog and Korean. An Organics Disposal Ban Backgrounder brochure was also developed in the above seven languages.
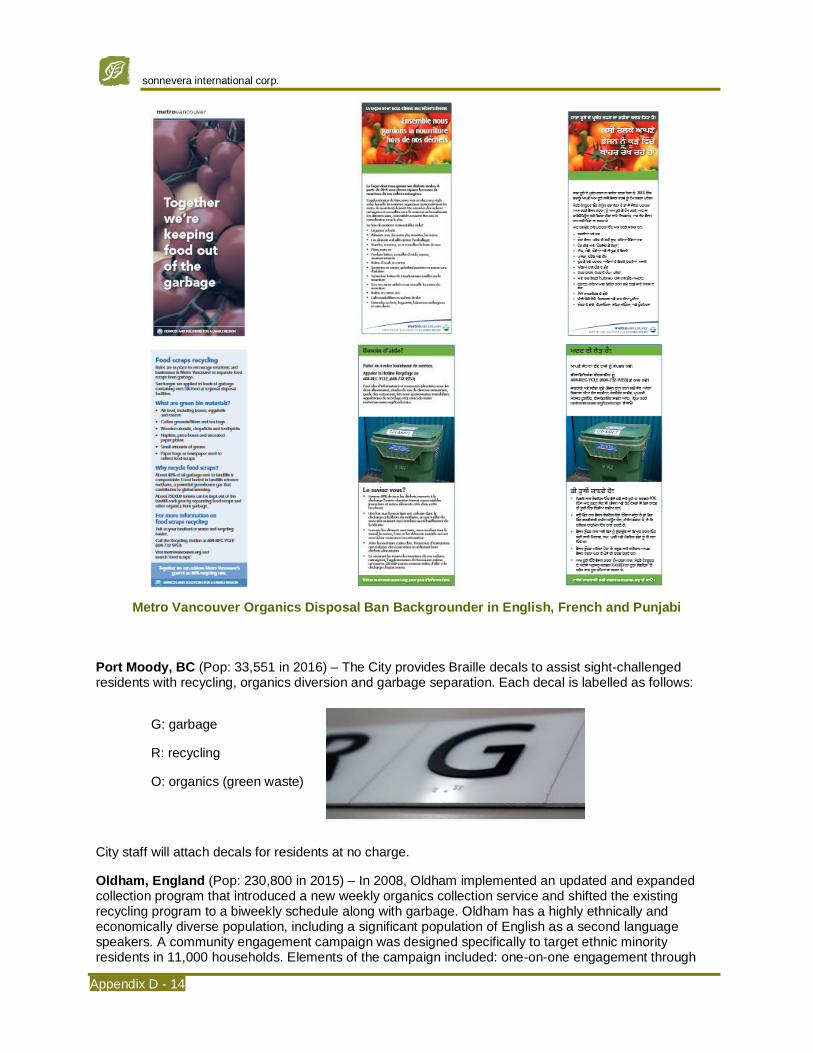
sonnevera international corp.
Appendix D - 14
Metro Vancouver Organics Disposal Ban Backgrounder in English, French and Punjabi
Port Moody, BC (Pop: 33,551 in 2016) – The City provides Braille decals to assist sight-challenged residents with recycling, organics diversion and garbage separation. Each decal is labelled as follows:
G: garbage
R: recycling
O: organics (green waste)
City staff will attach decals for residents at no charge.
Oldham, England (Pop: 230,800 in 2015) – In 2008, Oldham implemented an updated and expanded collection program that introduced a new weekly organics collection service and shifted the existing recycling program to a biweekly schedule along with garbage. Oldham has a highly ethnically and economically diverse population, including a significant population of English as a second language speakers. A community engagement campaign was designed specifically to target ethnic minority residents in 11,000 households. Elements of the campaign included: one-on-one engagement through

Strategic Waste Management Plan (SWMP) – Appendix The City of Yellowknife
Appendix D - 15
walkabouts in housing estates and meetings with community groups; engagement with community leaders and inter-faith groups; employment of community language speakers to lead outreach events; production of multi-language print and branding materials, as well as use of graphics and photos to explain the program. Use of community language speakers, and engagement with community leaders in order to build trust were found to be keys to success. The results showed that participation in the new paper recycling and comingled recycling collection rose by 43% compared to the pre-campaign ‘old’ program. Participation in the new organics collection exceeded the local target.
A Waste and Resources Action Programme case study of the Oldham campaign is available online.
Seattle, WA (Pop: 608,660 in 2010) – To ensure that all Seattle residents are engaged with recycling, food and yard waste, and garbage collection, the City offers the following online videos in Mandarin, Cantonese, Spanish and Vietnamese to assist residents:
• Recycling in apartments and condominiums
• What goes in my food and yard waste cart?
• What happens to my food and yard waste recycling?
• Beyond the curb
• Where your garbage goes and preventing waste
In addition to these videos, the Where Does It Go? flyer is available in multiple languages:
• English
• Amharic
• Cambodian
• Chinese
• Japanese
• Korean
• Laotian
• Oromo
• Russian
• Somali
• Spanish
• Tagalog
• Thai
• Tigrinya
• Vietnamese
Seattle Where Does It Go? – English Flyer
Seattle Where Does It Go? – Japanese Flyer

sonnevera international corp.
Appendix D - 16
Seattle Where Does It Go? – Russian Flyer
Seattle Where Does It Go? – Spanish Flyer
As part of the commercial food waste diversion program, Seattle Public Works through Green Your Business, provides restaurant kitchen collection posters in numerous languages.

Strategic Waste Management Plan (SWMP) – Appendix The City of Yellowknife
Appendix D - 17
Seattle Public Utilities Restaurant Kitchen Language Posters Collection

sonnevera international corp.
Appendix D - 18
Spruce Grove, AB (Pop: 34,066 in 2016) – Shred-4-Free Day takes place in June each year. On June 17, 2017 between 9:00 am and 1:00 pm, a secure Shred-it truck will be located at the Agrena. Participants can stop by with up to four boxes of materials, each weighing 30 lbs or less, and have it shredded on the spot. Shred-4-Free Day accepts personal paper documents, notebooks, cheques and ledgers (no hard covers).
Contact
Laura Blackwell Recycling Officer Herefordshire Council Brockington 35 Hafod Road Hereford Herefordshire, HR1 1SH England
T: 011 44 1432 260 520 [email protected]
Viktoria Salisbury Senior Waste Prevention Officer Worcestershire County Council County Hall Spetchley Road Worcester, WR5 2NP England
T: 011 44 1905 768 260 [email protected] www.worcestershire.gov.uk
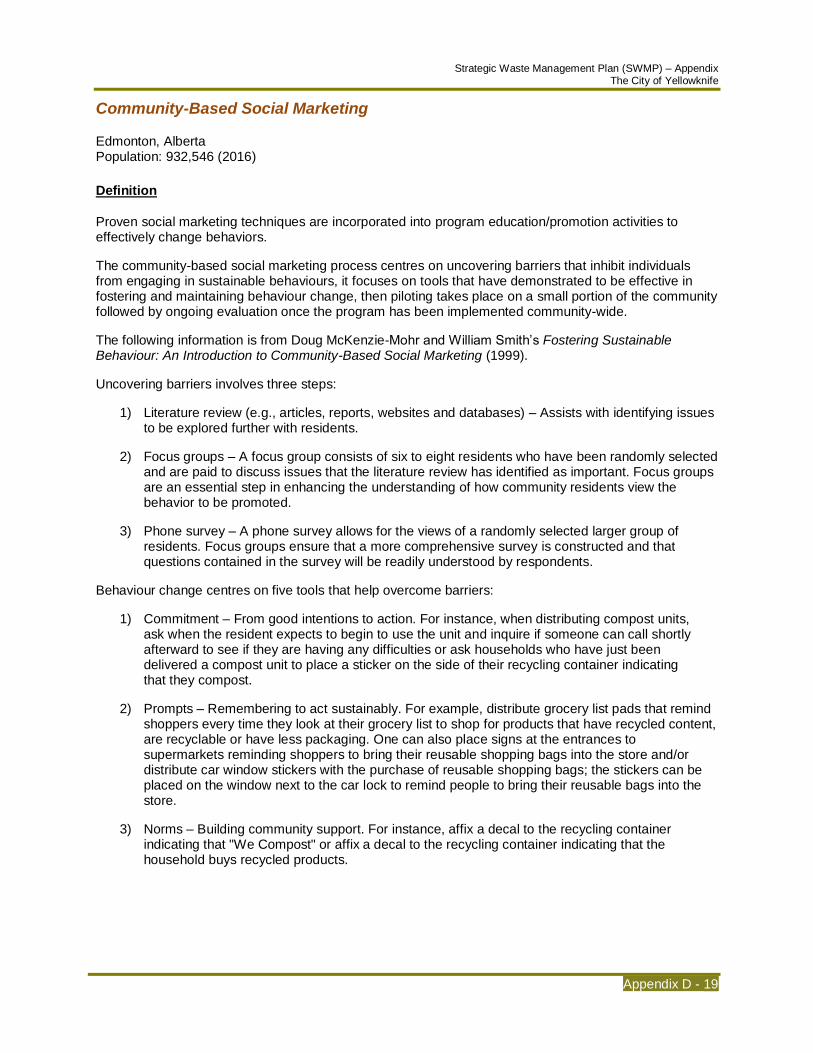
Strategic Waste Management Plan (SWMP) – Appendix The City of Yellowknife
Appendix D - 19
Community-Based Social Marketing
Edmonton, Alberta Population: 932,546 (2016)
Definition
Proven social marketing techniques are incorporated into program education/promotion activities to effectively change behaviors.
The community-based social marketing process centres on uncovering barriers that inhibit individuals from engaging in sustainable behaviours, it focuses on tools that have demonstrated to be effective in fostering and maintaining behaviour change, then piloting takes place on a small portion of the community followed by ongoing evaluation once the program has been implemented community-wide.
The following information is from Doug McKenzie-Mohr and William Smith’s Fostering Sustainable Behaviour: An Introduction to Community-Based Social Marketing (1999).
Uncovering barriers involves three steps:
1) Literature review (e.g., articles, reports, websites and databases) – Assists with identifying issues to be explored further with residents.
2) Focus groups – A focus group consists of six to eight residents who have been randomly selected and are paid to discuss issues that the literature review has identified as important. Focus groups are an essential step in enhancing the understanding of how community residents view the behavior to be promoted.
3) Phone survey – A phone survey allows for the views of a randomly selected larger group of residents. Focus groups ensure that a more comprehensive survey is constructed and that questions contained in the survey will be readily understood by respondents.
Behaviour change centres on five tools that help overcome barriers:
1) Commitment – From good intentions to action. For instance, when distributing compost units, ask when the resident expects to begin to use the unit and inquire if someone can call shortly afterward to see if they are having any difficulties or ask households who have just been delivered a compost unit to place a sticker on the side of their recycling container indicating that they compost.
2) Prompts – Remembering to act sustainably. For example, distribute grocery list pads that remind shoppers every time they look at their grocery list to shop for products that have recycled content, are recyclable or have less packaging. One can also place signs at the entrances to supermarkets reminding shoppers to bring their reusable shopping bags into the store and/or distribute car window stickers with the purchase of reusable shopping bags; the stickers can be placed on the window next to the car lock to remind people to bring their reusable bags into the store.
3) Norms – Building community support. For instance, affix a decal to the recycling container indicating that "We Compost" or affix a decal to the recycling container indicating that the household buys recycled products.

sonnevera international corp.
Appendix D - 20
4) Communication – Creating effective messages. Several techniques can be used and are not limited to the following:
– Ensure that the message is vivid, personal and concrete
– Have the message delivered by an individual or organization who is credible with the audience
– Make communications easy for residents to remember what to do and how and when to do it
– When possible, use personal contact to deliver the message
– Provide feedback to both the individual and community levels about the impact of sustainable behaviours
5) Incentives – Enhancing motivation to act. For instance, invoke user fees to increase motivation to recycle, compost and source reduction or attach a sizable deposit on household hazardous waste to provide the motivation necessary for individuals to take leftover products to a depot for proper disposal.
The above tools are powerful but they can be ineffective if significant external barriers exist. If the behavior is inconvenient, unpleasant, costly or time-consuming, no matter how well internal barriers are addressed the community-based social marketing strategy will be unsuccessful. Removing or minimizing external barriers is imperative. Examples include:
• It is too inconvenient to obtain a compost unit.
Solution: Deliver compost units door-to-door. When compost units are delivered for free, as they were in a pilot project in the City of Waterloo, Ontario participation rates can rival those for recycling programs. In that pilot project, a door hanger was distributed to 300 homes informing residents that they had been selected to receive a free composting unit. Of the 300 homes that were contacted, 253 (or 84%) agreed to accept compost units. In a follow-up survey, 77% of these households were found to be using their compost units.
• It is difficult to identify products that are recyclable or have recycled content.
Solution: Provide prompts that make their identification easier.
• The inconvenience of taking household hazardous waste to a depot results in little of this waste being diverted from the landfill.
Solution: Provide semi-annual hazardous waste home collection dates. Pass a municipal bylaw which mandates that hazardous materials must carry a sticker indicating that the product is a hazardous waste and when the collection dates are in that area.
Once barriers are identified and prioritized, and behaviour change tools are selected that match the barriers, the next stage is program design. At this time, a pilot project can be established. When the pilot is effectively changing behaviour, a community-wide program can be implemented.
Evaluation of the community-wide implementation can focus on baseline information in the activity prior to implementation and at several points afterwards.
Additional community-based social marketing information, including articles, reports, case studies and a list serve is located online.
Description
The City of Edmonton has a highly integrated waste management system with social marketing and community relations being key components.
Extensive blue box to blue bag and grasscycling social marketing campaigns were conducted in 1999 and 2005-2006 respectively.

Strategic Waste Management Plan (SWMP) – Appendix The City of Yellowknife
Appendix D - 21
The City decided to use social marketing tools as an alternative to information campaigns in order to change residential behaviour. Barriers to grasscycling and switching from the blue box to blue bag system were identified followed by the development of a strategy using behaviour change tools, a pilot took place including evaluation and then community-wide implementation.
Behaviour change strategies utilized include:
Blue Box to Blue Bag Grasscycling
• Direct mail with sample bags
• Bags for boxes exchange
• Open house
• Volunteers
• Advertising (print and tv)
• Two pilots:
• Direct mail and home visits
• Direct mail and demonstration yard
• Product tags
• Promotions (draw)
• Television and transit advertising
• Media interviews
Reduction Potential and Quantitative Results
Low to high reduction potential. Impacts each individual program.
A 2006 telephone survey and visual observations indicate that the City blue bag recycling program has an 88% voluntary participation rate. The same survey shows that grasscycling has increased to 39% participation compared to 26% from before grasscycling social marketing took place. Additionally, the grasscycling web page hits increased from 546 in 2005 to 5,771 in 2006.
Lessons Learned
Tips for applying social marketing tools to waste diversion programs from the City of Edmonton are:
• Every waste activity requires a unique social marketing program
• Research is essential
• Do not rely on a single communication vehicle
• Repeat, repeat, repeat
• Measure behaviour
Communities/Events with Similar Program
Chicago, IL (Pop: 2,695,598 in 2010) – The City of Chicago Department of Streets and Sanitation piloted an Oops hanging tag in Summer 2017. This new, friendly communication is part of the ongoing efforts to increase the number of people participating, correctly, in the City’s blue cart recycling program. The Oops tag pilot ran for three months and is complemented by educational postcards sent to each blue cart household.

sonnevera international corp.
Appendix D - 22
Chicago Oops Tag
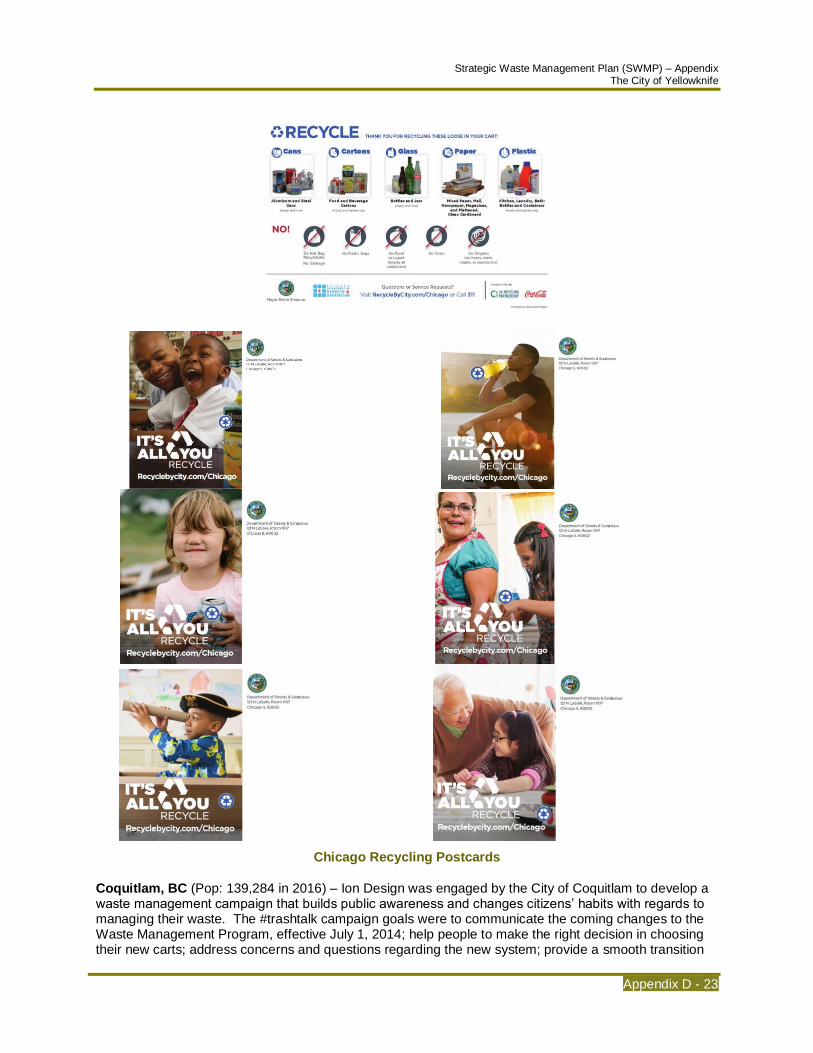
Strategic Waste Management Plan (SWMP) – Appendix The City of Yellowknife
Appendix D - 23
Chicago Recycling Postcards
Coquitlam, BC (Pop: 139,284 in 2016) – Ion Design was engaged by the City of Coquitlam to develop a waste management campaign that builds public awareness and changes citizens’ habits with regards to managing their waste. The #trashtalk campaign goals were to communicate the coming changes to the Waste Management Program, effective July 1, 2014; help people to make the right decision in choosing their new carts; address concerns and questions regarding the new system; provide a smooth transition
sonnevera international corp.
Appendix D - 24
by helping people to understand how to effectively use the new system, specifically the Green Cart; communicate positive changes for the environment and economically for the community; educate the community and help people to examine their own waste habits; and to engage residents to participate in City social media and apps.
The advertising concept was applied to print ads, outdoor, website and social media as well as produced as a public service announcement in conjunction with Shaw and Global TV.

Strategic Waste Management Plan (SWMP) – Appendix The City of Yellowknife
Appendix D - 25
Coquitlam #trashtalk Advertisements
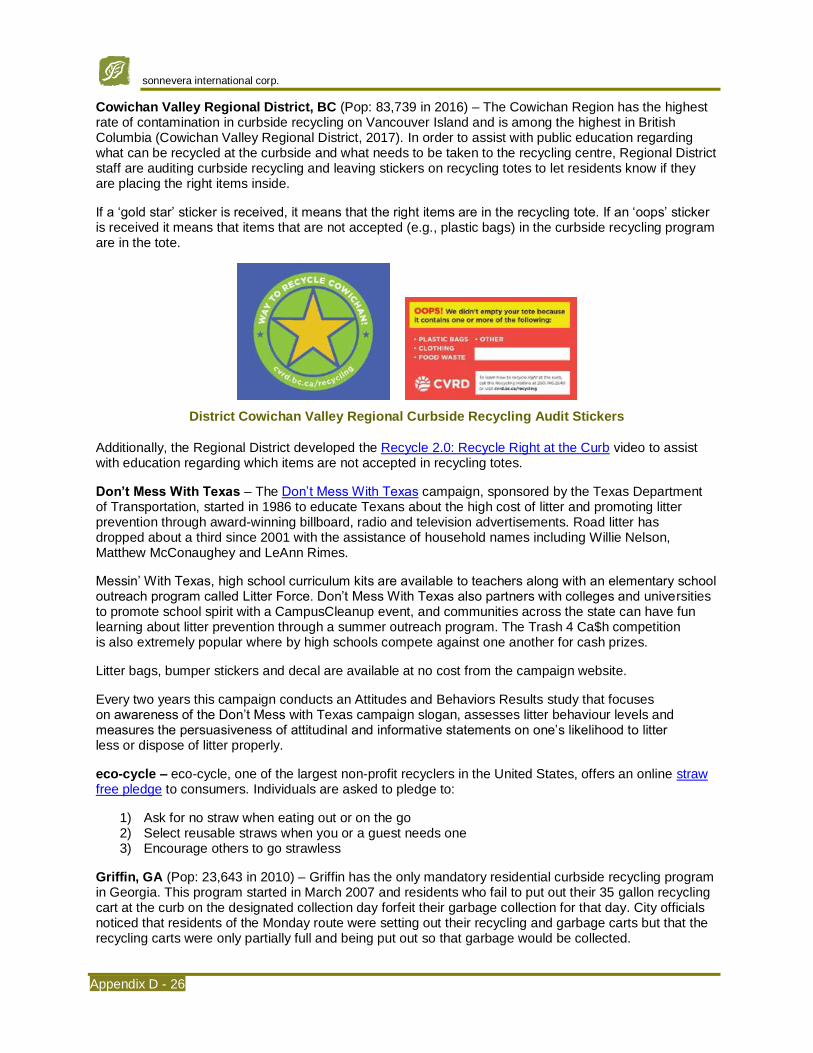
sonnevera international corp.
Appendix D - 26
Cowichan Valley Regional District, BC (Pop: 83,739 in 2016) – The Cowichan Region has the highest rate of contamination in curbside recycling on Vancouver Island and is among the highest in British Columbia (Cowichan Valley Regional District, 2017). In order to assist with public education regarding what can be recycled at the curbside and what needs to be taken to the recycling centre, Regional District staff are auditing curbside recycling and leaving stickers on recycling totes to let residents know if they are placing the right items inside.
If a ‘gold star’ sticker is received, it means that the right items are in the recycling tote. If an ‘oops’ sticker is received it means that items that are not accepted (e.g., plastic bags) in the curbside recycling program are in the tote.
District Cowichan Valley Regional Curbside Recycling Audit Stickers
Additionally, the Regional District developed the Recycle 2.0: Recycle Right at the Curb video to assist with education regarding which items are not accepted in recycling totes.
Don’t Mess With Texas – The Don’t Mess With Texas campaign, sponsored by the Texas Department of Transportation, started in 1986 to educate Texans about the high cost of litter and promoting litter prevention through award-winning billboard, radio and television advertisements. Road litter has dropped about a third since 2001 with the assistance of household names including Willie Nelson, Matthew McConaughey and LeAnn Rimes.
Messin’ With Texas, high school curriculum kits are available to teachers along with an elementary school outreach program called Litter Force. Don’t Mess With Texas also partners with colleges and universities to promote school spirit with a CampusCleanup event, and communities across the state can have fun learning about litter prevention through a summer outreach program. The Trash 4 Ca$h competition is also extremely popular where by high schools compete against one another for cash prizes.
Litter bags, bumper stickers and decal are available at no cost from the campaign website.
Every two years this campaign conducts an Attitudes and Behaviors Results study that focuses on awareness of the Don’t Mess with Texas campaign slogan, assesses litter behaviour levels and measures the persuasiveness of attitudinal and informative statements on one’s likelihood to litter less or dispose of litter properly.
eco-cycle – eco-cycle, one of the largest non-profit recyclers in the United States, offers an online straw free pledge to consumers. Individuals are asked to pledge to:
1) Ask for no straw when eating out or on the go 2) Select reusable straws when you or a guest needs one 3) Encourage others to go strawless
Griffin, GA (Pop: 23,643 in 2010) – Griffin has the only mandatory residential curbside recycling program in Georgia. This program started in March 2007 and residents who fail to put out their 35 gallon recycling cart at the curb on the designated collection day forfeit their garbage collection for that day. City officials noticed that residents of the Monday route were setting out their recycling and garbage carts but that the recycling carts were only partially full and being put out so that garbage would be collected.

Strategic Waste Management Plan (SWMP) – Appendix The City of Yellowknife
Appendix D - 27
After a three month residential grassroots education campaign that attempted to break down the barriers keeping residents from filling their carts weekly the City of Griffin reported a collection volume increase of 22% when compared to the same period in 2007. The effort began in October 2008 when officials launched a campaign designed to reach city residents through strategic advertising, participation at local events, a partnership with Keep Spalding-Griffin Beautiful and media relations with the help of the Curbside Value Partnership (a national invitation-only program of Keep America Beautiful).
Every Sunday from October to December a ¼ page ad was placed in the local newspaper. Additionally, the Monday route received three flyers, a different one the first week of each month from October-December, with their recycling cart that focused on removing the perception that recycling is something difficult.
An interesting fact about the City of Griffin is that it went from no city run recycling programs to mandatory recycling in 2007 for residents and the commercial sector (cardboard only).
For more information contact Phil Francis, City of Griffin Director of Central Services at (770) 229-6421.
Hamilton, ON (Pop: 536,917 in 2016) – In order to assist residents with following the correct set out procedures the City attaches bright education stickers to containers that require assistance.
Hamilton Container Education Stickers
Hamilton County, OH (Pop: 802,374 in 2010) – In 2010 the Hamilton County Recycling and Solid Waste District provided the Village of Woodlawn (Pop: 3,294) and the Village of Lockland (Pop: 3,449) with Recycling Outreach Plans by promoting behavioral change through social marketing. Both communities selected behaviors and identified barriers including:
Selected Behaviors and Identified Barriers
Village of Lockland Village of Woodlawn
• Deciding that recycling is a worthwhile activity
• Figuring out where the drop-off is located
• Designating a container for recycling
• Putting materials into the recycling container instead of the trash
• Driving or walking the recyclables to the drop-off
• Deciding that recycling is a worthwhile activity
• Figuring out how to get a recycling bin
• Driving to the municipal building to pick up a recycling bin
• Putting materials in the recycling bin instead of the trash
• Bringing the recycling bin to the curb with the trash every week
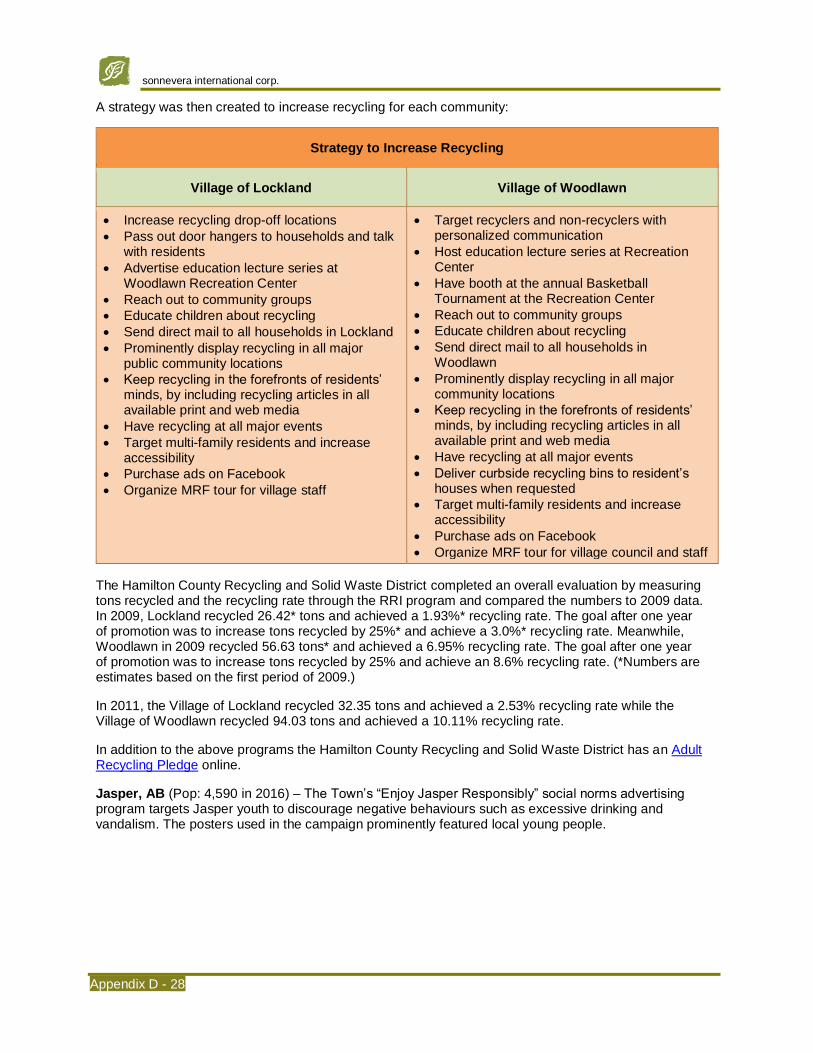
sonnevera international corp.
Appendix D - 28
A strategy was then created to increase recycling for each community:
Strategy to Increase Recycling
Village of Lockland Village of Woodlawn
• Increase recycling drop-off locations
• Pass out door hangers to households and talk with residents
• Advertise education lecture series at Woodlawn Recreation Center
• Reach out to community groups
• Educate children about recycling
• Send direct mail to all households in Lockland
• Prominently display recycling in all major public community locations
• Keep recycling in the forefronts of residents’ minds, by including recycling articles in all available print and web media
• Have recycling at all major events
• Target multi-family residents and increase accessibility
• Purchase ads on Facebook
• Organize MRF tour for village staff
• Target recyclers and non-recyclers with personalized communication
• Host education lecture series at Recreation Center
• Have booth at the annual Basketball Tournament at the Recreation Center
• Reach out to community groups
• Educate children about recycling
• Send direct mail to all households in Woodlawn
• Prominently display recycling in all major community locations
• Keep recycling in the forefronts of residents’ minds, by including recycling articles in all available print and web media
• Have recycling at all major events
• Deliver curbside recycling bins to resident’s houses when requested
• Target multi-family residents and increase accessibility
• Purchase ads on Facebook
• Organize MRF tour for village council and staff
The Hamilton County Recycling and Solid Waste District completed an overall evaluation by measuring tons recycled and the recycling rate through the RRI program and compared the numbers to 2009 data. In 2009, Lockland recycled 26.42* tons and achieved a 1.93%* recycling rate. The goal after one year of promotion was to increase tons recycled by 25%* and achieve a 3.0%* recycling rate. Meanwhile, Woodlawn in 2009 recycled 56.63 tons* and achieved a 6.95% recycling rate. The goal after one year of promotion was to increase tons recycled by 25% and achieve an 8.6% recycling rate. (*Numbers are estimates based on the first period of 2009.)
In 2011, the Village of Lockland recycled 32.35 tons and achieved a 2.53% recycling rate while the Village of Woodlawn recycled 94.03 tons and achieved a 10.11% recycling rate.
In addition to the above programs the Hamilton County Recycling and Solid Waste District has an Adult Recycling Pledge online.
Jasper, AB (Pop: 4,590 in 2016) – The Town’s “Enjoy Jasper Responsibly” social norms advertising program targets Jasper youth to discourage negative behaviours such as excessive drinking and vandalism. The posters used in the campaign prominently featured local young people.

Strategic Waste Management Plan (SWMP) – Appendix The City of Yellowknife
Appendix D - 29
Enjoy Jasper Responsibly Social Norms Campaign Poster
Prince Edward Island (Pop: 142,907 in 2016) - Island Waste Management Corporation uses driver tags as part of the ongoing education process to inform residential participants of Waste Watch sorting guidelines. This helps to stabilize program costs by reducing contamination in the recycling and composting streams.

sonnevera international corp.
Appendix D - 30
Island Waste Management Corporation Education Tags
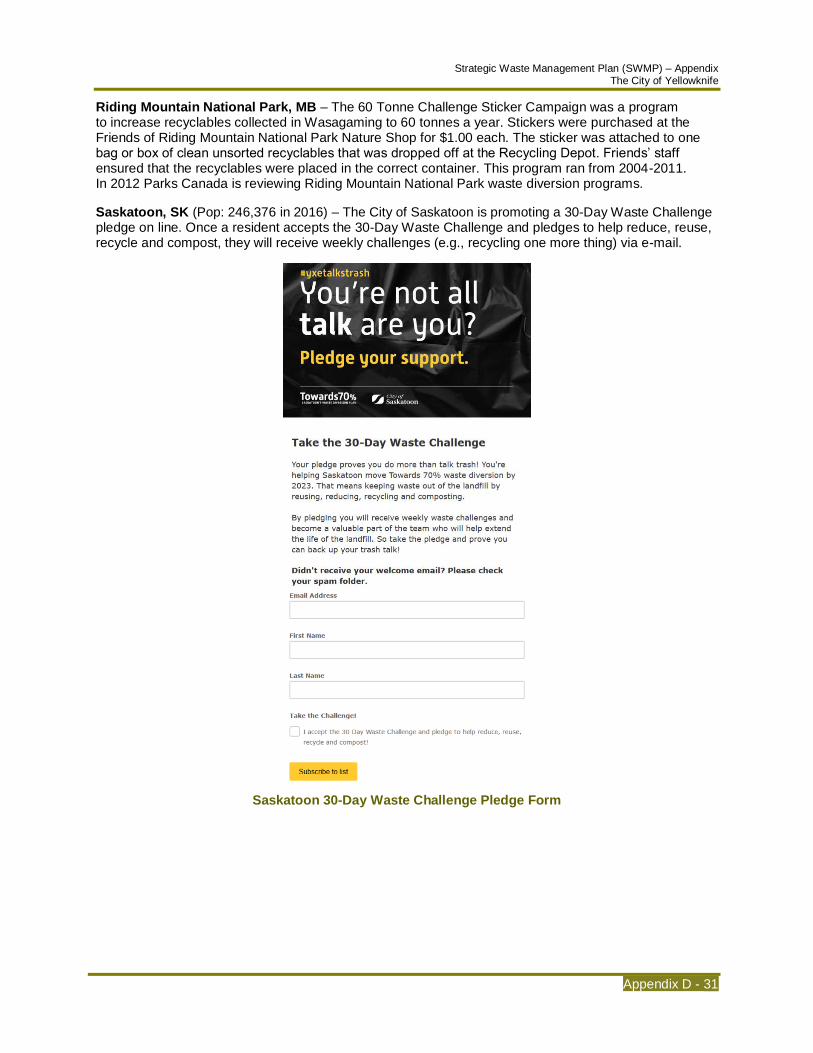
Strategic Waste Management Plan (SWMP) – Appendix The City of Yellowknife
Appendix D - 31
Riding Mountain National Park, MB – The 60 Tonne Challenge Sticker Campaign was a program to increase recyclables collected in Wasagaming to 60 tonnes a year. Stickers were purchased at the Friends of Riding Mountain National Park Nature Shop for $1.00 each. The sticker was attached to one bag or box of clean unsorted recyclables that was dropped off at the Recycling Depot. Friends’ staff ensured that the recyclables were placed in the correct container. This program ran from 2004-2011. In 2012 Parks Canada is reviewing Riding Mountain National Park waste diversion programs.
Saskatoon, SK (Pop: 246,376 in 2016) – The City of Saskatoon is promoting a 30-Day Waste Challenge pledge on line. Once a resident accepts the 30-Day Waste Challenge and pledges to help reduce, reuse, recycle and compost, they will receive weekly challenges (e.g., recycling one more thing) via e-mail.
Saskatoon 30-Day Waste Challenge Pledge Form
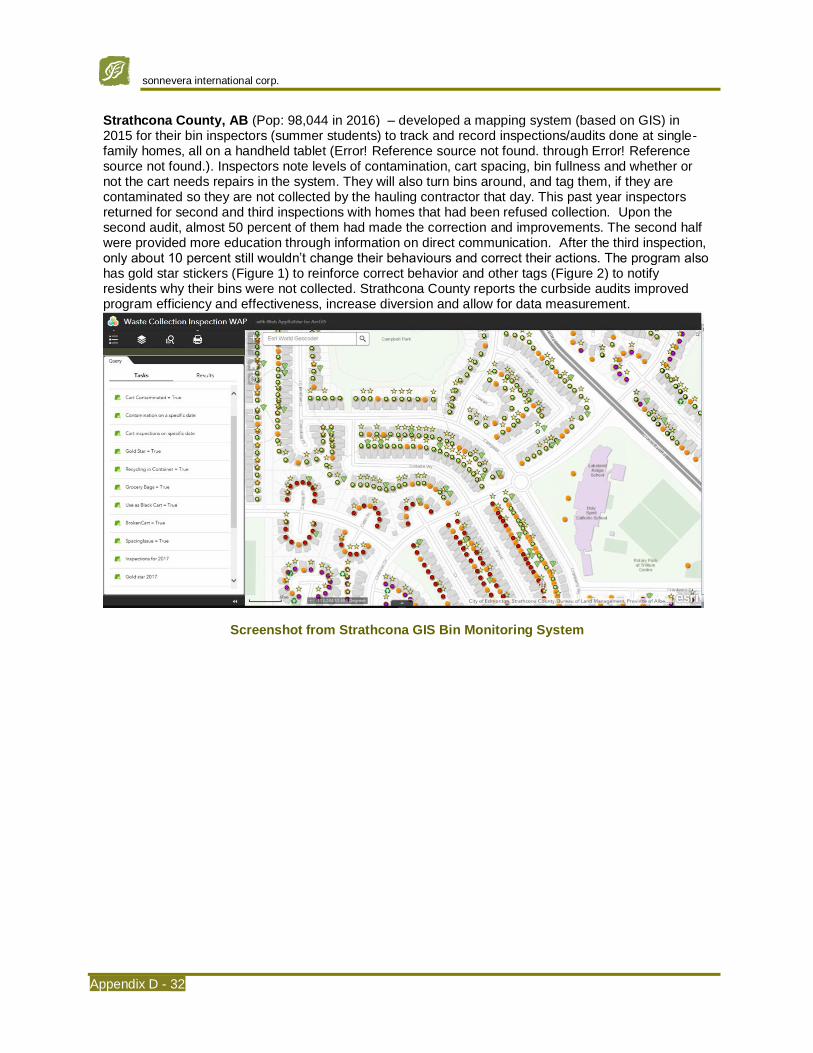
sonnevera international corp.
Appendix D - 32
Strathcona County, AB (Pop: 98,044 in 2016) – developed a mapping system (based on GIS) in 2015 for their bin inspectors (summer students) to track and record inspections/audits done at single-family homes, all on a handheld tablet (Error! Reference source not found. through Error! Reference source not found.). Inspectors note levels of contamination, cart spacing, bin fullness and whether or not the cart needs repairs in the system. They will also turn bins around, and tag them, if they are contaminated so they are not collected by the hauling contractor that day. This past year inspectors returned for second and third inspections with homes that had been refused collection. Upon the second audit, almost 50 percent of them had made the correction and improvements. The second half were provided more education through information on direct communication. After the third inspection, only about 10 percent still wouldn’t change their behaviours and correct their actions. The program also has gold star stickers (Figure 1) to reinforce correct behavior and other tags (Figure 2) to notify residents why their bins were not collected. Strathcona County reports the curbside audits improved program efficiency and effectiveness, increase diversion and allow for data measurement.
Screenshot from Strathcona GIS Bin Monitoring System

Strategic Waste Management Plan (SWMP) – Appendix The City of Yellowknife
Appendix D - 33
Inspection Questions
Curbside Audit GIS System on Tablet
Figure 1: Gold Star for Strathcona County Residents Using Their Carts Correctly
Figure 2: Tags/Stickers used in Strathcona County's Curbside Audit Program
Toronto, ON (Pop: 2,731,571 in 2016) – In 2015, approximately 45,000 tonnes of garbage and organic waste was mistakenly placed in the recycling bin. Blue bin contamination is a problem for a number of reasons:
• The Material Recovery Facility can separate come contamination, but there is a limited amount it can remove
• Loads that exceed the accepted level of contamination may end up in the landfill
• Removing contaminated materials from recyclable material increases cost
The City of Toronto introduced the “Not Wanted in Your Blue Bin” campaign in the summer of 2016 to bring awareness to residents about reducing blue bin recycling contamination. The most common culprits are organic waste, containers with food, textiles, VHS tapes and coffee cups. Descriptions of these culprits and where they should be diverted to or disposed is discussed online. Short, smart, humorous

sonnevera international corp.
Appendix D - 34
video clips are also online that focus on what happens when food scraps and recycling or recycling and textiles ‘get together’.
Toronto Not Wanted in Your Blue Bin Campaign
Beginning April 25, 2017, Solid Waste Management Services started a six month project to evaluate recycling material from curbside collection single family residential customers. Recycling routes are randomly selected for visual inspection by staff that views recycling bins on their designated collection day. Where the contents of the recycling bins have been observed to be contaminated, the bin will not be collected and staff will attach door hangers to the bin identifying the problem. This pilot project is aimed at educating residents about sorting out garbage from recycling. If needed, the City of open to issuing tickets at some point in time.
Waste Reduction Awards Program – CalRecycle (California Department of Resources Recycling and Recovery), formerly the California Integrated Waste Management Board, coordinates the Waste Reduction Awards Program (WRAP) which provides the opportunity for California businesses to gain public recognition for their outstanding efforts to reduce waste. Businesses do not compete against each other as each business is judged independently based on individual accomplishments. Successful applicants receive an award certificate from the State of California along with a camera-ready WRAP WINNER logo and window decal. The logo can be used on products, advertising and business websites to publicize waste reduction efforts. In addition, CalRecycle publicizes WRAP winners via local and statewide press releases and they are listed on the CalRecycle WRAP website.
Since 1993, more than 17,000 awards have been given to 4,288 California businesses, many being multiple-year winners.
The following are examples of how the WRAP winner logo is being promoted:
• AT&T Yellow Pages, a multi-year winner, places the logo on the back cover of all California white and yellow page telephone directories.
• Dole Fresh Vegetables printed the logo on its invoices.
• Nissan Motor Corporation printed the logo on ceramic coffee cups.
• Bayer Corporation uses the logo in newsletters and/or advertisements.
Annually CalRecycle recognizes five of the best examples of nonhazardous waste reduction efforts for the ‘WRAP of the Year’ award. These businesses serve as waste management models for the rest of their industry.
Waste Wise Program – This free, voluntary program set up by the United States Environmental Protection Agency (EPA) attempts to eliminate municipal solid waste. Participants, including government, nonprofit organizations and large businesses join the program by signing a three year contract and commit to reduce waste, establish waste reduction goals and track progress of their accomplishments. Within six months of joining, partners must set their three year goals in waste prevention, recycling collection and buying or manufacturing products with recycled content. Once the EPA approves an organization’s goals, they receive a Waste Wise logo for internal and external use. The EPA also publicizes organizations successful in reducing waste through EPA publications, case studies, and national and regional events.

Strategic Waste Management Plan (SWMP) – Appendix The City of Yellowknife
Appendix D - 35
Since launched in 1994 Waste Wise has more than 2,000 members in more than 54 industry sectors and has reported more than 120 million tons of waste reduced and made significant achievements reducing climate change impact.
Winnipeg Folk Festival – This annual event uses reusable plastic plates for all of its concession stands and for meals served to performers and volunteers backstage. A two dollar deposit is required when picking up a clean plate, which is returned when the used plate is brought back. This program is an integral component of the folk festival as no glass is allowed on site. Reusable mugs are sold by festival staff and concessioners and in 2008 biodegradable beer cups were used in the tavern areas and composted afterwards.
Contact
Connie Boyce Director of Community Relations City of Edmonton 3rd Floor, Century Plaza 9803 – 102A Avenue Edmonton, AB T5J 3A3
T: (780) 496-5407
McKenzie-Mohr & Associates 248 Eglinton Street Fredericton, NB E3B 2W1
T: (506) 455-5061 F: (506) 455-0550 [email protected]

sonnevera international corp.
Appendix D - 36
Branding
Strathcona County, Alberta
Population: 98,044 (2016)
Definition
The process of creating a unique name and image for a waste diversion program in the resident’s mind, mainly through advertising campaigns with a consistent theme.
Description
Strathcona County introduced Green Routine in June 2008 when the new curbside collection program was introduced. The Green Routine includes:
• Organics green cart collection
• Blue bag recycling collection (containers and Styrofoam)
• Garbage black cart collection
• Extra yard waste collection (October)
• Large item collection (May and September)
• Christmas tree collection (January)
Prior to the Green Routine starting and during the early program months numerous forms of Green Routine branded education and communication were utilized:
• Displays in public buildings (recreation centre, library, mall) that showed green and black carts along with the message “Coming to a Curbside Near You”.
• During the first year, every public event from festivals to trade fairs had a Green Routine presence.
• Newspaper advertisements, letters, calendars, website.
• Green team (summer students, May to mid-September) door knocked around the time green and black carts were distributed to answer questions and assist with education.
• On launch day Strathcona County partnered with Glen Allan Elementary School and children present skits related to waste diversion.
In 2012, the County provides a very informative website outlining the Green Routine programs listed above.
A Green Routine! Waste Services Guide and Waste Collection Calendar are available in print and online, a dedicated phone line known as the Green Line (780.449.5514) is open for program questions and a Green Routine! App is available for iPhones. Notice that the App below does not have the Green Routine logo or slogan “Get with the Green Routine!” but the colours are logo colours which are the colours of the collection containers; green for the green organic waste cart, blue for recyclables container and Styrofoam clear blue bags and black for the black garbage cart. All program education materials are consistent using Green Routine colours.

Strategic Waste Management Plan (SWMP) – Appendix The City of Yellowknife
Appendix D - 37
Strathcona County Green Routine! logo
Strathcona County Green Routine! App
Strathcona County Green Routine! waste calendar
Moving forward, in early 2013 Strathcona County will be transitioning to commingled blue bag collection for containers and paper with the upcoming Green Routine-branded “Let’s Mingle” party-themed campaign.
Reduction Potential and Quantitative Results
Branding is an important element of a social marketing campaign, that overall can contribute significantly to waste reduction.
In 2011, Strathcona County diverted 17,754 tonnes of material from the landfill including:
• Paper products – 3,960 tonnes
• Container recyclables – 2,975 tonnes
• Organic material – 10,635 tonnes
• Hazardous waste – 184 tonnes
It is anticipated that waste diversion would not be nearly as successful without the Green Routine, however, no quantitative data is available to confirm this (Seabrook, 2012). Strong user support for the program is noted.

sonnevera international corp.
Appendix D - 38
Communities with Similar Program
Lethbridge, AB (Pop: 92,729 in 2016) – Through the Create Memories, Not Garbage campaign, the City of Lethbridge used green angels to promote a happy, healthy and green holiday. The City also asked residents for ideas on how to reduce waste during the holiday season and posted their suggestions online.
City of Lethbridge Create Memories, Not Garbage Posters
St John’s, NL (Pop: 108,860 in 2016) – Curb It! is the City of St. John’s Waste Management program which includes recycling and garbage collection and the future compost program for residents and the commercial sector.
An extensive Curb It! branded website provides information and resources (brochure, newsletter, decal and instructional videos, including television ads) for users. Colouring worksheets are also available for children. It is anticipated in 2013 that a kids sorting game will be added to the website (Pardy, 2012).
The CurbIt! brand is also seen on recycling trucks, residential reminder tags and the my-waste app. Meanwhile, the program slogan “Sort It, Bag It, Curb It” is viewed on the website, in the reference guide and collection calendar, and on special event banners.

Strategic Waste Management Plan (SWMP) – Appendix The City of Yellowknife
Appendix D - 39
St John’s Curb It! Slogan
St John’s Curb It! Recycling Brochure
St John’s Curb It! Residential Reminder Tags
Curb It! Recycling Truck
After one year of curbside recycling the city announced that the recycling participation rate is 70%.
In August 2012, Curb It! won the Gold Communication Excellence Award given by the Solid Waste Management Association of America. This award recognizes excellence in the creation and implementation of communication tools to inform target audiences about new or existing waste management programs, projects or organizations. This is the fourth award the Curb It! program won since it began in October 2010; other awards include:
• Pinnacle Award of Excellence in Marketing Communications in 2011 from the International Association of Business Communications – Newfoundland and Labrador Chapter
• Newfoundland and Labrador Environmental Award in 2012 for the Municipality or Regional Waste Management Committee category from the Department of Environment and Conservation
• Waste Age magazine 2012 Equipment Color and Design Contest for the Best Recycling Vehicle (viewed above)

sonnevera international corp.
Appendix D - 40
Metro Vancouver, BC (Pop: 2,463,431 in 2016) – Ion Design developed the light-hearted, Hey! Food Isn’t Garbage! regional food waste recycling campaign to assist with public education for the Metro Vancouver food waste ban, effective January 1, 2015. The strategy was to provide impetus for behavioral change with regard to organic waste and ultimately create a social norm where food waste is recycled.
Metro Vancouver Hey! Food Isn’t Garbage! Posters
Metro Vancouver also developed the electronics recycling More Than Meets the Eye 2016 promotion and the 2015-2017 Create Memories, Not Garbage Christmas campaign

Strategic Waste Management Plan (SWMP) – Appendix The City of Yellowknife
Appendix D - 41
Metro Vancouver More Than Meets the Eye Posters

sonnevera international corp.
Appendix D - 42
Metro Vancouver Create Memories, Not Garbage Posters
Regional Municipality of Wood Buffalo, AB (Pop: 71,589 in 2016) – In partnership with Suncor Energy, the Regional Municipality of Wood Buffalo provided a household recycling program and education through the www.recycle-more.ca website. This campaign has since been discontinued.
RRRibbitt was the mascot branded throughout the household recycling program (website and program publications). He also visited at community events.
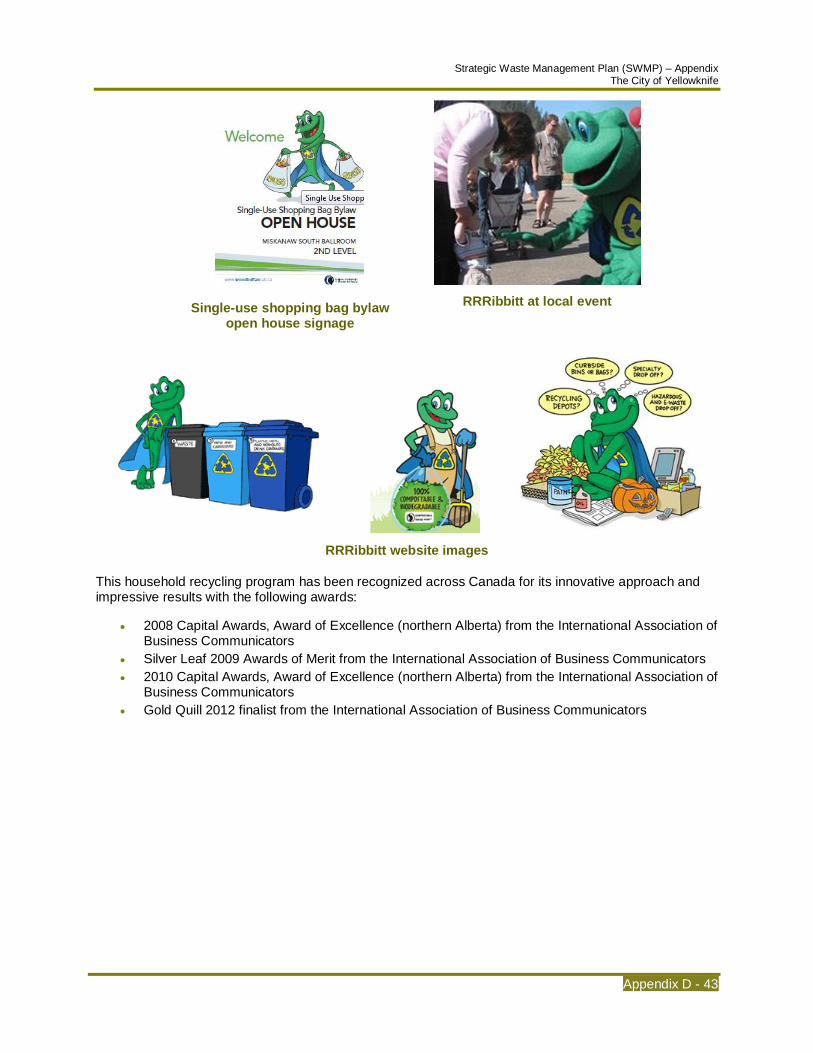
Strategic Waste Management Plan (SWMP) – Appendix The City of Yellowknife
Appendix D - 43
Single-use shopping bag bylaw open house signage
RRRibbitt at local event
RRRibbitt website images
This household recycling program has been recognized across Canada for its innovative approach and impressive results with the following awards:
• 2008 Capital Awards, Award of Excellence (northern Alberta) from the International Association of Business Communicators
• Silver Leaf 2009 Awards of Merit from the International Association of Business Communicators
• 2010 Capital Awards, Award of Excellence (northern Alberta) from the International Association of Business Communicators
• Gold Quill 2012 finalist from the International Association of Business Communicators

sonnevera international corp.
Appendix D - 44
Contact
Leah Seabrook Manager Waste Management Services Strathcona County 370 Streambank Avenue Sherwood Park, AB T8A 1N1
T: (780) 416-6797 [email protected]

Strategic Waste Management Plan (SWMP) – Appendix The City of Yellowknife
Appendix D - 45
Social Media
Medicine Hat, Alberta Population: 63,260 (2016)
Definition
Current and emerging electronic technologies that can be used to promote public awareness of reduction, reuse, recycling and composting programs.
Description
The City offers a free my-waste app that allows users to set up regular reminders for garbage and yard waste collection. Residents can view Medicine Hat’s collection schedules and waste management information at their fingertips, anytime they want. By using the “my-waste” platform, Medicine Hat’s app lets mobile device users view a full range of waste management information currently on the City’s website and the annual Waste Management Calendar. Residents can view collection set-out information, identify materials and locations for recycling drop-off and look up landfill disposal rates.
There are currently versions of the app for iPhone/iPad, Android and Blackberry Torch while an app for the new generation of RIM smartphones is planned for mid-2012.
Medicine Hat my-waste App
Reduction Potential and Quantitative Results
Low direct diversion potential, but can play an important role in public education.
Communities with Similar Program
Austin, TX (Pop: 2,056,405 in 2016) – Rethink/ is Austin’s own mobile app, designed to help everyone go green and protect what’s best about Austin. http://www.austintexas.gov/department/rethink-mobile-app
Banff, AB (Pop: 7,847 in 2016) – The Town developed an interactive map of recycling facilities in Banff. Click on the recycling symbols for information on each drop-off location (e.g., address, materials accepted).

sonnevera international corp.
Appendix D - 46
Banff Interactive Recycling Facility Map
Coquitlam, BC (Pop: 139,284 in 2016) – The City partnered with ReCollect to provide residents with a personalized Curbside Collection Schedule and electronic reminder of when to place garbage, recycling and green carts out. This service is available with an iPhone or Android device. Search “Coquitlam Curbside Collection” in the App store and download the App.
Portland, OR (Pop: 583,776 in 2010) – The City previously developed a fun, interactive e-training tool to educate employees how to Recycle at Work.
Portland Recycle at Work E-Tool (discontinued)
Okotoks – Waste Sorting Game http://www.okotoks.ca/town-services/public-works/garbage-organics-recycling/waste-sorting-game
Recycling Council of Alberta – Utilizes Facebook and Twitter to promote organization activities and related industry news.
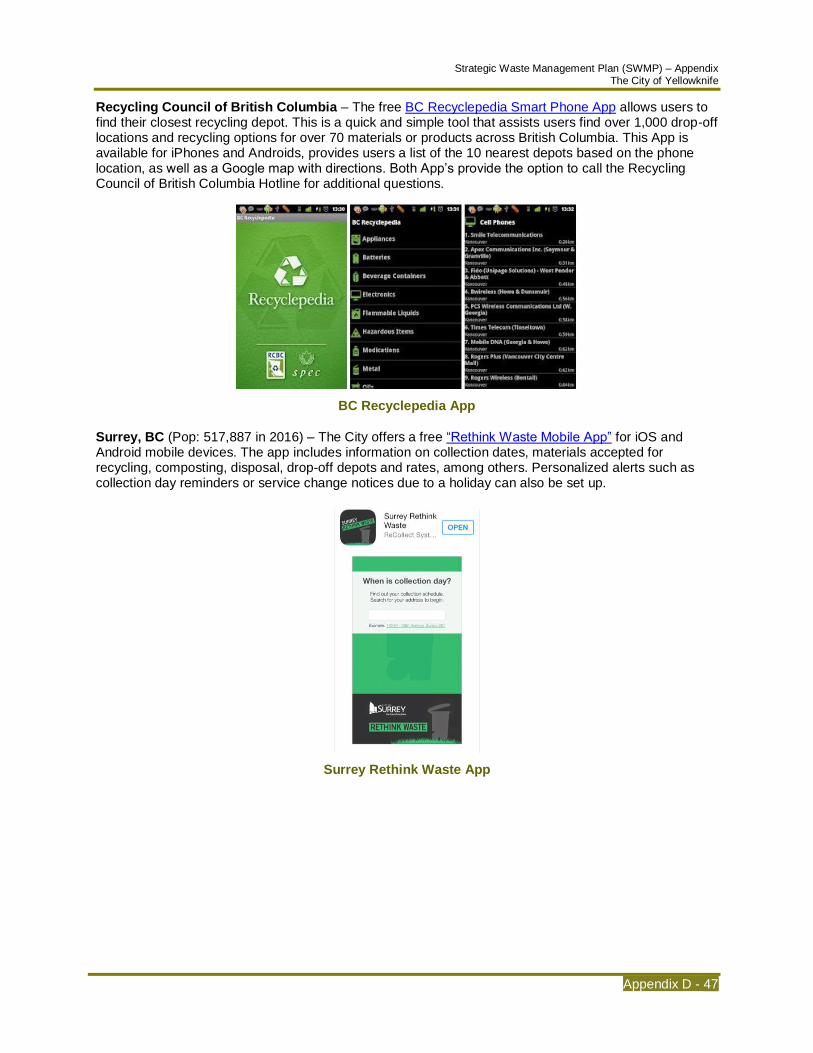
Strategic Waste Management Plan (SWMP) – Appendix The City of Yellowknife
Appendix D - 47
Recycling Council of British Columbia – The free BC Recyclepedia Smart Phone App allows users to find their closest recycling depot. This is a quick and simple tool that assists users find over 1,000 drop-off locations and recycling options for over 70 materials or products across British Columbia. This App is available for iPhones and Androids, provides users a list of the 10 nearest depots based on the phone location, as well as a Google map with directions. Both App’s provide the option to call the Recycling Council of British Columbia Hotline for additional questions.
BC Recyclepedia App
Surrey, BC (Pop: 517,887 in 2016) – The City offers a free “Rethink Waste Mobile App” for iOS and Android mobile devices. The app includes information on collection dates, materials accepted for recycling, composting, disposal, drop-off depots and rates, among others. Personalized alerts such as collection day reminders or service change notices due to a holiday can also be set up.
Surrey Rethink Waste App

sonnevera international corp.
Appendix D - 48
University of British Columbia – The University previously created an interactive map showing all of the buildings involved in the organics collection program.
University of British Columbia Interactive Organics Collection Map
Contact
Ed Jollymore Manager Solid Waste Utilities City of Medicine Hat 580 First Street SE Medicine Hat, AB T1A 8E6
T: (403) 529-8176 [email protected]
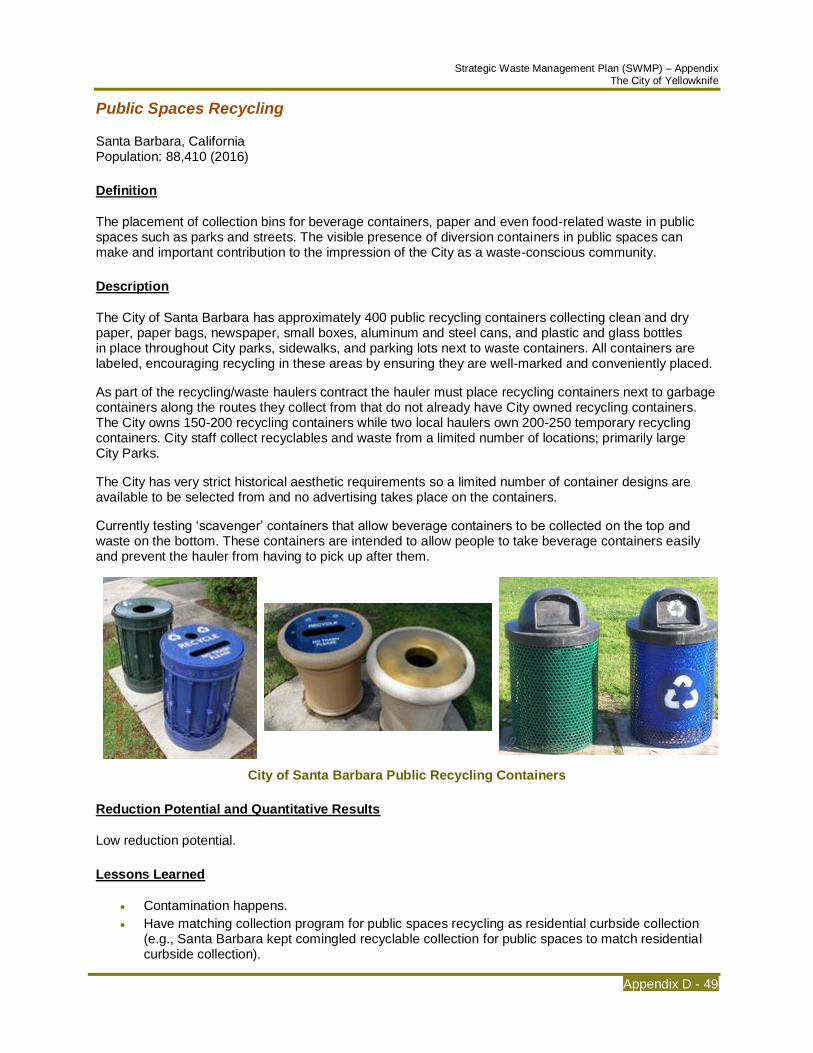
Strategic Waste Management Plan (SWMP) – Appendix The City of Yellowknife
Appendix D - 49
Public Spaces Recycling
Santa Barbara, California Population: 88,410 (2016)
Definition
The placement of collection bins for beverage containers, paper and even food-related waste in public spaces such as parks and streets. The visible presence of diversion containers in public spaces can make and important contribution to the impression of the City as a waste-conscious community.
Description
The City of Santa Barbara has approximately 400 public recycling containers collecting clean and dry paper, paper bags, newspaper, small boxes, aluminum and steel cans, and plastic and glass bottles in place throughout City parks, sidewalks, and parking lots next to waste containers. All containers are labeled, encouraging recycling in these areas by ensuring they are well-marked and conveniently placed.
As part of the recycling/waste haulers contract the hauler must place recycling containers next to garbage containers along the routes they collect from that do not already have City owned recycling containers. The City owns 150-200 recycling containers while two local haulers own 200-250 temporary recycling containers. City staff collect recyclables and waste from a limited number of locations; primarily large City Parks.
The City has very strict historical aesthetic requirements so a limited number of container designs are available to be selected from and no advertising takes place on the containers.
Currently testing ‘scavenger’ containers that allow beverage containers to be collected on the top and waste on the bottom. These containers are intended to allow people to take beverage containers easily and prevent the hauler from having to pick up after them.
City of Santa Barbara Public Recycling Containers
Reduction Potential and Quantitative Results
Low reduction potential.
Lessons Learned
• Contamination happens.
• Have matching collection program for public spaces recycling as residential curbside collection (e.g., Santa Barbara kept comingled recyclable collection for public spaces to match residential curbside collection).

sonnevera international corp.
Appendix D - 50
• Keep message simple on recycling containers (e.g., mobius loop).
• Colour coordinated containers, blue for recycling and dark green for waste.
• Must educate residents about public spaces recycling.
• Assist education of collectors; black bags for waste and clear bags for recycling.
• Ensure that collection is transparent; recycling is collected separate from waste and not together. If together, it gives the perception that the recyclables are going to be landfilled.
• In order for recycling to be effective, ensure recycling and waste containers are placed together so that residents do not place garbage in recycling container if it is standing alone.
Communities with Similar Program
Barrie, ON (Pop: 141,434 in 2016) – The City of Barrie has invested in an aggressive Public Space and Special Events Recycling Program 1989. Waste / recycling (beverage containers) bins in parks and along curbsides are emptied on a weekly basis.
The City has six years remaining on a 15-year contract with Creative Outdoor Advertising (formerly OMG) for 50 bins. The City receives free advertising space on three bins and gets $10/bin from advertising revenue. It is also responsible for collecting garbage and recycling from the bins.
The City also has 150 city-owned bins with no advertising placed throughout Barrie. The Busch Systems Two in One and Three in One bins are made of recycled plastic and have either two (garbage / beverage containers, approximately $500 each) or three openings (2 garbage / 1 beverage container, approximately $800 each). Each year, new bins are added to the program by request.
For more information contact Tracy Quann-Strasser, Waste Reduction Coordinator, at (705) 739-4220 ext. 5822 or [email protected].
Calgary, AB (Pop: 1,239,220 in 2016) – The City of Calgary implemented a “Waste in Public Spaces” program to ensure The City was compliant with the new mandatory recycling and organics diversion bylaw. The project involved retrofitting and installing hundreds of bins in parks, at bus stops, light rail transit (LRT) stops, and in municipal buildings. There was a big focus on “pairing” recycling and waste bins and having consistency in colours of receptacle containers, as well as City of Calgary branded signage.
The program also involved a comprehensive waste audit on the different public waste streams, including Parks, LRT stops, bus stops, municipal buildings, and specific Business Revitalization Zones.
Transitioning Parks bear bins to consistent coloured and signed bins
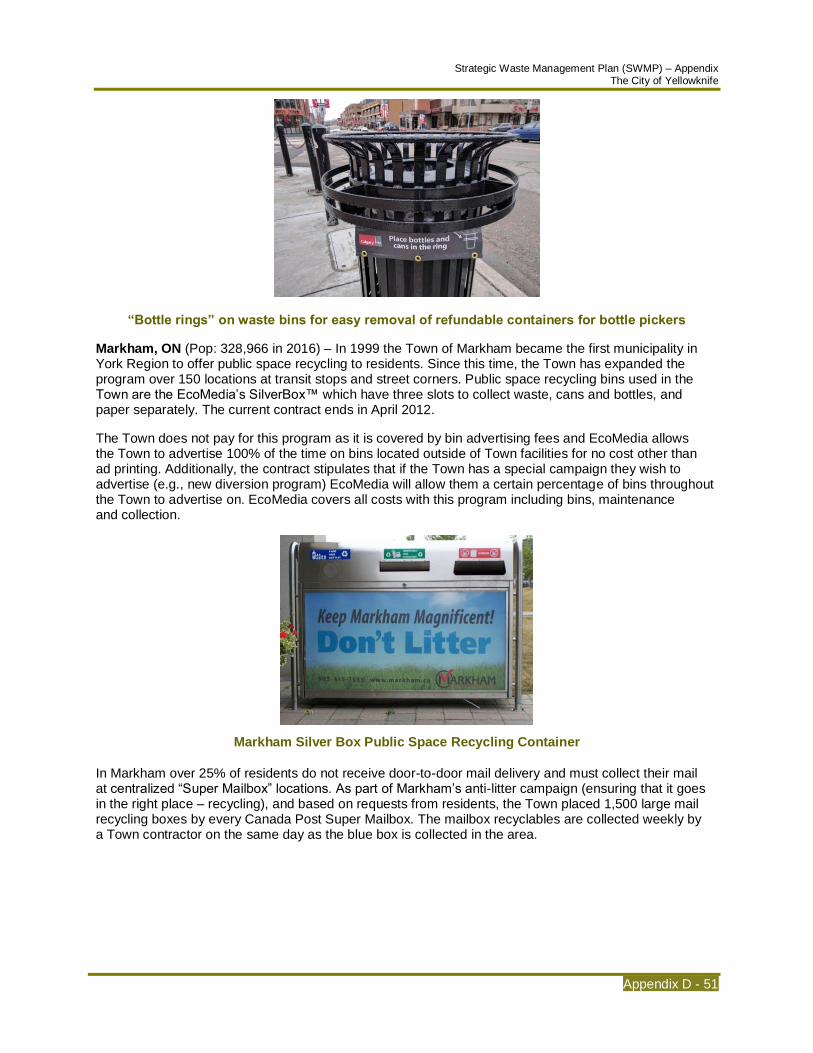
Strategic Waste Management Plan (SWMP) – Appendix The City of Yellowknife
Appendix D - 51
“Bottle rings” on waste bins for easy removal of refundable containers for bottle pickers
Markham, ON (Pop: 328,966 in 2016) – In 1999 the Town of Markham became the first municipality in York Region to offer public space recycling to residents. Since this time, the Town has expanded the program over 150 locations at transit stops and street corners. Public space recycling bins used in the Town are the EcoMedia’s SilverBox™ which have three slots to collect waste, cans and bottles, and paper separately. The current contract ends in April 2012.
The Town does not pay for this program as it is covered by bin advertising fees and EcoMedia allows the Town to advertise 100% of the time on bins located outside of Town facilities for no cost other than ad printing. Additionally, the contract stipulates that if the Town has a special campaign they wish to advertise (e.g., new diversion program) EcoMedia will allow them a certain percentage of bins throughout the Town to advertise on. EcoMedia covers all costs with this program including bins, maintenance and collection.
Markham Silver Box Public Space Recycling Container
In Markham over 25% of residents do not receive door-to-door mail delivery and must collect their mail at centralized “Super Mailbox” locations. As part of Markham’s anti-litter campaign (ensuring that it goes in the right place – recycling), and based on requests from residents, the Town placed 1,500 large mail recycling boxes by every Canada Post Super Mailbox. The mailbox recyclables are collected weekly by a Town contractor on the same day as the blue box is collected in the area.

sonnevera international corp.
Appendix D - 52
Markham Super Mailbox Recycling Container
A further expansion of the public space recycling program includes the 250 recycling containers in parks and sports fields that accept blue box recyclable’s. Organics containers are also located at leash-free dog parks for pet waste.
Markham Park Recycling Container
In 2011, Markham launched the use of Big Belly solar compactors in its two heritage business improvement areas and introduced 12 Big Belly recycling units in each community in order to increase sidewalk recycling options and to keep main streets clean. The Big Belly units take up as much space as ordinary recycling receptacles but the capacity is five times greater. A scaled-down garbage bin will be place by each new recycling container.

Strategic Waste Management Plan (SWMP) – Appendix The City of Yellowknife
Appendix D - 53
Markham Big Belly Recycling Container
New York City, NY (Pop: 8,175,133 in 2010) – More than 3,000 recycling bins are located across the City’s five boroughs (Manhattan, Brooklyn, Queens, the Bronx and Stanten Island). Green bins collect newspaper, magazines and mixed paper while blue bins are for metal, glass bottles and jars, rigid plastic containers and food and beverage containers. A detailed list of recycling bin locations is available online.
New York Public Recycling Containers
St. John’s, NL (Pop: 108,860 in 2016) – St. John’s partnered with OMG Atlantic and Ever Green Recycling in October 2002 to undertake a pilot recycling project in the downtown area of St. John’s. 30 stainless steel recycling/litter bins were placed throughout the downtown core. Each bin has three containers, one for beverage containers, one for paper and one for garbage. The bins are provided at no cost to the City other than the City collecting and disposing of the garbage from the bins and giving permission of where the bins can be placed. OMG advertising revenues cover the costs of the bins, installation and maintenance costs and OMG contracts the recycling collector.
Residents are quite happy with these bins as they are visually pleasing, and contain recyclables and garbage that may otherwise be blowing around with the strong St. John’s winds. At the beginning of this program contamination issues were a problem with garbage being placed in the recycling portion and vice versa.
Bin advertising was slow in 2008, and St. John’s is unsure of the program’s future.
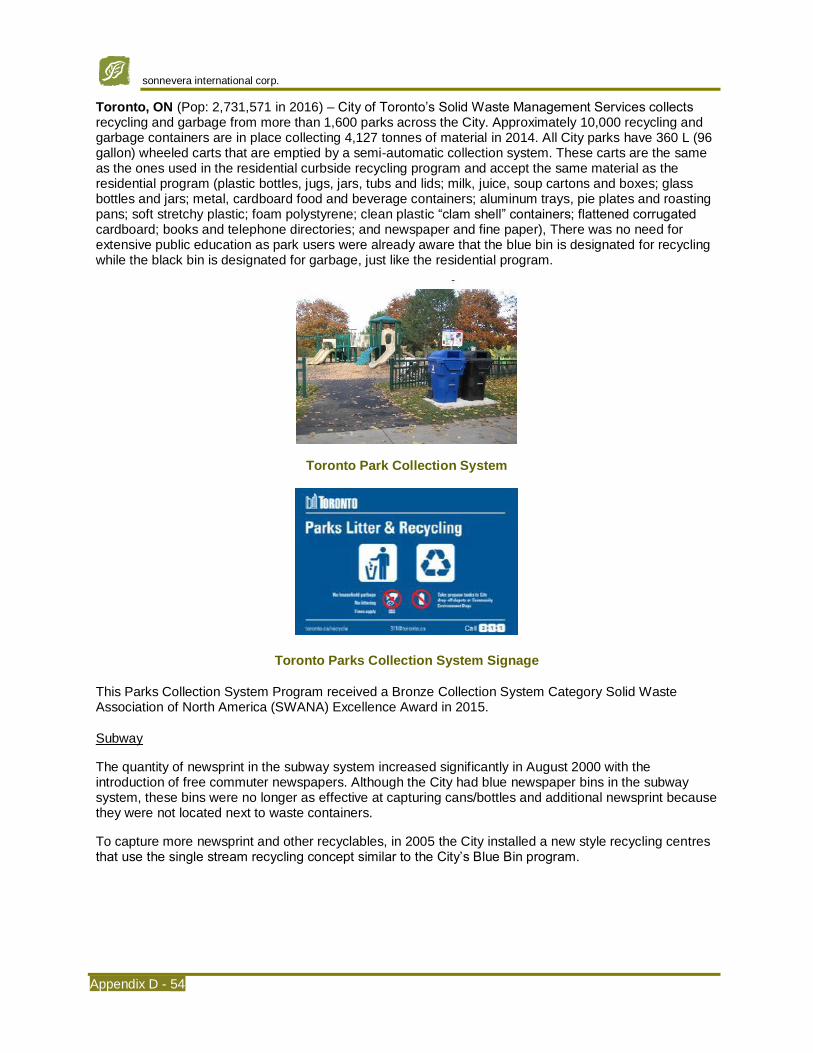
sonnevera international corp.
Appendix D - 54
Toronto, ON (Pop: 2,731,571 in 2016) – City of Toronto’s Solid Waste Management Services collects recycling and garbage from more than 1,600 parks across the City. Approximately 10,000 recycling and garbage containers are in place collecting 4,127 tonnes of material in 2014. All City parks have 360 L (96 gallon) wheeled carts that are emptied by a semi-automatic collection system. These carts are the same as the ones used in the residential curbside recycling program and accept the same material as the residential program (plastic bottles, jugs, jars, tubs and lids; milk, juice, soup cartons and boxes; glass bottles and jars; metal, cardboard food and beverage containers; aluminum trays, pie plates and roasting pans; soft stretchy plastic; foam polystyrene; clean plastic “clam shell” containers; flattened corrugated cardboard; books and telephone directories; and newspaper and fine paper), There was no need for extensive public education as park users were already aware that the blue bin is designated for recycling while the black bin is designated for garbage, just like the residential program.
Toronto Park Collection System
Toronto Parks Collection System Signage
This Parks Collection System Program received a Bronze Collection System Category Solid Waste Association of North America (SWANA) Excellence Award in 2015.
Subway
The quantity of newsprint in the subway system increased significantly in August 2000 with the introduction of free commuter newspapers. Although the City had blue newspaper bins in the subway system, these bins were no longer as effective at capturing cans/bottles and additional newsprint because they were not located next to waste containers.
To capture more newsprint and other recyclables, in 2005 the City installed a new style recycling centres that use the single stream recycling concept similar to the City’s Blue Bin program.

Strategic Waste Management Plan (SWMP) – Appendix The City of Yellowknife
Appendix D - 55
Toronto Subway Recycling Centre
Township of Langley, BC (Pop: 117,285 in 2016) – With the launch of a new Public Spaces Waste Management Strategy the Township is testing new receptacles throughout the Walnut Grove Community from April to September 2017.
Langley Public Spaces Pilot Project Receptacles
Dog waste containers are part of the bin system as pet waste is a prohibited material from regional landfills and Township public spaces garbage loads typically contain 40-50% dog waste (Township of Langley, 2017). With this pilot residents will have a designated container for dog waste and the material can be separated, then be disposed of correctly.
It was determined through staff field tests that the bin system used in this pilot project is the preferred option based on successful sorting by the public, ease of operations, aesthetics and customization options (Township of Langley, 2017). It is anticipated that the new receptacles will be discussed with local business associations and an onsite survey will take place with the public to determine the success of the pilot.
Resources
United States Environmental Protection Agency – The outreach initiative “Recycle on the Go” assists government officials establish public spaces recycling including parks, stadiums, convention centres, airports and other transportation hubs, shopping centers.
sonnevera international corp.
Appendix D - 56
Contact
Thomas Oretsky Environmental Specialist City of Santa Barbara 1221 Annacapa Street, 2nd Floor Santa Barbara, CA 93101
T: (805) 564-5669 [email protected]
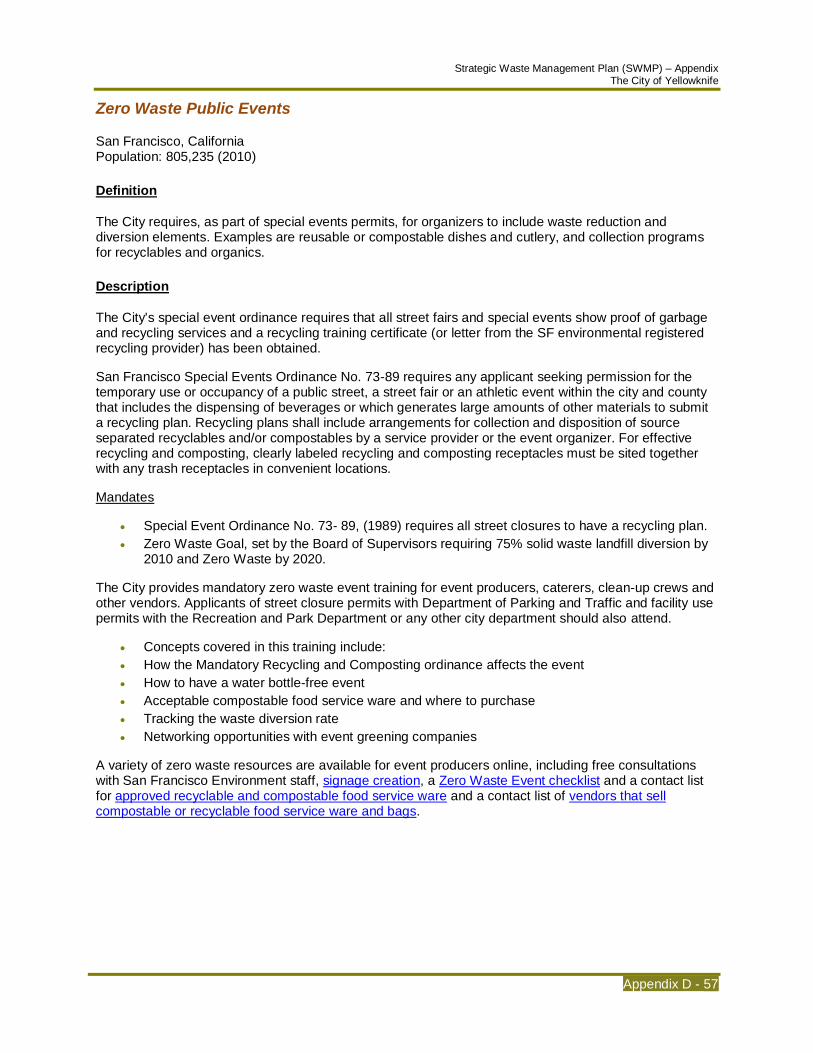
Strategic Waste Management Plan (SWMP) – Appendix The City of Yellowknife
Appendix D - 57
Zero Waste Public Events
San Francisco, California Population: 805,235 (2010)
Definition
The City requires, as part of special events permits, for organizers to include waste reduction and diversion elements. Examples are reusable or compostable dishes and cutlery, and collection programs for recyclables and organics.
Description
The City's special event ordinance requires that all street fairs and special events show proof of garbage and recycling services and a recycling training certificate (or letter from the SF environmental registered recycling provider) has been obtained.
San Francisco Special Events Ordinance No. 73-89 requires any applicant seeking permission for the temporary use or occupancy of a public street, a street fair or an athletic event within the city and county that includes the dispensing of beverages or which generates large amounts of other materials to submit a recycling plan. Recycling plans shall include arrangements for collection and disposition of source separated recyclables and/or compostables by a service provider or the event organizer. For effective recycling and composting, clearly labeled recycling and composting receptacles must be sited together with any trash receptacles in convenient locations.
Mandates
• Special Event Ordinance No. 73- 89, (1989) requires all street closures to have a recycling plan.
• Zero Waste Goal, set by the Board of Supervisors requiring 75% solid waste landfill diversion by 2010 and Zero Waste by 2020.
The City provides mandatory zero waste event training for event producers, caterers, clean-up crews and other vendors. Applicants of street closure permits with Department of Parking and Traffic and facility use permits with the Recreation and Park Department or any other city department should also attend.
• Concepts covered in this training include:
• How the Mandatory Recycling and Composting ordinance affects the event
• How to have a water bottle-free event
• Acceptable compostable food service ware and where to purchase
• Tracking the waste diversion rate
• Networking opportunities with event greening companies
A variety of zero waste resources are available for event producers online, including free consultations with San Francisco Environment staff, signage creation, a Zero Waste Event checklist and a contact list for approved recyclable and compostable food service ware and a contact list of vendors that sell compostable or recyclable food service ware and bags.
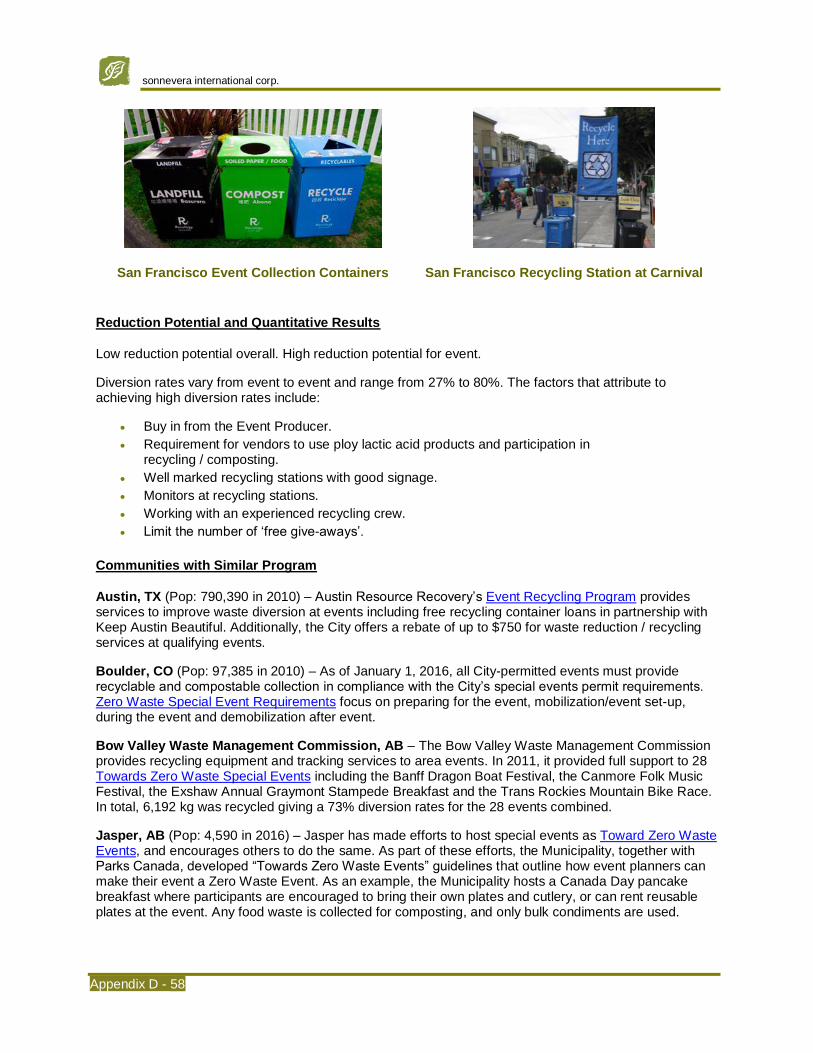
sonnevera international corp.
Appendix D - 58
San Francisco Event Collection Containers
San Francisco Recycling Station at Carnival
Reduction Potential and Quantitative Results
Low reduction potential overall. High reduction potential for event.
Diversion rates vary from event to event and range from 27% to 80%. The factors that attribute to achieving high diversion rates include:
• Buy in from the Event Producer.
• Requirement for vendors to use ploy lactic acid products and participation in recycling / composting.
• Well marked recycling stations with good signage.
• Monitors at recycling stations.
• Working with an experienced recycling crew.
• Limit the number of ‘free give-aways’.
Communities with Similar Program
Austin, TX (Pop: 790,390 in 2010) – Austin Resource Recovery’s Event Recycling Program provides services to improve waste diversion at events including free recycling container loans in partnership with Keep Austin Beautiful. Additionally, the City offers a rebate of up to $750 for waste reduction / recycling services at qualifying events.
Boulder, CO (Pop: 97,385 in 2010) – As of January 1, 2016, all City-permitted events must provide recyclable and compostable collection in compliance with the City’s special events permit requirements. Zero Waste Special Event Requirements focus on preparing for the event, mobilization/event set-up, during the event and demobilization after event.
Bow Valley Waste Management Commission, AB – The Bow Valley Waste Management Commission provides recycling equipment and tracking services to area events. In 2011, it provided full support to 28 Towards Zero Waste Special Events including the Banff Dragon Boat Festival, the Canmore Folk Music Festival, the Exshaw Annual Graymont Stampede Breakfast and the Trans Rockies Mountain Bike Race. In total, 6,192 kg was recycled giving a 73% diversion rates for the 28 events combined.
Jasper, AB (Pop: 4,590 in 2016) – Jasper has made efforts to host special events as Toward Zero Waste Events, and encourages others to do the same. As part of these efforts, the Municipality, together with Parks Canada, developed “Towards Zero Waste Events” guidelines that outline how event planners can make their event a Zero Waste Event. As an example, the Municipality hosts a Canada Day pancake breakfast where participants are encouraged to bring their own plates and cutlery, or can rent reusable plates at the event. Any food waste is collected for composting, and only bulk condiments are used.
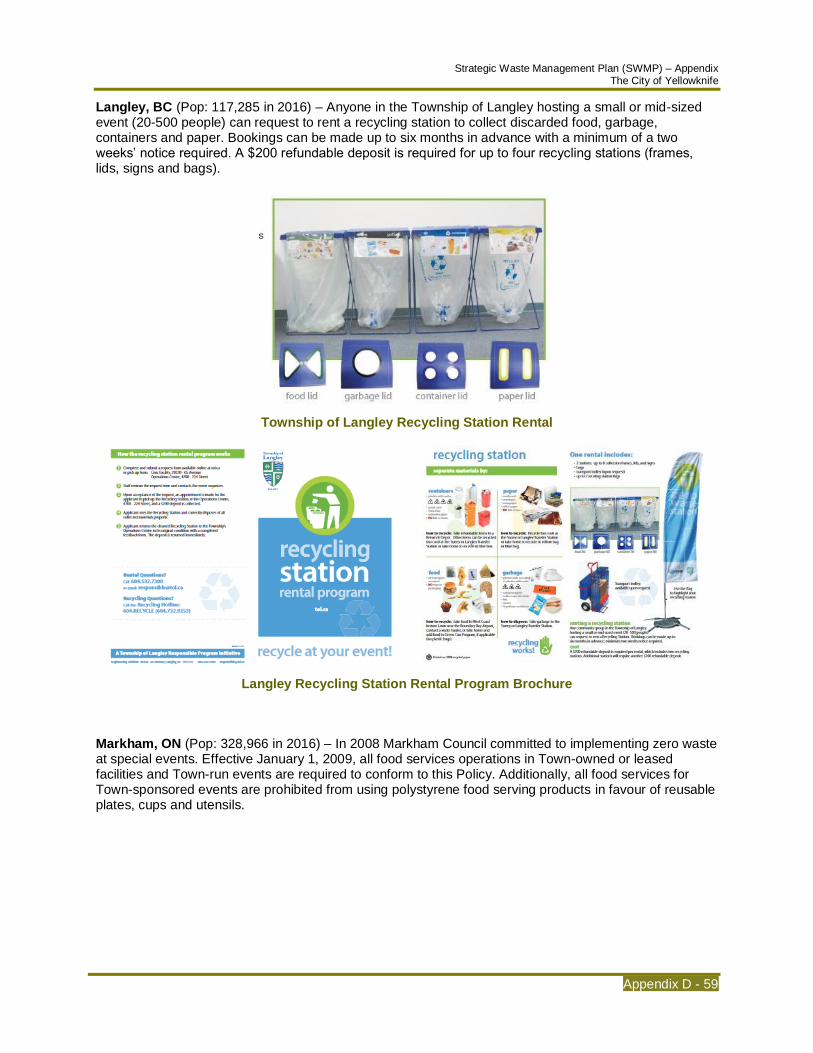
Strategic Waste Management Plan (SWMP) – Appendix The City of Yellowknife
Appendix D - 59
Langley, BC (Pop: 117,285 in 2016) – Anyone in the Township of Langley hosting a small or mid-sized event (20-500 people) can request to rent a recycling station to collect discarded food, garbage, containers and paper. Bookings can be made up to six months in advance with a minimum of a two weeks’ notice required. A $200 refundable deposit is required for up to four recycling stations (frames, lids, signs and bags).
Township of Langley Recycling Station Rental
Langley Recycling Station Rental Program Brochure
Markham, ON (Pop: 328,966 in 2016) – In 2008 Markham Council committed to implementing zero waste at special events. Effective January 1, 2009, all food services operations in Town-owned or leased facilities and Town-run events are required to conform to this Policy. Additionally, all food services for Town-sponsored events are prohibited from using polystyrene food serving products in favour of reusable plates, cups and utensils.

sonnevera international corp.
Appendix D - 60
Markham Public Events Container
Markham Public Events Container Inside
A copy of the Zero Waste Policy: Food and Catering Services is located online.
New York, NY (Pop: 8,175,133 in 2010) – The City requires all street events, including block parties and street fairs to recycle. Organizers need to contact the Department of Sanitation local District Superintendent (or designated officer) in the Community Board where the event is to be held at least three weeks before a planned event.
Metal cans, lightly soiled aluminum foil products, glass bottles and jars, hard-plastic containers and food and beverage cartons must be reycled. Corrugated cardboard (flattened and bundled with rope or twine) is also required.
Organizers need to provide recycling bins, garbage cans and bags. As long as they are properly labelled and are lined with the required clear bags, different types of containers are suitable for collecting recycling. Recycling signage must be clearly labelled and lettering must be at least four inches high for enhanced visibility.
Several recycling collection services are available for events:
• The Department of Sanitation can pick-up recycling every night of the event (fees may be incurred for this service)
• Place recycling out on the usual collection day, storing it off the street until the night before Department of Sanitation’s regularly scheduled collection
• Get permission from the District Superintendent to bring recycling to a local Department of Sanitation facility yourself
• Hire a private carter or recycling company to pick-up the recycling. Organizer must receive approval from the District Superintendent for the collection time and place.
San José, CA (Pop: 945,942 in 2016) – The Green Event Certification formally acknowledged events that strive to reduce environmental impacts and help the city achieve its zero waste goals. The city offered three event certification levels that demonstrate commitment to green practices.
Going Green Certification – event organizers arrange for recycling collection service, require vendors to use recyclable #1 plastic cups for cold beverages 7oz and larger and ban the use of Polystyrene. Events have a goal to achieve a minimum of 25% waste reduction.
Green Event Certification – in addition to the practices listed for Going Green, event organizers are to require vendors to use approved compostable service-ware, implement a composting program, provide education and environmental awareness and provide adequate recycling staff or volunteers at the event. Events have a goal to achieve a minimum of 50% waste reduction.

Strategic Waste Management Plan (SWMP) – Appendix The City of Yellowknife
Appendix D - 61
Zero Waste Certification – in addition to the best practices listed for Green Event, event organizers require all vendors to use only recyclable and compostable materials and collect and recycle cooking oil, prohibit single-use plastic water bottles and use water stations, provide an interactive activity to raise environmental awareness and implement solar alternatives (panels, generators, stages) to generate electricity during the event. Events have a goal to achieve a minimum of 75% waste reduction.
San Jose Event Certification Logos
For each certification, a Material Diversion Report is due to the Environmental Services Department within 10 days after completion of an event so that the City and State can evaluate the type of materials collected and the success of events in diverting materials from landfill through waste prevention, reduction, recycling and composting efforts.
The certification program has since been discontinued and replaced by the Zero Waste Event Program which requires all city events to comply with the program components.
To assist event organizers, the City offers an Eco-Station Loan program for local events to enable access to recycling and composting collection. Eco-Stations come with corresponding color-coded signs, lids and bags.
San José Eco-Station Loan for Special Events
San José Bag Eco-Station Loan for Special Events
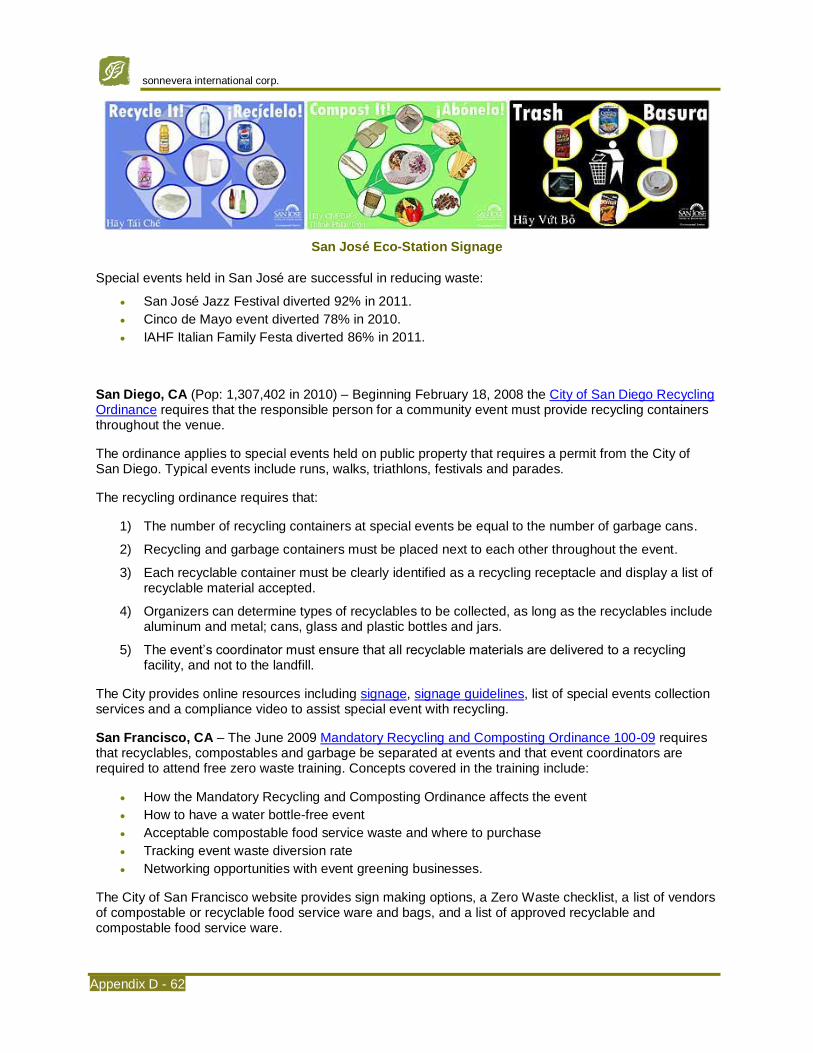
sonnevera international corp.
Appendix D - 62
San José Eco-Station Signage
Special events held in San José are successful in reducing waste:
• San José Jazz Festival diverted 92% in 2011.
• Cinco de Mayo event diverted 78% in 2010.
• IAHF Italian Family Festa diverted 86% in 2011.
San Diego, CA (Pop: 1,307,402 in 2010) – Beginning February 18, 2008 the City of San Diego Recycling Ordinance requires that the responsible person for a community event must provide recycling containers throughout the venue.
The ordinance applies to special events held on public property that requires a permit from the City of San Diego. Typical events include runs, walks, triathlons, festivals and parades.
The recycling ordinance requires that:
1) The number of recycling containers at special events be equal to the number of garbage cans.
2) Recycling and garbage containers must be placed next to each other throughout the event.
3) Each recyclable container must be clearly identified as a recycling receptacle and display a list of recyclable material accepted.
4) Organizers can determine types of recyclables to be collected, as long as the recyclables include aluminum and metal; cans, glass and plastic bottles and jars.
5) The event’s coordinator must ensure that all recyclable materials are delivered to a recycling facility, and not to the landfill.
The City provides online resources including signage, signage guidelines, list of special events collection services and a compliance video to assist special event with recycling.
San Francisco, CA – The June 2009 Mandatory Recycling and Composting Ordinance 100-09 requires that recyclables, compostables and garbage be separated at events and that event coordinators are required to attend free zero waste training. Concepts covered in the training include:
• How the Mandatory Recycling and Composting Ordinance affects the event
• How to have a water bottle-free event
• Acceptable compostable food service waste and where to purchase
• Tracking event waste diversion rate
• Networking opportunities with event greening businesses.
The City of San Francisco website provides sign making options, a Zero Waste checklist, a list of vendors of compostable or recyclable food service ware and bags, and a list of approved recyclable and compostable food service ware.
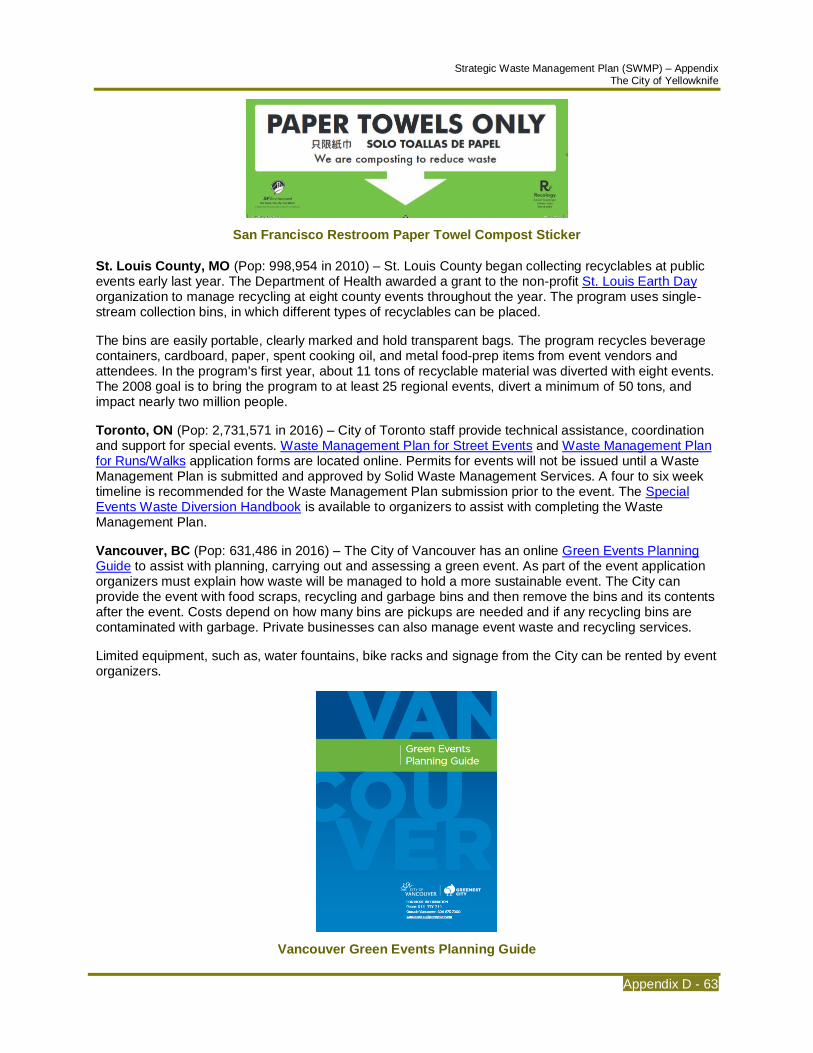
Strategic Waste Management Plan (SWMP) – Appendix The City of Yellowknife
Appendix D - 63
San Francisco Restroom Paper Towel Compost Sticker
St. Louis County, MO (Pop: 998,954 in 2010) – St. Louis County began collecting recyclables at public events early last year. The Department of Health awarded a grant to the non-profit St. Louis Earth Day organization to manage recycling at eight county events throughout the year. The program uses single-stream collection bins, in which different types of recyclables can be placed.
The bins are easily portable, clearly marked and hold transparent bags. The program recycles beverage containers, cardboard, paper, spent cooking oil, and metal food-prep items from event vendors and attendees. In the program's first year, about 11 tons of recyclable material was diverted with eight events. The 2008 goal is to bring the program to at least 25 regional events, divert a minimum of 50 tons, and impact nearly two million people.
Toronto, ON (Pop: 2,731,571 in 2016) – City of Toronto staff provide technical assistance, coordination and support for special events. Waste Management Plan for Street Events and Waste Management Plan for Runs/Walks application forms are located online. Permits for events will not be issued until a Waste Management Plan is submitted and approved by Solid Waste Management Services. A four to six week timeline is recommended for the Waste Management Plan submission prior to the event. The Special Events Waste Diversion Handbook is available to organizers to assist with completing the Waste Management Plan.
Vancouver, BC (Pop: 631,486 in 2016) – The City of Vancouver has an online Green Events Planning Guide to assist with planning, carrying out and assessing a green event. As part of the event application organizers must explain how waste will be managed to hold a more sustainable event. The City can provide the event with food scraps, recycling and garbage bins and then remove the bins and its contents after the event. Costs depend on how many bins are pickups are needed and if any recycling bins are contaminated with garbage. Private businesses can also manage event waste and recycling services.
Limited equipment, such as, water fountains, bike racks and signage from the City can be rented by event organizers.
Vancouver Green Events Planning Guide

sonnevera international corp.
Appendix D - 64
West Yellowhead Recycles, AB – West Yellowhead Recycles has two recycling trailers with eight slots and changeable magnetic signs to tailor the trailer to meet event needs. These trailers are available at no charge to anyone in Yellowhead County, Edson, Hinton and Jasper. A rental agreement must be signed and the event is responsible for picking the trailer up. Blue Rubbermaid Recycling bins, 32 gallon, are also available at no charge for any event located in Hinton, Edson, Jasper and Wildwood, while compost bins are available for events in Edson, Hinton, Jasper and Yellowhead County.
West Yellowhead Recycles Recycling Trailer and 32 Gallon Recycling bins Available for Events
“Tips to Make the Your Event Wastless” are also available on line.
Whole Earth Festival – The Whole Earth Festival (WEF) is a public event that takes place over three days on the Mother’s Day weekend on the University of California, Davis (UC Davis) campus. The event, attracts over 30,000 people and is planned and coordinated by a group of students with the help of Karma Patrol volunteers.
A much-emphasized aspect of WEF is the integrated solid waste prevention plan for minimizing waste generation at the festival while educating festival goers on ways they can lower their own ecological footprint.
Food waste composting, beverage container and cardboard recycling, reusable dishware and compostable dishware (used only if reusable dishware cannot keep up with demand) are some of the techniques utilized to achieve 97% diversion in 2008. As list of historical waste diversion is listed below.
Year Percent Diverted
(by Weight)
2003 95.5
2004 96.5
2005 97.1
2006 97.4
2007 98.1
2008 97.0
(Downey, 2008)
Resources
Auckland City Council – Guideline for Working Towards Zero Waste Events (2008).
CalRecycle – Recycling at Special Events: A Model for Local Government Recycling and Waste Reduction (2002)
Strategic Waste Management Plan (SWMP) – Appendix The City of Yellowknife
Appendix D - 65
Green Calgary’s Event Greening Guide provides tips and resources.
United States Environmental Protection Agency – The outreach initiative “Recycle on the Go” assists government officials establish special events recycling opportunities.
Contact
San Francisco Environment 11 Grove Street San Francisco, CA 94102 USA
T: (415) 355-3700 [email protected]

sonnevera international corp.
Appendix D - 66
Best Practices: Residential Waste Reduction / Diversion
Backyard Composting
Fredericton, New Brunswick Population: 58,220 (2016)
Definition
Some municipalities aggressively promote backyard composting, with some hosting sales of subsidized composters to their residents to encourage backyard composting. Education of residents purchasing the composters is important to ensure they have an understanding of how to properly use the bin.
Description
The City of Fredericton in cooperation with the Fredericton Backyard Composters (FBYC) offers an annual one-day subsidized composter sale in May to residents for $30/composter. Remaining Earth Machine composters are available on a first come first served basis until sold. In 2008, the composters were purchased wholesale for $33/unit plus taxes from Norseman Plastics in Ontario.
Both organizations have a permanent joint backyard composting display that provides examples of various types of backyard composters and information on successful backyard composting at the Fredericton Regional Sanitary Landfill.
The City of Fredericton facilitates and finances FBYC volunteer group. In 2008, $13,000 was allocated to the group for purchasing composters and all communication and education activities.
The FBYC present Master Composter training every second year and also provide workshops and presentations to schools and service groups. Seventy community members have been trained as master composters and in exchange for the free training each Master Composter provides 40 hours of volunteer time to backyard composting related activities. For instance, composter display site clean-up day, residential education, and when the one-day backyard composter sale started, the FBYC called owners 12 months after the purchase of the composter regarding use, comments and concerns. It was determined through these surveys that the City of Fredericton was on the right track offering composters to residents.
Reduction Potential and Quantitative Results
Low to medium reduction potential depends on subsidy level and supporting education. Works well in conjunction with Master Composter type program.
The first backyard composter sale took place in 1992 with 2,000 composters sold during the early years. The number of composters eventually decreased to 600 and in 2008, 250 composters were ordered.
Lessons Learned
• Beware if considering subsidized backyard composter sale that is being funded by residents that residents from other communities close by that do not have this program may purchase composters. Not a problem if City receives provincial funding, then program can be open to all residents. One option is to request to see drivers’ license before purchasing composter.
• One-day sale complements FBYC Master Composter program.
• Good relationship to have City fund program an FBYC volunteers staff one-day sales. Be prepared that City staff may need to fill in if not enough volunteers are available.

Strategic Waste Management Plan (SWMP) – Appendix The City of Yellowknife
Appendix D - 67
• Consider if City should be in the business of selling composters or if this should be something that the private sector sells.
• Consider using a debit machine at the sale to allow payment choice to residents.
• Beware that volunteer group numbers dwindle over time and there is the constant need to have fresh faces with new ideas.
Communities with Similar Program
Brantford, ON (Pop: 97,496 in 2016) – On May 5, 2012 the City of Brantford will hold a one day Composter Sale to all City residents (proof of residency is required). Composters will be sold for $20.
Boulder County, CO (Pop: 294,567 in 2010) – Boulder County is hosting a one day backyard composter sale on Earth Day, April 22, 2012. Soilsaver compost bins will be sold for $50 at the Boulder County Recycling Center. To support the sale the County is offering compost workshops throughout the County: April 19 (Broomfield), April 22 (Boulder), April 26 (Longmont), April 28 (Lafayette) and May 1 (Boulder).
In 2017, Boulder County provides online backyard composting education and promotes the Get the Dirt on Composting brochure. Residents can also purchase a maximum of two Soilsaver composters for $55 each at the Boulder County Recycling Center.
Boulder County Get the Dirt on Composting Brochure (2015) and Soil Saver Composter
Calgary, AB (Pop: 1,239,220 in 2016) – The City of Calgary, in partnership with ORBIS Corporation (formerly Norseman Plastics) and Green Calgary (formerly Clean Calgary), offered residents a one-day truckload backyard composter sale. On June 21, 2008, 6,000 Earth Machine composters were sold at six locations throughout the city for a subsidized rate of $25 (GST included).
Earth Machine
In 2012, The City sold Garden Gourmet composters online for $40 (delivered to door) and also provided composting information on their website. Green Calgary offered 10 community composter / rain barrel sales events throughout the spring and summer and one-day truckload sale on May 12, 2012.

sonnevera international corp.
Appendix D - 68
Garden Gourmet Backyard Composter
This program began in 1999 and to date over 65,000 composters have been sold to Calgarians.
In 2017, the City of Calgary promotes backyard composting education online and recommends purchasing backyard composters at home improvement stores and the Green Calgary EcoStore which sells the Soil Saver Composter for $75. Green Calgary continues its annual community composter / rain barrel sales with ten events from April 21 to June 24 at various Calgary locations.
Chilliwack, BC (Pop: 83,788 in 2016) – The City of Chilliwack in cooperation with Fraser Cheam Soil & Fibre Ltd. sell Earth Machine backyard composters year round at the Parr Road Green Depot for $44 plus tax.
County of Olmsted, MN (Pop: 144,248 in 2010) – A one day backyard composter and rain barrel truckload sale took place at the Olmsted County Fairgrounds in June 2010. Earth Machines were sold for $40 and Systern Rain Barrels for $45. To avoid lineups residents could preorder a composter or rain barrel.
County of Olmsted Composter and Rain Barrel Sale Promotion
Guelph, ON (Pop: 131,794 in 2016) – In the past, The City of Guelph Waste Resource Innovation Centre hosted three Eco Days (May 19, August 4 and October 13, 2008) each year to promote e-waste recycling, recycling facility tours, goods exchange weekends and rain barrel and backyard composter sales.
In 2017, Earth Machine backyard composters can be purchased at the Waste Resource Innovation Centre ($45) and year-round at ARC Industries (prices may vary). Basic composting information is available online along with the Orange you Interested in Composting? brochure.
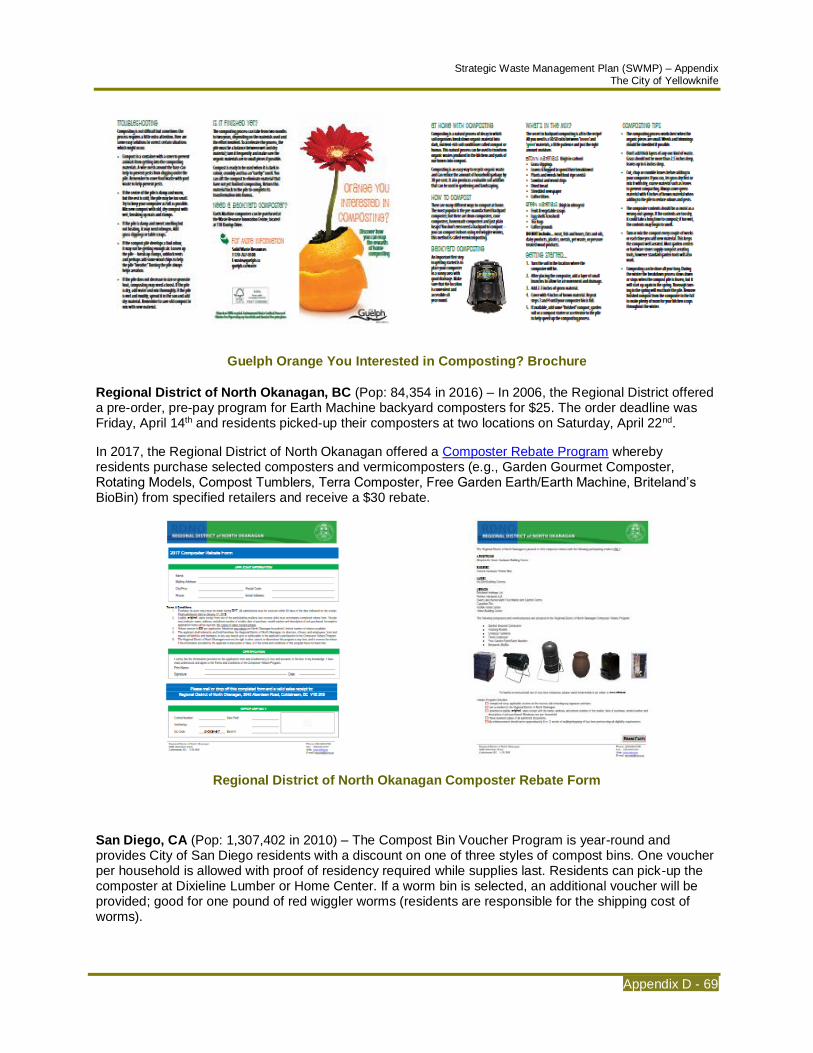
Strategic Waste Management Plan (SWMP) – Appendix The City of Yellowknife
Appendix D - 69
Guelph Orange You Interested in Composting? Brochure
Regional District of North Okanagan, BC (Pop: 84,354 in 2016) – In 2006, the Regional District offered a pre-order, pre-pay program for Earth Machine backyard composters for $25. The order deadline was Friday, April 14th and residents picked-up their composters at two locations on Saturday, April 22nd.
In 2017, the Regional District of North Okanagan offered a Composter Rebate Program whereby residents purchase selected composters and vermicomposters (e.g., Garden Gourmet Composter, Rotating Models, Compost Tumblers, Terra Composter, Free Garden Earth/Earth Machine, Briteland’s BioBin) from specified retailers and receive a $30 rebate.
Regional District of North Okanagan Composter Rebate Form
San Diego, CA (Pop: 1,307,402 in 2010) – The Compost Bin Voucher Program is year-round and provides City of San Diego residents with a discount on one of three styles of compost bins. One voucher per household is allowed with proof of residency required while supplies last. Residents can pick-up the composter at Dixieline Lumber or Home Center. If a worm bin is selected, an additional voucher will be provided; good for one pound of red wiggler worms (residents are responsible for the shipping cost of worms).
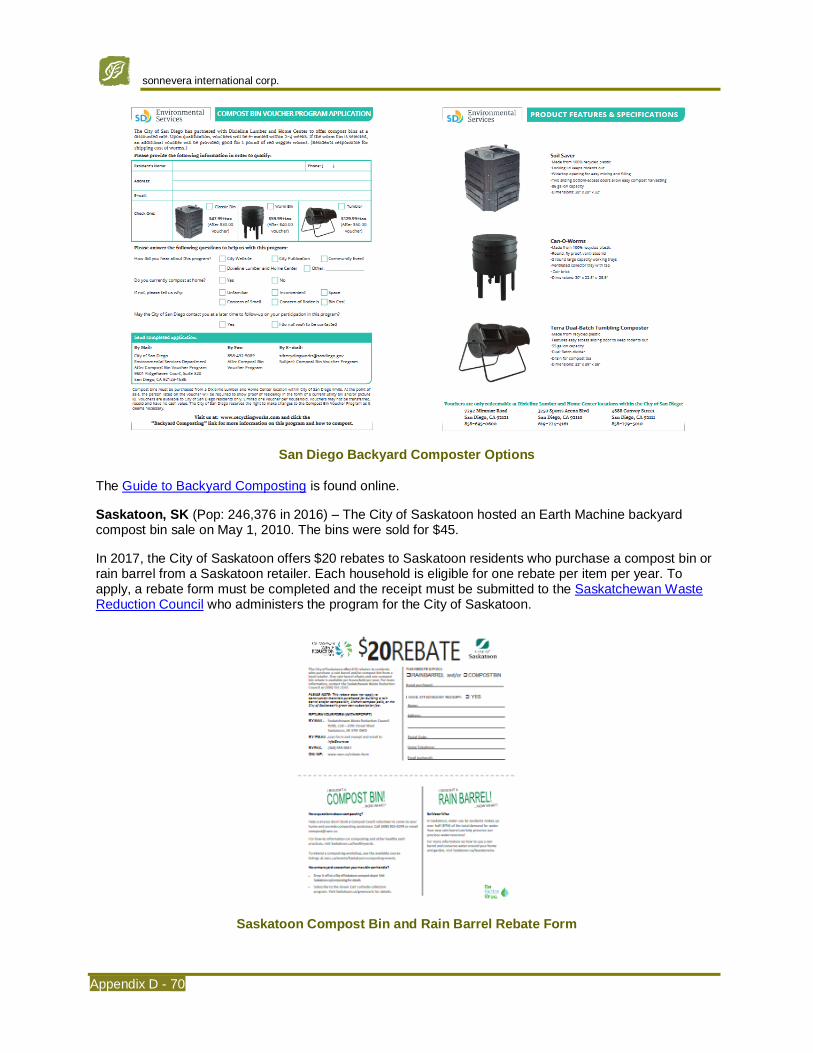
sonnevera international corp.
Appendix D - 70
San Diego Backyard Composter Options
The Guide to Backyard Composting is found online.
Saskatoon, SK (Pop: 246,376 in 2016) – The City of Saskatoon hosted an Earth Machine backyard compost bin sale on May 1, 2010. The bins were sold for $45.
In 2017, the City of Saskatoon offers $20 rebates to Saskatoon residents who purchase a compost bin or rain barrel from a Saskatoon retailer. Each household is eligible for one rebate per item per year. To apply, a rebate form must be completed and the receipt must be submitted to the Saskatchewan Waste Reduction Council who administers the program for the City of Saskatoon.
Saskatoon Compost Bin and Rain Barrel Rebate Form

Strategic Waste Management Plan (SWMP) – Appendix The City of Yellowknife
Appendix D - 71
St. John’s, NL (Pop: 108,860 in 2016) – The City of St. John’s, in partnership with the Multi-Material Stewardship Board and Memorial University Botanical Garden, offer free backyard composting information sessions to St. John’s residents. Thirteen backyard composting sessions were available to St. John’s residents only from April 1 – July 18, 2017. They also provide a standard compost bin for $40 or a tumbler bun for $55 (HST included).
St. John’s Tumbler Composter
Contact
Julie Baker Landscsape Horticulturist City of Fredericton Parks & Trees Division P.O. Box 130 Fredericton, NB E3B 4Y7
T: (506) 460-2447 (W) T: (506) 470-1469 (C) [email protected]

sonnevera international corp.
Appendix D - 72
Depot Recycling Systems (Expanded Drop-off Facilities)
Banff, Alberta Population: 7,851 (2016)
Definition
Increased number of locations and/or number bins at each drop-off location. May include unique materials collected or unique way materials are collected.
Description
The Town of Banff recycling program started with two large recycling drop-off depots. In 2008, it expanded to 18 mini-depots and then to 36 mini-depots in 2009 and 39 mini-depots in 2010. Depot collection bins are bear proof.
Today, mini recycling depots are located throughout Banff accepting mixed paper (newsprint, office paper, magazines, cardboard), mixed containers (plastic, metal food cans, drink cans and Tetra Packs) and glass (bottles and jars); one in each neighbourhood. Almost all Banff residents are within a five-minute walk from a recycling bin. Additionally, the Town operates two large recycling depots.
Banff Recycling and Organics Bin Location Map

Strategic Waste Management Plan (SWMP) – Appendix The City of Yellowknife
Appendix D - 73
Banff Neighbourhood Mini-Depot
Banff Large Recycling Depot
In order to assist residents with recycling opportunities, the Town has developed an extensive list of materials accepted, as seen in the table below.
Town of Banff Accepted Recycling Materials
Mixed paper Newsprint • Clean and dry newspaper
• Advertising inserts
• Brown paper grocery bags
• Pet food bags (no plastic liners)
Office paper • Clean and dry paper (okay to leave staples)
• White or coloured paper
• Photocopies
• Receipts
• Windowed envelopes
• Envelopes (without padding)
• File folders
• Fax paper
• Post-ItTM notes
• Shredded office paper
• Photocopy paper wrapping (ream wrap)
Magazines • Magazines
• Gift wrap
• Glossy fax paper
• Glossy flyers and brochures
• Catalogues
• Phone books
• Soft cover and paperback books
• Junk mail
Cardboard • Clean, dry and flattened cardboard
• Boxboard, shoe, detergent, product boxes etc.
• All food item boxes such as cereal, crackers, beer, pasta etc.
• Corrugated cardboard boxes
• Clean pizza boxes
• Toilet rolls and paper towel rolls
• Cardboard egg cartons and drink trays
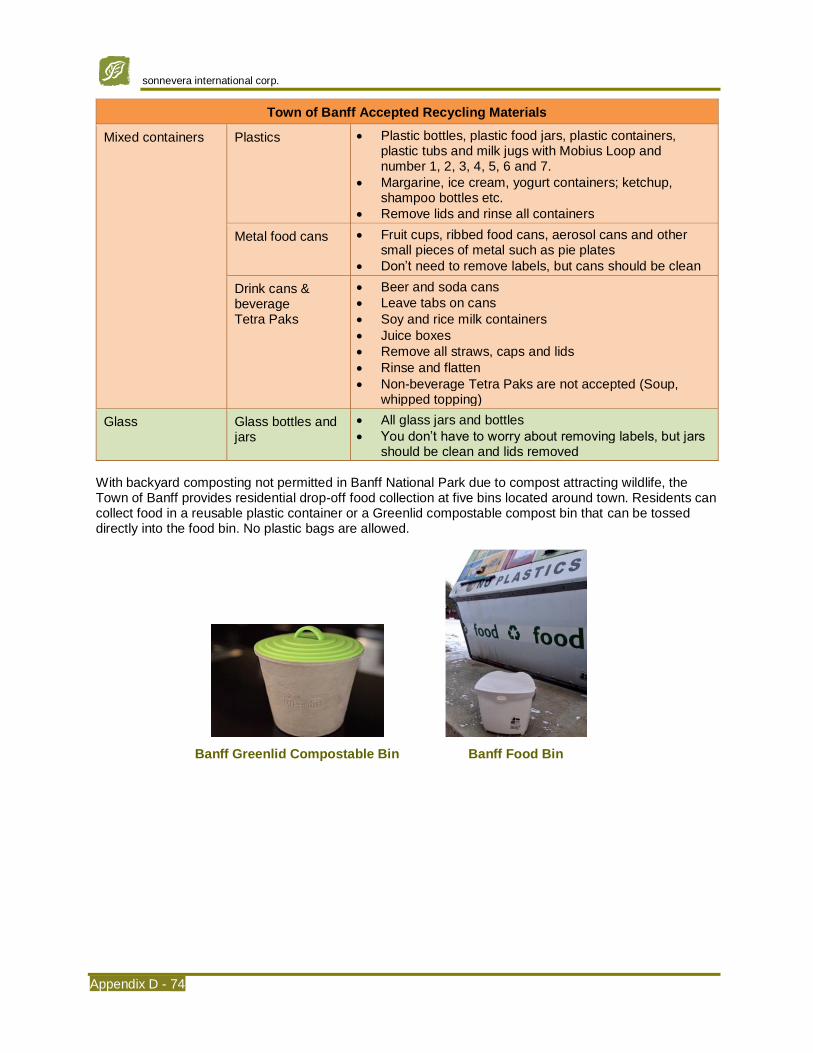
sonnevera international corp.
Appendix D - 74
Town of Banff Accepted Recycling Materials
Mixed containers Plastics • Plastic bottles, plastic food jars, plastic containers, plastic tubs and milk jugs with Mobius Loop and number 1, 2, 3, 4, 5, 6 and 7.
• Margarine, ice cream, yogurt containers; ketchup, shampoo bottles etc.
• Remove lids and rinse all containers
Metal food cans • Fruit cups, ribbed food cans, aerosol cans and other small pieces of metal such as pie plates
• Don’t need to remove labels, but cans should be clean
Drink cans & beverage Tetra Paks
• Beer and soda cans
• Leave tabs on cans
• Soy and rice milk containers
• Juice boxes
• Remove all straws, caps and lids
• Rinse and flatten
• Non-beverage Tetra Paks are not accepted (Soup, whipped topping)
Glass Glass bottles and jars
• All glass jars and bottles
• You don’t have to worry about removing labels, but jars should be clean and lids removed
With backyard composting not permitted in Banff National Park due to compost attracting wildlife, the Town of Banff provides residential drop-off food collection at five bins located around town. Residents can collect food in a reusable plastic container or a Greenlid compostable compost bin that can be tossed directly into the food bin. No plastic bags are allowed.
Banff Greenlid Compostable Bin
Banff Food Bin
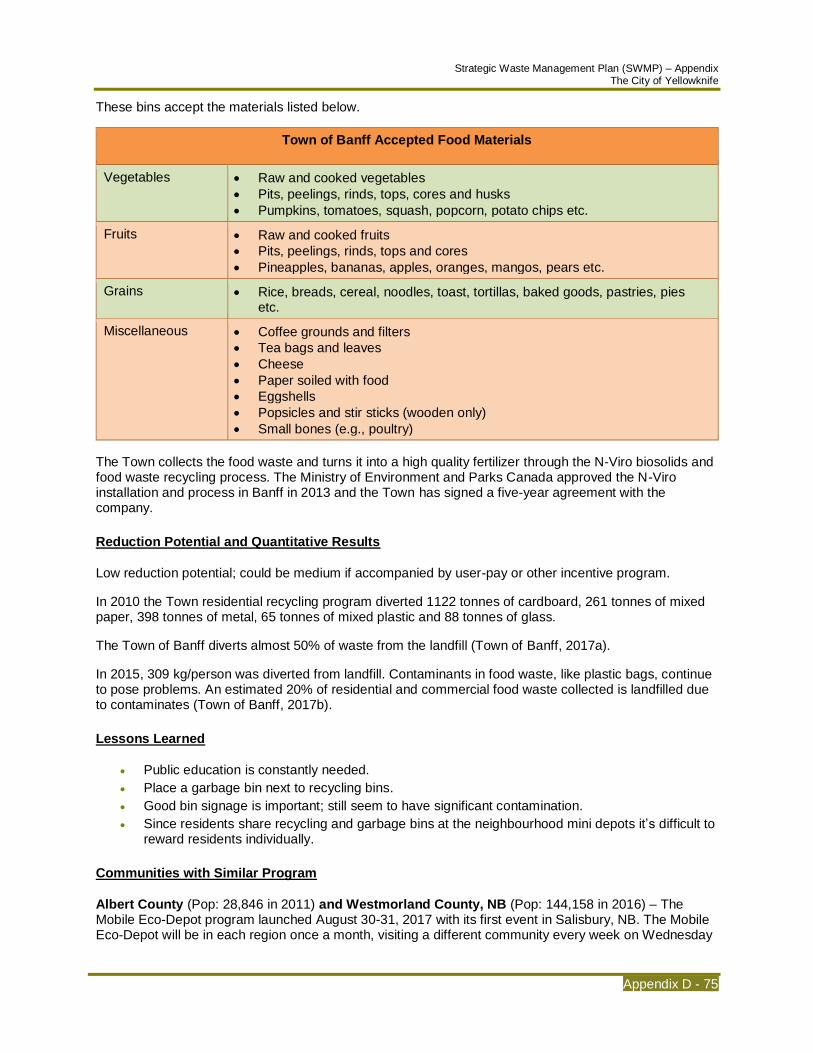
Strategic Waste Management Plan (SWMP) – Appendix The City of Yellowknife
Appendix D - 75
These bins accept the materials listed below.
Town of Banff Accepted Food Materials
Vegetables • Raw and cooked vegetables
• Pits, peelings, rinds, tops, cores and husks
• Pumpkins, tomatoes, squash, popcorn, potato chips etc.
Fruits • Raw and cooked fruits
• Pits, peelings, rinds, tops and cores
• Pineapples, bananas, apples, oranges, mangos, pears etc.
Grains • Rice, breads, cereal, noodles, toast, tortillas, baked goods, pastries, pies etc.
Miscellaneous • Coffee grounds and filters
• Tea bags and leaves
• Cheese
• Paper soiled with food
• Eggshells
• Popsicles and stir sticks (wooden only)
• Small bones (e.g., poultry)
The Town collects the food waste and turns it into a high quality fertilizer through the N-Viro biosolids and food waste recycling process. The Ministry of Environment and Parks Canada approved the N-Viro installation and process in Banff in 2013 and the Town has signed a five-year agreement with the company.
Reduction Potential and Quantitative Results
Low reduction potential; could be medium if accompanied by user-pay or other incentive program.
In 2010 the Town residential recycling program diverted 1122 tonnes of cardboard, 261 tonnes of mixed paper, 398 tonnes of metal, 65 tonnes of mixed plastic and 88 tonnes of glass.
The Town of Banff diverts almost 50% of waste from the landfill (Town of Banff, 2017a).
In 2015, 309 kg/person was diverted from landfill. Contaminants in food waste, like plastic bags, continue to pose problems. An estimated 20% of residential and commercial food waste collected is landfilled due to contaminates (Town of Banff, 2017b).
Lessons Learned
• Public education is constantly needed.
• Place a garbage bin next to recycling bins.
• Good bin signage is important; still seem to have significant contamination.
• Since residents share recycling and garbage bins at the neighbourhood mini depots it’s difficult to reward residents individually.
Communities with Similar Program
Albert County (Pop: 28,846 in 2011) and Westmorland County, NB (Pop: 144,158 in 2016) – The Mobile Eco-Depot program launched August 30-31, 2017 with its first event in Salisbury, NB. The Mobile Eco-Depot will be in each region once a month, visiting a different community every week on Wednesday
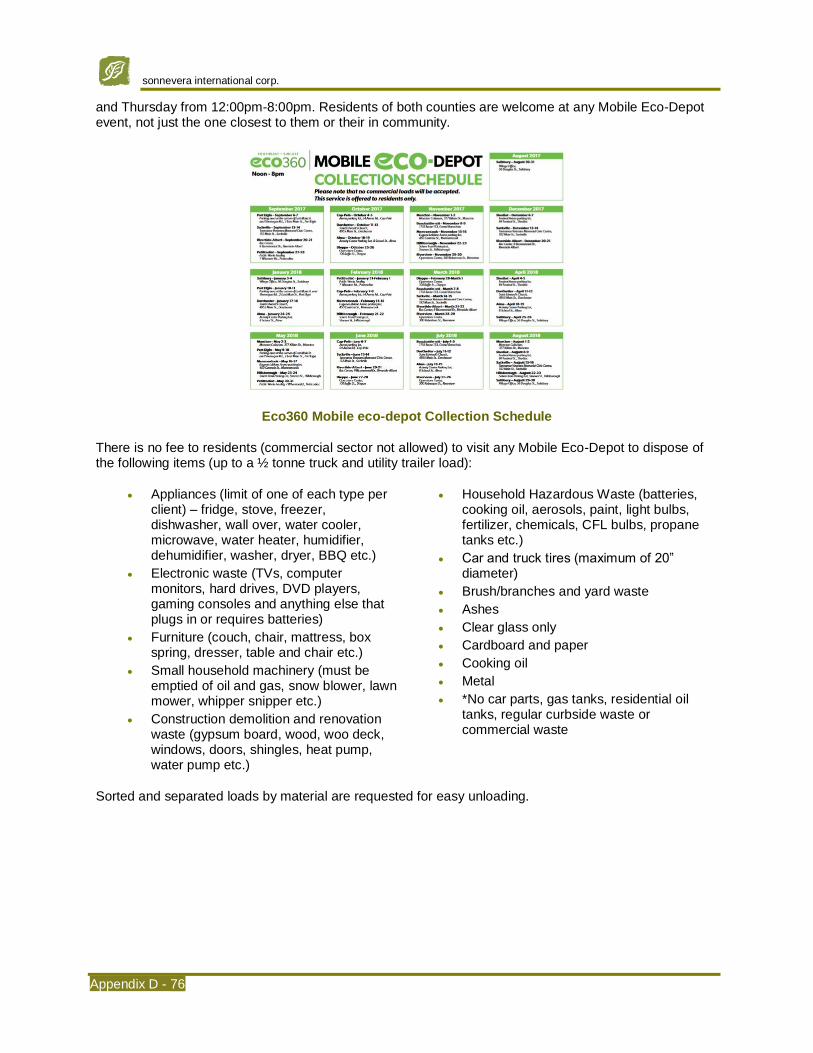
sonnevera international corp.
Appendix D - 76
and Thursday from 12:00pm-8:00pm. Residents of both counties are welcome at any Mobile Eco-Depot event, not just the one closest to them or their in community.
Eco360 Mobile eco-depot Collection Schedule
There is no fee to residents (commercial sector not allowed) to visit any Mobile Eco-Depot to dispose of the following items (up to a ½ tonne truck and utility trailer load):
• Appliances (limit of one of each type per client) – fridge, stove, freezer, dishwasher, wall over, water cooler, microwave, water heater, humidifier, dehumidifier, washer, dryer, BBQ etc.)
• Electronic waste (TVs, computer monitors, hard drives, DVD players, gaming consoles and anything else that plugs in or requires batteries)
• Furniture (couch, chair, mattress, box spring, dresser, table and chair etc.)
• Small household machinery (must be emptied of oil and gas, snow blower, lawn mower, whipper snipper etc.)
• Construction demolition and renovation waste (gypsum board, wood, woo deck, windows, doors, shingles, heat pump, water pump etc.)
• Household Hazardous Waste (batteries, cooking oil, aerosols, paint, light bulbs, fertilizer, chemicals, CFL bulbs, propane tanks etc.)
• Car and truck tires (maximum of 20” diameter)
• Brush/branches and yard waste
• Ashes
• Clear glass only
• Cardboard and paper
• Cooking oil
• Metal
• *No car parts, gas tanks, residential oil tanks, regular curbside waste or commercial waste
Sorted and separated loads by material are requested for easy unloading.
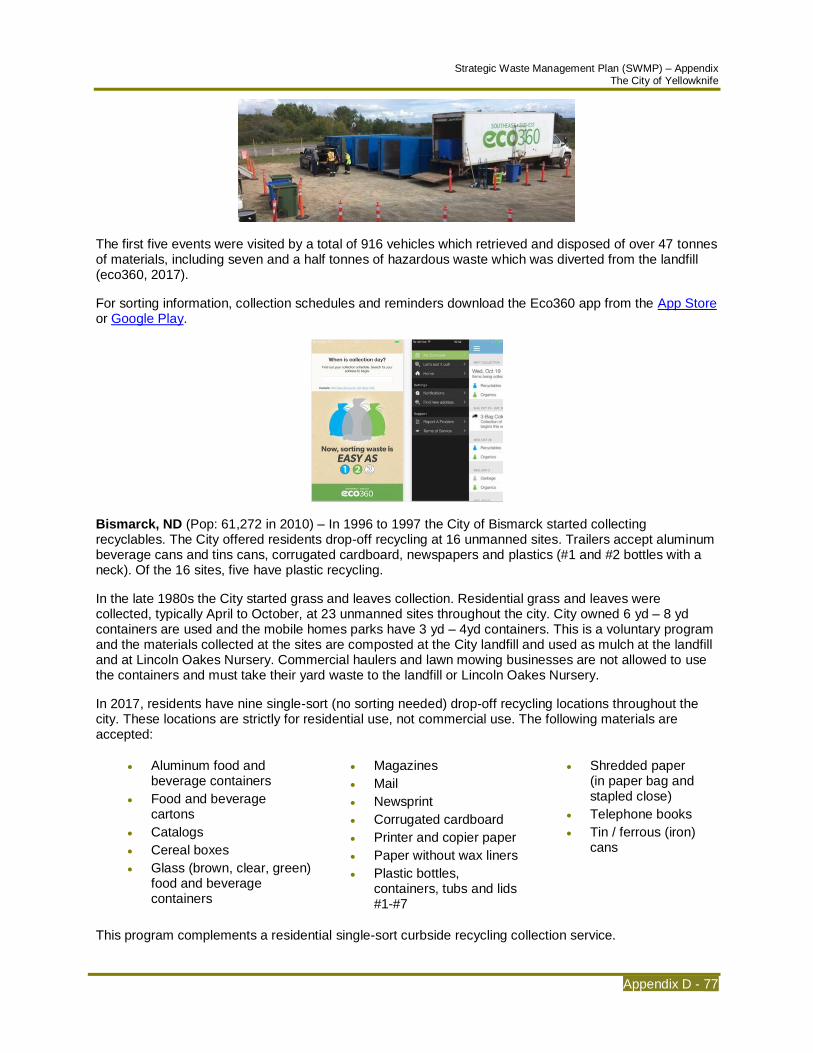
Strategic Waste Management Plan (SWMP) – Appendix The City of Yellowknife
Appendix D - 77
The first five events were visited by a total of 916 vehicles which retrieved and disposed of over 47 tonnes of materials, including seven and a half tonnes of hazardous waste which was diverted from the landfill (eco360, 2017).
For sorting information, collection schedules and reminders download the Eco360 app from the App Store or Google Play.
Bismarck, ND (Pop: 61,272 in 2010) – In 1996 to 1997 the City of Bismarck started collecting recyclables. The City offered residents drop-off recycling at 16 unmanned sites. Trailers accept aluminum beverage cans and tins cans, corrugated cardboard, newspapers and plastics (#1 and #2 bottles with a neck). Of the 16 sites, five have plastic recycling.
In the late 1980s the City started grass and leaves collection. Residential grass and leaves were collected, typically April to October, at 23 unmanned sites throughout the city. City owned 6 yd – 8 yd containers are used and the mobile homes parks have 3 yd – 4yd containers. This is a voluntary program and the materials collected at the sites are composted at the City landfill and used as mulch at the landfill and at Lincoln Oakes Nursery. Commercial haulers and lawn mowing businesses are not allowed to use the containers and must take their yard waste to the landfill or Lincoln Oakes Nursery.
In 2017, residents have nine single-sort (no sorting needed) drop-off recycling locations throughout the city. These locations are strictly for residential use, not commercial use. The following materials are accepted:
• Aluminum food and beverage containers
• Food and beverage cartons
• Catalogs
• Cereal boxes
• Glass (brown, clear, green) food and beverage containers
• Magazines
• Newsprint
• Corrugated cardboard
• Printer and copier paper
• Paper without wax liners
• Plastic bottles, containers, tubs and lids #1-#7
• Shredded paper (in paper bag and stapled close)
• Telephone books
• Tin / ferrous (iron) cans
This program complements a residential single-sort curbside recycling collection service.

sonnevera international corp.
Appendix D - 78
Bismarck Drop-off Recycling Container
Additionally, 18 yard waste drop-off sites for flowers, garden waste, grass and leaves are located throughout the city.
City staff collects the materials from the recycling trailers and yard waste containers and transports it to local recyclers or the landfill composting site. Both programs are funded partly through a $13.00/month garbage fee on the utility bill and landfill tipping fees.
Each Bismarck family is allowed one free load (1/4 pick-up truck or three garbage containers) of compost annually from the City landfill.
Calgary, AB (Pop: 1,239,220 in 2016) - Thirty-nine community single-sort drop-off recycling locations are available to residents that accept the following materials:
• Plastics (#1-#7, excluding foam cups, containers or packaging)
• Plastic bags
• Paper and cardboard
• Glass jars and bottles
• Metal food cans and foil
• Beverage containers
Calgary Google Maps Community Recycling Drop-off Depot Locations
This program complements a residential single-sort curbside recycling collection service.
Effective January 2015, the Waste and Recycling Bylaw prohibits private recycling companies from leaving material at Community Recycling Depots.

Strategic Waste Management Plan (SWMP) – Appendix The City of Yellowknife
Appendix D - 79
Calgary Recycling Drop-off Depot
Cochrane, AB (Pop: 25,853 in 2016) – The Town of Cochrane’s Eco Centre currently accepts over 40 materials including the following:
Fibre
• Newsprint & newspaper
• Corrugated cardboard
• Boxes and tubes
• Egg cartons
• Coloured paper, wrapping paper, brown paper
• Envelopes & junk mail
• Magazines, phonebooks
• Office paper, shredded paper
• Soup labels
Glass
• Food bottles & jars
Plastic
• Plastic wrap, plastic film and film foam, resealable bags, grocery bags
• Plastic jugs & bottles, plastic tubs & pails, plastic cutlery
Metal
• Food cans
• Tin foil & pie plates
• Ferrous and non-ferrous scrap metal
Beverage containers
• Pop, beer, wine & juice bottles
• Milk & juice cartons
• Tetra packs
Electronics
• Monitors, CPUs, laptops
• Printers & faxes
• Keyboards, cables & mice
• TVs
• Printer cartridges
• Cell phones
Household Hazardous Waste
• Paint, cans, aerosol
• Chemicals
• Fertilizers
• Used motor oil, filters & containers
• Used antifreeze
• Pesticide containers
Other
• Lead-acid batteries
• Eyeglasses
• Rechargeable & alkaline household batteries
• Cell phones
• Infant car seats
• Fluorescent tubes & CFLs
• Books, clothing, bicycles
• Yard waste (including seasonal Christmas tree program)
• Food waste, including cooking oil
• Propane Tanks
• Appliances
• Grease and cooking oil
Cochrane is also the only Calgary-area Eco Centre that accepts EPS packing foam, peanuts, foam servingware, take-out containers, meat trays, egg cartons, clamshell containers and styrofoam insulation.
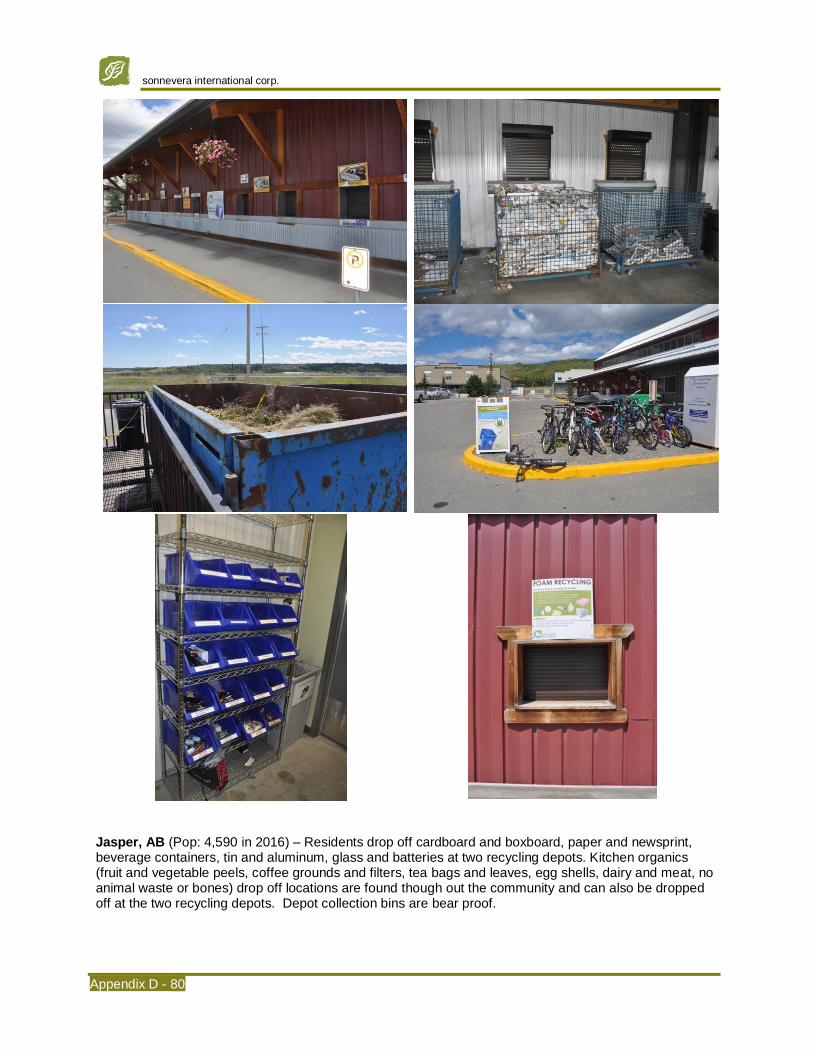
sonnevera international corp.
Appendix D - 80
Jasper, AB (Pop: 4,590 in 2016) – Residents drop off cardboard and boxboard, paper and newsprint, beverage containers, tin and aluminum, glass and batteries at two recycling depots. Kitchen organics (fruit and vegetable peels, coffee grounds and filters, tea bags and leaves, egg shells, dairy and meat, no animal waste or bones) drop off locations are found though out the community and can also be dropped off at the two recycling depots. Depot collection bins are bear proof.
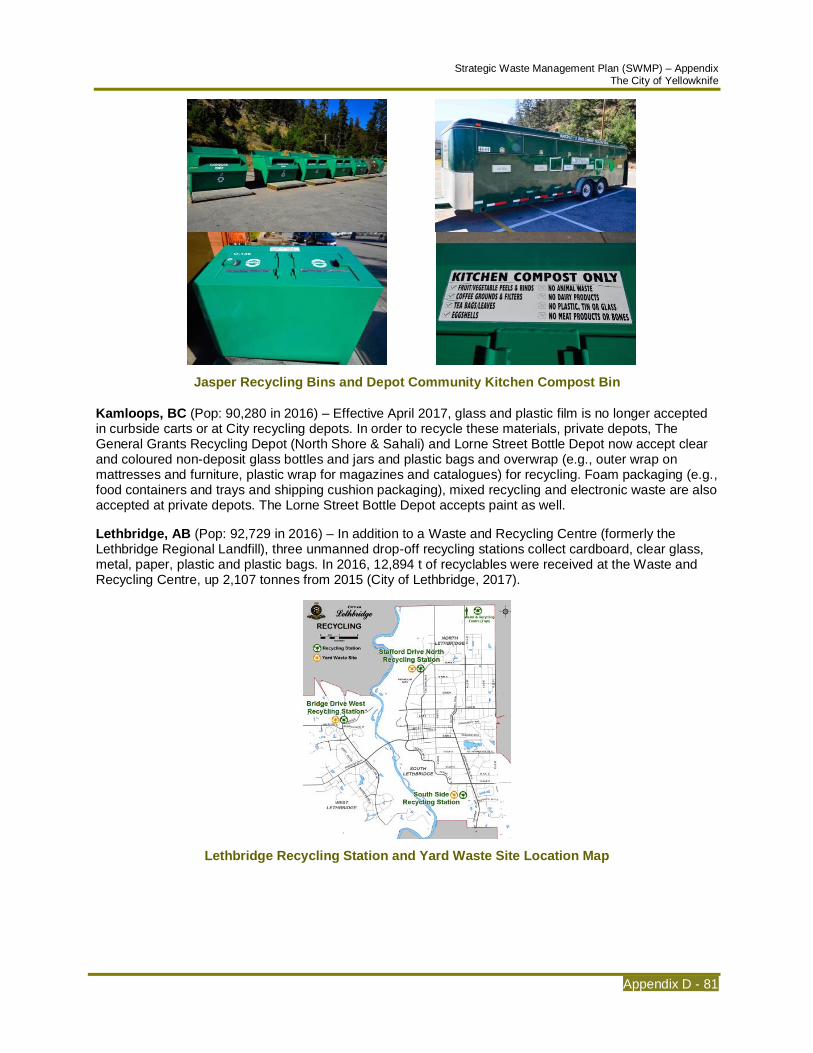
Strategic Waste Management Plan (SWMP) – Appendix The City of Yellowknife
Appendix D - 81
Jasper Recycling Bins and Depot Community Kitchen Compost Bin
Kamloops, BC (Pop: 90,280 in 2016) – Effective April 2017, glass and plastic film is no longer accepted in curbside carts or at City recycling depots. In order to recycle these materials, private depots, The General Grants Recycling Depot (North Shore & Sahali) and Lorne Street Bottle Depot now accept clear and coloured non-deposit glass bottles and jars and plastic bags and overwrap (e.g., outer wrap on mattresses and furniture, plastic wrap for magazines and catalogues) for recycling. Foam packaging (e.g., food containers and trays and shipping cushion packaging), mixed recycling and electronic waste are also accepted at private depots. The Lorne Street Bottle Depot accepts paint as well.
Lethbridge, AB (Pop: 92,729 in 2016) – In addition to a Waste and Recycling Centre (formerly the Lethbridge Regional Landfill), three unmanned drop-off recycling stations collect cardboard, clear glass, metal, paper, plastic and plastic bags. In 2016, 12,894 t of recyclables were received at the Waste and Recycling Centre, up 2,107 tonnes from 2015 (City of Lethbridge, 2017).
Lethbridge Recycling Station and Yard Waste Site Location Map

sonnevera international corp.
Appendix D - 82
Lethbridge Recycling Station
Lethbridge Plastics Signage
Lethbridge Cardboard Signage
Three seasonal (April 1 – November 30) yard waste sites, located at the drop-off recycling stations, accept leaves, grass, branches (up to 8” in diameter), garden trimmings (including weeds), clean pumpkins (not painted) and fallen fruit (removed from tree branches). Yard waste is composted by the City and used in City parks and planting beds. Branches are recycled into wood fibre mulch that may be available to residents at the yard waste site, as supplies permit. Wood mulch is also available and free for the taking at Peenaquim Park when supply is available.
London, ON (Pop: 383,822 in 2016) – In addition to a curbside recycling program, the City of London also has four drop-off locations that accept various waste streams including blue box recyclables; yard waste; electronics; renovation, construction and roofing materials; scrap metal and household garbage.
Markham, ON (Pop: 328,966 in 2016) – The City of Markham has four Community Recycling Depots that collect all Blue Box items (mixed paper and containers), cardboard, cellphones, fluorescent lights and tubes, household batteries, ink cartridges, polystyrene (Styrofoam), plastic bags, scrap metal, textiles and tires.
In 2016 Markham received a $67,000 matching grant from the Federation of Canadian Municipalities to assist with development of a textile recycling program. This program launched on October 18, 2017 with custom dedicated textiles collection bins. By the end of 2017 there will be over 50 Markham managed donation bins across the community located on City property (e.g., Community Recycling Depots, fire stations, community centres). Markham donation bins are also at 60 multi-residential properties with more locations expected by the end of 2017.
Markham Textile Recycling Bins
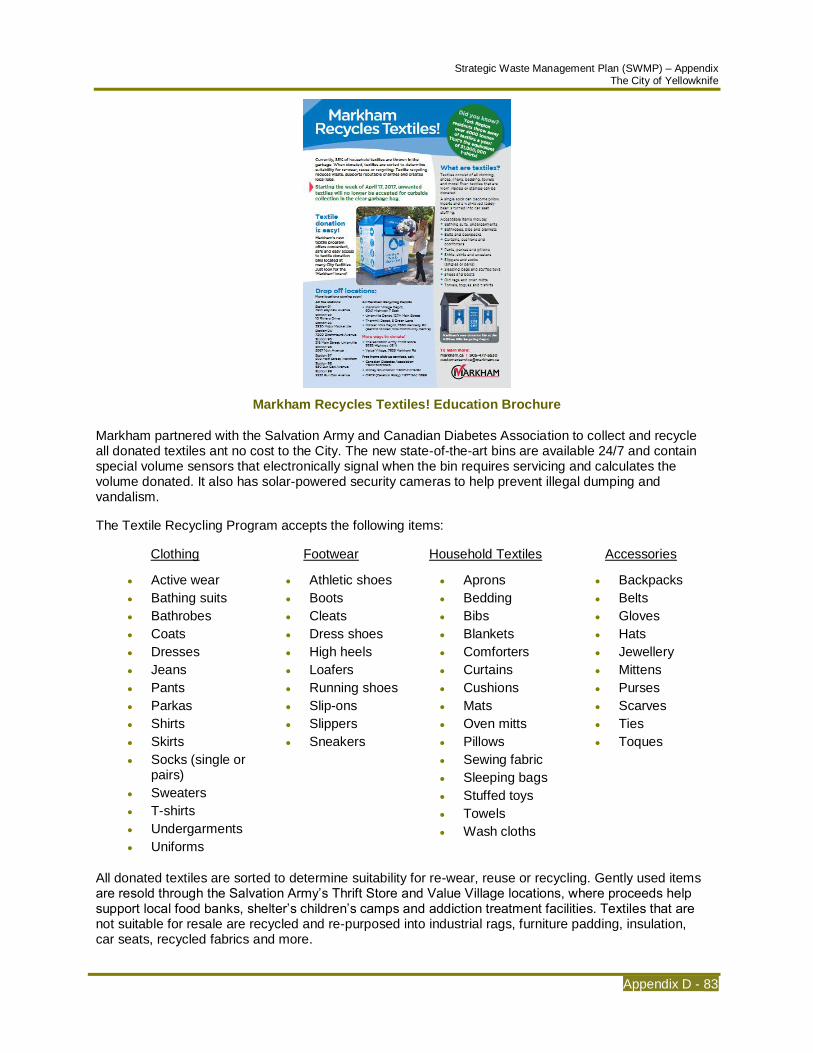
Strategic Waste Management Plan (SWMP) – Appendix The City of Yellowknife
Appendix D - 83
Markham Recycles Textiles! Education Brochure
Markham partnered with the Salvation Army and Canadian Diabetes Association to collect and recycle all donated textiles ant no cost to the City. The new state-of-the-art bins are available 24/7 and contain special volume sensors that electronically signal when the bin requires servicing and calculates the volume donated. It also has solar-powered security cameras to help prevent illegal dumping and vandalism.
The Textile Recycling Program accepts the following items:
Clothing Footwear Household Textiles Accessories
• Active wear
• Bathing suits
• Bathrobes
• Coats
• Dresses
• Jeans
• Pants
• Parkas
• Shirts
• Skirts
• Socks (single or pairs)
• Sweaters
• T-shirts
• Undergarments
• Uniforms
• Athletic shoes
• Boots
• Cleats
• Dress shoes
• High heels
• Loafers
• Running shoes
• Slip-ons
• Slippers
• Sneakers
• Aprons
• Bedding
• Bibs
• Blankets
• Comforters
• Curtains
• Cushions
• Mats
• Oven mitts
• Pillows
• Sewing fabric
• Sleeping bags
• Stuffed toys
• Towels
• Wash cloths
• Backpacks
• Belts
• Gloves
• Hats
• Jewellery
• Mittens
• Purses
• Scarves
• Ties
• Toques
All donated textiles are sorted to determine suitability for re-wear, reuse or recycling. Gently used items are resold through the Salvation Army’s Thrift Store and Value Village locations, where proceeds help support local food banks, shelter’s children’s camps and addiction treatment facilities. Textiles that are not suitable for resale are recycled and re-purposed into industrial rags, furniture padding, insulation, car seats, recycled fabrics and more.
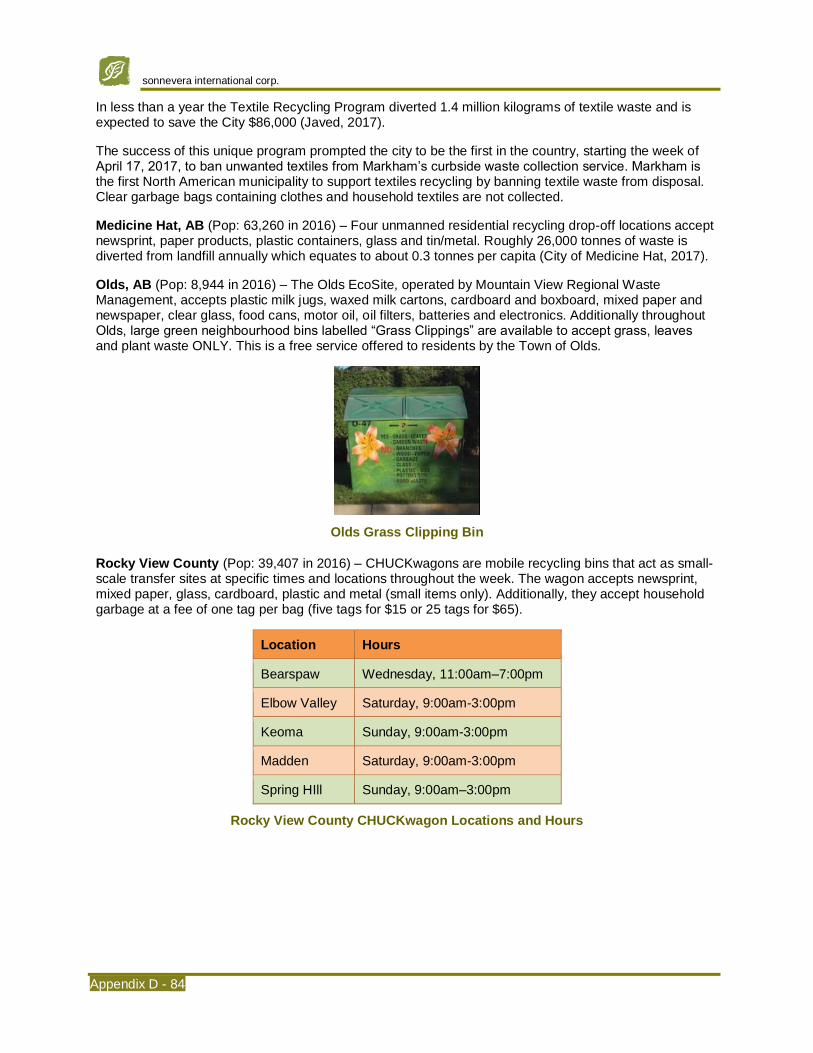
sonnevera international corp.
Appendix D - 84
In less than a year the Textile Recycling Program diverted 1.4 million kilograms of textile waste and is expected to save the City $86,000 (Javed, 2017).
The success of this unique program prompted the city to be the first in the country, starting the week of April 17, 2017, to ban unwanted textiles from Markham’s curbside waste collection service. Markham is the first North American municipality to support textiles recycling by banning textile waste from disposal. Clear garbage bags containing clothes and household textiles are not collected.
Medicine Hat, AB (Pop: 63,260 in 2016) – Four unmanned residential recycling drop-off locations accept newsprint, paper products, plastic containers, glass and tin/metal. Roughly 26,000 tonnes of waste is diverted from landfill annually which equates to about 0.3 tonnes per capita (City of Medicine Hat, 2017).
Olds, AB (Pop: 8,944 in 2016) – The Olds EcoSite, operated by Mountain View Regional Waste Management, accepts plastic milk jugs, waxed milk cartons, cardboard and boxboard, mixed paper and newspaper, clear glass, food cans, motor oil, oil filters, batteries and electronics. Additionally throughout Olds, large green neighbourhood bins labelled “Grass Clippings” are available to accept grass, leaves and plant waste ONLY. This is a free service offered to residents by the Town of Olds.
Olds Grass Clipping Bin
Rocky View County (Pop: 39,407 in 2016) – CHUCKwagons are mobile recycling bins that act as small-scale transfer sites at specific times and locations throughout the week. The wagon accepts newsprint, mixed paper, glass, cardboard, plastic and metal (small items only). Additionally, they accept household garbage at a fee of one tag per bag (five tags for $15 or 25 tags for $65).
Location Hours
Bearspaw Wednesday, 11:00am–7:00pm
Elbow Valley Saturday, 9:00am-3:00pm
Keoma Sunday, 9:00am-3:00pm
Madden Saturday, 9:00am-3:00pm
Spring HIll Sunday, 9:00am–3:00pm
Rocky View County CHUCKwagon Locations and Hours
Strategic Waste Management Plan (SWMP) – Appendix The City of Yellowknife
Appendix D - 85
Contact
Chad Townsend Environmental Coordinator Town of Banff Box 1260 Banff, AB T1L 1A1
T: (403) 762-1110 [email protected]
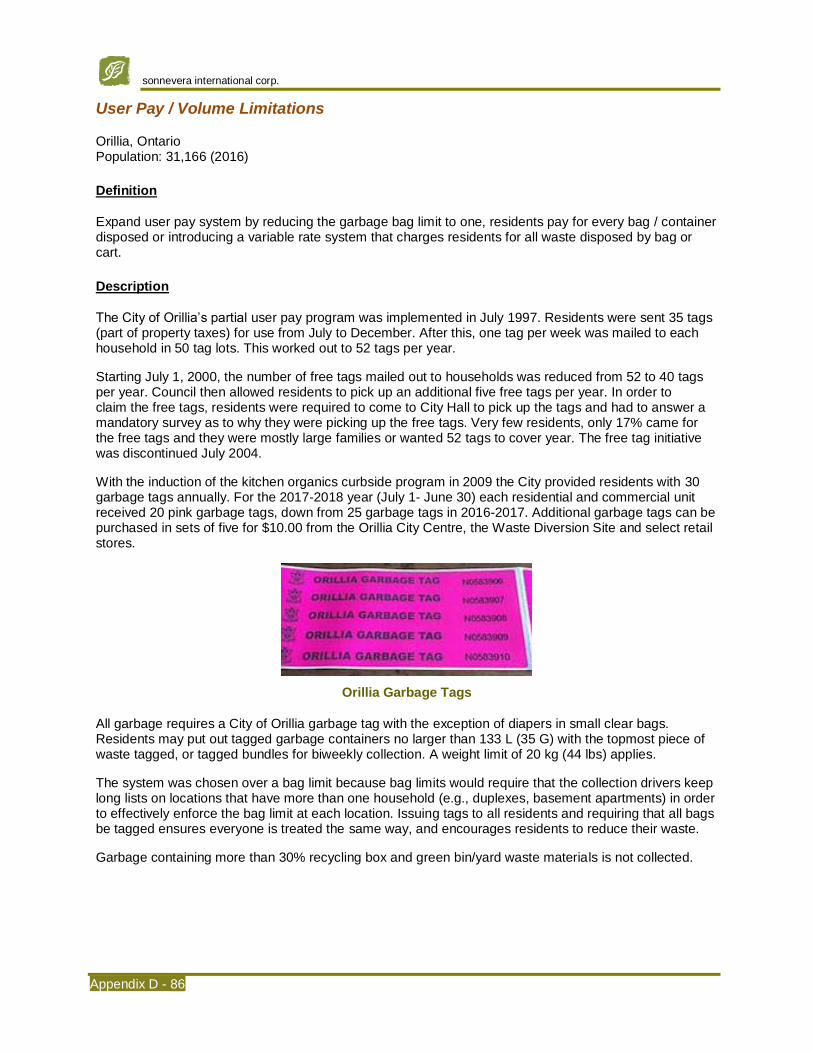
sonnevera international corp.
Appendix D - 86
User Pay / Volume Limitations
Orillia, Ontario Population: 31,166 (2016)
Definition
Expand user pay system by reducing the garbage bag limit to one, residents pay for every bag / container disposed or introducing a variable rate system that charges residents for all waste disposed by bag or cart.
Description
The City of Orillia’s partial user pay program was implemented in July 1997. Residents were sent 35 tags (part of property taxes) for use from July to December. After this, one tag per week was mailed to each household in 50 tag lots. This worked out to 52 tags per year.
Starting July 1, 2000, the number of free tags mailed out to households was reduced from 52 to 40 tags per year. Council then allowed residents to pick up an additional five free tags per year. In order to claim the free tags, residents were required to come to City Hall to pick up the tags and had to answer a mandatory survey as to why they were picking up the free tags. Very few residents, only 17% came for the free tags and they were mostly large families or wanted 52 tags to cover year. The free tag initiative was discontinued July 2004.
With the induction of the kitchen organics curbside program in 2009 the City provided residents with 30 garbage tags annually. For the 2017-2018 year (July 1- June 30) each residential and commercial unit received 20 pink garbage tags, down from 25 garbage tags in 2016-2017. Additional garbage tags can be purchased in sets of five for $10.00 from the Orillia City Centre, the Waste Diversion Site and select retail stores.
Orillia Garbage Tags
All garbage requires a City of Orillia garbage tag with the exception of diapers in small clear bags. Residents may put out tagged garbage containers no larger than 133 L (35 G) with the topmost piece of waste tagged, or tagged bundles for biweekly collection. A weight limit of 20 kg (44 lbs) applies.
The system was chosen over a bag limit because bag limits would require that the collection drivers keep long lists on locations that have more than one household (e.g., duplexes, basement apartments) in order to effectively enforce the bag limit at each location. Issuing tags to all residents and requiring that all bags be tagged ensures everyone is treated the same way, and encourages residents to reduce their waste.
Garbage containing more than 30% recycling box and green bin/yard waste materials is not collected.
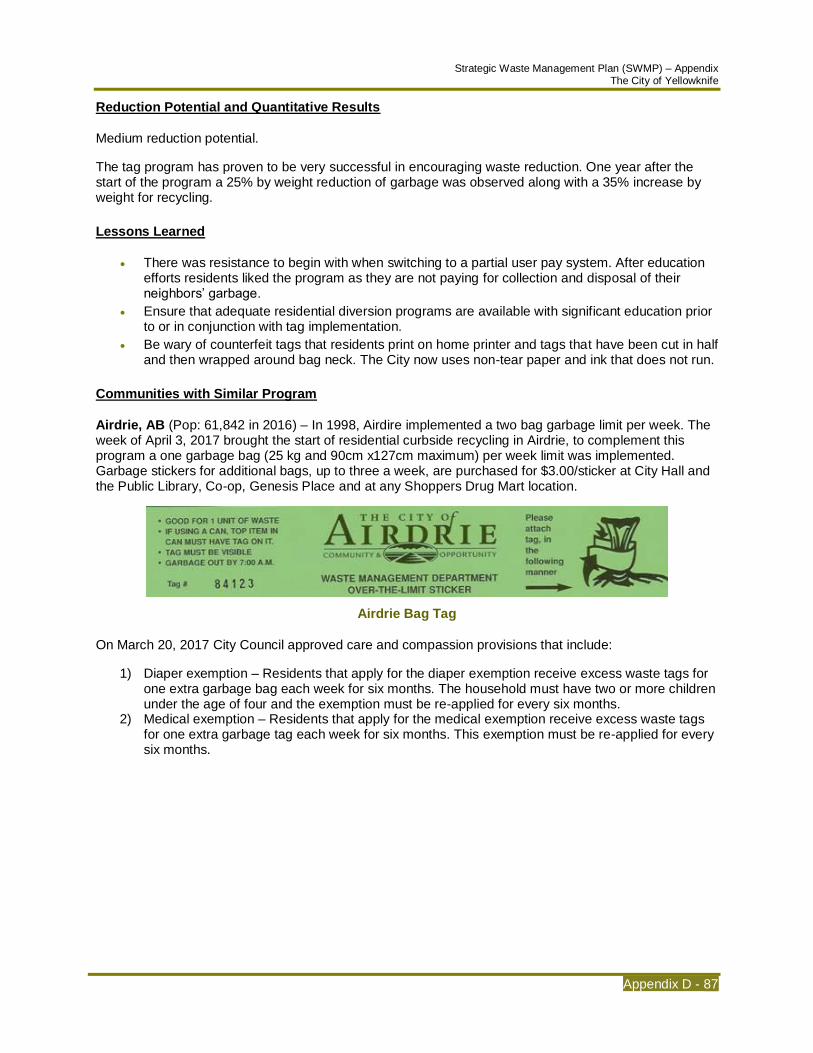
Strategic Waste Management Plan (SWMP) – Appendix The City of Yellowknife
Appendix D - 87
Reduction Potential and Quantitative Results
Medium reduction potential.
The tag program has proven to be very successful in encouraging waste reduction. One year after the start of the program a 25% by weight reduction of garbage was observed along with a 35% increase by weight for recycling.
Lessons Learned
• There was resistance to begin with when switching to a partial user pay system. After education efforts residents liked the program as they are not paying for collection and disposal of their neighbors’ garbage.
• Ensure that adequate residential diversion programs are available with significant education prior to or in conjunction with tag implementation.
• Be wary of counterfeit tags that residents print on home printer and tags that have been cut in half and then wrapped around bag neck. The City now uses non-tear paper and ink that does not run.
Communities with Similar Program
Airdrie, AB (Pop: 61,842 in 2016) – In 1998, Airdire implemented a two bag garbage limit per week. The week of April 3, 2017 brought the start of residential curbside recycling in Airdrie, to complement this program a one garbage bag (25 kg and 90cm x127cm maximum) per week limit was implemented. Garbage stickers for additional bags, up to three a week, are purchased for $3.00/sticker at City Hall and the Public Library, Co-op, Genesis Place and at any Shoppers Drug Mart location.
Airdrie Bag Tag
On March 20, 2017 City Council approved care and compassion provisions that include:
1) Diaper exemption – Residents that apply for the diaper exemption receive excess waste tags for one extra garbage bag each week for six months. The household must have two or more children under the age of four and the exemption must be re-applied for every six months.
2) Medical exemption – Residents that apply for the medical exemption receive excess waste tags for one extra garbage tag each week for six months. This exemption must be re-applied for every six months.

sonnevera international corp.
Appendix D - 88
Athens, GA (Pop: 115,452 in 2010) – The Athens-Clarke County unified government provides Athens residents with a variety of container size options and variable rates for garbage collection.
Roll Cart Sizes1 Average
Number of Bags
Average Number of
People
Monthly Fee for Curbside
and Handicap Customers
Monthly Fee for Backyard Customers
1-20 gallon 1 1 $15.60 $30.60
1-32 gallon 3 2-4 $17.60 $32.60
1-64 gallon 5 5-8 $21.60 $43.60
1-96 gallon 7 10-12 $28.60 $46.60
2-64 gallon 10 12-14 $37.60 $52.60
1-64 gallon and 1-96 gallon 12 14+ $50.60 $65.60
1No roll cart (vacant rate) is $13.60 per month
Athens-Clarke County Variable Garbage Rates
Excess waste bag tags can be purchased for $3.00 per tag.
Overflow stickers are required for all garbage bags left outside of the garbage can. These can be purchased at the Solid Waste Department Office or the Water Business Office for $2 each.
Curbside recycling services (32 and 96 gallon roll carts) are included for residential garbage customers at no additional charge.
Austin, TX (Pop: 790,390 in 2010) – A variable rate garbage cart system is available to residents so they can select the cart size which fits their needs best. Garbage carts sizes and monthly rates are listed below.
Garbage Cart Size 2017 Monthly Fee
24 gallon $17.90
32 gallon $19.15
64 gallon $24.30
96 gallon $42.85
Austin Variable Rate Garbage Cart Program
If a larger garbage cart is desired, there is a $15 one-time cart exchange fee. If the garbage cart is downsized to a smaller cart, there is no charge.
Extra garbage bags that do not fit in the garbage cart with lid closed can be placed next to the garbage cart and tagged with an Extra Garbage Sticker which can be purchased at grocery stores for $4 + tax. Extra bags without a sticker will be charged a per-bag fee of $9.60 + tax.
Barrie, ON (Pop: 141,434 in 2016) – In 1996 the City of Barrie had no bag limit. In 1997, a two bag limit was announced with $1 fee for extra garbage tags. In the Fall of 2005 the extra garbage bag tag increased to $2 per tag followed by the one bag limit and the introduction of the kitchen organics program in May 2006. A significant lesson learned moving to a one bag limit is to be proactive about a strong

Strategic Waste Management Plan (SWMP) – Appendix The City of Yellowknife
Appendix D - 89
educational program before the limit is implemented and to ensure that significant staff is available to answer residential questions in a timely manner.
Effective January 12, 2015, the garbage allowance is two bags or cans per residential dwelling every other week with a 20 kg (40 lbs) maximum per bag/can. Additional bag tags are $3.00 each and can be purchased at a variety of retailers throughout the community.
For more information contact Tracy Quann-Strasser, Waste Reduction Coordinator, at (705) 739-4220 ext. 5822 or [email protected]
Brockville, ON (Pop: 21,346 in 2016) – A one bag/container (maximum of 23 kg/50 lbs and 94 L/26 gal) per week of garbage is allowed. Excess waste bag tags can be purchased for $3.00 per tag. Brush and hedge trimmings may also be collected on garbage day, and are considered extra garbage if placed with regular garbage. Bag tags apply to this yard waste if necessary.
Burnaby, BC (Pop: 232,755 in 2016) – In April 2017, the City introduced every other week residential garbage collection. To promote greater waste reduction and to create incentives, this program offers residents the flexibility to choose which size garbage container meets their needs best. A pricing structure based on the size of the carts selected is found below.
Garbage Container Size and Collection Costs
Toter Container Size (Litres) Disposal Fee
Small 120 $25
Default 180 $75
Medium 240 $205
Large 360 $385
*A five percent discount is applied if the fee is paid on or before the Utility Levy Due Date.
Burnaby Variable Garbage Cart Program

sonnevera international corp.
Appendix D - 90
Burnaby Every Other Week Garbage Collection Brochure
On May 1, 2017, the City started accepting residential requests to make changes to garbage and green bins with the transition into the new garbage collection program. The toter exchange fee ($50) will be waiver once during this period. Additionally, the City will maintain the annual garbage disposal fee for the existing toter size up to a period of two years (until January 2019). After this date, if the resident wishes to keep the larger garbage toter, the City will apply the applicable Annual Garbage Disposal Fee for that size garbage toter. This courtesy is only applicable for exchanges where residents up size their garbage toter by one size (e.g., from 120 L to 180 L or 180 L to 240 L).
Charlottesville, VA (Pop: 43,475 in 2010) – Individual garbage stickers and annual garbage decals are available at City Hall and many convenience and grocery stores in the Charlottesville area.
Garbage Bag Size Maximum Weight Cost Per Sticker
13 gallon sticker 25 lbs $1.05
32 gallon sticker 50 lbs $2.10
Charlottesville Garbage Sticker Options
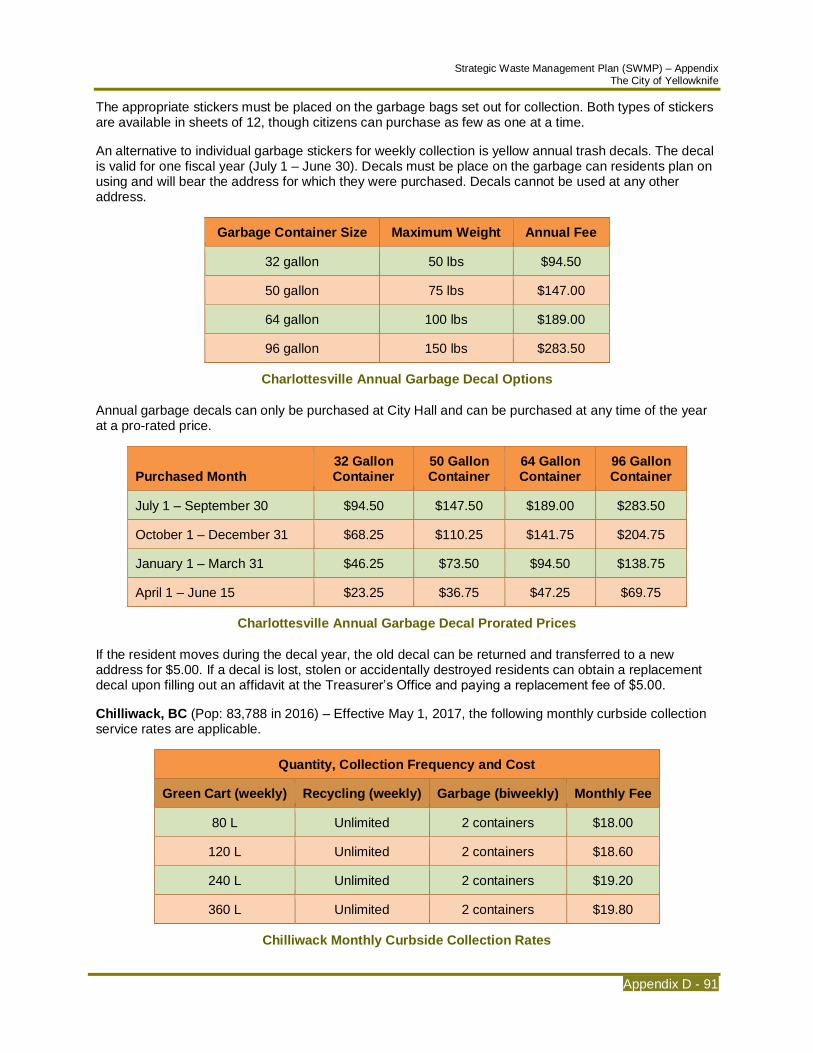
Strategic Waste Management Plan (SWMP) – Appendix The City of Yellowknife
Appendix D - 91
The appropriate stickers must be placed on the garbage bags set out for collection. Both types of stickers are available in sheets of 12, though citizens can purchase as few as one at a time.
An alternative to individual garbage stickers for weekly collection is yellow annual trash decals. The decal is valid for one fiscal year (July 1 – June 30). Decals must be place on the garbage can residents plan on using and will bear the address for which they were purchased. Decals cannot be used at any other address.
Garbage Container Size Maximum Weight Annual Fee
32 gallon 50 lbs $94.50
50 gallon 75 lbs $147.00
64 gallon 100 lbs $189.00
96 gallon 150 lbs $283.50
Charlottesville Annual Garbage Decal Options
Annual garbage decals can only be purchased at City Hall and can be purchased at any time of the year at a pro-rated price.
Purchased Month 32 Gallon Container
50 Gallon Container
64 Gallon Container
96 Gallon Container
July 1 – September 30 $94.50 $147.50 $189.00 $283.50
October 1 – December 31 $68.25 $110.25 $141.75 $204.75
January 1 – March 31 $46.25 $73.50 $94.50 $138.75
April 1 – June 15 $23.25 $36.75 $47.25 $69.75
Charlottesville Annual Garbage Decal Prorated Prices
If the resident moves during the decal year, the old decal can be returned and transferred to a new address for $5.00. If a decal is lost, stolen or accidentally destroyed residents can obtain a replacement decal upon filling out an affidavit at the Treasurer’s Office and paying a replacement fee of $5.00.
Chilliwack, BC (Pop: 83,788 in 2016) – Effective May 1, 2017, the following monthly curbside collection service rates are applicable.
Quantity, Collection Frequency and Cost
Green Cart (weekly) Recycling (weekly) Garbage (biweekly) Monthly Fee
80 L Unlimited 2 containers $18.00
120 L Unlimited 2 containers $18.60
240 L Unlimited 2 containers $19.20
360 L Unlimited 2 containers $19.80
Chilliwack Monthly Curbside Collection Rates
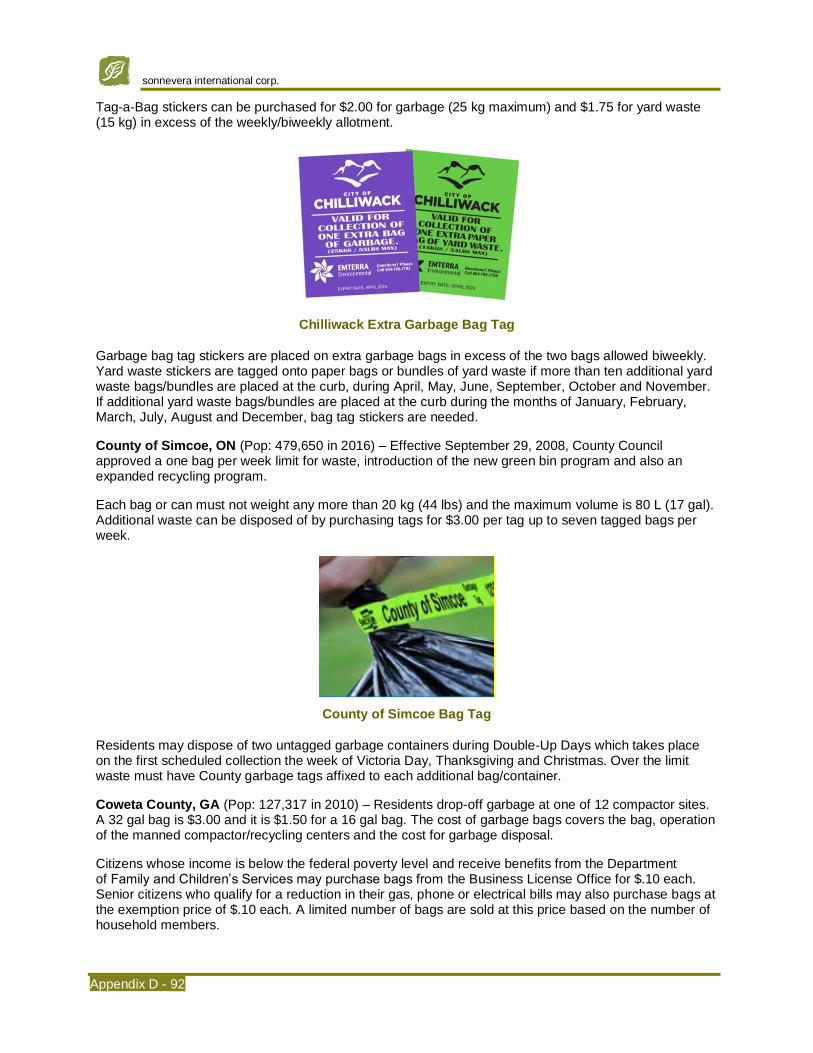
sonnevera international corp.
Appendix D - 92
Tag-a-Bag stickers can be purchased for $2.00 for garbage (25 kg maximum) and $1.75 for yard waste (15 kg) in excess of the weekly/biweekly allotment.
Chilliwack Extra Garbage Bag Tag
Garbage bag tag stickers are placed on extra garbage bags in excess of the two bags allowed biweekly. Yard waste stickers are tagged onto paper bags or bundles of yard waste if more than ten additional yard waste bags/bundles are placed at the curb, during April, May, June, September, October and November. If additional yard waste bags/bundles are placed at the curb during the months of January, February, March, July, August and December, bag tag stickers are needed.
County of Simcoe, ON (Pop: 479,650 in 2016) – Effective September 29, 2008, County Council approved a one bag per week limit for waste, introduction of the new green bin program and also an expanded recycling program.
Each bag or can must not weight any more than 20 kg (44 lbs) and the maximum volume is 80 L (17 gal). Additional waste can be disposed of by purchasing tags for $3.00 per tag up to seven tagged bags per week.
County of Simcoe Bag Tag
Residents may dispose of two untagged garbage containers during Double-Up Days which takes place on the first scheduled collection the week of Victoria Day, Thanksgiving and Christmas. Over the limit waste must have County garbage tags affixed to each additional bag/container.
Coweta County, GA (Pop: 127,317 in 2010) – Residents drop-off garbage at one of 12 compactor sites. A 32 gal bag is $3.00 and it is $1.50 for a 16 gal bag. The cost of garbage bags covers the bag, operation of the manned compactor/recycling centers and the cost for garbage disposal.
Citizens whose income is below the federal poverty level and receive benefits from the Department of Family and Children’s Services may purchase bags from the Business License Office for $.10 each. Senior citizens who qualify for a reduction in their gas, phone or electrical bills may also purchase bags at the exemption price of $.10 each. A limited number of bags are sold at this price based on the number of household members.

Strategic Waste Management Plan (SWMP) – Appendix The City of Yellowknife
Appendix D - 93
Craven County, NC (Pop: 103,505 in 2010) – On July 1, 2012, garbage stickers decreased from $2.50 to $2.25 per sticker. The number of stickers required correlates to the garbage container size, for instance:
• Up to 33 gallons, not more than 50 lbs, is one sticker.
• 34-64 gallons, not more than 100 lbs, is two stickers.
• 65-90 gallons, not more than 150 lbs, is three stickers.
Dufferin County, ON (Pop: 61,735 in 2016) – One untagged bag container of garbage is collected per week. Garbage that exceeds this limit must have a bag tag ($2 each) attached. Garbage must be placed at the curb:
• In a clear colourless garbage bag
• In a clear colourless bag within a garbage container
• Loose in a container
Non-transparent (opaque) bags are not collected.
Each bag/container may contain two opaque privacy bags, no larger than 51 cm x 56 cm (20” x 22”).
Each bag/container must not exceed 20 kg (44 lbs), 79 cm x 107 cm (31” x 42”) and 125 L (33 gal).
Residents may dispose of two untagged bags /containers of garbage on designated collection day during the weeks of Victoria Day, Thanksgiving and Christmas.
The County considers bag limit exemptions for families with two or more children under four that use diapers, for medical reasons and for registered accessory apartments.
Durham Region, ON (Pop: 645,862 in 2016) – A four bag/container limit exists per biweekly household collection with a maximum weight of 20 kg (44 lbs). Garbage bag tags can be purchased for $2.50 each at municipal facilities for bags/containers that are over the limit.
Durham Region Extra Bag Tag
Edson, AB (Pop: 8,414 in 2016) – In March 1998, the Town of Edson started a two-bag or container maximum for weekly residential collection. The maximum garbage bag size allowed is 30” x 36”, while the garbage can maximum size is 80 L. Either container has a maximum weight of 40 lbs. Each bag or container in excess of two requires the purchase of a $2.00 tag from the Town Office or Leisure Centre.
Edson Extra Garbage Sticker
Georgina, ON (Pop: 45,418 in 2016) – Each household is permitted to set out one free garbage bag or container with a 22 kg (50 lb) maximum every other week. Disposable bags cannot exceed 76 cm x 122 cm (30” x 48”) for bags, boxes are to be closed and no larger than 76 cm x 122 cm (30” x 48”) and refuse cans/containers are to be reusable metal or plastic, no larger than 50 m (20”) in diameter and 90 cm (36”) in height and have handles and a lid. Additional garbage tags can be purchased from the Civic Centre,
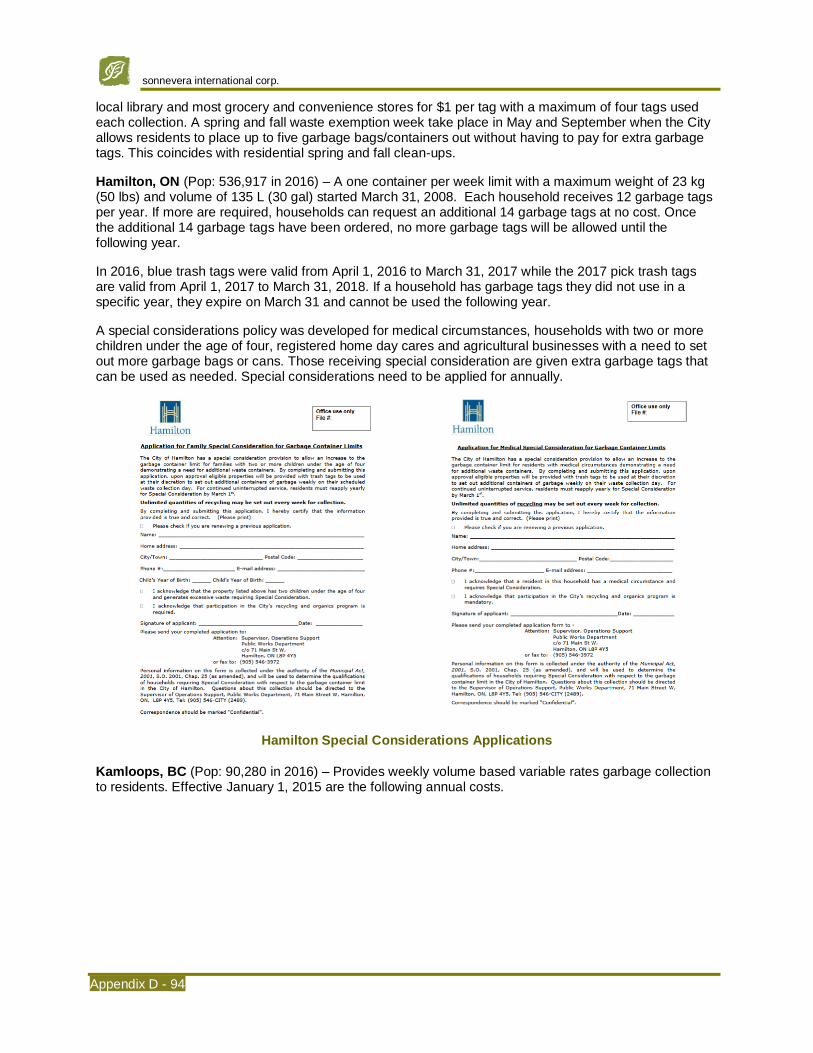
sonnevera international corp.
Appendix D - 94
local library and most grocery and convenience stores for $1 per tag with a maximum of four tags used each collection. A spring and fall waste exemption week take place in May and September when the City allows residents to place up to five garbage bags/containers out without having to pay for extra garbage tags. This coincides with residential spring and fall clean-ups.
Hamilton, ON (Pop: 536,917 in 2016) – A one container per week limit with a maximum weight of 23 kg (50 lbs) and volume of 135 L (30 gal) started March 31, 2008. Each household receives 12 garbage tags per year. If more are required, households can request an additional 14 garbage tags at no cost. Once the additional 14 garbage tags have been ordered, no more garbage tags will be allowed until the following year.
In 2016, blue trash tags were valid from April 1, 2016 to March 31, 2017 while the 2017 pick trash tags are valid from April 1, 2017 to March 31, 2018. If a household has garbage tags they did not use in a specific year, they expire on March 31 and cannot be used the following year.
A special considerations policy was developed for medical circumstances, households with two or more children under the age of four, registered home day cares and agricultural businesses with a need to set out more garbage bags or cans. Those receiving special consideration are given extra garbage tags that can be used as needed. Special considerations need to be applied for annually.
Hamilton Special Considerations Applications
Kamloops, BC (Pop: 90,280 in 2016) – Provides weekly volume based variable rates garbage collection to residents. Effective January 1, 2015 are the following annual costs.
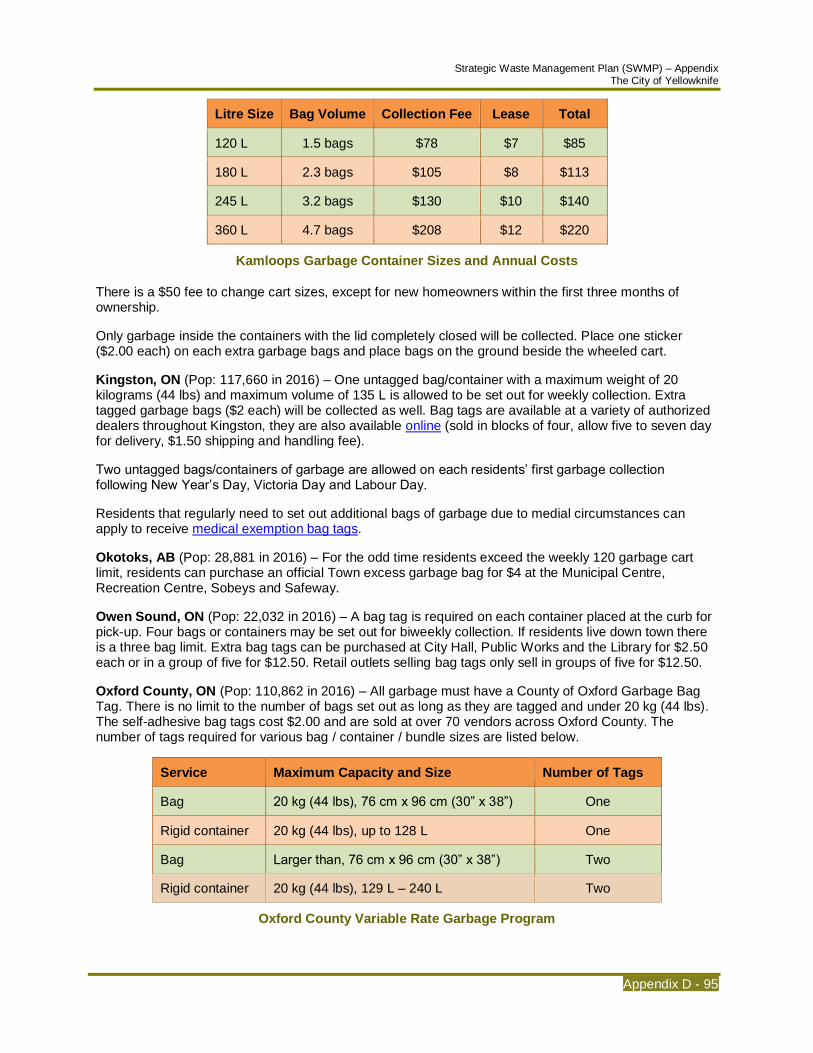
Strategic Waste Management Plan (SWMP) – Appendix The City of Yellowknife
Appendix D - 95
Litre Size Bag Volume Collection Fee Lease Total
120 L 1.5 bags $78 $7 $85
180 L 2.3 bags $105 $8 $113
245 L 3.2 bags $130 $10 $140
360 L 4.7 bags $208 $12 $220
Kamloops Garbage Container Sizes and Annual Costs
There is a $50 fee to change cart sizes, except for new homeowners within the first three months of ownership.
Only garbage inside the containers with the lid completely closed will be collected. Place one sticker ($2.00 each) on each extra garbage bags and place bags on the ground beside the wheeled cart.
Kingston, ON (Pop: 117,660 in 2016) – One untagged bag/container with a maximum weight of 20 kilograms (44 lbs) and maximum volume of 135 L is allowed to be set out for weekly collection. Extra tagged garbage bags ($2 each) will be collected as well. Bag tags are available at a variety of authorized dealers throughout Kingston, they are also available online (sold in blocks of four, allow five to seven day for delivery, $1.50 shipping and handling fee).
Two untagged bags/containers of garbage are allowed on each residents’ first garbage collection following New Year’s Day, Victoria Day and Labour Day.
Residents that regularly need to set out additional bags of garbage due to medial circumstances can apply to receive medical exemption bag tags.
Okotoks, AB (Pop: 28,881 in 2016) – For the odd time residents exceed the weekly 120 garbage cart limit, residents can purchase an official Town excess garbage bag for $4 at the Municipal Centre, Recreation Centre, Sobeys and Safeway.
Owen Sound, ON (Pop: 22,032 in 2016) – A bag tag is required on each container placed at the curb for pick-up. Four bags or containers may be set out for biweekly collection. If residents live down town there is a three bag limit. Extra bag tags can be purchased at City Hall, Public Works and the Library for $2.50 each or in a group of five for $12.50. Retail outlets selling bag tags only sell in groups of five for $12.50.
Oxford County, ON (Pop: 110,862 in 2016) – All garbage must have a County of Oxford Garbage Bag Tag. There is no limit to the number of bags set out as long as they are tagged and under 20 kg (44 lbs). The self-adhesive bag tags cost $2.00 and are sold at over 70 vendors across Oxford County. The number of tags required for various bag / container / bundle sizes are listed below.
Service Maximum Capacity and Size Number of Tags
Bag 20 kg (44 lbs), 76 cm x 96 cm (30” x 38”) One
Rigid container 20 kg (44 lbs), up to 128 L One
Bag Larger than, 76 cm x 96 cm (30” x 38”) Two
Rigid container 20 kg (44 lbs), 129 L – 240 L Two
Oxford County Variable Rate Garbage Program

sonnevera international corp.
Appendix D - 96
Poquoson, VA (Pop: 12,150 in 2010) – Residents can select from the following garbage collection plans effective July 1, 2015:
Plan A (weekly) – 35 gallon container ($24.75 bimonthly fee)
Plan B (weekly) – 65 gallon container ($41 bimonthly fee)
Plan C (weekly) – Two, 65 gallon container ($75 bimonthly fee)
Plan D (biweekly) – 35 gallon container for homeowners age 65 and older ($15 bimonthly fee)
Plan E – No container (use City disposal bags), plus cost of bags ($8.25 bimonthly fee). This plan is reserved for residents of townhouses and dwellings that the City and contractor providing the collection service has determined that containers cannot be serviced.
Green plastic bags (30 gallon, 50 lb maximum) bearing the City’s seal can be purchased at local stores for $1.75/bag or five bags for $8.75 for extra garbage that does not fit into the containers.
Portland, OR (Pop: 583,776 in 2010) – Standard garbage service is every other week. Residents select the black cart size that best fits their garbage collection needs.
Portland Garbage Cart Options
In 2017, the 20 gallon cart is $24.50/month, 35 gallon cart is $29.15/month, 60 gallon cart is $35.00/month and 90 gallon cart is $41.50/month.
Prince George, BC (Pop: 74,003 in 2016) – In 2004, the City of Prince George implemented a variable cart collection system. Prior to the implementation of the program, a survey found that residents placed, on average, 3.18 cans/bags out on each collection day. With this information, City staff developed a system that defaulted to a medium cart size equivalent to three bags of garbage. The current 2017 rates and cart sizes are provided in the table below.
Cart Litre Size Bag Volume Annual Collection Fee1
Subscription Level
Small 135 L/35 gal 1.5 – 2 $146 10%
Medium 250 L/65 gal 3 $192 80%
Large 360 L/95 gal 4 – 5 $233 10%
1Includes 10% discount for paying utility bill on time.
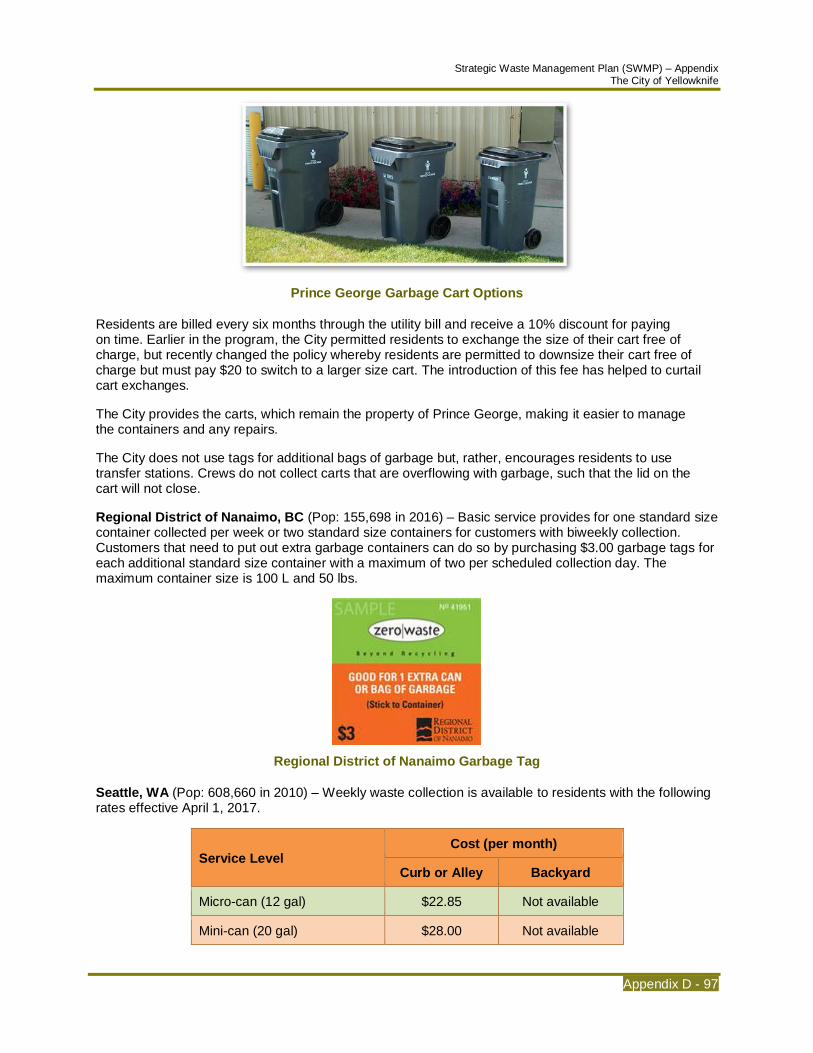
Strategic Waste Management Plan (SWMP) – Appendix The City of Yellowknife
Appendix D - 97
Prince George Garbage Cart Options
Residents are billed every six months through the utility bill and receive a 10% discount for paying on time. Earlier in the program, the City permitted residents to exchange the size of their cart free of charge, but recently changed the policy whereby residents are permitted to downsize their cart free of charge but must pay $20 to switch to a larger size cart. The introduction of this fee has helped to curtail cart exchanges.
The City provides the carts, which remain the property of Prince George, making it easier to manage the containers and any repairs.
The City does not use tags for additional bags of garbage but, rather, encourages residents to use transfer stations. Crews do not collect carts that are overflowing with garbage, such that the lid on the cart will not close.
Regional District of Nanaimo, BC (Pop: 155,698 in 2016) – Basic service provides for one standard size container collected per week or two standard size containers for customers with biweekly collection. Customers that need to put out extra garbage containers can do so by purchasing $3.00 garbage tags for each additional standard size container with a maximum of two per scheduled collection day. The maximum container size is 100 L and 50 lbs.
Regional District of Nanaimo Garbage Tag
Seattle, WA (Pop: 608,660 in 2010) – Weekly waste collection is available to residents with the following rates effective April 1, 2017.
Service Level Cost (per month)
Curb or Alley Backyard
Micro-can (12 gal) $22.85 Not available
Mini-can (20 gal) $28.00 Not available
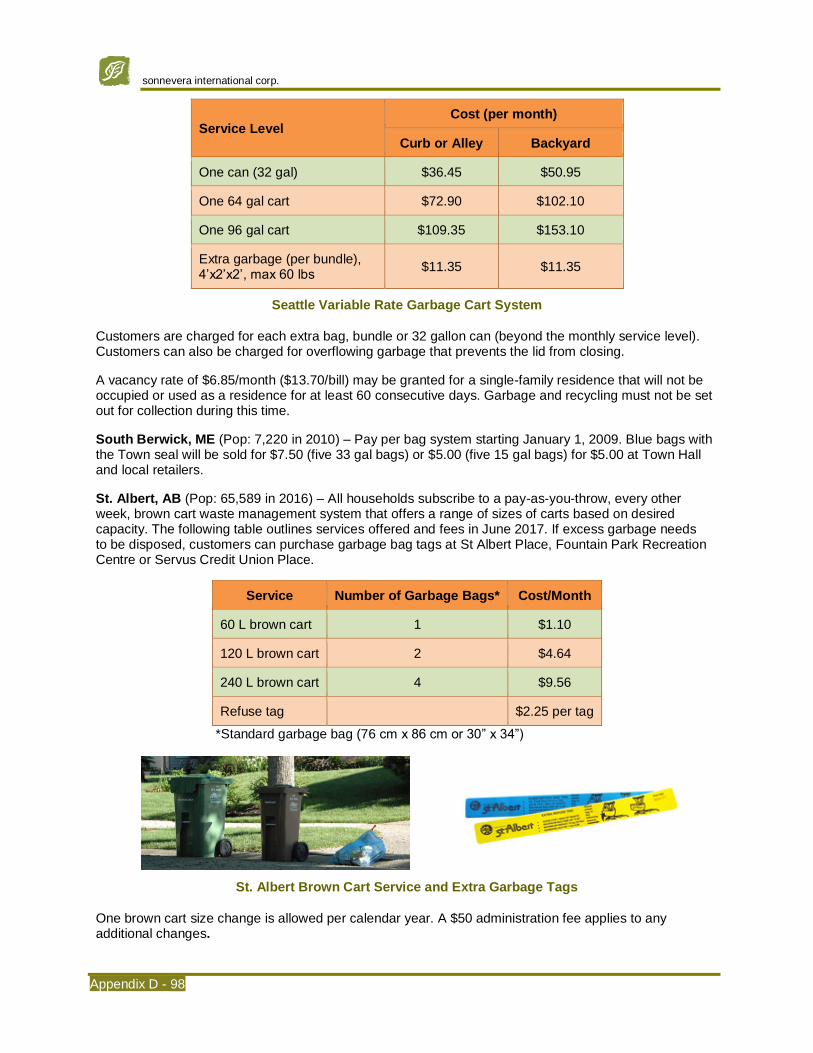
sonnevera international corp.
Appendix D - 98
Service Level Cost (per month)
Curb or Alley Backyard
One can (32 gal) $36.45 $50.95
One 64 gal cart $72.90 $102.10
One 96 gal cart $109.35 $153.10
Extra garbage (per bundle), 4’x2’x2’, max 60 lbs
$11.35 $11.35
Seattle Variable Rate Garbage Cart System
Customers are charged for each extra bag, bundle or 32 gallon can (beyond the monthly service level). Customers can also be charged for overflowing garbage that prevents the lid from closing.
A vacancy rate of $6.85/month ($13.70/bill) may be granted for a single-family residence that will not be occupied or used as a residence for at least 60 consecutive days. Garbage and recycling must not be set out for collection during this time.
South Berwick, ME (Pop: 7,220 in 2010) – Pay per bag system starting January 1, 2009. Blue bags with the Town seal will be sold for $7.50 (five 33 gal bags) or $5.00 (five 15 gal bags) for $5.00 at Town Hall and local retailers.
St. Albert, AB (Pop: 65,589 in 2016) – All households subscribe to a pay-as-you-throw, every other week, brown cart waste management system that offers a range of sizes of carts based on desired capacity. The following table outlines services offered and fees in June 2017. If excess garbage needs to be disposed, customers can purchase garbage bag tags at St Albert Place, Fountain Park Recreation Centre or Servus Credit Union Place.
Service Number of Garbage Bags* Cost/Month
60 L brown cart 1 $1.10
120 L brown cart 2 $4.64
240 L brown cart 4 $9.56
Refuse tag $2.25 per tag
*Standard garbage bag (76 cm x 86 cm or 30” x 34”)
St. Albert Brown Cart Service and Extra Garbage Tags
One brown cart size change is allowed per calendar year. A $50 administration fee applies to any additional changes.

Strategic Waste Management Plan (SWMP) – Appendix The City of Yellowknife
Appendix D - 99
Stratford, ON (Pop: 31,465 in 2016) – Residents pay directly for the cost of collecting and disposing of garbage at the landfill site. The pay as you waste system treats garbage like a utility where decreased usage means decreased costs. All garbage placed out for pick-up needs to be tagged for collection. Rates in June 2017 are listed in the following table.
Type of Garbage Set Out Capacity and Size Cost (number of
tags needed)
Plastic Bag Up to 30” x 38” or 76 cm x 96 cm,
85 L, maximum 22 kg/50 lbs
$2.50 (1 tag)
Plastic Bag (Grocery Bag) Standard plastic grocery bag with
two handles
(1/2 tag cut
lengthwise)
Rigid Container Up to 128 L, maximum 22 kg/50 lbs $2.50 (1 tag)
129 L to 240 L ‘Carts Ahoy’ $5.00 (2 tags)
241 L to 360 L ‘Carts Ahoy’ $7.50 (3 tags)
Bundle (must be tied) 22 kg or 50 lbs, 100 cm x 50 cm x 50
cm or 39” x 20” x 20”
$2.50 (1 tag)
Landfill Drop-off Bag or can (up to 5 bags or cans) $3.00 per bag or can
Landfill Drop-off Loose loads of garbage (or more
than 5 bags or cans)
$77.00 per tonne
$15.00 minimum fee
Sunshine Coast Regional District, BC (Pop: 29,970 in 2016) – Residents are allowed to set out one 77-litre can with a maximum weight of 20 kg (44 lbs) of garbage each week. Extra garbage stickers can be purchased for $2.50 each.
Toronto, ON (Pop: 2,731,571 in 2016) – A biweekly volume based variable rate grey cart collection system is offered to residents. Curbside collection rates effective January 1, 2017 are in the table below.
Garbage Cart Size Number of Garbage Bags Annual Cost Rebate* Annual Net Cost
Small 1 $249.67 $227.01 $22.66
Medium 1 ½ $303.08 $163.76 $139.32
Large 3 $411.62 $72.41 $339.21
Extra-large 4 ½ $477.44 $0.00 $477.44
*Each single family utility account receives one annual rebate prorated accordingly on each utility bill. The rebate is per year, regardless of how many garbage bins are ordered. The rebate is applied once (based on the largest garbage bin on the account) and the annual fee associated with any additional garbage bins is charged at full cost.
Toronto Single Family Home Curbside Bin Collection (includes garbage, recycling, organics, yard waste and household hazardous waste collection)
The City will collect additional garbage if each bag has an extra garbage bag tag attached to it. Bag tags can be purchased online or at Toronto Canadian Tire and Shoppers Drug Mart stores for $5.11 per tag.
The dialysis exemption program includes one large garbage bin for dialysis waste plus a garbage bin (small, medium, large or extra-large) for regular garbage. The dialysis exemption application must be renewed by December 31 of each year.
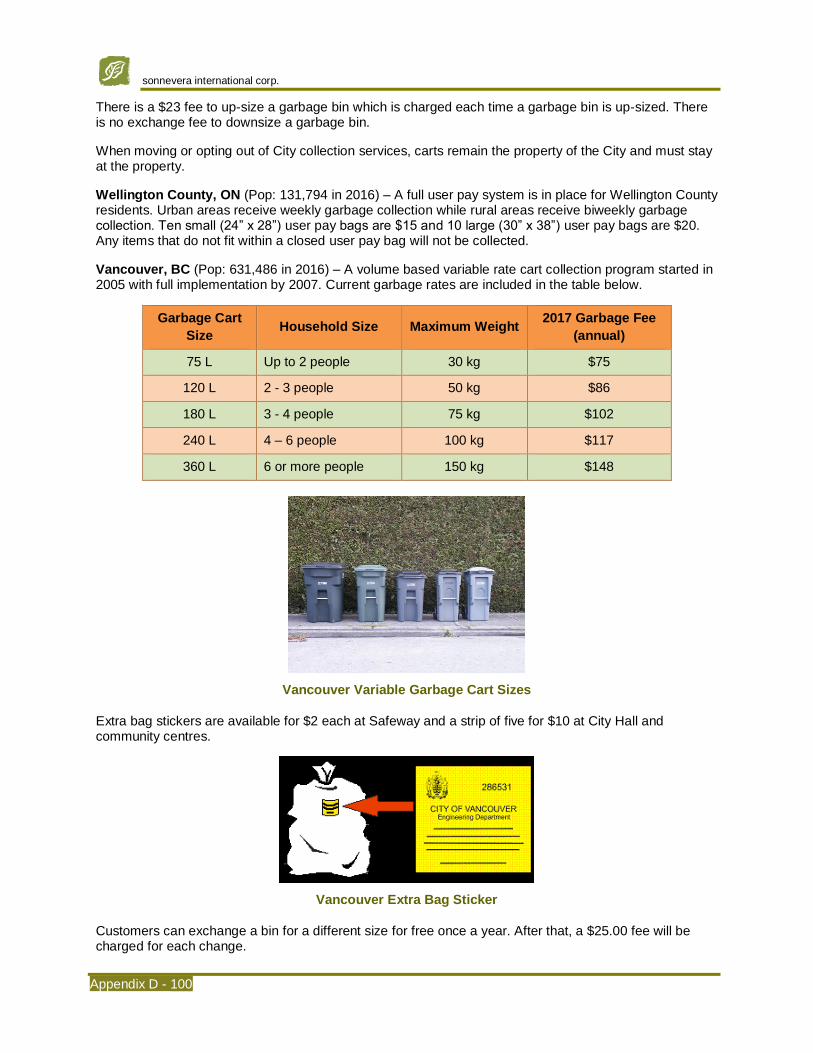
sonnevera international corp.
Appendix D - 100
There is a $23 fee to up-size a garbage bin which is charged each time a garbage bin is up-sized. There is no exchange fee to downsize a garbage bin.
When moving or opting out of City collection services, carts remain the property of the City and must stay at the property.
Wellington County, ON (Pop: 131,794 in 2016) – A full user pay system is in place for Wellington County residents. Urban areas receive weekly garbage collection while rural areas receive biweekly garbage collection. Ten small (24” x 28”) user pay bags are $15 and 10 large (30” x 38”) user pay bags are $20. Any items that do not fit within a closed user pay bag will not be collected.
Vancouver, BC (Pop: 631,486 in 2016) – A volume based variable rate cart collection program started in 2005 with full implementation by 2007. Current garbage rates are included in the table below.
Garbage Cart
Size Household Size Maximum Weight
2017 Garbage Fee
(annual)
75 L Up to 2 people 30 kg $75
120 L 2 - 3 people 50 kg $86
180 L 3 - 4 people 75 kg $102
240 L 4 – 6 people 100 kg $117
360 L 6 or more people 150 kg $148
Vancouver Variable Garbage Cart Sizes
Extra bag stickers are available for $2 each at Safeway and a strip of five for $10 at City Hall and community centres.
Vancouver Extra Bag Sticker
Customers can exchange a bin for a different size for free once a year. After that, a $25.00 fee will be charged for each change.
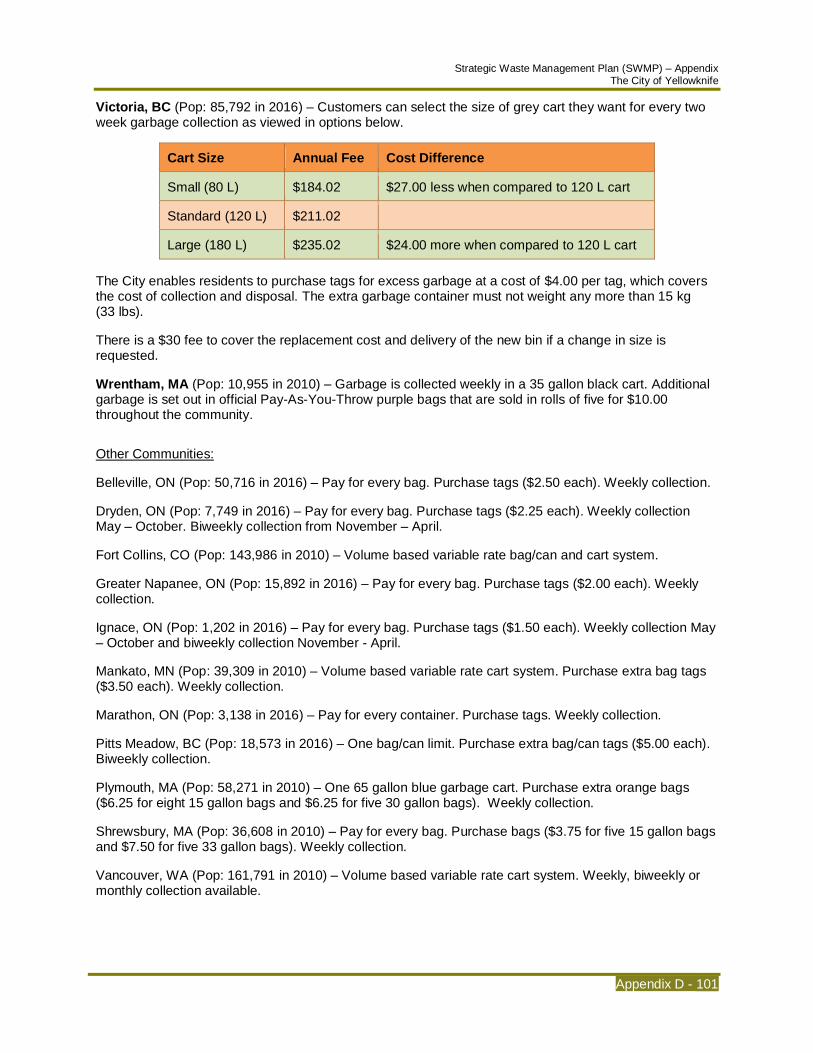
Strategic Waste Management Plan (SWMP) – Appendix The City of Yellowknife
Appendix D - 101
Victoria, BC (Pop: 85,792 in 2016) – Customers can select the size of grey cart they want for every two week garbage collection as viewed in options below.
Cart Size Annual Fee Cost Difference
Small (80 L) $184.02 $27.00 less when compared to 120 L cart
Standard (120 L) $211.02
Large (180 L) $235.02 $24.00 more when compared to 120 L cart
The City enables residents to purchase tags for excess garbage at a cost of $4.00 per tag, which covers the cost of collection and disposal. The extra garbage container must not weight any more than 15 kg (33 lbs).
There is a $30 fee to cover the replacement cost and delivery of the new bin if a change in size is requested.
Wrentham, MA (Pop: 10,955 in 2010) – Garbage is collected weekly in a 35 gallon black cart. Additional garbage is set out in official Pay-As-You-Throw purple bags that are sold in rolls of five for $10.00 throughout the community.
Other Communities:
Belleville, ON (Pop: 50,716 in 2016) – Pay for every bag. Purchase tags ($2.50 each). Weekly collection.
Dryden, ON (Pop: 7,749 in 2016) – Pay for every bag. Purchase tags ($2.25 each). Weekly collection May – October. Biweekly collection from November – April.
Fort Collins, CO (Pop: 143,986 in 2010) – Volume based variable rate bag/can and cart system.
Greater Napanee, ON (Pop: 15,892 in 2016) – Pay for every bag. Purchase tags ($2.00 each). Weekly collection.
Ignace, ON (Pop: 1,202 in 2016) – Pay for every bag. Purchase tags ($1.50 each). Weekly collection May – October and biweekly collection November - April.
Mankato, MN (Pop: 39,309 in 2010) – Volume based variable rate cart system. Purchase extra bag tags ($3.50 each). Weekly collection.
Marathon, ON (Pop: 3,138 in 2016) – Pay for every container. Purchase tags. Weekly collection.
Pitts Meadow, BC (Pop: 18,573 in 2016) – One bag/can limit. Purchase extra bag/can tags ($5.00 each). Biweekly collection.
Plymouth, MA (Pop: 58,271 in 2010) – One 65 gallon blue garbage cart. Purchase extra orange bags ($6.25 for eight 15 gallon bags and $6.25 for five 30 gallon bags). Weekly collection.
Shrewsbury, MA (Pop: 36,608 in 2010) – Pay for every bag. Purchase bags ($3.75 for five 15 gallon bags and $7.50 for five 33 gallon bags). Weekly collection.
Vancouver, WA (Pop: 161,791 in 2010) – Volume based variable rate cart system. Weekly, biweekly or monthly collection available.
sonnevera international corp.
Appendix D - 102
Contact
Greg Preston Manager of Waste Management City of Orillia 50 Andrew Street South, Suite 300 Orillia, Ontario L3V 7T5
T: (705) 325-2444 [email protected]
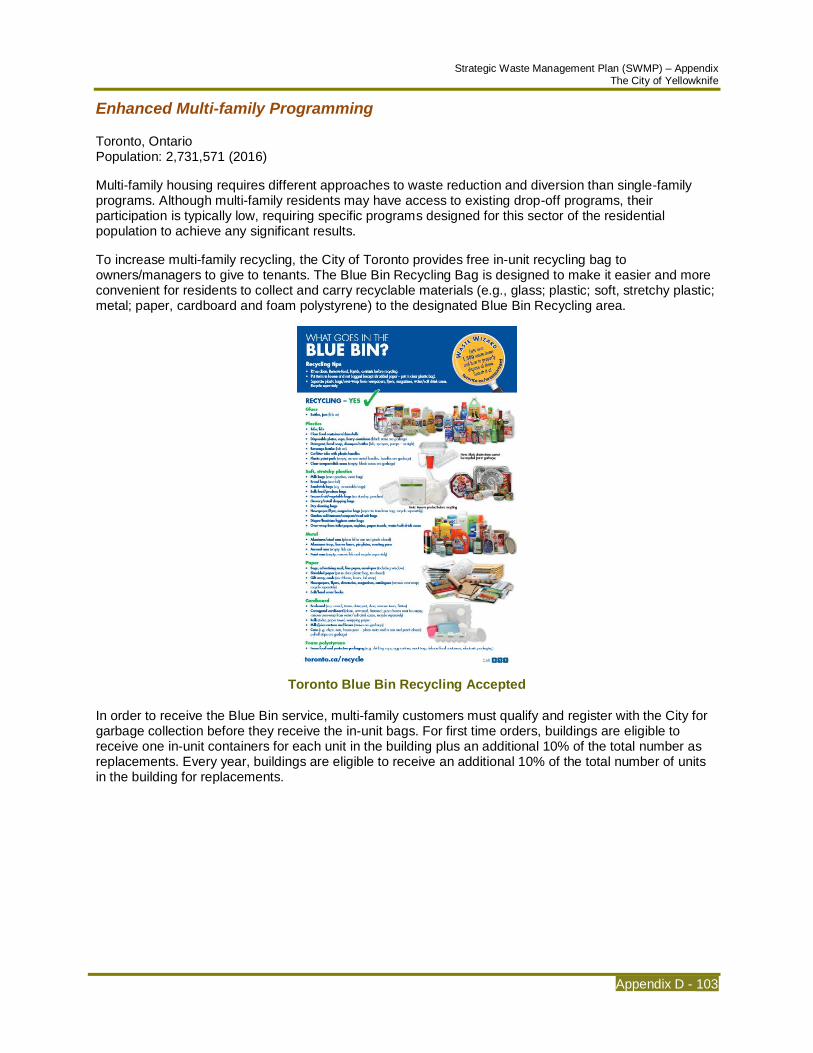
Strategic Waste Management Plan (SWMP) – Appendix The City of Yellowknife
Appendix D - 103
Enhanced Multi-family Programming
Toronto, Ontario Population: 2,731,571 (2016)
Multi-family housing requires different approaches to waste reduction and diversion than single-family programs. Although multi-family residents may have access to existing drop-off programs, their participation is typically low, requiring specific programs designed for this sector of the residential population to achieve any significant results.
To increase multi-family recycling, the City of Toronto provides free in-unit recycling bag to owners/managers to give to tenants. The Blue Bin Recycling Bag is designed to make it easier and more convenient for residents to collect and carry recyclable materials (e.g., glass; plastic; soft, stretchy plastic; metal; paper, cardboard and foam polystyrene) to the designated Blue Bin Recycling area.
Toronto Blue Bin Recycling Accepted
In order to receive the Blue Bin service, multi-family customers must qualify and register with the City for garbage collection before they receive the in-unit bags. For first time orders, buildings are eligible to receive one in-unit containers for each unit in the building plus an additional 10% of the total number as replacements. Every year, buildings are eligible to receive an additional 10% of the total number of units in the building for replacements.
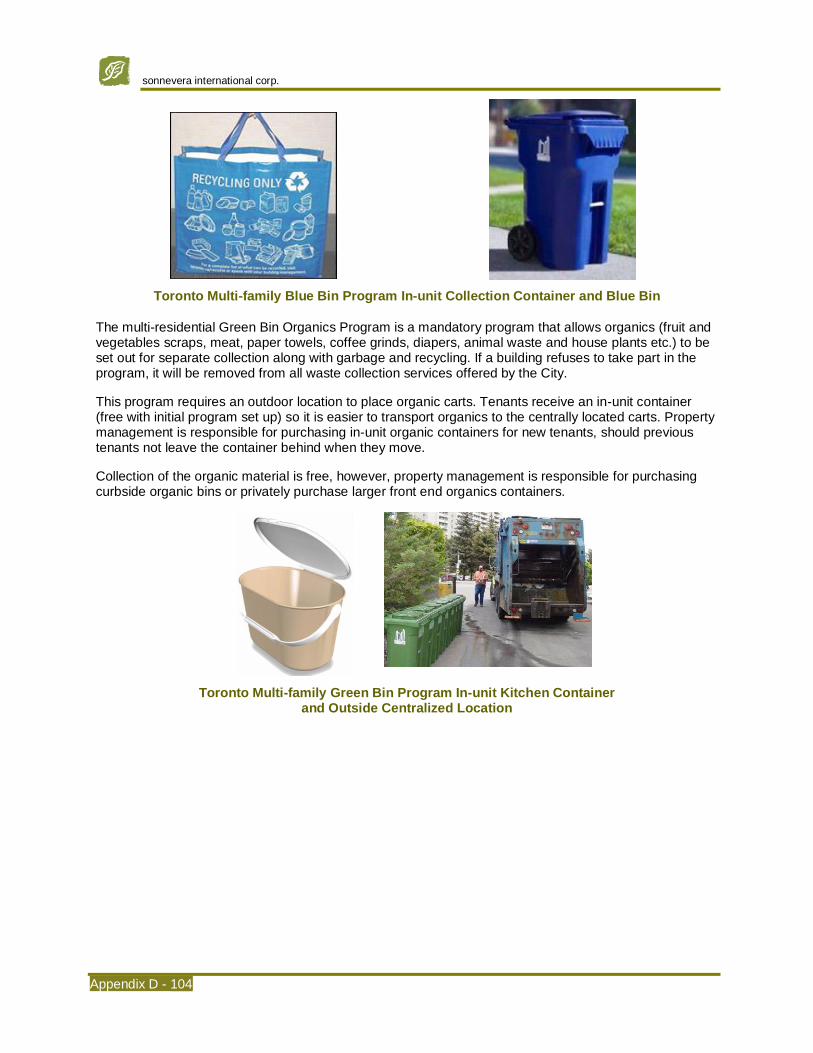
sonnevera international corp.
Appendix D - 104
Toronto Multi-family Blue Bin Program In-unit Collection Container and Blue Bin
The multi-residential Green Bin Organics Program is a mandatory program that allows organics (fruit and vegetables scraps, meat, paper towels, coffee grinds, diapers, animal waste and house plants etc.) to be set out for separate collection along with garbage and recycling. If a building refuses to take part in the program, it will be removed from all waste collection services offered by the City.
This program requires an outdoor location to place organic carts. Tenants receive an in-unit container (free with initial program set up) so it is easier to transport organics to the centrally located carts. Property management is responsible for purchasing in-unit organic containers for new tenants, should previous tenants not leave the container behind when they move.
Collection of the organic material is free, however, property management is responsible for purchasing curbside organic bins or privately purchase larger front end organics containers.
Toronto Multi-family Green Bin Program In-unit Kitchen Container and Outside Centralized Location
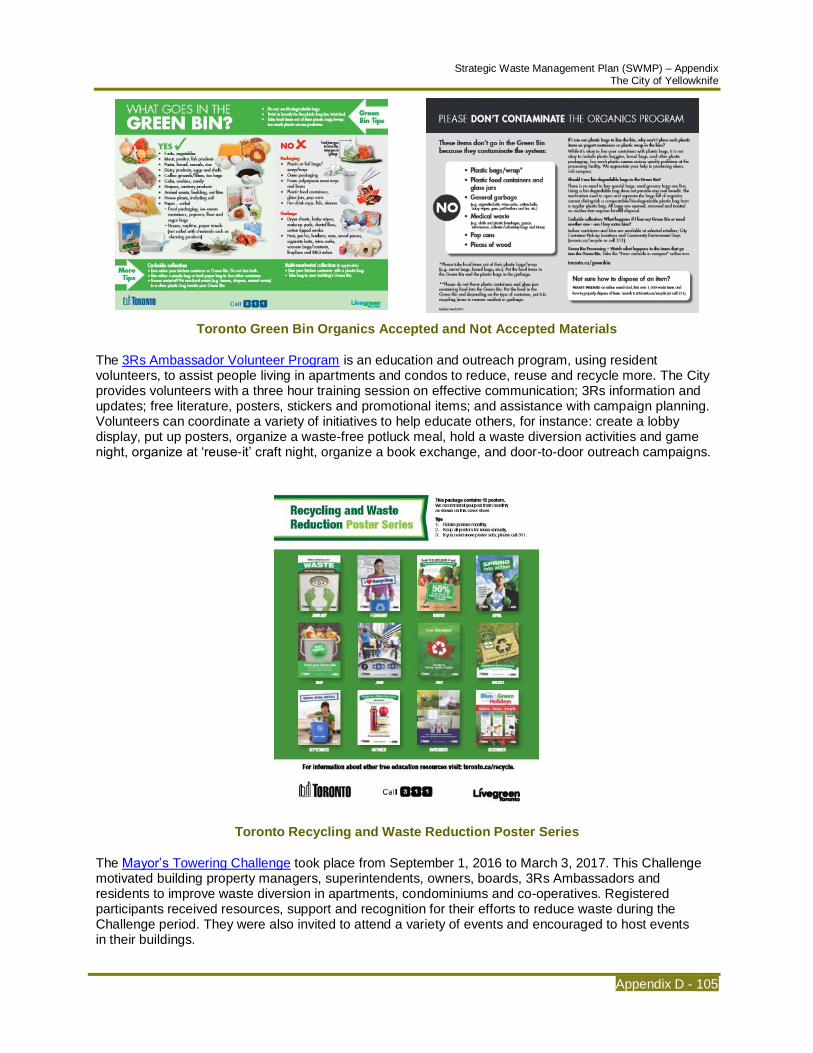
Strategic Waste Management Plan (SWMP) – Appendix The City of Yellowknife
Appendix D - 105
Toronto Green Bin Organics Accepted and Not Accepted Materials
The 3Rs Ambassador Volunteer Program is an education and outreach program, using resident volunteers, to assist people living in apartments and condos to reduce, reuse and recycle more. The City provides volunteers with a three hour training session on effective communication; 3Rs information and updates; free literature, posters, stickers and promotional items; and assistance with campaign planning. Volunteers can coordinate a variety of initiatives to help educate others, for instance: create a lobby display, put up posters, organize a waste-free potluck meal, hold a waste diversion activities and game night, organize at ‘reuse-it’ craft night, organize a book exchange, and door-to-door outreach campaigns.
Toronto Recycling and Waste Reduction Poster Series
The Mayor’s Towering Challenge took place from September 1, 2016 to March 3, 2017. This Challenge motivated building property managers, superintendents, owners, boards, 3Rs Ambassadors and residents to improve waste diversion in apartments, condominiums and co-operatives. Registered participants received resources, support and recognition for their efforts to reduce waste during the Challenge period. They were also invited to attend a variety of events and encouraged to host events in their buildings.
sonnevera international corp.
Appendix D - 106
Toronto The Mayor’s Towering Challenge Logo
Buildings with nine units or more were eligible to participate in this Challenge. Final submission requirements included tracking building waste volume and lifts, generating ideas for improving waste diversion and tracking improvements, and reflecting on waste diversion implementation during the Challenge period.
Recognition was given to buildings that submitted information on the City of Toronto website. All successful buildings were awarded a plaque/certificate. The winner of the following categories was announced at an Awards Ceremony at City Hall in May 2017:
• Most improved
• Best resident engagement initiative
• Best reduce and reuse initiative
• Most innovative
• Best leadership
Winners of the above categories received two memberships each to The Sharing Depot where members have access to a wide range of things without having to own or store them (e.g., camping equipment, house party supplies, board games, toys and sporting equipment).
The Chute Closure Program allows multi-residential buildings to close their garbage chutes if they meet certain criteria in order to increase the building’s waste diversion. This program is only for multi-residential buildings that receive City of Toronto collection services. By closing garbage chutes disposal of Blue Bin recycling and Green Bin organics and garbage is equally convenient for residents and helps to minimize waste going to the landfill.
Reduction Potential and Quantitative Results
Medium reduction potential.
Communities with Similar Program
Arlington County, VA (Pop: 207,627 in 2010) – Multi-family dwellings are required to recycle cardboard, mixed paper (magazines, newspaper office paper etc.), metal/aluminum, glass (bottles and jars) and plastic (food and beverage containers as well as rigid plastic containers) as per Arlington County Code Chapter 10: Garbage, Refuse and Weeds. A relatively recent amendment, effective January 1, 2016, to the Code requires an adjacent recycling container next to any waste container for use by tenants and visitors,
Arlington County recommends a single stream collection program whereby recyclable materials are collected in one container. Dual stream, which is the less preferred method, is the collection of recyclable materials in separate, designated containers.
Multi-family dwellings receive annual recycling compliance inspections in order to ensure that all Code requirements are followed, to inform and educate and to gather data to improve the accuracy of Arlington County’s Annual Recycling Rate. Each inspection costs $66. This fee helps the County provide numerous resources, such as the Recycling System Toolkit, that can improve the property recycling system.
Educational materials must be distributed to tenants through written or electronic means within 14 days f occupancy and at least annually thereafter.
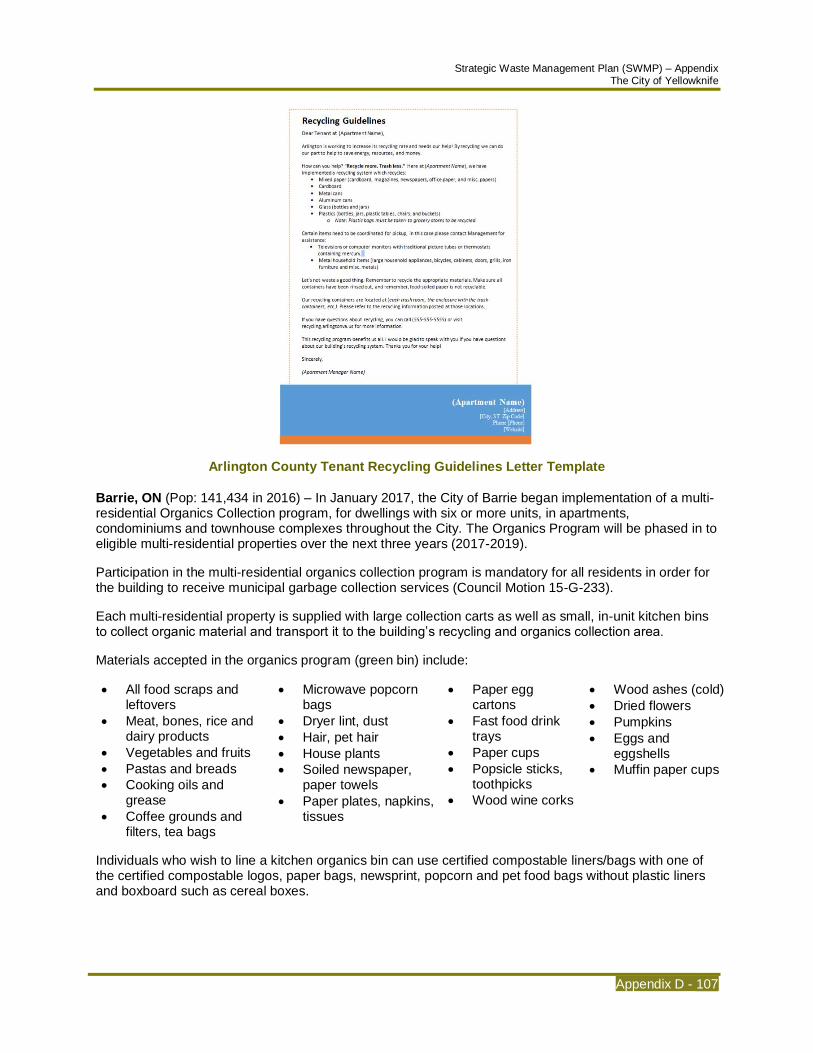
Strategic Waste Management Plan (SWMP) – Appendix The City of Yellowknife
Appendix D - 107
Arlington County Tenant Recycling Guidelines Letter Template
Barrie, ON (Pop: 141,434 in 2016) – In January 2017, the City of Barrie began implementation of a multi-residential Organics Collection program, for dwellings with six or more units, in apartments, condominiums and townhouse complexes throughout the City. The Organics Program will be phased in to eligible multi-residential properties over the next three years (2017-2019).
Participation in the multi-residential organics collection program is mandatory for all residents in order for the building to receive municipal garbage collection services (Council Motion 15-G-233).
Each multi-residential property is supplied with large collection carts as well as small, in-unit kitchen bins to collect organic material and transport it to the building’s recycling and organics collection area.
Materials accepted in the organics program (green bin) include:
• All food scraps and leftovers
• Meat, bones, rice and dairy products
• Vegetables and fruits
• Pastas and breads
• Cooking oils and grease
• Coffee grounds and filters, tea bags
• Microwave popcorn bags
• Dryer lint, dust
• Hair, pet hair
• House plants
• Soiled newspaper, paper towels
• Paper plates, napkins, tissues
• Paper egg cartons
• Fast food drink trays
• Paper cups
• Popsicle sticks, toothpicks
• Wood wine corks
• Wood ashes (cold)
• Dried flowers
• Pumpkins
• Eggs and eggshells
• Muffin paper cups
Individuals who wish to line a kitchen organics bin can use certified compostable liners/bags with one of the certified compostable logos, paper bags, newsprint, popcorn and pet food bags without plastic liners and boxboard such as cereal boxes.
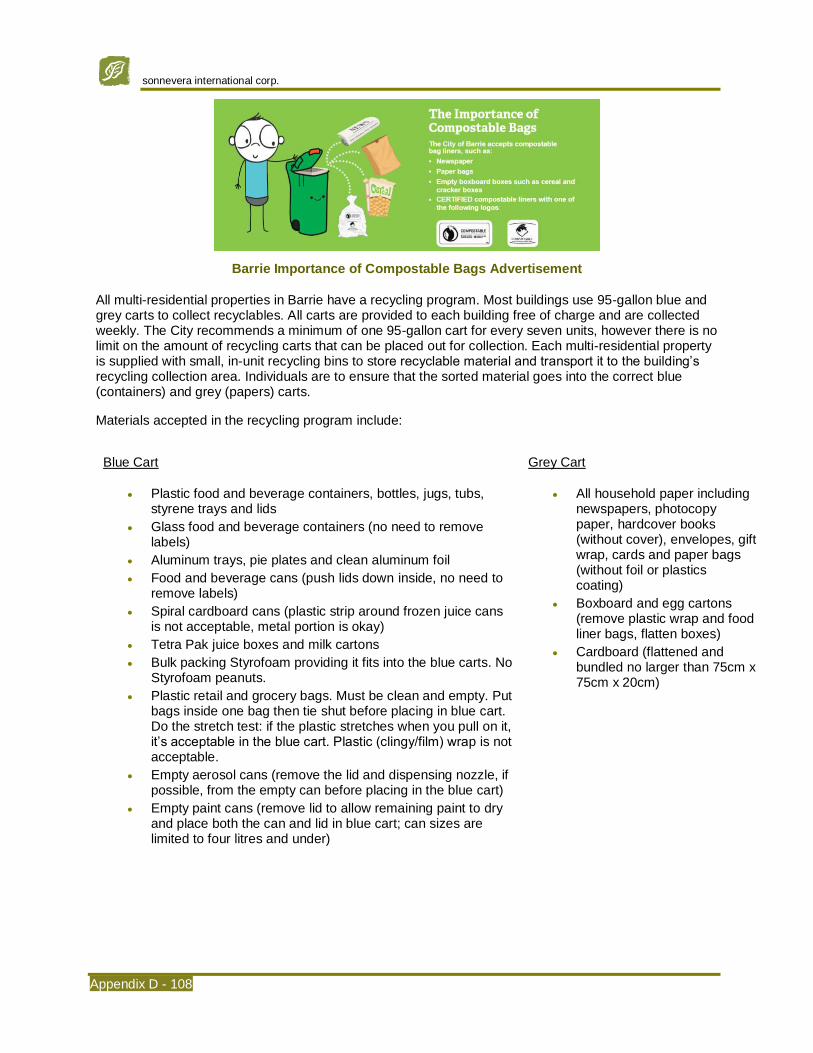
sonnevera international corp.
Appendix D - 108
Barrie Importance of Compostable Bags Advertisement
All multi-residential properties in Barrie have a recycling program. Most buildings use 95-gallon blue and grey carts to collect recyclables. All carts are provided to each building free of charge and are collected weekly. The City recommends a minimum of one 95-gallon cart for every seven units, however there is no limit on the amount of recycling carts that can be placed out for collection. Each multi-residential property is supplied with small, in-unit recycling bins to store recyclable material and transport it to the building’s recycling collection area. Individuals are to ensure that the sorted material goes into the correct blue (containers) and grey (papers) carts.
Materials accepted in the recycling program include:
Blue Cart Grey Cart
• Plastic food and beverage containers, bottles, jugs, tubs, styrene trays and lids
• Glass food and beverage containers (no need to remove labels)
• Aluminum trays, pie plates and clean aluminum foil
• Food and beverage cans (push lids down inside, no need to remove labels)
• Spiral cardboard cans (plastic strip around frozen juice cans is not acceptable, metal portion is okay)
• Tetra Pak juice boxes and milk cartons
• Bulk packing Styrofoam providing it fits into the blue carts. No Styrofoam peanuts.
• Plastic retail and grocery bags. Must be clean and empty. Put bags inside one bag then tie shut before placing in blue cart. Do the stretch test: if the plastic stretches when you pull on it, it’s acceptable in the blue cart. Plastic (clingy/film) wrap is not acceptable.
• Empty aerosol cans (remove the lid and dispensing nozzle, if possible, from the empty can before placing in the blue cart)
• Empty paint cans (remove lid to allow remaining paint to dry and place both the can and lid in blue cart; can sizes are limited to four litres and under)
• All household paper including newspapers, photocopy paper, hardcover books (without cover), envelopes, gift wrap, cards and paper bags (without foil or plastics coating)
• Boxboard and egg cartons (remove plastic wrap and food liner bags, flatten boxes)
• Cardboard (flattened and bundled no larger than 75cm x 75cm x 20cm)
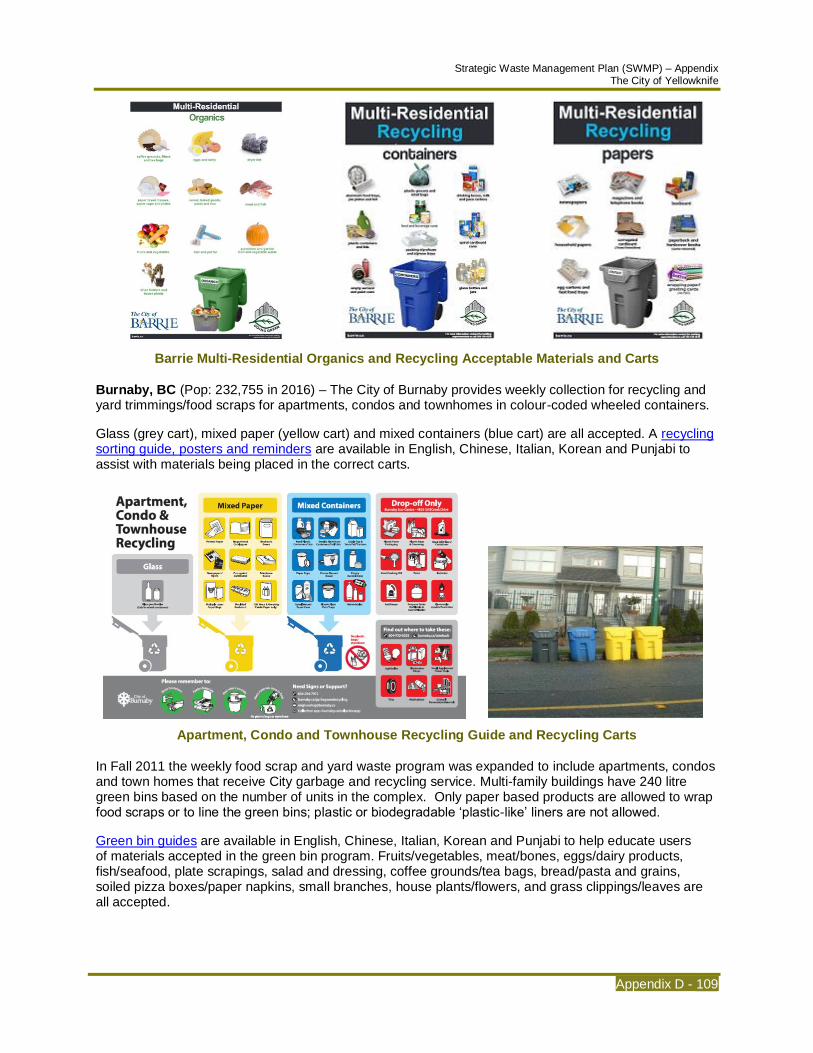
Strategic Waste Management Plan (SWMP) – Appendix The City of Yellowknife
Appendix D - 109
Barrie Multi-Residential Organics and Recycling Acceptable Materials and Carts
Burnaby, BC (Pop: 232,755 in 2016) – The City of Burnaby provides weekly collection for recycling and yard trimmings/food scraps for apartments, condos and townhomes in colour-coded wheeled containers.
Glass (grey cart), mixed paper (yellow cart) and mixed containers (blue cart) are all accepted. A recycling sorting guide, posters and reminders are available in English, Chinese, Italian, Korean and Punjabi to assist with materials being placed in the correct carts.
Apartment, Condo and Townhouse Recycling Guide and Recycling Carts
In Fall 2011 the weekly food scrap and yard waste program was expanded to include apartments, condos and town homes that receive City garbage and recycling service. Multi-family buildings have 240 litre green bins based on the number of units in the complex. Only paper based products are allowed to wrap food scraps or to line the green bins; plastic or biodegradable ‘plastic-like’ liners are not allowed.
Green bin guides are available in English, Chinese, Italian, Korean and Punjabi to help educate users of materials accepted in the green bin program. Fruits/vegetables, meat/bones, eggs/dairy products, fish/seafood, plate scrapings, salad and dressing, coffee grounds/tea bags, bread/pasta and grains, soiled pizza boxes/paper napkins, small branches, house plants/flowers, and grass clippings/leaves are all accepted.

sonnevera international corp.
Appendix D - 110
Burnaby Apartment, Condo and Townhouse Green Bin Program Guide
Calgary, AB (Pop: 1,239,220 in 2016) – Since February 1, 2016, all multi-family buildings must have recycling collection for tennants. This includes condos, apartments, townhouses or any building with five or more units. The Multi-family Recycling Guide for Building Owners and Managers provides a step-by-step process to follow for developing a recycling program. Material accepted in the recycling program must be, at a minimum, what is accepted in the residential blue cart recycling program:
• Newspaper
• Catalogues and magazines
• Mixed paper (e.g., flyers, envelopes and office paper)
• Shredded paper
• Telephone books
• Boxboard and corrugated cardboard
• Glass jars and bottles
• Food cans and foil
• Refundable beverage containers
• Plastics containers #1-#7 except polystyrene foam
• Plastic bags
• Juice and soup boxes (such as Tetra PaksTM)
Some private recyclers mix all materials in one bin while others request materials sorted in separate bins. Either option is acceptable. Some private recyclers may accept other recyclable materials, but this is optional.
In November 2017 The City of Calgary will require multi-family apartment and condos to separate food and yard waste from garbage for composting and diversion. Similar to the multi-family recycling bylaw, building owners and managers have the choice to seek out a food and yard waste provider, and decide the best way to offer and manage the service. The Multi-family Food and Yard Waste Diversion Guide for Building Owners and Managers provides a step-by-step process to follow for developing a food and yard waste program. Material accepted in this food and yard waste program must be, at minimum, what is accepted in the residential green cart program:
• Plate scrapings
• Eggshells and dairy products
• Meat, fish, shellfish and bones
• Fruits and vegetables
• Bread, noodles, rice, beans and grains
• Jam, sauces, salad dressing and cooking oil
• Pastries, cookies, cakes and muffins
• Nuts, seeds, chips, popcorn and candy
• Paper plates and napkins
• Coffee filters and tea bags
• Leaves
• Plants and weeds
• Branches and prunings
• Grass clippings and sod
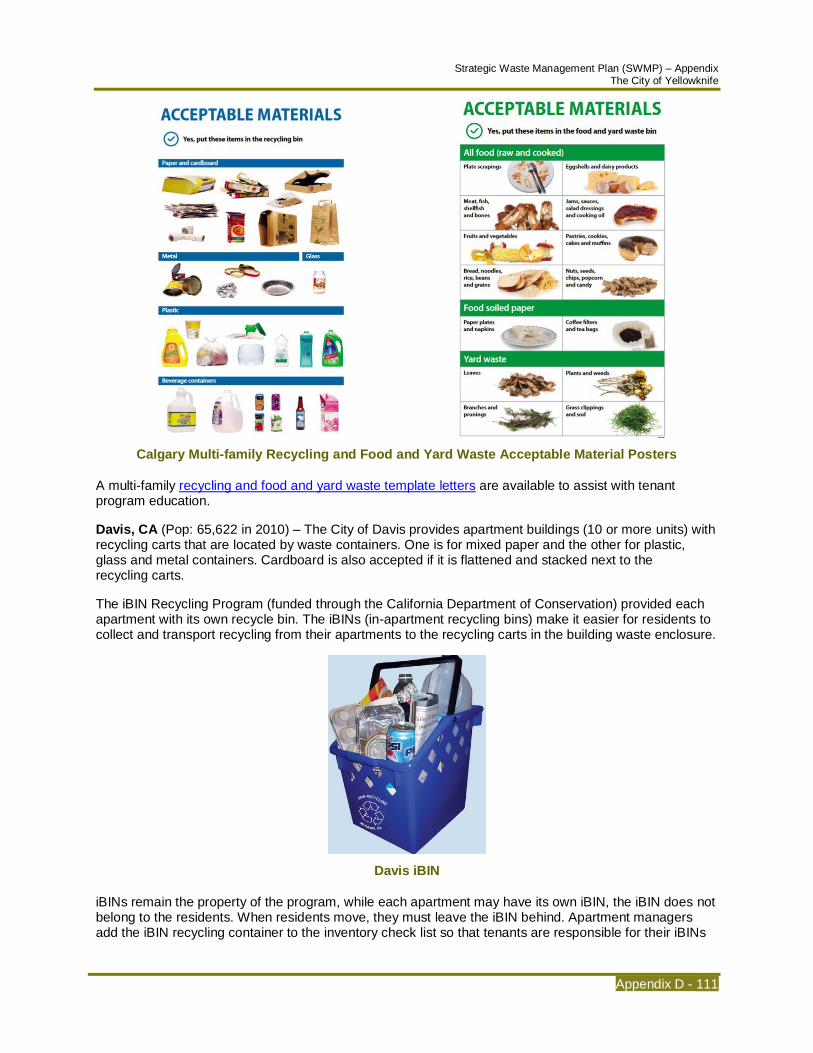
Strategic Waste Management Plan (SWMP) – Appendix The City of Yellowknife
Appendix D - 111
Calgary Multi-family Recycling and Food and Yard Waste Acceptable Material Posters
A multi-family recycling and food and yard waste template letters are available to assist with tenant program education.
Davis, CA (Pop: 65,622 in 2010) – The City of Davis provides apartment buildings (10 or more units) with recycling carts that are located by waste containers. One is for mixed paper and the other for plastic, glass and metal containers. Cardboard is also accepted if it is flattened and stacked next to the recycling carts.
The iBIN Recycling Program (funded through the California Department of Conservation) provided each apartment with its own recycle bin. The iBINs (in-apartment recycling bins) make it easier for residents to collect and transport recycling from their apartments to the recycling carts in the building waste enclosure.
Davis iBIN
iBINs remain the property of the program, while each apartment may have its own iBIN, the iBIN does not belong to the residents. When residents move, they must leave the iBIN behind. Apartment managers add the iBIN recycling container to the inventory check list so that tenants are responsible for their iBINs

sonnevera international corp.
Appendix D - 112
return at the end of their stay. The iBIN Recycling Program Newsletter provides more information on this program.
The City of Davis provides a Property Management Greener Guide to reducing waste, conserving waste and preventing pollution for property managers and tenants.
Effective July 2016, apartment properties received one 95 gallon organics cart per garbage service subscribed. Additional organics carts can be requested through Davis Waste Removal for a fee.
Level of Service 1x Per Week 2x Per Week 3x Per Week 4x Per Week 5x Per Week
1 Cart $0 $0 $57.90 $100.70 $150.15
Each Additional Cart $26.09 $52.18 $78.27 $104.36 $130.45
Davis Food Scrap Cart Service Frequency and Cost
The City purchased kitchen food scrap pails for each apartment and delivered the pails to property managers. Each pail had a flyer inside with detailed information about what can go in the organic carts. Typically organics carts are serviced on a weekly basis.
Organics accepted in this programs include food scraps (fruits and vegetables; bones; eggshells; rice, beans and pasta; meat, poultry, and seafood; dairy products (no liquids)), food soiled paper (milk cartons, ice cream cartons and other cartons found in the refrigerated section of stores; greasy pizza boxes; waxed paper; tea bags; coffee grounds and filters; and paper napkins and paper towels; facial tissue; paper plates; and paper take-out packaging) and yard trimmings (leaves, grass, plants and flowers).
The Apartment Move-Out Waste Reduction Program is a partnership between the City of Davis (Public Works Department) Recycling Program and property managers at apartment communities in Davis. In an effort to reduce the amount of good, usable material that typically ends up in the landfill during the yearly August move-out, donation stations are set up at participating apartment properties for residents to leave good, usable items for reuse (clothes, furniture, household goods, home décor etc.). Local non-profit groups, residents moving in, current residents and apartment staff can take items from the donation station. Volunteers recruited by the City assist City staff keeping the location station clean and tidy. City staff stops by each donation station periodically to collect bagged clothing for non-profit organizations.
Interested property managers can sign-up with the City who provides fliers and posters to advertise the program to tenants. The program typically starts the third week of August and ends on September 1. City Recycling Program staff mark off a donation station area (usually next to waste containers) with blue recycling caution tape and signs. Blue frames with bags and signs are set up to collect donated clothing. At the end of the program, City staff removes the donation station signs, traffic cones and caution tape.
Davis Apartment Move-out Waste Reduction Program Donation Station
Edmonton, AB (Pop: 932,546 in 2016) – All apartments, condos and townhouses that are not part of the City of Edmonton Blue Bag program are eligible for the Blue Bin program. Interested property managers or condo boards can call Waste Management Services to arrange for recycling collection. There is no
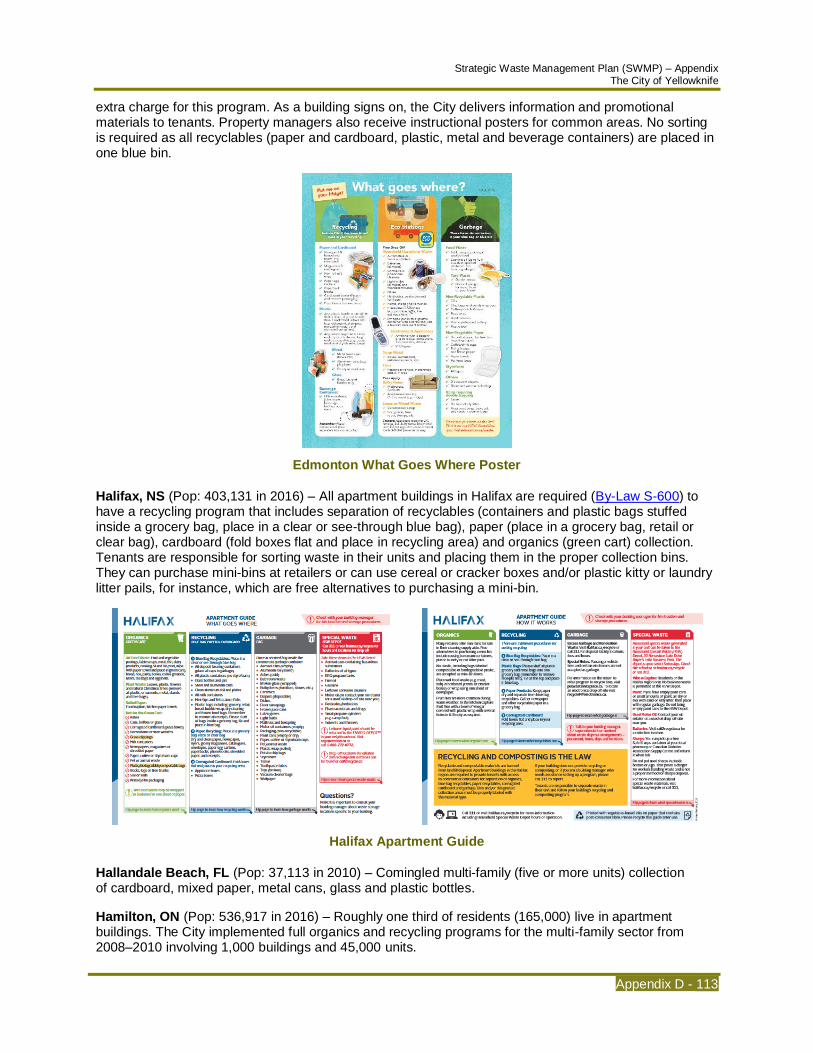
Strategic Waste Management Plan (SWMP) – Appendix The City of Yellowknife
Appendix D - 113
extra charge for this program. As a building signs on, the City delivers information and promotional materials to tenants. Property managers also receive instructional posters for common areas. No sorting is required as all recyclables (paper and cardboard, plastic, metal and beverage containers) are placed in one blue bin.
Edmonton What Goes Where Poster
Halifax, NS (Pop: 403,131 in 2016) – All apartment buildings in Halifax are required (By-Law S-600) to have a recycling program that includes separation of recyclables (containers and plastic bags stuffed inside a grocery bag, place in a clear or see-through blue bag), paper (place in a grocery bag, retail or clear bag), cardboard (fold boxes flat and place in recycling area) and organics (green cart) collection. Tenants are responsible for sorting waste in their units and placing them in the proper collection bins. They can purchase mini-bins at retailers or can use cereal or cracker boxes and/or plastic kitty or laundry litter pails, for instance, which are free alternatives to purchasing a mini-bin.
Halifax Apartment Guide
Hallandale Beach, FL (Pop: 37,113 in 2010) – Comingled multi-family (five or more units) collection of cardboard, mixed paper, metal cans, glass and plastic bottles.
Hamilton, ON (Pop: 536,917 in 2016) – Roughly one third of residents (165,000) live in apartment buildings. The City implemented full organics and recycling programs for the multi-family sector from 2008–2010 involving 1,000 buildings and 45,000 units.
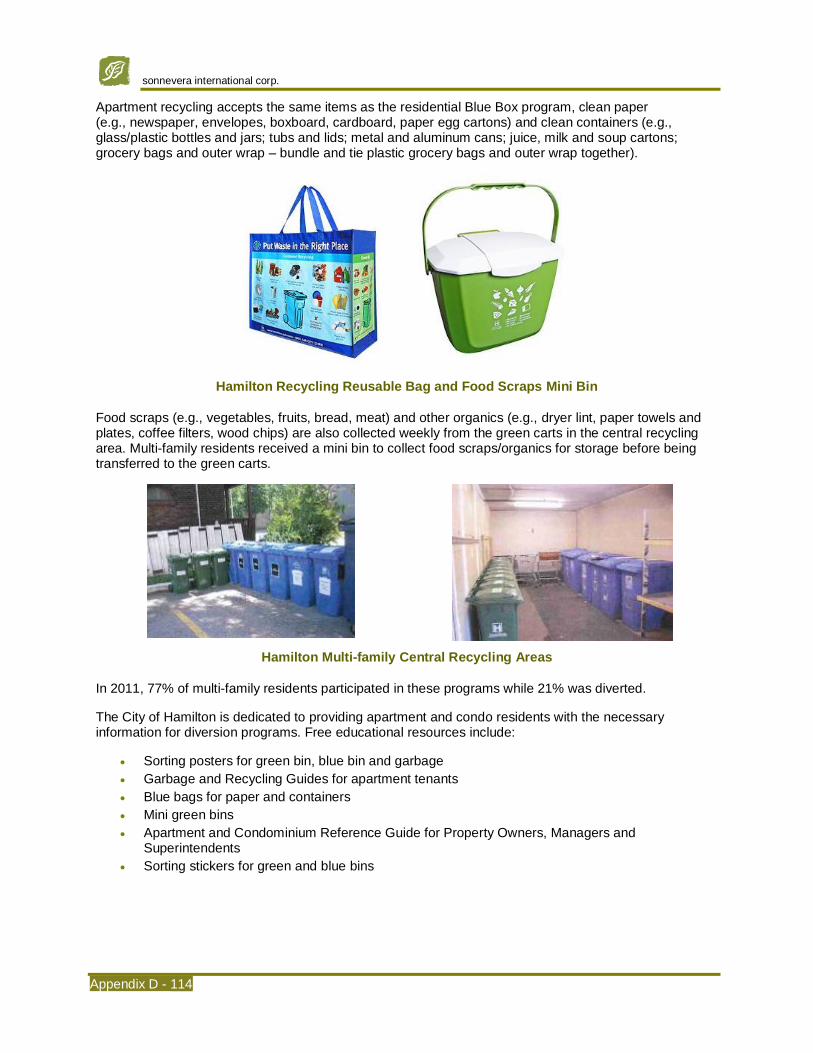
sonnevera international corp.
Appendix D - 114
Apartment recycling accepts the same items as the residential Blue Box program, clean paper (e.g., newspaper, envelopes, boxboard, cardboard, paper egg cartons) and clean containers (e.g., glass/plastic bottles and jars; tubs and lids; metal and aluminum cans; juice, milk and soup cartons; grocery bags and outer wrap – bundle and tie plastic grocery bags and outer wrap together).
Hamilton Recycling Reusable Bag and Food Scraps Mini Bin
Food scraps (e.g., vegetables, fruits, bread, meat) and other organics (e.g., dryer lint, paper towels and plates, coffee filters, wood chips) are also collected weekly from the green carts in the central recycling area. Multi-family residents received a mini bin to collect food scraps/organics for storage before being transferred to the green carts.
Hamilton Multi-family Central Recycling Areas
In 2011, 77% of multi-family residents participated in these programs while 21% was diverted.
The City of Hamilton is dedicated to providing apartment and condo residents with the necessary information for diversion programs. Free educational resources include:
• Sorting posters for green bin, blue bin and garbage
• Garbage and Recycling Guides for apartment tenants
• Blue bags for paper and containers
• Mini green bins
• Apartment and Condominium Reference Guide for Property Owners, Managers and Superintendents
• Sorting stickers for green and blue bins
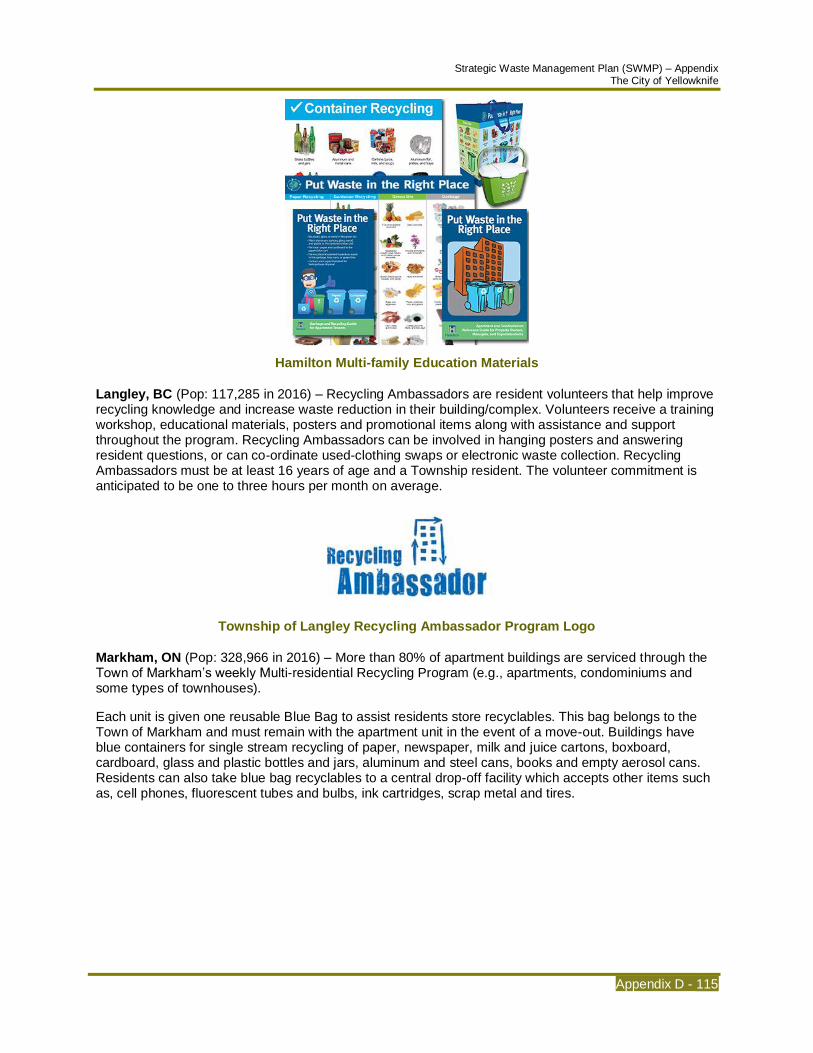
Strategic Waste Management Plan (SWMP) – Appendix The City of Yellowknife
Appendix D - 115
Hamilton Multi-family Education Materials
Langley, BC (Pop: 117,285 in 2016) – Recycling Ambassadors are resident volunteers that help improve recycling knowledge and increase waste reduction in their building/complex. Volunteers receive a training workshop, educational materials, posters and promotional items along with assistance and support throughout the program. Recycling Ambassadors can be involved in hanging posters and answering resident questions, or can co-ordinate used-clothing swaps or electronic waste collection. Recycling Ambassadors must be at least 16 years of age and a Township resident. The volunteer commitment is anticipated to be one to three hours per month on average.
Township of Langley Recycling Ambassador Program Logo
Markham, ON (Pop: 328,966 in 2016) – More than 80% of apartment buildings are serviced through the Town of Markham’s weekly Multi-residential Recycling Program (e.g., apartments, condominiums and some types of townhouses).
Each unit is given one reusable Blue Bag to assist residents store recyclables. This bag belongs to the Town of Markham and must remain with the apartment unit in the event of a move-out. Buildings have blue containers for single stream recycling of paper, newspaper, milk and juice cartons, boxboard, cardboard, glass and plastic bottles and jars, aluminum and steel cans, books and empty aerosol cans. Residents can also take blue bag recyclables to a central drop-off facility which accepts other items such as, cell phones, fluorescent tubes and bulbs, ink cartridges, scrap metal and tires.
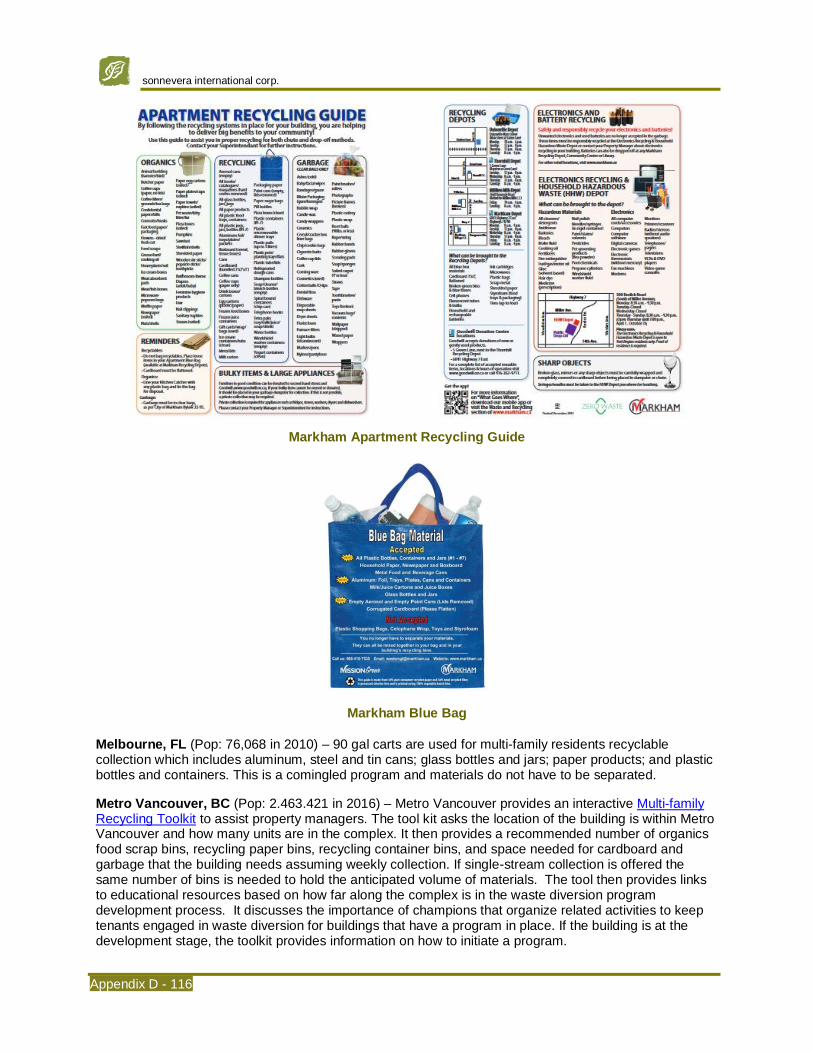
sonnevera international corp.
Appendix D - 116
Markham Apartment Recycling Guide
Markham Blue Bag
Melbourne, FL (Pop: 76,068 in 2010) – 90 gal carts are used for multi-family residents recyclable collection which includes aluminum, steel and tin cans; glass bottles and jars; paper products; and plastic bottles and containers. This is a comingled program and materials do not have to be separated.
Metro Vancouver, BC (Pop: 2.463.421 in 2016) – Metro Vancouver provides an interactive Multi-family Recycling Toolkit to assist property managers. The tool kit asks the location of the building is within Metro Vancouver and how many units are in the complex. It then provides a recommended number of organics food scrap bins, recycling paper bins, recycling container bins, and space needed for cardboard and garbage that the building needs assuming weekly collection. If single-stream collection is offered the same number of bins is needed to hold the anticipated volume of materials. The tool then provides links to educational resources based on how far along the complex is in the waste diversion program development process. It discusses the importance of champions that organize related activities to keep tenants engaged in waste diversion for buildings that have a program in place. If the building is at the development stage, the toolkit provides information on how to initiate a program.

Strategic Waste Management Plan (SWMP) – Appendix The City of Yellowknife
Appendix D - 117
Metro Vancouver Multi-family Collection Advertisements
Metro Vancouver provides a Food Scrap Recycling How-To Guide for Property Managers ad Stratas in English and Chinese for interested individuals along with a variety of posters and bin signage.
New Westminster, BC (Pop: 70,996 in 2016) – Recyclables are sorted into mixed paper and cardboard, newspaper, mixed containers (no glass) and food scraps carts.
After a successful pilot project that ran from April to September 2011 involving six multi-family housing buildings the City implemented a multi-family food scrap recycling program city-wide during the summer of 2012.
On average, pilot buildings saw a 25% reduction in waste with one building having a 50% reduction.
Okotoks, AB (Pop: 28,881 in 2016) – Multi-family residential recycling programs are to be in place by July 1, 2017 and organics collection programs by January 1, 2018.
Multi-family residential properties are required to fill out and submit a Waste Diversion Plan (WDP) yearly or if there are any changes to the program. When the WDP has been approved a notification will be sent out acknowledging and accepting the WDP. If the WDP is not approved, a notification of why the WDP was not approved is sent out. The WDP is required to be amended and re-submitted within 30 days of notification of denial.
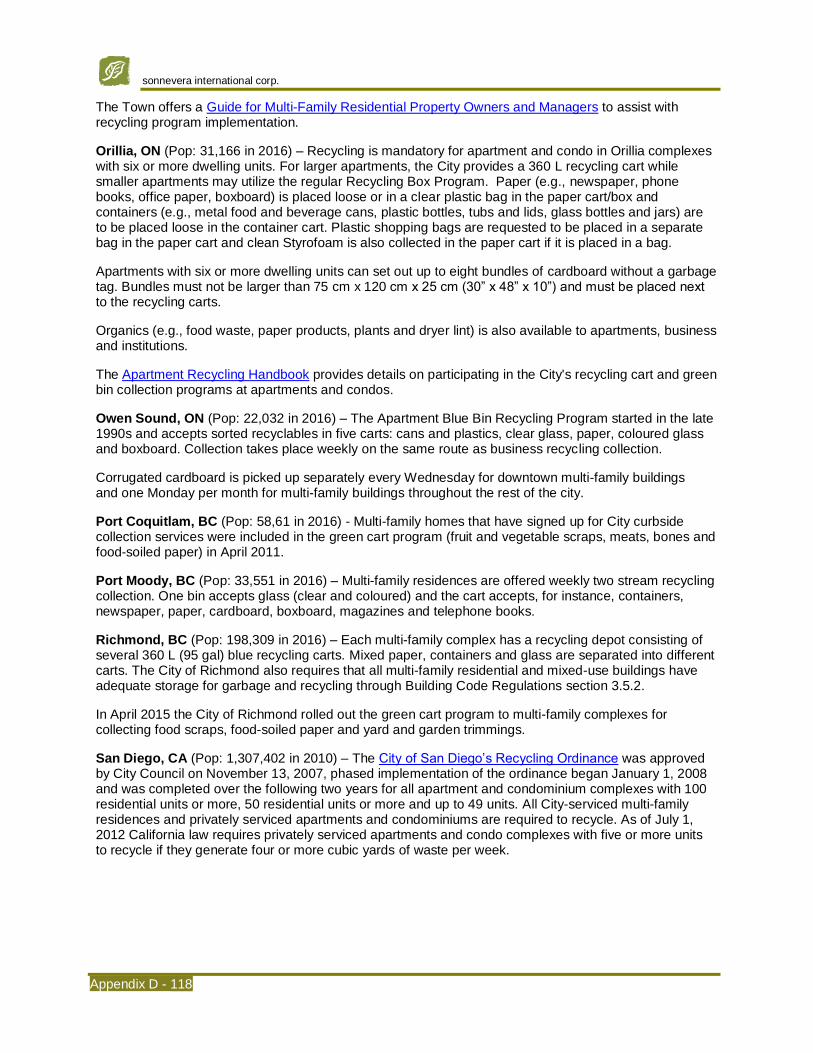
sonnevera international corp.
Appendix D - 118
The Town offers a Guide for Multi-Family Residential Property Owners and Managers to assist with recycling program implementation.
Orillia, ON (Pop: 31,166 in 2016) – Recycling is mandatory for apartment and condo in Orillia complexes with six or more dwelling units. For larger apartments, the City provides a 360 L recycling cart while smaller apartments may utilize the regular Recycling Box Program. Paper (e.g., newspaper, phone books, office paper, boxboard) is placed loose or in a clear plastic bag in the paper cart/box and containers (e.g., metal food and beverage cans, plastic bottles, tubs and lids, glass bottles and jars) are to be placed loose in the container cart. Plastic shopping bags are requested to be placed in a separate bag in the paper cart and clean Styrofoam is also collected in the paper cart if it is placed in a bag.
Apartments with six or more dwelling units can set out up to eight bundles of cardboard without a garbage tag. Bundles must not be larger than 75 cm x 120 cm x 25 cm (30” x 48” x 10”) and must be placed next to the recycling carts.
Organics (e.g., food waste, paper products, plants and dryer lint) is also available to apartments, business and institutions.
The Apartment Recycling Handbook provides details on participating in the City's recycling cart and green bin collection programs at apartments and condos.
Owen Sound, ON (Pop: 22,032 in 2016) – The Apartment Blue Bin Recycling Program started in the late 1990s and accepts sorted recyclables in five carts: cans and plastics, clear glass, paper, coloured glass and boxboard. Collection takes place weekly on the same route as business recycling collection.
Corrugated cardboard is picked up separately every Wednesday for downtown multi-family buildings and one Monday per month for multi-family buildings throughout the rest of the city.
Port Coquitlam, BC (Pop: 58,61 in 2016) - Multi-family homes that have signed up for City curbside collection services were included in the green cart program (fruit and vegetable scraps, meats, bones and food-soiled paper) in April 2011.
Port Moody, BC (Pop: 33,551 in 2016) – Multi-family residences are offered weekly two stream recycling collection. One bin accepts glass (clear and coloured) and the cart accepts, for instance, containers, newspaper, paper, cardboard, boxboard, magazines and telephone books.
Richmond, BC (Pop: 198,309 in 2016) – Each multi-family complex has a recycling depot consisting of several 360 L (95 gal) blue recycling carts. Mixed paper, containers and glass are separated into different carts. The City of Richmond also requires that all multi-family residential and mixed-use buildings have adequate storage for garbage and recycling through Building Code Regulations section 3.5.2.
In April 2015 the City of Richmond rolled out the green cart program to multi-family complexes for collecting food scraps, food-soiled paper and yard and garden trimmings.
San Diego, CA (Pop: 1,307,402 in 2010) – The City of San Diego’s Recycling Ordinance was approved by City Council on November 13, 2007, phased implementation of the ordinance began January 1, 2008 and was completed over the following two years for all apartment and condominium complexes with 100 residential units or more, 50 residential units or more and up to 49 units. All City-serviced multi-family residences and privately serviced apartments and condominiums are required to recycle. As of July 1, 2012 California law requires privately serviced apartments and condo complexes with five or more units to recycle if they generate four or more cubic yards of waste per week.
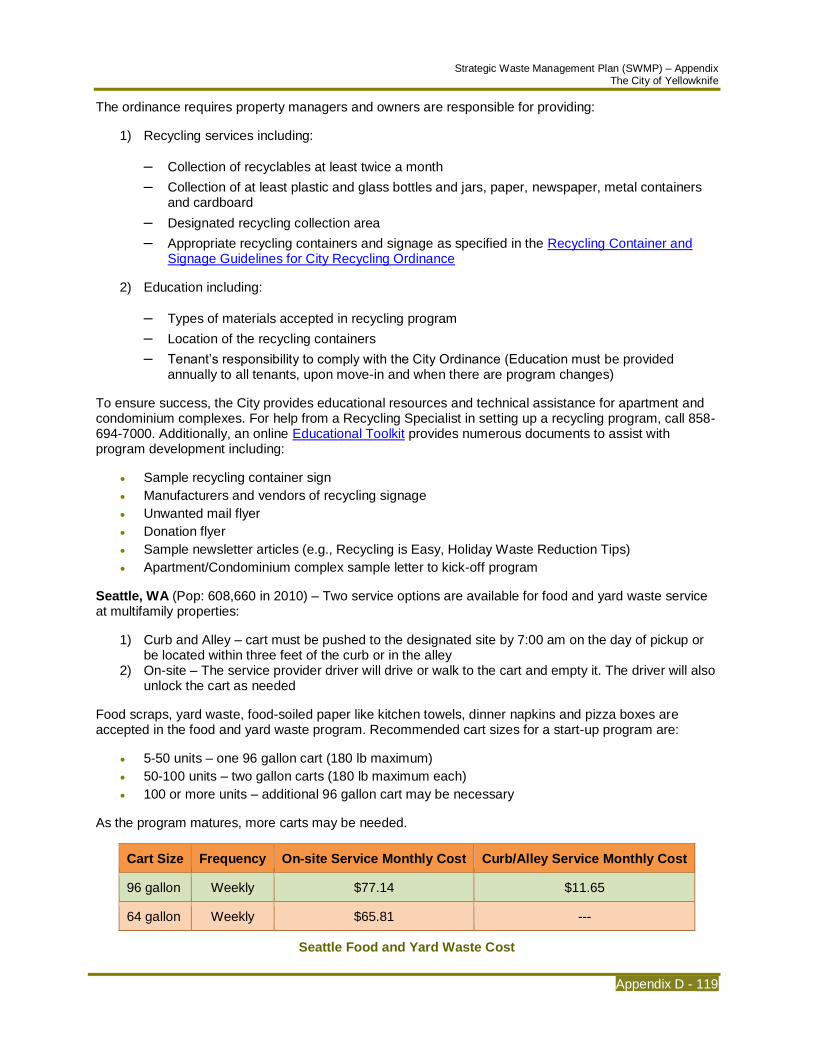
Strategic Waste Management Plan (SWMP) – Appendix The City of Yellowknife
Appendix D - 119
The ordinance requires property managers and owners are responsible for providing:
1) Recycling services including:
– Collection of recyclables at least twice a month
– Collection of at least plastic and glass bottles and jars, paper, newspaper, metal containers and cardboard
– Designated recycling collection area
– Appropriate recycling containers and signage as specified in the Recycling Container and Signage Guidelines for City Recycling Ordinance
2) Education including:
– Types of materials accepted in recycling program
– Location of the recycling containers
– Tenant’s responsibility to comply with the City Ordinance (Education must be provided annually to all tenants, upon move-in and when there are program changes)
To ensure success, the City provides educational resources and technical assistance for apartment and condominium complexes. For help from a Recycling Specialist in setting up a recycling program, call 858-694-7000. Additionally, an online Educational Toolkit provides numerous documents to assist with program development including:
• Sample recycling container sign
• Manufacturers and vendors of recycling signage
• Unwanted mail flyer
• Donation flyer
• Sample newsletter articles (e.g., Recycling is Easy, Holiday Waste Reduction Tips)
• Apartment/Condominium complex sample letter to kick-off program
Seattle, WA (Pop: 608,660 in 2010) – Two service options are available for food and yard waste service at multifamily properties:
1) Curb and Alley – cart must be pushed to the designated site by 7:00 am on the day of pickup or be located within three feet of the curb or in the alley
2) On-site – The service provider driver will drive or walk to the cart and empty it. The driver will also unlock the cart as needed
Food scraps, yard waste, food-soiled paper like kitchen towels, dinner napkins and pizza boxes are accepted in the food and yard waste program. Recommended cart sizes for a start-up program are:
• 5-50 units – one 96 gallon cart (180 lb maximum)
• 50-100 units – two gallon carts (180 lb maximum each)
• 100 or more units – additional 96 gallon cart may be necessary
As the program matures, more carts may be needed.
Cart Size Frequency On-site Service Monthly Cost Curb/Alley Service Monthly Cost
96 gallon Weekly $77.14 $11.65
64 gallon Weekly $65.81 ---
Seattle Food and Yard Waste Cost

sonnevera international corp.
Appendix D - 120
On-site customers can request additional pickups at additional cost. All carts used primarily for food waste include compostable liners which the service provider driver will insert every week at no additional cost. Carts primarily used for yard waste do not need a compostable liner.
If tenants chose to use bags to carry food scraps to the food and yard waste cart, the City of Seattle approved plain, uncoated paper bags and compostable bags. Plastic bags are not accepted.
Recycling is available for apartments, condominiums co-ops, fraternities, sororities and house boats free of charge through Seattle Public Works. Materials accepted include: clean paper and cardboard, glass and plastic bottles, plastic containers, aluminum and tin cans and scrap metal (less than 2’ x 2’ x 2’).
Free educational materials, including online videos and limited free assistance or on-site training in multiple languages, are available to assist tenants with food scrap and recycling programs. A sample letter to tenants about Seattle’s laws regarding food waste and recycling is also available along with a case study.
Vancouver, BC (Pop: 631,486 in 2016) – Effective October 2016, Recycle BC took full responsibility of Vancouver’s recycling program. Buildings with five or more units receive recycling cart collection from Recycle BC. Multi-family recycling collection accepts the following materials:
• Yellow Labeled Blue Cart – paper, boxboard, cardboard and newsprint; if cardboard is too large for the bag, flatten and cut it to no large than 78 cm x 78 cm (30” x 30”) and stack neatly and securely in a safe place between the recycling containers. Place shredded paper inside paper bag or box.
• Blue Labeled Blue Cart – containers (plastic and metal containers, milk cartons, spiral wound cans).
• Grey Labeled Blue Cart – clear and coloured non-deposit glass bottles and jars.
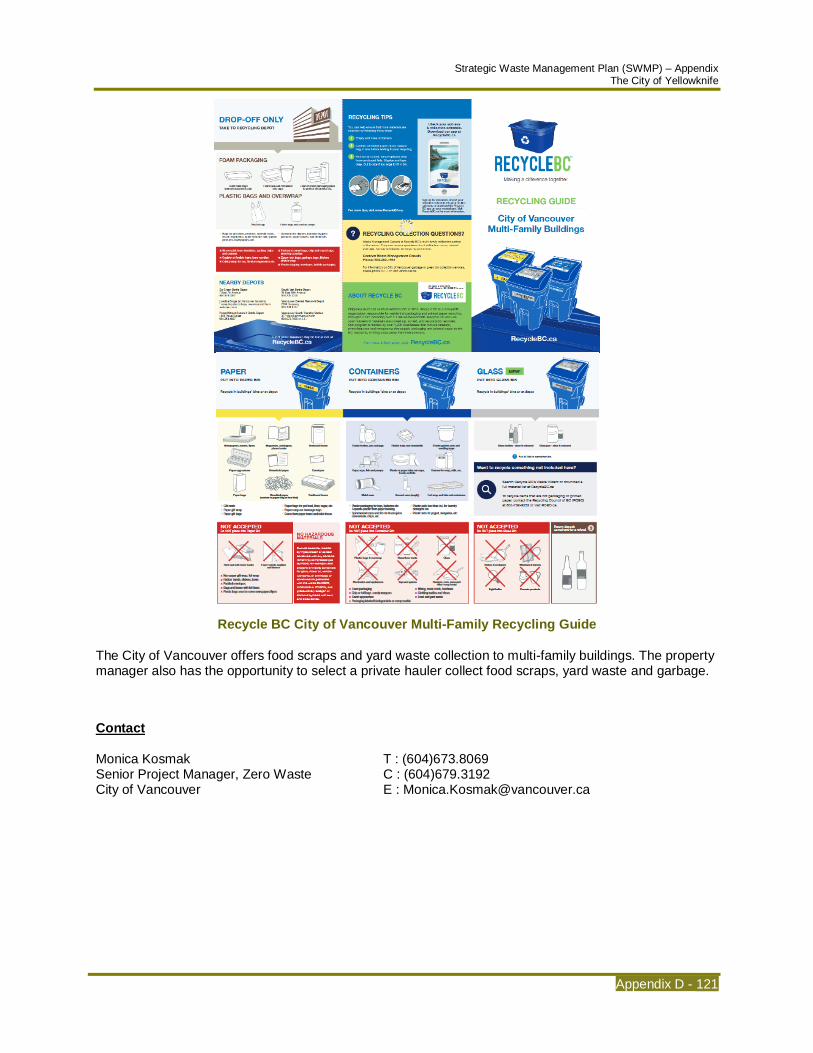
Strategic Waste Management Plan (SWMP) – Appendix The City of Yellowknife
Appendix D - 121
Recycle BC City of Vancouver Multi-Family Recycling Guide
The City of Vancouver offers food scraps and yard waste collection to multi-family buildings. The property manager also has the opportunity to select a private hauler collect food scraps, yard waste and garbage.
Contact
Monica Kosmak T : (604)673.8069 Senior Project Manager, Zero Waste C : (604)679.3192 City of Vancouver E : [email protected]
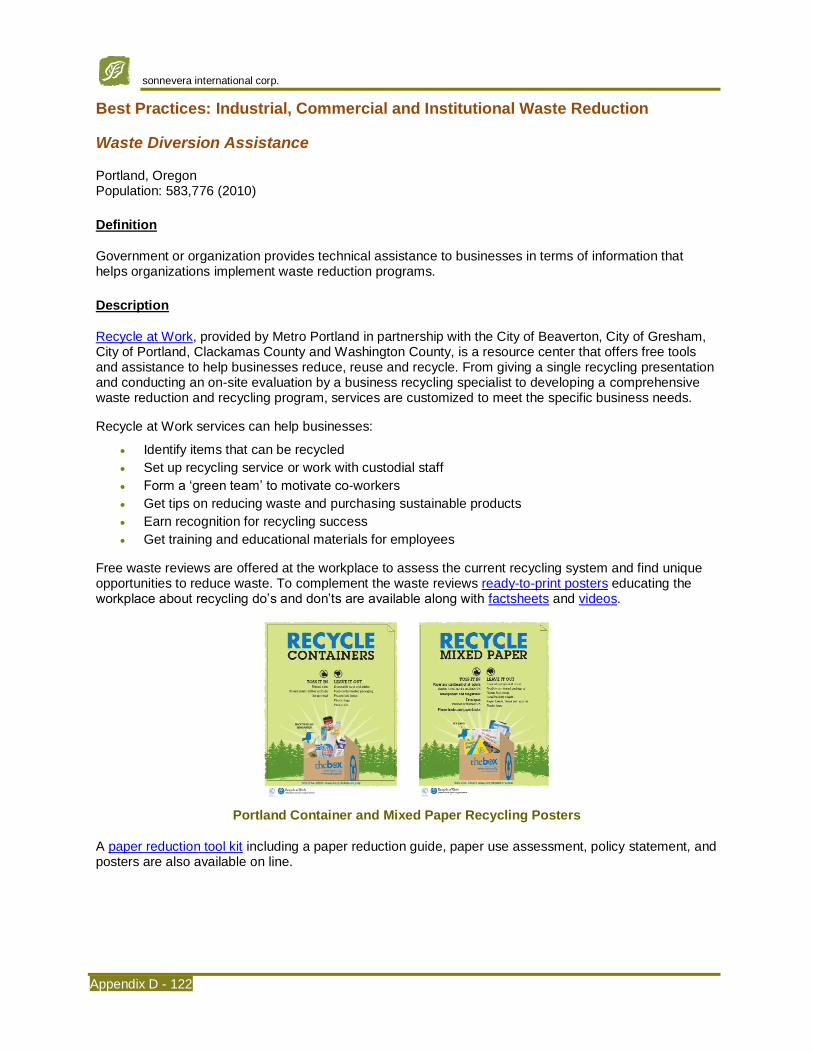
sonnevera international corp.
Appendix D - 122
Best Practices: Industrial, Commercial and Institutional Waste Reduction
Waste Diversion Assistance
Portland, Oregon Population: 583,776 (2010)
Definition
Government or organization provides technical assistance to businesses in terms of information that helps organizations implement waste reduction programs.
Description
Recycle at Work, provided by Metro Portland in partnership with the City of Beaverton, City of Gresham, City of Portland, Clackamas County and Washington County, is a resource center that offers free tools and assistance to help businesses reduce, reuse and recycle. From giving a single recycling presentation and conducting an on-site evaluation by a business recycling specialist to developing a comprehensive waste reduction and recycling program, services are customized to meet the specific business needs.
Recycle at Work services can help businesses:
• Identify items that can be recycled
• Set up recycling service or work with custodial staff
• Form a ‘green team’ to motivate co-workers
• Get tips on reducing waste and purchasing sustainable products
• Earn recognition for recycling success
• Get training and educational materials for employees
Free waste reviews are offered at the workplace to assess the current recycling system and find unique opportunities to reduce waste. To complement the waste reviews ready-to-print posters educating the workplace about recycling do’s and don’ts are available along with factsheets and videos.
Portland Container and Mixed Paper Recycling Posters
A paper reduction tool kit including a paper reduction guide, paper use assessment, policy statement, and posters are also available on line.
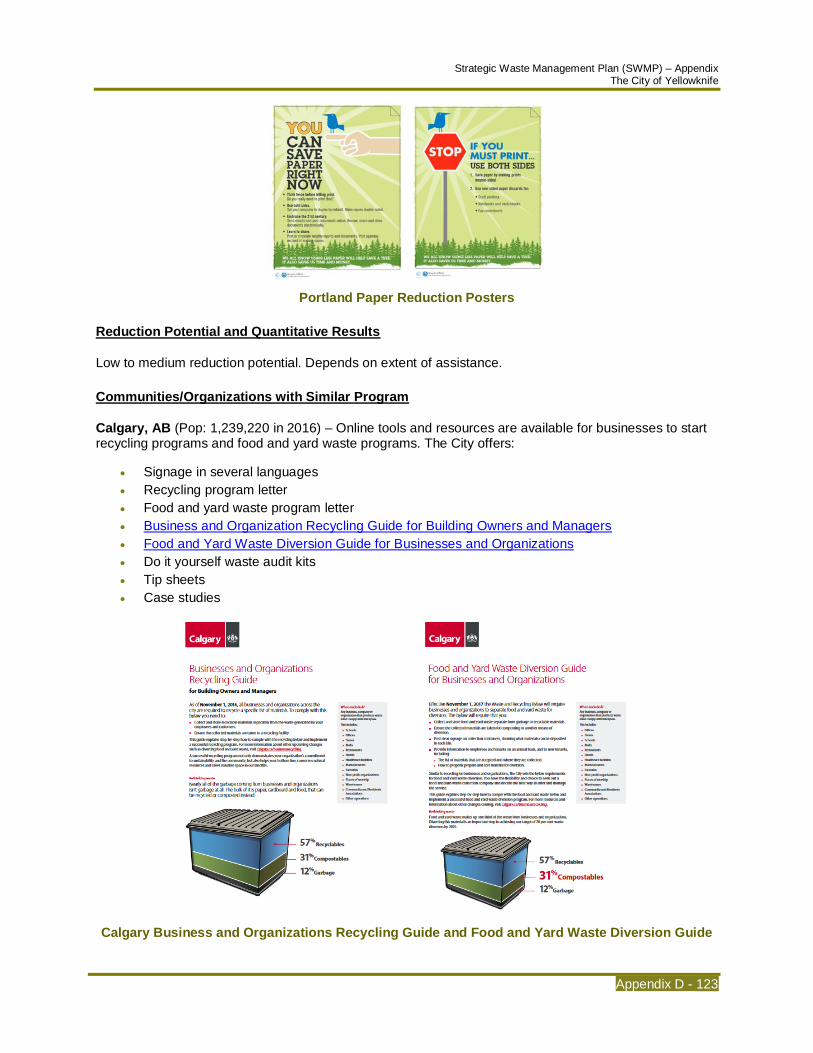
Strategic Waste Management Plan (SWMP) – Appendix The City of Yellowknife
Appendix D - 123
Portland Paper Reduction Posters
Reduction Potential and Quantitative Results
Low to medium reduction potential. Depends on extent of assistance.
Communities/Organizations with Similar Program
Calgary, AB (Pop: 1,239,220 in 2016) – Online tools and resources are available for businesses to start recycling programs and food and yard waste programs. The City offers:
• Signage in several languages
• Recycling program letter
• Food and yard waste program letter
• Business and Organization Recycling Guide for Building Owners and Managers
• Food and Yard Waste Diversion Guide for Businesses and Organizations
• Do it yourself waste audit kits
• Tip sheets
• Case studies
Calgary Business and Organizations Recycling Guide and Food and Yard Waste Diversion Guide
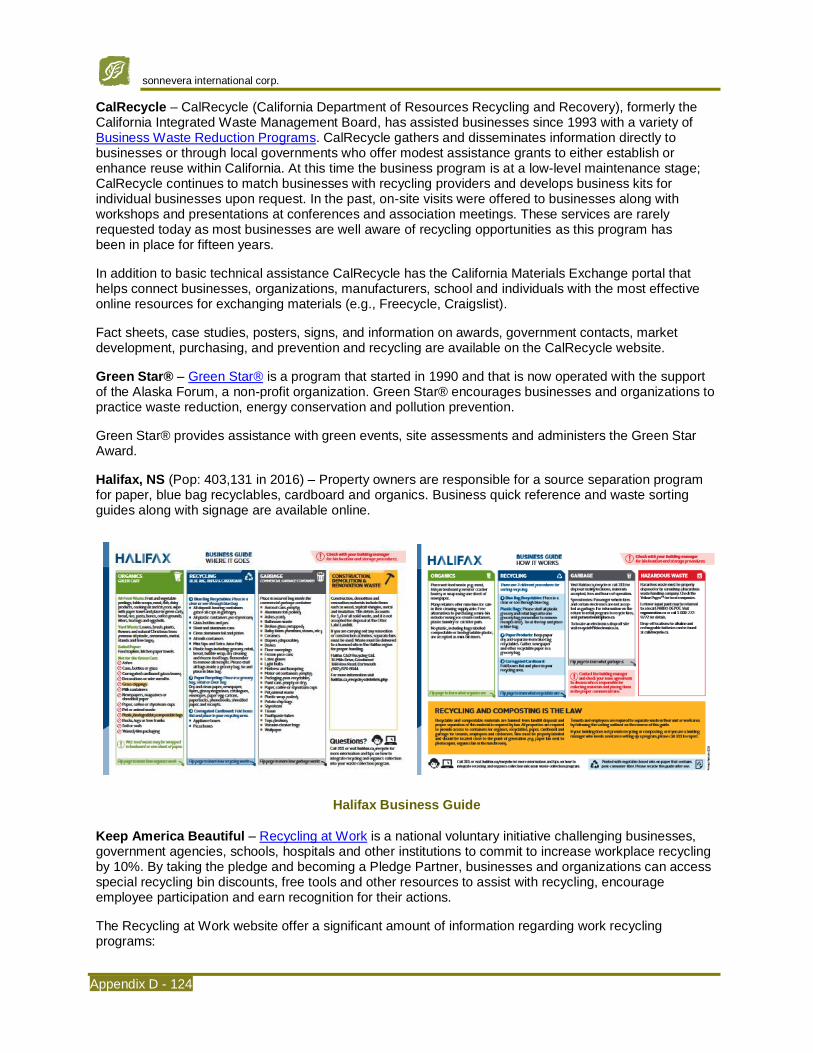
sonnevera international corp.
Appendix D - 124
CalRecycle – CalRecycle (California Department of Resources Recycling and Recovery), formerly the California Integrated Waste Management Board, has assisted businesses since 1993 with a variety of Business Waste Reduction Programs. CalRecycle gathers and disseminates information directly to businesses or through local governments who offer modest assistance grants to either establish or enhance reuse within California. At this time the business program is at a low-level maintenance stage; CalRecycle continues to match businesses with recycling providers and develops business kits for individual businesses upon request. In the past, on-site visits were offered to businesses along with workshops and presentations at conferences and association meetings. These services are rarely requested today as most businesses are well aware of recycling opportunities as this program has been in place for fifteen years.
In addition to basic technical assistance CalRecycle has the California Materials Exchange portal that helps connect businesses, organizations, manufacturers, school and individuals with the most effective online resources for exchanging materials (e.g., Freecycle, Craigslist).
Fact sheets, case studies, posters, signs, and information on awards, government contacts, market development, purchasing, and prevention and recycling are available on the CalRecycle website.
Green Star® – Green Star® is a program that started in 1990 and that is now operated with the support of the Alaska Forum, a non-profit organization. Green Star® encourages businesses and organizations to practice waste reduction, energy conservation and pollution prevention.
Green Star® provides assistance with green events, site assessments and administers the Green Star Award.
Halifax, NS (Pop: 403,131 in 2016) – Property owners are responsible for a source separation program for paper, blue bag recyclables, cardboard and organics. Business quick reference and waste sorting guides along with signage are available online.
Halifax Business Guide
Keep America Beautiful – Recycling at Work is a national voluntary initiative challenging businesses, government agencies, schools, hospitals and other institutions to commit to increase workplace recycling by 10%. By taking the pledge and becoming a Pledge Partner, businesses and organizations can access special recycling bin discounts, free tools and other resources to assist with recycling, encourage employee participation and earn recognition for their actions.
The Recycling at Work website offer a significant amount of information regarding work recycling programs:

Strategic Waste Management Plan (SWMP) – Appendix The City of Yellowknife
Appendix D - 125
• 10-Step Action Plan
• Education resources and training materials
• Customize communications templates and promotional materials
• Free webinars
• Periodic updates with helpful tips
• Case studies
King County, WA (Pop: 1,931,249 in 2010) – The King County Solid Waste Division focuses on workplace waste prevention and diversion activities through website education.
Montgomery County, MD (Pop: 975,934 in 2010) – The Non-Residential Recycling Program for Businesses and Organizations SORRT (Smart Organizations Reduce and Recycle Tons) offers education and information to ensure that businesses and employees in Montgomery County are aware of the County’s recycling polices and practices. Business Recycling Seminars (June 21, 2017, $10 per person) are available, along with business deskside recycling bins, newsletters, decals, posters, videos and a detailed Business Recycling Handbook.
Montgomery County SORRT Logo
New Jersey (Pop: 8,791,894 in 2010) – The New Jersey WasteWise Business Network is a free, voluntary program established by the United States Environmental Protection Agency, States are encouraged to set up WasteWise programs to help businesses reduce their waste by registering as a partner or endorser (sign up others). Partners receive technical assistance, access to a free helpline, information, tool kits and other resources.
New York, NY (Pop: 8,175,133 in 2010) – Zero Waste in NYC is New York City’s one-stop waste prevention and recycling resource. The site was written and produced by the New York City Department of Sanitation’s Bureau of Waste Prevention, Reuse and Recycling. It provides information for businesses, agencies and schools, and households.
Business and school information focuses on evaluating, reducing and reusing business waste; collection requirements; food scraps and yard waste; and mandatory and voluntary take-back programs. Focusing on all of these areas is needed in order to meet the 90 percent reduction of commercial waste by 2030 target.
New York City provides numerous waste diversion sign samples, in English, Chinese and Spanish, for business online along with English webinars on how to avoid business recycling and organics violations.
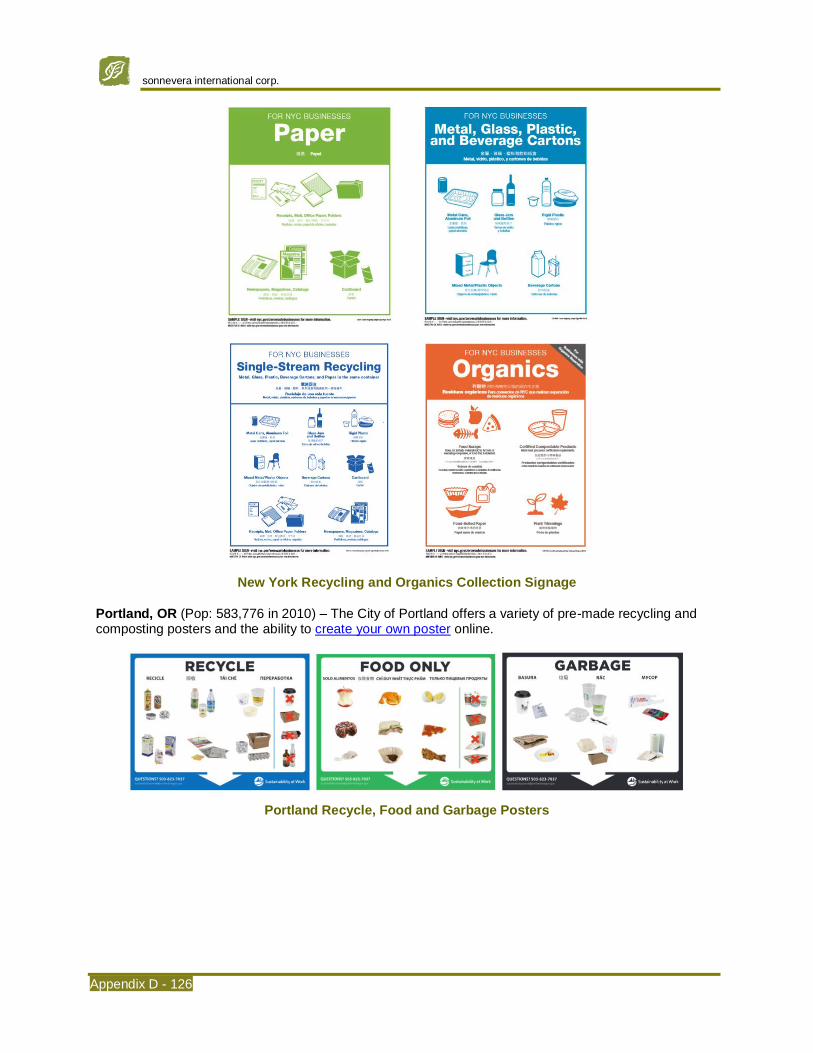
sonnevera international corp.
Appendix D - 126
New York Recycling and Organics Collection Signage
Portland, OR (Pop: 583,776 in 2010) – The City of Portland offers a variety of pre-made recycling and composting posters and the ability to create your own poster online.
Portland Recycle, Food and Garbage Posters

Strategic Waste Management Plan (SWMP) – Appendix The City of Yellowknife
Appendix D - 127
San Diego, CA (Pop: 1,307,402 in 2010) – To ensure success, the City provides educational resources and technical assistance for businesses. For help from a Recycling Specialist in setting up a recycling program, call 858-694-7000. Additionally, an online Educational Toolkit provides numerous documents to assist with program development including:
• Sample recycling container sign
• Manufacturers and vendors of recycling signage
• Sample newsletter articles (e.g., Shred it. Bag it. Recycle it; Recycling Creates New Products)
• Single commercial sample letter to tenants to kick-off program
• Multi-commercial sample letter to tenants or employees to kick-off program for commercial properties with more than one business
Case studies of various San Diego area businesses are also available.
San Francisco, CA (Pop: 805,235 in 2010) – The City offers an online Zero Waste Toolkit for businesses that includes printable signs and flyers, set up and training information, case studies and videos.
San Francisco Recycling and Composting Case Study
Seattle, WA (Pop: 608,660 in 2010) – Green Your Business (formerly The Resource Venture program), is a program by Seattle Public Utilities that promotes waste prevention and green procurement in businesses and provides free information and technical assistance to improve environmental performance of their operations. In 2015, the Green Your Business Program provided technical assistance to 750 businesses, conducted 370 recycling and composting program site visits to businesses and conducted 80 food service business visits to support compostable food packaging implementation.
A variety of publications are available online which include an education guide book called Seattle Business Recycling Guide: 6 Steps to Saving Money and Reducing Waste and other resources.
Green Your Business also features prominently in Seattle’s commercial food waste diversion program by providing information and assistance to businesses to start up a commercial food waste diversion program.

sonnevera international corp.
Appendix D - 128
Seattle Public Works Restaurant Dinner Area Posters (Standard Set) for Recycling, Food & Compostables, and Garbage
Seattle Public Utilities Specialty Cuisine Options for Food and Compostables Posters

Strategic Waste Management Plan (SWMP) – Appendix The City of Yellowknife
Appendix D - 129
Seattle Public Utilities “Stop Think Sort” Table Tent Advertisement
Seattle Public Works Round Bin Labels
West Yellowhead Recycles, AB – West Yellowhead Recycles offers online assistance for business recycling. They provide an ICI Flyer, detailed information of where to recycle ICI materials, waste reduction tips, a link to donate surplus food and reasons to decrease waste generation and green the business.
West Yellowhead Recycles 2016 ICI Flyer
West Yellowhead Recycles Cardboard Signage

sonnevera international corp.
Appendix D - 130
Contact
Pete Chism-Winfield
Program Specialist City of Portland 503-823-7652
T: (503) 823-7652 [email protected]

Strategic Waste Management Plan (SWMP) – Appendix The City of Yellowknife
Appendix D - 131
ICI Recognition
Mecklenburg County, North Carolina Population: 918,628 (2010)
Definition
Public acknowledgement of businesses and institutions that achieve significant waste reduction goals to encourage similar programs within other organizations, while reinforcing positive behaviours associated with these accomplishments, and helping to raise the public profile of participating businesses.
Description
Mecklenburg County’s Wipe Out Waste Ambassador Program is a free networking and educational program designed to recognize and reward local businesses that are committed to building a stronger community through recycling and reducing waste in the workplace. The Ambassador Program has over 200 member organizations and hosts four luncheons a year, including an annual awards banquet. A member directory is available along with recycling videos of businesses that receive awards at the annual banquet.
Wipe Out Waste Ambassador Logo
The 2016 Business Recognition Awards Banquet, held annually in October, commended businesses in the following categories:
• Outstanding Construction Recycling Program
• Sustainable Business of the Year
• Institutional Recycling Program of the Year
• Recycling Program of the Year – Property Managed Facility
• Recycling Program of the Year – Hospitality
• Non-Profit Waste Reduction Partner of the Year
• Sustainable Manufacturer of the Year
• Innovation Spotlight (3 recipients)
Reduction Potential and Quantitative Results
Low to medium reduction potential. Depends on extent of assistance.

sonnevera international corp.
Appendix D - 132
Communities/Organizations with Similar Program
Airdrie, AB (Pop: 61,581 in 2016) – The Environmental Stewardship Business Award, started in 2002, is awarded to a business that demonstrates commitment and is influential in the area of environmental sustainability through leadership and the integration of environmentally responsible practices into their corporate culture. Nominees do not have to be an environmental services company, where the core business function is focused on the environment. Award eligibility includes:
• Business must hold a valid City of Airdrie business license
• Nominees must not have received this award in the past five years
• Self-nominations are eligible
Airdrie Environmental Stewardship Business Award Logo
The Environmental Stewardship Business 2016 winner was Good Earth Coffeehouse.
Austin, TX (Pop: 790,390 in 2010) – The City of Austin’s Green Business Leaders (AGBL) program, provided by the Office of Sustainability, is voluntary and recognizes sustainable businesses. In order to receive recognition a business must complete the AGBL scorecard with at least one strategy in each of the following sections:
• Communication & Outreach
• Resource Management (e.g., divert at least 75% of waste annually from the landfill by reducing and/or recycling and have documentation to support your achievements)
• Water
• Energy
• Healthy Work Environment
• Transportation
• Community Stewardship
Once the supporting documentation has been approved by City staff the business is featured on the City of Austin website and the business can place the AGBL program logo on the storefront window and company website.
California (formerly Bay Area) Green Business Program, CA – The California Green Business Program verifies that businesses meet higher standards of environmental performance. Partnerships between government agencies and utilities helps local businesses comply with all environmental regulations and take actions to conserve resources, prevent pollution, and minimize waste. Over 1,000 businesses and public agencies have been certified since 1997.
The program was developed by Bay Area local governments in collaboration with US EPA, Cal EPA Department of Toxic Substances Control and the business community. The Association of Bay Area Governments coordinated the Program, which was initially implemented by Green Business Coordinators in nine participating counties. The program has since grown to cover all of California, now administered by PG&E Corporation.
The Green Business Standards present requirements that a business or public agency must achieve to be certified ‘green’. Businesses in over 20 different industries, including auto repair shops, printers,
Strategic Waste Management Plan (SWMP) – Appendix The City of Yellowknife
Appendix D - 133
hotels, restaurants, landscapers, wineries, janitorial and laundry services, grocery and retail stores, home remodelers, attorneys, architects, engineers, gift services, and a variety of office and home-based businesses, have successfully met the standards and are now recognized as Bay Area Green Businesses.
Four components are evaluated as part of the Green Business Program, solid waste reduction and recycling, water conservation, energy conservation and pollution prevention.
The solid waste reduction and recycling section requests the implementation of the following measures:
• Conduct a waste reduction assessment of solid waste stream
• Implement solid waste reduction and recycling measures:
1) Reduce waste in seven different ways, including eliminating use of individual water bottles and Styrofoam and setting printers and copiers to duplex.
2) Reuse materials in three ways.
3) Provide containers at convenient locations and recycle cardboard, newspaper, office/mixed papers, glass, metal, plastics and one additional material.
4) Purchase paper with at least 30% and paper towel with at least 35% port-consumer. content and at least two other recycled-content products.
Upon receiving Green Business certification recognition is received through:
• The Green Business Program website www.greenbiz.ca.gov
• The California Green Business Network’s recognition program website www.greenbusinessca.org
• City and agency newsletters
• Press coverage, promotional events and special recognition
• Window decals, certificates and promotional materials for business
• Green Business logo to use in business advertising
Bay Area Green Business Program Logo (discontinued)
sonnevera international corp.
Appendix D - 134
Bay Area Green Business Program Postcard
Burnaby, BC (Pop: 232,755 in 2016) – Since 1996, through the Environmental Awards Program, the City has recognized outstanding contributions of individuals, groups, organizations, institutions and businesses to advancing environmental sustainability and protecting and enhancing the natural environment in Burnaby.
All nominations for Business Stewardship, Communications, Community Stewardship, Green Choices, Planning and Development and Youth are submitted by March 31 and award recipients are announced at a regular Council meeting at the end of May.
Of specific interest to the City is how many of the following ten City of Burnaby Environmental Sustainability Strategy goals does the nominee contribute towards:
1) Conserve – World-leading waste reduction, diversion and management 2) Build – Buildings and infrastructure Conserve that have a positive impact on the environment 3) Green – Healthy and resilient ecosystems 4) Flow – Healthy and resilient watersheds 5) Breathe – A community resilient to climate change, with clean air and low carbon emissions 6) Live – A network of compact and complete communities, within fabric of healthy ecosystems 7) Move – A walkable, bikeable, and transit-supported city that supports a healthy community and
environment 8) Prosper – A prosperous economy that supports a healthy environment 9) Nourish – A food system that supports healthy people, a healthy community and a healthy
environment 10) Manage – Environmentally aware and engaged community working together to improve
Burnaby’s environmental performance
In 2017, four Environmental Awards and five Environmental Star Awards were presented. All winners have program descriptions posted on the City of Burnaby website.
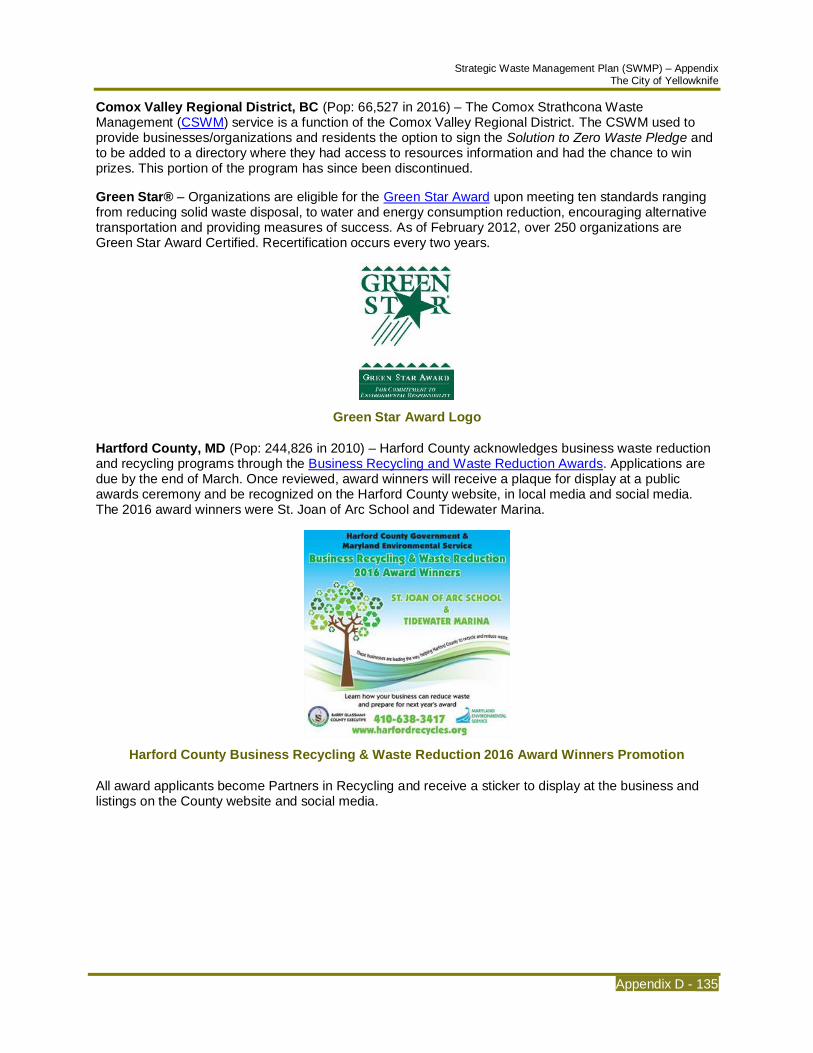
Strategic Waste Management Plan (SWMP) – Appendix The City of Yellowknife
Appendix D - 135
Comox Valley Regional District, BC (Pop: 66,527 in 2016) – The Comox Strathcona Waste Management (CSWM) service is a function of the Comox Valley Regional District. The CSWM used to provide businesses/organizations and residents the option to sign the Solution to Zero Waste Pledge and to be added to a directory where they had access to resources information and had the chance to win prizes. This portion of the program has since been discontinued.
Green Star® – Organizations are eligible for the Green Star Award upon meeting ten standards ranging from reducing solid waste disposal, to water and energy consumption reduction, encouraging alternative transportation and providing measures of success. As of February 2012, over 250 organizations are Green Star Award Certified. Recertification occurs every two years.
Green Star Award Logo
Hartford County, MD (Pop: 244,826 in 2010) – Harford County acknowledges business waste reduction and recycling programs through the Business Recycling and Waste Reduction Awards. Applications are due by the end of March. Once reviewed, award winners will receive a plaque for display at a public awards ceremony and be recognized on the Harford County website, in local media and social media. The 2016 award winners were St. Joan of Arc School and Tidewater Marina.
Harford County Business Recycling & Waste Reduction 2016 Award Winners Promotion
All award applicants become Partners in Recycling and receive a sticker to display at the business and listings on the County website and social media.

sonnevera international corp.
Appendix D - 136
Harford County Partners in Recycling Sticker
Keep America Beautiful – The Recycle at Work Pledge focuses on businesses increasing workplace recycling by 10 percent over the next two years. In order to achieve this goal the following actions are suggested:
• Identify opportunities to recycle more and waste less
• Make recycling more convenient in the workplace to encourage greater participation
• Increase employee awareness of waste reduction and recycling opportunities at the workplace
• Identify cost-effective opportunities to purchase products with recycled content
• Implement purchasing policies that consider a product’s end of life use and recyclability
• Report actions and progress through the Recycling at Work online reporting system
• Celebrate successes
• Invite at least one other business or organization to take this pledge
Once the pledge is signed the organization’s logo is featured on the Recycling at Work homepage and it is listed on the Pledge Partner page. Businesses and organizations that sustain a 70% of higher measurable recycling rate for the next two years are invited to share their success stories and applaud any recycling increases achieved each year.
King County, WA (Pop: 1,931,249 in 2010) – Each Spring King County businesses are invited to demonstrate their commitment to waste prevention and recycling and apply for recognition as a Best Workplace for Waste Prevention and Recycling. In 2016, the King County Solid Waste Division named 112 local businesses to its tenth annual Best Workplaces for Waste Prevention and Recycling list.
Some notable practices include Alaska Airlines implementing an on-board coffee ground composting program on all flights, Redhook Ale Brewery changing the design of their product packaging to use less cardboard and Blueprint Consulting LLC’s internal recycling competitions that aim to positively influence waste reduction behaviours in the office. Acknowledged businesses are identified by their logo and an honor roll graphic image along with their profiles on the King County website.
King County Best Workplace for Waste Prevention and Recycling Logo
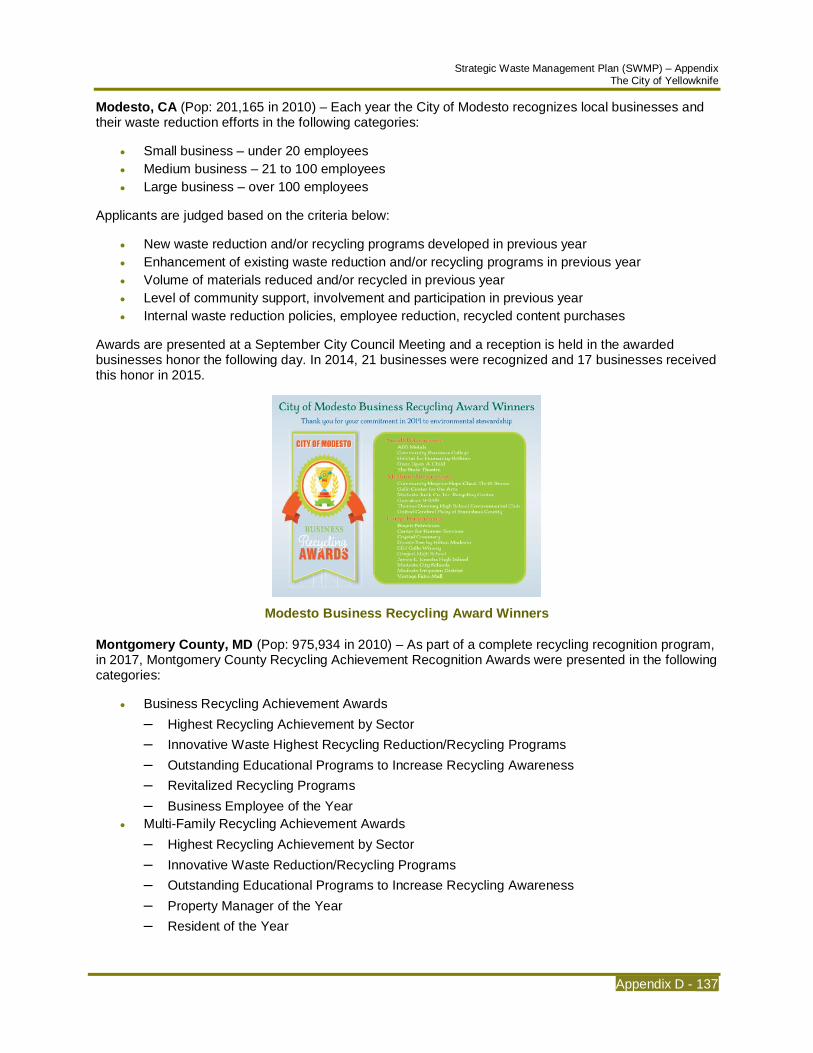
Strategic Waste Management Plan (SWMP) – Appendix The City of Yellowknife
Appendix D - 137
Modesto, CA (Pop: 201,165 in 2010) – Each year the City of Modesto recognizes local businesses and their waste reduction efforts in the following categories:
• Small business – under 20 employees
• Medium business – 21 to 100 employees
• Large business – over 100 employees
Applicants are judged based on the criteria below:
• New waste reduction and/or recycling programs developed in previous year
• Enhancement of existing waste reduction and/or recycling programs in previous year
• Volume of materials reduced and/or recycled in previous year
• Level of community support, involvement and participation in previous year
• Internal waste reduction policies, employee reduction, recycled content purchases
Awards are presented at a September City Council Meeting and a reception is held in the awarded businesses honor the following day. In 2014, 21 businesses were recognized and 17 businesses received this honor in 2015.
Modesto Business Recycling Award Winners
Montgomery County, MD (Pop: 975,934 in 2010) – As part of a complete recycling recognition program, in 2017, Montgomery County Recycling Achievement Recognition Awards were presented in the following categories:
• Business Recycling Achievement Awards
– Highest Recycling Achievement by Sector
– Innovative Waste Highest Recycling Reduction/Recycling Programs
– Outstanding Educational Programs to Increase Recycling Awareness
– Revitalized Recycling Programs
– Business Employee of the Year
• Multi-Family Recycling Achievement Awards
– Highest Recycling Achievement by Sector
– Innovative Waste Reduction/Recycling Programs
– Outstanding Educational Programs to Increase Recycling Awareness
– Property Manager of the Year
– Resident of the Year

sonnevera international corp.
Appendix D - 138
• Residential Recycler of the Year
• Recycling Volunteers of the Year
Winner program descriptions are posted on the Montgomery County website.
San Diego, CA (Pop: 1,307,402 in 2010) – For the past 25 years the City of San Diego’s Environmental Services Department presents the Waste Reduction and Recycling Awards to businesses in order to recognize their exemplary waste reduction efforts. A four page application along with a brief 200 word summary of program highlights is required by each business applicant. For applicants that have received this award previously, they must describe how their program has improved since the last win. The 2017 awards ceremony took place on April 6, recognizing the following business categories:
1. Outstanding Achievement Award – Any business or organization that consistently demonstrates extraordinary efforts expanding and existing recycling program year after year; awarded “Recycler of the Year” for five consecutive years; and has participated in the city’s Business Recycling program for at least 10 years. The 2017 winners are:
• San Diego County Regional Airport Authority
• Qualcomm
• Sand Diego Zoo Global
• SeaWorld San Diego
2. Recycler of the Year Award – Applicants with the most comprehensive, innovative and/or improved recycling programs. The 2017 winners are:
• Bahia Resort Hotel
• Cox Communications Inc.
• San Diego Convention Center Corporation
• KYOCERA International Inc.
• Sony Electronics, LLC
• Paradise Point Resort and Spa
• Point Loma Nazarene University
3. Rising Star – New applicants that have achieved exemplary recycling results through innovation and persistence. The 2017 winners are:
• Café Gratitude San Diego, LLC
• Hazard Center
• Specialty Produce
4. Industry Leader Award – A special award was presented to EDCO Disposal. This family owned and locally operated waste collection and recycling company celebrated its 50th anniversary in 2017, serving customers in the San Diego and Southern California region.
Washington County, OR (Pop: 531,345 in 2010) – The Green Business Award recognizes businesses’ and institutions’ sustainability efforts, including:
• Reuse and above-and-beyond recycling
• Toxics reduction
• Green purchasing
• Corporate social responsibility
• And more…
This award is available to all organizations, businesses and institutions in Washington County, with the exception of those located in the City of Beaverton.
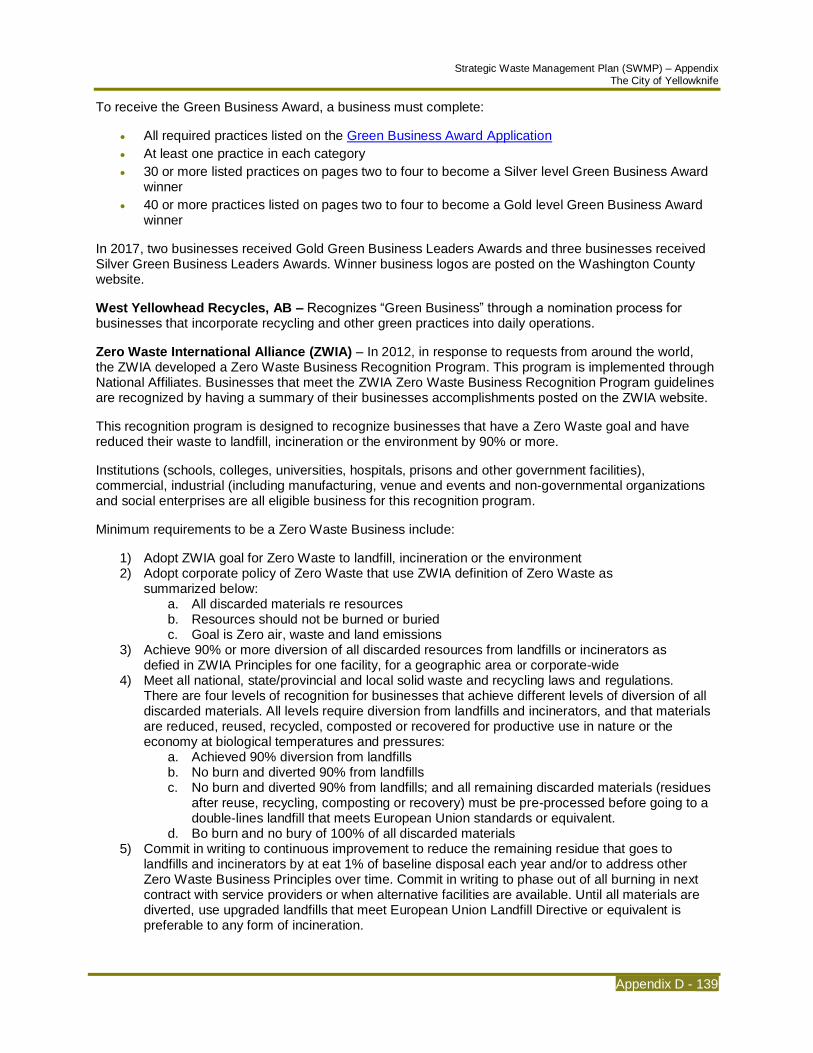
Strategic Waste Management Plan (SWMP) – Appendix The City of Yellowknife
Appendix D - 139
To receive the Green Business Award, a business must complete:
• All required practices listed on the Green Business Award Application
• At least one practice in each category
• 30 or more listed practices on pages two to four to become a Silver level Green Business Award winner
• 40 or more practices listed on pages two to four to become a Gold level Green Business Award winner
In 2017, two businesses received Gold Green Business Leaders Awards and three businesses received Silver Green Business Leaders Awards. Winner business logos are posted on the Washington County website.
West Yellowhead Recycles, AB – Recognizes “Green Business” through a nomination process for businesses that incorporate recycling and other green practices into daily operations.
Zero Waste International Alliance (ZWIA) – In 2012, in response to requests from around the world, the ZWIA developed a Zero Waste Business Recognition Program. This program is implemented through National Affiliates. Businesses that meet the ZWIA Zero Waste Business Recognition Program guidelines are recognized by having a summary of their businesses accomplishments posted on the ZWIA website.
This recognition program is designed to recognize businesses that have a Zero Waste goal and have reduced their waste to landfill, incineration or the environment by 90% or more.
Institutions (schools, colleges, universities, hospitals, prisons and other government facilities), commercial, industrial (including manufacturing, venue and events and non-governmental organizations and social enterprises are all eligible business for this recognition program.
Minimum requirements to be a Zero Waste Business include:
1) Adopt ZWIA goal for Zero Waste to landfill, incineration or the environment 2) Adopt corporate policy of Zero Waste that use ZWIA definition of Zero Waste as
summarized below: a. All discarded materials re resources b. Resources should not be burned or buried c. Goal is Zero air, waste and land emissions
3) Achieve 90% or more diversion of all discarded resources from landfills or incinerators as defied in ZWIA Principles for one facility, for a geographic area or corporate-wide
4) Meet all national, state/provincial and local solid waste and recycling laws and regulations. There are four levels of recognition for businesses that achieve different levels of diversion of all discarded materials. All levels require diversion from landfills and incinerators, and that materials are reduced, reused, recycled, composted or recovered for productive use in nature or the economy at biological temperatures and pressures:
a. Achieved 90% diversion from landfills b. No burn and diverted 90% from landfills c. No burn and diverted 90% from landfills; and all remaining discarded materials (residues
after reuse, recycling, composting or recovery) must be pre-processed before going to a double-lines landfill that meets European Union standards or equivalent.
d. Bo burn and no bury of 100% of all discarded materials 5) Commit in writing to continuous improvement to reduce the remaining residue that goes to
landfills and incinerators by at eat 1% of baseline disposal each year and/or to address other Zero Waste Business Principles over time. Commit in writing to phase out of all burning in next contract with service providers or when alternative facilities are available. Until all materials are diverted, use upgraded landfills that meet European Union Landfill Directive or equivalent is preferable to any form of incineration.

sonnevera international corp.
Appendix D - 140
6) Submit summary of Zero Waste initiatives to be published on the ZWIA and National Affiliate websites and indicate which sector they would like to be listed in United Nations Standard Products and Service Code
7) Submit data annually to National Affiliate to be able to continue use of “ZWIA approved” Recognition Program that ZWIA is authorized to post. A fill year of data will be provided for each annual renewal. Data submitted will be public and published on the National Affiliate’s website
The first businesses officially recognized by this recognition program are Whole Foods (San Diego County, CA) and the Sierra Nevada Brewing Company (Chico, CA). These businesses were certified as Zero Waste by the U.S. Zero Waste Business Council which works with the Grassroots Recycling Network which is the ZWIA National Affiliate in eth United States. Other businesses are in the process of being recognized by affiliates in Brazil and Canada.
Contact
CalRecycle 1001 I Street PO Box 4025 Sacramento, CA 95812
T: (916) 341-6604 [email protected]

Strategic Waste Management Plan (SWMP) – Appendix The City of Yellowknife
Appendix D - 141
Enhanced ICI Food Waste Diversion
Seattle, Washington Population: 608,660 (2010)
Definition
Diversion of food waste, particularly from restaurants and grocery stores through City and/or private sector collection.
Description
Starting January 1, 2015, the City of Seattle requires businesses not to place food scraps, compostable paper and yard waste in their garbage through the Seattle Municipal Code Section 21.36.082.
The City offers a food scrap collection service and saves money for businesses that generate significant amounts of food waste, such as restaurants, grocery stores, bakeries, hotels, schools and flower shops.
Through the commercial compost program the following materials are collected:
• Food scraps
– Meat, fish and dairy
– Shells and bones
– Eggshells, nutshells (paper carton)
– Fruit and vegetables
– Pasta and rice
– Bread and grains
• Food-soiled paper
– Coffee grounds, filters and tea bags
– Paper bags, towels and newspaper
– Greasy pizza boxes and waxed cardboard
– Uncoated paper plates and napkins
• Plants and flowers
• Approved Compostable Packaging
If bags are used to transport materials to the food/yard waste containers, use either paper bags or approved compostable bags that are accepted at Cedar Grove Composting. Plastic bags are not accepted.
Current program info can be found at: http://www.seattle.gov/util/ForBusinesses/SolidWaste/FoodYardBusinesses/Commercial/index.htm
Seattle Commercial Compost Container Monthly Rates* (effective April 1, 2017)
Service Type Each Container, Weekly Pickup
Compacted Material, Each
Container, Weekly Pickup
32 Gal $33.71 ---
60 Gal $65.81 ---
90 Gal $77.14 ---
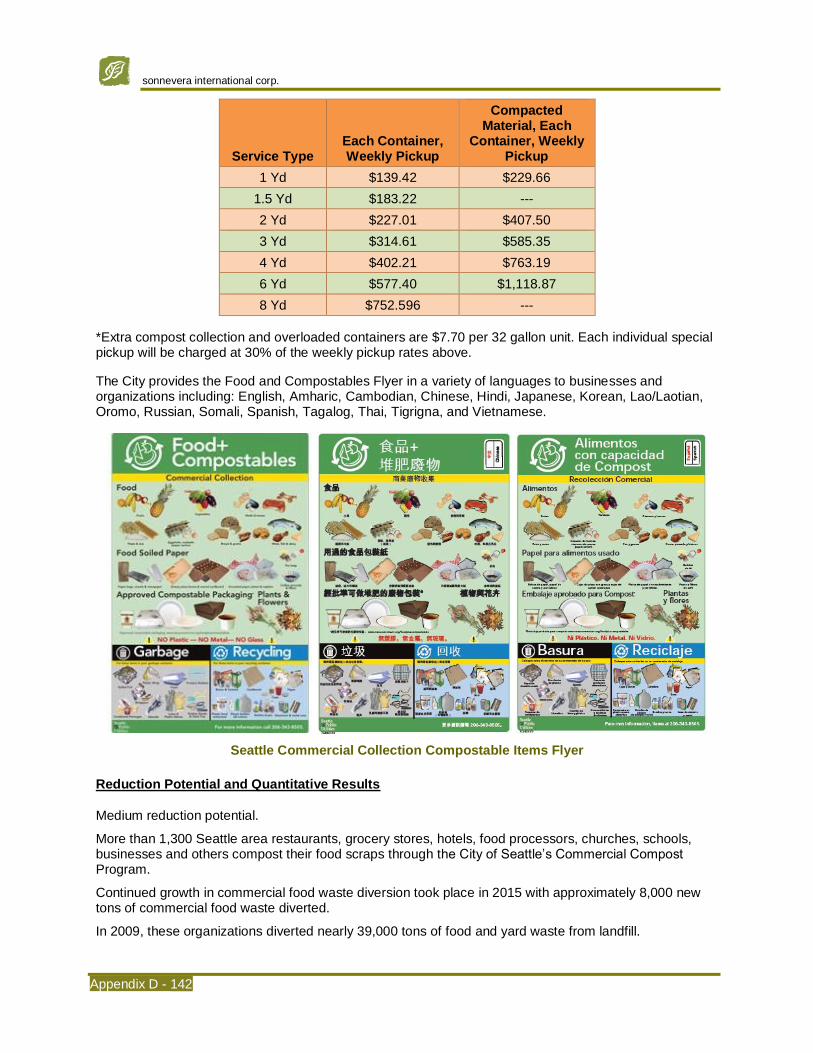
sonnevera international corp.
Appendix D - 142
Service Type Each Container, Weekly Pickup
Compacted Material, Each
Container, Weekly Pickup
1 Yd $139.42 $229.66
1.5 Yd $183.22 ---
2 Yd $227.01 $407.50
3 Yd $314.61 $585.35
4 Yd $402.21 $763.19
6 Yd $577.40 $1,118.87
8 Yd $752.596 ---
*Extra compost collection and overloaded containers are $7.70 per 32 gallon unit. Each individual special pickup will be charged at 30% of the weekly pickup rates above.
The City provides the Food and Compostables Flyer in a variety of languages to businesses and organizations including: English, Amharic, Cambodian, Chinese, Hindi, Japanese, Korean, Lao/Laotian, Oromo, Russian, Somali, Spanish, Tagalog, Thai, Tigrigna, and Vietnamese.
Seattle Commercial Collection Compostable Items Flyer
Reduction Potential and Quantitative Results
Medium reduction potential.
More than 1,300 Seattle area restaurants, grocery stores, hotels, food processors, churches, schools, businesses and others compost their food scraps through the City of Seattle’s Commercial Compost Program.
Continued growth in commercial food waste diversion took place in 2015 with approximately 8,000 new tons of commercial food waste diverted.
In 2009, these organizations diverted nearly 39,000 tons of food and yard waste from landfill.

Strategic Waste Management Plan (SWMP) – Appendix The City of Yellowknife
Appendix D - 143
Communities/Organizations with Similar Program
Banff, AB (Pop: 7,851 in 2016) – Businesses are required to separate food waste (e.g., vegetables and fruits, coffee grounds, cheese, rice, bread, cereal, noodles, plate scrapings, soiled paper with food, popsicles and store sticks (wood only)) through Bylaw 377 (Non-Residential Waste Bylaw).
The Town offers food waste collection in two bin sizes (360 L and 660 L) with three pick-ups per week (Tuesday, Thursday and Saturday). Quarterly food waste collection rates, effective January 1, 2017, for a 360 L bin range from $77 (one bin collected once a week) to $684 (six bins collected three times a week). For a 660 L bin the quarterly range is $102 (one bin collected once a week) to $1137 (six bins collected three times a week). Additional bins and collection frequency are available.
Halifax, NS (Pop: 403,131 in 2016) – Organic material (food and yard waste), fibre recyclables and blue box recyclables are unacceptable for landfill disposal. A source separation for these materials is required by law (By-law No. S-600) at all commercial properties in Halifax.
The commercial sector, businesses and institutions must take part in an organics collection program along with recycling and garbage collection. Property owners are to contact their waste hauler to review source separated collection services. Food and yard waste along with boxboard, soiled paper, sawdust and wood shavings are collected in green carts.
Effective November 5, 2007 pursuant to an amendment to Section 12.2 of By-Law No. S-600, signage of sufficient size and number is required to be posted to provide occupants with specific recycling and organics instructions for proper sorting of organic material, and fibre and blue bag recyclables.
Jasper, AB (Pop: 4,590 in 2016) – Hotels and restaurants have the option to order a compost collection cart which is picked up by the Town. Currently there are 19 restaurants / hotels / grocery stores that participate in the organics collection program, and more businesses are interested in signing on.
Organics Bin Outside a Jasper Grocery Store
Noetix Corp. – this 60 employee software provider in Redmond, WA set up a food composting program in the lunch room to facilitate proper disposal of coffee filters, corn based plates and utensils and food waste. Waste Management started business food waste curbside collection in 2009 and Noetix receives twice a week collection from this hauler. Eco bags are used to line the food waste container in the lunch room and are removed nightly by the cleaning staff. Food waste is taken to Cedar Grove Composting for processing and sold back to the public. Some employees that do not have residential food waste collection bring home food waste to the office to be diverted. Noetix had their first zero waste event, a summer picnic in 2009, which included food waste diversion.
Regional District of Nanaimo, BC (Pop: 155,698 in 2016) – In April 2005, the Regional District of Nanaimo Board of Directors approved a commercial food waste diversion program. Effective December 1, 2005, the Board implemented a ban of ICI organics, affecting approximately 800 businesses and institutions, at the landfill when the International Composting Corporation in vessel composting facility opened near Duke Point.

sonnevera international corp.
Appendix D - 144
Banned compostable materials include:
• Fruits and vegetables
• Soiled paper plates and cups
• Meat, fish, shellfish, poultry and bones
• Soiled paper towels and napkins
• Dairy products
• Soiled waxed paper
• Bread, pasta and baked goods
• Food soiled cardboard and paper
• Tea bags, coffee grounds and filters
• Egg shells
• Wooden stir sticks / chop sticks
By-law 1428 imposed a ban on all food and organic waste from commercial sources including food services, food and beverage stores, hospitals, educational institutions with food services, nursing and residential homes, community food services. Examples of this are kitchen waste receptacles in restaurants, waste bins in grocery store produce departments and bags of damp paper towels from commercial restrooms. This ban also included yard waste.
The Regional District worked with haulers to provide alternative organic collection options and provided stakeholder sessions prior to implementation of the by-law and ban.
An estimated 6,000 tonnes of commercial organics is diverted per year through this program. By 2010, the Regional District hopes to divert 75% of food waste from landfill to licensed composting facilities.
Businesses are required to pay for collection and processing of the organic food waste as well as the bins.
Towards the end of 2008, the Regional District is planning to revisit education / communication options for the ICI sector including site visits and bylaw compliance.
San Francisco, CA (Pop: 805,235 in 2010) – The City offers a variety of programs to divert food waste from the commercial sector including redistribution of food to food banks, recovering food processing waste by farmers as animal feed, collection of grease and meat for rendering, on-site composting pilots and offering food waste collection services provided by the City’s two franchised haulers.
More than 1,800 San Francisco restaurants and other food-related businesses are providing food scraps and other compostable material to San Francisco's food scrap compost program. These food scraps are made into nitrogen rich compost and used by vineyards in the heart of California's wine country, including Napa, Sonoma, El Dorado and Mendocino Counties.
City of San Francisco Business Composting
To encourage commercial sector food recovery, the City contracts with a consultant to assist program development and analysis. The consultant also provides training, monitoring, follow-up, and outreach to food waste generating customers with commercial food collection service (provided by the city’s haulers). The City has also funded indoor sorting containers to assist participants. In addition, the City and County have provided more than $350,000 in grant money to help build the edible food recovery infrastructure.
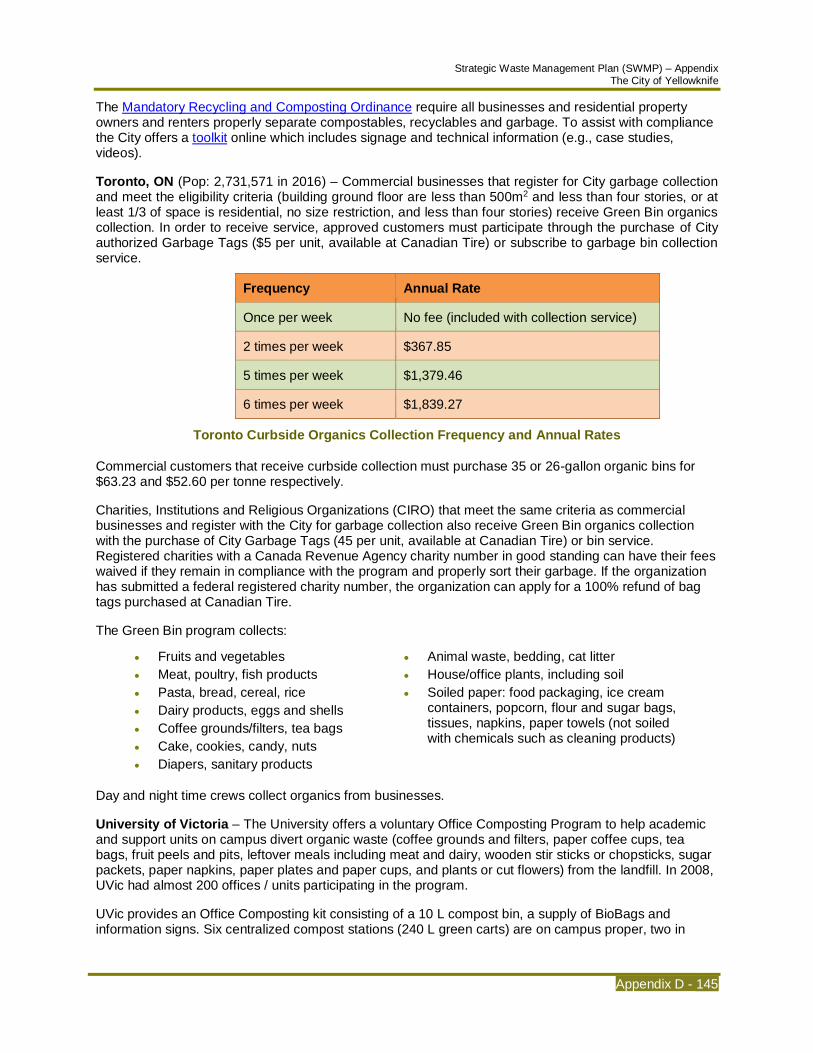
Strategic Waste Management Plan (SWMP) – Appendix The City of Yellowknife
Appendix D - 145
The Mandatory Recycling and Composting Ordinance require all businesses and residential property owners and renters properly separate compostables, recyclables and garbage. To assist with compliance the City offers a toolkit online which includes signage and technical information (e.g., case studies, videos).
Toronto, ON (Pop: 2,731,571 in 2016) – Commercial businesses that register for City garbage collection and meet the eligibility criteria (building ground floor are less than 500m2 and less than four stories, or at least 1/3 of space is residential, no size restriction, and less than four stories) receive Green Bin organics collection. In order to receive service, approved customers must participate through the purchase of City authorized Garbage Tags ($5 per unit, available at Canadian Tire) or subscribe to garbage bin collection service.
Frequency Annual Rate
Once per week No fee (included with collection service)
2 times per week $367.85
5 times per week $1,379.46
6 times per week $1,839.27
Toronto Curbside Organics Collection Frequency and Annual Rates
Commercial customers that receive curbside collection must purchase 35 or 26-gallon organic bins for $63.23 and $52.60 per tonne respectively.
Charities, Institutions and Religious Organizations (CIRO) that meet the same criteria as commercial businesses and register with the City for garbage collection also receive Green Bin organics collection with the purchase of City Garbage Tags (45 per unit, available at Canadian Tire) or bin service. Registered charities with a Canada Revenue Agency charity number in good standing can have their fees waived if they remain in compliance with the program and properly sort their garbage. If the organization has submitted a federal registered charity number, the organization can apply for a 100% refund of bag tags purchased at Canadian Tire.
The Green Bin program collects:
• Fruits and vegetables
• Meat, poultry, fish products
• Pasta, bread, cereal, rice
• Dairy products, eggs and shells
• Coffee grounds/filters, tea bags
• Cake, cookies, candy, nuts
• Diapers, sanitary products
• Animal waste, bedding, cat litter
• House/office plants, including soil
• Soiled paper: food packaging, ice cream containers, popcorn, flour and sugar bags, tissues, napkins, paper towels (not soiled with chemicals such as cleaning products)
Day and night time crews collect organics from businesses.
University of Victoria – The University offers a voluntary Office Composting Program to help academic and support units on campus divert organic waste (coffee grounds and filters, paper coffee cups, tea bags, fruit peels and pits, leftover meals including meat and dairy, wooden stir sticks or chopsticks, sugar packets, paper napkins, paper plates and paper cups, and plants or cut flowers) from the landfill. In 2008, UVic had almost 200 offices / units participating in the program.
UVic provides an Office Composting kit consisting of a 10 L compost bin, a supply of BioBags and information signs. Six centralized compost stations (240 L green carts) are on campus proper, two in
sonnevera international corp.
Appendix D - 146
operation buildings and 18 residence stations exist. Compost station carts are collected by ReFUSE and transported to the Fisher Road Recycling Facility (40 km north of Victoria) for in-vessel processing.
Yosemite National Park, CA – Delaware North Companies Parks & Resorts initiated a comprehensive composting program for Yosemite National Park in 2009 to complement its longstanding recycling efforts at the park. Through November 2010, the composting initiative diverted 216 tons of organic waste including food waste and paper products from Yosemite’s kitchens and restaurants to Mariposa County’s composting facility (an enclosed in vessel system, including an air and odor control system and a water re-circulation system). This represents about 10% of the 2,100 tons of solid waste that Yosemite sent to landfill during the same period (Delaware North Companies Parks and Resorts, 2011).
The composting program started at four locations, The Ahwahnee, Yosemite Lodge at the Falls, Degnan’s Deli and The Loft and subsequently expanded to include kitchens at Curry Village, Village Grill, White Wolf Lodge, Tuolumne Meadows Lodge and the High Sierra Camps. In each kitchen, Delaware North placed separate garbage containers and organic containers with a compostable material liner.
In October 2010 the National Parks Service at Yosemite joined the initiative by collecting organic waste at its housing complex in Yosemite Valley. During the spring of 2012 Delaware North expanded the program to its housing facilities.
With the continued expansion of this initiative there is the potential to divert 1,400 tons of waste (half of Yosemite’s waste stream) from being landfilled (Delaware North Companies Parks and Resorts, 2011).
Additionally, Delaware North worked closely with Mariposa County to test the ability of plastic and paper alternatives to biodegrade at the County composting facility. Containers made of plant starches, potato starch products for dishware and paper products made with recycled paper were identified as the best options. By using biodegradable dinnerware and packaging more organic waste is diverted from the landfill.
As a result of this program, Delaware North Companies Parks and Resorts received a top 2011 environmental achievement award from the National Park Service for initiating this comprehensive composting program in Yosemite National Park.
Contact
Seattle Public Utilities Seattle Municipal Tower 700, 5th Avenue, Suite 4900 Seattle, WA 98124-4018 USA
T: (206) 684-3000

Strategic Waste Management Plan (SWMP) – Appendix The City of Yellowknife
Appendix D - 147
Enhanced ICI Recycling Collection
Toronto, Ontario Population: 2,731,571 (2016)
Definition
Businesses receive collection of recyclables by either the City or private sector. This program can be linked to residential recycling programs.
Description
Commercial businesses that register for City garbage collection and meet the eligibility criteria (building ground floor are less than 500 m2 and less than four stories, or at least 1/3 of space is residential, no size restriction, and less than four stories) receive Blue Bin recycling collection. In order to receive service, approved customers must participate through the purchase of City authorized Garbage Tags ($5 per unit, available at Canadian Tire) or subscribe to garbage bin collection service.
Commercial customers that receive curbside collection must purchase 95-gallon recycling bins for $97.72 per tonne.
Charities, Institutions and Religious Organizations (CIRO) that meet the same criteria as commercial businesses and register with the City for garbage collection also receive Blue Bin recycling collection with the purchase of City Garbage Tags (45 per unit, available at Canadian Tire) or bin service. Registered charities with a Canada Revenue Agency charity number in good standing can have their fees waived if they remain in compliance with the program and properly sort their garbage. If the organization has submitted a federal registered charity number, the organization can apply for a 100% refund of bag tags purchased at Canadian Tire.
The Blue Bin program collects:
• Plastic bottles. Jugs (lids on)
• Milk, juice, soup cartons and boxes
• Plastic food jars, tubs lids
• Glass bottles, jars
• Metal, cardboard food and beverage containers
• Aluminum trays, pie plates, roasting pans
• Soft stretchy plastic
• Foam Polystyrene
• Clean plastic ”clam shell” containers
• Corrugated cardboard (flatten)
• Books, telephone directories
• Newspaper, fine paper
Day and night time crews collect recycling from businesses.
Reduction Potential and Quantitative Results
Medium to high reduction potential.
Community/Organizations with Similar Program
Examples below are municipal business collection programs. The private sector typically offers cardboard collection, at a minimum, for businesses. Contact private haulers or recycling collection businesses to determine local options.
Banff, AB (Pop: 7,851 in 2016) – Businesses are required to separate cardboard (clean, dry and flattened) through Bylaw 377 (Non-Residential Waste Bylaw). Cardboard is considered to be corrugated cardboard boxes, boxboard, toilet paper and paper towel rolls, pressboard and waxed cardboard boxes.
sonnevera international corp.
Appendix D - 148
The Town offers collection in two bin sizes (660 L and 1100L) with daily pickups if needed. Quarterly cardboard collection rates, effective January 1, 2017, for a 660 L bin range from $170 (one bin collected once a week) to $1617 (six bins collected three times a week). For a 1100 L bin the quarterly range is $219 (one bin collected once a week) to $2503 (six bins collected three times a week). Additional bins and collection frequency are available.
Barrie, ON (Pop: 145,614 in 2016) – Blue (glass, plastic, metal containers) and grey (paper products) recycling boxes are collected weekly. Large cardboard under 75 cm x 75 cm x 20 cm is requested to be flattened and placed next to boxes with a one bundle per week maximum for businesses. This is considered to be a City service and is paid for through business taxes.
Boise, ID (Pop: 205,671 in 2010) – The City offers commercial recycling service to all businesses, non-profit organizations, churches, schools and multi-family complexes. Newspapers and inserts, aluminum and tin cans, mixed paper and plastics (#1-#7) are collected in either blue bins, wheeled carts and green dumpsters. Daily, weekly or monthly collection is available by Allied Waste.
Hamilton, ON (Pop: 747,545 in 2016) – Businesses that are along existing residential collection routes can participate in recyclable curbside collection. One blue box is for containers (e.g., pop cans, cardboard cans, empty aerosol cans, aluminum trays, plastic bottles #1 & #2, plastic tubs #5, Tetra-Pack items) and the other is for paper products (e.g., boxboard, magazines, newspaper, paper, cardboard).
London, ON (Pop: 383,822 in 2016) – Curbside recycling collection, on a six work day cycle, is available to businesses located on existing residential collection routes at no charge. Quantities are limited to five blue boxes (e.g., food, beverage and liquid containers) and not weighing more than 18 kg / 40 lbs and two bundles of cardboard per collection.
Mecklenburg County, NC (Pop: 918,628 in 2010) – The County provides commercial drop-off centers to business parks and small business owners that are interested in promoting recycling. The drop-off centres help to reduces garbage costs while providing a cost-effective way for small business to recycle. For qualifying applicants, Mecklenburg County can place an eight cubic yard recycling container at the facility. Businesses hosting the commercial drop-off center pay and annual fee ($285) to cover the County’s direct operational costs to service the container. Recycling centers accept office paper; cardboard; magazines; newspaper; phonebooks; empty aerosol cans; milk and juice containers; aluminum, steel and tin cans; glass bottles and plastics (except #6).
Orillia, ON (Pop: 31,166 in 2016) – For larger businesses, the City provides 360 L recycling carts while smaller businesses may utilize the regular Recycling Box Program. Paper (e.g., newspaper, phone books, office paper, boxboard) is placed loose or in a clear plastic bag in the paper cart and containers (e.g., metal food and beverage cans, plastic bottles, tubs and lids, glass bottles and jars) are to be placed loose in the container cart. Plastic shopping bags are requested to be placed in a separate bag in the paper cart and clean Styrofoam is also collected in the paper cart if it is placed in a bag.
Businesses and institutions are limited to four bundles of cardboard without a garbage tag. Bundles must not be larger than 75 cm x 120 cm x 25 cm (30” x 48” x 10”) and must be placed next to the recycling carts.
Owen Sound, ON (Pop: 22,032 in 2016) – Businesses are given five blue carts (65 gal) by the City to collect separated recyclables (e.g., cans and plastics, clear glass, paper, coloured glass and boxboard). Collection takes place weekly on the same route as multi-family recycling collection. This is a tax base service.
Corrugated cardboard is picked up separately every Wednesday for downtown businesses and one Monday per month for businesses throughout the rest of the city with the exception of the Industrial Park.
Port Moody, BC (Pop: 33,551 in 2016) – The City offers comingled recycling services to local businesses. A 360 L cart is used to collect plastic bottles, cardboard boxes and used office paper on a weekly basis.
Strategic Waste Management Plan (SWMP) – Appendix The City of Yellowknife
Appendix D - 149
Regional Municipality of Waterloo (Pop: 535,134 in 2016) – Region of Waterloo businesses are eligible to receive blue box recycling collection only if the business is located on an existing municipal curbside collection route. Businesses not meeting this criterion must hire their own contractors for recycling collection.
A maximum of three blue boxes and three bundles of corrugated cardboard are allowed per eligible business weekly. Note: corrugated cardboard must be broken down to no larger than 75 cm x 75 cm x 20 cm (30" x 30" x 8") and tied.
Contact
Sandra Zavaglia Supervisor of Operational Support City of Toronto 505 Richmond Street West Toronto, Ontario M5V 1Y3
T: (416) 392-6892

sonnevera international corp.
Appendix D - 150
Best Practices: Regulatory Options
Differential Tipping Fees
Vancouver, British Columbia Population: 631,486 (2016)
Definition
Differential tipping fees are applied to loads of waste containing designated recyclables and compostable materials – contaminated loads cost more to dispose.
Description
The 2017 garbage tipping fees are:
• Up to one tonne - $133/tonne
• One to nine tonnes - $112/tonne
• Nine tonnes or more - $80/tonne
Garbage is inspected at the Vancouver Landfill for prohibited and recyclable materials. Surcharges apply to garbage loads containing banned recyclable materials that have not been separated for recycling or proper disposal, or if the load is not secured using tarps or ropes to prevent litter.
Vancouver Landfill Surcharges
Surcharge Level Applies To
$65 minimum Garbage loads containing one or more banned hazardous and operational impact or banned product stewardship program materials1
50% surcharge Garbage loads containing banned recyclable materials as follows:
• 5% or more by weight or volume of one or a combination of cardboard, printed paper, glass bottles and jars, plastic and metal containers, and yard and garden trimmings
• 10% or more by weight or volume of clean wood waste (decreases to 5% on July 1, 2017)
• 25% or more by weight or volume of food waste (decreases to 5% on July 1, 2017)
50% surcharge All unsecured loads
1Product stewardship program materials: antifreeze and antifreeze containers; gasoline; pesticide products; pharmaceutical products and medications; lead acid batteries; oil, oil filters and oil containers; paint products; solvents and flammable liquids; electronic and electrical products including metal household or commercial appliances; tires; thermostats; fluorescent lights and batteries.
Reduction Potential and Quantitative Results
Low, medium to high diversion potential, depending on degree of enforcement, the materials targeted and how far away other disposal options are.
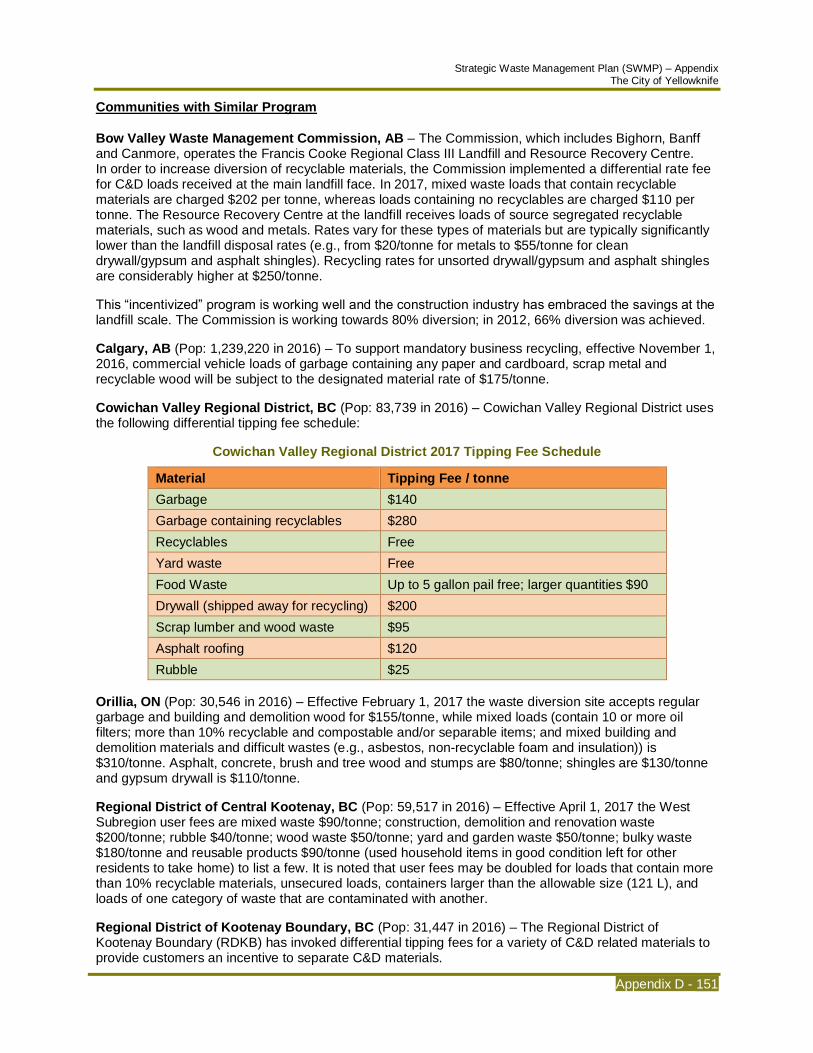
Strategic Waste Management Plan (SWMP) – Appendix The City of Yellowknife
Appendix D - 151
Communities with Similar Program
Bow Valley Waste Management Commission, AB – The Commission, which includes Bighorn, Banff and Canmore, operates the Francis Cooke Regional Class III Landfill and Resource Recovery Centre. In order to increase diversion of recyclable materials, the Commission implemented a differential rate fee for C&D loads received at the main landfill face. In 2017, mixed waste loads that contain recyclable materials are charged $202 per tonne, whereas loads containing no recyclables are charged $110 per tonne. The Resource Recovery Centre at the landfill receives loads of source segregated recyclable materials, such as wood and metals. Rates vary for these types of materials but are typically significantly lower than the landfill disposal rates (e.g., from $20/tonne for metals to $55/tonne for clean drywall/gypsum and asphalt shingles). Recycling rates for unsorted drywall/gypsum and asphalt shingles are considerably higher at $250/tonne.
This “incentivized” program is working well and the construction industry has embraced the savings at the landfill scale. The Commission is working towards 80% diversion; in 2012, 66% diversion was achieved.
Calgary, AB (Pop: 1,239,220 in 2016) – To support mandatory business recycling, effective November 1, 2016, commercial vehicle loads of garbage containing any paper and cardboard, scrap metal and recyclable wood will be subject to the designated material rate of $175/tonne.
Cowichan Valley Regional District, BC (Pop: 83,739 in 2016) – Cowichan Valley Regional District uses the following differential tipping fee schedule:
Cowichan Valley Regional District 2017 Tipping Fee Schedule
Material Tipping Fee / tonne
Garbage $140
Garbage containing recyclables $280
Recyclables Free
Yard waste Free
Food Waste Up to 5 gallon pail free; larger quantities $90
Drywall (shipped away for recycling) $200
Scrap lumber and wood waste $95
Asphalt roofing $120
Rubble $25
Orillia, ON (Pop: 30,546 in 2016) – Effective February 1, 2017 the waste diversion site accepts regular garbage and building and demolition wood for $155/tonne, while mixed loads (contain 10 or more oil filters; more than 10% recyclable and compostable and/or separable items; and mixed building and demolition materials and difficult wastes (e.g., asbestos, non-recyclable foam and insulation)) is $310/tonne. Asphalt, concrete, brush and tree wood and stumps are $80/tonne; shingles are $130/tonne and gypsum drywall is $110/tonne.
Regional District of Central Kootenay, BC (Pop: 59,517 in 2016) – Effective April 1, 2017 the West Subregion user fees are mixed waste $90/tonne; construction, demolition and renovation waste $200/tonne; rubble $40/tonne; wood waste $50/tonne; yard and garden waste $50/tonne; bulky waste $180/tonne and reusable products $90/tonne (used household items in good condition left for other residents to take home) to list a few. It is noted that user fees may be doubled for loads that contain more than 10% recyclable materials, unsecured loads, containers larger than the allowable size (121 L), and loads of one category of waste that are contaminated with another.
Regional District of Kootenay Boundary, BC (Pop: 31,447 in 2016) – The Regional District of Kootenay Boundary (RDKB) has invoked differential tipping fees for a variety of C&D related materials to provide customers an incentive to separate C&D materials.

sonnevera international corp.
Appendix D - 152
Additionally, in January 2006, the RDKB District implemented a “five times” penalty for mixed construction and demolition loads containing banned materials to encourage source separation and diversion of recyclable materials. Prior to January, the RDKB charged only two times the penalty. It found the double (two times) penalty did not work well enough as a disincentive to promote diversion. Businesses would rather pay the penalty than source separate.
If mixed construction and demolition loads arrive with 10% or more material that is recyclable, the entire load is subject to a tipping fee five times the regular rate.
Controlled Refuse Disposal Sites, Regional District of Kootenay Boundary, BC – Effective May 26, 2016
Material Rate
Clean Wood Waste (unpainted wood, branches and woody plant waste) $50/tonne
Rubble (gravel, brick, concrete, asphalt and rock or a mixture thereof) $50/tonne
Construction/Demolition/Land Clearing Waste $175/tonne
Mixed Construction Loads containing banned recyclable material $875/tonne*
Tar, gravel roofing, asphalt shingles $60/tonne
Mixed Waste $110 /T
Yard or Garden Waste (grass clippings, leaves) $5/load
*Loads containing 10% or more of banned recyclables materials (yard and garden waste, glass food containers, tin cans, #1 to #7 plastic containers, paper, cardboard, newspaper, magazines, phone books, office paper) are charged five times the regular tipping fee.
Regional District of Nanaimo, BC (Pop: 155,698 in 2016) – Effective January 1, 2014, municipal waste, construction/demolition and roofing (asphalt/tar/gravel) material is a $6 flat rate for 0-50 kg and $125/tonne for 51 kg or greater. Municipal waste containing recyclables for 0-50 kg is a $6 flat rate and $250/tonne for 51 kg or greater. Construction and demolition waste containing recyclables is a $6 flat rate for 0-50 kg and $360/tonne for 51 kg or greater, while wood waste and gypsum is a $6 flat rate for 0-50 kg and $250/tonne for 51 kg and greater. Organic waste is a $6 flat rate for 0-50 kg and $110/tonne for 51 kg or greater, but if the organic load contains recyclables it is a $6 flat rate for 0-50 kg and $250/tonne for 51 kg or greater. Gypsum, wood waste, recyclable cardboard, paper, metal, plastic containers, tires and organic waste from commercial sources are prohibited from landfill disposal.
Simcoe County, ON (Pop: 479,650 in 2016) – In 2001, Simcoe County introduced differential tipping fees at its landfill sites to encourage source separation and diversion of targeted materials. The differential tipping fees use a three-tier approach to encourage source separation of divertible materials (e.g., brush, metal, wood, cardboard, tires, leaf and yard waste, drywall, shingles, and curbside recyclables including paper, glass, boxboard, steel and aluminum cans, newspaper, cardboard and magazines). The 2017 tipping fee for separated shingles, drywall and wood is $75/tonne and $155/tonne for waste loads. Loads containing divertible materials are called mixed waste loads and are penalized with a doubling of the regular tipping fee to $310/tonne.
Simcoe County 2017 Differential Tipping Fees
Material Description Tonnage Rate $/tonne
Volume Rate $/unit
General waste (without divertable materials) $155/tonne $25/m3
Mixed waste loads (loads containing divertable materials) $310/tonne $50/m3
Asphalt shingles, drywall and wood waste $75/tonne $35/m3
Brush, leaves, yard waste, scrap metal and textiles No charge No charge
Blue box recyclables No charge No charge

Strategic Waste Management Plan (SWMP) – Appendix The City of Yellowknife
Appendix D - 153
Contact
City of Vancouver Engineering Services 507 W Broadway Vancouver, BC V5Z 1E6
T: (604) 872-7000

sonnevera international corp.
Appendix D - 154
Disposal Bans
Nova Scotia Population: 923,598 (2016)
Definition
Certain materials prohibited from waste stream – may be enforced at curb or landfill.
Description
Nova Scotia has an extensive list of recyclable/divertible materials that are banned from landfill and incineration disposal province wide including:
Nova Scotia Recyclable/Divertible Material Bans
Designated Material Ban
Implementation Date
Beverage containers April 1, 1996
Corrugated cardboard April 1, 1996
Newsprint April 1, 1996
Used tires April 1, 1996
Lead-acid (automotive) batteries April 1, 1996
Leaf and yard waste June 1, 1996
Post-consumer paint products, formerly known as waste paint April 1, 1997
Ethylene glycol (automotive antifreeze) April 1, 1997
Compostable organic material (food waste, yard waste, soiled and non-recyclable paper)
June 1, 1997
Steel/tin food containers April 1, 1998
Glass food containers April 1, 1998
Low-density polyethylene bags and packaging April 1, 1998
High-density polyethylene bags and packaging April 1, 1998
Televisions February 1, 2008
Desktop, laptop and notebook computers, including CPU’s, keyboards, mice, cables and other components in the computer
February 1, 2008
Computer monitors February 1, 2008
Computer printers, including printers that have scanning or fax capabilities or both
February 1, 2008
Computer scanners February 1, 2009
Audio and video playback and recording systems February 1, 2009
Telephones and fax machines February 1, 2009
Cell phones and other wireless devices February 1, 2009
Disposal bans stimulate stewardship programs (e.g., beverage containers, used tires, paint) and recycling/organic diversion programs (e.g., residential curbside recycling and organic collection) in Nova Scotia.

Strategic Waste Management Plan (SWMP) – Appendix The City of Yellowknife
Appendix D - 155
Reduction Potential
High reduction potential.
Communities with Similar Program
Capital Regional District, BC (Pop: 383,360 in 2016) – The following residential related materials are strictly prohibited from disposal at the Hartland Landfill: corrugated cardboard, directories, mixed paper, newspaper, yard and garden waste. All of these items are accepted at the Heartland recycling facility for a $6 entrance fee for residents and $26 fee for commercial haulers. The Blue Box (blue bag – newspapers and mixed paper products; blue box – plastic containers, glass bottles and jars, aluminum and tin cans) recyclables collection program, in place since 1989, has assisted residents with diverting over 19,000 tonnes of material from the landfill. Yard waste depots and leaf and branch collection programs along with backyard composting education are used to assist with yard waste diversion.
Calgary, AB (Pop: 1,239,220 in 2016) – Effective October 1, 2018, paper including newspaper, catalogues and magazines, mixed paper (including office paper), shredded paper, telephone books, and boxboard and cardboard materials will be banned from City landfills. This ban applies to all commercial loads. Additionally, a food and yard waste ban from City landfills is anticipated on October 1, 2019. Commercial loads of garbage containing food and yard waste will be subject to a financial penalty.
Edson, AB (Pop: 8,414 in 2016) – Edson does not have an outright landfill material ban, however through the Waste Management Bylaw No. 1858 (Town of Edson, 1998) cardboard and similar crating materials, newsprint, paper products, lawn clippings, garden waste and other recyclable products accepted the Recycling Depot are excluded from waste collection. If these materials are found in the garbage they will be left behind with a green sticker that states that these materials should be taken to the Recycling Depot. Only wet waste materials (e.g., kitchen and bathroom waste) are accepted for curbside collection or at the landfill. A two-bag / container limit is also in place, additional garbage will be collected when $2.00 tags are purchased.
Markham, ON (Pop: 328,966 in 2016) – Starting the week of April 17, 2017, the City of Markham banned unwanted textiles from Markham’s curbside collection service. Markham is the first North American municipality to support textiles recycling by banning textile waste from disposal. Clear garbage bags containing clothes and household textiles are not collected.
Metro Vancouver, BC (Pop: 2,463,431 in 2016) – At Metro Vancouver disposal facilities, loads are inspected for banned materials that should not be in the garbage, such as recyclable materials, product stewardship materials or hazardous materials that pose a risk to waste collection staff, the public or the environment. The 2017 Tipping Fee Bylaw No. 302 lists related banned materials:
Recyclable Materials:
• Beverage containers (e.g., metal, glass or plastic)
• Corrugated cardboard
• Recyclable paper
• Green waste
• Food waste
• Clean wood
Product Stewardship Materials:
• Solvents and flammable liquids
• Pesticides
• Gasoline
sonnevera international corp.
Appendix D - 156
• Pharmaceutical products and medications
• Oil, oil filters and oil containers
• Lubricating oils and lubricating oil containers
• Paint
• Lead-acid batteries
• Antifreeze and antifreeze containers
• Electronics and electrical products, including household commercial appliance, as identified in Schedule 3 – Electronics and Electrical Products to the Recycling Regulation
• Tires pursuant to Schedule 4 – Tire Product Category to the Recycling Regulation
Pincher Creek, AB (Pop: 3,642 in 2016) – On November 1, 2008 the Town of Pincher Creek banned cardboard from municipal solid waste collection in the industrial and commercial sectors. On April 1, 2009, the Town no longer collected cardboard from residential customers. After invoking the cardboards bans, a significant increase in cardboard was delivered to the recycling center (from Nov 1 to April 1 there was a 62% increase), requiring the purchase of a horizontal baler.
Ontario (Pop: 13,448,494 in 2016) – The province listed a number of potential disposal (e.g., landfill, incineration) bans on a range of materials, including food waste, materials designated under existing waste diversion programs, beverage containers, corrugated cardboard and some paper materials, and fluorescent bulbs and tubes to be phased in as part of the Provincial Strategy for a Waste Free Ontario Act: Building the Circular Economy, released February 28, 2017. Disposal ban implementation on materials with existing waste diversion programs is anticipated in 2021.
Prince Edward Island (Pop: 142,907 in 2016) – The province banned electronic waste from disposal in landfills in 2010.
Quebec (Pop: 8,164,361 in 2016) – A province-wide ban on paper, cardboard, wood and organics is anticipated to be phased in between 2020 and 2022.
Regional District of Nanaimo, BC (Pop: 155,698 in 2016) – In 2005 the Regional District implemented a disposal ban on ICI organic waste that affected roughly 800 businesses and institutions. The bylaw, which is enforced at their landfill and transfer station, bans all food and yard waste. If a load of waste arriving at their disposal facilities contains an evident volume of organic waste, it is subject to a doubling of the tipping fee on the whole load. An estimated 6,000 tonnes of commercial organics is diverted annually through this program. The Regional District has also banned gypsum (drywall), wood waste, recyclable cardboard, paper, metal, household plastic containers, and tires from disposal.
Saskatoon, SK (Pop: 246,376 in 2016) – The City of Saskatoon is working towards a paper and cardboard landfill ban for local businesses. Administration plans to meet with businesses about a ban before the end of 2017.
Seattle, WA (Pop: 608,660 in 2010) – Ordinance #12372, prohibits the disposal of certain recyclables from residential, commercial and self-haul garbage. Administrative Rule SPU-DR-01-04, “Prohibition of Recyclables from Garbage” details how the City ordinance is to be carried out.
Residents (single and multi-family) are prohibited from disposing significant amounts of paper, cardboard, glass and plastic bottles and jars as well as aluminum and tin cans in their garbage as of January 1, 2005. Yard debris has been prohibited from residential garbage since 1989, with the exception of contaminated and food soiled paper.
Strategic Waste Management Plan (SWMP) – Appendix The City of Yellowknife
Appendix D - 157
Commercial businesses are prohibited from disposing of significant amounts of paper, cardboard and yard debris in garbage as of January 1, 2005. Exceptions include:
• Commercial or multifamily customers without adequate space for recycling as determined by Seattle Public Utilities inspection
• Garbage dumpsters that receive waste form the public
• Contaminated and soiled paper
Self-haul customers at the City’s Recycling and Disposal Station are prohibited from disposing of significant amounts of recyclable paper, cardboard and yard debris in the garbage pit.
‘Significant amounts of recyclables’ is defined as “more than 10% by volume of container, dumpster or self-haul vehicle’s load based on visual inspection by an Seattle Public Utilities inspector, contractor or transfer station worker.”
Toronto, ON (Pop: 2,731,571 in 2016) – The Toronto Municipal Code Waste Collection, Residential Properties, Chapter 844-8, states that grass clippings and sod will not be collected by the City and that the owners are not allowed to “set out prohibited waste for collection by the City, either on its own or mixed with any waste with respect to which the City provides services.”
Additionally, construction, renovation and demolition waste including but not limited to soil, plaster, drywall, masonry and tile, bricks, concrete, cinder blocks, paving stones, asphalt, wood, windows and window glass, shingles, scrap metal, insulation (such as fiberglass or Styrofoam), scrap wood or carpeting (unless cut, broken or securely tied into bundles or pieces less than 120 cm x 80 cm x 80 cm and free of all nails and staples), asbestos and urea formaldehyde are not allowed to be set out for City collection. The above materials are considered prohibitive waste.
Contact
Nova Scotia Environment PO Box 442 5151 Terminal Road Halifax, NS B3J 2P8
T: (902) 424-3600 F: (902) 424-0503
sonnevera international corp.
Appendix D - 158
Residential Mandatory Recycling / Source Separation
Seattle, Washington Population: 608,660 (2010)
Definition
Residents are required by bylaw to participate in recycling/composting programs.
Description
City of Seattle Ordinance #121372 prohibits the disposal, effective January 1, 2005, of significant amounts (more than 10% by volume of container) of certain recyclables from residential, commercial and self-haul garbage. Administrative Rule SPU-DR-01-04, “Prohibition of Recyclables in Garbage” details how the City ordinance is to be carried out.
Single and multi-family recyclable items to be diverted from garbage include:
• Paper
• Cardboard
• Glass bottles and jars
• Plastic bottles and jars
• Aluminum and tin cans
• Yard debris (prohibited from residential garbage since 1989)
A three step program took place for implementing the recycling requirements:
1) Outreach and Education in 2004 – Seattle Public Utilities conducted an educational outreach program through direct mail to residents and businesses. A new, automated (206) RECYCLE phone number was established to answer basic questions about the recycling requirements for single-family residents, apartment dwellers, businesses and self-haul customers to the City’s Recycling and Disposal Stations.
2) Educational Tagging in 2005 – Contractors and inspectors placed educational notice tags on garbage cans and dumpsters which contained significant amounts of recyclables. Transfer station customers received educational notices.
3) Enforcement in 2006 – Effective January 1, 2006, the City of Seattle began enforcing the mandatory recycling ordinance ‘with consequences’.
• Single-family Residents – The City’s contractors do not pick up garbage cans that have significant amounts of recyclables. A tag is left on the can instructing customers to separate out the recyclables and place the container out at the curb for collection the following week. A copy of the single-family enforcement tag is located at the end of this section.
• Apartment Owners or Property Managers – City inspectors mail to the garbage account holder up to two warning notices before a $50 surcharge is added to the apartment building’s garbage bill. A copy of the apartment owners / business owners / property managers enforcement tag is found at the end of this section.
• Business Owners or Property Managers – City inspectors mail to the garbage account holder up to two warning notices before a $50 fine is imposed.
• Recycling and Disposal Station Customers – Self-haul customers are asked to separate out recyclable paper and cardboard as well as yard debris from their loads and not to dispose of such material in the garbage pit.

Strategic Waste Management Plan (SWMP) – Appendix The City of Yellowknife
Appendix D - 159
Recycling and yard waste collection programs exist to assist residents and businesses with meeting the requirements of this ordinance:
• All single-family households have a free, curbside recycling service.
• Apartments are also eligible for the City’s free recycling service.
• Pickup of yard trimmings at the curb is available to all City residents who chose to subscribe and backyard composting has long been promoted as another alternative.
• The City’s Recycling and Disposal Stations accept recyclables for free and yard trimmings for a fee less than garbage.
• Interested business can sign up to receive the City’s free, biweekly curbside recycling service.
• Businesses can contact the Resource Venture to obtain information on other private commercial recycling services where the pickup service is more frequent and revenue might be received for large quantities of recyclables as office paper.
• Private commercial recycling pickup services are also available for yard trimmings.
Seattle Municipal Code section 21.36.083 requires that residents living in single-family structures, multifamily structures and mixed-use buildings shall separate food waste and compostable paper for recycling effective January 1, 2015.
Reduction Potential and Quantitative Results
High reduction potential.
Two months after Seattle began enforcing the mandatory recycling ordinance, garbage haulers and city inspectors found few violations of the law that some feared would be difficult to enforce and follow. When enforcement first started out, more than 90 percent of apartment and businesses complied with the new ordinance. In January 2006, 71 apartment tags were handed out and 44 in February. Commercial business tags went from 10 in January to two in February, and 227 household garbage cans were left behind in January and 133 in February. Seattle collects 150,000 household garbage cans a week (Langston, 2006).
Communities with Similar Program
Arlington County, VA (Pop: 207,627 in 2010) – Through Ordinance 93-22, 11-13-93 property managers or owners of multi-family properties are required by County Code to:
• Establish and maintain a recycling program for residents to recycle newspapers, glass bottles and jars, and metal food and beverage containers. The recycling collection system must be separate from garbage collection. Properties are encouraged to include additional recyclable materials such as plastic bottles and jugs, magazines, mixed paper and corrugated cardboard.
• File a Multi-family Recycling Plan Form upon receiving a Certificate of Occupancy (within 30 days).
• Submit an updated Multi-family Recycling Plan Form by February 1st of every third year. Note: Next Filing of Updated Plans is by February 1, 2012.
• Disseminate educational materials periodically to inform residents, employees and any business tenants about the program.
A recycling toolkit is available to assist with mandatory recycling online.
Single-family dwelling also abide by mandatory recycling of newspaper, glass bottles and jars and metal food and beverage cans.
Brant County, ON (Pop: 36,707 in 2016) – Yard waste and grass clippings are not accepted at the curb. The County encourages residents to recycle and compost yard waste.

sonnevera international corp.
Appendix D - 160
Cheltenham Township, PA (Pop: 36,882 in 2012) – Mandatory recycling guidelines apply to all Cheltenham residents who have trash collection. Recyclables collected include: cans, cardboard, glass, paper and plastics. Households that participate in the Township’s recycling program are offered free 6-gallon and 14-gallon recycling containers.
Edson, AB (Pop: 8,414 in 2016) – Through the Waste Management Bylaw No. 1858 (Town of Edson, 1998) cardboard and similar crating materials, newsprints, paper products, lawn clippings, garden waste and other recyclable products accepted the Recycling Depot are excluded from waste collection. If these materials are found in the garbage they will be left behind with a green sticker that states that these materials should be taken to the Recycling Depot. Only wet waste materials (e.g., kitchen and bathroom waste) are accepted for curbside collection or at the landfill. A two-bag / container limit is also in place, additional garbage will be collected when $2.00 tags are purchased.
Griffin, GA (Pop: 23,643 in 2010) – Griffin has had a mandatory residential curbside recycling program that collects glass, plastic, newspaper, paper and cardboard, magazines, telephone books, metal cans and aluminum cans since March 2007. This is the only mandatory curbside program in Georgia.
Chapter 74 (Solid Waste), Sec 74-76 (Residential Recycling Program) of the Code of Griffin states “It shall be the responsibility of all residential solid waste customers of the city to dispose of recyclable materials in an approved recycling container. No item that that has been classified as recyclable material shall be disposed in a customer's solid waste container. All recyclable materials may be commingled (mixed) in the same recycling container. Nothing herein shall be construed to limit the right of any individual, organization or other entity to donate any recyclable material for proper disposal, if such disposal does not violate any laws or this article” (City of Griffin, 2009a).
Halifax, NS (Pop: 403,131 in 2016) – All residents are required to have a source separation program for paper, blue bag recyclables (containers, plastic bags), cardboard and organics as per Halifax Regional Municipality By-Law S-600.
Kamloops, BC (Pop: 90,280 in 2016) – In March 2008, the City expanded its Residential Curbside Recycling Pilot Program to a mandatory city-wide curbside recycling program. The pilot program demonstrated that customers receiving curbside recycling services reduced the volume of garbage they place at the curb by 25% to 50%. Under the curbside recycling program, residents are provided with 245 L carts and are charged an annual fee of $50. The City received a grant from the provincial government to purchase recycling trucks and containers which kept the costs low (without the grant the recycling fee would have doubled).
Madison, WI (Pop: 233,209 in 2010) – Mandatory every other week recycling collection.
Orillia, ON (Pop: 30,546 in 2016) – Recycling is mandatory for the 130 apartment complexes with six or more dwelling units.
Peel Region, ON (Pop: 1,381,739 in 2016) – Mandatory residential recycling.
San Diego, CA (Pop: 1,307,402 in 2010) – The City of San Diego’s Recycling Ordinance was approved by City Council on November 13, 2007, phased implementation of the ordinance began January 1, 2008 and was completed over the following two years. All single family residences, City-serviced multi-family residences and privately serviced apartments and condominiums are required to recycle.
The ordinance requires recycling of plastic and glass bottles and jars, paper, newspaper, metal containers and cardboard. City serviced residences and must also recycle rigid plastics including clean food waste containers, jugs, tubs, trays, pots, buckets and toys. Residents serviced by a private hauler are encouraged to recycle these additional items as well.
Effective July 1, 2012, the exemption threshold of the ordinance was lowered from six cubic yards per week to four cubic yards per week. Therefore, privately serviced apartments and condominiums generating four or more cubic yards of waste per week are required to recycle.

Strategic Waste Management Plan (SWMP) – Appendix The City of Yellowknife
Appendix D - 161
San Francisco, CA (Pop: 805,235 in 2010) – On June 23, 2009 the City of San Francisco signed Mandatory Recycling and Composting Ordinance No. 100-09, the first law in the United States that requires all residents and businesses separate their recycling and compost material from garbage.
San Francisco Recycling, Composting and Waste Containers
South Berwick, ME (Pop: 7,220 in 2010) – Mandatory residential recycling.
South Kingstown, RI (Pop: 30,639 in 2010) – The Town has a licensing program that requires all private haulers to be licensed by the Town and a condition of that license is that haulers are required to collect curbside residential recyclables. Haulers that do not meet this condition are not allowed to collect waste in the Town.
Wallingford, CT (Pop: 45,135 in 2010) – Residents are mandated to recycle glass, metal food and beverage containers, plastics (#1-2), newspaper, magazines, catalogs, junk mail, and corrugated cardboard through curbside collection or dropping off at the recycling center. They are also mandated to recycle lead-acid batteries, leaves/brush, scrap metals and major appliances, used motor oil and white office paper.
Contact
Seattle Public Utilities Seattle Municipal Tower 700, 5th Avenue, Suite 4900 Seattle, WA 98124-4018 USA
T: (206) 684-3000

sonnevera international corp.
Appendix D - 162
ICI Mandatory Recycling / Source Separation
Sacramento County, California Population: 1,418,788 (2010)
Definition
Businesses must participate in recycling and organics programs/or must divert designated materials through a recycling program.
Description
California State law requires communities achieve 50% diversion.
The Business Recycling Ordinance requires that businesses in the Region generating more than 4 cubic yards of garbage per week must participate in waste diversion and provide on-site source separated recycling of designated recyclables such as cardboard, office paper and beverage containers. Implementation of the plan began in January 2007.
Reason for the Ordinance - For ten years, franchised commercial waste haulers have been required to recycle 30 percent of what they collect. The current commercial recycling rate is estimated to be only 15 to 20 percent. Almost all homes now have a recycling program available, but only one in five businesses have a recycling program available. We need much more recycling from the business community. For these reasons, SWA has adopted a new Business Recycling Ordinance.
The new Business Recycling Ordinance is being implemented in the following phases, with early emphasis on education.
Phase 1: Inventory of commercial waste generators.
Phase 2: Ongoing education and outreach about the ordinance and service options.
Phase 3: Site inspections with education as the primary objective.
The County’s environmental department will conduct site inspections to educate the business community about what is required to comply with the program and to provide information about the options available to establish recycling programs. Administration of this ordinance will be funded through the existing commercial hauler franchise fees.
All food or Beverage Service Establishments (e.g., restaurants, delicatessens, bars, caterers, cafeterias, etc.) must recycle:
• Aluminum and steel container
• Empty steel & aerosol cans
• All colors of empty glass food and beverage containers
• All empty plastic food and beverage containers
• #1 – #7, including water bottles
• All cardboard and boxes
Food service establishments must provide clearly labeled recycling containers where customers can place recyclable items listed above.

Strategic Waste Management Plan (SWMP) – Appendix The City of Yellowknife
Appendix D - 163
All other Businesses must recycle:
• All clean and dry paper, whole or shredded, including:
– Newspaper
– Cardboard
– Magazines
– Catalogs
– Phone books
– Computer paper
– Junk mail
• All clean and empty plastic food and beverage containers
• # 1 - 7, including water bottles.
• Empty aluminum cans and scrap metal
• Wood pallets
In any business where customers or clients regularly discard designated recyclables, you must provide a way for them to recycle. Businesses must post notices and place labeled recycling containers near garbage bins in customer areas, same as for your employees
Responsibilities:
• Businesses are required to keep items such as cardboard, office paper and beverage containers separate from the garbage.
• Businesses must post signs and place recycling containers in work areas.
• Businesses need to have separate and labeled collection containers for recyclables.
• Simple employee training about the recycling program must be provided.
• Businesses must arrange for collection of their recyclables by using a Franchised Hauler, an Authorized Recycler or by hauling the recyclables themselves to a recycling facility.
• Businesses must ensure that the material is being taken to a recycling facility for processing.
Reduction Potential and Quantitative Results
High reduction potential depending on targeted materials.
Communities with Similar Program
Arlington County, VA (Pop: 207,627 in 2010) – Every business and non-residential property is required by County Code to:
• Establish and maintain a recycling program to recycle the two materials it generates annually in the greatest quantities. The recycling collection system must be separate from trash / refuse collection.
• File a Business Recycling Plan Form upon receiving a Certificate of Occupancy (within 30 days).
• Submit an updated Business Recycling Plan Form by February 1st of every third year.
• Disseminate educational materials to inform employees and business tenants about the program.
A recycling toolkit is available to assist with mandatory recycling online.
Banff, AB (Pop: 7,847 in 2016) – Businesses are required to sort waste into three bins: cardboard, food and garbage as of February 28, 2017 through Bylaw 377 (Non-Residential Waste Bylaw).
sonnevera international corp.
Appendix D - 164
Blowing Rock, NC (Pop: 1,241 in 2010) – Businesses must participate in Town recycling program that collects cardboard and glass from small businesses. Large businesses must use a private collection service for cardboard and glass.
Boulder, CO (Pop: 97,385 in 2010) – On June 16, 2015, City Council adopted new universal zero waste requirements that seek to expand business recycling and composting. As part of the zero waste requirements, businesses are must separate recyclables and compostables from garbage, post zero waste signs and educate employees about what items go where by September 2016.
Calgary, AB (Pop: 1,239,220 in 2016) - Effective November 1, 2016, Bylaw 39M2015, requires businesses and organizations to recycle the same materials as residents (cardboard and paper, glass jars and bottles, food cans and foil, refundable beverage containers, plastic containers (1-7), juice and soup boxes) and specific commercial waste such as scrap metal, clear plastic film and raw unprocessed wood. On November 1, 2017 business and organizations were also required to separate all food and yard waste for diversion.
California (Pop: 37,253,956 in 2010) – As required by Assembly Bill 341, Mandatory Commercial Recycling was approved by the office of Administrative Law on May 7, 2012 and became effective immediately. Additionally, the Governor signed Senate Bill 1018 on June 27, 2012 which included an amendment that requires businesses that generate four cubic yards or more of commercial solid waste per week to retain recycling services.
Implementation dates are as follows:
• Effective July 1, 2012, mandatory recycling of commercial solid waste by businesses that generate four cubic yards or more of waste per week or a multifamily residential dwelling of five units or more.
• Effective July 1, 2012, implementation of commercial recycling programs by jurisdiction, including education, outreach and monitoring programs to be phased in over time.
• August 2013, each jurisdiction is to report progress achieved in implementing commercial recycling programs, including education, outreach and monitoring, and if applicable, enforcement efforts and exemptions, by submitting updates in the electronic annual report as per Section 41821.
• August 2014, CalRecycle to review jurisdictions’ that are in a two year review cycle on their implementation of the regulation, with reviews conducted every two or four years thereafter depending on each jurisdiction’s review status.
County of Santa Barbara, CA (Pop: 423,895 in 2010) – Effective September 1, 2003 the County implemented a mandatory recycling program for businesses in the unincorporated areas of Santa Barbara County. Under this program, materials currently accepted in the single family residential recycling program (excluding green waste) were prohibited from being disposed in the garbage.
Griffin, GA (Pop: 23,643 in 2010) – Griffin invoked mandatory commercial recycling of old corrugated cardboard containers in March 2007. Chapter 74 (Solid Waste), Sec 74-77 (Commercial Recycling, Policies and Reporting Requirements) states that:
“All commercial waste generators within the city shall be required to recycle old corrugated cardboard containers (OCC). OCC shall not be disposed of in the generator's solid waste container. OCC shall be separated and properly recycled. Commercial generators may provide their own bailers or containers to store and collect OCC. Arrangements for storage, collection and recycling of OCC shall be made with the city's solid waste department and must be approved by the director” (City of Griffin, 2009b).
Halifax, NS (Pop: 403,131 in 2016) – All commercial properties are required to implement a source separation program for paper, blue bag recyclables (containers, plastic bags), cardboard and organics as per Halifax Regional Municipality By-Law S-600.
Strategic Waste Management Plan (SWMP) – Appendix The City of Yellowknife
Appendix D - 165
Mecklenburg County, NC (Pop: 918,628 in 2010) – On January 1, 2002, the Source Separation Ordinance (Business Recycling Ordinance) came into effect. This Ordinance requires businesses to source separate corrugated cardboard and office paper from garbage.
Minneapolis, MN (Pop: 382,578 in 2010) - Effective September 1, 2011, Minneapolis businesses, workplaces and places of worship are required to recycle after a new ordinance took effect. Ordinance 174.435 requires:
• Regular recycling collection (at least twice a month) for all recyclables generated on-site including paper, cardboard, metal cans, plastic bottles, and glass bottles and jars
• Recycling containers
• Recycling collection and storage areas
• Written recycling information and instructions sent to tenants and/or employees annually or posted
• A written recycling plan
Offenders who fail to follow the ordinance will receive a written warning notifying them that they have 10 days to comply, with further violations leading to fines.
New York, NY (Pop: 8,175,133 in 2010) – On February 5, 2016 new business recycling rules were published. Effective August 1, 2016, all businesses in New York City are required to recycle paper, metal, glass, plastic and beverage containers and to ensure to the best of their ability that the recyclable materials are properly handled by their private carter. If textiles are more than 10% of monthly waste the business is required by law to separate and recycle all textile waste, including fabric scraps, clothing, belts, bags and shoes. The new business recycling rules will be fully enforced starting August 1, 2017.
If yard waste is more than 10% of monthly waste the business is required by law to separate and recycle all yard and plant waste, including grass clippings, garden debris, leaves and branches. This material must be set out separately from all other material. Additionally, certain large food waste generating businesses are required by law to separate organic waste for beneficial use. This material must be set out separately from all other material.
Beginning July 19, 2016 certain New York businesses are required by law to separate their organic waste (food scraps, plant trimmings, food soiled paper and certified compostable products). If a business meets the minimum requirements, they must comply with the business organic rules:
• All food service establishments in hotels with more than 150 or more rooms
• All food service vendors in arenas or stadiums with seating capacity of at least 15,000 people
• Food manufacturers with a floor area of at least 25,000 ft2
• Food wholesalers with a floor area of at least 20,000 ft2
Businesses covered by this proposal are given the option to arrange for collection by a private carter, transport organic waste themselves, or process the material on site. Suitable processing methods include composting and aerobic and anaerobic digestion. A food waste grinder is not permitted. The new business organic rules were fully enforced starting January 19, 2017.
Ontario (Pop: 13,448,494 in 2016) – Even though they have not been enforced, the 3Rs Regulations are still on the books in Ontario.
Ontario Regulation 103/94 focuses on the requirement for the establishment of source separation programs for designated waste materials from the ICI sector, including construction and demolition and multi-unit residential buildings.
Owen Sound, ON (Pop: 22,032 in 2016) – Following Ontario Regulation 103/94, Bylaw No. 2006-001 Regulates the Collection, Handling and Recycling of Waste and Recyclable Materials in Certain Premises on the City of Owen Sound.

sonnevera international corp.
Appendix D - 166
This is essentially a by-law for mandatory recycling in the commercial/industrial sector.
Rancho Cordova, CA (Pop: 64,776 in 2010) – On October 20, 2008, the Business and Multi-Family Recycling Ordinance (No. 20-2008) was passed. This Ordinance requires owners and/or business operators and multi-family complex (with five or more units) that subscribe to four cubic yards per week or more of garbage collection service to implement an on-site recycling program for mixed paper, newspaper, magazines, junk mail, cardboard, plastic containers (#1–#7), glass containers and aluminum and tin cans.
San Diego, CA (Pop: 1,307,402 in 2010) – The City of San Diego’s Recycling Ordinance was approved by City Council on November 13, 2007, phased implementation of the ordinance began January 1, 2008 and was completed over the following two years (February 18, 2008 – 20,000 ft2 or more, January 1, 2009-10,000 ft2 or more and January 1, 2010 – all businesses). All privately serviced businesses and commercial/institutional facilities are required to recycle.
The ordinance requires recycling of plastic and glass bottles and jars, paper, newspaper, metal containers and cardboard. Privately serviced commercial and institutional properties must also recycle rigid plastics including clean food waste containers, jugs, tubs, trays, pots, buckets and toys.
Property managers and owners are responsible for providing:
1) Recycling services including:
– Collection of recyclables as frequently as necessary
– Collection of at least plastic and glass bottles and jars, paper, newspaper, metal containers and cardboard
– Designated collection areas
– Appropriate recycling containers and signage as specified in the Recycling Container and Signage Guidelines for City Recycling Ordinance.
2) Education including:
– Employee/tenant’s Types of materials accepted in recycling program
– Location of the recycling containers
– Employee/tenant’s responsibility to comply with the City Ordinance (Education must be provided annually, upon occupancy and when there are changes to the program).
Effective July 1, 2012, the exemption threshold of the ordinance was lowered from six cubic yards per week to four cubic yards per week. Therefore, privately serviced businesses, commercial and institutional facilities generating four or more cubic yards of waste per week are required to recycle.
San Francisco, CA (Pop: 805,235 in 2010) - On June 23, 2009 the City of San Francisco signed Mandatory Recycling and Composting Ordinance No. 100-09, the first law in the United States that requires all residents and businesses separate their recycling and compost material from garbage.
Seattle, WA (Pop: 608,660 in 2010) - Seattle Municipal Code sections 21.36.082 requires that commercial establishments recycle paper, cardboard and yard waste effective January 1, 2005. Commercial establishments are also required to recycle glass bottles and jars, plastic cups, bottles and jars and aluminum and tine can for recycling effective July 1, 2014. As of January 1, 2015, all commercial establishments must separate food waste and compostable paper for recycling.
St. John’s, NL (Pop: 108,860 in 2016) – All ICI businesses with 25 or more employees must participate in a mandatory office paper recycling program that started September 2005. All remaining businesses need to comply with the regulation starting March 2006. The program applies to all IC&I enterprises in St. John’s and three other adjacent municipalities set up recycling programs and source separate

Strategic Waste Management Plan (SWMP) – Appendix The City of Yellowknife
Appendix D - 167
office paper including white and colour paper, newspaper, business cards, envelopes, post it notes and file folders.
Wallingford, CT (Pop: 45,135 in 2010) – Businesses are mandated to recycle the following materials:
• Glass food and beverage containers
• Newspaper, junk mail, magazines and catalogs
• White office paper
• Scrap metal
• Lead acid batteries
• Leaves
• Metal food and beverage containers
• Corrugated cardboard
• Plastics #1 and #2
• Waste oil (used case oil)
• NiCad Rechargeable Batteries
Contact
Sacramento County Environmental Management Department 2nd Floor, Suite 230/240 Sacramento, CA 95826-3913 USA
T: (916) 875-8484 [email protected]

Strategic Waste Management Plan (SWMP) – Appendix The City of Yellowknife
E-1
Appendix E – Composting
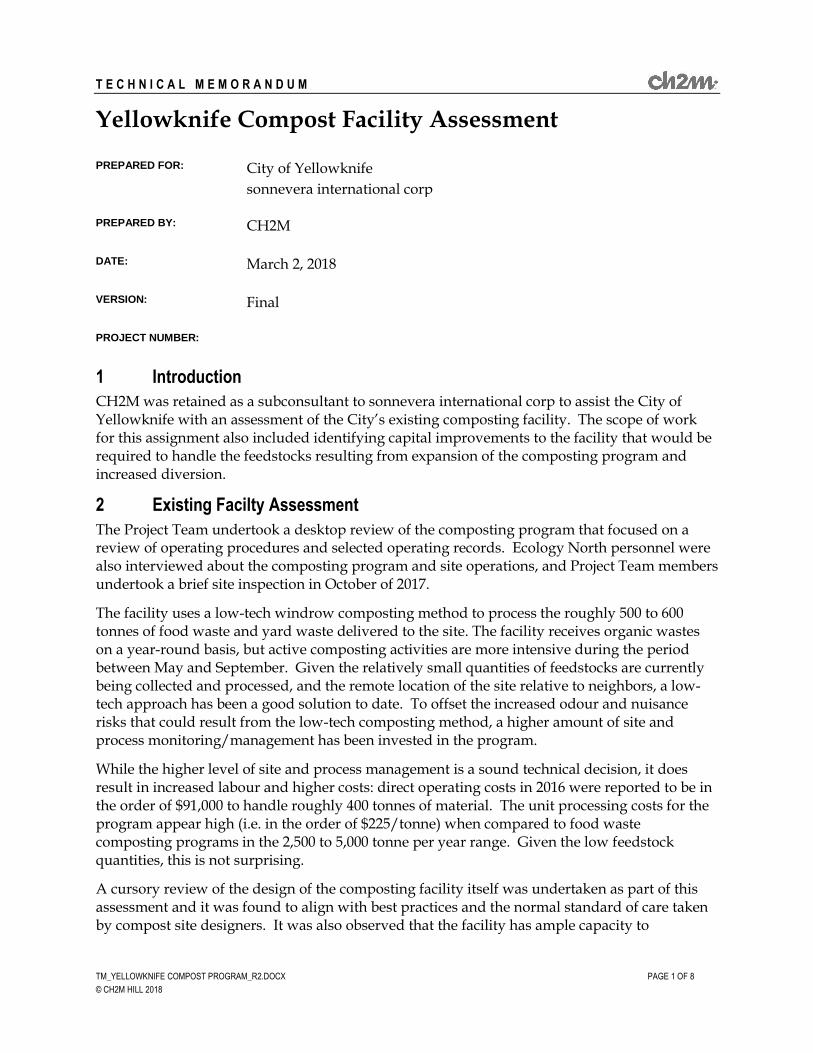
TM_YELLOWKNIFE COMPOST PROGRAM_R2.DOCX PAGE 1 OF 8
© CH2M HILL 2018
T E C H N I C A L M E M O R A N D U M
Yellowknife Compost Facility Assessment
PREPARED FOR: City of Yellowknife
sonnevera international corp
PREPARED BY: CH2M
DATE: March 2, 2018
VERSION: Final
PROJECT NUMBER:
1 Introduction
CH2M was retained as a subconsultant to sonnevera international corp to assist the City of Yellowknife with an assessment of the City’s existing composting facility. The scope of work for this assignment also included identifying capital improvements to the facility that would be required to handle the feedstocks resulting from expansion of the composting program and increased diversion.
2 Existing Facilty Assessment
The Project Team undertook a desktop review of the composting program that focused on a review of operating procedures and selected operating records. Ecology North personnel were also interviewed about the composting program and site operations, and Project Team members undertook a brief site inspection in October of 2017.
The facility uses a low-tech windrow composting method to process the roughly 500 to 600 tonnes of food waste and yard waste delivered to the site. The facility receives organic wastes on a year-round basis, but active composting activities are more intensive during the period between May and September. Given the relatively small quantities of feedstocks are currently being collected and processed, and the remote location of the site relative to neighbors, a low-tech approach has been a good solution to date. To offset the increased odour and nuisance risks that could result from the low-tech composting method, a higher amount of site and process monitoring/management has been invested in the program.
While the higher level of site and process management is a sound technical decision, it does result in increased labour and higher costs: direct operating costs in 2016 were reported to be in the order of $91,000 to handle roughly 400 tonnes of material. The unit processing costs for the program appear high (i.e. in the order of $225/tonne) when compared to food waste composting programs in the 2,500 to 5,000 tonne per year range. Given the low feedstock quantities, this is not surprising.
A cursory review of the design of the composting facility itself was undertaken as part of this assessment and it was found to align with best practices and the normal standard of care taken by compost site designers. It was also observed that the facility has ample capacity to

YELLOWKNIFE COMPOST FACILITY ASSESSMENT
TM_YELLOWKNIFE COMPOST PROGRAM_R2.DOCX PAGE 2 OF 8
© CH2M HILL 2018
accommodate future growth in the diversion/collection program, and has suitable environmental protection and surface water controls.
Based on our review of the Operations and Maintenance Manual and discussions with Ecology North personnel, is appears that best management practices are being followed with respect to site operations. Although there is room for minor improvements, the operations procedures are thorough and well documented. The amount and nature of the operations records kept is more detailed than would normally be expected at a site of this size, but that should not be interpreted as a negative comment.
Our Project Team also discussed the finished product testing and use practices with Ecology North staff. The sampling and testing procedures being followed are consistent with normal industry practices and an experienced third-party laboratory is being used to complete the required analyses. It appears that product marketing is a collaborative effort between the City and Ecology North, but there are no defined marketing roles and responsibilities.
Based on our review, the following improvements to management protocols and procedures should be considered:
• Staff should develop a template form that can be used to document routine (e.g. weekly or biweekly) inspections of the composting facility.
• Staff should correct the reference to pathogen time and temperature requirements on page 24 of the Operations and Maintenance Manual to make it consistent with the information provided on page 30.
• Staff should take advantage of the ability of spreadsheets (or other software) to electronically track process data and develop trend charts. Experience has shown that trend charting (versus reviewing raw numerical data) is more intuitive and provides better insight into compost pile conditions.
• A more complete discussion of the protocols for leachate sampling should be included in the Operations and Maintenance Manual.
Based on our review of operating practices, the following modifications to field practices should be considered:
• Based on discussions, it appears that there is not enough coarse amendment being used in the compost piles. Increasing the amount of coarse amendment in the composting piles will increase free air space and improve passive aeration. The result of this will be reduced potential for odours, and more efficient degradation of materials.
• Equipping the front-end loader used at the site with an over-sized bucket (e.g. snow bucket) would help with operational efficiency and reduce the amount of time required to turn the composting piles.
• The feedstocks being accepted in the program contains film plastic (compostable and non-compostable), kraft bags, carboard, and food soiled paper. While the amounts of these materials in the feedstocks do not appear to be excessive relative to what is encountered in similar programs in other jurisdictions, the manual turning process used at the facility combined with dry pile conditions results in a higher amount of litter. If off-site litter becomes an issue, consideration could be given to screening the windrows
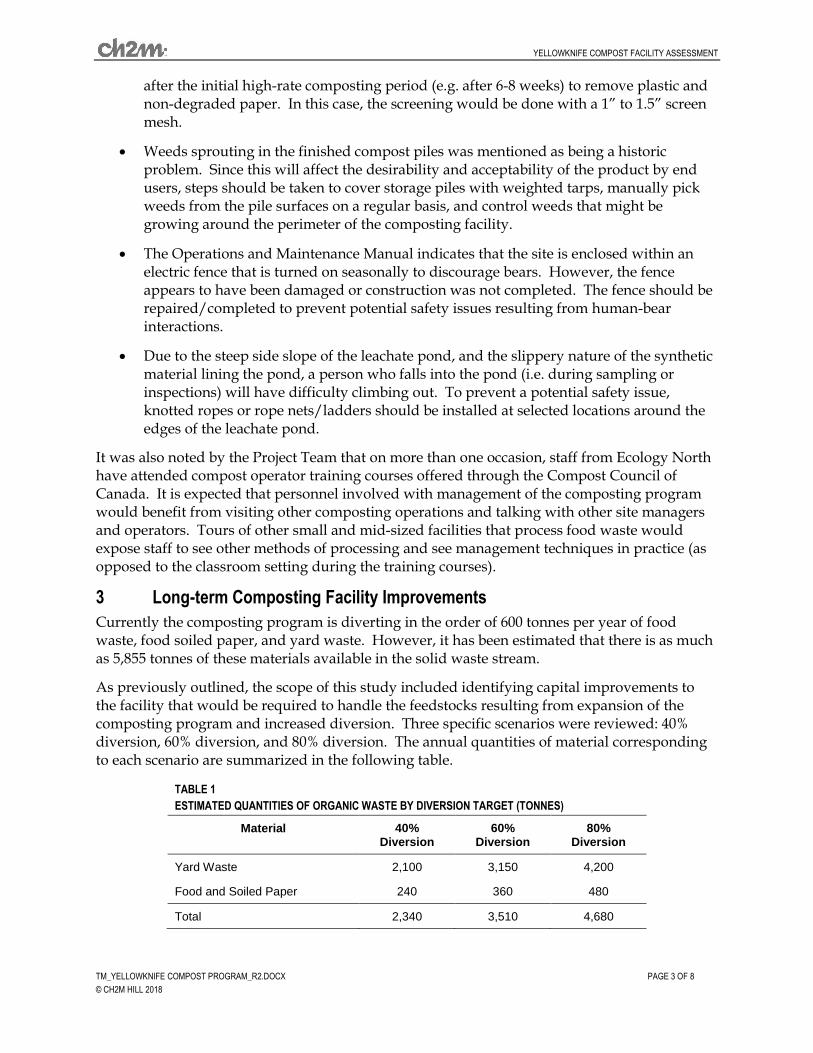
YELLOWKNIFE COMPOST FACILITY ASSESSMENT
TM_YELLOWKNIFE COMPOST PROGRAM_R2.DOCX PAGE 3 OF 8
© CH2M HILL 2018
after the initial high-rate composting period (e.g. after 6-8 weeks) to remove plastic and non-degraded paper. In this case, the screening would be done with a 1” to 1.5” screen mesh.
• Weeds sprouting in the finished compost piles was mentioned as being a historic problem. Since this will affect the desirability and acceptability of the product by end users, steps should be taken to cover storage piles with weighted tarps, manually pick weeds from the pile surfaces on a regular basis, and control weeds that might be growing around the perimeter of the composting facility.
• The Operations and Maintenance Manual indicates that the site is enclosed within an electric fence that is turned on seasonally to discourage bears. However, the fence appears to have been damaged or construction was not completed. The fence should be repaired/completed to prevent potential safety issues resulting from human-bear interactions.
• Due to the steep side slope of the leachate pond, and the slippery nature of the synthetic material lining the pond, a person who falls into the pond (i.e. during sampling or inspections) will have difficulty climbing out. To prevent a potential safety issue, knotted ropes or rope nets/ladders should be installed at selected locations around the edges of the leachate pond.
It was also noted by the Project Team that on more than one occasion, staff from Ecology North have attended compost operator training courses offered through the Compost Council of Canada. It is expected that personnel involved with management of the composting program would benefit from visiting other composting operations and talking with other site managers and operators. Tours of other small and mid-sized facilities that process food waste would expose staff to see other methods of processing and see management techniques in practice (as opposed to the classroom setting during the training courses).
3 Long-term Composting Facility Improvements
Currently the composting program is diverting in the order of 600 tonnes per year of food waste, food soiled paper, and yard waste. However, it has been estimated that there is as much as 5,855 tonnes of these materials available in the solid waste stream.
As previously outlined, the scope of this study included identifying capital improvements to the facility that would be required to handle the feedstocks resulting from expansion of the composting program and increased diversion. Three specific scenarios were reviewed: 40% diversion, 60% diversion, and 80% diversion. The annual quantities of material corresponding to each scenario are summarized in the following table.
TABLE 1
ESTIMATED QUANTITIES OF ORGANIC WASTE BY DIVERSION TARGET (TONNES)
Material 40% Diversion
60% Diversion
80% Diversion
Yard Waste 2,100 3,150 4,200
Food and Soiled Paper 240 360 480
Total 2,340 3,510 4,680

YELLOWKNIFE COMPOST FACILITY ASSESSMENT
TM_YELLOWKNIFE COMPOST PROGRAM_R2.DOCX PAGE 4 OF 8
© CH2M HILL 2018
In order to estimate costs, a conceptual design of the composting facility required to support the 40% diversion scenario was developed (i.e. the “base” facility). This facility was intentionally based on a modular design. This allowed the costs for the facilities needed to support the 60% and 80% diversion scenarios to be quickly pro-rated from the base facility design and costs.
In practical terms, a modular design would allow Yellowknife to construct new facility infrastructure in stages as participation in the program increases and the program is expanded to include new generators.
3.1 Preliminary Process Design and Mass Balance
In order to size equipment and processing infrastructure, a preliminary mix design and weekly mass and volume balance for the composting facility associated with the 40% diversion scenario was prepared by the Project Team.
The mix design was prepared based on assumptions regarding the weekly quantities of feedstocks that would be delivered to the facility and this assumed feedstock characteristics. The assumptions were based on data from existing food waste composting programs in Alberta and BC, and prior assessment and design work completed by the Project Team for other clients.
In Yellowknife’s case, a bulking agent would need to be added to the feedstocks prior to composting to adjust the moisture content and carbon to nitrogen ratio to optimal ranges. The bulking agent is also required to provide structure and increase free air space within the compost pile, which allows for the movement of air. Typically, wood chips made from tree branches and trunks, other coarse yard debris, forestry industry residuals, or dimension wood waste are used as amendment sources at composting facilities. For this assessment, it was assumed that ground dimension lumber diverted from the landfill, and coarse material removed from the compost during the final screening step would be used as bulking agents.
3.2 Description of Facility Components
A summary of the major system components associated with the recommended composting facility are provided in the following sections. Since the facility is modular in nature, these components would be the same for all three diversion scenarios.
3.2.1 Active Composting System
Due to the increased risk of bird attraction, odours and other nuisance conditions, continued use of the low-tech windrow composting approach is not recommended. The Project Team instead recommends that Yellowknife move to an aerated composting system. Migrating to an aerated system would also provide more certainty in terms of pathogen reduction relative to the existing windrow composting system, and would reduce labour and equipment requirements during the initial weeks of the composting process.
There are a range of aerated in-vessel composting systems available that could be implemented in Yellowknife to handle the feedstock quantities resulting from the three diversion scenarios. Vendors for such systems include Green Mountain Technologies, Engineered Compost Systems, DTEnvironmental, and Hot Rot. These pre-engineered systems are fully-enclosed and have automated aeration systems, which would help to prevent odour and nuisance conditions, speed up the composting process, contain litter, and reduce bird attraction.
Although there are several technical benefits to an in-vessel system, it is expected that the costs associated with these types of systems and the associated infrastructure would be prohibitive.
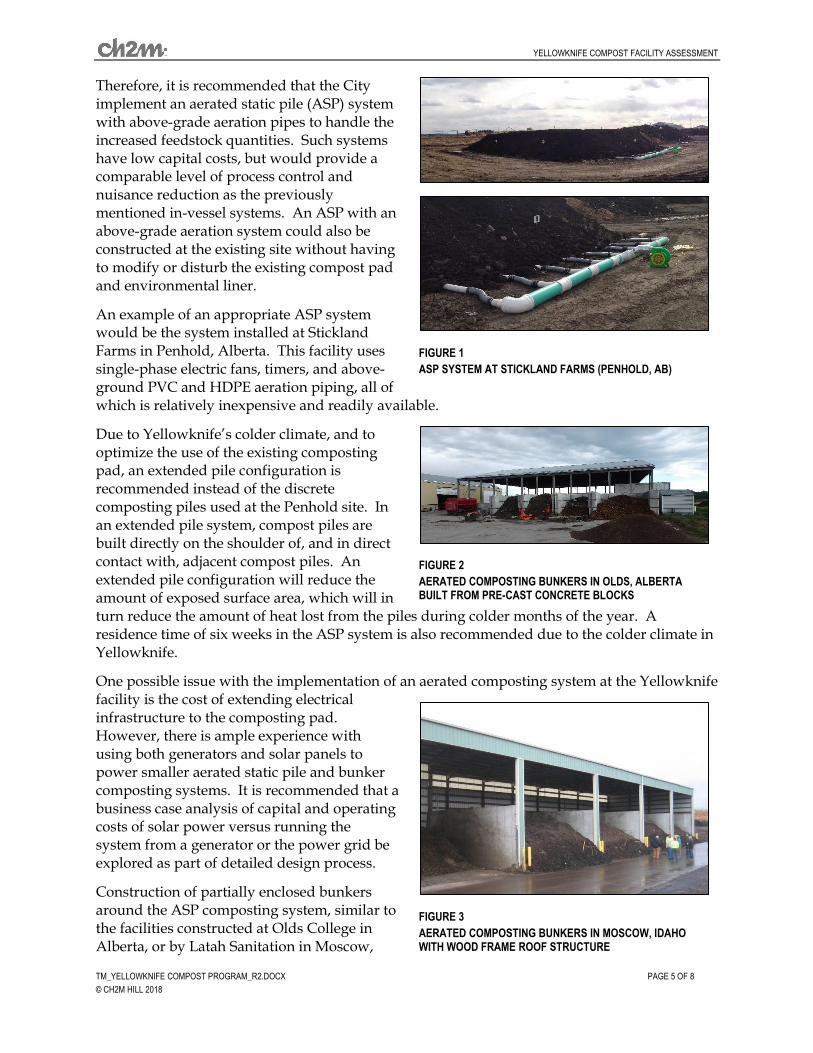
YELLOWKNIFE COMPOST FACILITY ASSESSMENT
TM_YELLOWKNIFE COMPOST PROGRAM_R2.DOCX PAGE 5 OF 8
© CH2M HILL 2018
Therefore, it is recommended that the City implement an aerated static pile (ASP) system with above-grade aeration pipes to handle the increased feedstock quantities. Such systems have low capital costs, but would provide a comparable level of process control and nuisance reduction as the previously mentioned in-vessel systems. An ASP with an above-grade aeration system could also be constructed at the existing site without having to modify or disturb the existing compost pad and environmental liner.
An example of an appropriate ASP system would be the system installed at Stickland Farms in Penhold, Alberta. This facility uses single-phase electric fans, timers, and above-ground PVC and HDPE aeration piping, all of which is relatively inexpensive and readily available.
Due to Yellowknife’s colder climate, and to optimize the use of the existing composting pad, an extended pile configuration is recommended instead of the discrete composting piles used at the Penhold site. In an extended pile system, compost piles are built directly on the shoulder of, and in direct contact with, adjacent compost piles. An extended pile configuration will reduce the amount of exposed surface area, which will in turn reduce the amount of heat lost from the piles during colder months of the year. A residence time of six weeks in the ASP system is also recommended due to the colder climate in Yellowknife.
One possible issue with the implementation of an aerated composting system at the Yellowknife facility is the cost of extending electrical infrastructure to the composting pad. However, there is ample experience with using both generators and solar panels to power smaller aerated static pile and bunker composting systems. It is recommended that a business case analysis of capital and operating costs of solar power versus running the system from a generator or the power grid be explored as part of detailed design process.
Construction of partially enclosed bunkers around the ASP composting system, similar to the facilities constructed at Olds College in Alberta, or by Latah Sanitation in Moscow,
FIGURE 1
ASP SYSTEM AT STICKLAND FARMS (PENHOLD, AB)
FIGURE 2
AERATED COMPOSTING BUNKERS IN OLDS, ALBERTA BUILT FROM PRE-CAST CONCRETE BLOCKS
FIGURE 3
AERATED COMPOSTING BUNKERS IN MOSCOW, IDAHO WITH WOOD FRAME ROOF STRUCTURE

YELLOWKNIFE COMPOST FACILITY ASSESSMENT
TM_YELLOWKNIFE COMPOST PROGRAM_R2.DOCX PAGE 6 OF 8
© CH2M HILL 2018
Idaho, could be considered as a future upgrade to the composting facility. The use of a bunker structure would provide a further level of protection from climate interferences. The bunker design used in Olds College (i.e. based on using pre-cast concrete blocks) could be constructed without disturbing or modifying the existing composting pad.
3.2.2 Mixing System
The amount of agitation and mixing that occurs in the proposed ASP composting system is significantly reduced relative to the current windrow system. Therefore, thorough mixing of feedstocks and amendments prior to their placement in the ASP system is needed to optimize the composting process and prevent nuisance conditions. While an acceptable level of mixing can be achieved with a front-end loader, it is generally much more effective and efficient to use a mixing system.
PTO (power take-off) and electrically driven vertical auger mixers, which are available from such vendors as Supreme International, Jaylor and Patz, have become very popular in the composting industry over the past ten years. Vertical mixers are more popular than the horizontal mixers that have historically been used at mid and large-scale sites. Vertical mixers also tend to be available in a smaller size range, such as the stationary mixing units manufactured by Penta and Vertablend.
As part of the facility upgrade, a small PTO (i.e. tractor-driven) vertical auger mixer is recommended. The mixer would be similar to the units used at the Stickland Farms compost site in Penhold, and the City of Whitehorse composting facility.
3.2.3 Curing and Screen Product Storage
Once the material has been stabilized in the ASP composting system, it will need to be further cured prior to being used as a soil amendment. However, the material will still be very biologically active and will have the potential to generate odours if not properly managed. It is therefore proposed that the material be cured for three to four months using the windrow method that is currently employed at the Yellowknife facility. Since the material will have gone through the pathogen reduction process in the ASP system, the turning frequency of the curing windrows can be based solely on pile temperatures and the need to re-establish porosity. It is expected at the start of the curing stage, weekly or biweekly turning would be needed, but this would taper off to turning every three to four weeks as the curing stage progresses.
After a period of three to four months, material in curing windrows could be screened to removed contaminants and recover bulking agents. The screened material would be consolidated into larger stockpiles and allowed to continue curing until it meets the desired level of maturity. To maximize the use of the existing compost pad, it is proposed that the stockpiles be built to a height of approximately 7.6 m (25 feet) using a stacking conveyor.
FIGURE 4
PTO MIXER USED AT CITY OF WHITEHORSE COMPOSTING FACILITY (SOURCE: TRANSFORM COMPOST SYSTEMS)
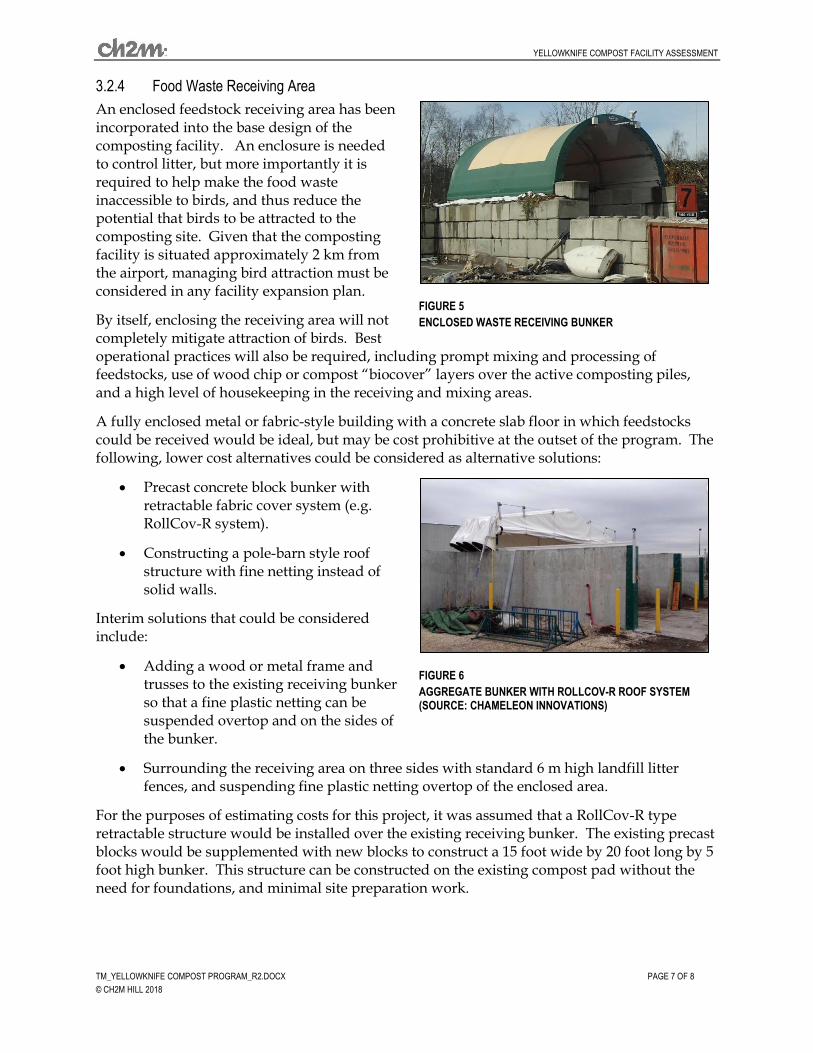
YELLOWKNIFE COMPOST FACILITY ASSESSMENT
TM_YELLOWKNIFE COMPOST PROGRAM_R2.DOCX PAGE 7 OF 8
© CH2M HILL 2018
3.2.4 Food Waste Receiving Area
An enclosed feedstock receiving area has been incorporated into the base design of the composting facility. An enclosure is needed to control litter, but more importantly it is required to help make the food waste inaccessible to birds, and thus reduce the potential that birds to be attracted to the composting site. Given that the composting facility is situated approximately 2 km from the airport, managing bird attraction must be considered in any facility expansion plan.
By itself, enclosing the receiving area will not completely mitigate attraction of birds. Best operational practices will also be required, including prompt mixing and processing of feedstocks, use of wood chip or compost “biocover” layers over the active composting piles, and a high level of housekeeping in the receiving and mixing areas.
A fully enclosed metal or fabric-style building with a concrete slab floor in which feedstocks could be received would be ideal, but may be cost prohibitive at the outset of the program. The following, lower cost alternatives could be considered as alternative solutions:
• Precast concrete block bunker with retractable fabric cover system (e.g. RollCov-R system).
• Constructing a pole-barn style roof structure with fine netting instead of solid walls.
Interim solutions that could be considered include:
• Adding a wood or metal frame and trusses to the existing receiving bunker so that a fine plastic netting can be suspended overtop and on the sides of the bunker.
• Surrounding the receiving area on three sides with standard 6 m high landfill litter fences, and suspending fine plastic netting overtop of the enclosed area.
For the purposes of estimating costs for this project, it was assumed that a RollCov-R type retractable structure would be installed over the existing receiving bunker. The existing precast blocks would be supplemented with new blocks to construct a 15 foot wide by 20 foot long by 5 foot high bunker. This structure can be constructed on the existing compost pad without the need for foundations, and minimal site preparation work.
FIGURE 5
ENCLOSED WASTE RECEIVING BUNKER
FIGURE 6
AGGREGATE BUNKER WITH ROLLCOV-R ROOF SYSTEM (SOURCE: CHAMELEON INNOVATIONS)

YELLOWKNIFE COMPOST FACILITY ASSESSMENT
TM_YELLOWKNIFE COMPOST PROGRAM_R2.DOCX PAGE 8 OF 8
© CH2M HILL 2018
3.3 Capital Cost Estimates
A rough order of magnitude (ROM) cost opinion for the equipment and components required for the composting facilities corresponding to each diversion scenario was prepared by the Project Team. This cost opinion is considered a Class 4 cost as defined by the Association for the Advancement of Cost Engineering International (AACE), and is based on the conceptual design for the base facility and assumptions related to feedstock characteristics, processing technologies and equipment. The estimate is not intended to be used in facility procurement as final costs of the project will depend on actual technologies and equipment procured as well as other variable factors including host location, labour and material costs, competitive market conditions, and implementation schedule.
Breakdowns of the cost of items are provided in Table 2. The assumed markups and taxes for the estimates are also summarized in Table 2. These costs and markups are based upon vendor quotations obtained during past work by the Project Team, our best judgement, and general assumptions on how the project will be contracted (i.e. design-bid-build).
TABLE 2
ORDER OF MAGNITUDE COST ESTIMATES FOR FACILITY IMPROVEMENTS
Cost Item 40% Diversion Scenario
60% Diversion Scenario
80% Diversion Scenario
Preconstruction and site preparation $ - $ - $ -
Access roads and scale $ - $ - $ -
Security and landscaping $ - $ - $ -
Receiving area improvements $ 28,550 $ 28,550 $ 28,550
ASP composting system (positive aeration) $ 83,250 $ 124,875 $ 166,500
Mixing equipment (with tractor) $ 157,500 $ 157,500 $ 157,500
Composting pad expansion/improvements $ - $ - $ -
Surface water pond expansion/improvements $ - $ - $ -
Staff building $ - $ - $ -
Miscellaneous equipment - stacking conveyor $ 40,000 $ 40,000 $ 40,000
Allowance for diesel electrical generator $ 15,000 $ 30,000 $ 45,000
Probable Construction Cost $ 324,300 $ 380,925 $ 437,550
Contingency (25%) $ 81,000 $ 95,000 $ 109,000
Construction/Contract Management 5%) $ 16,000 $ 19,000 $ 22,000
Specialty Engineering and Permitting $ 25,000 $ 25,000 $ 25,000
$ 12,000 $ 12,000 $ 12,000
Total Probable Cost $ 458,300 $ 531,925 $ 605,550
Estimate Low Range (-30%): $ 320,800 $ 372,300 $ 423,900
Estimate High Range (+50%): $ 687,500 $ 797,900 $ 908,300

Strategic Waste Management Plan (SWMP) – Appendix The City of Yellowknife
F-1
Appendix F – Salvage Area Stories

TM_YELLOWKNIFE COMPOST PROGRAM_R2.DOCX PAGE 1 OF 8
© CH2M HILL 2018
T E C H N I C A L M E M O R A N D U M
Yellowknife Compost Facility Assessment
PREPARED FOR: City of Yellowknife
sonnevera international corp
PREPARED BY: CH2M
DATE: March 2, 2018
VERSION: Final
PROJECT NUMBER:
1 Introduction
CH2M was retained as a subconsultant to sonnevera international corp to assist the City of Yellowknife with an assessment of the City’s existing composting facility. The scope of work for this assignment also included identifying capital improvements to the facility that would be required to handle the feedstocks resulting from expansion of the composting program and increased diversion.
2 Existing Facilty Assessment
The Project Team undertook a desktop review of the composting program that focused on a review of operating procedures and selected operating records. Ecology North personnel were also interviewed about the composting program and site operations, and Project Team members undertook a brief site inspection in October of 2017.
The facility uses a low-tech windrow composting method to process the roughly 500 to 600 tonnes of food waste and yard waste delivered to the site. The facility receives organic wastes on a year-round basis, but active composting activities are more intensive during the period between May and September. Given the relatively small quantities of feedstocks are currently being collected and processed, and the remote location of the site relative to neighbors, a low-tech approach has been a good solution to date. To offset the increased odour and nuisance risks that could result from the low-tech composting method, a higher amount of site and process monitoring/management has been invested in the program.
While the higher level of site and process management is a sound technical decision, it does result in increased labour and higher costs: direct operating costs in 2016 were reported to be in the order of $91,000 to handle roughly 400 tonnes of material. The unit processing costs for the program appear high (i.e. in the order of $225/tonne) when compared to food waste composting programs in the 2,500 to 5,000 tonne per year range. Given the low feedstock quantities, this is not surprising.
A cursory review of the design of the composting facility itself was undertaken as part of this assessment and it was found to align with best practices and the normal standard of care taken by compost site designers. It was also observed that the facility has ample capacity to

YELLOWKNIFE COMPOST FACILITY ASSESSMENT
TM_YELLOWKNIFE COMPOST PROGRAM_R2.DOCX PAGE 2 OF 8
© CH2M HILL 2018
accommodate future growth in the diversion/collection program, and has suitable environmental protection and surface water controls.
Based on our review of the Operations and Maintenance Manual and discussions with Ecology North personnel, is appears that best management practices are being followed with respect to site operations. Although there is room for minor improvements, the operations procedures are thorough and well documented. The amount and nature of the operations records kept is more detailed than would normally be expected at a site of this size, but that should not be interpreted as a negative comment.
Our Project Team also discussed the finished product testing and use practices with Ecology North staff. The sampling and testing procedures being followed are consistent with normal industry practices and an experienced third-party laboratory is being used to complete the required analyses. It appears that product marketing is a collaborative effort between the City and Ecology North, but there are no defined marketing roles and responsibilities.
Based on our review, the following improvements to management protocols and procedures should be considered:
• Staff should develop a template form that can be used to document routine (e.g. weekly or biweekly) inspections of the composting facility.
• Staff should correct the reference to pathogen time and temperature requirements on page 24 of the Operations and Maintenance Manual to make it consistent with the information provided on page 30.
• Staff should take advantage of the ability of spreadsheets (or other software) to electronically track process data and develop trend charts. Experience has shown that trend charting (versus reviewing raw numerical data) is more intuitive and provides better insight into compost pile conditions.
• A more complete discussion of the protocols for leachate sampling should be included in the Operations and Maintenance Manual.
Based on our review of operating practices, the following modifications to field practices should be considered:
• Based on discussions, it appears that there is not enough coarse amendment being used in the compost piles. Increasing the amount of coarse amendment in the composting piles will increase free air space and improve passive aeration. The result of this will be reduced potential for odours, and more efficient degradation of materials.
• Equipping the front-end loader used at the site with an over-sized bucket (e.g. snow bucket) would help with operational efficiency and reduce the amount of time required to turn the composting piles.
• The feedstocks being accepted in the program contains film plastic (compostable and non-compostable), kraft bags, carboard, and food soiled paper. While the amounts of these materials in the feedstocks do not appear to be excessive relative to what is encountered in similar programs in other jurisdictions, the manual turning process used at the facility combined with dry pile conditions results in a higher amount of litter. If off-site litter becomes an issue, consideration could be given to screening the windrows

YELLOWKNIFE COMPOST FACILITY ASSESSMENT
TM_YELLOWKNIFE COMPOST PROGRAM_R2.DOCX PAGE 3 OF 8
© CH2M HILL 2018
after the initial high-rate composting period (e.g. after 6-8 weeks) to remove plastic and non-degraded paper. In this case, the screening would be done with a 1” to 1.5” screen mesh.
• Weeds sprouting in the finished compost piles was mentioned as being a historic problem. Since this will affect the desirability and acceptability of the product by end users, steps should be taken to cover storage piles with weighted tarps, manually pick weeds from the pile surfaces on a regular basis, and control weeds that might be growing around the perimeter of the composting facility.
• The Operations and Maintenance Manual indicates that the site is enclosed within an electric fence that is turned on seasonally to discourage bears. However, the fence appears to have been damaged or construction was not completed. The fence should be repaired/completed to prevent potential safety issues resulting from human-bear interactions.
• Due to the steep side slope of the leachate pond, and the slippery nature of the synthetic material lining the pond, a person who falls into the pond (i.e. during sampling or inspections) will have difficulty climbing out. To prevent a potential safety issue, knotted ropes or rope nets/ladders should be installed at selected locations around the edges of the leachate pond.
It was also noted by the Project Team that on more than one occasion, staff from Ecology North have attended compost operator training courses offered through the Compost Council of Canada. It is expected that personnel involved with management of the composting program would benefit from visiting other composting operations and talking with other site managers and operators. Tours of other small and mid-sized facilities that process food waste would expose staff to see other methods of processing and see management techniques in practice (as opposed to the classroom setting during the training courses).
3 Long-term Composting Facility Improvements
Currently the composting program is diverting in the order of 600 tonnes per year of food waste, food soiled paper, and yard waste. However, it has been estimated that there is as much as 5,855 tonnes of these materials available in the solid waste stream.
As previously outlined, the scope of this study included identifying capital improvements to the facility that would be required to handle the feedstocks resulting from expansion of the composting program and increased diversion. Three specific scenarios were reviewed: 40% diversion, 60% diversion, and 80% diversion. The annual quantities of material corresponding to each scenario are summarized in the following table.
TABLE 1
ESTIMATED QUANTITIES OF ORGANIC WASTE BY DIVERSION TARGET (TONNES)
Material 40% Diversion
60% Diversion
80% Diversion
Yard Waste 2,100 3,150 4,200
Food and Soiled Paper 240 360 480
Total 2,340 3,510 4,680
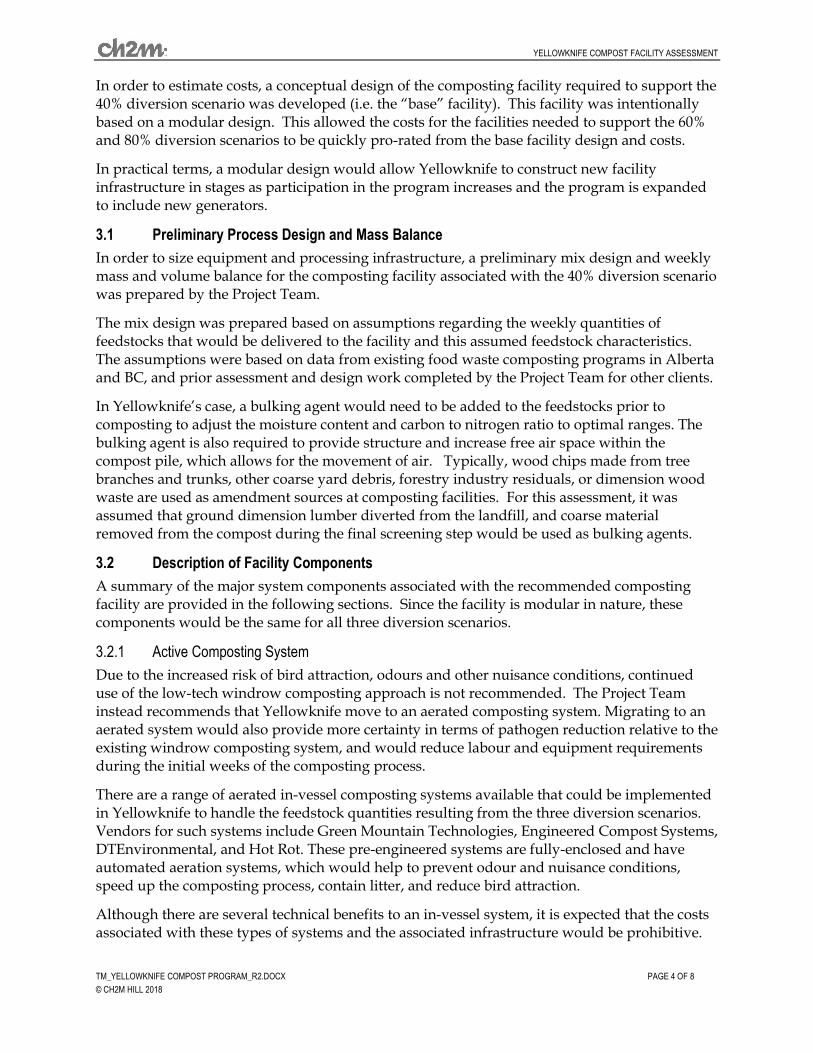
YELLOWKNIFE COMPOST FACILITY ASSESSMENT
TM_YELLOWKNIFE COMPOST PROGRAM_R2.DOCX PAGE 4 OF 8
© CH2M HILL 2018
In order to estimate costs, a conceptual design of the composting facility required to support the 40% diversion scenario was developed (i.e. the “base” facility). This facility was intentionally based on a modular design. This allowed the costs for the facilities needed to support the 60% and 80% diversion scenarios to be quickly pro-rated from the base facility design and costs.
In practical terms, a modular design would allow Yellowknife to construct new facility infrastructure in stages as participation in the program increases and the program is expanded to include new generators.
3.1 Preliminary Process Design and Mass Balance
In order to size equipment and processing infrastructure, a preliminary mix design and weekly mass and volume balance for the composting facility associated with the 40% diversion scenario was prepared by the Project Team.
The mix design was prepared based on assumptions regarding the weekly quantities of feedstocks that would be delivered to the facility and this assumed feedstock characteristics. The assumptions were based on data from existing food waste composting programs in Alberta and BC, and prior assessment and design work completed by the Project Team for other clients.
In Yellowknife’s case, a bulking agent would need to be added to the feedstocks prior to composting to adjust the moisture content and carbon to nitrogen ratio to optimal ranges. The bulking agent is also required to provide structure and increase free air space within the compost pile, which allows for the movement of air. Typically, wood chips made from tree branches and trunks, other coarse yard debris, forestry industry residuals, or dimension wood waste are used as amendment sources at composting facilities. For this assessment, it was assumed that ground dimension lumber diverted from the landfill, and coarse material removed from the compost during the final screening step would be used as bulking agents.
3.2 Description of Facility Components
A summary of the major system components associated with the recommended composting facility are provided in the following sections. Since the facility is modular in nature, these components would be the same for all three diversion scenarios.
3.2.1 Active Composting System
Due to the increased risk of bird attraction, odours and other nuisance conditions, continued use of the low-tech windrow composting approach is not recommended. The Project Team instead recommends that Yellowknife move to an aerated composting system. Migrating to an aerated system would also provide more certainty in terms of pathogen reduction relative to the existing windrow composting system, and would reduce labour and equipment requirements during the initial weeks of the composting process.
There are a range of aerated in-vessel composting systems available that could be implemented in Yellowknife to handle the feedstock quantities resulting from the three diversion scenarios. Vendors for such systems include Green Mountain Technologies, Engineered Compost Systems, DTEnvironmental, and Hot Rot. These pre-engineered systems are fully-enclosed and have automated aeration systems, which would help to prevent odour and nuisance conditions, speed up the composting process, contain litter, and reduce bird attraction.
Although there are several technical benefits to an in-vessel system, it is expected that the costs associated with these types of systems and the associated infrastructure would be prohibitive.

YELLOWKNIFE COMPOST FACILITY ASSESSMENT
TM_YELLOWKNIFE COMPOST PROGRAM_R2.DOCX PAGE 5 OF 8
© CH2M HILL 2018
Therefore, it is recommended that the City implement an aerated static pile (ASP) system with above-grade aeration pipes to handle the increased feedstock quantities. Such systems have low capital costs, but would provide a comparable level of process control and nuisance reduction as the previously mentioned in-vessel systems. An ASP with an above-grade aeration system could also be constructed at the existing site without having to modify or disturb the existing compost pad and environmental liner.
An example of an appropriate ASP system would be the system installed at Stickland Farms in Penhold, Alberta. This facility uses single-phase electric fans, timers, and above-ground PVC and HDPE aeration piping, all of which is relatively inexpensive and readily available.
Due to Yellowknife’s colder climate, and to optimize the use of the existing composting pad, an extended pile configuration is recommended instead of the discrete composting piles used at the Penhold site. In an extended pile system, compost piles are built directly on the shoulder of, and in direct contact with, adjacent compost piles. An extended pile configuration will reduce the amount of exposed surface area, which will in turn reduce the amount of heat lost from the piles during colder months of the year. A residence time of six weeks in the ASP system is also recommended due to the colder climate in Yellowknife.
One possible issue with the implementation of an aerated composting system at the Yellowknife facility is the cost of extending electrical infrastructure to the composting pad. However, there is ample experience with using both generators and solar panels to power smaller aerated static pile and bunker composting systems. It is recommended that a business case analysis of capital and operating costs of solar power versus running the system from a generator or the power grid be explored as part of detailed design process.
Construction of partially enclosed bunkers around the ASP composting system, similar to the facilities constructed at Olds College in Alberta, or by Latah Sanitation in Moscow,
FIGURE 1
ASP SYSTEM AT STICKLAND FARMS (PENHOLD, AB)
FIGURE 2
AERATED COMPOSTING BUNKERS IN OLDS, ALBERTA BUILT FROM PRE-CAST CONCRETE BLOCKS
FIGURE 3
AERATED COMPOSTING BUNKERS IN MOSCOW, IDAHO WITH WOOD FRAME ROOF STRUCTURE
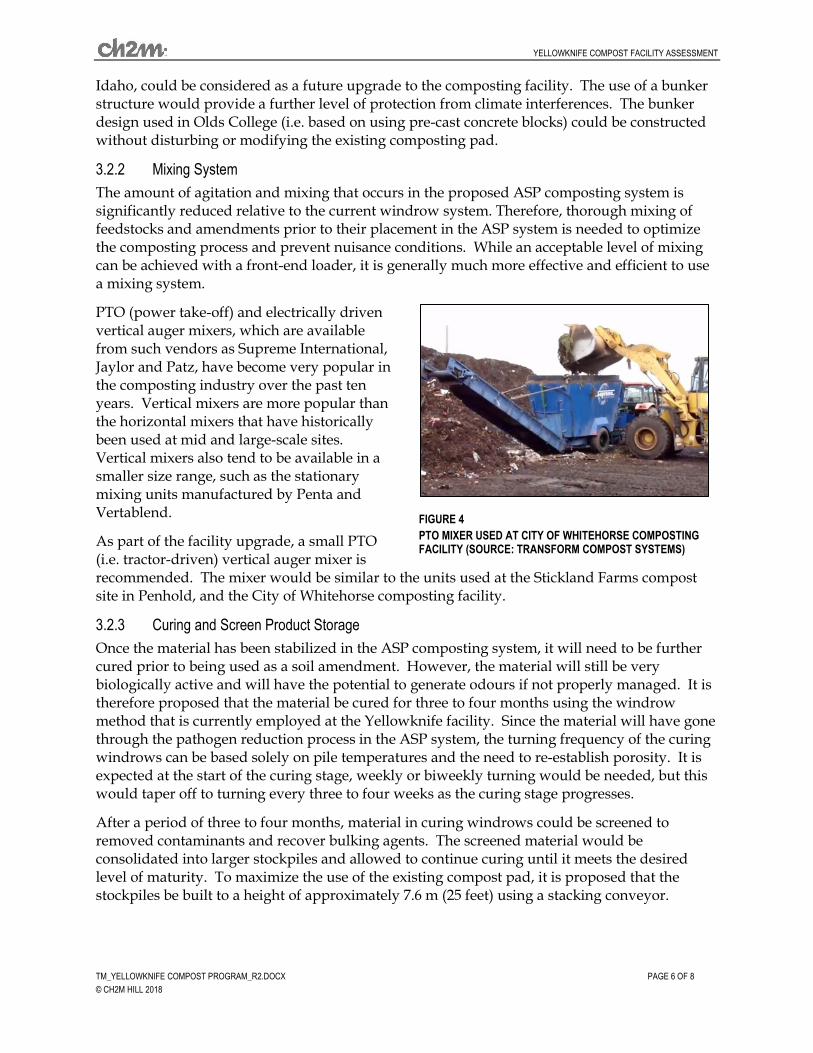
YELLOWKNIFE COMPOST FACILITY ASSESSMENT
TM_YELLOWKNIFE COMPOST PROGRAM_R2.DOCX PAGE 6 OF 8
© CH2M HILL 2018
Idaho, could be considered as a future upgrade to the composting facility. The use of a bunker structure would provide a further level of protection from climate interferences. The bunker design used in Olds College (i.e. based on using pre-cast concrete blocks) could be constructed without disturbing or modifying the existing composting pad.
3.2.2 Mixing System
The amount of agitation and mixing that occurs in the proposed ASP composting system is significantly reduced relative to the current windrow system. Therefore, thorough mixing of feedstocks and amendments prior to their placement in the ASP system is needed to optimize the composting process and prevent nuisance conditions. While an acceptable level of mixing can be achieved with a front-end loader, it is generally much more effective and efficient to use a mixing system.
PTO (power take-off) and electrically driven vertical auger mixers, which are available from such vendors as Supreme International, Jaylor and Patz, have become very popular in the composting industry over the past ten years. Vertical mixers are more popular than the horizontal mixers that have historically been used at mid and large-scale sites. Vertical mixers also tend to be available in a smaller size range, such as the stationary mixing units manufactured by Penta and Vertablend.
As part of the facility upgrade, a small PTO (i.e. tractor-driven) vertical auger mixer is recommended. The mixer would be similar to the units used at the Stickland Farms compost site in Penhold, and the City of Whitehorse composting facility.
3.2.3 Curing and Screen Product Storage
Once the material has been stabilized in the ASP composting system, it will need to be further cured prior to being used as a soil amendment. However, the material will still be very biologically active and will have the potential to generate odours if not properly managed. It is therefore proposed that the material be cured for three to four months using the windrow method that is currently employed at the Yellowknife facility. Since the material will have gone through the pathogen reduction process in the ASP system, the turning frequency of the curing windrows can be based solely on pile temperatures and the need to re-establish porosity. It is expected at the start of the curing stage, weekly or biweekly turning would be needed, but this would taper off to turning every three to four weeks as the curing stage progresses.
After a period of three to four months, material in curing windrows could be screened to removed contaminants and recover bulking agents. The screened material would be consolidated into larger stockpiles and allowed to continue curing until it meets the desired level of maturity. To maximize the use of the existing compost pad, it is proposed that the stockpiles be built to a height of approximately 7.6 m (25 feet) using a stacking conveyor.
FIGURE 4
PTO MIXER USED AT CITY OF WHITEHORSE COMPOSTING FACILITY (SOURCE: TRANSFORM COMPOST SYSTEMS)

YELLOWKNIFE COMPOST FACILITY ASSESSMENT
TM_YELLOWKNIFE COMPOST PROGRAM_R2.DOCX PAGE 7 OF 8
© CH2M HILL 2018
3.2.4 Food Waste Receiving Area
An enclosed feedstock receiving area has been incorporated into the base design of the composting facility. An enclosure is needed to control litter, but more importantly it is required to help make the food waste inaccessible to birds, and thus reduce the potential that birds to be attracted to the composting site. Given that the composting facility is situated approximately 2 km from the airport, managing bird attraction must be considered in any facility expansion plan.
By itself, enclosing the receiving area will not completely mitigate attraction of birds. Best operational practices will also be required, including prompt mixing and processing of feedstocks, use of wood chip or compost “biocover” layers over the active composting piles, and a high level of housekeeping in the receiving and mixing areas.
A fully enclosed metal or fabric-style building with a concrete slab floor in which feedstocks could be received would be ideal, but may be cost prohibitive at the outset of the program. The following, lower cost alternatives could be considered as alternative solutions:
• Precast concrete block bunker with retractable fabric cover system (e.g. RollCov-R system).
• Constructing a pole-barn style roof structure with fine netting instead of solid walls.
Interim solutions that could be considered include:
• Adding a wood or metal frame and trusses to the existing receiving bunker so that a fine plastic netting can be suspended overtop and on the sides of the bunker.
• Surrounding the receiving area on three sides with standard 6 m high landfill litter fences, and suspending fine plastic netting overtop of the enclosed area.
For the purposes of estimating costs for this project, it was assumed that a RollCov-R type retractable structure would be installed over the existing receiving bunker. The existing precast blocks would be supplemented with new blocks to construct a 15 foot wide by 20 foot long by 5 foot high bunker. This structure can be constructed on the existing compost pad without the need for foundations, and minimal site preparation work.
FIGURE 5
ENCLOSED WASTE RECEIVING BUNKER
FIGURE 6
AGGREGATE BUNKER WITH ROLLCOV-R ROOF SYSTEM (SOURCE: CHAMELEON INNOVATIONS)

YELLOWKNIFE COMPOST FACILITY ASSESSMENT
TM_YELLOWKNIFE COMPOST PROGRAM_R2.DOCX PAGE 8 OF 8
© CH2M HILL 2018
3.3 Capital Cost Estimates
A rough order of magnitude (ROM) cost opinion for the equipment and components required for the composting facilities corresponding to each diversion scenario was prepared by the Project Team. This cost opinion is considered a Class 4 cost as defined by the Association for the Advancement of Cost Engineering International (AACE), and is based on the conceptual design for the base facility and assumptions related to feedstock characteristics, processing technologies and equipment. The estimate is not intended to be used in facility procurement as final costs of the project will depend on actual technologies and equipment procured as well as other variable factors including host location, labour and material costs, competitive market conditions, and implementation schedule.
Breakdowns of the cost of items are provided in Table 2. The assumed markups and taxes for the estimates are also summarized in Table 2. These costs and markups are based upon vendor quotations obtained during past work by the Project Team, our best judgement, and general assumptions on how the project will be contracted (i.e. design-bid-build).
TABLE 2
ORDER OF MAGNITUDE COST ESTIMATES FOR FACILITY IMPROVEMENTS
Cost Item 40% Diversion Scenario
60% Diversion Scenario
80% Diversion Scenario
Preconstruction and site preparation $ - $ - $ -
Access roads and scale $ - $ - $ -
Security and landscaping $ - $ - $ -
Receiving area improvements $ 28,550 $ 28,550 $ 28,550
ASP composting system (positive aeration) $ 83,250 $ 124,875 $ 166,500
Mixing equipment (with tractor) $ 157,500 $ 157,500 $ 157,500
Composting pad expansion/improvements $ - $ - $ -
Surface water pond expansion/improvements $ - $ - $ -
Staff building $ - $ - $ -
Miscellaneous equipment - stacking conveyor $ 40,000 $ 40,000 $ 40,000
Allowance for diesel electrical generator $ 15,000 $ 30,000 $ 45,000
Probable Construction Cost $ 324,300 $ 380,925 $ 437,550
Contingency (25%) $ 81,000 $ 95,000 $ 109,000
Construction/Contract Management 5%) $ 16,000 $ 19,000 $ 22,000
Specialty Engineering and Permitting $ 25,000 $ 25,000 $ 25,000
$ 12,000 $ 12,000 $ 12,000
Total Probable Cost $ 458,300 $ 531,925 $ 605,550
Estimate Low Range (-30%): $ 320,800 $ 372,300 $ 423,900
Estimate High Range (+50%): $ 687,500 $ 797,900 $ 908,300

Strategic Waste Management Plan (SWMP) – Appendix The City of Yellowknife
G-1
Appendix G – Landfill and Finances

TECHNICAL MEMO
Tetra Tech Canada Inc.14940 - 123 Avenue
Edmonton, AB T5V 1B4 CANADATel 780.451.2121 Fax 780.454.5688
ISSUED FOR REVIEW
To: Christina Seidel Date: February 27, 2018
c: Lindsay Seidel Memo No.: 1
From: Michel Lefebvre Lauren Quan
File: 704-SWM.PLAN03014-01
Subject: Landfill Analysis, Waste Generation Forecast, and Rate Structure
This ‘Issued for Review’ document is provided solely for the purpose of client review and presents our interim findings and recommendations to date. Our usable findings and recommendations are provided only through an ‘Issued for Use’ document, which will be issued subsequent to this review. Final design should not be undertaken based on the interim recommendations made herein. Once our report is issued for use, the ‘Issued for Review’ document should be either returned to Tetra Tech Canada Inc. (Tetra Tech) or destroyed.
1.0 INTRODUCTION
Tetra Tech Canada Inc. (Tetra Tech) was retained by sonnevera international corp. to complete analysis of the City of Yellowknife (the City) solid waste disposal facility. The City operates a balefill and landfill facility at its solid waste facility (SWF) located north of the intersections of Northwest Territories Highway 3 and Highway 4. The SWF is located approximately 2 km from downtown Yellowknife with the disposal area of the facility located approximately 3 km from the Yellowknife Airport.
2.0 SOLID WASTE DISPOSAL
The City measures the tonnage of materials entering the SWF each year. The total waste disposed at the facility is shown in Table 1. Of the material disposed at the facility, between 5,300 tonnes and 8,300 tonnes was construction and demolition (C&D) material that is disposed in a different section of the facility without baling. Most material entering the facility for disposal is municipal solid waste (MSW) which is baled and placed in an engineered cell.
Table 1: Summary of Waste Disposal at the SWF from 2014 to 2017 (as reported by the City)
Description 2014 2015 2016 2017
Total Waste Disposed (tonnes) 19,514.82 27,515.49 19,338.56 24,288.70
C&D Disposed (tonnes) 5,325.46 7,380.96 5,988.53 8,282.10
Total MSW Balefilled (tonnes) 14,189.36 20,134.53 13,350.03 16,006.60
3.0 SOLID WASTE DISPOSAL PROJECTIONS
Data available from the City of Yellowknife indicates that between 19,000 tonnes and 28,000 tonnes of waste per year was disposed at the Yellowknife SWF from 2014 to 2017. Based on NWT Bureau of Statistics (BOS) population estimates for the Yellowknife region, the average disposal rate was 1.143 tonnes/capita of which an average 390 kg/capita was C&D material and 753 kg/capita was MSW which is typically baled and placed for disposal.

LANDFILL ANALYSIS, WASTE GENERATION NFORECAST, AND RATE STRUCTURE
FILE: 704-SWM.PLAN03014-01 | FEBRUARY 20, 2018 | ISSUED FOR REVIEW
2 Yellowknife Landfill and Finances.docx
The BOS has projected populations for the Yellowknife region in five-year increments from 2020 through 2035. Based on these population projections and the average per capita disposal rate over the past several years, the annual disposal tonnage (total waste disposed at the SWF) is expected to exceed 25,500 tonnes per year by 2035. The estimated cumulative tonnage disposed from 2017 to 2035 is 464,300 tonnes.
Figure 2 shows the annual and cumulative MSW balefilled and C&D landfilled material.
‐
0.20
0.40
0.60
0.80
1.00
1.20
1.40
2014 2015 2016 2017
TonnesPerCapita
Year
PerCapitaWasteLandfilled(t)
PerCapitaWasteBalefilled(t)
PerCapitaC&DLandfilled(t)
0
5,000
10,000
15,000
20,000
25,000
30,000
35,000
40,000
0
50,000
100,000
150,000
200,000
250,000
300,000
350,000
AnnualDisposal(tonnes)
CumulativeDisposalfrom2017(tonnes)
Year
CumulativeWasteBalefilled(t)
CumulativeC&DLandfilled(t)
AnnualWasteBalefilled(t)
AnnualC&DDisposed(t)
Figure 2: Summary of Annual and Cumulative Materials Disposed at the Yellowknife Solid Waste Facility
Figure 1: Summary of Per Capita Disposal in Yellowknife from 2014 to 2017

LANDFILL ANALYSIS, WASTE GENERATION NFORECAST, AND RATE STRUCTURE
FILE: 704-SWM.PLAN03014-01 | FEBRUARY 20, 2018 | ISSUED FOR REVIEW
3 Yellowknife Landfill and Finances.docx
4.0 DISPOSAL OPERATIONS
The Yellowknife SWF has multiple areas for material storage, processing, and disposal. The facility has been operating since 1974 when it opened as a dump with uncontrolled burning and has developed to a modified landfill (1990), then to a balefill (1993). The City has invested in several upgrades and expansions over the facility’s four decades of operation. The facility is now home to a centralized compost facility, hydrocarbon soil and water treatment facility, C&D waste disposal area, recyclable material storage, baling facility, landfill cell (balefill area), residential drop-off transfer station, and weigh scales.
4.1 Balefill
The City operates a primarily balefill operation where MSW is compacted into bales and stacked in the landfill disposal area. Balefills are not common in North America as most landfill owners have opted for conventional methods where solid waste is tipped into the disposal area and compacted using heavy equipment. Balers are commonly used at material recovery facilities (MRFs) to compact and consolidate materials to improve transportation efficiency. Bales are tied with wires to hold materials together during transport.
The SWF balefill disposal area is in the northeast corner of the site. The baling facility is located near the facility entrance and weigh scales. MSW is dumped onto a tipping floor by collection vehicles. A skid steer screens materials and pushes them into the baler hopper. The materials are baled by a Harris Grizzly ™ Two Ram Baler (200-100) purchased in 2008. The baler is operated and maintained by a baler operator. Bales of solid waste produced in the facility are loaded into a dump truck by a front-end loader and hauled to the landfill cell for disposal. Per the manufacturer’s specifications, the baled density of solid waste is expected to be 36 lb/ft3 to 48 lb/ft3
(577 kg/m3 to 767 kg/m3)1.
At the request of council, the City commissioned an External Review of the Solid Waste Facility Operations and Processes in 2005 (Dillon Consulting 2005). That review provided a detailed financial analysis of balefilling vs conventional landfilling techniques including equipment capital, operational, and maintenance costs as well as the labour cost of the three staff members required to manage the baling process. The financial review has not been replicated as a component of the solid waste management plan. The following sections have been developed for consideration by the City based on the external review as well as a review of solid waste baling procedures from other jurisdictions.
4.1.1 Advantages of Balefill Operations
Several advantages to balefill operations have been identified by municipalities managing disposal facilities:
Baling reduces wind-blown waste. In some regions (e.g., Southern Alberta) high wind speeds historically forced closures of the landfill tipping face due to safety, environmental and aesthetic concerns associated with blowing litter. The City of Lethbridge, Alberta, which receives the second most windy days of any city in Canada, maintains a baler to ensure that waste disposal can occur throughout the year.
Baling reduces bird attraction. Operators have found that the tightly packed bales of waste are less attractive to birds than conventional landfills. Transport Canada’s bird hazard risk assessment typically requires a minimum 8 km buffer for commercial airports and landfills containing food wastes. Transport Canada has
1 Manufacturer’s specifications reported as attached to staff Memorandum to Committee dated April 14, 2008 regarding Award Purchase of
new Baler for Solid Waste Facility.
LANDFILL ANALYSIS, WASTE GENERATION NFORECAST, AND RATE STRUCTURE
FILE: 704-SWM.PLAN03014-01 | FEBRUARY 20, 2018 | ISSUED FOR REVIEW
4 Yellowknife Landfill and Finances.docx
historically applied a more practical 3 km setback in the North. The Yellowknife SWF is slightly more than 3 km from the airport. It is not clear whether baling MSW is an operational requirement from Transport Canada.
Baling reduces cover material required. A lack of wind-blown waste reduces the need for daily cover material, reducing the cost and volume of soil required in the landfill.
Baling increases waste density. Baling is sometimes used by facilities as an alternative to in-place compaction within the landfill cell. Baling waste increases density of landfills compared to open dump sites with no in-place compaction and small facilities which do not use steel-wheeled landfill compactors. Waste baling is also used by some transfer facilities to decrease long-haul trucking costs by maximizing density of loads shipped over long distances.
Baling may offer cost advantages. Fuel for landfill compaction equipment is a significant cost to municipalities. Fuel costs are reduced for balefill operations as equipment is smaller and more efficient. The 2006 External Review of Solid Waste Facility Operations and Processes (Dillon) indicated cost savings of baling over conventional landfilling methods over a 20 year period.
4.1.2 Disadvantages of Balefill Operations
While there are advantages to balefill operations, there are also several disadvantages have been identified by municipalities managing disposal facilities:
Not all material is suitable for baling. Some MSW and most C&D material is not baled in Yellowknife. While C&D material is disposed separately, the bulky and hardened MSW material that is disposed in the balefill area is disposed loose, decreasing the overall density of waste.
Baling may not outperform density of in-place compaction. The density of waste bales is dependent on the baler’s configuration and the characteristics of the waste. Larger, more expensive balers produce larger and denser bales. It is expected that bales produced in Yellowknife have a high density but an estimated 20% of MSW is placed loose. The apparent density estimated by Dillon (2006) is 0.60 tonnes/m3, lower than the 0.75 tonnes/m3 typically expected in a modern landfill.
Baling MSW requires significant maintenance and downtime affects operations. While recyclable materials are relatively uniform and dry, MSW composition and moisture content may vary widely between loads. Regular preventative maintenance as well as mechanical servicing is required to prevent significant downtime. When downtime occurs, MSW must be stored until equipment can be repaired.
Baling MSW may produce significant leachate. Many facilities have had issues managing the amount of liquid produced by the baling process. Precipitation and waste composition significantly affect the leachate produced by baling MSW. Leachate management systems are typically required at the baling facility to control environmental impact.
4.2 Construction and Demolition Waste Landfilling
Not all solid waste materials are processed through the baling facility. Many bulky and hardened materials are not appropriate for baling and are placed directly in the disposal area. Additionally, C&D materials are disposed in a designated area of the SWF without compaction other than what is achieved through pushing and covering the materials.

LANDFILL ANALYSIS, WASTE GENERATION NFORECAST, AND RATE STRUCTURE
FILE: 704-SWM.PLAN03014-01 | FEBRUARY 20, 2018 | ISSUED FOR REVIEW
5 Yellowknife Landfill and Finances.docx
5.0 LANDFILL ANALYSIS
The preliminary design report prepared by Dillon Consulting estimated that the “New Solid Waste Facility” would have sufficient capacity to provide the estimated 535,800 m3 required for solid waste and cover material over 20 years (through 2026). The report (Dillon 2006) notes that an approximate 375,000 m3 of airspace could be generated by sustaining existing quarrying operation for 7.5 years, increasing the total landfill capacity to 40 years.
The landfill analysis has been limited to the balefill disposal area of the SWF (identified as Cell A and Cell B in facility plans). Although C&D material is also deposited at the site, it is primarily managed separately from the MSW that is suitable for baling and has therefore not been considered in the airspace analysis.
5.1 Landfill Airspace
A preliminary landfill airspace analysis was conducted based on the topographical information made available from the City. The GIS data of the most recent flight survey and the limit of waste identified in the Solid Waste Facility Landfill Cell B Record Drawings (Dillon 2017) allowed the calculation of approximate airspace remaining in the balefill area (Cell A and Cell B). Final cover contours were not provided for analysis, therefore Tetra Tech developed conceptual level final contours to form the basis of landfill airspace calculations. Based on final cover contours of 3H:1V, there is an estimated 284,800 m3 of airspace remaining in the balefill area.
5.2 Landfill Lifespan
The landfill lifespan was calculated based on a status quo scenario. In this scenario, no additional diversion programs were considered resulting in a constant per capita MSW disposal rate of 753 kg/capita/year. Typically landfill lifespan is calculated based on measured apparent density at the subject site but this site-specific information was not available for the Yellowknife SWF. Based on the New Solid Waste Facility – Preliminary Design Report (Dillon 2006) the expected apparent density (density of waste in the landfill including cover materials) of the balefill facility is 0.60 tonnes/cu. m.2 Table 2 shows that the balefill facility has an estimated 10 years of airspace remaining at the current disposal rate.
Table 2: Landfill Airspace Consumption
Year Annual MSW
(tonnes) Annual Volume Consumed
(m3) Total Volume Remaining
(m3)
2018 16,339 27,231 257,572
2019 16,453 27,421 230,151
2020 16,566 27,611 202,540
2021 16,661 27,769 174,771
2022 16,756 27,927 146,845
2023 16,851 28,084 118,760
2024 16,945 28,242 90,518
2025 17,040 28,400 62,118
2026 17,125 28,542 33,576
2027 17,211 28,684 4,892
2028 17,296 28,826 -23,935
2 Apparent density calculated in the preliminary design report assumed 80% of the material would be baled with a density of 0.75t/m3, 20% of
waste would be placed loose with a density of 0.5t/m3, and 15% cover material would be used.
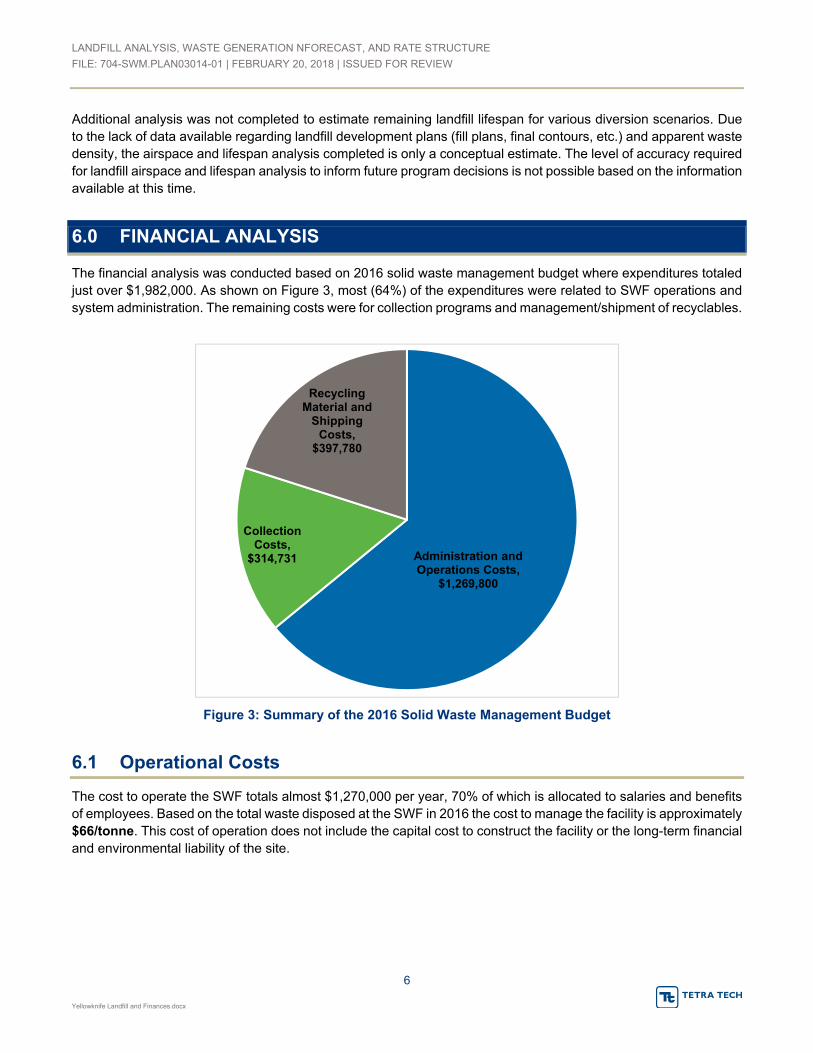
LANDFILL ANALYSIS, WASTE GENERATION NFORECAST, AND RATE STRUCTURE
FILE: 704-SWM.PLAN03014-01 | FEBRUARY 20, 2018 | ISSUED FOR REVIEW
6 Yellowknife Landfill and Finances.docx
Additional analysis was not completed to estimate remaining landfill lifespan for various diversion scenarios. Due to the lack of data available regarding landfill development plans (fill plans, final contours, etc.) and apparent waste density, the airspace and lifespan analysis completed is only a conceptual estimate. The level of accuracy required for landfill airspace and lifespan analysis to inform future program decisions is not possible based on the information available at this time.
6.0 FINANCIAL ANALYSIS
The financial analysis was conducted based on 2016 solid waste management budget where expenditures totaled just over $1,982,000. As shown on Figure 3, most (64%) of the expenditures were related to SWF operations and system administration. The remaining costs were for collection programs and management/shipment of recyclables.
6.1 Operational Costs
The cost to operate the SWF totals almost $1,270,000 per year, 70% of which is allocated to salaries and benefits of employees. Based on the total waste disposed at the SWF in 2016 the cost to manage the facility is approximately $66/tonne. This cost of operation does not include the capital cost to construct the facility or the long-term financial and environmental liability of the site.
Administration and Operations Costs,
$1,269,800
Collection Costs,
$314,731
Recycling Material and
Shipping Costs,
$397,780
Figure 3: Summary of the 2016 Solid Waste Management Budget

LANDFILL ANALYSIS, WASTE GENERATION NFORECAST, AND RATE STRUCTURE
FILE: 704-SWM.PLAN03014-01 | FEBRUARY 20, 2018 | ISSUED FOR REVIEW
7 Yellowknife Landfill and Finances.docx
6.2 Closure and Post Closure Costs
In addition to ongoing operational costs, the future costs for closure and post-closure care are crucial in assessing landfill finances.
The capital cost for closure was calculated based on the waste footprint for the balefill area (Cell A and Cell B) using conceptual closure contours developed by Tetra Tech, and unit costs developed by Dillon (2016) to estimate the probably closure and post-closure costs. The estimated future cost to close the balefill area is approximately $3.6 million as shown in Table 3.
Table 3: Closure Capital Cost Estimate
Item Description Unit Approx. Quantity
Unit Price
Total Price
Admin, Execution and Closeout
Bonds, Insurance, Mobilization, Demobilization, Temporary Controls, and Closeout (10%)
$249,200
Site Preparation Grading m2 34,500 $4 $138,000
Cover System Final Cover – supply and place m2 34,500 $65 $2,242,500
Landscaping Hydroseeding m2 34,500 $2 $69,000
Erosion Control m2 16,000 $2 $32,000
Surface Water Management Ditches – supply, place, compact, and seed L.M. 700 $15 $10,500
Subtotal $2,741,200
Engineering (15%) $411,180
Contingency (15%) $411,180
Total (Excluding GST) $3,563,560
In additional to the capital cost of closure, the City will retain responsibility to manage and monitor the site in the post-closure care period to ensure that the previously placed waste materials are not negatively impacting the surrounding environment.
At a minimum, the SWF will require ongoing monitoring of surface water, groundwater, and vapors (landfill gas). The cost to maintain the cover system and environmental controls should also be considered. The estimated post-closure costs for the facility are $108,000 per year.
6.3 Cost of Landfilling
A net present value analysis was completed to calculate the cost of landfilling using status quo programs and methods. The analysis considered operations, capital, and closure costs for Cell A and Cell B.
The key assumptions were built into the financial model:
All expenditures allocated within “8000 SW Management – Admin/Proc” are included in the financial analysis.
No tax requisition has been assumed in the analysis3.
No existing closure reserve has been assumed.
3 The City’s 2018 budget (City of Yellowknife 2017) indicates that approximately 30% of projected revenues to the Solid Waste Management
Fund are from a Solid Waste Levy. Budget documents available online do not indicate what portion of the solid waste levy is allocated to Administration and Operations Costs.

LANDFILL ANALYSIS, WASTE GENERATION NFORECAST, AND RATE STRUCTURE
FILE: 704-SWM.PLAN03014-01 | FEBRUARY 20, 2018 | ISSUED FOR REVIEW
8 Yellowknife Landfill and Finances.docx
Landfill design factors have been assumed to calculate landfill volume available of 284,803 m3:
Cell development to final slopes of 3H:1V;
Apparent waste density of 0.60 tonnes/m3;
Disposal rate for MSW of 753 kg/capita/year;
Population growth per BOS projected populations for the Yellowknife Region (on average approximately 0.5%-1% per year);
Closure of the current balefill area (Cell A and Cell B) in 2028; and
30-year post-closure period (through 2049).
General Inflation 2.5%.
Discount Interest Rate 3.0%.
Based on the analysis the cost of landfilling is:
$200/tonne
$120/m3
Current commercial tipping fees at the SWF are $121/tonne. Higher tipping rates are charged for materials from outside of City boundaries and for special waste. Various volume-based tipping fees are charged for residential loads and a portion of material is disposed for free on Amnesty Days throughout the year. Assuming that $121/tonne is the average tipping fee charged for all material disposed at the SWF, the net present value of the balefill area is -$13,145,000. This analysis indicates that the current tipping fee structure may be undervaluing airspace.
Additional refinement of operating costs related solely to the balefill area (rather than the full SWF) would provide a more accurate analysis of the cost of airspace. A more detailed analysis of revenue generated through the SWF’s current tipping fee schedule coupled with analysis of the solid waste reserve funds would be required to assess the financial viability of the existing system.
7.0 RECOMMENDATIONS
Additional data is required to complete an accurate analysis of landfill airspace, landfill lifespan, cost of disposal, and system finances. The following is recommended to provide the City with the data and planning required to accurately assess disposal operations at the SWF:
Confirm any operational requirements imposed by Transport Canada. It is unclear in previous design documents whether baling MSW is a direct requirement from Transport Canada based on its Bird Hazard Risk Assessment criteria. The City should engage Transport Canada and the local airport operator in discussions to determine whether operational changes to the disposal process at the SWF are acceptable and request a written record of the airport operator’s hazard assessment for the SWF.
Conduct annual airspace monitoring. The City should conduct annual surveys of the balefill and C&D landfill areas to definitively quantify annual airspace consumption and facilitate the calculation of apparent waste density for each location. In order to calculate apparent waste density, the City must also accurately track the placement (C&D or balefill) of materials entering the facility. The determination of apparent density is deemed

LANDFILL ANALYSIS, WASTE GENERATION NFORECAST, AND RATE STRUCTURE
FILE: 704-SWM.PLAN03014-01 | FEBRUARY 20, 2018 | ISSUED FOR REVIEW
9 Yellowknife Landfill and Finances.docx
important as it is a metric for landfill operational efficiency with respect to both compaction and use of cover soil.
Develop a Design and Operations Plan for the SWF. A design and operations plan should at a minimum include a site development plan and development sequencing, quantify airspace, project airspace consumption and remaining site life (based on apparent waste density measured through annual surveys), clarify the operational procedures at the SWF, and quantify development and closure costs over the life of the facility.
Disaggregate financial tracking for different portions of the SWF. Costs to manage these operations should be split from the operations of other portions of the facility to allow financial analysis of balefill/landfill operations. A greater level of specificity in costs and revenues associated with distinct operations at the SWF would allow more accurate and useful cost-benefit analysis for operational changes in each area.
Update the economic analysis for the balefill facility. The baseline economic analysis presented in this document should be updated based on the facility planning, performance, and financial information collected through the steps outlined above. An updated economic analysis could review the implications to site life and the fundamental economics associated with potential diversion programs.
Collecting the additional data outlined above will aid the City in effectively managing the solid waste disposal system in Yellowknife. Understanding the short-term and long-term implications of diversion programs allows municipalities to manage financially, operationally, and environmentally sustainable systems.
8.0 LIMITATIONS OF REPORT
This report and its contents are intended for the sole use of sonnevera international corp. and the City of Yellowknife and their agents. Tetra Tech Canada Inc. (Tetra Tech) does not accept any responsibility for the accuracy of any of the data, the analysis, or the recommendations contained or referenced in the report when the report is used or relied upon by any Party other than sonnevera international corp. and the City of Yellowknife, or for any Project other than the proposed development at the subject site. Any such unauthorized use of this report is at the sole risk of the user. Use of this document is subject to the Limitations on the Use of this Document attached in the Appendix or Contractual Terms and Conditions executed by both parties.

LANDFILL ANALYSIS, WASTE GENERATION NFORECAST, AND RATE STRUCTURE
FILE: 704-SWM.PLAN03014-01 | FEBRUARY 20, 2018 | ISSUED FOR REVIEW
10 Yellowknife Landfill and Finances.docx
9.0 CLOSURE
We trust this technical memo meets your present requirements. If you have any questions or comments, please contact the undersigned.
Respectfully submitted, Tetra Tech Canada Inc. ISSUED FOR REVIEW ISSUED FOR REVIEW Prepared by: Reviewed by: Lauren Quan, P.Eng. Michel Lefebvre, M.Sc., P.Eng. Project Engineer Manager Solid Waste Management Practice Solid Waste Management Practice Direct Line: 778.945.5776 Direct Line: 587.460.3549 [email protected] [email protected] /bvb Attachment (1): Tetra Tech’s Limitations on the Use of this Document

LANDFILL ANALYSIS, WASTE GENERATION NFORECAST, AND RATE STRUCTURE
FILE: 704-SWM.PLAN03014-01 | FEBRUARY 20, 2018 | ISSUED FOR REVIEW
11 Yellowknife Landfill and Finances.docx
REFERENCES
City of Yellowknife. 2013. Landfill Closure Plan Presentation.
Dillon Consulting Ltd. 2006. External Review of the Solid Waste Facility Operations & Processes.
Dillon Consulting Ltd. 2006. New Solid Waste Facility – Preliminary Design Report.
Dillon Consulting Ltd. 2016. Solid Waste Facility Landfill Cell B Drawings Issued for Tender.
Northwest Territories Bureau of Statistics. 2017. Population Estimates as of July 1, by Community, 2001 - 2017. https://www.statsnwt.ca/population/population-estimates/bycommunity.php [accessed January 16, 2018].
Northwest Territories Bureau of Statistics. 2017. Population Projections, by Community, 2016 to 2035. https://www.statsnwt.ca/population/community-projections/ [accessed January 16, 2018].
LIMITATIONS ON USE OF THIS DOCUMENT
1
GEOENVIRONMENTAL 1.1 USE OF DOCUMENT AND OWNERSHIP
This document pertains to a specific site, a specific development, and a specific scope of work. The document may include plans, drawings, profiles and other supporting documents that collectively constitute the document (the “Professional Document”). The Professional Document is intended for the sole use of TETRA TECH’s Client (the “Client”) as specifically identified in the TETRA TECH Services Agreement or other Contractual Agreement entered into with the Client (either of which is termed the “Contract” herein). TETRA TECH does not accept any responsibility for the accuracy of any of the data, analyses, recommendations or other contents of the Professional Document when it is used or relied upon by any party other than the Client, unless authorized in writing by TETRA TECH. Any unauthorized use of the Professional Document is at the sole risk of the user. TETRA TECH accepts no responsibility whatsoever for any loss or damage where such loss or damage is alleged to be or, is in fact, caused by the unauthorized use of the Professional Document. Where TETRA TECH has expressly authorized the use of the Professional Document by a third party (an “Authorized Party”), consideration for such authorization is the Authorized Party’s acceptance of these Limitations on Use of this Document as well as any limitations on liability contained in the Contract with the Client (all of which is collectively termed the “Limitations on Liability”). The Authorized Party should carefully review both these Limitations on Use of this Document and the Contract prior to making any use of the Professional Document. Any use made of the Professional Document by an Authorized Party constitutes the Authorized Party’s express acceptance of, and agreement to, the Limitations on Liability. The Professional Document and any other form or type of data or documents generated by TETRA TECH during the performance of the work are TETRA TECH’s professional work product and shall remain the copyright property of TETRA TECH. The Professional Document is subject to copyright and shall not be reproduced either wholly or in part without the prior, written permission of TETRA TECH. Additional copies of the Document, if required, may be obtained upon request. 1.2 ALTERNATIVE DOCUMENT FORMAT
Where TETRA TECH submits electronic file and/or hard copy versions of the Professional Document or any drawings or other project-related documents and deliverables (collectively termed TETRA TECH’s “Instruments of Professional Service”), only the signed and/or sealed versions shall be considered final. The original signed and/or sealed electronic file and/or hard copy version archived by TETRA TECH shall be deemed to be the original. TETRA TECH will archive a protected digital copy of the original signed and/or sealed version for a period of 10 years. Both electronic file and/or hard copy versions of TETRA TECH’s Instruments of Professional Service shall not, under any circumstances, be altered by any party except TETRA TECH. TETRA TECH’s Instruments of Professional Service will be used only and exactly as submitted by TETRA TECH. Electronic files submitted by TETRA TECH have been prepared and submitted using specific software and hardware systems. TETRA TECH makes no representation about the compatibility of these files with the Client’s current or future software and hardware systems. 1.3 STANDARD OF CARE
Services performed by TETRA TECH for the Professional Document have been conducted in accordance with the Contract, in a manner
consistent with the level of skill ordinarily exercised by members of the profession currently practicing under similar conditions in the jurisdiction in which the services are provided. Professional judgment has been applied in developing the conclusions and/or recommendations provided in this Professional Document. No warranty or guarantee, express or implied, is made concerning the test results, comments, recommendations, or any other portion of the Professional Document. If any error or omission is detected by the Client or an Authorized Party, the error or omission must be immediately brought to the attention of TETRA TECH. 1.4 DISCLOSURE OF INFORMATION BY CLIENT
The Client acknowledges that it has fully cooperated with TETRA TECH with respect to the provision of all available information on the past, present, and proposed conditions on the site, including historical information respecting the use of the site. The Client further acknowledges that in order for TETRA TECH to properly provide the services contracted for in the Contract, TETRA TECH has relied upon the Client with respect to both the full disclosure and accuracy of any such information. 1.5 INFORMATION PROVIDED TO TETRA TECH BY OTHERS
During the performance of the work and the preparation of this Professional Document, TETRA TECH may have relied on information provided by third parties other than the Client. While TETRA TECH endeavours to verify the accuracy of such information, TETRA TECH accepts no responsibility for the accuracy or the reliability of such information even where inaccurate or unreliable information impacts any recommendations, design or other deliverables and causes the Client or an Authorized Party loss or damage. 1.6 GENERAL LIMITATIONS OF DOCUMENT
This Professional Document is based solely on the conditions presented and the data available to TETRA TECH at the time the data were collected in the field or gathered from available databases. The Client, and any Authorized Party, acknowledges that the Professional Document is based on limited data and that the conclusions, opinions, and recommendations contained in the Professional Document are the result of the application of professional judgment to such limited data. The Professional Document is not applicable to any other sites, nor should it be relied upon for types of development other than those to which it refers. Any variation from the site conditions present, or variation in assumed conditions which might form the basis of design or recommendations as outlined in this report, at or on the development proposed as of the date of the Professional Document requires a supplementary exploration, investigation, and assessment. TETRA TECH is neither qualified to, nor is it making, any recommendations with respect to the purchase, sale, investment or development of the property, the decisions on which are the sole responsibility of the Client. 1.7 NOTIFICATION OF AUTHORITIES
In certain instances, the discovery of hazardous substances or conditions and materials may require that regulatory agencies and other persons be informed and the client agrees that notification to such bodies or persons as required may be done by TETRA TECH in its reasonably exercised discretion.
Strategic Waste Management Plan (SWMP) – Appendix The City of Yellowknife
H-1
Appendix H – WtE Technologies

MEMORANDUM
TO: Christina Seidel, Sonnevera International Corp. FROM: Konrad Fichtner, Veronica Bartlett (Morrison Hershfield)
PROJECT No.:
180150800
RE: Review of waste to energy technologies for the City of Yellowknife
DATE: 2/22/2018
C:\USERS\KFICHTNER\DOCUMENTS\123 PROJECTS\YELLOWKNIFE WTE\MH MEMO YELLOWKNIFE V4.DOCX
The purpose of this memo is to identify appropriate waste to energy (WTE) technologies for the volumes and types of waste available after recycling and composting in the City of Yellowknife. The assumed location of any future technology would be at the solid waste facility. Potential technologies will be reviewed and the preferred technology identified; its cost then compared with the cost of landfilling. All information is based on what is available in the public domain and is considered adequate for comparative purposes.
1.1 AVAILABLE FEEDSTOCK
The total landfill disposal for 2016 was 12,300 tonnes. During this year, approximately 4,800 tonnes of construction and demolition (C&D) waste was diverted from landfill. There is a significant component of the existing C&D waste stream that is suitable as feedstock for a WTE facility. The waste composition study conducted by AET during Fall 2017 showed that approximately 50% of the C&D waste is clean (untreated) wood waste and 10% is treated wood. We assumed that 60% of the C&D waste can be regarded as a feedstock. In total approximately 15,000 tonnes of feedstock is available for a WTE facility in 2016. This is likely to increase to 30,000 tonnes per year by 2035 based on waste projections for landfilled waste and C&D waste. The total feedstock quantity identified will be used as a basis for determining an appropriate size of technology. These disposal figures for Yellowknife are after diversion (recycling and composting).
Yellowknife has developed several strategies to divert waste from landfilling. The city provides a collection of recycling from residents via Blue Bin Stations located around town. The ICI sector is not permitted to use these collection points and these users have to take materials to a waste management facility where they are charged fees. Yellowknife has a Green Cart organics program for all single-family households1. In Fall of 2017 this program was fully rolled out City-wide. All households now have a collection cart service for organics. Recycling and composting are generally considered environmentally superior to energy recovery (according to the waste hierarchy). For the WTE study, it has been assumed that collected paper, fibres, plastics and organics will continue to be recycled and composted and not used in the combustion process.
The heating value of the feedstock could range from 11 – 13 GJ/tonne. New waste diversion initiatives in Yellowknife will influence the heating value. The reduction of organic waste (e.g. food waste) will increase the heating value of the feedstock, although this can be partially offset by increased diversion
1 https://www.yellowknife.ca/en/living-here/Green-Cart-Program.asp

- 2 -
of plastic and paper/cardboard packaging. It has been conservatively estimated by Morrison Hershfield that the lower heating value of waste, as received, will be 11 GJ/tonne.
In summary, the feedstock available for WTE is approximately 15,000 tonnes per year, growing to about 30,000 tonnes per year by 2035.
1.2 OTHER BACKGROUND INFORMATION WTE generally has electricity or heat or both as a product for the generation of revenue. In 2017 the City paid approximately 23 cents per kWh for electricity, which, with adjustment riders is approximately 28 cents per kWh. The average heating oil cost in 2017 was $0.82/L, which equates to approximately $21 per GJ.
In Yellowknife there are 20 boilers sized at more than 20kW for a total capacity of about 12MW. It is generally not feasible to convert fossil fuel or biomass boilers to using MSW as fuel, but it may be possible to replace some of the boilers and use heat generated by a WTE facility. The WTE plant must be close enough to the users of the heat to make such use technically and financially feasible. The City is currently installing a district biomass heating system for 5 City buildings, and heat from WTE could theoretically be used to help offset other fuels. A feasibility study would be required to calculate the benefits of cost savings versus the cost of installing heat piping and heat exchangers from the potential WTE site at the solid waste facility. A study completed in 2013 revealed that biomass and paper products represented approximately 8,000 tonnes of the City’s waste produced. Combustion tests revealed that waste paper contains similar amounts of energy to wood, but that this type of fuel would be challenging to burn efficiently without specialized boilers. For the purpose of this study, it has been assumed that paper would continue to be recycled. However, if WTE is found to be financially feasible, the potential to include paper into the feedstock could be considered in the future and a technology specified that could handle the paper along with other mixed MSW.
1.3 TECHNOLOGY REVIEW
This section reviews various WTE technologies and assesses their suitability for the City of Yellowknife (waste quantities, energy recovery ability, etc.). In order to keep the implementation risk low only technologies that are deemed mature and proven are considered.
The following section provide an overview of the various technologies that were evaluated as part of this study with an overview of the technology, information on costs, and a summary of the benefits and disadvantages for each technology.
The technologies reviewed are:
• Conventional combustion.
• Gasification.

- 3 -
CONVENTIONAL COMBUSTION TECHNOLOGY
The main components of a conventional waste to energy facility are illustrated in Figure 1.
Following some form of feedstock preparation, the combustion process is used to release the heat, which is then converted to steam or hot water. The steam in turn can be converted to electricity or used in industrial processes. The gases, after the heat has been extracted, are then cleaned before being vented to the atmosphere. Two forms of ash come from the process: bottom ash from the actual burning of the feedstock, and fly ash from the flue gas cleaning process.
Figure 1: Main Components of a Conventional Waste to Energy System
There are several technologies that have been developed and are commonly used. They employ a conventional combustion approach. The major classifications are:
▪ mass burn: used for large applications, usually over 200 tonnes per day or 70,000 tonnes per year;
▪ controlled air, starved air, or modular systems (sometimes also called close coupled gasification systems): for applications up to 300 tonnes per day, or 100,000 tonnes per year;
▪ fluidized bed technologies: for preprocessed waste with capacities up to about 200 tonnes per day (70,000 tonnes per year); and
▪ rotary kilns: usually used for specialty waste that requires a high degree of agitation and containment, such as hazardous or medical waste (these systems are highly specialized, costly, and not normally used for MSW. They will not be discussed further in this report).
Following waste presorting or preprocessing, waste enters the actual furnace area, where it is converted into heat through combustion. As the waste travels through the system, it is slowly reduced to ash and inerts. These are removed at one end of the process. The ash, inerts and metals are then collected and sent either for recycling (metals) or disposal (ash, slag). Many plants in Europe now process the ash into low grade building materials, thus recycling it. WTE facilities generally generate 20 to 25% residue by weight and 5 to 10% residue by volume. This means that less than 10% of the volume of material entering a conventional WTE plant will need to be landfilled (if the ash is not recycled).
In larger WTE facilities, the boiler section is an integral part of the combustion area. In smaller units, the boiler is often a separate unit. Steam can be produced for industrial processes or to drive a steam
Electricity
Combustion Energy RecoveryFeedstock
PreparationFlu Gas Cleaning
Bottom Ash Fly Ash
Exhaust
(60160 Waste to Energy 14Feb06.vsd)
Steam Heating

- 4 -
turbine generator set for the production of electricity. A WTE facility is similar to a wood or biomass fired power plant, except that municipal solid waste is burned instead of wood. Combustion of waste, however, requires adherence to much stricter emission standards than for the burning of wood or biomass.
MSW contains heat energy, principally in the form of its constituent organic carbon molecules. Unprocessed MSW typically has a heat value of approximately 10,500 to 12,800 kilo-joules/kg (4,500 - 5,500 Btu/lb). At this heating value, a WTE facility can supply, after in-plant consumption, at least 450 to 700 kWh of electricity from each tonne of waste burned. Actual heat values depend on the specific composition of the waste, including the circumstances of its collection and delivery to a facility, as well as the extent to which the waste is pre-processed at the facility to remove inert and high moisture content materials. The anticipated composition of the Yellowknife waste stream includes plastics, fines, and textiles, that all have high heating value. The system is not dependent on paper and food waste, which are expected to be diverted to recycling and composting systems. Wet waste can make a system operate less efficiently.
The solid residue remaining after thermal treatment/destruction is typically termed ‘bottom ash’. This material is mechanically collected, cooled (typically water quenched then drained) magnetically/ electrically screened to recover recyclable ferrous/aluminum materials (although these metals can be recovered during the MSW in-feed preparation) and removed for final disposal, typically placed in MSW landfill sites. The material can, depending upon its chemical composition, physical state, and regulatory requirements, be utilized as a form of aggregate substitute. Bottom ash from a WTE facility is typically 5 to 10% by volume and 20 to 25% by weight of the incoming waste stream to a thermal treatment/destruction facility.
Air pollution control systems generate the other solid residue from a facility. Termed ‘fly ash’, this material is comprised of the fine particulate contaminants captured from the flue gas and the reagents (e.g., lime) used to effect capture. Fly ash may be classified as hazardous waste (higher propensity to leach contaminants in hazardous concentrations) as it contains the contaminants removed from the exhaust gases and is usually managed via further chemical stabilization and/or ultimate disposal in secure hazardous waste landfill sites.
It is possible to add on to any process the treatment of ash through vitrification. This employs extremely high temperatures to convert ash into inert vitrified substances, which can be ground and used as aggregate, thus fully recycled. There are no known applications of ash vitrification on a large commercial scale for MSW combustors in North America, mainly due to the high energy costs required to vitrify the ash.
Due to its heterogeneous nature, the burning of municipal solid waste produces emissions, which must be tightly controlled. Modern combustion systems address this issue in two ways: (1) the combustion program is optimized so that as few pollutants as possible are generated in the first place, and (2) extensive air pollution controls systems are integrated into the process so that ultimate emissions meet all regulatory standards. Modern WTE emission guidelines, including CCME standards are among the most stringent for any combustion device.
Air pollution control systems include equipment to continuously and/or periodically monitor emissions performance and to report performance for process control and regulatory compliance purposes. Modern air pollution control systems are interlinked to the waste in-feed control, thermal treatment/destruction units and energy recovery/conversion units of a facility, so that trends in emission performance are discerned and appropriate adjustments in the facility’s unit functions are automatically made to ensure that emissions meet or are better than regulatory standards.

- 5 -
Compared to landfill disposal, thermal processing usually results in a net reduction of greenhouse gas (GHG) emissions, provided the recovered energy is used to offset fossil fuels. The reductions are generated by the avoided methane emissions from landfilling (from anaerobic decomposition of organics), and from avoided carbon dioxide emissions from burning fossil fuels to produce electricity and heat. The WTE process does generate some GHG emissions from the combustion of fossil-fuel derived products such as plastics. However, the combustion of biogenic waste (food waste, yard waste, wood waste etc.) does not contribute to anthropogenic emissions of carbon dioxide, since the carbon contained in those materials is part of the active carbon cycle.
In a thermal treatment facility, organic materials are converted to carbon dioxide and water. When considering GHG emissions, only the carbon dioxide from the non-renewable portion of the waste stream is generally counted. The amount of organic waste is either determined on a case-by-case basis or by a general countrywide rule. In some European countries, for example, it is assumed that half of the energy produced in a WTE facility is from renewable sources.
LANDFILL AVOIDANCE AND SPACE SAVINGS
Thermal processing does not eliminate the need for landfills. It can, however, significantly reduce the amount of landfill space required. This translates into savings by avoiding or deferring the development of new landfill space and avoiding the use of land, which could be used for other purposes.
As a general rule, if thermal processing is employed, a minimum of 10% of the input material by volume (or 25% by weight) will still need to be landfilled. This would be in addition to a non-combustible waste that would require disposal. Furthermore, thermal plants require a constant source of feedstock, so that they are usually built to capture only a certain percentage of the total waste stream and provide a margin of safety, should the availability of waste change (for example through increased recycling or composting).
Therefore, landfill capacity will still be required for:
▪ the ash/residue from a thermal facility,
▪ non-combustible wastes,
▪ wastes that are generated over and above the thermal processing capacity (the plant should always be undersized to allow for fluctuations in the waste stream and additional recycling/diversion),
▪ future growth in waste, and
▪ a back-up management method for when the thermal processing plant and other waste processing facilities, such as compost plants, have scheduled and unscheduled shut downs.
COSTS OF CONVENTIONAL COMBUSTION/WTE
With a worldwide inventory of over 600 conventional combustion or WTE facilities, there is a lot of statistical information on the costs of this technology. Of course there are many local factors to be considered, but for comparative purposes, the average known costs can be very helpful. In the figures below (Figure 2 and Figure 3) the costs, based on capacity have been plotted for different capacities of plants. As can be seen, the average capital costs for a 40,000 tonne per year facility (smallest size on the graph) are over $1,200 per tonne of installed capacity and the operating costs would be in the range of $115 per tonne. Since these figures are from 2007, an escalation of about 15% should be applied. Since the waste volume in Yellowknife is considerably smaller than what is captured in this table, it can be safely assumed that the capital and operations costs per tonne will be substantially higher than the maximum costs shown in the tables.

- 6 -
Figure 2: Cost of capital for conventional combustion/WTE versus capacity
Figure 3: Typical operational costs for conventional combustion/WTE versus capacity
Source: Ramboll. 2007. Memo to MacViro during the Durham/York Environmental Assessment

- 7 -
ADVANTAGES AND DISADVANTAGES OF CONVENTIONAL THERMAL WTE
There is considerable technical and emotional debate about the advantages and risks of conventional combustion systems. Experience from the past, before modern emission standards and controls were in place, has caused waste incineration to receive a bad name.
Advantages of conventional waste to energy systems:
▪ It is well established worldwide. More than 36 million people in 29 countries dispose of their MSW at waste to energy facilities;
▪ There are many examples of well-operated waste to energy facilities in the developed world. Modern WTE facilities have minimal impact on the environment and generally a positive greenhouse gas balance;
▪ Conventional combustion is relatively simple and costs less to build and operate than most advanced systems, such as gasification and pyrolysis;
▪ Other wastes, such as biosolids and biomedical materials can be destroyed; and
▪ The technology is reliable.
Disadvantages of conventional waste to energy systems:
▪ Public perception and opposition can be significant;
▪ It does not represent an advanced form of waste management, but is rather one of the traditional technologies available;
▪ Fly ash may be hazardous, which requires some form of treatment or stabilization before disposal;
▪ Electrical and heat energy generated may not be recognized as “green”; and
▪ In the eyes of some regulators and the public, recovering energy in a WTE plant is not considered diversion but a form of waste disposal.
GASIFICATION
GENERAL
Gasification is a generic term used to describe a process of partial combustion of carbonaceous fuel to generate syngas. It involves the thermal break-down of solid materials into a gaseous constituent (syngas), and an ash residue. In principle, if solid materials are subjected to a large quantity of oxygen (air) and heat, they will combust. If the air is reduced to less than what is needed for combustion, it results in gasification. When waste is heated with zero air in an enclosed chamber, then the process is termed pyrolysis.
It is important to consider the complete system when evaluating and comparing gasification and pyrolysis systems, since they do not consist of a single step, but rather a combination of steps, such as feedstock pre-processing, thermal separation (gas, liquid, char), high-grading and removal of contaminates from gas and liquids produced, and finally the combustion of products for the recovery of energy. Several of these steps may be combined and provided as a single unit by the supplier. The complete process is demonstrated in Figure 4.
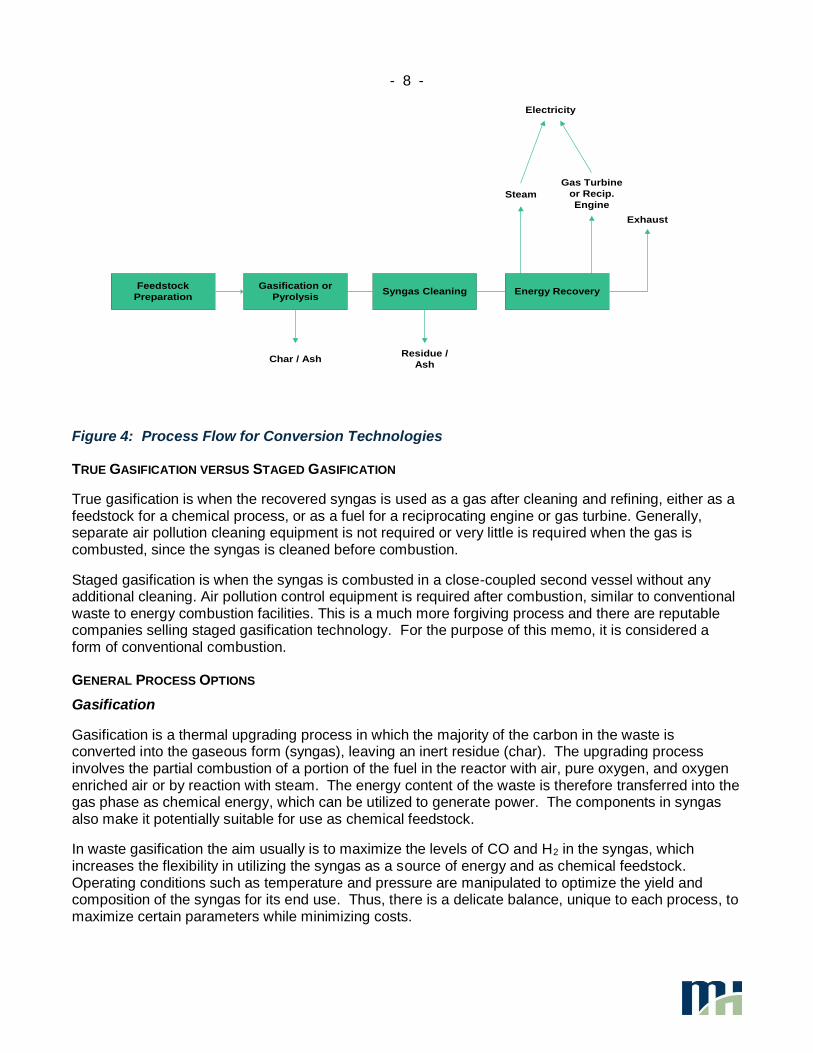
- 8 -
Figure 4: Process Flow for Conversion Technologies
TRUE GASIFICATION VERSUS STAGED GASIFICATION
True gasification is when the recovered syngas is used as a gas after cleaning and refining, either as a feedstock for a chemical process, or as a fuel for a reciprocating engine or gas turbine. Generally, separate air pollution cleaning equipment is not required or very little is required when the gas is combusted, since the syngas is cleaned before combustion.
Staged gasification is when the syngas is combusted in a close-coupled second vessel without any additional cleaning. Air pollution control equipment is required after combustion, similar to conventional waste to energy combustion facilities. This is a much more forgiving process and there are reputable companies selling staged gasification technology. For the purpose of this memo, it is considered a form of conventional combustion.
GENERAL PROCESS OPTIONS
Gasification
Gasification is a thermal upgrading process in which the majority of the carbon in the waste is converted into the gaseous form (syngas), leaving an inert residue (char). The upgrading process involves the partial combustion of a portion of the fuel in the reactor with air, pure oxygen, and oxygen enriched air or by reaction with steam. The energy content of the waste is therefore transferred into the gas phase as chemical energy, which can be utilized to generate power. The components in syngas also make it potentially suitable for use as chemical feedstock.
In waste gasification the aim usually is to maximize the levels of CO and H2 in the syngas, which increases the flexibility in utilizing the syngas as a source of energy and as chemical feedstock. Operating conditions such as temperature and pressure are manipulated to optimize the yield and composition of the syngas for its end use. Thus, there is a delicate balance, unique to each process, to maximize certain parameters while minimizing costs.
Electricity
Gasification or
PyrolysisSyngas Cleaning
Feedstock
PreparationEnergy Recovery
Char / Ash
Exhaust
Gas Turbine
or Recip.
EngineSteam
Residue /
Ash
(60160 Waste to Energy Pyrolysis 14Feb06.vsd)

- 9 -
Plasma Gasification
A variation of gasification uses electrical energy in the form of a high temperature plasma (greater than 2,000 oC). The high temperature of the electric arc breaks down the organic parts of the waste into elemental gas. The main advantage of using plasma to heat the waste is that a clean syngas is created, mostly without the tars that have to be meticulously cleaned from the traditionally created syngas. Sometimes a plasma is used only for syngas cleaning after a more traditional gasification process, in order to save energy costs. The main drawback of plasma gasification is the high cost of input energy.
Pyrolysis
Pyrolysis is the thermal degradation of carbonaceous materials, typically at temperatures between 400oC and 600 oC either in the complete absence of oxygen, or with such a limited supply, that gasification does not occur to any appreciable extent. Such processes de-volatilize and decompose solid organic materials by heat; consequently, no combustion is possible. The products of pyrolysis always include gas, liquid and solid char with the relative proportions of each depending on the method of pyrolysis and the reaction parameters, such as temperature, heating rate, pressure and residence time. In general, lower temperatures produce more liquid product and high temperatures produce more syngas. When operated at 800 oC or greater, the main product is syngas.
It should be noted that the site area requirements for a gasification facility can vary significantly, depending on the type of process used and the selection of the constituent elements of the system.
FEEDSTOCK REQUIREMENTS
Gasification and pyrolysis systems typically require homogeneous feedstock necessitating front-end processing of MSW. The degree of pre-processing depends on the actual process. This significantly raises costs and requires energy inputs into the process. In most cases, extensive shredding and classification is required, sometimes combined with pelletization.
PROCESS OUTPUTS
Gasification creates a syngas and ash or slag. The quality of the syngas differs between processes, which is a result of the initial waste calorific value and the gasifying agent (air, steam or O2) used. The syngas can be utilized for energy generation or as a chemical feedstock. Extraction of hydrogen from the syngas for fuel cells is one of the newer applications for syngas currently being researched. Some gasification processes produce a slag that may be reused as a civil engineering raw material, but the ash produced in many gasification processes is landfilled.
Pyrolysis processes produce char, oil and syngas. The syngas can be used in a similar way as the syngas from gasification. Pyrolysis oils are high in heavy organics and could be used as fuel oil or distilled to lighter fuels or chemical products. The char from some pyrolysis reactors has a high heating value and could be combusted to recuperate some of its energy value
Once cleaned, the syngas can be burned in an internal combustion engine, gas turbine, or in a boiler under excess-air conditions. Alternatively, the syngas can be used in chemical processes such as ethanol production. The syngas has an energy content about one fifth to one third that of natural gas.
There are numerous firms that offer gasification and pyrolysis systems for MSW, however, many are at a demonstration or pilot scale, and very few plants have actually been built. Therefore, actual operating experience and performance data is not readily available. Some information can be taken from the only large scale gasification plant in North America that is currently being commissioned in Edmonton by

- 10 -
Enerkem. Other performance have been summarized by the International Solid Waste Association (ISWA) in a white paper from 2013, showing that in general, conversion technologies (pyrolysis/gasification) are less efficient in producing electricity per tonne of waste (that can be sold to the grid) than conventional mass burn combustion. Examples of vendors of technologies in this category include Enerkem (gasification, Enerkem process), Harvest International New Energy / Alter NRG (plasma gasification, Westinghouse Plasma Gasification process), Nexterra (gasification, Nexterra process – primarily wood and biosolids) and Powerhouse Energy (gasification, Pyromex process).
GASIFICATION COSTS
The Enerkem gasification facility in Edmonton is the only conversion technology in North America for which capital costs are known. For a capacity of 100,000 tonnes of feedstock per year year (or about 14 tonnes per hour), the capital costs are projected at $100 million for the plant itself, plus $40 million for converting feedstock into refuse derived fuel (RDF). This results in capital cost of about $1,400 per tonne of installed annual capacity.
It can be assumed that conversion technologies, like most waste processing facilties, benefit from economies of scale, similar to conventional WTE technologies. For conventional WTE plants, a wealth of statistics are available and were provided in the previous section. Comparison of conventional WTE with the Enerkem facility costs indicates that gasification technologies may cost about 20% more than conventional WTE plants.
Similar to capital costs, there are few reference facilities providing any kind of reliable costs. Given that conversion technologies and the associated RDF preparation steps are far more complex and costly than conventional WTE, it can be safely assumed that operating costs for gasification or pyrolysis would be higher, if not substantially higher than WTE costs. Examples of typical WTE operating costs, dependent on the size of the plant, are shown in the section on WTE. For gasification, $40 per tonne for feedstock preparation should be assumed and added to conventional WTE operations costs.
ADVANTAGES AND DISADVANTAGES OF GASIFICATION
Advantages of Gasification: ▪ Energy recovery from waste that would otherwise be landfilled ▪ One commercial scale facility being commissioned in Canada (All other full scale operating
plants in Japan) ▪ Potentially lower emissions than from conventional WTE ▪ Can create a non-leachable residue suitable for other applications if combined with plasma
heating
Disadvantages of Gasification: ▪ Very few commercial facilities worldwide and only one in Canada (still in commissioning) ▪ Needs substantial pre-processing ▪ Considerably more expensive than landfilling ▪ Lower energy recovery in practice than from conventional WTE ▪ Higher costs than conventional WTE ▪ Technologies are too new and may not be able to obtain financing ▪ Module sizes small enough for Yellowknife may not be available or unproven ▪ High costs of new technology and smaller units may discourage development

- 11 -
1.4 COMPARISONS OF TECHNOLOGIES For the purpose of this assessment, an annual capacity of 15,000 tonnes will be used. While this may be inadequate to handle all of the waste in the coming years, it provides opportunities for additional diversion and helps deal with fluctuations that are natural in waste generation over the year. For this size range, the most commonly used and most proven WTE technology is two-stage controlled air combustion. It operates reliably with many reference facilities from 5,000 to 50,000 tonnes per year capacity. Mass burn combustion, which is the most popular technology usually starts with the smallest module size around 70,000 tonnes per year. Other technologies such as fluidized bed and rotary kilns are generally too expensive for MSW and used more for hazardous and medical waste. This assessment will therefore be based on a two-stage controlled air combustion technology. This is proven around the world and there are Canadian companies with proven track records that can provide this kind of equipment. Gasification is also proven in principle, but there are very few reference facilities, and those that exist are generally in the 100,000 tonne per year capacity and larger. Only one gasification facility exists in Canada that is close to commercial operation (Edmonton). All other commercially operating gasification plants for MSW are in Japan. As such, gasification for the recovery of energy in the size range required for Yellowknife is considered technically not appropriate at this time. The question of whether existing boilers for the generation of heat can be retrofitted to burn MSW is often asked. There are several reasons this is generally not feasible:
• Emission standards for WTE are much more stringent than for other fuels, requiring a major additional effort to clean up flue gases;
• Existing boilers are usually not protected against the kind of corrosion that can occur when burning MSW;
• Materials storage and handling can be odourous, problematic from a housekeeping perspective, and requires special equipment for the feeding of feedstock; and
• Some kinds of ash require handling as hazardous waste and special treatment/stabilization before disposal.
The preferred method of utilizing WTE for existing installations is to circulate heat through a district energy network. The feasibility of this will depend on the proximity of users to the WTE facility and their specific heating costs.
Primary outputs and performance from WTE are summarized in the following Table 1.
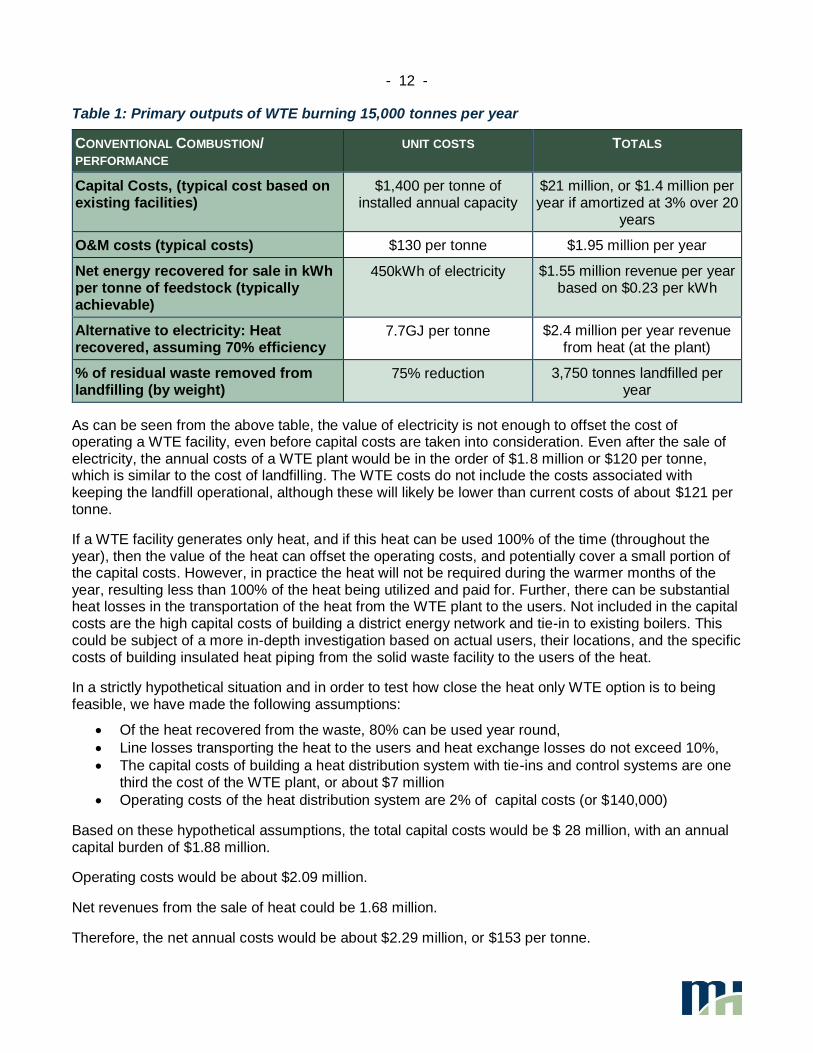
- 12 -
Table 1: Primary outputs of WTE burning 15,000 tonnes per year
CONVENTIONAL COMBUSTION/ PERFORMANCE
UNIT COSTS TOTALS
Capital Costs, (typical cost based on existing facilities)
$1,400 per tonne of installed annual capacity
$21 million, or $1.4 million per year if amortized at 3% over 20
years
O&M costs (typical costs) $130 per tonne $1.95 million per year
Net energy recovered for sale in kWh per tonne of feedstock (typically achievable)
450kWh of electricity $1.55 million revenue per year based on $0.23 per kWh
Alternative to electricity: Heat recovered, assuming 70% efficiency
7.7GJ per tonne $2.4 million per year revenue from heat (at the plant)
% of residual waste removed from landfilling (by weight)
75% reduction 3,750 tonnes landfilled per year
As can be seen from the above table, the value of electricity is not enough to offset the cost of operating a WTE facility, even before capital costs are taken into consideration. Even after the sale of electricity, the annual costs of a WTE plant would be in the order of $1.8 million or $120 per tonne, which is similar to the cost of landfilling. The WTE costs do not include the costs associated with keeping the landfill operational, although these will likely be lower than current costs of about $121 per tonne.
If a WTE facility generates only heat, and if this heat can be used 100% of the time (throughout the year), then the value of the heat can offset the operating costs, and potentially cover a small portion of the capital costs. However, in practice the heat will not be required during the warmer months of the year, resulting less than 100% of the heat being utilized and paid for. Further, there can be substantial heat losses in the transportation of the heat from the WTE plant to the users. Not included in the capital costs are the high capital costs of building a district energy network and tie-in to existing boilers. This could be subject of a more in-depth investigation based on actual users, their locations, and the specific costs of building insulated heat piping from the solid waste facility to the users of the heat.
In a strictly hypothetical situation and in order to test how close the heat only WTE option is to being feasible, we have made the following assumptions:
• Of the heat recovered from the waste, 80% can be used year round,
• Line losses transporting the heat to the users and heat exchange losses do not exceed 10%,
• The capital costs of building a heat distribution system with tie-ins and control systems are one third the cost of the WTE plant, or about $7 million
• Operating costs of the heat distribution system are 2% of capital costs (or $140,000)
Based on these hypothetical assumptions, the total capital costs would be $ 28 million, with an annual capital burden of $1.88 million.
Operating costs would be about $2.09 million.
Net revenues from the sale of heat could be 1.68 million.
Therefore, the net annual costs would be about $2.29 million, or $153 per tonne.
- 13 -
1.5 CONCLUSIONS AND RECOMMENDATIONS
The most feasible WTE technology is controlled air two –stage combustion. It can be designed for the generation of electricity, for the recovery of heat, or for a combination of both. The preferred WTE technology would not change, even if the quantity of waste were to double, or if other materials were added, such as paper.
Gasification is not feasible at the current state of technology due to the small size of the application in Yellowknife and the lack of reference gasification facilities and gasification technology suppliers in North America.
Converting existing boilers to burn some form of waste is technically not feasible, however, tie-in to existing systems is technically possible through a district energy network.
WTE would not replace a landfill, it would only reduce the amount of waste going to a landfill. There will still be a need for a landfill for the ash coming from a WTE plant, for the growth in waste that the WTE plant cannot handle (since the WTE capacity is constant), and for periods of scheduled and unscheduled downtime of the WTE facility. Waste reduction to landfill in the best case would be 75% by weight and 90% by volume.
The cost of WTE, after revenues from the sale of electricity could be in the same range as current landfill costs. However, WTE is not a replacement for the landfill, although some reduction in landfill operational costs can be expected.
WTE could provide a reliable and local source of electricity. The cost to generate this electricity would be higher than what it is now, since some landfill costs will still accrue.
WTE has the potential to tie into a district energy network and provide an additional source of heat. The feasibility of this can only be determined with a site specific study, since there are too many unknowns and variables to provide definitive costs.
It is recommended to calculate the potential landfill cost savings if the waste disposed is reduced by 75%. This information can then be used to determine the actual total waste management costs if WTE is implemented, either for electricity or for heat.
It is further recommended to consider a detailed, site specific study into the cost of transporting heat from a WTE facility located at the solid waste facility and feeding this heat into a new and/or existing district energy system.
Strategic Waste Management Plan (SWMP) – Appendix The City of Yellowknife
I-1
Appendix I – Canadian Tipping Fees
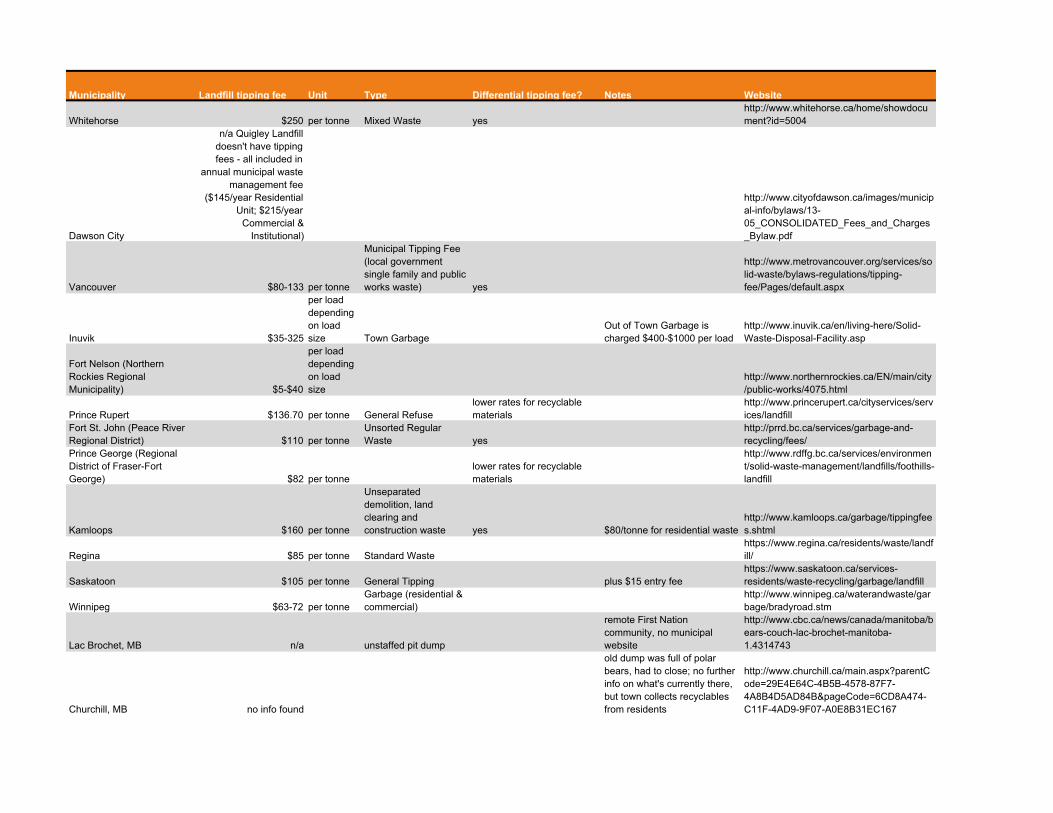
Municipality Landfill tipping fee Unit Type Differential tipping fee? Notes Website
Whitehorse $250 per tonne Mixed Waste yeshttp://www.whitehorse.ca/home/showdocument?id=5004
Dawson City
n/a Quigley Landfill doesn't have tipping fees - all included in
annual municipal waste management fee
($145/year Residential Unit; $215/year
Commercial & Institutional)
http://www.cityofdawson.ca/images/municipal-info/bylaws/13-05_CONSOLIDATED_Fees_and_Charges_Bylaw.pdf
Vancouver $80-133 per tonne
Municipal Tipping Fee (local government single family and public works waste) yes
http://www.metrovancouver.org/services/solid-waste/bylaws-regulations/tipping-fee/Pages/default.aspx
Inuvik $35-325
per load depending on load size Town Garbage
Out of Town Garbage is charged $400-$1000 per load
http://www.inuvik.ca/en/living-here/Solid-Waste-Disposal-Facility.asp
Fort Nelson (Northern Rockies Regional Municipality) $5-$40
per load depending on load size
http://www.northernrockies.ca/EN/main/city/public-works/4075.html
Prince Rupert $136.70 per tonne General Refuselower rates for recyclable materials
http://www.princerupert.ca/cityservices/services/landfill
Fort St. John (Peace River Regional District) $110 per tonne
Unsorted Regular Waste yes
http://prrd.bc.ca/services/garbage-and-recycling/fees/
Prince George (Regional District of Fraser-Fort George) $82 per tonne
lower rates for recyclable materials
http://www.rdffg.bc.ca/services/environment/solid-waste-management/landfills/foothills-landfill
Kamloops $160 per tonne
Unseparated demolition, land clearing and construction waste yes $80/tonne for residential waste
http://www.kamloops.ca/garbage/tippingfees.shtml
Regina $85 per tonne Standard Wastehttps://www.regina.ca/residents/waste/landfill/
Saskatoon $105 per tonne General Tipping plus $15 entry feehttps://www.saskatoon.ca/services-residents/waste-recycling/garbage/landfill
Winnipeg $63-72 per tonneGarbage (residential & commercial)
http://www.winnipeg.ca/waterandwaste/garbage/bradyroad.stm
Lac Brochet, MB n/a unstaffed pit dump
remote First Nation community, no municipal website
http://www.cbc.ca/news/canada/manitoba/bears-couch-lac-brochet-manitoba-1.4314743
Churchill, MB no info found
old dump was full of polar bears, had to close; no further info on what's currently there, but town collects recyclables from residents
http://www.churchill.ca/main.aspx?parentCode=29E4E64C-4B5B-4578-87F7-4A8B4D5AD84B&pageCode=6CD8A474-C11F-4AD9-9F07-A0E8B31EC167
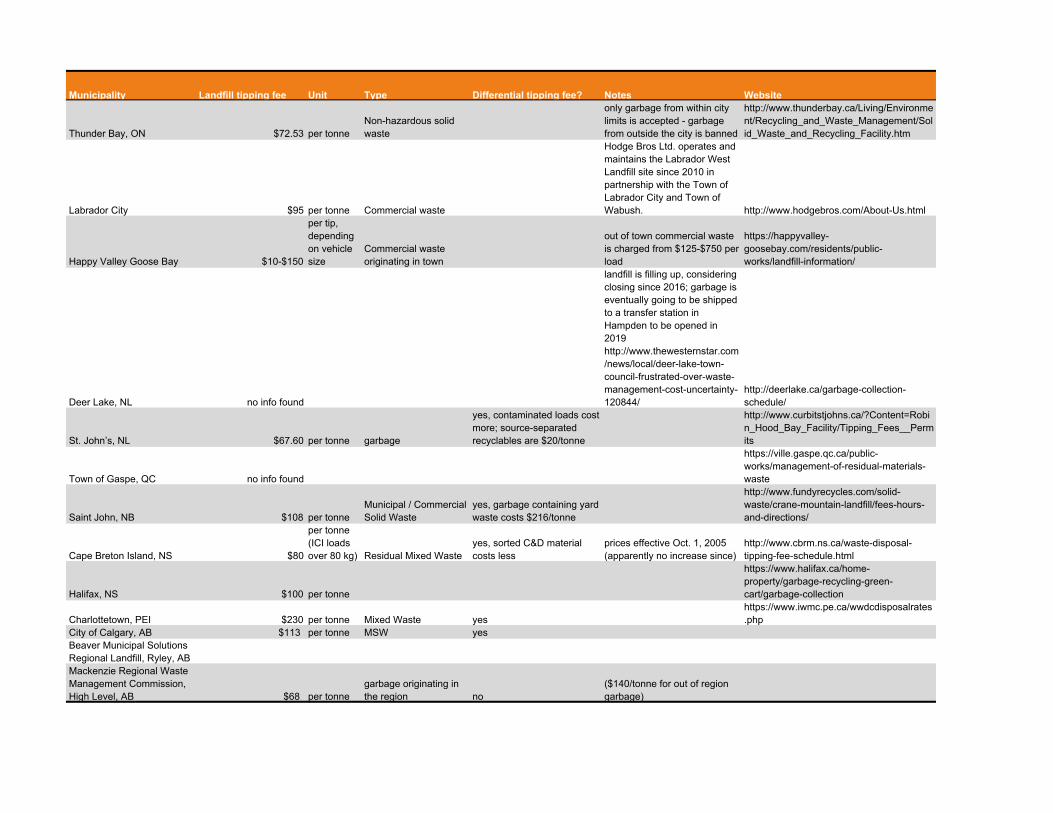
Municipality Landfill tipping fee Unit Type Differential tipping fee? Notes Website
Thunder Bay, ON $72.53 per tonneNon-hazardous solid waste
only garbage from within city limits is accepted - garbage from outside the city is banned
http://www.thunderbay.ca/Living/Environment/Recycling_and_Waste_Management/Solid_Waste_and_Recycling_Facility.htm
Labrador City $95 per tonne Commercial waste
Hodge Bros Ltd. operates and maintains the Labrador West Landfill site since 2010 in partnership with the Town of Labrador City and Town of Wabush. http://www.hodgebros.com/About-Us.html
Happy Valley Goose Bay $10-$150
per tip, depending on vehicle size
Commercial waste originating in town
out of town commercial waste is charged from $125-$750 per load
https://happyvalley-goosebay.com/residents/public-works/landfill-information/
Deer Lake, NL no info found
landfill is filling up, considering closing since 2016; garbage is eventually going to be shipped to a transfer station in Hampden to be opened in 2019http://www.thewesternstar.com/news/local/deer-lake-town-council-frustrated-over-waste-management-cost-uncertainty-120844/
http://deerlake.ca/garbage-collection-schedule/
St. John’s, NL $67.60 per tonne garbage
yes, contaminated loads cost more; source-separated recyclables are $20/tonne
http://www.curbitstjohns.ca/?Content=Robin_Hood_Bay_Facility/Tipping_Fees__Permits
Town of Gaspe, QC no info found
https://ville.gaspe.qc.ca/public-works/management-of-residual-materials-waste
Saint John, NB $108 per tonneMunicipal / Commercial Solid Waste
yes, garbage containing yard waste costs $216/tonne
http://www.fundyrecycles.com/solid-waste/crane-mountain-landfill/fees-hours-and-directions/
Cape Breton Island, NS $80
per tonne (ICI loads over 80 kg) Residual Mixed Waste
yes, sorted C&D material costs less
prices effective Oct. 1, 2005 (apparently no increase since)
http://www.cbrm.ns.ca/waste-disposal-tipping-fee-schedule.html
Halifax, NS $100 per tonne
https://www.halifax.ca/home-property/garbage-recycling-green-cart/garbage-collection
Charlottetown, PEI $230 per tonne Mixed Waste yeshttps://www.iwmc.pe.ca/wwdcdisposalrates.php
City of Calgary, AB $113 per tonne MSW yesBeaver Municipal Solutions Regional Landfill, Ryley, ABMackenzie Regional Waste Management Commission, High Level, AB $68 per tonne
garbage originating in the region no
($140/tonne for out of region garbage)
sonnevera international corp.
References
Statistics Canada, 2014. Government of Canada. Available at: https://www.statcan.gc.ca/tables-tableaux/sum-som/l01/cst01/envir32b-eng.htm
Doug McKenzie-Mohr and William Smith’s Fostering Sustainable Behaviour: An Introduction to Community-Based Social Marketing (1999).
Wolski, D., 2017. Merlin Plastics Alberta Inc. Personal Communication. December 8th, 2017. P. (403) 259.6637