City of Stevenson
188
City of Stevenson Phone (509) 427-5970 7121 E Loop Road, PO Box 371 Fax (509) 427-8202 Stevenson, Washington 98648 June 2021 Planning Commission Regular Meeting Monday, June 14, 2021 6:00 PM A. Preliminary Matters 1. Public Comment Expectations: In Person: Attendess at City Hall should follow current CDC guidance regarding use of masks, social distancing, and attendance. Webinar: https://us02web.zoom.us/s/85637388112 Conference Call: +1 253 215 8782 or +1 346 248 7799 ID #: 856 3738 8112 Please raise hand to comment. Individual comments should be limited to 3 mins. Tools: *6 to mute/unmute & *9 to raise hand 2. Public Comment Period: (For items not located elsewhere on the agenda) 3. Minutes: May 10, 2021 Meeting Minutes C. Old Business 4. Zoning Amendment: Increasing Residential Building Capacity: Subcommittee Report: Public Involvement B. New Business 5. Planning Commission Work Plan: Scheduling the Remainder of 2021, Includes Community Suggestions on Critical Areas, Cemetery Planning, Rock Creek D. Discussion 1
-
Upload
khangminh22 -
Category
Documents
-
view
1 -
download
0
Transcript of City of Stevenson
City of Stevenson
Phone (509) 427-5970 7121 E Loop Road, PO Box 371 Fax (509) 427-8202 Stevenson, Washington 98648
June 2021 Planning Commission Regular Meeting
Monday, June 14, 2021
6:00 PM
A. Preliminary Matters
1. Public Comment Expectations:
In Person: Attendess at City Hall should follow current CDC guidance regarding use of masks, social distancing, and attendance.
Webinar: https://us02web.zoom.us/s/85637388112 Conference Call: +1 253 215 8782 or +1 346 248 7799 ID #: 856 3738 8112
Please raise hand to comment. Individual comments should be limited to 3 mins.
Tools: *6 to mute/unmute & *9 to raise hand
2. Public Comment Period: (For items not located elsewhere on the agenda)
3. Minutes: May 10, 2021 Meeting Minutes
C. Old Business
4. Zoning Amendment: Increasing Residential Building Capacity: Subcommittee Report: Public Involvement
B. New Business
5. Planning Commission Work Plan: Scheduling the Remainder of 2021, Includes Community Suggestions on Critical Areas, Cemetery Planning, Rock Creek
D. Discussion
1

6. Thought of the Month: None
7. Staff & Commission Reports: ICMA Fellowship (Parking Intern), First Street Overlook, Utility Service Outside City Limits
E. Adjournment
2
1
MINUTES Stevenson Planning Commission Meeting
May 10th, 2021 6:00 PM
In Person: City Hall was limited to 20 individuals.
Mask Usage was required of all attendees. Webinar: https://us02web.zoom.us/s/85637388112
Conference Call: +1.253. 215. 8782 or +1.346. 248. 7799 ID #: 856 3738 8112
Attending: Planning Commission Chair Valerie Hoy-Rhodehamel; Commissioners Auguste Zettler, Davy Ray, Jeff Breckel, Mike Beck; Community Development Director Ben Shumaker.
Public attendees: Mary Repar, Rick May, Phil Crawford, Karen Rutledge, Julie May, Tracy Gratto, Pat Rice, Brian McNamara, Kelly O’Malley McKee, John Mobley, David Wyatt and other unidentified participants.
Planning Commission Chair Valerie Hoy-Rhodehamel opened the meeting at 6:03 p.m.
A. Preliminary Matters 1. Public Comment Expectations:
PC Chair Valerie Hoy-Rhodehamel explained the public comment process and how to use the online tools to remotely participate. Please raise hand to comment, and limit comments to 3 minutes. Tools: For virtual attendees use *6 to mute/unmute & *9 to raise hand.
2. Public Comment Period: (For items not located elsewhere on the agenda) >Mary Repar provided comments on affordable housing. She sent the Planning Commission a letter she would like to have entered into the public record. She spoke of a non-profit organization called REACH (reach.cdc.org) that purchases homes to use for affordable housing and suggested they may be worth further discussion. She encouraged thinking differently regarding home ownership or renters. She noted one definition of affordable housings indicates people should only spend 1/3 of their income for rental costs. She asked what can be done through policy and legislative changes to address the issue.
3. Minutes: March & April, 2021 Meeting Minutes. MOTION to approve March 8th, 2021 regular Planning Commission meeting minutes, March 15th, 2021 Special Planning Commission meeting minutes and April 12th, 2021 regular Planning Commission meeting minutes as presented made by Commissioner Beck, seconded by Commissioner Zettler.
• Voting aye: Commissioners Valerie Hoy-Rhodehamel, Auguste Zettler, Davy Ray, Jeff Breckel, Mike Beck
B. New Business No new business was presented.
3

2
C. Old Business 4. Zoning Amendment: Increasing Residential Building Capacity: Reestablishing Public Involvement Expectations
Community Development Director Ben Shumaker directed Commissioners to the staff report, which provided background information and history of the Planning Commission’s efforts to create a responsive public engagement process using a number of communication methods. He noted there were two points of discussion before the Planning Commission regarding communication about proposed changes to the zoning districts in Stevenson:
1. Should the public involvement strategies be expanded to include an all-community Open House? Conceptually, the Open House would be held at the Hegewald Center. The format would involve a staff preamble explaining the why, what, how questions underlying the potential zoning changes followed by break-out exercises for the public to provide guidance on specific topics (e.g., location, affordability, transportation corridors/utility services, building design, etc.) 2: Is a follow-up, all-community Town Hall appropriate to satisfy the public’s need for engagement on this topic? Conceptually, the Town Hall would also be held at the Hegewald Center. The format would involve a staff listing of potential actions gleaned from the Open House, followed by round-robin opportunities for verbal testimony and written comment sheets.
D. Discussion
The Commissioners then held an active discussion regarding what they envisioned for the structure and agenda of the Open House and/or Town Hall gatherings. Introductions of the topics by staff with information and descriptions, breakout sessions, dot voting exercises, sample street-scapes and Q/A opportunities for public input were considered. Information gathered would then be used to reflect the public input at a follow up meeting as a way to determine if comments received were interpreted correctly. It was agreed a more formal facilitated meeting would be best. Commissioner Breckel maintained it would be beneficial to clearly state all the reasons why the Planning Commission started down the rezone path in order to quell rumors and misinformation. He said he would like to see a joint Planning Commission and City Council endeavor regarding how to best engage the public. All Commissioners were in favor of the expanded communication opportunities provided through an open house. PC Chair Hoy-Rhodehamel stated it would be easier to explain the R3 rezone, as the maps were hard to follow. Commissioner Beck asked to have all stakeholders invited, not just residents. He received confirmation from Shumaker there was no time limit, and grant extensions were being worked on. Commissioners Ray and Zettler echoed the positive response, with Commissioner Zettler stating it would be good to have all voices heard, as some people think they are not being listened to.
4
3
At 6:27 p.m. Planning Commission Chair Hoy-Rhodehamel opened the meeting to public comments. Following is a summary of the comments received:
>Rick May suggested the Planning Commission members review information in the Johnson Economic Report and the recently completed Skamania County Housing Needs Analysis for guidance regarding affordable housing. >Phil Crawford advocated for a more ‘citizen-centric’ approach to city government. He agreed with getting all stakeholders involved, noting it would be hard work but doable. He complimented Community Development Director Shumaker on the work he has done to get the word out regarding the zoning proposals. >Tracy Gratto agreed Shumaker has done tremendous work. She repeated her offer to help with organizing neighborhood meetings. Following a question from Shumaker she provided details on what she meant by creative engagement. >Brian McNamara recalled the recent moratorium on building in the downtown area galvanized many property owners and other stakeholders. He stated there will be a battle over affordable housing as there is limited buildable space in the area. He requested written meeting minutes be posted in a more timely manner and possibly printed in the local newspaper. Commissioner Zettler noted it was possible to put the audio recordings of meetings on the city website. >Julie May suggested there be time provided for residents and others to offer city staff ideas on public outreach and engagement and suggested the city invite people to offer specific input and feedback. >Mary Repar requested further discussions on affordable/workforce housing, with a focus on more inclusion, rather than separation, of subsidized housing units within neighborhoods. She stated she hears from residents they do not want more cars or traffic. >Kelly O’Malley McKee with the Stevenson Downtown Association shared that many local restaurants are having trouble re-hiring employees, and affordable housing is an issue. >Rick May spoke about enterprise zones and encouraging business investment in affordable housing. >Pat Rice suggested streamlining services in order to make building easier, and to look at what can be done within the current zoning districts rather than changing them. He called for active listening on the part of city staff, and more succinct communication to convey specific messages. >Phil Crawford offered it may be the time to initiate a small task force to work on communication and outreach.
Community Development Director Shumaker briefly reviewed the comments, noting none spoke of holding open houses, and questioned if there would be support for any. Commissioner Breckel then pointed out there were broad issues raised, with outreach only one of many topics. He suggested organizing and structuring public forums where opinions can be expressed safely and comfortably, adding the effort would provide dividends. Landlords, financial institutions and developers need to be a part of the decision making. He advised changes will take place and it would be best to think things through rather than just observe.
5
4
Commissioner Beck asked about updating the Stevenson Comprehensive Plan. The last revision was in 2013. There is no legal requirement to review the entire plan on a set schedule, but changes can be made through the two-year amendment cycles. Commissioners Ray and Zettler also expressed interest in examining the Comprehensive Plan, with Commissioner Zettler commenting the plan gives concept to future directions and decisions and should stay current. Commissioner Beck recommended the proposed extensive outreach efforts should be included as a part of any Comprehensive Plan discussion. Additional comments were received regarding positive community interest in holding open house style public meetings with Planning Commission and City Council members in attendance; suggestions on zoning density, and a request to have a more rapid response process for some issues. Commissioner Breckel agreed to work with Community Development Director Shumaker in forming a sub-committee, participate in meetings and provide a report about public outreach strategies to the Planning Commission at the June 2021 PC meeting.
5. Staff & Commission Reports: ICMA Fellowship (Parking Intern); Public Tree Preservation Plan, Columbia Realignment Project
• Community Development Director Shumaker shared that interviews are scheduled with intern applicants for the city parking analysis, with the intent to have them start in mid-June.
• The DNR funded Tree Management Plan is underway, with an inventory and assessment of tree values and conditions a goal. Maintenance, preservation and management methods are also being established.
• The Columbia Realignment Project has received funding for further studies. There will be a more thorough look for contamination, with remediation performed if found. The purpose is to get the area back into productive use and includes some support for additional parking analysis/evaluation of fee-in-lieu programs
6. Thought of the Month: None E. Adjournment The meeting was declared adjourned at 7:40 p.m. by Planning Commission Chair Valerie Hoy-Rhodehamel. Minutes prepared by Johanna Roe
6
Page 1 of 1
City of Stevenson Planning Department
(509)427-5970 7121 E Loop Road, PO Box 371 Stevenson, Washington 98648
TO: Planning Commission FROM: Ben Shumaker DATE: June 14th, 2021
SUBJECT: Increasing Residential Building Capacity – Public Involvement
Introduction This memo acts as a placeholder for the discussion of public involvement related to the potential zoning text and/or map changes being discussed. At the May 10th, 2021 meeting the Planning Commission appointed Commissioner Jeff Breckel to head a public involvement subcommittee. The subcommittee consists of:
• Mike Beck (Planning Commissioner) • Jeff Breckel (Planning Commissioner) • Phil Crawford (Resident/Property Owner) • Tracy Gratto (Resident/Property Owner) • Brian McNamara (Resident/Property Owner) • Julie May (Resident/Property Owner) • Rick May (Resident/Property Owner) • Pat Rice (Resident/Property Owner) • Ben Shumaker (City staff)
The subcommittee has met via a series of emails (Attachment) and held a face-to-face meeting on Friday, June 11th at 5:00pm. At the time of this writing, the meeting has not yet occurred.
Subcommittee Recommendation Verbal reports from the subcommittee will occur at tonight’s meeting. If a written report is produced it will be made available at this meeting as an addendum to this report
Prepared by,
Ben Shumaker Community Development Director Attachment
- Subcommittee Emails
7
Ben Shumaker <[email protected]>
Public Engagement Work GroupJeff Breckel <[email protected]> Thu, May 27, 2021 at 4:11 PMTo: Phillip E Crawford <[email protected]>, Gratto Tracy <[email protected]>, [email protected], [email protected],[email protected], [email protected], Ben Shumaker <[email protected]>
At its mee�ng on May 10, the Stevenson Planning Commission discussed the need to broaden public engagement in its current review of the city’sresiden�al zoning. I volunteered to work with those of you at the mee�ng who expressed an interest to bring the Commission a plan to engage thepublic in the City’s residen�al zoning review.
Key ques�ons we’ll focus on include:
· What should be the goals or expecta�ons for a public engagement process? · What are the ques�ons, problems or issues for which we’re seeking public input? · Are public workshops the best vehicle for obtaining the public’s input? If so, how do we promote, prepare for and organize workshops? Are there other methods we should consider?· How can we help ensure that we engage a representa�ve cross sec�on of affected interests?· What informa�on does the public need to provide informed input and how do we make it clear and accessible?· What role, if any, should the current dra� zoning amendments play in the discussion?· How do we let the public know how their input was used in preparing zoning recommenda�ons?
I am wri�ng to confirm your interest in working on this plan. I’d also like to know your preference for mee�ng �mes, a�ernoon or evening. Once Ihear back from you, I’ll work to set up a workable mee�ng �me and loca�on.
If you have any ques�ons or thoughts about how we proceed in pu�ng together a plan for the Commission’s considera�on, please let me know. And, thanks for volunteering to help move this conversa�on ahead.
Jeff Breckel
8

Ben Shumaker <[email protected]>
Public Engagement Work GroupPat Rice <[email protected]> Fri, May 28, 2021 at 8:16 AMTo: Jeff Breckel <[email protected]>Cc: Phillip E Crawford <[email protected]>, Gratto Tracy <[email protected]>, Rick May <[email protected]>, Julie May<[email protected]>, Pat Rice <[email protected]>, [email protected], Ben Shumaker <[email protected]>
Hi Jeff,
Thank you for including me in this group. I can confirm that I am highly interested in being part of this group. As far as time goes, being retired, I amsomewhat flexible as to when to meet....so, of course, pick a time that works for everyone else and just let me know. The more advance notice I have thebetter, as then if I have a scheduling conflict, this allows me time to change the time/date of my other commitment (because this is very important and is apriority for me).
Thank you for taking this on. And yes, I do have some thoughts " about how we proceed in pu�ng together a plan for the Commission’sconsidera�on" and I promise to get these thoughts to you by next Tuesday, June 1st.
Take care, Pat Rice[Quoted text hidden]
9
Ben Shumaker <[email protected]>
Public Engagement Work GroupRick May <[email protected]> Fri, May 28, 2021 at 10:37 AMTo: Jeff Breckel <[email protected]>Cc: Phillip E Crawford <[email protected]>, Gratto Tracy <[email protected]>, Julie May <[email protected]>, Pat Rice<[email protected]>, [email protected], Ben Shumaker <[email protected]>, "[email protected]"<[email protected]>, Robert Muth <[email protected]>, Amy Weissfeld <[email protected]>, PaulHendricks <[email protected]>, "[email protected]" <[email protected]>, Dave Cox<[email protected]>, David Ray <[email protected]>, Mike Beck <[email protected]>, Valerie Hoy<[email protected]>, Auguste Zettler <[email protected]>
Hello Jeff,
Thank you for the efforts to broaden public engagement. It is appreciated. I am available to meet at your convenience. As for the zoning change, for anincreasing number of the folks in Stevenson, there are fundamental problems at play here. These issues include:
(1) The 2020 Housing Needs Analysis specifically stated the "Complete sewer and water master plan update before allowing major zoning changes." Whywas the recommendation ignored? Why Is this zoning change being proposed before this update?
(2) Why has there been a lack of discussions on how sewer will be economically brought to the areas where sewer hookup will be required by the zoningchange?
(3) Why has there been a lack of adequate discussions or studies concerning the negative social and economic impact from the proposed zoningchanges?
(4) Why has there been a lack of discussions and implementation on the recommendations from the 2020 Housing Needs Analysis, which will createsignificantly more density as compared to the proposed zoning change?
(5) Information from Planning was supplied to the public concerning such items as projected need and a lack of available land that do not match the factsfrom the Housing Needs Analysis and Johnson Economics Report. Planning used quotes from the 2020 Housing Study to support zoning changes, butdid not provide information and statistics that clearly states another conclusion. Why was this information supplied and not corrected? Why is the zoningchange being proposed when the facts do not show a need?
(6) Why has there been a lack of discussions of other methods which would substantially increase the available developable land in Stevenson without anunpopular zoning change? These include eliminating process barriers in the code, decreasing building setback requirements, decreasing setbacks forseasonal streams that flow only during rainy periods, allowing increased use of shared driveways and increasing allowable ADU units.
The Planning Commission makes good decisions when fully and accurately informed. In reality, we are dealing with larger issues than a zoning changehere. We are dealing with issues of transparency, public response, reliability of information and adequate vetting of the issues. Again thank you for yourefforts. I am at your disposal to discuss any issues.
Rick May503-341-2932
On Thu, May 27, 2021 at 4:11 PM Jeff Breckel <[email protected]> wrote:[Quoted text hidden]
-- Rick [email protected]
10
Ben Shumaker <[email protected]>
More ideasPhillip E Crawford <[email protected]> Fri, May 28, 2021 at 4:18 PMTo: Breckel Jeff <[email protected]>Cc: Gratto Tracy <[email protected]>, May Rick <[email protected]>, May Julie <[email protected]>, Rice Pat<[email protected]>, [email protected], Shumaker Ben <[email protected]>
Jeff-
You probably opened the door too far, at least for me, when you asked for ideas. But here’s some more stuff related to public involvement.
Another thought to post on the wall as we look forward to meeting and generating ideas: we will likely need some funding (e.g., for gathering informationand workshops) unless we want to do all the work ourselves (I don’t). I think Ben mentioned some public engagement money might be part of the grant heis administering in support of the rezone. Further, the city has allocated $4,500 for a contractor to conduct a diversity workshop so it might not beunreasonable to request funds if we need them.
2 attachments
Public Involvement Ideas for City.pdf45K
Stevenson Taskforce.pdf66K
11
Public InvolvementIdeas for City of Stevenson
Communication with the community.
The city needs to begin building the case for change at the outset when facing a major problem or change that is likely to be important to the larger citizenry or to any substantial group of people. The problems needs to be stated in lay terms understandable to everyone. This is the first step in building support. Unfortunately, the usual way these things play out is the public does not hear much until the solution is presented, e.g., zoning change or huge new water/sewer bills
How can this be done?Newspaper, online, newsletter, community groups and organizations, neighborhood
associations (not yet created), stakeholder groups. After the problem is identified, periodic updates must continue.
It is critical to tailor information and involvement to the audience —generally simple, brief, and how the problem and solution relate to them. Much of what the city puts out is city government centric, not citizen centric. It’s about what the city is doing to solve it’s problems, not what the city is doing to solve the citizens’ problems.
Another way to think about this is that city should begin by selling the importance of a problem to be solved not an action to be taken. If people are convinced there is a legitimate problem, especially one important them or their town, implementation of a solution by the city will go much more smoothly.
Procedural JusticeOften the people most affected by city decisions are the least likely to be directly involved in the developing those decisions. Current examples are increasing utility rates and zoning changes. What is involved here is something Indiana University Professor, Sanya Carley, calls procedural justice. Approaching decision making from a procedural justice perspective requires a “bottoms up” approach that involves stakeholders in an authentic way at the earliest stages of proposed changes, commonly by identifying an important problem facing the community. This approach paves the way for eventual consensus prior to implementation. Finding consensus after the decision has been made, or even somewhere along the way, is less likely to succeed and is much more difficult.
In Stevenson the proposed rezoning of a significant part of the town is an example where procedural justice was not applied. The process began with a study commissioned by non-elected people. The contractor who did the study involved a very limited group of stakeholders, primarily business, development, and government representatives. The city translated study recommendations directly into up-zoning a large area of single family residences as well as changes in the zoning code. The public at large, especially the residential property owners, were not invited to participate as stakeholders. Hence, this was not a bottoms up approach for a large
12

part of the stakeholders who would ultimately be affected by decisions that came directly from the results of the study.
The outcome? The city received negative responses, ranging from confusion to outright opposition. It is easy to attribute these kinds of negative responses to NIMBY behavior. However, Carley says, “There's this derogatory undertone of the concept of NIMBYism that suggests that people are somehow irrational. Like if it's near them, then they all of a sudden don't like it. But we find that it's not irrational at all.” What is actually happening is people are concerned about things that are very important to them. “It's the value of their environment. It's the value of their home and what it means to them, what it means to them culturally, what it means to them historically. Once we account for all these things, that irrational concept of NIMBYism just completely disappears,” Carley says.
13
1
Task Force ExpectationsWhat can we expect to accomplish? What is our charter? Based on the results of the May commission meeting, it seems part of our task is to determine this for ourselves.
Our task seems to have two related parts.1. What to do about the rezoning proposal in terms of public involvement.2. Develop a broad public involvement proposal.
The first question for the rezone initiative is what do we expect to come out of a public involvement effort? What can participants expect as a result of their involvement? Are we asking them to contribute to solving a problem (also not yet defined adequately) or simply receive information about a plan that is complete or nearly complete. The options could range from:
a. Continue as proposed in the latest draft from the city.b. Modify — many options here.c. Propose ways to meet needs with current zoning and ordinancesd. Postpone work until COVID improvements allow better participationd. Make no changes. Allow things to continue as they have been.
One way to approach our task is to think about it as if we were a busy, unaware property owner who suddenly heard a rumor about an up-zone of the neighborhood. If I were that property owner what would I like to know and how would I want to express my concerns to the city or otherwise be involved?
The kind of broader public involvement process we propose may depend somewhat on the choices we make regarding the rezone initiative. Is the rezone possibly a starting point leading to the initiation of a broader program? Might consider raising the question there and recruiting interested people, assuming we get good participation and people are positive about the results.
Zoning Issue.Scope of our task. How do we approach the zoning issue with the public?What we propose may depend largely on how we describe the problem.
Do we start with a problem/need question? Just exactly what is the problem? Who has the problem? Is there a problem for property owner/residents, renters, employers? Is it the same for everyone? Or is this primarily a problem for businesses and the low-wage employees who can’t afford housing in the current market? Does the city have a problem with infrastructure costs? Are most property owners likely to benefit, or are they being asked to take risks and make sacrifices for the good of others, such as businesses and their low income workers?
Do we start with the assumption the problem is already defined by the studies the city has relied on to initiate the zoning change? Does the task then become selling the zoning proposal? Or modifying it? How much modification is on the table?
Can the needs identified in the studies be met with something different from the zoning changes proposed by the city? How far should we pursue that option?
14
2
How reliable are the results and recommendations of the studies? Who commissioned them and why did they do it? What was the stakeholder involvement? Are we saying deficiencies in the studies can be rectified by public involvement?
What is the relationship between the zoning initiative and the sewer problem facing the city? Will water, transportation, and other infrastructure needs become a problem soon?
Is the zoning initiative congruent with the comprehensive plan? Does the comp plan need to be updated to reflect the assumptions and conclusions of the studies relied on by the city for the rezoning initiative.
How will proposed changes affect existing qualities and property values?Will the proposed up-zoning change property values? In what way and how soon?Will any changes in property values be offset by other effects of the zoning change, i.e.,
is this a trade-off situation for property owners?How will the up-zoning change quality of life factors such as who lives in various parts
of town (more grouping of similar incomes, less diverse neighborhoods, etc.), open/green space, housing density, noise, parking, traffic, appearance, sense of community?
Current inventory of buildable property.Does the city have an inventory of property available for construction of affordable
housing? Does this inventory identify properties zoned for affordable housing, but not served with utilities? Are these properties mapped so that decision makers and citizens can better understand their relationships among variables such as schools and quality of life values?Does the inventory provide any information as to the suitability or practicality for builder/investors to construct affordable housing? For example, are some parcels too steep or unstable to be developed at reasonable cost?
How does the inventory match up with demand/need projections? How solid are these numbers? Rick May has worked on this.
Cost of housing. The city has taken the position in proposing the zoning change that it has an obligation to provide or promote more affordable housing.
What is the city’s definition of affordable housing?What are the main factors determining the availability of affordable housing?Is it the city, the free market, business community, state, something else, or a combination
of things that should be responsible for providing affordable housing? How big is the city’s responsibility in the mix? Should more responsibility be focused elsewhere?
If a part of the population cannot afford adequate housing, is that due to income disparity rather than cost/availability of housing?
If the business community is concerned about lack of housing for the workforce it wants, does it have an obligation to do more than promote rezoning of residential properties? Is it reasonable to expect the community to provide housing for employees paid so little they cannot afford normal housing options? Could businesses offer a commuting or housing stipend to help solve this problem? It seems to be commonly accepted that a large portion of the working people of the county commute outside the county to work and apparently do so willingly rather than move closer to the job. What about the reverse? Is the difference due mostly to income disparity?
15

3
Can the city effectively influence the availability of affordable housing by changing zoning or other factors over which it has control?
Meeting the need. The city indicates that zoning classification and other requirements of the zoning ordinance are impediments to providing needed affordable housing both now and in the future. What evidence is there to support that position? Many factors influence the availability of housing, among them availability of land with necessary infrastructure, availability of builders willing and able to build what is needed, cost of construction, availability of funding for construction, wage rates, job availability and characteristics, cost and availability of utilities and other services, enough buyers/renters able to pay, etc. What part does the city play in influencing these to the extent it would make any difference? Is availability of suitable land a significant barrier to providing affordable housing both now and in the future? Has the city developed an inventory of currently available property and matched that with demand? Do potential builders say shortage of property is a significant deterrent to construction?
Growth. The results and recommendations of the studies, especially the EDC study, are about growth and what Stevenson and other Skamania County communities should do to accommodate it. Because these studies seem to be the single most important driver of the zoning changes, it might be worthwhile to identify the assumptions underlying these studies. For example, the studies focused heavily on meeting housing needs, but were silent on meeting quality of life factors, Should we review some of the common assumptions about growth such as: a) growth is inevitable, so just accept it; b) if you aren’t growing you are dying; c) excessive growth is the realm of cancer; d) the free market should be allowed to control growth; e) government creates barriers to the free market; f) the role of planning should be to remove barriers to development or conversely, the role of planning is to manage growth based on public values g) property rights trump all other factors; h) growth increases the tax base so we all benefit; i) growth is an essential part of economic development; j) stable state economics is a myth, j) growth reduces the cost of services. Of course, many of these assumptions are either outright wrong or open to debate, but they often guide important decisions.
To what degree are citizens of Stevenson obligated to accommodate growth? Does it matter if this growth is being driven primarily by external forces, e.g., regional demand? Or by local businesses that hope to benefit directly from it? What is the role of zoning in controlling/managing growth? Should current residents be expected to sacrifice quality of life values to accommodate growth? How will growth affect quality of life factors? Does growth degrade or enhance the reasons most people give for choosing Stevenson as a place to live? What happens to these values if we do not accommodate the proposed growth? Again, the studies are silent on these matters.
Importance of public involvement. What will happen if the city adopts the rezone without additional public involvement? Is the city willing to scrap the project or significantly modify it if the public tells them that’s what it wants? How far is the city willing to go to assure that the public accepts the changes it deems necessary? Just how high a value does the city put on public good will? Does it see building good will now as important for solving future problems such as water and transportation infrastructure?
16

4
Does the city see citizens as an untapped resource base or an impediment or distraction to carrying out the work they feel obligated to do?
Broader Public Involvement Initiative.Our task is to determine the value and potential for a broad based public involvement
program and to present one or more models that would be feasible for Stevenson.
A new public involvement program could apply to only the planning commission or could apply to city government as a whole. Yes or no?
The program needs to be citizen centric, not government centric. Think of it as the city operates at the will of the citizens, not the other way around. That requires a mechanism for knowing what the citizens want.
A citizen involvement program should be a permanent part of the administrative process so that it is always in operation rather than something that has to be cranked up or reinvented each time a problem or issue arises. That is, it should be something that both city government and citizens can use as a reliable, convenient, and low cost way for engagement. Does this mean that the current form of city government, assumed to be representative government, is not adequate or is not functioning as well as it could?
How satisfied are people with how things work now? Would it be worthwhile to go through a sensing process with citizens and city government people to find out?
Who in city government would be responsible to lead/manage a more robust citizen involvement program? Is the city prepared to do something like this? Has the time come for this to be necessary for the successful operation of the city?
What are some approaches/models we could consider for a comprehensive public involvement program?
1. Neighborhood based groups Portland has a long experience with neighborhood associations, and Tracy Gratto has much experience with their organization, structure, and function. This approach has many characteristics that seem to be appropriate in Stevenson. In order to be successful, this form of public involvement would need strong and continuing support from the city. What would be the minimum amount of support for a successful. start? For example, are there already enough skilled people throughout the neighborhoods to get the process started? How long would it take to train additional people and who would do it? How formal would the structure have to be? Legal questions?
2. Enhanced relationship between city officials and their constituents. The current system appears to be somewhat passive in this regard. Are there ways to make it more active?
What about planning commission members? As appointed officials, are they even thought to have constituents? The current way meetings are conducted promotes citizen participation better than the more formal way the council conducts its meetings. However, both
17

5
situations are not the best for generating ideas, reducing barriers, and encouraging creative thought from the larger citizenry.
City council members and mayor? Do they perceive themselves as having defined, general, or any constituencies at all? Do they have any organized, proactive way to interact with citizens other than council meetings?
Is it reasonable/possible to expect any increased interaction of volunteer officials with their constituents given the additional time that might require? What are some ways to improve the process without unacceptable burdens on the volunteers?
3.Another model. Although used more often for conflict situations, an approach that uses key informants from the community can be effective for gathering ideas, developing solutions and arriving at consensus.
4. Community councils. Skamania County has some in operation, e.g., Underwood. Is this a useful model for Stevenson?
Activities for large group meeting.a. Best and Worst
What are the best and worst outcomes if we do nothing? If we adopt the proposed zoning changes?
b. Many, many others.
Other things to consider. Procedural justice.Physical arrangements for meetings. Most meeting room layouts favor an adversarial or
power differential relationship and the usual process favors those with public speaking skills. Meeting agendas similarly impose limits that discourage public presentation, especially for those unable to prepare their comments in an efficient way to meet time limits. Meeting managers often invite guests to submit written testimony if they feel an oral presentation is not adequate. This favors those with writing skills. If the city truly wants to hear fully from all constituents, reducing these barriers could be helpful. An alternative is to have facilitated work sessions, designed to draw out and record contributions from all participants. Extending that intent could include seeking out and inviting people who would not ordinarily feel confident enough to participate in a formal meeting as currently conducted.
Phil Crawford17 May 2021
18

Ben Shumaker <[email protected]>
More ideasRick May <[email protected]> Fri, May 28, 2021 at 10:52 PMTo: Phillip E Crawford <[email protected]>Cc: Breckel Jeff <[email protected]>, Gratto Tracy <[email protected]>, May Julie <[email protected]>, Rice Pat<[email protected]>, [email protected], Shumaker Ben <[email protected]>
Wow Phil. That is the most well thought out and complete presentation of the issues I have seen. Thank you for the substantial time and efforts you took.Well done.
Rick May[Quoted text hidden]-- Rick [email protected]
19

Ben Shumaker <[email protected]>
More ideasJeff Breckel <[email protected]> Sat, May 29, 2021 at 11:14 AMTo: Phillip E Crawford <[email protected]>Cc: Gratto Tracy <[email protected]>, May Rick <[email protected]>, May Julie <[email protected]>, Rice Pat<[email protected]>, [email protected], Shumaker Ben <[email protected]>
Phil:Thanks for sharing your thoughts. They will certainly help to frame the discussion when we meet. The folks who have responded seem to be fairlyflexible with regard to meeting times. I'll try to get some options out next week after Ben gets back from some time off. I agree there will be a fair amountof work involved in preparing for and conducting workshops. Hopefully our little group will be able to develop a scope of work we can use to identify andrequest funding.
Thanks again for joining this endeavor.
Jeff
On Fri, May 28, 2021 at 4:19 PM Phillip E Crawford <[email protected]> wrote:[Quoted text hidden]
20

Ben Shumaker <[email protected]>
More ideasJulie f-May <[email protected]> Sat, May 29, 2021 at 12:28 PMTo: Jeff Breckel <[email protected]>Cc: "[email protected]" <[email protected]>, "[email protected]" <[email protected]>, Tracy Gratto<[email protected]>, Rice Pat <[email protected]>, [email protected], Shumaker Ben <[email protected]>, Rick May<[email protected]>
Hi Jeff~My times that are not available are most Mondays and Weds. plus Saturday afternoons.Open to most other times barring some appointments here and there and conference calls 12-1 every 2nd & 4th Tuesday.Thanks for bringing this together~~Julie
Julie -f- MayCell: [email protected]~ connect & create ~
[Quoted text hidden]
21

Ben Shumaker <[email protected]>
doodle poll ???Tracy Gratto <[email protected]> Sat, May 29, 2021 at 6:51 PMTo: Rick May <[email protected]>, "to: Phillip E Crawford" <[email protected]>, "cc: Breckel Jeff" <[email protected]>,Gratto Tracy <[email protected]>, May Julie <[email protected]>, Rice Pat <[email protected]>, [email protected], ShumakerBen <[email protected]>
Hi All, No once asked me to do this but sometimes it aids in getting a meeting together. I am open to other dates and approaches but thought I'd suggestthis:
doodle poll for scheduling
I asked for 1.5 hours to see if we can accomplish as much as possible early on. If you can't make the entire meeting, pls still mark yes if you arecomfortable attending part of the meeting. -- Be well ~ Tracy pronouns: she/herphone: 503 702 9714
22

Ben Shumaker <[email protected]>
doodle poll ???Brian McNamara <[email protected]> Mon, May 31, 2021 at 11:42 AMReply-To: Brian McNamara <[email protected]>To: Tracy Gratto <[email protected]>, Rick May <[email protected]>, "to: Phillip E Crawford" <[email protected]>, "cc: Breckel Jeff"<[email protected]>, May Julie <[email protected]>, Rice Pat <[email protected]>, Shumaker Ben<[email protected]>
Hello to all,
As a local stakeholder in downtown Stevenson I have seen the city government move forward with unpopular zoning changes such as the recent"moratorium" aimed at increasing density in the "C1" area. The overwhelming majority of affected property owners where completely unaware of the CityCouncil plan to make the 1 year moratorium permanent (Zoning Code Amendment: ZON2020-01). It took a grass roots effort to thwart that misguidedzoning change and was only partially successful in retaining owners original property rights. We are almost exactly 1 year from that effort and we find ourselves facing another city government driven rezoning effort that few stakeholders understand and fewer want.
I hope the attached article solidifies our efforts to garner increased public engagement before the city government moves any further on rezoning issues. Strong city resident/neighborhood groups should have a seat at the table in the future. So when is the first meeting?
Best regards,
Brian McNamara
https://www.king5.com/video/news/local/tacoma/residents-in-tacoma-push-back-on-plans-by-leadership-to-expand-housing/281-97b98c87-6998-4ba1-a88c-5bfeaff57ea3?jwsource=em
Sent from Yahoo Mail on Android[Quoted text hidden]
23

Ben Shumaker <[email protected]>
doodle poll ???Jeff Breckel <[email protected]> Mon, May 31, 2021 at 4:07 PMTo: Tracy Gratto <[email protected]>Cc: Rick May <[email protected]>, "to: Phillip E Crawford" <[email protected]>, May Julie <[email protected]>, Rice Pat<[email protected]>, [email protected], Shumaker Ben <[email protected]>
Tracy:Your Doodle poll suggestion may well help us find a workable meeting time. Thanks for setting it up.
Jeff[Quoted text hidden]
24

Ben Shumaker <[email protected]>
doodle poll ???Tracy Gratto <[email protected]> Mon, May 31, 2021 at 9:09 PMTo: Gratto Tracy <[email protected]>, May Julie <[email protected]>, Rice Pat <[email protected]>, Rick May<[email protected]>, Shumaker Ben <[email protected]>, [email protected], "cc: Breckel Jeff" <[email protected]>, "to:Phillip E Crawford" <[email protected]>
I think many of us were on vacation so this isn’t intended as a pushy nudge, but I do wonder if folks are comfortable replying by tomorrow afternoon orindicating if you are not intending to participate link for scheduling is below. I’ve got some plans pending on Friday but that looks like the winner so far!
So far we have Phil, Pat and Karen and Jeff.
Thanks all, Tracy
On Sat, May 29, 2021 at 6:51 PM Tracy Gratto <[email protected]> wrote:[Quoted text hidden][Quoted text hidden]
25

26

27

Ben Shumaker <[email protected]>
Public Engagement Work Group Meeting - June 11Brian McNamara <[email protected]> Fri, Jun 4, 2021 at 5:43 PMReply-To: Brian McNamara <[email protected]>To: Jeff Breckel <[email protected]>, Phillip E Crawford <[email protected]>, Gratto Tracy <[email protected]>, May Rick<[email protected]>, May Julie <[email protected]>, Pat Rice <[email protected]>, Ben Shumaker <[email protected]>,Mike Beck <[email protected]>
Thanks Jeff,
See you there.
Best regards,
Brian
Sent from Yahoo Mail on Android[Quoted text hidden]
28
Ben Shumaker <[email protected]>
Public Engagement Work Group Meeting - June 11Rick May <[email protected]> Sat, Jun 5, 2021 at 11:12 AMTo: Jeff Breckel <[email protected]>Cc: Phillip E Crawford <[email protected]>, Gratto Tracy <[email protected]>, May Julie <[email protected]>, Pat Rice<[email protected]>, Brian McNamara <[email protected]>, Ben Shumaker <[email protected]>, Mike Beck<[email protected]>
Hello Jeff,
Thank you for your efforts, it's appreciated. I will be along the MacKenzie River Friday afternoon and may have sketchy service. If I cannot call in Julie willspeak for both of us. Thanks again. It is great to see this level of public outreach.
Rick May503-341-2932[Quoted text hidden]-- Rick [email protected]
29
Page 1 of 4
City of Stevenson Planning Department
(509)427-5970 7121 E Loop Road, PO Box 371 Stevenson, Washington 98648
TO: Planning Commission FROM: Ben Shumaker DATE: June 14th, 2021
SUBJECT: 2021 Work Plan
Introduction This memo presents the Planning Commission with an update on past projects, introduces 2021-2023 project priorities established by the City Council, and provides a list of additional projects the Planning Commission could prioritize for action at their meetings.
Projects from 2020 Project priorities for 2020 were identified by the Planning Commission in September, 2019. Staff family/medical leave, COVID-19, and the significant workload related to these projects caused many priorities to continue into 2021. These projects include Downtown Plan Review/Implementation, Increasing Residential Building Capacity, the Public Tree Inventory/Management Plan, and Capital Improvement Program.
City Council Priority Projects The Planning Commission has not yet reviewed priorities for 2021. The City Council has established goals for 2022-2023 which could involve Planning Commission or staff support. These items are in bold text.
• First Tier: o Wastewater Upgrades o Downtown Planning o Fire Hall o Water System Continued Maintenance o Develop Deliberate Growth Strategy
• Second Tier Projects: o Housing Affordability o Russel Avenue Rebuild, Phase 2 o Broadband o Waterfront Development o Parks Plan o Workforce Education/Youth Leadership
Community Suggested Priorities Over the last month, several community members have suggested City action on projects.
• Critical Areas Ordinance – See attached. Implementation of the Critical Areas Code has triggered concern about its appropriateness. Critical Areas Ordinances are required by the State and must be reviewed according to State expectations on 8-year cycles. Stevenson last reviewed/amended its Code in 2018 and is not required to do so again until 2026. An out-of-cycle review is possible.
o Planning Commission Meetings: 2 to 4 o Staff Time: Moderate o Specialized Studies: Best available science synthesis
• Downtown On-Street Parking Permits – Regulation of on-street parking (duration, vehicle height/length, overnight prohibition) have not been comprehensively reviewed in decades. Downtown businesses, property owners, and residents have suggested modifications to the regulations on a quick timeline. This regulation bridges land use, public works, and policing.
30
Page 2 of 4
o Planning Commission Meetings: ~1 (if the City Council acts as the lead public forum) o Staff Time: Low effort o Specialized Studies: Parking inventory & usage model (to be generated by our Parking Intern)
• Cemetery Planning – A joint effort has been suggested by the public to work with the Cemetery District on future cemetery sites. Currently, the City regulates where cemeteries are and are not allowed via the Zoning Code and the draft Shoreline Master Program. The scope for a joint effort has not been explored, nor has the City discussed the concept with the Cemetery District.
o Planning Commission Meetings: ~2 (if a subcommittee leads the effort) o Staff Time: Low to Moderate effort o Specialized Studies: Meeting facilitation, GIS mapping, hydro-geologic analysis
• Opportunity Zones – A suggestion has been made for the City to lead a discussion of how Opportunity Zones—a relatively new tax shelter—are promoted and used in our area. Full details of the program’s intricacies are the domain of accountants. As understood by the City’s Planning staff, the federal program is intended to funnel capital into census tracts which have been determined disadvantaged by states. The capital comes from private sector entities through the deferral or avoidance capital gains taxes when the gains are invested directly into new developments in designated Opportunity Zones such as Stevenson.
o Planning Commission Meetings: Unknown o Staff Time: Low to Moderate o Specialized Studies: Unknown
• Rock Creek Public Access – Resulting partially from the discussion of Iman Cemetery Road’s requested vacation, a petition has been submitted asking the City to “consider actions to alleviate the problems that trespassing and abuse have brought to our neighborhood. In addition, the enhancement of a pathway to Rock Creek would benefit our community and visitors alike.” This area is identified in the Comprehensive Plan as a potential park with the opportunity to be one of Stevenson’s “Sacred Places”. Assumed needs:
o Planning Commission Meetings: ~2 (with additional public workshops/charrettes) o Staff Time: Moderate to High o Specialized Studies: Meeting facilitation, design visualization via graphics/maps, geologic analysis,
habitat analysis, cost estimation
Ongoing Planning Commission Projects
While the City Council priorities above will require Planning Commission meeting time, there are still opportunities for the Planning Commission to undertake additional work. Some recommendations follow:
• Residential Building Capacity – The project is underway through grant support from the Washington Department of Commerce. All deliverables for the grant must be submitted by June 30, and the work associated with the project is expected to be completed by October 15th, 2021.
o Planning Commission Meetings: 2-4 (with additional public workshops possible) o Staff Time: Moderate to High o Specialized Studies: Meeting facilitation
• Comprehensive Plan Amendment – The Planning Department received an application to amend the Comprehensive Plan in 2020. The application was submitted by the City Administrator and review of the proposal began according to the cycle established in SMC 17.11. During the review, the COVID-19-related restriction on meetings occurred. The City has agreed to defer action until the Planning Commission could meet and engage the public on the proposal. , and In January of even years, the Planning Commission must establish a review calendar for any comprehensive plan amendment proposals submitted during the last biennium. At this time no amendments have been proposed, but a request is anticipated prior to the
31

Page 3 of 4
deadline. Expect minimal to moderate staff time and moderate commission meeting time (during Q1 only).
o Planning Commission Meetings: ~2 (with additional public workshops/charrettes) o Staff Time: Moderate to High o Specialized Studies: Meeting facilitation
• Shoreline Master Program – In December, 2018, the City finalized a proposed amendment to the Shoreline Master Program and submitted it to the Washington Department of Ecology for their review. Ecology is expected to issue its list of “Required and Recommended Changes” shortly. The Planning Commission/Shoreline Advisory Committee will be asked to review the recommended changes to determine which should be included in the draft presented to City Council.
o Planning Commission Meetings: 1 to 2 o Staff Time: Moderate o Specialized Studies: None
• Downtown Planning – Several parking-related activities are scheduled for this summer including a graduate-level intern and traffic study. The result of these efforts will involve inventorying on- and off-street parking, monitoring parking usage, identifying opportunities to increase supply, and estimating costs for the improvements. Additionally, work will begin on a brownfields-related grant studying the realignment of Columbia Street and creating an actionable plan for the redevelopment of adjacent properties.
o Planning Commission Meetings: 4+ o Staff Time: High o Specialized Studies: Graduate intern, traffic consultant, cost estimation, brownfields analysis,
market studies/pro formas • Conditional Use Permit Reviews – Periodic review of conditional use permits are typically scheduled to
occur in October of the odd numbered years after issuance. o Planning Commission Meetings: 1 to 2 o Staff Time: Low o Specialized Studies: None
• Application Reviews – An unknown amount of land division and conditional use permit activity will occur in 2019 that will require commission and staff time to address.
• Lot Line Considerations – Boundary Line Adjustments, Lot Consolidations, Tax Lot Segregations, Legal Lot Determinations. In the past few years, staff has dealt with several questions and issues regarding applications and request related to each of these concepts. However, the City only has policies related to Boundary Line Adjustments and to some degree Lot Consolidations. Even those are somewhat ambiguous and have frustrated the regulated public. The Planning Commission has reviewed ~70% of the project and has so far delayed establishing its public involvement expectations for the project.
o Planning Commission Meetings: 2 to 4 o Staff Time: Moderate o Specialized Studies: None
Other Potential Planning Commission Projects
• Zoning Code Reformat, Next Phase – Earlier phases of the reformat took the existing content and reorganized it, incorporated some policy changes and past Use Interpretations, and streamlined the number of uses considered within select use categories. The scope of this could extend to other use categories and work to align the Zoning Code and Shoreline Master Program, a design standards update related to Downtown development, and/or the Lot Line Considerations project.
32

Page 4 of 4
• New Projects from Comprehensive Plan – The Planning Commission could consider implementing any of the numerous projects called out in the 2013 Comprehensive Plan (attached).
Prepared by,
Ben Shumaker Community Development Director Attachments
- Community Submissions/Emails, City Council Goals, Comprehensive Plan Chapter 3
33
Ben Shumaker <[email protected]>
Re: Affordable housing commentScott Anderson <[email protected]> Wed, May 12, 2021 at 1:28 PMTo: Hayden Damian <[email protected]>Cc: Ben Shumaker <[email protected]>
Thank you for your email Hayden and your interest in Housing Affordability. This has been a hot topic of mine since taking office. I would encourage you to keep an eye out for Planning Commission meetings which will be discussing this topic. Feel free to reach out to our Planner Ben Shumaker (CC'd) to be added to the email list.
On Sat, Apr 17, 2021 at 10:43 PM Hayden Damian <[email protected]> wrote:
Honorable Mayor Scott Anderson,
I am writing you to support the Stevenson City Council goals for 2021-2022, specifically goal #7 Housing Affordability. The cost of homes and the lack of
available rental housing is concerning to me, as I am from a younger generation, and is something I consider very relevant to the community. The
zoning laws currently in place discourage people from my generation from renting homes and apartments. They also limit options and opportunities, as
some people who work here are seasonal, and may not have any options for housing.
With these things considered, I would like to voice my concern on this issue. In my opinion, I would like to see this topic being discussed more on future
city council meetings. I also would like to hear more about possible alternatives to the current zoning laws, especially in relation to rental apartments, or
multi-family housing. Again, I believe this issue is relevant, especially towards younger generations. If you would like to discuss this further, my contact
information is below.
Respectfully,
Hayden Damian
750 NW Angel Heights Rd.
Stevenson, WA 98648
-- Scott AndersonMayor, City of [email protected] E. Loop Rd/PO Box 371Stevenson, WA 98648-0371(509) 427-5970Find more at ci.stevenson.wa.usand cityofstevenson.com
34
https://www.google.com/maps/search/750+NW+Angel+Heights+Rd.+Stevenson,+WA+98648?entry=gmail&source=g

5-19-2021
Hello City Council, Planning Commission and members of the public,
Please add these comments to the packets for the May 20, 2021 City Council and June 14, 2021 Planning
Commission meetings. I had submitted this for inclusion in the City Council Meeting packet for the April
15th meeting. While not printed, Leana Kinley kindly read the original in the meeting. Unfortunately, the
numbers associated with the complex issue of “affordable housing” included are better understood when
read. Since then, I have added some further thoughts on the realities of “affordable housing” and what it
means for the City of Stevenson.
I am writing to address the definition and use of the buzz words “affordable housing” and “workforce housing” as it pertains to the stated desire of Stevenson City Government to increase affordable housing and business density in the Stevenson downtown core. As described by Ben Schumaker, the generally accepted standard measure of “affordable housing” is considered to be 30% of a person’s gross monthly income, including utilities. Stevenson’s downtown economic vitality is based largely on tourism. The Covid-19 pandemic has shown how fickle relying on that can be. Service industry workers are at the bottom end of the wage scale. Often these are seasonal minimum wage jobs without health care benefits and offering less than full time employment.
WA just increased the minimum wage to $13.69/hour. Let’s look at an example of what “affordable housing” might be for a local worker making $15/hour. A cook, cashier, housekeeper, factory worker, etc. working 40 hours per week at $15/hour will earn $600/week, or $2400 gross income per month. “Affordable housing” at 30% of $2400 = $760/month including utilities (utilities can easily reach $150/month). Currently, 1-bedroom residences in downtown Stevenson run between $900 and $1200/month. However, rents are paid in net wages. Doing the math, $1000/month rent (including utilities) will leave about $1000 for food, auto, insurance, health care, etc. What if this was a single earner with a family or a single parent?
If hotels, restaurants, and industry (i.e., port factory workers) cannot find low wage help, they should be
encouraged to find their own solutions beyond expecting City, County or State tax and housing subsidies
while paying low wages without the benefit of health care (aka, a living wage). Not everyone wants to be
a service industry or factory worker, even if they are receiving subsidized rent. At current wages a
minimum wage worker would likely not be eligible for subsidized housing benefits.
“Affordable housing” is a great goal. But what it really means is “subsidized housing” in the form of direct rental assistance from government agencies. Other hidden subsidizes are those provided by local governments to promote development. Service industry jobs are not likely to offer “living wages” anytime soon. Without calling on current property owners to forego charging market rates reflecting rising property taxes, local levies and increased repair costs (and some are!), rents will continue to rise with demand. However, as will be seen below, perhaps current rents are actually affordable.
“Subsidies” include HUD Section 8 assistance and other government financial assistance to those in need. It also includes potential City “subsidies” to developers in the form of zoning changes such as reduced off-street parking requirements and increasing the allowed number of buildings on C1, R1, R2, and R3 lots to encourage further development. If I were a developer I would wait for these City “subsidies” to increase the potential return on investment. In depth public input should be gathered before the City moves to
35
give developers big breaks on City system development charges, especially extending services beyond City limits.
Let’s face the facts here, building and owning “affordable (aka subsidized) housing” is not a popular investment for most developers or the small-scale investor. These are often built by a developer and then sold to a corporate entity or REIT (real estate investment trust) who employ administrators to handle the multiple issues that make subsidized housing less attractive to own (Google search “pros and cons of owning Section 8 housing”). Commissioner Breckel aptly noted that funding for such projects are largely matters for banks and developers to pursue. However, the Stevenson City Council seems hyper interested in providing concessions to get high density housing development moving, especially in the C1 downtown area.
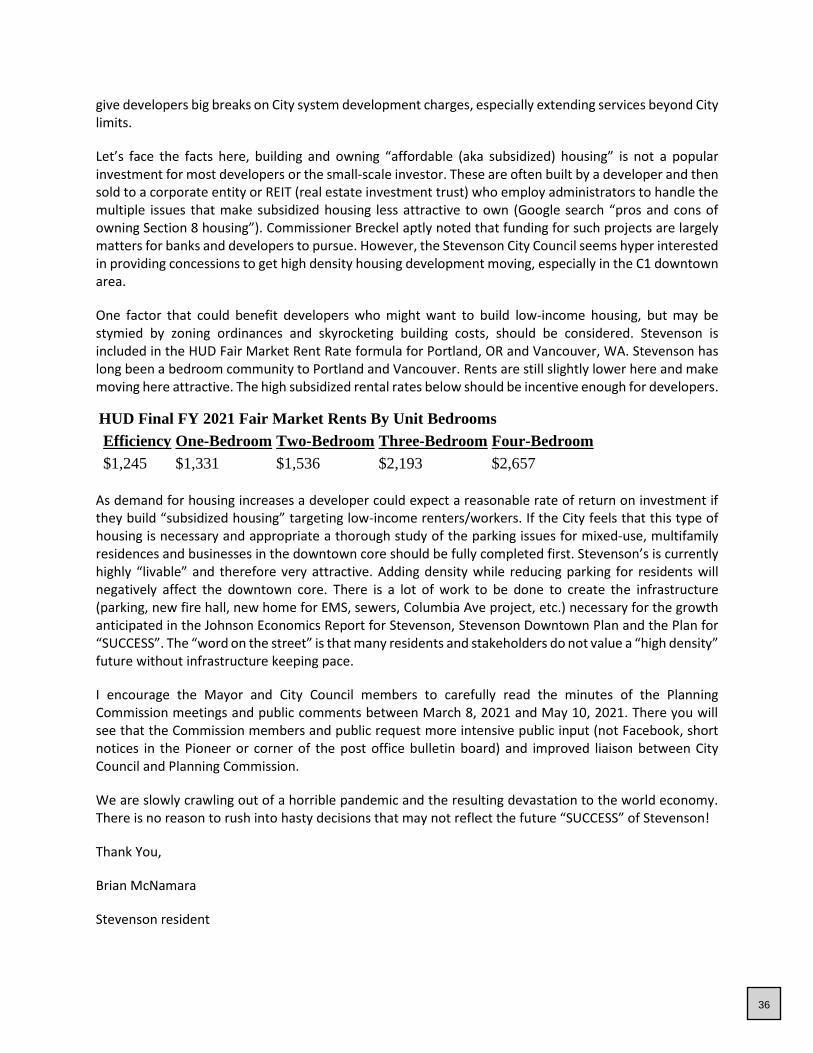
One factor that could benefit developers who might want to build low-income housing, but may be stymied by zoning ordinances and skyrocketing building costs, should be considered. Stevenson is included in the HUD Fair Market Rent Rate formula for Portland, OR and Vancouver, WA. Stevenson has long been a bedroom community to Portland and Vancouver. Rents are still slightly lower here and make moving here attractive. The high subsidized rental rates below should be incentive enough for developers.
HUD Final FY 2021 Fair Market Rents By Unit Bedrooms Efficiency One-Bedroom Two-Bedroom Three-Bedroom Four-Bedroom
$1,245 $1,331 $1,536 $2,193 $2,657
As demand for housing increases a developer could expect a reasonable rate of return on investment if they build “subsidized housing” targeting low-income renters/workers. If the City feels that this type of housing is necessary and appropriate a thorough study of the parking issues for mixed-use, multifamily residences and businesses in the downtown core should be fully completed first. Stevenson’s is currently highly “livable” and therefore very attractive. Adding density while reducing parking for residents will negatively affect the downtown core. There is a lot of work to be done to create the infrastructure (parking, new fire hall, new home for EMS, sewers, Columbia Ave project, etc.) necessary for the growth anticipated in the Johnson Economics Report for Stevenson, Stevenson Downtown Plan and the Plan for “SUCCESS”. The “word on the street” is that many residents and stakeholders do not value a “high density” future without infrastructure keeping pace.
I encourage the Mayor and City Council members to carefully read the minutes of the Planning Commission meetings and public comments between March 8, 2021 and May 10, 2021. There you will see that the Commission members and public request more intensive public input (not Facebook, short notices in the Pioneer or corner of the post office bulletin board) and improved liaison between City Council and Planning Commission.
We are slowly crawling out of a horrible pandemic and the resulting devastation to the world economy. There is no reason to rush into hasty decisions that may not reflect the future “SUCCESS” of Stevenson!
Thank You,
Brian McNamara
Stevenson resident
36

Ben Shumaker <[email protected]>
Opportunity Zones conversation ~ Re: Creative ways to achieve some planning goalsJulie May <[email protected]> Thu, May 20, 2021 at 8:05 PMTo: Scott Anderson <[email protected]>, Ben Shumaker <[email protected]>, Leana Kinley <[email protected]>, KarlRussell <[email protected]>Cc: Julie May <[email protected]>, Robert Muth <[email protected]>, Robert Muth <[email protected]>, Amy Weissfeld<[email protected]>, Paul Hendricks <[email protected]>, Annie McHale <[email protected]>, DaveCox <[email protected]>, David Ray <[email protected]>, Mike Beck <[email protected]>, Jeff Breckel<[email protected]>, Valerie Hoy <[email protected]>, Auguste Zettler <[email protected]>
Hello All~
In regards to opening up more discussions about “tools” in the City’s tool box to help with supporting affordable housing and interesting “mixed-use”development in the downtown core that would have housing at a rate & configuration to support some goals spoken about for “worker-housing” etc…Please see if this is a useful tool to explore.
This is something that may not be available in future years as it sunsets as a government plan. (Let’s hope it gets extended) However, it is a very veryinteresting investment tool with advantages for people who may be in the process of a 1031 Exchange sale wanting to get better advantages or justanyone wanting to invest into a model that does have better tax advantages as hold the investment in the property over 5, 7,10 years. Of course there ismuch to learn if not versed in these and it feels like there are more layers to know about the “out” needed for the investment, however, this could be a toolto promote for the city of Stevenson to attract.
Opportunity Zones:https://badermartin.com/want-to-defer-or-reduce-capital-gains-tax-looking-to-invest-in-a-real-estate-or-other-business-what-to-know-about-the-tax-benefits-of-opportunity-zones/#02
I just think we need to be looking at many many creative solutions and do not want to lose sight of this possibility.
Does anyone on these councils know more, have been involved in, know of folks trying to get these going in Stevenson or money to invest in a project?
By the way~ ALL of Stevenson qualifies to be in these “Opportunity Zone” currently and WE can create our own. Community group, individual, City.
I believe this is something interesting to understand and tap into.
Bullets on as if a 1031 Exchanged property is in the mix:The Readers Digest version of the benefits are as follows:
Invest your gain without the need to replace the debt Defer the taxes you'd pay now for 5 years. If you hold the investment in the Fund for 5 years, you will receive a 10% step up in basis from the initial investment. (ie. If youreinvested a gain of $1M, at the end of the 5th year, you'd owe tax on $900,000 instead of $1M.) If you hold the investment in the fund for 10 years, 100% of the gain during the 10-year hold is tax free at the federal level and inall but 4 states.If the property is substantially improved, there are accelerated depreciation benefits and you can avoid recapturing thedepreciation at the time of sale.
There are a lot of Qualified Opportunity Zone Funds out there. You can even create your own~ which we should figure out HOW TO DO INSTEVENSON.
Hope this is helpful~~Julie
Julie May;Marketing & Public Relations Manager for Bowles [email protected](cell) 503-201-9460
On May 17, 2021, at 6:09 PM, Julie May <[email protected]> wrote:
Hello Planning Commission members, City Council members and Scott, Ben, Leana~
I’ve been thinking a lot about how to bridge some gaps and problem-solve since the last Planning Commission meeting, and actually longerto be fair.
I realize there is a lot of discussion going on about how to do zoning changes that the City could possibly benefit from doing and being alittle out in front of the “change" curve that is headed our way inevitably.
What I have gathered from discussions, feedback, pushback, dialogues and the Planning Commission meetings is that there is a need totake a good look at zoning changes, yet what has been put on the table is a bit hard to pull off in the larger scope approach it currently hasbeen laid out to be.
37

Overall feedback is that we need more community and land/property owner input before any more sweeping changes occur. I agree andwould like to support that in any capacity I can for gathering input.
What also has happened as the community has had a chance to voice concerns is a “slow-down” or outright halt to some changes. For the most part, that is good. Time to think a bit on things and regroup for an even better outcome.But… I do feel like if we can also take a look at things that are common sense changes that may have a positive move toward things I haveheard as themes in these conversations around how do we do this, what do we want, how does this go “equitably" ~ like:~Flexibility~Expanded ability to develop &/or increase density (w/o impacting the “feel” of the community we all enjoy)~Common sense fixes to “issues” repeatedly run into. Ex: lot set-backs, parking, driveways~Support for “affordable housing"
I wonder if even though we have heard loud and clear that more time is needed for public input on zoning changes, that there could be anopportunity to still do some common sense changes to the zoning codes now, that do not dive into complete re-zoning like changing R1 toR3 etc.
My suggestion is to have a “break out” work group look at what makes sense to still move forward on now to achieve some positive goals.
Things like the suggestions from the Housing Needs Study the City paid for seem to make sense. One that stands out as solving a lot of the above bullets is to allow one attached & one detached ADU per lot. Other things that seem to make sense~ fix some of the setbacks, possibly look at shared driveway regulations to be more flexible, (maybemore controversial given the sewer issue, yet positive for infill-development) take another look at continuing to allow septic in areas with nocurrent sewer access or creative solutions like the decentralized sewer solutions mentioned in the reports.
I don’t think we need to go all the way back to the drawing board on zoning as you do have a number of reports now and could expand onthem if feel the need. There are some great ways we can ease into assisting the density of growth in Stevenson without having tocompletely change zoning in large areas or disrupting the “neighborhood” feel many are worried about.
I believe there is enough interest in some of these “fixes” toward flexibility that you could have community support and communityinvolvement in such “break out” work groups to explore this route and then present to the public.
I hope you seriously consider this avenue as I think this could be one great step in the right direction as you spend more time on gatheringmore public input on the larger discussions of "what, when, how" of the larger zoning vision for our community.
I also would challenge the City to continue to gather supports and resources for how to do “affordable housing” and support investment intoapartments as that need is apparent. (Anyone want to find out more about utilizing the Opportunity Zones here??)
I hope this is helpful and I look forward to more open discussion of possibilities.Let me know your thoughts.
Wishing you all well~~Julie
Stevenson, WA
Julie May;Marketing & Public Relations Manager for Bowles [email protected](cell) 503-201-9460
38

May 27, 2021
To the City of Stevenson planning department:
Attn: Ben
I am the landowner of 201 SW Atwell Rd in Stevenson, WA. I am aware that the city is planning to
rezone the area close to my property and I would like to be included in this rezoning. I would like my
property to be rezoned as R3. If there is any additional information needed or anything I can do to aid in
the process, please contact me at [email protected].
Respectfully,
Mercedes Lux
39

Ben Shumaker <[email protected]>
Clarifications of Definitions of Waters of the USRick May <[email protected]> Fri, May 28, 2021 at 2:01 PMTo: Ben Shumaker <[email protected]>Cc: Scott Anderson <[email protected]>, "Kolb, Samuel S (DFW)" <[email protected]>
Hello Ben,
Thank you for the quick response. I appreciate you reaching out and asking for clarification. It appears the City of Stevenson has classified all streams inStevenson relying on Fish & Wildlife Conservation Area Reports. It also appears these reports relied on WAC stream categories. If so, the WAC has nosuch category as a seasonal ditch with no "fish and wildlife habitat conservation areas". If you use only the WAC categories in your report, then of coursea seasonal ditch has to be classified as something. Therefore, with no other option, a seasonal ephemeral stream becomes a regulated Ns stream. Whenall you have is a hammer, the whole world looks like a nail. This is a basic problem with requiring reports to use specific WAC classification systems. Thisis also may be the reason why The Army Corp of Engineers and EPA has recently stated there is a category called ephemeral stream that is notregulated. In addition, this is why other jurisdictions have created the classification of non-regulated ephemeral streams. This classification helps handlethe hole in relying on the WAC classifications. If your Conservation Area Report cannot classify a seasonal ephemeral stream with no significant fish andwildlife function as something beside a Ns stream, then your report is creating setbacks that have no reason to exist. I realize the importance of beingable to rely on code and regulations. However, you have an opportunity to create a reasonable method to solve a significant problem. Creating a methodto verify with a habitat expert whether a seasonal stream has or does not have significant fish and wildlife habitat conservation attributes would be abenefit to all. It gives the public a way to remove unneeded setbacks and create additional development opportunities. It also supports your goal ofincreasing density. Thank you.
Rick May
On Fri, May 28, 2021 at 11:43 AM Ben Shumaker <[email protected]> wrote:
Hi Rick-
I believe the approach you are asking for already exists.
The first task of qualified professionals when preparing Fish & Wildlife Habitat Conserva�on Area Reports is to confirm or correct the classifica�onsof habitats and/or stream types on a site. This process priori�zes the exper�se of those professionals over the City’s maps and allows for them toperform site-specific reviews to determine where the regula�ons do and do not apply.
See SMC 18.13.020(B)(3) & (4) and SMC 18.13.095(C)(1)(a).
Is the exis�ng process somehow different than the one you describe?
Thank you,
BEN SHUMAKER
From: Rick May [mailto:[email protected]] Sent: Friday, May 28, 2021 11:27 AMTo: Ben Shumaker <[email protected]>Cc: Sco� Anderson <[email protected]>; Kolb, Samuel S (DFW) <[email protected]>Subject: Re: Clarifica�ons of Defini�ons of Waters of the US
Hello Ben,
Thank you for the information. As for SMC 18.13.020 (B) I believe the City of Stevenson is on very shaky ground when it considers all localephemeral streams not regulated by the EPA, Army Corp of Engineers or any other agency as "fish and wildlife habitat conservation areas". Studiescan easily be provided by Environmental Engineers which shows at least some local ephemeral streams have no significant fish and wildlife habitatconservation attributes. This is especially true with seasonal streams running in ditches in Stevenson. You can also see a number of cities that breakout Ns streams from ephemeral streams and choose not to regular ephemeral streams.There is a vaste difference between Ns streams that havesignificant fish and wildlife habitat conservation areas and ditches which run only in the rainy season. This is an opportunity for Planning and the City tolook at setbacks that may have no real purpose. It is an opportunity to bring usable land back into economic use. The simple request is for the city toallow a method to provide an environmental analysis from an appropriate engineer to show whether an ephemeral stream has any significant fish andwildlife habitat conservation areas. If not, then setbacks have no purpose. This is a common sense approach that gives the public an opportunity toremove harmful and unnecessary setbacks, while continuing to protect the environment.
Rick May
503-341-2932 40

RCW-365-190-130 - "Fish and wildlife habitat conservation" means land management for maintaining populations of species in suitable habitats withintheir natural geographic distribution so that the habitat available is sufficient to support viable populations over the long term and isolatedsubpopulations are not created. This does not mean maintaining all individuals of all species at all times, but it does mean not degrading or reducingpopulations or habitats so that they are no longer viable over the long term.
On Fri, May 28, 2021 at 9:32 AM Ben Shumaker <[email protected]> wrote:
Hi Rick-
Yes, the Planning Department believes the City has authority to regulate development near ephemeral streams.
The Stevenson Cri�cal Areas Code designates Cri�cal Areas at SMC 18.13.020(B), which includes “fish and wildlife habitat conserva�on areas”.Such designa�ons are required of the City by the State Growth Management Act, RCW 36.70A.170 and subject to the State’s guidelines at WAC365-190-130.
The Stevenson Cri�cal Areas Code classifies fish and wildlife habitat conserva�on areas at SMC 18.13.095(B). Included within theseclassifica�ons are Type Ns waters, “streams that do not have surface flow during at least some por�on of the year, and do not meet the physicalcriteria of a Type F stream” as a riparian area. This classifica�on relies on the State water typing system of WAC 222-16-030.
Regarding the State’s regula�on of development near ephemeral streams, Sam Kolb has been copied here to represent the WashingtonDepartment of Fish & Wildlife’s interests in those areas.
The Planning Department is unaware of a regional governmental en�ty with the authority to regulate development near ephemeral streams.
Thank you,
BEN SHUMAKER
From: Rick May [mailto:[email protected]] Sent: Wednesday, May 26, 2021 2:03 PMTo: Ben Shumaker <[email protected]>Cc: [email protected]: Re: Clarifica�ons of Defini�ons of Waters of the US
Hello Ben,
Thank you for your response. Does the Planning Department believe the City of Stevenson or any other Washington State or regional governmentaldepartment have jurisdictional powers over ephemeral streams? If so, please state the code or regulation which gives this power to the City ofStevenson or any regional governmental entity to regulate streams not considered as waters of the United States. Please be specific if possible.Thank you.
Rick May
503-341-2932
On Tue, May 25, 2021 at 11:53 AM Ben Shumaker <[email protected]> wrote:
Thank you for this clarification of federal regulatory practices.
On Sat, May 22, 2021 at 2:51 PM Rick May <[email protected]> wrote:
Hello Scott, Ben and Karl,
Attached is a recent clarification of what is considered as waters of the US. This clarification states "ephemeral streams, swales, gullies, rillsand pools" are not considered waters of the US and therefore not regulated by EPA or the Army Corp of Engineers. Karl, a lot of the water workyou do is also considered non-jurisdictional
There may be a number of streams noted as Ns streams in Stevenson which would better fit under the category of ephemeral streams. If so,the 50 foot setbacks on both sides of these Ns streams could be removed. This may significantly increase the amount of developable land in 41
Stevenson.
I have one short stream on our property which is currently dry and flows only during heavy rains. I believe this may be a good example of thistype of non-jurisdictional stream. I suggest the City find a fairly easy way for Property Owners to supply an engineering report, whichwould state a stream meets the definition of an ephemeral stream. If the City accepts the report, the setbacks could then be removed, freeingup land for development. Thank you.
Rick May
503-341-2932
--
Rick May
503-341-2932
--
Rick May
503-341-2932
-- Rick [email protected]
42
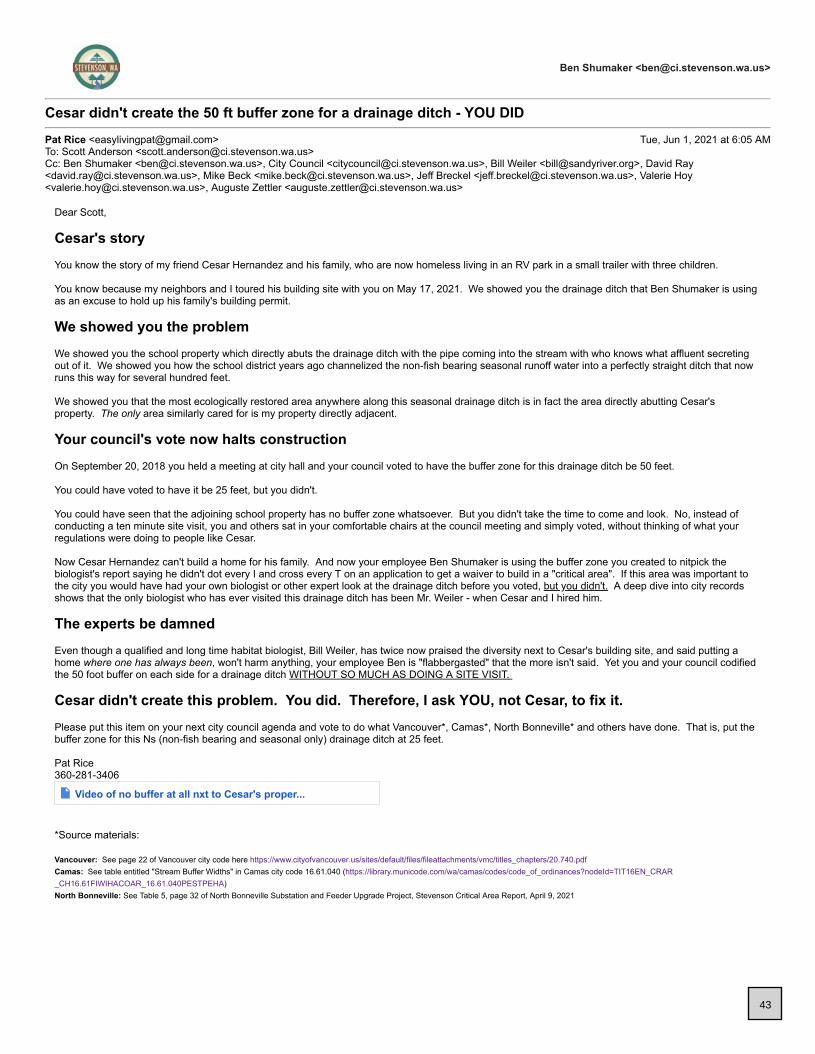
Ben Shumaker <[email protected]>
Cesar didn't create the 50 ft buffer zone for a drainage ditch - YOU DIDPat Rice <[email protected]> Tue, Jun 1, 2021 at 6:05 AMTo: Scott Anderson <[email protected]>Cc: Ben Shumaker <[email protected]>, City Council <[email protected]>, Bill Weiler <[email protected]>, David Ray<[email protected]>, Mike Beck <[email protected]>, Jeff Breckel <[email protected]>, Valerie Hoy<[email protected]>, Auguste Zettler <[email protected]>
Dear Scott,
Cesar's storyYou know the story of my friend Cesar Hernandez and his family, who are now homeless living in an RV park in a small trailer with three children.
You know because my neighbors and I toured his building site with you on May 17, 2021. We showed you the drainage ditch that Ben Shumaker is usingas an excuse to hold up his family's building permit.
We showed you the problemWe showed you the school property which directly abuts the drainage ditch with the pipe coming into the stream with who knows what affluent secretingout of it. We showed you how the school district years ago channelized the non-fish bearing seasonal runoff water into a perfectly straight ditch that nowruns this way for several hundred feet.
We showed you that the most ecologically restored area anywhere along this seasonal drainage ditch is in fact the area directly abutting Cesar'sproperty. The only area similarly cared for is my property directly adjacent.
Your council's vote now halts constructionOn September 20, 2018 you held a meeting at city hall and your council voted to have the buffer zone for this drainage ditch be 50 feet.
You could have voted to have it be 25 feet, but you didn't.
You could have seen that the adjoining school property has no buffer zone whatsoever. But you didn't take the time to come and look. No, instead ofconducting a ten minute site visit, you and others sat in your comfortable chairs at the council meeting and simply voted, without thinking of what yourregulations were doing to people like Cesar.
Now Cesar Hernandez can't build a home for his family. And now your employee Ben Shumaker is using the buffer zone you created to nitpick thebiologist's report saying he didn't dot every I and cross every T on an application to get a waiver to build in a "critical area". If this area was important tothe city you would have had your own biologist or other expert look at the drainage ditch before you voted, but you didn't. A deep dive into city recordsshows that the only biologist who has ever visited this drainage ditch has been Mr. Weiler - when Cesar and I hired him.
The experts be damnedEven though a qualified and long time habitat biologist, Bill Weiler, has twice now praised the diversity next to Cesar's building site, and said putting ahome where one has always been, won't harm anything, your employee Ben is "flabbergasted" that the more isn't said. Yet you and your council codifiedthe 50 foot buffer on each side for a drainage ditch WITHOUT SO MUCH AS DOING A SITE VISIT.
Cesar didn't create this problem. You did. Therefore, I ask YOU, not Cesar, to fix it.Please put this item on your next city council agenda and vote to do what Vancouver*, Camas*, North Bonneville* and others have done. That is, put thebuffer zone for this Ns (non-fish bearing and seasonal only) drainage ditch at 25 feet.
Pat Rice360-281-3406
Video of no buffer at all nxt to Cesar's proper...
*Source materials:
Vancouver: See page 22 of Vancouver city code here https://www.cityofvancouver.us/sites/default/files/fileattachments/vmc/titles_chapters/20.740.pdfCamas: See table entitled "Stream Buffer Widths" in Camas city code 16.61.040 (https://library.municode.com/wa/camas/codes/code_of_ordinances?nodeId=TIT16EN_CRAR_CH16.61FIWIHACOAR_16.61.040PESTPEHA)North Bonneville: See Table 5, page 32 of North Bonneville Substation and Feeder Upgrade Project, Stevenson Critical Area Report, April 9, 2021
43
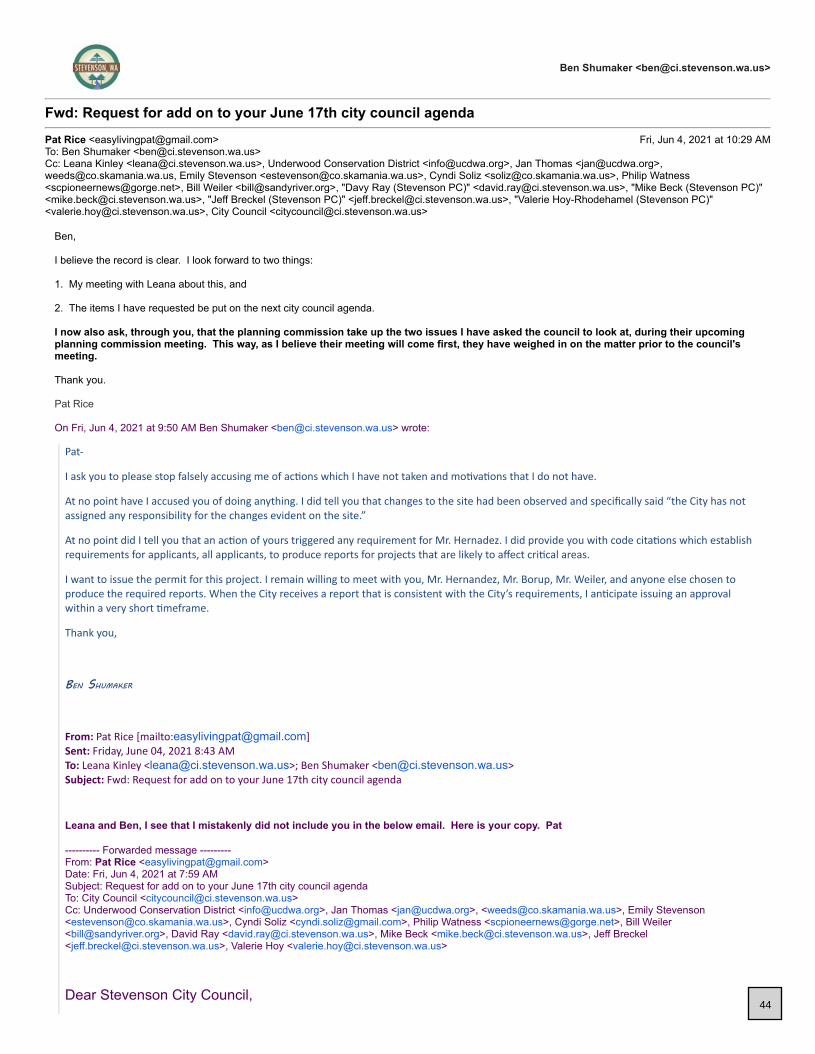
Ben Shumaker <[email protected]>
Fwd: Request for add on to your June 17th city council agendaPat Rice <[email protected]> Fri, Jun 4, 2021 at 10:29 AMTo: Ben Shumaker <[email protected]>Cc: Leana Kinley <[email protected]>, Underwood Conservation District <[email protected]>, Jan Thomas <[email protected]>,[email protected], Emily Stevenson <[email protected]>, Cyndi Soliz <[email protected]>, Philip Watness<[email protected]>, Bill Weiler <[email protected]>, "Davy Ray (Stevenson PC)" <[email protected]>, "Mike Beck (Stevenson PC)"<[email protected]>, "Jeff Breckel (Stevenson PC)" <[email protected]>, "Valerie Hoy-Rhodehamel (Stevenson PC)"<[email protected]>, City Council <[email protected]>
Ben,
I believe the record is clear. I look forward to two things:
1. My meeting with Leana about this, and
2. The items I have requested be put on the next city council agenda.
I now also ask, through you, that the planning commission take up the two issues I have asked the council to look at, during their upcomingplanning commission meeting. This way, as I believe their meeting will come first, they have weighed in on the matter prior to the council'smeeting.
Thank you.
Pat Rice
On Fri, Jun 4, 2021 at 9:50 AM Ben Shumaker <[email protected]> wrote:
Pat-
I ask you to please stop falsely accusing me of ac�ons which I have not taken and mo�va�ons that I do not have.
At no point have I accused you of doing anything. I did tell you that changes to the site had been observed and specifically said “the City has notassigned any responsibility for the changes evident on the site.”
At no point did I tell you that an ac�on of yours triggered any requirement for Mr. Hernadez. I did provide you with code cita�ons which establishrequirements for applicants, all applicants, to produce reports for projects that are likely to affect cri�cal areas.
I want to issue the permit for this project. I remain willing to meet with you, Mr. Hernandez, Mr. Borup, Mr. Weiler, and anyone else chosen toproduce the required reports. When the City receives a report that is consistent with the City’s requirements, I an�cipate issuing an approvalwithin a very short �meframe.
Thank you,
BEN SHUMAKER
From: Pat Rice [mailto:[email protected]] Sent: Friday, June 04, 2021 8:43 AMTo: Leana Kinley <[email protected]>; Ben Shumaker <[email protected]>Subject: Fwd: Request for add on to your June 17th city council agenda
Leana and Ben, I see that I mistakenly did not include you in the below email. Here is your copy. Pat
---------- Forwarded message ---------From: Pat Rice <[email protected]>Date: Fri, Jun 4, 2021 at 7:59 AMSubject: Request for add on to your June 17th city council agendaTo: City Council <[email protected]>Cc: Underwood Conservation District <[email protected]>, Jan Thomas <[email protected]>, <[email protected]>, Emily Stevenson<[email protected]>, Cyndi Soliz <[email protected]>, Philip Watness <[email protected]>, Bill Weiler<[email protected]>, David Ray <[email protected]>, Mike Beck <[email protected]>, Jeff Breckel<[email protected]>, Valerie Hoy <[email protected]>
Dear Stevenson City Council,44
As you know by now, yesterday I was accused of committing a crime by Ben Shumaker and Leana McKinleybecause I had removed by hand tool the invasive species Himalayan blackberries from the drainage ditchcommonly referred to as "Owl Creek".
In addition, Ben Shumaker told me that even if you, the council, voted to return the drainage ditch Owl Creekback to its original 25 foot buffer, that because I had removed invasive blackberries by hand without a permit,that he "would still require" Cesar Hernandez to produce for him a habitat biologist report before signing offon his permit request to build his family a home at 199 NW Del Ray.
In addition to my previous request to put on your June 17th agenda the topic of reverting Owl Creek back to a25 foot buffer*, I also ask you consider at this meeting a proposal to amend your city code to allow forthe removal by hand the invasive Himalayan blackberry plant without requiring a permit.
I make this request based on the latest available science. Page 26 of the attached report from theWashington Department of Fish and Wildlife states:
4. Invasive and/or Noxious Plant Removal – Many CAOs do not require a permit for control and removal of invasive and/or noxious weeds within theriparian ecosystem. We support this when weed control efforts (1) employ hand weeding with light equipment; (2) use only Ecology approved aquaticherbicides and adjuvants (a substance added to herbicides to improve application); avoid use of hazardous substances; and (3) do not result in soilcompaction.
Thank you for considering this request.
Pat Rice
*Because you lacked the science when you affirmed this in 2018 and had never even performed a cursory site visit.
45
Ben Shumaker <[email protected]>
Some clarifications that could be helpfulPat Rice <[email protected]> Thu, Jun 3, 2021 at 5:15 PMTo: Leana Kinley <[email protected]>Cc: Ben Shumaker <[email protected]>, City Council <[email protected]>
Leana,
The debris in these photos was illegally dumped by someone and I simply cleaned it up. Are you serious? Please tell me this is some kind of joke. Yourother anecdotal information is also equally troubling.
I would like to sit down with you soon to discuss this further.
Pat Rice
On Thu, Jun 3, 2021 at 5:04 PM Leana Kinley <[email protected]> wrote:Pat,
Records regarding violations of any ordinance or law, city, state or federal are attached and further description is below.
This includes three photos submitted by you on June 18, 2020 regarding brush and debris at 199 NW Del Ray and the subsequent photos included inthe report submitted by William Weiler showing the vegetation removed and stating: "On his own volition, Mr. Rice has taken the lead with his neighborsto undertake extensive riparian and upland habitat restoration, covering 356 feet of stream bank on both sides. They have cleared ivy, Himalayanblackberries, vinca minor, bamboo and English holly. Up to one-half acre along the creek within the 50 foot regulator buffer on each side of the streamcorridor is also being restored as well as 7/10th of an acre that has been enhanced beyond the creek corridor area." This is in violation of thefollowing codes: SMC 18.13.010(A)(2), 18.13.035(B). and 18.13.035(D).
There was a fire call for an illegal yard burn containing building materials on February 20, 2021, incident report attached. This is in violation of SMC8.25.030(5).
Evidence of demolition of a building without a permit includes the photos mentioned above, and the report by William Weiler where there is a house inthe photo, and the report references an extension of an existing house. The current application in process is for a new house at 199 NW Del Ray ratherthan a remodel and/or addition (application attached). There is no demolition permit on record for 199 NW Del Ray. This is in violation of SMC15.01.020(A) (specifically IBC Ch 33: Safeguards During Construction, section 3303: Demolition attached), SMC 15.01.030(C), SWCAA 476-040(2)and SWCAA 476-050(1) (a copy of SWCAA 476 is attached).
This is the extent of the records pertaining to your request.
Thanks,
Leana Kinley, EMPA, CMC
City Administrator7121 E. Loop Rd/PO Box 371Stevenson, WA 98648-0371(509) 427-5970
On Thu, Jun 3, 2021 at 3:22 PM Ben Shumaker <[email protected]> wrote:
Hi Pat-
See green text below.
Thank you,
BEN SHUMAKER
From: Pat Rice [mailto:[email protected]] Sent: Thursday, June 03, 2021 2:34 PMTo: Ben Shumaker <[email protected]>Cc: Leana Kinley <[email protected]>Subject: Re: Some clarifica�ons that could be helpful
Ben, 46

I just read your response and I need a little help.
Please let me clarify my question. Besides you indicating to me that Cesar Hernandez (orsomeone else) may have taken down his house without a permit, do you have evidence ofanything else happening anywhere in the vicinity that you think violated any ordinance or law,city, state, or federal? First, I never indicated to you that Cesar Hernadez took down the house, onlythat the house is now gone. If so, I now expound on my public records request and ask for anelectronic copy of this evidence. Leana will provide City records responsive to your request.And should you believe that you have evidence of a violation, what causes you to believe that CesarHernandez is the responsible party? Again, the City has not assigned any responsibility for thechanges evident on the site.Additionally, I think you'd have to prove that Cesar Hernandez himself violated some rule or regulationin the first 25 feet next to his property before you could force him to complete a habitat report foranything that occurred within that area (should the city council at its next meeting revert the buffer zone back to its original 25feet).Also, I ask you now to provide me with your legal authority to force anyone to file a "habitat biologistreport" should you be able to prove they in fact did work within a buffer zone. I assume you must havethis authority, or you wouldn't have brought it up. I just need the code or statute you are relying on.Refer to SMC 18.13.015(A) in addition to the specific sections related to Critical Area Reportrequirements which were provided earlier today [SMC 18.13.020(A), SMC 18.13.020(B)(3), SMC 18.13.035(B), SMC18.13.050(A), SMC 18.13.095(C)(1), SMC 18.13.095(E)].
Thank you for your help on the above.
Pat Rice
On Thu, Jun 3, 2021 at 2:07 PM Ben Shumaker <[email protected]> wrote:
Hello Pat-
The full scope of the regulated ac�vi�es occurring on the property is unknown to the City at this �me, in part, because:
- The lack of any past Cri�cal Areas Permit authorizing regulated ac�vi�es on the site, and
- The failure of the Cri�cal Area Report submi�ed with the current proposal to supply the informa�on required in SMC 18.13.050(C),especially (4), and SMC 18.13.095(C)(1), especially (g).
When that report is provided, we an�cipate it will address, and secure authoriza�on for, the ac�vi�es occurring on the site leading to theobserved changes below as well as others that may be desired by the project proponents. Among the observed changes:
- At some point between June 18th, 2020 and February 9th, 2021 the vegetated state of the property changed from that shown in the firsta�achment’s photos to that shown in the second a�achment’s photos. The second a�achment verbally describes this work but does notprovide a site plan showing its loca�on in rela�on to the Type Ns stream, and it concludes with a recommenda�on jus�fied by “the lack ofcurrent vegeta�on”.
- At some point between February 9th and April 9th, 2021 the exis�ng structures on the property were demolished.
If this response by email was not what you were hoping for, please feel free to call for a phone conversa�on.
Thank you,
BEN SHUMAKER
From: Pat Rice [mailto:[email protected]] Sent: Thursday, June 03, 2021 1:03 PMTo: Ben Shumaker <[email protected]>Cc: Leana Kinley <[email protected]>Subject: Re: Some clarifica�ons that could be helpful
Ben, 47
Thank you so much for answering my email. Regarding your answer to my number 4 question, could you tell me what specific "activities" that tookplace on the property that you are referring to? Again, I appreciate your help on this.
Pat
On Thu, Jun 3, 2021 at 10:38 AM Ben Shumaker <[email protected]> wrote:
See green text below.
A request: In your email, you express apprecia�on for the phone call and also a desire to communicate via email instead. If you wouldprefer one type of response over another, please con�nue to specify as part of your future communica�ons. I am happy to connect withthe public in the way they most prefer.
Thank you,
BEN SHUMAKER
From: Pat Rice [mailto:[email protected]] Sent: Thursday, June 03, 2021 4:58 AMTo: Ben Shumaker <[email protected]>Cc: Leana Kinley <[email protected]>Subject: Some clarifica�ons that could be helpful
Good morning Ben,
I appreciate your time on the phone yesterday. The purpose of this email is to help me understand some things. If you would answer by returnemail, rather than calling me, that would be helpful.
1. Regarding my public records request, my understanding of what you were saying to me is that you already sent me in earlier emails all thescience, studies, etc., that you and others relied on to update Chapter 18.13 of the city code on September 20, 2018. Is this what you weresaying? Yes. In particular, references to the science used to develop the current regulations are available in the 2 attached documents. See thegraphic and table in the first attachment and the 3rd recital in the second.
If I misunderstood you, and you still have documents that I have not yet received that are responsive to my PRR dated yesterday, June 2, 2021,please let me know, and I will look forward to receiving them.
2. Has the city ever had a habitat biologist or other science type expert look at any of the Ns streams within the Stevenson City limits? As anapplicant, yes. In advance of the 2008 update, yes.
3. Do you have any data or information of any kind that specifically supports the Ns stream commonly known as Owl Creek as needing aprotective buffer of 50 feet? Or is all the science and information you and others relied on more generally about what is best for Ns streams andnot tied specifically to any particular Ns stream within Stevenson? No. No. As required by RCW 36.70A.172 and under the guidance of WAC365-195, the City used the best available science to determine buffers widths. Science in the form of site specific analyses on private propertieswas not available to the City.
4. You told me that even if the council voted to reverse themselves and re-establish the old buffer of 25 on the Ns drainage ditch passing byCesar's property, that you would still require a habitat biologist report. Please tell me why you said this. Some relevant sections of the CriticalAreas Code include SMC 18.13.020(A), SMC 18.13.020(B)(3), SMC 18.13.035(B), SMC 18.13.050(A), SMC 18.13.095(C)(1), SMC18.13.095(E). Facts related to the activities performed on the site and the development proposal are also relevant.
Thanks Ben.
Pat Rice48

49
RIPARIAN ECOSYSTEMS, VOLUME 2: MANAGEMENT RECOMMENDATIONS
A PRIORITY HABITATS AND SPECIES DOCUMENT OF THE WASHINGTON DEPARTMENT OF FISH AND WILDLIFE
December 2020
This document should be cited as follows:
Riparian Ecosystems, Volume 2: Management Recommendations. 2020. Amy Windrope, Terra Rentz, Keith Folkerts, and Jeff Azerrad. A Priority Habitats and Species Document of the Washington Department of Fish and Wildlife, Olympia, Washington.
50

Riparian Ecosystems, Volume 2: Management Recommendations i
ACKNOWLEDGMENTS
Land Acknowledgement: We acknowledge the traditional, ancestral, territory of Washington state on which we are learning, working, and organizing today. We recognize the longstanding history that has brought us to reside on this land and seek to understand those who first lived here.
Many people were involved with creation of both Volumes 1 and 2 for Priority Habitats and Species (PHS) Riparian Ecosystems. WDFW extends our sincere appreciation to the following individuals and organizations that played important roles during development and/or review of both volumes.
The Washington Department of Ecology (Ecology) and U.S. Environmental Protection Agency (EPA) provided funds that made this document possible (Contract C1300107).
The Washington State Academy of Sciences, with coordination by Dr. Robert Bates, provided an independent peer review that improved the scientific rigor of Volume 1.
Federal (EPA and NOAA Fisheries) and tribal entities (individual tribes, the Northwest Indian Fisheries Commission, Columbia River Inter-Tribal Fish Commission, and Upper Columbia United Tribes) as well as numerous state agencies (Washington State departments of Ecology, Natural Resources, and Commerce; Recreation and Conservation Office; Washington State Conservation Commission; and Puget Sound Partnership) reviewed draft versions of this document. During the summer 2018 public comment period, local governments and members of the public provided valuable feedback that led to a more concise and user-friendly final version of Volume 2.
Within WDFW, Keith Folkerts led coordination, contract planning and budgeting for this work. Tim Quinn and George Wilhere were integral in ensuring a strong relationship with information in Volume 1 and provided additional valuable feedback on multiple drafts. Terry Johnson developed the Site-Potential Tree Height mapping tool and wrote the associated user guide information in the Appendix to this Volume 2. Alison Hart produced final graphics and ensured consistent formatting and stylistic usage throughout. Mary Huff provided editorial support, improved the document’s organization, and (in late 2020) took it across the finish line.
WDFW recognizes and appreciates the significant role that tribes, local governments, conservation organizations, and others play in accomplishing our agency’s mission. Indeed, we are certain that without these concerted efforts to designate and protect the riparian ecosystems that are essential for most of the state’s fish and wildlife species, WDFW would be unable to fulfill its mandate on behalf of all of Washington’s residents.
While we acknowledge and have deep appreciation for all the review and comments provided, WDFW bears sole responsibility for this document and any errors contained herein.
51

Riparian Ecosystems, Volume 2: Management Recommendations ii
TABLE OF CONTENTS Acronyms for Volume 2 ....................................................................................................................................................... iii
Overview ........................................................................................................................................................... 1
1.1 Our Role as Washington’s Conservation Agency .................................................................. 1
1.2 Purpose and Applicability of Volume 2 ................................................................................. 3
1.3 Science Synthesis and Management Implications (Volume 1) Summary ........................... 4
1.4 Key Findings and Recommendations ..................................................................................... 6
1.5 Relationship with Washington’s Development Laws and Regulations ............................... 9
1.6 Organization of Volume 2 ..................................................................................................... 10
CHAPTER 2. Riparian Management Zone Delineation ........................................................................................... 11
2.1 Introduction ........................................................................................................................... 11
2.2 Foundational Concepts in RMZ Determinations ................................................................. 11
2.3 Procedures for RMZ Delineation .......................................................................................... 14
CHAPTER 3. Riparian Regulatory Protections .......................................................................................................... 23
3.1 Introduction ........................................................................................................................... 23
3.2 Recommendations to Local Jurisdictions ............................................................................ 23
3.3 Riparian Management in Urban Areas ................................................................................. 29
3.4 Managing Watersheds ........................................................................................................... 30
CHAPTER 4. Restoring Riparian Ecosystems ............................................................................................................. 34
4.1 Introduction ........................................................................................................................... 34
4.2 Restoration Actions ............................................................................................................... 35
4.3 Implementing Riparian Strategies Through Incentives ..................................................... 36
4.4 Suggested Restoration Practices .......................................................................................... 38
CHAPTER 5. Improving Protection through Adaptive Management ............................................................... 40
5.1 Introduction ........................................................................................................................... 40
5.2 Common Questions Addressed by Adaptive Management ................................................ 41
5.3 Recommended Implementation Monitoring Efforts .......................................................... 42
5.4 Effectiveness of Regulatory Protections of Critical Areas .................................................. 44
5.5 Using Land Cover Change to Understand Long-term Regulatory Protection ................... 44
5.6 Conclusion .............................................................................................................................. 47
Literature Cited ...................................................................................................................................................................... 48
Glossary of Terms .................................................................................................................................................................. 53
APPENDIX. Site-Potential Tree Height Mapping Tool ............................................................................................ 61
52
Riparian Ecosystems, Volume 2: Management Recommendations iii
ACRONYMS FOR VOLUME 2 CAO Critical Areas Ordinance
CMZ Channel Migration Zone
CREP Conservation Reserve Enhancement Program
DFC Desired Future Condition
DNR Department of Natural Resources (Washington State)
EBM Ecosystem Based Management
EPA Environmental Protection Agency (U.S.)
ESA Endangered Species Act
FEMA Federal Emergency Management Agency
FEMAT Forest Ecosystem Management Assessment Team
FPA Forest Practices Act
FWHCA Fish and Wildlife Habitat Conservation Area
GIS Geographic Information System
GMA Growth Management Act
HMP Habitat Management Plan
HRCD High Resolution Change Detection
LID Low Impact Development
NHD National Hydrography Dataset
NOAA National Oceanographic and Atmospheric Administration
NRCS Natural Resources Conservation Service
OHWM Ordinary High-Water Mark
OSS On-site Sewage Systems
PHS Priority Habitats and Species
RCO Recreation and Conservation Office (Washington State)
RCW Revised Code of Washington
RMZ Riparian Management Zone
RZ Riparian Zone
SMA Shoreline Management Act
SMP Shoreline Master Program
SPTH Site-Potential Tree Height
SPTH200 Site-Potential Tree Height (at age 200 years)
USFS United States Forest Service
53

Riparian Ecosystems, Volume 2: Management Recommendations iv
USFWS United States Fish and Wildlife Service
UWCIG University of Washington Climate Impacts Group
VSP Voluntary Stewardship Program
WAC Washington Administrative Code
WDFW Washington Department of Fish and Wildlife
WFPB Washington Forest Practices Board
WRIA Water Resource Inventory Area
WSCC Washington State Conservation Commission
WWRP Washington Wildlife and Recreation Program
54

Riparian Ecosystems, Volume 2: Management Recommendations 1
OVERVIEW
1.1 OUR ROLE AS WASHINGTON’S CONSERVATION AGENCY The mission of the Washington Department of Fish and Wildlife (WDFW) is to preserve, protect, and perpetuate the state’s fish, wildlife, and ecosystems while providing sustainable fish and wildlife recreational and commercial opportunities. We offer the following science-based guidance to further that mission through the preservation, protection, and—where possible—restoration of healthy, intact, and fully functioning riparian ecosystems statewide. As described throughout this volume, we believe that protection and restoration1 of Washington’s riparian ecosystems is a foundational conservation action; considering a growing population and changing climate, it is also an urgent one.
Within the State of Washington’s land use decision-making framework, WDFW’s role is that of advisor. We provide information relative to our mission about the habitat needs of fish and wildlife, and the likely implications of various land use decisions on those resources over time. Through the Priority Habitats and Species (PHS) Program, we work cooperatively with land use decision makers and landowners to facilitate solutions that accommodate their needs and the needs of fish and wildlife. We provide this PHS document, Riparian Ecosystems Volume 2: Management Recommendations in support of that effort.
Priority Habitats are places that warrant special consideration for protection when land use decisions are made and should also be prioritized for restoration or enhancement wherever possible. To qualify as a “Priority Habitat” in WDFW’s PHS program, an ecosystem or habitat component must provide unique or significant value to many species. Specifically, it must have one or more of the following attributes (WDFW 2008):
• Comparatively high fish and wildlife density • Comparatively high fish and wildlife species diversity • Important fish or wildlife breeding habitat
1 Restoration of riparian ecosystems is critically important because legacy of environmental impacts resulting from the ways land use has affected riparian areas over the past 200 years. In other words, what remains available for protection is not enough to provide the full functions and values Washington’s fish and wildlife need.
WDFW’S MISSION To preserve, protect, and perpetuate Washington’s fish, wildlife, and ecosystems while providing sustainable fish and wildlife recreational and commercial opportunities.
WDFW’S RIPARIAN VALUES We value the protection and restoration of healthy, intact, and fully functioning riparian ecosystems statewide.
WDFW’S RECOMMENDATION Within the context of wise watershed management, preserve, protect, and—where possible—restore the full extent of riparian ecosystems.
55

Riparian Ecosystems, Volume 2: Management Recommendations 2
• Important fish or wildlife seasonal ranges • Important fish or wildlife movement corridors • Limited availability • High vulnerability to habitat alteration • Unique or dependent species
Riparian areas (comprised of riparian ecosystems, active floodplains, and riverine wetlands) meet all these criteria, and were among the first Priority Habitats described by WDFW. Riparian areas provide important ecological functions that help create and maintain aquatic habitats in addition to supporting terrestrial wildlife. Riparian areas alongside rivers and streams are the focus of this document, however much of the science reviewed in Volume 1 and the recommendations in this Volume 2 are relevant for lakes, ponds, and marine shorelines as well.
As previously mentioned, one role of WDFW in land use decision making is that of advisor. In that role, recommendations like those contained in this document and in complementary PHS documents (available at https://wdfw.wa.gov/species-habitats/at-risk/phs/recommendations) provide critical information for the protection (and where necessary, recovery) of Washington’s fish and wildlife. We recognize landowners and land managers most often face situations where various human needs must also be met; and thus, considerations other than fish and wildlife will be incorporated into land use decision making.
The information presented in this management recommendation document is not, in and of itself, science. Rather, it consists of policy recommendations which are informed by the best available science summarized in Volume 12 and which reflect WDFW’s mission and legislative mandate. To that end, these recommendations represent WDFW’s guidance for the protection and restoration of healthy, intact, and fully functioning riparian ecosystems and
2 The original manuscript of Riparian Ecosystems, Volume 1: Science Synthesis and Management Implications was publicly released in May 2018. In 2020, the format of the document was professionally designed, which included making limited updates to content focused on copyediting and improving usability. In accordance with standard citation practice, Volume 1 is now cited as having a 2020 publication date, but substantively, the current document is equivalent to the original 2018 version.
Ecosystem Based Management & WDFW’s Conservation Principles
In 2013, WDFW adopted ecosystem-based management principles into policy (WDFW Policy 5004). Ecosystem-based management is an integrated, science-based approach to natural resource management that aims to sustain the ability of ecosystems to provide goods and services upon which humans and other species depend. Importantly, ecosystem-based management recognizes the magnitude of humans as change agents in the ecosystem, and the role of social, economic, and ecological factors in managing complex and dynamic systems.
We believe that conservation is best achieved through employing the following ecosystem-based management principles:
1. We practice conservation by managing, protecting, and restoring ecosystems for the long-term benefit of people, and for fish wildlife and their habitats.
2. We work across disciplines to solve problems because of their connections among organisms, species and habitats.
3. We integrate ecological, social, economic, and institutional perspectives into our decision-making.
4. We embrace new knowledge and apply best science to address changing conditions through adaptive management.
5. We collaborate with our co-managers and conservation and community partners to help us achieve our shared goals.
56
Riparian Ecosystems, Volume 2: Management Recommendations 3
for how land managers and land use regulators can utilize best available science to protect these ecosystems within the scope of their authority and/or ability.
For example, local governments are encouraged to use information provided through PHS to guide critical area ordinance (CAO) updates and other land use policies, plans, or regulations. More specifically, WDFW advises using the information in this PHS Riparian Volume 2 for designating riparian areas as Fish and Wildlife Habitat Conservation Areas (FWHCAs) and protecting them for their inherent value, rather than just as buffers for rivers and streams. This is because riparian areas are so important for helping sustain endangered, threatened, and sensitive species; providing habitat connectivity for both aquatic and terrestrial wildlife; and for their critical role in protecting salmonid habitat (WAC 365-190-130).
In short, Volumes 1 and 2 focus on the science and management, respectively, of riparian ecosystems to support fish and aquatic wildlife species. Volume 1 characterizes riparian ecosystem functions and essential processes, while Volume 2 provides management guidance for riparian ecosystems in the context of watershed processes. To be clear, these two volumes do not provide a summary of science or recommendations regarding the contribution of riparian ecosystems for the protection of terrestrial wildlife species. However, our first generation PHS Riparian-specific document, Management Recommendations for Washington’s Priority Habitats: Riparian (Knutson and Naef 1997) does provide terrestrial species information related to riparian areas. Further, PHS has separate, species-specific management recommendations that address the needs of many terrestrial Priority Species.
This document provides recommendations applicable across the State of Washington but does not address unusual, site-scale environmental conditions or issues specific to particular ecological communities. We strongly encourage addressing such matters at a local level with the assistance of WDFW regional habitat biologists, and other technical experts and stakeholders such as tribal biologists and conservation organizations.
1.2 PURPOSE AND APPLICABILITY OF VOLUME 2 The purpose of this document is to provide guidance to protect and—where possible—restore healthy, intact, and fully functioning riparian ecosystems, which are fundamental for clean water, healthy salmon populations, and climate resilient watersheds.
Volume 2 provides information to:
• Protect existing and restore degraded riparian ecosystem functions in support of aquatic and terrestrial species recovery;
• Assist local governments with their responsibilities to protect priority fish and wildlife and their habitats;
• Assist landowners and local groups in implementing voluntary restoration actions on and off working lands; and
• Incorporate monitoring and adaptive management to understand how well regulatory and non-regulatory efforts are protecting riparian functions and values.
This guidance is applicable to riparian ecosystems statewide. We offer a specific focus on lands within the purview of the Growth Management Act (GMA) and Shoreline Management Act (SMA), although a broader application by local governments and other users is also appropriate.
57
Riparian Ecosystems, Volume 2: Management Recommendations 4
While many other federal, state, and tribal government programs and policies pertain to riparian ecosystems, they are not specifically addressed in this document. For instance, we do not discuss holistic protection of floodplains, nor do we discuss specific Endangered Species Act (ESA) requirements relative to listed salmonids and other species. Also, we do not address commercial forestlands that fall under the jurisdiction of the Forest Practices Act (FPA), or the Department of Ecology’s clean water regulations. These other programs and policies were developed with specific goals and objectives that may be different from the goals of this document, and as such may differ with guidance provided herein.
1.3 SCIENCE SYNTHESIS AND MANAGEMENT IMPLICATIONS (VOLUME 1) SUMMARY As stated above, Volume 1 (Quinn et al. 2020; see footnote 2) provides important information integral to the development of these management recommendations. It includes both overarching as well as specific considerations important to all efforts, large and small, to protect rivers and streams for the benefit of the aquatic species associated with them. Volume 1 focuses on the science of riparian ecosystems—specifically, how riparian areas interact with large-scale drivers (e.g., topography, geology, climate, and land use) and watershed processes to create and maintain riparian and aquatic habitat in support of fish and wildlife. Thus, we provide here an explicit definition of riparian ecosystems from Volume 1 that combines a variety of conceptual riparian descriptions from the scientific literature:
Riparian ecosystems are transitional between terrestrial and aquatic ecosystems, distinguished by gradients in biophysical conditions, ecological processes, and biota. They are areas through which surface and subsurface hydrology connect waterbodies with adjacent uplands. They include those portions of terrestrial ecosystems (i.e., a zone of influence) that significantly influence exchanges of energy and matter with aquatic ecosystems and the portion of the ecosystem characterized by moist soils and plants adapted to periodically saturated soils – the riparian zone (RZ). The width of the riparian ecosystem is typically defined by the outer edge of the zone of influence, which, in forested regions, is based on site-potential tree height (SPTH) measured from the edge of the active channel. While our definition of riparian ecosystem does not include the water in river or streams, it does include riverine wetlands and recognizes the riparian zone as a distinctive area within riparian ecosystems.
To assist managers in understanding important implications of the science synthesized in Volume 1, we reiterate the ten overarching findings of that document below. These findings are also discussed in more detail in later chapters.
1. Protection and restoration of riparian ecosystems continues to be critically important because: (a) they are disproportionately important, relative to area, for aquatic species (e.g., salmon) and terrestrial wildlife; (b) they provide ecosystem services such as water purification and fisheries (Naiman and Bilby 2001, NRC 2002, Richardson et al. 2005); and (c) by interacting with watershed-scale processes, they contribute to the creation and maintenance of aquatic habitats.
2. Stream riparian ecosystems encompass the riparian zone; the active floodplain, including riverine wetlands and the terraces; and adjacent uplands that contribute matter and energy
58
Riparian Ecosystems, Volume 2: Management Recommendations 5
to the active channel or active floodplain (Gregory et al. 1991, Naiman and Bilby 1998). Such terraces and adjacent uplands are called the zone of influence.
3. The width of the riparian ecosystem is estimated by one 200-year SPTH measured from the edge of the active channel or active floodplain. Protecting functions within at least one 200-year SPTH is a scientifically supported approach if the goal is to protect and maintain full function of the riparian ecosystem.
4. Where the riparian zone is narrow (<100 ft [30 m]) and the zone of influence lacks tall trees (<100 ft), (e.g., in parts of the Columbia Plateau Ecoregion), the pollution removal function may determine the width of the zone of influence.
5. The riparian ecosystem begins at the edge of the active channel or active floodplain, whichever is wider. As the active channel moves back and forth across the channel migration zone (CMZ), the riparian ecosystem moves with it. Consequently, there are times when the riparian ecosystem lies adjacent to or overlaps the CMZ (see Figure 2.3). Hence, to maintain riparian ecosystem functions, management must anticipate and protect future locations of the riparian ecosystem.
6. A near consensus of scientific opinion holds that the most effective and reliable means of maintaining viable self-sustaining fish, especially salmon, and wildlife populations is to maintain/restore ecosystems to conditions that resemble or emulate their historical range of natural variability (Swanson et al. 1994, Reeves et al. 1995, Bisson et al. 2009). This opinion is based in part on the complexity of processes that affect the expression of habitats over time and space.
7. The protection and restoration of watershed-scale processes, especially related to hydrology, water quality, connectivity, and inputs of wood, shade, and sediment are important for aquatic system function, and help maximize the ecological benefits of riparian ecosystem protections.
8. Riparian areas and surrounding watersheds are complex and dynamic systems comprised of many interacting components. Natural disturbances (flood, fire, and landslides) across the watershed and through time create the mosaic of conditions necessary for self-sustaining populations of fish, especially salmon, and other aquatic organisms.
9. Impending changes to aquatic systems as a result of climate change increase risk to species already threatened by human activities. The effects of climate change on rivers and streams threaten to reduce fish distribution and viability throughout the Pacific Northwest (Beechie et al. 2013).
10. The use of the precautionary principle and adaptive management are particularly appropriate when dealing with complex and dynamic systems, and when we have uncertainty related to exactly how management activities affect functioning of watersheds and riparian ecosystems.
59

Riparian Ecosystems, Volume 2: Management Recommendations 6
1.4 KEY FINDINGS AND RECOMMENDATIONS WDFW recognizes that there is a significant amount of work currently being done throughout the state to protect and restore riparian areas. This focus is longstanding and has ranged from regulatory protections that guide Washington’s growing population to voluntary conservation on our working lands. Below, we highlight what we believe—based on best available science and our agency’s mission—are the most important recommendations to ensure healthy, intact, and fully functioning riparian ecosystems that provide for the preservation, protection and perpetuation of Washington’s fish and wildlife:
1. Designate riparian ecosystems as critical areas: WDFW recognizes riparian ecosystems as a Priority Habitat for fish and wildlife and recommends that local jurisdictions designate those ecosystems as Fish and Wildlife Habitat Conservation Areas (FWHCAs), a type of critical area. We define the bounds of the riparian ecosystem as the riparian management zone (RMZ), and this RMZ should be designated as the location where protection and restoration of riparian ecosystem functions and values are addressed. RMZs provide a framework for delineating, evaluating, planning, and managing functions and values. In this volume, we provide a process for RMZ delineation (Chapter 2).
2. Include watershed–scale management considerations: Watershed-scale management is critical to realizing the full benefits of riparian ecosystem protection and restoration. Certain types of anthropogenic changes at the watershed scale can dramatically reduce the effectiveness of riparian ecosystems to protect aquatic habitat. For example, unmitigated delivery of stormwater from impervious surfaces like roads, parking lots, and rooftops to streams, for example, dramatically increases peak stream flows, alters channel form, and short-circuits the capacity of riparian areas to remove pollutants from runoff. Similarly, road-crossing culverts that are impassible to fish can reduce stream-network connectivity and dramatically reduce amounts of otherwise suitable habitat.
3. Use reference points to locate the inner edge of the RMZ:
• For streams without Channel Migration Zones (CMZs), the inner edge of the RMZ should be delineated starting at the outer edge of active floodplain, if this has or can be determined; otherwise, from the active channel, as delineated by the Ordinary High-Water Mark (OHWM)3.
• For streams with CMZs, the unpredictable nature of channel migration should be accommodated through delineation of an RMZ that encompasses both the entire CMZ and future locations of the riparian ecosystem. In these instances, the inner edge of the RMZ should be located at the outer edge of the CMZ.
Whether or not a stream has a CMZ, the distance from the inner edge of the RMZ to the outer edge of the RMZ should be one SPTH200.
3 Active floodplain delineations are rarely available, and we currently lack a repeatable, well-vetted, and widely accepted method for the delineation of active floodplains. Therefore, until such a process is developed, we recommend delineating the RMZ’s inner edge using the OHWM for streams without CMZs.
60

Riparian Ecosystems, Volume 2: Management Recommendations 7
4. Include CMZs in delineation of the RMZ: CMZs are important to protect for maintaining riparian functions and values, and so are included in the delineation of RMZs. Over time, a riparian ecosystem will occupy different parts of the CMZ and uplands outside the CMZ. Lateral channel migration and related streambank erosion processes can pose risks to homes and communities located near rivers; however, when channels are constrained from moving, aquatic and riparian ecosystems may degrade over time. To maintain riparian ecosystem functions, land managers must anticipate and protect future locations of the riparian ecosystem and thus delineate the RMZ accordingly.
5. Establish RMZ widths based on site-specific conditions: From the perspective of those riparian ecosystem functions affecting aquatic systems, the width of the riparian ecosystem varies with ecological conditions. The most efficient way to protect riparian functions is to adopt protections that recognize these differences, rather than uniform-width (i.e., one-size-fits-all) RMZs, as these may result in over-protection in some places and under-protection in others.
a. In forested ecoregions, start with SPTH200: At most riparian areas in forested ecoregions, SPTH200 is 100 feet or greater, and so the RMZ is delineated using one SPTH200. If SPTH200 is less than 100 feet, the RMZ is delineated by the pollution removal function (see below). In highly altered areas where soil data are not available, it may be necessary to estimate SPTH200 values based on nearby soils.
b. In dryland ecoregions, start with SPTH200 (if available), or the width of the riparian vegetation community: If site conditions do not support tree species or SPTH200 is less than 100 feet, then RMZ width is determined by the full extent of all riparian vegetation (the riparian zone) or by the pollution removal function—see below.
c. For both forested and dryland ecoregions, use the pollution removal function when appropriate: Where the SPTH200 and/or the width of the riparian vegetative community is less than 100 feet, we recommend that RMZ width be delineated at a minimum of 100 feet, as this provides the width necessary for 95% pollution removal target for most pollutants (approximately 85% for surface nitrogen.)4
To aid with site-specific RMZ delineation, WDFW created an internet-based mapping tool that reports recommended widths for RMZs (Appendix 1) statewide based on SPTH200. The tool also notes instances where a 100-foot RMZ should be applied to support the pollution removal function.
6. Apply the recommended RMZ delineation steps to all streams, whether or not they are fish-bearing: In 1997, WDFW recommended a lower level of protection for non-fish bearing streams than fish-bearing streams. In reviewing the current science literature for Volume 1, we found no evidence that full riparian ecosystem functions along non-fish-bearing streams are less important to aquatic ecosystems than full riparian ecosystem
4 See Chapter 2, Section 2.3.5 for more information about surface nitrogen removal and other site-specific characteristics that may require RMZ distances greater than 100 feet in order to ensure an adequate pollution removal function.
61

Riparian Ecosystems, Volume 2: Management Recommendations 8
functions along fish-bearing streams. This recommendation is based on four additional considerations. Non-fish-bearing streams:
• Support a unique community of aquatic and riparian-obligate wildlife;
• Provide movement corridors for wildlife, particularly in the face of changing climate conditions;
• Provision fish-bearing streams with matter and energy; and
• Provide cool water to downstream reaches. Washington State has already experienced increased stream temperatures due to climate change and expect further increases, which have direct implications for the persistence of fish.
7. Establish monitoring and adaptive management frameworks: We believe it is critical to understand if riparian ecosystems protections are working as intended, and if not, to adjust them accordingly. We recommend the establishment of monitoring and adaptive management designed to improve (where necessary) local permit implementation and compliance, and to increase effectiveness of actions intended to protect aquatic species.
8. Consider needs of relevant terrestrial species: As stated earlier, a review of new literature related to the needs of terrestrial Priority Species was not a focus of Volume 1. Nonetheless, riparian areas provide important functions for threatened, endangered, and sensitive terrestrial wildlife that require consideration by landowners and land managers. WDFW regional habitat biologists, tribal biologists and/or other local habitat experts can assist in identification of site-specific terrestrial species needs. Because riparian protections
WAC 365-190-130 FISH AND WILDLIFE HABITAT CONSERVATION AREAS
(1) “Fish and wildlife habitat conservation” means land managed for maintaining populations of species in suitable habitats within their natural geographic distribution, so that the habitat is sufficient to support viable populations over the long term and isolated subpopulations are not created. This does not mean maintaining all individuals of all species at all times, but it does mean not degrading or reducing populations or habitats so that they are no longer viable over the long term. Counties and cities should engage in cooperative planning and coordination to help assure population viability.
Fish and wildlife habitat conservation areas contribute to the state's biodiversity and occur on both publicly- and privately-owned lands. Designating these areas is an important part of land use planning for appropriate development densities, urban growth area boundaries, open space corridors, and incentive-based land conservation and stewardship programs.”
WAC 173-26-186 GOVERNING PRINCIPLES OF THE [SMP] GUIDELINES
(8) “Through numerous references to and emphasis on the maintenance, protection, restoration, and preservation of “fragile” shoreline “natural resources,” “public health,” “the land and its vegetation and wildlife,” “the waters and their aquatic life,” “ecology,” and “environment,” the act makes protection of the shoreline environment an essential statewide policy goal consistent with other policy goals of the act. It is recognized that shoreline ecological functions may be imparted not only by shoreline development subject to the substantial development permit requirements of the act but also by past actions, unregulated activities, and development that is exempt from the act’s permit requirements. The principle regarding protecting shoreline ecological systems is accomplished by these guidelines in several ways, and in the context of related principles.”
62

Riparian Ecosystems, Volume 2: Management Recommendations 9
benefit both aquatic and many terrestrial wildlife species, concentrating protections around riparian areas may also be an efficient use of resources.
1.5 RELATIONSHIP WITH WASHINGTON’S DEVELOPMENT LAWS AND REGULATIONS
Relationship with the Growth Management Act (GMA) The GMA requires local jurisdictions to designate and protect critical areas, and in so doing, use best available science and give special consideration to anadromous species5. The GMA also encourages state agencies to provide technical assistance to counties and cities in the review of their critical areas ordinances (CAOs), comprehensive plans, and development regulations [RCW 36.70A.130(6)(g)]. While the Washington State Department of Commerce (Commerce) administers the GMA, WDFW is the lead state agency for advising local governments on matters related to one type of critical area: Fish and Wildlife Habitat Conservation Areas (FWHCAs), and we produce PHS Management Recommendations like this Volume 2 in support of that role.
This document provides guidance that is consistent with the GMA, under which local governments exercise their land use responsibilities: specifically, protection of the functions and values of critical areas. It also reflects the legal and policy framework within which WDFW and the PHS program operate, which includes among other things providing a source of best available science necessary to support local governments in distinguishing and delineating those critical areas (e.g., FWHCAs).
WDFW understands that local jurisdictions have existing critical area regulations that have been approved by elected officials and in many cases have been found to be compliant with GMA through the Growth Management Hearings Board and courts. We acknowledge that revising a critical area regulation can be a lengthy, expensive, and contentious process, and so jurisdictions frequently do not make updates to their CAOs more frequently than required by law or rule. In this volume, we aim to be more precise about where recent science has improved our certainty around the need for riparian protections, as well as for specific practices; and how to incorporate best available science and WDFW’s management recommendations.
WDFW also recommends local jurisdictions continue considering PHS best available science (e.g., Volume 1; PHS maps), incorporating PHS Management Recommendations, and seeking technical assistance from WDFW’s regional habitat biologists not just when updating and implementing critical area policies and regulations, but in all land use planning efforts.
Relationship with the Shoreline Management Act (SMA) As with GMA, WDFW plays a role of technical advisor under SMA, working directly through locally led development processes, with the goal of addressing needs for fish and wildlife. Under SMA, the Department of Ecology (Ecology) has a role approving Shoreline Master Program (SMP) updates when they are deemed consistent with all statutory and regulatory requirements. Ecology also has
5 RCW 36.70A.172(1): “In designating and protecting critical areas under this chapter, counties and cities shall include the best available science in developing policies and development regulations to protect the functions and values of critical areas. In addition, counties and cities shall give special consideration to conservation or protection measures necessary to preserve or enhance anadromous fisheries.”
63

Riparian Ecosystems, Volume 2: Management Recommendations 10
a direct role in implementation of SMPs, including issuing the final decision to approve, deny, or put conditions on locally issued conditional use permits and variances. [Under GMA, Commerce does not approve comprehensive plan updates or CAOs.]
The goal of SMA is “to prevent the inherent harm in an uncoordinated and piecemeal development of the state’s shorelines” (RCW 90.58.020). To achieve that end, WDFW recommends local jurisdictions designate riparian areas and provide the same levels of protection for them within the SMA jurisdiction areas as they do under GMA. While the SMA does not apply to streams with 20 cubic feet per second (cfs) or less mean annual flow, we recommend the application of the guidelines in this Volume 2 to all rivers and streams, regardless of size.
1.6 ORGANIZATION OF VOLUME 2 Chapter 1 aims to establish Volume 2’s purpose and intent; articulate WDFW’s values; and provide policy context regarding protection and designation of riparian ecosystems.
In Chapter 2, we define the RMZ based on SPTH200 with special considerations for urban and dryland landscapes; and provide a stepwise process for identifying and delineating the RMZ both for requiring riparian protections and for classifying RMZs as a FWHCA under GMA.
Chapter 3 articulates policies, plans, and practices that protect riparian ecosystems. WDFW recognizes that counties and cities have a long history of providing such protections, and the responsibility to include best available science when updating CAOs. The protection recommendations described in this chapter are intended to help counties and cities moving forward with reviewing and updating their CAOs and other relevant policies and plans.
Chapter 4 explains the importance of restoration in riparian management, which is necessary for recovery of the degraded riparian functions present in many locations and is critical to recover salmon stocks and preserve Washington’s riparian-dependent Priority Species. To that end, we outline voluntary approaches to improve riparian functions. Although Volume 2 is not a restoration guide, it is applicable to restoration practitioners in that it describes management actions that enhance riparian functions and values. We do not address restoration project design or standards but provide links within this chapter to resources that do.
Chapter 5 will assist with developing monitoring programs in support of adaptive management, designed to ensure transparent programs that consistently deliver sufficient protection of riparian functions. Careful monitoring and adaptive management are particularly important when a land use may harm a critical area and scientific information about the likely severity of harm is lacking. Although specific to local governments, this chapter provides valuable resources for any land manager interested in engaging in adaptive management.
Finally, this volume includes an appendix that contains a “how-to” process for utilizing WDFW’s SPTH mapping tool to help determine recommended minimum RMZ widths around the state. The tool itself is available at wdfw.maps.arcgis.com/apps/MapSeries/index.html?appid=919ea98204eb4f5fa70eca99cd5b0de1.
64

Riparian Ecosystems, Volume 2: Management Recommendations 11
CHAPTER 2. RIPARIAN MANAGEMENT ZONE DELINEATION
2.1 INTRODUCTION We define the extent of the riparian ecosystem as the area that provides full ecological function for bank stability, shade, pollution removal, contributions of detrital nutrients, and recruitment of large woody debris. For the purposes of management or regulatory protection, the riparian management zone (RMZ) encompasses the riparian ecosystem, and—when present—the channel migration zone (CMZ) to account for lateral movement of the riparian ecosystem over time. RMZs can also provide habitat for many terrestrial wildlife species including movement corridors. WDFW categorizes the riparian ecosystem as a Priority Habitat, and thus recommends local jurisdictions designate all riparian areas as critical areas: specifically, Fish and Wildlife Habitat Conservation Areas (FWHCAs), as mentioned in Chapter 1.
The RMZ provide an initial framework for delineating, assessing, planning, and managing riparian ecosystems. The RMZ as defined here is not necessarily the same as setbacks or buffers. Setbacks are areas meant to protect an important feature (e.g., a stream or wetland) from certain types of adjacent activities, e.g., the area separating a building from the bank of a river. Setbacks are not typically designed to provide ecological function. On the other hand, buffers, which also protect important features, are commonly undeveloped, naturally vegetated areas that can contribute habitat and in the case of a stream, to riparian functions. In this document, we reserve the use of the term RMZ to mean the area capable of providing full function and managed to that end.
2.2 FOUNDATIONAL CONCEPTS IN RMZ DETERMINATIONS
Desired Future Condition A major goal in fulfilling WDFW’s mission to preserve, protect, and perpetuate Washington’s fish, wildlife, and ecosystems is the protection and restoration of healthy, intact, and fully functioning riparian areas. More specifically, the goal will be achieved through management strategies that result in ecosystem composition and structure that provides the five key ecological functions associated with riparian ecosystems. A useful benchmark for this goal is desired future condition (DFC) for riparian areas. DFC describes what land managers are attempting to achieve, often in terms of composition and structure (e.g., vegetation or land-use), over a period of time in a given geographic area. The DFC we recommend results in fully functioning riparian ecosystems as measured by the five key ecological functions (bank stability, shade, pollution removal, contributions of detrital nutrients, and recruitment of large woody debris) in western Washington. The DFC for composition and structure is old, structurally complex conifer-dominant forest. Such forests exhibit large diameter trees, contain numerous large snags and logs, and have multi-layered canopies and canopy gaps, which promote understory plant diversity.
Throughout the Columbia Plateau, differences in hydrology and geomorphology manifest substantial site-level differences in composition and structure of riparian vegetation, and hence, the DFC for composition and structure is more site-dependent in the Columbia Plateau than in western Washington. Nonetheless, the DFC in the Columbia Plateau is based on the same concepts of ecosystem composition and structure that support the same five key ecological functions in forested regions; specifically, biologically diverse vegetation communities consisting of native trees,
65
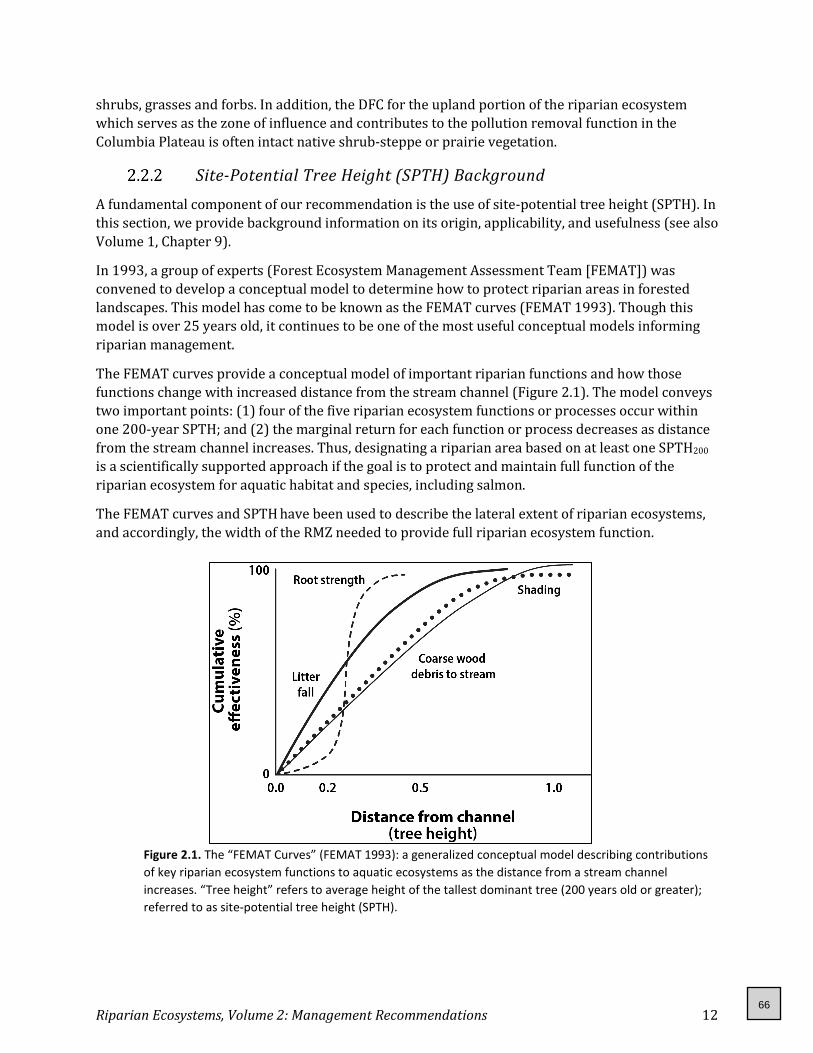
Riparian Ecosystems, Volume 2: Management Recommendations 12
shrubs, grasses and forbs. In addition, the DFC for the upland portion of the riparian ecosystem which serves as the zone of influence and contributes to the pollution removal function in the Columbia Plateau is often intact native shrub-steppe or prairie vegetation.
Site-Potential Tree Height (SPTH) Background A fundamental component of our recommendation is the use of site-potential tree height (SPTH). In this section, we provide background information on its origin, applicability, and usefulness (see also Volume 1, Chapter 9).
In 1993, a group of experts (Forest Ecosystem Management Assessment Team [FEMAT]) was convened to develop a conceptual model to determine how to protect riparian areas in forested landscapes. This model has come to be known as the FEMAT curves (FEMAT 1993). Though this model is over 25 years old, it continues to be one of the most useful conceptual models informing riparian management.
The FEMAT curves provide a conceptual model of important riparian functions and how those functions change with increased distance from the stream channel (Figure 2.1). The model conveys two important points: (1) four of the five riparian ecosystem functions or processes occur within one 200-year SPTH; and (2) the marginal return for each function or process decreases as distance from the stream channel increases. Thus, designating a riparian area based on at least one SPTH200
is a scientifically supported approach if the goal is to protect and maintain full function of the riparian ecosystem for aquatic habitat and species, including salmon.
The FEMAT curves and SPTH have been used to describe the lateral extent of riparian ecosystems, and accordingly, the width of the RMZ needed to provide full riparian ecosystem function.
Figure 2.1. The “FEMAT Curves” (FEMAT 1993): a generalized conceptual model describing contributions of key riparian ecosystem functions to aquatic ecosystems as the distance from a stream channel increases. “Tree height” refers to average height of the tallest dominant tree (200 years old or greater); referred to as site-potential tree height (SPTH).
66
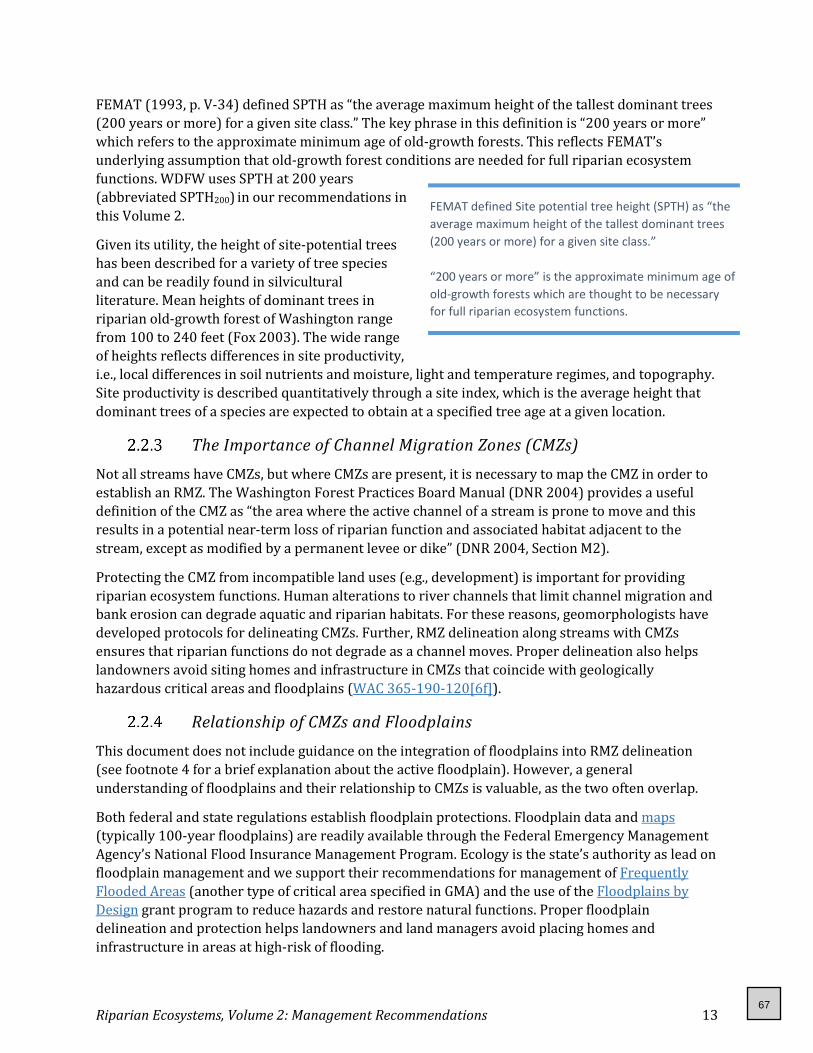
Riparian Ecosystems, Volume 2: Management Recommendations 13
FEMAT (1993, p. V-34) defined SPTH as “the average maximum height of the tallest dominant trees (200 years or more) for a given site class.” The key phrase in this definition is “200 years or more” which refers to the approximate minimum age of old-growth forests. This reflects FEMAT’s underlying assumption that old-growth forest conditions are needed for full riparian ecosystem functions. WDFW uses SPTH at 200 years (abbreviated SPTH200) in our recommendations in this Volume 2.
Given its utility, the height of site-potential trees has been described for a variety of tree species and can be readily found in silvicultural literature. Mean heights of dominant trees in riparian old-growth forest of Washington range from 100 to 240 feet (Fox 2003). The wide range of heights reflects differences in site productivity, i.e., local differences in soil nutrients and moisture, light and temperature regimes, and topography. Site productivity is described quantitatively through a site index, which is the average height that dominant trees of a species are expected to obtain at a specified tree age at a given location.
The Importance of Channel Migration Zones (CMZs) Not all streams have CMZs, but where CMZs are present, it is necessary to map the CMZ in order to establish an RMZ. The Washington Forest Practices Board Manual (DNR 2004) provides a useful definition of the CMZ as “the area where the active channel of a stream is prone to move and this results in a potential near-term loss of riparian function and associated habitat adjacent to the stream, except as modified by a permanent levee or dike” (DNR 2004, Section M2).
Protecting the CMZ from incompatible land uses (e.g., development) is important for providing riparian ecosystem functions. Human alterations to river channels that limit channel migration and bank erosion can degrade aquatic and riparian habitats. For these reasons, geomorphologists have developed protocols for delineating CMZs. Further, RMZ delineation along streams with CMZs ensures that riparian functions do not degrade as a channel moves. Proper delineation also helps landowners avoid siting homes and infrastructure in CMZs that coincide with geologically hazardous critical areas and floodplains (WAC 365-190-120[6f]).
Relationship of CMZs and Floodplains This document does not include guidance on the integration of floodplains into RMZ delineation (see footnote 4 for a brief explanation about the active floodplain). However, a general understanding of floodplains and their relationship to CMZs is valuable, as the two often overlap.
Both federal and state regulations establish floodplain protections. Floodplain data and maps (typically 100-year floodplains) are readily available through the Federal Emergency Management Agency’s National Flood Insurance Management Program. Ecology is the state’s authority as lead on floodplain management and we support their recommendations for management of Frequently Flooded Areas (another type of critical area specified in GMA) and the use of the Floodplains by Design grant program to reduce hazards and restore natural functions. Proper floodplain delineation and protection helps landowners and land managers avoid placing homes and infrastructure in areas at high-risk of flooding.
FEMAT defined Site potential tree height (SPTH) as “the average maximum height of the tallest dominant trees (200 years or more) for a given site class.” “200 years or more” is the approximate minimum age of old-growth forests which are thought to be necessary for full riparian ecosystem functions.
67

Riparian Ecosystems, Volume 2: Management Recommendations 14
The Bureau of Land Management provides common clues to help determine the presence of an active floodplain (BLM 2015) such as visual evidence of frequent inundation, which may include but is not limited to:
• Fresh deposits of fine sediment; • Floodplain vegetation matted down or lying flat on floodplain from overbank flow or by
deposition or overbank sediment; • Debris piled on the upstream side of tree trunks; or • High water marks seen on rocks, trees, or other stationary objects; and ice-rafted deposits
on the floodplain.
However, BLM advises caution when relying on these visual clues. Furthermore, looking for signs that an active floodplain is present is only the first step toward delineating the outer edge of an active floodplain. We recommend reviewing BLM’s technical reference titled Proper Functioning Condition Assessment for Lotic Areas (BLM 2015) and to consult Ecology for assistance regarding floodplain delineation and protections.
Good floodplain management is not only beneficial for human communities, it is also good for fish and wildlife. Although we do not describe use of the 100-year floodplain to measure the RMZ in Volume 2, we recommend that landowners and land use decision makers treat floodplains similarly to RMZs due to their importance to instream health, as habitat, and for their ecological services.
2.3 PROCEDURES FOR RMZ DELINEATION To conserve riparian habitat, one must first establish the lateral extent (i.e., width) of the RMZ. In Chapter 1, we noted that an RMZ encompasses the riparian zone and zone of influence (Figure 2.2, page 16), and, where present, considers the CMZ (Figure 2.3, page 18). In this section, we outline general steps for collecting site-specific information essential to map an RMZ. These steps will help you identify a site’s proximity to streams as well as essential site characteristics. With this information, we then explain how to delineate an RMZ.
In the rest of this section, we explain how to:
• Identify the ecoregion in which the riparian ecosystem is located (e.g., forested or dryland); • Verify the presence of a stream; • Identify the inner edge of the RMZ; and finally • Determine the RMZ width.
Determining Ecosystem Location We have identified two distinct types of ecoregions statewide, each with a slightly different RMZ delineation procedure: (1) Forested, and (2) Dryland. In general, forested ecoregions dominate western Washington, northeastern Washington, and portions of southeast, north central, and eastern Cascades. Dryland ecosystems are more readily contained in the Columbia Plateau Ecoregion east of the Cascade Range.
Landowners and land use planners should utilize the SPTH mapping tool, described in Appendix 1, to determine the ecoregion where the river or stream lies. Appendix 1 also provides instructions for using this tool to determine the 200-year site-potential tree height (SPTH200) at a given location.
68

Riparian Ecosystems, Volume 2: Management Recommendations 15
Verifying the Presence of a Stream Once you have identified which ecoregion you are in (e.g., Columbia Plateau), a qualified professional6 should visit the site to verify the stream’s location on or near the project area. It is very important not to rely solely on “stream maps” (e.g., DNR stream layer, National Hydrography Dataset) in place of a site visit (which is also important for mapping RMZs) because existing mapped stream layers often have errors, including streams whose locations are mapped inaccurately on the landscape, and streams actually present on the landscape that are missing from maps. Instead, use the site visit to validate existing stream maps.
Identifying the Inner Edge of the RMZ Once you have verified a stream’s location, proceed to locate the inner edge of the RMZ. Accurate RMZ delineation is dependent on using the correct starting point. In this section, we describe how to determine the location of the RMZ’s inner edge using either the Channel Migration Zone (CMZ), if one is present; or the Ordinary High-Water Mark (OHWM). Ecology, as the state’s water quality lead, provides extensive guidance and resources associated with OHWM or CMZ, and those resources are referenced here forward.
2.3.3 (A) Identifying Ordinary High-Water Mark (OHWM)
Delineate the RMZ’s inner edge by identifying the OHWM along both sides of the stream following the procedure in Chapter 3 of Ecology’s OHWM delineation manual (Anderson et al. 2016).
6 Qualified professionals can be entities and individuals identified by the jurisdiction, WDFW regional habitat biologists, tribal biologists, Ecology staff, and/or other individuals familiar with stream verification and who have local expertise (e.g., Conservation District staff, Stream Teams, etc.).
69
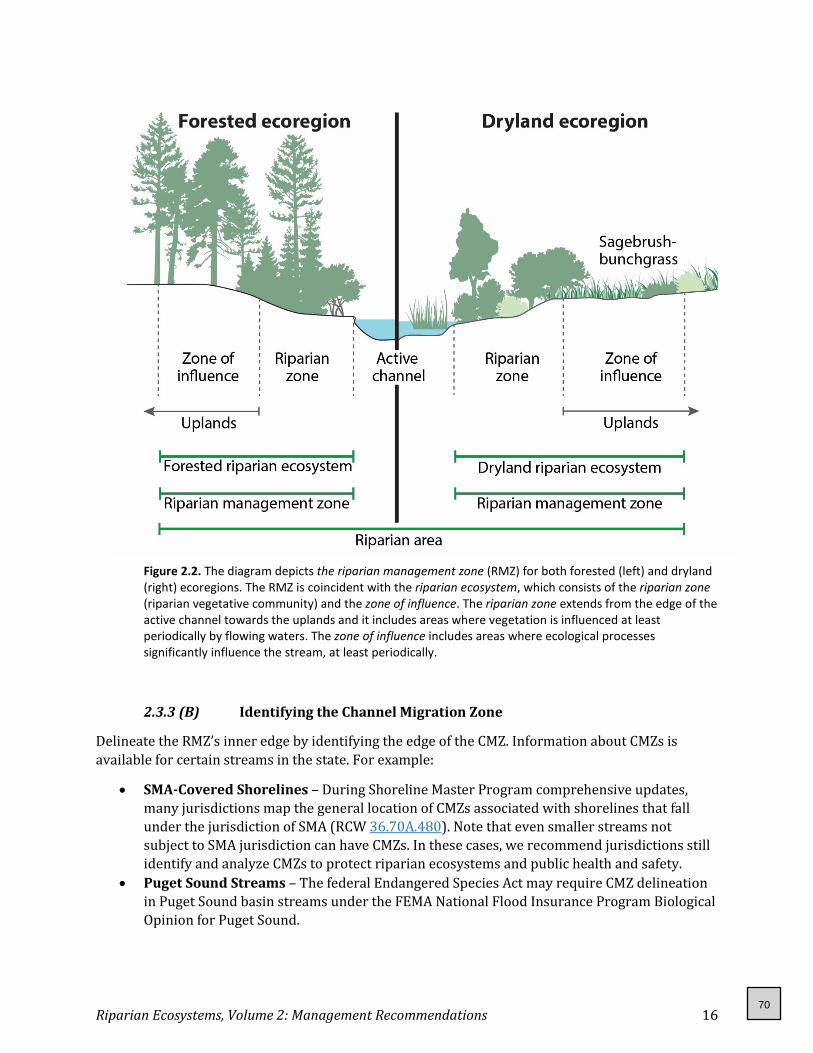
Riparian Ecosystems, Volume 2: Management Recommendations 16
Figure 2.2. The diagram depicts the riparian management zone (RMZ) for both forested (left) and dryland (right) ecoregions. The RMZ is coincident with the riparian ecosystem, which consists of the riparian zone (riparian vegetative community) and the zone of influence. The riparian zone extends from the edge of the active channel towards the uplands and it includes areas where vegetation is influenced at least periodically by flowing waters. The zone of influence includes areas where ecological processes significantly influence the stream, at least periodically.
2.3.3 (B) Identifying the Channel Migration Zone
Delineate the RMZ’s inner edge by identifying the edge of the CMZ. Information about CMZs is available for certain streams in the state. For example:
• SMA-Covered Shorelines – During Shoreline Master Program comprehensive updates, many jurisdictions map the general location of CMZs associated with shorelines that fall under the jurisdiction of SMA (RCW 36.70A.480). Note that even smaller streams not subject to SMA jurisdiction can have CMZs. In these cases, we recommend jurisdictions still identify and analyze CMZs to protect riparian ecosystems and public health and safety.
• Puget Sound Streams – The federal Endangered Species Act may require CMZ delineation in Puget Sound basin streams under the FEMA National Flood Insurance Program Biological Opinion for Puget Sound.
70
Riparian Ecosystems, Volume 2: Management Recommendations 17
• Other Local Examples – Check with your jurisdiction to see if they have more detailed CMZ maps.
Ecology provides the following resources which can help landowners and land managers assess the presence and extent of CMZs where maps and data on CMZs do not currently exist:
• CMZ Home Page provides a high-level look at CMZ identification, and references useful documents;
• Channel Migration Processes and Patterns in Western Washington (Legg and Olson 2014) describes the general channel migration processes that occur in western Washington;
• A Methodology for Delineating Planning-Level Channel Migration Zones (Olson et al. 2014) provides a process for delineating “planning-level” CMZs and gives a few good examples in the appendices;
• A Framework for Delineating Channel Migration Zones (Rapp and Abbe 2003) is a more in-depth guide on how to develop “detailed” CMZs; and
• Screening Tools for Identifying Migrating Stream Channels in Western Washington (Legg and Olson 2015) outlines the “CHAMP” (channel migration potential) GIS layer with guidance on using it to identify high-risk CMZs.
71

Riparian Ecosystems, Volume 2: Management Recommendations 18
Figure 2.3. This diagram depicts the spatial relationship between the riparian management zone (RMZ) and channel migration zone (CMZ) over time. As the active channel moves laterally within the CMZ, the riparian ecosystem moves with it. As a result, when considering the establishment of an RMZ, delineation should occur at the edge of the CMZ to account for the full extent of both the present day and future riparian ecosystems. Time 1 and Time 2 could be separated by days or centuries. This depiction of a forested system is one representation of a CMZ, which are also present in dryland systems: both should be managed for accordingly.
72
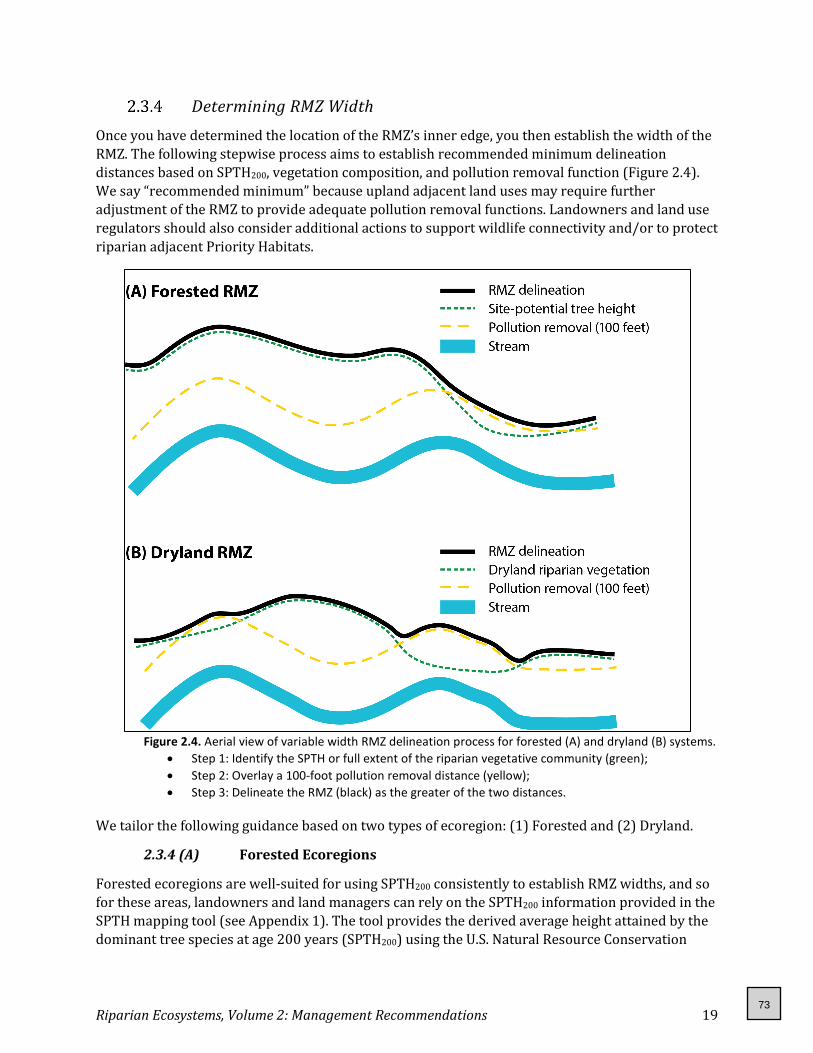
Riparian Ecosystems, Volume 2: Management Recommendations 19
Determining RMZ Width Once you have determined the location of the RMZ’s inner edge, you then establish the width of the RMZ. The following stepwise process aims to establish recommended minimum delineation distances based on SPTH200, vegetation composition, and pollution removal function (Figure 2.4). We say “recommended minimum” because upland adjacent land uses may require further adjustment of the RMZ to provide adequate pollution removal functions. Landowners and land use regulators should also consider additional actions to support wildlife connectivity and/or to protect riparian adjacent Priority Habitats.
Figure 2.4. Aerial view of variable width RMZ delineation process for forested (A) and dryland (B) systems. • Step 1: Identify the SPTH or full extent of the riparian vegetative community (green); • Step 2: Overlay a 100-foot pollution removal distance (yellow); • Step 3: Delineate the RMZ (black) as the greater of the two distances.
We tailor the following guidance based on two types of ecoregion: (1) Forested and (2) Dryland.
2.3.4 (A) Forested Ecoregions
Forested ecoregions are well-suited for using SPTH200 consistently to establish RMZ widths, and so for these areas, landowners and land managers can rely on the SPTH200 information provided in the SPTH mapping tool (see Appendix 1). The tool provides the derived average height attained by the dominant tree species at age 200 years (SPTH200) using the U.S. Natural Resource Conservation
73

Riparian Ecosystems, Volume 2: Management Recommendations 20
Service (NRCS) forest productivity site index values, which we recommend for delineation of RMZs (see Sec 9.3 in Volume 1 for background on the origin and use of SPTH200). In forested ecoregions, contributions of large wood as a riparian ecosystem function often define the farthest lateral extent of the RMZ.
Occasionally, the SPTH200 may be less than 100 feet, in which case the pollution removal function (described in more detail in Section 2.3.5 below) defines the lateral extent of the RMZ.
In Washington, STPH200 can be as large as 260 feet: therefore, be sure to evaluate each soil polygon within 260 feet of the stream channel to ensure that RMZ delineation is in fact being driven by the largest dominant tree species.
2.3.4 (B) Dryland Ecoregion
Riparian ecosystems in arid and semi-arid regions of North America (also referred to as the dryland ecoregion) make up less than 1 to 3 percent of the landscape (Patten 1998). Dryland riparian ecosystems are hydrologically linked to and influenced by adjacent surface waters; as a result, surface waters sustain riparian vegetation that is clearly distinct from upland vegetation.
Riparian ecosystems in dryland environments are highly variable due to various site-level conditions. While these ecosystems may support large trees in low gradient floodplains, tree presence in riparian ecosystems throughout the dryland ecoregion is much more varied than in forested ecoregions, and so in many cases, the contribution of large wood no longer serves as the outermost ecological function for RMZ delineation. Further, riparian vegetation may be minimal or even non-existent, particularly along degraded, incised streams. In dryland ecoregions, the outermost of three factors drives delineation of the RMZ: (1) SPTH200 (if trees are present); (2) riparian vegetative community; or (3) pollution removal function.
2.3.4 (C) Considerations in Highly Modified and Urban Systems
In some locations, riparian systems have been substantially modified, and current site-specific conditions may not provide adequate indication of where riparian vegetation would naturally occur. On the whole, this is particularly true of riparian systems in dryland ecoregions. In these instances, we recommend considering nearby sites with unaltered vegetation or selecting a representative site with similar bank height and gradient conditions to identify adequate riparian vegetation delineation for both protection and restoration.
Protecting Columbia Plateau’s Priority Habitats Supports Riparian Health
Native shrub-steppe vegetation and other drought-tolerant plant communities dominate Washington’s dryland environments. Approximately 450 plant community associations occur in this region, with over 20% of these associations considered vulnerable (WDFW 2005, p. 523). Among the most imperiled ecosystems in North America, historical shrub-steppe has been greatly reduced due to conversion to other land uses (Vander Haegen 2007).
Riparian areas are critical to most animal species using shrub-steppe. Biodiversity in these vegetative communities increases dramatically where surface water occurs, and riparian areas directly support numerous species found only in or near water (Rogers et al. 1988, Johnson and O’Neil 2001). Linking and protecting upland adjacent Priority Habitat(s) not only aims to support Washington’s wildlife and their associated habitat conservation goals, but also works to protect and maintain riparian ecosystem integrity.
74
Riparian Ecosystems, Volume 2: Management Recommendations 21
Similarly, four major urban areas (Seattle, Spokane, Tacoma, and Bellingham) in forested ecoregions lack NRCS soils data. For these areas, WDFW identified nearby NRCS soils polygons and calculated weighted averages as estimates reflective of the surrounding environment (“imputed SPTH200”). Much like in forested areas where SPTH200 data are available, we recommend using the imputed SPTH200 values specified for each of these urban areas to delineate RMZs within them.
Width delineation steps Step 1: Use SPTH200 if it is at least 100 feet.
In forested ecoregions, WDFW recommends full protection within one SPTH200, identified with the use of our SPTH mapping tool (https://arcg.is/1ueq0a). The mean SPTH200 in western Washington ranges from 100 to 240 feet (Fox 2003). Some soil polygons have SPTH200 information for multiple tree species; therefore, each soil polygon within one SPTH200 should be evaluated to ensure RMZ delineation is driven by the largest dominant tree species. Occasionally the SPTH200 in forested ecoregions is less than 100 feet; for example, red alder is a fairly common riparian tree species, yet the SPTH200 for this species does not always exceed 100 feet. If red alder is the only species for which SPTH200 information is available for a certain location, and it is less than 100 feet, then skip to Step 3.
In dryland ecoregions, it is less common, but still possible to find riparian vegetation which includes—and may even be dominated by—large trees. Examples of large tree species in these areas are black cottonwood (Populus trichocarpa) and ponderosa pine (Pinus ponderosa). If SPTH200 in dryland ecoregions exceeds 100 feet, then it should be used for the RMZ width. Step 2: In dryland ecoregions, if SPTH200 is less than 100 feet or if no large trees are present, identify the extent of the riparian vegetative community.
In dryland ecoregions, the riparian vegetative community is often comprised of shrubs, sedges, grasses, and forbs that are distinct from upland communities. For example, in the Columbia Plateau, vegetation within riparian ecosystems often exhibits an abrupt demarcation between the riparian zone and zone of influence. Phreatophytic7 trees and shrubs and hydrophytic8 herbaceous plants are confined to moist streamside areas, but the upland zone of influence may consist of sagebrush or bunchgrass communities [for more information, see Volume 1, Chapter 7 (Section 7.1.1)]. Where trees are not present or consist only of small species (less than 100 feet tall), WDFW recommends full protection of the entire riparian vegetative community. In some places the community may only be a few feet wide but in others it may extend up to several hundred feet, particularly when associated with a wetland or floodplain (Bermingham et al. 2013). Where the riparian vegetative community is less than 100 feet wide, go to step 3.
7 A phreatopyhtic plant is a species that obtains water from the subsurface zone of saturation either directly or through the capillary fringe (Thomas 2014). 8 Hydrophytic plants are those that are adapted to growing conditions associated with periodically saturated soils. They include obligate wetland plants that almost always occur in wetlands under natural conditions, facultative wetland plants that usually occur in wetlands but are occasionally found in non-wetlands, and facultative plants that equally likely to occur in wetlands or non-wetlands (Lichvar et al. 2012).
75

Riparian Ecosystems, Volume 2: Management Recommendations 22
Step 3: Overlay 100-foot pollution removal delineation
The following applies to both forested and dryland ecoregions.
Our recommendation to protect full riparian function recognizes the importance of the pollution removal function of riparian ecosystems. Because pollution removal depends on multiple factors, including slope, soils, plant community composition, and upland uses, establishing a standard RMZ width for 100% pollution removal even at the site scale was impractical.
Where neither SPTH200 nor the extent of the riparian vegetative community is at least 100 feet, we recommend RMZ delineation of a minimum distance of 100 feet, because this distance will achieve 95% or more removal efficacy of phosphorous, sediment, and most pesticides. To be clear, we value a similar removal efficacy for nitrogen, and at a 100-foot width, an RMZ would achieve only 80% removal efficacy for surface runoff containing excess nitrogen. However, the literature reflects that both the actual risk posed by excess nitrogen, as well as the efficacy of its removal, are very site-specific. In recognition of this, we strongly recommend that, where upland uses contribute nitrogen, the 100-foot minimum pollution removal distance be extended accordingly when determining the appropriate RMZ width.
Further, if RMZ widths are being based on a minimum pollution removal function at locations with steep slopes or poorly drained soils, distances greater than 100 feet should also be considered: this applies for all pollutants. Additionally, WDFW recommends cities and counties identify high intensity land uses that may be located adjacent to riparian areas within their jurisdiction and establish wider RMZs to enhance the pollution removal function in these locations as well, following guidance from Ecology.
When dealing with variables such as those outlined above, it may be necessary to seek expert assistance in determining the appropriate adjustments to RMZ widths based on the pollution removal function.
76

Riparian Ecosystems, Volume 2: Management Recommendations 23
CHAPTER 3. RIPARIAN REGULATORY PROTECTIONS
3.1 INTRODUCTION This chapter gives guidance to help local governments review, develop, and implement regulatory tools to protect riparian ecosystems as critical areas, i.e., Fish and Wildlife Habitat Conservation Areas (FWHCAs). We describe key steps toward creating effective programs to protect riparian ecosystems consistent with the goals of the Growth Management Act (GMA), Shoreline Management Act (SMA), and Voluntary Stewardship Program (VSP). More specifically, this chapter describes recommendations for carrying out common land use activities and provides steps for developing Habitat Management Plans (HMPs). The riparian management zone (RMZ) should serve as the focal area to apply our recommendations.
Parcel-scale regulations are foundational to Washington’s traditional land use regulatory approaches for protecting rivers and streams and their adjacent riparian ecosystem. However, sole reliance upon a regulatory approach at this site scale may result in loss of aquatic system function over the long term (see Volume 1). Thus, we believe that site-scale regulations must work in coordination with watershed-scale planning (Chapter 4) and that both should be monitored and adaptively managed (Chapter 5). In this chapter, we present considerations and recommendations for managing and protecting riparian ecosystems at both site- and watershed-scales.
3.2 RECOMMENDATIONS TO LOCAL JURISDICTIONS Protection of watersheds commonly falls under the purview of agencies other than WDFW. Nonetheless, we encourage local jurisdictions (and their long-range planners in particular) to consider how land use patterns at all scales collectively affect fish and wildlife and other important ecosystem services.
The scientific literature review (see Volume 1) informs WDFW’s position that protecting the area within one SPTH200 from the edge of a stream channel maintains full riparian ecosystem functions for all aquatic species, including salmon, and promotes healthy, intact riparian ecosystems. This recommendation provides the greatest level of certainty that land use activities do not impair functions and values of riparian ecosystems. We recommend the use of monitoring and adaptive management (see Chapter 5) to inform regulations and evaluate the complement of both regulatory and voluntary conservation measures in achieving outcomes.
Land use decision makers should ensure all programs that can affect riparian habitat (e.g., CAOs; SMPs; and ordinances for clearing and grading, fire hazard reduction, and tree protection) are coordinated to optimize the ability of local policies, rules, and management activities to protect those habitats. Further, jurisdictions should look for gaps such as inconsistencies, exemptions and loopholes, or inefficient practices (e.g., inspection and monitoring protocols) that could impede protection of or cause harm to riparian ecosystems.
To that end, we provide important questions to consider when reviewing CAOs, Comprehensive Plans, or other plans that can affect riparian ecosystems:
77
Riparian Ecosystems, Volume 2: Management Recommendations 24
1. Conservation Strategies: • What external strategies exist (salmon recovery plans, reach-scale assessments, and
incentive-based plans) to maintain, protect and restore riparian areas? • Which of these strategies (if any) currently inform your regulatory, planning, and/or
voluntary processes or programs? • If these strategies are not in your current programs, could they be incorporated to
provide additional benefits to riparian ecosystems? Are there other strategies that could also (or instead) benefit riparian ecosystems?
• Which of these strategies may help your jurisdiction satisfy mitigation obligations? • How are riparian restoration and/or enhancement programs informed by these
strategies?
2. Regulatory Buffers: • Does your jurisdiction rely on SPTH200 for delineating regulatory riparian buffers? • If your jurisdiction does not rely on SPTH200 for delineating those buffers, does your
jurisdiction currently have regulatory buffers for riparian areas that are equal to or greater than the distance equal to SPTH200?
• Are there buffer exemptions? If so, how do those affect riparian function across your jurisdiction?
• Do your buffers consider the CMZ? • Do your buffers consider adjacent wetlands and appropriate wetland delineation
methodology as prescribed by Ecology? • If your jurisdiction’s CAO or SMP buffers are less than SPTH200, can you use the RMZ to
identify areas to do mitigation or areas impacted that will require mitigation?
3. Restoration and Adaptive Management (see also Chapter 5): • Can your jurisdiction use the RMZ to identify areas for incentive-based restoration? • Do you have a monitoring and adaptive management program for improving permit
implementation? • Is your jurisdiction collecting information on effectiveness of protecting riparian areas? • If you collect effectiveness information, what programs (e.g., incentives, regulations)
could you improve to increase riparian conservation?
4. Other Programs and Regulations • What other regulations separate from CAOs, may inadvertently affect riparian areas?
(e.g., clearing and grading ordinance that lack safeguards for riparian protection.) • Are there opportunities to connect riparian areas with other protected areas (e.g.,
frequently flooded areas, geologically hazardous areas, green belts, parks, wetlands, and aquifer recharge areas)?
Recommendations for Common Activities in the RMZ Local governments should regulate all land use activities that are likely to impact functions of a riparian ecosystem found within the RMZ to ensure, at a minimum, that the existing functions and values are protected from development actions. For the purposes of meeting requirements under GMA, SMA, and VSP, we describe the RMZ as the area in which functions and values are contributed
78

Riparian Ecosystems, Volume 2: Management Recommendations 25
to the riparian ecosystem: providing a delineated space not just for protection, but also for mitigation and management. We also recommend prioritizing the RMZ as the space for restoration9. We provide specific information and recommendations for the following ten common activities: (Note that neither the list of activities nor the recommendations themselves are exhaustive; for more information, contact your WDFW regional habitat biologist.)
1. On-site Sewage Systems (OSS) 2. Bank hardening 3. Clearing, grading, and placement of fill 4. Removal of noxious weeds 5. Forest practices and conversions 6. Firewise and wildfire hazard reduction 7. Removal of hazard trees 8. Non-compensatory restoration and enhancement 9. Emergency activities
10. Educational or Recreational Areas
1. On-site Sewage Systems (OSS) – Historically, developers sited OSS at lower elevations bordering streams, lakes and wetlands in order to use passive gravity flow. The disadvantage of these systems is that when drain fields are located near water features, they can more easily contaminate water with high loads of nutrients and toxic pollutants, causing significant impacts to flora, fauna and water quality. The State Department of Health adopted rules establishing public health standards for location, design, installation, operation, maintenance, and monitoring of OSS, including requiring setbacks from waterbodies (WAC 246-272A) which modern OSS systems, using pump systems, can support. Some OSS may meet public health standards even if located within RMZs; nevertheless, jurisdictions should exercise authority to require HMPs to ensure project proponents protect habitat functions of riparian critical areas.
2. Bank Hardening – We recommend jurisdictions avoid allowing new development that requires bank protection now or is likely to in the future (consider channel migration, wind and wave action, and climate change), unless it addresses an imminent threat as an emergency activity (see Emergency Activities in this section below). Always look to alternative places to site a project so that no bank protection measures are needed. If measures cannot be avoided, require that a project proponent evaluate the effectiveness of bioengineering alternatives (also known as soft armoring) prior to proposing hard armoring. Follow bank protection recommendations in the Washington State Integrated Streambank Protection Guidelines (Cramer et al. 2002) when bank protection is unavoidable.
3. Clearing, Grading, and Filling – We recommend jurisdictions acknowledge impacts of clearing, grading, and filling on riparian areas in their CAOs by limiting these activities to areas outside the RMZ (unless directly related to restoration) as they can negatively affect riparian areas. If a clearing, grading, or filling project must encroach in an RMZ, limit disturbance and minimize
9 As explained previously, many riparian areas had already experienced a substantial degree of degradation before laws like GMA, SMA, and VSP were passed, so while protecting what level of riparian functions and values remain is essential, protection alone will not be sufficient for meeting the needs of the state’s fish and wildlife species.
79
Riparian Ecosystems, Volume 2: Management Recommendations 26
effects to the greatest extent possible. Require that a qualified professional prepare an HMP describing how the project proponent will follow the mitigation sequence.
Jurisdictions that exempt small areas from filling or grading ordinances in riparian ecosystems should calculate cumulative impacts from these exemptions. They should also mitigate impacts and subsequently establish monitoring to ensure that mitigation measures are effectively negating potential losses to habitat function.
4. Invasive and/or Noxious Plant Removal – Many CAOs do not require a permit for control and removal of invasive and/or noxious weeds within riparian ecosystem. We support this when weed control efforts (1) employ hand weeding with light equipment; (2) use only Ecology-approved aquatic herbicides and adjuvants (a substance added to herbicides to improve application); avoid use of hazardous substances; and (3) do not result in soil compaction. Local governments should retain some oversight authority for more extensive invasive and/or noxious plant control projects to ensure adequate protections of riparian functions, especially water quality. Most communities issue an exemption letter or permit, which should include conditions to ensure impacts to fish, wildlife, and habitat are minimal.
It is important to note that even plants native to the region can, in certain circumstances, be detrimental to riparian areas. An example is in Puget Sound Prairies, where in the absence of periodic fire events (typically prescribed fire), common western Washington conifer species like Douglas fir outcompete native deciduous species (primarily Oregon white oak). In these circumstances, conifer removal and re-establishment of historical riparian conditions (oak and prairie vegetation) should occur under an approved HMP. WDFW regional habitat biologists can assist in preparing, reviewing, and implementing such a plan.
5. Forest Practices and Conversions – The state’s Forest Practices Act (RCW 76.09 and WAC 222) regulates forest practice activities on forestland: We recommend that the proponent always contact DNR prior to conducting forest practice activities and seek technical assistance from a WDFW regional habitat biologist to ensure protections for Priority Habitats and Species. When conducting commercial forest practice activities, the forest practice rules—not the CAO—apply for protection of resources on site. Lands converted from forestry to another use require a special forest practice permit, and when converting land, local CAOs are applied. If conversion occurs, WDFW recommends timber harvests not be allowed within SPTH200.
6. Wildfire Hazard Reduction – Wildfire is a concern in Washington, though the threat varies across the state. Local regulations to reduce wildfire hazards should be coordinated with a Firewise program in order to require landowners to consult with a Firewise professional (http://www.dnr.wa.gov/firewise) before removing trees or manipulating vegetation in an RMZ. Understanding the composition of historical forest stands and shrub-steppe can help ensure retention of riparian functions when carrying out wildfire hazard reduction activities. When fuel (vegetation) reduction efforts involve the removal of merchantable trees, the proponent should check with the local jurisdiction and DNR, which may require a permit for tree removal.
7. Removing Hazard Trees – Tree trimming or removal in RMZs is sometimes necessary to address public safety concerns but should be balanced with the potential impacts to riparian ecosystem function. Jurisdictions should define a “hazard tree” (sometimes referred to as a “danger tree”) as a threat to life, property or public safety, and require that the method of tree removal not
80

Riparian Ecosystems, Volume 2: Management Recommendations 27
adversely affect riparian ecosystem functions if possible. Specifically, we recommend that any removal of hazard trees involve an avoidance and minimization of damage to remaining trees and vegetation within the RMZ. We further recommend that local governments require a qualified arborist to evaluate requests for hazard tree removal. The qualified arborist should be able to establish when a tree presents an imminent threat to life, property or public safety.
It is important to note that snags (dead trees) are a Priority Habitat feature for wildlife, and so should be preserved if not hazardous.
Some local governments use Forest Practice Rules (WAC 222-21-010[4]), which define a hazard tree as “any qualifying timber reasonably perceived to pose an imminent danger to life or improved property.” This applies to any tree within 1.5 tree-lengths of the structure. A DNR forester can verify during a site visit that a tree is a hazard based on this definition, and thus removing the hazard would not be subject to the Forest Practice jurisdiction or require a Forest Practice Application.
8. Restoration and Enhancement – We encourage local governments to include in their CAOs allowances for restoration and/or enhancement of the riparian ecosystem, including in-channel or streamside work, especially on lands set aside for conservation. To the extent possible, jurisdictions should promote incentives and set up a streamlined review process for restoration or enhancement projects to help facilitate project proponents not just meeting the minimum requirements of the local CAO, but instead going “above and beyond”. Significant resources are available to jurisdictions that address limiting factors in riparian areas or undertake high priority restoration activities that benefit salmon or other listed species (see Chapter 4 for information on restoration).
9. Emergency Activities – Local codes typically have provisions for emergency activities (e.g., bank stabilization to address imminent threats to homes) that provide relief from time delays related to procedural code requirements. Local regulations should distinguish the immediate need to permit an emergency activity from the need to compensate for its impacts after-the-fact.
10. Educational or Recreational Areas – Public access to shorelines is a priority use under the SMA and providing educational and/or recreational developments such as trails, viewing platforms, or similar facilities may also enhance the public’s understanding and appreciation of riparian areas, streams, and habitats. Thus, some focused use of the RMZ for educational and recreational activities may be desirable, if it does not create significant disturbances. Most CAOs include allowances for unpaved access to a stream for aesthetic or recreational enjoyment with defined limits on clearing to avoid impacts and minimizing soil, vegetation, and habitat disturbances: this is an allowance we support. That said, construction of trails could allow greater access for pets and other high intensity recreation, which may increase predation on, and/or disturbance of fish and wildlife species. Regulations should minimize impacts from recreational trails and interpretive facilities to the extent practicable, informed by PHS data and associated management recommendations.
Project-specific Riparian Habitat Management Plans When reviewing proposed projects near streams, local governments typically require applicants to provide detailed site-specific HMPs (often called a Critical Area Report). Here we describe six aspects of Riparian HMPs that we recommend be addressed in CAOs:
81

Riparian Ecosystems, Volume 2: Management Recommendations 28
1. When HMPs are required; 2. Which additional critical areas must be delineated, and how; 3. Which specific land use actions must be identified, and how; 4. Mitigation requirements; 5. Monitoring and Adaptive Management requirements; and 6. Articulate who must prepare and review the HMP.
1. When required – We recommend jurisdictions require an HMP whenever someone proposes a land use activity in an RMZ (regardless of the jurisdiction’s regulatory RMZ delineation) or when a proposal likely could affect riparian or aquatic functions. In cases where there is less confidence in the spatial accuracy of the RMZ, consider requiring a Riparian HMP when impacts occur adjacent to the RMZ’s zone of influence.
Maps, DNR’s stream layers, the National Hydrography Dataset (NHD), and other (e.g., local) stream layers are important for triggering HMPs. An HMP should be required whenever a stream is present near proposed development activities, including but not limited to subdivisions (plats, short plats, and large lot subdivisions), land/vegetation disturbing activities (e.g., clearing and grading, septic drain field siting), and stormwater routing.
2. Critical Area Delineation – HMPs should have the extent of critical areas within and adjacent to a proposed project site identified, along with ecosystem functions that need protection. Follow the RMZ delineation procedure outlined in Chapter 2, along with locations of other critical areas on or near the site (e.g., wetlands, geologic hazards, frequently flooded, critical aquifer recharge areas; informed by Ecology). Also, identify salmon and other priority aquatic species that use the stream network in the immediate vicinity as well as up- and downstream. Likewise, HMPs should identify Priority Species that may use the riparian corridor and any other Priority Habitats to which the corridor is connected. Attach the delineation map (1) to the property’s title to inform future property owners of the site’s critical areas, and (2) use it to update the jurisdiction’s critical areas maps.
3. Land Use Action Identification – A complete HMP should describe relevant management recommendations for Priority Habitats and Species found on or near the site. Include a map in the HMP showing the location of proposed land use actions. It should identify and quantify current and proposed disturbances to the RMZ and other FWHCAs.
4. Mitigation – The HMP should have a description of the project proponent’s mitigation sequencing. It should describe in detail measures to avoid impacts and minimize unavoidable impacts (e.g., clustering, conservation easements, and seasonal construction restrictions). If mitigation or compensation is necessary, the HMP should identify ways to improve riparian ecosystem function by enhancing riparian corridor connectivity (e.g., removal of stream barriers) or by improving the quality of the riparian area (e.g., replacing invasive vegetation with appropriate native vegetation).
5. Monitoring and Adaptive Management –The HMP should describe requirements for monitoring and adaptive management. In addition, it should identify measurable standards and expectations to monitor compliance (e.g., areal extent of vegetative cover, composition of riparian tree species, maximum invasive plant cover). The HMP should identify frequency of visits to monitor the site (e.g., at year 1, 2, 3, 5, 8, and 10) as well as measurable triggers for requiring more actions (e.g., maximum percent area coverage of invasive plants). The HMP
82
Riparian Ecosystems, Volume 2: Management Recommendations 29
should specify who is responsible for preparing, reviewing, and submitting reports. Finally, if deemed necessary by the jurisdiction, the report should include a cost estimate for monitoring, and the project proponent should post a bond for this amount or more to allow for overages.
6. Preparer and Reviewer – A qualified professional biologist, botanist, or ecologist should prepare the HMP; additional expertise related to CMZs, unstable slopes, and wetlands may also be necessary. Additionally, an independent professional with similar qualifications should review the HMP. WDFW’s regional habitat biologists can often serve in this role, especially for larger projects. USFWS or NOAA Fisheries should also review the HMP if the project might affect a federally listed fish or wildlife species.
3.3 RIPARIAN MANAGEMENT IN URBAN AREAS Some people have raised questions about the applicability of RMZs to urban and urbanizing areas. These concerns generally fall into two categories: (1) the science on RMZs comes largely from agricultural and forestry settings, and so is perceived to be irrelevant to urban areas; and (2) there is a belief that the need to maximize density of development in urban areas is in direct conflict with the protection of riparian areas.
Concerns over the relevancy of literature on riparian functions to urban areas is largely unfounded. While most riparian ecosystem studies are from non-urban settings, the principles are the same. Functions of shade, bank stability, large wood recruitment, nutrient inputs, and pollutant removal operate similarly in urban areas as they do in other settings. However, within urban areas, these riparian ecosystem functions are often greatly diminished or even absent altogether.
The role that urban RMZs play in delivering habitat functions for aquatic and many terrestrial species is also like that in non-urban areas. Factors that may be different in urban areas are that urban riparian ecosystems may perform some functions at reduced levels due to their position in developed watersheds, which are often heavily degraded. However, intact RMZs in urban areas function as wildlife corridors that link habitat patches, which is critical for many species. In fact, sometimes RMZs in urban areas may be more important from a habitat standpoint, because within urban areas, adjacent uplands are often even more degraded than the RMZs, which then are often the only remaining areas where habitat functions are provided. Thus, a key element to maintain in urban RMZs is connectivity, both in and along streams.
Many Puget Sound salmon move through channelized streams, traversing heavily urbanized areas prior to reaching spawning grounds and as juveniles on a reciprocal journey to marine waters. Salmon must pass through a wide spectrum of development. For example, adults returning to spawn often start in urban cores (e.g., downtown Seattle), where streams are often channelized; then pass through areas with small lots and high urban density and into suburban creeks where larger lots allow for more riparian protection; and finally, to rural lots with less development and better ecosystem health. When juveniles make their journeys in reverse, they generally spending more time in each of these areas than their parents did, and yet because of their small size, they are also at much greater risk of not surviving any of them. While the decades-long decline of many of our native salmon stocks illustrate just how challenging this is, their persistence—especially the subspecies which are showing signs of improvement—shows us what is possible. Therefore, it is critical that the urban environment maintain and enhance the ability of different species and ages of salmon to not just survive, but thrive, while in these disturbed areas.
83

Riparian Ecosystems, Volume 2: Management Recommendations 30
Many of the actions we recommend urban communities focus on are the same or similar to those appropriate in less densely developed areas. For example, it is critical to maintain connectivity through properly sized culverts such that all fish can pass through at all relevant life stages. Additional riparian function can be achieved through revegetation efforts using native plants and by improving connectivity between habitat patches. A landscape analysis can help identify existing connections to protect, as well as areas where restoring connectivity is a priority. On the other hand, some actions are particularly well-suited to urban jurisdictions, like standards for Low Impact Development (LID) and state-of-the-art stormwater management. Further, when changes are made to urban infrastructure, this may create opportunities to improve riparian functions while contributing to new or improved public open spaces.
Recommendations for urban riparian ecosystems:
1. Delineate urban RMZs to protect what areas remain and to highlight lost or degraded areas to target for restoration.
2. Quantify current conditions, with a goal of maintaining and improving functions through regulatory and voluntary means.
3. Identify and prioritize restoration opportunities and projects within the RMZ: a. Protect riparian functions that remain, especially in places that are relatively high
functioning; implement actions that enhance degraded functions (see Chapter 4). b. Prioritize opportunities to maintain and restore in-stream and riparian connectivity. c. Adopt a stormwater design manual equivalent to Ecology’s most current manual for
western and eastern Washington. d. Manage stormwater by adopting Ecology’s latest manual regarding LID for new
development, redevelopment and retrofit projects. 4. When replacing or removing existing infrastructure within an RMZ:
a. Map RMZ to pinpoint the best sites to restore – consider connectivity and adjacency to other Priority Habitats;
b. Improve aquatic connectivity by replacing culverts and removing barriers to movement;
c. Revegetate with native plants and consider improvements for wildlife by integrating structures necessary for nesting, breeding, and foraging;
d. As infrastructure is remodeled or replaced, incorporate additional setbacks from streams;
e. Control access to RMZ to limit soil compaction; f. Avoid operating equipment near the stream to reduce sedimentation and soil
compaction; and g. Avoid using chemicals in the RMZ which are not approved for use there by Ecology.
3.4 MANAGING WATERSHEDS As described in Chapter 8 of Volume 1, land use activities in a watershed can affect the stream network, even when the riparian ecosystem itself is relatively undisturbed. “Watershed management” is a land management approach that seeks to minimize negative effects of upland land uses on aquatic systems, which include riparian areas. The remainder of this chapter focuses on key watershed elements important to managing and protecting functional aquatic systems. Many of the approaches we outline here are non-regulatory and can complement regulatory efforts;
84
Riparian Ecosystems, Volume 2: Management Recommendations 31
as previously stated, we recommend cities and counties inventory current conditions of critical areas and, based on that inventory, develop watershed scale management plans accordingly.
Fully functional riparian ecosystems, in combination with targeted watershed protections, provide significant benefits to humans. These benefits, often described as ecosystem goods and services, include clean water; decreased flooding; increased nutrient cycling, sediment and pollutant filtering; reduced erosion; carbon sequestration; and cultural services such as recreational, spiritual, and other nonmaterial benefits. These services provide real but often unquantified economic benefits to individuals and society that largely go unnoticed until they are lacking.
Watershed-Scale Recommendations to Protect Aquatic Systems To achieve desired ecosystem goods and services watershed managers should focus on influencing watershed processes that act upon water, wood, sediment, nutrients, vegetation, and pollutants at both the site- and watershed-scale. This section focuses on watershed-scale management.
Restore and Protect Watershed Processes – Efforts to improve watershed conditions should first focus on protecting and restoring watershed processes (e.g., natural disturbances) that create and retain habitat for fish and wildlife. Maintain the frequencies, magnitudes, and durations of natural disturbances (flood and fire being the most common) to the greatest extent that surrounding land uses can tolerate.
Manage Land for Stormwater – Stormwater runoff can change the timing, quality, and quantity of water provided to streams. Land uses should avoid/minimize changes to surface water flows. Protection and restoration efforts should focus on attenuating peak flows and reducing pollutants. Primary tools available to local governments include land use designations/zoning code, and stormwater regulations. See City of Redmond Watershed Management Plan (City of Redmond 2013).
Manage Land for Stream Temperatures – Reduced riparian vegetation cover, decreased streamflow, and simplified stream channels (e.g., increased width-to-depth ratio and reduced groundwater exchange) can lead to increased water temperature (Volume 1, Chapter 4). Modifications like these are often the result of land use activities such as riparian vegetation removal; water diversions; unmanaged livestock grazing; and stream channelization associated with roads, levees, and other forms of development. Identify and restore thermally sensitive stream reaches at the watershed scale to maintain optimal stream temperatures for sensitive aquatic species such as salmonids.
Restore and Protect Connectivity – Manage watersheds to avoid creating longitudinal (e.g., dams, road crossings), lateral (e.g., levees and roads/buildings that cutoff riparian areas and floodplains from their stream), and vertical (water withdrawals, reductions of floodplains) barriers to fish and wildlife movement and fragmentation of their habitat. This is especially important for highly mobile species that require a variety of habitat components across large areas. For example, where CMZs interact with floodplains, dikes and levees restrict the movement of the river or stream and also serve as a barrier for fish and many forms of wildlife.
Restoration to correct existing barriers to movement of water, wood, sediment, and species (e.g., removing blocking culverts) is a high priority with proven benefits for salmon. Connectivity to achieve nearly or completely contiguous RMZs is important to water quality and to achieve
85

Riparian Ecosystems, Volume 2: Management Recommendations 32
connectivity among patches. Ensuring connectivity both for terrestrial and aquatic wildlife works towards a more interconnected and healthy riparian system.
Plan for Climate Change – Impending changes to aquatic systems caused by climate change increases risk to species already threatened, and riparian ecosystem protection is one of the most useful responses to ameliorate those risks. For example, because more intense rainfall events will lead to wider streams, larger culverts will be necessary to support fish passage. WDFW, in collaboration with the University of Washington’s Climate Impacts Group, created an online tool (UWCIG 2017) that estimates how much a stream’s channel width will increase with climate change in the years 2040 and 2080. Connectivity within the RMZ allows voluntary migration for species and helps minimize temperature change and increase off-channel storage of water to reduce low flows.
Conduct Monitoring and Adaptive Management – Monitoring and adaptive management are important elements to both site-scale and watershed-scale; this is addressed further in Chapter 5.
Tools and Key References for Assessing Current Watershed Conditions Washington’s State agencies, including WDFW, have developed multiple tools to assist local government in assessing watershed conditions. Jurisdictions can utilize these resources—many available at no cost—to quantify changes in land cover, tailor planning for specific species, coordinate monitoring activities, inform restoration, and assess watershed health.
WDFW’s High Resolution Change Detection (HRCD) is a spatial dataset that characterizes changes in land cover. This tool allows jurisdictions to evaluate in specific ways how watersheds are changing at a sub-parcel scale over 2- to 3-year intervals. This dataset is currently available throughout the entire Puget Sound basin and in some Eastern Washington watersheds. HRCD data is available at www.pshrcd.com.
WDFW’s Priority Habitats and Species program has several resources of interest to watershed planners. In addition to this two-volume document on riparian ecosystems, readers will find useful ideas in Land Use Planning for Salmon, Steelhead and Trout: A land use planner’s guide to salmonid habitat protection and recovery (Knight 2009) and Landscape Planning for Washington’s Wildlife: Managing for Biodiversity in Developing Areas (Azerrad et al. 2009).
Since 2004, the Pacific Northwest Aquatic Monitoring Partnership has collaborated with West Coast federal, state, and tribal agencies to coordinate monitoring activities and develop common approaches. This partnership provides best practices, mapping tools, and protocols, and serves as a voluntary clearinghouse for a wide variety of monitoring projects.
Since 2009, Ecology’s Watershed Health Monitoring Project has been monitoring sites throughout the state to assess watershed health. This project’s protocols can be adapted by jurisdictions and scaled to watersheds of various sizes. Data is stored in the Environmental Information Management database. This sophisticated database allows users to input and retrieve data via the web, reliably store it, and make it available for analysis. Quality assurance/quality control measures ensure data put into the database are of high quality.
Ecology’s Puget Sound Watershed Characterization is a Puget Sound-wide tool that compares areas based on their suitability and value for restoration and protection. This tool informs two fundamental questions: (1) where to focus protection and restoration on the landscape first, and
86

Riparian Ecosystems, Volume 2: Management Recommendations 33
(2) what types of activities and actions (i.e., restoration, protection, conservation, or development) are most appropriate to that place. With insights gained by this tool, decision-makers can incorporate information regarding watershed processes to improve plans (e.g., comprehensive plans, subarea plans, CAOs, stormwater plans) and conservation efforts (e.g., in-lieu fee programs, open space tax credits, open space land acquisitions).
In 2016, the Washington Department of Commerce (Commerce) published Building Cities in the Rain (Ballash 2016) to help communities improve watersheds while redeveloping and revitalizing urban areas. The guidance describes an optional three-step process for prioritizing watersheds for stormwater retrofits in urban areas. Commerce’s Puget Sound Mapping Project uses an interactive map to help users develop insights about how current and expected development patterns might affect the region’s environmental health. The tool is designed to help decision makers consider information from the Puget Sound Watershed Characterization (described above) when making decisions regarding development projects, urban growth boundaries, and compensatory mitigation.
Finally, the University of Washington’s Climate Impacts Group has developed a suite of tools, many in concert with WDFW, which may be useful for landowners and land use decision makers including climate trends, culvert design projections, and habitat connectivity.
87
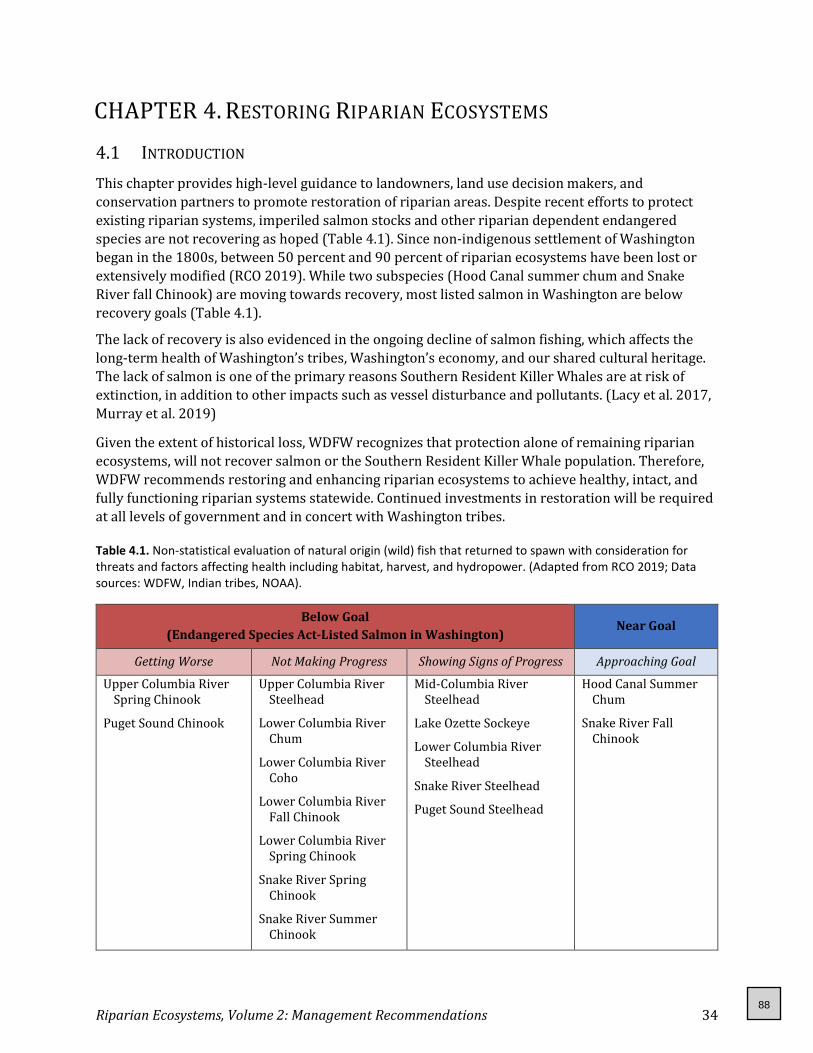
Riparian Ecosystems, Volume 2: Management Recommendations 34
CHAPTER 4. RESTORING RIPARIAN ECOSYSTEMS
4.1 INTRODUCTION This chapter provides high-level guidance to landowners, land use decision makers, and conservation partners to promote restoration of riparian areas. Despite recent efforts to protect existing riparian systems, imperiled salmon stocks and other riparian dependent endangered species are not recovering as hoped (Table 4.1). Since non-indigenous settlement of Washington began in the 1800s, between 50 percent and 90 percent of riparian ecosystems have been lost or extensively modified (RCO 2019). While two subspecies (Hood Canal summer chum and Snake River fall Chinook) are moving towards recovery, most listed salmon in Washington are below recovery goals (Table 4.1).
The lack of recovery is also evidenced in the ongoing decline of salmon fishing, which affects the long-term health of Washington’s tribes, Washington’s economy, and our shared cultural heritage. The lack of salmon is one of the primary reasons Southern Resident Killer Whales are at risk of extinction, in addition to other impacts such as vessel disturbance and pollutants. (Lacy et al. 2017, Murray et al. 2019)
Given the extent of historical loss, WDFW recognizes that protection alone of remaining riparian ecosystems, will not recover salmon or the Southern Resident Killer Whale population. Therefore, WDFW recommends restoring and enhancing riparian ecosystems to achieve healthy, intact, and fully functioning riparian systems statewide. Continued investments in restoration will be required at all levels of government and in concert with Washington tribes.
Table 4.1. Non-statistical evaluation of natural origin (wild) fish that returned to spawn with consideration for threats and factors affecting health including habitat, harvest, and hydropower. (Adapted from RCO 2019; Data sources: WDFW, Indian tribes, NOAA).
Below Goal (Endangered Species Act-Listed Salmon in Washington)
Near Goal
Getting Worse Not Making Progress Showing Signs of Progress Approaching Goal
Upper Columbia River Spring Chinook
Puget Sound Chinook
Upper Columbia River Steelhead
Lower Columbia River Chum
Lower Columbia River Coho
Lower Columbia River Fall Chinook
Lower Columbia River Spring Chinook
Snake River Spring Chinook
Snake River Summer Chinook
Mid-Columbia River Steelhead
Lake Ozette Sockeye
Lower Columbia River Steelhead
Snake River Steelhead
Puget Sound Steelhead
Hood Canal Summer Chum
Snake River Fall Chinook
88

Riparian Ecosystems, Volume 2: Management Recommendations 35
4.2 RESTORATION ACTIONS Although this section focuses on restoring riparian areas for the benefit of salmon, emulating historical conditions benefits many other aquatic and terrestrial species as well. WDFW is available to provide technical assistance and species-specific guidance for terrestrial species-focused restoration and recovery efforts. To recover salmon, we must protect all remaining existing riparian and watershed functions, while seeking opportunities to restore functions that have been lost over time. We provide the following information to assist the restoration community10 in understanding what is important to restore.
Developing a Restoration Strategy Aquatic restoration strategies typically start with a clear set of goals and objectives. The selection of appropriate restoration strategies is informed by the political, social, and ecological context of the watershed, and bounded by the extent of opportunities and constraints. It is important in ecosystem restoration to consider the habitat attributes and scale necessary for a desired suite of species, be they aquatic or terrestrial. At a watershed scale, restoration efforts should focus first on projects that offer the greatest potential for success. The Stream Habitat Restoration Guidelines (Cramer 2012) suggest the following prioritization of stream habitat restoration strategies that are specific to instream related activities most often geared at anadromous fish:
1. Protect existing habitat. Protect areas that provide healthy, high-quality habitat functions (strongholds, refugia, and key sub-watersheds) to prevent further degradation. Secure, expand, and link protected areas.
2. Connect habitat. Connect and provide access to isolated habitat, including instream, off-channel, and estuarine habitat made inaccessible by culverts, levees, fragmentation, or other man-made obstructions.
3. Restore habitat-forming processes. Employ land use recovery and watershed restoration techniques to restore processes that create, maintain, and connect habitats (including restoring sediment dynamics, large wood dynamics, and flow regimes; avoiding/removing manmade disturbances within the riparian ecosystem; and maintaining water quality, floodplain connectivity, and channel evolutionary processes). Employ a combination of active or passive restoration techniques, as necessary. Active restoration involves accelerating processes or attempting to change the trajectory of succession; passive restoration simply involves ceasing environmental stressors such as agriculture, grazing, or timber harvest, and then allowing nature to take its course.
4. Create new or enhance existing habitat. Improve existing or create new habitat for specific species by installing instream structures such as large woody debris; reconfiguring channel shape, cross-section, or profile to reduce incision or restore flow; or constructing one or more new side channels.
In conjunction with other state agencies and partners, WDFW provides multiple technical guidance documents to help design and implement riparian restoration projects that have proven successful 10 Many watersheds in Washington have salmon recovery restoration goals that can be obtained from regional Salmon Recovery Boards or Lead Entities for Salmon Recovery. Lead Entities and Salmon Recovery Boards are in every region of the state, including those areas without salmon or other anadromous fish (https://www.rco.wa.gov/salmon_recovery/regions/regional_orgs.shtml).
89

Riparian Ecosystems, Volume 2: Management Recommendations 36
in different types of landscapes, including on marine shorelines, and on river- and streambanks. These are part of a suite of Aquatic Habitat Guidelines found at https://wdfw.wa.gov/licenses/environmental/hpa/application/assistance. They include:
• Water Crossing Design Guidelines (Barnard et al. 2013) • Stream Habitat Restoration Guidelines (Cramer 2012) • Integrated Streambank Protection Guidelines (Cramer et al. 2012) • Land Use Planning for Salmon, Steelhead and Trout: A land use planner’s guide to salmonid
habitat protection and recovery (Knight 2009) • Draft Fishway Guidelines for Washington State (Bates 2000) • Draft Fish Protection Screen Guidelines for Washington State (Nordlund and Bates 2000)
Marine Shoreline Design Guidelines (Johannessen et al. 2014) • Your Marine Waterfront (WDFW 2016) • Protecting Nearshore Habitat and Functions in Puget Sound (AHGP 2010)
4.3 IMPLEMENTING RIPARIAN STRATEGIES THROUGH INCENTIVES There are several types of conservation incentives available to individuals and local governments:
• Financial assistance: grant programs that provide funding for conservation activities • Tax adjustment: tax reductions for landowners undertaking conservation activities • Technical assistance: advice and/or hands-on help for landowners on tools or techniques • Recognition: promotion of landowners who undertake conservation actions
Each of these will be described (and examples provided) in more detail, below.
Financial Assistance State and federal grant funds are available for riparian ecosystem conservation and restoration projects on public and private lands through the Recreation and Conservation Office (RCO) and Salmon Recovery Funding Board. To access these funds and to learn more, go to https://www.rco.wa.gov/grants/index.shtml. Grant programs include:
• Aquatic Lands Enhancement Account • Washington Wildlife and Recreation Program (WWRP; Riparian Protection, Critical Habitat,
Natural Areas, and Urban Wildlife Habitat Categories) • Salmon Recovery Funding Board • Estuary and Salmon Restoration Program—a program of WDFW • Land and Water Conservation Fund • Puget Sound Acquisition and Restoration
Land trusts also help land owners conserve habitat for key aquatic and terrestrial species, often leveraging funds from foundations and other non-governmental sources; see www.walandtrusts.org for a county-specific list of land trusts.
For agricultural property owners, local conservation districts and the Washington State Conservation Commission (WSCC) can provide technical assistance to find an approach that works for the farmer and improves riparian ecosystem function. Technical assistance is also available
90

Riparian Ecosystems, Volume 2: Management Recommendations 37
from the federal Natural Resources Conservation Service (NRCS), Washington State University Extension, and WDFW. Additionally, a host of state and federal financial incentives to expand and maintain riparian functions within the riparian management zone (RMZ) are available, some of which are listed below. For example, the Conservation Reserve Enhancement Program (CREP) provides funding to landowners for riparian preservation and is the most successful riparian buffer program in Washington. Since CREP’s 1999 inception in our state, more than 900 miles of stream buffers have been planted, and as of October 2020, producers had over 13,500 acres actively enrolled in CREP. Contact your local conservation district or the RCO to learn more.
• Conservation Reserve Enhancement Program (NRCS) • Environmental Quality Incentives Program (NRCS) • Conservation Stewardship Program (NRCS) • Conservation Reserve Program (NRCS) • Regional Conservation Partnership Program (NRCS) • Agricultural Conservation Easement Program (NRCS) • Agricultural Land Easements (NRCS) • WWRP Farmland Preservation Grants (RCO)
Timber landowners have access to a variety of forestry-oriented conservation incentive programs (see list, below) and can also receive technical assistance from DNR’s Forest Stewardship Program ([email protected] / 360-902-1428):
• Forestry Riparian Easement (DNR) • Rivers and Habitat Open Space Program (DNR) • Healthy Forests Reserve Program (NRCS) • Family Forest Fish Passage Program (DNR) • Forest Legacy (USFS) • WWRP Forestland Preservation Grant Program (RCO)
Tax Reduction Incentives Landowners can receive a substantial tax reduction by converting land into “open space” status because of the Open Space Taxation Act (WAC 458-30), enacted in 1970. Lands with riparian areas often qualify for this incentive; see your county assessor and local planning department for details.
Technical Assistance Local governments and individual landowners who want to improve riparian habitat for a suite of species can request land use advice from a variety of sources, including:
• WDFW regional habitat and district wildlife biologists. Go to http://arcg.is/1SgsHqk to find the names and direct contact information for your local biologists, or call the regional office in your area:
o Region 1 – Eastern: 509-892-1001 o Region 2 – North Central: 509-754-4624 o Region 3 – South Central: 509-575-2740 o Region 4 – North Puget Sound: 425-775-1311 o Region 5 – Southwest: 360-696-6211
91

Riparian Ecosystems, Volume 2: Management Recommendations 38
o Region 6 – Coastal: 360-249-4628 • Salmon Recovery Lead Entities or Regional Fisheries Enhancement Groups • Tribal natural resource departments • Local Conservation Districts
4.4 SUGGESTED RESTORATION PRACTICES The following section provides a series of suggested restoration practices promoted by WDFW, other state and federal agencies, and conservation partners. We encourage consideration of these activities and others within and adjacent to the RMZ, as delineated in accordance with our recommendations in Chapter 2. Further, it is not unusual to find other types of Priority Habitats (e.g., wetlands, shrub-steppe) adjacent to riparian areas. In such cases, restoration practices should not degrade or disturb the adjacent habitat, but rather—if feasible—improve it in addition to improving the riparian habitat. The same approach should be used where riparian-adjacent Priority Species areas are present. Like most restoration practices, the ones recommended below can range in complexity, both biologically and technically, so landowners are strongly encouraged to seek technical assistance from WDFW and other experts before taking any action: This will help save money, time, and greatly increase the likelihood of success for any restoration activity. Landowners should also be aware that many of these activities may require permits11, 12 issued by one or more agencies such as WDFW for the Hydraulic Code rules, and DNR for the Forest Practices rules; as well as permits from the local jurisdiction.
1. Improve quality of vegetation for both aquatic and terrestrial wildlife by removing invasive species wherever present. Further, to avoid the likely return of invasive species, cleared areas should be replaced with native riparian vegetation: specifically, native vegetation that provides needed ecosystem functions as described in Volume 1 and throughout this document (e.g., shade, large wood, pollution removal).
2. Where riparian areas already possess some native vegetation, enhance them with a greater mixture of native plants that provide necessary habitat components (forage, cover, breeding, roosting, etc.) for a diversity of species and multiple riparian functions (e.g., streambank stability, wood recruitment, organic litter input, and pollutant removal). The specific mix of vegetation will vary by ecoregion and local needs, but likely includes conifers, grasses, and herbaceous plants.
3. Increase off-channel habitat and improve natural flow regimes by removing dikes or levees and restoring access to and within the floodplain.
11 The Governor’s ORIA Office provides additional assistance for general permitting questions (https://www.oria.wa.gov/site/alias__oria/347/Permitting.aspx) 12 Larger projects may also trigger permit requirements with federal agencies, such as the U.S. Army Corps of Engineers (USACE).
92
Riparian Ecosystems, Volume 2: Management Recommendations 39
4. In areas of incised channels, reintroduce beaver or construct beaver dam surrogates to store sediments, raise streambed elevation, raise water table elevation, and restore riparian vegetation.
5. Remove reed canary grass, which can greatly inhibit channel morphology and aquatic species movement. (Management techniques for reed canary grass vary and are often site-specific: contact your local WDFW regional habitat biologist for technical assistance.)
6. Through proper consultation with WDFW and tribal biologists, increase the presence of large wood in streams and rivers to improve habitat for salmon, resident fish species, and aquatic amphibians.
7. Increase connectivity through removal of non-fish passing culverts. If replacement culverts are needed, ensure they are adequately sized and climate-change-resilient; see WDFW’s online resource on Incorporating Climate Change into the Design of Water Crossing Structures (Wilhere et al. 2016).
8. Reduce soil erosion by increasing vegetation complexity and density, excluding (or substantially minimizing) soil compacting activities, and implementing upland soil management techniques where applicable.
9. For agricultural operators: add and/or improve fencing structures to increase the amount of riparian area acreage from which livestock are excluded to reduce compaction, erosion, and overgrazing.
93

Riparian Ecosystems, Volume 2: Management Recommendations 40
CHAPTER 5. IMPROVING PROTECTION THROUGH ADAPTIVE
MANAGEMENT
5.1 INTRODUCTION Adaptive management is widely recognized as an essential component of effective natural resource management because it provides a systematic process for continually improving policies and management through outcome-based learning. The adaptive management process is a continual cycle of planning, acting, monitoring, evaluating, and adjusting (Figure 5.1). This feedback loop provides information for making adjustments that focus on improving decisions in all phases of resource management. The utility of adaptive management programs should be considered by conservation practitioners, landowners, and land use planners to ensure that conservation actions achieve desired outcomes: in the case of this document, that means preserving, protecting, and restoring healthy, intact, and fully functioning riparian areas. In addition to improving ecosystem outcomes, adaptive management should improve clarity of regulations—resulting in increased transparency to all stakeholders.
All cities and counties are currently protecting critical areas, including riparian ecosystems, through a variety of regulatory and non-regulatory mechanisms. One regulatory challenge is understanding how well these mechanisms meet their intent of protecting ecosystem functions and values and how to make improvements where they are falling short. This chapter was written in collaboration with the Washington Department of Commerce (Commerce) and relies heavily on the Commerce’s 2018 update of the Critical Areas Ordinance Handbook (Bonlender 2018), with one exception, as noted.
Figure 5.1. A simple depiction of the adaptive management cycle (modified from Bormann et al. 1994).
The process for monitoring we describe here supports both local and larger-scale actions that improve our collective efforts to protect riparian ecosystems throughout the state. For example, the Puget Sound Partnership (Partnership) uses “Vital Signs” of ecosystem health and recovery, such as riparian forest cover, to understand ecosystem condition, articulate shared goals and progress, and inspire action towards meeting those goals.
94
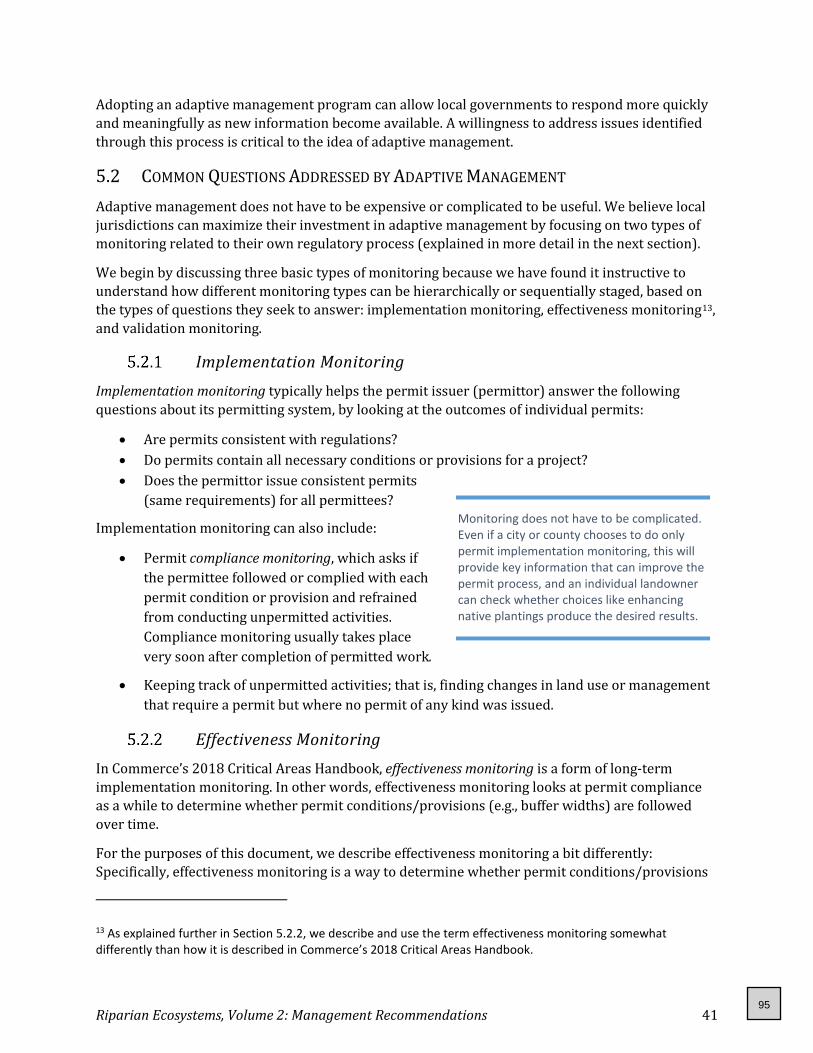
Riparian Ecosystems, Volume 2: Management Recommendations 41
Adopting an adaptive management program can allow local governments to respond more quickly and meaningfully as new information become available. A willingness to address issues identified through this process is critical to the idea of adaptive management.
5.2 COMMON QUESTIONS ADDRESSED BY ADAPTIVE MANAGEMENT Adaptive management does not have to be expensive or complicated to be useful. We believe local jurisdictions can maximize their investment in adaptive management by focusing on two types of monitoring related to their own regulatory process (explained in more detail in the next section).
We begin by discussing three basic types of monitoring because we have found it instructive to understand how different monitoring types can be hierarchically or sequentially staged, based on the types of questions they seek to answer: implementation monitoring, effectiveness monitoring13, and validation monitoring.
Implementation Monitoring Implementation monitoring typically helps the permit issuer (permittor) answer the following questions about its permitting system, by looking at the outcomes of individual permits:
• Are permits consistent with regulations? • Do permits contain all necessary conditions or provisions for a project? • Does the permittor issue consistent permits
(same requirements) for all permittees?
Implementation monitoring can also include:
• Permit compliance monitoring, which asks if the permittee followed or complied with each permit condition or provision and refrained from conducting unpermitted activities. Compliance monitoring usually takes place very soon after completion of permitted work.
• Keeping track of unpermitted activities; that is, finding changes in land use or management that require a permit but where no permit of any kind was issued.
Effectiveness Monitoring In Commerce’s 2018 Critical Areas Handbook, effectiveness monitoring is a form of long-term implementation monitoring. In other words, effectiveness monitoring looks at permit compliance as a while to determine whether permit conditions/provisions (e.g., buffer widths) are followed over time.
For the purposes of this document, we describe effectiveness monitoring a bit differently: Specifically, effectiveness monitoring is a way to determine whether permit conditions/provisions
13 As explained further in Section 5.2.2, we describe and use the term effectiveness monitoring somewhat differently than how it is described in Commerce’s 2018 Critical Areas Handbook.
Monitoring does not have to be complicated. Even if a city or county chooses to do only permit implementation monitoring, this will provide key information that can improve the permit process, and an individual landowner can check whether choices like enhancing native plantings produce the desired results.
95

Riparian Ecosystems, Volume 2: Management Recommendations 42
are working relative to intended environmental outcomes. For example, “Are permit conditions/provisions leading to the riparian function(s) (e.g., shade, bank stability) that they were intended to provide?” Effectiveness monitoring typically involves some on-the-ground measurement of environmental variables affected by land use activities.
Validation Monitoring Research within the adaptive management framework is often referred to as validation monitoring. In the context of land use regulations, the questions relate to how management of critical areas (e.g., riparian) affects the specific environmental resource it was intended to protect (e.g., water quality, salmon). Validation monitoring may be beyond the fiscal means of most local governments. Moreover, it often involves questions that must be addressed over large spatial extents (e.g., at watershed or multi-watershed scale). In comparison, implementation and effectiveness monitoring are often tied to local jurisdiction’s regulatory processes at the site scale: For these reasons, the next two sections focus more on these two types of monitoring
5.3 RECOMMENDED IMPLEMENTATION MONITORING EFFORTS We advise local governments to focus first on using implementation monitoring to evaluate their regulatory processes that affect riparian ecosystems. Implementation monitoring tracks execution of the permitting system from the perspective of both the permit issuer (permittor) and permit holder (permittee) (Figure 5.2). This effort can result in regular status reports that help demonstrate how well local governments and permittees are working together to meet resource objectives in a fair and consistent manner.
Figure 5.2. Depiction of the adaptive management cycle specific to permit compliance.
96
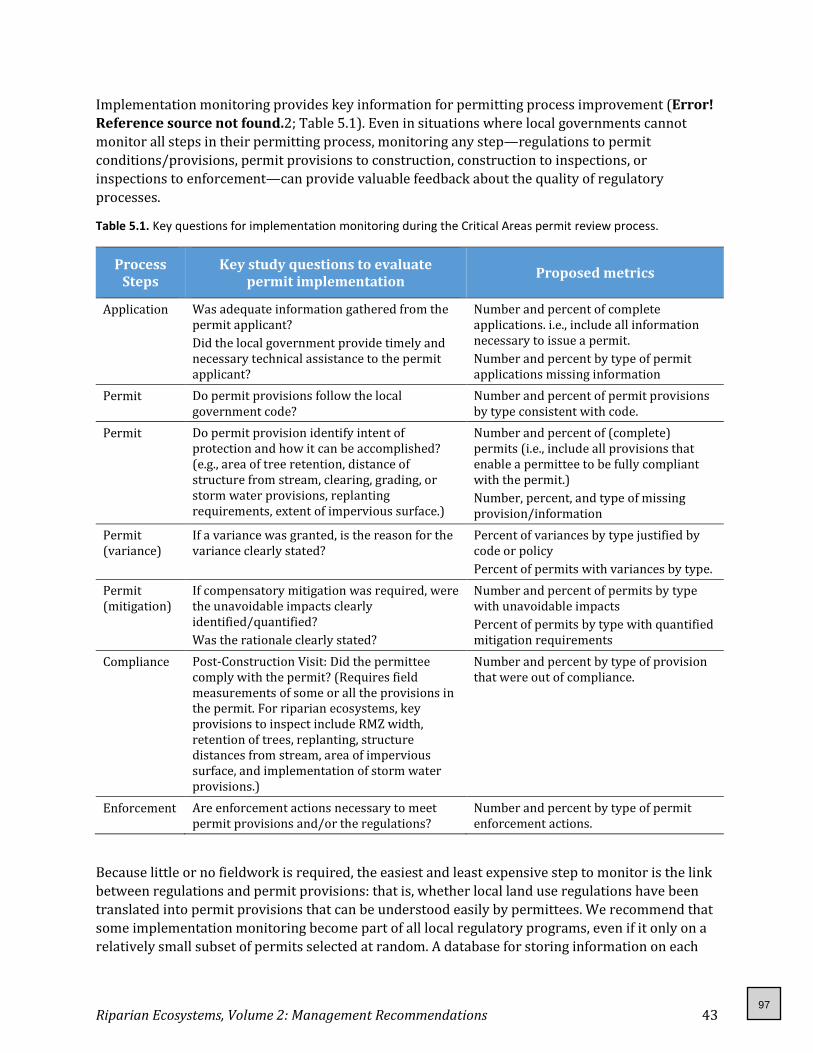
Riparian Ecosystems, Volume 2: Management Recommendations 43
Implementation monitoring provides key information for permitting process improvement (Error! Reference source not found.2; Table 5.1). Even in situations where local governments cannot monitor all steps in their permitting process, monitoring any step—regulations to permit conditions/provisions, permit provisions to construction, construction to inspections, or inspections to enforcement—can provide valuable feedback about the quality of regulatory processes.
Table 5.1. Key questions for implementation monitoring during the Critical Areas permit review process.
Process Steps
Key study questions to evaluate permit implementation Proposed metrics
Application Was adequate information gathered from the permit applicant? Did the local government provide timely and necessary technical assistance to the permit applicant?
Number and percent of complete applications. i.e., include all information necessary to issue a permit. Number and percent by type of permit applications missing information
Permit Do permit provisions follow the local government code?
Number and percent of permit provisions by type consistent with code.
Permit Do permit provision identify intent of protection and how it can be accomplished? (e.g., area of tree retention, distance of structure from stream, clearing, grading, or storm water provisions, replanting requirements, extent of impervious surface.)
Number and percent of (complete) permits (i.e., include all provisions that enable a permittee to be fully compliant with the permit.) Number, percent, and type of missing provision/information
Permit (variance)
If a variance was granted, is the reason for the variance clearly stated?
Percent of variances by type justified by code or policy Percent of permits with variances by type.
Permit (mitigation)
If compensatory mitigation was required, were the unavoidable impacts clearly identified/quantified? Was the rationale clearly stated?
Number and percent of permits by type with unavoidable impacts Percent of permits by type with quantified mitigation requirements
Compliance Post-Construction Visit: Did the permittee comply with the permit? (Requires field measurements of some or all the provisions in the permit. For riparian ecosystems, key provisions to inspect include RMZ width, retention of trees, replanting, structure distances from stream, area of impervious surface, and implementation of storm water provisions.)
Number and percent by type of provision that were out of compliance.
Enforcement Are enforcement actions necessary to meet permit provisions and/or the regulations?
Number and percent by type of permit enforcement actions.
Because little or no fieldwork is required, the easiest and least expensive step to monitor is the link between regulations and permit provisions: that is, whether local land use regulations have been translated into permit provisions that can be understood easily by permittees. We recommend that some implementation monitoring become part of all local regulatory programs, even if it only on a relatively small subset of permits selected at random. A database for storing information on each
97

Riparian Ecosystems, Volume 2: Management Recommendations 44
step (i.e., a permit tracking system—see Table 5.1, Figure 5.3) is a critical tool for creating a complete system of accountability.
Figure 5.3. One system of permit accountability that includes implementation monitoring of internal permit processes, inspection for permit compliance, a database from which to judge outcomes, and a feedback loop connecting outcomes with policy intent.
Long-term implementation monitoring can help answer additional questions, such as: “Are rules/regulations intended to provide long-term protection of critical areas (e.g., RMZs) actually followed or maintained over time?” One way to answer this is by looking at changes in land cover, which describes the type and amount of vegetation, roads, and buildings occurring on the landscape. By comparing high quality aerial photographs taken of the same locations over time, change can be quantified and attributed to specific activities, both from natural disturbances (e.g., wildfires, river channel migration) and human activities (e.g., timber harvesting, residential subdivision construction, highway widening). In Section 5.5, we describe one such process WDFW developed and for which information for many parts of the state are already available.
5.4 EFFECTIVENESS OF REGULATORY PROTECTIONS OF CRITICAL AREAS Where implementation monitoring has been successful, that is, either documenting a highly functional permitting process or improving poorly performing permitting process, we encourage additional effort on effectiveness monitoring. As described above, our primary goal for effectiveness monitoring would focus on understanding how well the permit conditions/provisions lead to measurable outcomes on the ground (e.g., protection/restoration of one or more riparian functions or values) over an extended period.
5.5 USING LAND COVER CHANGE TO UNDERSTAND LONG-TERM REGULATORY
PROTECTION High Resolution Change Detection (HRCD) is a tool that is useful for detecting changes in two specific types of land cover (tree canopy and impervious surfaces) over set time periods. Land cover change analysis like HRCD can show jurisdictions the degree to which critical area regulations are maintaining RMZs as intended. This information can then help shape if, where, why, and how adjustments to permitting processes should occur. By combining land cover change analysis with targeted questions about permitting processes, jurisdictions can begin to adaptively manage changes to their overall regulatory system.
98

Riparian Ecosystems, Volume 2: Management Recommendations 45
The example in the following section is adapted from Commerce’s Critical Areas Handbook (Bonlender 2018). Chapter 7 of that document provides a number of similar monitoring program examples, nearly all of which were developed by cities or counties.
Example: WDFW/Thurston County Shoreline Master Program In 2015, Thurston County and WDFW utilized a National Estuary Program grant to quantify shoreline vegetation, land cover change, and evaluate land use permit compliance. Specifically, Thurston County used WDFW’s HRCD data to monitor compliance within the County’s Shoreline Master Program (SMP) jurisdiction. This project developed a protocol manual for using HRCD for this purpose, available to all jurisdictions within the Puget Sound region.
Adaptive Management Framework in the Voluntary Stewardship Program
The Voluntary Stewardship Program (VSP) was authorized by the Legislature in 2011 through RCW 36.70A.705. The goals of VSP are to protect and enhance critical areas where agricultural activities are conducted, maintain and improve the long-term viability of agriculture in the State of Washington, and reduce conversion of farmland to other uses. The program provides counties with an alternative approach from traditional development regulations that require protection (and encourage enhancement) of critical areas at the individual parcel scale. Instead, VSP relies upon voluntary practices and incentive programs to protect (and enhance) at a watershed scale. Counties “opted-in” to VSP, and as of 2019, 27 of the state’s 39 counties are participating.
Under VSP, local workgroups created work plans that include benchmarks for protection and enhancement of critical areas designed to be achieved through voluntary and incentive-based actions. VSP requires monitoring and adaptive management to maintain and enhance critical areas, including riparian ecosystems, and directs workgroups to monitor at the watershed or sub-watershed scale. Key requirements for county-level programs include:
1. Establishing a durable system to track and report goals, benchmarks, and performance metrics. 2. Developing implementation and effectiveness monitoring programs and conducting monitoring on a pre-
determined schedule. 3. Establishing an adaptive management program with (a) “triggers”; (b) subsequent actions to take; and (c)
a process to review/update both the triggers and actions over time. 4. Reporting on the achievement of protection and enhancement goals and benchmarks at specified
intervals.
Numerous counties have utilized WDFW’s recommended VSP Adaptive Management Matrix in approved VSP Work Plans. Examples include:
• Chelan County, Appendix I (Approved April 2017) • Grant County, Tables 5-7 through 5-10 (Approved June 2017) • Asotin County, Tables 5-3 through 5-5 (Approved May 2018) • Okanogan County, Chapter 6 (Approved September 2018) • Spokane County, Section 4 (Approved November 2018)
Jurisdictions can adapt matrices as templates for connecting goals, benchmarks, performance metrics, monitoring, and adaptive management for other uses beyond VSP. These matrices can be modified as frameworks to identify specific elements of any adaptive management plan.
99

Riparian Ecosystems, Volume 2: Management Recommendations 46
One goal of the pilot project was to answer several related sets of questions:
For Thurston County:
• What land cover change is happening within designated SMP areas? What change is happening throughout the Deschutes River watershed (WRIA 13)?
• How does change known by permit records compare with detected changes by HRCD? • What changes, if any, can be made to the land use permits or permitting process that could
increase the relevancy or efficacy in utilizing the HRCD in compliance monitoring?
For WDFW:
• How well can HRCD detect changes relative to land use permit records? • Using Thurston County’s SMP area as an example test area, what land cover changes are
happening which HRCD is not capturing? • With the development of a HRCD user manual, can HRCD be successfully utilized by other
entities in the absence of direct assistance by WDFW?
The pilot quantified increases in impervious surfaces and decrease in tree canopy within marine areas of the SMP jurisdiction and checked for relevant permits issued. It consisted of five phases:
Phase 1: Initial SMP Change Analysis: Staff from WDFW’s Habitat Program and the County’s Long-Range Planning Department intersected the HRCD dataset with the County’s SMP area and tax parcel data within ArcGIS for three time periods of HRCD availability (2006 to 2009, 2009 to 2011, and 2011 to 2013). Staff compared known areas of change to those locations with the county’s land use permit records to find locations of observed change via HRCD without any permit record. During this phase, land cover change statistics were also produced, including total area of change and discrete occurrences of land cover change events.
Phase 2: Learning What the HRCD Misses: Using the SMP area in the County, WDFW staff manually looked for land cover changes not captured by the HRCD analysis, to understand how accurate HRCD was in capturing all land cover change situations (rates of omission error).
Phase 3: Developing a Standardized Method for Utilizing the HRCD: A major goal of this project was to develop support materials for others to be able to utilize HRCD to answer land use management questions independent of WDFW staff assistance. Using lessons learned in Phases 1 and 2, WDFW and the County agreed upon a recommended method for applying HRCD to a specific management question, and collaboratively developed a “how-to” manual. In this phase, WDFW staff also developed a web-based service (https://hrcd-wdfw.hub.arcgis.com) where users can download the HRCD dataset, detail the methodology of HRCD construction, find WDFW contact information, and more.
Phase 4: Testing the Manual through Remaining SMP Analysis in WRIA 13: Using only the HRCD dataset and the manual produced in Phase 3, County staff examined land cover change within the remaining SMP areas within WRIA 13 successfully for the same three time periods that HRCD data was available and utilized in the earlier phase.
Phase 5: Training and Outreach: With the lessons learned and products derived from Phases 1 through 4 of the project, staff worked in conjunction with the Coastal Training Program, managed by Ecology, to develop and deliver a workshop for planning staff within other state agencies, local
100

Riparian Ecosystems, Volume 2: Management Recommendations 47
governments, and some non-governmental organizations. WDFW also used this opportunity to train internal staff on the benefits, limitations, and uses of HRCD.
The evaluators analyzed land cover change within Thurston County’s SMP area between 2006 and 2013, pulling permit records from timeframes that corresponded with the available HRCD datasets. The project’s findings were very helpful, not only because of the information collected, but also in providing proof of concept for several of the steps/tools.
For example: The utility of HRCD in analyzing patterns of land cover change in a specific geographic area of concern were well demonstrated. The HRCD analysis found that, from 2006 to 2013, less than half of one percent (0.39%) of the riparian area contained within the SMP had land cover change – approximately two-thirds of this was due to canopy loss, with one-third due to new impervious surfaces. The HRCD analysis did not find any permitted developments that were out of compliance, though it did find unpermitted events (e.g., tree removal) in each time period studied.
Furthermore, the HRCD dataset proved to be relatively simple to use. With the development of standard application methods, Thurston County was able to complete an analysis of their remaining SMP area without any further assistance from WDFW.
On the flip side, Thurston County found that comparing actual permit compliance with HRCD data was “tedious and difficult” because of limitations with the county’s permit tracking database (AMANDA). For example, in many cases, land use permits did not include enough information to determine conclusively that a parcel with observed change via HRCD was out of compliance or determine that the parcel had a permit record during the study’s timeframe in question.
Local governments can use HRCD analysis at the start to find land cover changes that are otherwise unknown; as they begin to understand patterns, HRCD analysis provides indications to identify locations that warrant closer investigation through other methods.
5.6 CONCLUSION Implementation and effectiveness monitoring are important parts of adaptive management and can be undertaken relatively easily by local governments. Many of our riparian ecosystems are already degraded and stressed, so it is worth our while to investigate whether the actions put in place to protect them are being carried out as required and leading to the specific environmental responses that were intended. This is now more important than ever, because in spite of advances in science and efforts to improve regulatory processes, climate change and population pressures are increasingly confronting many parts of the state. Using monitoring and adaptive management to track successes and failures and then learning from both will make our challenges easier to overcome.
101

Riparian Ecosystems, Volume 2: Management Recommendations 48
LITERATURE CITED Volume 1 serves as the primary source and citation for this document:
Quinn, T., G. Wilhere, and K. Krueger (managing editors). 2020. Riparian Ecosystems, Volume 1: Science Synthesis and Management Implications. Habitat Program, Washington Department of Fish and Wildlife, Olympia, Washington.
Anderson, P.S., S. Meyer, P. Olson, and E. Stockdale. 2016. Determining the ordinary high water mark for Shoreline Management Act compliance in Washington State. Publication No. 16-06-029. Washington State Department of Ecology, Olympia, Washington. (https://fortress.wa.gov/ecy/publications/documents/1606029.pdf)
Arid Lands Initiative. 2014. The Arid Lands Initiative: shared priorities for conservation at a landscape scale. Summary prepared by S.A. Hall and the Arid Lands Initiative Core Team. SAH Ecologia LLC, Wenatchee, Washington. Available at (https://www.sciencebase.gov/catalog/file/get/546d0a6ae4b0fc7976bf1db0?f=__disk__ab%2Fd6%2F7d%2Fabd67df8a73f48f87922d184ffec6e9b8dac635c)
Ashcroft, M.B. 2010. Identifying refugia from climate change. Journal of Biogeography 37:1407-1413.
Azerrad, J., J. Carleton, J. Davis, T. Quinn, C. Sato, M. Tirhi, G. Wilhere, and S. Tomassi. 2009. Landscape planning for Washington’s wildlife: managing for biodiversity in developing areas. Habitat Program, Washington Department of Fish and Wildlife. Olympia, Washington. (https://wdfw.wa.gov/publications/00023)
Ballash, H. 2016. Building cities in the rain. Washington State Department of Commerce. Olympia, Washington. (https://www.ezview.wa.gov/site/alias__1780/overview/34828/overview.aspx)
Barnard, R. J., J. Johnson, P. Brooks, K. M. Bates, B. Heiner, J. P. Klavas, D.C. Ponder, P.D. Smith, and P. D. Powers. 2013. Water crossings design guidelines. Habitat Program, Washington Department of Fish and Wildlife, Olympia, Washington. (https://wdfw.wa.gov/publications/01501)
Bermingham, B., C. Douglas, B. Floyd, D. Koellmann, P. Mugunthan, and J. Small. 2013. Final draft semi-arid riparian functions and associated regulatory protections to support shoreline master program updates. Anchor QEA LLC., Kennewick, Washington.
Bonlender, B. 2018. Critical area handbook: A handbook for reviewing critical areas regulation. Washington State Department of Commerce, Olympia, Washington. (https://www.commerce.wa.gov/serving-communities/growth-management/growth-management-topics/critical-areas/)
Bormann, B.T., P.G. Cunningham, M.H. Brookes, V.W. Manning, and M.W. Collopy. 1994. Adaptive ecosystem management in the Pacific Northwest. PNW-GTR-341. U.S. Forest Service, Pacific Northwest Research Station, Portland, Oregon.
BLM (Bureau of Land Management). 2015. Riparian area management: proper functioning condition assessment for lotic areas. Technical Reference 1737-15. BLM, National Operations Center, Denver, Colorado.
City of Redmond. 2013. City of Redmond, Washington citywide watershed management plan. Prepared by Herrera Environmental Consultants, Inc. Seattle, Washington. (https://www.redmond.gov/DocumentCenter/View/4055/Watershed-Management-Plan-2013-PDF)
102
Riparian Ecosystems, Volume 2: Management Recommendations 49
Cordell, H. K., D. Murphy, K.H. Ritters, and J.E. Harvard III. 2005. The natural ecological value of wilderness. Pages 205-249 in H.K. Cordell, J.C. Bergstrom, J. M. Bowker (editors). The Multiple Values of Wilderness. Venture Publishing, State College, Pennsylvania.
Cramer, M.L. (managing editor). 2012. Stream habitat restoration guidelines. Co-published by the Washington Departments of Fish and Wildlife, Natural Resources, Transportation, and Ecology, Washington State Recreation and Conservation Office, Puget Sound Partnership, and the U.S. Fish and Wildlife Service, Olympia, Washington.
Cramer, M., K. Bates, D. Miller, K. Boyd, L. Fortherby, P. Skidmore, and T. Hoitsma. 2002. Integrated streambank protection guidelines. Washington Department of Fish and Wildlife, Olympia, Washington. (https://wdfw.wa.gov/publications/00046)
DNR (Washington Department of Natural Resources). 2004. Forest Practices Board Manual, Section M2: standard methods for identifying bankfull channel features and channel migration zones. DNR, Forest Practices Division, Olympia, Washington. (https://www.dnr.wa.gov/publications/fp_board_manual.pdf?amcgpv)
EnviroVision, Herrera Environmental, and Aquatic Habitat Guidelines Working Group. 2010. Protecting nearshore habitat and functions in Puget Sound, revised edition. Washington State Department of Fish and Wildlife, Olympia, Washington. (https://wdfw.wa.gov/publications/00047)
Fetherston, K.L., R.J. Naiman, and R.E. Bilby. 1995; Large woody debris, physical process, and riparian forest succession in montane river networks of the Pacific Northwest. Geomorphology 13:133-144.
Fox, M.J. 2003. Spatial organization, position, and source characteristics of large woody debris in 2485 natural systems. Ph.D. Dissertation. University of Washington, Seattle, Washington.
Harris, R.R. 1987. Occurrence of vegetation on geomorphic surfaces in the active floodplain of a California alluvial stream. American Midland Naturalist 118:393-405.
Hilty, J.A., and A.M. Merenlender. 2004. Use of riparian corridors and vineyards by mammalian predators in northern California. Conservation Biology 18:126-135.
Johannessen, J., A. MacLennan, A. Blue, J. Waggoner, S. Williams, W. Gerstel, R. Barnard, R. Carman, and H. Shipman. 2014. Marine shoreline design guidelines. Washington Department of Fish and Wildlife, Olympia, Washington. (https://wdfw.wa.gov/publications/01583)
Johnson, D.H., and T.A. O’Neil. 2001. Wildlife Habitat Relationships in Oregon and Washington. Oregon State University Press, Corvallis, Oregon.
Keppel, G., K.P. Van Niel, G.W. Wardell-Johnson, C.J. Yates, M. Byrne, L. Mucina, A.G.T. Schut, S.D. Hopper, and S.E. Franklin. 2012. Refugia: identifying and understanding safe havens for biodiversity under climate change. Global Ecology and Biogeography 21:393-404.
Knight, K. 2009. Land use planning for salmon, steelhead and trout: a land use planner’s guide to salmonid habitat protection and recovery. Habitat Program, Washington Department of Fish and Wildlife, Olympia, Washington. (https://wdfw.wa.gov/publications/00033)
Knutson, K.L., and V.L. Naef. 1997. Management recommendations for Washington’s Priority Habitats: riparian. Habitat Program, Washington Department of Fish and Wildlife, Olympia, Washington. (https://wdfw.wa.gov/publications/00029)
Krosby, M., D.M. Theobald, R. Norheim, and B.H. McRae. 2018. Identifying riparian climate corridors to inform climate adaptation planning. PLOS ONE 13(11): e0205156.
103
Riparian Ecosystems, Volume 2: Management Recommendations 50
Lacy, R.C., Williams, R., Ashe, E., Balcomb III, K.C., Brent, L.J., Clark, C.W., Croft, D.P., Giles, D.A., MacDuffee, M. and Paquet, P.C. (2017). Evaluating anthropogenic threats to endangered killer whales to inform effective recovery plans. Scientific reports, 7(1), 1-12.
Legg, N.T., and P.L. Olson. 2015. Screening tools for identifying migrating stream channels in western Washington – geospatial data layers and visual assessments. Publication No. 15-06-003. Washington State Department of Ecology, Olympia, Washington. (https://fortress.wa.gov/ecy/publications/documents/1506003.pdf)
Legg, N.T., and P.L. Olson. 2014. Channel migration processes and patterns in western Washington: A synthesis for floodplain management and restoration. Publication No. 14-06-028. Washington State Department of Ecology, Olympia, Washington. (https://fortress.wa.gov/ecy/publications/documents/1406028.pdf)
Lichvar, R.W., N.C. Melvin, M.L Butterwick, and W.N Kirchner. 2012. National wetland plant list indicator rating definitions. ERCD/CRREL TN-12-1. U.S. Army Corps of Engineers, Washington, D.C.
Murray, C.C., Hannah, L.C., Doniol-Valcroze, T., Wright, B., Stredulinsky, E., Locke, A., and R. Lacy. (2019). Cumulative Effects Assessment for Northern and Southern Resident Killer Whale Populations in the Northeast Pacific. Department of Fisheries and Oceans, Canadian Scientific Advisory Research Document 2019/056. x. + 88 pp.
Naiman, R. J., and R. E. Bilby. 1998. (editors) River ecology and management: lessons from the Pacific Coastal Ecoregion. Springer Science & Business Media, New York.
Naiman, R.J., H. Decamps, and M. Pollock. 1993. The role of riparian corridors in maintaining regional biodiversity. Ecological Applications 3:209-212.
Nordland, B., and K. Bates. 2000. Draft fish protection and screen guidelines for Washington State. Habitat Program, Washington Department of Fish and Wildlife, Olympia, Washington. (https://wdfw.wa.gov/publications/00050)
NRC (National Research Council). 2002. Riparian areas: functions and strategies for management. The National Academies Press, Washington, D.C. https://doi.org/10.17226/10327.
Olson, P. L., N. T. Legg, T. B. Abbe, M. A. Reinhart, and J. K. Radloff. 2014. A methodology for delineating planning-level channel migration zones. Publication No. 14-06-025. Washington State Department of Ecology, Olympia, Washington. (https://fortress.wa.gov/ecy/publications/documents/1406025.pdf)
Patten, D.T. 1998. Riparian ecosystems of semi-arid North America: diversity and human impacts. Wetlands 18:498-512. https://doi.org/10.1007/BF03161668.
Puget Sound Partnership. 2020. Puget Sound Vital Signs. Available: https://www.psp.wa.gov/evaluating-vital-signs.php (December 2020).
Quinn, T., et al. 1998. Habitat Associations of the riparian-dependent amphibian, reptile, mammals, and mollusks in commercial forest lands of Washington State: a report to the Timber, Fish & Wildlife policy committee. Washington Department of Natural Resources, Olympia, Washington.
Rapp, C.F., and T.B. Abbe. 2003. A framework for delineating channel migration zones. Publication No. 03-06-027. Washington State Department of Ecology, Olympia, Washington. (https://fortress.wa.gov/ecy/publications/documents/0306027.pdf)
RCO (Recreation and Conservation Office). 2019. State of Salmon. RCO, Olympia, Washington. https://stateofsalmon.wa.gov/exec-summary/ Retrieved July 23, 2019.
104

Riparian Ecosystems, Volume 2: Management Recommendations 51
Richardson, J.S., R.J. Naiman, F.J. Swanson, and D.E. Hibbs. 2005. Riparian communities associated with Pacific Northwest headwater streams: assemblages, processes, and uniqueness. Journal of American Water Resources Association 41:935-947.
Rogers, L.E, R.E. Fitzner, L.L. Cadwell, and B.E. Vaughan. 1988. Terrestrial animal habitats and population responses. Pages 182-257 in W.H. Rickard, L.E. Rogers, B.E. Vaughan, and S.F. Liebetrau (editors). Shrub-steppe: balance and change in a semi-arid terrestrial ecosystem. Elsevier, New York.
Rosgen, D.L. 1996. Applied river morphology: Second edition. Wildland Hydrology Books, Fort Collins, Colorado.
Seavy, N.E., T. Gardali, G.H. Golet, F.T. Griggs, C.A. Howell, R. Kelsey, S.L. Small, J.H. Viers, and J.F. Weigand. 2009. Why climate change makes riparian restoration more important than ever: recommendations for practice and research. Ecological Restoration 27:330-338.
Shared Strategy Development Committee. 2007. Puget Sound salmon recovery plan. Shared Strategy for Puget Sound, Seattle, Washington.
Smith, D. 2005. Off-channel habitat inventory and assessment for the upper Skagit River basin. Report to non-flow coordinating committee of the Skagit River Hydroelectric Project (FERC No. 553). Skagit River System Cooperative, La Conner, Washington.
Thomas, F.M. 2014. Ecology of phreatophytes. Progress in Botany 75:335-375.
Thomas, J.W. (technical editor]). 1979. Wildlife Habitats in Managed Forests: The Blue Mountains of Oregon and Washington. Agriculture Handbook No. 553. U.S. Forest Service, Washington, D.C. (https://www.srs.fs.usda.gov/pubs/gtr/uncaptured/gtr_pnw080.pdf)
Thomas, J.W., J.F. Franklin, J. Gordon, and K.N. Johnson. 2006. The Northwest Forest Plan: Origins, components, implementation experience and suggestions for change. Conservation Biology 20:277-87.
USFS (U.S. Forest Service). 2008. Stream simulation: an ecological approach to providing passage for aquatic organisms at road-crossings. National Technology and Development Program, San Dimas, California.
USFS (U.S. Forest Service). 2001. Selway and Middle Fork Clearwater Rivers Subbasin Assessment. Nez Perce, Clearwater, and Bitterroot National Forests, Idaho. Retrieved August 26, 2019.
Vander Haegen, M.W. 2007. Fragmentation by agriculture influences reproductive success of birds in a shrub-steppe landscape. Ecological Applications 17: 934-947.
Ward, J.V., and J.A. Stanford. 1995. Ecological connectivity in alluvial river ecosystems and its disruption by flow regulation. Regulated Rivers: Research & Management 11:105-119.
Washington Sea Grant. 2009. Protection of marine riparian functions in Puget Sound, Washington. Washington Department of Fish and Wildlife, Olympia, Washington. (https://wdfw.wa.gov/publications/00693)
WDFW (Washington Department of Fish and Wildlife). 2005. Washington’s comprehensive wildlife conservation strategy, final draft. WDFW, Olympia, Washington.
WDFW (Washington Department of Fish and Wildlife). 2016. Your marine waterfront: A guide to protecting your property while promoting healthy shorelines. WDFW, Olympia, Washington. (https://wdfw.wa.gov/publications/01791)
105

Riparian Ecosystems, Volume 2: Management Recommendations 52
Williams, P.B., E. Andrews, J.J. Opperman, S. Bozkurt, and P.B. Moyle. 2009. Quantifying activated floodplains on a lowland regulated river: its application to floodplain restoration in the Sacramento Valley. San Francisco Estuary and Watershed Science 7(1).
Wolman, M.G., and L.B Leopold. 1957. River flood plains: some observations on their formation. Geological Survey Professional Paper 282-C. U.S. Government Printing Office, Washington, D.C.
106
Riparian Ecosystems, Volume 2: Management Recommendations 53
GLOSSARY OF TERMS Active channel: The active channel is defined by the lower limit of continuous riparian vegetation (Naiman et al. 1998) and may be delineated by absence of both moss on rocks and rooted vegetation (USFS 2008). The upper most elevation of the active channel is sometimes equated with the ordinary high-water mark.
Active floodplain: Located between the active channel and adjacent terrace or hillslopes (Fetherston et al. 1995; Harris 1987). Depending on the watershed, the flood return interval of the active floodplain varies between 1 and 10 years (Wolman and Leopold 1957; Ward and Stanford 1995; Lichvar et al. 2006; Williams et al. 2009; BLM 2015).
Adaptive management: The systematic acquisition and application of reliable information to improve management over time. It often includes treating management decisions as experiments in order to address critical uncertainties and learn more quickly from experience. It involves setting objectives, monitoring conditions, and adjusting management based on results. Hallmarks of a sound adaptive management program include: (1) adequate funding for monitoring and research, (2) a willingness to change course when pre-established triggers are reached, and (3) a commitment to gather data and evaluate conditions at appropriate spatial extents and time scales. See Ecosystem-based management and WAC 365-195-920(2).
Anadromous fisheries: The commercial, recreational or subsistence harvest of fish that are born in freshwater, rear at sea, and return to freshwater to spawn. Anadromous fisheries of Washington include salmon (Chinook, coho, chum, sockeye, and pink), steelhead, bull trout, coastal cutthroat trout, green sturgeon, white sturgeon, eulachon, longfin smelt, and Pacific lamprey.
Aquatic species: Wildlife species that live in marine or freshwater including fish, shellfish (e.g., clams, snails, mussels), amphibians (e.g., frogs, salamanders), reptiles (e.g., turtles), crustaceans (e.g., crayfish), insects (e.g., larval mayflies, stoneflies, caddisflies, dragonflies) and various other invertebrates.
Best Available Science: Information produced through a valid scientific process that WDFW or another local, state or federal agency has determined represents the best available science consistent with criteria set out in WAC 365-195-900 through 365-195-925. (Volume 1 of this document is an example of Best Available Science regarding riparian ecosystems.)
Biota: The animal and plant life of a region, habitat, or geological period.
Buffer: The area around a critical area that separates the critical area from incompatible uses. For example, a 200m buffer may be established around a heron-nesting colony (the critical area) to keep suburban land uses from disrupting the colony. See WAC 365-190-130(3)(a). Riparian ecosystems are both buffers (for instream habitat) and critical areas on their own merit.
Channel Migration Zone: The area within which a river channel is likely to migrate and occupy over a specified time period (e.g., 100 years).
Channel slope or gradient: The average steepness of a stream segment measured as its change in elevation divided by its length. Typically, a segment’s gradient is considered low if less than 2%, moderate between 2% and 4%, and high if greater than 4%.
107
Riparian Ecosystems, Volume 2: Management Recommendations 54
Classification (critical area): Defining categories to which critical areas are assigned. The Priority Habitats and Species (PHS) program provides WDFW’s recommended classification scheme for Fish and Wildlife Habitat Conservation Areas. Classification precedes designation in counties’ and cities’ effort to protect critical areas. See WAC 365-190-040(4).
Complexity: The complicated state seen in dynamic environments that contain multiple components and processes that interact with one another in a web of interactions whose outcomes are often unpredictable. Complexity can be described with conceptual models; outcomes of well-understood complex phenomena can be partially predicted using computer models.
Connectivity: Landscape connectivity is the physical relationship between landscape elements. Functional connectivity describes the degree to which landscapes facilitate or impede the movement of organisms between areas of habitat.
Critical Aquifer Recharge Area: Areas with an essential recharging effect on aquifers used for potable water. One of five types of Critical Areas identified in the Growth Management Act.
Critical Area(s): Places that the Growth Management Act requires all counties and cities to designate and protect, specifically, (1) Wetlands; (2) Critical Aquifer Recharge Areas; (3) Fish and Wildlife Habitat Conservation Areas (e.g., Riparian Management Zones); (4) Frequently Flooded Areas; and (5) Geologically Hazardous Areas. In developing policies and regulations to protect the functions and values of critical areas, counties and cities are required to include best available science and give special consideration to conservation or protection measures necessary to preserve or enhance anadromous fisheries. See RCW 36.70A.172(1). The presence of a critical area may limit some land development options. See WAC 365-190-040(6).
Delineation (critical area): The act of applying definitions or performance standards in the field to identify the boundary of a critical area.
Designation (critical area): Assigning critical areas into established categories and specifying their general distribution, location, and extent. Designation can be made by maps (which are useful for public awareness and for identifying if a proposal may affect a critical area) and by performance standards or definitions (which allow for specific identification and site-scale delineation during permit review). WDFW’s Priority Habitats and Species (PHS) program provides the agency’s recommended designation maps and performance standards/definitions for Fish and Wildlife Habitat Conservation Areas. Designation occurs after classification in counties’ and cities’ efforts to protect critical areas. See WAC 365-190-040(5).
Disturbance regime: The frequency, magnitude, and duration of disturbance events.
Disturbance: A pronounced, temporary change in environmental conditions within an ecosystem. Disturbances often act quickly and can alter ecosystem composition, structure, and function.
Ecological (biological) integrity: Ability of an ecological system to support and maintain a community of organism that has species composition, diversity, and functional organization comparable to those of natural habitats within a region. An ecological system has integrity when its dominant ecological characteristics (composition, structure, function, and processes) occur within their historical ranges of natural variability. See Historical condition and Range of natural variability.
108

Riparian Ecosystems, Volume 2: Management Recommendations 55
Ecosystem(s): A spatially explicit unit of the Earth that includes all the organisms, along with all components of the abiotic (chemical and physical) environment. Ecosystems have composition, structure, and functions.
Ecosystem composition (or ecological composition): All living (biotic) and nonliving parts of an ecosystem.
Ecosystem function(ing) (or ecological function): (1) The process or cause and effect relationship underlying two or more interacting components, e.g., terrestrial plant material as food/substrate for aquatic invertebrates. (2) The sum of processes that sustain the system. (3) The capacity of natural processes and components to provide goods and services that satisfy human needs, either directly or indirectly. Ecosystem functions can be conceived as a subset of ecological processes (See Ecosystem process).
Ecosystem process (or ecological process): Interactions among components of an ecosystem, biotic (living organisms) and abiotic (chemical and physical) components. Many processes involve transfer, conversion, or storage of matter or energy (See Ecosystem function).
Ecosystem structure (or ecological structure): The arrangement of and relations among the parts or elements (components) of an ecosystem.
Ecosystem-based management (EBM): Management driven by explicit goals; executed by policies, protocols, and practices; and made adaptable by monitoring and research; based on our best understanding of the ecological interactions and processes necessary to sustain ecosystem composition, structure, and function. EBM acknowledges that humans are an important ecosystem component and focuses on managing human activities within ecosystems. EBM often involves balancing ecological, economic, and social objectives within the context of existing laws and policies.
Enhance: To improve a critical area’s existing ecosystem processes, structure, and/or functions so that its ecological integrity is more like its historical condition.
Erosion: The loosening and transport of soil particles and other sediment by water. Terrestrial erosion includes raindrop splash erosion, overland flow sheet erosion, surface flow rill (shallow) and gully (deeper) erosion. Channel erosion includes streambank erosion and channel incision (gouging). Rill and gully erosion diminish the ability of the riparian area to trap sediment and pollutants and can often be avoided with intact riparian vegetation.
Fish and Wildlife Habitat Conservation Areas (FWHCA): A type of Critical Area specified in the Growth Management Act. The intent of FWHCAs are to maintain populations of species in suitable habitats within their natural geographic distribution so that (1) the habitat available is sufficient to support viable populations over the long term, and (2) isolated subpopulations are not created. FWHCAs come in a variety of types including waters of the state, places with which listed species have a primary association, habitats and species of local importance, and riparian ecosystems. See WAC 365-190-130.
Flow regime (stream): The distribution of stream flow through space and time. Flow regimes can be described by their magnitude (e.g., mean annual, hourly maximum), timing, frequency or return periodicity, duration, spatial distribution, and rate of change. The pathways that water takes to reach a stream (e.g., surface runoff) and within a stream exert a strong influence on the flow regime.
109

Riparian Ecosystems, Volume 2: Management Recommendations 56
Function: Physical, chemical, or biological processes that occur within an ecosystem. WAC 365-196-830 says, “Functions are the conditions and processes that support the ecosystem. Conditions and processes operate on varying geographic scales ranging from site-specific to watershed and even regional scales.” See also Ecosystem function(ing) and Ecosystem process.
Habitat: The resources and conditions presented in an area that support the functional needs of a species (e.g., hiding, migration, resting, feeding, breeding, and rearing), and which are necessary for its survival and reproduction. Habitat is species-specific, scale dependent, and more than vegetation composition or structure.
Hazard Tree: A tree that a jurisdiction’s building official or other recognized professional (e.g., certified arborist, registered landscape architect, or certified forester) has determined poses a near-term hazard to public safety or to an existing permanent structure or public utility.
Herbaceous: Non-woody plants such as grasses and ferns.
Historical condition: See Ecological integrity and Range of natural variability.
Hydrology: Description of the properties, distribution, movement, and storage of water on and below the Earth’s surface.
Impervious surface: Ground surfaces that resist or prevent water infiltration, e.g., roofs of houses, roadways.
Imputed: estimated; a value assigned to missing data by inference from the values of data within the same dataset.
Infiltration: The rate or process by which water on the ground enters the soil.
Instream: Within flowing freshwater; also, the area waterward of the Ordinary High-Water Mark.
Large Woody Debris: Large dead woody material (such as fallen trees and branches) in various stages of decomposition that provide nutrient capital to forest and aquatic resources and serve as habitat in forest and riparian ecosystems. Large wood is usually defined as having diameter greater than 4 in (10 cm) and length greater than 6 ft (≈ 2 m).
Low Impact Development (LID): A storm water and land-use management strategy that tries to mimic natural hydrologic conditions by emphasizing pre-disturbance hydrologic processes of infiltration, filtration, storage, evaporation, and transpiration.
Mitigation: General category of measures that a proponent may take to avoid, minimize, and compensate for impacts.
Mitigation sequence: The stepwise process of protecting a critical area through, first (1) avoiding harm to the critical area to the maximum extent practicable, then (2) minimizing unavoidable harm to the maximum extent practicable, and finally (3) providing compensation for all unavoidable harm by restoring, creating, enhancing, or preserving the critical area’s ecological functions and values to replace those impacted or lost through permitted activities.
Monitoring: The process of observing and checking the progress or quality environmental conditions for the purposes of adaptive management. Often described as having three types – implementation, effectiveness, and validation.
110

Riparian Ecosystems, Volume 2: Management Recommendations 57
Morphology (stream channel, aka fluvial geomorphology): A stream channel’s shape and how it changes over time. Channel morphology is influenced by the abundance and variation in sediment sources, the ability of water to transport sediment downstream, and interactions of sediment with riparian vegetation and woody debris.
Off-Channel Habitat: Overflow channels, sloughs, alcoves, wetlands, and small streams found within the floodplains of larger river channels. Off-channel habitat consists of waters connected to and draining into rivers and streams by inundation during peak flow events (Smith 2005; WAC 222-16-031). Off-channel habitat provides habitat for salmonids and other aquatic species which often afford (1) spawning habitat that does not experience scouring high flows; and (2) summer rearing habitat that does not experience loss of stream flow.
Ordinary High Water Mark (OHWM): (1) That mark that will be found by examining the bed and banks and ascertaining where the presence and action of waters are so common and usual, and so long continued in all ordinary years, as to mark upon the soil a character distinct from that of the abutting upland (Washington Department of Ecology 2016). (2) That line on the shore established by the fluctuations of water and indicated by physical characteristics such as a clear, natural line impressed on the bank, shelving, changes in the character of soil, destruction of terrestrial vegetation, the presence of litter and debris, or other appropriate means that consider the characteristics of the surrounding areas (U.S. Army Corps of Engineers, 2014).
Organic litter: Plant, leaf, tree, or soil litter, and duff are dead plant materials that have fallen to the ground. In this document, organic litter is referenced as available for contributions to the stream system.
Passive Restoration: Allowing natural succession to occur in an ecosystem after removing a source of disturbance.
Population viability (local): The likelihood that a population of a species will persist for some length of time.
Precautionary principle: Erring on the side of not harming resources when faced with uncertainty, especially for potential harm that is essentially irreversible. Utilizing a precautionary approach in land use planning involves: (1) taking preventive action (avoiding impacts); (2) shifting the burden of proof to the project proponents; (3) exploring a wide range of potential alternatives; and/or (4) including multiple stakeholders and disciplines in decision making.
Priority Area: The area within a Priority Species’ natural geographic distribution within which protective measures and/or management actions are needed to (1) support viable populations over the long term and (2) avoid creating isolated subpopulations.
Priority Habitat: A State of Washington habitat type with unique or significant value to many species; an area with one or more of the following attributes: (1) comparatively high fish and wildlife density; (2) comparatively high species diversity; (3) important breeding habitat; (4) important seasonal ranges; (5) important movement corridors; (6) limited availability; (7) high vulnerability to habitat alteration; or (8) unique or dependent species. Examples of Priority Habitats include but are not limited to instream, riparian, shrub steppe, Oregon white oak woodlands, freshwater wetlands, and marine nearshore.
111
Riparian Ecosystems, Volume 2: Management Recommendations 58
Priority Habitats & Species (PHS): WDFW’s primary means of transferring fish and wildlife information from resource experts to local governments, landowners, and others for the protection of fish, wildlife, and habitat. Includes endangered, threatened, sensitive, candidate, and vulnerable species and habitats deemed priorities of WDFW and reflective of best available science. See WAC 365-190-130.
Priority Species: A State of Washington fish or wildlife species requiring protective measures and/or management actions to ensure its survival. A Priority Species fits one or more of the following criteria: (1) is a state-listed endangered, threatened, sensitive, or candidate species, (2) has vulnerable aggregations, or (3) is of recreational, commercial, and/or tribal importance. Examples of Priority Species include but are not limited to steelhead/rainbow trout, bull trout/Dolly Varden, great blue heron, cavity-nesting ducks, sage grouse, fisher, orca, and elk.
Process: See Ecosystem process.
Protect: To prevent the degradation of existing ecosystem functions and values.
Range of natural variability (or Historical range of natural variability): Refers to the range of ecological conditions (components, structures and functions) in a time period before widespread anthropogenic changes.
Recruitment (wood): The process of wood moving from a riparian area to the stream channel. Sources of recruitment include bank erosion, windthrow, landslides, debris flows, snow avalanches, and tree mortality due to, for example, fire, ice storms, beavers, insects, or disease. Dominant factors include, but are not limited to, channel width, slope steepness, slope stability, forest composition and structure, and local wind patterns.
Refugia (singular Refugium): sites to which biota retreat, persist in and potentially expand from under changing environmental conditions (Keppel et al. 2012).
Riparian: An adjective meaning alongside a waterbody: stream, river, lake, pond, bay, sea, and ocean. Riparian areas are sometimes referred to by different names: riparian ecosystems, riparian habitats, riparian corridors, or riparian zones. Depending on the contexts, these terms may have somewhat different meanings.
Riparian area: A defined area encompassing both sides of a water body, composed of aquatic ecosystems (i.e., the river or stream), riparian ecosystem, and riverine wetlands. Riparian areas are three dimensional: longitudinal up and down streams, lateral to the width of the riparian ecosystem, and vertical from below the water table to above the canopy of mature site-potential trees (NRC 2002).
Riparian buffer: Buffer refers to its purpose, which is to reduce or prevent adverse impacts to water quality, fisheries, and aquatic biodiversity from human activities occurring upslope of the buffer. Riparian buffers managed specifically for pollutant removal may also be called a vegetated filter strip.
Riparian ecosystem: Riparian areas are transitional between terrestrial and aquatic ecosystems and distinguished by gradients in biophysical conditions, ecological processes, and biota. They are areas through which surface and subsurface hydrology connect waterbodies with their adjacent uplands. They include those portions of the ecosystem distinguished by gradients (i.e., riparian
112
Riparian Ecosystems, Volume 2: Management Recommendations 59
zones) and portions of terrestrial ecosystems that significantly influence exchanges of energy and matter with aquatic ecosystems (i.e., the Zone of Influence). Our definition of riparian ecosystem does not include adjacent waters (i.e., rivers or streams, but does include riverine wetlands) and recognizes the riparian zone as a distinctive area within riparian ecosystems.
Riparian Management Zone: A delineable area defined in a land use regulation; often synonymous with riparian buffer. For the purposes of this document, we define the RMZ as the area that has the potential to provide full riparian functions. In many forested regions of the state this area occurs within one 200-year site-potential tree height measured from the edge of the stream channel. In situations where a CMZ is present, this occurs within one site-potential tree height measured from the edges of the CMZ. In non-forest zones the RMZ is defined by the greater of the outermost point of the riparian vegetative community or the pollution removal function, at 100-feet.
Riparian values: The benefits that riparian ecosystems provide to society, including but not limited to flood damage reduction, water quality improvement, provision of harvestable populations of salmon, and provision of recreational opportunities. Riparian values have direct economic consequences to local communities through fishing opportunities, and flood and water quality protection, among others.
Riparian zone: A distinctive area within riparian ecosystems. The riparian zone contains wet or moist soils and plants adapted to growing conditions associated with periodically saturated soils. See Riparian ecosystem.
Risk: A situation involving exposure to danger, harm, or loss. Risk reflects the magnitude of the adverse impact and its probability of occurring. Risk is appropriately managed by applying the precautionary principle (especially for irreversible losses) and through adaptive management.
Salmonid: A family of fish comprised of salmon, trout and whitefish. Native salmonid species in Washington State include: Chinook Salmon (Oncorhynchus tshawytscha), Chum Salmon (O. keta), Coho Salmon (O. kisutch), Pink Salmon (O. gorbuscha), Sockeye Salmon/Kokanee (O. nerka), Steelhead/Rainbow Trout (O. mykiss), Cutthroat Trout (O. clarki), Bull Trout (Salvelinus confluentus), Dolly Varden (S. malma), Pygmy Whitefish (Prosopium coulteri), and Mountain Whitefish (P. williamsoni). This list does not include names of subspecies. (See anadromous fisheries).
Site class: The classification of a site based on the productivity of its dominant tree species. Site classes vary based on local differences in soil nutrients and moisture, light and temperature regimes, and topography. Site classes are typically described as most productive (I) through least productive (V).
Site-Potential Tree Height: The average maximum height of the tallest dominant trees for a given age and site class.
Stronghold: Habitat strongholds are refugia watersheds that contain high quality habitat with depressed or weak populations. The habitat in these areas has a high to very high potential to support these species. The population level in these areas is not considered to be a function of habitat, but other factors (USFS2001).
Structure: See Ecosystem structure.
113

Riparian Ecosystems, Volume 2: Management Recommendations 60
Succession: Ecological succession is the process by which the biological community composition recovers over time following a disturbance event.
Uncertainty (scientific): The absence of information about the state of something or a relevant variable. Sources of uncertainty include, but are not limited to natural variation (i.e., because outcomes vary in difficult-to-predict ways through time and space), model uncertainty (i.e., we do not understand how things interact with each other), systematic error (e.g., poorly designed experiments or calibrated instruments), or measurement error. See Risk.
Values: The level of benefits that the space, water, minerals, biota, and all other factors that make up a natural ecosystem provide to support native life forms, including humans (Cordell et al. 2005).
Vegetative filter strips: A riparian buffer designed to capture nutrients, contaminant compounds, and sediment transported by run-off. Filter strips are sometimes synonymous with riparian buffers.
Water quality: Physical, chemical, and biological characteristics of water that describe its suitability to meet human needs or habitat requirements for fish and wildlife.
Watershed processes: The fluxes of energy (e.g., sunlight, wildfire) and materials (particularly water and sediment) that interact with biota (e.g., vegetative cover, salmon, beavers, soil microbes) to form a watershed’s physical features and characteristics, which give rise to its instream physical and ecological conditions. These processes occur within a context that reflects the watershed’s climate, geology, topography, and existing human land use. See Ecosystem process.
Watershed: A land area that drains to a common waterbody.
Wetland: Those areas that are inundated or saturated by surface or ground water at a frequency and duration sufficient to support—and that under normal circumstances do support—a prevalence of vegetation typically adapted for life in saturated soil conditions. Examples include but are not limited to swamps, marshes, and bogs.
Zone of Influence: The portions of terrestrial ecosystems that significantly influence exchanges of energy (e.g., sunlight) and matter (e.g., large wood, sediment, nutrients) with aquatic ecosystems.
114

Riparian Ecosystems, Volume 2: Management Recommendations 61
APPENDIX. SITE-POTENTIAL TREE HEIGHT MAPPING TOOL The Site-Potential Tree Height (SPTH) Mapping Tool helps users find information they need to conserve, protect, and restore riparian ecosystems within a project site. The SPTH mapping tool works on personal computers (PCs) and mobile devices (tablets and smartphones).
SITE-POTENTIAL TREE HEIGHT MAP DATA The SPTH mapping tool contains several GIS data layers, explained below:
1. Site-potential Tree Height at 200 Years (SPTH200), 2. Imputed14 SPTH200 Values for Urban areas, 3. Dryland Ecosystems – No SPTH Values, and 4. Other Lands – No SPTH Values.
Site-potential Tree Height at 200 Years (SPTH200)
WDFW derived the SPTH200 values from forest productivity site index information using Natural Resource Conservation Service (NRCS) soil polygons and its Soil Data Viewer tool for ArcGIS. The NRCS-provided forest productivity site index values, in feet, were for ages 50 years in Western Washington and typically 100 years in Eastern Washington. WDFW determined SPTH200 values using tree site index equations. Each soil polygon has one or more tree species records with associated SPTH200. When multiple tree species records with associated SPTH200 are available, WDFW recommends using the largest SPTH200 value of the tree species historically present at the site (such trees may currently be found on the site, but also may not). For example, if a project site contains mostly red alder but Douglas-fir is present (or was present prior to modern human alterations), use the Douglas-fir SPTH200 for that soil polygon.
Imputed SPTH200 Values
Four large urban areas (Seattle, Spokane, Tacoma, and Bellingham) lacked NRCS soil polygons; therefore, forest productivity information could not be mapped for most locations within those areas. Similarly, numerous soil polygons labelled as “Urban Land” lacked forest productivity information. For each of these four urban areas, WDFW calculated an imputed SPTH200 by using an area-weighted average for 200-year site index values within a two-mile buffer around the perimeter. WDFW recommends the use of this imputed SPTH200 as a guide for delineating RMZs in these urban areas. At the time of publication, WDFW had calculated imputed SPTH200 information for those large urban areas. WDFW expects to continue to update the map.
Dryland Ecosystems and Other Lands
Not all soil polygons are forested, or have forest productivity information from NRCS; therefore, not all of them have associated SPTH200 values. In addition, Benton, Franklin, Grant, and Adams counties had no forest productivity information in their NRCS soil polygons. These areas without SPTH200 values were classified in one of two ways: as “dryland ecosystems”, or “other lands.”
14 Imputed: estimated; a value assigned to something by inference from the value of the products or processes to which it contributes.
115

Riparian Ecosystems, Volume 2: Management Recommendations 62
• WDFW approximated the area contained within “dryland ecosystems” using the Arid Lands Initiative study area boundary (Arid Lands Initiative, 2014) and have developed associated process steps that we recommend be used to derive RMZ widths (Volume 2, Section 2.2.3).
• The “other lands” comprise the remaining soil polygons and are small and dispersed across the landscape. These polygons include the NRCS soil map unit name, if applicable, and often represent soils that do not support tree growth, such as beaches and wetlands, as well as certain types of heavily modified sites like gravel pits. Please consult with a WDFW regional habitat biologist on deriving RMZs for “other lands” and consider following a similar process for delineation in dryland ecosystems.
USING THE MAPPING TOOL The mapping tool can be accessed from several locations:
• WDFW web site (https://wdfw.wa.gov/species-habitats/at-risk/phs/recommendations),
• Washington Geospatial Open Data Portal (http://geo.wa.gov/), and
• ArcGIS Online (AGOL) (https://wdfw.maps.arcgis.com/apps/MapSeries/index.html?appid=919ea98204eb4f5fa70eca99cd5b0de1).
The mapping tool consists of the statewide map with the four riparian datasets described above; user tools; and a sidebar explaining map contents, how to use the map, and links to supporting documents.
The four riparian datasets have unique colors indicating where the information occurs.
• Green: Area where SPTH200 has been calculated.
• Orange: Areas where SPTH200 values have been imputed.
• Pale brown: Dryland ecosystems where there is no tree height information.
• Beige: Places for which no SPTH site index information is available.
Tribal and publicly owned/managed lands federal and tribal lands are typically subject to different riparian regulations. Tribal, federal, and state lands are displayed in shades of grey. County-owned lands are shown in lavender, and city-owned lands are light blue.
The mapping tool contains the following tools (Figure A1):
1. Zoom Slider: zoom in or out on the center of the map. 2. Home icon: resets map to statewide extent. 3. Target icon: allows the user to zoom directly to their current location. 4. Address Search: zooms to a street address, place name, or latitude and longitude. 5. Measurement: use this to measure the distance between objects (e.g. edge of stream to
another point), or to measure an area (square feet of an area surrounding a project site). 6. Basemap Selector: change the basemap to show a different view of the landscape: aerial
imagery (default), topographic map, open street map, terrain with labels, and USGS national map.
116

Riparian Ecosystems, Volume 2: Management Recommendations 63
7. Legend: displays the map layers currently visible. For example, map layers displayed at a site-specific scale will not appear in the legend when zoomed out to the statewide extent.
8. Scale bar: shows the scale that the map is zoomed to. At a statewide extent, the scale bar will show 0 to 60 miles. When zoomed to a scale where you can view the project area, the scale bar will show 0 to 100 feet or 200 feet.
9. Coordinates: latitude and longitude (decimal degrees) are shown where the cursor is located on the map.
10. Panning: move the map by placing the cursor over a desired location and dragging it to the center of the map display.
Figure A1. Tools available on the SPTH200 and RMZ Online Map.
To zoom to a site location, use the Address Search tool or use a combination of the Zoom Slider and panning. (If using the Address Search tool, select the “ArcGIS World Geocoding Service” from the dropdown menu to the left of the search field for faster results.) Once the site is located, a click (on PCs) or tap (on mobile devices) of the cursor will open a popup window with information about that location. Be sure to review each window if multiple records are selected.
The NRCS soil polygons form a complex mosaic across the landscape, so you must zoom in close enough to clearly see your project site. Clicking (or tapping, on mobile devices) on the map when it is zoomed out will result in erroneous returns of the SPTH200 values. Below is an example of using these tools to obtain riparian information at a project site.
117
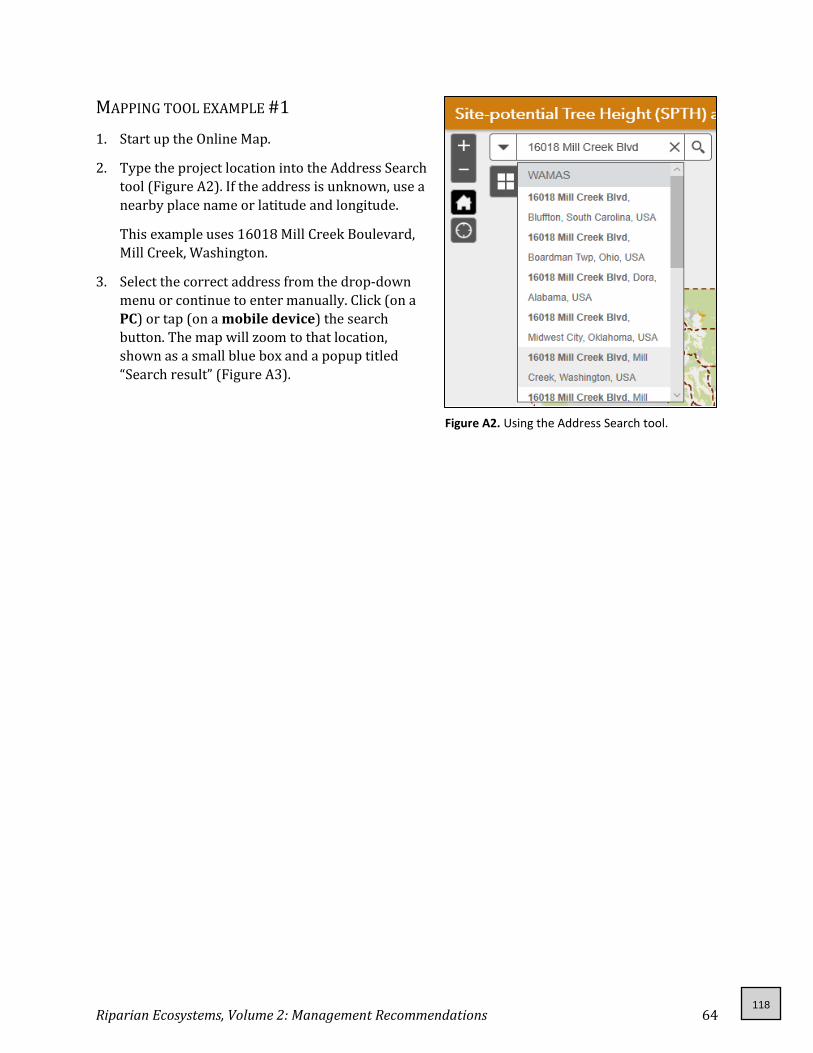
Riparian Ecosystems, Volume 2: Management Recommendations 64
MAPPING TOOL EXAMPLE #1 1. Start up the Online Map.
2. Type the project location into the Address Search tool (Figure A2). If the address is unknown, use a nearby place name or latitude and longitude.
This example uses 16018 Mill Creek Boulevard, Mill Creek, Washington.
3. Select the correct address from the drop-down menu or continue to enter manually. Click (on a PC) or tap (on a mobile device) the search button. The map will zoom to that location, shown as a small blue box and a popup titled “Search result” (Figure A3).
Figure A2. Using the Address Search tool.
118

Riparian Ecosystems, Volume 2: Management Recommendations 65
Figure A3. Zoomed in aerial image of the site address.
4. Click (or tap) on the “X” in the Address Search tool to close the popup. Zoom and pan until you can clearly see where the project site is on the landscape (Figure A4).
In this example, the project site lies in a wooded area to the west of the address selected in the previous screen. We panned west to center the map display over the project site. In this screen, you can see the outlines of the soil polygons.
119

Riparian Ecosystems, Volume 2: Management Recommendations 66
Figure A4. Adjusting the map display over the project site.
5. Click (or tap) near a stream on the project site. The outline of the soil polygon selected will turn blue, and a popup window will provide information about the SPTH200 (Figure A5). On a PC, the popup should automatically show (1) the SPTH200 in feet, (2) the species of tree it is based on, and (3) the reference study used to derive the height value. On a mobile device, tap the arrow on the right side of the popup to display this information.
120
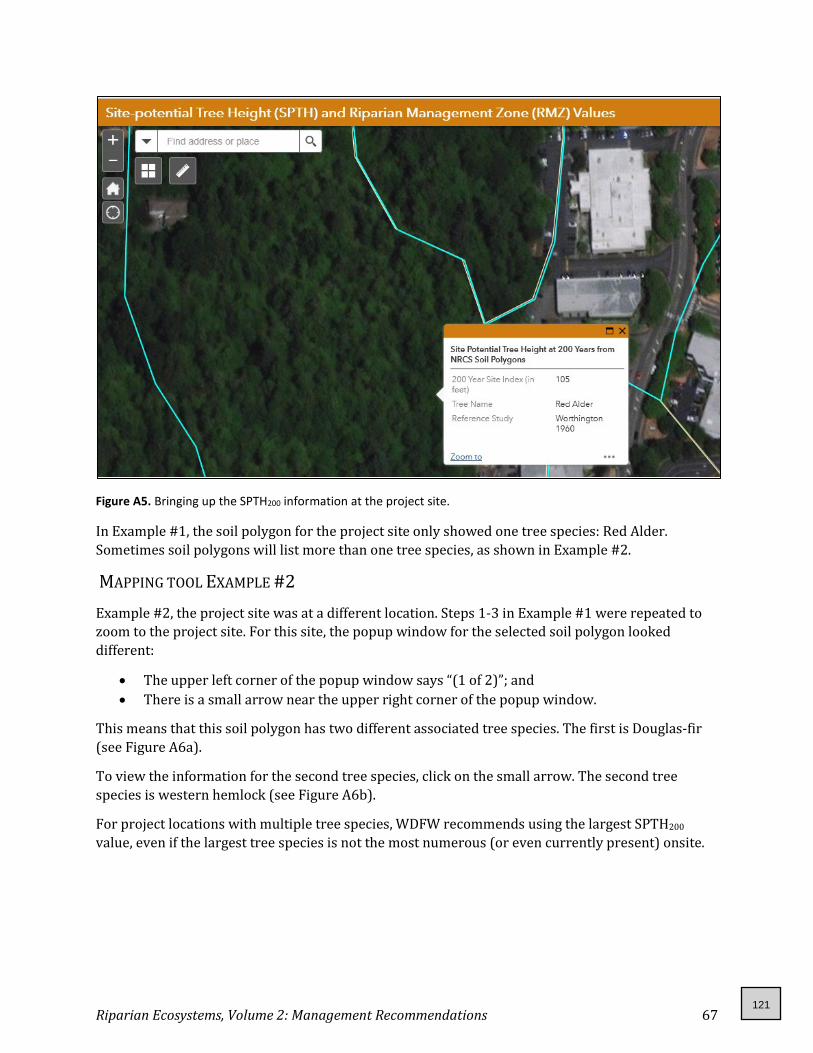
Riparian Ecosystems, Volume 2: Management Recommendations 67
Figure A5. Bringing up the SPTH200 information at the project site.
In Example #1, the soil polygon for the project site only showed one tree species: Red Alder. Sometimes soil polygons will list more than one tree species, as shown in Example #2.
MAPPING TOOL EXAMPLE #2 Example #2, the project site was at a different location. Steps 1-3 in Example #1 were repeated to zoom to the project site. For this site, the popup window for the selected soil polygon looked different:
• The upper left corner of the popup window says “(1 of 2)”; and • There is a small arrow near the upper right corner of the popup window.
This means that this soil polygon has two different associated tree species. The first is Douglas-fir (see Figure A6a).
To view the information for the second tree species, click on the small arrow. The second tree species is western hemlock (see Figure A6b).
For project locations with multiple tree species, WDFW recommends using the largest SPTH200 value, even if the largest tree species is not the most numerous (or even currently present) onsite.
121

Riparian Ecosystems, Volume 2: Management Recommendations 68
Figure A6a. SPTH information for the first of multiple tree species at a given site.
Figure A6b. SPTH200 information for the second of multiple tree species at a given site.
122
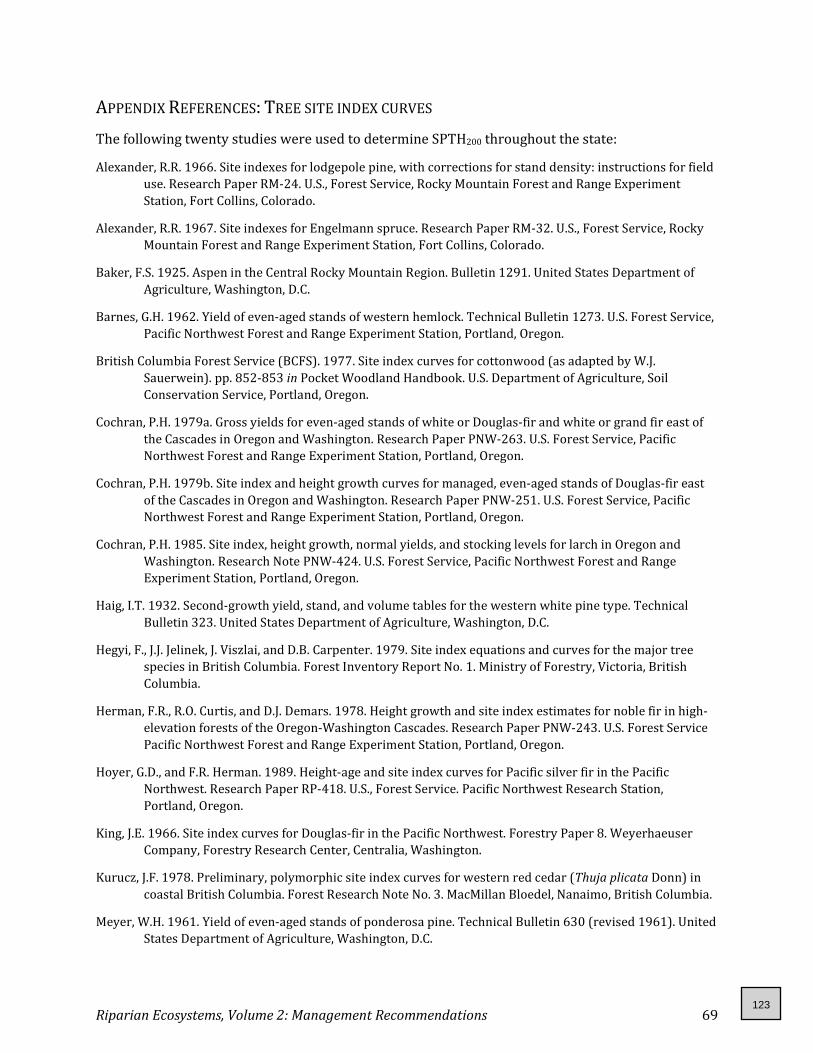
Riparian Ecosystems, Volume 2: Management Recommendations 69
APPENDIX REFERENCES: TREE SITE INDEX CURVES The following twenty studies were used to determine SPTH200 throughout the state:
Alexander, R.R. 1966. Site indexes for lodgepole pine, with corrections for stand density: instructions for field use. Research Paper RM-24. U.S., Forest Service, Rocky Mountain Forest and Range Experiment Station, Fort Collins, Colorado.
Alexander, R.R. 1967. Site indexes for Engelmann spruce. Research Paper RM-32. U.S., Forest Service, Rocky Mountain Forest and Range Experiment Station, Fort Collins, Colorado.
Baker, F.S. 1925. Aspen in the Central Rocky Mountain Region. Bulletin 1291. United States Department of Agriculture, Washington, D.C.
Barnes, G.H. 1962. Yield of even-aged stands of western hemlock. Technical Bulletin 1273. U.S. Forest Service, Pacific Northwest Forest and Range Experiment Station, Portland, Oregon.
British Columbia Forest Service (BCFS). 1977. Site index curves for cottonwood (as adapted by W.J. Sauerwein). pp. 852-853 in Pocket Woodland Handbook. U.S. Department of Agriculture, Soil Conservation Service, Portland, Oregon.
Cochran, P.H. 1979a. Gross yields for even-aged stands of white or Douglas-fir and white or grand fir east of the Cascades in Oregon and Washington. Research Paper PNW-263. U.S. Forest Service, Pacific Northwest Forest and Range Experiment Station, Portland, Oregon.
Cochran, P.H. 1979b. Site index and height growth curves for managed, even-aged stands of Douglas-fir east of the Cascades in Oregon and Washington. Research Paper PNW-251. U.S. Forest Service, Pacific Northwest Forest and Range Experiment Station, Portland, Oregon.
Cochran, P.H. 1985. Site index, height growth, normal yields, and stocking levels for larch in Oregon and Washington. Research Note PNW-424. U.S. Forest Service, Pacific Northwest Forest and Range Experiment Station, Portland, Oregon.
Haig, I.T. 1932. Second-growth yield, stand, and volume tables for the western white pine type. Technical Bulletin 323. United States Department of Agriculture, Washington, D.C.
Hegyi, F., J.J. Jelinek, J. Viszlai, and D.B. Carpenter. 1979. Site index equations and curves for the major tree species in British Columbia. Forest Inventory Report No. 1. Ministry of Forestry, Victoria, British Columbia.
Herman, F.R., R.O. Curtis, and D.J. Demars. 1978. Height growth and site index estimates for noble fir in high-elevation forests of the Oregon-Washington Cascades. Research Paper PNW-243. U.S. Forest Service Pacific Northwest Forest and Range Experiment Station, Portland, Oregon.
Hoyer, G.D., and F.R. Herman. 1989. Height-age and site index curves for Pacific silver fir in the Pacific Northwest. Research Paper RP-418. U.S., Forest Service. Pacific Northwest Research Station, Portland, Oregon.
King, J.E. 1966. Site index curves for Douglas-fir in the Pacific Northwest. Forestry Paper 8. Weyerhaeuser Company, Forestry Research Center, Centralia, Washington.
Kurucz, J.F. 1978. Preliminary, polymorphic site index curves for western red cedar (Thuja plicata Donn) in coastal British Columbia. Forest Research Note No. 3. MacMillan Bloedel, Nanaimo, British Columbia.
Meyer, W.H. 1961. Yield of even-aged stands of ponderosa pine. Technical Bulletin 630 (revised 1961). United States Department of Agriculture, Washington, D.C.
123

Riparian Ecosystems, Volume 2: Management Recommendations 70
Meyer, W.H. 1937. Yield of even-aged stands of Sitka spruce and western hemlock. Technical Bulletin 544. United States Department of Agriculture, Washington, D.C.
Monserud, R.A. 1985. Applying height growth and site index curves for inland Douglas-fir. Research Paper INT-347. U.S. Forest Service. Intermountain Research Station, Ogden, Utah.
Schmidt, W.C., R.C. Shearer, and A.L. Roe. 1976. Ecology and silviculture of western larch forests. Technical Bulletin 1520. U.S. Forest Service, Washington, D.C.
Wiley, K.N. 1978. Site index tables for western hemlock in the Pacific Northwest. Forestry Paper No. 17. Weyerhaeuser Company, Western Forestry Research Center, Centralia, Washington.
Worthington, N.P., F.A. Johnson, G.R. Staebler, and W.J. Lloyd. 1960. Research Paper No. 36. Normal yield tables for red alder. U.S. Forest Service, Pacific Northwest Forest and Range Experiment Station, Portland, Oregon.
124

Ben Shumaker <[email protected]>
Two items for your June 14th planning commission agendaPat Rice <[email protected]> Sun, Jun 6, 2021 at 4:27 PMTo: Valerie Hoy <[email protected]>, David Ray <[email protected]>, Auguste Zettler <[email protected]>,Jeff Breckel <[email protected]>, Mike Beck <[email protected]>Cc: Ben Shumaker <[email protected]>, Leana Kinley <[email protected]>, Underwood Conservation District <[email protected]>, EmilyStevenson <[email protected]>, Cyndi Soliz <[email protected]>, Rick May <[email protected]>, Curt & Sherry Esch<[email protected]>, tesmith729 <[email protected]>, Jan Thomas <[email protected]>, Philip Watness <[email protected]>
Dear Stevenson Planning Commission Members Valerie Hoy, David Ray, Mike Beck, Jeff Breckel and AugusteZettler,
RE: Request for two issues to be placed on your June 14th meeting agenda
I am asking that the following two issues be put on your agenda for your June 14th meeting.
(1) Remove requirement that a permit be obtained when eradicating by hand invasive plants
As has been explained to me by Ben, a permit is apparently needed to dig out by hand invasive plants withinthe city's critical area buffer zones. This means that I am guilty of breaking the law because of my efforts toeradicate invasive plants such as Himalayan blackberry bushes in the buffer zone of the drainage ditch thatpasses through my neighbors and my property.
Requiring a permit to implement the intent of your critical area codes doesn't make any sense. I ask you torecommend to the city council that this permit requirement be removed for people like me who are using handtools to eradicate invasive plants from these areas.
This action on your part would be supported by the Washington Department of Fish and Wildlife. On page 26of the attached report you will see this language:
4. Invasive and/or Noxious Plant Removal – Many CAOs do not require a permit for control and removal of invasive and/or noxious weeds withinriparian ecosystem. We support this when weed control efforts (1) employ hand weeding with light equipment; (2) use only Ecology approved aquaticherbicides and adjuvants (a substance added to herbicides to improve application); avoid use of hazardous substances; and (3) do not result in soilcompaction. Local governments should retain some oversight authority for more extensive invasive and/or noxious plant control projects to ensureadequate protections of riparian functions, especially water quality. Most communities issue an exemption letter or permit, which should include conditionsto ensure impacts to fish, wildlife, and habitat are minimal.
(2) Revert the buffer for Ns streams back to 25 feet
Through extensive research (including public records requests, studying city codes up and down the gorge,etc.) my neighbors and I have learned that when the Stevenson City Council doubled the protective bufferzones on the Ns drainage ditch that runs through our properties, that it failed to do its homework.
No on-site visits of any kind were done by anyone. No habitat biologists or other experts were consulted andasked to look at this drainage ditch, historically known as Owl Creek.
Under the guise of following the science, studies, research and best practices that applied to larger streamselsewhere were cited to justify the doubling of the buffer zones for Ns streams in the City of Stevenson. Butthis approach was nonsensical because the Washington Department of Fish and Wildlife practices cited, wereintended to protect fish bearing and other streams, not non-fish bearing drainage areas that are dried up sixmonths of the year.
When I broached the subject of putting the buffer zone back to 25 feet for the Owl Creek drainage ditch, I wastold by Ben and others that a long and arduous review process would need to take place. It is apparent thatthe city council can be nilly-willy, arbitrary and capricious in its rulemaking, but us citizens are held to a differentstandard when we try to correct the city's error in judgment (making a rule absent logic and basic goodscientific practices).
125

Bad rulemaking keeps family homeless longer
The city's bad rulemaking behavior in this instance has mired the home building permit of Cesar Hernandez inred tape. Mr. Hernandez is trying to build his family a home approximately 37 feet away, out of the bank areaentirely, from the Owl Creek drainage ditch. The new home will sit almost exactly where the old home existed(a structure that was so badly dilapidated that it had to be demolished).
Vancouver, Camas, North Bonneville and even Skamania County all have 25 foot buffer zones for Ns streams. These entities claim to have also followed science. When doing so, they came to a different conclusion thanour small town did. I doubt we followed some great scientific principle that they somehow missed.
Thank you for considering the above two issues at your next planning commission meeting on June 14th.
Pat Rice
RIPARIAN ECOSYSTEMS, VOLUME 2.pdf2892K
126
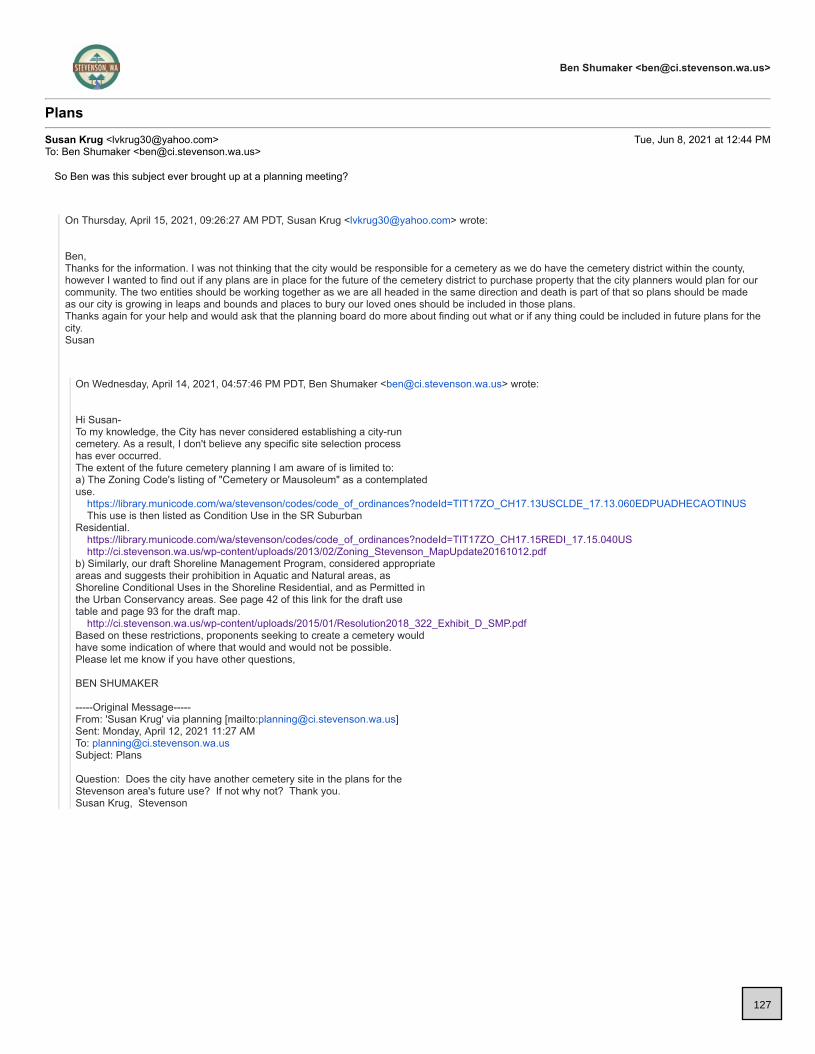
Ben Shumaker <[email protected]>
PlansSusan Krug <[email protected]> Tue, Jun 8, 2021 at 12:44 PMTo: Ben Shumaker <[email protected]>
So Ben was this subject ever brought up at a planning meeting?
On Thursday, April 15, 2021, 09:26:27 AM PDT, Susan Krug <[email protected]> wrote:
Ben,Thanks for the information. I was not thinking that the city would be responsible for a cemetery as we do have the cemetery district within the county,however I wanted to find out if any plans are in place for the future of the cemetery district to purchase property that the city planners would plan for ourcommunity. The two entities should be working together as we are all headed in the same direction and death is part of that so plans should be madeas our city is growing in leaps and bounds and places to bury our loved ones should be included in those plans.Thanks again for your help and would ask that the planning board do more about finding out what or if any thing could be included in future plans for thecity.Susan
On Wednesday, April 14, 2021, 04:57:46 PM PDT, Ben Shumaker <[email protected]> wrote:
Hi Susan-To my knowledge, the City has never considered establishing a city-runcemetery. As a result, I don't believe any specific site selection processhas ever occurred.The extent of the future cemetery planning I am aware of is limited to:a) The Zoning Code's listing of "Cemetery or Mausoleum" as a contemplateduse. https://library.municode.com/wa/stevenson/codes/code_of_ordinances?nodeId=TIT17ZO_CH17.13USCLDE_17.13.060EDPUADHECAOTINUS This use is then listed as Condition Use in the SR SuburbanResidential. https://library.municode.com/wa/stevenson/codes/code_of_ordinances?nodeId=TIT17ZO_CH17.15REDI_17.15.040US http://ci.stevenson.wa.us/wp-content/uploads/2013/02/Zoning_Stevenson_MapUpdate20161012.pdfb) Similarly, our draft Shoreline Management Program, considered appropriateareas and suggests their prohibition in Aquatic and Natural areas, asShoreline Conditional Uses in the Shoreline Residential, and as Permitted inthe Urban Conservancy areas. See page 42 of this link for the draft usetable and page 93 for the draft map. http://ci.stevenson.wa.us/wp-content/uploads/2015/01/Resolution2018_322_Exhibit_D_SMP.pdfBased on these restrictions, proponents seeking to create a cemetery wouldhave some indication of where that would and would not be possible.Please let me know if you have other questions,
BEN SHUMAKER
-----Original Message-----From: 'Susan Krug' via planning [mailto:[email protected]]Sent: Monday, April 12, 2021 11:27 AMTo: [email protected]: Plans
Question: Does the city have another cemetery site in the plans for theStevenson area's future use? If not why not? Thank you.Susan Krug, Stevenson
127
Ben Shumaker <[email protected]>
Critical AreasRick May <[email protected]> Mon, Jun 14, 2021 at 1:22 PMTo: Robert Muth <[email protected]>Cc: Amy Weissfeld <[email protected]>, Paul Hendricks <[email protected]>, "[email protected]"<[email protected]>, Dave Cox <[email protected]>, "[email protected]"<[email protected]>, David Ray <[email protected]>, Mike Beck <[email protected]>, Jeff Breckel<[email protected]>, Valerie Hoy <[email protected]>, Auguste Zettler <[email protected]>,"[email protected]" <[email protected]>
Hello Robert, Thank you for the efforts and the Ecologist comments. The problem is Stevenson has a number of ephemeral streams that do not attach toany other waterways. I have one on my acreage that starts at the north of our site, runs 160 feet and ends. As per Pacific Habitat Services,this is simply a dead-end seasonal stream covered with blackberry bushes on a gently sloping area. Yet it is still classified as a Ns streamand therefore has 18,000 square feet of setbacks. That is equivalent to three homesites in this R-1 zone. There is little to no usefulscientific evidence that points toward significant ecological benefits from this type of ephemeral streams or streams running in manmadeditches found throughout Stevenson. My 160-foot dead end stream runs only during heavy rains, so it's simply not there long enough tobe useful for inserts or amphibians. Due to the undergrowth, birds can't get to the water even if it's flowing. Yet in Stevenson there is no mechanism to adjust setbacks considering what is actually happening on the ground. SMC 18.13.095 states aCritical Area is where "overwhelming evidence exists supporting the use of riparian buffers of adequate size to maintain healthy,productive fish and wildlife habitat." Does this overwhelming evidence exist for seasonal streams and ditches in Stevenson? Streams and wetland boundaries have not been formally delineated and individual assessment of streams has not been done or hired outby the City of Stevenson. I agree with Dr. Laura McMullen comment sites "should definitely be evaluated case-by-case". However, thisis not done in Stevenson. The City of Stevenson has classified all streams using the Washington Fish & Wildlife Conservation streamcategories, whether the streams have significant ecological benefits or not. Using WFWC categories, all seasonal streams have 50-footsetbacks on each side, no matter what the facts are on the ground.
Rick May
[Quoted text hidden]-- Rick [email protected]
128

Ben Shumaker <[email protected]>
Critical AreasRobert Muth <[email protected]> Mon, Jun 14, 2021 at 11:53 AMTo: Rick May <[email protected]>Cc: Amy Weissfeld <[email protected]>, Paul Hendricks <[email protected]>, "[email protected]"<[email protected]>, Dave Cox <[email protected]>, "[email protected]"<[email protected]>, David Ray <[email protected]>, Mike Beck <[email protected]>, Jeff Breckel<[email protected]>, Valerie Hoy <[email protected]>, Auguste Zettler <[email protected]>,"[email protected]" <[email protected]>
Rick - Thank you for the information you have provided to the Planning Commission and City Council. Admittedly, I am not an expert in the environmentalissues raised in your email. I did stop to take the time to reach out to an expert in the field.
Below is the response I received from Dr. Laura McMullen whose expertise is in the area of discussion. Dr. McMullen is an Ecologist with ICF in thePortland, Oregon location. Full disclosure, Dr. McMullen is my cousin who received her PhD from Oregon State University.
Hi Robert,
No short answer to this one, but I'll give you some things to chew on. Quite relevant to my current work on an EIS for the ODF that mainly has to do w/what/ when/ why/ where to buffer!
First off, buffer zones are important for more than salmon and resident fish populations. In fact, many amphibians and also a variety of insects dependupon fishless areas to successfully reproduce. Small mammals and birds can also benefit from buffers along any type of stream. See attached articleincluding a study from Olympic peninsula on buffer importance- an older article but still relevant.
Another point to consider- climate change predictions not only show drier summers in the future in the PNW, but also much heavier rainfall and flooding inearly spring. Tree and plant roots and riparian areas in general can help to stabilize soil. These areas in and around Stevenson that have ephemeralstreams are likely on steep slopes and prone to landslide disturbance events- which are triggered by heavy rainfall. Buffers help protect against landslidesand slope erosion. Development in these areas would be risky from a liability perspective of landslides and the soil and topography should definitely beevaluated case-by-case carefully before making any development decisions.
While it is true that currently ephemeral streams are not recognized federally as needing protection, this was a roll-back instigated just 2 years ago underthe Trump administration and is not backed by sound science. In fact, Biden is trying to reverse these orders currently- be aware, there will soon be legalchanges of some type about what types of streams require protection. It is not the right time to make a change for less protection in my opinion until wesee what the current administration does. The fact that your colleague brings up this point right now, may be because he realized this also (that protectionmay be required soon again for these stream types) and is trying to act before that happens. See another article attached, and this one: https://www.washingtonpost.com/climate-environment/2021/06/09/biden-epa-clean-water-act/
It is certainly invalid to say these areas have "no ecological reasons to exist"- they currently have no legal reason, but certainly do ecologically- includingprotection for downstream areas from pollutants, infiltration and runoff- and that reduced landslide risk. While folks could "gain" a bit of land fordevelopment- are these areas really great to develop on anyhow? Would be good to see a map.
Happy to help more, or if Stevenson needs some actual contracted help on this one, our firm would be very well suited to assist.
-Laura
Laura E. McMullen, [email protected][Quoted text hidden]
2 attachments
SciFi.#53.pdf325K
Opinion_ The proposed change to the definition of “waters of the United States” flouts sound science.pdf1297K
129
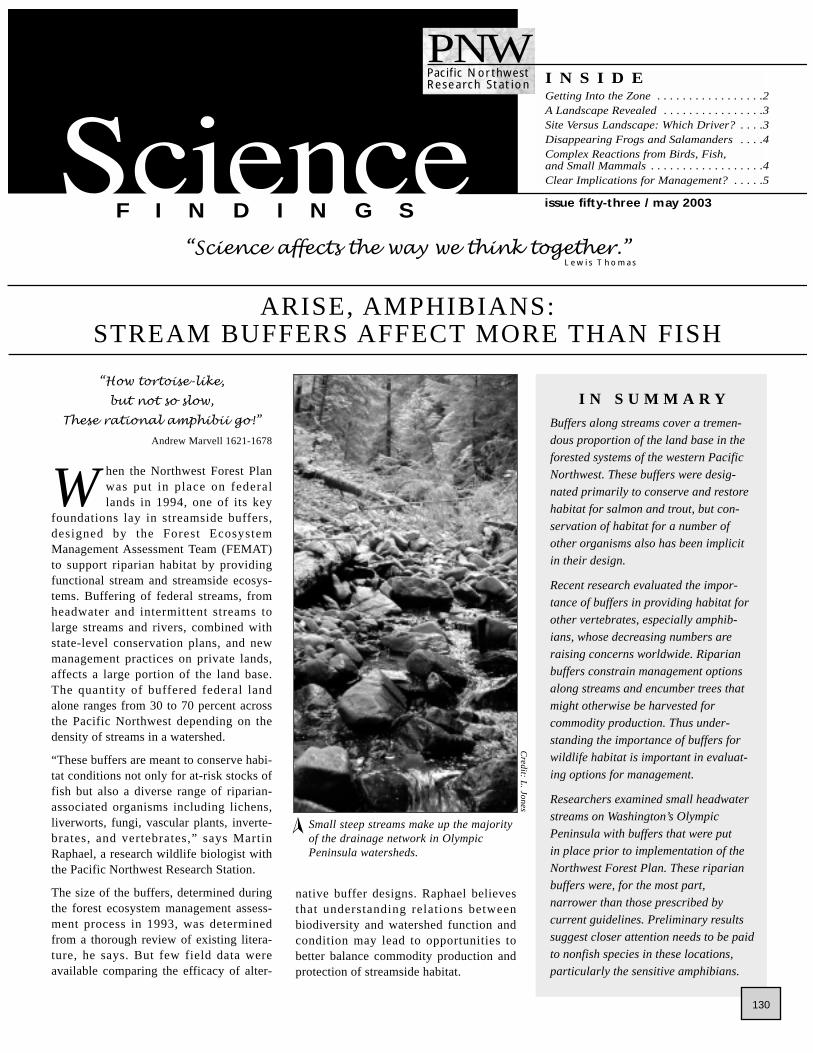
“Science affects the way we think together.”
F I N D I N G S
I N S I D EGetting Into the Zone . . . . . . . . . . . . . . . . .2A Landscape Revealed . . . . . . . . . . . . . . . .3Site Versus Landscape: Which Driver? . . . .3Disappearing Frogs and Salamanders . . . .4Complex Reactions from Birds, Fish, and Small Mammals . . . . . . . . . . . . . . . . . .4Clear Implications for Management? . . . . .5
PNWPacif ic NorthwestResearch Stat ion
L ew i s T h o m a s
issue fifty-three / may 2003
I N S U M M A R Y
Buffers along streams cover a tremen-dous proportion of the land base in theforested systems of the western PacificNorthwest. These buffers were desig-nated primarily to conserve and restorehabitat for salmon and trout, but con-servation of habitat for a number ofother organisms also has been implicitin their design.
Recent research evaluated the impor-tance of buffers in providing habitat forother vertebrates, especially amphib-ians, whose decreasing numbers areraising concerns worldwide. Riparianbuffers constrain management optionsalong streams and encumber trees thatmight otherwise be harvested forcommodity production. Thus under-standing the importance of buffers forwildlife habitat is important in evaluat-ing options for management.
Researchers examined small headwaterstreams on Washington’s OlympicPeninsula with buffers that were put in place prior to implementation of theNorthwest Forest Plan. These riparianbuffers were, for the most part,narrower than those prescribed bycurrent guidelines. Preliminary resultssuggest closer attention needs to be paidto nonfish species in these locations,particularly the sensitive amphibians.
ARISE, AMPHIBIANS: STREAM BUFFERS AFFECT MORE THAN FISH
“How tortoise-like,
but not so slow,
These rational amphibii go!”
Andrew Marvell 1621-1678
W hen the Northwest Forest Planwas put in place on federallands in 1994, one of its key
foundations lay in streamside buffers,designed by the Forest EcosystemManagement Assessment Team (FEMAT)to support riparian habitat by providingfunctional stream and streamside ecosys-tems. Buffering of federal streams, fromheadwater and intermittent streams tolarge streams and rivers, combined withstate-level conservation plans, and newmanagement practices on private lands,affects a large portion of the land base.The quantity of buffered federal landalone ranges from 30 to 70 percent acrossthe Pacific Northwest depending on thedensity of streams in a watershed.
“These buffers are meant to conserve habi-tat conditions not only for at-risk stocks offish but also a diverse range of riparian-associated organisms including lichens,liverworts, fungi, vascular plants, inverte-brates, and vertebrates,” says MartinRaphael, a research wildlife biologist withthe Pacific Northwest Research Station.
The size of the buffers, determined duringthe forest ecosystem management assess-ment process in 1993, was determinedfrom a thorough review of existing litera-ture, he says. But few field data wereavailable comparing the efficacy of alter-
native buffer designs. Raphael believesthat understanding relations betweenbiodiversity and watershed function andcondition may lead to opportunities tobetter balance commodity production andprotection of streamside habitat.
Credit: L
. Jones
Small steep streams make up the majorityof the drainage network in OlympicPeninsula watersheds.
➢
130
B isson notes that despite theacknowledged importance of ripar-ian zones to fish and wildlife, rela-
tively few studies have examined theresponse of riparian systems to manage-ment alternatives for commodity produc-tion, riparian protection, or restoration. Heand Raphael recently completed phase 1 ofthe riparian ecosystem management study(REMS) to explore these effects.
A number of key riparian buffer questionsstill need addressing. What buffer widthsand configurations are needed to protectfish and wildlife habitat along differentstream types? What proportion of riparianzones should remain in different forestgrowth and development stages over broadlandscapes? Can riparian vegetation bedeliberately managed for the benefit ofaquatic or terrestrial wildlife?
It was the last question that informed thedesign of REMS. The study examined theeffect of different streamside buffers onthe major aquatic vertebrates, includingfishes, amphibians, birds, and smallmammals. Species included trout,sculpins, tailed frogs, salamanders, 20species of birds, and five common speciesof shrews and mice.
Sixty-two streams and associated riparianzones were examined on Washington’sOlympic Peninsula from 1996 to 1999.Most study sites were located in smallwatersheds, with about one third too smallor steep to support fishes.
“These small streams comprise a hugenetwork in an area of high drainage, likethe Olympic Peninsula,” says Raphael.“Probably 75 to 80 percent of the land-scape is close to, or strongly associatedwith, the small-stream network.”
“Our study is one of the first to emphasizevery small headwater streams. Most otherstudies have had a fish focus, and REMShas added many other species to the mix,”Bisson adds. “This is not least because ofincreasing interest in aquatic organismsother than fishes, particularly the decliningnumbers of amphibians, and the need tobetter understand riparian buffers ascrucial landscape components for smallmammals and birds.”
The researchers used a retrospectiveapproach, involving comparisons of manysites, representing differing times sincelogging and different buffer characteris-tics. The retrospective approach (“substi-tuting space for time”) provides a greatdeal of information fairly rapidly, but the
researchers acknowledge that it doesn’toffer true control over buffer size in rela-tion to size of streams, topographic relief,and other landscape attributes. “We haveto take what the landscape offers us andtry to unravel the confounding effects ofsuch things as topography and gradient,”Raphael says.
Specifically, how does active management(that is, vegetation management withinriparian zones) affect the stream and ripar-ian species that are theoretically protectedby buffers?
Many recent studies have shown thatwatersheds containing mostly young,managed forests have reduced diversity ofaquatic and terrestrial vertebrate popula-tions. As a result, the emerging practicesof ecosystem management have embracedthe idea of restoring riparian areas toconditions more like those created bynatural processes explains Peter Bisson, aresearch fish biologist with the PNWResearch Station .
“Virtually all aquatic species and manyterrestrial plant and animal species closelyassociated with riparian zones are sensi-
tive to management-induced changes inriparian condition,” he says. “The waythese species respond to anthropogenicdisturbance is usually complex andstrongly influenced by ecological
processes at a particular site. Thus it isdifficult to predict how a particularecosystem will change following amanagement activity.”
Science Findings is online at:
http://www.fs.fed.us/pnwThe site includes our new Science Update—scientific knowledge of pressing decisions about controversial natural resource and environmental issues.
GETTING INTO THE ZONE
Purpose of PNW Science Findings
To provide scientific information to people who make and influence decisions about managing land.
PNW Science Findings is publishedmonthly by:
Pacific Northwest Research StationUSDA Forest ServiceP.O. Box 3890Portland, Oregon 97208(503) 808-2137
Sherri Richardson Dodge, [email protected]
Send new subscriptions and change of address information [email protected]
Carlyn Mitas, Design & [email protected]
Forest ServiceUnited StatesDepartment of
Agriculture
K E Y F I N D I N G S
• Bird, resident fish, and mammal community composition and structure aregenerally comparable between buffered and intact streamside forest, althoughresponses to harvest are complex.
• Amphibian populations decline sharply after timber harvest, and with narrowstreamside buffers. Furthermore, populations are slow to recover in second-growth forest, and different species do so at different rates.
• Amphibian recovery depends on recolonization of riparian areas as surroundingsecond-growth forests mature. Recolonization depends on retaining patches ofuncut old forests as refugia or sources of dispersing amphibian populations.
� �
2131
U nexpectedly, when the re-searchers set out to locate studysites, they discovered that almost
no sites on the peninsula offered the condi-tions proposed by the Northwest ForestPlan. So much of the landscape either hadalready been managed before that plan wasin place or was kept out of the matrixlands available for management bysupporting threatened or endangeredspecies, that little was left in the bufferedbut managed category on federal lands.
“The result was that our study ended uplooking at buffers that are more similar innature to State and Private managed lands,from the times when smaller buffers wererequired,” says Bisson. “Within this inves-tigation, we found no streams with largeNorthwest Forest Plan buffers—either oneor two tree heights wide, so we wereunable to evaluate that particular buffertreatment.”
Instead, virtually all study sites were inunmanaged watersheds or areas previouslylogged according to older buffer stripguidelines that permitted timber harvestingto within 10 to 30 meters of the channel.Most sites, even those on the OlympicNational Forest, had been managed with aheavy emphasis on wood production.Nonetheless, the Olympic Peninsulauniquely offers a concentric series of land-scape types around the largely wilderness
core of Olympic National Park that are amicrocosm of the western part of thePacific Northwest, Bisson notes.
Six site conditions were represented: oldsites (unmanaged with intact forest on bothsides of the stream); buffered old sites (oldforest with adjacent clearcuts leavingbuffers of 10 to 30 meters); mature sites(second-growth stands 35 to 100 years oldwith no adjacent harvest); thinned maturesites (intact second growth with commer-
cial thinning); buffered mature si tes(second growth with adjacent clearcutsleaving 10 to 30 meters of second-growthforest); young sites (cutover sites with nointact buffers, generally up to 35 yearsold).
Site types were not equally distributedacross the study area because of differingownerships and management practicehistories.
A LANDSCAPE REVEALED
T he REMS project was designed toevaluate vertebrate responses toriparian management at the site
level—typically a 300-meter reach ofstream and associated riparian area.
“But we could not ignore the possibilitythat fishes and amphibians may have beeninfluenced by broad-scale characteristicsof the watersheds they inhabited, irrespec-tive of the condition of the immediatelyadjacent riparian zone,” Bisson says.
Initial analysis of the relationship betweenvarious vertebrates and site-level featuressuch as channel type, number of pools andriffles, substrate, and gradient, left manyunanswered questions about what environ-mental factors were most influential, heexplains. So the researchers expanded theassessment to take in landscape-scale
factors such as forest age, drainage charac-teristics, elevation, road density, anddisturbance history.
“We always thought the land-scape levelfactors would have an influence on theriparian zone,” Raphael says. “The chal-lenge comes in teasing those out from thesite-level effects.”
Raphael and Bisson looked for statisticalcorrelations among their array of vari-ables, by using an approach that recog-nized the complexity of relationshipsbetween vertebrate population densitiesand the many variables in their data set.Because of the expense of examining thesevariables via field data, they designed aseparate investigation of the data after themain study to determine cost effectivenessof various indicators as units of analysis.
“The thought was that some of this wouldbe very useful for monitoring purposes, tofind which kinds of site- or landscape-level factors might be inexpensive to trackand yet provide a good ‘signal’ for effectsin the riparian zone,” Raphael explains.“We sought factors that have a high signal-to-noise ratio to keep research or monitor-ing costs down.” This involved derivingthe “information value” of variousfactors—looking at the relative cost ofobtaining them and seeing which weremost explanatory in terms of organismabundance. It provided a kind of menu ofthings you’d like to know, Bisson explains,and how much they can tell you, relativeto the cost of finding them out.
SITE VERSUS LANDSCAPE: WHICH DRIVER?
3
L A N D M A N A G E M E N T I M P L I C AT I O N S
• Fish population densities are highly variable from site to site, probably influ-enced more by presence or absence of recent large disturbance events thanadjacent forest barriers. In-stream disturbances are probably more influential tofish than buffer width.
• Birds and mammals are relatively mobile and probably have a reasonable recol-onization ability.
• Amphibians are a good indicator of change in the environment. After timberharvest, numbers and diversity drop sharply; some species had not reestab-lished populations by the time next harvest was to occur. Where existing streambuffers of old forest were narrow, they did not ameliorate the effects of loggingthe adjacent stand.
• Conservation of riparian forest helps maintain distribution of stream-associatedamphibians; sources of refugia are essential. Evaluation of streamside forest atthe scale of entire watersheds will help determine prospects for long-termpersistence and local viability of amphibian population.
��
132

Amphibians proved to be the mostresponsive to riparian forest condi-tion and the amount of late-seral
forest in their watersheds,” Raphael says.“While some seemed to be adaptive gener-alists, others were more sensitive to forestmanagement in or near the stream zone.Our study suggested that stream-dwellingamphibians were negatively affected bymanagement activity near small streams;their densit ies dropped sharply aftertimber harvest.”
Across the categories of sites, it appearedthat riparian areas composed of young-early successional forests did not supportamphibian populations at the densitiesobserved in late-seral si tes, he says.Generally, they were most numerous anddiverse in old forests. This was not caused
by changes in stream temperature: moststreams, regardless of previous forestmanagement history, maintained tempera-tures within the critical thermal limits ofeven sensitive species.
“Overall, the key finding around amphib-ians is in regard to their recovery,”Raphael says. “While not all speciesrespond the same way, there is typically arapid decrease in population after manage-ment activity in the riparian zone, andrecovery for some species can be quiteslow. In some sites, the numbers are stilllow as much as 60 years after timberharvest.” In other words, around the timeharvest might be considered again.
It is not clear whether the drop in numbersresults from mortality or downstreamdispersal, but recovery appears to depend
on several main factors, according toRaphael: retention of patches of uncutolder forest to serve as refugia or sourcesof dispersal, and recolonization of riparianareas as surrounding second-growthforests mature.
“Potential for large-scale reduction inamphibian numbers is high, and indeed thefocus on amphibian population declineworldwide is increasing. It seems clearthat amphibian numbers should at least beconsidered as part of the buffer zoneassessment and recommendation process,”he says.
Other vertebrate species showed lessalarming trends, with variable responsesreflecting the complexity both of theresearch question and the landscapes inwhich sites are nested.
DISAPPEARING FROGS AND SALAMANDERS
F ishes demonstrated the differencesin response between site- andlandscape-level factors. The study
showed little association between speciesabundance and riparian forest age or thepercentage of older forest in the water-shed, according to Bisson. However, theytended to be strongly influenced by thecondition of instream habitat.
“Although the riparian forest probablyinfluenced in-stream habitat, our resultssuggested that the number and size ofpools and other habitat parameters impor-tant to fishes was likely controlled by anumber of other factors, including recruit-ment of logs and large boulders to thechannels by bank erosion, landslides,debris flows, and other disturbance mecha-nisms,” Bisson says.
Other parameters affecting the local abun-dance of fishes in these headwater streamsincluded elevation of the watershed, gradi-ent of the channel, and the amount ofprimary production—aquatic plant produc-tion controlled by light and nutrients.Headwater streams on the OlympicPeninsula are typically disturbance prone,Bisson explains, as this was reflected bythe variability in fish populations from siteto site.
In general, fish abundance did not differsignificantly by buffer type, but differedamong other site attributes except streamwidth. Bisson notes that abundance offishes was affected significantly by eleva-tion, and parent rock appeared to be moreimportant for fishes than for other verte-brates.
“Thus, at the site level, we accepted thehypothesis that the characteristics of theriparian forest had no influence on fishabundance in these stream,” Bisson says.
Responses of birds to forest conditionsalong streams were also highly variable.
Of the 20 species of birds whose abun-dances differed significantly among siteconditions, a majority (13 species) reachedtheir highest abundances in mature siteswith buffers. In these sites, a diversity ofhabitats included large trees, brushy condi-tions, open ground, a forest edge, and ariparian to upland interface, Raphaelexplains. Abundance of birds was gener-ally greater at lower elevation sites withflatter gradients and at higher elevations.An exception was the American dipper,which was more abundant in widerstreams, and most abundant in cutover,young sites.
COMPLEX REACTIONS FROM BIRDS, FISH, AND SMALL MAMMALS
W R I T E R ’ S P R O F I L ESally Duncan is a science communications analyst and writer specializing in natural resource issues. She is currently a Ph.D. candidatein Environmental Sciences at Oregon State University in Corvallis.
Tailed frogs inhabit headwater streamsand are sensitive to changes in riparianforests.
➢ Cope’s giant salamander is an importantpredator in headwater streams.
➢
“
4
Credit: L
. Jones
Credit: P. B
isson
133

Among small mammals, significant differ-ences among site conditions appeared onlyfor the Pacific jumping mouse among thefive common species surveyed. Slightvariations according to elevation and
gradient were apparent, but correlationswere weak. The researchers emphasize thattheir results should not be extendedbeyond the l imited number of smallmammal species they were able to capture.
“Our results indicate that fishes, birds, andmammals—at least the more commonspecies that were abundant enough tomake valid comparisons—persisted insites after logging whether or not bufferswere present,” Raphael says.
5
P redictable relationships betweenspecies abundance and managementactivities will require calibration
with local data, Raphael points out,because local populations can be confinedto small areas (resident headwater trout,amphibians with restricted distribution).Relations between management andspecies bounded on a very large scale(anadromous salmon, Neotropical migra-tory birds) are more difficult to establish.
Most headwater organisms are controlledby multiple biotic and abiotic factors, andchanging a single variable, particularly atthe landscape level, will not reliably resultin a predictable response in vertebratepopulations. Relying on an alternativeapproach of simulation modeling or land-scape analysis often involves manyuntested and often incorrect assumptions,Raphael notes, but should continue along-side species investigations to keep build-ing knowledge.
Despite REMS providing such variableresults, and its being based on relativelynarrower buffers than the Northwest ForestPlan imposed, there are still some indica-tions for management flexibili ty, theresearchers believe.
“Variable-width buffers, as opposed tofixed width, may be an option, provided
the planning begins with conservativebuffers around small streams. Then youcan practice some management withinriparian zones depending on local condi-tions,” Bisson suggests. “I think somemanagers have come to regard theFEMAT-established buffers as more hardand fast than they were intended to be.With careful analysis, there are probablyareas where you could formulate manage-ment prescriptions that depart from thedefault FEMAT recommendations.”
Bisson recalls that during the REMS study,it became clear in many ways just howlittle we know about what lives in thesesmall headwater streams. At the beginningof inventory for phase 2 (experimental) ofthe study, a number of new species ofmill ipede, and possibly a previouslyunknown genus, have been discovered bya collaborating researcher.
“The most useful outcome of our studymay in fact be to bring more scientificattention to small, headwater, non-fish-bearing streams and their riparian areas,”he says.
“I don’t see no p’ints about
that frog that’s any better’n
any other frog.”
Mark Twain, The Celebrated Jumping Frog, 1865
F O R F U RT H E R R E A D I N GBisson, P.A. [and others]. 2002. Influence of site and landscape features on vertebrateassemblages in small streams. In: Johnson, A; Haynes, R. eds. Proceedings of the WoodCompatibility Initiative workshop. Gen. Tech. Rep. PNW-GTR-563. Portland, OR:U.S.Department of Agriculture, Forest Service. Pacific Northwest Research Station.
Raphael, M.G. [and others]. 2002. Effects of streamside forest management on the compo-sition and abundance of stream and riparian fauna of the Olympic Peninsula. In: Johnson,A.; Haynes, R. eds. Proceedings of the Wood Compatibility Initiative workshop. Gen.Tech. Rep. PNW-GTR-563. Portland, OR: U.S. Department of Agriculture, Forest Service.Pacific Northwest Research Station.
CLEAR IMPLICATIONS FOR MANAGEMENT?
Location of study sites on the OlympicPeninsula, Washington. Names of themajor river basins (study sites) are indicated.
➢
Comparison of the average number ofsite scale and landscape scale variablessignificantly influencing fish andamphibian species in headwater streamson the Olympic Peninsula.
➢
Credit: U
SD
AF
orest Service
Credit: U
SD
AF
orest Service
RiversStudy sites
Olympic PeninsulaOlympic National ForestOlympic National Park
6
5
4
3
2
1
0Landscape scaleSite scale
AmphibiansFishes
Num
ber
of s
igni
fica
nt p
aram
eter
s
134

135
F I N D I N G S
The U.S. Department of Agriculture (USDA) prohibits discrimination in all its programs and activities on the basis of race, color, national origin, gender, religion, age, disability, political beliefs,sexual orientation, or marital or family status. (Not all prohibited bases apply to all programs.) Persons with disabilities who require alternative means for communication of program information(Braille, large print, audiotape, etc.) should contact USDA’s TARGET Center at (202) 720-2600 (voice and TDD). To file a complaint of discrimination, write USDA, Director, Office of CivilRights, Room 326-W, Whitten Building, 14th and Independence Avenue, SW, Washington, DC 20250-9410 or call (202) 720-5964 (voice and TDD). USDA is an equal opportunity provider andemployer.
U.S. Department of AgriculturePacific Northwest Research Station333 S.W. First AvenueP.O. Box 3890Portland, OR 97208-3890
Official BusinessPenalty for Private Use, $300
PRSRT STDUS POSTAGE
PAIDPORTLAND OR
PERMIT N0 G-40
MARTIN RAPHAEL is a research wildlife biologist in theEcosystem Processes Program, Pacific Northwest ResearchStation. He is actively involved in the development of monitor-ing plans for the northern spotted owl and marbled murrelet inthe Pacific Northwest. His research includes habitat relation-ships of forest wildlife, ecology of the marbled murrelet andAmerican marten, and investigations into the roles of riparianhabitat for terrestrial and aquatic organisms.
Raphael can be reached at:
Pacific Northwest Research Station/USDA Forest ServiceForestry Sciences Laboratory3625 93rd Avenue SWOlympia, WA 98512-9193Phone: (360) 753-7662E-mail: [email protected]
PETE BISSON is a research fish biologist in the Aquatic andLand Interactions Program, Pacific Northwest Research Station.From 1974 to 1995 he was an aquatic biologist for the
Weyerhaeuser Company in Tacoma, Washington. In 1995 hejoined the Forest Service, where his studies have included fishpopulations, stream habitats and food webs, riparian zones, anda variety of management issues related to aquatic ecosystems.He has served on two National Research Council committees:one on Pacific salmon and the other on watershed management.
Bisson can be reached at:
Pacific Northwest Research Station/USDA Forest ServiceForestry Sciences Laboratory3625 93rd Avenue SWOlympia, WA 98512-9193Phone: (360) 753-7671E-mail: [email protected]
C O L L A B O R AT O R SKathy O’Halloran, Olympic National Forest
Scott Horton, Washington Department of Natural Resources
Phil Peterson, Simpson Timber
S C I E N T I S T P R O F I L E S
136
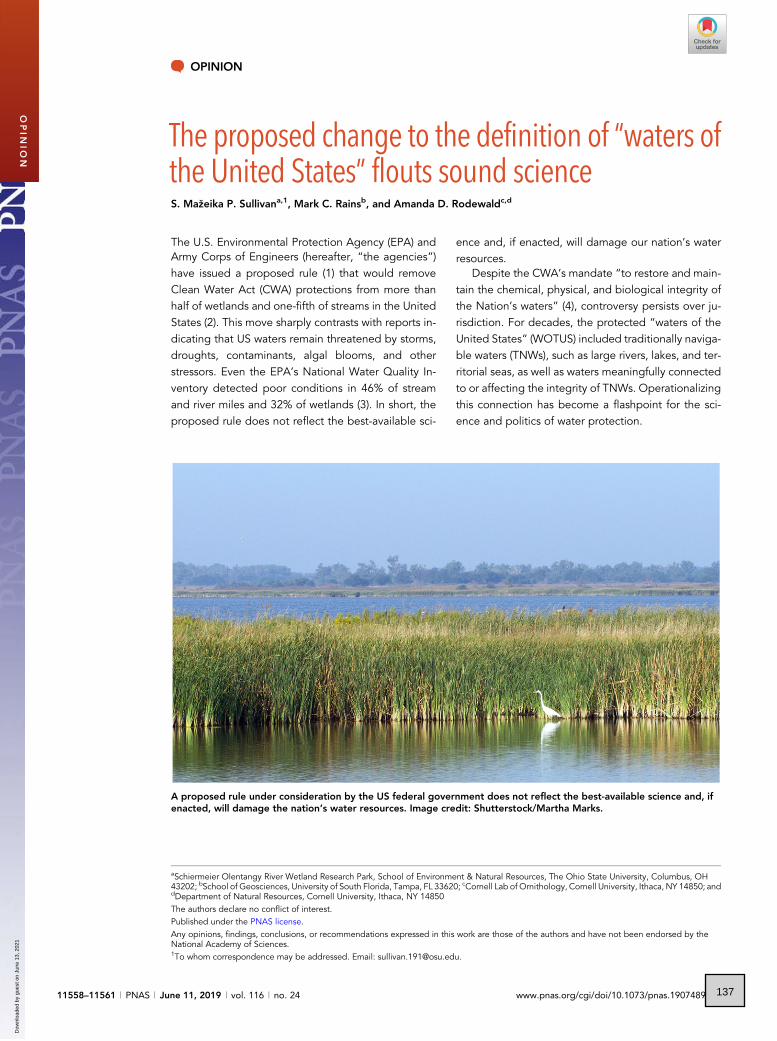
OPINION
The proposed change to the definition of “waters ofthe United States” flouts sound scienceS. Ma�zeika P. Sullivana,1, Mark C. Rainsb, and Amanda D. Rodewaldc,d
The U.S. Environmental Protection Agency (EPA) andArmy Corps of Engineers (hereafter, “the agencies”)have issued a proposed rule (1) that would removeClean Water Act (CWA) protections from more thanhalf of wetlands and one-fifth of streams in the UnitedStates (2). This move sharply contrasts with reports in-dicating that US waters remain threatened by storms,droughts, contaminants, algal blooms, and otherstressors. Even the EPA’s National Water Quality In-ventory detected poor conditions in 46% of streamand river miles and 32% of wetlands (3). In short, theproposed rule does not reflect the best-available sci-
ence and, if enacted, will damage our nation’s waterresources.
Despite the CWA’s mandate “to restore and main-tain the chemical, physical, and biological integrity ofthe Nation’s waters” (4), controversy persists over ju-risdiction. For decades, the protected “waters of theUnited States” (WOTUS) included traditionally naviga-ble waters (TNWs), such as large rivers, lakes, and ter-ritorial seas, as well as waters meaningfully connectedto or affecting the integrity of TNWs. Operationalizingthis connection has become a flashpoint for the sci-ence and politics of water protection.
A proposed rule under consideration by the US federal government does not reflect the best-available science and, ifenacted, will damage the nation’s water resources. Image credit: Shutterstock/Martha Marks.
aSchiermeier Olentangy River Wetland Research Park, School of Environment & Natural Resources, The Ohio State University, Columbus, OH43202; bSchool of Geosciences, University of South Florida, Tampa, FL 33620; cCornell Lab of Ornithology, Cornell University, Ithaca, NY 14850; anddDepartment of Natural Resources, Cornell University, Ithaca, NY 14850The authors declare no conflict of interest.Published under the PNAS license.Any opinions, findings, conclusions, or recommendations expressed in this work are those of the authors and have not been endorsed by theNational Academy of Sciences.1To whom correspondence may be addressed. Email: [email protected].
11558–11561 | PNAS | June 11, 2019 | vol. 116 | no. 24 www.pnas.org/cgi/doi/10.1073/pnas.1907489116
OPIN
ION
Dow
nloa
ded
by g
uest
on
June
13,
202
1
137

Connectivity among waterbodies was the corner-stone of the Obama administration’s Clean WaterRule (CWR), which reflected a state-of-the-sciencesynthesis of more than 1,200 scientific publications[known as the “Connectivity Report” (5)], input from49 experts, and a rigorous review by a 25-memberpanel of the EPA’s Scientific Advisory Board (SAB)(6). Since then, scientific evidence supporting the2015 CWR, and hence contradicting the new pro-posal, has only accumulated, especially as related in-termittent (i.e., flow seasonally) and ephemeral (i.e.,flow periodically, after precipitation events) streams,riparian and floodplain zones, and non-floodplainwetlands (i.e., geographically isolated with no directsurface water connection to a navigable water) (Fig. 1)(7–9).
The Trump administration’s proposed rule largelyignores or misrepresents several conclusions of theConnectivity Report and SAB review. In relying moreupon case law than science, the proposed rule wouldremove protection for millions of stream miles andacres of wetlands that keep waters and watershedshealthy. Some of our most vulnerable waters will loseprotection, including ephemeral streams, non-flood-plain wetlands, and some floodplain wetlands. Theproposed rule is inconsistent with the best-availablescience regarding scale, structural and functional con-nectivity, and consideration of multiple dimensionsof connectivity.
Delicate BalanceClean water depends on complex and highly variableinteractions among climate, geology, topography,land use–land cover, human perturbations, and eco-system processes operating across multiple spatial andtemporal scales. As such, the SAB cautioned that con-nectivity of any single waterbody must be evaluatedfrom systems-level perspectives, such as watershedsand riverscapes, groundwater basins, and fluvial hy-drosystems. Although the contribution of a singlewetland or stream to water health may be small, thecumulative effects are striking. For example, ephem-eral and intermittent streams constitute more thantwo-thirds of all streams in the conterminous UnitedStates (10), more than half of which feed public watersystems supporting about a third of Americans (11).The proposed rule fails to consider watersheds fromsuch a broad perspective, instead excluding theephemeral streams and non-floodplain wetlands thatmaintain watershed integrity.
The proposed rule further deviates from science byimproperly recognizing structural connectivity (i.e.,how waterbodies are physically connected to oneanother) and functional connectivity (i.e., interactionsamong elements, such as the movement of sedimentsalong river networks). Both mediate the movement ofmass, energy, and biota among waterbodies (6, 10).Although streams are structurally connected to down-stream waters through networks of continuous bedsand banks, the proposed rule ignores the typicalphysical evidence (e.g., use of bed, banks, and anordinary high-water mark) and suggests potentially
using blue-line streams on U.S. Geological Surveytopographic or National Hydrology Dataset maps as away to indicate a jurisdictional stream. Although theagencies indicate that combining this information withother measures (for example, with fieldwork and therelative size of a stream, also known as “stream order”)will be important to avoid overestimating flow anderroneously concluding the presence of a jurisdic-tional tributary, they fail to recognize the oppositeproblem. In fact, the poor resolution of currentlymapped drainage networks can miss one-third ofstream lengths relative to higher-resolution data (e.g.,Light Detection and Ranging [LIDAR]) and thus lead toa gross underestimation of presence of streams.
To the extent that the proposed rule improperlyquantifies structural connectivity, it ignores functionalconnectivity entirely. Functional connectivity varieswidely over time, partly as related to floodplain andriver size and the propensity for overbank flooding.Indeed, the functional connectivity of a water todownstream waters may persist even without directhydrologic surface connection “in a typical year,” acriterion used by the proposed rule to establish juris-diction of wetlands. Consistent with new science, theSAB recommended that functional gradients of con-nectivity are not binary in nature and, rather, should beviewed as a gradient of frequency, duration, magni-tude, and predictability of connections (6). Yet theproposed rule uses that binary lens to eliminate pro-tection from all ephemeral streams and non-floodplainwetlands, irrespective of connectivity and the conse-quences for downstream waters.
The near-exclusive emphasis of the proposed rule onhydrologic connectivity contradicts the CWA’s mandateto protect chemical and biological connectivity as well.
Fig. 1. The proposed WOTUS rule would remove protections for ephemeralstreams, such as those seen here—dry and wet phases of a stream in Arizona(A and B), dry phase of a stream in Colorado (C)—as well as non-floodplainwetlands (D, in Alaska). Nonperennial streams comprise millions of streammiles,and non-floodplain wetlands encompass millions of acres in the United States.Image credits: A and B, Michael T. Bogan (University of Arizona, Tucson, AZ);C, Daniel C. Allen (University of Oklahoma, Norman, OK); and D, Mark Rains.
Sullivan et al. PNAS | June 11, 2019 | vol. 116 | no. 24 | 11559
Dow
nloa
ded
by g
uest
on
June
13,
202
1
138

Multiple lines of evidence point to the importance ofchemical and biological connectivity. For instance, non-floodplain wetlands can be important chemical sources(e.g., nutrients, dissolved organic compounds, salts)and sinks (via a suite of physicochemical processesincluding denitrification, sedimentation, long-termstorage in plant detritus, and ammonia volatilization)to downstream waters (8). Likewise, animals transportnutrients, energy, and other organisms between dis-parate locations at both local and landscape scales.Through these movements, biota also prevent in-breeding, escape stressors, locate mates, find foodresources, and recolonize habitats, thus contributingto biodiversity and exchanging nutrients and carbonamong waterbodies and serving as critical agents ofconnectivity and resiliency among streams, wetlands,and downstream waters (7).
The proposed rule also misinterprets and contra-dicts previous recommendations from the EPA’s ownscientists and SAB. The rule is not only inconsistentwith the science of the Connectivity Report and theSAB review, but its exclusions are justified with in-formation from the SAB review that has been mis-interpreted or taken out of context. For instance, theproposed rule justifies the removal of federal pro-tection for ephemeral streams and non-floodplainwetlands by improperly referencing a conceptualmodel developed by the SAB. The model in question
illustrates how connectivity gradients can facilitate theevaluation of the downstream impacts of changes tostreams and wetlands (Fig. 2). Although the connec-tivity gradient does suggest that certain ephemeralstreams and non-floodplain wetlands may be com-parably less connected to downstream waters thanperennial streams and floodplain wetlands, the SABaffirmed that even low levels of connectivity can beimportant relative to impacts on the chemical, physi-cal, and biological integrity of downstream waters.
Indeed, the relative lack of connectivity betweensome wetlands and downstream waters is inverselyrelated to their contribution to water quality (12). Forinstance, when non-floodplain wetlands capture water,materials, and nutrients from stormwater or agriculturalrunoff, pollution to downstream waters is prevented orreduced. Scientific advances since the development ofthis figure bolster the notion of a connectivity gradient,indicating that having no connectivity is unlikely, andthat even habitat in non-floodplain wetlands is importantfor downstream waters.
Another shortcoming of the proposed rule is itsdeparture from a critical recommendation from theSAB, which was that connectivity gradients must becontextualized within broader watershed processes,including the aggregate, collective effects of water-bodies. The cumulative effects of waterbodies are aparticularly important consideration for non-floodplainwetlands, where the relative distance (compared withfloodplain wetlands, for example) from a jurisdic-tional water may be greater and, thus, the impactsto downstream waters relatively lower. However, thecumulative effects of aggregated wetlands can stronglyinfluence fluxes or transport of water, materials, andbiota to downstream waters (8). Because of variabilityin the degree of connectivity between non-floodplainwetlands and downstream waters, the SAB recom-mended a case-by-case analysis to determine the de-gree of connection, which was adopted by the currentCWR.
In addition to improperly using the science to jus-tify summarily removing protections for all non-floodplainwetlands, the agencies go one step further by claim-ing that removing case-by-case evaluations of non-floodplain wetlands will help improve the clarity ofthe rule and ease of implementation. However, theypropose case-by-case judgments in multiple otherinstances. For instance, the agencies suggest using acombination of methods to distinguish perennial andintermittent from ephemeral flows as defined by theproposed rule, including field visits and remote andfield-based tools. Similarly, under the proposed rule,ditches that may have been constructed in a tributarywould have to be evaluated on a case-by-case basis.Thus, the proposed rule selectively applies case-by-case consideration to waterbodies, for which suchexamination is likely to result in exclusion from CWAprotections, and removes such consideration fromwaterbodies (i.e., non-floodplain wetlands) where acase-by-case examination may bemore likely to affordprotection.
Fig. 2. The agencies improperly used the above figure from the SAB review tosupport removing federal protection for ephemeral streams and non-floodplainwetlands. The conceptual figure is meant to convey that connectivity betweenstreams and wetlands and downstream waters is more appropriatelyrepresented by a connectivity gradient (A and B); this is not a binary property.Aggregate effects and low levels of connectivity can be important. Reprintedfrom ref. 6.
11560 | www.pnas.org/cgi/doi/10.1073/pnas.1907489116 Sullivan et al.
Dow
nloa
ded
by g
uest
on
June
13,
202
1
139

Dire ImplicationsIf enacted, the proposed rule will erode protectionsfor millions of miles of ephemeral and headwaterstreams (10, 13) and more than 16 million acres ofwetlands in the conterminous United States, includ-ing many playa lakes, prairie potholes, Carolina andDelmarva Bays, pocosins, and vernal pools (14). Assuch, the rule increases the vulnerability of alreadysensitive waters that provide critical ecosystem services,such as protecting water quality, recharging aquifers,transporting organic material, safeguarding habitatsfor endangered species, and supporting recreationaland commercial endeavors. Severe losses of wetlandfunctions are likely under the proposed rule, withimpacts to wetlands in arid and semi-arid regionsparticularly high. For instance, the Cimarron RiverWatershed in northeastern New Mexico is projectedto lose between 18 and 69% of wetland acres underthe proposed rule (15).
Particularly worrisome is that the proposed rule islikely to facilitate the removal of waters from pro-tection in the future, given anticipated trends in human
activities and climate change. In some areas of thecountry, perennial streams are shifting to intermittentand ephemeral streams, presumably as a result ofgroundwater pumping accentuated by a changingclimate (16). Under the proposed rule, these newlyephemeral streams will lose protection, setting adangerous precedent by opening the door for fur-ther losses of protection.
Every nation’s citizens need clean water to behealthy and productive—today and into the future.When carefully considered and integrated, science pro-vides an evidence-based strategy to ensure cleanwater—as with the Obama administration’s CWR.However, the current administration’s proposed ruleat once contradicts both the rich body of science aboutwater connectivity and the clearly articulatedmandate ofCWA. Furthermore, it lacks the alleged clarity toutedby the agencies. The apparent opposition to enact-ing science-based policies undermines decades ofefforts—and investments by tax-paying Americans—to clean and protect our nation’s waters.
1 Revised Definition of “Waters of the United States,” 84 Fed. Reg. 4154 (14 February 2019) (To be codified at 33 CFR Part 328 and 40CFR Parts 110, 112, 116, 117, 122, 230, 232, 300, 302, and 401).
2 A. Wittenberg, K. Bogardus, EPA claims ‘no data’ on impact of weakening water rule. But the numbers exist. Science, 11 December2018. https://www.sciencemag.org/news/2018/12/epa-claims-no-data-impact-weakening-water-rule-numbers-exist. Accessed 3May 2019.
3 U.S. Environmental Protection Agency, “National water quality inventory report to Congress” (Publication 841-R-16-011, EPA, 2017;https://www.epa.gov/waterdata/national-water-quality-inventory-report-congress).
4 Federal Water Pollution Control Act (Clean Water Act) 33 U.S.C. 1251 et seq. Sec. 101, 3 (1972).5 U.S. Environmental Protection Agency, “Connectivity of streams and wetlands to downstream waters: A review and synthesis of thescientific evidence (final report)” (Publication 600/R-14/475F, EPA, 2015; https://cfpub.epa.gov/ncea/risk/recordisplay.cfm?deid=296414).
6 U.S. Environmental Protection Agency, “Letter to Gina McCarthy. October 17, 2014. SAB review of the draft EPA report connectivityof streams and wetlands to downstream waters: A review and synthesis of the scientific evidence” National Service Center forEnvironmental Publications, 17 October 2014. https://nepis.epa.gov/Exe/tiff2png.cgi/P100RO1Y.PNG?-r+75+-g+7+D%3A%5CZYFILES%5CINDEX%20DATA%5C11THRU15%5CTIFF%5C00001458%5CP100RO1Y.TIF. Accessed 3 May 2019.
7 K. A. Schofield et al., Biota connect aquatic habitats throughout freshwater ecosystem mosaics. J. Am. Water Resour. Assoc. 54, 372–399 (2018).
8 C. R. Lane, S. G. Leibowitz, B. C. Autrey, S. D. LeDuc, L. C. Alexander, Hydrological, physical, and chemical functions and connectivityof non-floodplain wetlands to downstream waters: A review. J. Am. Water Resour. Assoc. 54, 346–371 (2018).
9 M. J. Cohen et al., Do geographically isolated wetlands influence landscape functions? Proc. Natl. Acad. Sci. U.S.A. 113, 1978–1986(2016).
10 T. L. Nadeau, M. C. Rains, Hydrological connectivity between headwater streams and downstream waters: How science can informpolicy. J. Am. Water Resour. Assoc. 43, 118–133 (2007).
11 U.S. Environmental Protection Agency, “Section 404 of the Clean Water Act. Geographic information systems analysis of the surfacedrinking water provided by intermittent, ephemeral, and headwater streams in the U.S.” (2009) https://www.epa.gov/cwa-404/geographic-information-systems-analysis-surface-drinking-water-provided-intermittent. Accessed 3 May 2019.
12 J. M. Marton et al., Geographically isolated wetlands are important biogeochemical reactors on the landscape. Bioscience 65, 408–418 (2015).
13 L. Levick et al., “The ecological and hydrological significance of ephemeral and intermittent streams in the arid and semi-aridAmerican Southwest” (Publication 600/R-08/134, EPA 2008; https://www.epa.gov/sites/production/files/2015-03/documents/ephemeral_streams_report_final_508-kepner.pdf).
14 C. R. Lane, E. D’Amico, Identification of putative geographically isolated wetlands of the conterminous United States. J. Am. WaterResour. Assoc. 52, 705–722 (2016).
15 Saint Mary’s University of Minnesota, Modeling federally protected waters and wetlands. Saint Mary’s University of Minnesota,GeoSpatial Services (2019). https://www.arcgis.com/apps/Cascade/index.html?appid=f3de6b30c0454c15ac9d3d881f18ae33).Accessed 9 February 2019.
16 J. S. Perkin et al., Groundwater declines are linked to changes in Great Plains stream fish assemblages. Proc. Natl. Acad. Sci. U.S.A.114, 7373–7378 (2017).
Sullivan et al. PNAS | June 11, 2019 | vol. 116 | no. 24 | 11561
Dow
nloa
ded
by g
uest
on
June
13,
202
1
140
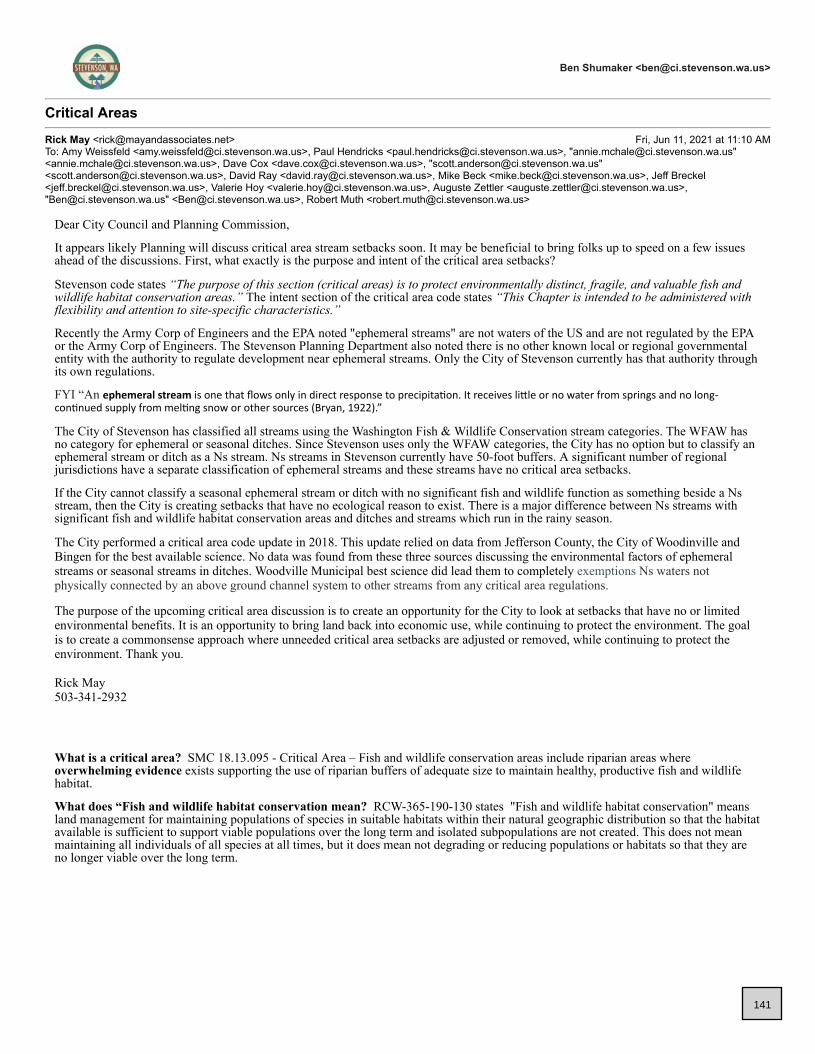
Ben Shumaker <[email protected]>
Critical AreasRick May <[email protected]> Fri, Jun 11, 2021 at 11:10 AMTo: Amy Weissfeld <[email protected]>, Paul Hendricks <[email protected]>, "[email protected]"<[email protected]>, Dave Cox <[email protected]>, "[email protected]"<[email protected]>, David Ray <[email protected]>, Mike Beck <[email protected]>, Jeff Breckel<[email protected]>, Valerie Hoy <[email protected]>, Auguste Zettler <[email protected]>,"[email protected]" <[email protected]>, Robert Muth <[email protected]>
Dear City Council and Planning Commission,
It appears likely Planning will discuss critical area stream setbacks soon. It may be beneficial to bring folks up to speed on a few issuesahead of the discussions. First, what exactly is the purpose and intent of the critical area setbacks?
Stevenson code states “The purpose of this section (critical areas) is to protect environmentally distinct, fragile, and valuable fish andwildlife habitat conservation areas.” The intent section of the critical area code states “This Chapter is intended to be administered withflexibility and attention to site-specific characteristics.”
Recently the Army Corp of Engineers and the EPA noted "ephemeral streams" are not waters of the US and are not regulated by the EPAor the Army Corp of Engineers. The Stevenson Planning Department also noted there is no other known local or regional governmentalentity with the authority to regulate development near ephemeral streams. Only the City of Stevenson currently has that authority throughits own regulations.
FYI “An ephemeral stream is one that flows only in direct response to precipita�on. It receives li�le or no water from springs and no long-con�nued supply from mel�ng snow or other sources (Bryan, 1922).”
The City of Stevenson has classified all streams using the Washington Fish & Wildlife Conservation stream categories. The WFAW hasno category for ephemeral or seasonal ditches. Since Stevenson uses only the WFAW categories, the City has no option but to classify anephemeral stream or ditch as a Ns stream. Ns streams in Stevenson currently have 50-foot buffers. A significant number of regionaljurisdictions have a separate classification of ephemeral streams and these streams have no critical area setbacks.
If the City cannot classify a seasonal ephemeral stream or ditch with no significant fish and wildlife function as something beside a Nsstream, then the City is creating setbacks that have no ecological reason to exist. There is a major difference between Ns streams withsignificant fish and wildlife habitat conservation areas and ditches and streams which run in the rainy season.
The City performed a critical area code update in 2018. This update relied on data from Jefferson County, the City of Woodinville andBingen for the best available science. No data was found from these three sources discussing the environmental factors of ephemeralstreams or seasonal streams in ditches. Woodville Municipal best science did lead them to completely exemptions Ns waters notphysically connected by an above ground channel system to other streams from any critical area regulations.
The purpose of the upcoming critical area discussion is to create an opportunity for the City to look at setbacks that have no or limitedenvironmental benefits. It is an opportunity to bring land back into economic use, while continuing to protect the environment. The goalis to create a commonsense approach where unneeded critical area setbacks are adjusted or removed, while continuing to protect theenvironment. Thank you. Rick May 503-341-2932
What is a critical area? SMC 18.13.095 - Critical Area – Fish and wildlife conservation areas include riparian areas whereoverwhelming evidence exists supporting the use of riparian buffers of adequate size to maintain healthy, productive fish and wildlifehabitat.
What does “Fish and wildlife habitat conservation mean? RCW-365-190-130 states "Fish and wildlife habitat conservation" meansland management for maintaining populations of species in suitable habitats within their natural geographic distribution so that the habitatavailable is sufficient to support viable populations over the long term and isolated subpopulations are not created. This does not meanmaintaining all individuals of all species at all times, but it does mean not degrading or reducing populations or habitats so that they areno longer viable over the long term.
141
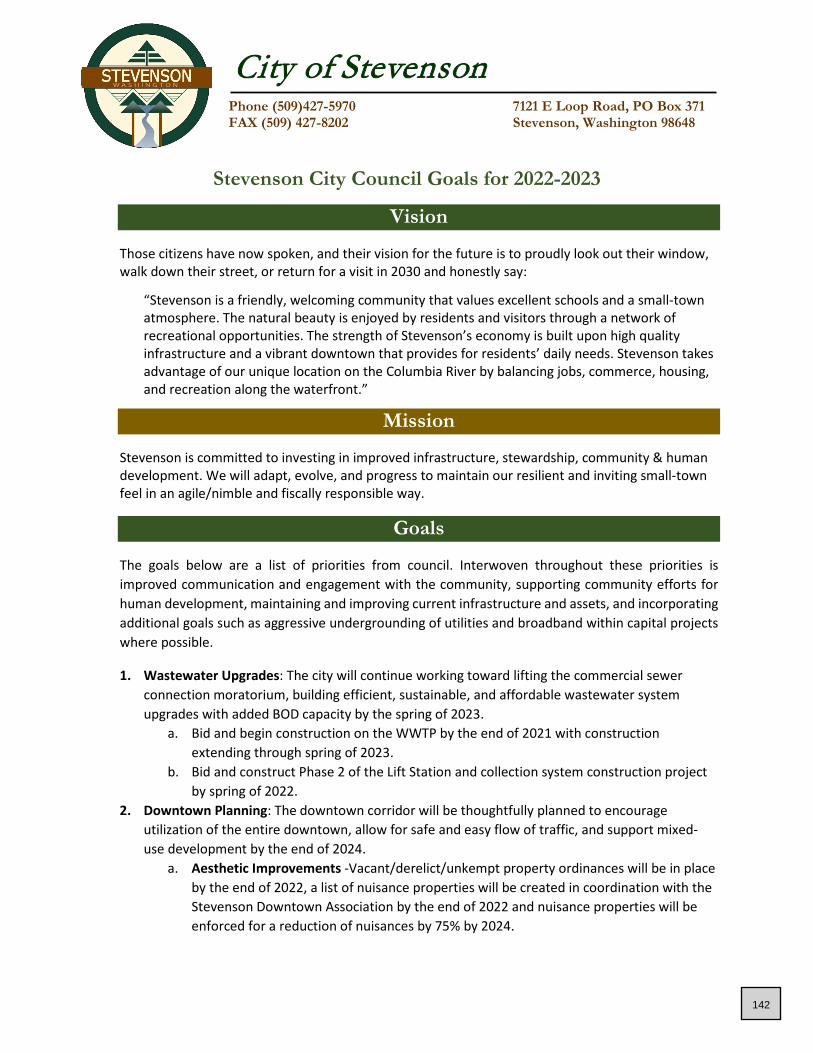
City of Stevenson
Phone (509)427-5970 7121 E Loop Road, PO Box 371 FAX (509) 427-8202 Stevenson, Washington 98648
Stevenson City Council Goals for 2022-2023
Vision
Those citizens have now spoken, and their vision for the future is to proudly look out their window, walk down their street, or return for a visit in 2030 and honestly say:
“Stevenson is a friendly, welcoming community that values excellent schools and a small-town atmosphere. The natural beauty is enjoyed by residents and visitors through a network of recreational opportunities. The strength of Stevenson’s economy is built upon high quality infrastructure and a vibrant downtown that provides for residents’ daily needs. Stevenson takes advantage of our unique location on the Columbia River by balancing jobs, commerce, housing, and recreation along the waterfront.”
Mission
Stevenson is committed to investing in improved infrastructure, stewardship, community & human development. We will adapt, evolve, and progress to maintain our resilient and inviting small-town feel in an agile/nimble and fiscally responsible way.
Goals
The goals below are a list of priorities from council. Interwoven throughout these priorities is improved communication and engagement with the community, supporting community efforts for human development, maintaining and improving current infrastructure and assets, and incorporating additional goals such as aggressive undergrounding of utilities and broadband within capital projects where possible.
1. Wastewater Upgrades: The city will continue working toward lifting the commercial sewer connection moratorium, building efficient, sustainable, and affordable wastewater system upgrades with added BOD capacity by the spring of 2023.
a. Bid and begin construction on the WWTP by the end of 2021 with construction extending through spring of 2023.
b. Bid and construct Phase 2 of the Lift Station and collection system construction project by spring of 2022.
2. Downtown Planning: The downtown corridor will be thoughtfully planned to encourage utilization of the entire downtown, allow for safe and easy flow of traffic, and support mixed-use development by the end of 2024.
a. Aesthetic Improvements -Vacant/derelict/unkempt property ordinances will be in place by the end of 2022, a list of nuisance properties will be created in coordination with the Stevenson Downtown Association by the end of 2022 and nuisance properties will be enforced for a reduction of nuisances by 75% by 2024.
142

Stevenson City Council Goals for 2022-2023 (cont.)
b. East-side Downtown Improvements will be made to encourage development with an increase of developed or utilized properties of 25% by 2024.
i. First Street Overlook will be constructed in 2021. ii. Columbia Street Realignment will move forward with conceptualization and
planning for a complete path forward with funding partners by the end of 2022. 3. Fire Hall: The city will partner with Skamania County Fire District 2 and the Skamania County
Department of Emergency Management to build a new fire hall that meets the needs of the agencies, is affordable to the community and is a valued asset of Rock Creek Drive.
a. Design Completion b. Apply for and secure Construction Funding c. Enter into interlocal agreements between various agencies for the funding and/or
maintenance of the property. d. Bid and construct new fire hall.
4. Water System Continued Maintenance a. Replace most of the failing AC Pipes, about 30% of the city waterlines, by 2030. Projects
outlined in the next few years include: i. School Street
ii. Loop Rd iii. Upper Russell (in conjunction with Park Plaza construction) iv. Frank Johns
b. Water Treatment Plant Maintenance includes painting interior. c. Establish Hegewald Well as a permanent water source.
5. Develop Deliberate Growth Strategy by the end of 2021. a. Complete Capital Improvement Program b. Complete a Strategic Plan for the Fire Department c. Explore Industrial Sites: Apply for a CERB grant to evaluate the feasibility of additional
industrial sites away from the Waterfront by the end of 2019.
Remaining Uncompleted Goals from 2019-2024 Strategic Plan
6. Housing Affordability: The city will work with private and public partners to increase the availability of attainable housing by 20 units, reduce the unhoused population by 20% and increase temporary shelter availability by 75% by the end of 2024.
7. Russell Ave Rebuild-Phase 2 from Second St. to Vancouver Ave and tie in with the Courthouse Plaza project if funding allows.
8. Broadband - complete the Broadband Strategic Plan by the end of 2019 and collaborate with community partners to facilitate the completion and implementation of the Strategic Broadband Plan starting in 2020.
9. Waterfront Development-The City will work with the Port of Skamania to develop a waterfront development plan by the end of 2021.
10. Parks Plan Develop a park plan to include maintenance of current parks and standards by the end of 2020.
11. Partner with School District on Workforce Education Development and Develop Youth Leadership Process to include honorary student councilmembers by the end of 2020.
143
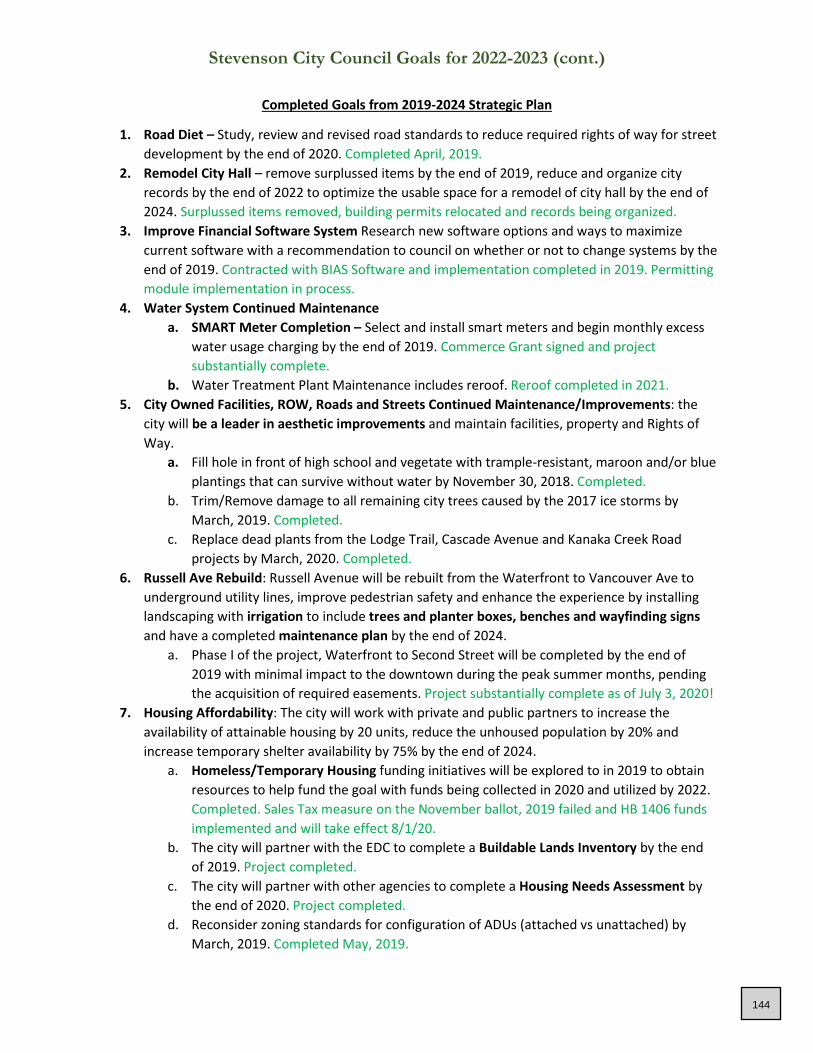
Stevenson City Council Goals for 2022-2023 (cont.)
Completed Goals from 2019-2024 Strategic Plan
1. Road Diet – Study, review and revised road standards to reduce required rights of way for street development by the end of 2020. Completed April, 2019.
2. Remodel City Hall – remove surplussed items by the end of 2019, reduce and organize city records by the end of 2022 to optimize the usable space for a remodel of city hall by the end of 2024. Surplussed items removed, building permits relocated and records being organized.
3. Improve Financial Software System Research new software options and ways to maximize current software with a recommendation to council on whether or not to change systems by the end of 2019. Contracted with BIAS Software and implementation completed in 2019. Permitting module implementation in process.
4. Water System Continued Maintenance a. SMART Meter Completion – Select and install smart meters and begin monthly excess
water usage charging by the end of 2019. Commerce Grant signed and project substantially complete.
b. Water Treatment Plant Maintenance includes reroof. Reroof completed in 2021. 5. City Owned Facilities, ROW, Roads and Streets Continued Maintenance/Improvements: the
city will be a leader in aesthetic improvements and maintain facilities, property and Rights of Way.
a. Fill hole in front of high school and vegetate with trample-resistant, maroon and/or blue plantings that can survive without water by November 30, 2018. Completed.
b. Trim/Remove damage to all remaining city trees caused by the 2017 ice storms by March, 2019. Completed.
c. Replace dead plants from the Lodge Trail, Cascade Avenue and Kanaka Creek Road projects by March, 2020. Completed.
6. Russell Ave Rebuild: Russell Avenue will be rebuilt from the Waterfront to Vancouver Ave to underground utility lines, improve pedestrian safety and enhance the experience by installing landscaping with irrigation to include trees and planter boxes, benches and wayfinding signs and have a completed maintenance plan by the end of 2024.
a. Phase I of the project, Waterfront to Second Street will be completed by the end of 2019 with minimal impact to the downtown during the peak summer months, pending the acquisition of required easements. Project substantially complete as of July 3, 2020!
7. Housing Affordability: The city will work with private and public partners to increase the availability of attainable housing by 20 units, reduce the unhoused population by 20% and increase temporary shelter availability by 75% by the end of 2024.
a. Homeless/Temporary Housing funding initiatives will be explored to in 2019 to obtain resources to help fund the goal with funds being collected in 2020 and utilized by 2022. Completed. Sales Tax measure on the November ballot, 2019 failed and HB 1406 funds implemented and will take effect 8/1/20.
b. The city will partner with the EDC to complete a Buildable Lands Inventory by the end of 2019. Project completed.
c. The city will partner with other agencies to complete a Housing Needs Assessment by the end of 2020. Project completed.
d. Reconsider zoning standards for configuration of ADUs (attached vs unattached) by March, 2019. Completed May, 2019.
144

Stevenson City Council Goals for 2022-2023 (cont.)
8. Wastewater Upgrades: The city will continue working toward lifting the commercial sewer connection moratorium, building efficient, sustainable and affordable wastewater system upgrades with added BOD capacity by the end of 2021.
a. Complete CERB Feasibility Study on the Alternatives Analysis by the end of Feb, 2019 and implementation of proposed alternatives by August, 2019. Final CERB Report completed Dec. 2020.
b. Contract with DOE for design funding by Jan 31, 2019. Completed February, 2019 c. Advertise for Design Engineer immediately upon contract with DOE. Phase Design
Engineering contract as necessary to address collection system (including pump stations and geotechnical study) prior to performance on WWTP design. Contract signed April, 2019
d. Complete Design of the project to apply to DOE for construction funding by Oct, 2019. Delayed until 2020 due to delay in DOE loan contract and CERB Study.
e. Update Facilities Plan with the CERB Study and design work by Oct, 2019. CERB Study included in revised facilities plan update, submitted for DOE approval February, 2019. Design work will be completed and submitted to DOE end of June, 2020.
f. Plan for the relocation of Public Works equipment with the expansion of the WWTP to be implemented with construction of the upgrades by the end of 2021. Alternatives sites researched and some relocation implemented.
g. Continue with the Sewer Lining project to reduce Infiltration and Inflow at the wastewater treatment plant during rain events by inspecting 10% of the wastewater collection system each year and repairing as needed and as budget allows. Contract for Geotech report as identified in GSP before repairs are made in Montell neighborhood. Ongoing. The final report on Geotech for Montell neighborhood stated it is more cost effective to treat Infiltration and Inflow at the plant than to fix the sewer lines and install French drains.
h. Enter into agreements with all Significant Industrial Users for individual discharge limits and rates by the end of the second quarter 2019. Signed agreement with Backwoods Brewing, draft with LDB remains in process.
i. Update FOG program to improve compliance by 90% by the end of 2019 and 100% by 2020. Updates shall include clear instructions of how the proposed escalating fees/fines will be imposed. FOG Ordinance updated March, 2019.
j. Continue with minor improvements in both collection system and plant and encouraging BOD reduction to reach a goal of 0 NPDES effluent violations. Ongoing. Coordinating with SIUs and Dirt Huggers for side stream material removal. Installed interim measures to improve plant performance and guide design.
k. Complete funding package requirements for collection system and sign contracts by the end of 2020. Completed.
l. Continue with the Sewer Lining project to reduce Infiltration and Inflow at the wastewater treatment plant during rain events by inspecting 10% of the wastewater collection system each year and repairing as needed and as budget allows. Completed in 2020 and scheduled for 2021.
145

Stevenson City Council Goals for 2022-2023 (cont.)
m. Implement updated rate structure after completion of rate study by the end of 2020. Rate study completed and the model will be updated in 2021 after funding streams are secured.
n. Relocate Public Works equipment and materials with the expansion of the WWTP to be implemented with construction of the upgrades by the end of 2022. Completed in 2021.
o. Continue with minor improvements in both collection system and plant and encouraging BOD reduction to reach a goal of 0 NPDES effluent violations. In process
p. Apply for construction funding with DOE, USDA and others to maximize grants and leverage low-interest loans to reduce cost impact to residents. In process
q. Complete and sign finding contracts for WWTP funding by the fall of 2021. In process r. Complete permitting requirements for construction by the fall of 2021. In process. s. Bid Lift Station and collection system construction project by the summer of 2021. In
process and on track. t. Begin construction on the lift stations and collection system by fall of 2021. In process.
9. City Property Security - The city will evaluate security needs at all city facilities and begin implementing security enhancements in 2019. An interior security door has been installed to prevent visitors from coming behind the counter without authorization. Plexiglass has been installed as well. Security cameras being discussed and researched for 2021 install.
10. Parks Plan Develop a park plan to include maintenance of current parks and standards by the end of 2020.
a. Parks and Rec District – Develop committee to research and evaluate interest for a park and recreation district by the end of 2020. Determine a way forward go/no go by 2021. Pool district created in 2021 by voters.
11. Downtown Planning: The downtown corridor will be thoughtfully planned to encourage utilization of the entire downtown, allow for safe and easy flow of traffic, and support mixed-use development by the end of 2024.
a. A city-wide Traffic Study will be completed by the end of 2021. In process. i. Unimproved Street Plan: The city will develop an unimproved street plan to
include funding mechanisms and opportunities by the end of 2019 and begin construction on at least one project by the end of 2021. Project may be incorporated into the city-wide traffic study. 1. Del Ray - The city will work property owners to determine development
opportunities for public and private uses by the end of 2020. 2. Lotz Road Improvements will be included in the unimproved street plan.
b. Design Standards outlined in the Downtown Plan will be reviewed and updated by the end of 2021. In process.
c. Mixed-Use – The city will reduce barriers to mixed use to encourage increase mixed use development by the end of 2024. In process.
12. City Owned Facilities, ROW, Roads and Streets Continued Maintenance/Improvements: the city will be a leader in aesthetic improvements and maintain facilities, property and Rights of Way.
a. Landscaping – The city will create a plan for landscaping and maintenance for city property and rights of way, which may include agreements with adjacent property owners, by the end of 2020. Tree management plan being created in 2021.
146

Stevenson Comprehensive Plan
April, 2013
FIGURE 3-1: PLAN GOALS Stevenson Comprehensive Plan Goals
Goal 1—Community & Schools: The Stevenson community is active and engaged and provides excellent schools and diverse activities for its youth.
Goal 2—Urban Development: Development within the Stevenson Urban Area wisely considers the long-term interests of the community.
Goal 3—Housing: A variety of housing options accommodates all residents.
Goal 4—Downtown & Waterfront: A vibrant and attractive downtown is home to diverse businesses and welcoming to residents and visitors.
Goal 4A—Waterfront: The waterfront is an extension of the downtown core and a place where people live, work, and play.
Goal 5—Business & Industry: Stevenson supports businesses that employ its residents and meet community needs.
Goal 6—Tourism: Stevenson attracts visitors by providing and promoting a variety of tourist amenities and activities.
Goal 7—Transportation & Circulation: Multi-modal transportation options provide people and goods with safe, efficient, and convenient options.
Goal 8—Utilities & Services: Reliable utilities and convenient services fulfill the needs of the current and future community.
Goal 9—Parks & Recreation: Residents and visitors enjoy access to a network of world-class parks, open spaces, and recreational opportunities.
CHAPTER 3-GOALS & OBJECTIVES The Stevenson Comprehensive Plan uses nine Goals to focus the community’s Cornerstone Principles and refine the citizens’ Vision. Like the Cornerstone Principles, the topics of these Goals closely relate
to the community’s day-to-day needs and desires. Like the Vision, these Goals are broad, general statements describing the ultimate endpoint where the actions taken on their behalf should lead. A Plan for Action This Chapter’s nine main sections correspond to the nine Goals. After a brief introduction, each Goal is followed by a six-column matrix containing information about how that Goal can be achieved. When viewed as a whole, the six columns serve as an Action Plan designating what, why, how, and when activities should be done and who should do them.
11
Phot
o Cr
edit:
Mar
a Ha
ight
147
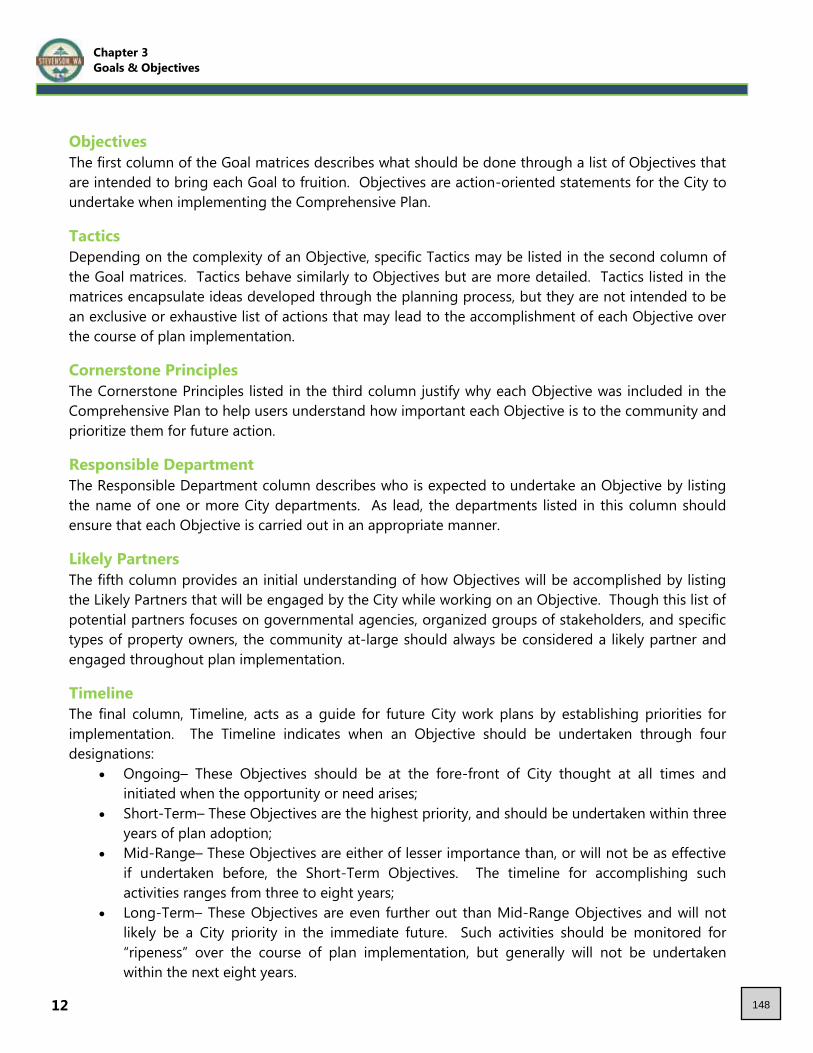
Objectives The first column of the Goal matrices describes what should be done through a list of Objectives that are intended to bring each Goal to fruition. Objectives are action-oriented statements for the City to undertake when implementing the Comprehensive Plan. Tactics Depending on the complexity of an Objective, specific Tactics may be listed in the second column of the Goal matrices. Tactics behave similarly to Objectives but are more detailed. Tactics listed in the matrices encapsulate ideas developed through the planning process, but they are not intended to be an exclusive or exhaustive list of actions that may lead to the accomplishment of each Objective over the course of plan implementation.
Cornerstone Principles The Cornerstone Principles listed in the third column justify why each Objective was included in the Comprehensive Plan to help users understand how important each Objective is to the community and prioritize them for future action. Responsible Department The Responsible Department column describes who is expected to undertake an Objective by listing the name of one or more City departments. As lead, the departments listed in this column should ensure that each Objective is carried out in an appropriate manner. Likely Partners The fifth column provides an initial understanding of how Objectives will be accomplished by listing the Likely Partners that will be engaged by the City while working on an Objective. Though this list of potential partners focuses on governmental agencies, organized groups of stakeholders, and specific types of property owners, the community at-large should always be considered a likely partner and engaged throughout plan implementation. Timeline The final column, Timeline, acts as a guide for future City work plans by establishing priorities for implementation. The Timeline indicates when an Objective should be undertaken through four designations:
�� Ongoing– These Objectives should be at the fore-front of City thought at all times and initiated when the opportunity or need arises;
�� Short-Term– These Objectives are the highest priority, and should be undertaken within three years of plan adoption;
�� Mid-Range– These Objectives are either of lesser importance than, or will not be as effective if undertaken before, the Short-Term Objectives. The timeline for accomplishing such activities ranges from three to eight years;
�� Long-Term– These Objectives are even further out than Mid-Range Objectives and will not likely be a City priority in the immediate future. Such activities should be monitored for “ripeness” over the course of plan implementation, but generally will not be undertaken within the next eight years.
12
Chapter 3 Goals & Objectives
148
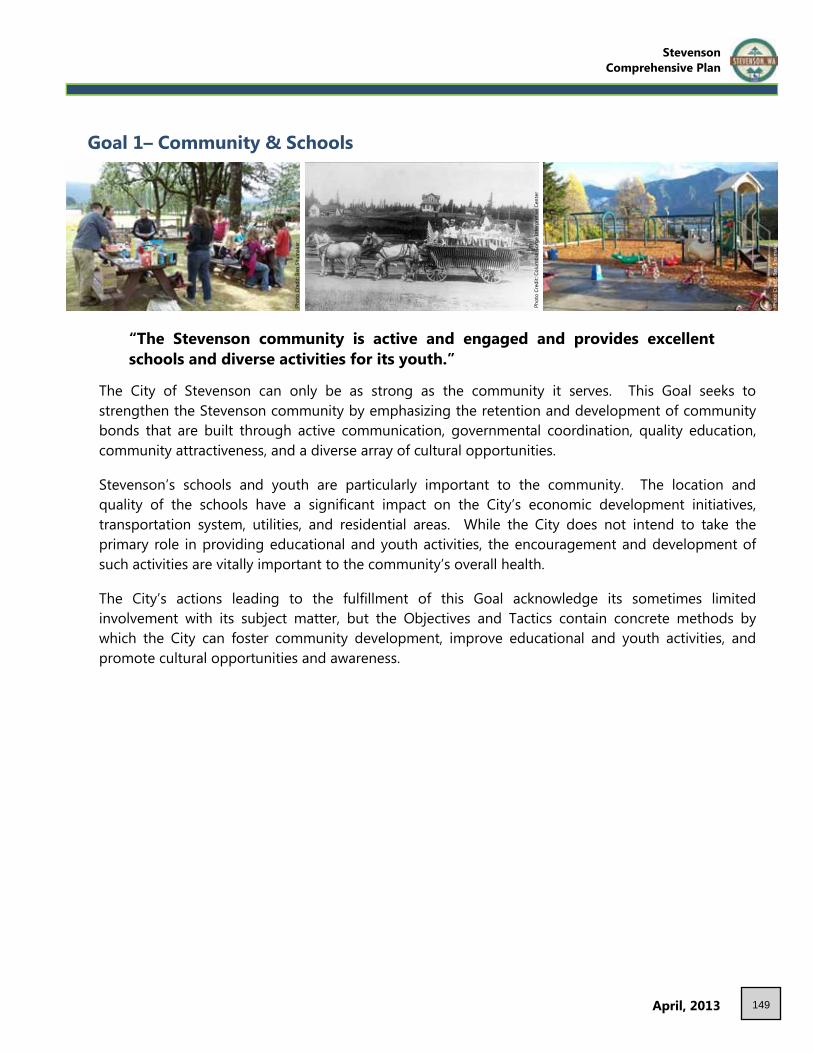
Stevenson Comprehensive Plan
April, 2013
Goal 1– Community & Schools
“The Stevenson community is active and engaged and provides excellent schools and diverse activities for its youth.”
The City of Stevenson can only be as strong as the community it serves. This Goal seeks to strengthen the Stevenson community by emphasizing the retention and development of community bonds that are built through active communication, governmental coordination, quality education, community attractiveness, and a diverse array of cultural opportunities. Stevenson’s schools and youth are particularly important to the community. The location and quality of the schools have a significant impact on the City’s economic development initiatives, transportation system, utilities, and residential areas. While the City does not intend to take the primary role in providing educational and youth activities, the encouragement and development of such activities are vitally important to the community’s overall health. The City’s actions leading to the fulfillment of this Goal acknowledge its sometimes limited involvement with its subject matter, but the Objectives and Tactics contain concrete methods by which the City can foster community development, improve educational and youth activities, and promote cultural opportunities and awareness.
13
Phot
o Cr
edit:
Ben
Shu
mak
er
Phot
o Cr
edit:
Col
umbi
a Go
rge
Inte
rpre
tive
Cent
er
Phot
o Cr
edit:
Ben
Shu
mak
er
149
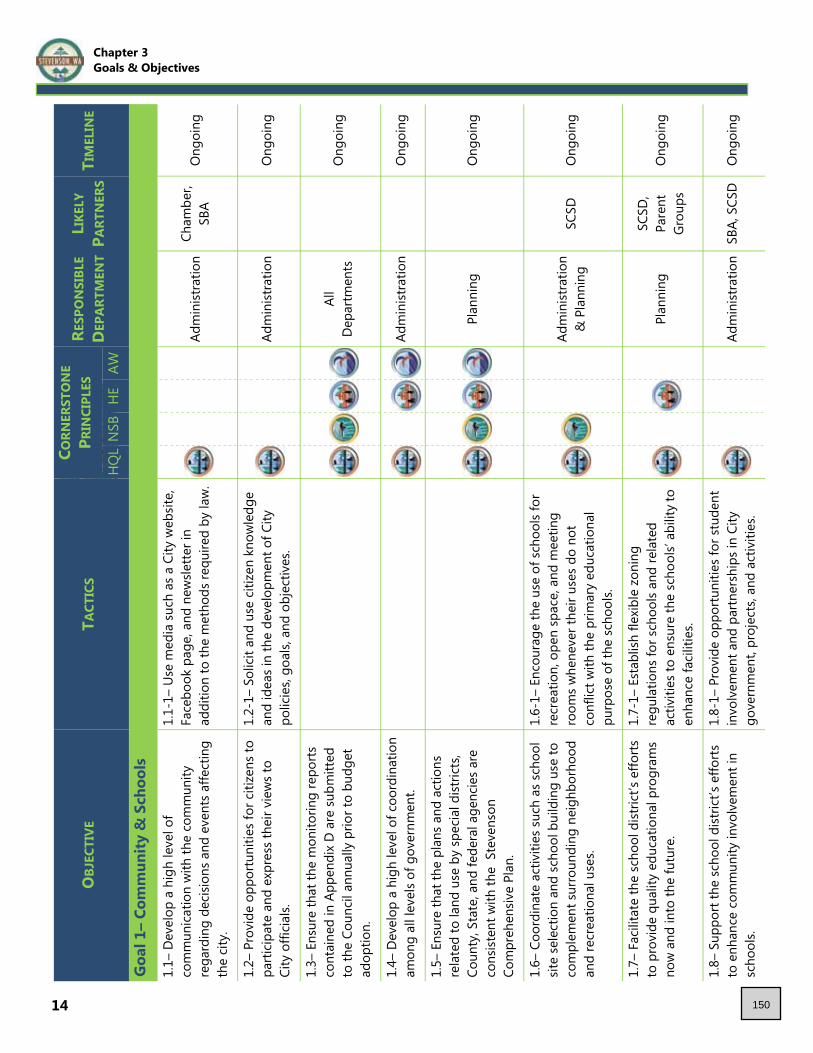
14
OBJ
ECTI
VE
TACT
ICS
CORN
ERST
ON
E PR
INCI
PLES
RE
SPO
NSI
BLE
DEP
ARTM
ENT
LIKE
LY
PART
NER
S TI
MEL
INE
HQ
L N
SB
HE
AW
Goa
l 1–
Com
mun
ity &
Sch
ools
1.1–
Dev
elop
a h
igh
leve
l of
co
mm
unic
atio
n w
ith th
e co
mm
unity
re
gard
ing
deci
sions
and
eve
nts
affe
ctin
g th
e ci
ty.
1.1-
1– U
se m
edia
suc
h as
a C
ity w
ebsit
e,
Face
book
pag
e, a
nd n
ewsle
tter i
n
ad
ditio
n to
the
met
hods
requ
ired
by la
w.
Adm
inist
ratio
n Ch
ambe
r, SB
A O
ngoi
ng
1.2–
Pro
vide
opp
ortu
nitie
s fo
r citi
zens
to
parti
cipat
e an
d ex
pres
s th
eir v
iew
s to
Ci
ty o
ffici
als.
1.2-
1– S
olici
t and
use
citi
zen
know
ledg
e an
d id
eas i
n th
e de
velo
pmen
t of C
ity
polic
ies,
goal
s, an
d ob
ject
ives
.
Ad
min
istra
tion
O
ngoi
ng
1.3–
Ens
ure
that
the
mon
itorin
g re
ports
co
ntai
ned
in A
ppen
dix
D a
re su
bmitt
ed
to th
e Co
unci
l ann
ually
prio
r to
budg
et
adop
tion.
All
Dep
artm
ents
Ong
oing
1.4–
Dev
elop
a h
igh
leve
l of c
oord
inat
ion
amon
g al
l lev
els
of g
over
nmen
t.
Adm
inist
ratio
n
Ong
oing
1.5–
Ens
ure
that
the
plan
s an
d ac
tions
re
late
d to
land
use
by
spec
ial d
istric
ts,
Coun
ty, S
tate
, and
fede
ral a
genc
ies
are
cons
isten
t with
the
Ste
vens
on
Com
preh
ensiv
e Pl
an.
Plan
ning
Ong
oing
1.6–
Coo
rdin
ate
activ
ities
suc
h as
sch
ool
site
sele
ctio
n an
d sc
hool
bui
ldin
g us
e to
co
mpl
emen
t sur
roun
ding
nei
ghbo
rhoo
d an
d re
crea
tiona
l use
s.
1.6-
1– E
ncou
rage
the
use
of s
choo
ls fo
r
re
crea
tion,
ope
n sp
ace,
and
mee
ting
room
s w
hene
ver t
heir
uses
do
not
co
nflic
t with
the
prim
ary
educ
atio
nal
purp
ose
of th
e sc
hool
s.
Adm
inist
ratio
n &
Pla
nnin
g SC
SD
Ong
oing
1.7–
Fac
ilita
te th
e sc
hool
dist
rict’s
effo
rts
to p
rovi
de q
ualit
y ed
ucat
iona
l pro
gram
s no
w a
nd in
to th
e fu
ture
.
1.7-
1– E
stab
lish
flexi
ble
zoni
ng
regu
latio
ns fo
r sch
ools
and
rela
ted
activ
ities
to e
nsur
e th
e sc
hool
s’ ab
ility
to
enha
nce
faci
litie
s.
Plan
ning
SC
SD,
Pa
rent
Gr
oups
O
ngoi
ng
1.8–
Sup
port
the
scho
ol d
istric
t’s e
fforts
to
enh
ance
com
mun
ity in
volv
emen
t in
scho
ols.
1.8-
1– P
rovi
de o
ppor
tuni
ties
for s
tude
nt
invo
lvem
ent a
nd p
artn
ersh
ips i
n Ci
ty
gove
rnm
ent,
proj
ects
, and
act
iviti
es.
Adm
inist
ratio
n SB
A, S
CSD
O
ngoi
ng
Chapter 3 Goals & Objectives
150

Stevenson Comprehensive Plan
April, 2013 15
OBJ
ECTI
VE
TACT
ICS
CORN
ERST
ON
E P R
INCI
PLES
RE
SPO
NSI
BLE
DEP
ARTM
ENT
LIKE
LY
PART
NER
S TI
MEL
INE
HQ
L N
SB
HE
AW
Goa
l 1–
Com
mun
ity &
Sch
ools
1.9–
Sup
port
voca
tiona
l and
wor
kfor
ce
train
ing
prog
ram
s th
at b
uild
ski
lls s
ervi
ng
the
need
s of
exi
stin
g an
d fu
ture
empl
oym
ent o
ppor
tuni
ties
and
bu
sines
ses i
n th
e ar
ea, e
spec
ially
in th
e fo
rest
ry a
nd ti
mbe
r ind
ustri
es.
Adm
inist
ratio
n
EDC,
SBA
, SC
SD,
Pa
rent
Gr
oups
, W
ork-
Sour
ce
Shor
t-Te
rm
1.10
– Fa
cilita
te a
nd e
ncou
rage
the
regi
onal
libr
ary
syst
em to
mai
ntai
n th
e hi
gh le
vel o
f edu
catio
nal s
ervi
ce to
the
com
mun
ity.
Adm
inist
ratio
n FV
RL
Ong
oing
1.11
– Su
ppor
t the
Col
umbi
a Go
rge
Inte
rpre
tive
Cent
er, e
spec
ially
in th
eir
educ
atio
nal a
nd c
hild
ren’
s pr
ogra
mm
ing
effo
rts.
Adm
inist
ratio
n CG
IC
Ong
oing
1.12
– D
evel
op a
nd e
nhan
ce c
ultu
ral
oppo
rtuni
ties.
1.12
-1–
Facil
itate
and
sup
port
de
velo
pmen
t of a
bric
ks-a
nd-m
orta
r
perfo
rmin
g ar
ts c
ente
r. 1.
12-2
– D
evel
op a
pub
lic a
rt pl
an.
1.12
-3–
Inst
all p
ublic
art
in k
ey lo
catio
ns
thro
ugho
ut th
e Ci
ty, e
spec
ially
alo
ng th
e Co
lum
bia
Rive
r wat
erfro
nt.
1.12
-4–
Dev
elop
an
inte
rpre
tive
signa
ge
plan
. 1.
12-5
– In
stal
l int
erpr
etiv
e sig
ns in
key
lo
catio
ns th
roug
h th
e Ci
ty, e
spec
ially
hi
ghlig
htin
g St
even
son’
s un
ique
re
latio
nshi
p w
ith th
e Co
lum
bia
Rive
r.
Adm
inist
ratio
n &
Pla
nnin
g
CGIC
, Ch
ambe
r, Co
unty
, SB
A, S
PAF
Mid
-Ra
nge
1.13
– Su
ppor
t com
mun
ity-b
ased
ac
tiviti
es a
nd e
vent
s th
at c
ater
to
resid
ents
of S
teve
nson
, esp
ecia
lly d
urin
g th
e w
inte
r mon
ths.
Adm
inist
ratio
n Ch
ambe
r, Co
unty
, SB
A O
ngoi
ng
151
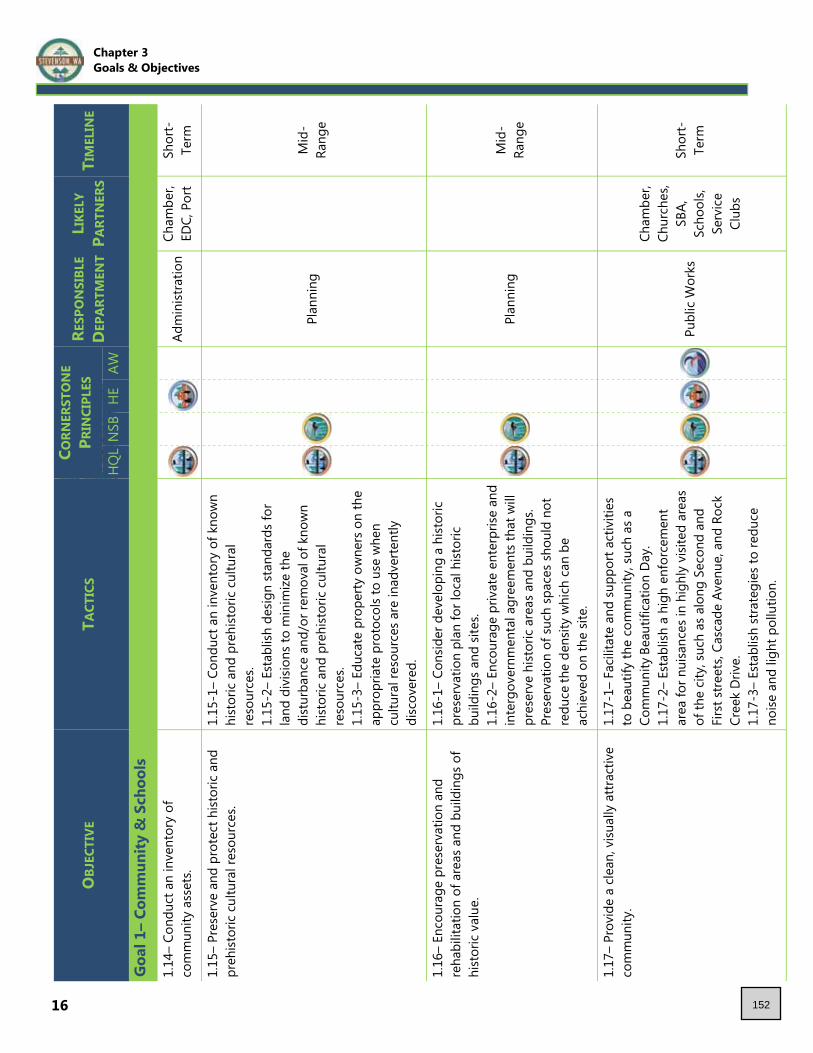
16
OBJ
ECTI
VE
TACT
ICS
CO
RNER
STO
NE
P RIN
CIPL
ES
RESP
ON
SIBL
E D
EPAR
TMEN
T
LIKE
LY
PART
NER
S TI
MEL
INE
H
QL
NSB
H
E AW
Goa
l 1–
Com
mun
ity &
Sch
ools
1.14
– Co
nduc
t an
inve
ntor
y of
com
mun
ity a
sset
s.
Adm
inist
ratio
n Ch
ambe
r, ED
C, P
ort
Shor
t-Te
rm
1.15
– Pr
eser
ve a
nd p
rote
ct h
istor
ic a
nd
preh
istor
ic c
ultu
ral r
esou
rces
. 1.
15-1
– Co
nduc
t an
inve
ntor
y of
kno
wn
hist
oric
and
pre
hist
oric
cul
tura
l
reso
urce
s. 1.
15-2
– Es
tabl
ish d
esig
n st
anda
rds
for
land
div
ision
s to
min
imize
the
dist
urba
nce
and/
or re
mov
al o
f kno
wn
hist
oric
and
pre
hist
oric
cul
tura
l
reso
urce
s. 1.
15-3
– Ed
ucat
e pr
oper
ty o
wne
rs o
n th
e ap
prop
riate
pro
toco
ls to
use
whe
n
cu
ltura
l res
ourc
es a
re in
adve
rtent
ly
di
scov
ered
.
Plan
ning
Mid
-Ra
nge
1.16
– En
cour
age
pres
erva
tion
and
re
habi
litat
ion
of a
reas
and
bui
ldin
gs o
f hi
stor
ic v
alue
.
1.16
-1–
Cons
ider
dev
elop
ing
a hi
stor
ic
pres
erva
tion
plan
for l
ocal
hist
oric
build
ings
and
site
s. 1.
16-2
– En
cour
age
priv
ate
ente
rpris
e an
d in
terg
over
nmen
tal a
gree
men
ts th
at w
ill
pres
erve
hist
oric
are
as a
nd b
uild
ings
. Pr
eser
vatio
n of
suc
h sp
aces
sho
uld
not
redu
ce th
e de
nsity
whi
ch c
an b
e ac
hiev
ed o
n th
e sit
e.
Plan
ning
Mid
-Ra
nge
1.17
– Pr
ovid
e a
clea
n, v
isual
ly a
ttrac
tive
com
mun
ity.
1.17
-1–
Facil
itate
and
sup
port
activ
ities
to
bea
utify
the
com
mun
ity, s
uch
as a
Co
mm
unity
Bea
utifi
catio
n D
ay.
1.17
-2–
Esta
blish
a h
igh
enfo
rcem
ent
area
for n
uisa
nces
in h
ighl
y vi
sited
are
as
of th
e ci
ty, s
uch
as a
long
Sec
ond
and
Firs
t stre
ets,
Casc
ade
Aven
ue, a
nd R
ock
Cree
k D
rive.
1.
17-3
– Es
tabl
ish s
trate
gies
to re
duce
no
ise a
nd li
ght p
ollu
tion.
Publ
ic W
orks
Cham
ber,
Chur
ches
, SB
A,
Scho
ols,
Serv
ice
Club
s
Shor
t-Te
rm
Chapter 3 Goals & Objectives
152
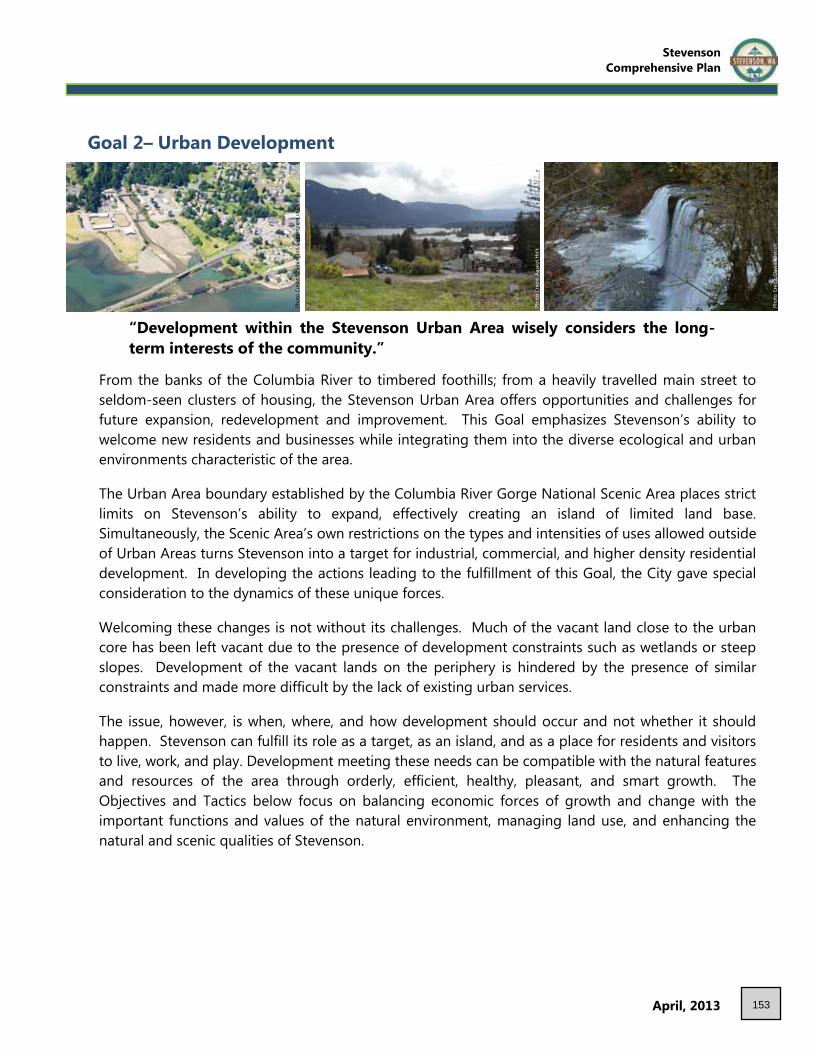
Stevenson Comprehensive Plan
April, 2013
Goal 2– Urban Development
“Development within the Stevenson Urban Area wisely considers the long-term interests of the community.”
From the banks of the Columbia River to timbered foothills; from a heavily travelled main street to seldom-seen clusters of housing, the Stevenson Urban Area offers opportunities and challenges for future expansion, redevelopment and improvement. This Goal emphasizes Stevenson’s ability to welcome new residents and businesses while integrating them into the diverse ecological and urban environments characteristic of the area. The Urban Area boundary established by the Columbia River Gorge National Scenic Area places strict limits on Stevenson’s ability to expand, effectively creating an island of limited land base. Simultaneously, the Scenic Area’s own restrictions on the types and intensities of uses allowed outside of Urban Areas turns Stevenson into a target for industrial, commercial, and higher density residential development. In developing the actions leading to the fulfillment of this Goal, the City gave special consideration to the dynamics of these unique forces. Welcoming these changes is not without its challenges. Much of the vacant land close to the urban core has been left vacant due to the presence of development constraints such as wetlands or steep slopes. Development of the vacant lands on the periphery is hindered by the presence of similar constraints and made more difficult by the lack of existing urban services. The issue, however, is when, where, and how development should occur and not whether it should happen. Stevenson can fulfill its role as a target, as an island, and as a place for residents and visitors to live, work, and play. Development meeting these needs can be compatible with the natural features and resources of the area through orderly, efficient, healthy, pleasant, and smart growth. The Objectives and Tactics below focus on balancing economic forces of growth and change with the important functions and values of the natural environment, managing land use, and enhancing the natural and scenic qualities of Stevenson.
17
Phot
o Cr
edit:
Daw
n N
ielso
n
Phot
o Cr
edit:
Aas
cot H
olt
Phot
o Cr
edit:
Was
hing
ton
Depa
rtm
ent o
f Eco
logy
153

18
OBJ
ECTI
VE
TACT
ICS
CORN
ERST
ON
E P R
INCI
PLES
RE
SPO
NSI
BLE
DEP
ARTM
ENT
LIKE
LY
PART
NER
S TI
MEL
INE
HQ
L N
SB
HE
AW
Goa
l 2–
Urb
an D
evel
opm
ent
2.1–
Pro
tect
the
natu
ral a
nd s
ceni
c
qual
ities
of t
he a
rea
by re
gula
ting
land
us
e an
d ca
refu
lly m
anag
ing
urba
n ch
ange
.
Plan
ning
Ong
oing
2.2–
Pre
serv
e, p
rote
ct, a
nd e
nhan
ce th
e fu
nctio
ns a
nd v
alue
s of e
colo
gica
lly
sens
itive
are
as (h
abita
t are
as, w
etla
nds)
w
ith s
peci
al c
onsid
erat
ion
give
n to
anad
rom
ous f
isher
ies,
as re
quire
d by
the
Grow
th M
anag
emen
t Act
.
2.2-
1– R
egul
ate
land
use
with
in a
nd
adja
cent
to e
colo
gica
lly s
ensit
ive
area
s w
hile
allo
win
g fo
r the
reas
onab
le u
se o
f pr
ivat
e pr
oper
ty.
2.2-
2– C
onsid
er e
stab
lishi
ng a
fund
ing
sour
ce to
acq
uire
eco
logi
cally
sen
sitiv
e ar
eas.
2.2-
3– C
ondu
ct a
Urb
an A
rea-
wid
e
in
vent
ory
of e
colo
gica
lly s
ensit
ive
area
s. 2.
2-4–
Enc
oura
ge a
gree
men
ts th
at w
ill
pres
erve
eco
logi
cally
sen
sitiv
e ar
eas
in
appr
opria
te p
ropo
rtion
s con
siste
nt w
ith
avai
labl
e re
sour
ces.
Pro
visio
n of
suc
h op
en sp
aces
shou
ld n
ot re
duce
the
de
nsity
whi
ch c
an b
e ac
hiev
ed o
n th
e sit
e 2.
2-5–
Est
ablis
h a
stre
am c
orrid
or
m
anag
emen
t pla
n an
d pr
ogra
m.
2.2-
6– C
onsid
er s
tream
cor
ridor
s fo
r m
ultip
le u
se in
con
form
ance
with
oth
er
plan
s. 2.
2-7–
Reg
ulat
e th
e us
e of
fill
in st
ream
co
rrido
rs.
2.2-
8– M
aint
ain
stre
am c
orrid
ors
in a
na
tura
l sta
te, p
rese
rvin
g tre
e lin
es a
nd
vege
tatio
n w
here
ver p
ossib
le.
Adm
inist
ratio
n &
Pla
nnin
g
Shor
t-Te
rm
Chapter 3 Goals & Objectives
154
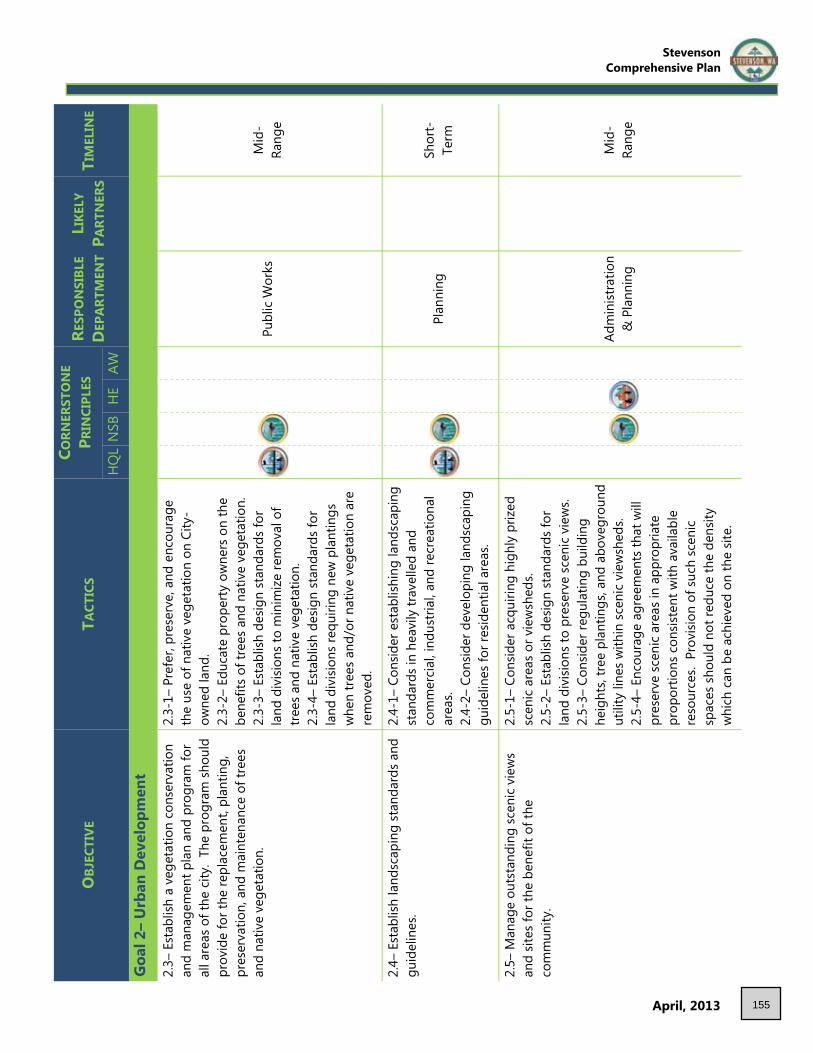
Stevenson Comprehensive Plan
April, 2013 19
OBJ
ECTI
VE
TACT
ICS
CORN
ERST
ON
E PR
INCI
PLES
RE
SPO
NSI
BLE
DEP
ARTM
ENT
LIKE
LY
PART
NER
S TI
MEL
INE
HQ
L N
SB
HE
AW
Goa
l 2–
Urb
an D
evel
opm
ent
2.3–
Est
ablis
h a
vege
tatio
n co
nser
vatio
n an
d m
anag
emen
t pla
n an
d pr
ogra
m fo
r al
l are
as o
f the
city
. Th
e pr
ogra
m s
houl
d pr
ovid
e fo
r the
repl
acem
ent,
plan
ting,
pr
eser
vatio
n, a
nd m
aint
enan
ce o
f tre
es
and
nativ
e ve
geta
tion.
2.3-
1– P
refe
r, pr
eser
ve, a
nd e
ncou
rage
th
e us
e of
nat
ive
vege
tatio
n on
City
-ow
ned
land
. 2.
3-2–
Edu
cate
pro
perty
ow
ners
on
the
bene
fits o
f tre
es a
nd n
ativ
e ve
geta
tion.
2.
3-3–
Est
ablis
h de
sign
stan
dard
s fo
r la
nd d
ivisi
ons
to m
inim
ize re
mov
al o
f tre
es a
nd n
ativ
e ve
geta
tion.
2.
3-4–
Est
ablis
h de
sign
stan
dard
s fo
r la
nd d
ivisi
ons
requ
iring
new
pla
ntin
gs
whe
n tre
es a
nd/o
r nat
ive
vege
tatio
n ar
e re
mov
ed.
Publ
ic W
orks
Mid
-Ra
nge
2.4–
Est
ablis
h la
ndsc
apin
g st
anda
rds
and
guid
elin
es.
2.4-
1– C
onsid
er e
stab
lishi
ng la
ndsc
apin
g st
anda
rds
in h
eavi
ly tr
avel
led
and
com
mer
cial
, ind
ustri
al, a
nd re
crea
tiona
l ar
eas.
2.4-
2– C
onsid
er d
evel
opin
g la
ndsc
apin
g gu
idel
ines
for r
esid
entia
l are
as.
Plan
ning
Shor
t-Te
rm
2.5–
Man
age
outs
tand
ing
scen
ic v
iew
s an
d sit
es fo
r the
ben
efit
of th
e
com
mun
ity.
2.5-
1– C
onsid
er a
cqui
ring
high
ly p
rized
sc
enic
are
as o
r vie
wsh
eds.
2.5-
2– E
stab
lish
desig
n st
anda
rds
for
land
div
ision
s to
pre
serv
e sc
enic
vie
ws.
2.5-
3– C
onsid
er re
gula
ting
build
ing
heig
hts,
tree
plan
tings
, and
abo
vegr
ound
ut
ility
line
s with
in s
ceni
c vi
ewsh
eds.
2.5-
4– E
ncou
rage
agr
eem
ents
that
will
pr
eser
ve s
ceni
c ar
eas i
n ap
prop
riate
pr
opor
tions
con
siste
nt w
ith a
vaila
ble
reso
urce
s. P
rovi
sion
of s
uch
scen
ic
spac
es s
houl
d no
t red
uce
the
dens
ity
whi
ch c
an b
e ac
hiev
ed o
n th
e sit
e.
Adm
inist
ratio
n &
Pla
nnin
g
Mid
-Ra
nge
155
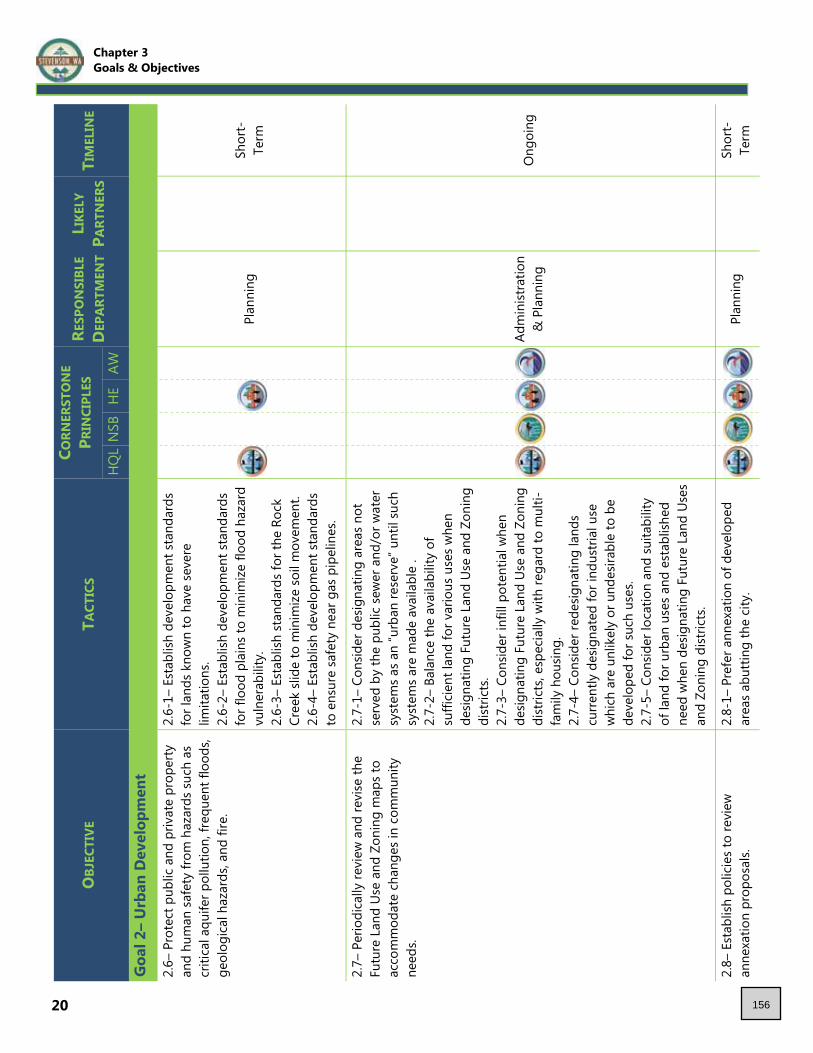
20
OBJ
ECTI
VE
TACT
ICS
CORN
ERST
ON
E P R
INCI
PLES
RE
SPO
NSI
BLE
DEP
ARTM
ENT
LIKE
LY
PART
NER
S TI
MEL
INE
HQ
L N
SB
HE
AW
Goa
l 2–
Urb
an D
evel
opm
ent
2.6–
Pro
tect
pub
lic a
nd p
rivat
e pr
oper
ty
and
hum
an s
afet
y fro
m h
azar
ds su
ch a
s cr
itica
l aqu
ifer p
ollu
tion,
freq
uent
floo
ds,
geol
ogic
al h
azar
ds, a
nd fi
re.
2.6-
1– E
stab
lish
deve
lopm
ent s
tand
ards
fo
r lan
ds k
now
n to
hav
e se
vere
limita
tions
. 2.
6-2–
Est
ablis
h de
velo
pmen
t sta
ndar
ds
for f
lood
pla
ins
to m
inim
ize fl
ood
haza
rd
vuln
erab
ility
. 2.
6-3–
Est
ablis
h st
anda
rds
for t
he R
ock
Cree
k sli
de to
min
imiz
e so
il m
ovem
ent.
2.6-
4– E
stab
lish
deve
lopm
ent s
tand
ards
to
ens
ure
safe
ty n
ear g
as p
ipel
ines
.
Plan
ning
Shor
t-Te
rm
2.7–
Per
iodi
cally
revi
ew a
nd re
vise
the
Futu
re L
and
Use
and
Zoni
ng m
aps
to
acco
mm
odat
e ch
ange
s in
com
mun
ity
need
s.
2.7-
1– C
onsid
er d
esig
natin
g ar
eas
not
serv
ed b
y th
e pu
blic
sew
er a
nd/o
r wat
er
syst
ems a
s an
“urb
an re
serv
e” u
ntil
such
sy
stem
s are
mad
e av
aila
ble
. 2.
7-2–
Bal
ance
the
avai
labi
lity
of
suffi
cien
t lan
d fo
r var
ious
use
s w
hen
de
signa
ting
Futu
re L
and
Use
and
Zoni
ng
dist
ricts
. 2.
7-3–
Con
sider
infil
l pot
entia
l whe
n
desig
natin
g Fu
ture
Lan
d Us
e an
d Zo
ning
di
stric
ts, e
spec
ially
with
rega
rd to
mul
ti-fa
mily
hou
sing.
2.
7-4–
Con
sider
rede
signa
ting
land
s
curre
ntly
des
igna
ted
for i
ndus
trial
use
w
hich
are
unl
ikel
y or
und
esira
ble
to b
e de
velo
ped
for s
uch
uses
. 2.
7-5–
Con
sider
loca
tion
and
suita
bilit
y of
land
for u
rban
use
s an
d es
tabl
ished
ne
ed w
hen
desig
natin
g Fu
ture
Lan
d Us
es
and
Zoni
ng d
istric
ts.
Adm
inist
ratio
n &
Pla
nnin
g
Ong
oing
2.8–
Est
ablis
h po
licie
s to
revi
ew
an
nexa
tion
prop
osal
s. 2.
8-1–
Pre
fer a
nnex
atio
n of
dev
elop
ed
area
s abu
tting
the
city
.
Pl
anni
ng
Sh
ort-
Term
Chapter 3 Goals & Objectives
156
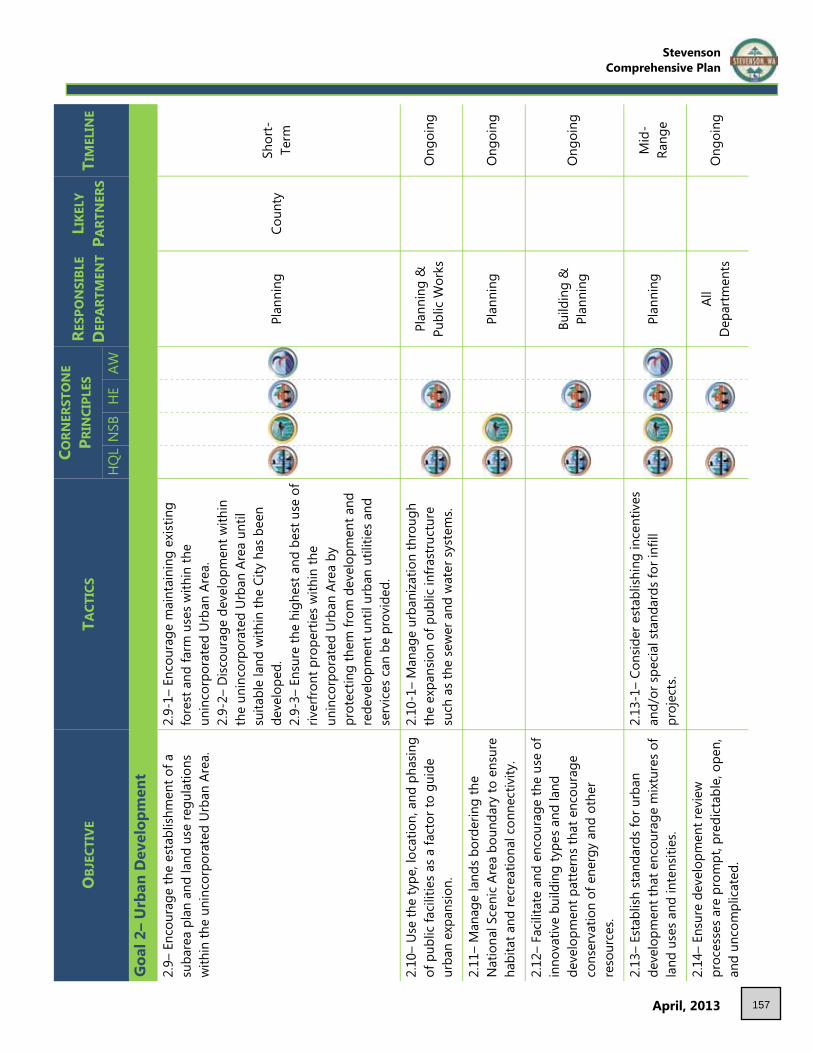
Stevenson Comprehensive Plan
April, 2013 21
OBJ
ECTI
VE
TACT
ICS
CORN
ERST
ON
E P R
INCI
PLES
RE
SPO
NSI
BLE
DEP
ARTM
ENT
LIKE
LY
PART
NER
S TI
MEL
INE
HQ
L N
SB
HE
AW
Goa
l 2–
Urb
an D
evel
opm
ent
2.9–
Enc
oura
ge th
e es
tabl
ishm
ent o
f a
suba
rea
plan
and
land
use
regu
latio
ns
with
in th
e un
inco
rpor
ated
Urb
an A
rea.
2.9-
1– E
ncou
rage
mai
ntai
ning
exi
stin
g fo
rest
and
farm
use
s w
ithin
the
unin
corp
orat
ed U
rban
Are
a.
2.9-
2– D
iscou
rage
dev
elop
men
t with
in
the
unin
corp
orat
ed U
rban
Are
a un
til
suita
ble
land
with
in th
e Ci
ty h
as b
een
deve
lope
d.
2.9-
3– E
nsur
e th
e hi
ghes
t and
bes
t use
of
river
front
pro
perti
es w
ithin
the
un
inco
rpor
ated
Urb
an A
rea
by
pr
otec
ting
them
from
dev
elop
men
t and
re
deve
lopm
ent u
ntil
urba
n ut
ilitie
s an
d se
rvic
es c
an b
e pr
ovid
ed.
Plan
ning
Co
unty
Sh
ort-
Term
2.10
– Us
e th
e ty
pe, l
ocat
ion,
and
pha
sing
of p
ublic
faci
litie
s as
a fa
ctor
to g
uide
ur
ban
expa
nsio
n.
2.10
-1–
Man
age
urba
niza
tion
thro
ugh
the
expa
nsio
n of
pub
lic in
frast
ruct
ure
such
as
the
sew
er a
nd w
ater
sys
tem
s.
Pl
anni
ng &
Pu
blic
Wor
ks
O
ngoi
ng
2.11
– M
anag
e la
nds
bord
erin
g th
e
N
atio
nal S
ceni
c Ar
ea b
ound
ary
to e
nsur
e ha
bita
t and
recr
eatio
nal c
onne
ctiv
ity.
Pl
anni
ng
O
ngoi
ng
2.12
– Fa
cilita
te a
nd e
ncou
rage
the
use
of
inno
vativ
e bu
ildin
g ty
pes
and
land
deve
lopm
ent p
atte
rns t
hat e
ncou
rage
co
nser
vatio
n of
ene
rgy
and
othe
r
re
sour
ces.
Build
ing
&
Plan
ning
Ong
oing
2.13
– Es
tabl
ish s
tand
ards
for u
rban
deve
lopm
ent t
hat e
ncou
rage
mix
ture
s of
land
use
s an
d in
tens
ities
.
2.13
-1–
Cons
ider
est
ablis
hing
ince
ntiv
es
and/
or s
peci
al s
tand
ards
for i
nfill
pr
ojec
ts.
Plan
ning
Mid
-Ra
nge
2.14
– En
sure
dev
elop
men
t rev
iew
proc
esse
s are
pro
mpt
, pre
dict
able
, ope
n,
and
unco
mpl
icat
ed.
Al
l
D
epar
tmen
ts
O
ngoi
ng
157

22
OBJ
ECTI
VE
TACT
ICS
CORN
ERST
ON
E PR
INCI
PLES
RE
SPO
NSI
BLE
DEP
ARTM
ENT
LIKE
LY
PART
NER
S TI
MEL
INE
HQ
L N
SB
HE
AW
Goa
l 2–
Urb
an D
evel
opm
ent
2.15
– M
inim
ize th
e im
pact
s of
abu
tting
co
nflic
ting
land
use
s by
subj
ectin
g th
e m
ore
inte
nsiv
e la
nd u
se o
r the
site
bei
ng
deve
lope
d to
spe
cial
site
dev
elop
men
t st
anda
rds.
Plan
ning
Ong
oing
Chapter 3 Goals & Objectives
158

Stevenson Comprehensive Plan
April, 2013 23
Goal 3– Housing
“A variety of housing options accommodates all residents.”
Stevenson is home to a diverse array of individuals with broad differences in preference and financial capability. These differences are reflected in the size, type, density, and price ranges of the homes residents occupy. This Goal emphasizes the importance of Stevenson’s residential neighborhoods to the overall vitality of the city. Over the past twenty years Stevenson has experienced shifting trends that greatly affect the housing its residents seek. It has shifted from a remote rural outpost to an outer-rim bedroom community for the Portland-Vancouver area. It has shifted from a year-round home of blue-collar millworkers to a center for tourism and seasonal occupants having a greater dependence on service industry workers. Housing affordability has been important throughout all of these shifts and will continue to be important during the shifts that are likely to occur over the next twenty years. The City understands the importance of housing quality and affordability, and the Objectives and Tactics leading to this Housing Goal reflect this understanding through their focus on maintaining and improving existing residential areas and adding new residential areas to accommodate the mixed preferences and financial capabilities of the community.
Phot
o Cr
edits
: Ben
Shu
mak
er
159
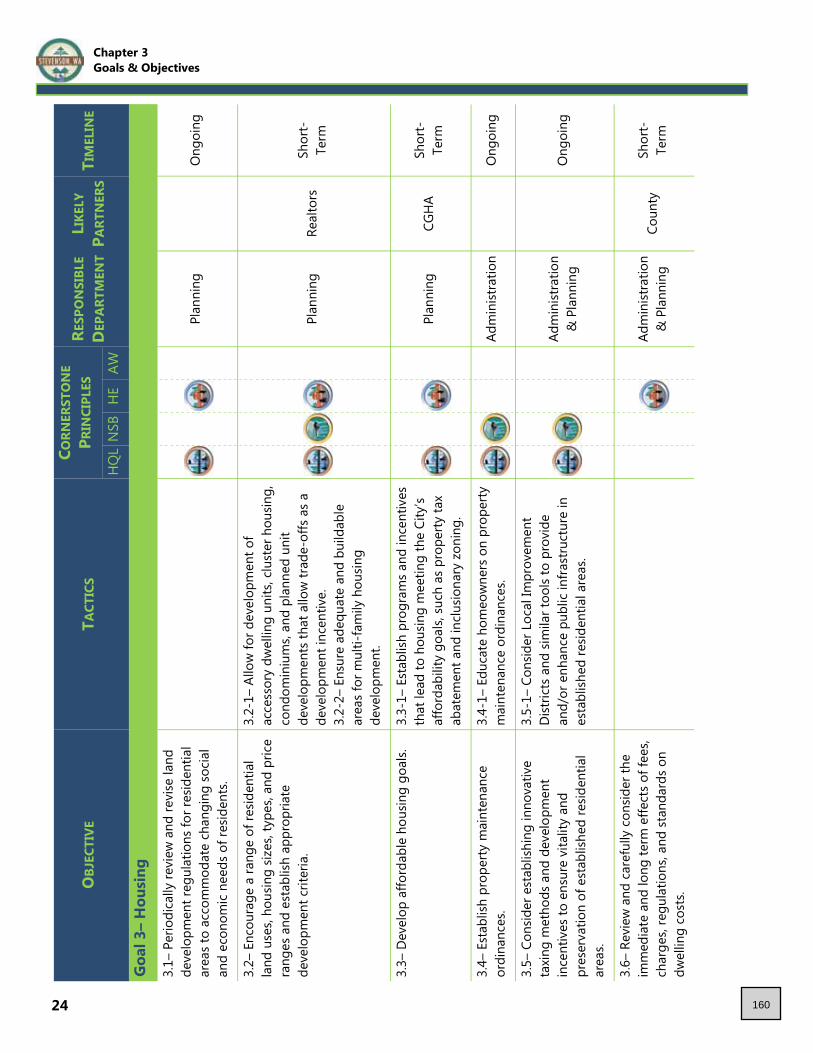
24
OBJ
ECTI
VE
TACT
ICS
CORN
ERST
ON
E PR
INCI
PLES
RE
SPO
NSI
BLE
DEP
ARTM
ENT
LIKE
LY
PART
NER
S TI
MEL
INE
HQ
L N
SB
HE
AW
Goa
l 3–
Hou
sing
3.1–
Per
iodi
cally
revi
ew a
nd re
vise
land
de
velo
pmen
t reg
ulat
ions
for r
esid
entia
l ar
eas
to a
ccom
mod
ate
chan
ging
soc
ial
and
econ
omic
nee
ds o
f res
iden
ts.
Plan
ning
Ong
oing
3.2–
Enc
oura
ge a
rang
e of
resid
entia
l la
nd u
ses,
hous
ing
sizes
, typ
es, a
nd p
rice
rang
es a
nd e
stab
lish
appr
opria
te
deve
lopm
ent c
riter
ia.
3.2-
1– A
llow
for d
evel
opm
ent o
f
acce
ssor
y dw
ellin
g un
its, c
lust
er h
ousin
g,
cond
omin
ium
s, an
d pl
anne
d un
it
deve
lopm
ents
that
allo
w tr
ade-
offs
as
a de
velo
pmen
t inc
entiv
e.
3.2-
2– E
nsur
e ad
equa
te a
nd b
uild
able
ar
eas
for m
ulti-
fam
ily h
ousin
g
de
velo
pmen
t.
Plan
ning
Re
alto
rs
Shor
t-Te
rm
3.3–
Dev
elop
affo
rdab
le h
ousin
g go
als.
3.
3-1–
Est
ablis
h pr
ogra
ms
and
ince
ntiv
es
that
lead
to h
ousin
g m
eetin
g th
e Ci
ty’s
affo
rdab
ility
goa
ls, s
uch
as p
rope
rty ta
x ab
atem
ent a
nd in
clus
iona
ry z
onin
g.
Plan
ning
CG
HA
Shor
t-Te
rm
3.4–
Est
ablis
h pr
oper
ty m
aint
enan
ce
ordi
nanc
es.
3.4-
1– E
duca
te h
omeo
wne
rs o
n pr
oper
ty
mai
nten
ance
ord
inan
ces.
Ad
min
istra
tion
O
ngoi
ng
3.5–
Con
sider
est
ablis
hing
inno
vativ
e ta
met
hods
and
dev
elop
men
t
in
cent
ives
to e
nsur
e vi
talit
y an
d
pres
erva
tion
of e
stab
lishe
d re
siden
tial
area
s.
3.5-
1– C
onsid
er L
ocal
Impr
ovem
ent
D
istric
ts a
nd si
mila
r too
ls to
pro
vide
an
d/or
enh
ance
pub
lic in
frast
ruct
ure
in
esta
blish
ed re
siden
tial a
reas
.
Ad
min
istra
tion
& P
lann
ing
O
ngoi
ng
3.6–
Rev
iew
and
car
eful
ly c
onsid
er th
e im
med
iate
and
long
term
effe
cts o
f fee
s, ch
arge
s, re
gula
tions
, and
sta
ndar
ds o
n dw
ellin
g co
sts.
Adm
inist
ratio
n &
Pla
nnin
g Co
unty
Sh
ort-
Term
Chapter 3 Goals & Objectives
160
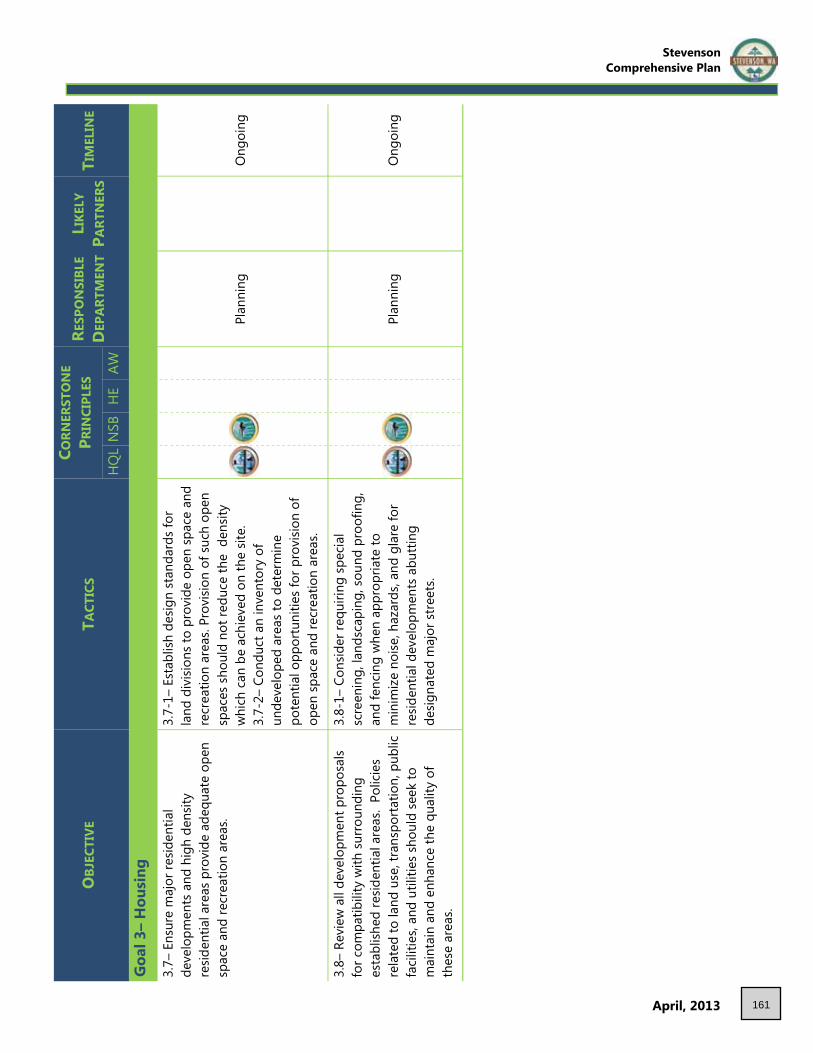
Stevenson Comprehensive Plan
April, 2013 25
OBJ
ECTI
VE
TACT
ICS
CORN
ERST
ON
E P R
INCI
PLES
RE
SPO
NSI
BLE
DEP
ARTM
ENT
LIKE
LY
PART
NER
S TI
MEL
INE
HQ
L N
SB
HE
AW
Goa
l 3–
Hou
sing
3.7–
Ens
ure
maj
or re
siden
tial
de
velo
pmen
ts a
nd h
igh
dens
ity
re
siden
tial a
reas
pro
vide
ade
quat
e op
en
spac
e an
d re
crea
tion
area
s.
3.7-
1– E
stab
lish
desig
n st
anda
rds
for
land
div
ision
s to
pro
vide
ope
n sp
ace
and
recr
eatio
n ar
eas.
Prov
ision
of s
uch
open
sp
aces
sho
uld
not r
educ
e th
e d
ensit
y w
hich
can
be
achi
eved
on
the
site.
3.
7-2–
Con
duct
an
inve
ntor
y of
unde
velo
ped
area
s to
det
erm
ine
po
tent
ial o
ppor
tuni
ties
for p
rovi
sion
of
open
spa
ce a
nd re
crea
tion
area
s.
Plan
ning
Ong
oing
3.8–
Rev
iew
all
deve
lopm
ent p
ropo
sals
for c
ompa
tibili
ty w
ith s
urro
undi
ng
es
tabl
ished
resid
entia
l are
as.
Polic
ies
rela
ted
to la
nd u
se, t
rans
porta
tion,
pub
lic
facil
ities
, and
util
ities
shou
ld se
ek to
m
aint
ain
and
enha
nce
the
qual
ity o
f th
ese
area
s.
3.8-
1– C
onsid
er re
quiri
ng s
peci
al
scre
enin
g, la
ndsc
apin
g, s
ound
pro
ofin
g,
and
fenc
ing
whe
n ap
prop
riate
to
m
inim
ize
noise
, haz
ards
, and
gla
re fo
r re
siden
tial d
evel
opm
ents
abu
tting
desig
nate
d m
ajor
stre
ets.
Plan
ning
Ong
oing
161
Page Intentionally Left Blank
162

Stevenson Comprehensive Plan
April, 2013
Goal 4– Downtown & Waterfront
“A vibrant and attractive downtown is home to diverse businesses and welcoming to residents and visitors.”
Standing anywhere in downtown Stevenson and looking around, observers easily understand how enviable the setting is. The views change constantly as clouds and wisps of fog move in, out and through the mountainous terrain, as the sun moves daily from east to west and shifts seasonally to the south and north, and as the wind shifts the direction of the Columbia River’s waves. Functionally, the downtown area is kept compact by the boundaries of the Columbia River, Rock and Kanaka creeks, and the steep slopes rising as the Cascade foothills. This Goal emphasizes maintaining and enhancing the look, functionality, and vitality of the downtown core.
“The waterfront is an extension of the downtown core and a place where people live, work, and play.”
The Columbia River, Rock Creek, and Rock Cove waterfronts are key components to improving the look and function of downtown Stevenson and are acknowledged here as a Sub-Goal. The availability of land on Stevenson’s Columbia River waterfront is unique within the Gorge where railroads and highways either form barriers to waterfront property access or are the waterfront property owners themselves. The scenic assets of Rock Creek and Rock Cove add additional growth potential for development and redevelopment on their abutting lands. This growth, development, and change can be managed to benefit current and future residents and visitors. The Objectives and Tactics selected to achieve this Goal and Sub-Goal focus on developing Area Plans, improving the appeal of the area through public and private activities, and ensuring the functionality of the area through proper infrastructure and uses.
27
Phot
o Cr
edit:
Julie
May
field
Phot
o Cr
edit:
Ben
Shu
mak
er
Phot
o Cr
edit:
Mich
elle
Rus
sek
163

28
OBJ
ECTI
VE
TACT
ICS
CORN
ERST
ON
E P R
INCI
PLES
RE
SPO
NSI
BLE
DEP
ARTM
ENT
LIKE
LY
PART
NER
S TI
MEL
INE
HQ
L N
SB
HE
AW
Goa
l 4–
Dow
ntow
n &
Wat
erfr
ont
4.1–
Rev
ise th
e “D
ownt
own
Plan
” to
en
cour
age
impr
ovin
g th
e do
wnt
own
com
mer
cial
are
a to
sup
port
loca
l nee
ds
and
expa
nd th
e re
crea
tion
and
tour
ist
indu
stry
.
4.1-
1– E
stab
lish
prog
ram
s to
beau
tify
the
dow
ntow
n co
re.
4.1-
2– C
onsid
er e
stab
lishi
ng d
ownt
own
desig
n st
anda
rds
and/
or g
uide
lines
.
Pl
anni
ng
SBA
Mid
-Ra
nge
4.2–
Per
iodi
cally
revi
ew a
nd re
vise
the
dow
ntow
n co
mm
erci
al a
rea
boun
dary
, ba
sing
the
loca
tion,
type
and
am
ount
of
com
mer
cial
act
ivity
on
com
mun
ity n
eed.
4.2-
1– E
nsur
e th
e co
mm
erci
al a
rea
boun
dary
enc
oura
ges
com
pact
ness
and
is
pede
stria
n-or
ient
ed.
Plan
ning
ED
C, S
BA
Shor
t-Te
rm
4.3–
Per
iodi
cally
revi
ew a
nd re
vise
zon
ing
ordi
nanc
es to
div
ersif
y an
d en
hanc
e th
e do
wnt
own
econ
omy.
4.3-
1– P
rote
ct c
omm
erci
al s
pace
from
in
com
patib
le u
ses,
such
as
indu
stria
l. 4.
3-2–
Enc
oura
ge a
dapt
ive
reus
e in
the
desig
n of
new
dow
ntow
n bu
ildin
gs.
4.3-
3– E
nsur
e th
e vi
abili
ty, s
alab
ility
, and
re
-bui
ldab
ility
of e
xist
ing
singl
e-fa
mily
ho
mes
in th
e do
wnt
own
area
by
in
clud
ing
zoni
ng p
rovi
sions
suc
h as
de
signa
ting
all h
omes
bui
lt pr
ior t
o
Janu
ary
1st,
2013
as p
erm
itted
use
s or
in
corp
orat
ing
gene
rous
con
tinua
tion
polic
ies
for n
onco
nfor
min
g sin
gle-
fam
ily
uses
. 4.
3-4–
Con
sider
allo
win
g ne
w s
ingl
e-fa
mily
dev
elop
men
t in
the
dow
ntow
n ar
ea a
s con
ditio
nal u
ses
acco
rdin
g to
sp
ecifi
c cr
iteria
suc
h as
the
pres
ence
of
lot s
izes
too
smal
l to
supp
ort n
ew
co
mm
erci
al u
ses.
Plan
ning
Ch
ambe
r, ED
C, S
BA
Ong
oing
4.4–
Enc
oura
ge m
ore
inte
nsiv
e us
e of
ex
istin
g co
mm
erci
al sp
ace.
Adm
inist
ratio
n Ch
ambe
r, ED
C, S
BA
Ong
oing
4.5–
Ret
ain
gove
rnm
ent a
dmin
istra
tive
facil
ities
in th
e do
wnt
own
com
mer
cial
ar
ea.
Pl
anni
ng
Coun
ty,
DSH
S,
Port,
USP
S O
ngoi
ng
Chapter 3 Goals & Objectives
164
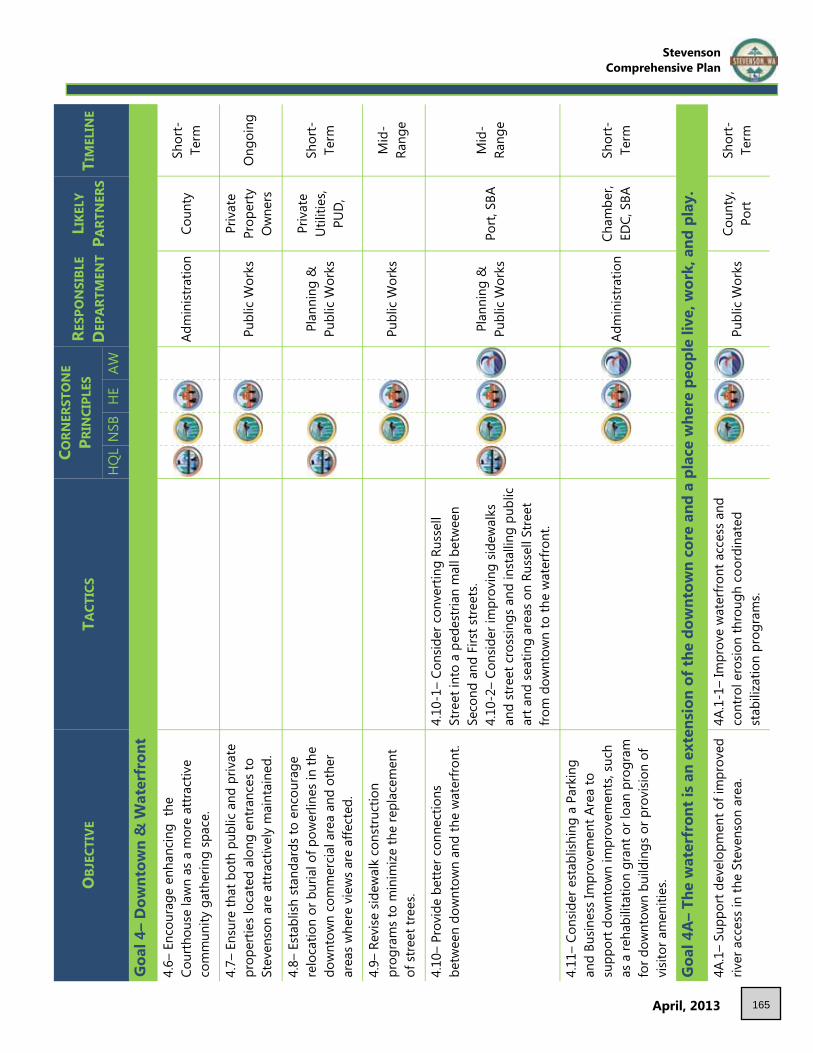
Stevenson Comprehensive Plan
April, 2013 29
OBJ
ECTI
VE
TACT
ICS
CORN
ERST
ON
E P R
INCI
PLES
RE
SPO
NSI
BLE
DEP
ARTM
ENT
LIKE
LY
PART
NER
S TI
MEL
INE
HQ
L N
SB
HE
AW
Goa
l 4–
Dow
ntow
n &
Wat
erfr
ont
4.6–
Enc
oura
ge e
nhan
cing
the
Cour
thou
se la
wn
as a
mor
e at
tract
ive
com
mun
ity g
athe
ring
spac
e.
Ad
min
istra
tion
Coun
ty
Shor
t-Te
rm
4.7–
Ens
ure
that
bot
h pu
blic
and
priv
ate
prop
ertie
s lo
cate
d al
ong
entra
nces
to
Stev
enso
n ar
e at
tract
ivel
y m
aint
aine
d.
Pu
blic
Wor
ks
Priv
ate
Prop
erty
O
wne
rs
Ong
oing
4.8–
Est
ablis
h st
anda
rds t
o en
cour
age
relo
catio
n or
bur
ial o
f pow
erlin
es in
the
dow
ntow
n co
mm
erci
al a
rea
and
othe
r ar
eas w
here
vie
ws a
re a
ffect
ed.
Plan
ning
&
Publ
ic W
orks
Priv
ate
Utili
ties,
PUD
,
Shor
t-Te
rm
4.9–
Rev
ise s
idew
alk
cons
truct
ion
prog
ram
s to
min
imiz
e th
e re
plac
emen
t of
stre
et tr
ees.
Pu
blic
Wor
ks
M
id-
Rang
e
4.10
– Pr
ovid
e be
tter c
onne
ctio
ns
betw
een
dow
ntow
n an
d th
e w
ater
front
. 4.
10-1
– Co
nsid
er c
onve
rting
Rus
sell
Stre
et in
to a
ped
estri
an m
all b
etw
een
Seco
nd a
nd F
irst s
treet
s.
4.10
-2–
Cons
ider
impr
ovin
g sid
ewal
ks
and
stre
et c
ross
ings
and
inst
allin
g pu
blic
art a
nd s
eatin
g ar
eas o
n Ru
ssel
l Stre
et
from
dow
ntow
n to
the
wat
erfro
nt.
Plan
ning
&
Publ
ic W
orks
Po
rt, S
BA
Mid
-Ra
nge
4.11
– Co
nsid
er e
stab
lishi
ng a
Par
king
an
d Bu
sines
s Im
prov
emen
t Are
a to
supp
ort d
ownt
own
impr
ovem
ents
, suc
h as
a re
habi
litat
ion
gran
t or l
oan
prog
ram
fo
r dow
ntow
n bu
ildin
gs o
r pro
visio
n of
vi
sitor
am
eniti
es.
Adm
inist
ratio
n Ch
ambe
r, ED
C, S
BA
Shor
t-Te
rm
Goa
l 4A
– Th
e w
ater
fron
t is
an e
xten
sion
of t
he d
ownt
own
core
and
a p
lace
whe
re p
eopl
e liv
e, w
ork,
and
pla
y.
4A.1
– Su
ppor
t dev
elop
men
t of i
mpr
oved
riv
er a
cces
s in
the
Stev
enso
n ar
ea.
4A.1
-1–
Impr
ove
wat
erfro
nt a
cces
s an
d co
ntro
l ero
sion
thro
ugh
coor
dina
ted
st
abili
zatio
n pr
ogra
ms.
Publ
ic W
orks
Co
unty
, Po
rt
Shor
t-Te
rm
165

30
OBJ
ECTI
VE
TACT
ICS
CORN
ERST
ON
E P R
INCI
PLES
RE
SPO
NSI
BLE
DEP
ARTM
ENT
LIKE
LY
PART
NER
S TI
MEL
INE
HQ
L N
SB
HE
AW
Goa
l 4–
Dow
ntow
n &
Wat
erfr
ont
4A.2
– Es
tabl
ish a
Sho
relin
es M
aste
r
Prog
ram
to g
uide
the
bala
nced
deve
lopm
ent o
f ind
ustri
al, c
omm
erci
al,
resid
entia
l, re
crea
tiona
l, an
d na
tura
l use
s. 4A
.2-1
– En
cour
age
the
use
of th
e
river
front
for c
omm
erci
al, r
esid
entia
l, re
crea
tion,
and
ope
n sp
ace
purp
oses
co
nsist
ent w
ith th
e Sh
orel
ines
Man
agem
ent A
ct.
4A.2
-2–
Prot
ect,
enha
nce,
and
mai
ntai
n th
e na
tura
l, sc
enic
, hist
oric
, arc
hite
ctur
al,
and
recr
eatio
nal q
ualit
ies
alon
g th
e Ri
ver.
4A.2
-3–
Supp
ort r
ecre
atio
nal a
ctiv
ities
on
the
publ
ic la
nds
and
wat
ers
of th
e
Co
lum
bia
Rive
r, Ro
ck C
ove,
and
Roc
k Cr
eek.
Adm
inist
ratio
n &
Pla
nnin
g
CGIC
, Ch
ambe
r, Co
unty
, Po
rt,
Prop
erty
O
wne
rs,
SBA
Shor
t-Te
rm
4A.3
– M
anag
e la
nds
abut
ting
the
Colu
mbi
a Ri
ver a
nd R
ock
Cree
k fo
r the
be
nefit
of t
he c
omm
unity
.
4A.3
-1–
Rev
iew
all
prop
osal
s fo
r
shor
elin
e us
e fo
r com
patib
ility
with
the
goal
s and
pol
icie
s of t
he S
kam
ania
Co
unty
Sho
relin
e M
anag
emen
t Mas
ter
Prog
ram
. 4A
.3-2
– Re
view
dev
elop
men
t pro
posa
ls lo
cate
d on
or n
ear b
anks
and
floo
dway
of
the
Rive
r and
cre
eks
to m
aint
ain
the
recr
eatio
n an
d op
en sp
ace
pote
ntia
l w
hile
pro
mot
ing
heal
thy
and
visu
ally
at
tract
ive
envi
ronm
ents
. 4A
.3-3
– Re
view
land
use
pol
icies
to
en
sure
com
plia
nce
with
the
Shor
elin
es
Man
agem
ent M
aste
r Pro
gram
.
Plan
ning
&
Publ
ic W
orks
Coun
ty,
Port,
Pr
oper
ty
Ow
ners
Ong
oing
4A.4
– Re
duce
impe
dim
ents
to a
ttrac
ting
wat
erfro
nt in
vest
ors.
4A
.4-1
– En
hanc
e Ca
scad
e Av
enue
as
the
mai
n w
ater
front
stre
et.
4A.4
-2–
Use
vario
us m
arke
ting
tech
niqu
es to
attr
act w
ater
front
inve
stor
s, su
ch a
s a
“Com
e on
in, t
he
wat
er’s
fine”
slo
gan.
Adm
inist
ratio
n Pu
blic
Wor
ks
& P
lann
ing
Cham
ber,
EDC,
Por
t, Pr
oper
ty
Ow
ners
SB
A
Shor
t-Te
rm
Chapter 3 Goals & Objectives
166

Stevenson Comprehensive Plan
April, 2013 31
OBJ
ECTI
VE
TACT
ICS
CORN
ERST
ON
E P R
INCI
PLES
RE
SPO
NSI
BLE
DEP
ARTM
ENT
LIKE
LY
PART
NER
S TI
MEL
INE
HQ
L N
SB
HE
AW
Goa
l 4–
Dow
ntow
n &
Wat
erfr
ont
4A.5
– Co
nsid
er re
purp
osin
g th
e Ti
chen
or
Build
ing
for r
etai
l and
lodg
ing
purp
oses
.
Plan
ning
ED
C, P
ort
Long
-Te
rm
4A.6
– En
cour
age
deve
lopm
ent o
f a
la
ndsc
apin
g pl
an fo
r the
fairg
roun
ds.
Pl
anni
ng
Coun
ty
Ong
oing
4A.7
– Su
ppor
t dev
elop
men
t of a
larg
e w
ater
front
gat
herin
g pl
ace,
suc
h as
a
amph
ithea
ter f
or c
omm
unity
eve
nts.
Ad
min
istra
tion
Port,
SBA
Lo
ng-
Term
167

Page Intentionally Left Blank
168

Stevenson Comprehensive Plan
April, 2013
Goal 5– Business & Industry
“Stevenson supports businesses that employ its residents and meet community needs.”
The mix of businesses and industries in Stevenson ranges from creative, locally-owned establishments, to regionally-respected firms, to nationally-recognized institutions. These businesses employ and serve Stevenson’s residents and contribute to the positive atmosphere of Stevenson’s commercial and industrial areas. This Goal seeks to contribute to the success of existing businesses, develop new economic opportunities, and ensure that the local business community remains a healthy component of Stevenson’s overall vitality. Making productive use of Stevenson’s existing people, facilities, and resources is particularly important to the city’s economic future. This includes building on the forest industries so important to Stevenson’s early development, the high tech industries thriving in the region, and other as-yet unidentified resources which will put Stevenson on the cutting edge of the economic future of the Gorge and Pacific Northwest. While the City recognizes the limited role government has in business conduct, it also recognizes the importance of businesses to the citizens, residents, and visitors. The Objectives and Tactics that will advance the City toward its economic goals seek to create an accommodating economic environment through consistent dialogue with the business community, support of targeted economic growth and diversity programs, and provision of appropriate land, facilities, infrastructure and services.
33
Phot
o Cr
edit:
Mich
elle
Rus
sek
Phot
o Cr
edit:
Ben
Shu
mak
er
Phot
o Cr
edit:
Jazm
en B
araj
as
169
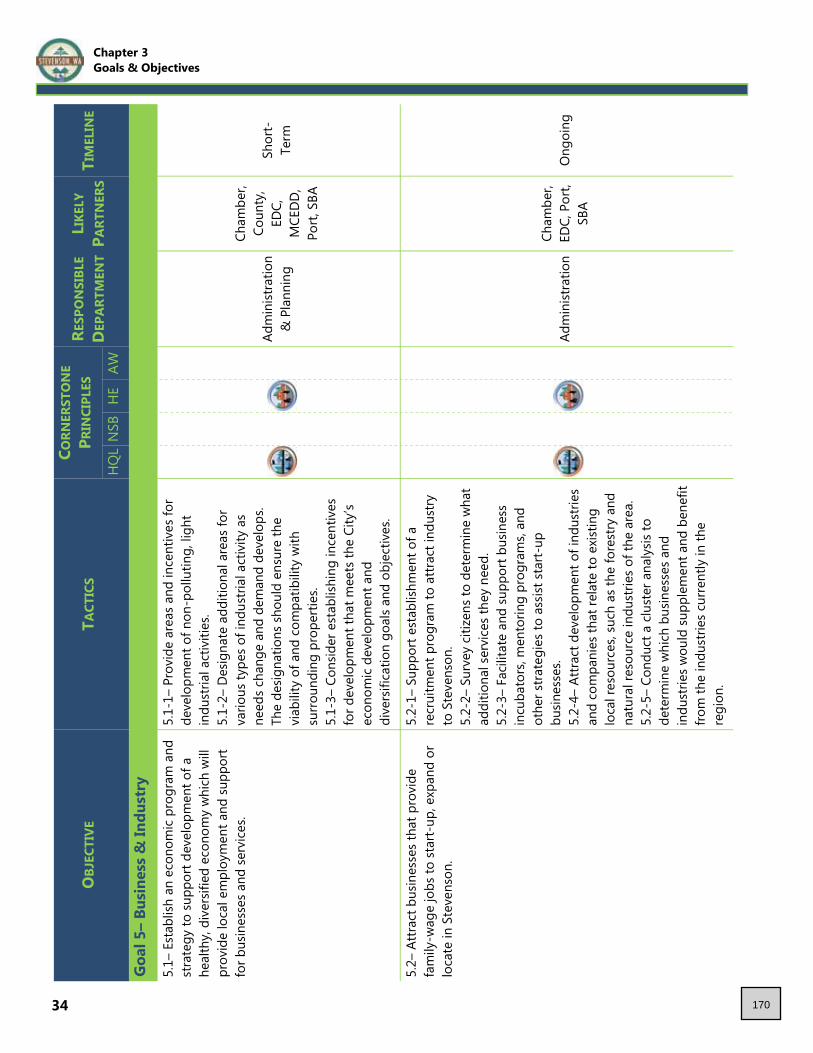
34
OBJ
ECTI
VE
TACT
ICS
CORN
ERST
ON
E PR
INCI
PLES
RE
SPO
NSI
BLE
DEP
ARTM
ENT
LIKE
LY
PART
NER
S TI
MEL
INE
HQ
L N
SB
HE
AW
Goa
l 5–
Busi
ness
& In
dust
ry
5.1–
Est
ablis
h an
eco
nom
ic p
rogr
am a
nd
stra
tegy
to su
ppor
t dev
elop
men
t of a
he
alth
y, d
iver
sifie
d ec
onom
y w
hich
will
pr
ovid
e lo
cal e
mpl
oym
ent a
nd s
uppo
rt fo
r bus
ines
ses
and
serv
ices
.
5.1-
1– P
rovi
de a
reas
and
ince
ntiv
es fo
r de
velo
pmen
t of n
on-p
ollu
ting,
ligh
t
indu
stria
l act
iviti
es.
5.1-
2– D
esig
nate
add
ition
al a
reas
for
vario
us ty
pes o
f ind
ustri
al a
ctiv
ity a
s ne
eds c
hang
e an
d de
man
d de
velo
ps.
The
desig
natio
ns sh
ould
ens
ure
the
vi
abili
ty o
f and
com
patib
ility
with
su
rroun
ding
pro
perti
es.
5.1-
3– C
onsid
er e
stab
lishi
ng in
cent
ives
fo
r dev
elop
men
t tha
t mee
ts th
e Ci
ty’s
econ
omic
dev
elop
men
t and
dive
rsifi
catio
n go
als
and
obje
ctiv
es.
Adm
inist
ratio
n &
Pla
nnin
g
Cham
ber,
Coun
ty,
EDC,
M
CED
D,
Port,
SBA
Shor
t-Te
rm
5.2–
Attr
act b
usin
esse
s th
at p
rovi
de
fam
ily-w
age
jobs
to s
tart-
up, e
xpan
d or
lo
cate
in S
teve
nson
.
5.2-
1– S
uppo
rt es
tabl
ishm
ent o
f a
re
crui
tmen
t pro
gram
to a
ttrac
t ind
ustry
to
Ste
vens
on.
5.2-
2– S
urve
y ci
tizen
s to
det
erm
ine
wha
t ad
ditio
nal s
ervi
ces t
hey
need
. 5.
2-3–
Fac
ilita
te a
nd s
uppo
rt b
usin
ess
incu
bato
rs, m
ento
ring
prog
ram
s, an
d ot
her s
trate
gies
to a
ssist
sta
rt-up
busin
esse
s.
5.2-
4– A
ttrac
t dev
elop
men
t of i
ndus
tries
an
d co
mpa
nies
that
rela
te to
exi
stin
g lo
cal r
esou
rces
, suc
h as
the
fore
stry
and
na
tura
l res
ourc
e in
dust
ries
of th
e ar
ea.
5.2-
5– C
ondu
ct a
clu
ster
ana
lysis
to
de
term
ine
whi
ch b
usin
esse
s an
d
indu
strie
s wou
ld su
pple
men
t and
ben
efit
from
the
indu
strie
s cu
rren
tly in
the
regi
on.
Adm
inist
ratio
n Ch
ambe
r, ED
C, P
ort,
SBA
Ong
oing
Chapter 3 Goals & Objectives
170

Stevenson Comprehensive Plan
April, 2013 35
OBJ
ECTI
VE
TACT
ICS
CORN
ERST
ON
E PR
INCI
PLES
RE
SPO
NSI
BLE
DEP
ARTM
ENT
LIKE
LY
PART
NER
S TI
MEL
INE
HQ
L N
SB
HE
AW
Goa
l 5–
Busi
ness
& In
dust
ry
5.3–
Est
ablis
h st
rate
gies
to re
tain
and
gr
ow e
xist
ing
busin
esse
s.
5.3-
1– C
ondu
ct a
n an
nual
inve
ntor
y of
lo
cal b
usin
esse
s.
5.3-
2– P
erio
dica
lly s
urve
y lo
cal
bu
sines
ses t
o un
ders
tand
how
the
City
ca
n su
ppor
t the
ir su
cces
s an
d gr
owth
.
Adm
inist
ratio
n Ch
ambe
r, ED
C, P
ort,
SBA
Ong
oing
5.4–
Sup
port
netw
orki
ng o
ppor
tuni
ties
such
as t
he “C
ham
ber B
reak
s.”
Ad
min
istra
tion
Cham
ber
Ong
oing
5.5–
Fac
ilita
te a
nd s
uppo
rt pr
ovisi
on o
f ad
equa
te u
tility
, tra
nspo
rtatio
n, a
nd
com
mun
icat
ions
infra
stru
ctur
e to
mee
t th
e ne
eds
of S
teve
nson
’s bu
sines
s
com
mun
ity.
Adm
inist
ratio
n Co
unty
, ED
C O
ngoi
ng
5.6–
Sup
port
the
deve
lopm
ent o
f
in
dust
rial l
ands
and
bui
ldin
gs.
Ad
min
istra
tion
Coun
t, ED
C, P
ort
Ong
oing
5.7–
Pro
mot
e St
even
son’
s lo
cal r
esou
rces
an
d am
eniti
es (e
.g.,
low
ene
rgy
cost
s, fib
er o
ptic
s) a
nd lo
catio
n ne
ar th
e I-5
,
I-8
4, a
nd ra
ilroa
d co
rrido
rs to
attr
act
in
dust
ry a
nd c
omm
erce
to e
nsur
e ta
x ba
se s
tabi
lity.
Adm
inist
ratio
n Ch
ambe
r, ED
C, P
ort,
SBA
Ong
oing
5.8–
Pre
serv
e la
nds
desig
nate
d fo
r
in
dust
rial u
se fo
r tha
t use
, pro
tect
them
fro
m in
com
patib
le u
ses,
and
ensu
re
acce
ss to
goo
d in
frast
ruct
ure.
5.8-
1– C
onsid
er th
e fe
asib
ility
and
bene
fits
of e
stab
lishi
ng in
dust
rial a
reas
al
ong
Ryan
Alle
n Ro
ad n
ear t
he g
arba
ge
trans
fer s
tatio
n.
5.8-
2– C
onsid
er re
gion
al ta
x sh
arin
g
prog
ram
s as
an
alte
rnat
ive
to d
evel
opin
g in
dust
rial l
and
in S
teve
nson
.
Plan
ning
ED
C, P
ort
Ong
oing
5.9–
Est
ablis
h st
anda
rds f
or in
dust
rial
land
use
to e
ncou
rage
non
pollu
ting,
en
viro
nmen
tally
safe
, lig
ht in
dust
ries.
Pl
anni
ng
EDC,
Por
t M
id-
Rang
e
171

Page Intentionally Left Blank
172

Stevenson Comprehensive Plan
April, 2013 37
Goal 6– Tourism
“Stevenson attracts visitors by providing and promoting a variety of tourist amenities and activities.”
The degree to which a community can capture outside financial resources is the key to how prosperous that community is and how competitive it is in relation to other communities. For the first 75 years of its existence, Stevenson’s prosperity was based on logging, mining, fishing, and other natural resource extraction industries. In the past quarter century however, the focus has shifted from the extraction of natural resources to the industries based on the amenities natural resources provide. By 2000 visitors and tourists enjoying Stevenson’s natural resources contributed almost 75 cents to every retail dollar spent in Skamania County. This Goal is included in the Comprehensive Plan as an acknowledgement of the tourist contribution to Stevenson’s overall prosperity. While Stevenson has been a leader in tourism accommodation and promotion of innovative tourist and visitor amenities, more and more communities are gaining ground through the initiation of similar efforts. The Objectives and Tactics of this Goal seek to maintain and improve our status as a tourist destination through continued tourism promotional efforts and by encouraging businesses and amenities that will improve the experiences of Stevenson’s visitors.
Phot
o Cr
edit:
Joan
na G
ram
mon
Phot
o Cr
edit:
John
McS
herr
y
Phot
o Cr
edit:
John
McS
herr
y
173
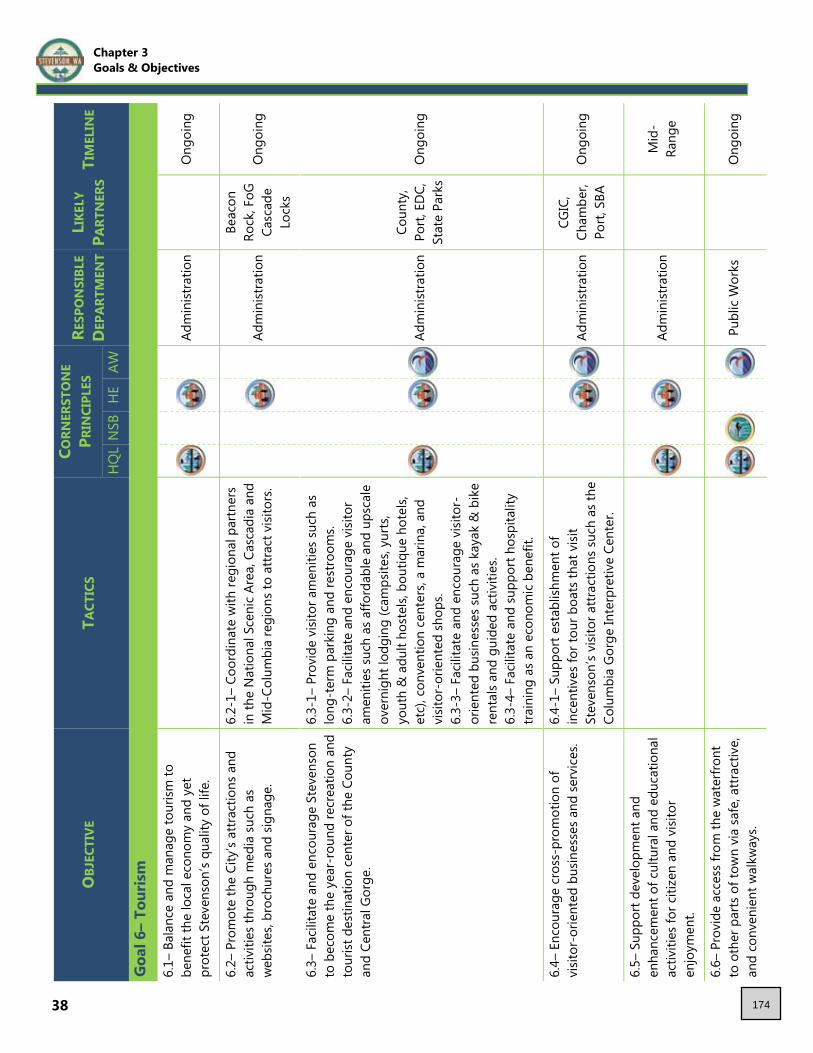
38
OBJ
ECTI
VE
TACT
ICS
CORN
ERST
ON
E P R
INCI
PLES
RE
SPO
NSI
BLE
DEP
ARTM
ENT
LIKE
LY
PART
NER
S TI
MEL
INE
HQ
L N
SB
HE
AW
Goa
l 6–
Tour
ism
6.1–
Bal
ance
and
man
age
tour
ism to
be
nefit
the
loca
l eco
nom
y an
d ye
t
pr
otec
t Ste
vens
on’s
qual
ity o
f life
.
Ad
min
istra
tion
O
ngoi
ng
6.2–
Pro
mot
e th
e Ci
ty’s
attra
ctio
ns a
nd
activ
ities
thro
ugh
med
ia s
uch
as
web
sites
, bro
chur
es a
nd s
igna
ge.
6.2-
1– C
oord
inat
e w
ith re
gion
al p
artn
ers
in th
e N
atio
nal S
ceni
c Ar
ea, C
asca
dia
and
Mid
-Col
umbi
a re
gion
s to
attra
ct v
isito
rs.
Adm
inist
ratio
n
Beac
on
Rock
, FoG
Ca
scad
e Lo
cks
Ong
oing
6.3–
Fac
ilita
te a
nd e
ncou
rage
Ste
vens
on
to b
ecom
e th
e ye
ar-r
ound
recr
eatio
n an
d to
urist
des
tinat
ion
cent
er o
f the
Cou
nty
and
Cent
ral G
orge
.
6.3-
1– P
rovi
de v
isito
r am
eniti
es s
uch
as
long
-ter
m p
arki
ng a
nd re
stro
oms.
6.3-
2– F
acili
tate
and
enc
oura
ge v
isito
r am
eniti
es s
uch
as a
fford
able
and
ups
cale
ov
erni
ght l
odgi
ng (c
amps
ites,
yurts
, yo
uth
& a
dult
host
els,
bout
ique
hot
els,
etc)
, con
vent
ion
cent
ers,
a m
arin
a, a
nd
visit
or-o
rient
ed s
hops
. 6.
3-3–
Fac
ilita
te a
nd e
ncou
rage
visi
tor-
orie
nted
bus
ines
ses s
uch
as k
ayak
& b
ike
rent
als a
nd g
uide
d ac
tiviti
es.
6.3-
4– F
acili
tate
and
sup
port
hos
pita
lity
train
ing
as a
n ec
onom
ic b
enef
it.
Adm
inist
ratio
n Co
unty
, Po
rt, E
DC,
St
ate
Park
s O
ngoi
ng
6.4–
Enc
oura
ge c
ross
-pro
mot
ion
of
vi
sitor
-orie
nted
bus
ines
ses a
nd se
rvic
es.
6.4-
1– S
uppo
rt es
tabl
ishm
ent o
f
ince
ntiv
es fo
r tou
r boa
ts th
at v
isit
Stev
enso
n’s v
isito
r attr
actio
ns su
ch a
s the
Co
lum
bia
Gorg
e In
terp
retiv
e Ce
nter
.
Adm
inist
ratio
n CG
IC,
Cham
ber,
Port,
SBA
O
ngoi
ng
6.5–
Sup
port
deve
lopm
ent a
nd
en
hanc
emen
t of c
ultu
ral a
nd e
duca
tiona
l ac
tiviti
es fo
r citi
zen
and
visit
or
enjo
ymen
t.
Adm
inist
ratio
n
Mid
-Ra
nge
6.6–
Pro
vide
acc
ess
from
the
wat
erfro
nt
to o
ther
par
ts o
f tow
n vi
a sa
fe, a
ttrac
tive,
an
d co
nven
ient
wal
kway
s.
Pu
blic
Wor
ks
O
ngoi
ng
Chapter 3 Goals & Objectives
174

Stevenson Comprehensive Plan
April, 2013 39
OBJ
ECTI
VE
TACT
ICS
CORN
ERST
ON
E P R
INCI
PLES
RE
SPO
NSI
BLE
DEP
ARTM
ENT
LIKE
LY
PART
NER
S TI
MEL
INE
HQ
L N
SB
HE
AW
Goa
l 6–
Tour
ism
6.7–
Enc
oura
ge d
evel
opm
ent o
f
m
ount
ain
biki
ng a
nd h
ikin
g tra
ils a
nd
othe
r visi
tor a
men
ities
on
the
publ
ic
land
s im
med
iate
ly o
utsid
e of
Ste
vens
on.
Adm
inist
ratio
n
BPA,
Bik
e gr
oups
, Co
unty
, Fo
G, U
SFS,
W
aDN
R,
Ong
oing
6.8–
Est
ablis
h a
quie
t zon
e at
railr
oad
cros
sings
with
in th
e ci
ty.
Pu
blic
Wor
ks
BNSF
, Ch
ambe
r, SB
A, P
ort
Shor
t-Te
rm
175

Page Intentionally Left Blank
176
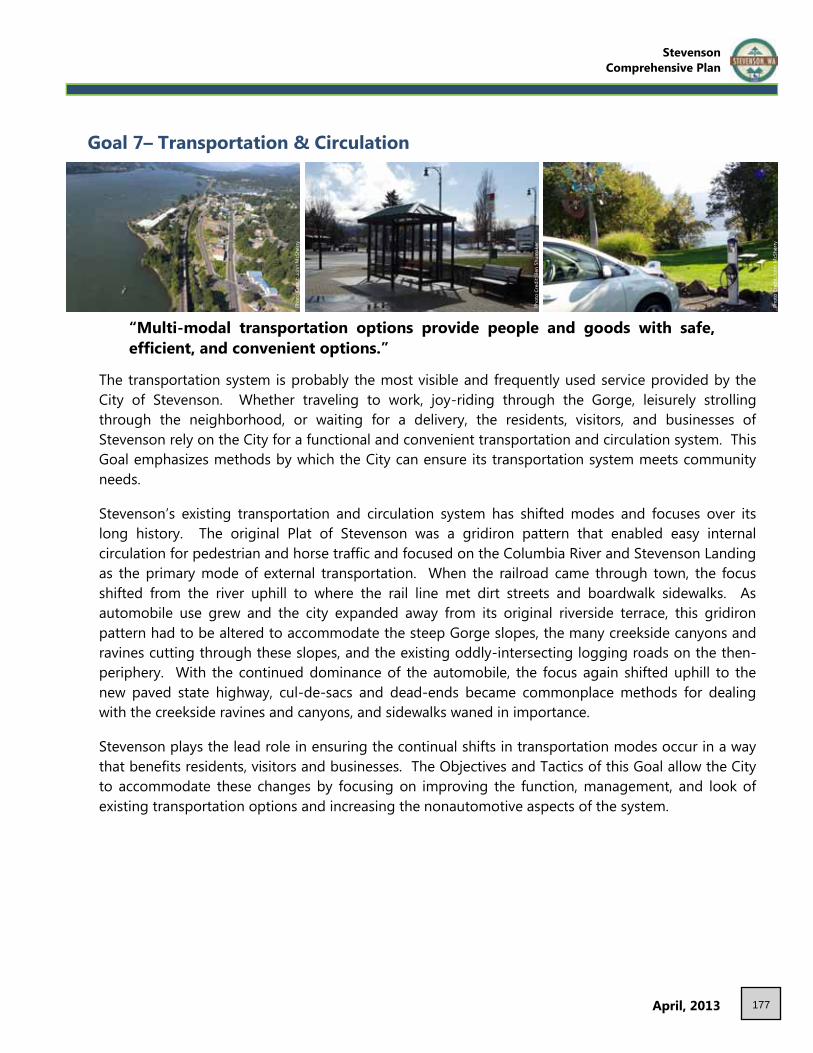
Stevenson Comprehensive Plan
April, 2013
Goal 7– Transportation & Circulation
“Multi-modal transportation options provide people and goods with safe, efficient, and convenient options.”
The transportation system is probably the most visible and frequently used service provided by the City of Stevenson. Whether traveling to work, joy-riding through the Gorge, leisurely strolling through the neighborhood, or waiting for a delivery, the residents, visitors, and businesses of Stevenson rely on the City for a functional and convenient transportation and circulation system. This Goal emphasizes methods by which the City can ensure its transportation system meets community needs. Stevenson’s existing transportation and circulation system has shifted modes and focuses over its long history. The original Plat of Stevenson was a gridiron pattern that enabled easy internal circulation for pedestrian and horse traffic and focused on the Columbia River and Stevenson Landing as the primary mode of external transportation. When the railroad came through town, the focus shifted from the river uphill to where the rail line met dirt streets and boardwalk sidewalks. As automobile use grew and the city expanded away from its original riverside terrace, this gridiron pattern had to be altered to accommodate the steep Gorge slopes, the many creekside canyons and ravines cutting through these slopes, and the existing oddly-intersecting logging roads on the then-periphery. With the continued dominance of the automobile, the focus again shifted uphill to the new paved state highway, cul-de-sacs and dead-ends became commonplace methods for dealing with the creekside ravines and canyons, and sidewalks waned in importance. Stevenson plays the lead role in ensuring the continual shifts in transportation modes occur in a way that benefits residents, visitors and businesses. The Objectives and Tactics of this Goal allow the City to accommodate these changes by focusing on improving the function, management, and look of existing transportation options and increasing the nonautomotive aspects of the system.
41
Phot
o Cr
edit:
John
McS
herr
y
Phot
o Cr
edit:
Ben
Shu
mak
er
Phot
o Cr
edit:
John
McS
herr
y
177

42
OBJ
ECTI
VE
TACT
ICS
CORN
ERST
ON
E P R
INCI
PLES
RE
SPO
NSI
BLE
DEP
ARTM
ENT
LIKE
LY
PART
NER
S TI
MEL
INE
HQ
L N
SB
HE
AW
Goa
l 7–
Tran
spor
tatio
n &
Circ
ulat
ion
7.1–
Dev
elop
a lo
ng ra
nge
trans
porta
tion
plan
. 7.
1-1–
Con
sider
the
feas
ibili
ty a
nd
be
nefit
s of
est
ablis
hing
one
-way
co
uple
ts o
n 1st
and
2nd
Stre
ets.
7.
1-2–
Con
sider
the
feas
ibili
ty a
nd
be
nefit
s of
usin
g ro
unda
bout
s at
in
ters
ectio
ns th
roug
hout
the
city
. 7.
1-3–
Dev
elop
impr
ovem
ent p
lans
for
exist
ing
right
s-of
-way
. 7.
1-4–
Con
sider
traf
fic c
alm
ing
mea
sure
s su
ch a
s na
rrow
stre
ets.
7.1-
5– M
inim
ize tr
affic
con
gest
ion
and
facil
itate
the
safe
, effi
cien
t mov
emen
t of
peop
le a
nd c
omm
oditi
es th
roug
h th
e de
sign
of th
e tra
nspo
rtatio
n sy
stem
.
Publ
ic W
orks
BN
SF,
Coun
ty
Shor
t-Te
rm
7.2–
Est
ablis
h an
d m
anag
e th
e
trans
porta
tion
syst
em in
a m
anne
r whi
ch
cont
ribut
es to
com
mun
ity a
ppea
ranc
e an
d liv
abili
ty, r
ecog
nize
s and
resp
ects
the
char
acte
ristic
s of n
atur
al fe
atur
es, a
nd
min
imiz
es th
e ef
fect
s on
abu
tting
land
us
es.
Publ
ic W
orks
Ong
oing
7.3–
Dev
elop
a tr
ansp
orta
tion
syst
em
that
pro
vide
s all
citiz
ens w
ith
tra
nspo
rtatio
n ch
oice
s and
alte
rnat
ives
7.3-
1– S
uppo
rt es
tabl
ishm
ent o
f a
re
gion
al tr
ansit
syst
em.
7.3-
2– S
uppo
rt pr
ovisi
on o
f saf
e an
d co
nven
ient
tran
sit st
ops.
Publ
ic W
orks
BN
SF,
Coun
ty
Mid
-Ra
nge
7.4–
Dev
elop
a p
lan
for s
afe
and
co
nven
ient
alte
rnat
e fo
rms
of
tra
nspo
rtatio
n, s
uch
as b
ikew
ays,
wal
kway
s, an
d pa
thw
ays.
7.4-
1– C
onsid
er s
epar
atin
g pe
dest
rian,
bi
cycl
e, a
nd a
uto
traffi
c. 7.
4-2–
Pro
vide
saf
e an
d ac
cess
ible
pede
stria
n cr
ossin
gs th
roug
hout
the
city
.
Publ
ic W
orks
Ch
ambe
r, Co
unty
, SB
A
Mid
-Ra
nge
7.5–
Per
iodi
cally
revi
ew a
nd re
vise
stan
dard
s fo
r pub
lic a
nd p
rivat
e ro
ads.
Publ
ic W
orks
SB
A M
id-
Rang
e
Chapter 3 Goals & Objectives
178
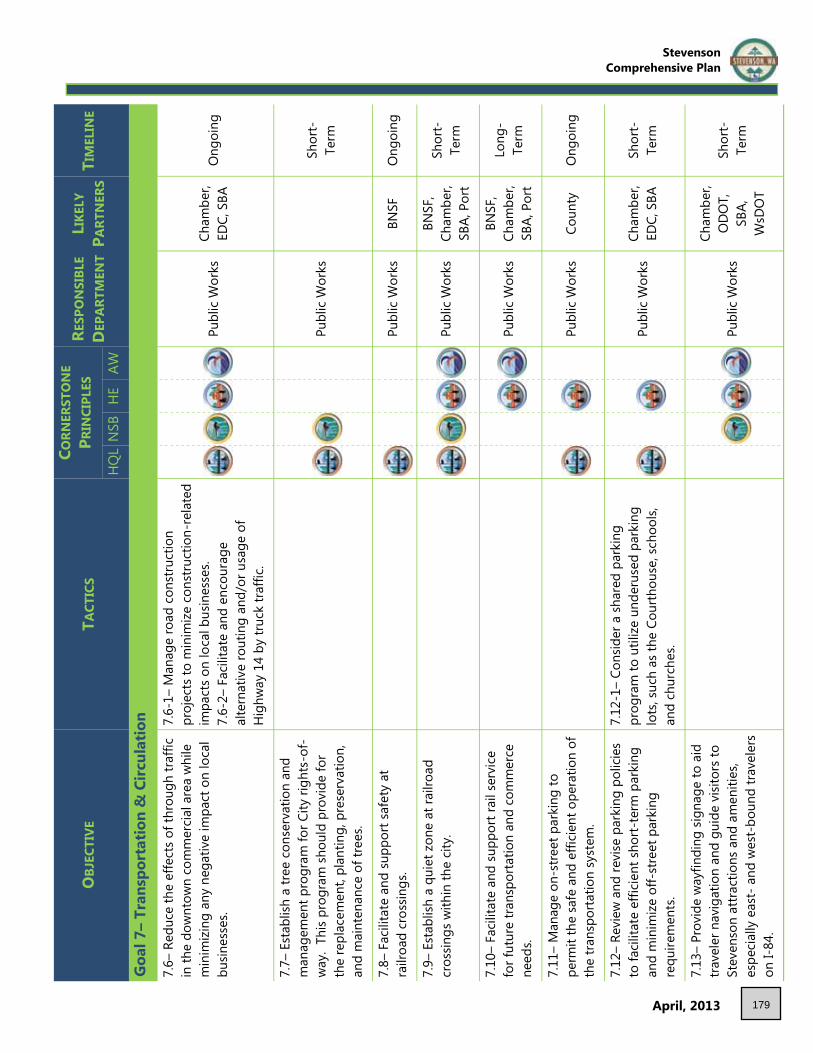
Stevenson Comprehensive Plan
April, 2013 43
OBJ
ECTI
VE
TACT
ICS
CORN
ERST
ON
E P R
INCI
PLES
RE
SPO
NSI
BLE
DEP
ARTM
ENT
LIKE
LY
PART
NER
S TI
MEL
INE
HQ
L N
SB
HE
AW
Goa
l 7–
Tran
spor
tatio
n &
Circ
ulat
ion
7.6–
Red
uce
the
effe
cts
of th
roug
h tra
ffic
in th
e do
wnt
own
com
mer
cial
are
a w
hile
m
inim
izing
any
neg
ativ
e im
pact
on
loca
l bu
sines
ses.
7.6-
1– M
anag
e ro
ad c
onst
ruct
ion
proj
ects
to m
inim
ize c
onst
ruct
ion-
rela
ted
impa
cts o
n lo
cal b
usin
esse
s. 7.
6-2–
Fac
ilita
te a
nd e
ncou
rage
alte
rnat
ive
rout
ing
and/
or u
sage
of
Hig
hway
14
by tr
uck
traffi
c.
Publ
ic W
orks
Ch
ambe
r, ED
C, S
BA
Ong
oing
7.7–
Est
ablis
h a
tree
cons
erva
tion
and
man
agem
ent p
rogr
am fo
r City
righ
ts-o
f-w
ay.
This
prog
ram
sho
uld
prov
ide
for
the
repl
acem
ent,
plan
ting,
pre
serv
atio
n,
and
mai
nten
ance
of t
rees
.
Publ
ic W
orks
Shor
t-Te
rm
7.8–
Fac
ilita
te a
nd s
uppo
rt sa
fety
at
ra
ilroa
d cr
ossin
gs.
Pu
blic
Wor
ks
BNSF
O
ngoi
ng
7.9–
Est
ablis
h a
quie
t zon
e at
railr
oad
cros
sings
with
in th
e ci
ty.
Pu
blic
Wor
ks
BNSF
, Ch
ambe
r, SB
A, P
ort
Shor
t-Te
rm
7.10
– Fa
cilita
te a
nd s
uppo
rt ra
il se
rvic
e fo
r fut
ure
trans
porta
tion
and
com
mer
ce
need
s.
Pu
blic
Wor
ks
BNSF
, Ch
ambe
r, SB
A, P
ort
Long
-Te
rm
7.11
– M
anag
e on
-stre
et p
arki
ng to
perm
it th
e sa
fe a
nd e
ffici
ent o
pera
tion
of
the
trans
porta
tion
syst
em.
Pu
blic
Wor
ks
Coun
ty
Ong
oing
7.12
– Re
view
and
revi
se p
arki
ng p
olic
ies
to fa
cilita
te e
ffici
ent s
hort-
term
par
king
an
d m
inim
ize o
ff-st
reet
par
king
requ
irem
ents
.
7.12
-1–
Cons
ider
a s
hare
d pa
rkin
g
pr
ogra
m to
util
ize u
nder
used
par
king
lo
ts, s
uch
as th
e Co
urth
ouse
, sch
ools,
an
d ch
urch
es.
Publ
ic W
orks
Ch
ambe
r, ED
C, S
BA
Shor
t-Te
rm
7.13
– Pr
ovid
e w
ayfin
ding
sig
nage
to a
id
trave
ler n
avig
atio
n an
d gu
ide
visit
ors
to
Stev
enso
n at
tract
ions
and
am
eniti
es,
espe
cial
ly e
ast-
and
wes
t-bo
und
trave
lers
on
I-84
.
Publ
ic W
orks
Cham
ber,
OD
OT,
SB
A,
WsD
OT
Shor
t-Te
rm
179

Page Intentionally Left Blank
180
Stevenson Comprehensive Plan
April, 2013 45
Goal 8– Utilities & Services
“Reliable utilities and convenient services fulfill the needs of the current and future community.”
City governments exist to serve their citizens. This Goal of the Comprehensive Plan emphasizes the aspects by which the City can serve its citizens through proper management and provision of utility services. The City of Stevenson provides a number of services to its residents. Responsible management of tax- and rate-payer contributions tops the list, but the City also ensures buildings are inspected for safety, clean drinking water is provided to the tap, fires are suppressed before they can spread, sewage is collected and treated, justice is served through policing and the court system, and neighborhood nuisances are remedied. The City also coordinates with outside utility and service providers to ensure that its residents and visitors receive the services they require. The Objectives and Tactics leading to the fulfillment of this Goal contain methods by which the City can manage and improve upon the services it provides and ensure that other utility and service providers do likewise.
Phot
o Cr
edits
: Ben
Shu
mak
er
181

46
OBJ
ECTI
VE
TACT
ICS
CORN
ERST
ON
E P R
INCI
PLES
RE
SPO
NSI
BLE
DEP
ARTM
ENT
LIKE
LY
PART
NER
S TI
MEL
INE
HQ
L N
SB
HE
AW
Goa
l 8–
Util
ities
& S
ervi
ces
8.1–
Enc
oura
ge C
ity s
taff
and
offic
ials
to
enha
nce
thei
r ski
lls th
roug
h tra
inin
g an
d co
ntin
uing
edu
catio
n on
topi
cs re
leva
nt
to th
eir j
ob p
erfo
rman
ce, s
uch
as
m
anag
emen
t and
com
mun
icat
ion.
All
Dep
artm
ents
Ong
oing
8.2–
Dev
elop
a lo
ng-r
ange
fina
ncia
l pla
n.
Ad
min
istra
tion
O
ngoi
ng
8.3–
Per
iodi
cally
revi
ew a
nd re
vise
the
capi
tal f
acili
ties p
lan.
Adm
inist
ratio
n &
Pub
lic
Wor
ks
O
ngoi
ng
8.4–
Iden
tify
and
corre
ct h
ealth
and
sa
fety
haz
ards
with
in th
e St
even
son
Ur
ban
Area
.
Ad
min
istra
tion
Coun
ty,
Port
O
ngoi
ng
8.5–
Est
ablis
h m
aint
enan
ce p
rogr
ams t
o pr
eser
ve th
e lo
ng-t
erm
via
bilit
y of
the
City
’s ca
pita
l fac
ilitie
s.
Ad
min
istra
tion
& P
ublic
W
orks
Shor
t-Te
rm
8.6–
Offs
et th
e co
sts
of n
ew d
evel
opm
ent
to e
xist
ing
city
resid
ents
by
esta
blish
ing
deve
lopm
ent c
harg
es.
Ad
min
istra
tion
O
ngoi
ng
8.7–
Pro
vide
ade
quat
e ea
sem
ent a
nd
right
-of-
way
wid
ths
for p
ublic
and
priv
ate
utili
ties
and
emer
genc
y an
d ot
her
serv
ices
.
Plan
ning
&
Publ
ic W
orks
Ong
oing
8.8–
Bas
e th
e pr
ovisi
on fo
r fut
ure
publ
ic
facil
ities
and
util
ities
upo
n fin
anci
al c
ost
and
adeq
uacy
of d
esire
d le
vels
of s
ervi
ce.
8.8-
1– C
onsid
er p
rovi
ding
pub
lic fa
cilit
ies
and
utili
ties i
n ad
vanc
e of
nee
d.
8.8-
2– C
oord
inat
e ur
ban
deve
lopm
ent
with
priv
ate
utili
ty a
genc
ies
to e
nsur
e th
e av
aila
bilit
y of
serv
ices
whe
n ne
eded
. 8.
8-3–
Con
tinue
to p
rovi
de w
ater
and
se
wer
ser
vice
s with
in th
e Ur
ban
Area
.
Adm
inist
ratio
n Co
unty
, PU
D
Ong
oing
Chapter 3 Goals & Objectives
182

Stevenson Comprehensive Plan
April, 2013 47
OBJ
ECTI
VE
TACT
ICS
CORN
ERST
ON
E P R
INCI
PLES
RE
SPO
NSI
BLE
DEP
ARTM
ENT
LIKE
LY
PART
NER
S TI
MEL
INE
HQ
L N
SB
HE
AW
Goa
l 8–
Util
ities
& S
ervi
ces
8.9–
Man
age
urba
niza
tion
thro
ugh
the
expa
nsio
n of
the
sew
er s
yste
m.
8.9-
1– P
erm
it se
ptic
sys
tem
s on
ly w
hen
prov
ision
of s
ewer
ser
vice
is te
chni
cally
in
feas
ible
with
in th
e pl
anni
ng p
erio
d.
8.9-
2– R
evise
land
dev
elop
men
t
re
gula
tions
to p
rohi
bit s
eptic
sys
tem
in
stal
latio
ns in
are
as w
here
pro
visio
n of
se
wer
ser
vice
is fe
asib
le d
urin
g th
e
plan
ning
per
iod.
Plan
ning
&
Publ
ic W
orks
Ong
oing
8.10
– Co
nsid
er a
ltern
ativ
e w
aste
disp
osal
sy
stem
s fo
r diff
icul
t site
s an
d to
enco
urag
e co
nser
vatio
n of
wat
er.
Pu
blic
Wor
ks
O
ngoi
ng
8.11
– Co
ordi
nate
the
infra
stru
ctur
e
impr
ovem
ent a
nd m
aint
enan
ce p
roje
cts
of m
ultip
le u
tiliti
es to
redu
ce c
osts
and
di
srup
tive
impa
cts.
Publ
ic W
orks
Ong
oing
8.12
– Es
tabl
ish a
sto
rmw
ater
util
ity to
pr
ovid
e fo
r the
col
lect
ion
and
treat
men
t of
sto
rmw
ater
runo
ff an
d th
e
m
aint
enan
ce o
f sto
rmw
ater
facil
ities
.
8.12
-1–
Esta
blish
sta
ndar
ds fo
r lan
d
deve
lopm
ent o
rdin
ance
s to
pro
vide
for
the
colle
ctio
n an
d tre
atm
ent o
f
st
orm
wat
er ru
noff.
Publ
ic W
orks
Shor
t-Te
rm
8.13
– Co
nsid
er a
ltern
ativ
e en
ergy
reso
urce
s to
bene
fit th
e co
mm
unity
. 8.
13-1
– Fa
cilita
te a
nd s
uppo
rt lo
cal
en
ergy
reso
urce
dev
elop
men
t and
use
, su
ch a
s ge
othe
rmal
.
Ad
min
istra
tion
Coun
ty,
Port,
PUD
, St
ate
Mid
-Ra
nge
8.14
– Fa
cilita
te a
nd s
uppo
rt th
e
expa
nsio
n of
hig
h-sp
eed
com
mun
icat
ion
utili
ties
such
as
broa
dban
d, fi
ber o
ptic
s, an
d W
i-Fi.
Adm
inist
ratio
n
Ong
oing
8.15
– Fa
cilita
te a
nd s
uppo
rt th
e bu
rial o
f ex
istin
g ab
oveg
roun
d ut
ility
line
s.
Ad
min
istra
tion
& P
ublic
W
orks
Priv
ate
Utili
ties,
PUD
O
ngoi
ng
183

48
OBJ
ECTI
VE
TACT
ICS
CORN
ERST
ON
E P R
INCI
PLES
RE
SPO
NSI
BLE
DEP
ARTM
ENT
LIKE
LY
PART
NER
S TI
MEL
INE
HQ
L N
SB
HE
AW
Goa
l 8–
Util
ities
& S
ervi
ces
8.16
– Re
quire
the
buria
l of n
ew u
tility
lin
es.
Pl
anni
ng &
Pu
blic
Wor
ks
Priv
ate
Utili
ties,
PUD
O
ngoi
ng
8.17
– Fa
cilita
te a
nd e
ncou
rage
the
colle
ctio
n, re
cycl
ing,
disp
osal
, and
reus
e of
sol
id w
aste
with
in th
e St
even
son
Ur
ban
Area
.
8.17
-1–
Cons
ider
sol
id w
aste
for u
se in
bi
omas
s en
ergy
pro
ject
s. 8.
17-2
– Co
nsid
er c
ompo
stin
g so
lid w
aste
th
roug
h a
com
mun
ity-s
cale
facil
ity.
Publ
ic W
orks
Co
unty
So
lid
Was
te
Shor
t-Te
rm
8.18
– Pe
riodi
cally
revi
ew a
nd re
vise
the
City
’s la
w e
nfor
cem
ent p
rogr
am.
Ad
min
istra
tion
O
ngoi
ng
8.19
– Su
ppor
t Ste
vens
on F
ire
Dep
artm
ent a
nd th
e Sk
aman
ia C
ount
y H
ospi
tal D
istric
t to
mai
ntai
n hi
gh q
ualit
y se
rvic
es.
8.19
-1–
Cons
ider
est
ablis
hing
a jo
int
facil
ity to
hou
se e
mer
genc
y re
spon
se
agen
cies
.
Ad
min
istra
tion
O
ngoi
ng
8.20
– En
cour
age
esta
blish
men
t of c
ount
y-w
ide
miti
gatio
n an
d em
erge
ncy
actio
n pr
ogra
ms
for s
pills
, exp
losio
ns a
nd o
ther
di
sast
ers.
Adm
inist
ratio
n Co
unty
, EM
S, F
ire
Mid
-Ra
nge
Chapter 3 Goals & Objectives
184

Stevenson Comprehensive Plan
April, 2013 49
Goal 9– Parks & Recreation
“Residents and visitors enjoy access to a network of world-class parks, open spaces, and recreational opportunities.”
The need for recreation has been universally known to humans from their earliest beginnings. The magnitude of this recreational need has increased as more leisure time has become available and the availability of funds for recreational pursuits has increased. This Goal deals with improving the quality of life for Stevenson residents and visitors by enhancing the parks and recreational opportunities that are available. As a Gorge town, some of the country’s premier hiking, hunting, mountain climbing, fishing, kayaking, and wind sports surround Stevenson on all sides. Many residents enjoy these activities, and many more visitors are drawn to the area for these relatively solitary activities. Inside Stevenson, a different, more gregarious variety of recreational opportunities exist, including festivals, fairs, and organized or pick-up sporting events. Balancing and connecting these gregarious and solitary varieties of recreation are of special importance to Stevenson. The Objectives and Tactics of this Goal seek to do so by ensuring the facilities we already have are properly maintained, new lands, facilities, and funding are available, and trails or pathways are developed as part of the park system.
Phot
o Cr
edit:
Ben
Shu
mak
er
Phot
o Cr
edit:
John
McS
herr
y
Phot
o Cr
edit:
Julie
May
field
185

50
OBJ
ECTI
VE
TACT
ICS
CORN
ERST
ON
E P R
INCI
PLES
RE
SPO
NSI
BLE
DEP
ARTM
ENT
LIKE
LY
PART
NER
S TI
MEL
INE
HQ
L N
SB
HE
AW
Goa
l 9–
Park
s &
Rec
reat
ion
9.1–
Est
ablis
h a
park
s and
recr
eatio
n pl
an
that
ens
ures
Ste
vens
on p
roje
cts
are
el
igib
le fo
r Sta
te g
rant
fund
s.
9.1-
1– C
onsid
er p
oten
tial p
ark
need
s as
ad
ditio
nal l
and
deve
lops
.
Ad
min
istra
tion
Sh
ort-
Term
9.2–
Pre
serv
e op
en s
pace
and
re
crea
tiona
l res
ourc
es.
9.2-
1– E
stab
lish
coop
erat
ive
agre
emen
ts
to e
nsur
e th
at re
crea
tion
and
open
spa
ce
land
s and
faci
litie
s will
be
prov
ided
. 9.
2-2–
Sec
ure
dedi
catio
ns a
nd e
asem
ents
ad
equa
te fo
r cha
nnel
mai
nten
ance
,
publ
ic op
en s
pace
, and
futu
re
recr
eatio
nal u
se a
long
all
natu
ral,
perm
anen
t stre
am c
orrid
ors.
9.
2-3–
Enc
oura
ge p
rivat
e en
terp
rise
and
inte
rgov
ernm
enta
l agr
eem
ents
that
will
pr
ovid
e op
en s
pace
for r
ecre
atio
nal l
ands
an
d fa
cilit
ies.
Pro
visio
n of
suc
h op
en
spac
es s
houl
d no
t red
uce
the
dens
ity
whi
ch c
an b
e ac
hiev
ed o
n th
e sit
e.
Adm
inist
ratio
n &
Pla
nnin
g
Long
-Te
rm
9.3–
Mai
ntai
n pa
rks a
nd re
crea
tiona
l la
nds
and
faci
litie
s.
Pu
blic
Wor
ks
O
ngoi
ng
9.4–
Con
sider
est
ablis
hing
a p
erm
anen
t fu
ndin
g so
urce
for t
he a
cqui
sitio
n,
de
velo
pmen
t, an
d m
aint
enan
ce o
f par
k an
d re
crea
tion
land
s and
faci
litie
s.
Adm
inist
ratio
n
Mid
-Ra
nge
9.5–
Dev
elop
a p
athw
ays
and
trails
pla
n to
hig
hlig
ht S
teve
nson
’s re
crea
tiona
l, hi
stor
ical
, and
com
mer
cial
site
s.
9.5-
1– C
onsid
er u
sing
stre
am c
orrid
ors
as
part
of a
par
kway
or g
reen
way
con
cept
. 9.
5-2–
Incl
ude
conn
ectio
ns a
mon
g th
e pa
rks
and
trails
of t
he C
ity, i
ts p
artn
er
agen
cies
, and
priv
ate
entit
ies.
9.5-
3– In
clud
e na
ture
wal
ks, s
ceni
c vi
stas
, an
d co
nnec
tions
to fo
rest
s in
the
plan
.
Plan
ning
&
Publ
ic W
orks
Mid
-Ra
nge
Chapter 3 Goals & Objectives
186

Stevenson Comprehensive Plan
April, 2013 51
OBJ
ECTI
VE
TACT
ICS
CORN
ERST
ON
E P R
INCI
PLES
RE
SPO
NSI
BLE
DEP
ARTM
ENT
LIKE
LY
PART
NER
S TI
MEL
INE
HQ
L N
SB
HE
AW
Goa
l 9–
Park
s &
Rec
reat
ion
9.6–
Pro
vide
pat
hway
s an
d tra
ils th
at
high
light
Ste
vens
on’s
recr
eatio
nal,
hist
oric
al, a
nd c
omm
erci
al s
ites.
9.6-
1– U
se s
trea
m c
orrid
ors
as p
art o
f a
park
way
or g
reen
way
con
cept
. 9.
6-2–
Con
nect
the
park
s an
d tra
ils o
f the
Ci
ty, i
ts p
artn
er a
genc
ies,
and
priv
ate
entit
ies.
9.6-
3– In
clud
e na
ture
wal
ks, s
ceni
c vi
stas
, an
d co
nnec
tions
to fo
rest
s in
the
syst
em
of p
athw
ays.
Publ
ic W
orks
Ong
oing
9.7–
Dev
elop
a b
alan
ced
syst
em o
f
recr
eatio
n fa
cilit
ies,
land
s an
d pr
ogra
ms
that
mee
ts th
e re
crea
tion
need
s of
re
siden
ts a
nd v
isito
rs a
like.
9.7-
1– D
evel
op s
mal
l par
cels
of la
nd
resu
lting
from
urb
aniza
tion
as m
ini-p
arks
or
land
scap
ed a
reas
. 9.
7-2–
Fac
ilita
te a
nd e
ncou
rage
the
in
stal
latio
n of
ligh
ts a
nd o
ther
impr
ovem
ents
at t
he H
egew
ald
Skat
eboa
rd P
ark.
9.
7-3–
Fac
ilita
te a
nd s
uppo
rt th
e
deve
lopm
ent o
f maj
or c
omm
unity
recr
eatio
n fa
cilit
ies f
or c
itize
ns, s
uch
as
expa
ndin
g th
e po
ol a
ctiv
ity c
ente
r,
pr
ovid
ing
cove
red
pavi
lion
spac
es,
de
velo
ping
a y
outh
cen
ter,
and
othe
r sp
aces
for r
ecre
atio
n, p
hysic
al fi
tnes
s, an
d w
elln
ess c
lass
es.
Adm
inist
ratio
n
Ong
oing
9.8–
Pro
mot
e St
even
son’
s re
crea
tiona
l op
portu
nitie
s thr
ough
med
ia su
ch a
s w
ebsit
es, b
roch
ures
, and
sig
nage
.
Ad
min
istra
tion
O
ngoi
ng
9.9–
Pro
tect
Roc
k Co
ve to
impr
ove
ha
bita
t, w
ater
qua
lity
and
ambi
ance
.
Plan
ning
Mid
-Ra
nge
187
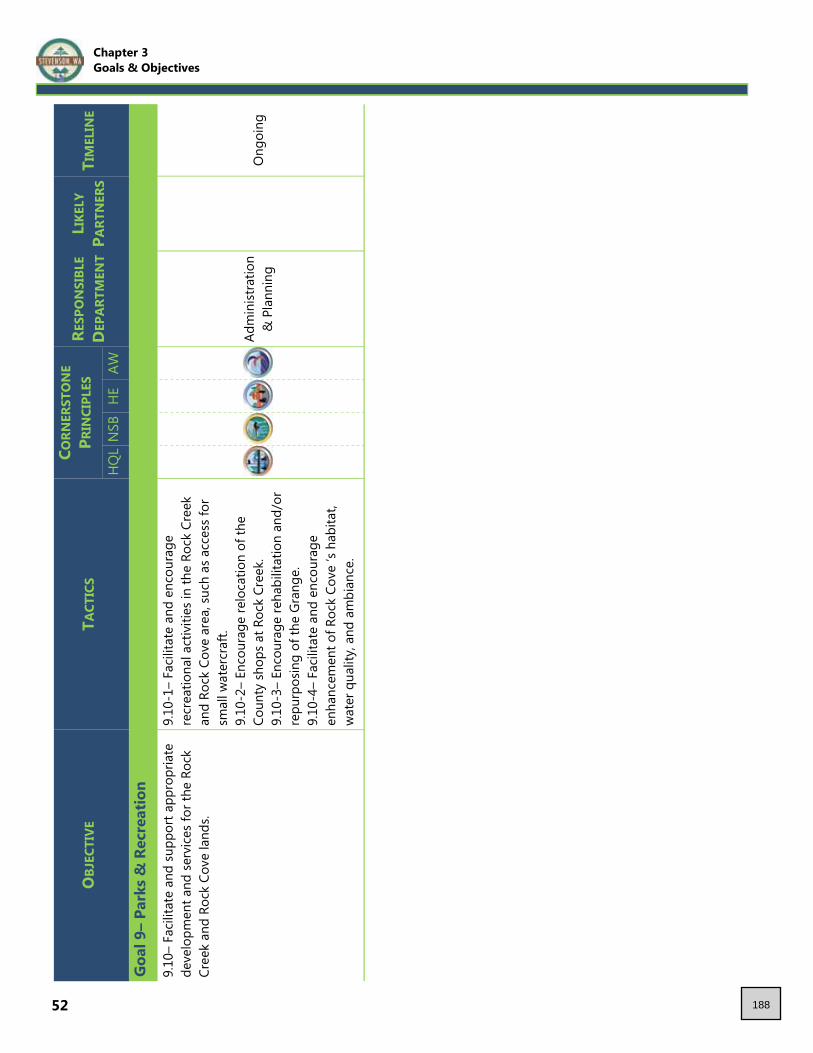
52
OBJ
ECTI
VE
TACT
ICS
CORN
ERST
ON
E P R
INCI
PLES
RE
SPO
NSI
BLE
DEP
ARTM
ENT
LIKE
LY
PART
NER
S TI
MEL
INE
HQ
L N
SB
HE
AW
Goa
l 9–
Park
s &
Rec
reat
ion
9.10
– Fa
cilita
te a
nd s
uppo
rt ap
prop
riate
de
velo
pmen
t and
ser
vice
s fo
r the
Roc
k Cr
eek
and
Rock
Cov
e la
nds.
9.10
-1–
Facil
itate
and
enc
oura
ge
re
crea
tiona
l act
iviti
es in
the
Rock
Cre
ek
and
Rock
Cov
e ar
ea, s
uch
as a
cces
s for
sm
all w
ater
craf
t.
9.10
-2–
Enco
urag
e re
loca
tion
of th
e Co
unty
sho
ps a
t Roc
k Cr
eek.
9.
10-3
– En
cour
age
reha
bilit
atio
n an
d/or
re
purp
osin
g of
the
Gran
ge.
9.10
-4–
Facil
itate
and
enc
oura
ge
en
hanc
emen
t of R
ock
Cove
‘s h
abita
t, w
ater
qua
lity,
and
am
bian
ce.
Adm
inist
ratio
n &
Pla
nnin
g
Ong
oing
Chapter 3 Goals & Objectives
188