City of Minneapolis Transportation Action Plan
252
-
Upload
khangminh22 -
Category
Documents
-
view
0 -
download
0
Transcript of City of Minneapolis Transportation Action Plan


D R A F T M I N N E A P O L I S T R A N S P O R T A T I O N A C T I O N P L A N - M a r c h 2 0 2 0 2
Our transportation system is the backbone of our city.We all depend on it to safely get where we need to go.In Minneapolis, we are building streets that reflect our
values and the vision outlined for transportationin Minneapolis 2040.

D R A F T M I N N E A P O L I S T R A N S P O R T A T I O N A C T I O N P L A N - M a r c h 2 0 2 0 3
We are focused on expanding transportation options for people walking, biking and taking transit – emphasizing low carbon and more affordable ways to get around. We are building a system for
people that addresses our climate emergency.
The Minneapolis Transportation Action Planis how we will get there.

D R A F T M I N N E A P O L I S T R A N S P O R T A T I O N A C T I O N P L A N - M a r c h 2 0 2 0 4
WALKING 401. Focus pedestrian improvements along and across the Pedestrian Priority Network. 43
2. Prioritize visibility and safety of pedestrians at intersections and midblock crossings. 45
3. Improve street lighting to increase visibility for pedestrians on streets and to meet the City’s energy goals. 48
4. Improve winter walking and rolling. 50
5. Ensure City’s policies and practices support consistent access to the sidewalk network. 53
6. Create and improve pedestrian connections across freeways, highways, rivers and railroads. 55
7. Partner with developers, utilities and property owners to provide high-quality pedestrian and public realm improvements. 57
8. Set policies and practices to leverage, manage, monitor and design for new and emerging technologies that increase visibility and comfort of pedestrians. 59
TA B L E O F CO N T E N TS
E X E C U T I V E S U M M A RYTransportation goals 8
Strategies and actions 9
Plan highlights 10
I N T R O D U C T I O NThe Transportation Action Plan in context 11
Transportation challenges 11
Goals to guide transportation decisions 11
Climate 12
Safety 14
Equity 15
Prosperity 17
Mobility 18
Active Partnerships 19
Structure of the TAP 20
Policies that frame the Transportation Action Plan 22
Key partnerships 24
How people move in Minneapolis 26
M I N N E A P O L I S S T R E E TS I N 2030Minneapolis streets in 2030 30
Shifting modes by 2030 31
Greenhouse gas reduction 32
Vehicle miles traveled reduction 32
Anticipated progress on upcoming corridors 33
Quick results 34
H O W W E G E T T H E R E: S T R AT E G I E S A N D AC T I O N SStrategies and actions 38

D R A F T M I N N E A P O L I S T R A N S P O R T A T I O N A C T I O N P L A N - M a r c h 2 0 2 0 5
BICYCLING 611. Complete the All Ages and Abilities Network 65
2. Build bikeway connections that overcome significant physical barriers during the buildout of the All Ages and Abilities Network. 67
3. Prioritize a network of neighborhood greenways during the buildout of the All Ages and Abilities Network. 69
4. Enhance intersection design and safety during the buildout of the All Ages and Abilities Network. 71
5. Plan and implement bikeway connections to and between regional destinations and adjacent city networks. 73
6. Maintain the All Ages and Abilities Network to provide year-round access. 75
7. Provide wayfinding to help people navigate the All Ages and Abilities Network. 79
8. Design bikeways using best practices that reflect the community and serve as an asset to people who may not currently ride a bike or use micromobility. 81
9. Update bicycle and micromobility parking practices to support demand and diversity of vehicles to significantly expand bicycle racks in the right of way. 83
10. Expand safe biking and micromobility education and encouragement. 86
11. Measure biking and micromobility ridership levels and user comfort. 88
TRANSIT 901. Increase transit coverage so that 75% of city residents are located within a quarter mile and 90% of residents are
located within a half mile of high frequency transit corridors. 93
2. Increase the speed and reliability of transit. 99
3. Increase available resources for transit and actively manage capital transit investments. 103
4. Partner with Metro Transit and other agencies to pursue new transit projects of high impact. 105
5. Expand multimodal access to transit. 110
6. Support efforts to ensure transit is a safe, comfortable and affordable option for all city residents. 112
TECHNOLOGY 1161. Harness technological advancements for citywide benefits, ensuring newly adopted technologies support safe
street operations and focus on human-centered design. 119
2. Increase access to shared mobility services by removing the barriers of physical ability, geographic placement, language, payment methods, income and technology and digital literacy. 122
3. Formulate public-private partnerships to implement innovative, ambitious and scalable pilots. 125
4. Require private shared mobility providers, including transportation network companies, to share data that supports the City’s ongoing transportation planning and operations work, with a focus on equity and access for all and minimizing greenhouse gas emissions. 128
5. Build a culture of continuous improvement in knowledge, education and communications around new technologies that advance transportation options. 130
6. Encourage and support electric vehicles by developing public charging stations and incentivizing private off-street stations; incentivize power sources from renewable generated electricity. 132
7. Continue to develop internal resources capacity for advanced mobility initiatives. 135
FREIGHT 1371. Utilize land use tools to improve the efficiency of deliveries. 141
2. Improve the safety and efficiency of freight movements and integrate freight into the Complete Streets framework. 144
3. Provide freight operators with tools to better navigate the city. 146
4. Transition vehicle fleets to zero-emissions technology where technology allows. 148

D R A F T M I N N E A P O L I S T R A N S P O R T A T I O N A C T I O N P L A N - M a r c h 2 0 2 0 6
5. Implement dynamic freight loading zones into citywide curbside management efforts. 150
6. Work with private sector and agency partners to guide and implement freight planning initiatives. 152
7. Regulate new delivery technologies that use the public right of way. 154
8. Develop a freight education program to educate the public and freight operators. 156
STREET OPERATIONS 1581. Update the City’s Complete Streets Policy. 160
2. Use quick-build tools to eliminate traffic related deaths and severe injuries on city streets. 161
3. Plan for efficient and practical operations of people walking, biking and taking micromobility options or transit throughout the street design process. 164
4. Leverage City resources and partnerships to promote, educate and encourage walking, biking and transit as alternatives to driving. 166
5. Price and manage use of the curb to encourage walking, biking and using transit and to discourage driving alone. 168
6. Induce regional mode shift by prioritizing pedestrian, bicycle and transit facilities and operations into capital transportation projects. 171
7. Align traffic signal operations with the Complete Streets Policy. 173
8. Coordinate with agency partners who own, operate and manage infrastructure within the City to plan, build and operate at the City’s standards. 175
9. Manage street detours in line with Complete Streets Policy. 179
DESIGN 1811. Develop a Street Design Guide that informs the planning and design of all future street projects. The Street
Design Guide will recognize streets as the city’s largest public space and institutionalize the City’s Complete Streets Policy, Vision Zero commitment, greenhouse gas emission reduction goal and stormwater management requirements through the design of city right of way. 183
2. Foster vibrant public spaces for street life. 186
3. Incorporate carbon-reduction design elements into City infrastructure projects. 189
4. Green the streets. 191
5. Use street design to improve transit operations. 193
6. Seek design exceptions and variances to established standards when standards established by other units of government conflict with the City’s Complete Streets Policy. 195
A P P E N D I C E SAppendix A: Engagement Summaries
Appendix B: Acknowledgments
Appendix C: Minneapolis 2040 and the Transportation Action Plan goal alignment
Appendix D: Snapshots of topic areas
PROGRESS 199The implementation framework 199
Monitoring progress: Tracking indicators demonstrate influence 199
Monitoring progress: Key metrics to measure progress on our plan 203

D R A F T M I N N E A P O L I S T R A N S P O R T A T I O N A C T I O N P L A N - M a r c h 2 0 2 0 7
E X E C U T I V E S U M M A R YD R A F T Tr a n s p o r t a t i o n A c t i o n P l a n
The Minneapolis Transportation Action Plan (TAP) is a 10-year action plan to guide future planning, design and implementation of transportation projects for all people in all the ways they move around. This plan is shaped by Minneapolis 2040, the Climate Action Plan, Vision Zero, and Complete Streets.
In 2030 our streets will reflect our City values. Our streets will be designed to address a climate emergency by emphasizing low or no carbon travel. Our streets will add protection for people walking and bicycling and will be designed to prioritize an effective transit system that serves all trips. Our streets will be organized to enhance access to jobs. Though our streets will continue to serve car traffic, our future depends on our ability to increase the city’s population as projected in Minneapolis 2040 without the car traffic associated with growth. This plan does not eliminate places for people to drive, it simply rebalances space to incentivize and allow for low carbon transportation options.
*includes school bus. 2010 Source: Metropolitan Council Travel Behavior Inventory
We've set a mode shift goal to have 3 of every 5 trips taken by walking, biking, or transit.
22% of the land area of the city is held in trust for the public within our streets; the TAP will leverage opportunities on our streets to reach our transportation goals.
15%
25% 25% 25%20%
43%
20%
2010 all trips
2030 all trips goal
13%
4%10%
Walk Bike Public Transit* Multi-Occupancy Vehicle Drive Alone

D R A F T M I N N E A P O L I S T R A N S P O R T A T I O N A C T I O N P L A N - M a r c h 2 0 2 0 8
The TAP seeks to unlock the potential of our streets as places for people and as an invaluable asset for broader outcomes achieved by making the right investments in our transportation network.
The TAP outlines a vision for our streets in 2030. We did not constrain that vision with concerns about resources but rather articulated how, with additional partnerships, time, and funding, we can make our city reflect the vision for transportation laid out in Minneapolis 2040.
Reach Vision Zero by prioritizing safety for all people and eliminate traffic fatalities and severe injuries by 2027
Build and operate a transportation system that contributes to equitable opportunities and outcomes for all people
Provide mobility options that move people and goods through reliable connections; retain top talent and grow Minneapolis as the economic engine of the region
Reshape the transportation system to address climate change, using technology, design and mobility options to aggressively reduce greenhouse gas emissions caused by vehicles
Embrace and enable innovation and advances in transportation to increase and improve mobility and access options for all
Create and seize opportunities to achieve shared goals and responsibilities through partnering and leveraging funding opportunities with national and regional partners and others who invest in the city
T r a n s p o r t a t i o n G o a l s
Climate
Safety
Equity
Prosperity
Mobility
Active Partnerships
This plan is guided by six goals. These goals create the groundwork and will help guide transportation decisions by the City for the next 10 years. Every strategy and action will support one or more of these six goals:

D R A F T M I N N E A P O L I S T R A N S P O R T A T I O N A C T I O N P L A N - M a r c h 2 0 2 0 9
S t r a t e g i e s a n d A c t i o n s
DESIGN FOR PEOPLE
IMPROVE STREET OPERATIONS AND
ADDRESS COMPETING DEMANDS
MANAGE INCREASED FREIGHT NEEDS
WHILE PRESERVING THE STREET
INVITE NEW TECHNOLOGY TO ADVANCE
TRANSPORTATION OPTIONS
DEFINE THE MINNEAPOLIS
TRANSIT NETWORK
INCREASE THE AVAILABILITY AND
SAFETY FOR BICYCLING AND MICROMOBILITY
TRAVEL
PROMOTE A SAFE AND INVITING WALKING
AND ROLLING ENVIRONMENT
The strategies and actions in this action plan reflect a tension that exists in the street that results from competing uses for limited right of way. Reaching our transportation goals requires strategic action. Listed in this plan are 55 strategies and 283 actions that we plan to undertake in the next 10 years.
Each strategy is followed by several actions, detailing how we, along with our partners, will make tangible improvements on our streets. To reflect Minneapolis goals and values in our streets, the strategies and actions within this plan are focused on seven topics:

D R A F T M I N N E A P O L I S T R A N S P O R T A T I O N A C T I O N P L A N - M a r c h 2 0 2 0 10
P l a n H i g h l i g h t s
We will find opportunities in our challenges by rethinking our streets.
The TAP calls for action over the next 10 years to leverage our streets to reach citywide goals. When implemented, the actions in the TAP will help us create more travel options for more people.
1
22
3
4
5
6
7
8
9
10
Reach a mode share goal in pursuit of our climate goals where 3 of every 5 trips are taken by walking, rolling, bicycling or transit.
Improve the experience of people walking and rolling on our streets, with the creation of a plaza program, the inclusion of pedestrian lighting on all street reconstruction projects and actions focused on safer street crossings.
Realize a City-led transit vision that makes taking transit a more attractive and affordable option for more people.
Expand transit coverage so that 75% of residents are within a 5-minute walk of high frequency transit and 90% are within a 10-minute walk; implement transit advantages along all the high frequency transit corridors.
Use street design to provide a more comfortable and healthier environment for people – including more green infrastructure and trees in street projects.
Act quickly to improve our streets, focusing on paint and lower-cost infrastructure improvements to make change that improves street design and operations.
Increase the All Ages and Abilities Network nearly twofold, focusing on a low-stress and protected bicycle and micromobility network for all system users.
Update the Complete Streets Policy to incorporate freight, micromobility and green infrastructure.
Adopt a strong curbside management policy to prioritize space for people and value the competing demands for curb space.
Implement a network of mobility hubs where people can connect to multiple shared transportation options – like transit, bikes, scooters and cars.

D R A F T M I N N E A P O L I S T R A N S P O R T A T I O N A C T I O N P L A N - M a r c h 2 0 2 0 11
T h e T r a n s p o r t a t i o n A c t i o n P l a n i n c o n t e x t
The Minneapolis Transportation Action Plan (TAP) is a 10-year action plan to guide future planning, design and implementation of transportation projects for all people however they choose to move around.
The TAP supports the bold policies adopted in the Minneapolis 2040 Comprehensive Plan, which identifies transportation as a critical component to increase equity, address climate change, reduce carbon emissions, improve human health through improved air quality and increased active travel and enable the movement of people, goods and services across the City of Minneapolis (the City). How we achieve the vision of Minneapolis 2040 depends upon our ability to define and then realize the value of our Minneapolis streets. Approximately 22% of the land area of the city is held in trust for the public within our streets (often called the public right of way). The TAP seeks to unlock the potential of our streets as places for people and as an invaluable asset for broader outcomes achieved by making the right investments in our transportation network. Our streets need to reflect our values of creating a more sustainable, equitable, safe and prosperous city; the set of strategies and actions contained within this plan strives to make every journey contribute to that vision.
I N T R O D U C T I O N
TRANSPORTATION CHALLENGES
We can face our challenges by rethinking our streets. Minneapolis is a city that experiences disparities of wealth based on race. We are a cold weather city that experiences heavy snow, ice and rain storms. We have largely devoted our streets to the ease of access for vehicles over the past hundred years; as a result, pedestrians, people on bikes and people in cars die and suffer life-altering injuries each year. We are both contributing to climate change as well as experiencing the effects. These challenges cannot be solved through transportation alone, but the way the City plans and provides for transportation choices has an impact on all of them.
GOALS TO GUIDE TRANSPORTATION DECISIONS
There are six transportation goals that guide the strategies and actions developed in this plan: climate, safety, equity, prosperity, mobility and active partnerships.

M I N N E A P O L I S T R A N S P O R T A T I O N A C T I O N P L A N 12
1 City of Minneapolis Climate Action Plan (2013). 2006 baseline year for 80% reduction. 2 Citywide Greenhouse Gas Emissions Inventory (2018) 3 Minneapolis 2040
Reshape the transportation system to address climate change using technology, design, and mobility options to aggressively reduce greenhouse gas emissions caused by vehicles.
INTRO
CLIMATE
L i n k s t o M i n n e a p o l i s 2 0 4 0 g o a l s
The goals in the TAP relate directly to the goals of Minneapolis 2040 and further refine the transportation contributions to reaching these broader citywide adopted goals. Appendix C illustrates the alignment between the transportation goals and the 14 goals of Minneapolis 2040.
Minneapolis has set a goal of reducing our greenhouse gas emissions by 80% by the year 2050.1 Emissions from on-road transportation account for approximately 24% of greenhouse gas emissions in Minneapolis.2 Even with mass adoption of electric cars, Minneapolis will need to reduce automobile passenger miles by 38% to reach our goal of reducing greenhouse gas emissions by 80% by 2050.3
To reach our citywide climate goals, we will need to change how we move around. We will need to improve options for transit, walking and bicycling and we’ll need to rapidly electrify fleets. As our population continues to increase, every effort will support reducing miles traveled in single occupancy and high-carbon vehicles because the health of our city and our climate depends on it.
Climate Safety Equity Prosperity MobilityActive
Partnerships

D R A F T M I N N E A P O L I S T R A N S P O R T A T I O N A C T I O N P L A N - M a r c h 2 0 2 0 13
INTRO
2006
20%
40%
60%
80%
100%
0%2007 2008 2009 2010 2011 2012 20142013 2015 2016 20182017
On-Road Transportation Solid Waste WastewaterElectricity Natural Gas
20060
600,000
300,000
900,000
1,200,000
2007 2008 2009 2010 2011 2012 20142013 2015 2016 20182017
Figure 1: Citywide emissions by type: Transportation accounts for 24% (2018)
Figure 2: Total emissions (metric tons of carbon dioxide) from on-road transportation
2006
20%
40%
60%
80%
100%
0%2007 2008 2009 2010 2011 2012 20142013 2015 2016 20182017
On-Road Transportation Solid Waste WastewaterElectricity Natural Gas
20060
600,000
300,000
900,000
1,200,000
2007 2008 2009 2010 2011 2012 20142013 2015 2016 20182017
Source: Citywide Greenhouse Gas Emissions Inventory (2018)
Source: Citywide Greenhouse Gas Emissions Inventory (2018)

M I N N E A P O L I S T R A N S P O R T A T I O N A C T I O N P L A N 14
4 City of Minneapolis Vision Zero Crash Study (2018), Minneapolis Public Works and MnDOT 5 City of Minneapolis Vision Zero Crash Study (2018)
Reach Vision Zero by prioritizing safety for all people and eliminate traffic fatalities and severe injuries by 2027.
In 2017, the City adopted a Vision Zero Policy which commits to zero traffic-related fatalities and severe injuries by 2027. It is unacceptable that people die in traffic crashes on our streets. We are committed to improving safety on Minneapolis streets for all people.
Every year from 2007-2016, an average of 95 people either died or experienced a life-altering injury on streets in Minneapolis.4 These injuries are disproportionately
suffered by those walking and bicycling, in lower income neighborhoods, and by our Native American population.5 Our strategies and actions directly address these inequities by focusing on ways to improve conditions for those most impacted. Transitioning automobile trips to walking and bicycling requires safe streets for these users and makes progress toward our climate goal. The City has a 2020-2022 Vision Zero Action Plan which details citywide actions and initiatives to make progress on our goal to end traffic fatalities and severe injuries by 2027.
Figure 3: Fatal and severe injury crashes*
PedestrianVehicle Bicycle
2007 2008 2009 2010 2011 2012 20142013 2015
20
0
60
80
40
120
140
100
2015 2016 2017 2018
160
SAFETY
INTRO
Source: City of Minneapolis Vision Zero Crash Study (2018)
*The Department of Public Safety expanded the definition of “serious injury” for crash reports starting in 2016 to align with federal standards, which makes it impossible to directly compare data before and after 2016.

D R A F T M I N N E A P O L I S T R A N S P O R T A T I O N A C T I O N P L A N - M a r c h 2 0 2 0 15
INTRO
Build and operate a transportation system that contributes to equitable opportunities and outcomes for all people.
Equity translates to fair and just opportunities and outcomes for all people. The City is committed to the development of policies, practices and strategic investments to reverse racial disparity trends, eliminate institutional racism, and ensure that outcomes and opportunities for all people are no longer predictable by race.6 Transportation is a critical part of this work.
Not all people have the same access to transportation. More than one of every six people in Minneapolis (16.5%) live in a household without an automobile.7 In some neighborhoods as many as 40-50% of households don’t have access to a vehicle. While some households choose not to own a car, there are many households that cannot afford to do so. Transportation is one of the top two household costs, accounting for approximately 19% of household income in Minneapolis.8
One of the goals of this plan is to reduce single occupancy and high-carbon motor vehicle trips, but the current transportation network affords more opportunities to those who can purchase a car, such as access to more jobs. To design, build and operate an equitable transportation system, it is imperative that we focus on underserved communities that are in need of expanded, improved and affordable mobility options.
Additionally, 11% of Minneapolis residents self-report a disability, which may present mobility challenges.9 Given these realities, the existing transportation system results in different challenges for different people. The approach to our work recognizes these realities and will help address them.
6 City of Minneapolis (2017) 7 Household Size by Vehicles Available, U.S. Census Bureau, 2013-2018 American Community Survey 5-Year Estimates 8 2013 American Housing Survey; American Community Survey 2009-2013 (5 year estimates) 9 Disability Characteristics, U.S. Census Bureau, 2013-2017 American Community Survey 5-Year Estimate
EQUITY

D R A F T M I N N E A P O L I S T R A N S P O R T A T I O N A C T I O N P L A N - M a r c h 2 0 2 0 16
INTRO
Figure 4: Households without access to a car, 2018
Source: 2018 American Community Survey 5-Year Estimates

D R A F T M I N N E A P O L I S T R A N S P O R T A T I O N A C T I O N P L A N - M a r c h 2 0 2 0 17
INTRO
10 Minneapolis 2040 and the Decennial Census, Metropolitan Council 11 2010 and 2018 American Community Survey 5-Year Estimates
Provide mobility options that move people and goods through reliable connections; retain top talent and grow Minneapolis as the economic engine of the region.
Minneapolis has been experiencing record-breaking development in recent years, and it is anticipated that nearly 60,000 more people will live in Minneapolis by 2040.10 To retain top talent, grow our educational and employment opportunities and continue as the economic engine of the region, we must provide mobility options that reliably move people, goods and services (including utilities) throughout the city while significantly reducing our climate footprint.
Connecting people to jobs makes our region and city more competitive. Companies are increasingly choosing where to relocate based, in part, on the transportation choices that will be available to their employees. Increasing the number of jobs accessible by transportation options also supports individual prosperity, helping our city reach goals of equity and economic inclusion.
Morning and afternoon commute times are often the busiest times on our streets. As our city continues to grow, our transportation system must get people where they need to go while still meeting our broader goals. In the last 10 years, we’ve added more than 50,000 new employees due to a mix of population growth and a decrease in unemployment, from 9% in 2010 to 5.5% in 2018.11 This trend is expected to continue in the coming decades as well. With 60,000 more people anticipated by 2040, it is critical that we focus on mode shift and reducing total vehicle miles traveled so that every new person does not equate to one more car on our streets. As we deal with a growing city, it’s important that we provide transportation options and services, as well as the supporting infrastructure, to ensure our streets are safe, environmentally friendly and accessible to everyone who lives, works or visits our city.
Figure 5: Minneapolis Commuting Population
PROSPERITY
Source: ACS 5-year estimates (2008-2017) and ACS 3-year estimates (2008)
2008 2009 2010 2011 2012 20142013 2015 2016 2017
190,000
180,000
210,000
220,000
200,000
240,000
230,000
Source: American Community Survey 5-year estimates (2008-2017) and American Community Survey 3-year estimates (2008).
Num
ber o
f Wor
kers
16
Year
s an
d O
ver

D R A F T M I N N E A P O L I S T R A N S P O R T A T I O N A C T I O N P L A N - M a r c h 2 0 2 0 18
INTRO
Embrace and enable innovation and advances in transportation to increase and improve mobility and access options for all.
We are committed to making transportation options safer, more reliable, more convenient and with fewer climate impacts so that we can more quickly reach our citywide goals.
From the onset of the bicycle to the automobile, planes and drones, transportation has always been impacted by technology. Rapid changes to transportation are even more visible now with the introduction of bikesharing, ride-hailing, scooter sharing and car sharing options, all within the last 15 years. Predicting what might be next is challenging, but we know that if we stay committed to our goals, we can both anticipate and respond to change while harnessing technology to support the transportation future we want.
The City of Minneapolis has over 1,000 miles of streets and parkways that serve a variety of different types of mobility needs and transportation options. There are trips in and out of the city, between neighborhoods, or that serve as the last mile to and from transit
stops. In fact, there are over 200 transit routes spread throughout the city that carry millions of passengers every year. We also have a bikeshare system that has seen 400% growth in annual ridership since it launched in 2010, with about 460,000 trips in 2017.12
From the time that our regional bikeshare system launched, other shared mobility options such as ride-hail, electric scooters and dockless bikeshare have emerged. In the summer of 2018, two scooter share companies brought their businesses to Minneapolis. During the first season of operation, these companies reported about 210,000 scooter trips in 2018.
In recent years, there have also been efforts to accommodate electric vehicles. As these mobility options continue to emerge, the City will be evaluating these options to ensure they are equitably and safely operated, work to support our mode share goals and that the City’s infrastructure can support the move from fossil fuel to renewable energy options.
12 Nice Ride Minnesota (2019)
Figure 6: Nice Ride trips (system-wide) and scooter trips in Minneapolis
MOBILITY
2010 2011 2012 20142013 2015 2016 2017 2018 20190
300,000
600,000
900,000
1,200,000
1,500,000
Nice Ride trips Scooter trips
Source: Nice Ride Minnesota (2019) and Minneapolis scooter pilot program data (2019)

D R A F T M I N N E A P O L I S T R A N S P O R T A T I O N A C T I O N P L A N - M a r c h 2 0 2 0 19
INTRO
Create and seize opportunities to achieve shared goals and responsibilities through partnering and leveraging funding opportunities with national and regional partners and others who invest in the city.
Government, businesses, developers, community organizations, residents and visitors are all partners in achieving our transportation goals. The City and our agency partners hold in trust the public right of way (often referred to as streets), which comprises 22% of the available land area.13 The City has a commitment to Vision Zero and Complete Streets, and we need to work with our partners to create a more seamless transportation system that allows people to use streets as routes, places and destinations – no matter which governmental agency manages the right of way.
13 City of Minneapolis Parcel, Parks, and Waterway Data
Figure 7: Jurisdictional map
AC TIVE PARTNERSHIPS
Source: Minneapolis Public Works, 2019

D R A F T M I N N E A P O L I S T R A N S P O R T A T I O N A C T I O N P L A N - M a r c h 2 0 2 0 20
INTRO
PROMOTE A SAFE AND INVITING WALKING AND ROLLING ENVIRONMENT: The plan identifies actions to make it easier, safer and more comfortable for people to get around walking or rolling using a wheelchair, stroller or other assistive mobility device. Actions are focused on a Pedestrian Priority Network. All future references to “walking” in this document are inclusive of “walking and rolling” as defined above.
INCREASE THE AVAILABILITY AND SAFETY FOR BICYCLING AND MICROMOBILITY TRAVEL: With an emphasis on establishing a low-stress network for all ages and abilities, the plan focuses on making the choice to bike or take other micromobility options easier for more people, as well as improving safety and comfort for those who ride.
DEFINE THE MINNEAPOLIS TRANSIT NETWORK: A quarter-million transit trips begin, end or travel through Minneapolis each weekday. Transit is a critical part of the City’s transportation network; the plan outlines strategies and actions to support a reliable, convenient and comfortable public transit network.
INVITE NEW TECHNOLOGY TO ADVANCE TRANSPORTATION OPTIONS: Technology is changing the way we travel. The plan defines how to integrate technology and new business and service models. Shared scooters, bicycles and electric vehicles are examples of new mobility options.
MANAGE INCREASED FREIGHT NEEDS WHILE PRESERVING THE STREET: Freight is a critical component of our economy. The plan considers how raw materials, food and packages are delivered to people and businesses every day in our city with strategies and actions to improve the sustainable and efficient movement of freight to, from and through Minneapolis.
IMPROVE STREET OPERATIONS AND ADDRESS COMPETING DEMANDS: This topic further defines how the City’s Complete Streets Policy, commitment to Vision Zero and transportation goals come together into daily operations and transportation system planning. It provides a foundation for evaluating competing demands within limited street space by taking a comprehensive, people-first approach.
DESIGN FOR PEOPLE: Streets are important community public spaces where we live, gather, travel, shop or wait for the bus, on a daily basis. We aim to design, build and maintain streets that are safe, functional and support the movement of people and goods throughout the city. Actions in this topic focus on the many ways streets need to serve people through design. The City’s Street Design Guide (to be released in 2020) is a companion document to the TAP and will identify street typologies and provide guidance for how we approach design on all streets within the city, with the exception of freeways.
To reflect Minneapolis
goals and values in our streets, the strategies
and actions within this plan are focused on
seven topics:
S t r u c t u r e o f t h e T A PRELATIONSHIP TO OTHER PLANNING EFFORTS

D R A F T M I N N E A P O L I S T R A N S P O R T A T I O N A C T I O N P L A N - M a r c h 2 0 2 0 21
The TAP replaces Access Minneapolis, and all its parts, in full. Access Minneapolis was developed between 2007-2011, with updates as recently as 2017. Access Minneapolis includes:
● Downtown Action Plan
● Citywide Action Plan
● Design Guidelines for Streets and Sidewalks14
INTRO
THE TAP IN RELATIONSHIP TO THE VISION ZERO AC TION PLAN?
The City adopted a Vision Zero Action Plan in December 2019 that identifies strategies and actions across multiple City departments to make progress toward our goal of zero traffic-related deaths and severe injuries; the initial plan is for years 2020-2022 and will be updated as we make progress toward our goal. The TAP and its strategies and actions support the Vision Zero Action Plan by building off the work outlined in that plan. The specific Vision Zero strategies and actions are not repeated verbatim in this document, but rather assumes the City is working toward the strategies and actions in both plans simultaneously. Those strategies and actions articulated in the Vision Zero Action Plan are set for completion by 2022.
THE TAP'S INFLUENCE ON PROJEC T PRIORITIZATION AND CAPITAL PROJEC T DEVELOPMENT
The City prioritizes capital projects through the process and criteria identified as a part of its 20 Year Streets Funding Plan and publishes its multi-year plan of programmed projects annually
through the Capital Improvement Program process. The TAP identifies new projects and programs that will be incorporated into the City’s existing approach to prioritizing, programming and delivering transportation projects. Many projects in the TAP will require additional resources – staff time or funding – including those identified for near-term implementation (see Quick results section). The detail provided in the action plan also allows for us to apply for grant funding opportunities and potentially leverage other regional or national partnerships to achieve the actions identified.
FISCAL PLANNING AND IMPLICATIONS
The TAP is not a fiscally constrained plan. There are strategies and actions with large financial impacts on the City and its partners. While we understand additional resources are needed, we are also adjusting our existing delivery of capital projects and programs to reflect the strategies and actions outlined and to capitalize on opportunities to value-engineer and creatively finance initiatives.
THE TAP REPLACES ACCESS MINNEAPOLIS
14 The Design Guidelines for Streets and Sidewalks will remain in effect until the completion of the Street Design Guide, which is anticipated to be complete in 2020.
● Streetcar Planning
● Pedestrian Master Plan
● Bicycle Master Plan

D R A F T M I N N E A P O L I S T R A N S P O R T A T I O N A C T I O N P L A N - M a r c h 2 0 2 0 22
INTRO
RELATIONSHIP TO OTHER CITY AND REGIONAL PLANS
Metropolitan Council Transportation Policy PlanThe Metropolitan Council developed a Transportation Policy Plan as a part of its regional development guide, Thrive MSP 2040, which sets the direction for the region’s growth and development. The most recent update to the Transportation Policy Plan was October 2018. The Transportation Policy Plan is a fiscally constrained plan that identifies regionally important projects. The TAP supports the Transportation Policy Plan and goes further to identify projects, some with regional impacts, which are important to the City of Minneapolis. Identification of some projects in the TAP may be incorporated into the Transportation Policy Plan in the future, in either the fiscally constrained portion or an increased revenue scenario.
Metro Transit Network Next Metro Transit is an operating division of the Metropolitan Council and is the regional transit agency that operates most, but not all, of the transit service in Minneapolis.15 Metro Transit is currently developing a plan to guide the expansion of the regional bus network, called Network Next, and will develop a prioritized vision for the bus network of 2040, including the local and express bus network, arterial bus rapid transit network and service quality investments like speed and reliability improvements and customer facilities.
The transit strategies and actions have been developed in coordination with Metro Transit and will be coordinated with the Network Next effort.
Minneapolis ADA Transition Plan for Public WorksThe Minneapolis Americans with Disabilities Act (ADA) Transition Plan for Public Works details how the City complies with the 1990 Americans with Disabilities Act. The TAP works in tandem with the ADA Plan; as such, all projects and programs identified in the TAP will comply with the ADA. This plan goes further in identifying ways the City can create greater access through improvements to our transportation network.
20 Year Streets Funding PlanThe 20 Year Streets Funding Plan (approved in 2016, updated in 2018) details the process and criteria for how the City selects street improvement projects for inclusion in the annual Capital Improvement Program. The 20 Year Street Funding Plan is not superseded by the TAP; rather, the TAP helps inform how we design and operate our streets, as well as identifies additional projects outside of the typical reconstruction process that are prioritized for development. The City remains committed to prioritizing the Capital Improvement Program through a data-driven process that prioritizes equity as well as asset condition.
15 Other transit service is provided by Minnesota Valley Transit Authority, SouthWest Transit and other transit providers that serve cities and counties in the region who opted-out of Metro Transit service.

D R A F T M I N N E A P O L I S T R A N S P O R T A T I O N A C T I O N P L A N - M a r c h 2 0 2 0 23
INTRO
P o l i c i e s t h a t f r a m e t h e T r a n s p o r t a t i o n A c t i o n P l a n
In addition to the Minneapolis 2040 Plan, two key transportation policies help direct the goals, strategies and actions of the TAP. The Complete Streets Policy and Vision Zero Policy provide key guidance to frame all the work detailed in the TAP.
The City of Minneapolis adopted a Complete Streets Policy in May, 2016. The Policy establishes a modal hierarchy that holds throughout all phases of planning, design, construction and operations of our streets. The TAP proposes to update the Complete Streets Policy (see street operations Action 1.1) to reflect greater nuance in prioritization to accommodate the complexity of our streets. Thus far, this hierarchy has proved helpful within and outside of city government to explain and guide our work. The role of freight, new mobility options, storage of vehicles and stormwater management will be reflected in the updated Complete Streets Policy.
In 2017, the City adopted a Vision Zero Policy that committed to ending fatal and severe injuries on our streets within 10 years. This steadfast commitment to safety permeates throughout our plan; the work we do aims to reach Vision Zero and focus on those who are disproportionately impacted by traffic crashes (e.g., those walking, biking, Native Americans and those in ACP50 areas - areas of concentrated poverty with the majority of residents people of color).
COMPLETE STREETS POLICY
VISION ZERO
Figure 8: Complete Streets hierarchy

D R A F T M I N N E A P O L I S T R A N S P O R T A T I O N A C T I O N P L A N - M a r c h 2 0 2 0 24
INTRO
K e y p a r t n e r s h i p s
AGENCY PARTNERSHIPS
Hennepin County owns 85 miles of arterials within city boundaries, including some
of our largest commercial
corridors like Lake Street,
Lowry Avenue, parts of
Lyndale Avenue and
West Broadway.
The Minneapolis Park and
Recreation Board (MPRB)
owns and operates
55 miles of parkways within city boundaries.
These include most of the
streets and trails along the lakes, river and creek,
along with Kings Highway
and other parkways like Saint Anthony Parkway and Minnehaha
Parkway.
The Minnesota Department of Transportation
owns and operates 15 miles of state highways
in Minneapolis and 30 miles
of interstates, including 394, 94,
and 35W.
Notable Minnesota
Department of Transportation state highways include Central
Avenue, Hiawatha
Avenue, Olson Memorial
Highway and University Ave
NE.
The University of Minnesota owns
just over four miles of streets within city boundaries.
These include Pillsbury Drive SE,
Delaware Street SE, Church Street SE, 23rd Avenue SE,
Harvard Street SE, Walnut Street SE,
6th Street SE, 5th Street SE,
Beacon Street, East River Parkway,
2nd Street S, Union Street SE,
21st Avenue S and the University of Minnesota
Transitway.
The Navy owns about 1.5 miles of
streets near the southern border
of the city, though they are restricted
for private use.
The City cannot reach our goals without the support of other key agencies who own, operate and manage streets within the city. Hennepin County, the Minnesota Department of Transportation, the Minneapolis Park and Recreation Board and the University of Minnesota all hold critical roles in the way our streets function. While the reach of the TAP covers all streets within the city regardless of ownership, we acknowledge the jurisdictional roles and responsibilities of our partners regarding their streets.
0.18% University of Minnesota
91.03% City of Minneapolis
2.12% MN Dept of Transportation
2.29% Minneapolis Park and Rec Board
3.60%Hennepin County
Figure 9: Roadway jurisdiction
Source: Minneapolis Public Works, 2019

D R A F T M I N N E A P O L I S T R A N S P O R T A T I O N A C T I O N P L A N - M a r c h 2 0 2 0 25
INTRO
ORGANIZATION, INDUSTRY AND COMMUNITY PARTNERSHIPS
In addition to the agencies listed, the City has several key organizational, industry and business partnerships that will support us in achieving the strategies and actions outlined in this plan.
● Metro Transit is the operator of the regional transit system and delivered the transit service for 80.6 million trips systemwide in 2018, or an average of over 220,000 each day. They are a key partner in reaching our transportation vision in Minneapolis.
● Mobility providers – suburban transit providers, private ride-hailing companies and shared-micromobility companies are all partners in offering non-single occupancy travel options. These service providers offer new mobility options that promote equity and improve mobility, while transitioning dependency from the private car.
● The Twin Cities Shared Mobility Collaborative focuses on regionally advancing shared mobility and is a partner in advancing new mobility options.
● Philanthropic foundations are partners in our pursuit of data-driven decision-making and regional and national collaboration, particularly in the strategies and actions related to inviting new technology and advancing transportation options.
● Private industry, including freight shippers and business owners, are key partners for many of our freight strategies and actions.
● Private property owners and building managers are partners for maintaining and improving our pedestrian network, particularly when it comes to winter maintenance. They are also partners in coordinating improved freight deliveries. Private developers and the Department of Community Planning and Economic Development are key partners related to implementing private sector related improvements through the development review process and other land use related strategies and actions.
● The University of Minnesota and other research institutions are key partners for freight and other data or research related partnerships.
Figure 10: Minnesota Department of Transportation state highway within Minneapolis

M I N N E A P O L I S T R A N S P O R T A T I O N A C T I O N P L A N 26
16 Between 2008 and 2018 the annual VMT in Minneapolis decreased from 2.44 billion miles to 2.37 billion miles. In the same time, the annual VMT per capita decreased from 7,189 miles to 5,567 miles. Source: Minnesota Department of Transportation Traffic Data Reports. During this time frame population increased from about 384,000 to over 425,000.
17 Walking and Biking in Numbers 18 2018 American Community Survey 5-Year Estimates
H o w p e o p l e m o v e i n M i n n e a p o l i s
We surveyed over 5,000 people during the summer of 2018 to ask how they most often travel and how they would prefer to travel. What we heard was that half typically travel by car (50%), but many of those same people would prefer to travel more by biking (36%) and transit (22%). Every category (transit, biking, walking, rideshare, car share and other) saw an increase in desired travel mode versus current way of travel except for the private car.
The City has several policies that aim to provide people with a wide variety of transportation options that are safe, sustainable, convenient and accessible. This includes Minneapolis 2040, our Complete Streets Policy, our Climate Action Plan and our Vision Zero Policy. One of the commonalities between these plans and associated policies is that they all aim to reduce the number of trips that people take in single occupancy vehicles.
Trends from various sources show that we are making progress toward reducing single occupancy vehicle trips. Despite a growth in population we have managed to keep the number of vehicle miles traveled at the same level, which shows that people are driving less per capita.16 Based on our annual bicycle and pedestrian counts we have seen steady increases at our count locations over the past 10 years.17 From census data we can see that younger generations are driving less than older generations.18
While there is reason to celebrate these trends, the pace at which people are reducing their driving is far too slow to reach our goals.
Figure 11: How I travel vs. how I want to travel
Personal Car
Transit
Biking
Walking
Rideshare
Car Share
Other
14%
18%
15% 50%
36%
22%
20%
16%
2%2%2%
.5%1.5%1%
Most frequently
used
Most preferred
used
Source: City of Minneapolis, 2018

D R A F T M I N N E A P O L I S T R A N S P O R T A T I O N A C T I O N P L A N - M a r c h 2 0 2 0 27
INTRO
People are driving less In the last decade the average number of miles driven per person each day has decreased by about three miles.
A SNAPSHOT IN TIME: OUR STARTING POINT FOR TRAVEL TRENDS IN MINNEAPOLIS
Figure 12: Average daily vehicle miles traveled per person in Minneapolis
Despite a rise in population, total vehicle miles traveled has stayed relatively constantBetween 2010 and 2018 Minneapolis saw an increase of over 35,000 people.19 Despite this growth in population, the total amount of vehicle miles traveled remains fairly constant.20
19 Demographic and Housing Estimates, U.S. Census Bureau, 2010 and 2018 American Community Survey 1-Year Estimates 20 Minnesota Department of Transportation, Roadway Data, VMT by Route System in each City within each County (2001-2014, 2016-2018)
Figure 13: Average daily vehicle miles traveled
2007 2008 2009 2010 2011 20132012 2014 2015 2016
10
8
14
16
12
20
18
2017
2007 2008 2009 2010 2011 20132012 2014 2015 20164,000,000
4,500,000
5,000,000
5,500,000
6,000,000
6,500,000
7,000,000
2017
Source: Minnesota Department of Transportation Traffic Data Reports, 2007-2017
Source: Minnesota Department of Transportation Traffic Data Reports, 2007-2017

D R A F T M I N N E A P O L I S T R A N S P O R T A T I O N A C T I O N P L A N - M a r c h 2 0 2 0 28
INTRO
People are walking and biking moreThe City has been collecting information about the number of people walking and biking at 30 benchmark locations since 2007. While the mode share for bicycling and walking stayed relatively constant over this period,22 these counts show that the number of people walking and biking in Minneapolis has steadily risen over this period.
People are more likely to walk, bike or take transit for shorter tripsThe Metropolitan Council maintains a regional travel demand model. According to the model, for trips less than one mile people choose to walk 46% of the time and drive 16% of the time.21
A SNAPSHOT IN TIME: OUR STARTING POINT FOR TRAVEL TRENDS IN MINNEAPOLIS
21 Metropolitan Council Regional Travel Demand Model, 2015 Scenario 22 2010 and 2018 and American Community Survey 5-Year Estimates
Figure 14: Minneapolis trips beginning and/or ending in Minneapolis
Figure 15: People walking vs. biking
Number of people counted walking at benchmark locations in Minneapolis has increased by 21%
Number of people counted biking at benchmark locations in Minneapolis has increased by 53%
Number of people biking at benchmark locations has increased by an average of 6% annually among all locations
6%Number of people walking to work or school has increased by 7% since 2007
53%7%21%
2
Source: Walking and Biking in Numbers
Source: Metropolitan Council Regional Travel Demand Model, 2015 Base Scenario

D R A F T M I N N E A P O L I S T R A N S P O R T A T I O N A C T I O N P L A N - M a r c h 2 0 2 0 29
INTRO
Overall commute mode share has remained fairly constantBetween 2010 and 2018 the commute mode share to work stayed relatively constant.24 While there was a slight decline in driving alone to work (-1.3%) and carpooling to work (-0.2%), there hasn’t been a substantial shift in the way people get around.
Commute to work changes by age According to the U.S. Census Bureau clear trends are seen connecting age and commute to work preferences. Younger workers more likely to travel to work by means other than driving alone. The likelihood of walking, taking a taxi, motorcycle, bicycle or other means, using public transit, or carpooling all decline with age, while the likelihood of working at home or driving alone to work all increase with age.23
A SNAPSHOT IN TIME: OUR STARTING POINT FOR TRAVEL TRENDS IN MINNEAPOLIS
23 Means of Transportation to Work by Age, U.S. Census Bureau, 2017 American Community Survey 5-Year Estimates 24 American Community Survey 1-Year Estimates.
Figure 16: Commute travel mode by age, Minneapolis residents
Figure 17: Driving to work alone vs. carpooling to work
0.9% 2.4%1.8% 2.4%0.4%
Carpooled Drove alone
Bicycle
2.4%0.4%
Public transportation
0.6%Worked at home
0.6%Walked
0.6%Taxi, motorcycle, other
INCREASED
DECREASED
Source: 2010 and 2018 American Community Survey 5-Year Estimates
Source: 2018 American Community Survey 5-Year Estimates

D R A F T M I N N E A P O L I S T R A N S P O R T A T I O N A C T I O N P L A N - M a r c h 2 0 2 0 30
MINNEAPOLIS STREETSin 2030
In 2030 our streets will reflect our City values. Our streets will be designed to address a climate emergency by emphasizing low- or no-carbon travel. Our streets will add protection for people walking and bicycling and will be designed to prioritize an effective transit system that serves all trips. Our streets will be organized to enhance access to jobs. Though our streets will continue to serve car traffic, our future depends on our ability to increase the city’s population as projected in Minneapolis 2040 without the car traffic associated with growth. This plan does not eliminate places for people to drive, it simply rebalances space to incentivize and allow for low carbon transportation options.
To that end, there are three major metrics that we can monitor that reflect reaching our goals: mode shift, greenhouse gas reduction and reduction in vehicle miles traveled, which emphasize the TAP’s focus on climate and equity.
Figure 18: Climate goal metrics
Reduce vehicle miles traveled
Increase walking, biking, and transit trips
Reduce greenhouse gas
emissions
Climate Goal

D R A F T M I N N E A P O L I S T R A N S P O R T A T I O N A C T I O N P L A N - M a r c h 2 0 2 0 31
MPLS STREETS
S h i f t i n g m o d e s b y 2 0 3 0
Mode split measures the percentage of travelers using a particular type of transportation (walk, bike, transit, car) for a particular trip (work, school, errands). Mode split data is collected from the Metropolitan Council through the Travel Behavior Inventory, which has been collected every 10 years but will be collected more frequently moving forward. This dataset accounts for all trips taken by all people in a household.
Reflecting a reduction of car trips and an increase of walking, biking and transit trips is important to frame the strategies and actions of this plan, which is expressed as shifting modes.
There are six key reasons to set a 2030 mode shift goal:
We’ve set a goal of having 60% of trips taken by means other than a car –
35% by walking and biking and 25% by transit.25
2010 data shows that 68% of all trips that start or end in Minneapolis are taken by car – either individually (43%) or with other people (25%). Walking, biking, transit and school bus trips account for just under a third of all trips (32%).
Reduce costs for more residents through improved
access to lower cost transportation options
6
25 The 2010 data is anticipated to be updated by the Metropolitan Council by the time the TAP is adopted; the mode shift goal may be adjusted based on changes to baseline data; we understand that 2010 trip data may be significantly different than the forthcoming 2018-2019 dataset.
Capture new trips from new residents in ways other than cars
5
Reduce crash impacts from large vehicles
3
Improve quality of life related to trip time
and congestion
4
Allocate space across all
modes equitably
2Reduce greenhouse gas emissions and improve air quality
1
Figure 19: All trips starting and ending in Minneapolis; mode split (2010) and mode split goal (2030)
15%
25% 25% 25%20%
43%
20%
2010 all trips
2030 all trips goal
13%
4%10%
Walk Bike Public Transit* Multi-Occupancy Vehicle Drive Alone
*Includes school bus

D R A F T M I N N E A P O L I S T R A N S P O R T A T I O N A C T I O N P L A N - M a r c h 2 0 2 0 32
MPLS STREETS
G r e e n h o u s e g a s r e d u c t i o n
The environmental impacts of gas-powered vehicles continue to degrade the air we breathe and have negative impacts on health, environment and quality of life. The Minneapolis Climate Action Plan set a goal of 80% reduction of greenhouse gas emissions by 2050, from 2006
baseline levels. 2006 baseline was just under 5.2 million metric tons citywide from all sources; the goal is just over one million metric tons in 2050.26
Emissions from on-road transportation account for approximately 24% of greenhouse gas emissions in Minneapolis.27
V e h i c l e m i l e s t r a v e l e d r e d u c t i o n
Measuring the total number of vehicle miles driven is important to measuring mode shift and greenhouse gas reduction. In line with goals set in the Climate Action Plan and reinforced in Minneapolis 2040, we’ve set a goal of reducing
vehicle miles traveled by 1.8% per year.28 To reach this goal, the average person in Minneapolis would have to travel just four miles per day less in a car.29
Figure 20: Greenhouse gas emissions (metric tons) from transportation sector historically and projected to reach City's goal
Figure 21: Vehicle miles traveled historically and projected to reach City's goal
26 Climate Action Plan 27 Minneapolis Sustainability Office - Citywide Greenhouse Gas Emissions Inventory 2018 28 The vehicles miles traveled reduction is calculated from 2018 baseline data of 2,368,057,420 miles traveled on Minneapolis streets; 1.8% annual reduction needed between
2018 and 2030. Annual vehicle miles traveled data provided by the Minnesota Department of Transportation. 29 Minnesota Department of Transportation vehicle miles traveled data reflects all vehicle miles traveled in the City of Minneapolis and does not solely represent vehicle
miles traveled for Minneapolis residents. Current population and projected population estimates for Minneapolis residents of all ages were used to calculate daily average mileage.
2009 2010 2011 2012 2013 2014 20152016 2017
2018
2030
20082007
2006
1.11M1.15M
1.09M 1.06M 1.08M 1.08M 1.11M 1.13M 1.12M 1.12M1.08M 1.06M
1.02M
.70M
2009 2010 20112012 2013 2014 2016 2017
2018
2030
20082007
2006
2.41B2.52B
2.44B2.39B 2.40B 2.39B
2.48B 2.51B 2.50B 2.47B 2.44B2.37B
1.87B
Source: Citywide Greenhouse Gas Emissions Inventory
Source: Minnesota Department of Transportation (MnDOT); Roadway Data, VMT by Route System in each City, within each County

D R A F T M I N N E A P O L I S T R A N S P O R T A T I O N A C T I O N P L A N - M a r c h 2 0 2 0 33
MPLS STREETS
A n t i c i p a t e d p r o g r e s s o n u p c o m i n g c o r r i d o r s
Certain streets in Minneapolis will be reconstructed within the next 10 years – the timeframe of the TAP – and their street designs will be influenced by the strategies and actions identified in this plan.
Upcoming capital projects will be influenced by the Street Design Guide, which will reference the priority networks defined in this plan: the Pedestrian Priority Network, the All Ages and Abilities Network (for biking and micromobility), Transit Priority Projects and the Truck Route Network. When the Pedestrian Priority Network, the All Ages and Ability Network and streets with transit overlap on the same street segment, the design decisions are often most difficult, especially when the public right of way is most constrained. These corridors, while challenging, provide the greatest opportunity to make bold changes to advance mode shift goals, greenhouse gas reduction and reductions in vehicle miles traveled.
While subject to change, the streets shown in Figure 22 are currently recommended for street reconstruction sometime within the next 10 years and have overlapping priority networks.
Figure 22: Upcoming street reconstruction/overlapping priority networksUpcoming street reconstruction/overlapping priority networks
Overlapping Priority NetworksProjects in the City 5-Year CIP
Potential City Projects Beyond the 5-Year CIP
Projects in the County 5-Year CIP
Potential County Projects Beyond the 5-Year CIP
The corridors on this map have three or more overlapping networks from the Transportation Action Plan. These include the All Ages and Abilities Bicycle Network, the Pedestrian Priority Network, the Freight Route Network and the Transit Network.

D R A F T M I N N E A P O L I S T R A N S P O R T A T I O N A C T I O N P L A N - M a r c h 2 0 2 0 34
MPLS STREETS
Q u i c k r e s u l t s
Key quick-build projects identified in our strategies and actions are highlighted below. These are tactical projects that greatly and quickly increase access and mobility, but do not require an entire street to be reconstructed. Examples include reconfiguring streets to provide transit advantages, building out a network of mobility hubs and making operational changes to streets downtown to encourage mode shift and promote safety.
TRANSIT PRIORITY LANES
Transit priority lanes, often realized as bus-only lanes, provide dedicated space for people traveling by bus or other transit vehicles, unobstructed from other traffic. By dedicating space on our streets for transit, we are improving the speed and reliability of travel which encourages more people to take transit. Collectively, this lightens our carbon footprint and lessens the demand
for parking at destinations, which helps free up more space for active uses of our shared public space – an example of a virtuous circle created by giving residents options. We have piloted bus-only lanes on Hennepin Avenue S, Chicago Avenue and Nicollet Avenue; these early pilots have shown that improvements can be realized in speed and reliability for those on transit.
4th Avenue South between
Washington Avenue and 10th Street South
5th Avenue South between
Washington Avenue and 10th Street South
6th Street North/South between
1st Avenue North and 13th Avenue South
7th Street North/South between
1st Avenue North and 13th Avenue South
8th Street North/South downtown
between 1st Avenue North and
13th Avenue South
4th Street North/South from the
west/freeway connections to the Marquette/2nd Avenue
transit facilities
Streets where we plan to allocate space for bus-only lanes include:
The City has begun to pilot mobility hubs in neighborhoods throughout the city – which locate several low carbon, shared transportation services or options at the same location. This allows people to make more seamless connections between bus, bikeshare, scooters and/or carshare and helps to ensure transit trips have a more significant reach by coordinating viable options to complete the last leg of a trip. They also serve as gathering spots anchored in transportation that provide a sense
of place and opportunity for people to enjoy the street.
Twelve pilot mobility hubs in Minneapolis were installed in 2019; these are providing early lessons on how to build out a network. Over the next couple of years, people should expect to see a network of mobility hubs developed throughout the city.
MOBILITY HUBS

D R A F T M I N N E A P O L I S T R A N S P O R T A T I O N A C T I O N P L A N - M a r c h 2 0 2 0 35
MPLS STREETS
Figure 23: Downtown Minneapolis bus-only lanesProjects in the City 5-Year CIP
Potential City Projects Beyond the City 5-Year CIP
Projects in the County CIP
All Other Overlapping CorridorsExistingPlanned
Figure 24: Mobility hub pilot

D R A F T M I N N E A P O L I S T R A N S P O R T A T I O N A C T I O N P L A N - M a r c h 2 0 2 0 36
MPLS STREETS
A FOCUS ON DOWNTOWN OPERATIONAL CHANGES TO MOVE PEOPLE
Over 205,000 people work downtown.30 Streets downtown play a huge role in the regional economy and how people decide to travel to work. The speed of transit, the safety of bike lanes and the space and comfort of the sidewalk all influence how people decide to travel to, from and through downtown. By focusing on operational changes to our street network – without waiting for a large capital project – we can open travel options in the densest area of the city where we can make the most impact most quickly.
Near term operational changes will largely be realized by making safety improvements to High Injury Streets identified in our Vision Zero efforts. These streets are identified because they have not had recent safety improvements and are not planned for near-term reconstruction. Near-term safety improvements on these streets will be done with changes in paint, additional bollards, or potential signal changes as outlined in the Vision Zero Action Plan.
3rd Avenue South between
1st Street and 12th Street
11th Avenue South between
6th Street and Franklin Avenue
9th Street between
Hennepin Avenue and Chicago Avenue
7th Street between
2nd Avenue and 11th Avenue South
High Injury Streets downtown that we plan to make improvements to between 2020 and 2022 include:
6th Street between
2nd Avenue and Chicago Avenue
3rd Street from
5th Avenue South to Chicago Avenue
Hennepin Avenue between
12th Street and 16th Street
30 https://www.mplsdowntown.com/facts
Figure 25: Paint and bollards improve conditions for people walking and bicycling; 11th Avenue and 2nd Street S
Before After

D R A F T M I N N E A P O L I S T R A N S P O R T A T I O N A C T I O N P L A N - M a r c h 2 0 2 0 37
MPLS STREETS
Figure 26: High Injury Streets in downtown

D R A F T M I N N E A P O L I S T R A N S P O R T A T I O N A C T I O N P L A N - M a r c h 2 0 2 0 38
Reaching our transportation goals requires strategic action. Listed in this plan are strategies and actions that we plan to undertake in the next 10 years. Each strategy is followed by several actions, detailing how we, along with our partners, will make tangible improvements on our streets.
A strategy is a broad approach to reach an outcome that moves us toward achieving one of our six goals.
An action is a specific step needed to accomplish the strategy.
The transportation policies of Minneapolis 2040, from which the TAP strategies and actions build, support a multimodal network that prioritizes walking, biking and transit.
Each action identifies specific goals it supports and an estimated level of effort it will require to complete it – high, medium or low. This is meant to acknowledge that there are many factors which contribute to the success of a specific action – including support of agency partners, funding opportunities and alignment with advancements in technology and other industry changes. Identifying a scale of anticipated difficulty helps give perspective on when a specific action might be accomplished; the City will strive to complete all actions but acknowledges difficulties in predicting 10 years into the future.
The strategies and actions listed reflect major themes we heard through community engagement for the TAP specifically but also through the Minneapolis 2040 development process. For the TAP-specific engagement, we connected with thousands of people and heard the strong desire to continue to build walkable, bikeable, transit-oriented communities, with less dependence on cars. A full summary of engagement is found in Appendix A.
The strategies and actions were developed in partnership with workgroups on each of the topic areas, along with guidance from an Interagency Technical Advisory Team, Steering Committee and Policy Advisory Committee. Membership for those committees includes City staff, partner agency representatives and other stakeholders and are listed in Appendix B.
HOW WE GET THEREStrategies and actions

D R A F T M I N N E A P O L I S T R A N S P O R T A T I O N A C T I O N P L A N - M a r c h 2 0 2 0 39
MPLS STREETS
The strategies and actions in this action plan reflect a tension that exists in the street that results from competing uses for limited right of way. We must acknowledge this tension and take a context-sensitive approach to our work, recognizing there may be multiple ways to achieve similar outcomes. Similarly, when an idea is posited where further study or evaluation is needed, it indicates that we do want to achieve the outcome, but there may be more work to undertake before definitively stating we will pursue it.
When an action identified in one topic area is linked to an action in another, that relationship is noted, and the actions are linked. When a strategy or action applies to more than one topic or strategy, the action is referenced below the strategy as “see also action” in a different topic area.
Actions are divided into two categories: actions we will do and actions we will support. Actions we will do are preceded by DO and are colored in dark gray, and actions we will support are preceded by SUPPORT and are colored in light gray.

D R A F T M I N N E A P O L I S T R A N S P O R T A T I O N A C T I O N P L A N - M a r c h 2 0 2 0 40
Walking has the lowest negative carbon impact compared to other transportation modes while generating high returns in public health and equity. Everyone is a pedestrian at some point in their day because every trip begins and ends with walking. Walking is a key component of successful public transit, supports vibrant business districts and healthy people, reduces carbon footprint and contributes to safer neighborhoods by putting more eyes on the street.
Over 10% of trips in Minneapolis starting or ending in Minneapolis are less than one mile31 – a distance that takes the typical person 15 to 20 minutes walking. Minneapolis has over 2,000 miles of sidewalk.32 Unfortunately, pedestrians are overrepresented in the number of severe and fatal injuries on our street network, comprising nearly 1/3 of all total severe and fatal injuries.33 As the number of people walking continues to increase, it is critical that it is formally recognized as a mode of travel, and made more welcoming, accessible and safer as a transportation option – which, without other conflicting modes, is inherently a safe activity.
2010 data shows people walk for 15% of their trips; by 2030 our goal is to increase that number to 25%. We’ll get there through a combination of improved conditions for people walking as well as land use and population growth trends that are shaped through the policies outlined in Minneapolis 2040.34
Promote a safe and inviting walking and rolling environment
WALKING
Throughout the TAP ‘walking’ refers to people walking or rolling – using a wheelchair, stroller or other assistive mobility device – and ‘pedestrian’ as a person walking or rolling.
Figure 27: Crashes resulting in severe injury or death
31 Metropolitan Council’s 2010 Travel Behavior Inventory, 10.6% of all trips. 32 City of Minneapolis Public Works 33 City of Minneapolis Vision Zero Crash Study (2018) 34 The 2010 data is anticipated to be updated by the Metropolitan Council by the time the TAP is adopted; the mode shift goal may be adjusted based on changes to baseline
data; we understand that 2010 trip data may be significantly different than the forthcoming 2018-2019 dataset.
Because many improvements that prioritize pedestrians also do the same for those bicycling, the strategies and actions listed here often support or are linked to bicycle strategies and actions.
5 %
1%
11%Source: Vision Zero Crash Study (2018)

D R A F T M I N N E A P O L I S T R A N S P O R T A T I O N A C T I O N P L A N - M a r c h 2 0 2 0 41
Figure 28: Pedestrian Priority NetworkDraft Pedestrian Priority Network
LegendPedestrian Priority Network
Trails

D R A F T M I N N E A P O L I S T R A N S P O R T A T I O N A C T I O N P L A N - M a r c h 2 0 2 0 42
W A L K I N G S T R AT E G I E S
Focus pedestrian improvements along and across the Pedestrian Priority Network.
2
Prioritize visibility and safety of pedestrians at intersections and midblock crossings.
2
Improve street lighting to increase visibility for pedestrians on streets and to meet the City’s energy goals.
Improve winter walking and rolling.2
Ensure City’s policies and practices support consistent access to the sidewalk network.
2
Create and improve pedestrian connections across freeways, highways, rivers and railroads.
2 1
2
3
4
5
6
Partner with developers, utilities and property owners to provide high-quality pedestrian and public realm improvements.
7
Set policies and practices to leverage, manage, monitor and design for new and emerging technologies that increase visibility and comfort of pedestrians.
8
● Bicycling Strategy 3 — Prioritize a network of neighborhood greenways during the buildout of the All Ages and Abilities Network.
● Street operations Strategy 3 — Plan for efficient and practical operations of people walking, biking and taking micromobility or transit throughout the street design process.
● Street operations Strategy 4 — Leverage City resources and partnerships to promote, educate and encourage walking, biking and transit as alternatives to driving.
● Street operations Strategy 5 — Price and manage use of the curb to encourage walking, biking and using transit and to discourage driving alone.
● Street operations Strategy 6 — Induce regional mode shift by prioritizing pedestrian, bicycle and transit facilities and operations into capital transportation projects.
● Design Strategy 2 — Foster vibrant public spaces for street life
S E E A L S O S T R AT E G I E S :

D R A F T M I N N E A P O L I S T R A N S P O R T A T I O N A C T I O N P L A N - M a r c h 2 0 2 0 43
STR ATEGY 1Focus pedestrian improvements along and across the
Pedestrian Priority Network.
The Pedestrian Priority Network is a grid of streets that represent where people frequently walk and will be used to focus investments to improve the ease, comfort and safety of people walking throughout the year. The network is 282 miles and will be the focus of planning, design, operations and maintenance improvements for pedestrians across the city, replacing all existing network maps.
The Pedestrian Priority Network was developed by studying numerous factors that influence where people walk, including transit services, high density areas, commercial activity, land use and High Injury Streets for pedestrians. Trails are also noted on the Pedestrian Priority Network; a large portion of trails are owned and managed by the Minneapolis Park and Recreation Board and provide important connections for the network as they are key walking places.
S T R A T E G I E S & A C T I O N S : W A L K I N G
Figure 29: Typical street on Pedestrian Priority Network

D R A F T M I N N E A P O L I S T R A N S P O R T A T I O N A C T I O N P L A N - M a r c h 2 0 2 0 44
Actions to focus pedestrian improvements along and across the Pedestrian Priority Network.
A C T I O N S
_ Actions Supports Difficulty
DO ACTION 1.1Prioritize citywide planning, design, operations and maintenance improvements for pedestrians on and across the Pedestrian Priority Network.
Safety, Mobility Medium
DO ACTION 1.2Review the 20 Year Streets Funding Plan metrics to identify and implement changes necessary to prioritize capital improvements along the Pedestrian Priority Network.
Mobility Low
DO ACTION 1.3Replace the Pedestrian Street Lighting Corridor with the Pedestrian Priority Network for project programming, maintenance and other purposes, and align funding to address the additional mileage (~70 miles); update the Street Lighting Policy to reflect this change.
Mobility Medium
D R A F T M I N N E A P O L I S T R A N S P O R T A T I O N A C T I O N P L A N - M a r c h 2 0 2 0 45
STR ATEGY 2Prioritize visibility and safety of pedestrians at
intersections and midblock crossings.
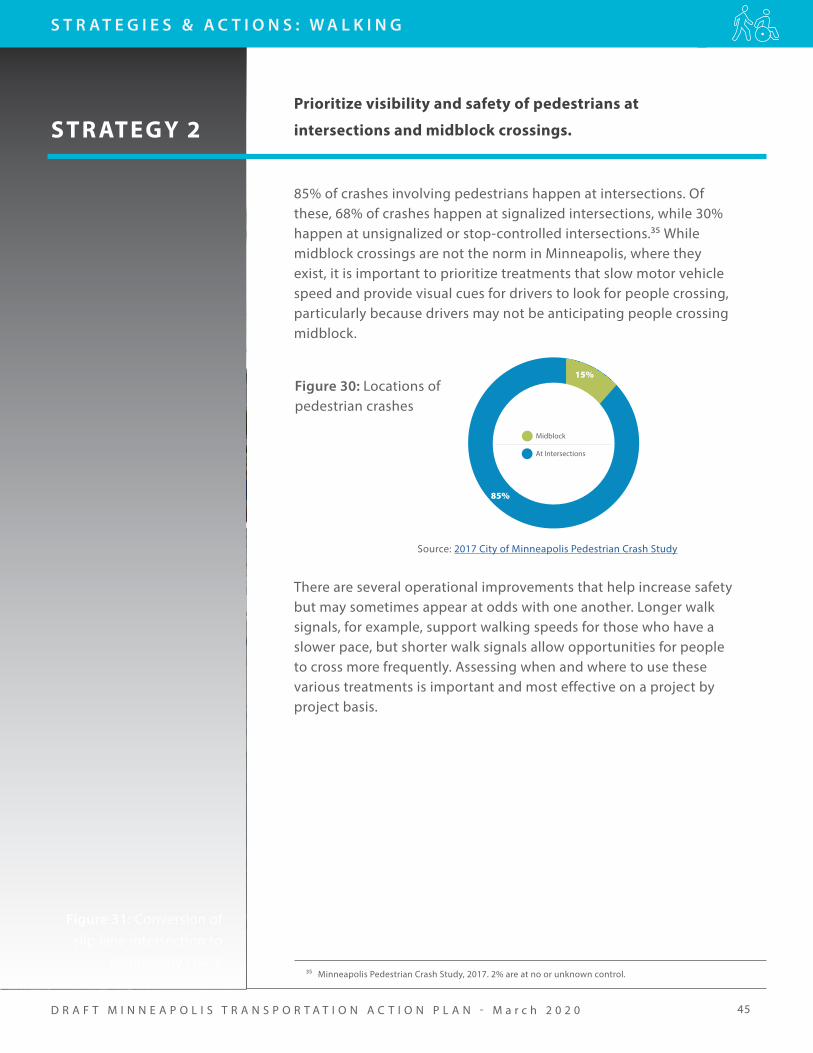
85% of crashes involving pedestrians happen at intersections. Of these, 68% of crashes happen at signalized intersections, while 30% happen at unsignalized or stop-controlled intersections.35 While midblock crossings are not the norm in Minneapolis, where they exist, it is important to prioritize treatments that slow motor vehicle speed and provide visual cues for drivers to look for people crossing, particularly because drivers may not be anticipating people crossing midblock.
35 Minneapolis Pedestrian Crash Study, 2017. 2% are at no or unknown control.
S T R A T E G I E S & A C T I O N S : W A L K I N G
Figure 30: Locations of pedestrian crashes
5-14
5. Findings in Minneapolis Pedestrian Crashes
Intersection CharacteristicsIntersections have the highest potential for conflicts - they have more users interacting near them and more movements and modes sharing space. Minneapolis in particular has a grid street network that creates high intersection density and more opportunities for pedestrian/vehicle conflicts at intersections. Only 15 percent of crashes occurred at midblock locations in Minneapolis. Statewide, where intersection density is lower, non-intersection locations make up 39 percent of crashes.
The majority of pedestrian crashes in Minneapolis happen at intersections.
85%
15%
Midblock
At Intersections
Figure 5-24. Locations of Pedestrian CrashesSource for Pedestrian Crash Data: 10-Year Dataset
Locations of Pedestrian Crashes
Source for Pedestrian Crash Data: 10 year Dataset
There are several operational improvements that help increase safety but may sometimes appear at odds with one another. Longer walk signals, for example, support walking speeds for those who have a slower pace, but shorter walk signals allow opportunities for people to cross more frequently. Assessing when and where to use these various treatments is important and most effective on a project by project basis.
Source: 2017 City of Minneapolis Pedestrian Crash Study
Figure 31: Conversion of slip lane intersection to
community space

D R A F T M I N N E A P O L I S T R A N S P O R T A T I O N A C T I O N P L A N - M a r c h 2 0 2 0 46
Figure 32: Midblock crossing – Hennepin Ave between Lake and 31st St
Before
After

D R A F T M I N N E A P O L I S T R A N S P O R T A T I O N A C T I O N P L A N - M a r c h 2 0 2 0 47
_ Actions Supports Difficulty
DO ACTION 2.1Modify signal operation to give pedestrians a walk signal at signalized intersections without having to press a button except where doing so would provide greater benefit to pedestrians, bicyclists and transit. Note that the ADA requires pedestrian pushbuttons be installed to provide audio and vibrotactile information to pedestrians when activated.
Safety, Equity, Mobility
Low
DO ACTION 2.2Develop criteria for adding marked crosswalks at unsignalized intersections and midblock marked crossings to reduce distances between formalized crossings.
Safety, Mobility
Medium
DO ACTION 2.3Adjust and restrict vehicle turns at intersections based on street context and data. This includes strategies such as ‘No Turn on Red’.
Safety Medium
DO ACTION 2.4Restrict the installation of new slip lanes (unsignalized turn lanes at intersections) and convert existing slip lanes to community space. See design Strategy 2
Safety Medium
DO ACTION 2.5Prioritize the implementation of curb extensions, pedestrian crossing medians, tabled crossings, interim painted curb extensions and related safety improvements along and across the Pedestrian Priority Network and High Injury Streets.
Safety Low
DO ACTION 2.6Increase funding to implement pedestrian and bicycle improvements near or connecting to schools through the City’s Safe Routes to School program and other funding opportunities to encourage students to walk or bicycle to/from school. See bicycle Strategy 2
Safety, Mobility,
Active partnerships
High
DO ACTION 2.7Discontinue the use of vehicular level of service and/or vehicle counts as sole justification for the installation of traffic signals, and include pedestrian and bicycle counts in the evaluation of new traffic signal need. See street operations Action 3.2
Safety, Mobility
Medium
Actions to prioritize visibility and safety of pedestrians at intersections and midblock crossings.
A C T I O N S

D R A F T M I N N E A P O L I S T R A N S P O R T A T I O N A C T I O N P L A N - M a r c h 2 0 2 0 48
STR ATEGY 3Improve street lighting to increase visibility for
pedestrians on streets and to meet the City’s energy goals.
Lighting plays an important role in people’s comfort walking on city streets. In Minneapolis, having adequate lighting no matter the place within the city is important, especially when the sun rises as late as 7:45 am and sets as early as 4:30 pm during the winter. This strategy adjusts the City’s approach to street reconstruction projects so that pedestrian lighting is always included as part of the reconstruction project; previously, pedestrian lighting was only included as a project cost if the street was identified on the Pedestrian Street Lighting Corridor. The City typically installs 50 lights per year (3,000 feet) of standalone pedestrian scale lighting projects along a Pedestrian Street Lighting Corridor, not as a part of a street reconstruction project; these installations will now be focused on the Pedestrian Priority Network.
S T R A T E G I E S & A C T I O N S : W A L K I N G
Figure 33: Wood pole streetlight
Figure 34: Pedestrian scale streetlight

D R A F T M I N N E A P O L I S T R A N S P O R T A T I O N A C T I O N P L A N - M a r c h 2 0 2 0 49
Actions to improve street lighting to increase visibility for pedestrians on streets and to meet the City's energy goals.
A C T I O N S
_ Actions Supports Difficulty
DO ACTION 3.1Update the Street Lighting Policy to include pedestrian lighting on all street reconstruction projects included as part of the capital project cost.
Safety, Equity, Active partnerships
High
DO ACTION 3.2Require the provision of pedestrian lighting in the public right of way with private development projects that meet size and location thresholds.
Safety, Active partnerships
Low

D R A F T M I N N E A P O L I S T R A N S P O R T A T I O N A C T I O N P L A N - M a r c h 2 0 2 0 50
STR ATEGY 4 Improve winter walking and rolling.
Maintaining winter access for people walking in the city is critically important. Minneapolis experiences an average of 54 inches of snow per year36, in addition to freeze and thaw cycles , and the system in place to ensure the sidewalks are kept clear and passable involves many people and institutions throughout the city. Currently, City ordinance requires property owners of duplexes and single-family homes to clear the public sidewalk abbutting their property within 24 hours of snow ending, and all other property owners to clear their sidewalks within four daylight hours of the snow ending. Clearing corners to the gutter line are the responsibility of the corner lot property owner. There is a City-led corner cleaning program that works to clear corners after large storms, post-plowing of the streets, until all corners are cleared citywide. Moving forward and in alignment with Walking Strategies 1 and 5, the City-led corner clearing program will move to align with the Pedestrian Priority Network.
The 2018 Minneapolis Pedestrian and Bicycling Winter Maintenance Study provides options to enhance the quality and consistency of clearing snow and ice from sidewalks and bikeways; many of those ideas are reflected in the actions below.
S T R A T E G I E S & A C T I O N S : W A L K I N G
Final Report | April 2018
PEDESTRIAN AND BICYCLE WINTER MAINTENANCE STUDY
Figure 35: Winter Maintenance Study
36 https://www.dnr.state.mn.us/climate/twin_cities/snowfall.html
Figure 36: Snow-clearing timelines
24
4

D R A F T M I N N E A P O L I S T R A N S P O R T A T I O N A C T I O N P L A N - M a r c h 2 0 2 0 51
Actions to improve winter walking and rolling.
A C T I O N S
continued on next page
_ Actions Supports Difficulty
DO ACTION 4.1Expand education and awareness to educate residents and businesses on City’s sidewalk snow and ice removal ordinance, related standards and responsibilities.
Safety, Equity, Mobility, Active
partnerships Low
DO ACTION 4.2Collaborate with the Neighborhood and Community Relations Department to build and share a list of community resources for clearing sidewalks to help clear snow for those who are unable.
Safety, Equity, Mobility, Active
partnerships Low
DO ACTION 4.3Work in partnership with Metro Transit to develop enhanced winter maintenance standards and enforcement for transit stops and stations. See transit Strategy 5
Safety, Mobility, Active
partnerships Medium
DO ACTION 4.4Change 311 and related property reports language to more accurately communicate when issues are resolved in the computer system vs. on the street as snow and ice complaints are received and processed.
Mobility Low
DO ACTION 4.5Consider further streamlining inspection process by eliminating sending an Order to Correct and instead proceed with authorizing snow removal or ice mitigation.
Mobility Medium
DO ACTION 4.6Consider adding financial penalties to properties out of compliance with snow and ice clearing responsibilities, with an emphasis on properties with repeat issues.
Safety, Equity, Mobility
Medium
DO ACTION 4.7Evaluate feasibility of changing City of Minneapolis Ordinance 445.20 for sidewalk clearing to require clearing the sidewalks earlier.
Equity, Mobility High

D R A F T M I N N E A P O L I S T R A N S P O R T A T I O N A C T I O N P L A N - M a r c h 2 0 2 0 52
● Bicycling Action 6.9 — snow and ice removal on the All Ages and Abilities Network trails
● Bicycling Action 6.10 — snow and ice removal on greenways
● Street operations Action 9.4 — snow and ice removal at construction sites
S E E A L S O A C T I O N S :
Actions to improve winter walking and rolling.
A C T I O N S ( c o n t i n u e d )
_ Actions Supports Difficulty
DO ACTION 4.8Continue to pilot, evaluate and implement processes that improve winter conditions for people walking; focus on coordination, sidewalk inspections, corner clearing and a willingness to test new solutions to improve snow and ice clearance.
Safety, Equity, Mobility
High

D R A F T M I N N E A P O L I S T R A N S P O R T A T I O N A C T I O N P L A N - M a r c h 2 0 2 0 53
STR ATEGY 5Ensure City’s policies and practices support consistent
access to the sidewalk network.
A variety of activities can cause temporary or permanent obstacles to accessing the over 2,000 miles of sidewalks in the city, including temporary closures due to street projects, utility work or private development projects, upheaving or other physical obstruction that makes a sidewalk inaccessible to people using wheeled devices to travel and lack of sidewalk for other reasons, including deferred maintenance.
City crews inspect sections of the city each year to determine where repairs are needed, and then work with property owners to fix the sidewalks – usually with a focus on broken or heaved sidewalks that hinder movement. Temporary patches are also deployed on an as-needed basis (typically complaint driven) until permanent fixes are secured.
S T R A T E G I E S & A C T I O N S : W A L K I N G
Figure 37: Sidewalk in need of replacement
Figure 38: Sidewalk gap (on left) filled with the construction of new sidewalk (on right)

D R A F T M I N N E A P O L I S T R A N S P O R T A T I O N A C T I O N P L A N - M a r c h 2 0 2 0 54
Actions to ensure City’s policies and practices support consistent access to the sidewalk network.
A C T I O N S
● Street operations Strategy 9 — street detours and Complete Streets
S E E A L S O S T R AT E G Y :
_ Actions Supports Difficulty
DO ACTION 5.1Complete a condition inventory of sidewalk, City-owned multiuse trails and street crossings. See bicycling Action 6.6
Equity, Mobility High
DO ACTION 5.2Prioritize sidewalk repair locations by using a data-driven approach based on the sidewalk inventory data.
Safety, Equity, Mobility
Medium
DO ACTION 5.3Fund and implement proactive inspections of temporary pedestrian access routes adjacent to work zones to ensure access requirements are being met; issue fines for non-conforming or non-existent pedestrian access routes and consider withholding future permit approvals until non-compliant access routes are eliminated.
Safety, Mobility Medium
DO ACTION 5.4Confirm location of and fill gaps in the sidewalk network and prioritize gaps near parks and other public destinations. See bicycling Action 6.6
Safety, Prosperity, Mobility, Active
partnerships Medium
DO ACTION 5.5Provide pedestrian crossings at all legs of legal intersections by default; retroactively work to install these where they do not exist.
Safety, Mobility, Active
partnerships Medium

D R A F T M I N N E A P O L I S T R A N S P O R T A T I O N A C T I O N P L A N - M a r c h 2 0 2 0 55
STR ATEGY 6Create and improve pedestrian connections across
freeways, highways, rivers and railroads.
There are a number of natural and human-made obstructions that limit pedestrian movement across them – such as freeways, railroads and rivers. This strategy focuses on how to make existing overpasses or underpasses more attractive, inviting and part of a seamless pedestrian network.
S T R A T E G I E S & A C T I O N S : W A L K I N G
Figure 39: Existing underpass in Minneapolis
Figure 40: New 5th Street pedestrian bridge over I-35W
Figure 41: Underpass park in Toronto

D R A F T M I N N E A P O L I S T R A N S P O R T A T I O N A C T I O N P L A N - M a r c h 2 0 2 0 56
Actions to create and improve pedestrian connections across freeways, highways, rivers and railroads.
A C T I O N S
● Bicycling Action 2.2 — non-motorized bridge over Interstate 94
● Bicycling Action 2.6 — new river crossings for Midtown Greenway and Great Northern Greenway
● Street operations Action 6.5 — eliminate gaps in street grid and reopen Nicollet Ave at Lake St
S E E A L S O A C T I O N S :
_ Actions Supports Difficulty
DO ACTION 6.1Establish spacing guidelines for connections across freeways, rivers and railroads to identify locations for new pedestrian (and bicycle) bridges or underpasses. See bicycling Strategy 2
Equity, Mobility, Active
partnerships Low
DO ACTION 6.2Reestablish the street grid in places where streets do not exist through the creation of new pedestrian and bicycle connections. See street operations Action 5.8
Mobility High
DO ACTION 6.3Identify funding for connectivity, safety and aesthetic improvements for underpass or overpass improvement projects such as I-94 near the Farmer’s Market and the I-94 viaduct through the North Loop.
Mobility, Active partnerships
High
DO ACTION 6.4Improve local street connections to freeway entrances and exits to improve pedestrian safety and comfort through enhancing signal operations and street design.
Safety, Mobility, Active
partnerships High
_ _ _ _
SUPPORT ACTION 6.5Identify opportunities and partnerships to design, fund and construct lids over highways and railroads. See street operations Action 8.5
Equity, Prosperity, Mobility, Active
partnerships High

D R A F T M I N N E A P O L I S T R A N S P O R T A T I O N A C T I O N P L A N - M a r c h 2 0 2 0 57
STR ATEGY 7
Partner with developers, utilities and property owners
to provide high-quality pedestrian and public realm
improvements.
As population growth and development occurs, more demands and interruptions are imposed on the sidewalk system. In 2018, it was the third straight year in which over $1.5 billion in building permits were granted, with 2019 exceeding more than $2 billion. This strategy focuses on collaborating with developers and utility companies to minimize impacts to the right of way and to restore the asset to its original or better condition.
S T R A T E G I E S & A C T I O N S : W A L K I N G
Figure 42: Protected bikeway and enhanced pedestrian realm near The Commons Park
Figure 43: Curb bump out
Figure 44: Greenway promenade

D R A F T M I N N E A P O L I S T R A N S P O R T A T I O N A C T I O N P L A N - M a r c h 2 0 2 0 58
Actions to partner with developers, utilities and property owners to provide high-quality pedestrian and public realm improvements.
A C T I O N S
● Street operations Action 6.5 — eliminate gaps in street grid and reopen Nicollet Ave at Lake St
● Design Action 2.6 — minimize curb cuts
S E E A L S O A C T I O N S :
_ Actions Supports Difficulty
DO ACTION 7.1Require right of way restoration by contractor, developer or utility companies to comply with latest ADA and City standards prior to issuing additional permits, certificates of occupancy or obtaining future site plan or other approvals. See design Action 1.4
Safety, Equity, Mobility, Active
partnerships High
DO ACTION 7.2Change parking ramp exit requirements to include mirrors and messaging to prioritize pedestrians; rather than alerting pedestrians that a car is approaching, messaging should alert drivers that a pedestrian or bicyclist is approaching.
Safety, Equity, Active partnerships
Medium
DO ACTION 7.3Improve driveway sightlines on high volume entrances and exits, particularly along High Injury Streets.
Safety, Equity, Mobility
Medium
DO ACTION 7.4Require developers to implement public realm improvements called for in the Street Design Guide including filling public sidewalk gaps in conjunction with approvals for building construction and site modification. See design Action 1.4
Prosperity, Active
partnerships Medium
DO ACTION 7.5Secure transportation easements for public pedestrian walkways in coordination with development.
Mobility, Active partnerships
Medium
DO ACTION 7.6Encourage the use of skyways as transportation routes by requiring convenient and easily accessible vertical connections between the skyway system and the public sidewalks, particularly along transit corridors and the Pedestrian Priority Network. Use the development review and permitting process in collaboration with the Department of Community Planning and Economic Development and continue to work with partners to update wayfinding and signage standards in the Minneapolis skyway system.
Equity, Prosperity,
Mobility, Active partnerships
Medium

D R A F T M I N N E A P O L I S T R A N S P O R T A T I O N A C T I O N P L A N - M a r c h 2 0 2 0 59
STR ATEGY 8
Set policies and practices to leverage, manage, monitor and
design for new and emerging technologies that increase
visibility and comfort of pedestrians.
This strategy outlines ways we can use technology to improve how people walking are detected on our streets, how they may access information about preferred walking routes based on real-time information like congestion (noise impacts, air quality impacts) and how infrastructure might physically change given their presence, such as through brighter lighting or LED crosswalks that recognize when a pedestrian is crossing a street.
Improvements for people who are blind or vision-impaired are also likely to be more readily available with new technologies, such as those accessed from smartphones or other devices. These technologies can detail real-time conditions (such as detours or unexpected obstacles in the path of travel) into a user’s ear.
S T R A T E G I E S & A C T I O N S : W A L K I N G
Figure 45: Pedestrian counter
Figure 46: LED light-up crosswalk

D R A F T M I N N E A P O L I S T R A N S P O R T A T I O N A C T I O N P L A N - M a r c h 2 0 2 0 60
Actions to set policies and practices to leverage, manage, monitor and design for new and emerging technologies that increase visibility and comfort of pedestrians.
A C T I O N S
_ Actions Supports Difficulty
DO ACTION 8.1Assess digital wayfinding tools that provide real-time information on getting around the city by foot and integrate successful tools into the mobility hub network. See technology Action 3.1, design Action 5.3
Mobility Low
DO ACTION 8.2Explore emerging technology such as adaptive lighting which can brighten when pedestrians, bicyclists or other street users are detected or expected, enhancing visibility and comfort of all right of way users while aligning with the City’s lighting and energy goals.
Climate, Safety,
Mobility Medium
DO ACTION 8.3Test new technologies related to pedestrian detection and data collection, including passive detection at traffic signals to expedite and lengthen the walk phase in response to pedestrian presence and demand. See technology Strategy 1
Climate, Safety, Equity,
Mobility
Medium
DO ACTION 8.4Assess demonstrations of new applications that provide navigation assistance for people who are blind or low vision and the potential impact on City practices.
Safety, Equity,
Mobility Low

D R A F T M I N N E A P O L I S T R A N S P O R T A T I O N A C T I O N P L A N - M a r c h 2 0 2 0 61
The City’s growing bikeway network has encouraged more people to bike and use micromobility vehicles. Even with this progress, many people in Minneapolis do not see riding a bicycle or scooter as a routine way to get around. Narrow bike lanes, lack of physical separation from motor vehicles, challenging intersection crossings and snow or ice are just some of the reasons why people do not feel comfortable.
Over two-thirds of residents say they often or sometimes ride a bicycle to get to school, visit parks or run errands.38 And on average, over 4% of Minneapolis residents ride a bicycle to work (4.1%), which is one of the highest bicycle commuting rates in the country.39
Over 30% of the trips we take in Minneapolis are less than three miles.37 Sometimes these trips feel a little too far to walk. Bicycles and other low-power micromobility options, such as electric-assist bicycles and scooters, can be ideal for these short trips. As more people use these new transportation options, the demand for safe and comfortable places to ride, charge and park these vehicles will increase.
Options are expanding with new types of bicycles and low-powered vehicles:
● Nice Ride bikeshare increases access to a bicycle and can be used for one-way trips and connections to transit
● Adaptive bicycles improve access for people with disabilities
● Electric-assist bicycles help people ride up hills or in windy weather, go farther or carry more weight
● Cargo bicycles help people carry kids and groceries
● Shared scooters have quickly proven to be popular for many and are effective first and last connections for transit access
BICYCLINGIncrease the availability and safety of bicycling and micromobility travel
37 Metropolitan Council Travel Demand Model, 2010. 38 City of Minneapolis Resident Survey, 2016 39 Means of Transportation to Work for Workers 16 Years and Older, U.S. Census Bureau, 2013-2017 American Community Survey 5-Year Estimate

D R A F T M I N N E A P O L I S T R A N S P O R T A T I O N A C T I O N P L A N - M a r c h 2 0 2 0 62
To make bicycling, in all its new forms, a real option for more people, the plan establishes an All Ages and Abilities Network to be constructed over the next ten years. This network will include protected lanes and trails that are physically separated from moving cars, trucks and buses, will feature improved intersection crossings and be accessible year-round. The goal for the All Ages and Abilities Network is for people on bikes to only share space with cars on quiet low-speed streets or on neighborhood greenways.
People biked for 4% of their trips in 2010; we’ve set a goal to increase that to 10% of trips taken by bicycle or micromobility by 2030.40
The terms ‘biking’, ‘bicycling’ and ‘bikeways’ broadly refers
to people who use any type of bicycle or micromobility
vehicle like scooters or electric-assist bicycles.
40 The 2010 data is anticipated to be updated by the Metropolitan Council by the time the TAP is adopted; the mode shift goal may be adjusted based on changes to baseline data; we understand that 2010 trip data may be significantly different than the forthcoming 2018-2019 dataset.
Micromobility includes various human-scale vehicles – like
bicycles and scooters, which are typically shared and can be
electric or human-powered.
Figure 47: Adaptive vehicle types
Side by sideIce trikeHandcycle
Greenspeed
Source: Twin Cities Adaptive Cycling

D R A F T M I N N E A P O L I S T R A N S P O R T A T I O N A C T I O N P L A N - M a r c h 2 0 2 0 63
Figure 48: All Ages and Abilities Network
Legend
Low Stress Bikeway
Connector Bikeway
Near-Term Low Stress Bikeway (by 2030)
Connector or Long-Term Low Stress Bikeway
Draft All Ages and Abilities Network
Existing Bikeways
Future Bikeways
See page 63 for description of bikeway types.

D R A F T M I N N E A P O L I S T R A N S P O R T A T I O N A C T I O N P L A N - M a r c h 2 0 2 0 64
B I C Y C L I N G S T R AT E G I E S
Complete the All Ages and Abilities Network.
2
Build bikeway connections that overcome significant physical barriers during the buildout of the All Ages and Abilities Network.
2
Prioritize a network of neighborhood greenways during the buildout of the All Ages and Abilities Network.
Enhance intersection design and safety during the buildout of the All Ages and Abilities Network.
2
Plan and implement bikeway connections to and between regional destinations and adjacent city networks.
Maintain the All Ages and Abilities Network to provide year-round access.
1
2
3
4
5
6
Provide wayfinding to help people navigate the All Ages and Abilities Network.
7
Design bikeways using best practices that reflect the community and serve as an asset to people who may not currently ride a bike or use micromobility.
8
Update bicycle and micromobility parking practices to support demand and diversity of vehicles to significantly expand bicycle racks in the right of way.
9
Expand safe biking and micromobility education and encouragement. 10
Measure biking and micromobility ridership levels and user comfort.
11
● Street operations Strategy 3 — Plan for efficient and practical operations of people walking, biking and taking micromobility or transit throughout the street design process
● Street operations Strategy 4 — Leverage City resources and partnerships to promote, educate and encourage walking, biking and transit as alternatives to driving
● Street operations Strategy 5 — Price and manage use of the curb to encourage walking, biking and using transit, and to discourage driving alone
● Street operations Strategy 6 — Induce regional mode shift by prioritizing pedestrian, bicycle and transit facilities and operations into capital transportation projects
S E E A L S O S T R AT E G I E S :

D R A F T M I N N E A P O L I S T R A N S P O R T A T I O N A C T I O N P L A N - M a r c h 2 0 2 0 65
STR ATEGY 1 Complete the All Ages and Abilities Network
S T R A T E G I E S & A C T I O N S : B I C Y C L I N G
The All Ages and Abilities Network will include three primary bikeway types:
● Protected bike lanes: routes on relatively busy streets with some form of physical separation from motor vehicle traffic, such as bollards, concrete curbs, parked cars and planters.
● Trails: non-motorized paths for pedestrians and bicyclists, typically more separated from the street than protected bike lanes, and are typically located near rivers, lakes, parkways and railroad corridors.
● Neighborhood greenways: routes that enhance local, low volume streets and give priority to people walking, biking and rolling. This will include removing or significantly limiting motor vehicles along sections of the street.
There is an additional type of bikeway highlighted on the All Ages and Abilities Network called connector bikeways which are standard bike lanes without physical separation from motor vehicles that may or may not meet the definition of an All Ages and Abilities bikeway depending on the context of the street (including volume, width and speeds).
Figure 49: Multiple types of vehicles in bike lane

D R A F T M I N N E A P O L I S T R A N S P O R T A T I O N A C T I O N P L A N - M a r c h 2 0 2 0 66
Actions to complete the All Ages and Abilities Network.
A C T I O N S
_ Actions Supports Difficulty
DO ACTION 1.1Build all low-stress routes identified on the All Ages and Abilities Network by 2030, which will include a total of 136 miles of new or upgraded bikeways, including:
● 79 miles of protected bike lanes that provide a low-stress riding experience on high volume corridors.
● 48 miles of new neighborhood greenways that manage motor vehicle volume and speed, improve safety at major crossings and reduce stopping at minor crossings. Start with the Northside Greenway and the Southside Greenway.
● 9 miles of new trails that provide connections along the Mississippi River or along rail lines that could be converted to trails.
Climate, Safety, Equity, Mobility
High
DO ACTION 1.2Consider building bikeways not included on the All Ages and Abilities Network to respond to development opportunities and changing transportation demands.
Safety, Mobility Low
DO ACTION 1.3Use design to build projects that prevent blocked lanes or conflicts with loading and parked vehicles.
Safety, Mobility Medium

D R A F T M I N N E A P O L I S T R A N S P O R T A T I O N A C T I O N P L A N - M a r c h 2 0 2 0 67
Bikeways work best in a connected network; the existing network will be added to and improved over the coming decade. The network is funneled into more focused corridors as major natural and manmade barriers are crossed, including rivers, railroads and highways. This strategy focuses on capitalizing on opportunities to partner with the Minnesota Department of Transportation, Hennepin County, Minneapolis Park and Recreation Board and others to ensure any crossing of a major barrier includes a high-quality facility for people traveling on bike or other micromobility vehicle, as well as for pedestrians. These opportunities are most obvious when a project is active, but the actions detailed here include efforts to retrofit existing bridges with facilities for increased safety and comfort for people biking and using micromobility options.
Build bikeway connections that overcome significant
physical barriers during the buildout of the All Ages and
Abilities Network.STR ATEGY 2
Figure 50: Cyclists on Sabo Bridge
S T R A T E G I E S & A C T I O N S : B I C Y C L I N G
Figure 51: Protected bikeways

D R A F T M I N N E A P O L I S T R A N S P O R T A T I O N A C T I O N P L A N - M a r c h 2 0 2 0 68
Actions to build bikeway connections that overcome significant physical barriers during the buildout of the All Ages and Abilities Network.
A C T I O N S
_ Actions Supports Difficulty
DO ACTION 2.1Build protected bike lanes on existing motorized bridges over the Mississippi River, railroad corridors, freeways and expressways. See walking Strategy 6
Safety, Equity, Mobility
High
DO ACTION 2.2Partner with the Minnesota Department of Transportation to build a new non-motorized bridge over I-94 between Lowry Avenue North and Dowling Avenue North, connecting North Minneapolis to the Mississippi River. See walking Strategy 6
Equity, Mobility High
DO ACTION 2.3Consider planning new crossings of Regional Bicycle Barriers (as defined in the Metropolitan Council’s Transportation Policy Plan) as project development opportunities arise.
Safety, Equity, Mobility
Medium
_ _ _ _
SUPPORT ACTION 2.4Coordinate with Minneapolis Park and Recreation Board’s Neighborhood and Regional Park Capital Investment Projects to improve bikeway connections between parkway trails and City-owned bikeways.
Equity, Mobility, Active
partnerships Low
SUPPORT ACTION 2.5Coordinate with the Minneapolis Park and Recreation Board to evaluate converting one-way trail operations to two-way, particularly around Bde Maka Ska, Lake of the Isles and Lake Harriet.
Equity, Mobility, Active
partnerships High
SUPPORT ACTION 2.6Work with agency partners to evaluate opportunities to build new river crossings for the Midtown Greenway and Great Northern Greenway. See walking Strategy 6
Equity, Mobility, Active
partnerships High
● Street operations Action 6.2 — Advance the All Ages and Abilities Network through bridge maintenance and repair
S E E A L S O A C T I O N :

D R A F T M I N N E A P O L I S T R A N S P O R T A T I O N A C T I O N P L A N - M a r c h 2 0 2 0 69
The City published a Greenways Study in 2019. The most significant outcome of the Greenways Study was the introduction of the concept of neighborhood greenways, which replaces the term bicycle boulevard that was used in the 2011 Bicycle Master Plan.
Neighborhood greenways are similar to bicycle boulevards, in that they will be installed on low volume residential streets that connect neighborhood destinations and manage motor vehicle volume and speed. Neighborhood greenways differ from bicycle boulevards because they will optimize travel for pedestrians and bicyclists by eliminating or significantly reducing motor vehicle use. Neighborhood greenways will also greatly improve the walking environment throughout the city by limiting interactions with motor vehicles and improving the experience of crossing the street.
Neighborhood greenways will be linear and have logical beginning and end points, typically connecting to other bikeways on the All Ages and Abilities Network as they are installed. Each block will be unique based on the context of the neighborhood, technical analysis and community engagement. Some blocks may fully remove motor vehicle access, others may narrow the vehicular travel space by half and other blocks could primarily focus on intersection treatments such as curb extensions, median refuge islands and traffic circles. All greenways will be designed and built to accommodate emergency vehicles. Neighborhood greenways may also be used for flooding and stormwater management mitigation.
Prioritize a network of neighborhood greenways during the
buildout of the All Ages and Abilities Network.STR ATEGY 3
S T R A T E G I E S & A C T I O N S : B I C Y C L I N G
Figure 52: Bicycle boulevard
Figure 53: Neighborhood Greenway

D R A F T M I N N E A P O L I S T R A N S P O R T A T I O N A C T I O N P L A N - M a r c h 2 0 2 0 70
Actions to prioritize a network of neighborhood greenways during the buildout of the All Ages and Abilities Network.
A C T I O N S
● Bicycling Action 8.2 — Medians and intersection improvements
● Bicycling Action 8.3 — Greening and stormwater infrastructure
S E E A L S O A C T I O N S :
_ Actions Supports Difficulty
DO ACTION 3.1Implement neighborhood greenways. In addition to building new greenways, this program should include improvements to 10 miles of existing neighborhood greenways (21 miles existing).
Climate, Safety, Equity, Mobility
High
DO ACTION 3.2Include greening and stormwater infrastructure elements, public art and public realm improvements as standard in all greenway projects.
Climate, Safety, Equity, Mobility
High

D R A F T M I N N E A P O L I S T R A N S P O R T A T I O N A C T I O N P L A N - M a r c h 2 0 2 0 71
Minneapolis crash data shows that 80% of bicycle crashes happen at an intersection – 48% at signalized intersections and 32% at stop signs.41 Focusing design strategies on the intersection to minimize exposure and risk from vehicles is key to improving safety and comfort for bicyclists. An added benefit is that improved conditions for bicyclists tends to increase comfort, reduce crossing distances and improve visibility for pedestrians. A key focus of this strategy is building protected intersections. Protected intersections better protect bicyclists traveling through the intersection through the inclusion of design treatments like vertical separation elements and turning wedges.
Enhance intersection design and safety during the buildout of
the All Ages and Abilities Network.STR ATEGY 4
Figure 54: Protected intersections
41 Minneapolis Vision Zero Crash Study (2018).
S T R A T E G I E S & A C T I O N S : B I C Y C L I N G
Figure 55: Raised crossings

D R A F T M I N N E A P O L I S T R A N S P O R T A T I O N A C T I O N P L A N - M a r c h 2 0 2 0 72
Actions to enhance intersection design and safety during the buildout of the All Ages and Abilities Network.
A C T I O N S
_ Actions Supports Difficulty
DO ACTION 4.1Build protected intersections along the entire bikeway network, prioritizing the All Ages and Abilities Network and High Injury Streets as identified in the Vision Zero Action Plan.
Safety, Mobility High
DO ACTION 4.2Build median islands, curb extensions, raised crossings, signals and/or reduce the number of travel lanes along the All Ages and Abilities Network on crossings of any street types other than low volume residential streets. See bicycling Action 8.2
Safety, Mobility High
DO ACTION 4.3Install transit islands where appropriate to ensure compatibility of protected bikeways, transit operations and people walking, with careful consideration for accessibility. See design Strategy 5
Safety, Equity, Mobility
High

D R A F T M I N N E A P O L I S T R A N S P O R T A T I O N A C T I O N P L A N - M a r c h 2 0 2 0 73
Connecting to the larger regional bike network is important as it allows regional commuters and other people living outside of Minneapolis to connect to destinations in the city. Coordinated regional connections also promote alternatives to driving for longer distances.
The actions below build upon several of our partner’s planning efforts. These include the Metropolitan Council’s long-term vision for the Regional Bicycle Transportation Network, which identifies regionally significant connections for bicyclists like the extension of the Midtown Greenway across the Mississippi River, as well as the Minneapolis Park and Recreation Board’s efforts to complete the Grand Rounds trail system, which will be a 50+ mile system of trails in Minneapolis.
Plan and implement bikeway connections to and between
regional destinations and adjacent city networks. STR ATEGY 5
S T R A T E G I E S & A C T I O N S : B I C Y C L I N G
Actions to plan and implement bikeway connections to and between regional destinations and adjacent city networks.
A C T I O N S
_ Actions Supports Difficulty
SUPPORT ACTION 5.1Partner with the Metropolitan Council to identify opportunities to implement the Regional Bicycle Transportation Network, prioritizing the All Ages and Abilities Network and considering where the Regional Bicycle Transportation Network crosses regional barriers and/or provides direct connections to adjacent city bicycle networks. Potential example includes extending the Midtown Greenway across the Mississippi River into St. Paul.
Safety, Mobility,
Active partnerships
Low
SUPPORT ACTION 5.2Support the Minneapolis Park and Recreation Board in completing the Grand Rounds Missing Link, connecting Northeast and Southeast Minneapolis.
Mobility, Active
partnerships Low
SUPPORT ACTION 5.3Work with partners to support bikeway connecting South Minneapolis directly to Minneapolis-St. Paul Airport Terminal 1 and Blue Line Light Rail stations.
Prosperity, Mobility,
Active partnerships
Medium

D R A F T M I N N E A P O L I S T R A N S P O R T A T I O N A C T I O N P L A N - M a r c h 2 0 2 0 74
Figure 56: Existing Regional Bicycle Trail Network

D R A F T M I N N E A P O L I S T R A N S P O R T A T I O N A C T I O N P L A N - M a r c h 2 0 2 0 75
Maintenance of the All Ages and Abilities Network includes sweeping, replacement of bollards, repainting street lines, snow and ice clearance, maintaining smooth pavement and providing the same quality of access when detours are required along parts of the network.
Bicycle lanes are often impacted by construction, utility activities and development. There are obstructions, both planned and unplanned, that put bicyclists and other users into general traffic lanes. Depending on the confidence of the rider, this experience ranges from acceptable but inconvenient, to unacceptable, to terrifying. To preserve a network where people of all ages and abilities feel comfortable riding, we need to put practices in place that manage the right of way for these users and maintain predictable comfort measures along the All Ages and Abilities Network.
Maintain the All Ages and Abilities Network to provide year-
round access.STR ATEGY 6
Figure 57: Well maintained winter bicycle facility
S T R A T E G I E S & A C T I O N S : B I C Y C L I N G

D R A F T M I N N E A P O L I S T R A N S P O R T A T I O N A C T I O N P L A N - M a r c h 2 0 2 0 76
Figure 58: Bollard not maintained
Figure 59: Detour difficulty for bike lanes
Figure 60: Curb separated bike lane prevents temporary parking in lane

D R A F T M I N N E A P O L I S T R A N S P O R T A T I O N A C T I O N P L A N - M a r c h 2 0 2 0 77
continued on next page
Actions to maintain the All Ages and Abilities Network to provide year-round access.
A C T I O N S
_ Actions Supports Difficulty
DO ACTION 6.1Develop and implement a written All Ages and Abilities Network Maintenance Plan that is regularly updated.
Safety, Equity, Prosperity,
Mobility Medium
DO ACTION 6.2Require low-stress bikeway detours or temporary bike lanes in place of general travel lanes any time bike lanes are impacted due to construction closures and detours to ensure continuity, including during construction activities, utility projects and closures related to development projects; ensure restoration meets City standards. See street operations Strategy 9
Safety, Equity, Prosperity,
Mobility Medium
DO ACTION 6.3Implement and fund proactive inspections of bikeway detour or temporary bike lane requirements around work zones and ensure compliance, issue fines for and eliminate non-conforming or non-existent bikeway detour or temporary bike lane routes. See street operations Strategy 9
Safety, Mobility Medium
DO ACTION 6.4Improve existing protected bike lanes with more permanent separation, such as curb barriers and planters or other green infrastructure. Consider opportunities to improve the pavement condition when selecting improvements as a part of retrofit projects.
Safety, Equity Medium
DO ACTION 6.5Replace all missing bicycle bollards on protected bikeways each spring by June 1st.
Safety, Equity, Mobility
Low
DO ACTION 6.6Inspect and maintain trail and bike lane pavement condition in coordination with routine sidewalk and roadway pavement inventory cycle. See walking Action 5.1
Safety, Equity, Mobility
Medium
DO ACTION 6.7Improve the pavement condition along the All Ages and Abilities Network with routine street and trail maintenance projects, including sealcoat and resurfacing projects.
Safety, Equity, Mobility
Medium

D R A F T M I N N E A P O L I S T R A N S P O R T A T I O N A C T I O N P L A N - M a r c h 2 0 2 0 78
Actions to maintain the All Ages and Abilities Network to provide year-round access.
A C T I O N S ( c o n t i n u e d )
● Street operations Strategy 9 — Street detours and Complete Streets
S E E A L S O S T R AT E G Y :
_ Actions Supports Difficulty
DO ACTION 6.8Sweep the All Ages and Abilities Network once a week during spring, summer and fall.
Safety, Equity, Mobility
Medium
DO ACTION 6.9Prioritize clearing snow and ice on the All Ages and Abilities Network, including trails and protected bikeways within 24 hours of a snow event.
Safety, Equity, Mobility
Medium
DO ACTION 6.10Determine best way to ensure existing and future neighborhood greenways have the same quality of snow and ice clearance as trails and protected bikeways.
Safety, Equity, Mobility
High
DO ACTION 6.11 Increase lighting on the All Ages and Abilities Network by installing standalone lighting where bikeways are not adequately lit by pedestrian or roadway lighting. See walking Strategy 3
Safety, Equity, Mobility
Medium

D R A F T M I N N E A P O L I S T R A N S P O R T A T I O N A C T I O N P L A N - M a r c h 2 0 2 0 79
Bicycle wayfinding signage currently exists at several locations around Minneapolis, including the Midtown Greenway and at the newly installed mobility hub pilots. Providing a similar set of navigational wayfinding signs, designed for those using the All Ages and Abilities Network, will help provide direction to those on the network. An interconnected All Ages and Abilities Network with signage that shows users time or distance to certain destinations on a low-stress corridor will give users the ability to navigate the network, and the destinations it will serve, with assuredness.
Provide wayfinding to help people navigate the All Ages and
Abilities Network.STR ATEGY 7
Figure 61: Midtown Greenway wayfinding information
S T R A T E G I E S & A C T I O N S : B I C Y C L I N G
Figure 62: Mobility hub wayfinding signage

D R A F T M I N N E A P O L I S T R A N S P O R T A T I O N A C T I O N P L A N - M a r c h 2 0 2 0 80
Actions to provide wayfinding to help people navigate the All Ages and Abilities network.
A C T I O N S
● Technology Action 3.1 — Implement mobility hub network
S E E A L S O A C T I O N :
_ Actions Supports Difficulty
DO ACTION 7.1Develop a wayfinding plan for the All Ages and Abilities Network in the city and coordinate with neighboring jurisdictions and regional partners.
Mobility, Active partnerships
Medium
DO ACTION 7.2Install wayfinding signs along the existing All Ages and Abilities Network and include signage as new projects are built.
Mobility Low
DO ACTION 7.3Promote the All Ages and Abilities Network with maps, educational materials and partnerships with community organizations.
Mobility, Active partnerships
Low

D R A F T M I N N E A P O L I S T R A N S P O R T A T I O N A C T I O N P L A N - M a r c h 2 0 2 0 81
Bikeways provide clear benefits to the users of them, but often provide additional benefits to those who travel along the same corridor. Examples include traffic calming and reduced speeds of vehicles which lowers the risks and severity of crashes along those corridors. Including additional elements like greening along bikeways provides multiple benefits, like more protection to the bicyclists, helping to capture rainwater before it enters the stormwater system, creating habitat for birds and other small animals and providing visual interest for people traveling along the corridor, no matter the mode of travel.
Design bikeways using best practices that reflect the
community and serve as an asset to people who may not
currently ride a bike or use micromobility.STR ATEGY 8
Figure 64: King Street jersey barriers
S T R A T E G I E S & A C T I O N S : B I C Y C L I N G
Figure 63: 3rd Avenue bike planters

D R A F T M I N N E A P O L I S T R A N S P O R T A T I O N A C T I O N P L A N - M a r c h 2 0 2 0 82
Actions to design bikeways using best practices that reflect the community and serve as an asset to people who may not currently ride a bike or use micromobility.
A C T I O N S
● Bicycling Action 1.3 — Use design to prevent blocked lanes
S E E A L S O A C T I O N :
_ Actions Supports Difficulty
DO ACTION 8.1Design protected bikeways to accommodate access to the curb for the mobility impaired, working directly with the Minneapolis Advisory Committee on People with Disabilities and the broader disability community to test and monitor designs.
Safety, Equity, Mobility
Low
DO ACTION 8.2Incorporate median islands and intersection treatments into protected bikeways and neighborhood greenways that benefit people walking as they cross streets. See bicycling Action 4.2
Safety, Mobility Medium
DO ACTION 8.3Install greening and stormwater infrastructure elements along trails, protected bike lanes and neighborhood greenways. See design Strategy 4
Climate, Prosperity,
Mobility, Active partnerships
Medium
DO ACTION 8.4Integrate public realm or public art projects into bikeway features to reflect the community when appropriate.
Prosperity Medium

D R A F T M I N N E A P O L I S T R A N S P O R T A T I O N A C T I O N P L A N - M a r c h 2 0 2 0 83
The rise of different types of vehicles, including scooters, bikeshare and other new vehicle types increase the need for safe spaces to park these vehicles. The City currently operates five accommodations for bike and micromobility parking:
Update bicycle and micromobility parking practices to
support demand and diversity of vehicles to significantly
expand bicycle racks in the right of way.STR ATEGY 9
Bike rack programThe Bike Rack Cost Share program allows eligible businesses to be reimbursed up to 50% of the bicycle rack cost and 50% of the installation cost. Schools, libraries, parks and other eligible public facilities can request to receive racks at no cost.
S T R A T E G I E S & A C T I O N S : B I C Y C L I N G
Bike corral programThe Bicycle Corral Cost Share Program is designed for businesses with high bicycle demand and limited space in the boulevard or sidewalk area. It is a low-cost method to provide bicycle parking in the same space occupied by an on-street parked car. Businesses are reimbursed up to 50% of the bike corral cost.
Figure 65: On street custom bike racks
Bike lockersPublic bike lockers are available to rent at Ramp A, Courthouse Ramp, the University of Minnesota and at Metro Transit stations and transit centers.
Nice Ride station placementNice Ride has both stations for docked bicycles and painted spots on sidewalks for the dockless blue bikes.
Figure 66: Bike corral

D R A F T M I N N E A P O L I S T R A N S P O R T A T I O N A C T I O N P L A N - M a r c h 2 0 2 0 84
Scooter parking zonesThe City has created several on-street scooter parking zones to provide a designated space for scooters to be parked, out of the pedestrian clear zone and in a predictable manner for scooter users.
Figure 67: Nice Ride hub
Figure 68: Scooter parking zone

D R A F T M I N N E A P O L I S T R A N S P O R T A T I O N A C T I O N P L A N - M a r c h 2 0 2 0 85
Actions to update bicycle and micromobility parking practices to support demand and diversity of vehicles to significantly expand bicycle racks in the right of way.
A C T I O N S
● Technology Action 2.4 — Provide adaptive shared vehicles
● Technology Action 6.2 — Electric charging infrastructure is compatible with bicycles and micromobility
● Street operations Action 5.1 — Develop curbside management policy
S E E A L S O A C T I O N S :
_ Actions Supports Difficulty
DO ACTION 9.1Develop approach and criteria to reserve curbside or furnishing zone space on all mixed-use block faces for seasonal on-street bicycle and micromobility parking at no charge. See technology Action 2.1, street operations Action 5.11
Equity, Mobility Medium
DO ACTION 9.2Complete a citywide evaluation of bike rack installations and develop a process to identify locations to add bike racks across the city, including adding hitches to meter poles and stand-alone bike racks.
Mobility Medium
DO ACTION 9.3Install bike and micromobility parking with all capital projects, consistent with the Street Design Guide. See design Strategy 1
Equity, Mobility Low
DO ACTION 9.4Expand the bicycle rack cost share and bicycle corral programs to make free for businesses and residences within ACP50 areas.
Equity, Mobility Low
DO ACTION 9.5Update the Zoning Code, which requires minimum bike parking for new developments, to accommodate increased demand and a range of vehicle types, including adaptive and cargo bicycles and electric charging needs.
Equity, Mobility Low
_ _ _ _
SUPPORT ACTION 9.6Work with Metro Transit to implement secure and covered bicycle parking at transit stations. See transit Strategy 5
Safety, Mobility, Active
partnerships Medium

D R A F T M I N N E A P O L I S T R A N S P O R T A T I O N A C T I O N P L A N - M a r c h 2 0 2 0 86
The City of Minneapolis partners with Minneapolis Public Schools on Safe Routes to School projects and planning efforts. This strategy focuses on that partnership as well as broader education efforts for residents and businesses.
Expand safe biking and micromobility education and
encouragement.STR ATEGY 10
Figure 69: Open streets Minneapolis
Figure 70: Pop up event
S T R A T E G I E S & A C T I O N S : B I C Y C L I N G

D R A F T M I N N E A P O L I S T R A N S P O R T A T I O N A C T I O N P L A N - M a r c h 2 0 2 0 87
Actions to expand biking and micromobility education and encouragement.
_ Actions Supports Difficulty
DO ACTION 10.1Provide on-site education for bikeway projects post-installation to help people understand changes to street operations, particularly when an All Ages and Abilities project is implemented. This can include temporary visual materials and pop-up engagement in the neighborhood.
Safety, Active partnerships
Low
DO ACTION 10.2Ensure that Open Streets Minneapolis continues to be a sustainable program and evolves. Explore different route types, lengths, frequency and repetition, including ideas like ‘car free Sundays’, low-programmed open streets, partnering with the Minneapolis Park and Recreation Board for events on parkways and finding other ways to encourage and give people the opportunity to envision Minneapolis streets in a different way.
Safety, Prosperity, Active
partnerships Medium
_ _ _ _
SUPPORT ACTION 10.3Help Minneapolis Public Schools get to a universal bike education program for fourth and fifth grade students.
Safety, Equity, Active partnerships
Low
SUPPORT ACTION 10.4Work with the Minnesota Department of Public Safety to add more bicycle, scooter and other new mobility options to the driver’s education curriculum.
Safety, Mobility, Active
partnerships High
● Walking Action 2.6 — Use the Safe Routes to School program to encourage walking and biking
● Technology Action 2.1 — Welcome and maintain bikeshare and micromobility option
S E E A L S O A C T I O N S :

D R A F T M I N N E A P O L I S T R A N S P O R T A T I O N A C T I O N P L A N - M a r c h 2 0 2 0 88
Building out a safe and convenient bike network will require monitoring, including impacts of investments on perceptions and use patterns of existing and new riders. In so doing, we will be able to adjust our approach if needed in light of user preference and use patterns.
Being able to help public understanding of new micromobility options through data – including use data, crash data and travel behavior choices – will help the public better react to the changing mobility options as well as give people more information for their own journey.
Measure biking and micromobility ridership levels and user
comfort.STR ATEGY 11
Figure 71: Minneapolis of bike/walk counts program dashboard
S T R A T E G I E S & A C T I O N S : B I C Y C L I N G

D R A F T M I N N E A P O L I S T R A N S P O R T A T I O N A C T I O N P L A N - M a r c h 2 0 2 0 8989
Actions to measure biking and micromobility ridership levels and user comfort.
A C T I O N S
_ Actions Supports Difficulty
DO ACTION 11.1Expand use of automated counters to measure seasonal traffic variation and integrate biking and micromobility count data into traffic databases.
Mobility Low
DO ACTION 11.2Require data sharing from micromobility service providers to understand travel behavior and inform infrastructure and policy changes. See technology Strategy 4
Mobility, Active partnerships
Low
DO ACTION 11.3Conduct a biennial survey in coordination with micromobility service providers to collect information on the perceptions of biking and micromobility including who is riding and the experiences of people riding. See technology Strategy 4, technology Action 7.4
Mobility, Active partnerships
Low

D R A F T M I N N E A P O L I S T R A N S P O R T A T I O N A C T I O N P L A N - M a r c h 2 0 2 0 90
Transit is a central component of Minneapolis 2040 and throughout the engagement process for the TAP, we repeatedly and clearly heard that people want reliable access to transit. Transit is a critical foundation for the City’s multimodal transportation system while also contributing to economic competitiveness by attracting business, private investment and top talent to the city. Over 30,000 (16.5%) households in the city do not have access to or choose not to own a personal car, with the highest concentration of car-free individuals living in neighborhoods around downtown Minneapolis.42 The comprehensive plan calls for more growth in population and jobs, focused along and near transit corridors.
To effectively plan for this growth, the City will partner with the Metropolitan Council to plan for and invest in a transit priority projects that aim to improve the coverage, speed and reliability of transit service. The Metropolitan Council provides a backbone of service and operation, and the City of Minneapolis, through this chapter of the Transportation Action Plan, defines a clear set of priorities, goals and actions for the city.
Transit must be convenient, reliable and frequent to effectively reduce trips made by single occupancy vehicles. In 2010 people took transit for 13% of their trips (including 2% by school bus). Our goal is to increase that to 1 in 4 trips (25%) by 2030.44
Over 30,000 (16.5%) of households in the city do not have access to a vehicle, with the highest concentration of car-free individuals living in neighborhoods around downtown Minneapolis.43
Define the Minneapolis Transit Network
TRANSIT
42 Household Size by Vehicles Available, U.S. Census Bureau, 2013-2017 American Community Survey 5-Year Estimates 43 Household Size by Vehicles Available, U.S. Census Bureau, 2013-2017 American Community Survey 5-Year Estimates 44 The 2010 data is anticipated to be updated by the Metropolitan Council by the time the TAP is adopted; the mode shift goal may be adjusted based on changes to baseline
data; we understand that 2010 trip data may be significantly different than the forthcoming 2018-2019 dataset.

D R A F T M I N N E A P O L I S T R A N S P O R T A T I O N A C T I O N P L A N - M a r c h 2 0 2 0 91
Figure 72: Transit Priority Projects Draft Transit Priority ProjectsLegend
Existing High Frequency Transit Network
Future Transit Priority Corridors ***
Planned High Frequency Transit Network
C LineC Line
55(Future D Line)(Future D Line)
1111
1010
Green LineGreen Line
22
Blue LineBlue Line
A LineA Line
55(Future D Line)(Future D Line)
1111
1818
66(Future E Line)(Future E Line)
Green LineGreen LineExtensionExtension
21 (Future B Line)21 (Future B Line)
Blue LineBlue LineExtensionExtension
Existing Transit Priority Corridors
Enhanced Neighborhood- Based Transit
*** These corridors may be prioritized for increased service, transit signal priority or preemption, bus only lanes or other improvements.

D R A F T M I N N E A P O L I S T R A N S P O R T A T I O N A C T I O N P L A N - M a r c h 2 0 2 0 92
T R A N S I T S T R AT E G I E S
Increase transit coverage so that 75% of city residents are located within a quarter mile and 90% of residents are located within a half mile of high frequency transit corridors.
2
Increase the speed and reliability of transit.
2
Increase available resources for transit and actively manage capital transit investments.
2
Partner with Metro Transit and other agencies to pursue new transit projects of high impact.
2
Expand multimodal access to transit.2
Support efforts to ensure transit is a safe, comfortable and affordable option for all city residents.
2
1
2
3
4
5
6
● Street operations Strategy 3 — Plan for efficient and practical operations of people walking, biking and taking micromobility or transit throughout the street design process.
● Street operations Strategy 4 — Leverage City resources and partnerships to promote, educate and encourage walking, biking and transit as alternatives to driving.
● Street operations Strategy 5 — Price and manage use of the curb to encourage walking, biking and using transit, and to discourage driving alone.
● Street operations Strategy 6 — Induce regional mode shift by prioritizing pedestrian, bicycle and transit facilities and operations into capital transportation projects.
● Design Strategy 5 — Use street design to improve transit operations.
S E E A L S O S T R AT E G I E S :

D R A F T M I N N E A P O L I S T R A N S P O R T A T I O N A C T I O N P L A N - M a r c h 2 0 2 0 93
STR ATEGY 1
Increase transit coverage so that 75% of city residents are located within a quarter mile and 90% of residents are located within a half mile of high frequency transit corridors.
Minneapolis 2040 allows greater density of housing near existing and planned high frequency transit lines. The Transit Priority Projects map identifies corridors to improve frequency and reliability on existing routes and identifies where new crosstown services are needed.
High frequency transit corridors have service every 15 minutes during key weekday and Saturday hours. Currently, 47% of Minneapolis residents have a quarter mile access, or about a 5-minute walk, to high frequency transit. An additional 24% of people have access within a half mile, or about a 10-minute walk. The TAP sets a goal of 75% of city residents located within a quarter mile and 90% of residents located within a half mile walk of high frequency transit corridors.
The current transit system undergoes minor service adjustments quarterly, with more major adjustments done through Metro Transit’s Service Improvement Plan and when major capital projects come online. The last full Service Improvement Plan was completed in 2015 with an update report in 2017, and Metro Transit’s Network Next will be looking at larger service adjustments systemwide in 2020. With many development and new population centers in Minneapolis, ensuring growth corridors are well served by transit is a focus of this strategy. Each of the strategies below will depend on upon the partnership with Metro Transit and should be coordinated with Network Next.
S T R A T E G I E S & A C T I O N S : T R A N S I T
Figure 73: Hennepin Ave bus only lane pilot

D R A F T M I N N E A P O L I S T R A N S P O R T A T I O N A C T I O N P L A N - M a r c h 2 0 2 0 94
Figure 74: Existing and planned high frequency transit routes
Legend
Existing High Frequency Transit Network
Planned High Frequency Transit Network

D R A F T M I N N E A P O L I S T R A N S P O R T A T I O N A C T I O N P L A N - M a r c h 2 0 2 0 95
Figure 75: 5- and 10-minute walksheds to existing high frequency transit

D R A F T M I N N E A P O L I S T R A N S P O R T A T I O N A C T I O N P L A N - M a r c h 2 0 2 0 96
_ Actions Supports Difficulty
DO ACTION 1.1Expand the high frequency network.
Equity, Prosperity, Mobility, Active
partnerships High
DO ACTION 1.2Coordinate with Metro Transit’s Network Next plan to reflect the strategies and actions in this plan.
Equity, Prosperity, Mobility, Active
partnerships Medium
DO ACTION 1.3Establish enhanced neighborhood-based transit options, considering the use of new vehicle types, in growing neighborhoods to provide enhanced access and connections to housing, goods, services, employment and other destinations including existing high-frequency transit routes. Explore options along the downtown riverfront and North Loop first.
Prosperity, Mobility
High
_ _ _ _
SUPPORT ACTION 1.4Increase the high frequency network from 15 to 10 minutes or better.
Equity, Prosperity, Mobility, Active
partnerships High
SUPPORT ACTION 1.5Improve the quality and expand the high frequency network of local crosstown service, specifically from north to northeast Minneapolis and from south to southwest Minneapolis.
Equity, Prosperity, Mobility, Active
partnerships High
Actions to increase transit coverage and proximity to high frequency transit.
A C T I O N S
continued on next page

D R A F T M I N N E A P O L I S T R A N S P O R T A T I O N A C T I O N P L A N - M a r c h 2 0 2 0 97
_ _ _ _
SUPPORT ACTION 1.6Expand coverage to new or growing markets and improve transit service to areas that are currently underserved based on potential demand from population or development increases. Focus initially on:
● Marshall St NE – between Broadway St NE and Lowry Ave NE ● Lyndale Ave N – between West Broadway and northern city boundary ● Lowry Ave – western city boundary to eastern city boundary ● W Broadway Ave/Broadway St NE – extend from Lyndale Ave N to the
eastern city boundary ● Como Ave SE – between University Ave SE and eastern city boundary ● 38th St – Bryant Ave S to 42nd Ave S ● Xerxes Ave to 46th Street Station - traveling along 50th Street W, Bryant Ave
S, 46th St E, Cedar Ave, 42nd St E, 28th Ave S, 46th St E ● Lyndale Ave S – Hennepin/Lyndale merge near Loring Park to southern city
boundary ● Washington Ave – West Broadway to Cedar Ave continuing to 46th St ● 2nd St N – Hennepin Ave to Dowling Ave N ● Johnson St NE – Hennepin Ave to 37th Ave NE ● Xerxes Ave – 44th St W to 54th St W ● 28th Ave S – 38th St E to 58th St E ● 4th St SE and University Ave SE – Central Ave to 27th Ave SE
Equity, Prosperity, Mobility,
Active partnerships
High
SUPPORT ACTION 1.7Work with Metro Transit and Minneapolis Public Schools to ensure the transit system offers safe, reliable and convenient transit routes and service for high school students.
Climate, Safety, Equity,
Mobility, Active
partnerships
High
SUPPORT ACTION 1.8Support reverse commute service connecting Minneapolis residents to suburban employment centers.
Climate, Prosperity, Mobility,
Active partnerships
Medium
SUPPORT ACTION 1.9Partner with Metro Transit to identify and secure bus layover locations, including restroom availability, that provide efficient access at the beginning of routes.
Mobility, Active
partnerships Low
Actions to increase transit coverage and proximity to high frequency transit.
A C T I O N S ( c o n t i n u e d )
continued on next page

D R A F T M I N N E A P O L I S T R A N S P O R T A T I O N A C T I O N P L A N - M a r c h 2 0 2 0 98
_ _ _ _
SUPPORT ACTION 1.10Explore partnerships and opportunities with private companies and other organizations to subsidize and implement neighborhood or employer circulators.
Prosperity, Mobility,
Active partnerships
Medium
Actions to increase transit coverage and proximity to high frequency transit.
A C T I O N S ( c o n t i n u e d )
● Technology Action 1.6 — Research and integrate automated transit vehicles
● Technology Action 6.7 — Siting of electric charging stations
S E E A L S O A C T I O N S :

D R A F T M I N N E A P O L I S T R A N S P O R T A T I O N A C T I O N P L A N - M a r c h 2 0 2 0 99
45 2018 American Community Survey 5-Year Estimates
STR ATEGY 2 Increase the speed and reliability of transit.
Many improvements can be made to transit within City streets and by adapting the City’s practices. Bus priority lanes, adjustments to signal timing, curb extensions or in-lane transit stops and stop consolidation are all examples of using existing street right of way to improve speed and reliability. Large transit projects often take years to plan, design, fund and construct, and often involve multiple agencies – including city, regional, state, federal offices as well as transit operators. This 10-year action plan recognizes that while that process is valid and necessary for certain types of transit projects like light rail or bus rapid transit projects, there are other quick-build opportunities that we can identify and implement in the near term to make improvements sooner rather than later. We need to invest now in transit projects. The actions below focus on near-term opportunities to improve the transit in the city.
Transit accounts for 14% of all commuter trips. Over 200,000 employees work in downtown Minneapolis each day and 13.5% of commuter trips.45 During busy commute times, bus service becomes unreliable due to congestion during peak travel hours. An added focus on downtown is included in this chapter due to the density of trips.
S T R A T E G I E S & A C T I O N S : T R A N S I T
Figure 76: Painted bus lane

D R A F T M I N N E A P O L I S T R A N S P O R T A T I O N A C T I O N P L A N - M a r c h 2 0 2 0 100
Figure 77: Transit signal priority
Bus-only lanes refer to using one travel lane for buses only, either for a select period of time or throughout the entire day depending on context.

D R A F T M I N N E A P O L I S T R A N S P O R T A T I O N A C T I O N P L A N - M a r c h 2 0 2 0 101
_ Actions Supports Difficulty
DO ACTION 2.1Use full-time dedicated bus-only lanes or dynamic lanes (peak period operation) to improve the speed, frequency and reliability of transit on congested corridors.
Climate, Prosperity,
Mobility, Active partnerships
High
DO ACTION 2.2Install a bus-only lane and/or other transit advantages on the following high priority corridors:
● 4th Ave S between Washington Ave and 10th St S ● 5th Ave S between Washington Ave and 10th St S ● 6th St N/S between 1st Ave N and 13th Ave S ● 7th St N/S between 1st Ave N and 13th Ave S ● 8th St N/S downtown between 1st Ave N and 13th Ave S ● 4th St from the freeway connections on the west to Marquette and 2nd Aves
Climate, Equity, Prosperity,
Mobility, Active partnerships
High
DO ACTION 2.3Evaluate the potential for a bus-only lane and/or other transit advantages on the following corridors, considering partnerships with other jurisdictions.
● Hennepin Ave between Washington Ave S and 12th St S ● Hennepin Ave between Franklin Ave and 12th St S ● West Broadway Ave from western city boundary to eastern city boundary ● Central Ave from 3rd Ave bridge to northern city boundary ● University Ave/4th St from Hennepin/1st Ave NE to eastern city boundary ● 11th Street South between Hennepin and Marquette ● 12th Street South between Hawthorne to 2nd Avenue
Climate, Equity, Prosperity,
Mobility, Active partnerships
High
DO ACTION 2.4Improve transit speed and reliability throughout downtown; focus on Nicollet Mall and Marquette/2nd Ave operations first.
Climate, Equity, Prosperity,
Mobility, Active partnerships
High
DO ACTION 2.5Plan for transit during street reconstruction projects. Ensure that road reconstruction projects on high frequency transit corridors allocate dedicated space for bus-only lanes or other transit advantages, and if applicable, integrate bus rapid transit-ready station design. See street operations Strategy 9
Climate, Equity, Prosperity,
Mobility, Active partnerships
High
Actions to increase the speed and reliability of transit.
A C T I O N S
continued on next page

D R A F T M I N N E A P O L I S T R A N S P O R T A T I O N A C T I O N P L A N - M a r c h 2 0 2 0 102
_ _ _ _
DO ACTION 2.6Prioritize the use of curb space for transit operations and passengers and allow for dynamic flexibility depending on the time of day. See street operations Action 5.2
Prosperity, Mobility, Active
partnerships High
SUPPORT ACTION 2.7Support transit advantages on freeways, including direct connections into and out of downtown, that rely on lane conversions instead of expansions where technically feasible and with consideration of local impacts. Direct connections into downtown should connect to streets with transit-only facilities, including from:
● I-94 between downtown Minneapolis and downtown St Paul ● I-94 north of downtown ● I-35W north of downtown
Climate, Prosperity,
Mobility, Active partnerships
High
SUPPORT ACTION 2.8Increase enforcement of bus-only lane operation to ensure effectiveness on existing and future routes:
● Increase targeted parking enforcement strategies for vehicles blocking current and future bus-only lanes.
● Support the implementation of automated enforcement.
See street operations Action 6.6
Equity, Mobility, Active
partnerships High
SUPPORT ACTION 2.9Increase the size of the traffic control agent workforce, assign traffic control agents in coordination with transit operators and ensure that traffic control agents are educated and focused on increasing person throughput, prioritizing the movement of transit vehicles over automobiles.
Climate, Prosperity,
Mobility, Active partnerships
High
Actions to increase the speed and reliability of transit.
A C T I O N S ( c o n t i n u e d )

D R A F T M I N N E A P O L I S T R A N S P O R T A T I O N A C T I O N P L A N - M a r c h 2 0 2 0 103
STR ATEGY 3Increase available resources for transit and actively
manage capital transit investments.
Currently, the City contributes to transit improvements through partnerships with Metro Transit and funding from our cooperative project fund in the Capital Improvement Program. As the City prioritizes its role in making transit work more effectively, leveraging existing mechanisms to fund transit improvements is an important part of the work. Existing mechanisms include:
● cooperative project funding;
● partnering with private development to include transit amenities into building construction projects;
● land use controls through the Department of Community Planning and Economic Development including incentivizing transit through parking regulations;
● adjusting signal timing and including transit priority signalization along transit corridors; and
● redesigning streets to allow better transit facilities and interactions with other modes, particularly along the curb.
Actions below focus on adjustments to our existing tools to better recognize transit improvements as a prioritizing force within our capital program as well as to look creatively to leverage additional resources for transit improvements on city streets in coordination with regional partners.
S T R A T E G I E S & A C T I O N S : T R A N S I T
Figure 78: Transit infrastructure on bridge at 46th St S over Interstate 35W

D R A F T M I N N E A P O L I S T R A N S P O R T A T I O N A C T I O N P L A N - M a r c h 2 0 2 0 104
_ Actions Supports Difficulty
DO ACTION 3.1Modify capital programs to support transit investments on corridors that have the highest ridership and lowest car ownership rates and allocate funds in a manner that advances citywide transit priorities.
Equity, Mobility, Active
partnerships High
DO ACTION 3.2Work with the Department of Community Planning and Development and other agency partners to convert excess right of way to development parcels; an example includes along Olson Memorial Highway (Highway 55).
Mobility, Active partnerships
High
DO ACTION 3.3Continue to leverage private development opportunities to implement or improve transit investments in the public right of way.
Climate, Mobility, Active
partnerships Medium
_ _ _ _
SUPPORT ACTION 3.4Support transit infrastructure improvements during freeway bridge maintenance and replacement projects along transit corridors.
Climate, Mobility, Active
partnerships Low
SUPPORT ACTION 3.5Support regional efforts to better operate transit through larger regional investments in high-impact locations in Minneapolis. Examples include exploring better operations for buses at the Washington Ave and I-35 W intersection.
Climate, Prosperity,
Mobility, Active partnerships
Medium
Actions to increase available resources for transit and actively manage capital transit investments.
A C T I O N S
● Street operations Action 6.5 — Eliminate gaps in the street grid and reopen Nicollet Avenue at Lake St
S E E A L S O A C T I O N :

D R A F T M I N N E A P O L I S T R A N S P O R T A T I O N A C T I O N P L A N - M a r c h 2 0 2 0 105
STR ATEGY 4Partner with Metro Transit and other agencies to pursue
new transit projects of high impact.
Light rail and bus rapid transit routes provide the major spines of the existing METRO transitway system in Minneapolis, along with one commuter rail line. Bus rapid transit service includes off-board fare payment, fewer stops compared to regular transit lines, enhanced shelters that include real-time vehicle information and longer buses that allow for all-door boarding. Light rail service is similar but runs along dedicated rail lines. The existing light rail has routinely exceeded ridership expectations and has spurred development along the corridors. High frequency transit serves about 3% of the region by land area, but the volume of development it is capturing is significant.46
Light rail and bus rapid transit are major capital investments; however, bus rapid transit projects are less costly to build and quicker to plan and construct than light rail projects, which require a larger scale of investment and time needed for implementation. Fifty percent of the funding for design and construction of light rail and bus rapid transit projects is historically provided by the federal government. We believe that expanding the METRO transitway network is an effort worth investing in. It will be critical with any new light rail developments in Minneapolis that provisions are in place to ensure that nearby residents benefit from the transit investment, including through preservation and construction of affordable housing.
Several projects in Minneapolis have gone through early environmental review processes and have a locally preferred alternative identified. The extents of these corridors are extended below in cases, reflecting the vision of increasing high frequency transit to more people throughout the city.
S T R A T E G I E S & A C T I O N S : T R A N S I T
46 Development Trends Along Transit: Regional growth near high frequency transit in the Twin Cities, 2019.

D R A F T M I N N E A P O L I S T R A N S P O R T A T I O N A C T I O N P L A N - M a r c h 2 0 2 0 106
Figure 79: Nicollet-Central LPA

D R A F T M I N N E A P O L I S T R A N S P O R T A T I O N A C T I O N P L A N - M a r c h 2 0 2 0 107
Figure 80: METRO transitways

D R A F T M I N N E A P O L I S T R A N S P O R T A T I O N A C T I O N P L A N - M a r c h 2 0 2 0 108
_ Actions Supports Difficulty
DO ACTION 4.1Plan, design and construct high capacity, neighborhood-based transit along the Nicollet-Central corridor.
Climate, Prosperity,
Mobility, Active partnerships
High
DO ACTION 4.2Plan, design and construct high capacity, neighborhood-based transit within the dedicated right of way along the Midtown Greenway from West Lake Station on the METRO Green Line Extension to Lake Street Station on the METRO Blue Line.
Climate, Prosperity,
Mobility, Active partnerships
High
DO ACTION 4.3Plan, design and construct high capacity, neighborhood-based transit along the West Broadway corridor from downtown Minneapolis to the northwest suburbs.
Climate, Prosperity,
Mobility, Active partnerships
High
_ _ _ _
SUPPORT ACTION 4.4Advocate and provide continued support for the METRO Blue Line Extension light rail project, connecting Minneapolis with the region’s northwestern communities.
Climate, Prosperity,
Mobility, Active partnerships
High
SUPPORT ACTION 4.5Support bus rapid transit on Olson Memorial Highway (Highway 55) extending to the region’s western communities.
Climate, Prosperity,
Mobility, Active partnerships
Low
SUPPORT ACTION 4.6Develop long-term operations plans for new transit services in partnership with Metro Transit and other partner agencies.
Climate, Mobility, Active
partnerships Medium
SUPPORT ACTION 4.7Advocate for light rail and bus rapid transitways that provide direct connections to regional job centers and other destinations outside of the downtown core within Minneapolis, connecting Minneapolis residents with the regional rail system.
Prosperity, Mobility, Active
partnerships High
Actions to partner with Metro Transit and other agencies to pursue new transit projects of high impact.
A C T I O N S
continued on next page

D R A F T M I N N E A P O L I S T R A N S P O R T A T I O N A C T I O N P L A N - M a r c h 2 0 2 0 109
_ _ _ _
SUPPORT ACTION 4.8Advocate for transitway alignments that are conducive to transit-oriented development and that would include preservation, maintenance and construction of housing at all levels of affordability.
Climate, Equity, Prosperity,
Mobility, Active partnerships
Medium
SUPPORT ACTION 4.9Continue to partner with the Hennepin County Regional Railroad Authority, Metro Transit, the Minnesota Department of Transportation and developers near Target Field Station to plan for the expansion of future commuter rail, inter-city passenger rail and/or high-speed rail projects and supporting facilities.
Equity, Prosperity, Mobility, Active
partnerships High
SUPPORT ACTION 4.10Support statewide efforts to advance the Northern Lights Express connecting Minneapolis with Duluth via high speed rail.
Climate, Equity, Prosperity,
Mobility, Active partnerships
Medium
Actions to partner with Metro Transit and other agencies to pursue new transit projects of high impact.
A C T I O N S ( c o n t i n u e d )
● Transit Action 6.8 — Integrate unique and interactive design on high impact transit projects
S E E A L S O A C T I O N :

D R A F T M I N N E A P O L I S T R A N S P O R T A T I O N A C T I O N P L A N - M a r c h 2 0 2 0 110
STR ATEGY 5 Expand multimodal access to transit.
Ensuring that a connected multimodal system feeds into the transit network will expand people’s ability to rely on transit and lessen dependency on the automobile. Supporting technological advancements to integrate payment options and partner with shared mobility providers are key to increasing access to transit while reducing friction.
S T R A T E G I E S & A C T I O N S : T R A N S I T
Figure 81: New vehicle type: autonomous shuttle
Figure 82: Mobility hubs bring transit and shared mobility services together
Figure 83: Mobility hub linked to transit stop

D R A F T M I N N E A P O L I S T R A N S P O R T A T I O N A C T I O N P L A N - M a r c h 2 0 2 0 111
_ Actions Supports Difficulty
DO ACTION 5.1Prioritize pedestrian improvements connecting residents to transit service, including completing missing links in the sidewalk network, safe crossings at high volume intersections and maintaining pedestrian access through construction zones. See walking Action 5.4
Safety, Equity, Mobility, Active
partnerships Medium
DO ACTION 5.2Explore partnership opportunities to implement and subsidize shared ride and other on demand mobility services targeting first and last mile transit options to connect people to transit stops and stations.
Climate, Equity, Mobility, Active
partnerships Medium
Actions to expand multimodal access to transit.
A C T I O N S
● Walking Action 4.3 — Winter maintenance at transit stops and stations
● Bicycling Action 9.6 — Bike parking at transit stations
● Technology Action 2.1 — Bikeshare and micromobility
● Technology Action 3.1 — Implement mobility hub network
● Technology Action 3.3 — Integrated payment technology
S E E A L S O A C T I O N S :

D R A F T M I N N E A P O L I S T R A N S P O R T A T I O N A C T I O N P L A N - M a r c h 2 0 2 0 112
Support efforts to ensure transit is a safe, comfortable and
affordable option for all city residents.
We heard through our engagement that free transit fares, lower transit fares or more affordable transit was a desire for most people as current transit fares were considered a barrier for many individuals.
Transit fares (local bus and METRO/light rail) on Metro Transit currently are $2.50 for rush hour rides (6:00-9:00 am and 3:00-6:30 pm Monday – Friday) and $2.00 for non-rush hour rides. Reduced fares of $1.00 are available for low-income individuals with valid documentation, seniors (65+), youth (6-12) and Medicare card holders during non-rush hours; express bus rides cost more. People with disabilities with valid documentation can ride the system (local bus, METRO and express bus) for $1.00 at any time with the Transit Assistance Pass (TAP card). Metro Transit also has a partnership with Minneapolis Public Schools which offers Go To Cards to high school students who take the city bus to school for $97/quarter.47
There is currently one example of a zone discount and two examples of free fares within the Metro Transit system:
● The downtown zone has a $0.50 fare for rides within an established zone.
● Free rides between the Minneapolis Convention Center and the METRO Blue and Green lines on 5th Street in downtown Minneapolis via the Route 18, 10 or 59 along Nicollet Mall. This service is available 7 days a week between 5:00 am and 1:00 am.
Additionally, there are several times throughout the year that Metro Transit offers free rides, in partnership with others, to encourage safe travel behaviors. These days typically include afternoon/evening/night of St Patrick’s Day, New Year’s Eve and other days on occasion.
Feeling safe while riding or waiting for transit was another key theme we heard during engagement. There are many elements that contribute to real and perceived safety conditions at station locations and on transit vehicles – including the presence or lack of presence of other riders, lighting, security cameras, access to emergency phones, the cleanliness of vehicles and waiting areas and the conduct of fellow passengers or other people on the vehicle or at or near a stop. Special considerations during winter – like clear and passable paths from stations to vehicles for all users and at waiting areas are also important to make transit safe and comfortable.
S T R A T E G I E S & A C T I O N S : T R A N S I T
Figure 84: High school students getting on the bus
STR ATEGY 6
47 Metro Transit. https://www.metrotransit.org/student-pass-admin.

D R A F T M I N N E A P O L I S T R A N S P O R T A T I O N A C T I O N P L A N - M a r c h 2 0 2 0 113
Figure 85: Well maintained transit stop
Figure 86: Metro Transit offers free fares along Nicollet Mall
Figure 87: TAP card benefit

D R A F T M I N N E A P O L I S T R A N S P O R T A T I O N A C T I O N P L A N - M a r c h 2 0 2 0 114
continued on next page
_ Actions Supports Difficulty
DO ACTION 6.1Study and assess the feasibility of free or reduced transit fares; evaluate the passage of programs citywide and/or within certain zones or based on trip distance.
Equity, Mobility, Active
partnerships High
DO ACTION 6.2Establish requirements for Metropass participation for all new commercial, mixed-use and residential buildings within a half mile of a high frequency transit corridor.
Climate, Mobility, Active
partnerships High
_ _ _ _
SUPPORT ACTION 6.3Support Metro Transit initiatives tied to increased security of the transit system that address real and perceived safety issues while considering equity concerns.
Safety, Equity, Active partnerships
Low
SUPPORT ACTION 6.4Work with partner agencies to improve customer comfort through clean waiting areas and upgraded amenities such as shelters, lighting, seating, heat and real-time schedule information. See technology Action 3.1
Safety, Equity, Mobility, Active
partnerships Medium
SUPPORT ACTION 6.5Work with Metro Transit to expand affordable fare programs and increase participation among eligible residents.
Equity, Mobility, Active
partnerships High
SUPPORT ACTION 6.6Support Metro Transit’s work with Minneapolis Public Schools and other non-profit organizations to provide affordable fares for all program participants.
Equity, Mobility, Active
partnerships Low
SUPPORT ACTION 6.7Work with Metro Transit to expand additional fare-free days throughout the year.
Equity, Mobility, Active
partnerships Medium
Actions to support efforts to ensure transit is a safe, comfortable and affordable option for all city residents.
A C T I O N S

D R A F T M I N N E A P O L I S T R A N S P O R T A T I O N A C T I O N P L A N - M a r c h 2 0 2 0 115
_ _ _ _
SUPPORT ACTION 6.8Encourage investment and design of integrated design elements to engage people and reflect the communities that transit serves through signage/wayfinding, public art, plaza/open spaces, streetscape, real-time traffic count displays and other creative or interactive design elements on major transit projects (light rail, bus rapid transit, etc.) See design Strategy 5
Equity, Prosperity, Active
partnerships Medium
SUPPORT ACTION 6.9Support partner agency efforts to work with new immigrant and non-English speaking communities to educate and build familiarity with the transit system for prospective riders.
Equity, Mobility, Active
partnerships Medium
Actions to support efforts to ensure transit is a safe, comfortable and affordable option for all city residents.
A C T I O N S ( c o n t i n u e d )
● Walking Action 4.3 — Winter maintenance at transit stops and stations
● Technology Action 3.3 — Integrated payment technology
S E E A L S O A C T I O N S :

D R A F T M I N N E A P O L I S T R A N S P O R T A T I O N A C T I O N P L A N - M a r c h 2 0 2 0 116
It is difficult to know what changes will come to transportation in the next 10 years. If the past 10 years of significant technological advancement in transportation is any indication, to successfully meet our goals we will need to continue to build off our historical investment in the City’s core infrastructure. Rapid changes of the past 10 years were driven primarily by the market introduction of the smartphone and phone-based applications on top of improved cellular coverage. The technology paired with shared mobility business models allowed real-time access to widely distributed vehicles and modes. These emerging technology-enabled mobility options are what we are referring to as advanced mobility.
Invite New Technology to Advance Transportation Options
TECHNOLOGY
By proactively focusing on the ability of our systems, infrastructure, operations and staff to adapt to further change, we will make sure that these innovations happen with and for us, not to us. We are growing our planning capacity internally and externally by leveraging our community, public and private partnerships. Our vision is that all people in Minneapolis can travel safely, equitably and reliably through both public and private services.
This topic outlines how we will most thoughtfully integrate technology to help us meet our goals. This topic is most commonly defined by these four advancements in transportation, all of which are enabled by new business models and technology:
● Shared fleets (vehicles available to the public for temporary use)
● Electric vehicles (including transit, automobiles, scooters and bicycles)
● Connected infrastructure and connected people (the ability for vehicles, people and traffic systems to communicate through computer systems over wireless networks)
● Automation of transportation (vehicle technology that automates part of driving)

D R A F T M I N N E A P O L I S T R A N S P O R T A T I O N A C T I O N P L A N - M a r c h 2 0 2 0 117
Technology improvements have attracted new business models and accompanying capital into the transportation market that are important for local government to understand and influence. The City will seek partnerships with those entities that share our values and will help us achieve our City goals, creating the right balance of regulation and support for innovation to enable new solutions. It is the City’s role to communicate the challenges and set the rules for engagement, so that the private sector can develop the solutions successfully.
Numerous actions throughout this plan are influenced by new technology advancements. These are noted throughout the document as supporting strategies in this topic area.
Shared mobility refers to transportation services that are shared among users, either at the same time or one after another and accessed on as an-needed basis.
Advanced mobility describes an approach to maximizing travel opportunities through new and evolving technology in safe, equitable and reliable ways, through
public and private services and collaboration.
Figure 88: Electronic ticketing Figure 89: Nice Ride technology

D R A F T M I N N E A P O L I S T R A N S P O R T A T I O N A C T I O N P L A N - M a r c h 2 0 2 0 118
T E C H N O L O G Y S T R AT E G I E S
Harness technological advancements for citywide benefits, ensuring newly adopted technologies support safe street operations and focus on human-centered design.
2
Increase access to shared mobility services by removing the barriers of physical ability, geographic placement, language, payment methods, income and technology and digital literacy.
Formulate public-private partnerships to implement innovative, ambitious and scalable pilots.
Require private shared mobility providers, including transportation network companies, to share data that supports the City’s ongoing transportation planning and operations work, with a focus on equity and access for all and minimizing greenhouse gas emissions.
Build a culture of continuous improvement in knowledge, education and communications around new technologies that advance transportation options.
Encourage and support electric vehicles by developing public charging stations and incentivizing private off-street stations; incentivize power sources from renewable generated electricity.
1
2
3
4
5
6
Continue to develop internal resources capacity for advanced mobility initiatives.
7
● Street operations Strategy 3 — Plan for efficient and practical operations of people walking, biking and taking micromobility or transit throughout the street design process.
● Street operations Strategy 4 — Leverage City resources and partnerships to promote, educate and encourage walking, biking and transit as alternatives to driving.
● Street operations Strategy 5 — Price and manage use of the curb to encourage walking, biking and using transit, and to discourage driving alone.
● Street operations Strategy 6 — Induce regional mode shift by prioritizing pedestrian, bicycle and transit facilities and operations into capital transportation projects.
● Design Strategy 5 — Use street design to improve transit operations.
S E E A L S O S T R AT E G I E S :

D R A F T M I N N E A P O L I S T R A N S P O R T A T I O N A C T I O N P L A N - M a r c h 2 0 2 0 119
STR ATEGY 1
Harness technological advancements for citywide benefits,
ensuring newly adopted technologies support safe street
operations and focus on human-centered design.
Increased pressure on our curb space, driven by an increase in land use density, e-commerce deliveries and new advanced mobility modes, is pushing us to manage our right of way in a more sophisticated manner. In order to serve changing customer needs and stay on track toward a low carbon future, we must price and allocate space based on our 2030 goals and priorities and the true value of the space.
The changes we are making to how our streets are designed and operated to accommodate these changes aims to encourage low carbon travel and keep a human focus on our streets.
S T R A T E G I E S & A C T I O N S : T E C H N O L O G Y
Figure 90: Autonomous transit shuttle
Figure 91: Repurposing space on 4th Street downtown
When information is shared between vehicles, infrastructure and/or people, often through a device
they carry, they are said to be “connected”.

D R A F T M I N N E A P O L I S T R A N S P O R T A T I O N A C T I O N P L A N - M a r c h 2 0 2 0 120
continued on next page
_ Actions Supports Difficulty
DO ACTION 1.1Ensure newly adopted technologies and policies complement and enhance the existing public transportation system.
Prosperity, Mobility
Medium
DO ACTION 1.2Ensure that all emerging technology pilots adhere to the standards outlined in Technology Action 2.2. See technology Action 2.2
Safety, Equity, Mobility
Low
DO ACTION 1.3Convert street space for shared mobility services (either high occupancy motor vehicles or micromobility options) and other emerging technologies. These conversions should improve the quality of pedestrians or transit travel.
Equity, Prosperity, Mobility
High
DO ACTION 1.4Continue to offer Minneapolis as a testing ground for automated vehicle pilots and learn from other cities doing similar work. Pilots should only test a shared model of travel, such as shuttles, and adhere to Technology Action 2.2. See technology Action 2.2
Mobility Medium
DO ACTION 1.5Evaluate impacts of automated vehicles on street design and vice-versa, with specific emphasis on the safety of people walking and biking and adjust guidance as necessary. See design Action 1.7
Mobility Medium
DO ACTION 1.6Research and develop recommendations for integrating and regulating privately operated, automated transit vehicles as well as employing them within government. See transit Strategy 1
Safety, Mobility Medium
DO ACTION 1.7Ensure traffic signal system compatibility with next generation communication systems through cellular or DSRC (dedicated short-range communication channels) and V2X (vehicle to infrastructure/vehicle/everything communications systems).
Mobility, Active partnerships
High
Actions to harness technological advancements for citywide benefits, ensuring newly adopted technologies support safe street operations and improve the safety and comfort of users.
A C T I O N S

D R A F T M I N N E A P O L I S T R A N S P O R T A T I O N A C T I O N P L A N - M a r c h 2 0 2 0 121
_ Actions Supports Difficulty
DO ACTION 1.8Collaborate with partners to research and understand the feasibility of unmanned aerial vehicles (drones) operating in the urban context, including permitting, weather implications, data implications, privacy and local impacts of federal regulatory decisions. See freight Action 7.1
Mobility, Active partnerships
High
DO ACTION 1.9Prepare for drones for delivery, as an inspection vehicle or for other means of advancing mobility in the city including removal of trips from the system. See freight Action 7.1
Safety, Prosperity, Mobility, Active
partnerships High
DO ACTION 1.10Incorporate elements in street reconstruction projects which support advanced mobility, such as electric vehicle charging infrastructure, protected micromobility lanes and designated spaces for pick up and drop off, including flex zones which change purpose by time of day, week or season.
Mobility Medium
DO ACTION 1.11Implement Safe Vehicle actions from 2020-2022 Vision Zero Action Plan, focusing on:
● Determining how advanced mobility options are shaping the safety of city streets and responding appropriately;
● Piloting and managing emerging vehicle technologies with the potential to improve safety; and
● Continuing to monitor safety on the City’s scooter share pilot and make adjustments to provider requirements, public education, or street
design as appropriate.
See street operations Action 2.1
Safety, Mobility Medium
Actions to harness technological advancements for citywide benefits, ensuring newly adopted technologies support safe street operations and improve the safety and comfort of users.
A C T I O N S ( c o n t i n u e d )
● Walking Strategy 8 — Use technology to increase pedestrian visibility and comfort
● Transit Action 2.8 — Effective bus-only lane operations
● Freight Action 1.3 — Shared freight lockers
● Freight Strategy 7 — Regulate new delivery technologies
● Street operations Strategy 5 — Price and manage the curb
S E E A L S O S T R AT E G I E S A N D A C T I O N S :

D R A F T M I N N E A P O L I S T R A N S P O R T A T I O N A C T I O N P L A N - M a r c h 2 0 2 0 122
STR ATEGY 2
Increase access to shared mobility services by removing the
barriers of physical ability, geographic placement, language,
payment methods, income and technology and digital literacy.
Shared vehicles and services create options for people who do not have access to or choose not to have a private vehicle. Increasing access to shared fleets is important for shifting travel behaviors and maintaining affordability. The City is focused on ensuring full access to these shared mobility service options for those who could benefit most by removing barriers such as lack of a smartphone, bank account or a driver’s license. By partnering with local organizations and other public agencies that are already working on access issues, we are leveraging resources to have the greatest impact.
Figure 92: Percentage of household income spent on transportation
Figure 93: HOURCAR car sharing system
S T R A T E G I E S & A C T I O N S : T E C H N O L O G Y
Average Minneapolis Household
Federal Poverty Income Household
Source: 2013 American Housing Survey; American Community Survey 2009-2013 (5 year estimates)

D R A F T M I N N E A P O L I S T R A N S P O R T A T I O N A C T I O N P L A N - M a r c h 2 0 2 0 123
Figure 94: Nice Ride docked station

D R A F T M I N N E A P O L I S T R A N S P O R T A T I O N A C T I O N P L A N - M a r c h 2 0 2 0 124
_ Actions Supports Difficulty
DO ACTION 2.1Maintain and welcome an environment where bikeshare and micromobility options thrive and provide real mobility options and benefits. See technology Action 6.4, bicycling Strategy 9
Climate, Equity, Prosperity,
Mobility, Active partnerships
Medium
DO ACTION 2.2Include conditions in agreements with shared mobility service providers that require equitable access: low-price options, education and outreach about how to access services, geographic distribution with a focus in areas of concentrated poverty with majority people of color, non-English resources, non-smartphone access, ADA access to vehicles and services and multiple payment methods including options for the unbanked.
Equity, Active partnerships
Low
DO ACTION 2.3Work with public and private partners to standardize the low-income eligibility and registration process for shared mobility services.
Equity, Active partnerships
High
DO ACTION 2.4Work with shared mobility service providers to provide adaptive vehicles where possible and vehicles with additional storage and passenger capacity. See bicycling Action 9.1
Equity, Mobility, Active
partnerships Medium
DO ACTION 2.5Review existing validation requirements for alternatives to having a driver’s license to operate shared mobility services where potentially feasible.
Equity Medium
DO ACTION 2.6Evaluate the reintroduction of car sharing or similar model that allows for one-way trips and analyze city support for viability. See street operations Action 5.8
Equity, Mobility, Active
partnerships High
DO ACTION 2.7Institute a process to consult with communities, grassroot coalitions and non-profits to evaluate existing services, envision and create new solutions to reduce barriers to shared mobility services that best suit the needs of low-income and underrepresented individuals.
Equity, Prosperity Mobility, Active
partnerships High
Actions to increase access to shared mobility services by removing the barriers of physical ability, geographic placement, language, payment methods, income and technology.
A C T I O N S

D R A F T M I N N E A P O L I S T R A N S P O R T A T I O N A C T I O N P L A N - M a r c h 2 0 2 0 125
STR ATEGY 3Formulate public-private partnerships to implement
innovative, ambitious and scalable pilots.
Technology innovations in transportation are primarily being developed and deployed by the private sector; public agencies have the role of regulating and permitting their use on city streets as right of way managers. The partnerships with both the private sector and other public agencies are critical to our ability to deploy safe and successful pilots. All pilots are selected to help determine permanent advanced mobility implementations.
Mobility as a Service, the concept of a multimodal trip planning and payment as a subscription service through one virtual platform, presents a partnership opportunity. Working with regional partners such as Metro Transit, as well as private service and application providers, to enable the deployment of Mobility as a Service will help people take into account environmental, personal health, financial and time considerations when trip planning. Our approach allows for compatibility with mobility providers and utilizes open data to allow for multiple private platforms.
Financial incentives can change how people travel. This can benefit their health and the environment.
Another key opportunity for partnering regionally is to pilot and deploy mobility hubs. Mobility hubs are physical places where people can connect to multiple modes of transportation to make their trip as safe, convenient and reliable as possible. Most hubs are centered on transit connections, where multiple modes are available to extend the reach of transit. Bicycle and micromobility parking, car share vehicles and wayfinding and real time information are all potential components of mobility hubs.
S T R A T E G I E S & A C T I O N S : T E C H N O L O G Y
Figure 95: Metro transit app on phone

D R A F T M I N N E A P O L I S T R A N S P O R T A T I O N A C T I O N P L A N - M a r c h 2 0 2 0 126
Figure 96: Mobility hub visualization
Figure 97: Mobility hub
Mobility hubs are places where people can connect to multiple modes of transportation to make their trip as safe, convenient and reliable as possible.

D R A F T M I N N E A P O L I S T R A N S P O R T A T I O N A C T I O N P L A N - M a r c h 2 0 2 0 127
_ Actions Supports Difficulty
DO ACTION 3.1Implement a network of mobility hubs in partnership with Metro Transit. Mobility hubs will be designed to connect transit with other shared mobility services such as bikeshare, scooter share and carshare. Mobility hubs will vary in scale based on context, space and viability and may have placemaking, vehicle charging and wayfinding features. See walking Action 8.1, transit Strategy 5
Mobility, Active partnerships
High
DO ACTION 3.2Work with public and private partners and community-based organizations to evaluate future mobility hub locations and ensure that the geographic placement of mobility hubs includes locations in ACP50 areas.
Equity, Mobility, Active
partnerships Medium
DO ACTION 3.3Collaborate with public and private partners to enable a virtual platform for accessing and paying for transit and shared mobility services, including a multimodal subscription package. See transit Strategy 5
Equity, Prosperity, Mobility, Active
partnerships High
DO ACTION 3.4Work with the Metropolitan Council and Metro Transit to expand app-based vanpool and carpool. See street operations Strategy 4
Climate, Prosperity,
Mobility, Active partnerships
Medium
DO ACTION 3.5Work with the Metropolitan Council and Metro Transit to pilot a microtransit service within Minneapolis and the greater Twin Cities region. See street operations Strategy 4
Equity, Mobility, Active
partnerships Medium
Actions to formulate public-private partnerships to implement innovative, ambitious and scalable pilots.
A C T I O N S
● Transit Action 5.2 — On demand mobility services
● Technology Action 7.3 — New technologies
S E E A L S O A C T I O N S :

D R A F T M I N N E A P O L I S T R A N S P O R T A T I O N A C T I O N P L A N - M a r c h 2 0 2 0 128
STR ATEGY 4
Require private shared mobility providers, including transportation network companies, to share data that supports the City’s ongoing transportation planning and operations work, with a focus on equity and access for all and minimizing greenhouse gas emissions.
Access to trip and vehicle data can provide critical information for supporting management of the right of way and future planning of mobility options. Data can also support decision making around additional infrastructure and safety improvements and policy development to support mode shift and greenhouse gas reductions.
In line with the City’s Data Policy, the privacy and protection of user data is our top priority. In order to establish and communicate clear and consistent standards of data processing, the City developed a Mobility Data Methodology and Analysis that can be applied across mobility service providers. This allows the City to access, use and share data in a way which is safe, intentional and transparent.
S T R A T E G I E S & A C T I O N S : T E C H N O L O G Y
Figure 98: City of Minneapolis data policy workflow

D R A F T M I N N E A P O L I S T R A N S P O R T A T I O N A C T I O N P L A N - M a r c h 2 0 2 0 129
● Bicycling Action 11.2 — Requiring data sharing from micromobility service operators
● Bicycling Action 11.3 — Survey of bicycle and micromobility users
S E E A L S O A C T I O N S :
_ Actions Supports Difficulty
DO ACTION 4.1Ensure that all data is fully aggregated and anonymized for the protection of users.
Equity, Active partnerships
Medium
DO ACTION 4.2Require data from all shared mobility providers to further City goals that abides by the City’s Mobility Data Methodology and Analysis.
Active partnerships
Low
DO ACTION 4.3Analyze data received to understand impacts to safety, trip behavior, equitable access and the environment.
Mobility, Active partnerships
Medium
DO ACTION 4.4Work with public partners to establish a standardized process for data requests and a system to share data across agencies.
Active partnerships
Medium
DO ACTION 4.5Create and publish fully anonymized and aggregated open data sets and public transparency dashboards. See technology Action 5.1
Climate, Safety, Equity, Prosperity,
Mobility, Active partnerships
Medium
Actions to require private shared mobility providers, including transportation network companies, to share data that supports the City’s ongoing transportation planning and operations work,
with a focus on equity and access for all and minimizing greenhouse gas emissions.
A C T I O N S

D R A F T M I N N E A P O L I S T R A N S P O R T A T I O N A C T I O N P L A N - M a r c h 2 0 2 0 130
STR ATEGY 5
Build a culture of continuous improvement in knowledge,
education and communications around new technologies that
advance transportation options.
Many of the challenges in realizing greater adoption of shared fleets can be addressed through increased awareness and education of available services and how they work. Partnering with mobility service providers through requirements in agreements can help leverage more resources to increase awareness and understanding. Using feedback gathered through education and community engagement throughout our pilots will help us adjust our approach to planning and delivering mobility services.
S T R A T E G I E S & A C T I O N S : T E C H N O L O G Y
Figure 99: Scooter safety Facebook/Instagram post from City of Minneapolis social media channel

D R A F T M I N N E A P O L I S T R A N S P O R T A T I O N A C T I O N P L A N - M a r c h 2 0 2 0 131
● Bicycling Action 10.4 — Adding bicycle and micromobility content to driver’s education
S E E A L S O A C T I O N :
_ Actions Supports Difficulty
DO ACTION 5.1Create a City of Minneapolis webpage dedicated to new transportation technologies and systems, including information on shared, electric, connected and automated vehicle systems, as well as active pilots, projects and policies. The webpage should include an open data portal for information sharing. See technology Action 4.5
Mobility, Active partnerships
Low
DO ACTION 5.2Partner with the public and private sector to develop a curriculum, marketing and outreach programs for employers and employees.
Safety, Mobility, Active
partnerships Medium
_ _ _ _
SUPPORT ACTION 5.3Utilize shared mobility operator partnership agreements to expand engagement and education efforts.
Active partnerships
Low
Actions to build a culture of continuous improvement in knowledge, education and communications around new technologies that advance transportation options.
A C T I O N S

D R A F T M I N N E A P O L I S T R A N S P O R T A T I O N A C T I O N P L A N - M a r c h 2 0 2 0 132
STR ATEGY 6
Encourage and support electric vehicles by developing public
charging stations and incentivizing private off-street stations;
incentivize power sources from renewable generated electricity.
While electric cars, trucks and buses will be important to reach climate goals, the adoption of electric vehicles alone will not get us to our goals. Prioritizing the shared element of advanced mobility is key to reduce dependency on automobiles and support walking, biking and transit.
Electric vehicle adoption is important to reduce greenhouse gas emissions, and we have seen hybrid and electric vehicles showing up in greater numbers on our streets – from electric buses, to personal cars, to shared scooters and bikes. It is estimated that by 2040, 55% of all new car sales will be electric.48 Currently just 2.4% of the cars and trucks in Minneapolis area are hybrid or electric;49 as this number grows, there is potential for transportation related greenhouse gas emissions to be reduced. Working in tandem with our vehicle miles traveled reduction goal and mode shift goal, this is an important part of meeting our overall climate goal.
S T R A T E G I E S & A C T I O N S : T E C H N O L O G Y
Figure 100: Transit electric charging station – C Line
Figure 101: EV charging stations for bikes, scooters and cars
48 Electric Vehicle Outlook: 2018 Bloomberg New Energy Finance (2018) 49 Driving Innovation, Auto Alliance (AA) (2018)
Source: Metro Transit

D R A F T M I N N E A P O L I S T R A N S P O R T A T I O N A C T I O N P L A N - M a r c h 2 0 2 0 133
Figure 102: Electric vehicle charging stations in public right of way
Figure 103: City of Minneapolis electric fleet Figure 104: Solar charging Nice Ride station

D R A F T M I N N E A P O L I S T R A N S P O R T A T I O N A C T I O N P L A N - M a r c h 2 0 2 0 134
_ Actions Supports Difficulty
DO ACTION 6.1Assess the projected demand and current supply of the electric vehicle charging network in the city and propose and implement additional charging locations.
Climate, Mobility Medium
DO ACTION 6.2Ensure all public electric vehicle charging infrastructure is scalable to service multiple vehicle types – including shared cars, bicycles and scooters with minimal right of way space impacts; incentivize or support all private infrastructure to do the same. See bicycling Strategy 9
Climate, Mobility Low
DO ACTION 6.3Implement renewable energy sourced charging stations (supplemental solar-powered) in place of hard-wired only electric charging stations.
Climate Low
DO ACTION 6.4Encourage and incentivize the conversion of shared mobility fleets to electric in city agreements. See technology Action 2.1
Climate Low
_ _ _ _
SUPPORT ACTION 6.5Partner with public and private entities for education and outreach campaigns which promote the benefits and operation of electric vehicles.
Climate, Active partnerships
Low
SUPPORT ACTION 6.6Work with the Department of Community Planning and Economic Development to require developers to build off-street electric vehicle charging stations in their developments.
Climate, Active partnerships
Low
SUPPORT ACTION 6.7Support partner transit agencies as electric fleets are incorporated including expedited siting of charging locations. See transit Action 1.9
Climate, Mobility, Active
partnerships Low
Actions to encourage and support electric vehicles by developing public charging stations and incentivizing off-street stations; incentivize power sources from renewable generated electricity.
A C T I O N S
● Freight Strategy 4 — Transition fleets to zero-emissions technology
S E E A L S O S T R AT E G Y :

D R A F T M I N N E A P O L I S T R A N S P O R T A T I O N A C T I O N P L A N - M a r c h 2 0 2 0 135
STR ATEGY 7Continue to develop internal resources capacity for advanced
mobility initiatives.
The City is working actively to prepare for what may come. We work with public and private partners and cities around the world to adopt best practices and focus on being at the forefront of technological advancements occurring in transportation. In order to understand the new data and information that advanced mobility affords us, we are building internal capacity to ingest data, with dashboards, visualizations, new tracking tools and the digital mapping of the curb. We are committed to both stimulating innovation and maintaining control of the public right of way while increasing and protecting the safety and security of people using our streets.
Figure 105: Digital mapping of the curb
S T R A T E G I E S & A C T I O N S : T E C H N O L O G Y

D R A F T M I N N E A P O L I S T R A N S P O R T A T I O N A C T I O N P L A N - M a r c h 2 0 2 0 136
_ Actions Supports Difficulty
DO ACTION 7.1Develop a City multi-disciplinary team and funding mechanisms to facilitate advancing transportation technology and pilots in Minneapolis.
Mobility Medium
DO ACTION 7.2Launch a program to educate City staff, appointed and elected officials and stakeholders on advanced mobility topics.
Mobility, Active partnerships
Medium
DO ACTION 7.3Create and publicize a refined process for businesses that want to test or deploy new technologies or services in the city.
Mobility, Active partnerships
High
_ _ _ _
DO ACTION 7.4Implement a travel behavior study based upon shared mobility modes and seasonal impacts. See bicycling Action 11.3
Climate, Mobility Medium
Actions to develop internal resource capacity for advanced mobility initiatives.
A C T I O N S

D R A F T M I N N E A P O L I S T R A N S P O R T A T I O N A C T I O N P L A N - M a r c h 2 0 2 0 137
As our city continues to grow and consumer choices continue to evolve, the demand for the movement and delivery of goods will also grow. In Hennepin County, freight tonnage is expected to increase by nearly 40% by the year 2040.50 Additionally, the growth of e-commerce (purchases made online and delivered to homes and businesses) will continue to play an important role in the growing demands of goods movement. Nationally, package volume from the United States Postal Service has more than doubled in the past decade from 3.1 billion in 2010 to 6.2 billion in 2018.51
The increased demand for goods will also increase demands on our city streets. Technology plays a large role in how these goods are delivered; as cities and companies experiment with drones, delivery robots, delivery lockers and sophisticated algorithms to make deliveries more efficient, we will look to learn from and implement the best ideas. As the volume of freight moving through and to Minneapolis continues to grow, we need to be prepared to mitigate any negative impacts to safety, congestion and the environment.
Minneapolis 2040 established a freight policy which states the City will accommodate freight movement and facilities to support the local and regional economy.
Nationally, package
volume from the United
States Postal Service
has more than doubled
in the past decade from
3.1 billion in 2009 to
6.2 billion in 2018.
Manage Increased Freight Needs While Preserving the Street
FREIGHT
50 Hennepin County Public Works. Hennepin County Freight Study (2016) 51 United States Postal Service (2018). Includes Priority Mail, Priority Mail Express, First-Class Packages, Package Services, Parcel Return Service, and Parcel Select.

D R A F T M I N N E A P O L I S T R A N S P O R T A T I O N A C T I O N P L A N - M a r c h 2 0 2 0 138
Large truck Personal vehicle
Figure 106: Types of freight
Small van Delivery bike

D R A F T M I N N E A P O L I S T R A N S P O R T A T I O N A C T I O N P L A N - M a r c h 2 0 2 0 139
Figure 107: Truck route networkTruck Route Network
Legend
Enhanced Neighborhood- Based Transit
10-Ton Truck Route
Truck Route
Interstate System
T R U C K R O U T E N E T W O R K

D R A F T M I N N E A P O L I S T R A N S P O R T A T I O N A C T I O N P L A N - M a r c h 2 0 2 0 140
F R E I G H T S T R AT E G I E S
Utilize land use tools to improve the efficiency of deliveries.2
Improve the safety and efficiency of freight movements and integrate freight into the Complete Streets framework.
2
Provide freight operators with tools to better navigate the city.2
Transition vehicle fleets to zero-emissions technology where technology allows.
2
Implement dynamic freight loading zones into citywide curbside management efforts.
2
Work with private sector and agency partners to guide and implement freight planning initiatives.
2
1
2
3
4
5
6
Regulate new delivery technologies that use the public right of way.7
Develop a freight education program to educate the public and freight operators.
8
● Technology Strategy 6 — Develop and incentivize electric vehicle charging stations
S E E A L S O S T R AT E G Y :

D R A F T M I N N E A P O L I S T R A N S P O R T A T I O N A C T I O N P L A N - M a r c h 2 0 2 0 141
STR ATEGY 1 Utilize land use tools to improve the efficiency of deliveries.
Minneapolis 2040 outlined several important freight and land use actions including:
S T R A T E G I E S & A C T I O N S : F R E I G H T
● A production and processing policy – which aims to expand and maintain areas for production, processing and distribution of products, services and ideas.
● Action items in that policy that link to transportation include:
● Designate Production and Processing Areas that comprise large contiguous tracts of land historically used for industrial purposes, that are well-served by transportation infrastructure for both people and freight and that contain building stock suitable for production and processing businesses to expand access to higher wage job opportunities.
● Prioritize use of land in Production and Processing Areas for production, processing and last mile distribution of products and services uses that have minimal or no air, water or noise pollution impacts and that provide quality living-wage jobs.
● Improve transit, bicycle and pedestrian access to areas of employment, including Production and Processing Areas and Production Mixed Use Areas.
● Develop guidance for future development in Production and Processing Areas and Production Mixed Use Areas served by regional transit lines in order to ensure a minimum level of development and job intensities.
The following actions further define land use tools that can be utilized to improve the efficiency of deliveries - through smaller loading zones, consolidating freight deliveries, minimizing time needed at the curb, better securing residential deliveries and linking delivery options with other transportation efforts like mobility hubs.
Figure 108: Outdoor delivery locker

D R A F T M I N N E A P O L I S T R A N S P O R T A T I O N A C T I O N P L A N - M a r c h 2 0 2 0 142
continued on next page
Figure 109: Mini-consolidation center idea
_ Actions Supports Difficulty
DO ACTION 1.1Work with the Department of Community Planning and Economic Development to revise the Zoning Code to improve the efficiencies of onsite deliveries by updating onsite loading requirements for new developments.
Prosperity, Mobility
Low
DO ACTION 1.2Work with developers and property owners to develop small urban consolidation centers to break down loads and minimize the use of large vehicles for last mile deliveries, encouraging the use of low carbon modes like electric cargo bikes for final deliveries.
Climate, Prosperity,
Mobility, Active partnerships
Medium
DO ACTION 1.3Pilot a shared locker system that can accommodate multiple e-commerce deliveries and is available to the public; focus on incorporating as component of mobility hub project. See technology Action 3.1
Climate, Prosperity,
Mobility, Active partnerships
Medium
DO ACTION 1.4Use available tools and regulatory authority to coordinate delivery services for businesses in the same building or block, potentially including coordinating time of day, sharing delivery service providers and sharing use of loading dock space.
Climate, Prosperity
High
Actions to utilize land use tools to improve the efficiency of deliveries.
A C T I O N S

D R A F T M I N N E A P O L I S T R A N S P O R T A T I O N A C T I O N P L A N - M a r c h 2 0 2 0 143
_ Actions Supports Difficulty
DO ACTION 1.5Coordinate with the Department of Community Planning and Economic Development to mandate that private developments design buildings to accommodate increased online package deliveries.
Prosperity, Active partnerships
Low
DO ACTION 1.6Investigate the feasibility of implementing a time restricted truck free zone.
Climate, Prosperity,
Mobility High
DO ACTION 1.7Maintain and maximize the use of the existing commercial and residential alley network for deliveries, especially in commercial and business nodes.
Prosperity, Mobility
Low
DO ACTION 1.8Standardize a process to identify and mitigate loading and circulation impacts to nearby properties if an alley must be vacated.
Prosperity, Mobility
Low
Actions to utilize land use tools to improve the efficiency of deliveries.
A C T I O N S ( c o n t i n u e d )

D R A F T M I N N E A P O L I S T R A N S P O R T A T I O N A C T I O N P L A N - M a r c h 2 0 2 0 144
STR ATEGY 2Improve the safety and efficiency of freight movements and
integrate freight into the Complete Streets framework.
The City’s Vision Zero Crash Study and subsequent analysis reviewed crashes that involved trucks between 2007 and September 2019. Data indicates that large trucks were involved in approximately 3.5% of severe and fatal crashes.52 This strategy focuses on how we can more thoughtfully incorporate safety considerations into the systems that deliver goods throughout the city – through the planning and design of streets and better data collection. Through better data collection we can understand where and how often trucks of different sizes are using the system, so we can better accommodate and design appropriately along those streets as well as streets where there is not as much truck traffic. Understanding curbside space needs for loading and unloading goods and ensuring truck-related crashes on our system are well documented is an important action in pursuit of safe freight movements.
Several actions in this strategy focus on freight safety related concerns we heard through engagement for the TAP, specifically around carrying hazardous goods through the city. Currently, there are more than a dozen freight rail corridors that travel through the city. To date, there have been no crashes related to these corridors that have involved a car; data for crashes involving pedestrians or bicyclists is not available.
Figure 110: Truck unloading at curb
S T R A T E G I E S & A C T I O N S : F R E I G H T
Figure 111: Truck unloading 52 Minneapolis Public Works.

D R A F T M I N N E A P O L I S T R A N S P O R T A T I O N A C T I O N P L A N - M a r c h 2 0 2 0 145
_ Actions Supports Difficulty
DO ACTION 2.1Add a section to the City’s Complete Streets Checklist regarding truck volumes and on-street loading data to evaluate and incorporate freight needs into street design process. See street operations Action 1.1
Safety Medium
DO ACTION 2.2Incorporate a data traffic count collection effort to gain insight into the volume of freight activity occurring within the city; include commercial vehicles and classification by type.
Safety, Mobility Medium
DO ACTION 2.3Advocate for revisions to Municipal State Aid rules (Sections 9936, 9941, 9946, 9951 in Chapter 8820) to allow greater flexibility for State Aid Cities to use smaller design vehicles in the designs of streets on the State Aid system. See design Action 6.2
Safety Medium
DO ACTION 2.4Collaborate with the Minnesota Department of Transportation Rail Safety and Coordination Office to review freight rail risk factors data and crash data for all modes to identify rail grade crossing locations to improve.
Safety, Active partnerships
Medium
Actions to improve the safety and efficiency of freight movements and integrate freight into the Complete Streets framework.
A C T I O N S

D R A F T M I N N E A P O L I S T R A N S P O R T A T I O N A C T I O N P L A N - M a r c h 2 0 2 0 146
STR ATEGY 3 Provide freight operators with tools to better navigate the city.
A key part of this strategy is to update the 2002 Truck Route Network (Figure 107). The purpose of this network is to designate routes for trucks to travel based upon their trip purpose (across town or across the country) and serve as an input in future roadway redesigns. The network will be an overlay in the Street Design Guide so that designers are directed to consider freight demands when designing future roadway projects. The Truck Route Network will be updated in coordination with Minneapolis 2040 future land uses and freight truck volume data and comparing against routes established in the current Truck Route Map. The updated network will provide guidance to where trucks should travel unless otherwise impractical (typically for the last few blocks of a delivery).
Maintaining and updating the Truck Route Network as freight volumes change over time helps planners, designers and managers of the street network keep decisions and impacts to freight a key part of street design and operation conversations.
S T R A T E G I E S & A C T I O N S : F R E I G H T
Figure 112: Street with truck traffic

D R A F T M I N N E A P O L I S T R A N S P O R T A T I O N A C T I O N P L A N - M a r c h 2 0 2 0 147
_ Actions Supports Difficulty
DO ACTION 3.1Adopt an update to the 2002 Truck Route Network.
Prosperity, Mobility
Medium
DO ACTION 3.2Provide the Truck Route Network on the City’s website; publish it through an API. See technology Action 4.5
Prosperity, Mobility
Low
DO ACTION 3.3Revise the Trucks and Truck Routes ordinance to align with the planning goals of this action plan.
Prosperity, Mobility
Low
DO ACTION 3.4Communicate live construction detour information affecting truck routes through the City’s website, an API and other communications outlets. See technology Action 4.5
Prosperity, Mobility
Low
_ _ _ _
SUPPORT ACTION 3.5Support regional and statewide agencies in their freight planning efforts to install intelligent transportation systems (ITS) and other wayfinding or real-time signage information.
Mobility, Active partnerships
Low
Actions to provide freight operators with tools to better navigate the city.
A C T I O N S
An API stands for application programming interface; APIs are an interface that allows apps to take functionality and data from other apps.

D R A F T M I N N E A P O L I S T R A N S P O R T A T I O N A C T I O N P L A N - M a r c h 2 0 2 0 148
STR ATEGY 4Transition vehicle fleets to zero-emissions technology
where technology allows.
Transportation emissions account for 24% of the greenhouse gas emissions in the city.53 Nationally, light-duty vehicles, which include passenger cars and light-duty trucks, account for 59% of greenhouse gas emissions from the transportation sector, while medium- and heavy-duty trucks account for 23%.54
Working to mitigate the impact of freight-related greenhouse gas emissions, including freight delivered via small vehicles is an important part of reaching our climate goals. Evaluating and working to make bicycles, delivery trikes and other small electric vehicles more attractive for deliveries is part of the work to lower greenhouse gas emissions coming from freight.
The current idling policy under Title 3 of the Minneapolis Code of Ordinances, Air Pollution and Environmental Protection, sets limits for idling in loading and unloading zones, exceptions to those limits, and associated penalties. Ensuring compliance with the policies we have in place is critical to minimizing air pollution and protecting air quality.
S T R A T E G I E S & A C T I O N S : F R E I G H T
53 City of Minneapolis Greenhouse Gas emissions data, Office of Sustainability. 54 EPA Office of Transportation and Air Quality.
Figure 113: Cargo delivery bike
Figure 114: Low emission zone, London

D R A F T M I N N E A P O L I S T R A N S P O R T A T I O N A C T I O N P L A N - M a r c h 2 0 2 0 149
_ Actions Supports Difficulty
DO ACTION 4.1Identify locations along the Truck Route Network to install electric charging stations.
Climate, Mobility Low
DO ACTION 4.2Facilitate and expand bicycle, courier and small truck deliveries.
Climate, Prosperity
Medium
DO ACTION 4.3Evaluate the establishment of a Low Emission Zone(s) which would only allow trucks that meet certain emissions standards to enter.
Climate, Equity High
DO ACTION 4.4Evaluate the City’s idling policy for commercial vehicles (ordinance 58.30) to reduce the current idling duration.
Climate, Equity Medium
Actions to transition vehicle fleets to zero-emissions technology where technology allows.
A C T I O N S
● Technology Strategy 6 — Develop and incentivize electric vehicle charging stations
S E E A L S O S T R AT E G Y :

D R A F T M I N N E A P O L I S T R A N S P O R T A T I O N A C T I O N P L A N - M a r c h 2 0 2 0 150
STR ATEGY 5Implement dynamic freight loading zones into citywide
curbside management efforts.
The loading and unloading of goods is a critical function in the city. Every business, whether it is a coffee shop, restaurant, small manufacturer or office – has deliveries. While some businesses have off-street parking lots, below ground loading docks or loading bays, many businesses rely on the curb in front or the alley behind their establishment to be able to receive goods. This demand for loading zones also applies to the personal delivery of packages from online vendors or food delivery services.
This strategy focuses on laying out a path to better understand freight-related curbside demands, experimenting with how to best accommodate them, and implementing mechanisms that better manage curbside freight demands in balance with other competing curbside demands.
Figure 115: Truck unloading
S T R A T E G I E S & A C T I O N S : F R E I G H T
Figure 116: Time restricted loading zone
Figure 117: Alley in commercial area for
freight delivery

D R A F T M I N N E A P O L I S T R A N S P O R T A T I O N A C T I O N P L A N - M a r c h 2 0 2 0 151
_ Actions Supports Difficulty
DO ACTION 5.1Investigate freight loading zone demand and supply.
Prosperity Medium
DO ACTION 5.2Identify high intensity delivery zones in the city.
Prosperity Medium
DO ACTION 5.3Document all private loading bays and alleys within the city to assess where gaps in loading zones exist, supplementing existing curbside and private loading areas data. See street operations Action 5.12
Prosperity, Mobility, Active
partnerships Medium
DO ACTION 5.4Procure and study e-commerce delivery data to supplement field collection efforts in partnership with others.
Prosperity, Mobility, Active
partnerships High
DO ACTION 5.5Pilot multiple locations to implement dynamic curb pricing for on-street deliveries and other curbside needs. See street operations Action 5.2
Prosperity, Mobility
Medium
Actions to implement dynamic freight loading zones into citywide curbside management efforts.
A C T I O N S

D R A F T M I N N E A P O L I S T R A N S P O R T A T I O N A C T I O N P L A N - M a r c h 2 0 2 0 152
STR ATEGY 6Work with private sector and agency partners to guide and
implement freight planning initiatives.
There are multiple partnership opportunities that will help advance the City’s work in this area. Opportunities include joining already established networks to collaborate regionally on what is a regional, state and national-scoped network. Supporting academic or state-sponsored freight research projects help tie City-specific concerns with the larger regional and interstate nature of freight goods movement.
Figure 118: Nighttime delivery zone
S T R A T E G I E S & A C T I O N S : F R E I G H T
Figure 119: Amazon Prime delivery van

D R A F T M I N N E A P O L I S T R A N S P O R T A T I O N A C T I O N P L A N - M a r c h 2 0 2 0 153
_ Actions Supports Difficulty
DO ACTION 6.1Participate in the Minnesota Freight Advisory Committee to collaborate with regional partners to solve freight related issues.
Active partnerships
Low
DO ACTION 6.2Partner with academic institutions, government agencies and private sector businesses to research freight urban logistics, including last mile connections and curb-to-door delivery.
Active partnerships
Medium
DO ACTION 6.3Partner with academic institutions, government agencies and private sector businesses to assess the impacts of e-commerce deliveries in neighborhoods to determine if actions are needed to mitigate impacts.
Active partnerships
Medium
DO ACTION 6.4Evaluate the option of coupling a pricing mechanism with off-peak loading incentives.
Prosperity, Active partnerships
Medium
DO ACTION 6.5Develop an off-hours delivery pilot to incentivize non-peak delivery times.
Prosperity, Active partnerships
Medium
Actions to work with private sector and agency partners to guide and implement freight planning initiatives.
A C T I O N S

D R A F T M I N N E A P O L I S T R A N S P O R T A T I O N A C T I O N P L A N - M a r c h 2 0 2 0 154
STR ATEGY 7Regulate new delivery technologies that use the public
right of way.
In cities around the country we’ve seen delivery robots, drone delivery and other creative, more efficient ways of redefining the delivery of goods to doorsteps, lockers or businesses. With more automation, delivery trucks full of packages could be out for delivery at any hour of the day or night. Planning for these new technologies and developing agreements with providers to ensure the operators are aligned with our transportation goals is critical. Managing the curb is another important part of how changing delivery options will operate on our streets.
Figure 120: Delivery bot uses public sidewalk to deliver goods
S T R A T E G I E S & A C T I O N S : F R E I G H T
Figure 121: Autonomous delivery locker
Figure 122: Delivery drone

D R A F T M I N N E A P O L I S T R A N S P O R T A T I O N A C T I O N P L A N - M a r c h 2 0 2 0 155
_ Actions Supports Difficulty
DO ACTION 7.1Manage autonomous delivery in the right of way (vehicles, drones, sidewalk robots and other emerging technologies) by establishing agreements with service providers to ensure that their operations align with the City of Minneapolis transportation goals. See technology Action 1.2, technology Action 1.4
Prosperity, Active partnerships
Medium
DO ACTION 7.2Expand standard data sharing requirements to all automated modes; write into regulation the creation of APIs for transmission of fleet data for delivery services. See technology Strategy 4
Prosperity, Active partnerships
Medium
Actions to regulate new delivery technologies that use the public right of way.
A C T I O N S
● Technology Action 1.8 — Research unmanned aerial vehicles (drones) permitting and local impacts
● Technology Action 1.9 — Proactively prepare for freight drone activity
S E E A L S O A C T I O N S :

D R A F T M I N N E A P O L I S T R A N S P O R T A T I O N A C T I O N P L A N - M a r c h 2 0 2 0 156
STR ATEGY 8Develop a freight education program to educate the public
and freight operators.
Education about the Truck Route Network is essential for making it useful. Having an informed driver population that understands which streets are more accommodating to larger freight vehicles will help deliveries run more smoothly, and keep drivers and others using our streets know where to expect potential truck traffic. Thinking about how to develop and communicate an education program that explains the goals, rationales and expectations of freight delivery in the city is needed to better partner with freight operators and business owners.
On the public side, ensuring residents understand truck operating norms and limitations is helpful to promote safe behavior around large vehicles. Events like ‘behind the big wheel’ that has occurred at Open Streets helps bicyclists and pedestrians experience the vantage point from a large truck and where harder to see spots exist.
Figure 123: Truck navigates a local street alongside a bicyclist
S T R A T E G I E S & A C T I O N S : F R E I G H T

D R A F T M I N N E A P O L I S T R A N S P O R T A T I O N A C T I O N P L A N - M a r c h 2 0 2 0 157
_ Actions Supports Difficulty
DO ACTION 8.1Develop an urban delivery handbook to help businesses and operators better understand the rules and regulations regarding the delivery of goods within the city.
Safety, Active partnerships
Medium
DO ACTION 8.2Collaborate with partners to educate truck drivers on City regulations, the Truck Route Network and online resources. See freight Action 3.1, freight Action 3.2
Safety, Active partnerships
Medium
DO ACTION 8.3Partner with others to host demonstrations at public events such as Open Streets to educate the public about safety around large vehicles.
Safety, Active partnerships
Low
Actions to develop a freight education program to educate the public and freight operators.
A C T I O N S

D R A F T M I N N E A P O L I S T R A N S P O R T A T I O N A C T I O N P L A N - M a r c h 2 0 2 0 158
The public right of way, often referred to as our streets, comprises almost a quarter of the land area in the city55 and refers to what many people consider the street, boulevard and sidewalk up to the private property line. The City holds this land in trust for the public good. The public right of way on any one street is limited and planning for the safe and efficient movement of people and goods within this confined space requires balancing many demands.
As growth occurs throughout the city, there is increasing need for more walkable and livable communities. Minneapolis is experiencing record-setting growth; 2018 will be the seventh year in a row that the city has seen over $1 billion in new development.56 Adapting our streets to respond to this growth within limited right of way requires a future-flexible transportation system that embraces innovative and more efficient ways to move people and goods throughout the city.
A transportation system that works for everyone regardless of ability or income will offer multiple options for getting around safely and comfortably. Achieving this balance takes a people first approach. The Street Operations topic clarifies how the Complete Streets Policy, commitment to Vision Zero and climate goal come together into daily operations and systems planning.
Minneapolis is experiencing record-setting growth; 2018 will be the seventh year in a row that the city has seen over
$1 billion in new development.
Improve Street Operations and Address Competing Demands
STREET
OPERATIONS
55 City of Minneapolis Parcel, Parks, and Waterway Data 56 Building Value of Work, City of Minneapolis Department of Community Planning and Economic Development (2018)
Figure 124: The public right of way comprises 22% of our land area and is held in trust for public benefit

D R A F T M I N N E A P O L I S T R A N S P O R T A T I O N A C T I O N P L A N - M a r c h 2 0 2 0 159
S T R E E T O P E R AT I O N S T R AT E G I E S
Update the City’s Complete Streets Policy.2
Use quick-build tools to eliminate traffic related deaths and severe injuries on city streets.
2
Plan for efficient and practical operations of people walking, biking and taking micromobility options or transit throughout the street design process.
2
Leverage City resources and partnerships to promote, educate and encourage walking, biking and transit as alternatives to driving.
2
Price and manage use of the curb to encourage walking, biking and using transit and to discourage driving alone.
2
Induce regional mode shift by prioritizing pedestrian, bicycle and transit facilities and operations into capital transportation projects.
2
1
2
3
4
5
6
Align traffic signal operations with the Complete Streets Policy. 7
Coordinate with agency partners who own, operate and manage infrastructure within the City to plan, build and operate at the City’s standards.
8
Manage street detours in line with Complete Streets Policy. 9

D R A F T M I N N E A P O L I S T R A N S P O R T A T I O N A C T I O N P L A N - M a r c h 2 0 2 0 160
STR ATEGY 1 Update the City’s Complete Streets Policy.
The City adopted a Complete Streets Policy in 2016 that has successfully driven the design and operations of numerous streets in the city since its passage. Given the pace of change on our streets, we recognize the need to update the policy to incorporate more fully the complex and often competing needs within the right of way.
Figure 125: Complete Streets hierarchy
S T R A T E G I E S & A C T I O N S : S T R E E T O P E R A T I O N S
_ Actions Supports Difficulty
DO ACTION 1.1Incorporate freight, micromobility and green infrastructure into the City’s existing Complete Streets Policy. See freight Action 2.1, design Strategy 4
Climate, Safety, Equity, Prosperity,
Mobility, Active partnerships
Medium
Actions to update the City’s Complete Streets Policy.
A C T I O N S

D R A F T M I N N E A P O L I S T R A N S P O R T A T I O N A C T I O N P L A N - M a r c h 2 0 2 0 161
STR ATEGY 2Use quick-build tools to eliminate traffic related deaths
and severe injuries on city streets.
The City is committed to eliminating death and severe injuries on our streets by 2027. The City has a 2020-2022 Vision Zero Action Plan which outlines strategies and specific actions to get us closer to that goal. The way streets operate have a huge impact on safety for all modes; this strategy acknowledges the deep connection between street operations and Vision Zero without duplicating the Vision Zero Action Plan.
Figure 126: Reconfiguring space on W 15th Street near Loring Park
S T R A T E G I E S & A C T I O N S : S T R E E T O P E R A T I O N S

D R A F T M I N N E A P O L I S T R A N S P O R T A T I O N A C T I O N P L A N - M a r c h 2 0 2 0 162
Figure 127: 4 lane undivided streets in Minneapolis

D R A F T M I N N E A P O L I S T R A N S P O R T A T I O N A C T I O N P L A N - M a r c h 2 0 2 0 163
_ Actions Supports Difficulty
DO ACTION 2.1Complete all Safe Streets strategies and actions in the Vision Zero Action Plan and any updates of the 2020-2022 plan, with a focus on reducing speeds, reconfiguring road space to support safer travel and encourage more people to walk, bike and take transit and install safety improvements at intersections along High Injury Streets. See technology Action 1.11
Safety High
DO ACTION 2.2Prepare final evaluation of 4-lane undivided streets for safety conversions; potential design solutions include 4-to-3 lane conversions. Current 4-lane undivided streets for evaluation include:
● Lyndale Ave N between Plymouth Ave and West Broadway
● Hennepin Ave S between Franklin Ave and 31st St
● 3rd Ave S between 1st St S and 12th St S
● 31st St E between 1st Ave S and Park Ave
● Harmon Pl between Spruce Pl and 10th St S
● Johnson St NE between Broadway Ave NE and I-35W freeway entrance ramp
● Huron Blvd SE between Fulton St SE and Delaware St SE
● Hawthorn Ave from 8th St to 11th St
● Lowry Ave N between Queen Ave N and Oliver Ave N and Lowry Avenue N and NE between 4th St N and Central Ave NE
● Broadway Ave N and NE segments between Fremont Ave N and University Ave NE
● Washington Ave N segments between 14th Ave N and 26th Ave N
● Lyndale Ave S between Franklin Ave and 31st St
● Cedar Ave S between 24th St and 38th St and between 7th St S and 9th St S
● Franklin Ave between Aldrich Ave S and Chicago Ave
● Lake St segments between Dupont Ave and West River Pkwy
● Excelsior Blvd between France Ave and Abbott Ave S
● University Ave SE segments between Oak St SE and St. Mary’s Ave SE
● Marshall St NE from 30th Ave NE to St. Anthony Pkwy
● Hennepin Ave E segments between 8th St SE and 33rd Ave SE
● Central Ave NE segments between 2nd St SE and 27th Ave NE
● University Ave NE and SE between Central Ave and 27th Ave NE
Climate, Safety, Equity,
Prosperity, Mobility,
Active partnerships
High
Actions to use quick-build tools to eliminate traffic related deaths and severe injuries on city streets.
A C T I O N S

D R A F T M I N N E A P O L I S T R A N S P O R T A T I O N A C T I O N P L A N - M a r c h 2 0 2 0 164
STR ATEGY 3
Plan for efficient and practical operations of people walking,
biking and taking micromobility options or transit throughout
the street design process.
Minneapolis has a 2030 mode shift goal of getting to 35% of all trips walking, biking or micromobility, 25% transit (including school bus) and 20% each of multi-occupancy vehicle and driving alone. To get there we need to plan, design and construct streets that provide more options for people to travel more efficiently and make it more convenient for people to make those choices. By pushing back on pre-determined growth in vehicular trips when performing traffic analyses and measuring level of service from a motor vehicle point of view we can ensure a people first future versus continuing a car first approach. The approach in this strategy is to focus street operational and design decisions on daily people throughput without letting the peak vehicular travel hour drive decisions.
Figure 128: Vehicle miles traveled per capita
S T R A T E G I E S & A C T I O N S : S T R E E T O P E R A T I O N S
Figure 129: Street space needed for 38 people to travel 5 different ways
Source: 2001-2017 American Community Survey 1-year estimates and Minnesota Department of Transportation Traffic Data Reports, 2007-2017

D R A F T M I N N E A P O L I S T R A N S P O R T A T I O N A C T I O N P L A N - M a r c h 2 0 2 0 165
_ Actions Supports Difficulty
DO ACTION 3.1Plan and design for zero or decreasing motor vehicle trip growth and positive growth in other modes for trip forecasting for street projects where the City is the primary implementer. Work with project partners to encourage this approach in project planning when the City is a partner versus a lead.
Climate, Mobility Medium
DO ACTION 3.2Discontinue the use of vehicular level of service except where necessary to meet funding, legislative or other jurisdictional requirements. See walking Action 2.5
Mobility Medium
DO ACTION 3.3Advocate to use potential for mode shift and non-motorized counts as evaluation measures in Regional Solicitation applications.
Mobility, Active partnerships
Medium
Actions to plan for efficient and practical operations of people walking, biking and taking micromobility options or transit throughout the street design process.
A C T I O N S
Level of service is a traditional transportation engineering performance indicator that measures level of delay for motor vehicles through an intersection.

D R A F T M I N N E A P O L I S T R A N S P O R T A T I O N A C T I O N P L A N - M a r c h 2 0 2 0 166
STR ATEGY 4
Leverage City resources and partnerships to promote,
educate and encourage walking, biking and transit as
alternatives to driving.
The actions listed in this strategy support the work of others in the region who work to promote mode shift to transit, walking and biking downtown in particular and beyond. The actions also speak to the City’s transportation demand management strategies which focus on helping people make the decision and use existing infrastructure to walk, bike or take micromobility or transit options.
Travel Demand Management Plans are tools that help to ensure new development accurately plans for travel patterns in line with City goals. Travel Demand Management Plans are required by ordinance for all non-residential development containing 100,000 square feet or more of new or additional gross floor area to address the transportation impacts of the development on air quality, parking and roadway infrastructure. Travel Demand Management Plans are reviewed by Public Works and the Department of Community Planning and Economic Development staff.
Figure 130: #MoveLikeABoss campaign by Move Minneapolis
S T R A T E G I E S & A C T I O N S : S T R E E T O P E R A T I O N S

D R A F T M I N N E A P O L I S T R A N S P O R T A T I O N A C T I O N P L A N - M a r c h 2 0 2 0 167
_ Actions Supports Difficulty
DO ACTION 4.1Explore efforts to contract with Move Minneapolis to expand work on mode shift to include larger employment areas outside of downtown.
Climate, Mobility, Active
partnerships Medium
DO ACTION 4.2Update Travel Demand Management Plan requirements in the Zoning Code to apply to more development projects than they do currently, to address mode split goals and traffic growth rates, Metropass participation and mandatory self-reporting audits that occur every two years as well as any additional monitoring needed to improve safety.
Climate, Safety, Mobility, Active
partnerships Medium
DO ACTION 4.3Work with community and agency partners to enhance communication practices about the importance of walking, biking and using transit for citywide events.
Mobility, Active partnerships
Low
_ _ _ _
SUPPORT ACTION 4.4Partner with Move Minneapolis to recruit downtown employers and property owners to increase walking, biking and transit use among their employees and residents.
Climate, Mobility, Active
partnerships Medium
Actions to leverage City resources and partnerships to promote, educate and encourage walking, biking and transit as alternatives to driving.
A C T I O N S

D R A F T M I N N E A P O L I S T R A N S P O R T A T I O N A C T I O N P L A N - M a r c h 2 0 2 0 168
STR ATEGY 5Price and manage use of the curb to encourage walking,
biking and using transit and to discourage driving alone.
During public engagement, we asked a question about ranking the importance of uses typically accommodated along the curb. The results show that people understand the multiple demands for curbside use beyond the typical parking uses. All these uses, and the careful consideration of the opportunity cost of the curb, are necessary to evaluate when implementing new ways of managing the curb.
Past decisions have rendered much of the public right of way available for the travel and storage of private vehicles at little cost, the increasing demands and opportunities for the space forces the City to reconsider how this space is allocated and accessed. How space is allocated, what access exists for who and at what cost, will guide the use of the City’s streets.
Minneapolis has 8,330 on-street metered parking spaces that are priced for at least part of the day.57 Approximately 32 miles, or 3% of the miles in the city are metered. Comprehensively evaluating the opportunity to extend where and how curbs are priced through modernized ordinances is a specific action outlined below with a large potential to align practices more accurately with our transportation goals and Complete Streets Policy.
Cornerstone to this strategy is the development of a curbside management policy. The City will manage the curb in a way that reflects our goals and supports advancements in mobility. A concrete way this will happen is to create flexible curbside space for different uses, including loading and unloading of people (on transit or in shared or private cars) and goods, storage of all types of vehicles and mobility spaces (transit and bike lanes).
S T R A T E G I E S & A C T I O N S : S T R E E T O P E R A T I O N S
Figure 131: Parklets use curbside space to extend sidewalk
Figure 132: Curbside use activity ranking
57 Minneapolis Parking
Figure 133: Curbside use reserved for bike corral
190 participants ranked curbside uses in the following order:

D R A F T M I N N E A P O L I S T R A N S P O R T A T I O N A C T I O N P L A N - M a r c h 2 0 2 0 169
Figure 134: Organizing the curb along King Street, Toronto
_ Actions Supports Difficulty
DO ACTION 5.1Adopt a strong curbside management policy that takes full advantage of a dynamic urban environment; prioritize the curb in alignment with the City’s Complete Streets Policy and value the competing demands for curb space.
Mobility Low
DO ACTION 5.2Develop a multi-purpose dynamic curb zone pilot for multiple corridors to accommodate all users and develop a revenue structure which charges across modes for use of these zones. See transit Action 2.6, freight Action 5.5
Mobility High
DO ACTION 5.3Modernize ordinances to incentivize desired uses through pricing structure – for example, to encourage use of curbside for parklets and other street activation uses or shared, electric vehicles. See technology Strategy 1
Prosperity, Mobility
Low
DO ACTION 5.4Utilize technology along commercial corridors and within downtown and other commercial areas to manage all curbside uses. See technology Strategy 1
Prosperity, Mobility
High
DO ACTION 5.5Employ on-street and off-street parking strategies to support transit corridors (parking maximums for new developments, facilitated shared parking incentives, dynamic pricing, expanded metered parking).
Climate, Equity, Mobility
High
Actions to price and manage use of the curb to encourage walking, biking and using transit and to discourage driving alone.
A C T I O N S
continued on next page
Source: City of Toronto, Ontario

D R A F T M I N N E A P O L I S T R A N S P O R T A T I O N A C T I O N P L A N - M a r c h 2 0 2 0 170
Congestion pricing is a tool to manage the volume of motor vehicles entering certain zones by charging a fee during a set period of the day or week.
Placemaking – or activation – refers to using street as shared public spaces for people.
_ Actions Supports Difficulty
DO ACTION 5.6Investigate implementation of a per trip fee for applicable curbside uses including delivery and shared mobility services.
Mobility High
DO ACTION 5.7Study congestion pricing with the intent to discourage single occupancy vehicle trips.
Mobility High
DO ACTION 5.8Pursue legislative changes and governmental support needed to make car sharing more attractive. See technology Action 2.6
Mobility High
DO ACTION 5.9Price on-street parking meters to support multimodal street operations and mode share goals.
Mobility Medium
DO ACTION 5.10Evaluate whether meters or priced curb space should be expanded to more corridors.
Mobility Medium
DO ACTION 5.11Assign and mark typical block faces in downtown to flexibly assign space for activation or placemaking, on-street bicycle or scooter parking, passenger and freight loading, drop off/pick up and standard vehicular storage zones, where immediate adjacent curbside space is not used for bike or transit mobility. See bicycling Action 9.1
Mobility High
DO ACTION 5.12Continue the process of digitizing the activities on the curb (parking, loading, etc.), and plan for digital communication between the curb and vehicles.
Mobility High
DO ACTION 5.13Utilize public-private partnerships to implement solutions when parking and mobility challenges arise, such as district parking, mobility hubs, carpool incentives, electric vehicle priority, stormwater retention, water filtration and others. See bicycling Strategy 9, technology Action 3.1, technology Strategy 6
Active partnerships
Medium

D R A F T M I N N E A P O L I S T R A N S P O R T A T I O N A C T I O N P L A N - M a r c h 2 0 2 0 171
STR ATEGY 6
Induce regional mode shift by prioritizing pedestrian, bicycle and transit facilities and operations into capital transportation projects.
The way a street operates is driven by individual choice of how, where and how fast to travel, the physical space of the street including lane and striping, signal operations, surrounding land uses and how many other people are also using the same space.
The City has long prioritized all modes when delivering transportation projects; this strategy calls out specific actions that will help more quickly elevate options for walking, biking and transit improvements. Dedicating space proportional to planned travel patterns and mode shares in a systems-based approach will help to induce mode shift.
Figure 135: Bus only lane on Chicago Avenue, prioritizes transit travel
S T R A T E G I E S & A C T I O N S : S T R E E T O P E R A T I O N S
Figure 136: Dedicated space for bicycle travel

D R A F T M I N N E A P O L I S T R A N S P O R T A T I O N A C T I O N P L A N - M a r c h 2 0 2 0 172
● Transit Action 2.8 — Effective bus-only operation
S E E A L S O A C T I O N :
_ Actions Supports Difficulty
DO ACTION 6.1Allocate street space to support planned travel patterns and desired mode shares.
Mobility Medium
DO ACTION 6.2Advance the All Ages and Abilities Network, transit improvements and emergency response infrastructure through the bridge maintenance and replacement process. See bicycling Strategy 2
Mobility Medium
DO ACTION 6.3Pilot innovative street operations and designs in response to changing conditions, markets, travel patterns, demographics, mode shift goals and technology to more efficiently use the public right of way.
Mobility Low
DO ACTION 6.4Capitalize on opportunities to benefit vulnerable users, such as restriping streets outside of the Capital Improvement Program, adding delineators or markings and enhancing signage or wayfinding.
Safety, Equity, Mobility
Low
DO ACTION 6.5Restore or eliminate gaps in the street grid when conducting planning or development activities. In particular, as soon as possible reconnect the street grid at Nicollet Ave and Lake Street. See walking Action 6.3
Equity, Prosperity, Mobility, Active
partnerships High
_ _ _ _
SUPPORT ACTION 6.6Support efforts to obtain legislative authority for automated enforcement and if granted, support its use to enforce vehicles blocking intersections, crosswalks, bicycle facilities and travel lanes.
Safety, Mobility High
Actions to induce regional mode shift by prioritizing pedestrian, bicycle and transit facilities and operations into capital transportation projects.
A C T I O N S

D R A F T M I N N E A P O L I S T R A N S P O R T A T I O N A C T I O N P L A N - M a r c h 2 0 2 0 173
STR ATEGY 7 Align traffic signal operations with the Complete Streets Policy.
Traffic signals are timed and coordinated citywide to promote safe and consistent travel times. The actions below do not include exhaustive adjectives like ‘all’ and ‘every’ because specific movements allowed by a traffic signal may have a negative impact for some other competing use; this approach does not indicate a lack of commitment to completing this strategy but rather realistically approaching its implementation. For example, longer walk times for pedestrians goes against shorter cycle lengths, which also have benefits for pedestrians. Automatic display of the WALK signal without having to push a button, may, in some cases extend the total cycle length, creating additional delay for pedestrians and transit vehicles. Transit queue jumps prioritize those traveling on bus or other transit, but elongate waiting times for pedestrians crossing that street – the same holds true for green arrows for specific turning time for vehicles.
The City is doing adjustments on most traffic signals in 2020 to align with new, lower speed limits. This adjustment is being done with recognition that a larger, citywide alignment of signals with Complete Streets will be done in the future.
Figure 137: Queue jump for transit lets transit vehicle surpass other vehicles after red light
S T R A T E G I E S & A C T I O N S : S T R E E T O P E R A T I O N S
Figure 138: Bike signal

D R A F T M I N N E A P O L I S T R A N S P O R T A T I O N A C T I O N P L A N - M a r c h 2 0 2 0 174
_ Actions Supports Difficulty
DO ACTION 7.1Identify locations where operation of traffic signals should be evaluated to prioritize pedestrian mobility, comfort and safety.
Safety, Equity, Mobility
Low
DO ACTION 7.2Implement transit advantages along all high frequency transit corridors, through transit only lanes, transit signal priority, queue jumps and other treatments as appropriate.
Safety, Equity, Mobility
Medium
DO ACTION 7.3Use traffic signals to increase efficiency of people biking. Include specific bike signals on the All Ages and Abilities Network, and time signals to reduce the need for people biking to stop.
Safety, Equity, Mobility
Medium
DO ACTION 7.4Re-time traffic signal coordination to encourage vehicle speeds at or below the posted speed limit.
Safety, Mobility Low
Actions to align traffic signal operations with the Complete Streets Policy.
A C T I O N S
Figure 139: Leading pedestrian interval

D R A F T M I N N E A P O L I S T R A N S P O R T A T I O N A C T I O N P L A N - M a r c h 2 0 2 0 175
Coordinate with agency partners who own, operate and
manage infrastructure within the City to plan, build and
operate at the City’s standards.
Streets in Minneapolis are owned and operated by one of five agencies: the City of Minneapolis, Hennepin County, the Minnesota Department of Transportation, the Minneapolis Park and Recreation Board and the University of Minnesota. Typically, the systems and volumes increase from local to county to state systems – and design decisions are often influenced by accommodating an increasingly higher volume of street users.
While final responsibility and determination for design decisions for a particular street is held by the underlying jurisdictional owner, the design process is often collaborative between the overlapping jurisdictions and we work with our partners to reach design and operational decisions that reflect our values and goals while recognizing their underlying authority.
S T R A T E G I E S & A C T I O N S : S T R E E T O P E R A T I O N S
STR ATEGY 8
Figure 140: A County road in Minneapolis that was redesigned to better fit local context
Figure 141: Street at highway entrance

D R A F T M I N N E A P O L I S T R A N S P O R T A T I O N A C T I O N P L A N - M a r c h 2 0 2 0 176
Figure 142: Existing raised I-94 viaduct in the North Loop

D R A F T M I N N E A P O L I S T R A N S P O R T A T I O N A C T I O N P L A N - M a r c h 2 0 2 0 177
continued on next page
_ Actions Supports Difficulty
DO ACTION 8.1Manage vehicle traffic volumes and mobility on the regional system and local streets by allocating space efficiently for use throughout the day versus focusing on peak travel times.
Mobility, Active partnerships
Medium
DO ACTION 8.2Ensure that streets serving freeway connections reflect the Complete Streets Policy; maintain local street qualities as opposed to facilitating freeway movements at streets leading to or from freeway access ramps, where streets change character (from highway to arterial) or when streets change owner (from State or County to City). See design Strategy 6
Mobility, Active partnerships
High
DO ACTION 8.3When partner agencies have authority over street design and use of the right of way, pursue changes that better align with the Street Design Guide, the Complete Streets Policy and Vision Zero.
Safety, Mobility, Active
partnerships Medium
DO ACTION 8.4Study the viability of the following changes to the regional network:
● Convert the I-94 freeway bridge connections via 3rd/4th Streets (North Loop viaduct) to MnPASS only, with the long-term goal of eliminating this and similar facilities.
● Close or reconfigure Interstate 394 access at Washington Avenue N and 3rd Avenue N.
Climate, Mobility, Active
partnerships High
Actions to coordinate with agency partners who own, operate and manage infrastructure within the City to plan, build and operate at the City’s standards.
A C T I O N S

D R A F T M I N N E A P O L I S T R A N S P O R T A T I O N A C T I O N P L A N - M a r c h 2 0 2 0 178
_ _ _ _
SUPPORT ACTION 8.5Support efforts to convert street right of way to land for other uses, using public/private partnerships as appropriate. Ideas include:
● Develop lids or land bridges to reconnect communities. See walking Action 6.5
● Identify alternatives for using the land on freeway embankments such as energy collection with solar panels or wind harvesting; water management and purposeful plantings; and as dedicated public transit corridors.
Prosperity, Mobility, Active
partnerships High
Actions to coordinate with agency partners who own, operate, and manage infrastructure within the City to plan, build and operate at the City’s standards.
A C T I O N S ( c o n t i n u e d )
● Transit Action 2.7 — Transit advantages on freeways through lane conversions
● Design Action 6.1 — Changes to regional functional class system
S E E A L S O A C T I O N S :

D R A F T M I N N E A P O L I S T R A N S P O R T A T I O N A C T I O N P L A N - M a r c h 2 0 2 0 179
STR ATEGY 9 Manage street detours in line with Complete Streets Policy.
The actions listed here outline specific ways to improve the implementation of detours to maintain safe access for all street users. Ensuring clear passage for pedestrians should be the first priority, and bicyclists or those on micromobility vehicles should not be deposited into mixed traffic if they have otherwise been traveling in a separated facility. Ensuring that emergency responders can navigate the space is always a top priority during construction, and detours should be designed to accommodate.
Figure 143: Bikes may use full lane signage
S T R A T E G I E S & A C T I O N S : S T R E E T O P E R A T I O N S
Figure 144: Sidewalk closed

D R A F T M I N N E A P O L I S T R A N S P O R T A T I O N A C T I O N P L A N - M a r c h 2 0 2 0 180
● Walking Action 5.3 — Inspect pedestrian access requirements around work zones and ensure compliance
● Bicycling Action 6.2 — Require low-stress bikeway detours
● Bicycling Action 6.3 — Inspect bikeway detours and ensure compliance
S E E A L S O A C T I O N S :
_ Actions Supports Difficulty
DO ACTION 9.1Provide safe, direct and comfortable temporary facilities for non-motorized users during construction in accordance with the current and updated Complete Streets Policy.
Safety, Equity, Mobility
Medium
DO ACTION 9.2Price lane obstruction permits to reflect the Complete Streets hierarchy such that removal of pedestrian or bicycle access is more costly than general purpose travel lane closures.
Equity, Mobility Medium
DO ACTION 9.3Reconstruct disturbed pedestrian, bicycle and transit facilities in accordance with planned future conditions, not existing, when altered by development or utility work, as documented in this plan and the Street Design Guide.
Safety, Mobility High
DO ACTION 9.4Inspect and enforce non-compliance at construction sites where pedestrian walkways are not being cleared of snow and ice. See walking Strategy 4
Safety, Mobility, Active
partnerships High
Actions to manage street detours in line with Complete Streets Policy.
A C T I O N S

D R A F T M I N N E A P O L I S T R A N S P O R T A T I O N A C T I O N P L A N - M a r c h 2 0 2 0 181
There are over 1,000 miles of streets in Minneapolis. Streets include sidewalks, transit stops, bikeways and roadway space. They provide space for trees and include critical infrastructure such as pipes for drinking water, stormwater drains to collect rain and cables for electricity and communications. They are the common canvas for public art and community gathering places.
Minneapolis streets are the backbone of people’s daily routines and we want to make sure they work for everyone, no matter how you get around. Yet, street designs of the last century have favored the movement of cars over people. Wide roads and complicated intersections have resulted in streets that are uncomfortable for many, especially those walking, bicycling or taking transit, the very young, old or those experiencing any type of special mobility needs. Additionally, current auto-centric street designs make it challenging to build attractive and welcoming public spaces, where people want to walk, bicycle, shop and spend more time.
The City recognizes the consequences of past street design decisions and adopted a Climate Action Plan (2013), Complete Streets Policy (2016) and commitment to Vision Zero (2017), all of which take a fresh approach to thinking about how we design our streets and how street design can impact people’s choices of how to travel. To ensure that Minneapolis street design reflects these priorities, the Minneapolis Transportation Action Plan is updating our Street Design Guide. This new design guide is a key step to make walking, bicycling and transit real options in Minneapolis, eliminating all traffic deaths and severe injuries and addressing the effects of climate change.
The Street Design Guide will be finalized in 2020, separate from and guided by the Transportation Action Plan.
Design for people
DESIGN

D R A F T M I N N E A P O L I S T R A N S P O R T A T I O N A C T I O N P L A N - M a r c h 2 0 2 0 182
D E S I G N S T R AT E G I E S
Develop a Street Design Guide that informs the planning and design of all future street projects. The Street Design Guide will recognize streets as the city’s largest public space and institutionalize the City’s Complete Streets Policy, Vision Zero commitment, greenhouse gas emission reduction goal and stormwater management requirements through the design of city right of way.
2
Foster vibrant public spaces for street life.
2
Green the streets.
1 3
5
Seek design exceptions and variances to established standards when standards established by other units of government conflict with the City’s Complete Streets Policy.
6
Incorporate carbon-reduction design elements into City infrastructure projects.
2
Use street design to improve transit operations.
2
4
● Bicycling Strategy 3 — Neighborhood greenways
S E E A L S O S T R AT E G Y :

D R A F T M I N N E A P O L I S T R A N S P O R T A T I O N A C T I O N P L A N - M a r c h 2 0 2 0 183
STR ATEGY 1
Develop a Street Design Guide that informs the planning
and design of all future street projects. The Street Design
Guide will recognize streets as the city’s largest public
space and institutionalize the City’s Complete Streets
Policy, Vision Zero commitment, greenhouse gas emission
reduction goal and stormwater management requirements
through the design of city right of way.
The City of Minneapolis has strong policies that direct resources and set an agenda relative to transportation. Key policies include:
S T R A T E G I E S & A C T I O N S : D E S I G N
● Complete Streets, which establishes a modal priority framework that prioritizes people as they walk, bicycle and take transit over people when they drive;
● Vision Zero, which sets a goal of ending traffic related fatalities and life-changing injuries on our streets by 2027;
● Climate-related goal to reduce citywide greenhouse gas emissions by 30% by 2025 and 80% by 2050 (from 2006 emissions levels); and
● Stormwater management programs that increase pervious areas and incorporate stormwater quality practices into linear projects to improve the water quality in the city’s lakes, creeks and the Mississippi River.
These policies give clear direction for an approach to how we design our streets. Street design must reflect these policies and translate them into opportunities for increased health and safety outcomes for everyone and improved walking, biking, transit and green infrastructure.
The Street Design Guide will:
● Directly support transportation goals and provide the starting point for all designs for street reconstruction projects in the city.
● Serve as a starting point for street design changes to better meet our goals and provide safer and more convenient options without waiting for a street reconstruction project, through projects that rely primarily on operational changes through street restriping and use of bollards.
● Inform approaches for all partnership projects on streets owned and operated by other jurisdictions.

D R A F T M I N N E A P O L I S T R A N S P O R T A T I O N A C T I O N P L A N - M a r c h 2 0 2 0 184
Figure 145: Typical street type in Street Design Guide
Figure 146: Typical design exhibit in Street Design Guide
Style 1 // Callouts and Dimensions(Dark Blue, Text and Leaders)

D R A F T M I N N E A P O L I S T R A N S P O R T A T I O N A C T I O N P L A N - M a r c h 2 0 2 0 185
_ Actions Supports Difficulty
DO ACTION 1.1Establish an updated street typology based on planned land use and built form to inform the character of streets and organize design guidance.
Safety, Mobility Low
DO ACTION 1.2Create typical concepts and cross-sections for each street type based on common street widths, including designs for reconstruction, resurfacing and other interim street projects.
Safety Low
DO ACTION 1.3Publish the Street Design Guide online in a user-friendly format on a platform that is accessible to City staff, partner agencies, private developers and the public.
Safety, Active partnerships
Low
DO ACTION 1.4Update requirements for private development and utility work that impacts the street right of way to incorporate treatments detailed in the Street Design Guide. See walking Strategy 7
Safety, Active partnerships
Low
DO ACTION 1.5Update the Complete Streets checklist for transportation projects to align with the Street Design Guide.
Safety Low
DO ACTION 1.6Review the Street Design Guide every two years and make updates as needed to reflect changes in transportation options, local and national best practices and new information as a result of research and evaluation of pilot projects and data evaluation.
Safety Low
DO ACTION 1.7Research, evaluate and adopt design guidance for automated vehicles and automated transit curbside use needs and travel lane impacts. See technology Action 1.5
Safety, Mobility, Active
partnerships High
Actions to develop a Street Design Guide that informs the planning and design of all future street projects.
A C T I O N S

D R A F T M I N N E A P O L I S T R A N S P O R T A T I O N A C T I O N P L A N - M a r c h 2 0 2 0 186
STR ATEGY 2 Foster vibrant public spaces for street life.
Streets are spaces where people travel through but also where people gather, meet and socialize. This strategy aims to create more attractive places within the public right of way that are inviting, that encourage people to linger and enjoy the city where they live, work or play. Many initiatives that support people enjoying public space also have multiple benefits, for example, added greenery helps contain stormwater and can treat stormwater through water purification naturally before entering the city’s waterways.
Figure 147: Lou Gehrig Plaza in Bronx, NY
S T R A T E G I E S & A C T I O N S : D E S I G N
Figure 148: Public art in Minneapolis
Before After
Figure 149: City Parklet

D R A F T M I N N E A P O L I S T R A N S P O R T A T I O N A C T I O N P L A N - M a r c h 2 0 2 0 187
Figure 150: Sidewalk design allows ample space for activities
Actions to foster vibrant public spaces for street life.
A C T I O N S
continued on next page
_ Actions Supports Difficulty
DO ACTION 2.1Create a Minneapolis Plaza Program to convert underused street space for pedestrians using guidance from the plaza standards in the Minneapolis Zoning Code.
Prosperity, Active partnerships
Medium
DO ACTION 2.2Revamp the existing courtesy bench program (Minneapolis Ordinance 283) and create a new request process for installing benches and potentially other street furniture.
Equity, Prosperity Medium
DO ACTION 2.3Coordinate with the Department of Community Planning and Economic Development to simplify the process to ‘paint the pavement’ through creative crosswalks, murals and other art in the public right of way.
Prosperity, Active partnerships
Medium
DO ACTION 2.4Establish the parklet and street café programs as permanent seasonal programs instead of pilot programs.
Safety, Active partnerships
Low
DO ACTION 2.5Explore opportunities for car-free streets.
Climate, Safety, Prosperity,
Mobility High

D R A F T M I N N E A P O L I S T R A N S P O R T A T I O N A C T I O N P L A N - M a r c h 2 0 2 0 188
● Walking Action 2.4 — Covert slip lanes to community space
● Bicycling Strategy 3 — Neighborhood greenways
● Bicycling Action 10.2 —Open Streets Minneapolis is sustainable and evolves
● Technology Action 3.1 — Implement mobility hub network
S E E A L S O S T R AT E G I E S A N D A C T I O N S :
_ Actions Supports Difficulty
DO ACTION 2.6Consolidate or eliminate existing curb cuts and minimize new curb cuts for vehicle access across sidewalks during street and development projects See walking Strategy 7
Safety, Equity, Mobility
Medium
Actions to foster vibrant public spaces for street life.
A C T I O N S ( c o n t i n u e d )

D R A F T M I N N E A P O L I S T R A N S P O R T A T I O N A C T I O N P L A N - M a r c h 2 0 2 0 189
STR ATEGY 3Incorporate carbon-reduction design elements into City
infrastructure projects.
This strategy goes beyond how people travel to consider actions that are aimed at the materials we travel on and the impervious space they cover. Continuing to test and evaluate materials as they become available for inclusion in our capital transportation projects to increase product longevity and reduce environmental impacts, minimizing the footprint of the impervious portion of the street design and being open to alternatives to salt and sand that meet objectives around safety in snow and ice are the focus of the strategy.
S T R A T E G I E S & A C T I O N S : D E S I G N
Figure 151: Reducing lane width of travel lanes offers multiple benefits, including less impervious surface
Add a planting buffer
Add more trees
Ways to create more pervious space
Cross section of a typical street

D R A F T M I N N E A P O L I S T R A N S P O R T A T I O N A C T I O N P L A N - M a r c h 2 0 2 0 190
_ Actions Supports Difficulty
DO ACTION 3.1Test and evaluate new and emerging techniques in pavement materials, utilities and other public infrastructure to increase material longevity and reduce lifecycle carbon footprint.
Climate Low
DO ACTION 3.2Update the Street Design Guide to reflect evaluations and best practices related to environmental stewardship objectives.
Climate Low
DO ACTION 3.3Reduce the negative environmental impacts of street designs by decreasing the amount of asphalt or concrete in favor of increasing green space.
Climate Medium
DO ACTION 3.4Continue investigating alternatives to traditional salt and sand winter maintenance.
Climate Low
Actions to incorporate carbon-reduction design elements into City infrastructure projects.
A C T I O N S

D R A F T M I N N E A P O L I S T R A N S P O R T A T I O N A C T I O N P L A N - M a r c h 2 0 2 0 191
STR ATEGY 4 Green the streets.
Green street elements bring life to the street, capture carbon from the air, reduce heat island effects and provide critical stormwater management function to reduce localized flooding and improve water quality. We will seize opportunities as we make improvements to streets to increase functional and aesthetic street treatments that contribute to climate benefits in the city. Functional elements treat and/or contain stormwater before entering the larger stormwater network. Aesthetic treatments include public realm improvements like plantings, boulevards and trees that help contribute to a sense of place.
S T R A T E G I E S & A C T I O N S : D E S I G N
Figure 152: Temporary installation of trees helps add greenery quickly and creates street life

D R A F T M I N N E A P O L I S T R A N S P O R T A T I O N A C T I O N P L A N - M a r c h 2 0 2 0 192
_ _ _ _
SUPPORT ACTION 4.4Achieve 40% tree canopy coverage by 2040 by working with partners and the Minneapolis Tree Advisory Commission and by preserving and enhancing tree plantings in the City’s right of way. Prioritize coverage where it least exists and in areas of concentrated poverty with majority people of color.
Climate, Active partnerships
Medium
_ Actions Supports Difficulty
DO ACTION 4.1Build and maintain stormwater infrastructure into streets, using native plants and bioswales to reduce runoff and treat water prior to entering waterways.
Climate, Active partnerships
High
DO ACTION 4.2Experiment with planting materials, such as biochar, that help street trees and plants survive in harsh winter conditions.
Climate Medium
DO ACTION 4.3Add greening elements to streetscapes to support the comfort and pleasure of people using the streets, as bikeway protection where appropriate, around transit stops and stations and in high volume pedestrian areas.
Climate, Active partnerships
Medium
Actions to green the streets.
A C T I O N S
Figure 153: Incorporating stormwater infrastructure on street projects will help with localized flooding issues

D R A F T M I N N E A P O L I S T R A N S P O R T A T I O N A C T I O N P L A N - M a r c h 2 0 2 0 193
STR ATEGY 5 Use street design to improve transit operations.
Many high frequency transit corridors are the same corridors where people want to be bicycling, walking or visiting for shopping or other needs. Designing the right of way to support all these activities, and creatively bringing design and operational options together that integrate these uses can be seen in examples locally and from afar.
S T R A T E G I E S & A C T I O N S : D E S I G N
Figure 154: Bike/transit interaction
Figure 155: Transit island, Chicago
Figure 156: Parklet designed into bus stop, San Antonio
Figure 157: Bus bump out

D R A F T M I N N E A P O L I S T R A N S P O R T A T I O N A C T I O N P L A N - M a r c h 2 0 2 0 194
_ _ _ _
SUPPORT ACTION 5.3Support Metro Transit’s efforts to improve wayfinding throughout the city in the public right of way, with an emphasis on connections to the high frequency network. See walking Action 8.1, technology Action 3.1
Safety, Mobility, Active
partnerships Low
_ Actions Supports Difficulty
DO ACTION 5.1Adapt street designs, signals, organization and operations as appropriate to support transit facilities and transit priority.
Climate, Safety, Prosperity,
Mobility High
DO ACTION 5.2Design intersections and transit stops to foster safe and predictable interactions between all users consistent with the updated Street Design Guide and Metro Transit’s bus stop design guidelines. Explore integrating creative ideas like parklets and plazas with bus stop designs. See technology Action 3.1
Safety, Equity, Mobility, Active
partnerships High
Actions to use street design to improve transit operations.
A C T I O N S
● Bicycling Action 4.3 — Install transit island for bicycle/transit compatibility
● Transit Action 2.5 — Plan for transit during street reconstruction projects
S E E A L S O A C T I O N S :

D R A F T M I N N E A P O L I S T R A N S P O R T A T I O N A C T I O N P L A N - M a r c h 2 0 2 0 195
STR ATEGY 6
Seek design exceptions and variances to established
standards when standards established by other units of
government conflict with the City’s Complete Streets Policy.
Regional functional classification is a national system of classifying streets into different categories, with implications for street design, intersection controls and speed limits. Classifications have impacts on which streets are eligible to receive regionally allocated federal funds through the Regional Solicitation process. There are 4 classes defined within the Twin Cities metropolitan area, including:
S T R A T E G I E S & A C T I O N S : D E S I G N
● Principal arterials, which are intended to move vehicle traffic over long distances. The principal arterials in Minneapolis are the Interstate system, Hiawatha Avenue and Olson Memorial.
● Minor arterials, including A and other minor arterials, which are intended to serve medium-to-short trips and support access to major traffic generators. Examples include Broadway Avenue, Lake Street, Lyndale Avenue and Johnson Street Northeast.
● Collector streets, including major and minor collectors, which are intended to balance providing direct access to residences and businesses and providing connections between neighborhoods and to arterial streets. Examples include Dowling Avenue North, 18th Avenue Northeast and 38th Street.
● Local streets, which are intended to primarily provide direct access to residences and businesses and serve only short trips.
Municipal State Aid Routes are designated streets within Minneapolis that are eligible to receive funds for street maintenance and construction based on a formula determined by the State Legislature.
Projects on the State Aid System need to follow the Municipal State Aid Rules, however variances or design exceptions can be sought and granted where desired designs do not conform with current State Aid Standards.

D R A F T M I N N E A P O L I S T R A N S P O R T A T I O N A C T I O N P L A N - M a r c h 2 0 2 0 196
Figure 158: Municipal state aid routes in MinneapolisMunicipal State Aide Routes
Legend
MSA Routes

D R A F T M I N N E A P O L I S T R A N S P O R T A T I O N A C T I O N P L A N - M a r c h 2 0 2 0 197
Figure 159: Functional classifications, in MinneapolisFunctional Classifications
Legend
Principal Arterial
Major Collector
Other Arterials
A-Minor Reliever
A-Minor Augmentor

D R A F T M I N N E A P O L I S T R A N S P O R T A T I O N A C T I O N P L A N - M a r c h 2 0 2 0 198
_ Actions Supports Difficulty
DO ACTION 6.1Work with the Minnesota Department of Transportation to request changes to the Twin Cities Regional Functional Classification System to better align with updated street typologies in the Street Design Guide. Initial changes include:
● Add 3rd St N/S from 2nd Ave N to Portland Ave as an A Minor on the regional functional classification system.
● Add 6th St N/S from 2nd Ave N to 13th Ave as an A Minor on the regional functional classification system.
● Remove 10th St S from Hennepin Ave to 5th Ave S as an A Minor on the regional functional classification system.
● Add 4th Ave S from Washington Ave S to 7th St S as an A Minor on the regional functional classification system.
● Add 5th Ave S from Washington Ave S to 7th St S as an A Minor on the regional functional classification system.
● Change 26th St E/W from Hennepin Ave S to Cedar Ave from Other Minor to Major Collector and extend to Minnehaha.
● Change 28th St E/W from Hennepin Ave S to Cedar Ave from Other Minor to Major Collector and extend to Hiawatha.
● Add Diamond Lake Rd from Lyndale Ave S to Portland Ave S as an A Minor on the regional functional classification system.
● Add Highway 121 from Highway 62 to 58th St E as an A Minor on the regional functional classification system.
● Adjust other streets as appropriate.
Active partnerships
Low
DO ACTION 6.2Evaluate potential changes the City may request to the Municipal State Aid Routes to better align with the updated street typologies.
Active partnerships
Low
DO ACTION 6.3Evaluate potential changes to the Municipal State Aid Rules the City may advocate for to provide flexibility needed for the City to use the Street Design Guide with few or no variances.
Active partnerships
Low
DO ACTION 6.4Evaluate the need for variances, design exceptions and pilots to support the use of the Street Design Guide during street reconstruction projects.
Mobility, Active
partnerships Low
Actions to seek design exceptions and variances when standards established by other units of government conflict with the City’s Complete Streets Policy.
A C T I O N S
● Freight Action 2.3 — Design vehicles on State Aid system
S E E A L S O A C T I O N :

D R A F T M I N N E A P O L I S T R A N S P O R T A T I O N A C T I O N P L A N - M a r c h 2 0 2 0 199
PROGRESS
T H E I M P L E M E N T A T I O N F R A M E W O R K
THE PACE OF PROGRESS: IMPLEMENTATION STRATEGIESThe strategies and actions in this plan vary in complexity and scale. Some represent tangible projects that will be planned, funded, scoped, designed, constructed and exist out in the world – these are easier to plan and schedule. Others are about changing how we approach the work – the rationale for how decisions are made or which projects move forward. Given the various scale and complexity, including those that require contribution and collaboration with partner agencies, it is difficult to predict with precision when or how the actions will be completed.
REPORTING ON PROGRESSStaff will report on the success and challenges of achieving the strategies and actions laid out in this plan through two venues: our annual Your City, Your Streets Progress Report and a more formal progress report on the plan every two years.
The Transportation Action Plan identifies strategies and actions for the next 10 years – from 2020 to 2030. But the pace of change in the transportation
world – through technology, new ways of getting around, as well as increased attention and focus on the link between transportation choices and climate change – ensures that some focus areas in this plan will evolve over the next ten years. If major adjustments are needed, we will amend the plan to address those needs.
M O N I T O R I N G P R O G R E S S : T R A C K I N G I N D I C A T O R S D E M O N S T R A T E I N F L U E N C E
We have identified five tracking indicators that over time will measure how our efforts influence broader change. The impacts of our transportation plans, projects and investments influence these indicators but are not solely responsible for their success. We know the City’s transportation investments alone will not result in our reaching these goals, but they are important metrics for us to monitor.
All the tracking indicators work toward a more inclusive transportation system that has equity at its core – by shifting people into more sustainable and affordable modes, protecting our most vulnerable street users, reducing pollution, connecting people to frequent and reliable transit and reducing the distance people travel to get to their daily needs. By pursuing the strategies and actions in the TAP we aim to advance the City of Minneapolis’ work on advancing equity and racial equity.58
Making and monitoring progress on the action plan
PROGRESS
58 Minneapolis City Council definitions: Equity is defined as fair and just opportunities and outcomes for all people; racial equity is defined as the development of policies, practices and strategic investments to reverse racial disparity trends, eliminate institutional racism, and ensure that outcomes and opportunities for all people are no longer predictable by race.

D R A F T M I N N E A P O L I S T R A N S P O R T A T I O N A C T I O N P L A N - M a r c h 2 0 2 0 200
PROGRESS
Figure 161: People walking and on bikes are overrepresented in crashes that result in fatalities or severe injuries
59 Mode split data is taken from Metropolitan Council’s Travel Behavior Inventory (TBI) 2010 data set. The TBI has typically been updated every 10 years; the Metropolitan Council is moving toward a more continual update which would produce new data every 3 years. This data set is the most reliable data that measures trips beyond commute to work travel patterns.
60 Note for draft plan: The 2010 data is anticipated to be updated by the Metropolitan Council by the time the TAP is adopted; the mode shift goal may be adjusted based on changes to baseline data; we understand that 2010 trip data may be significantly different than forthcoming 2019 data.
61 Crashes excluded from this include: 1) crashes on freeways; 2) crashes on private property; 3) Crashes reported as a suicide or a homicide in which the ‘party at fault’ intentionally inflicted serious bodily harm that causes the victim’s death; and 4) crashes caused directly and exclusively by a medical condition.
SAFETYThe City committed to Vision Zero in 2017 with the goal of reaching zero traffic related fatalities and life-altering injuries within 10 years.
MODE SHIFTToday, people driving alone make up 43% of all trips in Minneapolis.59 To meet our goals we have set a mode split goal of reducing that number to 20%. Mode shift goals are for trips that start or end in Minneapolis only.
All trips goal: Zero severe and fatal traffic crashes by 2027
2016-2018 baseline: 13 people killed; 133 people severely injured annually61
Source: Injuries/deaths from Vision Zero Crash Study, percent of trips from 2010 Met Council Travel Behavior Inventory. Automobile category includes cars, trucks, motorcycles, but not transit.
Figure 160: Comparison of trips
15%
25% 25% 25%20%
43%
20%
2010 all trips
2030 all trips goal
13%
4%10%
Walk Bike Public Transit* Multi-Occupancy Vehicle Drive Alone
*Includes school bus

D R A F T M I N N E A P O L I S T R A N S P O R T A T I O N A C T I O N P L A N - M a r c h 2 0 2 0 201
PROGRESS
Goal: 80% reduction by 2050 (from 2006 baseline); or 700,000 metric tons in 2030
2010 baseline: 1,019,144 metric tons
VEHICLE MILES TRAVELEDCurrently, nearly 2.5 billion miles are driven on Minneapolis streets each year, or simply put, each resident drives 15 miles per day on average.62 For the City to meet its greenhouse gas emissions goal of an 80% reduction by 2050, we need to reduce the average amount of driving per person. To support our 2050 greenhouse gas emissions goal, Minneapolis residents will need to drive four less miles per day on average, reducing their average daily driving to 11 miles per day, by 2030.63
GREENHOUSE GAS EMISSIONS FROM THE TRANSPORTATION SECTORAs of 2018, the transportation sector accounted for 24% of greenhouse gas emissions in Minneapolis. The City has adopted a goal of an 80% reduction by 2050, starting from a 2006 baseline.
Goal: 500 million less vehicle miles traveled by 2030 (from 2018 baseline); 1,868,057,420 miles traveled in 2030
2018 baseline: 2,368,057,420 miles
Figure 162: Greenhouse gas emissions (metric tons) from transportation sector historically and projected to reach City's goal
2009 2010 2011 2012 2013 2014 20152016 2017
2018
2030
20082007
2006
1.11M1.15M
1.09M 1.06M 1.08M 1.08M 1.11M 1.13M 1.12M 1.12M1.08M 1.06M
1.02M
.70M
Figure 163: Vehicle miles traveled historically and projected forward
2009 2010 20112012 2013 2014 2016 2017
2018
2030
20082007
2006
2.41B2.52B
2.44B2.39B 2.40B 2.39B
2.48B 2.51B 2.50B 2.47B 2.44B2.37B
1.87B
62 Minnesota Department of Transportation and US Census, American Community Survey. Minnesota Department of Transportation vehicle miles traveled data is a collection of all vehicle miles traveled in the City of Minneapolis and does not solely represent vehicle miles traveled for Minneapolis residents. Current population and projected population estimates include all Minneapolis residents regardless of age and were used to calculate daily average mileage.
63 Actual daily vehicle miles traveled reduction per person is 4.1 miles, assuming 2030 population forecasts.
Source: Citywide Greenhouse Gas Emissions Inventory
Source: Minnesota Department of Transportation (MnDOT); Roadway Data, VMT by Route System in each City, within each County

D R A F T M I N N E A P O L I S T R A N S P O R T A T I O N A C T I O N P L A N - M a r c h 2 0 2 0 202
PROGRESS
TRANSIT PROXIMITYNearly one-half of people living in Minneapolis are within a five-minute walk of high frequency transit; the goal is to increase this number by over 50% over the next 10 years.
Goal: 75% within ¼ mile (5-minute walk); 90% within ½ mile (10-minute walk)
2018 baseline: 47% within ¼ mile (5-minute walk); 68% within ½ mile (10-minute walk)
Figure 164: 5- and 10-minute current walksheds to high frequency transit
Source: Based on 2018 American Community Survey 5-year estimates

D R A F T M I N N E A P O L I S T R A N S P O R T A T I O N A C T I O N P L A N - M a r c h 2 0 2 0 203
PROGRESS
P E D E S T R I A N I M P R O V E M E N T S
Goal: 100 miles of pedestrian realm improvements; 3,800 pedestrian intersection corner improvements
Baseline will be measured from 2020 moving forward
To measure success in pedestrian improvements, we look to measure two separate but related metrics: miles of pedestrian realm improvements and number of pedestrian intersection improvements. Pedestrian realm improvements include sidewalk replacement or filling of gaps and installation of boulevards or pedestrian lighting. Pedestrian intersection improvements include the number of corners with curb extensions and ADA ramps.
A C T I O N S C O M P L E T E D A C R O S S T O P I C S
Goal: 100% of actions completed or in progress by 2030 Baseline will be measured from 2020 moving forward
There are 55 strategies and 274 actions across 7 topic areas in the TAP. We will track progress on these strategies and actions as: completed, in progress, or not yet started. Our goal is to have 100% of the actions completed or in progress by 2030. We acknowledge that some are more difficult to accomplish than others and that conditions will change over the next 10 years. There will be some things we set out to do that will remain undone at the end of 10 years, due to changing priorities, lack of partnership opportunities or better ideas replacing what is laid out in this plan.
Accomplishing these goals will require bringing in outside funding sources and seizing opportunities with development projects and other partners.
M O N I T O R I N G P R O G R E S S : K E Y M E T R I C S T O M E A S U R E P R O G R E S S O N O U R P L A NThis plan lays out specific strategies and actions that are intended to be completed over the next 10 years. The most basic way to measure progress is by documenting the completion of the actions laid out in this plan.
EQUITY The TAP details strategies and actions that will, if implemented, help to reverse racial disparity trends, eliminate institutional racism and ensure that outcomes and opportunities for all people are no longer predictable by race. The most affordable transportation options will be more widely available to more people and people will not be as burdened by the costs of daily travel.
There are four key metrics detailed below. The goal is to have each of them progress within ACP50 areas at a rate equal to or greater than the citywide rate. ACP50 areas are areas of concentrated poverty with more than 50% people of color.

D R A F T M I N N E A P O L I S T R A N S P O R T A T I O N A C T I O N P L A N - M a r c h 2 0 2 0 204
PROGRESS
Figure 165: Areas of Concentrated Poverty where 50% or More Residents are People of Color (ACP50s)

D R A F T M I N N E A P O L I S T R A N S P O R T A T I O N A C T I O N P L A N - M a r c h 2 0 2 0 205
PROGRESS
N U M B E R O F T R A N S I T P R I O R I T Y P R O J E C T S I M P L E M E N T E D
Goal: All 23 corridors identified in the plan
Many improvements to transit depend on operational and design changes on our streets that prioritize transit. Tracking and reporting on the number of corridors where transit priority improvements have been installed is a key metric to measure progress on the plan. The TAP identifies 23 corridors for transit priority projects, including:
Bus-only lanes and/or transit advantages on 6 corridors: ● 4th Avenue South between Washington Avenue and 10th Street South ● 5th Avenue South between Washington Avenue and 10th Street South ● 6th Street North/South between 1st Avenue North and 13th Avenue South ● 7th Street North/South between 1st Avenue North and 13th Avenue South ● 8th Street North/South downtown between 1st Avenue North and 13th Avenue South ● 4th Street from the west/freeway connections to Marq2
New high frequency neighborhood-based transit on 3 corridors: ● Nicollet-Central corridor ● Midtown Greenway from West Lake Station on the Green Line Extension to Lake Street Station on the Blue Line ● West Broadway from downtown Minneapolis to the northwest suburbs
Transit priorities on 14 corridors. These corridors may be prioritized for increased service, transit signal priority or preemption, a bus-only lane or other improvements.
● Marshall Street NE – between Broadway Street NE and Lowry Avenue NE ● Lyndale Avenue N – between West Broadway and northern city boundary ● Lowry Avenue –western city boundary to eastern city boundary ● West Broadway – extend from Lyndale Avenue N to the eastern city boundary ● Como Avenue SE – between University Avenue SE and eastern city boundary ● 38th Street – Bryant Avenue S to 42nd Avenue S ● Lyndale Avenue S – Hennepin/Lyndale merge near Loring Park to southern city boundary ● Washington Avenue – West Broadway to Cedar Avenue continuing to 46th Street ● 2nd Street N – Hennepin Avenue to Dowling Avenue ● 50th Street W/Dupont Avenue S/46th Street E/42nd Street E – Xerxes Avenue to 46th Street Station ● Johnson Street NE – Hennepin Avenue to 37th Avenue NE ● Xerxes Avenue – 44th Street W to 54th Street W ● 28th Avenue S – 38th Street E to 58th Street E ● 4th Street SE and University Avenue SE – Central Avenue to 27th Avenue SE
M I L E S O F A L L A G E S A N D A B I L I T I E S N E T W O R K C O M P L E T E D
Goal: 100% of the network, 284 miles 2019 baseline: 146 miles exist on the All Ages and Abilities Network
M I L E S O F A L L A G E S A N D A B I L I T I E S N E T W O R K C O M P L E T E D
Goal: 100% of the network, 282 miles 2019 baseline: 146 miles exist on the All Ages and Abilities Network
The All Ages and Abilities Network consists of 282 miles. The goal is to complete the entire buildout of this network by 2030. 146 miles of this network already exist and 136 miles needs to be built, some of which will be upgrades from existing striped bike lanes.
Baseline will be measured from 2020 moving forward

D R A F T M I N N E A P O L I S T R A N S P O R T A T I O N A C T I O N P L A N - F e b r u a r y 2 0 2 0 1
APPENDICESA p p e n d i x A : E n g a g e m e n t S u m m a r i e s
Phase I: 2018
Phase II: January-June 2019
Phase III: 2020 – coming with final plan

MINNEAPOLIS 2040 COMPREHENSIVE PLANMinneapolis 2040 is the City’s Comprehensive Plan which was approved by the City Council in December 2018 to be submitted to the Metropolitan Council. The plan sets the long-term transportation vision for the city. The Phase I Engagement Summary summarizes the transportation direction set in Minneapolis 2040 and highlights input from the public gathered during 2018 at events held throughout the summer and fall, and through an online survey.
Phase I Engagement SummaryMinneapolis Transportation Action Plan | Department of Public Works | March 2019
Ensure that the quality and function of the transportation system contributes to equitable outcomes for all people.
Reduce the energy, carbon, and health impacts of transportation through reduced single-occupancy vehicle trips and phasing out of fossil fuel vehicles.
Eliminate fatalities and severe injuries that are a result of crashes on City streets by 2027.
Support, build, and maintain a multimodal transportation system that promotes growth in a sustainable manner and prioritizes walking, biking and transit.
MINNEAPOLIS 2040 COMPREHENSIVE PLAN
Key transportation related themes
100 total policies / 24 transportation related policies
Transportation10 other topic areas
ENVIRONMENT SAFETY EQUITY MULTIMODAL OPTIONS


TAKEAWAYS FROM THE SURVEY
In this survey, residents younger than 25, residents in North and the University of Minnesota area, African Americans, Asian Americans, and Latinos were most underrepresented. We will be doing specific engagement to ensure that we hear from underrepresented voices to inform this plan.
NEXT STEPSThroughout 2019, we will be seeking input and feedback on initial ideas and draft elements of the plan.
Public Works will be hosting a number of engagement events, including:
• Community workhops
• Cultural dialogues
• Organization workshops
• Additional in-person and online activities
Check out our website to stay involved!
* Respondents could choose more than one response; percentages do not equate 100 percent.
More availability near me 22%20%
16%
Better integration with transitLower price option
What would encourage you to use a shared mode, such as rideshare, bikeshare or electric scooters?*
SHARED
We received 2,744 responses to our online survey conducted between from the end of August through early November 2018.
FOLLOW US
STAY UPDATED
More transit options 59%
58%37%
More frequent serviceImproved reliability
What would encourage you to take transit more frequently? *
TRANSIT
Bikeways and streets that feel safer 48%44%
40%
Better driver behaviorMore bikeways
What would allow you to bicycle for more trips?*
BICYCLE
Shorter distances to destinations 49%39%
36%30%27%
23%
Safer neighborhood
Better lightingFewer cars / calmer streets
Slower car speedsBetter winter maintenance
WALKWhat would encourage you to walk more than you currently do?*

D R A F T M I N N E A P O L I S T R A N S P O R T A T I O N A C T I O N P L A N - F e b r u a r y 2 0 2 0 15
APPENDICESA p p e n d i x B : A c k n o w l e d g m e n t s
A C K N O W L E D G M E N T S
Three committees and eight workgroups were established to help develop and guide the work of creating the Transportation Action Plan. The members identified below were critical to the development of this plan. Many agencies are represented in these committees and groups; while their participation was instrumental to the final plan, not all strategies and actions align completely with those agencies’ practices and procedures; their jurisdictional responsibilities are acknowledged, respected and identified throughout the action plan.
Thank you for the partnership, collaboration and conversation to all the community members, agency partners and staff who helped shape this plan.
* Entities represented by only one member at each meeting.
DEPARTMENT ACRONYMS
• Department of Community Planning and Economic Development (CPED)
• Minneapolis Advisory Committee on People with Disabilities (MACOPD)
• Minneapolis Bicycle Advisory Committee (BAC)
• Minneapolis Committee on Aging (MACOA)
• Minneapolis Fire Department (MFD)
• Minneapolis Health Department (MHD)
• Minneapolis Neighborhood and Community Relations (NCR)
• Minneapolis Park and Recreation Board (MPRB)
• Minneapolis Pedestrian Advisory Committee (PAC)
• Minneapolis Public Works Transportation Engineering and Design (TED)
• Minneapolis Public Works Transportation Planning and Programming (TPP)
• Minneapolis Surface Water and Sewers (SWS)
• Minneapolis Traffic and Parking Services (TPS)
• Minneapolis Transportation Maintenance and Repair (TMR)
• Minnesota Department of Transportation (MnDOT)
• University of Minnesota (UMN)

D R A F T M I N N E A P O L I S T R A N S P O R T A T I O N A C T I O N P L A N - F e b r u a r y 2 0 2 0 16
APPENDICES
POLICY ADVISORY COMMIT TEE
Lisa Bender, City Council President
David Frank, Community Planning and Economic Development Director
Robin Hutcheson, Public Works Director
Kevin Reich, Council Member and Transportation and Public Works Committee Chair
Nuria Riviera-Vandermyde, City Coordinator*
Mark Ruff, Interim City Coordinator*
Abdi Salah, Mayor Frey’s Senior Policy Aide on Transportation
Abdi Warsame, Council Member and Ways and Means Committee Chair
STEERING COMMIT TEE
Don Elwood, Director, TED
Jenifer Hager, Director, TPP
Brette Hjelle, Deputy Director, PW
Stephanie Johnson,
Mike Kennedy, Director, TMR
Katrina Kessler, Director, SWS*
Steve Mosing, Interim Director, TPS
Liz Stout, Water Resources Regulatory Manager, SWS*
Jon Wertjes, Director, TPS
Heather Worthington, Long Range Planning Director, CPED
INTERAGENCY TECHNICAL ADVISORY COMMIT TEE
Andrew Caddock, UMN
City Coordinator’s Office (invited)
Carrie Christensen, MPRB
Bill Dossett, Nice Ride Minnesota Executive Director
Chad Ellos, Hennepin County Public Works
Adam Harrington, Metro Transit
Kim Havey, Minneapolis Office of Sustainability
Gloria Jeff, MnDOT Metro District*
Josh Johnson, TPP/TPS
Nathan Koster, TPP
Tracy Lindgren, TMR
Michael Marshall, United Parcel Service
Ole Mersinger, TED
Paul Mogush, CPED
Steve Mosing, TPS
Sarah Stewart, MHD
Liz Stout, SWS
John Tompkins, MnDOT Metro District*
Jessica Treat, Move Minnesota
Amy Vennewitz, Metropolitan Council
Director, SWS*

D R A F T M I N N E A P O L I S T R A N S P O R T A T I O N A C T I O N P L A N - F e b r u a r y 2 0 2 0 17
APPENDICES
TOPIC WORKGROUPS
Walking
Neal Baxter, PAC
Daniel Elias, MPRB
Julia Curran, PAC
Matthew Dyrdahl, TPP
Ethan Fawley, TPP
Kelsey Fogt, TPP
Jasna Hadzic-Stanek, TPP
Matt Hanan, TED
Margot Imdieke, MACOPD
Aaron Johnson, TPS
Emily Kettell, Hennepin County
Lonn Koranda, TPS
Elisha Langat, TMR
Steve Mahowald, Metro Transit
Ken Rodgers, MACOPD
Rattana Sengsoulichanh, CPED
Heidi Schallberg, Metropolitan Council
Paul St. Martin, PAC
Sarah Stewart, MHD
Julia Tabbut, PAC
Mary Treacy, MACOA
Mackenzie Turner-Bargen, MnDOT
Peter Vader, PAC
Bicycling
Simon Blenski, TPP
Carrie Christensen, MPRB
Tom Dailey, TPS
Tony Drollinger, Metro Transit
Wes Durham, CPED
Matthew Dyrdahl, TPP
Steve Elmer, Metropolitan Council
Ethan Fawley, TPP
Matthew Hendricks, BAC
Jordan Kocak, Hennepin County
Nick Mason, BAC
Dan Miller, BAC
Ahmed Omar, TED
Emily Smoak, BAC
Sarah Stewart, MHD
Julie Swanson, TPS
Denny Thoreson, TMR
Mackenzie Turner-Bargen, MnDOT

D R A F T M I N N E A P O L I S T R A N S P O R T A T I O N A C T I O N P L A N - F e b r u a r y 2 0 2 0 18
APPENDICES
Transit
Joseph Gladke, Hennepin County
Adam Hayow, TED
Cole Hiniker, Metropolitan Council
Becca Hughes, TPP
Carl Jensen, MnDOT
Chris Kartheiser, TPP
Allan Klugman, TPS
Jennifer Lowry, TPS
Michael Mechtenberg, Metro Transit
Caroline Miller, TPP
Daniel Pena, Metropolitan Council
Don Pflaum, TPP
Katie Roth, Metro Transit
Joseph Scala, Hennepin County
Jim Voll, CPED
Technology
Michael Corbett, MnDOT
John Doan, Hennepin County
Madel Duenas, CPED
Jasna Hadzic-Stanek, TPP
Kim Havey, City Coordinator- Sustainability
Jay Hieptas, MnDOT
Brette Hjelle, Administrative Services
Debra Johnson, TED
Josh Johnson, TPS
Alexander Kado, TPP
Meredith Klekotka, Metro Transit
John Levin, Metro Transit
Kelly Muellman, City Coordinator- Sustainability
Daniel Pena, Metropolitan Council
Danielle Elkins, PW FUSE Executive Advisor
Kristin White, MnDOTFreight
Andrew Andrusko, MnDOT
Steve Elmer, Metropolitan Council
Nicole George, MnDOT
Jason Gottfried, Hennepin County
Tilahun Hailu, TPS
Becca Hughes, TPP
Alexander Kado, TPP
Caroline Miller, TPP
Francis Loetterle, MnDOT
Jeff Miller, Traffic Control
Shane Morton, TPS
Steve Peterson, Metropolitan Council
John Thompkins, MnDOT
Al Thunberg, Fleet Services
Petru Vizoli, TED
Jim Voll, CPED

D R A F T M I N N E A P O L I S T R A N S P O R T A T I O N A C T I O N P L A N - F e b r u a r y 2 0 2 0 19
APPENDICES
Street operations
Antoinette Brasson, Metro Transit
Michael Corbett, MnDOT
Tim Drew, TPS
Wes Durham, CPED
Tony Fischer, Metropolitan Council
Dave Hanson, Metro Transit
Forrest Hardy, TPP
Liz Heyman, TPP
Maury Hooper, Hennepin County
Gloria Jeff, MnDOT
Jennifer Lowry, TPS
Shane Morton, TPS
Ronnie Toledo, TPS
Katie White, TPP
Menbere Woodajo, TED
Design
Abdullahi Abdulle, TPP
Simon Blenski, TPP
Adrienne Bockheim, CPED
Sonya Burseth, Metro Transit
Steve Collin, TMR
Ray Cruz, MFD
Madel Duenas, CPED
Chad Ellos, Hennepin County
Chris Englemann, TED
Bob Ervin, Minneapolis Water
Ethan Fawley, TPP
Anna Flintoff, Metro Transit
Tony Fischer, Metropolitan Council
Cole Hiniker, Metropolitan Council
Chris Hoberg, MnDOT
Paul Hudalla, SWS
Margot Imdieke, MACOPD
Josh Johnson, TPS
Michael Mechtenberg, Metro Transit
Craig Pinkalla, MPRB
Scott Poska, TPS
Bill Prince, TPS
Danny Rohloff, SWS
Ken Rodgers, MACOPD
Jeremy Strehlo, SWS
Larry Veek, TPP

D R A F T M I N N E A P O L I S T R A N S P O R T A T I O N A C T I O N P L A N - F e b r u a r y 2 0 2 0 20
APPENDICES
Website engagement and strategic communication
Cheyenne Brodeen, NCR
Patty Day, Communications
Jordan Gilgenbach, Communications
Sophia Ginis, Metro Transit
Brey Golding, CPED
Jasna Hadzic-Stanek, TPP
Christina Kendrick, NCR
Sarah McKenzie, Communications
Karen Moe, NCR
Meseret Wolana, TED
PLAN DEVELOPMENT
Transportation Planning and Programming Project Management Team
Simon Blenski
Matthew Dyrdahl
Ethan Fawley
Jasna Hadzic-Stanek
Forrest Hardy
Becca Hughes
Alexander Kado
Chris Kartheiser
Kathleen Mayell
Caroline Miller
Amy Morgan
Virginie Nadimi
Katie White
Kristian Zimmerman
Additional staff contributors
Millicent Flowers, TPP
Jessica Paine, TED

Phase II Engagement SummaryMinneapolis Transportation Action Plan | Department of Public Works | August 2019
Minneapolis Public Works conducted engagement for Phase II of the Minneapolis Transportation Action Plan to get input on draft ideas for improving transportation for all people in all the ways they move around Minneapolis. Phase II engagement built off the framework set by the Minneapolis 2040 Comprehensive Plan (2016–2018) and high-level Phase I Transportation Action Plan engagement (2018). The Phase II Engagement Summary includes feedback received from engagement activities conducted between January and June 2019.
Input received in Phase II is helping shape the draft plan. Phase III engagement will seek feedback on the draft plan through a series of in-person and online events. Phase II was coordinated with engagement for the Vision Zero Action Plan.
PHASE II FEEDBACK IN CONTEXT
Starting with the data (2017-2018)
Understanding the context (2018)
Join the conversation (early 2019)
Bringing it all together (late 2019/early 2020)
Adopting the plan (2020)

Four main engagement methods were used during Phase II to connect with as many and as diverse a sampling of people who live and work in Minneapolis.
PHASE II ENGAGEMENT APPROACH
3 4
1 2In-person events including community workshops, organization workshops, ward forums, and other City-hosted events like “An evening with Janette Sadik-Khan”.
Online engagement including the Transportation Action Plan website, online surveys, social media, and a Facebook Live open house.
Community engagement contractswhere staff partnered with six community organizations and artists to do targeted engagement to reach traditionally underrepresented groups.
Community dialogues which were facilitated and customized conversations between City staff and community members of historically underrepresented groups.
ENGAGEMENT PROCESSCity staff developed a multi-faceted approach to Phase II engagement, including prioritizing engagement with historically underrepresented groups. The focus of Phase II was sharing information on existing conditions and receiving input on potential approaches to making improvements on our street across seven topic areas. Staff also collected feedback on draft priority bicycle and pedestrian networks.
Advanced Mobility Pedestrian Bicycle Transit Freight Street Operations Street Design

3events
4events
PHASE II ENGAGEMENT BY THE NUMBERS City staff and partners engaged with community members through
Ward forums
2,500
4,000
33Events and
presentations
Including:
During Phase II, City staff received over
6 3
7 10
Community workshops
Organization workshops
Community dialogues
30Community
engagement activities
Messaging reached nearly 100,000 people on social
media with over 700,000
impressions
comments
responses to multiple-choice questions
Engagement events map
Community dialogue
Community engagement hosted by community partners
Community workshop
Organization workshop
Other event or presentation
Ward forum
In addition, community partners hosted

ENGAGEMENT SPOTLIGHT: COMMUNITY CONTRACTS FOR ENGAGEMENT
To expand the reach of engagement, Public Works partnered with six community-based organization and artists for creative engagement projects. These partners were selected after an open solicitation in early 2019 which generated 15 proposals. The six partners engaged with 758 people around the Transportation Action Plan through a series of 30 different activities.
Residents in Minneapolis talked about public housing and transportation needs.
Comunidades Latinas Unidas En Servicio (CLUES) focused conversations on access to food and transportation issues
Feedback from this engagement is incorporated in this summary, and a separate summary detailing this engagement is available on the Transportation Action Plan website.
High school students used historic letterpress to make postcard art related to transportation.
City staff worked with the following organizations and artists.
1
2Harrison Neighborhood Association, who did outreach and engagement sessions with residents with an extra focus on reaching East African and Southeast Asian residents
3Minneapolis Highrise Representative Council, who engaged with public housing residents
4 Move Minnesota, who engaged with Minneapolis Community and Technical College students
5Seward Redesign and West Bank Community Development Corporation, who led conversations with Somali community members
6Streetcorner Letterpress, who did screen print transportation visioning with high school students
Comunidades Latinas Unidas En Servicio (CLUES), who did focus groups with Latino families on transportation access

OVERARCHING FEEDBACK
City staff asked three overarching questions throughout Phase II engagement. Collectively, more than 2,500 responses to these questions were received. The questions attempted to gauge how people can help support the goals of reducing greenhouse gas emissions, what success of this plan would look like 10 years in the future, and what is the largest opportunity to transform transportation in Minneapolis.
To reach the City’s greenhouse gas reduction goal, we need to reduce driving by more than 33 percent. What are two things that would support you driving less? (1,893 responses)
Improving or reducing the cost of transit was the most common response. Some respondents shared future technology ideas such as electrifying transportation, automated vehicles, or flying cars. Reducing or slowing cars was also a common theme.
This graphic illustrates the frequency of words given in the responses.
How would you measure the success of the Transportation Action Plan? Select up to 2 priorities. (1,179 responses)
Encouraging the use of electric vehicles
Better transitMore bikeways
Shorter distances to destinationsLess parking or more expensive parking
More or cheaper car sharingMore electric scooters/bicycles
11%10%
77%40%
27%14%
Getting more people to walk, bike, and use transit
Reducing the distances and frequency that people drive vehicles
Improving the equity of transportation investments
Eliminating all fatal traffic crashes
33%
28%
14%
41%
64%
1
2
Dream big. What would transform transportation in Minneapolis in the next decade? (333 responses)3

Topic Specific Engagement Summaries
Engagement for advanced mobility focused on shared and electric vehicles as the top two areas to gather public input on. Connected and autonomous vehicles were topics discussed during Phase I, which are two other major themes covered in the advanced mobility topic.
ADVANCED MOBILITY ENGAGEMENT SUMMARY
“We need to bring back one-way car sharing like Car2go or similar.”
More widely distributed, predictable and reliable shared mobility options, especially outside of downtown, that are accessible by all
Dedicate space for new mobility options to co-exist safely with other modes through pick up/drop off zones for ride hailing and parking zones for bikes and scooters
Support for moving more people in less space in shared and electric capacities
1 2 3
What is most important when using shared mobility services? Choose up to three. (358 responses)
Staff also engaged on the topic of mobility hubs, which provide a physical space to find multiple mobility options (scooters, bikes, transit, car share, etc.). Mobility hubs use transit as a backbone, and help foster first and last mile transit connections. Feedback on mobility hubs included the desire for potential locations within walking distance of destinations such as grocery stores, schools, parks and the airport, and to include features such as benches, lockers and kiosks that provide real-time connection information.
These modes are available near me when I need them
23%
There is allocated street space for me to feel safe taking this mode
49%
My personal safety is maintained when I use this mode
27%

PEDESTRIAN ENGAGEMENT SUMMARYEngagement for the pedestrian topic focused on ways the City can prioritize walking as a more viable option for everyday trips for more people. Staff also presented the draft Pedestrian Priority Network. Most people were supportive of the proposed network and provided recommendations for potential uses, including year-round maintenance, public realm improvements, and safe crossings.
Participants were asked what the top three most important things the City should prioritize to make walking a more viable option. While there was fairly equal distribution among the (612 respondents) different answer options, winter maintenance received the most votes (18%), with a particular focus on transit stops and intersections. Improving driver behavior, such as encouraging people to drive more slowly and yield to pedestrians (10%), as well as providing more safe places to cross (8%) were also noted as important improvements. Answers also varied somewhat by section of the city.
“I would walk more if there was more pedestrian scale lighting.”
1Include more benches, greening, and improved lighting as part of all street projects
2 Create more pedestrian only streets and car-free pedestrian plazas
3Improve snow clearance of sidewalks, intersections and bus stops
4Improve safety of people walking at intersections and midblock crossings, especially on high speed and high-volume roads
Top recommendations for improving walking conditions by area
NorthSnow clearance, especially at transit stops, and driver
behavior
Northeast Safer places to cross
and improved sidewalk condition
DowntownSnow clearance and more
safe places to cross
SoutheastDriver behavior and snow
clearance
SouthwestSnow clearance and driver
behavior

BICYCLE AND LOW-POWERED VEHICLES ENGAGEMENT SUMMARY
Engagement for the bicycle and low-powered vehicle topic asked what would allow people to bike or use low-powered vehicles for more trips. Staff also asked for feedback on the draft All Ages and Abilities network, which would include a network of low-stress bikeways to be built by 2030. Staff received hundreds of comments about individual streets and other ideas to improve the network.
Most people were very supportive of more low-stress bikeways, but wanted to ensure they would be well-connected and easy to navigate. People stressed the importance of connecting the network to existing bikeways, in addition to commercial areas and activity centers like downtown, bus stops, parks, and schools were received and documented.
Comments showed that many people want to bike or bike for more trips, but need more comfortable routes that connect to destinations. People are also interested in using bike share and scooter share, but feel there are not enough stations throughout the city, they are limited by payment or age restrictions, or do not know how to use the services.
1Increase access to dockless bike share and scooter share, and expand education about how to use those services
2Consider the needs of youth, families, and non-conventional commuters when designing bikeways
3Freeways, busy streets, and complex intersections are significant sources of stress when biking
4Improve year-round maintenance of bikeways
“I would like to see better bike connections to schools.”
What destinations should the bike network connect to? Choose up to three. (262 responses)
42%
Existing bikeways
Commercial and mixed-use areas
Activity centers like downtown
Bus stops and lightrail stations
Parks
Schools
Adjacent cities
33%
31%
27%
24%
40%
44%

TRANSIT INPUT SUMMARY
Engagement for the transit topic focused on ways to improve transit through increased access, reliability, and safety. Most people expressed a desire for more transit options with faster travel times and supported the idea of adding more high frequency service throughout the city.
Participants were asked to choose the top three options that they think would encourage people to use transit. More frequent service or additional high-frequency lines received the highest overall ranking from the various in-person events and the online survey.
“Having benches, heated shelters and lighting at more bus stops would encourage me to use transit more.”
1Create a network of bus only lanes to support fast, reliable and frequent bus service on all major transit streets
2Improve the safety and security at all transit stops, facilities and vehicles
3Improve winter snow clearing and maintenance at bus stops, sidewalks and corners
4Consider free transit fares citywide as well as less expensive fares and zones
What do you think would encourage people to use transit more? Choose up to three. (397 responses)
95% of all respondents agreed that having more frequent service would increase their transit use
29%More frequent service or additional high-
frequency lines
Improved reliability or better on-time performance
Improved facilities: lighting, heating, benches, safety/security
Lower fares or zones where transit trips are free/reduced
46%
38%
30%
64%
Transit came up as a top priority though multiple engagement venues. The comments received and conversations with the public highlighted several additional themes to improving transit service, reliability, comfort and convenience throughout the city.
• Improve the cleanliness at all transit stops, facilities and vehicles • Incorporate more heated shelters, lighting, and benches• Improve non-peak service citywide and extend hours • Incorporate more electric buses and trolleys • Consider free transit fares citywide as well as less expensive fares

FREIGHT ENGAGEMENT SUMMARY
Freight engagement activities focused on providing feedback on potential freight strategies such as requiring trucks to have improved safety features, incentivizing carbon-neutral delivery vehicles and incentivizing smaller truck vehicle sizes. Engagement activities also gauged the impact of e-commerce and the interest in consolidated delivery options.
Attendees viewed freight vehicles, specifically large trucks, as unsafe for bicyclists and pedestrians, environmentally hazardous, and consuming too much physical space in the street. Attendees were in favor of strategies and policies focused on improving the safety of trucks, limiting truck sizes, incentivizing carbon-neutral freight vehicles, and providing more on-street and off-street loading options to better organize freight delivery.
How much do you support these freight management ideas? (139 responses)
Provide more loading zones and/or curb space to accommodate deliveries, especially in downtown
Use smaller trucks and break down bigger loads into smaller loads for delivery on city streets
Design streets for smaller trucks instead of semi-trucks
1 2 3
“We should encourage smaller trucks in place of large semi-trucks.”
Provide an incentive to use bicycle or low-carbon options for deliveries
Provide an incentive to use cleaner running trucks and electric delivery vans
Establish a pilot testing program for personal delivery devices (robots, drones, etc)
Provide an incentive for businesses to use smaller trucks or loads
76%
68%
60%
20%
Attendees also indicated an interest in reducing the externalities of e-commerce deliveries by utilizing clustered drop-offs such as delivery lockers. Attendees were not supportive of testing drones or other new devices for personal delivery.
very supportive
very supportive
very supportive
very supportive

STREET OPERATIONS INPUT SUMMARY
Engagement for street operations addressed how to achieve the City’s modal and environmental goals through a wide range of multimodal strategies. Comments ranged across all the ways people get around (walking, biking, taking transit, driving, etc) with specific concerns about mobility needs for each mode. Participants were asked to consider how they would reallocate space within the right of way to achieve the City’s goals. Many people expressed an interest in driving less if other options were more convenient and comfortable. There was a sense that prioritizing transit service would best achieve mode shift away from driving, while improvements to bikeways and the pedestrian realm were also essential.
An additional activity focused on ranking uses that are typically accommodated curbside, usually what people typically think of as a parking lane. Participants were asked to rank these activities according to their preferred use of this curbside space, while keeping in mind the City’s established Complete Streets modal hierarchy.
“Let’s prioritize transit by installing bus only lanes.”
1Prioritize transit over general purpose traffic and add more high-frequency transit in various part of city
2Improve traffic signal operations for people walking, including eliminating the need to push a button to cross the street and increase the ease of crossing
3Poor driver behavior and facilities do not meet the needs and safety of people walking and biking
4Better integrate the Complete Streets policy into operational decision-making
The participants ranked curbside uses in the following order: (190 responses)
What do you think are the right policy actions to reach our goals? (299 responses)
Implement a network of bus-only lanes
Reduce on-street parking for walking, biking, and transit improvements
Establish a network of car-free neighborhood greenways
Reduce the number of vehicle lanes, for walking biking, and transit
improvements
AgreeStrongly Agree
60%88%
59%
58%86%
60%81%
As stated in Minneapolis 2040, the city is committed to reducing greenhouse gas emissions by 80% by 2050. City staff asked what policies would incentivize travel behavior change.
1. Transit boarding
2. Bike lanes
3. Activation (parklets, etc)
4. Stormwater
5. Passenger drop-off
6. Freight loading
7. Parking
81%

STREET DESIGN ENGAGEMENT SUMMARYEngagement for the street design topic focused on how the design of sidewalks, bikeways, roadways, and intersections can support the City’s Complete Streets and Vision Zero policies and reduce greenhouse gases.The feedback received on street design was largely supportive of rethinking how we design our streets to reduce crashes and provide more transportation options. People across all engagement activities were supportive of reducing the speeds of cars and trucks through design and providing more dedicated space for people walking, biking, and taking transit.
Design streets to encourage slower car speeds
Build designated spaces for all users, including wider sidewalks, more comfortable bikeways and bus only lanes
Provide more space for trees and greening1 2 3
What options do you think have highest potential to reduce motor vehicle speed? (347 responses)
“Main commercial corridors have destinations and are growing, but are the worst to walk on. We need to make [them] better.”
Install trees and greening
29%
28%
Reduce the number of travel lanes
Eliminate slip turns
32%
Install neighborhood traffic circles 27%
Reduce the width of travel lanes 25%

D R A F T M I N N E A P O L I S T R A N S P O R T A T I O N A C T I O N P L A N - F e b r u a r y 2 0 2 0 21
APPENDICESAppendix C: Minneapolis 2040 and the Transportation Action Plan goal alignment
This page intentionally left blank

Minneapolis
Minneapolis 2040 Goals Aligned Transportation Action Plan
Equity
Equity Prosperity
Prosperity
Climate Safety
MobilityEquity Prosperity
Prosperity
Equity MobilityClimate
Eliminate disparitiesGoal 1: In 2040, Minneapolis will see all communities fully thrive regardless of race, ethnicity, gender, country of origin, religion, or zip code having eliminated deep-rooted disparities in wealth, opportunity, housing, safety, and health.
1
2
3
4
5
6
7
More residents and jobsGoal 2. In 2040, Minneapolis will have more residents and jobs, and all people will equitably benefit from that growth.
Affordable and accessible housingGoal 3. In 2040, all Minneapolis residents will be able to afford and access quality housing throughout the city.
Living-wage jobsGoal 4. In 2040, all Minneapolis residents will have the training and skills necessary to participate in the economy and will have access to a living-wage job.
Healthy, safe, and connected peopleGoal 5. In 2040, the people of Minneapolis will be socially connected, healthy, and safe.
High-Quality Physical EnvironmentGoal 6. In 2040, Minneapolis will enjoy a high-quality and distinctive physical environment in all parts of the city.
History and CultureGoal 7. In 2040, the physical attributes of Minneapolis will reflect the city’s history and cultures.

Active Partnerships
Safety ProsperityEquity Mobility
Climate
Climate
Climate
Climate Prosperity
8
9
10
11
12
13
14 Active partnerships: supports all TAP goals
Equitable Civic Participation SystemGoal 14. In 2040, Minneapolis will have an equitable civic participation system that enfranchises everyone, recognizes the core and vital service neighborhood organizations provide to the City of Minneapolis, and builds people’s long term capacity to organize to improve their lives and neighborhoods.
Creative, Cultural, and Natural AmenitiesGoal 8. In 2040, Minneapolis will have the creative, cultural, and natural amenities that make the city a great place to live.
Complete neighborhoodsGoal 9. In 2040, all Minneapolis residents will have access to employment, retail services, healthy food, parks, and other daily needs via walking, biking, and public transit.
Climate Change ResilienceGoal 10. In 2040, Minneapolis will be resilient to the effects of climate change and diminishing natural resources, and will be on track to achieve an 80% reduction in greenhouse gas emissions by 2050.
Clean environmentGoal 11. In 2040, Minneapolis will have healthy air, clean water, and a vibrant ecosystem.
Healthy, Sustainable, and Diverse EconomyGoal 12. In 2040, Minneapolis will remain the economic center of the region with a healthy,
Proactive, Accessible, and Sustainable GovernmentGoal 13. In 2040, Minneapolis City government will be proactive, accessible, and fiscally sustainable.

D R A F T M I N N E A P O L I S T R A N S P O R T A T I O N A C T I O N P L A N - F e b r u a r y 2 0 2 0 24
APPENDICES
1 U.S. Census Bureau’s American Community Survey 5-year Estimates (2012-2016) 2 30 annual benchmark locations; Annual Minneapolis Bicyclist and Pedestrian Count data
MORE PEOPLE ARE WALKING OR ROLLING
Reliable data for counting pedestrians in Minneapolis comes from two sources: the U. S. Census Bureau and the City of Minneapolis’ annual counting program. The two data sources measure different things: the way people travel to work or school (U.S. Census Bureau) and the number of people walking at select locations throughout the city (City of Minneapolis Count Program). Together, they give us an idea of trends for people walking in Minneapolis. According to the U.S. Census Bureau, 3,567 more people walked or rolled to work or school between 2007-2017.1 Over the same time, the number of people walking or rolling increased by 21% at annually counted city benchmark locations.2
Figure 1: People are walking more
W a l k i n g s n a p s h o t i n M i n n e a p o l i s
SEVERE AND FATAL PEDESTRIAN CRASHES ARE INCREASING
After years of decline, pedestrian injuries and deaths have been rising in recent years in Minneapolis. From 2007 to 2016, a pedestrian was severely injured or killed on Minneapolis streets every 13 days on average. Most of the crashes (80%) involving pedestrians occur on, and are concentrated along, a small number of streets (see Figure 2 on the next page). Pedestrian crashes disproportionately impact lower-income neighborhoods where the majority of residents are people of color.
Pedestrians are the most vulnerable street users; 11% of reported pedestrian crashes lead to a life-altering injury or death.
A p p e n d i x D : S n a p s h o t s o f t o p i c a r e a s
This figure represents the change between 2007 and 2017.

D R A F T M I N N E A P O L I S T R A N S P O R T A T I O N A C T I O N P L A N - F e b r u a r y 2 0 2 0 25
APPENDICES
Figure 2: High Injury Street map
§̈¦35W
§̈¦94§̈¦394
§̈¦35W
Pedestrian Crash Study
Ten Year Crash DatabaseCrash Concentration Corridors
High Injury Network
Pedestrian Crash Concentration Corridors
Crashes are concentrated.80% of all pedestrian crashes occurredon 10% of roadway miles in the City.

D R A F T M I N N E A P O L I S T R A N S P O R T A T I O N A C T I O N P L A N - F e b r u a r y 2 0 2 0 26
APPENDICES
DESIGNING FOR PEDESTRIANS FIRST
In recent years, there has been an increased focus on improving pedestrian infrastructure. In 2017, the city upgraded 3,000 crosswalk markings from parallel line crosswalk to Minneapolis Zebra crosswalks that will improve the visibility of pedestrian crossings. The city has also implemented, and continues to evaluate the effectiveness of, leading pedestrian signal intervals (LPI) that allows a pedestrian to begin crossing the street before vehicles receive a green light. This ensures that pedestrians are more visible within the crosswalk before vehicles begin moving.
There are multiple ways to improve safety and comfort for those walking and rolling. Curb extensions, sometimes called bumpouts or bulbouts, extend the sidewalk area into the street to shorten pedestrian crossing distances and improve visibility. Wide sidewalks allow people to pass each other comfortably and can also provide space for public realm improvements such as pedestrian lighting, trees, benches or other features that help to buffer pedestrians from moving vehicles and contribute to a walkable environment. Reducing the number of four lane streets, multiple lane one-way streets, and slowing motor vehicle speeds are also important for safety and comfort for people walking, particularly as they cross the street.
Figure 3: Street design for pedestrians
Curb extension Zebra crosswalk ‘Green’ for peds before cars
Parklets and street cafes Pedestrian median refuge
Urban greening (planting/boulevard)
Wide sidewalks
Seating Lighting

M I N N E A P O L I S T R A N S P O R T A T I O N A C T I O N P L A N 27
3 Our Streets Minneapolis. 4 City of Minneapolis Parklet Program Survey (2017).
AC TIVATING PUBLIC SPACES
Programming public spaces with events and activities encourages people to be active and demonstrates alternative uses for street space. Minneapolis has many programs oriented to improving the pedestrian environment. One of the more successful programs is Open Streets. Open Streets is a series of events when a street is closed to vehicular traffic for part of the day (typically 6 hours) and opened up to those walking and bicycling; street vendors are out, activities like yoga and dancing are organized, and there are spots with live music and other activities. Open Streets focuses on promoting healthy living, sustainable transportation, civic pride and discovering local businesses. The event started in 2011 with one event and an estimated 5,000 attendees. It has since expanded to 7 or 8 events annually, with an estimated 103,500 attendees in 2019.3
Figure 4: Parklet
Figure 5: Open Streets event
Parklets and street cafés are other programs that activate streets through partnerships with businesses and community organizations. Parklets provide amenities like seating, plantings, bike parking and public space for people to linger and enjoy through the conversion of on-street parking spaces. The City currently operates three public parklets, and organizations or businesses can also apply to host a parklet. The street café program is offered to local businesses to expand their outdoor seating areas into the street. A survey from 2017 showed that all businesses that hosted parklets would recommend hosting a parklet to another business, and they agreed that the parklet contributed to increased sales and foot traffic. Both hosts and users agreed that the parklet improved the streetscape and enhanced neighborhood identity.4

M I N N E A P O L I S T R A N S P O R T A T I O N A C T I O N P L A N 28
5 City of Minneapolis Department of Public Works. 6 Means of Transportation to Work for Workers 16 Years and Over. U.S. Census Bureau, 1990-2000 Decennial Census 7 As reported to Minneapolis Public Works by the Minneapolis Police Department and Minneapolis Park Police.
B i c y c l i n g s n a p s h o t i n M i n n e a p o l i s
BICYCLING IS GET TING SAFER
Bicycling in Minneapolis is safer than it was 25 years ago, in part due to more bikeways and more people bicycling. Between 1993 and 2017, the miles of bikeway have increased 199%5 and the average number of bicycle commuters increased 212%.6 During that same time, the bicycle crash rate decreased by 75%.7 While bicycling is getting safer, people biking are the most overrepresented in severe and fatal crashes in Minneapolis.
Figure 6: Bikeway miles vs bicycle crash rate
EXISTING BIKEWAY NET WORK
The existing bikeway network is not comfortable for all people. Over the last 10 years, the city’s bikeway network doubled in size to 255 miles of bikeways (through 2019). However, only 49% of this network meets the criteria of an all ages and abilities bikeway (protected bike lanes and trails) and most of this mileage does not connect to schools or commercial areas. To encourage people of all ages and abilities to bicycle, we must build a connected network of comfortable bikeways.
1991 1996 2001 2006 2011 2016 2017
50
0
150
200
100
300
250
400
350
2%
0%
6%
8%
4%
12%
10%
16%
14%
Bicycle injuries and fatalities Relative injury rate

D R A F T M I N N E A P O L I S T R A N S P O R T A T I O N A C T I O N P L A N - F e b r u a r y 2 0 2 0 29
APPENDICES
Figure 7: Existing bike network

M I N N E A P O L I S T R A N S P O R T A T I O N A C T I O N P L A N 30
8 Minneapolis Public Works Pedestrian and Bicyclist Traffic Counts, 2007-2017
Figure 8: Types of bicycle and micromobility
DESIGNING FOR NEW USERS
If we want bicycling an attractive transportation option for more people, it is important to consider how we can support more children, seniors, women, people of color, low-income people, people with disabilities and people with multiple passengers to bicycle as we design bikeways and streets.
We also need to support a growing fleet of low-powered vehicles. From cargo bicycles to adaptive bicycles, and electric assist bicycles to electric scooters, these new vehicles can expand who is able to bicycle and what trips bicycles can be used for.
Typical adult bicycle Kids bicycle Bike share
Adaptive bicycle Bicycle with a trailer
Electric scooter
Cargo bicycle
Electric-assist bicycle Electric skateboard
DESIGNING FOR COMFORT
City of Minneapolis traffic counts show that bicycling is growing six times faster on protected bike lanes and trails than on other bikeway types.8 Conventional bike lanes and well-designed bicycle boulevards (also called neighborhood greenways) on less busy streets can also be attractive places to bike. Protected bike lanes and neighborhood greenways will be prioritized as a part of the All Ages and Abilities Network to improve and expand the existing network.
Figure 9: Existing bikeway mileage
Bike Lanes
On-Street Protected Bikeways
O�-Street Protected Bikeways
Bike
way
Typ
e Shared Lane
Bike Boulevard
13
23
105
91
23
0 20 40 60 80 100 120

M I N N E A P O L I S T R A N S P O R T A T I O N A C T I O N P L A N 31
9 Metropolitan Council Boardings and Alightings Data, 2013-2018. 10 Metropolitan Council (2018)
T r a n s i t s n a p s h o t i n M i n n e a p o l i s
TRANSIT RIDERSHIP OVER TIME
Metro Transit, as a part of the Metropolitan Council, operates most of the local transit service in the region. Despite increases in light rail (LRT) and rapid bus (BRT) use, the overall number of Metro Transit trips in the region declined by 9% between 2014 and 2018,9 after previous years of gains.
Figure 10: Average weekday transit ridership
LOCAL AND HIGH FREQUENCY TRANSIT ROUTES
Transit routes are distributed throughout the city and operate as either local or high frequency bus routes or light rail lines. High frequency routes mean buses or light rail arrive every 15 minutes or better.10 High frequency routes (bus and light rail) have the highest ridership in the city, operating most of the day and throughout the week. A total of 153 total transit routes, including 11 high frequency routes, serve residents, workers and visitors in the city.
0
500,000
1,000,000
1,500,000
2,000,000
2,500,000
3,000,000
Green Line Northstar A-LineBus Blue Line
20182017201620152013 2014

D R A F T M I N N E A P O L I S T R A N S P O R T A T I O N A C T I O N P L A N - F e b r u a r y 2 0 2 0 32
APPENDICES
Figure 11: Existing and planned high frequency transit routes
Legend
Existing High Frequency Transit Network
Planned High Frequency Transit Network

M I N N E A P O L I S T R A N S P O R T A T I O N A C T I O N P L A N 33
11 Household Size by Vehicles Available, U.S. Census Bureau, 2014-2018, American Community Survey 5-Year Estimate
HOUSEHOLDS WITHOUT VEHICLES
More than one of every six people in Minneapolis (16.5%) live in households without access to an automobile,11 by choice or necessity. Car-free households are more common in densely-populated urban areas and high poverty neighborhoods where vehicle ownership is challenging. Less auto dependence typically correlates with higher transit ridership.
Figure 12: Percent of households without a vehicle, 2014-2018
Source: 2018 American Community Survey 5-Year Estimates

D R A F T M I N N E A P O L I S T R A N S P O R T A T I O N A C T I O N P L A N - F e b r u a r y 2 0 2 0 34
APPENDICES
T e c h n o l o g y s n a p s h o t i n M i n n e a p o l i s
THE PACE OF TECHNOLOGICAL CHANGE IN TRANSPORTATION
The pace of change in technology that impacts transportation options has been increasing. Transportation options have been increasing due to new models enabled by a few technological improvements that have enabled all new shared modes – smartphones, wifi and 5G network. The impacts of innovation can mean something that was not on our streets five years ago (scooters) are now commonplace. Focusing on preparing and setting goals allows us to effectively regulate and manage these service models through policies and design.

D R A F T M I N N E A P O L I S T R A N S P O R T A T I O N A C T I O N P L A N - F e b r u a r y 2 0 2 0 35
APPENDICES
Figure 13: Timeline of advanced mobility
NATIONAL
The Growth of Advanced MobilityThe pace of local adoption of national advancements is nearing a balance
The transportation landscape has rapidly evolved in the last twenty years and at a rate not experienced since the introduction of the automobile. Growth in shared mobility, electri�cation, and connected/automated vehicle technologies and services are introducing more mobility choices, and changing people’s transportation behavior.
LOCAL
Car Share | March 1998Carshare Portland launches as the nation's �rst car share
Car Share | September 2013Two-year car share pilot begins with HOURCAR, Zipcar and car2go
Bike Share | August 2008SmartBike DC launches in Washington DC as the nation's �rst modern bike
share
Bike Share | June 2010Nice Ride Launches bike share
Ride Hail | May 2011Uber launches ride hailing service
Ride Hail | June 2012Lyft launches ride hailing service
Ride Hailing | October 2012Uber launches ride hailing service in Minneapolis
Ride Hailing | February 2014Lyft launches ride hailing service in Minneapolis
Transit | November 2016Metro Transit smartphone app allows electronic payment
Ride Hail | January 2017Bluegogo launches in San Francisco as the na-
tion's �rst dockless bike share
Scooter Share | September 2017Bird launches in Santa Monica, CA as the nation's �rst scooter share
Scooter Share | May 2019City of Minneapolis relaunches shared electric scooter pilot program with 2,000 scooter cap
Scooter Share | August 2018City of Minneapolis launches shared electric scooter pilot program with 400 scooter cap
Bike share | August 2018Nice Ride adds dockless bikes to their bike share program
Bike Share | October 2015Zyp BikeShare launches in Birmingham, AL as the nation's �rst
large-scale e-bike pedal assist bike share
Ride Hail | November 2012Massachusetts Bay Transportation Authority launches the nation's �rst
commuter rail ticketing smartphone app
Shared
Vehicle | December 1997Toyota Prius debuts as the �rst mass-produced gasoline electric
hybrid vehicle
Vehicle | January 2018Los Angeles Mayor Jerry Brown signs executive order committing the
state of California to a goal of 5 million zero-emission vehicles on the road by 2030
Vehicle | February 2019Metro Transit begins transition to zero-emission all-electric bus �eet by debuting new electric bus for BRT C-lineVehicle | February 2019MnDOT announces plans to increase electric vehicle registration statewide to 200,000 vehicles by the year 2030, up from almost 7,000 electric vehicles registered in the state in the year 2018
Infrastructure | January 2017MnDOT joins the Great Lakes Emission Corridor to facilitate electric vehicle usage along Interstate 94
Vehicle | April 2018City of St. Paul awarded federal funding to deliver electric vehicle carsharing service in partnership with the City of Minneapolis, HOURCAR and Xcel Energy
Infrastructure | August 2018Xcel Energy launches the Electric Vehicle Service Pilot Program, which provides at-home installation of level-2 electric vehicle charging stations (4-6 hour full charge time)
Infrastructure | 2010Washington, Oregon and California become the �rst corridor coalition to
commit to building a multi-state highway electric charging corridor along I-5 from Canada to Mexico
Vehicle | December 2016Chevy Bolt debuts as a zero-emission all-electric vehicle with a 200+
mile range
Vehicle | July 2017Los Angeles Country Metro Transportation Authority adopts plan to transi-
tion entire bus �eet to zero-emission all-electric by the year 2030
Infrastructure | June 2017Electrify America begins development of national electric vehicle charging
station network; a $2 billion, 10-year investment
ElectricConnected Infrastructure | March 2001
The City of San Francisco installs the nation's �rst large-scale system of Audi-ble Pedestrian Signals (APS) with countdown timers
Connected Infrastructure | 2011The City of Minneapolis installs state of the art Tra�c Management CenterConnected Infrastructure | November 2011The City of Minneapolis installs its �rst push-button activated bicycle tra�c signal at the intersection of 5th St NE & Broadway St NE
Connected Infrastructure | December 2009Marq2 transit corridor features NextTrip signs with real-time bus arrival/departure information
Connected Infrastructure | February 2013 The City of Los Angeles becomes the �rst major city in the world to synchro-
nize its entire tra�c signal system (4,500 signals) Autonomous vehicles | January 2018AV shuttle (EZ mile) available for public demonstration on Nicollet Mall during Super Bowl LII (52)
Autonomous vehicles | April 2018AV shuttle (EZ mile) available for public demonstration on Midtown Greenway
Autonomous vehicles | May 2018City of Minneapolis implements multi-modal counting program (Miovision) through video software imagery evaluation
Connected Infrastructure | August 2018MnDOT connected corridor project begins installing Vehicle-to-Infrastructure (V2I) technology along Olson Memorial Highway MN-55, allowing optimized signal timing for snow plow and other service vehicles.
Autonomous Vehicles | December 2018Waymo announces the nation's �rst commercial autonomous ride hail service
will operate in multiple cities in Arizona
Autonomous Freight | December 2018Nuro launches pilot for autonomous delivery cargo vehicles
Autonomous Vehicles | January 2019Uber Elevate announces an aerial ride hailing service with plans to o�er
rides in the next 5-10 years
Autonomous Freight | March 2017 Amazon begins testing drone delivery
Autonomous Freight | January 2017Starship Technologies tests sidewalk delivery robots in Washington DC
Connected Infrastructure | 2017The City of Minneapolis installs video-detection bicycle tra�c signals along Washington Ave S from Hennepin Ave to 5th Ave S
Autonomous Vehicles | January 2009 Google begins testing autonomous vehicles
Automated/Connected
1997
1998
1999
2000
2001
2002
2003
2004
2005
2006
2007
2008
2009
2010
2011
2012
2013
2014
2015
2016
2017
2018
2019

M I N N E A P O L I S T R A N S P O R T A T I O N A C T I O N P L A N 36
12 FDIC, 2017 Banking Status Survey 13 FDIC, 2017 Banking Status Survey 14 FDIC, 2017 Banking Status Survey
ACCESS TO TECHNOLOGY
Access to technology is critical to ensuring everyone benefits from new transportation options. As shared mobility services grow in popularity, solutions for those without smartphone and banking access are needed. In the City of Minneapolis, 23.3% of households do not have access to a smartphone.12
Figure 14: Households without smart phone access
Figure 15: Banked and underbanked householdsAdditionally, in the Twin Cities metro region, 1.5% of households are categorized as unbanked, meaning they are not a member of a bank or similar financial institution.13 These groups are limited in their ability to utilize popular shared mobility services which typically require a smartphone and banking access. For this survey, the term underbanked refers to households that had an account at an insured institution but also obtained financial products or services outside of the banking system.14
0%
2%
4%
6%
8%
10%
12%
14%
16%
18%
20%
Minneapolis Minnesota USA
Households

D R A F T M I N N E A P O L I S T R A N S P O R T A T I O N A C T I O N P L A N - F e b r u a r y 2 0 2 0 37
APPENDICES
AUTOMATED TECHNOLOGY
Done correctly, automated vehicles could be a tool for future mobility that can be applied to a variety of service models, including transit, urban delivery and ride sharing. Despite much speculation around when the fully autonomous vehicle will enter the mainstream market, it is important to consider that the transition to full automation is an evolution. Vehicles currently operate on our streets that already have a certain level of automation inherent to them. Level 1 vehicles are those where the driver is in control, but some assistance is given – tools like adaptive cruise control, lane-departure assistance and automated braking to avoid collisions. Some new models of vehicles integrate Level 2 technologies, which automate both speed and steering. The integration of higher levels of automation will continue to impact all people who use the public right of way, including those walking, biking, taking transit and operating analog vehicles.
Figure 16: Levels of automation

D R A F T M I N N E A P O L I S T R A N S P O R T A T I O N A C T I O N P L A N - F e b r u a r y 2 0 2 0 38
APPENDICES
F r e i g h t s n a p s h o t i n M i n n e a p o l i s
FREIGHT: A LONG JOURNEY
Have you ever wondered how coffee makes its way to your mug? Coffee, and most other goods in your home and office, were transported via freight. Figure 17 shows a supply chain of how coffee moves through the international freight system before it gets to you.
Figure 17: From bean to cup

M I N N E A P O L I S T R A N S P O R T A T I O N A C T I O N P L A N 39
15 Estimated Annual U.S. Trade Retail Sales - Total and E-Commerce: 1998-2016. U.S. Census Bureau
E-COMMERCE IS ON THE RISE
People are doing an increasing proportion of their shopping online. E-commerce, defined as the sale or purchase of goods or services through the internet, has grown rapidly throughout the United States in recent years. In 2016, e-commerce accounted for 8% of national retail sales, a percentage which has been growing steadily since 2010.15 With this growing use of online shopping and growing customer demand for fast deliveries, delivery vehicles are using residential streets more often. We need to plan for this consumer demand for convenience delivery and understand its impact on our streets and the ability to incentivize smaller scale delivery vehicles like electric cargo bikes.
Figure 18: Growth of e-commerce in the U.S.
EXISTING FREIGHT NET WORK IN MINNEAPOLIS
The safe, efficient and reliable movement of freight is vital to a healthy local and regional economy. All industries, especially manufacturing, construction, wholesale and retail trade, rely on a multimodal freight system to transport goods. The existing truck route network and long-established freight railway network are closely tied to these types of land uses. As land uses and freight needs change, we need to ensure our truck routes are in the right place and that locations where our streets intersect with the freight railway are redesigned and mitigated for a people first approach in accordance with our Complete Streets Policy.
2007 2008 2009 2010 2011 20132012 2014 2015 20162007 2008 2009 2010 2011 20132012 2014 2015
$50,000
$0
$150,000
$200,000
$100,000
$300,000
$250,000
$400,000
$350,000
Mill
ions
Estimated Annual U.S. Trade Retail Sales - Total and E-Commerce: 1998-2016. U.S. Census Bureau

D R A F T M I N N E A P O L I S T R A N S P O R T A T I O N A C T I O N P L A N - F e b r u a r y 2 0 2 0 40
APPENDICES
Figure 19: Freight and land use map

D R A F T M I N N E A P O L I S T R A N S P O R T A T I O N A C T I O N P L A N - F e b r u a r y 2 0 2 0 41
APPENDICES
S t r e e t o p e r a t i o n s s n a p s h o t i n M i n n e a p o l i s
AN EXTENSIVE TRANSPORTATION SYSTEM
Within Minneapolis there is an extensive transportation system that includes networks of streets, sidewalks, bikeways and transit routes that offer people many options for getting around. The same person may need to use, or choose to use, a different part of this system depending upon the time of the day, day of the week or by season. No matter the way one travels, these networks come together on our streets. The City of Minneapolis owns and operates some, but not all, of this transportation system. In Minneapolis you can find:
● 1,062 miles of streets and 394 bridges (Minneapolis owns 107 of the bridges) ● More than 2,000 miles of sidewalks ● 150 miles of on-street bikeways and 105 miles of off-street bikeways and trails ● 811 traffic signals, operated and maintained by the City of Minneapolis ● 207 local transit routes and 11 high frequency transit routes ● Many street trees, boulevards and public spaces
STREETS HAVE MANY DEMANDS
The space available on our streets is a fixed resource with many competing needs. Streets are spaces for people walking, biking, taking transit, driving and places that accommodate parking, deliveries, trash collection and more. Additionally, these public spaces are often the shared living rooms of our communities, including the realm between the street and the sidewalk that houses our trees and crucial drainage.
Planning a safe and efficient transportation system for everyone within this limited space is complex. The City of Minneapolis’ Complete Streets Policy helps to give preference and guidance for how to manage those competing demands. This modal priority framework prioritizes people as they walk, then those on bicycle and transit, over people when they drive.
Figure 20 shows the many different uses that are often accommodated within the limited public space available for streets, or public right of way. The typical street right of way width within the city is between 60 feet and 80 feet, although constraints often make the usable right of way narrower. However, a few larger streets in the city have a right of way of 100 feet or more.
Figure 20: Typical Minneapolis street

D R A F T M I N N E A P O L I S T R A N S P O R T A T I O N A C T I O N P L A N - F e b r u a r y 2 0 2 0 42
APPENDICES
Figure 21: Minneapolis transportation system

M I N N E A P O L I S T R A N S P O R T A T I O N A C T I O N P L A N 43
16 Minneapolis Downtown Council, Downtown Facts. https://www.mplsdowntown.com/facts/
REDESIGNING OUR TRANSPORTATION FOR A GROWING CITY
Minneapolis is growing faster than it has since 1950. Between 2010 and 2016, the city added an additional 12,000 housing units and more than 37,000 residents. While our population is increasing, the space within our streets is not. If all new residents and commuters in Minneapolis traveled as we do today, the number of cars on our streets, and the resulting congestion, and greenhouse gas emissions would all increase in unison. To manage this growth in a way that meets our transportation and climate goals, we need to make strategic investments that allocate space on our streets in a more efficient way. This means prioritizing transportation options that have less impact on our environment and that are able to move more people more efficiently.
Figure 22 illustrates that people walking, or traveling by bus, bike or scooter results in a much more efficient use of limited street space compared to people driving alone. Transit-only infrastructure like Marquette Avenue and 2nd Avenue S are part of an efficient commute for many of the 205,000 people16 working daily in downtown Minneapolis.
Figure 22: Use of street space by 38 people

D R A F T M I N N E A P O L I S T R A N S P O R T A T I O N A C T I O N P L A N - F e b r u a r y 2 0 2 0 44
APPENDICES
S n a p s h o t o f s t r e e t d e s i g n i n M i n n e a p o l i s
GOOD STREET DESIGN
Good street design is many things – most effectively shown through images. Good street design:
● Is for people
● Helps meet climate goals
● Is accessible for all people
● Includes space for all users
● Encourages safer, slower speeds
● Supports commerce and retail
● Is comfortable and welcoming
● Is flexible
● Moves many people effectively
The Street Design Guide will be finalized in 2020, separate from
and guided by the Transportation Action
Plan.
Figure 23: Good street design
Is for people Is accessible for all people Includes space for all users
Encourages safer, slower speeds
Supports commerce and retail
Helps meet climate goals
Is comfortable and welcoming
Is flexible Moves many people effectively