City of Edmond
222
City of Edmond NOTICE OF PUBLIC MEETING The City of Edmond encourages participation from all its citizens. If participation at any Public meeting is not possible due to a disability, notification to the City Clerk at least 48 hours prior to the scheduled meeting is encouraged to make the necessary accommodations. The City may waive the 48-hour rule if signing is not the necessary accommodation. AGENDA Finance/Audit Committee Wednesday, March 19, 2014 4:00 p.m. City Council Chambers 20 S. Littler, Edmond, OK CITY COUNCIL WORKSHOP 1. Call to Order. 2. Approve the minutes from February 19th, 2014. 3. Discussion and consideration of the responses to the 2014 request for internal audit services. 4. Discussion and consideration of the arbitrage rebate calculations by EideBailly of the EPWA Sales Tax & Utility System Revenue Bonds, Series 2004. 5. Discussion and consideration of the annual review of the 457(b) and 401(a) deferred compensation plans and the funds performances for year 2013 presented by Great-West Retirement representative Gary Wilkins and Chara Green. 6. Discussion and consideration of the analysis by DiMeo Schneider & Associates, LLC, of the 457 Deferred Compensation Plan as of December, 2013. 7. Accept the City Treasurer's month end investment reports for January 31st and February 28th, 2014. 8. New Business - (In accordance with the Open Meeting Act, new business is defined as any matter not known about or which could not have been reasonably foreseen prior to the time of posting of the agenda.) 9. Adjournment.
-
Upload
khangminh22 -
Category
Documents
-
view
2 -
download
0
Transcript of City of Edmond

City of EdmondNOTICE OF PUBLIC MEETING
The City of Edmond encourages participation from all its citizens. If participation at any Public meetingis not possible due to a disability, notification to the City Clerk at least 48 hours prior to the scheduledmeeting is encouraged to make the necessary accommodations. The City may waive the 48-hour rule ifsigning is not the necessary accommodation.
AGENDA
Finance/Audit CommitteeWednesday, March 19, 2014
4:00 p.m.City Council Chambers
20 S. Littler, Edmond, OK
CITY COUNCIL WORKSHOP
1. Call to Order.
2. Approve the minutes from February 19th, 2014.
3. Discussion and consideration of the responses to the 2014 request for internal audit services.
4. Discussion and consideration of the arbitrage rebate calculations by EideBailly of the EPWA SalesTax & Utility System Revenue Bonds, Series 2004.
5. Discussion and consideration of the annual review of the 457(b) and 401(a) deferredcompensation plans and the funds performances for year 2013 presented by Great-WestRetirement representative Gary Wilkins and Chara Green.
6. Discussion and consideration of the analysis by DiMeo Schneider & Associates, LLC, of the 457Deferred Compensation Plan as of December, 2013.
7. Accept the City Treasurer's month end investment reports for January 31st and February 28th,2014.
8. New Business - (In accordance with the Open Meeting Act, new business is defined as any matternot known about or which could not have been reasonably foreseen prior to the time of posting ofthe agenda.)
9. Adjournment.

Finance/Audit Committee 2. Meeting Date: 03/19/2014
InformationAgenda ItemApprove the minutes from February 19th, 2014.
Background
AttachmentsFeb 2014 Minutes

Page 1 of 2
FINANCE/AUDIT COMMITTEE
February 19, 2014 1. Call to Order. Chairman Stephen Schaus called a regular Finance/Audit Committee meeting to order at 4:00 pm in the City Council Chambers on Wednesday, February 19, 2014. Present were Charles Lamb, Nick Massey, Larry Stevens, City staff, and guests. 2. Approve the minutes of January 14, 2014. Motion made by Massey, seconded by Lamb, to approve the minutes. Motion carried unanimously. Chairman Schaus stated the following three items would be discussed at one time. Chris Gander, Bond Advisor with BOSC-Oppenheim, .addressed the Committee and stated the three following outstanding bonds will be combined into the “Sales Tax and Utility System Revenue Refunding Bonds, Series 2014 in the aggregate amount not to exceed $25,000,000. He stated the savings on Series 2003B (Sr. Bonds) will be $140,000, the 2004 (Sr. Bonds) will be $850,000 and the 2004 (Jr. Bonds, the callable portion) will be $1,200,000. He noted the average interest rate will be approximately 2.75%. The Bonds will be sold on March 6th and close soon after April 1st due to the call date. 3. Discussion and Consideration of refunding the Utility System Revenue Bonds, Series 2003B (Sr. Bonds). Motion by Lamb, seconded by Massey, to approve refunding of the above Bonds. Motion carried unanimously. 4. Discussion and Consideration of refunding the Utility System Revenue Bonds, Series 2004 (Sr. Bonds). Motion by Massey, seconded by Lamb, to approve refunding the above Bonds. Motion carried unanimously. 5. Discussion and Consideration of refunding the Sales Tax and Utility System Revenue Bonds, Series 2004 (Jr. Bonds – the callable portion). Motion by Lamb, seconded by Massey, to approve refunding the above Bonds. Motion carried unanimously. 6. Discussion and Consideration of the analysis by DiMeo Schneider & Associates, LLC, of the 457 Deferred Compensation Plan as of December, 2013. In 2012 the Committee approved a budget of $14,950 for one-time investment consulting services. In 2013 the City hired DiMeo Schneider as the Pension Plan Fund Manager, to perform an analysis of the 457 Plan investment options, fee, and fund performance. DiMeo Schneider also re-negotiated the City’s costs with the current service providers, Great-West Retirement (record-keeper) and its affiliate, Advised Asset Group (investment advisors), with annual savings of $8,302 for administrative fees and the reduction of asset-based fees for managed accounts of approximately $4,000 to $5,000 annually.

Page 2 of 2
Holly Wescott, Treasury Coordinator, addressed the Committee and stated as a result of the negotiations, new contracts with both entities will need to be formally approved by Council. In addition, the Committee will need to discuss and determine if the City wants to offer different funds or move to lower-cost shareclasses. DiMeo recommended to terminate without replacement Davis NY Venture A and to discuss termination of Heartland Value and OakMark. Other issues recommended for discussion was whether to replace Risk based funds with Target Date Funds and replacing AAG with a non-affiliated group acting in an advising/consulting capacity because AAG is not independent of Great-West and DiMeo advocated independent services. She stated Great-West representatives will attend the next meeting to present the annual review of the 457 Plan. She noted during the last discussion with Gary Wilkins, the regional director, he indicated they wanted to accommodate whatever direction the City chooses to go regarding these issues. Great West is not suggesting adding any additional funds, but are willing to offer substitutions. Consensus of the Committee was to continue this item until the next meeting in order to further discuss the recommendations from DiMeo Schneider with Great-West. 7. Acceptance of the City Treasurer’s Investment Report for month ending December 31, 2013. Motion by Lamb, seconded by Massey, to accept the Treasurer’s investment report for December, 2013. Motion carried unanimously. 8. New Business: Holly Wescott, Treasury Coordinator, addressed the Committee and stated a team has been created to work on a new RFP for merchant services. 9. Adjournment. The meeting adjourned at 4:30 pm.

Finance/Audit Committee 3. Meeting Date: 03/19/2014
InformationAgenda ItemDiscussion and consideration of the responses to the 2014 request for internal audit services.
Background
AttachmentsCrawford RFP ResponseCompass RFP Response

PROPOSAL FOR INTERNAL AUDIT SERVICES
FOR
THE CITY OF EDMOND
INTERNAL AUDIT SERVICES RFP14-012 CLOSING DATE MARCH 4, 2014 AT 2:00 PM CST

PROPOSAL FOR INTERNAL AUDIT SERVICES FOR THE CITY OF EDMOND
INTERNAL AUDIT SERVICES RFP14-012
2
TABLE OF CONTENTS
Description
Page
LETTER OF INTRODUCTION – TRANSMITTAL LETTER
3
I. COMPANY BACKGROUND INFORMATION:
PROFILE OF THE FIRM FINANCIAL SOUNDNESS PERSONNEL INTERNAL AUDIT TEAM FOR CITY OF EDMOND EXPERIENCE LIST OF CLIENTS & CONTACTS
4-13
II. ENGAGEMENT STRATEGY
PREPARATION AND START-UP GOALS, OBJECTIVES AND SCOPE
13-14
METHODOLOGY
III. FEES AND COSTS
14
ATTACHMENT A – FIRM ORGANIZATION CHART
ATTACHMENT B – CITY COUNCIL & MANAGEMENT RISK SURVEY ATTACHMENT C – RISK ASSESSMENT ATTACHMENT D – ENGAGEMENT PROFILE ATTACHMENT E – INTERNAL AUDIT PLAN ATTACHMENT F – INTERNAL AUDIT REPORTS ATTACHMENT G – CALCULATION OF ESTIMATED HOURS & FEES ATTACHMENT H – FIRM PEER REVIEW ATTACHMENT I – PROOF OF PROFESSIONAL LIABILITY INSURANCE ATTACHMENT J – FIRM OAB ANNUAL PERMIT Firm Contact Person: Frank Crawford, CPA Firm President Crawford & Associates, P.C. 10308 Greenbriar Place Oklahoma City, OK 73159 Phone: (405) 691-5550 Cell Phone: (405) 229-9084 Fax: (405) 691-5646 Email: [email protected]

PROPOSAL FOR INTERNAL AUDIT SERVICES FOR THE CITY OF EDMOND
INTERNAL AUDIT SERVICES RFP14-012
3
March 4, 2014 Ms. Brenda Mayer, CPPO Purchasing Manager City of Edmond 100 East First Edmond, Oklahoma 73034 Dear Ms. Mayer: Crawford & Associates, P.C. is pleased to provide the enclosed response to your request for internal audit services. As you may already know, we are a very unique Firm in that since 1984 we have provided accounting, auditing and consulting services exclusively to state and local governments. We are recognized throughout Oklahoma and the Nation as the leader in this field by both our CPA peers and the various governmental entities in the State and the Country. We have been recognized by the Governmental Accounting Standards Board (GASB) as the first auditing Firm in the United States to have audited a local government which early implemented the provisions of GASB Statement 34, The New Reporting Model. In addition, Firm Chairman Emeritus Mike Crawford is the AICPA national representative and past Vice Chairman of the Governmental Accounting Standards Advisory Council (GASAC) that advises the GASB; and Firm President Frank Crawford is the past Chairman of the AICPA National Government Expert Panel that works directly with the GASB and leads the accounting profession nationally in governmental auditing. In 1997, the Firm recognized a need for providing expert internal auditing and related consulting services. Therefore, the practice was expanded to meet this need by adding professional staff that had specific internal auditing and related consulting experience to provide those services to our clients. As a result, we have experienced significant growth in the demand for those services and continue to welcome opportunities to provide these specialized services to assist our clients in meeting their needs. In addition, we place the utmost importance on maintaining and enhancing the integrity and objectivity of the accounting and audit profession. In fact, Firm Chairman Emeritus, Mike Crawford, is the co-author of the national publication, The CPAs’ Multistate Guide to Ethics and Professional Conduct, and annually provides ethics training to other CPAs across the country. We feel strongly that, when acquiring internal audit services of such a specialized nature, the most important factors to consider in relation to fees are qualifications, experience and level of available services. We believe when you compare the qualifications, experience and service of our Firm in relation to that of any other Firm, you will agree that Crawford & Associates, P.C., is the best Firm available to the City of Edmond. We encourage you to learn more about Crawford & Associates and our proud history and exciting future at our web site www.crawfordcpas.com. We are very excited about the opportunity to serve the City of Edmond as internal auditor and would be more than happy to meet with you to further discuss our proposal. Respectfully submitted, Crawford & Associates, P.C

PROPOSAL FOR INTERNAL AUDIT SERVICES FOR THE CITY OF EDMOND
INTERNAL AUDIT SERVICES RFP14-012
4
I. COMPANY BACKGROUND INFORMATION: PROFILE OF THE FIRM OVERVIEW – HISTORY OF THE FIRM Crawford & Associates, P.C. is a 20-person Firm headquartered in Oklahoma City, Oklahoma. Since its creation in 1984, the Firm has earned an international, national and statewide reputation second to none in the area of governmental accounting and consulting. Our vision in 1984 to establish a CPA Firm to exclusively serve governments has proven to be ahead of its time, as many professional service Firms are now learning the value of specialization. Crawford & Associates, established by brothers Mike and Frank Crawford, specializes in providing consulting and accounting services solely to governmental entities and training and consultation to other CPA Firms that provide accounting and auditing services to governmental entities. We offer a variety of services including annual financial statement preparation, accounting and reconciliation assistance, accounting and financial management technical assistance, internal control analysis and design, data-mining analysis, accounting policy and procedure development, contract internal auditing, fraud and other special investigations, quality assurance reviews, training, and expert witness testimony in litigation and labor arbitration matters. In addition, the Firm is nationally recognized for its financial analysis tool, the Performeter®, used by government entities around the world as a measure of the government’s financial health and performance. FINANCIAL SOUNDNESS Crawford and Associates is celebrating its 30th year in business, has no long-term debt, owns title to all its assets, and is 100% owned by five local shareholders. The Firm in its 30 year existence has never had any litigation filed against it, nor has the Firm ever been subject to an investigation by a regulatory authority. Furthermore, the Firm has no contingent liabilities. PERSONNEL – FIRM ASSOCIATES (See Organization Chart at Attachment A) INDIVIDUAL POSITION YEARS WITH FIRM LOCATION Mike Crawford, CPA Chairman Emeritus 30 Oklahoma City Frank Crawford, CPA President/Shareholder 28 Oklahoma City Deanna Crawford, CPA Manager/ Shareholder 22 McAlester, OK Marcy Twyman, CPA Manager/Shareholder 12 Oklahoma City G. Dwayne Tate, CPA Manager/Shareholder 9 Oklahoma City Brenda Wright, CPA Manager/Shareholder 12 Oklahoma City Justin Kersey, CPA, CFE Manager 6 Oklahoma City Richard Rose, CPA Manager 5 Oklahoma City Chris Pembrook, CPA Manager 3 Oklahoma City Stephanie Ballard, CPA Manager 3 Oklahoma City Joni Parker, CPA Consultant 12 Davis, OK Amanda Copeland, CPA Consultant 12 Oklahoma City Tammy Hunt Consultant 26 Oklahoma City Kristy Awtry Consultant 10 Oklahoma City Kimberly Green Consultant 10 Oklahoma City Andrea Depee Consultant 9 Oklahoma City Jennifer Traxler Consultant 8 Oklahoma City D. Ann Matthews Consultant 6 Durant, OK Kristin Lamar, CFE Consultant 7 Oklahoma City Courtney Crowder Consultant 9 Oklahoma City Wendy Moreno Quality Control Manager 21 Oklahoma City Candy Dow Office Administrator 10 Oklahoma City Debbie Crawford Office Staff 21 Oklahoma City

PROPOSAL FOR INTERNAL AUDIT SERVICES FOR THE CITY OF EDMOND
INTERNAL AUDIT SERVICES RFP14-012
5
PRESIDENT FRANK CRAWFORD, CPA Frank Crawford is President of Crawford & Associates, P.C., Certified Public Accountants, an accounting Firm located in Oklahoma City, OK. The Firm specializes in providing auditing, consulting and accounting services solely to governmental entities and is a member of the AICPA’s. Over the last 30 years, Crawford & Associates has provided a variety of audit and accounting services to all sizes of government including many types of financial statement audits and attestation services, fraud investigations, internal control analysis, accounting policy and procedure development, contract internal auditing and internal monitoring, developing management anti-fraud programs and controls, quality assurance reviews, training, and expert witness testimonies.
Mr. Crawford recently completed a 4 year term as Chairman of the AICPA Government Expert Panel, and is currently the Chairman of the Oklahoma Society of CPAs Government Accounting and Auditing Committee (15 years), and has also been involved in a number of other AICPA committees and task forces as they relate to governmental accounting and auditing, including the AICPA Governmental Accounting and Auditing Committee, the AICPA Government and Not-For-Profit Expert Panel, the AICPA Government Performance and Accountability Committee, and the AICPA GASB 34 Audit Guide Revision Task Force.
Mr. Crawford is also currently the Chairman of the AICPA National Governmental Accounting and Conference Planning Task Force (10 years), and is also a member and co-chair of the Planning Committee of the AICPA’s Government and Not-For-Profit Training Conference (14 years).
Over the years, Mr. Crawford has assisted both the AICPA and GASB in the development of several implementation guides as a member of an advisory group, task force or technical content provider. His experience with GASB 34 implementation and audit issues dates back to June 30, 1999, as auditor of the first general-purpose government in the United States to implement the requirements of GASB 34.
Mr. Crawford is also currently working with many of the territories, commonwealths and freely-associated states on audit finding resolution and financial analysis projects and serves as a technical consultant and advisor to a number of Federal Government Agencies.
Frank is a frequent lecturer, trainer and discussion leader for numerous groups, including U.S. Federal Government Agencies, various local and national CPA Firms, a number of State Societies, and has appeared in several AICPA continuing professional education videos and live satellite CPE broadcasts and Webcasts related to governmental accounting and auditing.
MANAGING SHAREHOLDER MARCY TWYMAN, CPA Marcy Twyman, CPA, joined Crawford & Associates in March 2002 as Audit and Consulting Manager. Before coming to the Firm, Marcy was Finance Director at the City of Guymon, Oklahoma for 11 years. The City of Guymon was the first city in the United States to implement GASB 34. She was key in the implementation of GASB 34 and has taught various classes and seminars on the subject. Marcy is a frequent lecturer, trainer, and discussion leader for various groups including the Oklahoma Society of CPAs, Oklahoma Municipal League, and Oklahoma Municipal Clerks, Treasurers, and Finance Officers Association related to governmental accounting and management. She has also served on task forces and participated in field tests for the Governmental Accounting Standards Board in their standards-setting process. She was recognized as the 2000 Outstanding CPA in Business and Industry by the Oklahoma Society of CPAs. In 2004, Marcy became a shareholder of Crawford & Associates and currently serves as managing shareholder. She is a graduate of Panhandle State University. She has managed multiple internal audit engagements including several State colleges and universities and State agencies.

PROPOSAL FOR INTERNAL AUDIT SERVICES FOR THE CITY OF EDMOND
INTERNAL AUDIT SERVICES RFP14-012
6
SHAREHOLDER BRENDA WRIGHT, CPA Brenda Wright, CPA, rejoined Crawford & Associates in February 2009 as Consulting Manager and became a shareholder in 2011. From 1991 to 2001, she worked for the Firm in financial statement auditing, internal auditing, and consulting divisions. Prior to rejoining the Firm, she served as Finance Director for the City of Mustang, Oklahoma, for seven years. Brenda has over 20 years of governmental accounting, auditing, and consulting experience. She is a frequent lecturer, trainer, and discussion leader for various groups including the Oklahoma Society of CPAs, Oklahoma Municipal League, and Oklahoma Municipal Clerks, Treasurers, and Finance Officers Association related to governmental accounting and management. She is a graduate of East Central University. She has managed multiple internal audit engagements including several State colleges and universities and State agencies. THE INTERNAL AUDIT TEAM FOR THE CITY OF EDMOND The internal audit team assembled for the City of Edmond is unparalleled in its qualifications, experience and reputation. The team’s knowledge of state and governmental accounting principles and Oklahoma State law, combined with their experience in Oklahoma State government and Oklahoma Higher Education is second to none. Under the guidance of Firm President Frank Crawford, CPA, the internal audit practice is headed by Dwayne Tate, CPA, with over 20 years’ experience with Oklahoma Higher Education institutions. Dwayne has an unprecedented understanding of colleges and universities which stems from his prior roles as Assistant Controller for the University of Central Oklahoma, Controller for Rose State College, Director of Finance for Oklahoma City Community College, and as Director of Internal Auditing for the Board of Regents for Oklahoma Colleges and Universities. To complement Dwayne Tate is a seasoned senior manager, Chris Pembrook, CPA, CGAP, Cr.FA, MBA, who has over 7 years’ experience with state agencies through his former position as Deputy Director of the Local Government and Special Services Division for the Office of State Auditor and Inspector, in addition to severing as CFO for the Oklahoma Police Pension System. Also, Chris has extensive knowledge and experience using the professional data base mining software, ACL, for audit, financial, risk and compliance data analysis. From his use of the ACL software, Chris has identified multiple instances of non-compliance with college and university pro-card purchasing policies and procedures. The internal audit team also includes Justin Kersey, CPA, CFE, and Richard Rose, CPA, both of whom have five or more years’ experience performing internal audits and financial consulting services for many Oklahoma Higher Education institutions. Brief profile descriptions are listed below. SHAREHOLDER G. DWAYNE TATE, CPA Dwayne Tate, CPA, joined Crawford & Associates in April 2005 as Consulting Manager and became shareholder in 2008. He was hired to head up the Oklahoma Higher Education Internal Audit, Consulting, and Special Projects division of the Firm. Prior to joining the Firm, he was Controller for Rose State College and Director of Finance for Oklahoma City Community College, and has a combined total of thirteen years financial management experience in Oklahoma Higher Education. He also has three years’ experience as Director of Internal Audit for the Board of Regents of Oklahoma Colleges and Universities, and two years’ experience as staff auditor with KPMG Peat Marwick. He is a graduate of the University of Oklahoma. He has managed multiple internal audit engagements including several State colleges and universities and State agencies.

PROPOSAL FOR INTERNAL AUDIT SERVICES FOR THE CITY OF EDMOND
INTERNAL AUDIT SERVICES RFP14-012
7
MANAGER CHRIS PEMBROOK, CPA, CGAP, Cr.FA, MBA Chris Pembrook joined Crawford & Associates in September 2011. He has a degree in accounting from East Central University and an MBA from Oklahoma Christian University. Prior to joining the Firm, he served as the Chief Financial Officer of the Oklahoma Police Pension & Retirement System. He also worked for the Oklahoma State Auditor’s Office for seven years, two of the years serving as the Deputy Director of the Local Government and Special Services Division. During that time, he was responsible for all audit engagements for that division and supervised a staff of 54 employees. He was key in the implementation of division-wide use of ACL data-mining analysis software which helped decrease audit budgets from 35% - 50%. He is a graduate of East Central University. He has worked on various internal audit engagements including several State colleges and universities and State agencies. MANAGER JUSTIN KERSEY, CPA, CFE
Justin is a Certified Public Accountant and Certified Fraud Examiner, and joined Crawford & Associates in July 2008 and serves as accountant and consultant. He is a 2005 graduate of the University of Central Oklahoma with a bachelor's degree in accounting. Prior to joining the Firm, Justin worked as a fleet accountant in the international department of Hertz. He is a graduate of the University of Central Oklahoma. He has worked on various internal audit engagements including several State colleges and universities and State agencies. MANAGER RICHARD ROSE, CPA
Richard joined Crawford & Associates in January 2009 as a professional accountant and consultant. He is a 2000 graduate of the Southwestern Oklahoma State University with a bachelor's degree in accounting. Prior to joining the Firm, Richard worked as an auditor and staff accountant for Hunter & Gibbins, P.C., in Elk City, Oklahoma. He is a graduate of Southwestern Oklahoma State University. He has worked on various internal audit engagements including several State colleges and universities and State agencies. EXPERIENCE Crawford & Associates is a properly licensed CPA Firm in good standing with the Oklahoma Accountancy Board (license # 743). All of the Crawford & Associates staff that provide professional services meet or exceed all continuing education requirements of the Oklahoma Accountancy Board and the Governmental Accountability Office to the extent applicable. In addition, the Firm’s audit and attest practice undergoes a peer review once every three years as required. A copy of our most recent peer review report is attached (See Attachment H), and is also available on our web site at www.crawfordcpas.com. Crawford and Associates currently provides internal audit and consulting services to 20 of the 28 public colleges and universities in the State of Oklahoma. Eleven of those 18 are our internal audit clients, including the Six Regional Universities, Oklahoma City Community College, Rose State College, Western Oklahoma State College, Murray State College, and Eastern Oklahoma State College. We also currently provide internal audit services for the Oklahoma Firefighters Pension System and the Oklahoma Law Enforcement Retirement System. We are proud of our relationship with the numerous governmental clients we have served over the past 30 years. The majority of our clients are Oklahoma municipalities, 60 plus and counting in total. We have also served State agencies, colleges and universities, and other government trusts or organizations. Over the past thirty years we have served over 100 different state and local governments in Oklahoma and around the world. Below is a list of our State and Local Government clients with references including contact information:

PROPOSAL FOR INTERNAL AUDIT SERVICES FOR THE CITY OF EDMOND
INTERNAL AUDIT SERVICES RFP14-012
8
LISTING OF CITY & TOWN CONSULTING CLIENTS:
Contact Title
Client Address
Phone number/Email
Donna Doolen, Finance Director/Treasurer
City of Ada 231 S Townsend Ada, OK 74821
(580) 436-6300 [email protected]
Amy Lucas, Sr. Accountant
City of Altus 509 S. Main Altus, OK 73521
(580) 481-2202 [email protected]
Joe Don Dunham, Business Manager
City of Alva 415 4th Street Alva, OK 73717-2340
(580) 327-1340 [email protected]
Betty Koehn, Finance Director
City of Bixby PO Box 70 Bixby, OK 74008-0070
(918) 366-4430 [email protected]
Robert Floyd, City Manager
City of Blanchard PO Box 480 Blanchard, OK 73010
(405) 485-9392 [email protected]
Sandy Gaches, Clerk
Town of Byars PO Box 251 Byars, OK 74831-0251
(405) 783-4255 [email protected]
Coleen Bishop, Clerk/Treasurer
Town of Byng 110 Byng Avenue Byng, OK 74820
(580) 436-2545 [email protected]
Jennifer Firgard, Clerk/Treasurer
Town of Cashion 102 S. Main Cashion, OK 73016-0027
(405) 433-2243 [email protected]
Bette Sanders, Finance Director
City of Checotah 414 W Gentry Checotah, OK 74426-2444
(918) 473-5411 [email protected]
Pam Polk, City Manager
City of Collinsville 106 N 12th St Collinsville, OK 74021-0730
(918) 371-1010 [email protected]
Janice Goins, Dep Clerk/Treasurer
City of Commerce PO Box 99 Commerce, OK 74339-0099
(918) 675-4373 [email protected]
Sondra Easterly, Clerk
Town of Covington 224 W Main Covington, OK 73730-0078
(580) 864-7428 [email protected]
Ed Stanton, City Manager
City of Crescent PO Box 561 Crescent, OK 73028-0561
(405) 969-2538 [email protected]
Brenda Wadsworth, Clerk/Treasurer
Town of Dewar PO Box 7 Dewar, OK 74431-0007
(918) 652-4042 [email protected]
Earlene Walker, Treasurer
City of Durant PO Box 578 Durant, OK 74702-0578
(580) 924-7222 [email protected]
Ross Vanderhamm, Finance Director
City of Edmond PO Box 2970 Edmond, OK 73083-2970
(405) 348-8830 [email protected]
Gayla Duke, Finance Director
City of El Reno 101 N Choctaw El Reno, OK 73036-0700
(405) 262-4070

PROPOSAL FOR INTERNAL AUDIT SERVICES FOR THE CITY OF EDMOND
INTERNAL AUDIT SERVICES RFP14-012
9
Luena King, Clerk/Treasurer
City of Elgin PO Box 310 Elgin, OK 73538-0310
(580) 492-5777 [email protected]
Donna Hysell, Clerk/Treasurer
City of Eufaula PO Box 684 Eufaula, OK 74432
(918) 689-2534 [email protected]
Fabian Reyes, Finance Director/Treasurer
City of Frederick PO Box 399 Frederick, OK 73542-0399
(580) 335-7551 [email protected]
Mary Hays, Clerk/Treasurer
City of Geary PO Box 125 Geary, OK 73040-0125
(405) 884-54665 [email protected]
Wanda Calvert, Clerk/Treasurer
City of Guthrie PO Box 908 Guthrie, OK 73044-0908
(405) 282-2489 [email protected]
Kimberly Meek, City Manager/ Finance Director
City of Guymon 219 NW 4th St. Guymon, OK 73942-4708
(580) 338-0137 [email protected]
Tiffany Tilman, Clerk/City Manager
Town of Hennessey PO Box 306 Hennessey, OK 73742-0306
(405) 853-2416 [email protected]
Donna White, Clerk/Treasurer
City of Henryetta PO Box 608 Henryetta, OK 74437-0608
(918) 652-3348 [email protected]
Lorrie Brittian, Clerk/Treasurer
City of Holdenville PO Box 789 Holdenville, OK 74848-0789
(405) 379-3397 [email protected]
Tina Foshee, City Manager
City of Idabel 201 E Main Idabel, OK 74745-4875
(580) 286-7608 [email protected]
Tom Trueblood, Mayor
City of Kaw City PO Box 30 Kaw City, OK 74641-0030
(580) 269-2525 [email protected]
Linda Betts, Clerk
Town of Keyes PO Box 121 Keyes, OK 73947-0121
(580) 546-7651 [email protected]
Anita James, Treasurer
City of Kingfisher 301 N Main Kingfisher, OK 73750-2795
(405) 375-3705 [email protected]
Sherry Pierce, Clerk
Town of Kiowa PO Box 69 Kiowa, OK 74553-0069
(918) 432-5621
Rick Endicott, Finance Director
City of Lawton 103 SW 4th Street Lawton, OK 73501-4031
(580) 581-3305 [email protected]
Kathy Griffith, Clerk
City of Lindsay PO Box 708 Lindsay, OK 73052-0708
(405) 756-2019 [email protected]
Toni Ervin, CFO
City of McAlester PO Box 578 McAlester, OK 74502-0578
(918)423-9300 [email protected]
Barbara Bush, Clerk/Treasurer
City of Medford PO Box 123 Medford, OK 73759-0123
(580) 395-2823

PROPOSAL FOR INTERNAL AUDIT SERVICES FOR THE CITY OF EDMOND
INTERNAL AUDIT SERVICES RFP14-012
10
Lindsay Schnakenberg, Finance Director
City of Miami PO Box 1288 Miami, OK 74355-1288
(918) 542-6685 [email protected]
Judy Redman, Finance Director/Treasurer
City of Midwest City 100 N Midwest Blvd. Midwest City, OK 73110
(405) 732-2281 [email protected]
Dawn Vieregge, City Clerk
City of Minco PO Box 512 Minco, OK 73059-0512
(405) 352-4274 [email protected]
Kim Johnson, Clerk/Treasurer
City of Morris 501 S. Hughes Morris, OK 74445
(918) 733-4222 [email protected]
Janet Watts, Finance Director
City of Mustang 1501 N Mustang Rd Mustang, OK 73064
(405) 376-4521 [email protected]
Sharon Ferguson, Treasurer
City of Newcastle PO Box 179 Newcastle, OK 73065-0179
(405) 387-4427 [email protected]
Cathy Keller, Finance Director
City of Nichols Hills 6407 Avondale Nichols Hills, OK 73116
(405) 843-6637 [email protected]
Evelyn Atkinson, Clerk/Treasurer
City of Okemah 502 W Broadway Okemah, OK 74859-2400
(918) 623-1050 [email protected]
Ronnia Andrews, Clerk
City of Okmulgee PO Box 250 Okmulgee, OK 74447-0250
(918) 756-4060 [email protected]
Sherry Bishop, Clerk
City of Owasso PO Box 180 Owasso, OK 74055-0180
(918) 376-1500 [email protected]
Jennifer Smith, Clerk
City of Piedmont PO Box 240 Piedmont, OK
(405) 373-2621
Donna Mobly, Clerk/Treasurer
City of Prague 1116 N Jim Thorpe Blvd. Prague, OK 74864-3523
(405) 567-2270 [email protected]
Kelly Lamberson, Finance Director
City of Sand Springs PO Box 338 Sand Springs, OK
(918) 246-2500 [email protected]
Pam Vann, Treasurer
City of Sapulpa PO Box 1130 Sapulpa, OK 74067-1130
(918) 224-3040 [email protected]
Joan Johnson, Clerk/Treasurer
Town of Shattuck PO Box 670 Shattuck, OK 73858-0670
(580) 938-2916 [email protected]
Brian McDougal City Manager
City of Shawnee PO Box 1448 Shawnee, OK 74802
(405) 878-1601 [email protected]
Shirley Lett, Clerk/Treasurer
Town of Skiatook PO Box 399 Skiatook, OK 74070-0399
(918) 396-2797 [email protected]
Heather Shelley, Clerk/Treasurer
Town of Springer PO Box 368 Springer, OK 73458
(580) 653-2500

PROPOSAL FOR INTERNAL AUDIT SERVICES FOR THE CITY OF EDMOND
INTERNAL AUDIT SERVICES RFP14-012
11
Cheryl Monks, Clerk/Treasurer
City of Stigler 115 S Broadway Stigler, OK 74462-2318
(405) 372-0025 [email protected]
Shelldon Miggletto, Clerk/Treasurer
City of Stilwell 503 W Division Stilwell, OK 74960-2811
(918) 696-8111
Cheryl LaFerney, Clerk
City of Tuttle PO Box 10 Tuttle, OK 73089-0010
(405) 381-2335 cheryl.laferney@tuttle_ok.gov
Dollie Glenn, Clerk
City of Walters PO Box 485 Walters, OK 73572-0485
(580) 875-3337 [email protected]
Pamela Ramirez, Clerk/Treasurer
City of Warr Acres 5930 NW 49th St. Warr Acres, OK 73122
(405) 789-2892 cityclerk@warracres_ok.gov
Karen Johnson, Clerk/Treasurer
City of Wewoka PO Box 1497 Wewoka, OK 74884-1497
(405) 257-2413 [email protected]
Tennie Clark, Clerk/Treasurer
City of Wilburton 300 W Main St. Wilburton, OK 74578-4048
(918) 465-5361 [email protected]
Doug Haines, Finance Director/Treasurer
City of Woodward 1219 8th St. Woodward, OK 73801-3287
(580) 256-2280 [email protected]
Beverly Badgley, Clerk/Treasurer
City of Wynnewood 207 W Robert S Kerr Wynnewood, OK 73098-7603
(405) 665-2307 [email protected]
LISTING OF INTERNAL AUDIT CLIENTS:
Contact Title
Client Address
Phone number/Email
Sheridan McCaffree Executive Director
Regional University System of Oklahoma 3555 Northwest 58th Street, Suite 320 Oklahoma City, Oklahoma 73112
(405) 942-8817 [email protected]
Charlie Babb General Counsel
Regional University System of Oklahoma 3555 Northwest 58th Street, Suite 320 Oklahoma City, Oklahoma 73112
(405) 942-8817 [email protected]
Dr. Steve Turner President
Northeastern State University 600 North Grand Avenue Tahlequah, Oklahoma 74464
(918) 458-2030 [email protected]
David Koehn Vice President for Administration and Finance
Northeastern State University 600 North Grand Avenue Tahlequah, Oklahoma 74464
(918) 458-2030 [email protected]
Sue Catron Director of Business Affairs
Northeastern State University 600 North Grand Avenue Tahlequah, Oklahoma 74464
(918) 456-5511 [email protected]
Jessica Boles Vice President for Administration and Finance
East Central University 1100 East 14th Street Ada, Oklahoma 74820
(580) 559-5539 [email protected]
Susie Shockey Controller
East Central University 1100 East 14th Street Ada, Oklahoma 74820
(580) 559-5216 [email protected]

PROPOSAL FOR INTERNAL AUDIT SERVICES FOR THE CITY OF EDMOND
INTERNAL AUDIT SERVICES RFP14-012
12
David Pecha Vice President for Administration
Northwestern Oklahoma State University 709 Oklahoma Boulevard Alva, Oklahoma 73717
(580) 327-8528 [email protected]
Ross Walkup Vice President for Business Affairs
Southeastern Oklahoma State University 1405 North 4th Avenue Durant, Oklahoma 74701
(580) 745-2148 [email protected]
Kay Lynn Roberts Controller
Southeastern Oklahoma State University 1405 North 4th Avenue Durant, Oklahoma 74701
(580) 745-2977 [email protected]
Tom Fagan Vice President for Administration and Finance
Southwestern Oklahoma State University 100 Campus Drive Weatherford, Oklahoma 73096
(580) 774-3000 [email protected]
Brenda Burgess Controller
Southwestern Oklahoma State University 100 Campus Drive Weatherford, Oklahoma 73096
(580) 774-3021 [email protected]
Lisa Harper Assistant Vice President for Financial Operations
University of Central Oklahoma 100 North University Drive Edmond, Oklahoma 73034
(405) 974-2753 [email protected]
Dr. Paul Sechrist President
Oklahoma City Community College 7777 South May Avenue Oklahoma City, Oklahoma 73159
(405) 682-1611 [email protected]
Dr. John Boyd, Vice President for Business and Finance
Oklahoma City Community College 7777 South May Avenue Oklahoma City, Oklahoma 73159
(405) 682-7501 [email protected]
Brenda Carpenter Director of Finance
Oklahoma City Community College 7777 South May Avenue Oklahoma City, Oklahoma 73159
(405) 682-1611 ext.367 [email protected]
Ray Blanke Controller
Rose State College 6420 S.E. 15th Midwest City, Oklahoma 73110
(405) 733-7314 [email protected]
Tricia Latham Vice President for Business Affairs
Western Oklahoma State College 2801 North Main Altus, Oklahoma 73521
(580) 477-7725 [email protected]
Heather Hood Controller
Western Oklahoma State College 2801 North Main Altus, Oklahoma 73521
(580) 477-7725 [email protected]
Dr. Steve Smith President
Eastern Oklahoma State College 1301 West Main Street Wilburton, OK 74578
(918) 465-1723 [email protected]
LaDonna Howell Vice President for Business & Finance
Eastern Oklahoma State College 1301 West Main Street Wilburton, OK 74578
(918) 465-1753 [email protected]
Alaina Bray Controller
Eastern Oklahoma State College 1301 West Main Street Wilburton, OK 74578
(918) 465-1895 [email protected]
Joy McDaniel President
Murray State College One Murray Campus Tishomingo, Oklahoma 73460
(580) 371-2371 [email protected]
Dennis Westman Assistant Vice President of Administrative Services
Murray State College One Murray Campus Tishomingo, Oklahoma 73460
(580) 371-2371, ext. 121 [email protected]
Ginger Poplin, Executive Director
Oklahoma Law Enforcement Retirement System 421 NW 13TH ST., SUITE 100 Oklahoma City, OK 73103
(405) 522-4932 [email protected]

PROPOSAL FOR INTERNAL AUDIT SERVICES FOR THE CITY OF EDMOND
INTERNAL AUDIT SERVICES RFP14-012
13
Bob Jones, Executive Director
Oklahoma Firefighters Pension and Retirement System 4545 North Lincoln Blvd., Suite 265 Oklahoma City, OK 73105-3414
(405) 522-4600 [email protected]
Duane Michael, Chief Financial Officer / Assistant Executive Director
Oklahoma Firefighters Pension and Retirement System 4545 North Lincoln Blvd., Suite 265 Oklahoma City, OK 73105‐3414
(405) 522-4600 [email protected]
II. ENGAGEMENT STRATEGY – GOALS, OBJECTIVES, and SCOPE: PREPARATION AND START-UP The goal of the Internal Audit Firm is to function as an essential component of the City’s internal control process by striving to assist the City council, management, and staff in providing reasonable assurance of achieving the three primary objectives of the internal control process:
1. Financial reports are reliable and resources/assets are adequately safeguarded; 2. Operations are conducted in an effective and efficient manner, relatively free of waste and abuse; and
3. Compliance with applicable provisions of laws, regulations, grants and contracts is achieved.
In accordance with the Standards for the Professional Practice of Internal Auditing, “The objective of internal auditing is to assist management and staff of an organization in the effective performance of their responsibilities. To accomplish this objective, internal auditing provides analysis, appraisals, recommendations, counsel, and information regarding the activities reviewed. The ultimate objective of an internal audit is to promote effective internal controls at a reasonable cost. The scope of internal auditing encompasses the examination and evaluation of the adequacy and effectiveness of the organization’s system of internal control and the quality of performance in carrying out assigned responsibilities. The scope of internal auditing includes: Reviewing the reliability and integrity of financial and operating information and the means used to
identify, measure, classify, and report such information.
Reviewing the systems established to ensure compliance with those policies, plans, procedures, laws, and regulations which could have a significant impact on operations and reports, and determining whether the organization is in compliance.
Reviewing the means of safeguarding assets and, as appropriate, verifying the existence of such assets. Appraising the effectiveness and efficiency of operations within the organization. Reviewing operations or programs to ascertain whether results are consistent with established goals and
objectives, and whether the operations or programs are being implemented or performed as planned.”

PROPOSAL FOR INTERNAL AUDIT SERVICES FOR THE CITY OF EDMOND
INTERNAL AUDIT SERVICES RFP14-012
14
METHODOLOGY To accomplish the stated goals, objectives, and scope of internal audit, Crawford & Associates, P.C., uses a six step approach which results in a risk-based long-term audit plan approved by the City in which a list of internal audit areas are identified, assessed for risk, and determined for frequency of review based on input from the City Council and Finance/Audit Committee, City management and staff, and Crawford & Associates, P.C. Listed below is our Six Step Approach:
STEP 1. Identify potential internal audit areas for audit planning purposes through City
Council/Management Survey of Importance, ranking areas for importance by High, Medium, or Low. (See example at Attachment B)
STEP 2. Perform an independent risk analysis to identify high risk audit areas for audit
planning purposes, based on the following risk factors: Materiality, Internal Controls, Public Exposure, Complexity, Change, and Pressures (See example at Attachment C)
STEP 3. Develop engagement profile forms for each audit area to include the audit area’s risk
score and estimated hours. (See example at Attachment D) STEP 4. Prepare an annual written internal audit plan based upon the priorities determined by
the risk analysis and City Council/Management input. (See example at Attachment E) STEP 5. Perform an annual internal audit in accordance with the plan and professional
standards. STEP 6. Report the results of the internal audit and any recommendations in writing to the City
Council and Finance/Audit Committee. (See examples at Attachment F)
The internal audit will be performed in accordance with generally accepted accounting principles (GAAP) and auditing standards as set forth by the American Institute of Certified Public Accountants (AICPA), and other applicable professional standards. We will also utilize professional auditing software, such as ACL data-mining analysis software, to perform the internal audit in an efficient and effective manner. III. Fees and Costs Fees and out-of-pocket expenses for this engagement will be billed monthly as the work progresses and are payable upon receipt of our invoices. Out-of-pocket expenses include such costs incurred by our Firm in providing the services including travel, lodging, telecommunications, printing, document reproduction, and the like, excluding any such expenses incurred directly by the City on behalf of our staff. Our fees for these services will be billed at our standard hourly rates, as follows, for the individual performing such services based on the actual number of hours of work, including travel time, performed by that individual. Standard Hourly Rates:
Firm Chairman $225 Firm President $225 Shareholders $155 Consulting Managers $140 Consulting Staff $100 Clerical Staff $35
The estimated fees for this internal audit engagement have been summarized at Attachment G – Statement of Fees and Calculation of Estimated Hours.

PROPOSAL FOR INTERNAL AUDIT SERVICES FOR THE CITY OF EDMOND
INTERNAL AUDIT SERVICES RFP14-012
15
ATTACHMENT A – ORGANIZATION CHART

Frank Crawford, CPA Firm President
& Majority Shareholder
Marcy Twyman, CPA Minority & Managing
Shareholder
Brenda Wright, CPA Minority Shareholder
Dwayne Tate, CPA Internal Audit & Minority
Shareholder
Deanna Crawford, CPA Minority Shareholder
Wendy Treadwell
Quality Assurance
Tammy Hunt Quality Assurance, Client Support
Richard Rose, CPA* IT
Andrea Depee CIC Support
Kimberly Green Customer Service
Candy Dow Administrator Assistant
Justin Kersey, CPA Internal Audit &
Consulting Manager
Chris Pembrook, MBA, CPA, CGAP, CR.FA
Internal Audit & Consulting Manager
Richard Rose, CPA* Internal Audit &
Consulting Manager
Joni Parker, CPA Consulting Manager
Stephanie Ballard, CPA
Consulting Manager
D. Ann Matthews Consulting Staff
Courtney Crowder Consulting Staff
Jennifer Traxler Consulting Staff
Andres Numez Consulting Staff
Kristin Lamar, MBA Consulting Staff
Amanda Copeland, CPA
Consulting Manager
Kristy Awtry Consulting Staff
*Denotes Dual Role Yellow highlight denotes staff assigned directly to the City of Edmond internal audit proposal
PROPOSAL FOR INTERNAL AUDIT SERVICES FOR THE CITY OF EDMOND
INTERNAL AUDIT SERVICES RFP14-012
ATTACHMENT B – CITY COUNCIL/MANAGEMENT SURVEY

CRAWFORD & ASSOCIATES LIST OF INTERNAL AUDIT AREAS
CITY COUNCIL / MANAGEMENT SURVEY OF IMPORTANCE
Instructions: The purpose of this Survey of Importance is to facilitate a risk-based approach to the performance of internal audit type monitoring procedures on an annual basis. The summary of this Survey’s results will be considered in conjunction with our Firm’s assessment of risk and the amount of resources made available for internal audit type monitoring activities to determine the frequency of audit for each potential internal audit area. Please indicate your assessment of the importance for each of the following Engagement Areas by circling the appropriate letter (H = High, M = Medium, or L = Low).
Engagement Name
Engagement Description
Board/Mgmt.Importance
(H,M,L,)
1. Sales Tax Revenue Collection and Usage Review and evaluate internal controls, policies and procedures, and records for ensuring accurate and complete revenue collection and timely deposit, and to ensure compliance with approved use of sales tax revenues.
H M L
2. Utility Billing System and Revenue Collection
Review and evaluate the internal controls, policies and procedures for utility billing, and compare to actual accounts and billings and approved rate schedules, to determine the level of compliance with those policies and procedures, and to determine the accuracy and completeness of the assessment of utility billings.
H M L
3. Hotel/Motel Tax Revenue Collection Review and evaluate the internal controls, policies and procedures, and records for ensuring accurate and complete revenue collection and timely deposit. H M L
4. Municipal Court Revenue Collection Review and evaluate the internal controls, policies and procedures, and records for ensuring accurate and complete revenue collection and timely deposit. H M L
5. Parks & Recreation – Operations & Revenue Collections
Review and evaluate the internal controls, policies and procedures for operations and evaluate the adequacy and effectiveness for proper safeguarding of assets and the accuracy and completeness of revenue collections.
H M L
6. Human Resources and Payroll
Review and evaluate the internal controls, policies and procedures, and records for payroll expenditures, and test for accuracy and existence. Also, review and evaluate the internal controls, procedures, and records documenting the process of hiring new employees, terminations and retirements, and determine compliance with the established design of internal controls.
H M L
7. Purchasing, Payables, & Expenditures
Review and evaluate internal controls, policies and procedures, and records for purchasing and payables/expenditures to verify accuracy, completeness, and evidence of proper approval, and to ascertain compliance with all applicable laws, regulations, and procedures for purchasing and payables.
H M L
8. Procurement/Purchasing Card (Pro-Card) Review and evaluate the internal controls, policies and procedures for the City’s use of the Pro-Card and determine the level of compliance with those policies and procedures (using Data Analysis/Mining software - ACL).
H M L
9. Grants and Contracts
Review and evaluate the internal controls, policies and procedures for administering grants and contracts and evaluate the adequacy and effectiveness for proper safeguarding of assets. Also, review related expenditure records to verify evidence of proper approval and verification of allowable costs, and ascertain compliance with all applicable laws and regulations relating to grants and contracts.
H M L
10. Fleet Management
Review/Performance of preventive maintenance practices, fleet availability, cost effectiveness, and fuel usage.
H M L
11. Cash-on-Hand Review and evaluate the internal controls and procedures for safeguarding cash, and perform cash counts to verify existence. H M L
12. Capital Assets Review and evaluate the internal controls, procedures, and records for receiving, recording, disposing, and tracking capital assets. H M L

CRAWFORD & ASSOCIATES LIST OF INTERNAL AUDIT AREAS
CITY COUNCIL / MANAGEMENT SURVEY OF IMPORTANCE
Instructions: The purpose of this Survey of Importance is to facilitate a risk-based approach to the performance of internal audit type monitoring procedures on an annual basis. The summary of this Survey’s results will be considered in conjunction with our Firm’s assessment of risk and the amount of resources made available for internal audit type monitoring activities to determine the frequency of audit for each potential internal audit area. Please indicate your assessment of the importance for each of the following Engagement Areas by circling the appropriate letter (H = High, M = Medium, or L = Low).
Engagement Name
Engagement Description
Board/Mgmt.Importance
(H,M,L,)
13. General Ledger Account Reconciliations
Review and evaluate the internal controls, procedures, and records documenting the performance of the account reconciliations (e.g., cash), including outstanding reconciling items, and determine compliance with the established design of internal controls.
H M L
14. Information Technology – General Controls
Review and evaluate the general internal controls, policies and procedures regarding the information system (e.g., passwords, segregation of duties, data protection).
H M L
15. Disaster Recovery Plan Review and evaluate the internal controls, policies and procedures, for administering the City’s Disaster Recovery Plan and determine compliance thereof.
H M L
16. Police – Seized Property Inventory Review and evaluate the internal controls & policies and procedures as it relates to compliance with applicable laws & regulations. H M L
17. Follow-up on Prior Year Audit Findings Review and evaluate the City’s implementation of its corrective action plan to the prior year audit findings, as documented in the City’s Management Responses.
Required Annually
1. Please list below your top three areas from the listing above, those that are most important to you: 1.
2.
3.
2. Please list below any additional areas you would like the internal audit function to consider:
1.
2.
3. 4.
5.

PROPOSAL FOR INTERNAL AUDIT SERVICES FOR THE CITY OF EDMOND
INTERNAL AUDIT SERVICES RFP14-012
ATTACHMENT C – RISK ASSESSMENT

CRAWFORD & ASSOCIATES INDEPENDENT INTERNAL AUDIT SERVICE
RISK ASSESSMENT FORM
AUDIT AREA: Human Resources and Payroll
Risk Factor Evaluation
Weight Score
1. Materiality The measure of the exposure to loss or embarrassment due to the relative dollar significance of the audit area to the budget or financial statements as a whole.
3 Over 10% of base 2 Between 2-10% of base 1 Under 2% of base Value selected: 3
x 4
12 2. Internal Controls The measure of the quality of the existing internal controls over the audit area based on existing knowledge and past audits.
3 Known to be weak 2 Acceptable 1 Known to be strong Value selected: 1
x 3
3
3. Public Exposure The measure of the likely political exposure and adverse publicity resulting from public perception or regulatory impact.
3 Major impact 2 Minor impact 1 No impact Value selected: 3
x 4
12 4. Complexity The measure of the overall complexity of the audit area including: degree of regulation, degree of automation, and number of transactions and processes.
3 Very complex 2 Moderately complex 1 Not complex Value selected: 3
x 1
3
5. Change The measure of the degree of changes in the audit areas operations in the last 12 months, including: changes in key personnel, changes in systems, and reorganization.
3 Major changes 2 Moderate changes 1 Little or no changes Value selected: 1
x 2
2
6. Pressures The measure of the degree of internal and/or external pressures on management or employees of the audit area to meet certain objectives, either personal or professional.
3 Significant pressures 2 Moderate pressures 1 Little or no pressure Value selected: 1
x 3
3
Total Score For Audit Area
35

PROPOSAL FOR INTERNAL AUDIT SERVICES FOR THE CITY OF EDMOND
INTERNAL AUDIT SERVICES RFP14-012
ATTACHMENT D – ENGAGEMENT PROFILE

CRAWFORD & ASSOCIATES INDEPENDENT INTERNAL AUDIT SERVICE
ENGAGEMENT PROFILE FORM AUDIT AREA: Human Resources and Payroll RISK SCORE: 35 ESTIMATED AUDIT HOURS: 24-32 ENGAGEMENT FREQUENCY: Every 2 - Years INTERNAL CONTROL OBJECTIVE(S) AFFECTED:
X Financial Reporting Reliability and/or Safeguarding of Resources
Effective and Efficient Operations, Controls over Waste and Abuse
X Compliance with Laws, Regulations, Grants and Contracts ENGAGEMENT DESCRIPTION:
The system of internal control and administrative procedures surrounding the payroll process will be reviewed and evaluated for adequacy and effectiveness. Considering that payroll expenditures comprise approximately 80 % of the College’s Educational and General Budget, internal controls must be adequate and effective to properly safeguard College assets. A random sample of payroll records will be selected for testing to verify accuracy, existence, and completeness, and to ascertain compliance with applicable laws and regulations. ANTICIPATED ENGAGEMENT BENEFITS:
Deterrent to or Detection of Waste and Abuse
X Improved Policies, Programs or Controls
X Enhanced Reliability of Financial Reports X Enhanced Compliance

PROPOSAL FOR INTERNAL AUDIT SERVICES FOR THE CITY OF EDMOND
INTERNAL AUDIT SERVICES RFP14-012
ATTACHMENT E – INTERNAL AUDIT PLAN

CRAWFORD & ASSOCIATES INTERNAL AUDIT PLAN
FY 2014
Engagement Name Risk Score
City Council/Mgmt. Importance
(H,M,L,)
Estimated Hours
1. Sales Tax Revenue Collection and Usage 40 M 16-24
2. Utility Billing System and Revenue Collection 40 M 16-24
3. Human Resources and Payroll 35 H 16-24
4. Purchasing, Payables, & Expenditures 35 H 16-24
5. Procurement/Purchasing Card (Pro-Card) 35 H 16-24
6. Grants and Contracts 35 M 16-24
7. Follow-up on Prior Year Audit Findings N/A N/A 16-24
8. Report Writing, Meetings, and Presentations -- -- 24-32
Total Planned Hours 136-200

CRAWFORD & ASSOCIATES
LIST OF INTERNAL AUDIT AREAS & PROPOSED SCHEDULE ASSESSMENT OF RISK & IMPORTANCE
Engagement Name Risk Score
City Council/Mgmt.
Importance (H,M,L,)
Estimated Hours
Planned
Frequency Proposed Schedule per Fiscal Year
2014 2015 2016 2017 2018
1. Sales Tax Revenue Collection and Usage 40 M 16-24 2 years
2. Utility Billing System and Revenue Collection
40 M 16-24 2 years
3. Hotel/Motel Tax Revenue Collection 25 L 16-24 4 years
4. Municipal Court Revenue Collection 25 L 16-24 4 years
5. Parks & Recreation – Operations & Revenue Collections
25 L 16-24 4 years
6. Human Resources and Payroll 35 H 16-24 2 years
7. Purchasing, Payables, & Expenditures 35 H 16-24 2 years
8. Procurement/Purchasing Card (Pro-Card) 35 H 16-24 2 years
9. Grants and Contracts 35 M 16-24 3 years
10. Fleet Management 35 M 16-24 3 years
11. Cash-on-Hand 30 M 16-24 3 years
12. Capital Assets 25 L 16-24 4 years
13. General Ledger Account Reconciliations 25 L 16-24 4 years
14. Information Technology – General Controls
35 H 16-24 2 years
15. Disaster Recovery Plan 35 H 16-24 2 years
16. Police – Seized Property Inventory 30 M 16-24 3 years
17. Follow-up on Prior Year Audit Findings N/A N/A 16-24 Annual

PROPOSAL FOR INTERNAL AUDIT SERVICES FOR THE CITY OF EDMOND
INTERNAL AUDIT SERVICES RFP14-012
ATTACHMENT F – INTERNAL AUDIT REPORTS

[Date] [Example Council] [Address] [City], OK [Zip code] Re: Report on Internal Audit Type Monitoring Activities – [Example Entity] Members of the Council: The [Example] engaged Crawford and Associates, P. C. to provide certain professional services as identified in the Scope and Objectives of Our Services section below with regards to [Example Entity (EE)]. This report describes the scope and objectives of our services, the specific procedures we performed, our findings and recommendations, and (EE) management’s responses to our findings and recommendations. Scope and Objectives of Our Services The scope of our professional services was limited to performing certain consulting services designed to assist the [Example Council] in meeting its fiduciary responsibilities. These services were performed in accordance with the standards applicable to consulting engagements of the American Institute of Certified Public Accountants. With regards to this specific engagement, the scope of our services included certain internal audit type monitoring procedures in the following areas at (EE):
Purchasing Procurement Card Human Resources/Employment Services & Payroll Capital Assets Cash-on-hand Grants & Contracts
The objectives of our services in this engagement were to obtain information and review selected accounting records to determine whether any recommendations are warranted regarding the design of established internal control policies and procedures, and to report on the level of compliance with those policies and procedures as designed based on our test work. Purchasing Procedures Performed: To accomplish the stated objectives, we performed the following procedures:
Obtained and reviewed (EE) and [Example Council] policies and procedures regarding purchasing. We also conducted interviews with appropriate management and personnel.
Selected a random sample of 34 purchase orders processed during the audit scope period of January 1, 2013 through December 31, 2013. To ensure a proportionately representative selection, we stratified the sample in the following manner:
o Five (5) purchase orders greater than $2,500, but less than or equal to $10,000 – those requiring a minimum of three verbal quotes;

Procedures Performed – continued:
o Four (4) purchase orders greater than $10,000, but less than or equal to $25,000 – those requiring a minimum of three written quotes;
o Six (6) purchase orders greater than $25,000, but less than or equal to $100,000 – those requiring competitive bids and must be reported to the [Example Council] ;and
o Nineteen (19) purchase orders greater than $100,000 – those requiring [Example Council] approval before purchase.
For each purchase order selected, we verified there was properly documented approvals and compliance with
purchasing policies and procedures including but not limited to quote, competitive bid, and/or [Example Council] notification or approval requirements.
Findings: All purchase orders tested were properly approved in accordance with (EE) and [Example Council] policies
and procedures.
All purchase orders tested complied with all quote, competitive bid, and/or [Example Council] notification or approval requirements.
Recommendations: We have no recommendations at this time. Procurement Card Procedures Performed: To accomplish the stated objectives, we performed the following procedures:
Obtained and reviewed (EE) policies and procedures, and laws and regulations regarding the use of the procurement card. We also conducted interviews with appropriate management and personnel.
Performed data analysis of procurement card transactions for the audit scope period of January 1, 2013
through December 31, 2013, for 190 cards with 12,655 transactions, to ensure that no single purchase exceeded the individual purchase amounts set forth by (EE) policies and the individual card limit, to ensure cardholders did not split transactions in order to make purchases in excess of their single transaction limit, and to ensure that the monthly billing cycle purchase limit did not exceed the card limit as set forth by (EE) policies and the individual card limit.
Through the use of data analysis procedures we judgmentally selected monthly billing cycles for twenty one
(21) cardholders from the audit scope period of January 1, 2013 through December 31, 2013. For each monthly billing cycle selected, we verified whether supporting documentation indicated the following:
o All charges were properly supported by invoices or other supporting documentation.
o All charges were properly approved.
o All charges appear to be for a public purpose.
o All charges were for allowable purchases set by (EE) policy.

Findings:
All procurement card transactions tested were properly within cardholder limits for monthly billing cycle limits.
All procurement card transactions tested were properly approved.
12,654 of the total 12,655 transactions tested were properly supported by invoices or other supporting documentation. The following is the one charge noted that was not properly supported:
o One purchase only had a total charge receipt and not a detail receipt. So testing of public purpose and what was actually purchased could not be determined.
12,651 of the 12,655 transactions tested were expended for a public purpose. The following are the four (4) charges noted that were not for a public purpose:
o One (1) purchase of personal shoes o Two (2) purchases of funeral flowers o One (1) purchase of a sympathy card
12,650 of the 12,655 transactions tested were in compliance with (EE) policy regarding charges for allowable
purchases. The following are the five (5) charges noted that were not allowable purchases according to (EE) policy:
o Two (2) purchases of computer monitors o One (1) purchase of a printer over $500 o One (1) purchase of gasoline o One (1) purchase of travel-related (i.e., parking) expense
12,647 of the total 12,655 transactions tested were in compliance with (EE) policy regarding split purchasing.
We identified four (4) instances involving eight (8) transactions in which a cardholder split a purchase and exceeded the individual transaction limit. Of the four (4) instances noted, two (2) of the transactions had been identified and addressed by the procurement card administrator prior to our beginning the internal audit.
Recommendations: We recommend (EE) management provide additional training to cardholders who have violated (EE) policies, specifically addressing split purchase transactions and unallowable purchases. We also recommend (EE) management update the Procurement Card policy to reflect current practices on campus. Human Resources/Employment Services and Payroll Procedures Performed: To accomplish the stated objectives, we performed the following procedures:
Obtained and reviewed (EE) policies and procedures regarding Human Resources/Employment Services and Payroll. We also conducted interviews with appropriate management and personnel to gain an understanding of and to document the internal controls surrounding the employment services and payroll processes. We then conducted a walkthrough of the employment services and payroll processes, and evaluated the established internal controls as designed, noting any recommendations for strengthening those controls.
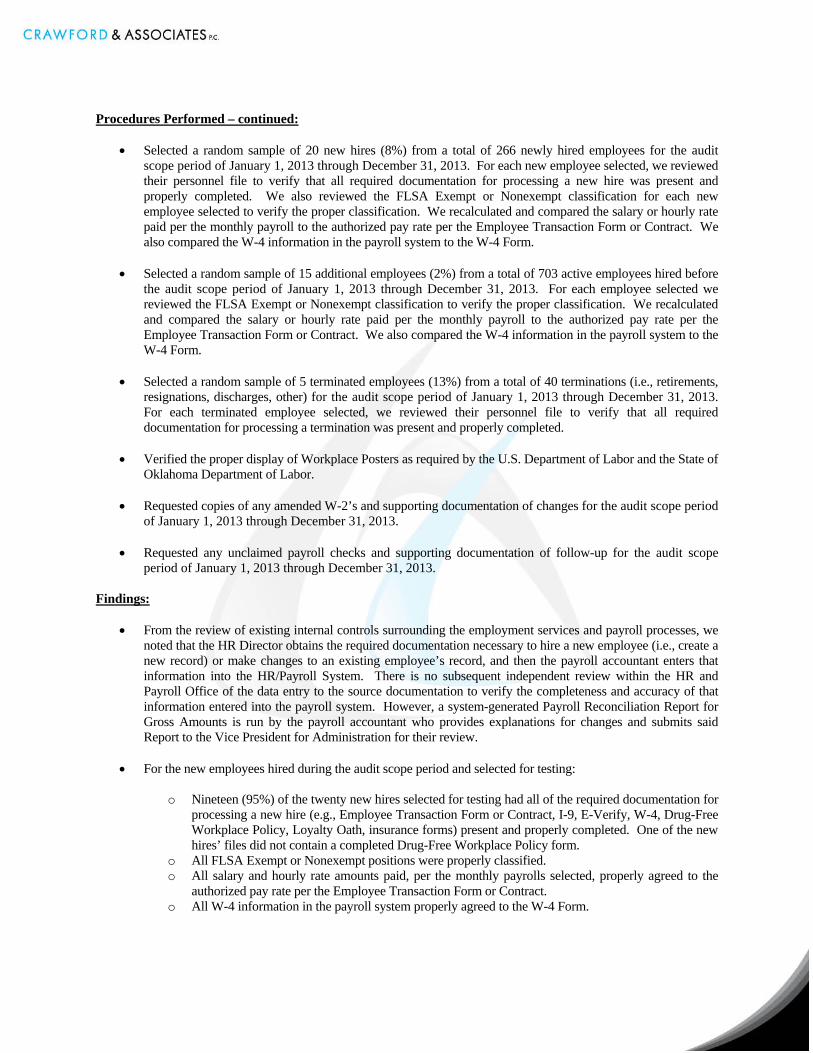
Procedures Performed – continued:
Selected a random sample of 20 new hires (8%) from a total of 266 newly hired employees for the audit
scope period of January 1, 2013 through December 31, 2013. For each new employee selected, we reviewed their personnel file to verify that all required documentation for processing a new hire was present and properly completed. We also reviewed the FLSA Exempt or Nonexempt classification for each new employee selected to verify the proper classification. We recalculated and compared the salary or hourly rate paid per the monthly payroll to the authorized pay rate per the Employee Transaction Form or Contract. We also compared the W-4 information in the payroll system to the W-4 Form.
Selected a random sample of 15 additional employees (2%) from a total of 703 active employees hired before the audit scope period of January 1, 2013 through December 31, 2013. For each employee selected we reviewed the FLSA Exempt or Nonexempt classification to verify the proper classification. We recalculated and compared the salary or hourly rate paid per the monthly payroll to the authorized pay rate per the Employee Transaction Form or Contract. We also compared the W-4 information in the payroll system to the W-4 Form.
Selected a random sample of 5 terminated employees (13%) from a total of 40 terminations (i.e., retirements, resignations, discharges, other) for the audit scope period of January 1, 2013 through December 31, 2013. For each terminated employee selected, we reviewed their personnel file to verify that all required documentation for processing a termination was present and properly completed.
Verified the proper display of Workplace Posters as required by the U.S. Department of Labor and the State of
Oklahoma Department of Labor.
Requested copies of any amended W-2’s and supporting documentation of changes for the audit scope period of January 1, 2013 through December 31, 2013.
Requested any unclaimed payroll checks and supporting documentation of follow-up for the audit scope period of January 1, 2013 through December 31, 2013.
Findings:
From the review of existing internal controls surrounding the employment services and payroll processes, we
noted that the HR Director obtains the required documentation necessary to hire a new employee (i.e., create a new record) or make changes to an existing employee’s record, and then the payroll accountant enters that information into the HR/Payroll System. There is no subsequent independent review within the HR and Payroll Office of the data entry to the source documentation to verify the completeness and accuracy of that information entered into the payroll system. However, a system-generated Payroll Reconciliation Report for Gross Amounts is run by the payroll accountant who provides explanations for changes and submits said Report to the Vice President for Administration for their review.
For the new employees hired during the audit scope period and selected for testing:
o Nineteen (95%) of the twenty new hires selected for testing had all of the required documentation for
processing a new hire (e.g., Employee Transaction Form or Contract, I-9, E-Verify, W-4, Drug-Free Workplace Policy, Loyalty Oath, insurance forms) present and properly completed. One of the new hires’ files did not contain a completed Drug-Free Workplace Policy form.
o All FLSA Exempt or Nonexempt positions were properly classified. o All salary and hourly rate amounts paid, per the monthly payrolls selected, properly agreed to the
authorized pay rate per the Employee Transaction Form or Contract. o All W-4 information in the payroll system properly agreed to the W-4 Form.

Findings – continued:
For the active employees hired prior to the audit scope period and selected for testing:
o All FLSA Exempt or Nonexempt positions were properly classified. o All salary and hourly rate amounts paid, per the monthly payrolls selected, properly agreed to the
authorized pay rate per the Employee Transaction Form or Contract. o All W-4 information in the payroll system properly agreed to the W-4 Form.
For the terminated employees, terminated during the audit scope period and selected for testing, all required
documentation for processing a termination was present and properly completed.
All Workplace Posters as required by the U.S. Department of Labor and the State of Oklahoma Department of Labor were properly displayed.
There were no amended W-2’s noted for the audit scope period.
There were no unclaimed payroll checks noted for the audit scope period. Recommendations:
1. We recommend (EE) management implement an independent review process within the HR and Payroll Office to ensure the accuracy and completeness of data entry to the source documentation for either creating a new payroll record or modifying an existing record. We further recommend that the independent review be performed by the HR Director prior to submitting the Payroll Reconciliation Report for Gross Amounts to the Vice President for Administration.
2. We recommend (EE) management reinforce with staff compliance with the designed internal control procedure to properly maintain all required supporting documentation and forms in the personnel files. We further recommend that documentation supporting staff’s due diligence and good-faith efforts or attempts to obtain the required forms also be maintained in the personnel files.
Capital Assets Procedures Performed: To accomplish the stated objectives, we performed the following procedures:
Obtained and reviewed (EE) policies and procedures regarding capital assets. We also conducted interviews with appropriate management and personnel.
Selected a random sample of 10 capital asset additions (66.7%) from a total of 15 capital assets added during
the audit scope period of January 1, 2013 through December 31, 2013. For each of the additions selected, we verified the asset was properly located, properly tagged, and agreed to the invoice regarding description, date acquired, and amount.
Selected a random sample of 20 capital assets from the capital assets listing and traced them to the floor. For
each of the capital assets selected, we verified the asset was properly located, properly tagged, properly included in the inventory records, and had a matching description in the inventory records.
Selected a random sample of 5 capital assets from the floor and traced them to the capital assets listing. For each of the capital assets selected, we verified the asset was properly located, properly tagged, properly included in the inventory records, and had a matching description in the inventory records.

Procedures Performed – continued:
Selected a random sample of 10 capital asset disposals (91%) from a total of 11 capital assets disposed during the audit scope period of January 1, 2013 through December 31, 2013. For each of the disposals selected, we verified the asset was properly disposed or deleted from the capital assets listing in compliance with asset disposal policies and procedures.
Findings:
For the capital asset additions selected for testing:
o All capital assets were properly located. o All capital assets were recorded with the correct description and date acquired.
o Eight (80%) of the 10 capital assets were recorded at the correct amount or invoice cost. The
following two capital assets were not recorded at the correct amount:
Asset ID Asset Reported Actual
Item # Number Description Amount Cost
1 013099 Latitude E5520 Laptop $ 10,208.37 $ 1,208.37 2 N/A ST Imaging Digital Printer $ 8,975.00 $ 9,195.00
o Six (60%) of the 10 capital assets were properly tagged. The following four capital assets were not tagged:
Asset ID Asset Dollar Item # Number Description Location Amount 1 Not Tagged Cybex 770T-CT Treadmill WC $ 10,538.50 2 Not Tagged ST Imaging Digital Printer LB $ 9,195.00 3 Not Tagged Z925A MN $ 8,947.00 4 Not Tagged John Deere Gator TX AGE $ 6,555.00
For the capital assets selected for list to floor testing:
o Sixteen (80%) of the 20 capital assets could be located. The following four capital assets could not be located:
Asset ID Asset Reported Dollar
Item # Number Description Location Amount
1 010691 Polycom BS4000 CODEC H.323 IE-129 $ 7,049.53 2 4-28622 1996 Chevy Van MN-SHED $ 21,525.00 3 008288 Alpha Server 400 SH-203 $ 9,434.00 4 006867 Treadmill WC-206 $ 6,140.00

Findings – continued:
o All sixteen of the capital assets that were located had a matching description in the inventory records.
o Twelve (75%) of the 16 capital assets located were properly tagged. The following four capital
assets did not have a tag number issued:
Asset ID Asset Dollar Item # Number Description Location Amount 1 N/A Kwikgoal Pro Premier Goal 2B8 Field $ 5,500.00 2 N/A Sewer machine Mongoose 184 Fleet Building $ 37,840.00 3 N/A Polycom VS4000 CODEC H.323 EN-220 $ 7,049.00 4 N/A Polycom VS4000 CODEC H.323 EN-208 $ 8,050.00
o Twelve (75%) of the 16 capital assets located were located in the proper location according to inventory records. The following four capital assets were found, but were not located in their proper location according to inventory records:
Asset ID Asset Reported Dollar
Item # Number Description Location Amount
1 N/A Polycom VS4000 CODEC H.323 EN-220 $ 7,049.00 2 N/A Polycom VS4000 CODEC H.323 EN-208 $ 8,050.00 3 011341 Viewstation 82033034C3DM7 EN $ 10,949.00 4 010366 Polycom VS400 CODEC H.323 WW-B $ 8,400.00
For the capital assets selected for floor to list testing:
o All five of the capital assets had a proper matching description in the inventory records.
o Three (60%) of the 5 capital assets were properly tagged. The following two capital assets did not have a tag number recorded in the inventory listing:
Asset ID Asset Dollar Item # Number Description Location Amount 1 13474 Elmo Projector WW-116 $ 1,964.00 2 12561 IETV Camera EN-220 $ 3,499.30
o Four (80%) of the 5 capital assets were located in the proper location according to inventory records.
The following capital asset did not have a room location recorded in the inventory records:
Asset ID Asset Dollar Number Description Location Amount 13474 Elmo Projector WW-116 $ 1,964.00

Findings – continued:
All ten of the capital asset disposals selected for testing were traced to the appropriate documentation to support the deletion.
Recommendations: We recommend (EE) management and staff responsible for maintaining the capital assets inventory system and accounting for capital assets ensure that:
All capital asset additions are properly recorded at actual cost; All capital assets are properly located; All capital assets are properly tagged; and Inventory records are updated on a regular basis to remain current.
Cash-on-Hand Procedures Performed: To accomplish the stated objectives, we performed the following procedures:
Obtained and reviewed (EE) policies and procedures regarding cash-on-hand. We also conducted interviews with appropriate management and personnel to gain an understanding of and to document the internal controls for safeguarding cash-on-hand.
Obtained a complete listing of cash-on-hand, noting locations and authorized amounts. We then conducted a walkthrough of certain selected locations and evaluated the established internal controls, as designed for safeguarding cash-on-hand, noting any recommendations for strengthening those controls. We also conducted unannounced or surprise cash counts at certain selected locations to verify the accuracy and completeness of cash-on-hand.
Obtained daily cashier checkout (end of day balancing) forms for certain selected days during the audit scope period of January 1, 2013 through December 31, 2013, to test compliance with the internal control policies and procedures as designed.
Findings:
The complete listing of cash-on-hand is recorded and maintained in the (EE)’s general ledger. The authorized amounts and current balances of cash-on-hand were communicated to us by (EE) management. During our cash-count testing procedures we identified no material difference between the total cash-on-hand as compared to the general ledger balance and the authorized balance.
During our walk-throughs and discussions with (EE) management and personnel, we noted that the end of day
balancing procedures do not include a review and reconciliation of the cash/check composition of daily receipts to the deposit. We also noted that the end of day balancing reports for the Wellness Center and Library do not document that an independent review of the daily balancing has been performed by someone other than the person responsible for the cash drawer.

Recommendations:
1. We recommend (EE) management revise the end of day balancing procedures to include a review and reconciliation of the cash/check composition of daily receipts to the deposit.
2. We recommend that the end of day balancing reports for the Wellness Center and Library have an independent review, and that such review be documented by signature and date on the daily balancing reports.
Grants and Contracts Procedures Performed: To accomplish the stated objectives, we performed the following procedures:
Obtained and reviewed (EE) policies and procedures regarding grants and contracts.
Conducted interviews with appropriate management and personnel to gain an understanding of and to document the internal controls surrounding the grants and contracts process.
Conducted a walkthrough of the grants and contracts process, and evaluated the established internal controls as designed, noting any recommendations for strengthening those controls.
Obtained a complete listing of grants and contracts, noting those that had not recently been audited, so as to not duplicate any recently completed external audits or program reviews.
Selected a sample of grants and/or contract that had not recently been audited to determine whether:
o The grant was properly reported in accordance with OMB Circular A-133, as of the most recent
Schedule of Expenditures of Federal Awards (SEFA).
o Any Non-cash assistance received was properly reported as an expenditure, as required by OMB Circular A-133.
o Compliance with significant and material compliance requirement(s), identified as a major component of the grant.
Findings:
From the listing of grants and contracts, specifically those that had not recently been audited, we selected the following grant to review:
o National School Lunch Program (NSLP) – Federal grant – CFDA #10.555
For the grant selected, we reviewed the following:
o The (EE), in regards to NSLP, qualifies as a Recreational Child Care Institution (RCCI). As an RCCI, the (EE) is required to have a Statement of Fact and a Master Roster of all eligible participants of the grant, or a similar document containing the appropriate information. The (EE) does maintain a Statement of Fact; however, the (EE) does not maintain a Master Roster by the individual responsible for review of daily meal counts and the creation and invoicing for monthly reimbursement of the grant.

Findings – continued:
o The (EE) is required to perform no less than one on-site review for each site under its jurisdiction by February 1 each year. Based on interviews with staff responsible for the annual review, it appears the (EE) is conducting the annual review by February 1. However, it appears documentation is not maintained that identifies the areas reviewed, results, and the date of the review.
o Per discussion with (EE) staff and review of documentation provided by the various cafeterias, the (EE) received non-cash assistance in the form of commodities during Fiscal Year 2013. OMB Circular A-133.315 requires the following:
“Include, in either the schedule or a note to the schedule, the value of the Federal awards expended in the form of non-cash assistance. While not required, it is preferable to present this information in the schedule.”
Review of the Fiscal Year 2013 SEFA, it appears that the non-cash assistance received was not reported on the schedule or in the notes to the schedule.
o The Fiscal Year 2013 SEFA reported CFDA #10.555, National School Lunch Program, as a direct
grant from the U.S. Department of Agriculture (USDA). Upon review of contracts specific to the grant, we compared the information presented on the SEFA to the requirements of OMB Circular A-133 and identified the following:
The single program reported should have included the following grants: CFDA #10.553 – School Breakfast Program CFDA #10.559 – Summer Food Service Program for Children
The grants should be identified as a cluster.
The grants should include the pass-through entity, the Oklahoma State Department of
Education.
Recommendations:
1. We recommend (EE) management create and maintain a Master Roster to assist and strengthen the internal controls surrounding the monthly invoicing process by ensuring only eligible participants are included on the monthly invoice.
2. We recommend (EE) management create or use the annual checklist form, provided by the Oklahoma State Department of Education, to conduct the annual reviews of each site. We also recommend the form contain the date of the review and be signed-off by the individual performing the review.
3. We recommend (EE) management implement procedures to ensure all forms of non-cash assistance are identified and properly reported on the SEFA.
4. We recommend (EE) management implement procedures to ensure all grants, in which the (EE) is a sub-recipient, include the pass-through entity on the SEFA. We also recommend that all grants, that are part of a cluster, appropriately present all applicable CFDA numbers.

Follow-up on Prior Year Recommendations
Miscellaneous Claims Encumbrance and Pre-Audit System: Although there are similar current audit period findings, it appears our recommendations regarding account coding, proper encumbrances, proper fiscal year and proper supporting documentation have been implemented. We understand that the proper selection of an account code is often times a subjective process.
(EE) Food Service – Contract Compliance: It appears our recommendation regarding the specific monitoring and recalculating of monthly commission payments has been implemented.
We would like to express our appreciation for all the courtesy and assistance we received from staff during our work at the (EE) and hope that this report will be of benefit to the [Example Council] and (EE). Crawford & Associates, P.C.

CRAWFORD & ASSOCIATES, P.C.
Proposal for CANA-P Service (Computerized Analysis of Numerical Anomalies of the Purchasing card process)

2
CANA-P Service As our governments continue to become more efficient and effective with their procurement processes, we at Crawford & Associates have developed a Computerized Analysis of Numerical Anomalies of the Purchasing card process (CANA-P).
Using specialized software and our years of experience with government finance and familiarity with governmental purchasing processes, we have developed a package of services to enhance your government’s
internal controls over the Purchasing card process by using data analytics to identify anomalies within the process that might need further investigation. The data analytics are designed to look for, among other
things, the following:
Benford’s Law anomalies (looks for the non-randomness of specific numbers)
Split purchases that violate policy regulations
Unusual vendors and/or unusual quantities from vendors
Fuel reasonableness tests
Memberships, subscriptions, and dues
Online purchases
Unusual trends by individual cardholders
Other tests as needed
Service packages We have designed this service for the ultimate flexibility, depending on the specific needs of your government. Currently, these packages are designed to be performed on a quarterly basis.
Services Option 1 Option 2 Option 3
Data analytics X X X
Quarterly reports with identification of anomalies X X X
Design, modification and monitoring of P card policies X X
Investigation of anomalies X

[Example Entity]
PROCUREMENT CARD ANALYSIS FOR THE PERIOD OF
OCTOBER 2011 THROUGH SEPTEMBER 2012

()
"° > ~ '"T1
0 "° 0 P.C.
& ASSOCiATES
July 22, 2013
[Director/Offical], [Title] [Street Address] [City], Oklahoma [Zip Code]
Re: Report on Procurement Card Data Mining & Analysis
[Director/Official]:
The [Example Entity] engaged Crawford and Associates, P. C. to provide certain professional services as identified in the Scope and Objectives of Our Services section below. 1bis report describes the scope and objectives of our services, the specific procedures we performed, and our findings and recommendations.
Scope and Objectives of Our Services
The scope of our professional services was limited to perform.mg certain consulting services designed to assist management in meeting its fiduciary responsibilities. These services were performed in accordance with the standards applicable to consulting engagements of the American Institute of Certified Public Accountants. With regards to tlus specific engagement, the scope of our services included certain internal audit type monitoring procedures performed at the [Example Entity]:
• Perform data mining and analysis procedures related to procurement card transactions based on current [Example Entity] policy, and provide the results of the mining procedures and analysis to [Example Entity] staff for their consideration.
The objectives of our services in this engagement were to perform data mining and analysis procedures to identify any procurement card transaction( s) that could potentially need further review due to the potential risk of violation of existing policies, the identification of potential policy weaknesses, and the identification of transactions that could pose a potential higher risk due to their nature.
Procedures Performed:
To accomplish the stated objectives, we performed certain procedures based on the availability of data maintained in the Bank of America system utilized by the [Example Entity]. Limitations were placed on this analysis due to the fact that "Level Ilf' data was not being captured for the [Example Entity] by the Bank of America pcard program for the period being reviewed.
If "Level III" data had been captured by Bank of America, additional procedures could have been applied to the data which would further assist in the identification of violations of current policies and for transactions that may require further review. 1bis additional analysis would increase the likelihood of identification of the foilowing items identified as non-allowable purchase in the [Example Entity]'s current policies such as:
T: 405-691-5550 F: 405·691 ·5646 I W: www.crawfordcpas.com E: [email protected] I l 0308 Greenbriar Place, Oklahoma City, OK 73159

CRAWFORD & ASSOCIATES,c
> Alcoholic Beverages > Cash Advances > Controlled Substances > Personal Items > Weapons, Ammunition (except Police Department) > Fuel & Lube (except when traveling for business)
The analysis performed for the period of October 2011 through September 2012 included the following:
• Split Purchase test : o Review for $1,500 quote limit
o Same cardholder, same vendor, same day o Same department, same vendor, same day
o Review for $3,000 quote limit o Same cardholder, same vendor, same day o Same department, same vendor, same day
• P-Card Holder Analysis which includes the following for each cardholder: o Total number and amount of transactions o Average transaction amount o Single, Monthly transaction ($) limits o Top two purchase made ($) o Minimum purchase made ($) o Variance Analysis between the Max and Min purchase ($)
• Benford Analysis by department: o Supporting tables for deviations from expected results for management's consideration of
further review
• Cross-tabulation tables for Departmental expenses by Merchant Category Code.
• Sales Tax transactions with total amount not recovered during the period.
• Round Amount Identification for Vendors that are more likely to carry gift cards.
Summary of Results:
1. We performed tests to identify potential split purchase transactions. These tests were an attempt to identify potential split purchases related to the [Example Entity]'s Purchasing Policies Secdon B. Competitive Bidding regulations regarding quote requirements that have been set at $1,500 & $3,000. Our test identified:
• $1,500 Limit 17 transactions for an amount of$16,473.10
• $3,000 Limit 8 transactions for an amount of $10,655.05
2. The P-Card Holder Analysis was performed to identify potential losses in cost savings for individuals not utilizing their p-card and/or identify those individuals, whom based on the usage, may not need a

CRAWFORD & ASSOCIATES,c
card. This possible reduction in cards issued could further minimize the potential risk to the [Example Entity] from its p~ard program. This analysis may also assist in the identification of card(s) that need single transaction limits instituted to reduce potential risks or identify which cards might need the monthly credit limit reduced based on the cardholders activity. Examples of information provided:
Twenty-four cardholders had fewer than 15 transactions per card for the time period of October 2011 to September 2012
Forty-three cardholders had a maximum single transaction amount less than $1,500 of which twenty-three did not have a single transaction amount established for the cardholder.
Four cardholders have a monthly credit limit of $100,000, of which the largest cardholder expense amount was $112,916 for the period of October 2011 to September 2012. The average expense for the same period was $92, 105.
Eight cardholders have a monthly credit limit of $20,000, of which the largest cardholder expense amount was $119,910 for the period of October 2011 to September 2012. The average expense for the same period was $64,780
3. We performed tests to identify all transactions for the period in which sales taxes were charged inappropriately, and not subsequently refunded. The tests identified net sales tax charged inappropriately that has not yet been refunded in the amount of $538.23.
4. We performed tests to identify transaction amounts that are of even dollar amounts with vendors that are more likely to sell gift cards (e.g. Walmart, Target, etc.). This test excludes restaurants as they inherently contain a higher potential rate of occurrence of an even dollar amount due to tips applied to the transaction. Our tests identified 22 transactions for an amount of $2,225 .00 that management may wish to consider additional review of the transaction(s) supporting detail.
Additional tables can be provided electronically to the [Example Entity], upon request, for any of the Benford Analysis charts for review by the p-card administrator.
We would like to express our appreciation for all the courtesy and assistance we received from staff during our work at the [Example Entity] and hope that this report will be of benefit to the [Example Entity]'s management.
~:·a, .. ~..,.~~G. Crawford & Associates, P .C.

CRAWFORD & ASSOCIATES, P.C. EXAMPLE ENTITY
POTENTIAL SPLIT TRANSACTIONS DEPARTMENT
$1,500 QUOTE POLICY
CH_Full_Name - - Txn::_Number Purchase_Date . Vendor_Name _ _ Total_Card_Spend CA_DEPT CA_:::Test_ST_ l
Barlow.Bill TXN00003149 4/4/2012 MYDER,LLC
Barlow, Bill TXN00003153 4/4/2012 MYDER,LLC
Lowery.Jim TXN00002646 2/21/2012 LOGAN COUNTY ASPHALT CO.
Lowery,Jim TXN00002647 2/21/2012 LOGAN COUNTY ASPHALT CO.
Luckinbill,David TXN00003371 4/18/2012 RICKS AUTOMOTIVE
Luckinbill,David TXN00003375 4/18/2012 RICKS AUTOMOTIVE
Downey, Chris TXNOOOOl 789 12/7 /2011 RONS TIRE
Newby, Bill TXN00001811 12/7 /2011 RONS TIRE
Maze, Steve TXN00001964 12/20/2011 SPECIAL OPS UNIFORMS,
Maze, Steve TXN00001972 12/20/2011 SPECIAL OPS UNIFORMS,
Hurst, Josh TXN00004039 6/8/2012 LOGAN COUNTY ASPHALT CO.
Hurst, Josh TXN00004059 6/8/2012 LOGAN COUNTY ASPHALT CO.
Baker, Ted TXN00004183 6/19/2012 NEWMAN SIGNS
Baker, Ted TXN00004187 6/19/2012 NEWMAN SIGNS
Baker, Ted TXN00004067 6/11/2012 TRAFFIC SIGNALS
Baker, Ted TXN00004073 6/11/2012 TRAFFIC SIGNALS Baker, Ted TXN00004075 6/11/2012 TRAFFIC SIGNALS
TOTAL($)
1,420.49
190.00
1,271.74
401.00
877.66
1,278.56
762.00
1,445.28
1,493.63
129.99
1,248.68
900.47
821.10
982.50
1,450.00
900.00
900.00
s 16,473.10
Fire Department
Fire Department
Fleet
Fleet
Fleet
Fleet
Line Maint
Line Maint
Pol ice Department
Police Department
Street Department
Street Department
Street Department
Street Department
Street Department
Street Department
Street Department
Yes
Yes
Yes
Yes
Yes
Yes
Yes
Yes
Yes
Yes
Yes
Yes
Yes
Yes
Yes
Yes
Yes
cpembrook
Rectangle
CRAWFORD & ASSOCIATES, P.C. EXAMPLE ENTITY POTENTIAL SPLIT
TRANSACTI ONS $1,500 QUOTE POLICY
CH_Full_Name Txn_Number Purchase_Date Vendor_Name Tota(.Card_Spend Total_ltem_Tax CA_Test_ST_l
Barlow,Bill TXN00003149 4/4/2012 MYDER,LLC 1,420.49 0 Yes
Barlow,Bill TXN00003153 4/4/2012 MYDER,LLC 190.00 O Yes
Hurst,Josh TXN00004039 6/8/2012 LOGAN COUNTY ASPHALT CO. 1,248.68 0 Yes
Hurst.Josh TXN00004059 6/8/2012 LOGAN COUNTY ASPHALT CO. 900.47 O Yes
Lowery, Jim TXN00002646 2/21/2012 LOGAN COUNTY ASPHALT CO. 1,271.74 0 Yes
Lowery, Jim TXN00002647 2/21/2012 LOGAN COUNTY ASPHALT CO. 401.00 O Yes
Luckinbill, David TXN00003371 4/18/2012 RICKS AUTOMOTIVE 877.66 O Yes
Luckinbill, David TXN00003375 4/18/2012 RICKS AUTOMOTIVE 1,278.56 O Yes
Baker, Ted TXN00004183 6/19/2012 NEWM AN SIGNS 821.10 O Yes
Baker, Ted TXN00004187 6/19/2012 NEWMAN SIGNS 982.50 O Yes
Baker, Ted TXN00004067 6/11/2012 TRAFFIC SIGNALS 1.450.00 o Yes
Baker ,Ted TXN00004073 6/11/2012 TRAFFIC SIGNALS 900.00 O Yes
Baker, Ted TXN00004075 6/11/2012 TRAFFIC SIGNALS 900.00 O Yes
Maze.Steve TXN00001964 12/20/2011 SPECIAL OPS UNIFORMS, 1,493.63 O Yes
Maze, Steve TXN00001972 12/20/2011 SPECIAL OPS UNIFORMS, 129.99 O Yes
TOTAL($) s 14,265.82
cpembrook
Rectangle

CRAWFORD & ASSOCIATES, P.C. EX/\J\IPLE ENTITY
POTENTIAL SPLIT TRANSACTIONS DEPART~IENT
$3,000 QUOTE POLJ CY
CH_Full_Name Txn_Number Purchase_Oate Vendor_Name Total_Grd_Spend CA_OEPT CA_Test_ST_l Barlow, Bill TXN00001871 12/12/2011 STOLZ TELECOM LLC 2,052.43 Fire Department Yes
Barlow, Bill TXN00001873 12/12/2011 STOLZ TELECOM LLC 1,560.32 Fire Department Yes
Dogan, Don TXN00002507 2/8/2012 COUNTRY FORD MERCURY 2,784.51 Fleet Yes
Dogan, Don TXN00002518 2/8/2012 COUNTRY FORD MERCURY 632.79 Fleet Yes
Parker, Pennie TXN00002591 2/16/2012 COUNTRY FORD MERCURY 2,331.15 Fleet Yes
Dogan, Don TXN00002594 2/16/2012 COUNTRY FORD MERCURY 882.31 Fleet Yes
Baker, Ted TXN00004998 8/17 /2012 TRAFFIC SIGNALS 2,100.00 Street Department Yes
Baker, Ted TXN00005013 8/17 /2012 TRAFFIC SIGNALS 1,525.00 Street Department Yes TOTAL($) s 13,868.51
cpembrook
Rectangle

CRAWFORD & ASSOCIATES, P.C. EXAMPLE ENTITY POTENTIAL SPLIT
TRANSACTIONS$3,000 QUOTE POLICY
CH_Full_Name Txn_Number Purchase_Date -- Vendor_Name Tota1.:_card-_Spend Total_ltem_Tax CA_Test_ST_l Barlow, Bill TXN00001871 12/12/2011 STOLZ TELECOM LLC 2,052.43 O Yes
Bar low, Bill TXN00001873 12/12/2011 STOLZ TELECOM LLC 1,560.32 0 Yes
Baker, Ted TXN00004998 8/17/2012 TRAFFIC SIGNALS 2,100.00 0 Yes
Baker, Ted TXN00005013 8/17/2012 TRAFFIC SIGNALS 1,525.00 O Yes
Dogan, Don TXN00002507 2/8/2012 COUNTRY FORD MERCURY 2,784.51 O Yes
Dogan, Don TXN00002518 2/8/2012 COUNTRY FORD MERCURY 632.79 0 Yes
TOTAL($) s 10,655.05
cpembrook
Rectangle

Clu\WFOl!IJ & 1\SSOl'l1\TES P.C.
l'·l'1\l!O 110 1.!l Ell flNfll .YSIS
CMs Sl72 s 50.00 I s 50.00 s l ,500.00 s 50.00 s 50.00 s 50.00 1.00 LOO CL: SLSK; STL Sl.S; No C.sh
John 1113 s 14S.48 1 s 14S.48 s l ,S00.00 s 145.48 s 145.48 s 145.48 1.00 1.00 No Slgnoff CL: SI .SK; STL SLS; No C.
lee 6740 s 640. 12 3 s 213.37 s s 379.83 s 241.91 s 18.38 l .S7 20.67 CL: SSK; STL: N/A; No C.sh
Maxine 4622 s 1,818.06 3 s 606.02 s s 1.n9.oo s 19.S3 s 19.S3 9 1.09 9 1.09 CL: SSK; STL: N/A; No C.sh
lee 9S21 s 338.S9 4 s 84.6S s 1.soo.00 s 141.97 s 78.3S s 54.60 1.81 2.60 NoSl&noff CL:SLSK;STLSl .S; NoC.
Shelby 4438 s S38.41 4 s 134.60 s l,S00.00 s 400.00 s 87.07 s 22.84 4.S9 17.SI CL: SI.SK; STL Sl .S; No C.sh
April 4207 s 939.SO 4 s 234.88 s l ,S00.00 s 800.00 s 64.6S s 34.SO 12.37 23.19 CL: $1.SK; STL $1.S; No C.sh
l•mv 2424 s 2S9.7S s s Sl.95 s l ,S00.00 s 138.00 s 80.00 s S.22 l.73 26.44 No Signoff CL: SI.SK; STL Sl.S; No C.
Roy 8S38 s S09.76 6 s 84.96 s s 199.9S s 120.00 s 12.87 1.67 I S.54 No Slgnoff CL: $SK; STL: N/A; No C.sh
Jim 544S s 676.97 6 s 112.83 s l ,S00.00 s S26.00 s 132.00 s 8.97 3.98 S8.64 CL: SI.SK; STL Sl.S; No C.sh
Cayton 7416 s 566.48 7 s 80.93 s l ,S00.00 s 3SO.OO $ 92.00 s 3.48 3.80 IOO.S7 No Slgnoff CL: SI.SK; STL SLS; No C. Matt 9968 s 76S.60 7 s 109.37 s s 499.00 s IS4.97 s 32.26 3 .22 IS.47 CL: SSK; STL: N/ A; No C.sh cartton 7714 s 806.16 7 s 115.17 s s 400.00 s 241.99 s 12.00 1.6S 33.33 No Slanoff CL: $SK; STl: N/ A; No C.sh lance 6908 s 1,766.14 7 s 2S2.31 s s S23.38 s S23.38 s 49.00 1.00 10.68 CL: SIOK; STL: N/A; No C.sh Forest 446S s l ,809.04 8 s 226.13 s s 396.40 s 3S9. IO s 4.99 1. 10 79.44 No Slanoff CL: SSK; STL: N/A; No C.sh Ralph 198S s J ,949.99 8 s 243.7S s s l ,620.00 s 249.99 s 12.00 6.48 13S.OO No Slgnoff Cl: SSK; STL: N/A; NoC.sh (yndi 6717 s S,482.93 8 s 685.37 s s 3,000.00 s l,2SO.OO s S8.S8 2.40 Sl.21 CL: SSK: STL: N/A; No C.sh Tra~I 620S s 116 .IS 9 s 12.91 s l ,S00.00 s 18.46 s 16.41 s 4 .34 1.12 4 .2S No Slgnoff CL: SI.SK; STL Sl.S; llo C.
S.•n 315S s 385.0S 9 s 42.78 s l .S00.00 s 111. 16 s 64.37 s 12.00 1.73 9.26 No Slgnoff CL: SI.SK; STL Sl.S; No C. Dale 8747 s 1.160.90 9 s 128.99 s 1,500 00 s 3S9.97 s 220.80 s 10.98 1.63 32.78 No Signoff CL: SI.SK; STL Sl.5; No C. John S377 s 489.42 10 s 48.94 s s 100.00 s 100.00 s 10.60 LOO 9.43
Rv•n 7660 s 79S.99 11 s 72.36 s l ,S00.00 s 41S.60 s 107.83 s 20.00 3.85 20.78 No Slgnolf CL: SI.SK; STL SLS; No C. frank 4498 s 852.89 13 s 6S.61 s s 264.00 s 194.99 s 6 .80 l.3S 38.82 No Signoff CL: SIOK; STL: N/A; NoC.Sh Lee 8797 s S,236.29 14 s 374.02 s s 4,S37.00 s 160.00 s 13.9S 28.36 325.23 E.T. 99S s 1,664.49 16 s 104.03 s s 762.00 s 219.99 s 7.SO 3.46 101.60 No Slanorr CL: $SK; STL: N/A; No C.sh
Donna 3044 s 4,128.82 16 s 258.05 s s 1,371-43 s 1,14S.50 s 6 .94 1.20 197.61 CL: SSK; STL: N/A; No C.sh David n06 s l ,25S.76 17 s 73.117 s s 31S.00 s 264.00 s S.99 L19 S2.59 No Signoff CL: SSK: STL: N/A; No C.Sh Jim 9731 s 1,346.70 J7 s 79.22 s l ,S00.00 s 280.00 s 192.00 s S.97 1.46 46.90 CL: SI.SK; STL Sl.S; No C.sh Raymon 214 s 11.786.78 20 s S89.34 s s S,717.38 s 2.731.36 s 3.24 2.09 1,764.62 No Sicooff CL: SIOK; STL: N/A; No C.Sh Charlei 7S64 s 1,767.67 25 s 70.71 s 1,500.00 s 455.14 s 431.90 s S.99 1.05 7S.98 CL: SI.SK; STl Sl.S; No C.sh Aaron 7163 s 4,324.72 2S s 172.99 s s 8 18.0S s 729.00 s 14.63 J.12 SS.92 CL: SIOK; STL: N/A; NoC.sh Justin 2434 s l ,374.S8 27 s 50.91 s s 489.9S s 220.73 s S.83 2.22 84.04 CL: SSK; STL: N/A; No C.sh Jamie 5488 s l,654.52 27 s 61.28 s l ,S00.00 s 371.61 s 349.78 s l.99 1.06 186.74 No Slgnofl CL: SI.SK; STL SLS; No C. Jason 6707 s 2,S89.07 27 s 9S.89 s l,S00.00 s l , 20S.OO s 297.96 s I.SO 4.04 803.33 No Slgnorr Cl: SJ.SK; STl Sl.S; Noc. Mike 3420 s 960.37 28 s 34.30 s l ,S00.00 s 330.00 s 296.86 $ 336 1. 11 98.21 CL: SI.SK; STl SJ .S; No C.sh Erin 277 s 1,148.21 29 s 39.S9 s l ,S00.00 s 219.68 $ 110.77 $ 8. J7 1.98 26.89 No Slgnoff CL: SI.SK; STl Sl.5; No C. Ricky 8276 $ 4,2S7.68 29 s 146.82 s s l ,SJ3.00 s 780.00 s 2.60 1.94 S81.92 No Slgnoff Cl: SSK; STL: N/A; No Cash
Mark 9828 s 4,896.64 30 s 163.22 s l ,S00.00 s 729.00 $ 729.00 s 6 .63 1.00 109.9S CL: SI.SK; STL SJ.S; No C.sh Rob 2306 s l,348.01 31 s 43.48 $ l,S00.00 s 285.90 s 129.99 $ L73 2.20 16S.26 No Signofl CL: $1.SK; STl Sl.S; No C. Kenneth J3S8 s 4,381.44 3 1 $ 141.34 s 1,500.00 $ 783.24 $ 491.71 s 3.69 1.S9 212.26 No Slgnoff Cl: SI.SK; STl Sl.5; No C. Jaylene 4901 s 33,392.77 33 s 1,011.90 s s 16,837.00 s 3,419.00 s 6.80 4.92 2,476.03 CL: S20K; STL: N/A; No C.sh Ondy 85SS s S, 287.99 34 s ISS.S3 s s 998.00 s 986.9S s 8.66 1.01 11S.24 CL: SSK; STL: N/A; No C.sh Ray 696 s S,672.64 34 s 166.84 s l,S00.00 s l ,3S0.86 s 839.47 s 18.11 1.61 74.S9 No 51gnoff CL: SI.SK; STL Sl .S; No C. KeJTV 168 s 3,027.06 3S s 86.49 s l ,S00.00 s 999.28 s 376.99 s 1.06 2.6S 942.72 llo Slgnoff CL: SI.SK; STl SLS; No C. Justin 4213 s 3,891.43 37 s 105.17 s s 720.72 s 648.96 s 2.37 I.II 304.10 No Signofl CL: SSK; STL: N/A; No C.sh Navmon 9679 s 8,S88.94 38 s 226.02 s s 3,824.23 s 799.98 s 7.38 4.78 S l 8.19 No Signoff Cl: SSK.; STL: N/A; No Ush ~an th 15S9 s 3,350.70 39 s 85.92 s l ,S00.00 s 384.00 s 247.96 s 12.00 J .SS 32.00 CL: Sl.SK; STL Sl.S; No C.sh Anthony 6108 s 7,S34.86 40 s 188.37 s s 1,871.13 s 989.85 s L68 1.89 1, 113.77 CL: SSK: STL: N/A; No C.sh Suzy 4250 s 4,548.11 42 s 108.29 s l ,S00.00 s 726.00 s 291.43 s 2.91 2.49 249.48 CL: SI.SK; STL Sl.S; Noc.sh Joe 6894 s S,234.82 42 s 124.64 s s 2,S94.02 s 342.34 s 2.16 7.S8 l ,200.94 No Sl&noff CL: SSK; STL: N/A; No C.sh cnmon 7181 s I0,4S930 4S s 232.43 s s 6,195.47 s 1,60038 s 4.99 3.87 l ,241.S8 CL: SIOK; STL: N/A; Noc.sh Dakota 7827 s 23,7SS.76 46 s Sl6.49 s s 4,857.98 s 3,044.37 s S.30 1.60 916.60 No Slgnoff CL: SIOK; STL: N/ A; No C.sh Ste.e 9971 s 30,954.20 48 s 644.88 s s S,724.00 s 3,810.4S s 4 .14 I .SO l ,382.61 No Sl&noff CL: SIOK; STL: N/ A; No C.sh Ste.e S360 s 9,926.14 54 s 183.82 s s 1,493.63 s 1,009.28 s 3.98 1.48 375.28 CL: SIOK; STL: N/ A; No C.sh Justin 9011 s 6,066.29 SS s 110.30 s s 483.79 s 402.99 s l.20 1.20 403.16 No Slgnoff Cl: SIOK; STL: N/A; No C.sh Dun 6896 s 10,186.90 60 s 169.78 s s 3,439.S9 s l ,278.S6 s l .S2 2.69 2,262.89 No Slgnoff CL: SSK; STL: N/A; No C.sh Greg 7395 s 4,465.62 68 s 65.67 s 1,500.00 s 432.3S s 385.90 s 1.40 1.12 308.82 CL: SI.SK; STl SJ.S; No C.sh Kim 7S47 s 60,309.48 70 s 861.56 s s 9.31S.OO s 6,282.84 s I0.9S 1.48 850.68 CL: S20K; STl: N/A; No C.sh Edgar 5422 s I0.26S.70 85 s 120.77 s s 1,842.60 s l,44S.28 s l.99 1.27 925.93 No 5ignoff Cl: SSK; STL: N/A; No C.sh RlW rd 937S s 29.809.34 109 s 273.48 s s 6, 150.00 s 2, 144.40 s 1.99 2.87 3,090.4S Cl: SI OK; STL: N/A; No C.sh Josh 5026 s 39,630.4S 110 s 360.28 s s 4,8S7.98 s 2,734.64 s 2.36 1.78 2,0SS.47 No Slgnoff Cl : SIOK; STL: N/A; No C.sh kenneth 2193 s 16,444,48 113 s l4S.S3 s l,S00.00 s 1,670.26 s 1,307.22 s 2.29 1.28 729.37 No Slgnoff Cl : SI.SK; STl $1.S; No C. Vtrdell 3208 s S7,723.44 113 s SI0.83 s s 9,487.00 s 6,726.16 s J.83 J.41 5, 184.15 CL: SlOOK; STl : N/A; No C.sh Tenny I Sl2 s 110,106.26 136 s 809.60 s s 23,000.00 s 11,407.95 s 1.57 2.02 14,649.68 Cl: $100K; STl: N/A; NoC.sh Woody S397 s 87,676.S8 141 s 621.82 s s 15,168.00 s J0,892 .00 s 14.03 1.39 1,081. 11 CL: SIOOK; STL: N/A; No C.sh Kevin 87SO s 61,935.23 IS8 s 392.00 s s S,673.00 s 3,282.89 s 0.40 J.73 14, 182.SO CL: S20K; STL: N/A; No C.sh Slselly 4S27 s SO,S32.0I 160 s 31S.83 s s S,430.60 s 4,054.00 s 2.36 1.34 2,301.10 CL: SIOK; STL: N/A; No C.sh Ch.-. rles 1048 s 119,910.05 164 s 731.16 s s 9,435.87 s 7,601.90 s 2.79 1.24 3,382.03 Cl: S20K; STL: N/A; No C.sh Eric 14 13 s 6S,996.4S 168 s 392.84 s s 7,313.60 s 7,047.96 s 2.76 1.04 2,649.86 CL: S20K; STL: N/A; No C.sh Richard 9S9S s 42,779. lS 170 s 251.64 s s 6,4 16.62 s l ,S00.00 s 2.99 4.28 2, 146.03 CL: S20K; STL: N/A; No C.sh S.ndr> 3S07 s 112,916.6S 210 s S37.70 s s 11,360.00 s 10,400.00 s 0.99 1.09 11,474.7S CL: SIOOK; STl: N/A; No C.sh ~nnie 6281 s 47,481.72 239 s 198.67 s s 3,S54.49 s 3,138.23 s 2.92 1. 1.3 1, 217.29 CL: SI OK; STL: N/A; Noc.sh C.ndy 1.209 s 28,613.84 246 s 116.32 s s 1,790.86 s l ,SSl.27 s 2.99 J .15 S98.9S CL: SSK; STL: N/A; No C.sh Kevin 2008 s 74,786.91 299 s 2S0.12 s s 7,649.13 s S,837.02 s O.S9 1.31 12,964.63 Cl: S20K; STL: N/A; No C.sh D•n 3161 s S9, l33.02 S28 s 111.99 s s 2,784.SI s 2,008.00 s 0.40 1.39 6,961.28 tl o Signoff CL: $201(; STL: N/A; llo C.sh
Thi s analys i s captu res t he profi le of cardholde r usage !or t he period covered . This analys i s can be used aooist i n the f ollowing: A. Ident i fi c ation of under util ize d c a rda - reduce n potentia l coot sav i ngs. B. Ide nt i f ication o f cards that due to uoage may need t o be canceled due t o t he f requency o f uoe - inc reased r isk t o the c ity. C. Establish~ent of S ingle a nd Monthly cardholde r t ransaction limits .


100
80
60
40
20
Waste Benford leading 1
· ······~······································· ·· ·················································································
\~············· · ······························ · ··········-----------·--·······················-----·-·· ·····-··----
',_ '-~································ ••••••••• t:-..... ~·--------· ....... ._ ............................ .
II
Leading Digits
BENFORD ONT otal_Card_Spend LEADING 1 BOUNDS TO GRAPH
0 Aat0IC0.m1 • ExpecledCoun • Lower Bo.ind • Upper Bound II


PROPOSAL FOR INTERNAL AUDIT SERVICES FOR THE CITY OF EDMOND
INTERNAL AUDIT SERVICES RFP14-012
ATTACHMENT G – CALCULATION OF ESTIMATED HOURS & FEES

CRAWFORD & ASSOCIATES, P.C.CITY OF EDMONDInternal Audit Plan - Hours and FeesCalculation of Estimated Hours and Fees
Minimum Maximum16 24 Sales Tax Revenue Collection and Usage16 24 Utility Billing System and Revenue Collection16 24 Human Resources and Payroll16 24 Purchasing, Payables, & Expenditures16 24 Procurement/Purchasing Card (Pro-Card)16 24 Grants and Contracts16 24 Follow-up on Prior Year Audit Findings24 32 Report Writing, Meetings, and Presentations
136 200
Average Hours 168
Hourly Rate 140$ Justin Kersey, Manager 100% involvementHourly Rate 140$ Richard Rose, Manager 100% involvementHourly Rate 140$ Chris Pembrook, Senior Manager 100% involvementHourly Rate 155$ Dwayne Tate, Shareholder 100% involvement
Average Hrly Rate 144$
Per Year 24,192.00$ Calculation of Projected Fees based on Average Hourly Rate and Average Hours
HOURS

PROPOSAL FOR INTERNAL AUDIT SERVICES FOR THE CITY OF EDMOND
INTERNAL AUDIT SERVICES RFP14-012
ATTACHMENT H – PEER REVIEW


PROPOSAL FOR INTERNAL AUDIT SERVICES FOR THE CITY OF EDMOND
INTERNAL AUDIT SERVICES RFP14-012
ATTACHMENT I – CERTIFICATE OF PROFESSIONAL LIABILITY INSURANCE


PROPOSAL FOR INTERNAL AUDIT SERVICES FOR THE CITY OF EDMOND
INTERNAL AUDIT SERVICES RFP14-012
ATTACHMENT J – OAB ANNUAL PERMIT


Internal Audit Services
RFP: 14-012
March 4, 2014
Submitted to Brenda Mayer City of Edmond P.O. Box 2970
Edmond, Oklahoma 73083-2970
Submitted by Compass Consulting LLC
PO Box 700264 Tulsa, Oklahoma 74170

Page 2
Compass RFP: 14-012 Response
Table of Contents
Section Section/Page RFQ Response
Introduction Page 3 Background Pages 4 - 9 Engagement Strategy Pages 10 - 17 Cost Proposal Page 17 Appendix A: Resumes Pages 18 – 24 Appendix B: Insurance Certificates Pages 25 – 27 Appendix C: Example Audit Report Pages 28 - 40 Appendix D: Example Initiation Memo Page 41 - 43

Page 3
Compass RFP: 14-012 Response
Introduction
Compass Consulting, LLC is pleased to offer our proposal to provide internal audit services, including
detailed risk assessment, audit plan development and internal audits to the City of Edmond for fiscal
year 2014 with potential for two additional one-year terms.
Compass is an Economically Disadvantaged Women Owned Small Business (EDWOSB) located in Tulsa,
Oklahoma. The Compass team has over 40 years of internal audit and accounting experience. We have
• Created a high performing audit department from inception including developing a quantifiable
risk assessment process, building annual audit plans and performing audits.
• Implemented financial control assessment processes that document internal controls, complied
with “OMB Circular A-110, A-123, and A-133” requirements and eliminated material weaknesses
and significant deficiencies within 2 years.
• Performed operational, compliance and information technology audits in a variety of industries.
• Reported opportunities for improvement with management and jointly developed operationally
feasible action plans to remediate issues.
• Communicated with executive management, Board members and Audit Committees through
reporting and meeting presentations.
The principals of Compass have experience in corporate and governmental environments. We have
audited tribal governments, gaming, and government contracting entities which are highly regulated.
Our competitive advantage over regional accounting firms is 1) our expertise in internal audit services
and 2) our commitment to staffing projects with experienced internal auditors rather than staff level
associates. Compass principals will be performing risk assessments, developing audit plans and
communicating with Finance/Audit Committee. Principals will be highly involved in developing test
programs and reviewing work during each audit.
The attached response will show the City of Edmond that Compass has the necessary resources and
knowledge to meet the goals of the Finance/Audit Committee related to managing risk, improving
overall control and governance structures, deploying resources effectively and complying with policies,
standards and regulations. We look forward to building a great working relationship and helping you
mitigate business risk.

Page 4
Compass RFP: 14-012 Response
Background
Financial Soundness
Compass is financially sound with no debt and limited overhead. Compass has been in business since
June 2012 and continues to grow its client base. Neither Compass nor the principals have been involved
in any litigation or investigation related to audit or consulting services in the past three years.
Personnel
The Compass team has over 40 years of audit and accounting experience. Our principals hold several
certifications including Certified Public Accountant, Certified Internal Auditor, Chartered Global
Management Accountant and Certification in Risk Management Assurance. Compass maintains
certifications through meeting continuing education requirements annually required for all
certifications. We have experience in creating internal audit departments, managing complex projects,
performing audits across multiple industries and departments, performing investigations, and
interacting with senior level management and boards. In addition, our practices have quality control,
continuing education, and regulatory requirements built in to ensure compliance with Institute of
Internal Auditors Standards. Compass’ CEO and COO have Certifications in Risk Management Assurance
(CRMA). This certification is awarded to internal auditors and risk management professionals with
responsibility for and experience in risk assurance and governance practices. It demonstrates Compass’
ability to evaluate organizational and external components and develop overall enterprise risk
management programs and risk based audit programs. This certification requires knowledge and
experience in implementing risk management across organizations, departments, and processes using a
combination of the COSO Enterprise Risk Management Framework and other frameworks.
Below we have summarized experience of Compass, discussed how their experience is critical to project
success and their overall contribution to the project.
1. Sharon Bertram, CEO/Compass Audit Executive
Sharon’s resume has been provided in Appendix A for your review. She has over 30 years of
experience in accounting and auditing and is a Certified Public Accountant, Certified Internal
Auditor, Certified Global Management Accountant, Certified in Risk Management Assurance and
a Shared Services and Outsourcing Professional. As CEO and the project’s executive sponsor,

Page 5
Compass RFP: 14-012 Response
she will ensure adequate time and resources are dedicated to the City of Edmond. She is
committed to participating in risk assessment activities and audit plan development, attending
meetings with the Finance/Audit Committee and/or city council and reviewing work product for
quality control purposes.
Sharon has successfully completed large complex projects as follows:
• Developed and implemented Shared Service Strategy for parent company with 38
businesses over seven business portfolios. Five portfolios performed on government
contracts or as a subcontractor to a prime in areas of aerospace, IT, security, logistics,
and construction.
• Built and directed audit department that planned and performed financial, operational,
compliance, fraud, information technology and contract audits. Performed from 15 to
30 reviews annually identifying internal controls, process improvements and cost
savings.
• Designed and performed compliance reviews in a casino environment for Bank Secrecy
Act compliance which required data analysis and validation of large data sets.
• Oversight over casino and Peoplesoft HRMS system implementation projects.
• Responsible for development and completion of financial control assessment project for
largest tribal government in U.S.
• Lead financial audits while in public accounting of public and private companies, banks,
cities and tribal governments.
• Managed data conversion of Defined Contribution plan assets and accounts totaling
$770 million
2. Jeff Coffman, COO/Audit Director
Jeff’s resume has been provided in Appendix A for your review. Jeff has over 10 years of
experience in auditing and is a Certified Internal Auditor, and Certified in Risk Management
Assurance. As COO and the project’s operations director, he is responsible for maintaining
accountability for the project, participating risk assessment and audit plan development,
reviewing/creating audit test plans, performing/directing on-site test work, and participating in
project meetings.

Page 6
Compass RFP: 14-012 Response
Jeff has extensive audit experience that will be beneficial to the overall success of the project as
follows:
• Managed due diligence projects on business acquisitions to include coordination of
resources, writing test plans, performing test work, mapping processes, reporting and
developing integration plans
• Had oversight over corporate policy and procedure department for multiple
organizations
• Implemented a financial internal control documentation strategy and remediated
internal control weaknesses
• Managed complex compliance, operational and fraud audit projects
• Audited invoices for contract and regulatory compliance
3. Sunny Austin, Project Administration
Sunny has over 7 years of experience in administration and 5 years’ experience specifically
working for audit related departments. She is responsible for maintaining maintain project
plans, status reports, scheduling meetings, and other administrative project tasks.
4. Experienced Auditors
Upon completion of a risk assessment and determination of resources required; Compass will
staff City of Edmond’s project with experienced auditors.
Organizational Chart
Sharon Bertram CEO/Owner
Jeff Coffman COO/Owner
Experienced Auditors
Sunny Austin Audit Administrator

Page 7
Compass RFP: 14-012 Response
Experience
Compass Consulting was created in 2012 as an Oklahoma Limited Liability Corporation. Ownership is
comprised as follows: Sharon Bertram 60% and Jeff Coffman 40%. Compass is not a big regional
accounting firm, but we have the expertise to perform the work requested and will provide quality work
product and excellent customer service. We have experience providing similar services with emphasis
on government and regulatory requirements including:
State Government
• Oklahoma Statutes
• Oklahoma Competitive Bidding Act
• Accounting rules and standards – Government Accounting Standards and OMB Circular
A-110, A-123, and A-133
Tribal Governments
• Tribal laws and regulations
• Federal laws and regulations related to federal grants and awards
• Accounting rules and standards – Government Accounting Standards and OMB Circular
A-110, A-123, and A-133
Gaming
• Tribal gaming laws and regulations
• Federal gaming laws and regulations related to casinos (National Indian Gaming
Commission, Indian Gaming Regulatory Act, etc.)
• Accounting rules and standards – Government Accounting Standards and Casino
Accounting Guidance
• Federal Bank Secrecy Act Regulations
• Internal Revenue Service Regulations
Government Contracting Entities
• Federal Acquisition Regulations
• Small Business Administration rules and regulations
• Export Compliance regulations
• Security Clearance regulations
• Government contract compliance

Page 8
Compass RFP: 14-012 Response
Financial Institution Sub Contractors
• Fair Credit Reporting Act
• Fair and Accurate Credit Transaction Act of 2003 (16 CFR 681.2)
• Dodd-Frank Act
• Gramm-Leach-Bliley Act (GLBA)
• Fair Debt Collection Practices Act
• Consumer Financial Protection Bureau Regulations
At any time Compass is engaged with 4 to 6 clients for services including: internal audit outsourcing,
policy and procedures, fraud investigations, merger and acquisition due diligence, business valuations,
and special projects.
The principals of Compass have experience in corporate and governmental environments. We have
audited tribal governments, gaming, and government contracting entities which are highly regulated.
Audits performed have resulted in annual cost savings or deferment of costs in many cases. Over the
last 5 years annual cost savings ranged from $250,000 to $1,000,000 a year. As mentioned above,
Compass’ experience includes the creation and management of a highly successful audit department
that planned and performed financial, operational, compliance, fraud, information technology and
contract audits. Ms. Bertram began the group herself from the ground up, and within 5 years had a
functional department of 20+ auditors with oversight of 30+ businesses in multiple industries.
Compass is diligent about delivering reports on time and within budget. While we do not have a quality
control report, the Cherokee Nation Business audit department under the direction of Ms. Bertram
received the highest rating during a Quality Assurance Review with several best practices being noted.
Recent client surveys indicated very positive marks for Compass’ and its principles’ performance
including managing project cost, schedule, communication and overall customer satisfaction. Survey
overall scores resulted in a rating of 9.9 out of 10.
Systems and technology-driven internal controls are constantly changing. We have experience using a
variety of different computing platforms and systems. Data mining products such as ACL are sometimes
utilized to perform testing and also set up continuous monitoring efforts for different areas of business.

Page 9
Compass RFP: 14-012 Response
Compass has the ability to use technology and also explain to clients why that technology is beneficial
and how it can mitigate risk.
References
Compass principals have provided Internal Audit Services in a corporate environment for: Cherokee
Nation Businesses, a wholly owned business of the Cherokee Nation. The following references can
speak to our expertise and experience:
Jay Hannah, Sr. VP Bancfirst (Former Cherokee Nation Businesses Chairman of Board)
405-270-1007
David Stewart, CAO of Oklahoma Ordnance Works Authority (Former Cherokee Nation Businesses
CEO)
918-630-3000
Callie Catcher, Osage Nation Treasurer (Former Cherokee Nation Treasurer)
918-287-5357
We have also provided due diligence and business valuation audits and performed special projects
for OneFire Holding Company, a Muscogee Creek Nation Company.
Gary Warnock, Managing Partner of OneFire
918-740-2423

Page
10
Compass RFP: 14-012 Response
Engagement Strategy
Preparation and Startup
Risk Assessment and Audit Plan Development
The first step is to develop a baseline for risk assessment and evaluation of control
effectiveness, and develop an audit plan for a three year period with built in flexibility to enable
responsiveness and change. Best practice is for audit departments to have a systematic process
to assess overall risk and develop a risk based audit plan. The risk assessment process begins
with developing an overall understanding of the organization and its business objectives.
Throughout the process we will be developing an audit universe of potential coverage areas
based on business units, processes, operations, and budgets. Accounts will be evaluated on
several key factors such as account balance, volume of activity, fraud potential, level of
automation, etc. This will confirm that high and medium risk accounts are addressed in the
major processes identified. In addition, we will gather information to include:
• Stakeholder concerns
• Volume of transactions
• Current state control environment
• Budget allocations, and
• Other risk factors such as major construction projects, system changes, etc.
This allows prioritization of audit areas based on business impact and inherent risks such as
changes in systems or processes, organizational changes, expansion, or external factors. Once a
draft plan is developed, Compass will work with the Finance/Audit Committee to review the
audit plan and design the best plan to address high priority risk. The plan will include an
allocation of time for special projects to allow for flexibility and responsiveness to management
needs. A well-defined audit plan will permit the Finance/Audit Committee to establish current
and longer term budgets and plans. Estimated hours to complete for each project will be
included in the annual audit plan. This will allow the Finance/Audit Committee to make
decisions related to number of audit to be performed and audit resources required to establish
coverage goals that give them the needed level of assurance. Risk assessment and audit plans

Page
11
Compass RFP: 14-012 Response
would be reviewed annually and evolve as risk profiles are enhanced and knowledge of control
structures increases. To be most effective, the risk assessment process needs to be repeated
each year to ensure priorities and risk are updated.
Data Analytics/Continuous Monitoring
Continuous monitoring enables management to continually review business processes for
adherence to and deviations from intended levels of performance and effectiveness. It is a
proactive method to detect risks and execute cost effective changes. Whereas implementation
of a comprehensive continuous monitoring process is not achievable in the first year, allocating
a small amount of time to begin analysis of continuous monitoring opportunities and begin
developing simple data mining and auditing tools is prudent.
The audit plan will be presented to the Finance/Audit Committee for approval and the Council for
approval if needed.
Audit Process
Our processes are designed to conform to all requirements of the Institute of Internal Auditors
International Standards for the Professional Practice of Internal Auditing and other regulatory guidance.
All audits will be designed to address four major objectives:
• To remain independent and objective examining all facts and circumstances
• To verify the reliability and integrity of financial and operational information
• To ensure compliance with laws, regulations, and internal policy and procedures, and
• To evaluate the effectiveness and efficiency of processes.
For each audit, a four step process is performed by the Compass team.

Page
12
Compass RFP: 14-012 Response
• Step One – Planning
The planning stage of the engagement consists of research and data gathering to gain a firm
understanding of the project. This would include:
o An initiation memo will be prepared for each engagement. See Appendix D for an
example.
o Review of significant financial reports used to make decisions such as budget,
department financials, metrics, etc.
o Review of policies, administrative regulations, employee manuals, organizational charts,
forms, and other applicable guidelines.
o Interview key management personnel related to their areas of concern.
This phase also includes research of a variety of sources:
o Regulatory websites for applicable statutory guidelines and requirements
o Audit resource sites such as Auditnet, Institute of Internal Auditors (IIA), Information
Systems Audit and Control Associations (ISACA), Protiviti, Knowledgeleader, and other
internet resources
o Available industry guidance and resources
Upon review of initial information, we will begin to specify scope and objectives in more detail,
perform a review level risk assessment, draft audit programs and develop process/internal
control questionnaires. Our audit program template includes the following columns:
Area/Objective Risks Control Discussion Audit Approach
In addition, a detailed project schedule will be developed for each project.
• Step Two – Preliminary Review
Compass will provide a list of requested interviews and documentation prior to any on-site work
to allow scheduling of meetings and preparation of material. Department management and
staff level personnel will be interviewed to gather information and develop process
flowcharts/narratives. Once process mapping is complete, Compass will request management
review and sign off to confirm accuracy.

Page
13
Compass RFP: 14-012 Response
• Step Three – Fieldwork/Analysis of Internal Controls and Processes
During this phase, preliminary review information will be used to tailor test programs
specifically for processes, concerns and risks. Test programs are designed to focus on the
highest risk areas first. This allows Compass and management to adjust resources and time
commitments based on findings without impacting coverage of more critical processes and
reducing testing in less risky areas if needed. Any changes to the original project plan will be
documented with a change order and approved by management prior to implementation.
Our team will perform tests of transactions, analytical reviews, and validate other data and
processes. Roles and responsibilities will be evaluated to ensure proper segregation. Policies
will be reviewed for improvement opportunities. Internal controls will be identified and, if
necessary, tested to verify compliance. Control deficiencies and efficiencies will be identified.
As the audit progresses, Compass will have periodic update meetings with management to
discuss and confirm findings. All findings will be discussed with appropriate management and
validated.
Compass relies on internal policies related to work paper preparation and review to maintain
consistent and quality work product. We have the capability to perform in-depth data analysis
through a variety of analytical tools. All audit documentation will be reviewed by a Compass
principal to ensure quality. The principal will document their review and ensure any issues are
remediated prior to sign-off and submittal to management for review.
ACL and other audit documentation software will be used to increase efficiency and
effectiveness of the audit. ACL allows us to analyze large quantities of data more quickly. Audit
documentation software drives consistent documentation standards, allows quality control
review and signoff and speeds up reporting with issue tracking and automatic report draft
population.
• Step Four – Reporting and Remediation
No later than 30 days after completion of fieldwork, a draft report will be completed including
all significant findings. Management responses will be included of operationally feasible
remediation action plans, responsible party (s) and action plan due dates. The final report will

Page
14
Compass RFP: 14-012 Response
be issued once the report has been updated for exit conference decisions and approved by the
Finance/Audit Committee. Compass will be available for presentation of reports as requested.
In addition to the final report (see example in Appendix C), the following items will be provided:
1. A verbal findings report that contains observations that do not represent a
significant weakness but management needs an awareness of and monitoring.
2. A documentation package that contains updated flowcharts, policy updates, and
other data prepared during the review and beneficial to the auditee moving
forward.
Auditing and Fieldwork
Potential First Year Audit Plan
For the City of Edmond we would expect the following types of audits:
Process audits – to evaluate the internal controls needed to ensure the reliability of
financial information, protection of city assets, and compliance with regulations, policies
and procedures. The major processes would include accounts receivable, billing,
accounts payable, payroll, investments, purchasing, etc. and be audited on a rotating
basis.
Financial control audits – to evaluate, document and test financial controls
Performance audits – objective and systematic examinations of specific areas of the City
to provide and assessment of the performance and management of the operations.
These reviews include regulatory compliance, goal and objective accomplishment, data
reliability, service delivery and safeguarding of assets.
Rate reviews – review of utility rates and charges to determine the rate models are
accurately and consistently applied.

Page
15
Compass RFP: 14-012 Response
Construction audits – review of active capital expansion programs to include review of
payment request, change orders, project costs, project management and
subcontractors.
Information system audits – review and evaluate the availability, confidentiality and
integrity of the City’s information technology infrastructure. Audits could include
application reviews, processing facility reviews, system development reviews,
architecture reviews, etc.
Without much more knowledge of the City of Edmond, it is not possible to provide a detailed
audit plan. But an example of a plan for year one may be
Title Description Activity Type Estimated hours
Public Safety Center Construction Construction audit to include review of payment request, change orders, cost monitoring and project management.
Construction 400
Data Security and Privacy Audit of City’s network security and protection of confidential data
IT 280
Procurement Audit procurement processes to ensure compliance, control and efficiency
Major Process - Rotation
350
City Ethics Program Assessment Assessment of City’s ethics program as part of effective governance and to monitor conflict of interest, code of conduct and reporting.
Governance 240
Sales and Use Tax Verification of collections for sales and use tax, and any applicable franchise fees
Financial 380
Police Department Performance Audit
Performance audit and compliance with policy, procedures and best practices.
Performance 300
Credit Cards – Continuous Monitoring
Audit credit card process and build continuous monitoring reports to assess CCard
On-going assessment, continuous
240

Page
16
Compass RFP: 14-012 Response
expenditures and compliance
monitoring,
Unallocated Audit To support flexibility to respond to request and emerging risk areas
TBD 240
Fraud, Waste and Abuse investigations
Evaluation of allegations of fraud, waste and abuse
Asset protection 50
Follow-up Follow up on status of management action plans to address report recommendations
Administration 50
Administration/Risk Assessment Preparation of annual audit risk assessment and plan; audit committee meetings and other administration activities and reporting
Risk Assessment 150
Strategy Plan
If Compass is awarded the City of Edmond project, we are committed to grow our business as needed to
serve the client needs. This will include hiring an experienced audit manager to be focused on the City
of Edmond’s account. Based on the risk assessment and audit resource needs, additional staff will be
hired. To enable us to serve the client immediately, Jeff Coffman, Compass COO, will be acting audit
manager until an experience manager can be hired. If necessary, experienced contract auditors will be
engaged for the first project as needed.
State Laws, Statutes and/or local ordinances
Compass was engaged by the Oklahoma Ordnance Works Authority (OOWA), a state trust organization,
to develop policy and procedures in compliance with Oklahoma state laws and regulations. This enabled
us to gain a firm understanding of State procurement regulations and state laws that impacted OOWA.
During the planning stage of each audit, Compass will review any state laws, local ordinances and other
regulations that would impact risks and testing protocols.
Reporting
In addition to individual audit reports for each project as discussed above, we will provide the following:
• Monitoring report related to progress against the approved Audit Plan
• Audit metrics such as report turnaround, budget vs. actual hours, etc.
• Red/yellow/green report to confirm progress on action plans

Page
17
Compass RFP: 14-012 Response
Compass will discuss reporting with the City of Edmond’s Finance/Audit Committee and customize
reporting as needed to meet their expectations and needs.
Fee Schedule
Fee Schedule Proposed hourly rates
Professional audit staff
position Hourly Rates Average %
Involvement CEO/COO $125.00 30% Audit Manager/Staff $100.00 60% Audit Administrator $40.00 10%
Fee Value
Compass Consulting’s principals have experience in Internal Auditing and have excellent ratings from
customers (9.9 out of 10). Value of Internal Audit’s contribution will be seen in:
• Operationally feasible action plans
• Consultative nature of services
• Provided assurance of compliance, asset protection and information reliability
• Quality of reports
• Cost savings and deferments
• Adding value to the decision making processes
• Documentation and communication of controls
This value will be communicated to the Finance/Audit Committee and the City as a whole based on
reporting, audit metrics and benchmarking.

Page
18
Compass RFP: 14-012 Response
Appendix A
Resumes

Page 19
Sharon B. Bertram, CPA, CIA, CRMA, CGMA, SSOp 8900 S. 28th West Ave., Tulsa, Oklahoma 74132
(918) 527-7412 or 299-6698 [email protected]
Broad experience in internal audit, enterprise risk management, compliance, policy development, due diligence, business process improvement, human resources and shared service delivery. Expertise in managing teams to develop and achieve goals and objectives. Have implemented high value and cost effective processes and programs. Skilled at service delivery and consultation to internal clients.
Professional Qualities and Strengths Operational Efficiencies Risk Focused Articulate Communicator Project Management
Strategic Vision Coaching and Mentoring Team Building and Collaboration Compliance Management
Budget and Cost Control Audit Management Quality Service Delivery Board Interaction
Professional Highlights Compass Consulting, Tulsa, Oklahoma 2012 – Present CEO/Owner Owner of an Economically Disadvantaged Women Owned Small Business offering a variety of services to businesses, governmental entities and tribes and striving to maximize the efficiency and effectiveness of their operations, ensure compliance with laws and regulations, and strengthen governance and internal controls. Cherokee Nation Businesses/Enterprises, Catoosa, Oklahoma 2002 – 2012 Sr. Vice President, Audit, Risk and Compliance Services Sr. Vice President, Shared Services and Administration Vice President, Audit Services Directed multiple departments including Audit Services, Enterprise Risk Management, Ethics Office, Policy Administration, Information Technology, Human Resources, Due Diligence, Business Process Improvement, and Government Compliance Key Contributions
• Responsible for oversight of Shared Service departments service delivery, metrics, and strategies • Developed Shared Services strategy to deliver integrated services across seven business
portfolios consisting of entertainment, information services, manufacturing and other government contracting initiatives with consolidated revenue of $600 million
• Managed comprehensive due diligence of company acquisitions and integration • Implemented benchmarking, metrics and periodic reporting • Directed enterprise risk management process across the organization to enable management to
proactively mitigate risk • Ensured processes and procedures were developed related to compliance with government
contract provisions, Service Contract Act regulations, gaming and export compliance requirements.
• Frequent Board interaction and presentations related to acquisitions and strategies • Implemented new benefit plan design for governmental entities to reduce costs and meet
competitive demands • Directed audit department which planned and performed financial, operational, compliance,
fraud and contract audits managing corporate risk through the identification of internal
Page 20
control/process improvements and cost savings. • Developed internal audit department and strategies from scratch covering nine casino
entertainment facilities and other tribal for profit entities including 8(a) operations • Designed and implemented Title 31 compliance training and monitoring program ensuring
regulatory compliance and mitigating risk. Audit program developed and performed semi-annually test resulting in deferment of over $1 million dollars in potential penalties
• Assessed corporate risk using a quantitative model resulting in an annual audit plan presented to Audit Committee, senior management and approved by multiple Boards
• Facilitated Audit Committee meetings and Board presentations including discussions on external financial audit, internal audit plans and status, ethics program, and issue resolution
• Directed multiple forensic audits and coordinated with tribal and federal authorities on prosecution.
• Coached and mentored employees, initiated audit orientation and training development programs and provided positive feedback and motivation
• Designed OMB A-123/SAS 115 compliance program and implemented documentation and testing of financial controls to include use of internal and external resources
• Implemented Ethics Hotline and procedures for all tribal entities, including annual solicitation of conflict of interest statements
• Performed as Ethics Officer with responsibility for chairing the Ethics Committee, administration of the hotline, and resolution of investigations
• Coordinated Minimum Internal Control Standards (MICS) reviews performed by internal audit staff and external auditors
• Empowered official responsible for Export and DSS Security Compliance; Cleared at Secret Level Central and South West Services, Tulsa, Oklahoma 1992 - 2002 Consultant, Audit Services Key Contributions Planned, managed and performed financial, operational, fraud and contract audits managing corporate risk through the identification of internal control/process improvements and cost savings.
• Managed data conversion of Defined Contribution plan assets totaling $770 million to Fidelity in their first weekend conversion
• Led merger team who recommended an organizational structure reducing headcount by 30 FTEs and developed a strategy for design and delivery of benefits to over 40,000 active and retired employees resulting in savings of over $60 million
• Implemented a new Cash Balance Pension Plan and enhanced 401K Retirement Plan that reduced costs by $20 million including design of a testing strategy to ensure legal compliance and data accuracy for conversion
• Analyzed plan documents and regulatory requirements to design testing plans and perform complex compliance reviews of pension, 401K and health & welfare plans
• Audited operation and maintenance contract and negotiated a $500,000 settlement for administrative cost overcharges
• Managed risk by strengthening controls over derivative trading and foreign currency transactions and ensuring activity was properly valued and reported in compliance with FAS 133 requirements
• Managed all aspects of audit consulting projects, recommended value-added process improvements and produced over $20 million of savings for the corporation

Page 21
Coopers and Lybrand, Tulsa, Oklahoma 1990 - 1992 Senior Auditor, Audit Services Governmental Accounting specialist performing city and tribal government financial audits.
Formal Education and Certifications
Masters/Bachelor Degrees, Oklahoma State University, Stillwater, Oklahoma (Graduated with honors)
Certified Public Accountant Certified Internal Auditor Certified Risk Management Assurance Chartered Global Management Accountant Shared Services and Outsourcing Professional
Additional Experience and Skills Consolidations External Audit Coordination Asset Valuation
General Ledger Revenue Distribution Joint Interest Billing
Payroll Benefit Plans Policy Administration
Professional Development • CPA Continuing Education Current • M&A Leadership Conference • Shared Service Conference 2010 • Speaker at Oklahoma Indian Gaming Conference 2009 • Speaker at IIA Gaming Conference 2007 and 2008 • IIA General Audit Management Conference • IIA Vision University for Advanced Chief Audit Executives • UNR Gaming Institute – Table Games Management and other gaming related training • Speaker at Conference for Accountancy – Tulsa University • Leadership for Extraordinary Performance, Darden Graduate School of Business Administration
at the University of Virginia • Advanced Consulting Skills, Designed Learning
Professional Associations
• Member, American Institute of Certified Public Accountants • Member, Institute of Internal Auditors • Member, Association of Certified Fraud Examiners • IIA Board of Governors – Tulsa Chapter • DVIS Board of Directors

Page 22
Jeff W. Coffman, CIA, CRMA 10488 South 86th East Ave., Tulsa, Oklahoma 74133
(918) 855-1260 [email protected]
Experience in internal audit, enterprise risk management, compliance, policy development, due diligence, and business process improvement. Strong problem solver, project manager and creative thinker.
Core Competencies – Technical Proficiencies Due Diligence Risk Management Internal Controls Project Management
Process Development Internal Audit Financial Analysis Compliance
Policy and Procedure Development Cross Functional Team Leader Communication
Professional Experience Compass Consulting, Tulsa, Oklahoma January 2013 – Present Chief Operating Officer Compass is an Economically Disadvantaged Women Owned Small Business offering a variety of services to businesses, governmental entities and tribes and striving to maximize the efficiency and effectiveness of their operations, ensure compliance with laws and regulations, and strengthen governance and internal controls. Cherokee Nation Businesses (CNB), Tulsa, OK May 2005-Present CNB is the economic development arm of the second largest Native American Tribe in the United Jurisdiction s. CNB manages a diverse portfolio of over 40 business entities in the areas of Gaming, Manufacturing, IT, Environmental, Construction, Healthcare, Security Integration and Defense Operations generating in excess of $600 million in annual revenues. Sr. Manager of ERM, Ethics and Due Diligence February 2012-Present Variety of responsibilities as a member of CNB’s Business Process Improvement group focused on creating business efficiencies across the entire organization.
• Managed CNB’s Enterprise Risk Management program. This program consolidated the risk management activities across all 40 companies and developed a common risk language and mitigation method.
• Revised and Developed corporate and subsidiary level policies and procedures consolidating functions across 40 entities
• Created internal SharePoint site for all corporate and subsidiary level policies and procedures to be accessed by all employees across multiple organizations
• Managed a companywide Ethics program including employee training and inquiries from a third party hotline.
• Performed business process improvement efforts including documenting current processes, facilitating process updates and finalizing approved policies.
Manager, Due Diligence June 2010- February 2012 Created a new department under CNB’s Shared Services Division focused on the due diligence for potential acquisitions. Developed a methodology for testing, reporting and integration project management plan for all potential acquisitions.
• Developed a testing program that included: Financial, Legal (contract review), Human Resources, and Information Technology aspects

Page 23
• Managed due diligence projects of 8 potential acquisitions from letter of intent to integration/termination
• Updated complex valuation models based on diligence findings • Prepared revenue projections based on current and anticipated contracts • Provided final reports including recommendations to executive management and the board of
directors Manager, Internal Audit Services October 2008-June 2010 Project Leader, Internal Audit Services March 2006-October 2008 Internal Audit Services provided key audit and risk management services to the entire portfolio of CNB companies. As part of the Internal Audit Management Team, responsibilities included leading operational, financial, compliance and investigative reviews as well as assist Audit Executive Management with administration.
• Implemented SAS112/115 financial control review programs for 3 entities • Investigation Lead on over 50 internal investigations such as kickbacks, theft, and vendor favoritism • Established budget, scope, objectives and testing methodologies for audit projects • Reviewed testing documentation for application of audit standards • Developed reports of audit findings for program and executive management and board of directors • Facilitated opening and closing conferences with key audit clientele • Coached and mentored employees and provided constructive feedback through performance
evaluations Auditor (I, II, Sr.), Internal Audit Services May 2005-March 2006 Internal Audit Services provided key audit and risk management services to the entire portfolio of CNB companies. As part of the Internal Audit Team, responsibilities included performing operational, financial, compliance and investigative reviews.
• Performed operational, financial and compliance audits in conformance with IIA standards • Developed procedures for asset review, reconciliation and reporting • Implemented time tracking solution for the department • Assisted with system implementations and testing • Participated in due diligence for potential acquisitions • Performed fraud investigations
WilTel Communications, Tulsa, OK September 2000-May 2005 WilTel was a market leading telecommunications service provider that spun off from the Williams Companies as Williams Communications in 2001 and subsequently restructured and emerged as WilTel in 2002. The company ran fiber optic cable through decommissioned pipelines to create a nationwide communications network. Level 3 Communications purchased WilTel in December 2005. Lead Analyst, Access Cost 2004-2005
• Lead a group of three associates in auditing payable invoices for contract/tariff compliance • Worked cross-functionally with planning, payables, billing, tax and finance to verify margin and cost
on a per order basis • Maintained vendor relationships via dispute resolution and invoice recognition for 60 vendors • Responsible for a voice service cost dispute accrual and a voice service cost general ledger variance
report

Page 24
Business Analyst II, Revenue/Contract Compliance 2000-2004 • Developed and maintained a database of customer contract information for over 400 customer
agreements; used by multiple groups across the organization • Reviewed pending and executed revenue agreements for compliance with company billing
practices • Audited invoices vs. customer contracts for billing compliance • Performed billing functions, including A/R (collections), for 57 data service customers; responsible
for billing and collecting approximately $500,000 in revenue each month, and customer disputes > $25,000
• Developed and maintained departmental metrics • Cross-functional Process Improvement Team lead within the financial shared services organization • Implemented an audit process of current contracts to make contract review more efficient • Responsible for calculating and applying revenue deficiencies for all revenue committed data
customers Integral part in an audit of collocation racks that led to the revision of billing procedures and back-billing of over $50,000 in revenue
Formal Education and Certifications Master of Accounting and Financial Analysis Northeastern State University, Broken Arrow, OK; May 2008 Bachelor of Business Administration, Accounting and Finance Northeastern State University, Tahlequah OK; August 2000 Certified Internal Auditor Certified Risk Management Assurance
Additional Experience and Skills External Audit Coordination Asset Valuation Teammate
Policy Administration Peoplesoft Sharepoint
Quickbooks Microsoft Applications
Professional Development • IIA Governance, Risk and Control Conference • M&A Leadership Conference • IIA Audit Manager Training • IIA Sarbanes-Oxley Primer • IIA Gaming Conference
Professional Associations • Member, Institute of Internal Auditors • Member , Tulsa Chapter of the Association of Certified Fraud Examiners

Page 25
Appendix B
Insurance Certificates

Page 26

Page 27

Page 28
Appendix C
Audit Report Example

Page 29

Page 30

Page 31

Page 32

Page 33

Page 34

Page 35

Page 36

Page 37

Page 38

Page 39

Page 40

Page 41
Appendix D
Initiation Memo Example

Page 42

Page 43

Finance/Audit Committee 4. Meeting Date: 03/19/2014
InformationAgenda ItemDiscussion and consideration of the arbitrage rebate calculations by EideBailly of the EPWA Sales Tax &Utility System Revenue Bonds, Series 2004.
Background
AttachmentsEideBailly


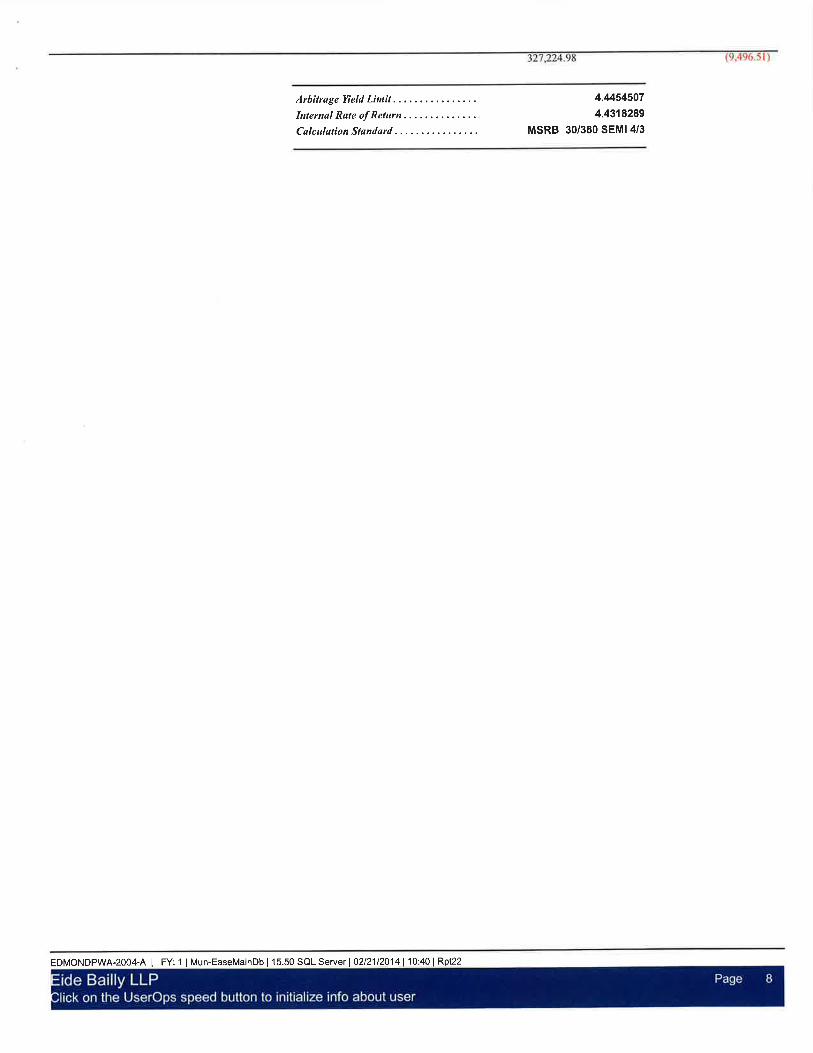


Finance/Audit Committee 5. Meeting Date: 03/19/2014
InformationAgenda ItemDiscussion and consideration of the annual review of the 457(b) and 401(a) deferred compensation plansand the funds performances for year 2013 presented by Great-West Retirement representative GaryWilkins and Chara Green.
Background
AttachmentsFund Performance ReviewPlan ReviewInvestment Balances

FUND PERFORMANCE REVIEW
CITY OF EDMOND 457 DEFERRED COMPENSATION PLAN | 98719-01Reporting Period Ending December 31, 2013
The analytical material contained herein merely describes the process that AAG applies in evaluating funds. It may or may not be based on the plan's current investment policy and is not intended to be used by plan sponsor as a primary
basis for deciding whether to make a particular fund available under the plan. Funds listed on the Fund Performance Review are designed to meet stated investment objectives and risk profiles, but do not constitute investment advice from
AAG or its affiliate. Plan fiduciaries should review the educational material provided and consult with their investment advisers if necessary to make the investment decision. Neither AAG, nor its representatives, agents or affiliates are
permitted to give legal, ERISA, or tax advice. Any discussion of these matters included or related to this document or other educational information is provided for informational purposes only. Such discussion does not purport to be
complete or to cover every situation. Current tax and ERISA law are subject to interpretation and legislative change. The appropriateness of any product for any specific taxpayer may vary depending on the particular set of facts and
circumstances. You should consult with and rely on your own legal and tax advisers.
Unpublished Work © 2003-2012 Great-West FinancialSM
Not intended as an offer or solicitation by Advised Assets Group, LLC or any of its affiliates.
Prepared by Advised Assets Group, LLC | 8515 East Orchard Road | Greenwood Village, Colorado 80111

FUND PERFORMANCE REVIEW
The Fund Performance Review is compiled at the request of the Plan Sponsor and/or broker. It is designed as a high level analytical tool to aide
plan sponsors in carrying out their fiduciary responsibilities; it is not intended as investment advice. Plan Sponsors may wish to review the
enclosed material with their investment adviser, consultant or broker, if necessary, prior to making final investment decisions.
Funds listed on the Fund Performance Review are designed to meet stated investment objectives and risk profiles. Risks associated with the
investment options can vary significantly and the relative risks of investment categories may change under certain economic conditions. The
investment return and principal value of an investment will fluctuate so that an investor’s shares, when redeemed, may be more or less than their
original cost. Current performance may be lower or higher than performance data shown due to market activity. Past performance is not a
guarantee of future results.
IMPORTANT DISCLOSURES
FOR PLAN SPONSOR USE ONLY - NOT FOR USE WITH PLAN PARTICIPANTS
Not intended as an offer or solicitation of securities
Page 2 of 22
CONFIDENTIAL - DO NOT DISCLOSE OR DISSEMINATE
Data Source: Morningstar Direct®
98719-01 | CITY OF EDMOND 457 DEFERRED COMPENSATION PLAN

• To quantify historical fund performance relative to peer group benchmarks.
• To identify funds that have consistently underperformed over the long-term.
• To assist in identifying style drift and discern gaps within the plan portfolio.
• An objective analysis based on set criteria.
• Based on long-term and risk-adjusted performance.
• Comparison against peer group of similar funds as determined by Morningstar, Inc.®
• Statistics are derived from an independent third-party: primarily Morningstar Direct®
• The Fund Performance Review is designed as a high level analytical tool to aide plan sponsors in carrying
* out their fiduciary responsibilities.
The purpose of this document is to provide investment -related information only for the plan sponsor in its role as a fiduciary to the Plan, not as investment advice for plans or plan participants. Although the data
contained in this report is from reliable sources, Advised Assets Group, LLC cannot guarantee is completeness or accuracy. Risks associated with investment options can vary significantly with each
particular investment category and the relative risks of categories may change under certain economic conditions. The investment return and principal of an investment will fluctuate so that an investor's
shares, when redeemed, may be more of less than their original cost.
Current performance may be lower or higher than performance data shown due to market volatility. Past performance is no guarantee of future returns.
2012 Morningstar, Inc.® All Rights Reserved. Use of this content requires expert knowledge. It is to be used by specialist institutions only. The information contained herein: ( 1) is proprietary to Morningstar
and/or its content providers; (2) may not be copied, adapted or distributed; and (3) is not warranted to be accurate, complete or timely. Neither Morningstar nor its content providers are responsible for any
damages or losses arising from the use of this information, except where such damages or losses cannot be limited or excluded by law in your jurisdiction.
OBJECTIVE:
FUNDAMENTALS:
SOURCE:
SCOPE:
FUND PERFORMANCE REVIEW: OVERVIEW
FOR PLAN SPONSOR USE ONLY - NOT FOR USE WITH PLAN PARTICIPANTS
Not intended as an offer or solicitation of securities
Page 3 of 22
CONFIDENTIAL - DO NOT DISCLOSE OR DISSEMINATE
Data Source: Morningstar Direct®
98719-01 | CITY OF EDMOND 457 DEFERRED COMPENSATION PLAN

• Return Composite: Determined by taking the equal weighted average of the 3, 5 and 10 year category return percentiles.
• Sharpe Composite: Calculated by averaging the 3 and 5 year category Sharpe percentiles.
• Overall Composite: The equally weighted average of the Return Composite and Sharpe Composite.
• Overall Morningstar Rating™: Represents a measure of an investment's risk-adjusted return, relative to similar investments.
The Overall Composite is the sole determinate for the Overall Rating for funds that do not have an Overall Morningstar Category
Rating.
• OVERALL RATING: Based on performance, risk-adjusted performance and the Overall Morningstar Rating™.
FUND PERFORMANCE REVIEW: CRITERIA
• LONG-TERM ROLLING ANALYSIS: Based on the accumulated trailing 12 quarters "Overall Ratings".
For expanded definitions of the Composites, Sharpe Ratio and Ratings, please refer to the corresponding glossary. Information for this fund evaluation was received from what we believe to be reliable sources, but
we cannot absolutely guarantee accuracy, completeness or suitability for any purpose. The performance data quoted within represents past performance and is not a guarantee or indication of future investment
results. For each fund with at least a three-year history, Morningstar calculates a Morningstar Rating based on a Morningstar Risk-Adjusted Return measure that accounts for variation in a fund's monthly performance
(including the effects of sales charges, loads, and redemption fees), placing more emphasis on downward variations and rewarding consistent performance. The top 10% of the funds in each category receive 5 stars,
the next 22.5% receive 4 stars, the next 35% receive 3 stars, the next 22.5% receive 2 stars and the bottom 10% receive 1 star. (Each share class is counted as a fraction of one fund within this scale and rated
separately, which may cause slight variations in the distribution percentages). The Overall Morningstar Rating for a fund is derived from a weighted average of the performance figures with its three-, five- and
ten-year (if applicable) Morningstar Rating metrics. Past Performance is no guarantee of future results.
• FUNDS RECEIVING A WARNING: Please see the footnotes page for Special Product Consideration Funds.
FOR PLAN SPONSOR USE ONLY - NOT FOR USE WITH PLAN PARTICIPANTS
Not intended as an offer or solicitation of securities
Page 4 of 22
CONFIDENTIAL - DO NOT DISCLOSE OR DISSEMINATE
Data Source: Morningstar Direct®
98719-01 | CITY OF EDMOND 457 DEFERRED COMPENSATION PLAN
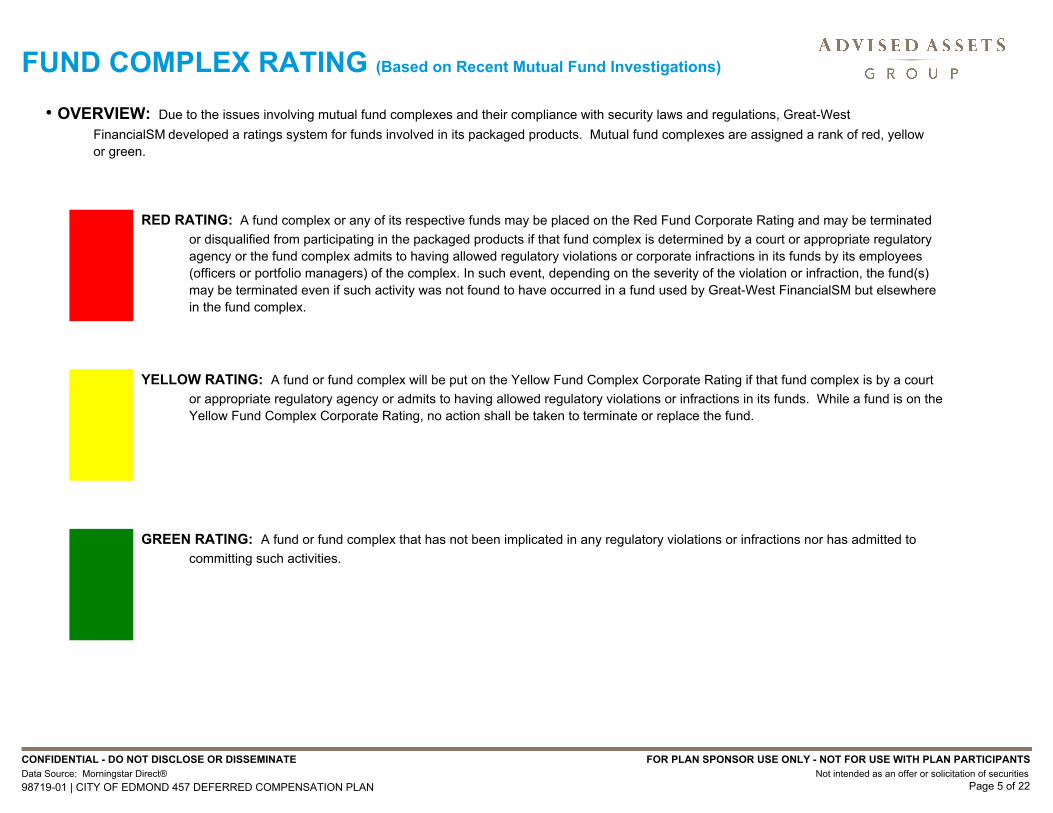
FUND COMPLEX RATING (Based on Recent Mutual Fund Investigations)
• OVERVIEW: Due to the issues involving mutual fund complexes and their compliance with security laws and regulations, Great-West
FinancialSM developed a ratings system for funds involved in its packaged products. Mutual fund complexes are assigned a rank of red, yellow
or green.
RED RATING: A fund complex or any of its respective funds may be placed on the Red Fund Corporate Rating and may be terminated
or disqualified from participating in the packaged products if that fund complex is determined by a court or appropriate regulatory
agency or the fund complex admits to having allowed regulatory violations or corporate infractions in its funds by its employees
(officers or portfolio managers) of the complex. In such event, depending on the severity of the violation or infraction, the fund(s)
may be terminated even if such activity was not found to have occurred in a fund used by Great-West FinancialSM but elsewhere
in the fund complex.
YELLOW RATING: A fund or fund complex will be put on the Yellow Fund Complex Corporate Rating if that fund complex is by a court
or appropriate regulatory agency or admits to having allowed regulatory violations or infractions in its funds. While a fund is on the
Yellow Fund Complex Corporate Rating, no action shall be taken to terminate or replace the fund.
GREEN RATING: A fund or fund complex that has not been implicated in any regulatory violations or infractions nor has admitted to
committing such activities.
FOR PLAN SPONSOR USE ONLY - NOT FOR USE WITH PLAN PARTICIPANTS
Not intended as an offer or solicitation of securities
Page 5 of 22
CONFIDENTIAL - DO NOT DISCLOSE OR DISSEMINATE
Data Source: Morningstar Direct®
98719-01 | CITY OF EDMOND 457 DEFERRED COMPENSATION PLAN

PERFORMANCE SUMMARY
Fund Name
Ticker
Symbol
Fund
Complex
Rating
Morningstar
Category Overall
Mstar
RatingSharpe Return
Composite %
Overall Rating¹
Consecutive
Quarters
Below
# of Quarters
Below Out of
Trailing 12
Long-Term Rolling Analysis²
PassNeutralTGVAX Thornburg International Value A LW 0 0 out of 1210 34.0 20.527.3 3 Foreign Large GrowthInternational
PassAboveRERCX American Funds EuroPacific Gr R3 0 0 out of 1269.0 67.068.0 4 Foreign Large Blend
PassAboveIARAX Invesco Real Estate A Load Waived 0 0 out of 1211 47.3 54.550.9 4 Real EstateSpecialty
FailBelowRYLPX Royce Low Priced Stock Svc 4 5 out of 1214 3.7 1.52.6 1 Small GrowthSmall-Cap
FailBelowHRTVX Heartland Value 5 6 out of 1221.0 39.530.3 2 Small Value
PassAboveBGRFX Baron Growth Retail 0 0 out of 1277.0 86.081.5 4 Mid-Cap GrowthMid-Cap
PassAboveCHTTX ASTON/Fairpointe Mid Cap N 0 0 out of 1291.3 61.076.2 4 Mid-Cap Blend
PassNeutralJARTX Janus Forty S 0 3 out of 1257.7 25.541.6 4 Large GrowthLarge-Cap
PassNeutralJENRX Jensen Quality Growth R 0 0 out of 1222.3 53.037.7 3 Large Growth
PassNeutralNYVTX Davis NY Venture A Load Waived 0 4 out of 1232.7 21.026.8 3 Large Blend
PassNeutralACGIX Invesco Growth and Income A Load Waived 0 0 out of 1253.7 43.048.3 4 Large Value
PassAboveOARBX Oakmark Equity & Income II 0 0 out of 1251.7 84.568.1 4 Aggressive AllocationAsst All/Other
PassAbovePTRAX PIMCO Total Return Admin 0 0 out of 1212 69.7 31.550.6 4 Intermediate-Term BondBond /MMF30
Please refer to the Appendix page for additional footnotes
FOR PLAN SPONSOR USE ONLY - NOT FOR USE WITH PLAN PARTICIPANTS
Not intended as an offer or solicitation of securities
Page 6 of 22
CONFIDENTIAL - DO NOT DISCLOSE OR DISSEMINATE
Data Source: Morningstar Direct®
98719-01 | CITY OF EDMOND 457 DEFERRED COMPENSATION PLAN

RETURN ANALYSIS
1 Year
ReturnFund Name
1 Year
Return
1 Year
Percent
3 Year
Return
3 Year
Percent
Performance vs. Benchmark (Annualized Returns and Return Percentiles)
5 Year
Return
5 Year
Percent
10 Year
Return
10 Year
Percent
Incept.
Date
4th
Quarter
2013 1 Year
Percent
4th
Quarter
2013
5.67 50 18.89 50 7.41 50 13.77 50 7.15 50 Foreign Large Growth Peer Group N/A10International
4.22 26 15.35 32 4.90 16 11.52 16 8.34 70 Thornburg International Value A LW 05/28/1998
5.78 50 20.00 50 7.10 50 12.20 50 6.73 50 Foreign Large Blend Peer Group N/A
7.53 83 19.79 48 7.05 49 13.17 73 8.59 85 American Funds EuroPacific Gr R3 05/21/2002
-0.35 50 1.67 50 8.58 50 16.15 50 8.07 50 Real Estate Peer Group N/A11Specialty
-0.41 46 1.79 55 8.47 45 15.24 28 8.81 69 Invesco Real Estate A Load Waived 12/31/1996
8.05 50 41.03 50 16.17 50 22.08 50 9.40 50 Small Growth Peer Group N/A14Small-Cap
3.97 2 12.91 1 0.25 1 15.27 2 7.05 8 Royce Low Priced Stock Svc 12/15/1993
9.20 50 35.99 50 14.56 50 19.89 50 9.34 50 Small Value Peer Group N/A
10.21 77 32.11 18 11.86 13 19.66 47 7.16 3 Heartland Value 12/28/1984
8.12 50 35.37 50 13.97 50 20.98 50 9.39 50 Mid-Cap Growth Peer Group N/AMid-Cap
7.96 43 38.32 78 17.70 89 22.10 68 10.52 74 Baron Growth Retail 12/30/1994
8.63 50 33.71 50 15.01 50 20.42 50 9.20 50 Mid-Cap Blend Peer Group N/A
9.20 62 44.49 96 16.29 77 26.31 98 11.69 99 ASTON/Fairpointe Mid Cap N 09/19/1994
10.34 50 33.91 50 14.96 50 18.85 50 7.52 50 Large Growth Peer Group N/ALarge-Cap
10.70 59 31.73 30 14.71 46 18.01 35 9.94 92 Janus Forty S 05/01/1997
10.66 58 31.80 31 13.84 32 16.19 11 6.63 24 Jensen Quality Growth R 07/30/2003
10.10 50 31.90 50 14.94 50 17.19 50 7.03 50 Large Blend Peer Group N/A
10.87 82 34.56 78 13.04 24 16.42 35 6.78 39 Davis NY Venture A Load Waived 02/17/1969
9.49 50 31.52 50 14.73 50 16.20 50 7.21 50 Large Value Peer Group N/A
8.82 31 33.84 70 14.51 44 16.02 46 7.82 71 Invesco Growth and Income A Load Waived 08/01/2046
7.01 65 23.83 75 10.53 55 11.98 6 8.02 94 Oakmark Equity & Income II 07/13/2000Asst All/Other
0.16 50 -1.72 50 3.63 50 6.25 50 4.40 50 Intermediate-Term Bond Peer Group N/A1230Bond /MMF
-0.10 32 -2.17 33 3.82 58 6.65 58 5.77 93 PIMCO Total Return Admin 09/08/1994
Please refer to the Appendix page for additional footnotes
FOR PLAN SPONSOR USE ONLY - NOT FOR USE WITH PLAN PARTICIPANTS
Not intended as an offer or solicitation of securities
Page 7 of 22
CONFIDENTIAL - DO NOT DISCLOSE OR DISSEMINATE
Data Source: Morningstar Direct®
98719-01 | CITY OF EDMOND 457 DEFERRED COMPENSATION PLAN

SHARPE RATIO AND EXPENSE ANALYSIS
Fund Name 3 Yr Ratio 3 Yr % 5 Yr Ratio 5 Yr % 3 Yr
Sharpe Ratio and Percentiles
5 Yr
Expense
Ratio
Manager
Tenure
Expense
%
Fund Size
$ MM
Standard
Deviation
International 0.538 50 0.793 50 15.76 18.77 1.30 5010 - - Foreign Large Growth Peer Group
0.378 17 0.698 24 15.75 17.77 1.29 52 16 28403.2 Thornburg International Value A LW
0.501 50 0.677 50 16.37 19.91 1.23 50 - - Foreign Large Blend Peer Group
0.511 54 0.755 80 15.62 18.57 1.14 59 30 121209.9 American Funds EuroPacific Gr R3
Specialty 0.578 50 0.707 50 16.55 25.35 1.22 5011 - - Real Estate Peer Group
0.590 55 0.710 54 15.93 23.82 1.25 49 19 2019.3 Invesco Real Estate A Load Waived
Small-Cap 0.967 50 1.124 50 17.01 19.54 1.33 5014 - - Small Growth Peer Group
0.103 1 0.754 2 18.97 21.94 1.51 34 13 1427.2 Royce Low Priced Stock Svc
0.916 50 0.967 50 16.24 21.38 1.31 50 - - Small Value Peer Group
0.780 14 1.000 65 15.92 19.88 1.16 65 29 1249.9 Heartland Value
Mid-Cap 0.931 50 1.173 50 15.39 17.90 1.22 50 - - Mid-Cap Growth Peer Group
1.260 94 1.270 78 13.65 16.84 1.32 39 19 8323.5 Baron Growth Retail
0.972 50 1.094 50 15.26 18.42 1.17 50 - - Mid-Cap Blend Peer Group
0.900 35 1.190 87 18.55 21.67 1.11 54 15 5104.3 ASTON/Fairpointe Mid Cap N
Large-Cap 1.077 50 1.148 50 13.86 16.29 1.11 50 - - Large Growth Peer Group
1.000 33 1.040 18 14.73 17.39 1.04 57 1 3248.5 Janus Forty S
1.179 72 1.095 34 11.55 14.66 1.17 45 21 5299.8 Jensen Quality Growth R
1.163 50 1.075 50 12.72 16.02 1.06 50 - - Large Blend Peer Group
1.000 23 0.970 19 13.07 17.18 0.88 66 18 20885.0 Davis NY Venture A Load Waived
1.155 50 1.000 50 12.94 16.69 1.06 50 - - Large Value Peer Group
1.140 46 0.970 40 12.55 16.67 0.82 76 15 9033.3 Invesco Growth and Income A Load Waived
Asst All/Other 1.080 87 1.110 82 9.64 10.70 1.09 65 18 20167.9 Oakmark Equity & Income II
Bond /MMF 1.183 50 1.746 50 2.89 3.33 0.80 5012 - -30 Intermediate-Term Bond Peer Group
0.970 22 1.670 41 3.89 3.86 0.71 61 27 237264.3 PIMCO Total Return Admin
Please refer to the Appendix page for additional footnotes
FOR PLAN SPONSOR USE ONLY - NOT FOR USE WITH PLAN PARTICIPANTS
Not intended as an offer or solicitation of securities
Page 8 of 22
CONFIDENTIAL - DO NOT DISCLOSE OR DISSEMINATE
Data Source: Morningstar Direct®
98719-01 | CITY OF EDMOND 457 DEFERRED COMPENSATION PLAN

ANNUAL RETURNS AND STATISTICS
Fund Name 2013 2012 2011 2010 2009
Calendar Year Returns
Alpha Beta R2
MPT Statistics (3 year)Turnover
Ratio
Number of
Holdings
% in Top
10 Holdings
Portfolio Construction
International 18.89 18.68 -12.05 13.80 36.12 N/A N/A N/A N/A N/A N/A Foreign Large Growth Peer Group10
15.35 15.34 -13.24 13.70 31.43 0.09 0.93 94 34 86 23.9% Thornburg International Value A LW
20.00 18.16 -13.61 10.49 31.46 N/A N/A N/A N/A N/A N/A Foreign Large Blend Peer Group
19.79 18.89 -13.85 9.07 38.71 2.09 0.93 96 27 395 21.5% American Funds EuroPacific Gr R3
Specialty 1.67 16.84 8.09 27.58 29.30 N/A N/A N/A N/A N/A N/A Real Estate Peer Group11
1.79 16.55 7.58 22.79 29.69 0.39 0.87 59 60 45 54.3% Invesco Real Estate A Load Waived
Small-Cap 41.03 13.96 -2.59 27.71 35.91 N/A N/A N/A N/A N/A N/A Small Growth Peer Group14
12.91 4.48 -14.58 31.49 53.58 -19.56 1.37 76 8 115 19.5% Royce Low Priced Stock Svc
36.01 15.93 -4.50 25.42 31.50 N/A N/A N/A N/A N/A N/A Small Value Peer Group
32.11 13.83 -6.92 21.28 44.49 -5.87 1.17 78 24 134 19.8% Heartland Value
Mid-Cap 35.37 14.45 -3.82 25.75 40.57 N/A N/A N/A N/A N/A N/A Mid-Cap Growth Peer Group
38.32 16.43 1.24 24.01 34.24 0.97 1.03 84 9 103 26.2% Baron Growth Retail
33.71 16.84 -3.33 24.00 35.97 N/A N/A N/A N/A N/A N/A Mid-Cap Blend Peer Group
44.49 16.45 -6.55 23.02 66.18 -5.77 1.43 87 37 50 30.0% ASTON/Fairpointe Mid Cap N
Large-Cap 33.91 15.32 -1.77 16.00 34.95 N/A N/A N/A N/A N/A N/A Large Growth Peer Group
31.73 23.65 -7.32 5.62 43.53 -2.88 1.12 85 43 37 43.7% Janus Forty S
31.80 13.27 -1.17 11.54 28.65 -0.71 0.91 91 22 29 43.7% Jensen Quality Growth R
31.90 15.42 -0.15 14.28 27.09 N/A N/A N/A N/A N/A N/A Large Blend Peer Group
34.56 12.73 -4.78 12.11 32.06 -3.55 1.06 95 7 71 48.5% Davis NY Venture A Load Waived
31.52 14.90 -0.33 13.35 23.98 N/A N/A N/A N/A N/A N/A Large Value Peer Group
33.84 14.58 -2.09 12.65 24.26 -1.63 1.01 95 29 78 25.9% Invesco Growth and Income A Load Waived
Asst All/Other 23.83 8.75 0.27 9.17 19.47 0.87 1.10 86 25 146 30.2% Oakmark Equity & Income II
Bond /MMF -1.72 6.41 6.39 7.48 12.50 N/A N/A N/A N/A N/A N/A Intermediate-Term Bond Peer Group1230
-2.17 10.08 3.91 8.56 13.55 0.53 1.01 51 380 20509 75.7% PIMCO Total Return Admin
Please refer to the Appendix page for additional footnotes
FOR PLAN SPONSOR USE ONLY - NOT FOR USE WITH PLAN PARTICIPANTS
Not intended as an offer or solicitation of securities
Page 9 of 22
CONFIDENTIAL - DO NOT DISCLOSE OR DISSEMINATE
Data Source: Morningstar Direct®
98719-01 | CITY OF EDMOND 457 DEFERRED COMPENSATION PLAN

INDEX PERFORMANCE
Index
Total
Return
1 Year
Annual
Return
2013
Annual
Return
2012
Annual
Return
2011
Annual
Return
2010
Annual
Return
2009
Total
Return
Annlzd
3 Year
Total
Return
Annlzd
5 Year
Total
Return
Annlzd
10 Year
-4.98 -4.50 12.08 8.52MSCI EMF ID -4.98 15.15 -20.41 16.36 74.50International 10
22.78 8.17 12.44 6.91MSCI EAFE Ndtr_D 22.78 17.32 -12.14 7.75 31.78
26.68 11.49 15.02 6.98MSCI World Ndtr_D 26.68 15.83 -5.54 11.76 29.99
43.30 16.82 22.58 9.41Russell 2000 Growth 43.30 14.59 -2.91 29.09 34.47Small-Cap 14
38.82 15.67 20.08 9.07Russell 2000 38.82 16.35 -4.18 26.85 27.17
34.52 14.49 17.64 8.61Russell 2000 Value 34.52 18.05 -5.50 24.50 20.58
35.74 15.63 23.37 9.77Russell Mid Cap Growth 35.74 15.81 -1.65 26.38 46.29Mid-Cap
33.50 15.64 21.89 10.36Standard & Poor's Midcap 400 33.50 17.88 -1.73 26.64 37.38
33.46 15.97 21.16 10.26Russell Mid Cap Value 33.46 18.51 -1.38 24.75 34.21
33.48 16.45 20.39 7.83Russell 1000 Growth 33.48 15.26 2.64 16.71 37.21Large-Cap
32.39 16.18 17.94 7.41Standard & Poor's 500 32.39 16.00 2.11 15.06 26.46
32.53 16.06 16.67 7.58Russell 1000 Value 32.53 17.51 0.39 15.51 19.69
-2.02 3.26 4.44 4.55BarCap US Aggregate Bond -2.02 4.21 7.84 6.54 5.93Bond /MMF 1230
-2.01 5.11 7.89 5.23BarCap US Credit -2.01 9.37 8.35 8.47 16.04
-1.41 2.42 3.69 4.61BarCap US MBS -1.41 2.59 6.23 5.37 5.89
-2.60 2.70 2.26 4.14BarCap US Government Bond -2.60 2.02 9.02 5.52 -2.20
0.37 0.81 1.25 2.67BarCap US Govt 1-3 Yr 0.37 0.51 1.56 2.40 1.41
Please refer to the Appendix page for additional footnotes
FOR PLAN SPONSOR USE ONLY - NOT FOR USE WITH PLAN PARTICIPANTS
Not intended as an offer or solicitation of securities
Page 10 of 22
CONFIDENTIAL - DO NOT DISCLOSE OR DISSEMINATE
Data Source: Morningstar Direct®
98719-01 | CITY OF EDMOND 457 DEFERRED COMPENSATION PLAN

100% Total
• The Profile funds range from Aggressive to Conservative.
Aggressive Profile
Asset Class
International 25%
Small Cap
Mid Cap
Large Cap
20%
30%
25%
Allocation
COMPOSITION: • The asset classes for each Profile vary. Therefore, the mix of funds in which each invests also varies.
• Each profile invests in a mix of underlying funds subject to the same standards of other funds within
* Great-West FinancialSM packaged annuities.
FUNDS:
TYPE: • Profiles are static asset allocation funds that invest in underlying funds.
RISK: • They range from aggressive risk to conservative risk and invest in an optimized mix of international equity
* funds, US equity funds and fixed income funds. Allow investors to diversify among several different funds
* and asset classes with one holding.
OBJECTIVE: • To provide a well diversified portfolio. This helps to spread investing risks among various asset classes.
PROFILE SERIES: FUNDS
EXAMPLE:
Please refer to the Appendix page for additional footnotes
FOR PLAN SPONSOR USE ONLY - NOT FOR USE WITH PLAN PARTICIPANTS
Not intended as an offer or solicitation of securities
Page 11 of 22
CONFIDENTIAL - DO NOT DISCLOSE OR DISSEMINATE
Data Source: Morningstar Direct®
98719-01 | CITY OF EDMOND 457 DEFERRED COMPENSATION PLAN

PROFILE SERIES: PERFORMANCE
Profiles compared to a series of blended benchmarks of passive indexes based on the overall asset allocation of the
particular Profile.
For example, Aggressive Profile (which is 73% domestic equity funds and 27% international funds) compared to a
weighted average return of:
73% Wilshire 5000
27% MSCI EAFE Index
Inception
Date Fund Name 1 Year 3 Year 5 Year 10 Year/S.I.
Underlying
Fund
Expense
Admin
Fee
Total
Fund
Expense
Performance (Annualized Returns)
09/16/1999 Great-West Moderate Profile II Init 0.80% 0.10% 0.90% 16.29% 8.97% 12.47% 7.04% 0.00
Weighted Composite 15.97% 9.25% 11.95% 6.29%
09/27/1999 Great-West Moderately Cnsrv Prfl II Init 0.76% 0.10% 0.86% 12.03% 7.47% 10.86% 6.48% 0.00
Weighted Composite 11.26% 7.61% 10.14% 5.84%
09/16/1999 Great-West Moderately Agg Prfl II Init 0.93% 0.10% 1.03% 20.42% 10.38% 14.47% 7.47% 0.00
Weighted Composite 20.20% 10.76% 13.64% 6.94%
09/30/1999 Great-West Conservative Profile II Init 0.71% 0.10% 0.81% 7.67% 5.97% 9.34% 5.57% 0.00
Weighted Composite 6.70% 5.89% 8.17% 5.03%
09/16/1999 Great-West Aggressive Profile II Init 1.05% 0.10% 1.15% 29.07% 12.88% 17.28% 7.76% 0.00
Weighted Composite 29.37% 13.61% 16.79% 7.75%
The performance data quoted above represents past performance and is not a guarantee or indication of future
investment results. Composite returns adjusted for applicable operating expenses and fees.
The investment return and principal value of an investment will fluctuate so that an investor's shares, when redeemed,
may be more or less than their original cost.
Please refer to the Appendix page for additional footnotes
FOR PLAN SPONSOR USE ONLY - NOT FOR USE WITH PLAN PARTICIPANTS
Not intended as an offer or solicitation of securities
Page 12 of 22
CONFIDENTIAL - DO NOT DISCLOSE OR DISSEMINATE
Data Source: Morningstar Direct®
98719-01 | CITY OF EDMOND 457 DEFERRED COMPENSATION PLAN

PROFILE SERIES: ASSET CLASS RANGES
The five Profiles range from aggressive to conservative. More aggressive Profiles are weighted towards
international, small cap and mid-cap equities while more conservative Profiles are weighted towards short-term and
bond investments.
Profiles will always be invested within the ranges below:
Specific Profile asset allocations (within these ranges) set on an annual basis. Individual Profiles rebalanced back to
target allocations quarterly.
International:
Small Cap:
Mid Cap:
Large Cap:
Real Estate:
Bond:
10 - 40% 0 - 30% 0 - 15%
5 - 35% 0 - 25% 0 - 15%
15 - 45% 0 - 30% 0 - 15%
30 - 50% 15 - 45% 10 - 40%
0 - 10% 0 - 10% 0 - 10%
0 - 10% 10 - 30% 25 - 45%
Aggressive
Profile
Moderate
Profile
Conservative
Profile
Moderately
Aggressive
Profile
5 - 25%
0 - 10%
20 - 50%
5 - 35%
0 - 25%
5 - 35%
Moderately
Conservative
Profile
20 - 40%
0 - 10%
10 - 40%
0 - 25%
0 - 15%
0 - 30%
Short-Term: 0 - 10% 5 - 25% 25 - 45%0 - 15% 10 - 30%
Please refer to the Appendix page for additional footnotes
FOR PLAN SPONSOR USE ONLY - NOT FOR USE WITH PLAN PARTICIPANTS
Not intended as an offer or solicitation of securities
Page 13 of 22
CONFIDENTIAL - DO NOT DISCLOSE OR DISSEMINATE
Data Source: Morningstar Direct®
98719-01 | CITY OF EDMOND 457 DEFERRED COMPENSATION PLAN

14.56%
4.80%
9.76%
Conservative
Profile
PROFILE SERIES: CURRENT ALLOCATIONS
Asset class ranges are developed using Modern Portfolio Theory and Ibbotson Optimizer software. Long-term
returns, volatility and correlation of returns of the asset classes evaluated.
An efficient frontier of available investments created using Optimizer Software
with the intent of maximizing returns at the minimum possible risk.
Committee of investment professionals meets to review output from software
and finalize allocations. Once the asset class ranges determined, underlying
investment managers are chosen to provide exposure to different investment
styles: i.e. Growth, Value, Blend
Expected Risk (standard deviation)
Expected Return
(average annual)
Current Profile Allocations
International
Great-West MFS International Growth Fund
Great-West MFS International Value Fund
Small Cap
Great-West Small Cap Growth Fund
Great-West Loomis Sayles Small Cap Value Fund
Great-West Invesco Small Cap Value Fund
Mid Cap
Great-West T. Rowe Price Mid Cap Growth Fund
Great-West Goldman Sachs Mid Cap Value Fund
Large Cap
Great-West Multi-Manager Large Cap Growth Fund
Great-West American Century Growth
Great-West Putnam Equity Income Fund
Great-West T. Rowe Price Equity Income Fund
Bond
Great-West U.S. Government Mortgage Securities Fund
Great-West Templeton Global Bond Fund
Great-West Federated Bond Fund
Great-West Putnam High Yield Bond Fund
Great-West Loomis Sayles Bond Fund
Short-Term
Guaranteed Portfolio Fund
Great-West Short Duration Bond Fund
25.22%
8.32%
16.90%
8.73%
2.91%
2.91%
2.91%
20.37%
4.07%
16.30%
42.68%
7.04%
7.04%
14.30%
14.30%
0.00%
0.00%
0.00%
0.00%
0.00%
0.00%
0.00%
0.00%
0.00%
5.04%
1.68%
1.68%
1.68%
11.76%
2.35%
9.41%
24.64%
4.07%
4.07%
8.25%
8.25%
24.00%
5.04%
6.48%
4.80%
2.40%
5.28%
16.00%
16.00%
0.00%
6.51%
2.15%
4.36%
2.25%
0.75%
0.75%
0.75%
5.25%
1.05%
4.20%
11.02%
1.82%
1.82%
3.69%
3.69%
40.97%
8.61%
11.04%
8.20%
4.10%
9.02%
29.00%
22.50%
6.50%
Aggressive
Profile
Moderate
Profile
Moderately
Aggressive
Profile
Moderately
Conservative
Profile
10.53%
3.47%
7.06%
3.66%
1.22%
1.22%
1.22%
8.50%
1.70%
6.80%
17.82%
2.94%
2.94%
5.97%
5.97%
32.99%
6.93%
8.90%
6.60%
3.30%
7.26%
22.00%
22.00%
0.00%
18.06%
5.96%
12.10%
6.27%
2.09%
2.09%
2.09%
14.59%
2.92%
11.67%
30.58%
5.05%
5.05%
10.24%
10.24%
18.00%
3.78%
4.86%
3.60%
1.80%
3.96%
9.00%
9.00%
0.00%
Alternative
Great-West Real Estate Index
3.00%
3.00%
3.50%
3.50%
4.00%
4.00%
4.50%
4.50%
5.00%
5.00%
Please refer to the Appendix page for additional footnotes
FOR PLAN SPONSOR USE ONLY - NOT FOR USE WITH PLAN PARTICIPANTS
Not intended as an offer or solicitation of securities
Page 14 of 22
CONFIDENTIAL - DO NOT DISCLOSE OR DISSEMINATE
Data Source: Morningstar Direct®
98719-01 | CITY OF EDMOND 457 DEFERRED COMPENSATION PLAN

PROFILE SERIES: UNDERLYING FUNDS
PercentileFund Name
1 Year
Return
1 Year
Percentile
3 Year
Return
3 Year
Percentile
4th
Quarter
2013 5 Year
Return
5 Year
Percentile
10 Year
Return
10 Year
Percentile
Performance vs. Benchmark (Annualized Returns and Return Percentiles %) 4th
Quarter
2013
Return
18.89 50 7.41 50 13.77 50 7.15 50Foreign Large Growth Peer Group 5.67 50International 10
18.21 45 9.10 74 13.55 45 8.56 76Great-West MFS International Growth Init Foreign Large Growth 5.76 52
21.68 50 7.41 50 11.59 50 6.60 50Foreign Large Value Peer Group 6.02 50
27.99 98 13.75 100 16.18 97 6.96 60Great-West MFS International Value Init Foreign Large Value 5.21 25
41.03 50 16.17 50 22.08 50 9.40 50Small Growth Peer Group 8.05 50Small-Cap 14
44.82 73 18.30 78 22.03 49 7.34 11Great-West Small Cap Growth Init Small Growth 8.65 62
37.69 50 15.41 50 20.11 50 8.84 50Small Blend Peer Group 9.05 50
34.87 25 15.27 47 19.41 35 9.95 77Great-West Loomis Sayles Sm Cp Val Init Small Blend 8.96 47
35.99 50 14.56 50 19.89 50 9.34 50Small Value Peer Group 9.20 50
35.66 48 14.77 54 19.22 39 N/A N/AGreat-West Invesco Small Cap Value Init Small Value 7.82 11
35.37 50 13.97 50 20.98 50 9.39 50Mid-Cap Growth Peer Group 8.12 50Mid-Cap
36.36 60 15.08 67 23.00 82 10.94 82Great-West T. Rowe Price Mid Cap Gr Init Mid-Cap Growth 7.72 33
34.91 50 14.65 50 20.13 50 9.25 50Mid-Cap Value Peer Group 8.73 50
33.66 38 15.92 68 19.79 43 N/A N/AGreat-West Goldman Sachs MidCap Val Init Mid-Cap Value 9.94 71
33.91 50 14.96 50 18.85 50 7.52 50Large Growth Peer Group 10.34 50Large-Cap
29.40 15 N/A N/A N/A N/A N/A N/AGreat-West American Century Growth Init Large Growth 9.40 24
28.93 11 11.90 10 17.48 27 8.82 81Great-West Multi-Manager LgCpGr Init Large Growth 10.69 59
31.52 50 14.73 50 16.20 50 7.21 50Large Value Peer Group 9.49 50
31.65 52 N/A N/A N/A N/A N/A N/AGreat-West Putnam Equity Income Init Large Value 9.39 47
30.01 32 14.74 50 16.83 64 7.41 58Great-West T. Rowe Price Equity Inc Init Large Value 8.81 31
-2.93 50 2.76 50 5.52 50 4.77 50World Bond Peer Group 0.38 50Bond 12
0.56 83 4.32 78 7.63 67 7.58 95Great-West Templeton Global Bond Init World Bond 1.93 88
6.61 50 8.17 50 16.27 50 7.26 50High Yield Bond Peer Group 3.19 50
7.67 72 8.18 50 16.85 63 6.20 11Great-West Putnam High Yield Bond Init High Yield Bond 3.48 70
0.93 50 5.49 50 11.05 50 6.29 50Multisector Bond Peer Group 1.71 50
N/A N/A N/A N/A N/A N/A N/A N/AGuaranteed Portfolio Fund Multisector Bond N/A N/A
8.05 95 9.40 96 15.37 91 8.26 92Great-West Loomis Sayles Bond Init Multisector Bond 2.40 76
-1.72 50 3.63 50 6.25 50 4.40 50Intermediate-Term Bond Peer Group 0.16 50
-2.20 31 3.17 33 5.82 40 4.73 64Great-West Federated Bond Init Intermediate-Term Bond 0.46 65
-2.63 50 2.14 50 3.13 50 3.81 50Intermediate Government Peer Group -0.60 50
-2.02 74 2.25 57 3.65 66 4.11 72Great-West US Gov Mortg Sec Init Intermediate Government -0.60 48
0.58 24 N/A N/A N/A N/A N/A N/AGreat-West Real Estate Index Initial (Idx) Real Estate -1.21 16Index Funds 16
Please refer to the Appendix page for additional footnotes
FOR PLAN SPONSOR USE ONLY - NOT FOR USE WITH PLAN PARTICIPANTS
Not intended as an offer or solicitation of securities
Page 15 of 22
CONFIDENTIAL - DO NOT DISCLOSE OR DISSEMINATE
Data Source: Morningstar Direct®
98719-01 | CITY OF EDMOND 457 DEFERRED COMPENSATION PLAN

IMPORTANT DISCLOSURES
Footnote
Subscript Disclosure
The Overall Rating is derived from the 3, 5 and 10 year net-of-fee performance figures, the 3 and 5 year Sharpe Ratio and the Morningstar Rating. 1
The Long-Term Rolling Analysis accumulates the trailing 12 quarter Overall Ratings and determines a Pass / Fail designation accordingly. 2
A Percentile Ranking of 100% represents the best in class performance, whereas 0% represents the lowest. 3
MSCI EMF ID: A capitalization-weighted index of stocks from 26 emerging markets that only includes issues that may be traded by foreign investors. The reported returns
reflect equities priced in US dollars and do not include the effects of reinvested dividends.
4
The Fund Performance Review is a proprietary high level analytical tool that is used to evaluate fund performance and is not intended as an offer or solicitation of securities,
or as investment advice.
5
Please check on the availability of the Great-West product and its Blue Sky status for NAV. 6
MSCI Eafe Ndtr_D: Widely accepted as a benchmark for international stock performance, the EAFE Index is an aggregate of 21 individual country indexes that collectively
represent many of the major markets of the world.
7
MSCI World Ndtr_D: Includes all 23 MSCI developed market countries. Ndtr_D indexes are calculated daily and take into account actual dividends reinvested daily before
withholding taxes, but exclude special tax credits declared by companies.
8
Russell 2000 Growth: Market-weighted total return index that measures the performance of companies within the Russell 2000 Index having higher price-to-book ratios and
higher forecasted growth values.
9
Foreign investments, if part of the fund lineup, involve special risks, including currency fluctuations and political developments. 10
Specialty funds limit the number of issuers in which they invest and are generally non-diversified. 11
An investment in a Money Market Portfolio/Fund, if part of the portfolio/fund lineup, is not insured or guaranteed by the Federal Deposit Insurance Corporation. Although the
portfolio/fund seeks to preserve the value of your investment at $1.00 per share, it is possible to lose money by investing in the portfolio/fund.
12
Russell 2000: Consists of the smallest 2000 companies in the Russell 3000 Index, representing approximately 7% of the Russell 3000 total market capitalization. 13
Equity securities of small-sized companies may be more volatile than securities of larger, more established companies. 14
Russell 2000 Value: Market-weighted total return index that measures the performance of companies within the Russell 2000 Index having lower price-to-book ratios and
lower forecasted growth values.
15
Index Funds are not provided an overall rating as their objective is to track their respective index, not to outperform managed funds. 16
Russell Midcap Growth: Market-weighted total return index that measures the performance of companies within the Russell Midcap Index having higher price-to-book ratios
and higher forecasted growth values.
17
Standard & Poor's Midcap 400: Includes approximately 10% of the capitalization of U.S. equity securities. These are comprised of stocks in the middle capitalization range. 18
Russell Midcap Value: Market-weighted total return index that measures the performance of companies within the Russell Midcap Index having lower price-to-book ratios and
lower forecasted growth values.
19
Barra Large Cap Growth: Market capitalization-weighted index of the stocks in the Standard & Poor's 500 Index having the lowest book to price ratios. The index consists of
approximately half of the S&P 500 on a market capitalization basis.
20
Standard & Poor's 500: A market capitalization-weighted index of 500 widely held stocks often used as a proxy for the stock market. It measures the movement of the largest
issues. Standard and Poor's chooses the member companies for the 500 based on market size, liquidity and industry group representation.
21
Barra Large Cap Value: Market capitalization-weighted index of the stocks in the Standard & Poor's 500 Index having the highest book to price ratios. The index consists of
approximately half of the S&P 500 on a market capitalization basis.
22
Barclays Capital Aggregate Bond: Composed of the Barclays Capital Govt/Credit Index, the Mortgage-Backed Securities Index, and the Asset-Backed Securities Index. 23
Bar Cap Credit: Listed for corporate bond-general and high-quality funds. This index tracks the returns of all publicly issued, fixed-rate, nonconvertible, dollar-denominated,
SEC-registered, investment-grade corporate debt.
24
Bar Cap Mortgage-Backed: Includes 15- and 30-year fixed-rate securities backed by mortgage pools of the Government National Mortgage Association (GNMA). 25
FOR PLAN SPONSOR USE ONLY - NOT FOR USE WITH PLAN PARTICIPANTS
Not intended as an offer or solicitation of securities
Page 16 of 22
CONFIDENTIAL - DO NOT DISCLOSE OR DISSEMINATE
Data Source: Morningstar Direct®
98719-01 | CITY OF EDMOND 457 DEFERRED COMPENSATION PLAN

IMPORTANT DISCLOSURES
Footnote
Subscript Disclosure
Bar Cap Government Bond: Listed for government-bond general and Treasury funds because it tracks the returns of U.S. Treasuries, agency bonds, and one- to three-year
U.S. government obligations. This index is effective for tracking portfolios holding non-mortgage government securities.
26
Bar Cap 1-3 Year Government: Comprised of both the Treasury Bond index (all public obligations of the U.S. Treasury, excluding flower bonds and foreign-targeted issues)
and the Agency Bond Index (all publicly issued debt of U.S. Government agencies and quasi-federal corporations and corporate-debt guaranteed by the U.S. Government).
27
In certain instances the fund shown and the related data is the load waived share class. 28
Investment options available in the plan may be through mutual funds and / or a group fixed annuity contract. Total return performance shown above represents that of the
underlying fund and does not include a deduction for any applicable annuity contract of administrative fees / expenses. Performance numbers shown above would be less
after applicable fees / expenses are deducted.
29
FOR PLAN SPONSOR USE ONLY - NOT FOR USE WITH PLAN PARTICIPANTS
Not intended as an offer or solicitation of securities
Page 17 of 22
CONFIDENTIAL - DO NOT DISCLOSE OR DISSEMINATE
Data Source: Morningstar Direct®
98719-01 | CITY OF EDMOND 457 DEFERRED COMPENSATION PLAN

APPENDIX A - ADDITIONAL DISCLOSURES
1. An investment in a money market fund, if part of the fund lineup, is not insured or guaranteed by the Federal Deposit Insurance Corporation.
Although the fund seeks to preserve the value of your investment at $1.00 per share, it is possible to lose money by investing in the fund.
FOR PLAN SPONSOR USE ONLY - NOT FOR USE WITH PLAN PARTICIPANTS
Not intended as an offer or solicitation of securities
Page 18 of 22
CONFIDENTIAL - DO NOT DISCLOSE OR DISSEMINATE
Data Source: Morningstar Direct®
98719-01 | CITY OF EDMOND 457 DEFERRED COMPENSATION PLAN

APPENDIX B - GLOSSARY12b-1 Fee The maximum annual charge deducted from fund assets to pay for distribution and marketing costs. Although usually set on a percentage basis, this amount will occasionally
be a flat figure.
Actively managed A fund attempts to add portfolio value through such active investment techniques as sector allocation (top-down) and/or security selection (bottom-up).
Aggressive Growth (Objective) Funds that seek high growth of capital. Investments may include smaller companies, companies in newly-emerging industries or in special situations
(i.e., turnaround, mergers & acquisitions, etc.).
Alpha is the coefficient that measures the portion of an investment's return arising from non-market or unsystematic risk. In actively managed portfolios, alpha is considered to be the
value added by the manager through sector or security selection. A negative alpha would indicate that active management had produced less-than-market returns.
Annual Returns Total returns calculated on a calendar-year basis. The annual return for a fund will be the same as its trailing 12-month total return only at year-end.
Annualized Returns Returns for periods longer than one year are expressed as "annualized returns." This is equivalent to the compound rate of return which, over a certain period of time,
would produce a fund’s total return over that same period.
Asset Allocation (Objective) Funds that seek high total return by investing in a mix of equities, fixed-income securities and money market instruments.
Barclays Capital Aggregate Index Composed of the Barclays Capital Govt/Credit Index, the Mortgage-Backed Securities Index, and the Asset-Backed Securities Index. The returns
published for the index are total returns, which include reinvestment of dividends.
Barclays Capital Government Bond Index Listed for government-bond general and Treasury funds. Because it tracks the returns of U.S. Treasuries, agency bonds, and one- to three-year
U.S. government obligations, this index is effective for tracking portfolios holding non-mortgage government securities. The returns published for the index are total returns, which include
reinvestment of dividends.
Basis Point One-hundredth of a percentage point. For example, 50 basis points equals .50%.
Beta also known as market or systematic risk, beta is the coefficient that measures an investment's volatility relative to "the market" (the S & P 500 Index has a beta of 1.00) as a whole.
Portfolios with a beta greater than 1.00 will move higher or lower than the market as a whole, while those with betas of less than 1.00 will move less than the market.
Bond funds Contrary to individual bonds, which offer a guaranteed rate of return, bond funds are variable funds and their returns may rise or fall depending on market conditions. Funds
with 70% or more of their assets invested in bonds are classified as Bond Funds. Bond funds are divided into two main groups: Taxable Bond and Municipal Bond. Taxable Bond Fund
categories include the following: Long-Term Government, Intermediate-Term Government, Short-Term Government, Long-Term Bond, Intermediate-Term Bond, Short-Term Bond,
Ultrashort-Bond, International- Bond, High-Yield Bond, Emerging-Markets Bond and Multisector Bond.
Capital Appreciation The market rise in share value of a company as it experiences growth in earnings and/or assets. By extension, funds will experience capital appreciation as the
underlying securities in their portfolios appreciate in value.
Capitalization The total market value of all stock issued by a company. Funds are frequently categorized by the market capitalization of the stocks in their portfolios; i.e., “small cap”
generally refers to companies valued by the market at less than $1 billion, “Mid-cap” to companies valued between $1 billion and $5 billion, and “Large-cap” to companies valued at more
than $5 billion.
Corporate Bond--General (Objective) Funds that seek income by investing in fixed-income securities. Funds with this objective may hold a variety of issues, including but not limited to
government bonds, high-quality corporates, mortgages, asset-backeds, bank loans and junk bonds.
Corporate Bond--High Yield (Objective) Funds that seek income by generally investing 65% or more of their assets in bonds rated below BBB. The price of these issues is generally
affected more by the condition of the issuing company (similar to a stock) than by the interest-rate fluctuation that usually causes bond prices to move up and down.
Diversification The investment practice of spreading assets in a portfolio among a number of different companies, industries, sectors and/or instruments. Under Modern Portfolio Theory,
the practice of diversification may assist an investor in reducing overall portfolio risk and evening out portfolio returns.
Domestic equity funds are placed in a category based on the style and size of the stocks they typically own. The style and size parameters are based on the divisions used in the
investment style box: Value, Blend, or Growth style and Small, Medium, or Large median market capitalization.
Equity-Income (Objective) Funds that are expected to pursue current income by investing at least 65% of their assets in dividend-paying equity securities.
Excess Returns The percentage of fund assets paid for operating and administrative expenses, as well as management fees. Fund expenses are reflected in a Fund’s NAV.
FOR PLAN SPONSOR USE ONLY - NOT FOR USE WITH PLAN PARTICIPANTS
Not intended as an offer or solicitation of securities
Page 19 of 22
CONFIDENTIAL - DO NOT DISCLOSE OR DISSEMINATE
Data Source: Morningstar Direct®
98719-01 | CITY OF EDMOND 457 DEFERRED COMPENSATION PLAN

APPENDIX B - GLOSSARY (CONTINUED)Expense Ratio The percentage of fund assets paid for operating expenses and management fees, including 12b-1 fees, administrative fees, and all other asset-based costs incurred by
the fund, except brokerage costs. Fund expenses are reflected in the fund’s NAV. Sales charges are not included in the expense ratio.
Foreign Stock Category An international fund having no more than 10% of stocks invested in the United States.
Fund of Funds A fund that specializes in buying shares in other mutual funds rather than individual securities. Quite often this type of fund is not discernible from its name
alone, but rather through prospectus wording (i.e.: the fund’s charter).
Government Bond--General (Objective) Offerings that pursue income by investing in a combination of mortgage-backed securities, Treasuries, and agency securities.
Growth (Objective) Funds that pursue capital appreciation by investing primarily in equity securities. Current income, if considered at all, is a secondary concern.
Growth and Income (Objective) Growth of capital and current income are near-equal objectives for these funds. Investments are typically selected for both appreciation potential and
dividend-paying ability.
Index Fund A fund that tracks a particular index and attempts to match returns. While an index typically has a much larger portfolio than a mutual fund, the fund’s management may study
the index’s movements to develop a representative sampling, and match sectors proportionately.
International Equity Funds with 40% or more of their equity holdings in foreign stocks (on average over three years) are placed in the international equity class. These categories include
Europe, Japan, International Hybrid, Latin America, Diversified Pacific, Pacific ex. Japan, Specialty Precious Metals, Diversified Emerging Markets, World Stock, and Foreign Stock. Foreign
investments involve special risks, including currency fluctuations and political developments.
Life Cycle These funds are geared toward investors of a certain age or with a specific time horizon for investing. Typically they are grouped together in sets (i.e. conservative, moderate,
and aggressive portfolios).
Management Fees The management fee is the percentage deducted from fund assets to pay an advisor or subadvisor. Often, as the fund's net assets grow, the percentage deducted for
management fees decreases. For example, a particular fund may report a management fee of 0.40% on the first $500 million in assets, 0.35% on all assets between $500 million and
$1 billion, and 0.30% on assets in excess of $1 billion. Thus, if the fund contains $1.5 billion in total net assets, the advisor scales back its management fees accordingly. Alternatively,
the fund may compute the fee as a flat percentage of average net assets.
The management fee might also come in the form of a group fee (G), a performance fee (P), or a gross income fee (I). Note: The management fee is just one (albeit a major) component
of a fund's costs. The overall expense ratio is the most useful number for investors. Actual fees are also noted in this section.
Morningstar was founded in 1984 to provide investors with useful information for making intelligent, informed investment decisions. The company’s first product, originally named the
Mutual Fund Sourcebook, proved to be innovative in its ability to tap into an underserved market. Soon a demand grew for an even more in-depth and analytical publication, leading to the
launch of Morningstar Mutual Funds in late 1986. Morningstar and Advised Assets Group are separate and unaffiliated. The Morningstar name is a registered mark of Morningstar. Marks
used in conjunction with Morningstar products or services are the property of Morningstar or its subsidiaries.
Morningstar Category identifies funds based on their actual investment styles as measured by their underlying portfolio holdings (portfolio statistics and compositions over the past
three years). If the fund is new and has no portfolio, we estimate where it will fall before assigning a more permanent category. When necessary, we may change a category assignment
based on current information.
MSCI EAFE Ndtr_D Listed for foreign stock funds (EAFE refers to Europe, Australasia, and Far East). Widely accepted as a benchmark for international stock performance, the EAFE Index
is an aggregate of 21 individual country indexes that collectively represent many of the major markets of the world. Ndtr_D indexes are calculated daily and take into account actual
dividends reinvested daily before withholding taxes, but exclude special tax credits declared by companies. In addition, Ndtr_D indexes subtract withholding taxes retained at the source,
for foreigners who do not benefit from a double taxation treaty. The returns published for the index are total returns, which include reinvestment of dividends.
MSCI World Ndtr_D Includes all 23 MSCI developed market countries. Ndtr_D indexes are calculated daily and take into account actual dividends reinvested daily before withholding
taxes, but exclude special tax credits declared by companies. In addition, Ndtr_D indexes subtract withholding taxes retained at the source, for foreigners who do not benefit from a double
taxation treaty.
Mutual fund An investment option that pools money from many shareholders and invests it in a group of stocks, bonds, or other securities. Also known as an open-end investment
management company, mutual funds are securities required to be registered with the SEC.
FOR PLAN SPONSOR USE ONLY - NOT FOR USE WITH PLAN PARTICIPANTS
Not intended as an offer or solicitation of securities
Page 20 of 22
CONFIDENTIAL - DO NOT DISCLOSE OR DISSEMINATE
Data Source: Morningstar Direct®
98719-01 | CITY OF EDMOND 457 DEFERRED COMPENSATION PLAN

NAV Stands for net asset value, which is the fund’s share price. Funds compute this value by dividing the total net assets by the total number of shares.
Net Assets The month-end net assets of the mutual fund, recorded in millions of dollars. Net-asset figures are useful in gauging a fund’s size, agility, and popularity. They help determine
whether a small company fund, for example, can remain in its investment-objective category if its asset base reaches an ungainly size.
Overall Rating The equal weighted average of the Return Composite and the Sharpe Composite. The Return Composite is the equal weighted average of the 3, 5, and 10 year
category return percentiles. The Sharpe Composite is the equal weighted average of the 3 and 5 year category sharpe percentiles.
Prospectus A fund's formal written statement, generally issued on an annual basis. In this statement the fund sets forth its proposed purposes and goals, and other facts (e.g.: history
and investment objective) that an investor should know in order to make an informed decision.
Prospectus Objective Indicates a particular fund’s investment goals, based on the wording in a fund's prospectus.
R-squared (R2) measures the degree to which movement in one variable is related to the movement in another variable. Portfolios with a high R-squared will react similarly to various
market conditions. By combining investments with low correlations, an investor can reduce the overall risk within a portfolio.
Risk Basically there are four types of risk: 1) inflation risk means your money may not earn enough in the long run because as prices go up the value of your money goes down;
2) market risk means you could lose money because the price of a stock may go down; 3) credit risk means a company or organization that borrowed your money may not be able to pay it
back; and 4) interest rate risk means you could lose money because as interest rates go up the value of bond investments goes down.
Russell 1000 Consists of the 1000 largest companies within the Russell 3000 index. Also known as the Market-Oriented Index, because it represents the group of stocks from which
most active money managers choose. The returns published for the index are total returns, which include reinvestment of dividends.
Russell 1000 Growth Market-capitalization weighted index of those firms in the Russell 1000 with higher price-to-book ratios and higher forecasted growth values. The Russell 1000
includes the largest 1000 firms in the Russell 3000, which represents approximately 98% of the investable US equity market.
Russell 1000 Value Market-capitalization weighted index of those firms in the Russell 1000 with lower price-to-book ratios and lower forecasted growth values. The Russell 1000
includes the largest 1000 firms in the Russell 3000, which represents approximately 98% of the investable US equity market.
Russell 2000 Consists of the smallest 2000 companies in the Russell 3000 Index, representing approximately 7% of the Russell 3000 total market capitalization. The returns published
for the index are total returns, which include reinvestment of dividends.
Russell 2000 Growth Market-weighted total return index that measures the performance of companies within the Russell 2000 Index having higher price-to-book ratios and higher
forecasted growth values. The Russell 2000 Index includes the 2000 firms from the Russell 3000 Index with the smallest market capitalizations. The Russell 3000 Index represents 98%
of the of the investable US equity market.
Russell 2000 Value Market-weighted total return index that measures the performance of companies within the Russell 2000 Index having lower price-to-book ratios and lower forecasted
growth values. The Russell 2000 Index includes the 2000 firms from the Russell 3000 Index with the smallest market capitalizations. The Russell 3000 Index represents 98% of the of
the investable US equity market.
Share Classes Shares of the same fund that offer different shareholder rights and obligations, such as different fee and load charges. Common share classes are A (front-end load), B
(deferred fees), C (no sales charge and a relatively high annual 12b-1 fee, such as 1.00%). Multi-class funds hold the same investment portfolio for all classes, and differ only in their
surrounding fee structure.
Sharpe Ratio measures the risk-adjusted performance of a portfolio. It is calculated by subtracting the risk-free rate of return (i.e., the return on treasury bills) from the return of the
portfolio as a whole, then dividing by the standard deviation of the returns. The higher the Sharpe Ratio, the better the risk-adjusted performance of the portfolio.
Standard Deviation A statistical measurement of dispersion about an average, which, for a mutual fund, depicts how widely the returns varied over a certain period of time. Investors use
the standard deviation of historical performance to try to predict the range of returns that are most likely for a given fund. When a fund has a high standard deviation, the predicted range of
performance is wide, implying greater volatility.
Tax-deferred earnings You don't have to pay taxes on any earnings in your 401(k) until you withdraw your money. The money in a 401(k) can grow faster than with other types of savings
plans, because the earnings you accumulate, if any, are also tax-deferred.
APPENDIX B - GLOSSARY (CONTINUED)
FOR PLAN SPONSOR USE ONLY - NOT FOR USE WITH PLAN PARTICIPANTS
Not intended as an offer or solicitation of securities
Page 21 of 22
CONFIDENTIAL - DO NOT DISCLOSE OR DISSEMINATE
Data Source: Morningstar Direct®
98719-01 | CITY OF EDMOND 457 DEFERRED COMPENSATION PLAN

APPENDIX B - GLOSSARY (CONCLUDED)Turnover Ratio A measure of the percentage of holdings that have been "turned over" -- replaced with other holdings -- within a portfolio during the course of a year.
Variable funds Investments that fluctuate with market conditions. Unlike guaranteed investments, such as bonds or CDs, variable funds don't guarantee a specific rate of return. They do
offer potential for higher earnings in return for higher degree of market risk.
World Stock Category An international fund having more than 10% of stocks invested in the US. Also known as global funds. Foreign Investments involve special risks, including
currency fluctuations and political developments.
FOR PLAN SPONSOR USE ONLY - NOT FOR USE WITH PLAN PARTICIPANTS
Not intended as an offer or solicitation of securities
Page 22 of 22
CONFIDENTIAL - DO NOT DISCLOSE OR DISSEMINATE
Data Source: Morningstar Direct®
98719-01 | CITY OF EDMOND 457 DEFERRED COMPENSATION PLAN

PLAN REVIEW
CITY OF EDMOND 457 DEFERRED COMPENSATION PLAN | 98719-01Reporting Period Ending December 31, 2013

Executive Summary
Plan Assets
Asset Allocation
Plan Utilization
Participant Details
Contribution Analysis
Distributions
Loans
Web Site & KeyTalk® Utilization
Reality Investing® Advisory Services
Services Offered
Glossary of Terms
TABLE OF CONTENTS
City of Edmond 457 Deferred Compensation Plan98719-01 Reporting Period Ending December 31, 2013 For Plan Sponsor Use Only

Plan Assets
Plan Asset Balance
Account Reduction Loan Balance
Total Plan Asset Balance
As of 12/31/2012 As of 12/31/2013
$9,980,595 $11,246,863 $13,080,283
$10,319,791 $11,647,045 $13,523,130
Cash Flow
01/01/2011
to
12/31/2011
Contributions
Distributions
Net Cash Flow
$859,939
$253,107
$606,832
01/01/2012
to
12/31/2012
01/01/2013
to
12/31/2013
$866,347
$622,475
$243,873
$915,626
$1,140,752
$-225,126
As of 12/31/2011
$339,196 $400,182 $442,848
EXECUTIVE SUMMARY
City of Edmond 457 Deferred Compensation Plan98719-01 Reporting Period Ending December 31, 2013 For Plan Sponsor Use Only

Participants 12/31/2011
Eligible Employees
Participants Contributing
Active Participants with Balances
12/31/2012 12/31/2013
319 316 323
263 262 270
295 295 308
Cash Flow
Terminated Participants with Balances
Participants with Loan Balance
35 39 38
Plan Utilization 12/31/2011
Participation Rate
Average Participant Paycheck Contribution Dollar Amount**
Average Participant Paycheck Contribution Percentage Rate*
82.45% 82.91%
$137 $121
6.17% 5.00%
Average Participant Contribution Amount***
Average Participant Balance
$3,162
$30,237
$3,307
$33,669
12/31/2012 12/31/2013
83.59%
$133
5.71%
$3,270
$37,794
Investment Options in Plan with a Balance 22 22 23
Figures provided represent plan information as of the reporting date listed. Please refer to the Glossary of Terms for a description of each figure's calculation.
*If your plan only allows participant paycheck elections by amount, this will reflect 0%.
**If your plan only allows participant paycheck elections by percent, this will reflect $0.
***Average of total contributions during the reporting period.
716363
EXECUTIVE SUMMARY
City of Edmond 457 Deferred Compensation Plan98719-01 Reporting Period Ending December 31, 2013 For Plan Sponsor Use Only

The average number of investment options offered
in Defined Contribution plans is 19.90.*
*Source: PLANSPONSOR Defined Contribution Survey, 2012,
457 Plans
$0
$2,000,000
$4,000,000
$6,000,000
$8,000,000
$10,000,000
$12,000,000
$14,000,000
12/31/2011 12/31/2012 12/31/2013
Your plan's total asset balance is illustrated here. Total asset balance includes the balances of all employed and previously
employed participants, in addition to plan forfeiture assets. Total loan balance includes all outstanding loans.
Plan Asset History
% Change in Plan Assets
Number of Investment Options
12/31/2012 to 12/31/2013
12/31/2011 to 12/31/2012
As of 12/31/2013, your plan offered 19 investment
options.
16.11%
12.86%
Plan Asset Balance Account Reduction Loan Balance
Plan Asset History
12/31/2013 $13,523,130
12/31/2012 $11,647,045
12/31/2011 $10,319,791
(Includes Plan Asset Balance and Account Reduction
Loan Balance)
PLAN ASSETS
City of Edmond 457 Deferred Compensation Plan98719-01 Reporting Period Ending December 31, 2013 For Plan Sponsor Use Only

Asset Class
Number of
Participants
% of
Total
Assets
As of
12/31/2013
Number of
Participants
% of
Total
Assets
As of
12/31/2012Investment Option
ASSET ALLOCATION
Asset AllocationAsset Allocation Great-West Aggressive Profile II Fund I $250,683 25 $403,423 362.23% 3.08%
Asset Allocation Great-West Conserv Profile II Fund I $5,562 5 $7,955 90.05% 0.06%
Asset Allocation Great-West Mod Aggr Profile II Fund I $280,183 19 $407,450 272.49% 3.11%
Asset Allocation Great-West Mod Conserv Profile II Fund I $39,784 10 $34,763 100.35% 0.27%
Asset Allocation Great-West Moderate Profile II Fund I $463,406 31 $586,331 354.12% 4.48%
$1,039,618 $1,439,9229.24% 11.01%
International FundInternational Fund American Funds EuroPacific Gr R3 $523,824 152 $695,742 1634.66% 5.32%
International Fund Thornburg International Value - A $644,830 166 $534,623 1515.73% 4.09%
$1,168,654 $1,230,36510.39% 9.41%
SpecialtySpecialty Invesco Real Estate A $426,868 159 $389,985 1583.80% 2.98%
$426,868 $389,9853.80% 2.98%
Small CapSmall Cap Heartland Value Fund $183,291 98 $152,497 981.63% 1.17%
Small Cap Royce Low Priced Stock Svc $116,543 92 $148,370 1031.04% 1.13%
$299,834 $300,8682.67% 2.30%
Mid CapMid Cap ASTON/Fairpointe Mid Cap N $793,555 170 $1,377,998 1807.06% 10.53%
Mid Cap Baron Growth Retail $778,982 160 $1,105,921 1736.93% 8.45%
$1,572,537 $2,483,91913.98% 18.99%
Large CapLarge Cap BlackRock Equity Index - Collective F $797,105 152 $922,188 1587.09% 7.05%
Large Cap Davis New York Venture A $982,880 135 $1,345,927 1448.74% 10.29%
Large Cap Invesco Growth & Income A $388,675 110 $619,397 1393.46% 4.74%
Large Cap Janus Forty Class S $274,582 102 $397,631 1192.44% 3.04%
Large Cap Jensen Quality Growth R $125,911 29 $162,088 281.12% 1.24%
$2,569,154 $3,447,23122.84% 26.35%
BalancedBalanced Oakmark Equity & Income II $419,152 36 $528,176 433.73% 4.04%
$419,152 $528,1763.73% 4.04%
Bond Bond PIMCO Total Return Admin $1,439,662 177 $1,584,161 18012.80% 12.11%
$1,439,662 $1,584,16112.80% 12.11%
Fixed Fixed Great-West Portfolio Fund (*) $2,001,624 80 $1,395,560 7617.80% 10.67%
$2,001,624 $1,395,56017.80% 10.67%
BrokerageBrokerage TD Ameritrade SDB Money Market $111,493 10 $23,794 110.99% 0.18%
Brokerage TD Ameritrade SDB Money Market Roth $0 0 $7,987 10.00% 0.06%
Brokerage TD Ameritrade SDB Securities $198,269 10 $248,316 91.76% 1.90%
City of Edmond 457 Deferred Compensation Plan98719-01 Reporting Period Ending December 31, 2013 For Plan Sponsor Use Only

Asset Class
Number of
Participants
% of
Total
Assets
As of
12/31/2013
Number of
Participants
% of
Total
Assets
As of
12/31/2012Investment Option
ASSET ALLOCATION
$309,762 $280,0972.75% 2.14%
Grand Total
*Your plan's default investment election(s).
$11,246,863 $13,080,283100.00% 100.00%
City of Edmond 457 Deferred Compensation Plan98719-01 Reporting Period Ending December 31, 2013 For Plan Sponsor Use Only
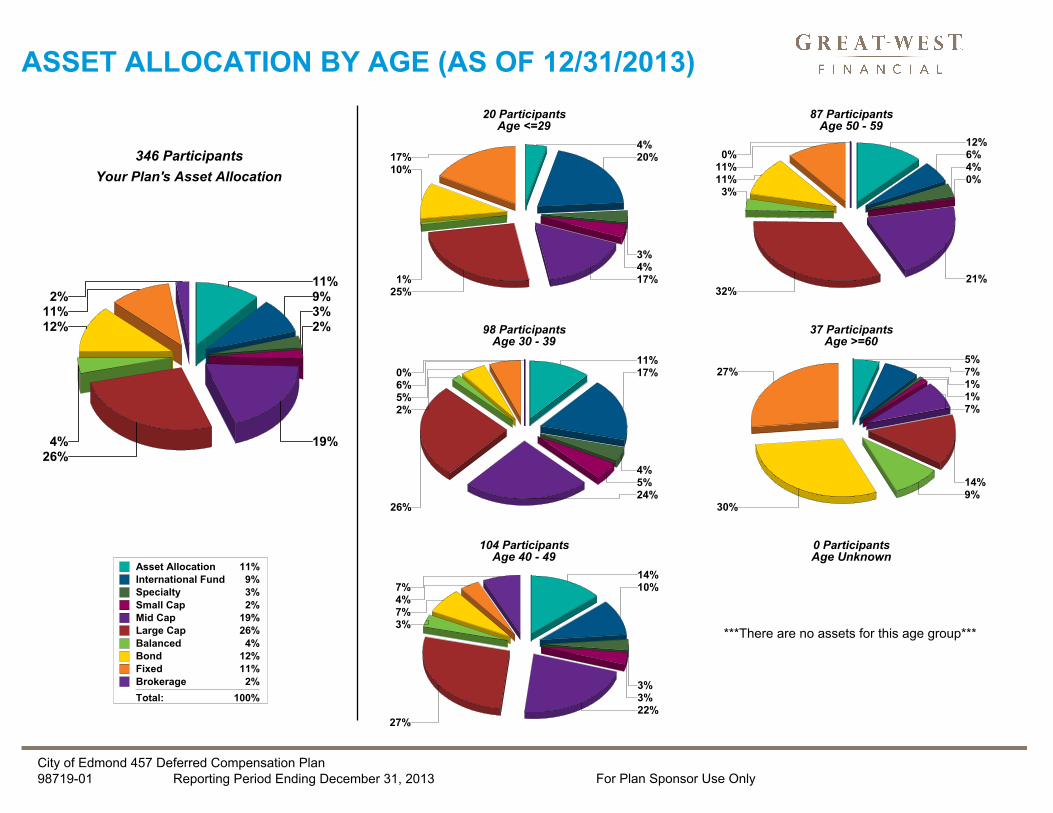
4%20%
3%4%17%
25%1%
10%17%
Age <=2920 Participants
5%7%1%1%7%
14%9%
30%
27%
Age >=60
11%9%3%2%
19%26%4%
12%11%2%
Asset Allocation 11%International Fund 9%Specialty 3%
Small Cap 2%Mid Cap 19%Large Cap 26%
Balanced 4%
Bond 12%Fixed 11%
Brokerage 2%
Total: 100%
Your Plan's Asset Allocation
11%17%
4%5%24%
26%
2%5%6%0%
Age 30 - 39
14%10%
3%3%22%
27%
3%7%4%7%
Age 40 - 49
12%6%4%0%
21%32%
3%11%11%0%
Age 50 - 59
Age Unknown
***There are no assets for this age group***
346 Participants
87 Participants
0 Participants
37 Participants98 Participants
104 Participants
ASSET ALLOCATION BY AGE (AS OF 12/31/2013)
City of Edmond 457 Deferred Compensation Plan98719-01 Reporting Period Ending December 31, 2013 For Plan Sponsor Use Only

The number of investment options that plan participants direct contributions, as well as the number of investment options where
balances are held in plan participant accounts, is shown here, by age and gender.
Average Number of Investment Option Allocations for New Contributions As of 12/31/2013
Average Number of Investment Options for Existing Account Balances As of 12/31/2013
Age
<=29
30 - 39
40 - 49
50 - 59
>=60
Unknown
Male Female Unknown
Age UnknownFemaleMale
<=29
30 - 39
40 - 49
50 - 59
>=60
Unknown
0
1
2
3
4
5
6
7
8
<= 29 30 - 39 40 - 49 50 - 59 >= 60 Unknown
0
2
4
6
8
10
Average by Gender
0
2
4
6
8
10
<= 29 30 - 39 40 - 49 50 - 59 >= 60 Unknown
0
2
4
6
8
10
Average by Gender
8
7
5
4
6
0
5
8
6
5
4
0
0
4
0
0
0
0
5
4
7
5
6
0
9
7
6
4
5
0
0
0
0
0
0
0
Male Female Unknown
ASSET ALLOCATION
City of Edmond 457 Deferred Compensation Plan98719-01 Reporting Period Ending December 31, 2013 For Plan Sponsor Use Only
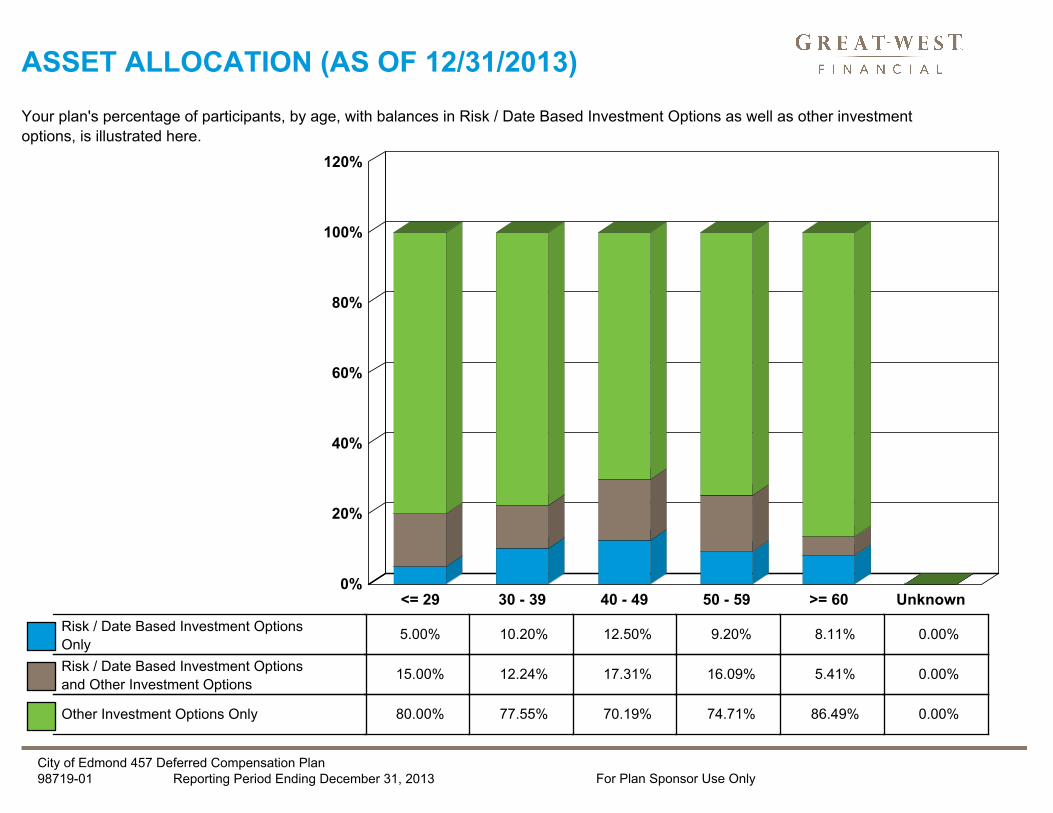
Your plan's percentage of participants, by age, with balances in Risk / Date Based Investment Options as well as other investment
options, is illustrated here.
Risk / Date Based Investment Options
and Other Investment Options
Other Investment Options Only
5.00% 10.20% 12.50% 9.20% 8.11% 0.00%
15.00% 5.41% 12.24% 17.31% 16.09% 0.00%
80.00% 86.49% 77.55% 70.19% 74.71% 0.00%
0%
20%
40%
60%
80%
100%
120%
<= 29 30 - 39 40 - 49 50 - 59 >= 60 Unknown
Risk / Date Based Investment Options
Only
ASSET ALLOCATION (AS OF 12/31/2013)
City of Edmond 457 Deferred Compensation Plan98719-01 Reporting Period Ending December 31, 2013 For Plan Sponsor Use Only

100%
Age <=29
50%
13%
25%13%
Age 30 - 39
17%8%
25%25%
25%
Age 40 - 49
20%
20%20%
40%
Age 50 - 59
33%
67%
Age >=60
Age Unknown
28%
7%21%
14%
31%
Great-West Aggressive Profile II Fund I 28%
Great-West Conserv Profile II Fund I 7%
Great-West Mod Aggr Profile II Fund I 21%
Great-West Mod Conserv Profile II Fund I 14%
Great-West Moderate Profile II Fund I 31%
Total: 100%
Percentage of Participants with Balances inOne Risk / Date Based Investment Option
***There are no balances for this age group***
29 Participants
8 Participants
12 Participants
5 Participants
3 Participants
0 Participants
1 Participant
ASSET ALLOCATION (AS OF 12/31/2013)
City of Edmond 457 Deferred Compensation Plan98719-01 Reporting Period Ending December 31, 2013 For Plan Sponsor Use Only

Your plan's participation rates by age are shown here. Your plan's participation rate equals the total number of participants making
regular contributions divided by the total number of eligible employees.
Average Participation Rate by Age
Participation Rate
Defaulted Participants
The average Defined Contribution plan participation
rate for eligible employees is 71.90%.*
*Source: PLANSPONSOR Defined Contribution Survey, 2012,
457 Plans
Your plan has 270 employees participating in the
plan. As of 12/31/2013, 1 of these employees have
not made an active investment election and their
contributions are currently being allocated to the
plan's default investment option.0%
20%
40%
60%
80%
100%
<= 29 30 - 39 40 - 49 50 - 59 >= 60 Unknown
18
# of Contributing
Participants as of
12/31/201383 65 23 081
12/31/2011 12/31/2012 12/31/2013
As of 12/31/2013, the participation rate for your plan
was 83.59%.
PLAN UTILIZATION
City of Edmond 457 Deferred Compensation Plan98719-01 Reporting Period Ending December 31, 2013 For Plan Sponsor Use Only

Your plan's average participant contribution amount by age is shown here. Your plan's average participant contribution amount
equals the total amount of contributions divided by the total number of contributing participants.
Average Participant Contribution Amount by Age
Paycheck Contribution Information
Average Participant Contribution Amount by Age
As of 12/31/2013, your plan's average participant
paycheck contribution percentage rate was 5.71%
per payroll period.**
As of 12/31/2013, your plan's average participant
paycheck contribution dollar amount was $133 per
payroll period.**
**If your plan only allows participant paycheck elections by percent
(or amount) the value will reflect as 0% (or $0).
The average deferral rate among non-highly
compensated participants in Defined Contribution
plans is 5.20%.*
*Source: Profit Sharing/401(k) Council of America, 55th Annual
Survey of Profit Sharing and 401(k) Plans, 2012
Age
<=29
30 - 39
40 - 49
50 - 59
>=60
Unknown
2011
$2,518
2012 2013
$2,891
$2,946
$3,363
$5,743
$0
$2,149
$2,886
$3,194
$3,679
$5,786
$0
$1,806
$2,717
$3,226
$3,747
$5,213
$0
$0
$1,000
$2,000
$3,000
$4,000
$5,000
$6,000
<= 29 30 - 39 40 - 49 50 - 59 >= 60 Unknown
23 065818318
12/31/2011 12/31/2012 12/31/2013
# of Contributing
Participants as of
12/31/2013
PLAN UTILIZATION
City of Edmond 457 Deferred Compensation Plan98719-01 Reporting Period Ending December 31, 2013 For Plan Sponsor Use Only

Your plan's average participant balance and the average number of investment options held by your plan participants are shown
here.
Average Participant Balance
Number of Investment Options
As of 12/31/2013, participants in your plan held an
average of 5.93 investment options.
On average, participants hold 4.40 investment
options in their Defined Contribution plan account.*
*Source: PLANSPONSOR Defined Contribution Survey, 2012,
457 Plans
# of Participants
with a Balance
330 334 346
$0
$5,000
$10,000
$15,000
$20,000
$25,000
$30,000
$35,000
$40,000
12/31/2011 12/31/2012 12/31/2013
$30,237
$33,669
$37,794
PARTICIPANT DETAILS
City of Edmond 457 Deferred Compensation Plan98719-01 Reporting Period Ending December 31, 2013 For Plan Sponsor Use Only

Here is a breakdown of your plan's average participant balance by age, by year.
Average Participant Balance by AgeYour Plan
2012 20132011Age
<=29 $9,825$10,743$9,446
30 - 39
$0$0$0Unknown
$64,183$55,205$63,105>=60
$48,975$51,262$45,58450 - 59
$38,051$30,845$26,84740 - 49
$23,341$19,049$15,083
Average Participant Account Balance ¹
*Source: Tabulations from the EBRI/ICI Participant-Directed
Retirement Plan Data Collection Project
Note: Information provided by the EBRI Issue Brief, No. 380,
December 2012, Page 8
¹Account Balances are participant account balances held in
401(k) plans at the participants' current employers and are net of
plan loans. Retirement savings held in plans at previous
employers or rolled over into IRAs are not included.
# of Participants
with a Balance as
of 12/31/201320 98 104 87 37 0
12/31/2011 12/31/2012 12/31/2013
$37,794$33,669$30,237All Ages
The average participant account balance for year-end
2011 is $58,991.*
$0
$10,000
$20,000
$30,000
$40,000
$50,000
$60,000
$70,000
<= 29 30 - 39 40 - 49 50 - 59 >= 60 Unknown
PARTICIPANT DETAILS
City of Edmond 457 Deferred Compensation Plan98719-01 Reporting Period Ending December 31, 2013 For Plan Sponsor Use Only

Average Account Balance - All Participants As of 12/31/2013
Average Account Balance - Contributing Participants As of 12/31/2013
Age
<=29
30 - 39
40 - 49
50 - 59
>=60
Unknown
Male Female Unknown
Age UnknownFemaleMale
<=29
30 - 39
40 - 49
50 - 59
>=60
Unknown
Average Account Balance
Your participants have an average balance of
approximately $37,794 in this plan.
$12,301
$92,583
$26,365
$40,018
$52,641
$0
$4,050
$30,771
$9,899
$31,833
$38,776
$0
$0
$0
$0
$0
$0
$0
$4,477
$39,006
$6,732
$36,331
$49,273
$0
$12,606
$64,815
$30,047
$46,968
$44,567
$0
$0
$0
$0
$0
$0
$0
Male Female Unknown
$0
$20,000
$40,000
$60,000
$80,000
$100,000
<= 29 30 - 39 40 - 49 50 - 59 >= 60 Unknown
$0
$5,000
$10,000
$15,000
$20,000
$25,000
$30,000
$35,000
$40,000
$45,000
Average by Gender
$0
$10,000
$20,000
$30,000
$40,000
$50,000
$60,000
$70,000
<= 29 30 - 39 40 - 49 50 - 59 >= 60 Unknown
$0
$5,000
$10,000
$15,000
$20,000
$25,000
$30,000
$35,000
$40,000
Average by Gender
PARTICIPANT DETAILS
City of Edmond 457 Deferred Compensation Plan98719-01 Reporting Period Ending December 31, 2013 For Plan Sponsor Use Only

The number and percentage of participants who have an account balance but have not made a contribution during the reporting
period, by age and gender, are illustrated here.
Percentage of Participants with an Account Balance and No Current Paycheck Contributions During the Period
Number of Participants with an Account Balance and No Current Paycheck Contributions During the Period
Non-Contributing Participants
23.12% of your participants with an
account balance are currently not
contributing to their DC plan.
Industry Percentage of
Contributing Participants
On average, only 57% of American
workers are saving for retirement*
*Source: EBRI Issue Brief No. 384, The
2013 Retirement Confidence Survey
Male Female Unknown
0%
20%
40%
60%
80%
100%
<= 29 30 - 39 40 - 49 50 - 59 >= 60 Unknown
0%
10%
20%
30%
40%
50%
60%
70%
Percentage by Gender
0
2
4
6
8
10
12
14
16
<= 29 30 - 39 40 - 49 50 - 59 >= 60 Unknown
0
20
40
60
Total by Gender
PARTICIPANT DETAILS
City of Edmond 457 Deferred Compensation Plan98719-01 Reporting Period Ending December 31, 2013 For Plan Sponsor Use Only

Your plan's contribution amounts by money type are shown here.
Contributions by Money Type
Contribution Detail
Money Type
01/01/2011
to
12/31/2011
Before Tax
After Tax
Roth
Rollover
Employer
Total
$831,531
$0
$0
$28,408
$0
$859,939
$824,830
$866,347
$0
$24
$41,494
$0
$789,230
$915,626
$0
$25,000
$101,396
$0
01/01/2012
to
12/31/2012
01/01/2013
to
12/31/2013
Before Tax After Tax Roth Rollover Employer
$0
$200,000
$400,000
$600,000
$800,000
$1,000,000
12/31/2011 12/31/2012 12/31/2013
CONTRIBUTIONS
City of Edmond 457 Deferred Compensation Plan98719-01 Reporting Period Ending December 31, 2013 For Plan Sponsor Use Only

Number of
Participants
Contributing
% of
Total
Number of
Participants
Contributing
% of
TotalAsset Class Investment Option
Contributions
01/01/2012 -
12/31/2012
Contributions
01/01/2013 -
12/31/2013
CONTRIBUTION ANALYSIS
Asset Allocation 2.49% 3.30%Great-West Aggressive Profile II Fund I $21,586 20 $30,180 29Asset AllocationAsset Allocation 0.18% 0.15%Great-West Conserv Profile II Fund I $1,586 3 $1,407 6Asset Allocation 2.83% 3.00%Great-West Mod Aggr Profile II Fund I $24,541 15 $27,470 20Asset Allocation 0.64% 0.67%Great-West Mod Conserv Profile II Fund I $5,515 6 $6,133 7Asset Allocation 2.67% 3.28%Great-West Moderate Profile II Fund I $23,110 20 $30,069 24
8.81% 10.40%$76,337 $95,258
International Fund 6.21% 6.20%American Funds EuroPacific Gr R3 $53,760 130 $56,783 129International FundInternational Fund 7.29% 5.98%Thornburg International Value - A $63,129 137 $54,796 133
13.49% 12.19%$116,889 $111,579
Specialty 3.91% 3.48%Invesco Real Estate A $33,858 130 $31,829 134Specialty
3.91% 3.48%$33,858 $31,829
Small Cap 3.54% 1.56%Heartland Value Fund $30,653 119 $14,277 113Small CapSmall Cap 2.57% 1.31%Royce Low Priced Stock Svc $22,228 122 $12,002 99
6.10% 2.87%$52,881 $26,279
Mid Cap 6.91% 6.37%ASTON/Fairpointe Mid Cap N $59,864 142 $58,293 144Mid CapMid Cap 8.36% 8.48%Baron Growth Retail $72,441 132 $77,645 137
15.27% 14.85%$132,304 $135,938
Large Cap 7.57% 8.85%BlackRock Equity Index - Collective F $65,568 127 $80,995 127Large CapLarge Cap 5.99% 5.49%Davis New York Venture A $51,875 132 $50,268 135Large Cap 2.46% 3.15%Invesco Growth & Income A $21,350 123 $28,802 123Large Cap 5.01% 4.20%Janus Forty Class S $43,433 106 $38,446 116
21.03% 21.68%$182,227 $198,510
Balanced 3.91% 4.11%Oakmark Equity & Income II $33,865 36 $37,627 47Balanced
3.91% 4.11%$33,865 $37,627
Bond 9.06% 11.87%PIMCO Total Return Admin $78,463 133 $108,710 134Bond
9.06% 11.87%$78,463 $108,710
Fixed 18.41% 18.56%Great-West Portfolio Fund (*) $159,524 95 $169,896 58Fixed
18.41% 18.56%$159,524 $169,896
Grand Total 100.00% 100.00%
*Your plan's default investment election(s).
$866,347 $915,626
City of Edmond 457 Deferred Compensation Plan98719-01 Reporting Period Ending December 31, 2013 For Plan Sponsor Use Only

Total Paycheck Contributions From 01/01/2013 to 12/31/2013
Total Rollover Contributions From 01/01/2013 to 12/31/2013
Average Contributions
Your participants contribute an
average of $3,270 per year.*
*Average of total contributions during the
reporting period.
Industry Average of
Participants Contributing
In comparison, based on
NAGDCA survey results, the
average deferral for
governmental DC plans is about
$3,884.*
*Source: National Association of
Governmental Defined Contribution
Administrators, 2011 Survey of Defined
Male Female Unknown
$0
$40,000
$80,000
$120,000
$160,000
$200,000
$240,000
<= 29 30 - 39 40 - 49 50 - 59 >= 60 Unknown$0
$500
$1,000
$1,500
$2,000
$2,500
$3,000
$3,500
$4,000
Average by Gender
$0
$4,000
$8,000
$12,000
$16,000
$20,000
$24,000
$28,000
<= 29 30 - 39 40 - 49 50 - 59 >= 60 Unknown$0
$2,000
$4,000
$6,000
$8,000
$10,000
$12,000
$14,000
$16,000
$18,000
Average by Gender
CONTRIBUTION ANALYSIS
City of Edmond 457 Deferred Compensation Plan98719-01 Reporting Period Ending December 31, 2013 For Plan Sponsor Use Only

Please Note: There are 8 eligible, employed participants in your plan who have not elected a paycheck contribution percentage / amount.
Paycheck Contributions per Pay Period
As a Percentage of Salary
Paycheck Contributions per Pay Period
In Dollars
Percent
# of
Participants % of Total Dollars
# of
Participants % of Total
Average Paycheck Contribution
The average deferral rate among non-highly compensated participants in Defined Contribution plans is 5.20%.*
*Source: Profit Sharing/401(k) Council of America, 55th Annual Survey of Profit Sharing and 401(k) Plans, 2012
0%
1%
2%
3%
4%
5%
6%
7%
8%
9%
10+%
$0 - 25
$26 - 50
$51 - 75
$76 - 100
$101 - 125
$126 - 150
$151 - 175
$176 - 200
$201 - 225
$226 - 250
>$250
107
6
19
2
15
2
6
62
14
36
22
3
0 0.00%
3 17.65%
1 5.88%
2 11.76%
1 5.88%
6 35.29%
0 0.00%
0 0.00%
1 5.88%
0 0.00%
36.77%
2.06%
6.53%
0.69%
5.15%
0.69%
2.06%
21.31%
4.81%
12.37%
7.56%
17.65%
CONTRIBUTION ANALYSIS (AS OF 12/31/2013)
City of Edmond 457 Deferred Compensation Plan98719-01 Reporting Period Ending December 31, 2013 For Plan Sponsor Use Only

An overview of your plan's distribution activity is shown here, including distribution reasons, number of distributions and percentage
of rollovers / transfers versus payment to self.
Reasons for Distribution As of 12/31/2013
Percentages are based on dollar amount of distributions.
Distributions
Number
01/01/2013 to 12/31/2013
01/01/2012 to 12/31/2012
01/01/2011 to 12/31/2011
$1,140,752
$622,475
$253,107
21
24
27
84.07%
77.89%
9.85%
Industry Average
According to a national study of pre-retirement termination
(i.e. job changes) for those participants between age 55-70,
39% transferred their money to an IRA, 7% took a cash
payment, 47% left the money in their plan, and 6%
transferred to a new employer pension plan.*
*Source: LIMRA, Asset Retention: Keys to Success in the Rollover
Market (2011)
Comparing Common Distribution Reasons
Percentages are based on dollar amount of distributions.
2%
88%
7%3%
Death Benefit De Minimis In-Service
Retirement Separation of Service Other
As of 12/31/2013
0%
20%
40%
60%
80%
100%
Retirement Separation of Service In-Service
Percentage of
Distribution
Amounts
Rolled Over /
TransferredAmount
Rollovers / Transfers Payments to Self
95.80% 4.20% 56.32% 43.68% 0.00% 0.00%
DISTRIBUTIONS
City of Edmond 457 Deferred Compensation Plan98719-01 Reporting Period Ending December 31, 2013 For Plan Sponsor Use Only

$0
$200,000
$400,000
$600,000
$800,000
$1,000,000
Top Pro
vider
s
Oth
er
0
2
4
6
Top Pro
vider
s
Oth
er
Full Withdrawal Rollover IRA Summary by Top Providers by Number of Participants
Full Withdrawal Rollover IRA Summary by Top Providers by Dollars
Participant Distributions
The top providers represent
100.00% of total assets
withdrawn and rolled to an IRA.
Percentage of Assets
The top providers represent
100.00% of total participants
withdrawn and rolled to an IRA.
0
1
2
3
AM
ERIP
RIS
E
FINANCIA
L
EDW
ARD
JONES
PERSH
ING L
LC
SCOTTR
ADE
$0
$100,000
$200,000
$300,000
$400,000
$500,000
$600,000
$700,000
AM
ERIP
RIS
E
FINANCIA
L
EDW
ARD
JONES
PERSH
ING L
LC
SCOTTR
ADE
DISTRIBUTIONS (FROM 01/01/2013 TO 12/31/2013)
City of Edmond 457 Deferred Compensation Plan98719-01 Reporting Period Ending December 31, 2013 For Plan Sponsor Use Only

The total amount of all plan participant rollovers, contributions and withdrawals made, by month, are reflected here.
Total Contribution and Withdrawal Summary*
Month Rollover
Payroll
Contributions Withdrawals
*Monthly totals may not exactly match the amounts for the reporting periods on the Executive Summary pages due to any retroactive changes or corrections made.
Rollover Payroll Contributions Withdrawals
$0
$0
$0
$25,000
$0
$0
$7,792
$0
$0
$0
$0
$0
$66,283
$64,959
$64,660
$64,486
$98,098
$66,347
$65,892
$69,113
$70,429
$72,141
$107,780
$72,645
$8,750
$8,750
$19,735
$646,935
$21,894
$8,750
$13,887
$83,046
$272,705
$54,638
Jan 2013
Feb 2013
Mar 2013
Apr 2013
May 2013
Jun 2013
Jul 2013
Aug 2013
Sep 2013
Oct 2013
Nov 2013
Dec 2013
$0
$100,000
$200,000
$300,000
$400,000
$500,000
$600,000
$700,000
Jan 2
013
Feb 2
013
Mar
201
3
Apr 2
013
May
201
3
Jun 2
013
Jul 2
013
Aug 2
013
Sep 2
013
Oct
201
3
Nov
2013
Dec
201
3
$34,086
$20,208
DISTRIBUTIONS
City of Edmond 457 Deferred Compensation Plan98719-01 Reporting Period Ending December 31, 2013 For Plan Sponsor Use Only

Hardship Withdrawals (in Dollars)
Average Hardship Withdrawals (in Dollars)
Number of Participants Taking Hardships
Male Female Unknown
($6)
($4)
($2)
$0
$2
$4
$6
<= 29 30 - 39 40 - 49 50 - 59 >= 60 Unknown-6
-4
-2
0
2
4
6
<= 29 30 - 39 40 - 49 50 - 59 >= 60 Unknown
($6)
($4)
($2)
$0
$2
$4
$6
<= 29 30 - 39 40 - 49 50 - 59 >= 60 Unknown
***There are no hardships*** ***There are no hardships***
***There are no hardships***
DISTRIBUTIONS (FROM 01/01/2013 TO 12/31/2013)
City of Edmond 457 Deferred Compensation Plan98719-01 Reporting Period Ending December 31, 2013 For Plan Sponsor Use Only
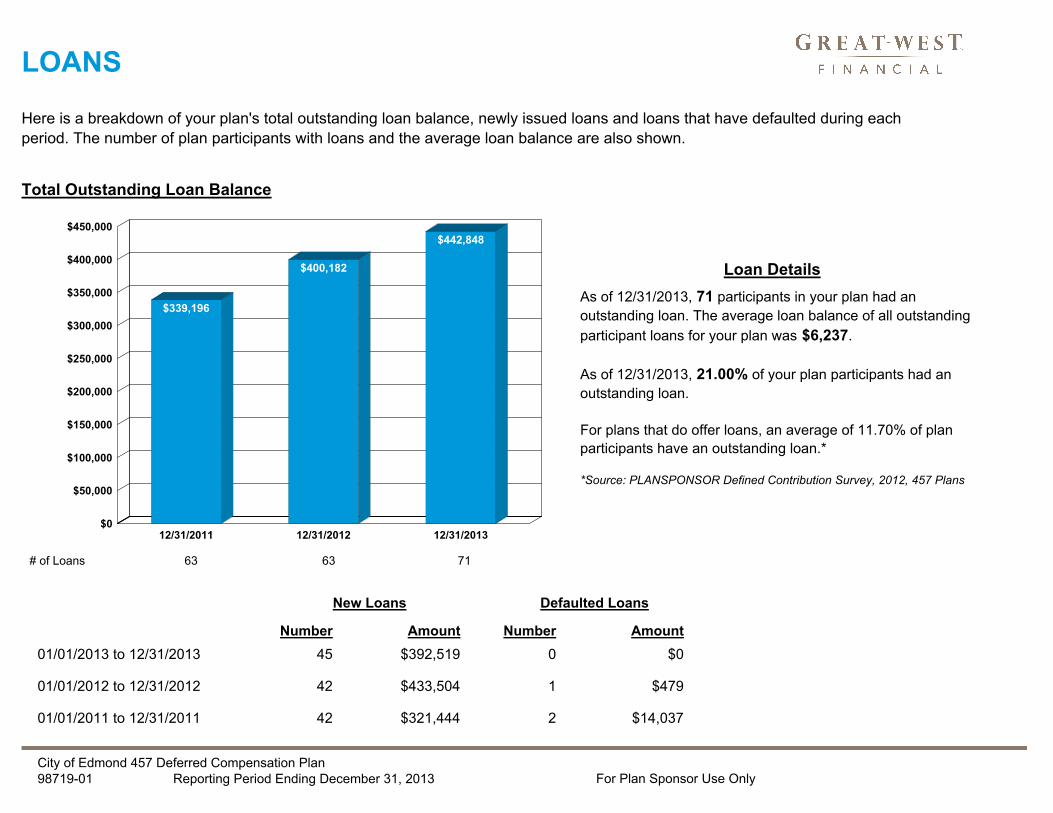
Here is a breakdown of your plan's total outstanding loan balance, newly issued loans and loans that have defaulted during each
period. The number of plan participants with loans and the average loan balance are also shown.
Total Outstanding Loan Balance
Loan Details
As of 12/31/2013, 71 participants in your plan had an
outstanding loan. The average loan balance of all outstanding
participant loans for your plan was $6,237.
As of 12/31/2013, 21.00% of your plan participants had an
outstanding loan.
For plans that do offer loans, an average of 11.70% of plan
participants have an outstanding loan.*
*Source: PLANSPONSOR Defined Contribution Survey, 2012, 457 Plans
New Loans
01/01/2013 to 12/31/2013
01/01/2012 to 12/31/2012
01/01/2011 to 12/31/2011
Defaulted Loans
Number Amount
45
42
42
$392,519
$433,504
$321,444
Number Amount
0
1
2
$0
$479
$14,037
$0
$50,000
$100,000
$150,000
$200,000
$250,000
$300,000
$350,000
$400,000
$450,000
12/31/2011 12/31/2012 12/31/2013
$339,196
$400,182
$442,848
# of Loans 63 63 71
LOANS
City of Edmond 457 Deferred Compensation Plan98719-01 Reporting Period Ending December 31, 2013 For Plan Sponsor Use Only

01/01/2011
to
12/31/2011
01/01/2012
to
12/31/2012
01/01/2013
to
12/31/2013
Activity Detail Activity Summary
WEB SITE
182
7,251
196
7,693
204
8,031
Account InquiriesAccount Changes
2013
2012
2011
*We recently redesigned the participant website and renamed some categories reported in this chart. As a result, you may see similarly named categories representing the same transaction.
TotalsAverage Distinct Users 60 61 67Total Logins 4,255 3,978 4,520
Account InquiriesAccount Balance 922 298 99Account Summary 375 0 0Account and Certificates Overview (*) 1,357 2,093 2,482Allocation and Asset Allocation (*) 212 423 193Allocations 110 0 0Asset Allocation 28 92 21Balance Comparison 164 70 84Disbursement Summary 145 162 133Electronic Statements 59 0 0Fund Overview and Prospectus (*) 157 432 514Fund Returns 193 253 151Fund Values 292 354 263Investment Overview 193 147 157Personal Rate of Return 1,061 1,028 727Statement on Demand 243 0 0Statement on Demand and Quarterly (*) 126 196 164Transaction History 2,394 2,145 2,263
8,031 7,693 7,251Totals
Account ChangesAllocations 36 28 19Deferral 44 61 52Fund Transfers 55 48 40Loan Requests 38 33 39Rebalancer 13 10 7Registration 18 16 25
204 196 182Totals
City of Edmond 457 Deferred Compensation Plan98719-01 Reporting Period Ending December 31, 2013 For Plan Sponsor Use Only

01/01/2011
to
12/31/2011
01/01/2012
to
12/31/2012
01/01/2013
to
12/31/2013
Activity Detail Activity Summary
KeyTalk®
6
21
11
22
4
15
Account InquiriesAccount Changes
2013
2012
2011
TotalsAverage Distinct Users 5 7 6Opt to Client Service Representative 91 87 84Total Calls 123 127 119
Account InquiriesAccount Balance 0 0 3Allocations 2 1 0Loans 11 19 18Transaction History 2 2 0
15 22 21Totals
Account ChangesDeferrals 0 4 0Loan Requests 4 7 6
4 11 6Totals
City of Edmond 457 Deferred Compensation Plan98719-01 Reporting Period Ending December 31, 2013 For Plan Sponsor Use Only

0%
10%
20%
30%
40%
50%
60%
<= 29 30 - 39 40 - 49 50 - 59 >= 60 Unknown
Utilization by Service and Age - Active Participants with a Balance As of 12/31/2013
Utilization by Service and Age - Active and Terminated Participants with a Balance As of 12/31/2013
Advice Managed Accounts
0%
5%
10%
15%
20%
25%
30%
35%
40%
Advice Managed Accounts
0%
5%
10%
15%
20%
25%
30%
35%
Advice Managed Accounts
0%
10%
20%
30%
40%
50%
60%
<= 29 30 - 39 40 - 49 50 - 59 >= 60 Unknown
REALITY INVESTING® ADVISORY SERVICES
City of Edmond 457 Deferred Compensation Plan98719-01 Reporting Period Ending December 31, 2013 For Plan Sponsor Use Only

Administrative ServicesAvailable Today /
InformationAdministrative Services
Available Today /
Information
Years on System
Online Statements
Beneficiary Recordkeeping
Online Enrollment
Deferral Recordkeeping
Automatic Enrollment
Default Percentage
Auto Escalation Percentage
Loans Available
Online Loan Initiation
Loan File Feeds
To-Do List
9.24
Yes
Yes
Yes
No
No
N/A
Auto Escalation Percentage Maximum
N/A
N/A
Yes
Yes
No
No
SERVICES OFFERED
Advisory Services Yes
SecureFoundation No
IRA Rollover Solution Yes
Approval Services Yes
QDIA Notices No
City of Edmond 457 Deferred Compensation Plan98719-01 Reporting Period Ending December 31, 2013 For Plan Sponsor Use Only

Term Description
Funds in Plan with a Balance Count of funds or investment options within the plan’s fund lineup that have
balances greater than $0.01 are included. This includes any employer stock
awaiting purchase and self-directed brokerage products, as applicable.
Eligible Employees Employees who have met age and service requirements and are actively
employed. The count is based upon employee information that has been
transmitted to or input by the plan on the recordkeeping system.
Distributions All full and partial withdrawals for every disbursement reason and tax reason code.
In this report, the five most common distribution types are illustrated individually;
any other types are combined into the “Other” category.
Defaulted Loan A loan that is not current on all loan assessments, which are due by the prior
quarter-end; when this occurs, the loan will default as of the next quarter-end. The
outstanding amount with accrued interest as of the default date will be tax-reported
for the calendar year in which it defaulted.
Account Reduction Loan Balance The total amount of all active, outstanding loans held by plan participants. Loans
that have been offset or deemed as a distribution are not included.
Active Participants with Balances Plan participants who are actively employed and have a balance.
Contributions Amounts deposited for all money types, both regular payroll and single rollovers.
Assets that are added to the plan during conversion to our recordkeeping system
are not included.
Loan Balance (Average) The average of all outstanding loan balances in the plan. This includes defaulted
loan balances, but does not include offset or deemed loan balances.
GLOSSARY OF TERMS
City of Edmond 457 Deferred Compensation Plan98719-01 Reporting Period Ending December 31, 2013 For Plan Sponsor Use Only

Participant Paycheck Contribution
Percentage Rate (Average)
Term Description
For plans that utilize our deferral recordkeeping services, this is the average rate
of all percentage deferrals that have been established by actively employed
participants for any held employee money types during the reporting period. Only
participant deferral amounts that are greater than 1% are included.
Net Cash Flow The plan’s total contributions less total distributions. Forfeited amounts and loan
balances are not included in this calculation.
Participant Balance (Average) The average balance of all actively employed and terminated plan participants.
Only participant balances that are $0.01 or greater are included. This balance
does not include any outstanding loan amounts.
Participant Contribution Amount
(Average)
The total amount of plan contributions for all money types divided by the number
of contributing participants, both currently employed or employed during the
reporting period.
Participant Paycheck Contribution
Dollar Amount (Average)
For plans that utilize our deferral recordkeeping services, this is the average
amount of all dollar amount deferrals that have been established by actively
employed participants for any held employee money types during the reporting
period. Only participant deferral amounts that are greater than $0.01 are included.
Participants Contributing The number of actively employed plan participants who have regular payroll
contributions during the reporting period.
GLOSSARY OF TERMS
City of Edmond 457 Deferred Compensation Plan98719-01 Reporting Period Ending December 31, 2013 For Plan Sponsor Use Only
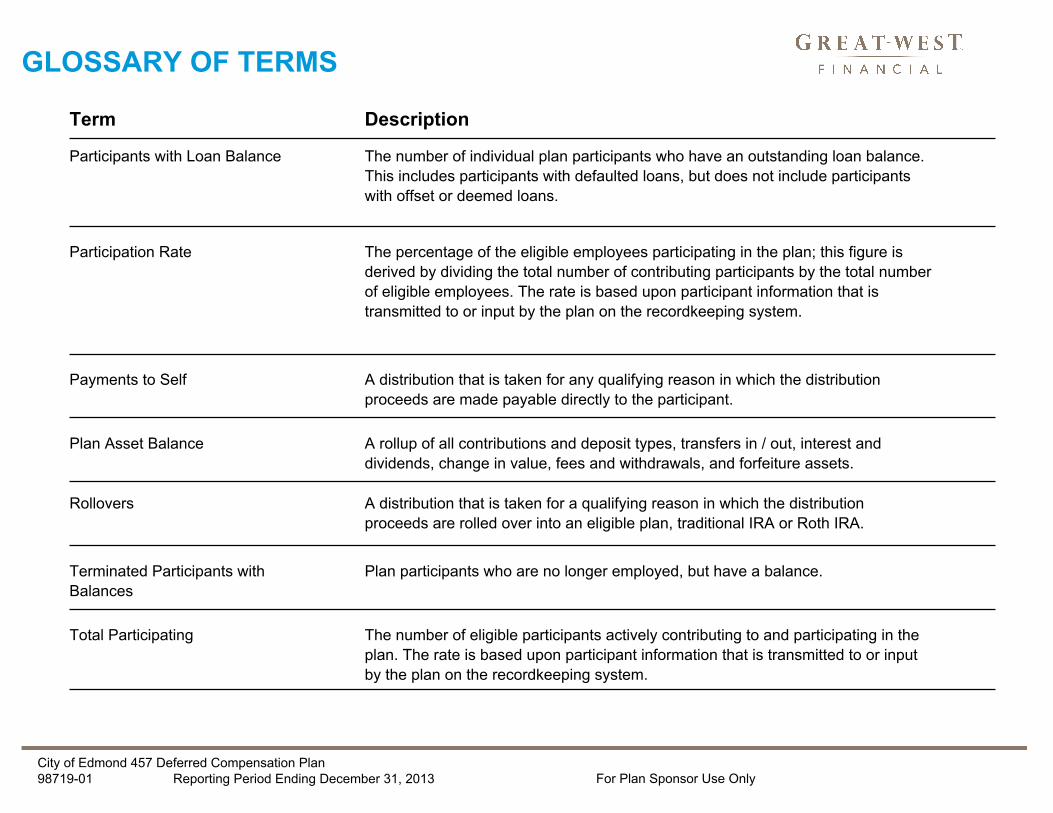
Term Description
Terminated Participants with
Balances
Plan participants who are no longer employed, but have a balance.
Participants with Loan Balance The number of individual plan participants who have an outstanding loan balance.
This includes participants with defaulted loans, but does not include participants
with offset or deemed loans.
The percentage of the eligible employees participating in the plan; this figure is
derived by dividing the total number of contributing participants by the total number
of eligible employees. The rate is based upon participant information that is
transmitted to or input by the plan on the recordkeeping system.
Participation Rate
Payments to Self A distribution that is taken for any qualifying reason in which the distribution
proceeds are made payable directly to the participant.
Plan Asset Balance A rollup of all contributions and deposit types, transfers in / out, interest and
dividends, change in value, fees and withdrawals, and forfeiture assets.
Rollovers A distribution that is taken for a qualifying reason in which the distribution
proceeds are rolled over into an eligible plan, traditional IRA or Roth IRA.
Total Participating The number of eligible participants actively contributing to and participating in the
plan. The rate is based upon participant information that is transmitted to or input
by the plan on the recordkeeping system.
GLOSSARY OF TERMS
City of Edmond 457 Deferred Compensation Plan98719-01 Reporting Period Ending December 31, 2013 For Plan Sponsor Use Only

Term Description
Transfers A distribution that is taken for a qualifying reason in which the proceeds are
disbursed as a permissible plan transfer.
Total Plan Asset Balance A rollup of all contributions and deposit types, transfers in / out, interest and
dividends, changes in value, fees and withdrawals, and forfeiture assets plus the
total amount of all active, outstanding participant loans.
GLOSSARY OF TERMS
Core securities, when offered, are offered through GWFS Equities, Inc. and/or other broker dealers.
GWFS Equities, Inc., Member FINRA/SIPC, is a wholly owned subsidiary of Great-West Life & Annuity Insurance Company.
Great-West FinancialSM refers to products and services provided by Great -West Life & Annuity Insurance Company (GWL&A), Corporate Headquarters: Greenwood
Village, CO; Great-West Life & Annuity Insurance Company of New York, Home Office: White Plains, NY; its subsidiaries and affiliates. The trademarks, logos, service
marks, and design elements used are owned by GWL&A.
Great-West Retirement Services® refers to products and services of Great -West Financial companies, as applicable, and FASCore, LLC (FASCore Administrators, LLC in
California), subsidiaries of GWL&A.
Managed account, guidance and advice services are offered by Advised Assets Group, LLC (AAG), a federally registered investment adviser and wholly owned subsidiary
of Great-West Life & Annuity Insurance Company and an affiliate of Great -West Life & Annuity Insurance Company of New York, Home Office White Plains, New York .
More information can be found at www.adviserinfo.sec.gov.
City of Edmond 457 Deferred Compensation Plan98719-01 Reporting Period Ending December 31, 2013 For Plan Sponsor Use Only

Participation by Asset Class and Investment OptionPlan Number: 98719-01
Plan Name: City of Edmond 457 Deferred Compensation Plan
Effective Date: 12/31/2013
0K
500K
1000K
1500K
2000K
2500K
3000K
3500K
Asset
Allo
catio
n
Balan
ced
Bond
Broke
rage
Fixed
Inte
rnat
iona
l
Larg
e Cap
Mid C
ap
Small C
ap
Specialty
Valu
e
Participation by Asset Class - Investment Value
11.0%
4.0%
12.1%
2.1%
10.7%
9.4%
26.4%
19.0%
2.3% 3.0%
Asset Allocation 11.0%Balanced 4.0%Bond 12.1%Brokerage 2.1%Fixed 10.7%International 9.4%Large Cap 26.4%Mid Cap 19.0%Small Cap 2.3%Specialty 3.0%
Total: 100.0%
Participation by Asset Class - Percent of Assets
Participants% of
Assets
Unit/Share
Value
SharesInvestment NameInvestment
ID
Asset
Class
Balance Inception To
Date Cost
P
l
a
n
N
u
m
b
e
P
l
a
n
N
a
m
D
i
v
i
s
i
o
n
B
a
s
i
D
i
v
i
s
i
o
n
V
a
l
u
D
i
v
i
s
i
o
n
N
a
m
Asset Allocation9
8
7
1
9
-
0
C
it
y
o
f
E
d
9
8
7
1
9
-
0
C
it
y
o
f
E
dMXAGP
Asset Allocation
$324,263.25GREAT-WEST AGGRESSIVE PROFILE II FUND I $403,423.36 49,018.634311 $8.23 3.08% 369
8
7
1
9
-
0
C
it
y
o
f
E
dMXCNP
Asset Allocation
$8,321.22GREAT-WEST CONSERV PROFILE II FUND I $7,954.96 923.918896 $8.61 0.06% 99
8
7
1
9
-
0
C
it
y
o
f
E
dMXMAP
Asset Allocation
$388,024.02GREAT-WEST MOD AGGR PROFILE II FUND I $407,449.77 46,459.494731 $8.77 3.12% 279
8
7
1
9
-
0
C
it
y
o
f
E
dMXMCP
Asset Allocation
$34,673.89GREAT-WEST MOD CONSERV PROFILE II FUND I $34,763.00 3,820.110878 $9.10 0.27% 109
8
7
1
9
-
0
C
it
y
o
f
E
dMXMDP
Asset Allocation
$592,835.95GREAT-WEST MODERATE PROFILE II FUND I $586,331.38 73,567.299409 $7.97 4.48% 35
Total: Asset Allocation9
8
7
1
9
-
0
C
it
y
o
f
E
d
Asset Allocation
$1,439,922.47 $1,348,118.33 11.01%
International9
8
7
1
9
-
0
C
it
y
o
f
E
d
9
8
7
1
9
-
0
C
it
y
o
f
E
dRERCX
International
$582,741.54AMERICAN FUNDS EUROPACIFIC GR R3 $695,741.97 14,455.473624 $48.13 5.32% 1639
8
7
1
9
-
0
C
it
y
o
f
E
dTGVAX
International
$448,086.08THORNBURG INTERNATIONAL VALUE - A $534,622.61 17,031.619660 $31.39 4.09% 151
Total: International9
8
7
1
9
-
0
C
it
y
o
f
E
d
International
$1,230,364.58 $1,030,827.62 9.41%
Specialty9
8
7
1
9
-
0
C
it
y
o
f
E
d
9
8
7
1
9
-
0
C
it
y
o
f
E
dIARAX
Specialty
$430,782.31INVESCO REAL ESTATE A $389,985.23 17,988.249354 $21.68 2.98% 158
Total: Specialty9
8
7
1
9
-
0
C
it
y
o
f
E
d
Specialty
$389,985.23 $430,782.31 2.98%
Small Cap9
8
7
1
9
-
0
C
it
y
o
f
E
d
9
8
7
1
9
-
0
C
it
y
o
f
E
dHT-VAL
Small Cap
$134,849.35HEARTLAND VALUE FUND $152,497.26 3,169.102611 $48.12 1.17% 989
8
7
1
9
-
0
C
it
y
o
f
E
dRYLPX
Small Cap
$155,169.12ROYCE LOW PRICED STOCK SVC $148,370.40 10,893.570848 $13.62 1.13% 103
Total: Small Cap9
8
7
1
9
-
0
C
it
y
o
f
E
d
Small Cap
$300,867.66 $290,018.47 2.30%
Mid Cap9
8
7
1
9
-
0
C
it
y
o
f
E
d
9
8
7
1
9
-
0
C
it
y
o
f
E
dBGRFX
Mid Cap
$836,881.12BARON GROWTH RETAIL $1,105,920.71 15,281.480825 $72.37 8.45% 1739
8
7
1
9
-
0
C
it
y
o
f
E
dCHTTX
Mid Cap
$1,035,291.95ASTON/FAIRPOINTE MID CAP N $1,377,998.37 31,339.512451 $43.97 10.53% 180
Total: Mid Cap9
8
7
1
9
-
0
C
it
y
o
f
E
d
Mid Cap
$2,483,919.08 $1,872,173.07 18.99%
Large Cap9
8
7
1
9
-
0
C
it
y
o
f
E
d
9
8
7
1
9
-
0
C
it
y
o
f
E
dACGIX
Large Cap
$506,955.49INVESCO GROWTH & INCOME A $619,396.52 22,923.633850 $27.02 4.74% 1399
8
7
1
9
-
0
C
it
y
o
f
E
dDV-NYV
Large Cap
$1,087,870.29DAVIS NEW YORK VENTURE A $1,345,926.71 32,502.455514 $41.41 10.29% 1449
8
7
1
9
-
0
C
it
y
o
f
E
dJENRX
Large Cap
$107,410.38JENSEN QUALITY GROWTH R $162,088.43 4,307.425794 $37.63 1.24% 28
PDBO1
Page 1 of 23/5/2014 6:51:07AM

Participants% of
Assets
Unit/Share
Value
SharesInvestment NameInvestment
ID
Asset
Class
Balance Inception To
Date Cost
P
l
a
n
N
u
m
b
e
P
l
a
n
N
a
m
D
i
v
i
s
i
o
n
B
a
s
i
D
i
v
i
s
i
o
n
V
a
l
u
D
i
v
i
s
i
o
n
N
a
m
9
8
7
1
9
-
0
C
it
y
o
f
E
dJS-CAP
Large Cap
$345,606.48JANUS FORTY CLASS S $397,631.33 9,822.909321 $40.48 3.04% 1199
8
7
1
9
-
0
C
it
y
o
f
E
dS18500
Large Cap
$622,194.66BLACKROCK EQUITY INDEX - COLLECTIVE F $922,188.16 49,408.219694 $18.66 7.05% 158
Total: Large Cap9
8
7
1
9
-
0
C
it
y
o
f
E
d
Large Cap
$3,447,231.15 $2,670,037.30 26.35%
Balanced9
8
7
1
9
-
0
C
it
y
o
f
E
d
9
8
7
1
9
-
0
C
it
y
o
f
E
dOARBX
Balanced
$450,968.65OAKMARK EQUITY & INCOME II $528,175.55 16,256.558429 $32.49 4.04% 43
Total: Balanced9
8
7
1
9
-
0
C
it
y
o
f
E
d
Balanced
$528,175.55 $450,968.65 4.04%
Bond9
8
7
1
9
-
0
C
it
y
o
f
E
d
9
8
7
1
9
-
0
C
it
y
o
f
E
dPI-TRT
Bond
$1,635,959.47PIMCO TOTAL RETURN ADMIN $1,584,160.53 148,190.885718 $10.69 12.11% 180
Total: Bond9
8
7
1
9
-
0
C
it
y
o
f
E
d
Bond
$1,584,160.53 $1,635,959.47 12.11%
Fixed9
8
7
1
9
-
0
C
it
y
o
f
E
d
9
8
7
1
9
-
0
C
it
y
o
f
E
dPORT
Fixed
GREAT-WEST PORTFOLIO FUND $1,395,559.82 10.67% 76
Total: Fixed9
8
7
1
9
-
0
C
it
y
o
f
E
d
Fixed
$1,395,559.82 10.67%
Brokerage9
8
7
1
9
-
0
C
it
y
o
f
E
d
9
8
7
1
9
-
0
C
it
y
o
f
E
dAMRTMM
Brokerage
TD AMERITRADE SDB MONEY MARKET $23,794.28 0.18% 119
8
7
1
9
-
0
C
it
y
o
f
E
dAMRTMR
Brokerage
TD AMERITRADE SDB MONEY MARKET ROTH $7,986.78 0.06% 19
8
7
1
9
-
0
C
it
y
o
f
E
dAMRTSC
Brokerage
TD AMERITRADE SDB SECURITIES $248,315.74 1.90% 9
Total: Brokerage9
8
7
1
9
-
0
C
it
y
o
f
E
d
Brokerage
$280,096.80 2.14%
$13,080,282.87 $9,728,885.22 100.00%C
it
y
o
f
E
dPLAN TOTAL
9
8
7
1
9
-
0
9
8
7
1
9
-
0
C
it
y
o
f
E
d$3,518.90FORFEITURE BALANCE (INCLUDED IN ABOVE VALUES) $0.00
PDBO1
Page 2 of 23/5/2014 6:51:07AM

Finance/Audit Committee 6. Meeting Date: 03/19/2014
InformationAgenda ItemDiscussion and consideration of the analysis by DiMeo Schneider & Associates, LLC, of the 457Deferred Compensation Plan as of December, 2013.
BackgroundThis item was continued from the February meeting after discussion of the recommended changes to theplan. (The full analysis was provided in the February packet.)
The following items are change requests to Great-West as recommended by DiMeo Schneider:
• Explore changing Shareclass option as part of fee reduction for Baron Growth Retail and InvescoGrowth and Income (They do not have to be Baron Growth Instl and Invesco Growth and Income Y; weare open to Great-West options with lower expense ratios. We’d also like to look at any other shareclassoptions where you can see expense savings opportunities.)
• Explore Fund Replacement options for Heartland Value, Royce (now that I read the AAG review), andOakmark (If we do not add target dates funds, then leave OakMark alone. If we do, map OakMark fundsinto target date fund.)
• Remove Davis NY Venture A (no replacement necessary, we have several Large Cap options) (Mapinto new Investco fund)
• Discuss Target Date Funds to review for replacement of our risk-based funds
• Secure Foundation information for a insured option of target date funds
• Logistical mapping information from his mapping analyst at headquarters
• Remove Jensen(frozen account) and map into Janus

Finance/Audit Committee 7. Meeting Date: 03/19/2014
InformationAgenda ItemAccept the City Treasurer's month end investment reports for January 31st and February 28th, 2014.
Background
AttachmentsJanuary Investment ReportsFebruary Investment Reports