city of east peoria, illinois financial statements year ended ...
107
CITY OF EAST PEORIA, ILLINOIS FINANCIAL STATEMENTS YEAR ENDED APRIL 30, 2018
-
Upload
khangminh22 -
Category
Documents
-
view
1 -
download
0
Transcript of city of east peoria, illinois financial statements year ended ...
CITY OF EAST PEORIA, ILLINOIS
FINANCIAL STATEMENTS
YEAR ENDED APRIL 30, 2018

CITY OF EAST PEORIA, ILLINOISTABLE OF CONTENTS
YEAR ENDED APRIL 30, 2018
FINANCIAL SECTION
INDEPENDENT AUDITORS’ REPORT 1
BASIC FINANCIAL STATEMENTS
GOVERNMENT-WIDE FINANCIAL STATEMENTS
STATEMENT OF NET POSITION 4
STATEMENT OF ACTIVITIES 6
FUND FINANCIAL STATEMENTS
BALANCE SHEET – GOVERNMENTAL FUNDS 8
RECONCILIATION OF GOVERNMENTAL FUNDS BALANCE SHEET TO THE STATEMENT OF NET POSITION 12
STATEMENT OF REVENUES, EXPENDITURES, AND CHANGES IN FUND BALANCES (DEFICITS) – GOVERNMENTAL FUNDS 13
RECONCILIATION OF THE STATEMENT OF REVENUES, EXPENDITURES, AND CHANGES IN FUND BALANCES (DEFICITS) OF GOVERNMENTAL FUNDS TO THE STATEMENT OF ACTIVITIES 15
STATEMENT OF NET POSITION – PROPRIETARY FUNDS 17
STATEMENT OF REVENUES, EXPENSES, AND CHANGES IN NET POSITION – PROPRIETARY FUNDS 19
STATEMENT OF CASH FLOWS – PROPRIETARY FUNDS 20
STATEMENT OF FIDUCIARY NET POSITION 22
STATEMENT OF CHANGES IN FIDUCIARY NET POSITION – PENSION TRUST FUNDS 23
NOTES TO BASIC FINANCIAL STATEMENTS 24
REQUIRED SUPPLEMENTARY INFORMATION
SCHEDULE OF CHANGES IN THE NET PENSION LIABILITY AND RELATED RATIOS – FIREFIGHTER’S PENSION PLAN (UNAUDITED) 70
SCHEDULE OF CHANGES IN THE NET PENSION LIABILITY AND RELATED RATIOS – POLICE PENSION PLAN (UNAUDITED) 71
SCHEDULE OF CHANGES IN THE NET PENSION LIABILITY AND RELATED RATIOS – ILLINOIS MUNICIPAL RETIREMENT PLAN (UNAUDITED) 72
SCHEDULE OF EMPLOYER CONTRIBUTIONS – PENSION PLANS (UNAUDITED) 73
OTHER POSTEMPLOYMENT BENEFIT PLAN (UNAUDITED) 74
SCHEDULES OF INVESTMENT RETURNS – POLICE AND FIREFIGHTER’S PENSION PLANS (UNAUDITED) 75
CITY OF EAST PEORIA, ILLINOISTABLE OF CONTENTS
YEAR ENDED APRIL 30, 2018
REQUIRED SUPPLEMENTARY INFORMATION (CONTINUED)
SCHEDULE OF REVENUES, EXPENDITURES, AND CHANGES IN FUND BALANCE – BUDGET AND ACTUAL (CASH BASIS) – GENERAL FUND 76
SCHEDULE OF REVENUES, EXPENDITURES, AND CHANGES IN FUND BALANCE – BUDGET AND ACTUAL (CASH BASIS) – RIVERBOAT GAMING TAX FUND 77
SCHEDULE OF REVENUES, EXPENDITURES, AND CHANGES IN FUND BALANCE (DEFICIT) – BUDGET AND ACTUAL (CASH BASIS) –SPECIAL TAX ALLOCATION FUND 78
NOTES TO REQUIRED SUPPLEMENTARY INFORMATION 79
SUPPLEMENTARY INFORMATION
GENERAL FUND:
COMBINING BALANCE SHEET – BY ACCOUNT 82
COMBINING SCHEDULE OF REVENUES, EXPENDITURES, AND CHANGES IN FUND BALANCES – BY ACCOUNT 84
NONMAJOR GOVERNMENTAL FUNDS:
COMBINING BALANCE SHEET 86
COMBINING SCHEDULE OF REVENUES, EXPENDITURES, AND CHANGES IN FUND BALANCES 90
FIDUCIARY FUNDS:
COMBINING SCHEDULE OF FIDUCIARY NET POSITION 94
SCHEDULE OF CHANGES IN ASSETS AND LIABILITIES – AGENCY FUNDS 96
COMBINING SCHEDULE OF CHANGES IN FIDUCIARY NET POSITION 97
STATISTICAL INFORMATION:
ASSESSED VALUATIONS, TAXES LEVIED, TAX RATES, TAX EXTENSIONS, AND TAX COLLECTIONS (UNAUDITED) 98
LEGAL DEBT MARGIN 101
SCHEDULE OF RECEIPTS AND DISBURSEMENTS BY DISTRICT –SPECIAL TAX ALLOCATION FUND 102
SCHEDULE OF RECEIPTS AND DISBURSEMENTS BY DISTRICT –CAPITAL PROJECTS FUND 103

CliftonLarsonAllen LLPCLAconnect.com
(1)
INDEPENDENT AUDITORS’ REPORT
Honorable Mayor and CommissionersCity of East Peoria, IllinoisEast Peoria, Illinois
Report on the Financial Statements
We have audited the accompanying financial statements of the governmental activities, the business-type activities, the discretely presented component unit, each major fund, and the aggregate remaining fund information of the City of East Peoria, Illinois (the City), as of and for the year ended April 30, 2018, and the related notes to the financial statements, which collectively comprise the City’s basic financial statements as listed in the table of contents.
Management’s Responsibility for the Financial Statements
Management is responsible for the preparation and fair presentation of these financial statements in accordance with accounting principles generally accepted in the United States of America; this includes the design, implementation and maintenance of internal control relevant to the preparation and fair presentation of financial statements that are free from material misstatement, whether due to fraud or error.
Auditors’ Responsibility
Our responsibility is to express opinions on these financial statements based on our audit. We did not audit the financial statements of the East Peoria Mass Transit District discretely presented component unit. We did not audit the Police Pension Trust Fund and Firefighter’s Pension Trust Fund, which represent 79%, 88%, and 42%, respectively, of the assets, net position/fund balance, and revenues of the aggregate remaining fund information. Those statements were audited by other auditors whose reports have been furnished to us, and our opinion, insofar as it relates to the amounts included for the East Peoria Mass Transit District discretely presented component unit, Police Pension Trust Fund, and Firefighter’s Pension Trust Fund is based solely on the reports of the other auditors. We conducted our audit in accordance with auditing standards generally accepted in the United States of America. Those standards require that we plan and perform the audit to obtain reasonable assurance about whether the financial statements are free of material misstatement.
An audit involves performing procedures to obtain audit evidence about the amounts and disclosures in the financial statements. The procedures selected depend on the auditors’ judgment, including the assessment of the risks of material misstatement of the financial statements, whether due to fraud or error. In making those risk assessments, the auditor considers internal control relevant to the City’s preparation and fair presentation of the financial statements in order to design audit procedures that are appropriate in the circumstances, but not for the purpose of expressing an opinion on the effectiveness of the City’s internal control. Accordingly, we express no such opinion. An audit also includes evaluating the appropriateness of accounting policies used and the reasonableness of significant accounting estimates made by management, as well as evaluating the overall financial statement presentation of the financial statements.
Honorable Mayor and CommissionersCity of East Peoria, Illinois
(2)
We believe that the audit evidence we have obtained is sufficient and appropriate to provide a basis for our audit opinions.
Opinions
In our opinion, based on our audit and the reports of other auditors, the financial statements referred to above present fairly, in all material respects, the respective financial position of the governmental activities, the business-type activities, the discretely presented component unit, each major fund, and the aggregate remaining fund information of the City as of April 30, 2018, and the respective changes in financial position thereof for the year then ended in accordance with accounting principles generally accepted in the United States of America.
Other Matters
Required Supplementary Information
Accounting principles generally accepted in the United States of America require that the pension and other post-employment information on pages 70 through 75 and budgetary comparison information on pages 76 through 78 be presented to supplement the basic financial statements. Such information,although not a part of the basic financial statements, is required by the Governmental Accounting Standards Board, who considers it to be an essential part of financial reporting for placing the basic financial statements in an appropriate operational, economic, or historical context. We and the other auditors have applied certain limited procedures to the required supplementary information in accordance with auditing standards generally accepted in the United States of America, which consisted of inquiries of management about the methods of preparing the information and comparing the information for consistency with management’s responses to our inquiries, the basic financial statements, and other knowledge we obtained during our audit of the basic financial statements. We do not express an opinion or provide any assurance on the information because the limited procedures do not provide us with sufficient evidence to express an opinion or provide any assurance. The City has not presented the management’s discussion and analysis that accounting principles generally accepted in the United States of America require to be presented to supplement the basic financial statements. Such missing information, although not a part of the basic financial statements, is required by the Governmental Accounting Standards Board, who considers it to be an essential part of financial reporting for placing the basic financial statements in an appropriate operational, economic, or historical context. Our opinion on the basic financial statements is not affected by this missing information.
Other Information
Our audit was conducted for the purpose of forming opinions on the financial statements that collectively comprise the City’s basic financial statements. The combining financial statements and statistical information are presented for purposes of additional analysis and are not a required part of the basic financial statements.
Honorable Mayor and CommissionersCity of East Peoria, Illinois
(3)
The combining financial statements are the responsibility of management and were derived from and relate directly to the underlying accounting and other records used to prepare the basic financial statements. Such information has been subjected to the auditing procedures applied in the audit of the basic financial statements and certain additional procedures, including comparing and reconciling such information directly to the underlying accounting and other records used to prepare the basic financial statements or to the basic financial statements themselves, and other additional procedures in accordance with auditing standards generally accepted in the United States of America by us and the other auditors. In our opinion, based on our audit, the procedures performed as described above, and the report of the other auditors, the information is fairly stated in all material respects, in relation to the basic financial statements as a whole.
The statistical information listed in the table of contents has not been subjected to the auditing procedures applied in the audit of the basic financial statements and, accordingly, we do not express an opinion or provide any assurance on it.
CliftonLarsonAllen LLP
Peoria, IllinoisOctober 24, 2018

CITY OF EAST PEORIA, ILLINOISSTATEMENT OF NET POSITION
APRIL 30, 2018
See accompanying Notes to Basic Financial Statements.(4)
Component
Primary Government UnitTotal East Peoria
Governmental Business-Type Primary Mass Transit
ASSETS Activities Activities Government District
CURRENT ASSETS
Cash and Investments $ 10,046,922 $ 3,092,200 $ 13,139,122 $ 64,159
Receivables (Net, Where Applicable, of
Allowances for Estimated Uncollectible Amounts):
Property Taxes 11,226,748 - 11,226,748 442,101
Sales Tax 3,809,453 - 3,809,453 -
State Income Tax 471,532 - 471,532 -
Personal Property Replacement Tax 253,300 - 253,300 8,068
Motor Fuel Tax Allotments 53,573 - 53,573 -
Gaming Tax 378,525 - 378,525 -
Water and Sewer Revenue Receivables:
Billed - 839,743 839,743 -
Unbilled Charges - 990,739 990,739 -
Customer Charges (Net of Allowance) 456,488 158,811 615,299 -
Assessments 13,772 - 13,772 -
Hotel/Motel Taxes 151,950 - 151,950 -
Intergovernmental 805,039 - 805,039 -
Notes 241,646 - 241,646 -
Fines 21,516 - 21,516 -
Capital Lease 599,733 - 599,733 -
Other 243,669 - 243,669 -
Developer 98,469 - 98,469 -
Prepaid Expenses - 26,403 26,403 -
Inventory, at Cost - 105,357 105,357 -
Internal Balances 851,960 (851,960) - -
Assets Held for Resale 1,430,000 - 1,430,000 -
Total Current Assets 31,154,295 4,361,293 35,515,588 514,328
NONCURRENT ASSETS
Restricted Assets, Cash and Investments 908,909 - 908,909 -
Receivables (Net Where Applicable, of
Allowances for Estimated Uncollectible Amounts):
Assessments 12,580 - 12,580 -
Capital Lease 7,121,469 - 7,121,469 -
Capital Assets:Not Depreciable:
Land 10,244,067 3,647,682 13,891,749 -
Construction-in-Progress 27,601 2,064,149 2,091,750 -
Depreciable:
Land Improvements 5,680,007 7,679,585 13,359,592 -
Buildings 53,713,181 24,746,940 78,460,121 -
Machinery, Equipment, and Vehicles 18,190,348 15,071,848 33,262,196 -
Infrastructure 122,826,945 40,543,229 163,370,174 -
Accumulated Depreciation (85,537,466) (58,785,607) (144,323,073) -
Total Noncurrent Assets 133,187,641 34,967,826 168,155,467 -
Total Assets 164,341,936 39,329,119 203,671,055 514,328
DEFERRED OUTFLOWS OF RESOURCES
Deferred Charge on Refunding 578,232 - 578,232 -
Deferred Amounts Related to Pensions 8,131,716 1,177,472 9,309,188 -
Total Deferred Outflows of Resources 8,709,948 1,177,472 9,887,420 -
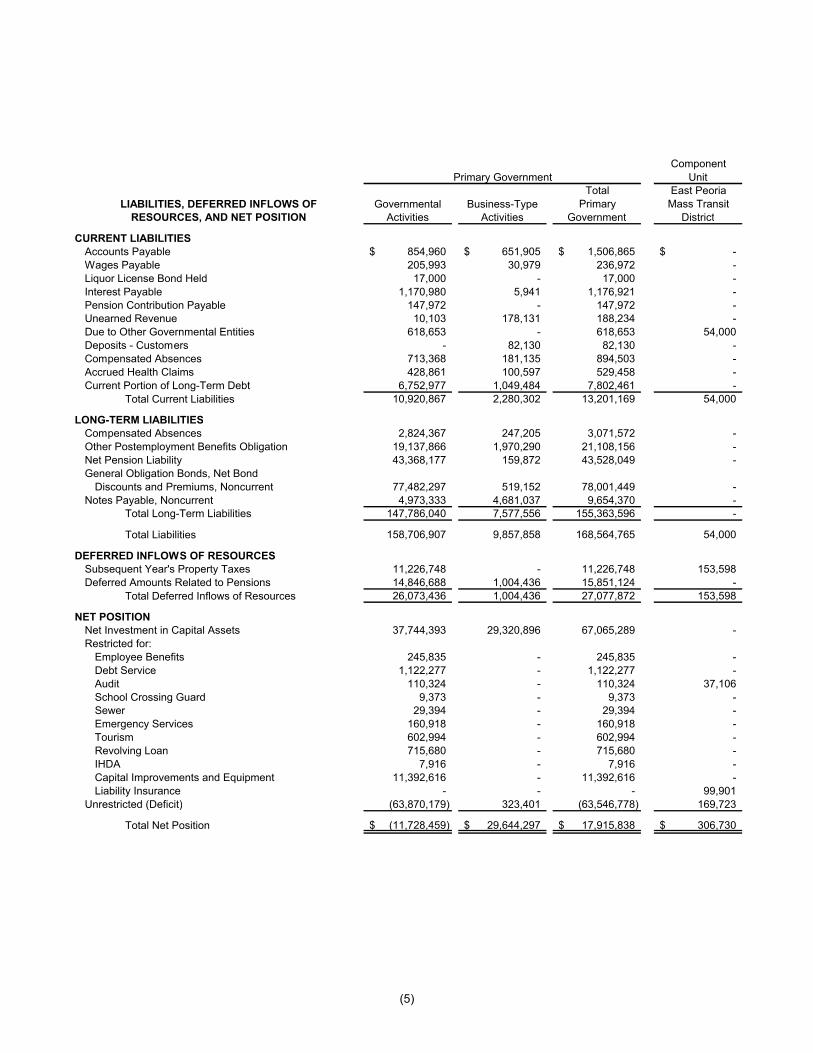
(5)
Component
Primary Government UnitTotal East Peoria
LIABILITIES, DEFERRED INFLOWS OF Governmental Business-Type Primary Mass Transit
RESOURCES, AND NET POSITION Activities Activities Government District
CURRENT LIABILITIESAccounts Payable 854,960$ 651,905$ 1,506,865$ -$
Wages Payable 205,993 30,979 236,972 -
Liquor License Bond Held 17,000 - 17,000 -
Interest Payable 1,170,980 5,941 1,176,921 -
Pension Contribution Payable 147,972 - 147,972 -Unearned Revenue 10,103 178,131 188,234 -
Due to Other Governmental Entities 618,653 - 618,653 54,000
Deposits - Customers - 82,130 82,130 -
Compensated Absences 713,368 181,135 894,503 -
Accrued Health Claims 428,861 100,597 529,458 -
Current Portion of Long-Term Debt 6,752,977 1,049,484 7,802,461 -
Total Current Liabilities 10,920,867 2,280,302 13,201,169 54,000
LONG-TERM LIABILITIESCompensated Absences 2,824,367 247,205 3,071,572 -
Other Postemployment Benefits Obligation 19,137,866 1,970,290 21,108,156 -
Net Pension Liability 43,368,177 159,872 43,528,049 -
General Obligation Bonds, Net Bond
Discounts and Premiums, Noncurrent 77,482,297 519,152 78,001,449 -
Notes Payable, Noncurrent 4,973,333 4,681,037 9,654,370 -Total Long-Term Liabilities 147,786,040 7,577,556 155,363,596 -
Total Liabilities 158,706,907 9,857,858 168,564,765 54,000
DEFERRED INFLOWS OF RESOURCESSubsequent Year's Property Taxes 11,226,748 - 11,226,748 153,598
Deferred Amounts Related to Pensions 14,846,688 1,004,436 15,851,124 -
Total Deferred Inflows of Resources 26,073,436 1,004,436 27,077,872 153,598
NET POSITIONNet Investment in Capital Assets 37,744,393 29,320,896 67,065,289 -
Restricted for:
Employee Benefits 245,835 - 245,835 -
Debt Service 1,122,277 - 1,122,277 -
Audit 110,324 - 110,324 37,106
School Crossing Guard 9,373 - 9,373 -Sewer 29,394 - 29,394 -
Emergency Services 160,918 - 160,918 -
Tourism 602,994 - 602,994 -
Revolving Loan 715,680 - 715,680 -
IHDA 7,916 - 7,916 -
Capital Improvements and Equipment 11,392,616 - 11,392,616 -
Liability Insurance - - - 99,901
Unrestricted (Deficit) (63,870,179) 323,401 (63,546,778) 169,723
Total Net Position (11,728,459)$ 29,644,297$ 17,915,838$ 306,730$
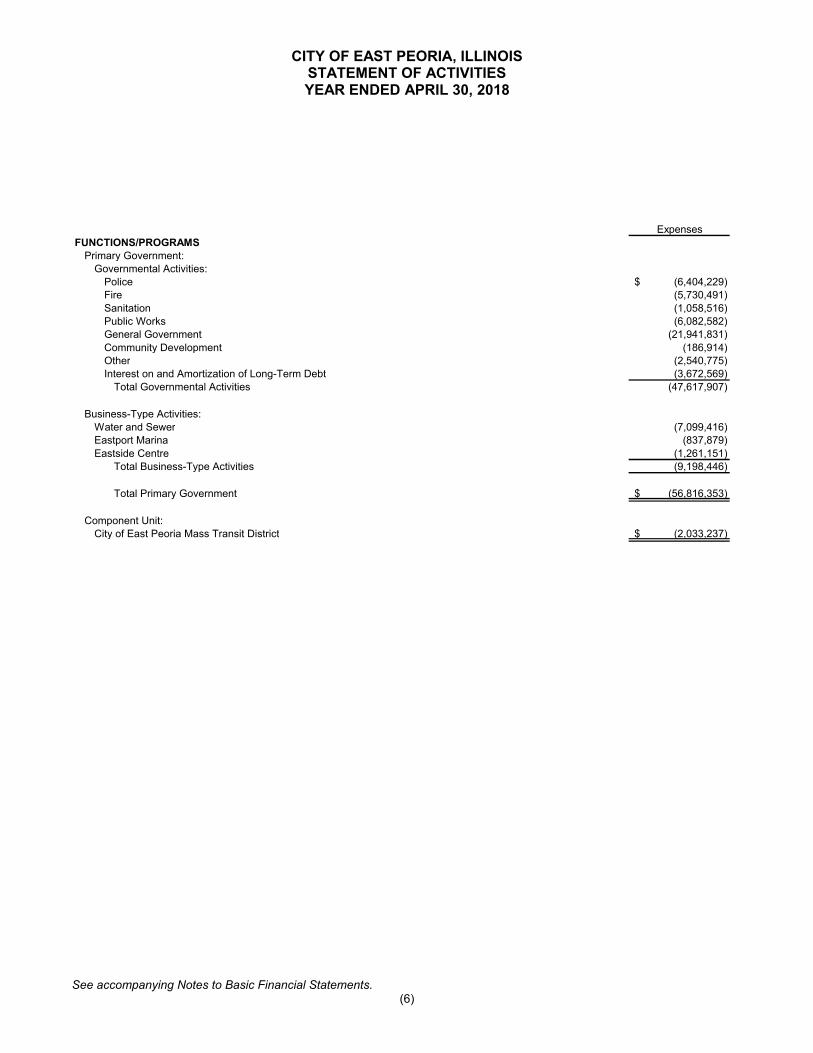
CITY OF EAST PEORIA, ILLINOISSTATEMENT OF ACTIVITIESYEAR ENDED APRIL 30, 2018
See accompanying Notes to Basic Financial Statements.(6)
Expenses
FUNCTIONS/PROGRAMSPrimary Government:
Governmental Activities:Police (6,404,229)$ Fire (5,730,491)
Sanitation (1,058,516)Public Works (6,082,582)General Government (21,941,831)
Community Development (186,914)Other (2,540,775)Interest on and Amortization of Long-Term Debt (3,672,569)
Total Governmental Activities (47,617,907)
Business-Type Activities:Water and Sewer (7,099,416)Eastport Marina (837,879)
Eastside Centre (1,261,151)Total Business-Type Activities (9,198,446)
Total Primary Government (56,816,353)$
Component Unit:City of East Peoria Mass Transit District (2,033,237)$
(7)
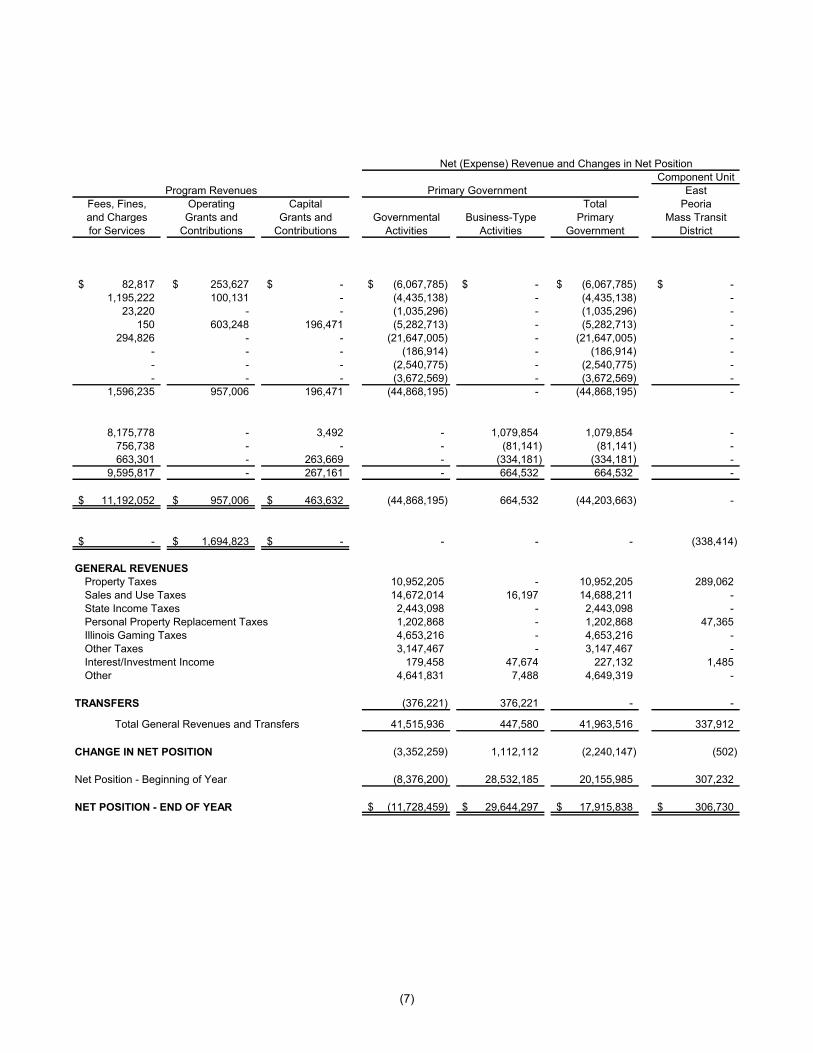
Net (Expense) Revenue and Changes in Net Position
Component Unit
Program Revenues Primary Government East
Fees, Fines, Operating Capital Total Peoria
and Charges Grants and Grants and Governmental Business-Type Primary Mass Transit
for Services Contributions Contributions Activities Activities Government District
82,817$ 253,627$ -$ (6,067,785)$ -$ (6,067,785)$ -$
1,195,222 100,131 - (4,435,138) - (4,435,138) -
23,220 - - (1,035,296) - (1,035,296) -
150 603,248 196,471 (5,282,713) - (5,282,713) -
294,826 - - (21,647,005) - (21,647,005) -
- - - (186,914) - (186,914) -
- - - (2,540,775) - (2,540,775) -
- - - (3,672,569) - (3,672,569) -
1,596,235 957,006 196,471 (44,868,195) - (44,868,195) -
8,175,778 - 3,492 - 1,079,854 1,079,854 -
756,738 - - - (81,141) (81,141) -
663,301 - 263,669 - (334,181) (334,181) -
9,595,817 - 267,161 - 664,532 664,532 -
11,192,052$ 957,006$ 463,632$ (44,868,195) 664,532 (44,203,663) -
-$ 1,694,823$ -$ - - - (338,414)
GENERAL REVENUESProperty Taxes 10,952,205 - 10,952,205 289,062
Sales and Use Taxes 14,672,014 16,197 14,688,211 -
State Income Taxes 2,443,098 - 2,443,098 -
Personal Property Replacement Taxes 1,202,868 - 1,202,868 47,365
Illinois Gaming Taxes 4,653,216 - 4,653,216 -
Other Taxes 3,147,467 - 3,147,467 -
Interest/Investment Income 179,458 47,674 227,132 1,485
Other 4,641,831 7,488 4,649,319 -
TRANSFERS (376,221) 376,221 - -
Total General Revenues and Transfers 41,515,936 447,580 41,963,516 337,912
CHANGE IN NET POSITION (3,352,259) 1,112,112 (2,240,147) (502)
Net Position - Beginning of Year (8,376,200) 28,532,185 20,155,985 307,232
NET POSITION - END OF YEAR (11,728,459)$ 29,644,297$ 17,915,838$ 306,730$

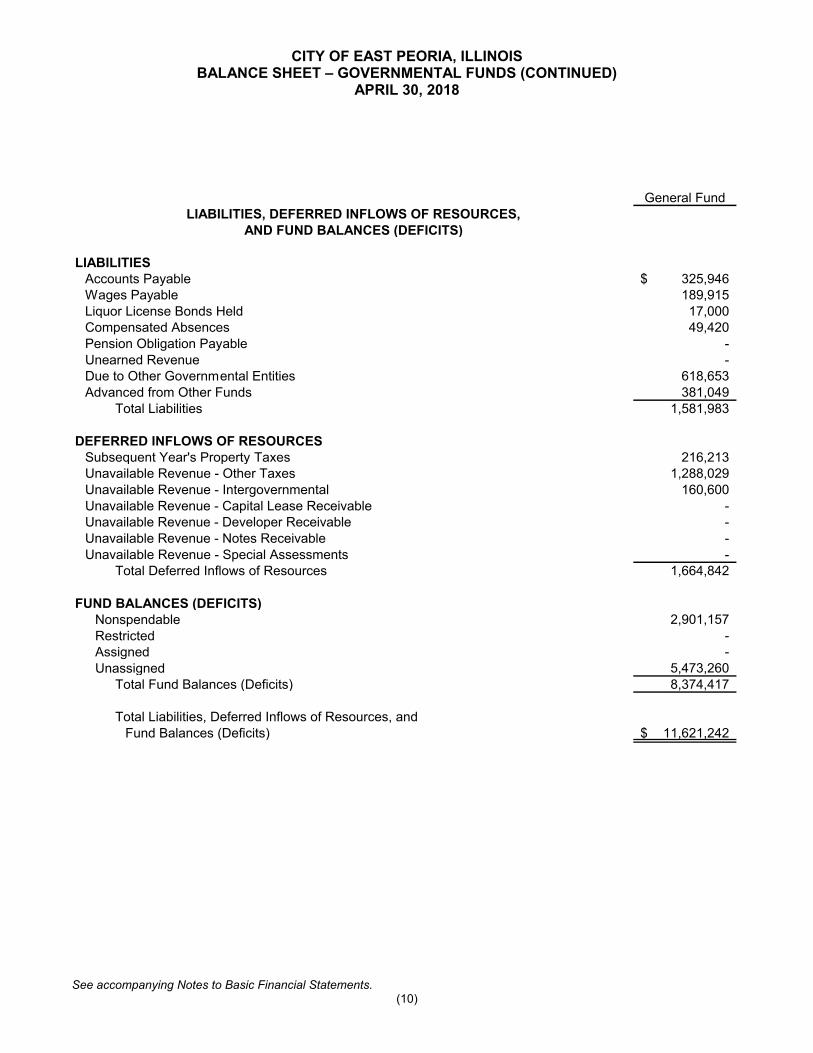
CITY OF EAST PEORIA, ILLINOISBALANCE SHEET – GOVERNMENTAL FUNDS
APRIL 30, 2018
See accompanying Notes to Basic Financial Statements.(8)
General FundASSETS
Cash and Investments 3,265,292$ Receivables (Net, Where Applicable, of Allowances for
Estimated Uncollectible Amounts):Property Taxes 216,213 Sales Tax 3,495,994 State Income Tax 471,532 Personal Property Replacement Tax 177,900 Motor Fuel Tax Allotments -Gaming Tax -Customer Charges 456,488 Assessments -Hotel/Motel Taxes -Intergovernmental 533,630 Notes -Fines 21,516 Capital Lease -Other 81,520 Developer -Advanced to Other Funds 2,901,157
Assets Held for Resale -Restricted Assets, Cash and Investments -
Total Assets 11,621,242$

(9)
Riverboat Special Tax Capital Other Gaming Allocation Projects GovernmentalTax Fund Fund Fund Funds Total
251,329$ 3,018$ -$ 5,977,160$ 9,496,799$
- 781,026 4,750,741 5,478,768 11,226,748 - - 313,459 - 3,809,453- - - - 471,532- - - 75,400 253,300 - - - 53,573 53,573
378,525 - - - 378,525 - - - - 456,488 - - - 26,352 26,352 - - 23,685 128,265 151,950
10,103 - 261,306 - 805,039- - - 241,646 241,646- - - - 21,516 - - 7,721,202 - 7,721,202- - 29,313 132,836 243,669- - 98,469 - 98,469
8,438,550 2,639,532 381,451 780,431 15,141,121- - 1,430,000 - 1,430,000- - 908,909 - 908,909
9,078,507$ 3,423,576$ 15,918,535$ 12,894,431$ 52,936,291$
CITY OF EAST PEORIA, ILLINOISBALANCE SHEET – GOVERNMENTAL FUNDS (CONTINUED)
APRIL 30, 2018
See accompanying Notes to Basic Financial Statements.(10)
General FundLIABILITIES, DEFERRED INFLOWS OF RESOURCES,
AND FUND BALANCES (DEFICITS)
LIABILITIESAccounts Payable 325,946$ Wages Payable 189,915 Liquor License Bonds Held 17,000 Compensated Absences 49,420 Pension Obligation Payable -Unearned Revenue -Due to Other Governmental Entities 618,653 Advanced from Other Funds 381,049
Total Liabilities 1,581,983
DEFERRED INFLOWS OF RESOURCESSubsequent Year's Property Taxes 216,213 Unavailable Revenue - Other Taxes 1,288,029 Unavailable Revenue - Intergovernmental 160,600 Unavailable Revenue - Capital Lease Receivable -Unavailable Revenue - Developer Receivable -Unavailable Revenue - Notes Receivable -Unavailable Revenue - Special Assessments -
Total Deferred Inflows of Resources 1,664,842
FUND BALANCES (DEFICITS)Nonspendable 2,901,157 Restricted -Assigned -Unassigned 5,473,260
Total Fund Balances (Deficits) 8,374,417
Total Liabilities, Deferred Inflows of Resources, andFund Balances (Deficits) 11,621,242$
(11)
Riverboat Special Tax Capital Other Gaming Allocation Projects GovernmentalTax Fund Fund Fund Funds Total
170,436$ -$ 329,430$ 29,148$ 854,960$ - - - 16,078 205,993 - - - - 17,000 - - - - 49,420 - - - 147,972 147,972
10,103 - - - 10,103 - - - - 618,653
428,939 6,481,826 6,605,982 391,365 14,289,161 609,478 6,481,826 6,935,412 584,563 16,193,262
- 781,026 4,750,741 5,478,768 11,226,748 - - 79,795 65,667 1,433,491 - - 79,514 - 240,114- - 7,721,202 - 7,721,202- - 98,469 - 98,469- - - 241,646 241,646- - - 12,580 12,580- 781,026 12,729,721 5,798,661 20,974,250
- - - - 2,901,157 7,141,816 3,295,759 582,385 4,069,145 15,089,105 1,327,213 - - 2,442,062 3,769,275
- (7,135,035) (4,328,983) - (5,990,758)8,469,029 (3,839,276) (3,746,598) 6,511,207 15,768,779
9,078,507$ 3,423,576$ 15,918,535$ 12,894,431$ 52,936,291$
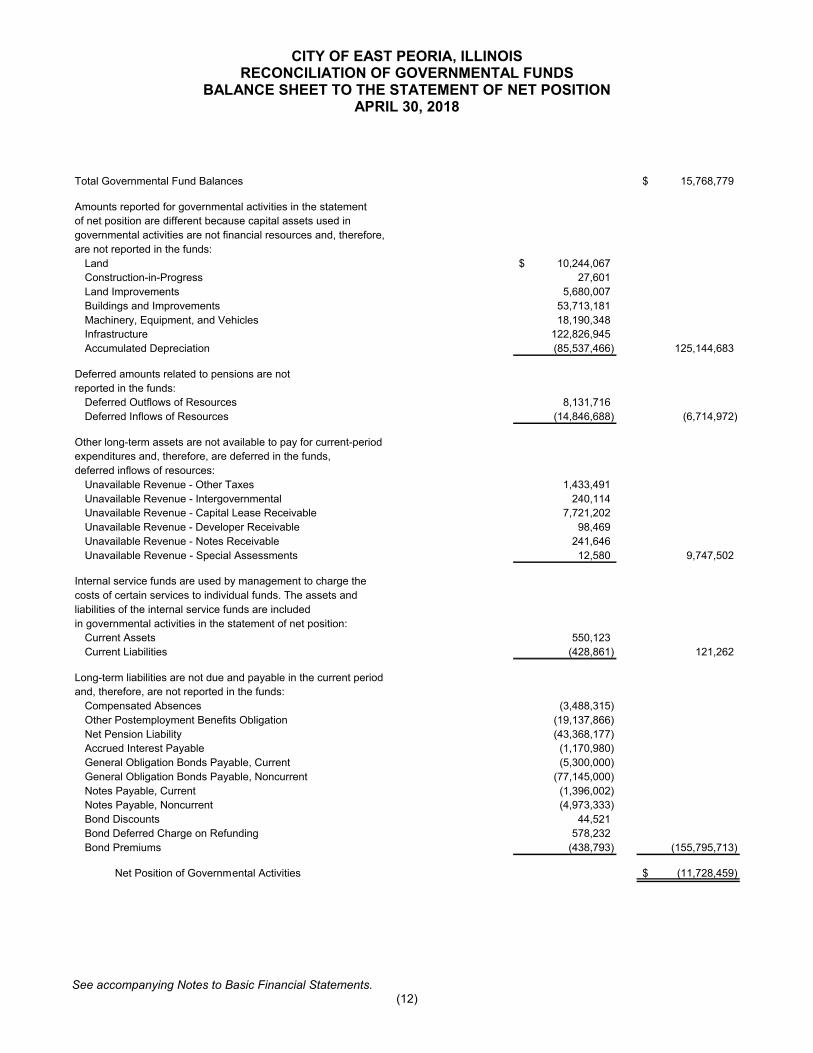
CITY OF EAST PEORIA, ILLINOISRECONCILIATION OF GOVERNMENTAL FUNDS
BALANCE SHEET TO THE STATEMENT OF NET POSITIONAPRIL 30, 2018
See accompanying Notes to Basic Financial Statements.(12)
Total Governmental Fund Balances 15,768,779$
Amounts reported for governmental activities in the statement
of net position are different because capital assets used in
governmental activities are not financial resources and, therefore,
are not reported in the funds:
Land 10,244,067$
Construction-in-Progress 27,601
Land Improvements 5,680,007
Buildings and Improvements 53,713,181
Machinery, Equipment, and Vehicles 18,190,348
Infrastructure 122,826,945
Accumulated Depreciation (85,537,466) 125,144,683
Deferred amounts related to pensions are not
reported in the funds:
Deferred Outflows of Resources 8,131,716
Deferred Inflows of Resources (14,846,688) (6,714,972)
Other long-term assets are not available to pay for current-period
expenditures and, therefore, are deferred in the funds,
deferred inflows of resources:
Unavailable Revenue - Other Taxes 1,433,491
Unavailable Revenue - Intergovernmental 240,114
Unavailable Revenue - Capital Lease Receivable 7,721,202
Unavailable Revenue - Developer Receivable 98,469
Unavailable Revenue - Notes Receivable 241,646
Unavailable Revenue - Special Assessments 12,580 9,747,502
Internal service funds are used by management to charge the
costs of certain services to individual funds. The assets and
liabilities of the internal service funds are included
in governmental activities in the statement of net position:
Current Assets 550,123
Current Liabilities (428,861) 121,262
Long-term liabilities are not due and payable in the current period
and, therefore, are not reported in the funds:
Compensated Absences (3,488,315)
Other Postemployment Benefits Obligation (19,137,866)
Net Pension Liability (43,368,177)
Accrued Interest Payable (1,170,980)
General Obligation Bonds Payable, Current (5,300,000)
General Obligation Bonds Payable, Noncurrent (77,145,000)
Notes Payable, Current (1,396,002)
Notes Payable, Noncurrent (4,973,333)
Bond Discounts 44,521
Bond Deferred Charge on Refunding 578,232
Bond Premiums (438,793) (155,795,713)
Net Position of Governmental Activities (11,728,459)$
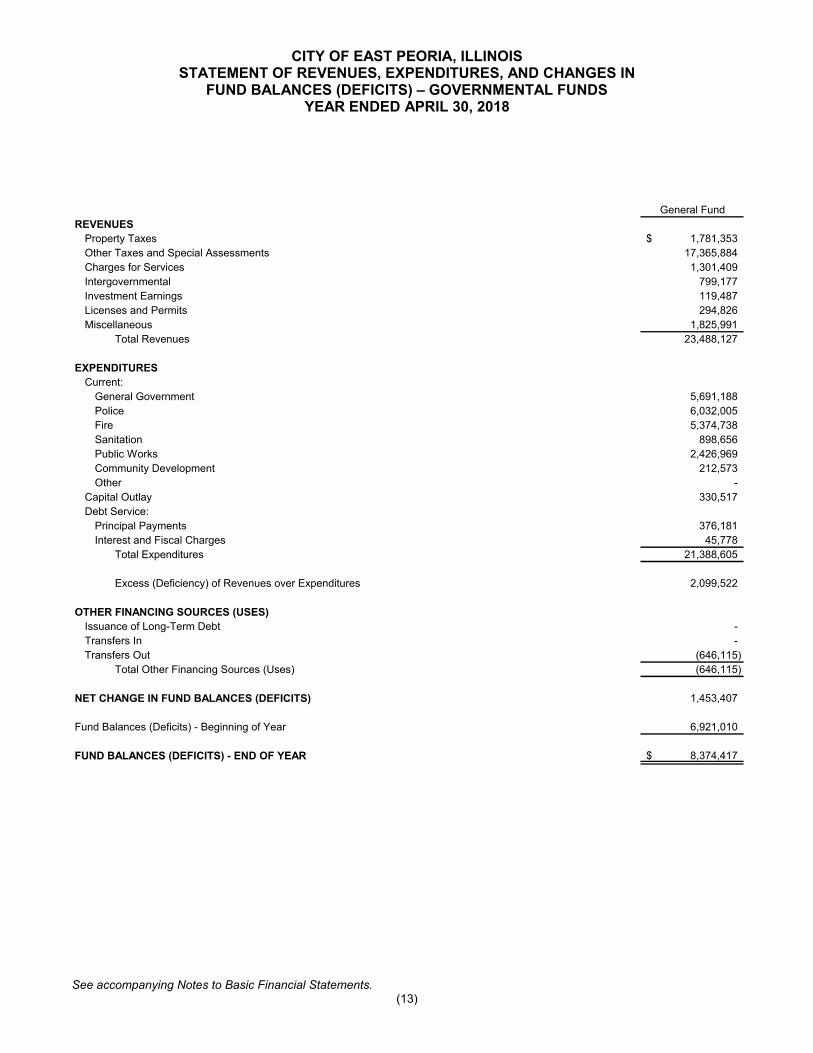
CITY OF EAST PEORIA, ILLINOISSTATEMENT OF REVENUES, EXPENDITURES, AND CHANGES IN
FUND BALANCES (DEFICITS) – GOVERNMENTAL FUNDSYEAR ENDED APRIL 30, 2018
See accompanying Notes to Basic Financial Statements.(13)
General Fund
REVENUES
Property Taxes 1,781,353$
Other Taxes and Special Assessments 17,365,884
Charges for Services 1,301,409
Intergovernmental 799,177
Investment Earnings 119,487
Licenses and Permits 294,826
Miscellaneous 1,825,991
Total Revenues 23,488,127
EXPENDITURES
Current:
General Government 5,691,188
Police 6,032,005
Fire 5,374,738
Sanitation 898,656
Public Works 2,426,969
Community Development 212,573
Other -
Capital Outlay 330,517
Debt Service:
Principal Payments 376,181
Interest and Fiscal Charges 45,778
Total Expenditures 21,388,605
Excess (Deficiency) of Revenues over Expenditures 2,099,522
OTHER FINANCING SOURCES (USES)
Issuance of Long-Term Debt -
Transfers In -
Transfers Out (646,115)
Total Other Financing Sources (Uses) (646,115)
NET CHANGE IN FUND BALANCES (DEFICITS) 1,453,407
Fund Balances (Deficits) - Beginning of Year 6,921,010
FUND BALANCES (DEFICITS) - END OF YEAR 8,374,417$

(14)
Riverboat Special Tax Capital Other
Gaming Allocation Projects Governmental
Tax Fund Fund Fund Funds Total
-$ 793,344$ 4,514,869$ 3,862,639$ 10,952,205$
4,653,216 - 1,803,335 1,314,733 25,137,168
- - - - 1,301,409
196,471 - - 1,750,767 2,746,415
14,213 567 16,547 27,752 178,566
- - - - 294,826
- - 2,354,727 416,806 4,597,524
4,863,900 793,911 8,689,478 7,372,697 45,208,113
- 137,117 - 3,168,611 8,996,916
- - - 1,789,578 7,821,583
- - - 1,939,250 7,313,988
- - - - 898,656
- - - 769,831 3,196,800
- - - - 212,573
1,333,074 - 2,336,990 162,000 3,832,064
2,639,828 - 505,369 467,188 3,942,902
287,731 - 5,508,491 370,000 6,542,403
16,290 - 3,608,643 29,564 3,700,275
4,276,923 137,117 11,959,493 8,696,022 46,458,160
586,977 656,794 (3,270,015) (1,323,325) (1,250,047)
1,313,000 - - - 1,313,000
- - 2,300,000 269,894 2,569,894
(2,300,000) - - - (2,946,115)
(987,000) - 2,300,000 269,894 936,779
(400,023) 656,794 (970,015) (1,053,431) (313,268)
8,869,052 (4,496,070) (2,776,583) 7,564,638 16,082,047
8,469,029$ (3,839,276)$ (3,746,598)$ 6,511,207$ 15,768,779$
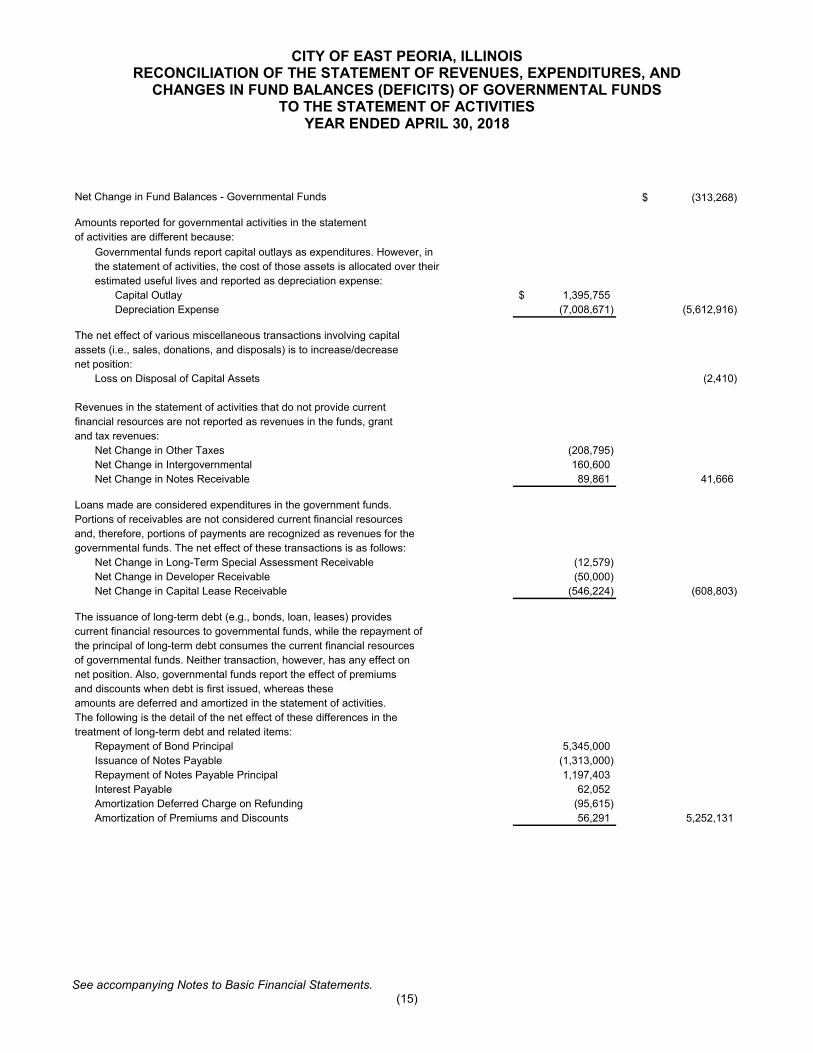
CITY OF EAST PEORIA, ILLINOISRECONCILIATION OF THE STATEMENT OF REVENUES, EXPENDITURES, AND
CHANGES IN FUND BALANCES (DEFICITS) OF GOVERNMENTAL FUNDSTO THE STATEMENT OF ACTIVITIES
YEAR ENDED APRIL 30, 2018
See accompanying Notes to Basic Financial Statements.(15)
Net Change in Fund Balances - Governmental Funds (313,268)$
Amounts reported for governmental activities in the statement
of activities are different because:
Governmental funds report capital outlays as expenditures. However, in
the statement of activities, the cost of those assets is allocated over their
estimated useful lives and reported as depreciation expense:
Capital Outlay 1,395,755$
Depreciation Expense (7,008,671) (5,612,916)
The net effect of various miscellaneous transactions involving capital
assets (i.e., sales, donations, and disposals) is to increase/decrease
net position:
Loss on Disposal of Capital Assets (2,410)
Revenues in the statement of activities that do not provide current
financial resources are not reported as revenues in the funds, grant
and tax revenues:
Net Change in Other Taxes (208,795)
Net Change in Intergovernmental 160,600
Net Change in Notes Receivable 89,861 41,666
Loans made are considered expenditures in the government funds.
Portions of receivables are not considered current financial resources
and, therefore, portions of payments are recognized as revenues for the
governmental funds. The net effect of these transactions is as follows:
Net Change in Long-Term Special Assessment Receivable (12,579)
Net Change in Developer Receivable (50,000)
Net Change in Capital Lease Receivable (546,224) (608,803)
The issuance of long-term debt (e.g., bonds, loan, leases) provides
current financial resources to governmental funds, while the repayment of
the principal of long-term debt consumes the current financial resources
of governmental funds. Neither transaction, however, has any effect on
net position. Also, governmental funds report the effect of premiums
and discounts when debt is first issued, whereas these
amounts are deferred and amortized in the statement of activities.
The following is the detail of the net effect of these differences in the
treatment of long-term debt and related items:
Repayment of Bond Principal 5,345,000
Issuance of Notes Payable (1,313,000)
Repayment of Notes Payable Principal 1,197,403
Interest Payable 62,052
Amortization Deferred Charge on Refunding (95,615)
Amortization of Premiums and Discounts 56,291 5,252,131

CITY OF EAST PEORIA, ILLINOISRECONCILIATION OF THE STATEMENT OF REVENUES, EXPENDITURES, AND
CHANGES IN FUND BALANCES (DEFICITS) OF GOVERNMENTAL FUNDSTO THE STATEMENT OF ACTIVITIES (CONTINUED)
YEAR ENDED APRIL 30, 2018
See accompanying Notes to Basic Financial Statements.(16)
Some expenses reported in the statement of activities do not require
the use of current financial resources and, therefore, are not reported as
expenditures in governmental funds:
Change in Compensated Absences 172,045$
Change in Other Postemployment Benefit Obligation (2,403,508)
Net Pension Liability and Related Deferrals 233,971 (1,997,492)$
Internal service funds are used by management to charge the costs of
various activities internally to individual funds. The net expense of
certain activities of internal service funds is reported with governmental
activities. (111,167)
Change in Net Position of Governmental Activities (3,352,259)$
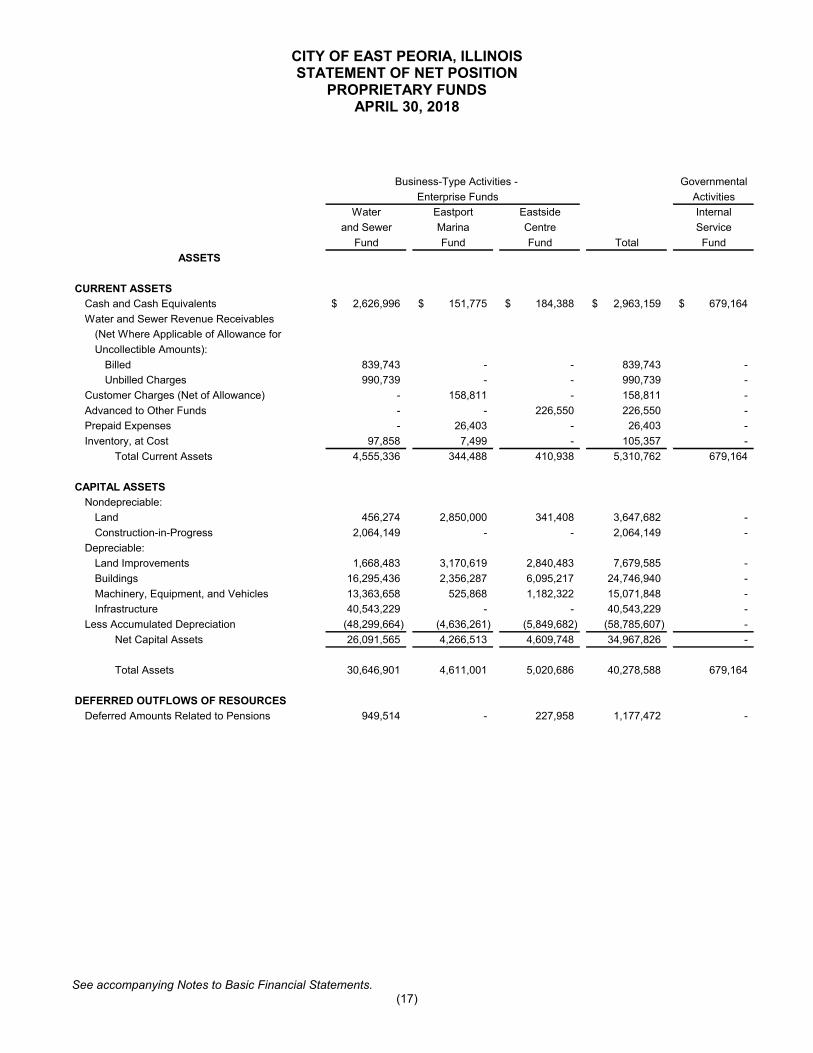
CITY OF EAST PEORIA, ILLINOISSTATEMENT OF NET POSITION
PROPRIETARY FUNDSAPRIL 30, 2018
See accompanying Notes to Basic Financial Statements.(17)
Business-Type Activities - Governmental
Enterprise Funds Activities
Water Eastport Eastside Internal
and Sewer Marina Centre Service
Fund Fund Fund Total Fund
ASSETS
CURRENT ASSETS
Cash and Cash Equivalents 2,626,996$ 151,775$ 184,388$ 2,963,159$ 679,164$
Water and Sewer Revenue Receivables
(Net Where Applicable of Allowance for
Uncollectible Amounts):
Billed 839,743 - - 839,743 -
Unbilled Charges 990,739 - - 990,739 -
Customer Charges (Net of Allowance) - 158,811 - 158,811 -
Advanced to Other Funds - - 226,550 226,550 -
Prepaid Expenses - 26,403 - 26,403 -
Inventory, at Cost 97,858 7,499 - 105,357 -
Total Current Assets 4,555,336 344,488 410,938 5,310,762 679,164
CAPITAL ASSETS
Nondepreciable:
Land 456,274 2,850,000 341,408 3,647,682 -
Construction-in-Progress 2,064,149 - - 2,064,149 -
Depreciable:
Land Improvements 1,668,483 3,170,619 2,840,483 7,679,585 -
Buildings 16,295,436 2,356,287 6,095,217 24,746,940 -
Machinery, Equipment, and Vehicles 13,363,658 525,868 1,182,322 15,071,848 -
Infrastructure 40,543,229 - - 40,543,229 -
Less Accumulated Depreciation (48,299,664) (4,636,261) (5,849,682) (58,785,607) -
Net Capital Assets 26,091,565 4,266,513 4,609,748 34,967,826 -
Total Assets 30,646,901 4,611,001 5,020,686 40,278,588 679,164
DEFERRED OUTFLOWS OF RESOURCES
Deferred Amounts Related to Pensions 949,514 - 227,958 1,177,472 -

CITY OF EAST PEORIA, ILLINOISSTATEMENT OF NET POSITION (CONTINUED)
PROPRIETARY FUNDSAPRIL 30, 2018
See accompanying Notes to Basic Financial Statements.(18)
Business-Type Activities - Governmental
Enterprise Funds Activities
Water Eastport Eastside Internal
and Sewer Marina Centre Service
Fund Fund Fund Total Fund
LIABILITIES AND NET POSITION
CURRENT LIABILITIES
Accounts Payable 608,744$ -$ 43,161$ 651,905$ -$
Wages Payable 25,666 - 5,313 30,979 -
Interest Payable 5,892 - 49 5,941 -
Deposits, Customers 82,130 - - 82,130 -
Compensated Absences 161,169 - 19,966 181,135 -
Unearned Revenue - 178,131 - 178,131 -
Accrued Health Claims - - - - 529,458
Current Portion of Long-Term Debt 1,031,763 - 17,721 1,049,484 -
Total Current Liabilities 1,915,364 178,131 86,210 2,179,705 529,458
LONG-TERM LIABILITIES
Compensated Absences, Noncurrent 173,664 - 73,541 247,205 -
Advanced from Other Funds 902,217 144,293 32,000 1,078,510 -
Other Postemployment Benefits Obligation - - 1,970,290 1,970,290 -
Net Pension Liability 128,921 - 30,951 159,872 -
General Obligation Bonds, Plus
Bond Premiums, Noncurrent 519,152 - - 519,152 -
Notes Payable, Noncurrent 4,631,594 - 49,443 4,681,037 -
Total Long-Term Liabilities 6,355,548 144,293 2,156,225 8,656,066 -
Total Liabilities 8,270,912 322,424 2,242,435 10,835,771 529,458
DEFERRED INFLOWS OF RESOURCES
Deferred Amounts Related to Pensions 809,978 - 194,458 1,004,436 -
NET POSITION
Net Investment in Capital Assets 20,511,799 4,266,513 4,542,584 29,320,896 -
Unrestricted 2,003,726 22,064 (1,730,833) 294,957 149,706
Total Net Position 22,515,525$ 4,288,577$ 2,811,751$ 29,615,853$ 149,706$
Total Enterprise Funds Net Position 29,615,853$
Amounts reported for business-type activities in the statement of
net position are different because an internal service fund
is used by management to charge the cost of certain
services to individual funds. A portion of the assets and liabilities of
the internal service fund are included in business-type
activities in the statement of net position. 28,444
Net Position of Business-Type Activities 29,644,297$

CITY OF EAST PEORIA, ILLINOISSTATEMENT OF REVENUES, EXPENSES, AND CHANGES IN NET POSITION
PROPRIETARY FUNDSYEAR ENDED APRIL 30, 2018
See accompanying Notes to Basic Financial Statements.(19)
Business-Type Activities - Governmental
Enterprise Funds ActivitiesWater Eastport Eastside Internal
and Sewer Marina Centre Service
Fund Fund Fund Total Fund
OPERATING REVENUESWater Sales 3,485,618$ -$ -$ 3,485,618$ -$
Sewer Service Charges 4,401,013 - - 4,401,013 -Fuel Sales - 148,496 - 148,496 -
Storage and Rentals - 608,242 15,931 624,173 -
Fees for Services - - 375,118 375,118 -Tap-In Charges 30,829 - - 30,829 -
Water Assessments 8,400 - - 8,400 -
Sewer Assessments 13,200 - - 13,200 -Penalties 184,228 - - 184,228 -
Individual Sewer Permits 1,040 - - 1,040 -
Contractorsʼ Sewer Permits 1,295 - - 1,295 -Sewer Inspection Fees 1,005 - - 1,005 -
Sewer Connection Fees 17,130 - - 17,130 -Concession Sales - - 202,004 202,004 -
Charges for Coverage - - - - 3,319,900
Miscellaneous 32,020 - 70,248 102,268 -Total Operating Revenues 8,175,778 756,738 663,301 9,595,817 3,319,900
OPERATING EXPENSESSalaries and Benefits 3,238,892 224,878 597,628 4,061,398 -
Contractual Services 238,615 80,000 66,357 384,972 -Utilities 565,085 64,051 25,388 654,524 -
Repair and Maintenance 469,106 90,991 148,062 708,159 -
Insurance 549,600 43,178 32,000 624,778 -Other Supplies and Expenses 604,876 248,951 172,356 1,026,183 -
Depreciation 1,247,187 85,830 197,681 1,530,698 -
Insurance Claims - - - - 3,458,245 Total Operating Expenses 6,913,361 837,879 1,239,472 8,990,712 3,458,245
OPERATING INCOME (LOSS) 1,262,417 (81,141) (576,171) 605,105 (138,345)
NONOPERATING REVENUES (EXPENSES)Interest 45,034 874 1,557 47,465 1,102
Reimbursements 7,488 - - 7,488 -Municipal Sales Tax - - 16,197 16,197 -
Interest, Fiscal Charges, and Amortization (163,920) - (17,529) (181,449) -
Total Nonoperating Revenues (Expenses) (111,398) 874 225 (110,299) 1,102
INCOME (LOSS) BEFORE TRANSFERS 1,151,019 (80,267) (575,946) 494,806 (137,243)
TRANSFERS IN - - 376,221 376,221 -
CAPITAL CONTRIBUTIONS 3,492 - 263,669 267,161 -
CHANGE IN NET POSITION 1,154,511 (80,267) 63,944 1,138,188 (137,243)
Total Net Position - Beginning of Year 21,361,014 4,368,844 2,747,807 28,477,665 286,949
TOTAL NET POSITION - END OF YEAR 22,515,525$ 4,288,577$ 2,811,751$ 29,615,853$ 149,706$
Total Enterprise Funds Change in Net Position 1,138,188$
Amounts reported for business-type activities in the statement of
activities are different because an internal service fundis used by management to charge the cost of certain
services to individual funds. A portion of the activity of the internal service fund is included in business-type
activities in the statement of activities. (26,076)
Change in Net Position of Business-Type Activities 1,112,112$

CITY OF EAST PEORIA, ILLINOISSTATEMENT OF CASH FLOWS
PROPRIETARY FUNDSYEAR ENDED APRIL 30, 2018
See accompanying Notes to Basic Financial Statements.(20)
Business-Type Activities - Governmental
Enterprise Funds Activities
Water Eastport Eastside Internal
and Sewer Marina Centre Service
Fund Fund Fund Total Fund
CASH FLOWS FROM OPERATING ACTIVITIES
Receipts from Customers and Users 8,015,004$ 713,978$ 663,301$ 9,392,283$ 3,319,900$
Payments to Suppliers (3,180,064) (537,771) (208,573) (3,926,408) (3,414,468)
Payments to Employees (3,287,337) (224,878) (571,480) (4,083,695) -
Net Cash Provided (Used) by
Operating Activities 1,547,603 (48,671) (116,752) 1,382,180 (94,568)
CASH FLOWS FROM NONCAPITAL
FINANCING ACTIVITIES
Reimbursements 7,488 - - 7,488 -
Municipal Sales Tax - - 16,197 16,197 -
Transfer to/from Other Funds 538,000 - 376,221 914,221 -
Net Cash Provided by Noncapital
Financing Activities 545,488 - 392,418 937,906 -
CASH FLOWS FROM CAPITAL AND
RELATED FINANCING ACTIVITIES
Proceeds from Issuance of Notes Payable 1,187,000 - - 1,187,000 -
Principal Payments on Notes Payable (802,569) - (127,017) (929,586) -
Interest and Fiscal Charges Paid on
Bonds and Notes Payable (206,594) - (17,529) (224,123) -
Purchase of Capital Assets (1,641,337) - - (1,641,337) -
Principal Payment on Bonds (235,000) - - (235,000) -
Net Cash Used by Capital
and Related Financing Activities (1,698,500) - (144,546) (1,843,046) -
CASH FLOWS FROM INVESTING ACTIVITIES
Interest on Investments 45,034 874 1,557 47,465 1,102
INCREASE (DECREASE) IN CASH AND
CASH EQUIVALENTS 439,625 (47,797) 132,677 524,505 (93,466)
Cash and Cash Equivalents - Beginning of Year 2,187,371 199,572 51,711 2,438,654 772,630
CASH AND CASH EQUIVALENTS -
END OF YEAR 2,626,996$ 151,775$ 184,388$ 2,963,159$ 679,164$

CITY OF EAST PEORIA, ILLINOISSTATEMENT OF CASH FLOWS (CONTINUED)
PROPRIETARY FUNDSYEAR ENDED APRIL 30, 2018
See accompanying Notes to Basic Financial Statements.(21)
Business-Type Activities - Governmental
Enterprise Funds Activities
Water Eastport Eastside Internal
and Sewer Marina Centre Service
Fund Fund Fund Total Fund
RECONCILIATION OF OPERATING INCOME
(LOSS) TO NET CASH PROVIDED (USED)
BY OPERATING ACTIVITIES
Operating Income (Loss) 1,262,417$ (81,141)$ (576,171)$ 605,105$ (138,345)$
Adjustments to Reconcile Operating Income
(Loss) to Net Cash Provided (Used) by
Operating Activities:
Depreciation 1,247,187 85,830 197,681 1,530,698 -
Change in Assets and Liabilities:
Customer Charges and Receivables (159,304) (40,506) - (199,810) -
Prepaid Expenses - (22,362) - (22,362) -
Inventory (16,591) 11,762 - (4,829) -
Accounts Payable, Claims, Retainage,
and Wages Payable (77,304) - 21,905 (55,399) 43,777
Deposits (1,470) - - (1,470) -
Unearned Revenue - (2,254) - (2,254) -
Compensated Absences (49,342) - 25,151 (24,191) -
Other Postemployment Benefits Obligation - - 333,224 333,224 -
Net Pension Liability and Related Deferrals (657,990) - (118,542) (776,532) -
Net Cash Provided (Used) by
Operating Activities 1,547,603$ (48,671)$ (116,752)$ 1,382,180$ (94,568)$
NONCASH CAPITAL AND RELATED
FINANCING ACTIVITIES
Amortization of Premiums, Discounts,
and Deferred Charge on Refunding 12,615$ -$ -$ 12,615$ -$
Capital Contributions 3,492$ -$ 263,669$ 267,161$ -$
Purchases of Capital Assets Included
in Accounts Payable as of April 30, 2018 509,299$ -$ -$ 509,299$ -$

CITY OF EAST PEORIA, ILLINOISSTATEMENT OF FIDUCIARY NET POSITION
APRIL 30, 2018
See accompanying Notes to Basic Financial Statements.(22)
PensionTrusts Agency
ASSETSCash and Cash Equivalents 1,236,482$ 26,994$
Receivables:Other 3,529 -Accrued Interest and Dividends 127,854 -
Total Receivables 131,383 -
Investments, at Fair Value:Money Market Funds 1,261,496 -Municipal Bonds 754,241 -Corporate Bonds 7,710,927 -U.S. Government Notes and Bonds 4,251,537 -U.S. Government Agency Obligations 2,076,354 -Mutual Funds 13,977,521 -Common Stocks 19,654,593 -
Total Investments 49,686,669 -
Total Assets 51,054,534 26,994$
LIABILITIESAccounts Payable and Accrued Payroll Taxes 5,008 -$Amounts Held for Others - 26,994
Total Liabilities 5,008 26,994$
Net Position Held in Trust for Pension Benefits 51,049,526$

CITY OF EAST PEORIA, ILLINOISSTATEMENT OF CHANGES IN FIDUCIARY NET POSITION
PENSION TRUST FUNDSYEAR ENDED APRIL 30, 2018
See accompanying Notes to Basic Financial Statements.(23)
ADDITIONSContributions:
Plan Membersʼ Contributions 776,448$ Employer Contributions 3,778,100
Total Contributions 4,554,548
Net Investment Income:Net Appreciation in Fair Value of Investments 2,050,675 Dividends and Interest 1,299,503
Total Investment Income 3,350,178 Less: Investment Expenses 256,947
Net Investment Income 3,093,231
Total Additions 7,647,779
DEDUCTIONSBenefits Paid 3,727,326 Refunds of Contributions 2,785Administrative Expenses 100,627
Total Deductions 3,830,738
Change in Net Position 3,817,041
NET POSITION HELD IN TRUST FOR PENSION BENEFITS
Beginning of Year 47,232,485
End of Year 51,049,526$

CITY OF EAST PEORIA, ILLINOISNOTES TO BASIC FINANCIAL STATEMENTS
APRIL 30, 2018
(24)
NOTE 1 SUMMARY OF SIGNIFICANT ACCOUNTING POLICIES
Organization
The City of East Peoria, Illinois (the City) is a municipality located in Central Illinois. Revenues are substantially generated as a result of taxes assessed and allocated to the City (examples would be property, sales, gaming, purchase, and hotel), charges for services performed, and governmental grants. Revenues are therefore dependent on the economy within the territorial boundaries of the City and nearby surrounding area and the appropriations of grant entitlements. Taxable industries within the area are primarily manufacturing and retail. The surrounding area has a substantial agricultural base. Additionally, there are large nonprofit employers such as hospitals and other local governments within the area.
The City provides many functions and services to citizens, including police, fire, sanitation, health and welfare, public works, community development, and general administrative services.
Reporting Entity
For financial reporting purposes, in accordance with Section 2100 of the Codification of Governmental Accounting and Financial Reporting Standards, the City is a primary government in that it is a city with a separately elected governing body — one that is elected by the citizens in a general, popular election and is fiscally independent of other units of government.
With this criteria, the City has determined whether other entities are component units of the City. Component units are legally separate organizations for which the elected officials of the City of East Peoria are financially accountable. The City of East Peoria would be considered financially accountable if it appoints a voting majority of the organization’s governing body and (1) it is able to impose its will (significantly influence the programs, projects, activities, or level of services performed or provided by the organization) on the organization or (2) there is a potential for the organization to provide specific financial benefits to, or impose specific financial burden on, the City of East Peoria (i.e., entitled to or can access the organization’s resources, is legally obligated or has otherwise assumed the obligation to finance deficits of, or provide financial support to the organization). If an organization is fiscally dependent on the City of East Peoria, the City is considered financially accountable regardless of whether the organization has (1) a separately elected governing board, (2) a governing board appointed by a higher level of government, or (3) a jointly appointed board.
Blended component units, although legally separate entities, are, in substance, part of the City’s operations and therefore data from these units are combined with data of the primary government. The discretely presented component unit is reported in a separate column/row in the government-wide statements to emphasize that it is legally separate from the government.
CITY OF EAST PEORIA, ILLINOISNOTES TO BASIC FINANCIAL STATEMENTS
APRIL 30, 2018
(25)
NOTE 1 SUMMARY OF SIGNIFICANT ACCOUNTING POLICIES (CONTINUED)
Reporting Entity (Continued)
The City of East Peoria is not a component unit of any other entity. However, entities which meet criteria as a component unit of the City are as follows:
Fiduciary Funds - City of East Peoria Police and Firefighter’s Pension Funds: The Police and Firefighter’s Pension Funds were established to provide retirement, death, and disability payments to the police and firemen of the City or their beneficiaries. Each is a single-employer defined benefit pension plan. Contribution levels are mandated by Illinois Statutes and may be amended only by the Illinois legislature.
As the Pension Funds were created by City ordinance and due to the financial benefit of the City, the Police and Firefighters Pension Funds are reported as blended component units of the City.
The fiscal year-end for both the Police and Firefighter’s Pension Funds is April 30 and both funds have been reflected as fiduciary funds in the financial statements.
Complete financial statements for each of these individual component units may be obtainedat the following addresses:
City of East Peoria Police Pension Fund City of East Peoria Firefighter’s Pension FundJeff Becker, Director of Finance Jeff Becker, Director of Finance401 W. Washington St. 401 W. Washington St.East Peoria, Illinois 61611 East Peoria, Illinois 61611
Discretely Presented Component Unit - East Peoria Mass Transit District: The East Peoria Mass Transit District was organized to provide bus transportation to the City of East Peoriathrough a contractual agreement with the Greater Peoria Mass Transit District.
As the City appoints the voting majority of the District’s board and is able to impose its will on the District, the District is reported as a discretely presented component unit of the City.
The fiscal year-end for the East Peoria Mass Transit District is June 30, 2018.
Complete financial statements for the District may be obtained at the following address:
East Peoria Mass Transit District401 W. Washington St.East Peoria, Illinois 61611
CITY OF EAST PEORIA, ILLINOISNOTES TO BASIC FINANCIAL STATEMENTS
APRIL 30, 2018
(26)
NOTE 1 SUMMARY OF SIGNIFICANT ACCOUNTING POLICIES (CONTINUED)
Basis of Presentation
Government-Wide and Fund Financial Statements: The government-wide financial statements (i.e., the statement of net position, including the discretely presented component unit, and the statement of activities) report information on all of the nonfiduciary activities of the primary government and its component units. Governmental activities, which normally are supported by taxes and intergovernmental revenues, are reported separately from business-type activities, which rely to a significant extent on fees and charges for support. The primary government is reported separately from certain legally separate component units for which the primary government is financially accountable.
The statement of activities demonstrates the degree to which the direct expenses of a given function or segment are offset by program revenues. Direct expenses are those that are clearly identifiable with a specific function or segment. Program revenues include (1) charges to customers or applicants who purchase, use, or directly benefit from goods,services, or privileges provided by a given function or segment and (2) grants andcontributions that are restricted to meeting the operational or capital requirements of aparticular function or segment. Taxes and other items not properly included among programrevenues are reported instead as general revenues.
Separate financial statements are provided for governmental funds, proprietary funds, and fiduciary funds, even though the latter are excluded from the government-wide financial statements. Major individual governmental funds and major individual enterprise funds are reported as separate columns in the fund financial statements.
These financial statements have been prepared in conformity with the accounting principles generally accepted in the United States of America (GAAP) that apply to governmental units. The Governmental Accounting Standards Board (GASB) is the accepted standard-setting body for establishing governmental accounting and financial reporting principles.
Measurement Focus and Basis of Accounting
The government-wide financial statements are reported using the economic resources measurement focus and the accrual basis of accounting, as are the proprietary and fiduciary fund financial statements. The agency funds do not have a measurement focus as they are custodial in nature. Under the accrual basis of accounting, revenues are recorded when earned and expenses are recorded when a liability is incurred, regardless of the timing of related cash flows. Property taxes are recognized as revenues in the year for which they are levied for budgetary purposes. Grants and similar items are recognized as revenue as soon as all eligibility requirements imposed by the provider have been met.

CITY OF EAST PEORIA, ILLINOISNOTES TO BASIC FINANCIAL STATEMENTS
APRIL 30, 2018
(27)
NOTE 1 SUMMARY OF SIGNIFICANT ACCOUNTING POLICIES (CONTINUED)
Measurement Focus and Basis of Accounting (Continued)
Governmental fund financial statements are reported using the current financial resources measurement focus and the modified accrual basis of accounting. Revenues are recognized as soon as they are both measurable and available. Revenues are considered to be available when they are collectible within the current period or soon enough thereafter to pay liabilities of the current period. For this purpose, the government considers revenues to be available if they are collected within 60 days of the end of the current fiscal period. Other taxes and interest associated with the current fiscal period are all considered to be susceptible to accrual and so have been recognized as revenues of the current fiscal period. Only the portion of special assessments receivable due within the current fiscal period is considered to be susceptible to accrual as revenue of the current period. All other revenue items are considered to be measureable and available only when cash is received by the government. Expenditures generally are recorded when a liability is incurred, as under accrual accounting. However, debt service expenditures, claims, and judgments are recorded only when payment is due.
The accounts of the City are organized on the basis of funds, each of which is considered to be a separate accounting entity. The operations of each fund are accounted for by providing a separate set of self-balancing accounts which comprise its assets, deferred outflows of resources, liabilities, deferred inflows of resources, fund balance/net position, revenues, and expenditures/expenses.
Governmental Fund Type: Governmental Funds are those through which governmental functions of the City are financed. The acquisition, use, and balances of the City’s expendable resources and the related liabilities are accounted for through governmental funds. The City reports the following major governmental funds:
General Fund: The General Fund is the general operating fund of the City. All general tax revenues and other receipts that are not allocated by law or contractual agreement to some other fund are accounted for in this fund. This fund pays the general operating expenditures, the fixed charges, and the capital improvement costs that are not paid through other funds.
Riverboat Gaming Tax Fund (A Special Revenue Fund): This fund is used to collect and disburse riverboat gaming taxes. The gaming taxes are restricted for capital purposes.
Special Tax Allocation Fund (A Special Revenue Fund): This fund is used to account for the activities of the various tax increment financing districts in the City.
Capital Projects Fund (A Capital Projects Fund): This fund is used to account for development projects being carried out by the City. Such projects are financed by proceeds from general obligation bonds, loan proceeds, and tax increment financing activities.

CITY OF EAST PEORIA, ILLINOISNOTES TO BASIC FINANCIAL STATEMENTS
APRIL 30, 2018
(28)
NOTE 1 SUMMARY OF SIGNIFICANT ACCOUNTING POLICIES (CONTINUED)
Measurement Focus and Basis of Accounting (Continued)
Proprietary Fund Types: Proprietary fund types are used to account for a government’s ongoing organizations and activities which are similar to those often found in the private sector.
Enterprise Funds: To account for operations financed and operated in a manner similar to private business enterprises where the intent of the governing body is the costs (expenses, including depreciation) of providing goods or services to the general public on a continuing basis be financed or recovered primarily through user charges.
The City reports the following major proprietary funds:
Water and Sewer Fund: The Water and Sewer Fund is used to account for the water and sewer services offered to the residents of the City.
Eastport Marina Fund: The marina accounts for the boating services offered to the public. The City has elected to report this fund as a major fund for public interest purposes.
Eastside Centre Fund: The Eastside Centre accounts for the athletic events and health club memberships that are offered to the public.
Additionally, the City reports the following fund types:
Internal Service Fund: The Internal Service Fund is used by the City to account for employee health benefits, workers’ compensation, and general liability provided to other funds on a cost reimbursement basis.
Pension Trust Funds: The Pension Trust Funds account for the activities of the City of East Peoria Police and Firefighter’s Pension Funds, which accumulate resources for retirement, death, and disability benefits to the police and firemen of the City or their beneficiaries.
Agency Funds: The Agency Funds are utilized to account for monies and properties received and held by the City in a trustee or custodial capacity for other entities, such as employees, other governments, or nonpublic organizations.
As a general rule, the effect of interfund activity has been eliminated from the government-wide financial statements.
CITY OF EAST PEORIA, ILLINOISNOTES TO BASIC FINANCIAL STATEMENTS
APRIL 30, 2018
(29)
NOTE 1 SUMMARY OF SIGNIFICANT ACCOUNTING POLICIES (CONTINUED)
Measurement Focus and Basis of Accounting (Continued)
Amounts reported as program revenues include (1) charges to customers or applicants for goods, services, or privileges provided, (2) operating grants and contributions, and (3) capital grants and contributions. Internally dedicated resources are reported as generalrevenues rather than as program revenues. Likewise, general revenues include all taxes.
Proprietary funds distinguish operating revenues and expenses from nonoperating items. Operating revenues and expenses generally result from providing services and producing and delivering goods in connection with a proprietary fund’s principal on-going operations. Operating expense for enterprise funds and internal service funds include the cost of sales and services, administrative expenses, and depreciation on capital assets. All revenues and expenses not meeting this definition are reported as nonoperating revenues and expenses.
Property Taxes
Property taxes attach as an enforceable lien on property as of January 1. The City’s property tax is levied each year at the time the budget for the ensuing year is passed and is extended against the assessed valuation of the City on January 1. Taxes are due and payable in two installments in June and September at the County Collector’s office. Sale of taxes on any uncollected amounts is prior to November 30. Distribution of prior levy year taxes to all taxing bodies, including City funds, is also made prior to November 30.
Property taxes reflected as revenues in the governmental fund financial statements for fiscal year 2018 represent the 2016 tax levy which was received by the City during the months of July 2017 through November 2017. The general property taxes receivable and the related deferred inflow of resources at April 30, 2018 are based on the City’s 2017 extended tax levy.
Cash and Cash Equivalents
The City considers all liquid investments with a maturity date of three months or less when purchased to be cash equivalents. At April 30, 2018, the City had no investments qualified as cash equivalents.
Investments
Investments are stated at fair value, which is based on quoted market prices, except money market investments and participating interest-earning investment contracts that have a remaining maturity at the time of purchase of one year or less, which are reported at amortized cost.
Interfund Transactions
Transactions among City funds that would be treated as revenues and expenditures/ expenses if they involved organizations external to City government are accounted for as revenues and expenditures/expenses in the funds involved.

CITY OF EAST PEORIA, ILLINOISNOTES TO BASIC FINANCIAL STATEMENTS
APRIL 30, 2018
(30)
NOTE 1 SUMMARY OF SIGNIFICANT ACCOUNTING POLICIES (CONTINUED)
Interfund Transactions (Continued)
Transactions which constitute reimbursements to a fund for expenditures initially made from it which are properly applicable to another fund are recorded as expenditures in the reimbursing fund and as reductions of expenditures in the reimbursed fund.
Transactions which constitute the transfer of resources from a fund receiving revenues to a fund through which the revenues are to be expended are separately reported in the respective funds’ operating statements.
Activity between funds that is representative of lending/borrowing arrangements at the end of the fiscal year is referred to as “due to/from other funds.” Any residual balances outstanding between the governmental activities and business-type activities are reported in the government-wide financial statements as “internal balances.”
Noncurrent portions of long-term interfund loan receivables are reported as advances within the governmental funds and are sometimes classified as nonspendable or restricted fund balance, which indicates they do not constitute expendable available financial resources and, therefore, are not available for appropriation.
Inventory
Inventories are stated at the lower of cost or market with cost determined on a first-in, first-out (FIFO) basis.
Capital Assets
Capital assets, which include property, plant, equipment, and infrastructure assets (e.g., roads, bridges, sidewalks, and similar items), are reported in the City’s government-wide financial statements. Capital assets are defined by the City as assets with an initial, individual cost of more than $2,500, except for assets of the Water and Sewer Fund, which uses a threshold of $5,000 on an initial useful life of one year or greater. Capital assets are recorded at historical cost or estimated historical cost if purchased or constructed.
The costs of normal maintenance and repairs that do not add to the value of the asset or materially extend asset lives are not capitalized. Major outlays for capital assets and improvements are capitalized as projects are constructed. Interest incurred, net of investment income on project specific debt service expenditures, is included as part of the capitalized value of the assets constructed in the enterprise funds. There was no interest capitalized for the year ended April 30, 2018.
Depreciation of capital assets is computed on the straight-line method over the following estimated useful lives:
Land Improvements 20 - 50 YearsBuildings 10 - 50 YearsMachinery, Equipment, and Vehicles 5 - 20 YearsInfrastructure 20 - 100 Years
CITY OF EAST PEORIA, ILLINOISNOTES TO BASIC FINANCIAL STATEMENTS
APRIL 30, 2018
(31)
NOTE 1 SUMMARY OF SIGNIFICANT ACCOUNTING POLICIES (CONTINUED)
Unearned Revenue
Unearned revenue arises when assets are recognized before revenue recognition criteria has been satisfied.
Deferred Outflows of Resources
In addition to assets, the statement of net position reports a separate section for deferred outflows of resources. This separate financial statement element, deferred outflows of resources, represents a consumption of net position that applies to a future period(s) and so will not be recognized as an outflow of resources (expense/expenditure) until then. The City has two types of items that qualify for reporting in this category. One is the deferred charge on refunding reported in the government-wide and proprietary funds statement of net position. A deferred charge on refunding results from the difference in the carrying value of refunded debt and its reacquisition price. This amount is deferred and amortized over the shorter of the life of the refunded or refunding debt. Additionally, the City has deferred outflows related to pension expense to be recognized in future periods and for pension contributions made after the measurement dates.
Deferred Inflows of Resources
In addition to liabilities, the statement of net position and balance sheet reports a separate section for deferred inflows of resources. This separate financial statement element, deferred inflows of resources, represents an acquisition of net position that applies to a future period(s) and so will not be recognized as an inflow of resources (revenue) until that time. The governmental funds report unavailable revenues from several sources: property taxes, other taxes, capital lease receivable, notes receivable, and special assessments. These amounts are deferred and recognized as an inflow of resources in the period that the amounts become available. In the City’s government-wide statements, only the property tax revenues remain under the full accrual basis of accounting and will become an inflow in the year for which they are levied and budgeted for. Additionally, the City has deferred inflows related to pension expense to be recognized in future periods.
Pensions
For purposes of measuring the net pension liability, deferred inflows and outflows of resources related to pensions, and pension expense, information about the fiduciary net position of the City pension plans and additions to/deductions from the City pension plans fiduciary net position have been determined on the same basis as they are reported by the plans. For this purpose, benefit payments (including refunds of employee contributions) are recognized when due and payable in accordance with the benefit terms. Investments are reported at fair value.
CITY OF EAST PEORIA, ILLINOISNOTES TO BASIC FINANCIAL STATEMENTS
APRIL 30, 2018
(32)
NOTE 1 SUMMARY OF SIGNIFICANT ACCOUNTING POLICIES (CONTINUED)
Compensated Absences – Primary Government
City employees earn vacation throughout the year based upon their anniversary date, and must use the days earned in the same anniversary year within one month after their anniversary date, unless prior approval from a department head is received. Any unused vacation time is payable to employees upon termination. Employees can accumulate ten days of sick leave per year and sick leave is carried over to the following year. Accumulated sick pay is paid out upon retirement to a maximum of 60 days or 120 days for department heads and union personnel.
All compensated absences are accrued when incurred in the government-wide, proprietary,and fiduciary fund financial statements. A liability for these amounts is reported in governmental funds only if they have matured, for example, as a result of employee resignations and retirements.
Long-Term Liabilities
In the government-wide financial statements and proprietary fund types in fund financial statements, long-term debt and other long-term obligations are reported as liabilities in the applicable governmental activities, business-type activities, or proprietary fund statement of net position. Bond premiums and discounts are deferred and amortized over the life of the bonds. Bonds payable are reported net of the applicable bond premium or discount. Bond issuance costs are recorded as a nonoperating expense when incurred.
In the fund financial statements, governmental fund types recognize bond premiums and discounts during the current period. The face amount of debt issued is reported as other financing sources. Premiums received on debt issuances are reported as other financing sources while discounts on debt issuances are reported as other financing uses. Bond issuance costs are recorded as debt service expenditures when incurred.
Fund Balance
In the governmental fund financial statements, fund balances are classified as follows:
Nonspendable: Amounts which cannot be spent either because they are in a nonspendable form or because they are legally or contractually required to be maintained intact.
Restricted: Amounts restricted to specific purposes when constraints placed on the use of the resources are either externally imposed by creditors, grantors, or state or federal laws or imposed by law through constitutional provisions or enabling legislation.
Committed: Amounts which can be used only for specific purposes pursuant to constraints formally imposed by the City Council through resolution approved prior to year-end. Those committed amounts cannot be used for any other purpose unless the City Council removes or changes the specified use by taking the same action it employed to commit those amounts.
Assigned: Amounts constrained by the City’s intent to use them for a specific purpose. The authority to assign fund balance has been delegated by the City Council to the Treasurer/Comptroller.
CITY OF EAST PEORIA, ILLINOISNOTES TO BASIC FINANCIAL STATEMENTS
APRIL 30, 2018
(33)
NOTE 1 SUMMARY OF SIGNIFICANT ACCOUNTING POLICIES (CONTINUED)
Fund Balance (Continued)
Unassigned: All amounts not included in other spendable classifications. The General Fund is the only fund that would report a positive amount in unassigned fund balance. Residual deficit amounts of other governmental funds would also be reported as unassigned.
When an expenditure is incurred in governmental funds which can be paid using either restricted or unrestricted resources, the City’s procedure is to pay the expenditure from restricted fund balance and then from less-restrictive classifications — committed, assigned and then unassigned fund balances.
Net Position
Net position represents the difference between assets plus deferred outflows of resources and liabilities plus deferred inflows of resources. Net investment in capital assets consists of capital assets, net of accumulated depreciation, reduced by the outstanding balances of any borrowings used for the acquisition, construction, or improvement of those assets. Net investment in capital assets excludes unspent debt proceeds. Unspent debt proceeds (which includes proceeds reserved for debt retirement) for the Capital Projects Fund was$-0-. Net position is reported as restricted when there are limitations imposed on its use through enabling legislation or through external restrictions imposed by creditors, grantors,or laws or regulations of other governments.
Net position by enabling legislation includes $110,324 for audit, $245,835 for employee benefits, $29,394 for sewer chlorination, $11,392,616 for capital improvements and equipment, and $160,918 for emergency services.
The City first applies restricted resources when an expense is incurred for purposes for which both restricted and unrestricted net position are available.
Use of Estimates
The preparation of financial statements in conformity with generally accepted accounting principles requires management to make estimates and assumptions that affect the reported amounts of assets, deferred outflows of resources, liabilities, and deferred inflows of resources and disclosures of contingent assets and liabilities at the date of the financial statements and the reported amounts of revenues and expenses during the reporting period. Actual results could differ from those estimates.
CITY OF EAST PEORIA, ILLINOISNOTES TO BASIC FINANCIAL STATEMENTS
APRIL 30, 2018
(34)
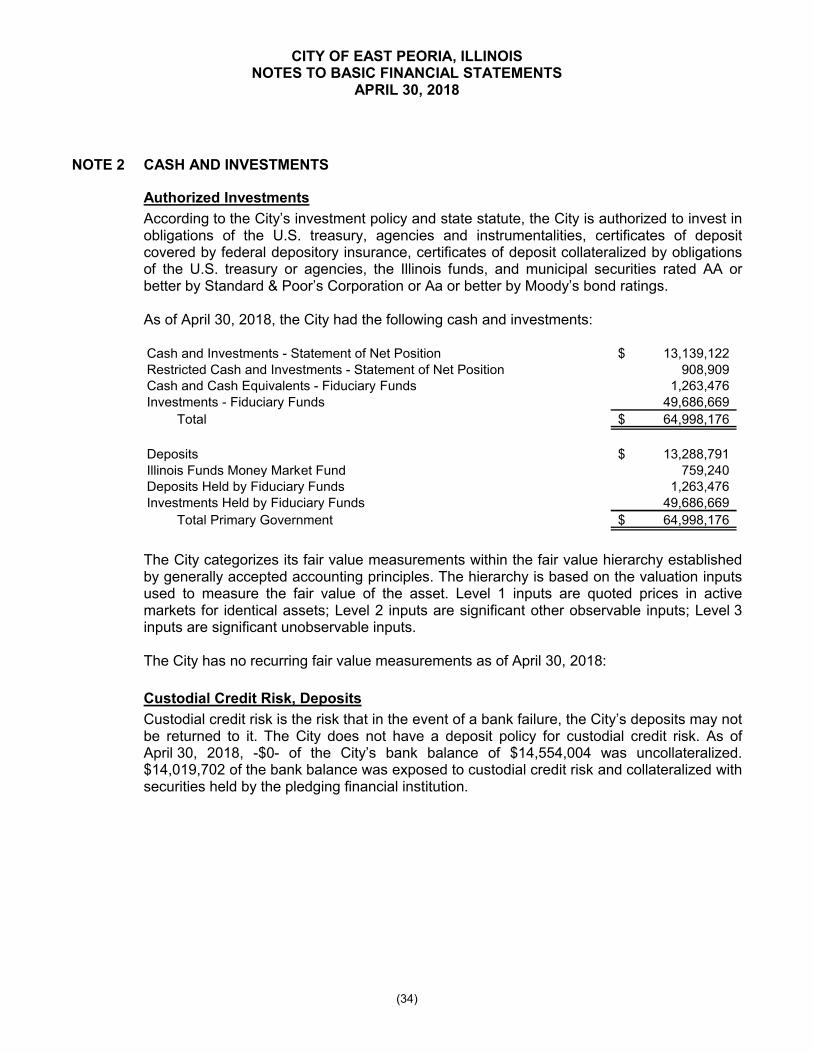
NOTE 2 CASH AND INVESTMENTS
Authorized Investments
According to the City’s investment policy and state statute, the City is authorized to invest in obligations of the U.S. treasury, agencies and instrumentalities, certificates of deposit covered by federal depository insurance, certificates of deposit collateralized by obligations of the U.S. treasury or agencies, the Illinois funds, and municipal securities rated AA or better by Standard & Poor’s Corporation or Aa or better by Moody’s bond ratings.
As of April 30, 2018, the City had the following cash and investments:
Cash and Investments - Statement of Net Position 13,139,122$ Restricted Cash and Investments - Statement of Net Position 908,909Cash and Cash Equivalents - Fiduciary Funds 1,263,476Investments - Fiduciary Funds 49,686,669
Total 64,998,176$
Deposits 13,288,791$ Illinois Funds Money Market Fund 759,240Deposits Held by Fiduciary Funds 1,263,476Investments Held by Fiduciary Funds 49,686,669
Total Primary Government 64,998,176$
The City categorizes its fair value measurements within the fair value hierarchy established by generally accepted accounting principles. The hierarchy is based on the valuation inputs used to measure the fair value of the asset. Level 1 inputs are quoted prices in active markets for identical assets; Level 2 inputs are significant other observable inputs; Level 3 inputs are significant unobservable inputs.
The City has no recurring fair value measurements as of April 30, 2018:
Custodial Credit Risk, Deposits
Custodial credit risk is the risk that in the event of a bank failure, the City’s deposits may not be returned to it. The City does not have a deposit policy for custodial credit risk. As of April 30, 2018, -$0- of the City’s bank balance of $14,554,004 was uncollateralized. $14,019,702 of the bank balance was exposed to custodial credit risk and collateralized with securities held by the pledging financial institution.

CITY OF EAST PEORIA, ILLINOISNOTES TO BASIC FINANCIAL STATEMENTS
APRIL 30, 2018
(35)
NOTE 2 CASH AND INVESTMENTS (CONTINUED)
Interest Rate Risk
Interest rate risk is the risk that changes in interest rates will adversely affect the fair value of an investment. Investments held for longer periods are subject to increased risk of adverse interest rate changes. The City does not have a formal policy that limits investment maturities as a means of managing its exposure to fair value losses arising from increasing interest rates.
Credit Risk
Credit risk is the risk that an issuer or other counterparty to a debt investment will not fulfill its obligations. The City has no investment policy that would further limit its investment choices.
Illinois Funds – The fair value of the City’s position in this fund is equal to the value of theCity’s fund shares. The portfolio is regulated by oversight of the Treasurer of the state of Illinois and private rating agencies. The portfolio has AAAm ratings from Standard and Poor’s. The assets of the fund are mainly invested in securities issued by the United States government or agencies related to the United States. Assets of the fund not invested in United States government securities are fully collateralized by pledged securities. The time to maturity of the investments in this external investment pool averages less than one year. The carrying amount of these deposits at April 30, 2018 was $759,240.
Cash and Investments, Pension Trust Funds (The Funds)
The pension trust funds may invest funds as authorized by the Illinois Pension Code, generally in obligations of the United States, the State of Illinois and its local districts, certain insurance contracts, insured deposits of federal and state saving and loans, banks, and credit unions, and certain common preferred stock.
Deposits
Custodial credit risk for deposits is the risk that in the event of a bank failure, the Fund’s deposits may not be returned or the Fund will not be able to recover collateral securities in the possession of an outside party. The Fund’s deposit policy provides that all deposits be guaranteed by the U.S. Government, insured by the Federal Deposit Insurance Corporation (FDIC) or fully collateralized with securities held by the Fund or its agent in the Fund’s name or by its counterparty’s trust department or agent in the Fund’s name.
As of April 30, 2018, none of the deposits of the City of East Peoria Police Pension and the City of East Peoria Firefighter’s Pension Plans were exposed to custodial credit risk.

CITY OF EAST PEORIA, ILLINOISNOTES TO BASIC FINANCIAL STATEMENTS
APRIL 30, 2018
(36)
NOTE 2 CASH AND INVESTMENTS (CONTINUED)
Investments
As of April 30, 2018, the Police Pension Fund had the following investments:
Fair Value/ Average Weighted
Carrying Credit Quality/ Average Years Concentration
Type of Investment Amount Ratings (1) to Maturity (2) Percentage
U.S. Government Notes and
Bonds, Explicitly Guaranteed 1,950,469$ N/A 9.35 7%
U.S. Government Agencies 1,568,507 Aaa to Aa+ 17.25 6
Money Market Funds 497,966 N/A - 2
Municipal Bonds 427,677 A2 to Aaa 4.80 2
Corporate Bonds 4,538,934 Aaa to Bbb 9.10 17
Common Stock 15,146,881 N/A N/A 55
Mutual Funds, Equities 2,827,823 N/A N/A 10
Total Investments 26,958,257$
As of April 30, 2018, the Firefighter’s Pension Fund had the following investments:
Fair Value/ Average Weighted
Carrying Credit Quality/ Average Years Concentration
Type of Investment Amount Ratings (1) to Maturity (2) Percentage
U.S. Government Notes and
Bonds, Explicitly Guaranteed 2,301,068$ N/A 9.35 10%
U.S. Government Agencies 507,847 Aaa 4.26 2
Money Market Funds 763,530 N/A - 3
Municipal Bonds 326,564 Aaa to Aa 8.90 1
Corporate Bonds 3,171,993 Aaa to Baa3 9.88 14
Common Stock 4,507,712 N/A N/A 20
Mutual Funds, Equities 11,149,698 N/A N/A 48
Total Investments 22,728,412$
(1) Ratings are provided where applicable to indicate associated credit risk. N/A indicatesnot applicable. Obligations of the U.S. Government or obligations explicitly guaranteedby the U.S. Government are not considered to have credit risk.
(2) Interest rate risk is estimated using the weighted average years to maturity method.
Investments are subject to certain inherent risks including credit, interest rate, and custodial credit risk. The Funds’ policies related to these risks are as follows:
(1) Credit risk is the risk that an issuer or other counterparty to an investment will not fulfillits obligations. Investing is performed in accordance with investment policies adopted bythe Board of Trustees complying with Illinois Compiled Statutes. Funds may only beinvested in permitted investments as authorized in Chapter 40, Article 5/1, Paragraphs113.1 through 113.10 of the Illinois Compiled Statutes.
CITY OF EAST PEORIA, ILLINOISNOTES TO BASIC FINANCIAL STATEMENTS
APRIL 30, 2018
(37)
NOTE 2 CASH AND INVESTMENTS (CONTINUED)
Investments (Continued)
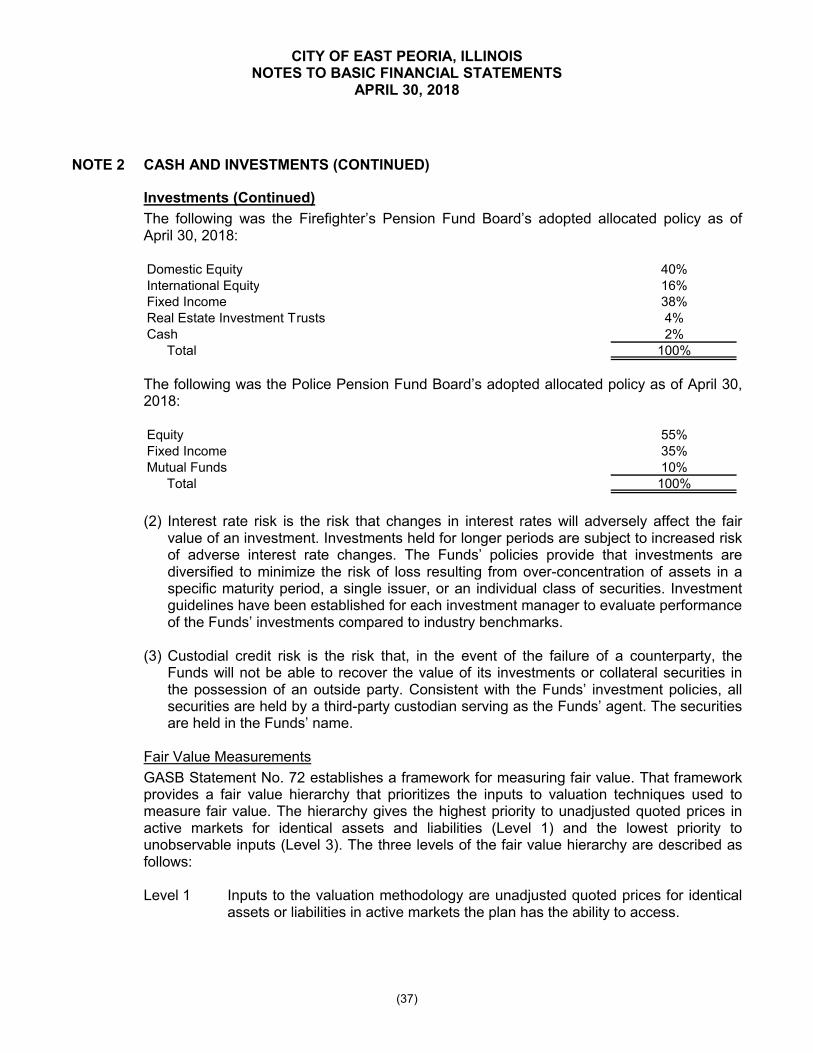
The following was the Firefighter’s Pension Fund Board’s adopted allocated policy as of April 30, 2018:
Domestic Equity 40%International Equity 16%Fixed Income 38%Real Estate Investment Trusts 4%Cash 2%
Total 100%
The following was the Police Pension Fund Board’s adopted allocated policy as of April 30, 2018:
Equity 55%Fixed Income 35%Mutual Funds 10%
Total 100%
(2) Interest rate risk is the risk that changes in interest rates will adversely affect the fairvalue of an investment. Investments held for longer periods are subject to increased riskof adverse interest rate changes. The Funds’ policies provide that investments arediversified to minimize the risk of loss resulting from over-concentration of assets in aspecific maturity period, a single issuer, or an individual class of securities. Investmentguidelines have been established for each investment manager to evaluate performanceof the Funds’ investments compared to industry benchmarks.
(3) Custodial credit risk is the risk that, in the event of the failure of a counterparty, theFunds will not be able to recover the value of its investments or collateral securities inthe possession of an outside party. Consistent with the Funds’ investment policies, allsecurities are held by a third-party custodian serving as the Funds’ agent. The securitiesare held in the Funds’ name.
Fair Value Measurements
GASB Statement No. 72 establishes a framework for measuring fair value. That framework provides a fair value hierarchy that prioritizes the inputs to valuation techniques used to measure fair value. The hierarchy gives the highest priority to unadjusted quoted prices in active markets for identical assets and liabilities (Level 1) and the lowest priority to unobservable inputs (Level 3). The three levels of the fair value hierarchy are described as follows:
Level 1 Inputs to the valuation methodology are unadjusted quoted prices for identical assets or liabilities in active markets the plan has the ability to access.
CITY OF EAST PEORIA, ILLINOISNOTES TO BASIC FINANCIAL STATEMENTS
APRIL 30, 2018
(38)
NOTE 2 CASH AND INVESTMENTS (CONTINUED)
Investments (Continued)
Fair Value Measurements (Continued)
Level 2 Inputs to the valuation methodology include: Quoted prices for similar assets or liabilities in active markets; Quoted prices for identical or similar assets and liabilities in nonactive
markets; Inputs other than quoted prices that are observable for the asset or
liability; Inputs that are derived principally from or corroborated by observable
market data by correlation or other means.If the asset or liability has a specified (contractual) term, the Level 2 input must be observable for substantially the full term of the asset or liability.
Level 3 Inputs to the valuation methodology are unobservable and significant to the fair value measurement.
The asset’s or liability’s fair value measurement level within the fair value hierarchy is based on the lowest level of any input that is significant to the fair value measurement. Valuation techniques used need to maximize the use of observable inputs and minimize the use of unobservable inputs.
The following is a description of the valuation methodologies used for assets measured at fair value. There have been no changes in the methodologies used at April 30, 2018 from prior year.
Common stock and mutual funds – equities: Valued at public traded prices that are quoted daily.
Corporate bonds and municipal bonds: Valued using matrix pricing model using inputs of price or yield of a similar security.
U.S. Government and U.S. government agencies: Valued using matrix pricing model using inputs of price or yield of a similar security.
The preceding methods described may produce a fair value calculation that may not be indicative of net realizable value or reflective of future fair values. Furthermore, although the Funds believe their methods are appropriate and consistent with other market participants, the use of different methodologies or assumptions to determine the fair value of certain financial instruments could result in a different fair value measurement at the reporting date.
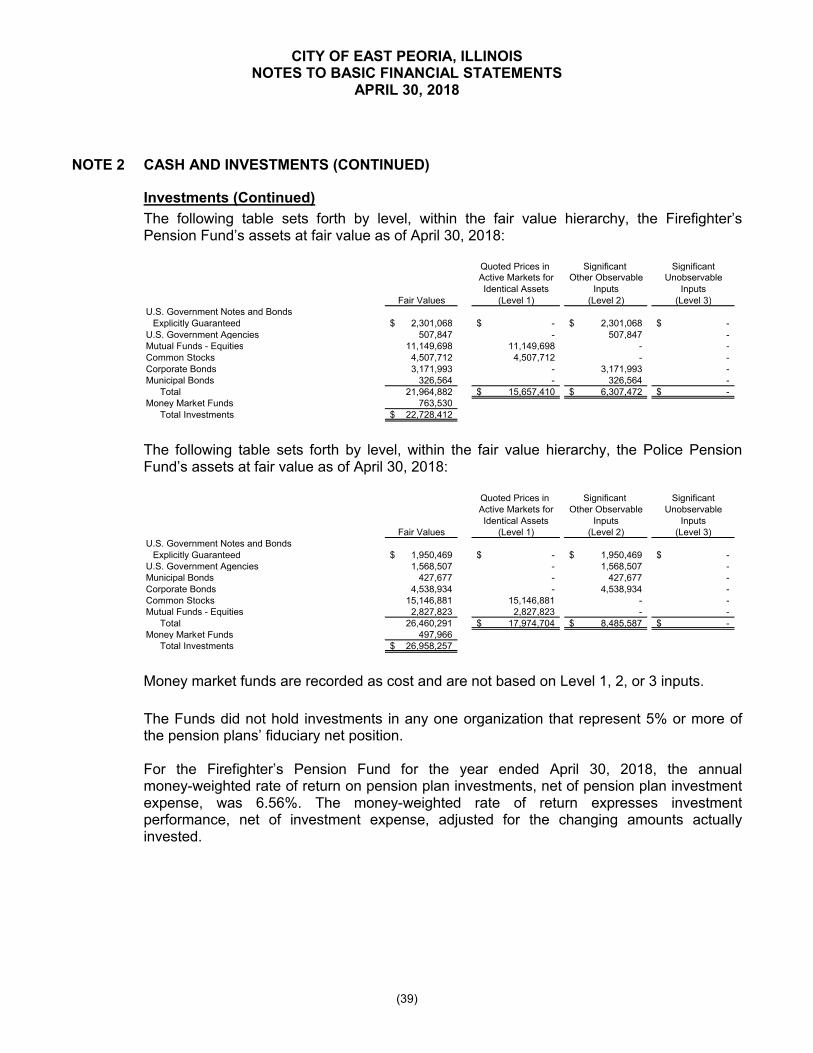
CITY OF EAST PEORIA, ILLINOISNOTES TO BASIC FINANCIAL STATEMENTS
APRIL 30, 2018
(39)
NOTE 2 CASH AND INVESTMENTS (CONTINUED)
Investments (Continued)
The following table sets forth by level, within the fair value hierarchy, the Firefighter’s Pension Fund’s assets at fair value as of April 30, 2018:
Quoted Prices in Significant SignificantActive Markets for Other Observable UnobservableIdentical Assets Inputs Inputs
Fair Values (Level 1) (Level 2) (Level 3)U.S. Government Notes and Bonds
Explicitly Guaranteed 2,301,068$ -$ 2,301,068$ -$U.S. Government Agencies 507,847 - 507,847 -Mutual Funds - Equities 11,149,698 11,149,698 - -Common Stocks 4,507,712 4,507,712 - -Corporate Bonds 3,171,993 - 3,171,993 -Municipal Bonds 326,564 - 326,564 -
Total 21,964,882 15,657,410$ 6,307,472$ -$Money Market Funds 763,530
Total Investments 22,728,412$
The following table sets forth by level, within the fair value hierarchy, the Police Pension Fund’s assets at fair value as of April 30, 2018:
Quoted Prices in Significant SignificantActive Markets for Other Observable UnobservableIdentical Assets Inputs Inputs
Fair Values (Level 1) (Level 2) (Level 3)U.S. Government Notes and Bonds
Explicitly Guaranteed 1,950,469$ -$ 1,950,469$ -$U.S. Government Agencies 1,568,507 - 1,568,507 -Municipal Bonds 427,677 - 427,677 -Corporate Bonds 4,538,934 - 4,538,934 -Common Stocks 15,146,881 15,146,881 - -Mutual Funds - Equities 2,827,823 2,827,823 - -
Total 26,460,291 17,974,704$ 8,485,587$ -$Money Market Funds 497,966
Total Investments 26,958,257$
Money market funds are recorded as cost and are not based on Level 1, 2, or 3 inputs.
The Funds did not hold investments in any one organization that represent 5% or more of the pension plans’ fiduciary net position.
For the Firefighter’s Pension Fund for the year ended April 30, 2018, the annual money-weighted rate of return on pension plan investments, net of pension plan investment expense, was 6.56%. The money-weighted rate of return expresses investment performance, net of investment expense, adjusted for the changing amounts actually invested.
CITY OF EAST PEORIA, ILLINOISNOTES TO BASIC FINANCIAL STATEMENTS
APRIL 30, 2018
(40)
NOTE 2 CASH AND INVESTMENTS (CONTINUED)
Investments (Continued)
For the Police Pension Fund for the year ended April 30, 2018, the annual money-weighted rate of return on pension plan investments, net of pension plan investment expense, for assets held with Benjamin F. Edwards & Co. was 5.77%. The annual money-weighted rate of return on pension plan investments, net of pension plan investment expenses, for assets held with the Commerce Trust Company was 7.57%. The money-weighted rate of return expresses investment performance, net of investment expense, adjusted for the changing amounts actually invested.
Cash and Investments, Discretely Presented Component Unit
Custodial credit risk is the risk that, in the event of a bank failure, the District’s deposits may not be returned to it. The District does not have a deposit policy for custodial credit risk. As of June 30, 2018, none of the District’s bank balance of $64,159 was exposed to custodial credit risk.
NOTE 3 SPECIAL ASSESSMENTS FUND
The City has levied special assessments against various landowners in conjunction with improvements made which benefit the landowners. These special assessments are being paid to the City over a number of years. The noncurrent portion of the special assessment receivable is deferred in the governmental funds as it is not available as of year-end. An analysis of the current and long-term portions of special assessments receivable at April 30, 2018 is as follows:
Total Special Assessments Receivable 26,352$ Less Amounts Not Receivable Within One Year 12,580
Current Special Assessments Receivable 13,772$
NOTE 4 LEASE RECEIVABLE
In June 2003, the City entered into a development agreement under which the developer would construct and operate an Embassy Suites hotel and the City would construct and provide for operation of a conference center which would be adjacent or connected to the hotel. In August 2007, the City entered into a lease agreement under the terms of which the developer will lease the conference center from the City in exchange for regular escalating payments over a 20-year period.

CITY OF EAST PEORIA, ILLINOISNOTES TO BASIC FINANCIAL STATEMENTS
APRIL 30, 2018
(41)
NOTE 4 LEASE RECEIVABLE (CONTINUED)
As of April 30, 2018, components of the lease receivable were as follows:
Total Lease Receivable Payments 10,114,201$ Amount Representing Interest 2,392,999
Net 7,721,202$
The lease requires the developer to make all capital expenditures necessary to maintain the conference center in first class condition.
At the conclusion of the lease, the City will convey the conference center and hotel site to the developer in exchange for $100 each.
As of April 30, 2018, future minimum lease revenue expected to be received were as follows:
Fiscal Year Ending April 30,2019 1,032,120$ 2020 1,055,040 2021 1,077,960 2022 1,100,880 2023 1,123,800
2024-2027 4,724,401 Total Lease Receivable Payments 10,114,201
Less: Amount Representing Interest (2,392,999)
Lease Receivable 7,721,202$
In July 2010, the City entered into a lease agreement with Bass Pro Outdoor World, LLC for the lease of a retail space owned by the City. Monthly lease payments are based on gross sales of the retail operation of 1% of gross sales of boats, recreational vehicles, off-road vehicles, and all-terrain vehicles, with a max of $250 for each such vehicle sold and 2% of all other gross sales, which began in September 2011. The lease term is 20 years with six consecutive renewal options of five years each. For the year ended April 30, 2018, lease revenues from this lease were $421,241. As of April 30, 2018, there was a lease receivable of $29,313 included in other receivables on the City’s financial statements in the Capital Projects Fund.
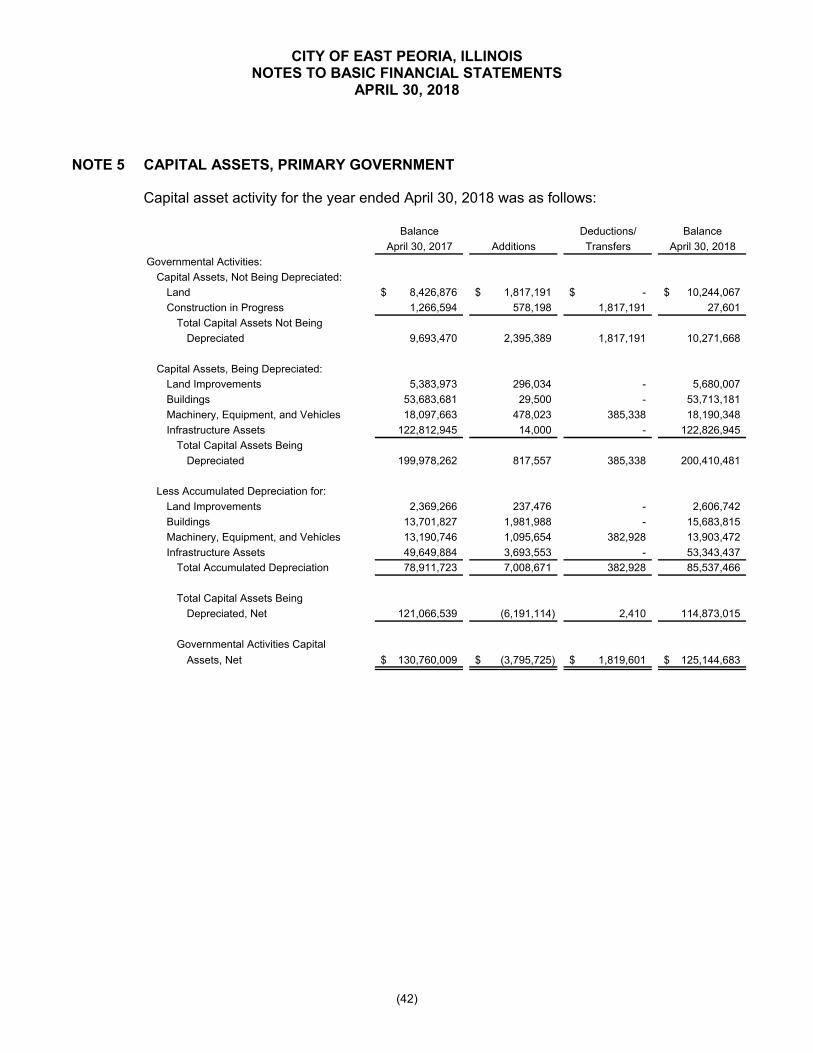
CITY OF EAST PEORIA, ILLINOISNOTES TO BASIC FINANCIAL STATEMENTS
APRIL 30, 2018
(42)
NOTE 5 CAPITAL ASSETS, PRIMARY GOVERNMENT
Capital asset activity for the year ended April 30, 2018 was as follows:
Balance Deductions/ Balance
April 30, 2017 Additions Transfers April 30, 2018
Governmental Activities:
Capital Assets, Not Being Depreciated:
Land 8,426,876$ 1,817,191$ -$ 10,244,067$
Construction in Progress 1,266,594 578,198 1,817,191 27,601
Total Capital Assets Not Being
Depreciated 9,693,470 2,395,389 1,817,191 10,271,668
Capital Assets, Being Depreciated:
Land Improvements 5,383,973 296,034 - 5,680,007
Buildings 53,683,681 29,500 - 53,713,181
Machinery, Equipment, and Vehicles 18,097,663 478,023 385,338 18,190,348
Infrastructure Assets 122,812,945 14,000 - 122,826,945
Total Capital Assets Being
Depreciated 199,978,262 817,557 385,338 200,410,481
Less Accumulated Depreciation for:
Land Improvements 2,369,266 237,476 - 2,606,742
Buildings 13,701,827 1,981,988 - 15,683,815
Machinery, Equipment, and Vehicles 13,190,746 1,095,654 382,928 13,903,472
Infrastructure Assets 49,649,884 3,693,553 - 53,343,437
Total Accumulated Depreciation 78,911,723 7,008,671 382,928 85,537,466
Total Capital Assets Being
Depreciated, Net 121,066,539 (6,191,114) 2,410 114,873,015
Governmental Activities Capital
Assets, Net 130,760,009$ (3,795,725)$ 1,819,601$ 125,144,683$
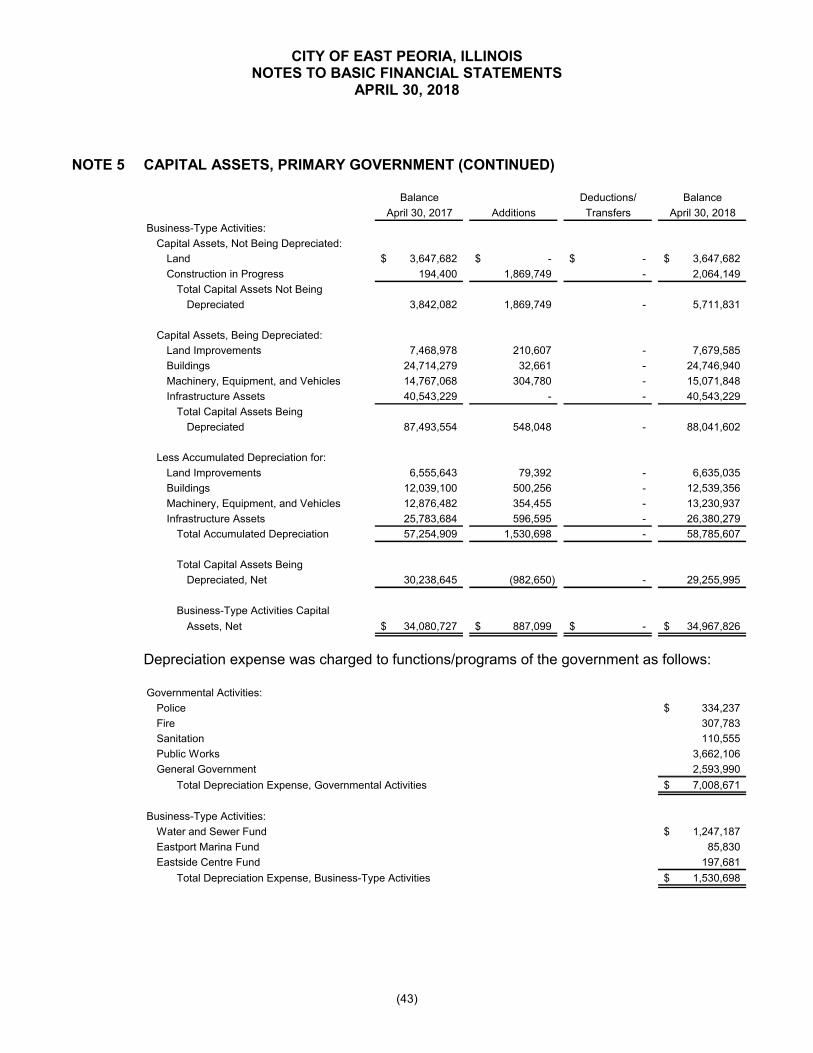
CITY OF EAST PEORIA, ILLINOISNOTES TO BASIC FINANCIAL STATEMENTS
APRIL 30, 2018
(43)
NOTE 5 CAPITAL ASSETS, PRIMARY GOVERNMENT (CONTINUED)
Balance Deductions/ Balance
April 30, 2017 Additions Transfers April 30, 2018
Business-Type Activities:
Capital Assets, Not Being Depreciated:
Land 3,647,682$ -$ -$ 3,647,682$
Construction in Progress 194,400 1,869,749 - 2,064,149
Total Capital Assets Not Being
Depreciated 3,842,082 1,869,749 - 5,711,831
Capital Assets, Being Depreciated:
Land Improvements 7,468,978 210,607 - 7,679,585
Buildings 24,714,279 32,661 - 24,746,940
Machinery, Equipment, and Vehicles 14,767,068 304,780 - 15,071,848
Infrastructure Assets 40,543,229 - - 40,543,229
Total Capital Assets Being
Depreciated 87,493,554 548,048 - 88,041,602
Less Accumulated Depreciation for:
Land Improvements 6,555,643 79,392 - 6,635,035
Buildings 12,039,100 500,256 - 12,539,356
Machinery, Equipment, and Vehicles 12,876,482 354,455 - 13,230,937
Infrastructure Assets 25,783,684 596,595 - 26,380,279
Total Accumulated Depreciation 57,254,909 1,530,698 - 58,785,607
Total Capital Assets Being
Depreciated, Net 30,238,645 (982,650) - 29,255,995
Business-Type Activities Capital
Assets, Net 34,080,727$ 887,099$ -$ 34,967,826$
Depreciation expense was charged to functions/programs of the government as follows:
Governmental Activities:
Police 334,237$
Fire 307,783
Sanitation 110,555
Public Works 3,662,106
General Government 2,593,990
Total Depreciation Expense, Governmental Activities 7,008,671$
Business-Type Activities:
Water and Sewer Fund 1,247,187$
Eastport Marina Fund 85,830
Eastside Centre Fund 197,681
Total Depreciation Expense, Business-Type Activities 1,530,698$
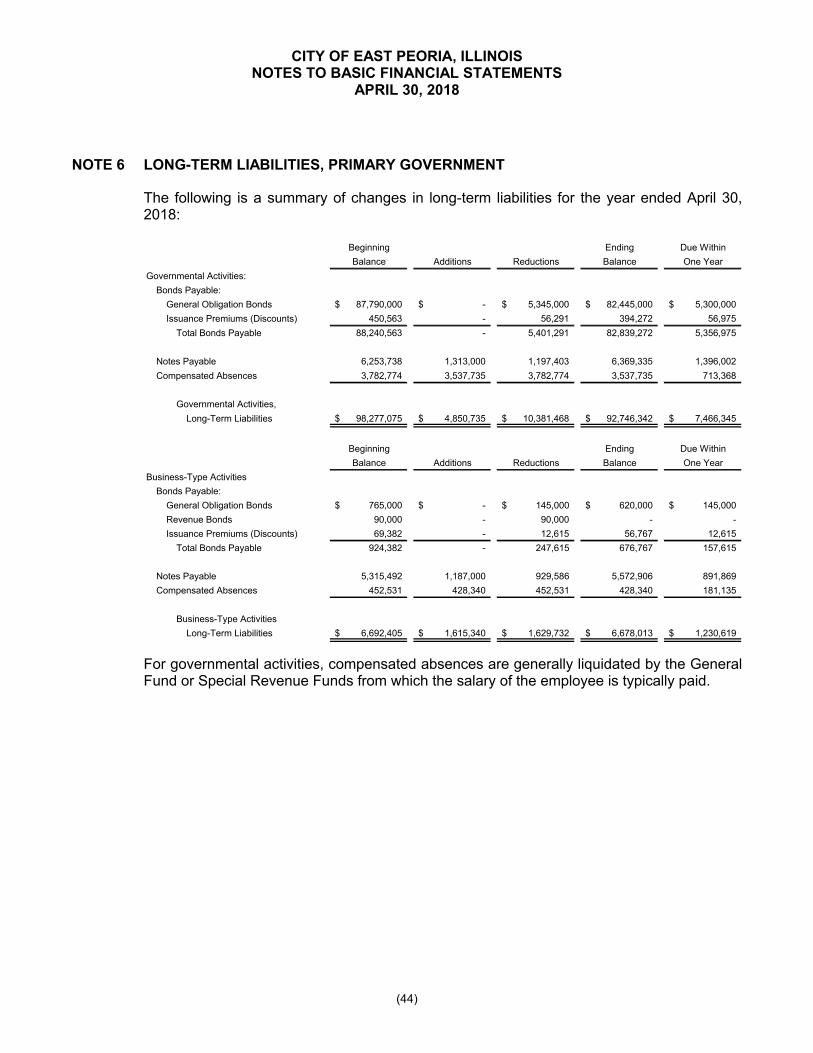
CITY OF EAST PEORIA, ILLINOISNOTES TO BASIC FINANCIAL STATEMENTS
APRIL 30, 2018
(44)
NOTE 6 LONG-TERM LIABILITIES, PRIMARY GOVERNMENT
The following is a summary of changes in long-term liabilities for the year ended April 30, 2018:
Beginning Ending Due Within
Balance Additions Reductions Balance One Year
Governmental Activities:
Bonds Payable:
General Obligation Bonds 87,790,000$ -$ 5,345,000$ 82,445,000$ 5,300,000$
Issuance Premiums (Discounts) 450,563 - 56,291 394,272 56,975
Total Bonds Payable 88,240,563 - 5,401,291 82,839,272 5,356,975
Notes Payable 6,253,738 1,313,000 1,197,403 6,369,335 1,396,002
Compensated Absences 3,782,774 3,537,735 3,782,774 3,537,735 713,368
Governmental Activities,
Long-Term Liabilities 98,277,075$ 4,850,735$ 10,381,468$ 92,746,342$ 7,466,345$
Beginning Ending Due Within
Balance Additions Reductions Balance One Year
Business-Type Activities
Bonds Payable:
General Obligation Bonds 765,000$ -$ 145,000$ 620,000$ 145,000$
Revenue Bonds 90,000 - 90,000 - -
Issuance Premiums (Discounts) 69,382 - 12,615 56,767 12,615
Total Bonds Payable 924,382 - 247,615 676,767 157,615
Notes Payable 5,315,492 1,187,000 929,586 5,572,906 891,869
Compensated Absences 452,531 428,340 452,531 428,340 181,135
Business-Type Activities
Long-Term Liabilities 6,692,405$ 1,615,340$ 1,629,732$ 6,678,013$ 1,230,619$
For governmental activities, compensated absences are generally liquidated by the General Fund or Special Revenue Funds from which the salary of the employee is typically paid.

CITY OF EAST PEORIA, ILLINOISNOTES TO BASIC FINANCIAL STATEMENTS
APRIL 30, 2018
(45)
NOTE 6 LONG-TERM LIABILITIES, PRIMARY GOVERNMENT (CONTINUED)
Long-term debt payable as of April 30, 2018 is comprised of the following individual issues:
Governmental Activities - General Obligation Bonds
General Obligation Bonds:
$23,695,000, General Obligation Refunding Bonds, Series 2007, due in
annual installments of $370,000 to $2,915,000, through January 2027;
interest at rates of 4.85% to 5.5% 15,480,000$
$25,270,000, General Obligation Bonds, Series 2010A, due in annual
installments of $855,000 to $1,740,000, through January 2033; interest at
rates of 2.00% to 4.50% 19,845,000
$3,920,000 General Obligation Bonds, Series 2012A, due in annual
installments of $170,000 to $265,000, through January 2032, interest at
rates of 1.076% to 3.575% 3,050,000
$3,920,000, General Obligation Bonds, Series 2012B, due in annual
installments of $170,000 to $265,000, through January 2032; interest at
rates of 1.076% to 3.575% 3,050,000
$12,280,000, General Obligation Bonds, Series 2012C, due in annual
installments of $495,000 to $890,000, through January 2032; interest at
rates of 1.470% to 4.575% 2,915,000
$4,880,000, General Obligation Bonds, Series 2012D, due in annual
installments of $200,000 to $355,000, through January 2032; interest at
rates of 1.470% to 4.575% 1,155,000
$2,385,000, General Obligation Refunding Bonds, Series 2012F, due in
annual installments of $235,000 to $295,000, through January 2022; interest
at rates of 2.00% to 4.00% 1,135,000
$770,000, General Obligation Refunding Bonds, Series 2013A, due in
annual installments of $250,000 to $275,000, through January 2024; interest
at rates of 2.00% to 3.00% 520,000
$6,215,000, General Obligation Refunding Bonds, Series 2013B, due in
annual installments of $25,000 to $675,000, through January 2033; interest
at rates of 2.00% to 4.00% 4,730,000

CITY OF EAST PEORIA, ILLINOISNOTES TO BASIC FINANCIAL STATEMENTS
APRIL 30, 2018
(46)
NOTE 6 LONG-TERM LIABILITIES, PRIMARY GOVERNMENT (CONTINUED)
Governmental Activities - General Obligation Bonds (Continued)
$18,570,000, General Obligation Refunding Bonds, Series 2014, due in
annual installments of $5,000 to $1,565,000, through January 2033; interest
at rates of 2.00% to 5.00% 17,680,000$
$6,925,000, General Obligation Refunding Bonds, Series 2016A, due in
annual installments of $590,000 to $890,000, through January 2032; interest
at rates of 2.90% to 4.00% 6,925,000
$2,745,000, General Obligation Refunding Bonds, Series 2016B, due in
annual installments of $240,000 to $355,000, through January 2032; interest
at rates of 2.90% to 4.00% 2,745,000
$3,280,000, General Obligation Refunding Bonds, Series 2016C, due in
annual installments of $65,000 to $1,610,000, through January 2021; interest
at rates of 1.50% to 2.25% 3,215,000
Total General Obligation Bonds, Governmental Activities 82,445,000$
Governmental Activities - Notes Payable
Notes Payable:
Note payable to bank, due in semiannual installments of $210,980 including
interest at 2.50% as of August 26, 2016 through May 2021 (Kohlʼs Property) 1,438,159$
Note payable to bank, due in semiannual installments of $31,893, including
interest at 2.50%, through August 2023 (Steak-N-Shake Property) 331,249
Note payable to bank, due in annual installments of $572,094, including
interest at 2.50%, through January 2024 (Camp Street Property) 3,147,857
Note payable to bank, due in annual installments of $179,465, including
interest at 1.50%, through September 2018 (Garbage Truck) 176,848
Note payable to bank, due in annual installments of $2,674, including
interest at 1.69%, through October 2019 (Laptops) 45,137
Note payable to bank, due in annual installments of $44,017, including
interest at 2.15%, through December 2022 (Early Retirement Incentive) 1,230,085
Total Notes Payable, Governmental Activities 6,369,335$

CITY OF EAST PEORIA, ILLINOISNOTES TO BASIC FINANCIAL STATEMENTS
APRIL 30, 2018
(47)
NOTE 6 LONG-TERM LIABILITIES, PRIMARY GOVERNMENT (CONTINUED)
Business-Type Activities - General Obligation Bonds
General Obligation Bonds:
Water and Sewer Fund Long-Term Debt:
$2,595,000, General Obligation Refunding Bonds, Series 2012-E,
due in annual installments of $165,000 to 430,000 through May 2022;
interest rate at 2.00% to 4.00% 620,000$
Business-Type Activities - Notes Payable
Notes Payable:
Note payable to the State of Illinois Environmental Protection Agency, due
in semiannual installments of $48,918 through April 2019, including interest
at 2.865% 142,648$
Note payable to the State of Illinois Environmental Protection Agency, due
in semiannual installments of $31,553 through April 2020, including interest
at 2.625% 122,176
Note payable to the State of Illinois Environmental Protection Agency, due
in semiannual installments of $33,056 through June 2023, including
interest at 2.57% 337,080
Note payable to the State of Illinois Environmental Protection Agency, due
in semiannual installments of $122,694 through November 2027, including
interest at 2.5% 2,032,959
Note payable to the State of Illinois Environmental Protection Agency, due
in semiannual installments of $32,554 through February 2028, including
interest at 2.5% 572,923
Note payable to bank, due in monthly installments of $15,593 through July
2023, including interest at 2.45% 938,039
Note payable to bank, due in monthly installments of $6,730 through July
2021, including interest at 1.83% 247,880
Note payable to bank, due in annual installments of $44,017, including
interest at 2.15%, through December 2022 (Early Retirement Incentive) 1,112,042
Eastside Centre Long-Term Debt:
Note payable to bank, due in annual installments of $1,575, including
interest at 1.99%, through December 2021 with the remaining principal
balance due at maturity (Backhoe) 67,159
Total Notes Payable, Business-Type Activities 5,572,906$
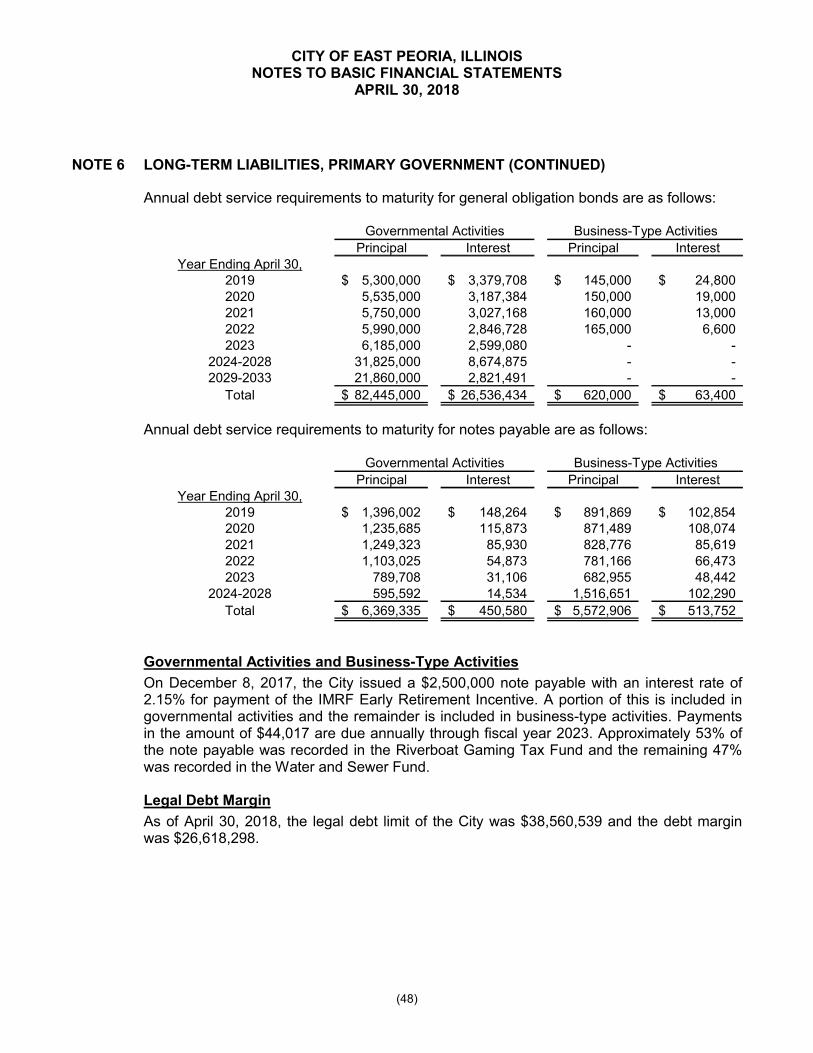
CITY OF EAST PEORIA, ILLINOISNOTES TO BASIC FINANCIAL STATEMENTS
APRIL 30, 2018
(48)
NOTE 6 LONG-TERM LIABILITIES, PRIMARY GOVERNMENT (CONTINUED)
Annual debt service requirements to maturity for general obligation bonds are as follows:
Principal Interest Principal InterestYear Ending April 30,
2019 5,300,000$ 3,379,708$ 145,000$ 24,800$ 2020 5,535,000 3,187,384 150,000 19,000 2021 5,750,000 3,027,168 160,000 13,000 2022 5,990,000 2,846,728 165,000 6,600 2023 6,185,000 2,599,080 - -
2024-2028 31,825,000 8,674,875 - -2029-2033 21,860,000 2,821,491 - -
Total 82,445,000$ 26,536,434$ 620,000$ 63,400$
Governmental Activities Business-Type Activities
Annual debt service requirements to maturity for notes payable are as follows:
Principal Interest Principal InterestYear Ending April 30,
2019 1,396,002$ 148,264$ 891,869$ 102,854$ 2020 1,235,685 115,873 871,489 108,074 2021 1,249,323 85,930 828,776 85,619 2022 1,103,025 54,873 781,166 66,473 2023 789,708 31,106 682,955 48,442
2024-2028 595,592 14,534 1,516,651 102,290
Total 6,369,335$ 450,580$ 5,572,906$ 513,752$
Governmental Activities Business-Type Activities
Governmental Activities and Business-Type Activities
On December 8, 2017, the City issued a $2,500,000 note payable with an interest rate of 2.15% for payment of the IMRF Early Retirement Incentive. A portion of this is included in governmental activities and the remainder is included in business-type activities. Payments in the amount of $44,017 are due annually through fiscal year 2023. Approximately 53% of the note payable was recorded in the Riverboat Gaming Tax Fund and the remaining 47% was recorded in the Water and Sewer Fund.
Legal Debt Margin
As of April 30, 2018, the legal debt limit of the City was $38,560,539 and the debt margin was $26,618,298.

CITY OF EAST PEORIA, ILLINOISNOTES TO BASIC FINANCIAL STATEMENTS
APRIL 30, 2018
(49)
NOTE 6 LONG-TERM LIABILITIES, PRIMARY GOVERNMENT (CONTINUED)
Pledged Revenues
The City has pledged a portion of future sales tax and lease revenues relating to Bass Pro to repay $45,000,000 in General Obligation bonds, Series 2010A and 2010B issued August 2010. Proceeds from the bonds were used to acquire and construct Bass Pro Shop and to pay the costs of the issuance of the bonds. In May 2015, the Series 2010B bonds were fully refunded with the issuance of $18,570,000 in General Obligation Refunding bonds, Series 2014. The 2010A and 2014 bonds are payable solely from a portion of sales tax, incremental property taxes, and lease income revenues and are payable through January 2033. The total principal and interest remaining to be paid on the bonds is $51,925,312. Principal and interest of the 2010A and 2014 bonds paid for the current year and total sales tax and lease income revenues were $3,462,381 and $421,241, respectively.
This City has pledged a portion of future business district and sales tax revenues related to Target Area Business District Taxes, Costco Area Business District Taxes, and sales taxes to repay $9,670,000 in General Obligation bonds, Series 2016A and 2016B, as well as pay the costs of the issuance of the bonds. The 2016A and 2016B bonds are payable from a portion of business district tax and sales tax revenues and are payable through January 2032. The total principal and interest remaining to be paid on the bonds is $13,228,505. Principal and interest of the 2016A and 2016B bonds paid for the current year and total business district tax and sales tax revenues were $338,250 and $855,140, respectively.
Debt Covenants
Bond indentures sometimes contain significant limitations and restrictions on annual debt service requirements, maintenance of and flow of monies through various restricted accounts, and minimum amounts to be maintained in various funds. As of April 30, 2018, none of the City’s long-term liabilities had any such debt covenants requiring the restriction of assets.
Conduit Debt
The City has issued certain limited obligation revenue refunding bonds to provide financial assistance for student housing at a local community college. The debt is secured by the property financed, revenues from the housing facility, and a guarantee by the College Foundation. The City is not obligated in any manner for repayment of this debt and, accordingly, it is not reported as a liability in the accompanying financial statements. The amount outstanding of the conduit debt obligation as of April 30, 2018 was $16,765,000.
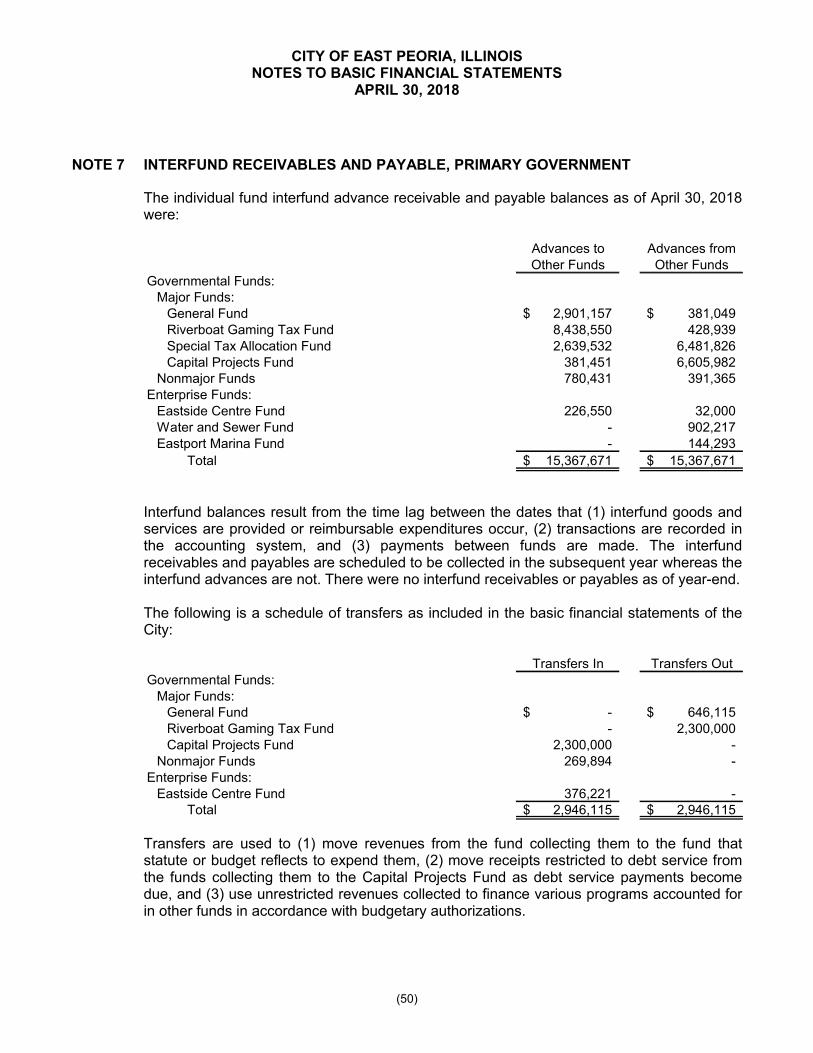
CITY OF EAST PEORIA, ILLINOISNOTES TO BASIC FINANCIAL STATEMENTS
APRIL 30, 2018
(50)
NOTE 7 INTERFUND RECEIVABLES AND PAYABLE, PRIMARY GOVERNMENT
The individual fund interfund advance receivable and payable balances as of April 30, 2018were:
Advances to Advances fromOther Funds Other Funds
Governmental Funds:Major Funds:
General Fund 2,901,157$ 381,049$ Riverboat Gaming Tax Fund 8,438,550 428,939 Special Tax Allocation Fund 2,639,532 6,481,826 Capital Projects Fund 381,451 6,605,982
Nonmajor Funds 780,431 391,365 Enterprise Funds:
Eastside Centre Fund 226,550 32,000 Water and Sewer Fund - 902,217Eastport Marina Fund - 144,293
Total 15,367,671$ 15,367,671$
Interfund balances result from the time lag between the dates that (1) interfund goods and services are provided or reimbursable expenditures occur, (2) transactions are recorded in the accounting system, and (3) payments between funds are made. The interfund receivables and payables are scheduled to be collected in the subsequent year whereas the interfund advances are not. There were no interfund receivables or payables as of year-end.
The following is a schedule of transfers as included in the basic financial statements of the City:
Transfers In Transfers OutGovernmental Funds:
Major Funds:General Fund -$ 646,115$ Riverboat Gaming Tax Fund - 2,300,000Capital Projects Fund 2,300,000 -
Nonmajor Funds 269,894 -Enterprise Funds:
Eastside Centre Fund 376,221 -Total 2,946,115$ 2,946,115$
Transfers are used to (1) move revenues from the fund collecting them to the fund that statute or budget reflects to expend them, (2) move receipts restricted to debt service from the funds collecting them to the Capital Projects Fund as debt service payments become due, and (3) use unrestricted revenues collected to finance various programs accounted for in other funds in accordance with budgetary authorizations.
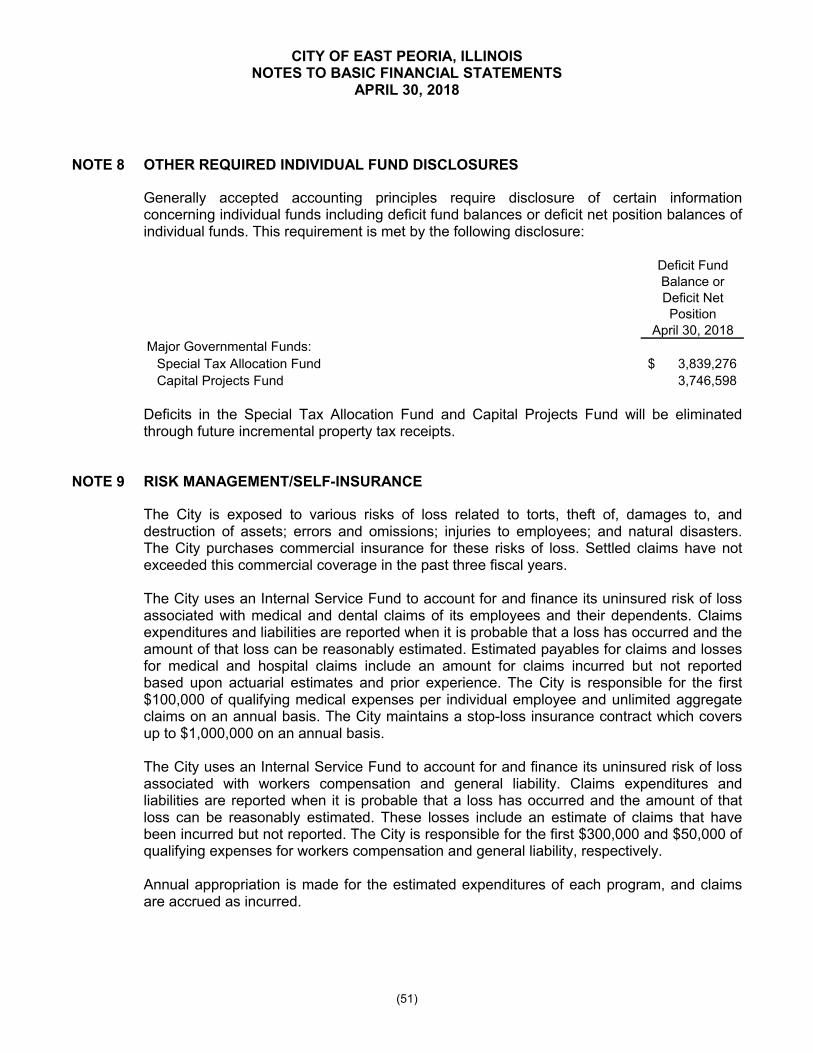
CITY OF EAST PEORIA, ILLINOISNOTES TO BASIC FINANCIAL STATEMENTS
APRIL 30, 2018
(51)
NOTE 8 OTHER REQUIRED INDIVIDUAL FUND DISCLOSURES
Generally accepted accounting principles require disclosure of certain information concerning individual funds including deficit fund balances or deficit net position balances of individual funds. This requirement is met by the following disclosure:
Deficit FundBalance orDeficit NetPosition
April 30, 2018Major Governmental Funds:
Special Tax Allocation Fund 3,839,276$
Capital Projects Fund 3,746,598
Deficits in the Special Tax Allocation Fund and Capital Projects Fund will be eliminated through future incremental property tax receipts.
NOTE 9 RISK MANAGEMENT/SELF-INSURANCE
The City is exposed to various risks of loss related to torts, theft of, damages to, and destruction of assets; errors and omissions; injuries to employees; and natural disasters. The City purchases commercial insurance for these risks of loss. Settled claims have not exceeded this commercial coverage in the past three fiscal years.
The City uses an Internal Service Fund to account for and finance its uninsured risk of loss associated with medical and dental claims of its employees and their dependents. Claims expenditures and liabilities are reported when it is probable that a loss has occurred and the amount of that loss can be reasonably estimated. Estimated payables for claims and losses for medical and hospital claims include an amount for claims incurred but not reported based upon actuarial estimates and prior experience. The City is responsible for the first $100,000 of qualifying medical expenses per individual employee and unlimited aggregate claims on an annual basis. The City maintains a stop-loss insurance contract which covers up to $1,000,000 on an annual basis.
The City uses an Internal Service Fund to account for and finance its uninsured risk of loss associated with workers compensation and general liability. Claims expenditures and liabilities are reported when it is probable that a loss has occurred and the amount of that loss can be reasonably estimated. These losses include an estimate of claims that have been incurred but not reported. The City is responsible for the first $300,000 and $50,000 ofqualifying expenses for workers compensation and general liability, respectively.
Annual appropriation is made for the estimated expenditures of each program, and claims are accrued as incurred.
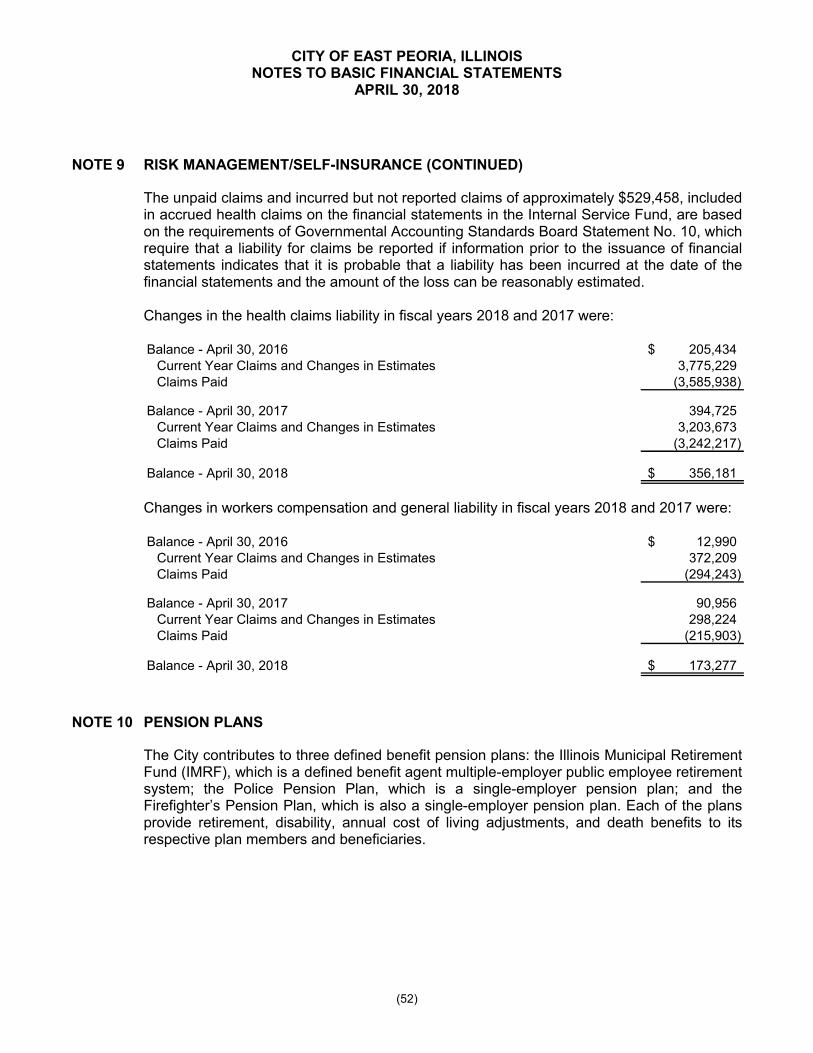
CITY OF EAST PEORIA, ILLINOISNOTES TO BASIC FINANCIAL STATEMENTS
APRIL 30, 2018
(52)
NOTE 9 RISK MANAGEMENT/SELF-INSURANCE (CONTINUED)
The unpaid claims and incurred but not reported claims of approximately $529,458, included in accrued health claims on the financial statements in the Internal Service Fund, are based on the requirements of Governmental Accounting Standards Board Statement No. 10, which require that a liability for claims be reported if information prior to the issuance of financial statements indicates that it is probable that a liability has been incurred at the date of the financial statements and the amount of the loss can be reasonably estimated.
Changes in the health claims liability in fiscal years 2018 and 2017 were:
Balance - April 30, 2016 205,434$ Current Year Claims and Changes in Estimates 3,775,229 Claims Paid (3,585,938)
Balance - April 30, 2017 394,725 Current Year Claims and Changes in Estimates 3,203,673 Claims Paid (3,242,217)
Balance - April 30, 2018 356,181$
Changes in workers compensation and general liability in fiscal years 2018 and 2017 were:
Balance - April 30, 2016 12,990$ Current Year Claims and Changes in Estimates 372,209 Claims Paid (294,243)
Balance - April 30, 2017 90,956 Current Year Claims and Changes in Estimates 298,224 Claims Paid (215,903)
Balance - April 30, 2018 173,277$
NOTE 10 PENSION PLANS
The City contributes to three defined benefit pension plans: the Illinois Municipal Retirement Fund (IMRF), which is a defined benefit agent multiple-employer public employee retirement system; the Police Pension Plan, which is a single-employer pension plan; and the Firefighter’s Pension Plan, which is also a single-employer pension plan. Each of the plans provide retirement, disability, annual cost of living adjustments, and death benefits to its respective plan members and beneficiaries.
CITY OF EAST PEORIA, ILLINOISNOTES TO BASIC FINANCIAL STATEMENTS
APRIL 30, 2018
(53)
NOTE 10 PENSION PLANS (CONTINUED)
A. IMRF
Plan Description
The City’s defined benefit pension plan for regular employees provides retirement and disability benefits, post-retirement increases, and death benefits to plan members and beneficiaries. The City’s plan is managed by the Illinois Municipal Retirement Fund (IMRF), the administrator of a multi-employer public pension fund. A summary of IMRF’s pension benefits is provided in the “Benefits Provided” section of this document. Details of all benefits are available from IMRF. Benefit provisions are established by statute and may only be changed by the General Assembly of the State of Illinois. IMRF issues a publicly available Comprehensive Annual Financial Report that includes financial statements, detailed information about the pension plan’s fiduciary net position, and required supplementary information. The report is available for download at www.imrf.org.
Benefits Provided
IMRF has three benefit plans. The vast majority of IMRF members participate in the Regular Plan (RP). IMRF also offers the Sheriff’s Law Enforcement Personnel (SLEP) plan for sheriffs, deputy sheriffs, and selected police chiefs, as well as the Elected County Official (ECO) plan for officials elected prior to August 8, 2011 (the ECO plan was closed to new participants after that date).
All three IMRF benefit plans have two tiers. Employees hired before January 1, 2011, are eligible for Tier 1 benefits. Tier 1 employees are vested for pension benefits when they have at least eight years of qualifying service credit. Tier 1 employees who retire at age 55 (at reduced benefits) or after age 60 (at full benefits) with eight years of service are entitled toan annual retirement benefit, payable monthly for life, in an amount equal to 1-2/3% of thefinal rate of earnings for the first 15 years of service credit, plus 2% for each year of service credit after 15 years to a maximum of 75% of their final rate of earnings. Final rate of earnings is the highest total earnings during any consecutive 48 months within the last 10 years of service, divided by 48. Under Tier 1, the pension is increased by 3% of the originalamount on January 1 every year after retirement.
Employees hired on or after January 1, 2011, are eligible for Tier 2 benefits. For Tier 2employees, pension benefits vest after ten years of service. Participating employees whoretire at age 62 (at reduced benefits) or after age 67 (at full benefits) with ten years ofservice are entitled to an annual retirement benefit, payable monthly for life, in anamount equal to 1-2/3% of the final rate of earnings for the first 15 years of service credit,plus 2% for each year of service credit after 15 years to a maximum of 75% of their finalrate of earnings. Final rate of earnings is the highest total earnings during any 96 consecutive months within the last 10 years of service, divided by 96. Under Tier 2, thepension is increased on January 1 every year after retirement, upon reaching age 67, by the lesser of:
3% of the original pension amount, or 1/2 of the increase in the Consumer Price Index of the original pension amount.
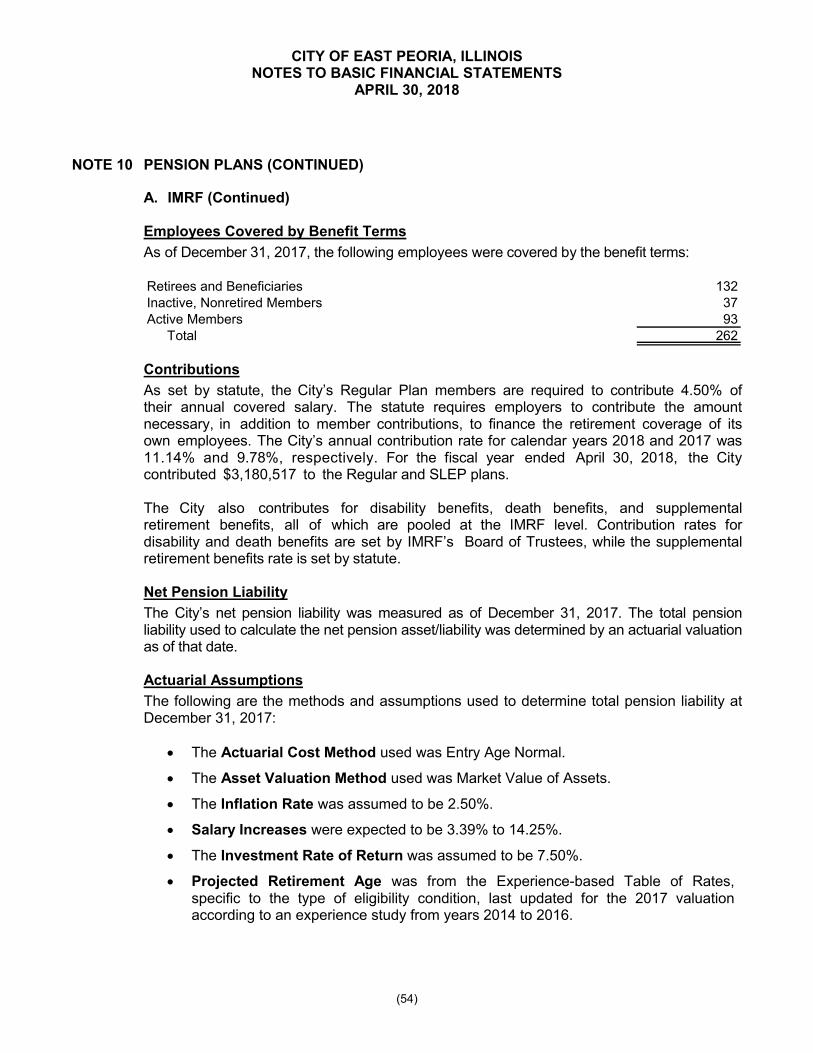
CITY OF EAST PEORIA, ILLINOISNOTES TO BASIC FINANCIAL STATEMENTS
APRIL 30, 2018
(54)
NOTE 10 PENSION PLANS (CONTINUED)
A. IMRF (Continued)
Employees Covered by Benefit Terms
As of December 31, 2017, the following employees were covered by the benefit terms:
Retirees and Beneficiaries 132Inactive, Nonretired Members 37Active Members 93
Total 262
Contributions
As set by statute, the City’s Regular Plan members are required to contribute 4.50% oftheir annual covered salary. The statute requires employers to contribute the amountnecessary, in addition to member contributions, to finance the retirement coverage of itsown employees. The City’s annual contribution rate for calendar years 2018 and 2017 was11.14% and 9.78%, respectively. For the fiscal year ended April 30, 2018, the Citycontributed $3,180,517 to the Regular and SLEP plans.
The City also contributes for disability benefits, death benefits, and supplementalretirement benefits, all of which are pooled at the IMRF level. Contribution rates fordisability and death benefits are set by IMRF’s Board of Trustees, while the supplementalretirement benefits rate is set by statute.
Net Pension Liability
The City’s net pension liability was measured as of December 31, 2017. The total pension liability used to calculate the net pension asset/liability was determined by an actuarial valuation as of that date.
Actuarial Assumptions
The following are the methods and assumptions used to determine total pension liability at December 31, 2017:
The Actuarial Cost Method used was Entry Age Normal.
The Asset Valuation Method used was Market Value of Assets.
The Inflation Rate was assumed to be 2.50%.
Salary Increases were expected to be 3.39% to 14.25%.
The Investment Rate of Return was assumed to be 7.50%.
Projected Retirement Age was from the Experience-based Table of Rates,specific to the type of eligibility condition, last updated for the 2017 valuationaccording to an experience study from years 2014 to 2016.
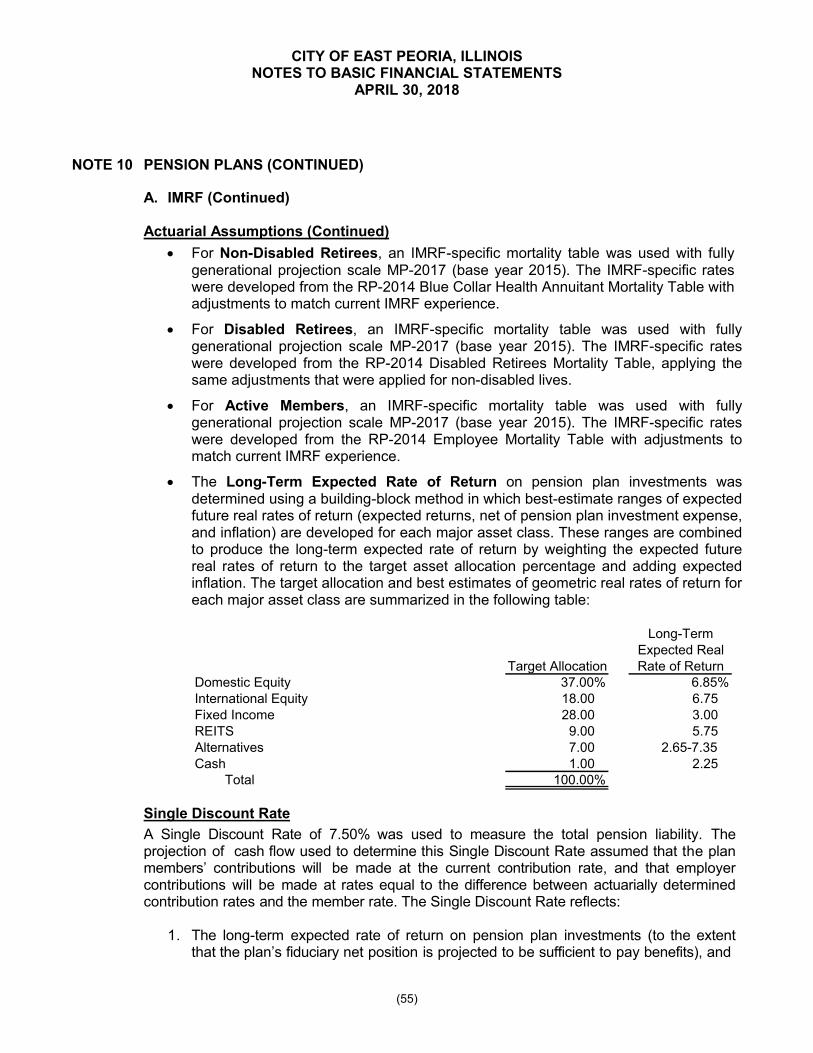
CITY OF EAST PEORIA, ILLINOISNOTES TO BASIC FINANCIAL STATEMENTS
APRIL 30, 2018
(55)
NOTE 10 PENSION PLANS (CONTINUED)
A. IMRF (Continued)
Actuarial Assumptions (Continued)
For Non-Disabled Retirees, an IMRF-specific mortality table was used with fullygenerational projection scale MP-2017 (base year 2015). The IMRF-specific rateswere developed from the RP-2014 Blue Collar Health Annuitant Mortality Table withadjustments to match current IMRF experience.
For Disabled Retirees, an IMRF-specific mortality table was used with fullygenerational projection scale MP-2017 (base year 2015). The IMRF-specific rateswere developed from the RP-2014 Disabled Retirees Mortality Table, applying thesame adjustments that were applied for non-disabled lives.
For Active Members, an IMRF-specific mortality table was used with fullygenerational projection scale MP-2017 (base year 2015). The IMRF-specific rateswere developed from the RP-2014 Employee Mortality Table with adjustments tomatch current IMRF experience.
The Long-Term Expected Rate of Return on pension plan investments wasdetermined using a building-block method in which best-estimate ranges of expectedfuture real rates of return (expected returns, net of pension plan investment expense,and inflation) are developed for each major asset class. These ranges are combinedto produce the long-term expected rate of return by weighting the expected futurereal rates of return to the target asset allocation percentage and adding expectedinflation. The target allocation and best estimates of geometric real rates of return foreach major asset class are summarized in the following table:
Long-TermExpected Real
Target Allocation Rate of ReturnDomestic Equity 37.00% 6.85%International Equity 18.00 6.75 Fixed Income 28.00 3.00 REITS 9.00 5.75 Alternatives 7.00 2.65-7.35Cash 1.00 2.25
Total 100.00%
Single Discount Rate
A Single Discount Rate of 7.50% was used to measure the total pension liability. Theprojection of cash flow used to determine this Single Discount Rate assumed that the planmembers’ contributions will be made at the current contribution rate, and that employercontributions will be made at rates equal to the difference between actuarially determinedcontribution rates and the member rate. The Single Discount Rate reflects:
1. The long-term expected rate of return on pension plan investments (to the extentthat the plan’s fiduciary net position is projected to be sufficient to pay benefits), and
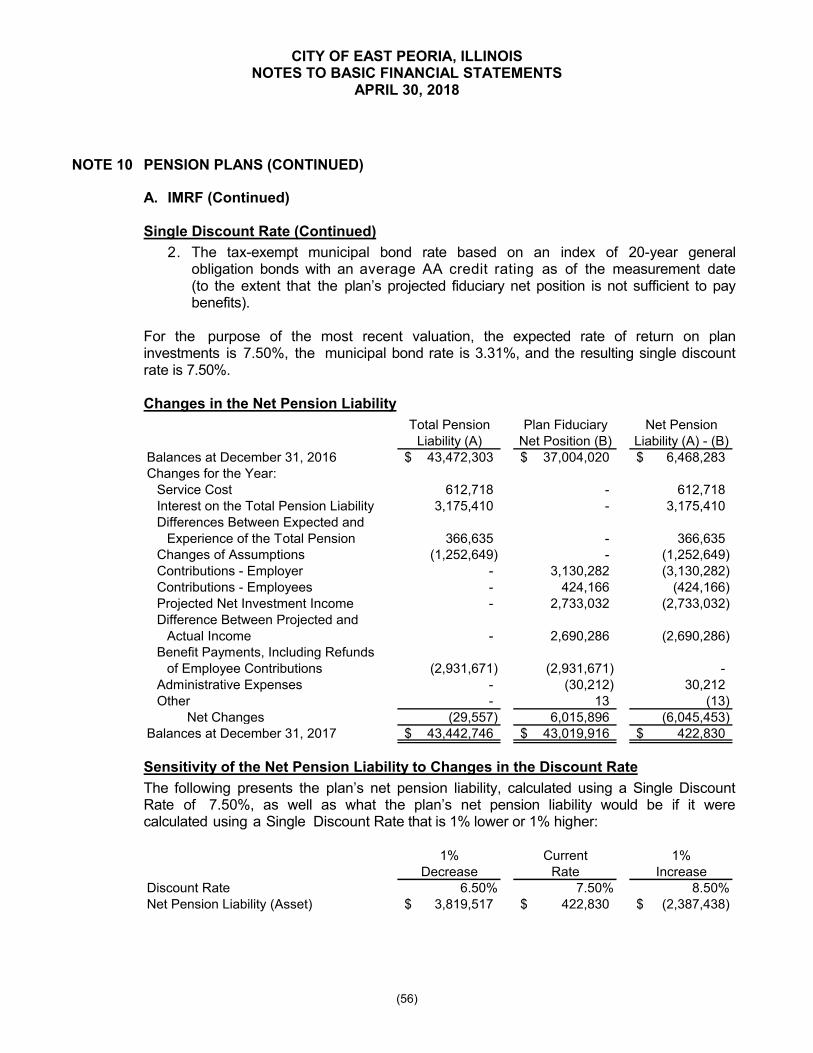
CITY OF EAST PEORIA, ILLINOISNOTES TO BASIC FINANCIAL STATEMENTS
APRIL 30, 2018
(56)
NOTE 10 PENSION PLANS (CONTINUED)
A. IMRF (Continued)
Single Discount Rate (Continued)
2. The tax-exempt municipal bond rate based on an index of 20-year generalobligation bonds with an average AA credit rating as of the measurement date(to the extent that the plan’s projected fiduciary net position is not sufficient to paybenefits).
For the purpose of the most recent valuation, the expected rate of return on planinvestments is 7.50%, the municipal bond rate is 3.31%, and the resulting single discountrate is 7.50%.
Changes in the Net Pension Liability
Total Pension Plan Fiduciary Net PensionLiability (A) Net Position (B) Liability (A) - (B)
Balances at December 31, 2016 43,472,303$ 37,004,020$ 6,468,283$ Changes for the Year:
Service Cost 612,718 - 612,718Interest on the Total Pension Liability 3,175,410 - 3,175,410Differences Between Expected and
Experience of the Total Pension 366,635 - 366,635Changes of Assumptions (1,252,649) - (1,252,649)Contributions - Employer - 3,130,282 (3,130,282)Contributions - Employees - 424,166 (424,166) Projected Net Investment Income - 2,733,032 (2,733,032) Difference Between Projected and
Actual Income - 2,690,286 (2,690,286) Benefit Payments, Including Refunds
of Employee Contributions (2,931,671) (2,931,671) -Administrative Expenses - (30,212) 30,212 Other - 13 (13)
Net Changes (29,557) 6,015,896 (6,045,453) Balances at December 31, 2017 43,442,746$ 43,019,916$ 422,830$
Sensitivity of the Net Pension Liability to Changes in the Discount Rate
The following presents the plan’s net pension liability, calculated using a Single DiscountRate of 7.50%, as well as what the plan’s net pension liability would be if it werecalculated using a Single Discount Rate that is 1% lower or 1% higher:
1% Current 1%Decrease Rate Increase
Discount Rate 6.50% 7.50% 8.50%Net Pension Liability (Asset) 3,819,517$ 422,830$ (2,387,438)$
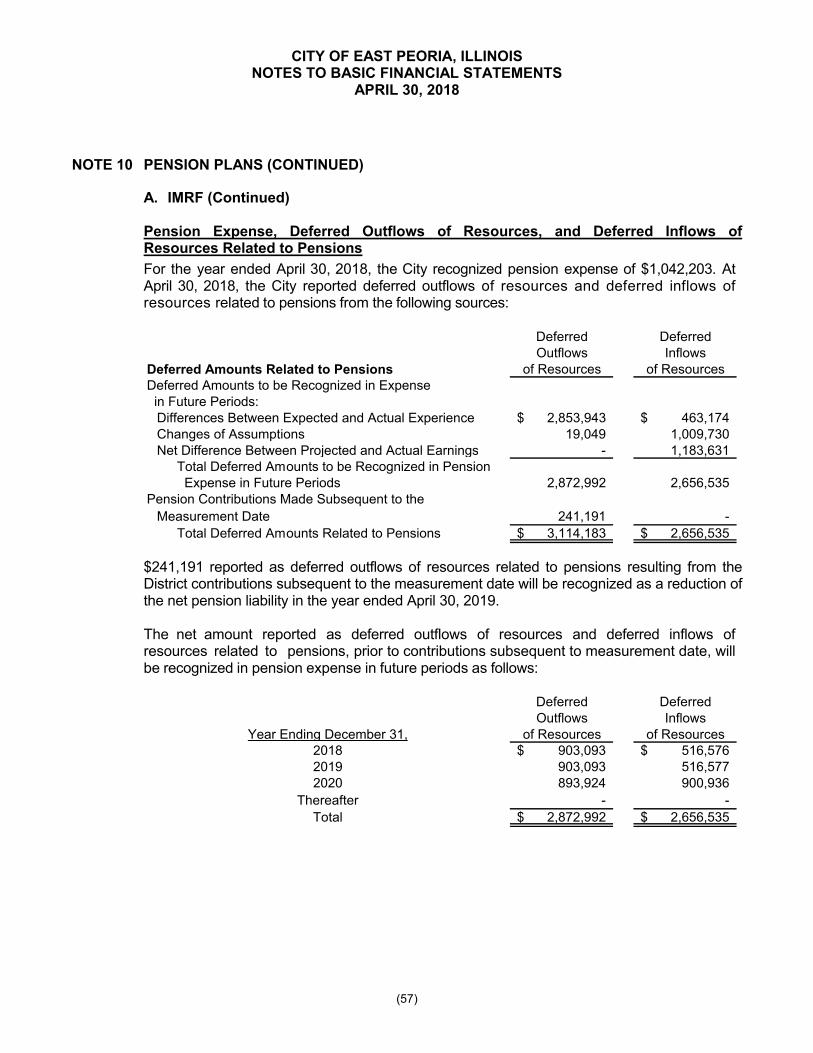
CITY OF EAST PEORIA, ILLINOISNOTES TO BASIC FINANCIAL STATEMENTS
APRIL 30, 2018
(57)
NOTE 10 PENSION PLANS (CONTINUED)
A. IMRF (Continued)
Pension Expense, Deferred Outflows of Resources, and Deferred Inflows of Resources Related to Pensions
For the year ended April 30, 2018, the City recognized pension expense of $1,042,203. AtApril 30, 2018, the City reported deferred outflows of resources and deferred inflows of resources related to pensions from the following sources:
Deferred DeferredOutflows Inflows
Deferred Amounts Related to Pensions of Resources of ResourcesDeferred Amounts to be Recognized in Expense in Future Periods:
Differences Between Expected and Actual Experience 2,853,943$ 463,174$ Changes of Assumptions 19,049 1,009,730 Net Difference Between Projected and Actual Earnings - 1,183,631
Total Deferred Amounts to be Recognized in Pension Expense in Future Periods 2,872,992 2,656,535
Pension Contributions Made Subsequent to the
Measurement Date 241,191 -
Total Deferred Amounts Related to Pensions 3,114,183$ 2,656,535$
$241,191 reported as deferred outflows of resources related to pensions resulting from the District contributions subsequent to the measurement date will be recognized as a reduction of the net pension liability in the year ended April 30, 2019.
The net amount reported as deferred outflows of resources and deferred inflows ofresources related to pensions, prior to contributions subsequent to measurement date, willbe recognized in pension expense in future periods as follows:
Deferred DeferredOutflows Inflows
Year Ending December 31, of Resources of Resources2018 903,093$ 516,576$ 2019 903,093 516,577 2020 893,924 900,936
Thereafter - -
Total 2,872,992$ 2,656,535$
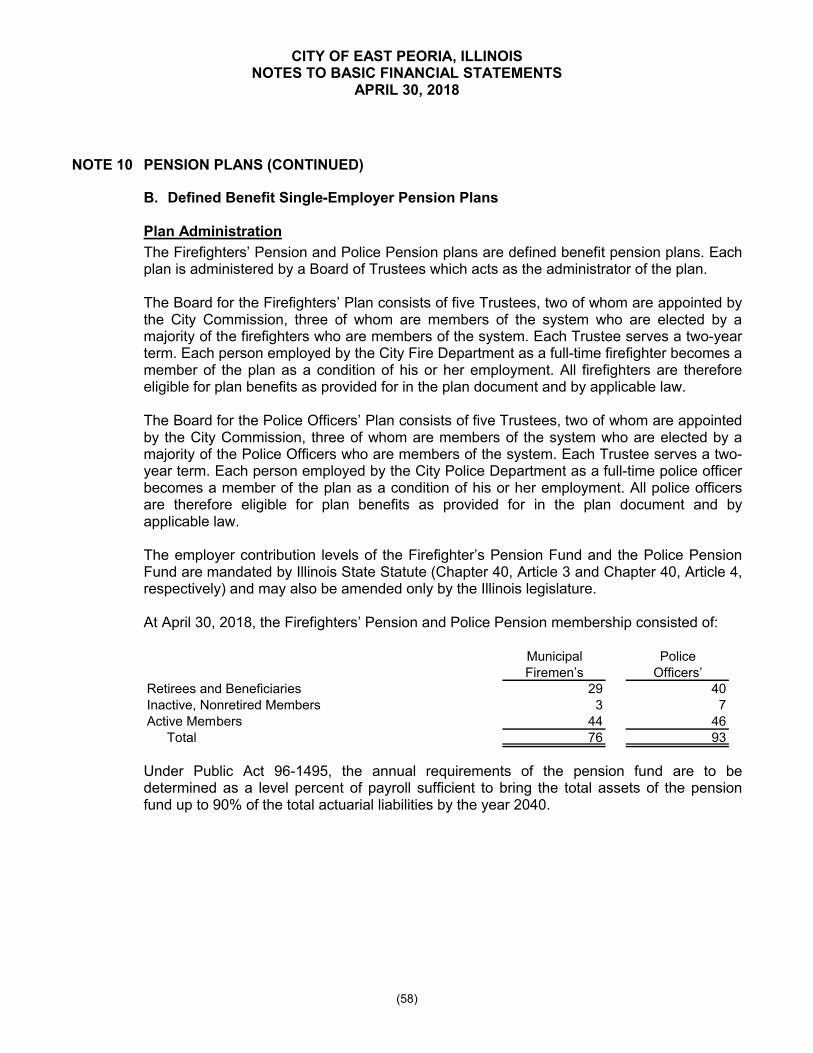
CITY OF EAST PEORIA, ILLINOISNOTES TO BASIC FINANCIAL STATEMENTS
APRIL 30, 2018
(58)
NOTE 10 PENSION PLANS (CONTINUED)
B. Defined Benefit Single-Employer Pension Plans
Plan Administration
The Firefighters’ Pension and Police Pension plans are defined benefit pension plans. Each plan is administered by a Board of Trustees which acts as the administrator of the plan.
The Board for the Firefighters’ Plan consists of five Trustees, two of whom are appointed by the City Commission, three of whom are members of the system who are elected by a majority of the firefighters who are members of the system. Each Trustee serves a two-year term. Each person employed by the City Fire Department as a full-time firefighter becomes a member of the plan as a condition of his or her employment. All firefighters are therefore eligible for plan benefits as provided for in the plan document and by applicable law.
The Board for the Police Officers’ Plan consists of five Trustees, two of whom are appointed by the City Commission, three of whom are members of the system who are elected by a majority of the Police Officers who are members of the system. Each Trustee serves a two-year term. Each person employed by the City Police Department as a full-time police officer becomes a member of the plan as a condition of his or her employment. All police officers are therefore eligible for plan benefits as provided for in the plan document and by applicable law.
The employer contribution levels of the Firefighter’s Pension Fund and the Police Pension Fund are mandated by Illinois State Statute (Chapter 40, Article 3 and Chapter 40, Article 4, respectively) and may also be amended only by the Illinois legislature.
At April 30, 2018, the Firefighters’ Pension and Police Pension membership consisted of:
Municipal PoliceFiremenʼs Officersʼ
Retirees and Beneficiaries 29 40Inactive, Nonretired Members 3 7Active Members 44 46
Total 76 93
Under Public Act 96-1495, the annual requirements of the pension fund are to be determined as a level percent of payroll sufficient to bring the total assets of the pension fund up to 90% of the total actuarial liabilities by the year 2040.
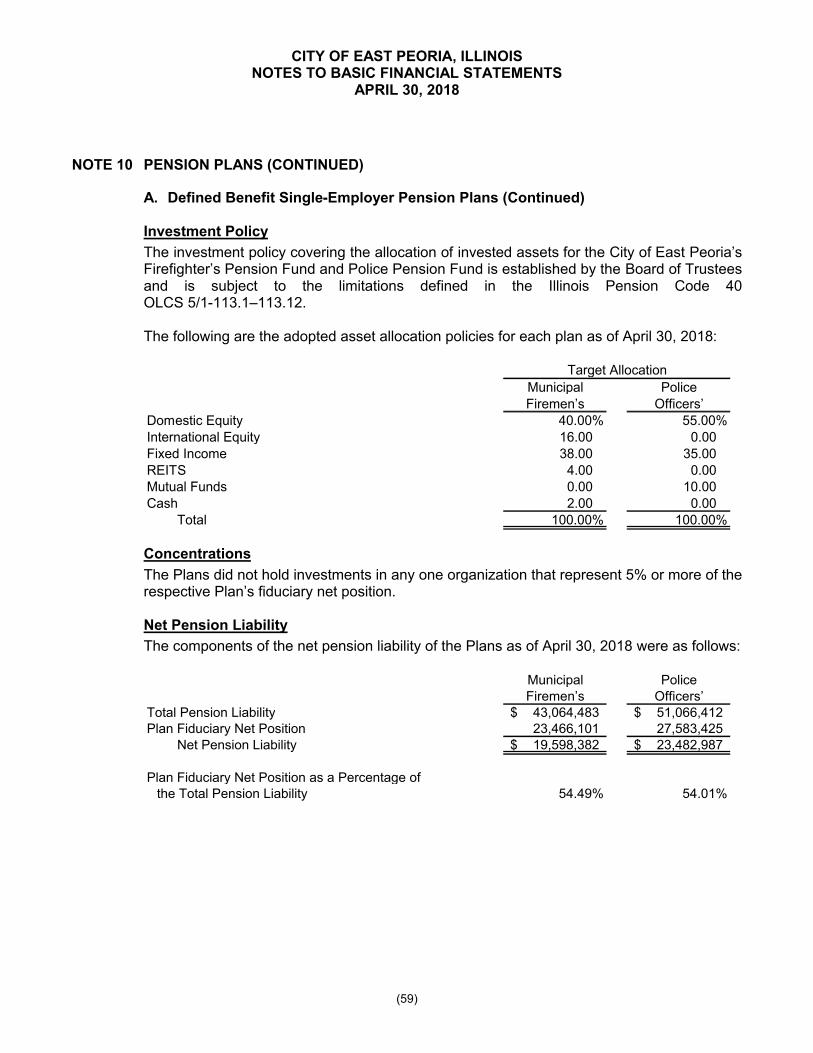
CITY OF EAST PEORIA, ILLINOISNOTES TO BASIC FINANCIAL STATEMENTS
APRIL 30, 2018
(59)
NOTE 10 PENSION PLANS (CONTINUED)
A. Defined Benefit Single-Employer Pension Plans (Continued)
Investment Policy
The investment policy covering the allocation of invested assets for the City of East Peoria’s Firefighter’s Pension Fund and Police Pension Fund is established by the Board of Trustees and is subject to the limitations defined in the Illinois Pension Code 40 OLCS 5/1-113.1‒113.12.
The following are the adopted asset allocation policies for each plan as of April 30, 2018:
Municipal PoliceFiremenʼs Officersʼ
Domestic Equity 40.00% 55.00%International Equity 16.00 0.00 Fixed Income 38.00 35.00 REITS 4.00 0.00 Mutual Funds 0.00 10.00 Cash 2.00 0.00
Total 100.00% 100.00%
Target Allocation
Concentrations
The Plans did not hold investments in any one organization that represent 5% or more of the respective Plan’s fiduciary net position.
Net Pension Liability
The components of the net pension liability of the Plans as of April 30, 2018 were as follows:
Municipal PoliceFiremenʼs Officersʼ
Total Pension Liability 43,064,483$ 51,066,412$ Plan Fiduciary Net Position 23,466,101 27,583,425
Net Pension Liability 19,598,382$ 23,482,987$
Plan Fiduciary Net Position as a Percentage ofthe Total Pension Liability 54.49% 54.01%
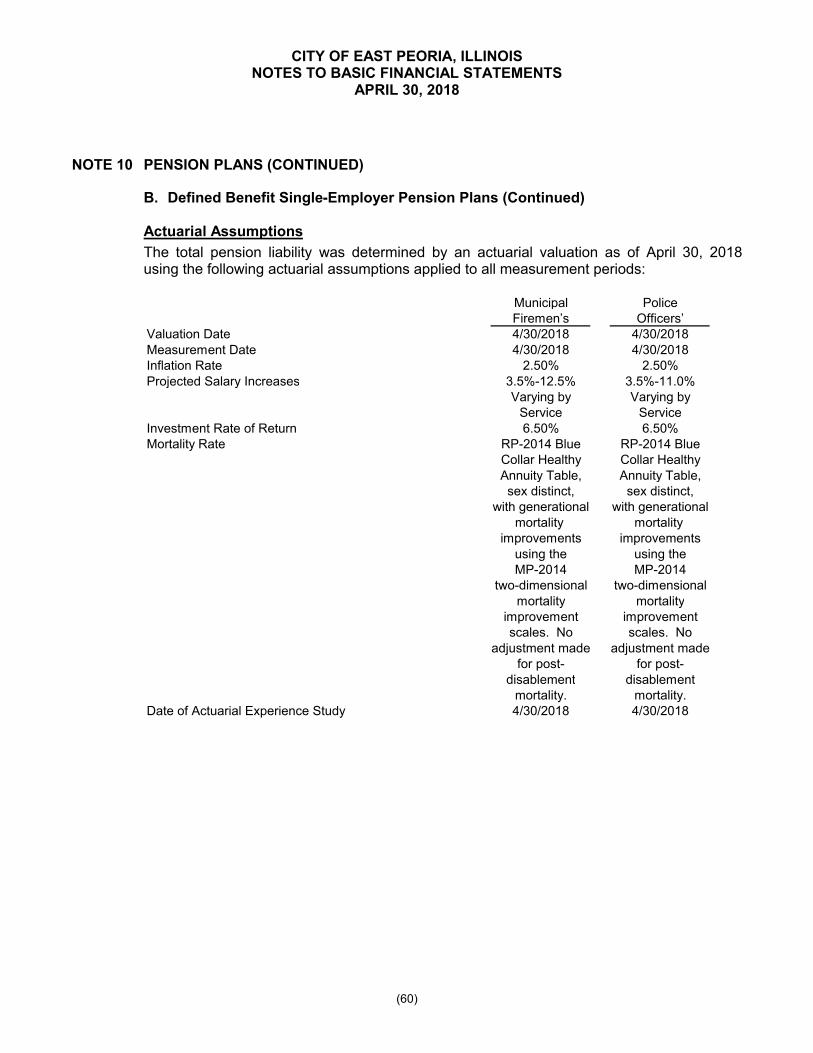
CITY OF EAST PEORIA, ILLINOISNOTES TO BASIC FINANCIAL STATEMENTS
APRIL 30, 2018
(60)
NOTE 10 PENSION PLANS (CONTINUED)
B. Defined Benefit Single-Employer Pension Plans (Continued)
Actuarial Assumptions
The total pension liability was determined by an actuarial valuation as of April 30, 2018using the following actuarial assumptions applied to all measurement periods:
Municipal PoliceFiremenʼs Officersʼ
Valuation Date 4/30/2018 4/30/2018Measurement Date 4/30/2018 4/30/2018Inflation Rate 2.50% 2.50%Projected Salary Increases 3.5%-12.5% 3.5%-11.0%
Varying by Varying byService Service
Investment Rate of Return 6.50% 6.50%Mortality Rate RP-2014 Blue RP-2014 Blue
Collar Healthy Collar HealthyAnnuity Table, Annuity Table,sex distinct, sex distinct,
with generational with generationalmortality mortality
improvements improvementsusing the using theMP-2014 MP-2014
two-dimensional two-dimensionalmortality mortality
improvement improvementscales. No scales. No
adjustment made adjustment madefor post- for post-
disablement disablementmortality. mortality.
Date of Actuarial Experience Study 4/30/2018 4/30/2018
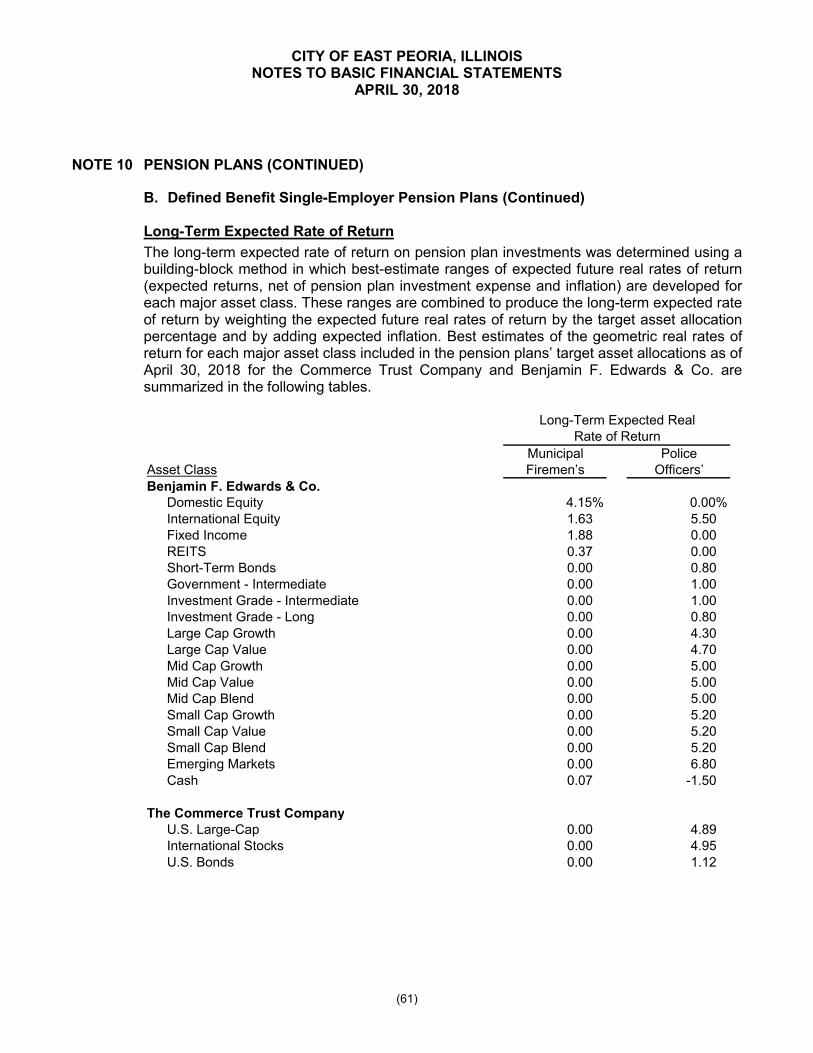
CITY OF EAST PEORIA, ILLINOISNOTES TO BASIC FINANCIAL STATEMENTS
APRIL 30, 2018
(61)
NOTE 10 PENSION PLANS (CONTINUED)
B. Defined Benefit Single-Employer Pension Plans (Continued)
Long-Term Expected Rate of Return
The long-term expected rate of return on pension plan investments was determined using a building-block method in which best-estimate ranges of expected future real rates of return (expected returns, net of pension plan investment expense and inflation) are developed for each major asset class. These ranges are combined to produce the long-term expected rate of return by weighting the expected future real rates of return by the target asset allocation percentage and by adding expected inflation. Best estimates of the geometric real rates of return for each major asset class included in the pension plans’ target asset allocations as of April 30, 2018 for the Commerce Trust Company and Benjamin F. Edwards & Co. are summarized in the following tables.
Municipal PoliceAsset Class Firemenʼs OfficersʼBenjamin F. Edwards & Co.
Domestic Equity 4.15% 0.00%International Equity 1.63 5.50 Fixed Income 1.88 0.00 REITS 0.37 0.00 Short-Term Bonds 0.00 0.80 Government - Intermediate 0.00 1.00 Investment Grade - Intermediate 0.00 1.00 Investment Grade - Long 0.00 0.80 Large Cap Growth 0.00 4.30 Large Cap Value 0.00 4.70 Mid Cap Growth 0.00 5.00 Mid Cap Value 0.00 5.00 Mid Cap Blend 0.00 5.00 Small Cap Growth 0.00 5.20 Small Cap Value 0.00 5.20 Small Cap Blend 0.00 5.20 Emerging Markets 0.00 6.80 Cash 0.07 -1.50
The Commerce Trust CompanyU.S. Large-Cap 0.00 4.89 International Stocks 0.00 4.95 U.S. Bonds 0.00 1.12
Rate of ReturnLong-Term Expected Real
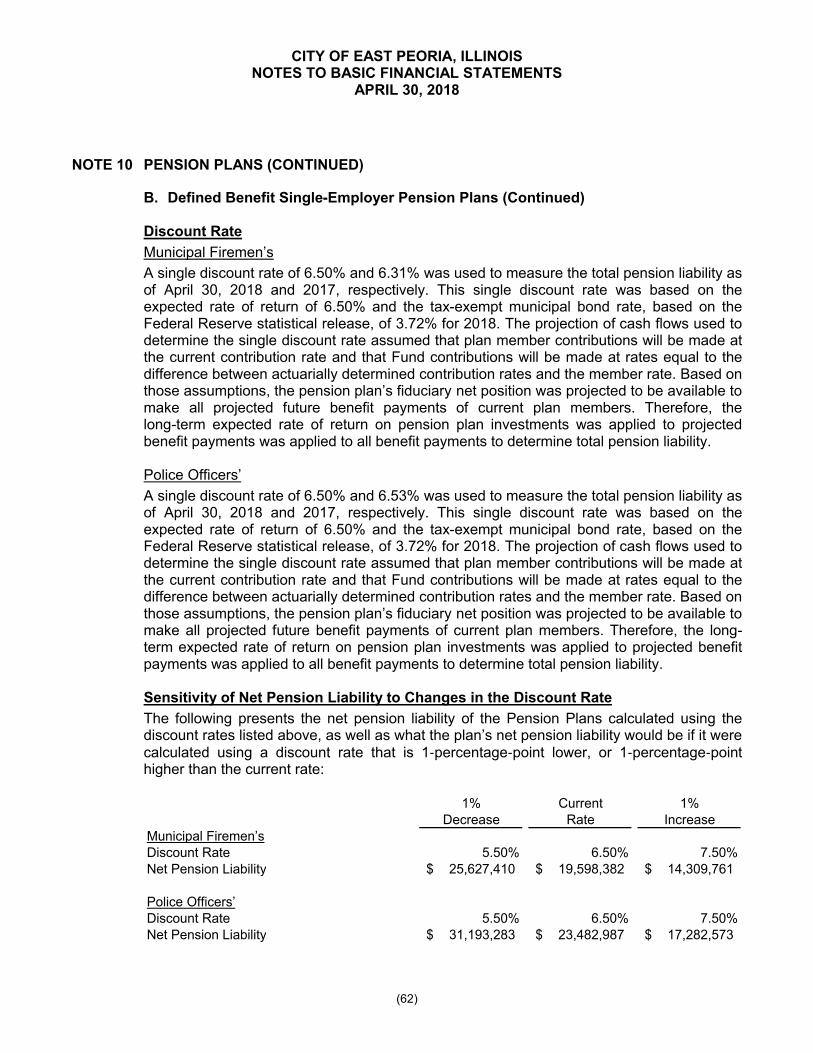
CITY OF EAST PEORIA, ILLINOISNOTES TO BASIC FINANCIAL STATEMENTS
APRIL 30, 2018
(62)
NOTE 10 PENSION PLANS (CONTINUED)
B. Defined Benefit Single-Employer Pension Plans (Continued)
Discount Rate
Municipal Firemen’s
A single discount rate of 6.50% and 6.31% was used to measure the total pension liability as of April 30, 2018 and 2017, respectively. This single discount rate was based on the expected rate of return of 6.50% and the tax-exempt municipal bond rate, based on the Federal Reserve statistical release, of 3.72% for 2018. The projection of cash flows used to determine the single discount rate assumed that plan member contributions will be made at the current contribution rate and that Fund contributions will be made at rates equal to the difference between actuarially determined contribution rates and the member rate. Based on those assumptions, the pension plan’s fiduciary net position was projected to be available to make all projected future benefit payments of current plan members. Therefore, the long-term expected rate of return on pension plan investments was applied to projected benefit payments was applied to all benefit payments to determine total pension liability.
Police Officers’
A single discount rate of 6.50% and 6.53% was used to measure the total pension liability as of April 30, 2018 and 2017, respectively. This single discount rate was based on theexpected rate of return of 6.50% and the tax-exempt municipal bond rate, based on the Federal Reserve statistical release, of 3.72% for 2018. The projection of cash flows used to determine the single discount rate assumed that plan member contributions will be made at the current contribution rate and that Fund contributions will be made at rates equal to the difference between actuarially determined contribution rates and the member rate. Based on those assumptions, the pension plan’s fiduciary net position was projected to be available to make all projected future benefit payments of current plan members. Therefore, the long-term expected rate of return on pension plan investments was applied to projected benefit payments was applied to all benefit payments to determine total pension liability.
Sensitivity of Net Pension Liability to Changes in the Discount Rate
The following presents the net pension liability of the Pension Plans calculated using the discount rates listed above, as well as what the plan’s net pension liability would be if it were calculated using a discount rate that is 1-percentage-point lower, or 1-percentage-point higher than the current rate:
1% Current 1%Decrease Rate Increase
Municipal FiremenʼsDiscount Rate 5.50% 6.50% 7.50%Net Pension Liability 25,627,410$ 19,598,382$ 14,309,761$
Police OfficersʼDiscount Rate 5.50% 6.50% 7.50%Net Pension Liability 31,193,283$ 23,482,987$ 17,282,573$
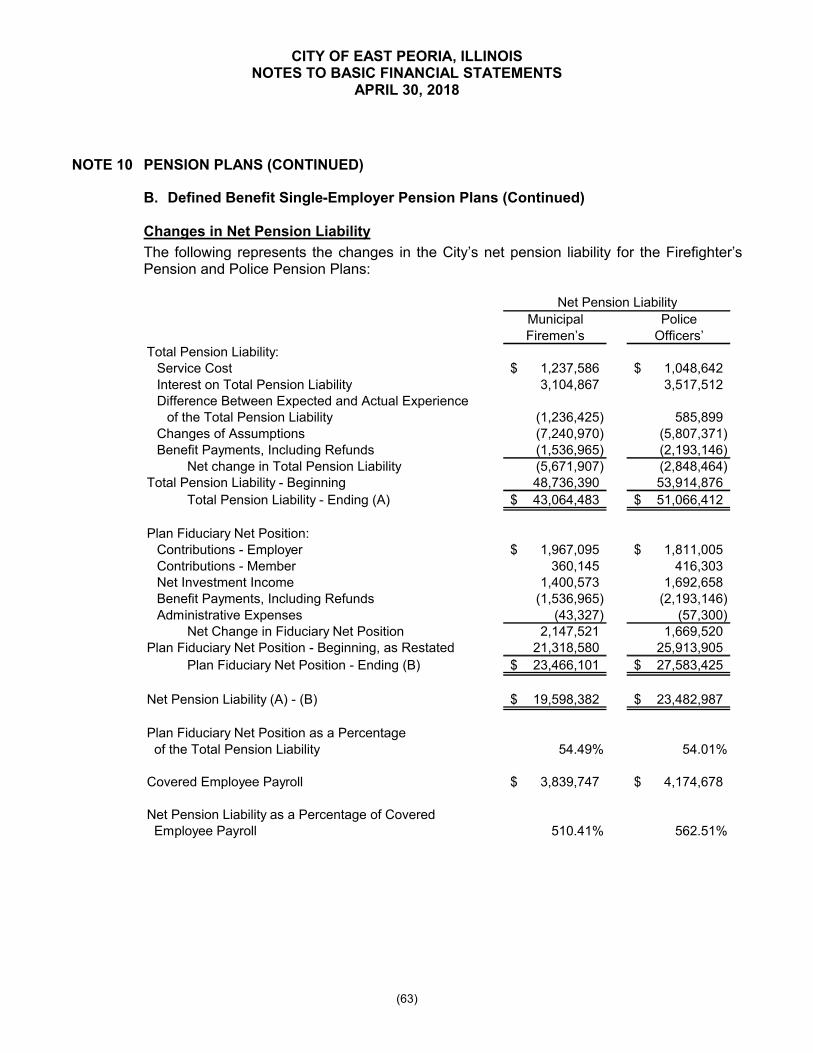
CITY OF EAST PEORIA, ILLINOISNOTES TO BASIC FINANCIAL STATEMENTS
APRIL 30, 2018
(63)
NOTE 10 PENSION PLANS (CONTINUED)
B. Defined Benefit Single-Employer Pension Plans (Continued)
Changes in Net Pension Liability
The following represents the changes in the City’s net pension liability for the Firefighter’s Pension and Police Pension Plans:
Municipal PoliceFiremenʼs Officersʼ
Total Pension Liability:Service Cost 1,237,586$ 1,048,642$ Interest on Total Pension Liability 3,104,867 3,517,512 Difference Between Expected and Actual Experience
of the Total Pension Liability (1,236,425) 585,899 Changes of Assumptions (7,240,970) (5,807,371) Benefit Payments, Including Refunds (1,536,965) (2,193,146)
Net change in Total Pension Liability (5,671,907) (2,848,464) Total Pension Liability - Beginning 48,736,390 53,914,876
Total Pension Liability - Ending (A) 43,064,483$ 51,066,412$
Plan Fiduciary Net Position:Contributions - Employer 1,967,095$ 1,811,005$ Contributions - Member 360,145 416,303 Net Investment Income 1,400,573 1,692,658 Benefit Payments, Including Refunds (1,536,965) (2,193,146) Administrative Expenses (43,327) (57,300)
Net Change in Fiduciary Net Position 2,147,521 1,669,520 Plan Fiduciary Net Position - Beginning, as Restated 21,318,580 25,913,905
Plan Fiduciary Net Position - Ending (B) 23,466,101$ 27,583,425$
Net Pension Liability (A) - (B) 19,598,382$ 23,482,987$
Plan Fiduciary Net Position as a Percentage of the Total Pension Liability 54.49% 54.01%
Covered Employee Payroll 3,839,747$ 4,174,678$
Net Pension Liability as a Percentage of Covered Employee Payroll 510.41% 562.51%
Net Pension Liability

CITY OF EAST PEORIA, ILLINOISNOTES TO BASIC FINANCIAL STATEMENTS
APRIL 30, 2018
(64)
NOTE 10 PENSION PLANS (CONTINUED)
B. Defined Benefit Single-Employer Pension Plans (Continued)
Pension Expense and Deferred Inflows/Outflows of Resources Related to Pensions
For the year ended April 30, 2018, the City will recognize pension expense of $4,905,821. Total pension expense recognized for all three plans for the year ended April 30, 2018 was $5,948,024. On April 30, 2018 the City reported deferred outflows of resources and deferred inflows of resources related to pensions from the following sources:
Deferred DeferredOutflows Inflows
of Resources of ResourcesDifferences Between Expected and Actual Experience 468,289$ (1,172,394)$ Changes of Assumptions 2,303,082 (6,818,970) Net Difference Between Projected and Actual Earnings 281,327 -
Total Deferred Amounts Related to Pensions 3,052,698$ (7,991,364)$
Deferred DeferredOutflows Inflows
of Resources of ResourcesDifferences Between Expected and Actual Experience 957,022$ (21,778)$ Changes of Assumptions 1,778,981 (5,181,357) Net Difference Between Projected and Actual Earnings 406,299 -
Total Deferred Amounts Related to Pensions 3,142,302$ (5,203,135)$
Municipal Firemen's
Police Officers'
The net amount reported as deferred outflows of resources and deferred inflows of resources related to pensions will be recognized in pension expense in future periods as follows:
MunicipalFiremen's
Net DeferredInflows
Year Ending April 30, of Resources2019 (401,655)$ 2020 (401,653) 2021 (662,544) 2022 (590,873) 2023 (718,137)
Thereafter (2,163,804) Total (4,938,666)$
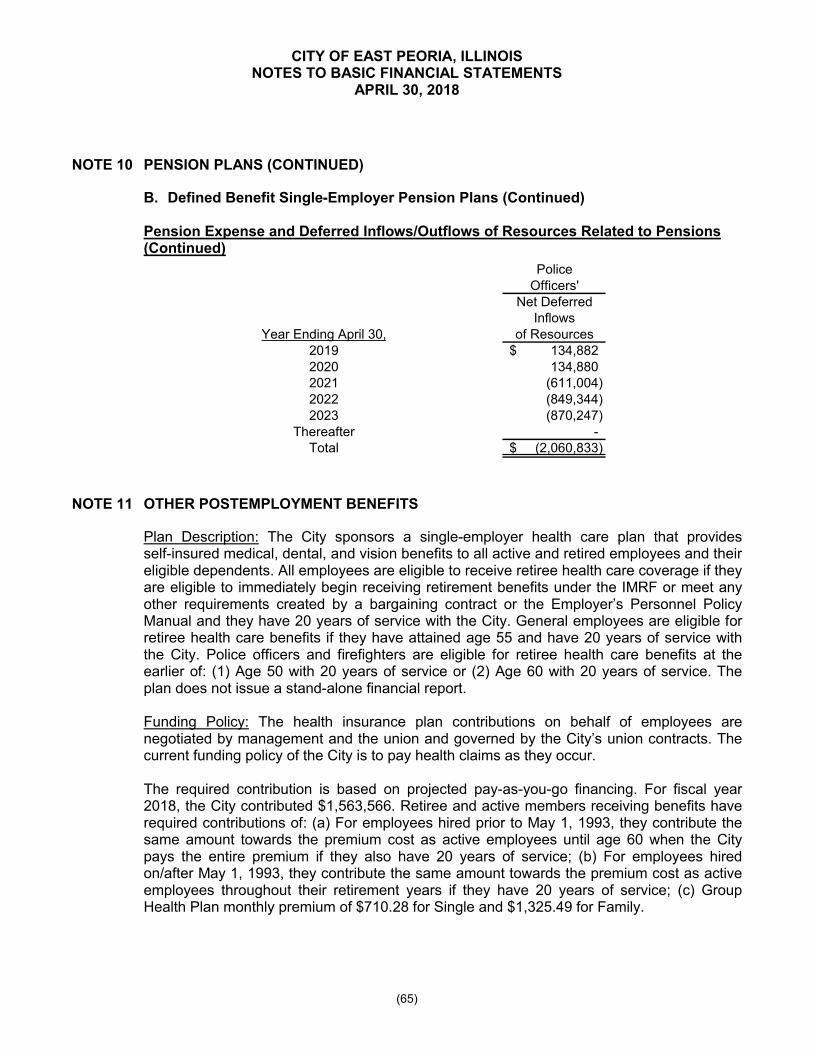
CITY OF EAST PEORIA, ILLINOISNOTES TO BASIC FINANCIAL STATEMENTS
APRIL 30, 2018
(65)
NOTE 10 PENSION PLANS (CONTINUED)
B. Defined Benefit Single-Employer Pension Plans (Continued)
Pension Expense and Deferred Inflows/Outflows of Resources Related to Pensions (Continued)
PoliceOfficers'
Net DeferredInflows
Year Ending April 30, of Resources2019 134,882$ 2020 134,880 2021 (611,004) 2022 (849,344) 2023 (870,247)
Thereafter -Total (2,060,833)$
NOTE 11 OTHER POSTEMPLOYMENT BENEFITS
Plan Description: The City sponsors a single-employer health care plan that provides self-insured medical, dental, and vision benefits to all active and retired employees and their eligible dependents. All employees are eligible to receive retiree health care coverage if they are eligible to immediately begin receiving retirement benefits under the IMRF or meet any other requirements created by a bargaining contract or the Employer’s Personnel Policy Manual and they have 20 years of service with the City. General employees are eligible for retiree health care benefits if they have attained age 55 and have 20 years of service with the City. Police officers and firefighters are eligible for retiree health care benefits at the earlier of: (1) Age 50 with 20 years of service or (2) Age 60 with 20 years of service. The plan does not issue a stand-alone financial report.
Funding Policy: The health insurance plan contributions on behalf of employees are negotiated by management and the union and governed by the City’s union contracts. The current funding policy of the City is to pay health claims as they occur.
The required contribution is based on projected pay-as-you-go financing. For fiscal year 2018, the City contributed $1,563,566. Retiree and active members receiving benefits have required contributions of: (a) For employees hired prior to May 1, 1993, they contribute the same amount towards the premium cost as active employees until age 60 when the City pays the entire premium if they also have 20 years of service; (b) For employees hired on/after May 1, 1993, they contribute the same amount towards the premium cost as active employees throughout their retirement years if they have 20 years of service; (c) Group Health Plan monthly premium of $710.28 for Single and $1,325.49 for Family.

CITY OF EAST PEORIA, ILLINOISNOTES TO BASIC FINANCIAL STATEMENTS
APRIL 30, 2018
(66)
NOTE 11 OTHER POSTEMPLOYMENT BENEFITS (CONTINUED)
Annual OPEB Cost and Net OPEB Obligation: The City’s annual other postemployment benefit (OPEB) cost (expense) is calculated based on the annual required contribution (ARC) of the employer, an amount actuarially determined in accordance to the parameters of GASB Statement No. 45. The ARC represents a level of funding that, if paid on an ongoing basis, is projected to cover the normal cost each year and amortize any unfunded actuarial liabilities over a period not to exceed 30 years. The following table shows the components of the City’s annual OPEB cost for the year, the amount actuarially contributed to the plan, and changes in the City’s annual OPEB obligation:
Annual Required Contribution 4,263,138$ Interest on Net OPEB Obligation 703,561 Adjustment to Annual Required Contribution (666,401)
Annual OPEB Cost 4,300,298
Contributions and Payments Made 1,563,566 Increase in Net OPEB Obligation 2,736,732
Net OPEB Obligation - Beginning of Year 18,371,424
Net OPEB Obligation - End of Year 21,108,156$
The General Fund will be used to liquidate the net OPEB obligation attributable to governmental activities.
The City’s annual OPEB cost, the percentage of annual OPEB cost contributed to the plan,and the net OPEB obligations for 2018 and the two preceding years is as follows:
Percentage ofAnnual OPEB
Annual Cost Net OPEBFiscal Year Ending OPEB Cost Contributed Obligation
April 30, 2018 4,300,298$ 36.7% 21,108,156$ April 30, 2017 4,300,298 36.7 18,371,424 April 30, 2016 4,172,092 37.7 15,634,692
Funded Status and Funding Progress: As of April 30, 2017, the most recent valuation date, the plan was -0-% funded. The actuarial accrued liability for benefits was $62,970,506 and the actuarial value of assets is none, resulting in an unfunded actuarial accrued liability (UAAL) of $62,970,506. The covered payroll (annual payroll of active employees covered by the plan) was $12,618,069. The ratio of the UAAL to the covered payroll was 499.1%.

CITY OF EAST PEORIA, ILLINOISNOTES TO BASIC FINANCIAL STATEMENTS
APRIL 30, 2018
(67)
NOTE 11 OTHER POSTEMPLOYMENT BENEFITS (CONTINUED)
Actuarial valuations of an ongoing plan involve estimates of the value of reported amounts and assumptions about the probability of occurrence of events far into the future. Examples include assumptions about future employment, mortality, and the health care cost trend. Amounts determined regarding the funded status of the plan and annual required contributions of the employer are subject to continual revision as actual results are compared with past expectations and new estimates are made about the future. The schedule of funding progress, presented as required supplementary information following the notes to the financial statements, presents multi-year trend information about whether the actuarial value of plan assets is increasing or decreasing over time relative to the actuarial accrued liability for benefits.
Actuarial Methods and Assumptions: Projections of benefits for financial reporting purposes are based on the substantive plan (the plan as understood by the employer and the plan members) and included in the types of benefits provided at the time of each valuation and the historical pattern of sharing of benefit costs between the employer and plan members to that point. The actuarial methods and assumptions used include techniques that are designed to reduce the effects of short-term volatility in actuarial accrued liabilities and the actuarial value of assets, consistent with the long-term perspective of the calculations.
In the April 30, 2017 actuarial valuation, projected unit credit with linear proration to decrement method was used. The actuarial assumptions included a 4.5% discount rate, salary increases of 3%, an inflation rate of 3%, mortality rates using the SOA RPH-2006Total Dataset Mortality Table (fully generational with Scale MP-2014), and health care cost trend rates beginning at 9% and steadily declining to 4.5%. The UAAL is being amortized as a level percentage of pay on an open basis. The amortization of UAAL is done over a period of 30 years.
NOTE 12 CONTINGENT LIABILITIES
Amounts received or receivable from grant agencies are subject to audit and adjustments by grantor agencies, principally the federal government. Disallowed claims, including amounts already collected, may constitute a liability of the applicable funds. The amount, if any, of expenditures that may be disallowed by the grantor cannot be determined at this time, although the City expects such amounts, if any, to be immaterial.
The City is a defendant in various lawsuits. It is the opinion of the City that resolution of these matters would not have a material adverse effect on the financial condition of the City and the outcome of these claims is not presently determinable.
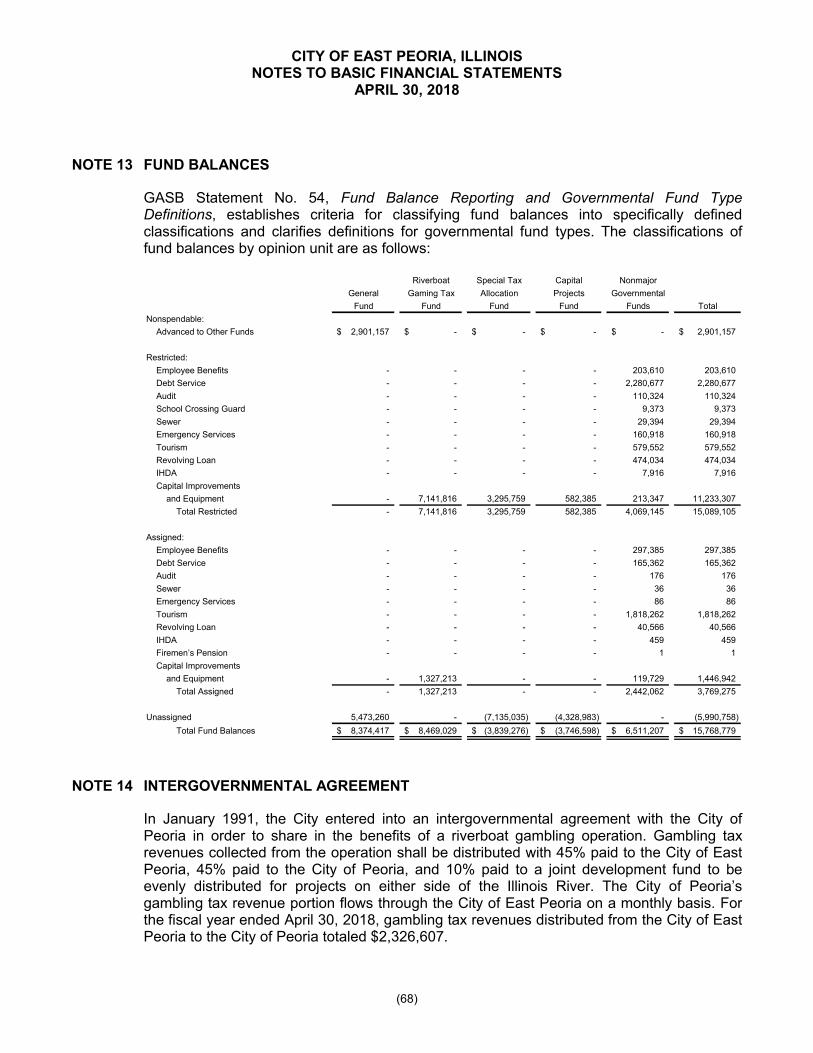
CITY OF EAST PEORIA, ILLINOISNOTES TO BASIC FINANCIAL STATEMENTS
APRIL 30, 2018
(68)
NOTE 13 FUND BALANCES
GASB Statement No. 54, Fund Balance Reporting and Governmental Fund Type Definitions, establishes criteria for classifying fund balances into specifically defined classifications and clarifies definitions for governmental fund types. The classifications of fund balances by opinion unit are as follows:
Riverboat Special Tax Capital Nonmajor
General Gaming Tax Allocation Projects Governmental
Fund Fund Fund Fund Funds Total
Nonspendable:
Advanced to Other Funds 2,901,157$ -$ -$ -$ -$ 2,901,157$
Restricted:
Employee Benefits - - - - 203,610 203,610
Debt Service - - - - 2,280,677 2,280,677
Audit - - - - 110,324 110,324
School Crossing Guard - - - - 9,373 9,373
Sewer - - - - 29,394 29,394
Emergency Services - - - - 160,918 160,918
Tourism - - - - 579,552 579,552
Revolving Loan - - - - 474,034 474,034
IHDA - - - - 7,916 7,916
Capital Improvements
and Equipment - 7,141,816 3,295,759 582,385 213,347 11,233,307
Total Restricted - 7,141,816 3,295,759 582,385 4,069,145 15,089,105
Assigned:
Employee Benefits - - - - 297,385 297,385
Debt Service - - - - 165,362 165,362
Audit - - - - 176 176
Sewer - - - - 36 36
Emergency Services - - - - 86 86
Tourism - - - - 1,818,262 1,818,262
Revolving Loan - - - - 40,566 40,566
IHDA - - - - 459 459
Firemenʼs Pension - - - - 1 1
Capital Improvements
and Equipment - 1,327,213 - - 119,729 1,446,942
Total Assigned - 1,327,213 - - 2,442,062 3,769,275
Unassigned 5,473,260 - (7,135,035) (4,328,983) - (5,990,758)
Total Fund Balances 8,374,417$ 8,469,029$ (3,839,276)$ (3,746,598)$ 6,511,207$ 15,768,779$
NOTE 14 INTERGOVERNMENTAL AGREEMENT
In January 1991, the City entered into an intergovernmental agreement with the City of Peoria in order to share in the benefits of a riverboat gambling operation. Gambling tax revenues collected from the operation shall be distributed with 45% paid to the City of East Peoria, 45% paid to the City of Peoria, and 10% paid to a joint development fund to be evenly distributed for projects on either side of the Illinois River. The City of Peoria’s gambling tax revenue portion flows through the City of East Peoria on a monthly basis. For the fiscal year ended April 30, 2018, gambling tax revenues distributed from the City of East Peoria to the City of Peoria totaled $2,326,607.
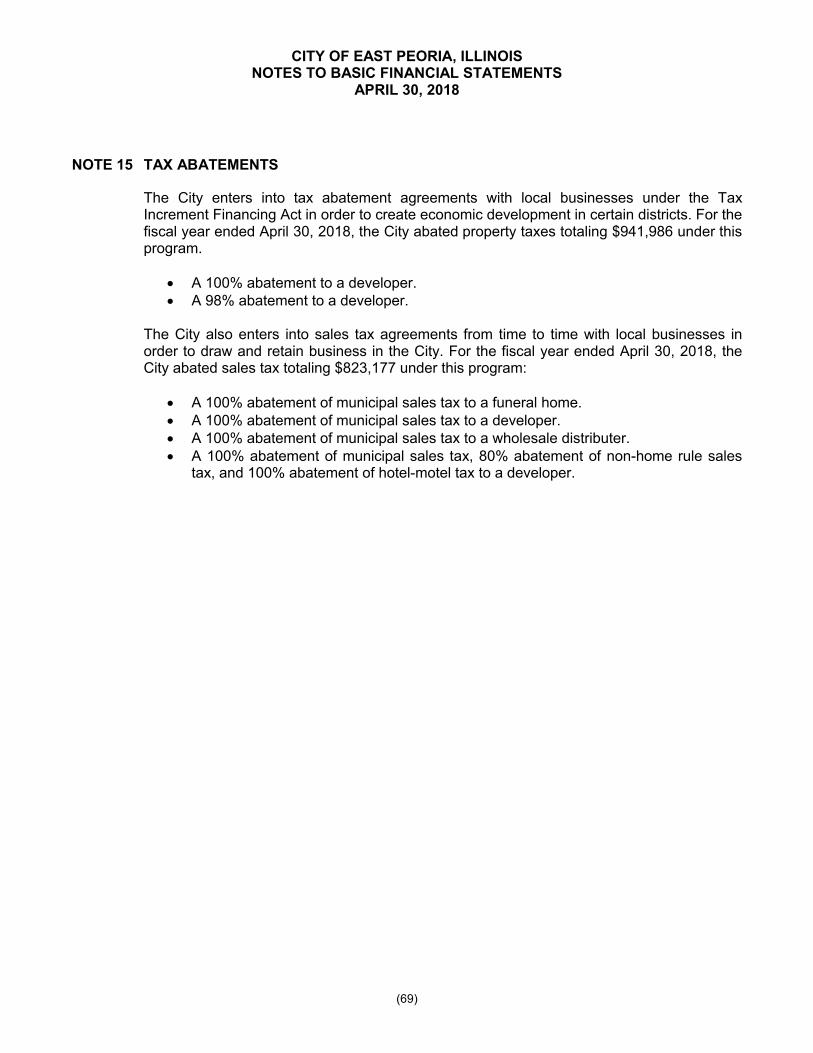
CITY OF EAST PEORIA, ILLINOISNOTES TO BASIC FINANCIAL STATEMENTS
APRIL 30, 2018
(69)
NOTE 15 TAX ABATEMENTS
The City enters into tax abatement agreements with local businesses under the Tax Increment Financing Act in order to create economic development in certain districts. For the fiscal year ended April 30, 2018, the City abated property taxes totaling $941,986 under this program.
A 100% abatement to a developer. A 98% abatement to a developer.
The City also enters into sales tax agreements from time to time with local businesses in order to draw and retain business in the City. For the fiscal year ended April 30, 2018, the City abated sales tax totaling $823,177 under this program:
A 100% abatement of municipal sales tax to a funeral home. A 100% abatement of municipal sales tax to a developer. A 100% abatement of municipal sales tax to a wholesale distributer. A 100% abatement of municipal sales tax, 80% abatement of non-home rule sales
tax, and 100% abatement of hotel-motel tax to a developer.
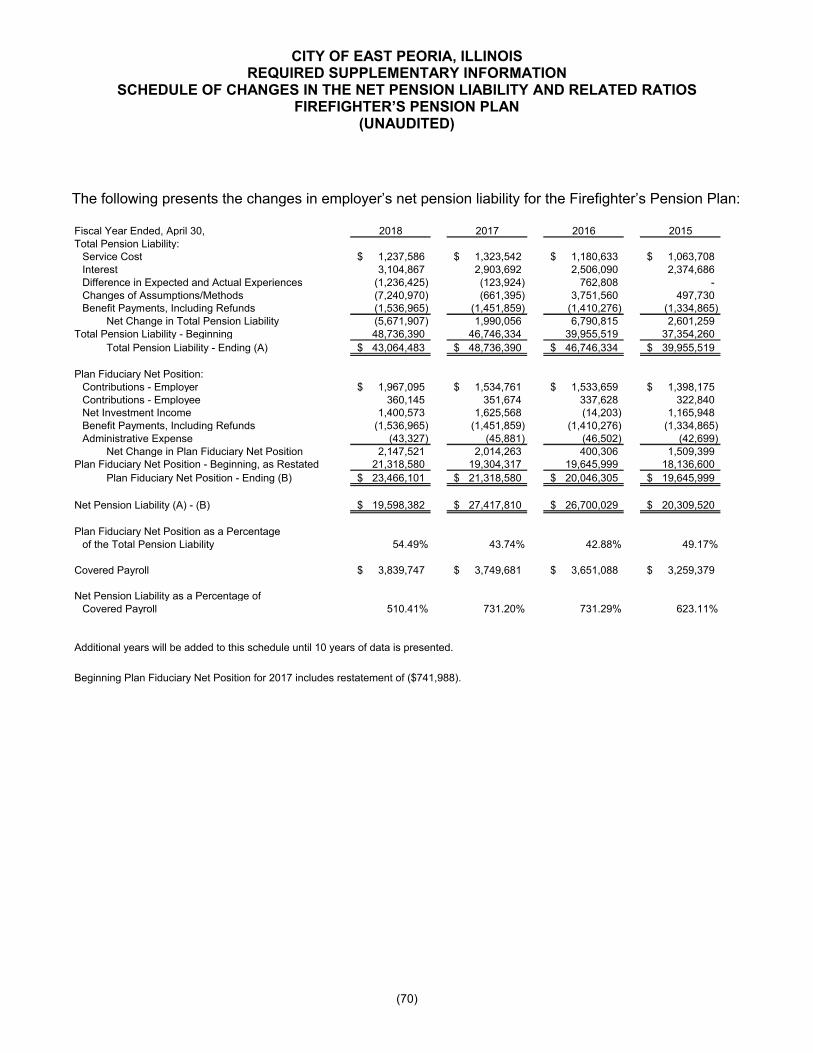
CITY OF EAST PEORIA, ILLINOISREQUIRED SUPPLEMENTARY INFORMATION
SCHEDULE OF CHANGES IN THE NET PENSION LIABILITY AND RELATED RATIOSFIREFIGHTER’S PENSION PLAN
(UNAUDITED)
(70)
The following presents the changes in employer’s net pension liability for the Firefighter’s Pension Plan:
Fiscal Year Ended, April 30, 2018 2017 2016 2015Total Pension Liability:
Service Cost 1,237,586$ 1,323,542$ 1,180,633$ 1,063,708$ Interest 3,104,867 2,903,692 2,506,090 2,374,686 Difference in Expected and Actual Experiences (1,236,425) (123,924) 762,808 -Changes of Assumptions/Methods (7,240,970) (661,395) 3,751,560 497,730 Benefit Payments, Including Refunds (1,536,965) (1,451,859) (1,410,276) (1,334,865)
Net Change in Total Pension Liability (5,671,907) 1,990,056 6,790,815 2,601,259 Total Pension Liability - Beginning 48,736,390 46,746,334 39,955,519 37,354,260
Total Pension Liability - Ending (A) 43,064,483$ 48,736,390$ 46,746,334$ 39,955,519$
Plan Fiduciary Net Position:Contributions - Employer 1,967,095$ 1,534,761$ 1,533,659$ 1,398,175$ Contributions - Employee 360,145 351,674 337,628 322,840 Net Investment Income 1,400,573 1,625,568 (14,203) 1,165,948 Benefit Payments, Including Refunds (1,536,965) (1,451,859) (1,410,276) (1,334,865) Administrative Expense (43,327) (45,881) (46,502) (42,699)
Net Change in Plan Fiduciary Net Position 2,147,521 2,014,263 400,306 1,509,399 Plan Fiduciary Net Position - Beginning, as Restated 21,318,580 19,304,317 19,645,999 18,136,600
Plan Fiduciary Net Position - Ending (B) 23,466,101$ 21,318,580$ 20,046,305$ 19,645,999$
Net Pension Liability (A) - (B) 19,598,382$ 27,417,810$ 26,700,029$ 20,309,520$
Plan Fiduciary Net Position as a Percentageof the Total Pension Liability 54.49% 43.74% 42.88% 49.17%
Covered Payroll 3,839,747$ 3,749,681$ 3,651,088$ 3,259,379$
Net Pension Liability as a Percentage ofCovered Payroll 510.41% 731.20% 731.29% 623.11%
Additional years will be added to this schedule until 10 years of data is presented.
Beginning Plan Fiduciary Net Position for 2017 includes restatement of ($741,988).
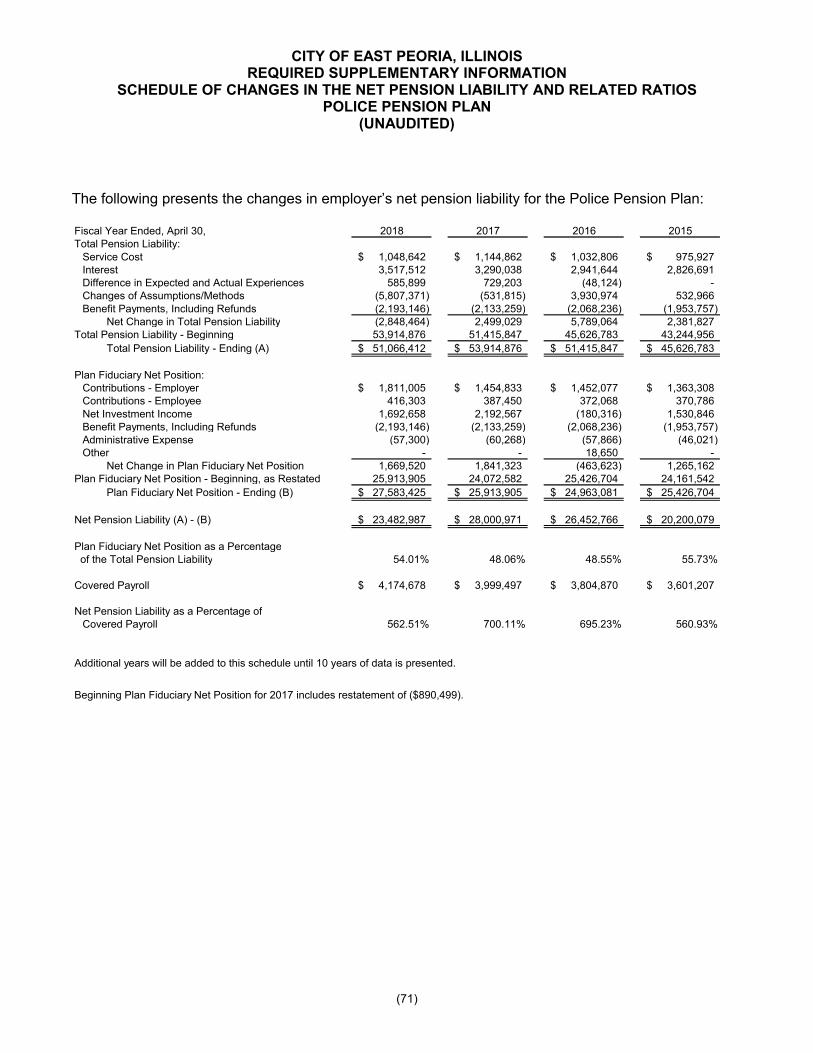
CITY OF EAST PEORIA, ILLINOISREQUIRED SUPPLEMENTARY INFORMATION
SCHEDULE OF CHANGES IN THE NET PENSION LIABILITY AND RELATED RATIOSPOLICE PENSION PLAN
(UNAUDITED)
(71)
The following presents the changes in employer’s net pension liability for the Police Pension Plan:
Fiscal Year Ended, April 30, 2018 2017 2016 2015Total Pension Liability:
Service Cost 1,048,642$ 1,144,862$ 1,032,806$ 975,927$ Interest 3,517,512 3,290,038 2,941,644 2,826,691 Difference in Expected and Actual Experiences 585,899 729,203 (48,124) -Changes of Assumptions/Methods (5,807,371) (531,815) 3,930,974 532,966 Benefit Payments, Including Refunds (2,193,146) (2,133,259) (2,068,236) (1,953,757)
Net Change in Total Pension Liability (2,848,464) 2,499,029 5,789,064 2,381,827 Total Pension Liability - Beginning 53,914,876 51,415,847 45,626,783 43,244,956
Total Pension Liability - Ending (A) 51,066,412$ 53,914,876$ 51,415,847$ 45,626,783$
Plan Fiduciary Net Position:Contributions - Employer 1,811,005$ 1,454,833$ 1,452,077$ 1,363,308$ Contributions - Employee 416,303 387,450 372,068 370,786 Net Investment Income 1,692,658 2,192,567 (180,316) 1,530,846 Benefit Payments, Including Refunds (2,193,146) (2,133,259) (2,068,236) (1,953,757) Administrative Expense (57,300) (60,268) (57,866) (46,021) Other - - 18,650 -
Net Change in Plan Fiduciary Net Position 1,669,520 1,841,323 (463,623) 1,265,162 Plan Fiduciary Net Position - Beginning, as Restated 25,913,905 24,072,582 25,426,704 24,161,542
Plan Fiduciary Net Position - Ending (B) 27,583,425$ 25,913,905$ 24,963,081$ 25,426,704$
Net Pension Liability (A) - (B) 23,482,987$ 28,000,971$ 26,452,766$ 20,200,079$
Plan Fiduciary Net Position as a Percentage of the Total Pension Liability 54.01% 48.06% 48.55% 55.73%
Covered Payroll 4,174,678$ 3,999,497$ 3,804,870$ 3,601,207$
Net Pension Liability as a Percentage ofCovered Payroll 562.51% 700.11% 695.23% 560.93%
Additional years will be added to this schedule until 10 years of data is presented.
Beginning Plan Fiduciary Net Position for 2017 includes restatement of ($890,499).

CITY OF EAST PEORIA, ILLINOISREQUIRED SUPPLEMENTARY INFORMATION
SCHEDULE OF CHANGES IN THE NET PENSION LIABILITY AND RELATED RATIOSILLINOIS MUNICIPAL RETIREMENT PLAN
(UNAUDITED)
(72)
The following present the changes in employer net pension liability for IMRF:
Calendar Year Ended, December 31, 2017 2016 2015Total Pension Liability:
Service Cost 612,718$ 678,762$ 671,499$ Interest 3,175,410 2,795,820 2,770,972 Difference in Expected and Actual Experiences 366,635 4,204,926 (1,145,802)Changes of Assumptions/Methods (1,252,649) (54,676) 48,418 Benefit Payments, Including Refunds (2,931,671) (2,283,962) (1,652,047)
Net Change in Total Pension Liability (29,557) 5,340,870 693,040 Total Pension Liability - Beginning 43,472,303 38,131,433 37,438,393
Total Pension Liability - Ending (A) 43,442,746$ 43,472,303$ 38,131,433$
Plan Fiduciary Net Position:Contributions - Employer 3,130,282$ 691,435$ 697,158$ Contributions - Employee 424,166 647,437 336,032 Projected Net Investment Income 2,733,032 2,606,508 2,634,081 Difference Between Projected and Actual Income 2,690,286 409,889 (3,036,329)Benefit Payments, Including Refunds (2,931,671) (2,283,962) (1,652,047)Administrative Expense (30,212) (60,069) 57,529 Other 13 20 (930)
Net Change in Plan Fiduciary Net Position 6,015,896 2,011,258 (964,506)Plan Fiduciary Net Position - Beginning 37,004,020 34,992,762 35,957,268
Plan Fiduciary Net Position - Ending (B) 43,019,916$ 37,004,020$ 34,992,762$
Net Pension Liability (A) - (B) 422,830$ 6,468,283$ 3,138,671$
Plan Fiduciary Net Position as a Percentageof the Total Pension Liability 99.03% 85.12% 91.77%
Covered Payroll 5,906,838$ 6,359,506$ 6,274,254$
Net Pension Liability as a Percentage ofCovered Payroll 7.16% 101.71% 50.02%
Additional years will be added to this schedule until 10 years of data is presented.

CITY OF EAST PEORIA, ILLINOISREQUIRED SUPPLEMENTARY INFORMATIONSCHEDULE OF EMPLOYER CONTRIBUTIONS
PENSION PLANS(UNAUDITED)
LAST 10 FISCAL YEARS
(73)
IMRF
Fiscal Year Actuarially Contribution ActualEnded Determined Actual Deficiency Covered Contribution as
April 30, Contribution Contribution (Excess) Payroll a % of Payroll2016 697,697$ 676,350$ 21,347$ 6,274,254$ 10.78%2017 689,370 657,230 32,140 6,359,506 10.33%2018 577,689 3,180,517 (2,602,828) 5,906,838 53.84%
Firefighterʼs Pension Plan
Fiscal Year Actuarially Contribution ActualEnded Determined Actual Deficiency Covered Contribution as
April 30, Contribution Contribution (Excess) Payroll a % of Payroll2009 1,002,083$ 1,039,357$ (37,274)$ 2,228,829$ 46.63%2010 1,113,550 1,099,877 13,673 2,389,575 46.03%2011 1,231,513 1,305,136 (73,623) 2,387,396 54.67%2012 1,189,171 1,396,644 (207,473) 2,516,887 55.49%2013 1,297,317 1,204,896 92,421 2,772,563 43.46%2014 1,484,030 1,305,609 178,421 2,878,446 45.36%2015 1,530,040 1,398,175 131,865 3,259,379 42.90%2016 1,886,252 1,533,659 352,593 3,651,088 42.01%2017 2,006,864 1,534,761 472,103 3,749,681 40.93%2018 1,958,460 1,967,095 (8,635) 3,839,747 51.23%
Police Pension Plan
Fiscal Year Actuarially Contribution ActualEnded Determined Actual Deficiency Covered Contribution as
April 30, Contribution Contribution (Excess) Payroll a % of Payroll2009 953,055$ 1,015,801$ (62,746)$ 2,490,240$ 40.79%2010 1,056,009 1,049,887 6,122 2,434,980 43.12%2011 1,174,708 1,221,371 (46,663) 2,608,531 46.82%2012 1,169,543 1,330,790 (161,247) 2,650,355 50.21%2013 1,241,069 1,237,716 3,353 2,860,312 43.27%2014 1,344,592 1,268,764 75,828 2,998,823 42.31%2015 1,423,257 1,363,308 59,949 3,601,207 37.86%2016 1,712,134 1,452,077 260,057 3,804,870 38.16%2017 1,861,680 1,454,833 406,847 3,999,497 36.38%2018 1,802,442 1,811,005 (8,563) 4,174,678 43.38%
Additional years will be added to this schedule until 10 years of data is presented.
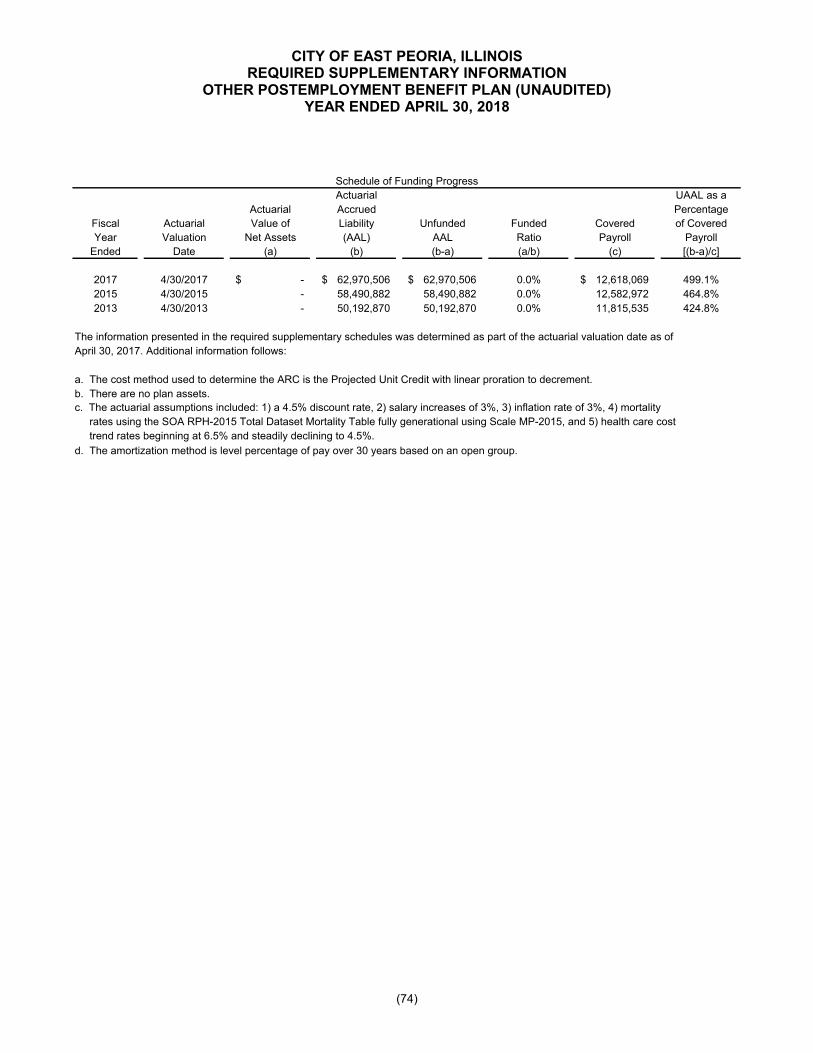
CITY OF EAST PEORIA, ILLINOISREQUIRED SUPPLEMENTARY INFORMATION
OTHER POSTEMPLOYMENT BENEFIT PLAN (UNAUDITED)YEAR ENDED APRIL 30, 2018
(74)
Schedule of Funding Progress
Actuarial UAAL as a
Actuarial Accrued Percentage
Fiscal Actuarial Value of Liability Unfunded Funded Covered of Covered
Year Valuation Net Assets (AAL) AAL Ratio Payroll Payroll
Ended Date (a) (b) (b-a) (a/b) (c) [(b-a)/c]
2017 4/30/2017 -$ 62,970,506$ 62,970,506$ 0.0% 12,618,069$ 499.1%
2015 4/30/2015 - 58,490,882 58,490,882 0.0% 12,582,972 464.8%
2013 4/30/2013 - 50,192,870 50,192,870 0.0% 11,815,535 424.8%
The information presented in the required supplementary schedules was determined as part of the actuarial valuation date as of
April 30, 2017. Additional information follows:
a. The cost method used to determine the ARC is the Projected Unit Credit with linear proration to decrement.
b. There are no plan assets.
d. The amortization method is level percentage of pay over 30 years based on an open group.
c. The actuarial assumptions included: 1) a 4.5% discount rate, 2) salary increases of 3%, 3) inflation rate of 3%, 4) mortality
rates using the SOA RPH-2015 Total Dataset Mortality Table fully generational using Scale MP-2015, and 5) health care cost
trend rates beginning at 6.5% and steadily declining to 4.5%.

CITY OF EAST PEORIA, ILLINOISREQUIRED SUPPLEMENTARY INFORMATION
SCHEDULES OF INVESTMENT RETURNSPOLICE AND FIREFIGHTER’S PENSION PLANS
(UNAUDITED)
(75)
The following presents the annual money-weighted rate of return, net of investment expenses:
Firefighterʼs Pension Plan
Fiscal YearEnded
April 30, Rate2015 6.73%2016 -0.08%2017 8.57%2018 6.56%
Police Pension PlanThe
Fiscal Year Commerce Benjamin F.Ended Company Edwards & Co.
April 30, Rate Rate2015 N/A 6.90%2016 0.29% -2.48%2017 10.04% 8.64%2018 7.57% 5.77%
Additional years will be added to this schedule until 10 years of data is presented.

CITY OF EAST PEORIA, ILLINOISSCHEDULE OF REVENUES, EXPENDITURES, AND CHANGES IN FUND BALANCE –
BUDGET AND ACTUAL (CASH BASIS) – GENERAL FUNDYEAR ENDED APRIL 30, 2018
(76)
Variance
With
Original/Final Final
Budget Actual Budget
REVENUES
Taxes and Special Assessments 17,295,566$ 19,166,576$ 1,871,010$
Charges for Services 900,000 1,177,437 277,437
Intergovernmental 208,000 278,780 70,780
Investment Earnings 21,610 119,487 97,877
Licenses and Permits 227,300 294,826 67,526
Miscellaneous 2,411,100 1,823,817 (587,283)
Total Revenues 21,063,576 22,860,923 1,797,347
EXPENDITURES
Current:
General Government 6,223,434 5,902,630 320,804
Police 5,924,039 6,032,005 (107,966)
Fire 4,814,713 5,374,738 (560,025)
Sanitation 795,544 898,656 (103,112)
Public Works 2,034,000 2,426,969 (392,969)
Community Development 233,140 212,573 20,567
Capital Outlay 615,000 330,517 284,483
Debt Service:
Principal Payments - 376,181 (376,181)
Interest and Fiscal Charges - 45,778 (45,778)
Total Expenditures 20,639,870 21,600,047 (960,177)
Excess (Deficiency) of Revenues
over Expenditures 423,706 1,260,876 837,170
OTHER FINANCING USES
Net Transfers - (808,255) (808,255)
NET CHANGE IN FUND BALANCE 423,706$ 452,621 28,915$
RECONCILIATION TO MODIFIED ACCRUAL BASIS -
NET CHANGE RESULTING FROM RECORDING OF
ACCOUNTS RECEIVABLE, PAYABLE, AND OTHER
ACCRUED ITEMS 1,000,786
Fund Balance, Modified Accrual Basis -
Beginning of Year 6,921,010
FUND BALANCE, MODIFIED ACCRUAL BASIS -
END OF YEAR 8,374,417$

CITY OF EAST PEORIA, ILLINOISSCHEDULE OF REVENUES, EXPENDITURES, AND CHANGES IN FUND BALANCE –
BUDGET AND ACTUAL (CASH BASIS) – RIVERBOAT GAMING TAX FUNDYEAR ENDED APRIL 30, 2018
(77)
Variance
With
Original/Final Final
Budget Actual Budget
REVENUES
Taxes 4,685,000$ 4,647,959$ (37,041)$
Intergovernmental 655,250 196,471 (458,779)
Investment Earnings 800 14,213 13,413
Total Revenues 5,341,050 4,858,643 (482,407)
EXPENDITURES
Current:
Other - 1,331,912 (1,331,912)
Capital Outlay 2,929,260 2,639,828 289,432
Debt Service:
Principal Payments 2,300,000 287,731 2,012,269
Interest and Fiscal Charges - 16,290 (16,290)
Total Expenditures 5,229,260 4,275,761 953,499
Excess of Revenues
over Expenditures 111,790 582,882 471,092
OTHER FINANCING SOURCES (USES)
Issuances of Long-Term Debt - 1,313,000 1,313,000
Net Transfers - (1,781,066) (1,781,066)
Total Other Financing Sources (Uses) - (468,066) (468,066)
NET CHANGE IN FUND BALANCE 111,790$ 114,816 3,026$
RECONCILIATION TO MODIFIED ACCRUAL BASIS -
NET CHANGE RESULTING FROM RECORDING OF
ACCOUNTS RECEIVABLE, PAYABLE, AND OTHER
ACCRUED ITEMS (514,839)
Fund Balance, Modified Accrual Basis -
Beginning of Year 8,869,052
FUND BALANCE, MODIFIED ACCRUAL BASIS -
END OF YEAR 8,469,029$

CITY OF EAST PEORIA, ILLINOISSCHEDULE OF REVENUES, EXPENDITURES, AND CHANGES IN FUND BALANCE (DEFICIT) –
BUDGET AND ACTUAL (CASH BASIS) – SPECIAL TAX ALLOCATION FUNDYEAR ENDED APRIL 30, 2018
(78)
Variance
With
Original/Final Final
Budget Actual Budget
REVENUES
Taxes 790,000$ 793,344$ 3,344$
Investment Earnings 250 567 317
Total Revenues 790,250 793,911 3,661
EXPENDITURES
Current:
General Government 135,000 137,117 (2,117)
Excess of Revenues
over Expenditures 655,250 656,794 1,544
OTHER FINANCING USES
Net Transfers (655,250) (656,794) (1,544)
NET CHANGE IN FUND BALANCE (DEFICIT) -$ - -$
RECONCILIATION TO MODIFIED ACCRUAL BASIS -
NET CHANGE RESULTING FROM RECORDING OF
ACCOUNTS RECEIVABLE, PAYABLE, AND OTHER
ACCRUED ITEMS 656,794
Fund Balance (Deficit), Modified Accrual Basis -
Beginning of Year (4,496,070)
FUND BALANCE (DEFICIT), MODIFIED ACCRUAL
BASIS - END OF YEAR (3,839,276)$

CITY OF EAST PEORIA, ILLINOISNOTES TO REQUIRED SUPPLEMENTARY INFORMATION
APRIL 30, 2018
(79)
NOTE 1 BASIS OF ACCOUNTING
The City of East Peoria, Illinois’ budget is prepared on the cash basis for all budgeted funds, including the major funds (General, Riverboat Gaming Tax, and Special Tax Allocation) as presented in the required supplementary information.
NOTE 2 BUDGETARY DATA, PRIMARY GOVERNMENT
Through the implementation of GASB Statement No. 54, Fund Balance Reporting and Governmental Fund Type Definitions, various Special Revenue Funds were reclassified and are now included with the General Fund. These funds have been included with the General Fund budgetary comparison schedule.
The City follows these procedures in establishing the budgetary data reflected in the financial statements:
At the regular or special call meeting of the City Council in May, the proposed budget forthe fiscal year commencing on May 1 is submitted. The budget includes proposedexpenditures and the means of financing them.
Prior to August 1, the final budget is legally enacted through passage of an appropriationordinance.
Transfers of budgeted amounts among object classifications, or any budget increases bymeans of an emergency or supplemental appropriation, require approval by a majority ofthe City Council member. Adjustments made during the year are reflected in the budgetinformation included in the financial statements.
For reporting purposes, the City reports its budget on the cash basis of accounting.
An amended budget was not prepared for the City; therefore, the original budget is the final budget.
Excess of actual expenditures over final budget in individual funds are as follows:
Final Budget Actual OverageGeneral Fund 20,639,870$ 21,600,047$ (960,177)$ Special Tax Allocation Fund 135,000$ 137,117$ (2,117)$
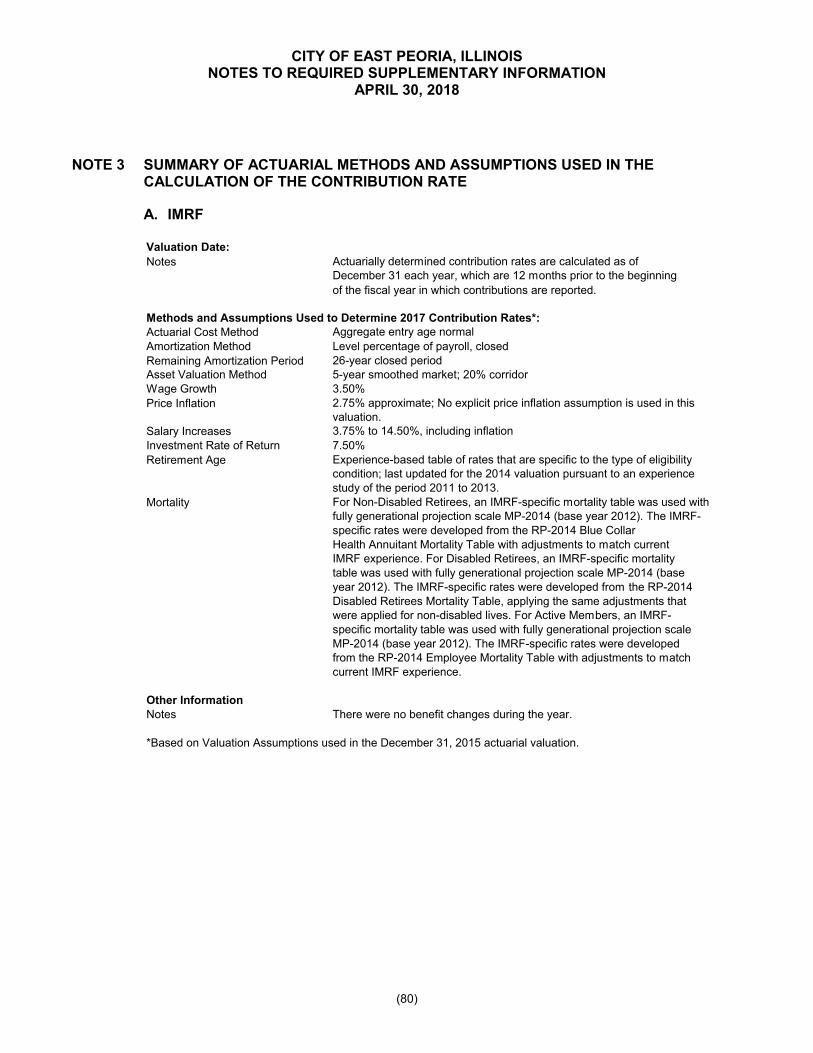
CITY OF EAST PEORIA, ILLINOISNOTES TO REQUIRED SUPPLEMENTARY INFORMATION
APRIL 30, 2018
(80)
NOTE 3 SUMMARY OF ACTUARIAL METHODS AND ASSUMPTIONS USED IN THE CALCULATION OF THE CONTRIBUTION RATE
A. IMRF
Valuation Date:
Notes Actuarially determined contribution rates are calculated as ofDecember 31 each year, which are 12 months prior to the beginning
of the fiscal year in which contributions are reported.
Methods and Assumptions Used to Determine 2017 Contribution Rates*:Actuarial Cost Method Aggregate entry age normal
Amortization Method Level percentage of payroll, closed
Remaining Amortization Period 26-year closed periodAsset Valuation Method 5-year smoothed market; 20% corridorWage Growth 3.50%
Price Inflation 2.75% approximate; No explicit price inflation assumption is used in thisvaluation.
Salary Increases 3.75% to 14.50%, including inflation
Investment Rate of Return 7.50%
Retirement Age Experience-based table of rates that are specific to the type of eligibilitycondition; last updated for the 2014 valuation pursuant to an experiencestudy of the period 2011 to 2013.
Mortality For Non-Disabled Retirees, an IMRF-specific mortality table was used with fully generational projection scale MP-2014 (base year 2012). The IMRF-specific rates were developed from the RP-2014 Blue CollarHealth Annuitant Mortality Table with adjustments to match currentIMRF experience. For Disabled Retirees, an IMRF-specific mortality table was used with fully generational projection scale MP-2014 (base year 2012). The IMRF-specific rates were developed from the RP-2014 Disabled Retirees Mortality Table, applying the same adjustments that were applied for non-disabled lives. For Active Members, an IMRF- specific mortality table was used with fully generational projection scale MP-2014 (base year 2012). The IMRF-specific rates were developed from the RP-2014 Employee Mortality Table with adjustments to match current IMRF experience.
Other InformationNotes There were no benefit changes during the year.
*Based on Valuation Assumptions used in the December 31, 2015 actuarial valuation.
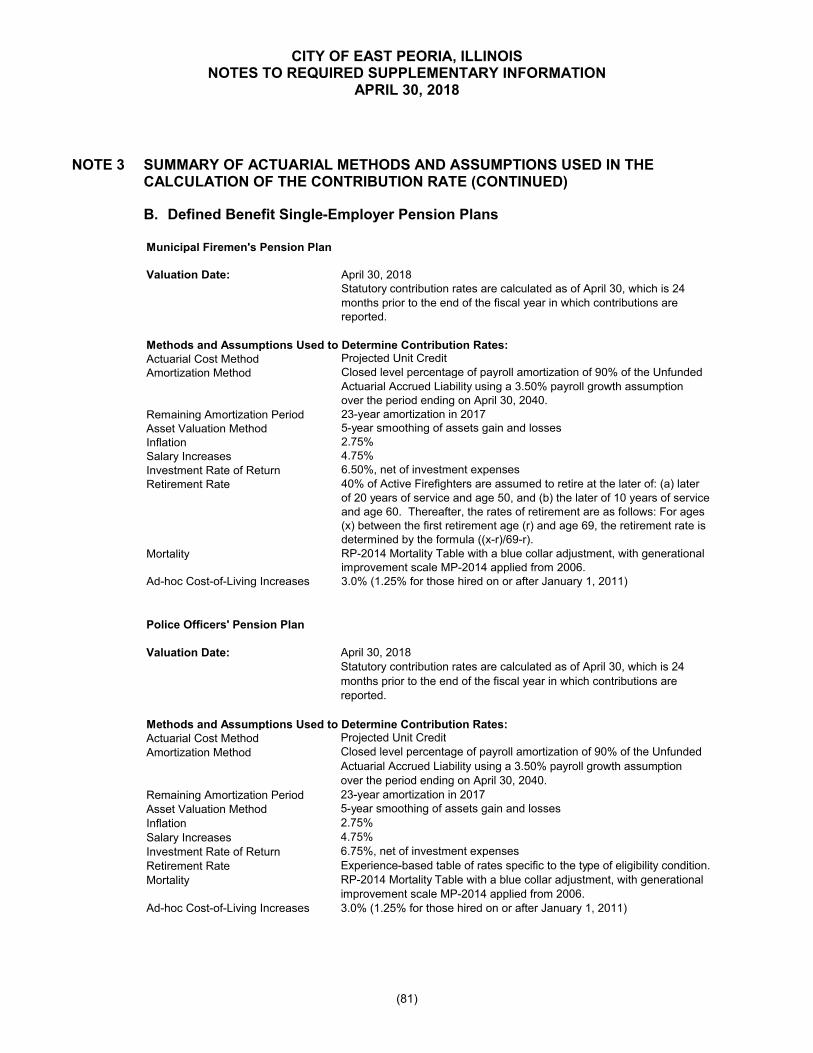
CITY OF EAST PEORIA, ILLINOISNOTES TO REQUIRED SUPPLEMENTARY INFORMATION
APRIL 30, 2018
(81)
NOTE 3 SUMMARY OF ACTUARIAL METHODS AND ASSUMPTIONS USED IN THE CALCULATION OF THE CONTRIBUTION RATE (CONTINUED)
B. Defined Benefit Single-Employer Pension Plans
Municipal Firemen's Pension Plan
Valuation Date: April 30, 2018Statutory contribution rates are calculated as of April 30, which is 24
months prior to the end of the fiscal year in which contributions are reported.
Methods and Assumptions Used to Determine Contribution Rates:Actuarial Cost Method Projected Unit Credit
Amortization Method Closed level percentage of payroll amortization of 90% of the Unfunded
Actuarial Accrued Liability using a 3.50% payroll growth assumption over the period ending on April 30, 2040.
Remaining Amortization Period 23-year amortization in 2017
Asset Valuation Method 5-year smoothing of assets gain and losses
Inflation 2.75%
Salary Increases 4.75%
Investment Rate of Return 6.50%, net of investment expenses
Retirement Rate 40% of Active Firefighters are assumed to retire at the later of: (a) laterof 20 years of service and age 50, and (b) the later of 10 years of serviceand age 60. Thereafter, the rates of retirement are as follows: For ages(x) between the first retirement age (r) and age 69, the retirement rate isdetermined by the formula ((x-r)/69-r).
Mortality RP-2014 Mortality Table with a blue collar adjustment, with generationalimprovement scale MP-2014 applied from 2006.
Ad-hoc Cost-of-Living Increases 3.0% (1.25% for those hired on or after January 1, 2011)
Police Officers' Pension Plan
Valuation Date: April 30, 2018Statutory contribution rates are calculated as of April 30, which is 24
months prior to the end of the fiscal year in which contributions arereported.
Methods and Assumptions Used to Determine Contribution Rates:Actuarial Cost Method Projected Unit Credit
Amortization Method Closed level percentage of payroll amortization of 90% of the Unfunded
Actuarial Accrued Liability using a 3.50% payroll growth assumption over the period ending on April 30, 2040.
Remaining Amortization Period 23-year amortization in 2017
Asset Valuation Method 5-year smoothing of assets gain and losses
Inflation 2.75%
Salary Increases 4.75%
Investment Rate of Return 6.75%, net of investment expenses
Retirement Rate Experience-based table of rates specific to the type of eligibility condition.
Mortality RP-2014 Mortality Table with a blue collar adjustment, with generationalimprovement scale MP-2014 applied from 2006.
Ad-hoc Cost-of-Living Increases 3.0% (1.25% for those hired on or after January 1, 2011)
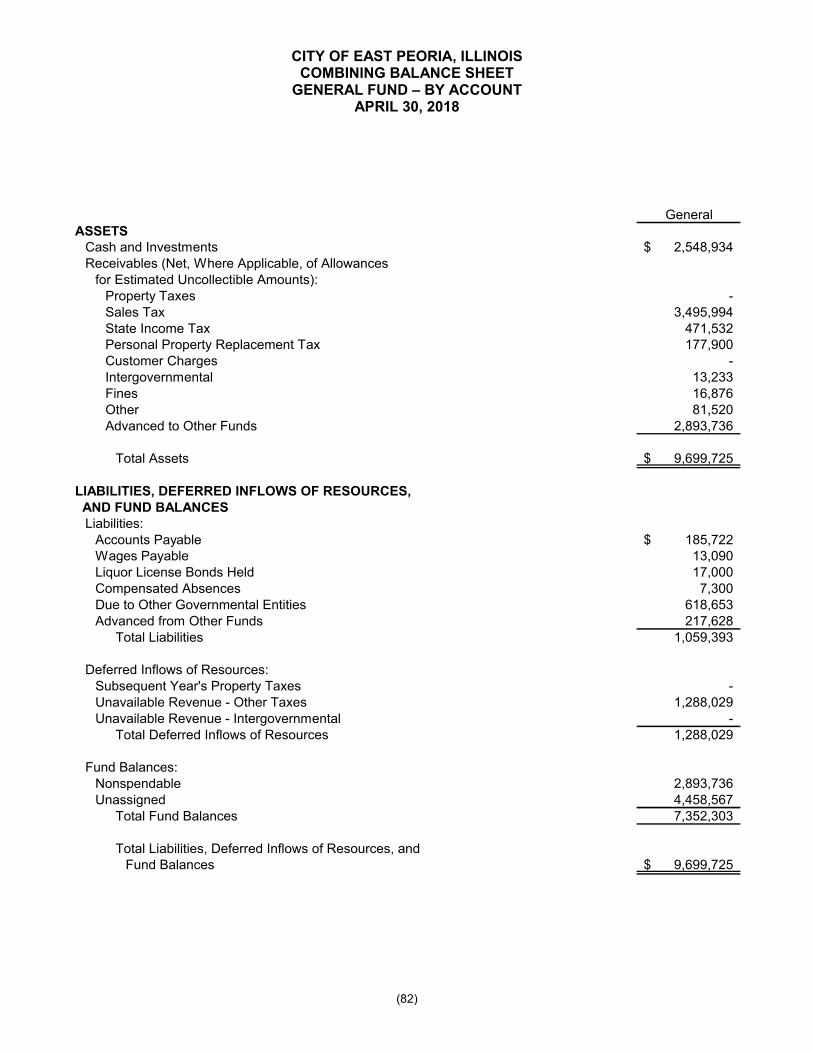
CITY OF EAST PEORIA, ILLINOISCOMBINING BALANCE SHEET
GENERAL FUND – BY ACCOUNTAPRIL 30, 2018
(82)
GeneralASSETS
Cash and Investments 2,548,934$ Receivables (Net, Where Applicable, of Allowances
for Estimated Uncollectible Amounts):Property Taxes -Sales Tax 3,495,994 State Income Tax 471,532 Personal Property Replacement Tax 177,900 Customer Charges -Intergovernmental 13,233 Fines 16,876 Other 81,520 Advanced to Other Funds 2,893,736
Total Assets 9,699,725$
LIABILITIES, DEFERRED INFLOWS OF RESOURCES, AND FUND BALANCES
Liabilities:Accounts Payable 185,722$ Wages Payable 13,090 Liquor License Bonds Held 17,000 Compensated Absences 7,300Due to Other Governmental Entities 618,653 Advanced from Other Funds 217,628
Total Liabilities 1,059,393
Deferred Inflows of Resources:Subsequent Year's Property Taxes -Unavailable Revenue - Other Taxes 1,288,029 Unavailable Revenue - Intergovernmental -
Total Deferred Inflows of Resources 1,288,029
Fund Balances:Nonspendable 2,893,736 Unassigned 4,458,567
Total Fund Balances 7,352,303
Total Liabilities, Deferred Inflows of Resources, andFund Balances 9,699,725$

(83)
Garbage Street CombiningPolice Fire Collection and Ambulance General
Protection Protection and Disposal Bridge Service Fund
183,451$ 394,121$ 108,076$ 30,710$ -$ 3,265,292$
- - - 216,213 - 216,213- - - - - 3,495,994- - - - - 471,532- - - - - 177,900- 456,488 - - - 456,488 - - - 520,397 - 533,630
4,640 - - - - 21,516- - - - - 81,520- - - 7,421 - 2,901,157
188,091$ 850,609$ 108,076$ 774,741$ -$ 11,621,242$
23,037$ 37,690$ 9,476$ 70,021$ -$ 325,946$ 78,278 80,972 4,697 12,878 - 189,915
- - - - - 17,000- 19,225 14,835 8,060 - 49,420- - - - - 618,653- 59,000 59,421 45,000 - 381,049
101,315 196,887 88,429 135,959 - 1,581,983
- - - 216,213 - 216,213- - - - - 1,288,029- - - 160,600 - 160,600- - - 376,813 - 1,664,842
- - - 7,421 - 2,901,15786,776 653,722 19,647 254,548 - 5,473,26086,776 653,722 19,647 261,969 - 8,374,417
188,091$ 850,609$ 108,076$ 774,741$ -$ 11,621,242$
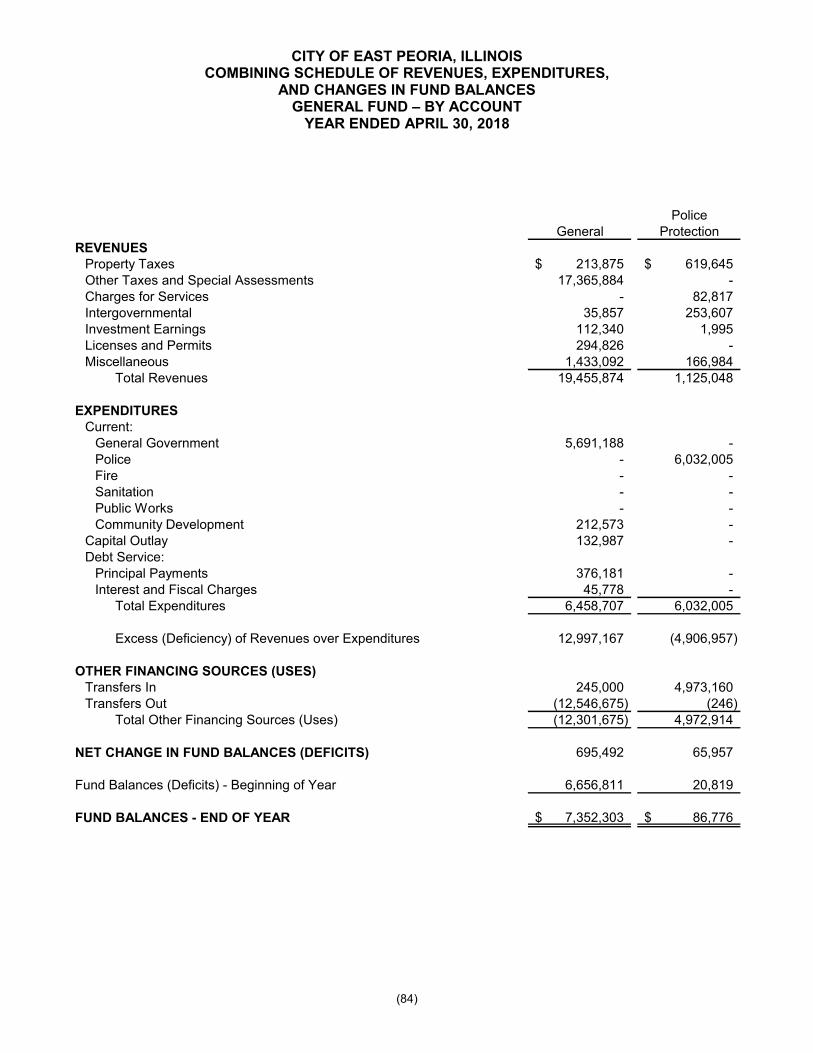
CITY OF EAST PEORIA, ILLINOISCOMBINING SCHEDULE OF REVENUES, EXPENDITURES,
AND CHANGES IN FUND BALANCESGENERAL FUND – BY ACCOUNT
YEAR ENDED APRIL 30, 2018
(84)
PoliceGeneral Protection
REVENUESProperty Taxes 213,875$ 619,645$ Other Taxes and Special Assessments 17,365,884 -Charges for Services - 82,817Intergovernmental 35,857 253,607Investment Earnings 112,340 1,995Licenses and Permits 294,826 -Miscellaneous 1,433,092 166,984
Total Revenues 19,455,874 1,125,048
EXPENDITURESCurrent:
General Government 5,691,188 -Police - 6,032,005Fire - -Sanitation - -Public Works - -Community Development 212,573 -
Capital Outlay 132,987 -Debt Service:
Principal Payments 376,181 -Interest and Fiscal Charges 45,778 -
Total Expenditures 6,458,707 6,032,005
Excess (Deficiency) of Revenues over Expenditures 12,997,167 (4,906,957)
OTHER FINANCING SOURCES (USES)Transfers In 245,000 4,973,160 Transfers Out (12,546,675) (246)
Total Other Financing Sources (Uses) (12,301,675) 4,972,914
NET CHANGE IN FUND BALANCES (DEFICITS) 695,492 65,957
Fund Balances (Deficits) - Beginning of Year 6,656,811 20,819
FUND BALANCES - END OF YEAR 7,352,303$ 86,776$
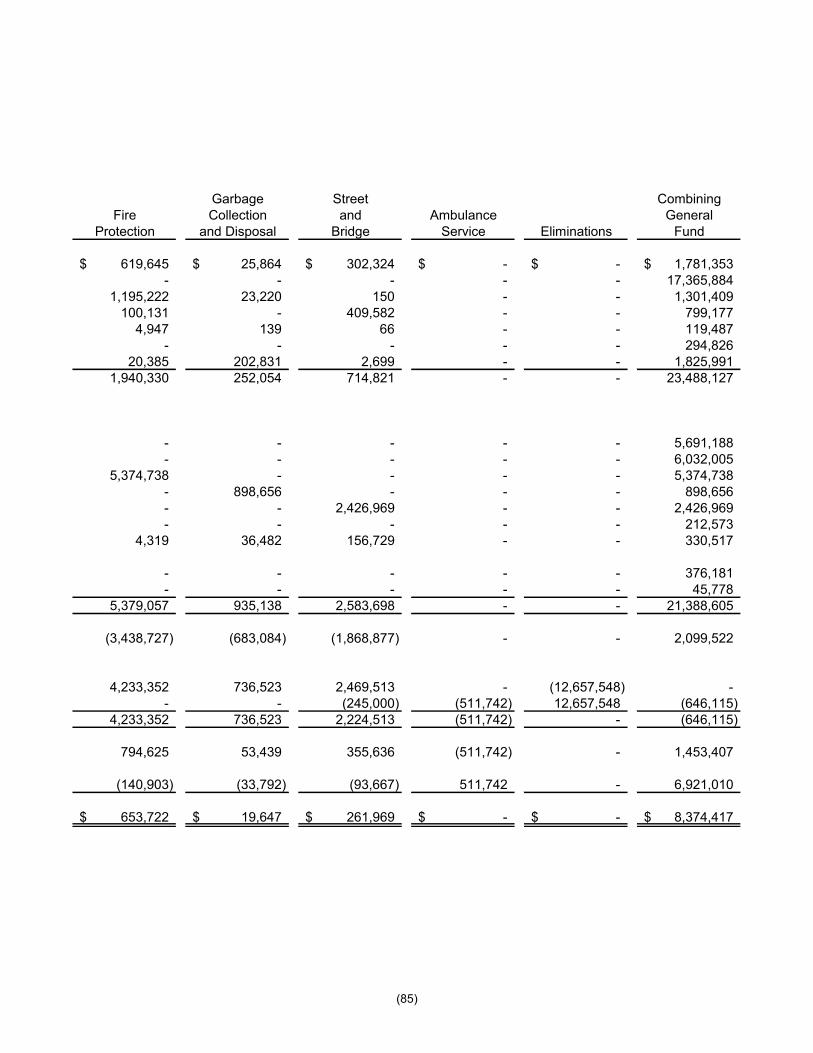
(85)
Garbage Street CombiningFire Collection and Ambulance General
Protection and Disposal Bridge Service Eliminations Fund
619,645$ 25,864$ 302,324$ -$ -$ 1,781,353$ - - - - - 17,365,884
1,195,222 23,220 150 - - 1,301,409100,131 - 409,582 - - 799,177
4,947 139 66 - - 119,487 - - - - - 294,826
20,385 202,831 2,699 - - 1,825,9911,940,330 252,054 714,821 - - 23,488,127
- - - - - 5,691,188- - - - - 6,032,005
5,374,738 - - - - 5,374,738- 898,656 - - - 898,656- - 2,426,969 - - 2,426,969- - - - - 212,573
4,319 36,482 156,729 - - 330,517
- - - - - 376,181- - - - - 45,778
5,379,057 935,138 2,583,698 - - 21,388,605
(3,438,727) (683,084) (1,868,877) - - 2,099,522
4,233,352 736,523 2,469,513 - (12,657,548) -- - (245,000) (511,742) 12,657,548 (646,115)
4,233,352 736,523 2,224,513 (511,742) - (646,115)
794,625 53,439 355,636 (511,742) - 1,453,407
(140,903) (33,792) (93,667) 511,742 - 6,921,010
653,722$ 19,647$ 261,969$ -$ -$ 8,374,417$
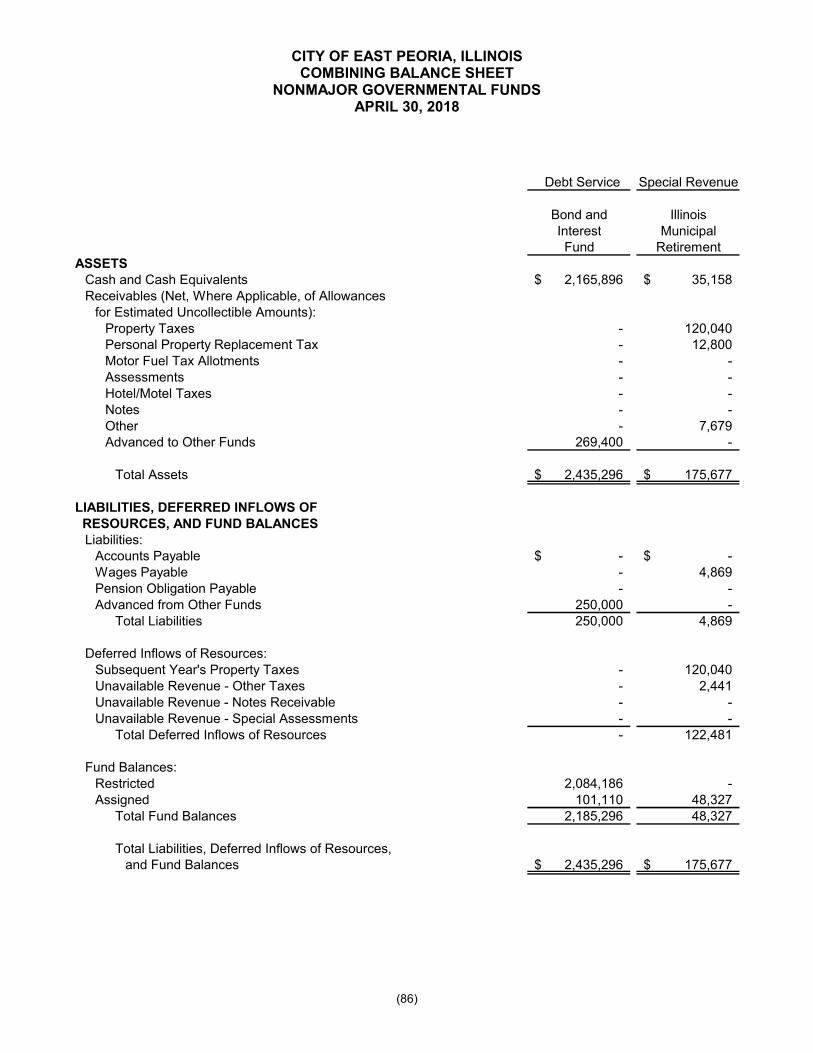
CITY OF EAST PEORIA, ILLINOISCOMBINING BALANCE SHEET
NONMAJOR GOVERNMENTAL FUNDSAPRIL 30, 2018
(86)
Debt Service Special Revenue
Bond and IllinoisInterest MunicipalFund Retirement
ASSETSCash and Cash Equivalents 2,165,896$ 35,158$ Receivables (Net, Where Applicable, of Allowances
for Estimated Uncollectible Amounts):Property Taxes - 120,040Personal Property Replacement Tax - 12,800Motor Fuel Tax Allotments - -Assessments - -Hotel/Motel Taxes - -Notes - -Other - 7,679Advanced to Other Funds 269,400 -
Total Assets 2,435,296$ 175,677$
LIABILITIES, DEFERRED INFLOWS OF RESOURCES, AND FUND BALANCES
Liabilities:Accounts Payable -$ -$Wages Payable - 4,869Pension Obligation Payable - -Advanced from Other Funds 250,000 -
Total Liabilities 250,000 4,869
Deferred Inflows of Resources:Subsequent Year's Property Taxes - 120,040Unavailable Revenue - Other Taxes - 2,441Unavailable Revenue - Notes Receivable - -Unavailable Revenue - Special Assessments - -
Total Deferred Inflows of Resources - 122,481
Fund Balances:Restricted 2,084,186 -Assigned 101,110 48,327
Total Fund Balances 2,185,296 48,327
Total Liabilities, Deferred Inflows of Resources,and Fund Balances 2,435,296$ 175,677$
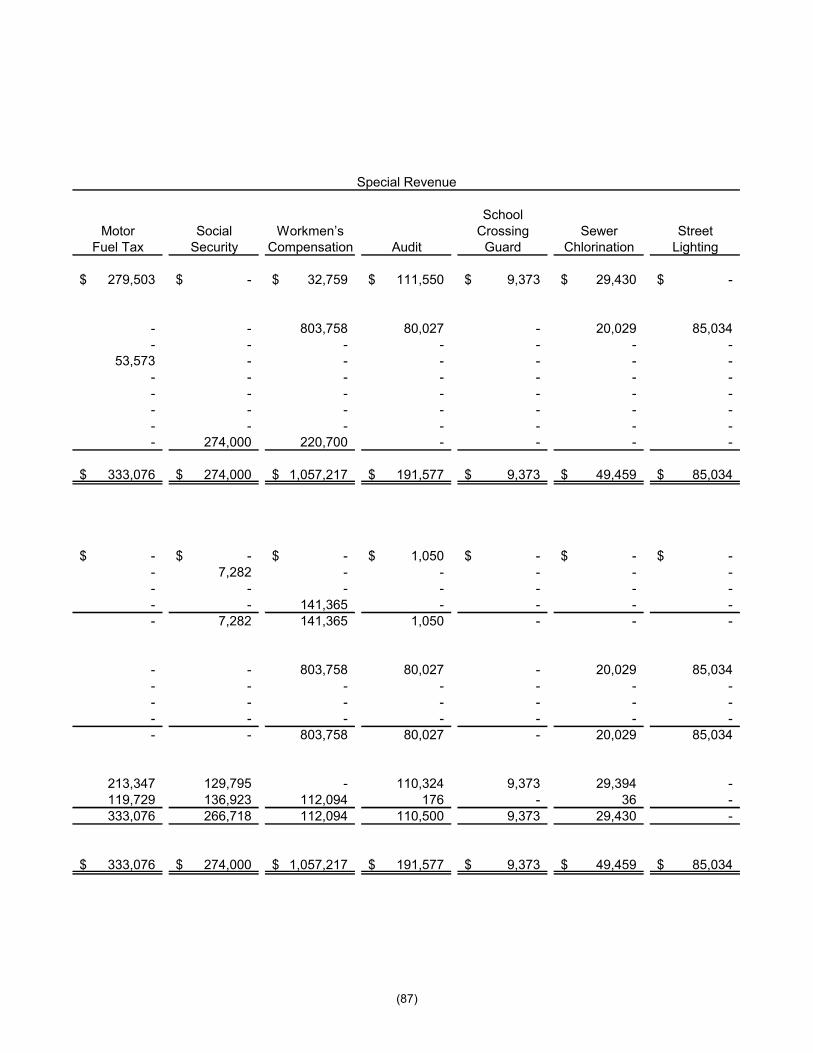
(87)
Special Revenue
SchoolMotor Social Workmenʼs Crossing Sewer Street
Fuel Tax Security Compensation Audit Guard Chlorination Lighting
279,503$ -$ 32,759$ 111,550$ 9,373$ 29,430$ -$
- - 803,758 80,027 - 20,029 85,034 - - - - - - -
53,573 - - - - - -- - - - - - -- - - - - - -- - - - - - -- - - - - - -- 274,000 220,700 - - - -
333,076$ 274,000$ 1,057,217$ 191,577$ 9,373$ 49,459$ 85,034$
-$ -$ -$ 1,050$ -$ -$ -$- 7,282 - - - - -- - - - - - -- - 141,365 - - - -- 7,282 141,365 1,050 - - -
- - 803,758 80,027 - 20,029 85,034 - - - - - - -- - - - - - -- - - - - - -- - 803,758 80,027 - 20,029 85,034
213,347 129,795 - 110,324 9,373 29,394 -119,729 136,923 112,094 176 - 36 -333,076 266,718 112,094 110,500 9,373 29,430 -
333,076$ 274,000$ 1,057,217$ 191,577$ 9,373$ 49,459$ 85,034$

CITY OF EAST PEORIA, ILLINOISCOMBINING BALANCE SHEET (CONTINUED)
NONMAJOR GOVERNMENTAL FUNDSAPRIL 30, 2018
(88)
Special RevenueEmergencyService and
Unemployment DisasterInsurance Assistance
ASSETSCash and Cash Equivalents 77,406$ 154,387$ Receivables (Net, Where Applicable, of Allowances
for Estimated Uncollectible Amounts):Property Taxes 16,005 50,028 Personal Property Replacement Tax - -Motor Fuel Tax Allotments - -Assessments - -Hotel/Motel Taxes - -Notes - -Other - -Advanced to Other Funds - 7,967
Total Assets 93,411$ 212,382$
LIABILITIES, DEFERRED INFLOWS OF RESOURCES, AND FUND BALANCES
Liabilities:Accounts Payable 3,550$ 1,350$ Wages Payable - -Pension Obligation Payable - -Advanced from Other Funds - -
Total Liabilities 3,550 1,350
Deferred Inflows of Resources:Subsequent Year's Property Taxes 16,005 50,028 Unavailable Revenue - Other Taxes - -Unavailable Revenue - Notes Receivable - -Unavailable Revenue - Special Assessments - -
Total Deferred Inflows of Resources 16,005 50,028
Fund Balances:Restricted 73,815 160,918 Assigned 41 86
Total Fund Balances 73,856 161,004
Total Liabilities, Deferred Inflows of Resources,and Fund Balances 93,411$ 212,382$

(89)
Special RevenueTotal
Firemenʼs Police NonmajorHotel/Motel Revolving Special IHDA Pension Pension Governmental
Tax Loan Assessments Grant Levy Fund Levy Fund Funds
2,320,116$ 514,600$ 238,607$ 8,375$ -$ -$ 5,977,160$
- - - - 2,195,245 2,108,602 5,478,768- - - - 27,000 35,600 75,400- - - - - - 53,573- - 26,352 - - - 26,352
128,265 - - - - - 128,265- 241,646 - - - - 241,646- - - - 72,215 52,942 132,836- - 8,364 - - - 780,431
2,448,381$ 756,246$ 273,323$ 8,375$ 2,294,460$ 2,197,144$ 12,894,431$
23,198$ -$ -$ -$ -$ -$ 29,148$3,927 - - - - - 16,078
- - - - 76,259 71,713 147,972- - - - - - 391,365
27,125 - - - 76,259 71,713 584,563
- - - - 2,195,245 2,108,602 5,478,76823,442 - - - 22,955 16,829 65,667
- 241,646 - - - - 241,646- - 12,580 - - - 12,580
23,442 241,646 12,580 - 2,218,200 2,125,431 5,798,661
579,552 474,034 196,491 7,916 - - 4,069,1451,818,262 40,566 64,252 459 1 - 2,442,0622,397,814 514,600 260,743 8,375 1 - 6,511,207
2,448,381$ 756,246$ 273,323$ 8,375$ 2,294,460$ 2,197,144$ 12,894,431$
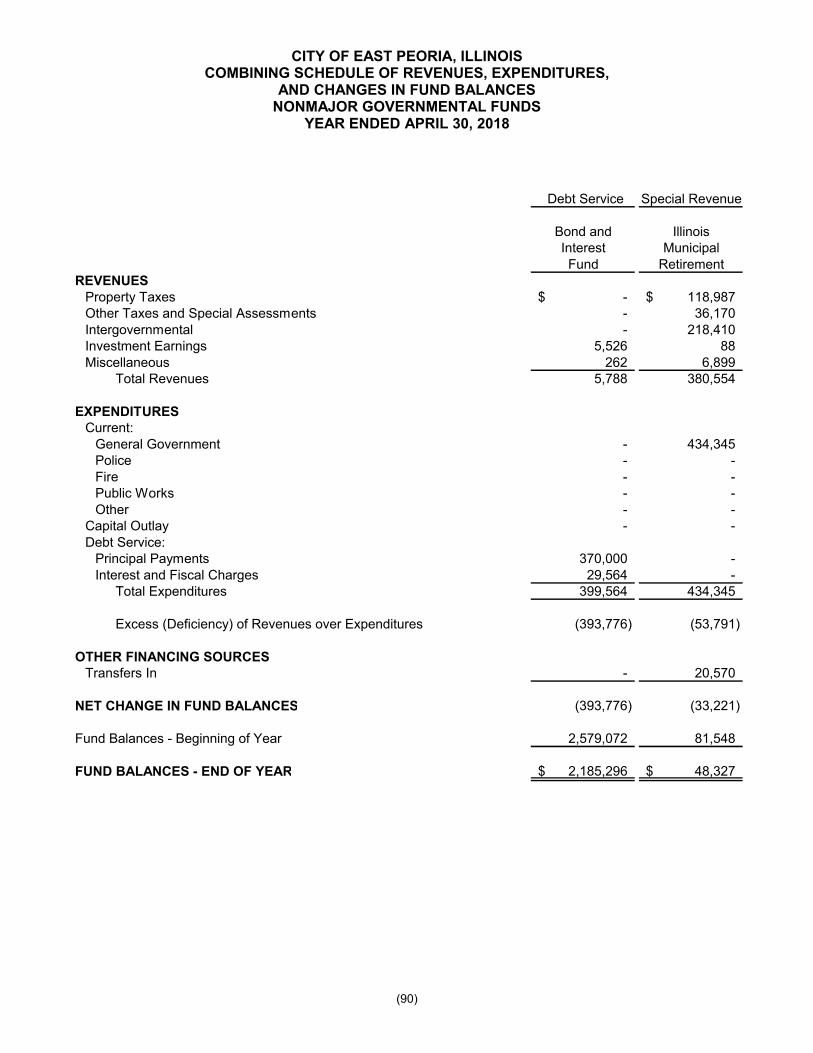
CITY OF EAST PEORIA, ILLINOISCOMBINING SCHEDULE OF REVENUES, EXPENDITURES,
AND CHANGES IN FUND BALANCESNONMAJOR GOVERNMENTAL FUNDS
YEAR ENDED APRIL 30, 2018
(90)
Debt Service Special Revenue
Bond and IllinoisInterest MunicipalFund Retirement
REVENUESProperty Taxes -$ 118,987$ Other Taxes and Special Assessments - 36,170Intergovernmental - 218,410Investment Earnings 5,526 88Miscellaneous 262 6,899
Total Revenues 5,788 380,554
EXPENDITURESCurrent:
General Government - 434,345Police - -Fire - -Public Works - -Other - -
Capital Outlay - -Debt Service:
Principal Payments 370,000 -Interest and Fiscal Charges 29,564 -
Total Expenditures 399,564 434,345
Excess (Deficiency) of Revenues over Expenditures (393,776) (53,791)
OTHER FINANCING SOURCESTransfers In - 20,570
NET CHANGE IN FUND BALANCES (393,776) (33,221)
Fund Balances - Beginning of Year 2,579,072 81,548
FUND BALANCES - END OF YEAR 2,185,296$ 48,327$
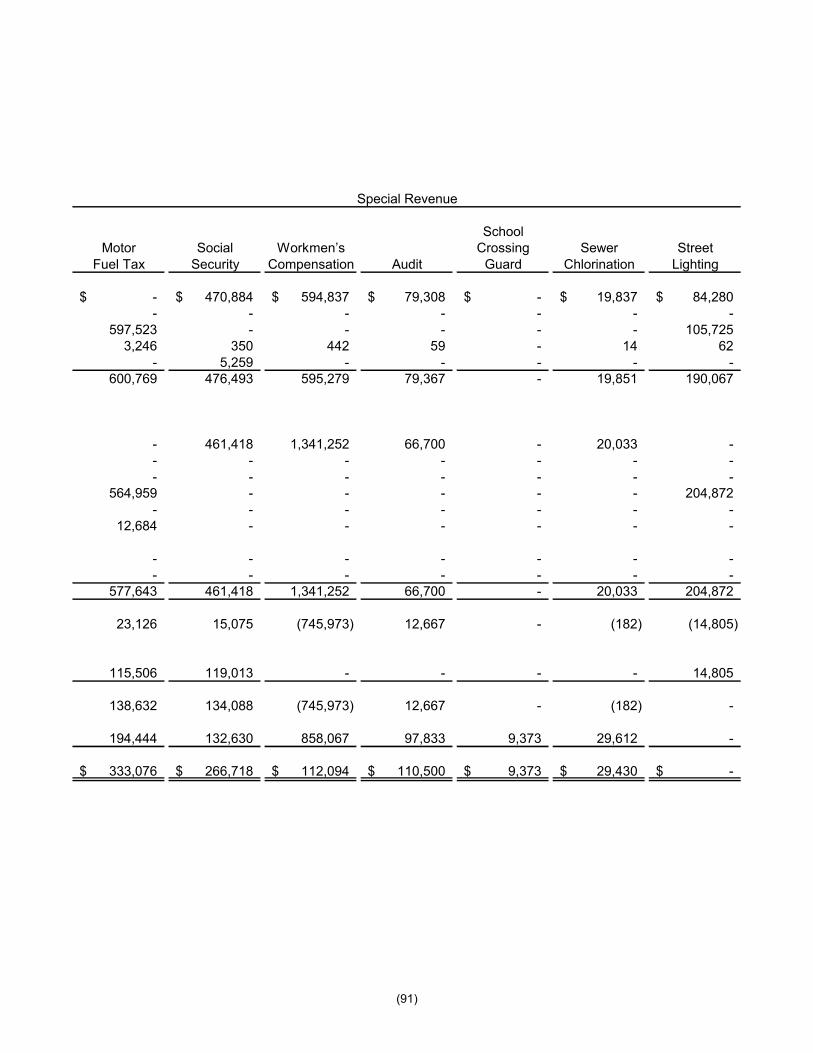
(91)
Special Revenue
SchoolMotor Social Workmenʼs Crossing Sewer Street
Fuel Tax Security Compensation Audit Guard Chlorination Lighting
-$ 470,884$ 594,837$ 79,308$ -$ 19,837$ 84,280$ - - - - - - -
597,523 - - - - - 105,7253,246 350 442 59 - 14 62
- 5,259 - - - - -600,769 476,493 595,279 79,367 - 19,851 190,067
- 461,418 1,341,252 66,700 - 20,033 -- - - - - - -- - - - - - -
564,959 - - - - - 204,872- - - - - - -
12,684 - - - - - -
- - - - - - -- - - - - - -
577,643 461,418 1,341,252 66,700 - 20,033 204,872
23,126 15,075 (745,973) 12,667 - (182) (14,805)
115,506 119,013 - - - - 14,805
138,632 134,088 (745,973) 12,667 - (182) -
194,444 132,630 858,067 97,833 9,373 29,612 -
333,076$ 266,718$ 112,094$ 110,500$ 9,373$ 29,430$ -$
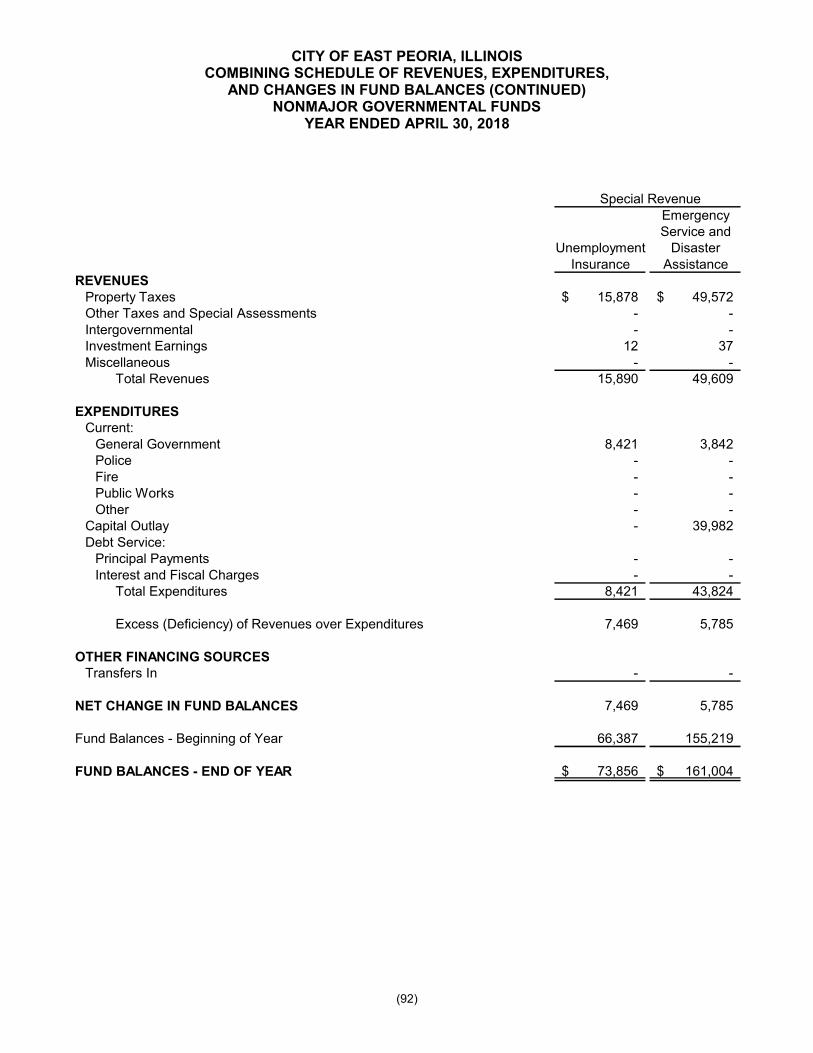
CITY OF EAST PEORIA, ILLINOISCOMBINING SCHEDULE OF REVENUES, EXPENDITURES,
AND CHANGES IN FUND BALANCES (CONTINUED)NONMAJOR GOVERNMENTAL FUNDS
YEAR ENDED APRIL 30, 2018
(92)
Special RevenueEmergencyService and
Unemployment DisasterInsurance Assistance
REVENUESProperty Taxes 15,878$ 49,572$ Other Taxes and Special Assessments - - Intergovernmental - - Investment Earnings 12 37 Miscellaneous - -
Total Revenues 15,890 49,609
EXPENDITURESCurrent:
General Government 8,421 3,842 Police - - Fire - - Public Works - - Other - -
Capital Outlay - 39,982 Debt Service:
Principal Payments - - Interest and Fiscal Charges - -
Total Expenditures 8,421 43,824
Excess (Deficiency) of Revenues over Expenditures 7,469 5,785
OTHER FINANCING SOURCESTransfers In - -
NET CHANGE IN FUND BALANCES 7,469 5,785
Fund Balances - Beginning of Year 66,387 155,219
FUND BALANCES - END OF YEAR 73,856$ 161,004$
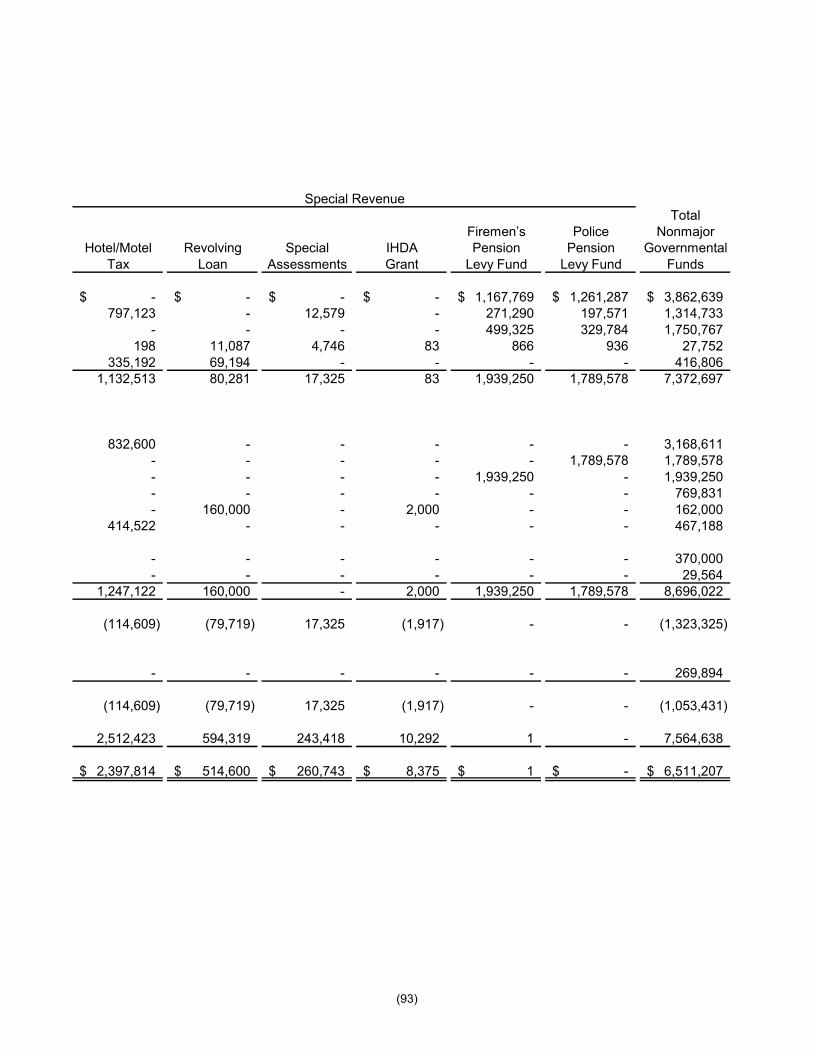
(93)
Special RevenueTotal
Firemenʼs Police NonmajorHotel/Motel Revolving Special IHDA Pension Pension Governmental
Tax Loan Assessments Grant Levy Fund Levy Fund Funds
-$ -$ -$ -$ 1,167,769$ 1,261,287$ 3,862,639$ 797,123 - 12,579 - 271,290 197,571 1,314,733
- - - - 499,325 329,784 1,750,767 198 11,087 4,746 83 866 936 27,752
335,192 69,194 - - - - 416,806 1,132,513 80,281 17,325 83 1,939,250 1,789,578 7,372,697
832,600 - - - - - 3,168,611- - - - - 1,789,578 1,789,578- - - - 1,939,250 - 1,939,250- - - - - - 769,831- 160,000 - 2,000 - - 162,000
414,522 - - - - - 467,188
- - - - - - 370,000- - - - - - 29,564
1,247,122 160,000 - 2,000 1,939,250 1,789,578 8,696,022
(114,609) (79,719) 17,325 (1,917) - - (1,323,325)
- - - - - - 269,894
(114,609) (79,719) 17,325 (1,917) - - (1,053,431)
2,512,423 594,319 243,418 10,292 1 - 7,564,638
2,397,814$ 514,600$ 260,743$ 8,375$ 1$ -$ 6,511,207$
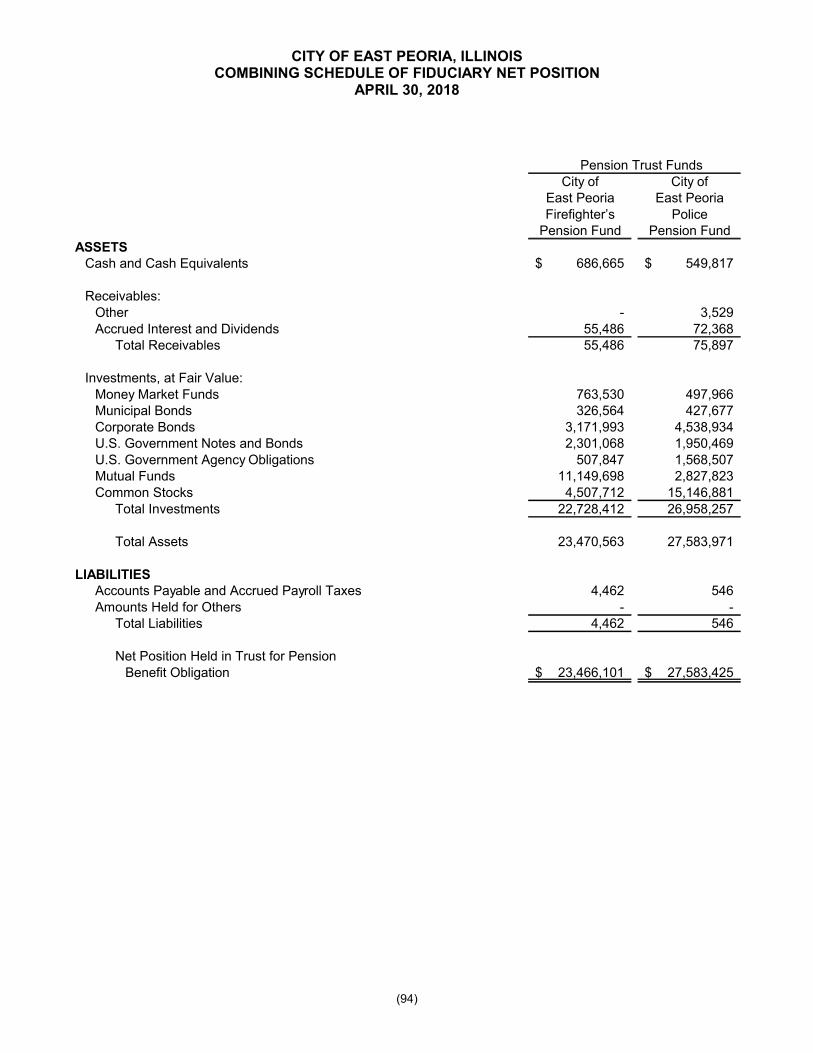
CITY OF EAST PEORIA, ILLINOISCOMBINING SCHEDULE OF FIDUCIARY NET POSITION
APRIL 30, 2018
(94)
Pension Trust FundsCity of City of
East Peoria East PeoriaFirefighterʼs Police
Pension Fund Pension FundASSETS
Cash and Cash Equivalents 686,665$ 549,817$
Receivables:Other - 3,529Accrued Interest and Dividends 55,486 72,368
Total Receivables 55,486 75,897
Investments, at Fair Value:Money Market Funds 763,530 497,966 Municipal Bonds 326,564 427,677 Corporate Bonds 3,171,993 4,538,934 U.S. Government Notes and Bonds 2,301,068 1,950,469 U.S. Government Agency Obligations 507,847 1,568,507 Mutual Funds 11,149,698 2,827,823 Common Stocks 4,507,712 15,146,881
Total Investments 22,728,412 26,958,257
Total Assets 23,470,563 27,583,971
LIABILITIESAccounts Payable and Accrued Payroll Taxes 4,462 546Amounts Held for Others - -
Total Liabilities 4,462 546
Net Position Held in Trust for PensionBenefit Obligation 23,466,101$ 27,583,425$

(95)
Agency FundsLevi King Total
Total Pension Scholarship Dependent Unreimbursed AgencyTrust Funds Fund Care Fund Medical Fund Funds
1,236,482$ 7,468$ 9,057$ 10,469$ 26,994$
3,529 - - - - 127,854 - - - - 131,383 - - - -
1,261,496 - - - - 754,241 - - - -
7,710,927 - - - - 4,251,537 - - - - 2,076,354 - - - -
13,977,521 - - - - 19,654,593 - - - - 49,686,669 - - - -
51,054,534 7,468$ 9,057$ 10,469$ 26,994$
5,008 -$ -$ -$ -$ - 7,468 9,057 10,469 26,994
5,008 7,468$ 9,057$ 10,469$ 26,994$
51,049,526$

CITY OF EAST PEORIA, ILLINOISSCHEDULE OF CHANGES IN ASSETS AND LIABILITIES
AGENCY FUNDSYEAR ENDED APRIL 30, 2018
(96)
Balance, Balance, Beginning Additions Deductions Ending
LEVI KING SCHOLARSHIP FUNDAssets, Cash and Cash Equivalents 7,468$ -$ -$ 7,468$
Liabilities, Amounts Held for Others 7,468$ -$ -$ 7,468$
DEPENDENT CARE FUNDAssets, Cash and Cash Equivalents 9,784$ 24,227$ 24,954$ 9,057$
Liabilities, Amounts Held for Others 9,784$ 24,227$ 24,954$ 9,057$
UNREIMBURSED MEDICAL FUNDAssets, Cash and Cash Equivalents 21,917$ 80,779$ 92,227$ 10,469$
Liabilities, Amounts Held for Others 21,917$ 80,779$ 92,227$ 10,469$
TOTALAssets, Cash and Cash Equivalents 39,169$ 105,006$ 117,181$ 26,994$
Liabilities, Amounts Held for Others 39,169$ 105,006$ 117,181$ 26,994$
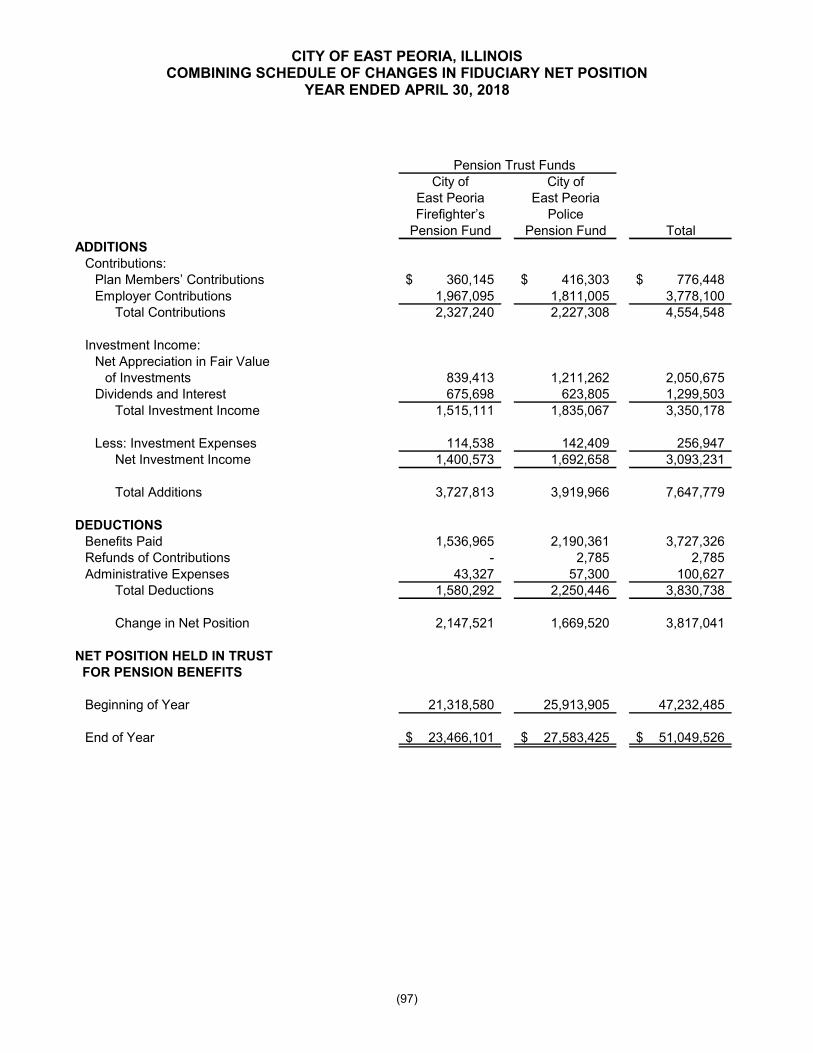
CITY OF EAST PEORIA, ILLINOISCOMBINING SCHEDULE OF CHANGES IN FIDUCIARY NET POSITION
YEAR ENDED APRIL 30, 2018
(97)
Pension Trust FundsCity of City of
East Peoria East PeoriaFirefighterʼs Police
Pension Fund Pension Fund TotalADDITIONS
Contributions:Plan Membersʼ Contributions 360,145$ 416,303$ 776,448$ Employer Contributions 1,967,095 1,811,005 3,778,100
Total Contributions 2,327,240 2,227,308 4,554,548
Investment Income:Net Appreciation in Fair Value
of Investments 839,413 1,211,262 2,050,675 Dividends and Interest 675,698 623,805 1,299,503
Total Investment Income 1,515,111 1,835,067 3,350,178
Less: Investment Expenses 114,538 142,409 256,947 Net Investment Income 1,400,573 1,692,658 3,093,231
Total Additions 3,727,813 3,919,966 7,647,779
DEDUCTIONSBenefits Paid 1,536,965 2,190,361 3,727,326 Refunds of Contributions - 2,785 2,785Administrative Expenses 43,327 57,300 100,627
Total Deductions 1,580,292 2,250,446 3,830,738
Change in Net Position 2,147,521 1,669,520 3,817,041
NET POSITION HELD IN TRUST FOR PENSION BENEFITS
Beginning of Year 21,318,580 25,913,905 47,232,485
End of Year 23,466,101$ 27,583,425$ 51,049,526$

CITY OF EAST PEORIA, ILLINOISASSESSED VALUATIONS, TAXES LEVIED, TAX RATES, TAX EXTENSIONS,
AND TAX COLLECTIONS (UNAUDITED)APRIL 30, 2018
(98)
2017 Tax Levy
Assessed Valuation, Excluding Tax
Increment Financing District Increment 447,078,708$
Collected
Amount Within 60
Extended by Days After
Fund Levy Rate County Clerk April 30, 2018
Sewer Chlorination 20,000$ 0.00448 20,029$ -$
Illinois Municipal Retirement 120,000 0.02685 120,040 -
Workmenʼs Compensation 803,728 0.17978 803,758 -
Audit 80,000 0.01790 80,027 -
Street Lighting 85,000 0.01902 85,034 -
Unemployment Insurance 16,000 0.00358 16,005 -
Civil Defense 50,000 0.01119 50,028 -
Firemenʼs Pension 2,195,236 0.49102 2,195,245 -
Police Pension 2,108,564 0.47164 2,108,602 -
Total 5,478,528$ 1.22546 5,478,768$ -$
Note: TIF and Township Road and Bridge levies are excluded.
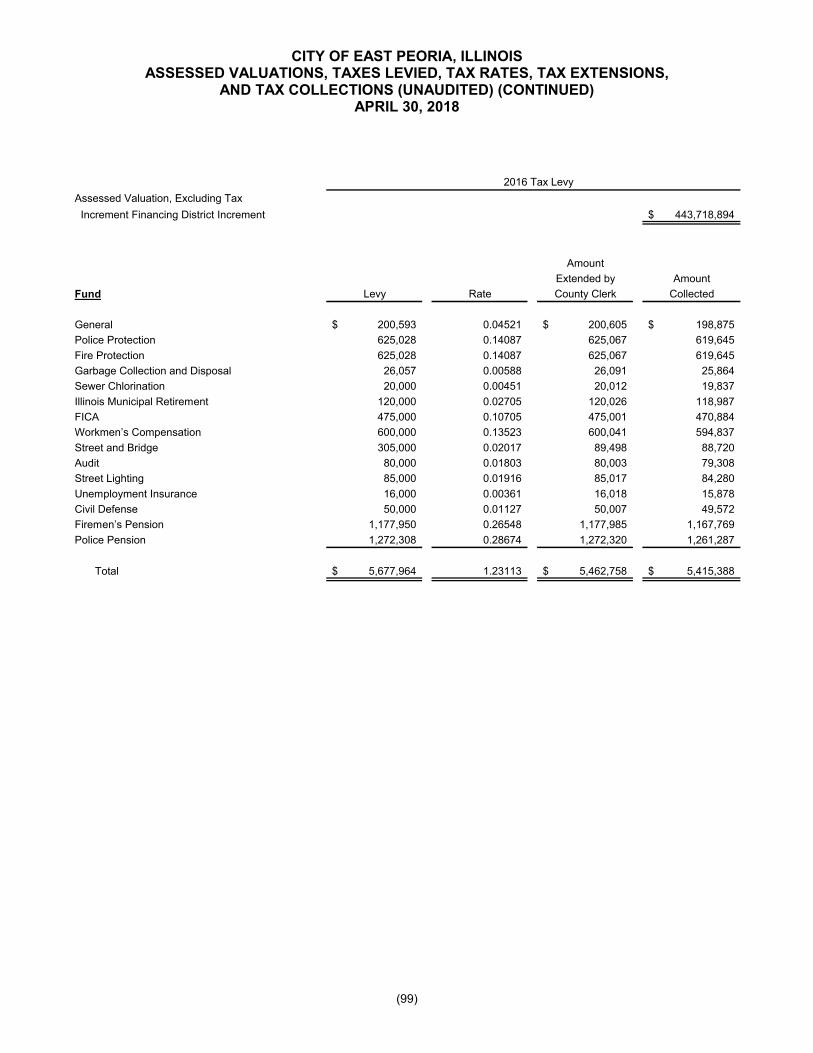
CITY OF EAST PEORIA, ILLINOISASSESSED VALUATIONS, TAXES LEVIED, TAX RATES, TAX EXTENSIONS,
AND TAX COLLECTIONS (UNAUDITED) (CONTINUED)APRIL 30, 2018
(99)
2016 Tax Levy
Assessed Valuation, Excluding Tax
Increment Financing District Increment 443,718,894$
Amount
Extended by Amount
Fund Levy Rate County Clerk Collected
General 200,593$ 0.04521 200,605$ 198,875$
Police Protection 625,028 0.14087 625,067 619,645
Fire Protection 625,028 0.14087 625,067 619,645
Garbage Collection and Disposal 26,057 0.00588 26,091 25,864
Sewer Chlorination 20,000 0.00451 20,012 19,837
Illinois Municipal Retirement 120,000 0.02705 120,026 118,987
FICA 475,000 0.10705 475,001 470,884
Workmenʼs Compensation 600,000 0.13523 600,041 594,837
Street and Bridge 305,000 0.02017 89,498 88,720
Audit 80,000 0.01803 80,003 79,308
Street Lighting 85,000 0.01916 85,017 84,280
Unemployment Insurance 16,000 0.00361 16,018 15,878
Civil Defense 50,000 0.01127 50,007 49,572
Firemenʼs Pension 1,177,950 0.26548 1,177,985 1,167,769
Police Pension 1,272,308 0.28674 1,272,320 1,261,287
Total 5,677,964$ 1.23113 5,462,758$ 5,415,388$

(100)
2015 Tax Levy 2014 Tax Levy
441,216,885$ 432,907,928$
Amount Amount
Extended by Amount Extended by Amount
Levy Rate County Clerk Collected Levy Rate County Clerk Collected
200,592$ 0.04542 200,401$ 198,847$ 100,000$ 0.02310 100,002$ 99,424$
625,000 0.14166 625,028 620,149 600,000 0.13860 600,010 598,372
625,000 0.14166 625,028 626,283 600,000 0.13860 600,010 598,372
625,000 0.14166 625,028 620,149 600,000 0.13860 600,010 598,372
20,000 0.00454 20,031 19,877 15,000 0.00347 15,022 14,979
120,000 0.02720 120,011 119,073 120,000 0.02772 120,002 119,674
475,000 0.10766 475,014 471,307 466,292 0.10772 466,328 465,058
700,000 0.15866 700,035 694,570 700,000 0.16170 700,012 698,101
315,150 0.02254 99,450 98,676 403,000 0.04340 187,882 187,368
120,000 0.02720 120,011 119,073 90,000 0.02079 90,002 89,758
80,000 0.01814 80,037 79,410 80,000 0.01848 80,001 79,783
16,000 0.00363 16,016 15,890 12,000 0.00278 12,035 12,002
50,000 0.01134 50,034 49,641 100,000 0.02310 100,002 99,729
745,000 0.16886 745,039 739,221 700,260 0.16176 700,272 698,359
900,000 0.20399 900,038 893,015 811,141 0.18738 811,183 808,968
5,616,742$ 1.22416 5,401,201$ 5,365,181$ 5,397,693$ 1.19720 5,182,773$ 5,168,319$
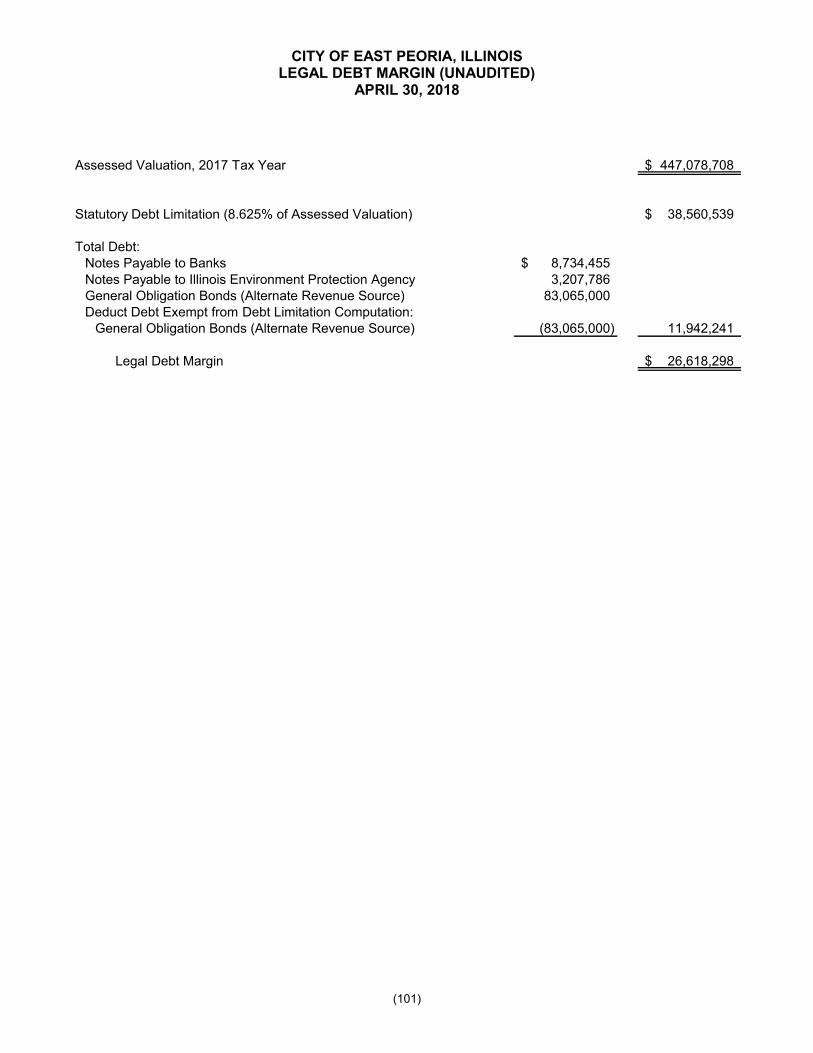
CITY OF EAST PEORIA, ILLINOISLEGAL DEBT MARGIN (UNAUDITED)
APRIL 30, 2018
(101)
Assessed Valuation, 2017 Tax Year 447,078,708$
Statutory Debt Limitation (8.625% of Assessed Valuation) 38,560,539$
Total Debt:Notes Payable to Banks 8,734,455$ Notes Payable to Illinois Environment Protection Agency 3,207,786 General Obligation Bonds (Alternate Revenue Source) 83,065,000 Deduct Debt Exempt from Debt Limitation Computation:
General Obligation Bonds (Alternate Revenue Source) (83,065,000) 11,942,241
Legal Debt Margin 26,618,298$
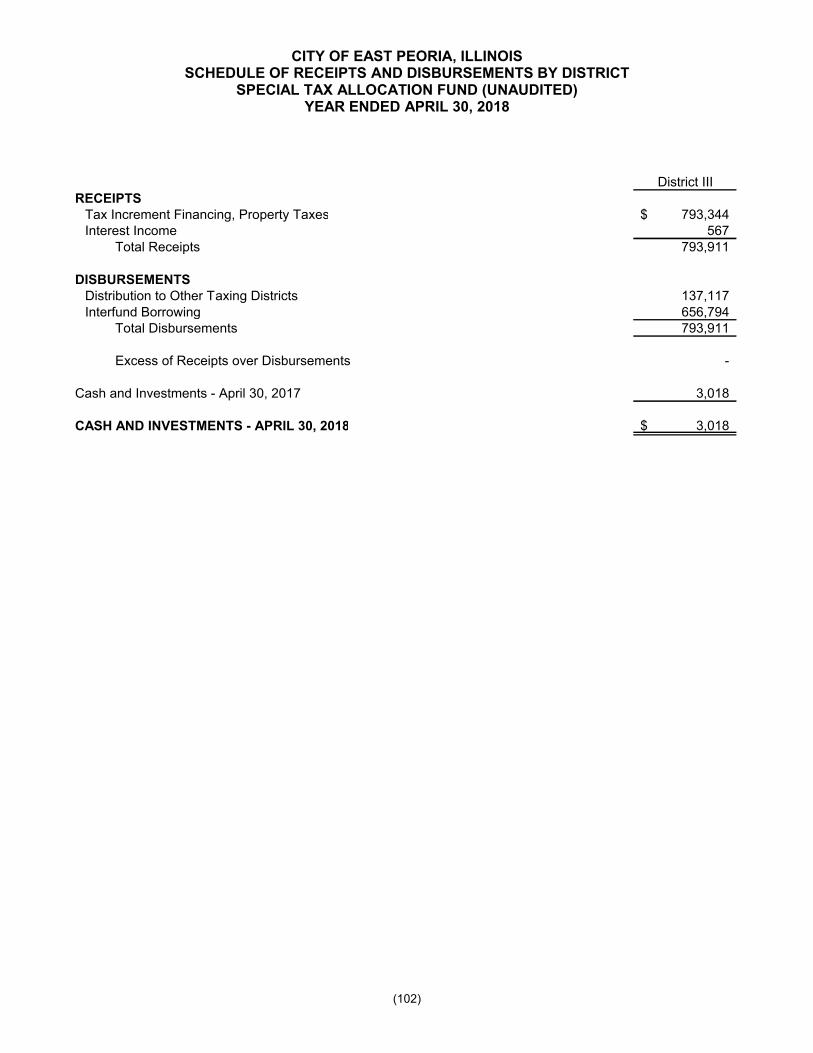
CITY OF EAST PEORIA, ILLINOISSCHEDULE OF RECEIPTS AND DISBURSEMENTS BY DISTRICT
SPECIAL TAX ALLOCATION FUND (UNAUDITED)YEAR ENDED APRIL 30, 2018
(102)
District IIIRECEIPTS
Tax Increment Financing, Property Taxes 793,344$ Interest Income 567
Total Receipts 793,911
DISBURSEMENTSDistribution to Other Taxing Districts 137,117 Interfund Borrowing 656,794
Total Disbursements 793,911
Excess of Receipts over Disbursements -
Cash and Investments - April 30, 2017 3,018
CASH AND INVESTMENTS - APRIL 30, 2018 3,018$
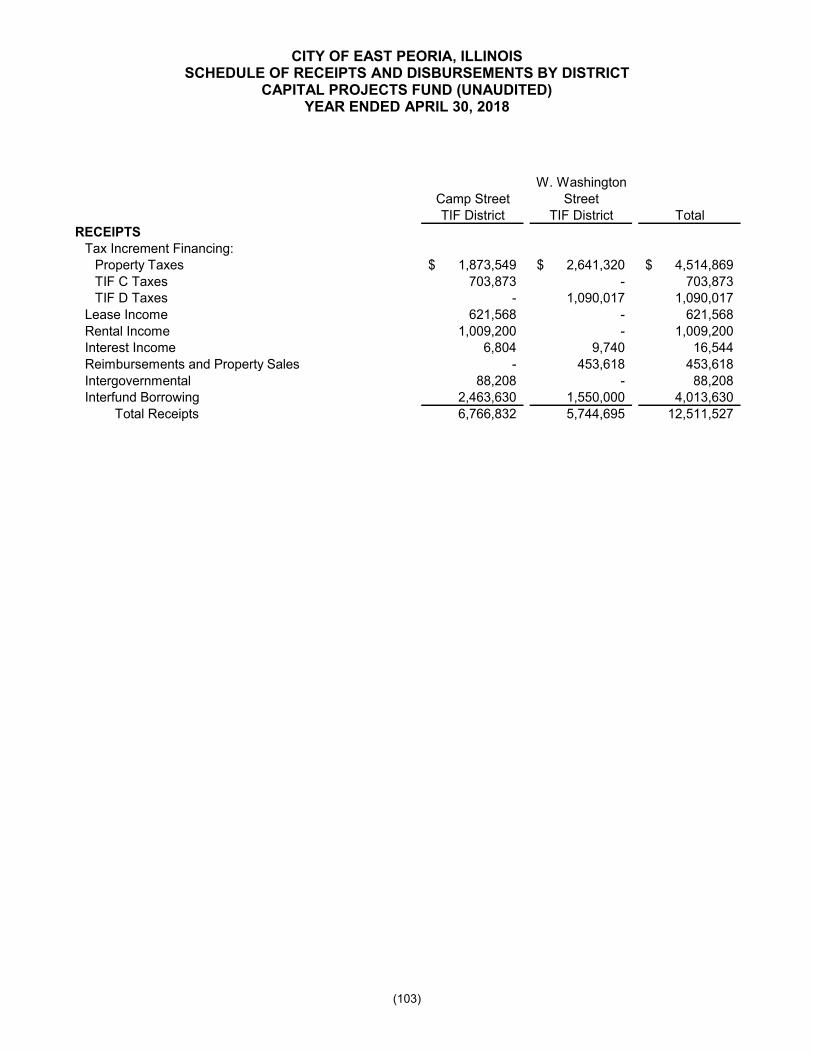
CITY OF EAST PEORIA, ILLINOISSCHEDULE OF RECEIPTS AND DISBURSEMENTS BY DISTRICT
CAPITAL PROJECTS FUND (UNAUDITED)YEAR ENDED APRIL 30, 2018
(103)
W. WashingtonCamp Street StreetTIF District TIF District Total
RECEIPTSTax Increment Financing:
Property Taxes 1,873,549$ 2,641,320$ 4,514,869$ TIF C Taxes 703,873 - 703,873TIF D Taxes - 1,090,017 1,090,017
Lease Income 621,568 - 621,568Rental Income 1,009,200 - 1,009,200Interest Income 6,804 9,740 16,544Reimbursements and Property Sales - 453,618 453,618Intergovernmental 88,208 - 88,208Interfund Borrowing 2,463,630 1,550,000 4,013,630
Total Receipts 6,766,832 5,744,695 12,511,527
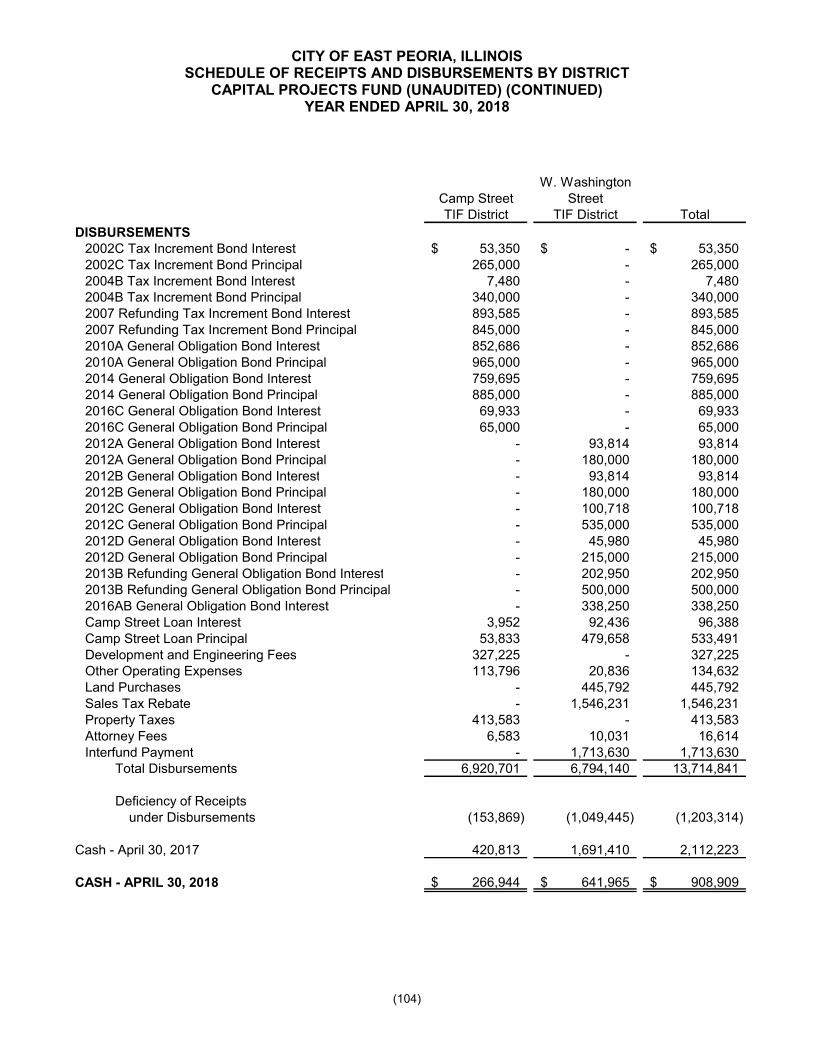
CITY OF EAST PEORIA, ILLINOISSCHEDULE OF RECEIPTS AND DISBURSEMENTS BY DISTRICT
CAPITAL PROJECTS FUND (UNAUDITED) (CONTINUED)YEAR ENDED APRIL 30, 2018
(104)
W. WashingtonCamp Street StreetTIF District TIF District Total
DISBURSEMENTS2002C Tax Increment Bond Interest 53,350$ -$ 53,350$ 2002C Tax Increment Bond Principal 265,000 - 265,0002004B Tax Increment Bond Interest 7,480 - 7,4802004B Tax Increment Bond Principal 340,000 - 340,0002007 Refunding Tax Increment Bond Interest 893,585 - 893,5852007 Refunding Tax Increment Bond Principal 845,000 - 845,0002010A General Obligation Bond Interest 852,686 - 852,6862010A General Obligation Bond Principal 965,000 - 965,0002014 General Obligation Bond Interest 759,695 - 759,6952014 General Obligation Bond Principal 885,000 - 885,0002016C General Obligation Bond Interest 69,933 - 69,9332016C General Obligation Bond Principal 65,000 - 65,0002012A General Obligation Bond Interest - 93,814 93,8142012A General Obligation Bond Principal - 180,000 180,000 2012B General Obligation Bond Interest - 93,814 93,814 2012B General Obligation Bond Principal - 180,000 180,000 2012C General Obligation Bond Interest - 100,718 100,718 2012C General Obligation Bond Principal - 535,000 535,000 2012D General Obligation Bond Interest - 45,980 45,980 2012D General Obligation Bond Principal - 215,000 215,000 2013B Refunding General Obligation Bond Interest - 202,950 202,950 2013B Refunding General Obligation Bond Principal - 500,000 500,000 2016AB General Obligation Bond Interest - 338,250 338,250 Camp Street Loan Interest 3,952 92,436 96,388 Camp Street Loan Principal 53,833 479,658 533,491 Development and Engineering Fees 327,225 - 327,225Other Operating Expenses 113,796 20,836 134,632Land Purchases - 445,792 445,792Sales Tax Rebate - 1,546,231 1,546,231 Property Taxes 413,583 - 413,583Attorney Fees 6,583 10,031 16,614Interfund Payment - 1,713,630 1,713,630
Total Disbursements 6,920,701 6,794,140 13,714,841
Deficiency of Receipts under Disbursements (153,869) (1,049,445) (1,203,314)
Cash - April 30, 2017 420,813 1,691,410 2,112,223
CASH - APRIL 30, 2018 266,944$ 641,965$ 908,909$


![CY FS (City of East Peoria, Illinois AUD [4/30/2019] (In Process))](https://static.fdokumen.com/doc/165x107/63192d671a1adcf65a0e8ade/cy-fs-city-of-east-peoria-illinois-aud-4302019-in-process.jpg)