2010-ecologiax etnoecologia Da-Biologia-a-Etnobiologia-Lopes-et-al
The European carbon balance. Part 2: croplands
P. C I A I S *, M . WA T T E N B A C H w , N . V U I C H A R D *, P. S M I T H w , S . L . P I A O *, A . D O N z,S . L U Y S S A E R T § , I . A . J A N S S E N S § , A . B O N D E A U } , R . D E C H O W k, A . L E I P **, P C . S M I T H *,
C . B E E R k, G . R . V A N D E R W E R F w w , S . G E R V O I S *, K . V A N O O S T zz, E . T O M E L L E R I k,A . F R E I B A U E R k, E . D . S C H U L Z E k and C A R B O E U R O P E S Y N T H E S I S T E A M *
*Laboratoire des Sciences du Climat et de l’Environnement, CEA CNRS UVSQ, 91191 Gif sur Yvette, France, wInstitute of
Biological and Environmental Sciences, School of Biological Sciences, University of Aberdeen, Cruickshank Building, St. Machar
Drive, Aberdeen AB24 3UU, UK, zMax-Planck Max-Planck Institute for Biogeochemistry, Hans-Knoell-Strasse 10, 07745 Jena,
Germany, §Department of Biology, University of Antwerpen, Universiteitsplein 1, 2610 Wilrijk, Belgium, }Potsdam Institute for
Climate Impact Research (PIK), Telegrafenberg, PO Box 601203, D-14412 Potsdam, Germany, kMax-Planck Institute for
Biogeochemistry, Hans-Knoell-Strasse 10, 07745 Jena, Germany, **European Commission – DG Joint Research Centre, Institute for
Environment and Sustainability, Ispra, Italy, wwFaculty of Earth and Life Sciences, VU University Amsterdam, Netherlands,
zzDepartement de Geographie, Universite catholique de Louvain, 3 Place Louis Pasteur, 1348 Louvain-la-Neuve, Belgium
Abstract
We estimated the long-term carbon balance [net biome production (NBP)] of European (EU-25)croplands and its component fluxes, over the last two decades. Net primary production (NPP)estimates, from different data sources ranged between 490 and 846 gC m�2 yr�1, and mostlyreflect uncertainties in allocation, and in cropland area when using yield statistics. Inventoriesof soil C change over arable lands may be the most reliable source of information on NBP, butinventories lack full and harmonized coverage of EU-25. From a compilation of inventories weinfer a mean loss of soil C amounting to 17 g m�2 yr�1. In addition, three process-basedmodels, driven by historical climate and evolving agricultural technology, estimate a smallsink of 15 g C m�2 yr�1 or a small source of 7.6 g C m�2 yr�1. Neither the soil C inventory data,nor the process model results support the previous European-scale NBP estimate by Janssensand colleagues of a large soil C loss of 90� 50 gC m�2 yr�1. Discrepancy between measuredand modeled NBP is caused by erosion which is not inventoried, and the burning of harvestresidues which is not modeled. When correcting the inventory NBP for the erosion flux, andthe modeled NBP for agricultural fire losses, the discrepancy is reduced, and cropland NBPranges between �8.3� 13 and �13� 33 g C m�2 yr�1 from the mean of the models andinventories, respectively. The mean nitrous oxide (N2O) flux estimates ranges between 32and 37 g C Eq m�2 yr�1, which nearly doubles the CO2 losses. European croplands act as smallCH4 sink of 3.3 g C Eq m�2 yr�1. Considering ecosystem CO2, N2O and CH4 fluxes provides forthe net greenhouse gas balance a net source of 42–47 g C Eq m�2 yr�1. Intensifying agriculturein Eastern Europe to the same level Western Europe amounts is expected to result in a neardoubling of the N2O emissions in Eastern Europe. N2O emissions will then become the mainsource of concern for the impact of European agriculture on climate.
Keywords: agriculture, ecosystem models, EU-25, green house gas balance, inventory, uncertainty
Received 21 January 2009 and accepted 18 May 2009
Introduction
In their analysis of the European carbon budget, Jans-
sens et al. (2003) concluded that there was a large soil
organic carbon (SOC) loss to the atmosphere from
croplands. This loss was based on extrapolation from
an earlier model study with simple assumptions about
crop yield and farmer practice (Vleeshouwers & Verha-
gen, 2002). In fact, the large and widespread increase in
crop yield observed everywhere in Europe during
Correspondence: S. Luyssaert, e-mail:
*Members of the CARBOEUROPE Synthesis Team: G. Abril,
O. Bouriaud, G. Churkina, J. Grace, M. Jung, G.-J. Nabuurs, J.-D.
Paris, D. Papale, P. Peylin, M. Reichstein, M.-J. Schelhaas, J.-F.
Soussana, M. Vetter, N. Viovy, S. Zaehle.
Global Change Biology (2010) 16, 1409–1428, doi: 10.1111/j.1365-2486.2009.02055.x
r 2009 Blackwell Publishing Ltd 1409

recent decades, does not seem to have entrained a
parallel increase in soil carbon stocks (Arrouays et al.,
2002). Soil carbon is rather observed to be decreasing in
regions of intensive agriculture (Fardeau et al., 1988;
Walter et al., 1995) and increasing in others, reflecting
changes in management practice (Sleutel et al., 2003),
with some areas showing no change (Dersch & Boehm,
1997; Heidmann et al., 2002).
In addition to CO2 emitted by SOC decomposition,
agricultural soils emit N2O by nitrification and denitri-
fication of mineral nitrogen, which in croplands is
driven predominantly by fertilizer inputs. This N2O
flux, once converted into CO2 radiative forcing equiva-
lent, is a significant component of the European green-
house gas (GHG) balance, roughly 8% in CO2
equivalents of fossil fuel CO2 emissions, according to
the report of each country to the United Nations Frame-
work Convention on Climate Change (UNFCCC, 2000).
Further, for most EU-25 countries, N2O emissions from
cultivated soils are the most uncertain part of GHG
emissions declared to the UNFCCC (Rypdal & Wini-
warter, 2001; Leip et al., 2008).
The GHG balance of European croplands is driven
by agricultural practice both for CO2 and N2O fluxes,
and additionally by the effects of climate change
(Gervois et al., 2008). Agricultural practice affects: (i)
the input of carbon to the soil through manure,
nonharvested and nonburned residues, (ii) the de-
composition of soil carbon, for example through
tillage timing and intensity, the soil mineral N content,
and irrigation, and (iii) N2O emissions from
soils through fertilization practice. Models developed
to quantify long-term soil carbon changes at for
example the European scale must hence account for
regional and temporal differences in these farming
practices.
The goal of this paper is to contribute to a better level
of understanding of the productivity and carbon bal-
ance of European croplands in relation to other terres-
trial ecosystems such as grasslands (Ciais et al.,
unpublished results) and forests (Luyssaert et al.,
2009). Here, we analyze data from ecological cropland
sites, from a compilation of cropland inventories
and repeated measurements, and the output of biogeo-
chemical models in order to address the following
questions:
What is the net primary production (NPP) of crop-
lands in the EU-25, as estimated by each independent
data stream?
What is the fate of the carbon incorporated in biomass
and soils, and its return to the atmosphere?
How does the long-term carbon balance or net biome
production (NBP) relate to NPP?
To what degree do the emissions of nitrous oxide
(N2O) offset the carbon sequestration in cropland
soils?
Components of the carbon balance
A general description of the carbon balance is given in
Ciais et al (unpublished results). In croplands, the bulk
of NPP is allocated to the production of biomass in
foliage, shoots and roots. However, because not all of
the biomass produced remains on site, direct measure-
ments of total NPP are impossible and the biomass
removed needs to be corrected for. Examples of biomass
removal processes include harvest, and herbivory
by insects and mammals. In addition other components
of NPP are rarely measured such as weed production,
seed production, emission of volatile organic com-
pounds (VOC) to the atmosphere, exudation from roots
and carbon transfer to root symbionts. The sum of
all these components is the total ecosystem NPP (see
Ciais et al., unpublished results, for the definitions of
and relationships between the carbon balance
components). However, depending on the ecosystem,
some of these components are difficult to measure or
are of minor importance. In this manuscript NPP of
croplands denotes the sum of NPPfoliage, NPPshoots and
NPProots.
The net ecosystem carbon balance (NECB) is the
term applied to the total rate of organic carbon accu-
mulation in (or loss from) ecosystems (Chapin et al.,
2005). When integrated over time and space the NECB
equals the net biome production (NBP; Schulze &
Heimann, 1998; Buchmann & Schulze, 1999; Chapin
et al., 2005). In this study, NBP of croplands is quantified
as
NBP ¼ NPP� Rh1 �H �D� F� VOC� Eþ I; ð1Þ
where Rh1 is the soil heterotrophic respiration, D is
the C flux of photosynthetic origin loss to hydraulic
conduits and rivers, F is the loss to the atmosphere by
fire disturbance, H the harvested component of NPP,
VOC the NPP component emitted as biogenic volatile
compounds emissions to the atmosphere, E the flux
of C exported from cropland ecosystems by erosion –
but not necessarily lost to the atmosphere, and I the
input to the soil, e.g. via manure applications. Assum-
ing that 100% of H is respired as CO2 after digestion of
crop products by animals and humans, we can identify
H to a component of heterotrophic respiration taking
place outside ecosystems, called Rh2. When summing
up the C balance at continental scale, we need to add
the flux T of respiration by humans and livestock of
1410 P. C I A I S et al.
r 2009 Blackwell Publishing Ltd, Global Change Biology, 16, 1409–1428

crop products imported by trade from outside EU-25.
This gives:
NBP ¼ NPP� Rh1 � Rh2 � T �D� F� VOC� Eþ I: ð2Þ
Materials and methods
Study area
The C fluxes representing the photosynthetic carbon
uptake [gross primary production (GPP)], respiratory
and fire disturbance, are estimated for croplands in
EU-25. Our definition of croplands follows the land
use classification of the underlying data sources: for
ecological site studies we followed the classification of
the principal investigator of the site, for yield statistics
we followed the national classification, and when data
came from ecosystem models we followed the CORINE
land use classification (EEA, 2007). Further, the EU-25
contains member states of the European Union
(31 December 2006) i.e. Austria, Belgium, Cyprus, Czech
Republic, Denmark, Estonia, Finland, France, Germany,
Greece, Hungary, Ireland, Italy, Latvia, Lithuania,
Luxembourg, Malta, Netherlands, Poland, Portugal,
Slovakia, Slovenia, Spain, Sweden and United Kingdom.
In general, the numbers represent mean values for the
EU-25 over the period 1990–1999 (Table 1). For some
data streams, the period is longer (e.g. soil C inven-
tories) or shorter (e.g. MODIS data only after 2000).
However, with the need to better understand regional
details in the carbon cycle’s response to perturbations
and gradual changes, regional information is provided
to complete the EU-25 mean values. Despite the general
nature of the results, estimates at the EU-25 level are
derived from spatially explicit datasets and models.
There are inevitable inconsistencies in the various input
datasets and methodologies that were used, and these
are only, in part, corrected for by scaling the carbon
fluxes to the same spatial domain i.e. the EU-25 crop-
land area (1.08� 106 km2) defined from EEA (2007)
agricultural area, subtracted by the grassland area
diagnosed from the Land Use/Cover Area Frame
Statistical Survey (LUCAS) (Ciais et al., unpublished
results).
Data sources
Most of the results presented here (Fig. 1) are new data
or model results, which were prepared between 2003
and 2008. References to these data or models are given
in Table 2. When other data were needed to complete
the analyses or discussion, in-text citations are given.
Mean EU-25 flux estimates from inventories and mod-
els were reported without uncertainty and a min-max
range is provided for the modeling results. Mean EU-25
flux estimates from ecological site studies were reported
with an uncertainty expressed by the Sd resulting from
propagating site-level uncertainties. Uncertainties of the
summary statistics at the EU-25 level are expressed by
the SD of the mean values of these approaches, thereby
assessing uncertainty arising from comparing the dif-
ferent approaches rather than the uncertainty of each
approach.
Inventories of yield statistics. EU-25 cropland NPP was
estimated by transformation of the FAO (FAO, 2009)
Table 1 Spatial and temporal coverage of the different methods
Method Spatial coverage/upscaled to
Temporal
coverage
FAO national yield
statistics
EU-25 at country scale (1.03� 106 km2 crops) 1961–now
EUROSTAT regional yield
statistics
EU-25 1970–now
River database European watershed draining into the Artic Sea, Baltic Sea, North Sea,
Atlantic Ocean, Mediterranean sea, and Black sea
1980–2000
Site and regional
inventories studies
Austria, Belgium, Finland, UK, Franconia (Germany), France Last 40–20 years
EOS-Terra-MODIS EU-25 at 1 km by 1 km 2000–2006
CASA EU-25 at 11 by 11 driven by MODIS burned area data 1997–2006
ORCHIDEE-STICS Western European subdomain of EU-25 (Fig. 2) with 0.56 106 km2 cropland
coverage
1990–1999
LPJml EU-25 with 1.18� 106 km2 1990–1999
RothC EU-25 1990–1999
T H E E U R O P E A N C A R B O N B A L A N C E : PA R T 2 1411
r 2009 Blackwell Publishing Ltd, Global Change Biology, 16, 1409–1428
national yield statistics in two ways. Allometric factors
and conversion ratios were compiled for 19 different
crop varieties to calculate NPP, according to Eqn (3):
NPP ¼ ðH=HIÞ � ð1þ RFÞ �DM� CC; ð3Þ
where H is the yield given by statistics, HI the harvest
index defined as the ratio of yield to aboveground NPP,
RF the root production expressed as a fraction of
aboveground NPP, and DM and CC are factors
converting fresh biomass as reported by FAO into dry
matter and carbon content, respectively. In a first
method, NPP was calculated with global values of HI
and RF from Goudriaan et al. (2001), further called
Goudriaan factors. Corresponding HI values are
0.47–0.49 for maize and wheat, respectively. The
values of DM and CC were from Spitters & Kramer
(1986) and Marcelis et al. (1998). In a second, alternative
method, NPP was calculated by taking crop and region-
specific factors for HI and accounting for the proportion
of NPP unaccounted for by yield statitics (e.g. losses to
pests, disease and herbivory and weed NPP) and the
proportion of NPP occurring below ground, as used by
Haberl et al. (2007), further called the Haberl factors.
Note that the factors of Goudriaan are in line with our
definition of NPP (see ‘Components of the carbon
balance’) whereas the factors of Haberl result in the
total NPP. The third method used an independent
dataset of yield statistics from the NUTS3 level
database of EUROSTAT (2009) and the Goudriaan
factors.
Export of C to rivers. The export of C from cropland soils
into rivers was estimated by taking the average
cropland area of each river basin in the EU-25, for
which values of D were produced in Meybeck & Ragu
(1996) and Ciais et al. (2008). Only C of atmospheric
origin is accounted for in D, not C from geological
pools. The flux D includes losses of dissolved organic
carbon (DIC) of atmospheric origin by weathering, and
the export of dissolved organic carbon (DOC),
particulate organic carbon (POC) from cropland soils.
There is a large uncertainty on the value of D. There is
an even larger uncertainty associated with the
component of D derived from erosion of old soil
organic matter, as opposed to that derived from
carbon recently added to the soil. Most of river
transported carbon originates from ecosystems, but
can have different lifetimes through the river filters,
being either degassed to the atmosphere within a year,
or sequestered in long-lived organic sediments. The
recent data compilation of Ciais et al. (2008) suggests
that a minimum fraction of 70% of the ecosystem carbon
transported by rivers returns rapidly to the atmosphere.
Erosion. Soil C erosion (E) defined as the sum of human
accelerated erosion and the effect of natural processes,
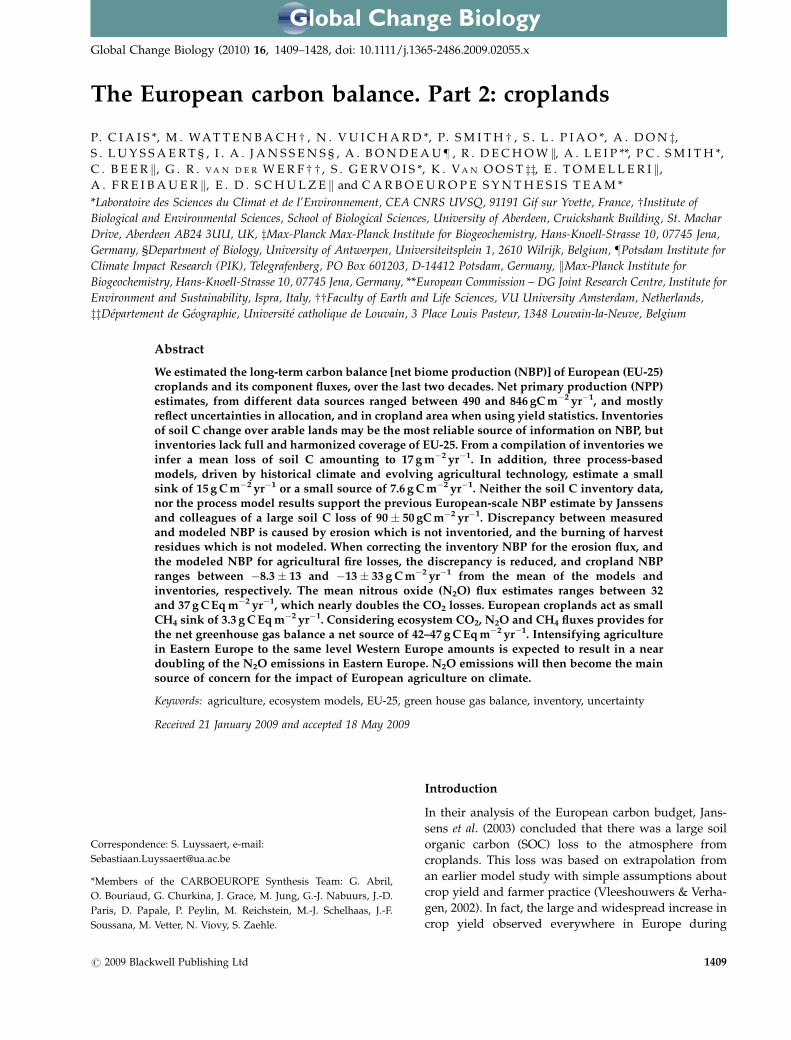
Fig. 1 EU-25 croplands carbon cycle. Fluxes in Tg C yr�1 over a cropland area of 1.08� 106 km2. Rh2 is calculated to close the carbon
balance.
1412 P. C I A I S et al.
r 2009 Blackwell Publishing Ltd, Global Change Biology, 16, 1409–1428
is a significant flux in the European GHG balance
context and cannot be neglected, especially on
croplands. The global map of E created by Van Oost
et al. (2007) showed significant cropland soil erosion
rates in EU-25, of the order of 10–15 g C m�2 yr�1 (see
Fig. 2, Table S2 and S3 in Van Oost et al. (2007)),
compared with arable lands in the rest of the World.
Erosion maps from the Van Oost et al. (2007), modeled
at 10 km spatial resolution, were averaged at EU-25
scale with a mask of the EU-25 croplands based upon
the CORINE land cover.
Fires. Fire emissions (F) from croplands, chiefly from
burning of residues, were calculated for the period
1997–2006 from the global biomass burning emission
dataset GFEDv2 of Van der Werf et al. (2006). The
GFEDv2 emissions data available at 11 by 11 spatial
resolution, combine the CASA model (Potter et al., 1993)
forced by variable climate fields and 10-daily burned
areas from remote sensing (Giglio et al., 2006). We used
a mask of EU-25 croplands based upon CORINE land
cover. Owing to the coarse modeling approach used,
however, our estimate for EU-25 may include some
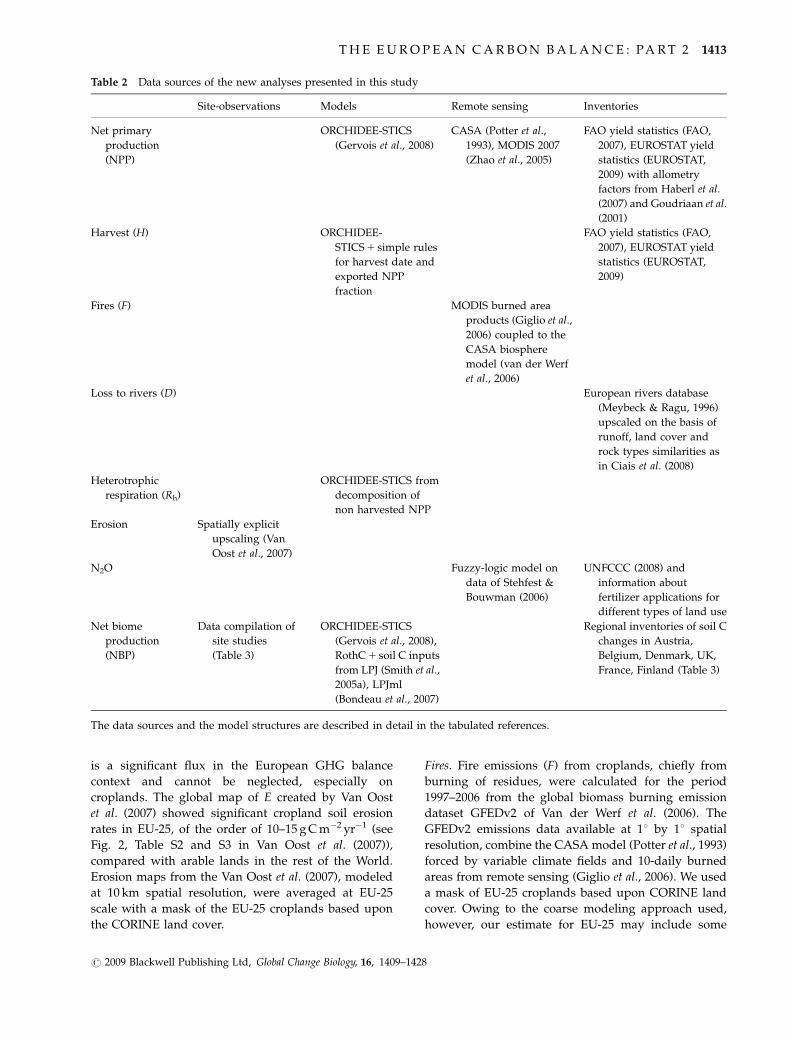
Table 2 Data sources of the new analyses presented in this study
Site-observations Models Remote sensing Inventories
Net primary
production
(NPP)
ORCHIDEE-STICS
(Gervois et al., 2008)
CASA (Potter et al.,
1993), MODIS 2007
(Zhao et al., 2005)
FAO yield statistics (FAO,
2007), EUROSTAT yield
statistics (EUROSTAT,
2009) with allometry
factors from Haberl et al.
(2007) and Goudriaan et al.
(2001)
Harvest (H) ORCHIDEE-
STICS 1 simple rules
for harvest date and
exported NPP
fraction
FAO yield statistics (FAO,
2007), EUROSTAT yield
statistics (EUROSTAT,
2009)
Fires (F) MODIS burned area
products (Giglio et al.,
2006) coupled to the
CASA biosphere
model (van der Werf
et al., 2006)
Loss to rivers (D) European rivers database
(Meybeck & Ragu, 1996)
upscaled on the basis of
runoff, land cover and
rock types similarities as
in Ciais et al. (2008)
Heterotrophic
respiration (Rh)
ORCHIDEE-STICS from
decomposition of
non harvested NPP
Erosion Spatially explicit
upscaling (Van
Oost et al., 2007)
N2O Fuzzy-logic model on
data of Stehfest &
Bouwman (2006)
UNFCCC (2008) and
information about
fertilizer applications for
different types of land use
Net biome
production
(NBP)
Data compilation of
site studies
(Table 3)
ORCHIDEE-STICS
(Gervois et al., 2008),
RothC 1 soil C inputs
from LPJ (Smith et al.,
2005a), LPJml
(Bondeau et al., 2007)
Regional inventories of soil C
changes in Austria,
Belgium, Denmark, UK,
France, Finland (Table 3)
The data sources and the model structures are described in detail in the tabulated references.
T H E E U R O P E A N C A R B O N B A L A N C E : PA R T 2 1413
r 2009 Blackwell Publishing Ltd, Global Change Biology, 16, 1409–1428

nonagricultural fires. The uncertainty reported on F
corresponds to the SD of interannual variations in
GFEDv2 emissions between 1997 and 2006.
Trade of crop products. The C fluxes of imported and
exported crop products by international trade (T) must
be included in the GHG balance when working at the
EU-25 scale. We used the methodology described in
Ciais et al. (2007) to account for the digestion of C in
imported food and feed products, resulting in a release
of CO2 to the atmosphere. Similarly, the C fluxes of
exported food products will be respired outside the EU-
25 and must be subtracted from the GHG balance. In
other words, the trade of crop products modulates the
heterotrophic respiration component Rh2, that occurs
away from cropland ecosystems. Estimation of the C
source (imports) and C sink (exports) resulting from
trade at EU-25 scale were obtained from FAO trade
statistics. Geospatial estimates of these fluxes are those
provided by Ciais et al. (2008).
Regional soil C change inventories. For the purpose of this
study, we compiled cropland NBP data from regional
inventories over Austria, Belgium, Denmark, Finland,
France, UK and some regions in Germany. Altogether,
these inventoried regions represent 33% of the total EU-
25 cropland area. Details of the compilation are given in
Table 3.
Primary productivity
0
500
1000
1500g
C m
–2 y
r–1g
C m
–2 y
r–1
g C
m–2
yr–1
g C
m–2
yr–1
0
100
200
300
400
500 Harvest removal and respiration
–20
–10
0
10
20 Net carbon balance (NBP)
–30–20–10
01020304050 Disturbance and lateral fluxes
0
10
20
30
40
50
N2O emissions(from UNFCCC)
N2O emissions(from fuzzy logic)
g C
–C
O2
eq m
–2 y
r–1
N2O emissions
(a) (b)
(c) (d)
(e)
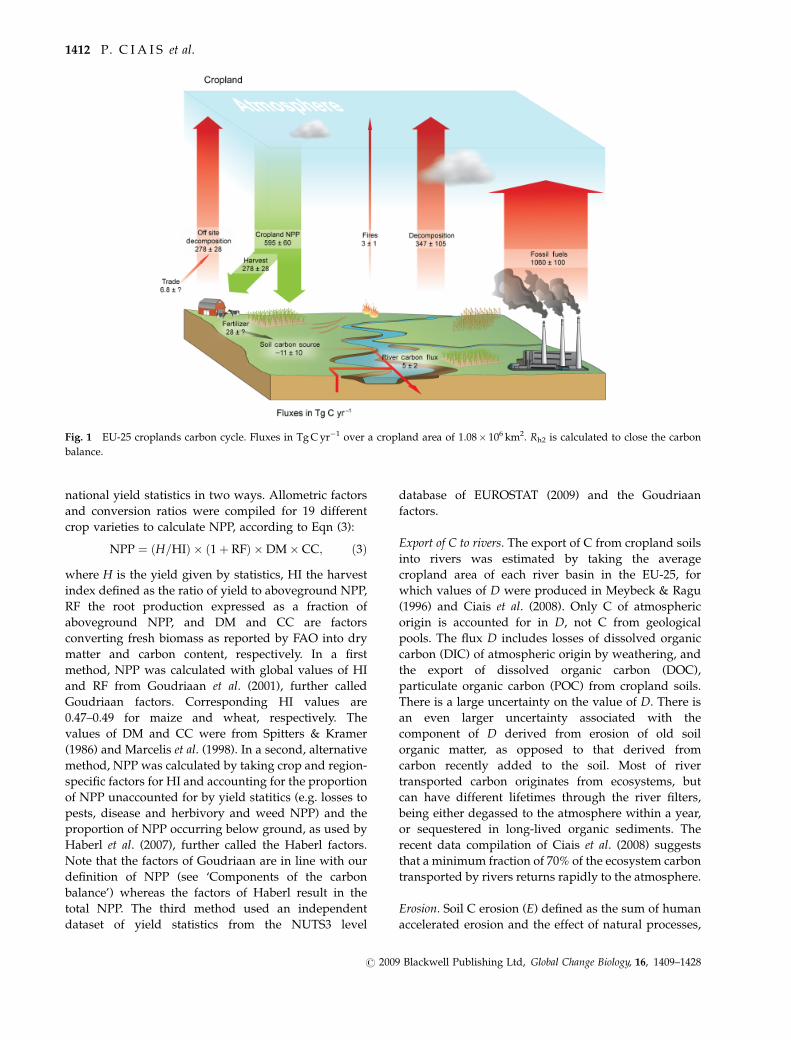
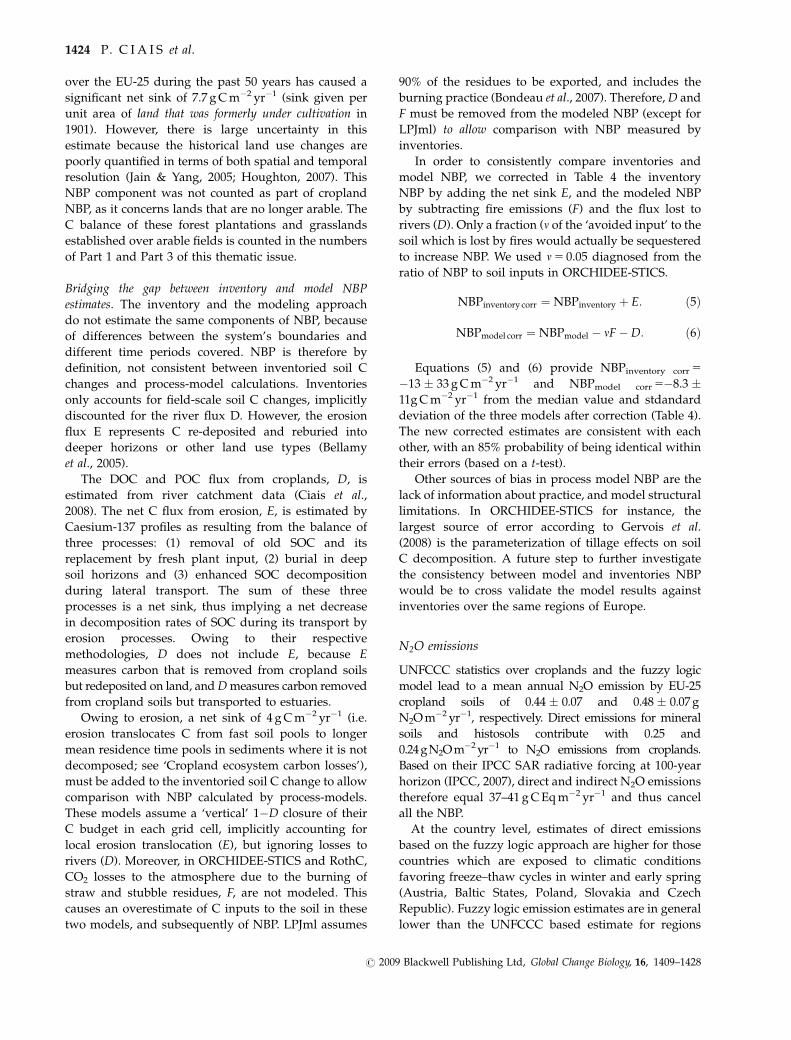
Fig. 2 Component fluxes of European cropland C balance. By convention, losses of C by the European continent are o0 and gains are
40. (a) Gross and net primary productivity estimated using models or harvest statistics and allometry data. (b) Harvest removal and
respiration components. (Rh2) respiration by humans and animals is calculated by mass balance (see text). (c) Disturbance, imported food
products emitted to atmosphere, carbon lost to rivers and accumulated over land outside croplands by erosion. (d) Net carbon balance
estimated by three models and by regional soil C inventories with incomplete coverage. White bars are results before correction of C
removed by rivers and of erosion, black bars show uncorrected carbon balance (see text). By convention C losses by croplands are o0
and C gains are 40. (e) N2O emissions to the atmosphere in g C CO2 equivalent units. The Net GHG balance of cropland is the sum of net
carbon balance and N2O fluxes.
1414 P. C I A I S et al.
r 2009 Blackwell Publishing Ltd, Global Change Biology, 16, 1409–1428

Ecosystem models. Cropland NPP and NBP were
independently assessed using the results of spatially
explicit process-based models of cultivated ecosystems:
ORCHIDEE-STICS (Gervois et al., 2008), RothC (Smith
et al., 2005a) and LPJml (Bondeau et al., 2007). In this
context, the generic DGVM vegetation models com-
piled for forest NPP by Luyssaert et al. (2009) are
inappropriate, because they treat crops as natural
grasses, leading to a very different NPP, although not
necessarily smaller than the one observed; crops have a
higher resource use efficiency (LUE) but a shorter
growing season than natural grasses.
ORCHIDEE-STICS is a generic model of cultivated
ecosystems parameterized with three generic crop
varieties widespread in Europe (De Noblet-Ducoudre
et al., 2004; Gervois et al., 2004, 2008; Gervois, 2004;
Smith et al., 2009a, b). These varieties are winter wheat
(Soissons) assumed to represent all other types of winter
cereals and rape seed, grain yield maize (DK-604)
assumed to represent all C4 crops, and soybean
assumed to represent all types of other summer C3
crops. For NPP calculation, the ORCHIDEE-STICS
model was run over the period 1996–2002 with a time
step of 3-h over a western European domain, W,
bounded by 101W–201E and 35–551N (0.56� 106 km2
of croplands) shown in Fig. 3.
The ORCHIDEE-STICS mean annual NPP over
the western domain W of EU-25, called NPPO�STICS,
was extrapolated over the whole EU-25 territory by
using the FAO derived NPP, NPPFAO, according to
Eqn (4):
NPPO�STICSðEU� 25Þ ¼ ½NPPFAOðEU� 25Þ=NPPFAOðWÞ��NPPO�STICSðWÞ: ð4Þ
In doing so, we checked that over the domain W
where they overlap, the mean NPP of ORCHIDEE-
STICS and FAO were in quite good agreement
(within � 8%), so that Eqn (4) did not amplify any
initial bias of the model over this Western domain.
However, in Eqn (4) management types are not
described in Eastern Europe, and gaps have been
filled with data from Western Europe, which is likely
to lead to an overestimation of NPP so that also the
overall estimate is likely to be overestimated.
The ORCHIDEE-STICS model was also used to
simulate NBP between 1901 and 2000. In this version,
the model simulated winter wheat and maize only,
ignoring summer C3 crops (Gervois et al., 2008). The
soil carbon decomposition module of ORCHIDEE-
STICS is similar to the CENTURY model equations
(Parton et al., 1988). Starting from ancestral farmingTab
le3
Det
ails
of
the
site
stu
die
s
Reg
ion
NB
P[g
m�
2]
Min
Max
Dep
th
Mea
sure
men
t
inte
rval
(yea
rs)
So
urc
eC
rop
lan
dar
ea(k
m2)
Lon
gte
rmob
serv
atio
nal
stu
dies
(plo
tsc
ale)
No
rth
Ger
man
y48
�37
219
0–35
�30
Nie
der
&R
ich
ter
(200
0)
Ger
man
y(F
ran
con
ia)
�6
�26
0–10
027
Rin
kle
be
&M
akes
chin
(200
3)
Reg
ion
alan
dn
atio
nal
repe
ated
inve
nto
ries
Fin
lan
d�
910–
2011
Mak
ela
-Ku
rtto
&S
ipp
ola
(200
2)20
057
Den
mar
k19
0–50
11H
eid
man
net
al.
(200
2)23
020
Wal
on
ia(B
elg
ium
)�
120–
3050
Go
idts
&v
anW
esem
ael
(200
7)95
00
Fla
nd
ers
(Bel
giu
m)
�48
0–24
12S
leu
tel
etal
.(2
007)
3041
Bel
giu
m�
30–
3040
Let
ten
set
al.
(200
5)14
136
Au
stri
a�
240–
20�
26D
ersc
h&
Bo
ehm
(199
7)14
790
UK
�9
0–15
15H
ow
ard
etal
.(1
995)
,T
ho
mp
son
etal
.(2
005)
5928
0
Fra
nce
�16
0–30
10A
nto
ni
etal
.(2
004)
195
150
Wei
gh
ted
mea
n(�
SD
)�
17�
33
Mea
n�
23
NB
Pes
tim
ates
for
sele
cted
lon
g-t
erm
stu
dy
site
san
dso
me
cro
pla
nd
reg
ion
sin
Eu
rop
ed
eriv
edfr
om
rep
eate
dso
ilo
rgan
icca
rbo
nin
ven
tori
es.
Cro
pla
nd
reg
ion
sin
Eu
rop
e,
esti
mat
edu
sin
gm
easu
rem
ent
extr
apo
lati
on
.A
lld
ata
are
ing
Cm�
2y
r�1,
po
siti
ve
nu
mb
ers
for
net
eco
syst
emC
gai
n.
T H E E U R O P E A N C A R B O N B A L A N C E : PA R T 2 1415
r 2009 Blackwell Publishing Ltd, Global Change Biology, 16, 1409–1428

practice and crop varieties in 1901, the model was
driven in the domain W by rising CO2 and transient
climate fields at a resolution of 10 km, and by evolving
agricultural technology after 1950. The technological
evolution parameterized by Gervois et al. (2008)
included increased yields, increased HI, increased N-
fertilizers and decreased manure applications, maize
irrigation, and increased tillage which accelerated SOC
decomposition.
RothC is a soil carbon model (Smith et al., 2005a). For
this purpose, RothC was prescribed with changing NPP
– discounted for harvest – from the LPJ vegetation
model (Sitch et al., 2003) as the soil carbon input. In a
similar way than ORCHIDEE-STICS, the RothC model
was initialized and run at a resolution of 10 km from
1900 to 2100 (Smith et al., 2005a).
LPJmL (Sitch et al., 2003) is another DGVM that has
been extended to represent the carbon and water cycles
of managed land (Bondeau et al., 2007). The version
used here considers 11 crops functional types, eight of
them being cultivated in the EU-25: temperate cereals
(wheat like), maize, soybean, rice, temperate roots
(sugarbeet like), sunflowers, rapeseed, pulses. The Leff
et al. (2004) crop distribution is used to determine the
grid cell fraction cover of each of these types within the
cropland cover database provided for CarboEurope
(Vetter et al., 2008) for the window [151W–601E;
30–751N]. Remaining crops are put within the
temperate cereals type. For each type and each grid
cell, the model determines from the climatic conditions
the most appropriate variety. The sowing date, the heat
unit requirements, and the base temperature, differ for
Latit
ude
LongitudeNPP
(a) (b)
(c) (d)
(e) (f)
Harvest/NPP
Latit
ude
Latit
ude
Latit
ude
Latit
ude
Latit
ude
LongitudeHarvested C Inputs C
Longitude
Longitude
NBP NBP/NPP
Longitude
Longitude
l
Fig. 3 Distribution of cropland component carbon fluxes from the ORCHIDEE-STICS crop model, after Gervois et al. (2008). The model
is forced with variable CO2, climate and changing farmers practice during the past century. Fluxes are given as area weighted average
values for winter wheat and maize over each grid cell, over the decade 1990–1999. All grid-cells containing less than 20% of croplands
have been masked in white. (a) Net primary production, (b) ratio of yield (harvest exported from ecosystem) to NPP, (c) Yield, (d) input
of C to the soil, defined as NPP – Yield, with burning or harvest of agricultural residues being ignored, (e) Net biome production defined
as the mean annual soil C storage change over 1990–1999, (f) ratio of NBP to NPP.
1416 P. C I A I S et al.
r 2009 Blackwell Publishing Ltd, Global Change Biology, 16, 1409–1428

each crop over the European window. For example,
spring wheat is grown in higher latitudes, while winter
wheat is grown over central and southern Europe.
Several management factors impact the crop cycle
and its productivity. The current version of the model
deals with four of these: fertilization, irrigation, fate of
residues and intercropping. Agricultural productivity
relies to a large extent on the level of fertilizer input. We
used crop-specific data on usage of industrial fertilizer
at the country-level (IFA, 2002): the period 1990–1999
was a period of transition for the eastern countries of
the current EU-25 and far less inputs were used
compared to western Europe. On the other hand, the
use of animal manure was probably more common in
Eastern Europe, but is not considered within the model.
The model may therefore underestimate the crop
productivity of the eastern countries of EU-25. In
order to allow comparison with the results of other
models within the CarboEurope project, irrigation has
been deactivated in the version of LPJmL used here,
which reduces the crop productivity of southern
Mediterranean Europe. We have also considered a
removal of 90% of the crop residues, which are either
burned or used (e.g. for animals), but in all cases the
carbon is returned to the atmosphere during the same
year. Finally, there is no intercropping in the version
used here (the fields remain bare between two crop
cycles).
Using the management options previously
described, LPJmL was run on a 0.251 resolution grid
for the EU-25 window. The regional climate model
(REMO; Jacob & Podzun, 1997), driven with NCEP
reanalysis (Kalnay et al., 1996) at the boundaries of the
European model domain (Feser et al., 2001) provides
meteorological data for the period 1948–2005. The data
are available at http://www.bgc-jena.mpg.de/bgc-
systems/projects/ce_i/index.shtml. In order to build
the soil carbon pool, a 1000-year spin-up of LPJmL
was run using the meteorological data of 1948–1958,
and a transient run for the period 1958–2005 was
performed. In this model run, only the atmospheric
conditions changed during that period; the land use
and the management options remained constant. In
reality, both land use and management have changed,
most likely in a way that leads to increase soil carbon
sequestration (e.g. higher crop productivity).
Contribution of land cover changes to NBP. In order to
assess the contribution of past land use change on NBP
over EU-25, the ORCHIDEE-STICS was used. We first
integrated the model until C pools reached equilibrium,
based on average climate reconstructed data during the
period of 1901–1910 (Mitchell & Jones, 2005), the
atmospheric CO2 concentration, and land cover of
1860. Based on this starting equilibrium state, a
simulation from 1901 to 2000 was carried out, with
prescribed land cover maps combining Ramankutty &
Foley (1999) and Mather et al. (1998). Changing land
cover is prescribed to the model at a time step of 10
years, and the dynamic evolution of C pools and NPP
consecutive to a transition is calculated by ORCHIDEE,
until a new equilibrium is reached. The main trend of
EU-25 land cover change is an abandonment of
croplands, causing C sequestration in regrowing
forests and grasslands. Grid points with disappearing
croplands over the last 20 years are not considered as
cropland NBP however, but rather accounted for as
forest (Luyssaert et al., this thematic issue, Part 3) or
grassland NBP (Ciais et al., this thematic issue, Part 1).
Remote sensing. We derived remote-sensing cropland
NPP estimates over EU-25 from EOS-Terra-MODIS
MODIS-2007 version 5 data product, which use a LUE
approach (Zhao et al., 2005) on a 1 km2 cell basis for the
years 2000–2006. Mean annual NPP per cell was
calculated by using the MODIS-2007 Version 5 mean
NPP with the MODIS land cover cropland area estimate
based on its UMD classification scheme (mod12q1
v004). These values were aggregated to country level
by overlaying the UN country map (FAO, 2007).
An alternative remote-sensing NPP estimate was
derived from the CASA model (Potter et al., 1993)
forced by the AVHRR FAPAR products (Tucker et al.,
2005), and using a different LUE formulation form that
used by MODIS (2007) to calculate NPP. In CASA, the
nonlimited LUE is set to 0.5 mol C/mol FAPAR, and it is
the same for crop and natural vegetation.
N2O
UNFCCC statistics. UNFCCC statistics report national
N2O emissions from agricultural soils by different
sectors. According to the agricultural sector considered,
N2O emitted by cropland and grassland soils were split
as follows. The categories synthetic fertilizer-related
emissions (4.D.1.1 in UNFCCC nomenclature), N2O
emissions falling into the animal manure category
(4.D.1.2) and nitrogen fixation emissions (4.D.1.3) were
split according to rules for region- and crop type-specific
nitrogen demand on cropland with the remainder being
allocated to grassland. This procedure follows state-of-
the-art approaches by Freibauer (2003) and CAPRI-
Dynaspat.
The resulting allocation factors for N input to
cropland vary between 480% in Hungary, Finland and
Sweden to o50% of the N input in Austria, Germany
and the Netherlands. N2O emissions from histosols
(4.D.1.5) were attributed to croplands according to the
T H E E U R O P E A N C A R B O N B A L A N C E : PA R T 2 1417
r 2009 Blackwell Publishing Ltd, Global Change Biology, 16, 1409–1428
emissions from cropland and grassland by country in
Drosler et al. (2008). In average, 43% of the total N2O
emissions from agricultural histosols in EU-25 were
assigned to croplands, and the rest attributed to
grasslands.
N2O emissions falling in the other direct and indirect
emissions categories of the UNFCCC were all attributed
to croplands, except for pasture emissions (4.D.2) and
nitrogen fixation emissions (4.D.1.3) that were all
attributed to grasslands. UNFCCC statistics for the
years 1990 until 2000 have been used.
Fuzzy logic model. A fuzzy logic model developed by
R. Dechow (unpublished results) was used to calcu-
late direct N2O emissions. It is a sequence of ‘IF-THEN’
rules that aims to estimate N2O emissions based on a
combination of input factors. Training of the model
finds the most suitable combination of information
about soil properties (texture, organic carbon organic
nitrogen), climatic conditions and management options
(amount of mean applied N, type of applied fertilizer)
in order to match direct annual N2O emissions known
at the site level. Cross-validation was performed by
excluding a subset of sites from the calibration dataset
(R2 5 0.45). Training and cross-validation data come
from 30 sites with 163 variables that were extracted
from the N2O emissions database described in Stehfest
& Bouwman (2006).
Factors used for up-scaling to the EU-25 level were
the amount of applied N, sand content, pH, crop type
(cereals, roots and vegetables, fallow, other), mean
autumn precipitation and winter temperature of the
precedent year. Nitrogen addition via fertilizer in
1990–1999 was extrapolated from CAPRI-Dynaspat
data for the year 2000 (Leip et al., 2008) and country
budgets from the EUROSTAT database.
Seasonal precipitation and temperature were
derived from simulations with the REMO model
(Vetter et al., 2007). Local distribution of cropland
areas for the year 2000 originates from a two-step
regression approach (Leip et al., 2008) taking into
consideration environmental factors (climate, soil
properties, land cover, etc.), statistical data of the
CAPRI database with information at NUTS 2 Level
and the Land Use/Cover Area Frame Statistical
Survey (LUCAS; European Commission; Kempen
et al., 2007). This data was extrapolated to the time
period 1990–1999 using statistics from FAO.
N2O emissions from histosols were calculated using
national emission inventories from Drosler et al. (2008).
Other direct and indirect sources came from UNFCCC
statistics. N2O flux estimate provided is the mean value
over the 1990s decade.
Results and discussion
Net primary production
NPP from yield statistics. The mean NPP over the EU-25
croplands obtained from the FAO yield statistics and
Goudriaan factors is 646 g C m�2 yr�1, and the mean
total NPP from the FAO statistics and Haberl factors is
846 g C m�2 yr�1, using a cropland area of 1.03� 106 km2
to remain consistent with FAO (Table 1). Using the
EUROSTAT statistics and Goudriaan factors, with the
CORINE cropland area (1.06� 106 km2; see ‘Materials
and methods’), the corresponding NPP is 586 g
C m�2 yr�1. The range of cropland NPP estimates at the
scale of EU-25, caused by uncertain area (different
definitions of croplands in FAO vs. this synthesis),
hence appears very small.
NPP from process-oriented models. The NPP distribution
obtained from ORCHIDEE-STICS is provided in Fig. 3a.
NPP is uniformly high over western and central Europe
(approximately 1000 g C m�2 yr�1), but lower NPP
values in Southern Europe (600–700 g C m�2 yr�1). The
mean annual NPPO�STICS extrapolated over EU-25
using Eqn (3) is 585 g C m�2 yr�1, amounting to 43% of
the modeled GPP (Table 4). The NPP value calculated
over EU-25 is much lower than the NPP that was
originally calculated over Western Europe. This
reflects the East-West gradient in FAO statistical data
on crop yields applied in Eqn (3). By means of
sensitivity tests of ORCHIDEE-STICS where the model
parameters are varied (Smith et al., 2008a, b) the
uncertainty of NPPO�STICS was estimated to be on the
order of 15%. Therefore, NPPO�STICS is consistent
within the uncertainty of NPP estimates derived from
yield statistics (Table 4). For the period 1990–1999, an
average cropland NPP of 482 g C m�2 yr�1 is obtained
from LPJml (using a cropland area of 1.18� 106 km2).
This value is certainly a low estimate; a run with
activated irrigation and intercropping would likely
result in a higher value.
NPP from remote sensing models. Cropland NPP from
CASA is 494 g C m�2 yr�1. Note that in CASA the
nonlimited LUE value was not increased for crops
compared with natural vegetation. The mean annual
cropland NPP from MODIS-2007 (Zhao et al., 2005) is
419 g C m�2 yr�1. Both remote sensing-based estimates
are lower than the estimates from yield statistics and
NPPO�STICS. The low MODIS 2007 values are likely due
to a low bias in the LUE parameter (Reichstein, 2006).
Optimizing the MODIS GPP against site-level eddy
covariance observations (Tomelleri et al., 2008)
provides a GPP estimate of 879 g C m�2 yr�1,
1418 P. C I A I S et al.
r 2009 Blackwell Publishing Ltd, Global Change Biology, 16, 1409–1428
translating into a slightly higher NPP of
510 g C m�2 yr�1 with a GPP to NPP ratio of 0.58
(Zhao et al., 2005).
Crops may have a higher LUE than grasses and
forests (e.g. Turner et al., 2003), but their growing
season is also generally shorter, so that the mean
annual crop NPP is not necessarily larger than that of
grasslands, especially for pastures where N is efficiently
recycled. Therefore, the application of a NPP/GPP ratio
of 0.52 (Moureaux et al., 2008) to the upper part of the
estimate range (� 600 g C m�2 yr�1) leads to a GPP of
1150 g C m�2 yr�1 or 1.2 Pg C yr�1 for Europe which is
consistent with the independent estimate for whole
watersheds based on the carbon-water coupling
exploited by Beer et al. (2007).
Controls of NPP. The long term trend of NPP of
croplands is driven by technological changes (490%)
rather than by climate and atmospheric CO2
concentrations (o10%) (Bondeau et al., 2007; Gervois
et al., 2008). However, the interannual variability of
cropland NPP is determined by fluctuating climate
conditions. For example, during the summer 2003
drought and heat wave, yields of summer crops
dropped dramatically, in particular for maize in
France and Italy (Ciais et al., 2005). The magnitude of
such climatically induced crashes in productivity are
also a function of the adaptability of practices (e.g.
irrigation), and specific phenology of each crop. For
instance, Smith et al. (2009) analyzed the impacts on
crop yields for the years 1976 and 2003, and concluded
that winter wheat already had a significant fraction of
dead leaves during the 2003 heatwaves (early July and
early August), and hence its yield was less dramatically
affected than that of summer crops.
Sources of uncertainty. Comparison of cropland NPP for
the EU-25 given by the different approaches allows an
analysis to be made of the largest sources of
discrepancy. A main cause of discrepancies when
assessing NPP from yield statistics are the allocation
factors used to extrapolate aboveground and
belowground NPP components. For instance, varying
allometric factors from the global values used in
Goudriaan et al. (2001) to the crop/region specific
values of Haberl et al. (2007) leads to discrepancy in
mean NPP of 30% (Haberl vs. Goudriaan) (Table 4). This
shows that the definitions of NPP and total NPP are
very important: the NPP that is lost through herbivory
and diseases or the NPP of weeds is partly accounted
for in the Haberl factors, but not in Goudriaan, which
explains the inferred NPP differences. Concerning the
extrapolation of aboveground NPP from yield using HI
information, in his review of literature data, Hay (1995)
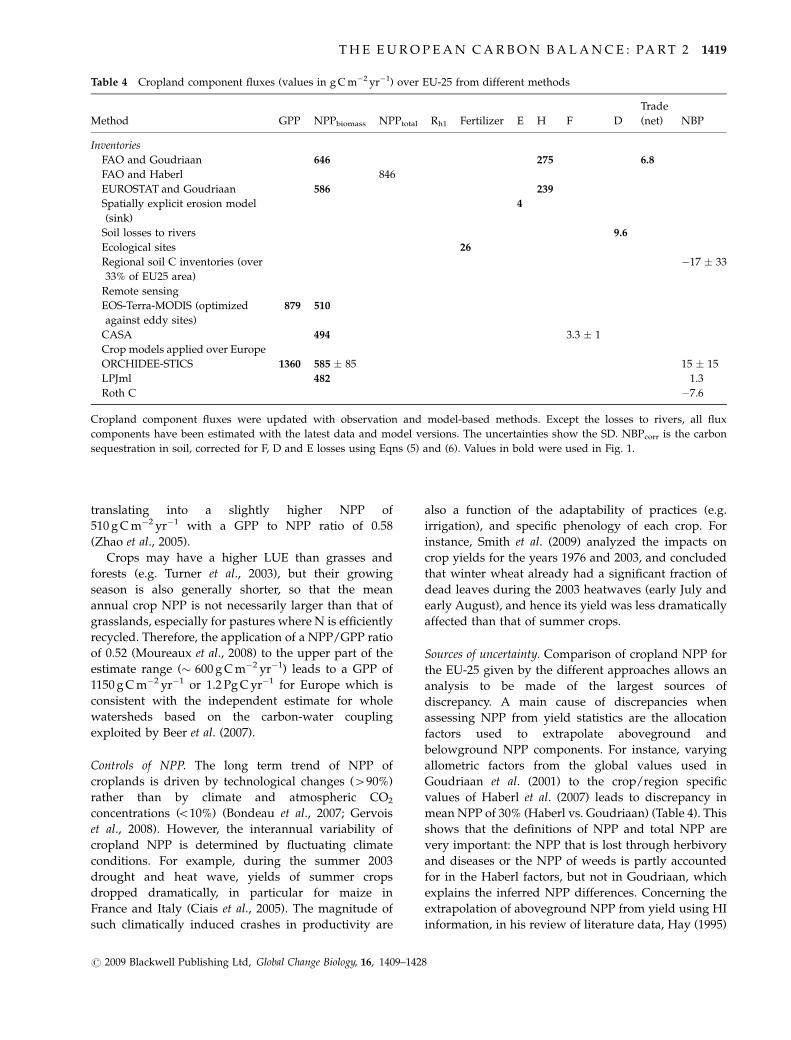
Table 4 Cropland component fluxes (values in g C m�2 yr�1) over EU-25 from different methods
Method GPP NPPbiomass NPPtotal Rh1 Fertilizer E H F D
Trade
(net) NBP
Inventories
FAO and Goudriaan 646 275 6.8
FAO and Haberl 846
EUROSTAT and Goudriaan 586 239
Spatially explicit erosion model
(sink)
4
Soil losses to rivers 9.6
Ecological sites 26
Regional soil C inventories (over
33% of EU25 area)
�17 � 33
Remote sensing
EOS-Terra-MODIS (optimized
against eddy sites)
879 510
CASA 494 3.3 � 1
Crop models applied over Europe
ORCHIDEE-STICS 1360 585 � 85 15 � 15
LPJml 482 1.3
Roth C �7.6
Cropland component fluxes were updated with observation and model-based methods. Except the losses to rivers, all flux
components have been estimated with the latest data and model versions. The uncertainties show the SD. NBPcorr is the carbon
sequestration in soil, corrected for F, D and E losses using Eqns (5) and (6). Values in bold were used in Fig. 1.
T H E E U R O P E A N C A R B O N B A L A N C E : PA R T 2 1419
r 2009 Blackwell Publishing Ltd, Global Change Biology, 16, 1409–1428

reported an observed spatial variability in HI of
selected crop species on the order of 35%, with an
additional long-term trend (1 0.4% yr�1) for species
like wheat, and no significant trend for maize. Such
variability of HI and also of belowground NPP
allocation depends on climate and practice, as
illustrated by Fig. 2d with the ORCHIDEE-STICS
results. As a test, applying the modeled spatially
variable maps of yield/NPP ratio to the FAO yield
statistics produces a 30% higher mean NPP for wheat
than using the fixed Goudriaan factors. From these
various combinations, as seen in Table 4, we conclude
that there is a 30% uncertainty on EU-25 cropland NPP
due to uncertain allocation parameters.
The second source of discrepancy in cropland NPP
estimates lies in the estimates of cropland area.
Fortunately, the cropland area definition (LUCAS) we
used in this synthesis is very close to the one of FAO,
but uncertainties in area must not be ignored. Because
of definitional differences (crop rotation, mosaic of
cultivated and natural ecosystems) cropland area
differs, for instance, by 30% (0.3� 106 km2) between
the CORINE database and FAO (CORINE being
higher), which translates into an equivalent difference
in NPP, when using a similar NPP per unit area.
The models used in this study (i.e. ORCHIDEE-
STICS and LPJmL) do not use HI to derive NPP. For
ORCHIDEE-STICS, the uncertainty in yield predictions
from the models is given by the uncertainty in yield and
biomass which has been reported at 15% (Brisson et al.,
2002). LPJmL uses allocation factors (Bondeau et al.,
2007), hence, uncertainties are in the same order of
magnitude as the NPP to yield conversions (i.e. 30%)
For the LUE-approaches (i.e. CASA and MODIS-2007)
we estimated an uncertainty of around 22% based on
the two estimates presented in this paper (‘Net primary
production’). Because the modeled uncertainties in
yield are lower than the uncertainties in the NPP
estimates derived from yield statistics, we recommend
to directly compare modeled with observed yield,
rather than to convert yield data to NPP.
In summary, the largest sources of uncertainty when
estimating NPP from yield inventory statistics are, in
decreasing order of importance: (i) the NPP definition
[35% bias between total NPP and Eqn (1) NPP], (ii)
allometry (30% random error), (iii) cropland area (up to
30% bias between CORINE and FAO areas) and (iv)
input yield data themselves (14% bias between
EUROSTAT and FAO yields). Given these sources of
bias and errors, one must be very careful when cross
validating models with yield statistics (Bondeau et al.,
2007; Gervois et al., 2008). In this respect, we
recommend to strictly use the same area, and to
compare modeled with observed yield in addition to
comparing modeled NPP to NPP derived from yield
data.
Cropland ecosystem carbon losses
Harvest. Over the period 1990–1999, the mean crop
harvest, or yield, (H) over the EU-25 territory was 275
and 239 g C m�2 yr�1, for the FAO and the EUROSTAT
yield datasets, respectively [using the same DM and CC
factors as in Eqn (2)]. From these data, we infer a mean
ratio H/NPP 5 0.4. Figure 3c provides a map of the
spatial distribution of H in ORCHIDEE-STICS, as an
area weighted average of the three modeled crop
varieties in each 10 km cell. Figure 3b provides the
corresponding map of H/NPP ratios. The regional
patterns of H in Fig. 3c result from variable climate
and soils, from variable fractional coverage of each
variety, and from differing amounts of maize
irrigation and of fertilizer application (impacting C
allocation). Although the spatial distribution of H is
linearly related to that of NPP in Fig. 2, there is a
residual variability on the order of 15% in the ratio
H/NPP, which reflects allometry variations and should
be accounted for in refining future data-oriented
estimates of H from NPP.
Heterotrophic respiration. Cropland heterotrophic
respiration (Rh) stems from decomposition of soil
organic matter in croplands (Rh1) and decomposition
of crop products ingested by humans and livestock,
including ingestion of crop products imported from
outside the EU-25 (Rh2). The trade balance respiration
is estimated below. The annual storage of harvest (H)
being a negligible fraction of the total flux, we have
Rh2 5 H. The flux Rh1 is calculated as a residual by
Rh1 5 NPP�Rh2�T 1 E�D�F�NBP. Rh1 is estimated at
299 g C m�2 yr�1, with harvest from FAO statistics and
mean NBPcorr from the ORCHIDEE-STICS, LPJml and
RothC models (see ‘Materials and methods’). This gives
a fraction of 65% of the total NPP being available for soil
respiration, similar to the soil chamber measurements
derived estimate of 60% determined by Moureaux et al.
(2008) over a Belgian winter wheat field.
Because NBP is such a small fraction of NPP in
cultivated lands, the total Rh 5 Rh1 1 Rh2 amounts to
98% of NPP at EU-25 level, but Rh can also exceed NPP
locally in regions behaving as C sources. The
heterotrophic respiration component Rh1 respired by
soils is twofold smaller than Rh2 respired by humans
and animals after ingestion of crop products (Fig. 2).
The carbon sequestration efficiency (CE) of croplands,
defined as the ratio NBP/NPP, ranges from �0.03 to
0.01. This CE range is low compared to the values of
other ecosystems. In grasslands CE equals 0.13, and in
1420 P. C I A I S et al.
r 2009 Blackwell Publishing Ltd, Global Change Biology, 16, 1409–1428

forests CE is 0.2; (Ciais et al. and Luyssaert et al., this
thematic issue). The smaller CE values in croplands
reflect a smaller return of carbon to the soil, coupled
with an accelerated decomposition of soil organic
matter due to plowing (e.g. destruction of soil micro
aggregates and oxygenation). At face value, improved
cropland management can greatly increase cropland
soil C sequestration (Smith et al., 2008a, b).
Human and animal digestion of H corresponds to
most of the heterotrophic respiration component Rh2.
This flux has a nonuniform pattern across the EU-25,
with higher values in cities and regions of intensive
farming, where domestic animals ingest crop feedstock
in addition to local forage (Ciais et al., 2007). Locally, Rh2
can then be a significant source of CO2 to the
atmosphere, reaching up to 100 g C m�2 yr�1 over large
cities (see Fig. 4 in Ciais et al., 2007). When working at
EU-25 scale, we need to correct the Rh2 component for
the digestion and respiration of crop products
associated with trade.
C balance of crop product trade. Across the EU-25
boundaries, the trade, consumption, and respiration of
imported and exported crop products causes a net CO2
flux T, to the atmosphere. The import of food products
slightly exceeds the export, leaving a small source of
CO2 to the atmosphere T 5 6.8 g C m�2 yr�1 over the EU-
25 (Ciais et al., 2008). Note that, although small, the
magnitude of this net source of CO2 due to imported
food/feed is comparable to the NBP. This flux should be
accounted for when comparing the carbon budget from
atmospheric observations against the carbon budget
from upscaled field-observations.
Fires. EU-25 agricultural fire emissions F, amount to
3.3 � 1 g C m�2 yr�1. Most fire emissions now occur in
Eastern European member states, where harvest
residues are more frequently burnt in the field. In EU-
25, the deliberate burning of agricultural residues was
officially banned in 1993 (except for specific crops).
Because agricultural fires are human-prescribed, their
reported inter-annual variation appears quite large,
similar to the one of forest fires for instance, which
themselves are expected to be more sensitive to climatic
variability. Further examination of annual F estimates
reveals that the random interannual variability appears
small, but there is a decreasing trend in F from an earlier
emission of 3.9 Tg C yr�1 in 1991 down to 2.9 Tg C yr�1
in 1993 (start of the residue burning ban) and a further
decrease thereafter (Giglio et al., 2006). From our
emissions dataset, we infer a negative trend in F of
�0.46 Tg C yr�1 (R2 5 0.95) after 2000, indicating
compliance to the fire regulations by the new Eastern
European EU-25 member states who joined the EU at
that time (Fig. 4).
Export of C from cropland soils to rivers. The export of
carbon of atmospheric origin from cropland soils into
rivers (D) is 9.6 g C m�2 yr�1. The corresponding carbon
flux in rivers is 12 Tg C yr�1 over the EU-25 based upon
the CORINE area and includes atmospheric-derived
DIC by mineral alteration and weathering processes,
and export of DOC and POC. To our knowledge, there is
no estimate of how much of the total flux D results from
recently added C (agriculture and domestic waste) and
from older C (erosion of soil organic matter pools, and
from natural ecosystems at steady state). Typically 30%
of D could come from old pools, against 70% from more
recently added C pools, but the anthropogenic fraction
of this latter flux is not known (Ciais et al., 2008).
Export of C from cropland soils by erosion. For the EU-25,
the ‘gross’ C flux of cropland soils displaced by erosion,
estimated from the high-resolution maps of Van Oost
et al. (2007), amounts to 45 g C m�2 yr�1. Van Oost et al.
(2007) indicate that most of this gross flux removed
from arable soils gets re-deposited elsewhere, yielding a
net erosion sink (E) of 4 g C m�2 yr�1. At EU-25 scale, the
erosion must be used to correct NBP derived from soil
carbon inventories. Otherwise, all the soil C change
measured by inventories will be considered as a flux
exchanged with the atmosphere, whereas part of this C
flux is translocated and reburied by erosion processes
(Fig. 1).
Net biome production
Observed NBP from site studies and national and regional
soil C inventories. Eddy covariance observations of the
0
1
2
3
4
5
6
1996 1998 2000 2002 2004 2006 2008
Em
issi
ons
(t g
C y
r–1)
Fig. 4 Annual EU-25 agricultural fire emissions deduced from
MODIS burned area data incorporated in the CASA ecosystem
model by Van der Werf et al. (2006) (GFEDv2). The date after
which fire emissions started to decrease corresponds to a ban on
burning harvest residues implemented in new Eastern European
member states.
T H E E U R O P E A N C A R B O N B A L A N C E : PA R T 2 1421
r 2009 Blackwell Publishing Ltd, Global Change Biology, 16, 1409–1428
net CO2 exchange (NEE) of croplands are becoming
avaiable and support a net CO2 uptake of �34 to
�193 g C m�2 yr�1 for different crops over several
years (Anthoni et al., 2004; Aubinet et al., 2009).
However, exports need to be deducted from the NEE
to obtain NBP. The mean NBP from five European
cropland sites including 20 site years of eddy
covariance measurements was 88 � 56 g C m�2 yr�1.
However, these flux data suffer from lacking
representativity and high year-to-year variability due
to climate and management variability (W.L. Kutsch,
unpublished results), hence, intensive site studies do
not have sufficient coverage to derive an upscaled
estimate of cropland NBP at the EU-25 scale.
A more robust estimation of cropland NBP can be
derived from repeated soil carbon inventories assuming
no net change in biomass stocks. A compilation of NBP
data from long term study sites and national and
regional gridded inventory measurements including
repeated soil C stock measurements in the EU-25 is
given in Table 3. Worth noting is that only two studies
out of ten reported the NBP of croplands to be a net
sink. The positive NBP at a study of field sites in North
Germany (Nieder & Richter, 2000) may be due to
improved management by decreasing the plowing
depth. Gridded inventories have a better spatial
representativity than sites to quantify NBP, but there
is no harmonized soil C change inventory for the EU-25.
Inventories were conducted with different sampling
depth and time periods of repeated sampling.
However, they cover 33% of European croplands with
long-term integration on different crop rotations and
interannual climate variability. Reported soil C stock
changes were between �91 and 19 g C m�2 yr�1.
Highest C losses reported from the Finish inventory
(Makela-Kurtto & Sippola, 2002) may be due to the
cultivation of organic soils (peatlands) which are
especially susceptible to disturbances by tillage and
drainage. Changes in management practice such as
manure application was found to decrease soil C
stocks in Belgium (Sleutel et al., 2007). A detailed
repeated gridded soil inventory over England and
Wales at 5 km resolution (Bellamy et al., 2005) shows
practically no change in cropland soil carbon
concentrations during 1978–2003, in contrast with
larger C losses from other land use types. However,
this inventory lacks data on bulk densities to derive
reliable soil C stocks. Smith et al. (2007) suggested that
only a small percentage of the reported C loss in
England and Wales could be attributed to climate
change. In France, a recent study combining inventory
data (0–30 cm) and more than a million surface samples,
suggests a net soil carbon loss from agriculture of
53 Mt C yr�1 between 1990–1995 and 1999–2004,
equivalent to a loss 16 g C m�2 yr�1 (Arrouays et al.,
2002; Antoni & Arrouays, 2007). The median NBP
value of area-weighted national and regional soil C
inventories as summarized in Table 3, provides a net
soil carbon loss of 17 � 33 g C m�2 yr�1 (range �91
to 1 19 g C m�2 yr�1).
NBP from models. The three process-oriented models
ORCHIDEE-STICS, RothC, and LPJml were used to
derive NBP estimates. The ORCHIDEE-STICS model,
initialized with ancestral farming practice and crop
varieties in 1900 and integrated over the past century,
provides an NBP of 15 � 15 g C m�2 yr�1 over the
period 1990–1999 (small sink). The spatial distribution
of NBP (Fig. 3e) shows common patterns with the
distribution of NPP, with regional sinks in Central and
Eastern Europe and regional sources in the Iberian
Peninsula, the latter reflecting warming and drying
trends. Most of the NBP is explained in this model by
changes in agricultural technology, with a small
contribution of recent climate change over Southern
Europe (Gervois et al., 2008). RothC provides an NBP
of �7.6 g C m�2 yr�1 over 1990–1999 (small source). For
the same period, LPJml estimates NBP a nonsignificant
sink of 1.3 g C m�2 yr�1. Also here, the result is extremely
dependent on assumptions about the management
options employed and how these have changed over
recent decades. For example, reduced tillage, increased
irrigation, and increased fertilizer use, could increase soil
carbon sequestration (toward a sink), but soil erosion
(not accounted for within the model) would increase the
source. In summary, the three process models integrated
over Europe predict mean NBP of different sign, but
agree on the relatively small absolute magnitude of NBP.
All models sensitivity tests point to the strong sensitivity
of NBP to the assumed choice and past history of
management options.
In both ORCHIDEE-STICS and RothC, the simulated
soil C dynamics included the effect of past changes in
agricultural technology on input and tillage, as well as
the effects of climate and atmospheric CO2 changes. The
spatial pattern of NBP shows a similar pattern to NPP
and to NPP changes (Fig. 3). This pattern can be
explained by technology changes (490%) rather than
by climate and CO2 (o10%) (Gervois et al., 2004). The
only regions where climate change seems to have
impacted agricultural soil C storage in comparable
magnitude with technology, via an increase in Rh1
and a precipitation-induced reduction in soil C inputs,
are the Iberian Peninsula and some southern
Mediterranean regions.
Past and future trends in NBP. In the ORCHIDEE-STICS
simulation during the 20th Century, most of the C
1422 P. C I A I S et al.
r 2009 Blackwell Publishing Ltd, Global Change Biology, 16, 1409–1428

initially contained in the slow and passive soil C pools
(mean residence times of 1000–100 years) was quickly
lost between 1950 and 1980 through increased tillage,
but a reversal in NBP occurred in the 1980s. Active C
pools increased since the 1980s in response to increasing
crop NPP, but at a slower rate than the initial loss,
because it takes a long time to replenish the slow C
pools. This is why ORCHIDEE-STICS provides a net
soil C loss during 1950–2000, but a net C gain (NBP40)
during the sub-period 1980–2000. For the future, Smith
et al. (2005a) reported that projected climate change to
2080 might have limited impact on cropland NBP due
to the balancing effects of increased losses due to faster
decomposition and increased inputs due to choice of
crops/harvestable fraction and improved technology.
They attributed uncertainties in future projections
mainly to differences in projected climate (2000–2080)
by four GCMs forced by the four IPCC SRES emission
scenarios, and differing assumptions about the
implementation of technology. Smith et al. (2005a) also
suggested that croplands could become a net carbon
sink under improved technology, but the uncertainty
(due to climate projections and interactions between
decomposition, NPP and technology) was also large,
with a 9% uncertainty due to forecast changes in
technology alone.
Comparison with earlier estimates. Regional inventories
and two out of the three models indicate that croplands
are a net source of CO2 to the atmosphere, but this
source is five times smaller than the large positive flux
(90 � 50 g C m�2 yr�1) given by Janssens et al. (2003,
2005), based upon output from the CEASR model of
Vleeshouwers & Verhagen (2002). ORCHIDEE-STICS,
RothC and LPJml have more detailed soil carbon
decomposition parameterization than CESAR and use
longer initialization phases, reducing the risk of model
drift or transient behavior at the start of the study
period. Most likely, the use of only one soil carbon
pool in CESAR overestimated the soil carbon losses as
reported by Janssens et al. (2003). Moreover, comparison
of carbon sequestration potential in Europe with other
studies (Smith et al., 2005b), suggests that CESAR
produces larger responses than other methods/models.
Agriculture in Europe has changed greatly over the
past two decades with yields increasing (Ewert et al.,
2005) but the carbon returns to the soil are reported not
keeping pace with the yield increase, due to an
opposing trend in harvest index (Hay, 1995). Changes
in agricultural practice, with a shift from organic to
mineral fertilizers, and within the organic fertilizers,
from dry lot manure to liquid slurries due to changes in
animal housing (Sleutel et al., 2003) also decreased the
carbon inputs to cropland soils. These factors act to
drive NBP into a C source to the atmosphere. In the
opposite direction, increasing the area of set-a-side, and
more extensive rotations during the 1990s, have begun
to address this longer term loss of soil C such that
during the 1990s, cropland soils appear to be
approximately in balance (Smith et al., 2005a), in
agreement with our results, and certainly less of a
source than suggested in Janssens et al. (2003).
Contribution of land use change to NBP. We found with the
ORCHIDEE-STICS model prescribed with changes in
land use since 1901 that the abandonment of arable land
Fig. 5 N2O emissions by cropland soils for the EU-25 countries.
T H E E U R O P E A N C A R B O N B A L A N C E : PA R T 2 1423
r 2009 Blackwell Publishing Ltd, Global Change Biology, 16, 1409–1428
over the EU-25 during the past 50 years has caused a
significant net sink of 7.7 g C m�2 yr�1 (sink given per
unit area of land that was formerly under cultivation in
1901). However, there is large uncertainty in this
estimate because the historical land use changes are
poorly quantified in terms of both spatial and temporal
resolution (Jain & Yang, 2005; Houghton, 2007). This
NBP component was not counted as part of cropland
NBP, as it concerns lands that are no longer arable. The
C balance of these forest plantations and grasslands
established over arable fields is counted in the numbers
of Part 1 and Part 3 of this thematic issue.
Bridging the gap between inventory and model NBP
estimates. The inventory and the modeling approach
do not estimate the same components of NBP, because
of differences between the system’s boundaries and
different time periods covered. NBP is therefore by
definition, not consistent between inventoried soil C
changes and process-model calculations. Inventories
only accounts for field-scale soil C changes, implicitly
discounted for the river flux D. However, the erosion
flux E represents C re-deposited and reburied into
deeper horizons or other land use types (Bellamy
et al., 2005).
The DOC and POC flux from croplands, D, is
estimated from river catchment data (Ciais et al.,
2008). The net C flux from erosion, E, is estimated by
Caesium-137 profiles as resulting from the balance of
three processes: (1) removal of old SOC and its
replacement by fresh plant input, (2) burial in deep
soil horizons and (3) enhanced SOC decomposition
during lateral transport. The sum of these three
processes is a net sink, thus implying a net decrease
in decomposition rates of SOC during its transport by
erosion processes. Owing to their respective
methodologies, D does not include E, because E
measures carbon that is removed from cropland soils
but redeposited on land, and D measures carbon removed
from cropland soils but transported to estuaries.
Owing to erosion, a net sink of 4 g C m�2 yr�1 (i.e.
erosion translocates C from fast soil pools to longer
mean residence time pools in sediments where it is not
decomposed; see ‘Cropland ecosystem carbon losses’),
must be added to the inventoried soil C change to allow
comparison with NBP calculated by process-models.
These models assume a ‘vertical’ 1�D closure of their
C budget in each grid cell, implicitly accounting for
local erosion translocation (E), but ignoring losses to
rivers (D). Moreover, in ORCHIDEE-STICS and RothC,
CO2 losses to the atmosphere due to the burning of
straw and stubble residues, F, are not modeled. This
causes an overestimate of C inputs to the soil in these
two models, and subsequently of NBP. LPJml assumes
90% of the residues to be exported, and includes the
burning practice (Bondeau et al., 2007). Therefore, D and
F must be removed from the modeled NBP (except for
LPJml) to allow comparison with NBP measured by
inventories.
In order to consistently compare inventories and
model NBP, we corrected in Table 4 the inventory
NBP by adding the net sink E, and the modeled NBP
by subtracting fire emissions (F) and the flux lost to
rivers (D). Only a fraction (n of the ‘avoided input’ to the
soil which is lost by fires would actually be sequestered
to increase NBP. We used n5 0.05 diagnosed from the
ratio of NBP to soil inputs in ORCHIDEE-STICS.
NBPinventory corr ¼ NBPinventory þ E: ð5Þ
NBPmodel corr ¼ NBPmodel � nF�D: ð6Þ
Equations (5) and (6) provide NBPinventory corr 5
�13 � 33 g C m�2 yr�1 and NBPmodel corr 5�8.3 �11g C m�2 yr�1 from the median value and stdandard
deviation of the three models after correction (Table 4).
The new corrected estimates are consistent with each
other, with an 85% probability of being identical within
their errors (based on a t-test).
Other sources of bias in process model NBP are the
lack of information about practice, and model structural
limitations. In ORCHIDEE-STICS for instance, the
largest source of error according to Gervois et al.
(2008) is the parameterization of tillage effects on soil
C decomposition. A future step to further investigate
the consistency between model and inventories NBP
would be to cross validate the model results against
inventories over the same regions of Europe.
N2O emissions
UNFCCC statistics over croplands and the fuzzy logic
model lead to a mean annual N2O emission by EU-25
cropland soils of 0.44 � 0.07 and 0.48 � 0.07 g
N2O m�2 yr�1, respectively. Direct emissions for mineral
soils and histosols contribute with 0.25 and
0.24 gN2O m�2 yr�1 to N2O emissions from croplands.
Based on their IPCC SAR radiative forcing at 100-year
horizon (IPCC, 2007), direct and indirect N2O emissions
therefore equal 37–41 g C Eq m�2 yr�1 and thus cancel
all the NBP.
At the country level, estimates of direct emissions
based on the fuzzy logic approach are higher for those
countries which are exposed to climatic conditions
favoring freeze–thaw cycles in winter and early spring
(Austria, Baltic States, Poland, Slovakia and Czech
Republic). Fuzzy logic emission estimates are in general
lower than the UNFCCC based estimate for regions
1424 P. C I A I S et al.
r 2009 Blackwell Publishing Ltd, Global Change Biology, 16, 1409–1428

which are rarely exposed to freeze–thaw cycles (Bel-
gium, Netherlands, UK and France). Main disagree-
ment between estimates is observed for Greece with
fertilization-based direct emission coefficients of 1% vs.
0.4% for the fuzzy logic model and the UNFCCC
statistics, respectively. Despite major methodological
differences between the UNFCCC statistics and the
fuzzy logic approach, the mean annual N2O emission
by EU-25 cropland soils of the two approaches matches
very well.
Figure 6 shows lower emissions over eastern EU-25
countries. Compared with high-density areas of plot-
sized measured annual N2O budgets at croplands
(Central and West Europe) those regions are often
characterized by climatic conditions that favor high
emission rates. If these eastern countries continue to
intensify their agriculture in the near future, and soon
apply the same amounts of N-fertilizer as those cur-
rently applied in western countries, we expect a near
doubling of N2O emissions. N2O emissions will then
become the main source of concern in assessing the
impact of agriculture on climate.
Methane
Most agricultural crops in Europe are on aerobic soils,
so methane sources are very low, occurring only from
anaerobic microsites especially after manure applica-
tion. Methanogenesis is restricted to completely anae-
robic soil conditions as occur in rice paddies when the
soils are flooded. These CH4 emissions were estimated
at 1.3 Tg C Eq yr�1 over the EU-25 (Freibauer, 2003).
Indeed cropland soils are known to be a sink for
methane, and provide overall net oxidation of methane,
though the sink capacity of cropland soils is consider-
ably lower than that of aerobic grassland or forest soils
(Willison et al., 2005). Strength of the methane sink was
estimate at 0.05 g CH4 m�2 yr�1 or 4.9 Tg C Eq yr�1 for
the EU-25. At the European scale the net exchange of
methane i.e. 3.3 g C Eq m�2 yr�1 is small compared to
the net CO2 flux from croplands.
Conclusions and recommendations
We have shown in this paper that NBP of three spatially
explicit models and 10 sites or regional inventories
studies agree on the magnitude of the cropland NBP.
Cropland NBP in EU-25 is a small source or sink, and
this is a major revision to the earlier estimated strong
source suggested by Janssens et al. (2003). The major
driver of NBP is likely to be current and past manage-
ment. NBP follows NPP, but the NBP–NPP relationship
is modulated by agricultural management practice im-
pacting the litter input (fate of residues) and the decom-
position of soil organic matter (tillage).
Cropland NPP estimated by models, or inferred from
yield statistics, was found to be in the range
451–595 g C m�2 y�1 (excluding NPPresidual). Compared
with the NPP values compiled for forests and grass-
lands NPP of crops is on average similar to that of
forests, but lower than that of grasslands.
The carbon sequestration efficiency (CE 5 NBP/NPP)
of croplands is very small: CE 5�0.03 to 0.03 compared
with grasslands (CE 5 0.13) and forests (CE 5 0.2). This
is supported by analyses of long-term measurements of
NBP or SOC, which show conversion of either forest or
grassland to croplands results in very significant losses
of SOC (Guo & Gifford, 2002). However, because a
different fraction of NPP is harvested in each of the
three ecosystems, the ratio of NBP to the C input to the
soil (I 5 NPP�H) is more appropriate to compare than
the ratio NBP/NPP. This ratio equals 0.23 for forests,
0.29 for grasslands, and from 6 to 25� 10�4 for crop-
lands. This indicates that per unit of input, the seques-
tration in cropland soils is much less efficient than in
other biomes, possibly as a result of soil tillage.
Latit
ude
Longitude
(a) (b)
Statistic-based emission factor Fuzzy-based emission factor
Latit
ude
Longitude
Fig. 6 N2O emissions per ha of croplands for the EU-25 countries.
T H E E U R O P E A N C A R B O N B A L A N C E : PA R T 2 1425
r 2009 Blackwell Publishing Ltd, Global Change Biology, 16, 1409–1428
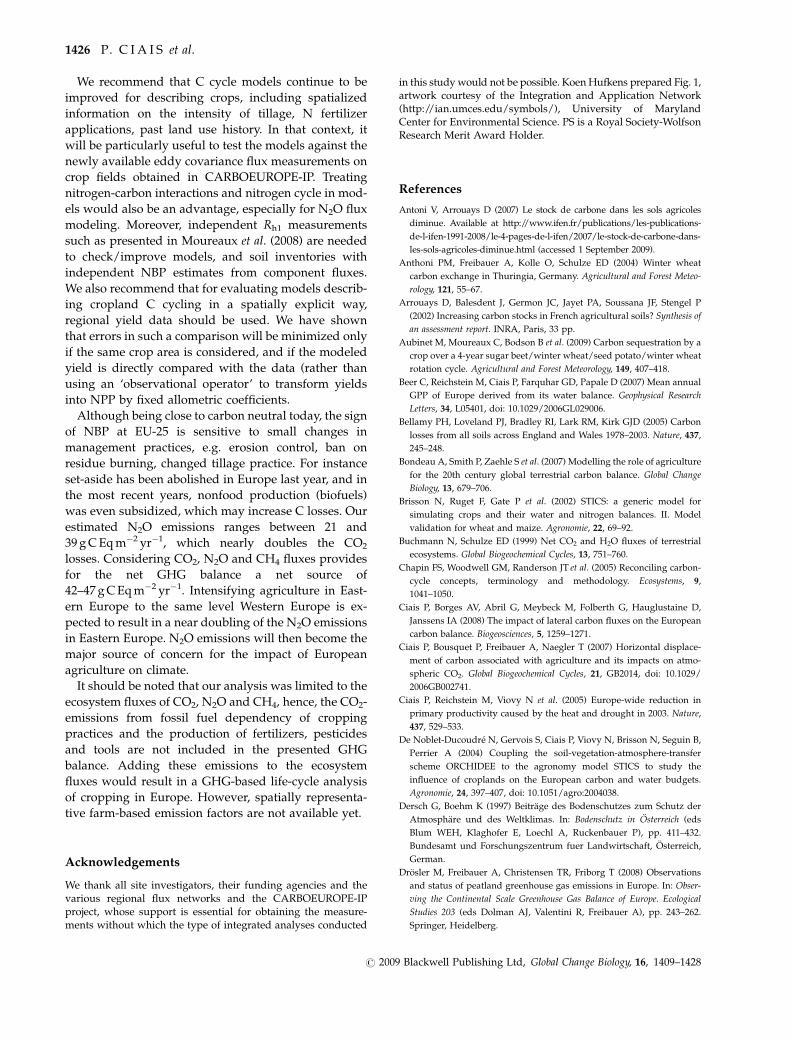
We recommend that C cycle models continue to be
improved for describing crops, including spatialized
information on the intensity of tillage, N fertilizer
applications, past land use history. In that context, it
will be particularly useful to test the models against the
newly available eddy covariance flux measurements on
crop fields obtained in CARBOEUROPE-IP. Treating
nitrogen-carbon interactions and nitrogen cycle in mod-
els would also be an advantage, especially for N2O flux
modeling. Moreover, independent Rh1 measurements
such as presented in Moureaux et al. (2008) are needed
to check/improve models, and soil inventories with
independent NBP estimates from component fluxes.
We also recommend that for evaluating models describ-
ing cropland C cycling in a spatially explicit way,
regional yield data should be used. We have shown
that errors in such a comparison will be minimized only
if the same crop area is considered, and if the modeled
yield is directly compared with the data (rather than
using an ‘observational operator’ to transform yields
into NPP by fixed allometric coefficients.
Although being close to carbon neutral today, the sign
of NBP at EU-25 is sensitive to small changes in
management practices, e.g. erosion control, ban on
residue burning, changed tillage practice. For instance
set-aside has been abolished in Europe last year, and in
the most recent years, nonfood production (biofuels)
was even subsidized, which may increase C losses. Our
estimated N2O emissions ranges between 21 and
39 g C Eq m�2 yr�1, which nearly doubles the CO2
losses. Considering CO2, N2O and CH4 fluxes provides
for the net GHG balance a net source of
42–47 g C Eq m�2 yr�1. Intensifying agriculture in East-
ern Europe to the same level Western Europe is ex-
pected to result in a near doubling of the N2O emissions
in Eastern Europe. N2O emissions will then become the
major source of concern for the impact of European
agriculture on climate.
It should be noted that our analysis was limited to the
ecosystem fluxes of CO2, N2O and CH4, hence, the CO2-
emissions from fossil fuel dependency of cropping
practices and the production of fertilizers, pesticides
and tools are not included in the presented GHG
balance. Adding these emissions to the ecosystem
fluxes would result in a GHG-based life-cycle analysis
of cropping in Europe. However, spatially representa-
tive farm-based emission factors are not available yet.
Acknowledgements
We thank all site investigators, their funding agencies and thevarious regional flux networks and the CARBOEUROPE-IPproject, whose support is essential for obtaining the measure-ments without which the type of integrated analyses conducted
in this study would not be possible. Koen Hufkens prepared Fig. 1,artwork courtesy of the Integration and Application Network(http://ian.umces.edu/symbols/), University of MarylandCenter for Environmental Science. PS is a Royal Society-WolfsonResearch Merit Award Holder.
References
Antoni V, Arrouays D (2007) Le stock de carbone dans les sols agricoles
diminue. Available at http://www.ifen.fr/publications/les-publications-
de-l-ifen-1991-2008/le-4-pages-de-l-ifen/2007/le-stock-de-carbone-dans-
les-sols-agricoles-diminue.html (accessed 1 September 2009).
Anthoni PM, Freibauer A, Kolle O, Schulze ED (2004) Winter wheat
carbon exchange in Thuringia, Germany. Agricultural and Forest Meteo-
rology, 121, 55–67.
Arrouays D, Balesdent J, Germon JC, Jayet PA, Soussana JF, Stengel P
(2002) Increasing carbon stocks in French agricultural soils? Synthesis of
an assessment report. INRA, Paris, 33 pp.
Aubinet M, Moureaux C, Bodson B et al. (2009) Carbon sequestration by a
crop over a 4-year sugar beet/winter wheat/seed potato/winter wheat
rotation cycle. Agricultural and Forest Meteorology, 149, 407–418.
Beer C, Reichstein M, Ciais P, Farquhar GD, Papale D (2007) Mean annual
GPP of Europe derived from its water balance. Geophysical Research
Letters, 34, L05401, doi: 10.1029/2006GL029006.
Bellamy PH, Loveland PJ, Bradley RI, Lark RM, Kirk GJD (2005) Carbon
losses from all soils across England and Wales 1978–2003. Nature, 437,
245–248.
Bondeau A, Smith P, Zaehle S et al. (2007) Modelling the role of agriculture
for the 20th century global terrestrial carbon balance. Global Change
Biology, 13, 679–706.
Brisson N, Ruget F, Gate P et al. (2002) STICS: a generic model for
simulating crops and their water and nitrogen balances. II. Model
validation for wheat and maize. Agronomie, 22, 69–92.
Buchmann N, Schulze ED (1999) Net CO2 and H2O fluxes of terrestrial
ecosystems. Global Biogeochemical Cycles, 13, 751–760.
Chapin FS, Woodwell GM, Randerson JT et al. (2005) Reconciling carbon-
cycle concepts, terminology and methodology. Ecosystems, 9,
1041–1050.
Ciais P, Borges AV, Abril G, Meybeck M, Folberth G, Hauglustaine D,
Janssens IA (2008) The impact of lateral carbon fluxes on the European
carbon balance. Biogeosciences, 5, 1259–1271.
Ciais P, Bousquet P, Freibauer A, Naegler T (2007) Horizontal displace-
ment of carbon associated with agriculture and its impacts on atmo-
spheric CO2. Global Biogeochemical Cycles, 21, GB2014, doi: 10.1029/
2006GB002741.
Ciais P, Reichstein M, Viovy N et al. (2005) Europe-wide reduction in
primary productivity caused by the heat and drought in 2003. Nature,
437, 529–533.
De Noblet-Ducoudre N, Gervois S, Ciais P, Viovy N, Brisson N, Seguin B,
Perrier A (2004) Coupling the soil-vegetation-atmosphere-transfer
scheme ORCHIDEE to the agronomy model STICS to study the
influence of croplands on the European carbon and water budgets.
Agronomie, 24, 397–407, doi: 10.1051/agro:2004038.
Dersch G, Boehm K (1997) Beitrage des Bodenschutzes zum Schutz der
Atmosphare und des Weltklimas. In: Bodenschutz in Osterreich (eds
Blum WEH, Klaghofer E, Loechl A, Ruckenbauer P), pp. 411–432.
Bundesamt und Forschungszentrum fuer Landwirtschaft, Osterreich,
German.
Drosler M, Freibauer A, Christensen TR, Friborg T (2008) Observations
and status of peatland greenhouse gas emissions in Europe. In: Obser-
ving the Continental Scale Greenhouse Gas Balance of Europe. Ecological
Studies 203 (eds Dolman AJ, Valentini R, Freibauer A), pp. 243–262.
Springer, Heidelberg.
1426 P. C I A I S et al.
r 2009 Blackwell Publishing Ltd, Global Change Biology, 16, 1409–1428

EEA (2007) Update of Corine Land Cover 2000. European Environmental
Agency. Available at http://etc-lusi.eionet.europa.eu/CLC2006/
(accessed 1 September 2009).
EFMA (European Fertilizer Manufacturer Association) (2008) Available at
http://cms.efma.org/EPUB/easnet.dll/ExecReq/Page?eas:template_
im=000BC2&eas:dat_im=000C55 (accessed 1 September 2009).
EUROSTAT (2009) Available at http://epp.eurostat.ec.europa.eu/portal/
page/portal/agriculture/data/database (accessed 1 September 2009).
Ewert F, Rounsevell MDA, Reginster I et al. (2005) Future scenarios of
European agricultural land use. I: estimating changes in crop produc-
tivity. Agriculture, Ecosystems and Environment, 107, 101–116.
FAO (Food and Agriculture Organization of the United Nations) (2009)
Food and Agriculture Organizaion Agricultureal Database. Available
at http://faostat.fao.org/site/567/default.aspx#ancor (accessed 2
September 2009).
Fardeau JC, Guiraud C, Thiery J, Morel C, Boucher B (1988) Taux net
annuel de minealisation de la matiere organique des sols de grande
culture de Beauce. Consequences pour l’azote. Comptes Rendus del
Academie Agricole, 74, 61–70.
Feser F, Weisse R, von Storch H (2001) Multi-decadal atmospheric
modeling for Europe yields multi-purpose data. EOS Transactions, 82,
305–310.
Freibauer A (2003) Regionalised inventory of biogenic greenhouse gas
emissions from European agriculture. European Journal of Agronomy, 19,
135–160.
Gervois S (2004) Les zones agricoles en Europe: evaluation de leur role sur les
bilans d’eau et de carbone a l’echelle de l’Europe; sensibilite de ces bilans aux
changements environnementaux sur le vingtieme siecle. PhD Thesis
(in French), Univ. Pierre et Marie Curie Paris, 252 pp.
Gervois S, Ciais P, Noblet-Ducoudre N, Brisson N, Vuichard N, Viovy N
(2008) The carbon and water balance of European croplands through-
out the 20th Century. Global Biogeochemical Cycles, 22, GB2022,
doi: 10.1029/2007GB003018.
Gervois S, de Noblet-Ducoudre N, Viovy N, Ciais P, Brisson N, Seguin B,
Perrier A (2004) Including croplands in a global biosphere model:
methodology and evaluation at specific sites. Earth Interactions, 8,
1–25, doi: 10.1175/1087-3562(2004)8.
Giglio L, van der Werf GR, Randerson JT, Collatz GJ, Kasibhatla P (2006)
Global estimation of burned area using MODIS active fire observations.
Atmospheric Chemistry and Physics, 6, 957–974.
Goidts E, van Wesemael B (2007) Regional assessment of soil organic
carbon changes under agriculture in Southern Belgium (1955–2005).
Geoderma, 141, 341–354.
Goudriaan J, Groot JJR, Uithol PWJ (2001) Productivity of agro-ecosys-
tems. In: Terrestrial Global Productivity (eds Roy J, Saugier B, Mooney
HA), pp. 303–314. Academic Press, San Diego.
Guo LB, Gifford RM (2002) Soil carbon stocks and land use change: a meta
analysis. Global Change Biology, 8, 345–360.
Haberl H, Erb KH, Krausmann F et al. (2007) Quantifying and mapping
the human appropriation of net primary production in earth’s terres-
trial ecosystems. Proceedings of the National Academy of Sciences of the
United States of America, 104, 12942–12945.
Hay RKM (1995) Harvest index: a review of its use in plant breeding and
crop physiology. Annals of Applied Biology, 126, 197–216.
Heidmann T, Christensen BT, Olesen SE (2002) Changes in soil C and N
content in different cropping systems and soil types. In: Greenhouse Gas
Inventories for Agriculture in the Nordic Countries (eds Petersen SO,
Olesen JE), pp. 77–86. Ministry of Food, Agriculture and Fisheries,
Danish Institute of Agricultural Sciences, Foulum, Denmark.
Houghton RA (2007) Balancing the global carbon budget. Annual Review
Earth Planetary Science, 35, 313–347.
Howard PJA, Loveland PJ, Bradley RI, Dry FT, Howard DM, Howard DC
(1995) The carbon content of soil and its geographical-distribution in
Great-Britain. Soil Use and Management, 11, 9–15.
IFA (2002) Fertilizer Use by Crop, 5th edn. International Fertilizer Indus-
try10 Association.11, Rome, Available at http://www.fertilizer.org/ifa/
statistics.asp.
IPCC (ed.) (2007) The Physical Science Basis Contribution of Working Group I
to the Fourth Assessment Report of the IPCC. Cambridge University Press,
Cambridge, New York.
Jacob D, Podzun R (1997) Sensitivity studies with the regional climate
model REMO. Meteorology and Atmospheric Physics, 63, 119–129.
Jain AK, Yang XJ (2005) Modeling the effects of two different land cover
change data sets on the carbon stocks of plants and soils in concert with
CO2 and climate change. Global Biogeochemical Cycles, 19, doi: 10.1029/
2004GB002349.
Janssens IA, Freibauer A, Ciais P et al. (2003) Europe’s terrestrial bio-
sphere absorbs 7 to 12% of European anthropogenic CO2 emissions.
Science, 300, 1538–1542.
Janssens IA, Freibauer A, Schlamadinger B et al. (2005) The carbon budget
of terrestrial ecosystems at country-scale – a European case study.
Biogeosciences, 2, 15–26.
Kalnay E, Kanamitsu M, Kistler R et al. (1996) The NCEP/NCAR 40-year
reanalysis project. Bulletin of the American Meteorological Society, 77,
437–471.
Kempen M, Heckelei T, Britz W, Leip A, Koeble R (2007) Computation of a
European Agricultural Land Use Map – Statistical Approach and Validation.
Technical Paper, Institute for Food and Resource Economics, Bonn.
Leff B, Ramankutty N, Foley J (2004) Geographic distribution of major
crops across the world. Global Biogeochemical Cycles, 18, GB1009,
doi: 10.1029/2003GB002108.
Leip A, Marchi G, Koeble R, Kempen M, Britz W, Li C (2008) Linking an
economic model for European agriculture with a mechanistic model to
estimate nitrogen and carbon losses from arable soils in Europe.
Biogeosciences, 5, 73–94.
Lettens S, van Orshoven J, van Wesemael B, Muys B, Perrin D (2005)
Soil organic carbon changes in landscape units of Belgium between
1960 and 2000 with reference to 1990. Global Change Biology, 11,
2128–2140.
Luyssaert S, Ciais P, Piao SL et al. (2009) The European carbon balance.
Part 3: forests. Global Change Biology, in press.
Makela-Kurtto R, Sippola J (2002) Monitoring of Finnish arable land:
changes in soil quality between 1987 and 1998. Agricultural and Food
Science in Finland, 11, 273–284.
Marcelis LFM, Heuvelink E, Goudriaan J (1998) Modelling biomass
production and yield of horticultural crops: a review. Scientia Horticul-
turae Amsterdam, 74, 83–111.
Mather AS, Needle CS, Fairbairn J (1998) Human drivers of global land
cover change: the case of forest. Hydrology Process, 12, 1983–1994.
Meybeck M, Ragu A (1996) River Discharges to the Oceans, An assessment of
suspended solids, major ions, and nutrients. Environment Information and
Assessment Rpt. UNEP, Nairobi, 250 pp.
Mitchell TD, Jones PD (2005) An improved method of constructing a
database of monthly climate observations and associated high-resolu-
tion grids. International Journal of Climatology, 25, 693–712.
Moureaux C, Debacq A, Hoyaux J et al. (2008) Carbon balance assessment
of a Belgian winter wheat crop (Triticum aestivum L.). Global Change
Biology, 14, 1353–1366, doi: 10.1111/j.1365-2486.2008.01560.x MODIS
2007. Available at http://modis.gsfc.nasa.gov/.
Nieder R, Richter J (2000) C and N accumulation in arable soils of West
Germany and its influence on the environment - Developments 1970 to
1998. Journal of Plant Nutrition and Soil Science-Zeitschrift Fur Pflanze-
nernahrung Und Bodenkunde, 163, 65–72.
Parton W, Stewart J, Cole C (1988) Dynamics of C, N, P, and S in grassland
soil: a model. Biogeochemistry, 5, 109–131.
Potter CS, Field CB, Randerson J, Matson PA, Vitousek PM, Mooney HA
(1993) A model of global net ecosystem production. Ecological Society of
America Bulletin, 74.
T H E E U R O P E A N C A R B O N B A L A N C E : PA R T 2 1427
r 2009 Blackwell Publishing Ltd, Global Change Biology, 16, 1409–1428

Ramankutty N, Foley JA (1999) Estimating historical changes in global
land cover: croplands from 1700 to 1992. Global Biogeochemical Cycles,
13, 997–1027.
Reichstein M (2006) Integration of FLUXNET and Earth observation data
with biogeochemical modelling. iLeaps Newsletter, 3, 32–34.
Rinklebe J, Makeschin F (2003) Der Einfluss von Acker- und Waldnutzung
auf Boden und Vegetation - ein Zeitvergleich nach 27 Jahren. Forstwis-
senschaftliches Centralblatt, 122, 81–98.
Rypdal K, Winiwarter W (2001) Uncertainties in greenhouse gas emis-
sions inventories - evaluation, comparability, and implications. Envir-
onmental Science and Policy, 4, 107–116.
Schulze ED, Heimann M (1998) Carbon and water exchange of terrestrial
systems. In: Asian Change in the Context of Global Change. Vol. 3, IGBP
Series (eds Galloway JN, Melillo J), pp. 145–161. Cambridge University
Press, Cambridge, UK.
Sitch S, Smith B, Prentice IC et al. (2003) Evaluation of ecosystem
dynamics, plant geography and terrestrial carbon cycling in the LPJ
dynamic global vegetation model. Global Change Biology, 9, 161–185.
Sleutel S, DeNeve S, Hofman G (2003) Estimates of carbon stock changes
in Belgian cropland. Soil Use and Management, 19, 166–171.
Sleutel S, De Neve S, Hofman G (2007) Assessing causes of recent organic
carbon losses from cropland soils by means of regional-scaled input
balances for the case of Flanders (Belgium). Nutrient Cycling in Agro-
ecosystems, 78, 265–278.
Smith J, Smith P, Wattenbach M et al. (2005a) Projected changes in mineral
soil carbon of European croplands and grasslands, 1990–2080. Global
Change Biology, 11, 2141–2152.
Smith P, Andren O, Karlsson T, Perala P, Regina K, Rounsevell M,
van Wesemael B (2005b) Carbon sequestration potential in European
croplands has been overestimated. Global Change Biology, 11,
2153–2163.
Smith P, Chapman SJ, Scott WA et al. (2007) Climate change cannot be
entirely responsible for soil carbon loss observed in England and
Wales, 1978–2003. Global Change Biology, 13, 2605–2609.
Smith P, Martino D, Cai Z et al. (2008a) Greenhouse gas mitigation
in agriculture. Philosophical Transactions of the Royal Society, B, 363,
789–813.
Smith PC, De Noblet-Ducoudre N, Ciais P, Peylin P, Viovy N (2009a)
European-wide simulations of present croplands using an proved
terrestrial biosphere model, Part 2: phenology and productivity. Journal
of Geophysical Research, in press.
Smith PC, Ciais P, Peylin P, De Noblet-Ducoudre N, Viovy N, Meurdesoif Y,
Bondeau A (2009b) European-wide simulations of present croplands using
an improved terrestrial biosphere model, Part 2: interannual variability
and carbon fluxes in 2003. Journal of Geophysical Research, in press.
Spitters CJT, Kramer T (1986) Differences between spring wheat cultivars
in early growth. Euphytica, 35, 273–292.
Stehfest E, Bouwman L (2006) N2O and NO emission from agricultural
fields and soils under natural vegetation: summarizing available
measurement data and modelling of global annual emissions. Nutrient
Cycling in Agroecosystems, 74, 207–228.
Thompson TRE, Bradley RI, Hollis JM, Bellamy PH, Dufour MJD (2005) Soil
information and its application in the United Kingdom: an update. In: Soil
Resources of Europe, European Soil Bureau Report No 9 (eds) Jones RJA,
Houskova B, Bullock P, Montanarella L. 2nd edn. Ispra, Italy, 420 pp.
Tomelleri E, Migliavacca M, Reichstein M (2008) Data oriented estimation
of European NEE and its Uncertainty. Geophysical Research Abstracts, 10,
09683.
Tucker CJ, Pinzon JE, Brown ME et al. (2005) An extended AVHRR 8-km
NDVI dataset compatible with MODIS and SPOT vegetation NDVI
data. International Journal of Remote Sensors, 26, 4485–4498.
Turner DP, Urbanski S, Bremer D, Wofsy SC, Meyers T, Gower ST,
Gregory M (2003) A cross-biome comparison of daily light use effi-
ciency for gross primary production. Global Change Biology, 9, 383–395.
UNFCCC (2008) Statistics. Available at http://unfccc.int/di/DetailedBy-
Party/Setup.do (accessed 18 November 2008).
Van der Werf GR, Randerson JT, Giglio L, Collatz GJ, Kasibhatla PS,
Arellano AF (2006) Interannual variability in global biomass burning
emissions from 1997 to 2004. Atmospheric Chemistry and Physics, 6,
3423–3441.
Van Oost K, Quine TA, Govers G et al. (2007) The impact of agricultural
soil erosion on the global carbon cycle. Science, 318, 626–629.
Vetter M, Churkina G, Bondeau A et al. (2007) Analyzing the causes and
spatial pattern of the European 2003 carbon flux anomaly in Europe
using seven models. Biogeosciences Discussion, 2, 1201–1240.
Vetter M, Churkina G, Jung M et al. (2008) Analyzing the causes and
spatial pattern of the European 2003 carbon flux anomaly in Europe
using seven models. Biogeosciences, 5, 561–583.
Vleeshouwers LM, Verhagen A (2002) Carbon emission and sequestration
by agricultural land use: a model study for Europe. Global Change
Biology, 8, 519–530.
Walter C, Bouedo C, Aurousseau P (1995) Cartographie communale des
teneurs en matiere organique des sols bretons et analyse de leurevolu-
tion temporelle de 1980 a 1995. Memoire ENSA Rennes, 3.
Willison TW, Goulding KWT, Powlson DS (2005) Effect of land-use
change and methane mixing ratio on methane uptake from United
Kingdom soil. Global Change Biology, 1, 209–212.
Zhao M, Heinsch FA, Nemani RR, Running SW (2005) Improvements of
the MODIS terrestrial gross and net primary production global data set.
Remote Sensing of Environment, 95, 164–117.
1428 P. C I A I S et al.
r 2009 Blackwell Publishing Ltd, Global Change Biology, 16, 1409–1428
Copyright © 2022 FDOKUMEN