Farooque et al. - 2014 - Measuring stem cell dimensionality in tissue scaffolds

Snake and Bird Predation Drive the RepeatedConvergent Evolution of Correlated Life History Traitsand Phenotype in the Izu Island Scincid Lizard(Plestiodon latiscutatus)Matthew C. Brandley1*, Takeo Kuriyama2, Masami Hasegawa2
1 School of Biological Sciences, University of Sydney, Sydney, NSW, Australia, 2 Faculty of Science, Toho University, Funabashi City, Chiba, Japan
Abstract
Predation may create strong natural selection pressure on the phenotype and life history characteristics of prey species. TheIzu scincid lizards (Plestiodon latiscutatus) that inhabit the four Japanese Izu Islands with only bird predators are drab brown,mature later, lay small clutches of large eggs, and hatch large neonates. In contrast, skinks on seven islands with both snakeand bird predators are conspicuously colored, mature early, lay large clutches of small eggs, and hatch small neonates. Wetest the hypothesis that these suites of traits have evolved independently on each island via natural selection pressures fromone of two predator regimes – birds-only and birds + snakes. Using two mtDNA genes and a nuclear locus, we infer a time-calibrated phylogeny of P. latiscutatus that reveals a basal split between Mikura and all islands south, and Miyake, all islandsnorth, and the Izu Peninsula. Populations inhabiting Miyake, Niijima, Shikine, and Toshima are not monophyletic, suggestingeither multiple colonizations or an artifact of incomplete lineage sorting (ILS). We therefore developed novel phylogeneticcomparative analyses that assume either a multiple colonization or more restrictive single colonization ILS scenario andfound 1) statistically significant support for the of different suites of phenotypic and life history characteristics with thepresence of bird-only or bird + snake predator assemblages, and 2) strong phylogenetic support for at least twoindependent derivations of either the ‘‘bird-only’’ or ‘‘snakes + birds’’ phenotypes regardless of colonization scenario. Finally,our time-calibrated phylogeographic analysis supports the conclusion that the ancestor to modern Izu Island P. latiscutatusdispersed from the mainland to the Izu proto-islands between 3–7.6 million years ago (Ma). These lineages remainedpresent in the area during successive formation of the islands, with one lineage re-colonizing the mainland 0.24-0.7 Ma.
Citation: Brandley MC, Kuriyama T, Hasegawa M (2014) Snake and Bird Predation Drive the Repeated Convergent Evolution of Correlated Life History Traits andPhenotype in the Izu Island Scincid Lizard (Plestiodon latiscutatus). PLoS ONE 9(3): e92233. doi:10.1371/journal.pone.0092233
Editor: Corrie S. Moreau, Field Museum of Natural History, United States of America
Received November 24, 2013; Accepted February 19, 2014; Published March 25, 2014
Copyright: � 2014 Brandley et al. This is an open-access article distributed under the terms of the Creative Commons Attribution License, which permitsunrestricted use, distribution, and reproduction in any medium, provided the original author and source are credited.
Funding: This research was partially supported by Grants-in-Aid for Scientific Research (C) from the Ministry of Education, Culture, Sports, Science, andTechnology to M.H. Hasegawa (19570026, 21570024 and 24570031), and the Sasakawa Scientific Research Grant from The Japan Science Society and the FujiwaraNatural History Foundation to T.Kuriyama. The funders had no role in study design, data collection and analysis, decision to publish, or preparation of themanuscript
Competing Interests: The authors have declared that no competing interests exist.
* E-mail: [email protected].
Introduction
Predation may result in strong selection on prey phenotype and
life history. For example, predation by visually-orienting predators
may impose a strong natural selection pressure to evolve a cryptic
color pattern in prey species, or life history traits that improve
predator avoidance [1]. Extensive studies of poeciliid fish have
demonstrated an association between high rates of predation and a
maternal life history strategy that favors early sexual maturity and
high fecundity (i.e., clutch size) at the expense of offspring size
(e.g., [2–5]). That this life history strategy has evolved multiple
times both within and amongst species in high predation
environments is strong evidence that this life history strategy is a
response to natural selection due to predation.
Detecting this convergent evolution of life history requires
knowledge of a species’ evolutionary and/or biogeographical
history. For example, if two populations share a unique phenotype,
but genetic data reveals they are also sister lineages, we could
conclude that the phenotype evolved once prior to the splitting of
the lineage. Similarly, if isolated habitats with no connectivity are
independently colonized by the same species, these populations
each become a ‘‘natural experiment’’ to test how species evolve in
response to different selection pressures.
Because oceanic islands form with no connection to the
mainland and are colonized only by limited dispersal, they serve
as ‘blank slates’ on which we can observe the varied outcome of
ecological and evolutionary processes. One such oceanic island
model system is the Japanese Izu Islands (Fig. 1). The Izu Islands
are an ideal study system because of their geologic and taxonomic
diversity, range in island size (approximately 10 to 9908 ha), and
distance of islands from the mainland (,23 to ,260 km). In
particular, the skink Plestiodon latiscutatus (formerly Eumeces okadae
[6]) inhabits all Izu Islands, yet one or more of its major predators
the Japanese weasel (Mustela itatsi), Izu Island Thrush (Turdus
celaenops), and four-lined ratsnake (Elaphe quadrivirgata) inhabits
every island (see Table 1). For example, M. itatsi is native only to
Oshima (although it was subsequently introduced to, and persists
in, Toshima, Miyake, Hachijojima and Aogashima [8–10]); at
PLOS ONE | www.plosone.org 1 March 2014 | Volume 9 | Issue 3 | e92233
least one species of predatory bird (especially T. celaenops) inhabits
all the major Izu Islands [11,12]; ratsnakes inhabit most, but not
all of the islands ([12]; Fig. 1). The islands’ similarity in climate and
vegetation makes them a unique test case to evaluate the effects of
different predator assemblages on the evolution of life history of
prey species. Moreover, as previous phylogeographic research has
revealed varied patterns of historical colonization of the Izu Islands
in Campanula plants [13,14], Euhadra snails [15], Apodemus mice
[16–18], and the four-lined ratsnake, Elaphe quadrivirgata [19], it is
likely that the order in which these islands were colonized would
also substantially affect subsequent ecological and phenotypic
evolution of the species community (e.g., whether the colonizer
was from a distant, mainland-adapted or closer, island-adapted
population).
Previous research has identified suites of life history traits in the
skink P. latiscutatus that appear to correlate with each island’s
predator assemblage [8,9,12,20–22]. For example, skinks on
Oshima (the largest island that is nearest to the mainland and
with the most taxonomically diverse assemblage of predators)
mature earlier with a small body and lay comparatively large
clutches of small eggs [12]. Whereas skinks that inhabit bird-only
islands mature later with a large body size and lay smaller clutches
with larger eggs [12]. Moreover, there are striking differences in
color pattern between P. latiscutatus populations that inhabit snake
+ bird and bird-only predator islands. Skinks on snake + bird
islands have a dorsal color pattern with vivid yellow stripes and
pronounced blue tail in juveniles ([24]; Fig. 1B), whereas skink
populations on bird-only islands are uniformly drab brown in
colour (Fig. 1C). Given the similar habitats amongst the islands,
these results suggest a causal link between the presence of
particular predators and the life history and color pattern
evolution of their skink prey.
Evidence that these phenotype and life history traits evolved
independently on two more islands with the identical suites of
predators would indicate that predator diversity was the primary
natural selection pressure. However, because phylogenetic infor-
mation was unavailable when these previous life history studies
were conducted, it was not possible to disentangle these potential
cases of repeated in situ convergent evolution via natural selection
from a pattern caused by evolution and subsequent dispersal
amongst islands. For example, if skink populations on bird-only
islands were not closely related, it would suggest that their
phenotype evolved independently on each island, thereby
suggesting convergent evolution due to natural selection pressure
by bird predators. On the other hand, if all bird-only predator
island skink populations shared a recent common ancestor
exclusive of bird + snake island populations, then one could not
distinguish the possibility of selection on life history and phenotype
from a founder effect and subsequent dispersal to other islands.
We evaluate the diversity of phenotype and life history strategies
of P. latiscutatus on the Izu Islands in a newly constructed
phylogenetic framework. We use phylogenetic comparative
methods to evaluate the relationships between a suite of life
history characteristics and color pattern and link those results to an
island’s predator assemblage. Finally, because the identity of island
colonizers and their relative timing of colonization shape the
evolution of community assemblages (e.g. [23]), it is important to
uncover general biogeographic patterns in the island system. We
therefore also compare the pattern of P. latiscutatus colonization of
the Izu Islands with that of other taxa inhabiting the islands by
consulting the latest knowledge on geological history and
geochronology of island formation of the Izu-Bonin Island arc
[25–27].
Methods
Study Islands, Life History and Phenotypic DataCollection
Life history traits and juvenile color pattern of Plestiodon
latiscutatus (formerly Eumeces okadae; [6]) were studied in ten of the
Izu Islands (Oshima, Toshima, Niijima, Shikine, Kozu, Tadanae,
Miyake, Mikura, Hachijokojima and Aogashima), in the Izu
Peninsula (Japanese mainland) and in the small offshore island
(Hatsushima) off the east coast of the Izu Peninsula (Fig. 1). These
islands, ranging in area from 10 to 9,908 ha, are all volcanic and
located off the south coast of central Japan linearly from north
(Oshima) to south (Aogashima) over the distance of ca. 230 km
(Fig. 1). The climates, under the influence of the warm temperate
water of the Kuroshio Current, are uniformly mild with average
air temperatures of 16.2–17.9 C. Because of rich annual rainfall
reaching 2000–3000 mm, the islands are well vegetated with
broad-leaved evergreen forest dominated by Castanopsis cuspidata
and Machilus thunbergii and secondary forest dominated by the
deciduous trees Alnus sieboldiana and Hydrangea macrophylla. Terres-
trial reptile and mammalian faunas of the Izu Islands and Izu
Peninsula are summarized in Table 1. Predation regime (fauna
and abundance), consequence of predatory mammal introduction,
prey resource use and other ecologically relevant information can
be found in the literature [9,12].
Protocols, procedures and methods to obtain life history data
both from the field and laboratory followed Hasegawa [9]. In
brief, life history traits were based on data from intensive mark-
recapture studies on Miyake from 1977 to 1984 [9,21], and from
less intensive mark-recapture studies conducted for the six other
insular populations (Oshima, Toshima, Shikine, Kozu, Mikura,
and Aogashima) from 1981 to 1984. The two Izu Peninsula
populations (Daiyusan and Hiekawa), an offshore island (Hatsush-
ima) and two Izu Islands (Niijima and Hachijokojima) were
studied with mark-recapture methods from intermittently from
1994 to 2012. Snout-vent length (SVL) and body mass were
measured to the nearest 1 mm and 0.1 g, respectively. The lizards
were sexed, males were considered mature if exhibiting reddish
nuptial (red or orange) coloration around the head. Maturity and
reproductive conditions of females were determined [28]. In the
spring (April–May), gravid (reproductive) females were classified as
mature and reproductive in that year if they were either gravid or
spent; otherwise they were classified as either immature or mature,
but non-reproductive. Presence of mature but nonreproductive
females was taken as evidence of missed reproductive opportuni-
ties. Clutch size was determined from the counts of yolked ovarian
follicles, oviductal eggs, and corpora lutea in the female body
cavities and from eggs in natural nests. At least 10 gravid females
captured on each island during the late spring and early summer
were brought back to the laboratory to lay eggs. Females were
individually maintained in plastic containers with damp peat moss
and small flat stones for a nesting site. Within 12 h of egg laying,
the body masses of post-egg-laying (spent) females and of
individual eggs were measured to the nearest mg. SVL, tail
length, and body mass of hatchlings were measured to the nearest
mm and mg within one day of hatching. Stripe pattern and blue
tail coloration were individually scored for the hatchling lizards.
The vividness of each of the head stripe and five body stripes was
scored subjectively from absent (0), faint (1), obscure (2) and vivid
(3) for dorsal, dorso-lateral and lateral stripes both in bead and
body, and a sum of score for each stripe was calculated for each
hatchling. Thus, sums of stripe scores varied from 0 for non-stripe
to 18 for the most intensely striped individuals. For blue tail
coloration, we measured the length of pure blue colored portion of
Convergent Evolutionary Responses to Predation
PLOS ONE | www.plosone.org 2 March 2014 | Volume 9 | Issue 3 | e92233

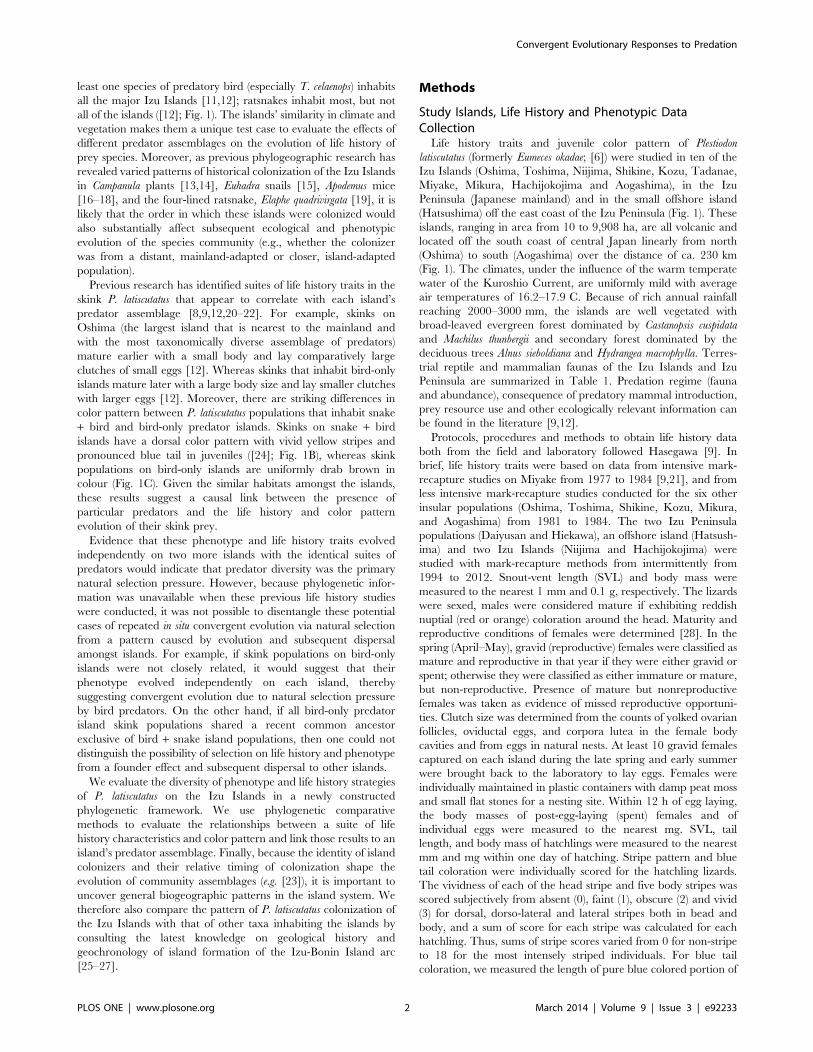
Figure 1. A. Map of the Izu Islands and nearby mainland Japan. The weasel (Mustela itatsi), snake (Elaphe quadrivirgata), and bird (Turduscelaenops) icons indicate whether those predators historically inhabit the island (the weasel has been subsequently introduced to Toshima, Miyake,
Convergent Evolutionary Responses to Predation
PLOS ONE | www.plosone.org 3 March 2014 | Volume 9 | Issue 3 | e92233

tail (without the anterior stretch of black body stripes), and its
proportion to the total length of tail was calculated for the
individual lizards.
DNA Collection and SequencingWe sampled multiple individuals from each of the major Izu
Islands and the small island of Tadanae and from three
‘‘mainland’’ populations including Atami, Izu Peninsula, and
Hatsushima, a continental island population off the east coast of
the Izu Peninsula (Fig. 1; Table 1). We also sampled two
individuals of P. japonicus as outgroups as numerous phylogenetic
studies have inferred it as the sister lineage to P. latiscutatus [29–
31,74].
DNA was isolated from tissue using Qiagen DNeasy columns.
We amplified two mitochondrial genes (cyt b and ND1) using
primers CB1 and CB6THR [32] for cyt b; newly developed
primers ND1-LATF, 59-CTC TCC CTA ATC ATG CAC CCA
TTT TTC AC-39 and ND1-LATR, 59-TGA GCT CCT TAG
TGC AGG TTC AGA TCC TG-39 for ND1; and one nuclear
gene (R35) using primers R35F and R35R [30] using standard
polymerase chain reaction (PCR) techniques (95uC for 2 min
followed by 40 cycles of 95uC for 30 s, 55uC for 30 s and 72uC for
60 s). PCR products were cleaned using ExoSap-IT (USB Corp.
Ohio, USA). Purified templates were dye-labeled using BigDye
(Applied Biosystems, California, USA) and sequenced on an ABI
3077 automated DNA sequencer (Applied Biosystems) using the
same primers. Nucleotide sequences were examined and aligned
by eye and an open reading frame for these genes were verified
using MACCLADE v4.08 [33]. The sizes of the final data sets were
953 bp (cyt b), 957 bp (ND1), and 612 bp (R35) for the number of
individuals listed in Table 2. R35 sequences with two or more
polymorphic sites were phased into individual alleles using
Bayesian inference with PHASE 2.1.1 [34,35].
Time-calibrated Phylogenetic and BiogeographicAnalyses
Mitochondrial DNA. Reconstructing colonization history
requires knowledge of a taxon’s phylogenetic history and age of
lineage divergences. Bayesian phylogenetic analyses assuming a
relaxed molecular clock permit the simultaneous estimation of
phylogeny, divergence time [36,37], and biogeographic history
[38] while also incorporating rate heterogeneity among lineages
and phylogenetic uncertainty (and thus, estimates of error) in the
tree estimation process. Moreover, these analyses estimate
statistical support for phylogenetic and biogeographic reconstruc-
tions by calculating Bayesian posterior probabilities.
We used BEAST v1.7.3 [37] to estimate the phylogeny,
divergence times, and biogeographic history using the combined
mtDNA data set (cyt b and ND1) for the 155 sampled individuals
of P. latiscutatus. Because assuming different nucleotide substitution
models for individual data partitions improves both phylogenetic
and divergence time estimation [31,39], we calculated the best
partitioning scheme and substitution models for the codon
positions of each gene using Partitionfinder v1.0.1 [41]. Partition-
finder recommended three total partitions: cyt b codon position
one, ND1 two; cyt b two, ND1 three; cyt b three, ND1 one and the
substitution models TrN + G for partitions one and three, and
HKY + G for partition two.
Estimating divergence times from molecular data requires some
a priori estimate ages for at least one divergence. These are
commonly estimated by incorporating fossil taxa as age constraints
to ‘‘calibrate’’ the relaxed molecular clock. However, there are no
known Plestiodon fossils that can be used as calibration age
constraints. We therefore used the age distribution of the most
recent common ancestor of P. japonicus and P. latiscutatus inferred
by a multi-locus time-calibrated phylogenetic analysis of Plestiodon
[30] as our age calibration constraint. Although secondary
calibrations have been rightly criticized for potentially compound-
ing date estimation error [40], we note that Bayesian age
estimation permits the explicit incorporation of this error by
permitting age calibration constraints (rather than point estimates)
in the form of statistical distributions, thus eliminating at least one
negative feature of secondary calibrations [31]. Also, the age
distribution is broad and thus likely not overly precise (see Results).
Simultaneously with estimating phylogeny and divergence
times, we inferred ancestral biogeographic area using the discrete
traits model of Lemey et al. [38]. We coded all P. latiscutatus
individuals into groups representing each island or mainland
peninsula populations.
Each BEAST analysis was run for 107 generations and sampled
every 2000 generations. We modeled the age of the root of the tree
(P. japonicas+P. latiscutatus) as a normal distribution of ages with a
mean = 6.3 Ma and standard deviation = 1.38 (95% CI = 3.6–
9.0 Ma; [31]) and enforced a separate lognormal relaxed
molecular clock for the cyt b and ND1 data. We otherwise used
default priors except that we modeled the mean rate of the cyt b
and ND1 molecular clocks at uniform distributions with bounds of
0.0 and 0.1 substitutions per site. We ran eight BEAST analyses
assuming a birth-death tree prior. To determine convergence
amongst each analysis, we constructed cumulative posterior
probability plots for each clade using the cumulative function in
AWTY [42]. Stationarity was assumed when the cumulative
posterior probabilities of all clades stabilized. If posterior
probability estimates for clades were similar in the analyses, the
results were combined. We interpret posterior probabilities $0.95
as suitably strong support for both phylogenetic reconstruction and
estimation of ancestral biogeographic area [43].
R35 nuclear locus analyses. Preliminary phylogenetic
analyses of the R35 alleles revealed very little phylogenetic
structure due to very few nucleotide substitutions (only six
parsimony-informative sites), and therefore imprecise information
about the evolutionary history of the sampled P. latiscutatus
populations. We instead visualized the genetic diversity of R35
amongst the sampled localities by calculating the allele frequencies
for each population and visually inspected them for general trends.
Comparative Analyses of Life History TraitsWe performed phylogenetic comparative analyses to estimate
correlations amongst life history characteristics (correlations of
phylogenetic independent contrasts) and then linked those life
history traits to the type of predators on multiple Izu Islands
(phylogenetic ANOVA). For statistical analysis, arithmetic means
of the sampled life history and phenotype characters were
converted to independent contrasts to remove non-independence
due to phylogenetic history [44] under different phylogenetic
scenarios (see below). Correlations of independent contrasts of life
Hachijojima and Aogashima since the 1930s). Interior bathymetric lines indicate a depth of 100 m and exterior lines a depth of 200 m unlessotherwise specified; B. typical striped morph of Plestiodon latiscutatus inhabiting islands with snake predators (Oshima, Toshima, Niijima, Shikine,Kozu, Tadanae, and Mikura); C. typical drab morph of the same species inhabiting bird-only predator islands (Miyake, Hachijojima, Hachijokojima, andAogashima).doi:10.1371/journal.pone.0092233.g001
Convergent Evolutionary Responses to Predation
PLOS ONE | www.plosone.org 4 March 2014 | Volume 9 | Issue 3 | e92233

history traits were performed using the CAPER package in R [45]
using scripts written by M.C.B. We conducted phylogenetic
generalized least squares (PGLS) analysis of variance (phylogenetic
ANOVA) analyses [46] to determine how variation in life history
traits correlates to the presence of predators on each island after
accounting for phylogenetic relationships. There exist three major
classes of skink predators on the Izu Islands including weasels,
birds, and snakes, but we focus only on the potential influence of
snake and bird predation on life history variation. Unlike weasels
that are historically native to Oshima (they were subsequently
introduced into Toshima in the 1930s, Hachijojima in the 1960s,
Miyake and Aogashima in the 1980s), and predatory birds that
inhabit all islands, snakes inhabit eight of the 11 islands sampled
for this study and likely derive from independent colonizations
[19]. Therefore, snakes offer multiple independent opportunities
to assess the affects on the presence of different predators on the
life history traits of their prey, P. latiscutatus. Moreover, snake-less
islands offer an opportunity to assess the effects of bird-only
predation on P. latiscutatus life history and color evolution.
Phylogenetic ANOVA (pANOVA hereafter) analyses were
performed using the GEIGER [47] package in R and scripts
written by M.C.B. We regressed the mean values of both hatchling
and maternal life history traits against a dummy variable coded 0
or 1 (0 = island has snakes; 1 = island does not have snakes). The
overall correlation coefficient (R) represents deviations from the
mean of the comparison group and was tested for significance
using a t-test [46].
Because both independent contrasts and phylogenetic ANOVA
analyses use phylogenetic information to remove the effect of non-
independence caused by the organisms’ shared evolutionary
history, the results are therefore fundamentally reliant on the
underlying phylogeny. Inspection of the mtDNA phylogeny (Fig. 2)
reveals multiple populations that are not monophyletic including
the mainland, Miyake, Niijima, Shikine, and Toshima popula-
tions. This pattern could be indicative of multiple colonizations to
these islands (i.e., the pattern represents the true colonization
history), or it could result simply from a stochastic process where
drift has not eliminated older mtDNA haplotypes such as
incomplete lineage sorting (i.e., the pattern is an artifact of
molecular evolution). Incomplete lineage sorting is a phenomenon
where ancestral alleles (or haplotypes, in the case of mtDNA) that
are present before a lineage splits (i.e., when two or more
populations are reproductively isolated) are retained in its
descendant lineages after the divergence [48]. These ancestral
alleles will be lost to genetic drift over time and replaced by new
alleles unique to the new descendant lineages; however, during
short time frames, there is a chance that these alleles will not be
lost due to drift (e.g., [49–51]). The distinction between these two
processes (multiple colonizations and incomplete lineage sorting)
has significant effects on how we interpret life history evolution.
We assume that our sampled life history data represents the
frequency of these traits on each island (e.g., the mean hatchling
SVL for the entire population of Aogashima is 30.461.3 mm;
Table 1). If two or more lineages colonized an island, then it would
suggest that each lineage convergently evolved the same distribu-
tions of life history traits, thereby increasing the strength of
correlations amongst traits in subsequent comparative analysis.
This is not problematic if indeed the islands were colonized
multiple times. However, if the non-monophyly of island
populations is simply an artifact of molecular evolution, and that
each island was indeed colonized only once, then assuming
multiple colonizations would create false positive support for our
trait correlation analyses.Table
1.Predatorassemblagesofislandsin
thisstudywithsummarystatistics
oflifehistory
andphenotypetraitsofeachsampledIzuIslandpopulationofPlestiodonlatiscutatus.
Hatchlings
Moth
ers
SVL(m
m)
Mass
(g)
Stripeindex
Pro
portionofbluetail
SVL(m
m)
Clutchsize(eggs)
Eggmass
(g)
Population
Predato
rMean6SD
NMean6SD
NMean6SD
NMean6SD
NMean6SD
NMean6SD
NMean6SD
N
Aogashim
aBirds
30.461.3
68
0.5760.08
69
3.962.6
69
0.3860.03
37
85.364.6
20
6.561.9
20
0.05760.007
11
Hachijo
kojim
aBirds
31.461.5
107
0.6160.09
108
7.362.6
108
0.3760.04
108
84.063.8
35
6.661.9
35
0.06260.007
35
Kozu
Birds+snakes
28.861.2
142
0.4960.06
143
16.261.2
143
0.5160.03
70
80.264.7
46
7.861.7
46
0.04860.005
36
Mikura
Birds+snakes
30.561.0
61
0.5560.05
62
10.362.4
62
0.4960.09
56
80.064.0
49
7.161.8
52
0.05160.006
35
Miyake
Birds
30.661.1
73
0.6360.07
42
3.463.1
74
0.4960.03
46
82.364.3
92
7.361.9
115
0.05960.007
37
Niijim
aBirds+snakes
29.261.5
141
0.5160.07
120
15.061.2
142
0.4960.03
132
82.864.7
37
8.262.3
38
0.05260.007
19
Oshim
aMam
mals+birds+snakes
26.561.1
175
0.4060.06
158
16.160.8
176
0.5560.04
137
78.466.2
30
8.862.0
28
0.04160.005
20
Shikine
Birds+snakes
29.261.0
70
0.5260.04
71
11.063.4
71
0.5560.03
30
80.163.5
23
8.061.0
22
0.05160.006
20
Toshim
aBirds+snakes
27.561.1
120
0.4260.05
118
16.161.1
121
0.5260.03
75
81.264.2
26
9.062.1
26
0.04360.006
20
doi:10.1371/journal.pone.0092233.t001
Convergent Evolutionary Responses to Predation
PLOS ONE | www.plosone.org 5 March 2014 | Volume 9 | Issue 3 | e92233
We therefore performed the independent contrast and pA-
NOVA comparative analyses, assuming both the multiple
colonization scenario supported by our inferred phylogeny, and
single colonization scenarios that assume the presence of two
distinct lineages on an island is an artifact of incomplete lineage
sorting. For the multiple colonization scenario, we performed the
comparative analyses using a phylogeny pruned to the minimum
number of possible independent colonizations. Assuming a single
colonization to each island poses a challenge because there are
multiple possible resolutions of our phylogeny compatible with a
single colonization scenario (e.g., Toshima may be sister to a
mainland or Niijima + Shikine clade [Fig. 2]). We therefore
developed a novel method that accounts for the multiple possible
resolutions whereby we sample a tree from the posterior
distribution of trees estimated by the BEAST analysis, and prune
the tree to include only one randomly chosen individual per island.
We then use this tree for the IC and pANOVA analyses. We
repeated this process for all 8000 trees in the posterior distribution
thereby creating a distribution of p values from each test using R
scripts written by M.C.B. Because there is no objective way to
interpret distributions of p values, we subjectively interpret the
results assuming that a distribution of p values that cluster closer to
0 are more suggestive of a statistical relationship between two
variables than a distribution that includes mid- to high p values.
We note that the tree topology of the pruned tree will depend on
which of the multiple island lineages are retained (i.e., sampling
any one of the Toshima lineages would change the topology of a
single tree). However, because this process is random across the
8000 trees, we assume there is no systematic bias. Indeed,
repeating the analysis with different random number seeds yields
identical results (not shown). We also emphasize that this method
also incorporates phylogenetic uncertainty as not all clades have a
posterior probability of 1.0. Life history data, DNA data, and R
scripts are available from the Dryad Digital Repository:
doi:10.5061/dryad.v47s1.
Ethics StatementAnimals were captured by hand or by a fishing pole with a
mealworm attached to the end of a string. When euthanasia was
necessary, it was performed via overdose of sodium pentobarbital.
All animal work was reviewed and approved by the Toho
University Bioethics and Animal Ethics Committee (approval
number: #12–51–242). Fieldwork and sample collection on Kozu
was approved by the village of Kozu on 1 July 2011 (no permit
number issued) in accordance with their ordinance governing
plant and animal protection. No specific permission is required for
fieldwork or collection on the remaining Izu Islands. This study
did not involve endangered or protected species.
Results
Phylogeny and Biogeographic ReconstructionsMtDNA. The Bayesian analyses achieved stationarity by two
million generations. The consensus of 8000 trees in the posterior
distribution, clade posterior probabilities, 95% credible intervals of
age, and biogeographic reconstructions are provided in Fig. 2. The
most notable broad pattern of P. latiscutatus colonization of the Izu
Islands is a basal split in the phylogeny between a northern clade
including populations from the Izu Peninsula, Miyake, and islands
north, and a southern clade containing Mikura and islands south.
The northern clade comprises two clades: a clade inhabiting
Miyake (and a Shikine haplotype), and a clade containing
populations from the Izu Peninsula and the northern Izu Islands
(Fig. 2). The populations inhabiting Niijima, Shikine, and
Toshima are not monophyletic. Furthermore, Niijima and Shikine
are inhabited by two distantly related clades. The southern clade is
composed of clades inhabiting Mikura, Hachijokojima, and
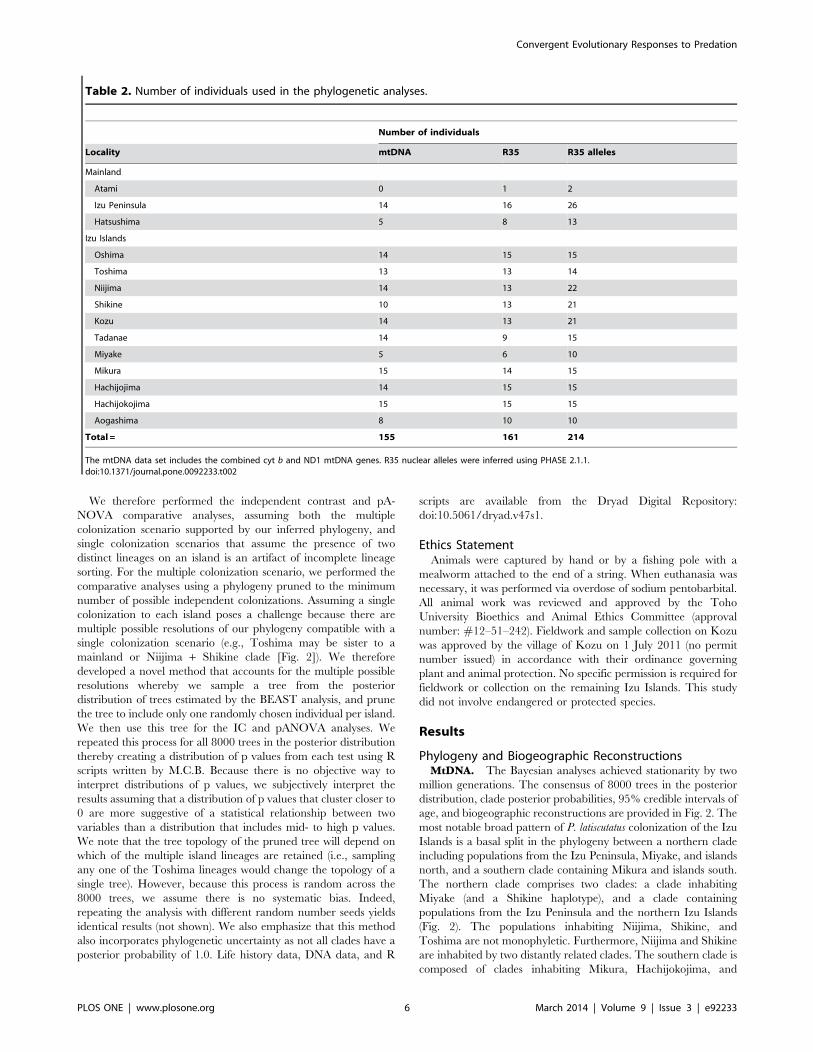
Table 2. Number of individuals used in the phylogenetic analyses.
Number of individuals
Locality mtDNA R35 R35 alleles
Mainland
Atami 0 1 2
Izu Peninsula 14 16 26
Hatsushima 5 8 13
Izu Islands
Oshima 14 15 15
Toshima 13 13 14
Niijima 14 13 22
Shikine 10 13 21
Kozu 14 13 21
Tadanae 14 9 15
Miyake 5 6 10
Mikura 15 14 15
Hachijojima 14 15 15
Hachijokojima 15 15 15
Aogashima 8 10 10
Total = 155 161 214
The mtDNA data set includes the combined cyt b and ND1 mtDNA genes. R35 nuclear alleles were inferred using PHASE 2.1.1.doi:10.1371/journal.pone.0092233.t002
Convergent Evolutionary Responses to Predation
PLOS ONE | www.plosone.org 6 March 2014 | Volume 9 | Issue 3 | e92233
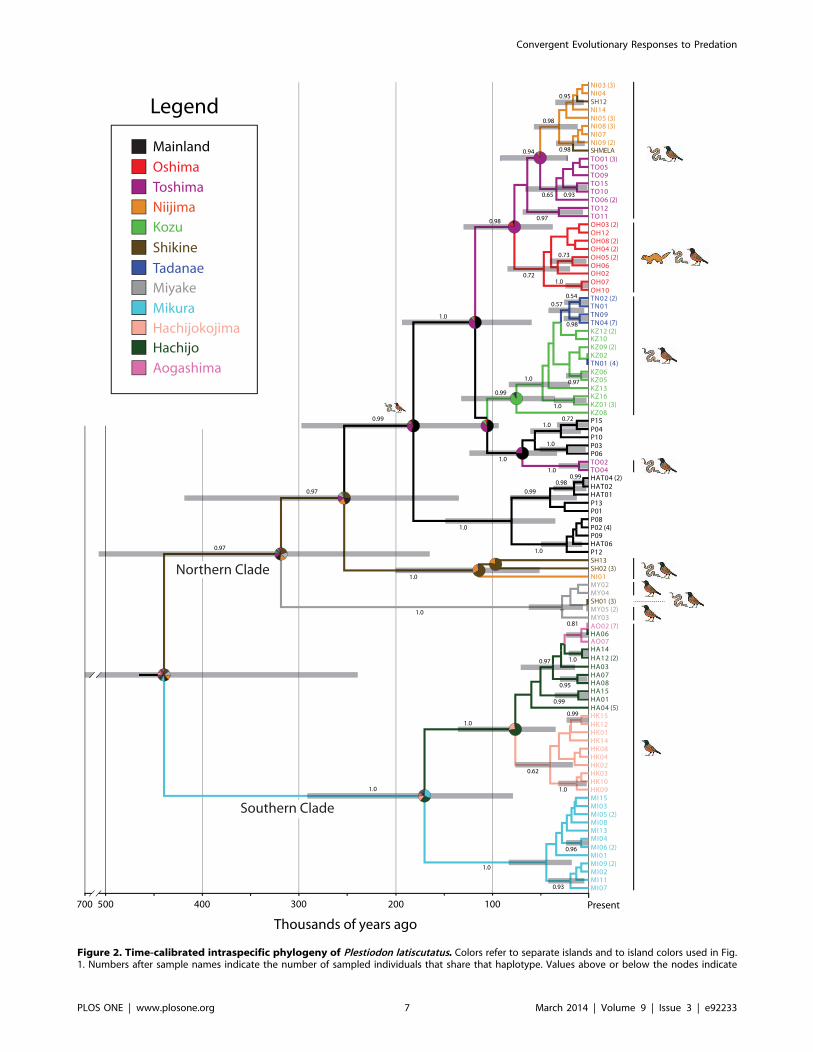
Figure 2. Time-calibrated intraspecific phylogeny of Plestiodon latiscutatus. Colors refer to separate islands and to island colors used in Fig.1. Numbers after sample names indicate the number of sampled individuals that share that haplotype. Values above or below the nodes indicate
Convergent Evolutionary Responses to Predation
PLOS ONE | www.plosone.org 7 March 2014 | Volume 9 | Issue 3 | e92233
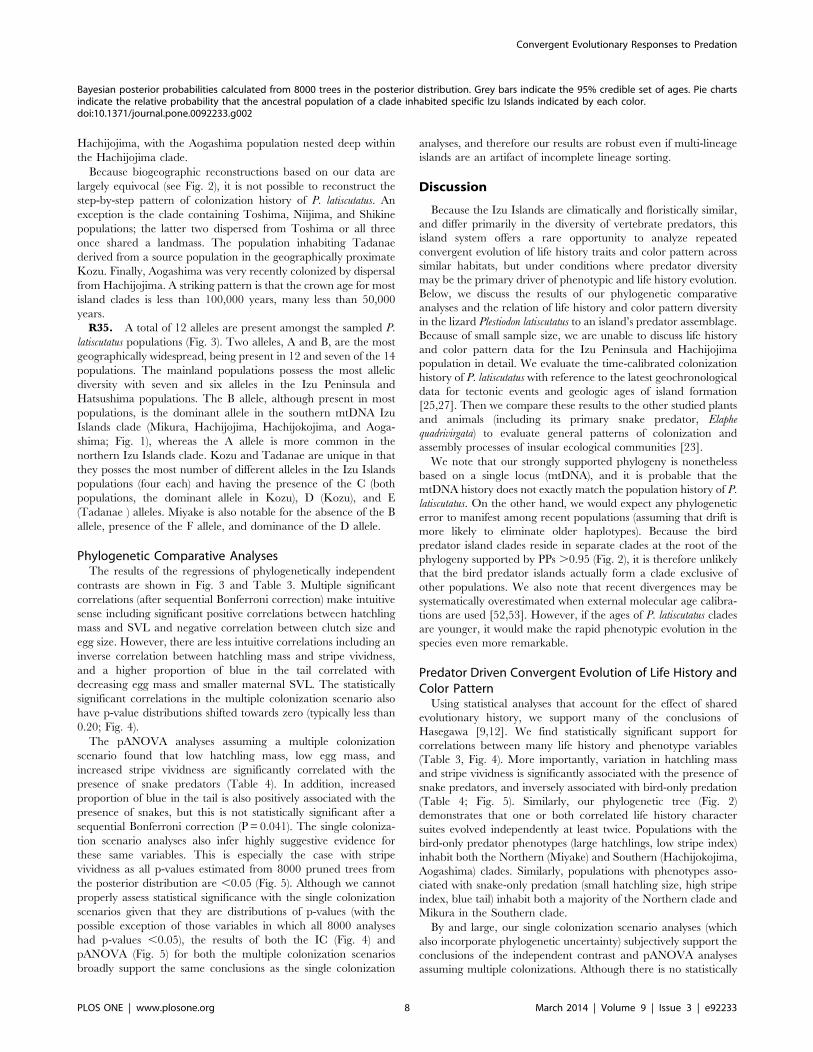
Hachijojima, with the Aogashima population nested deep within
the Hachijojima clade.
Because biogeographic reconstructions based on our data are
largely equivocal (see Fig. 2), it is not possible to reconstruct the
step-by-step pattern of colonization history of P. latiscutatus. An
exception is the clade containing Toshima, Niijima, and Shikine
populations; the latter two dispersed from Toshima or all three
once shared a landmass. The population inhabiting Tadanae
derived from a source population in the geographically proximate
Kozu. Finally, Aogashima was very recently colonized by dispersal
from Hachijojima. A striking pattern is that the crown age for most
island clades is less than 100,000 years, many less than 50,000
years.
R35. A total of 12 alleles are present amongst the sampled P.
latiscutatus populations (Fig. 3). Two alleles, A and B, are the most
geographically widespread, being present in 12 and seven of the 14
populations. The mainland populations possess the most allelic
diversity with seven and six alleles in the Izu Peninsula and
Hatsushima populations. The B allele, although present in most
populations, is the dominant allele in the southern mtDNA Izu
Islands clade (Mikura, Hachijojima, Hachijokojima, and Aoga-
shima; Fig. 1), whereas the A allele is more common in the
northern Izu Islands clade. Kozu and Tadanae are unique in that
they posses the most number of different alleles in the Izu Islands
populations (four each) and having the presence of the C (both
populations, the dominant allele in Kozu), D (Kozu), and E
(Tadanae ) alleles. Miyake is also notable for the absence of the B
allele, presence of the F allele, and dominance of the D allele.
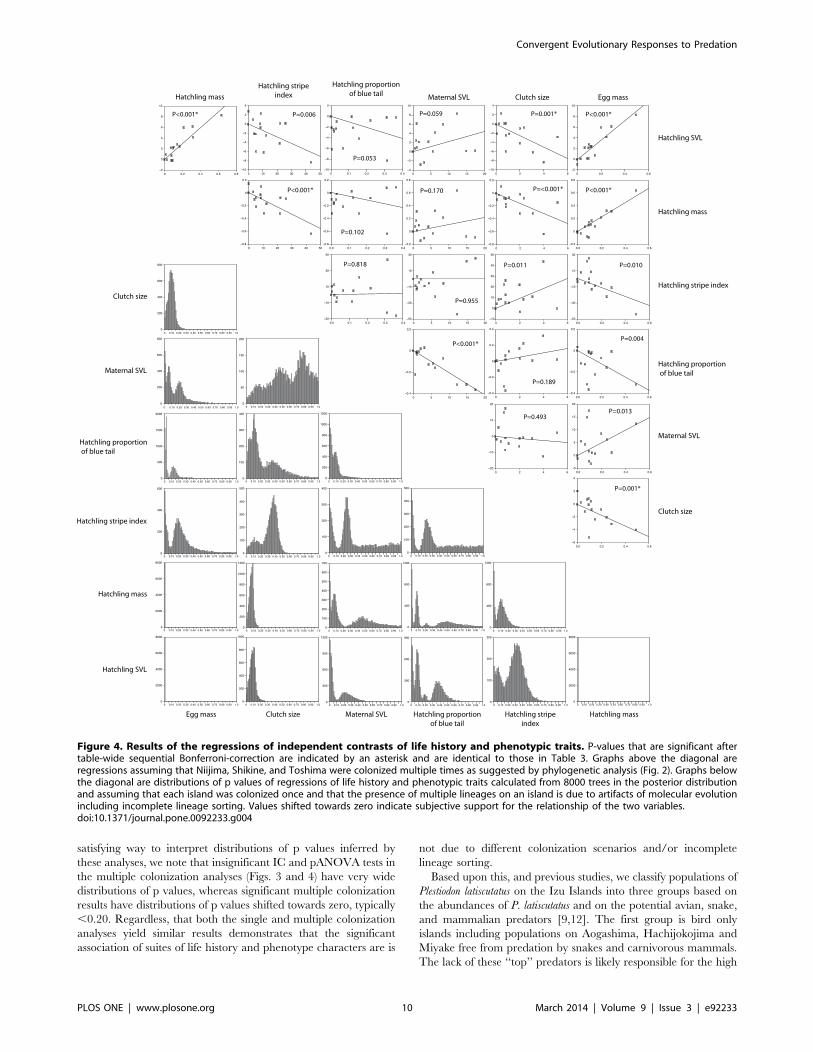
Phylogenetic Comparative AnalysesThe results of the regressions of phylogenetically independent
contrasts are shown in Fig. 3 and Table 3. Multiple significant
correlations (after sequential Bonferroni correction) make intuitive
sense including significant positive correlations between hatchling
mass and SVL and negative correlation between clutch size and
egg size. However, there are less intuitive correlations including an
inverse correlation between hatchling mass and stripe vividness,
and a higher proportion of blue in the tail correlated with
decreasing egg mass and smaller maternal SVL. The statistically
significant correlations in the multiple colonization scenario also
have p-value distributions shifted towards zero (typically less than
0.20; Fig. 4).
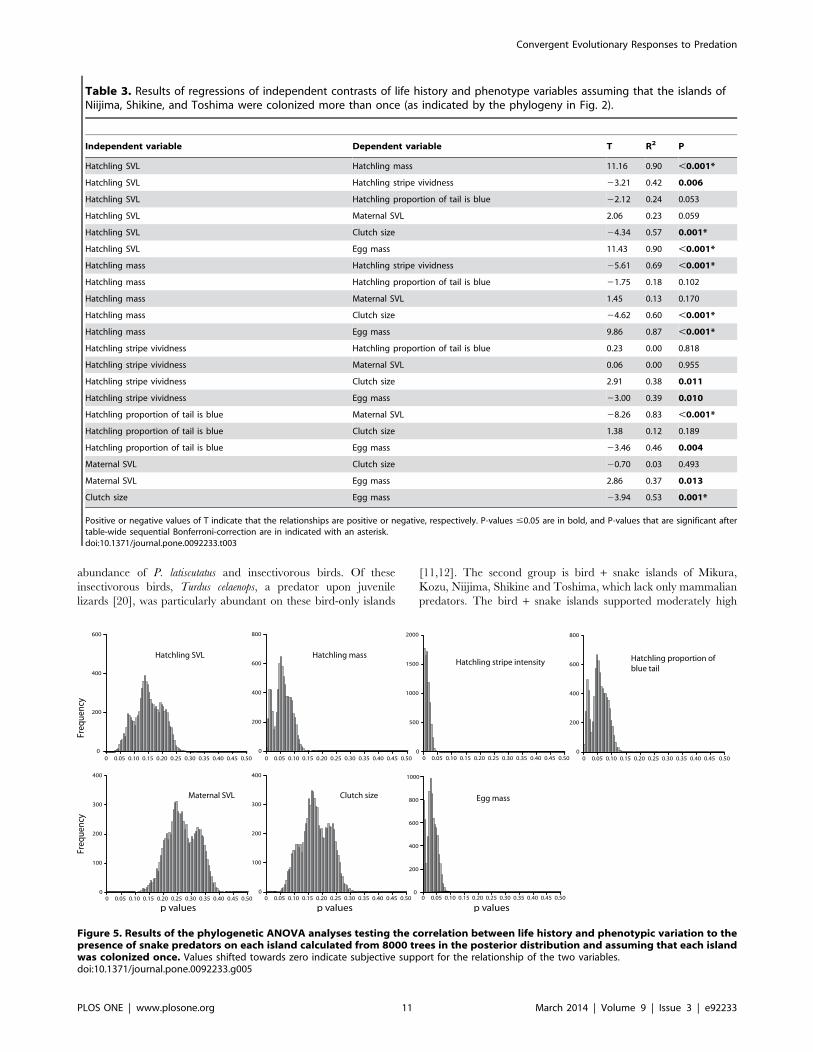
The pANOVA analyses assuming a multiple colonization
scenario found that low hatchling mass, low egg mass, and
increased stripe vividness are significantly correlated with the
presence of snake predators (Table 4). In addition, increased
proportion of blue in the tail is also positively associated with the
presence of snakes, but this is not statistically significant after a
sequential Bonferroni correction (P = 0.041). The single coloniza-
tion scenario analyses also infer highly suggestive evidence for
these same variables. This is especially the case with stripe
vividness as all p-values estimated from 8000 pruned trees from
the posterior distribution are ,0.05 (Fig. 5). Although we cannot
properly assess statistical significance with the single colonization
scenarios given that they are distributions of p-values (with the
possible exception of those variables in which all 8000 analyses
had p-values ,0.05), the results of both the IC (Fig. 4) and
pANOVA (Fig. 5) for both the multiple colonization scenarios
broadly support the same conclusions as the single colonization
analyses, and therefore our results are robust even if multi-lineage
islands are an artifact of incomplete lineage sorting.
Discussion
Because the Izu Islands are climatically and floristically similar,
and differ primarily in the diversity of vertebrate predators, this
island system offers a rare opportunity to analyze repeated
convergent evolution of life history traits and color pattern across
similar habitats, but under conditions where predator diversity
may be the primary driver of phenotypic and life history evolution.
Below, we discuss the results of our phylogenetic comparative
analyses and the relation of life history and color pattern diversity
in the lizard Plestiodon latiscutatus to an island’s predator assemblage.
Because of small sample size, we are unable to discuss life history
and color pattern data for the Izu Peninsula and Hachijojima
population in detail. We evaluate the time-calibrated colonization
history of P. latiscutatus with reference to the latest geochronological
data for tectonic events and geologic ages of island formation
[25,27]. Then we compare these results to the other studied plants
and animals (including its primary snake predator, Elaphe
quadrivirgata) to evaluate general patterns of colonization and
assembly processes of insular ecological communities [23].
We note that our strongly supported phylogeny is nonetheless
based on a single locus (mtDNA), and it is probable that the
mtDNA history does not exactly match the population history of P.
latiscutatus. On the other hand, we would expect any phylogenetic
error to manifest among recent populations (assuming that drift is
more likely to eliminate older haplotypes). Because the bird
predator island clades reside in separate clades at the root of the
phylogeny supported by PPs .0.95 (Fig. 2), it is therefore unlikely
that the bird predator islands actually form a clade exclusive of
other populations. We also note that recent divergences may be
systematically overestimated when external molecular age calibra-
tions are used [52,53]. However, if the ages of P. latiscutatus clades
are younger, it would make the rapid phenotypic evolution in the
species even more remarkable.
Predator Driven Convergent Evolution of Life History andColor Pattern
Using statistical analyses that account for the effect of shared
evolutionary history, we support many of the conclusions of
Hasegawa [9,12]. We find statistically significant support for
correlations between many life history and phenotype variables
(Table 3, Fig. 4). More importantly, variation in hatchling mass
and stripe vividness is significantly associated with the presence of
snake predators, and inversely associated with bird-only predation
(Table 4; Fig. 5). Similarly, our phylogenetic tree (Fig. 2)
demonstrates that one or both correlated life history character
suites evolved independently at least twice. Populations with the
bird-only predator phenotypes (large hatchlings, low stripe index)
inhabit both the Northern (Miyake) and Southern (Hachijokojima,
Aogashima) clades. Similarly, populations with phenotypes asso-
ciated with snake-only predation (small hatchling size, high stripe
index, blue tail) inhabit both a majority of the Northern clade and
Mikura in the Southern clade.
By and large, our single colonization scenario analyses (which
also incorporate phylogenetic uncertainty) subjectively support the
conclusions of the independent contrast and pANOVA analyses
assuming multiple colonizations. Although there is no statistically
Bayesian posterior probabilities calculated from 8000 trees in the posterior distribution. Grey bars indicate the 95% credible set of ages. Pie chartsindicate the relative probability that the ancestral population of a clade inhabited specific Izu Islands indicated by each color.doi:10.1371/journal.pone.0092233.g002
Convergent Evolutionary Responses to Predation
PLOS ONE | www.plosone.org 8 March 2014 | Volume 9 | Issue 3 | e92233

Figure 3. Pie charts representing the relative proportion of phased R35 allele alleles in the mainland and Izu Islands. The order ofpresentation of the pie charts is the same as the order of the islands north to south (see Fig. 1).doi:10.1371/journal.pone.0092233.g003
Convergent Evolutionary Responses to Predation
PLOS ONE | www.plosone.org 9 March 2014 | Volume 9 | Issue 3 | e92233
satisfying way to interpret distributions of p values inferred by
these analyses, we note that insignificant IC and pANOVA tests in
the multiple colonization analyses (Figs. 3 and 4) have very wide
distributions of p values, whereas significant multiple colonization
results have distributions of p values shifted towards zero, typically
,0.20. Regardless, that both the single and multiple colonization
analyses yield similar results demonstrates that the significant
association of suites of life history and phenotype characters are is
not due to different colonization scenarios and/or incomplete
lineage sorting.
Based upon this, and previous studies, we classify populations of
Plestiodon latiscutatus on the Izu Islands into three groups based on
the abundances of P. latiscutatus and on the potential avian, snake,
and mammalian predators [9,12]. The first group is bird only
islands including populations on Aogashima, Hachijokojima and
Miyake free from predation by snakes and carnivorous mammals.
The lack of these ‘‘top’’ predators is likely responsible for the high
Figure 4. Results of the regressions of independent contrasts of life history and phenotypic traits. P-values that are significant aftertable-wide sequential Bonferroni-correction are indicated by an asterisk and are identical to those in Table 3. Graphs above the diagonal areregressions assuming that Niijima, Shikine, and Toshima were colonized multiple times as suggested by phylogenetic analysis (Fig. 2). Graphs belowthe diagonal are distributions of p values of regressions of life history and phenotypic traits calculated from 8000 trees in the posterior distributionand assuming that each island was colonized once and that the presence of multiple lineages on an island is due to artifacts of molecular evolutionincluding incomplete lineage sorting. Values shifted towards zero indicate subjective support for the relationship of the two variables.doi:10.1371/journal.pone.0092233.g004
Convergent Evolutionary Responses to Predation
PLOS ONE | www.plosone.org 10 March 2014 | Volume 9 | Issue 3 | e92233
abundance of P. latiscutatus and insectivorous birds. Of these
insectivorous birds, Turdus celaenops, a predator upon juvenile
lizards [20], was particularly abundant on these bird-only islands
[11,12]. The second group is bird + snake islands of Mikura,
Kozu, Niijima, Shikine and Toshima, which lack only mammalian
predators. The bird + snake islands supported moderately high
Table 3. Results of regressions of independent contrasts of life history and phenotype variables assuming that the islands ofNiijima, Shikine, and Toshima were colonized more than once (as indicated by the phylogeny in Fig. 2).
Independent variable Dependent variable T R2 P
Hatchling SVL Hatchling mass 11.16 0.90 ,0.001*
Hatchling SVL Hatchling stripe vividness 23.21 0.42 0.006
Hatchling SVL Hatchling proportion of tail is blue 22.12 0.24 0.053
Hatchling SVL Maternal SVL 2.06 0.23 0.059
Hatchling SVL Clutch size 24.34 0.57 0.001*
Hatchling SVL Egg mass 11.43 0.90 ,0.001*
Hatchling mass Hatchling stripe vividness 25.61 0.69 ,0.001*
Hatchling mass Hatchling proportion of tail is blue 21.75 0.18 0.102
Hatchling mass Maternal SVL 1.45 0.13 0.170
Hatchling mass Clutch size 24.62 0.60 ,0.001*
Hatchling mass Egg mass 9.86 0.87 ,0.001*
Hatchling stripe vividness Hatchling proportion of tail is blue 0.23 0.00 0.818
Hatchling stripe vividness Maternal SVL 0.06 0.00 0.955
Hatchling stripe vividness Clutch size 2.91 0.38 0.011
Hatchling stripe vividness Egg mass 23.00 0.39 0.010
Hatchling proportion of tail is blue Maternal SVL 28.26 0.83 ,0.001*
Hatchling proportion of tail is blue Clutch size 1.38 0.12 0.189
Hatchling proportion of tail is blue Egg mass 23.46 0.46 0.004
Maternal SVL Clutch size 20.70 0.03 0.493
Maternal SVL Egg mass 2.86 0.37 0.013
Clutch size Egg mass 23.94 0.53 0.001*
Positive or negative values of T indicate that the relationships are positive or negative, respectively. P-values #0.05 are in bold, and P-values that are significant aftertable-wide sequential Bonferroni-correction are in indicated with an asterisk.doi:10.1371/journal.pone.0092233.t003
Figure 5. Results of the phylogenetic ANOVA analyses testing the correlation between life history and phenotypic variation to thepresence of snake predators on each island calculated from 8000 trees in the posterior distribution and assuming that each islandwas colonized once. Values shifted towards zero indicate subjective support for the relationship of the two variables.doi:10.1371/journal.pone.0092233.g005
Convergent Evolutionary Responses to Predation
PLOS ONE | www.plosone.org 11 March 2014 | Volume 9 | Issue 3 | e92233

densities of P. latiscutatus and the snake E. quadrivirgata [7] and low
densities of avian predators. The third group inhabits a single
island (Oshima) with the richest predator fauna, including the
native mammalian predator, the Japanese weasel (Mustela itatsi).
The density of P. latiscutatus Oshima was lowest among the islands.
This inverse correlation between predator richness and lizard
density found on the Izu Islands is a typical example of the
worldwide pattern of relationship between predation impact and
density of insular lizards [54]. However, very few studies have
demonstrated a clear relationship between patterns of predator
community structure and lizard life histories in insular environ-
ments (e.g., [55]).
Our previous research documented that the P. latiscutatus
hatchlings were larger and more drab-colored on islands with
high bird predation and no snake predators [9,12]. Hasagawa
[9,12] surmised that the small size of the primary bird predator,
the Izu Islands Thrush (Turdus celaenops), limits the body size of
prey it can consume [20] and thus there was strong selective
pressure to favor large hatchling SVL and mass, and therefore
large eggs and low clutch sizes. Moreover, given the high visual
acuity of bird predators [56], natural selection would favor an
inconspicuous, cryptic color pattern. T. celaenops, a gape-limited
insectivorous bird, attacks juvenile P. latiscutatus by attacking from
a perch above the juvenile lizards basking or foraging on the
brown colored leaf litter [20]; therefore, the striped and blue
colored tail of juvenile Plestiodon lizard would be conspicuous to
these predators. Indeed, field experiments using clay lizard models
demonstrated that birds will preferentially attack portions of clay
lizard models conspicuously colored blue [57]. It is thereby
reasonable to conclude that avian predation on juvenile lizards
favor inconspicuous dull coloration in juvenile lizards.
Conversely, P. latiscutatus that inhabit islands with snake
predators that can consume both adult and juveniles tend to
produce smaller hatchlings, smaller eggs, larger clutches, and have
conspicuous yellow stripes and blue tail. Contrary to the birds that
attack from above, the snake Elaphe quadrivirgata stalks and attacks
lizards, usually from behind, within short distance of ,20–30 cm,
and laboratory experiments using snake predator demonstrated
that the snake struck the body of lizards with blue-painted tails less
frequently than that of lizards with darkly painted tails [58]. The
striped body trunk would be effective to disrupt both the snake’s
perception of the lizard body and snake attacks at close range [59].
A combination of striped pattern and blue-colored tail therefore
distract the predator’s attention away from the more vulnerable
parts of the body (head and trunk), enabling lizards to escape from
predation at the cost of losing their tails [58–61].
Other studies of insular lizard populations that focused on the
combined effects of predation and intra-specific competition [62–
68] reported similar causal relationships between life history traits
and predation regimes. In other system with both bird and snake
predators, dwarf chameleons did not adjust the color of their
bodies when presented with either predator [69]. However, the
chameleons increased the brightness of their colors when
confronted with a snake. Although not directly analogous to our
results, this chameleon study demonstrates that different aspects of
chromatic (color) or achromatic (brightness) contrast are adapta-
tions to the different visual systems of snakes and birds. Meta-
analyses of island populations detected a broad pattern of
correlated ecological and life history shifts toward increased
population density and infrequent production of few, large
offspring, termed the ‘‘island syndrome’’ [70]. Alternatively,
specific environmental factors such as erratic environmental
conditions or high predation pressure have been found to that
reduce lizard population density and mold life history traits of
insular lizard populations in the opposite direction, a phenomenon
termed ‘‘reversed island syndrome’’ [66,67].
In conclusion, in the Izu Island system, predation directly
impacts upon the demographic parameters of lizard populations
(toward either low or high density) and indirectly upon prey
availability via intra-specific competition under different popula-
tion densities [9,12,21]. Both the typical island syndrome
(increased population density, infrequent production of few, large
offspring) and reversed island syndrome (decreased population
density, frequent production of many, small offspring) occur in the
Izu Islands populations of Plestiodon latiscutatus due mainly to
differential colonization history of bird, snake and mammal
predators.
Phylogeography of Plestiodon latiscutatus in Relation toGeochronology of the Izu Islands
In addition to allowing us to assess convergence in life history
and juvenile color pattern phenotypes, our inference of Plestiodon
latiscutatus phylogeny also informs the historical biogeography of
the species. Although the biogeographic reconstructions at the root
of the phylogeny are equivocal, likely due to the monophyly of
most island populations with few island-specific phylogenetic
grades, visual inspection clearly supports the hypothesis that extant
mainland Izu Peninsula populations derive from ancestors that
inhabited the Izu Islands. Although the biogeographic reconstruc-
tions are largely ambiguous in all but shallow nodes, there are
nonetheless clear examples of recent dispersal amongst geograph-
Table 4. Results of the phylogenetic ANOVA analyses testing whether variation in life history and phenotype traits are associatedwith the presence of snake predators on each island.
Trait P
Hatchling SVL 0.072
Hatchling mass 0.008*
Hatchling stripe vividness ,0.001*
Hatchling proportion of blue tail 0.041
Maternal SVL 0.249
Clutch size 0.072
Egg mass 0.006*
This analysis assumes that the islands of Niijima, Shikine, and Toshima were colonized more than once. P-values #0.05 are in bold, and P-values that are significant aftertable-wide sequential Bonferroni-correction are in indicated with an asterisk.doi:10.1371/journal.pone.0092233.t004
Convergent Evolutionary Responses to Predation
PLOS ONE | www.plosone.org 12 March 2014 | Volume 9 | Issue 3 | e92233

ically proximate islands including the colonization of Aogashima
from Hachijojima and Tadanae from Kozu. There are also
multiple instances of putative dispersal between Niijima and
Shikine, islands separated by ,3 km, and from Shikine to Miyake.
All of the Izu Islands, and most of the Izu Peninsula and central
Japan, are volcanic, formed in the complex interface of the
Eurasian, Pacific, and Philippine plates. The Izu Islands are
situated in a zone where the blocks of the Izu–Bonin arc’s upper
crust have been successively accreted onto the Honshu arc for the
past 15 million years [71,72]. The collision and accretion of older
island blocks triggered the formation of new volcanic islands
behind the collision front thereby creating a series of Izu proto-
islands. The present-day Izu Peninsula formed from a collision of
Izu proto-islands with the main island of Honshu 0.5–0.7 Ma [26],
and this collision may have triggered the formation of most of the
present-day Izu Islands. Indeed, geochronology data indicates that
at least Kozu and Niijima islands are younger (0.88–0.93 Ma) than
the Proto-Izu block (1.7–7.4 Ma). It is therefore reasonable to
assume that the volcanic activity that formed the current Izu
Islands was present in the past and that islands (although not
necessarily the present-day islands) have been continually present
in the region for millions of years.
The results of our phylogenetic analyses in this geological
context support an intriguing biogeographic hypothesis by
Okamoto et al. [73] in their analysis of mainland P. latiscutatus
phylogeography. In this biogeographic scenario, the common
ancestor of P. latiscutatus and P. japonicus inhabited mainland Japan
prior to the formation of the Izu Peninsula. The ancestor of the
present-day P. latiscutatus lineage dispersed to the Izu proto-islands
between 3 and 7.6 Ma. This date is coincident with the age of the
split between P. latiscutatus and P. japonicus [31] and the formation
of the Proto Izu Island block 1.7–7.4 Ma [27]. The P. latiscutatus
lineage diversified on the Izu proto-islands and reinvaded the
mainland after the formation of the Izu Peninsula [73]).
Throughout this period, the ancestors of the extant island
populations would have colonized these newly formed islands.
Since 1 Ma, these islands included some of the present-day Izu
Islands.
Okamoto et al.’s [72] Izu proto-island hypothesis is thus
congruent with the ages of P. latiscutatus clades estimated by our
phylogenetic analyses. If mainland Japan was colonized by the
collision of P. latiscutatus inhabited Izu proto-islands, we would
expect the age of the mainland Izu Peninsula lineages to coincide
with this collision occurring 0.5–0.7 Ma (assuming limited or no
dispersal from the proto-islands to the mainland prior to the
collision). Our estimated age of the split between the clade
containing the Izu Peninsula and most northern island populations
is ,0.7–0.24 Ma. Unfortunately, without fossil data, our estimates
of divergence age may not become more precise, even with
additional DNA data.
Another possibility is that the ages of the extant P. latiscutatus
populations do not coincide with age of colonization because of
processes of historical diversification. A striking contrast is the age
of the P. latiscutatus lineage (i.e., the age of the split between that
species and P. japonicus), approximately 3–7.6 Ma [31], and the
relatively young age of the crown clade of extant populations
(0.24–0.7 Ma). One potential explanation for this phenomenon is
that this clade experiences high lineage turnover, a phenomenon
in which birth and death of lineages is high (e.g., [74,75]), resulting
in an apparent lack of older lineages. That the mean ages of the
clades inhabiting the modern Izu Islands are almost all less than
0.1 Ma also deserves explanation. This pattern too could be
explained by high lineage turnover resulting in the extinction of
older P. latiscutatus lineages. Another potential explanation is that
the modern Izu Islands were formed, or became isolated, in the
past 100,000 years, however, the ages of the modern Izu Islands
except Kozu and Niijima (0.88–0.93 Ma, respectively; [27]) are
not known with certainty.
The phylogenetic split between islands north of Mikura
(including the mainland) and south of Miyake is unique when
compared to previous Izu Islands phylogeographic studies. This
pattern is also seen in the distribution of R35 alleles. The
northernmost island, Oshima, contains a single allele (A) that also
dominates the Toshima population immediately south. The A
allele continues to be present in the islands as far southern as
Kozu, but at a lower frequency. The A allele is completely absent
from the South Clade, and is replaced by the B allele in the three
southernmost islands and all but one individual in Mikura. This
north-south split result is puzzling since Miyake and Mikura are
geographically close (,17 km), and therefore we would expect
some dispersal. This pattern could be explained by an ancient
separation of populations prior to the collision of the Izu proto-
island with the mainland although the age of the north-south split
(0.24–0.7 Ma) is younger than or roughly simultaneous with the
hypothesized time of this collision (0.5–0.7 Ma).
A striking finding is that the age of the populations on Miyake is
very young (0.06–0.5 Ma), yet the entire lineage (which also
includes an individual from Shikine) is much older (0.16–0.56 Ma)
– a pattern similar to the Bermuda skink, Plestiodon longirostris [30].
Geologic evidence suggests that Miyake may have formed
approximately 10,000 years ago (it is presently an active volcano)
[76]. Thus, if the bird predation-mediated drab coloration and life
history characteristics evolved in situ on Miyake, then it must have
evolved very quickly.
Miyake is also notable for the dominance of the R35 D allele
that is only found in one A/D heterozygote in Kozu, but more
common on the Izu Peninsula. We lack the data to fully explain
this phenomenon, but we note that, since the introduction of the
Japanese weasel (Mustela itatsi) in the early 1980s, the population
size of Miyake P. latiscutatus has undergone a massive decline to
one-thousandth to ten thousandth of its pre-1980s population size
[8–10]. It is quite likely that this bottleneck has severely affected
the historical frequencies of R35 alleles.
The phylogeography of P. latiscutatus is unique when compared
to other Izu Islands taxa studied to date. The most relevant
comparison is to four-lined ratsnake, Elaphe quadrivirgata, the
primary snake predator of the Izu Islands P. latiscutatus. Kuriyama
et al. [19] found that all Izu Islands populations descend from
mainland ancestors within the past 0.20–0.58 Ma, and the
intraspecific phylogeny of E. quadrivirgata is composed of a clade
inhabiting Izu Peninsula, Oshima, and Mikura populations, and
another clade containing Toshima, Niijima, Shikine, Kozu, and
Tadanae populations. The latter pattern is similar to that seen in
P. latiscutatus and is likely due to the close proximity the islands
(Fig. 1) and potential land connections during Pleistocene glacial
maxima. However, there exist multiple dispersals of E. quadrivirgata
to and/or from the mainland and Oshima, and this pattern
strongly contrasts with P. latiscutatus where the Oshima population
is monophyletic and therefore descended from a single coloniza-
tion.
The phylogeographic pattern of P. latiscutatus is similar to
multiple patterns inferred for Apodemus mice in that there is a close
relationship between Niijima, Shikine, and Miyake populations,
but differ in that Oshima and Kozu were separately colonized by a
lineage of mainland Apodemus mice [16–18]. It is uncertain,
however, that the Izu Islands populations of Apodemus mice showed
deep split from mainland population like P. latiscutatus. Finally, our
results differ from phylogeographic studies of Campanula plants
Convergent Evolutionary Responses to Predation
PLOS ONE | www.plosone.org 13 March 2014 | Volume 9 | Issue 3 | e92233
[13,14] and Euhadra snails [15], which found that the entire Izu
Islands was colonized once. Taken together, these results
demonstrate that colonization of the Izu Islands did not follow a
general pattern, and instead the islands’ communities experienced
different patterns of colonization and therefore offer great
potential to explore replicated patterns and processes of commu-
nity assembly.
Conclusions
The significant associations among predator fauna, lizard
population density, and life history traits suggests that predator
identity and abundance have a direct role in molding the observed
geographical distribution of life-history traits in the Izu Islands
Plestiodon latiscutatus [12]. As far as we know, the Izu Islands P.
latiscutatus system is the most comprehensively examined classic
example of the island syndrome in lizard populations, with
datasets for predation regime, lizard density, intensity of intraspe-
cific competition for prey resources, intensity of male-male
competition for gravid females, degree of female choice, and
complete datasets of life history traits [8,9,12,20–22]. To fully
develop a mechanistic understanding of the proximate factors
responsible for evolutionary shifts of life history and other traits in
relation to ecological factors requires further analysis of the
potential causative physiological, endocrinological, immunologi-
cal, neurological and behavioral mechanisms controlling particular
life history traits (e.g., [65]). Nonetheless, our phylogenetic
approach to studying independent and repeated evolution is an
important step for the future mechanistic understanding of
phenotypic evolution.
Acknowledgments
We thank H. Abe, S. Fukasawa, K. Furuse, T. Hasegawa, M. Hiragi, Y.
Isaka, M. Kuroe, R. Mizusawa, T. Mizuta, R. Nakajyo, A. Nakanishi, K.
Osawa, T. Okamoto, H. Takahashi, H. Takeda, K. Tomizawa, H.
Sanayama, H. Usuda, members of the Laboratory of Geographical
Ecology of Toho University for their field assistance; A. Seago for animal
illustrations; A. Leache, A. Seago, and J. Van Dyke for comments on the
manuscript; and J. Mai for computational assistance, and Intersect
Australia Ltd. for supercomputing resources. We especially thank the late
T. Hamakawa and K. Hamakawa for transportation to Tadanae.
Author Contributions
Conceived and designed the experiments: MCB TK MH. Performed the
experiments: MCB TK MH. Analyzed the data: MCB. Contributed
reagents/materials/analysis tools: MCB TK MH. Wrote the paper: MCB
TK MH.
References
1. Ruxton GD, Sherratt TM, Speed MP (2004) Avoiding attack: the evolutionary
ecology of crypsis, warning signals and mimicry. Oxford University Press.
Oxford.
2. Reznick D, Endler JA (1982) The impact of predation on life history evolution in
Trinidadian guppies (Poecilia reticulata). Evol 36: 160–177.
3. Johnson JB, Belk MC (2001) Predation environment predicts divergent life-
history phenotypes among populations of the live-bearing fish, Brachyrhaphis
rhabdophora. Oecologia 126: 142–149.
4. Jennions MD, Telford SR (2002) Life-history phenotypes in populations of
Brachyrhaphis episcopi (Poeciliidae) with different predator communities. Oecologia
132: 44–50.
5. Riesch R, Martin RA, Langerhans RB (2013) Predation’s role in life-history
evolution of a livebearing fish and a test of the Trexler-DeAngelis model of
maternal provisioning. Am Nat 181: 78–93.
6. Motokawa J, Hikida T (2003) Genetic variation and differentiation in the
Japanese five-lined skink, Eumeces latiscutatus (Reptilia: Squamata). Zool Sci 20:
97–106.
7. Hasegawa M, Moriguchi H (1989) Geographic variation in food habits, body
size and life history traits of the snakes on the Izu Islands. In: Current
herpetology in East Asia. M. Matui, T. Hikida, and R. C. Goris (eds.).
Herpetological Society of Japan, Kyoto. 414–432.
8. Hasegawa M (1999) Impacts of the introduced weasel on the insular food webs.
in: Ota (ed) Tropical Island Herpetofauna: Origin, Current Diversity, and
Conservation. Elsevier Science. 129–154.
9. Hasegawa M (2003b) Ecological diversification of insular terrestrial reptiles: a
review of the studies on the lizard and snakes of the Izu Islands. Glob Environ
Res 7: 59–67.
10. Hasegawa M, Nishikata S (1991) Predation by the introduced weasel Mustela
itatsi upon Eumeces okadae on Miyake, Izu Islands. Nat Hist Res 1: 53–57.
11. Higuchi H (1973) Birds of the Izu Islands (I). Distribution and habitat of the
breeding land and freshwater birds. Tori 22: 14–24 (in Japanese with English
summary).
12. Hasegawa M (1994) Insular radiation of life history in the lizard Eumeces okadae
on the Izu Islands. Copeia 1994: 732–747.
13. Inoue K, Kawahara T (1990) Allozyme differentiation and genetic structure in
island and mainland Japanese populations of Campanula punctata (Campanula-
ceae). Am J Bot 77: 1140–1448.
14. Oiki S, Kawahara T, Inoue K, Ohara M, Maki M (2001) Random amplified
polymorphic DNA (RAPD) variation among populations of the insular endemic
plant Campanula microdonta (Campanulaceae). Ann Bot 87: 661–667.
15. Hayashi M, Chiba S (2004) Enhanced colour polymorphisms in island
populations of the land snail Euhadra peliomphala. Biol J Linn Soc 81: 417–425.
16. Suzuki H, Yasuda SP, Sakaizumi M, Wakana S, Motokawa M, et al. (2004)
Differential geographic patterns of mitochondrial DNA variation in two
sympatric species of Japanese wood mice, Apodemus speciosus and A. argenteus.
Genes Gen Syst 79: 165–176.
17. Tomozawa M, Suzuki H (2008) A trend of central versus peripheral structuring
in mitochondrial and nuclear gene sequences of the Japanese wood mouse,
Apodemus speciosus. Zool Sci 25: 273–285.
18. Takechi R, Hayashi F (2012) Historical Effects on Local Variation in Walnut-
Feeding Behavior by the Japanese Wood Mouse, Apodemus speciosus. Zool Sci 29:
71–78.
19. Kuriyama T, Brandley MC, Katayama A, Mori A, Honda M, et al. (2011) A
time-calibrated phylogenetic approach to assessing the phylogeography and
colonization history of snakes in the Japanese Izu Islands. J Biogeography 38:
259–271.
20. Hasegawa M (1990a) The thrush Turdus celaenops as an avian predator of juvenile
Eumeces okadae on Mayake-Jima, Izu Islands. Japan J Herpetol 13: 65–69.
21. Hasegawa M (1990b) Demography of an island population of the lizard, Eumeces
okadae, on Miyake, Izu Islands. Res Pop Ecol 32: 119–133.
22. Hasegawa M (2003a) Intraspecific variation in sexual dimorphism and mating
system in relation to interisland differences in predation pressure. In Fox SF,
McCoy JK, Baird TA. (eds), Lizard Social Behavior, Johns Hopkins University
Press. 172–189.
23. Emerson BC, Gillespie RG (2008) Phylogenetic analysis of community assembly
and structure over space and time. Trends Ecol Evol 23: 619–630.
24. Kuriyama T, Miyaji K, Sugimoto M, Hasegawa M (2006) Ultrastructure of the
dermal chromatophores in a lizard (Scincidae:Plestiodon latiscutatus) with
conspicuous body and tail coloration. Zool Sci: 793–799.
25. Kaneoka I, Ishiki N, Zashu S (1970) K-Ar ages of the Izu-Bonin Islands.
Geochem. J 4: 53–60.
26. Hirata D, Yamashita H, Suzuki K, Hirata Y, Bing Y, et al. (2010) Collision
accretion tectonics of the proto-Izu–Mariana Arc: a review. J Geograph 119;
1125–1160 (In Japanese with English summary).
27. Tani K, Fiske RS, Dunkley DJ, Ishizuka O, Oikawa T, et al. (2011) The Izu
Peninsula, Japan: Zircon geochronology reveals a record of intra-oceanic rear-
arc magmatism in an accreted block of Izu–Bonin upper crust. Earth Planet Sci
Lett 303: 225–239.
28. Hasegawa M (1984) Biennial reproduction in the lizard Eumeces okadae on
Miyake-jima, Japan. Herpetologica 40: 194–199.
29. Hikida T (1993) Phylogenetic relationships of the skinks ofthe genus Eumeces
(Scincidae: Reptilia) from East Asia.Japan. Japan J Herpetol 15: 1–21.
30. Brandley MC, Wang Y, Guo XG, Nieto Montes de Oca A, Ferıa Ortız M, et al.
(2011) Accommodating locus-specific heterogeneity in molecular dating
methods: an example using inter-continental dispersal of Plestiodon (Eumeces)
lizards. Syst Biol 60: 3–15.
31. Brandley MC, Wang Y, Guo XG, Nieto Montes de Oca A, Ferıa Ortız M, et al.
(2012) The phylogenetic systematics of blue-tailed skinks (Plestiodon) and the
family Scincidae. Zool J Linn Soc 165: 163–189.
32. Palumbi SR (1996) Nucleic acids II: the polymerase chain reaction. In: Hillis,
D.M., Moritz, C., Mable, B.K. (Eds.), Molecular Systematics. Sinauer
Associates, Sunderland, MA, 205–320.
33. Maddison D, Maddison W (2005) MacClade Version, 4.08, Sinauer Associates,
Inc., Sunderland, MA.
34. Stephens M, Smith NJ, Donnelly P (2001) A new statistical method for haplotype
reconstruction from population data. Am J Hum Genet 68: 978–989.
Convergent Evolutionary Responses to Predation
PLOS ONE | www.plosone.org 14 March 2014 | Volume 9 | Issue 3 | e92233

35. Stephens M, Donnelly P (2003) A comparison of Bayesian methods for
haplotype reconstruction from population genotype data. Am J Hum Genet 73:1162–1169.
36. Drummond AJ, Ho SYW, Phillips MJ, Rambaut A (2006) Relaxed
phylogenetics and dating with confidence. PLOS Biol 4: 699–710.37. Drummond AJ, Rambaut A (2007) BEAST: Bayesian evolutionary analysis by
sampling trees. BMC Evol Biol 7: 214.38. Lemey P, Rambaut A, Drummond AJ, Suchard MA (2009) Bayesian
phylogeography finds its roots. PLoS Comput Biol. 5: e1000520.
39. Brandley MC, Schmitz A, Reeder TW (2005) Partitioned Bayesian analyses,partition choice, and the phylogenetic relationships of scincid lizards. Syst Biol
54: 373–390.40. Graur D, Martin W (2004) Reading the entrails of chickens: molecular
timescales of evolution and the illusion of precision. Trends Genet 20: 80–86.41. Lanfear R, Calcott B, Ho SYW, Guindon S (2012) Partition Finder: combined
selection of partitioning schemes and substitution models for phylogenetic
analyses. Mol Biol Evol 29: 1695–1701.42. Nylander JAA, Wilgenbusch JC, Warren DL, Swofford DL (2008) AWTY (are
we there yet?): a system for graphical exploration of MCMC convergence inBayesian phylogenetics. Bioinformatics 24: 581–583.
43. Huelsenbeck JP, Rannala B (2004) Frequentist properties of Bayesian posterior
probabilities of phylogenetic trees under simple and complex substitutionmodels. Syst Biol 53: 904–913.
44. Felsenstein J (1985) Phylogenies and the comparative method. Am Nat 125: 1–15.
45. Orme D, Freckleton R, Thomas G, Petzoldt T, Fritz S, et al. (2012). CAPER:comparative analyses of phylogenetics and evolution in R. R package version
0.5.
46. Ord TJ, Martins EP (2006) Tracing the origins of signal diversity in anolelizards: phylogenetic approaches to inferring the evolution of complex
behaviour. Anim Behav 71: 1411–1429.47. Harmon LJ, Weir JT, Brock CD, Glor RE, Challender W (2008) GEIGER:
investigating evolutionary radiations. Bioinformatics 24: 129–131.
48. Maddison WP (1997) Gene trees in species trees. Syst Biol 46: 523–536.49. Carstens BC, Knowles LL (2007) Estimating phylogeny from gene tree
probabilities in Melanoplus grasshoppers despite incomplete lineage sorting. SystBiol 56: 400–411.
50. McGuire JA, Linkem CW, Koo M, Hutchison DW, Lappin AK, et al. (2007)Mitochondrial introgression and incomplete lineage sorting through space and
time: phylogenetics of crotaphytid lizards. Evolution 61: 2879–2897.
51. Leache AD (2009) Species tree discordance traces to phylogeographic cladeboundaries in North American fence lizards (Sceloporus). Syst Biol 58: 547–559.
52. Ho SYW, Phillips MJ, Cooper A, Drummond AJ (2005) Time dependency ofmolecular rate estimates and systematic overestimation of recent divergence
times. Mol. Biol. Evol. 22: 1561–1568.
53. Ho SYW, Shapiro B, Phillips MJ, Cooper A, Drummond AJ (2007) Evidence fortime dependency of molecular rate estimates. Syst. Biol. 56: 515–522.
54. Case T, Bolger D (1991) The role of introduced species in shaping thedistribution and abundance of island reptiles. Evol Ecol 5: 272–290.
55. Case T (1983) The reptiles: ecology. In:Case T, Coby M, Island Biogeography inthe Sea of Cortez. University of California Press, Berkeley, U.S.A., 159–209.
56. Osorio D, Vorobyev M (2005) Photoreceptor spectral sensitivities in terrestrial
animals: adaptations for luminance and colour vision. Proc Roy Soc Lond B Biol272: 1745–1752.
57. Watson CM, Roelke CE, Pasichnyk PN, Cox CL (2012) The fitnessconsequences of the autotomous blue tail in lizards: an empirical test of
predator response using clay models. Zoology 115: 339–344.
58. Cooper WE, Vitt LJ (1985) Blue tails and autotomy: enhancement of predationavoidance in juvenile skinks. Z Tierpsychol 70: 265–276.
59. Arnold EN (1984) Evolutionary aspects of tail shedding in lizards and their
relatives. J Nat Hist 18: 127–169.
60. Hawlena D, Boochnik R, Abramsky Z, Bouskila A (2006) Blue tail and striped
body: why do lizards change their infant costume when growing up? Behavioral
Ecology, 2006.
61. Hawlena D (2009) Colorful tails fade when lizards adopt less risky behaviors.
Behavioral Ecology and Sociobiology 64: 205–213.
62. Galan P, Lannoo MJ (2003) Reproductive Characteristics of an InsularPopulation of the Lizard Podarcis hispanica from Northwest Spain (Cıes Islands,
Galicia). Copeia 2003: 657–665.
63. Meiri S (2007) Size evolution in island lizards. Glob Ecol Biogeogr 16: 702–708.
64. Pafilis P, Meiri S, Foufopoulos J, Valakos ED (2009a) Intraspecific competition
and high food availability are associated with insular gigantism in a lizard.
Naturwissenschaften. 96: 1107–1113.
65. Pafilis P, Foufopoulos J, Poulakakis N, Lymberakis P, Valakos ED (2009b) Tail
shedding in island lizards (Lacertidae, Reptilia): Decline of antipredator defenses
in relaxed predation environments. Evolution 63: 1262–1278.
66. Raia P, Guarino F, Turano M, Polese G, Rippa D, et al. (2010) The blue lizard
spandrel and the island syndrome. BMC Evol Biol 10: 289.
67. Monti DM, Raia P, Vroonen J, Maselli V, Van Damme R, et al. (2012)Physiological change in an insular lizard population confirms the reversed island
syndrome. Biol J Linn Soc 108, 144–150.
68. Pafilis P, Foufopoulos J, Sagonas K, Runemark A, Svensson E, et al. (2011)Reproductive Biology of Insular Reptiles: Marine Subsidies Modulate
Expression of the ‘‘Island Syndrome’’. Copeia 2011: 545–552.
69. Stuart-Fox D, Whiting MJ, Moussalli A (2006) Camouflage and colour change:antipredator responses to bird and snake predators across multiple populations
in a dwarf chameleon. Biol J Linn Soc 88, 437–446.
70. Novosolov M, Raia P, Meiri S (2013) The island syndrome in lizards. GlobalEcol Biogeogr 22: 184–191.
71. Taira A, Saito S, Aoike KAN, Morita S, Tokuyama H, et al. (1998) Nature and
growth rate of the Northern Izu–Bonin (Ogasawara) arc crust and theirimplications for continental crust formation. Isl Arc 7: 395–407.
72. Amano K (1991) Multiple collision tectonics of the Southern Fossa Magna in
Central Japan. Mod Geol 15: 315–29.
73. Okamoto T, Motokawa J, Toda M, Hikida T (2006) Parapatric distribution of
the lizards Plestiodon (formerly Eumeces) latiscutatus and P. japonicus (Reptilia:
Scincidae) around the Izu Peninsula, central Japan, and its biogeographicimplications. Zool Sci 23: 419–425.
74. Alfaro ME, Santini F, Brock C, Alamillo H, Dornburg A, et al. (2009) Nine
exceptional radiations plus high turnover explain species diversity in jawedvertebrates.
75. Near TJ, Dornburg A, Tokita M, Suzuki D, Brandley MC, et al (2014) M. Boom
and bust: ancient and recent diversification in bichirs and ropefish (Polypteridae:Actinopterygii), a relictual lineage of ray-finned fishes. Evolution, in press.
76. Tsukui M, Niihori K, Sawanabe Y, Suzuki Y (2001) Stratigraphy and formation
of Miyake volcano. J Geograph 110: 156–157. (In Japanese with Englishabstract).
Convergent Evolutionary Responses to Predation
PLOS ONE | www.plosone.org 15 March 2014 | Volume 9 | Issue 3 | e92233
Copyright © 2022 FDOKUMEN