Amar et al 2010 Ravens Japple FINAL
10
Spatial and temporal associations between recovering populations of common raven Corvus corax and British upland wader populations Arjun Amar 1 *, Steve Redpath 2 , Innes Sim 1 and Graeme Buchanan 1 1 Royal Society for the Protection of Birds – Scotland, Dunedin House, 25 Ravelston Terrace, Edinburgh, EH4 3TP, UK; and 2 Aberdeen Centre for Environmental Sustainability, Aberdeen University & Macaulay Institute, Tillydrone Avenue, Aberdeen, AB24 2TZ, UK Summary 1. Recovering populations of predators and scavengers have often given rise to concerns about the impact they may have on prey species. Particularly, this is the case when the prey species are of economic or conservation importance. 2. Recovery of common raven Corvus corax populations in the UK and Europe has given rise to a conflict with some stakeholders over their concerns for both the protection of livestock and the possible detrimental impact on some upland bird species, particularly ground nesting waders. This has led to demands by some land managers for licences to lethally control ravens to protect upland breeding birds. 3. We used data from broad scale surveys of distribution and abundance of upland breeding birds in the UK carried out in 1980–1993 and 2000–2002 to test whether variation in raven abundance or change in raven abundance was negatively associated with changes in abundance of five species of waders. 4. We found no significant negative spatial or temporal relationships between ravens and any of the five species of waders. However, weak (0 05 < P < 0 1) negative relationships between raven abundance and trends of curlew Numenius arquata and lapwing Vanellus vanellus may warrant further investigation. 5. Synthesis and applications. Our study found no significant negative associations between raven abundance and population changes in upland waders, and so does not provide support to justify granting of licences for the lethal control of ravens in the interest of population-level conservation of these upland wader species. However, the near significant negative associations with lapwing and curlew merit further investigation. This study emphasizes the importance of making a thorough evaluation of the evidence base before making decisions regarding predator control. Key-words: avian conservation, grouse moors, lethal control, population decline, population limitation, predation, protected species Introduction Across Europe, many predatory species are recovering from the adverse effects of persecution, over-hunting or toxic pesticides. Whilst many organizations view these changes as positive, increases in predator numbers do raise concerns amongst other groups, because of their perceived impact on prey species. This is especially the case for those predators which take prey of either economic or conservation impor- tance (Redpath & Thirgood 1997; Landa et al. 1999; Stahl et al. 2002; Petty, Lurz & Rushton 2003; Amar et al. 2008). Such concerns can lead to conflicts between land users and conservation or statutory agencies, with land users often demanding the right to kill predators (Linnell et al. 2005; Treves & Naughton-Treves 2005). Therefore, licensing author- ities must balance the need to safeguard populations of vulner- able, recovering predators, whilst at the same time acknowledging and addressing the concerns that farmers, hunters or conservationists may have over increasing predator *Correspondence author. E-mail: [email protected] Journal of Applied Ecology 2010, 47, 253–262 doi: 10.1111/j.1365-2664.2010.01772.x Ó 2010 The Authors. Journal compilation Ó 2010 British Ecological Society
Transcript of Amar et al 2010 Ravens Japple FINAL
Spatial and temporal associations between
recovering populations of common raven Corvus
corax and British upland wader populations
Arjun Amar1*, Steve Redpath2, Innes Sim1 and Graeme Buchanan1
1Royal Society for the Protection of Birds – Scotland, Dunedin House, 25 Ravelston Terrace, Edinburgh, EH4 3TP,
UK; and 2Aberdeen Centre for Environmental Sustainability, Aberdeen University & Macaulay Institute, Tillydrone
Avenue, Aberdeen, AB24 2TZ, UK
Summary
1. Recovering populations of predators and scavengers have often given rise to concerns about the
impact they may have on prey species. Particularly, this is the case when the prey species are of
economic or conservation importance.
2. Recovery of common raven Corvus corax populations in the UK and Europe has given rise to
a conflict with some stakeholders over their concerns for both the protection of livestock and the
possible detrimental impact on some upland bird species, particularly ground nesting waders. This
has led to demands by some land managers for licences to lethally control ravens to protect upland
breeding birds.
3. We used data from broad scale surveys of distribution and abundance of upland breeding birds
in the UK carried out in 1980–1993 and 2000–2002 to test whether variation in raven abundance or
change in raven abundance was negatively associated with changes in abundance of five species of
waders.
4. We found no significant negative spatial or temporal relationships between ravens and any of
the five species of waders. However, weak (0Æ05 < P < 0Æ1) negative relationships between raven
abundance and trends of curlew Numenius arquata and lapwing Vanellus vanellus may warrant
further investigation.
5. Synthesis and applications. Our study found no significant negative associations between raven
abundance and population changes in upland waders, and so does not provide support to justify
granting of licences for the lethal control of ravens in the interest of population-level conservation
of these upland wader species. However, the near significant negative associations with lapwing and
curlew merit further investigation. This study emphasizes the importance of making a thorough
evaluation of the evidence base beforemaking decisions regarding predator control.
Key-words: avian conservation, grouse moors, lethal control, population decline, population
limitation, predation, protected species
Introduction
Across Europe, many predatory species are recovering from
the adverse effects of persecution, over-hunting or toxic
pesticides. Whilst many organizations view these changes as
positive, increases in predator numbers do raise concerns
amongst other groups, because of their perceived impact on
prey species. This is especially the case for those predators
which take prey of either economic or conservation impor-
tance (Redpath & Thirgood 1997; Landa et al. 1999; Stahl
et al. 2002; Petty, Lurz & Rushton 2003; Amar et al. 2008).
Such concerns can lead to conflicts between land users and
conservation or statutory agencies, with land users often
demanding the right to kill predators (Linnell et al. 2005;
Treves &Naughton-Treves 2005). Therefore, licensing author-
ities must balance the need to safeguard populations of vulner-
able, recovering predators, whilst at the same time
acknowledging and addressing the concerns that farmers,
hunters or conservationists may have over increasing predator*Correspondence author. E-mail: [email protected]
Journal of Applied Ecology 2010, 47, 253–262 doi: 10.1111/j.1365-2664.2010.01772.x
� 2010 The Authors. Journal compilation � 2010 British Ecological Society

populations. Such decisions need to be informed by evidence,
and in particular the impact that predators are having on prey
populations and livelihoods.
In theUK,persecutionof commonravenCorvus corax (here-
after simply raven) by farmers and gamekeepers caused a rapid
contraction in breeding range by the 20th century (Gibbons
et al.1994).More recently, however, both in theUKandacross
Europe, raven populations have increased rapidly (BirdLife
International 2004). In theUK, theBreedingBirdSurvey shows
that from 1994 to 2007 the population increased by 134%,with
increases of 267%, 155% and 34% in England, Scotland and
Wales respectively (Risely, Noble & Baillie 2008). The species
remains restricted largely to the uplands, and upland bird sur-
veys carried between 1980 and 1993 and repeated in 2000 or
2002 found increases in ravens,althoughwithconsiderablevari-
ation between survey areas (Sim et al. 2005). Ravens also occa-
sionally kill lambs (Ratcliffe 1997) and in the UK, licences are
granted tokill ravens toprotect livestock. InScotland, thenum-
ber of licences granted increased by nearly 300% from 21 in
1998 to61 in2008 (ScottishGovernment,unpublisheddata).
Concurrent with the increases in ravens reported by Sim
et al. (2005), populations of many upland wader species have
declined. Sim et al. (2005) reported widespread declines from
1980–1993 to 2000–2002 for three species of waders: lapwing
Vanellus vanellus (L.), dunlin Calidris alpina (L.) and curlew
Numenius arquata (L). For these species large per annum
decreases, sufficient to cause at least a 50% population decline
over 25 years, were found in several survey areas. For two
other species of wader, golden plover Pluvialis apricaria (L.)
and snipe Gallinago gallinago (L.), population changes varied
between survey areas, with declines of over 50% in some areas,
but increases of the same extent found elsewhere.
Ravens are omnivorous scavengers and predators (Ratcliffe
1997). Their diet varies greatly between studies (reviewed by
Ratcliffe 1997), and although full grown birds occasionally
form part of their diet (Klicka & Winker 1991; Hendricks &
Schlang 1998) these are thought to be more often scavenged
than predated (Marquiss, Newton&Ratcliffe 1978). However,
ravens prey regularly on the eggs and young of birds. Several
studies in theUKhave found the frequent presence of eggshells
in raven castings, which included curlew and other wader spe-
cies (Marquiss et al. 1978; Ewins, Dymond & Marquiss 1986;
Marquiss & Booth 1986). Another study in southern Norway
found that ravens were responsible for most of the June losses
of golden plover clutches (Byrkjedal 1987).
Thus, there is evidence to suggest that ravens could be an
important predator of breeding wader, and some stake-
holders have expressed concerns that ravens may have
been responsible for upland waders declines. For example,
Scottish Natural Heritage (SNH), the licensing authority in
Scotland, received licence applications in both 2007 and
2008 for the control of ravens to protect upland breeding
waders and wild gamebirds from 15 estates (SNH, un-
published data). No such licences have yet been issued,
because SNH have not been satisfied that there is sufficient
evidence to indicate that any wild bird populations are
affected by increases in raven populations.
These issues have been the source of much controversy, and
were included within a petition submitted to the Scottish
Parliament (http://www.scottish.parliament.uk/business/peti-
tions/docs/PE449.htm), which led to a review on the impact of
predatory birds on waders, songbirds, gamebirds and fisheries
(Park et al. 2005). This review concluded that analyses to
investigate changes in wader abundance in relation to preda-
tory birds, including the raven, was a high research priority
(Park et al. 2005).
The greatest insights into the role of predators in limiting
prey populations come from replicated predator removal
experiments (Newton 1998). However, these types of experi-
ments are logistically difficult to conduct at appropriately large
spatial scales, particularly when the predators involved are
legally protected. Where such studies are impractical, useful
knowledge can be gained by examining correlations between
changes in prey and predator abundance (Newton, Dale &
Rothery 1997; Thomson et al. 1998; Amar et al. 2008; Cham-
berlain, Glue & Toms 2009). In this study, we take advantage
of data provided by the Repeat Upland Bird Survey (RUBS)
(Sim et al. 2005) to undertake such a study. The RUBS pro-
vides data from original and repeat surveys of upland breeding
birds from a range of plots throughout Britain, providing data
on both the abundance and population change of wader spe-
cies and ravens from a number of discrete survey areas.
In this study, we use the RUBS data to examine spatial and
temporal associations between populations and trends in
ravens and waders. Spatially, using data from the repeat
surveys, we explore whether wader abundance correlates nega-
tively with raven abundance. Temporally, we examine whether
the changes in the abundance of any wader species are nega-
tively associated with either raven abundance in the repeat sur-
vey or the change in raven abundance between the two survey
periods on a plot. However, because any such relationship
could in theory be as a result of difference in abundance or
changes associated with environmental variables, we
constructed full models incorporating broad habitat and topo-
graphical measures prior to examining the hypothesis that
raven abundance or change was associated with wader abun-
dance or changes in wader populations (Whittingham et al.
2006). Temporal associations, and in particular negative
relationships between changes in wader and change in raven
abundance, would provide the strongest correlative evidence
that increases in raven populations might be responsible for
declines in wader populations. This study presents the first
attempt to test whether there are any negative associations
between raven and upland wader populations with a view to
helping inform policy on whether licenced control of raven
populations is likely to benefit broader upland bird conserva-
tion objectives.
Materials and methods
THE REPEAT UPLAND BIRD SURVEY
Sim et al. (2005) conducted re-surveys of upland birds on plots
distributed in a series of regionally discrete survey areas (Fig. 1).
254 A. Amar et al.
� 2010 The Authors. Journal compilation � 2010 British Ecological Society, Journal of Applied Ecology, 47, 253–262

Survey areas were not necessarily representative of the UK
uplands (Sim et al. 2005), because the rationale for survey area
selection in the original surveys varied, and was associated with
identifying areas with important upland breeding bird assemblages
for legal protection under UK and EU conservation legislation.
In many cases, these areas were simply known or suspected to
hold relatively high densities of upland breeding birds, particularly
waders. In others, they were areas directly threatened with large-
scale land use change, such as afforestation. They do, however,
represent plots from most of the main upland blocks of Britain.
Thirteen survey areas covering a total of 1713 km2 were originally
surveyed between 1980 and 1993, and were then resurveyed in
2000 or 2002. Thus, time between original and re-surveys varied
from 9 years (e.g. Exmoor) to up to 21 years (Migneint). Any
plots or areas of plots that were afforested between surveys were
not resurveyed; for partially afforested plots, we recalculated origi-
nal bird abundance within the plot removing those birds found in
the areas that were subsequently afforested. Bird surveys (see Sim
et al. 2005 for details) used either parallel transects (200 ⁄ 250 m
apart) or were based on the methods of Brown & Shepherd
(1993) which were broadly equivalent to 200 m transect surveys,
as they involve surveying to within 100 m of every point in the
plot. Surveys consisted of two visits, occurring between April and
July. For analyses, we used the maximum count from either of
the two visits (early and late) in both the original and re-survey.
Original and repeat surveys were always conducted using the same
methods.
USE OF RUBS DATA
Details of the number and average size of plots in the different survey
areas are given in Table 1. Survey areas were the same as Sim et al.
(2005) with a few exceptions. We split the North Wales area into two
(Berwyn and Migneint), because the original surveys took place in
different years. We excluded data from Staffordshire, South Scotland
and South-west Scotland because they lacked survey data for ravens
(Sim et al. 2005), and from East Flows because surveys used 500 m
transects and were therefore not comparability with themethods used
Fig. 1.Map of the UK showing and the
locationoftheplotsusedinthisstudy.Smaller
images to the right and top, show the survey
area locations in more detail with the key
place names to provide greater clarity on the
locations of plots. Please note that scales
vary.
Impacts of raven populations on upland waders 255
� 2010 The Authors. Journal compilation � 2010 British Ecological Society, Journal of Applied Ecology, 47, 253–262

in the other survey areas. Where survey plots were contiguous or
where they were separated by gaps of <200 m from a neighbouring
plot, they were combined into a single plot for the purpose of this
analysis. Altogether, we used data from surveys in 10 survey areas,
from 118 plots covering 1285 km2.
We had sufficient data to examine population changes for five
wader species: curlew, golden plover, snipe, dunlin and lapwing.
Counts of ravens (including flocks) were also made during the bird
surveys, and we calculated raven abundance, for use in our analysis,
using the maximum count between the two visits per total area (km2)
of the plot.
ENVIRONMENTAL ATTRIBUTES OF PLOTS
Environmental data extraction was undertaken using Map Info 6Æ0(MapInfo Corporation 2000) or idrisi 32 (Clark Laboratories 2001).
Plot boundaries were digitized and the area of land surveyed was
calculated. Topographical information was extracted from a 50 m
digital terrain model (Panorama, Ordnance Survey, Southampton,
UK). The average altitude of each plot was calculated as the arithme-
tic mean of altitudes at all 50 m points across the plot. A slope model
was produced in IDRISI, and the proportions of each plot with a
slope of<10� was calculated.The proportions of different habitats in plots were extracted from
the UK Land Cover Map 2000 (LCM2000; Fuller et al. 2005), a UK
habitat map with 25-m resolution produced by classification of satel-
lite images. We used data from five habitat types classified from
LCM2000 subclass level 2: (i) dwarf shrub heath, (ii) open shrub
heath, (iii) bog, (iv) rough grass and (v) acid grass. These five habitats
types accounted, on average, for 82% of the area within each plot.
We combined Dwarf Shrub Heath and Open Shrub Heath into its
lower level subclass 1 – hereafter termed ‘heather’. We then con-
structed a Principal Components Analysis (PCA) to describe the
broad differences in habitat between plots. The first two axes of this
PCA accounted for 76% of the variation in the data. The first axis,
which explained 45% of the variance, described a gradient of plots
from those dominated by heather to those dominated by acid grass,
bog and rough grass (eigenvectors: Heather = )0Æ876, Bog = 0Æ233,Rough grass = 0Æ374, Acid grass = 0Æ196). The second axis, which
explained 31% of the variance, distinguished plots which were domi-
nated by bog habitat from those which were grass dominated (eigen-
vectors: Heather = )0Æ015, Bog = )0Æ880, Rough grass = 0Æ335,AcidGrass = 0Æ337).
STATIST ICAL ANALYSIS
Because data were collected from multiple plots clustered in survey
areas, with differing numbers of plots in each area, it was necessary
to incorporate this lack of independence in our analysis. Therefore,
where possible we fitted a Generalized Linear Mixed Model
(GLMM), with survey area fitted as a random term. Where models
failed to converge using this approach, we used a Generalized
Linear Model (GLM), with survey area fitted as a fixed effect. This
latter approach is more conservative with respect to finding an
association with the explanatory covariates, as more variation in
the data is accounted for by survey area as a fixed effect. Models
were fitted using either a Poisson error structure and a log link
function, when examining wader abundance; or a binomial error
structure and logit link function, when examining wader population
change. All models were scaled to correct for over-dispersion.
Denominator degrees of freedom in GLMM were estimated using
Satterthwaite’s formula (Littell et al. 1996). Additionally, as timeTable
1.Detailsofplotsandcovariatesusedin
theanalysisforeach
survey
area
Survey
area
Plots
Plotsize
(km
2)
Totalarea
surveyed
(km
2)
Originalraven
abundance
(per
km
2)
Repeatraven
abundance
(per
km
2)
Change
(%)
PCA1scores
PCA2scores
%<
10�
slope
Altitude(m
)
Berwyn
514Æ4
(±7Æ01)
71Æ9
0Æ18(±
0Æ10)
1Æ33(±
0Æ62)
656
)0Æ57(±
0Æ06)
0Æ03(±
0Æ02)
96(±
18)
442(±
11)
Exmoor
916Æ1
(±10Æ91)
144Æ6
0Æ00(±
0Æ00)
0Æ00(±
0Æ00)
0*
)0Æ13(±
0Æ06)
0Æ10(±
0Æ02)
60(±
6)
309(±
21)
LakeDistrict
12
5Æ9
(±0Æ75)
70Æ4
0Æ31(±
0Æ09)
0Æ50(±
0Æ11)
59
0Æ06(±
0Æ05)
0Æ15(±
0Æ03)
82(±
4)
335(±
34)
Lew
is&
Harris
18
6Æ0
(±0Æ40)
108Æ5
0Æ60(±
0Æ19)
0Æ58(±
0Æ11)
)3
)0Æ23(±
0Æ09)
)0Æ27(±
0Æ08)
97(±
1)
76(±
6)
Migneint
29Æ8
(±1Æ35)
19Æ6
0Æ06(±
0Æ05)
0Æ60(±
0Æ12)
907
0Æ03(±
0Æ12)
0Æ26(±
0Æ03)
82(±
5)
425(±
15)
NEScotland
12
18Æ2
(±3Æ97)
218Æ9
0Æ06(±
0Æ02)
0Æ31(±
0Æ11)
413
)0Æ38(±
0Æ08)
)0Æ00(±
0Æ02)
61(±
7)
509(±
44)
NorthPennines
12
6Æ1
(±0Æ04)
72Æ7
0Æ08(±
0Æ03)
0Æ12(±
0Æ04)
51
0Æ01(±
0Æ06)
)0Æ10(±
0Æ10)
77(±
6)
508(±
34)
NorthYorkshire
10
6Æ3
(±0Æ53)
62Æ8
0Æ04(±
0Æ03)
0Æ07(±
0Æ07)
58
0Æ00(±
0Æ09)
0Æ03(±
0Æ06)
81(±
3)
494(±
22)
South
Pennines
22
10Æ2
(±3Æ57)
223Æ3
0Æ00(±
0Æ00)
0Æ06(±
0Æ03)
NA
)0Æ08(±
0Æ05)
)0Æ03(±
0Æ04)
75(±
3)
355(±
13)
WestFlows
16
18Æ3
(±4Æ01)
292Æ1
0Æ00(±
0Æ00)
0Æ15(±
0Æ07)
NA
)0Æ43(±
0Æ06)
)0Æ14(±
0Æ05)
89(±
2)
205(±
23)
Data
shownare
mean(±
1SE).
PCA,principalcoordinatesanalysis;NA,notapplicable,since
ravenswerenotrecorded
inthefirstsurveys.
*Figuresgiven
inSim
etal.2005forraven
change
inExmoorwereincorrect.
256 A. Amar et al.
� 2010 The Authors. Journal compilation � 2010 British Ecological Society, Journal of Applied Ecology, 47, 253–262

span between original and repeat surveys varied (from 9 to
21 years) between survey areas and because there were small differ-
ences in the distances between transects in different survey areas,
our ‘survey area’ term also controlled to some degree for the poten-
tial influence that these differences may have had on our measures
of abundance or population change. All analyses were carried out
in SAS version 9.1 (SAS Institute Inc 2004).
In each analysis, we constructed full models, as recommended for
hypothesis testing (Whittingham et al. 2006). Environmental vari-
ables, which included the first and second axis from the PCA describ-
ing habitat within each plot, and the average slope and altitude of
each plot were included in the model together with our raven term
(either abundance or change in abundance), the significance of which
was then examined from the results of a Type III analyses. Thus, our
models attempted to control for any additional influence of habitat or
topography on wader abundance or change before testing the
hypothesis that raven abundance was negatively associated with
wader abundance or changes. Mean values are presented as mean ±
1 SEunless otherwise stated.
Spatial association between wader and raven
abundance
For this analysis, we modelled wader density by using the counts of
each wader species on each plot during the repeat surveys as the
response variable and the log of the plot area as an offset. We
weighted the analysis by the square root of plot size to account for
our increased confidence in the abundance estimate on larger plots, as
larger plots were more likely to be representative of the overall abun-
dance and less susceptible to small-scale stochasticity. We carried out
these analyses within a GLM, fitting survey area as a fixed effect,
because of lack of model convergence when survey area was fitted as
a random effect in a mixed model. Raven abundance was included in
the full model, together with the habitat and typographical variables,
and we examined the effect of raven abundance using a Type III anal-
ysis.
Temporal association between wader change and
raven abundance or change
We used a binomial measure of wader population change on a plot as
our response variable, by fitting the repeat survey count in each plot
as the numerator, and the sum of the original and repeat counts in the
plot as the denominator. This model therefore examines the degree of
increase or decrease on a plot, and automatically weights appropri-
ately for small or large counts. In this analysis, we excluded all plots
with zero counts in the first episode because these ‘colonization
events’ would have a disproportionately higher value in the response
variable than plots showing large increases of pre-existing popula-
tions. However, numbers of plots excluded were relatively small, as
follows (excluded plots ⁄ total plots for the species): Golden Plover
n = 4 ⁄ 86; Lapwing n = 5 ⁄ 69; Dunlin n = 6 ⁄ 69; Curlew n = 7 ⁄ 95;Snipe n = 13 ⁄ 93). Plots that held no birds in both the original and
repeat surveys were also excluded. Raven abundance in the repeat
survey was included in the full model, together with the habitat and
typographical variables, and we examined the effect of ravens abun-
dance using a Type III analysis.
We used this same model structure to examine whether changes in
wader abundance were associated with changes in raven abundance,
replacing raven abundance as the explanatory variable with changes
in raven abundance, thismeasure was simply the abundance of ravens
present in the re-survey minus the abundance of ravens present in the
original-survey.
Results
CHANGES IN RAVEN AND WADER POPULATIONS
The full data on wader abundance and changes in abun-
dance between the original and repeat surveys are presented
elsewhere (Sim et al. 2005), with only the key data included
here for completeness (Table 2). Raven populations showed
increasing trends in all our survey areas, apart from on
Lewis and Harris (Sim et al. 2005). On Exmoor, no ravens
were recorded during either the original or repeat surveys. In
the South Pennines and the West Flows, ravens were first
recorded on the repeat visits, where none were counted origi-
nally. Elsewhere, there were increases of between 50% to
60% in the three northern England survey areas (Lakes,
North Pennines and North Yorkshire), and increases of over
400% in northeast Scotland and in the two survey areas in
Wales (Table 1).
Table 2. Change (%) in the average number of eachwader species counted in each survey area
Survey area Golden plover Lapwing Dunlin Curlew Snipe
Berwyn )89% (1Æ8, 0Æ2) )100% (2Æ8, 0Æ0) NA (0Æ0, 0Æ0) )78% (28Æ8, 6Æ2) )56% (1Æ8, 0Æ8)Exmoor NA (0Æ0, 0Æ0) )100% (0Æ1, 0Æ0) NA (0Æ0, 0Æ0) )63% (0Æ8, 0Æ3) +167% (0Æ3, 0Æ8)Lake District )95% (2Æ0, 0Æ1) )63% (6Æ5, 2Æ4) )100% (0Æ1, 0Æ0) )39% (15Æ3, 9Æ3) +67% (4Æ6, 7Æ7)Lewis & Harris +60% (22Æ7, 36Æ3) )19% (1Æ6, 1Æ3) +11% (30Æ3, 33Æ6) +133% (0Æ9, 2Æ1) +46% (3Æ5, 5Æ1)Migneint )60% (5Æ0, 2Æ0) )100% (2Æ5, 0Æ0) 0% (0Æ5, 0Æ5) )100% (15Æ5, 0Æ0) )50% (1Æ0, 0Æ5)Northeast Scotland )46% (18Æ3, 9Æ8) +17% (5Æ3, 6Æ2) )34% (3Æ2, 2Æ1) +8% (20Æ7, 22Æ3) +90% (2Æ0, 3Æ8)North Pennines +2% (28Æ5, 29Æ0) )26% (10Æ5, 7Æ8) )14% (4Æ3, 3Æ7) )29% (44Æ5, 31Æ5) 0% (4Æ3, 4Æ3)North Yorkshire )29% (32Æ3, 23Æ1) )45% (14Æ5, 8Æ0) )56% (3Æ6, 1Æ6) )41% (37Æ2, 22Æ1) )5% (4Æ3, 4Æ1)South Pennines +19% (12Æ6, 15Æ0) )9% (3Æ4, 3Æ1) )62% (2Æ6, 1Æ0) +116% (9Æ2, 19Æ9) )7% (1Æ5, 1Æ4)West Flows +38% (25Æ4, 35Æ0) )14% (0Æ7, 0Æ6) )5% (16Æ9, 16Æ0) )36% (3Æ3, 2Æ1) )64% (2Æ5, 4Æ1)
Figures in parentheses show the average numbers counted in each survey area in the original and repeat surveys. No statistical tests of
these changes were made. However, tests based on these data are given in Sim et al. (2005). Data in bold, are those survey areas where
changes were significant according to Sim et al. (2005). The significance results from Sim et al.’s (2005) North Wales survey area are
applied to both our Welsh survey areas.
NA, not applicable, given that no birds were counted in either period.
Impacts of raven populations on upland waders 257
� 2010 The Authors. Journal compilation � 2010 British Ecological Society, Journal of Applied Ecology, 47, 253–262
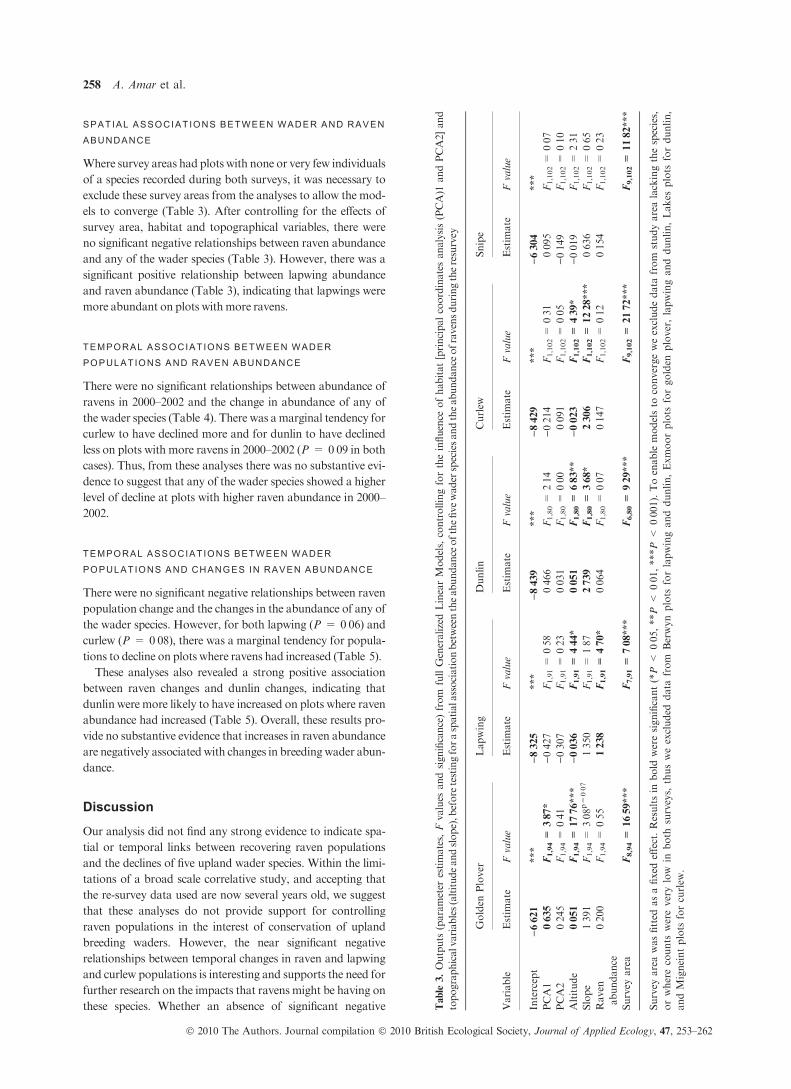
SPATIAL ASSOCIATIONS BETWEEN WADER AND RAVEN
ABUNDANCE
Where survey areas had plots with none or very few individuals
of a species recorded during both surveys, it was necessary to
exclude these survey areas from the analyses to allow the mod-
els to converge (Table 3). After controlling for the effects of
survey area, habitat and topographical variables, there were
no significant negative relationships between raven abundance
and any of the wader species (Table 3). However, there was a
significant positive relationship between lapwing abundance
and raven abundance (Table 3), indicating that lapwings were
more abundant on plots withmore ravens.
TEMPORAL ASSOCIATIONS BETWEEN WADER
POPULATIONS AND RAVEN ABUNDANCE
There were no significant relationships between abundance of
ravens in 2000–2002 and the change in abundance of any of
the wader species (Table 4). There was amarginal tendency for
curlew to have declined more and for dunlin to have declined
less on plots with more ravens in 2000–2002 (P = 0Æ09 in both
cases). Thus, from these analyses there was no substantive evi-
dence to suggest that any of the wader species showed a higher
level of decline at plots with higher raven abundance in 2000–
2002.
TEMPORAL ASSOCIATIONS BETWEEN WADER
POPULATIONS AND CHANGES IN RAVEN ABUNDANCE
There were no significant negative relationships between raven
population change and the changes in the abundance of any of
the wader species. However, for both lapwing (P = 0Æ06) andcurlew (P = 0Æ08), there was a marginal tendency for popula-
tions to decline on plots where ravens had increased (Table 5).
These analyses also revealed a strong positive association
between raven changes and dunlin changes, indicating that
dunlin were more likely to have increased on plots where raven
abundance had increased (Table 5). Overall, these results pro-
vide no substantive evidence that increases in raven abundance
are negatively associatedwith changes in breedingwader abun-
dance.
Discussion
Our analysis did not find any strong evidence to indicate spa-
tial or temporal links between recovering raven populations
and the declines of five upland wader species. Within the limi-
tations of a broad scale correlative study, and accepting that
the re-survey data used are now several years old, we suggest
that these analyses do not provide support for controlling
raven populations in the interest of conservation of upland
breeding waders. However, the near significant negative
relationships between temporal changes in raven and lapwing
and curlew populations is interesting and supports the need for
further research on the impacts that ravens might be having on
these species. Whether an absence of significant negative Table
3.Outputs
(parameter
estimates,Fvalues
andsignificance)from
fullGeneralizedLinearModels,controllingfortheinfluence
ofhab
itat
[principalcoordinatesan
alysis(PCA)1
andPCA2]an
d
topographicalvariables(altitudeandslope),before
testingforaspatialassociationbetweentheabundan
ceofthefive
wad
erspeciesan
dtheab
undance
ofravensduringtheresurvey
Golden
Plover
Lapwing
Dunlin
Curlew
Snipe
Variable
Estim
ate
Fvalue
Estim
ate
Fvalue
Estim
ate
Fvalue
Estim
ate
Fvalue
Estim
ate
Fvalue
Intercept
)6Æ621
***
)8Æ325
***
)8Æ439
***
)8Æ429
***
)6Æ304
***
PCA1
0Æ635
F1,94=
3Æ87*
)0Æ427
F1,91=
0Æ58
0Æ466
F1,80=
2Æ14
)0Æ214
F1,102=
0Æ31
0Æ095
F1,102=
0Æ07
PCA2
0Æ245
F1,94=
0Æ41
)0Æ307
F1,91=
0Æ23
0Æ031
F1,80=
0Æ00
0Æ091
F1,102=
0Æ05
)0Æ149
F1,102=
0Æ10
Altitude
0Æ051
F1,94=
17Æ76***
)0Æ036
F1,91=
4Æ44*
0Æ051
F1,80=
6Æ83**
)0Æ023
F1,102=
4Æ39*
)0Æ019
F1,102=
2Æ31
Slope
1Æ391
F1,94=
3Æ08p=
0Æ07
1Æ350
F1,91=
1Æ87
2Æ739
F1,80=
3Æ68*
2Æ306
F1,102=
12Æ28***
0Æ636
F1,102=
0Æ65
Raven
abundance
0Æ200
F1,94=
0Æ55
1Æ238
F1,91=
4Æ70*
0Æ064
F1,80=
0Æ07
0Æ147
F1,102=
0Æ12
0Æ154
F1,102=
0Æ23
Survey
area
F8,94=
16Æ59***
F7,91=
7Æ08***
F6,80=
9Æ29***
F9,102=
21Æ72***
F9,102=
11Æ82***
Survey
areawasfitted
asafixed
effect.Resultsin
bold
weresignificant(*P
<0Æ05,**P
<0Æ01,***P<
0Æ001).Toenable
modelsto
convergeweexcludedata
from
studyarealackingthespecies,
orwherecounts
wereverylow
inboth
surveys,
thusweexcluded
data
from
Berwynplots
forlapwinganddunlin,Exmoorplots
forgolden
plover,lapwinganddunlin,Lakes
plots
fordunlin,
andMigneintplots
forcurlew
.
258 A. Amar et al.
� 2010 The Authors. Journal compilation � 2010 British Ecological Society, Journal of Applied Ecology, 47, 253–262

Table
4.Outputs(parameter
estimates,Fvalues
andsignificance)from
fullGeneralizedLinearMixed
Models,controllingfortheinfluence
ofhab
itat
[principalcoordinatesanalysis(PCA)1
andPCA2]and
topographicalvariables(A
ltitudeandSlope),b
efore
testingforatemporalassociationbetweenchanges
inwad
erab
undance
ofthefivewader
speciesandtheabundance
ofravensduringtheresurvey
Golden
Plover
Lapwing
Dunlin
Curlew
Snipe
Estim
ate
Fvalue
Estim
ate
Fvalue
Estim
ate
Fvalue
Estim
ate
Fvalue
Estim
ate
Fvalue
Main
effects
Intercept
0Æ424
NS
)0Æ857
*)0Æ397
NS
)0Æ903
NS
)0Æ571
NS
PCA1
)0Æ383
F1,51=
2Æ51
)0Æ300
F1,57=
0Æ38
0Æ138
F1,26=
0Æ40
)0Æ592
F1,72=
3Æ660Æ05
)0Æ383
F1,35=
0Æ66
PCA2
0Æ738
F1,63=
5Æ08*
0Æ832
F1,51=
1Æ59
)0Æ104
F1,42=
0Æ07
0Æ331
F1,71=
0Æ81
0Æ206
F1,53=
0Æ13
Altitude
)0Æ011
F1,3=
4Æ82
0Æ012
F1,18=
1Æ71
)0Æ008
F1,4=
0Æ88
0Æ020
F1,4=
4Æ10*
0Æ009
F1,20=
0Æ78
Slope
NA
NA
NA
NA
0Æ378
F1,14=
0Æ13
)0Æ158
F1,73=
0Æ05
0Æ392
F1,42=
0Æ15
Raven
abundance
0Æ044
F1,43=
0Æ04
)0Æ137
F1,21=
0Æ68
0Æ318
F1,34=
2Æ940Æ09
)0Æ727
F1,76=
2Æ950Æ09
0Æ187
F1,29=
0Æ22
Random
effect
Survey
area
0Æ047
0Æ160
0Æ051
0Æ720
0Æ072
Survey
areawasfitted
asarandom
term
.Resultsin
bold
weresignificant(N
S,non-significant;*P<
0Æ05).
NA,notapplicable,asslopecovariate
hadto
beremoved
toallow
modelsto
converge.
Table
5.Outputs(parameter
estimates,Fvalues
andsignificance)from
fullGeneralizedLinearMixed
Models,controllingfortheinfluence
ofhabitat[principalcoordinatesan
alysis(PCA)1
andPCA2]and
topographicalvariables(A
ltitudeandSlope),b
efore
testingforatemporalassociationbetweenchanges
inwader
abundance
ofthefivewaderspeciesandthechangeinraven
abundance
betweenthesurveys
Golden
Plover
Lapwing
Dunlin
Curlew
Snipe
Estim
ate
Fvalue
Estim
ate
Fvalue
Estim
ate
Fvalue
Estim
ate
Fvalue
Estim
ate
Fvalue
Main
effects
Intercept
)0Æ514
NS
)1Æ242
*0Æ283
NS
)1Æ111
NS
)0Æ942
NS
PCA1
)0Æ286
F1,34=
1Æ37
)0Æ243
F1,59=
0Æ24
0Æ463
F1,57=
3Æ740Æ05
)0Æ597
F1,72=
3Æ610Æ06
)0Æ272
F1,50=
0Æ31
PCA2
0Æ672
F1,46=
4Æ57*
0Æ822
F1,56=
1Æ85
)0Æ263
F1,49=
0Æ47
0Æ287
F1,71=
0Æ62
0Æ292
F1,57=
0Æ28
Altitude
)0Æ006
F1,4=
1Æ78
0Æ023
F1,28=
3Æ870Æ05
)0Æ013
F1,7=
1Æ90
0Æ020
F1,76=
4Æ00*
0Æ017
F1,21=
2Æ44
Slope
0Æ981
F1,11=
3Æ07
NA
NA
)0Æ151
F1,20=
0Æ02
)0Æ027
F1,75=
0Æ00
0Æ589
F1,52=
0Æ33
Raven
change
14Æ24
F1,70=
1Æ70
)91Æ40
F1,52=
3Æ460Æ06
19Æ98
F1,52=
8Æ53**
)67Æ73
F1,73=
2Æ980Æ08
)56Æ17
F1,55=
1Æ82
Random
effect
Survey
area
0Æ005
0Æ178
0Æ134
0Æ634
0Æ179
Survey
areawasfitted
asarandom
term
.Resultsin
bold
weresignificant(N
S,non-significant;*P<
0Æ05,**P
<0Æ01).
NA,notapplicable,asslopecovariate
hadto
beremoved
toallow
modelsto
converge.
Impacts of raven populations on upland waders 259
� 2010 The Authors. Journal compilation � 2010 British Ecological Society, Journal of Applied Ecology, 47, 253–262

relationships between raven increases and wader populations
continues to hold in the intervening years since the resurveys
were undertaken is unknown. However, given that raven
changes in this analysis span a range of values varying from a
small decline to over 500% increases in some areas, it seems
unlikely that any such negative association would necessarily
emerge, even with the observed, continuing overall increase in
raven numbers (Risely et al. 2008).
Our data come from multiple survey areas throughout Brit-
ain, but these areas were not randomly selected. In theory,
therefore, if the plots used in this study were not representative
of the British uplands as a whole, we may have failed to detect
a significant effect of ravens when one really exists (i.e. a type II
error). Our plots could have differed from the wider uplands in
a few respects. First, some of our plots were originally selected
on the basis that they were particularly good for waders, and
so are likely to have had more waders than the average. Such
plots might be more resilient to the impacts of ravens, which
could in theory explain why no significant negative relation-
ships were found. Sim et al. (2005) also identified another
potential bias, plots where access was refused (and which were
therefore not re-surveyed) tended to have higher wader abun-
dance. To explore whether either of these issues could have
influenced our ability to find significant relationships, we tested
for an interaction between the effect of raven change on wader
changes, and the abundance of the wader species during the
original survey, by fitting the original abundance of eachwader
species (birds per ha) and the interaction between this and
raven change. For dunlin, we found a weak but significant
interaction between raven change and the original abundance
of dunlin on a plot (F1,51 = 4Æ89, P = 0Æ03), with the positive
relationship between dunlin change and ravens change being
stronger at sites where dunlin abundance was originally lower.
However, no other interactions were found, and thus we con-
sider it unlikely that these possible biases have had a strong
influence on the outcome of this study.
Tharme et al. (2001) found higher numbers of golden plo-
ver, lapwing and curlew on moorland managed for red grouse
shooting compared with moorland not managed for grouse
shooting. However, they found no difference in the abundance
of ravens between these two land management classes, adding
some support to the findings reported in the current study, par-
ticularly with respect to our spatial analysis. Some studies have
documented a negative effect of ravens on avian breeding suc-
cess. For example, Brambilla, Rubolini & Guidali (2004)
found a negative effect of raven occupancy on peregrine falcon
Falco peregrinus breeding success, Gaston & Elliot (1996)
found that risk of raven predation on Brunnich’s guillemot
Uria lomvia may influence nesting locations, and Kelly,
Etienne & Roth (2005) found higher predation rates on great
egret Ardea alba nests at heronries where raven presence and
productivity were highest. However, another study examining
the influence of nesting ravens on songbird breeding abun-
dance in Poland, found a positive effect of breeding ravens on
songbird densities, and in particular skylark Alauda arvensis
densities (Tryjanowski 2001). The positive relationship
between dunlin and raven changes in themain study is unlikely
to be causal, a more likely explanation is that another as yet
unknown and unmeasured variable is correlated with both
raven and dunlin change. For example, raven recovery may
have been greatest on grousemoors, where predator control of
red foxes Vulpes vulpes and carrion crows Corvus carone may
have been beneficial for dunlin populations (Jonsson 1990,
1991; Sotherton et al. 2009); therefore, this might be one expla-
nation for the apparent positive relationship between ravens
and dunlin.
So, why is it that raven increases have had little detectable
effect on upland waders in our analyses? Although we know
that ravens predate wader eggs and young chicks, we know
little about the extent of this predation. It may be that preda-
tion rates are not particularly high, or predation may tend to
occur early in the season, therefore allowing waders to re-lay
and still successfully fledge young (Ratcliffe 1997), as has been
documented for other species (Moorcroft & Wilson 2000). An
alternative explanation is that ravens do have an impact on
wader breeding success, but that these upland wader popula-
tions are drawing birds in from areas where breeding success is
much higher, thereby acting as sinks to the detriment of the
national populations (Pulliam 1988; Baillie et al. 2002). To
explore this issue would necessitate examining wader breeding
success in relation to varying raven abundance combined with
survival estimates of wader species to estimate if populations
were self sustaining in the presence of higher raven predation,
which was clearly outside the scope of this study. Another
potentially important issue, but one not considered within this
study is whether the effects of ravens on waders differs depend-
ing on whether the raven population in an area is made up of
breeding birds or non-breeding flocks. Predation by crows on
upland birds is known to differ between breeding and non-
breeding birds, with predation on willow ptarmigan Lagopus
lagopus being largely attributable to territorial birds (Erikstad,
Blom & Myberget 1982). Risk of predation by ravens of the
threatened desert tortoise Gopherus agassizii in California,
USA, was determined by either proximity to successful nests
or the spatial distribution of non-breeding flocks, suggesting
that both groups were important predators (Kristan & Boar-
man 2003). Findings from another study on raven diet on the
Italian island of Vulcano suggested that breeding ravens were
more predatory than the non-breeding flocks present on the
island (Sara & Busalacchi 2003). Thus, it would be useful for
any further research on raven predation in the British uplands
to examine the relative influence of breeding and non-breeding
individuals.
Although the negative relationships between raven change
and lapwing and curlew declines were non-significant, these
associations are still worthy of further investigation. We know
that lapwing populations on lowland wet grassland may be
susceptible to corvid predation, and that in areas with high
densities of predators, crow and fox control can improve their
breeding success (Bolton et al. 2007a). Furthermore, prelimin-
ary results from a predator removal experiment on moorland
habitat in northern England, found that lapwing and curlew
were the only two wader species to show a significant positive
numerical response in response to predator control, suggesting
260 A. Amar et al.
� 2010 The Authors. Journal compilation � 2010 British Ecological Society, Journal of Applied Ecology, 47, 253–262
that these speciesmight be particularly sensitive to any increase
in predators (Fletcher, Jones & Baines 2009). Any further
research should focus on establishing the causes of nesting fail-
ures of lapwing and curlews breeding in the uplands, and the
importance of ravens as a cause of failure. This can now be
achieved relatively simply with the use of remote camera tech-
nology which has been recently pioneered for examining the
causes of nesting failure in waders (Bolton et al. 2007b).
The issue of scale must also be considered when interpreting
the results from this study. Our study was carried out at a
national scale using data from multiple plots in multiple study
areas. The lack of any negative relationships at this large scale
does not mean that ravens could not have an impact at a smal-
ler scale or at some individual sites; however, if such local
effects are frequent then we would still have expected to see
such signals in our analyses. Indeed, thismight explain the near
significant results for lapwing and curlew.Where opportunities
exist, ravens are known to sometimes specialize on eggs and
young of certain bird species, for example black-legged kittiwa-
kes Rissa tridactyla (Tella, Torre & Ballesteros 1995) or great
egrets (Kelly et al. 2005) and there is evidence to suggest that
individual ravens may specialize on wader eggs or chicks. For
example, Whitfield (2002) suggested the decline of dotterel
Charadrius morinellus at one intensively monitored site in the
Scottish highlands was a local effect because of increased pre-
dation by ravens. On this site, numbers of breeding dotterel
correlated negatively with sighting rates of ravens in spring.
The impact of specialist predatory behaviour by ravens is illus-
trated by the fact that in one instance a pair was believed to
account for 53% of dotterel clutches (Sue Holt, unpublished
data, cited in Ratcliffe 1997). However, Whitfield (2002) using
paired observations on the same sites in different years
concluded that the more widespread reductions in breeding
dotterel were not related to changes in numbers of ravens.
Requests to control recovering populations of predators
and scavengers to protect populations of some prey
species (http://www.scottish.parliament.uk/business/petitions/
docs/PE187.htm), needs to be tackled within a logical frame-
work. In deciding whether to allow recovering predator popu-
lations to be controlled, it is important that policy makers
consider the evidence of whether the specific predator is indeed
having any negative impact on the prey of interest, and
whether the predator population can be controlled without
risks to its long-term conservation status. This correlative
study has suggested that there is at present little substantive
evidence to justify the control of raven populations for the
large-scale conservation benefit of breeding wader popula-
tions, although the negative temporal association for lapwing
and curlew are worthy of further research. The data do not
show strong indications that wader populations were more
likely to have declined where ravens had increased, the logical
corollary of which suggests that removing ravens from these
upland sites would not benefit wader populations. However,
because these analyses were correlative, experiment removals
would still be required where impacts are suspected to ulti-
mately establish cause and effect. Further research is urgently
needed to understand what factors are actually driving these
population declines. This study therefore highlights the need to
obtain robust evidence on the effects that protected predators
have on their prey, prior to initiating lethal control, and may
provide a framework for the types of analyses that should be
undertaken to help decision makers decide on whether to issue
control licences as future conflicts arise. If decisions are made
with out such information, resources could be targeting inap-
propriately away from the real cause of any prey decline, and
could potentially and needlessly jeopardize the conservation
status of the protected predator involved.
Acknowledgements
We are very grateful to Ellen Wilson for help with digitizing the plot data and
extracting information on area, altitude and slope, and to Helen Mitchell for
map making. We thank Richard Hasting at the Scottish Government for data
on the number of licences granted for lethal ravens control. The original RUBS
project was funded by RSPB, EN, Defra and CCW. We thank JNCC, SNH
and the Lake District and Yorkshire Dales National Parks Authorities for help
and assistance. Particular thanks are due to David Stroud (JNCC), David
Smallshire (Defra), Sian Whitehead (CCW), Phil Whitfield (SNH), Phil Taylor
(LDNPA), Ian Court (YDNPA) and David Noble (BTO) for their help and
advice on the RUBS data. This project was a partnership project funded by
SNH, RSPB and ACES, and we are grateful to Andy Douse and Ben Ross
(SNH) for his help with this project. We are grateful to JeremyWilson,Murray
Grant and James Pearce-Higgins for advice throughout this project, and to the
Associate Editor, Dave Parish and an anonymous reviewer for suggestions
which greatly improved themanuscript.
References
Amar, A., Thirgood, S., Redpath, S. & Pearce-Higgins, J. (2008) The impact of
raptors on the abundance of upland passerines and waders. Oikos, 117,
1143–1152.
Baillie, S.R., Sutherland, W.J., Freeman, S.N., Gregory, R.D. & Paradis, E.
(2002) Consequences of large-scale processes for the conservation of bird
populations. Journal of Applied Ecology, 37, 88–102.
BirdLife International (2004)Birds in Europe: Population Estimates, Trends and
Conservation Status. BirdLife Conservation Series No. 12. Birdlife Interna-
tional, Cambridge.
Bolton, M., Tyler, G., Smith, K. & Bamford, R. (2007a) The impact of preda-
tors control on lapwing Vanellus vanellus breeding success on wet grassland
nature reserves. Journal of Applied Ecology, 44, 534–544.
Bolton, M., Butcher, N., Sharpe, F., Stevens, D. & Fisher, G. (2007b) Remote
monitoring of nests using digital camera technology. Journal of Field Orni-
thology, 78, 213–220.
Brambilla, M., Rubolini, D. & Guidali, F. (2004) Rock climbing and raven
Corvus corax occurrence depress breeding success of cliff-nesting peregrines
Falco peregrinus.Ardeola, 51, 425–430.
Brown, A.F. & Shepherd, K.B. (1993) Amethod for censusing upland breeding
waders.Bird Study, 40, 189–195.
Byrkjedal, I. (1987) Antipredator predator behaviour and breeding success in
GreaterGolden Plover and EurasianDotterel.Condor, 89, 40–47.
Chamberlain, D.E., Glue, D.E. & Toms, M.P. (2009) Sparrowhawk Accipiter
nisus presence and winter bird abundance. Journal of Ornithology, 150, 247–
254.
ClarkLaboratories (2001) Idrisi 32.2. ClarkUniversity.
Erikstad, K.E., Blom, R. & Myberget, S. (1982) Territorial hooded crows as
predators on willow ptarmigan nests. Journal of Wildlife Management, 46,
109–114.
Ewins, P.J., Dymond, J.N. & Marquiss, M. (1986) The distribution, breeding
and diet of RavensCorvus corax in Shetland.Bird Study, 33, 110–116.
Fletcher, K., Jones, C. & Baines, D. 2009. The Game and Wildlife Conservation
Trust Review of 2008. The Game andWildlife Conservation Trust, Fording-
bridge, Hampshire, UK.
Fuller, R.M., Cox, R., Clarke, R.T., Rothery, P., Hill, R.A., Smith, G.M.,
Thomson, A.G., Brown, N.J., Howard, D.C. & Stott, A.P. (2005) The UK
land cover map 2000: planning, construction and calibration of a remotely
sensed use-oriented map of broad habitats. International Journal of Applied
Earth Observation and Geoinformation, 7, 202–216.
Impacts of raven populations on upland waders 261
� 2010 The Authors. Journal compilation � 2010 British Ecological Society, Journal of Applied Ecology, 47, 253–262
Gaston, A.J. & Elliot, R.D. (1996) Predation byRavensCorvus corax on Brun-
nich’s Guillemot Uria lomvia eggs and chicks and its possible impact of
breeding site selection. Ibis, 138, 742–748.
Gibbons, D.W., Gates, S., Green, R.E., Fuller, R.J. & Fuller, R.M. (1994) Buz-
zards Buteo buteo and Ravens Corvus corax in the uplands of Britain: limits
to distribution and abundance. Ibis, 137, S75–S84.
Hendricks, P. & Schlang, S. (1998) Aerial attacks by common ravens, Corvus
corax, on adult feral pigeons, Columbia livia. Canadian Field Naturalist, 112,
702–703.
Jonsson, P.E. (1990) The Dunlin Calidris alpine schinzii as a breeding bird in
Scania in 1990 – numbers, hatching success and population trends. Anser,
29, 261–272.
Jonsson, P.E. (1991) Reproduction and survival in a decline population of the
Southern Dunlin Calidris alpine schinzii. In Waders Breeding on Wet
Grasslands (Supplement, 61) (ed. H. Hotker), pp. 56–58. Wader Study
GroupBulletin, Nottingham.
Kelly, J.P., Etienne, K.L. & Roth, J.E. (2005) Factors influencing the
nest predatory behaviours of common ravens in heronries. Condor, 107,
402–415.
Klicka, J. &Winker, K. (1991) Observations of ravens preying on adult kittiwa-
kes.Condor, 93, 755–757.
Kristan W.B. III & Boarman, W.I. (2003) Spatial pattern of risk of common
raven predation on desert tortoises.Ecology, 84, 2432–2443.
Landa, A., Gudvangen, K., Swenson, J.E. & Roskaft, E. (1999) Factors associ-
ated with wolverine Gulo gulo predation on domestic sheep. Journal of
Applied Ecology, 36, 963–973.
Linnell, J., Nilsen, E.B., Lande, U.S., Herfindal, I., Odden, J., Skogen, K.,
Andersen, R. & Breitenmoser, U. (2005) Zoning as a means of mitigating
conflicts with large carnivores: principles and reality. People and Wildlife:
Conflict and Coexistence? (eds R.Woodroffe, S. Thirgood&A.Rabinowitz),
pp. 162–175. CambridgeUniversity Press, NewYork.
Littell, R.C., Milliken, G.A., Stroup, W.W. & Wolfinger, R.D. (1996) SAS
System forMixedModels. SAS Inst. Inc., Cary,NC.
MapInfo Corporation (2000) MapInfo Professional 6. MapInfo Corporation,
Troy, NY.
Marquiss,M. & Booth, C.J. (1986) The diet of RavensCorvus corax in Orkney.
Bird Study, 33, 190–195.
Marquiss, M., Newton, I. & Ratcliffe, D.A. (1978) The decline of the Raven
Corvus corax in relation to afforestation in southern Scotland and northern
England. Journal of Applied Ecology, 15, 129–144.
Moorcroft, D. &Wilson, J.D. (2000) The ecology of LinnetsCarduelis cannabi-
na on lowland farmland. Ecology and Conservation of Lowland Farmland
Birds (eds N.J. Aebischer, A.D. Evans, P.V. Grice & J.A. Vickery), pp.
173–181. BritishOrnithologists’ Union, Tring, Herts.
Newton, I. (1998)Population Limitation in Birds. Academic press, London.
Newton, I., Dale, L. & Rothery, P. (1997) Apparent lack of impact of Sparrow-
hawk on the breeding densities of some woodland songbirds. Bird Study, 44,
129–135.
Park, K.J., Calladine, J.R., Graham, K.E., Stephenson, C.M. & Wernham,
C.V. (2005)The Impacts of Predatory Birds onWaders, Songbirds, Gamebirds
and Fisheries Interests. A Report to Scotland’sMoorland Forum. BTO Scot-
land &Centre for Conservation Science, Stirling.
Petty, S.J., Lurz, P.W.W. & Rushton, S.P. (2003) Predation of red squirrels by
northern goshawks in a conifer forest in northern England: can this limit
squirrel numbers and create a conservation dilemma? Biological Conserva-
tion, 111, 105–114.
Pulliam, H.R. (1988) Sources, sinks, and population regulation. American
Naturalist, 132, 652–661.
Ratcliffe, D. (1997) The Raven: A Natural History in Britain and Ireland. T & A
DPoyser, London.
Redpath, S.M. & Thirgood, S.J. (1997) Birds of Prey and Red Grouse. The Sta-
tionaryOffice, London.
Risely, K., Noble, D.G. & Baillie, S.R. (2008) The Breeding Bird Survey 2007.
BTOResearchReport 508. British Trust forOrnithology, Thetford.
Sara, M. & Busalacchi, B. (2003) Diet and feeding habits of nesting and non-
nesting ravens (Corvus corax) on a Mediterranean island (Vulcano, Eolian
archipelago).Ethology Ecology & Evolution, 15, 119–131.
SAS Institute Inc. (2004) SAS ⁄ STAT 9.1 User’s Guide. SAS Institute Inc.,
Cary, NC.
Sim, I.M.W., Gregory, R.D., Hancock, M.H. & Brown, A.F. (2005) Recent
changes in the abundance of British upland breeding birds. Bird Study, 52,
261–275.
Sotherton, N., May, R., Ewald, J., Fletcher, K. & Newborn, D. (2009) Manag-
ing uplands for game and sporting interests – an industry perspective.Drivers
of Change in Upland Environments (eds A. Bonn, K. Hubacek, J. Stewart &
T. Allott), pp. 209–227. Routledge, Oxon.
Stahl, P., Vandel, J.M., Ruette, S., Coat, L., Coat, Y. & Balestra, L. (2002) Fac-
tors affecting Lynx predation on sheep in the French Jura. Journal of Applied
Ecology, 39, 204–216.
Tella, J.L., Torre, I. & Ballesteros, T. (1995) High consumption rate of Black-
LeggedKittiwakes.ColonialWaterbirds, 18, 231–233.
Tharme, A.P., Green, R.E., Baines, D., Bainbridge, I.P. & O’Brien, M. (2001)
The effect of management for red grouse shooting on the population density
of breeding birds on heather-dominated moorland. Journal of Applied Ecol-
ogy, 38, 439–457.
Thomson, D.L., Green, R.E., Gregory, R.D. & Baillie, S.R. (1998) The
widespread declines of songbirds inBritain donot correlatewith the spreadof
avianpredators.ProceedingsoftheRoyalSocietyLondonB,265,2057–2062.
Treves, A. & Naughton-Treves, L. (2005) Evaluating lethal control in the
management of human-wildlife conflict. People and Wildlife: Conflict or
Coexistence? (eds R.Woodroffe, S. Thirgood &A. Rabinowitz), pp. 86–106.
CambridgeUniversity Press, NewYork.
Tryjanowski, P. (2001) Proximity of raven (Corvus corax) nest modifies
breeding bird community in an intensively used farmland.Annales Zoologici
Fennici, 38, 131–138.
Whitfield, D.P. (2002) Status of breeding Dotterel Charadrius morinellus in
Britain in 1999.Bird Study, 49, 237–249.
Whittingham, M.J., Stephens, P.A., Bradbury, R.B. & Freckleton, R.P. (2006)
Why do we still use stepwise modelling in ecology and behaviour? Journal of
Applied Ecology, 75, 1182–1189.
Received 29 July 2009; accepted 9 January 2010
Handling Editor:MarkWhittingham
262 A. Amar et al.
� 2010 The Authors. Journal compilation � 2010 British Ecological Society, Journal of Applied Ecology, 47, 253–262