
C~I=~~:~~1y - Western Regional Power Committee
159
e ~ '1mI 'ITcliT" Couemment q~~:~lIJ ~~ !a'g'iI C~I=~~:~~1y wesrern RCllionnl Po\\Cr Connnluee 0('>: 3. 'l'f.l!l'm'll~. )tim !~. 'i'fl • 400 O\Il l- J. MIDC "re •• An~I"'rj (us!). \Iumh.o', 401) 0\1) ip'IlQ Phone: 0~2· ~82~ 1636: 2820019495/96: m rll.~; 022 - 28370193 Webslte~~~~~\~.K(-,\ In E·muil : m~..\~rpo" .DIC,jO Jlfl'1'11 _,.Ji, _0' ~ 1.s'I~O' 9001·2008 If,:~lqqr/lfT.I\',12015.16Ii 7 80~:J~: No WRPC/Opn tAR 12015.18/, 7 -_ Dale Z 2 _ .rcrr 'If I To, As per list Sub' Annual Report of Western Regional Power Committee for the year 2015·16 ~/Sir. ~ ~ ~ .mmt tfi't <r<t 2015·2016 tfi't ~ ~ <Ilt ... lffi!t 3fI'1<fIt ~ ~ ~ ~ I A copy of the Annual Report of Western Regional Power Committee for the year 2015-16 is sent herewith please 31cri!.'m I Yours faithfully. . , ~.c.~ (lJ~' '11",~i~ IS.D.Taksande) ~ ~/Member Secretary
-
Upload
khangminh22 -
Category
Documents
-
view
2 -
download
0
Transcript of C~I=~~:~~1y - Western Regional Power Committee
e~
'1mI 'ITcliT"Couemment q~~:~lIJ~~ !a'g'iI
C~I=~~:~~1ywesrern RCllionnl Po\\Cr Connnluee
0('>: 3. 'l'f.l!l'm'll~. )tim !~. 'i'fl • 400 O\Ill- J. MIDC "re •• An~I"'rj (us!). \Iumh.o', 401)0\1)
ip'IlQ Phone: 0~2· ~82~ 1636: 2820019495/96: mrll.~;022 - 28370193Webslte~~~~~\~.K(-,\ In E·muil : m~..\~rpo" .DIC,jO
Jlfl'1'11 _,.Ji, _0'
~1.s'I~O' 9001·2008
If,:~lqqr/lfT.I\',12015.16Ii 780~:J~:No WRPC/Opn tAR 12015.18/, 7 -_ Dale
Z 2 _
.rcrr 'If I To,
As per list
Sub' Annual Report of Western Regional Power Committee for the year2015·16
~/Sir.
~ ~ ~ .mmt tfi't <r<t 2015·2016 tfi't ~ ~ <Ilt...lffi!t 3fI'1<fIt ~ ~ ~ ~ I
A copy of the Annual Report of Western Regional Power Committee for
the year 2015-16 is sent herewith please
31cri!.'m I Yours faithfully.
.,~.c.~
(lJ~' '11",~i~IS.D.Taksande)
~ ~/Member Secretary

ClI~Cb ~ANNUAL REPORT
2015-16
~~~~~RtWESTERN REGIONAL POWI!:R COMMITfEE
~ ,!liG
qqi-3 ~,o3ITQ', t'r, '{iT, ~,IJ'fu;!, ~ (~), ~ 600 098F-3, MIDC , Mumbal-400093
!!
~ ..... ,.~...._~ ...."';'J';'~
ACKNOWLEDGEMENT
This Annual Progress Report for the year 2015-16 has been prepared under
the overall guidance of Member Secretary, WRPC, Mumbai. I am grateful to
him for his insights and valuable suggestions.
The specific contribution by the fol/owing officers & staff of WRPC is
appreciated and gratefully acknowledged.
1. Stn! Satyanarayan S., Superintending Engineer (C & P)
2. Shri L.K.S. Rsthote, Dy. Director (Opn.)
3. Shri Deepak Gawall, Dy. Director (Comml.)
4. Shri P.D. Lone, Dy. Director(C & P)
5. Shri A C. Suresh, Executive Engineer (Admn.)
6. Shri Ratnesh Kumar Yadav, Asst. Director (Opn.)
7. Shri Shiv Kumar Haridwaj, Steno-II
I also express my sincere thanks to all the officers from different Load
Dispatch Centers for their valuable support.
MUMBAI
22.07.2016
~71':(_OI6(V.K. GUPTA)
Superintending Engineer(O & $)
DISCLAIMER
This report is based on data received by Load Dispatch
Centers present in Western Region and CEA website. This
is an operational report with data analysis of the year
2015-16. Data/information in this report are indicative only
and should not be used for any Commercial purpose.
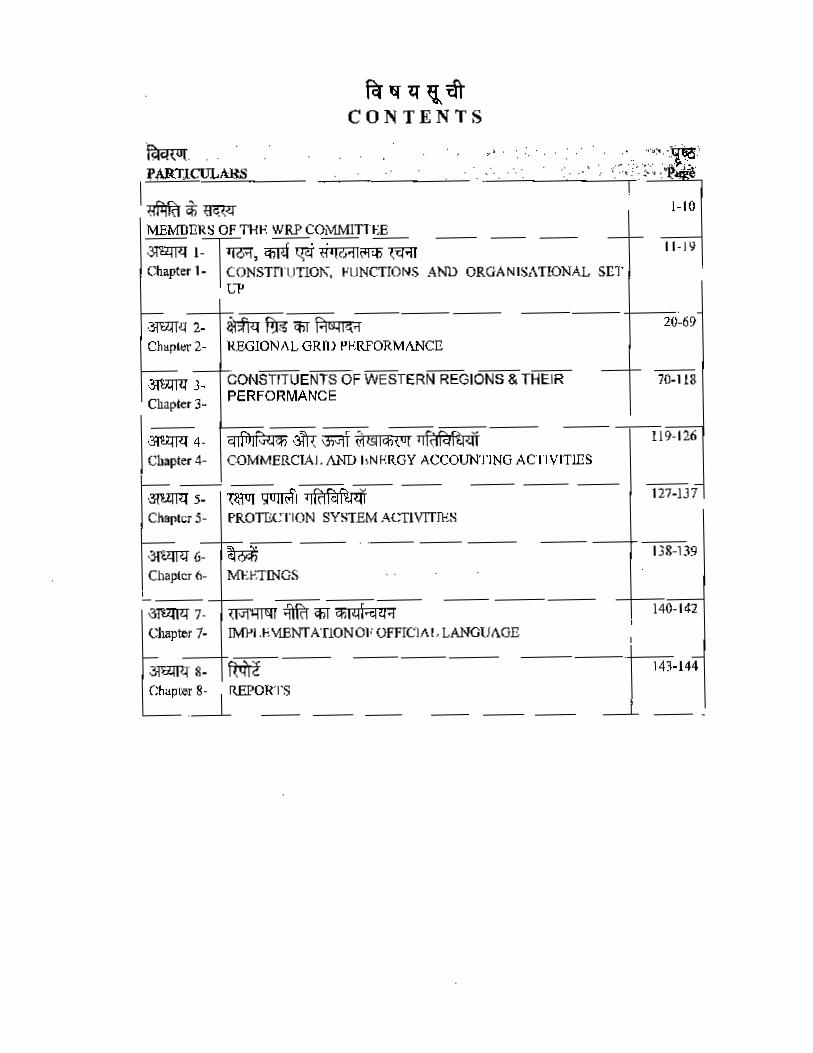
I~CI(ULPA.R.TlCULARS
",. "
I~of;~MEMOERS OF 1'1-IEWRP Co!'lllMITI'':£__ __ __ __
31'!2Wf 1:-f.j6"l, CfiI<f qq' ~i'li1i ~Chapter 1- I~.?NSTnUTlOK. "UNCTIONS ANb ORGANISATIONAL SET
Lt'
~ f!I& qrr PI~tq;;"""Ie.'1~----Chllj>ll:r2- lI.EGJONAL GRn) PERFORMANCE
.3ltlIm ~'-CONSTITUENTS OF WESTERN REGIONS sTHEIRChaplet 3- PERFORMANCE
-3I"c.iWI 4- cllfUlf;;tt'b -3l'n.: w:IT ~&ICfi{ij( Ilf<)~1WtlChapter 4- COMMERCIAL lIND hNr.RGY ACCOUNTING ACTI vrnns
'WIt ml IIRI~fu<lf _-PROrnCTION SYSTEM xcttvrrrss
·~6- ~Chapter' 6- Ml-:ElINGS
!_---i--~ 7- ~ ;flfu <liT CfillOli::et4'lChapter1- !M}>i ,ti"iENT A'flONOl' OFFICIAL LANGUAGE
1-10
II-I'}
10-118
119-126
I27-JJ7
138-139
140-142
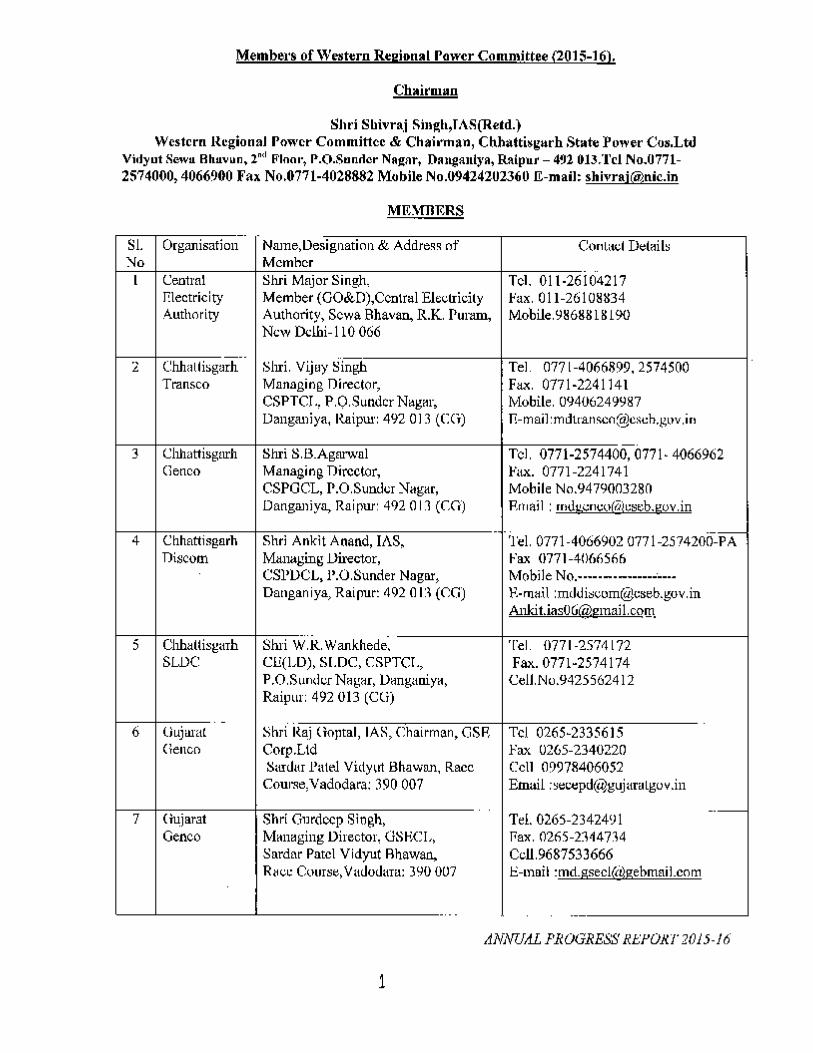
Members of We.stern Regional Power Committee (2015-16).
Chait'man
Shri Shivra] Singh,TAS(Retd.)Western Regional Power Committee & Chainnan, Chhatti~l: .. rh State Power Cos.Ltd
Vidyut Sewn Hhavun, 2'" FIoRI',P.O.sunilcr Nagar, Dallganlya, Ralpur - 4'2 013.Tcl No.0771-2574000,4066900 Fax No.0771·4028882 Mobile No.094242U2360 E-mail: [email protected]
SI. Organisation Name,Designation & Address of COf1la<;jDetail,"io MemberI Central Shri Major Singh, Tel. 011·26104217
Electricity Member (GO&D),Ccnlrai Electricity Fax, Oil-26108~34Authority Authority, Sewa Bhavan, R.K. PUl'lUD, Mobile.9868818190
New Delhi-II 0066
..2 Chhattisgarh Shri, Vijuy Singh Tel. 0771-4066899.2574500
Transco Managing Director, FllX. 0771·2241141CSPTCJ., P.O.Sundcr Nagar, Mobile. 09406249987Danganiya, Raipur: 492 013 (CG) E-mail:mdtransc([email protected]
3 Chhattisgarh Shri S.B.Agrnwal Tel. 0771·2574400,0771· 4066962Genco Managing Director, Fax, 0771-2241741
CSPGCL, P.O.Suw.lcr ~agar, Mobile No.9479003280Danganiya, Rai pur: 492 011 (CO) Email : rrHl;£.\.:ni,:(J(b~cs~b.gov.in
.. 'reI. 0771·4066902 0771-25?4200:.JiA4 Chhanisgarh Shri Ankit Anand, lAS,Discom Managing Director, Fax 0771-4066566
CSl'l>CL,l'.O.Sunder Nagar, Mobile No ... ·.·-·-· ••••"••••Danganiya, Raipur: 492 0 n (CG) P_·mail :mdo.lb\;om@1:seb.gov.in
Anki [email protected]_ ...
5 Chhattisgarh Shri W.R. Wankhede, Tel. 0771·257t!lnSWC CE(LD), SLDe, CSPTCr., FlIl<.0771-2574174
P.O.sundcr Nagar.Dangaaiya, CelJ.No.9425562412Raipur: 492013 reo)
. -6 Oujaral Shri Raj Goptal, lAS, Chairman, GSR Tel 0265-2335615
(leiter> Corp.Lld Fax 0265-2340220Sardar Patel Vidyut Bhawan, Race Cell 09978406052
Course.Vadodara: 390007 Email :~ecepd(U)gujaralgov.in
7 ( iujarat Shri Gurdecp Siogh, Tel. 0265-23424~ 1--
Genco Managing Director, GSHeL, Fax. 0265-2144714Sardar Patel Vidyut Rhawaa, Ccll.9687533666Race Course, Vadodara: 390007 E-mail :[email protected]
_ ... ..
ANNUAL PROGRESS 11.1::1'011.1'2015·16
1
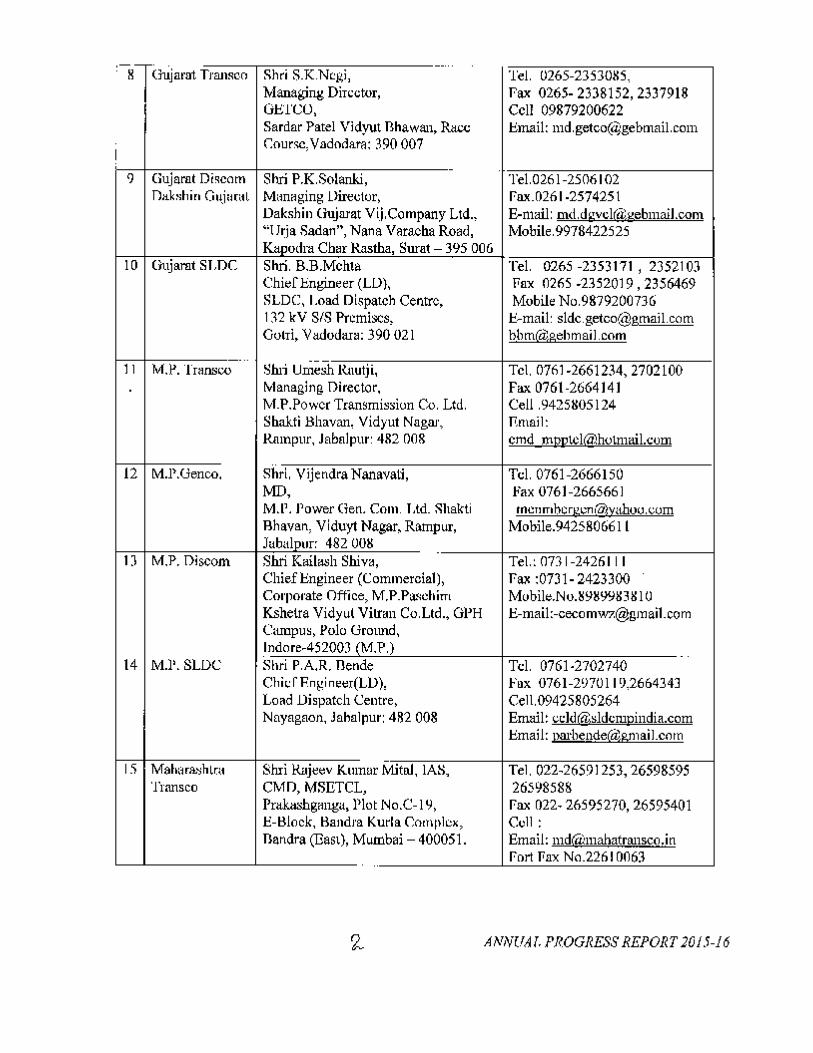
:-8TChijarm Transco-_ ...
Shri S.K.Ncgi, Tel. 026S-23530S5,Managing Director, Fax 0265-2338152,2337918GE'l'CO. Ccli 09879200622Sardar Patel Vidyut Bhawan, Race Email: md.getcoCQ)gebmail.com
ICourse, Vadodara: 390007
-<) Gujarat Discern Shri P.K.Solanki, Te1.0261-2506102
Dakshin Gujurut Managing Director, Fwc026I .2574251Dakshin Gujll1l1tVii, Company Ltd., E-mail: md.dgvcl(al!ebmail,com"lJrja Sadan", Nana Varaeha Road, Mobile,9978422525
I Kaeodra Char Rastha, Sural - 395 00610 Gnjarat SLDe Shri. B.B.Mchta Tel. 0265 -2353171, 2352103
Chief Engineer (LU}. Fax 0265 .2352019,2356469SLDe. Load Dispatch Centre, Mobile No.9879200736132 kV SfS Premises, J::-mai1: [email protected], Vadodara: 390021 bbm@:,gehmail.com
...Shri Umesh Rnutji,11 M.P. Transco Tel. 0761.2661234, 2702100Managing Director, Fax 0761·2664141M.P.Power Transmission ce. Ltd. Cell.9425K05124Shakti Bhavan, Vidyut Nagar, Email:Rampur, Jabalpur: 482 008 emd m12l!lCI@ho\l11ail.com
12 M.l',Uenco. Sitri. Vijendra Nanavati, Tel. 0761-2666150MD, Fax 0761-2665661M.l'. "ower Gen. Com. Ltd. Silakti InCTJrTlbcr~".,'T1I~)!..thoo.cornBhavan, Viduyt Nagar, Rampur, Mobile.94258066IlJabalpur: 482 008
1) M.P. Discom Shri Kailash Shiva, TeL: 0731-2426111Chief Engineer (Commercial), Fax :0731·2423300Corporate Office, M.P.Pa.~chiTTl Mobile.No.~':IlI99~3~ I0Kshelra Vidyut Viuan Co,Ltd., Gl'H J::-mai1:[email protected], Polo Ground,Indore-4S200J (M,P,) ..
14 M.l·, SLUe Silri P.A.R. nende Tel. 0761·2702740Chicf Engineertl.D], Fax 0761-2'170119,2664343Load Dispatch Centre, Cell.09425805264Nayngaon, Jabalpur: 482 008 Email: [email protected]
Email: parbendeC<i)gJ21aiJ.com
15 Maharashtra Shri Rajeev Kumar M.itnl, lAS, Tel. 022-26591253,26598595Transco CM!), MSETCL, 26598588
Prakashganga, Plot No,C-19. Fax 022- 26595270,26595401E-l:Ilock, Bandra Kurla Complex, CcII:Bandra (East), Mumbai - 400051. Email: [email protected]
Fort Fax No.226I 0063
ANNUAl. PROGRESS REPORT )015-16

)6 MaharashlJa G
17 Maharasbtra D
[8 Mabarasbtra S
.19 Goa
20 UT of Daman
21· lIT .. rrlMdm &Havcli
22 Central Gmt. ((NTI'C)
*
• Altcrnatc Mcm b(West·ll}in view ofdated )7.S.2011
J¢nco Shri Ripin Shrimali, lASCM'D. MSEGCl.Prakashgad, 2nd Floor.Pl()t No 0·9. Sandra (East)Mumhai: 400 051
iscom, Shri O.P .GuptaeMU, MSEDCI..Prakashgad, 2nd Floor.Plot NO 0-9. Bandrn (East).Mumbai: 400051
LDC Dr, Sunjuy Kulkarni.Chief Engineer (LD).Load Dispatch C<:DIre, KalwaThane Bclapur Rd.,P.O.· I\ruli,Navi Mumi>ai:400 708
Shri SLekshmanen, CB!::.Goa Electricity Department.Vidyut Bhawan, 3ro flonr, PHru\ii• Goa: 403 001
&, Diu Shti Sandeep Kumar.IASSecretary (Power),UT of Daman & ni,l.Sachivalaya, Moti Daman, Via
. Valli, Daman: 396210
Jeoco, Shri u. Kapoor,Director (Commercial)Nn'c Ltd.•NTPCBhawan,Core 7·InstiluliooaJ Area.SCOPE Complex.Lodhi Rd,Ncw nelhi: 110 003
e-rs-::(J::-) -=R'"'e-gl::C'o"'n"':aj""Executive Dircctor"';('"'W':'" e-st-:.I~) -=&--=R-cgl-:' oual Executive Directorbifurcution of WRHQ ofNTI'C!!s intimated by NTPC letter No.OI:C0:203
Nagar Shri Sandeep Kumar, h\SSccretary(Power),UN)) Administration,Dadra & Nagar Haveli,Sllvasa - 396230.
3
Tel. 022-26476231fax 022-26471060,265111400
(].m~il: msl@,Jnahagenc(>.inMobile.
TeL 26474644 Fax 264786nfoon.Tel..226 I 9499FHx.2265074IMobile:Email: md@mahadiscom,jn
Tel. 022·27601762Fax 022-27601769CcII: 9819363329E-mail:[email protected]
ANNUAL PIUX ;RKSS REPOJU'2015·16
Tel. 0832·2224680Fa:'(.0832-2421i9R6Cell. 7350688000F.·wail: cce-eillC.goafalnic.in
Td. 0260-22307260260·2231453
Fax 0260·223077 IE·muil:
TeL 0260-:>'632126Fax 0260·2645466
E-mail :.
Tel 011·24361012Fax 01 )-1)1368417ceu 09818557305Email: [email protected]
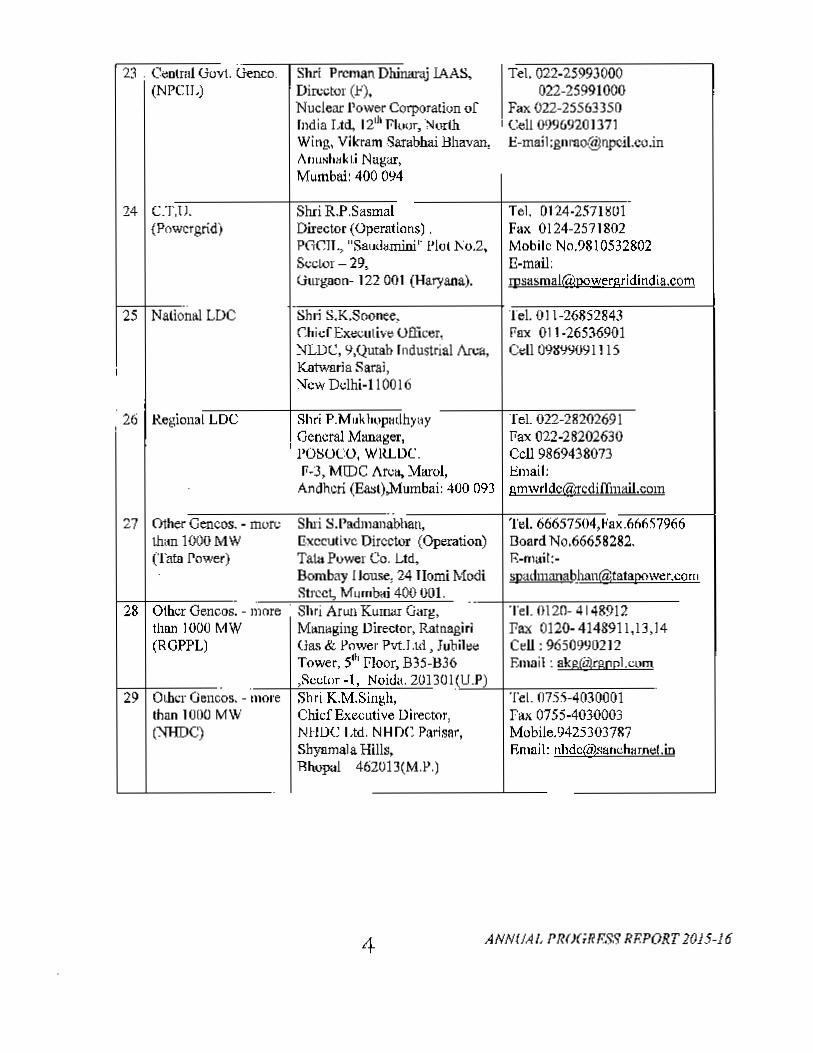
23 . Ceetral Govt, Gene(NPCIL)
24 C.T,lJ.(Powcrgrid]
25 Nalionlll LDC
I
26 Regional LDC,
27 Other Cencos, - mothan 1000 M W[Tata Power)
28 Other Gencos, - 010
than 1000 M W(RGPPL)
29 Other Gen~s. - 'mothan 1000 M \V(~C)
0, Shri Preman Dhinarej lAAS,Director (.t').Nuclear Power Corporation ofIndia LId, 12~ FlooT, 'lIIllrlhWing, Vikram Sarabhai Bhavan,""lL~""kl.iNagar,Mumbai: 400 094
Tel. 022-25993000022-25991000
Fax 022-25563350I CeU 09969201371
E-mail ;gnraif.elllp(lil.co.in
Shri R.P .SasmalDirector (Operations) .PuC-H., "Saudamiai ,. ['lot 1\0.2.Sector - 29.Gurgeon- 122001 (Haryana).
Shri S.K.Soonee,Chid Executive Officer,)fLUe, 9.Qulab lndustrial Area,Katwaria Sarai,:-.few Dclhi-llOOl6
Tel. 0124-2571~OIFax 0124-2571802Mobile No.9810532802E-mail:[email protected]
Tel. 011-26852843Fax 011-26536901Cell 098'.1'J0911 15
Shri P,MukloopHdhyayGeneral MlUllIger,
, l'OSUCO, WRLDC.fo-3, tvllDC 1\1'\:11, Marol,
Andhcri (Ea:sI),Mumbai: 400 093
TeL 022-28202691rax 022-28202630Cell 9869438073Email;[email protected]
I'\: Shri S.l'adlllonobhan,Executivc Director (Operation)TaU. Power Co. Ltd,Bombay I JOUl<e, 24 lIomi ModiStreet, Mu",b~i 400 001.
re ' SIn; AIUIl Kumar Garg,Mlmagillg Director, RatnegiriGas & I'ower Pvt.l.td • JubileeTower, S" Floor, B35-1:I36,S<.;<.;(ur-l Noiu(1.201301(\.:U"",P",)'-)-:-::--:-::==-=-=-==:--_
re Shri K.M.Sill~h, TeL 0755-4030001Chief Executive Director, Fax 0755-4030003NJJI)C I.ld. NHI)C Parisar, Mobile.9425JOJ7R7Sbynmala Hills, Email: Ilhdc(O)£l411<.;h.rn...l.inBhopal 462013(M.P.)
Tel. 666575()4,~ax.66(,57966Board No.66658282.R-m;til:-~Jladl11anab.han@!alapo\Vl:r.co",
Tel. 0120- 414g912Fax 0120-4148911,13.14Cell; 96509')0212Email: akg(idmrml.c<>",
4 ANNUAl. PRO(;RF.SS RF.PORT 1015-16
Shri l{'R.Mchtlt,CEO Rd iance Infrastructure Ltd,Dcdvidas Lane, Off SVP R~"td,Near Devidas TelephoneExchange, 13orivali(W~sl)
__ l-'Mumbai-4000:..:'J2~_.15 Other Gencos- more Shri Sat ish Jindal
than 1000MW Director & Chief'Exccutive(JSW Energy Lid) Officer, M/s.JSW Energy Ltd .•
:mec Tower. Ullpe,r GroundFloor (UGF). 15.•Bhikaji CamaPlace. New Delhi - 110066.
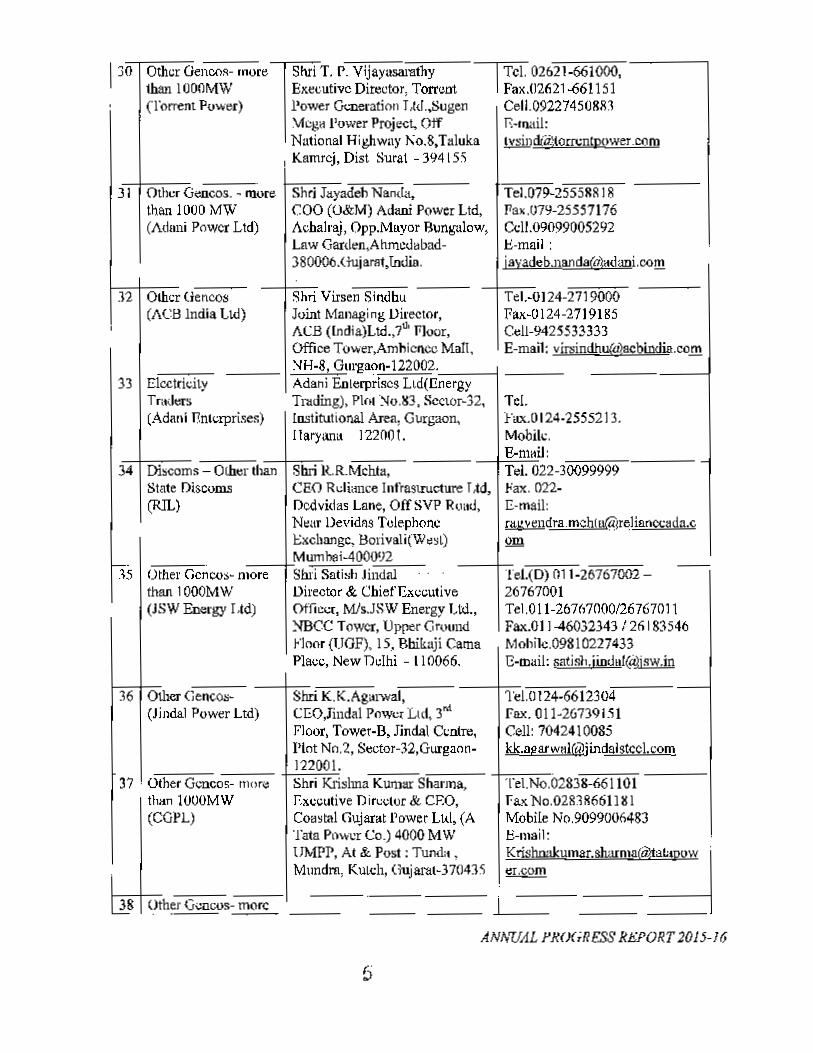
Other Gencos- morethan IOOOMW(Torrent Power)
) 1 Oth.:r Geocos. - morethan 1000 MW(Aduni Power Ltd)
32 Oilier UenC08(ACl:llndia Ltd)
33 ElectricityTI1~(Allani I1nlcrprises)
34 Discerns - Other thanStale J)iscoms(RIL)
36 01Mr Gencos-(Jindal Power LTd)
37 . Othu Gcoccs- moretI".n 1OUOM W(COPL)
38 Other Gcacos- more
Shri Virsen Sindhu Tel.-0124-2719000Joint Managi ng Director, Fax-o 124-27191 85ACJ3 (India)Ltd.,711o Floor, Cell-9425533333Office Tower.Ambience Mall. E-mail: [email protected]!!."'H-g. Gurgaoll-122002. __ ---1 _Adani Enterprises L~d(E!lergyTrading), Pint ')10.10. Sccwr-32,institutional Area, Gurgaon,Ilaryana 12200(,
Slvi T. P. VijayasarathyExecutive Director, Torrcot1'0_, Generation T Au ..Sugen\1cgH Power Project, OffNational Highway l\o.8,Taluka
I Kamrej, Dist Sural - 39415~
Shn J",yadeh Nand".COO (O&M) Adani Power Ltd,Achalre], Opp.Mayor Bungalow,Law Garden.Ahmedabad-380006.(~iaN!t,{ndin.
Sbri K.K.AgaIWal,CEO,Jindal Power Ltd, 3m
Floor, Tower-a, Jindal Centre,Plot No.2. S~ctoT-32.Gurgaon-122001.Shri Krishna Kumar Sharma,Executive nircctor & CEO,Coastal Gujarat Power Lul, (ATats p')"l..'! Co.) 4000 M WUMPl'. At & Post: Tunti:t ,Mundm, Kutch. (rujarat-37()4:l~
ANNUAL J'R()(iIlESS kEPORT2015-J6
f.':;t
---rTcl. 02621·661 000,I Fax.O'l621-661151
CeH.09227450883E-'!lui):Ivsind(1i!'lorn;ntp()wer.com
TeI.079-2555!!R 18l'ax.07'.1-25557176CcIl.09099005292E-mail:jayadllb.nanda(o) ..d®i.oom
Tel.Fax.OI24-2555213.Mobile.E-mail:Tel. 022-30099999Fax, 022-E·mall:~dra.mch(U@Jl'e;lilltlCQlda&om
Tel.(D) 011-26767002-26767001TeI.011-26767000lUi767011Fax.O] 146032343 /26183546Mohi1c.098] 0227433E-lDuil: satish.jiDl][email protected]
rao I24-6612304Fax. 011·26739151Cell: 7042410085kk.aparwaJru)jirulalsteelcom
Tel. No.02838-66 110 1fa.>< No.0281R661l KIMobile No.909900M83E-mail:K"''''w_.__ ,,, I~
i
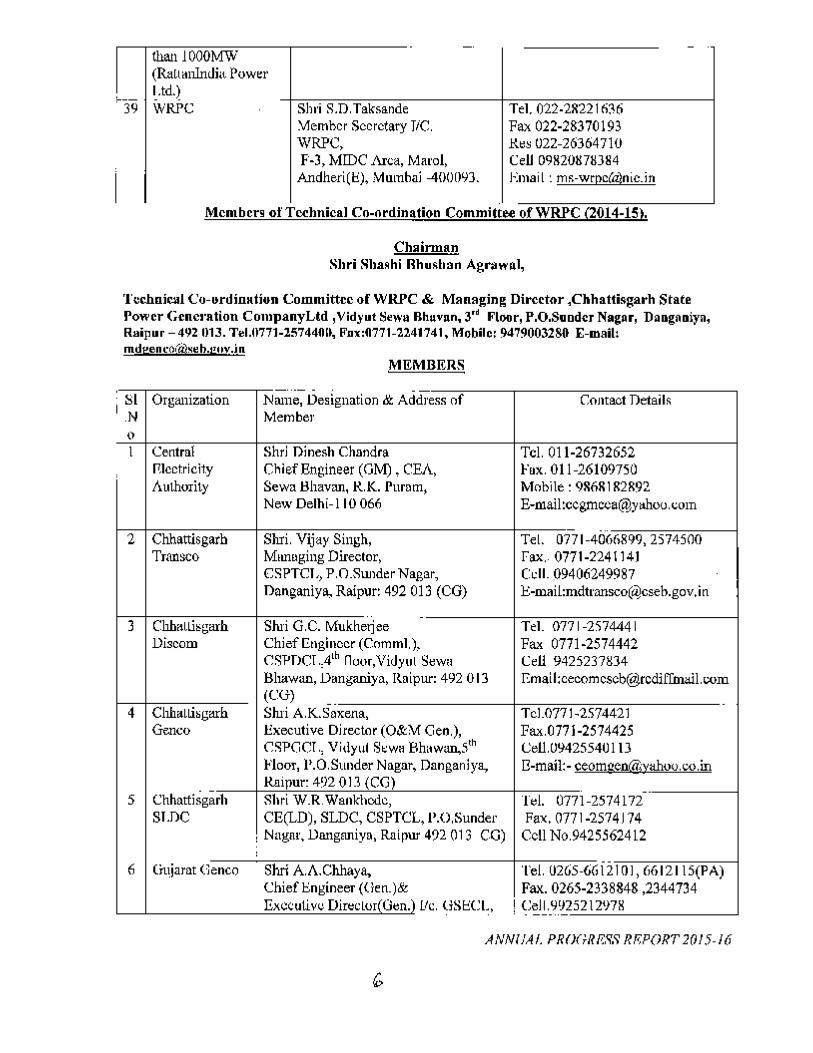
thanlOOOMW(Rauanlndia Powerl.td.)
39 WRPC SllI'i S.D.TaksandeMember Secretary TiC.WRPC,F·3, MIDC Area, Marol,
Andheri(Ii), Mumbai -4{)()()93.
Tel. 022.211221636Fax 022·28370193J:{~~U22·2636471OCeU 09820SlSJ84Email: ms·wrpc(alnic.in
Mcmben of Tcehnieal Co.ordinati(lR Committee ofWRPC (2{l14·1Sl.
CbllirmanSlIri Sba~hi Rhu~b3nAgNlwnl,
Technical Cc-urdinatiun Committee or WRPC & Managing Director ,Cbhattisgarh StatePower Cencration Companyl.td ,Vidyut S'WlI Rhuvlln. 3,d Floor, P,O,Suodcr Nag"r, n"ogoDiYB,Raipur - 492 013. T,,1.11771.15744ml.Fux:1l771·2141741, Mobile: 9479003280 E·mail:mdgen C'()r41seb.iJ(lv.j n
MEMBERS...- -
: 81 Organization Name, Designation & Address of Contact DetailsI.N Member
oI Central Shri Dinesh Chandra Tel. 011·26732652
, mcctricity Chief Engineer (Gl'vI), eEA, Fox. 01 1·26109750Authority Sewa Bhavan, RK. Purarn, Mobile: 9116R1R2Rn
New Delhi· I I0066 E·mail:eegnle<;a@ylihoo.<;om
2 Chhanisgarh Shri. Vijay Singh, Tel. 0771·4066899,2574500Transco Munaging Director, Fax. 0771.224114)
CSPTCL, P.O.SwlderNagar, ceu. 09406249987Danganiya, Ralpur: 492 013 (CG) }:;·mail:mdtransco(tilcseb.gov,in
.3 Chhauisgarh Slui G .C. Mukherjee Tel. 0771·2S74441
Diseom Chief Engineer (Com ml.), Fax 0771·2574442C:SPDCT.,4Ih [loer.Vidyut Sewa Cell 94252371!34Bhawan, Danganiya, Raipur: 492 013 Email:cecomcseb@rc<:tifIouUl.com(CG)
4 Chhauisgarh Shri A.K.SDxena, Tcl.077 1·2574421Genco Executive Director (O&M Gee.), Fax.0771·2574425
C:SPGCT., Vidyut Sewa Bhuwan,sth Cell.0942554U I 13Floor,P.O.Sullder Nagar, Danganiya, J:l·mail:· ceomQelli'ii1Xlihuo.co.inRaipur: 4')2 013 (CG)
5 Chhattisgarh Shri W.R.Wankhcdc, Tel. 0771·2574172"SLf)C CE(LD), SLDC, CSPTCL,I'.O,Sunder Fax. 0771.2574 J 74
, Nagar. Danganiya, Ralpur 492 013 CG) Cell NO.9425562412,
6 Gujarat Genco Shri A.A.Chhaya, Tel. 0265.6Gii10J, 6612115(PA)Chief engineer (Oen.)& Fax. 0265·2338848 ,2344734Executive Directoriuen.) LIe. HSEeL, ! eel I.9'125212978. --_ ..
ANNUAl. PR{)(TRP.SS RP.PORT 2015·/6
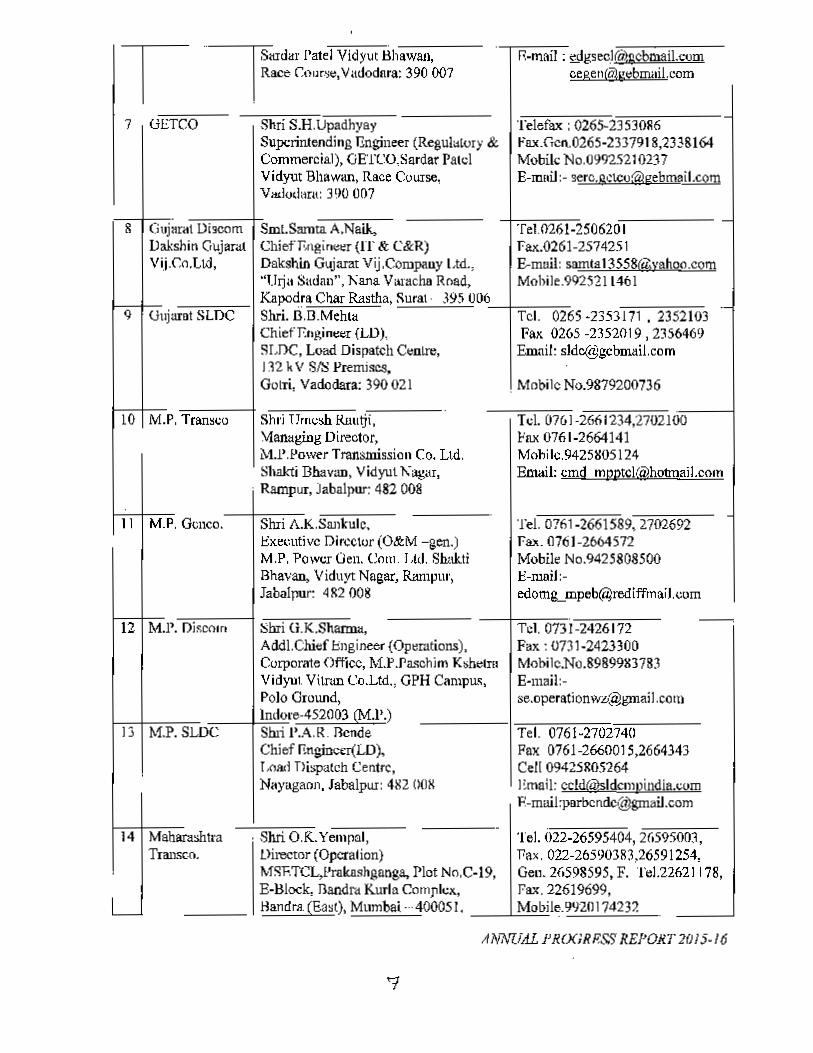
~ ~l!Idar Patel Vidyut Bhawan,I I Rare CO"""" Vadodara: 390 007
7 GETCO Shri S.H.UpadhyaySuperintending Engineer (ReguMory &Commercial), OETCO,Sardar PatelVidyut Bhawan, Race Course,Vltdo<.larn: 390 007
Smt.Samta A.Naik,Chief'Engineer (11' & C&R)Dakshin Guiarat Vij.Cornpauy Ltd.,"Urj .. Sudan", Kana Vuracha Road,
___ I Kapodra Char Rastha, Sural· ,195 006-:...._+:::-:---=,,:":SLOC Shri. n.D.Mehtli Tel. 0265 -2353171 . 2352103
Chief Engineer (LD). Fax 0265 -2352019 , 2356469SLJ)C, Load Dispatch Centre, Email: [email protected] 32 k V SIS Premises,Gotri, vadcdera: 390021
Shri G.K.Sharma,Addl.Chief engineer (Operations),Corporate Office, M.P,raschim KshetmVidyui Vitrun Co.Ltd., GPH Campus,Polo Ground,
__ +.!!In!!!do~re-452003(M.P.)LOC Shri I'.A.R. Rende
Chief I1nglocer(LD),Load Dispatch Centre,Nayagaon. Jabalpur: 4g2 OOl{
8 GujulAllDakshinvu.ce.t
9 Gujarat
10 M.P. Tr
II M.P. Gel
12 M.l'. Di.
n M.P.S
14 MTransco,
I
altanc;hlra
scorn
E-mail: ~g5ec)@;[email protected]
Telefax ; 0265-23530H6~·ax.Gc".0265-2337918,23J8164Mobile No.0992521 0237E-lDlliJ:- [email protected]
DiscernGujaraxld,
Tel026 1-250620 1Fax.0261-2574251E-muil: samta [email protected]
. Mobile No.9879200736
Shri nrnc~ Rnutji,\13ru1giog Director,i\.ti'.l!ow~r Transmission Co. Ltd.l-,1li1kti DhlIvUD, Vidyul K~'If,
. Rampur, Jabalpur: 482 008
T,,1. 0761-2661234,2702100Fax 0761-2664141Mohi1c.9425H05124Email: [email protected]
lCO. Shri A.K.Srul1culc.Executive Director (O&M -gen.)M.P. Power Gen. Com. Ltd, Shn!:.t;Bhavan, Viduyr Nagar, Rampur,Jabalpur: 4R2 008
Tel. 071i1-2661589, 2702692F8)I.0761-2664572Mobil~ No.9425808500E-mail:[email protected]
Tel. 0731-2426172Fax: 0731-2423300Mobile.No.8989'JK3783E-mail:-se.openltionw-~'ii)...gmail.cotD
Tel. 0761-2702740Fax 0761-2660015,2664343Cell 09425R05264Email: ec!d(<i)sldcmpindia.wmE-mail:porbcndc(Wnail.com
. Shri O.R.. Yempal, Tel. 022-26595404, 26595003,Director (Operation) Pax. 022-26590383,26591254,MSETCL,I'rak.ashganga, Plot No.C-19, Gen. 2(0598595, F. Te1.2262 I 178,E-BJock, Bandra Kurla Complex, Fax. 22619699,Handra. (Ea~l), Mumbai ...400051. __ ~M=ob~ile.9'i20 174231.
lIifl'fUAL l'R(XiRPSS REPORT 2015-16
11--1--- ~mail-dirpp;.vnlahlltramcojn
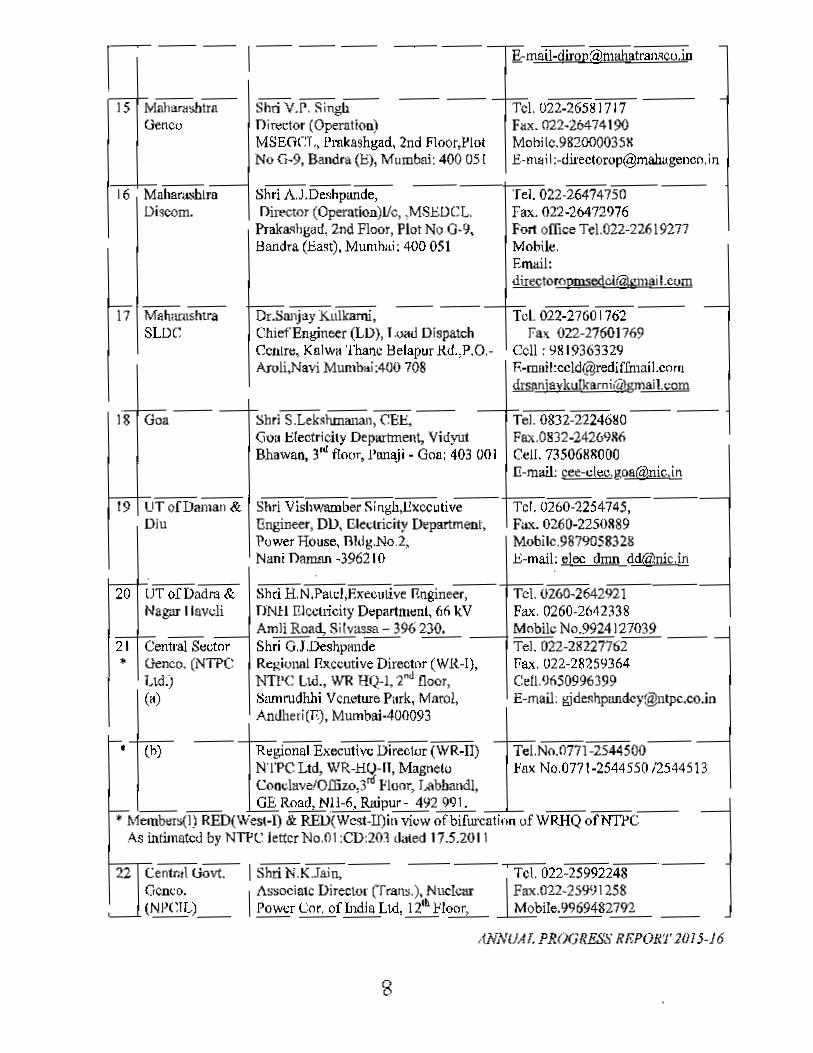
Mahar.s.lltrn Shri V.P. ::1ingh-- ----IS Tel. 022-26581717Genco Director (Operatioa) hx.022-2M74190
MSEOCT" Pmkashgad, 2nd Floor.Plot Mooile.982000035MNo G-9, Bandra (B), Mumbai: 400 05 ( E-m~ i(:-di1'eCiorop@mahag~nco. in
(6 Mahar..ro.lra Shri A.J.De~hpande, Tel. 022-26474750Discom. Director (Operation)lIc, ,MSEDCL. Fax. 022-20472976
Prakasbgad, 2nd Floor, Plot No 0·9, Fort office Tel.022-226192nBandra (Bast), Murnbai: 400051 Mobile.
EITIlIiI:[email protected]
---- -----17 Maharnshtra Dr.Sanjay Kulkarni, Tel. 022-27601762SLOe Chief Engineer (LO), l.oau Dispatch Fa" 022-27601769
Cclllr e, KDlwa Thane Betapur .ltd.,P.O.- Cell: 9819363329Aroli.Navi Mumbai :400 708 F.-mllil:[email protected],n
!!wniaykulkamiriilgmail.,.:om
--18 Goa ShrlS.Lek~hmallall, CEE,-- Tel. 0832-22246l!0Goo Electricity Department, Vidyut Fax.08J2-24269l16Bhawan, 3"' floor, J'flJll\ii - GOD;403 001 Cell. 735068!tOOO
E-mail; [email protected]
19 LIT of Daman & ShT!Vishwamber Si ngh.Exccutive Tel. U260-2254745,Diu Engineer, OU, Electricity Department, Fa.'<.0260-22501I89
'PUweT House, Bldg.No.2, Mubilc.9879058328Nani Daman -396210 E-mail: elec dmn df!(a'lnic,!n
20 UTorDadra& Shri H.N.Pau:I,F.Xe.llllive r..ogineer, Tcl. 0260-2642921NaF llavcli DNH Electricity Department, /it; IN Pax. 0260·2612338
AmH Road, Silvassa - 396 230. Mobile No.992412703921 Central Sector Shri GJ ..Deshpanae- -- Tel. 022-2R22n62-- --• Genco. (NTPC Rej,(ionIlIfl)(ccutive Director (WR-l), Fax. U22-28?'59364
tId.) NTi'C ua., WR HQ_l,2nd floor, CeU.%50996J99(a) Samrudhhi Vcneture Park. Maro], E-mail: [email protected]
Antiheri(E), Mumbai·400093
Regional Executive Director (WR-II)NTPC Ltd, WR-HO-II, MagnetoCoo<:lave!Ollizo,3ri1' floor, Labhandl,OE Rood. Nll-6. Raipur- 492 991.
• Me.nbers(J) RED(West-I) &'RE1)(Wcst-ll)in view of bifurcation ofWRHQ ofNTl'CAs intimated byNll'e leiter No.Ol :CD:203 dated 17.5.2011
TeI.No.0771-2544S00fax No.077 1-2544550 l2544513
(h)
22 Centr,,\ uovt'" I Shri N.K.Jain,Genco, 1 Associaic Director (Trans.). Nuclear(NPCIL)__ Pow<!rCor. of India Ltd, lib Floor,
Tel. 022-25992248IF~.(}'l..2-259'J1258~bile. 9969482792
A.NNUAl. PROGRESS REPOR1'2015-16
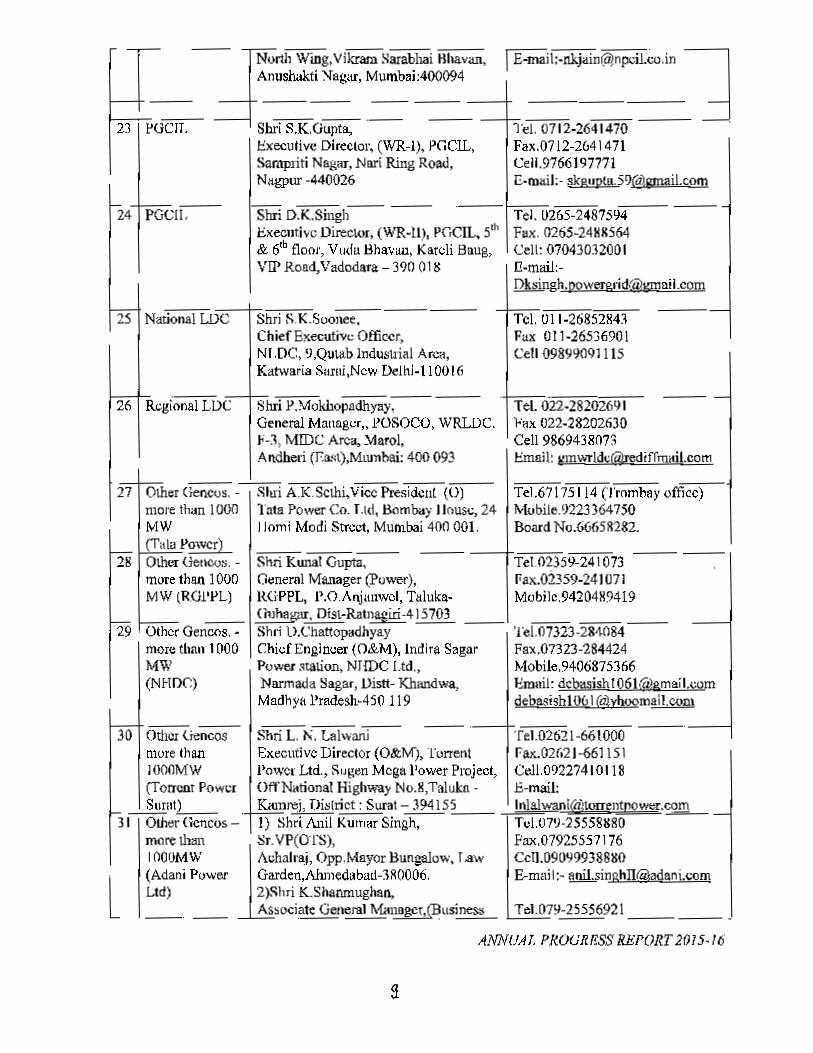
-IN"", WW. Vlkram Sarabhai H'iav an, fE'"''''''"J"...,,,,,.w.,.]Anushakti ~agllr, Mumbru:400094
-- -- -- --+23 !:'U-C""T,..-.- Sbri S.K.Gupta, ._- "1:1. 0712-2641470
Executive Director, (WR-l). PCoCIL, Fax.0712-2641471Sampriri Nagar,.Nnri Ring Road, Cel1.9766197771Nagpur -440026 [·moil:· skp,up!lLSl)(dlf!!!!!!ilcom
Shri D.K.Singh-- ---Executive Director, (WR-ll), !'(;ClL, 5'"& 6<bfloor, VIKlu Bbavaa, Kareli Smug,VlP Rood,Vadodara - 390 01 ~
~4 PGCI':"'''--
I 2S National WC:=--t-;Shri fi.K.Soonee.Chief Executive Officer,NI.DC, '),QUlab Industrial Area,Katwaria Sami,Ncw Delhl-I 10016
26 RegionalLDe
27 Other G=5. -more than 1000MW(Tala Power)Other Gencos. -more than 1000MW (RDl'l'L)
29 . Other Gencos, -more dum 1000MW(NHDq
Shri 1'.Mokhopadhyay,General Manager" I'OSOCO, WRL!)C.1'-:1, MIDC Area, Marol,Andberi (Ea.'t),Mmnbai: 400 093
Slui A.K.Sclhi,Viec President {OJlata Power Co. Ltd, Born bay House, 24J lomi Modi Strc ..1, Mumbai 400 00 I.
Shri Kunal Gupta,General Manager (power),H.GPPL, P.O.Anj,mwcl, T~luka-(i1lhagllr, D;st-Ratnagiri·4 15703 __Shri D.ChattopadhyayChief Engineer (O&M), Indira SagarPower station, NfIDC Ltd.,Narmada Sagar, Distt- Khandwa,Madh Jlll'radesh-4 50 119
ANNUAl. PROURESS REI'ORI2015·16
Tel. U265-2487594F~x.026S·24Hg564Cell: 07043032001Il-mail.-Oksingh·PQwergl'idf<Vgmnii.com
30 Shri L.~. Lalwan_j_- -_.Other Gencos Te1.0262i-661000more than Executive Director (O&M), Torrent l'ax.021i21-661 151IOOOMW !'Ov,'C( Ltd., Sugen Mctla Power Project, Cel1.0?2274 101 IS(Torrent Power OffNational Highway No.B.Talukn • E·mail:Surat) Kamrei, District: Surat - 394155 inlalwani~iIlrren~wt:r.com
31 Other Gcncos=- I) Shri Ani! Kumar Singh, TuI.07,)·25558H80more 1118n Sr.VP(OTS), FIlX.07925557176IOOIJMW Jr'" O".MoYO' Bungalow, ,~ Ccll.090Y99388l10
l(Adani Power Garden,Ahmedabad-3ROOO6. B-mrul:- ~.singhnla\adani.!ll!mLtd) Shri I<..Sharunugnan,
---- societe Gellel'al1\1anDgCt,(Bllsines~ To1.079-2555692I
Tel. U11-26852843Fux 011-26536901Cell 09899091115
Tel. 022-28202691Fax 022-28202630Cell 98694311073Email: gmwrldc@rediffmaiicom
Te1.67175 I 14 (Trombay office)Mobile.9223 364750Board No.66653232.
Te1.02359-241 073rax.O?~59-241071Mobilc.9420489419
'ret.o 7323·2M084 --Fax.07323-284424Mobile.9406875366Email: dcbasish I06 l(a)gmai I,comdebasishlOV 1(olyboomail.com

Development), Adani Power Ltd,Achalraj, Opp.Mnyor Bungalow, LawGardcn,Ahmedabad-380()()6.
Fax.079-25557\ 76E-mail;.Shanmughan.k@adanLcQro
Shri H.M.Jain,Sr.Vice President (Power),Acn (fnJia)Ud ..7'" Floor, OfficeTower.Ambience Ml.11.
~-I-::::---,-,,... __ +::'N=Hc!.--::~'Gurgaon-122002.33 RlocLricity The Director,
Traders Adani Enterrpriscs L1d.(En<:rgy(Ansul ('.arg) Trading)
Plot No-83, Sector 32, Institutional,~rca,Gurgaon, Ilaryana 122001.(fax 110 0124-'-555213)
32 Other Gcncos(ACB IndiaLtd)
Tel.-0124-27 19000Fax.Q124-2119185CeU-9953IS0412t-mail: acbpower@acbiJ\dja.com
34 Diseoms - Shri Avinash Waghanihare Tel. 022- 30099')99-
Other (him State Vice Prcsidernfflperations), F~x. 022-Discoms Reliance Infrastructure Ltd, E·mail:-(lUL) First Floor, Reliance Energy avifl!;!sh.waghamllarc@reliunceada
Mansgcmenllnstitute(REMl), .comJogcshwari- Vikhroli Link R08d(JVLR).Opposite snnpz Gate No.3,Andheri(E), Mwnbai-400 065.
3:> Other Gcncos- Shii Vijay D.Pl:IJ'ailjape,Scuior Vke Tel.02357-242501lo 242505more than President, MI£.JSW Energy Ltd., Fax.02357-242508l000MW Villagc:Nandwade, Postilnlgad, Mobilc.9552577377(JSW l:'nergy '·.1. & Dist·Ratnagiri-415614 F.-mail: vijay.oornnja[!£@isw.inLid) Maharashtra,
36 Other GCI1COS- Shr; Rant NiWns. Tel. 077li7-281990(Jindal Power President, Jindal Power Limited, Fax .07767-281995Ltd) 1).O.Tarnnar. Districcftalgarh, M"bile.0930289822.5
Chhartisg.trb - 496 107. Email:rarnniwas aYind.l ower.com
Other Gencos- Sl,,; Dinesh Kudalkar, Tel.:>Io.02R38-6615UO37 more than Chief - O&M. Coastal Gujarat Power Fax No.02838-661181
IOOOMW Ltd, (A Tala Po .....er Co.) 4000 M W Mobile :>10.9099995777(COP!.) UMPP, At & J>o~[: Tunda , Mundra, :E.-ffilI iI:
Kul.ch, Gujarat-370435 • d.kudalk"[email protected] , WRPC Shri S.D.Taksandc, Tel. 022-28221636 (0)
_L Member Secretary IIC. 022-28370193 (Fax:)Western Regional Power Committee 022·26364710 (H)fo-3,Mille Area, Marol, l\ndheri(R), 09820818384 (Cell)
I Mumbai -400093. r',ll1ail : ms-wrpc,tanicjn
ANNUAL PROGRESS II/~PORr2015-16
10
1

CHAPTER-1
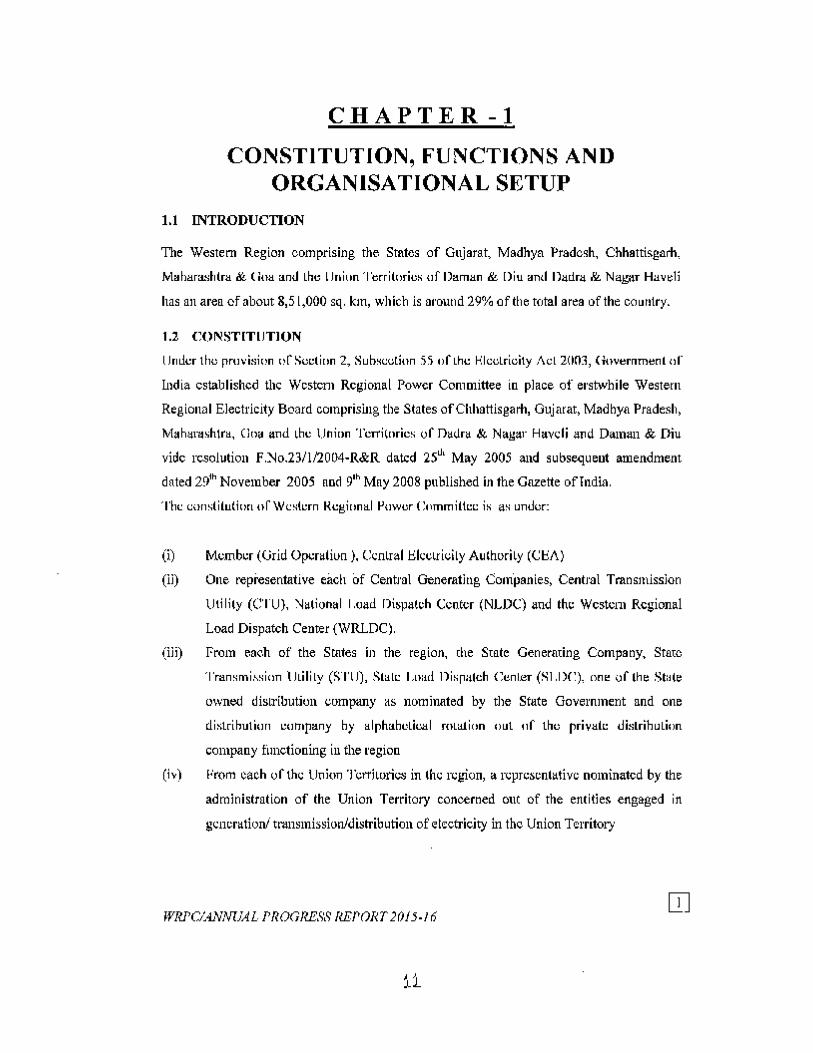
CHAPTER -1
CONSTITUTION, FUNCTIONS ANDORGANISATIONAL SETUP
1.1 INTRODUCTION
The Westem Region comprising the Smtes of Gujarat, Madhya Pradesh, Chhattisgarh,
Mab"r:JSI,Lra & IIna and the IJniun T"rriLmic, uf Daman & Diu and Dadra & Nagar Haveli
has an area of about 8,51,000 sq. km, which is around 29% of the total area of the country.
1.2 CONSTITIJTION
l Jndcr the provision of Scc(il,n 2, Subsection 55 elf the Hlcclricity Act 2()03, (nl'Y~rnrn~nl(If
India established the Western Regional Power Committee in place of erstwhile WesternRegional Electricity Board comprising the States ofClthattisgarh, Gujarat, Madbya Pradesh,
Mabarashtra, Goa and the Union Territories of n"dr" & Nagar Havcli and Damon &; Diuvide resolution F.~o.231J12004·R&;R dated 25~' May 2005 and subsequeut amendmentdated 29'" November 2005 and 9" May 2008 published in the Gazette of'India,The constitution nf\Ycs(crn Rcgiunall'uwcr (~.lmmittccis as under:
(i) Member (Grid Operation ], Central Hleclric;ily Authonty (CI:;I\)
(ii) One representative each of Central Generating Companies, Central Transmission
Utility (CTU), "l"lional l.oad Dispatch Center (NLDC) and the Western RegionalLoad Dispatch Center (WRLDC).
(iii) From each of the Stares in the region, the State Generaring Company, State
Transmission IJlility (!\TtJ), State Lila" Dispatch Center (SI.I)C), one of the SlaLe
owned distribution company as nominated by the State Government and one
distribution curnpany hy alphabetical rouuion nut uf the private distribution
company functioning in the region(iv) From each of the Union Territories in Ihe region, a representative nominated by the
administration of the Union Territory concerned one of the entities engaged in
generation/ transmission/distribution of el~ctriejty in the Union Territory
WR1'C'J..4..NlvlJAL I'ROGRES811Ef'ORT 2015 ..16
ii
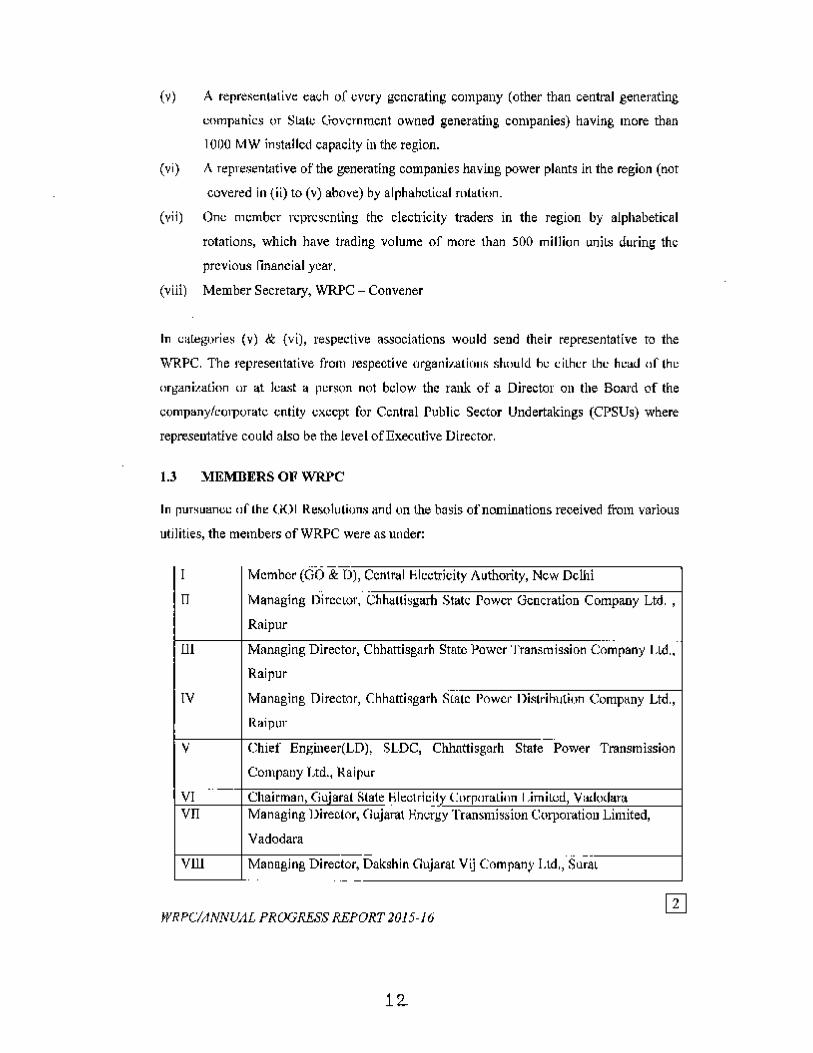
{v) A representative each of every generating company (other than central generatingcompanies or Slate Government owned generating companies) having more than
1000 MW installed capacity in the region.(vi) A representative of the generating companies having power plants in the region (not
covered in (ii) 10 (v) above) by alphabetical rutatinn.
(vii) One member representing the electricity traders in the region by alphabetical
rotations, which have trading volume of more than 500 million units during theprevious financial year.
(viii) Member Secretary, WRPC - Convener
In caltognri,," (v) & (vi), respective associations would send their representative to the'\\fRPC. The representative from respective organi,.atiolls should he either the head of the
organization or at least a person not below the rank of a Director on the Board of thecompany/corporate entity except for Central Public Sector Undertakings (CPSUs) whererepreseutative could also I>~the level of'Execntive Director.
1.3 :\lEl\mERS OF WRPC
In rUTS.OnCe of the 001 Resolutions lind on the basis of nominations received from variousutilities, the members of WRPC were as under:
I Member (GO & D), Central Hlcetricity Authority, New Delhi
II Managing [iircclOl·: i.;hhallisgarb State Power Generation Company Ltd. ,
Raipur_...
1lI Managlng Director, Cbhartlsgarh Stare Power Transmission Company Ltd..Raipur
IV Managing Director, Chhanisgarh Slate Power Dislrihllti(m COmp"DY Ltd.,Raipur
V Chief Engilleer(LD), SLDC, Chhnttisgarh State Power Transm issionCompany Ltd., Raipur
VI..
Chairman, Gujaral Stale lil"ctriei~ Corporathm lJmitcd, vadodaravn Managing Director, (lujarat Hm.:rgyTransmission Corporation Limited,
Vadodara
Vill Managing Director, Dakshin Gujaral Vij Compan,l.td.:Su~aL..-
WRPC:MNNUAL PROGRESS REPORT 1015·16
12.
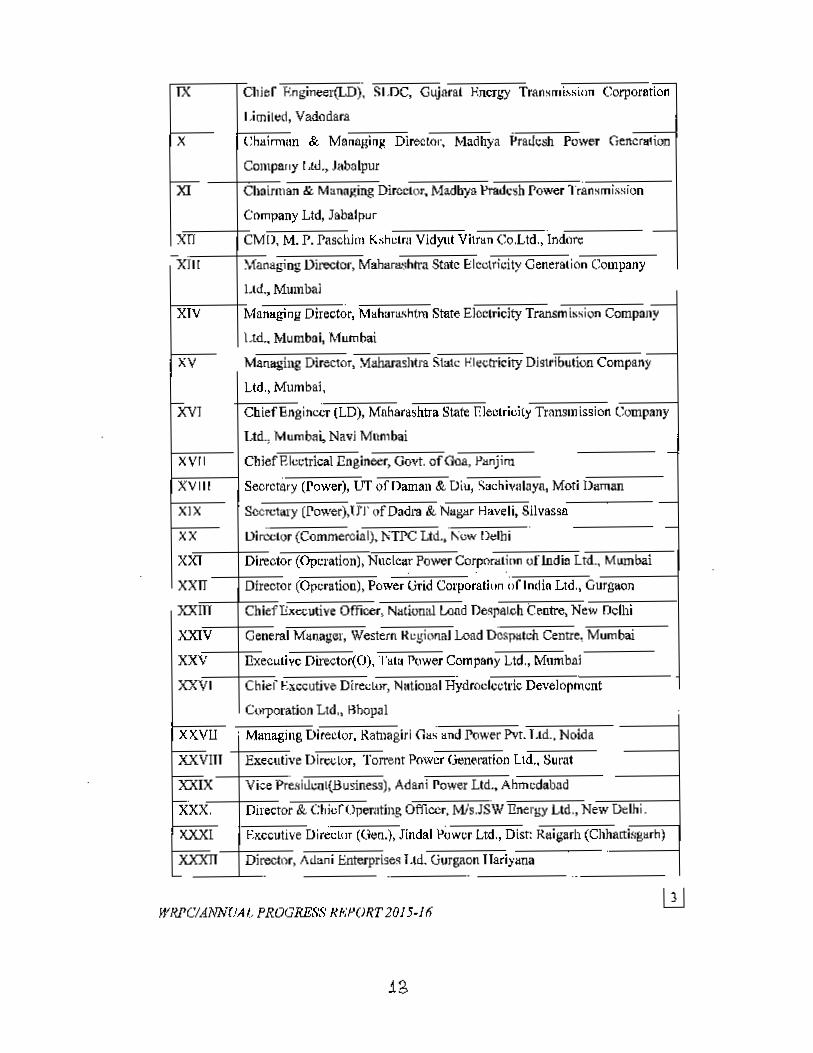
IX Chief Rn
Limited,
X Cbairmnn
Company
Xl Chairman
Company
xn CMIl,M.-xill '.fanalling
Ltd., MUlXIV Managing
ua, Mu
XV Manlll!ill8Ltd., Mu
'xvI CbiefEn
Ltd., Mu
XVII Cbieff!1c
XVIII Secretary
XIX Secretary
XX Ui..cclur (
XXI DireclO<~
xxn Director C
XXITl ChiefIix
XXIV General
XXV Ilxecutiv
XXVI Chief Ex
C rati
gineer(LD), SLOC, Gujaral Hncrb'Y Transrnlssiun Corporation
Vadodara
& Managing Director, Madhya Pradesh Power Gencr.tioo
I.td., Jabalpur
&. Managing Director, Madbya Pradesh Power Tr8.n,mi ..,;on
Ltd, Jabalpur
P. Pascbi'" Ksholr<1Vidy\11 Vit ra n Co.Lld., IndoreDirector, Maharashrra Stotc E:lcclrieily Generalio-n-'C'-'o-m-pa-n-y-
nbai
Director, Maharashtm Stato Eleclricity Transm ission Comp.JlY
mbai, MumbaiDirector,- ."'~""IIhar'---as-'h-:-IJ-·aSlate ElecCTicity DiSlributioo Company
mbai,
gin<i'-;r""'(L;-:D~)-,)\;~f;-oh;-a·r.shtraState Eleclricity Transm ission COOlpany
mba;' Navi Mumbai-----
~1rical Engineer, Covl. of Goa, I'lmjiru
(rower), LIT of Damall & Diu, ,>aehiv:1laya, Moti I)aman
(Powerj.U'I' (If Dad1'8 & N.~r Haveli, Silvassa
Commercial). NTPC Ltd.,'l\uw Il"'bi ---- -
Operation), Nuclear Power Corporation of Indio Ltd., Mwnbai
Operation), Power UTid Corporation ;,flndin Ltd .• Gurgaon
ecutive Officer, N~'iona.) Load Despatch Centre, New Oclbi
M"nager, Western Regional Load D1lspatch Centre, Mumbai
e Oirector{O), '1',1. rower Company Ltd., Mllmb.ai
ccutiveDirector,National HydroelectricDevelojlrn-en-,t:----
U1'J'O on Ltd .. ~hoVJI
XXvu . Managing Director. Rahlagiri (1", Hnd .Pt>werPvt. Lid., Noida
Executive Di"",lur, Torrent Power (';"n~ra!ion Ltd .. Sural
Vice Pre~iucol{Business), Adani Power Ltd., Ahmedabad
:-----+-=O"'ir-ecf-or & ChicfOp.mUng OffiCCT, Mis.JSW llneryy Ltd., New Delhi.
I-x.xx=:-::[;- Ex.ecutive Director ((len.), Jindal Power Ltd., Dist: Raigarh (Chhacr'"is-gH-r""h)-I
xxxn Director, Adani Enterprises Ltd, Gurgaon Hariyana
Jt'RPCM.N1vTJAI,PROGRf*,1! /U;I'ORT 20) 5·)6
-
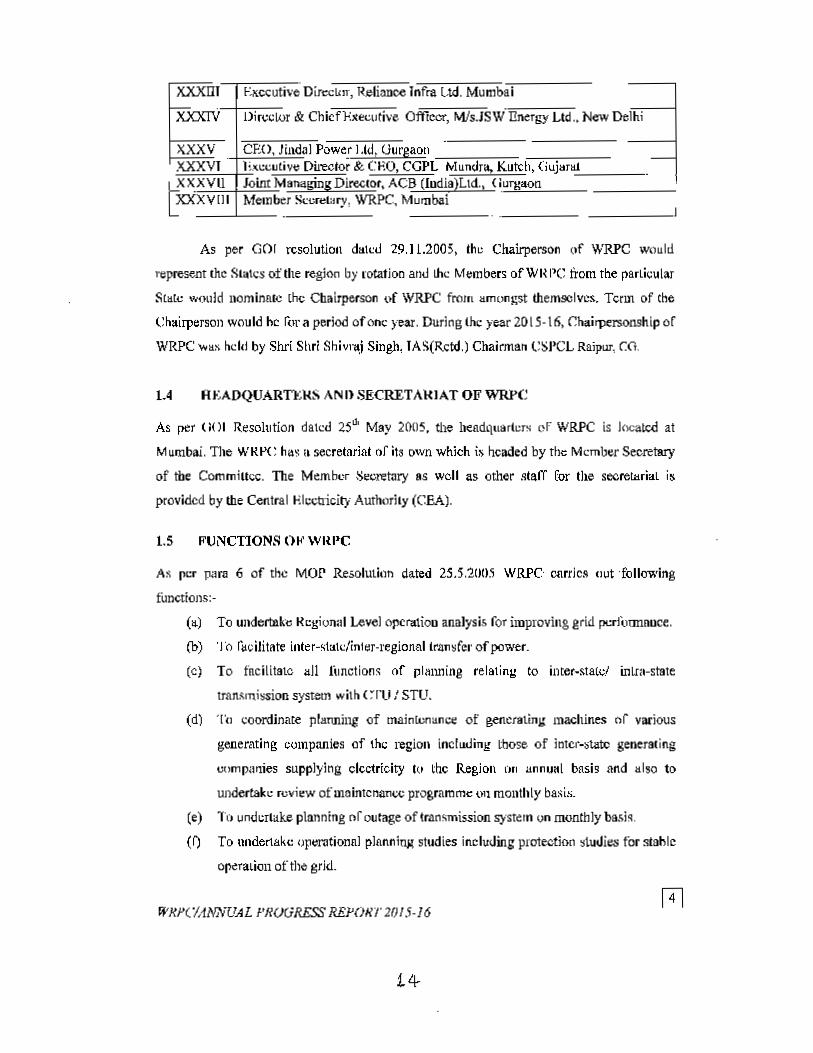
XXXIlT
xxxrvEKecutive Director, Reliance Infra L.td. MumbaiDirector & Chkf'Rxecurive Officer, Mls.JSW·"'Il""ne"-'-Il-y-:"L":"ld7".. New Del"t."-i--I
XXXV eRn, Jindal Power) .Id, Gurgaon _".--:---:-:-_:,:XXXVl~.;,:,;.,-r:=I\xCCIJ[j.....Director & CliO. CGPL MundT'" Kutd'-'.-;("'iu-:~,,-no1--:---
hXXXVll Join! Managing Director, ACB (Iudia)Ltd., O.::.UTg"'·"''''''on::.... _LXXXVIII Member Sccr~t"ry, WRPC, MUl111:tai
As per GOI resolution dated 29.1 1.2005, the Chairperson of \VRPC would
repeesent the Slates ofthe region by rotation and the Members ofWR I'e from the par1.icularSl~lc would nominate the Chairperson "r WRPC frnm ~m(>n!:stthemselves. Term of (heChairperson would he for a period of one year. During the year 2015· 16. C':h"i'llersonship of
WRPC w ..x held by Shri Shri Shivraj Singh, IAS(R.ctd.) Chairman CSI'CL Raipur, CO.
1.4 R.:ADQUARTI;\{S ANI) SECRETA\{JAT OF ware
As per 001 Resolution dated 2Sd, May 20()5, the headquarters "I' WRPC is located at
Mumbai. The WKI'C has a secretariat of its own which i.~headed by tbe Member Secretary
of !be Committee. The Membc< Secretary 8S well as other stafT for tile secretenai i.
provided by the Central Hlcctricity Authority (eM).
1.5 FUNCTIONS O~'WRI'C
A~ pa para 6 of !he MOr R.e.;olulion dated 25.5.21105 WRPC carries out 'followingfunctions: .
(a) To undertake Regionnl Level operation analysis for improving grid pcrfurmnuce.
(b) To r~cilitate lnter-starc/inter-regionel transfer of power.
(c) To facllitatc aII Iunctlons of ptanning relating to illter-Sla!c! intra-statetransmission system with (TU / STU.
(d) To coordinate plalUling of maintonunce of generating machines of variousgenerating companies of the region including those of inter-state generacing
companies suppl}oing clcclricity Iv tbc Region On annual basis and .. 1$0 to
undertake review of maintenance programme "'I monthly basis,(e) To undertake planning (If outage of transmission system on monthly basis.
(I) To undertake operational planning studies including protection studies tor mallie
op.:ralion of the grid.
WXPCIANNUAL f'ROGRESS RE1'OXt 21)/5-16
i4
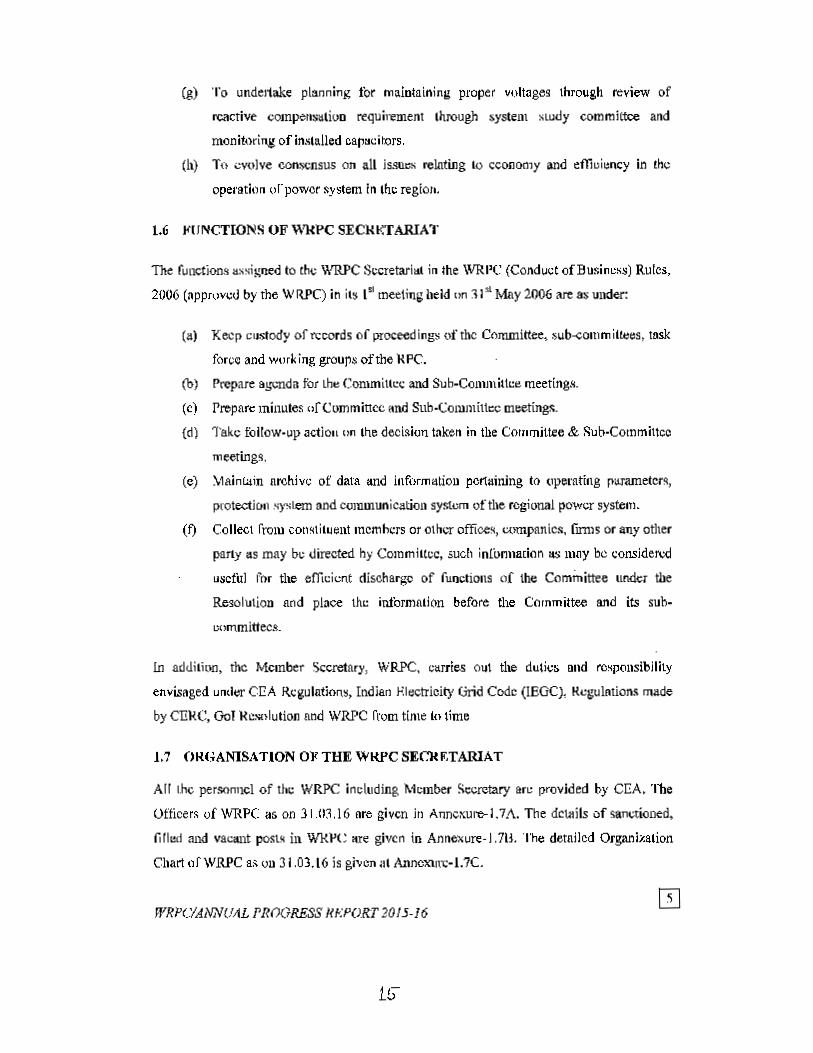
(g) To undertake planning lor maintaining proper voltages through review of
reactive compensation requirement through system study committee and
monitoring of irL<laIledC8f>"Citors.
(II) To evolve consensus on all issues relating 10 economy and efficiency in the
operation or power system in the region.
1.6 "UNCTIONS OF 'W}("PCSECI..a:'rARIA']'
The functions llssi!(ned to th" WRPC Sccretarlei in the WRI'C (Conduct of Business) Rutcs,
2006 [approved by the W RPC) in il$ I" meeting held nn :II" lvIay 2006 are as under:
(0) Keep custody of records of proceedings of rbc Committee, sub-committees, taskforce and working groups of the ){PC.
(b) Prepare 9b'Cl1dnfor the Committee and Sub-Ccmmatce meetings.
(c) Prepare minutes of Committee and Sub-Connuiuec meetings.(d) 'fake [ollow-up action on lIle decision taken in the Committee & Sub-Commhtce
meetings.
(e) :>'lainwin archive of dm and informaiioD pertaining to operntlng parameters,
protection system and communication system ofthe regional power system.
(I) Collect from constituent members or other offices, companlcs, rums Of any oilier
party as may be directed hy Commiucc, such inronnacion as may be considered
useful for the efficient dischargo of functions of the Committee under the
Resolution and place the information before the Committee and its sub-
eornrnlttecs.
10 addition, the Member Secretary, WRPC. carries out the duties and responsibility
envisaged under CEA Regulations, Indian Hlectrieity Grid Codc (IEGC), R"gullltions made
by cu){C, Gol l("""lution and WRPC from time In lime
1.7 ()RHANISATION O"FTHE WI{f'CSECl(~,TA1UAT
All the personnel of the WRPC including Member Secretary arc provided b)' CEA. The
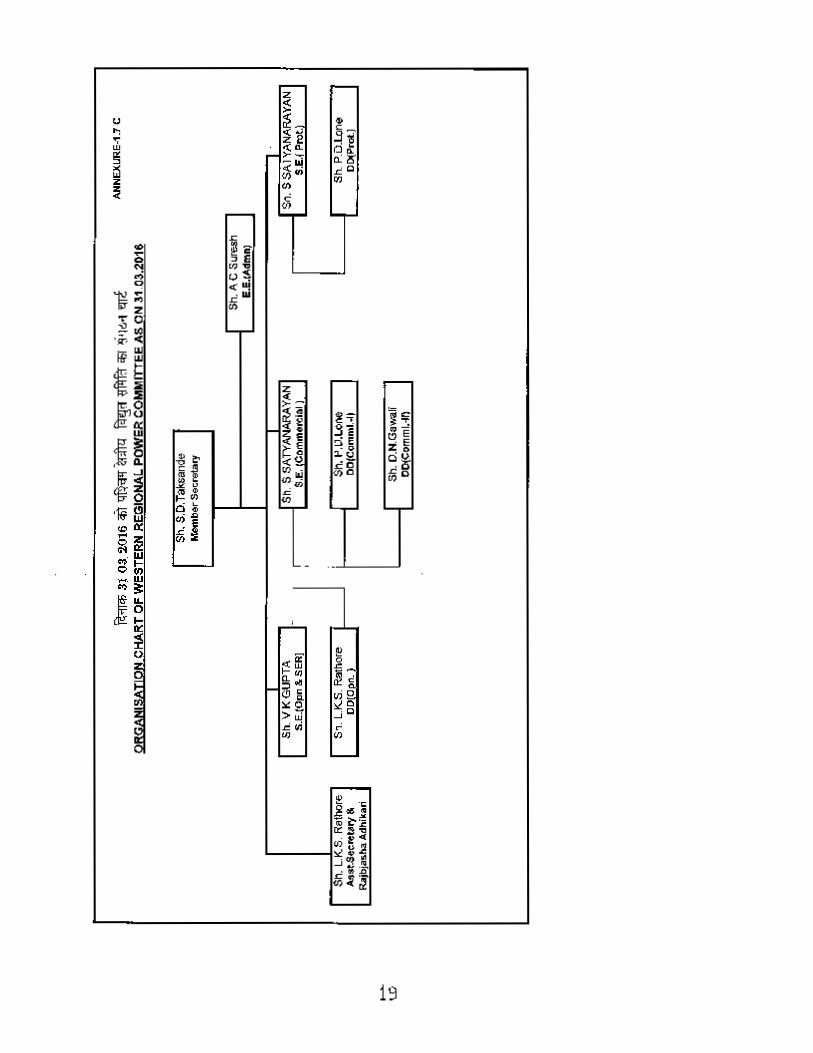
Officers of\"lRPC as on 3u13.16 ore given ill Annc"uro-l.7!\. The details of sanctioned.lilled and vacant posts in W}{PC are given in AnnelCure-1.71l. The detailed Organization
Chart ofWRPC 8~ Oil 31.03.16 is given at A11nO)(\II,-1.7C.
WRPC/ANN(!A.L PROGRESS /{f;PO,RT 2015·16
H,
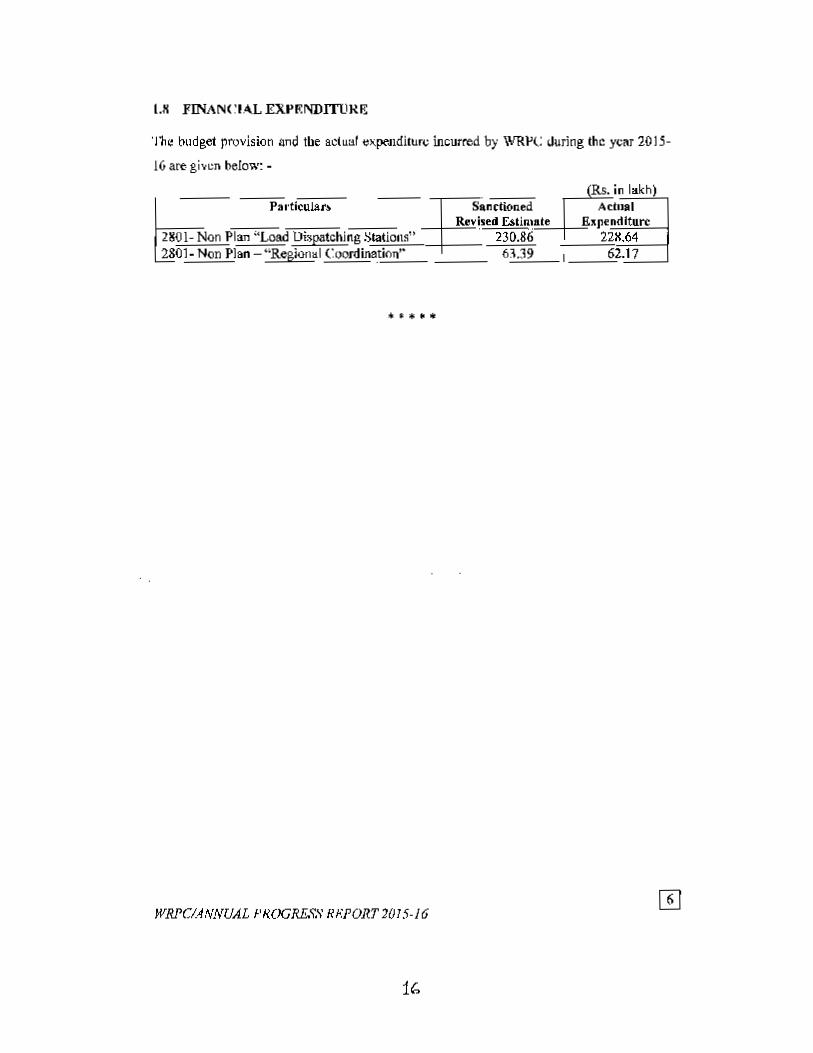
I.X FINANCIAL EXPRNDITllRg
The budget provision and tbe a~lua' expenditure incurred by WRl'C during Ihe year 20 lS-
I(i are gi."" below: -
. ~.inlakhP.,·ticuLat> E,.nClioned AdllOll
Revi,'" Estill,sl. IUpendltun:Non Plan "Load Di&patchingSlaliol\~" . 230.86 22X.MNon Plan -"Regional Coordjnetion" 6~.39 I 62.:.;,17.:...___.
WRPClANNUAL f'1{(JGRESS R~;PORT 2()15·16
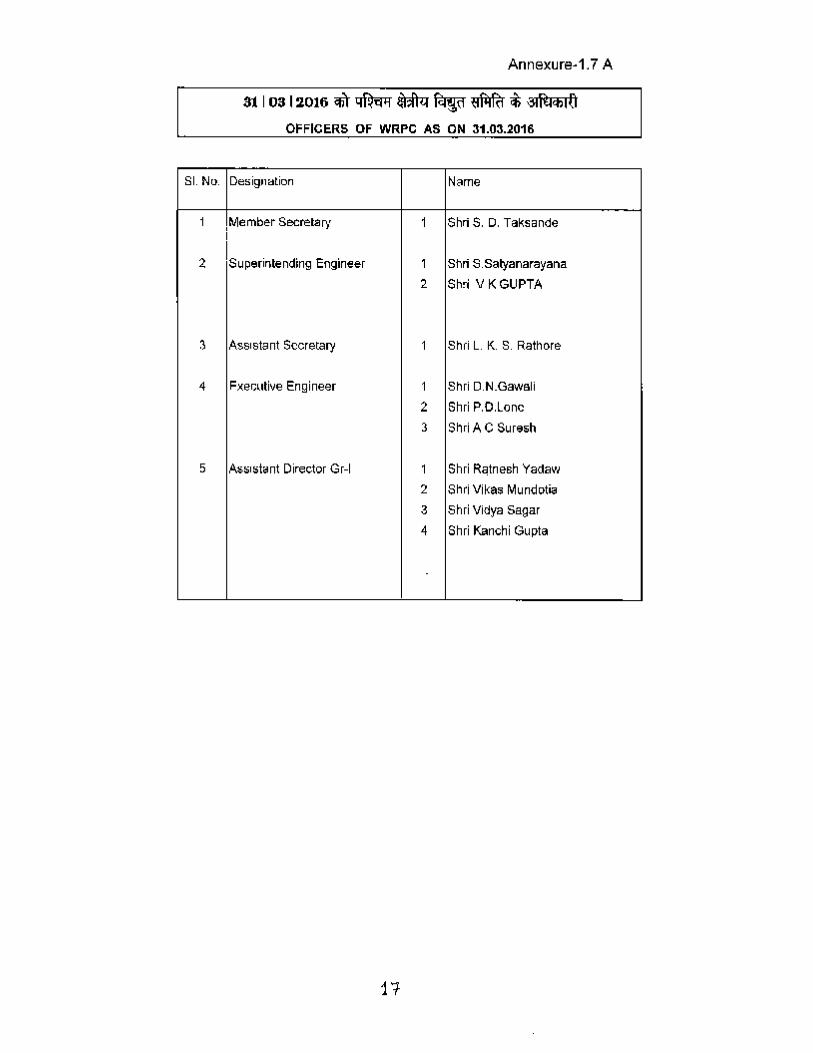
Annexure-1.7 A
at 103 12016 <lit ~ ~ ~ ~ c6 '3tRl<tlI{iOFFICERS OF WRPC AS ON 31.03.2016
SI. No. Designalion Name
1 ,Member Secretary 1 Shri S. D. TaksandeI
2 IS . d' E . 1 Shri S.Satyanarayanaupennlen .ng nglneer2 Sh"; VKGUPTA
3 Assistant Secretary 1 Shri L. K. S. Rathore
4 Fxecutive Engineer 1 Shri D.N.Gawali2 Shri P.O.lone3 Shri A C Suresh
5 Assrstant Director Gr-I 1 Shri Ratnesh Yadaw2 Shri Vikas Mundotia3 Shri Vidya Sagar4 Shri Kanchi Gupta
11
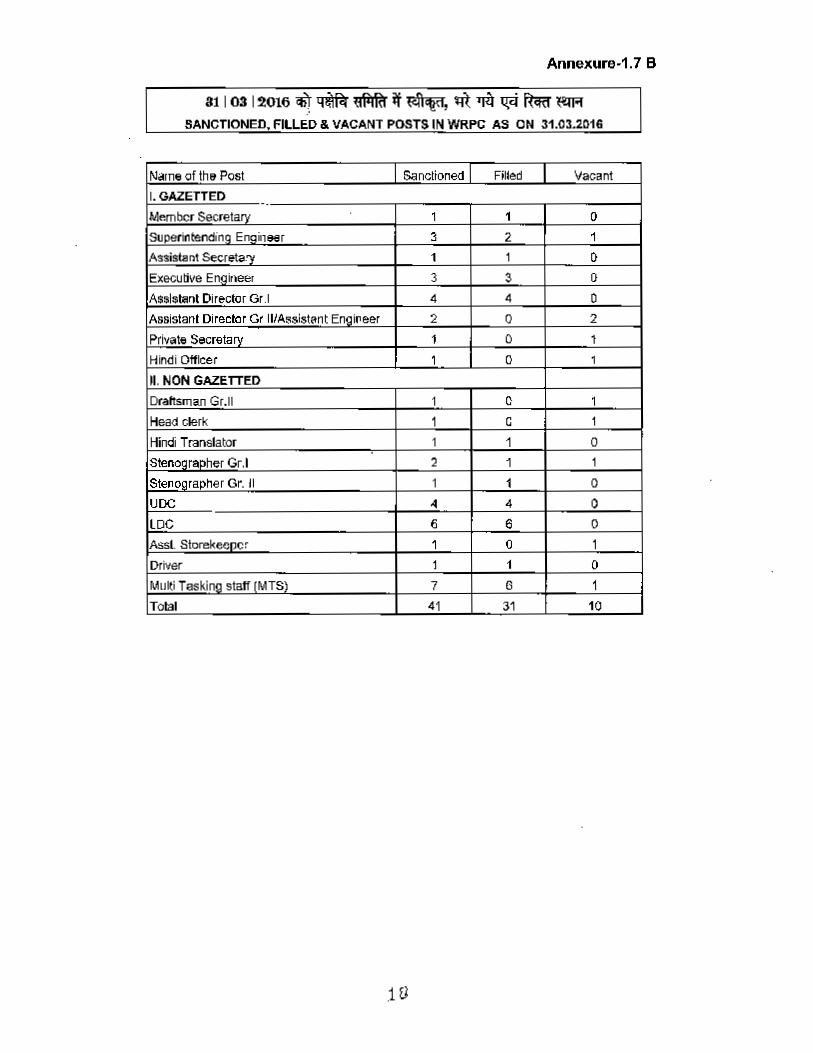
AnnexUnI-1.7 B
SANCTIONED. FILLED & VACANT POSTS IN WRPC AS ON 31.03.2.1)16
Name of the Post Sanctioned I Filled VacantI. GAZETTED '.Member Secretary 1 1 0SUperintendinQ EnQ;,eer 3 2 1
IIISecreta'Y 1 1 eExecutive Eng._ 3 3 0
AssIstant Direotor Gr.l 4 4 0Assistant Director Gr II/Assistant Engipeer 2 0 2Private Secretary 1 0 1Hindi Officer 1 0 ,II. NON GAZETTED
OraItsman Gr.1I 1 o 1
Head clerk 1 C 1
Iindi Tra"\Slator 1 1 0
Gr.t 2 1 ,$leooorapher Gr. II 1 1 0
UDC 4 4 0
lOC 6 6 0
Assl Storekeener 1 0 t
Driver 1 1 0
Multi Tasking stall (MTS) 7 6 1Total 41 31 10
.1 [l
.---- r-~I~..
;... £ §~de~;;"j ~~<Ii.; "CCI) '"
.-, ~ L...,....J
t cE
II>~ L..,
< :=~
L....r-J
T .---- ...-,.-II !5 =
~9d~
,,~
~~
C)E·0 ~~
~~
:1.<>§)g ~~
.'"tjo
.c
~ L,...J .........
L_ ..
-
r-'- .--I
~if: ~
I-~ '"..;~.. &!~g
'"0~
>",,0
~~..Jc
"II)L......J L......J
;
19

CHAPTER-2
CHAPTER-2
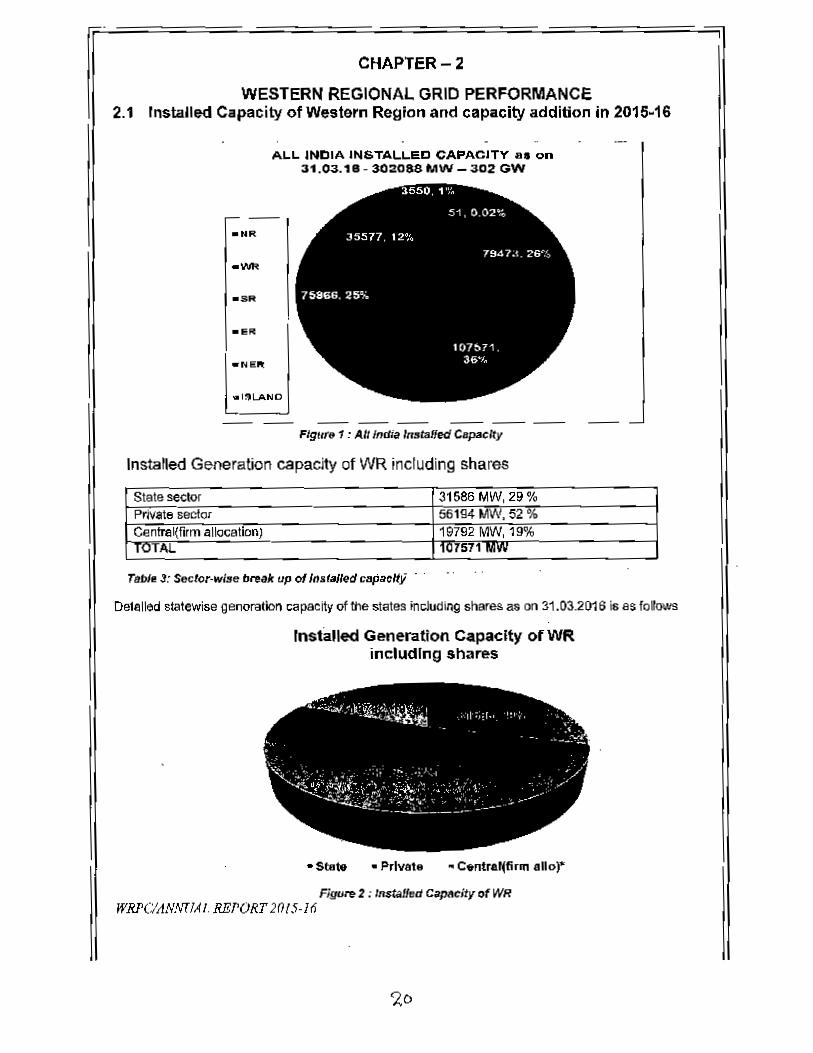
WESTERN REGIONAL GRID PERFORMANCE2.1 Installed Capacity of Western Region and capacity addition in 2015-16
Al..L INDIA INSTALLED CAPACITY ... on31.03.18 - 302088 MW - 302 GW
Flgu,,, 1:AlllnrJla Installed Capacity
Instaned Generation capacity of WR including shares
State sedOr 31586 MW, 29 %Private sector 56194 MW, 52 %Cen!Ja~f..m allocation) 19792 WMI, 19%TOTAL 101571 MVV
Oelelled statewise genoration capacity of the states inc:Judif1gshares as on 31.032016 is as !orows
Installed Generation Capacity ofWRincludIng shares
• Stale • Prtvate • C.ntral(fin" aUoy
Figure 2 ; Installed C.p~city of WRWRl'ClAl ..!..71AI REPORT 2(/(5·16
'40
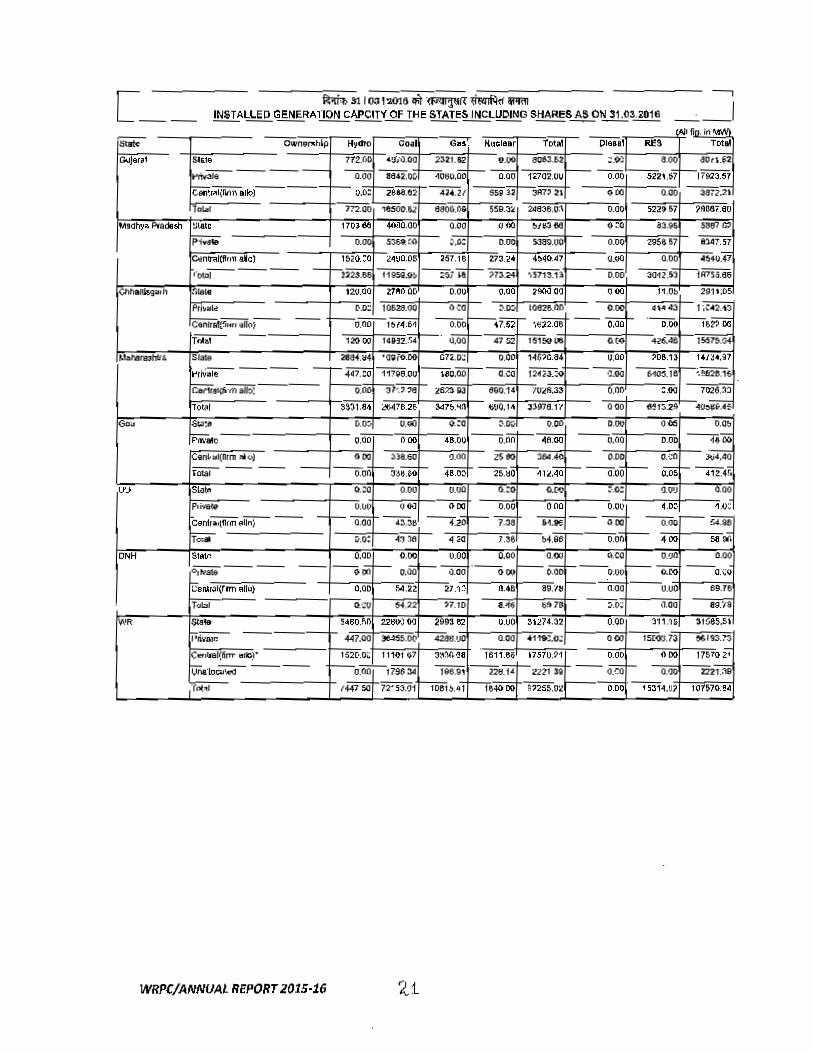
[__ _·_I----OWi;idp~aro ......"_.,.,. 00,,1 ~ Kucla.r fcxid Dfoe··'1 ""S T....~. ...,. rrue .:1J'1l.OIl ZlZI.1J2 •. 00 8063,62:
f-- :~h.:;aor\.i2...nv~----·_ --.:00 8842.05 '-:;0so.00I---.:ao 1502'(JU -,.923.51~.------- -0.0: 280&&,02 42 ....2'( 5si12 ~iffi2i 0'" (1,00 .. ;;:>;"".OJOlToyl 172.00 1eSOO.l2 8aol).0& 5S9..:1~ -"" "'" moS7 ,...,....,
r- ""'" 170)00 ""' e.00 0.00 ..'" ~Jf3 tIEl 0:0 ..... .5a67M
~ 0.00 53~',t:O :-.0: .... ......., """I 19S&S7 "i3a1
I tcenrat(1If111ale) l~(().:O 2'1UO.05 257.18 173.~" 4t\40,41 ··~I 0.0< •...,:ii,.....------ =-.. f19S41.,", ---;0; .. t-nu; ':s11'i1l f-- ---0:00 3OoU,·>1 'ima..
• .. ISsie •2uc 0 "'.".. 0.00 a.• .-0. ouo; 11.Gb ""-'"....... • .oc: ,........ 0":0 ~..D:i I082&.,M 0.00 ", .. 43 1~
~f~"n*II('I)-- -- r-o.no -,~ --0:00 ...7.$' ·.•rue --. 0Jiii r- 0... -,'.;>iii
IT"" ''''011 141J2,.';4 0.00 47 :i.2 IS1SUl$ ..,,' 46!6.48 1 !56?S..ti4
I.."'''·drsmtrs S.18l$ 2e8i,_''' 'Q~lo,OO g7i.O;; 0.1)0 1-4-57cur" o.DO_.
"/! ...'i7
~ -- -- -r-.w:;o 11]ii,DI) ~o:Oo'-· 0.\:0 i2m::~f--~ 6..o~,ii-".!!028."~al''''mSIIO~---- o.no 31',' '8 ~8J e90.1' ,_... 0.00 :.., iC26.Xl
t ... S$.':)1.811 4:'!:S·4':'B.2e- 547&,"1:\ ~JO.l" J3978,1', 000 ~1~.29 .....--:t<G= .st.3~a •. 00 •• 00 9.:G ~JIQ 0,00 0." 005 0."
~ .. e 0.00 0" 48.00 --O.M t----..:oo 0,(10 e.ee .....f9"".111 ~o) .oo ".... ..... 2$'"
",...., O.DC 0..;0 ~iOi&I-- --
_--0 .•• C---;,&:iO - IDO --..:-.ii t--:mM I- ---....r--ciiiO -~ ..
If' s.... 0.", 0.00 ..00 0.:0 CU.. :·.0: .... u o.DO
p.iY8bJ O.IJI) ."" 000 0.00 000 0." ,J)C '.0::~ee;;r--- -t-o:;;f-. ., ••• ---:[20 r--73i --.;:;;; --Oiiij -o:oo-~~ :i.o: ":oJ :If! '" 40 1.38 ... :eo j--.- ,...- .'" 50";.."..... """" 0.00 0.00 0.00 0.00 0.00 (}.CO O,tJO 0....
0jj;Si&' -- -- -- --.iii~ 0." t----.:ao '---0 .. r--o;oo 1-'--'...._~ --Q.'~~ ... oUo» 0.00 54.2l 21.1::' A.48 8V:ltI r---'o:aa --.... ...,.Tubl O.CV S.'" )7.10 .... ...,. ,j..D: 0..., ea'"
l- SIS" ~"60.!\1) 22~JM 2." 02 O.uo 31174.32 0.00 111.1 SI(leS..S1
r-~lI': 447." ~O< .... .'JO 0... .....1.:.0; 000 15(<<$.73 M.1g:}.~
jGoerllt6l!fil'lT Dlbr hrn.':0i: 111011$7 at'l:'lr.~8 16".86 '1570.'1 0." ... 11'51'O ~0=- ------ ~~'~ Iii.9t --neJ71- 2lli19 --tRQ -0]0 ---zm-:;;o...,.-
JTnt-'l1 1441~ ~1 ~':' • .Ql le40 DO m:5~02 .... '531<,..., 10'1'5Jd.!4
WRPC/ANNUAL REPORT 2015-16
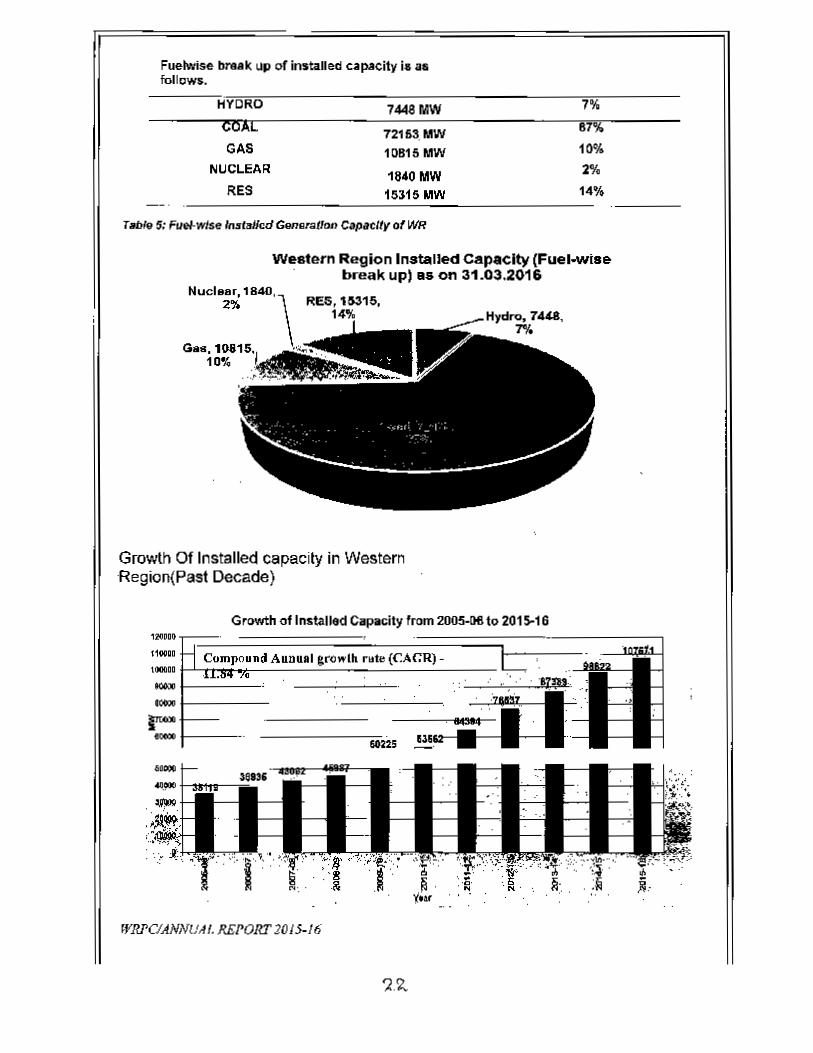
Fuelwise bra.k up of installed c~p.acity i" asfollows.
HYDRO 7448MWcoAl 72163.MWGAS 10815 MW
NUCLEAR 1840MWRES 15315 MW
7%
117%10%2%
14%
TIObIeS: Fuel-w/$" In~laJ/.d Gensr..!lon Capacity o( WR
Western Region l"sUllled Capacity (Fuel_i.e. break up) •• on 31.03.2016
Nuclear, 12%
Growth Of Installed capacily in WesternHegion{Past Decade)
Growth of Installed Capacity from 2005-tHI to 2015-1612Ollll&
f100liD L1000110 •"'"'"I-F......
60225
fJ'RPC/ANNUAI.REPOR:r20J5-16

Most of Ihe Ihermal power plants ale located In the Eastern part of the region and load centres are in tha
Western part. The region is predominantly thermal with hydra-thermal mix in the rati<J 01 7:77
peroenlage and reMwables of 14:77 percentage. Growth 01 Installed capacity Is mere prcnVnem in Is$!
5 years due to addition of many independent power plstlts.
Cllpacity addition 2015-16:6875 MWof capacity added iIllhp. yoar 2015-16. The details 01units commissioned are given as below:
SLN STATElISGSlIPP STAnONNAME CAPACtTY UNlT Date of Date 01CoDO. (MW) SynchroniZ3tion
I IPP Chhaltisgarh Maruli Clean Coal 300 1 17.04.2015 31.07.2015PowerUd
2 IPP.MP M B power· 600 1 19.0~.2015 '0052015
l_ IP<> Balco' _3_(l(J_ 1 22.02.2015 11.07.20154 . NT_J><:_ V;;>'I";;> 500 13 no;.nA ?n. ~ 30.10.20155 we Ico Sikl<a 250 4 171lQ.201S 28.12.20156 tPP. RK .. PPI • 360 1 ?R 0'.2015 27.11 ..20157 ,pp. aaicc 3011 3 14.10.2015 28.11.2015
BECL ~"navi"'1:1'"8 GETCO 250 1 25.11.2015 -
t 'I9 " Koradi· 660 6 25.02.2015 17.12.2015
~Gr.L,10 Koradi 6S0 9 21.01.2016 -11 IPP, 360 2 07.01.2016 1? rlU016
12 jpp, C1lhattisgarh (,I p~~.rer 600 1 23.02.2016 03.05.2016
13 IPP, GMR 685 2 re n, ?Q16 1 n4.201614 IPP, DBP~' 600 2 'U\ n,.,014 'Rn1.2C1615 11>1> Barco 3110 ~ 31.01.2016 1~ O!l.2015
16 htra Parli 250 8 3.03.2016
17 _I~MP M B power 600 2 17 11" 704.201616 IPP ~h &leo 3QO _2 17 M.?iI'" 'U\ D3.2018
19 RPL Sirmar21.03.2016 -IPP 270 2
20 ~..9J ... " SOO 9 21.03.2016 -
2i I""''' "JTPC . Mauda 500 III ?AM.201S -22 MatWa TPS 5~~75MV/
n? 01.2015 -Total
• Units w.:!re synchronize!;! in the year 2014-15 and dttcll3red commerCial operation In 201 Ge16.
rab!. 5; Generation C;>pacltya(/ded in 2Q15·16
fflJ(PC/ANNUAL llEPORT 2()15-16
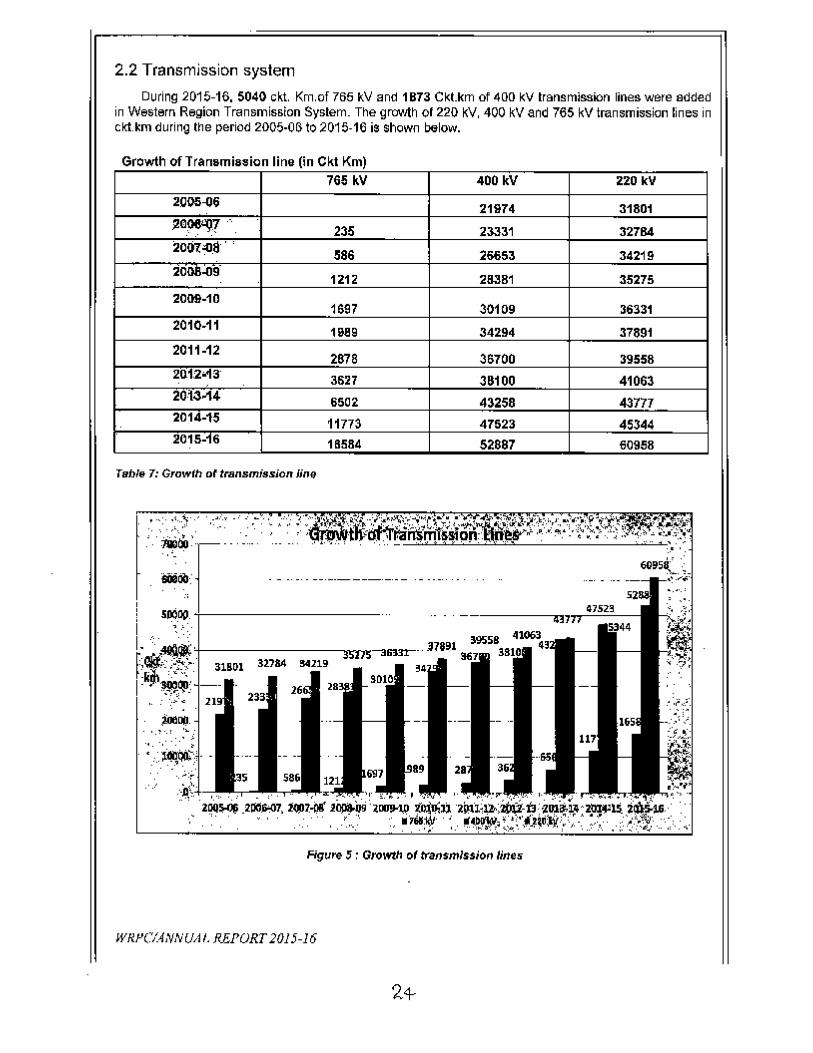
2.2 Transmission system
During 21)15-16. 5040 ckt, Km.of 765 kV and 1B73 Ckt.km of 400 kV transmission lines were addedin Western Region Transmission System. The growth of 220 kYo 400 kV and 765 kV transmission lines incxt.sm during the period 2005-06 102015-16 is shown below.
Growth of Transmission line (in Ckl Km)765 kV 400 kV 220 kV
2005-06 21974 31801;!G?6'W .'.
235 23331 32784200! .:c.a· ,
SS6 26653 342192068-09'
1Z12 28381 352752009-10
1697 30109 363312010·11 1989 34294 378912011·12 2878 36700 3955821)120<13' 3&27 38100 4106320\3014 S502 43258 437772014·15 11773 47523 45344201S-::i"6 18584 52887 60958
Table 7: Growth of transmission line
Figure 5 : Growth of transmission lines
WRPCfANNUAI.f/.EPORT2015-16
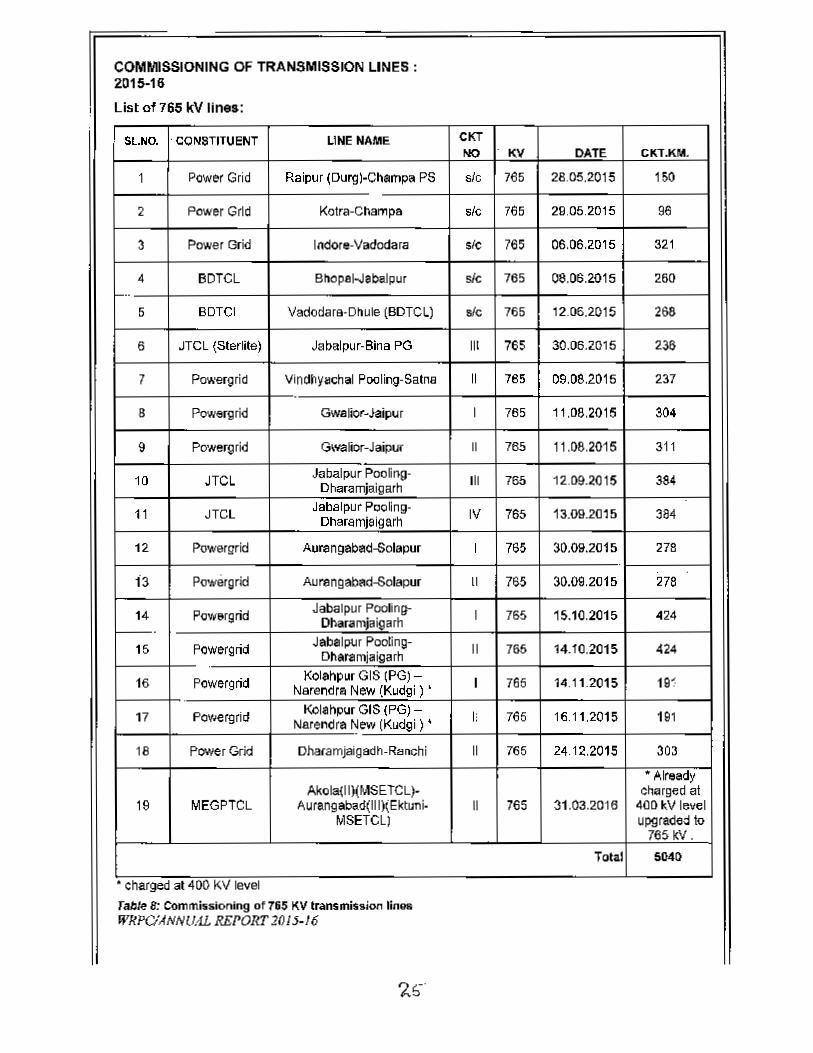
COMMISSIONING OF TRANSMISSION LINES:2015-16
List of 765 kV lines:
SLNO. . C{;)N8TITUENT LINE NAME CKTN{;) KV DATE CKT.KM.
1 Pow",r Grid Raipur (Durg)-Champa PS sic 765 28.05.2015 150
2 Power Grid Kotra-Champa sic 765 29.05.2015 se3 Power Grid IndOfe-Vadodara sic 765 06.06.2015 321
4 BOTCL Bhopahlabalpur sic 765 06.08.2015 260-
5 BOTCI Vadodars-Dhule (BDTel) sic 765 12.06.2015 268
6 JTCL (Sterlita) Jabalpur-Bina PO III 765 30.06.2015 236
7 Po .....ergrid Vind~yachal Pooling-Satne II 785 09.08.2015 237
8 Powerllrid OwaliOf-Jaill"r I 765 11.08.2015 3()4
9 PO'Nergrid Gwafior-Jaipur II 785 11.0S.2015 311
10 JTCl Jabalpur Pooling. III 765 12.09.2015 384Dharamjaigarh
11 JTCL Jabalpur Pooling· 11/ 765 1a.0Il.20t 5 384Dharamjaigarh
12 Powergrid Aurangabad-Solapur I 765 30.0Il.2015 278
13 pawe.grid Aurengaba~lapur II 765 30.09.2015 278
14 Powergrid Jabalpur Pooting- I 765 15.10.2015 424Ol>aramjaigarh
15 Powergrid Jabalpur Pooting- II 765 14.10.2015 424Dharamjaigarh
16 Powergrid Kolahpur GIS (PG)- I 765 14.11.2015 19<Narel'ldra New (Kudgl ) •
17 Powergrid Kolahpur GIS (PG) - I, 765 16.11.2015 191Narendra New (Kudgi ) •
18 Power Grid Dha{amjaigadh-R .. nchi II 765 24.12.2015 303
• AteadyAkola{II)(MSETCL)- charged al
19 MEGPTCL Aurangabad(III)( Ektuni- II 765 31.03.2016 400kV levelMSETCL) upgrade<:llo
765 KV.
Total 5040
• charged at 4()O KV levelfable 8: Commi'5sioning 0'7&5 KV transmission linnWkPCiANNll.1.L REPOIrI'20J5-J6
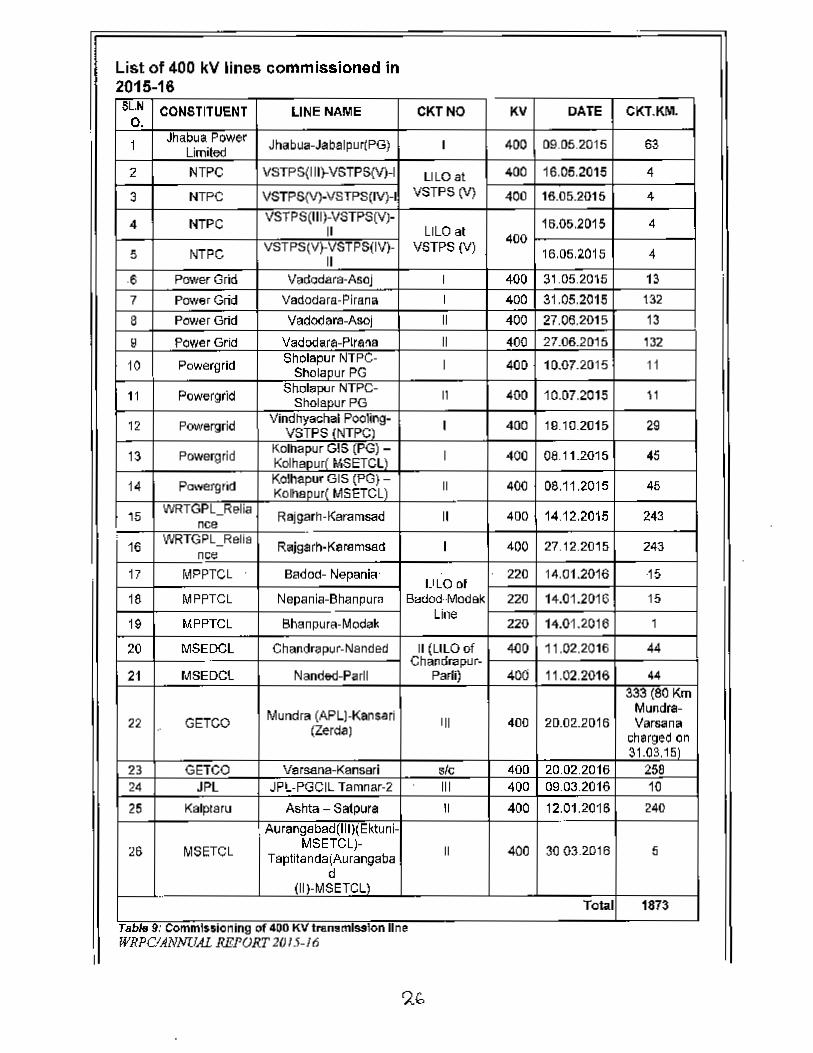
List of 400 kV lines commissioned in2015-16SLH CONSTITUENT UNENAME CKTNO KV DATE CKT.KM.
O.
1 Jhabua Power Jhabua-Jabalpur(PG) I 400 09.05.2015 63Limited2 HTPC VSTPS(III}-VSTP S(V)-I lILO at 400 16.05.2015 4
3 NTPe VSTPS(V)-VSTPS(IV)-I VSTPS (V) 400 16.05.2015 4
4 NTPe VSTPS(III)-VSTPS(VJ- 16.05.2015 411 L1LO at
VSTPS(V)·VSTPS(IV)- VSTPS (V) 400!I I~TPC 11 16.05.2015 4
·6 Power Grid Vadodara·AsoJ I 400 31.05.2015 137 Power Grid vaoooara-Plrana I 400 31.05.2015 132
8 POYlerGrid Vadodara-Asoj 11 400 27.06.2015 13
9 Pat/e,Grid Vadodara-P1t8!\S 11 400 27.06.2015 132
10 Pawergrid Sholapu' NTPC- I 400 10.07.2015 11Sholapu, PG
11 Powergrid Sholapur NTPC- II 400 10.07.2015 \1ShoIapurPG
12 Powergrid VindhyachalPooling- I 400 19.10.2015 29VSTPS (NTPC)
13 Powerg,id Kolhapur GIS (PG) - I 400 08.11.2015 45KolhaDur( MSETCLl
14 POlYe.grid KOlhapur GIS (PO) - II 400 08.11.2015 45Kolhsour{ MSETCLl
15 WRTOPL_Relia Rajgarh-Karamsad 11 400 14.12.2015 243nee0 WRTGPL_Relia16 Rajgarh-Keremssd I 400 27.12.2015 243nee
17 MPPTCL Badod- Nepani~' 220 14.01.2016 ·15LlLO of
18 MPPTCL Nepania-Bhanpum S"dod·Modak 220 14.01.2016 15
19 IoIPPTCl Bhanpu,a-Modak Lile14.01.2.01622{) I
20 MSEDCL Chandrapur-Nanded II(lIl0 of 400 11.02.2016 «Chandrapur-
21 MSEDCl Nanded-Par11 Parii) 4O(j 11.02.2016 «333(80Km
Mundra (APL)·Kansari Mundra-22
"GETCO (Zerda) 111 400 20.02.2016 Varsana
Charged5~n31.03.15
23 GETCO Ve,sana-KansB,1 sic 400 20.02.2016 25824 JPL JPL-PGCIL Tamnar-2 III 400 09.03.2016 10
25 Kafplsru Ashta _ Salpura 11 400 12.01.2016 240. Aursn9sbad(III)(Ektuni-
26 MSETCl MSETCL)- II 400 3003.2.016 5Tap1i1anda(Aurangabad
(II}-MSETCL)Toul 1873
Tabl. 9: CommIssionin of 400 KV Iran. missIon line9WRPClANNUAl. REPORT 20/5-/6
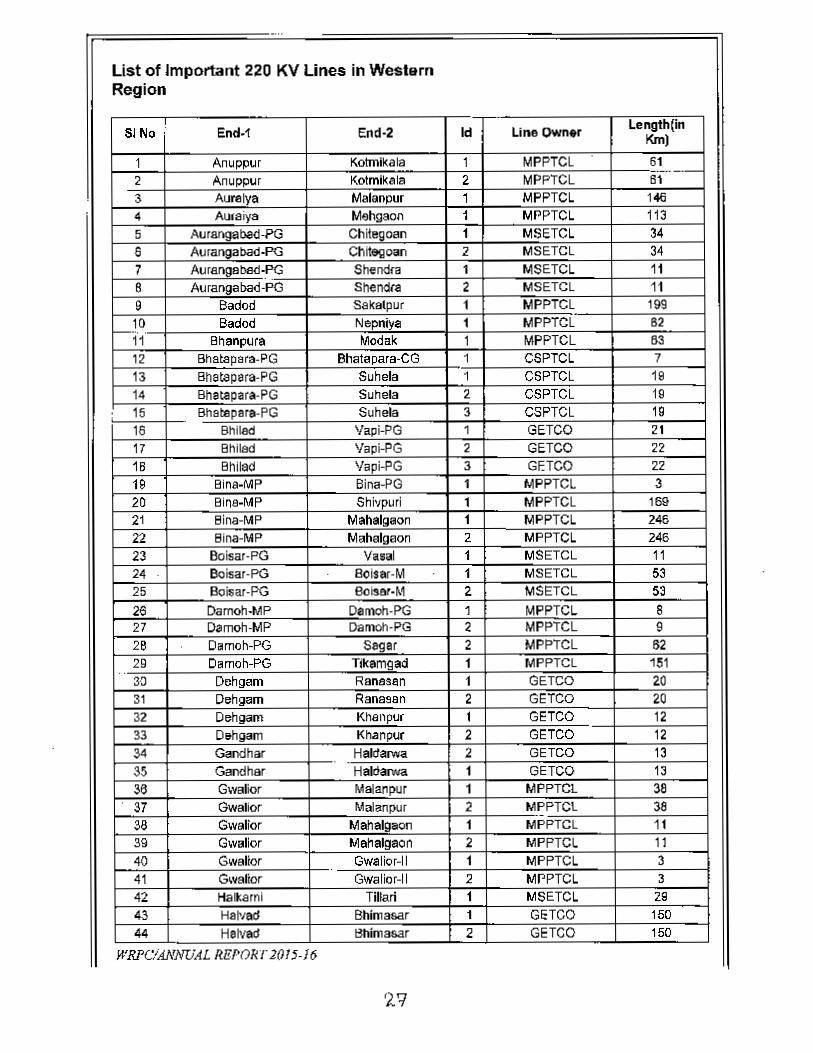
List of Important 220 KV Lines in WesternRegion
! End-1 End·2 Id Line Own.r Length,i"SINo' KIn)
1 Anuppur Kotmikala 1 MPPTCL 612 Anuppur 2 MPPTCL
_._ .._.-Kotmikala 61
3 Aurelya Malanpur 1 MPPTCL 10464 Aureiya Mehgaol1 1 MPPTCL 1135 Auranga~d·PG Chiiegoan 1 MSETCL 34S Auranga~·PG Chitegoan 2 MSETCL 347 Au rlIDlJllbed-!"G Shendra 1 MSETCL 118 AuFangabad-PG Shendrs 2 MSETCL 119 Baaod Sakalpur 1 MPPTCL 19910 Baaod Nepniya 1 MPPTCL 62
-11 Bhanpura Modak 1 MPPTCL 8312 Bhatapera·PG Bhatapara·CG 1 CSPTCL 713 Bhatapara·PG Suhela 1 CSPTCL 1914 Bhatapara.PG Suhela 2 CSPTCL 19
: 15 Bhaooparll·PG Suhela 3 CSPTCL 1916 Bhilad Vapi-PG 1 GETCO 2117 Bhilad Vapi-PG 2 GETCO 2218 Bhil8d Vapi-PG 3 GtTCO 2219 Bina-MP Bina·PG 1 MPPTCL 320 Bine-MP Shivpurl 1 MPPTCL 16921 Bina-MP Mahalgaon 1 MPPTCL 24622 Bina-MP Mahalgaon 2 MPPTCL 24623 Boisar·PG Vasal 1 MSETCL 1124 Boiser·PQ 8oisar·M 1 MSETCL 5325 Boil;ar·PG Bois91·M 2 MSETCL 532ii Darnoh·MP Damoh·PG 1 MPPTCL 827 Darnoh·MP Damoh·PG 2 MPPTCL 928 Darnoh-PG Sagar 2 MPPTCL 6229 Damoh-PG Tikamgad 1 MPPTCL 151..30 Dchgem Renesan 1 GETCO 2031 Dehgam Ransgen 2 GETCO 2032 Dehgam Khsnpur 1 GETCO 1233 D"hgam Khanpur 2 GETCO 1234 Gandhar Haldanva 2 GETCO 1335 Gandhar HaI6arwa 1 GETCO 1336 G1.vaIia< Malanpur 1 MPPTCL 3837 Gwalior Mala.npur 2 MPPTCl 3836 Gwalior Mahalgaon 1 MPPTCL 1139 Gwallor Mahalgaon 2 MPPTCL 1140 Gwalior Gwalior·11 1 MPPTCL 341 G\Yslior Gwalior·11 2 MPPTCL 342 Halkarnl Tillari 1 MSETCL 2943 Ha~'ad Bhimasar 1 GETCO 15044 Helvad 8himasar 2 GETCO 150
WRPClANNUAL REPORT 2015·16
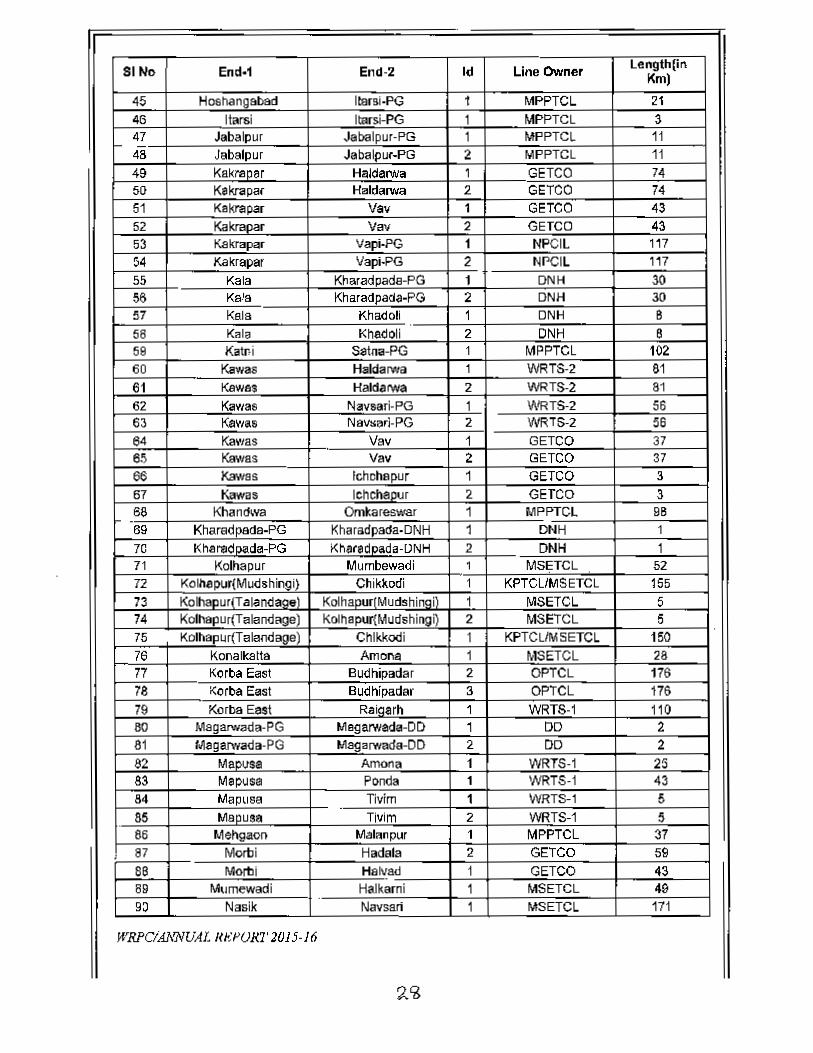
SiNo End-1 End-2 Id Line Owner length[i"Km)
45 Hoshangabad ltarsi-PG 1 MPPTCL 2146 Itarsi ltarsi-PG 1 MPPTCL 3
_ 47 Jabalpur Jabalpur-PG 1 MPPTCL 1148 Jabalpur Jabalpur-PG 2 MPPTCL 1149 KaI<l'apar HaldalWa 1 GETCO 7450 Kakrapa< HaIdaIwa 2 GETCO 7451 Kakrapar Vav 1 GETCO 4352 Kakrapar Vav 2 GETCO 4353 K8krapar Vapi-PG 1 NPCll 11754 Kakrapar Vapi-PG 2 NPCIL 117
55 Kala Kharadpada-PG 1 ONH 3056 K&'a Kharadpada-PG 2 DNH 3057 Kala Khadofi 1 DNH 858 Kala Khadoli 2 DNH 859 Katni Satna-PG 1 MPPTCL 10260 Kawas Haldarwa 1 WRTS-2 6161 K8W6S Haldarwa 2 WRTS-2 8162 Kawas Navsari-PG 1 WRT5-2 5663 Kawas Navsari-PG 2 WRl5-2 5664 Kawas Vav 1 GETCO 3765 Kawas Vav 2 GETCO 37
66 Kawas Ichchapur 1 GETCO 367 Kawas lchchaour 2 GETCO 3
f-68 Khandwa Omkareswar 1 MPPTCL 9869 Kharadpacla-PG Kharadpada-DNH 1 ONH 17e Kharadpada-PG Khsradpada-UNH 2 DNH 171 Kolhapur Mumbewadi , MSETCl 5272 KoVlapur(Mudshilgi} Chikllodi 1 KPTCUMSETCL 15573 Kolhapur(T alandage) Kolhapur(Mudshingil 1 MSETCL 574 Kolhapur(T alandage) Kolhapur{Mudshi"gi) 2 MSETCL 575 KOlhapur(Talandage) Chlkkodi 1 KPTCLIMSETCL 15076 Konalkalta Amona 1 MSETCL 2877 Korba East Bu<lhipadar 2 OPTCL 17678 Korba East BUdhipadar 3 OPTCL 17679 Korba East Raigarh 1 WRT5-1 11050 Magarwada-PG Magarwada-DD 1 DD 281 Magarwada-PG Magarwada-DD 2 DO 282 Mapvsa Amona 1 WRTS-1 2583 Mapusa Ponds 1 WRTS-1 4384 Mapusa Tivim 1 WRT5-1 555 Mapusa Trvim 2 WRTS-l 566 MeIIgaoo Malanpur 1 MPPTCL 37
, 87 Morbi Hadala 2 GETCO 5988 Morbi Halvad 1 GETCO 4389 Mumewadi Halkarni 1 MSETCL 499J Nasik Navsari 1 MSETCL 171
WRPClANNUAL ur;PU}I1' 2QJS-J6
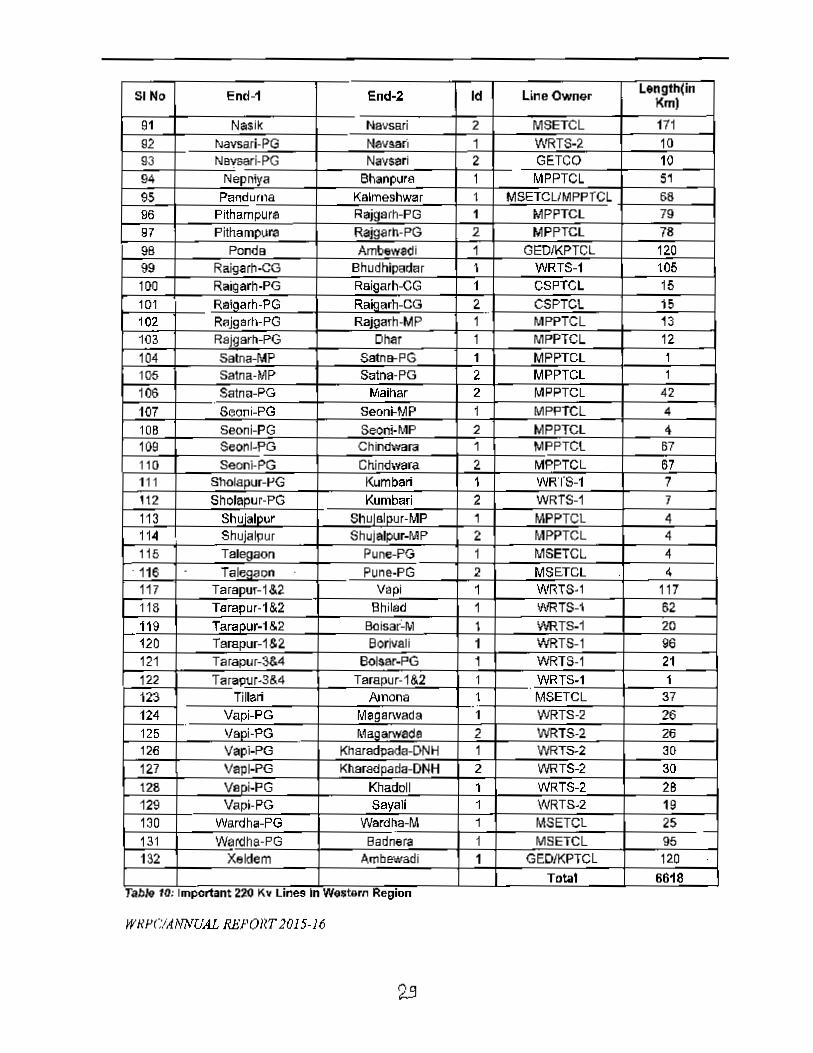
SI No End-1 cnd-.2 Id Line Owner Lenglh(inKm)
91 Nasik Navsari 2 MSETCL 17192 Navsari-PG Navsari 1 'II'RT6-2 1093 NBvsar;'PG Navsari 2 GETCO 1094 Nepn;ya Bhanpurs 1 MPPTCL 5195 Panduma Kalmeshwar 1 MSETCLIMPPTCL 6696 Pithampura Rajgarh-PG 1 MPPTCL 7997 Pithampura Rajgarh-PG 2 MPPTCL 7896 Ponda Ambew3di 1 GEDlKPTCL 12099 Raigarh-CG Bhudhipadar 1 WRT6-1 1051()O Raigarh-PG Raigarh-CG 1 CSPTCL 15101 Ra;Qarh-PG Raigarh-CG 2. CSPTCL 15
--102 Rajgsrll- PG Rajga,h-MP 1 MPPTCL 13103 Rsjgarto-PG Dhar 1 MPPTCL 12104 Satna-MP Satns-PG 1 MPPTCl 1105 Satna-MP S"lna-PG 2 MPPTCL 1106 SalnD-PG ""aihar 2 MPPTCL 42107 Seoni-PG Seoni-MP 1 MPPTCL 4lOB Seoni-PG Seoni-MP 2 MPPTCL 4109 SeOllI-PG Chindwara 1 MPPTCl 67110 Seonl-PG Chind\'lara 2. Mf'PTCl 67111 Sholapur-I'G Kumbari 1 WRT6-1 7112 Sholapur-PG Kumba,i 2 WRTS-l 7113 Shuialpur Shulslpur-MP 1 MPPTCL 411-4 Shujalpur Shujalpur-MP 2. MPPTCL 4115 T Pune-PO 1 MSETCL 4
- 116 Taiell80n Pune-PG 2 MSETCL 4117 Tar~u'-1&2 Vapi 1 wrns-I 117118 Tsrapur-l&2 Bhilad 1 WRTS-1 62119 Tarapur-t &2 Boisar~M 1 WRTS-l 20120 Tarapur-1S2. 80rivaJi 1 WRTS-l ss121 TaralXI(-3&4 BoIsar-PG 1 WRT6-1 21122 Tarapur-3&4 Tarapur-1&2 1 WRT6-1 1123 Tillari Amana 1 MSETCL 37--124 Vapl·PG Magarwada 1 WRTS-2 26125 Ifapi-PG Magarwade 2 WRTS-2. 26126 Vapi-PG Kharadpada·DNH 1 WRTS-2 30127 Vapl-PG Kharadpada-DNH 2 WRT6-2 JO128 Vepi.PG Khadoll , WRT6-Z 28129 Vapi-PG Sayal; 1 WRTS-2 19130 Wardha-PG Wardha-M 1 MSETCL 25 -131 Wardha-PG Badnera 1 MSETCL 95132 Xeldem Ambewadi 1 GEOIKPTCL 120
Totl' 6618Tab,. 10_ Important 220 Kv LInes In Western RegIon
WIII'CiANNUAL ssronr 2015-16
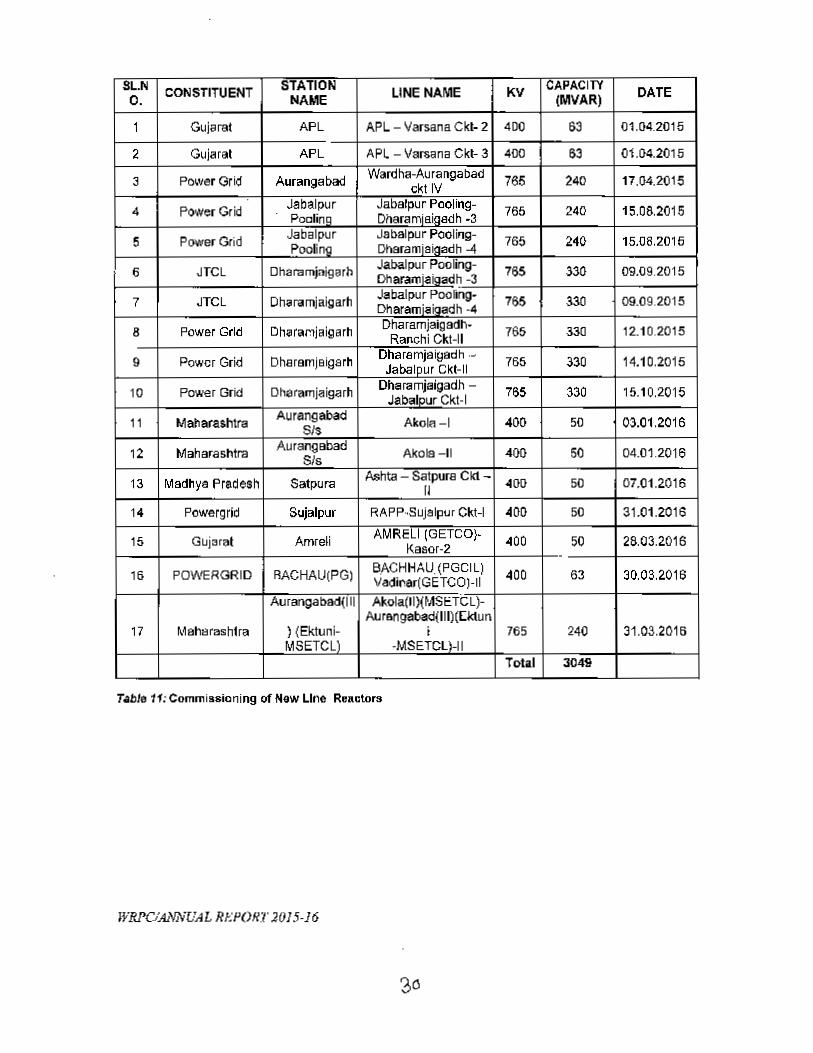
SLN CONSTITUENT STATION LINE NAME KV CAPACITY DATEo. NAME (MVAR)
1 Gujarat APL APL - Varsana Ckl- 2 400 63 01.04.2015
2 Gujaral APL APL - varsana Ckl- 3 400 63 01.04.2015
3 Power Grid Aurangabad Wardha-Aurangabad 765 240 17.04.2015ckt IV
4 Power Grid Jabalpur Jabalpur Pooling- 765 240 15.06.2015PoolinQ Dharamlaigadh -3
5 Power Grid Jabalpur Jabalpu' Poolng- 765 240 15.08.2015PoofillQ OtIaramlalaadh -4
6 JTCL Dharamjaigarh JabaJPl" Pooling- 765 330 09.09.2015Dharamlakladh -3
1 JTCL Dharamjaigarh Jabalpur Pooling- 765 330 09.09.2015Dharamlalaadh ·4
8 Power Grid Dharamjaigarh Dhara~lalg8dh- 765 330 12.10.2015Ranchl Ckt-II
9 Power Grid DharamjBigarh Dharemjslg8dh .• 765 330 14.10.2015JabalDur Ckt-II
10 Power Grid Dharamjaigarh Dharamjaigadh - 765 330 15.10.2015Jabalpur Ckt-l
II Maharashlta Aurangabad Akola-I 400 50 03.01.2016SIs
12 Maharashlta Aurangabad Akola -ti 40() 50 04.01.2016Sis
13 Madhya Pradesh setpura Ashta - Satpura CkI - 400 50 07.01.2016(I
14 Powergrid Sujalpur RAPP"SuJalpur Ckt-I 400 50 31.01.2016
15 GUjar,,! Amreli AMRELI (GETCO)- 400 50 28.03.2016Kasor·2 -15 POVVERGRIO RACHAU(PG) B.ACHHAU.(PGCIL) 400 63 30.03.2016Vadinar(GETCO)·iI
Aurangabad(1II AAoIa(IIXMSE TeL)-Aurangabad(III)(Eklun
17 Maharashtra 1 (Ektuni- i 765 240 31.03.2015MSETCLl ·MSETCLI-11
Total 3049
T.ble 11: Commissioning r1f Hew LIne Reactors
JIIRPC.JANlY"UAL RI-;POR1' 20J 5·]6
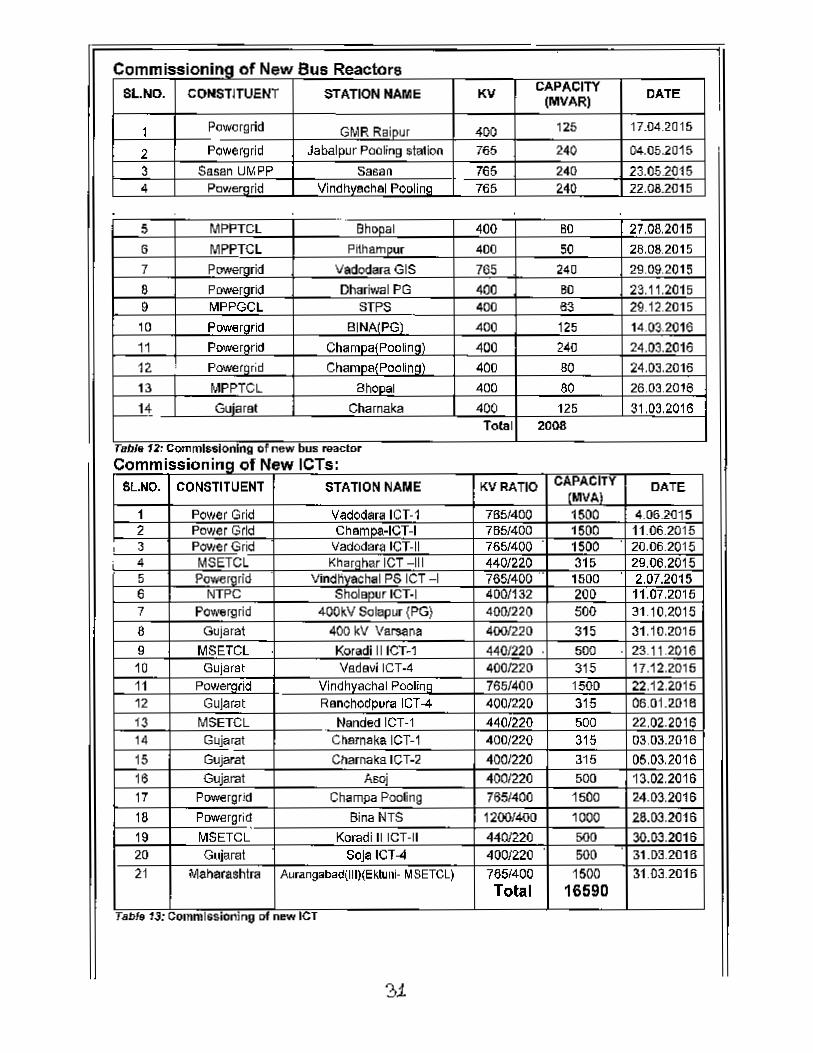
c fN B R toornmrsstcmnq 0 ew US eac raSLNO. CONSTITUENT STATION NAME KV CAPACITY DAle(MVAR)
1 Poworgrid GMR Raipur 400 125 17.04.2015
2 Powergrld Jabalpur Pooling slat Ion 765 240 04.05.2015
3 Sasan UIVoPP Sasan 765 240 23.0520154 POYlergrld Vindhyachal Pooling 765 240 22.08.2015
...Bhopal5 MPPTCL 400 8{) 27.08.2015
6 MPPTCL Pithampur 400 50 26.08.20157 P VatllXlara GIS 7135 240 29.09.2015
6 p Dhariwal PG 400 80 23.11.20159 MPPGCL STPS 400 63 29.12.201510 Powerarld BINA(PG) 400 125 14.03.2016
11 PowerJ!rld Champa{Poolinal 400 240 24.03.2016
12 Powergr;d Champa{Pooling) 400 80 24.03.201613 MPPTCL Bhopal 400 80 26.03.2016
14 Gujarst Charnaka 400 125 31.D3.2016Total 2008
r_ 12: e<>m_oninlI of new bus ....actorCo . _. fN leTmmtsssenmq 0 ew s:
SloNO. CONSTITUENT STATION NAME KVRATIO CApAcITY DATE(MVAI
1 Power Grid Vadodara ICT-1 765/400 1500 4.06.20152 Power Grid Champa-ICT-I 765/400 1500 11.06.2015
, 3 POYler Grid Vadodara ICT-II 7651400 1500 20.06.20154 MSETCL KharQhar ICT -III 440/220 315 29.06.20155 Powergrid Vindlivachal PS ICT -I 7651400 .. 1500 2.07.20156 NTPC ShoIBPur ICT-I 4001132 200 11.07.20157 Po...ergrid 400kV Solapur (PG) 4001220 500 31.10.20158 Gujersl 400 kV Varsa~a 400/220 315 31.10.20159 MSETCL Koradi IIICT·' 440/220 500 23.11.201610 GujerBt Vadavi ICT-4 4001220 315 17.12.201511 POYlerQ(id Vindhyachal PoolinR 765/400 1500 22.12.201512 Gularllt Rsnchodpura leT-4 4001220 315 06.01.201613 MSETCL Nanded ICT-1 440/220 500 22.02.201614 Gujara1 Charnaka ICT-1 4001220 315 03.032l11615 Gujaral CIlamaks1CT-2 4001220 315 05.03.201616 Gujaral Asoj 4001220 500 13.02.201617 Powergrid Champa Pooling 765/400 1500 24.03.2016
18 Powergri~ Bina NTS 1200/400 1000 28.03.201619 MSETCL Koradi IIICT-1I 4401220 SOO 3O.0J.201620 Gujaral Soja ICT-4 400/220 500 31.03.201621 Maharashlra Aurangabad(III)(Ektulli- MSETCL) 765/400 1500 31.03.2016
Total 16590Tabfe13. Commlss,onJng of new leT
31
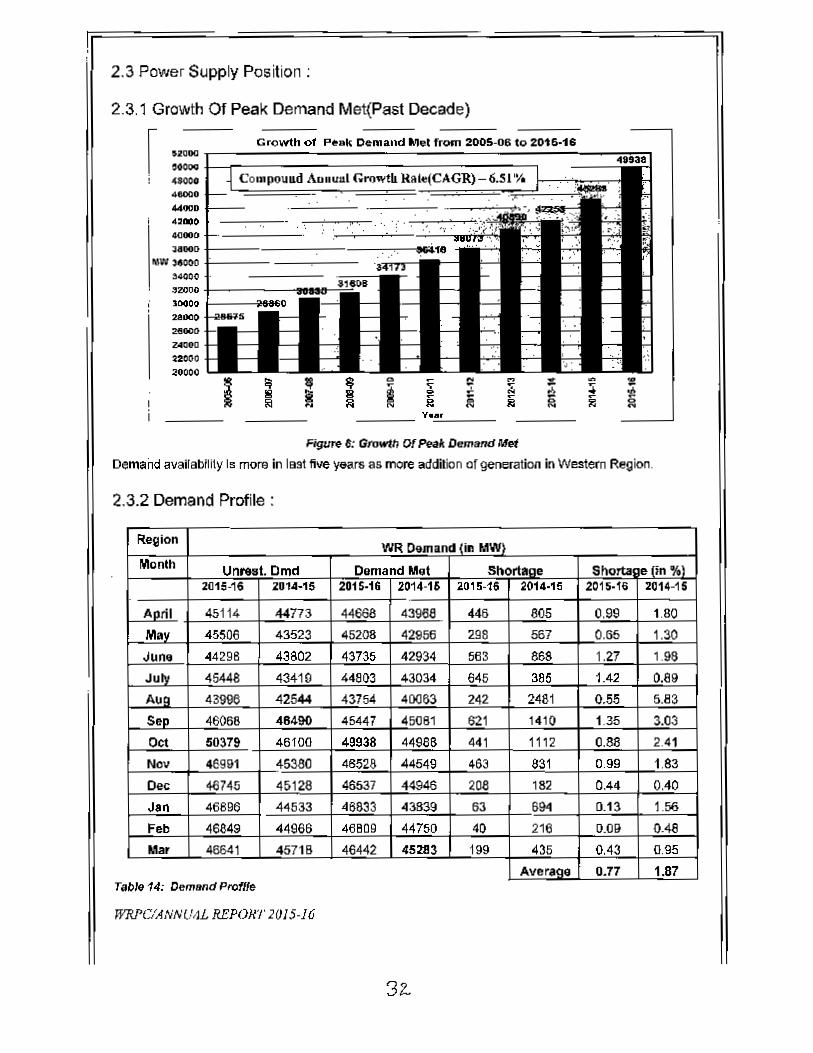
2.3 Power Supply Position:
2.3.1 Growth Of Peak Demand Met(Past Decade)
r ......!500DO
4$0004000 •....,..,.....,...l400D
MW 3$00034000....,.,.......-.2<1000
ZAOOD22000
~oooo
i
Crow1h 01 Pe-ak De-mand llJet from 2005-06 to 2016·18
Compoulld AlIlluul GrQwth kal,,(CAGR) - 6.SI 'Yo
I;;
=$ .. " C! " - -
~I!I III i ~ J. ;;;~
~t<l N !iI li ~ 2 ii
V •• r
Figure 8: Growth Of Peak Demand Met
OemaOd avaiIallimy I.more in last five years as more addition 01 gener.rtion in Western Region.
2.3.2 Demand Profile:
Region
Month
T"b~ 14: DemlKld ProffJe
WRl'ClANNU,IL REPOJ?T 1015·16
32.
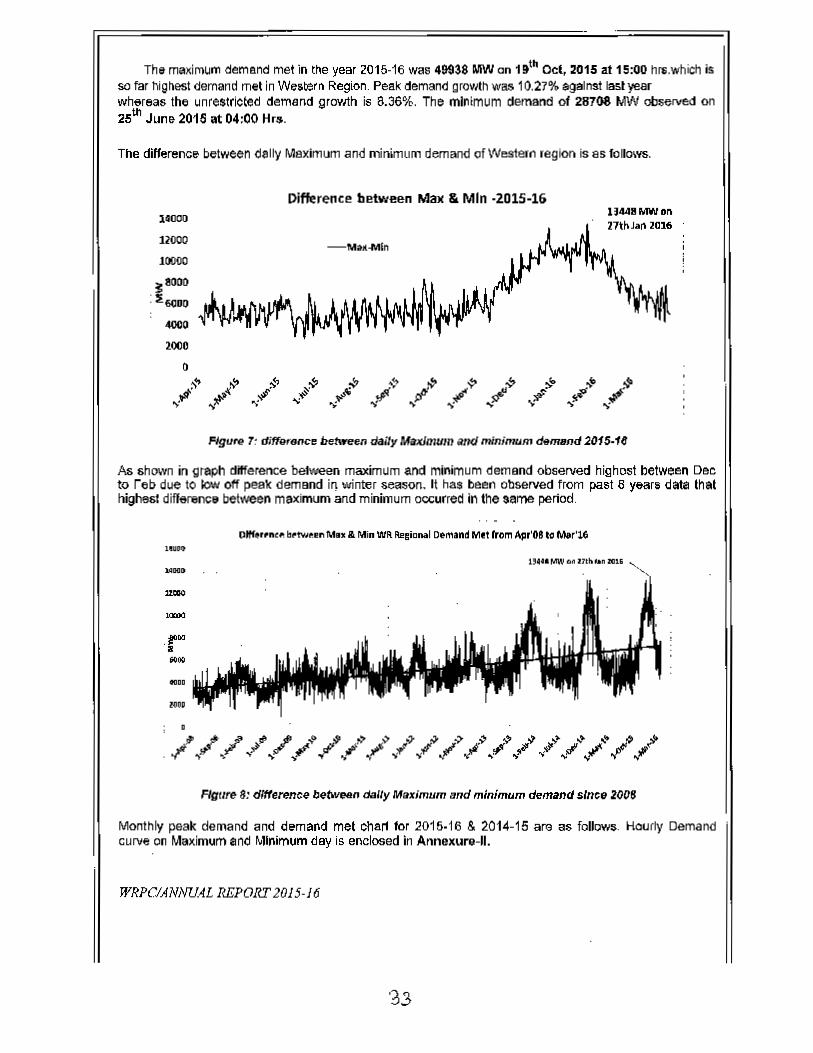
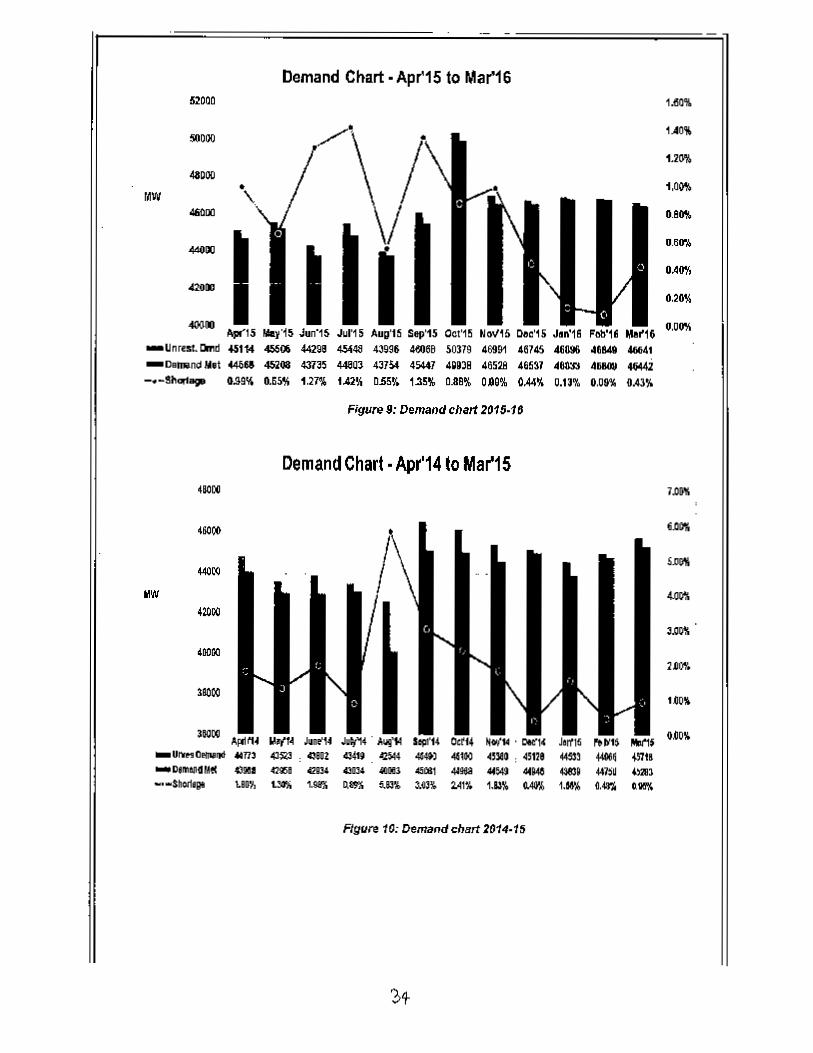
The maximum demand met in tile year 2015·16 was 49938 MW an 1tt- Ocl, 2015 at 15:00 hrs.which isso I'allligllesl demand met in We&tern Region. Peak demand growth was 10.27% agalnat la!'J }'earwher_ the unrestric{ed demand growth is 8.36%. The minimum demand of 28708 MIN ob$esved on25th June 20-15at~:OO Hrs.
The difference between dally Maximum and minimum demand ofWeslern region is 8S tallows.
Ditrerence between Maw &. Min ·2015-1611441 MW on271~J.nIOU11000
IlOaC
10000
;1:8000
#.: ~fiODO
«lOll
;tOOO
0
-Mill.-Mln
FIgure 7: difference between dally Mal(/mum and minimum d<om.nd 20,15-14
As shown in graph difference belween maximum and minimum demand observed highest between Decto reb due to low off peal<demand it) winter season. It has been observed from past S years data thathighest difference between maximum and minimum occurred in the same period.
Ottf~rr .. cf'\ b,.t'Wp.enMI. & Min WA.ReCional Dtmand MIt from Apr'OS", 1\1,.,'161'"11'..........
·r....-...,
Flgrlre 8: difference between dally Maximum 'Illd minimtJm d<omand slnc" 2008
Monthly peak demand and d..rnand mel chan tor 2015·16 & 2014-15 are as follows. Hourly Demandcurve OIl MaxIDum end Minimum day is enclosed in Annexure-II.
WRPc/ANNU,lJ.REPORT20J5·J6
'33
Demand Chart· Apr'15 to Mar'i652000
seDOO
411)00
lilt --~IIO
«103111
_Unrest.DII'Id f.5114 ~GIi-OalnlndM,t 446. ~08-.-Short., U9\1 o.~SII
1AO'll
1,21J'A
''-
,.-Jun'15 Jul'15 Aug'15 Sep'15 Oel~5 NcWI5 o.~s J.a'16 FOI>'1' lii0i'1.44298 45448 43996 4e068 50319 46991 46745 46396 41a.a .....43135 44103 43154 45441 49g38 46528 46531 463» 4110U 4644Z1.21'4 1A2% 0551'. 1.35% O.8B% OD9% 0.44\\ 0.11% 0.09'% 0.43\\
Figure 9: Demand chan 2015·16
Demand Chart •Apr'14 to Mar'15
IlOIlO
100110
-- ..... _ .. 17) 41R1, C)JIl 4S4I' _ _l -11m 8lI3, em 44SI3 417ft__ 0« 0. <nil _ -.. _ 451>1141. _ _ _ '-"Ill
--$ior1t;o u.,,!.lOII UIlI Q89iI Ul'4 lOR 2A!1. ~ e.e Ufl 1.01 .'"
Figure 10: Demand chBn 2014-15
Peak shortage in WR-
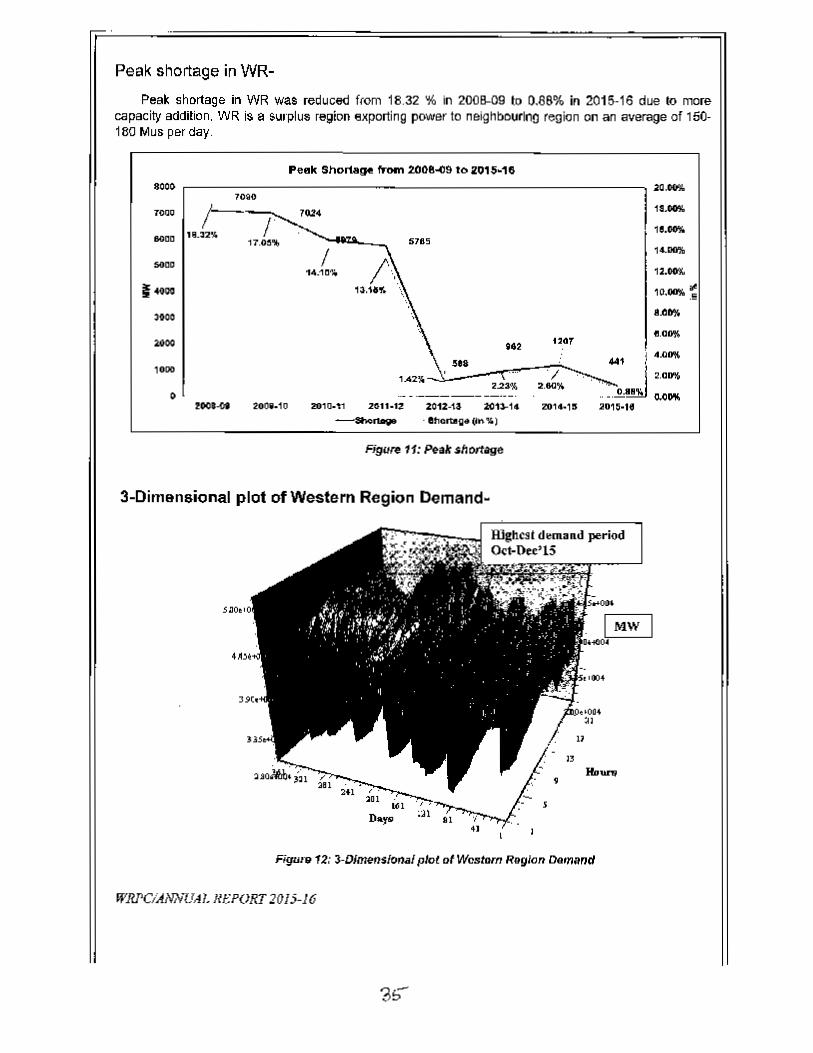
Peak shortage in WR was reduced (rom 18.32 % in 2008-09 to 0,88% in 2015-16 due to morecapacity addition. WR is a surplus region exporting power to neighbourlno region on an average 01 150-180 Mus per day.
~--------------------------------------------------~ ~,~
"_~11.105
,......11,~
1Ct~~ .!!
"2
..._._~_~_$:._a~~.2"'(,_."":!'~. --2.":j,1".....,. ~_U:A.J ::201c..15 2015·1.
Peek Shorta!J4! from 2008...,9 to 2015-168000
'OlIOT_ ;--OOQI) lL12",
....,~....
.....
.....,-
0~oo•..ot 200'·10
5115
...""
/14.1O'ft
.201
2010·" 2Gl1.1~ Z01Z-1a 2:01~14
-Shor1l9t .Ihon.g. (In%)
Figure 11: Peak shortage
3-Dimensional plot of Western Region Demand-
Hlghcst demand periodOct-Dec'15
,s
"Figure 12: J-Dlmens/onal plo! of Wcstom R9!}ion /)Qma"d
WRl'CIANNlJAI. !I/:.'PORT10/5-16
Seasonal Variation in Western Region Demand-
WR season.r Demand (dally max.) Plot 2013-14 to 2015-16~201)O
50000
<0000,,,it,,,,,...,.,..C200I.....~.0Il.3._S'GOO).2000
"""'"
l= II.-e
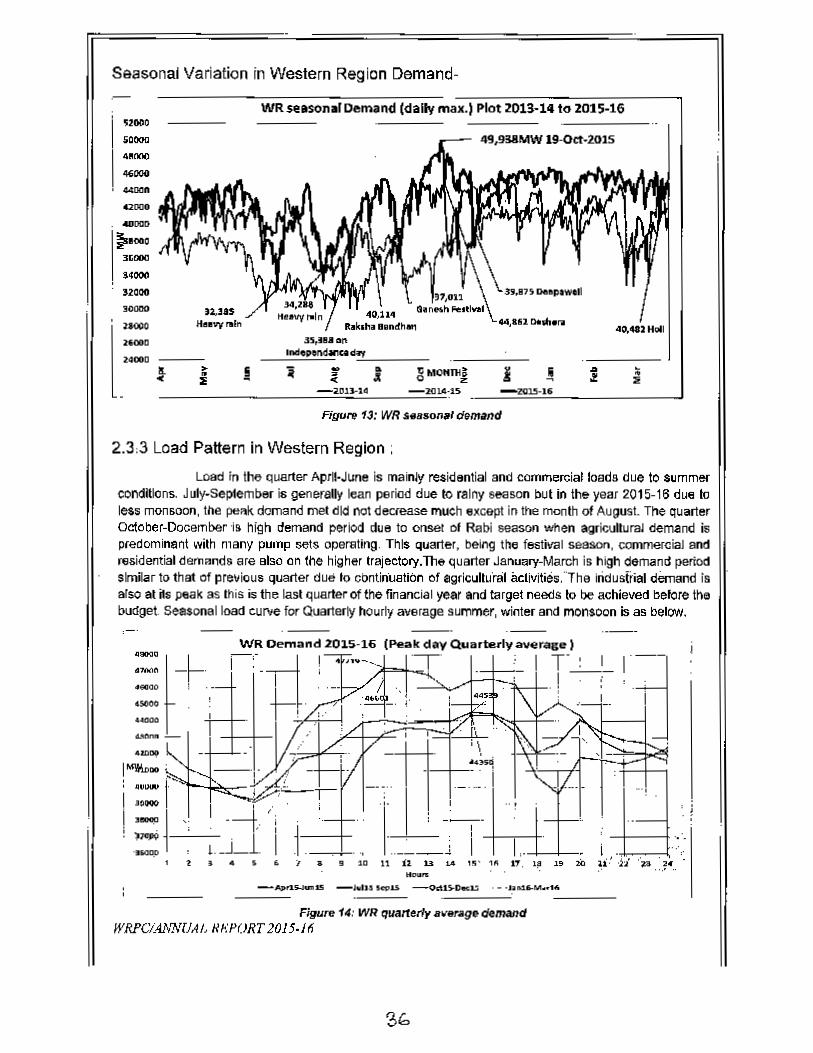
49,93.11MW 19-0ct-201S
.15,"'.1311\Incfeptl\dln" d.~..!.._ _
g 1201)..24
8,.'OHfHilOLA:tS
..! •:;
-Z(US-IS
Figu~ 1J: WR $8BJJon.' deMand
2.3,3 Load Pattern in Western Region:
Lost! in the quarter Aprll·June is mainly residential and commercial loads due to summerrondlt1ons. July-Seplember is generally lean period due to rainy season but in the year 2015-16 due toless monsoon, tile peak demand met did not decrease much except in the month Qf August. The quarterOctober-December 'is high demand period due to onset of Rebi season when agricultural demand ispredominant with many pump sets operating. This quarter, being the festival season, commE!fcial andresKlentiai der""nds are also on the higher trajectory.The quarter January-March is high demand periOdsrrolar to thai of pre'<lious quaI1e< due 10 cOntfluatiOn of agricultural ilctiviti6s.lhe i'idusii"ial dEmand ISalso at iIs peak as this is the last quarter of the financial year and target needs to be achieved before thebudget. Seasonal load curve for Quarterly hourly average summer, winter and monsoon is as below.:-.
4W",
IM\I\ooo ;
I ::fI-I ,.! ~1-':"'---- -1---1 ...
1,.-4--1-- ,11'. 1~ .1' 20 ~i:·j'l ·'zo .. 'J"~
.. J, • . ,. 11 11 11 t.6 Hi' 1"s ••Hours
Figure 14: WR quarterly aver~gedemandWRFCiANNUAL II~:PORT2015·16
I. ~
2.3.4 Annual Load Duration Curve
LOAD DURATION CURVE 2015-16 Vs 2014-15
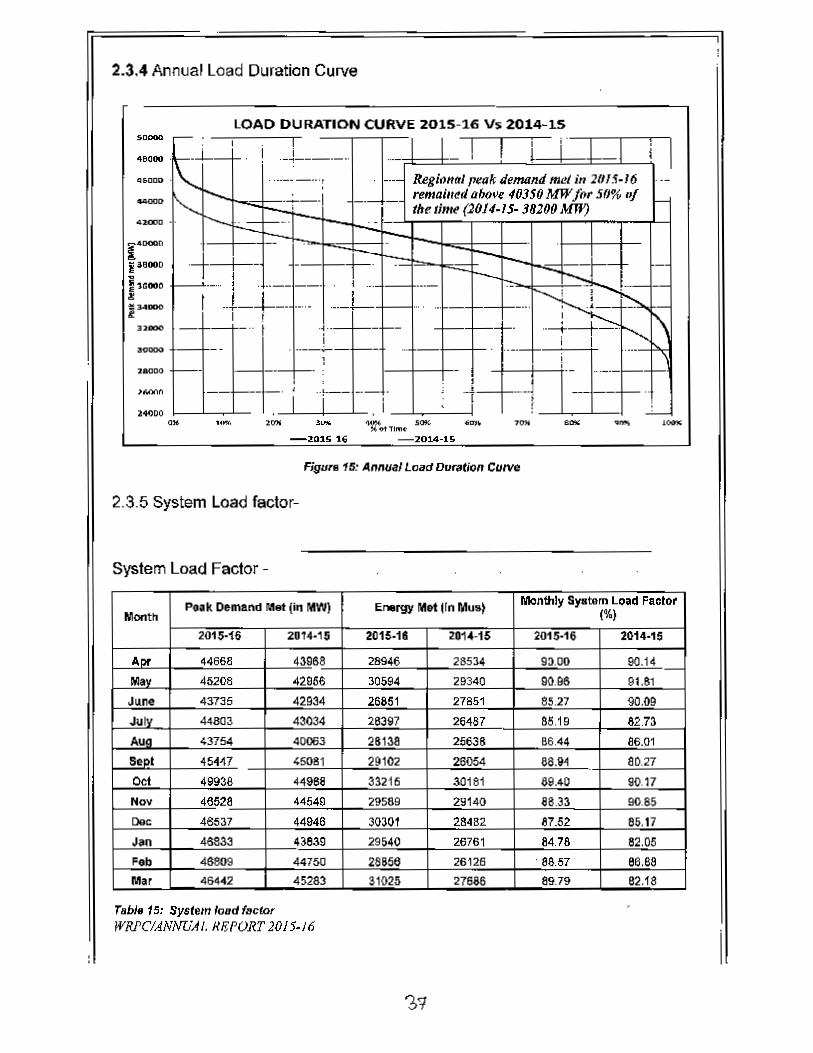
:::.~i_~. _J--_._.. -?·I~=I:::I__'!"'_':"_......1l=:Ii;='~~~~~~=~T"'i'I...... \ .._._., ..- &giollaJ (N:ilk lifemtllldmd in 2015-1(1
................ . -1--+-1 remal,,~d above 4035IJMW for 50''' of _..... "- ' th~ ttme (2014.15. 382IJOlO,fW)
......._ 0.:..:::: - _. - -.:..;.
r....· '-=t~n~=-l~=l:tjr--ir-.:: . L-I.~·G".. D. '-f=. -t- r--f-.-N --s: t T-- -_. ~.-L:=--: .. ~ -i -.....!)'-....-~-Ii.....! . ; <; [\=t-+ ~..I ..__~___ -+.--T'.......,...-;-I .:::::~..... _. _._f-. : 1--+-+
, I ,!::~ -- ~ i "1'-- ··~i·_.J......__ _,J-r-"··l_.L.,.-_·-..L._--Ir- t.._... -..,,.-:IUS l'
Figura 15: Annual Loac1Dor;otion CUM<
2.3.5 System Load factor-
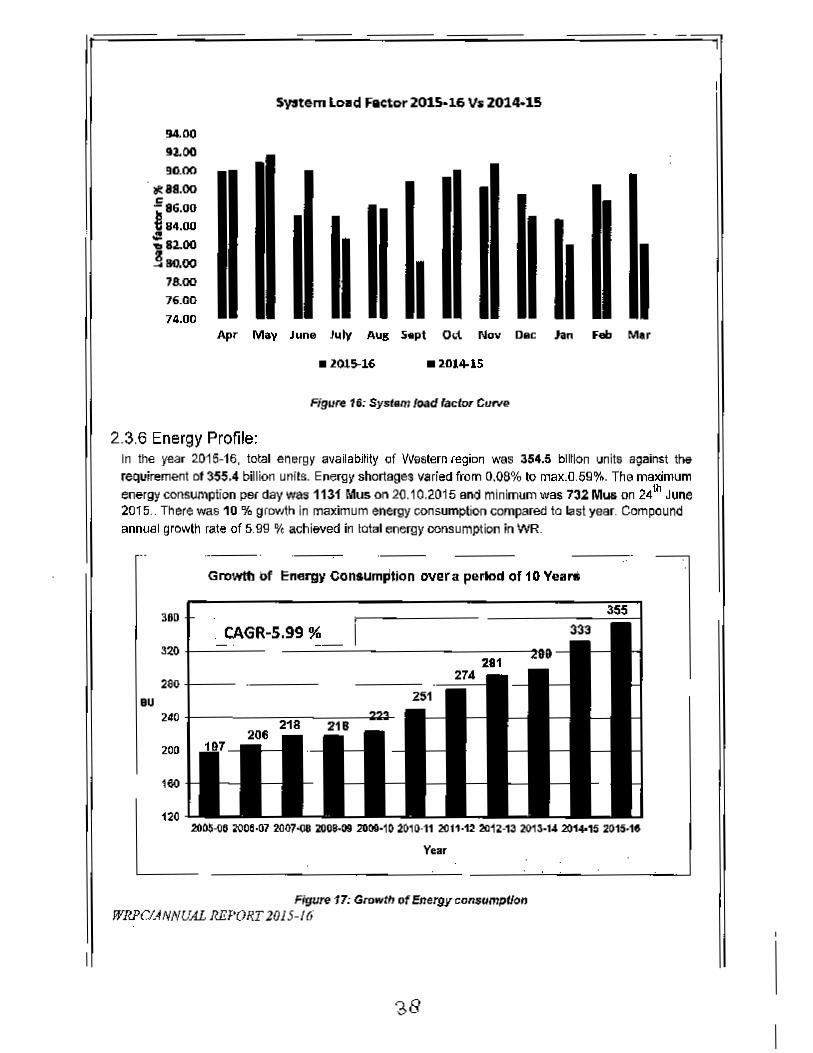
System Load Factor -
P•• k O~mand Met (in MW) Energy Met (In Mus) Monthly Systam Load Facio,Month (%)
2015-16 2U14·15 2015-16 2U1-4-15 2015-16 2014-15
ADr 44668 43968 28946 28534 9a.OO 90.14May 45208 42956 30S94 29340 90.96 91.81
JIlM 43735 42934 26851 21851 85.27 90.09
Julv 44803 43034 2.8397 26487 85.19 &2.73
Aua 43154 40063 28138 25638 86.44 86.01
Sepl 45H7 45081 29102 26054 66.91 80.21
Oct 49938 44988 33216 30181 69.40 90.17Nov 46528 44549 29589 29140 88.33 96.85
09c 48531 44946 30301 28482 87.52 85.17
Jan 46833 4~9 29&40 26761 84.76 82.05Feb 46809 447!10 28856 26126 . 88.57 86.88Mor 46442 45283 31025 27686 89.79 82.18
Table 15: System losdf"ctorWRl'CIANNUAI. REPORT 2015-16
System Load Factor201S·16 Vs 2014-1.5
~oo92.00!IO.OO
at8S.oociS6.001:84.00,:!.... 2..00.§ao.oo
78.0076.0074.00
Apr May June July Aug S.pt 0.1. Nov Dec hn Fe Mar
.ZOl.s.16
Figure 16: System load laolo, Curve
2.3.6 Energy Profile:In the year 2015-16. total energy avalablily of Western legion was 354.5 bliion \K1its against therequin!ment cl355.4 billion units. Energy shortages varied from 0.08% to max.O.59o/•. The maximumenefgyconsumption psr day was 1131 Mus on 20.10.2016 and minimum was 732 MU5 on 24111June2015 .. There was 10 % growth in maximum energy consumption compared to last year. Compoundannual growth rate of 5.99 o/e achieved in lotal energy consumption in WR.
Growttl bf Energ~ consumplion overa pel10dof 10YearS
380CAGR-S.99 %
3~
280au
240
200
1410
L2OClS-1102008·07 2{)07oCe200(1.01 21)00·102010·11 2011-12 2012-13 2013·14201 ... 15 2015·16
Year. ....
Figure 17: GrowttJ of Energy consumpllollWRPCI.~NNUALREPORT2015-16
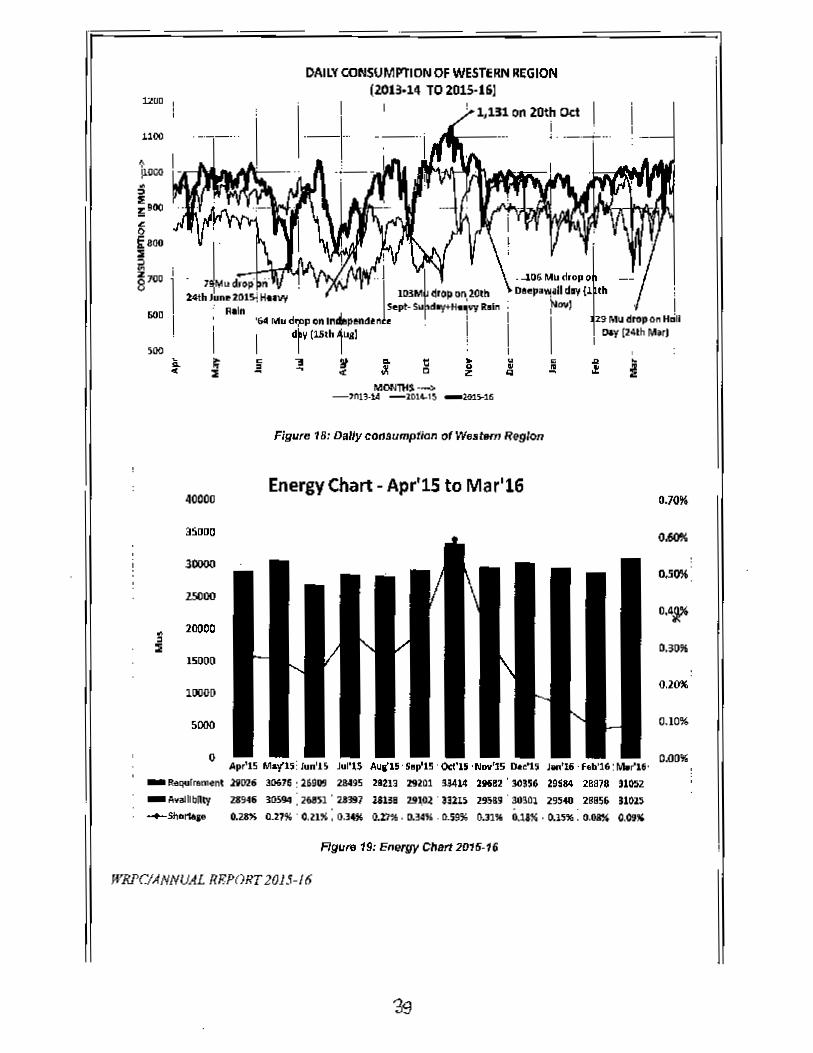
-".".._ mn, 10076: 1.1.9'" m~s >1213 19l01 mlA ZH!2 lO3S6
- AvallbRly Zl94S iDsg,,: 261m'l.II!lJ7 uua 29102' nns 295&9' 30;01 29540 28856 non.......SiI.,.,... 0.28)1 0.21%' o.m! ,D.14% 0.1'1%. D.34" . 0.59% D.m. 0.11"· o.m •. 0,1)1% 0.09"
Ur.tD
1100
40000
lSDDO
30000
zseoo
~ 20000,::Ii
lSOOO
10001l
,000
DAILYCONSUMPTION OF WESTERN REGION(2013.14 TO ZOlS·16j
1,131 on 20th Oct1._-: _.
Mor.JnfS -->-)nl,·tA -lD1L1~ _101~16
Figure 18: Dally consumption of We.tem Region
Energy Chart - AprtlS to Mart160.70"
o
D.SO% .
O,4~
0.100(,
0.10%
WR}'r.lAHNUAL R1?P()RT2015-/6
Fig"'" 19: Energy CIISr12016·16
Energy Chart - Apr'14 to Mar'1535000
30000 1.40"
1.to'lI .
0._
o.~ .
0.00'"
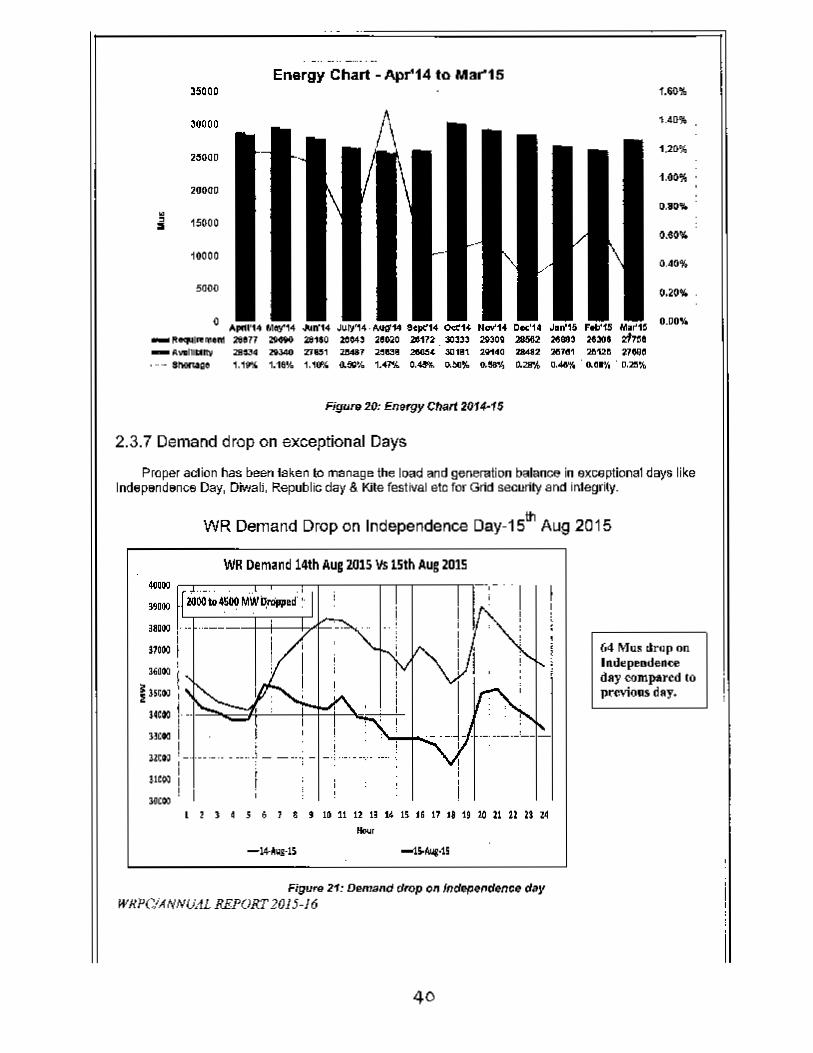
Proper aClion has been taken to manage the load and generation balance in exceptional days likeIndepltndltnce Day, Olwall. Republic day & Kite festival etc for Grid security and integrity.
23000
20OGO
•i 15000
11000
o"""". M~ JUIf'. J\UV"". AuctM .scpt', •
.... ,.~ .... 2tl77 :M9O 28110 2004' 2'~O 2011~._ A~ 2':1"4 19.)4O De, 2!MI1 25831 ~(. 3Dll'\ 291.0 DCl2 l51d1 Zl12t 27teC
• - - IMN:IIO t.'t'.( 1.16\.\ 1.1.n 4.tIOl,4 1•• 7'% O.4¥l. o.!lG~ o..S8"'~ 0..21"4 a.""'" o.CI% . 0.2:5%
Figu", 20: Energy Chart 2Q14-15
2.3.7 Demand drop on exceptional Days
WR Demand Drop on Independence Day-15th Aug 2015
WR Demand 14th AUG2015 Vs 15th Aug 2015
Ii4 Mill drop 00
Illdepeade_day roJllp""~ 10po:evx- dlY.
~,~ ~.~~~.-- ..r-r--,.,-.-------r'-'-----r<'<1110010_ MWbrcW.d· :. I
!",~381100 ..... ----
im~1:u;,~i
~ ,1)- !
"ctO t..p:~~~,--+=~~~I
ll(" iI
llt1';J :-I
ll® I!
lItO)
I•• _ ••• __ .1 ~_, ,
;I
!_ ..._._- ......_- ~
I 1 I • S 6 1 & t ~ U 11 l' " B t6 17 J. U ~ n II n ~.....
Figuro 21: DM'land Clrop on /nctepef'clen ee clayWR1'('/ANNUAL REJ'ORT 20J5-J6
40
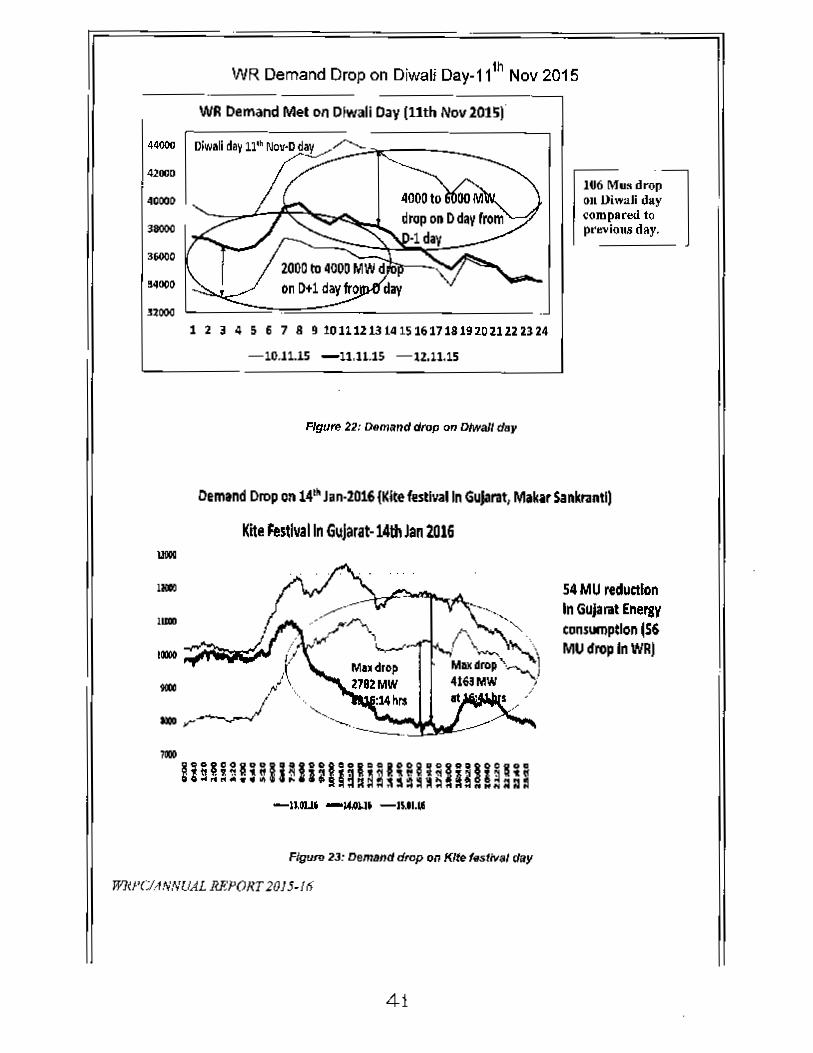
WR Demand Drop on Diwali Day-11th Nov 2015
WR DemandMel 011 Dlwali Day (11th Nov 2015)
1234S6789WI1UU~~~UUHwunnN
-10.11.15 -11,11,15 -12.11.15
FIgure 22: Demand drop on D/waJl day
116M....dl'Oll]on i)iwa]i daycompared topr""i01lS day.
Demlnd Drop on 14" Jan-20161Klte festIval I" Gujarat, Makar Sankrantl)
Kite Festival In GuJarat-141h Jan 2016IIIIIIII
71Il1O
~ig!~~!i~ll~li~lig~~~llil;~II~I!E~~a-lllIU6 -14£11 -11.11."
FlgUffJ 2J: Demand drop on Kite fesfe-al day
W1l.PC/ANNVAL IIEJ>ORT 20J5-/~'
41
S' MU reductionIn Gujarat Enersvtonslll1lptlon IS6MU drop In WR)
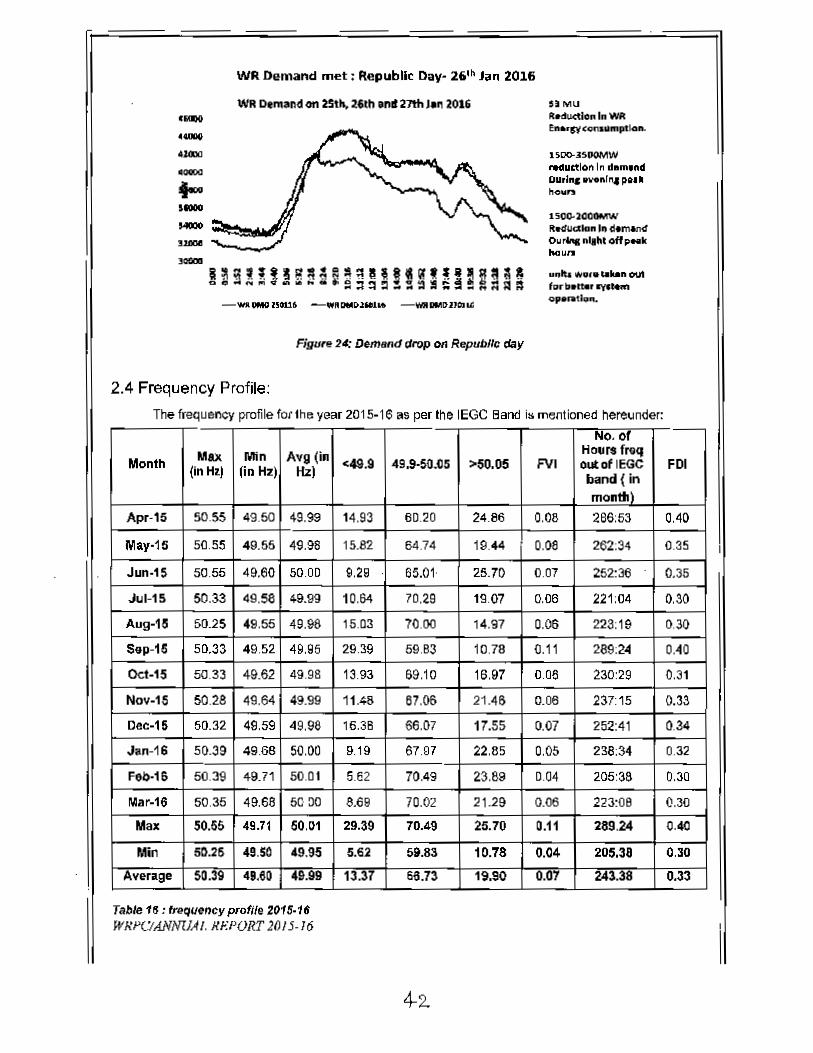
WR Demand met; Republic Day· 26'· Jan 2016
WR Demand on 25.11.:l6th Ind 27th J." 2016 'iMU.._ .._e;... rn'c.om;lihnpdoft.
1 Soo-.3S00MW'-CIuctlon In d.m, ...dDII,I ....... ,,(tI,I p.I.houn.-
-~~..",,_](,"""
1~;~;'S!g~~~~~a~R~~'~!~R~~~o~~~~~~~h_~~~~~!:~!~~:=M~~
lSCJO.2GOOMVrlItKualonl .. d.m.."crOu,... AlI"toffp .. khau,,"
u.,1ta *0,.. '-u" QUI'Of"~~op.ratlOllL
Figure 24: Demand drop on Republic day
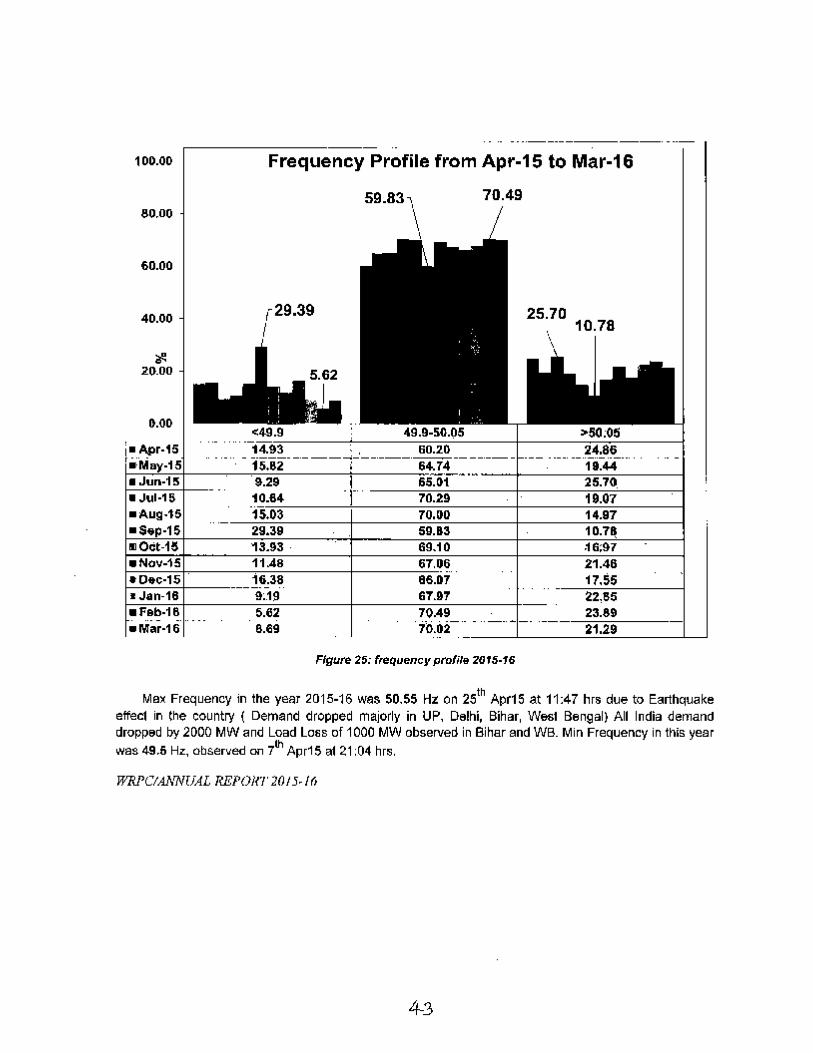
2.4 Frequency Profie:The frequency profile forlhe year 2015·16 as per the lEGe Band is mentioned hereunder:
NO. 01._
Mn Min Avg (in HoulS frsqMonth <49.9 49.9-50.05 >50.05 FVt Od:oflEGC FDI[II H2j fin Hz) Hz)
band ( inmonlto)
Apr·15 50.55 49.50 49.99 14.93 60.20 24.86 0.08 286:53 0.40
May·15 SO.55 49.55 49.98 15.82 64.74 19.44 , 0.08 262:34 0.35
Jun·15 50.55 49.60 50.00 9.29 65.01 2.5.70 0.07 252:36 0.35
Jul·1S !>O.33 49.58 49.99 10.64 70.29 19.07 0.06 221:04 0.30
Aug-1! 50.25 49.55 49.98 15.03 70.00 14.97 0.06 223:19 0.30
Sep-15 50.33 49.52. 49.95 29.39 59.83 10.78 0.1 I 289:2'" 0....0
Oct·1S 50.33 49.62 49.98 13.93 69.10 16.97 0.08 230:29 0.31
Nov-1S 50.28 49.64 49.99 11.48 67.06 21.46 0.06 237:15 0.33
Dec-iS 50.32 49.59 49.98 16.38 66.07 17.55 0.07 252:41 0.34
.fan-16 50.39 49.6S 50.00 9.19 67.97 22.85 0.05 238:34 0.32
Feb·iS 50.39 49.71 50.01 5.62 70.49 23.89 0.04 205:38 0.30
Mar-16 50.35 49.68 5O:lO 8.69 70.02 21.29 0.06 223:08 l!.30
IIIax SO.55 49.71 50.D1 29.39 70.49 25.70 0.11 289.24 0.40
Min 50.26 49.50 .9.95 5.62 59.83 10.78 0.04 205.38 0.30
Av~ra9" 50.39 49.60 49.99 13.37 66.73 19.90 0.01 243.38 0.33
Table f8: ~y profile 2015·16WKPCIANNlJAI. Jlf-.'f'ORT 20/5·16
4-2.
100.00
.... _ ..._-------_ ...._
110.00
r29•39I
Frequency Profile from Apr-15 to Mar-16
70.49
60.00
40.00
"#.20.00
0.00
Jul·1S
25.7010.78
Figure Z~: frequency profile 20'5-16
Max Frequency in the year 2015-16 was 50.55 Hz on zs" Apr15 at 11:47 hrs due to Earthquakeeffect in the country ( Demand dropped majorly in UP, Delhi, Bihar, Was! Bengal) All India demanddropped by 2000 MW and Load loss of 1000 MW observed in Bihar and WB. Min Frequency in this yearwas 49.6 Hz, observed on 7th Apr1S al21 :04 hrs,
WRPClANNUAL REPOl('1' 2015·1(,
4-.3

Max Freq on 25th Apr 1550.7
50.55 Hul 11:.41lv,SD.S
503
~SD.l
49.9
49.1
::~E~!~~~:~~!~g~!~~~~~!~~~!!~~!!~~.~"~~~~~"~~_MNN~HN
Time
FI9ure 26: A1ax. freq dBy plot
Frequencv 01"1Mm Dav 7th Apr 15
~~8~Q~8~R~g~~=g~a~8-g~~~~~~_NH~.~~~~_Z~o~!~~............... _. ......... ININNNri
TIm"Figure 27; Min. froq clay plot
.... ....---- ._.-_ ..'r.qll-.y~hu""""""""" OJMIMty.-ApOftIII" Anc:"ry~ I
.51',.-.t. for "'rln., lm,..,.""ant II---..~;·-'C:+==--4~
.__ . -1-' I.... ,
.......
... J.-__._J__ ..
Figure 28: AlB". V$ Min. Iraq. &/nce Apr'04WRPClANNIIA I. REPORT 201 5-16
4-4

"2.5 Energy Generation:
Total energy generated Vias 410 BU against the 372 BU in the last year, including state, central an<!private sector. There was 10% growth in total energy generation compared to last year. Month-wiseBreak-up of energy generation in 2015-16 & 2()14..15 is given below.
Generation 2014-15 VB 2016-16 (in Mus)State Sl>ct;o, G~.l1traI ~~~~<:l:r. .:. . ...F,f;'~.awJlP'j;i. '., . :>rot;'l.-Genitf;!t.IC!n
• ," - •••• , • < ••• " • • ." ..", ...., ........ .2014-15 20~5-.16 21)1';15 .201'5:16 . '2Q:l:4~' .~~~:,16 . Jb~~~i*~-~6...... '; . : ·'r ".~:.~'. • :,. ...
A:pr 1941;3 19432 7~46 7423 4854 6147 32263 33002.-May 19416 20579 8580 7928 4754 5961 32750 34469
June 18737 17624 7077 5539 4856 6245 30669 3(1608
.July 173S9 18492 6995 7027 5094 6502 29448 32021... . .-Aug 17129 17996 6995 7980 5088 6594 29212 32559
Be.PI 16046 19150 7891 7760 5230 7564 29166 34495
Oct 19413 2u92 6441 B107 5306 8728 33159 38327._. ..-Nov 19064 18998 7546 7019 1;089 7723 32700 33740
Dee 19079 19374 7015 7450 6287 B404 3238'· 35228
J;on 17957 193~7 7142 '(069 5637 8403 30736 34809
!'ob 16644 18635 7269 7213 5910 8077 29823 33925
. Mar-' 18118 19436 7198 8251 4832 9096 301~8 36782
Tolal 218425 230745 90095 89786 53937 89442 372457 409973
Table 17:G.".rar/on 2014·15 Vs 2016·16
Total Generation In WR 2014-15 V$ 2015-1645000
40000
35000
301l(J)
.,25000~:izoooo
15000
10000
SOOO
o
Figure 29: Genemlion 2014-15 Vs 2015,16WRPC!ANN(I.1I. REPORT 2015-16
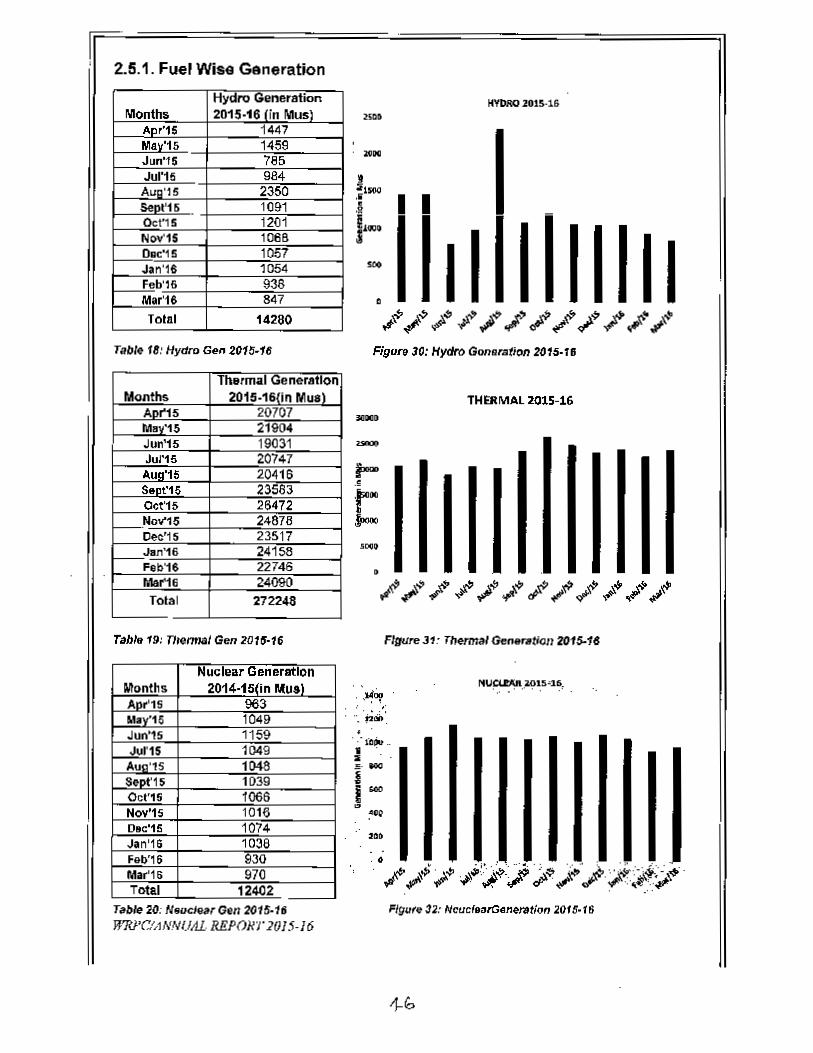
r=, 2.5.1. Fuel Wise Generation
Jul'15 984All '15 2350Se 1'16 1091Ocf15 1201NovlS 1068Osc'1S 1057.An·le 1054
Total 14280
Tallie 18: Hydro Gen 201~·16
T_ 19: Thermal Gen 2018·16
Nuc lear en erstlon2014·15 In Mus
1049115910491048103910661016
0.0'15 1074Jon"S 1038Feb'1S 930MarlS 970Total 12402
T;t1>1e20: UoucJe;t,Gen 2016·1'WR}'(''/,lNNUAL REPO}/T 10]5·]6
2S03
....!"'m••e.2
£,...l
•
I I
HYDRO 2015·16
II I I I I IIFiguro 30: Hydro Goo.",tion 2015·18
.....
'DO•
•
THERMAl 2015-1£
Fll1<1fe Jl: ThermaIGen.",tioll20f5-14
. ", #200.•
. " (COv_• •~£- ...
§.000o
: ... ':
20.
FlgUf. 32: Ncucl •• rG.nenoon 201$- 16
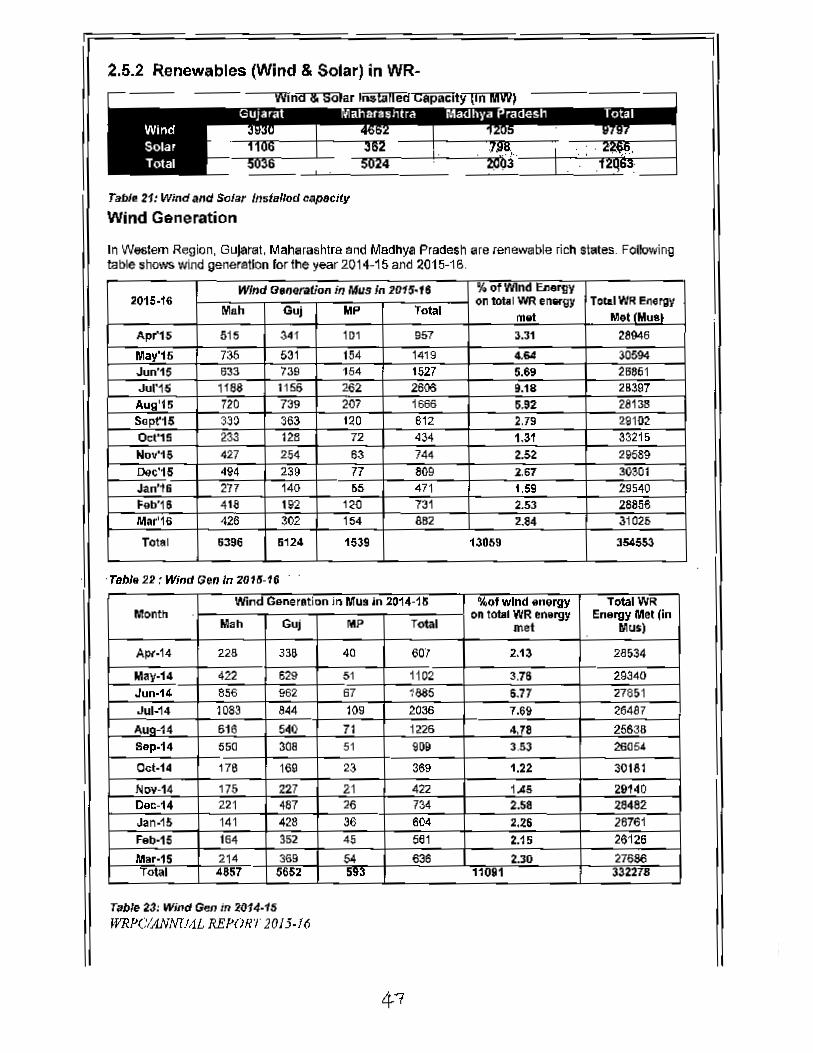
2,5.2 Renewables (Wind & Solar) in WR-
Table21: Wind"ltd SO/lIT insialkJdupscity
Wind Generation
In W86!em Region, Gutarat. Maharashtra and Madhya Pradesh are fet1ewabie rieil slates. Foflowinytable shows IfIind generetlon lor the year 2014·15 and 2015·15.
Wind C18"eraUon in Mus In 2015·18 oy. of WInd.""''ltY2015·1. on lObo' WR e_gy TOIaIWRE""rgy
Mah Gu; liP Totol mM M,t(Muo.Apr"15 515 341 101 957 3.31 28946
llI\"y'15 735 531 154 1419 4.64 30594Jon'1S 533 739 154 1527 5.69 25861.JuN5 1188 ',56 262 2606 9.18 28397Aug'15 720 739 207 1666 5.92 28138S.pt'IS 3J~ 363 120 812 2.79 291020tt'15 23J 128 72 434 1.31 33215
Nov'1S 427 254 63 744 2.52 29589Dec'lS 494 239 77 809 2.67 30301Jan'1& 'ZI7 140 65 471 1.59 295~OF"b'18 418 192 120 731 2.53 28858MarIS 426 302 154 882 2.84 31026
T""" 6399 &124 1539 ll059 354m
·TItbJ. 22 ~Wind Gel! In 2016·16
MonthWind I;" Mill in "401wln~ energy
En!:I:e~ (inon 'ObI' WR enorgyMah Gul MP Total met Mus)
Api.14 228 338 40 607 2.13 28534
422 629 _~1 1102 3.78 ~34O_Jun·14 856 l162 67 1885 6.77 VaS1
_.JuI.14 1083 844 109 2036 7.69 26487•. -,. 618 540 71 1226 4_,]8_ 25638S.p.14 550 308 51 ~O9 3.53 2605-4Ccl,,. 176 169 23 369 1.22 30181... _4' 175 227 _21 422 lAS 29140
221 487 26 734 2.58 2Il482Jan·1S 141 428 36 6()4 2,U 28761
~15 .164 3$2 45 5.61 2.15_ 26126
Mar·1S 214~
54 638 2.l0~IOlai 43~7 ~lU "O¥l
T~b/el3: Wind Galt in 2014·15WR?CIANNTML RE?ORt 2015·/(J

Compared to last year, wind generation in 2015-16 Vias increased by 17,74%. Wind generation wasmore during the period April to August wheroas less in rest of Ihe year as shown in the graph below.Maximum wind energy contribution of 9.18% of total WR energy consumption ooserved in the month ofJuly,2015.
Wind Gen in WR 2015·1614110,-------------------··- --- .' ' ..._-_ .._--
Flgure33: WlndGenerstlon 2015-16
Wind Gan in WR 2014-15.,..,----------------
Figure 34: WllldGeneralion 2014-15WRPClANNUALREPORI2015-16

Total Wind Generation in WR in 2015·16lOOD 11iUO
i!s.••~uaIt '"iUli·1111:td
Inl.1~
1.10
UD".r"ll
L..r.4 lobll WInd GEc_._n_"._n__ ~_%_of_"_"lI--=-r_..._t _ _J
•,"_
Figure 35: Wind Generation wrt Total WR Energy Mel-2015-18
Total Wind Generation in WR150C1·~--------- --.---------------~ 1.110
lDOCI ·L~ToD,YJIn4~_'_...._,._,__ ......._s_or_"_._fiy_IMt__ .J
-
Flguf'8 36: Wind Generation wrl. Total WR Enftrgy Met-2()f4-1S
WRPC!ANNUALRErORT201S-J6
LOD
1.1It

3-Dimensional graph of Wi nd ·2015-16
'f iuMW
FlgtJfe 37: 3· D Chan·Wind Goneration ·2015·16
WInd Genera,~lo"
Con stitu ent 1~~~lledC~pa~it~,(MWI
" ..So far highest Gen.
Gul.t.tMan8 ras htra
Madhya Pradesh,WR
~93D 2726 MWon ,5!h July 2.015at 19:00.nrs4662 2320 MWon 29th July 2015 at 14:00hr.1205 569 MW on 4t" July 2015 at 9:00 tv.
,,~S7 _, ,.',' ~~:~~~;~~~.J~~.20~'~~lIO:~[8
Tabla 24: Max, Wind G.",;raUon
Highest Wind Gen. on 06.07.2015
~OO~~--.-~~---.-.~-r-.~~-'~-'~~--.-~~~,5000 1 1 I I lvl..... 1 I 'i_...+-+-ol..... I!
:3S~~()~J,...-;_, -': -..i~__ -r "55~1 ,; ! ~ I i"i~~,~...-j
V Ii I" !! !'; ii'
::~==~t,~I=+=t~,~:~~~r=f!~~~~~~~·11~=t~~::tj[j2000 ! I ! ' , T1500, ! 'I I 'I' I II !I, Ii; ! II'I'! '~1:; 991 I. I I! :, ! i ! i
o~J:~:t:It:ljl~~::~lil::~Ic:~'~~;:::~:::j~::~,~:i~t 3 5 1 9 11 13 15 17 19 21 23
Hou1"6-Total _MAH -MP _ GUJ.
Figure 38: Max. Wind GenerationWRl'CitINN{I.4L REPOR.T 2015·16
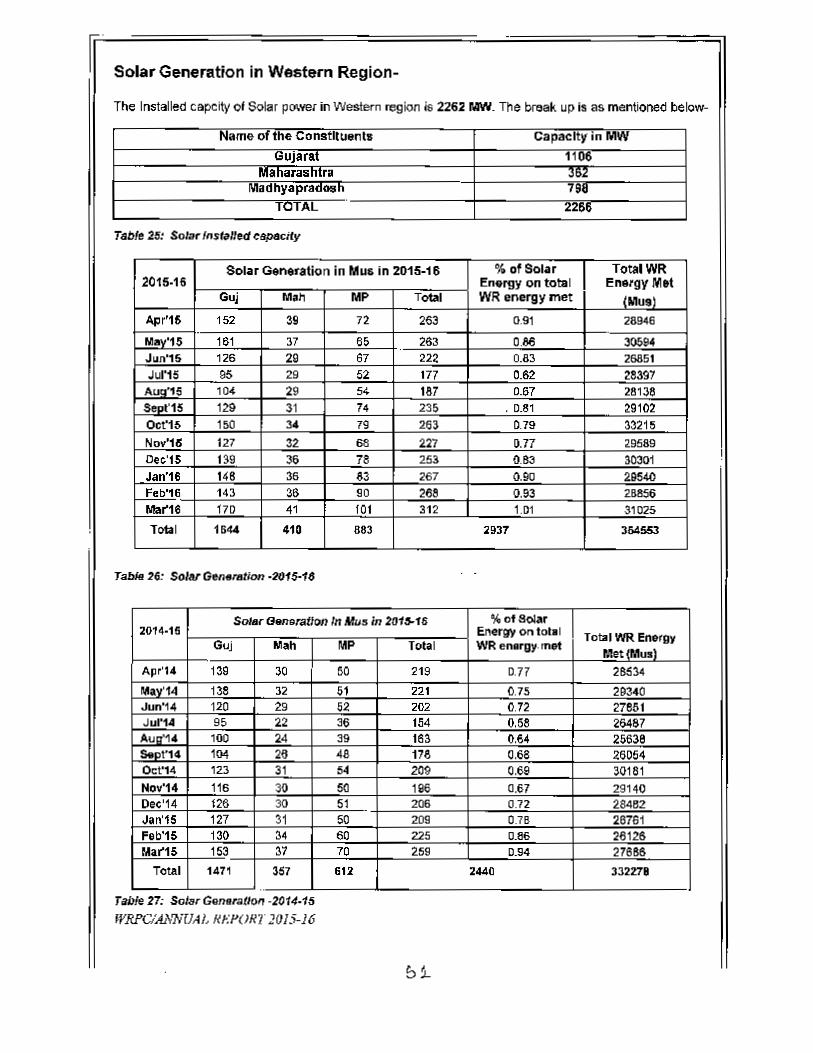
~.Solar Generation in Western Region-
The Installed capcily 01 Solar pOIYel in Weslern region js 2262 MW. The break up is as mentioned below-
Name 01 the Constituents Capacltv In MWGujarat 1106
Manarasn!ra Jb~Maanyapraa""n 798
.uTAL 221111
Table 25: Solar installed capacity
Solar co.n.... tion in Mu& in 2015·16 % 01Solar TotalWR2Ot5-15 Em'rgy on tollli Enetgy Met
Guj M.Il MP Total WR energy met (Mu.]Apr'15 152 39 72 263 0.91 28946
May'lS 161 37 6& 263 0.86 30594Jun'15 126 29 67 222 0.83 2685.Jul',S 95 29 52 177 0.62 28397
Au,,'15 104 29 54 187 0.67 2813&So""15 129 31 74 235 • 0.81 29102Oot'15 150 3A 79 263 0.79 33215N0'I'15 127 32 68 227 O.T7 2.9589Dee',S 139 36 78 253 0.83 30301Jan'16 148 36 83 267 0.90 29540Feb'16 143 36 90 268 0.93 28856Mar'16 170 41 101 312 1.01 3.025TC>la1 1 SoW 410 883 .937 364553
Table 26: SoIarGIffi.",llon ·20f5·f~
$oMr aen.ratlon In Mus in 2011J.18 %oISoI"r2014-15 Energy on totll To131WR Energy
Guj M"h MP Total WR enorgy. metMet (Mus)
Apr"4 139 30 50 219 0.77 26534lI'av'14 138 32 51 221 0.75 29340Jun'14 120 29 52 202 0.72 27851Jul"" 9& 22 36 154 0.58 26487
AU!7'14 100 24 39 ISiI 0.64 25638s.."YI4 104 26 46 17& 0.68 260540ct'14 123 31 54 209 0.69 30161No-t'14 116 30 50 lS6 0.~7 29140[)ec'14 126 30 51 206 0.72 28462Jan'IS 127 31 50 209 0.78 26761Feb'15 130 34 60 225 0.86 26126Mar'15 153 37 70 259 0.94 27686
Total 1471 357 612 .440 332278..
Table 27: SoiarGen.".l/of! ·2014·15WRFCIA}{}iTJAJ, IIHI'OR1' 2015·16
b1.
Solar Gen in WR 2015·161&0
111,..• 010 In
121
100 1$
iSOG
91
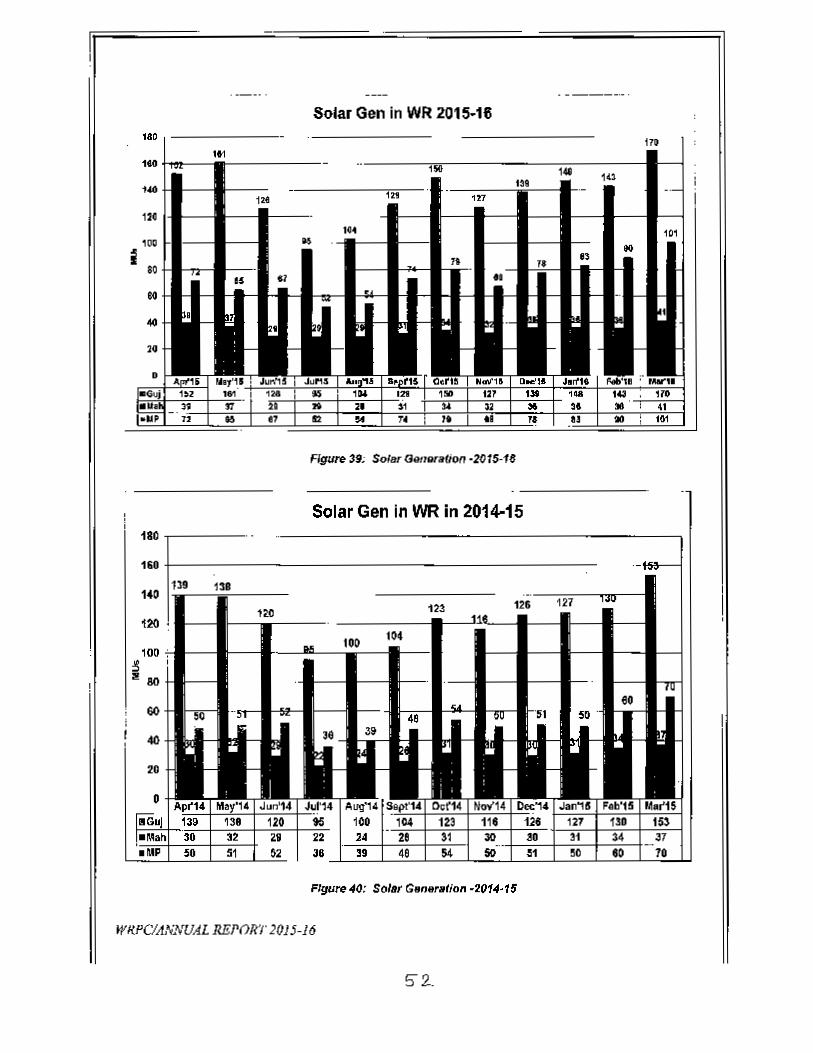
Figure 39; Solsr (JetlorBtion ·201S·111
Solar Gen in WR in 2014-15180,-----·
150+-----------------------------------------------
123
104,00
~"so
Figure 40: Soler G.ner.tioll ·2014·15
IYRPC/AJ.....VAL REI'OR'r }()J5·16
S" 2.
Total Solar Generation in WR in 2015-1635ct .•- . . . . .. 1.20
[ "T01A18olar oenerJ_tlDn --"It':' .nwgy met 1312
1.110
2sni
I :liDO,:Ii
0.10
10G
50 0.28
• I 0.00 JA.pns May~tS Jun'iS JuP'15 A.ug'1S8ept"15 Ocri5 Nov1S Oee'iS J.,n'16 Feb·.a "ar'16
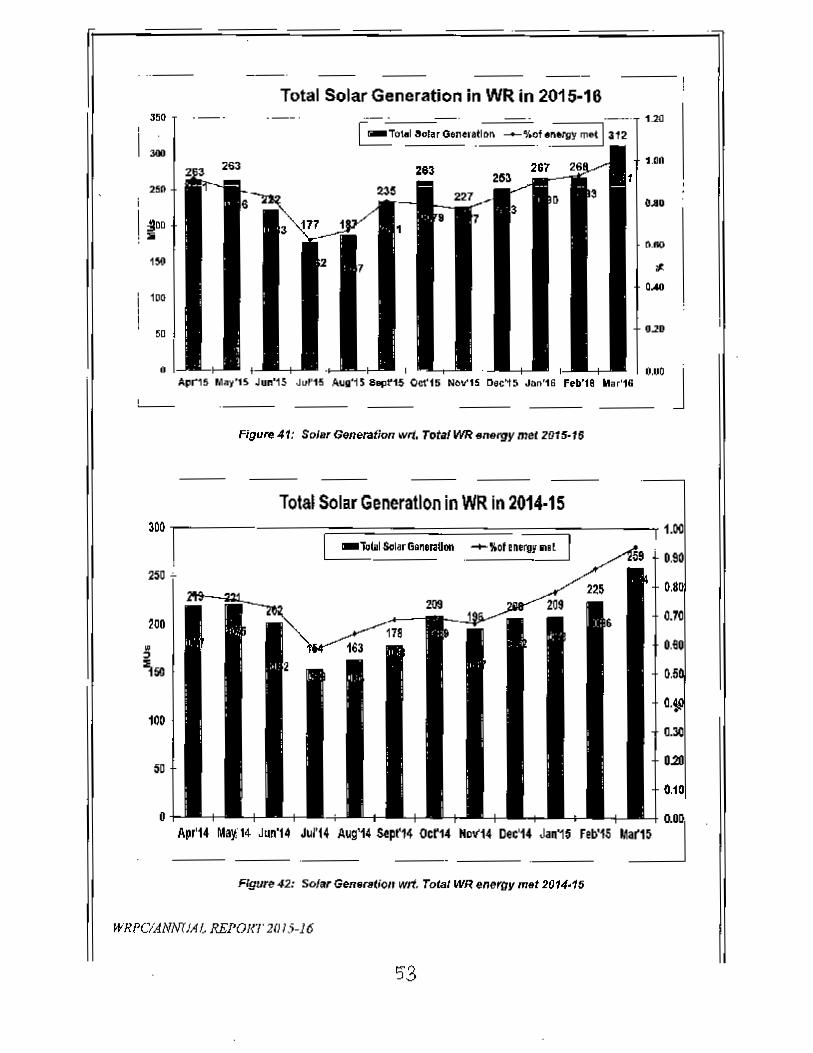
-' ---Figure 41: Soler G'm~tion wet, Total Wlhn<>I'!1Y me1201S·16
Total Solar Generation in WR in 2014·15lOG I2SU
Apr'14 M~14 Jun'14 J~I'14 Aug'14Sepf14 OCr14 Nov'14 Oec'14 J.n'15 feb'iS
Agt/re 42: Solar GM'nlliOI! wrt. Tolal WR energy m.t 2014·15
WRI'ClANNUAI, REPOI(,/' 2(1/5·16
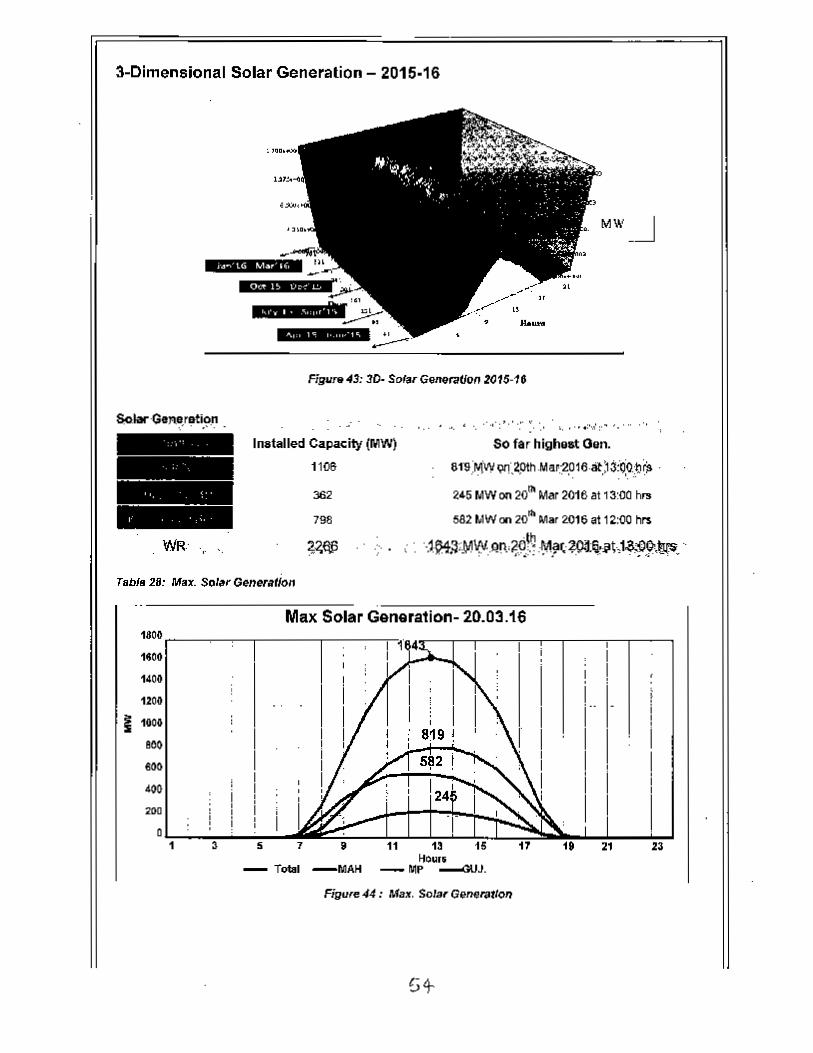
3-Dimensional Solar Generation - 2015·16
MW_j
Figure 43: 30· sorar Genqr.llion Z015·16
.'., ....." ". :.... ":",,, :.~'.' - ."
Inatalied Capacity (MW)
1106
362
798
So far highest Gen.
81"9;PitoN QI1, 2Jllh Ma'.-2.016 at) 3:Q,O.;b~ .
245 MW on 20rJl,Mar 2016 at 13:00 hrs
582 MW on 20'" Mar 2016 at 12:00 h'"
.... .. ·.1~.~;M\(IlQR~9!·~~ftlt;-?:Ol1~jI\,la.."j!).9.'.~.'>NR: ..' ,",
Max Solar Generation- 20.03.161'00
1eoo
1400
1200
I 1000
ecosee400
2!10
01 3 5 7 II
- Total -MAH
11 13 15HQuri
-MP ---GU).
Figure 44: Max. Solar G~nerat/o1't
23

2.5.3 Pump Storage Status in Western RegionThere are seven stations In western region having cepabiUly 01opetating in pumping mode ope<aIion
as men!ioned below. BUI due 10 several reasons like reservoir constraints. tarill issues a.nd other~ issues. only Ghetghar is working in Pump storage mode,
Flu",ped ' 08PlbiHIy ,d Wh,lherCapacity slora"" ' " " , I b.lng Ay,DabI.I"i .,.Station SI8~
,wIIl))n; , , ..,(1M) , , '"Cl!)n~lt ' '. ".~ r....n.uy;:P\bPf,~, ,. ;p.u!l(P1ng,·riijil:' " .m~ , ,", : !'lode '
- . ,.-- , ':. ' ,. ; ,
Paithon,(Jayakwadl) lx12 Maharashtra Yes Yes No No
-2 Ghalgh .. 2x125 Maharashtra Yo.; , Yes Y.s No
No3 UiaL"i ,.12 Maharashtra Yes Y•• Reservoir No
con~traints -No
4 BIlira Ixl50 lola"" rashtra Yes Yes Re9eMlir Noeonalrai rotSa;Tariff issues-No
5 Kadana·1 2><60 GuJaral Yes Yes Turbine No
- r vlbraUonNo
6 Kada1a-l1 2x6O Gujarat Yes Ye. Turbine "'0vibraUon
Tall lac
7 Samar 5)<200 S"Jarel No reservcir No YesSarOVSI Garude_kbe cornpleled
r.ble 29: Pump SIQ~e piIJnts In wn
Ghatghar Pump Storage -
. In Westem region there are 2 no's reversible Francis Turbine units each having generating
capacity of 125 MW at Ghatghar under Pump mode operation, The concept behind pumped
storage scheme is to store tail water coming out alter generation from a turbine and pump it
back by using same machine as pump, Ghatghar Pumped slDrage scheme consists of
transferring water alternatively between upper dam at Pravara river In Ahemdnaqar Dis!. and
lOwer dam at Shahl Nalla in Thane Dist Here generator can be used as moIor and turbine as a
pump. It operate on a weekly cycle with six hours daily generation (except Sunday) on peak
hours and pumping for seven hours during off peak period from Monday to Saturday. During
generation cycle. it will generate 125 MW and while pumping cycle, it will consume 150 WMIpower.
WIifCiANNfJAI. REPOm' 2015·16
55
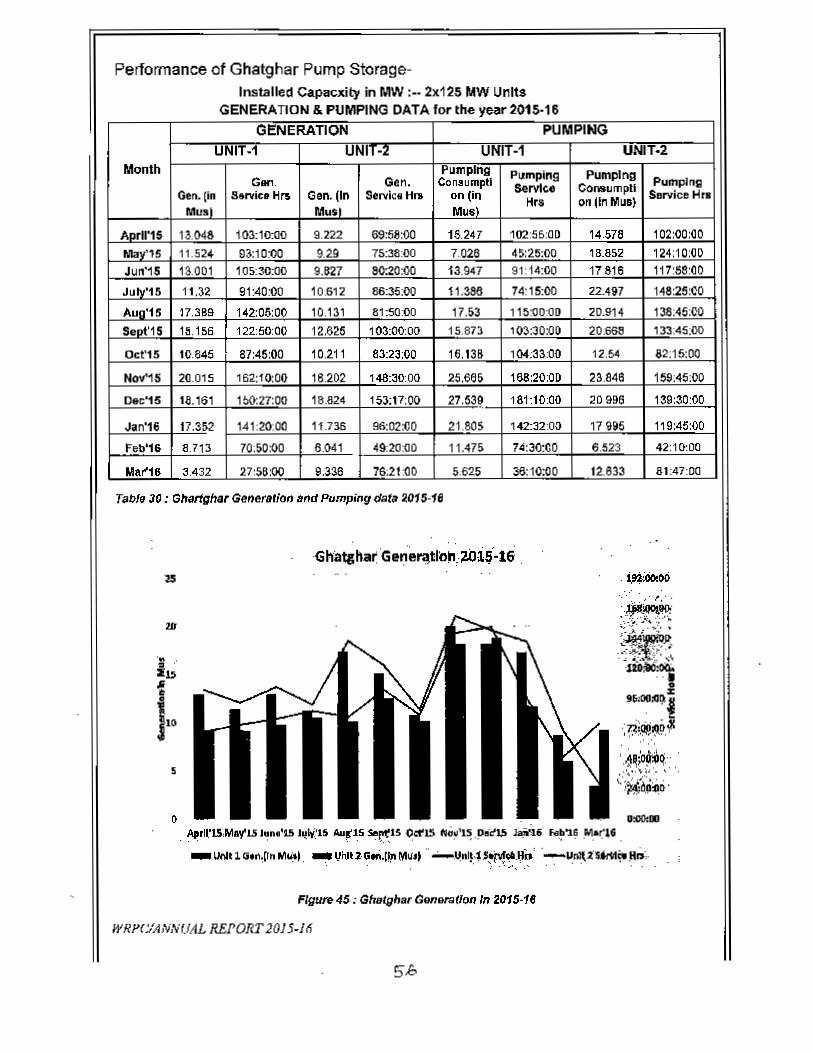
Performance of Ghatghar Pump Storage-Installed Capacxity in MW :•• 2x125 MW Units
GENERATION & PUMPING DATA lor the year 2015·16GIONERATION PUMPING
UNIT.1 UNI UNIT·1 UNIT·2Month umplng Pumping Pumping
Gan. Gen. Conlumptl S<!rv1ce Co ....umpll PumpingGtn.(in Sorvlc.til'S Gon. (In Servici HB on (in Hrs on lin MUI)
Service Hr.Mus Mu. Mus
13.048 103:10:00 9.222 69:58:00 15.241 102:55:00 14.578 102:00:00
15 11.524 93:10:00 9.:2.9 75:38:00 7.026 45:25;00 18.852 124:10:00Jun'15 13.001 105:30.110 9.827 80:20:00 13.947 91:14:00 17 816 117:58:00
Ju 11.32 91:40:00 10.6'2 86:35:00 t 1.386 74:15:00 22.497 H8:2S:®
17.389 142:05:00 10.13 , 81:50:00 17.53 115:00:00 20.914 13S:45:W
1'.156 122:50:00 12.625 103:00:00 15.873 103:30:00 20.668 133:45:00
Oct'15 10.845 87:45:00 10.2.11 83:23:00 16.138 104:33:00 12.54 82:15:00
NoV'15 20.015 162:10:00 16.202 148:30:00 25.685 168:20:00 2l.848 159:45:00
O&C'15 18. '61 lbO:27:00 18.824 153:17:00 27.53~ 1111:10:00 20996 139:30:00
~n'16 17.352 141:20:00 11.736 96:02:C0 21.805 142:3200 17995 119:45:00
Feb'fr. 8.713 70:50:00 6.041 49:20:00 11.475 74:30:00 6.523 42:10:00
YaJ'16 3.432 27:55:00 9.:>36 76:21:00 5.625 35:10:00 12..633 81:47:00
Ta!>le30: GItaJ1ghar Ge~ers'ion and Pumping data 2016·16
.~
5
.....~$t.:.:.~
o O~IIJ. AiI,II'1S,May'lJ l~n.'1.!i '~1i:1S"'~lS ~~15 ()ct'l!S f'I';.'l~ .D... 15 1";;<16 ... ~'l~."1.>(1& .
_lMItl G.n,pn"1"'1. _1!i1Jt2G.n.I"'fl1~"" "_.~nl!:1'~"'~'"'-~nIt..2"s.,",i'o."':';... -.' .' '.
Figure 45: Ghalgha, Gon"",(101lln 2015-16
WRPC/ANN(f.4L REJ'ORT 2015.16
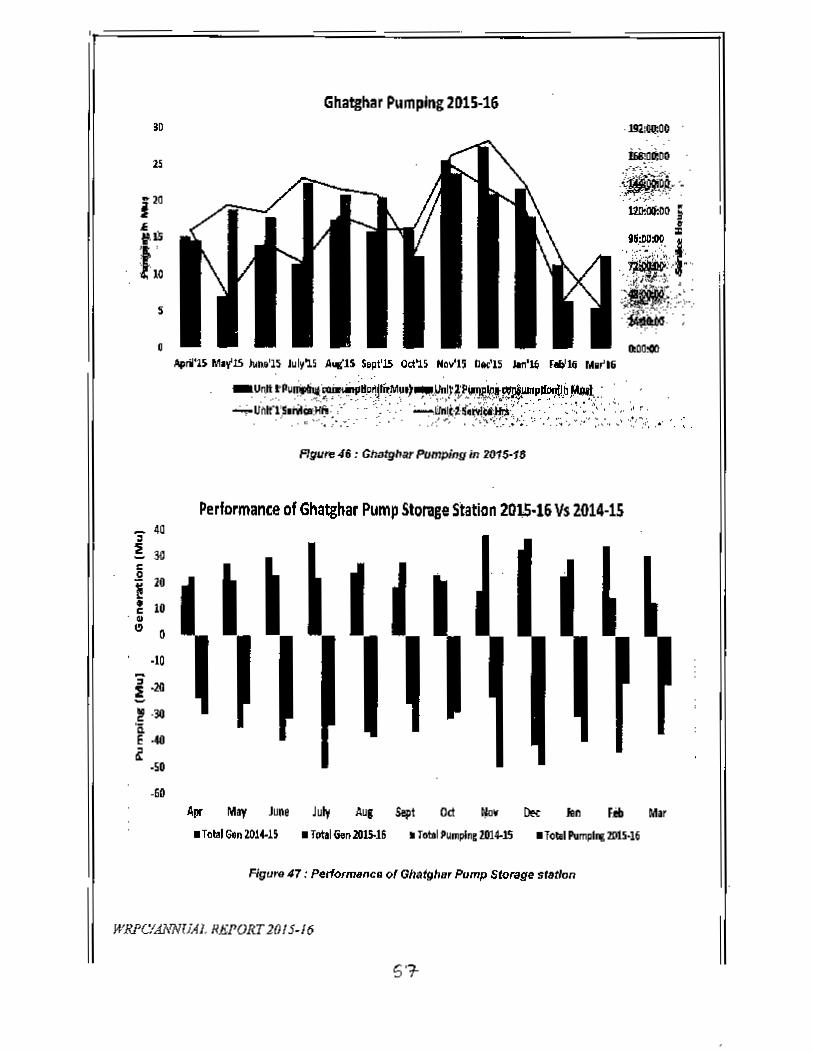
Gllatghar Pumping 2015-16
s
o
. .I!I2:GQ:OO
~D~DO
.(~b~~."...:~~~ .....: .U!l:iJt:oo ;
~~-;··~~:t:-....,....~.·~/~.S ..
~ ". :~-:.~. ..:-_':-.- .. ,..., ..•. - ...•..;
lItoo,cx)April'lS M'rlS ",.. 'IS July'l5 A'4(lS $opl'15 Oct'll N""15 D.. '15 Jon'~ r.... u; M.t'1&
_u'!".~Pu,,";ori~~i1D~I~·M~')"!'I'~!!~~~~~~,b~..: : '. '~.1Jt.r~~s•.~t:~~:·:~:.:~~~:'~.::··.·:/~}:~;:~~·;·.:;.·;:,.~;..:~~:~~~~::~;.-:'._:.
FIgure 46 : Gh;)tgharPumping;n 2015-11l
Performance of Ghatgllar Pump Storqe Station 201,S-16Vs 2014-15;- 40
~ 3Il
"
~ ~ i ~
s 20!• 11"...e 0
-10
!~:! ·30'aE-40,
-50
.(,0
Apr Mry June July AUI Stft Od t!o. OK Jon F.iII MI'
Flguro 41: Perl<>rt ... nco of GhatghBT Pump Slorage ststlon
WRPClANNUAl. RKPORT 2015-16
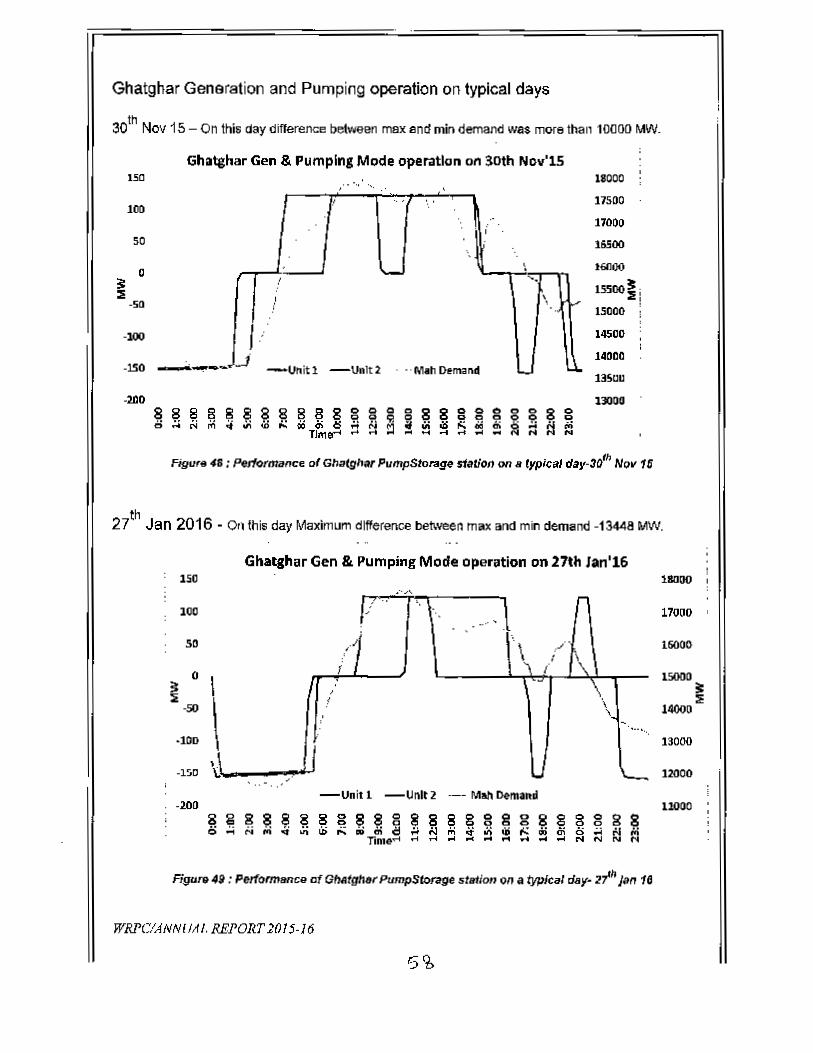
Ghatghar Generation and Pumping operation on typical days
30th Nov 15 - On this clay difference between max end min demand was more than 10000 MW.
S::5
·50
Ghatghar Gen & pumping Mode operation on 30th Nov'lS150 ...... , 1101X1
17S1lO
17000
16500
.61100
15500lt .::E!151!00 i,14500
14000
13Scc
13000
Figure" ; Perlolman~. o( GIJalghar PumpStorage stalion on It typical day.3(Jth Nov 16
27th Jan 2016 - On this day Maximum difference bet\veen max and min demand -13448 MW.
100
. ,
" " \ ..''. ,
'.
'- \! ~.! \ '", '-
j _;• _.i
-lI"ill -U"lt2 ··M.h Demand '-- .l.
so
o
.]00
-150 _';"..-II!!"--
·21)0
150Ghatchar Gen & Pumping Mode opaatiol1 on 27th Jan'16
.'Ar-o/: .. ,
.... ,.i ...,./ \ ,./
I \1 I:,
! \, ~, - _ .•..
\ 1.0.
100
so
o I
\·100
.. - .-Unit 1 -Unit 2 ._- MallDem.nd
~~~!~~!~~~~~~!~~2 ~ ~ ~ g ~ ~ !nme~ ~ " ~ M ~ ~ ~ ~ • N N N N
·200
Figure 49 : Perf(Jrmsnce of GMtghsr PumpSlol7Ige stetion on a typical dlJy- 2Th Jan 16
WRPCIANNIMI. REPORT 20/5·16
1l1000
17000
16000
lSOOO
~14000
13000
12000
llIlOO
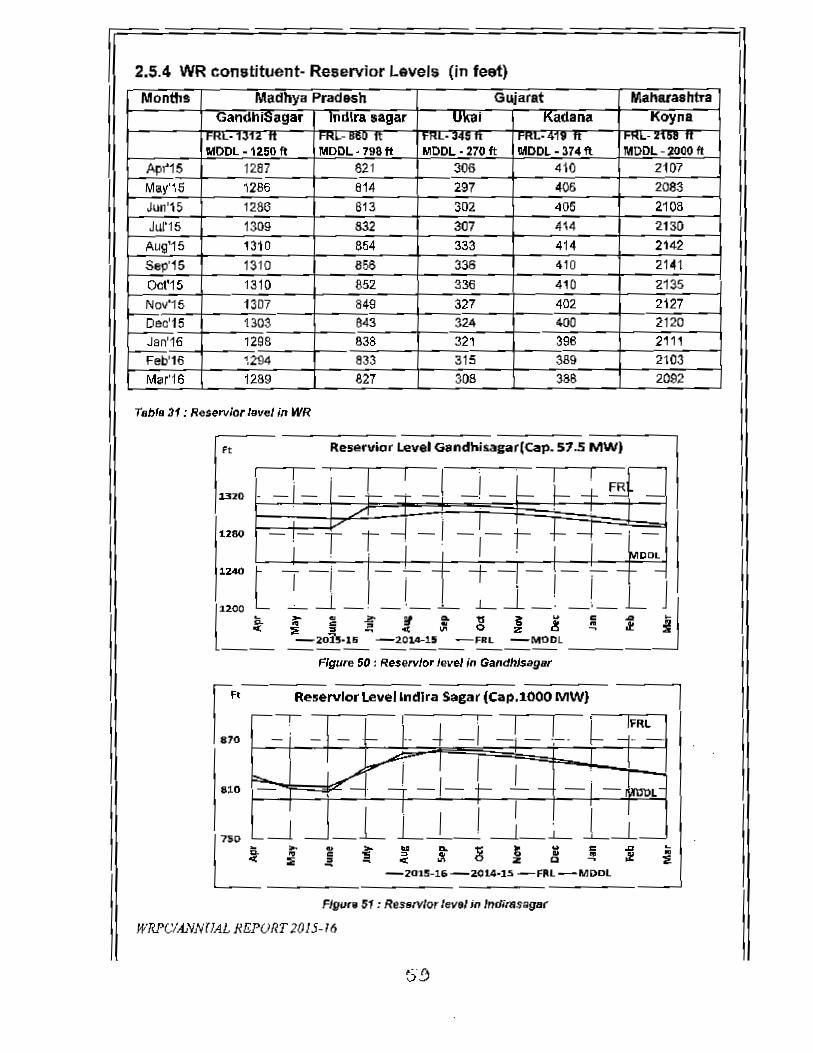
1r:.4 WRconstituent- Reservior Levels (in feet)MontfTs Madhya Pradesh Gl.Ijarat MaharaalrtTa
GandliiSagar Tndfra sagar UKlII Kadana Kayn.IH<1.- U12 n ,,.~-.IW It '~RL-.45 n I FRL-4', n 't-ML- n'8 rtMODL - 1250 It MODL - 798 It MDDL - 270 It IlilDDL - 374 It Mt>DL -lOOO II
Apr'15 1287 821 306 410 2107May'~5 ,286 814 297 406 2083J",n'15 1286 813 302 405 2103JuT1S 1309 832 307 414 2130Aug'15 1310 854 333 414 2142
Sep'15 1310 856 336 410 2141Oct'15 1310 652 336 410 2135No.t15 1307 849 327 402 2127Dec'15 1303 643 324 400 2120Jan'16 12.98 838 32, 3S8 2111
Feb'1S ~294 833 315 389 2103Mar'1S 12.89 627 308 388 2092
Tabl. :t1 : Reservior level jn WR
FlgUT&50 : Re$ervlor level jn G,,"dhlsag'"
IF.1.70
Reservlor Level IndIra Sagar (Cap.lOOO MW}
- -' ~
810
__j_i__ !__i ~!' ! & ~ :f-20t_S-16-201.4·1's-F~l-MDDl______ -l
F!gull 51 : Res.rvlor le'ololjn ,,,dims.gll'
WRPC/ANNUA.L REPURT 2015-16
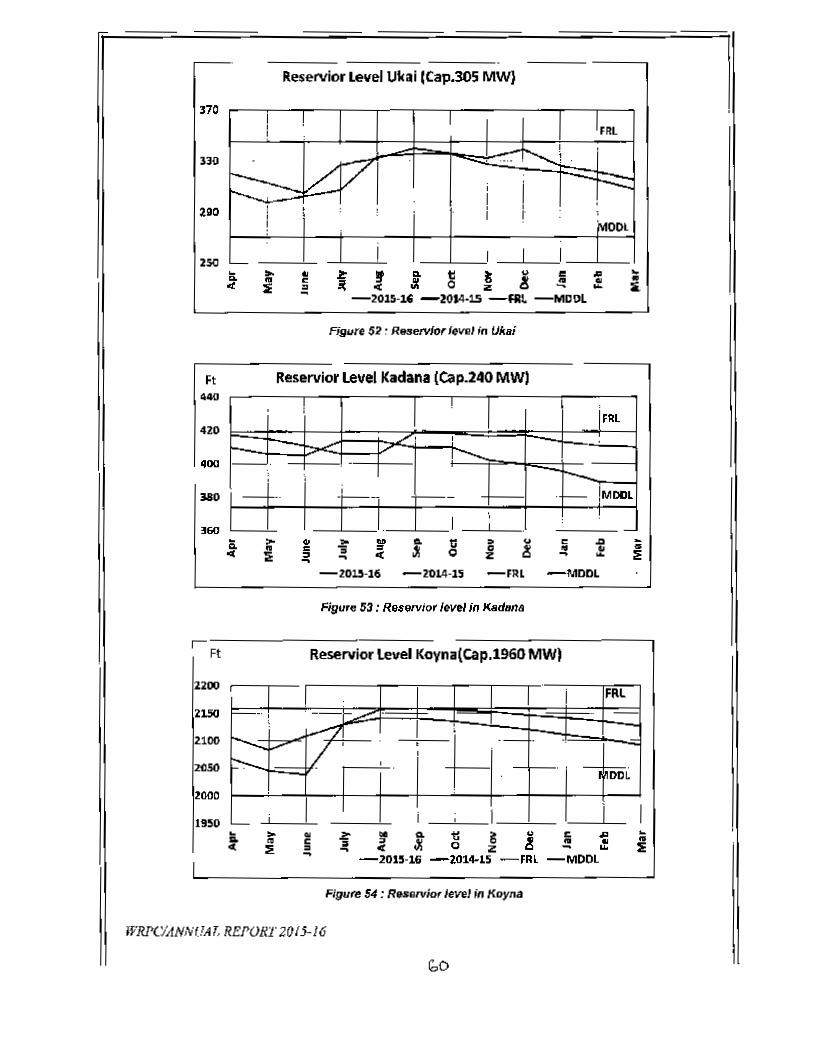
'-'Reservior level Ukai ICap.lOS MW}
370I ! I
IFRI.,, , ,no 7
.... .......... 1
t-- ~ ; i -r-::::I
liO i • , ! • ,, I f ,I jo4ool
250 '-- i I I I~ ... .. ~ " '" t: II " '" '" .." .. c JI ! .. .. •ct ~ -=
J;t '" 0 z - - ~-2015-U -lOI4·1S -fill. -MDDL
Fi9ur. 62 : Res.tvlor levol in Uxai
Ft Reservior level Kadana (Cap.240 MW).oo
! ! I ,
420IFRL
/' ,400
,............., ; -r--..
MD - .. +--1 r----- . _ !MOOl
I '; , I
'60 .-a >- .. ... ~ " tl ~ '" e .D ~
• ., -;; Jl 0 c ! .. " •c :0 " - « z - - :E- -2015·16 -2014-15 -FlU -MOOL
Figllre 53: Reservior level in K8dBIIB
r Ft Reservior level Koyna(cap.1960 MWI
2200 ,i FRL
2150 r----. -r_ ..... -; V'1f' I . I,2100 ..... , • t-._ .,2050 t--, , ..
DDL
~ I i I•'50 _i_ i • I-.. .. .. :? !t Q, tl ~ " " ". ..... " e ~ ! ~ .. ..'" :;, " " ct C Z ... :E-- -2015·16 -2014-15 -FRl -MOOL
IFigufe 54 : RNsrvio, level in KDyIld
WRPCIANN(!A T, REPORT 201.5·16
bO
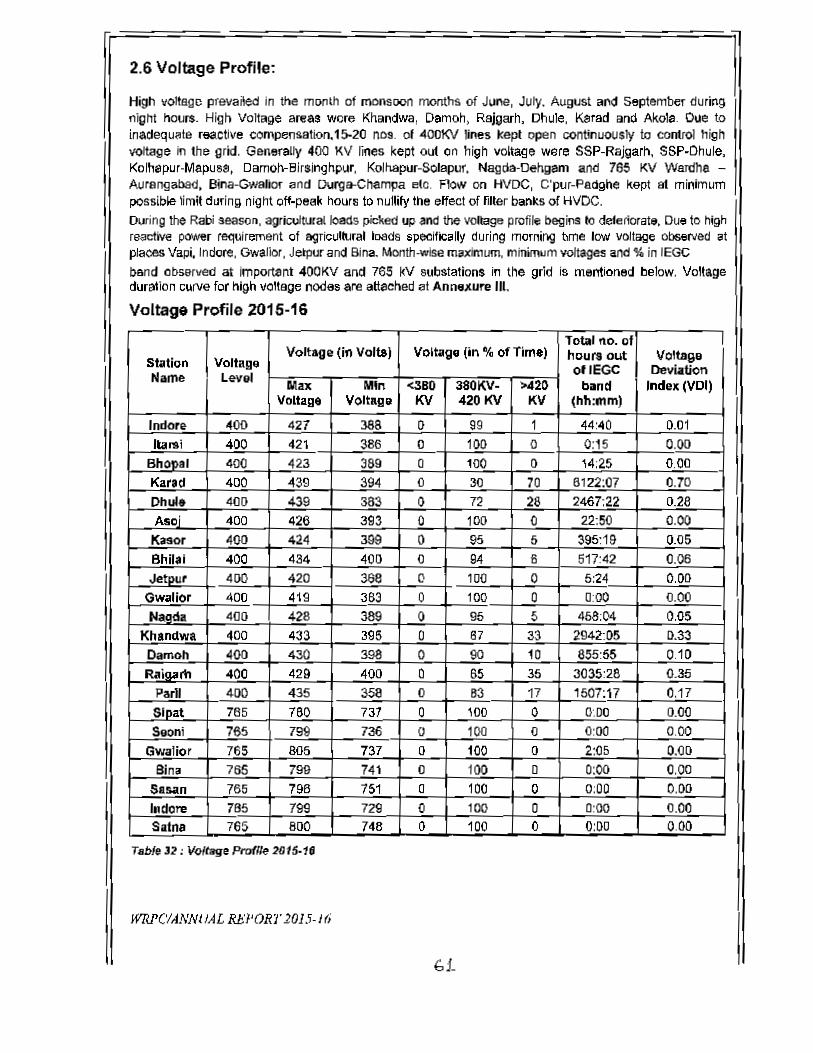
2.6 Voltage Profile:
High voltago preva~ed in the month of monsoon months of June, July. August aM September duringnight hours. High Voltage areas were Khandws, Darnoh, Rajgarh. Dhule, Karad and Akola. Que toinadequate reactiVe COfI1pensatlon.15-20 nos. 01 400KV lines kepi open continuously to control hillhvoltage in the grid. Generally 400 KV lines kept out on high voltage were SSP-Rajgarh. SSP-Ohule.Kolhapur-Mapusa, Oamoh-Birsinghpur. Kolhapur-Solapur. Nagda·OehQsm and 765 KV Wardha -Aurangabad, Bins-Gwalior and Ourga-Champa etc. Flow On HVDC, C'pur-Paclghe kept aI mininumpOSSible limit during night off-peak houra to nullify the elfect of filler banks of HVDe.During the Rabi season. agricultural loads picked up and the VOltage profile beQios 10OOIeriorata. Doe to ~reactive ~r requirement ot agricultural loads specifically during mornirog bme low voltage ob6erved atpIaoes Vapi. Indae. GwaflOt. JeIptJr and Bina. Month-wise maxJmum. minimum voltages and % in lEGeband cosarveo at Important 400KV am. 765 kV substations in the grid is menlioned below. Voltageduration cwve for high voHege nodes are attached at Annexure Ill.
Voltage Profile 2015-16
Tola! no. of
5btion VoltageVoltage (in Voll8) Volllige (in % of Time) hours out Voltage
Of race DeIli.J.tionName Level Max Min <380 380KV- >420 band Index (IIDI)Voltage Voltage KV 420KV KV (hh:mm)
Indore 400 427 388 0 99 1 44:40 0.01Ibrsi 400 421 386 0 100 0 0:15 0.00
Bhopal 400 423 389 a 100 0 14:25 0.00Karad 400 439 394 0 30 70 6122:07 0.70Dhule 400 439 383 0 72 28 2467:22 0.28
Asci 400 426 393 0 100 0 22:50 0.00Kasor 400 424 399 0 95 5 395:19 0.058hil~; 400 434 400 0 94 6 517:42 0.06JetllUr 400 420 368 o 100 0 5:24 0.00<>-liar 400 419 3S3 0 100 0 0:00 0.00Na.gda 400 428 389 0 S5 5 458:04 0.05
Khandwa 400 433 395 0 67 33 2942:05 0.33Dan\()h 400 430 398 0 00 10 855:55 0.10~luam 400 429 400 0 65 35 3035:28 0.35
Parll 400 435 358 0 63 17 1507:17 0.17Slpat 785 780 737 0 100 0 0·.00 0.00Secn; 765 799 736 0 100 0 0:00 0.00
G_liar 765 8()5 737 0 100 0 2:05 0.00Bin. 765 799 741 0 100 0 0:00 0.00
SaYIl 765 79B 751 0 100 0 0:00 0.00I.clore 785 799 729 0 100 0 0:00 0.00Salna 765 800 748 0 100 0 0:00 0.00
Table 32; Voltage Profile 2015-1'
WRl'CIANNt IAL RJ:;I'OR7"20],5·16
Gi-
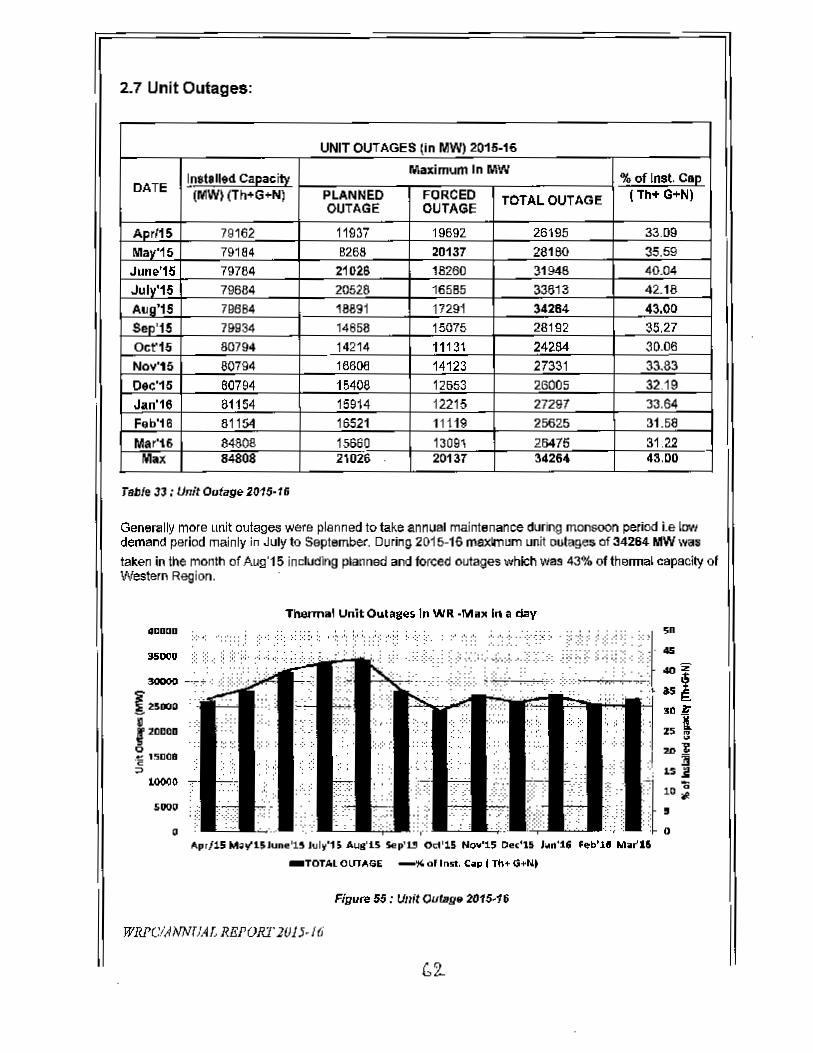
2.7 Unit Outages:
UNIT OUTAGES (In MW) 2016-16
IIl8t.hd capacityMaximum In MW
% of lnst. C.eDATE (MW) (Til-> G+N) PLANNED FORCED TOTAL OUTAGE (Ttt+ G+H)
OUTAGE OUTAGE
Aprl1S 79162 11937 19692 26195 33.09May'1S 79184 B266 20137 28180 35.59June'lS 79784 21026 16260 31946 40.04July'15 79684 20528 16585 33613 42.18Aug'1! 79684 18691 17291 )4284 43.00Sell'15 79934 14658 15075 28192 35.27Ocr15 80794 14214 11131 24264 30.06Nov'15 S0794 16606 14123 27331 33.83Dec'15 80794 15408 12653 26005 32.19Jan'16 81154 15914 12215 27297 33.64Feb'18 61154 16521 11119 25625 31.58Mar'16 848()8 15660 13091 26475 31.22
Max 84808 21026 20137 34264 43.00
rltbfe 33: Unit Outage 2015·16
Generally more unit outages were planned to take annual mainlenance during monsoon period i.e IDYldemand period mainly in July to September. During 2015·16 maximum unit outages of 34264 MW wataken in the month of Aug'15 incJudhg planned and forced outages which was 43% of thermaL capacity ofWestern Region. .
Tnermat Unit 0"t08es In WR -M." In a day
3ODOO ~t·: :::
12:5DODIf 20DO.
o.~ 150(1.;>
10000
• •
Apr/15 M~"1.SJun4!'1..5hsl~'1S AuS'iS Sep'13 Octl1S "0'lIl'15Oe<~S ,.....j. ~'1'"br'U
_TOTAL OlJTAGE -'" of In". C~p I Th+ G-I'Nt
Figure 5$: Unit Our.g. 2015-16
WRPCiANNU.4£REPORT1()15·/(j
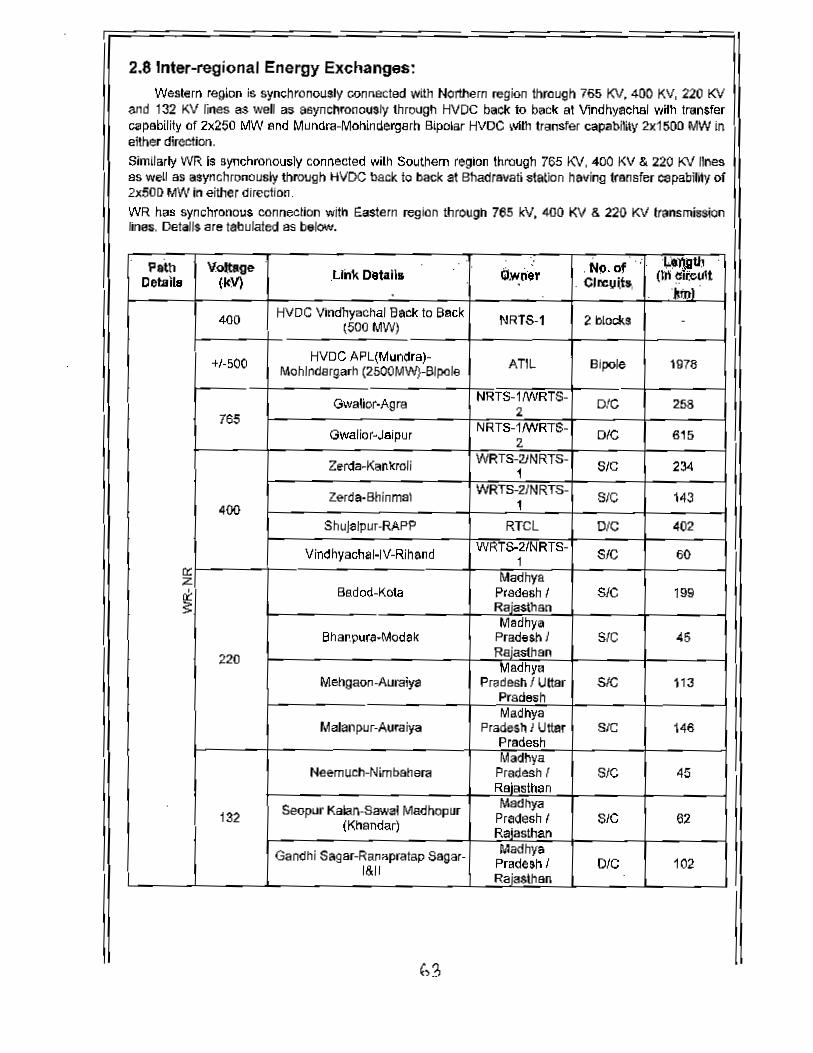
2.8 Inter-regional Energy Exchanges:Westem regiofl is synchrollOlJ$Iy connected with Northem region through 765 KV, 400 KV, 220 1'01
and 132 KV lines as well as asynchronously through HVDe bael< 10 bact< al Vioohyaehal v;iIh Iran$~
capebility of ZX250 MW and MuMra-Mohimlergarh Bipolar HVDe ",1111transfer capabilily 2x1500 MW ineither direction.s-nllarly WR is synchronously connected with Southern region through 765 1'01, "00 KV & 220 KV Hoes8S well as asynchronously through HVDC back 10 back al Bhadravati staUon having lransfer cspabilily of2x5ODMW in either direction.WR has synchronous conneclion with Eastern region through 765 kV. 400 KV & 220 KV transmissionlines. Details are tabulated as below.
Path Vol.l3ge .: Nfl.of .,.Llnt< Details Gl.wli'er (]if Illf.eUltDetails iW) . Clrcl.lita,iin_l
400 HVDC Vindhyachal Sael< to Back NRTS·1 2 blocks .(500 MW)
+/·500 HVDe APL(Mundra)- ATIL Bipole 1978Mohfndargarh (2SOOMW}-BIpole
Gwa!ie>r-Agra NRTS-1IWRTS- ole 2582765 NRTS-1/WRTS-Gwallor-Jalpur 2 ole 615
Zerda-Kankroli WRTS-VNRTS- SIC 2341
Zerda-Bhinmal WRTS-2JNRTS- SIC 143400 1
Shu)8lpur-RAPP RTCL Die 402
Vindhyachal-IV-Rihand WRTS-2/NRTS- SIC 6010:: Madhyazrl:. Badod-Kota Pradesh I SEe 199s: Rajasthan
MadhyaBhar.pura..Modak Pradesh I SIC 45
220 RaiasthanMadhya
Mehgaoo-Auraiya PradeSh! Uttar SIC 113PradeshMadhya
Malanpur-Auraiya Pradesh I Uttar SIC 146PradeshMadhya
Neemuch-Nimbahera Pradesh I SIC 45Rajasthan
Seopur Katall-Sawal Madhopur Madhya132 Pradesh I SIC 62(Khandar) Ralasthan
Gandhi Sagar-Ranapratap Sagar- MadhyaPradesh I DIC 1021&11 Rajasthan
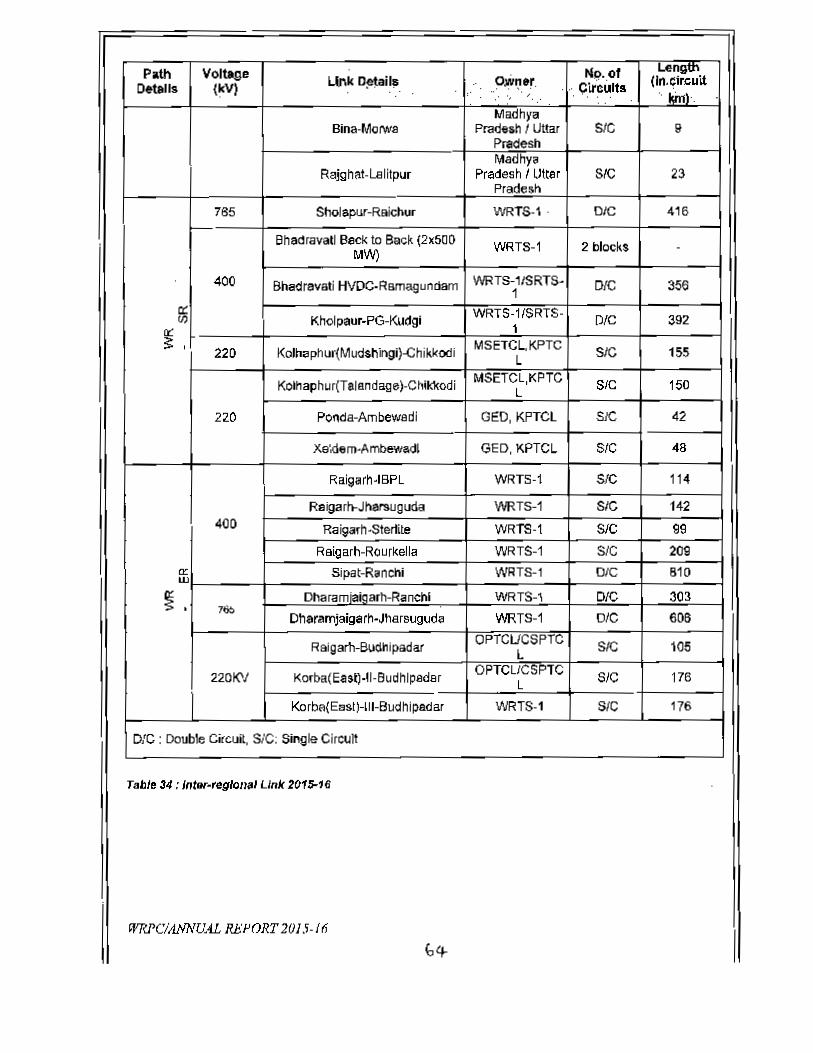
Path Voltage UnkD~iI, OJN,:,.er. 1'I~-.o' Lenlill'.
~Ia {WI.. . .. Circuits (In.elr,,uit,. .' .~, .. .. kml·...' ..
MadhyaBina·Morwa Pradesh I Uttar SIC 9
PradeshMadhya
Rajghal-LBlitpur Pradesh I Uttar SIC 23Pradesh
785 Sholapur-Ralchur WRTS-1· ole 416
BhadravaU Beck to Back (2x500 WRTS-l 2 blocks -WI)
400 Bhadravati HVDC-RBmsgunclam INRTS-1/SRTS· OIC 3561a: WRTS-lISRTS-In Kholpaur-PG-Kudgi DIC 392
oc 1~,
220 Kolhaphur(Mudshil'lgl)-Chikkodi MSETCL,KPTC SIC lS5L
Kolhaphur(Talandage)-Chikl<odi MSETCL,KPTC SIC 150L
220 Pooda-Ambewadi GED,KPTCl SIC 42
Xe',dem-Ambewadl GED, KPTCL SIC 48
Raigarh-IBPl WRTS-l SIC 11~
Raigart.-Jharsuguda WRTS-l SIC 142400 Raigarh-Ste~ile WRTS-l SIC 99
Raigarh-Rourkella WRTS-l SIC 209
a: Sipat-Ranchi WRTS-, DIC 810w
~. Dharamiaioarh-Ranchl WRTS-, ole 303760 Dharamjaigarll-Jharsuguda WRTS-l OIC 606
Raigarh-Budhlpadar OPTCUCSPTC SIC 105L
2201<'1 Korba(Eastl-II-Budhlpadsr OPTCLlCSPTC SIC 176LKorba{EasIHII-Budhipadar WRTS-l SIC 176
OlC : Double Circuit, SiC: Single CircuIt
Table34: inlw·reglollallink 2015-16
WRf'CillNNUiL REPORT 2015-1 Ii
Ib'f-
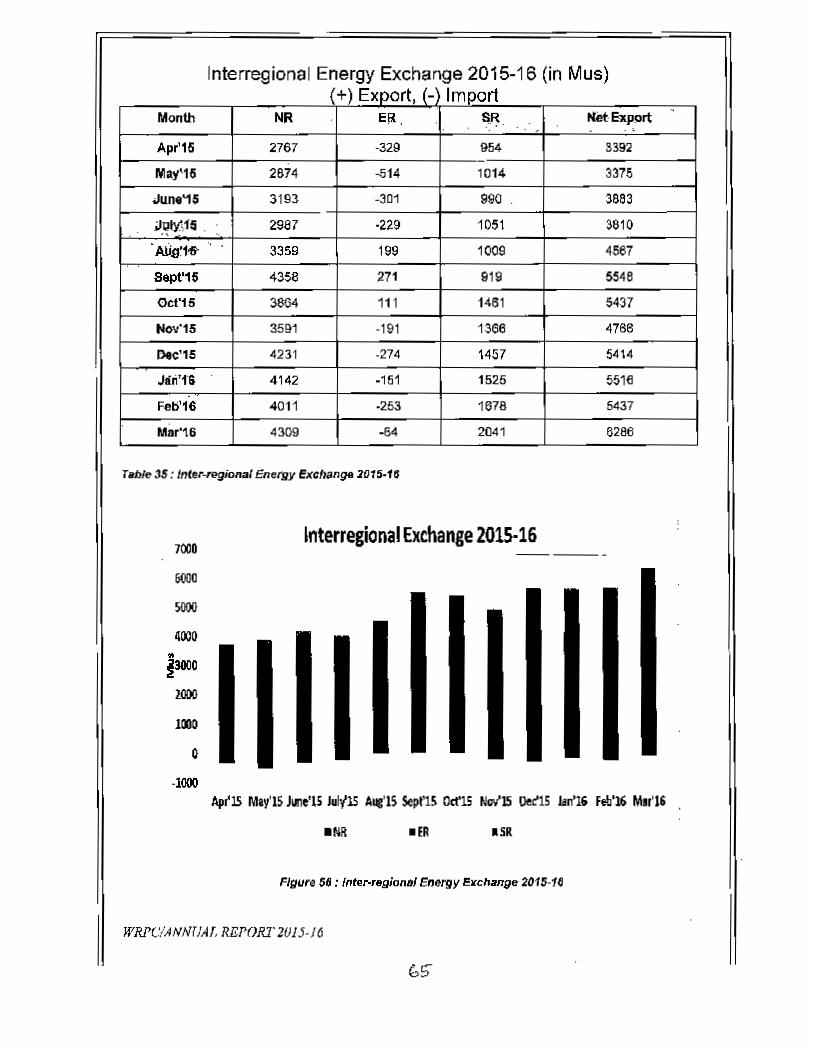
Interregional Energy Exchange 2015-16 (in Mus)(+) Export, {- Im(Jort
Month NR $.~ Net ExP9rt..
Ell . , . ,Apr'15 2767 -329 954 3392
May'16 2674 -014 1014 3375
Jlin.'15 3193 -301 S90 _ 3883
;.IQIY,I,11; . 2987 ·229 1051 3810"·AlIa~l~.. - 3359 199 1009 4567
8ept'1S 4358 271 919 5548
0et'15 3864 111 1461 5437
Nov'IS 3591 -191 1366 4768
Dec'15 4231 -274 1457 5414
Jiri'rS 4142 -151 1525 551e
Fet)'16 4011 ·253 1678 5437
""16 4309 -04 2041 6266
Table 3S ; Inl.r-n>gional Energy fJ(Ofliinge 2D15·16
Interregional Exchange 2015·161008
6000
SOOO
4000
1000
o·1000
Ap~15May'lSJllle'l5 July'lS Aug'lSSept'lS 0,1'15 Noo/lS 0ec'15 lan'li Fob'16Mu'16
.SIt
Figure sa; {"teNlIgiOns/ Energy E~ch~nge 2015-16
WRl'C!ANNrJAI. REPORT Z()1J·J6
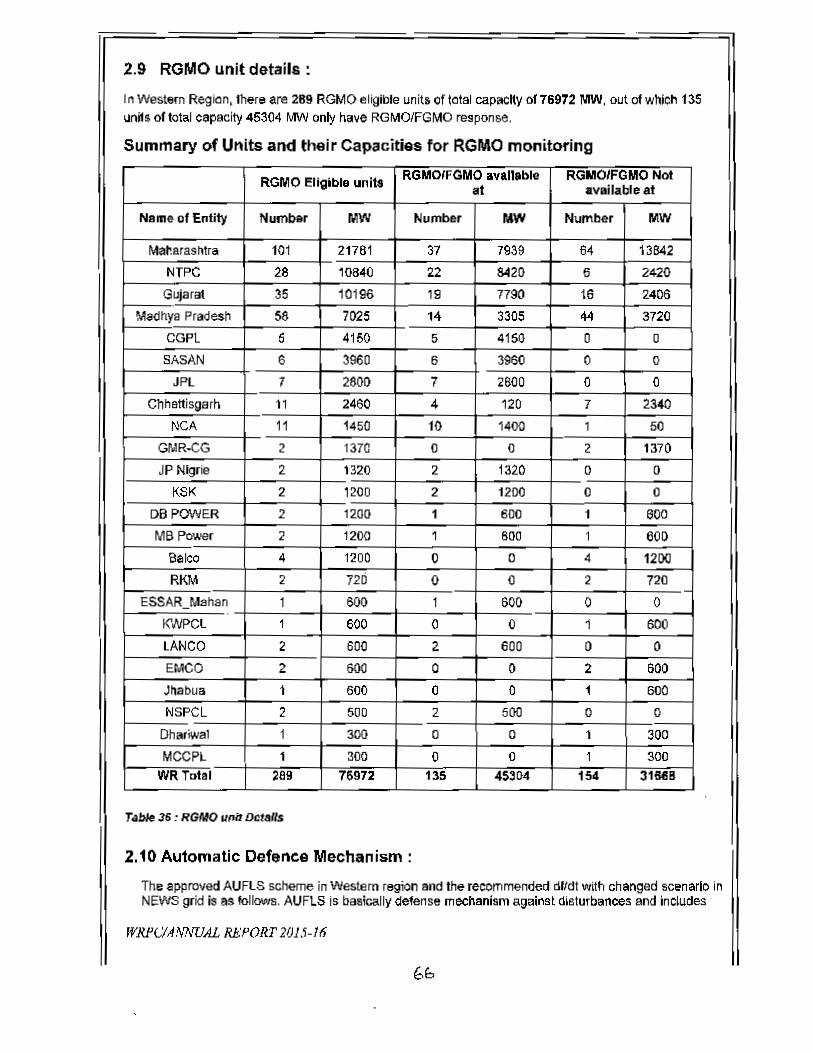
2.9 RGMOunit details:
In Western Region, lher" are 289 RGMO eligible units of total capacHy 0176972 MW. out of which 135units of tolal capacity 45304 MoJV only have RGMOIFGMO response.
Summary of Units and their Capacities for RGMOmonitoring
RGMO Eligible units RGMOIFGMO available RGMOIFGMO Notat aY1Ii ~bIe at
Ns me of Entity Number MW Number MW Number MW
MaI'.arasfltra 101 21761 37 7939 64 13642
NTPC 28 10840 22 8420 6 2420
Gujarat 35 10196 19 7790 16 2406
Madhya Pradesh 58 7025 14 3305 44 3720
CGPL 5 4150 5 4150 0 0SASAN IS 3960 6 3960 0 0
JPl 7 261)0 7 2600 a 0
Chhattisgam 11 2460 4 120 7 2J.CO
NCA 11 1450 10 1400 1 50GMR-CG 2 1370 0 0 2 1370
JP Nigrie 2 1320 2 1320 0 0
KSK 2 1200 2 1200 0 0
DB POWER 2 1200 1 600 1 600
MBPcNJer 2 1200 1 600 1 600Baico 4 1200 0 0 4 1200
RKM 2 720 0 0 2 72Q
ESSAR_Mahan.-
1 61)0 1 600 0 0K'M>Cl 1 600 0 0 1 600LANCO 2 600 2 600 0 0
EMCO 2 SOO 0 0 2 600
Jhabua 1 600 0 0 1 600
NSPCL 2 500 2 500 0 0
Dhariwal 1 300 0 0 1 300
MCCPl 1 300 0 0 1 300WRTDtal 289 76972 135 45304 154 31!1418
T.abIe 35 : RGMO 11MDotalls
2.10 Automatic Defence Mechanism:
The approved AUFlS scheme In Western region and the recommended dlldt with changed scenario inNEWS grid is as IoIlows. AUF\.S is basically defense mectlanism against disturbances anct includes
WRP<YA.'.,..NUALREPORT 2015-16
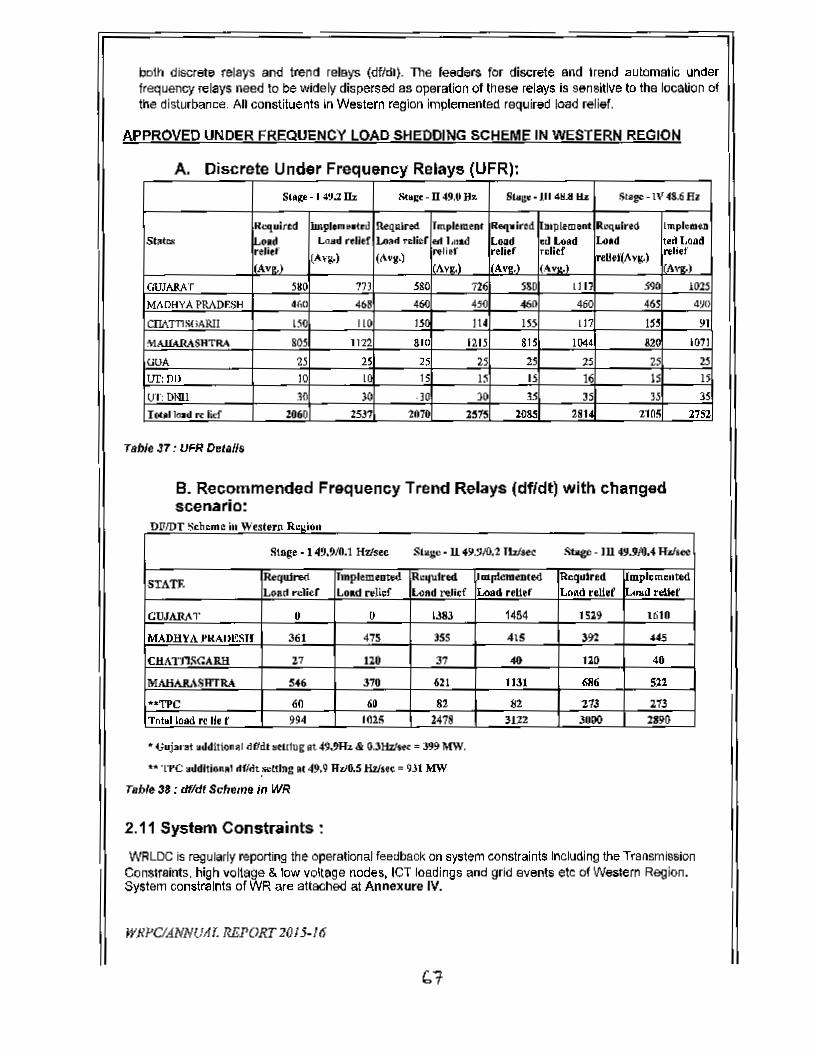
both discrBte relays and trend relays (dfldl). The feeders for discrete and trend automatic underfrequency relays need to be widely dispersed as operation 01 these relays is sensitive to the location oftI\e disturbance. All constituents in Western region implemented required load relief.
APPROVED UNDER FREqUENCY LOAD SHEDOING SCHEME IN WESTERN REGION
A. Discrete Under Frequency Relays (UFR):S,.p' . I49.llh !<t,,,,, . D 4'-0 If. SWj;C • 111 4111.1 H.&: SII,.. IV 48.6R.
R,cquifCd lmplem ".ted !\eqRlred mplemenf Reqllited Inplfmeat ~"'l- I~StJlttt: ':-••Id LOJld ttl)ef WI''' relief M 1.lIad L.. d ed told Lo.d ,,)1.00<1
relief'lA"~) ("'V·)
reller relief Telicf ~.U.I("vl(o)reJj~f
Av!.1 I\v.. 1 AVl!.1 .....,..1 1Ivt:.)
aJJAY.T SI! 771 580 726 5SI 1117 590 10".j
loIADHYAPRAD~ .r.< 468 ~ ~ £ %!II 46 <Ill<CIJ/\TnSnPoRlI I~O 110 150 IU ISS 117 IS 91
:\1AJJARASlITRA 805 1122 81<1 1215 81S 1044 82 1011
GOA 25 25 2; 25 25 l5 2 2lur: 1111 10 10 IS 15 I IE I 1UT:DNlI 30 JO ·10 )0 J; JS J.i 3I Oltll(1ad rocIkf %060 2517 1070 1515 1085 2814 nil! l1Sl
B. Recommended Frequency Trend Relays (df/dt) with changedscenario:
RDl1IDT; Cornein westere c..:h:ul
SI.~t • I "',9.11.1 Hrlsto s.aC". U49.!liO.1 Tbfu< Stxge. III 493""4 Jbf..e
STATF.""qui"", Tmplem.DtW Rt.:qu1rtd 011'1<"""'10<1 'Rcqd~red .. pI..... ttdLOAd relitr L.ad r.lI.r IAlftd re)1,f Load reUtf Load ,<liet x.... d ,eller
CUlAJL<1' U U 1.I8J 1454 1519 1610
.fADB YA 11tAl ~rr 361 475 )55 41S m US
ellA TnSCARB 17 uo 37 010 110 41
MAIIA&ASRTRA 546 370 611 1131 6li6 5'1
"'1?C 60 60 81 ~2 1.73 113Tntalloai ft 1M r 99-4 1015 l478 )U2 .lOOO 2J9(i
.. (;uj31'St IIdd1ti.Ollill df1dt !ltUlug Qt 49.'H~ & O.3HzJw = 399 MW,
... 'rrC IIddltionlll' d(/dt ,lWeltlnalIlt49.9 Rvo.S Hz/lf(: = 931 M\V
TIllM 33 : dIldl Scheme in WR
2.11 System Constraints:
WRLDe is regularly reporting the operational feedback on system constraints Including the TransmissionCollSlrairlts. high vo~age & low voltage nodes. leT loadings and grid events etc of Waslern Region.System consttalnls ofWR ate attached at Annexure IV.
WJWc/ANNUA r. REPORT 20 J 5·16
("1
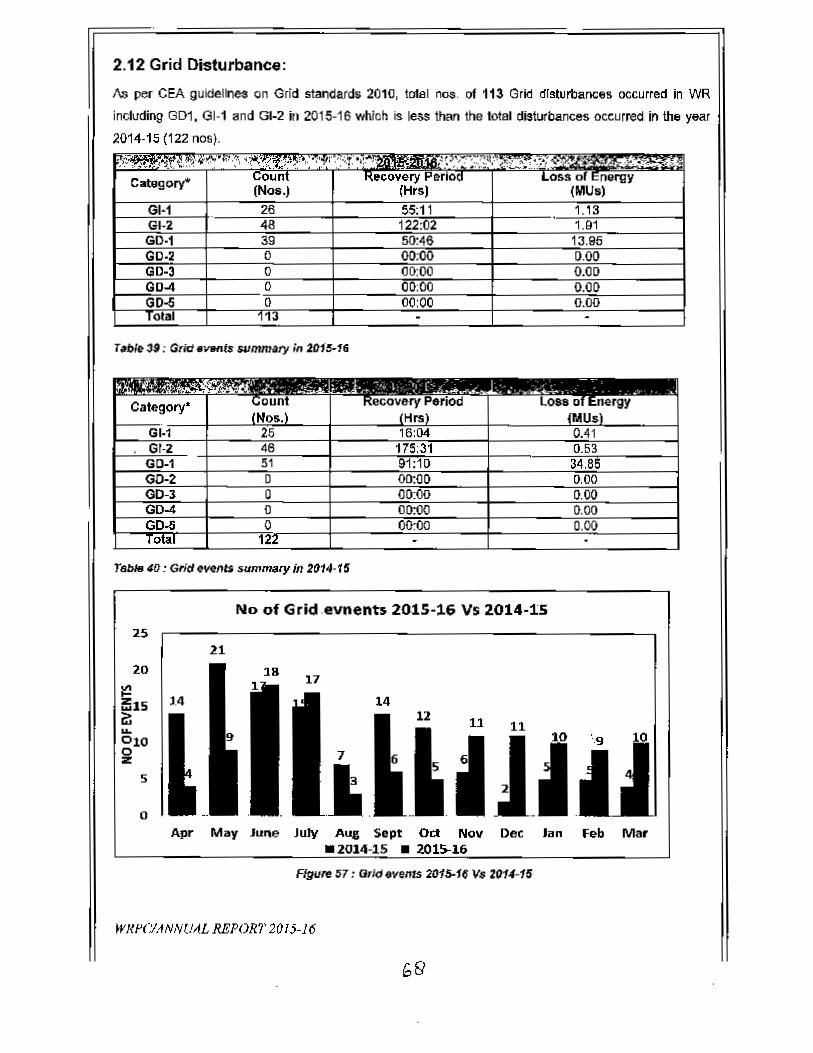
rr:::=Grid Disturbance:
II :.~ CEA guidelines on Grid standards 2010, totel nos. of 113 Grid disturbances occurred in WR
including G01, GI-1 and GI·2 il) 2015-16 which is less thAn the lotal disturbances occurred in the year
2014-15 (122 nos).
(Nos_)C:ol8gooy"
TabM ~O: Grid ewnts SlDlI_ty in 2014-1S
No of Grid .evnents 2015·16 Vs 2014-1525
21
20 18 17I!!!15 14
~ 11 11....0100z
5
0Apr May June JUly A,.g Sept OCi Nov Dec Jan Feb Mar
.2014-15 • 201!>-16
Flgu~ 57: Grid events 201S-1~ Vs 2014-15
WJ<PC/ANNUAL REPORT 2() I 5-16
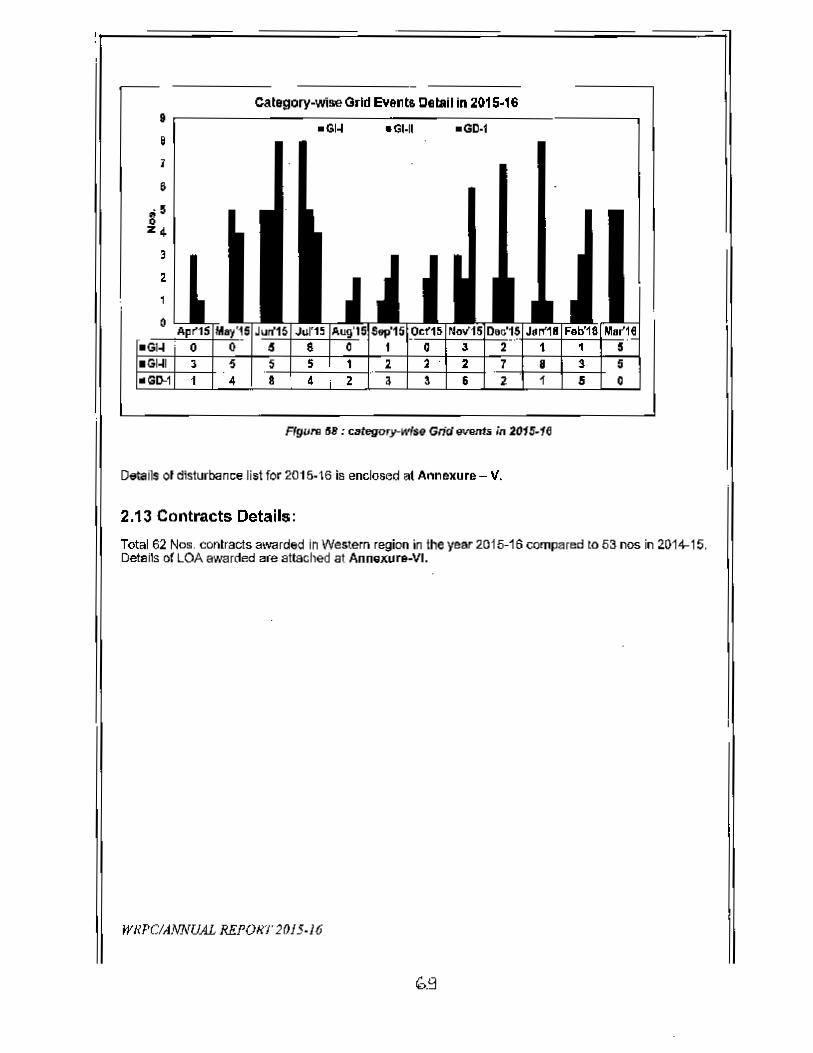
category-wise Grid EYentr. Detail in 2015·16•r---------------~----------~------.------__,.GI-I .1l1·1I .GD·l8
1
8
Flgul'O 5': c"tegory-Wfse GricJ"""nt. in 2015-16
Deta~s 01disturbance list for 2015·16 is enclosed at Annexure - V.
2.13 Contracts Details:Total 62 Nos. oontracls awarded In Western region in the year 2015-16 compared to 53 nos in 2014-15.Details of LOA awarded ale attached at Annexure-VI.
WI/PC/ANNUAL REPORT 2015.16
(,.9
CHAPTER-3
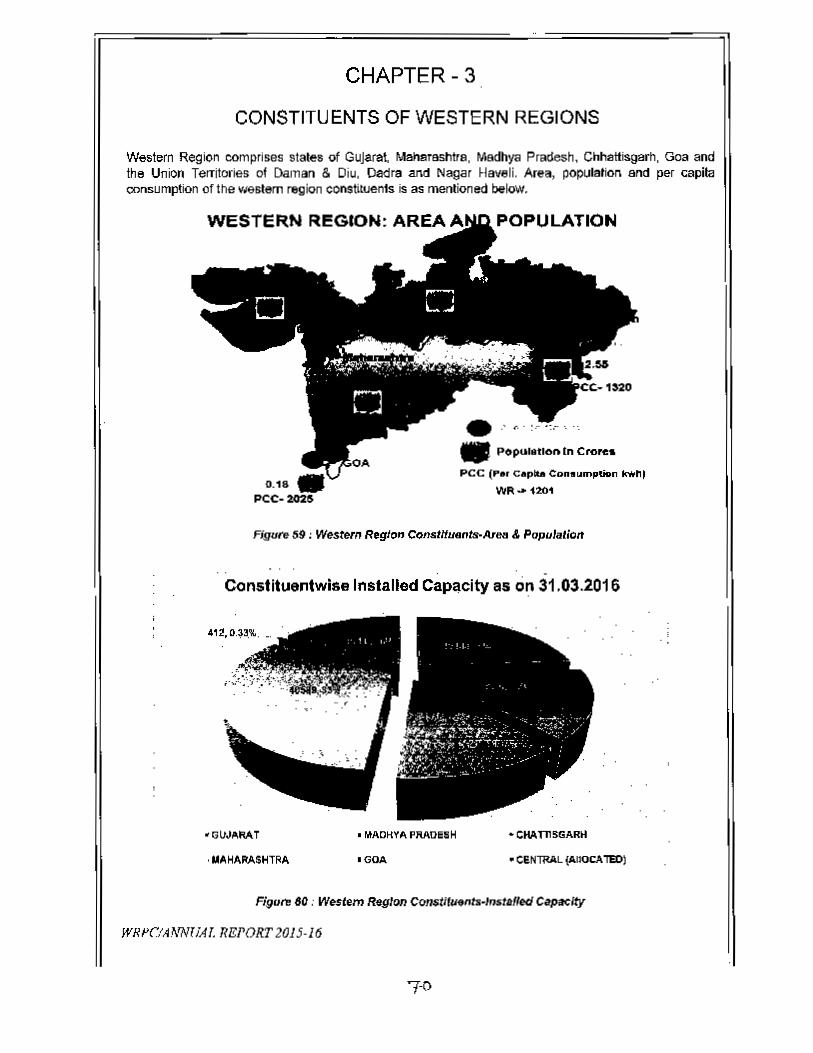
CHAPTER - 3
CONSTITUENTS OF WESTERN REGIONS
Western Region comprises states of Gujarat. Mahmeshtra. Madhya Pradesh. Chilaltisgarh. Goa oodthe Union Territories 01 Daman & Diu. Dadre and Nagar Haveli. Area, popufallon ancI per capitaoonsumpUon of the westem region constltuents is as mentioned below,
WESTERN REGION: AREA POPULATION
•.' ,.':"
0.18pcc- 2025
• POpuhlltlon In Crate: ..
pee (per Captla Con.umption k'*'"WR..»o 1201
Figure 59 : Western Region Constituents-Area & Papulalion
Constitu6ntwis8 Installed Capacity as em 31.03.2.016
• MADHYA PAAOESH -CHATnSGAROl
• GOA • C~lRAL (AllOCATED)
Figure eo : We,'em RegIon Canslifuents-h>staRed c..paclty
WRI'C"JAI.,rmiAT.nsrosr 2015·16

3.1 GUJARAT
Gujeralls dense with the population of 6.63 Cr within an area of 196024 sq. km. The per capitaconsumplion 01this s1aIe is 1663 kWh. InslaU8d capacity 01Gujarat is 29868 !loW as on 31.03.16.
Ins1aIled Capacity of Gujarat - 29868 MW(Fuel wise break·up)
Gujarat Installed capacity- 29868 MW IS on MlI,'16
- Coal .. Nuclear• Hydro • RES-GBS
scorce-ceaFigure 81 : Installed CapacIty of Gujarat
Central Sector share Allocation-
- - _.'''300:--~~~--~~--+-~--~
~:: 266.1
6043
V:;,
jg"'(PAT;API'
rAP .;tt'''' '>,
.S(PAT1vo) r r-o-tv
V'I> fPS-VS81.CGPl
~
.
lOla!
1000
12i
51)0 96.1 540.0
23923993.
1450 246.5 17.~-7~~__-+ ~1SCO~S'.~O +-__~~7.7-__--4
196 .5
Tltbie 41 ; Central sector share allocation to Olljsm
fftlU'C!ANNUAL REPORT 1015·16
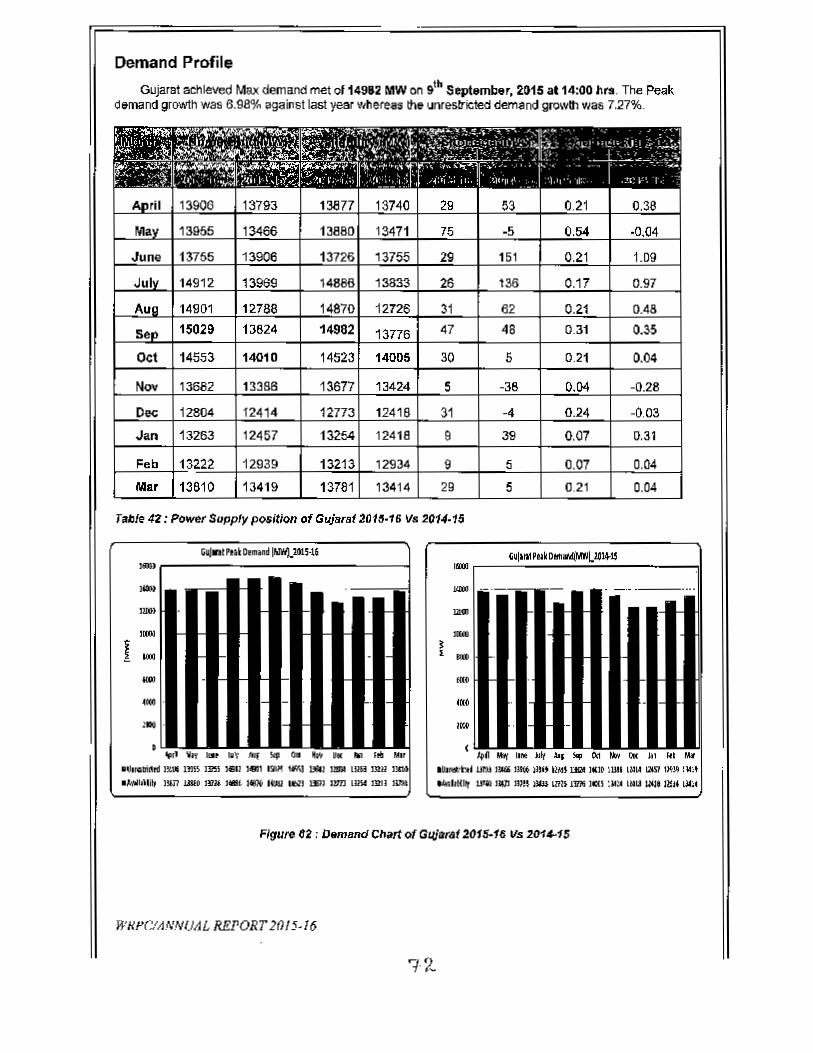
Demand ProfileGujarsl ach~ Max demand met of 14962 MWon 9th SeptIJmber. ~5 aI14:00 II.....The Peat.
demand growth was 6.98% agaillst las! year whereas 111&ul'lr~sbicted demand growl!> Vias 7.27%.
MIL' 13810 13419 13781 13414 29 5 0.21 0.04
Tabl. 42: Power Supply position of Gujaf.t 2013·16 VB 21)14·15
lois )Ip C. In rod'
11bM:b:t lJItJ BEl .. "", we tD ,.... ~UftUU DIISlQ9IJ
at.fbNllr uta ng'J JI}!!. »W LBt. 1_ lCCS:JC!f lW UllJI2Ii alt....
'.J"-....-I 1M
..,,..."" .
..."'.,,...,
I' ...IU.
~ 'ht at ., JtJ( 5I:p a. '" hi: JIi:I ,,, Ity~ 1:D nm DH MIl )e1 IW'!. W-.J BilU U5iII lIlIiI DlU I....... Bil Wit 9lJf. ,. .... If:IlI IE7J WD lRSf Iml IUJIl
Figure 02: Dem8nd Chart of Gqjarat 2015-16 Vs 201.".15
WIII'(:IIINNUAL REl'ORT}(}/ 5·16
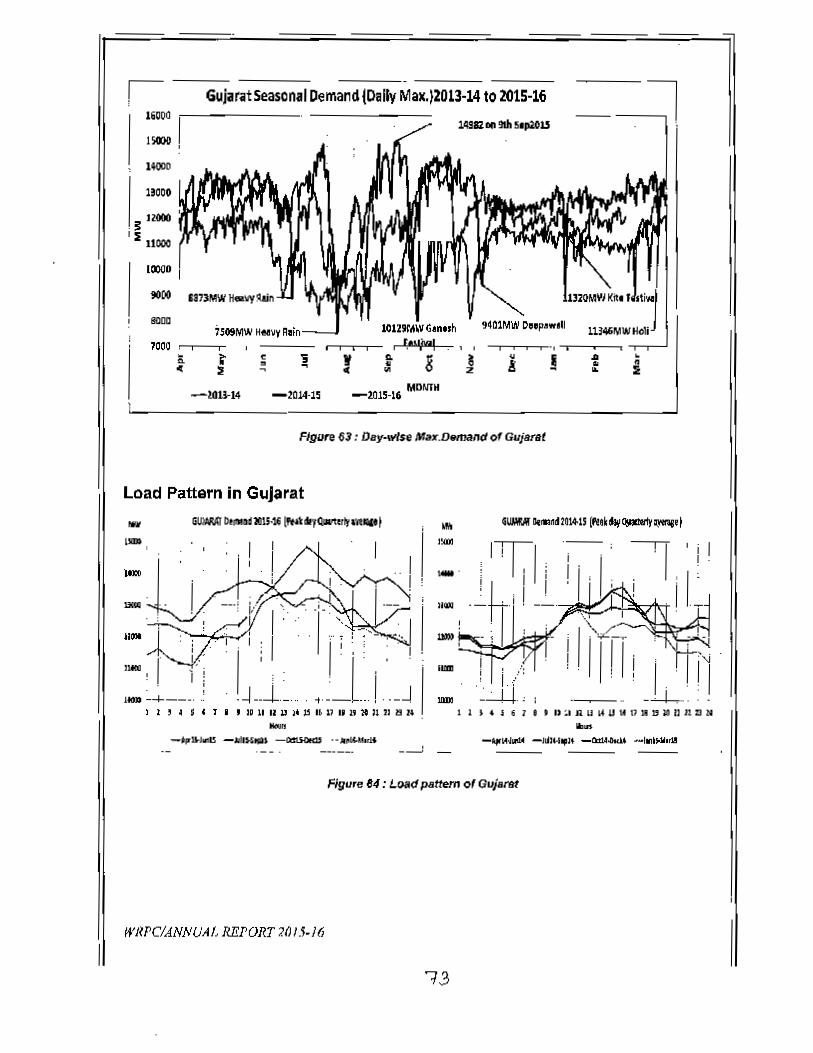
6ujiIr'it5easOnal Demand {Dally MaK.)2013-14 to 2015-1616000 I15C1)O ,
11000
13000
.;:'-':E UGOO
10000
9000 IS7lMW HOI"YIWn
!IlIIl
1000 ~-~ •j ..•..e•
-llllH4 MorJ'TH-:!IllS·I,
Figure 63: D8y·wl •• Max.Domand of Guj8f8t
Load Pattern in GuJarat
...... .......--11010
I..-J,... ,
I III-~ ...
i/~,
) 1 , ~ $ , 1 I , ~ U R U " U K D " n N Jl 21 8 N . 1 1 I. $ 6 7 • , I'~ n u ~ U W 0 m D.O nUM",.,
-lfrl4l1~ -1..J ..... l.. _CId.I~ -IIilUollI"lI""'.
Ngu,e B4 : Load pattern Of GUj8rat
WRPCIANNUAf_ REPORT 2(J 15-J 6
73

3· Dimensional Demand Met Chart·Glliarat have its highest demand period during the sept to Nov month due to festive season
(Navratrl. Ganesh Puja and Diwali)
Figure 55 : 3- Dimonsion.1 o.mllnc1 grapll of Gujar ..t
Gujarat load Duration Curve-(2015-16) Vs (2014-15):
I~UOOD-cE..'"'II ....g
GWARAT LOAD DURATION CURVE 2015·16 Vs 201~1511000 - - --j
I· i• il'H"'_'_ 1----,--- --_._- ,..... . .._ . r
~
,I
I
I , I
-It:- !"" , ..... 1--- -T
~ : II I,! i II
- -- - ---j
! - -I! r-r---..-" ............· ~I· I<,, -..: , ,! i I I"~i I, I•t -_ ..:. --- --!I : ,
ji ! ! •,- -,
1.$000
u...
...... ,,,. .... .." .... -" ofnrne -20U·11i> -ZOl."U
FIgure 8 6 : Load dUf8/ion CUfVfJof Gujltrll/
WRl'CIA.NNUAL lIE}'ORT 201,1-16
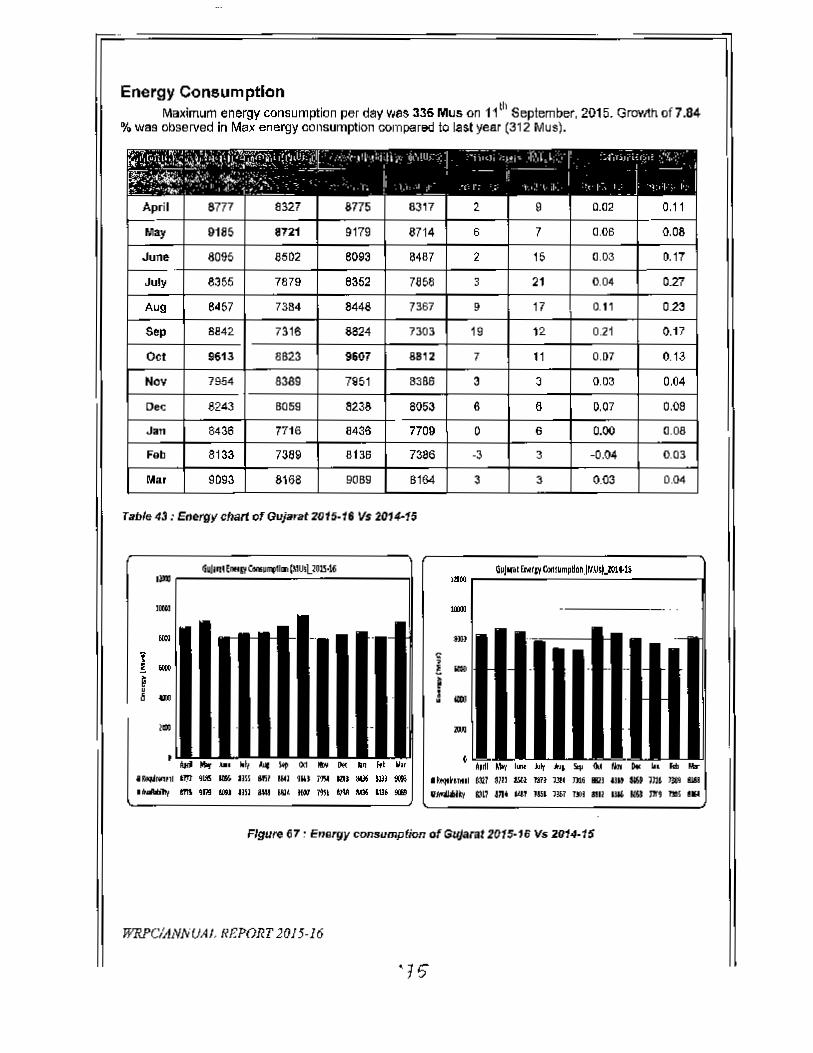
Energy ConsumptionMaximum energy consumption per day Vies 336 Mus on 11111September. 2015. Growlh of 7.84
% was observed in Me.. energy consumption compared to last year (312 Mus).
r;.~,r..+j""~L'~f);A;~.~'I·.i~~~~~~II:i~j\u~~tdD:(·.'i t:'1 III !1\"Hb , I ~)~d~ ':J~I'" .f,\l_L 'r .r, r ,,:-,. ,~,. "'; •. • • ~2.;:"'~ .1. ,_.. _ _ , , - ,[2::'1'''''' ...., ,~_i·.,: 'A~ 4.·... .-~-. !i • '- I: I
" I' '.. J I_~.""'1~' I ,~I.~~_,_,.__ . . , I. ) I ',1 -c 1 I" , J OJ, I 1
April 8777 8327 8775 8317 2 9 0.02 0.11
IoIAJ 1»85 8721 9179 8714 6 7 0.06 0.08
June 8095 8502 8<l93 8487 2 15 0.03 0.11
July 8355 7879 8352 7868 3 21 0.04 021
Aug 8457 7384 8448 7367 9 17 0.11 0.23
Sep 8242 7316 8824 7303 19 12 0.21 0..17
OCI 9613 8823 9607 8812 7 11 0.07 0..13
Nov 7954 a389 7951 8388 3 3 0.03 0.64
oee 8243 8059 8238 8053 6 6 0.07 O.OS
J3n 6438 7716 6435 7709 0 6 0.00 0.08
Feb 8133 7389 8136 7386 ·3 3 -0.04 0.03
Mar 9093 8168 90B9 8164 3 3 0.03 0.04
T2ble 43.' Energy chart of Quiarat 201~-16 Vs 2014-15
........
...•........ "".Od_klllll
.~ If!! a IS Jl5l W IiO 1K): i7SI IZU all U» Mio..... 1tt rm."r.! .. un aMI Kit JW flSl W AOC LUi ..
.. wr ..... ..Iblflh:flUI tm IRJ m 1m Dh ,. 5J Bt .. DlI P.I! _
I~rl tn, UU 141 WL )1Il 011 au: .. WIn" ..
Flgu","67: e"srgy consumption ofGl(}arat 2015-16 Vs 2014·15
WRJ'C/,fNNUAI. RF.PORT 2015·16

SEASDNALVARIATIOIIIIN DAILY CDN.UMPTIONOF GUlARAT(lOU-" TO 2015-161
._'-,- I I- -1"1.. ' ),JIG on 111h s.pt I
! ; ~:; drop (In ItUhun'l5-f(Jteo ~st""", :
)70 T- ••,,
<70
J9Mus drop G1'I
'-, llNOY'lS~Deepawl!lltS7Mus d.o.onZO' --- I Isep·15 .....e.vv .aln
lind sunday1
i
~..,,..,6]MLJt drop C)f\
llJul'I'l.S.-Hee"Y flal"llO _. J
.I f l-......"'.
41Mut dl't)pon 2'.I '(l1115-~lI.:avvR~ln
1 ~ 1_l'tn4tS
-~---~ ""
Renewable Energy in Gujarat
Figure 69 : Gllogiaphlealloceflo". 01 Wind,."d S"ter plants in G!I~T1t1
WRPClANNUAL REPORI 2015-16

Wind Generation: 3-Dimensional Chart-
Flgul'lt 70: J D - Wind Generation In GuJalat 2015-18
Maximum wind generation of 2726 MW was observed on SIJJJuly 2015. The hourly windgeneration graph for the s.arneday Is as mentioned.
Max. Wind Generation in Gujarat- 5th July 20152.800
2700
2600
I ---1- '-I" -'r ,k"' z Z!
I /\.1 ; lL- i"-tt,..-- .. .VV \;~ . I--...
I,
: •po... ...::;-- - i I-- '-'1 . i\ \})
- .
!V-1-' I-K .1.. I
! I I I!! ~ . .. . . -
2300
ZZOO
21001 2 3 4 5 6 7 8 9 10 11 1213 14 15 1617 18 19 2021 22 23 24
HRS
Figure 71 : Highest Wind Go".ration in Gaia",t
WRJ'C!IJNNUAL REI'ORI zot 5·} 6
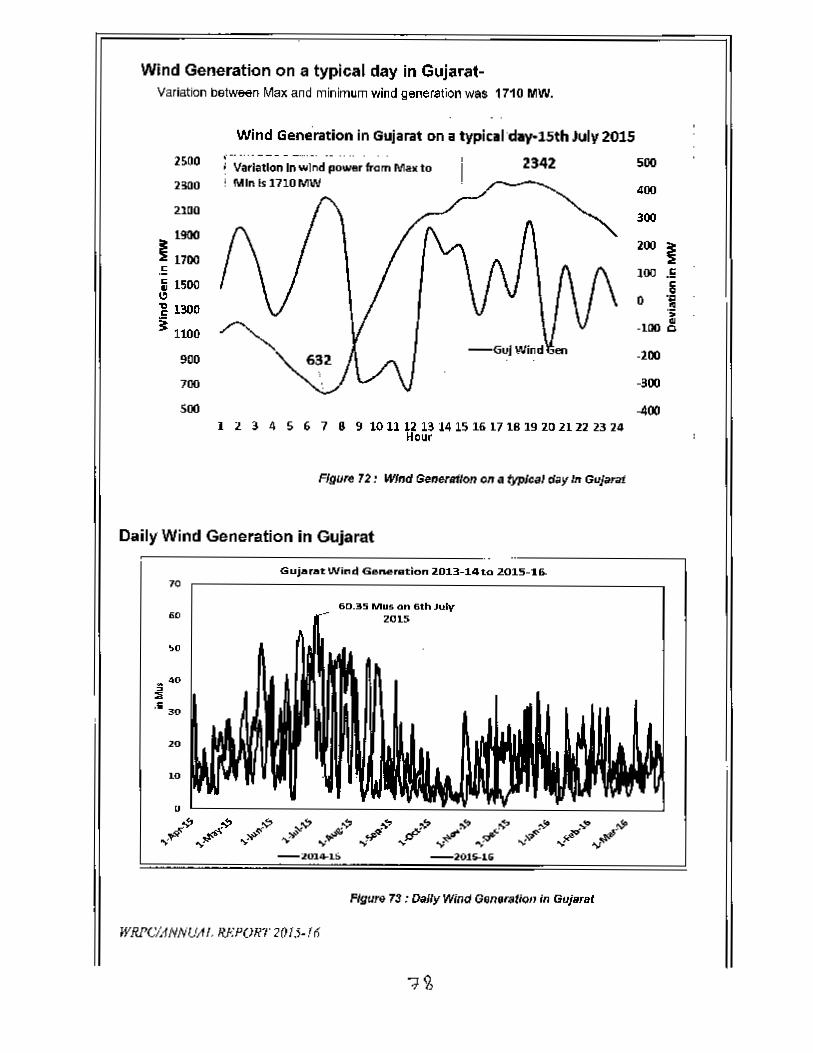
Wind Generation on a typical day in Gujarat-Variation between Max and milinum wind generation was 1710 MW.
Wind Generation in Gujarat on a typical day-15thJulV2015!{ ...... --- - _ •••• _ •• _ •
~ Variation In wlnd power from MaN to; MIn I. 1710MW
2500
HOO
2lOO
~
~ 1700.E~ 1500e-g 1300
~1100 ~
2342 500
400
300
200~
100 Es0
..,..">
·100 ~
·200
-300
-400
900-GuJWind en
700
SOO1 2 3 4 5 6 7 8 9 1011 12 13 14 15 1li 1718 19 20 21 22 23 24
Hour
Figure 72, Wind Generalon on a typical d~y 'It GuJ~r;d.
Daily Wind Generation in Gujarat
GujaratWind G6nerat:ion 2013-14t_0201S-~6.-
60.35 MUS on 6th JUty20iS
'0
.0
~.S 30
10
-:lOl4-l~ -201~16
figure 73 : DQ/ly Wind Generation in aui.r,.'
WI/PC/ANNUAl. RFPOHT201j-!6
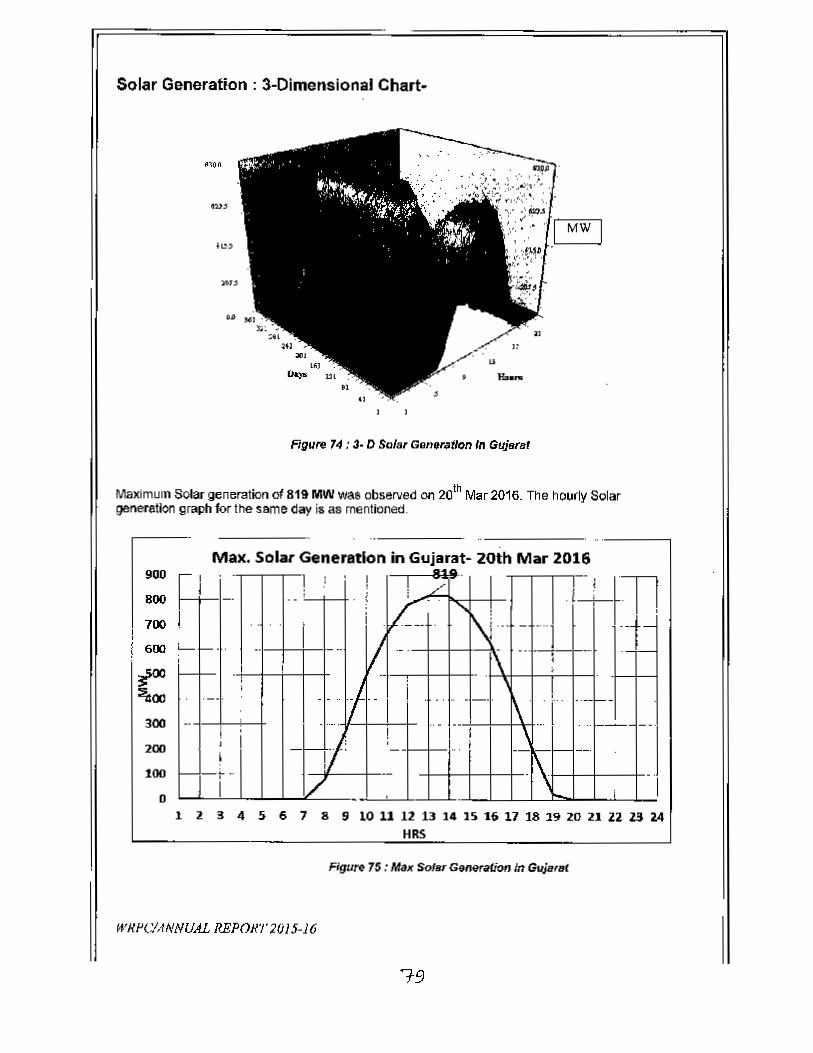
Solar Generation: 3-Dimensional Chart-
MW
Figure 74 : 3· D Sola, Gon.,."tJon In Gujfl(ft'
Maximum Solar generation 01819 MW was observed on 20th Mar 2016. The hourly Solargeneration graph for the same day is as menlloned.
Max. SoiaI' Generation in Gujarat- 20th Mar 2D16900
800
700
600
IIa- ....
I.I , I i,L .1 ! 11I
I.. ~ .£. ...... ! •
i i 1\1" - -"J 'i-VL_ - - _ . .. .-f-1\ .
• ,I ! ,
.- .. .. I).. i . . -_ .. r .._-~-1\ ...• r ---- _ .... . ..•" .. . .. ...jI I I i -..;
I -~!:-- I.. ; - __ .i .r\f- ,
1/._ ..
1I ,-
300
200
100
o1 2 3 4 5 6 7 8 9 10 11 12 13 14 15 15 11 18 19 20 21 22 23 24
HRS
F;gu", 75 : Max SOlflTGeneraliotJ /rI G~,lI(
WHI'C!.1NNUALREPORT2(j15-16
7-9

3.2 MAHARASHTRA
Population of Maharashtrs is 12.13 Cr. And area is 3,08,731 sq. km. The per capita consumption ofthis slate is 120"' kWh. Installed capacity of Maharashlra 1& 40589 MW including share from centralsector allocatioll. Mahanashlra achieved maximum demand met 21054 MW on dt. 19.10.2015 at 15:00hf9. The growth n maximOOl demand mot was 3.13% compared to last year d~d (204241\.1W).
Fuel-wise break-up of Installed Capacity - 40589 MW
Maharashtra Installed Capacity as on 31.03.2016
• Coal• Hydro ., Nuclear ·RfS
scurce-ceaFigure 78 : Insr"lIed captlc;!y of Maharitshtta
Central Seclor Share Allocation
KSTPS 2100 666.0 31.7
VSTPS-I 1260 460.0 36.5
VSTPS-II 1000 357.3 35.7
VSTPS ..." 1000 29B.8 29.7
KAWAS 656.2 204.0 31.1
GANDHAR 657.39 200.0 30.4
SIPAT 1000 293.7 29.4
~APAR 440 155.9 35.4
TAPS 1&2 320 160.0 SO.O
TAPP3&4 1080 439.4 40.7
KSTPS7 500 134.5 26.9
SIPAT1 1980 614.3 31.0
WRI'l':lANNUAL REPORT 2015-/6
'io
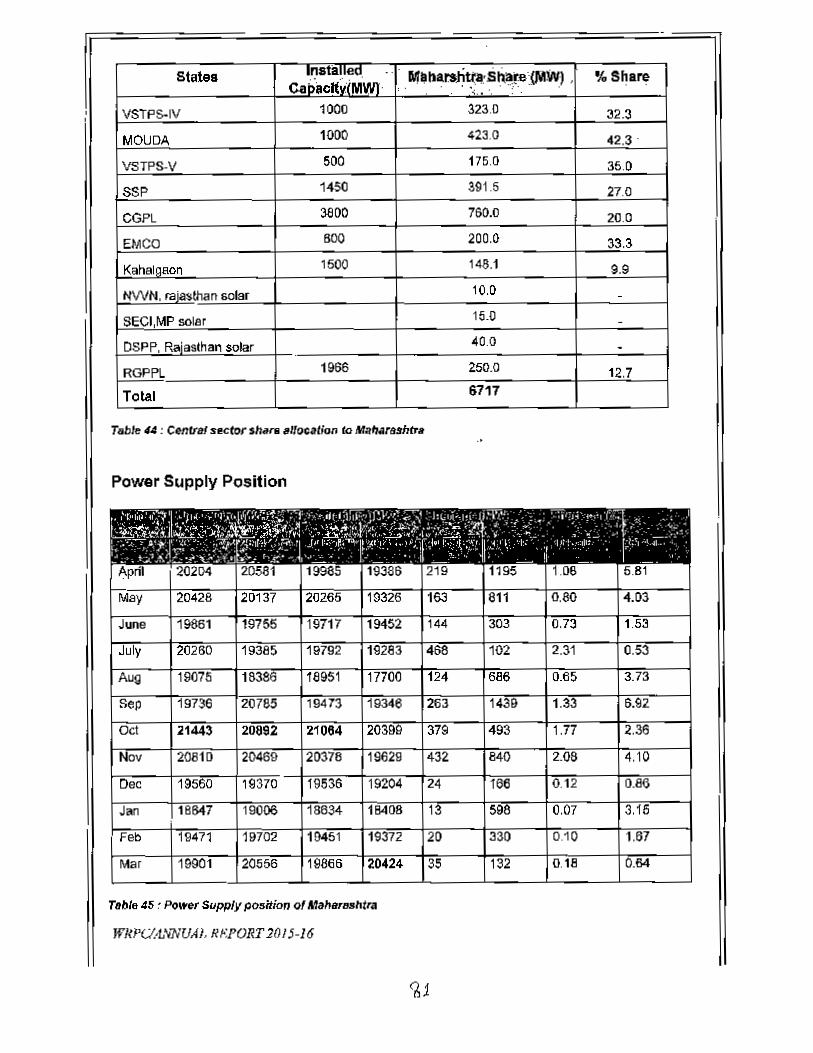
I Stales I.nstilliea .. . ~_bar.sJi«:l!:sti.~.e~(J'\1:Wj, % SharecapacKy,lMWJ I • ....., • '; • :', •
VSTPS-IV 1000 323.0 32.3
MOUDA 1000 423.0 42.3·
VSTPS-V 500 175.0 35.0
SSP 1450 391.5 27.0
CGPL 31100 760.0 20.0
EMCO SOO 200.0 33.3
Kahalaaon 1500 148.1 9.9
tNVN. raiasthan solar 10.0 -SECI,MP solar 15.0 -DSPP. Rajasthan solar 40.0 -RGPPl 1966 250.0 12.7
Total 6717
Table #4 : Cemn1 sector sh.", IflTocal,on to Mall<lrluhtr8
Power Supply Position
, --c77'1 r - - C''''''~''~I·· II'''' r:v "~~".J • diffi" ,.,--.. 'q . I,.1 t"\", ", . ~~.}I,f' .."1.11' tj, .. ~,~..... _',<-j f :.)Jj\"'; ,,~.'~ "-;,.\, :l}~\·.",L, .',; •• 'I' ~~ I~ II • .
1-~"··l"""'··"'f~~"\{I.,;JI -''''''''''''1''(. ,.c...~.~:~_ .....'" i "" i:» -«:~~,·.l\!""~ ;;"~'.')I; ..._ ~",h, ~'~'..:i..Jr.' .. - ",{ .~.' L,,'(~, - .; "'_. ~ __ .; _ ,,'.':-'"? I' ,1 7~.J."'~:~.!" --:;;'1 _r,fl. ","n.},_.J!1 ····,-fJ-;<I. 1"'~l ~,~ J. I;. ,~: [_,,-, ~I-, .. -- . " ...- ~- . , . ,,-., .
...:._ , ...1....::..._~'\.:. •• ;!J~·:...1..s::. 1"_' ,_. I _~ • _ 'I _ _n D4
May 2D428 2D137 20265 19326 163 811 0.60 4.03
Jooe 19851 19755 19717 19452 144 303 0.73 1.53
July 20260 19385 19792 19283 468 102 2.31 0.53
Aug 19075 18386 18951 17700 124 686 0.65 3.73
Sep 19736 20785 19413 19346 263 1430 1.33 6.92
Oct 21443 20892 21064 20399 379 493 1.77 2.36
Nov 20810 20469 21)376 19629 432 840 2.08 4.10
Dec 19560 19370 19536 19204 24 166 0.12 0.86
J.., 18547 19006 18634 18408 13 598 0.07 3.15
Feb 19471 19702 19451 19372 20 330 0.10 1.67
Mar 19001 20556 198(;6 20424 35 132 0.18 0.64
19985 19386 219 1195 106Api 202 20581 581
Tl1ble 4S , Power Supply position of Mah .. ,,,.htra
WJ(PC;IlL'iNUA}, Rf;PORT 2015-16
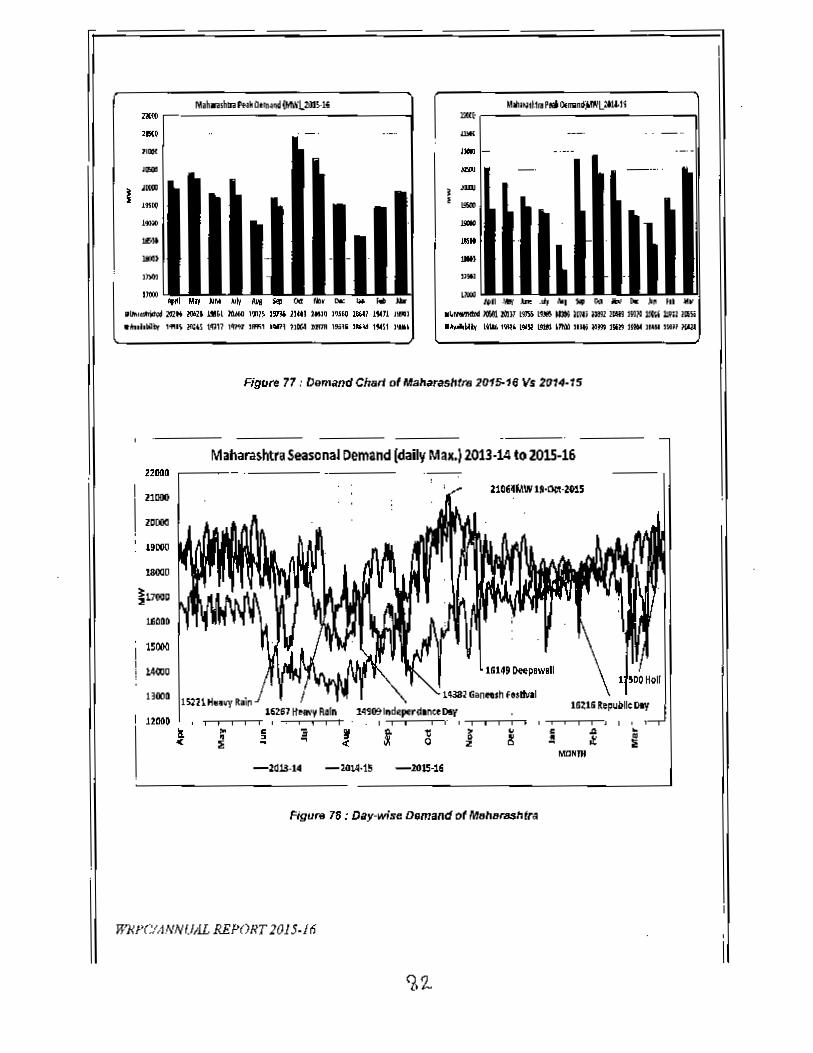
Mah_shlRha"Ollll~,",o,t.\'lZlllS,11i"'..,---------------1-'...
I ,...
,"" ... ... ,.,~ 212MllIlll UN )GiIiO ~ I" 1'''1 "0 J9SRI... , 1"11 J!I!lIt)
...... lint ,'U\ ~U 1011l~ ,"", llint ,,1rA lIl'mI 1St' '''''' 1tfU )\1101
....,..
....
.---.......,'"''.... ,.. '"' .... ... ....
.l.ft'WJIIIDIf __ lIJIl1lW l_ ... ~~imil 1M JPlnl*' 1:.9;:
..... Wllt l_ 1~' l"'R __ ~Itt»""'; 1Cm JM" I" 11U1,$Ui
Fi9"t'O 77 : 09mand ChBtl 01 Maharaslttra 20'15-16 Vs 2014·15
.,....21l1OO
2.000
UDOl
tIIIICI1l
~L7lIO.2
!.O...
150eQ
!MXJ.
13(1011
11llI»!!. ..•.. s
Maharashtra Seasonal Demand (daily Male.)2013·1410 2015-16
1&149 DftplW111
14382 Ganftsh ft$dvll
.,-,...,,,--.16287 H... y Iborn 1.'~'.d.perdl"'.Dr( -r.-.-~&,
<:
-2015-16
I •
i""'.111
W}U'(:t,1.NNUAL REPORT }OJ 5.11;

Load Pattern in Maharashtra:
,...~JIIIU -hBSttlIS -o&u~ -1In'w.tJt1!
34'" s'wunUUnftUUHMUn~~Ito,.
-,Ifill.,,,, -JilM4oI<!' ~. -_
FIgure 79 , Load psUem of M"haraslltra
Maharashtra 3-0 Demand Graph -(2015·16)
Figu~ 80: 3- Diflfflnsion,,' Demand graph of Mah.ra.'lln
WRPCiANNUAL REPORT 2015./(;
~I
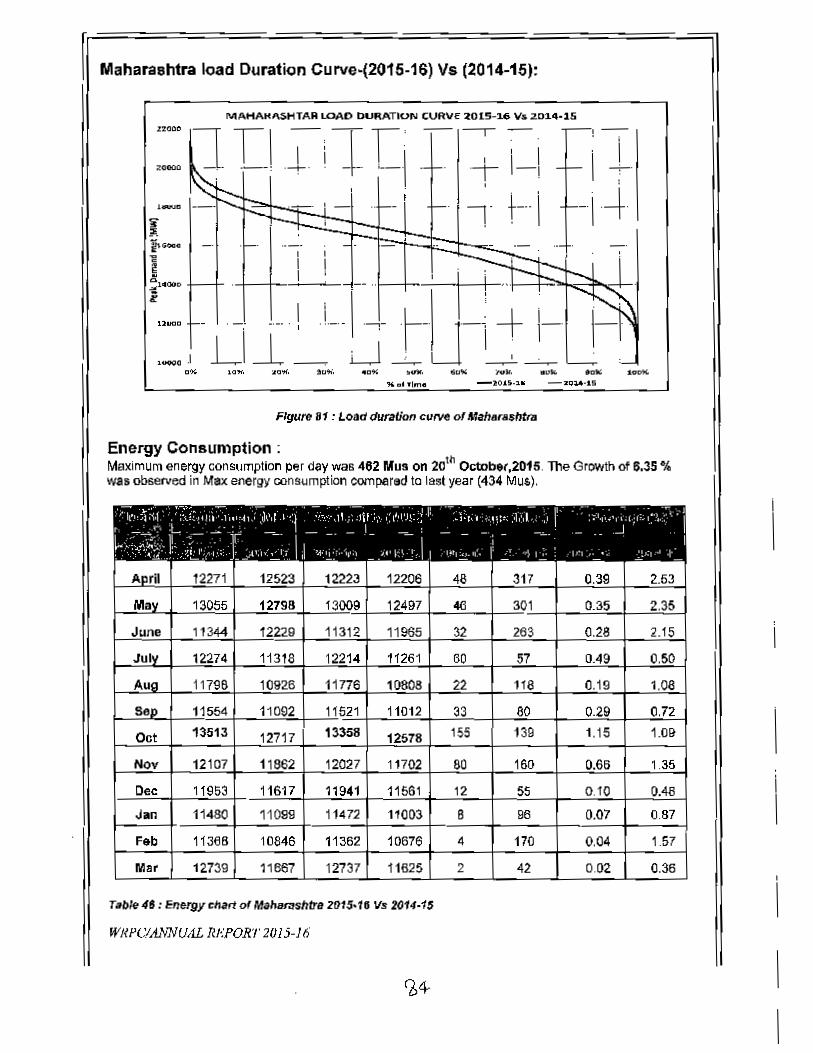
~ Maharashtra load Duration Curve-{2015-16) Vs (2014-16):
I\ItAHAHI\SHTAR lOAO bURAT\ON CURVe- 2015-1.6 V$ 2014-15
---,- -.]TI-, .rr:-,.-.-..t '--1 :-11;-i -t.
I I·+I-!•
_. --··1LI~_.
l)_UOO
I_JDO< ,"". .."
"0' Tlmtl
FIgure 81 : Load duraUon cllllle of Maharssht(lJ
Energy Consumption :Maximum energy consumption per day was 462 Mus on 20th October,20i5. The Growth of 6.35 '"was observed in Max energy consumption compared to lest year (434 Mus).
11480Jan 11099 11472 11003 8 96 0.07 0.87
1i366Feb 10846 11362 10676 170 0.04 1.574
0.3612739 11667 12737 11625 42lila' 2 0.02
r..ble4.: Energy chart 0' MahBr.lshtre 201S·fG Vs to14-1$
WRPCIANNU,fL RHPO}lT 2Qj5-}6
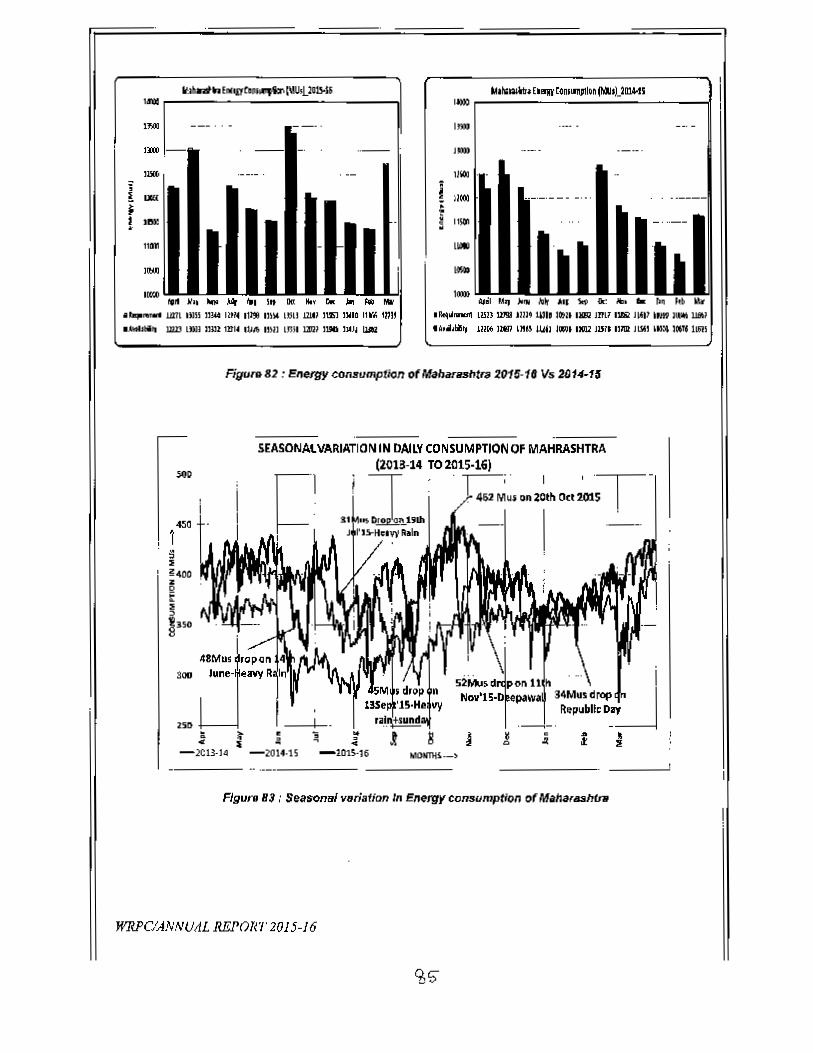
....1m>
'm> -...;! ...~l -II,.
"'''',....• " .11'), ... .._ _. 5.. DIl "',. C. ... Fe Mr
• ....,_.. urn om lll4t IHH I~ tm4 LDU mu ,... 000 nrlo Q)U
....... IIZD "'NI nm mw lWSo mll IBiI I.JIN me lJUI bA1
'0)))
U'"
"",
I/lOl
i~,.;•! I1S01
1I/l10
,''''',.",
.. .. lbJ: ..... "" ... ..-Jolt..._,.. IZID mra JllM WII .rt .. mu ra1 JIiV 111m ,_ 1W",1II1I6tw lUK naP UIB 1J.I(J , •• nail JUB mIit 100 'U JOG5 llR5
Figun> 82: E~ergy consumption of M.har •• IIt~ 2015-16 Vs 2014-fS
SEASONAl VARIATION IN DAllY CONSUMPnONOF MAHRASHTRA(1013-14 TO~U~~~:
]
, 'I'~462~u.o.~Oth 0<12015 !
Drop0ll.l,lhJ." ,;"H•• w A.ln":;0
7
.." 1---1 ,• l-ltll·J4 -2014·15 -lD1S'16
Figuro B3 : S.ason81 variation In Energy COn5lJmptionof Maha,ahln
WRPc/A}I/NUIIL REPOTa' 2Q15-/6

Renewable (Wind & Solar) Energy in Maharashtra -
Geographical Locations of Wind and Solar Plants in Maharashtra
Figure 84 : GeogT«phiclJllOC8l1onsof Wind and Sofar plants In ~tra
Wind Generation: 3-Dimensional Chart-
Figura 85: 3D- Wind Gen.retion in Msharashtra 1015-18
WFIl'CI-ANJWJlfl.RF,PORT 2015-]ij
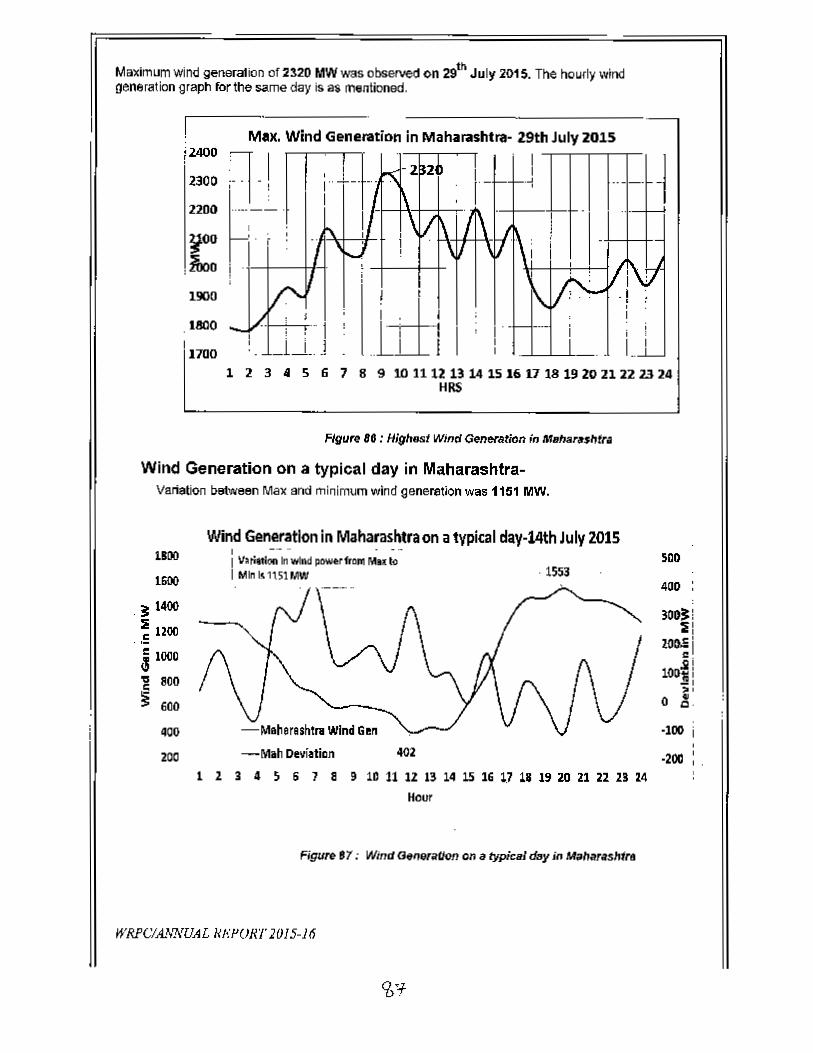
Maximum wind generation of2320 MWwas observed on 29th July 2015. The hourly windgeneration graph for the same day is as mentioned.
;2AOO!
Max. Wmd Generation in Mahil ...shtra- 29th July 2015II
.J,2300
22DD
1900
I ..II
, I
..ttl·,I1800I1700
123 • 5 6 7 89101112131415161718192021222324HRS
FIgure 10 : Highest Wind Generation in M.haT/ullt,.
Wind Generation on a typical day in Maharashtra-Variation between Mal( and minimum wind generation was 1151 MW.
Wind Generation in Maharashtraon a typical day-14th July 20151100
160()
. ~ 1400s 1200
.E.~lOOO
"800
~600
1 •I VlIl'Iarion In wInd powt:r froM MIl( '0I Min L<1151 MW ·1553
400
200 -Mah Deviation 402
1234~678 9WUI2a~~UUU~~lln2S~
Hour
Figure 87: Wind aeneraUOn on a typicsl d:Jy ill fbII",~
WRl'ClA.'o/!I'UAL!if-·FORI10J5-J6
5CO
400
~!~I
100.s '"Ilo~i
-I"',o z.·100 i
·200 , .
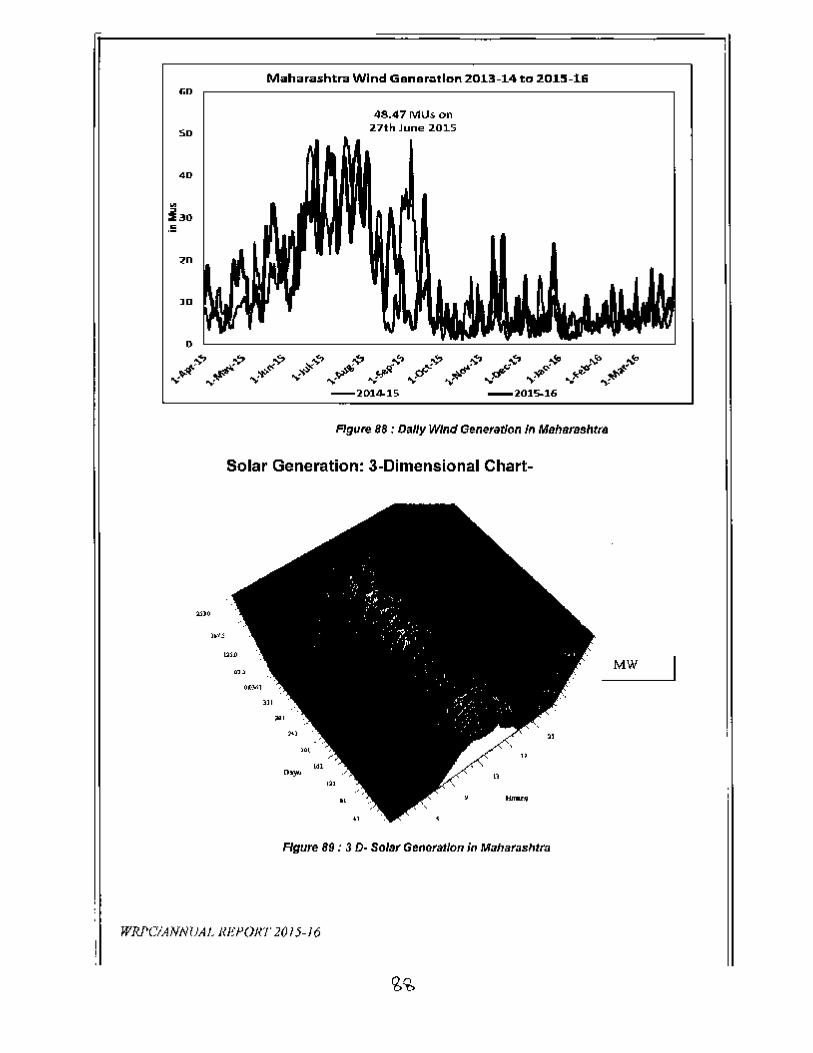
Maha,ashtra Wind Gana,,,tlDn 201.3-1.4 to 2015-16&0
4S.47 MUs on27th June 201.5So
FIgure 88 : Dally Wind Generation /" Mehsr8shtre
Solar Generation: 3-Dimensional Chart-
MW
FIgure 89 : 3 D· Solar Genor"t/on jn Mahar.shtm
WRf'CiANNUAl- RJ;PORT 2015-/6
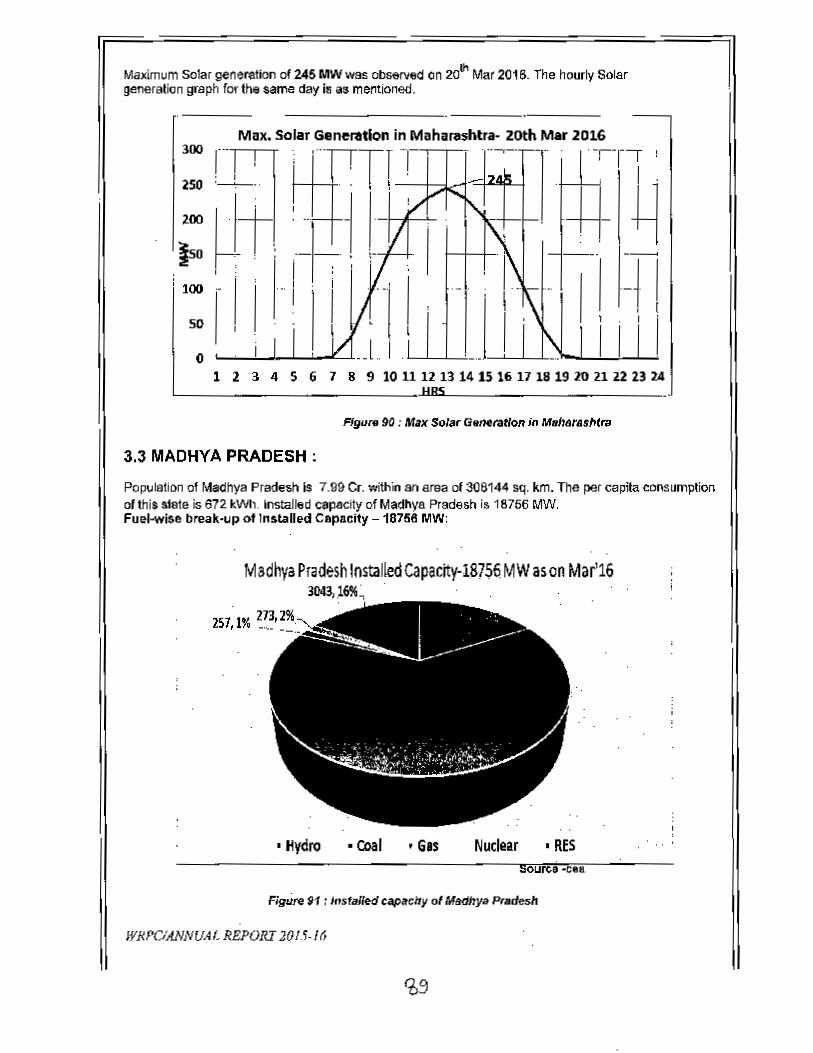
Maximum Solar generation of 245 MWwas observed on 201nMar 2016. The hourly Solargeneration graph for the same day is as mentioned.
: 100
Max. Solar Generation in Maharashtra- 20th Mar 2016300
250
200
Iso
so
o1234S6789rollUUUllHUU~~llun24
Figure 90 ; Max Solar Generation in M.hsrss/I(t;>
3.3 MADHYA PRADESH:
Popvlation of Madhya Prade$h Is 7.99 Cr. wilhin an area of 308144 sq. km. Tile per capita cons..-nptionof this slate is 672 kWh. Installed capacity of Madhya Pradesh is 18756 MW.Fuel-wise break-up of Installed Capacity -18756 MW:
Madhya Pradesh Installed Capacity-1.8756 MW as on Mar'1631143,16%~ .
251,1% _
• Hvdro • COal Nuclear • RESo • -eea
Figure g1 : Installed capacity 01 Madhya _"
WRf'D'ANNUAf.REPORI 2015./6

Central Sector Share Allocation"
KSTPS 2100 478.46
1260 440.3
1000 315.88
1000 242.88
656.2 140.15
657.39 117.17
1000 185.02 18.5
440 112.95
1080 228.94
500 74.69
SIPAT1 1980 331.27
1000 280.79
1000 180.79
500 140.04
ssp 1450 812 56.0
3960 1396.13
1320 465.3
1200 394.8
400
100
1500 6971
55
1966 200
Total 7162
anor:atic..n on C',oI)h'Rc1 O'IIpp.r:ity of 620.:; t.fu'J/unil
Table 47: Centlal sector share allocatloll 10Madhya Platiesll
WRPC!ANNUALREPOKI'2015·J6
90
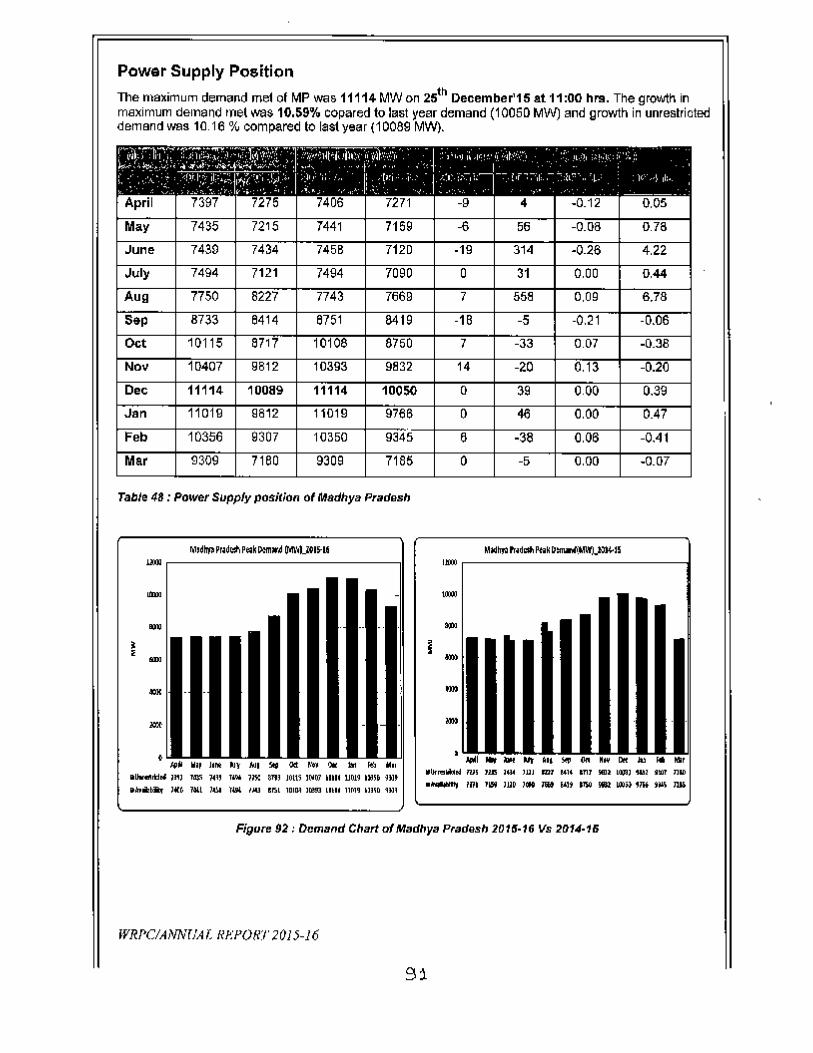
Power Supply PositionThe maximum demand mel of MP was 11114 MWon 2Sth December'lS at 11:00 hi'll. The growth inmaximum oemano met was 10.59% copared to last year demand (10050 MW) and growth in unrestricteddemand was 10.16 % compared to last year (10089 MW).
r'·;;)·"1-_·r.~..~ '--r'~"-r~--~.-" 1 : 'I)' A'·.l ,'.:l } I, . ~11;...:al,·1 ~" I'J'·~·' ;,·"l{t~I,')il> ,,~( .....,. ·'· ...JIi..V· .. " It,.,·~,b-.(~:,,:,!,'...'.~.> ~., "1:'''''' c : • I: ,~.~ " I I" r -. , ['" [. I . '[" _. -:-T- rr-:- I - - __ . 'L 1.;. '11-,/';!:~~~I~l('I-,i}< .' .... __ :,'.'" I' ;.I:.~,·.• ,r .. , ,I ... " ++~~. ~ l'~ ," . ~~~ ". ,'" "~.' " ~." , • ----
April 7397 7275 7406 7271 -9 4 ·0.12 0.05
May 7435 7215 7441 7159 -6 56 -0.08 0.78
June 7439 7434 7458 7120 ·19 314 ·0.26 4.22July 7494 7121 7494 7090 0 31 0.00 0.44
Aug 7750 8227 7743 7669 7 558 0.09 6.78
S<tp 8733 8414 8751 8419 -18 -5 -0.21 -0.06Oct 10115 8717 1010S 8750 7 -33 0.07 ·0.38
Nov 10407 9812 10393 9832 14 -20 0.13 -0.20Dec 11114 10089 11114 10050 0 39 0.00 0.39
Jan 11019 9812 11019 9766 0 48 0.00 0.41
Feb 10356 9307 10350 9345 6 -38 0.06 -0.41
Mar 9309 7180 9309 7185 0 -5 0.00 ·0.07
Table 48 : Power Supply posiCion of Madhya Pradesh
ft1,6IrPFr.ld~pe;kPem"" n""~UOIS-16 MI4IrJ; Pr~d"" Phil O!IY'JI(MWJjJM..15..,. IJrol
.... - .".
... .. .. ""~ i, ..)...'"
" .m
"" - ..,• • ~,.. WI, Jlnt ., M .. .. ,.... '" '" "" ."IIIUv.ut:l~ »o le" )Cl' T"" 1110: 31tJ JOI15 )(11111nil( Ufll9 n3S~ U1J .1Jt~1Ib:14ros l,us l~ lUI rm loll' enr .~ bUll ,'U i'tR nU)
litb"biq- )t(_(. nu ).UI }"" I~ tr..1 lDIlM )U!S3 IIU' 11M. nl~D 'Ull .- un 1'\:N JUO ,eM ]at 5il' P$O _ 11X11) "Ii ,~ JlJi
Figure 92 : Ocmand Chart of Madhya Pradesh 201fI·16 Vs 2014-16
WRPOANNrJAl. R/'.·POIIT 2015-16
9:1
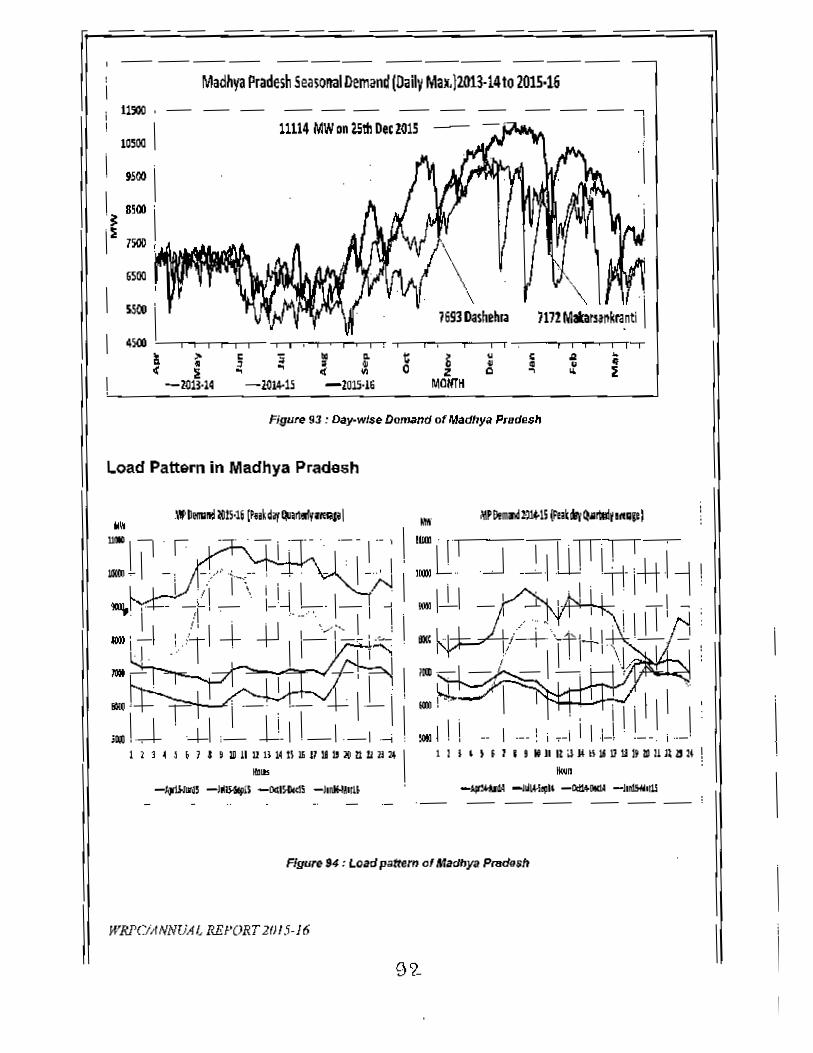
Madhya Pradesh Seasoll3lDemand (DailyMU)2()13·14 to 2015·16WQ3 •
IIl50l II t5ro 1
I~ 8500 'I.~I 7500
----,
Is
'\
~oo
I w.e·1 7693 Oashehla il7!Mabmllkta.ntdI 4>18 ,___..,.--.-~......-- ....-.--,-,........~_,....,. "'--"""""'----"'-""T""'T --~""""'""T""'T--r
l : s 'S ~ .,g. t z~ ~ C 12 •(~ .... '1,\ 0 Q ~: ~
-l!l1H4 -1014-15 -2015-16 MONTH
Rgure 93 : Day-wise Do"",nd of Madhya Prsd.sl!
Load Pattern in Madhya Pradesh
1 11 I I i II' NlllZaJlKlIl1lllHIUlIlI!ll11" I ~ I" IIIU:_:"l1lS11IlUlliIlUll14 \
-lJj>Jlr~'-i_~S -OcIIIGidS-ilnJI.I!IIU 'Il0l"
-.,. _ _'~I4-!,,1I -*'*" -il~
Figure 94 : Load pattern 01 Madhya Prad9sh
WRl'CiANNUAI, REPORT2/Jl5·J6
9?-
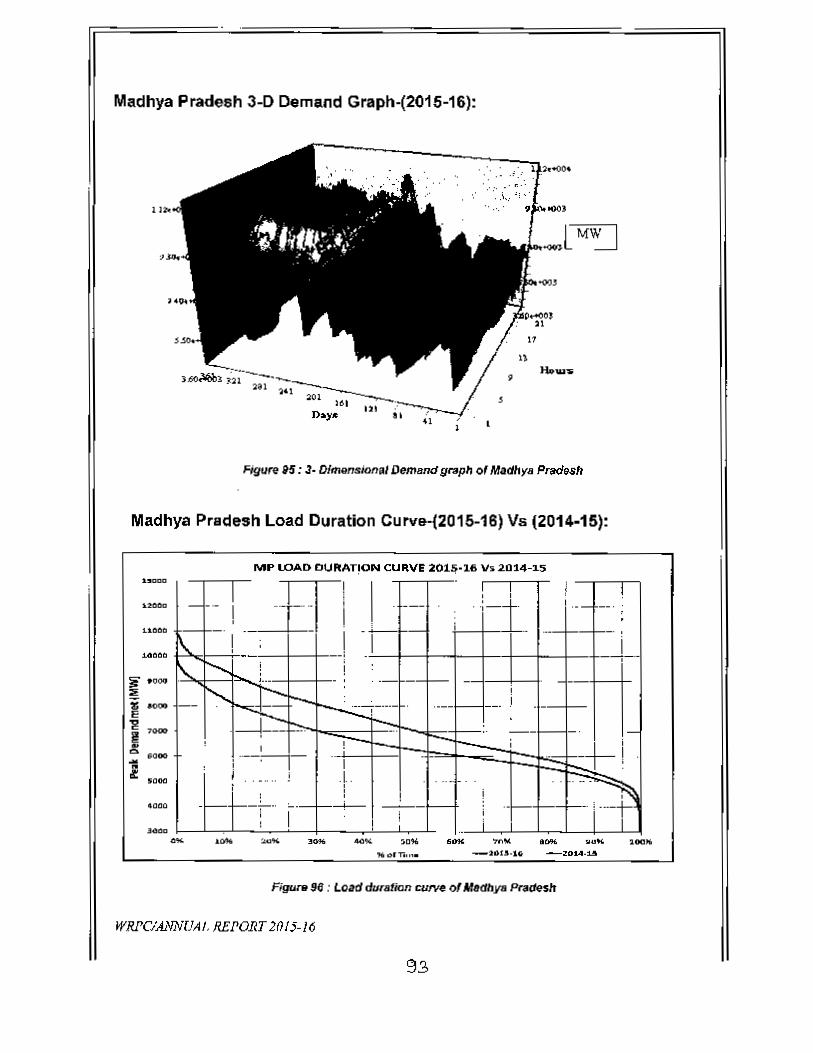
Madhya Pradesh 3-D Demand Graph-(2016-16):
. ',' .' •• + .:.:
" ' ..~.(~;~.
•,
Figure 115: J- Dlmem,ional Demand graph of Madhya P~Nh
Madhya Pradesh Load Duration Curve-(2015-16) Vs (2014-15):
MP LOADDURATIONCUIIVf 2<nli-16 Vs2014-15
1._ .H-r-·· ~I
I ! ! I Ii--- I --- :-1 '._- -_ . .-j1-- i ..- . ,
'- I -.! ~-, -r-, ;,
'- !~- - .- -- ,...... -<, 1- i
- :---":":::::'r-- .-- j
!-""::, .' - _. -. --,I -;-- -I-- ; -r; --~- ...
I . - ._,I .. - .. i I ,...~, , . ..., .. . ., i, !- .. ~.-I--+- ---!-- i ri I ;, ! i-
~.ooo:=;: ....E~.,...! ....'l:i&: ....
."""
""'"...."o.r .. "••
FigufTI ~6 : Load duration cUIVeof MacthyaPradesh
WRPClANN(JAI, REPORT 21115-16
93
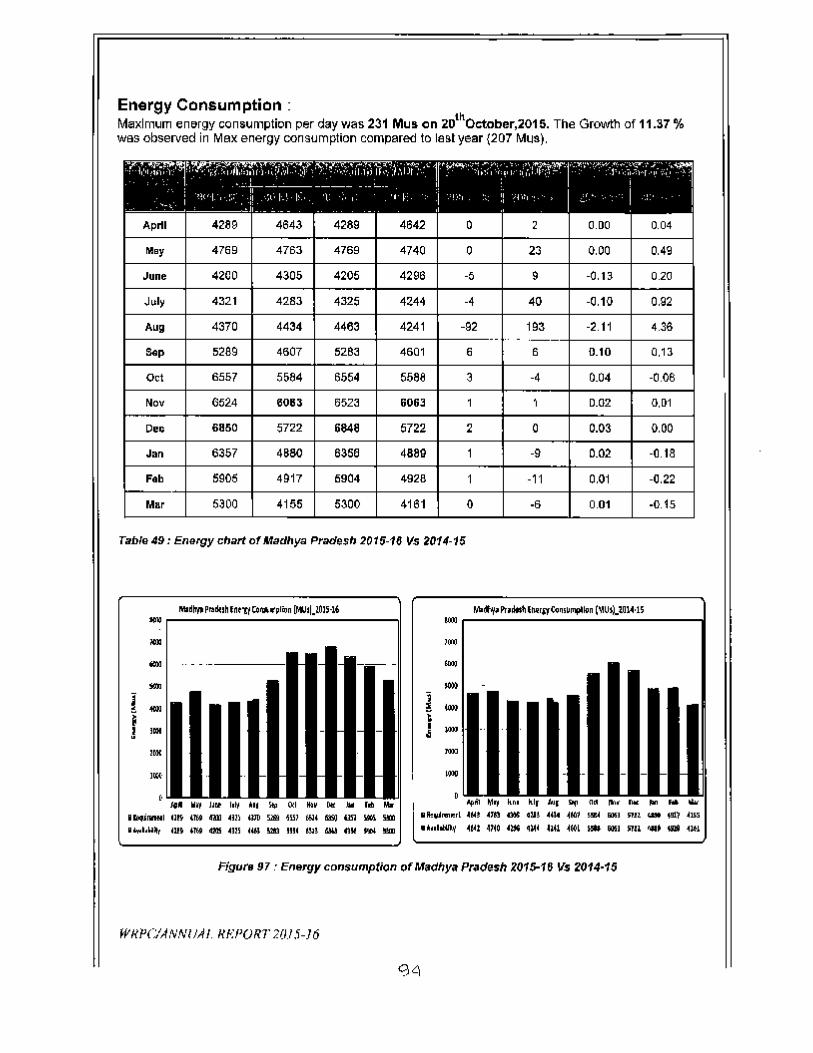
Energy Consumption:Maximum ene>rgyconsumption per day Vias 231 Mus on 201~October,2015. The Growth of 11.S7 %was observed in Max energy consumption compared to lesl year (207 Mus) .
....~,";,,,.~~ ... ~,-- "....,.'"1·..,,<r.:·"1rI'V~·'~~"""""'! ',""'''"'?.,,:r·I·Y'''7'''/.~'''..-.-:;r._' ~~l'''1'101''I _ j ~. 'r~>'IJ/~'~lL~j~_'_·-=~'II_l.'~~~~,,,.I)I:I' '10"., ':101 ,",' IT-,- r· 7:~41~r,;., _- __I
i o)"l, ': ;: ~\I.' I;· "1 ." I 'f I i I.", ", ': d.:,' > I _" I' I~~~. ~ 'JI_ _ _ _ _ _ ,I. I
Ap~1 4289 4643 4289 4642 0 2 0.00 0.04
May 4769 4763 4769 4740 0 23 0.00 0.49
June 42CO 4305 4205 4296 -5 9 -0.13 0.20
July 432.1 4283 4325 4244 -4 40 -0.10 0.92
Aug 4370 4434 4463 42.41 -92 193 -2.11 4.36
Sop 5289 4507 5283 4601 6 6 0.10 0.13
Oct 6557 5584 6554 5588 3 -4 0.04 -0.08
~ov 6524 6083 6523 6063 O.a2 0.01
Dec 68S0 5722 6848 5722 2. 0 0.03 0.00
Jan 6357 4 sao 6~5a 4889 -9 0.02 -0.18
Fob 5905 4917 5904 4928 -i I 0.01 -0.22
' ..ar 5300 4155 5300 4161 0 -6 0.01 -O.IS
Table 49: Energy cIJ"rt of Alaclhya Pr:>desIJ2015-16 Vs 2014-15
Mlllirp Pratluhtnt"ttCoI'lll .. plil)n~&lfl.lOJS·U~r-------~------~-------,I
,..10>,...,."
i w,1 11))'
,I«
It. lillY JIll' Iltt ii, SeQ 0:1 Itl' IlK' .iii rib MarIIri4itwIMI lin- (1ft Ql) ,on W!I 5lIB -SiS) 66U Q9J 1m ~ sm•• l,U'!lr ~u~,Nt G!S ..ns CUJ ~ III( (!n GM& au FbI !i!m
.~~m,.rl ue .153 eM 4U~ .cu.. ~KI1' 5SJ (OU SI'.U c,a. tsll JlSS
.'ul~ «Nl -1140 .~ 4141 ~m ~E(ll _ &JU SUl ..... .. ce
Figure 97 : Energy consumption of Madhya Praoesh 2015-18 Vs 2014-1~
iflI?PC'ANNlIAI. HI-:('OIl:1' 2(1.I5-}6
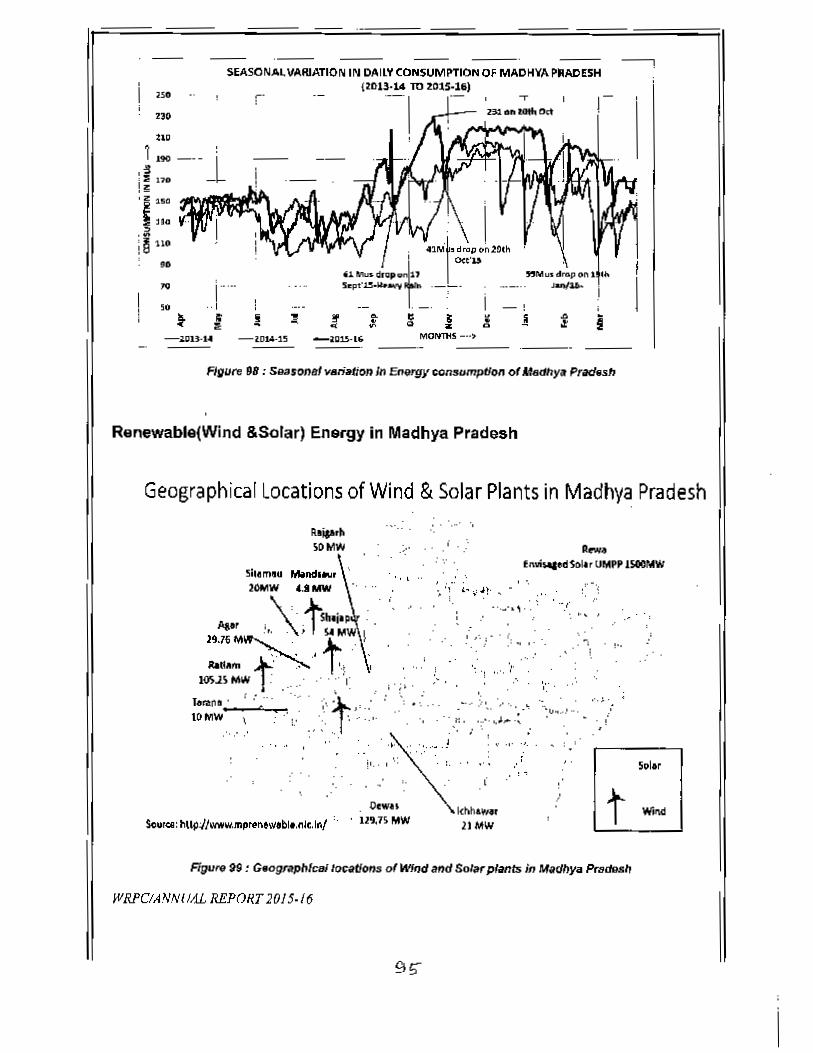
Geographical Locations of Wind & Solar Plants in Madhya Pradesh
SEASONAlVARlATION IN DAilY CONSUMPTION OF MADHYA PIIADESH(2013,14 TO2015,16)'--I250
no
,!190 _,- -L''1':; 170,1<
'I:".~iA 110
.0
.. .: I
. 41M·t'drop~n29thI ()(t'~
'.1Nlu~drop ClInt'5ept'J.!I ..W._'" •__ •
-- ._.; g Iz
MOflfftlS _ ••>--Figure 98: S..",ons/ vari"tion In Energy con.umptlon of M_}Q Pndosh
Renewable(Wind &Solar) Energy in Madhya Pradesh
-v-. . ',,,' "RljplhSOMW i ..,"..~. -.
::... ,'. , , '.I ," •
:. '1 '''.1 J~.I .• • '·~'1 ~ • "f
:. ... ~."
'..t-
. ...; ','...""....J-. ,. ,,.
t;
Ftgu-. 99 : G009171phlcBl/ol:allo",. ot Wind and So/., plants in Madhya Pra_h
WR/'C!ANNII.1L REPORT 2015·16
.-
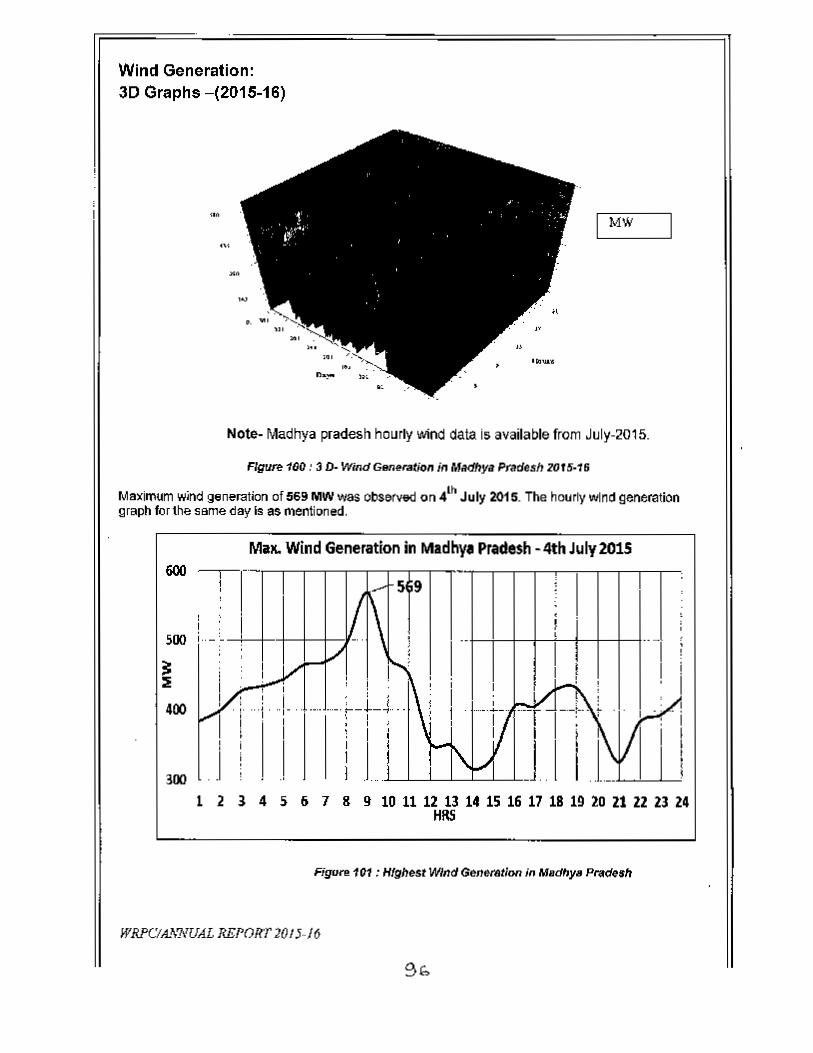
Wind Generation:3D Graphs -(2015-16)
- MW
Note- Madhya pradesh hourly wiod data is available from July-2015.
Figure 100: 3 D· Wind Generation jn Madhya Pradesh 2015·16
Ma)(imum wind generation of 569 MW was observed on 41h July 2015. The hourly wind generationgraph for the same day Is as mentioned.
Mill. Wind Generation in Madhya Pradesh - 4th July 2015
12J4S6789WUUU~~~uauwnunNHRS
Figu ... 101 : HIghest Wind Generstion in MBcDJYiIP...o.lSh
WRPCIA.....NUALREf'On·r20Ij··/6
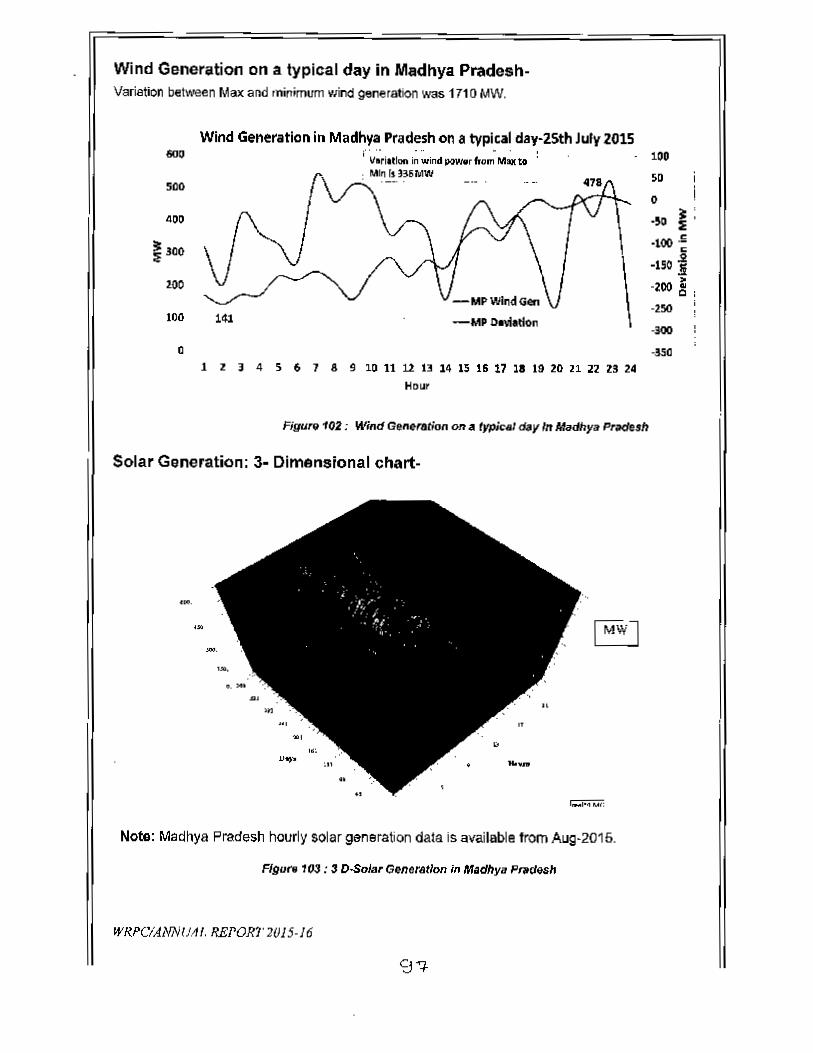
Wind Generation on a typical day in Madhya Pradesh-Variation between Max and minimum wind generation was 1710 MW.
Wind Generation in Madhya Pradesh on a typitai day-25th July 2015r''''- -'.
varitdon i1 \WId ~r from Max. to .: MII"I Is ~3.sru1W
500
400
100 141 -MPOmltlon
o1 Z 1 4 5 6 7 8 9 10 11 U 13 14 15 15 17 IS 19 20 11 21 Z32'
Hour
Figul'9102: Wind Generation on a typic.' day In MadhyaPr_$h
Solar Generation: 3- Dimensional chart-
Not.!: Madhya Pradesh hourly solar generation data is available from Aug-2015.
FIgure 103:' D-Solar Generation In M.dtIya PlMlesh
WRPClANNlJill. REPOR1' 1015-16
100
SD I
0 i·50 ~:
2:
\-100 .5
".2-150 .!i>
-200 ~ ;
-250
-'I0Il
.l5Q
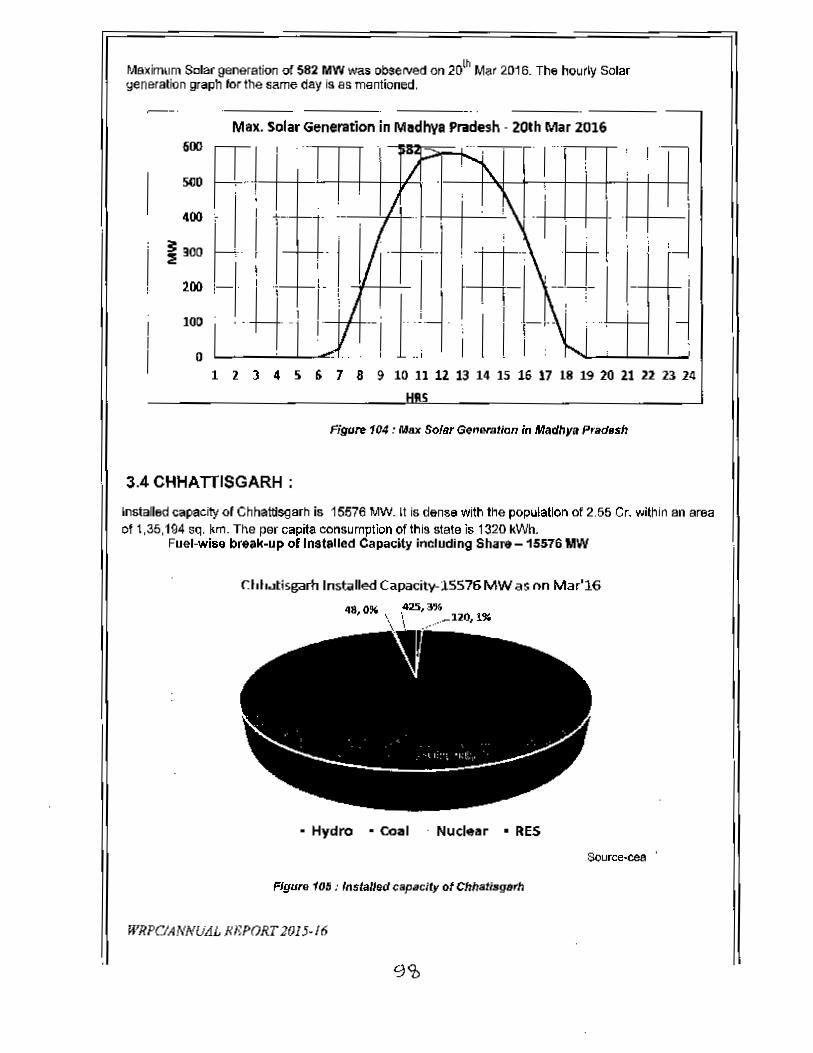
Maximum Solar generation of 582 MW was observed on 20lh Mal 2016. The hourly Solaryeneration graph for the same day is 8S mentioned.
Max. Solar Generation in Madhya Pradesh· 20th Mar 2016
lZJ4SS789rol1UUMU~"~W~Dnn.5
FigtJTe 104 : Max Solsr (S,,"wation in Madhya Pradesh
3.4 CHHATIISGARH :
Installed capacity of Chhattlsgarh is 15576 MW. It is dense with the population of 2.55 Cr. within an areaof 1,35,194 sq. km. The par capita consumptlon of this state IS 1320 kWh.
Ful>l-wise break-up of Installed Capacity including Share -15576 MW
r.I,h..Jtisgarh Installed Capacity-1SS76 MW as nn Mar'16425,3%
• Hydro • Coal Nuclear • RES
Source~eee .
Figurv 1M: /nslaIJad capacity of Chhatisg8rh
WRPCIANNULlL Ii/WORT 201 ).16
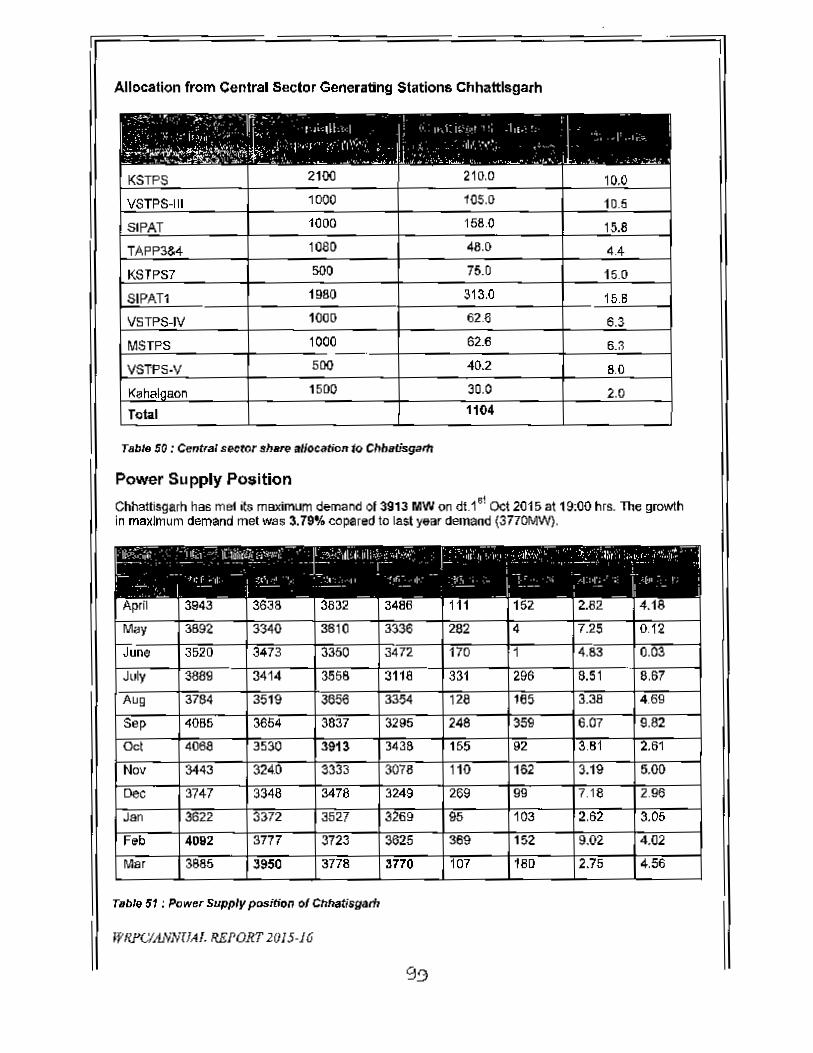
Allocation from Central Sector Generilting Stations Chhattlsgath
I " ~ -".. ': '1[" -, ''III I - I' ,,-,.,\ 1'''' ::, .1". ,- :1 - I,_ ;' I' "" ~ • I , • • "'.' , , .,' ' I
"- -_' -1i' ~._~., - . . l' r • II '. 1" II.. , ,- 1~ - 'Ifo-y' *-t"" "":. ..... ':.(-: "'_ ~ , ••_ '-"'-~".Jo!.J_~ l".___ ~ ~,__ _, _--...,. J . ___ .......' _, _,.__-_::... ~i...t-.... '", .- . ._.....;_ ,
KSTPS 2100 210,0 10.0
VSTPS-III 1000 105,0 10.5
StPAT 1000 158.0 15.8
TAPP3&4 1080 46,0 4.4
KSTPS7 500 75.0 15.0
SIPATl 1980 313,0 15.6
VSTPS-JV 1000 62.6 6.3
MSTPS 1000 62.6 6.3
VSTPS·V 500 40.2 8.0
KahalQ8cn 1500 30,0 2.0
Total 1104
Tab,. 50 : Central sector sh.re allocation to Chb8fjsgarlt
Power Supply Position
Chhatlisgarh has mel its maximum demand of 3913 MWon dU·! Oct 2015 at 19:00 hrs. The growthin maxImum demand met was 3.19% ccpared to last year demand (3770MW).
.. - - .. '-'j' . ,-, J....:. . :U "--:,, _ It·- :- , ..'-1. , .., . " 1•.l!l]I:(;~_,_"·1 I __ ~-." II! j Iii, !__"..~ ;;,' I ._t ,.- , -.l -"
._ 1 __ - T t« I,- -c r -II I 'I', ' '. .- " " ',f,- II ~I',' I " , ,- _I .- f- -' .- - , '_ -- , . , .
- - - - -, - , -' -Aprfl 3943 3638 3832 3486 111 152 2.82 4.18
May 3892 3340 3610 3336 282 4 7.25 0.12
June 3520 3473 3350 3472 170 1 4.83 0,03
July sees 3414 3558 3118 331 296 8.51 8,87
Aug 3784 3519 3656 3354 128 165 3.38 4.69
Sel' 40115 3654 3837 3295 248 359 6,07 9.82
Oct 4068 3530 3913 3438 155 92 3,81 2.51
Nov 3443 324,0 3333 3076 110 162 3.19 5.00
Dec 3747 3348 3478 3249 269 99 7.18 2.96
Jan 3622 3372 3527 3269 95 103 2,62 3.05
F..b 4092 3777 3723 3625 369 152 9.02 4.02
Ma, 3885 3950 3778 3770 107 180 2.75 4,56
TBbie 51 ; Power Supply posiCion of Chhatlsgam
WRYC:IJUv7v1JAI. REPORT 20/5·16
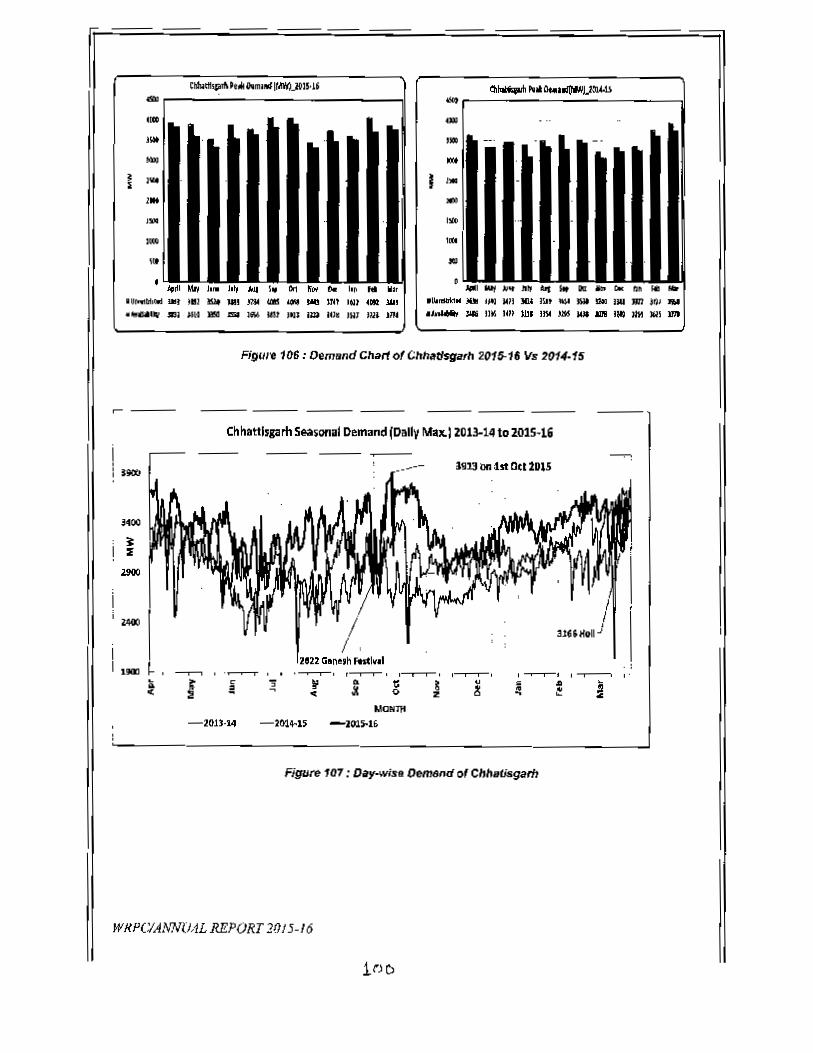
,..""...
•I ! ..
'50 ,.,,.. '".. ..
""• .,....11..0lIl .. , •• ! mt lin 11M <tIS "" ,., un 161' •• WI....... .n uu _ J:IiII IN JGt 3tll 1m 14'1 JWl lUl Jm
... ox.u..~ .. .w.. j~ J,t~l lIlA I\lt 11(.1 J;QI I:JI.J IlU lID 31).1."..... JIIi Jns tU~ U!. IlW SIS _ _ .. JIB 3IR5
FI!JUI~ 106: Oem&nd Chart of Clthat/sgafh 2015-18 V.2014-15
Chhattlsgarh Seasonal Demand fDallv Mal<.I2013-14 to 2015-16
i,: HDO Jn3lln bt O<I1D15
34"
t~, .--,--,--, ,~.&
• I~". " -~ e i-201)-14 -21)14--15
Figu~ 107: Dify-wl •• Oem8nd 0' CllhllUsgarfl
WHPClAl,'N(MLREPORT 10/5-16

Load Pattern in Chhattisgam
-.~~~; .. i
, .~ .~-
t ~ J. ~ ~ ii' louUUUnU"",,.Ml1lJllU...
,,lDi,
,_:+' ---+-1lD,,
IIi
..lOt '_ .•. -
J...• lID
1 2 t t i 6 } • • It , nUl' H U U 'I a ~ n u a M
"'"
Rgura 10S : Load pattern of ChI>atisgarlJ
Chhattisgarh 3-D Demand Graph -(2015-16):
Figure 109 : 3· Climenslonal Demand gr.ph of Cbhalisgam
lYRPCiANNUAL REPOI(T2015-11i
101
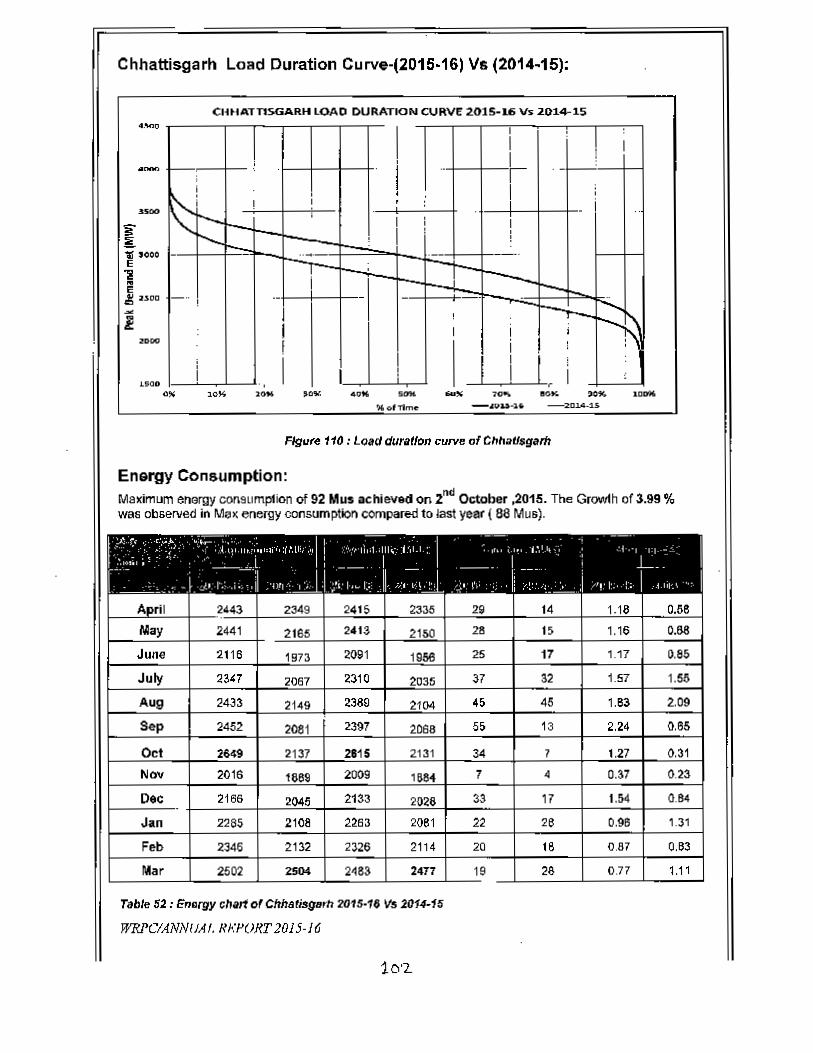
Chhattisgarh Load Duration Cu~2015·16) v« (21)14·15):
ClmATTISGARH LOAD DURATION CURVE 2015-1.6 Vs 2014-15
I II ! I
,I II
j - I . -,I
~i __, • ,
! I , i I-l- I i I
I ,!<, ,__ ,
" ... ' ._- ..
I, --;-- J-,.,
- ! .- - - r :::::~J I :-: I I I I !\! I ! I, I I I I I I,
II I i I ," ,1.S00 ." ,." ..." '0 .. ,.'"4." 7 .... e.",... • cm
')E,ofTlm~
Flgu(~ 110 : Load dur~tJoncutve of ClltJ.aflsgam
Energy Consumption:Maximum enGrgy consurnpnon of 92 Mus achieved on 2nd October ,2015. The Growih of 3.99 %was observed in Ma~ energy consumption compared to last year ( a8 Mus).
! ~(' r',~.. ....·1
I
1j ,,~I . II ,. ,.,t'll ',:I',',ll , ···.·Ii,;' ;III~·1',1.1 thl ;_", .,',1
",j , I I----- , -, ----~,,',.c.ll J ,d. ,31 I " r.; I,;.: ;,', ,
" ~ ""
,.I •
..,---_. .
2349 14 0.58
2165 1$ 0.68
June 2.116 2091 25 17 1.17 0.8~
July 23'7 2310 37 32 1.57 1.~
Aug 2433 21~9 2389 45 45 1.83 2.09
Sep 2452 2397 55 13 2.24 0.65
Oct 2649 2815 34 7 0.31
Nov 2016 2009 7 4 0.37 0.23
Dec 2166 2133 33 17 1.54 0.84
JIll 2285 2108 2263 2081 22 28 0.96 1.31
Feb 2346 2132 2326 2114 20 IS 0.87 0.83
Mar 2502 2504 2483 2417 19 26 0.77 1.11
Table 52: t:nargy chart of Chhari$9",h 2015-16 Vs 2014-16
WRl'ClANNUAJ.l?n'ORT 2015·16
10'2
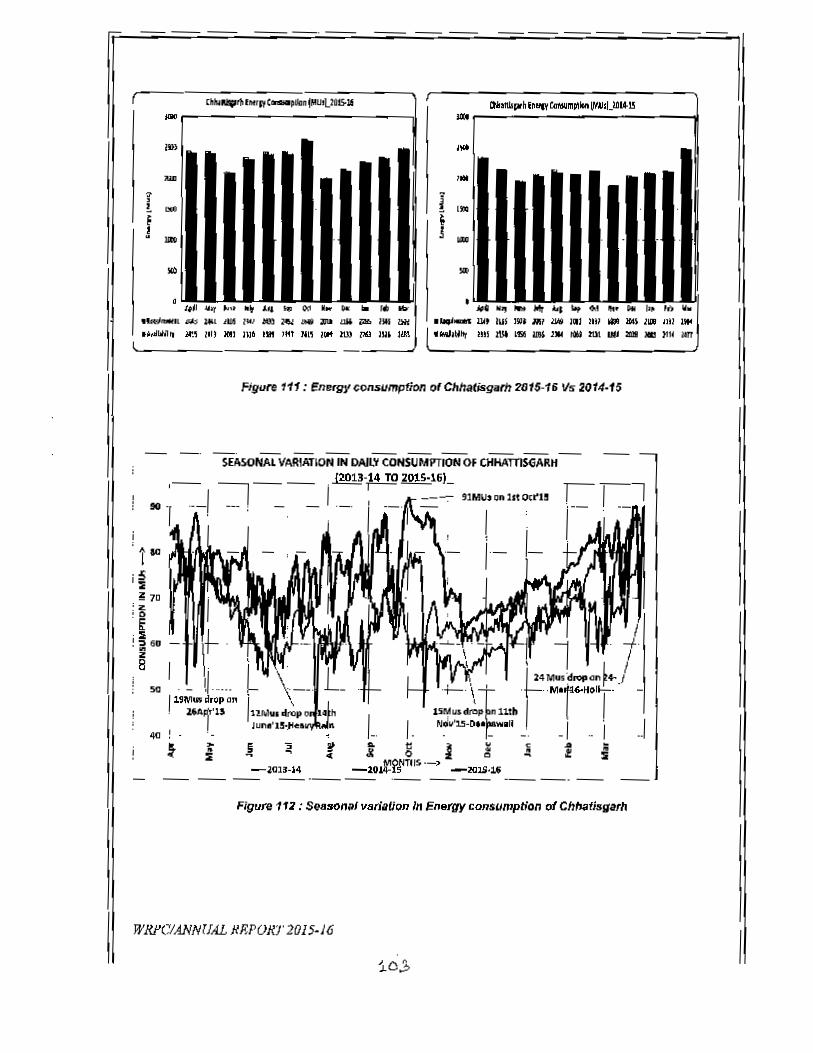
I ChIuNlprhfMIIVC .... pUOntPJIU'L20fS.16 ttlo .... "'h"...,_m~.. IfI·~_~..3- ""III> ,,..lUll ""
I "'"j ,..
f Iz ... ,.... ..• 'f""':.r~ .."'4S.N ...... _JC ..
• 'wirtlltu 111$ 14'1 dl6 1441 Kn 241 ~ _ UIi l'V.t UN l)H
..".,.,.. JO 1II) )ftJ JU' l!ll ,", Hl~ 1," til) l'Ii) un Ju,,\l
••....... Ult IUS It.J. 1141 _ m It).l .. __ nU ..
.WINItr un 1Ut ltSG I!M J)14 "* Nt .... :a ., ttl( Mn'
Figure 111: EnergJ/ consumption 01Chhalisgaih ~Ot$-16 Vs 2014-15
SEllSONALVAlUATIONIN DAllY CONSUMPTION OF CIfHA~"'RH,_ ,_ _ 1'2013.,14 TO2015.16,-
... , .._1 __.: _ _ ._. .::::"'- O1M\/,..II.o«"
tooi~
"'70:z'f.s.J., 50':28
L ..II .•r>:i
Af
-2-013 ...14
Figure 111: Seasonal variation In En"rgyconsumption of Ch~ti5garh
WRI'CIANNUAL REPORT 2015-16
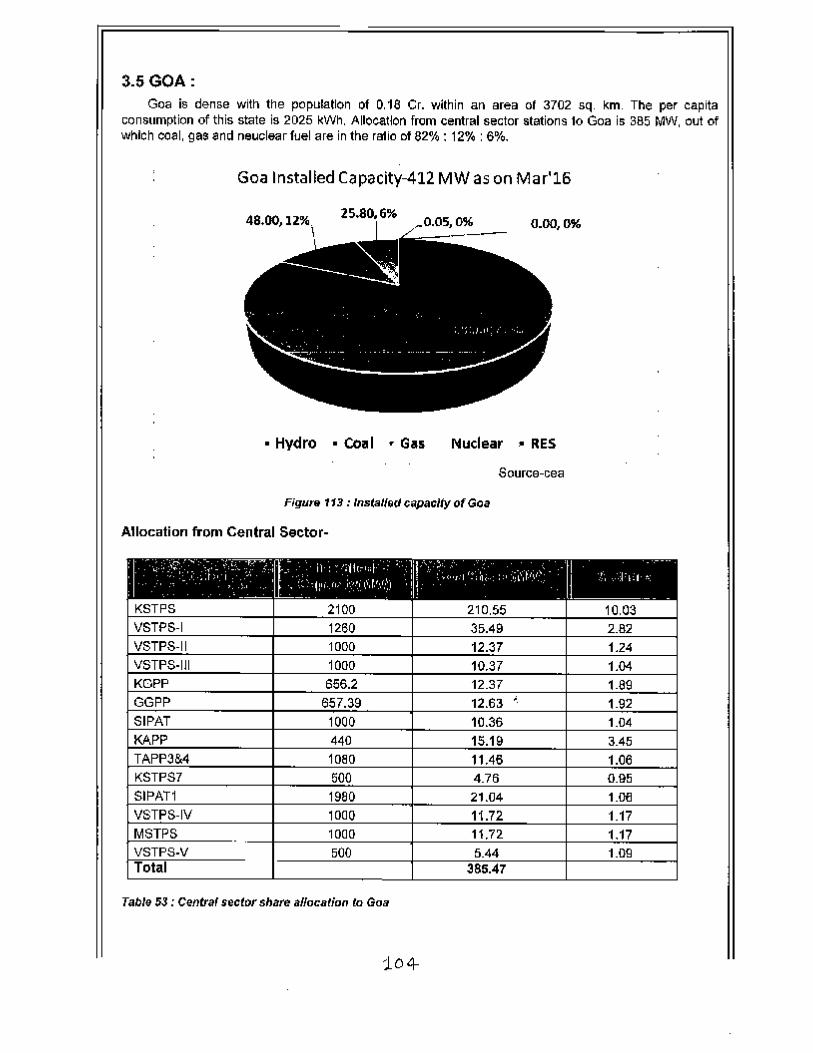
3.5 GOA:Goa is dense with the poputanon of 0.18 Cr. within an area 01 3702 sq. km. The per capita
consumption of this state is 2025 kWh. Allocation from central sector stations 10 Goa is 385 MW. out ofwhIch coal, gas and neuclear fuel are in the ratio of 82% : 12% : 6%.
Goa Installed Capacity-412 MW as on Mar'16
• Hydro • ceal • Gas Nuclear. RES
Sourcs-cea
Figure 113: Ins(al/ecJ clq1aclty of Goa
Allocation from Central Sector-
I- ,~.~. ,,·,~··t. .,' .; 1'!,,: ~" '11 _.'" .... ,. ',- -~~, 11: ·11(-'··1·, {.' .', ," •.
_' • r' I ~. . \ II- " .. <··,1 ·.,1< :. "llt/\I! 1 ~.I-·• • " .~ "(It, fl,' ,"', t\!!·/: I . I J. • ',!
KSTPS 2100 210,55 10,03VSTPS·I 1260 35,49 2.82VSTPS-II 1000 12.37 1.24VSTPS·11I 1000 10.37 1.04KGPP 656.2 12.37 1.99GGPP 657.39 12,63 -. 1.92SIPAT 1000 10,36 1.04KAPP 440 lS.19 3.45TAPP3&4 toao 11,46 1.06KSTPS7 500 4.76 0.95SIPATI 1980 21,04 1.D!lVSTPS-IV 1000 11.72 1.17MSTPS 1000 11.72 1.17VSTPS·V 500 5,44 1.09Total 385.47
Tabl. 5J : Central sector share alloca/ian to Gaa
104-

Power Supply PositionGoa has mel ils maximum demand of 505 MWon <11.26.04.20158119:00 Ius.
s.p 456 479 460 21 19 4.61 3.00
Oct 448 464 448 454 0 0 0.00
Nov 459 418 459 23 0 s.zz 0.00Dec 493 467 432 456 61 11 12.37 2.36
427 427Feb 428 459 428
Mar 446 476 445 12 0.22 2.52
Tallie Ii4 : _, Supply pl»llIcm of Go.
Ii'oo P"kD.""d (UVQ10lS·li G","'kOim"dl'/llJl,liI~·lliii! @
'Ill
Ie ...~ lOO ~ !to
'III ,(I)
III l\II
• JelIi ""'I I'. '" 01 ,... .. lI< ft' Ml'
11.III16'11Wf II "" ~18 'il' .U .~... '" 4IJ (I, lIB ~ IUIl«I1~dtal Jt.I W 11< 'M '" ,,. .~'" I!O '11 '"'/III''''11ri I. '" "9 <16 lIJ .~... 1M 4U en tllI 0111 lomb'l'" 1{9 Q I!t I9J .~.11 I~m '" III 'II III
Rgvre 114 : o.mand Cha" of Go. 2015-16 Vs 2014-15
WRPClA....'NUAr. kM'ORT 20J 5-Ui
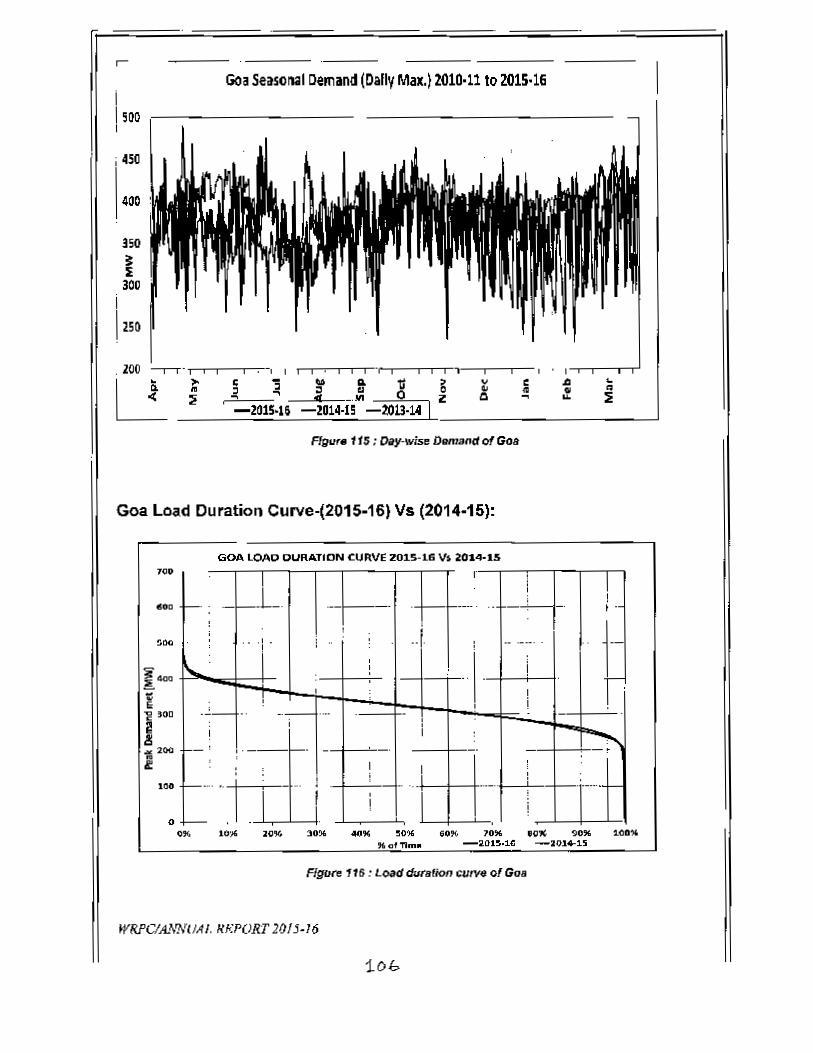
Goa Seasol1al Demand (Dally Max.) 2010·11 to 2015·16i1500 .---------I
i 450
400
350
~300
I
1250
. 200 ---rT' .,-,.--r-.,.,.~, , ,-.----.-, . ,-.-.---.-..'<~ : i ~___,1f...,_.,... ~ t: ~ ~ ; -:c _M 0 Z 0 ~ ~
-2015·U -2014·15 -1013·14 IFlgur.115: ~y·wise Dml.ndof Goa
Goa Load Duration Curve-(2015-16) Vs (2014-15):
GOA lOAO DURATIONCURVE2015·16 V. 20H·15
•• 0
! r!I
_. .__.L_. .._f--_ . .-.. , " r·-_l_ _ . i .., , i-, " j.: .. ., . ! .. .....!
~,
i:" r, !, ,.-:-- , !
" ""--- . . .,i! ~_- , ,._--_. - _. ,
: , ,I I: i :1--' 'n- ... j .. ... .,-_" ,or-
I , ~I i
I--
,..o
." ..." 20% 30!K. 40" 50% 60" 10"" '0" 90" 10.""of 'ftmlll -20IS.1.(; -20.1+15
Figure 116 : LOiId duration curve of Goa
WRPClA.>"'NUAI. /<I<.'PORT2fJ/j·}6
10(;,
.."::i
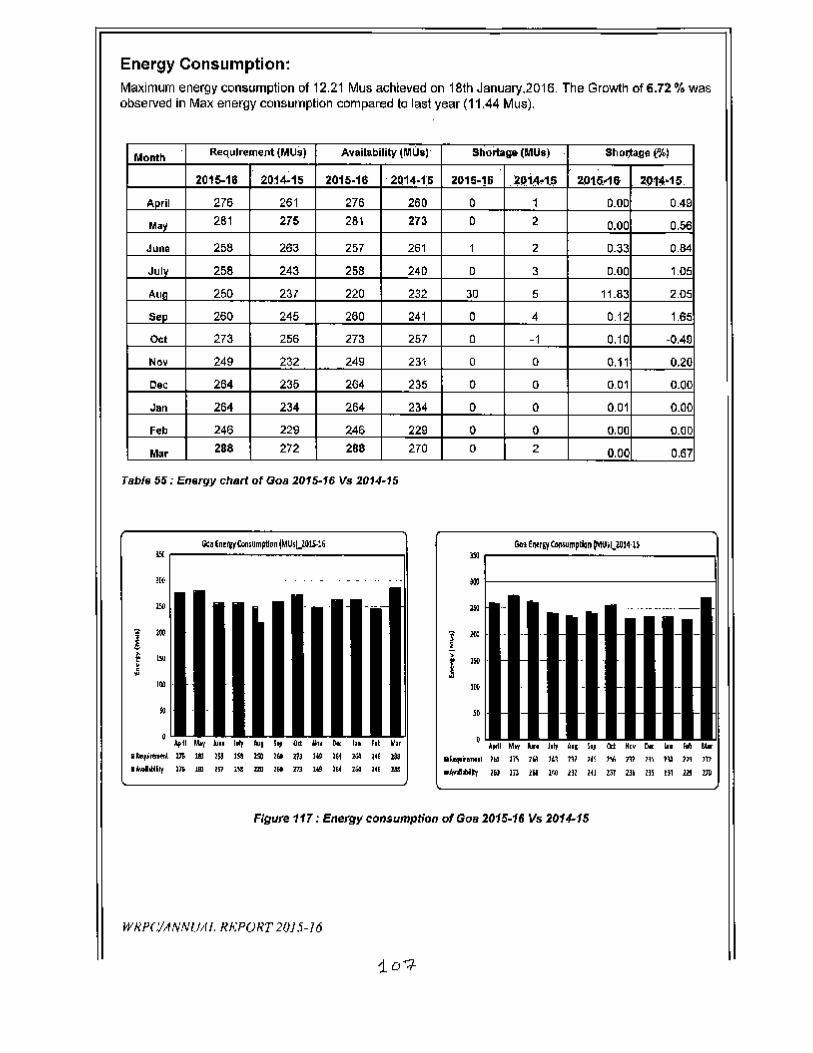
Energy Consumption:MaXimum energy consumption of 12.21 Mus achieved on 18th January.2016. The Growth of 6.72 % wasobserved in Max energy cOllsumption compared l<:J last year (11.44 Mus).
Month Requ' re ",eJlt (MUs) Availability IMU.)· Shoitage (MU.) Sh ot;lali. (Il»
2015-18 20j4-15 2015-16 . 2Q14-1:& 2015-16 l!111+ts 2D16.-1" 2.0'14-15.I'.orjl 276 261 276 260 0 , 0.00 0.49
May 281 275 28\ 273 0 2 0.00 0.56
JUlle 2:;8 263 2~7 261 1 2 0.33 0.84
Ju'y 258 243 2SS 240 0 3 0.00 1.05
...ua 250 23/ 220 232 30 5 11.83 2.05
see 260 245 260 241 0 4 0.12 1.65
Qe, 273 255 273 257 0 -1 0.10 -0.49
Nov 249 232 249 23'( 0 0 0.11 0.20
Doc 264 235 264 235 0 0 0.01 0.00
Jan 264 234 264 234 0 0 0.01 0.00
feb 246 229 246 229 0 0 0.00 O.OC
Mar 288 272 288 270 0 2 0.00 O.(p
Tablo 55 : E"orgy chari. of Goa 2015-16 Vs 2014-15
Gel! 'nt:ffr(Qn~QmFlltln (MUsl)OJS.!6 Gc1 El)fr", CdMulllpliaD v-tU;l2014·1~.. '"
SEASONAL VARIATION IN DAilY CONSUMPTJQN OF GOA
.~. . 120U.:14 TO2O~lli).I I
13
12
ill~10 .:..._::;l!: 9
~: 8:Ii~ 7
8 6
50. U ~.!!: 0 z
MON1lI5 .. ->-lUH&
I
I_j-10U·14 -Z015·16 ----
Figure 118: Se;,so1Ul1 vBri.lion In Enet'fJ¥ cOTlSlJmption at Goa
3.6 DAMAN & DIU;
Power Supply Position:DD has met ils maxmum demand or 314 MW 0" dt.22.03.2016 at t6:CO hIS.
Monm unres,OmCl(Mvvl Availability (MW) Shortage (MW) ge (%) !.ZD15-15 Z014-1S ~Q15·1ti 2014-1~ Z015·1I 201¥5 Z014-1~.
Apr 303 zso 303 290 0 0 0.00 0.00
May 305 272 305 272 0 0 0.00 D.OD
June 304 290 304 290 0 0 0.00 0.00
July 302 287 302 287 0 0 0.00 0.00
Aug 304 287 304 287 0 0 0.00 0.00
Sep 304 287 304 287 a 0 0.00 0.00
Oct 312 261 312 261 0 0 0.00 0.00
Nov 304 280 304 279 0 1 0.00 0.38
Dec 29J 272 29J 272 0 0 0.00 0.00
Jan 299 271 299 270 D 1 0.00 0.37
Feb 304 289 3()4 289 a 0 0.00 0.00
Mar 314 291 314 291 0 0 0.00 0.00
Table 56: Power Supply posilJolI of DD
WRPCIANNUdL REPOK!' 20/ 5-16
io~
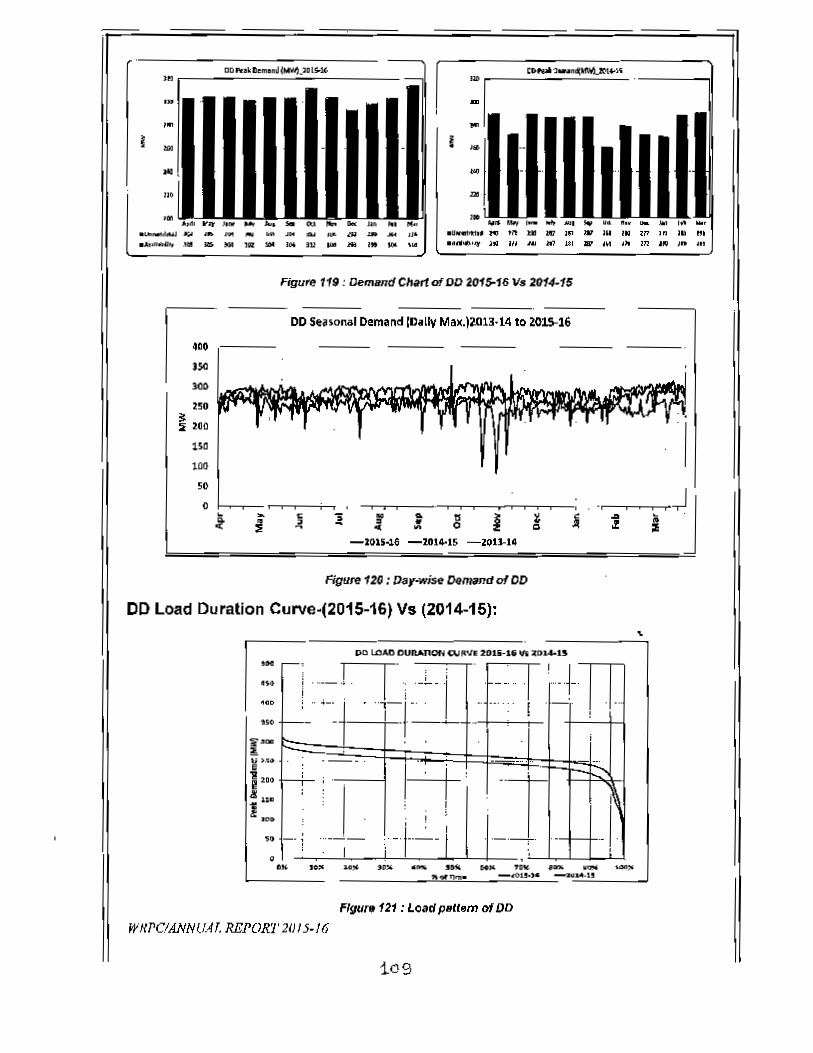
".,.••I.
! .....".•M ". '" '"-~•• .~~ ,. ,. - .~'" - - d'- ... .. .. .. '" ... '" .. .. •• ... ,.
! ..'"... '--Ii MrI 1- ~
.U"'~I'"' tit lS JI1 l" ., JU I. ~17 11'1 l. ".•• ,..... lilll III _ lt10 UI .. '114 ,)I m 'IID' .1ft ,.,
Figure 119: Demsnd Chari af DD 20foS-16 Vs 2014-15
j-;-,-301>
250
1200
ise100
50
o
DO Seuonai Demand IDilly Max.I~0l3·14 to 2O~li
,lne
-101~15-lOU-I'
Figure 120 : Day·wise D&mand af DD
DO Load DuraUon Curve-(2015-16) Vs (2014-15):
po LOA.O OUnAnON WI\VI! 201&-li Vi ~OJA.1S
...-; II' . 'IT! I; ~. I I' I:: ! :~=-1~'. "I'j;' -~'1 -..~.~~.!.;=_.- ! .•
... -- - . ---- .. +"":'-H
1i"'~F~=r9:~b:ktJ;;II:: -+-; .. j-+:.... ~i::: : : ; ; l I j T ~
: + ] •• _;- \"-·1-; ·1- .;~~.~~~"""'-l- - - - - - - - - -______ .?~""'..""'.."'.'__.=.::,.::;,,:;;.,::.~-"1A.u
WHl'ClANN(J.4f. REPORT 211/5-/6
,
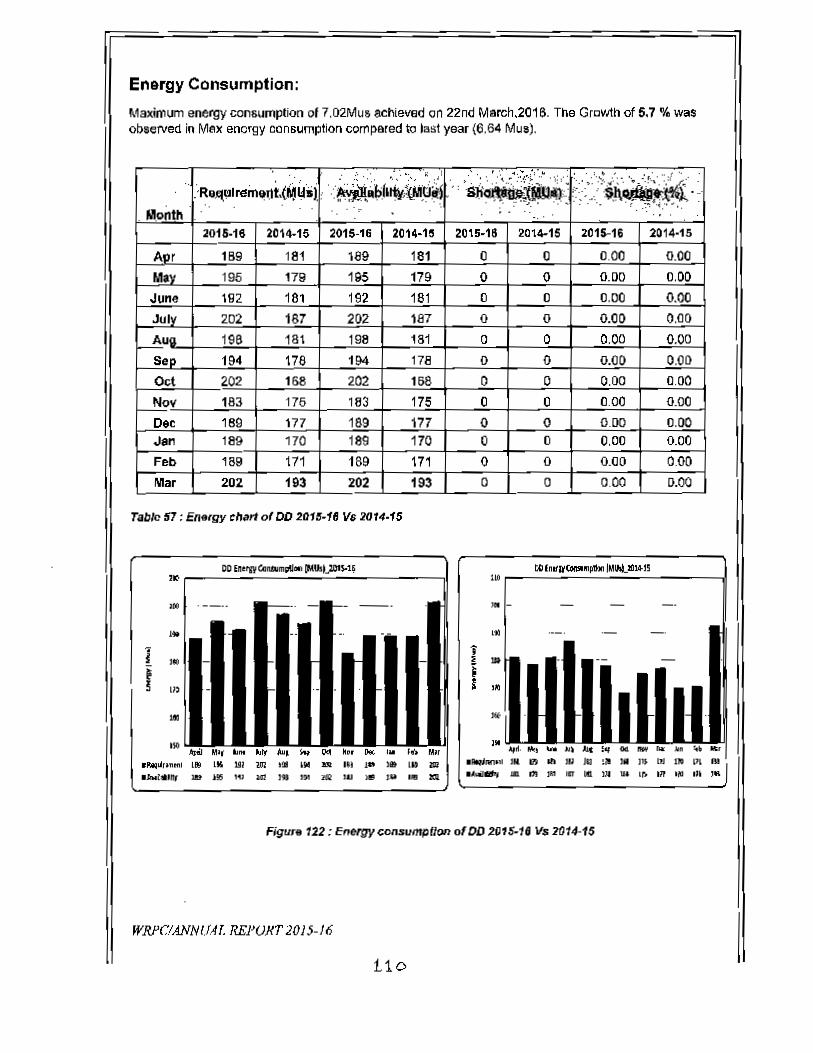
Enargy Consumption:
Maximumenergyconsumptionof7.02Mu5achievedon 22nd March,201S.rns Growthof 5,7 % wasobserved in Max etlCfgy consumptioncomparedto last year (6.64Mus).
" I ' : :~':. .::. ';,_ :; .i'l . .. ', .• :'......··~,..L'··..... : .. .]:... I...~ : •• "... ~.,,:!",' ."~ ~"'II.····..;;.'..'ti~li(.."'·'.i·rci~., -aJl' :"::';ili.~.~<···;'>":'.J..',,,:,,;),Ni.-.:~ "vo:o. I '.~':M "PI~v.o"'" .~~~ :,'., ~.!\~J'f.~"'I<. .NI.onth···· '.. . .,. '; ".' ::.:. ., ., '. ' ..".~.-_...
2015·16 2014-15 2015·16 2014-15 2015-18 2014-15 2015-16
AI!I' 189 181 189 161 0 0 0.00 0.00May 195 179 195 179 0 0 0.00 0.00Jlfte 192 181 192 181 0 0 0.00 0.00July 202 187 202 187 a 0 0.00 0.00
~uaL-+-~1~96~ '~8~1~__~19~8~__~I~al~__~O~~~0~+-~O~.0~0~ __ 0~.~oo~Sep 1904 178 194 178 0 0 0.00 0.00Oct 2.02 168 202 168 0 0 0.00 0.00
No~v-+__ ~1~83~~~17~5~ 1~8~3-+__ ~1~75~~~0~+- __ ~O~+-~0~.0~0-+__ ~O~.O~O~0.., 189 117 189 177 0 0 0.00 0.00Jan 18S 170 189 170 0 0 0.00 0.00Feb 189 171 189 171 0 a 0.00 0.00Mar 202 193 202 193 0 0 0.00 0.00
2Q14-15
Table 57: Energy .".11 of DO 2Q15-18 VS 2014·15
'"II.
"'" .., s.. .. ... '" ,y 'n ....-,. '" '" ... '" ". a ,.. '" ,.. ,It !III.JrNlll.", '" ." '" "" ,.. ,.. ,,. '"
,. ,.. ,,. ""
,.,...,
t! ..I J'..
,. •• "'" ••..... '*'lIl .. .. ,. lI> '" ,. ,~hi "'.~-OIl '" .. .. .. ,. .. '" ~ ...
Figure 122: Energy consumption of DD 2015-18 11$ 2014-15
WJ/J'CIANNU.-4T. REPU}{'!'20J5-16
ii0
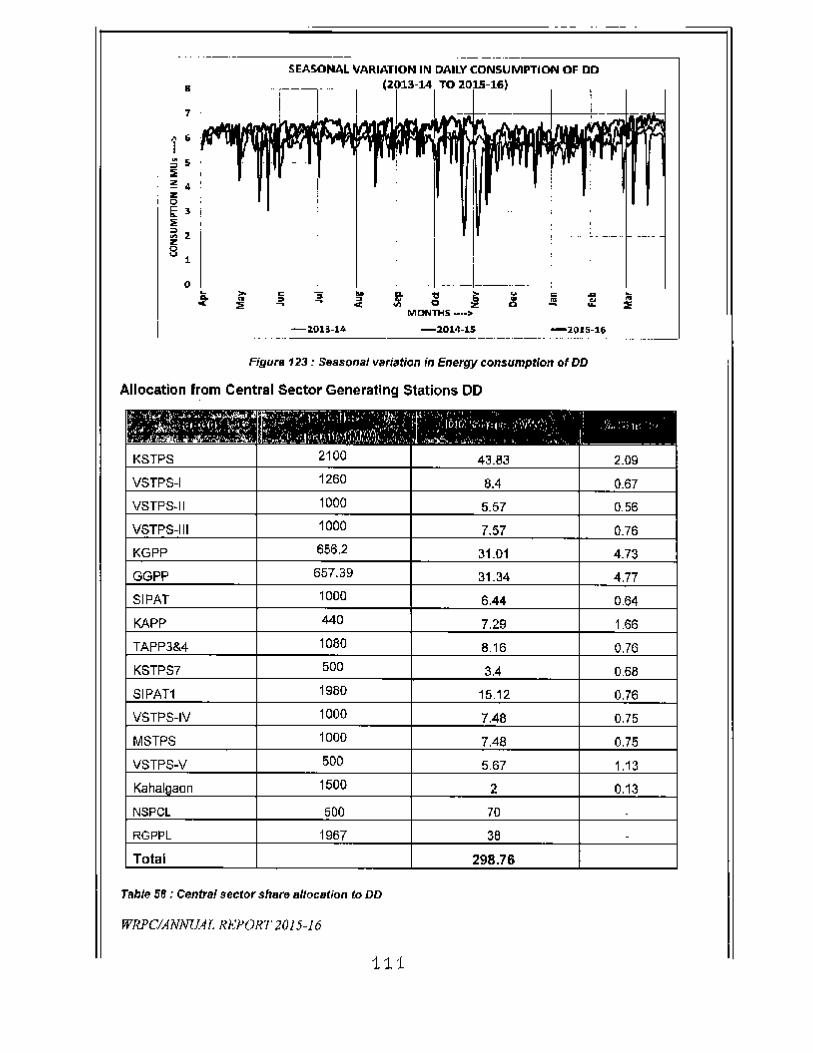
· ...__._._---- ._-_._. __._------,SEASOPIALVARIATION IN DAILYCONSUMPTION OF DD
•7
1 'is 5::<;!! •z, 0
Ii: ' ;:IE~ lz8 1
oc }! .. l' ~ j ~ .= ~ ~.;: ~ c'l ~ ~
-e 0 ~ ::<MDNl'HS _ ••>
--2.01!-14 -2014-15 -2015-16.__ ._-_ ............ ... ._ ..-Figuro 123 : Seasonal v"ri~tion in Energy consumption of OD
Allocation from Central Sector Generating Stations DD
~~?-.:;-~;~~'. II.:;:· '1><' r '.;i,~'" .-,..., . , •.• 1t!-. e-r •••• '<;\. • ',,-·.T:I;" .:1-, ./. ' •. i t.il, v' _ I__.~~l~':J~r:.I"\!"~J.~,•...}.~.~', .•. ~'),._-".__...' > > .~ r., --- -- -
KSTPS 2100 43.83 2.09
VSTPS-I 1260 8.4 0.67VSTPS·II 1000 5.57 0.56
VSTPS-III 1000 7.57 0.76
KG?P 656.2 31.01 4.73
GGPP 657.39 31.34 4.77
SIPAT '000 6.44 064
KAPP 440 7.29 1.66
TAPP3&4 1080 8.16 0.76KSTPS7 500 3.4 0.68
SIPAT1 1980 15.12 0.76VSTPS-IV 1000 7.46 0.75
MSTPS 1000 7.48 0.75VSTPS-V 500 5.67 1.13
KahaJoaon 1500 2 0.13
NS?CL 500 70
RGPPL 1967 38 -Total 298_76
Table 58 : Central sector sha", a/localion to DO
WRPCIANN1Ur. R~;}'OR,/,20/5-16
111
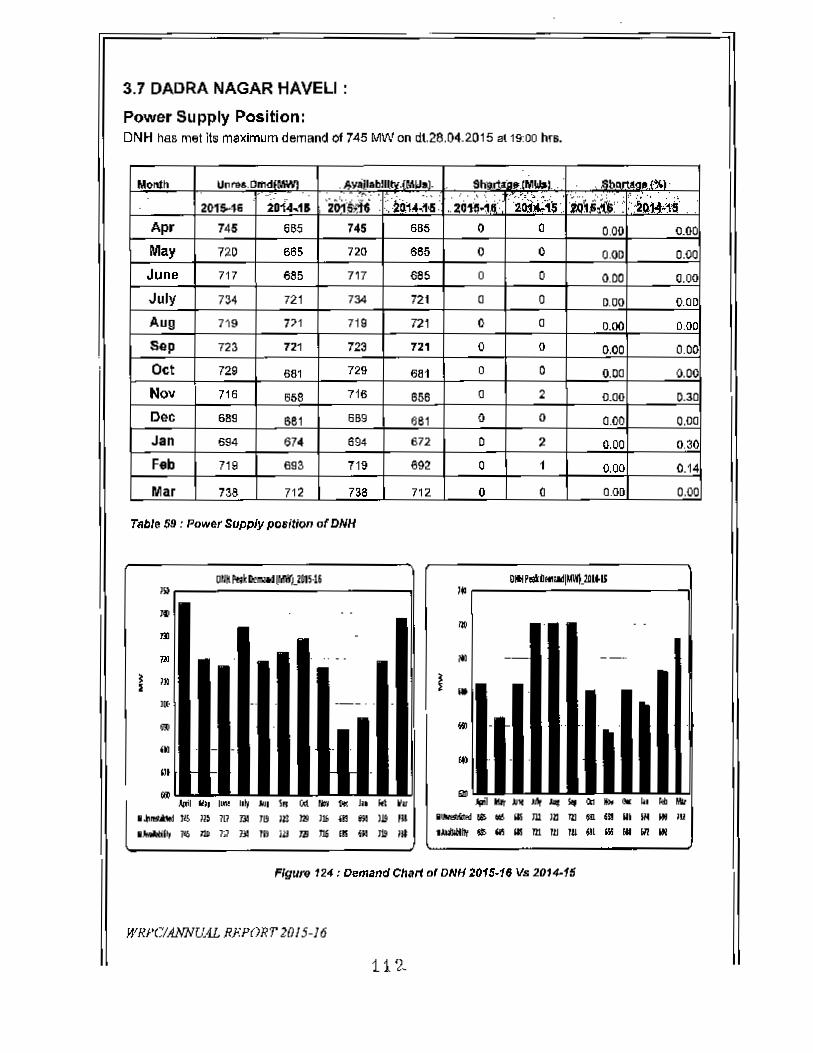
3.7 DADRA NAGAR HAVELI :
Power Supply Position:DNH has met its maximum demand of 745 MINcn dI.28.04.2015 0119:00 hrs.
- UnnM. .~~ty_~IMI_tj. St> •.-11 ..... IMliI!Il . "%1·
2015046 iD1"',11 :2O:;'5£~~·: :.:~a1~';;~::;a~.it.:Jii~~..~.::~~...Apr 745 665 745 685 0 0 O.Oll 0.001May 720 665 720 665 a 0 0.00 0.00
June 717 685 717 686 0 0 0.00 O.DC
July 7~ 721 734 721 a 0 000 o.ocAug 719 PI 719 nl 0 0 0.00 O.DC
Sap 723 721 723 721 0 0 0.00 O.DC
Oct 729 681 729 681 0 0 0.00 o.O(Nov 716 658 716 656 0 2 0.00 0.30
Dec 689 681 6S9 681 a 0 0.00 0.00
Jan 694 674 694 672 0 2 0.00 o.~Feb 719 693 719 692 0 1 0.00 0.14
Mar 736 712 738 712 0 0 0.00 0.00
Table 59 : Pow~r Supply position of DNH
1iIl"'_tw'l.lOISo11 GIll,..... IIJIIIlDlilSI I.
'" ..
'" ..rJl .
"/lIl " - . IOl -- -_ ..
l I. II .... ----." 10)
,. ..:~~," iI", 6111 "" ........ .~ ......... "" I. b. It! 'u ... ...-_II!> "'111 DO m III Ilt 15 III '" la 'U .~.. w. "' 111 )~ 1Z3 ... ,. in 1M ill ...- .. .. I"J JlI II! lJj nI '" 01 ... 1!9 III ._r. 1& '" ill DI DI 111 ill III ,. II! ill
Figure 124: Demand Chan of DNH 2015·16 Vs 2014-15
WRPClANNU.iL RRPORT 2015·16
11'2-
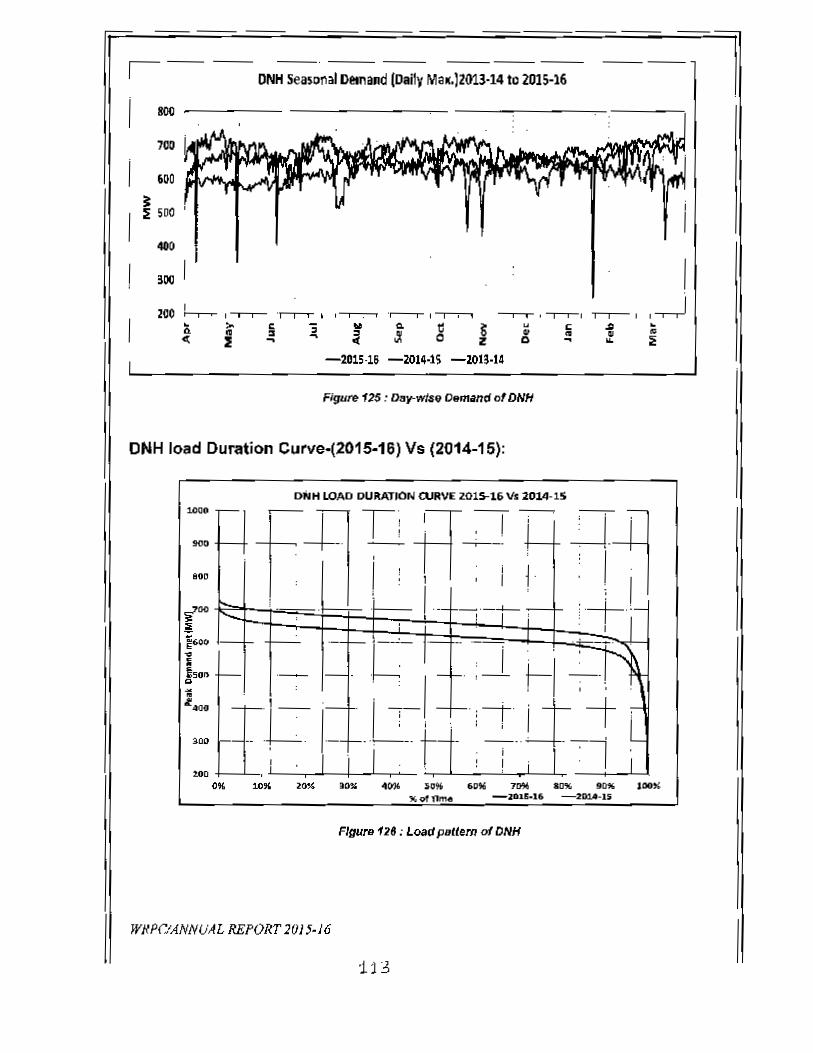
I -- ---ONH seas;l'IalDemand (DailyMaK.)2013-14to 2.0l~16
800 ----- -------~ ----,----_----,
400
I,-.-J
300
200 !-.--- ,........- -r+r-v- i I~
~ ..~ ~ ~
s-"! t:oCi
<I;•..s~z
-2014-15 -ZOU-14-2015·16
Figure 126 : Day-wise Oemimd of DNH
DNH load Duration Curve-(2015-16) Vs (2Q14-15):
OHH LOAD DU~ATJON CURVE 201s.-16 Vs 1()14-1S1000
"".
6-0" 7,", aD" 90""-)8.1&'16 -~u '00"
FIgure 126 : Lo,uj psltem uI DNH
WlIPr.lANNUAL REPORT 2015-J6
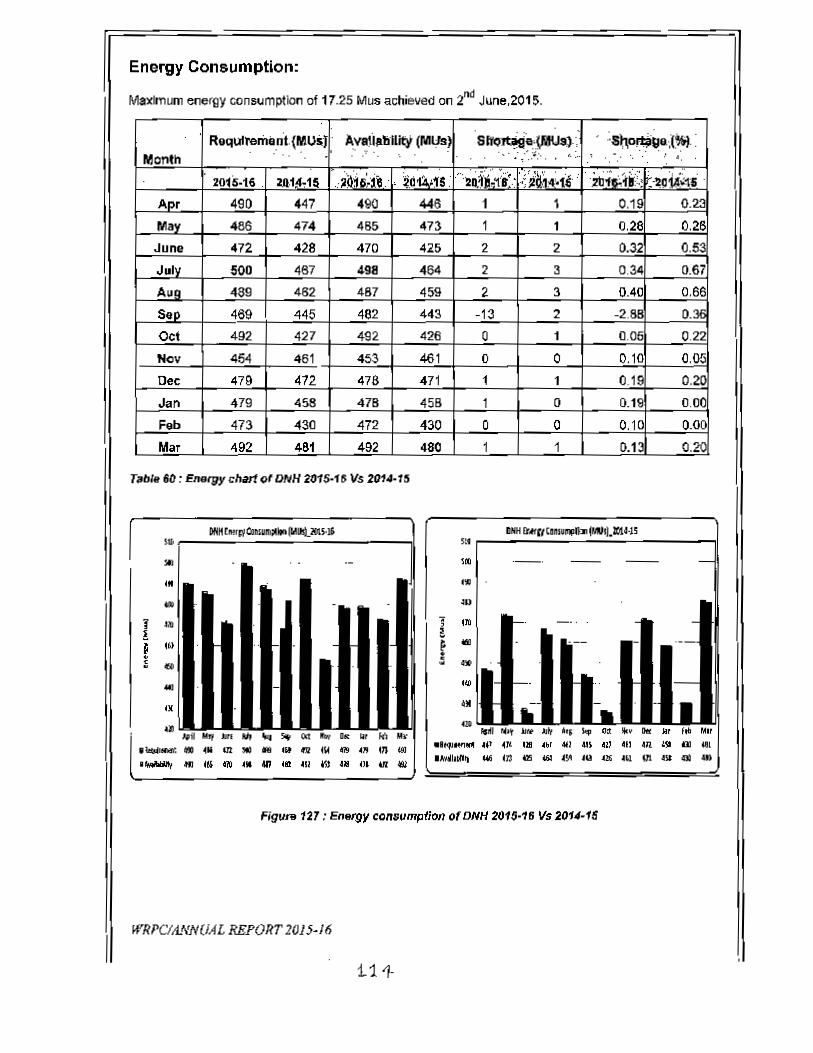
Energy Consumption:
Msximum energy consumption 0117.25 MllS achieved on fill June,201S.
Requfremil.n·l{MU~J· Avattlllillit;y (MUs). .... .' .~", \ .Month
490 447 490 446 1 1 0.19 O.Zl
May 486 474 485 473 1 1 0.2a O~2.E
June 472 428 470 425 2 2 0.32 O~
500 467 498 464 2 3 0.34 0.67
Aug 489 462 487 459 2 3 O.4Il O.se
Sap 469 445 482 443 -13 2 -2.88 0.3€4Q2 427 492 426 0 1 0.05 0.2:<Oct
~N~O~V~+-~45~4~__~4~6~1'_~4~S~3-r__~~1-+__~O__ ;- __ ~O__ r-__o~.~lnT-__ ~O.~~Dec 479 472 478 471 1 1 0.19 O.2(Jan 479 458 478 458 1 0 0.19 O.O(
Feb 473 430 472 430 0 0 o.ic O.(J(
Mar 492 481 492 480 1 1 0.13 O~
r"bl. 6C: Elt8lf1y ~harl ot DNH 2015·1S Vs 2014-15
"....
".'1» ..
•• "PWltnI ~p III..., ffl 4ft cD <fD Q: 9'",lJhtll" W6 113 iZ5 ~ ~SII 4Q AZIi ~Q !.]l .tV a ..• w",MlI!t !L1O •• m ,., .. ." flZ ~\.I ~ 4}9 In (Sl
• ~ 8'J '" tlO A. 4n (81 .asl ~ 1M .,1 til W
Flgu18 121: Enef!}y consvmption of DNN 2015·1& Vs 2014-15
WRPClANNUAL REPORT 2015-16
i11·
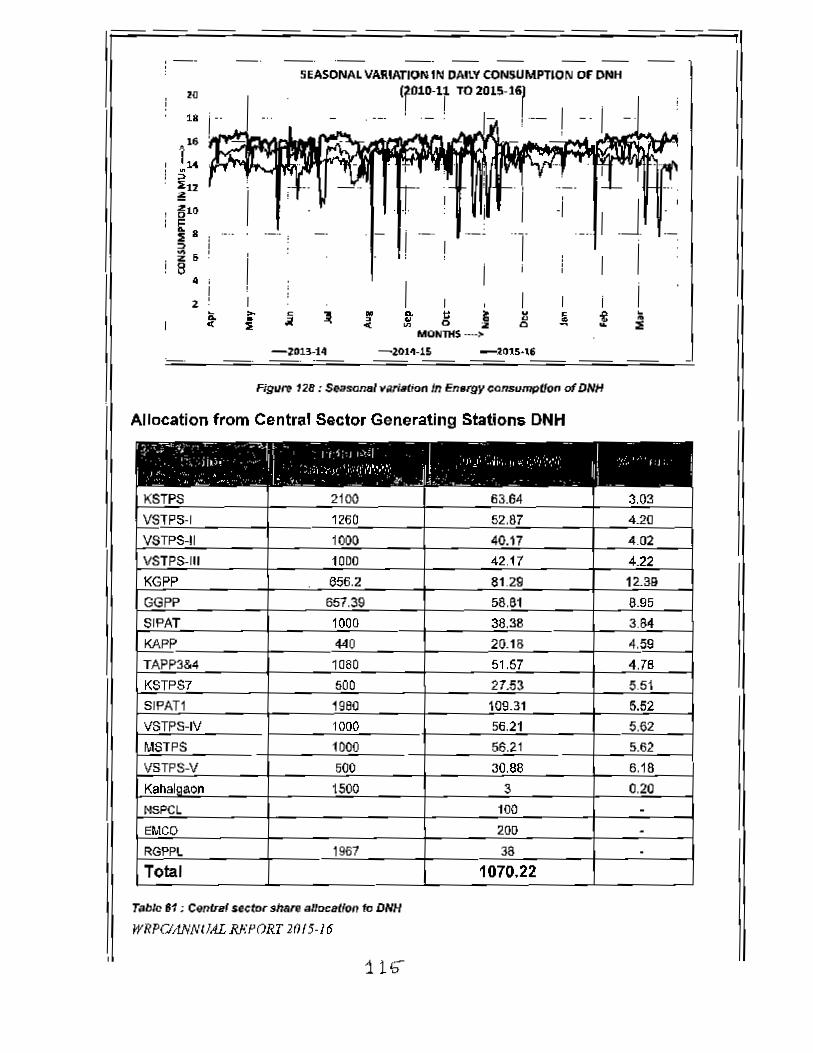
,-
10
...1
16
.14:>lE12i:!!~10
~ 8:>21 58 •
2li.'"
SEASONAL VARIATION IN DAilY CONSUMPTION or DPIH
(iOl~-l! TO 2015-161.__
•
I • ic ~ • ... ~ i; v < ii -• ~ .. 13 ~ •~ 0 .. & :Ii
MON1lfS ._>-ZOl!-t4 -lO'.·15 -1015·"-_. ._- -- -- --
Fig"", 12B : Seasonal lIar/aoon In En.I'9Y consumption 01 DNH
A1IOC<ltionfrom Central Sector Generating Station& DNHr~:-.:-~.~ .- ""11\ - -, f '.'J ;::.1 - I - - - -
, .III" 'J. ~I ,11'.', ~, ,",:, I , J ,
_I .. _~"""_:','J':"',,, ..j •. II~ ,, _ , .::__ ,_ - - I - -KSTPS 2100 63.64 3.03VSTPS·I 1260 52.67 4.20
VSTPS-II 1000 40.17 4.02VSTPS·III 1000 42.17 4.22
KGPP 656.2 81.29 12..311
GGPP 657.39 58.61 8.95
SIPAT 1000 36,38 3.84KAPP 440 20.18 4.59TAPP3&4 1080 51.57 4.76
KSTPS7 SOD 27.53 5.51
SIPATI 1980 109.31 5.52VSTPS-IV 1000 56.21 5.62
MSTPS 1000 56.21 5.62
VSTPS-V 500 30.88 S.18
Kahaloaon 1500 3 0.20
NSPCL 100 -ELlCO 200 -RGt>PL 1967 38 .Total 1070.22
Table If ;Cenlr.1 $o.(or ,hare allDcs(fon to DNH
WRPClANNIIAL R}.·PORT 2(115·/6
11S-
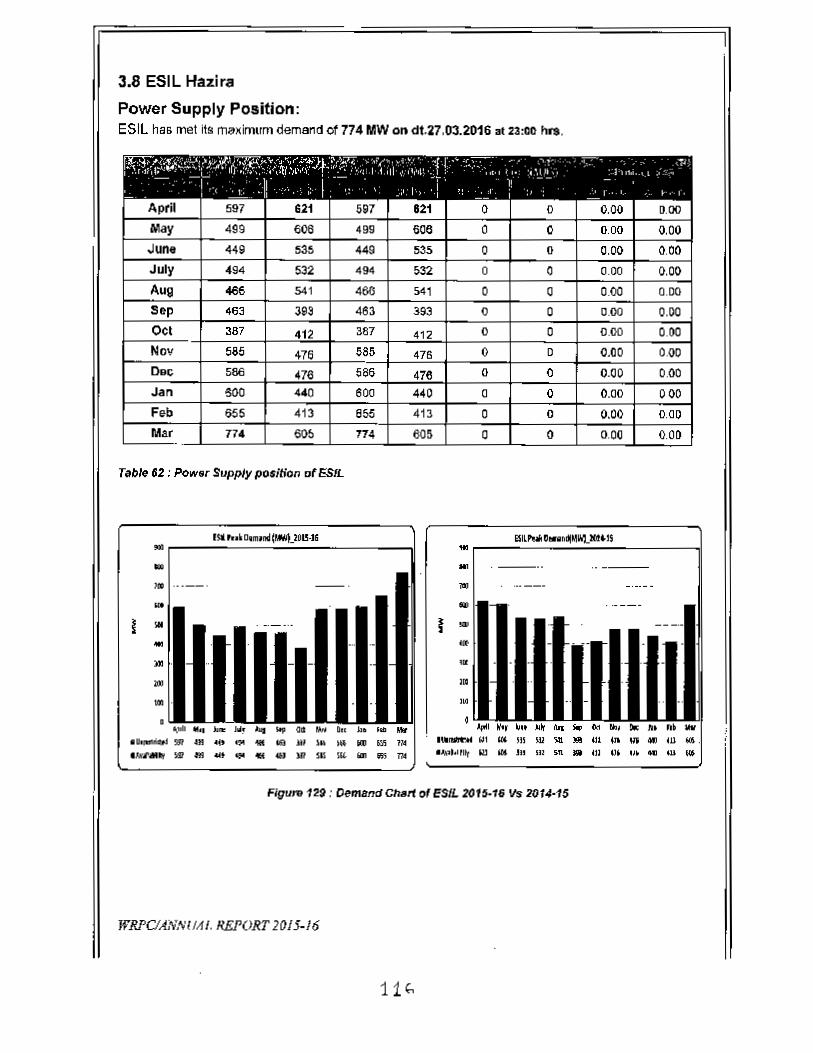
3.8 ESIL Hazira
Power Supply Position:ESIL has met its "",xirmrm demand of 774 MW on dt.27,03,2016 ot 23:00 "1'$,
~,-:. ..<{'r.:O..:f,-,,>:.,;~ -:::c.t~,...v J~'J'''~''~~ '~~':A--r;:,. ,"/.,. " \,' '.( I'" r-, ,- ... ,~ .- ,~~_.."..r. .", ~••. ";,; , '"I'rt"i~~ I Iff.: •• ,~I;I"" , ,'°',11,11\,,',"\' I ,,(_,1,. ,',lit" I ,"hl 'l '- -1- II I -- -r- l' - - -
, I' 1 . I ' " \ _,I 1, i " I I' , ' , , ,-- --April 597 621 597 121 0 0 0,00 0.00May 499 606 499 606 0 0 0.00 0.00June 448 535 449 535 0 0 0.00 0.00JIAy 494 532 494 1;32 0 0 0.00 0,00
Aug 466 541 466 541 0 0 0.00 0.00Sep 463 393 463 393 0 0 0.00 0,00Oct 387 412 387 412 0 0 0.00 0.00Nov 585 476 585 476 0 0 0.00 0.0009& see 476 586 476 0 0 0.00 0.00Jan 500 440 600 440 0 0 0.00 000Feb 655 413 855 413 0 0 0.00 0.00Mar n4 60!> n4 605 0 0 0.00 0.00
r_12 :Pow.r SIJPPly po.ition of f5$fL
1St Pl.•• a,m,nd (__ 'OI5·)S....,.,..i ..
..,
'"....... •• ON
• Ih~ 59i' '" ." e ... .., ,. '" .. "" 'M.,.,..., .. .. ... ... .. '" '" '" '" "" '" TN
'".......I ...
,I>,.'10I•
... .. .. .. ..."'1III't'M $.11 .. III ... '" .. III .. .. .. '" os• J,\JI"'", '" 1M .. '" sa • IV .. ... .. .. ..
Figuro 129: Oemand Ch.rl of ESfL ZOU-16 Its 20/4-15
WRPClANNlIllf. REJ'ORT 20/5-16
11..
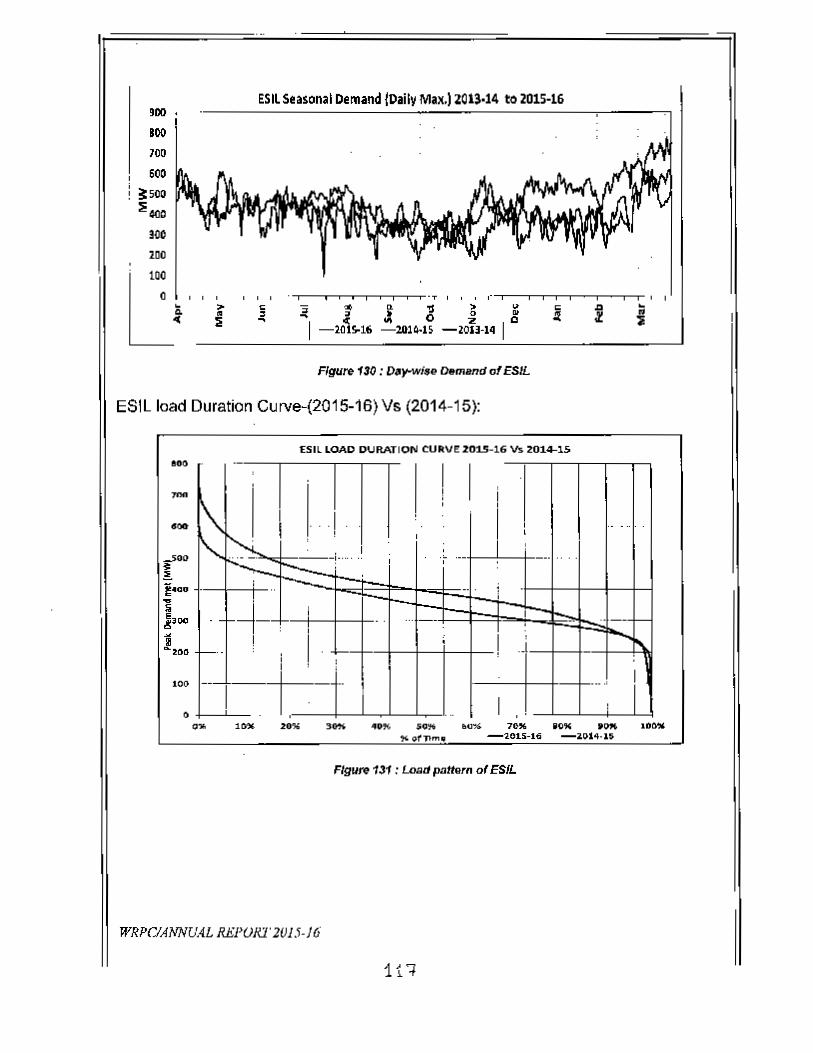
~ICO
100
600
:I: 500::E 400
JOO
100
[ ,
~>•::;
ESIl.Seasonal Demand IDailv Max.)ZOU·14 to 2015·16
, ,c~
...,-.---.~"'T'""-"""~'T I , , .'--r-,-,r-r--r-.,---r--r, ,Q. 'tS ')0 lot
J 0 ~ ~-2010-11 -lOU-14 I
..,..-lot!.l'
Rgure fJ(J : D.....wi.e o.mand af ESIL
ESIL load Duration Curve-(2015-16) Vs (2014-15):
ESll LOAD DURATION CUftVE 2015-16 Vs 2014-15I••
I I i!
1\: ,
I I,
!, .. ... . ,, ,
-,N_ :,.~--- -- ,I'S ::::::-:!-" ",
-- ,
I-- ;
i I I -r-.-- .., -I , : ! -..I ; _1 ...~- ,
; :I e ,
I..
1
--. II I
....JO.
Xi-1~ ..i-_
100
•100< 2." "", 4Dt(, $O~ e.u"" 70" '0" .OK lOW
"otTlmlll -'2.015-16 -1014-1.$
FIgure 131 : Load patto," 01ESIL
WRPOANN[ML REPOR1'2£J15-J6
1t':l
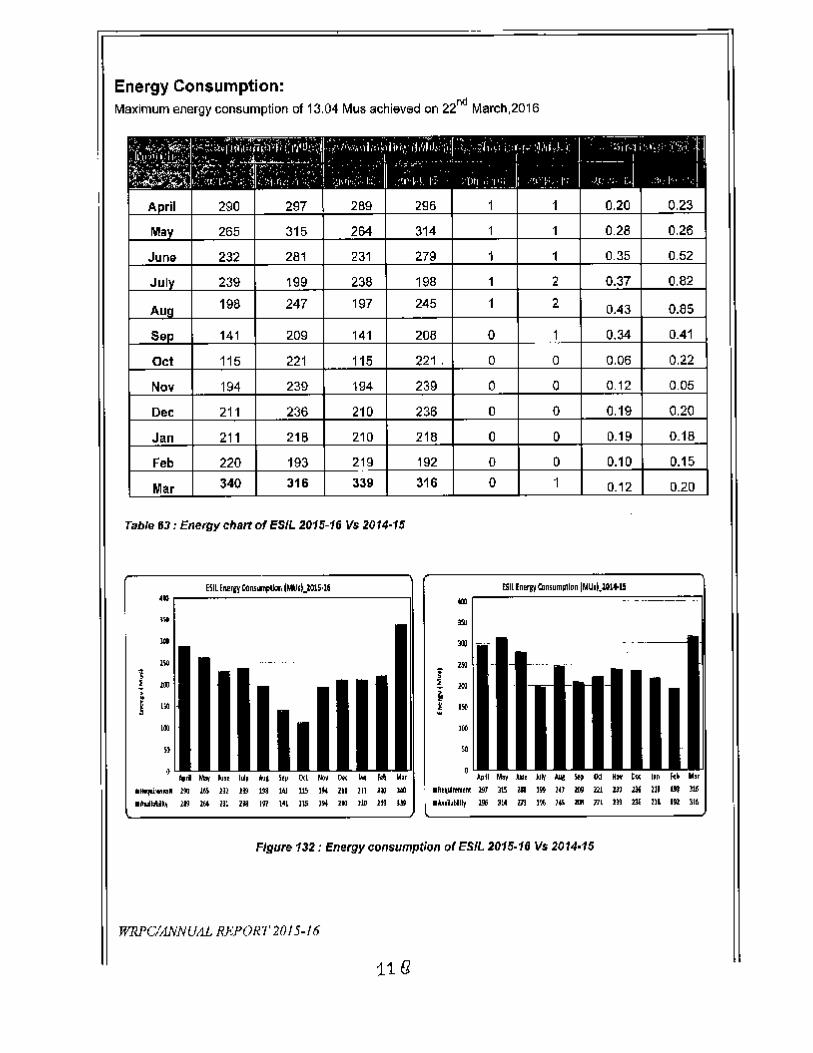
Energy Consumption:Maximum energy consumption of 13.04 Mus achieved on 22nd March.2016
Table 83; Enerflycharf of ES/L 2015-16 Vs 2:014-15
'DYO..,,,
'!! '"i ,.
,.,".) ro. IIDr "u I., N ~ .".,' It, 0<, .. II«
alfIIJIi. ... ol m '" 11! ," oo '" '" )1< '" U1 ,. ""• .ubW~ '" .. u: ,. '" ,.. "' '" ,. II. '" '"
'"
. .ftt\.llnntll: 191 lIS ~ ISIt IU D m J3:l ~ llJ ot 1I6.1tll~I"" lSti 3:.4 U! I~ }~ DI ]1l 1M 231 111 I~ 116
FlglJre 132:; Energy consumption of ESIL 2015-16 Vs 2014-15
WRl'ClANNUIlL RHP(iR'f' 2015-16
11e
CHAPTER-4
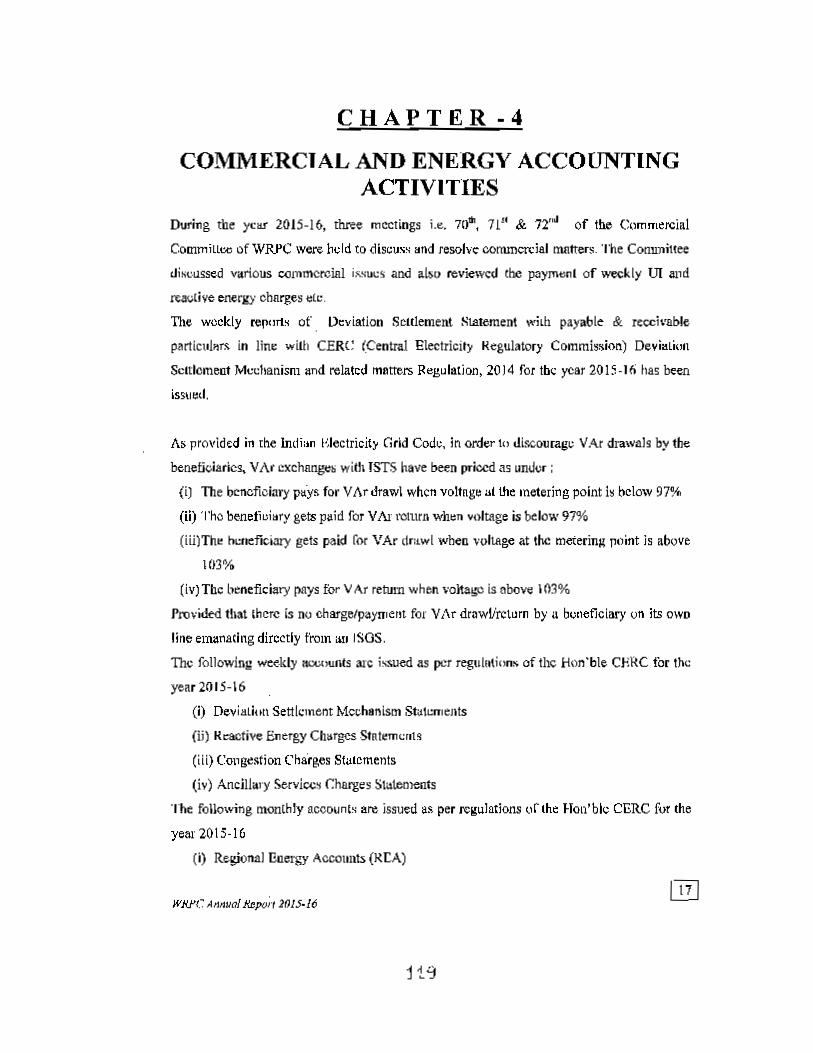
CHAPTER -4
COMMERCIAL AND ENERGY ACCOUNTINGACTIVITIES
During the YCOf2015-16, three meetings i.e, 70", n" &. ~ of the CommercialCommiuee ofWRJ'C were held to discuss and resolve commercial matters. The Committee
t1is<'<lSSed various commcrclnl issues and also reviewed the payr....'"t of weekly UI andreactive energy charges ere.
The weekly repons of. Deviation Sculement Statement Willi payable & recelvabte
partieu!"", in lin. with CERe (Central Electric;') Kegulatory Commissioe) Devil1LiunSettlement Mechanism and related matters Regulation, 20)4 fot tbc year 2015·16 has beenisS\J",I.
As provided in the Indian Electricity Grid Code, in order 10 discourage VAr drawals by tbebeneficiaries. VAr exchanges wid, ISTS have been priced as under :
(i) The beneficiary pays for Vhr drawl when voltage at the metering point i~below 9N(ii) The beneficiary gets paid for VIll' return when voltage is below 97%
(iiilTh. hcnefociary gets paid for VAr drawl wheo vohage at the meteri~ point is above103%
(iv) Thc beneficiary pays for VAT return when voka!>') is above 103%
Provided tbat there is no chargefpayn,em for Vi\r dr~wlirelum by a bcaeficiary on its owoline emanarlng directly from 1111 tSGS.
The following weekly ""wIlI,ls arc issued as per reguluti()n., of the Hun 'ble CBRe for theyear 20.5-16
(i) Devistion Settlement Mechanism Statements(ii) Kcacfi;.e Energy Charges Statements
(iii) Congestion Charges Statements[iv) Ancillary Services r:hnrges Statements
The following monthly accounts are issued as per regulations of the Hon'blc CERe fur the
year 2015·16(i) Regionaillnergy Accounts (Kt:A)

[Ii) Regional Transmission Accounts (RTA)
(Hi) Regional Transmission Deviation Accounts (l(TDA)
Other Important Activities include Share "Uocation of Central Sector nsnilil:S as per the
directives of M"p I ell..., Prepnring Comments ll1l Regulatory Issues and Resolution of
various Commercial i"uos involving' WesTern Region Members.
3.4 Cl1.RTIFICATION 01<' PERCF-NTAC)!:· OF OrE~ CYCLE GENERATION
DURING TllE MO:'lTH "Of{ NTPC GAS STATlONS fN WR
As per Monthly Opereting Pattern Adjuslmont (MOPA) formula b~ven in {,Of notificalioo
OIl tariffs, the pen:entage of Open Cyete geueration during the loonth is being certified by
the W.RPC secretariat for KaWD9 OPP and Gandhar fir" of NTPC. Accordingly, on (he
basis of daily un it generation data t\,rnishcJ by Kawas GPP and Gandhsr GI'P and daIa;records of unit outages IreJl\ ~LWRLDC, percentage of Open Cycle generation in respect of
Kawas OPP ami Gandhar GPP wero computed and certified on monthly bas;;; for the year
2Q15-\ 6 bas already isseed by Operation Circle.
II'I1J'CArmual ROl'o,' 10/;-/6

Settlement of DSM Pool AccountTotal DI$bulSement Amount during 2015-16 in WR was 1720 CT. Maximum DSM disbursement in 8 daywes Rs. 189.32 Cro ...s on dt.11.12.2015. A~erage disbursement per week was 39.08 ereres.
DSM charges disbursed - from 2004-0510 2015-16
- -,
....I.,..J- 1'1>:.
FIgure 17~ : DSM Charges
Summary of Deviation charges receipt and payments status for the FY 2015-16(Bill indudod up to SOthweek (07-13.03.16) and Payment received uplo 31.03.16)
AI! fig In Rs
~i""" R.aceMrble £rom Payable to WR Paid from WR Receive in WRo..tsbnd'''l9~. WRPool Pool Pool Pool
CSPDCL -115,974,938 1.321,698,793 115,974,938 '1,327,693.793 0Mt"t"~r
1,069,652.429 -268,456,129 0Management -1,069,652,429 21>8,456,129CO.Lt<1.GETCOLTD. -513,215,599 542,74;,314 613,215,~99 ·542,745,314 0
'Ul-2,000.743,595 1,064,743,842 2,000.743.595 .1,064,743,842 0Setllement
&QOunt
Gal -34,774,432 560,034,520 34,774,432 ·560 034,620 0D&D -31,352,951 192,984,725 31,306,378 ·192,984,725 -46,573
D&NH -127,357,175 31,?69,525 127,357,099 -31,269,525 -76
NTPC -2,56(),852,339 343,162,087 2,538,286,467 ·343,162,087 -22,565,872
N~ -57,283.77:1 16,815,213,756 57,283,775 -18,815,213.755 0
SR -2.151,865,126 303,227,S20 2.157,865,126 ·303,227,320 0
ER -8,042,214,599 591,135,646 6,D42,21~,599 ·591.135,846 0
WRPC/ANN'UAI. REPORI 2015· f6
l?i
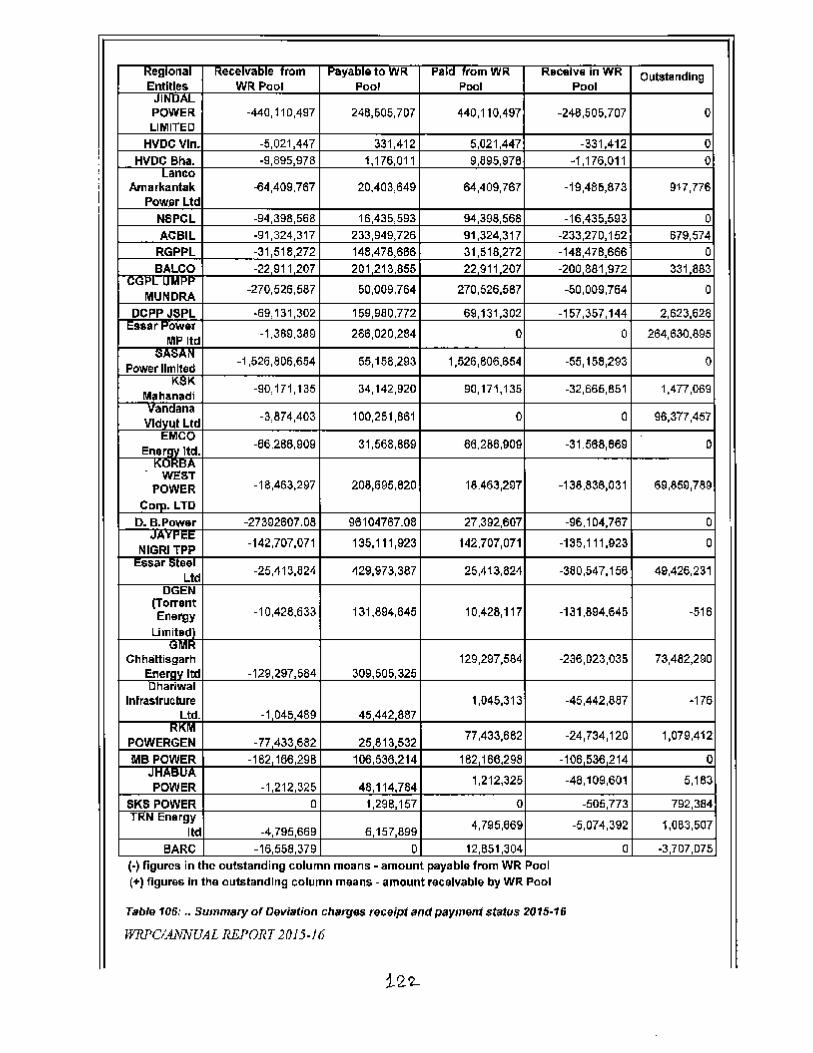
~WR po,,;rom p:;~VVI( "ala ;:,~ WI( p~~~WK Outstanding
POWER. -440.110.497 246,&05.707 440.110.497 -24l'.505,707 c
HVDCVln. _, n?1 .... 7 331.412 5.021.447 -331,412 cHVD~ -9895_978 '_176.011 Q RQ~.978 -1.176_011 c
Am.,kantak -<>4.409.767 :)ndn~AA'" 64.409.767 -19.486,873 917.776PowJlr Ltd
.... D... , _94 g.j ana 688 -16. aACBIL _01 "4.317 '" .4Q,726 91.324.317 _?~, ?7n 1", 679.574
RGPPL -" <1~.272 M.A'A~." 31,<1·7'77 -148 '7.~... 0
~-22.911.207 201.21 a.855 22.911.207 _?nn ~A1.972 331.883
-270.526.567 on nnQ.764 270.526,587 -50.009.764 0-~::-69,131.302 100 O'~.772 69.131,302 -157.357.144 ?" .. o~
-1.389.389 , ....n'n 284 0 0 ?A • '" ,,'"
-1.526.806.654 55,158293 1,526,806.654 -55,158,293 0~ -90,171,135 34, •• ? .,n 90,171.135 -32,666,851 1,477 .oss
~-a,874,403 100,251,861 0 0 Qil,~77 .4.7
-86.2.86.909 31 ~I\'RRo RA'AA Ani) -31.568,669 0~.
?nR 00 •• ,n 18463,297 ". A.a 76PPOWER -18.463.297 -13B.636,031
COlli. LTDD_R P~_. '.OB '_OS 27.~O?M7 -96.104,767 0
~;::. -142.707,071 135,111,923 142.707,071 -135.111.923 0
-25.~ 13,824 ~2.9,S73,S87 25,~13.a2' -3~O,547,156 AQ."" 131
(Torrent_1n 40~ .. ~.~ 131_894,645 10.428,117 -131.894.645 -516Energy
I ;m;'.rl'GMR
129,297,584 -236.023,035 AA<l <lotiChhattisgarh
~I _"0 ,Q7 _564 ,noon.~,.
InfraslruclUre I,045,3P -45,442.887 -176
~-l,n .. A." 45 AA? AR7
-77 .4.l~682 25.A1> ".,.4~~ AR' -24,734,120 1,079,412
M~ -lS2.1M ?QR 1M 182.1AA 'Q~I _.OA ~~ ~14 C
-1.212.325 48.114_784 1.212.325 -4a,109.601 5,183
SKS a , 0001"7 0 -505.773 7Q? 'A,TRN ~".'~~ _4.7<'. " ... 6.157,899 4,70
' .". -5.074.392 1,083.507
BARe _,. <0. 379 0 12.651.304 0 -3.707.075(-) fiGure. In the outstandInG column moans - amount payable from WR Pool(+) flgul'OG In the oul&landlng column means - amount receivable by WI< Pool
Table 106: .. Summary of Deviat;on cha'Yas (ecfiipt and payment status 2015-16
WRPC!.~VNUAL REPORT 2015-16
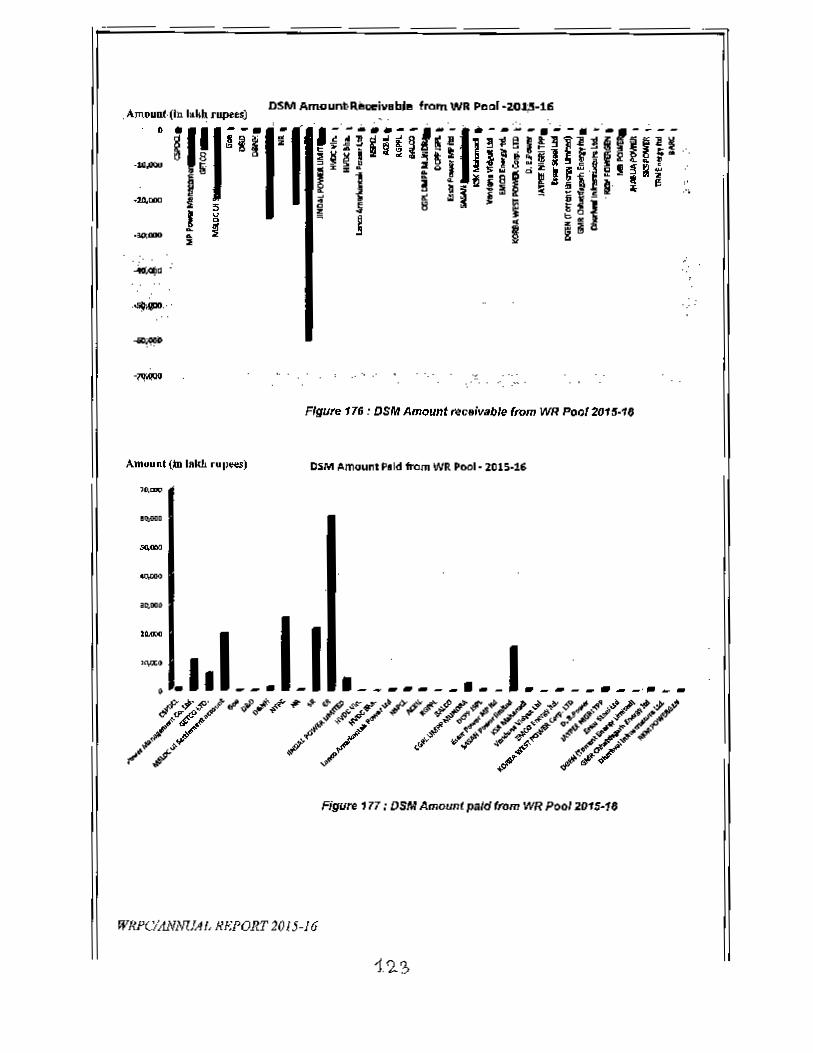
DSM Amounbllio.,..ivlb,. from WA Ptlol-ZOl;5-115
.Am.":iI,'~i'Ii";f ';I..._ Ii'
i....., i 5
._! iz.~.:
......"
.- .. • • ' • : ...... • • '." •••• "t....... _ •
FIgure 176: DSM Amount ",clivab/e (rom VIR Pool2011J.10
!ISM AmountPlld from WR Pool-lOIS-lt1-....'
FiguNI '77 : DSM Amount paid ffMr VIRPool 201$-10
WkPCIANN1.JAI, Hr.·PORT 2015-16
1.'2. '3>
..'.' .
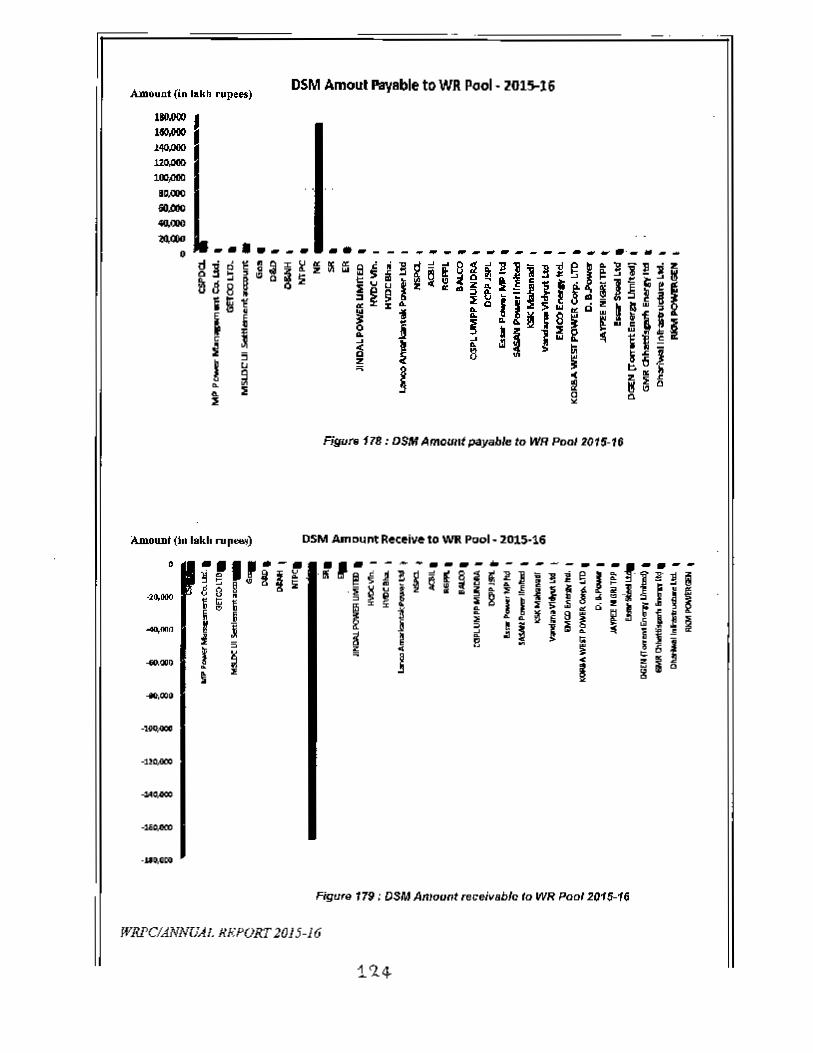
rAmou.o.t (in Illkb rupt")
DSM Amollt Payable to WR Pool- 2015-16
....- _. ,..- - - - - - - - - - - - - - - - - - •._ .. - -
Figure 178: DSM Amoullt payable to WR ""012015-16
DSM AmDunt Recei.e 10 WR Pool· 201S'16
.....,.------
FigurQ 179: DSM Amount receivable to WR ""012015-16
WRl'ClANNUAI. HI<·PORT 201 5·](;
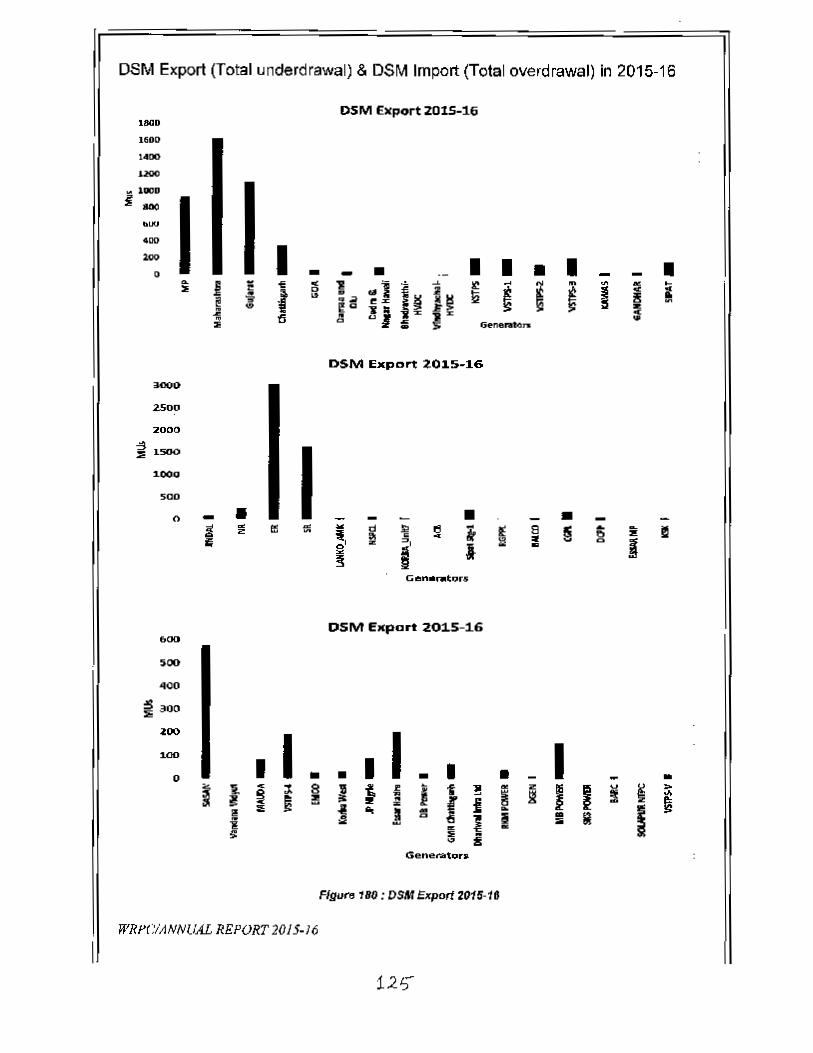
DSM Export (Total underdrawal) s DSM Import (Total overdrawal) in 2015-16
DSM Export Z015-16100.
IfiOI),_UCID
.... llllOD~ .... Iow
4DO- I • • • •0 - - • •~ i i -e '" 1! ~lt~l~l!!~ i M ~ C ~,. 0
~ ~ ~"" zl .. a Iii iIIij is .. ~"Ii %.It -c
ti • I.l ; I ..• gGt"nerat.o:n"
DSM Export 2015-16
0<>01)
2500
2000
~lSOO I101)0
SOO
o - • • •i!. ~ e ~ t, d J;, e i I: 8 § • 'i! I!l.." • 4 .. ..~, li! 0 IIii z
I -!l i'!Gen"nltora:
DSM ElCport 2015-16600
soo
400
~ 300
200
I I1.00
I I0 I • • - I • ..J ~ c ~ 8 J I " i I~ ~ z I I v
~ '"~ II § g !~ill f ! z i:15 ! ..
~ - ~ Ii g
~ i!i .. ~'"a -;: iGene"",or.
Flgu .... 180: DSAI Export 2015·16
WRn";iIlNNUAL REPORT 2015-16
125"
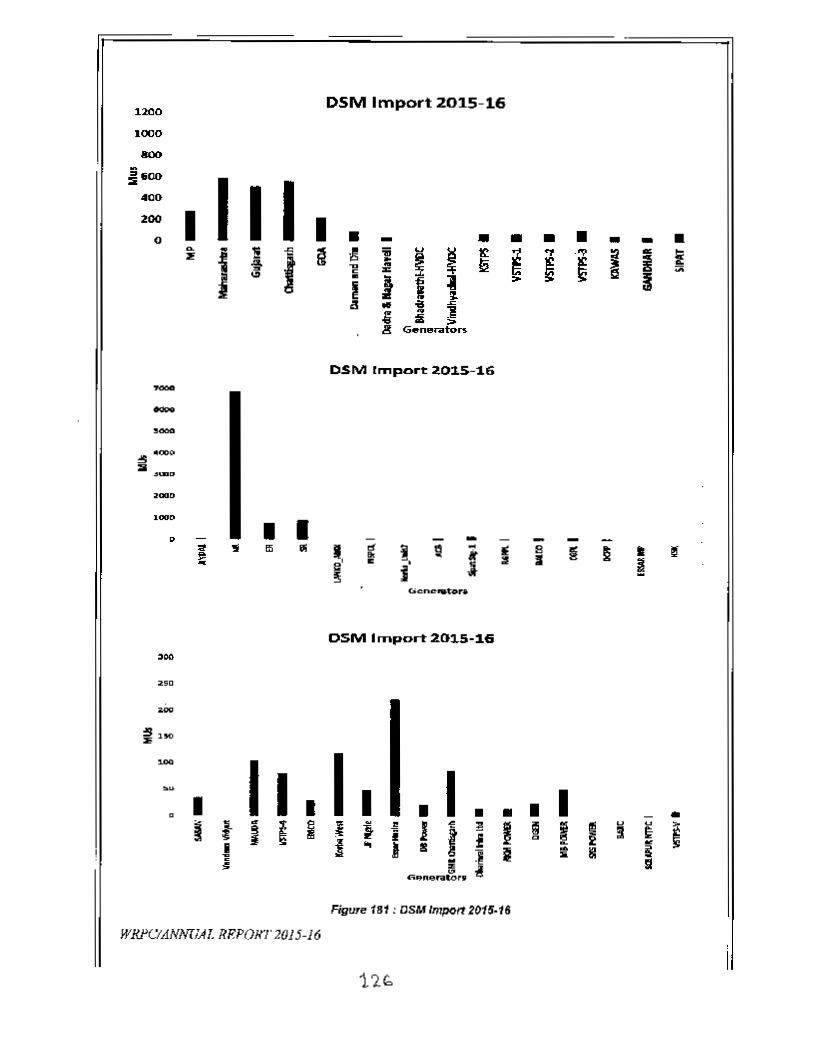
uoo DSM Import 2015-16
1000
800
:;~CO
I:Ii
I.00 I200 I I0 • - • • • • - - •~ • ! I~ -!, 'ii ....~
~ i .. .,<, ::2 '"' ~1f i g •~ !2 ~ ~ ~ i~ - ..c ,.
• J t I ,.~~ ;.
.!! .. iii ~, ~ :I:Ii ,.g Gener.ators
DSM IlTIport 2.015-16.---....
:5 eooe... ._.,....,.... •• • - -'" 'J 115 e; II d !, g k III s ~ § • !'Sl" '" 11- s' ..
l ~~!i i
c.i.c:ne .. Tor.
DSM Irnport2015-16>e,,,
>SO...S no,.
""" I I- I I I I• I • • • • • - •~ J j ~ i ~ j -!l I I l!
~~ i I u u iI i a 3 ~
i .. l II -t I - Ii: i.~ ,.- IIt:r-;1I't"er.t~r. 1!
Figure 181 : DSM Import 2(115.16
WKPCIANNrlAl. RF.POH"J"2015·16
1'2G.

CHAPTER- 5
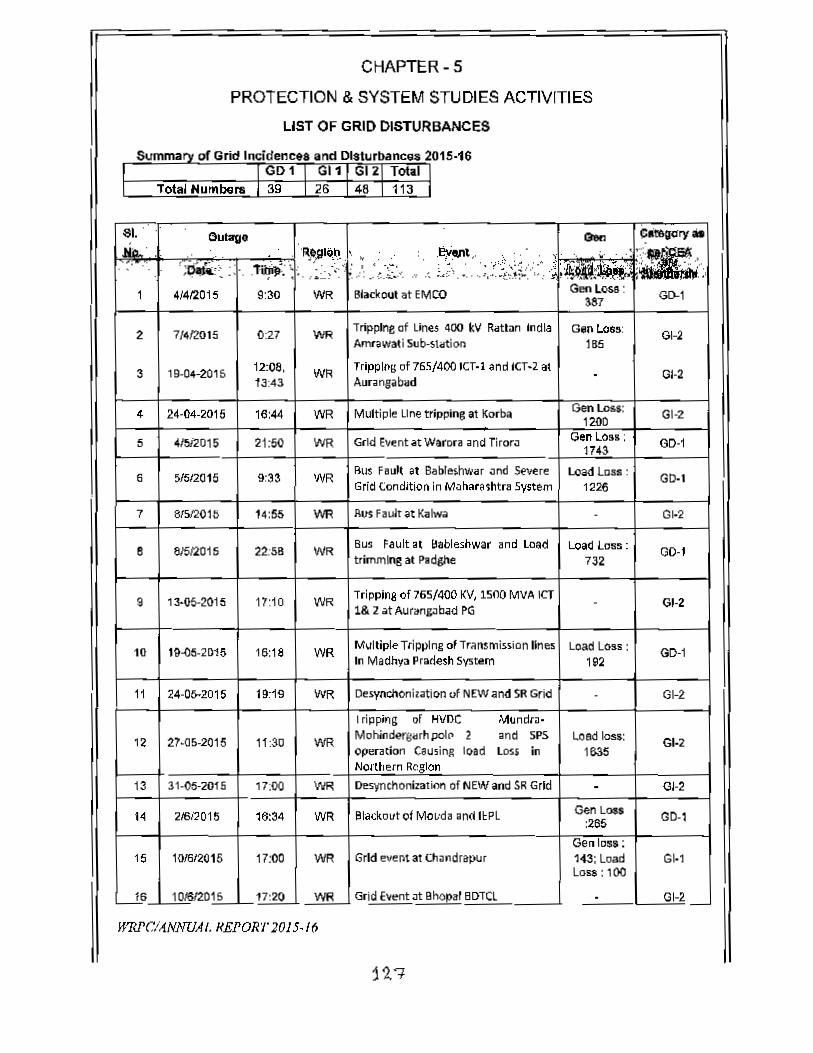
CHAPTER-S
PROTECTION & SYSTEM STUDIES ACTIVITIES
LIST OF GRID DISTURBANCES
e. .of Grid In~ . and W .~:5·:5I 1 GI11 121 Tolal
I Tolal 39 26 48 I 113
81. " Gul3g. Qorj ~lrIG<try..& "R'JI)Q,'1. :
,~:~":;,~~",~;:":,:.;" .
• ", v", ._; " '~::" ,~:'~<~. I#:;':~':~: ,', . ',-. •~<fu.;'" ,01.,. .. '_ ..
" . ~..'i_.'·. .'1;' "
,," "" f> .~, ';lr- , "
1 4/412015 9:30 WR Blackout .t EMCO Gen loss: 00-1337
2 71412015 0:27 WR Trtpplne of Lines 400 kV Rattan India Go" Loss: 01-2Amlawati Sub-station 185
3 19-04-2015 12:08. WR Tripping of 765/400 leT·) and ICT·2 at · Gl-213:43 Aurangab.d
~ 24-04-2015 16:44 WR Multiple Line tripping at Korba GenLoss: GI-21200
5 415i2015 21:50 WR Grid event at Waf'ora iJnd Tirora Gen loss: GO-I1743
6 51512015 9:33 WR Flu. Fault at 8ableshwar and ~""re load loss: GO-IGrid Condition in Moh.,.,htr. System 1226
7 81>12015 14:55 WR AilS Fault .t Kalwa - G~2
e 8ISI2015 22:58 WR Bus fault al aableshwar and LOad Load loss: GO-Itrimming at P8dghe 732
9 13-()$-2015 17:10 WI<Tripping 01765/400 KV. 1500 MVA ICT - 01-21& 2 st Aur.ngobad PG
10 11l-()5.2015 16:18 WI<Multiple Tripping 01 Transmission lines load loss: 00-1In Madhy. Pr.~esh svs",m 192
11 24·05-2015 19:19 WR Oes ynchoni,.ation of NEW and SRGrid - GI-2
I ripping ol HVOC Mundt:!·
12 27.05-2015 11:30 WR Mohjnd~ra.rh polo 2 and SPS Load loss: G1-2operation C8u5in~ load LOss in 1835Nonhern Rcg_1On
13 31-05-2015 17:00 WR Oesynchoniz.tion 01 NEW and SR Grid · OJ-2
14 2161"2015 16:34 WR 81<l~koutof Mo.-da and I~Pl GenLoos GO-I:2tlf>Genloss:
15 101612015 17:00 WR Grid event at Ch.ndrapur 143; load G~1tess :100
_is lOA'112015 17:20 WR Grid Event at Bhopal BDTCl · 01-2_
WRl'C.lItNNUAI. REPORT ]015·16
12.'1
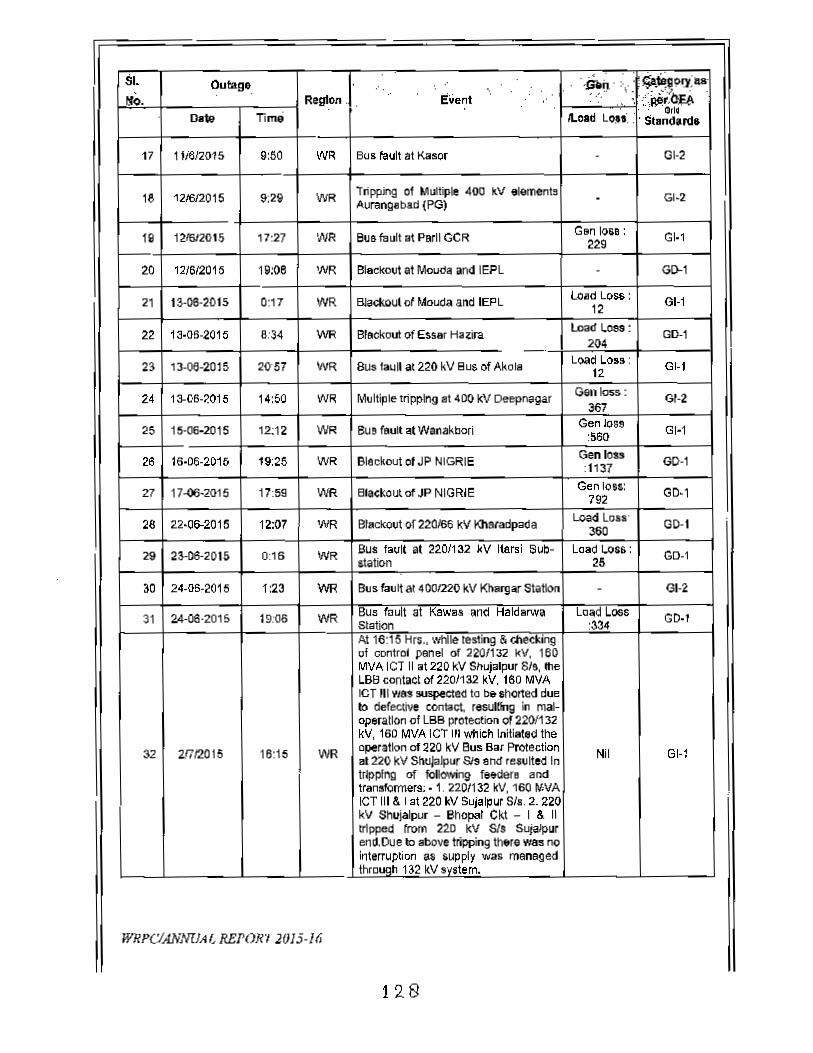
II SI. Outage. .'. : .' . '~'::~':~~9<}':U'.MO. RegIon. - E"venl .: ilt!,.C£.e.' , .-
Time Ilo.d L"" ...Or.
0.", . ' StondaFlla
17 lIM015 9:50 WR 80. tault at KaSJf - GI-2
18 121612015 9:29 WR Tripping of Multiple 400 kV element. . 01·2Aurangabad (P<3)
19 121612015 17:27 WR Bu. Iault at Parll GCR Gon los. : GI-l229
20 12J61201~ 19;06 INR Blackout at Moud. and IEPL . 00-1
21 13-08-2015 0:17 WR Bl~ckoul of M"uda and IEPL Load LoS$: 61-112
22 13-(15-2015 8:34 WR Blackout of Essar H. ~Ira Lead Loss: 00-1204
29 '3-08-2015 20'57 WR Bus faull at 220 kV Bus Gf Akals LGad toss : GH12
24 1~()6-~015 14:50 WR Multiple trlppln9 at 400 kV Deepnagar GEinloss: 01·,367
25 15-06-2015 '2:12 WR Bu. fault at Wanakborl Genla •• GI-l:560
26 16-06·2015 19:25 WR Blackout of JP NIGRle Genl~. 00-1:1'37
27 17-<16-20' 5 17:59 WR Blackout or JP NIGRle Gen loss: GD-1792
28 22·0&-2015 12:07 INR Blackout of 220166 kV KharadpadaLead Lo•• '
GD-l360
29 2~2015 O:Hl WR Bus faUlt at 2201132 kV I1arsi Sub- Load Loss: GO·lstation 25
30 24·05·2015 1:23 WR Bus 'au It at 4001220 kV Khargar Station - 01-2
31 24.(16,20'5 19;06 WR Bus fuutt at Kawa. and Halda,wa Load L06S GD-ISlation :334At 16:15 Hrs .. while testing & <:haCkingof control panel of 2201132 kV. leoMVAICT II at 220 kV S/KJjalpur SIS. 1heLBa contact <>f 2201132 xv, ISO MVAleT III was suspected to be shorted dueto defecUve contact, resufflng in mal-operation of LBB protection of 2201132kV. 160 MIlA ICT lII .... ichlMiated the
32 2!7r.!OIS 16:15 WR operation of 220 kV Bu. Bar Protection Nil GI·!at 220 kV ShujaJpur SI. and resulted Intripping of following feeder. andtransf'lIlllers;· 1, 220/132 kV. 160 tiNAICT III & I at 220 kV SuJalpur Sis, 2. 220kV Shlljalpur - Bhopal Ckt - I & IItripped !'rom 220 kV Sis Sujalpurend,Due to above tripping there wa. noirlterrupCion as suppfy was menagedthrough 132 kV syste m.
WlIPClAJiNUAI, REl'OJn 2015·16
129
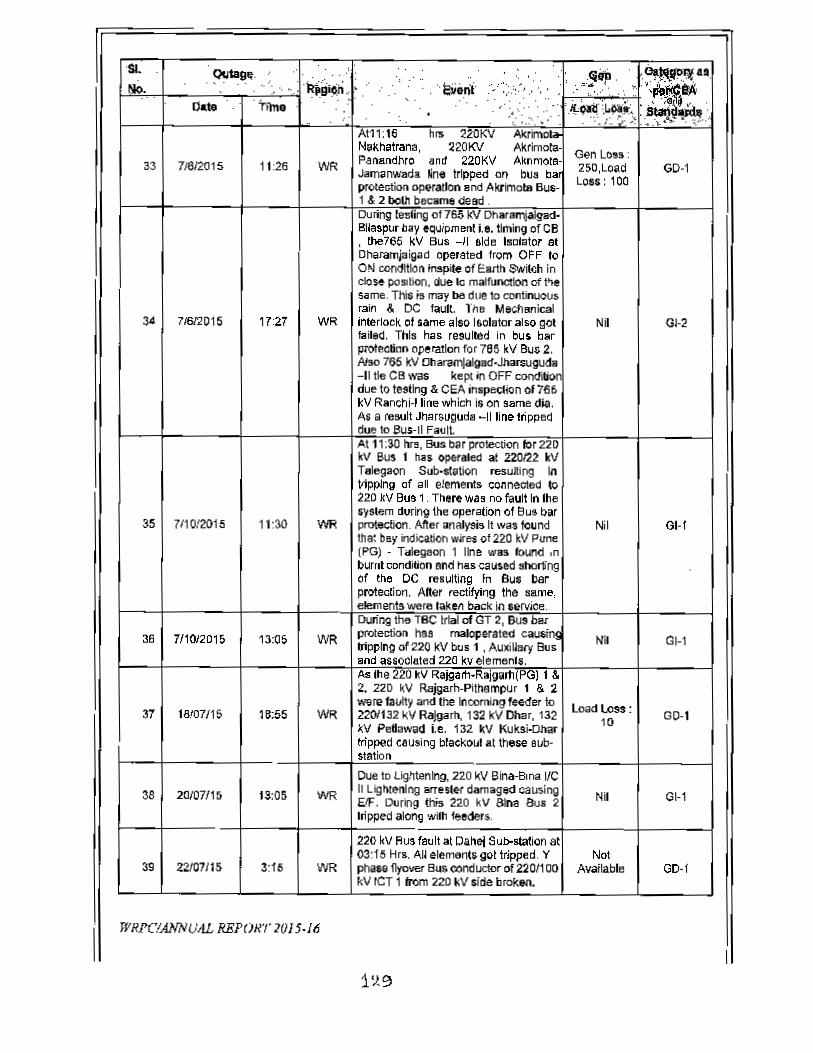
111. . ~ta9~ .': "'~:~.~'... '~
,~!\~U,.. :, . il~9i~ii<: " "e;i,nl " ' ,Il10. .,',,, .
<".JL<;:: ",~J[iC~, ,
aale 'Ttme ;.~~!~~."
'. : .... ~ -.-',Al11:16 hIS <lOKY AAIino~Nathatrana, 220KV Akrimota· Gen Loss :
33 71612015 11:26 WR Panandl'lro and 220KV Aknmota· 2S0,Load GD-lJamsnwad. ~ne tripped on bus baproteotion operallon and Akrimota Bus.- Loss: 100
1 & 2 both became dead.!lUring testing 01765 kV Ohararrjalgld·BlI.spu, bay ~qu;pm.nt i,e. liming of CB, lI>e765 kV Bus -II slde Isolator atDharamjaigad opsrated Irom OFF toON c:cndltlon in.pite of earth Switch incIQ'~position. due 10 malfuncrlon of ,.,.same. This is may be due 10alfTtinuOo.rain & DC fault, The Mecfl BIn ical
34 71512D15 17:27 WR interlc>ck of Same also 1&01.10' also got Nit GI,,2faitad, This has resulted in bu. b.rprotao~nn operation for 765 kV Bus 2,Nso 765 kV Dh.ramlalg.d·Jil arsug~.-II tie CB was kept in OfFdue to testng & CEA inspection of 766kV Ranchi·' line which is on seme dia,As a re....lt Jh.rsuguda -II line trippeddue to Bus·1I Fault.At 11:30 hrs, Bus bar protection lor 220kV Bus 1 has operated at 220122 kVTe!egaon Sub-slation resuliog InliippJng of .U e!ements connected to220 kV Bu. 1, There was no fault In thesystem duringlhe operalion of 8us bar
.'>5 7110!2015 11:30 WR protection, After .nall'$lslt was found Nil GJ..1tha: boy ind~ation wires of 220 kV Pone(PO) - Talegaon 1 I.,. W1!5 ~ ,nburnt condition end hIS caused .horing .of the DC resulting fn Bus barprotection, Alter rectifying the same,elements were taketl back in service,During the TBC trial of GT 2, Bu. bar
36 711012015 13:05 WR p<otectloo has mal<lperated ca<!$i11$ Nil GI-ltJipplng of 220 kV bus 1 ,Auxiliary Bu.and associated 220 kvelements,As the 220 kll Rajgarl1·Rajgarf1(PGj 1 &2. 220 kV Rajgarh.Plthampur I & 2we~ faulty and the Inooming feeder to load loss:31 1&!t)7/1S 18;55 WR 22C1tJ2 ~V Rajg.rh, 132 kV Char. 132 10 GO-I~v PellalYad ie. 132 kV KuksM:Jhar!ripped causing blaoK,,"1 at these Bub·station
Due to Ugmenlng, 220 ~V Sina·8,na IIC
38 20107/15 13:05 WR II Lightening arrester damaged calJ$lng N~ G~1ElF. During U-;, 220 kV 8tna au. 2lripped along wifh teeders.
220 kV Au! fault at Canoj Sub-station atQ3:15 Hrs, All elements got tripped, Y Not
39 221D7115 3:15 WR phaBe flyover Bus oonductor of 2201100 Available GI)'!kV icr 1 trom 220 kV side broken.
WRl'C!ANNUtIL REPORT tot 5-16
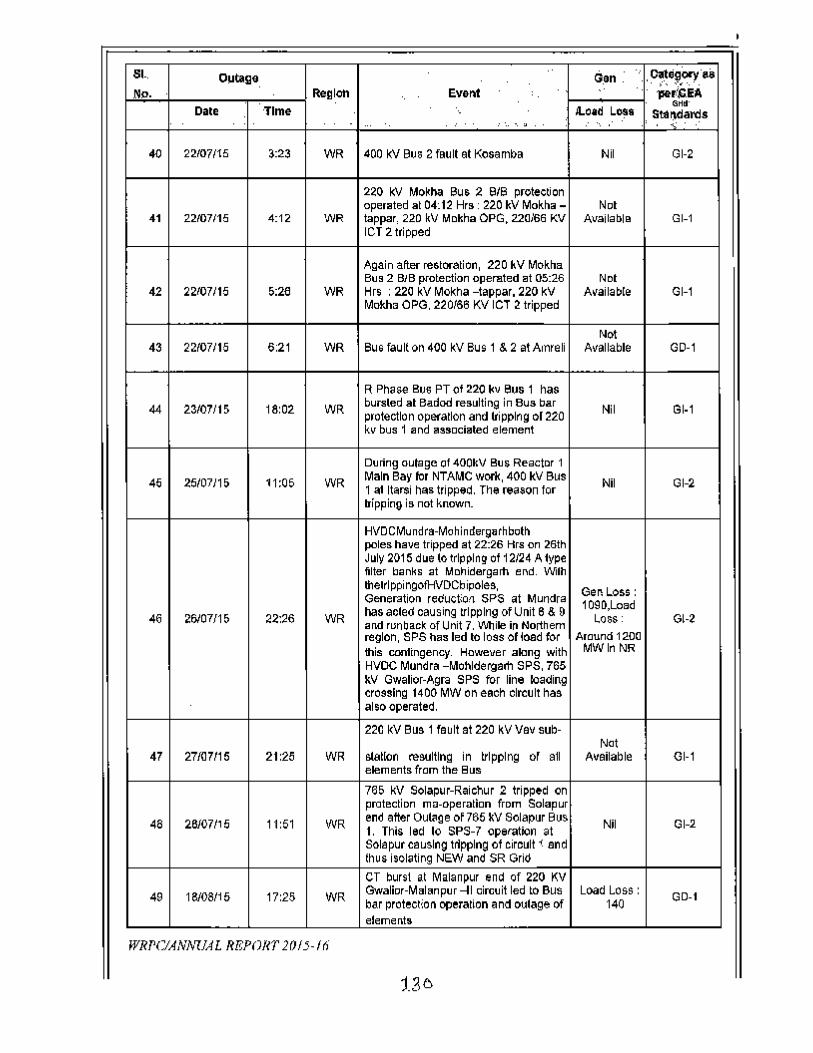
SI., Olltag8 G,a" : ' . categOry'aSND. Region Eve~ " ' '~;.aA
Date 'Time lLo.d ~... Gtfd'" , StlI(ld3l'(j$
: '.. ',,, .. . " ..
40 22107115 3:23 WR 400 kV Bus 2 fault at Kosamba Nil GI-2
220 I<V Mo~ha Bu& 2 BIB proteetionoperated at 04: 12 Hrs: 220 kV Mokha - Net
41 2.2107115 4:12 'NR tappar, 220 kV Mokha OPG, 2.2.0166KV Available GI-lICT 2.tripped
Again after restoratien, 220 kV MokhaBu. 2. BIB prolection operated at 05:2.6 Nol
42 22107/15 5:26 WR Hrs : 2.2.0kV Mokha -tappar, 220 kV Mailable GI-lMokh. OPG. 220166 KV ICT 2 tripped
Not43 22107115 6:21 WR 8U6 fault on 400 kV Bus I & 2 at A,nreli Available GO-I
R Phase Bus PT of 220 k. Bus I has
44 23107115 18:02. WR bursted al Badod resulting in Bus bar Nil GI-Iproteellon operanon and lIipplng 01220kv bus 1 and aesnciated element
DUling outage of 400kV Bus Reactor 1
45 25107115 11:05 WR Main Bay lor NTAMe work, 400 kV Bus Nil Gl-21 at Itarsi has tripped. The reason lorbippin9 is not known.
HVOCMundra-Mohinderg.rhbothpoles have tripped at 22:26 Hrs on 26thJuly 2015 due to tripping of 12124 A fypefilter banks at MDhidergam end. Wi1hlI1elrlppingofHVDCbipoles, Geo L.QSS :Generation reeuctioll SPS at Mundra 10S0,Loadhas acted causing tripping of Unit 8 & 946 26107/1, 22:26 WR and runhack "fUnit 7. White in Northern t.oss : GI-2region, 51'S has ted to loss 01toad lor Around 1200this contingency. However along with MWlnNRHVOC Mundr. -Mohldergath SPS, 765~V Gwalior-Agra SPS for line 1o.0in9crossing 1400 MW on each circuit hasalso operated.
22C kV Bus 1 fault at 220 kV Vav sub-Not
47 27/07115 21:25 WR slallon resulting in tripping 01 all Available GI-Ielements from the Bus
765 kV Solapur-Raichur 2 tripp~d onprotection ma-operabon from Solapur
46 26107115 11:51 WR end after Out~ge of 765 kV Sol.pur Bus Nil GI-2I. This led 10 SPS-7 operation atSola pur causing tripping of circuit' andthus isolating NEW and SR GrioCT burst at Malanpur end of 220 KV
49 18108115 17:25 WR Gwalier-Malanpur -11 circuit led to Bus Load Loss: GD-tbar protection QfJeration and outage of 140elements
WRT'CIANNUAL REPORT 2015-16

St· ~., :.;... ~·;~:~~;j.:<:;:~~~~~;t:.:·~',::':~:':::·:.~~:t:i,~~~~~''KO. . ...... .~~:~iT~ ...~ .... :'. . : ' ..... ~~.,: ',.... " ..',ll.Oiti "0" .•" 0..111 Time . stanilai.da
Bus fault on 220 kV Bus 1 at Satna(MP)occurred due to falling of R phasejumper 0( Satn.·Satna(MPl 2 on Bus 1.nv. led to Bu. ~u' and all elements onBus 1 8t Satna(Mp} tripped iI<lIdngthe 22W132 kV BHa ICT. this ted tooverloading Of2201132 kV Areva ICT on
50 2.0108115 19:01 WR Bu. 2. whioh also tripped causing loss Lood Loss :GO-Ishifting 0' load 10220 kif Maihar station 67
who.e 2201132 kif ICT .ubsequenUy~ipped on overcurrent protection. AIle!this 132 kV Keymore·Maihar circuit alsotripped' on OIC prctechon. Furlher 220kV KOIBr-Tons and 220 kV SaIIlo -Tonsh..., also tripped on ElF incicatlcn. Tllis
-, led to blackout at Kolar Station.At 16:1t Hr "R" phase CB 0( 400KV
i<arad-Kolhapur·1 90t burat causing Bu.51 Z8!08l15 16:11 INR bar protecVo.1 opera6on for 400 kV Bus Nil m·2
1. All eleMents connected to Bus 1tripped.220 kV Bus 2 Bus Sar protectionoperated at 40012'.0 kV Indo<1! SUb-
52 21912015 15:25 WR slatlon due 10leB o~er.otion 01220 tV NI Gl-ltndOre-JalpUl'll 2 cWcuil This eld totripping of all eteme Ais connected to220 kV Bu. 2 of Indore.Due 10broken B pl\ase jumper 0( 220kV Bus 2 at Mahalgaon , Bus fault
Load Loss :53 31912015 20:37 WR OCCUlTed.During the evenl all elements 312 00-1Ii'om 220/132 kV Mahalgaon sis trippedcausinG blackout at Ihe stalion.Due to relay maHullction dl6ing taut on
54 41912015 19:25 WR 765 W SotaplN-Kar .... 1ckl bo1II765 kVNil GI·2Solapur ·Raichur circuil tripped and
is(>lated the IJricl.WhIle Charging 0( the 220 KV IndOt.. -Ptthampura okl wh;ch was on TaC. itsisolator earth switch .,ere in closeposition creating a bus mull on 220
55 91S12015 13:10 INR System. Bus bar protection has ""I Load Loss : GD-Ioperated r~ulling In ttWhg of all 220 M, kif elements on bac:lu4J proIedicn. Thiscaused zero supply at no kV bus of400!~20 kV IAdore SIS. 220 kV Ea.tzone cot biacsout durino the event.Chandrapur Unit G LSB has Initiatedwhich ha. cau.ed 400 kV Bus Bar
aonLos.:,6 1610&/15 20:32 WR protection of 400 kV Bus 2. TN. led to470 G~2
Iripping of all elemants connected to400kV Bus 2.220kV Vapi·KI1eradpara-l1 ~ on R.pIllauij al both ends al18:46tn and
01 29109115 18:46 WR 220kVVapl-Kh.,.dpara-l tripped on y. Load LossGO·lph Oie prolection at Khara~para only. :380
A~oul 380MW load was thrown off InKharadapaM resulting in interruplion in
WRPClANNCUf. REPORT 2QJ5-16
i'bL

II
58 6-Oct-15 11:04 WR Blac~<)utal2201132 kV Sa"'a MP and Load tcss : GO-lNeamy sub-station 218
59 23-Ocl-15 0:23 WR Blackout at 220 ~V Miraj Sub-sUllion Load t.oss : GO-I206
4001220 kV rcr 2 at PaIIi(MS} trippe(Ion cftfferen~al protection operation due10burning of 81 S I wire of differenl,.1
60 2&-0<:1-15 21:17 WR cere- I in borIrinai box an~_go! Loed toss : GI-2disconnected from TB. Wilh Ihis olher 241.7two ICTs gal ove~o.d.d snd 'e,ullea inload ttrnmflg scheme operaliorc""sing Irlpping 01220 I<V circuli s.
61 2a·Oct-15 1.:39 WR Complete blact-o.Jt of Chute 6OTCI. Sis Nil GO-I
62 30-10-15 19:10 'NR Mulliple Tripping 81ParU (MSETCL) NI GI-2
63 2-Nov-15 10:50 WR Blackout at Omkare.hwar HPS Clen loss: GO-I174.3s. Due to snapping of 220 i<V B phasejumper between Bus sectlonali:zeb. circu~ bteal<er to Bus .... ian 1 Genlo$. :
6-1 7-Nov-I5 10:20 -INR isolalor Bue laun hes crealed at 220 I<V 170;Load GO·IBus 1 at 400/220 kV Parll Sub-.I"llon. Loss : a4aDue 1.0 no'-opera\ion 01 bus barproteelion, .114001220 kV ICTsDue 10 Delayed clearance 01 lauU on220 kV R8nann-Karalnsod line atRanasan end, other Iineo have Itjpped GenloS$:
65 13-NQv-15 13:45 WR on bacup protection. Tltis cause~ 143;load GI-Iislan<llng or TMant power !rom tile grid. Loss: 140The island further collpa.ed due totripping of unft 'UMIng at ledVli<:aIminimum.Tripped on ON. s.equence is Uk. Ihl$:1. Werdha-A'bad 8 4 !ripped on 0/11atA'b8d .121:46 hrs. 2. W8rdha-A·bad #21rlpped on oN at A'bad end 0122:13
~ 14-Nov-15 22:13 WR hr. ",ner charging of ckl-., 3. Warhd.· Nil Gt-2A'bad # 4 lripped 9122: I 3 hrs on oIv alWarclha, 4. Wardha-A'bad II 4 againcharged 31 22:55 hsr from A:b9d endand line tripped on operation of REFproteGilon at "'''ad.
.st,Ne.
SilVasa, "adri, rnassot and Kh.radparaare89 in DNH.
WRFClANNUA1_ RJ!»UR1· 21115- If;
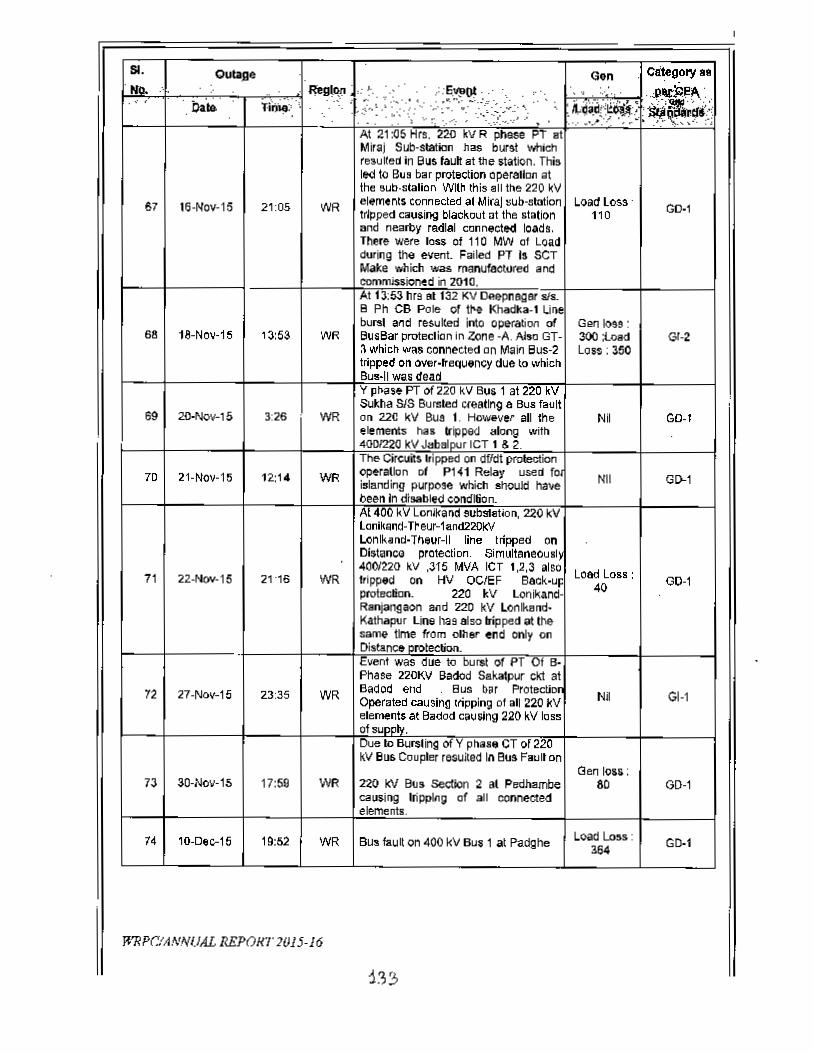
II Oublse
AI 21 :05 Hrs. 220 kv R phase PT alMiraj Sub· station has burst whichresulled In Bus lauh at the station, Thisled 10 Bus bar protection operation atthe sub,statlon WI(~this all the 220 ~V
WR elements conn acted al Mira! .ub-station ~oad tesstripped causing blackout at Ihe station 110and nearby radial connecte<l loads.There were loss of 110 tlNV 01 Loaddurillg the event. Failed PT Is SCTMake which was manufac::tored andcommissioned in 2010.
- < , - ---~ ...
67 16-Nov-15
68 18-Nov-15
21:05 GO-l
'3:53
3:26
AI 13:53 hra ot 132 KV Dp.epnagar sls_B Ph CB Pole of I~" Khadka· I Linebursl and rasuked into operation or
',IVR BusBar protecllon in Zone -A. AI.o GT-~ which was connected on Main 8us-2tripped on over.~equ.ncy due to whichBu.·11was dead
Gan loes :300 ;LoadLos. ; 350
131-2
69 2Q.Nov-15
Y phase PT of 220 kV BU$ I at 220 kVSuI<ha SIS Bu",ted ((eatfng 8 Bus fauH
WR on 22C kV Bu. I. ~ at theelement. has ItlIped along with4001220 kV Jabalpur ICT 1 s 2_
GD-INt
1D 21-Nov-15
21'16
23:35
Th e CireU~$I"pped on dffdt protectionWR op~r.tlon 01 P141 Relay used fo
islanding purpose which should ha.ebeen In disabled condltion_
Nil
Al 400 kV~Lonlkand substation, 220 kVlonikand· T~eur-l.nd220kVLonlk.nd· Tllsur-II line tripped onOistanco protection, Simultaneous')4001220 kV ,315 MVA ICT 1.2.3 also Load Loss:
WR ttiJlP'Kl on HV OCIEF Back"", 40protecll!Jn. 220 kV lorl_R~aon and 220 kV Lonl<and-Kathapur Lina nas also bipped at thesame time from olher end only onDistance protection.
00-171 22-Nov-15
Event was due to burst of PT Of B·Phase 220KV Bodod Sal<alpur ck! atBadod elld ,Bus bar ProtecUDn
WR Operated causing (ripping of all 220 kVelement. at Badod causing 220 kV 10 ssof supply_
Nil GI-172 27-Nov-15
73 3O-Nov-1S 17:59
Due 108ursllng 01 V phase CT 01220kV Bus Coupler resuled InBus FauJ on
Ger1Ia$S;aD220 kV Bus Section 2 at Pedh.mbe
causing lripplng of all connectedelements.
GO-I
W71PCfANNUAL REJ>OH"I' 1015-16
74 10-Doc-15 19:52 ~oad Loss:364WR Bus fault on 400 kV Bus 1 at Padghe GO-I
1.,3

$1, Outag~ '9... •· ", ci't$'o.!).i.9'.No. Raglen
..\'iv';n~
'. ~.~~.bat. 11iJ).
. .llOiid I..IMs. , ~.' .' . " ",
..R-Phase CT burst 3t Halkaml SiS of220kV Halkarnl· Mahalakh.mi-SIC linedue to this Bus bar protoc~on operated Gen loss:
7& 13-0e!>l!> 16:-40 WR and all feeders connecled to Bu. 20.1; Load GO-ltripped at 16:40HRS. Sub.equenlly Loss :20due 10lripping. 220kV MahalakhsmlAmona·S/C rm also ltWed and '1:2fI,NM.halakhsmi substation became da",.400 kV Bu. 1 and connected elementtripped because 01 2nd stage llippedwire got earthed for GAS DeTECTOR
76 16-0 • .,.15 11:03 WR of 89A of 400 W Pune-P",I 2 • 2nd I'll Gl-2.lase alarm 01 GAS DETECTOR wflidltrips Ille .mole compartment 01 thorespective liu. duel.B·ph Breaker pale of 2201132W,160MVA ICT-II at Urla blastad .nd all Load Lo •• :77 16-0Ic-15 13:09 WR feeder. connected to 132 kV UrI.
300GI-l
tripped alongwill\ 22(\1132kV16DMAVicr 1 & 3.Plio! wire of 220 kV CHPH-RBPH lin~1snapped on 220 kV 8u s-1 CHPH and Gen 10ss :
78 22-0oc.-15 8:45 WR Bua fault took place resulting In tripping 81 01-1of unlls-l.3 and 5.Both the 7651400 kV Jaba!pur PS leTha.ltippeo on """,!ux protection IrOm
79 24-Oe~15 5:00 WR 400 ~v end. However the grid voltage Nil 61-2III<!renot thaI high and frequency wasalSOnot low.Due 10Y Phase Bushing Flash OverOn400 KV Sid. of 4001220 ICT 4 at As<lj • NoOetillSBO 27-0ec-15 12:38 WR _et81 elements ~ped from Asq Sub- Pro..-tded Gl-2Sladon. The detail. are awailed from theGETCO and Golerat SLoe.At 05:57 hrs Bus Bar protection of 400kV Bus 1 & 2 operated due to R PhaseCTblastotBusCouplerat
81 28-1)ec..15 6:57 WR Ran~hodpura. 400 kV Bus 1 5 2 Nil GI-2b.ecame dead and 9' elementsconnected to the bus tripped. 220 kVBus Remain in service,At 02:29 hrs Bus Bar protection of 400kV OU5 4 operated et VSTPS d .. tng
32 28-0ec:-15 2:29 WR Ylithdr...mg of unlt-8{500 MW) due to Nil G~2low sdledUie as in6maled by NTPC.Further Detail. awailed Irom NTPC.
WIllie opening 01 765 kV Wardha-Auranagabad 1 • 766 kV Wardha-
83 ~-16 19:-43 WR Aurangabad-II end 765 kV PUne 1<11 01-2Sol8pur cireuit also tripped on overvoltaiJe.
I Y Phese breaker pole of 400 kVBhu9awal-A.aad circuil at Bhusawal
84 30· Dec-IS 18:29 WR r •• uhed in bus fault on 400 kV Bus 2 Nil G~resulting In all elemenls tripping fremBlw6awai Bus 2.
WRJ>CiANNUAL REPORT 20 15-16
134-
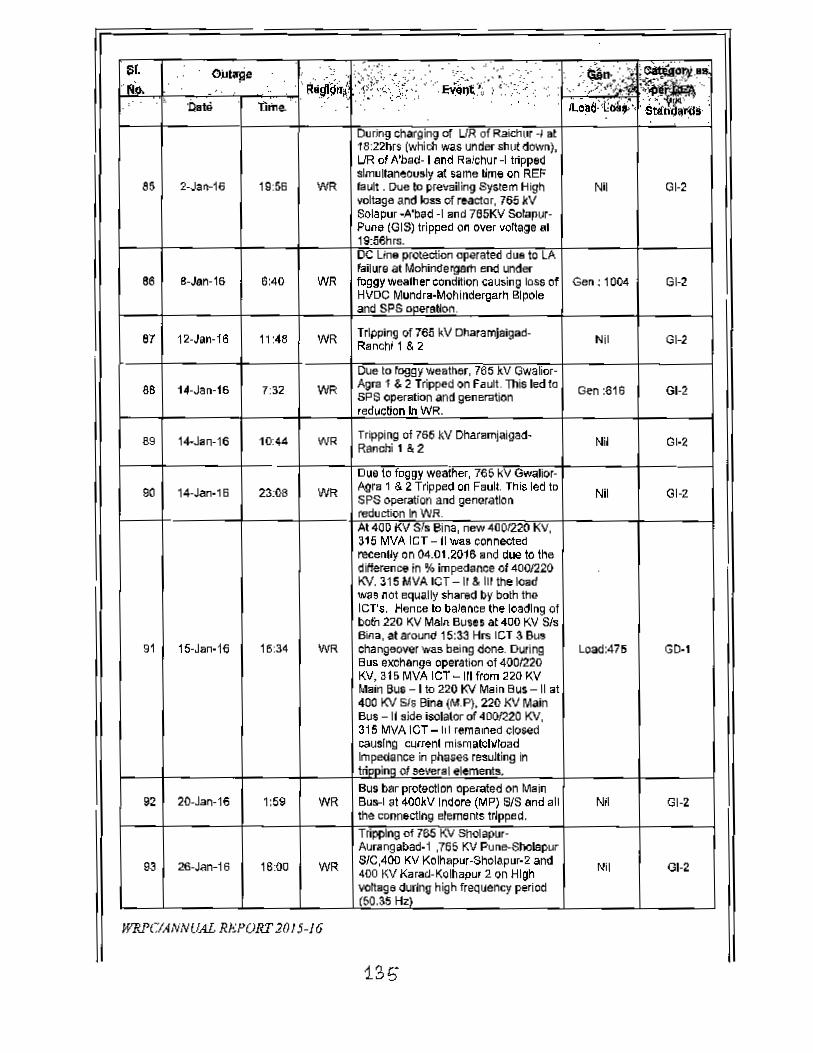
Sf. O)Jl¥!ie• \j .~I~~~~<~i\:··.~~~~:·;·~:)~·::··-:. ;~n.~.~.~...
~ ~R~J!!~n~' • .: .... ,ft•.:.'•• ~ " ;PJ!- ..'. - -c- :?,:.;_ .
~~S·:' . !l.1oi "(""e. 4.•• 6:~ci;:-·
During charging or I.IR of Raich(lr ., ot18:221)r. (which was under shutdown),UR 01A'ba<!·1 and Ra.'cINr -I trippedslmultaneou.lyat same time on REF
as 2·)an-16 19:66 WR faull . Due to prevailing Sy.tem "ligh Nil 01-2voltage and loss of reactor, 765 kVSolapur -A'bad -I and 785KV SdaptK-Puna (OIS) tripped 011over """age al19:56hrs.DC Un. protection operated duo to LAfailur. at Mohindergerh end under
as B-Jen-16 6:-40 WR filggy weather condition causilog IGSs at Gen: 1004 GI-2HVDC Mundr.·Mohindergarh Blpoleand SPS I)ll_erotion.
87 12-Jan-16 II :48 WR Tripping of 165 kV Oh.aramjaigad. Nit GI-2Rancl¥ I to 2
Due 10 foggy weathor, 765 ltV OW8lior-88 14-Jan·16 7:32 WR Agra 1 & 2 Tripped on Faull. This led to Gen :616 Gt-2SPS operalion and gen.",tion
,eduction In WR.
S9 14-Jan·16 10:44 WR Tripping 01766 kV Dharamjaigad- Nil 01-2Ranchi t & 2
Due 10foggy weaiher. 765 kV GwaIio(.
90 14-Jan.16 23:08 WR Agra 1 & 2 Tripped on Faull. This led to Nil 01-2SPS operalion and genaratlonreduclion In WR.At 400 KV Sf. Bina, new 4001220 KV.315 MV" ICT -11_. connectedrecenUy on 0-4.01.2016 and duo to thediHerenC1lin % impedance 014001220KY. 315 MVA icr -II & III the loadWlISnot equally shared by both Il1oIcrs. Hence 10baJa""" the loading ofbofro220 KV Main Bu, •• at 400 KV SisBina, at around 15:33 Hrs icr 3 Bu.
91 IS·Jan·16 16:34 WR changeover 'Nas being done. During Load:475 GO-IBus eJ00h8ngsoperalion of 400/220KV, 315 MVA tcr -III from 220 KVMain BUG - I to 220 KV Main Bus -II at400 KV SiS Bin. (M.P). 220 KV MainBus -II aide isolator of 4001220 KV.31S &JWAleT - hi remaned cIo><!dcausing cu"'>nl mismat<:lIlloadImpedance in phases resulting inIrippinQ 01several element s,Bus bar protection operated on Mllfl
92 2t).Jao.16 1:59 WR Bus-! at 400kV Indore (MP) SIS and all N~ 01-2Ihe connecting elements tripped.Tripping 01785 KV Shol_pur·Aurangabad.l .765 KV Pune-SholaplM'
93 26-Jan.16 18:00 WR S/C.400 KV KoIhapur-Sholapur-2 and MI Ot-2400 KV Korad·Kolhapu, 2 o:>nHI~h""nags during high frequency period(50.35 Hz)
WRPOAN,vUAL RJ£POR:r 201 5-16
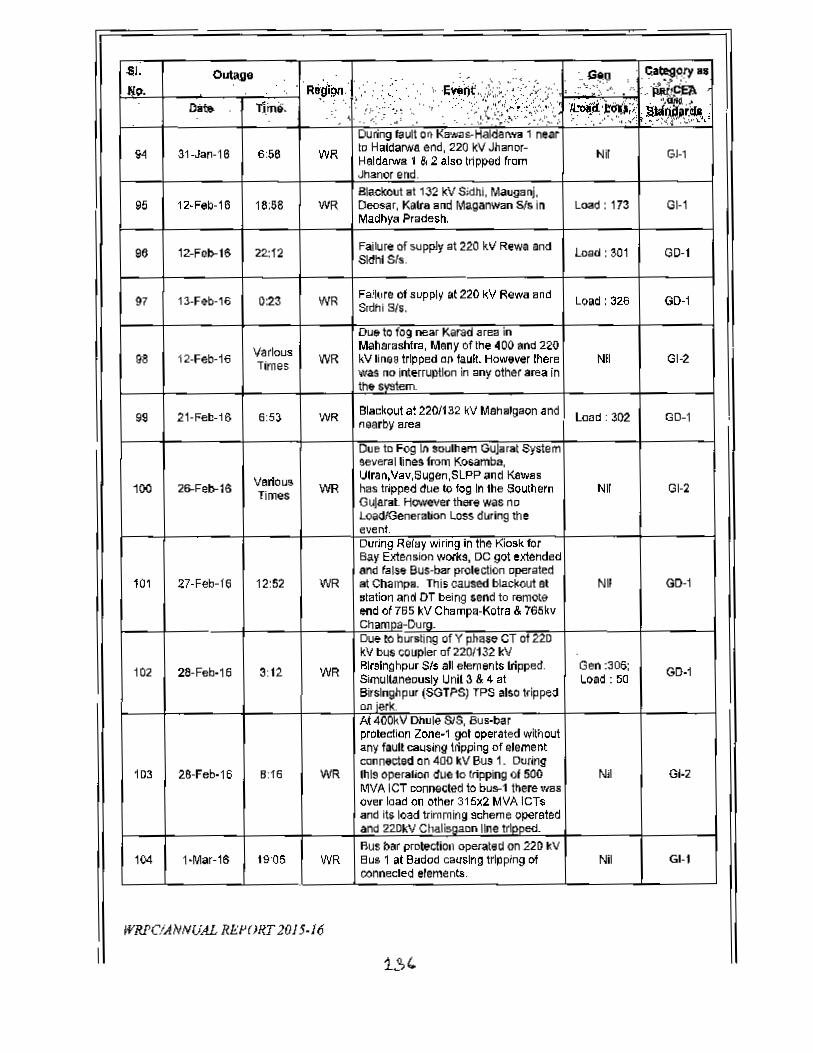
31-Jat>-18 GI-16:58 WRDUring fault on Kawo ...Halda" .. 1 nearto Hatdarwa end, 220 kV JhanOf-HeldaJwa I & 2 also tripped rromJhanor end.
Ni
G~195 12-Feb-16 16:58 WRBlackout at 132 kV Sjd~i, MauganJ,Deosar, Katra and Maganwan 51& InMadhya PradeSh.
L""d: 173
96 12-Fo1>-16
97
12-1'eb-16
22:12
0:23 WR
Failure of supply at 220 kV Rewa andSldhISI •. load: 301 GO-I
01-2
21-Fe!l-18
100 26-Feb-IS
101 27-Feb-16
102
lD3 2.8-Feb·16
variousTimes
6:53
VerlousTimes WR
Fa"'". of supPly at 22.0 W Rewa .ndS,dhi 81s. Load: 326 GO-I
0~2
00-1
GO·l
01-2
104 l-Mar·16 G1-1
12:52 WR
3:12 'NR
6:16 WR
19~5
WRPCiANNUAL RliI'()RT 20J 5-16
Due to fog near Karad area inMahar"shlra, Many of the 400 and 220kV fino. tripped on tauk. However there\,\ras no interruption in any other area inthe §ystem.
NA
Blackout a~2201132 W lAshalgaon andnearby area lood: 302 GO-I
Due 10Fog 11'1 soumem GUjarat Systemseveral lines from KO$8mba,Utran.V.v.S~.SLPP 3I1d Kawaihas tripped due 10tog In Ihe SouthernGujar.1. However there was noLoadlGeneration Loss during theevent.oumg Relay wimg in the Kiosk totBay Extension \yO/l<., DC 9"t extendedand false Bus-bar protection eperstedat Champa. This caused blackout at.tation and or being .end to remoteend 01765 kV Champa-Kotra & 765kvChampa·Durg.
Nil
Due to bursting of Y phase CT of 220kV bus coupler 0(2201132 kVf!tt!lnghptJr SIs al elements lriltpe<i.SimultaneouSly Unit 3 & 4 alBirslnghpur (SGTPS) TPS also I(ippe"on jerk.
Gen :301;;Load: 50
/oJ. 400kV Dhule SIS, 8us-b.rpmIedicn Zone-l go! operated wthoutany fault causing llipping of elementconnected on 400 kV Bus 1. Duringthis operation due to tripping of 500MVA ICT connected to bt&llhere v_OYer load on oIhe< 315x2 MVA leTsand it. load trimming scheme operatedand 220kV Chali"gaon line tripped.
Nil
fluS bar protection opetated on 220 kV8L1S 1 at Badod ca<l$lng ~pmg 01connecled efementa.
Nil
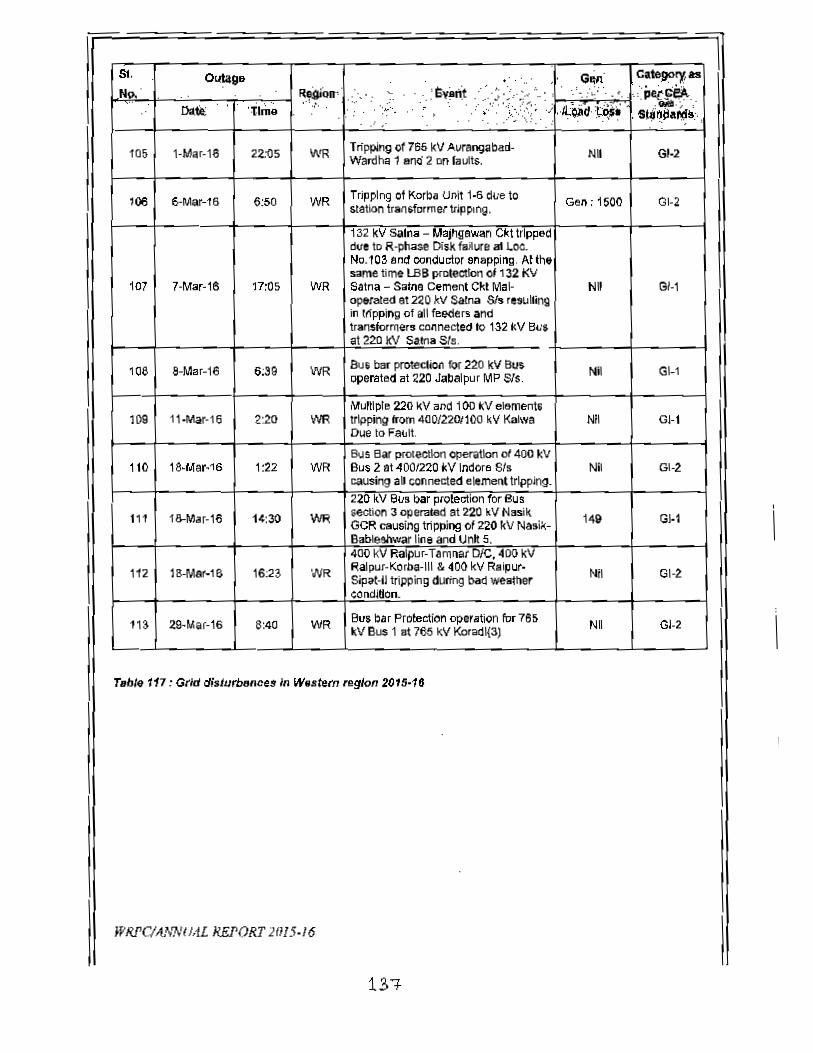
SI.Np,
6:39
Nil
105
106
107
I·Mar·IS
6-f,\ar·16
7·Mar·IS
22:05
17:05
Tripping of 765 KVAvrangabad·WaroM 1 aoci 2 DOfautts.WR NI
Tripping 01Korba Un« 1-6 dL'e tostation tran&fDrmer tripPing,'NFl. G_n: 1500
132 kV salna - M3j~g9wan Ckt trippeddue to R·phase Disk failure at LOG.No.103 end oonducicr snapping. At th.same time 1.B8 protection 01 I 32 KVSatna - Satne Cement Ck! Mal·opereteo 9t220 kV Salna SIs r•• ullingin IIIpping 01 all fee<!e~ andtransforme .. conneCleolD 132 «v et:sat 220 kV Sam Sis.
WR Nil
108
109
110
II'
112
113
8-Mar-16
1I-Mar·I6
IS-IIIar·1S
1S-Mar·16
lS·Mar-IS
29-10101·16
1~:30
c..tell"~as.;:~&e:A...s~~e~~:.
G/·2
G~2
GI·l
WR Bus bar protectio. for 220 kV Bu.operated at 220 Jabalpur MP Sis.
MUlHple 220 I<V and 100 kV e'IOment5tripping troln 400/2201100 kV KalIYaDue to Fa~1I.
WR Nil2:20
Bus Bar protection operation 01400 kVBus 2 at ~OOI22OkV Indora Sf.causing all connected element tripping.
1:22 WR Nil
220 kV Bus bar protection for Bussection 3 operated at 220 kV N.si~GCR causing Ilip»iflg 01220 kV Na.j~-Bableahwar line and Unk 5.
14~
16:23 WR
400 kV Ra!pur·Tamnar Ole. 400 1<\1Ralpur.Korba·'" & 400 kV Raipur.Slpat·1I tripping during bad weattleteOrldiHon.
Bus bar Protection operation for 765~VBus 1 at 765 kV Koradl{3)WR8>40
T.bI" 117: Grid disiurbeRcu in Wostem region 201S'18
WRPC/A.!.'NIML HEl'ORT 2(/15·16
13"1
GI-l
G~l
GI·2
GI-l
GI·2
GI·2
CHAPTER- 6
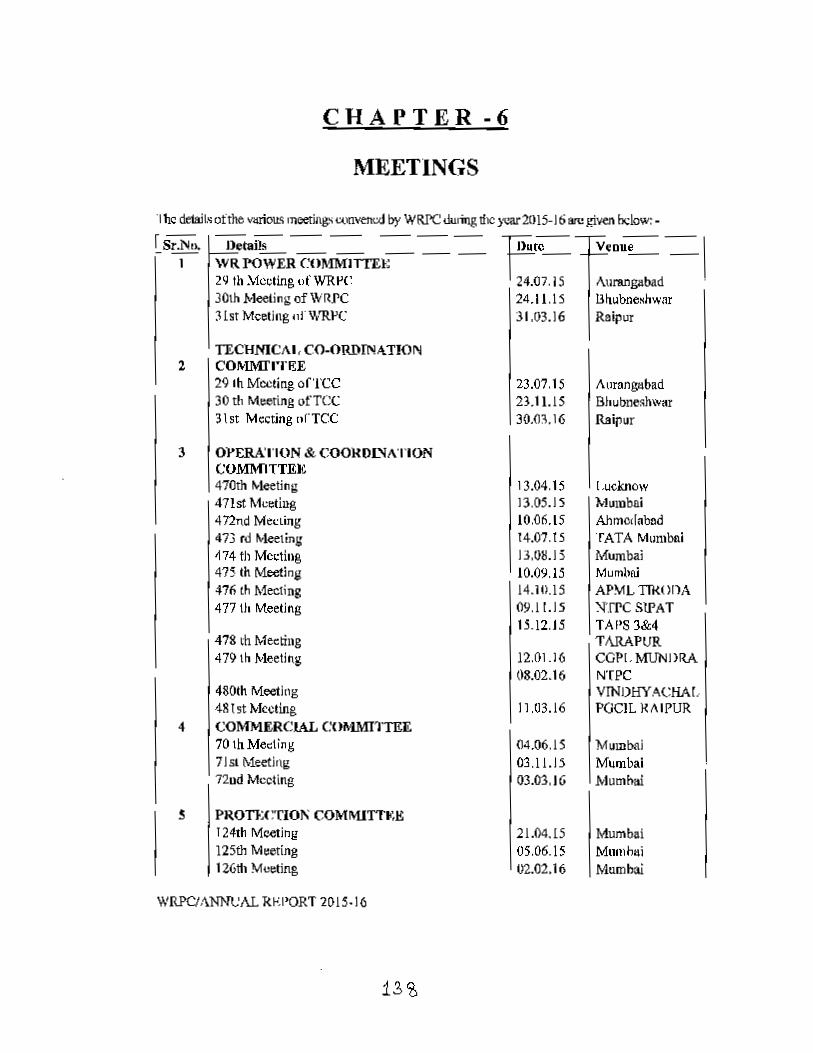
CHAPTER -6
MEETINGS
'Ihe ddail.ofthe ",,"00., meeringsconvencd by WRl'Cdurmg DIeycar2()15-16arul,oiven bclowr-
~Sr.Nt>.Details -=- -=- -=-== lJi!.re veou =\\VR roWER COMMITI'E~ I" ,29 th .'.feeling ufWRI'C 24.07. 15 l\ul1lllpd30th Meeting ofWRJ'C 24.11.15 l3hubile:<hwar3[st Meeting nf\VRI'C 31.03.16 Ralpur
AumngabadBhubneshwarRaipur
TECHNICAl, CO-ORDINATION2 COMMI'I'rll:E
29 IIIMeeting ofTCC30 tit Meeting ofTCC31st Meeting "rTee
23.01.1523.11.1530.03.16
3 Ol'tRATlllN & COOk DL'IATI ONCOMMITTE":470tlt Meeting471st Meeting4nnd Mecung473 rd Meeling~74 th Meeting475 th Meeting476 Ih Meeting477 th Meeting
13.04.15 [~know13.05.15 Mumbai10.06.15 Ahmedabed14.01.15 TATA Mumooi13,OH.15 Mumbai10.09.15 MumOOi14.lU.15 AP~L TlJ{Of)A09.11.15 XrrCSlPATlS.12.15 TAl'S 3&4
TARAPURJ2.(}1.I6 COP!. Ml]NI)RA03.02.16 NTPC
VINI)HYACHAL11.03.16 PGCll }{i\IPUR
04.06.15 MUlDbaJ03.11.15 Mumbai03.03,16 Mumbai
478 In Meeting4791h Meeting
MumbaiMllmhaiMumbai
4&Oth Meeting4815t Meeting
4 COMMERCIAL COMMITTEE70 IIIMeeting7 I SI l\.1eet;'1g720d Meeting
S PROTI;enOJli COMMITTlI,K124th Mcerinl:12Sth Meeting126th ~ceting
21.04. [505.06.1502.02.16
WRPC/ANNt'AL R~:I'ORT 2015.16
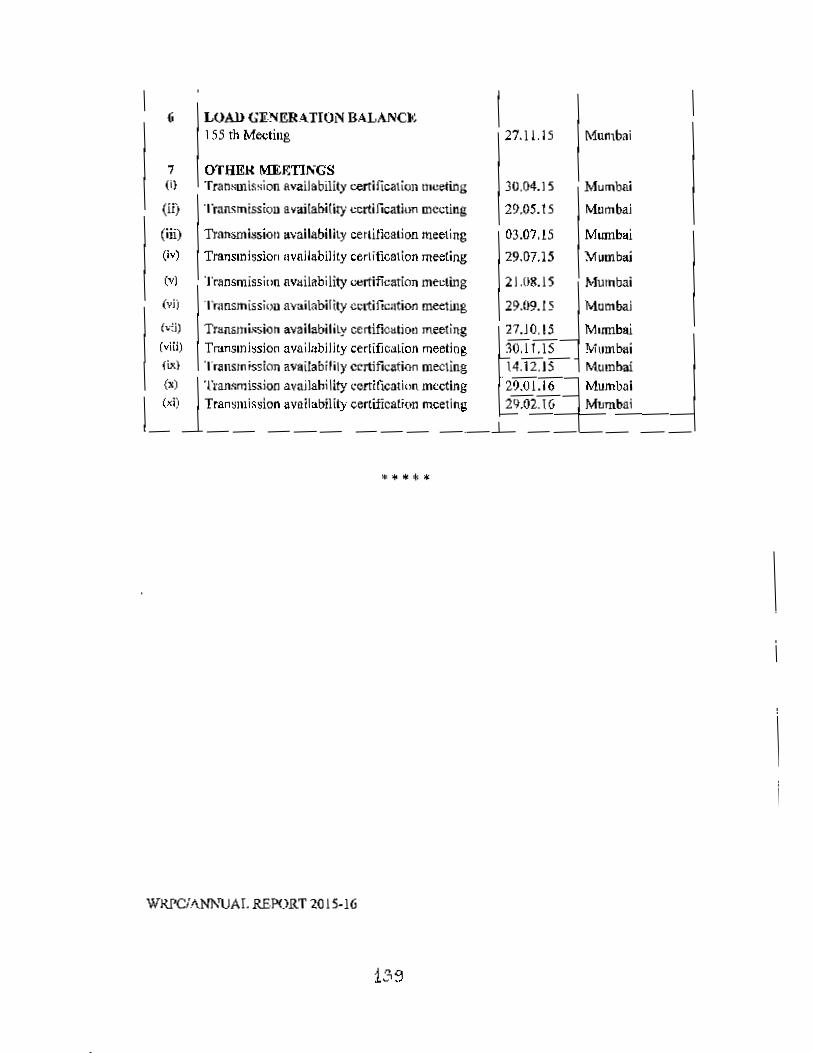
,
MumbaiMumbai
Mumbai"!VIumbai
Mutnbai(vi) Trnnsmissiou availability cCltificlItion meeting 29.09.15 Mambai('~i) Transmission availability certification meeting 27.10.15 Mumbai(viii) Transmlssioo availability unification meeting 30.11.15 Mum""ifix) Transmission availabilily certification meeting Mumbai(~) JTransmiS.ion availability certification meeting 29.01.16 JMumbniI (xi) Transmission availability certifiealion n=ti'lg 29.02.1& M~mc:.ba:..i -I
_ _ ...L __ _ __
WAl> GE~ERAI'ION BALANCJo;155 th Meeting 27.11.IS Mumbai
7 OTaKI(MEmr;GS(i) TranNUlission availability certification meeting(if) Transmissioa availability certification meeting
(in) Transmission availability cetlitlc8lion meeting(iv) Transmission availability CMitlcation meeting
(v) Transmission availability certiflcation meeting
30.04.15
29.05.15
03.07.15
29.07.15
21.0!U5
WRPC!ANNUAL REPORT 20 15-16
\
\
IIII

CHAPTER-7
WIIPC Annual R./JCI·! 201'.14
CHAPTER -7
IMPLElVIENTAT10N OF OFFICIALLANGUAGE POLICY
The Secretarial of Western Regional Power Committee hQ. been making nil out efforts t.oimpJemeru the Official Language Puliey of rhc Govt, of India. The action taken by WRPC,
Mllmbai during the yell!' 20J5-IG for irnplementation of the Official Language Policy arc a.sdetailed ill thix Clmptcr.
7.1 ffiN])1 TRAINING
All the concerned staff lui, been trained in Hindi Jangua.b"" typing & slenogrdJ)hy.ConsequCfttly. this office have been notified in the year 19'f2 in th" Gazette of India under
Rule No. 10(4) of Ofticial T.anguage Rules, 1976 and specific orders are bcinll' issued 'everyy;:ar WIder Kule ~o. 8 (4) ofOL Rules, 1976.
7.2 IMPI.El'<ffiNT ATIO:-l OJ<IlI'FIClAL LANGUAGE POLICY
This o11ke has been alwoys striving 10 implement the Officinll.anguagc Policy of the Govt.of India, Efforts continued during the year 2015·16 alsu in this direction. Accordingly, all
the Office Onk;rs, Circulars etc. were issued bi-lingually. Officillis were encouraged ~ pat
up n()[ings in Hindi lind 5 incentive schemes have been iJUplemonlcti. Entries in all Service
Books nod Reg;~'te)'sere, ore made in Hindi. The Annual Report tor the yea, 2014-15 Wastrans I!ltcd in lIin di
7.3 .\IIRETINGS OF THE OFl<'ICIAL LA:'oIGUAGE IMPLE"U~NTATIONCOMM I'ITEI!. (OI.lC)
tn pursuance of Gov(. of lodia Policy, an Official Language Implementation Committee
(OLlq has been eonstitulcd in this office with \he Member Secretary. WRI'C as its
Olairmun. The Commlttee holds its meeting regularly every quarter. During theyear 2015·16 four meetings of OLiC of the office were held. In these meetings, Ihe
Commiuee revie.....,o progress of implemenlation of "fficj,,1 language. The Committee
discussed and decided the actions to achieve the targets given in Annual Programme,
I~
1.4-6

Incentive Schemes for ~JI'lJring the use of Hindi, action, to observe Hindi Pakhawada and
<:OOducting Hindi Diwas etc.
7.4 INCIt~VF. SCDE.WES
The following Incentive Schemes prescribed by OffICial Language bcpartrn""l, l\.iinistty ofHume Affairs, GOI were implemented in the offioc <luring the year 2015-16:
(i) Incentive Schernc [or Original Hindi NOlini:/Drafiing in official wurk,
(ii) Incentive Scheme for eocouraging officers In give more and mcre uictmion in
Hindi.
In a<i.Jilioo to above, the following schemes have been evolved by the QLle of the office
and implemented:
(i) Small Incentive scheme lor those officers lind .~lalTmembers who d" not iCt
""nogb opporIDnitics to write 20,000 words in a year due to the di fferent natureof tlIeir job.
(ii) Incentive scl>cme to encourage typing iu Hindi on computer.(iii) Incentive scheme tor writing originnl articles for Hindi grub palrika "V"wJbyut
D8J1)AlI".
7.S HIND! I)IWAS & lflNnl FOR.NIGHT
"Hindi Fortnight" was observed in the "mce from 1st Sept. 20t5 to 15""Sept. 2015 and
"Hindi Diw ,,5" was celebrated 011 14.09.2015. Various competitions, nsmely, Tasveer kahndU hai, Cross word, Hindi typing on computer, Hindi Composition (2 groups), HindiComposition- common subjecl for all, Speech in Hindi (2 groups), noting & urailing in
Hindi, ",odin&, dictation & Hindi Knowledge were organized. om"",s and st81T
participated in these coiupetiuons in large number. Tho prize distribution functiu. was hckJ
on 05.II.?'o15. Prizes to the winners were distributed by SI111S D Tsksande, MemberSecretary, WRl'C. AI~o, Prizes were awarded to winners (If five Incentive Schemes
implememed during year 2015-16. A cultural programme was also organized on thi~
occasion in which officers and staff member.' 'lctively participated.
1.4-1.
WlU'C A•••• f lIe{X»11015· 16
7.6 fONllI WORKSJIOPS & TRAINING PROGRAMMF,S
Four Hindi Workshops wen; conducted during the year 20 IS· J 6.
7.7 PARTICiPATION IN MIfJ!:TTNGS OliTOLIC
W1H'C has been actively participating in the activities of Town OfrICIal I.au&uagc
Implementation Committee (I'OLIC). North Mumbai, During the year 2015·IIi, meetings of
TOlle were UT},Wli2cd on 111.08.2015& 24.02.2016. in which 'vie.nbcr Secretary & senior
officers 01 WRPC pal'licirated atongwlth officials of Hindi Section.
7.8 OB'I'IClAL LAl\'GUAGK INSPF.CnON
1. Sansadiya Rajbha..JJaSamiti Inspection was carried IlIJl on 3'" October 2015.
7.9 GHIHPATRIJ(A
Four issues of Hindi Grihpatrika Viuhyut Darpan were published dllring the year2015·16.
7.10 Special Achiewmcnl
During the your 2015-20\6, WIU'C. Mumbai has been awanled whh various awanls in the
field of hnplemcntation of official Jsnguegc:
» This office has been awaroed witb First prize for the year 2012·13 & Socond l'rue forthe year 2013-14" hy the .rOLIC Mumnai for the excellent impkmentation of Official
Lsnguugc Policy .
••••••••••••••••••• 111 •••••••••••••••••••••••••••••••••••••••••••••••••••••
142.
CHAPTER- 8
eH APTER -8
REPORTS
'lbe demiIs uribe \wiru< reports i$.u1 by ""RPC dwing !he ye>tr 20 15-168<U given below: •
~ Monrhly Progress Reports - March 201510 February 2016,
> Load Generauon Balance Report (I,GBR)
(i) ISI"LGBR fOrlhe period from April 2015 toMareh 2016.
(ii) 152'" LGD~ forthe period lrom July 2015 to Match 2016.(iii) 15J'~ H.iBR for the period from October 201; to March '2016,
(iy) 1541hl.Gmt for the period trom January 2t1l5 to MatCh 2016.
) Annual Report rur Ule year 2014·15,
• ,., • II' •
1.4.3
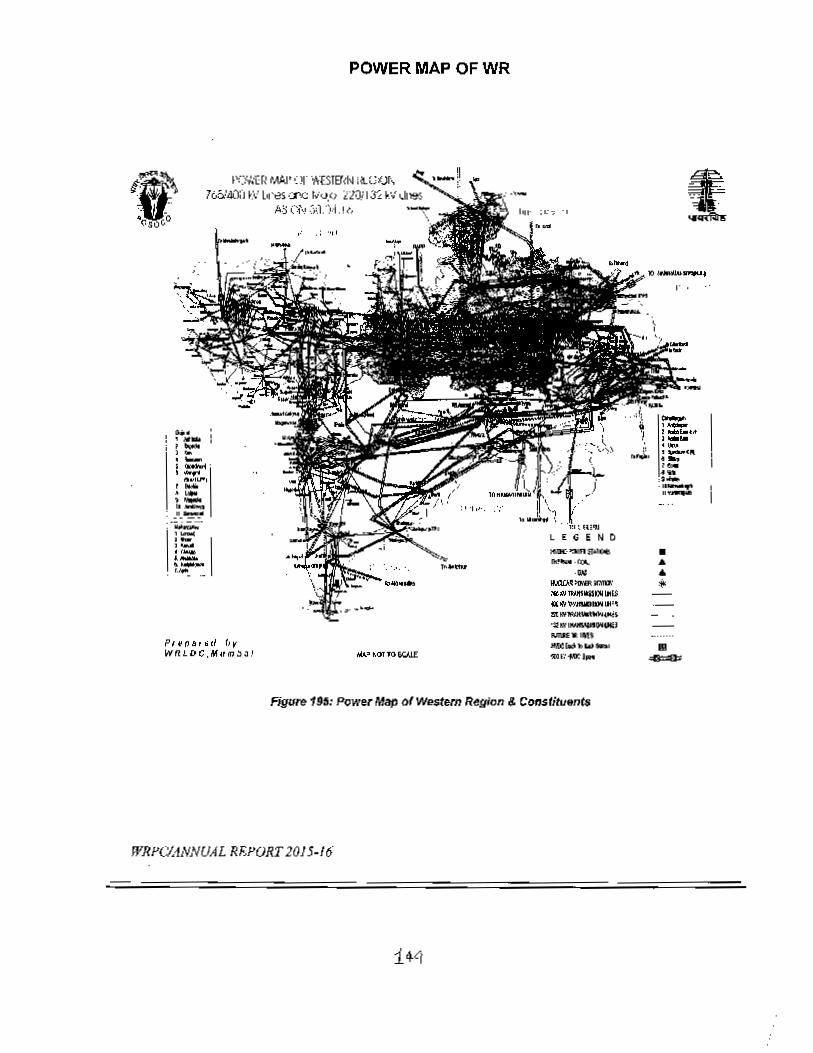
POWER MAP OF WR
p:·)'y' ..j;r~ tMI' ':)r ..."'l::STEr<hJ l<Lt,ix'Jr\7co.'41')j·J~:..·'l"·dS l.:t'(: r.io.() il(lj 13~ ~:.,'",11)9$
A'j (',,"~~.1.-:"1.!(,
,. 0
..., .....,_l~. --,_o._......., .... ....,_"-. _II.~."..~ ..:=- I,_._,-._
• r.a.oo__
P/~fJ.l.d L,.WR10C.M.lDj.3J
Mo1Ii(.~~ •.r ... ·n:.._ ".... ..1MlCA.)tM;R :;r.mJ,' ..*J1J~Wi5""'IIIl$tX~I"'~l'F'IftW~~"'.11' ...,....,._JtltW_ .. ..,.. IISlI:'_J ... -
Figure 19~: Power Map of Western R~gion & COII$,jtuents
WRPCIANNUAL RT>PORT20) 5-16